Embed Size (px)
Citation preview
Research Report DFE-RR169
Class Size and education in England evidence report
Economics, Evaluation and Appraisal Team
Education Standards Analysis and Research Division

The views expressed in this report are the authors’ and do not necessarily reflect those of the Department for Education.
2
Table of contents
EXECUTIVE SUMMARY................................................................................................................................... 1 1 INTRODUCTION ....................................................................................................................................... 4
1.1 DEFINITION AND MEASUREMENT ......................................................................................................... 4 1.2 DEFINITIONS SUMMARY TABLES .......................................................................................................... 7 1.3 CLASS SIZE, PUPIL TEACHER RATIO AND PUPIL ADULT RATIO............................................................. 8 1.4 CURRENT POLICY SITUATION AND BACKGROUND CONTEXT.............................................................. 10
2 POPULATION CHANGES AND CLASS SIZE .................................................................................... 13 2.1 INTRODUCTION ................................................................................................................................... 13 2.2 KEY FINDINGS .................................................................................................................................... 13 2.3 POPULATION CHANGES AT NATIONAL LEVEL..................................................................................... 13 2.4 POPULATION CHANGES AT A REGIONAL LEVEL .................................................................................. 23 2.5 CLASS SIZE AND SUBJECTS ................................................................................................................. 34 2.6 CONCLUSION ...................................................................................................................................... 35
3 IMPACT OF CURRENT LEGISLATION ON CLASS SIZE .............................................................. 36 3.1 INTRODUCTION ................................................................................................................................... 36 3.2 KEY FINDINGS .................................................................................................................................... 36 3.3 AVERAGE CLASS SIZE AND PUPIL TEACHER RATIO (PTR) .................................................................. 37 3.4 CLASSES WITH OVER 30 PUPILS........................................................................................................... 39 3.5 CLASS SIZE DISTRIBUTIONS................................................................................................................. 41 3.6 CONCLUSION ...................................................................................................................................... 45
4 HOW IMPORTANT IS CLASS SIZE? .................................................................................................. 46 4.1 INTRODUCTION ................................................................................................................................... 46 4.2 KEY FINDINGS .................................................................................................................................... 46 4.3 MAJOR STUDIES ON CLASS SIZE ......................................................................................................... 47 4.4 CLASS SIZE, CLASSROOM PROCESSES AND BEHAVIOUR....................................................................... 49 4.5 CLASS SIZE AND ATTAINMENT ............................................................................................................ 50 4.6 IMPACT ON PUPILS FROM DEPRIVED BACKGROUNDS ........................................................................... 52 4.7 IMPACT ON STAYING ON RATES........................................................................................................... 53 4.8 PARENTAL OPINION ON CLASS SIZE ................................................................................................... 53 4.9 IMPACT OF CLASS SIZE REDUCTION POLICIES COMPARED TO OTHER POLICIES AIMED AT IMPROVING ATTAINMENT..................................................................................................................................................... 54 4.10 CONCLUSION ...................................................................................................................................... 55
5 INTERNATIONAL COMPARISONS .................................................................................................... 57 5.1 INTRODUCTION ................................................................................................................................... 57 5.2 KEY FINDINGS .................................................................................................................................... 57 5.3 CLASS SIZE COMPARISONS .................................................................................................................. 58 5.4 CLASS SIZE AND ATTAINMENT ............................................................................................................ 59 5.5 CONCLUSION ...................................................................................................................................... 63
6 CONCLUSION.......................................................................................................................................... 64 BIBLIOGRAPHY ............................................................................................................................................... 65

Executive Summary This report gives an overview of the existing evidence base on class size and education in England. In particular, it considers how class sizes have changed over time; the impact of the increase in birth rate on pupil numbers and how this could affect the teacher requirement and class sizes; and the impact of class size on educational outcomes. The report also considers the impact of the 1998 School Standards and Framework Act1. This put a duty on Local Authorities (LAs) and schools to limit the size of infant classes taught by one teacher to 30 pupils. It became a legal requirement from September 2001. Local authority plans, produced in order to ensure the legal requirement was met, were subject to challenge, approval, intervention when required, funding and monitoring, and held to account against delivery. Overall, the available evidence in 4 (‘How Important is Class Size?’) and 5 (‘International Comparisons’) suggests that class size reduction policies are not the best option in terms of value for money to raising pupil attainment, compared to others such as increasing teacher effectiveness. Broadly evidence suggests that class size reduction policies have an uncertain and diminishing effect on pupil achievement in the long run. There will, however, be increasing demands for primary and secondary school places over the next few years, as the number of children born each year in England has increased each year since 2002, apart from in 2009. The number of births in 2010 was around 20% higher than in 2002 and 13% higher than in 2004 (ONS, 2011a). Whilst the continually falling pupil teacher ratios in independent schools implies there is demand for smaller class sizes in the market for education, while class size is the third most common reason for parents to choose to send their child to an independent school (Ipsos Mori, 2008). The key findings presented in this report are as follows: Section 2 – Population changes on class size • Annual births in England have increased every year since 2002, with the exception of
2009. Births in 2010 were around 20% higher than in 2002 and 13% higher than in 2004.
• Pupil numbers and average class size follow similar trends over time. Therefore the
recent and projected population increases are likely to increase demand for teachers and the number of class rooms, making it more challenging for Local Authorities (LAs) to keep Key Stage 1 classes within the legal limit of 30 pupils per class.
• There is regional variation within the average class size and population projections.
London is expected to experience greater population increases, and thus greatest increased demand for teachers and class rooms than other regions, in particular North East is expected to experience the smallest increase in population.
Section 3 - Impact of current legislation on class size • From 1998 to 2001 there was a fall in the average class size for Key Stage 1. Average
Key Stage 2 class size fell from 1999 to 2011. A fall in pupil numbers during this period coupled with the introduction of legislation and funding to reduce class size in anticipation of the law help explain these falls.
1 http://www.opsi.gov.uk/Acts/acts1998/ukpga_19980031_en_1
1
• The percentage of pupils in classes of over 30 pupils decreased significantly between 1998 and 2002, and has remained very low since 2002. The majority of those classes that are over 30 are lawful, i.e. the circumstances they exceed the 30 limit are permitted. The proportion of pupils in unlawfully large classes has wavered between 0.3% and 0.7% every year since records began in 2006 (Figure 3-5).
• The distribution of Key Stage 1 class sizes has shifted considerably between 1996 and
2002. In 1996, the distribution was approximately centred at 30. By 2002, while 26% of pupils were in classes of 30, very few (1%) were in classes of above 30 (Figure 3-6).
• The fall in the proportion of pupils in classes of over 30, the change in the Key Stage 1
class size distribution, and to some extent, the fall in average Key Stage 1 class size can be attributed to the legal limit of 30 pupils per class and the government funding and LA planning that preceded it. However, the fall in average Key Stage 1 class size was also the result of a fall in pupil numbers during this period.
• Given the projected rises in pupil numbers, the large number of schools with classes of
around 30 could place demands on LAs to ensure that infant class sizes remain within the 30 legal limit. Even in LAs where there continues to be some Key Stage 1 classes with below 30 pupils, a higher proportion of classes are likely to be full to capacity without increases in the number of classes. This could result in a reduction in the proportion of parents getting their child into their first choice of school.
Section 4 – How important is class size? • The evidence base on the link between class size and attainment, taken as a whole,
finds that a smaller class size has a positive impact on attainment and behaviour in the early years of school, but this effect tends to be small and diminishes after a few years.
• Research findings from England show that in smaller classes, individual pupils are the
focus of a teacher’s attention for more time; there is more active interaction between pupils and teachers; and more pupil engagement. In larger classes, there is more time spent by pupils interacting with each other; more time spent by teachers teaching the substantive content of the subject knowledge; and more time spent on non-teaching tasks like taking registers.
• Smaller classes have been found to lead to a small increase the number of years a
student spends in post-compulsory education. A study from Denmark estimated that a reduction in class size during the whole of compulsory schooling by 5% (from an average class size of 18) provides a rise in post-compulsory education by approximately 8 days.
• Research on parental opinion on class size in 1996 found that 96% of parents believed
that the number of children in a class affects the quality of teaching and learning. In the same study teachers and head teachers were also found to consider class size to be an important issue.
• A study by Hattie (2009) found the impact of reducing class size on attainment to be
smaller than the impact of other interventions. Hattie argues that value for money in raising attainment in schools is better achieved through other interventions than class size reduction. This is supported by research from Rivkin et al (2005) which finds that increasing teacher effectiveness has greater value for money than reducing class sizes, while Hanushek (2011) suggests assigning the most effective teachers to the largest classes to maximize the potential economic benefit.
2
Section 5 – International comparisons • The UK has one of the largest average primary school class sizes amongst the
Organisation for Economic Cooperation and Development (OECD) countries (Figure 5-1) but also has one of the highest overall Trends in International Mathematics and Science Study (TIMSS) scores for Science and Maths (Figure 5-3).
• The UK has experienced a fall in average primary school class size from 2000 to 2009
(Figure 5-1). The majority of OECD countries have experienced falls in primary average class size. Average secondary school class size has fallen in the UK since 2004 (Figure 5-2).
• Average primary school class size is more varied between countries than average
secondary school class size. • There is no clear relationship between average primary or secondary school class size
and educational attainment amongst OECD countries.
3

1 Introduction The number of children born each year in England has risen significantly since 2004 and, apart from between 2009 and 2011, is projected to continue rising. Over the next few years this will inevitably increase demand for primary and secondary school places. This report gives an overview of the existing evidence base on class size and education in England. In particular, it considers how class sizes have changed over time; and the impact of the increase in birth rate on pupil numbers and how this could affect the teacher requirement and class sizes; and the impact of class size on educational outcomes. Section 2 contains some background information on pupil numbers and class size. Section 3 looks at the impact of the current legal requirements regarding class size. Section 4 looks at the evidence on the importance of class size in terms of how it affects classroom processes, pupil behaviour and attainment. Section 5 compares average class sizes in the UK with other countries. Some background information on class size, its measurement and the current legislation relating to class size is presented on the next few pages.
A note on the charts in this report Where possible, the charts in this report go back to the same point in time. However, this was not possible for all graphs as limitations in data restricted the choice of start year. All charts represent English maintained schools unless otherwise stated.
1.1 Definition and Measurement There are a number of measurements and definitions associated with class sizes. As with all measurements, there are advantages and disadvantages to using them. 1.1.1 Class size Class size is defined as the number of pupils in a class with one teacher. Average class size represents the average number of pupils being taught by one teacher classes during a single selected period in each school on the day of the Annual School Census in January. It is calculated by dividing the number of pupils being taught by the number of classes, at the time of the Annual School Census in January2. This measurement gives information on the number of classes taught by one or more teachers (Blatchford, 2003). This is in line with OECD definitions of class size3. An advantage of using this measurement is that it provides a useful insight into the average number of pupils in each class. It is also possible to look at the distribution of class sizes, e.g. proportion over a certain size. However, the average class size does not include classes with more than one teacher or take into account of the number of support staff in the classroom. Therefore there could be a seemingly large class of 45 but there may be 2 support staff in the class which would in fact give a Pupil Adult Ratio of 15. 2 Statistics of Education Bulletin: http://www.education.gov.uk/rsgateway/DB/SBU/b000222/b12-2000.pdf 3 http://stats.oecd.org/glossary/detail.asp?ID=5347
4
In secondary schools, class sizes tend to vary by year group, subject and set, and may, for example, be smaller in optional KS4 subjects. The class size experienced by each pupil will therefore vary across their timetable. The class sizes collected in the Schools Census represent a snapshot at one point in time and therefore class size distributions will capture this variation as well as differences between schools. However the average class size is unaffected. The number of children in a class may also fluctuate throughout the year, which affects the class size measurement. This is particularly the case for English Reception classes where children may join at different points in the year, depending on their age. There is therefore likely to be a distinction between the class size measured on the day of the School Census and what is known in the literature as the ‘experienced class size’ (Blatchford, 2003). However, the class size measurement should not be dismissed too easily as this is likely to impact other measurements too. This measurement is particularly useful in providing information on the size of class an average teacher will have to teach and therefore gives an insight into classroom processes. There are also many other additional benefits of the class size measurement over other measurements, which are detailed below. 1.1.2 Pupil Teacher Ratio (PTR) The within-school Pupil Teacher Ratio (PTR) for each stage of schooling (LA maintained nursery, primary and secondary schools) is calculated from the Annual School Census by taking the full-time equivalent number of pupils on roll in schools (where a part-time pupil counts as one half) and dividing it by the full-time equivalent number of qualified teachers regularly employed in schools4 (calculated by looking at the number of hours worked by teachers)5. This measurement describes the total amount of qualified teacher resource per pupil. However, unlike the class size measure it includes all teachers in the school including those who are not classroom teachers: this will include some teachers in leadership positions who may teach very little or at all (as is the case for many headteachers) and other teachers in support roles or providing one-to-one or small group teaching (e.g. SENCOs). 1.1.3 Relationship between class sizes and PTRs Average class sizes are higher than PTRs, because as noted above the PTR calculation includes all teachers employed in schools, not just those teaching classes at the time of the Annual Schools Census count. The ratio of teachers teaching classes to total teacher numbers is known as the “contact ratio” – it can be considered cross-sectionally as the proportion of teachers teaching classes at any point in time, but it also represents the proportion of time an average teacher spends teaching a class across the school week. Class sizes and PTRs often show broadly similar trends over time. However where they move apart, this represents a change in the contact ratio. A reduction in the contact ratio may arise from more teachers being employed in non-classroom roles, or classroom teachers having more non-contact time. These in turn will reflect resource availability and allocation, to the extent that schools spend additional resource in ways other than reducing class size. 4 Full time equivalent teachers are calculated on a pro-rata basis according to the number of hours attended/worked. This will always be the same or less than the headcount which is the total number of pupils/teachers in a school. (OECD comparable) 5 ‘Class size and Pupil Teacher Ratios in Schools in England’ DfES publication 2002: http://www.education.gov.uk/rsgateway/DB/SBU/b000329/index.shtml
5
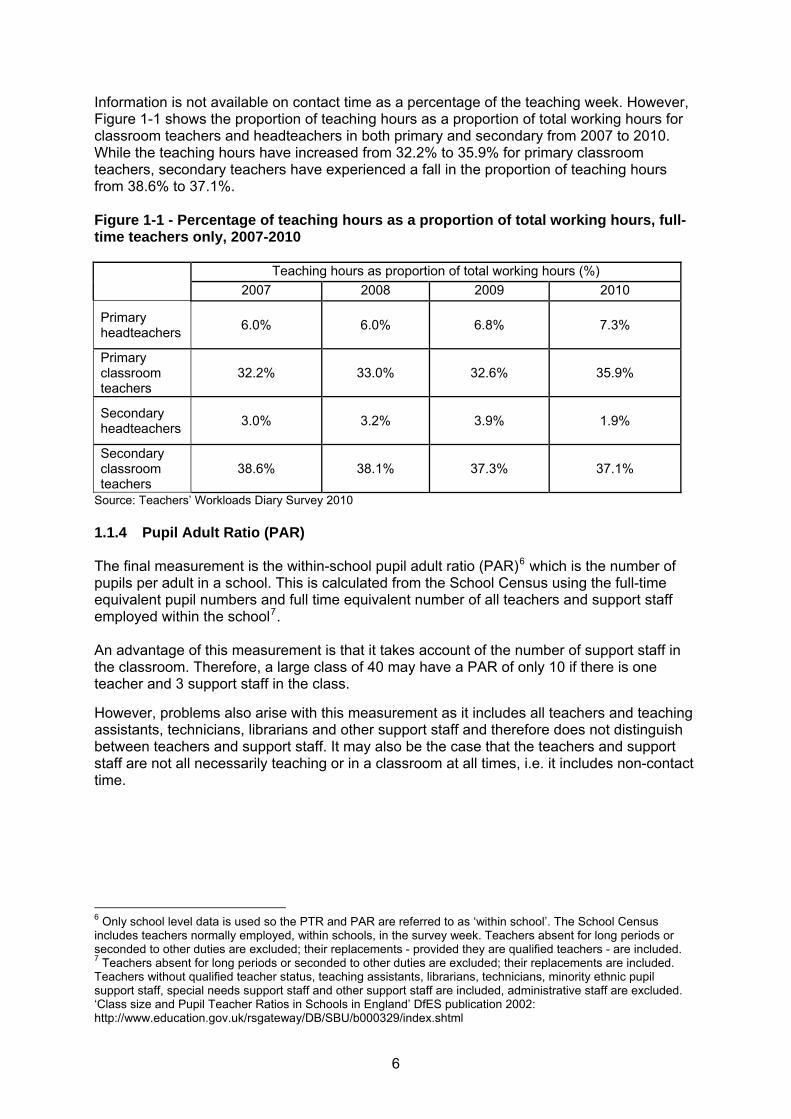
Information is not available on contact time as a percentage of the teaching week. However, Figure 1-1 shows the proportion of teaching hours as a proportion of total working hours for classroom teachers and headteachers in both primary and secondary from 2007 to 2010. While the teaching hours have increased from 32.2% to 35.9% for primary classroom teachers, secondary teachers have experienced a fall in the proportion of teaching hours from 38.6% to 37.1%. Figure 1-1 - Percentage of teaching hours as a proportion of total working hours, full-time teachers only, 2007-2010
Teaching hours as proportion of total working hours (%) 2007 2008 2009 2010
Primary headteachers 6.0% 6.0% 6.8% 7.3%
Primary classroom teachers
32.2% 33.0% 32.6% 35.9%
Secondary headteachers 3.0% 3.2% 3.9% 1.9%
Secondary classroom teachers
38.6% 38.1% 37.3% 37.1%
Source: Teachers’ Workloads Diary Survey 2010 1.1.4 Pupil Adult Ratio (PAR) The final measurement is the within-school pupil adult ratio (PAR)6 which is the number of pupils per adult in a school. This is calculated from the School Census using the full-time equivalent pupil numbers and full time equivalent number of all teachers and support staff employed within the school7. An advantage of this measurement is that it takes account of the number of support staff in the classroom. Therefore, a large class of 40 may have a PAR of only 10 if there is one teacher and 3 support staff in the class. However, problems also arise with this measurement as it includes all teachers and teaching assistants, technicians, librarians and other support staff and therefore does not distinguish between teachers and support staff. It may also be the case that the teachers and support staff are not all necessarily teaching or in a classroom at all times, i.e. it includes non-contact time.
6 Only school level data is used so the PTR and PAR are referred to as ‘within school’. The School Census includes teachers normally employed, within schools, in the survey week. Teachers absent for long periods or seconded to other duties are excluded; their replacements - provided they are qualified teachers - are included. 7 Teachers absent for long periods or seconded to other duties are excluded; their replacements are included. Teachers without qualified teacher status, teaching assistants, librarians, technicians, minority ethnic pupil support staff, special needs support staff and other support staff are included, administrative staff are excluded. ‘Class size and Pupil Teacher Ratios in Schools in England’ DfES publication 2002: http://www.education.gov.uk/rsgateway/DB/SBU/b000329/index.shtml
6
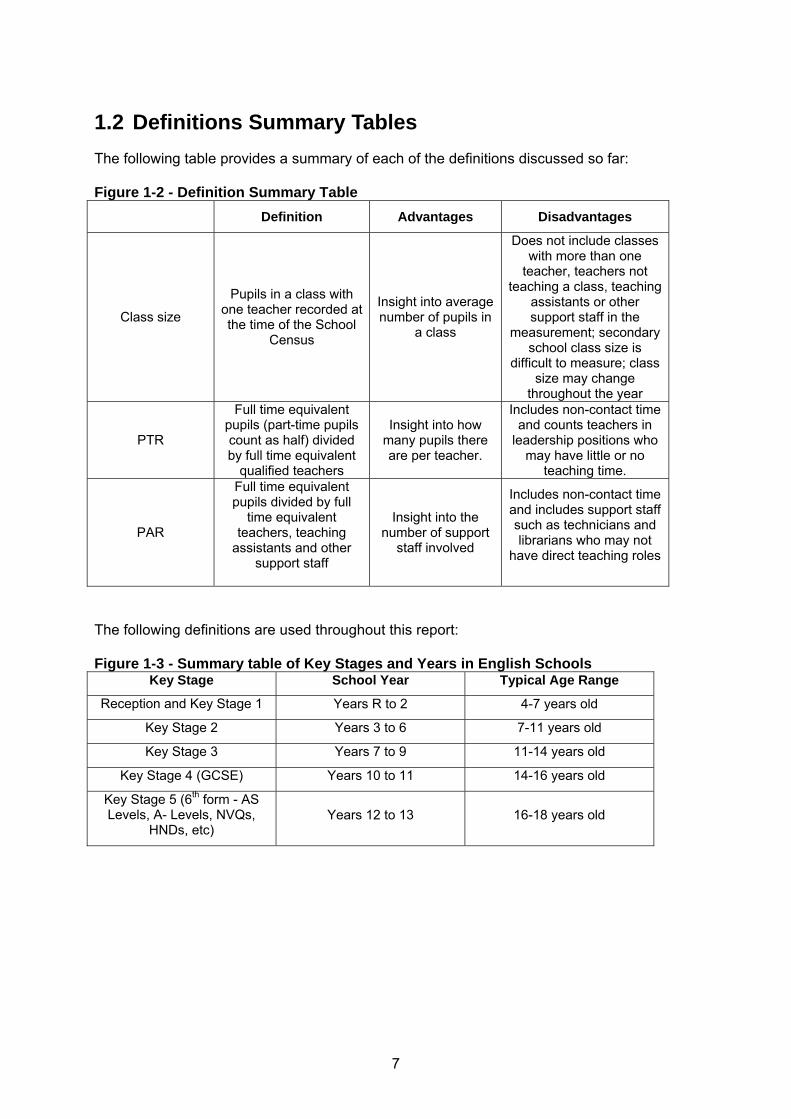
1.2 Definitions Summary Tables The following table provides a summary of each of the definitions discussed so far: Figure 1-2 - Definition Summary Table
Definition Advantages Disadvantages
Class size
Pupils in a class with one teacher recorded at the time of the School
Census
Insight into average number of pupils in
a class
Does not include classes with more than one
teacher, teachers not teaching a class, teaching
assistants or other support staff in the
measurement; secondary school class size is
difficult to measure; class size may change
throughout the year
PTR
Full time equivalent pupils (part-time pupils count as half) divided by full time equivalent
qualified teachers
Insight into how many pupils there are per teacher.
Includes non-contact time and counts teachers in
leadership positions who may have little or no
teaching time.
PAR
Full time equivalent pupils divided by full
time equivalent teachers, teaching
assistants and other support staff
Insight into the number of support
staff involved
Includes non-contact time and includes support staff such as technicians and librarians who may not
have direct teaching roles
The following definitions are used throughout this report: Figure 1-3 - Summary table of Key Stages and Years in English Schools
Key Stage School Year Typical Age Range
Reception and Key Stage 1 Years R to 2 4-7 years old
Key Stage 2 Years 3 to 6 7-11 years old
Key Stage 3 Years 7 to 9 11-14 years old
Key Stage 4 (GCSE) Years 10 to 11 14-16 years old
Key Stage 5 (6th form - AS Levels, A- Levels, NVQs,
HNDs, etc) Years 12 to 13 16-18 years old
7
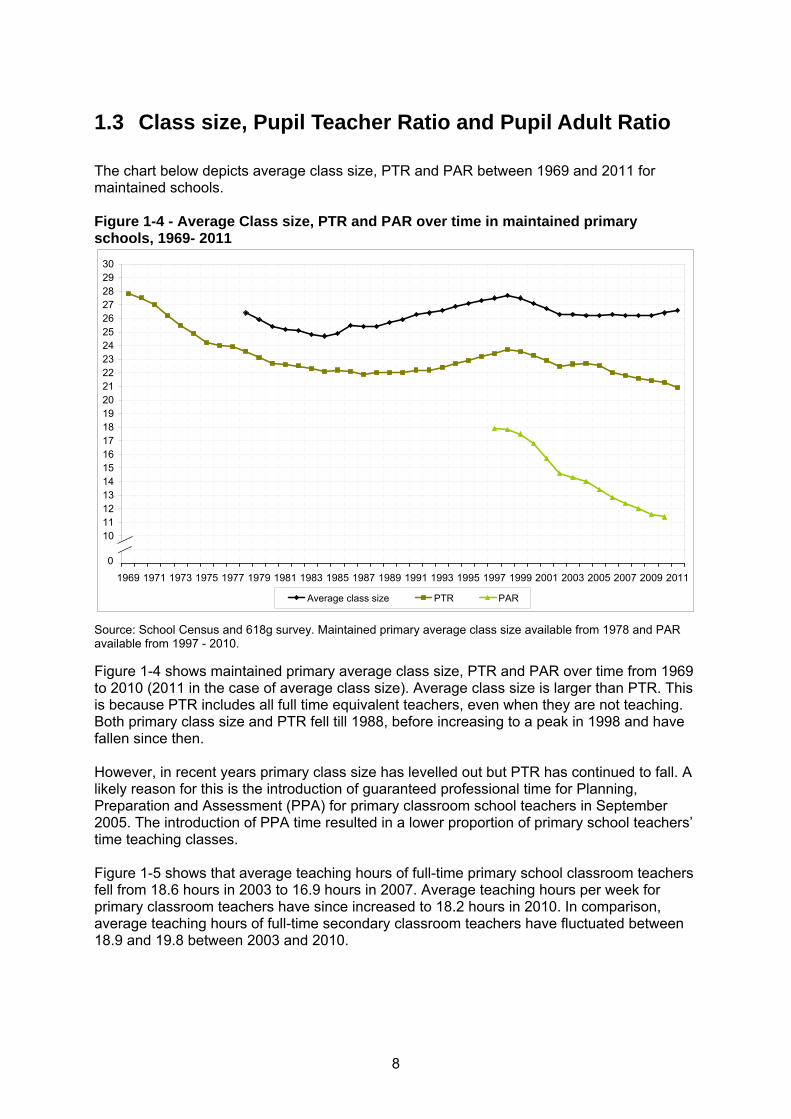
1.3 Class size, Pupil Teacher Ratio and Pupil Adult Ratio The chart below depicts average class size, PTR and PAR between 1969 and 2011 for maintained schools. Figure 1-4 - Average Class size, PTR and PAR over time in maintained primary schools, 1969- 2011
89
101112131415161718192021222324252627282930
1969 1971 1973 1975 1977 1979 1981 1983 1985 1987 1989 1991 1993 1995 1997 1999 2001 2003 2005 2007 2009 2011
Average class size PTR PAR
0
Source: School Census and 618g survey. Maintained primary average class size available from 1978 and PAR available from 1997 - 2010. Figure 1-4 shows maintained primary average class size, PTR and PAR over time from 1969 to 2010 (2011 in the case of average class size). Average class size is larger than PTR. This is because PTR includes all full time equivalent teachers, even when they are not teaching. Both primary class size and PTR fell till 1988, before increasing to a peak in 1998 and have fallen since then. However, in recent years primary class size has levelled out but PTR has continued to fall. A likely reason for this is the introduction of guaranteed professional time for Planning, Preparation and Assessment (PPA) for primary classroom school teachers in September 2005. The introduction of PPA time resulted in a lower proportion of primary school teachers’ time teaching classes. Figure 1-5 shows that average teaching hours of full-time primary school classroom teachers fell from 18.6 hours in 2003 to 16.9 hours in 2007. Average teaching hours per week for primary classroom teachers have since increased to 18.2 hours in 2010. In comparison, average teaching hours of full-time secondary classroom teachers have fluctuated between 18.9 and 19.8 between 2003 and 2010.
8

Figure 1-5 - Average teaching hours8 worked by full-time school classroom teachers in a week, 2003-2010
Average total teaching hours worked per week (average hours worked in one week in March), full-time only
2003 2004 2005 2006 2007 2008 2009 2010 Primary classroom teachers
18.6 (51.8)
18.5 (52.5)
18.1 (50.9)
17.8 (50.1)
16.9 (51.5)
17.7 (52.2)
17.3 (51.2)
18.2 (50.2)
Secondary classroom teachers
19.6 (50.8)
19.4 (49.9)
18.9 (49.3)
19.3 (49.1)
19.5 (48.7)
19.8 (49.9)
19.7 (50.4)
18.9 (49.9)
Source: Teachers’ Workloads Diary Survey 2009 and 2010 NB: Definition of teaching has changed from previous years: some classroom supervision, which was previously included in the teaching codes, is now classified as non-teaching pupil/parent contact Numbers of teaching assistants and other support staff increased after policy changes were introduced to boost the number of support staff in schools. This would explain the falling PAR from 2000 to 2010. Figure 1-6 - Average class size, PTR and PAR over time in maintained secondary schools, 1969-2011
9
10
11
12
13
14
15
16
17
18
19
20
21
22
23
1969 1971 1973 1975 1977 1979 1981 1983 1985 1987 1989 1991 1993 1995 1997 1999 2001 2003 2005 2007 2009 2011
Average class size PTR PAR
0
Source: School Census and 618g survey. Maintained average class sizes available from 1978 and PAR available from 1997 - 2010. State-funded9 secondary schools average class size from 2005. Figure 1-6 shows the average class size, PTR and PAR for maintained secondary schools. Similar to Figure 1-4, PTR is lower than secondary average class size over this period and there is a significant decrease in PAR from 2000 to 2010, due to the increase in the number of support staff in secondary schools. 8 2000 to 2006 definition of teaching hours 9 Includes local authority maintained nursery, primary, secondary, special schools, pupil referral units, city technology colleges, free schools and all academy types.
9

1.4 Current Policy Situation and Background Context 1.4.1 Infant class sizes Ofsted research in 199510 concluded that, given the cost of class size reduction policies, these were unlikely to achieve the educational benefits to be justified, except for earlier years of schooling, while the quality of teaching was the more important factor. This sparked debate from parents, teachers and academics about the importance of reducing class size in schools to influence attainment. This research was influential in determining the then opposition government’s position on infant class sizes and led to the manifesto commitment in 1997. The School Standards and Framework Act111998 introduced a commitment to place an upper limit on infant (Age 4-7: Reception and Key Stage 1) class sizes of a maximum 30 pupils per teacher. This put a duty on Local Authorities and schools to limit the size of infant classes taught by one teacher to 30 pupils. This became a legal requirement from September 2001. Local authority plans, produced in order to ensure the legal requirement was met, were subject to challenge, approval, intervention when required, funding and monitoring, and held to account against delivery. Permitted exceptions to the 30 maximum The legal class size limit has a number of exceptions to allow some schools to have classes above the maximum in certain permitted circumstances. The class size legislation makes allowance for the entry of an additional child in very limited circumstances, where not to admit the child would be prejudicial to his or her interests (‘excepted pupils’). However, every effort must be made to keep over large classes to a minimum. These circumstances are where: a) children with statements of special educational needs are admitted to the school
outside the normal admissions round; b) children move into the area outside the normal admissions round for whom there is no
other available school within reasonable distance (admission authorities must check with Local Authorities before determining that a child falls into this category);
c) children admitted, after initial allocation of places on the local offer date, because the
person responsible for making the original decision recognises that an error was made in implementing the school’s admission arrangements and that a place ought to have been offered;
d) children in care admitted outside the normal admissions round; e) children admitted where an independent appeal panel upholds an appeal on the
grounds that the child would have been offered a place if the admission arrangements had been properly implemented, and/or the admission authority’s decision to refuse a place was not one which a reasonable admission authority would have made in the circumstances of the case;
f) children are registered pupils at special schools and by arrangement with another
school which is not a special school, receive part of their education at that other school;
10 Ofsted (1995) ‘Class size and the quality of education’ 11 http://www.opsi.gov.uk/Acts/acts1998/ukpga_19980031_en_1
10

g) and, children with special education needs who are registered pupils at a school which
is not a special school and are normally educated in a special educational needs unit attached to that school, and attend, an infant class in the school (i.e. not in the unit), where this has been deemed as beneficial to the child.
In the case of f) and g), the child will remain an exception for any time they spend in an infant class at the mainstream school or outside the special educational needs unit. In all other circumstances the child will only remain an exception for the remainder of the school year in which they were admitted. Measures must be taken for the following year to ensure that the class falls within the infant class size limit12. Class size and school places Local Authorities are responsible for balancing the supply of places in their area, to ensure schools serve the needs of their local communities and provide good quality education in the most cost effective way. During periods of falling pupil numbers, local authorities have been encouraged to remove surplus places. 1.4.2 Other policies and class size A number of other policies may have an influence on class sizes School funding Pupil-teacher ratios depend largely on the extent to which the resources available to schools move in line with changes to pupil numbers, since teaching staff costs represent a large proportion of school expenditure. If funding does not keep pace with increases in the pupil population, PTRs tend to increase, and class sizes also tend to increase unless contact ratios can be raised. Non-contact time and workload agreement From 2005 the teacher workload agreement guaranteed primary classroom teachers 10% of their classroom time free for planning, preparation and assessment (PPA). This led to a divergence between PTRs and class sizes in primary schools, with average class sizes remaining static while PTRs fell, indicating a rise in FTE teacher numbers as some schools took on additional staff to cover PPA. Other changes to contact ratios, such as changes to the number of teachers in leadership roles, may also affect class sizes. Teacher vacancies/teacher recruitment and retention Projected future changes in the population of school pupils will place greater demand on teacher numbers. If a sufficient supply of teachers is not available to fill posts, class sizes and PTRs may increase. Conversely during periods when pupil numbers fall and therefore aggregate funding has started to fall, it has taken some time for these trends to be reflected in teacher numbers. Classroom availability With projected rising pupil numbers, more classrooms may be needed if current class size limits are to be adhered to.
12 http://media.education.gov.uk/assets/files/pdf/m/managing%20compliance.pdf
11
Early Years Current regulations for staff working in early years settings are set out in the Early Years Foundation Stage (EYFS)13. The ratio requirements set out the minimum numbers of staff that must be present with the children at any time. It may, according to circumstances, be necessary to exceed these minimum requirements. The provider should consider at all times whether there is adequate supervision of children and ensure that the needs of the individual children being cared for are met. The ratio requirements are dependent on the type of setting, the age of the children and the qualifications of the staff and are set out in full on page 49 of Appendix 2. On 30 March 2011 Dame Clare Tickell, Chief Executive of Action for Children, launched the report of her independent review of the EYFS. Dame Clare's report included recommendations on current ratios requirements, including one on appropriate ratios during reception classes14. Ministers are currently considering Dame Clare's recommendations and will consult on any changes they would like to make to the EYFS statutory framework and legislation.
13 http://www.education.gov.uk/childrenandyoungpeople/earlylearningandchildcare/a0068102/early-years-foundation-stage-eyfs 14 http://media.education.gov.uk/MediaFiles/B/1/5/%7BB15EFF0D-A4DF-4294-93A1-1E1B88C13F68%7DTickell%20review.pdf (see paragraphs 4.10 - 4.13, pg 39)
12

2 Population Changes and Class Size
2.1 Introduction This section assesses population changes and their impact on class size. We consider population changes at national and regional levels, and changes in class size.
2.2 Key Findings • Annual births in England have increased every year since 2002, with the exception of
2009. Births in 2010 were around 20% higher than in 2002 and 13% higher than in 2004.
• Pupil numbers and average class size follow similar trends over time. Therefore the
recent and projected population increases are likely to increase demand for teachers and the number of class rooms, making it more challenging for Local Authorities (LAs) to keep Key Stage 1 classes within the legal limit of 30 pupils per class.
• There is regional variation within the average class size and population projections.
London is expected to experience greater population increases, and thus greatest increased demand for teachers and class rooms than other regions, in particular North East is expected to experience the smallest increase in population.
2.3 Population Changes at National Level 2.3.1 Historical Birth Rate and School aged children population projections Live births Births are a key driver of the school-aged population therefore to assess the population changes impacting on class size, it is necessary to consider how annual birth rates have changed over time.
13
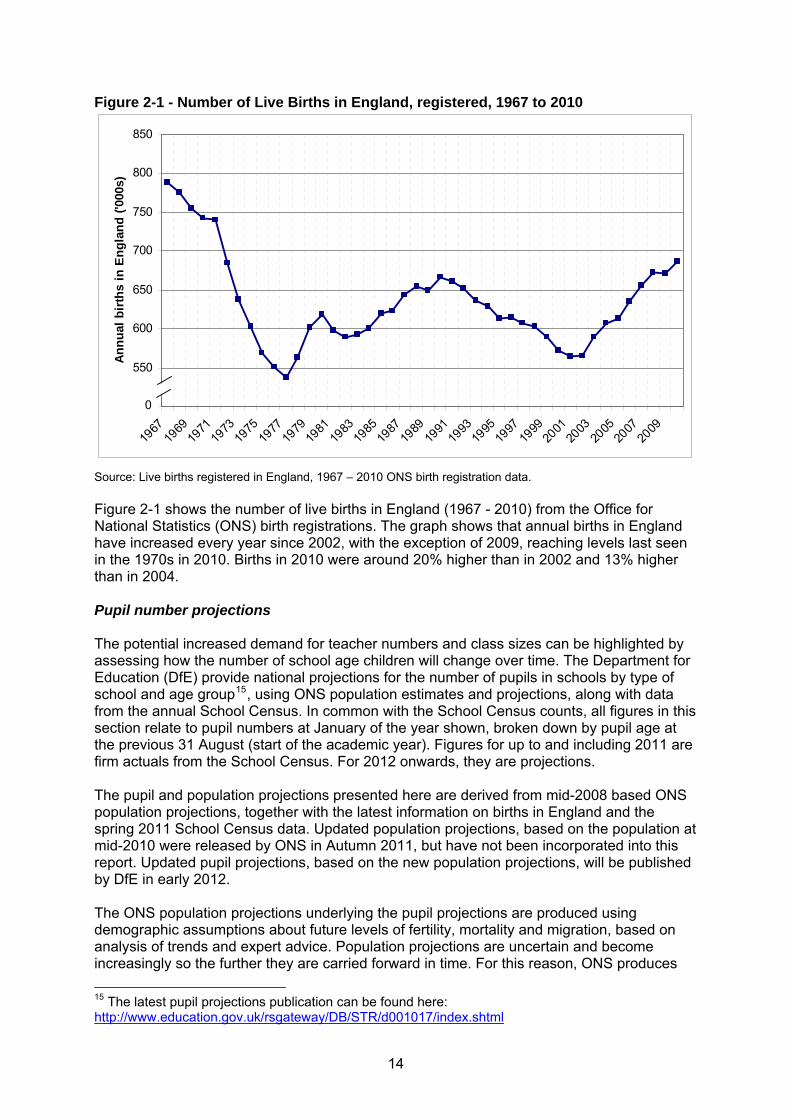
Figure 2-1 - Number of Live Births in England, registered, 1967 to 2010
500
550
600
650
700
750
800
850
1967
1969
1971
1973
1975
1977
1979
1981
1983
1985
1987
1989
1991
1993
1995
1997
1999
2001
2003
2005
2007
2009
Annu
al b
irths
in E
ngla
nd ('
000s
)
0
Source: Live births registered in England, 1967 – 2010 ONS birth registration data. Figure 2-1 shows the number of live births in England (1967 - 2010) from the Office for National Statistics (ONS) birth registrations. The graph shows that annual births in England have increased every year since 2002, with the exception of 2009, reaching levels last seen in the 1970s in 2010. Births in 2010 were around 20% higher than in 2002 and 13% higher than in 2004. Pupil number projections The potential increased demand for teacher numbers and class sizes can be highlighted by assessing how the number of school age children will change over time. The Department for Education (DfE) provide national projections for the number of pupils in schools by type of school and age group15, using ONS population estimates and projections, along with data from the annual School Census. In common with the School Census counts, all figures in this section relate to pupil numbers at January of the year shown, broken down by pupil age at the previous 31 August (start of the academic year). Figures for up to and including 2011 are firm actuals from the School Census. For 2012 onwards, they are projections. The pupil and population projections presented here are derived from mid-2008 based ONS population projections, together with the latest information on births in England and the spring 2011 School Census data. Updated population projections, based on the population at mid-2010 were released by ONS in Autumn 2011, but have not been incorporated into this report. Updated pupil projections, based on the new population projections, will be published by DfE in early 2012. The ONS population projections underlying the pupil projections are produced using demographic assumptions about future levels of fertility, mortality and migration, based on analysis of trends and expert advice. Population projections are uncertain and become increasingly so the further they are carried forward in time. For this reason, ONS produces 15 The latest pupil projections publication can be found here: http://www.education.gov.uk/rsgateway/DB/STR/d001017/index.shtml
14
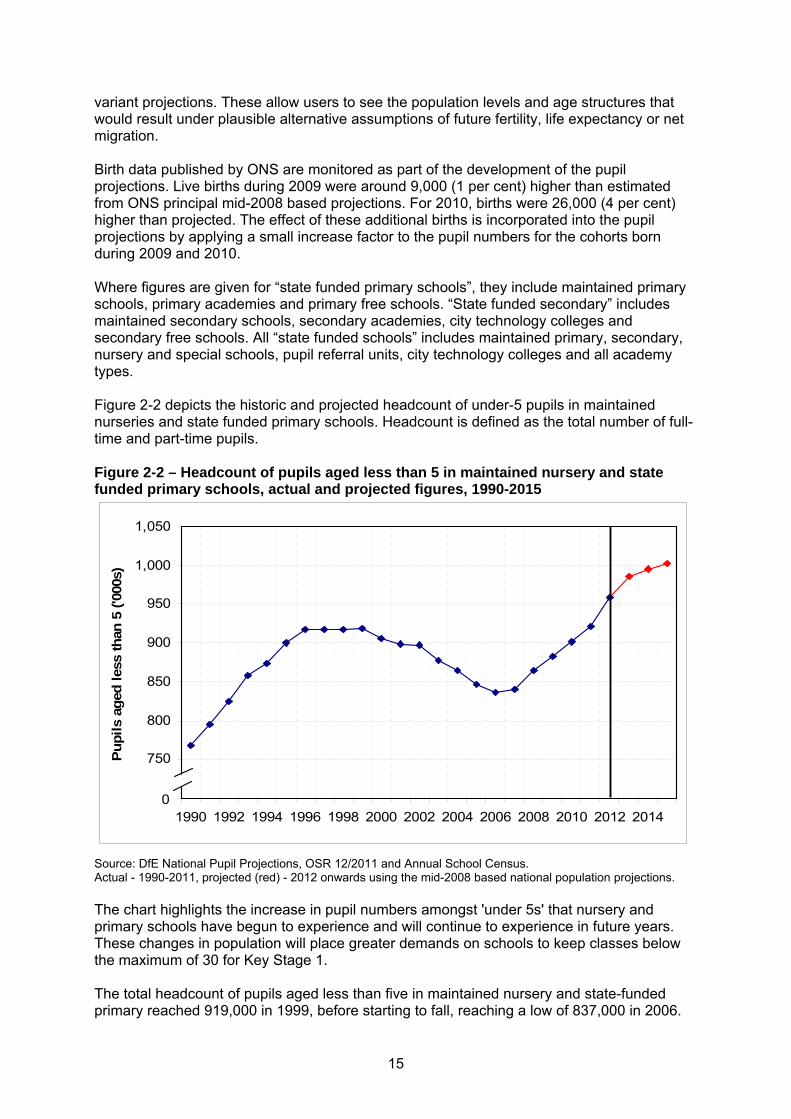
variant projections. These allow users to see the population levels and age structures that would result under plausible alternative assumptions of future fertility, life expectancy or net migration. Birth data published by ONS are monitored as part of the development of the pupil projections. Live births during 2009 were around 9,000 (1 per cent) higher than estimated from ONS principal mid-2008 based projections. For 2010, births were 26,000 (4 per cent) higher than projected. The effect of these additional births is incorporated into the pupil projections by applying a small increase factor to the pupil numbers for the cohorts born during 2009 and 2010. Where figures are given for “state funded primary schools”, they include maintained primary schools, primary academies and primary free schools. “State funded secondary” includes maintained secondary schools, secondary academies, city technology colleges and secondary free schools. All “state funded schools” includes maintained primary, secondary, nursery and special schools, pupil referral units, city technology colleges and all academy types. Figure 2-2 depicts the historic and projected headcount of under-5 pupils in maintained nurseries and state funded primary schools. Headcount is defined as the total number of full-time and part-time pupils. Figure 2-2 – Headcount of pupils aged less than 5 in maintained nursery and state funded primary schools, actual and projected figures, 1990-2015
700
750
800
850
900
950
1,000
1,050
1990 1992 1994 1996 1998 2000 2002 2004 2006 2008 2010 2012 2014
Pup
ils a
ged
less
than
5 ('
000s
)
0
Source: DfE National Pupil Projections, OSR 12/2011 and Annual School Census. Actual - 1990-2011, projected (red) - 2012 onwards using the mid-2008 based national population projections. The chart highlights the increase in pupil numbers amongst 'under 5s' that nursery and primary schools have begun to experience and will continue to experience in future years. These changes in population will place greater demands on schools to keep classes below the maximum of 30 for Key Stage 1. The total headcount of pupils aged less than five in maintained nursery and state-funded primary reached 919,000 in 1999, before starting to fall, reaching a low of 837,000 in 2006.
15
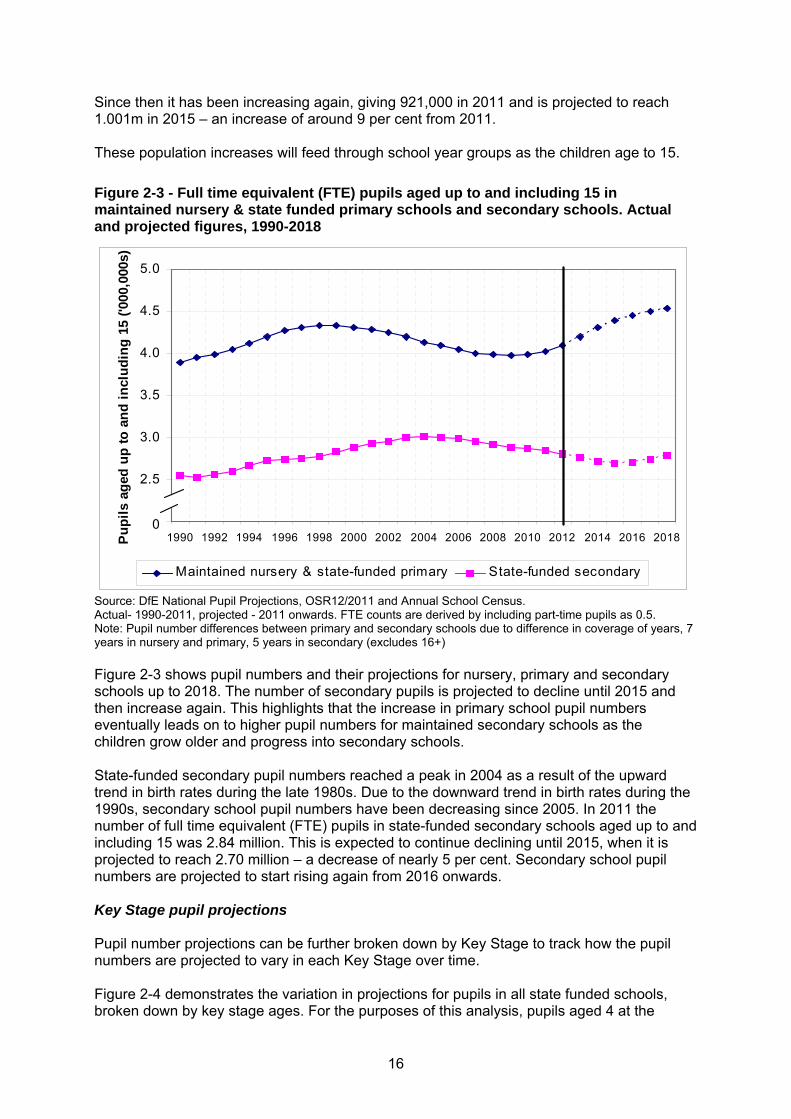
Since then it has been increasing again, giving 921,000 in 2011 and is projected to reach 1.001m in 2015 – an increase of around 9 per cent from 2011. These population increases will feed through school year groups as the children age to 15.
Figure 2-3 - Full time equivalent (FTE) pupils aged up to and including 15 in maintained nursery & state funded primary schools and secondary schools. Actual and projected figures, 1990-2018
2.0
2.5
3.0
3.5
4.0
4.5
5.0
1990 1992 1994 1996 1998 2000 2002 2004 2006 2008 2010 2012 2014 2016 2018Pupi
ls a
ged
up to
and
incl
udin
g 15
('00
0,00
0s)
Maintained nursery & state-funded primary State-funded secondary
0
Source: DfE National Pupil Projections, OSR12/2011 and Annual School Census. Actual- 1990-2011, projected - 2011 onwards. FTE counts are derived by including part-time pupils as 0.5. Note: Pupil number differences between primary and secondary schools due to difference in coverage of years, 7 years in nursery and primary, 5 years in secondary (excludes 16+) Figure 2-3 shows pupil numbers and their projections for nursery, primary and secondary schools up to 2018. The number of secondary pupils is projected to decline until 2015 and then increase again. This highlights that the increase in primary school pupil numbers eventually leads on to higher pupil numbers for maintained secondary schools as the children grow older and progress into secondary schools. State-funded secondary pupil numbers reached a peak in 2004 as a result of the upward trend in birth rates during the late 1980s. Due to the downward trend in birth rates during the 1990s, secondary school pupil numbers have been decreasing since 2005. In 2011 the number of full time equivalent (FTE) pupils in state-funded secondary schools aged up to and including 15 was 2.84 million. This is expected to continue declining until 2015, when it is projected to reach 2.70 million – a decrease of nearly 5 per cent. Secondary school pupil numbers are projected to start rising again from 2016 onwards. Key Stage pupil projections Pupil number projections can be further broken down by Key Stage to track how the pupil numbers are projected to vary in each Key Stage over time. Figure 2-4 demonstrates the variation in projections for pupils in all state funded schools, broken down by key stage ages. For the purposes of this analysis, pupils aged 4 at the
16

previous 31 August are included with key stage 1 and therefore this category covers ages 4 - 6; Key Stage 2 covers ages 7-10; Key Stage 3 covers aged 11-13; and Key Stage 4 is for ages 14 -15. All ages refer to age as at previous 31 August. Figure 2-4 - FTE pupil projections by Key Stage age group 1990-2015
750
950
1,150
1,350
1,550
1,750
1,950
2,150
2,350
2,550
1990 1992 1994 1996 1998 2000 2002 2004 2006 2008 2010 2012 2014
FTE
Pupi
ls ('
000s
)
Key stage 1 & 4 year olds Key stage 2 ages Key stage 3 ages Key stage 4 ages
0
Source: DfE National Pupil Projections, OSR 12/2011 and Annual School Census. Actual - 1999-2011, Projected - 2012 onwards. Includes pupils in all state funded schools. Note: Differences between Key Stages are due to differences in age coverage, Key Stage 1 & 4 year olds includes 3 school years, Key Stage 2 covers 4 school years etc. The chart demonstrates the projected increase in pupil numbers and how it feeds through the Key Stages. Key Stage 1 is already experiencing an increase, projected to continue to 2015. Key Stage 2 numbers will increase from 2011. Pupil numbers feed through the different Key Stages over time with Key Stage 3 not projected to increase before 2014. 2.3.2 Changes in pupil numbers, class size and PTR In the charts below, historical data is used to look at how changes in pupil numbers have related to changes in average class size and the Pupil Teacher Ratio (PTR) . Pupil numbers and class size at Key Stages 1 and 2 Figure 2-5 shows the number and the year on year changes in class size and pupil numbers over time for Key Stage 1 and 4 year olds between 1996 and 2011.
17

Figure 2-5 - Number of (FTE) pupils and average class size at Key Stage 1 & 4 year olds - 1996 to 2011
1,500
1,600
1,700
1,800
1,900
2,000
1996 1998 2000 2002 2004 2006 2008 2010
Pup
il nu
mbe
rs ('
000s
)
22.5
23.5
24.5
25.5
26.5
27.5
28.5
29.5
Ave
rage
cla
ss s
ize
Pupil numbers Average class size
0 0
Source: DfE National Pupil Projections, OSR 12/2011 and Annual School Census. Includes pupils in all state funded schools. Note: Differences between Key Stages are due to differences in age coverage, Key Stage 1 & 4 year olds includes 3 school years, Key Stage 2 covers 4 school years etc. The fall in Key Stage 1 and 4 year old pupil numbers from 1997 to 2007 corresponds to a fall in average class size over this period. After peaking in 1998, average class sizes fell at a slightly faster rate than the pupils number until 2001. However, while pupil numbers continued to fall, average class size increased slightly until 2004 and stayed roughly the same until 2007. From 2007, both pupil numbers and average class size have been increasing in conjunction.
18

Figure 2-6 - Number of (FTE) pupils and average class size at Key Stage 2 - 1996 to 2011
2,000
2,050
2,100
2,150
2,200
2,250
2,300
2,350
2,400
2,450
2,500
1996 1998 2000 2002 2004 2006 2008 2010
Pup
il nu
mbe
rs ('
000s
)
24
25
26
27
28
29
30
Ave
rage
cla
ss s
ize
Pupil numbers Average class size
0 0
Source: DfE National Pupil Projections, OSR 12/2011 and Annual School Census. Includes pupils in all state funded schools. Note: Differences between Key Stages are due to differences in age coverage, Key Stage 1 & 4 year olds includes 3 school years, Key Stage 2 covers 4 school years etc. Figure 2-6 shows that Key Stage 2 pupil numbers and class size also follow similar trends. From 1999 till 2001, average class size fell in relation to the number of pupils. From 2002 onwards, this relationship changed, with pupil numbers falling at a higher rate than falls in average class size. As with Key Stage 1, the real driver behind changing average class size at Key Stage 2 seems to be changes in pupil numbers. Pupil numbers and average class size in primary and secondary schools Figure 2-7 depicts the pupil numbers and average class size between 1979 and 2011. Data are available from further back in time than for Key Stage 1 and Key Stage 2, so it is possible to look at longer term trends.
19
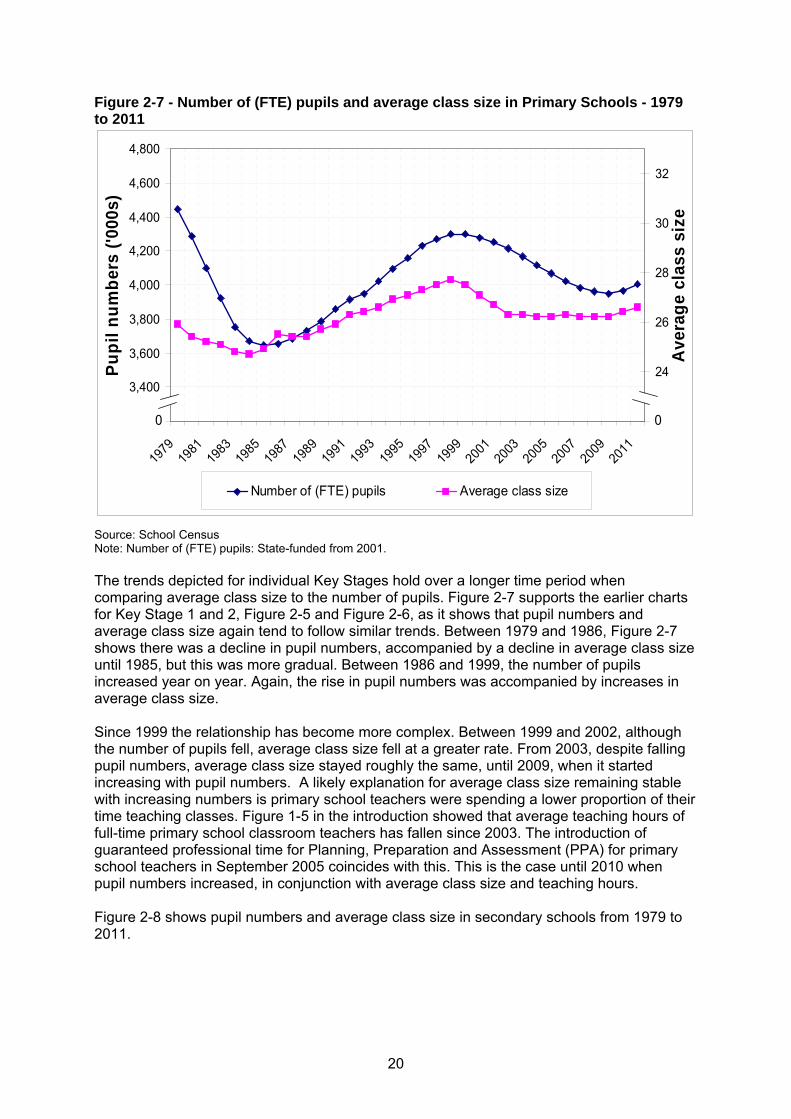
Figure 2-7 - Number of (FTE) pupils and average class size in Primary Schools - 1979 to 2011
3,200
3,400
3,600
3,800
4,000
4,200
4,400
4,600
4,800
1979
1981
1983
1985
1987
1989
1991
1993
1995
1997
1999
2001
2003
2005
2007
2009
2011
Pupi
l num
bers
('00
0s)
22
24
26
28
30
32
Ave
rage
cla
ss s
ize
Number of (FTE) pupils Average class size
0 0
Source: School Census Note: Number of (FTE) pupils: State-funded from 2001. The trends depicted for individual Key Stages hold over a longer time period when comparing average class size to the number of pupils. Figure 2-7 supports the earlier charts for Key Stage 1 and 2, Figure 2-5 and Figure 2-6, as it shows that pupil numbers and average class size again tend to follow similar trends. Between 1979 and 1986, Figure 2-7 shows there was a decline in pupil numbers, accompanied by a decline in average class size until 1985, but this was more gradual. Between 1986 and 1999, the number of pupils increased year on year. Again, the rise in pupil numbers was accompanied by increases in average class size. Since 1999 the relationship has become more complex. Between 1999 and 2002, although the number of pupils fell, average class size fell at a greater rate. From 2003, despite falling pupil numbers, average class size stayed roughly the same, until 2009, when it started increasing with pupil numbers. A likely explanation for average class size remaining stable with increasing numbers is primary school teachers were spending a lower proportion of their time teaching classes. Figure 1-5 in the introduction showed that average teaching hours of full-time primary school classroom teachers has fallen since 2003. The introduction of guaranteed professional time for Planning, Preparation and Assessment (PPA) for primary school teachers in September 2005 coincides with this. This is the case until 2010 when pupil numbers increased, in conjunction with average class size and teaching hours. Figure 2-8 shows pupil numbers and average class size in secondary schools from 1979 to 2011.
20
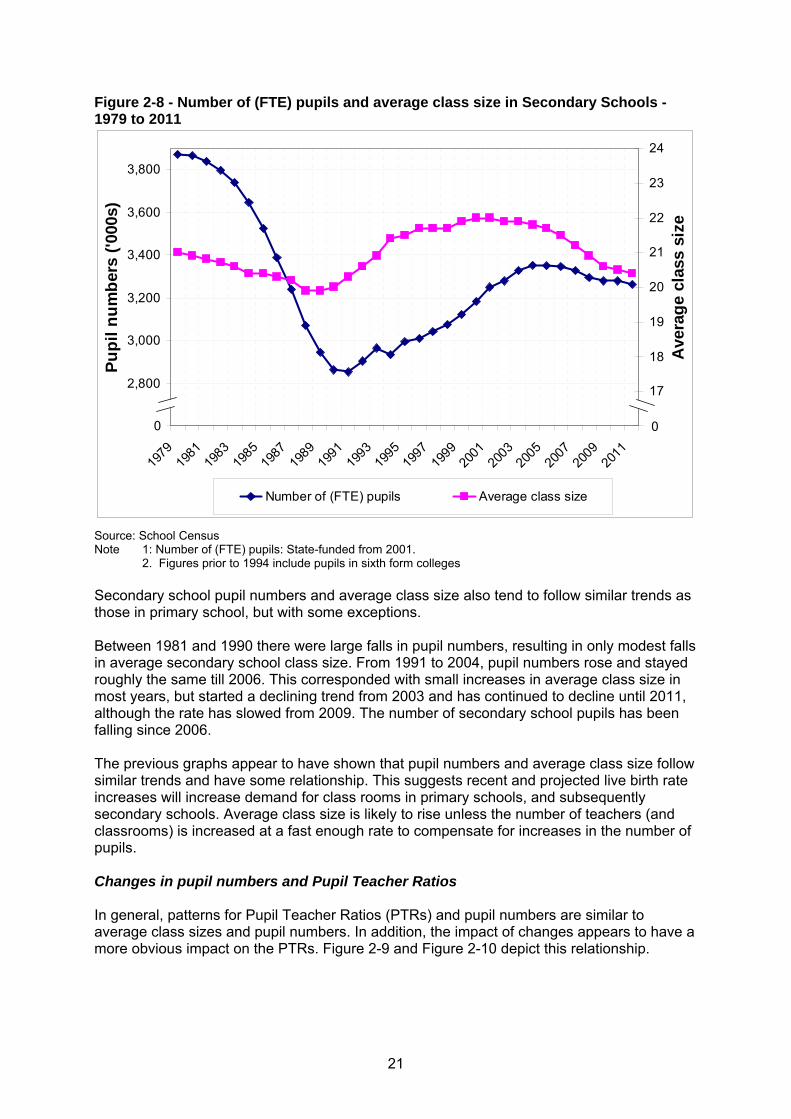
Figure 2-8 - Number of (FTE) pupils and average class size in Secondary Schools - 1979 to 2011
2,600
2,800
3,000
3,200
3,400
3,600
3,800
1979
1981
1983
1985
1987
1989
1991
1993
1995
1997
1999
2001
2003
2005
2007
2009
2011
Pupi
l num
bers
('00
0s)
16
17
18
19
20
21
22
23
24
Ave
rage
cla
ss s
ize
Number of (FTE) pupils Average class size
0 0
Source: School Census Note 1: Number of (FTE) pupils: State-funded from 2001.
2. Figures prior to 1994 include pupils in sixth form colleges Secondary school pupil numbers and average class size also tend to follow similar trends as those in primary school, but with some exceptions. Between 1981 and 1990 there were large falls in pupil numbers, resulting in only modest falls in average secondary school class size. From 1991 to 2004, pupil numbers rose and stayed roughly the same till 2006. This corresponded with small increases in average class size in most years, but started a declining trend from 2003 and has continued to decline until 2011, although the rate has slowed from 2009. The number of secondary school pupils has been falling since 2006. The previous graphs appear to have shown that pupil numbers and average class size follow similar trends and have some relationship. This suggests recent and projected live birth rate increases will increase demand for class rooms in primary schools, and subsequently secondary schools. Average class size is likely to rise unless the number of teachers (and classrooms) is increased at a fast enough rate to compensate for increases in the number of pupils. Changes in pupil numbers and Pupil Teacher Ratios In general, patterns for Pupil Teacher Ratios (PTRs) and pupil numbers are similar to average class sizes and pupil numbers. In addition, the impact of changes appears to have a more obvious impact on the PTRs. Figure 2-9 and Figure 2-10 depict this relationship.
21
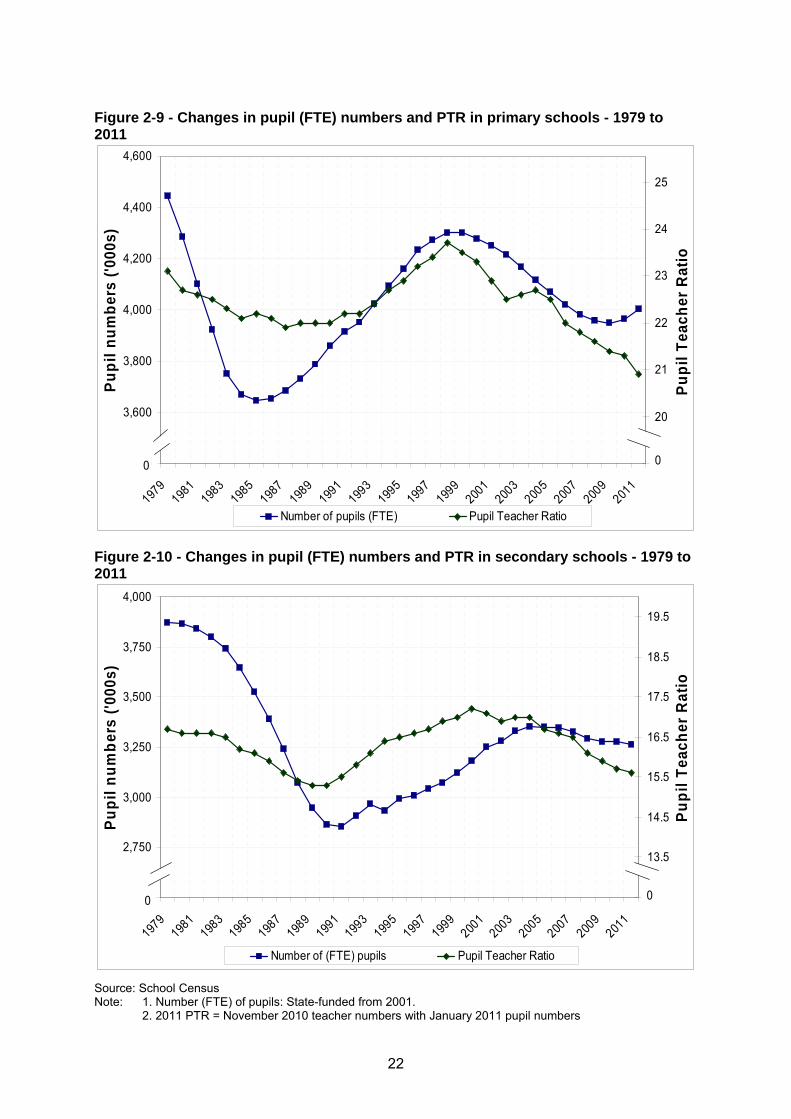
Figure 2-9 - Changes in pupil (FTE) numbers and PTR in primary schools - 1979 to 2011
3,400
3,600
3,800
4,000
4,200
4,400
4,600
1979
1981
1983
1985
1987
1989
1991
1993
1995
1997
1999
2001
2003
2005
2007
2009
2011
Pupi
l num
bers
('00
0s)
19
20
21
22
23
24
25
Pupi
l Tea
cher
Rat
io
Number of pupils (FTE) Pupil Teacher Ratio
0 0
Figure 2-10 - Changes in pupil (FTE) numbers and PTR in secondary schools - 1979 to 2011
2,500
2,750
3,000
3,250
3,500
3,750
4,000
1979
1981
1983
1985
1987
1989
1991
1993
1995
1997
1999
2001
2003
2005
2007
2009
2011
Pupi
l num
bers
('00
0s)
12.5
13.5
14.5
15.5
16.5
17.5
18.5
19.5
Pupi
l Tea
cher
Rat
io
Number of (FTE) pupils Pupil Teacher Ratio
0 0
Source: School Census Note: 1. Number (FTE) of pupils: State-funded from 2001. 2. 2011 PTR = November 2010 teacher numbers with January 2011 pupil numbers
22

2.4 Population Changes at a Regional level This section assesses how the school age population is expected to change for different regions. This will highlight how the demand for class rooms and teachers may affect different regions and how this may change the average class size by region. 2.4.1 Regional population projections School age regional variation The pupil projections in Section 2.3.1 show that national pupil numbers in nursery and primary schools are increasing. Pupil numbers in secondary schools are in decline and will continue until 2015 (Figure 2-3). However, there is regional variation within these figures as different regions are projected to have different levels of population growth. Long term pupil number projections are made at national level only. However, regional projections of school aged population are produced by ONS16 and can be used to demonstrate the trends in primary and secondary aged populations. The population projections presented here are the ONS mid-2008 based sub-national population projections. More information about the sub-national projections is available at http://www.ons.gov.uk/ons/rel/snpp/sub-national-population-projections/2008--based-projections/index.html The sub-national population projections presented here give population at mid-year, by age at mid-year and is therefore on a different basis to the pupil number data given in Section 2.3.
16 Note: The population projections are ONS mid-2008 based regional population projections.
23

Figure 2-11 - Projected change in population aged 5-10 between 2010 and 2015, by region
0%
2%
4%
6%
8%
10%
12%
14%
16%
2010 2011 2012 2013 2014 2015
Perc
enta
ge c
hang
e co
mpa
red
to 2
010
London
Yorkshire And TheHumber
East Midlands
East of England
South East
West Midlands
North East
North West
South West
Source: ONS mid-2008 based sub-national population projections. The figures have not been updated to reflect the latest mid-2010 sub-national population estimates.17 Figure 2-11 documents the projected change in population for 5-10 year olds by region. It shows that after a short period of a small decline in population in all regions except London, there is expected to be an increase in population across all regions. As can be seen, some regions are projected to experience greater increases in their primary aged population (aged 5 to 10) than other regions. London is expected to experience a much greater percentage change in population, with an approximate 15% increase from 2010 to 2015. The South West and North West are projected to increase the least – 10% from 2010 to 2015.
17 Note: The pupil and population projections presented here are derived from mid-2008 based ONS population projections. Updated population projections, based on the population at mid-2010 were released by ONS in Autumn 2011, but have not been incorporated into this report. Updated pupil projections, based on the new population projections, will be published by DfE in early 2012.
24
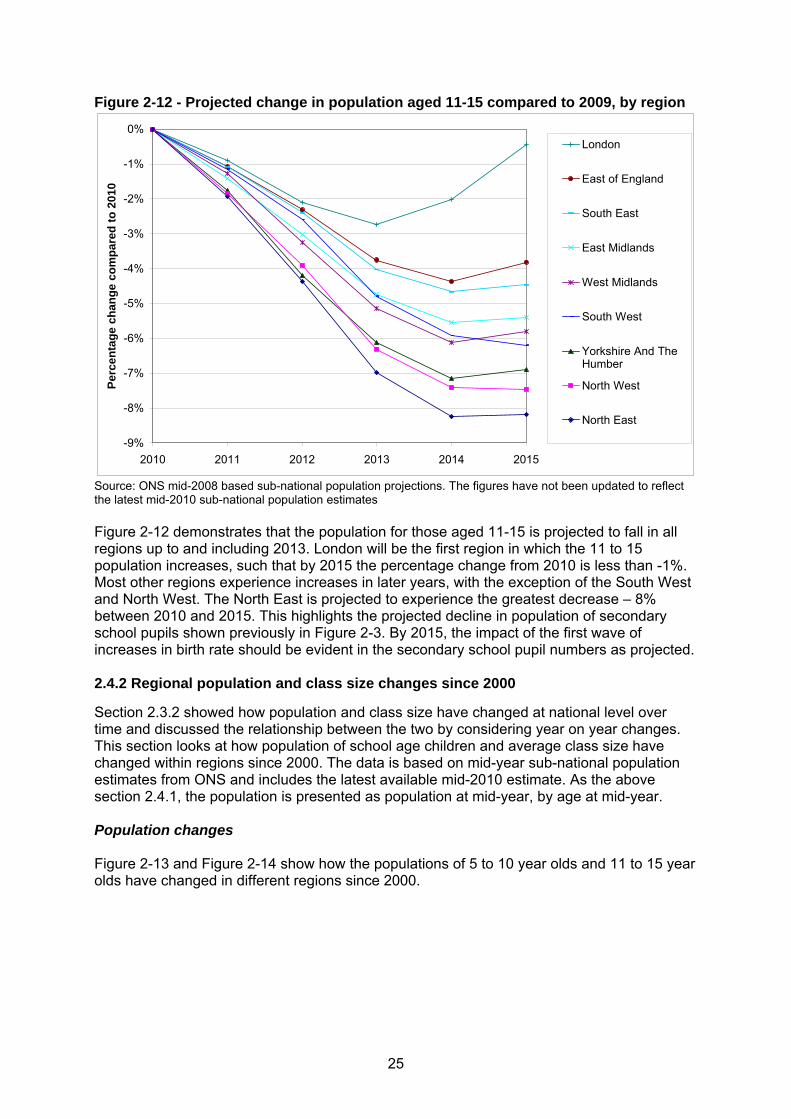
Figure 2-12 - Projected change in population aged 11-15 compared to 2009, by region
-9%
-8%
-7%
-6%
-5%
-4%
-3%
-2%
-1%
0%
2010 2011 2012 2013 2014 2015
Perc
enta
ge c
hang
e co
mpa
red
to 2
010
London
East of England
South East
East Midlands
West Midlands
South West
Yorkshire And TheHumber
North West
North East
Source: ONS mid-2008 based sub-national population projections. The figures have not been updated to reflect the latest mid-2010 sub-national population estimates Figure 2-12 demonstrates that the population for those aged 11-15 is projected to fall in all regions up to and including 2013. London will be the first region in which the 11 to 15 population increases, such that by 2015 the percentage change from 2010 is less than -1%. Most other regions experience increases in later years, with the exception of the South West and North West. The North East is projected to experience the greatest decrease – 8% between 2010 and 2015. This highlights the projected decline in population of secondary school pupils shown previously in Figure 2-3. By 2015, the impact of the first wave of increases in birth rate should be evident in the secondary school pupil numbers as projected. 2.4.2 Regional population and class size changes since 2000 Section 2.3.2 showed how population and class size have changed at national level over time and discussed the relationship between the two by considering year on year changes. This section looks at how population of school age children and average class size have changed within regions since 2000. The data is based on mid-year sub-national population estimates from ONS and includes the latest available mid-2010 estimate. As the above section 2.4.1, the population is presented as population at mid-year, by age at mid-year. Population changes Figure 2-13 and Figure 2-14 show how the populations of 5 to 10 year olds and 11 to 15 year olds have changed in different regions since 2000.
25

Figure 2-13 - Estimated population aged 5-10 by region 2000-2010, indexed with 2000 as base year
80
82
84
86
88
90
92
94
96
98
100
102
104
106
108
2000 2001 2002 2003 2004 2005 2006 2007 2008 2009 2010
Inde
x
London
East of England
South East
South West
East Midlands
West Midlands
Yorkshire And The Humber
North West
North East
Figure 2-14 - Estimated population aged 11-15 by region 2000-2010, indexed with 2000 as base year
80
82
84
86
88
90
92
94
96
98
100
102
104
106
108
2000 2001 2002 2003 2004 2005 2006 2007 2008 2009 2010
Inde
x
London
East of England
South West
South East
East Midlands
West Midlands
Yorkshire And The Humber
North West
North East
Source: ONS mid-2009 regional population estimates The charts show that there is variation between regions in the way the population of school age children has changed between 2000 and 2010. During this period, all regions have experienced a decrease in the population of children aged 5 to 10. However, the largest declines were experienced in the North East (-17%) and North West (-15%), while London
26

and the East of England only decreased 2 and 5%, respectively, over the same period. The regional population change for 11 to 15 year olds was similarly distributed London and the East of England experienced a modest rise of less than 2% during the period, however all regions have fallen since 2006. The North West and the North East experienced the steepest decline over this period (-12 and -14% respectively).
27
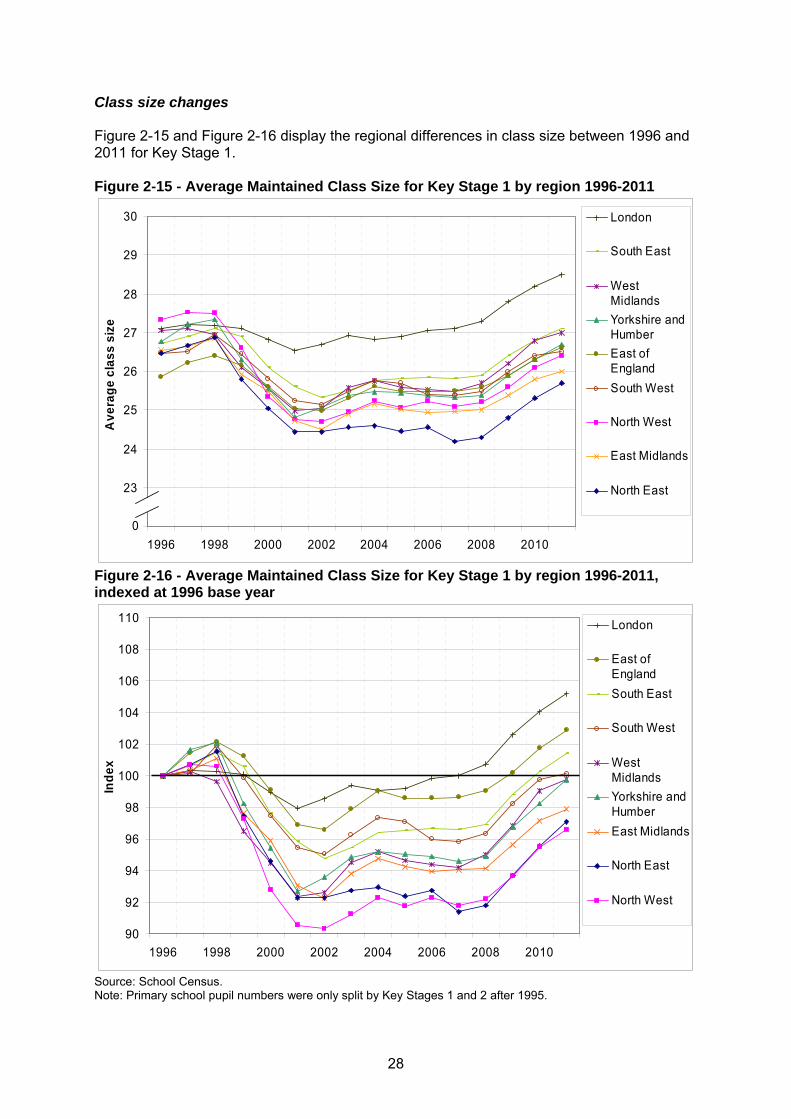
Class size changes Figure 2-15 and Figure 2-16 display the regional differences in class size between 1996 and 2011 for Key Stage 1. Figure 2-15 - Average Maintained Class Size for Key Stage 1 by region 1996-2011
22
23
24
25
26
27
28
29
30
1996 1998 2000 2002 2004 2006 2008 2010
Ave
rage
cla
ss s
ize
London
South East
WestMidlandsYorkshire andHumberEast ofEnglandSouth West
North West
East Midlands
North East
0
Figure 2-16 - Average Maintained Class Size for Key Stage 1 by region 1996-2011, indexed at 1996 base year
90
92
94
96
98
100
102
104
106
108
110
1996 1998 2000 2002 2004 2006 2008 2010
Inde
x
London
East ofEnglandSouth East
South West
WestMidlandsYorkshire andHumberEast Midlands
North East
North West
Source: School Census. Note: Primary school pupil numbers were only split by Key Stages 1 and 2 after 1995.
28

The above data show that average class size in Key Stage 1 largely decreased from 1998 to 2001 with steady increases in class size across most of the regions from 2002 onwards. From 2007 to 2011 all regions have experienced a larger increase in average class size. London has experienced larger increases in class size across this period which is in line with earlier charts showing larger population increases and population levels for London. The North East and East Midlands experienced the largest decreases in average class size until 2007, when average class sizes increased.
29
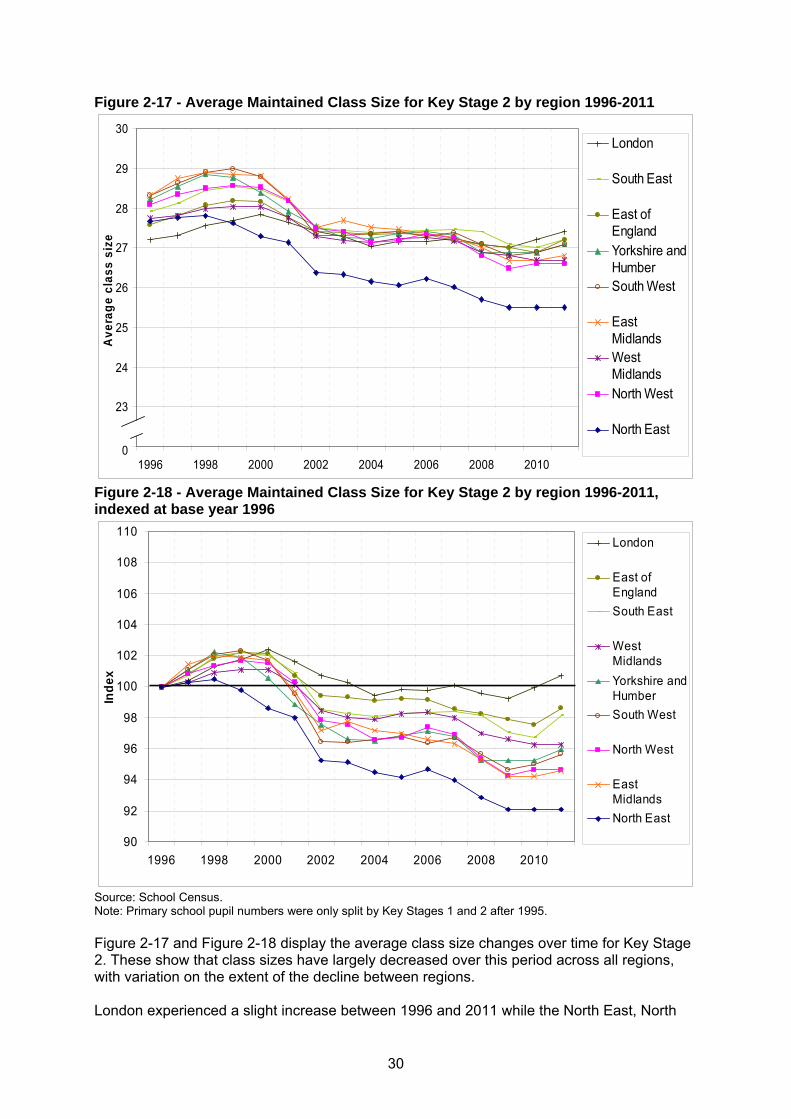
Figure 2-17 - Average Maintained Class Size for Key Stage 2 by region 1996-2011
22
23
24
25
26
27
28
29
30
1996 1998 2000 2002 2004 2006 2008 2010
Ave
rage
cla
ss s
ize
London
South East
East ofEnglandYorkshire andHumberSouth West
EastMidlandsWestMidlandsNorth West
North East0
Figure 2-18 - Average Maintained Class Size for Key Stage 2 by region 1996-2011, indexed at base year 1996
90
92
94
96
98
100
102
104
106
108
110
1996 1998 2000 2002 2004 2006 2008 2010
Inde
x
London
East ofEnglandSouth East
WestMidlandsYorkshire andHumberSouth West
North West
EastMidlandsNorth East
Source: School Census. Note: Primary school pupil numbers were only split by Key Stages 1 and 2 after 1995. Figure 2-17 and Figure 2-18 display the average class size changes over time for Key Stage 2. These show that class sizes have largely decreased over this period across all regions, with variation on the extent of the decline between regions. London experienced a slight increase between 1996 and 2011 while the North East, North
30
West and East Midlands experienced the largest falls. Average class size at Key Stage 2 is more similar between regions than at Key Stage 1. As with Key Stage 1, the North East has had the smallest average Key Stage 2 classes throughout the time period. As expected, the changes in average class size between 1996 and 2011, in Figure 2-15 and Figure 2-17, show a broadly similar pattern between regions as the population estimates of 5 to 10 year olds shown in Figure 2-13. Of the two regions with the largest population decreases: the North West and the North East had the largest and second largest decreases in average Key Stage 1 class size (before recovering from 2007) and the third largest and largest decreases in average Key Stage 2 class size. The East of England which had one of the lowest fall in the population of 5 to 10 years olds had the recovered falls in average Key Stage 1 class size by 2009 and the lowest fall in average Key Stage 2 class size. However, not all the changes in average class size can be explained by population. For example, the East Midlands had some of the largest falls in average class size at Key Stage 1 and Key Stage 2 but had a decrease in population that was average compared to other regions.
31

Figure 2-19 - Average maintained class size for Key Stage 3 by region 1995-2011
21
22
23
24
25
26
27
28
29
30
1995 1997 1999 2001 2003 2005 2007 2009 2011
Ave
rage
cla
ss s
ize
South West
South East
East ofEnglandEast Midlands
London
Yorkshire andthe HumberWest Midlands
North West
North East0
Figure 2-20 - Average maintained class size for Key Stage 3 by region 1995-2011, indexed with base year 1995
90
92
94
96
98
100
102
104
106
108
110
1995 1997 1999 2001 2003 2005 2007 2009 2011
Inde
x
East Midlands
East ofEnglandSouth East
South West
North West
Yorkshire andthe HumberWestMidlandsLondon
North East
Source: School Census Notes: 1. Defined by “Mainly under 14” for 1995 to 2000 and Year Groups 7 to 9 from 2001 to 2010. 2. London made by combining Inner and Outer London data for years 1998-2010. 3. North West made by combining North West and Merseyside for years 1998-2000.
32

Figure 2-19 and Figure 2-20 show that the average class size for Key Stage 3 classes have generally declined across all regions from 2000 to 2011, but most regions, in particular East Midlands, have larger average class sizes compared to 1995. The trends for different regions differ for Key Stage 3. The East Midlands has had the largest overall increase in Key Stage 3 average class size since 1995. On the other hand, since 2000 the East Midlands and Yorkshire and the Humber have experienced some of the largest declines in Key Stage 3 average class size. The East of England and the South East had the smallest decline. Figure 2-21 - Average maintained class size for Key Stage 4 by region 1995-2011
18
20
22
24
26
28
30
1995 1997 1999 2001 2003 2005 2007 2009 2011
Ave
rage
cla
ss s
ize
South East
London
South West
East ofEnglandEast Midlands
West Midlands
Yorkshire andthe HumberNorth West
North East
0
Figure 2-22 - Average maintained class size for Key Stage 4 by region 1995-2011, indexed with base year 1995
90
92
94
96
98
100
102
104
106
108
110South East
East of England
East Midlands
South West
1995 1997 1999 2001 2003 2005 2007 2009 2011
Inde
x
London
North West
Yorkshire andthe HumberWest Midlands
North East
Source: School Census
nder 14” for 1995 to 2000 and Year Groups 7 to 9 from 2001 to 2010. Notes:
ined by “Mainly u1. Def
33
2. London made by combining Inner and Outer London data for years 1998-2010. 3. North West made by combining North West and Merseyside for years 1998-2000. Figure 2-21 and Figure 2-22 show that since 2000 Key Stage 4 average class size has
11
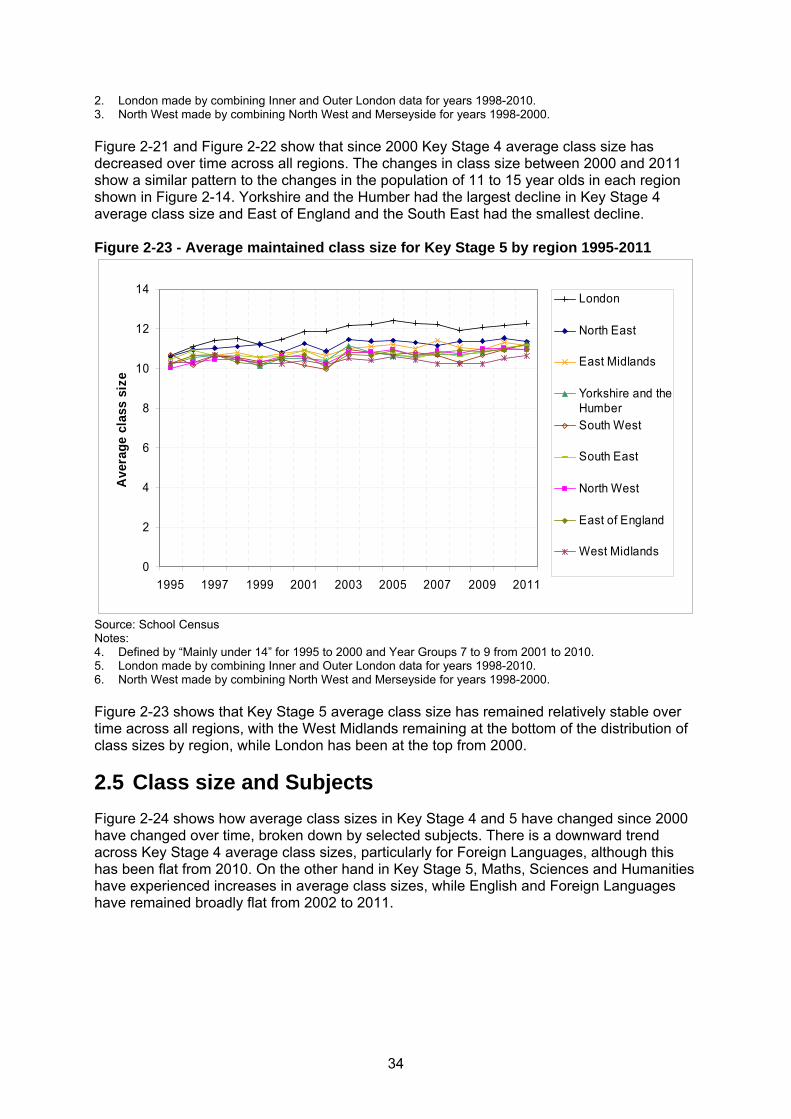
igure 2-23 - Average maintained class size for Key Stage 5 by region 1995-2011
decreased over time across all regions. The changes in class size between 2000 and 20show a similar pattern to the changes in the population of 11 to 15 year olds in each region shown in Figure 2-14. Yorkshire and the Humber had the largest decline in Key Stage 4 average class size and East of England and the South East had the smallest decline. F
0
2
4
6
8
10
12
14
1995 1997 1999 2001 2003 2005 2007 2009 2011
Ave
rage
cla
ss s
ize
London
North East
East Midlands
Yorkshire and theHumberSouth West
South East
North West
East of England
West Midlands
Source: School Census
ined by “Mainly under 14” for 1995 to 2000 and Year Groups 7 to 9 from 2001 to 2010.
igure 2-23 shows that Key Stage 5 average class size has remained relatively stable over
Figure 2-24 shows how average class sizes in Key Stage 4 and 5 have changed since 2000
s s
Notes: 4. Def5. London made by combining Inner and Outer London data for years 1998-2010. 6. North West made by combining North West and Merseyside for years 1998-2000. Ftime across all regions, with the West Midlands remaining at the bottom of the distribution ofclass sizes by region, while London has been at the top from 2000.
2.5 Class size and Subjects
have changed over time, broken down by selected subjects. There is a downward trend across Key Stage 4 average class sizes, particularly for Foreign Languages, although thihas been flat from 2010. On the other hand in Key Stage 5, Maths, Sciences and Humanitiehave experienced increases in average class sizes, while English and Foreign Languages have remained broadly flat from 2002 to 2011.
34
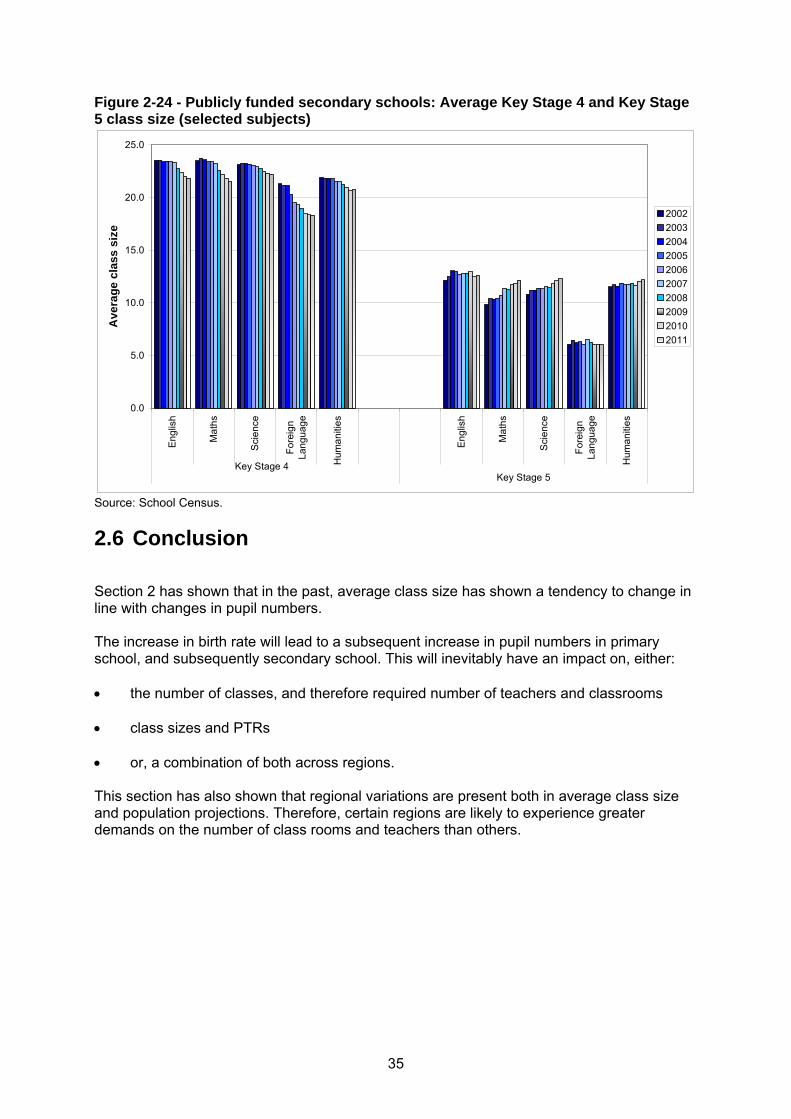
Figure 2-24 - Publicly funded secondary schools: Average Key Stage 4 and Key Stage 5 class size (selected subjects)
0.0
5.0
10.0
15.0
20.0
25.0
Engl
ish
Mat
hs
Sci
ence
Fore
ign
Lang
uage
Hum
aniti
es
Engl
ish
Mat
hs
Sci
ence
Fore
ign
Lang
uage
Hum
aniti
es
Key Stage 5
Ave
rage
cla
ss s
ize
2002200320042005200620072008200920102011
Key Stage 4
Source: School Census.
2.6 Conclusion Section 2 has shown that in the past, average class size has shown a tendency to change in line with changes in pupil numbers. The increase in birth rate will lead to a subsequent increase in pupil numbers in primary school, and subsequently secondary school. This will inevitably have an impact on, either:
• the number of classes, and therefore required number of teachers and classrooms • class sizes and PTRs • or, a combination of both across regions. This section has also shown that regional variations are present both in average class size and population projections. Therefore, certain regions are likely to experience greater demands on the number of class rooms and teachers than others.
35
3 Impact of current legislation on Class Size
3.1 Introduction This section looks at the impact on class size and Pupil Teacher Ratio (PTR) of the legal maximum of 30 pupils in an infant school class, introduced in September 2001 as a result of the 1998 School Standards and Framework Act18. The School Standards and Framework Act 1998 placed a duty on Local Authorities and schools to limit the size of infant classes for five-, six-, and seven-year-olds taught by one teacher to 30 or fewer pupils. The limit became a statutory responsibility on Local Authorities and schools from September 2001, the start of the 2001/02 school year. There is no upper class size for children aged eight to 11. Past changes in class size broken down by Key Stage and the number of infant classes over 30 are presented. This Section also looks into the distribution of class size over time to gain an understanding of how the maximum class size at 30 has caused a shift in the distribution.
3.2 Key Findings • From 1998 to 2001 there was a fall in the average class size for Key Stage 1. Average
Key Stage 2 class size fell from 1999 to 2011. The falls in average Key Stage 1 class size and subsequent falls in Key Stage 2 average class size can partly be attributed to the introduction of legislation and funding to reduce class size in anticipation of the law. However, a fall in pupil numbers during this period is also likely to be a factor.
• The percentage of pupils in classes over 30 has decreased over time since 1996. The
majority of classes over 30 are lawful, i.e. the circumstances through which they exceed the 30 limit are permitted. The proportion of pupils in unlawfully large classes has wavered between 0.3% and 0.7% every year since records began in 2006 (see Figure 3-5).
• Since the introduction of class size limits, the distribution of Key Stage 1 classes has
shifted. In 1996, the distribution was approximately centred at 30. By 2002, while 26% of pupils were in classes of 30, very few (1%) were in classes of above 30 (see Figure 3-6).
• The fall in the proportion of pupils in classes of over 30, the change in the Key Stage 1
class size distribution, and to some extent, the fall in average Key Stage 1 class size can be attributed to the legal limit of 30 pupils per class and government funding and LA planning that preceded it. However, the fall in average Key Stage 1 class size was also the result of a fall in pupil numbers during this period.
• In the presence of rises in pupil numbers, the large number of schools with classes of
around 30 could place further demands on LAs to ensure that infant class sizes remain within the 30 legal limit. Even in LAs where there continues to be some Key Stage 1 classes with below 30 pupils, a higher proportion of classes are likely to be full to capacity, without increases in the number of classes. This could result in a reduction in the proportion of parents getting their child into their first choice of school.
18 http://www.opsi.gov.uk/Acts/acts1998/ukpga_19980031_en_1
36

3.3 Average class size and Pupil Teacher Ratio (PTR) 3.3.1 Class Size changes over time by Key Stage Figure 1-4 and Figure 1-6 showed how primary and secondary school average class sizes have changed over time. Figure 3-1 shows how average primary school class size has changed over time, broken down by Key Stage19. The first vertical line on the chart indicates when the 1998 School Standards and Framework Act (discussed in Section 1.4) was passed. The second vertical line indicates when the limit of 30 pupils in a Key Stage 1 class became a legal requirement in September 2001. The period between the two lines is when Schools and LAs were anticipating the introduction of the legal requirement. Every local authority produced plans in order to ensure the legal requirement was met that were subject to challenge, approval, intervention when required, funding and monitoring, and held to account against delivery. Figure 3-1 - Average class size for maintained Key Stage 1 and Key Stage 2 classes between 1996 and 2011
23
24
25
26
27
28
29
1996 1998 2000 2002 2004 2006 2008 2010
Ave
rage
cla
ss s
ize
Key Stage 1 Key Stage 2
0
Source: School Census Notes: Key Stage 1 includes Reception classes from 2000. Key Stages 1 and 2 not available pre-1996. One teacher classes as taught during a single selected period in each school on the day of the census in January. Figures prior to 1997 include 6th form, includes Academies and CTCs from 2006. Lines denote the introduction of the School Standards and Framework Act 1998 and when it became law 2001 Figure 3-1 shows that average class size has remained relatively stable for Key Stage 1 and Key Stage 2 over this period. Average Key Stage 1 class size increased from 1996 to 1998. From 1998 to 2001 there was a fall in the average class size for Key Stage 1 from 27.1 to 25.2. This can partly be attributed to the introduction of government spending to reduce class size in anticipation of the law. Average Key Stage 2 class size has continued to fall from a high of 28.4 in 1999 to 27 in 2011. Section 2 showed that there are a number of factors that have affected class size apart from the introduction of legislation. Population also fell over this period contributing to the fall in class size. It is likely that a combination of factors led to 19 Data broken down by Key Stage does not go back further than 1996 for Key Stages 1 and 2.
37
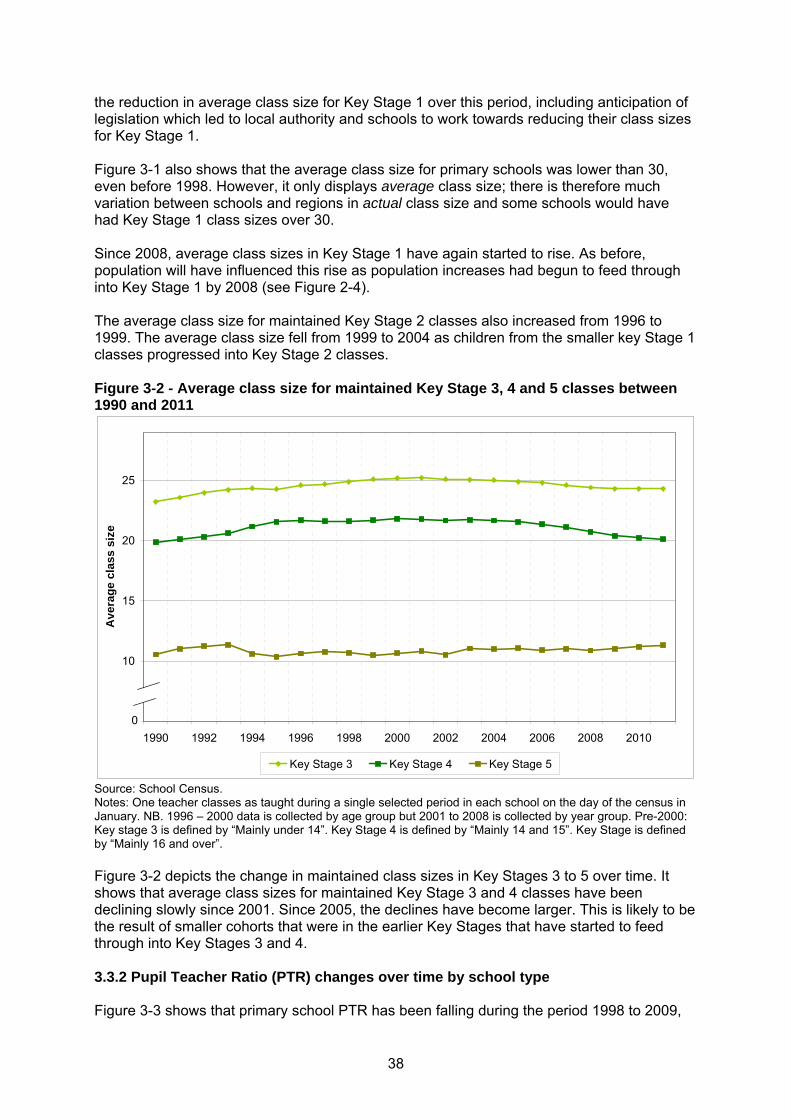
the reduction in average class size for Key Stage 1 over this period, including anticipation of legislation which led to local authority and schools to work towards reducing their class sizes for Key Stage 1. Figure 3-1 also shows that the average class size for primary schools was lower than 30, even before 1998. However, it only displays average class size; there is therefore much variation between schools and regions in actual class size and some schools would have had Key Stage 1 class sizes over 30. Since 2008, average class sizes in Key Stage 1 have again started to rise. As before, population will have influenced this rise as population increases had begun to feed through into Key Stage 1 by 2008 (see Figure 2-4). The average class size for maintained Key Stage 2 classes also increased from 1996 to 1999. The average class size fell from 1999 to 2004 as children from the smaller key Stage 1 classes progressed into Key Stage 2 classes. Figure 3-2 - Average class size for maintained Key Stage 3, 4 and 5 classes between 1990 and 2011
5
10
15
20
25
1990 1992 1994 1996 1998 2000 2002 2004 2006 2008 2010
Ave
rage
cla
ss s
ize
Key Stage 3 Key Stage 4 Key Stage 5
0
Source: School Census. Notes: One teacher classes as taught during a single selected period in each school on the day of the census in January. NB. 1996 – 2000 data is collected by age group but 2001 to 2008 is collected by year group. Pre-2000: Key stage 3 is defined by “Mainly under 14”. Key Stage 4 is defined by “Mainly 14 and 15”. Key Stage is defined by “Mainly 16 and over”. Figure 3-2 depicts the change in maintained class sizes in Key Stages 3 to 5 over time. It shows that average class sizes for maintained Key Stage 3 and 4 classes have been declining slowly since 2001. Since 2005, the declines have become larger. This is likely to be the result of smaller cohorts that were in the earlier Key Stages that have started to feed through into Key Stages 3 and 4. 3.3.2 Pupil Teacher Ratio (PTR) changes over time by school type Figure 3-3 shows that primary school PTR has been falling during the period 1998 to 2009,
38
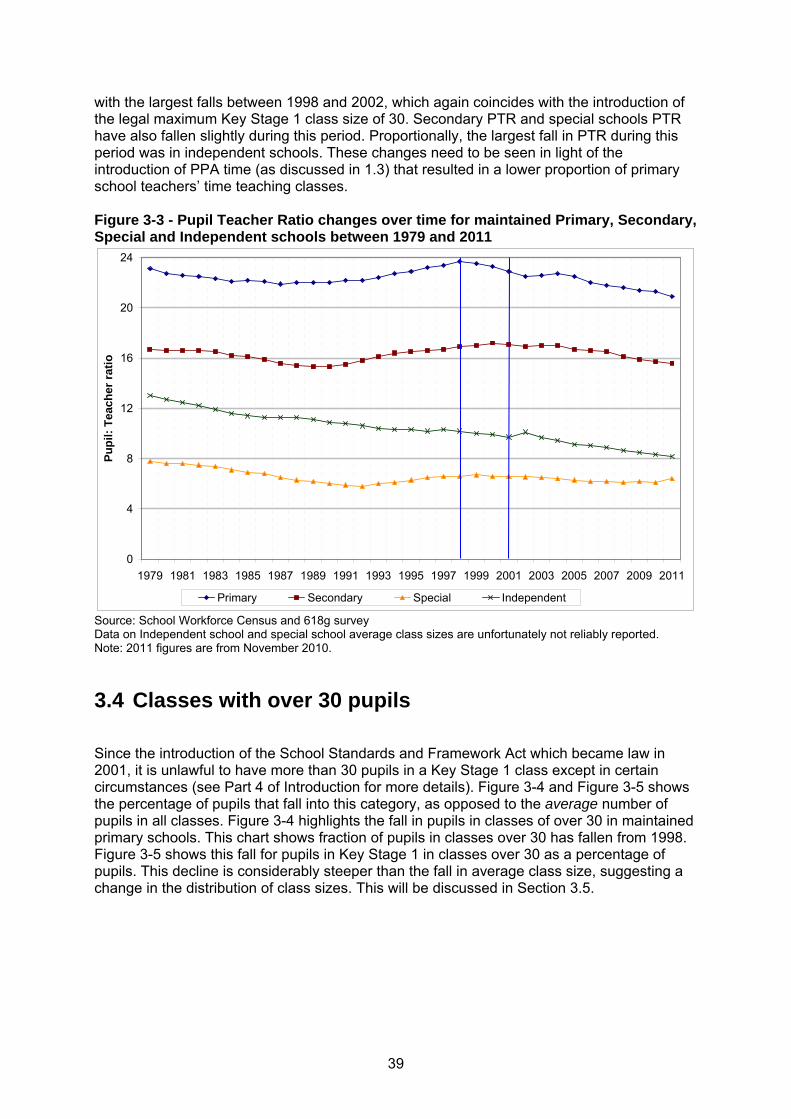
with the largest falls between 1998 and 2002, which again coincides with the introduction of the legal maximum Key Stage 1 class size of 30. Secondary PTR and special schools PTR have also fallen slightly during this period. Proportionally, the largest fall in PTR during this period was in independent schools. These changes need to be seen in light of the introduction of PPA time (as discussed in 1.3) that resulted in a lower proportion of primary school teachers’ time teaching classes. Figure 3-3 - Pupil Teacher Ratio changes over time for maintained Primary, Secondary, Special and Independent schools between 1979 and 2011
0
4
8
12
16
20
24
1979 1981 1983 1985 1987 1989 1991 1993 1995 1997 1999 2001 2003 2005 2007 2009 2011
Pupi
l: Te
ache
r rat
io
Primary Secondary Special Independent
Source: School Workforce Census and 618g survey Data on Independent school and special school average class sizes are unfortunately not reliably reported. Note: 2011 figures are from November 2010.
3.4 Classes with over 30 pupils Since the introduction of the School Standards and Framework Act which became law in 2001, it is unlawful to have more than 30 pupils in a Key Stage 1 class except in certain circumstances (see Part 4 of Introduction for more details). Figure 3-4 and Figure 3-5 shows the percentage of pupils that fall into this category, as opposed to the average number of pupils in all classes. Figure 3-4 highlights the fall in pupils in classes of over 30 in maintained primary schools. This chart shows fraction of pupils in classes over 30 has fallen from 1998. Figure 3-5 shows this fall for pupils in Key Stage 1 in classes over 30 as a percentage of pupils. This decline is considerably steeper than the fall in average class size, suggesting a change in the distribution of class sizes. This will be discussed in Section 3.5.
39
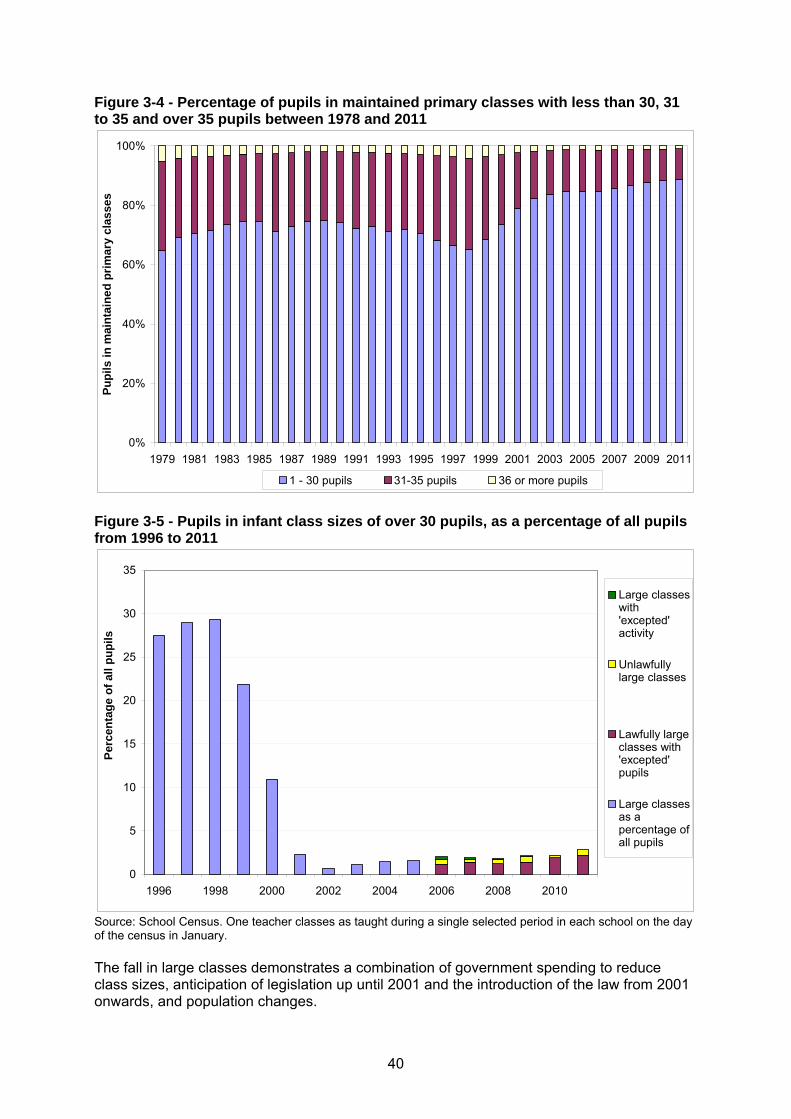
Figure 3-4 - Percentage of pupils in maintained primary classes with less than 30, 31 to 35 and over 35 pupils between 1978 and 2011
0%
20%
40%
60%
80%
100%
1979 1981 1983 1985 1987 1989 1991 1993 1995 1997 1999 2001 2003 2005 2007 2009 2011
Pupi
ls in
mai
ntai
ned
prim
ary
clas
ses
1 - 30 pupils 31-35 pupils 36 or more pupils
Figure 3-5 - Pupils in infant class sizes of over 30 pupils, as a percentage of all pupils from 1996 to 2011
0
5
10
15
20
25
30
35
1996 1998 2000 2002 2004 2006 2008 2010
Perc
enta
ge o
f all
pupi
ls
Large classeswith'excepted'activity
Unlawfullylarge classes
Lawfully largeclasses with'excepted'pupils
Large classesas apercentage ofall pupils
Source: School Census. One teacher classes as taught during a single selected period in each school on the day of the census in January. The fall in large classes demonstrates a combination of government spending to reduce class sizes, anticipation of legislation up until 2001 and the introduction of the law from 2001 onwards, and population changes.
40
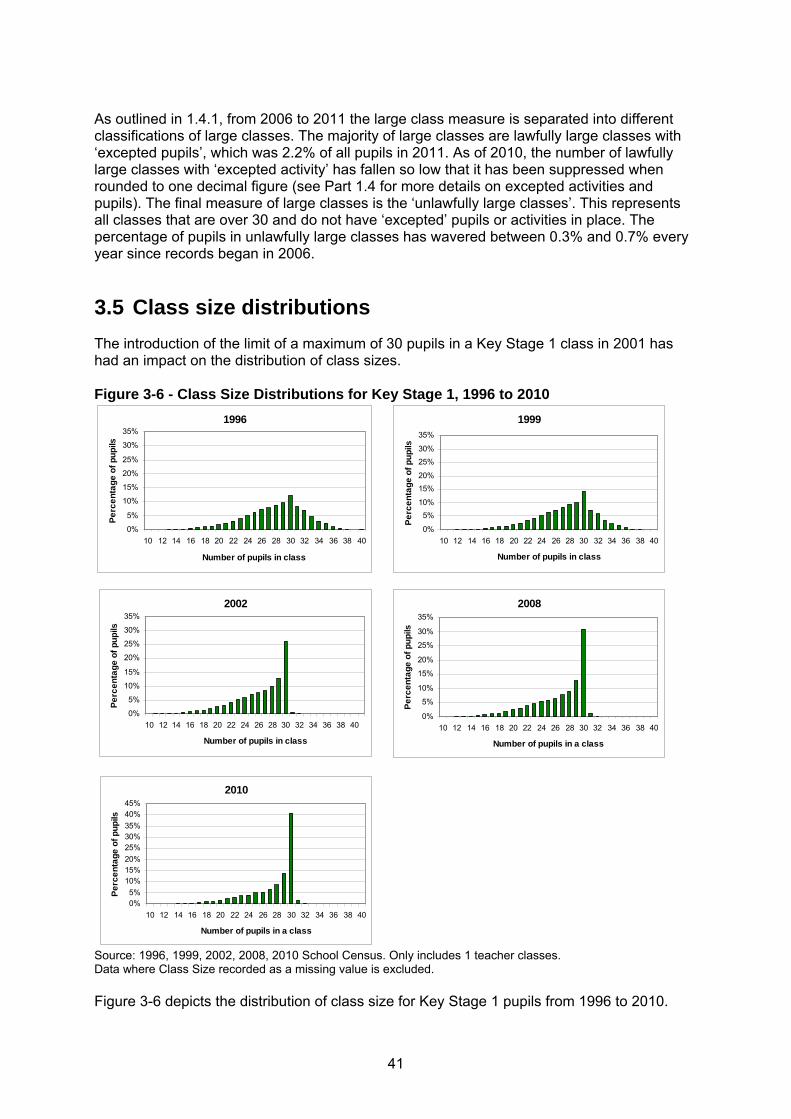
As outlined in 1.4.1, from 2006 to 2011 the large class measure is separated into different classifications of large classes. The majority of large classes are lawfully large classes with ‘excepted pupils’, which was 2.2% of all pupils in 2011. As of 2010, the number of lawfully large classes with ‘excepted activity’ has fallen so low that it has been suppressed when rounded to one decimal figure (see Part 1.4 for more details on excepted activities and pupils). The final measure of large classes is the ‘unlawfully large classes’. This represents all classes that are over 30 and do not have ‘excepted’ pupils or activities in place. The percentage of pupils in unlawfully large classes has wavered between 0.3% and 0.7% every year since records began in 2006.
3.5 Class size distributions The introduction of the limit of a maximum of 30 pupils in a Key Stage 1 class in 2001 has had an impact on the distribution of class sizes. Figure 3-6 - Class Size Distributions for Key Stage 1, 1996 to 2010
2008
0%
5%
10%
15%
20%
25%
30%
35%
10 12 14 16 18 20 22 24 26 28 30 32 34 36 38 40
Number of pupils in a class
Perc
enta
ge o
f pup
ils
2002
0%
5%
10%
15%
20%
25%
30%
35%
10 12 14 16 18 20 22 24 26 28 30 32 34 36 38 40
Number of pupils in class
Perc
enta
ge o
f pup
ils
1996
0%
5%
10%
15%
20%
25%
30%
35%
10 12 14 16 18 20 22 24 26 28 30 32 34 36 38 40
Number of pupils in class
Perc
enta
ge o
f pup
ils
1999
0%
5%10%
15%20%
25%30%
35%
10 12 14 16 18 20 22 24 26 28 30 32 34 36 38 40
Number of pupils in class
Perc
enta
ge o
f pup
ils
2010
0%5%
10%15%20%25%30%35%40%45%
10 12 14 16 18 20 22 24 26 28 30 32 34 36 38 40
Number of pupils in a class
Perc
enta
ge o
f pup
ils
Source: 1996, 1999, 2002, 2008, 2010 School Census. Only includes 1 teacher classes. Data where Class Size recorded as a missing value is excluded. Figure 3-6 depicts the distribution of class size for Key Stage 1 pupils from 1996 to 2010.
41

Before the announcement of the duty on class size the distribution in 1996 was approximately centred on 30. The largest proportion, 12%, of pupils were in classes of 30, while roughly 28% of pupils were in classes of over 30 pupils and 60% were in classes of less than 30. The distribution in 1999 was still a similar shape; however the proportion of pupils in classes of 30 had increased to 14%, while approximately only 22% of pupils were in a class with over 30 pupils and 64% were in classes of less than 30. A possible explanation for this could be that schools were already acting to reduce class sizes in preparation for the legislation that was due to be announced. After legislation was implemented, the distribution changed considerably. In 2002, the proportion of pupils in classes of 30 rose significantly to over 25%. There were also fairly high numbers of classes of 29 (13%). However, the percentage of pupils in classes of less than 30 increased to 73% (with 35% in classes of less than 26), while the proportion of pupils in classes over 30 had fallen to as little as 1%. The reason for this distribution is likely to be that after the legislation was introduced in 2001, the majority of classes that breached the legal maximum of 30 were reduced to 30 and so at present only very small numbers of classes are over 30 as this is now deemed unlawful. Rising average class size at Key Stage 1 between 2002 and 2008 class size has led to an increase in classes with 30 pupils, the maximum allowed, rather than producing over-sized classes. The distribution in 2008 shows that 31% of pupils were in KS1 classes with 30 pupils, while in 2010 that percentage had increased to 41%. In 2008, the percentage of pupils in classes of less than 30 fell to 67% while those in classes of less than 26 fell to 32%. These percentages continued to decrease to 57% and 23%, respectively, in 2010.
42
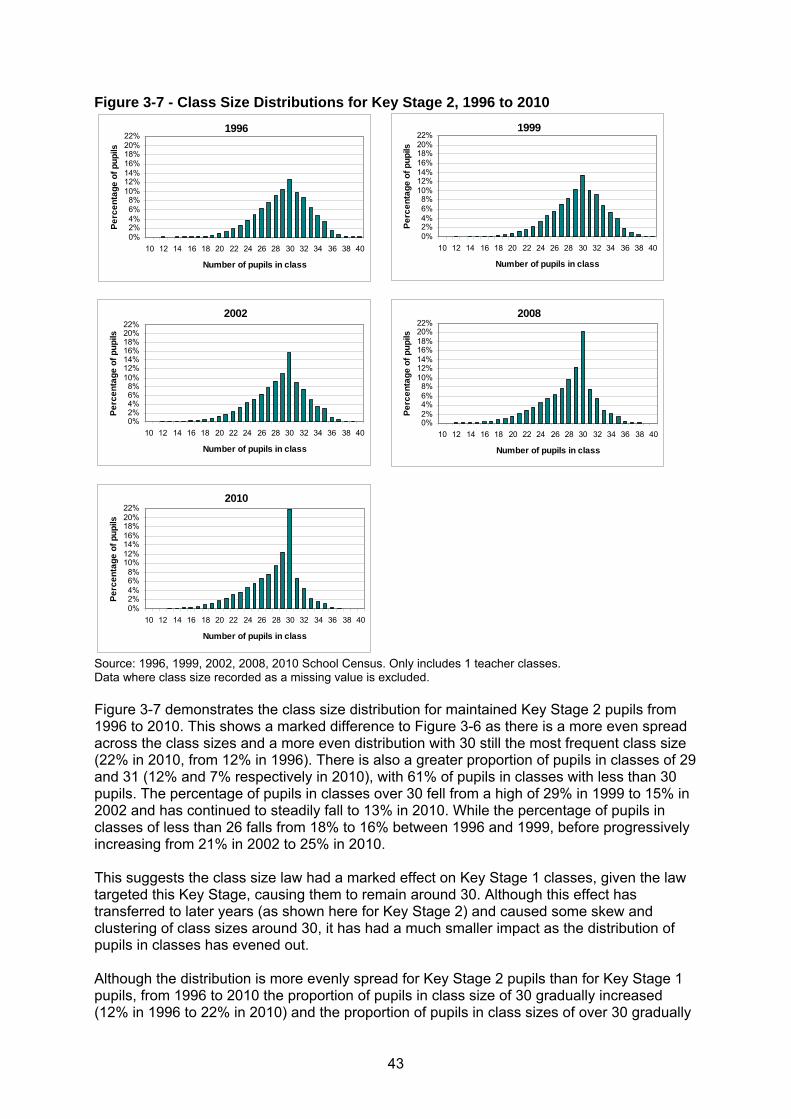
Figure 3-7 - Class Size Distributions for Key Stage 2, 1996 to 2010
2008
0%2%4%6%8%
10%12%14%16%18%20%22%
10 12 14 16 18 20 22 24 26 28 30 32 34 36 38 40
Number of pupils in class
Perc
enta
ge o
f pup
ils
2002
0%2%4%6%8%
10%12%14%16%18%20%22%
10 12 14 16 18 20 22 24 26 28 30 32 34 36 38 40
Number of pupils in class
Perc
enta
ge o
f pup
ils
1999
0%2%4%6%8%
10%12%14%16%18%20%22%
10 12 14 16 18 20 22 24 26 28 30 32 34 36 38 40
Number of pupils in class
Perc
enta
ge o
f pup
ils
1996
0%2%4%6%8%
10%12%14%16%18%20%22%
10 12 14 16 18 20 22 24 26 28 30 32 34 36 38 40
Number of pupils in class
Perc
enta
ge o
f pup
ils
2010
0%2%4%6%8%
10%12%14%16%18%20%22%
10 12 14 16 18 20 22 24 26 28 30 32 34 36 38 40
Number of pupils in class
Perc
enta
ge o
f pup
ils
Source: 1996, 1999, 2002, 2008, 2010 School Census. Only includes 1 teacher classes. Data where class size recorded as a missing value is excluded. Figure 3-7 demonstrates the class size distribution for maintained Key Stage 2 pupils from 1996 to 2010. This shows a marked difference to Figure 3-6 as there is a more even spread across the class sizes and a more even distribution with 30 still the most frequent class size (22% in 2010, from 12% in 1996). There is also a greater proportion of pupils in classes of 29 and 31 (12% and 7% respectively in 2010), with 61% of pupils in classes with less than 30 pupils. The percentage of pupils in classes over 30 fell from a high of 29% in 1999 to 15% in 2002 and has continued to steadily fall to 13% in 2010. While the percentage of pupils in classes of less than 26 falls from 18% to 16% between 1996 and 1999, before progressively increasing from 21% in 2002 to 25% in 2010. This suggests the class size law had a marked effect on Key Stage 1 classes, given the law targeted this Key Stage, causing them to remain around 30. Although this effect has transferred to later years (as shown here for Key Stage 2) and caused some skew and clustering of class sizes around 30, it has had a much smaller impact as the distribution of pupils in classes has evened out. Although the distribution is more evenly spread for Key Stage 2 pupils than for Key Stage 1 pupils, from 1996 to 2010 the proportion of pupils in class size of 30 gradually increased (12% in 1996 to 22% in 2010) and the proportion of pupils in class sizes of over 30 gradually
43
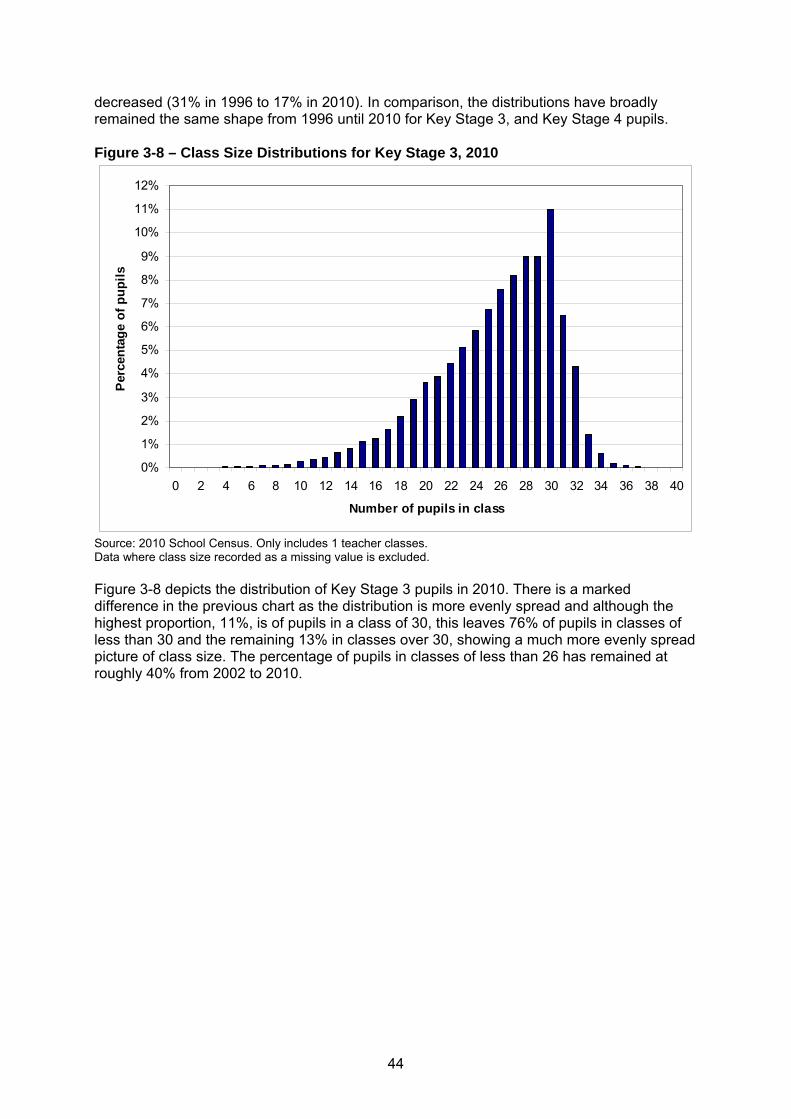
decreased (31% in 1996 to 17% in 2010). In comparison, the distributions have broadly remained the same shape from 1996 until 2010 for Key Stage 3, and Key Stage 4 pupils. Figure 3-8 – Class Size Distributions for Key Stage 3, 2010
0%
1%
2%
3%
4%
5%
6%
7%
8%
9%
10%
11%
12%
0 2 4 6 8 10 12 14 16 18 20 22 24 26 28 30 32 34 36 38 40
Number of pupils in class
Per
cent
age
of p
upils
Source: 2010 School Census. Only includes 1 teacher classes. Data where class size recorded as a missing value is excluded. Figure 3-8 depicts the distribution of Key Stage 3 pupils in 2010. There is a marked difference in the previous chart as the distribution is more evenly spread and although the highest proportion, 11%, is of pupils in a class of 30, this leaves 76% of pupils in classes of less than 30 and the remaining 13% in classes over 30, showing a much more evenly spread picture of class size. The percentage of pupils in classes of less than 26 has remained at roughly 40% from 2002 to 2010.
44
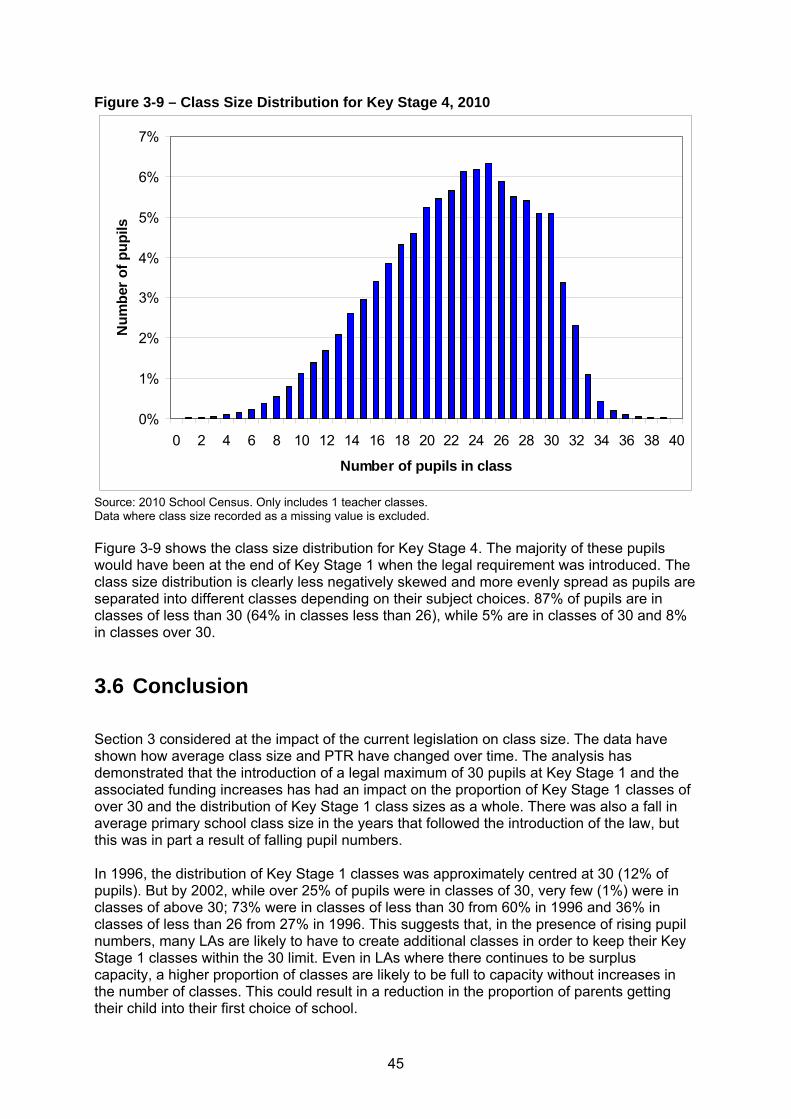
Figure 3-9 – Class Size Distribution for Key Stage 4, 2010
0%
1%
2%
3%
4%
5%
6%
7%
0 2 4 6 8 10 12 14 16 18 20 22 24 26 28 30 32 34 36 38 40
Number of pupils in class
Num
ber o
f pup
ils
Source: 2010 School Census. Only includes 1 teacher classes. Data where class size recorded as a missing value is excluded. Figure 3-9 shows the class size distribution for Key Stage 4. The majority of these pupils would have been at the end of Key Stage 1 when the legal requirement was introduced. The class size distribution is clearly less negatively skewed and more evenly spread as pupils are separated into different classes depending on their subject choices. 87% of pupils are in classes of less than 30 (64% in classes less than 26), while 5% are in classes of 30 and 8% in classes over 30.
3.6 Conclusion Section 3 considered at the impact of the current legislation on class size. The data have shown how average class size and PTR have changed over time. The analysis has demonstrated that the introduction of a legal maximum of 30 pupils at Key Stage 1 and the associated funding increases has had an impact on the proportion of Key Stage 1 classes of over 30 and the distribution of Key Stage 1 class sizes as a whole. There was also a fall in average primary school class size in the years that followed the introduction of the law, but this was in part a result of falling pupil numbers. In 1996, the distribution of Key Stage 1 classes was approximately centred at 30 (12% of pupils). But by 2002, while over 25% of pupils were in classes of 30, very few (1%) were in classes of above 30; 73% were in classes of less than 30 from 60% in 1996 and 36% in classes of less than 26 from 27% in 1996. This suggests that, in the presence of rising pupil numbers, many LAs are likely to have to create additional classes in order to keep their Key Stage 1 classes within the 30 limit. Even in LAs where there continues to be surplus capacity, a higher proportion of classes are likely to be full to capacity without increases in the number of classes. This could result in a reduction in the proportion of parents getting their child into their first choice of school.
45

4 How important is class size?
4.1 Introduction Section 4 looks at the importance of class size in determining children’s educational outcomes, something which is of relevance when considering the population changes outlined in Section 2. The focus of this section is the impact of class size on attainment since this is where there is the most available evidence.
4.2 Key Findings • The evidence base on the link between class size and attainment, taken as a whole,
finds that a smaller class size has a positive impact on attainment and behaviour in the early years of school, but this effect tends to be small and diminishes after a few years. The most recent research supports this.
• Research findings from England show that in smaller classes, individual pupils are the
focus of a teacher’s attention for more time; there is more active interaction between pupils and teachers; and more pupil engagement. In larger classes, there is more time spent by pupils interacting with each other; more time spent by teachers teaching the substantive content of the subject knowledge; and more time spent on non-teaching tasks like taking registers.
• Smaller classes have been found to lead to a small increase the number of years a
student spends in post-compulsory education. A study from Denmark estimated that a reduction in class size during the whole of compulsory schooling by 5% (from an average class size of 18) provides a rise in post-compulsory education by approximately 8 days.
• Research on parental opinion on class size found that 96% of parents believed that the
number of children in a class affects the quality of teaching and learning. In the same study teachers and head teachers were also found to consider class size to be an important issue.
• Continually falling Pupil Teacher Ratios in independent schools implies demand for
smaller class sizes in the market for education. Class size is the third most common reason for parents to choose to send their child to an independent school.
• A study by Hattie (2009) found the impact of reducing class size on attainment to be
smaller than the impact of other interventions. Hattie argues that value for money in raising attainment in schools is better achieved through other interventions than class size reduction. This is supported by research from Rivkin et al (2005) that find that increasing teacher effectiveness represents greater value for money than reducing class sizes, while Hanushek (2011) finds that teachers and their quality are, by far, the most important factor in determining student achievement.
46
4.3 Major Studies on Class Size Two key studies looking at the impact of class size on education are the Student Teacher Achievement Ratio (STAR) study which was carried out in America and the Class Size and Pupil Adult Ratio (CSPAR) Study from England. These are summarised below. Sections 4.4 to 4.6 will then assess the findings of these studies and other relevant studies and how they impact on class size. 4.3.1 National evidence - The CSPAR (Class Size and Pupil Adult Ratio) study In England, the Institute of Education conducted the Class Size and Pupil Adult Ratio (CSPAR) study between 2000 and 200320. This in-depth study assessed the educational consequences of class size and pupil-adult ratio differences by examining relationships between class sizes and other factors as they occur naturally in schools. The CSPAR study was longitudinal. A large cohort of pupils from a random selection of schools who entered reception classes (4 to 5 years old) during 1996/97 were followed up each year through primary school to assess how class size impacts on attainment. The schools in the study contained pupils from a wide range of social backgrounds, and were situated in urban, suburban and rural areas. Information was collected on each pupil’s term of entry, free school meal eligibility, age, ethnic background, pre-school attendance, English as an additional language, special needs status, and gender. Information was also collected on class size and on the adults present including whether they were qualified teachers and how experienced they were. Pupils were tested in English and Maths at the end of each year and given a Pupil Behaviour Rating21 by their teacher. The study also collected information from teachers on within-class groupings, time allocation in lessons, teachers’ experiences of the effect of class sizes, and case studies were used to carry out systematic observations of classes. For the teacher surveys, classes were defined in the following categories: large (30 and over), large medium (26 to 29), small medium (20 to 25) or small (under 20). For the systematic observations, classes were defined as large (30 and over) and small (20 or under). The longitudinal design of this study made it possible to take account of pupils’ prior attainment and to analyses how a pupil’s class size in a particular year affected attainment in subsequent years, thus ensuring a more accurate analysis of the impacts of class size. This reduced the likelihood of bias by other factors, such as non-random allocation to classes. This design also allowed long term measurement of pupil attainment, as the benefits of small classes may manifest in future years. Since the CSPAR study examined class sizes that occur naturally in schools, the results are only applicable to class sizes which are currently typical in schools. The relationships found do not necessarily apply to class sizes that are smaller or larger than this. 4.3.2 International evidence - The STAR Study
20 Key publications relating to this study are: Blatchford (2003), Blatchford, Bassett, Goldstein and Martin (2003) and Blatchford, Russell, Bassett, Brown and Martin (2004). 21 The Pupil Behaviour Rating was developed by the Institute of Education and was based on other behaviour rating scales, particularly Ladd and Profilet’s (1996) Child Behaviour Scale.
47

Tennessee’s Student / Teacher Achievement Ratio Project was introduced in 1985 as part of the ‘Tennessee Better Schools Programme’ which had been set up to improve educational standards in Tennessee. The state government wished to include a policy to reduce class sizes but there was not enough evidence to support the link between reducing class size and improvements in attainment. They therefore set up this experiment to test the impacts of reducing class size in primary schools before introducing a costly state-wide policy22. Selection and design All schools were invited to participate in the programme but each school needed a minimum of 57 students in a year group to take part to ensure that there was at least one of each class type: small (13-17 students); regular (22-26 students); and regular with aide / teaching assistant (22-26 students) The schools were distinguished by category into inner city, suburban, urban or rural schools depending on their locality. The experiment ensured that an appropriate number of schools from each category were chosen for the final selection. This meant around 79 schools were participants of the programme in the first year (US Kindergarten age 5-6), made up of 128 small classes, 101 regular classes and 99 regular classes with aides. 22 comparison schools were also set up involving 51 regular classes, to test the robustness of the experiment. The structure of the experiment was to use within-school design and random assignment of teachers and students so that the impacts of changing class size could be robustly analysed without any interference from school effects, for example variation of student achievement between schools. The STAR project faced some criticisms for faults in its design. One of the criticisms is that due to the experimental design, the researchers were able to gain a good deal of control over the main variable of interest, the class size but lost the ability to generalise the results outside the scope of the experiment. The gains in attainment found in this project (see below for more details) may not apply to schools with larger classes or different localities or to programmes that do not induce as large a reduction in class size. Another criticism of this study is that due to its experimental nature, the teachers and students involved in the project knew that they were on the project. This knowledge could have led to Hawthorne effects23, meaning there is potential bias in the results of the project. Once assigned to a class, the students were due to remain in the same class type until the end of the experiment after Grade 3 (UK year 4, aged 8-9) when they then returned to regular size classes. However, variation and movement occurred after the end of the first year of the programme which meant that some students were randomly re-assigned between regular and regular with aide classes, but the small class students were not reassigned. Even though the students were re-assigned at random, the study would have been strengthened if a baseline measure had been put in place at the start of the experiment, which would have thoroughly checked prior differences between students’ academic attainment. A final criticism is that the project was not set up to examine why small classes are deemed
22 Tennessee’s Student/Teacher Ratio Achievement (STAR) project’ http://www.herosinc.org/star.htm 23 A Hawthorne effect describes a temporary change in behaviour or performance in response to a change in the environmental conditions. The response is typically an improvement.
48

to be more effective (Blatchford 2003) and so the project does not look into classroom processes. As a result of these criticisms, Krueger 2003 revisited the STAR study. He found no presence of Hawthorne effects24 in the STAR study. He ran many tests on the assumptions and results of the study and came to the conclusion that the flaws of the study discussed earlier did not jeopardise the results.
4.4 Class size, classroom processes and behaviour 4.4.1 Primary schools For much of the time in primary school classes, pupils are seated and work within groups. Observations from the CSPAR study found that in larger classes, the number and size of groups within classes were larger, as teachers were obliged to teach in larger groups of 7-10. Qualitative evidence from teachers suggested that larger groups were a less effective environment as larger groups are less likely to meet the needs of the individual pupils within them (Blatchford et al, 2008, Blatchford et al, 2004; Kutnick et al, 2005). Results from observations of Year 6 classes participating in the CSPAR study showed that in small classes (25 or less), the contact between teachers and pupils was more individualised and task-related with a more active role for pupils, compared to large classes (31 or more) (Blatchford et al, 2005). On the other hand, in the smallest classes there are indications that pupils were less often involved in cooperative group work (Kutnick et al, 2005) With larger classes there was also more time spent on non-teaching tasks like taking registers. Pupils also spent less time interacting directly with teachers but more time interacting with each other (Blatchford et al, 2003 and 2004). In larger classes at Key Stage 1, there was more off-task pupil behaviour, where pupils were not occupied with the task in hand, e.g. wandering around, doing something else, and daydreaming (Blatchford et al 2003). However, no evidence was found on Key Stage 2 class size affecting the amount of off-task and on-task pupil behaviour (Blatchford et al 2004). Similar evidence was found using data from the Deployment and Impact of Support Staff (DISS) study which involved systematic observations being carried out in classrooms in 49 mainstream primary and secondary schools in England and Wales. The results showed that for both primary and secondary schools, in smaller classes, there were more times when pupils were the focus of a teacher’s attention and more times when they engaged in active interaction with teachers. It was also found that pupils’ classroom engagement was less in larger classes and this was particularly marked for pupils who were already attaining at low levels (Blatchford, 2008). Wilson (2002) found that teachers felt that with smaller classes as they will better be able to encourage positive behaviours and attitudes in their pupils. In addition, they felt the workload was more manageable and the experience less stressful with smaller classes. The detrimental effects of increasing class size (and also school size) on pupil behaviour seemed to be related to overcrowding, either pupils getting ‘lost in the crowd’ and teachers ability to focus on less motivated pupils. On the other hand, such indicative evidence does not provide an explanation of the relationship between achievement, behaviour and class size, which feasibly could be due to pupils paying more attention and behaving better in smaller class or 24 The Hawthorne effect is a reaction of subjects of study who may modify their behaviour (for better or worse) being measured due to the fact that they are aware they are being studied, rather than due to any particular manipulation in the experiment.
49
because teachers can spend more time with individual pupils and adapt to different learning needs. In larger classes, there was generally more time spent by teachers directly teaching the substantive content of the subject knowledge, e.g. communicating concepts facts or ideas. A likely reason for this is that more whole class teaching occurs in larger classes. Blatchford et al (2008) argues that while in larger classes pupils might be getting more educational input, this is at the expense of being largely passive and as part of a large group. There was no evidence of there being a threshold relating to class size where the effects of smaller classes start to become the most prevalent. The CSPAR study observed a slight tendency for better peer relations in large Key Stage 1 classes but the authors acknowledge that further research is needed to replicate this result. The authors also highlight that teachers may to some extent compensate for larger classes, for example, by adapting teaching methods or listening to children read at lunchtime (Blatchford et al. 2003). Kutnick et al (2005) suggested that adapting teaching approach might be feasible for certain activities or curriculum. Whole class teaching could be productive approach, but that it was not always appropriate for primary aged children. 4.4.2 Secondary Schools The study using DISS data found similar impacts of class size on classroom processes for secondary school classes, but that small classes were particularly beneficial for low attaining pupils at secondary school. A decrease in class size from 30 to 15 was associated with an increase in the probability of on-task behaviour by around 10 percentage points from 78% to 88% (Blatchford, 2008). 4.4.3 Summary The evidence on class size and class room processes suggests key features (good and bad) of smaller and larger classes are as follows: Smaller classes:
• More time when individual pupils are the focus of a teacher’s attention • More active interaction between pupils and teachers • More pupil engagement, particularly for pupils attaining at lower levels Larger classes:
• More time spent by pupils interacting with each other • More time spent by teachers directly teaching the substantive content of the subject
knowledge. • More time spent on non-teaching tasks like procedural talk and taking registers
4.5 Class size and attainment 4.5.1 Primary schools
50
The CSPAR Study CSPAR found statistically significant gains from smaller classes for all ability groups in both literacy and mathematics in the reception year. For literacy, the lowest ability groups gained the most from smaller classes. This indicates that reductions in class size could help narrow the attainment gap in reception year. For mathematics the gains from smaller classes were similar across ability groups. However, the study did not find evidence to show that this relationship was caused by the differences in classroom processes discussed earlier. In addition, the longer term effect of smaller reception classes and the effect of additional adults in the class were examined. For Years 1 to 6, there was no significant link between class size in a given year and educational progress in literacy or mathematics, other than larger classes being associated with greater literacy progress in Year 6 (Blatchford et al. 2003, Blatchford et al. 2004). However, for pupils who moved into a similar sized or smaller class, the benefit of being in a smaller class at reception continued to be reflected in literacy attainment in Year 1. For children who moved into larger classes, the benefit of being in a smaller reception class disappeared. Blatchford et al. (2003) argued that this could have been due to a ‘disruption effect’ of moving into a larger class. For Year 1 mathematics, the results indicated that the gains made in reception had been mostly eroded by the end of Year 1 as pupils in larger reception classes made more progress during Year 1. By Year 2, any attainment gains from being in a smaller reception class had been lost for both mathematics and literacy. To ensure that the results were not biased by more effective teachers being assigned to larger classes, analysis was conducted to look at whether there is a relationship between class size and a number of teacher characteristics, including age, length of teaching experience, participation in in-service training and a judgement by headteachers of teachers’ effectiveness. No such relationship was found (Blatchford et al. 2003) The lack of sustained impact of smaller classes on attainment found in the CSPAR study could have been due to many teachers adhering to established methods of teaching and instruction rather than adapting their teaching methods with smaller classes to take full advantage of their smaller size. In some of the case studies, very effective teaching was observed in smaller classes where teachers took full advantage of opportunities for more individual, focussed and sustained attention (Kutnick et al, 2005; Blatchford et al, 2003). Like most studies, the CSPAR study looked at literacy and maths attainment. It might be possible for class size to have an impact on other subjects; for example, more creative subject areas, which are harder to assess by testing (Blatchford 2003). STAR Study As with the CSPAR study, the STAR study pupils took part in tests to assess their reading and maths performance. Two tests were used, a ‘nationally-normed’ standardised test (Finn and Achilles 1999), the Stanford Achievement Test (SAT) and a curriculum-based test specific to the state, the Tennessee Basic Skills First test. Small class students achieved significantly higher test scores than those students in regular and regular with aide classes in both reading and maths for each grade of the study and in all locations.
51
However, like the CSPAR study the STAR study found that the effect of small classes starts to diminish after the first couple of years. The small class size effect reduced after Grade 1 (UK Year 2) but was still statistically significant at the end of Grade 3 (UK Year 4). The study stopped at the end of Grade 3 so it is not possible to assess the impact of class size on attainment after this point. Another benefit of smaller classes found by the STAR study was that students in small classes were less likely to be kept behind to repeat the year than students in regular classes. Over the four years of STAR, 19.8% of students in small classes were kept behind a year as compared with 27.4% of students in regular classes. The STAR programme tested the impacts of small classes on attainment. However, the small classes on this programme contained between 13 and 17 students and regular classes are for 22 to 25 students. Therefore, questions could be raised about the transferability of the results of this programme to the UK system and also the feasibility of introducing such large reductions in classes in the UK system. 4.5.2 Secondary schools There is very little evidence on the importance of class size on secondary school attainment. Two studies (Jenkins, et al., 2007; Levačić et al., 2006) found that a lower PTR was associated with higher attainment in mathematics and science at Key Stage 3, and with higher attainment in science and on the capped GCSE point score at GCSE. However, the measure used in these studies was expenditure per pupil on teachers in general, not number of pupils per class. Increased per‐pupil expenditure on teachers could be used to decrease class sizes or to give teachers more non‐contact time or more training, etc. The studies did not investigate which approach was more common or more effective. Wilson (2002) found that the British evidence on secondary schools was “inconclusive” and cautioned against any spurious interpretations of the positive correlation in secondary schools between larger classes and pupil attainment, as schools tend to assign less able pupils to smaller groups/classes. 4.5.3 Summary The STAR study found that class size had a large impact on attainment for those students in smaller classes. However, these effects seemed to diminish as the children got older and moved up through the programme. The major source of evidence from England, the CSPAR study, did not identify a positive impact of smaller classes on attainment beyond Year 2. Overall there is not a clear picture on the connection between class size, classroom processes and long run attainment. While there has been plenty of evidence on how class size effects classroom processes, to date researchers have not been successful in showing that class size affects certain classroom process which in turn affect attainment (Blatchford et al. 2008)
4.6 Impact on pupils from deprived backgrounds The evidence on the impact of class size on pupils from deprived backgrounds is mixed. As discussed in Section 4.5, for literacy progress there is some evidence from the CSPAR study that for classes of below 25, lower attaining pupils particularly benefited (Blatchford et
52

al, 2005). Since deprivation is associated with low attainment, it can be hypothesised that a reduction in reception class size from 25 to 15 would have positive benefits for pupils from deprived backgrounds in terms of their early literacy outcomes. The STAR study looked specifically at whether class size had a different impact on pupils from families of different socioeconomic status (SES). It found that while small classes did help low SES student achievement, there was no differential effect of a small class that favoured low achieving or low SES students over average students or high SES students.
4.7 Impact on staying on rates Most of the UK evidence on class size effects concentrates on primary school children and looks at the impact on attainment or classroom processes. A study using data from Denmark looked at the impact of class size in lower secondary school on the length of post-compulsory schooling. The study found a statistically significant relationship between smaller classes and length of time in post-compulsory education. Length of education is a long run outcome that is strongly positively correlated with earnings (Bingley, Jensen and Walker, 2005). The study concludes that a reduction in class size during the whole of compulsory schooling by 5% (a unit reduction from 18 to 17) provides a rise in post-compulsory education by approximately 8 days (about 1% of the mean length of post-compulsory schooling). This is interpreted as an increase of 0.2% in lifetime earnings per pupil, roughly £2700 over a working lifetime (undiscounted 2005 prices), however the study found that this was approximately the same as the undiscounted cost for such a class size reduction. In Denmark, it is common for students to pause their education before they enter higher education. A limitation of the study is that education continued at university after a break will not be included in the data. If for some reason children in larger classes were more likely to take a gap year before university, this could invalidate the results. A further limitation is that the data is relatively old covering enrolments in 8th grade between 1981 and 1990. This is difficult to avoid with data looking at longer term outcomes but if teaching methods have changed, it could mean the results are not relevant today. Nevertheless, the paper provides some compelling evidence that class size can have a small positive impact on the length of time a pupil spends in post-compulsory education.
4.8 Parental Opinion on Class Size There is little formal research evidence available on the parental opinion on class sizes, though this is a widely acknowledged concern. Research by Bennett in 1996 found class size to be a paramount concern among parents. It was found that three-quarters of parents knew exactly how many children were in their child's class and of these over 60% felt that this was too many. Over 96% of parents believed that the number of children in a class affects the quality of teaching and learning, however only 40% believed that class size was the most, or a very important factor in the choice of a primary school by parents. Less than 8% felt it was not a very important factor. This research would seem to suggest that parents consider class size to be an important issue, and in general prefer smaller classes for their children, although class size is not necessarily a deciding factor in choice of school.
53
Perhaps the strongest indication today of parents’ concerns about class sizes is shown in lower independent school class sizes. PTR, and likely therefore class size, is significantly lower in independent schools. As Figure 3-3 indicates, in November 2010, PTR in independent schools was 8.2, compared to 15.6 in maintained secondary, and 20.9 in maintained primary schools. This is an indication that there is demand for small class sizes in the market for primary education. If this was not so, independent schools would allow PTR class sizes to increase. PTR in independent schools has fallen every year since 2002, suggesting that class size continues to be an important issue for parents, the consumers in the market for independent school education. Evidence from a 2008 survey by Ipsos Mori for the Independent Schools Council25 also points to class size as a reason why parents choose to send their children to independent schools, rather than to schools in the maintained sector. In the survey, 57% of parents said they would send their child to an independent school if they could afford to. The third most common reason parents expressed for choosing to send their child to an independent school, with 25% of respondents, was smaller class sizes26. Another survey commissioned by the then Department for Children, Schools and Families (DCSF), found that out of all the reasons for dissatisfaction, class sizes being too large was only 7th, with 6% of respondents (GFK Social Research, 2008).
4.9 Impact of class size reduction policies compared to other policies aimed at improving attainment
Given the expense of implementing a class size reduction policy, or of maintaining class sizes at their current level in the light of projected increases in pupil numbers, it is useful to consider whether class size reduction is the most efficient policy for increasing attainment in school. In some countries, more had been achieved by focusing resources on purchasing more text books than reducing class size (Jamison, 1987; as cited by Wilson, 2002). A report by Hattie (2009) argues that the effect on attainment of class size reduction, compared to other interventions, is small. Hattie uses a measure known as effect size27 to collate evidence from various studies to compare the impact of different educational interventions on attainment. Effect sizes can compare the magnitude of different effects in different studies, where the variable of interest may not be measured in the same units. For example, effect sizes can be used to compare the attainment effects of reducing class size in the UK and Sweden, even though both countries have different examination systems28. When the effect size of various methods of intervention is compared, the effect of reducing class size is shown to be among the least effective of influences on student outcomes. The average effect size of a range of intervention methods in Hattie’s report was 0.40, where the effect size of reducing class size from 25 to 15 is just 0.13. Hattie suggests that the small effect size of reducing class size could be related to the teaching methods used in small classes, which are often the same methods used by teachers to teach larger classes. The effect size would perhaps be different if teachers adjusted their teaching techniques to optimise learning in small classes, for example by allowing less rigid learning, a shift to the
25 Ipsos Mori Survey, http://www.ipsos-mori.com/researchpublications/researcharchive/poll.aspx?oItemId=2293 26 The top two reasons were, ‘better standards’ and ‘better discipline’ 27 An effect size of one means that the mean of the outcome of interest, e.g. attainment, increases by one standard deviation. 28 For example, if the effect sizes were calculated and the studies showed that a decrease in the standard deviation of class size by one increases the standard deviation of maths in the UK by 0.3 and in Sweden by 0.1, it can be concluded that the effect of reducing class size in the UK is greater.
54

conception of the development of individuals and by allowing students to become teachers. A weakness of the report by Hattie is that the effect sizes used relate to the short term, rather than long-term impact on attainment. For example, for the CSPAR study (Blatchford, 2005) Hattie uses an effect size of 0.23. This is despite the study attempting but failing to find a long run impact on attainment, or an impact on attainment for year groups other than reception. It is also not necessarily the case that a similar effect size would be found when comparing classes of different sizes, for example, a class size of 35 compared to a class size of 25 (Hattie, 2009). Nevertheless, the fact that the Hattie result is based on a large number of research papers, and that all these research papers tend to find fairly similar effect sizes, the overall conclusion of Hattie’s analysis that smaller class sizes (without an adjustment of teaching methods) do not have as big an impact on attainment compared to other interventions seems reasonable. The relatively low impact of smaller classes on attainment is supported by an American study (Rivkin et al., 2005) that looked at longitudinal data from Texas and found that the same improvements in student achievement were found by increasing teacher quality slightly as are found by reducing class size by at least ten pupils. For example, in 4th Grade, large reductions in class size of at least ten pupils were needed to see the same change in student achievement that could be met by a small improvement in teacher quality. The two studies (Jenkins, et al., 2007; Levačić et al., 2006) estimating the relationship between school resources in secondary schools in England and pupil attainment referred to in Section 4.5.2, found that money spent towards reducing PTR had a slightly larger effect on attainment than an equivalent amount of money on general expenditure. However, since PTR relates to expenditure per pupil on teachers in general, increased per-pupil expenditure on reducing PTR could be used to decrease class sizes or to give teachers more non-contact time or more training etc. The study was also unable to identify what the schools which spent a higher than average amount of money per pupil spent the additional money on. Overall, this suggests that the best value for money can be achieved in increasing teacher effectiveness, rather than reducing the number of pupils in classes that has an uncertain and diminishing effect on pupil achievement in the long run. Hanushek (2011) claimed that teachers and their quality are, by far, the most important factor in determining student achievement. He estimates that a teacher who is one standard deviation above the average produces additional earnings for their class (a class of 20) of $400,000 in total each year. Krueger (1999) has estimated, using the Project STAR’s class size reduction by one-third, that there is a one-time improvement in test scores of approximately 0.22 standard deviations. However, evidence suggests that the effect of a class size reduction diminishes after a few years and much controversy remains over whether or not there is indeed any impact on student achievement.29 This suggests that the cost of reducing class size by this much needs to be compared to the alternative, such as assigning the most effective teachers to the largest classes to ensure they are raising the most students’ achievement as possible and maximizing the potential economic benefit (Hanushek, 2011).
4.10 Conclusion Many studies have investigated the links between class size and attainment through experimental and non-experimental methods. Researchers have differing views and cannot agree about the links between class size and attainment. Some deny (e.g. Leuven et al., 29 For more reading consider, for example, Ehrenberg, Brewer, Gamoran, & Willms, 2001; Hanushek, 1999; Mishel & Rothstein, 2002.
55
2008) any ‘class size effect’ whereas there are many researchers (e.g. Angrist and Lavy, 1997; Bruhwiler and Blatchford, 2009) who disagree, showing that class size does have an effect on attainment, albeit small or statistically insignificant in some cases. Section 4 has reviewed these studies and found that class size does have some impact on attainment and behaviour, but this effect is often small and diminishes after a few years. It is therefore important to assess the value for money of reducing class size against other policy options as the costs could potentially outstrip the benefits. There is not enough evidence to determine whether the relationship between class size and attainment varies for different sizes of class. For example, a greater understanding is needed on whether or not a fall in class size from 25 to 20 has the same effect as a fall in class size from 40 to 35, or whether families might compensate for larger classes.
56
5 International Comparisons
5.1 Introduction Section 5 investigates how UK class sizes compare with other Organisation for Economic Cooperation and Development (OECD) countries in primary and secondary schools over time using data from the Education at a Glance (EAG)30. This section also looks at attainment data from Trends in International Mathematics and Science Study (TIMSS), Progress in International Reading Literacy Study (PIRLS) and Programme for International Student Assessment (PISA) and compares it to class size to see if there is any international relationship between average class size and attainment in different countries.
5.2 Key Findings • The UK has one of the largest average primary school class sizes amongst the OECD
countries (Figure 5-1) but also has one of the highest overall TIMSS scores for Science and Maths (Figure 5-3).
• The UK has experienced a fall in average primary school class size from 2000 to 2009
(Figure 5-1). The majority of OECD countries have experienced falls in average primary school class size. Average lower secondary school class size has fallen in the UK since 2004 (Figure 5-2).
• Average primary school class size is more varied between countries than average
secondary school class size. • There is no clear relationship between average primary or secondary school class size
and educational attainment amongst OECD countries.
30 http://www.oecd.org/edu/eag2011
57
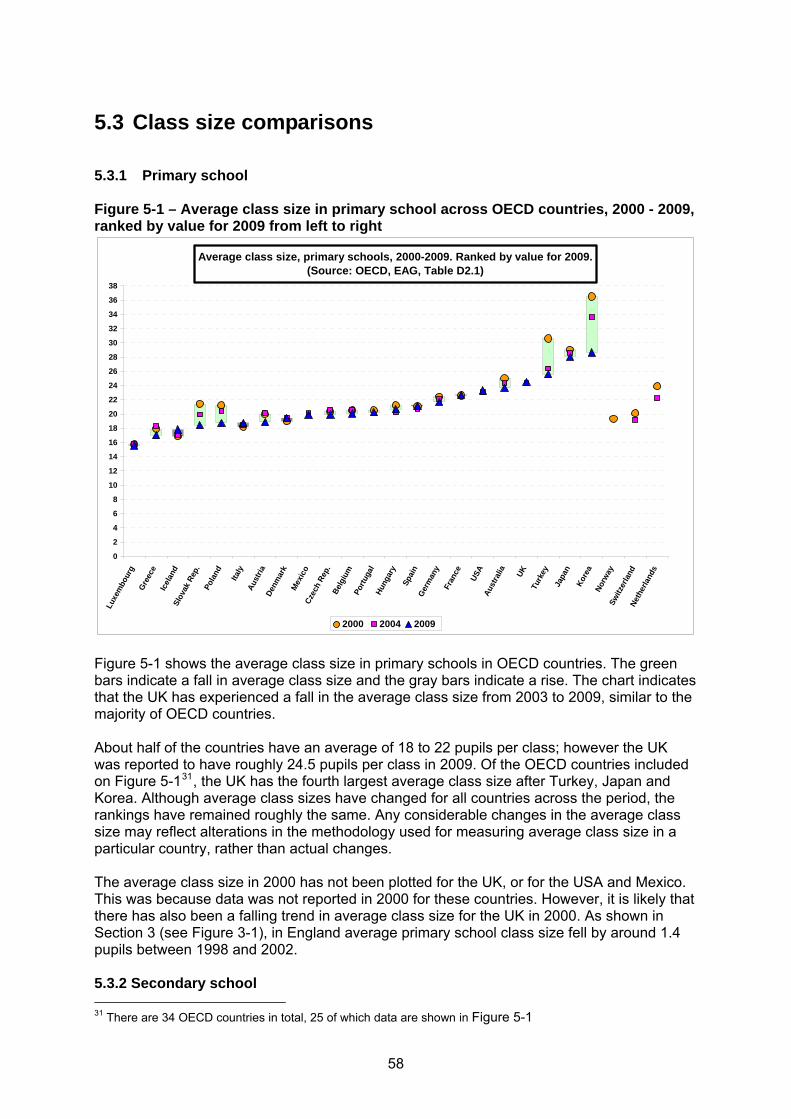
5.3 Class size comparisons 5.3.1 Primary school Figure 5-1 – Average class size in primary school across OECD countries, 2000 - 2009, ranked by value for 2009 from left to right
Average class size, primary schools, 2000-2009. Ranked by value for 2009.(Source: OECD, EAG, Table D2.1)
0
2
4
6
8
10
12
14
16
18
20
22
24
26
28
30
32
34
36
38
Luxe
mbo
urg
Gree
ceIc
elan
dSl
ovak
Rep
.Po
land Italy
Aust
riaDe
nmar
kM
exic
oCz
ech
Rep.
Belg
ium
Portu
gal
Hung
ary
Spai
nGe
rman
yFr
ance
USA
Aust
ralia UK
Turk
eyJa
pan
Kore
aNo
rway
Switz
erla
ndNe
ther
land
s
2000 2004 2009
Figure 5-1 shows the average class size in primary schools in OECD countries. The green bars indicate a fall in average class size and the gray bars indicate a rise. The chart indicates that the UK has experienced a fall in the average class size from 2003 to 2009, similar to the majority of OECD countries. About half of the countries have an average of 18 to 22 pupils per class; however the UK was reported to have roughly 24.5 pupils per class in 2009. Of the OECD countries included on Figure 5-131, the UK has the fourth largest average class size after Turkey, Japan and Korea. Although average class sizes have changed for all countries across the period, the rankings have remained roughly the same. Any considerable changes in the average class size may reflect alterations in the methodology used for measuring average class size in a particular country, rather than actual changes. The average class size in 2000 has not been plotted for the UK, or for the USA and Mexico. This was because data was not reported in 2000 for these countries. However, it is likely that there has also been a falling trend in average class size for the UK in 2000. As shown in Section 3 (see Figure 3-1), in England average primary school class size fell by around 1.4 pupils between 1998 and 2002. 5.3.2 Secondary school 31 There are 34 OECD countries in total, 25 of which data are shown in Figure 5-1
58

Figure 5-2 – Average class size in lower secondary school across OECD countries 2000-2009, ranked by value in 2009 from left to right.
Average class size, lower secondary schools, 2000-2009. Ranked by value in 2009.(Source: OECD, EAG, Table D2.1)
02468
10121416182022242628303234363840
Luxe
mbo
urg
Icel
and
UKDe
nmar
kFi
nlan
dSl
ovak
Rep
.
Italy
Gree
ceHu
ngar
yCz
ech
Rep.
Aust
riaPo
rtuga
l
USA
Pola
ndAu
stra
liaSp
ain
Fran
ceGe
rman
yM
exic
oJa
pan
Kore
aSw
itzer
land
Norw
ay
2000 2004 2009
Nearly one half of the OECD countries depicted in Figure 5-2 had an average class size between 19.5 and 22 in 2009. The UK has reduced its average class size since 2004; it has fallen by 1.4 pupils, from 21.0 to 19.6 in 2008. Data was not reported for the USA, UK or Mexico in 2000. The average class size for lower secondary schools shows less variation from 2000 to 2009 than the average class size for primary schools. Nearly half of the OECD countries have an average class size that has changed by only 0.5 pupils or less over the period. The measurements of average class size are less useful for secondary schools than for primary schools. In secondary school, class sizes regularly vary by subject, pupil characteristics and/ or age. This type of variation would not be picked up with average class size data. As a result the average class size measurement may not give an accurate representation of class sizes within secondary schools across all OECD countries, compared to average class sizes for primary schools.
5.4 Class size and attainment 5.4.1 Primary school
59

Figure 5-3 and Figure 5-4 plot the relative rankings of 12 OECD countries in the Trends in International Mathematics and Science Study (TIMSS) assessment for Maths and Science in descending order against their rankings of average class size in ascending order from left to right. Therefore, Italy has the lowest average class size and Japan the highest out of this group of countries. The TIMSS assessment is an international indicator of educational achievement. It consists of an academic assessment and also includes teacher, school and student questionnaires to obtain information on pupils’ characteristics and classroom environment. These data show that although the UK is ranked as having one of the largest average class sizes, it is ranked second for TIMSS score for Science and Maths. Italy is ranked with the smallest average class size among the countries yet is ranked 9th for Maths and 5th for Science in TIMSS whilst Japan has the largest class size but ranks 1st in both Maths and Science. However, as depicted in Figure 5-4, for PIRLS the UK is ranked 7th for reading, compared to Italy, which is ranked first. Figure 5-3 – Relationship between class size in 2004 and science and maths attainment in international studies in 2007, primary level, countries ranked on horizontal axis in ascending order of class size (left to right).
1
2
3
4
5
6
7
8
9
10
11
12
Italy
Denm
ark
Aust
ria
Hung
ary
Slov
ak R
ep.
Czec
h Re
p.
USA
Germ
any
Neth
erla
nds
Aust
ralia UK
*
Japa
n
Rel
ativ
e ra
nkin
g fo
r atta
inm
ent
TIMSS 2007 maths, age 10 TIMSS 2007 science, age 10
Relative class size ranking
Worst
Best
Smallest Largest
Source: OECD Education at a Glance, TIMSS 2007. * UK attainment data refers to England only.
60
Figure 5-4 – Relationship between class size and reading attainment in international studies, primary level, countries ranked on horizontal axis in ascending order of class size (left to right) in 2004.
1
2
3
4
5
6
7
8
9
Italy
Denmark
Slovak R
ep.
Austria
Hungary
German
y
Netherl
ands
USAUK*
Rel
ativ
e ra
nkin
g fo
r atta
inm
ent
PIRLS 2006 reading , age 10 Relative class size ranking
Smallest Largest
Best
Worst
Source: OECD Education at a Glance, PIRLS 2006. *UK attainment data refers to England only.
Overall, the charts show little evidence of a correlation between performance in TIMMS and PIRLS and class size32. 5.4.2 Secondary school Similarly, for secondary schools, Figure 5-5 and Figure 5-6 do not show a clear relationship between lower secondary school average class size and attainment. Figure 5-5 does not show any correlation, particularly considering the TIMSS results and class sizes of Japan, Korea and Italy. Japan and Korea have the largest class sizes but also the highest maths and science attainment at age 14. Italy has the smallest average class size and the lowest maths and science attainment. Figure 5-6, which compares average class size to PISA Reading results at age 15, contains a much larger number of OECD countries. It does not suggest a relationship between class size and reading at age 15.
32 Further research could be conducted to assess the relationship between TIMSS score and class size for 2000 and 2006.
61

Figure 5-5 – Relationship between lower secondary class size and attainment in science at age 14 - countries ranked on horizontal axis in ascending order of class size (left to right) in 2007.
1
2
3
4
5
6
7
8
Italy
Hungary UK*
Czech
Rep
.
Australi
aUSA
Japan
Korea
Rel
ativ
e ra
nkin
g fo
r atta
inm
ent
TIMSS07 Maths, age 14 TIMSS07 Science, age 14 Relative class size ranking
Smallest Largest
Best
Worst
Source: OECD Education at a Glance, TIMSS 2007. *UK attainment data refers to England only. Figure 5-6 – Relationship between lower secondary class size and attainment in reading at age 15 - countries ranked on horizontal axis in ascending order of class size (left to right) in 2007.
123456789
10111213141516171819202122
Switz
erla
ndIc
elan
dD
enm
ark
Luxe
mbo
urg
Finl
and
Italy
Hun
gary
Gre
ece
Port
ugal
Slov
ak R
ep.
UK
*C
zech
Rep
.A
ustra
liaA
ustr
iaU
SAFr
ance
Pola
ndSp
ain
Ger
man
yM
exic
oJa
pan
Kor
ea
Rel
ativ
e ra
nkin
g fo
r atta
inm
ent
PISA09 Reading, age 15 Relative class size rankingSmallest
Largest
Worst
Best
Source: OECD Education at a Glance, PISA 2009. Note: UK attainment data refers to England only. Although, these data do not show evidence of a relationship between class size and
62
attainment internationally, this could be a reflection of the difficulty of comparing education systems across countries, rather than due to a lack of any impact of class size on attainment. In particular, it is not surprising that no straightforward relationship is observed between average lower secondary school class size and attainment. Even, if class size were an important driver of secondary school attainment compared to other countries, it could be that secondary school attainment is also influenced by primary school class size as well.
5.5 Conclusion Section 5 has shown that average class size varies amongst the OECD countries. The UK is ranked as having large average class sizes for primary schools and has smaller average class sizes for secondary schools in comparison to other OECD countries. However, there is no clear relationship between a country’s average class size and attainment, suggesting that a country with a high class size rank does not necessarily have a low attainment level. This supports Section 4, which found that while class size does have an effect on attainment; it is often small and diminishes after a number of years.
63

6 Conclusion
Section 2 showed how the increasing birth rate has led pupil numbers to start increasing in primary schools from 2009, and is projected to do so later on in secondary schools from 2015. It showed how in the past, average class size and Pupil Teacher Ratio (PTR) have tended to be higher when pupil numbers are higher. This suggests that changes in pupil numbers have tended to be partially compensated by changes in the number of teachers, but not enough to prevent average class size and PTR from changing at all. Section 3 considered the context of the legal requirement of a maximum of 30 pupils in Key Stage 1 classes. Since the legal requirement was introduced, the distribution of class sizes at Key Stage 1 has changed shape. There are now a large number of classes with 30 pupils and very few classes over 30. The projected increases in pupil numbers are likely to result in certain Local Authorities experience larger increases in pupil numbers and therefore greater demands when attempting to keep Key Stage 1 classes within the legal limits. Section 4 summarised the larger and more robust studies on the importance of class size. Class size is found to have some positive impact on attainment and behaviour, but this effect is often small and diminishes after a few years. The value for money of class size reduction policies therefore needs to be assessed relative to other potential options, such as improving teacher effectiveness. Section 5 has shown that average class size varies amongst the OECD countries. The UK is ranked as having large average class sizes for primary schools and has smaller average class sizes for secondary schools in comparison to other OECD countries. However, there is no clear relationship between a country’s average class size and attainment.
64
Bibliography 1. Angrist, J. & Lavy, V. (1997) ‘Using Maimonides’ rule to estimate the effect of class size
on scholastic achievement’ Quarterly Journal of Economics 114: 2: pp 533-575 2. Angle, Fearn, Elston, Basset, McGinigal (2009), ‘Teachers’ Workloads Diary Survey
2009’, DCSF Research Report 159 3. Bennett (1996), ‘Class size in primary schools: Perceptions of head teachers, chairs of
governors, teachers and parents’, British Educational Research Journal, 22: 1, p. 33. 4. Bingley, Paul, Myrup Jensen, Vibeke and Walker, Ian, The Effects of School Class Size
on Length of Post-Compulsory Education: Some Cost-Benefit Analysis (May 2005). IZA Discussion Paper No. 1605. Available at SSRN: http://ssrn.com/abstract=731683
5. Blatchford (2003), ‘The Class Size Debate, Is small better?’ Open University Press. 6. Blatchford, Bassett, Goldstein and Martin (2003), ‘Are class size differences related to
pupils’ educational progress and classroom processes? Findings from the Institute of Education class size study of children aged 5 to 7 years’, British Educational Research Journal, 29: 5
7. Blatchford, Bassett, Brown, Martin and Russell (2004), ‘The effects of class size on
attainment and classroom processes in English primary schools (years 4 to 6) 2000 – 2003’, DfES Research Brief RBX13-04
8. Blatchford, Bassett, and Brown (2005) 'Teachers' and pupils' behaviour in large and small
classes: a systematic observation study of pupils aged 10/11 years', Journal of Educational Psychology 97:3, pp. 454-467
9. Blatchford, Basset and Brown (2008), ‘Do low attaining and younger students benefit
most from small classes? Results from a systematic observation study of class size effects on pupil classroom engagement and teacher pupil interaction’, presentation at American Educational Research Association Annual Meeting, New York.
10. Bruhwiler, C. and Blatchford, P. (2009) ‘Effects of class size and adaptive teaching
competency on classroom processes and academic outcome’ Learning and Instruction 21:1 pp 95-108
11. DCSF (2009), ‘Deprivation and Education: The evidence on pupils in England,
Foundation Stage to Key Stage 4’ https://www.education.gov.uk/publications/standard/publicationDetail/Page1/DCSF-RTP-09-01
12. DCSF (2009),’ Teachers’ Workload Diary Survey 2009’, Research Report DCSF-RR159
https://www.education.gov.uk/publications/standard/publicationDetail/Page1/DCSF-RR159
13. DfES (2002) ‘Class size and Pupil Teacher Ratios in Schools in England’ :
http://www.education.gov.uk/rsgateway/DB/SBU/b000329/index.shtml
65

14. DfE (2010),’ Teachers’ Workload Diary Survey 2010’, Research Report DFE-RR057 https://www.education.gov.uk/publications/RSG/SchoolsSO/Page7/DFE-RR057
15. DfE (2011a),’DfE: National Pupil projections: Future trends in pupil numbers - July 2011
update’, OSR 12/2011 http://www.education.gov.uk/rsgateway/DB/STR/d001017/index.shtml
16. DfE (2011b),’ Pupil Absence in Schools in England, Including Pupil Characteristics:
2009/10’, SFR 03/2011 http://www.education.gov.uk/rsgateway/DB/SFR/s000994/index.shtml
17. Early Years Foundation Stage (2011)
http://www.education.gov.uk/childrenandyoungpeople/earlylearningandchildcare/a0068102/early-years-foundation-stage-eyfs
18. Finn and Achilles (1999) ‘Tennessee’s class size study: Findings, implications,
misconceptions’ Educational Evaluation and Policy Analysis, 21: 2, pp. 97-109 19. Fredriksson, Peter, Ockert, Bjorn and Oosterbeek, Hessel, Long-Term Effects of Class
Size. IZA Discussion Paper No. 5879. Available at SSRN: http://ssrn.com/abstract=1906182
20. GFK Social Research (2008), ‘Survey of Parents in England 2008’, DCSF Research
Report RW041 http://www.education.gov.uk/rsgateway/DB/RRP/u015493/index.shtml 21. Hanushek (2011), ‘The economic value of higher teacher quality’, Economics of
Education Review, Vol 30, pp 466-479 22. Hattie (2005), ‘The Paradox of reducing class size and improving learning outcomes’,
International Journal of Educational Research, Vol 43, pp. 387-425 23. Hattie (2009), ‘Visible learning. A synthesis of over 800 meta-analyses relating to
achievement’, Routledge 24. HM Treasury Green Book (2003) http://www.hm-
treasury.gov.uk/data_greenbook_index.htm 25. Hutchings, Seeds, Coleman, Harding, Mansaray, Maylor, Minty and Pickering (2009),
‘Aspects of workforce remodelling: strategies used and impact on workload and standards’, DCSF Research Report No. DCS- RR153
26. Ipsos Mori Survey (June 2008), http://www.ipsos-
mori.com/researchpublications/researcharchive/poll.aspx?oItemId=2293 27. Jepsen and Rivkin (2002), ‘Class Size Reduction, Teacher Quality, and Academic
Achievement in California Public Elementary Schools.’ Public Policy Institute of California.
28. Jenkins et al (2006) ‘Estimating the Relationship between School Resources and Pupil
Attainment at GCSE’ DfES Research Report No.727 29. Krueger (1999) ‘Experimental Estimates of Education Production Functions’ The
Quarterly Journal of Economics, vol 114, No. 2, pp. 497-532 30. Krueger (2003) “Economic considerations and class size” Economic Journal, Royal
66
Economic Society, 113:485, pp. F34-F63 31. Kutnick, P., Sebba, J., Blatchford, P., Galton, M. and Thorp, J. (2005) The Effects of Pupil
Grouping: Literature Review. DfES Research Report 688. London: DfES 32. Ladd and Profilet (1996) ‘Child Behaviour Scale: A teacher-report measure of young
children's aggressive, withdrawn, and prosocial behaviors’ Developmental Psychology 32:6: pp. 1008-1024.
33. Leuven, E.; Oosterbeek, H. & Rønning, M. (2008) ‘Quasi-experimental estimates of the
effect of class size on achievement in Norway’ Scandinavian Journal of Economics 110: 4: pp 663-693
34. Levačić et al (2006) ‘ Estimating the Relationship between School Resources and Pupil
Attainment at Key Stage 3’ Institute of Education, University of London, DfES Research Report No 679
35. OECD (2003) Definitions on class size: http://stats.oecd.org/glossary/detail.asp?ID=5347 36. Ofsted (1995) ‘Class size and the quality of education’ London: Ofsted 37. Office for National Statistics (2011a) ’ Births and Deaths in England and Wales, 2010’
http://www.ons.gov.uk/ons/rel/vsob1/birth-summary-tables--england-and-wales/2010/index.html
38. Office for National Statistics (2011b) ’ Frequently Asked Questions: births & fertility’
http://www.ons.gov.uk/ons/rel/vsob1/parents--country-of-birth--england-and-wales/2010/faq-births-and-fertility.pdf
39. Office for National Statistics (2011c) ‘Internal Migration within England and Wales, year
ending June 2010’. http://www.ons.gov.uk/ons/rel/migration1/internal-migration-by-local-authorities-in-england-and-wales/2009-2010/internal-migration-within-england-and-wales--year-ending-june-2010.pdf
40. Office for National Statistics publication (2009) ‘Have women born outside the UK driven
the rise in UK births since 2001?’ http://www.palgrave-journals.com/pt/journal/v136/n1/abs/pt200917a.html
41. Office for National Statistics (2005) ‘Focus on Families - 2005 Summary Report’
http://www.ons.gov.uk/ons/rel/family-demography/focus-on-families/2005/focus-on-families-2005-summary-report.pdf
42. Rivkin, Hanushek and Kain (2005) ‘Teachers, Schools and Academic Achievement’
Econometrica, 73:2, pp. 417-458 43. School Standards and Framework Act
http://www.opsi.gov.uk/Acts/acts1998/ukpga_19980031_en_1 44. School’s admission code, exceptions to class size duty:
http://media.education.gov.uk/assets/files/pdf/m/managing%20compliance.pdf 45. School’s admission code:
http://www.education.gov.uk/schools/adminandfinance/schooladmissions/a00195/current-codes-and-regulations
67

68
46. Snook, Clark, Harker, O’Neill and O’Neill (2009), ‘Invisible learnings? A commentary on John Hattie’s “Visible learning: A synthesis of over 800 Meta-Analysis Relating to Attainment”’, New Zealand Educational Institute, http://www.nzei.org.nz/article/x_uid/00282.html
47. Tennessee’s Student / Teacher Ratio Achievement (STAR) project (2011)
http://www.herosinc.org/star.htm 48. The Importance of Teaching: Schools White Paper:
http://www.education.gov.uk/schools/teachingandlearning/schoolswhitepaper 49. Tickell (2011) The Early Years: Foundations for life, health and learning
http://media.education.gov.uk/MediaFiles/B/1/5/%7BB15EFF0D-A4DF-4294-93A1-1E1B88C13F68%7DTickell%20review.pdf
50. Wilson, V. (2002) Does Small Really Make a Difference? A review of the literature on the
effects of class size on teaching practice and pupils’ behaviour and attainment. SCRE

Ref: DFE-RR169 ISBN: 978-1-78105-026-2 © The Department for Education December 2011


![Chapter 6: Restoration Ecology Big Question: Can We Restore Damaged Ecosystems? [Unless otherwise identified, photos and charts are from the text for ESRM100.]](https://img.pdfslide.us/doc/110x75/56649d535503460f94a2faa3/chapter-6-restoration-ecology-big-question-can-we-restore-damaged-ecosystems.jpg)


![AMENDMENTS MADE IN INDIRECT TAX ACT...Rate of Excise Duty [Effective from 11-07- 2014, unless otherwise stated] 1.1 General Standard & concessional Rate of Duty maintained at 12% &](https://img.pdfslide.us/doc/110x75/60a7a5ef646b9d63822b6d7e/amendments-made-in-indirect-tax-act-rate-of-excise-duty-effective-from-11-07-.jpg)