Embed Size (px)
Citation preview
C L A S S
M A R C H 1 9 , 2 0 1 3
TRADE

SOFTWOOD IN THREE MINUTES
• http://www.youtube.com/watch?v=N-Uj-nw3XUk

TRADE THEORY (1)
• Absolute Advantage• Canada can produce lumber more cheaply while the US can
produce tomatoes more cheaply (costs are lower)• Benefits from trade are obvious-each country will specialize
Example of Absolute Advantage
Commodities Unit Costs of Production in terms of labour
Canada US
Lumber 4 6
Tomatoes 8 3

TRADE THEORY (2)
• Comparative Advantage• Canada can produce both lumber and tomatoes more cheaply
than the us• But here trade will still be beneficial (Ricardo)
Example of Comparative Advantage
Commodities Unit Costs of Production in terms of labour
Canada US
Lumber 4 6
Tomatoes 8 10

BENEFITS OF SPECIALIZATION
How Comparative Advantage Works
Commodities Production (outputs) per unit of labour
Total Output
Canada US
Lumber (railcars)
2.5 1.0
Tomatoes (bushels)
1.25 1.7
Ratio (opportunity cost)
2.0 1.7
No trade 1.25 bushels and 2.5 railcars
1.7 bushels and 1 railcar
2.95 bushels and 3.5 railcars
Specialization 5 railcars 3.4 bushels 3.4 bushels and 5 railcars
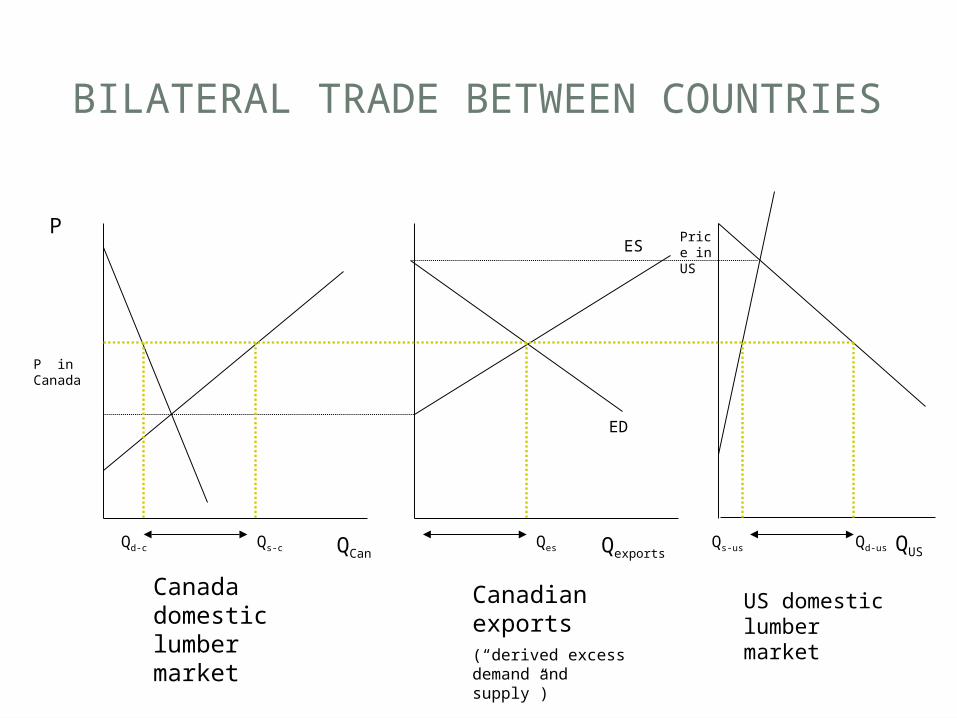
BILATERAL TRADE BETWEEN COUNTRIES
Canada domestic lumber market
US domestic lumber market
Qd-c Qs-c Qes Qs-us Qd-us
P
QCanQUSQexports
P in Canada
Price in US
Canadian exports(“derived excess demand and supply”)
ES
ED

FREE TRADE IN PRACTICE
• Free trade is well understood to offer these benefits from trade…
• There are also legitimate concerns that influence trade
• These include safety regulations• Environmental regulations• Controls over illegal activities

STRATEGIC TRADE
• But it also turns out that it can be in a country’s interest to renegotiate the terms of trade
• By imposing tariffs it can improve its welfare• More broadly there may be other reasons for
protectionism• Protecting a domestic industry• And there may also be non-economic motives
• National defense• Foreign policy• National pride

TRADE AGREEMENTS AND INSTITUTIONS
• FTA and NAFTA• WTO• TPP (under negotiation)

THE SOFTWOOD LUMBER DISPUTE
• “We can compete against any lumber industry in the world, but we can’t compete against their government, too.”• Steve Swanson, President, Swanson Group, Inc. and Past
Chairman of the Coalition for Fair Lumber Imports

IT IS AN OLD ONE….
• 19th Century• 1840-1846: American
tariff introduced of 20-30%
• Free trade briefly (1854-66; 1894-97)
• In 1866 Canada introduces export duty on sawlogs in response to US duties on lumber
• Century ends with US duty and Canadian restrictions on log exports
• 20th Century• Duties remain in place• In 1932 revenue tax
imposed (triple existing tariffs) and Canadian exports drop to 1890 levels
• 1950’s tariffs and taxes approximately 1%
• In 1962 group of US lumber producers propose market sharing agreement with 10%tariff in both countries when imports exceed 10%
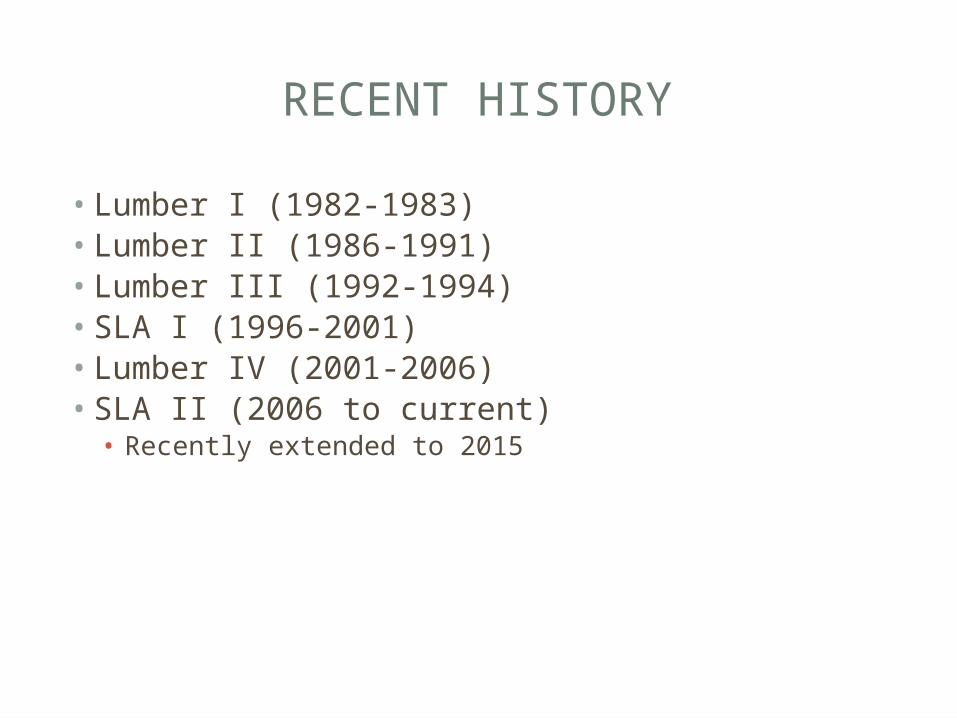
RECENT HISTORY
• Lumber I (1982-1983)• Lumber II (1986-1991) • Lumber III (1992-1994)• SLA I (1996-2001)• Lumber IV (2001-2006)• SLA II (2006 to current)
• Recently extended to 2015
LUMBER I
• In 1982 complaint filed-stumpage conveys a subsidy• In 1983 Determination-Department of Commerce
investigates and finds it does not
LUMBER II
• Complaint: stumpage conveyed a subsidy• Initial findings: subsidy of 15% against lumber
exported from BC, AB, ON and PQ• Resolved through MOU
• BC increases stumpage and no export tax• PQ introduces phased increases in stumpage and
corresponding phased decreases in tax• AB & ON make no changes and pay tax
• In 1991 Canada withdraws from MOU • Free Trade Agreement signed in 1986 and enters into force in 1989

LUMBER III
• Department of Commerce initiates complaint on October 31, 1991 (Canada had withdrawn as of September 3, 1991)
• DoC finds stumpage and log export control convey subsidies
• In July 1992 DoC imposes final countervailing duties of 6.51% on all provinces except Maritimes
• 1992-1994-series of decisions in Canada’s favour that end up in duties being refunded December 15, 1994

SOFTWOOD LUMBER AGREEMENT (SLA I)
• May 1996 to March 2001• Tariff Rate Quota system• Can ship up to 14.3 billion board feet feet duty
free; above that amount, incur costs of either $50; above 14.7 billion bf; $100/mbf (adjusted for inflation over period)
• Four provinces assigned quota• Companies within provinces receive quota

LUMBER IV
• Canada can’t agree on what is next and we are back in a world of litigation
• April 2, 2001 to September, 2006• Initial allegations allege subsidies of 39.9% and anti-dumping
margins of 22.5% to 73.9%• August 2001 DoC makes a determination of a 19.31% subsidy,
retroactively payable back to May• October 2001 DoC determines dumping margins for six
companies, ranging from 5.9% to 19.2%, with average margins applied to all others of 12.6%• Companies are Abitibi, Canfor, Slocan, Tembec, West Fraser, Weyerhaeuser

LUMBER IV (2)
• February 2002 Canada starts NAFTA challenges (WTO consultations initiated earlier)• March 2002 CVD set at 19.34%; dumping reduced to 9.7%• April 2002 CVD reduced to 18.8% and 8.4%• June 2004 first administrative review: CVD now 9.2%; dumping
4%• December 2005 second administrative review: CVD now 8.7%;
antidumping 2.1%
• Cost US industry astronomical sums of cash-$hundreds of millions

SOFTWOOD LUMBER AGREEMENT II
• April 27, 2006 Canada and US agree in principle to negotiated deal
• July 1, 2006 Canada and US conclude negotiations• September 26, 2006 deal signed
• http://dfait-maeci.gc.ca/trade/eicb/softwood/SLA-main-en.asp

SLA II (2)
• Seven year deal recently extended to nine years• Covers all provinces except Maritimes• Two options
• Option A has three-tiered tax, based on lumber prices, but no volume restriction (but surge tax)• BC and AB selected this option
• Option B has three-tiered tax but at lower levels for given prices and volumes capped• All the other provinces selected this option

SLA II (3)


FREE TRADE AGAIN!
Random Lengths
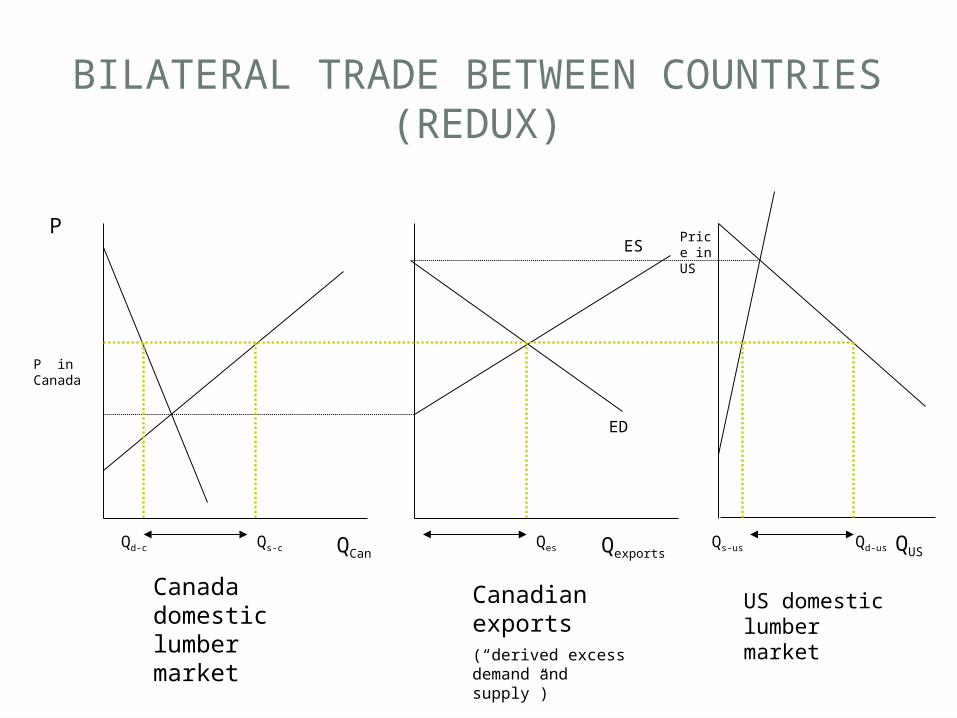
BILATERAL TRADE BETWEEN COUNTRIES (REDUX)
Canada domestic lumber market
US domestic lumber market
Qd-c Qs-c Qes Qs-us Qd-us
P
QCanQUSQexports
P in Canada
Price in US
Canadian exports(“derived excess demand and supply”)
ES
ED

THE EFFECT OF A TARIFF
Canada domestic
US domesticCanadian exports(“derived excess demand and supply”)
Qd-c Qes Qs-us Qd-usQd-c Qes-new
P in Canada
Price in US
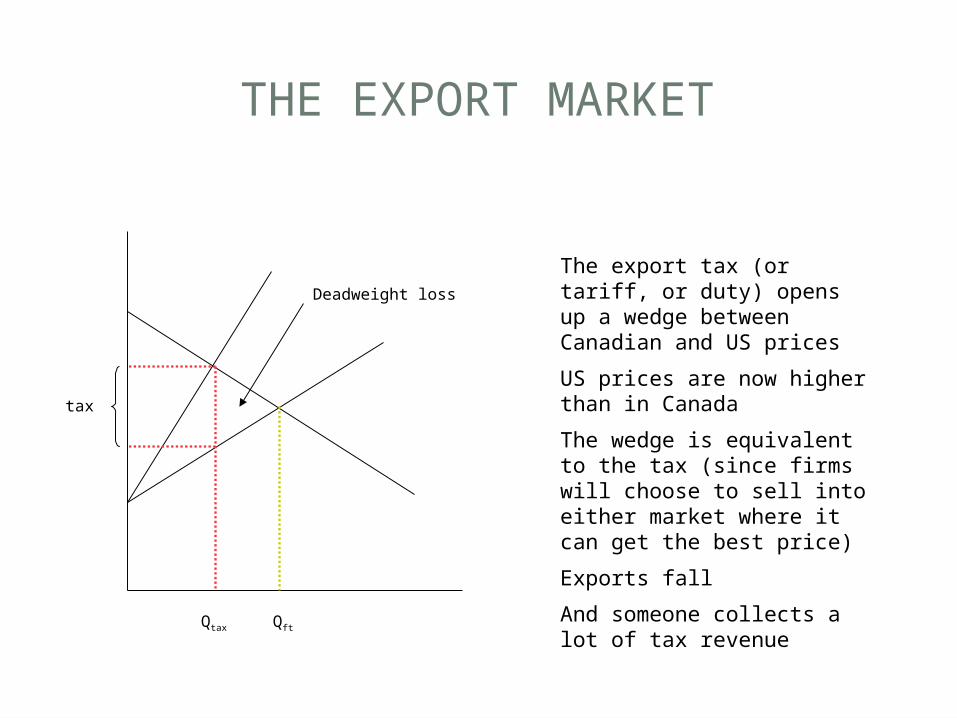
THE EXPORT MARKET
tax
QftQtax
Deadweight loss
The export tax (or tariff, or duty) opens up a wedge between Canadian and US prices
US prices are now higher than in Canada
The wedge is equivalent to the tax (since firms will choose to sell into either market where it can get the best price)
Exports fall
And someone collects a lot of tax revenue
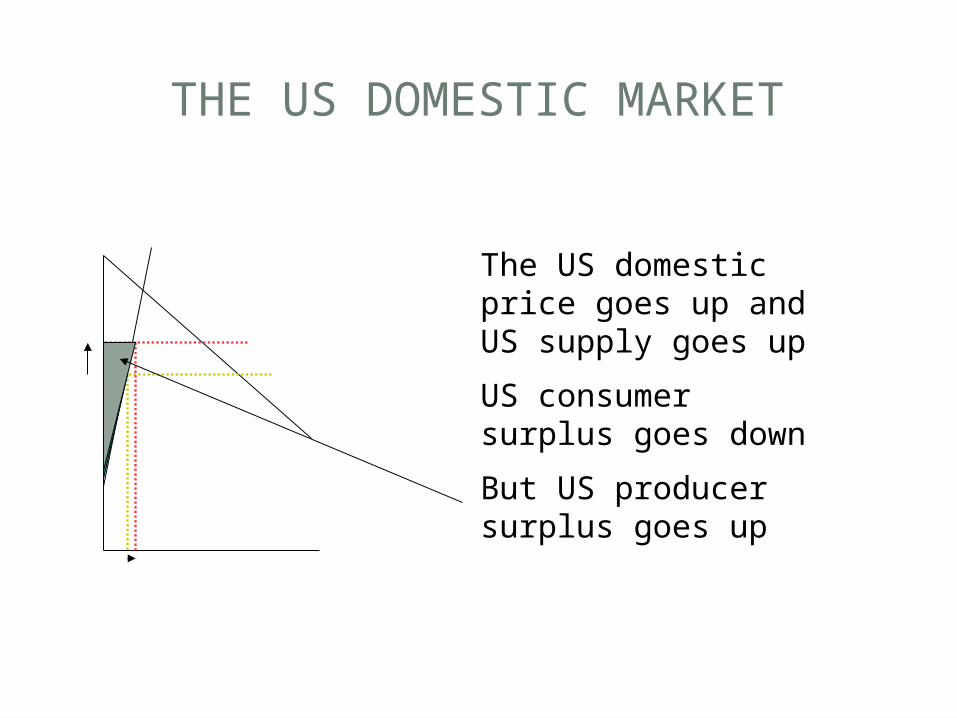
THE US DOMESTIC MARKET
The US domestic price goes up and US supply goes up
US consumer surplus goes down
But US producer surplus goes up

THE CANADIAN MARKET
In Canada the domestic price drops
Quantity supplied drops
Canadian consumer surplus goes up
And Canadian producer surplus drops

The Effect of a Quota
Canada domestic
US domestic
Qd-c Qes Qs-us Qd-usQd-c
P in Canada
Price in US
Canadian exports(“derived excess demand and supply”)

EFFECT OF A QUOTA
In the export market quantities drop and a wedge is created between US and Canadian price
A deadweight loss is created again
In this case however it is payments that accrue to quota holders (this is now economic rent!)
DIFFERENCES BETWEEN THE QUOTA AND TAX
• Besides who might appropriate tax revenues or quota rent
• A hard quota fixes how much can be exported• so increases in US demand will not translate into
increases in Canadian prices beyond a certain point• But at low enough US demand, prices may equilibrate
• Under a tax however, wedge is maintained regardless of whether US demand is high or low
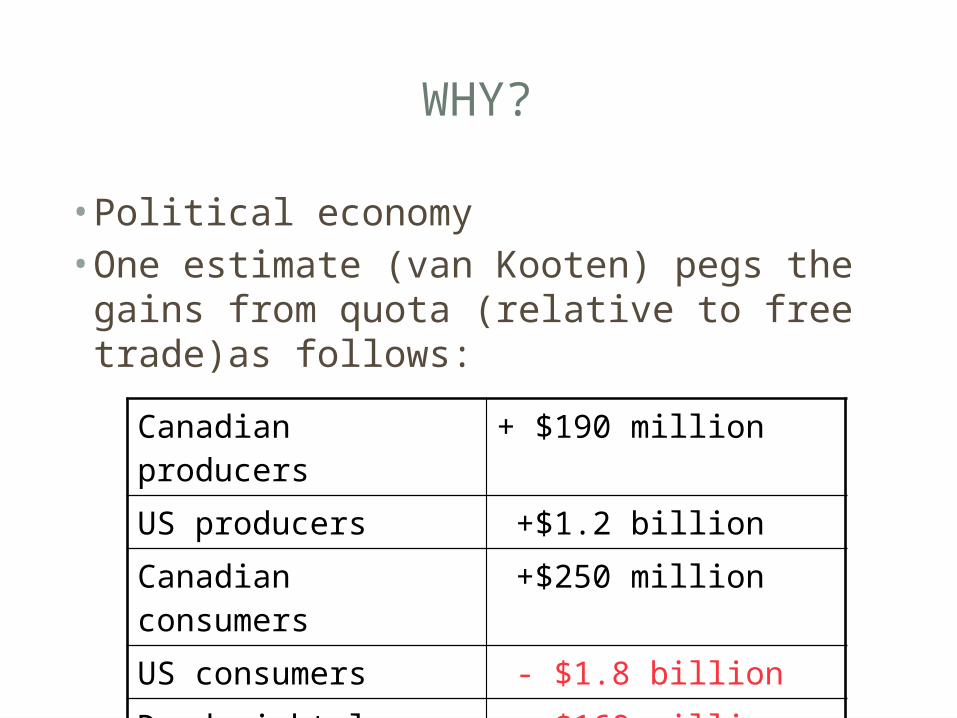
WHY?
• Political economy• One estimate (van Kooten) pegs the gains from
quota (relative to free trade)as follows:
Canadian producers + $190 million
US producers +$1.2 billion
Canadian consumers +$250 million
US consumers - $1.8 billion
Deadweight loss - $160 million

RECENT DEVELOPMENTS
• $5 billion-$1 billion to US interest ($500 million to Coalition, $500 million to US Endowment)
• No appeal - final• 3 arbitrations-under LCIA
• Adjustment factor; Canada lost• $68.5 million –export charge
• On and PQ programs tariff ($4 billion); Canada lost• .65% and 2% duty
• BC & MPB; Canada won• Fourth looming-BC Coast stumpage reduction
• Arbitration is a crapshoot
• After agreement no litigation for a year • If no agreement, how do you agree?

DYNAMICS OF THE DISPUTE
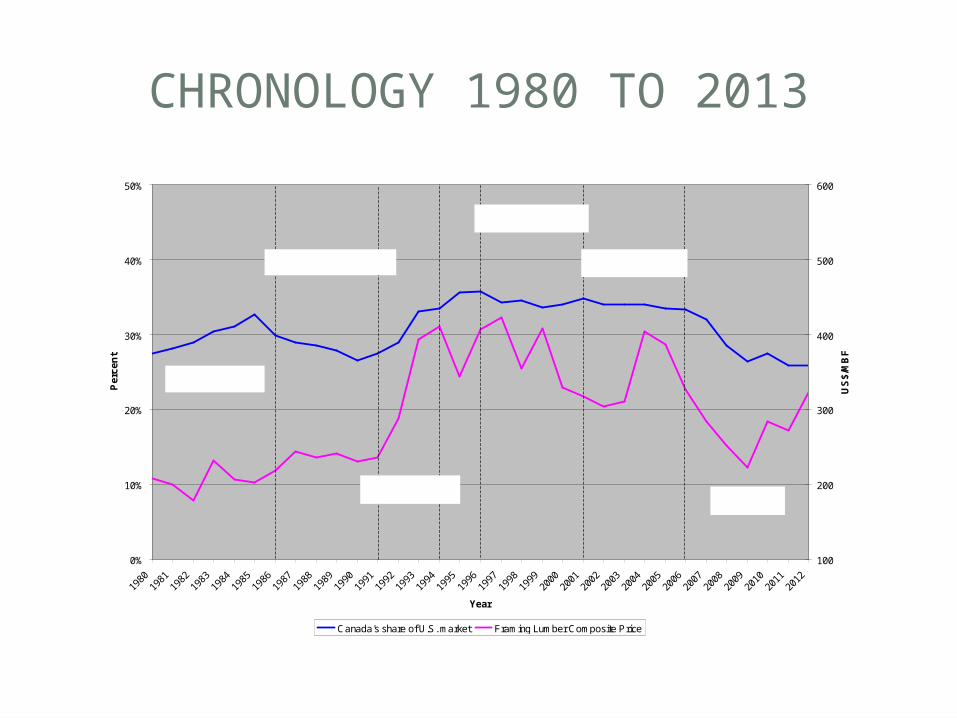
• Market share• Historically 30-35%• Now at 26%• Agreement designed to manage market share
CHRONOLOGY 1980 TO 2013
0%
10%
20%
30%
40%
50%
1980
1981
1982
1983
1984
1985
1986
1987
1988
1989
1990
1991
1992
1993
1994
1995
1996
1997
1998
1999
2000
2001
2002
2003
2004
2005
2006
2007
2008
2009
2010
2011
2012
Year
Pe
rce
nt
100
200
300
400
500
600
US
$/M
BF
Canada's share of U.S. market Framing Lumber Composite Price
Lumber II & MOU(1986-1991)
Lumber III(1991-1994)
Lumber IV(2001-2006)
2006 SLA(2006-2015)
Lumber I(1982-1983)
1996 SLA(1996-2001)
WILL IT GO AWAY?
• The financial returns are considerable• Political and legal machinery in place to continue• Different perspectives by Canadian and American
public contribute to persistence of dispute• 25 cent stumpage-wouldn’t happen under private system