Embed Size (px)
Citation preview

CLASS, CONSUMPTION, AND LIFESTYLES IN URUGUAY
by
Gabriel Chouhy
Licenciado en Sociología, Universidad de la República, 2006
Submitted to the Graduate Faculty of
the Dietrich School of Arts and Sciences in partial fulfillment
of the requirements for the degree of
Master of Arts in Sociology
University of Pittsburgh
2013
ii
UNIVERSITY OF PITTSBURGH
THE DIETRICH SCHOOL OF ARTS AND SCIENCES
This thesis was presented
by
Gabriel Chouhy
It was defended on
December 18, 2012
and approved by
John Markoff, PhD, Distinguished University Professor
Lisa D. Brush, PhD, Associate Professor
Melanie Hughes, PhD, Assistant Professor
Thesis Director: John Markoff, PhD, Distinguished University Professor

iii
Copyright © by Gabriel Chouhy
2013

iv
The advance of neoliberalism in the last quarter of the twentieth century transformed the material
culture of Latin American societies. Consumerism became a prominent means of expressing and
realizing citizen’s rights and freedoms. As the commodification of material life gains
importance, the patterns of class differentiation are expected to revolve, increasingly, around
consumption. In this thesis, I examine the classic sociological proposition that consumption plays
a fundamental role in the making of differentiating lifestyles, and that such lifestyles delimit and
reinforce social class cleavages. From this perspective, I study the statistical relations between
social structure and consumption, determining the extent to which class differences account for
variation in a set of consumption patterns inferred from the National Survey of Household
Expenditures and Incomes conducted in Uruguay in 2005/2006. I pick a set of food and non-food
items and use Multiple Correspondence Analysis to assess how the acquisition of specific goods
and services cluster along different dimensions and thus reveal different consumption patterns.
For food consumption, I identify a first dimension expressing the distinction between a
diversified and good quality diet, and a restricted and lower quality diet. A second dimension
revolves around the acquisition of calorific and “filling” food. For non-food consumption, the
first principal dimension makes the difference between the possession or not of omnivorous
tastes / positional goods, while the second dimension distinguishes between the quest for an
aesthetic / outward oriented lifestyle and a comfort-seeking / inward oriented lifestyle. To test
CLASS, CONSUMPTION, AND LIFESTYLES IN URUGUAY
Gabriel Chouhy, M.A.
University of Pittsburgh, 2013
v
class effects on these consumption patterns, I fit a set of linear regression models, using the
predicted scores derived from MCA as dependent variables. I confirm that 1) there is an overall
class effect on consumption patterns, 2) both income and education mediate such an effect, and
3) there is a specific class effect on consumption that is not reducible to the effect of purchasing
power and educational attainment.

vi
TABLE OF CONTENTS
1.0 INTRODUCTION............................................................................................................. 1
2.0 CONCEPTUAL FRAMEWORK .................................................................................... 5
2.1 THE ASCENT OF THE CITIZEN CONSUMER ........................................... 5
2.2 CONSUMPTION, CLASS AND INEQUALITY IN LATIN AMERICA ...... 9
2.3 CLASS DISTINCTION AND LIFESTYLES ................................................. 14
2.4 ON THE STUDY OF CONSUMPTION PATTERNS ................................... 16
2.5 ON THE STUDY OF SOCIAL CLASS........................................................... 18
3.0 DATA AND METHODS ................................................................................................ 23
3.1 MULTIPLE CORRESPONDANCE ANALYSIS .......................................... 25
3.2 ESTIMATING CLASS EFFECTS ON CONSUMPTION ............................ 29
3.3 OPERATIONALIZATION OF CLASS CATEGORIES .............................. 33
4.0 RESULTS ........................................................................................................................ 40
4.1 MCA FOR FOOD CONSUMPTION .............................................................. 40
4.2 MCA FOR NON-FOOD CONSUMPTION .................................................... 50
4.3 CLASS EFFECTS ON CONSUMPTION PATTERNS ................................. 58
5.0 DISCUSSION AND CONCLUSIONS .......................................................................... 69
BIBLIOGRAPHY ....................................................................................................................... 77
vii
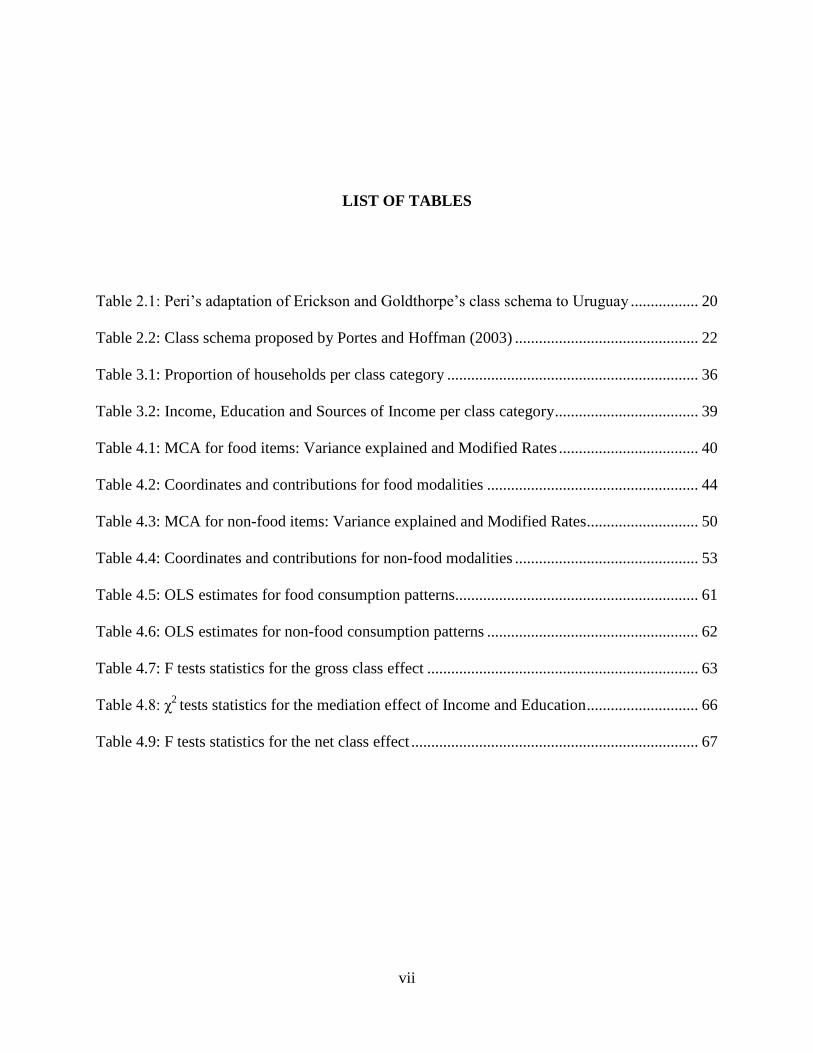
LIST OF TABLES
Table 2.1: Peri’s adaptation of Erickson and Goldthorpe’s class schema to Uruguay ................. 20
Table 2.2: Class schema proposed by Portes and Hoffman (2003) .............................................. 22
Table 3.1: Proportion of households per class category ............................................................... 36
Table 3.2: Income, Education and Sources of Income per class category .................................... 39
Table 4.1: MCA for food items: Variance explained and Modified Rates ................................... 40
Table 4.2: Coordinates and contributions for food modalities ..................................................... 44
Table 4.3: MCA for non-food items: Variance explained and Modified Rates ............................ 50
Table 4.4: Coordinates and contributions for non-food modalities .............................................. 53
Table 4.5: OLS estimates for food consumption patterns............................................................. 61
Table 4.6: OLS estimates for non-food consumption patterns ..................................................... 62
Table 4.7: F tests statistics for the gross class effect .................................................................... 63
Table 4.8: χ2
tests statistics for the mediation effect of Income and Education ............................ 66
Table 4.9: F tests statistics for the net class effect ........................................................................ 67

viii
LIST OF FIGURES
Figure 4.1: Class categories and food items of greatest contribution relative to Axis 1 .............. 43
Figure 4.2: Class categories and food items of greatest contribution relative to Axis 2 .............. 48
Figure 4.3: Class categories and non-food items of greatest contribution relative to Axis 1 ....... 52
Figure 4.4: Class categories and non-food items of greatest contribution relative to Axis 2 ....... 57
1
1.0 INTRODUCTION
In this paper, I examine a classic sociological thesis, originally formulated by Pierre Bourdieu
(1984): that consumption plays a fundamental role in the making of differentiating lifestyles, and
that such lifestyles delimit and reinforce social class cleavages. In other words, I argue that the
way in which class, consumption, and lifestyles interact plays a key role in the processes of the
production and reproduction of social inequalities, for the clustering of specific consumption
patterns into distinctive lifestyles is a paramount mechanism involved in the creation of
boundaries among social classes (Bourdieu 1984, Lamount 1992, Dimaggio and Useem 1978,
Bennett 2009).
I address this argument by determining the extent to which social class accounts for
variation in a set of consumption patterns inferred from the National Survey of Household
Expenditures and Incomes conducted in Uruguay in 2005/2006. The methodological strategy
consists of two sequential steps. First, I use Bourdieu’s preferred statistical technique, Multiple
Correspondence Analysis (MCA), to assess how the households’ expense reports on the
acquisition of specific goods and services reveal different consumption patterns and thus can be
read as an expression of meaningful and socially distinctive lifestyles. Then, using the predicted
scores from MCA, I fit a set of linear regression models to test three hypotheses: that there is an
overall class effect on consumption patterns, that both income and education mediate such an
effect, and that despite this mediation there is a specific class effect on consumption that is not
2
reducible to the effect of purchasing power and educational attainment. Although, for reasons
explained below, my analysis is restricted only to a limited sample of household units (those with
at least one parent with at least one child under the age of eighteen), results are consistent in
showing that “class counts” in the formation of lifestyles.
The examples for the systematic investigation of the triad class, consumption and
lifestyles have been mainly provided by the affluent countries of the developed world. In
contrast, said relationship has received marginal attention in Latin America. This is
understandable, insofar as these social phenomena have been generally associated with high
country-levels of economic prosperity and generalized patterns of mass consumption –a
markedly elusive situation in countries historically accustomed to recurrent economic crisis and
chronic underdevelopment.
Nevertheless, two important transformations have taken place in the last three decades
that render my case selection –Uruguay– theoretically relevant. First, after three decades of
democratization, structural adjustment and integration into the global economy, Uruguay –like
many other countries in Latin America— has entered an extraordinary period of economic
prosperity. As material life becomes commodified due to the expansion of consumer markets,
and as absolute affluence ceases to be a privilege of a wealthy minority, more and more citizens
find it relevant to invest in social status through fashioning consumerist lifestyles. That
“positional consumption” gains importance as a legitimate vehicle for organizing one’s lifestyle
and marking one’s social status entails radical changes in the (socio)logics of class
differentiation. Thus, this paper provides insights into these emerging dynamics of consumption
and class distinction in a peripheral but increasingly affluent democracy of the global south.

3
Second, not only has affluence made patterns of class differentiation revolve around
consumption; Uruguay has undergone decades of intensive neoliberalization that have ratified
the sovereignty of the “citizen consumer”. Neoliberalism embodies a radical societal project by
which citizenship is recentered around the figure of a self-reliant, autonomous individual
exercising her freedom in self-regulated, globalized markets. Under neoliberalism, consumption
comes to accomplish a strategic regulatory function, insofar as it constitutes a central field of
practices for the pursuit of self-fulfillment, which is in turn a key component in the cultivation of
human capital and a legitimate measure of social achievement. Therefore, this paper helps
understand how the struggle over legitimate lifestyles through the adoption of specific
consumption patterns shapes class relations in light of the advent of consumerist citizenship.
I organize the paper as follows. In the second chapter, I outline the conceptual framework
that guides my research inquiry. I provide some historical and theoretical arguments in order to
make the case that consumption plays an increasingly important role in modern societies. Then, I
conceptualize the Latin American transition to neoliberalism as a foundational moment that gives
birth to consumerist citizenship in the region, bringing about new dynamics of class inequality
that deserve careful consideration. Next, I review Bourdieu’s theses on distinction to highlight
the main mechanism involved in the making of distinctive lifestyles through consumption. I
conclude this chapter by discussing my methodological approach to the study of consumption
patterns and social class. In the third chapter, I delimit the scope of this research, introduce the
data to be analyzed, define the research strategy and summarize the estimation methods. In the
fourth chapter, I interpret a series of consumption patterns in Uruguay inferred from Multiple
Correspondence Analysis, and test class effects on such consumption patterns by estimating a

4
series of multivariate regression models. In the fifth chapter, I conclude by discussing my
findings and suggesting future steps in the research process.

5
2.0 CONCEPTUAL FRAMEWORK
2.1 THE ASCENT OF THE CITIZEN CONSUMER
In the First World, the passage to a consumer society began in the interwar period and was
definitively consolidated during the postwar era. Several scholars have pointed out that, already
in the heyday of Fordism, consumption was a constitutive element of the social organization of
labor in modern societies. Jeremy Rifkin (1995) shows how the production of lifestyles through
fashion and marketing became an issue of major importance to sustain the incredible expansion
of American capitalism in the first half of the twentieth century. Not incidentally, after the Great
Depression, the creation of Americans as consumer citizens realizing their life projects within a
prosperous market economy was an explicit goal pursued by the New Deal (McGovern 2006,
Cohen 2003). Thus, the making of consumer workers through the uninterrupted improvement of
their living standards was at the core of the socioeconomic regime of the postwar era (Beck &
Camiller 2000).
Both affluence and mass consumption significantly affected patterns of class formation.
In this sense, a tradition of studies on the U.S. highly consumerist society has shown that
affluence increases the role of “positional consumption”, based on a growing reliance on
“positional goods”: those possessions whose utility is not derived from their absolute use value
but from the fact that their mere consumption automatically excludes others (Hirsch 1978).

6
Precisely because of their exclusionary character, positional goods function as “symbols of class
status”, which, in Goffman’s (1951) words, “serve not so much to represent or misrepresent one's
position, but rather to influence in a desired direction other persons' judgment of it” (Goffman
1951: 297). According to Dalton Conley (2009), this relative dimension of consumption gains
importance as, thanks to prosperity, the satisfaction of basic needs ceases to be a problem for the
great majority. Likewise, this increase in the social value of positional consumption is enhanced
by the widening of income inequality. In that sense, Robert Frank (2009) argues that the
enormous accumulation of wealth experienced by the top income brackets of American society
in recent decades has triggered a cascade of expenditure and indebtedness due to families’ need
to keep up with escalating standards of positional consumption. The rationale behind this process
does not differ so much from the “conspicuous consumption” that Veblen (2007) observed at the
end of the nineteenth century within the American upper class, and the emulative dynamic that
this status-driven behavior engendered in those located just below the wealthiest – a dynamic
that would nowadays be extendible to the whole social ladder. In any event, all this suggests the
existence of a feedback mechanism between affluence, inequality and consumerism.
Researchers have accounted for the rise of affluence and positional consumption as a
locus of class divisions not only in the United States but in Western Europe as well. John
Goldthorpe (1968) has showed how the advent of the prosperous postwar era was changing both
the structural position and social behavior of the English working class. Although he rejects the
hypothesis of the working class’ embourgoisement –according to which it becomes completely
assimilated into the middle-class by adopting its habits, styles of décor, leisure activities and
aspirations–, the author highlights the progressive erosion of traditional working class

7
communities, as the counterpart of the individualization and privatization of lifestyles, now
increasingly centered around family life and consumption.
This thesis of the working class’s embourgoisement and its impact on social stratification
was also addressed by Robert Castel (2003) in the case of France. Through his historical
genealogy of “the social question”, Castel points out that the generalization of the salaried
condition in the postwar era turned consumption into a key aspect in regulating social relations.
Though social class differences remained, they no longer derived from the antithetical opposition
between proprietors and the dispossessed. Class struggle did take place, but within a social
structure now organized in a continuum of stratified occupations. Social differentiation takes on
the form of status competition among occupations, so “one’s position within the salaried classes
comes to define one’s social identity” (Castel 2003: 304). It is when the great majority becomes
affluent enough so as to achieve living standards far above subsistence levels, that consumption
definitely pervades society at large and is assimilated as a paramount principle of “generalized
differentiation” (Castel 2003: 340).
Yet, the productive, financial, technological and spatial “fixes” that followed the crisis of
profitability of the late 1970s at the core of the world capitalist economy (Silver 2003) brought
about a significant shift in the status of the consumer, in the so-called post-Fordist era. The
advent of globalization and the hegemonic advance of neoliberal forms of governance produced
three important transformations. First, instead of the passive, uniform consumer created by
cultural industries and advertising for the sake of mass standardization, we now witness the
emergence of the active, diversity-seeking consumer – “a creative, confident and rational being
articulating personal identity and serving the public interest” (Trentmann 2006:2). Not
incidentally, the consumer’s agency –hitherto obscured by the homogenizing forces of mass

8
standardization, and subsumed into the bureaucratic cage of the scientific-technical apparatuses
so incisively criticized by Marcuse (1964)– is now recovered for the sake of the empowered,
self-reflexive individual so characteristic of late or advanced modernity. Second, unlike
Keynesian political economy, which instituted the sharp separation between labor and
consumption, in contemporary societies the boundaries between both terms become blurred. As
Italian philosopher Maurizio Lazzarato argues, “life becomes inseparable from work” (Lazzarato
1996: 4). The distinction between work and consumption no longer makes sense because
“consumption cannot simply be reduced to buying or consuming (‘destroying’) a service or
product”. Rather, consumption involves the production of a whole “regime of signs” that
functions as an order of “valuations, judgments and beliefs about the world, of oneself and
others” (Lazzarato 2004: 22). Third, it follows that, insofar as consumption, like labor, comes to
be a socially valuable human activity, it is at the core of the production of modern subjectivities.
For consumption involves “belonging to a world, adhering to a certain universe.” It entails an
invitation to espouse “a way of dressing, of having a body, of eating, communicating and
travelling, a way of having a style, a way of speaking, etc.” (Lazzarato 2004: 22).
The sociological implications of this paradigm shift in the status of consumption should
not be overlooked. That the making of self-reflective, active consumers constitutes itself a
distinctive feature of neoliberalism means that the scope of the neoliberal project goes far beyond
the institutional framework delimited by a handful of pro-market reforms. Ultimately, as
Stephanie Lee Mudge (2008) contends, neoliberalism’s societal project consists of raising the
mechanisms embedded in the self-regulated market as a principle for organizing social life and
understanding human freedom. In other words, in its deepest meaning, neoliberalism is called to
undertake a radical recasting of the way political power is exercised throughout society and, thus,
9
the parameters upon which citizenship is delimited. Ultimately, neoliberalism is, according to
Rose and Miller (2010), a way of governing “at a distance”, a device for exercising political
power beyond the state that is widely prevalent in advanced societies.
Consumption is therefore a paramount component of the neoliberal technology of
government (Foucault 2010). In this respect, bringing consumption back in seems fundamental to
understanding contemporary forms of interpellation of the modern individual vis-à-vis society.
Under neoliberalism, every consumption practice can be considered as a capitalizing activity by
which the entrepreneurial individual expands her human capital and realizes her life project.
Consumption comes to form part of a process by which the modern individual’s subjectivity is
socially constructed, politically mobilized, and thus governed (Foucault 2010). Accordingly,
education, health care, sports, nourishment, child bearing, entertainment and art constitute
interrelated domains of a comprehensive lifestyle that, materialized in certain forms of
consumption, defines the individual’s place within the consumer society. This is why it is
important to look at how the formation of certain consumption patterns interacts with social class
dynamics.
2.2 CONSUMPTION, CLASS AND INEQUALITY IN LATIN AMERICA
Like in core countries, neoliberalism produced radical changes in the way consumption shapes
Latin Americans’ everyday life. Unlike the developed world, where mass consumption dates
back to the postwar period, consumerism was a novelty in the neoliberal era. The rise of
consumption is especially notable in the last decades of the twentieth century. And the U.S.’
popular material culture served as the dominant reference model. Just as during the belle époque

10
Latin American elites had been fascinated by the grand bourgeoisie’s lifestyle in London and
Paris, so did the American Way of Life become the dream to be achieved a hundred years later,
no matter what one’s social position (Bauer 2001). In short, neoliberalism revolutionized the
popular classes’ material culture, filling every corner of Latin America with the products of the
global economy, and rendering Latin-Americans consumerist citizens (Bauer 2001: 202).
Having the popular classes gain mass access to global consumer markets was an explicit
policy goal pursued, first, by neoliberal governments, and then, by the left wing / neo-populist
parties that took office in the aftermath of widespread popular mobilization against
neoliberalism. In the 1990s, structural adjustment policies launched by neoliberal reformers
significantly improved purchasing power due to the defeat of chronic inflation. Above all,
stabilization measures aimed at cheapening the dollar boosted the expansion of consumer credit
and favored the acquisition of imported goods by the poor. The expansion of consumption was
so tremendous that it might explain why, throughout the whole region, both the popular and
middle classes gave support to neoliberal presidents, despite pervasive deindustrialization, the
growth of unemployment and the informal economy, and the widening of income inequalities
(Panizza 2009). Yet, a new recessive economic cycle initiated in the late 1990s triggered
widespread social unrest, accelerating the political decline of the neoliberal right and catapulting
leftwing / populist coalitions into office. Still, the Latin American turn to the left undertook just a
partial reversal of the neoliberal hegemonic project. In the 2000s, the new dominant economic
paradigm aimed to bring the state back in to redress the most pernicious effects of neoliberal
restructuring by expanding social cohesion and seeking political consensus, all necessary
conditions for a successful integration into capitalist globalization. Improving living standards
among the middle and popular classes continued to play a central role in the legitimacy-building
11
process that enabled the creation of a virtuous cycle of economic competitiveness, social
integration and political stability (Leiva 2008). In the final analysis, the significant reduction of
poverty and the expansion of the middle classes experienced in the last decade (Ferreira et al.
2012, Franco 2011) imply that the huge majority of citizens has largely moved far above
minimum levels of consumption.
The ascent and definite consolidation of the citizen consumer in Latin America raises the
key question of how it has affected traditional patterns of social differentiation and, hence, the
production of inequalities. The new material culture that neoliberalism introduced has penetrated
so profoundly the Latin American ethos that it is no longer valid to think of class-formation
issues without referring to consumption as a locus of contemporary social practices. In this sense,
some scholars argue that the diffusion of a consumption-based model of interests erodes the
centrality of class dynamics, inasmuch as democratization of consumption turns the resource
struggle among social classes into mere contests over tastes (Baker 2009). However, such a
perspective tends to overlook the role consumption often plays in terms of “positionality”, that is,
consumption as marker of social divisions. Consumption constitutes a battlefield in which social
divisions manifest themselves, instituting new mechanisms for the everyday set-up of boundaries
among social classes. It serves as an omnipresent social domain wherein significant investments
take place in order to delineate distinctive lifestyles. In sum, consumption matters to the extent it,
according to Warde, “comprises a set of practices, which permit people to express self-identity,
to mark attachment to social groups, to accumulate resources, to exhibit social distinction, to
ensure participation in social practices, and more things besides” (Warde 1996: 303).
Analyzing class, consumption and lifestyles is therefore relevant to accounting for
inequalities in Latin America, an endeavor especially valid in a continent that is regrettably

12
known as the most unequal region in the world (Hoffman and Centeno 2003). Such an analysis
requires a relational perspective on the dynamics pertaining to all social classes considered in
connection to one another. It begins with acknowledging that what matters is not only the
analysis of the conditions of the poor but also that of society’s wealthy (Gootenberg 2010).
Inequality can therefore be understood as an outcome of the successful attempts of the upper and
middle classes to set up rigid boundaries, limit the social aspirations of those at the bottom, and
thus reinforce their social positions. Besides looking at the poor, it is important to look at what
the rich (or those that are close below them in the social hierarchy) do, more or less consciously,
in a widely diversified set of social dimensions to preserve their social status, and what they do
to keep the dispossessed unprivileged. These practices, which manifest chiefly at a micro social
level and tend to be deeply ingrained in everyday life, configure a never-ending process of
“boundary work”, on whose outputs inequality ultimately rests (Reygadas 2010).
Given this background, a comprehensive understanding of inequality in Latin America
through the lens of class, consumption and lifestyles must necessarily look at the privileged
classes’ social practices. Still, we know little about the recent social dynamics affecting these
strata in the middle income countries of the Southern Cone. Some studies in Argentina (Heredia
2003 and 2011; Svampa 2001 and 2004), which has followed a similar trajectory to that of
Uruguay, suggest that significant changes in the composition and cultural practices of the upper
and upper-middle classes have taken place since the neoliberal period. Moreover, specific
strategies of class differentiation via the quest for social homogenization seem to have deepened
in recent decades, as studies on the expansion of “golden ghettos”, “gated communities” and
“suburbanization” in the capital cities of the Southern Cone have documented (see Svampa 2001
and 2004 for Argentina, Alvarez 2007 for Uruguay, Borsdorf and Hidalgo 2007 for Santiago). In

13
that sense, the systematic reliance on certain consumption patterns for the sake of cultural
differentiation is accurately described in Jon Tevik’s (2006) ethnographic work about the
morality and sociability of Buenos Aires’ professionals. There the author shows how the
adoption of cosmopolitan consumer behavior combines with local elite’s traditions to configure
a set of distinctive cultural practices that allow these Porteños to define their distinctive tastes,
create class identity, mark their social status and classify others. Likewise, these conclusions are
well aligned with what Radakovich (2011) found in Montevideo regarding the existence of a
marked gap between an included segment of the population that has access to widely diversified
and globalized consumption, and a marginalized group characterized by its “infra-cultural
consumption”. Finally, van Bavel and Sell-Trujillo (2003) develop a compelling analysis of the
differentiating mechanisms behind the double rationality that governs the consumer behavior of
the poor and the well-off in Chile. On the one hand, by resorting to usurious credit, the poor
engage in consumerism because they see in it the only rational means to enjoy a more
respectable status and thus escape from the social stigma that a class-based society imposes on
them due to their unsatisfactory levels of material achievement. On the other hand, blaming the
poor for this “irrational” consumerist behavior, the well-off tend to rely on an “investment-
driven” rationality –which is only possible for those that, thanks to their patrimony, are in
position to engage in long term investments– as a “cultural capital” that allow them, unlike the
poor, to practice “rational” consumption and thus erect it in the “appropriate etiquette” of
economic behavior.
Beyond these highly valuable but still partial accounts, we are far from looking at the
“big picture” of what the privileged classes do along a widely diversified set of social
dimensions in order to mark, convey and thus reproduce their social position. In this regard, the
14
study of class, consumption and lifestyles in Uruguay is a contribution to the identification and
analysis of these decisive practices.
2.3 CLASS DISTINCTION AND LIFESTYLES
How does consumption “work” empirically to produce class enclosures? Through what kind of
mechanisms does consumption connect with culture, give form to distinctive lifestyles, create
boundaries and petrifies social distances? It was Pierre Bourdieu’s survey conducted in France
that proved that sophisticated statistical methods could be used to explore cultural practices and
consumption in connection to class differentiation. According to Bourdieu (1984), the “aesthetic
stances” that people adopt in a wide variety of fields such as music, painting, reading, sport,
house decoration, cooking, fashion or even food can be interpreted as practices more or less
consciously oriented towards the assertion of “one’s position in social space, as rank to be upheld
or a distance to be kept” (Bourdieu 1984: 57). Bourdieu argues that dominant classes’ everyday
practices are endowed by an “aesthetic disposition” that serves as a means of reproduction of
class domination at the cultural level. The “stylization of life”, in which struggles over the
definition of legitimate tastes play an essential role, appears as the most visible manifestation of
these practices. To the extent that aesthetic tastes emerge as detached from the constrictions of
necessity, they manifest the “practical affirmation” of the objective conditions of existence, and
thus enable classifications in the social space. Thus, the “aesthetic disposition” works as
“cultural capital”, as a means for yielding a profit in distinction through the exclusive
appropriation of socially valued activities, relations and positions.

15
Analytically, Bourdieu’s chief contribution to understanding the interactions among
culture, consumption and class can be summarized in three key arguments. First, cultural capital
–understood as the ability to define, master and manipulate the legitimate practices in particular
fields– has the attributes of private property, in the sense that those who hold it can gain at the
expense of those who do not hold it (Bennet 2009: 11). Second, cultural fields are structurally
homologous. Although practices within fields (whether in fashion, interior design, sport, culinary
pursuits, holiday choices, literature, music) can only be intelligible in terms of the relationships
that are internal to the field, they are structured along similar principles, like the polarization
between those practices endowed with honor and aesthetic grace, and those rendered ordinary
due to the constraints of necessity. Thus, practices carried out along different fields share
common patterns, forming a space of lifestyles that tend to correspond with the space of class
positions (Bennet 2009). Third, cultural transmission plays a crucial role in reproducing social
inequalities. As children from families considered to be cultivated are better prepared to perform
well in education, they are more likely to turn their inherited cultural capital into credentials that
can be used to acquire advantaged positions. Hence the social circulation and accumulation of
cultural capital has very much to do with class reproduction and inheritance (Bennet 2009).
In this paper, I do not attempt to systematically test these three propositions for the
Uruguayan case. It suffices to say that insofar as certain consumption practices observed in
myriad fields are a paramount locus for the expression of lifestyles, they activate mechanisms for
class differentiation. Through these mechanisms, consumption practices erect what Lamont
(1992) calls “symbolic boundaries”, which are “an essential medium through which individuals
acquire status, monopolize resources, ward off threats, or legitimate their social advantages”

16
(Lamont 1992: 178). This research borrows from this perspective on “boundary work” in order
to unpack the relationship between class, consumption and lifestyles in Uruguay.
2.4 ON THE STUDY OF CONSUMPTION PATTERNS
Methodologically, this work has two influential antecedents. First, Andres Peri (2000) explored
the possibilities of using Consumer Expenditures Surveys for both sociological and
demographical analyses, including social stratification and family dynamics as relevant
dimensions accounting for consumption patterns in Uruguay. Challenging neoclassic models of
consumption, Peri assumed that tastes and preferences (inferred from consumption patterns) can
be traced to the social structure via class-based effects, and thus treated as endogenous to the
econometric equations explaining consumption patterns. Thus he fit a set of regression models
wherein consumption was treated as a function of economic resources (income), cultural capital
(education) and –what matters most here– social class (see operationalization below, in table
2.1). Results indicated that social class has a significant effect on consumption in most of the 19
groups of goods and services, calling into question “the assumption that every household would
buy the same provided that they are endowed with the same income and with the same level of
education” (Peri 2000: 169)
This conclusion is relevant for this research. Nevertheless, Peri acknowledges that using
the same equation to estimate class effects on such diverse consumption aggregates may “hinder
the richness of cultural analysis” (Peri 2000: 103). Indeed, he suggests that in future analyses he
17
would select a series of consumption items and “fit regression equations tailored to the specific
consumption packages” (Peri 2000: 171). This is, precisely, an important challenge I attempt to
face here, “diving” into disaggregated items in order to see if specific goods and services cluster
in a way that may suggest the manifestation of taste patterns or, in Bourdieu’s terms, habitus.
To do so, I rely on a second antecedent: the study on class, culture and distinction in
contemporary Britain, conducted by Bennet and his collaborators (2009). In this study the
authors use original survey data about tastes and engagement in a set of cultural fields to update
Bourdieu’s thesis on class distinction. They find that even in postmodern contemporary Britain,
class still registers cultural divisions, however legitimate culture no longer rests upon the
exclusivity of specific cultural goods but upon a distinctive way and frequency of carrying out
this consumption. The contemporary form in which the “aesthetic disposition” manifests would
especially demand a more omnivorous orientation to every kind of cultural expression (whether
high or popular), in conformity with the expansion of mass culture and commodification of high
culture observed in the last decades.
If these results are all theoretically informative, it is the methodological orientation
followed by Bennett and his colleagues that inspires this research the most. The authors map the
dynamics of class, culture and distinction in Britain by replicating, yet in a more refined fashion,
Bourdieu’s most sophisticated statistical technique, namely, Multiple Correspondence Analysis. I
borrow from that study the use of MCA, and more specifically, the interpretative strategy and
criteria adopted to make sense of the empirical results. Instead of centering the interpretation of
social practices on atomized individuals and their attributes, MCA focuses on the relations
among practices “as variables whose interaction can be analyzed without the a priori assertion of
hierarchical relations of causal dependency between them”, offering “a powerful tool for

18
engaging methodologically with the relational organization of the social” (Bennett 2009: 34).
Specifically for this research, I do not test the effect of class over the amount of money spent in
undifferentiated aggregates of goods and services (like “food and beverages”, “Clothes and
footwear”, “transportation services” and the like). Rather, from MCA I derive a series of goods
and services that, irrespective of their type, are more exclusively consumed by particular groups
of people (their consumption is empirically associated). By looking at these series, I depict
lifestyles relationally and interpret (or at least speculate on) the meaning of the underlying
factors that organize the distribution of consumption patterns.
2.5 ON THE STUDY OF SOCIAL CLASS
The theoretical perspective adopted to delimit class categories deserves specific consideration, so
far as this research’s conceptual framework intends to bridge stratification studies and the
sociology of consumption. Different theoretical traditions in social stratification have addressed
the importance of class as a relevant concept accounting for the production of social inequalities.
Chiefly, neo-Marxist (Wright 1997) and neo-Weberian (Erikson and Goldthorpe 1992, Breen
2004) approaches argue that nominal categories, operationalized in macro-aggregates of
occupations sharing similar features in the system of production, still inform the ways in which
capitalist societies distribute socially valuated resources. Regardless of how open to social
mobility they see the social structure, both perspectives share the idea that positions in the
system of production are causally explanatory of relevant social outcomes, namely life chances,
inequalities, consumption, etc. For class lines impose, at least probabilistically, rigid barriers that
make the difference in a wide range of social outcomes. On the other hand, other perspectives

19
see disaggregated occupations as meaningful categories accounting for social stratification
dynamics (Grusky and Galescu 2005), or argue that the social structure can be conceptualized
gradationally, and operationalized by one-dimensional scales that express status attainment
through education and income (Blau et al 1994). Bourdieu himself introduces an eclectic
approach that relies more on disaggregated occupations but adds cultural capital, non-reducible
to economic capital, as a key factor activating specific dynamics of class differentiation.
Whether this or that perspective is more or less conceptually informative depends greatly
on whether we, theoretically, attach classes to underlying structures bringing about social
inequality, or whether we see classes as mere effects of distributive patterns of social resources,
say, educational credentials or income (Crompton 2008). Moreover, as Wright argues, which
concept of class is “right” depends as much on the question at hand as on political and theoretical
commitments. In any case, beyond the conceptual status we confer to class categories, there is
still the problem of how we test their relevance empirically. In other words, we might want to
show that, even after controlling by income and education, relatively aggregated class categories
help researchers to predict consumption patterns that fit the data relatively well. We too might
want to explore different ways of operationalizing class categories, testing which of them seem
to be the most empirically informative in accounting for consumption.
It follows that, in order to operationalize social class, it is critical to build a measure of
this concept different from income and education. If class counts, it does so to the extent that it
accounts for relations within the production process. Such relations produce specific levels of
income and are connected with the acquisition of certain skills, but all these dimensions are not
necessarily reducible to one another. In other words, one can expect high correlations between
class, education and income, but not complete collinearity.
20
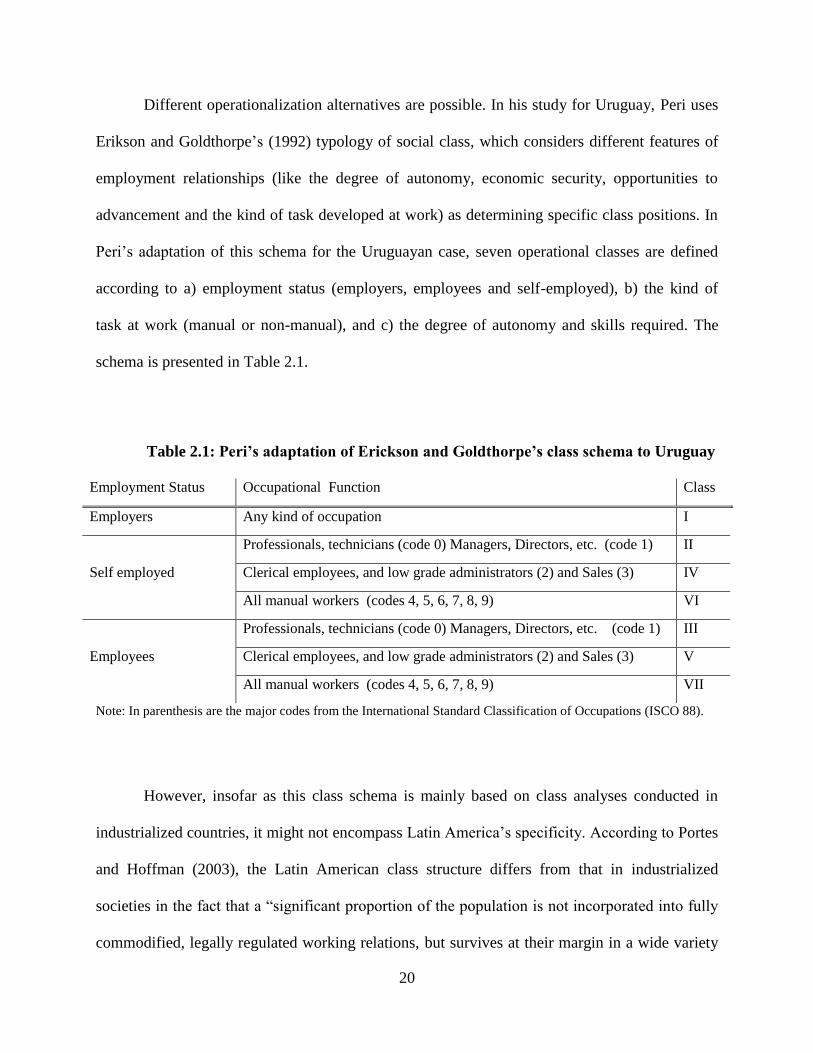
Different operationalization alternatives are possible. In his study for Uruguay, Peri uses
Erikson and Goldthorpe’s (1992) typology of social class, which considers different features of
employment relationships (like the degree of autonomy, economic security, opportunities to
advancement and the kind of task developed at work) as determining specific class positions. In
Peri’s adaptation of this schema for the Uruguayan case, seven operational classes are defined
according to a) employment status (employers, employees and self-employed), b) the kind of
task at work (manual or non-manual), and c) the degree of autonomy and skills required. The
schema is presented in Table 2.1.
Table 2.1: Peri’s adaptation of Erickson and Goldthorpe’s class schema to Uruguay
Employment Status Occupational Function Class
Employers Any kind of occupation I
Self employed
Professionals, technicians (code 0) Managers, Directors, etc. (code 1) II
Clerical employees, and low grade administrators (2) and Sales (3) IV
All manual workers (codes 4, 5, 6, 7, 8, 9) VI
Employees
Professionals, technicians (code 0) Managers, Directors, etc. (code 1) III
Clerical employees, and low grade administrators (2) and Sales (3) V
All manual workers (codes 4, 5, 6, 7, 8, 9) VII
Note: In parenthesis are the major codes from the International Standard Classification of Occupations (ISCO 88).
However, insofar as this class schema is mainly based on class analyses conducted in
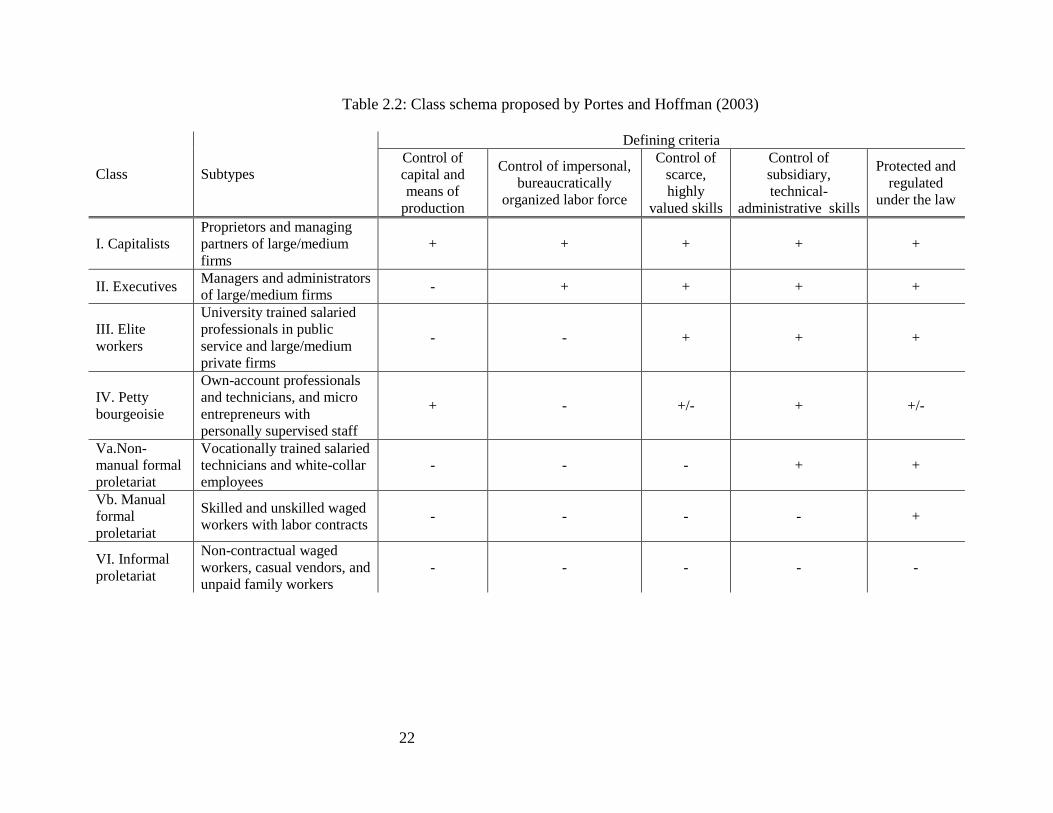
industrialized countries, it might not encompass Latin America’s specificity. According to Portes
and Hoffman (2003), the Latin American class structure differs from that in industrialized
societies in the fact that a “significant proportion of the population is not incorporated into fully
commodified, legally regulated working relations, but survives at their margin in a wide variety

21
of subsistence and semi-clandestine economic activities” (Portes and Hoffman 2003: 43). In
other words, the presence of a huge informal sector that segments the proletariat according to
different degrees of protection is an aspect that must not be overlooked. Though Uruguay is one
of the Latin American countries with the smallest presence of informality and the greatest labor
market regulations, it is far from having an occupational structure akin to that of a developed
country. Therefore, to operationalize social class, I adapt Portes and Hoffman’s schema, to the
extent that it seems more appropriate for Latin American countries.
This classification defines class according to access to an array of assets that determine
the degree of power and control individuals have over the production process (see Table 2.2).
The schema includes the control of the means of production, the control of valued skills, and the
control of organized labor. It is worth noting that all the variables needed to build this class
schema are included in the database, namely: a) Employment relationship (Employer, Employee
in public sector, Employee in the private sector, Self-employed, Unpaid, family worker); b) Kind
of task at work (codes adapted from ISCO-88), c) Size of the firm or agency (measured by the
number of workers); d) Formalization (measured by inclusion in health insurance). I expand on
this in the following section.
22
Table 2.2: Class schema proposed by Portes and Hoffman (2003)
Class Subtypes
Defining criteria
Control of
capital and
means of
production
Control of impersonal,
bureaucratically
organized labor force
Control of
scarce,
highly
valued skills
Control of
subsidiary,
technical-
administrative skills
Protected and
regulated
under the law
I. Capitalists
Proprietors and managing
partners of large/medium
firms
+ + + + +
II. Executives Managers and administrators
of large/medium firms - + + + +
III. Elite
workers
University trained salaried
professionals in public
service and large/medium
private firms
- - + + +
IV. Petty
bourgeoisie
Own-account professionals
and technicians, and micro
entrepreneurs with
personally supervised staff
+ - +/- + +/-
Va.Non-
manual formal
proletariat
Vocationally trained salaried
technicians and white-collar
employees
- - - + +
Vb. Manual
formal
proletariat
Skilled and unskilled waged
workers with labor contracts - - - - +
VI. Informal
proletariat
Non-contractual waged
workers, casual vendors, and
unpaid family workers
- - - - -
23
3.0 DATA AND METHODS
In the following pages, I work out a preliminary strategy to study the statistical relations between
social class, consumption patterns, and lifestyles in Uruguay. The question that I address is as
follows: How does social class shape patterns in consumption and reveal differences in lifestyles
that might manifest struggles for status differentiation? The goal of the analysis is, first, to
explore an adequate methodology for the study of consumption patterns in Uruguay and, then, to
develop a model of analysis to determinate the extent to which class differences account for
variation in these consumption patterns.
The data for this research comes from the 2005-2006 edition of the Encuesta Nacional de
Gastos e Ingresos de los Hogares (National Survey of Household Expenditures and Incomes -
NSHEI). This survey is conducted every decade by the Instituto Nacional de Estadística
(National Institute of Statistics), the government agency in charge of official statistics. The
NSHEI collects information on demographic, occupational, and educational characteristics of
household members; and records in detail all the goods and services they consume weekly or
monthly. Consequently, from these data it is possible to reconstruct class-based pattern of
consumption (and thus inference tastes and life-styles).
The NSHIS 2005-2006 has national coverage, including rural areas. The sample is
probabilistic, stratified and multi-stage; and is large enough to produce valid inferences for
different sub-universes. The unit of analysis is the household. The total number of households
included in the effective sample is 7043, covering 20772 individuals nested within households,

24
and 594587 records of expenditures. After excluding those households that cannot be allocated
into a class category due to incompatibly with Portes and Hoffman’s typology (see discussion
below), the sample totals 5831 households. For reasons that I explain below, only 2521
households are included in the final analysis.
Five different questionnaires are used to gather the data. The form NSHIS1, the only one
directly implemented by the interviewer, collects all the information regarding the household and
dwelling’s characteristics, the socio-demographic features of every household member, as well
as household incomes. The form NSHIS2 –the most important data source for the present study–
takes the form of a notebook in which the head of household records the daily expenses. There
she describes every item purchased, its quantity, price, and place of purchase. All this
information is then encoded to facilitate the statistical analysis. Individual expenses that are not
recorded in the form NSHIS2 are nevertheless registered by every household member in the form
NSHIS3. The NSHIS4 records all the expenses with a reference period exceeding a week
(durable goods, monthly fees, installments, etc.). The NSHIS5 is applied only in rural areas to
collect data on daily food consumption, especially taking into account that an important
proportion of this consumption may not derive from market exchanges1.
To analyze the data, I merge Bennet’s and Peri’s methodologies into a single one. Thus,
the analysis follows a two-step strategy: exploratory Multiple Correspondence Analysis first,
explanatory Regression Models afterwards. The use of MCA allows for a better comprehension
of the specific goods and services that matter most in the quest for distinction. At the same time,
1 For a detailed description of the NSHEI’s objectives and methodology, see
http://www.ine.gub.uy/anda/ddibrowser/?id=8#technicaldocuments . The datasets of the survey can be downloaded
from http://www.ine.gub.uy/anda/?page=catalog
25
multivariate regressions provide a robust and meaningful estimation of class effects on
consumption patterns.
3.1 MULTIPLE CORRESPONDANCE ANALYSIS
The first step in the analysis of consumption patterns consists of fitting Multiple Correspondence
Analysis (MCA) to assess how the acquisition of specific goods and services cluster along
different dimensions and thus reveal different consumption patterns. MCA allows for analyzing
patterns of relationships for several categorical dependent variables at once. Its procedures are
similar to those in Principal Component Analysis (PCA), but with categorical instead of interval
variables.
In short, the basic steps in MCA are as follows (Le Roux and Rouanet 2010):
I. Creating the data set: The data are organized by Individuals (Households) x Questions
(Consumed Items), such that each question becomes a categorical variable indicating two
modalities: whether the household consumed this or that particular item during the reference
period (a week or a month, depending on the item)
II. Beginning MCA: MCA creates two clouds (categories and individuals) referred to a set of
principal axes. As in PCA, the number of retained axes depends on a parsimony criteria, that
is, the axes retained are expected to account for a significant proportion of the total variance.
In other words, they maximize the variance of the clouds (in the orthogonal least squares
sense). For instance, the first principal axis is formed by projecting the cloud to a line so that

26
the projected variance of this cloud is maximal (it minimizes the sum of squares of residual
deviations). The second axis crosses the barycenter of the cloud and is perpendicular to the
first axis, reducing the cloud to a plane formed by axes 1 and 2. A three-dimensional cloud is
formed by projecting the cloud on the plane perpendicular to the first axis, yielding a residual
plane formed by axes 2 and 3, and so on.
III. Interpreting the meaning of the axes. It is important to look at the contributions of each item
to each of the principal axes. The contribution is, basically, the proportion of variance of the
axis due to the item, which is a function of the distance from the point to the barycenter of
the axis. For interpretation purposes, it is convenient to select a small number of items with
the greatest contribution and plot them along the axes. This helps infer the meaning behind
the tastes and preferences expressed in each side of the axes.
IV. Adding supplementary variables. MCA allows analysts to add variables that were not
included as active variables when running the model. These variables may be important to
classify lifestyles according to meaningful structuring factors (class, income, age, gender).
Around the mean points of the modalities of a supplementary variable, MCA enables the
researcher to draw the subclouds of individuals. For instance, different subclouds are formed
around the mean point of each social class so that one can see whether or not they overlap.
In the present analysis, I treat household reports on consumption of a particular good or
service as indicator variables, which, based on the households’ response patterns, MCA
transforms into a multidimensional cloud of modalities. Thus, if we had just one item, say, item
A, we would have 2 modalities (Yes_item_A and No_item_A). If we had 50 items, we would
have 100 modalities, and so on. MCA proceeds with an intuitive, quite straightforward logic.
Each modality forms a point in the cloud, with the distance between two modalities a function of
27
the households’ response patterns. For instance, if those households that consumed item A are
exactly the same that consumed item B, the modalities “Yes_item_A” and “Yes_item_B”)
occupy the same point in the cloud of modalities. After forming the cloud, I depict the modalities
with the greatest contributions along the first two principal axes, so as to confer meaning to the
particular clustering of modalities along each axis. Therefore, through inspecting the principal
axes I infer consumption patterns. Then I predict the households’ scores for each axis, and use
these scores as dependent variables in ordinary regression models.
Before proceeding with MCA, I made some technical decisions. In the specific case of
the NSHEI, at least three important problems arise. First, insofar as this survey records every
good and service purchased by the household during the reference period, one comes across
hundreds of goods and services that could be included in the analysis. In other words, one has to
deal with the “too-much-information” problem.
Another problem refers to the effect of household size on the quantity of goods and
services that are reported during the reference period. As our key variables are households’
reports on the purchase of a specific item, we may expect bigger households to report more
items. Of course, the “size” effect can be controlled when estimating multivariate models, but
one should try to neutralize this effect at an earlier stage of the analysis, in order to produce an
accurate description of consumption patterns. The presence of very small households is
especially problematic for that matter. Put simply, a one-person household may like eating dried
pasta or rice, but as these products normally come in packages of a significant size (e.g. a pound
or a kilo), one may expect for this person not to buy a package of pasta or rice during the
reference period (a week in this case) if he bought it the previous week.

28
The third problem, of a similar nature to the previous one, refers to the effect of
household composition. Even under the same budget restrictions, households’ reports will surely
differ on account of, say, the presence of children or elderly. More generally, one may expect
family households at an early stage of the life cycle to have markedly different dynamics from
those households without kinship relations, or from family households where all children have
grown up. Again, this effect can be statistically controlled later, but interferes in the very
description of consumption patterns through MCA.
Unfortunately, I find no satisfactory solution to any of these problems. The first problem
(too much information) can only be handled by choosing a balanced sample of items of different
kinds, which introduces certain degrees of arbitrariness into the analysis. The two remaining
problems arise because the NSHIS measures participation instead of tastes, that is, the survey is
not designed to assess preferences but to capture the actual household consumption. One can
infer tastes and preferences from patterns of participation in goods and services’ markets, but
that is not the intent of the survey.
Taking all these problems into account, I made some crucial decisions that I think may
improve the quality of the analysis that follows. First, I restricted the universe of household to
have rather comparable units. In terms of size, I will include only those households with more
than three people. This is to avoid the effect of household size in the formation of meaningful
consumption patterns. Second, to neutralize the effect of household composition and household
29
life cycle, I will work only with nuclear households at a relatively early stage of the life cycle.
Thus, I will include only those units with at least a parent with at least a child under eighteen2.
Finally, to deal with the too-much-information problem, I will first split the universe of
items recorded in the survey into two macro-groups: food and non-food items. Then I proceed
with the selection of goods and services that might be better telling of lifestyles, a criterion that,
again, is by no means exempt of arbitrariness. Within the food macro-group, I will select
between four and six items out of seven different subcategories of food (Bakery, Rice & Pasta,
Red Meat, Dairy products, Fruits, Vegetables & Tubers and Food & Drinks Away). Within the
non-food macro-group, considering its greater heterogeneity, I will pick just three items out of
eight different sub-categories (Housing, Transportation, Personal Care, Raising pets &
Gardening, Recreation, Reading, Travelling, and Education). Further details are provided in the
following sections (see the complete list of food and non-food items in the tables 4.2 and 4.4
presented below).
3.2 ESTIMATING CLASS EFFECTS ON CONSUMPTION
The second step of the research strategy consists of fitting several regression models to account
for variation in consumption patterns. The NSHIS provides three different measures of
2 When I run MCA with the full sample of households, the clustering of items along the treatment variables (class,
income, and education), are not substantively different from the results presented here. However, a significant
portion of the total variance is absorbed by the first axis, which highly correlates with household size. This makes
the use of MCA less effective in terms of inferring consumption patterns as valid indicators of taste.

30
consumption (Peri 2000). The first measure is the amount of money spent on a particular good or
service (or on a particular bundle of goods and services), which is expected to be strongly
associated with the level of income a household has at its disposal. This measure assumes an
interval scale that can be summarized by computing the average amount spent on a particular
item by the total sample of households. The second measure is the budget shares of a particular
good or service (or of a particular bundle of goods and services), which expresses the priorities a
household has in terms of consumption when allocating its income. This measure is a proportion
that can be summarized as the average share of income that the total sample of households spent
on a particular item. The third measure is the household expense reports on a particular good or
service (or in a particular bundle of goods and services), which takes on the form of a categorical
variable that can be summarized as a proportion of the total sample of households that chose to
consume a particular item during the reference period. In other words, this latter variable shows
how likely it is for a household to consume a good or service, no matter the amount spent.
Although this latter measure is not of interest in the econometric literature, it is probably the best
variable to capture variation in tastes (Peri 2000: 23), so it is given priority in the present
analysis.
Unlike Peri, I borrow from Benet’s approach in order to use MCA as a “qualitative filter”
to define consumption patterns. As mentioned in the previous sections, from the household
report of expenses in multiple items I predict the principal dimensions (axes) summarizing
consumption patterns. Then I treat the predicted scores of each dimension (derived from MCA)
as dependent variables. The assumption is that if each axis is to make sense in terms of
consumption patterns, and if to each household one can input a score due to each axis, one can

31
test class effects on consumption by regressing each axis by social class, net other relevant
variables to be included in the model.
Following Peri’s strategy (2000), I make a distinction between three different types of
class effects in order to answer three questions: 1) Is there an overall class effect on the principal
dimensions through which consumption of food and non-food express social differentiation? 2)
Is there a mediation of income and education in this class effect? 3) Is there a specific class effect
on consumption that is not due to the income and education mediation?
To answer these questions, I fit a set of nested linear regression models, so as to make
comparison across models that allow for testing the hypotheses associated with each question.
Formally, let us say that C represents a set of dummy variables indicating class location (our
treatment variables), D is a vector of demographic and geographic variables that we normally
expect to be associated with the households’ consumption patterns, I indicates household
income, and E the maximum years of education of any household member.
The first hypothesis posits that, controlling by households characteristics, there is a gross
class effect (regardless of income and education) on consumption patterns. There are two ways
of testing this hypothesis. First, looking at the statistical significance of the coefficients
representing class categories (C), net the other demographic factors (D) included in the model
C+D. Second, comparing the fit of this model with a simpler one that excludes C. If the
hypothesis that the model-fits do not differ each other (D-(D+C)=0) is rejected, one can conclude
that the difference is due to the inclusion of C.
The second hypothesis states that income and education mediate the relationship between
class and consumption, net the other factors. To test this, one has to contrast the coefficients of
class categories in the model D+C with a refined model that includes income and education
32
(D+C+I+E). A reduction of the coefficients of C is expected to take place. Formally, one has to
reject the null hypothesis that c1+c2+…ck | D+C = c1+c2+…ck | D+C+I+E.
The regression equations of the models to be estimated are as follows:
Model 1: Demographic and Geographic effects on consumption pattern Yk
𝑌𝑘𝑖 = 𝛽0 + 𝛽1𝐷𝑖 + 𝑢𝑖
Where:
𝑌𝑘𝑖 is the consumption level in dimension k of the i-household, the coordinates provided by MCA of
Axis 1, 2, 3…k.
𝛽0 is the intercept of the model
𝐷𝑖 is a vector of demographic and geographic characteristics of the i-household – Logarithm of
household size, Age and Gender of the head of household, Household composition and Household
geographic location (Montevideo or provinces)
𝛽1 is the effect of household’s demographics on 𝑌𝑘
𝑢𝑖 is the error term, assumed to be normally distributed so that 𝑢𝑖~𝑁(0;𝜎2)
Model 2: Gross class effect on consumption pattern Yk
𝑌𝑘𝑖 = 𝛽0 + 𝛽1𝐷𝑖 + 𝛽2𝐶𝑖 + 𝑢𝑖
Where:
𝐶𝑖 is the class category to which the i-household belongs, expressed as a set of 7 dummy variables
𝛽2 is the effect of social class on 𝑌𝑘
Model 3: Education and Income effects on consumption pattern Yk
𝑌𝑘𝑖 = 𝛽0 + 𝛽1𝐷𝑖 + 𝛽3𝐸𝑖 + 𝛽4𝐼𝑖 + 𝑢𝑖
Where:
𝐸𝑖 is the maximum years of education achieved by any member of the i-household
𝛽3 is the effect of education on 𝑌𝑘

33
3.3 OPERATIONALIZATION OF CLASS CATEGORIES
Regarding the independent variables, I construct a set of dummies of social class that are
included in the model along with education (household head’s years in formal schooling) and
household income in order to test whether there is an independent class effect on consumption. I
also include other indicators concerning household’s characteristics as control variables, namely,
if the household resides in the capital city or in provinces, age and sex of the household head,
and a measure of household composition.
As mentioned above, I adapted Portes and Hoffman’s operationalization of social class to
the Uruguayan reality. Capitalists (Class I) are those who own a firm with more than five
employees. Executives (Class II) are those occupying managerial positions under salaried
contract in big firms (more than five employees) or bureaucracies of the public sector. Elite
workers (Class III) are professionals and higher technicians with university degrees working
under salaried contracts in big firms or bureaucracies. The Petty bourgeoisie (Class IV) is the
most heterogeneous category. It includes self-employed professionals and higher technicians; or
managers, professionals and higher technicians employed in small firms (less than five
employees). Owners of small firms, including small landowners, also belong to this category.
𝐼𝑖 is the natural logarithm of the per capita income of the i-household
𝛽4 is the income effect on 𝑌𝑘
Model 4: Net class effect on consumption pattern Yk
𝑌𝑘𝑖 = 𝛽0 + 𝛽1𝐷𝑖 + 𝛽2𝐶𝑖 + 𝛽3𝐸𝑖 + 𝛽4𝐼𝑖 + 𝑢𝑖
34
The non-manual formal proletariat (Class Va) is composed by white collar employees (mainly
salesmen and clerks) of the public sector, or of the private sector (including rural labor) provided
that they declare to have health insurance other than the public sector. A note is necessary here:
Working in the public bureaucracy and state-related institutions generally provides access to
important benefits attached to a salaried contract. Those workers enjoy remarkable stability, have
access to housing facilities and are normally included in collective health insurance
arrangements. This is not the case for workers of the private sector. I use this indicator of having
“mutualista” (nonprofit private collective health insurance) as a proxy of formalization in the
labor market, since all formal workers employed in private firms automatically gain the right to
this kind of health benefit. Class Vb, the manual formal proletariat, includes blue collar workers
of the public sector, and those of the private sector provided that they are formalized (including
rural labor under formal labor contract). The criteria to determine formalization is the same as
that for Class Va. Class VIa, non-manual informal proletariat, includes white collar workers of
the private sector receiving wages but under a non-formal labor contract, as well as self-
employed non-manual workers. Finally, Class VIb comprises the informal manual workers of the
private sector, self-employed manual workers, rural labor and family (non-paid) labor.
Two caveats concerning this operationalization deserve some consideration. First, the
decision on how to assign a particular class category to a specific household is complicated,
since different household members may eventually belong to different social classes. There is no
rule of thumb for dealing with this problem. One option would be to take the head of household’s
social class as the indicator of the household’s social class. Another option might consist of
picking the highest class position among all the household members currently employed in the
labor market, considering it to be representative of the household’s social class. An inappropriate
35
solution to the problem of within-household heterogeneity would be to exclude those
households. For the present analysis, I choose the second option, that is, I consider the highest
social class of all household members to be the household’s social class. It means that if, for
instance, a household has two members employed in the labor market, one being a shopkeeper
(class IV), the other being an office clerk of the public administration (class Va), I consider that
such a household belongs to the petty bourgeoisie, for the former shopkeeper occupies a higher
position in the social structure than the latter.
The second caveat is implicit in the first one: only those households with at least one
member participating in the labor market are included in the analysis. This means the exclusion
of those households with all their members living on investments, retirement or government
transfers. Those receiving income entirely from capital or property investments are difficult to
classify. Certainly, they might be included within the capitalist class. Yet, they do not meet all
the criteria set by Portes and Hoffman in the operational definition of social class that is adopted
in this paper. According to such definition, the capitalist class not only controls capital and the
means of production, but also holds important degrees of power over organized labor, as well as
over scientific, technical and administrative skills that are crucial to the firm. In other words,
including those who live on investment and property assets without considering their actual
position within the system of production might imply getting away from the very notion of social
class employed in the context of this research. And with respect of those living on retirement or
on government transfers, a similar criterion applies. Insofar as the only fact we know about their
position in the system of production is the current exclusion from it, we can hardly allocate a
meaningful class position to them. Overall, therefore, these results only generalize to households
engaged in the labor market in some capacity.
36
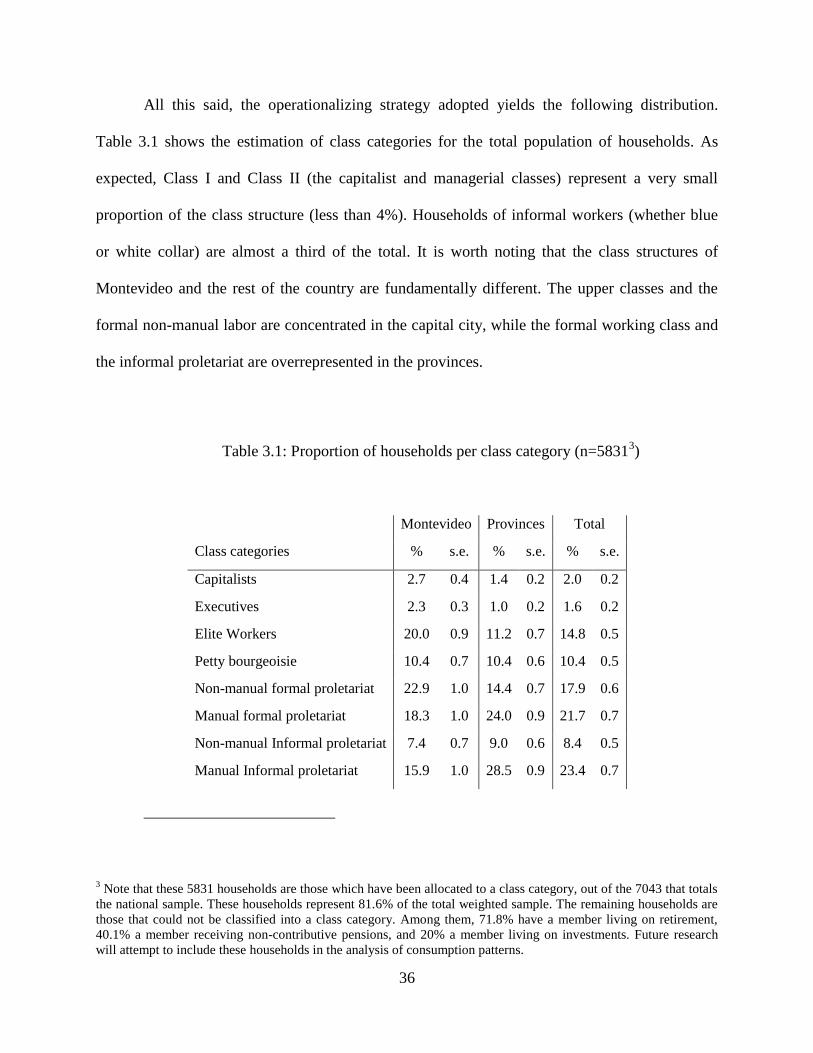
All this said, the operationalizing strategy adopted yields the following distribution.
Table 3.1 shows the estimation of class categories for the total population of households. As
expected, Class I and Class II (the capitalist and managerial classes) represent a very small
proportion of the class structure (less than 4%). Households of informal workers (whether blue
or white collar) are almost a third of the total. It is worth noting that the class structures of
Montevideo and the rest of the country are fundamentally different. The upper classes and the
formal non-manual labor are concentrated in the capital city, while the formal working class and
the informal proletariat are overrepresented in the provinces.
Table 3.1: Proportion of households per class category (n=58313)
Montevideo Provinces Total
Class categories % s.e. % s.e. % s.e.
Capitalists 2.7 0.4 1.4 0.2 2.0 0.2
Executives 2.3 0.3 1.0 0.2 1.6 0.2
Elite Workers 20.0 0.9 11.2 0.7 14.8 0.5
Petty bourgeoisie 10.4 0.7 10.4 0.6 10.4 0.5
Non-manual formal proletariat 22.9 1.0 14.4 0.7 17.9 0.6
Manual formal proletariat 18.3 1.0 24.0 0.9 21.7 0.7
Non-manual Informal proletariat 7.4 0.7 9.0 0.6 8.4 0.5
Manual Informal proletariat 15.9 1.0 28.5 0.9 23.4 0.7
3 Note that these 5831 households are those which have been allocated to a class category, out of the 7043 that totals
the national sample. These households represent 81.6% of the total weighted sample. The remaining households are
those that could not be classified into a class category. Among them, 71.8% have a member living on retirement,
40.1% a member receiving non-contributive pensions, and 20% a member living on investments. Future research
will attempt to include these households in the analysis of consumption patterns.

37
Table 3.2 presents some statistics for each social class. Generally speaking, the
operationalization of class seems to face validity once we note that capitalists and executives are
those with the highest incomes by far, followed by the other classes in a descending fashion. It is
remarkable that executives outperform capitalist households on measures of income, a result that
is probably associated with the underreporting of capital income that is characteristic in
households’ surveys. Class location also accounts for important differences in educational
attainment. In this case, elite workers (university educated professionals and technicians) rise to
the top of the hierarchy. Also note that, as expected, white collar workers accumulate more years
of education than blue collar workers, no matter whether they belong to the formal sector of the
economy.
The distribution of income sources across social classes makes sense as well. Almost all
households belonging to the capitalist class have members declaring income from self-
employment sources. Capitalists constitute the class category with the greatest proportion of
households receiving income from property and capital assets and the lowest proportion of
households receiving income from welfare and pension systems. Almost all executive, elite
working, and formal working classes (manual and non-manual), have members employed under
labor contracts. The access to property and capital income is much higher within the first two
salaried classes. In contrast, households belonging to the manual and non-manual formal
working class depend more on the welfare system. Petty bourgeois households are, along with
capitalist ones, those with greater dependence on self-employment income. However, both
classes differ in their access to property and capital assets, as well as in their dependence upon
the pension and welfare system and capital income. At the bottom of the social ladder, we have
38
the workers of the informal sector whose households, despite their scarce access to property and
capital, also have relatively low access to wage earnings. Due to their informal relation to the
labor market, these social classes are not the most covered by the welfare and pension system
either, which speaks to their vulnerability. It is important to note that an important proportion of
households belonging to these classes receive income from the pension system, even though they
are not included in the formal sector of the economy. This is not an inconsistency, since some of
these households may include retirees or persons receiving non-contributive pensions (due to
widowhood or disability).
Finally, in order to asses more appropriately the validity of this operationalization of
social class, I fit ANOVA models using social class as a predictor of income and education, and
conducted Bonfferroni multiple-comparison tests in order to see if each class category is distinct
from one another. Mean differences in income (expressed in logarithmic terms) are statistically
significant for all paired-combination of class categories, except between capitalists and
executives, between the petite bourgeoisie and the class of formal white collar workers, and
between both white and blue collar informal workers. In terms of education, mean differences
are statistically significant except among the three upper classes (capitalist, executives and elite
workers)4.
4 ANOVA outputs are available upon request to [email protected]
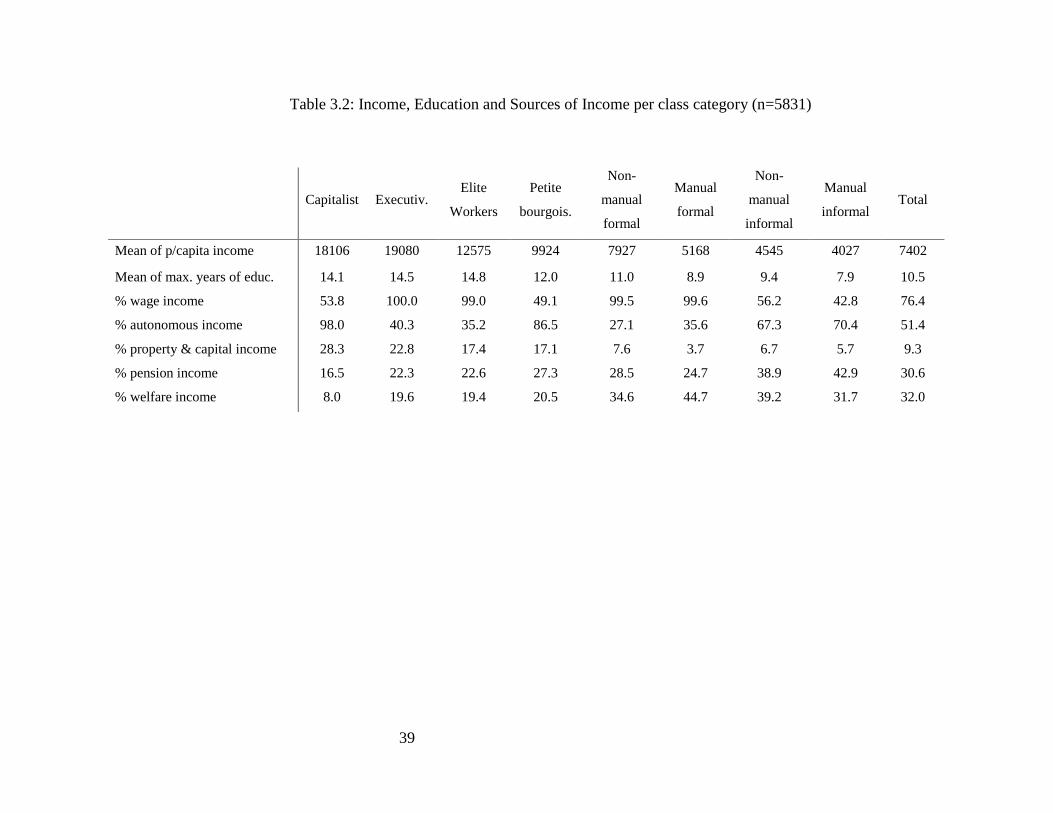
39
Table 3.2: Income, Education and Sources of Income per class category (n=5831)
Capitalist Executiv.
Elite
Workers
Petite
bourgois.
Non-
manual
formal
Manual
formal
Non-
manual
informal
Manual
informal Total
Mean of p/capita income 18106 19080 12575 9924 7927 5168 4545 4027 7402
Mean of max. years of educ. 14.1 14.5 14.8 12.0 11.0 8.9 9.4 7.9 10.5
% wage income 53.8 100.0 99.0 49.1 99.5 99.6 56.2 42.8 76.4
% autonomous income 98.0 40.3 35.2 86.5 27.1 35.6 67.3 70.4 51.4
% property & capital income 28.3 22.8 17.4 17.1 7.6 3.7 6.7 5.7 9.3
% pension income 16.5 22.3 22.6 27.3 28.5 24.7 38.9 42.9 30.6
% welfare income 8.0 19.6 19.4 20.5 34.6 44.7 39.2 31.7 32.0

40
4.0 RESULTS
4.1 MCA FOR FOOD CONSUMPTION
Let us start with the consumption of the food items selected. Table 4.1 shows the proportion of
the total variance (eigenvalue) of the cloud accounted for by each axes, plus the modified rates of
explained variance. If we look at this latter statistic, which considers only the axes that exceed
the average eigenvalue5, we find that the first three axes account for three quarters of the total
variation of food consumption. For brevity’s sake, I will only proceed with the interpretation of
the first two axes.
Table 4.1: MCA for food items: Variance explained and Modified Rates
Axes 1 2 3 4 5 6 7 8 9 10 11 12
Variances rates 18.3 9.8 5.8 4.8 4.1 4.0 3.6 3.3 3.1 2.9 2.8 2.7
Modified rates 52.9 16.9 4.4 2.3 1.2 1.0 0.5 0.3 0.1 0.0 0.0 0.0
To interpret the meaning of the axes, I followed Le Roux et al.’s (2008) strategy: for each
pole of each axis I picked ten modalities with the greatest contribution to the eigenvalue and
pictured them on a scatter plot, under the assumption that considering only the modalities that
5 See Greenacre and Blasius (2006) and Le Roux and Rouanet (2010) for an alternative formula.

41
matter more to the axes simplifies their interpretation. The complete list items, with their
coordinates and contributions, is shown in Table 4.2. Figure 4.1 depicts the result of this
operation. Note that there are modalities in Table 4.2 that do not show up in Figure 4.1, despite
having greater contributions than other modalities that do appear in the figure. This is because
the modalities represented in the figure are those that contribute to each pole of the axis the most,
so we have ten modalities with positive coordinates, and ten with negative coordinates. That the
distribution of modalities is not symmetrical along the first axis is, however, the first important
finding to be commented on. It means that there is more variation (and thus more items with
bigger contributions) on one side of the distribution than on the other. This is not a random
result, for the first axis roughly separates households with high levels of consumption from
households with low levels of consumption. As differences in tastes and preferences are more
likely to be found among consumerist households than among non-consumerist ones, the first
axis is biased towards the former group, and the second axis in turn expresses better the variation
within the former group. This explains why the distribution of modalities plotted on a two-
dimensional space adopts the form of a Japanese fan.
Thus, in terms of the first (and most important) axis, the figure reveals a clear gap in the
diet depending upon whether a household occupies the left or the right side of the figure.
Households on the left consume food and drinks away, like red-meat-based meals, pastas and
regular soda. They include dairy products like skim milk with vitamins or minerals, fresh cheese
and yogurt as key components of their diet, yogurt and fresh cheese. They also purchase red meat
cuts of the best quality (“cuadril”, “nalga”, “picaña”), vegetables like zucchini, and fruits like
oranges or peaches. The diet of the households located on the opposite (right) side can basically
be characterized, nevertheless, in negative terms. Thus, these households do not consume whole

42
milk, fresh cheese, yogurt, and oranges; nor do they purchase sweet cookies and waffles, and
popular bakery products based on animal fat like “bizcochos”. What they do consume is the
worst quality meat like common (instead of special) ground beef, the cheapest pasta (dried) and
rice.
In sum, one can conclude that Axis 1 expresses the distinction between a diversified and
good quality diet, on the one hand, and a restricted and lower quality diet, on the other.
In order to better describe this Axis, one can look at Table 4.2, which provides a
complete list of the food items included in the analysis, the coordinates of each modality for the
two principal axes, and the contributions of each modality to the total variance of each axis. The
first important conclusion that arises from the table is that food and drinks away (excluding
alcoholic beverages like beer), as well as dairy products (especially yogurt, fresh cheese and
skim milk), comprise the most important categories of food items accounting for the variance of
the first axis (22.0% and 20.9%, respectively). In other words, eating out and consuming dairy
products at home make the greatest difference in the quest for distinction in terms of a quality
and diversified diet. In a second level, we have the category of fruits (14.9%) and red meats
(14.5%). Contrarily, the consumption of rice and pasta (10.7%), bakery products (9.2%), and
vegetables and tubers (7.8%), does not make great difference.
Finally, in figure 4.1 I also depicted, for illustrative purposes only, the mean points of
class categories that which were included in MCA as supplementary (non-active) variables. The
relationship between social class and the first dimension (Axis 1) is quite evident. Capitalist and
executives, followed by elite workers, are those with a more diversified and better diet, whereas
manual informal workers, followed by non-manual informal workers, do not eat away nor
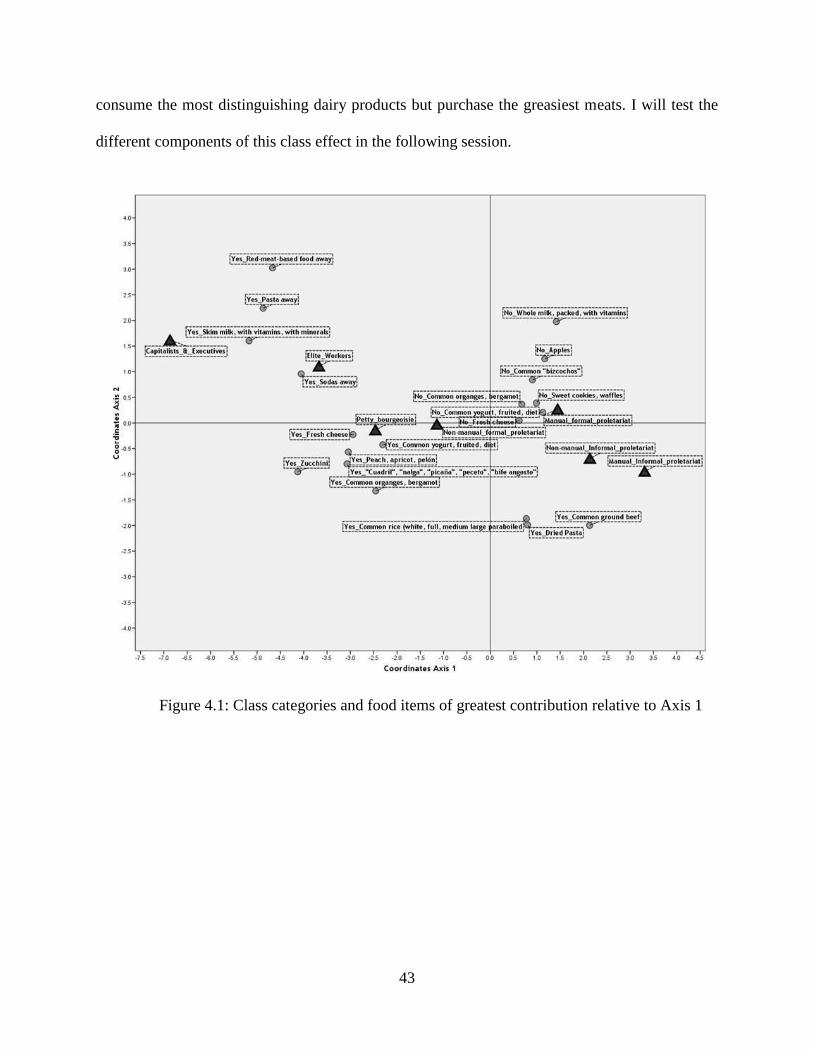
43
consume the most distinguishing dairy products but purchase the greasiest meats. I will test the
different components of this class effect in the following session.
Figure 4.1: Class categories and food items of greatest contribution relative to Axis 1
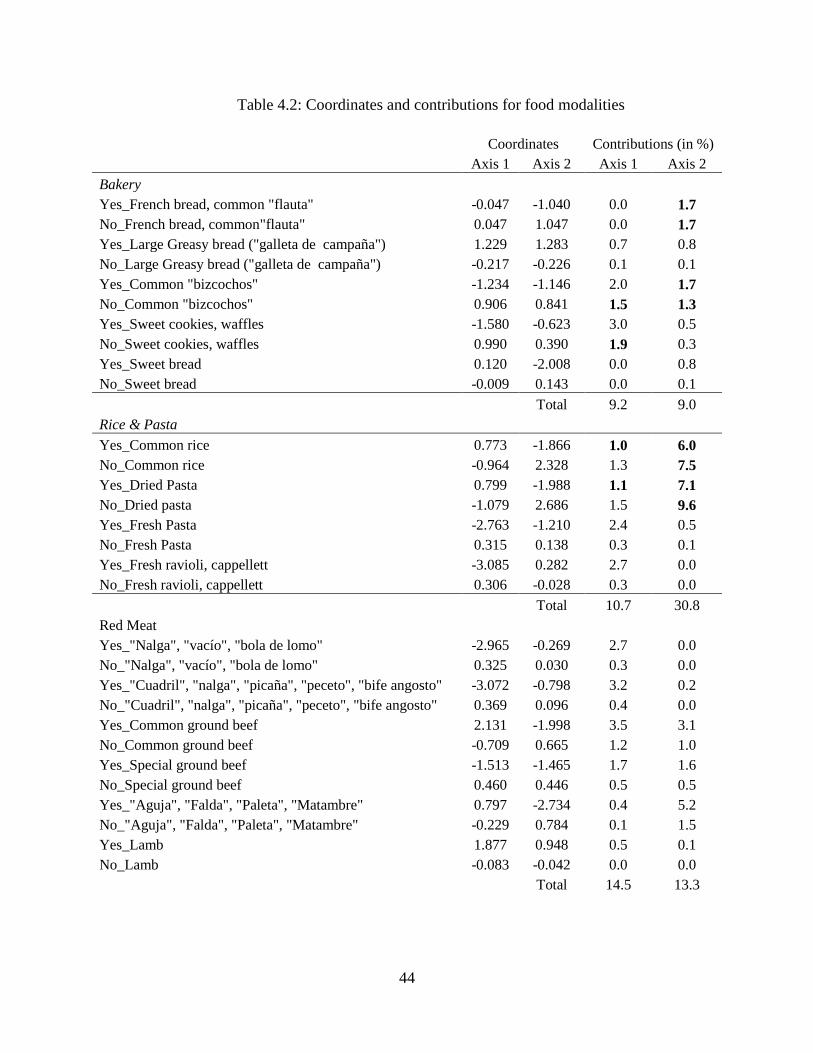
44
Table 4.2: Coordinates and contributions for food modalities
Coordinates Contributions (in %)
Axis 1 Axis 2 Axis 1 Axis 2
Bakery
Yes_French bread, common "flauta" -0.047 -1.040 0.0 1.7
No_French bread, common"flauta" 0.047 1.047 0.0 1.7
Yes_Large Greasy bread ("galleta de campaña") 1.229 1.283 0.7 0.8
No_Large Greasy bread ("galleta de campaña") -0.217 -0.226 0.1 0.1
Yes_Common "bizcochos" -1.234 -1.146 2.0 1.7
No_Common "bizcochos" 0.906 0.841 1.5 1.3
Yes_Sweet cookies, waffles -1.580 -0.623 3.0 0.5
No_Sweet cookies, waffles 0.990 0.390 1.9 0.3
Yes_Sweet bread 0.120 -2.008 0.0 0.8
No_Sweet bread -0.009 0.143 0.0 0.1
Total 9.2 9.0
Rice & Pasta
Yes_Common rice 0.773 -1.866 1.0 6.0
No_Common rice -0.964 2.328 1.3 7.5
Yes_Dried Pasta 0.799 -1.988 1.1 7.1
No_Dried pasta -1.079 2.686 1.5 9.6
Yes_Fresh Pasta -2.763 -1.210 2.4 0.5
No_Fresh Pasta 0.315 0.138 0.3 0.1
Yes_Fresh ravioli, cappellett -3.085 0.282 2.7 0.0
No_Fresh ravioli, cappellett 0.306 -0.028 0.3 0.0
Total 10.7 30.8
Red Meat
Yes_"Nalga", "vacío", "bola de lomo" -2.965 -0.269 2.7 0.0
No_"Nalga", "vacío", "bola de lomo" 0.325 0.030 0.3 0.0
Yes_"Cuadril", "nalga", "picaña", "peceto", "bife angosto" -3.072 -0.798 3.2 0.2
No_"Cuadril", "nalga", "picaña", "peceto", "bife angosto" 0.369 0.096 0.4 0.0
Yes_Common ground beef 2.131 -1.998 3.5 3.1
No_Common ground beef -0.709 0.665 1.2 1.0
Yes_Special ground beef -1.513 -1.465 1.7 1.6
No_Special ground beef 0.460 0.446 0.5 0.5
Yes_"Aguja", "Falda", "Paleta", "Matambre" 0.797 -2.734 0.4 5.2
No_"Aguja", "Falda", "Paleta", "Matambre" -0.229 0.784 0.1 1.5
Yes_Lamb 1.877 0.948 0.5 0.1
No_Lamb -0.083 -0.042 0.0 0.0
Total 14.5 13.3
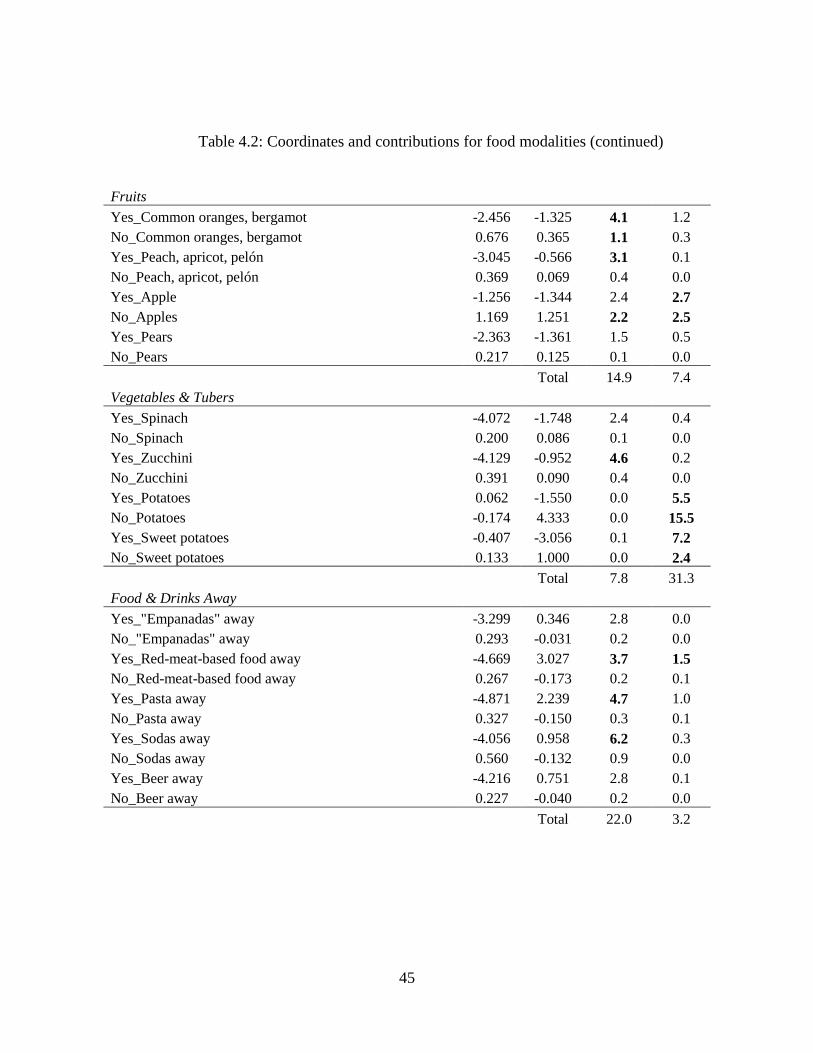
45
Table 4.2: Coordinates and contributions for food modalities (continued)
Fruits
Yes_Common oranges, bergamot -2.456 -1.325 4.1 1.2
No_Common oranges, bergamot 0.676 0.365 1.1 0.3
Yes_Peach, apricot, pelón -3.045 -0.566 3.1 0.1
No_Peach, apricot, pelón 0.369 0.069 0.4 0.0
Yes_Apple -1.256 -1.344 2.4 2.7
No_Apples 1.169 1.251 2.2 2.5
Yes_Pears -2.363 -1.361 1.5 0.5
No_Pears 0.217 0.125 0.1 0.0
Total 14.9 7.4
Vegetables & Tubers
Yes_Spinach -4.072 -1.748 2.4 0.4
No_Spinach 0.200 0.086 0.1 0.0
Yes_Zucchini -4.129 -0.952 4.6 0.2
No_Zucchini 0.391 0.090 0.4 0.0
Yes_Potatoes 0.062 -1.550 0.0 5.5
No_Potatoes -0.174 4.333 0.0 15.5
Yes_Sweet potatoes -0.407 -3.056 0.1 7.2
No_Sweet potatoes 0.133 1.000 0.0 2.4
Total 7.8 31.3
Food & Drinks Away
Yes_"Empanadas" away -3.299 0.346 2.8 0.0
No_"Empanadas" away 0.293 -0.031 0.2 0.0
Yes_Red-meat-based food away -4.669 3.027 3.7 1.5
No_Red-meat-based food away 0.267 -0.173 0.2 0.1
Yes_Pasta away -4.871 2.239 4.7 1.0
No_Pasta away 0.327 -0.150 0.3 0.1
Yes_Sodas away -4.056 0.958 6.2 0.3
No_Sodas away 0.560 -0.132 0.9 0.0
Yes_Beer away -4.216 0.751 2.8 0.1
No_Beer away 0.227 -0.040 0.2 0.0
Total 22.0 3.2
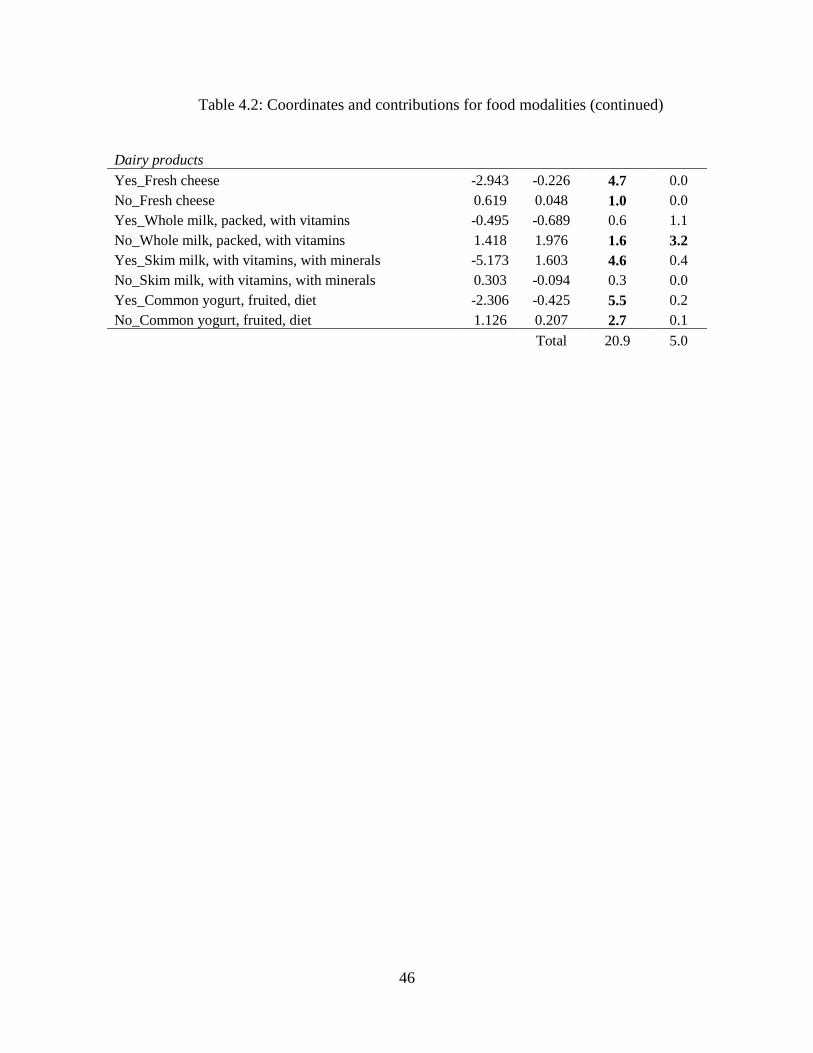
46
Table 4.2: Coordinates and contributions for food modalities (continued)
Dairy products
Yes_Fresh cheese -2.943 -0.226 4.7 0.0
No_Fresh cheese 0.619 0.048 1.0 0.0
Yes_Whole milk, packed, with vitamins -0.495 -0.689 0.6 1.1
No_Whole milk, packed, with vitamins 1.418 1.976 1.6 3.2
Yes_Skim milk, with vitamins, with minerals -5.173 1.603 4.6 0.4
No_Skim milk, with vitamins, with minerals 0.303 -0.094 0.3 0.0
Yes_Common yogurt, fruited, diet -2.306 -0.425 5.5 0.2
No_Common yogurt, fruited, diet 1.126 0.207 2.7 0.1
Total 20.9 5.0
47
Let us move to the interpretation of the second dimension. Figure 4.2 shows those food
items that make the difference on each side of Axis 2. On the bottom of the figure we have high
calorie meats (perfect for the stew or “guiso”) like “aguja”, “falda” and ground beef (common or
special); popular (and cheap) sides such as common rice or potatoes (common or sweet); and the
regular accompaniment: French bread from the bakery. Dried pasta or “fideos” (packaged, not
fresh and therefore cheap) also appear on this side of the figure, as well as bakery products for
breakfast or tea time like “bizcochos”. Finally, the only fruit that appears is the most popular
(and cheapest) one: the apple. The opposite pole of Axis 2 (the upper side) can also be described
in negative terms. The items are almost the same as those appearing at the bottom, but now they
reveal the absence of consumption. The only exception is the intake of red-meat-based meals
away.
In sum, one can conclude that Axis 2 expresses a pattern of consumption revolving
around the acquisition or not of calorific and “filling” food.
Looking again at Table 4.2 one can see that Vegetables & Tubers and Rice & Pasta are
the food categories that more greatly explain variation along Axis 2, with figures of 31.3% and
30.8% respectively. Moreover, that rice and dried pasta (and not fresh) on the one hand, and
potatoes (regular or sweet) are the modalities with the greatest contribution within these two food
categories is telling about the meaning of this dimension.
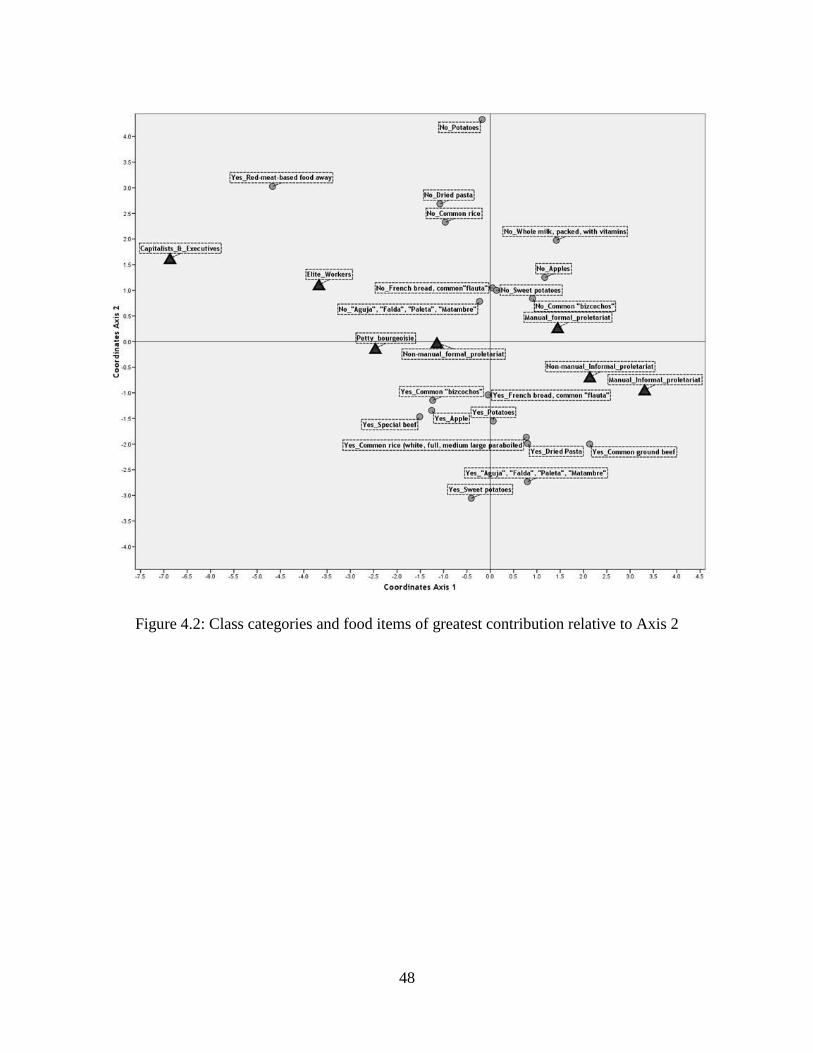
48
Figure 4.2: Class categories and food items of greatest contribution relative to Axis 2

49
Finally, it seems again that that class has some kind of relation to the consumption pattern
accounted for by this second dimension. In that sense, class divisions are organized in three
echelons: a first one composed by the dominant classes (capitalist, executives and elite workers),
a second formed by middle positions (petty bourgeoisie, formal white and blue collar workers),
and a third one wherein popular classes (informal manual and non-manual workers)
predominate. However, two important caveats have to be introduced to balance this conclusion.
First, it is worth noting that the distances among social class along Axis 2 are not as pronounced
as they are with respect to the first axis. If there is a class effect, it is not as strong. Second, I did
not plot a fundamental variable that would shed light on the interpretation of Axis 2: household
size. In analysis not shown in this paper, I found that the households that more actively engage in
this “filling” and calorific diet are precisely the biggest households. As we will see when fitting
multivariate regressions, household size has an important effect on this second dimension.

50
4.2 MCA FOR NON-FOOD CONSUMPTION
The analysis presented in the previous section may be replicated for non-food consumption. In
Table 4.3 one can find the total variance rate of the cloud accounted by each axis. The table also
contains the modified rates, which show that 82.2% of the total variation in consumption of the
non-food items selected for this analysis is accounted for by the first axis. The second axis
explains just a 4% of the total variance, and the remnant axes are negligible.
Table 4.3: MCA for non-food items: Variance explained and Modified Rates
Axes 1 2 3 4 5 6 7 8
Variances rates 34.2 7.3 5.4 4.6 4.3 3.9 3.6 3.4
Modified rates 82.2 4.0 1.3 0.5 0.3 0.1 0.0 0.0
Again, for each side of the first axis, I picked the ten modalities which most contribute to
the variability of the consumption pattern the axis summarizes. Figure 4.3 plots the distribution
of these modalities along the axis, and Table 4.4 displays the complete list of coordinates and
contributions of non-food items.
Totally different is the situation of those households located on the extreme right of the
figure, which, once again, may be defined in negative terms as non-participants in this pattern of
consumption. Contrary to the well-off households described above, these “abstemious”
households do not have access to cable TV, do not hire maid services, and they do not opt for
private education or language institutes. Neither do they pay for practicing sports or gymnastics,
nor do they ingest food and beverage in travels (probably because they do not even travel). Other
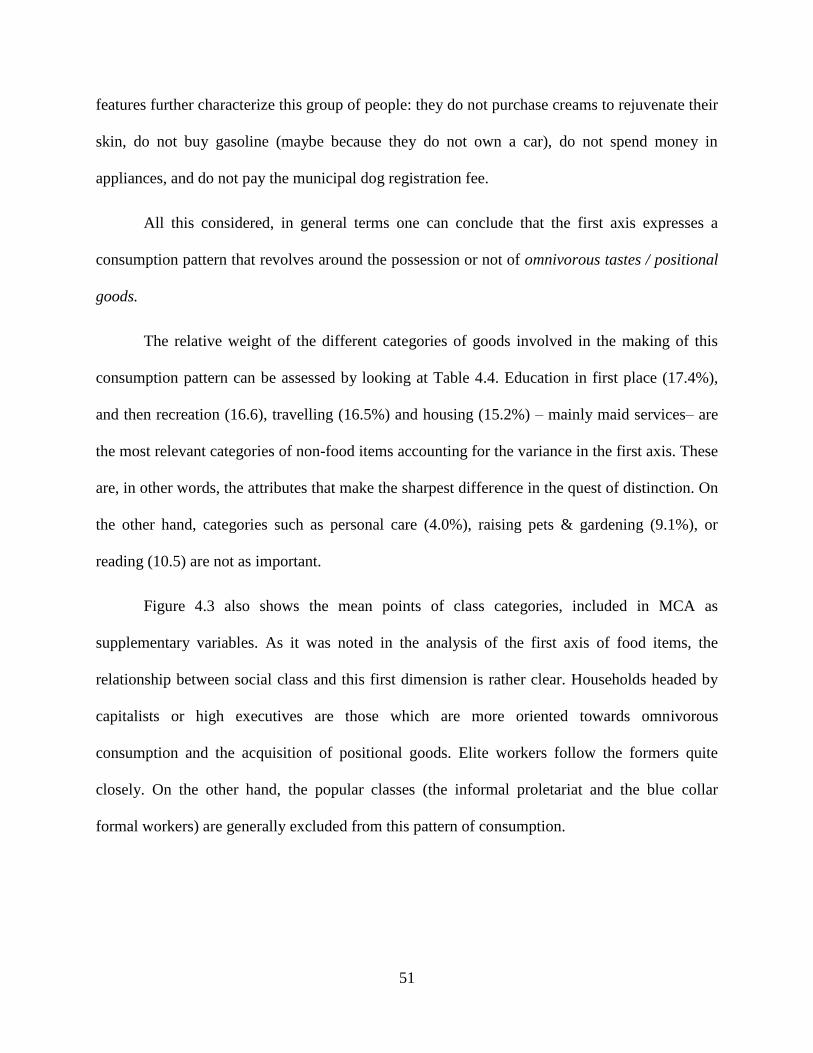
51
features further characterize this group of people: they do not purchase creams to rejuvenate their
skin, do not buy gasoline (maybe because they do not own a car), do not spend money in
appliances, and do not pay the municipal dog registration fee.
All this considered, in general terms one can conclude that the first axis expresses a
consumption pattern that revolves around the possession or not of omnivorous tastes / positional
goods.
The relative weight of the different categories of goods involved in the making of this
consumption pattern can be assessed by looking at Table 4.4. Education in first place (17.4%),
and then recreation (16.6), travelling (16.5%) and housing (15.2%) – mainly maid services– are
the most relevant categories of non-food items accounting for the variance in the first axis. These
are, in other words, the attributes that make the sharpest difference in the quest of distinction. On
the other hand, categories such as personal care (4.0%), raising pets & gardening (9.1%), or
reading (10.5) are not as important.
Figure 4.3 also shows the mean points of class categories, included in MCA as
supplementary variables. As it was noted in the analysis of the first axis of food items, the
relationship between social class and this first dimension is rather clear. Households headed by
capitalists or high executives are those which are more oriented towards omnivorous
consumption and the acquisition of positional goods. Elite workers follow the formers quite
closely. On the other hand, the popular classes (the informal proletariat and the blue collar
formal workers) are generally excluded from this pattern of consumption.
52
Figure 4.3: Class categories and non-food items of greatest contribution relative to Axis 1

53
Table 4.4: Coordinates and contributions for non-food modalities
Coordinates Contributions (in %)
Axis 1 Axis 2 Axis 1 Axis 2
Housing
Yes_Dishes -0.472 2.250 0.4 8.4
No_Dishes 0.314 -1.499 0.2 5.6
Yes_Housing supplies -1.868 1.826 3.4 3.2
No_Housing supplies 0.569 -0.556 1.0 1.0
Yes_Maid services -5.101 -3.927 9.3 5.5
No_Maid services 0.476 0.367 0.9 0.5
Total 15.2 24.3
Transportation
Yes_Gasoline -1.051 -0.718 2.6 1.2
No_ Gasoline 1.359 0.927 3.4 1.6
Yes_Public Transportation -0.422 1.277 0.4 3.3
No_Public Transportation 0.396 -1.198 0.3 3.1
Yes_Taxi -3.273 1.449 3.8 0.7
No_Taxi 0.301 -0.133 0.3 0.1
Total 10.8 10.0
Personal Care
Yes_Cosmetics and perfumes -1.282 4.961 1.0 14.4
No_Cosmetics and perfumes 0.210 -0.811 0.2 2.4
Yes_Skin creams -1.875 4.628 2.3 13.8
No_Skin cream 0.343 -0.846 0.4 2.5
Yes_Hair dyes, gels, etc. -0.369 2.756 0.1 7.0
No_Hair dyes, gels, etc. 0.106 -0.789 0.0 2.0
Total 4.0 42.1
Raising pets & Gardening
Yes_Plants (indoor and garden), flowers, etc. -3.355 3.828 2.8 3.6
No_Plants (indoor and garden), flowers, etc. 0.209 -0.238 0.2 0.2
Yes_Dog registration fee -1.576 -1.473 2.0 1.7
No_Dog registration fee 0.369 0.345 0.5 0.4
Yes_Veterinary fee -3.444 -2.860 3.5 2.4
No_Veterinary fee 0.262 0.218 0.3 0.2
Total 9.1 8.5

54
Table 4.4: Coordinates and contributions for non-food modalities (continued)
Recreation
Yes_Sports club, gym fee -3.129 -0.209 6.8 0.0
No_Sports club, gym fee 0.622 0.042 1.3 0.0
Yes_Bowling, recitals, cabaret ticket -2.770 1.774 1.8 0.7
No_Bowling, recitals, cabaret ticket 0.164 -0.105 0.1 0.0
Yes_Cable TV fee -1.591 -1.045 4.1 1.8
No_Cable TV fee 0.997 0.655 2.5 1.1
Total 16.6 3.7
Reading
Yes_Novels, Essays, Stories -4.518 0.854 3.9 0.1
No_Novels, Essays, Stories 0.219 -0.041 0.2 0.0
Yes_Newspapers -4.063 -2.731 3.4 1.5
No_Newspapers 0.208 0.140 0.2 0.1
Yes_Magazines -2.751 -0.155 2.6 0.0
No_Magazines 0.248 0.014 0.2 0.0
Total 10.5 1.7
Travelling
Yes_Excursions -2.473 1.953 1.3 0.8
No_Excursions 0.129 -0.102 0.1 0.0
Yes_Holydays travel -4.529 0.579 5.5 0.1
No_Holydays travel 0.310 -0.040 0.4 0.0
Yes_Food and beverage in travel -2.671 0.859 7.1 0.7
No_Food and beverage in travel 0.834 -0.268 2.2 0.2
Total 16.5 1.9
Education
Yes_Private Elementary School -3.320 -4.243 3.8 6.2
No_Private Elementary School 0.297 0.379 0.3 0.5
Yes_Private Secondary School -5.475 -0.945 7.2 0.2
No_Private Secondary School 0.334 0.058 0.4 0.0
Yes_Foreign Language Institute -3.668 -1.442 5.2 0.8
No_Foreign Language Institute 0.375 0.147 0.5 0.1
Total 17.4 7.8
55
The interpretation of the second axis is much more elusive. Households on the top half of
Figure 4.4 are more oriented towards personal care and housing decoration. Hence they consume
cosmetics, perfumes, skin creams, hair dyes and the like. They also practice some kind of
gardening through the purchase of plants or flowers, and equip their houses with dishes and other
supplies. Yet, they do not have cable TV, but do use public transportation instead of cars.
Contrarily, households on the bottom half do not prioritize personal care: no cosmetics,
perfumes, skin creams and hair dyes are consumed by these households. Neither do they buy
dishes, nor do they use public transportation. What these households do practice is raising a pet:
they pay for the municipal dog registration fee, as well as the veterinary fee. Finally, these
households prioritize more what would be considered long term investments, such as private
education for their children.
Again, making a clear interpretation of this axis seems problematic. Yet, we might state
that it makes the difference between an aesthetic / outward oriented lifestyle and a comfort-
seeking /inward oriented lifestyle.
To better grasp the differentiating pattern of this Axis, one can go back to Table 4.4 in
order to compare the contributions to the axis of each sub-group of non-food items. There one
finds that, contrary to what happened with the first axis, personal care (42.1%) and housing
(24.3%) are now the categories that account for most of the variability observed along the second
axis. Moreover, travelling (1.7%), reading (1.9%) and recreation (3.7%) have marginal
contribution to this axis.
Finally, the relation between social class and the consumption pattern represented by this
axis is as much or even more elusive than the interpretation of this axis itself. If there is a
relation, it is not linear at all. Thus, one can see that capitalists and executives, as well as the

56
petty bourgeois are those who fit better into the consumption pattern captured in the bottom half
of Figure 4.4. However, the class of elite workers seems to engage less in this pattern of
consumption. Similarly, the formal workers (both manual and non-manual) are those who most
approximate the other pole of the axis, while the poorest ones (those employed informally
occupy middle positions.
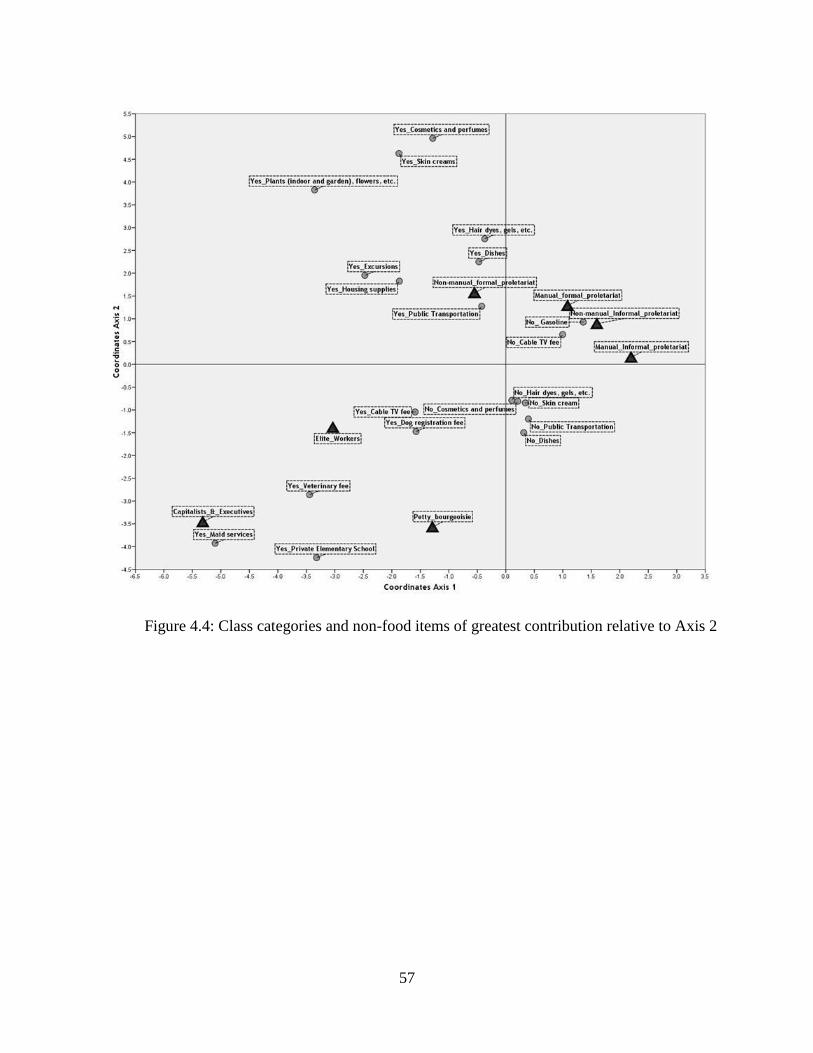
57
Figure 4.4: Class categories and non-food items of greatest contribution relative to Axis 2
58
4.3 CLASS EFFECTS ON CONSUMPTION PATTERNS
I have described a set of patterns regarding the consumption of a selected group of food and non-
food goods and services. These patterns were expressed through the interpretation of the
principal axes predicted by MCA. I have also suggested that there seems to be an isomorphism
between at least some of the axes and households’ class locations. Yet, this apparent class effect
derived from the geometric description of the data might be merely random. Nor do we know
whether this relationship results from the combined effect of income and education. Insofar as
social class entails a determinate location in the system of production –here defined by a certain
degree of control on capital, labor, technical and administrative skills, and assets like social
protection–, it is expected to correlate with specific levels of education and produce determinate
levels of income. This is why class operates as a unifying concept for social stratification. But an
explicit purpose of this research is to determine to what extent consumption patterns are
contingent to class positions irrespective of the mediation of their most important outcome,
income, or of a mediating and ever confounding structuring factor like cultural capital
(education).
The output of the regression models (tables 4.5 and 4.6) allows for addressing this issue6.
For the sake of parsimony, I will only discuss the three hypotheses posed in the previous section:
6 Some comments on the robustness of results are necessary. I explored the normality of the dependent variables,
which usually affects the robustness of the OLS estimation, and found that Axis 1for both food and non-food
consumption follow a similar distribution to income. In other words, the distribution of these axes are biased toward

59
a) the overall class effect hypothesis, b) the income and education mediation hypothesis, and c)
the net class effect hypothesis.
First, looking at the fixed effects of Model 2, it is clear that the coefficients for class
categories are statistically significant in at least three of the four consumption patterns derived
from MCA. Even after controlling by the household’s demographic characteristics and
geographic location, the capitalist and executive classes show a greater tendency to a diversified
and good quality diet (Axis 1 - Food) than the petty bourgeoisie (the reference category)7. They
are also more inclined to practice omnivorous and positional consumption than the petty
bourgeoisie and the subaltern classes. In this sense, the coefficients for the subaltern classes are
statistically significant as well, but in the opposite way: they tend to consume less diversified and
poorer-in-quality food items and acquire fewer goods and services comprising a pattern of
omnivorous and positional consumption.
If we move on to Axis 2, it is clear that the range of variation of the class coefficients
becomes more homogeneous, and follows a non-linear distribution, as was depicted in the
figures of the previous sections. For the model of food items, none of the class coefficients are
statistically significant, excepting that pertaining to capitalists and executives. For the model of
the pole of those who consume the most. To correct this bias, I attempted some logarithmic transformation. Results
do not change but we are still far from normality. Axes 2 are not as biased as are Axes 1, but models for Axes 2 are
clearly underspecified (the r2 are in fact very low and the intercept are non-significant). Other regression diagnoses
for Axes 1 show that the residuals are not normally distributed, and that the residual variance is heteroscedastic in
both cases (which makes sense since the dependent variable is highly biased). I find no severe problems of
multicollinearity. In future analyses, I should try out another estimation method (like structural equation modeling)
and engage in more systematic treatment of outliers in order to arrive to more robust estimates of class effects on
consumption. 7 Keep in mind that the signs of the axes retained by MCA are arbitrary with respect to their meaning. In this case, as
we have seen in the figure, the negative pole of Axis 1 for food items expresses a quest for a more diversified and
good quality food consumption.

60
non-food items, the coefficients are statistically significant, yet the model fit is, like in the model
for food items, clearly unsatisfactory (in both cases the adjusted r2 statistic is below 4%).

61
Table 4.5: OLS estimates for food consumption patterns
Axis 1 (Food) Axis 2 (Food)
Model 1 Model 2 Model 3 Model 4 Model 1 Model 2 Model 3 Model 4
(Null) (Gross
Class)
(Educ +
Inc)
(Net
Class) (Null)
(Gross
Class)
(Educ +
Inc)
(Net
Class)
Montevideo1 -0.411*** -0.278*** -0.137*** -0.135*** -0.077 -0.090* -0.125** -0.120**
Head of Household Age -0.015*** -0.009*** 0.000 0.000 -0.004* -0.005* -0.007** -0.007**
Head of Household Sex (Woman)2 -0.113* -0.123** -0.173*** -0.173*** -0.014 -0.017 -0.004 -0.006
Couple & kids3 -0.645*** -0.447*** -0.218** -0.227** 0.018 -0.020 -0.060 -0.064
Couple & kids + exten3 -0.467*** -0.299*** -0.191*** -0.197*** -0.039 -0.076 -0.089 -0.097
Houshold size (Ln) 0.607*** 0.347*** -0.204** -0.179** -0.644*** -0.618*** -0.495*** -0.513***
Capitalists & Executives4 -0.736*** -0.192* 0.264* 0.152
Elite Workers4 -0.163* 0.214*** 0.142 0.063
Manual formal proletariat4 0.276*** 0.224*** 0.007 0.018
Manual Informal Proletariat4 0.656*** 0.341*** 0.069 0.134
Non-manual formal proletariat4 0.760*** 0.251** -0.018 0.086
Non-manual Informal proletariat4 0.977*** 0.339*** -0.064 0.066
Income (Ln) -0.573*** -0.531*** 0.108** 0.106**
Education (years) -0.070*** -0.060*** 0.010 0.013
Constant 0.340* -0.129 5.999*** 5.277*** 1.147*** 1.132*** 0.107 0.044
r2 0.096 0.289 0.428 0.442 0.036 0.042 0.046 0.048
r2 (adj) 0.094 0.285 0.426 0.438 0.034 0.037 0.043 0.043
N 2521 2521 2521 2521 2521 2521 2521 2521
* p<0.05; ** p<0.01; *** p<0.001 1”Provinces other than the capital city” (Montevideo) is the reference category
2 “Male is the reference category” 3 “Single parent with kids” (with or without extension) is the reference category
4 “Petty Bourgeoisie”, petty bourgeoisie, is the reference category.
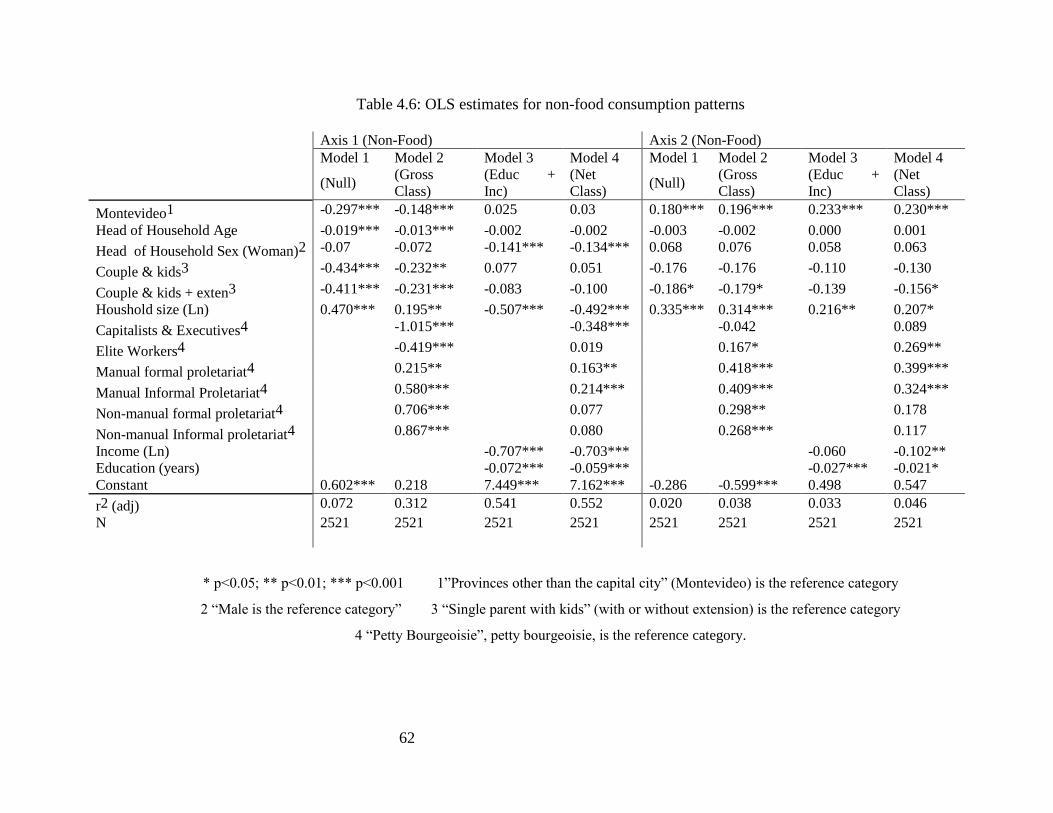
62
Table 4.6: OLS estimates for non-food consumption patterns
Axis 1 (Non-Food) Axis 2 (Non-Food)
Model 1 Model 2 Model 3 Model 4 Model 1 Model 2 Model 3 Model 4
(Null) (Gross
Class)
(Educ +
Inc)
(Net
Class) (Null)
(Gross
Class)
(Educ +
Inc)
(Net
Class)
Montevideo1 -0.297*** -0.148*** 0.025 0.03 0.180*** 0.196*** 0.233*** 0.230***
Head of Household Age -0.019*** -0.013*** -0.002 -0.002 -0.003 -0.002 0.000 0.001
Head of Household Sex (Woman)2 -0.07 -0.072 -0.141*** -0.134*** 0.068 0.076 0.058 0.063
Couple & kids3 -0.434*** -0.232** 0.077 0.051 -0.176 -0.176 -0.110 -0.130
Couple & kids + exten3 -0.411*** -0.231*** -0.083 -0.100 -0.186* -0.179* -0.139 -0.156*
Houshold size (Ln) 0.470*** 0.195** -0.507*** -0.492*** 0.335*** 0.314*** 0.216** 0.207*
Capitalists & Executives4 -1.015*** -0.348*** -0.042 0.089
Elite Workers4 -0.419*** 0.019 0.167* 0.269**
Manual formal proletariat4 0.215** 0.163** 0.418*** 0.399***
Manual Informal Proletariat4 0.580*** 0.214*** 0.409*** 0.324***
Non-manual formal proletariat4 0.706*** 0.077 0.298** 0.178
Non-manual Informal proletariat4 0.867*** 0.080 0.268*** 0.117
Income (Ln) -0.707*** -0.703*** -0.060 -0.102**
Education (years) -0.072*** -0.059*** -0.027*** -0.021*
Constant 0.602*** 0.218 7.449*** 7.162*** -0.286 -0.599*** 0.498 0.547
r2 (adj) 0.072 0.312 0.541 0.552 0.020 0.038 0.033 0.046
N 2521 2521 2521 2521 2521 2521 2521 2521
* p<0.05; ** p<0.01; *** p<0.001 1”Provinces other than the capital city” (Montevideo) is the reference category
2 “Male is the reference category” 3 “Single parent with kids” (with or without extension) is the reference category
4 “Petty Bourgeoisie”, petty bourgeoisie, is the reference category.

63
Another way of testing the same hypothesis is by comparing the fit of two models, one
that includes class categories, and another one that excludes them. This is to consider Model 1 as
nested within Model 2, so as to perform an F test that compares the difference between the
residual sum of squares returned by each model. If the observed value of F is statistically
significant, one can conclude that Model 2 fits the data better than Model 1, due to the inclusion
of new parameters (class coefficients in our case).
Table 4.7 provides the results of this procedure performed for the four consumption
patterns considered in this paper. Besides the F observed values, the degrees of freedom of each
test (the difference in the number of parameters across models) and the corresponding p-values,
the table includes the measure of model fit that is typically used in ordinary least squares
regressions – r2 , the proportion of variance accounted for by Model 2. It also contains the change
in r2 across models. This allows us to assess the improvement in the explanatory power of the
model that takes place when we introduce class as a predictor.
Table 4.7: F tests statistics for the gross class effect (Null Hypotesis: (D-(D+C)=0)
r2 Change in r2 F Df Prob > F
Food
Axis 1 28.9 19.2 112.8 6 0.000
Axis 2 4.2 0.6 2.7 6 0.014
Non-Food
Axis 1 30.5 23.0 138.5 6 0.000
Axis 2 4.3 2.1 9.0 6 0.000
All the F tests are statistically significant, meaning that the inclusion of class categories
improves the prediction of consumption patterns in the four cases considered. However, the level
of improvement shows important differences across axes: clearly, the first principal axes are

64
more strongly associated with class than are the second ones (the change in r2 is 19.2% and
23.0% for the first principal axes of food and non-food respectively, against a change of merely
0.6% and 2.1% for the second principal axes). In sum, there is an overall class effect on
consumption patterns, though the strength of this effect may be contingent to the specific pattern
under consideration.
The second hypothesis at issue states that this gross class effect can be decomposed so
income and education mediate the relationship between class and consumption. This mediating
effect can be tested by contrasting the coefficients for class categories of Model 2 (gross class
effect) against those of Model 4 (net class effect). From a quick overview of tables 4.5 and 4.6
we find that, indeed, the range of variation among the coefficients gets reduced once we have
introduced Income and Education as predictors. Note that the reduction is especially pronounced
for the first principal axes, which are more strongly correlated with class. Still, no matter the size
of this reduction, it could be statistically insignificant. Therefore, to evaluate this hypothesis
appropriately, I conducted Wald tests for all the coefficients of class between Model 2 and
Model 4 for each of the four consumption patterns under consideration. The idea is to reject the
null hypothesis that, for instance, the coefficients of Capitalist and Executives in Model 2 and
Model 4 are equal.
Table 4.8 summarizes the results of all of these tests. It shows the computed values,
degrees of freedom and p-values of the test statistic χ2. Not only is each coefficient compared
with its pair but also the joint distribution of Model 2 coefficients (before I+E) is tested against
the joint distribution of Model 4 coefficients (after I+E). Results are consistently statistically
significant for all the coefficients in all comparisons, except for that of Class Va, manual formal
proletariat. Note that the null hypothesis is rejected also when the coefficients are not significant
65
in the regression, as is the case of Axis 2 for the food consumption. This is because the test
informs about the statistical significance of the change in the coefficients, but not of the
coefficients themselves – in other words, the effect of a particular class category on a particular
consumption pattern is not at issue in this test. In any event, we can say that there is sufficient
evidence to sustain the hypothesis of the existence of a mediation effect of income and education
on the statistical relation between class and consumption.
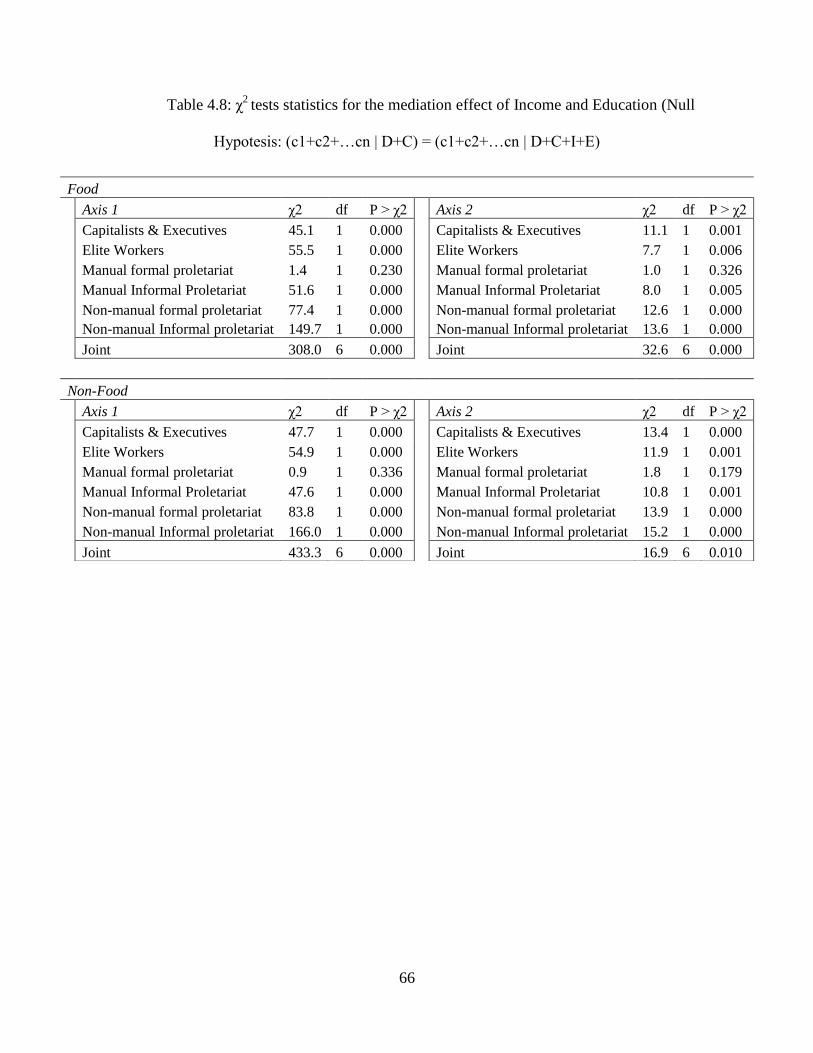
66
Table 4.8: χ2
tests statistics for the mediation effect of Income and Education (Null
Hypotesis: (c1+c2+…cn | D+C) = (c1+c2+…cn | D+C+I+E)
Food
Axis 1 χ2 df P > χ2
Axis 2 χ2 df P > χ2
Capitalists & Executives 45.1 1 0.000
Capitalists & Executives 11.1 1 0.001
Elite Workers 55.5 1 0.000
Elite Workers 7.7 1 0.006
Manual formal proletariat 1.4 1 0.230
Manual formal proletariat 1.0 1 0.326
Manual Informal Proletariat 51.6 1 0.000
Manual Informal Proletariat 8.0 1 0.005
Non-manual formal proletariat 77.4 1 0.000
Non-manual formal proletariat 12.6 1 0.000
Non-manual Informal proletariat 149.7 1 0.000
Non-manual Informal proletariat 13.6 1 0.000
Joint 308.0 6 0.000
Joint 32.6 6 0.000
Non-Food
Axis 1 χ2 df P > χ2
Axis 2 χ2 df P > χ2
Capitalists & Executives 47.7 1 0.000
Capitalists & Executives 13.4 1 0.000
Elite Workers 54.9 1 0.000
Elite Workers 11.9 1 0.001
Manual formal proletariat 0.9 1 0.336
Manual formal proletariat 1.8 1 0.179
Manual Informal Proletariat 47.6 1 0.000
Manual Informal Proletariat 10.8 1 0.001
Non-manual formal proletariat 83.8 1 0.000
Non-manual formal proletariat 13.9 1 0.000
Non-manual Informal proletariat 166.0 1 0.000
Non-manual Informal proletariat 15.2 1 0.000
Joint 433.3 6 0.000
Joint 16.9 6 0.010

67
Finally, the strategy for testing the last and most fundamental hypothesis, the net class
effect on consumption, is analogous to that for the first hypothesis. After inspecting again Table
4.9 one can see that many of the coefficients of class categories remain statistically significant
even after having introduced income and education as predictors (Model 4). The only exception
is the second principal axis for the consumption of food items, which already showed no
statistical significance in almost all the coefficients for social class even without the mediation of
income and education.
Table 4.9: F tests statistics for the net class effect (Null Hypotesis: (D+C+I+E)-
(D+I+E)=0)
r2 Change in r2 F Df Prob > F
Food
Axis 1 44.2 1.3 9.9 6 0.000
Axis 2 4.8 0.2 1.0 6 0.455
Non-Food
Axis 1 53.9 1.1 9.9 6 0.000
Axis 2 5.2 1.5 6.8 6 0.000
The F test for model fit comparison across models confirms this conclusion. Now the
comparison is between the full model (Model 4) and a simpler one that excludes social class but
includes income and education as predictors (Model 3). In the three cases where some of the
coefficients for class categories remain significant despite the mediation effect of monetary
resources and cultural capital, the F statistic is statistically significant, meaning that the inclusion
of social class improves the overall prediction of consumption patterns, net the effect of other
demographic and stratification variables. This result is of paramount importance, for it
demonstrates that differences in consumption patterns between two households that share the

68
same demographic characteristics cannot be reduced to the mere effect of the possession of
certain level of income or educational attainment. In other words, there is a net effect of social
class that cannot be overlooked.

69
5.0 DISCUSSION AND CONCLUSIONS
This paper began with a set of propositions suggesting the importance of studying consumption
patterns and social class in contemporary Latin America. In that sense, my argument is that the
advance of neoliberalism in the last quarter of the XX Century has been highly consequential in
terms of transforming the material culture of those societies. Consumerism has become a
prominent means of expressing and realizing citizen’s rights and freedoms. And as the
commodification of material life gains importance –the argument follows– the patterns of class
differentiation are expected to revolve, increasingly, around consumption. Thus, focusing on the
role of consumption in the making of distinguishing lifestyles seems crucial to understanding the
actual processes of production and reproduction of social inequalities.
From this perspective, I developed a strategy to study the statistical relations between
social structure and consumption, determining the extent to which class differences account for
variation in a set of consumption patterns inferred from the National Survey of Household
Expenditures and Incomes conducted in Uruguay in 2005/2006. First, I picked a set of food and
non-food items and used Multiple Correspondence Analysis to assess how the acquisition of
specific goods and services cluster along different dimensions and thus reveal different
consumption patterns. For food consumption, I identified a first dimension expressing the
distinction between a diversified and good quality diet, on the one hand, and a restricted and
lower quality diet, on the other. A second dimension revolves around the acquisition or not of
70
calorific and “filling” food. For non-food consumption, I found that the first principal dimension
makes the difference between the possession or not of omnivorous tastes / positional goods,
while the second dimension, of more elusive interpretation, distinguishes between the quest for
an aesthetic / outward oriented lifestyle and a comfort-seeking / inward oriented lifestyle.
A panoramic inspection of how class categories cluster along each of these four
dimensions suggested the existence of some sort of association between social class and
consumption. Yet, to better characterize this relationship, I fit a set of linear regression models,
using the predicted scores derived from MCA as dependent variables. Three hypotheses were
tested: 1) that there is an overall class effect on consumption patterns, 2) that both income and
education mediate such an effect, and 3) that despite this mediation there is a specific class effect
on consumption that is not reducible to the effect of purchasing power and educational
attainment. The statistical analysis provided us with good ground for sustaining these three
hypotheses.
Therefore, especially important to this research is the conclusion that differences in
consumption patterns between two households that share the same demographic characteristics
cannot be reduced to the mere effect of income and education. Theoretically speaking, all this
suggest that, following Bourdieu, Lamont and Bennet, we can consider the formation of
particular patterns of consumption as a crucial mechanism for the creation of boundaries among
social classes.
Methodologically, the research strategy conducted in support of this theory confirms that
integrating the best of different approaches to the study of consumption and social class may lead
to successful results. This is because, on the one hand, the replication of Bourdieu’s
methodology, namely, Multiple Correspondence Analysis, allowed depicting consumption
71
patterns as practices intrinsically anchored to the “relational organization of the social” (Bennett
2009: 34). On the other hand, the reliance on traditional techniques of inferential statistics
provided reliable measures to test the hypotheses under consideration. Otherwise, we would not
have been able to go beyond the mere description of consumption patterns.
Still, to better delimit the scope of the abovementioned conclusions, some caveats need
particular attention. First, it is worth noting that the data used in this research, the National
Survey of Household Expenditures and Incomes, has severe limitations for the study of
consumption as a vehicle for class- based distinction practices. This is so, above all, because the
survey captures participation in consumption (by measuring engagement in the purchase of
certain goods and services) but does not inquire directly about tastes. In that sense, what this
research has done is to infer patterns of participation in consumption that might eventually
manifest meaningful differences in tastes. However, this matching between participation and
tastes is by no way automatic, and should not be presupposed. The importance of measuring
tastes irrespective of participation becomes evident in Bennet’s study of distinction in Great
Britain. There the researchers measured participation by asking directly the frequency of doing
certain cultural activities, but also introduced measures of tastes over such activities through
expressions of likes and dislikes. More specifically, two types of questions were included in the
survey: one type referred to participation (how often do you participate in a, b, c...z?), with the
answers coded into a scale of frequency; the other referred to tastes (how do you like a, b, c...z?),
with answers coded into a scale of like/dislike). This design enabled the researches to treat
participation and tastes as independent dimensions. They performed Multiple Correspondence
Analysis including all the questions at once, and found that only 30% of the total variance is
attributable to participation, while tastes account for the remaining 70%. In other words, what
72
matters most for the quest of distinction is not necessarily the level of engagement itself but the
meaning conferred to certain consumption practices. Of course, one can hypothesize that the
formation of a particular taste is normally enhanced by a systematic engagement and, vice versa,
that a systematic engagement responds to preferences based on taste. But they are not the same
thing. At least hypothetically, it would be reasonable to expect tastes to be less dependent on
income than actual participation, which could give even more credit to the hypothesis of the non-
linearity between social class and income in accounting for distinction practices. Nevertheless, it
is precisely the very meanings attached to tastes that the NSHE is not able to capture. And there
are good reasons to believe that even if some specifics of consumption items like brands, product
quality or place of consumption were included in the survey, it would not be sufficient to capture
fully the symbolic dimension attached to the social organization of tastes.
A second caveat that cannot be overlooked is theoretical rather than methodological.
Here is worth bringing up Bourdieu once again, recalling that what he really attempted to
account for in his study of Distinction could not be directly inferred from the mere statistical
description of consumption patterns. For from the pure abstraction of the statistical artifact we
can hardly say anything about the meaning behind certain practices of consumption, meaning
that the researcher can only reestablish in light of the cultural milieu underlying such practices.
The interpretation of the axes of food consumption in the present research is useful to illustrate
this point. I posited that the difference between a diversified/good-quality diet and a
restricted/low-quality one may reveal a stake in the quest for distinction. I also stressed the
distinction between the ingestion or not of calorific and “filling” foods. But a reasonable critique
to these interpretations might contend that such differences in diet respond to the very earthly
desire to be better nourished. Based on what considerations can we assert that people who eat

73
yogurt are doing so to establish social distinction instead of seeking a better health? Does the
pursuit of satiation respond to socially constructed relations or is it simply built around biological
needs?
Given this consideration, no matter whether there are class-based differences in diet, the
contention that they reveal a quest for distinction seems quite problematic. Certainly, there is
nothing like a rule of thumb for an optimal solution to this problem. With the data at hand, we
can establish that the wealthier people are more readily able to have a “better” diet, and we know
they indeed get it. But we cannot conclude that this difference speaks of a quest for distinction.
However, the very notion of a “good diet”, and even the very definition of “biological needs”,
may result from socially constructed relations wherein social class has a role to play. In that
sense, analyzing some survey data collected in France, Luc Boltanski (1975), a disciple of
Bourdieu, showed that the meanings attached to specific foods register significant variations
across social classes, and that such variations correspond to differences in the “somatic culture”
characteristic of each class. Thus, he highlighted the popular classes’ tendency to prefer
“nutritious” and “fortifying” food, since the virtue of a good meal lies in the degree to which it
“maintains the body”, “fills”, “satiates” and “invigorates” (Boltanski 1975: 13). In other words,
popular notions of the appropriate nourishment would be based on the idea of “physical strength”
as an indispensable requisite for those who base their livelihood on developing an instrumental
relationship with the body. On the other hand, as the professional activity of the privileged
classes tends to get away from the necessity of strength and physical competence, they develop a
conscious, aesthetic relation with their body that relies on the virtue of “grace”, “beauty” and
“physical form” (Boltanski 1975:21), seeking the systematic training of physical sensations and

74
perceptions. This might explain why, for these classes, a meal reaches a satisfactory quality as
long as it is “healthy” and “light” for the body (Boltanski 1975:22).
Two important conclusions follow from this discussion. First, it is clear that a thoughtful
approach to how the dynamic of social distinction expresses itself through consumption requires
making at least some assumptions about the mechanisms governing the social construction of
tastes. A first approach to such mechanisms is provided by Bourdieu. He argued that just because
there is nothing preset in the formation of distinguishing tastes does not necessarily mean that
taste formation is governed either by a random or a completely arbitrary logic. Rather, it has to
do with power relations that are deeply ingrained into social class divisions. Concerning our
discussion of food consumption, this means that, because of their status and cultural authority,
dominant groups are in a better position to determine which experiences of food consumption are
endowed with a distinctive or exclusive trait. For “nothing is more distinctive, more
distinguished, than the capacity to confer aesthetic status on objects that are banal or even
‘common’ (…), or the ability to apply the principles of a ‘pure’ aesthetic to the most everyday
choices of everyday life, e.g., in cooking, clothing, completely reversing the popular disposition
which annexes aesthetics to ethics” (Bourdieu 1984:5). It is due to such ever-operative relations
of status and authority that these groups are able to institute the legitimate tastes by turning what
a priori seems to respond to organic needs into socially valued practices. Hence the mechanism
of class distinction through food consumption mirrors the very material distinction between
freedom and necessity: “The tastes of freedom can only assert themselves as such in relation to
the tastes of necessity, which are thereby brought to the level of the aesthetic and so defined as
vulgar” (Bourdieu 1984:56).

75
Again, mechanisms like those described by Bourdieu, which govern the configuration of
the meanings attached to consumption practices, cannot be informed by the secondary data used
in this research. This leads us to the second conclusion. Future studies in this area should
necessarily deploy research strategies aimed at observing such mechanisms. Moreover,
methodological designs should inquire directly about tastes besides participation, covering the
array of perceptions and meanings conferred to a myriad of consumption practices. For that
purpose, a more balanced combination of qualitative and quantitative research seems more likely
to succeed.
Furthermore, future research should decidedly engage in revising the conceptual
foundations behind the operational categories that are chosen to account for the social
configuration of tastes. As Chan and Goldthorpe (2007) have contended, it is worth remembering
the classic Weberian distinction between social class and status, noting that we may expect
consumption, especially cultural consumption, to be more strongly associated with the latter.
Inasmuch as the present research has tacitly assumed a mutual correspondence between positions
in the system of production and relations of authority and social superiority that revolve around
the distribution of honor and prestige, future research should explore possible disconnections
between these two concepts. Making such a distinction between social class and status, and
subjecting it to empirical test, might eventually help better understand social struggles in the
realm of consumption.
Finally, future research might systematically use surveys of household expenses for both
time series and comparative analysis of class, consumption and lifestyles. In this paper, I use
only the data collected in 2005/2006 for Uruguay. Yet, the analysis could be replicated for
previous editions of the NSHEI (1982/1983 and 1995/1996), as well as for the forthcoming one,

76
scheduled for 2015. This could provide a powerful empirical base for unpacking the historical
changes in patterns of social stratification and class distinction. Moreover, as this kind of survey
is being increasingly used in other countries in the region (and elsewhere), the present analysis
could lay the foundations for a broader comparative perspective on consumption patterns and
social class.
77
BIBLIOGRAPHY
Alvarez-Rivadulla, M. J. 2007. "Golden ghettos: gated communities and class residential
segregation in Montevideo, Uruguay." Environment and Planning A 39:47-63.
Baker, A. 2009. The market and the masses in Latin America: policy reform and consumption in
liberalizing economies. New York: Cambridge University Press.
Beck, U. and P. Camiller. 2000. The brave new world of work. New York Cambridge University
Press.
Bennett, Tony. 2009. Culture, class, distinction. New York: Routledge.
Blau, P.M., O.D. Duncan, and A. Tyree. 1967. "The process of stratification." Social
stratification. Class, race & gender. Pp. 317-329 in Social stratification: class, race, and
gender in sociological perspective, edited by David Grusky, Boulder, Colorado:
Westview Press
Boltanski, L. 1975. Los usos sociales del cuerpo. Buenos Aires: Ediciones Periferia.
Borsdorf, Axel and Rodrigo Hidalgo. 2007. "New dimensions of social exclusion in Latin
America: From gated communities to gated cities, the case of Santiago de Chile." Land
Use Policy 25:153-160.
Bourdieu, Pierre. 1984. Distinction: a social critique of the judgement of taste, Edited by P.
Bourdieu. Cambridge, Mass.: Harvard University Press.
Breen, Richard. 2004. Social mobility in Europe. Oxford: Oxford University Press.
Castel, Robert. 2003. From manual workers to wage laborers: transformation of the social
question. New Brunswick, N.J: Transaction Publishers.
Chan, T.W. and J.H. Goldthorpe. 2007. "Social Status and Newspaper Readership." American
Journal of Sociology 112:1095-1134.
Cohen, L. 2003. A consumers' republic: The politics of mass consumption in postwar America.
New York: Knopf.
Conley, D. 2009. Elsewhere, USA: How we got from the company man, family dinners, and the
affluent society to the home office, BlackBerry moms, and economic anxiety. New York:
Pantheon.
Crompton, Rosemary. 2008. Class and stratification. Malden, MA: Polity Press.
DiMaggio, Paul, and Michael Useem. 1978. "Social class and arts consumption." Theory and
Society 5(2): 141-161.
78
Erikson, Robert and John H. Goldthorpe. 1992. The constant flux: a study of class mobility in
industrial societies. New York: Oxford University Press.
Ferreira, Francisco H. G., Julian Messina, Jamele Rigolini, Luis-Felipe López-Calva, Maria Ana
Lugo, and Renos Vakis. 2013. Economic Mobility and the Rise of the Latin American
Middle Class. Washington, DC: World Bank
Franco, Rolando, Martín Hopenhayn, and Arturo León. 2011. "Crece y cambia la clase media en
América Latina: una puesta al día." Revista de la CEPAL 103: 7-26.
Foucault, Michel, Michel Senellart, and France Coll ge de. 2010. The birth of biopolitics:
lecture a o d anc -1979. New York: Picador.
Frank, R.H. 2009. "Post-consumer prosperity." The American Prospect 20:12-15.
Goffman, E. 1951. "Symbols of class status." British Journal of Sociology 2:294-304.
Goldthorpe, John H. 1968. The Affluent worker: political attitudes and behaviour. London:
Cambridge U.P.
Gootenberg, P. 2010. "Latin American Inequalities: New Perspectives from History, Politics and
Culture." Pp. 3-22 in Indelible Inequalities in Latin America: Insights from History,
Politics, and Culture, edited by P. Gootenberg and L. Reygadas, Durham, North
Carolina: Duke University Press.
Greenacre, M. and J. Blasius. 2006. Multiple correspondence analysis and related methods.
Boca Raton, Florida: Chapman & Hall/CRC.
Grusky, D.B. and G. Galescu. 2005. "Foundations of a Neo-Durkheimian class analysis." Pp. 51-
81 in Approaches to Class Analysis, edited by Erik Olin Wright, Cambridge, UK:
Cambridge University Press.
Heredia, M. 2011. "Ricos estructurales y nuevos ricos en Buenos Aires: primeras pistas sobre la
reproducción y la recomposición de las clases altas." Estudios Sociológicos 85:61-97.
—. 2003. "Reformas estructurales y renovación de las élites económicas en Argentina: estudio de
los portavoces de la tierra y del capital (Structural Reforms and Renewal of Economic
Elites in Argentine: Studies on the Spokesmen for Land and Capital)." Revista Mexicana
de Sociología 65:77-115.
Hirsch, F. 1978. Social limits to growth. New York: Routledge.
Hoffman, K. and M.A. Centeno. 2003. "The lopsided continent: inequality in Latin America."
Annual Review of Sociology 29: 363-390.
Lamont, Michèle. 1992. Money, morals, and manners : the culture of the French and American
upper-middle class. Chicago: University of Chicago Press.
Lazzarato, M. 1996. "Immaterial labour." Pp. 133-147 in Radical thought in Italy: A potential
politics, edited by P. Virno et al., Minneapolis: University of Minnesota Press.
—. 2004. "From capital-labour to capital-life." Ephemera: Theory and Politics in Organization
4:187-208.
Le Roux, B., H. Rouanet, M. Savage, and A. Warde. 2008. "Class and Cultural Division in the
UK." Sociology 42:1049-1071.
79
Le Roux, Brigitte and Henry Rouanet. 2010. Multiple correspondence analysis, vol. 163.
Thousand Oaks, Calif: Sage Publications.
Leiva, Fernando Ignacio. 2008. Latin American neostructuralism: the contradictions of post-
neoliberal development. Minnesota: University of Minnesota Press.
Marcuse, Herbert. 1964. One dimensional man; studies in the ideology of advanced industrial
society. Boston: Beacon Press.
McGovern, Charles. 2006. Sold American: consumption and citizenship, 1890-1945. Chapel
Hill: University of North Carolina Press.
Mudge, Stephanie Lee. 2008. "What is neo-liberalism?" Socio-Economic Review 6:703-731.
—. 2010. "What's Left of Leftism? Neoliberal Politics in Western Party Systems, 1945–2004."
Social Science History 35:337-380.
Panizza, Francisco. 2009. Contemporary Latin America: development and democracy beyond the
Washington consensus. London: Zed.
Peri, Luis Andres. 2000. "Consumption patterns in Uruguay: Between culture and the economy."
Dissertation, University of Texas at Austin.
PNUD. 2010. "Actuar sobre el futuro: Romper la transmisión intergeneracional de la
desigualdad. Informe Regional sobre Desarrollo Humano para América Latina y el
Caribe 2010." New York: PNUD.
Portes, A. and K. Hoffman. 2003. "Latin American class structures: Their composition and
change during the neoliberal era." Latin American Research Review 38:41-82.
Radakovich, Rosario. 2011. Retrato cultural: Montevideo entre cumbias, tambores y óperas.
Montevideo, Uruguay: Universidad de la República. Licenciatura en Ciencias de la
Comunicación.
Reygadas, L. 2010. "The Construction of Latin American Inequality." Pp. 23-51. in Indelible
Inequalities in Latin America: Insights from History, Politics, and Culture, edited by P.
Gootenberg and L. Reygadas, Durham, North Carolina: Duke University Press.
Rifkin, Jeremy. 1995. The end of work: the decline of the global labor force and the dawn of the
post-market era. New York: G.P. Putnam's Sons.
Rose, N. and P. Miller. 2010. "Political power beyond the state: Problematics of government."
The British Journal of Sociology 61:271-303.
Silver, Beverly J. 2003. Forces of labor : workers' movements and globalization since 1870.
Cambridge: Cambridge University Press.
Svampa, Maristella. 2004. La brecha urbana: Countries y barrios privados. Buenos Aires:
Capital Intelectual.
—. 2001. Los que ganaron: la vida en los countries y barrios privados. Buenos Aires: Editorial
Biblos.
Tevik, Jon C. 2006. Porteñologics : el significado del gusto y la moralidad en la clase media
profesional porteña. Buenos Aires: Antropofagia.

80
Trentmann, F. 2006. The making of the consumer: knowledge, power and identity in the modern
world. Oxford: Berg Publishers.
van Bavel, Ren and Lucía Sell-Trujillo. 2003. "Understandings of Consumerism in Chile."
Journal of Consumer Culture 3:343-362.
Veblen, Thorstein. 2007. "The theory of the leisure class." in Oxford world's classics. Oxford ;
New York: Oxford University Press Inc.
Warde, A. 1996. "Afterword: The future of the sociology of consumption.” Pp. 302-311 in
Consumption Matters, edited by Edgell et al., Oxford: Blackwell.
Wright, Erik Olin. 1997. Class counts: comparative studies in class analysis. New York:
Cambridge University Press.