Embed Size (px)
Citation preview

Vivaldi Asset Management, LLC | 225 W. Wacker Dr. | Suite 2100 | Chicago, IL 60606 | P: 312.248.8300
Vivaldi Multi-Strategy Fund
Class A Shares – OMOAXClass I Shares – OMOIX
SEMI-ANNUAL REPORTAUGUST 31, 2017

Vivaldi Multi-Strategy Fund A series of Investment Managers Series Trust II
This report and the financial statements contained herein are provided for the general information of the shareholders of the Vivaldi Multi-Strategy Fund. This report is not authorized for distribution to prospective investors in the Fund unless preceded or accompanied by an effective prospectus.
www.vivaldifunds.com
Table of Contents
Schedule of Investments ............................................................................................................................... 1
Statement of Assets and Liabilities ............................................................................................................. 13
Statement of Operations ............................................................................................................................ 14
Statements of Changes in Net Assets ......................................................................................................... 15
Statement of Cash Flows ............................................................................................................................ 16
Financial Highlights ..................................................................................................................................... 17
Notes to Financial Statements .................................................................................................................... 19
Expense Example ........................................................................................................................................ 32
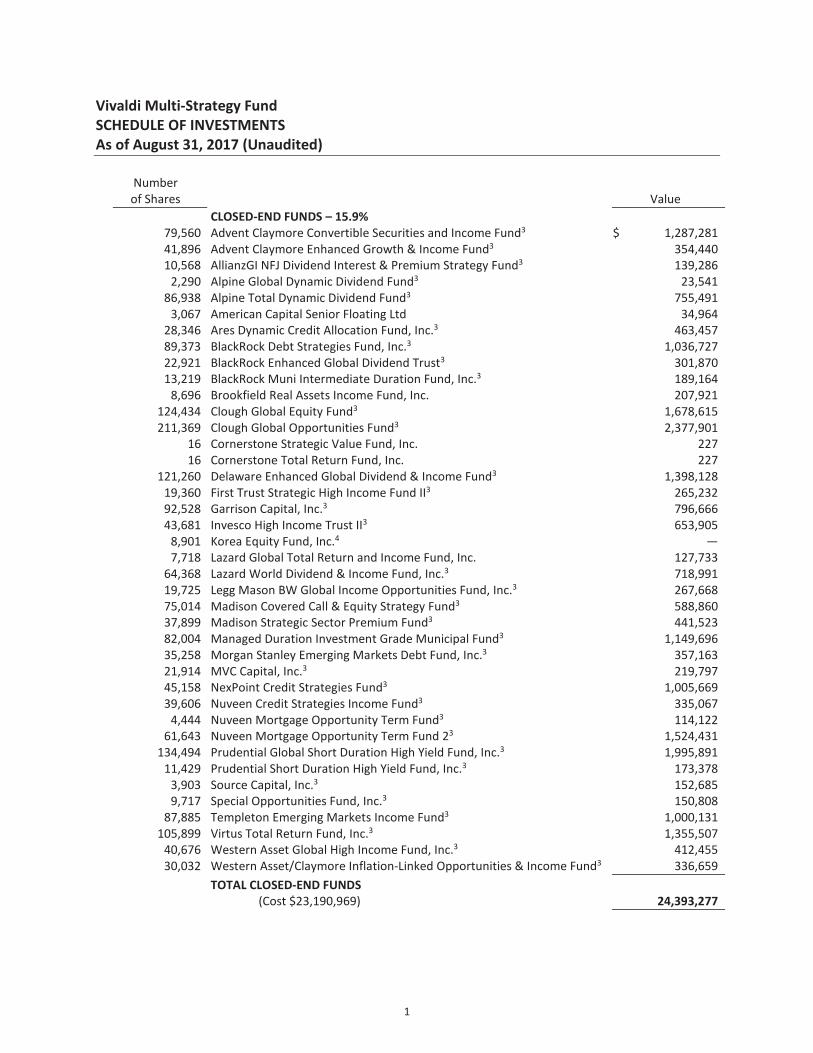
Vivaldi Multi-Strategy Fund SCHEDULE OF INVESTMENTS As of August 31, 2017 (Unaudited)
Number of Shares Value __________ ____________
CLOSED-END FUNDS – 15.9%
79,560 Advent Claymore Convertible Securities and Income Fund3 $ 1,287,281
41,896 Advent Claymore Enhanced Growth & Income Fund3 354,440
10,568 AllianzGI NFJ Dividend Interest & Premium Strategy Fund3 139,286
2,290 Alpine Global Dynamic Dividend Fund3 23,541
86,938 Alpine Total Dynamic Dividend Fund3 755,491
3,067 American Capital Senior Floating Ltd 34,964
28,346 Ares Dynamic Credit Allocation Fund, Inc.3 463,457
89,373 BlackRock Debt Strategies Fund, Inc.3 1,036,727
22,921 BlackRock Enhanced Global Dividend Trust3 301,870
13,219 BlackRock Muni Intermediate Duration Fund, Inc.3 189,164
8,696 Brookfield Real Assets Income Fund, Inc. 207,921
124,434 Clough Global Equity Fund3 1,678,615
211,369 Clough Global Opportunities Fund3 2,377,901
16 Cornerstone Strategic Value Fund, Inc. 227
16 Cornerstone Total Return Fund, Inc. 227
121,260 Delaware Enhanced Global Dividend & Income Fund3 1,398,128
19,360 First Trust Strategic High Income Fund II3 265,232
92,528 Garrison Capital, Inc.3 796,666
43,681 Invesco High Income Trust II3 653,905
8,901 Korea Equity Fund, Inc.4 —
7,718 Lazard Global Total Return and Income Fund, Inc. 127,733
64,368 Lazard World Dividend & Income Fund, Inc.3 718,991
19,725 Legg Mason BW Global Income Opportunities Fund, Inc.3 267,668
75,014 Madison Covered Call & Equity Strategy Fund3 588,860
37,899 Madison Strategic Sector Premium Fund3 441,523
82,004 Managed Duration Investment Grade Municipal Fund3 1,149,696
35,258 Morgan Stanley Emerging Markets Debt Fund, Inc.3 357,163
21,914 MVC Capital, Inc.3 219,797
45,158 NexPoint Credit Strategies Fund3 1,005,669
39,606 Nuveen Credit Strategies Income Fund3 335,067
4,444 Nuveen Mortgage Opportunity Term Fund3 114,122
61,643 Nuveen Mortgage Opportunity Term Fund 23 1,524,431
134,494 Prudential Global Short Duration High Yield Fund, Inc.3 1,995,891
11,429 Prudential Short Duration High Yield Fund, Inc.3 173,378
3,903 Source Capital, Inc.3 152,685
9,717 Special Opportunities Fund, Inc.3 150,808
87,885 Templeton Emerging Markets Income Fund3 1,000,131
105,899 Virtus Total Return Fund, Inc.3 1,355,507
40,676 Western Asset Global High Income Fund, Inc.3 412,455
30,032 Western Asset/Claymore Inflation-Linked Opportunities & Income Fund3 336,659 ____________
TOTAL CLOSED-END FUNDS (Cost $23,190,969) 24,393,277 ____________
1

Vivaldi Multi-Strategy Fund SCHEDULE OF INVESTMENTS - Continued As of August 31, 2017 (Unaudited)
Number of Shares Value __________ ____________
COMMON STOCKS – 57.6%
COMMUNICATIONS – 11.1%
256 Alphabet, Inc. - Class C*3 $ 240,468
23,257 eDreams ODIGEO S.A.* 77,523
43,817 Gray Television, Inc.*3 626,583
118,448 IMAX Corp*3 2,209,055
93,093 Level 3 Communications, Inc.*3 5,067,052
91,238 Liberty Global PLC LiLAC - Class A*3 2,373,100
18,321 Liberty Global PLC LiLAC - Class C*3 472,499
145,147 National CineMedia, Inc.3 785,245
26,568 Nexstar Broadcasting Group, Inc.3 1,599,394
11,816 Shutterfly, Inc.* 538,573
7,115 Straight Path Communications, Inc. - Class B*3 1,270,099
32,585 TEGNA, Inc.3 411,223
38,400 Twenty-First Century Fox, Inc.3 1,059,456
11,792 Twitter, Inc.* 199,403 ____________ 16,929,673 ____________ CONSUMER DISCRETIONARY – 3.1%
20,446 Advisory Board Co.* 1,088,749
1,379 Children's Place, Inc. 146,381
4,991 Copart, Inc.* 163,156
222,217 Drive Shack, Inc. 599,986
10,345 Francesca's Holdings Corp.* 75,105
15,360 HSN, Inc. 563,712
383,839 Imvescor Restaurant Group, Inc.3 1,100,371
10,300 Overstock.com, Inc.* 226,085
69,632 Potbelly Corp.* 835,584 ____________ 4,799,129 ____________ CONSUMER STAPLES – 2.0%
180,028 Darling Ingredients, Inc.*3 3,132,487 ____________ ENERGY – 2.1%
7,546 Cabot Oil & Gas Corp.3 192,800
9,035 Diamond Offshore Drilling, Inc.* 102,638
295 EQT Corp. 18,390
27,900 Kinder Morgan Canada Ltd. 387,401
12,226 Transocean Ltd.* 1 99,764
67,698 VTTI Energy Partners LP1,3 1,313,341
40,455 Western Refining Logistics LP 1,051,830 ____________ 3,166,164 ____________ FINANCIALS – 11.1%
20,416 Andina Acquisition Corp. II* 207,018
35,886 Ares Capital Corp.3 576,329
8,451 Atlantic Acquisition Corp.* 84,763
6 Berkshire Hathaway, Inc. - Class A*3 1,628,700
2

Vivaldi Multi-Strategy Fund SCHEDULE OF INVESTMENTS - Continued As of August 31, 2017 (Unaudited)
Number of Shares Value __________ ____________
COMMON STOCKS (Continued) FINANCIALS (Continued) 42,771 BlackRock Resources & Commodities Strategy Trust3 $ 370,825
7,531 Constellation Alpha Capital Corp.*3 76,666
64,750 DuPont Fabros Technology, Inc. – REIT3 4,167,310
5,519 First Potomac Realty Trust - REIT 61,427
14,096 Hennessy Capital Acquisition Corp. III*3 144,061
8,455 I-AM Capital Acquisition Co.* 85,818
82,958 Industrea Acquisition Corp.* 840,365
9,625 KBL Merger Corp. IV*3 97,790
120,037 Kingsway Financial Services, Inc.*3 720,222
45,522 Marcus & Millichap, Inc.*3 1,198,594
37,982 MMA Capital Management LLC*3 924,862
9,150 Modern Media Acquisition Corp.*3 95,526
9,150 National Energy Services Reunited Corp.*3 87,657
155,979 OHA Investment Corp.3 159,099
9,238 Osprey Energy Acquisition Corp.* 92,380
23,413 Pacific Continental Corp.3 556,059
21,166 Parkway, Inc. - REIT 485,971
18,569 Pensare Acquisition Corp.* 190,332
256,604 Resource Capital Corp.3 2,655,851
24,354 Royce Micro-Cap Trust, Inc.3 209,201
47,023 State National Cos., Inc.3 976,668
2,422 Stonegate Bank 116,765
12,168 TCG BDC, Inc.3 225,108 ____________ 17,035,367 ____________ HEALTH CARE – 14.6%
2,493 AbbVie, Inc.3 187,723
1,827 Amgen, Inc.3 324,786
767 Biogen, Inc.*3 242,801
4,691 Bristol-Myers Squibb Co.3 283,712
16,439 C.R. Bard, Inc.3 5,273,796
2,078 Centene Corp.*3 184,630
4,554 Gilead Sciences, Inc.3 381,215
10,642 Kite Pharma, Inc.* 1,894,170
1,101 McKesson Corp.3 164,390
38,145 Neuroderm Ltd.* 1,3 1,478,119
47,958 Novadaq Technologies, Inc.* 1,3 563,506
37,592 PAREXEL International Corp.*3 3,303,961
44,986 VCA, Inc.*3 4,181,899
120,109 VWR Corp.*3 3,965,999 ____________ 22,430,707 ____________ INDUSTRIALS – 1.3%
29,385 AerCap Holdings N.V.*3 1,478,065
3
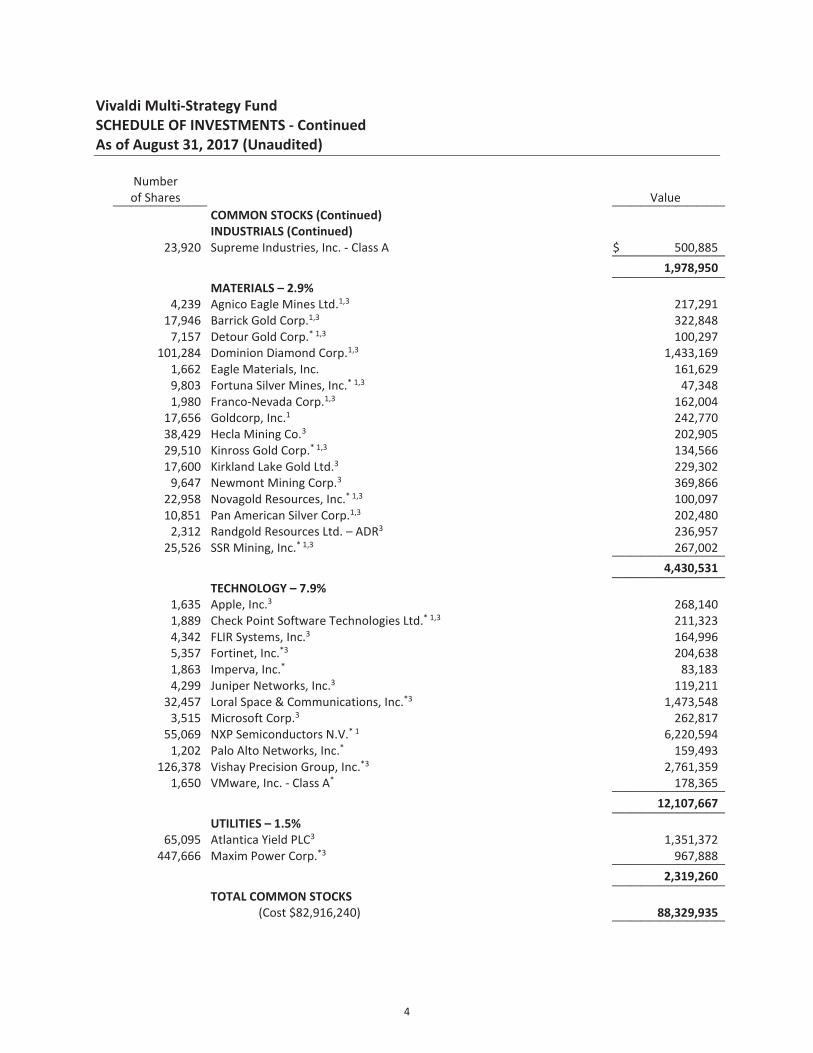
Vivaldi Multi-Strategy Fund SCHEDULE OF INVESTMENTS - Continued As of August 31, 2017 (Unaudited)
Number of Shares Value __________ ____________
COMMON STOCKS (Continued) INDUSTRIALS (Continued) 23,920 Supreme Industries, Inc. - Class A $ 500,885 ____________ 1,978,950 ____________ MATERIALS – 2.9%
4,239 Agnico Eagle Mines Ltd.1,3 217,291
17,946 Barrick Gold Corp.1,3 322,848
7,157 Detour Gold Corp.* 1,3 100,297
101,284 Dominion Diamond Corp.1,3 1,433,169
1,662 Eagle Materials, Inc. 161,629
9,803 Fortuna Silver Mines, Inc.* 1,3 47,348
1,980 Franco-Nevada Corp.1,3 162,004
17,656 Goldcorp, Inc.1 242,770
38,429 Hecla Mining Co.3 202,905
29,510 Kinross Gold Corp.* 1,3 134,566
17,600 Kirkland Lake Gold Ltd.3 229,302
9,647 Newmont Mining Corp.3 369,866
22,958 Novagold Resources, Inc.* 1,3 100,097
10,851 Pan American Silver Corp.1,3 202,480
2,312 Randgold Resources Ltd. – ADR3 236,957
25,526 SSR Mining, Inc.* 1,3 267,002 ____________ 4,430,531 ____________ TECHNOLOGY – 7.9%
1,635 Apple, Inc.3 268,140
1,889 Check Point Software Technologies Ltd.* 1,3 211,323
4,342 FLIR Systems, Inc.3 164,996
5,357 Fortinet, Inc.*3 204,638
1,863 Imperva, Inc.* 83,183
4,299 Juniper Networks, Inc.3 119,211
32,457 Loral Space & Communications, Inc.*3 1,473,548
3,515 Microsoft Corp.3 262,817
55,069 NXP Semiconductors N.V.* 1 6,220,594
1,202 Palo Alto Networks, Inc.* 159,493
126,378 Vishay Precision Group, Inc.*3 2,761,359
1,650 VMware, Inc. - Class A* 178,365 ____________ 12,107,667 ____________ UTILITIES – 1.5%
65,095 Atlantica Yield PLC3 1,351,372
447,666 Maxim Power Corp.*3 967,888 ____________ 2,319,260 ____________
TOTAL COMMON STOCKS (Cost $82,916,240) 88,329,935 ____________
4

Vivaldi Multi-Strategy Fund SCHEDULE OF INVESTMENTS - Continued As of August 31, 2017 (Unaudited)
Number of Shares Value __________ ____________
PREFERRED STOCKS – 1.8%
FINANCIALS – 1.8%
15,000 B. Riley Financial, Inc.
7.500%, 5/31/273 $ 382,800
9,932 B. Riley Financial, Inc.
7.500%, 10/31/21 255,252
2,402 Capitala Finance Corp.
5.750%, 5/31/22 60,002
2,700 Great Elm Capital Corp.
8.250%, 6/30/203 68,769
5,893 Harvest Capital Credit Corp.
6.125%, 9/15/22 149,270
15,907 KCAP Financial, Inc.
6.125%, 9/30/22 401,970
6,407 Stellus Capital Investment Corp.
5.750%, 9/15/22 160,560
2,964 THL Credit, Inc.
6.750%, 12/30/223 76,886
791 THL Credit, Inc.
6.750%, 11/15/213 20,265
38,139 TICC Capital Corp.
6.500%, 3/30/24 996,191
6,972 TriplePoint Venture Growth BDC Corp.
5.750%, 7/15/22 175,694 ____________ 2,747,659 ____________
TOTAL PREFERRED STOCKS (Cost $2,681,537) 2,747,659 ____________
Number
of Contracts __________ PURCHASED OPTIONS CONTRACTS – 0.1%
CALL OPTIONS – 0.0%
NXP Semiconductors N.V.
37
Exercise Price: $110.00, Notional Amount: $407,000, Expiration Date: October 20, 2017 14,430 ____________
TOTAL CALL OPTIONS (Cost $12,386) 14,430 ____________
PUT OPTIONS – 0.1%
NXP Semiconductors N.V.
28
Exercise Price: $110.00, Notional Amount: $308,000, Expiration Date: December 15, 2017 4,760
SPDR Bloomberg Barclays High Yield Bond ETF 248
Exercise Price: $37.00, Notional Amount: $917,600, Expiration Date: January 19, 2018* 22,940
403
Exercise Price: $37.00, Notional Amount: $1,491,100, Expiration Date: September 15, 2017* 6,448
5

Vivaldi Multi-Strategy Fund SCHEDULE OF INVESTMENTS - Continued As of August 31, 2017 (Unaudited)
Number
of Contracts Value __________ ____________ PURCHASED OPTIONS CONTRACTS (Continued) PUT OPTIONS (Continued) VanEck Vectors Semiconductor ETF
220
Exercise Price: $88.00, Notional Amount: $1,936,000, Expiration Date: November 17, 2017 $ 61,600 ____________
TOTAL PUT OPTIONS (Cost $169,637) 95,748 ____________
TOTAL PURCHASED OPTIONS CONTRACTS (Cost $182,023) 110,178 ____________
Number of Shares __________
RIGHTS – 0.0%
49 Reaves Utility Income Fund, Expiration Date: October 4, 2017* 17
905 RMR Real Estate Income Fund, Expiration Date: September 19, 2017* 498 ____________
TOTAL RIGHTS (Cost $0) 515 ____________
WARRANTS – 0.0%
9,150 National Energy Services Reunited Corp., Expiration Date: June 5, 2022* 4,575 ____________
TOTAL WARRANTS (Cost $5,033) 4,575 ____________
SHORT-TERM INVESTMENTS – 26.8%
41,062,409
Morgan Stanley Institutional Liquidity Fund - Government Portfolio -
Institutional Class, 0.88%2,3 41,062,409 ____________
TOTAL SHORT-TERM INVESTMENTS (Cost $41,062,409) 41,062,409 ____________
TOTAL INVESTMENTS – 102.2% (Cost $150,038,211) 156,648,548
Liabilities in Excess of Other Assets – (2.2)% (3,375,972) ____________ TOTAL NET ASSETS – 100.0% $ 153,272,576 ________________________ SECURITIES SOLD SHORT – (32.6)%
COMMON STOCKS – (26.0)%
COMMUNICATIONS – (3.4)%
(29,018) Beasley Broadcast Group, Inc. $ (288,729)
(30,900) Blucora, Inc.* (704,520)
(133,238) CenturyLink, Inc. (2,627,453)
(9,400) Criteo S.A.* (457,874)
(3,130) Saga Communications, Inc. (127,861)
(9,500) Tribune Media Co. (380,665)
(16,224) TrueCar, Inc.* (274,997)
(7,140) Tucows, Inc.* (377,349) ____________ (5,239,448) ____________
6

Vivaldi Multi-Strategy Fund SCHEDULE OF INVESTMENTS - Continued As of August 31, 2017 (Unaudited)
Number of Shares Value __________ ____________
SECURITIES SOLD SHORT (Continued) COMMON STOCKS (Continued) CONSUMER DISCRETIONARY – (4.2)%
(1,414) Alibaba Group Holding Ltd. - ADR* $ (242,840)
(380) AutoZone, Inc.* (200,807)
(8,333) CarMax, Inc.* (559,561)
(3,265) Cavco Industries, Inc.* (439,306)
(1,834) Domino's Pizza, Inc. (334,265)
(11,371) Freshpet, Inc.* (180,230)
(1,969) Hilton Worldwide Holdings, Inc. (126,666)
(5,234) JD.com, Inc. - ADR* (219,357)
(25,342) Liberty Interactive Corp. QVC Group - Class A* (560,565)
(12,674) Matthews International Corp. (763,609)
(2,649) Nutrisystem, Inc. (143,841)
(668) O'Reilly Automotive, Inc.* (131,015)
(5,703) Oxford Industries, Inc. (329,690)
(4,800) Papa John's International, Inc. (358,992)
(5,869) Sotheby's* (263,342)
(1,117) Tesla Motors, Inc.* (397,540)
(7,567) Wayfair, Inc.* (537,333)
(19,059) Wingstop, Inc. (617,702) ____________ (6,406,661) ____________ CONSUMER STAPLES – (1.1)%
(19,265) Blue Buffalo Pet Products, Inc.* (496,266)
(1,164) Clorox Co. (161,249)
(2,254) Colgate-Palmolive Co. (161,477)
(1,052) Costco Wholesale Corp. (164,890)
(1,509) Hershey Co. (158,324)
(640) J&J Snack Foods Corp. (81,594)
(2,447) Kellogg Co. (160,181)
(1,970) Kraft Heinz Co. (159,077)
(3,806) Mondelez International, Inc. - Class A (154,752) ____________ (1,697,810) ____________ ENERGY – (1.4)%
(21,155) Andeavor Logistics LP (1,052,461)
(1,216) Concho Resources, Inc.* (134,940)
(1,648) Diamondback Energy, Inc.* (149,622)
(12,793) Laredo Petroleum, Inc.* (158,889)
(6,471) Matador Resources Co.* (152,586)
(5,415) Parsley Energy, Inc. - Class A* (135,646)
(970) Pioneer Natural Resources Co. (125,760)
(3,557) Resolute Energy Corp.* (105,109)
(802) Rice Energy, Inc.* (21,943)
7

Vivaldi Multi-Strategy Fund SCHEDULE OF INVESTMENTS - Continued As of August 31, 2017 (Unaudited)
Number of Shares Value __________ ____________
SECURITIES SOLD SHORT (Continued) COMMON STOCKS (Continued) ENERGY (Continued) (4,719) RSP Permian, Inc.* $ (148,082) ____________ (2,185,038) ____________ FINANCIALS – (8.6)%
(4,306) Acadia Realty Trust - REIT (123,539)
(16,780) Australia & New Zealand Banking Group Ltd. (392,187)
(5,325) Bank of Montreal1 (382,282)
(6,555) Bank of Nova Scotia1 (407,328)
(13,900) Bank of the Ozarks, Inc. (597,144)
(29,131) BofI Holding, Inc.* (772,263)
(4,769) Canadian Imperial Bank of Commerce1 (400,405)
(5,439) China Life Insurance Co., Ltd. - ADR (87,677)
(15,040) Columbia Banking System, Inc. (559,037)
(6,491) Commonwealth Bank of Australia (391,142)
(10,424) DiamondRock Hospitality Co. - REIT (114,560)
(34,500) Digital Realty Trust, Inc. - REIT (4,082,730)
(951) Federal Realty Investment Trust - REIT (120,710)
(12,500) Health Insurance Innovations, Inc.* (420,625)
(1,397) Home BancShares, Inc. (32,564)
(3,762) Hudson Pacific Properties, Inc. - REIT (124,146)
(3,524) Iron Mountain, Inc. - REIT (138,916)
(7,743) Kilroy Realty Corp. (536,048)
(4,566) Mack-Cali Realty Corp. - REIT (104,516)
(18,276) National Australia Bank Ltd. (438,775)
(12,000) Omega Healthcare Investors, Inc. (382,440)
(11,066) Pennsylvania Real Estate Investment Trust - REIT (110,992)
(3,410) Primerica, Inc. (261,035)
(9,211) Ramco-Gershenson Properties Trust - REIT (121,125)
(1,923) Regency Centers Corp. - REIT (123,687)
(4,327) Royal Bank of Canada1 (320,457)
(2,992) Taubman Centers, Inc. - REIT (156,302)
(7,898) Toronto-Dominion Bank1 (423,412)
(21,783) Trupanion, Inc.* (476,612)
(3,972) Weingarten Realty Investors - REIT (127,263)
(15,600) Westpac Banking Corp. (387,799) ____________ (13,117,718) ____________ HEALTH CARE – (3.8)%
(8,354) Becton, Dickinson and Co. (1,666,122)
(1,500) Henry Schein, Inc.* (260,520)
(9,190) Insulet Corp.* (533,571)
(18,786) Lannett Co., Inc.* (329,694)
(59,584) MiMedx Group, Inc.* (969,432)
(6,800) Patterson Cos., Inc. (261,800)
8

Vivaldi Multi-Strategy Fund SCHEDULE OF INVESTMENTS - Continued As of August 31, 2017 (Unaudited)
Number of Shares Value __________ ____________
SECURITIES SOLD SHORT (Continued) COMMON STOCKS (Continued) HEALTH CARE (Continued) (8,373) Tactile Systems Technology, Inc.* $ (275,304)
(28,750) Teladoc, Inc.* (964,563)
(9,988) USANA Health Sciences, Inc.* (591,290) ____________ (5,852,296) ____________ INDUSTRIALS – (0.8)%
(18,452) AAON, Inc. (601,535)
(3,481) Kennametal, Inc. (121,835)
(5,726) Pool Corp. (570,825) ____________ (1,294,195) ____________ MATERIALS – (0.4)%
(51,600) Fortescue Metals Group Ltd. (246,535)
(4,940) Trex Co., Inc.* (375,440) ____________ (621,975) ____________ TECHNOLOGY – (1.9)%
(12,647) Advanced Micro Devices, Inc.* (164,411)
(13,164) Applied Optoelectronics, Inc.* (778,256)
(1,610) Autodesk, Inc.* (184,280)
(1,799) Cavium, Inc.* (113,895)
(1,883) Evolent Health, Inc. - Class A* (31,446)
(9,900) Impinj, Inc.* (378,576)
(32,814) MINDBODY, Inc. - Class A* (776,051)
(4,576) Motorola Solutions, Inc. (403,237) ____________ (2,830,152) ____________ UTILITIES – (0.4)%
(34,307) Spark Energy, Inc. - Class A (543,766) ____________
TOTAL COMMON STOCKS (Proceeds $38,221,168) (39,789,059) ____________
EXCHANGE-TRADED FUNDS – (6.6)%
(21,876) Deutsche X-trackers Harvest CSI 300 China A-Shares ETF (643,373)
(35,883) iShares China Large-Cap ETF (1,587,464)
(28,264) iShares MSCI Australia ETF (640,180)
(23,504) iShares MSCI China ETF (1,457,248)
(13,246) iShares MSCI Emerging Markets ETF (593,818)
(23,543) iShares MSCI Hong Kong ETF (581,277)
(45,000) SPDR Bloomberg Barclays High Yield Bond ETF (1,676,700)
(12,000) SPDR S&P500 ETF Trust (2,969,880) ____________
TOTAL EXCHANGE-TRADED FUNDS (Proceeds $9,502,604) (10,149,940) ____________
9

Vivaldi Multi-Strategy Fund SCHEDULE OF INVESTMENTS - Continued As of August 31, 2017 (Unaudited)
Number
of Contracts Value __________ ____________ SECURITIES SOLD SHORT (Continued)
TOTAL SECURITIES SOLD SHORT (Proceeds $47,723,772) $ (49,938,999) ____________
WRITTEN OPTIONS CONTRACTS – 0.0%
CALL OPTIONS – 0.0%
Darling Ingredients, Inc.
(500)
Exercise Price: $17.00, Notional Amount: $(850,000), Expiration Date: September 15, 2017 (30,000)
Straight Path Communications, Inc. (5)
Exercise Price: $180.00, Notional Amount: $(90,000), Expiration Date: November 17, 2017* (775)
(5)
Exercise Price: $180.00, Notional Amount: $(90,000), Expiration Date: December 15, 2017* (775) ____________
TOTAL CALL OPTIONS (Proceeds $22,067) (31,550) ____________
TOTAL WRITTEN OPTIONS CONTRACTS (Proceeds $22,067) $ (31,550) ____________
ADR – American Depository Receipt ETF – Exchange-Traded Fund LP – Limited Partnership PLC – Public Limited Company REIT – Real Estate Investment Trust * Non-income producing security. 1 Foreign security denominated in U.S. Dollars. 2 The rate is the annualized seven-day yield at period end. 3 All or a portion of this security is segregated as collateral for securities sold short.
4 Level 3 security fair valued under procedures established by the Board of Trustees, represents 0.00% of Net Assets. The total value of this security is $0. See accompanying Notes to Financial Statements.
10

As of August 31, 2017 (Unaudited)
FUTURES CONTRACTS
Number of UnrealizedContracts Expiration Value at Value at Appreciation
Long (Short) Description Date Trade Date August 31, 2017 (Depreciation)
(8) Australian Dollar Currency Futures September 2017 (595,897)$ (635,840)$ (39,943)$ (10) BP Currency Futures September 2017 (810,971) (808,750) 2,221 (10) Canadian Dollar Currency Futures December 2017 (797,861) (800,949) (3,088) (6) Copper Futures December 2017 (393,768) (464,775) (71,007)
(16) Euro FX Currency Futures September 2017 (2,324,808) (2,382,399) (57,591) (21) Euro-Bund Futures September 2017 (4,056,196) (4,055,250) 946 10 Gold Futures December 2017 1,292,528 1,322,200 29,672 (3) Japanese 10-Year Bond Futures September 2017 (4,114,873) (4,123,892) (9,019)
(11) Japanese Yen Currency Futures September 2017 (1,255,609) (1,251,044) 4,565 5 Natural Gas Futures July 2018 145,796 146,850 1,054 (7) New Zealand Dollar Currency Futures December 2017 (503,343) (501,480) 1,863 9 Platinum Futures October 2017 418,165 449,325 31,160 8 Silver Futures December 2017 663,572 703,000 39,428
32 U.S. 10-Year Treasury Note Futures December 2017 4,048,596 4,063,499 14,903 5 U.S. Long Bond Futures December 2017 774,859 780,469 5,610 (9) WTI Crude Futures December 2017 (423,605) (437,040) (13,435)
TOTAL FUTURES CONTRACTS (7,933,415)$ (7,996,076)$ (62,661)$
Vivaldi Multi-Strategy FundSCHEDULE OF INVESTMENTS - Continued
See accompanying Notes to Financial Statements.
11

Vivaldi Multi-Strategy Fund SUMMARY OF INVESTMENTS As of August 31, 2017 (Unaudited)
Security Type/Sector Percent of Total
Net Assets Closed-End Funds 15.9% Common Stocks
Health Care 14.6% Financials 11.1% Communications 11.1% Technology 7.9% Consumer Discretionary 3.1% Materials 2.9% Energy 2.1% Consumer Staples 2.0% Utilities 1.5% Industrials 1.3% __________
Total Common Stocks 57.6% Preferred Stocks 1.8% Purchased Options Contracts 0.1% Rights 0.0% Warrants 0.0% Short-Term Investments 26.8% __________Total Investments 102.2% Liabilities in Excess of Other Assets (2.2)% __________Total Net Assets 100.0% ____________________
See accompanying Notes to Financial Statements.
12

Vivaldi Multi-Strategy FundSTATEMENT OF ASSETS AND LIABILITIESAs of August 31, 2017 (Unaudited)
Assets:Investments, at value (cost $149,856,188) 156,538,370$ Purchased options contracts, at value (cost $182,023) 110,178Foreign currency, at value (cost $9,093) 9,118 Unrealized appreciation on open futures contracts 131,422Cash 1,053,352Cash deposited with brokers for securities sold short 50,179,679Cash deposited with brokers for futures contracts 440,552Due from Custodian 1,657,753Receivables: Investment securities sold 2,591,435 Fund shares sold 114,729 Dividends and interest 71,241Prepaid expenses 70,847Prepaid offering costs 8,340 Total assets 212,977,016
Liabilities:Securities sold short, at value (proceeds $47,723,772) 49,938,999Written options contracts, at value (proceeds $22,067) 31,550Foreign currency due to custodian, at value (proceeds $2,396,802) 2,510,304Unrealized depreciation on open futures contracts 194,083Payables: Investment securities purchased 6,602,582 Fund shares redeemed 57,770 Advisory fees 206,113 Shareholder servicing fees (Note 7) 24,231 Distribution fees (Note 6) 5,918 Dividends and interest on securities sold short 104,508 Auditing fees 8,875 Fund accounting fees 7,951 Transfer agent fees and expenses 7,392 Chief Compliance Officer fees 2,631 Trustees' fees and expenses 299Accrued other expenses 1,234 Total liabilities 59,704,440
Net Assets 153,272,576$
Components of Net Assets:Paid-in capital (par value of $0.01 per share with an unlimited number of shares authorized) 148,175,016$ Accumulated net investment loss (648,928)Accumulated net realized gain on investments, purchased options contracts, securities sold short, written options contracts, futures contracts and foreign currency transactions 1,537,240Net unrealized appreciation (depreciation) on: Investments 6,682,182 Purchased options contracts (71,845) Securities sold short (2,215,227) Written options contracts (9,483) Futures contracts (62,661) Foreign currency translations (113,718)
Net Assets 153,272,576$
Maximum Offering Price per Share:Class A Shares:
Net assets applicable to shares outstanding 27,933,860$ Shares of beneficial interest issued and outstanding 1,047,050Redemption price per share* 26.68 Maximum sales charge (5.00% of offering price)** 1.40 Maximum offering price to public 28.08$
Class I Shares:Net assets applicable to shares outstanding 125,338,716$ Shares of beneficial interest issued and outstanding 4,616,785Redemption price 27.15$
**On sales of $50,000 or more, the sales charge will be reduced.*No sales charge applies on investments of $1 million or more.
See accompanying Notes to Financial Statements.
13

Vivaldi Multi-Strategy FundSTATEMENT OF OPERATIONSFor the Six Months Ended August 31, 2017 (Unaudited)
Investment Income:Dividends (net of foreign withholding taxes of $5,757) 2,326,430$ Interest 150,785 Total investment income 2,477,215
Expenses:Advisory fees 1,216,617Interest expense 558,320Dividends on securities sold short (net of foreign withholding taxes of $3,478) 534,449Shareholder servicing fees - Class I (Note 7) 61,334Shareholder servicing fees - Class A (Note 7) 22,014Fund administration fees 39,148Distribution fees (Note 6) 36,690Fund accounting fees 23,298Shareholder reporting fees 22,411Registration fees 20,071 Offering costs 14,078Legal fees 14,066Chief Compliance Officer fees 13,610Transfer agent fees and expenses 13,540Miscellaneous 11,763Auditing fees 8,874Trustees' fees and expenses 3,777Custody fees 3,444Insurance fees 2,017 Total expenses 2,619,521 Net investment loss (142,306)
Realized and Unrealized Gain (Loss) on Investments, Purchased Options Contracts, Securities Sold Short, Written Options Contracts, Futures Contracts and Foreign Currency:
Net realized gain (loss) on:Investments 3,640,253Purchased options contracts (680,629)Securities sold short (2,168,584)Written options contracts 81,812Futures contracts 25,136Foreign currency transactions (82,082)
Net realized gain 815,906Net change in unrealized appreciation/depreciation on:
Investments 1,766,295Purchased options contracts 177,707Securities sold short (117,228)Written options contracts (16,670)Futures contracts 37,507Foreign currency translations (91,739)
Net change in unrealized appreciation/depreciation 1,755,872Net realized and unrealized gain on investments, purchased options contracts,
securities sold short, written options contracts, futures contracts and foreign currrency 2,571,778
Net Increase in Net Assets from Operations 2,429,472$
See accompanying Notes to Financial Statements.
14

Vivaldi Multi-Strategy FundSTATEMENTS OF CHANGES IN NET ASSETS
For theSix Months Ended For the August 31, 2017 Year Ended
(Unaudited) February 28, 2017Increase (Decrease) in Net Assets from:Operations:
Net investment loss (142,306)$ (1,689,126)$ Net realized gain 815,906 3,190,087 Net change in unrealized appreciation/depreciation on investments, purchased options contracts, securities sold short, written options contracts, futures contracts and foreign currency 1,755,872 639,356 Net increase in net assets resulting from operations 2,429,472 2,140,317
Distributions to Shareholders:From net realized gain: Class A - (334,841) Class I - (1,171,528) Total distributions to shareholders - (1,506,369)
Capital Transactions:Net proceeds from shares sold: Class A 3,715,127 29,390,814 Class I 32,620,194 95,685,383 Reinvestment of distributions: Class A - 309,267 Class I - 1,108,775 Cost of shares redeemed: Class A (7,007,324) (30,357,976) Class I (21,012,829) (13,778,754) Net increase in net assets from capital transactions 8,315,168 82,357,509
Total increase in net assets 10,744,640 82,991,457
Net Assets:Beginning of period 142,527,936 59,536,479 End of period 153,272,576$ 142,527,936$
Accumulated net investment loss (648,928)$ (506,622)$
Capital Share Transactions:Shares sold: Class A 140,862 1,112,635 Class I 1,216,717 3,561,701 Shares reinvested: Class A - 11,728 Class I - 41,403 Shares redeemed: Class A (265,595) (1,146,048) Class I (783,125) (513,031) Net increase in capital share transactions 308,859 3,068,388
See accompanying Notes to Financial Statements.
15

Vivaldi Multi-Strategy FundSTATEMENT OF CASH FLOWSFor the Six Months Ended August 31, 2017 (Unaudited)
Increase (Decrease) in Cash:Cash flows provided by (used for) operating activities:
Net increase in net assets resulting from operations 2,429,472$ Adjustments to reconcile net decrease in net assets from operations to net cash used for operating activities:
Purchases of long-term portfolio investments (219,561,104) Sales of long-term portfolio investments 224,078,278 Proceeds from securities sold short 98,412,457 Cover short securities (89,608,301) Premiums received on written options 268,828 Closed written options (187,016) Sale of short-term investments, net 3,881,551 Increase in cash held by brokers (21,106,082) Decrease in deposits at broker - foreign currency 105,959 Increase in cash Due from Custodian (1,657,753) Decrease in investment securities sold receivable 272,184 Increase in unrealized appreciation on open futures contracts (53,593) Decrease in dividends and interest receivables 24,391 Increase in other assets (19,542) Decrease in foreign currency payable (2,912,680) Increase in payables for securities purchased 1,687,649 Increase in unrealized depreciation on open futures contracts 16,086 Increase in payables for dividends on short positions 55,356 Increase in Advisory and Subadvisory fees 25,022 Decrease in accrued expenses (89,371) Litigation proceeds 3,120 Return of capital dividends received 1,795 Net realized gain on investments (872,852) Net change in unrealized appreciation/depreciation on investments (1,810,104)
Net cash used for operating activities (6,616,250)
Cash flows provided by (used for) financing activities:Proceeds from sale of shares 36,332,942 Redemption of shares, net of redemption fees (28,668,992) Net cash provided by financing activities 7,663,950
Net Increase in Cash 1,047,700
Cash:Beginning balance 5,652 Ending balance 1,053,352$
See accompanying Notes to Financial Statements.
16

Vivaldi Multi-Strategy FundFINANCIAL HIGHLIGHTS Class A*
Per share operating performance.For a capital share outstanding throughout each period.
For the For the PeriodSix Months Ended For the For the For the For the April 30, 2012**August 31, 2017 Year Ended Year Ended Year Ended Year Ended through
(Unaudited) February 28, 2017 February 29, 2016 February 28, 2015 February 28, 2014 February 28, 2013Net asset value, beginning of period 26.28$ 25.88$ 26.07$ 26.31$ 25.22$ 25.00$ Income from Investment Operations:
Net investment loss1 (0.06) (0.54) (0.17) (0.56) (0.56) (0.32) Net realized and unrealized gain on investments 0.46 1.38 1.25 0.61 1.70 0.56 Total from investment operations 0.40 0.84 1.08 0.05 1.14 0.24
Less Distributions:From net realized gain - (0.44) (1.27) (0.29) (0.05) (0.02) Total distributions - (0.44) (1.27) (0.29) (0.05) (0.02)
Redemption fee proceeds1 - - - 2 - 2 - 2 -
Net asset value, end of period 26.68$ 26.28$ 25.88$ 26.07$ 26.31$ 25.22$
Total return3 1.48% 4 3.22% 4.30% 0.21% 4.54% 0.96% 4
Ratios and Supplemental Data:Net assets, end of period (in thousands) 27,934$ 30,800$ 30,888$ 18,949$ 20,932$ 17,347$
Ratio of expenses to average net assets (including dividends on securities sold shortand interest expense):
Before fees waived and expenses absorbed 3.69% 5,6 3.71% 6 4.66% 6 3.89% 6 4.42% 6 5.49% 5,6
After fees waived and expenses absorbed 3.69% 5,6 3.66% 6 4.02% 6 3.26% 6 3.74% 6 3.80% 5,6
Ratio of net investment loss to average net assets (including dividends onsecurities sold short and interest expense):
Before fees waived and expenses absorbed (0.43)% 5 (2.08)% (3.31)% (2.52)% (3.10)% (4.20)% 5
After fees waived and expenses absorbed (0.43)% 5 (2.03)% (2.67)% (1.89)% (2.42)% (2.51)% 5
Portfolio turnover rate 176% 4 323% 393% 360% 270% 205% 4
*** Commencement of operations.
1 Based on average daily shares outstanding for the period.2 Amount represents less than $0.01 per share.3
4 Not annualized. 5 Annualized.6
Financial information from April 30, 2012 through December 18, 2016 is for the Vivaldi Orinda Macro Opportunities Fund, which was reorganized into the Vivaldi Multi-Strategy Fund as of the close of business December 18, 2016.
Total returns would have been lower had expenses not been waived or absorbed by the Advisor. Returns shown include Rule 12b-1 fees of up to 0.25% and do not reflect the deduction of taxes that a shareholder would pay on Funddistributions or the redemption of Fund shares.
If interest expense and dividends on securities sold short had been excluded, the expense ratios would have been lowered by 1.44% for the six months ended August 31, 2017. For the prior periods, the ratios would have been lowered by1.20%, 1.22%, 0.58%, 0.81% and 0.84%, respectively.
See accompanying Notes to Financial Statements.
17

Vivaldi Multi-Strategy FundFINANCIAL HIGHLIGHTS Class I*
Per share operating performance.For a capital share outstanding throughout each period.
For the For the PeriodSix Months Ended For the For the For the For the April 30, 2012**August 31, 2017 Year Ended Year Ended Year Ended Year Ended through
(Unaudited) February 28, 2017 February 29, 2016 February 28, 2015 February 28, 2014 February 28, 2013Net asset value, beginning of period 26.71$ 26.21$ 26.29$ 26.45$ 25.28$ 25.00$ Income from Investment Operations:
Net investment loss1 (0.02) (0.47) (0.51) (0.41) (0.50) (0.16) Net realized and unrealized gain on investments 0.46 1.41 1.70 0.54 1.72 0.46 Total from investment operations 0.44 0.94 1.19 0.13 1.22 0.30
Less Distributions:From net realized gain - (0.44) (1.27) (0.29) (0.05) (0.02) Total distributions - (0.44) (1.27) (0.29) (0.05) (0.02)
Redemption fee proceeds1 - - - 2 - 2 - 2 -
Net asset value, end of period 27.15$ 26.71$ 26.21$ 26.29$ 26.45$ 25.28$
Total return3 1.65% 4 3.56% 4.69% 0.52% 4.85% 1.20% 4
Ratios and Supplemental Data:Net assets, end of period (in thousands) 125,339$ 111,728$ 28,648$ 16,360$ 20,190$ 12,875$
Ratio of expenses to average net assets (including dividends on securities sold shortand interest expense):
Before fees waived and expenses absorbed 3.39% 5,6 3.41% 6 4.45% 6 3.58% 6 4.12% 6 5.77% 5,6
After fees waived and expenses absorbed 3.39% 5,6 3.36% 6 3.74% 6 2.95% 6 3.44% 6 3.46% 5,6
Ratio of net investment loss to average net assets (including dividends onsecurities sold short and interest expense):
Before fees waived and expenses absorbed (0.13)% 5 (1.78)% (3.21)% (2.19)% (2.80)% (4.41)% 5
After fees waived and expenses absorbed (0.13)% 5 (1.73)% (2.50)% (1.56)% (2.12)% (2.10)% 5
Portfolio turnover rate 176% 4 323% 393% 360% 270% 205% 4
*** Commencement of operations.
1 Based on average daily shares outstanding for the period.2 Amount represents less than $0.01 per share.3
4 Not annualized. 5 Annualized.6
Financial information from April 30, 2012 through December 18, 2016 is for the Vivaldi Orinda Macro Opportunities Fund, which was reorganized into the Vivaldi Multi-Strategy Fund as of the close of business December 18, 2016.
Total returns would have been lower had expenses not been waived or absorbed by the Advisor. Returns shown do not reflect the deduction of taxes that a shareholder would pay on Fund distributions or the redemption of Fund shares.
If interest expense and dividends on securities sold short had been excluded, the expense ratios would have been lowered by 1.44% for the six months ended August 31, 2017. For the prior periods, the ratios would have been lowered by1.20%, 1.27%, 0.57%, 0.81% and 0.80%, respectively.
See accompanying Notes to Financial Statements.
18

Vivaldi Multi-Strategy Fund NOTES TO FINANCIAL STATEMENTS August 31, 2017 (Unaudited)
Note 1 – Organization Vivaldi Multi-Strategy Fund (the ‘‘Fund’’) is organized as a diversified series of Investment Managers Series Trust II, a Delaware statutory trust (the “Trust”) which is registered as an open-end management investment company under the Investment Company Act of 1940, as amended (the “1940 Act”). The Fund seeks to achieve long-term capital appreciation by pursuing positive absolute returns across market cycles. In pursuing its objective, the Fund seeks to generate attractive long-term returns with low sensitivity to traditional equity and fixed-income indices. The Fund commenced investment operations on April 30, 2012, with two classes of shares, Class A and Class I. The shares of each class represent an interest in the same portfolio of investments of the Fund and have equal rights as to voting, redemptions, dividends and liquidation, subject to the approval of the Trustees. Income, expenses (other than expenses attributable to a specific class), and realized and unrealized gains and losses on investments are allocated to each class of shares in proportion to their relative shares outstanding. Shareholders of a class that bears distribution and service expenses under the terms of a distribution plan have exclusive voting rights to that distribution plan. The Fund is an investment company and accordingly follows the investment company accounting and reporting guidance of the Financial Accounting Standards Board (FASB) Accounting Standard Codification Topic 946 “Financial Services—Investment Companies.” Note 2 – Accounting Policies The following is a summary of the significant accounting policies consistently followed by the Fund in the preparation of its financial statements. The preparation of financial statements in conformity with accounting principles generally accepted in the United States of America (“GAAP”) requires management to make estimates and assumptions that affect the reported amounts and disclosures in the financial statements. Actual results could differ from these estimates. (a) Valuation of Investments The Fund values equity securities at the last reported sale price on the principal exchange or in the principal over the counter (“OTC”) market in which such securities are traded, as of the close of regular trading on the NYSE on the day the securities are being valued or, if the last-quoted sales price is not readily available, the securities will be valued at the last bid or the mean between the last available bid and ask price. Securities traded on the NASDAQ are valued at the NASDAQ Official Closing Price (“NOCP”). Options are valued at the mean between the last available bid and asked prices used. Debt securities are valued by utilizing a price supplied by independent pricing service providers. The independent pricing service providers may use various valuation methodologies including matrix pricing and other analytical pricing models as well as market transactions and dealer quotations. These models generally consider such factors as yields or prices of bonds of comparable quality, type of issue, coupon, maturity, ratings and general market conditions. If a price is not readily available for a portfolio security, the security will be valued at fair value (the amount which the Fund might reasonably expect to receive for the security upon its current sale) as determined in good faith by the Fund’s advisor, subject to review and approval by the Valuation Committee, pursuant to procedures adopted by the Board of Trustees. The actions of the Valuation Committee are subsequently reviewed by the Board at its next regularly scheduled board meeting. The Valuation Committee meets as needed. The Valuation Committee is comprised of all the Trustees, but action may be taken by any one of the Trustees. (b) Foreign Currency Translation The Fund’s records are maintained in U.S. dollars. The value of securities, currencies and other assets and liabilities denominated in currencies other than U.S. dollars are translated into U.S. dollars based upon foreign exchange rates prevailing at the end of the reporting period. The currencies are translated into U.S. dollars by
19

Vivaldi Multi-Strategy Fund NOTES TO FINANCIAL STATEMENTS - Continued August 31, 2017 (Unaudited)
using the exchange rates quoted as of 4:00 PM Eastern Standard Time. Purchases and sales of investment securities, income and expenses are translated on the respective dates of such transactions. The Fund does not isolate that portion of its net realized and unrealized gains and losses on investments resulting from changes in foreign exchange rates from the impact arising from changes in market prices. Such fluctuations are included with net realized and unrealized gain or loss from investments and foreign currency. Net realized foreign currency transaction gains and losses arise from sales of foreign currencies, currency gains or losses realized between the trade and settlement dates on securities transactions, and the differences between the amounts of dividends, interest, and foreign withholding taxes recorded on the Fund’s books and the U.S. dollar equivalent of the amounts actually received or paid. Net unrealized foreign currency translation gains and losses arise from changes in the value of assets and liabilities, other than investments in securities, resulting from changes in the exchange rates. (c) Short Sales Short sales are transactions under which the Fund sells a security it does not own in anticipation of a decline in the value of that security. To complete such a transaction, the Fund must borrow the security to make delivery to the buyer. The Fund then is obligated to replace the security borrowed by purchasing the security at market price at the time of replacement. The price at such time may be more or less than the price at which the security was sold by the Fund. When a security is sold short, a decrease in the value of the security will be recognized as a gain and an increase in the value of the security will be recognized as a loss, which is potentially limitless. Until the security is replaced, the Fund is required to pay the lender amounts equal to dividend or interest that accrue during the period of the loan which is recorded as an expense. To borrow the security, the Fund also may be required to pay a premium or an interest fee, which are recorded as interest expense. Cash or securities are segregated for the broker to meet the necessary margin requirements. The Fund is subject to the risk that it may not always be able to close out a short position at a particular time or at an acceptable price. (d) Options The Fund may write or purchase options contracts primarily to enhance the Fund’s returns or reduce volatility. In addition, the Fund may utilize options in an attempt to generate gains from option premiums or to reduce overall portfolio risk. When the Fund writes or purchases an option, an amount equal to the premium received or paid by the Fund is recorded as an asset or a liability and is subsequently adjusted to the current market value of the option written or purchased. Premiums received or paid from writing or purchasing options which expire unexercised are treated by the Fund on the expiration date as realized gains or losses. The difference between the premium and the amount paid or received on effecting a closing purchase or sale transaction, including brokerage commissions, is also treated as a realized gain or loss. If an option is exercised, the premium paid or received is added to the cost of the purchase or proceeds from the sale in determining whether the Fund has realized a gain or a loss on investment transactions. The Fund, as a writer of an option, may have no control over whether the underlying securities may be sold (call) or purchased (put) and as a result bears the market risk of an unfavorable change in the price of the security underlying the written option. (e) Exchange Traded Funds (“ETFs”) ETFs typically trade on securities exchanges and their shares may, at times, trade at a premium or discount to their net asset values. In addition, an ETF may not replicate exactly the performance of the benchmark index it seeks to track for a number of reasons, including transaction costs incurred by the ETF, the temporary unavailability of certain index securities in the secondary market or discrepancies between the ETF and the index with respect to the weighting of securities or the number of securities held. Investing in ETFs, which are investment companies, may involve duplication of advisory fees and certain other expenses. As a result, Fund shareholders indirectly bear
20

Vivaldi Multi-Strategy Fund NOTES TO FINANCIAL STATEMENTS - Continued August 31, 2017 (Unaudited)
their proportionate share of these acquired expenses. Therefore, the cost of investing in the Fund will be higher than the cost of investing directly in ETFs and may be higher than other mutual funds that invest directly in securities. Each ETF in which the Fund invests is subject to specific risks, depending on the nature of the ETF. Each ETF is subject to the risks associated with direct ownership of the securities comprising the index on which the ETF is based. These risks could include liquidity risk, sector risk, and risks associated with fixed-income securities. (f) Closed-end Funds (“CEFs”) The Fund may invest in shares of CEFs. A CEF is a pooled investment vehicle that is registered under the Investment Company Act of 1940 and whose shares are listed and traded on U.S. national securities exchanges. Investments in CEFs are subject to various risks, including reliance on management’s ability to meet a CEF’s investment objective and to manage a CEF’s portfolio, and fluctuation in the market value of a CEF’s shares compared to the changes in the value of the underlying securities that the CEF owns. In addition, the Fund bears a pro rata share of the management fees and expenses of each underlying CEF, which results in the Fund’s shareholders being subject to higher expenses than if they invested directly in the CEFs. (g) Futures Contracts The Fund may enter into futures contracts (including contracts relating to foreign currencies, interest rates, commodities securities and other financial indexes and other commodities), and purchase and write (sell) related options traded on exchanges designated by the Commodity Futures Trading Commission (“CFTC”) or, consistent with CFTC regulations, on foreign exchanges. A futures contract provides for the future sale by one party and the purchase by the other party of a specified amount of a commodity, such as an energy, financial agricultural or metal commodity, at a specified price, date, time and place. For example, a foreign currency futures contract provides for the future sale by one party and the purchase by the other party of a certain amount of a specified non-U.S. currency at a specified price, date, time and place. Similarly, an interest rate futures contract provides for the future sale by one party and the purchase by the other party of a certain amount of a specific interest rate sensitive financial instrument (e.g., a debt security) at a specified price, date, time and place. Securities, commodities and other financial indexes are capitalization weighted indexes that reflect the market value of the securities, commodities or other financial instruments respectively, represented in the indexes. A futures contract on an index is an agreement to be settled by delivery of an amount of cash equal to a specified multiplier times the difference between the value of the index at the close of the last trading day on the contract and the price at which the agreement is made. The clearing house of the exchange on which a futures contract is entered into becomes the counterparty to each purchaser and seller of the futures contract. A futures contract held by a Fund is valued daily at the official settlement price on the exchange on which it is traded. In computing daily net asset value, the Fund will mark to market its open futures positions. The Fund also is required to deposit and to maintain margin with respect to put and call options on futures contracts written by it. Such margin deposits will vary depending on the nature of the underlying futures contract (and the related initial margin requirements), the current market value of the option and other futures positions held by the Fund. Although some futures contracts call for making or taking delivery of the underlying assets, generally these obligations are closed out prior to delivery by offsetting purchases or sales of matching futures contracts (involving the same exchange, underlying security or index and delivery month). If an offsetting purchase price is less than the original sale price, a Fund realizes a capital gain, or if it is more, the Fund realizes a capital loss. Conversely, if an offsetting sale price is more than the original purchase price, a Fund realizes a capital gain, or if it is less, the Fund realizes a capital loss. The transaction costs also must be included in these calculations. As discussed below, however, the Fund may not always be able to make an offsetting purchase or sale. In the case of a physically
21

Vivaldi Multi-Strategy Fund NOTES TO FINANCIAL STATEMENTS - Continued August 31, 2017 (Unaudited)
settled futures contract, this could result in the Fund being required to deliver, or receive, the underlying physical commodity, which could be adverse to the Fund. At any time prior to the expiration of a futures contract, the Fund may seek to close the position by seeking to take an opposite position, which would operate to terminate the Fund’s existing position in the contract. Positions in futures contracts and options on futures contracts may be closed out only on the exchange on which they were entered into (or through a linked exchange). No secondary market for such contracts exists. Although the Fund may enter into futures contracts only if there is an active market for such contracts, there is no assurance that an active market will exist at any particular time. Most futures exchanges limit the amount of fluctuation permitted in futures contract prices during a single trading day. Once the daily limit has been reached in a particular contract, no trades may be made that day at a price beyond that limit or trading may be suspended for specified periods during the day. It is possible that futures contract prices could move to the daily limit for several consecutive trading days with little or no trading, thereby preventing prompt liquidation of futures positions at an advantageous price and subjecting the Fund to substantial losses. In such event, and in the event of adverse price movements, the Fund would be required to make daily cash payments of variation margin. In such situations, if the Fund had insufficient cash, it might have to sell assets to meet daily variation margin requirements at a time when it would be disadvantageous to do so. In addition, if the transaction is entered into for hedging purposes, in such circumstances the Fund may realize a loss on a futures contract or option that is not offset by an increase in the value of the hedged position. Losses incurred in futures transactions and the costs of these transactions will affect the Fund’s performance. (h) Equity Swaps The Fund may enter into equity swap contracts for hedging or investment purposes. Equity swap contracts may be structured in different ways. The counterparty may agree to pay the Fund the amount, if any, by which the notional amount of the equity swap contract would have increased in value had it been invested in particular stocks (or an index of stocks), plus the dividends that would have been received on those stocks. In these cases, the Fund may agree to pay to the counterparty a floating-rate of interest on the notional amount of the equity swap contract plus the amount, if any, by which that notional amount would have decreased in value had it been invested in such stocks. Therefore, the return to the Fund on any equity swap contract should be the gain or loss on the notional amount plus dividends on the stocks less the interest paid by the Fund on the notional amount. In other cases, the counterparty and the Fund may agree to pay the other the difference between the relative investment performance that would have been achieved if the notional amount of the equity swap contract had been invested in different stocks (or indices of stocks). The Fund may enter into equity swaps on a net basis, which means that the two payment streams are netted out, with the Fund receiving or paying, as the case may be, only the net amount of the two payments. Payments may be made at the conclusion of an equity swap contract or periodically during its term. Equity swaps normally do not involve the delivery of securities or other underlying assets. Accordingly, the risk of loss with respect to equity swaps is normally limited to the net amount of payments that the Fund is contractually obligated to make. If the other party to an equity swap defaults, the Fund’s risk of loss consists of the net amount of payment that the Fund is contractually entitled to receive, if any. The Fund will segregate cash or other liquid securities in an amount having an aggregate net asset value at least equal to the accrued excess of the Fund’s obligations over its entitlements with respect to each equity swap. (i) Short-Term Investments The Fund invests a significant amount (26.8% as of August 31, 2017) in the Morgan Stanley Institutional Liquidity Fund – Government Portfolio (“MVRXX”). MVRXX invests exclusively in a portfolio of short-term U.S. Treasury
22
Vivaldi Multi-Strategy Fund NOTES TO FINANCIAL STATEMENTS - Continued August 31, 2017 (Unaudited)
securities, as well as repurchase agreements collateralized fully by U.S. Treasury securities. The Fund may also hold cash. MVRXX files complete Semi-Annual and Annual Reports with the U.S. Securities and Exchange Commission for semi-annual and annual periods of each fiscal year on Form N-CSR. The Forms N-CSR are available on the website of the U.S. Securities and Exchange Commission at www.sec.gov, and may also be viewed and copied at the Commission’s Public Reference Room in Washington, DC. Information on the operation of the Public Reference Room may be obtained by calling 1-800-SEC-0330. The net expense ratio per April 30, 2017 Semi-Annual report of Morgan Stanley Institutional Liquidity Fund – Government Portfolio was 0.17%. (j) Investment Transactions, Investment Income and Expenses Investment transactions are accounted for on the trade date. Realized gains and losses on investments are determined on the identified cost basis. Dividend income is recorded net of applicable withholding taxes on the ex-dividend date and interest income is recorded on an accrual basis. Withholding taxes on foreign dividends, if applicable, are paid (a portion of which may be reclaimable) or provided for in accordance with the applicable country’s tax rules and rates and are disclosed in the Statement of Operations. Withholding tax reclaims are filed in certain countries to recover a portion of the amounts previously withheld. The Fund records a reclaim receivable based on a number of factors, including a jurisdiction’s legal obligation to pay reclaims as well as payment history and market convention. Discounts or premiums on debt securities are accreted or amortized to interest income over the lives of the respective securities using the effective interest method. Expenses incurred by the Trust with respect to more than one Fund are allocated in proportion to the net assets of each Fund except where allocation of direct expenses to each Fund or an alternative allocation method can be more appropriately made. The Fund incurred offering costs of approximately $26,993, which are being amortized over a one-year period from December 19, 2016. (k) Federal Income Taxes The Fund intends to comply with the requirements of Subchapter M of the Internal Revenue Code applicable to regulated investment companies and to distribute substantially all of its net investment income and any net realized gains to its shareholders. Therefore, no provision is made for federal income or excise taxes. Due to the timing of dividend distributions and the differences in accounting for income and realized gains and losses for financial statement and federal income tax purposes, the fiscal year in which amounts are distributed may differ from the year in which the income and realized gains and losses are recorded by the Fund. Accounting for Uncertainty in Income Taxes (the “Income Tax Statement”) requires an evaluation of tax positions taken (or expected to be taken) in the course of preparing a Fund’s tax returns to determine whether these positions meet a “more-likely-than-not” standard that, based on the technical merits, have a more than fifty percent likelihood of being sustained by a taxing authority upon examination. A tax position that meets the “more-likely-than-not” recognition threshold is measured to determine the amount of benefit to recognize in the financial statements. The Fund recognizes interest and penalties, if any, related to unrecognized tax benefits as income tax expense in the Statement of Operations. The Income Tax Statement requires management of the Fund to analyze tax positions taken in the prior three open tax years, if any, and tax positions expected to be taken in the Fund’s current tax year, as defined by the IRS statute of limitations for all major jurisdictions, including federal tax authorities and certain state tax authorities. As of and during the open years ended February 28, 2014 – 2017 and as of and during the year ended February 28, 2017, the Fund did not have a liability for any unrecognized tax benefits. The Fund has no examination in progress and is not
23
Vivaldi Multi-Strategy Fund NOTES TO FINANCIAL STATEMENTS - Continued August 31, 2017 (Unaudited)
aware of any tax positions for which it is reasonably possible that the total amounts of unrecognized tax benefits will significantly change in the next twelve months. (l) Distributions to Shareholders The Fund will make distributions of net investment income and capital gains, if any, at least annually. Distributions to shareholders are recorded on the ex-dividend date. The amount and timing of distributions are determined in accordance with federal income tax regulations, which may differ from GAAP. The character of distributions made during the year from net investment income or net realized gains may differ from the characterization for federal income tax purposes due to differences in the recognition of income expense and gain (loss) items for financial statement and tax purposes. Note 3 – Investment Advisory and Other Agreements The Trust, on behalf of the Fund, entered into an Investment Advisory Agreement (the “Agreement”) with Vivaldi Asset Management, LLC (the “Advisor”). Under the terms of the Agreement, the Fund pays a monthly investment advisory fee to the Advisor at the annual rate of 1.60% of the Fund’s average daily net assets. The Advisor has contractually agreed to waive its fees and/or pay for operating expenses of the Fund to ensure that total annual operating expenses (excluding any taxes, leverage interest, brokerage commissions, dividend and interest expenses on short sales, acquired fund fees and expenses (as determined in accordance with Form N-1A), expenses incurred in connection with any merger or reorganization, and extraordinary expenses such as litigation) do not exceed 2.25% and 1.95% of the Fund’s average daily net assets for Class A Shares and Class I Shares, respectively, until December 16, 2018. This agreement to waive fees and/or pay for operating expenses may only be terminated before that date by the Trust’s Board of Trustees. The Advisor has engaged Crescat Portfolio Management, LLC and RiverNorth Capital Management, LLC, (each, a "Sub-Advisor" and together, the “Sub-Advisors”) to manage the assets of the Fund and pays the Sub-Advisors from its advisory fees. For the six months ended August 31, 2017, the Advisor did not waive its fees or absorb other expenses. The Advisor may recover from the Fund fees and/or expenses previously waived and/or absorbed, if the Fund’s expense ratio, including the recovered expenses, falls below the expense at which they were waived. The Fund’s advisor is permitted to seek reimbursement from the Fund, subject to certain limitations, of fees waived or payments made to the Fund for a period ending three full fiscal years after the date of the waiver or payment. This reimbursement may be requested from the Fund if the reimbursement will not cause the Fund’s annual expense ratio to exceed the lesser of (a) the expense limitation amount in effect at the time such fees were waived or payments made, or (b) the expense limitation amount in effect at the time of the reimbursement. At August 31, 2017, the amount of these potentially recoverable expenses was $0. IMST Distributors, LLC serves as the Fund’s distributor; UMB Fund Services, Inc. (“UMBFS”) serves as the Fund’s fund accountant, transfer agent and co-administrator; and Mutual Fund Administration, LLC (“MFAC”) serves as the Fund’s other co-administrator. UMB Bank, n.a., an affiliate of UMBFS, serves as the Fund’s custodian. Certain trustees and officers of the Trust are employees of UMBFS or MFAC. The Fund does not compensate trustees and officers affiliated with the Fund’s co-administrators. For the six months ended August 31, 2017, the Fund’s allocated fees incurred for Trustees who are not affiliated with the Fund’s co-administrators are reported on the Statement of Operations.
24

Vivaldi Multi-Strategy Fund NOTES TO FINANCIAL STATEMENTS - Continued August 31, 2017 (Unaudited)
Dziura Compliance Consulting, LLC provides Chief Compliance Officer (“CCO”) services to the Trust. The Fund’s allocated fees incurred for CCO services for the six months ended August 31, 2017, are reported on the Statement of Operations. Note 4 – Federal Income Taxes At August 31, 2017, gross unrealized appreciation and depreciation on investments based on cost for federal income tax purposes were as follows: Cost of investments $ 103,180,571 Gross unrealized appreciation $ 9,053,638 Gross unrealized depreciation (5,556,210) Net unrealized appreciation on investments $ 3,497,428 The difference between cost amounts for financial statement and federal income tax purposes is due primarily to timing differences in recognizing certain gains and losses in security transactions. As of February 28, 2017, the components of accumulated earnings (deficit) on a tax basis were as follows: Undistributed ordinary income $ 1,107,765 Undistributed long-term capital gains 130,424 Accumulated earnings 1,238,189
Accumulated capital and other losses - Unrealized appreciation on investments 4,299,059 Unrealized depreciation on securities sold short (2,854,367) Unrealized appreciation on written options contracts 7,187 Unrealized depreciation on foreign currency transactions (21,980) Total accumulated earnings $ 2,668,088 The tax character of distributions paid during the fiscal years ended February 28, 2017 and February 29, 2016, respectively, was as follows: Distribution paid from: 2017 2016
Ordinary income $ 1,271,108 $ 1,039,990 Net long-term capital gains 235,261 383,232
Total taxable distributions $ 1,506,369 $ 1,423,222 Note 5 – Investment Transactions For the six months ended August 31, 2017, purchases and sales of investments, excluding short-term investments, were $217,327,505 and $221,834,522, respectively. Proceeds from securities sold short and cover short securities were $98,412,457 and $89,608,301, respectively, for the same period. Note 6 – Distribution Plan The Trust, on behalf of the Fund, has adopted a Distribution Plan (the “Plan”) pursuant to Rule 12b-1 under the 1940 Act that allows the Fund to pay distribution fees for the sale and distribution of its shares. With respect to
25

Vivaldi Multi-Strategy Fund NOTES TO FINANCIAL STATEMENTS - Continued August 31, 2017 (Unaudited)
Class A, the Plan provides for the payment of distribution fees at the annual rate of up to 0.25% of average daily net assets. Class I does not pay any distribution fees. For the six months ended August 31, 2017, distribution fees incurred are disclosed on the Statement of Operations. Note 7 – Shareholder Servicing Plan The Trust, on behalf of the Fund, has adopted a Shareholder Servicing Plan to pay a fee at an annual rate of up to 0.15% of average daily net assets of Class A shares and 0.10% of average daily net assets of Class I shares serviced by shareholder servicing agents who provide administrative and support services to their customers. For the six months ended August 31, 2017, shareholder servicing fees incurred are disclosed on the Statement of Operations. Note 8 – Indemnifications In the normal course of business, the Fund enters into contracts that contain a variety of representations which provide general indemnifications. The Fund’s maximum exposure under these arrangements is unknown, as this would involve future claims that may be made against the Fund that have not yet occurred. However, the Fund expects the risk of loss to be remote. Note 9 – Fair Value Measurements and Disclosure Fair Value Measurements and Disclosures defines fair value, establishes a framework for measuring fair value in accordance with GAAP, and expands disclosure about fair value measurements. It also provides guidance on determining when there has been a significant decrease in the volume and level of activity for an asset or a liability, when a transaction is not orderly, and how that information must be incorporated into a fair value measurement. Under Fair Value Measurements and Disclosures, various inputs are used in determining the value of the Fund’s investments. These inputs are summarized into three broad levels as described below:
Level 1 – Unadjusted quoted prices in active markets for identical assets or liabilities that the Fund has the ability to access. Level 2 – Observable inputs other than quoted prices included in Level 1 that are observable for the asset or liability, either directly or indirectly. These inputs may include quoted prices for the identical instrument on an inactive market, prices for similar instruments, interest rates, prepayment speeds, credit risk, yield curves, default rates and similar data.
Level 3 – Unobservable inputs for the asset or liability, to the extent relevant observable inputs are not available, representing the Fund’s own assumptions about the assumptions a market participant would use in valuing the asset or liability, and would be based on the best information available.
The availability of observable inputs can vary from security to security and is affected by a wide variety of factors, including, for example, the type of security, whether the security is new and not yet established in the marketplace, the liquidity of markets, and other characteristics particular to the security. To the extent that valuation is based on models or inputs that are less observable or unobservable in the market, the determination of fair value requires more judgment. Accordingly, the degree of judgment exercised in determining fair value is greatest for instruments categorized in Level 3.
26

Vivaldi Multi-Strategy Fund NOTES TO FINANCIAL STATEMENTS - Continued August 31, 2017 (Unaudited)
The inputs used to measure fair value may fall into different levels of the fair value hierarchy. In such cases, for disclosure purposes, the level in the fair value hierarchy within which the fair value measurement falls in its entirety is determined based on the lowest level input that is significant to the fair value measurement in its entirety. The inputs or methodology used for valuing securities are not an indication of the risk associated with investing in those securities. The following is a summary of the inputs used, as of August 31, 2017, in valuing the Fund’s assets carried at fair value:
*All common stocks held in the Fund are Level 1 securities. For a detailed break-out of common stocks by major industry classification, please refer to the Schedule of Investments. 1 Other financial instruments are derivative instruments such as futures. Futures contracts are valued at the unrealized appreciation (depreciation) on the instrument.
Level 1 Level 2 Level 3 Total Assets Investments
Common Stocks* $ 88,329,935 $ - $ - $ 88,329,935 Preferred Stocks 2,747,659 - - 2,747,659 Closed-End Mutual Funds 24,393,277 - - 24,393,277 Purchased Options Contracts 25,638 84,540 - 110,178 Rights 515 - - 515 Warrants 4,575 - - 4,575 Short-Term Investments 41,062,409 - - 41,062,409
Total Assets $ 156,564,008 $ 84,540 $ - $ 156,648,548 Other Financial Instruments1 Futures Contracts $ 131,422 $ - $ - $ 131,422 Liabilities Securities Sold Short
Common Stocks* $ 39,789,059 $ - $ - $ 39,789,059 Exchange-Traded Funds 10,149,940 - - 10,149,940 Written Options Contracts - 31,550 - 31,550 Total Liabilities $ 49,938,999 $ 31,550 $ - $ 49,970,549 Other Financial Instruments1 Futures Contracts $ 194,083 $ - $ - $ 194,083
27

Vivaldi Multi-Strategy Fund NOTES TO FINANCIAL STATEMENTS - Continued August 31, 2017 (Unaudited)
The following is a reconciliation of assets in which significant unobservable inputs (Level 3) were used in determining value: Vivaldi Multi-Strategy Fund Beginning balance February 28, 2017 $ - Transfers into Level 3 during the period - Transfers out of Level 3 during the period - Total realized gain/(loss) - Total unrealized appreciation/(depreciation) - Net purchases - Net sales - Balance as of August 31, 2017 $ - Note 10 – Derivative and Hedging Disclosure Derivatives and Hedging requires enhanced disclosures about the Fund’s derivative and hedging activities, including how such activities are accounted for and their effects on the Fund’s financial position, performance and cash flows. The Fund invested in options contracts, warrants and futures contracts during the six months ended August 31, 2017. The effects of these derivative instruments on the Fund’s financial position and financial performance as reflected in the Statement of Assets and Liabilities and Statement of Operations are presented in the tables below. The fair values of derivative instruments as of August 31, 2017 by risk category are as follows: Derivatives not designated as hedging instruments
Commodity Contracts
Equity Contracts
Foreign Exchange Contracts
Interest Rate
Contracts Total Assets Purchased options
contracts, at value $ - $ 110,178
$ - $ - $ 110,178
Warrants, at value - 4,575 - - 4,575 Unrealized
appreciation on open futures contracts 101,314 - 8,649 21,459 131,422
$ 101,314 $ 114,753 $ 8,649 $ 21,459 $ 246,175 Liabilities Written options
contracts, at fair value $ - $ 31,550
$ - $ - $ 31,550
Unrealized depreciation on open futures contracts 84,442 -
100,622
9,019 194,083 $ 84,442 $ 31,550 $ 100,622 $ 9,019 $ 225,633
28

Vivaldi Multi-Strategy Fund NOTES TO FINANCIAL STATEMENTS - Continued August 31, 2017 (Unaudited)
The effects of derivative instruments on the Statement of Operations for the six months ended August 31, 2017 are as follows: Derivatives not designated as hedging instruments
Commodity Contracts
Equity Contracts
Foreign Exchange Contracts
Interest Rate Contracts
Total Realized Gain (Loss) on
Derivatives
Purchased options contracts $ - $ (783,081) $ - $ 102,552 $ (680,529) Written options contracts - 81,812 - - 81,812 Futures contracts 56,073 (67,866) 91,982 (55,053) 25,136 $ 56,073 $ (769,135) $ 91,982 $ 47,499 $ (573,581)
Commodity Contracts
Equity Contracts
Foreign Exchange Contracts
Interest Rate Contracts
Total Net Change in Unrealized
Appreciation/Depreciation on Derivatives
Purchased options contracts $ - $ 177,707 $ - $ - $ 177,707 Warrants - 4,575 - - 4,575 Written options contracts - (16,670) - - (16,670) Futures contracts (7,375) - (90,975) 135,857 37,507 $ (7,375) $ 165,612 $ (90,975) $ 135,857 $ 203,119 The number of contracts are included on the Schedule of Investments. The quarterly average volumes of derivative instruments as of August 31, 2017 are as follows:
Quarterly Derivative Averages
Derivative Quarterly Average Number Options Contracts - Purchased Number of contracts 830 Options Contracts - Written Number of contracts (372) Warrants Market value $ 4,575 Futures Contracts - Long Number of contracts 52 Futures Contracts - Short Number of contracts (109)
29

Vivaldi Multi-Strategy Fund NOTES TO FINANCIAL STATEMENTS - Continued August 31, 2017 (Unaudited)
Note 11 - Disclosures about Offsetting Assets and Liabilities Disclosures about Offsetting Assets and Liabilities requires an entity to disclose information about offsetting and related arrangements to enable users of its financial statements to understand the effect of those arrangements on its financial position. The guidance requires retrospective application for all comparative periods presented. A Fund mitigates credit risk with respect to OTC derivative counterparties through credit support annexes included with International Swaps and Derivative Association, Inc. (“ISDA”) which are the standard contracts governing most derivative transactions between the Fund and each of its counterparties. These agreements allow the Fund and each counterparty to offset certain derivative financial instruments’ payables and/or receivables against each other and/or with collateral, which is generally held by the Fund’s custodian. The amount of collateral moved to/from applicable counterparties is based upon minimum transfer amounts specified in the agreement. To the extent amounts due to the Fund from its counterparties are not fully collateralized contractually or otherwise, the Fund bears the risk of loss from counterparty non-performance. The Fund’s Statement of Assets and Liabilities presents financial instruments on a gross basis, therefore there are no net amounts and no offset amounts within the Statement of Assets and Liabilities to present below. Gross amounts of the financial instruments, amounts related to financial instruments/cash collateral not offset in the Statement of Assets and Liabilities and net amounts are presented below:
Amounts Not Offset in Statement of Assets and
Liabilities
Description/Financial Instrument/Statement of Assets and Liabilities Category Counterparty
Gross Amounts Recognized in Statement of
Assets and Liabilities
Financial Instruments*
Cash Collateral** Net Amount
Unrealized appreciation on open futures contacts – asset
R.J. O'Brien $ 131,422 $ (131,422) $ - $ - Unrealized depreciation on
open futures contacts – liability
R.J. O'Brien 194,083 (131,422) (62,661) - *Amounts relate to master netting agreements and collateral agreements (for example, ISDA) which have been determined by the Advisor to be legally enforceable in the event of default and where certain other criteria are met in accordance with applicable offsetting accounting guidance. **Amounts relate to master netting agreements and collateral agreements which have been determined by the Advisor to be legally enforceable in the event of default but where certain other criteria are not met in accordance with applicable offsetting accounting guidance. The collateral amounts may exceed the related net amounts of financial assets and liabilities presented in the Statement of Assets and Liabilities. Where this is the case, the total amount reported is limited to the net amounts of financial assets and liabilities with that counterparty.
30

Vivaldi Multi-Strategy Fund NOTES TO FINANCIAL STATEMENTS - Continued August 31, 2017 (Unaudited)
Note 12 - Repurchase-to-Maturity Transactions, Repurchase Financings, and Disclosures Repurchase-to-Maturity Transactions, Repurchase Financings, and Disclosures require an entity to modify accounting for repurchase-to-maturity transactions and repurchase financing arrangements, as well as modify required disclosures for repurchase agreements, securities lending transactions, and repurchase-to-maturity transactions that are accounted for as secured borrowings. Management has evaluated the impact on the financial statement disclosures and determined that there is no effect. Note 13 - Disclosure for Investments in Certain Entities that Calculate Net Asset Value per Share (or Its Equivalent) Disclosure for Investments in Certain Entities that Calculate Net Asset Value per Share (or Its Equivalent) removes the requirement to categorize within the fair value hierarchy investments measured using the net asset value per share ("NAV") practical expedient, as well as removes certain disclosure requirements for investments that qualify, but do not utilize, the NAV practical expedient. Management has evaluated the impact on the financial statement disclosures and determined that there is no effect. Note 14 – Events Subsequent to the Fiscal Period End The Fund has adopted financial reporting rules regarding subsequent events which require an entity to recognize in the financial statements the effects of all subsequent events that provide additional evidence about conditions that existed at the date of the balance sheet. Management has evaluated the Fund’s related events and transactions that occurred through the date of issuance of the Fund’s financial statements. There were no events or transactions that occurred during this period that materially impacted the amounts or disclosures in the Fund’s financial statements.
31

Vivaldi Multi-Strategy Fund EXPENSE EXAMPLE For the Six Months Ended August 31, 2017 (Unaudited)
Expense Example As a shareholder of the Fund, you incur two types of costs: (1) transaction costs including sales charges (loads) on purchases within certain classes; and (2) ongoing costs, including management fees, distribution and/or service (12b-1) fees (Class A only) and other Fund expenses. The examples below are intended to help you understand your ongoing costs (in dollars) of investing in the Fund and to compare these costs with the ongoing costs of investing in other mutual funds.
These examples are based on an investment of $1,000 invested at the beginning of the period and held for the entire period from March 1, 2017 to August 31, 2017.
Actual Expenses The information in the row titled “Actual Performance” in the table below provides actual account values and actual expenses. You may use the information in these columns, together with the amount you invested, to estimate the expenses that you paid over the period. Simply divide your account value by $1,000 (for example, an $8,600 account value divided by $1,000 = 8.6), then multiply the result by the number in the appropriate row under the column titled “Expenses Paid During Period” to estimate the expenses you paid on your account during this period.
Hypothetical Example for Comparison Purposes The information in the row titled “Hypothetical (5% annual return before expenses)” of the table below provides hypothetical account values and hypothetical expenses based on the Fund’s actual expense ratios and an assumed rate of return of 5% per year before expenses, which is not the Fund’s actual return. The hypothetical account values and expenses may not be used to estimate the actual ending account balance or expenses you paid for the period. You may use this information to compare the ongoing costs of investing in the Fund and other funds. To do so, compare these 5% hypothetical examples with the 5% hypothetical examples that appear in the shareholder reports of the other funds.
Please note that the expenses shown in the table are meant to highlight your ongoing costs only and do not reflect any transaction costs, such as sales charges (load) or contingent deferred sales charges. Therefore, the information in the row titled “Hypothetical (5% annual return before expenses)” is useful in comparing ongoing costs only, and will not help you determine the relative total costs of owning different funds. In addition, if these transactional costs were included, your costs would have been higher.
Beginning Account Value
Ending Account Value
Expenses Paid During Period*
3/1/17 8/31/17 3/1/17 – 8/31/17 Class A Actual Performance $ 1,000.00 $ 1,014.80 $ 18.72
Hypothetical (5% annual return before expenses) 1,000.00 1,006.62 18.65
Class I Actual Performance 1,000.00 1,016.50 17.21 Hypothetical (5% annual return before expenses) 1,000.00 1,008.13 17.14
*Expenses are equal to the Fund’s annualized expense ratios of 3.69% and 3.39% for the Class A and Class I shares,respectively, multiplied by the average account values over the period, multiplied by 184/365 (to reflect the sixmonth period) for Class A shares and Class I shares. Assume all dividends and distributions were reinvested.
32

Vivaldi Multi-Strategy Fund
A series of Investment Managers Series Trust II
Investment Advisor Vivaldi Asset Management, LLC 225 West Wacker, Suite 2100
Chicago, Illinois 60606
Sub-Advisor Crescat Portfolio Management, LLC
1560 Broadway, Suite 2270 Denver, Colorado 80202
Sub-Advisor RiverNorth Capital Management, LLC
325 N. LaSalle Street, Suite 645 Chicago, Illinois 60654
Custodian UMB Bank, n.a.
928 Grand Boulevard, 5th Floor Kansas City, Missouri 64106
Fund Co-Administrator Mutual Fund Administration, LLC
2220 E. Route 66, Suite 226 Glendora, California 91740
Fund Co-Administrator, Transfer Agent and Fund Accountant UMB Fund Services, Inc.
235 W. Galena Street Milwaukee, Wisconsin 53212
Distributor IMST Distributors, LLC
Three Canal Plaza, Suite 100 Portland, Maine 04101
www.foreside.com

FUND INFORMATION
TICKER CUSIP Vivaldi Multi-Strategy Fund - Class A Vivaldi Multi-Strategy Fund - Class I
OMOAX OMOIX
46141T 687 46141T 679
Privacy Principles of the Vivaldi Multi-Strategy Fund for Shareholders The Fund is committed to maintaining the privacy of its shareholders and to safeguarding its non-public personal information. The following information is provided to help you understand what personal information the Fund collects, how we protect that information and why, in certain cases, we may share information with select other parties.
Generally, the Fund does not receive any non-public personal information relating to its shareholders, although certain non-public personal information of its shareholders may become available to the Fund. The Fund does not disclose any non-public personal information about its shareholders or former shareholders to anyone, except as permitted by law or as is necessary in order to service shareholder accounts (for example, to a transfer agent or third party administrator).
This report is sent to shareholders of the Vivaldi Multi-Strategy Fund for their information. It is not a Prospectus, circular or representation intended for use in the purchase or sale of shares of the Fund or of any securities mentioned in this report. Proxy Voting Policies and Procedures A description of the Fund’s proxy voting policies and procedures related to portfolio securities is available without charge, upon request, by calling the Fund at (877) 779-1999 or on the U.S. Securities and Exchange Commission’s (“SEC”) website at www.sec.gov. Proxy Voting Record Information regarding how the Fund voted proxies for portfolio securities, if applicable, during the most recent 12-month period ended June 30, is also available, without charge and upon request by calling the Fund at (877) 779-1999 or by accessing the Fund’s Form N-PX on the SEC’s website at www.sec.gov. Form N-Q Disclosure The Fund files its complete schedule of portfolio holdings with the SEC for the first and third quarters of each fiscal year on Form N-Q. The Fund’s Form N-Q is available on the SEC website at www.sec.gov or by calling the Fund at (877) 779-1999. The Fund’s Form N-Q may also be viewed and copied at the SEC’s Public Reference Room in Washington, DC. Information on the operation of the Public Reference Room may be obtained by calling (800) SEC-0330. Householding The Fund will mail only one copy of shareholder documents, including prospectuses, annual and semi-annual reports and proxy statements, to shareholders with multiple accounts at the same address. This practice is commonly called “householding” and is intended to reduce expenses and eliminate duplicate mailings of shareholder documents. Mailings of your shareholder documents may be householded indefinitely unless you instruct us otherwise. If you do not want the mailing of these documents to be combined with those for other members of your household, please call the Fund at (877) 779-1999.
Vivaldi Multi-Strategy Fund P.O. Box 2175
Milwaukee, WI 53201 Toll Free: (877) 779-1999