Embed Size (px)
Citation preview

A Paleolimnological Assessment of Cladoceran Assemblage Changes in Two Lakes
from Northern Ontario’s “Ring of Fire”
Clare Nelligan
An undergraduate thesis submitted to the
School of Environmental Studies in partial
fulfillment of the requirements for ENSC502
Queen’s University
Kingston, Ontario
April 2014
2
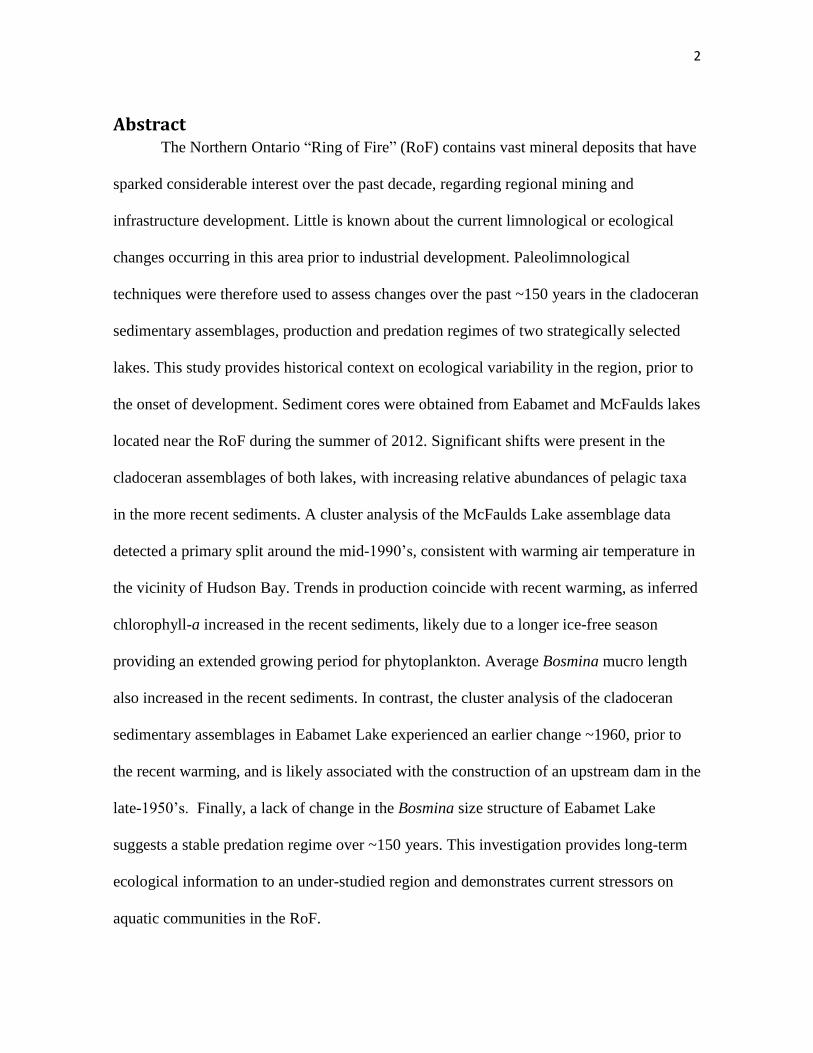
Abstract The Northern Ontario “Ring of Fire” (RoF) contains vast mineral deposits that have
sparked considerable interest over the past decade, regarding regional mining and
infrastructure development. Little is known about the current limnological or ecological
changes occurring in this area prior to industrial development. Paleolimnological
techniques were therefore used to assess changes over the past ~150 years in the cladoceran
sedimentary assemblages, production and predation regimes of two strategically selected
lakes. This study provides historical context on ecological variability in the region, prior to
the onset of development. Sediment cores were obtained from Eabamet and McFaulds lakes
located near the RoF during the summer of 2012. Significant shifts were present in the
cladoceran assemblages of both lakes, with increasing relative abundances of pelagic taxa
in the more recent sediments. A cluster analysis of the McFaulds Lake assemblage data
detected a primary split around the mid-1990’s, consistent with warming air temperature in
the vicinity of Hudson Bay. Trends in production coincide with recent warming, as inferred
chlorophyll-a increased in the recent sediments, likely due to a longer ice-free season
providing an extended growing period for phytoplankton. Average Bosmina mucro length
also increased in the recent sediments. In contrast, the cluster analysis of the cladoceran
sedimentary assemblages in Eabamet Lake experienced an earlier change ~1960, prior to
the recent warming, and is likely associated with the construction of an upstream dam in the
late-1950’s. Finally, a lack of change in the Bosmina size structure of Eabamet Lake
suggests a stable predation regime over ~150 years. This investigation provides long-term
ecological information to an under-studied region and demonstrates current stressors on
aquatic communities in the RoF.

3
Acknowledgements
I would like to thank my supervisor, Dr. John Smol, for his support and for
providing me with this opportunity. I would also like to acknowledge Dr. Adam Jeziorski
for his feedback, insight, and encouragement over the course of this project. Thank you to
Dr. Shelly Arnott for acting as my secondary examiner and Dr. Brian Cumming for his role
as course coordinator. Additional thanks are offered to Kathryn Hargan and other members
of PEARL who shared data, ideas and support throughout the year. The funding for this
project was provided by the Natural Sciences and Engineering Research Council of
Canada.
4
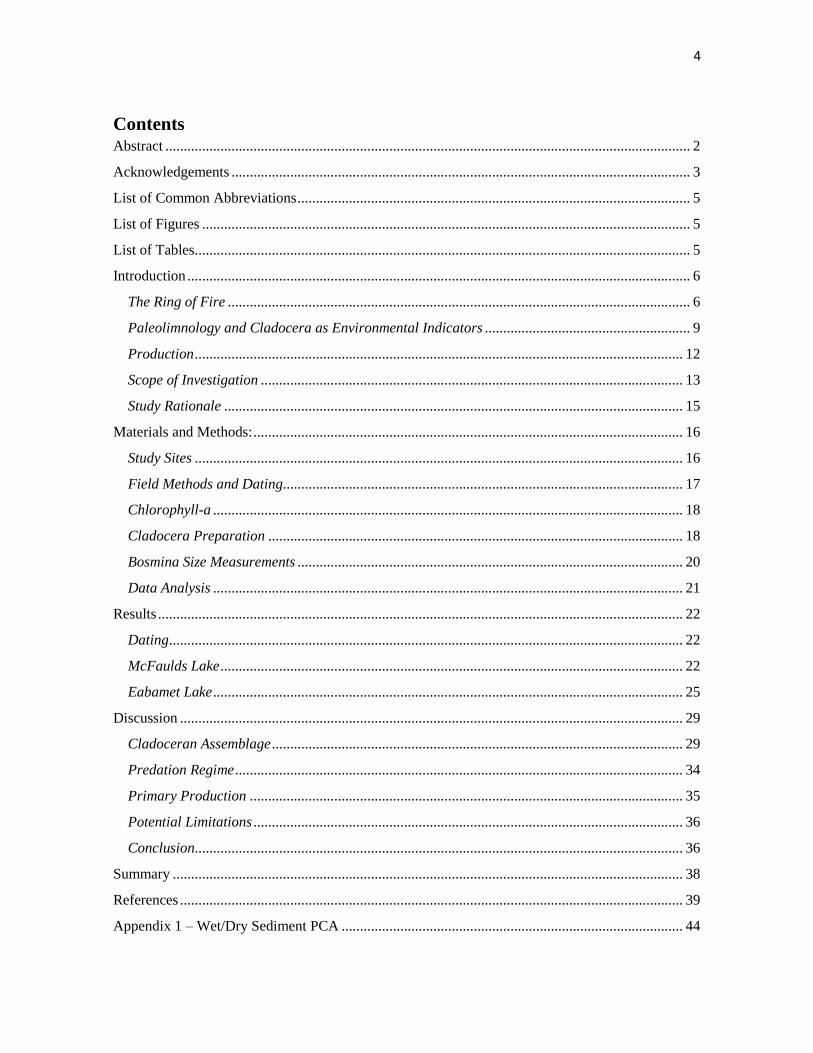
Contents Abstract ............................................................................................................................................... 2
Acknowledgements ............................................................................................................................. 3
List of Common Abbreviations ........................................................................................................... 5
List of Figures ..................................................................................................................................... 5
List of Tables ....................................................................................................................................... 5
Introduction ......................................................................................................................................... 6
The Ring of Fire .............................................................................................................................. 6
Paleolimnology and Cladocera as Environmental Indicators ........................................................ 9
Production ..................................................................................................................................... 12
Scope of Investigation ................................................................................................................... 13
Study Rationale ............................................................................................................................. 15
Materials and Methods: ..................................................................................................................... 16
Study Sites ..................................................................................................................................... 16
Field Methods and Dating............................................................................................................. 17
Chlorophyll-a ................................................................................................................................ 18
Cladocera Preparation ................................................................................................................. 18
Bosmina Size Measurements ......................................................................................................... 20
Data Analysis ................................................................................................................................ 21
Results ............................................................................................................................................... 22
Dating ............................................................................................................................................ 22
McFaulds Lake .............................................................................................................................. 22
Eabamet Lake ................................................................................................................................ 25
Discussion ......................................................................................................................................... 29
Cladoceran Assemblage ................................................................................................................ 29
Predation Regime .......................................................................................................................... 34
Primary Production ...................................................................................................................... 35
Potential Limitations ..................................................................................................................... 36
Conclusion..................................................................................................................................... 36
Summary ........................................................................................................................................... 38
References ......................................................................................................................................... 39
Appendix 1 – Wet/Dry Sediment PCA ............................................................................................. 44

5
Appendix 2 – 210
Pb Dating Profiles ................................................................................................... 45
Appendix 3 – Cladoceran Concentration Data .................................................................................. 47
Appendix 4 – Eabamet Inferred Chlorophyll-a ................................................................................. 48
Appendix 5 – Raw Data .................................................................................................................... 49
List of Common Abbreviations 1. Northern Ontario Ring of Fire – RoF
2. Dissolved Organic Carbon – DOC
3. Constrained Incremental Sum of Squares – CONISS
4. Visible Near Infrared Spectroscopy – NIRS
List of Figures
Figure 1: Location of study sites and the RoF..................................................................................... 7
Figure 2: Bosmina headshield and carapace subfossils. .................................................................... 12
Figure 3: Stratigraphy of cladoceran relative abundances in McFaulds Lake. ................................. 24
Figure 4: Average Bosmina size attributes in McFaulds Lake. ......................................................... 25
Figure 5: Stratigraphy of cladoceran relative abundance in Eabamet Lake. ..................................... 27
Figure 6: Average Bosmina size attributes in Eabamet Lake. ........................................................... 28
List of Tables
Table 1: Limnological variables McFaulds Lake and Eabamet Lake ............................................... 17

6
Introduction
The Ring of Fire
The discovery of vast mineral deposits in Northern Ontario’s “Ring of Fire” (RoF),
has sparked intense political, economic and scientific interest in this remote region over the
past decade. The RoF is located along the division between the James Bay Lowlands and
the Canadian Shield (Figure 1), and predominantly contains chromite as well as
considerable amounts of gold, zinc, nickel, copper and platinum (Dyer and Burke 2012).
The proposed mining and infrastructure development is of great economic importance to
Ontario as the RoF is estimated to contain 220 tonnes of extractable chromite, making it the
fourth largest chromite deposit in the world (Hjartarson et al. 2014). A recent report from
the Ontario Chamber of Commerce predicts that, within the first 10 years of development,
activity within the RoF has the potential to generate $9.4 billion in gross domestic product
and over $25 billion after 32 years of activity (Hjartarson et al. 2014). The provincial,
national and global significance of mining development in the RoF over the coming century
has the potential to rival Sudbury’s importance to the mining industry in the past.
Currently, over twenty mining companies have land claims within and surrounding
the RoF, with over $278 million already spent in mineral exploration (MNDM 2013).
Among the identified stakeholders, Noront Resources Ltd. has significant investments in
this area, and is currently in the midst of a provincial and federal environmental assessment
for their proposed chromite mine (Kuyek 2011). The recent push for development will
require substantial coordination between government and industry, because large scale
infrastructure will be needed before the proposed projects can begin operation. The

Figure 1: The location of the Northern Ontario RoF (illustrated in red) in relation to the Hudson Bay Lowlands and the
Precambrian Shield. Stars denote the locations of the study sites, McFaulds Lake and Eabamet Lake. Inset illustrates
the location of the RoF on a provincial map (Source of Inset: Ministry of Northern Development and Mines)

preliminary infrastructure includes: the KWG railway, roads, power and fibre-optic
networks (Kuyek 2011). The associated anthropogenic disturbance to the local environment
has sparked interest among local First Nations communities, potential developers, and both
national and provincial governments.
The Hudson Bay Lowlands, directly north of the RoF, has experienced a rapid
climatic transformation since the mid 1990’s that has been attributed to a shortened ice-
cover period on Hudson Bay (Joly et al. 2009, Rühland et al. 2013). The extended ice-free
period has been accompanied by a ~3°C increase in air temperature since the early 1900’s
and regional increases in sea-surface temperature (SST) (Rühland et al. 2013). The largest
increases in SST have occurred in James Bay and the southwest shores of Hudson Bay
where sea water is on average 5°C warmer (Galbraith et al. 2011). These impacts have been
compounded through a 5 MJ/m3 increase in sea water thermal storage due to the lengthened
period to absorb short-wave radiation, producing a warming positive feedback cycle (Joly
et al. 2009). Continued warming of this region is likely to impact the thermal and
limnological structure of the surrounding lakes.
Changes in limnological properties associated with warming are known to impact
aquatic biota. For instance, implications of the warmer thermal regime have already been
observed in coldwater fish taxa surrounding the Hudson Bay Lowlands. In 2001, intensified
stratification in Hawley Lake, a headwater lake of the Sutton River, resulted in mass
mortalities of downstream brook charr (Salvelinus fontinalis) attributed to extreme
temperature anomalies (Gunn and Snucins 2010). Furthermore, the lengthened ice-free

9
season has increased availability of annual pelagic habitat (Smol 2008). As a result of this
longer growing season, there is an associated increase in the relative abundance of pelagic
taxa (Smol and Douglas 2007). Climate-induced habitat changes have also been observed
to affect diatom assemblages, a major group of primary producers in lake ecosystems,
shifting the ratio of pelagic:littoral taxa present (Rühland et al. 2013). The impacts of
climate warming are felt throughout lake trophic levels and a thorough understanding of
these impacts will become increasingly important in future lake management.
As the majority of scientific investigations have occurred north of the RoF, in the
Hudson Bay Lowlands, the impact of climate warming within the RoF is still unknown.
Although observational data are currently limited, regional climate shifts are expected to be
recorded over 600 km inshore from Hudson Bay (Abraham et al. 2010), therefore it is
likely that aquatic biota in the RoF have already experienced limnological changes. With
the added evidence of rapid climate change and the uncertainty of other unknown drivers, it
is imperative to understand if and how the lakes surrounding the RoF are changing to
establish baseline limnological characteristics. This can eventually aid in identifying the
impacts of future stressors associated with development.
Paleolimnology and Cladocera as Environmental Indicators
Paleolimnology is a scientific discipline that uses the archive of physical, chemical
and biological indicators preserved in lake sediments, to infer past environmental
conditions (Smol 2008). Using paleolimnological techniques, it is possible to examine
ecosystem responses to environmental stressors, as well as provide information about
baseline conditions prior to the onset of the stressor in locations where direct monitoring

10
data is unavailable. Paleolimnological studies have played critical roles in developing our
understanding of the long-term effects of environmental stressors such as acidification,
climate change, and eutrophication on lake ecosystems (Smol 2008). However, in many
situations, isolating the impact of one particular stressor is difficult, as multiple stressors
commonly act simultaneously on ecosystems (Smol 2010). By using different indicators, a
more holistic assessment of past ecological change can be produced to better understand the
impact of a specific environmental disturbance. Through the use of a multi-proxy approach,
the effects of multiple stressors on aquatic environments can be more readily identified.
Cladoceran subfossils are widely used paleolimnological indicators that have been
employed in many different types of investigations (Smol 2008). Cladocera are an order of
Crustacea (class Branchiopoda) that play a multi-faceted role in lake ecosystems. They are
major consumers of primary producers, detritivores in benthic habitats, and a source of
food for planktivorous fish and invertebrate predators (Korhola and Rautio 2001). Due to
their diverse functions within aquatic ecosystems and their role as food-web intermediates,
they provide a critical link between upper and lower trophic levels. As cladocerans are
present in most types of freshwater habitats and are sensitive to environmental change
(such as climate), they are considered an excellent indicator group (Korhola and Rautio
2001).These characteristics have allowed the Cladocera to be successfully utilized to
examine changes in lake level, salinity (Bos et al. 1999), predation structure (Korosi et al.
2008), lake trophic level (Shumate et al. 2002) and understanding the biological impact of
acidification (Korosi and Smol 2012a).

11
Upon death, the cladoceran exoskeleton disarticulates into multiple chitinous
fragments that are readily preserved in lake sediments (Korhola and Rautio 2001). As these
subfossils are identifiable to the genus level, and often the species level, it is possible to
examine changes in cladoceran assemblages through time. The application of our
knowledge of cladoceran ecology, in combination with changes in the sedimentary
assemblage structure, it is possible to examine how lake ecosystems have changed over
time. This can aid in the understanding of past environmental change in the absence of
long-term monitoring, and provide critical information of the structure, function and
resilience of aquatic ecosystems.
Cladocera size structure can also be used to detect changes in lake predation
regimes, as some genera can undergo polymorphic alterations when exposed to different
predators. Specifically, the genus Bosmina is particularly useful. Bosmina is the most
common cladoceran genus found in North America and these species readily change the
length of their antennule, mucro and carapace to evade predation (Figure 1; Korosi and
Smol 2012a, Kerfoot 1975). The way in which they alter their size structure is also specific
to the type of dominant predator. For instance, invertebrate predators are gape limited, so
lengthened antennule and mucro sizes are observed in lakes where invertebrate predation is
dominant so Bosmina can actively avoid predation. This contrasts with lakes where fish
predation is dominant. Consequently, Bosmina typically exhibit smaller overall body size
(estimated through carapace length) in fish dominated lakes because planktivorous fish are
visual predators (Korosi et al. 2010). Bosmina size structure alone is not informative, but
relative changes in size through time can be used to infer changes in predation pressures

12
within a lake. Therefore, a morphologic analysis can be used to explore shifts in either
invertebrate predators or planktivorous fish communities and the potential impact on the
cladoceran assemblage (Korosi et al. 2010).
Figure 2: Left: Bosmina headshield illustrating the antennule length (A). Right: Bosmina
carapace, differentiating the carapace (B) and the mucro (C). Dashed lines indicate
where measurement
Production
Primary production is the amount of autotrophic biomass produced within a system
and is an important variable that can summarize overall lake trophic status. It acts as a
descriptor of the amount of energy available in that ecosystem, and is essential in
understanding energy flow and links that occurs between trophic levels (Frauendorf et al.
2013). Changes in primary production can be influenced by numerous abiotic factors (e.g.,
temperature, light availability, nutrients). For instance, increased temperature is associated
with the heightened metabolic rate in phytoplankton, leading to increased biomass
production (Gillooly et al. 2001). Climate warming influencing ice patterns have also been

13
observed to impact lake annual lake production in Arctic regions and elsewhere. For
example, a longer ice-free period extends the growing season and results in increased
accumulation of chlorophyll-a (a measurable proxy to infer primary production) in lake
sediments (Michelutti et al. 2010). By using the spectral absorbance of sedimentary sample,
past chlorophyll-a abundances can be tracked in paleolimnological investigations. (Wolfe
et al. 2006).
Through studying lakes in Northern Ontario, and specifically lakes in the RoF,
trends in primary production can be described over time. This knowledge can be used to
differentiate the impact of local stressors associated with development from regional
warming. Through examining changes in the concentration of spectrally-inferred
chlorophyll-a in sediment cores, it is possible to attribute increases in chlorophyll-a to a
longer growing season and heightened metabolic rates (Gillooly et al. 2001, Michelutti et
al. 2010). Changes in primary production have not been examined directly in these lakes, so
this investigation can provide baseline information on production within the RoF. Through
the use of paleolimnology, analysis of primary production in combination with cladoceran
subfossil analysis, the link between lower and upper trophic levels of lake systems in the
RoF can be characterized.
Scope of Investigation
This investigation expands on our the meager ecological knowledge of lakes in
Northern Ontario’s RoF, through detailed temporal analyses of two lakes of particular
interest due to their locations: one near the centre of the mineral deposits (McFaulds Lake),
and a second lake close to a First Nations community (Eabamet Lake). A paleolimnological

14
approach was used to collect a lake sediments to be analyzed for cladoceran subfossils,
Bosmina size measures and inferred chlorophyll-a. The analysis of the cladoceran
subfossils accumulated in the sediments of these lakes will allow the effects of current
stressors to be recognized prior to the onset of development. By also analyzing shifts in
predation regimes (inferred through Bosmina size structure) and production (inferred
through chlorophyll-a analysis), a more holistic story can be developed to further
understand environmental change in this region. Overall, the purpose of this investigation is
to infer whether there have been changes coincident with regional climate warming, or if
other directional changes in species composition have occurred. This work is aimed to
better understand the ecology of the Northern Ontario ”Ring of Fire”, to identify past and
present stressors, and to inform policy and planning in the near future.
Since this investigation is assessing cladoceran sedimentary assemblages, predation
regimes and production, there are three corresponding hypotheses that I will examine for
both study lakes:
1. Based on the regional climatic impacts associated with sea-ice changes in Hudson
Bay, I hypothesize that there will be increased planktonic dominance of the
cladoceran sedimentary assemblage after the mid 1990s, as lake ice should also be
decreasing.
2. The predation regime is unknown within this region, so I will test the hypothesis
that, despite the warming climate, predation regimes have not changed and no
significant differences in Bosmina mucro, antennule and carapace length will be
observed over the time period covered by the sediment core.

15
3. Due to the previously established relationship between primary production and
warming, I hypothesize that chlorophyll-a concentrations will increase in recent
sediments due to enhanced primary production associated with enhanced metabolic
rates and a lengthened growing season.
Study Rationale
Despite its great potential for future economic development, Northern Ontario has
been vastly under-studied. Due to a northern amplification of climate warming and
specifically the changing temperature regime around Hudson Bay (Rühland et al. 2013),
understanding the stability and function of northern ecosystems is becoming increasingly
important. The region is also important to the Eabametoong First Nations community, who
live in the community of Fort Hope, located on the north shore of Eabamet Lake (one of the
study sites). This area was historically used by the Hudson Bay Company in the late-1800s
as a trading post, but further developed throughout the mid-1900s into a town with a
resident population of ~2000 people today (Eabametoong First Nation 2010). Since this
community relies heavily on the services provided by the lake for their way of life, the
scientific knowledge gained in this investigation can accompany the traditional knowledge
of this community to inform future resource management.
In the absence of long-term monitoring, the paleolimnological approach can provide
a record of historical cladoceran assemblages. Using this record, it is possible to determine
how stressors such as a changing climate may have impacted the cladoceran assemblage.
Performing this investigation prior to large-scale development of the Northern RoF is
beneficial as it can help disentangle the effects of future industrial development from

16
current drivers. In addition, it allows for the collection and interpretation of baseline
conditions which are essential to properly inform decision making and public policy in the
near future.
Materials and Methods:
Study Sites
McFaulds Lake (52° 47' 15.304" N, 86° 3' 10.384" W) is located in the
approximate center of the RoF, and will be at the heart of any proposed developments
(Figure 1). This lake is situated on the James Bay Lowlands, but is relatively close to the
transition zone between the lowlands and the Precambrian Shield. It is part of the
Attawapiskat Watershed and ~270 km from James Bay. The lake itself is relatively large
(~6 km long and ~14 km in perimeter) and shallow, comprised of predominantly littoral
habitat. The shallow characteristic of this lake (2 m at coring site) makes it less likely to
thermally stratify. Low relief organic peat deposits and bogs also characterize this
landscape and are found above thick glacial deposits and Precambrian bedrock (Dyer and
Burke 2012).
Eabamet Lake (51° 31' 11.661" N, 87° 51' 6.868" W) is located ~200 km to the SW
of McFaulds Lake and is located on the Precambrian Shield (Figure 1). As a result, its
catchment is boreal in nature, underlain with gneiss, and has sporadic glacial deposits and
muskeg (Dugan et al. 2014). It is considerably larger than McFaulds Lake (~30 km long
and ~80 km in perimeter) and is more likely to be thermally stratified due to its greater
depth (8 m at coring site). It is part of the Albany River Watershed and is located ~ 420 km

17
from James Bay. Limnological parameters of both lakes from the date of sediment
collection can be found in Table 1.
Table 1: Limnological variables recorded from McFaulds Lake and Eabamet Lake at the
time of sediment core collection.
Parameter Eabamet
Lake
McFaulds
Lake
Date of Sampling July 15 2012 July 12 2012
Depth at
Coring Site (m) 9 2
pH 7.8 7.4
DOC (mg/L) 10.9 12.0
DO at Surface (%) 92.4 97.3
DO at Bottom (%) 74.2 93.7
Conductivity
(µS/cm) 96.4 46.2
Temperature at
Surface (°C) 21.7 23.1
Temperature at
Bottom (°C) 18.7 21.5
Predation Structure Unknown
Assumed
fishless due to
depth
Field Methods and Dating
Sediment cores were collected from Eabamet and McFaulds lakes in the summer of
2012 using a Glew (1989) gravity core and sectioned into 0.25 cm intervals using a Glew
extruder (Glew 1988). These cores were collected as part of a broader survey of lakes
within the region of the Northern Ontario RoF. The cores were subsequently dated using
210Pb radioisotopes (Binford 1990) and a constant rate of supply model was used to
determine sediment age base on 210
Pb concentration (Appleby 2001). The dates for the
sediment past background 210
Pb were extrapolated using a linear regression.

18
Chlorophyll-a
Chlorophyll-a analyses largely followed the methods outlined in Micheclutti et al.
(2010). Freeze-dried sediment was sieved through a 125 µm screen onto weigh paper to
equalize sediment grain size and the influence of water. Sediments were then transferred
from the weigh paper to a plastic vial so that the bottom 2 mm of the vial was completely
covered in sediment. This was repeated for each interval. The sediment filled vials were
subsequently run through a spectrophotometer to use Visible Near-Infrared Spectroscopy
(NIRS) to infer chlorophyll-a concentration. As wave absorption and chlorophyll-a
concentration are linearly correlated (Michelutti et al. 2010), the NIRS output of
absorbance was directly used to calculate inferred chlorophyll-a. This was done by
calculating the area under the 650-700 nm wavelength peak of a wavelength-absorbance
plot, in accordance to the methodology established by Wolfe et al. (2006). Inferred
chlorophyll-a concentrations were then used to assess annual lake primary production for
each interval analyzed.
Cladocera Preparation
The processing methods to isolate cladoceran subfossils from the sedimentary
assemblage were adapted from Korhola and Rautio (2001). Approximately 1.0 g of wet
sediment was processed for each 0.25 cm sectioned interval. Every interval in McFaulds
Lake and every other interval in Eabamet Lake was processed. A 10% potassium hydroxide
solution was used to process the 1.0 g of sediment on an 80°C hotplate for ~20 min. The
sediment slurry was sieved using a 38 µm mesh and isolated into a 12 mL plastic

19
scintillation vial. Ethanol was added to inhibit fungal growth and a few drops of safranin
solution was also added to stain the chitinous remains.
The slurry was then plated on microscope slides using a micropipette to add aliquots
in multiples of 50 µL. The number of aliquots added to each slide depended on the
cladoceran concentration of that specific interval. In addition, the number of slides counted
typically depended on the balance between the number of individuals and the concentration
of clastic material in the interval (as too many siliciclastics would cover identifiable
features on the cladoceran subfossils). For this reason, the number of aliquots added for
each interval varied with the amount of clastic material throughout the sediment core
(typically between 2 and 7 aliquots per slide). After the slurry had dried on the slide, the
cover slips were secured using glycerine jelly.
The above methodology was followed for all 23 intervals analyzed in the Eabamet
Lake sediment core; however, there was not enough wet sediment from McFaulds Lake to
obtain 1.0 g to be processed. For this reason a mixture of wet and freeze-dried sediment
was processed for the 23 intervals analyzed in the McFaulds Lake sediment core. The
freeze-dried sediment had previously been used to determine the radiometric chronology
for the sediment core. To identify any bias in the frequency and type of subfossils found in
the wet and dry sediment, the species assemblage from 1.0 g of wet sediment and 0.1 g dry
sediment were compared. This was done for three intervals throughout the length of the
sediment core (1.5 cm, 3.0 cm and 5.0 cm). A principal component analysis was performed
to look at variation among the species assemblages. Since variation was minimal between

20
wet and dry sediment at each set interval (Appendix 1) both wet and dry sediments were
processed to assess cladoceran subfossil assemblages.
The entire cover slip and the edges of glycerine jelly were analyzed for cladoceran
subfossils. As cladoceran taxa can leave behind multiple different subfossils (e.g. carapace,
headshield, postabdomen), only subfossil type with the greatest frequency were used in
establishing a representative sample of the species assemblage. Identification of cladoceran
subfossils was performed by following the guidelines established in Korosi and Smol
(2012b, c). Slides were assessed until ~100 cladoceran individuals were identified for each
interval, a greater value than the 70 typically required to obtain a representative sample
(Kurek et al. 2010).
Bosmina Size Measurements
Bosmina size measurements were analyzed to better understand changes in
predation structure in both lakes. Every observed Bosmina subfossil was photographed and
its antennule, mucro, and/or carapace length measured following the approach outlined in
Korosi et al. (2013). Only one antennule was measured for each head shield encountered
and one carapace measured when found in pairs to avoid sampling the same individual
twice. Carapace measurements were made across the largest carapace cross-section. At
least 35 measurements for each subfossil type (carapace, mucro, and antennule) were
required to produce a representative sample among size measures in accordance with
Brahney et al. (2010). The Bosmina size measures were averaged for each subfossil type
(antennule, mucro, and carapace) and each interval. The standard deviations of the size
measures in each interval were also calculated. A Mann-Kendall trend test was then

21
performed to determine significance and directionality of any trend in subfossil size
measures (Labaj et al. 2014).
Data Analysis
The collected data were then used to calculate relative abundance of each taxa in the
cladoceran assemblage. This was done by using the frequency of taxa identified and the
total number of individuals counted for each interval. A Constrained Incremental Sum of
Squares (CONISS) analysis was performed to determine significant groupings among all
intervals, not only adjacent ones (Grimm 1987). A broken stick analysis was subsequently
used to determine the number of significant clusters within the stratigraphy. These break
points were then aligned with the radioisotope 210
Pb dates to determine the time at which
changes in species assemblage occurred.
The cladoceran concentration for each interval was also calculated to determine
whether changes in relative abundance were associated with increases in the total
abundance of cladoceran compared to shifts within the species assemblage itself. This was
done by tabulating the total number of aliquots used to produce a significant count of ~100
individuals. The amount of sediment digested was then used to deduce how much of the
wet sediment was counted (by assuming that the vial was completely filled to 12 mL). This
produced a cladoceran concentration in individuals per gram of wet sediment digested. This
methodology differed to determine the cladoceran concentration for dry sediments
processed for McFaulds Lake, where using the percent water values derived from before
and after freezing drying, a value of individuals per gram of wet sediment was extrapolated.
22
Results
Dating
Radioisotope 210
Pb analysis of the McFaulds Lake and Eabamet Lake sediment
cores identified a deposition date of ~1850 at a depth of 5.125 cm and 9.125 cm
respectively (Appendix 2). Cladoceran analysis was only performed to a few intervals past
these depths due to the increasing uncertainty of sediment age with increasing sediment
depth.
McFaulds Lake
The species present in McFaulds Lake included: Bosmina spp. Daphnia longispina ,
Daphnia pulex, Eurycercus spp., Acroperus harpae, Kurzia latissima, Alona affinis, Alona
quadrangularis, Alona intermedia, Alona costata, Alona rustica, Alona guttata, Ledigia
spp., Monospilus dispar, Alonella nana, Chydorus brevilabris, Paralona pigra,
Holopedium glacialis, Polyphemus pediculus, Leptodora kindtii, Acantholeberis
curvirostris, Ophryoxus gracilis, and Sida crystallina americana. While 22 taxa were
recorded, the species assemblage of McFaulds Lake was comprised of 10 main taxa found
with > 2% relative abundance in at least 2 intervals (a criteria established to determine
important taxa within the lake).
The sedimentary cladoceran assemblage in McFaulds Lake was dominated by
Bosmina spp. and C. brevilabris (Figure 3). At a depth of 5.5 cm (~1840) the sedimentary
assemblage is almost entirely composed of C. brevilabris, ~83% of the species assemblage
(Bosmina comprised only ~10% of the relative abundance at the bottom of the core). No

23
Eubosmina longispina subfossils were encountered and zooplankton surveys of McFaulds
Lake indicate that Bosmina freyi was the only species of Bosmina present (hereby referred
to as Bosmina)(B. Keller pers. comm.).The CONISS analysis indicated two breakpoints
within the stratigraphy, the major split occurring in the mid-1990s and a secondary split
occurring in the early 1900’s (~1920) (Figure 3). Both splits indicate increased Bosmina
abundance, as Bosmina increased from 10% to 40% and C. brevilabris decreased from 83%
to 35% throughout the length of the analyzed sediment core. Overall Bosmina was less
abundant in the sedimentary assemblage of McFaulds compared to Eabamet Lake. There
were also large fluctuations in the concentration of cladoceran subfossils over the length of
the analyzed core for both lakes (Appendix 3), although these fluctuations do not
correspond with changes in the species assemblage.
There was also no significant change in Bosmina carapace or antennule size
structure in McFaulds Lake (Figure 4); however, the Mann-Kendall trend test revealed a
significant trend towards smaller mucro lengths in the recent sediments (τ=0.542,
p=0.003,).However, there were not enough size measures to be considered representative
for the majority of the sediment core (only four intervals had over 35 mucro subfossils
(Brahney et al. 2010). There were also too few Bosmina size measures of antennules
(intervals 0.25-5.5 cm) and carapaces (in all intervals) to be considered representative. This
is expected as Bosmina represented less than 40% of the species assemblage below 2 cm
depth, so the number of subfossils counted were not adequate for a significant
representation of the subfossil size structure since Bosmina are in such low abundance
(Brahney et al. 2010).

24
An assessment of past primary production was performed through recording
chlorophyll-a concentrations in McFaulds Lake sediments. Inferred chlorophyll-a in this
lake increases in recent sediment intervals (Figure 3). This increase starts around 5 cm,
below which inferred chlorophyll-a was below the detection limit of 0.01 mg/g dry wt of
sediment.
Figure 1: Stratigraphy of cladoceran relative abundances of major taxa recorded in
McFaulds Lake and inferred chlorophyll-a of the corresponding interval. These
data are aligned with the corresponding 210
Pb dates.

25
Figure 2: Changes in mean Bosmina size attributes (antennule, mucro and carapace length)
over the analyzed sediment core from McFaulds Lake with their respective
standard deviation. Results from Mann-Kendall Trend Test (τ and p values) are
also displayed for each attribute.
Eabamet Lake
The taxa recorded in Eabamet Lake included: Bosmina spp., Daphnia longispina,
Daphnia pulex, Eurycercus spp., Camptocercus spp., Alona affinis, Alona quadrangularis,
Alona costata, Alona rustica, Alona guttata, Leydigia spp., Rynchotalona falcata,
Monospilus dispar, Alona excisa, Alonella nana, Chydorus brevilabris, Polyphemus
pediculus, Ophryoxus gracilis, Latona spp. and Sida crystallina americana.
While there were twenty observed taxa throughout the length of the core, this
assemblage was also dominated by Bosmina spp. and Chydorus brevilabris. The lower
portion of the core contained 48% Chydorus brevilabris and 40% Bosmina in species
relative abundance. This contrasts with the top of the core, where Bosmina increased to

26
74% relative abundance and C. brevilabris decreased to 18% relative abundance.
Zooplankton surveys of Eabamet Lake indicate the Eubosmina longispina is present within
the species assemblage but in low abundance and was subsequently not observed within the
sedimentary record (B. Keller pers. comm.). Like in McFaulds Lake, Bosmina freyi is the
most abundant Bosmina species in the current zooplankton assemblage (B. Keller pers.
comm.).
The CONISS analysis of Eabamet Lake indicated one major breakpoint along the
stratigraphy occurring at ~1960. This indicates the split from the C. brevilabris to the
Bosmina dominated assemblage. This assemblage change is observable starting from
~1930, although the major split does not occur for another ~30 years. Apart from Daphnia
spp. and Alona affinis, which were at times 10% and 2% of the species assemblage
respectively, but the remaining taxa represented less than 2% of the species assemblage, or
appeared in less than 2 intervals and were thus removed from the Eabamet Lake
stratigraphy (Figure 5). Additionally, there was no observable trend in concentration of
cladoceran subfossils as the concentration remained relatively constant over the length of
the analyzed core (Appendix 3).
The assessment of Bosmina size structure indicated that there was no
significant change in mucro, carapace or antennule length throughout the top 5.5 cm of the
Eabamet Lake core, based on the Mann-Kendall trend test (Figure 6). Large standard
deviations illustrate that there is more variation of average size structure within an interval

27
Figure 3: Stratigraphy of cladoceran relative abundance of major taxa found in Eabamet
Lake illustrating the five main taxa found in > 2% relative abundance in at least 2
intervals. These data are aligned with the corresponding 210
Pb dates.
than between intervals. However, there were too few Bosmina subfossils to be considered
representative for antennules (intervals 2, 6.5, 8, 9-10.5 cm) and carapaces (intervals 0.5,
3.5, 5, 6.5, 8-10.5cm; Brahney et al. 2010). Specifically, from interval 8-10.5 cm, Bosmina
represented less than 40% of the sedimentary assemblage. As a result, the incidence of

28
Bosmina subfossils within the species assemblage was too rare to ensure that all three
subfossil types had enough size measurements to be considered representative.
Additionally, analysis of production through inferred chlorophyll-a concentrations in
Eabamet Lake were all below the detection limit of 0.01 mg/g dry wt (Appendix 4).
Figure 4: Changes in mean Bosmina size attributes (antennule, mucro and carapace length)
over the analyzed sediment core from Eabamet Lake with their respective
standard deviation. Results from Mann-Kendall Trend Test (τ and p values) are
also displayed for each attribute.

29
Discussion
Cladoceran Assemblage
The paleolimnological analysis of cladoceran microfossils recorded key assemblage
changes over the last ~150 years. In McFaulds Lake, most of the dominant taxa are littoral
such as: Eurycercus spp. and Acantholeberis curvirostris or have characteristics associated
with peatlands such as: Alona quadrangularis, Alona intermedia and Acroperus harpae
(Duigan 1992). The CONISS analysis indicated a primary split from a C. brevilabris to a
Bosmina dominated species assemblage in the mid-1990s. This response suggests that there
may have been an increase in pelagic habitat availability as Bosmina, a pelagic taxon, is
occupying a greater percentage of the species assemblage than the littoral C. brevilabris.
This shift from a littoral to a pelagic dominated assemblage is consistent with the
observations that earlier ice melt in the region is increasing the annual availability of
pelagic habitat (Rühland et al. 2013). The timing of this change is consistent with
exponential warming surrounding Hudson Bay caused by a positive feedback associated
with sea-ice decline (Rühland et al. 2013). This emphasizes that Hudson Bay may act as a
major driver of climate for the surrounding region of the RoF.
A secondary split in the cladoceran assemblage of McFaulds Lake occurred ~1920.
This split is too early to be due to the recent regional warming trend, but instead may be a
result of other climate changes, such as altered precipitation patterns. In an investigation of
spatial and temporal trends in Canadian climate, increases in annual average precipitation
were observed after 1920, although precipitation was averaged nationally, this may indicate
altered climate patterns occurred during this period (Zhang et al. 2001). The ~1920’s

30
breakpoint is not significant in Eabamet Lake, although there is an observable increase in
pelagic taxa starting in the early 1920’s and peaking in the 1990’s. This may suggest that,
while not significant, a similar trend may have occurred in both lakes. The lack of
significance may be a consequence of morphometric differences between the two lakes. As
the relative abundance of pelagic taxa in Eabamet Lake was initially higher than that of
shallow McFaulds, small changes in the abundance of pelagic taxa abundance may be less
apparent. Furthermore, local stressors (such as watershed modifications) impacting
Eabamet Lake may have also diminished this signal in the sedimentary record. This
emphasizes our lack of understanding of past local and regional environmental stressors,
and how challenging it is to infer what exactly caused the secondary split in the cladoceran
assemblage in ~1920.
The species assemblage of McFaulds contrasts strongly with that of Eabamet Lake.
First, the sedimentary cladoceran assemblage of Eabamet Lake is relatively simple
compared to McFaulds Lake because it is dominated by only four taxa. Unidentifiable
chydorid remains were in greater abundance than other sedimentary taxa within this lake.
This indicates that diversity may be underestimated as the high abundance of clastic
particles impeded successful identification of numerous Chydorus spp. headshields
throughout the length of the sediment core (although these remains may have just been
more of the major taxa). However, the presence of both Bosmina spp. and Daphnia spp.
(pelagic taxa) in the down core analysis was anticipated because Eabamet Lake has large
amounts of pelagic habitat, relative to littoral habitat. In addition, the observed species
assemblage corresponds with other regional surveys of northern zooplankton communities
31
as Bosmina longirostris and C. brevilabris were previously found to be present in 92% and
82% of sampled northern lakes respectively (Keller and Pitbaldo 1989).
Visual analysis of the sedimentary cladoceran trend in Eabamet Lake appears to be
similar to that of McFaulds Lake, with increases in pelagic taxa starting in the 1920’s and
peaking in the 1990’s. However, based on the Eabamet Lake cluster analysis for the
Cladocera data, the significant change in C. brevilabris and Bosmina relative abundance
occurred in ~1960, considerably earlier than the primary split observed in McFaulds Lake.
The timing of this change is of interest as it does not align with regional climate warming
because sea-ice on Hudson Bay mediated regional temperature, with rapid warming
occurring after the mid-1990s (Rühland et al. 2013). However, the 1960’s is of interest as it
was a period of substantial watershed alterations which potentially may explain the change
in species assemblage observed in Eabamet Lake. This also complicates a direct visual
comparison of trends with McFaulds Lake.
Multiple damming projects occurred along the Albany River, upstream of Eabamet
Lake during early to mid-1900s. A major project was the Root River Dam which was
constructed in 1957 on Lake St. Joseph- approximately 200 km upstream of Eabamet Lake.
This diversion project was aimed to divert water away from the Albany River and towards
the English River (into the Winnipeg River Watershed) (The Manitoba-Ontario Lake St.
Joseph Diversion Agreement Authorization Act, R.S.M. 1990, c. 245). Two additional
dams were constructed on Lake St. Joseph in the early 1930s - the Rats Rapids Dam and the
Cedar Channel Dam (Mishkeegogamang Ojibway Nation 2010).

32
Since the change in the Eabamet Lake cladoceran assemblage occurred in ~1960,
the Root River diversion project may have had a substantial impact on water flow and
downstream pelagic habitat compared to the earlier constructed dams. The mechanism for
the observed downstream increases in pelagic habitat availability is currently not realized,
but the timing of this event also coincides with historical flooding of Fort Hope in 1959 (B.
Keller, pers. comm.). It is hard to predict the downstream limnological impact of damming
and diversion efforts, as the impacts are largely dependent on site specific features. This has
been observed in surveys of downstream impacts of damming events, showing high
temporal and spatial variability (Baker et al. 2011). General trends noted by Baker et al.
(2011) included a reduction in downstream flow, increases in fine grain sediment transport
(potentially impacting downstream biota) and shifts in macroinvertebrate populations away
from flow-loving taxa. Due to this large variation in response to damming and the known
potential to impact downstream biota, it is likely that the change in cladoceran species
assemblage may be attributed to the diversion dam constructed on Lake St. Joseph.
A complementary study of the sedimentary diatom assemblage in Eabamet Lake
indicates an increase in planktonic diatoms in the mid-1990s (K. Hargan, unpublished
data); although a concurrent change is not apparent in the cladoceran assemblage. This can
potentially indicate that the climate-driven increases in planktonic habitat have not been
sufficient in trigging a change in the cladoceran assemblage to date. Future increases in
pelagic cladoceran species may still occur as it is likely that continued warming will further
increase the ice-free period of lakes within this region, a phenomenon which has occurred
in other northern locations (Benson et al. 2012).

33
Apart from abiotic factors (such as pelagic habitat availability), biotic interactions
may also explain the absence of a cladoceran response to mid-1990s climate warming.
Biotic factors are known to diminish the connection between trophic levels, impeding
bottom-up controls on zooplankton in some cases (Edwards and Richardson 2004). Since
the diatom data indicated an increase in pelagic diatom relative abundance, more pelagic
primary producers, a corresponding increase in pelagic zooplankton taxa is likely (since
there is a more abundant source of food). However, changes in the phenology of aquatic
phytoplankton have been observed to produce a mismatch in peak phytoplankton
production and peak zooplankton production in some systems (Winder and Schindler
2004). This can interrupt energy flow between trophic levels, diminishing bottom-up
responses in higher trophic levels (Schlueter et al. 2010). If this is true in Eabamet Lake,
this may be an alternate hypothesis as to why Cladocera have not responded to recent
climatic warming.
Physical differences between Eabamet and McFaulds lakes may be an additional
factor that contributes to the explanation of why a mid-1990’s warming signal is observed
in McFaulds Lake but not in Eabamet Lake. Although McFaulds Lake is large, it is likely
to be unstratified and have a shallow bathymetry (core depth ~2 m), characteristics
commonly associated with warmer lakes (Schindler and Scheuerell 2002). Additionally,
since shallow lakes of the Hudson Bay Lowlands are commonly categorized as polymictic
(Bos and Pellat 2012), continual wind-driven mixing of the water column could help aid in
dispersing the thermal energy, and further enhance warming. The much deeper Eabamet
Lake (core depth ~8m) is more likely to stratified (leading to increased thermal stability),

34
has upstream regulation of water flow, and is located within a boreal catchment. This
illustrates the important differences between these two lakes with respects to morphometry
and the surrounding catchment. These differences complicate direct comparisons between
these two lakes.
Predation Regime
No trend was observable from antennule and carapace size structure data obtained
from McFaulds Lake, which indicates mostly stable predation pressures have occurred over
the last ~150 years. Since this lake is less than 2 m in depth, it will likely freeze solid in the
winter (Prowse et al. 2011). As a result this lake can be considered fishless as solid ice
would impede this lake from having a resident fish population. This is reflected in the
results, as no change in carapace size infers that there has been no change in overall
Bosmina size potentially in response of lack of fish predation. Potential decreases in the
strength of macroinvertebrate predation may be producing the trend towards smaller
average mucro length. However, since the sample size is so small, and the mucro size
measures contain substantial variation, the confidence in this trend may not be strong. Since
fish and invertebrate communities are still unknown within this region, it is hard to
speculate if and how they will be impacted with future warming.
The Bosmina size measures for Eabamet Lake revealed no significant change in
mucro, antennule or carapace length over the analyzed core. From this, no significant
alterations in invertebrate or fish predation structure can be inferred (Kerfoot 1975). This is
expected as there have been no known alterations or fish stocking events within the region.
From this preliminary investigation of the predation structure in Eabamet Lake, the results

35
show it to be relatively stable over the last ~150 years. This reinforces that recent events of
coldwater fish kills, like those observed along the Sutton River (Gunn and Snucins 2010),
are rare in the region surrounding Eabamet Lake. This result is important to the people of
Fort Hope who have an economic and cultural dependence on the surrounding natural
resources, such as the fishery in Eabamet Lake (Eabametoong First Nation 2010).
Primary Production
Exponential increases in chlorophyll-a are consistent with the warming signal
observed in McFaulds Lake. This provides additional evidence that McFaulds Lake has
been affected by a lengthened ice-free period associated with warming as similar results
were also observed in warming Arctic ponds (Michelutti et al. 2010). Based on the data
provided by this investigation, increased chlorophyll-a is likely a result of both amplified
pelagic habitat availability leading to a longer growing season and due to increased
metabolic rates among phytoplankton. Below the mid to late-1800’s there was too little
chlorophyll-a in the sedimentary record to be detected through NIRS. This is likely due to
more extensive ice cover during this period, leading to little primary production (Smol and
Douglas 2007). This phenomenon is more common of Arctic ponds rather than subarctic
ponds, however due to the mediating affect of Hudson Bay on climate, it may be likely to
have also occurred in this region before ~1850 (Smol et al. 2005)
Inferred chlorophyll-a throughout the length of the Eabamet Lake sediment core
was too low to be detected with current the NIRS technology. This indicates that primary
production within Eabamet Lake has been consistently low. This corresponds to other
investigations in northern ecosystems which reveal lakes to be predominately oligotrophic

36
(Bos and Pellat 2012). While no change was observed over the length of the sediment core,
these results provide a baseline for Eabamet Lake primary production in light of future
development and associated stressors, which can potentially impact production.
Potential Limitations
There are two principal limitations associated with this type of paleolimnological
analysis that may introduce error into this investigation. First, it is difficult to disentangle
the effects of multiple stressors observed in the sediment record (Smol 2010). This is
especially evident in Eabamet Lake, where an unclear timeline of historic watershed
impacts make assemblage changes hard to interpret. Second, the prevalence of clastic
material within the sedimentary record made identification of cladoceran taxa particularly
challenging, as identifiable features were often obscured. However, overall, the lack of
research in the area surrounding the RoF emphasizes the benefits of the multiple proxy
paleolimnological approach as it provides a picture of past and present condition. While it
is still challenging to identify additional potential stressors in this region, these data provide
an approximate baseline of conditions within this area.
Conclusion
My paleolimnological data clearly indicate that McFaulds Lake has experienced
changes in both its production and cladoceran assemblage since the mid-1990’s, consistent
with regional climate warming. A potential change in invertebrate predation may have also
occurred in McFaulds Lake with average Bosmina mucro sizes exhibiting a decreasing
trend in recent sediment. However, a representative sample of Bosmina subfossils can
enhance the reliability of this trend.

37
Eabamet Lake also experienced changes in its cladoceran assemblage with increases
in the relative abundance of pelagic taxa; presumably as a result of changes in water control
due to damming along the Albany River. No change in production or predation regime was
observed in Eabamet Lake, indicating that these characteristics have likely remained stable
over the past ~150 years. Eabamet Lake is considerably larger than McFaulds Lake so it is
possible that the increased thermal inertia of this lake muted some of the ecological changes
associated with recent warming. In addition, since Eabamet Lake initial has a higher
abundance of pelagic taxa, this may be another contributing factor that may be limiting an
observable response to recent stressors. Continued monitoring of Eabamet is required to
determine if the cladoceran assemblages will eventually change as a result an increased ice-
free season, or if water flow control (through damming) is a stronger driver than climate
change. The paleolimnological data presented here provide a baseline for conditions for
two lakes in the RoF and may aid in the future management of the area.
Future research should better characterize this region in all aspects (ecological,
economic, political, and social) as it would aid in effective adaptive environmental
management and contribute to more informed collaboration with local stakeholders.
Specifically, increasing size measure counts to determine if the trend in the Bosmina size
measures in McFaulds Lake is reliable can help better characterize predation structure- a
parameter that should be more heavily investigated before development. This
paleolimnological investigation emphasizes the lack of knowledge within the region of the
RoF as the history of water control structures, specifically along the Albany River, remains
unclear today. Understanding past and present stressors within the RoF is becoming

38
increasingly important as pressing development will likely change the ecosystem
dramatically within the next decade.
Summary
1. Cladoceran and algal assemblages in the shallow McFaulds Lake have likely
already been impacted by climate change. This is observed by changes in
primary production, and increased availability of annual pelagic habitat is likely
leading to a longer growing season for algae. This has already impacted trophic
intermediates, such as pelagic cladoceran taxa, who reflect this warming signal
in their increased relative abundance in the species assemblage.
2. In Eabamet Lake, a significant shift towards a pelagic dominated cladoceran
assemblage occurred in ~1960. This demonstrates that this lake may be
controlled by upstream dams that were constructed during this period.
Production was below the detection limit for NIRS and never increased above
this level in the recent sediments. Both the Cladocera and the chlorophyll-a data
illustrates that annual pelagic habitat availability may be regulated by upstream
controls and therefore less likely to be affected by the lengthened ice-free season
associated with warming.
3. The investigation of Bosmina size structure indicates that the predation structure
has been stable over the past ~150 years in Eabamet Lake. Meanwhile, average
mucro size in McFaulds Lake shows an increasing trend in recent sediment;
however, the sample size for most intervals was too small to be considered
representative.
39
References
Abraham, K.F., L. M. McKinnon, Z. Jumean, S. M. Tully, L. R. Walton, and H. M.
Stewart. 2010. Hudson Plains Ecozone status and trends assessment. Ontario
Biodiversity Council Technical Report.
Appleby, P. 2001. Chronostratigraphic techniques in recent sediments. Pages 171-203 In
Anonymous Tracking environmental change using lake sediments, Springer.
Baker, D., B. Bledsoe, C. Albano, and N. Poff. 2011. Downstream effects of diversion
dams on sediment and hydraulic conditions of Rocky Mountain streams. River
research and applications 27:388-401.
Benson, B. J., J. J. Magnuson, O. P. Jensen, V. M. Card, G. Hodgkins, J. Korhonen, D. M.
Livingstone, K. M. Stewart, G. A. Weyhenmeyer, and N. G. Granin. 2012. Extreme
events, trends, and variability in Northern Hemisphere lake-ice phenology (1855–
2005). Climatic Change 112:299-323.
Binford, M. W. 1990. Calculation and uncertainty analysis of 210Pb dates for PIRLA
project lake sediment cores. Journal of Paleolimnology 3:253-267.
Bos, D. G., M. G. Pellatt. 2012. The water chemistry of shallow ponds around Wapusk
National Park of Canada, Hudson Bay Lowlands. Canadian Water Resources Journal
37:163-175.
Bos, D., B. Cumming, and J. Smol. 1999. Cladocera and Anostraca from the Interior
Plateau of British Columbia, Canada, as paleolimnological indicators of salinity and
lake level. Hydrobiologia 392:129-141.
Brahney, J., R. Routledge, D. G. Bos, and M. G. Pellatt. 2010. Changes to the productivity
and trophic structure of a sockeye salmon rearing lake in British Columbia. North
American Journal of Fisheries Management 30:433-444
Dugan, R., A. Garrigus, and S. Wilson. 2014. Characterization of geotechnical conditions
for proposed 329 km remote transportation corridor in Northern Ontario. Bridges
10:9780784412473.065.
Duigan, C. A. 1992. The ecology and distribution of the littoral freshwater Chydoridae
(Branchiopoda, Anomopoda) of Ireland, with taxonomic comments on some species.
Hydrobiologia 241:1-70.
Dyer, R.D, H. E. Burke. 2012. Preliminary results from the McFaulds Lake (“Ring of
Fire”) area lake sediment geochemistry pilot study, northern Ontario. Ontario
Geological Survey, Open File Report 6269, 26p.

40
Eabametoong First Nation. 2010. Accessed: 09/03/14.
http://www.eabametoongfirstnation.ca
Edwards, M., A. J. Richardson. 2004. Impact of climate change on marine pelagic
phenology and trophic mismatch. Nature 430:881-884.
Frauendorf, T. C., C. Colón‐Gaud, M. R. Whiles, T. R. Barnum, K. R. Lips, C. M. Pringle,
and S. S. Kilham. 2013. Energy flow and the trophic basis of macroinvertebrate and
amphibian production in a neotropical stream food web. Freshwater Biology 58:1340-
1352.
Galbraith, P. S., P. Larouche. 2011. Reprint of “Sea-surface temperature in Hudson Bay
and Hudson Strait in relation to air temperature and ice cover breakup, 1985–2009”.
Journal of Marine Systems 88:463-475.
Gillooly, J. F., J. H. Brown, G. B. West, V. M. Savage, and E. L. Charnov. 2001. Effects of
size and temperature on metabolic rate. Science 293:2248-2251.
Glew, J.R. 1988. A portable extruding device for close interval sectioning of
unconsolidated core samples. Journal of Paleolimnology 1:235-239.
Glew, J.R. 1989. A new trigger mechanism for sediment samplers. Journal of
Paleolimnology 2:241-243.
Grimm, E. C. 1987. CONISS: a FORTRAN 77 program for stratigraphically constrained
cluster analysis by the method of incremental sum of squares. Computers &
Geosciences 13:13-35.
Gunn, J., E. Snucins. 2010. Brook charr mortalities during extreme temperature events in
Sutton River, Hudson Bay Lowlands, Canada. Hydrobiologia 650:79-84.
Hjartarson, J., L. McGuinty, S. Boutilier, and E. Marjernikova. 2014. Beneath the Surface:
Uncovering the Economic Potential of Ontario’s Ring of Fire. Ontario Chamber of
Commerce.
Joly, S., S. Senneville, D. Caya, and F. Saucier. 2011. Sensitivity of Hudson Bay Sea ice
and ocean climate to atmospheric temperature forcing. Climate Dynamics 36:1835-
1849.
Keller, W., J. R. Pitblado. 1989. The distribution of crustacean zooplankton in northern
Ontario, Canada. Journal of Biogeography 16:249-259.
Kerfoot, W. C. 1975. The divergence of adjacent populations. Ecology 56:1298-1313.

41
Korhola A, Rautio M (2001) 2. Cladocera and other branchiopod crustaceans. In: Smol JP,
Birks HJB, Last WM (eds.) Tracking Environmental Change Using Lake Sediments.
Volume 4: Zoological Indicators. Kluwer Academic Publishers, Dordrecht, The
Netherlands, pp 4-41
Korosi, J.B., Kurek, J., and Smol, J.P. 2013. A review on the use of Bosmina size structure
inferred from lake sediments to track historic shifts in predation regimes. J. Plankton
Research 35:444-460.
Korosi, J. B., A. M. Paterson, A. M. DeSellas, and J. P. Smol. 2010. A comparison of pre-
industrial and present-day changes in Bosmina and Daphnia size structure from soft-
water Ontario lakes. Canadian Journal of Fisheries and Aquatic Sciences 67:754-762.
Korosi, J. B., A. M. Paterson, A. M. DeSellas, and J. P. Smol. 2008. Linking mean body
size of pelagic Cladocera to environmental variables in Precambrian Shield lakes: a
paleolimnological approach. Journal of Limnology 67:22-34.
Korosi, J. B., J. P. Smol. 2012a. An illustrated guide to the identification of cladoceran
subfossils from lake sediments in northeastern North America: part 1—the
Daphniidae, Leptodoridae, Bosminidae, Polyphemidae, Holopedidae, Sididae, and
Macrothricidae. Journal of Paleolimnology 48:571-586.
Korosi, J. B., J. P. Smol. 2012b. An illustrated guide to the identification of cladoceran
subfossils from lake sediments in northeastern North America: part 2—the
Chydoridae. Journal of Paleolimnology 48:587-622.
Korosi, J. B., J. P. Smol. 2012c. A comparison of present-day and pre-industrial cladoceran
assemblages from softwater Nova Scotia (Canada) lakes with different regional
acidification histories. Journal of Paleolimnology 47:43-54.
Kurek, J., J. B. Korosi, A. Jeziorski, and J. P. Smol. 2010. Establishing reliable minimum
count sizes for cladoceran subfossils sampled from lake sediments. Journal of
Paleolimnology 44:603-612.
Kuyek, J. 2011. Economic analysis of the Ring of Fire chromite mining play. MiningWatch
Canada Technical Report.
Labaj, A. L., A. Jeziorski, J. Kurek, and J. P. Smol. 2014. Long-term trends in Cladoceran
assemblages related to acidification and subsequent liming of Middle Lake (Sudbury,
Canada). Water, Air, & Soil Pollution 225:1-10.
The Manitoba-Ontario Lake St. Joseph Diversion Agreement Authorization Act, R.S.M.
1990, c. 245

42
Michelutti, N., J. M. Blais, B. F. Cumming, A. M. Paterson, K. Rühland, A. P. Wolfe, and
J. P. Smol. 2010. Do spectrally inferred determinations of chlorophyll a reflect trends
in lake trophic status? Journal of Paleolimnology 43:205-217.
Mishkeegogamang Ojibway Nation. 2010. Historic land uses: hydro development causes
flooding. Accessed: 09/03/14. http://www.mishkeegogamang.ca/
MNDM. 2013. Ring of fire secretariat: exploration and development. Assessed: 09/03/14.
http://www.mndm.gov.on.ca/en/ring-fire-secretariat/exploration-and-development
Prowse, T., K. Alfredsen, S. Beltaos, B. R. Bonsal, W. B. Bowden, C. R. Duguay, A.
Korhola, J. McNamara, W. F. Vincent, and V. Vuglinsky. 2011. Effects of changes in
arctic lake and river ice. Ambio 40:63-74.
Rühland K. M., A. M. Paterson, W. Keller, N. Michelutti, and J. P. Smol. 2013. Global
warming triggers the loss of a key Arctic refugium. Proceedings of the Royal Society
B. doi:10.1098/rspb.2013.1887
Schindler, D. E., M. D. Scheuerell. 2002. Habitat coupling in lake ecosystems. Oikos
98:177-189.
Schlueter, M. H., A. Merico, M. Reginatto, M. Boersma, K. H. Wiltshire, and W. Greve.
2010. Phenological shifts of three interacting zooplankton groups in relation to
climate change. Global Change Biology 16:3144-3153.
Shumate, B. C., C. L. Schelske, T. L. Crisman, and W. F. Kenney. 2002. Response of the
cladoceran community to trophic state change in Lake Apopka, Florida. Journal of
Paleolimnology 27:71-77.
Smol, J.P. 2010. The power of the past: Using sediments to track the effects of multiple
stressors on lake ecosystems. Freshwater Biology 55:43-59.
Smol, J. P. 2008. Pollution of lakes and rivers: a paleoenvironmental perspective. John
Wiley & Sons.
Smol, J. P., M. S. Douglas. 2007. From controversy to consensus: making the case for
recent climate change in the Arctic using lake sediments. Frontiers in Ecology and the
Environment 5:466-474.
Smol, J. P., A. P. Wolfe, H. J. Birks, M. S. Douglas, V. J. Jones, A. Korhola, R. Pienitz, K.
Ruhland, S. Sorvari, D. Antoniades, S. J. Brooks, M. A. Fallu, M. Hughes, B. E.
Keatley, T. E. Laing, N. Michelutti, L. Nazarova, M. Nyman, A. M. Paterson, B.
Perren, R. Quinlan, M. Rautio, E. Saulnier-Talbot, S. Siitonen, N. Solovieva, and J.
Weckstrom. 2005. Climate-driven regime shifts in the biological communities of
43
arctic lakes. Proceedings of the National Academy of Sciences of the United States of
America 102:4397-4402.
Tang, R., J. M. Clark, T. Bond, N. Graham, D. Hughes, and C. Freeman. 2013. Assessment
of potential climate change impacts on peatland dissolved organic carbon release and
drinking water treatment from laboratory experiments. Environmental Pollution
173:270-277.
Winder, M., D. E. Schindler. 2004. Climatic effects on the phenology of lake processes.
Global Change Biology 10:1844-1856.
Wolfe, A. P., R. D. Vinebrooke, N. Michelutti, B. Rivard, and B. Das. 2006. Experimental
calibration of lake-sediment spectral reflectance to chlorophyll a concentrations:
methodology and paleolimnological validation. Journal of Paleolimnology 36:91-100.
Zhang, X., W. Hogg, and É. Mekis. 2001. Spatial and temporal characteristics of heavy
precipitation events over Canada. Journal of Climate 14:1923-1937.

44
Appendix 1 – Wet/Dry Sediment PCA This appendix contains the Principal Component Analysis (PCA) of cladoceran
sedimentary assemblages found in wet and dry sediments for three intervals in McFaulds
Lake to assess variation among samples due to freeze drying.
Figure A.1: Principal component analysis (PCA) trajectory plot of sedimentary cladoceran
assemblages for both wet and dry sediment from McFaulds Lake at 1.5 cm, 3
cm and 5 cm core depths. Individual species vectors are labelled as: Alona
affinis (Aaff), Acantholeberis curvirostris (Acurv), Alona intermedia (Aint),
Alonella nana (Anan), Alona rustica (Arus), Alona quadrangularis (Aquad),
Bosmina spp.(Bosm), Chydorus brevilabris (Cbrev), Daphnia longispina
(Dlong), Daphnia pulex (Dpulex), Eurycercus spp. (Eury), Leydigia spp.
(Leyd), Ophryoxus gracilis (Ograc), and Sida crystallina americana (Scr).

45
Appendix 2 – 210Pb Dating Profiles This appendix contains the
210Pb decay and the respective sediment dates in relation
to depth of the collected core for both McFaulds Lake and Eabamet Lake.
Figure A.2a: (Left) 210
Pb decay in relation to sediment depth in McFaulds Lake. (Right)
Date of sediment in relation to sediment depth based on 210
Pb spectroscopy in
McFaulds Lake.

46
Figure A. 2b: (Left) 210
Pb decay in relation to sediment depth in Eabamet Lake. (Right)
Date of sediment in relation to sediment depth based on 210
Pb spectroscopy
in Eabamet Lake.

47
Appendix 3 – Cladoceran Concentration Data This appendix contains the concentration of sedimentary cladoceran subfossils for
each interval in both McFaulds Lake and Eabamet Lake.
Table A.3: Cladoceran subfossil concentrations (individuals/g of wet sediment) for each
interval analyzed in McFaulds Lake and Eabamet Lake.
Eabamet
Interval (cm)
Eabamet
Individuals/g dry
sediment
Mcfaulds
Interval (cm)
McFaulds
individuals/g dry
sediment
0-0.25 6280 0-0.25 4737
0.5-0.75 6382 0.25-0.5 5739
1.0-1.25 22355 0.5-0.75 26692
1.5-1.75 9843 0.75-1.0 4457
2.0-2.25 5445 1.0-1.25 17552
2.5-2.75 4326 1.25-1.5 2582
3.0-3.25 2164 1.5-1.75 17960
3.5-3.75 4219 1.75-2.0 2874
4.0-4.25 5027 2.0-2.25 10404
4.5-4.75 4261 2.25-2.5 16902
5.0-5.25 4163 2.5-2.75 9992
5.5-5.75 3254 2.75-3.0 6601
6.0-6.25 4120 3.0-3.25 5174
6.5-6.75 3513 3.25-3.5 5697
7.0-7.25 4382 3.5-3.75 4695
7.25-7.5 4454 3.75-4.0 7918
7.5-7.75 4765 4.0-4.25 8073
8.0-8.25 3480 4.25-4.5 9754
8.5-8.75 4251 4.5-4.75 10417
9.0-9.25 4018 4.75-5.0 10712
9.5-9.75 3014 5.0-5.25 9350
10.0-10.25 3247 5.25-5.5 6384
10.5-10.75 2275 5.5-5.75 7828

48
Appendix 4 – Eabamet Inferred Chlorophyll-a This appendix contains the inferred chlorophyll-a output for the Eabamet Lake
sediment core.
Figure A.4: Inferred chlorophyll-a (mg/g dry wt) over the length of the analyzed sediment
core in Eabamet Lake. Detection point for NIRS-spectroscopy is 0.01 mg/g dry
wt.

Appendix 5 – Raw Data This appendix contains the raw subfossil counts for McFaulds Lake and Eabamet Lake over the length of the analyzed
sediment. It also includes the raw 210
Pb decay values and chlorophyll-a output for both lakes.
Table A.5a: McFaulds Lake cladoceran taxa and subfossil raw counts. H= headshield, C= carapace, PAC= post abdominal claw,
TS= tail stem, CF= caudal furca, M= mandible, BES= basal exopodite segment.

50
Table A.5a: (Continued)

51
Table A.5b: Eabamet Lake cladoceran taxa and subfossil raw counts. H= headshield, C= carapace, PAC= post abdominal claw,
TS= tail stem, CF= caudal furca, M= mandible, BES= basal exopodite segment.

52
Table A.5b: (Continued)

53
Table A.5c: Radioisotope 210
Pb dating and chlorophyll-a raw data for Eabamet and McFaulds lakes.