Embed Size (px)
Citation preview
CityMatCH / NACCHO Emerging Issues in Maternal and Child Health Conference Call
Impact of Healthy Weight in Mothers on Birth Outcomes
August 19, 2004
Siobhan Dolan, MD, MPH
Assistant Medical DirectorMarch of Dimes Birth Defects Foundation, White Plains, NY
Assistant Professor of Obstetrics & Gynecology and Women’s Health Albert Einstein College of Medicine, Bronx, NY
[email protected] 914-997-4788
1991 1995
2002
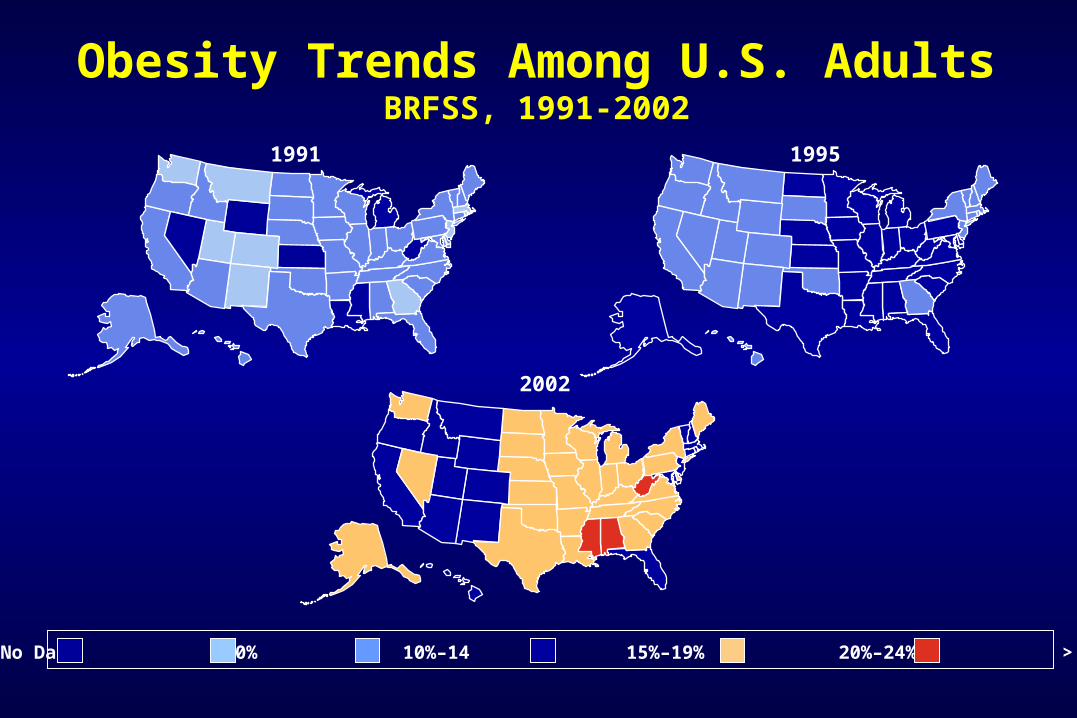
Obesity Trends Among U.S. AdultsBRFSS, 1991-2002
No Data <10% 10%–14 15%–19% 20%–24% > 25%
%
Ob
ese
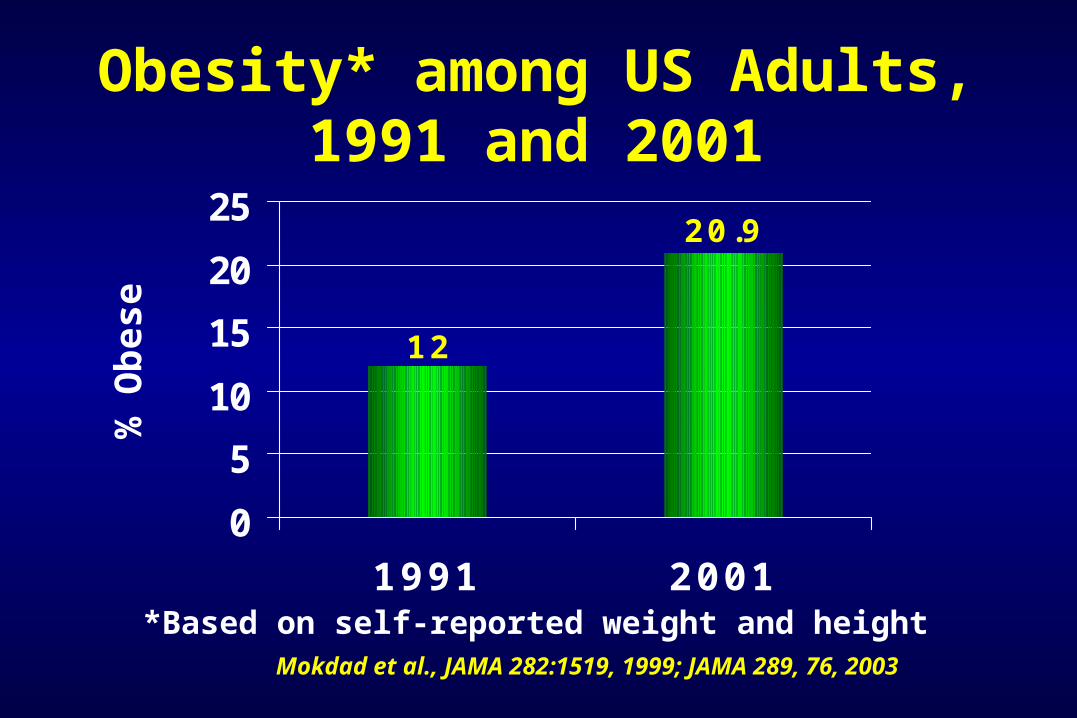
*Based on self-reported weight and heightMokdad et al., JAMA 282:1519, 1999; JAMA 289, 76, 2003
Obesity* among US Adults,1991 and 2001
20.9
12
0
5
10
15
20
25
1991 2001
Overweight (BMI 25-
29.9)22%
Under/Average Weight
(BMI < 25)56%
Obese(BMI >= 30)
22%
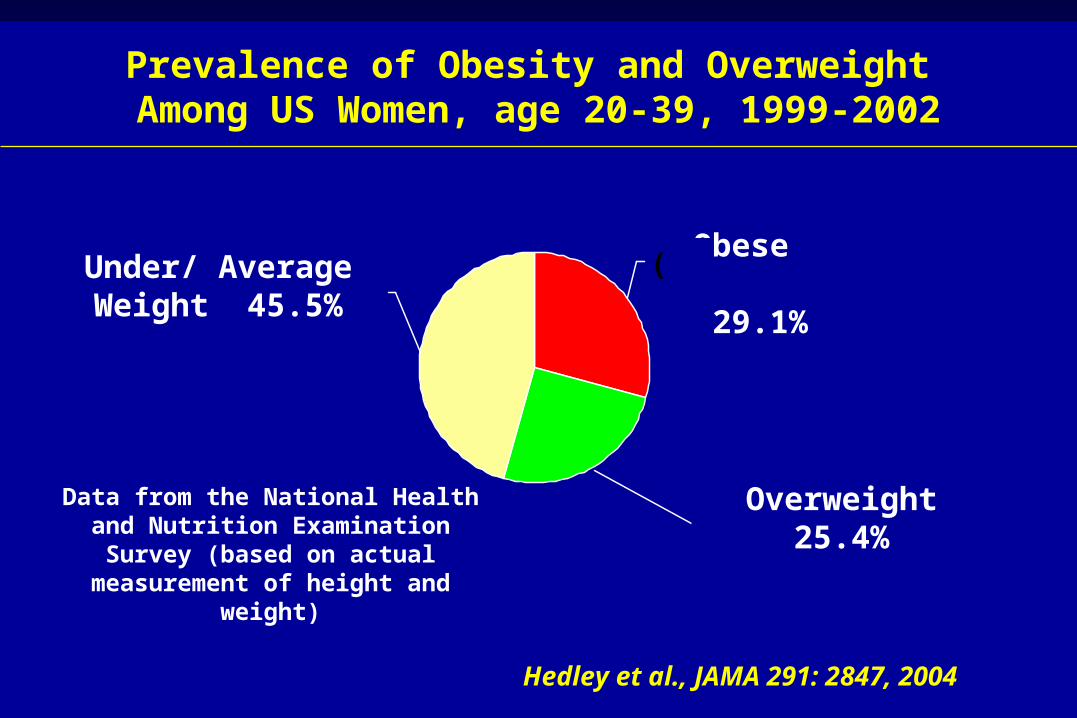
Prevalence of Obesity and Overweight Among US Women, age 20-39, 1999-2002
Data from the National Health and Nutrition Examination Survey (based on actual
measurement of height and weight)
Hedley et al., JAMA 291: 2847, 2004
Overweight 25.4%
Overweight 25.4%
Obese 29.1%
Under/ Average Weight 45.5%
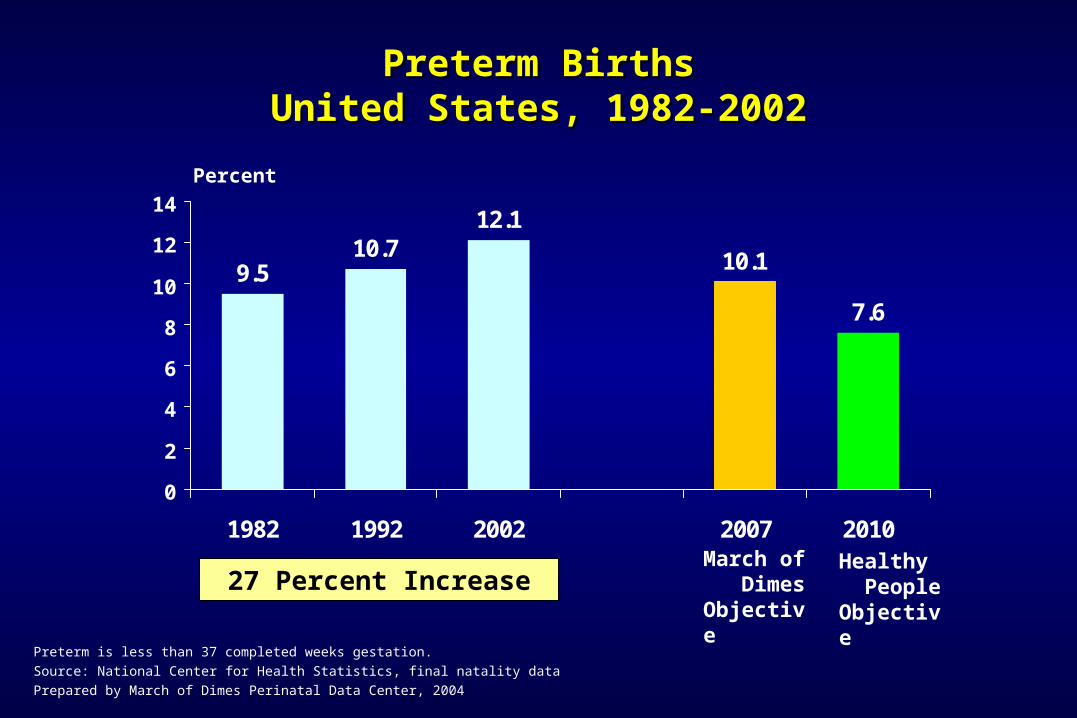
9.510.7
12.1
10.1
7.6
0
2
4
6
8
10
12
14
1982 1992 2002 2007 2010
Preterm BirthsPreterm BirthsUnited States, 1982-2002United States, 1982-2002
Preterm is less than 37 completed weeks gestation.
Source: National Center for Health Statistics, final natality data
Prepared by March of Dimes Perinatal Data Center, 2004
Percent
Healthy People Objective
March of Dimes Objective
27 Percent Increase
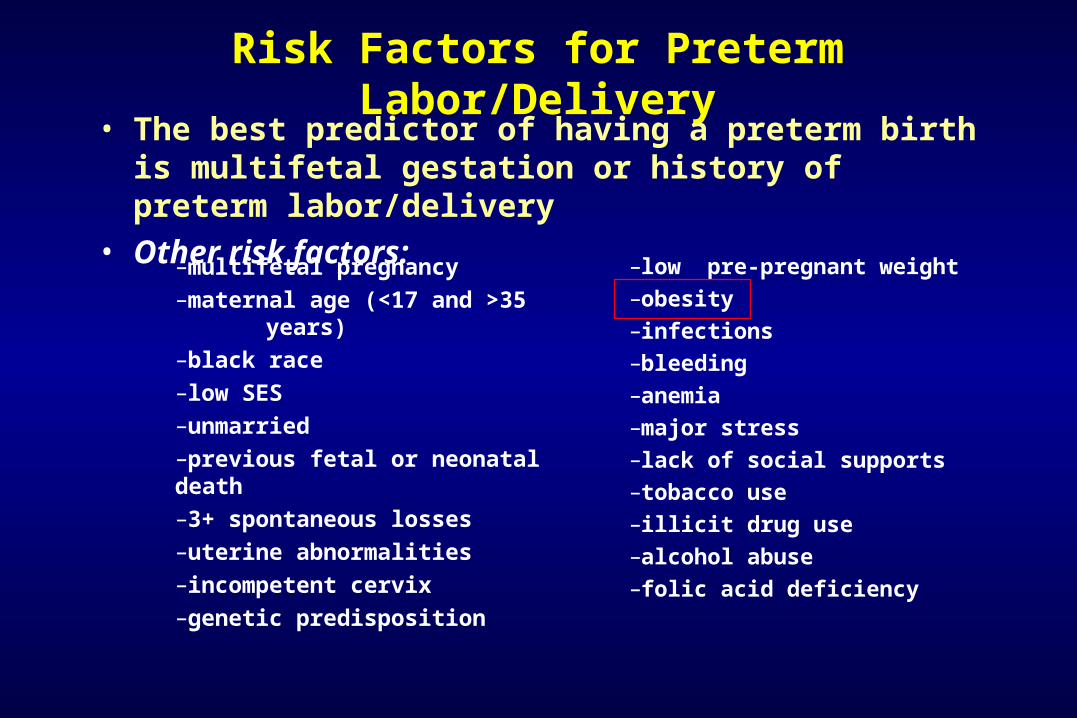
Risk Factors for Preterm Labor/Delivery• The best predictor of having a preterm birth is multifetal
gestation or history of preterm labor/delivery • Other risk factors:
–multifetal pregnancy
–maternal age (<17 and >35 years)
–black race
–low SES
–unmarried
–previous fetal or neonatal death
–3+ spontaneous losses
–uterine abnormalities
–incompetent cervix
–genetic predisposition
–low pre-pregnant weight
–obesity
–infections
–bleeding
–anemia
–major stress
–lack of social supports
–tobacco use
–illicit drug use
–alcohol abuse
–folic acid deficiency
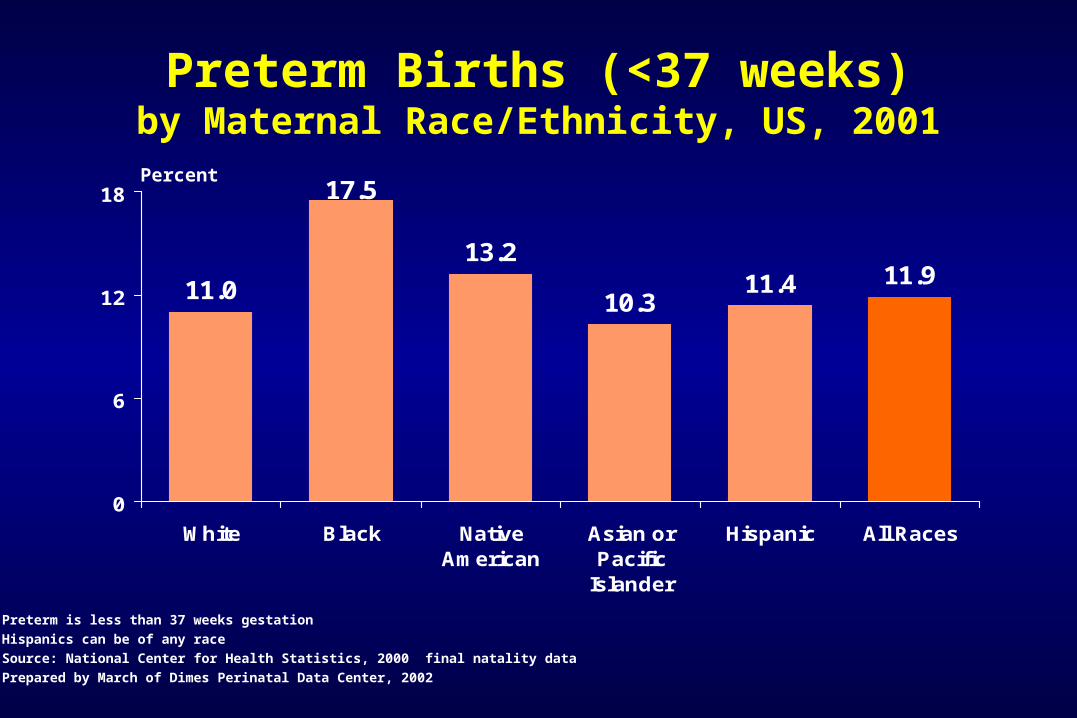
Preterm Births (<37 weeks)by Maternal Race/Ethnicity, US, 2001
11.0
17.5
13.2
10.311.4 11.9
0
6
12
18
White Black NativeAmerican
Asian orPacific
Islander
Hispanic All Races
Percent
Preterm is less than 37 weeks gestation
Hispanics can be of any race
Source: National Center for Health Statistics, 2000 final natality data
Prepared by March of Dimes Perinatal Data Center, 2002
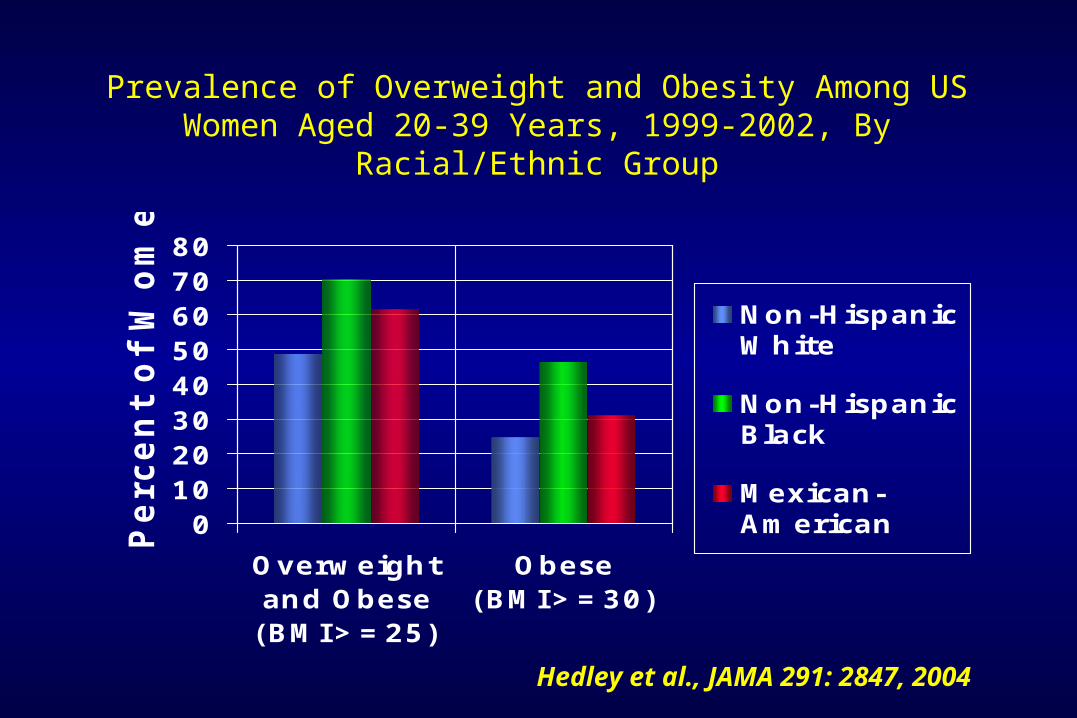
Prevalence of Overweight and Obesity Among US Women Aged 20-39 Years, 1999-2002, By Racial/Ethnic Group
01020304050607080
Overweightand Obese(BMI>=25)
Obese(BMI>=30)
Perc
en
t of
Wom
en
Non-HispanicWhite
Non-HispanicBlack
Mexican-American
Hedley et al., JAMA 291: 2847, 2004

What is the Impact of Healthy Weight in Mothers
on Birth Outcomes?
What is the impact of obesity and overweight on birth outcomes?
What is the impact of underweight on birth outcomes?
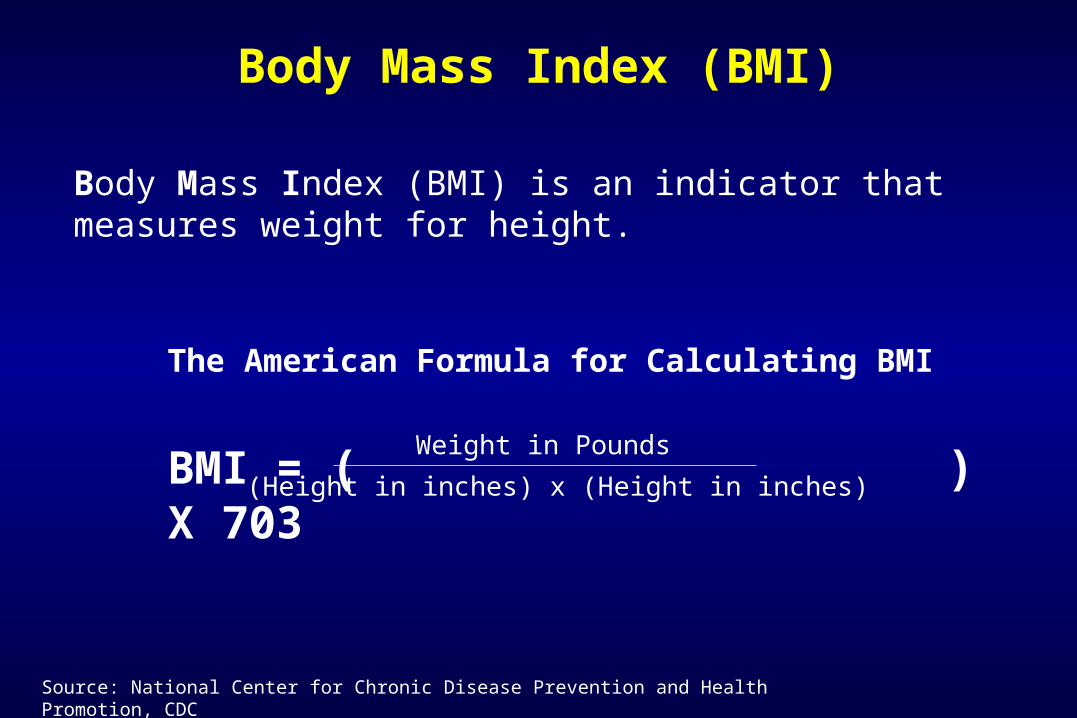
Body Mass Index (BMI) is an indicator that measures weight for height.
Body Mass Index (BMI)
The American Formula for Calculating BMI
BMI = ( ) X 703Weight in Pounds
(Height in inches) x (Height in inches)
Source: National Center for Chronic Disease Prevention and Health Promotion, CDC
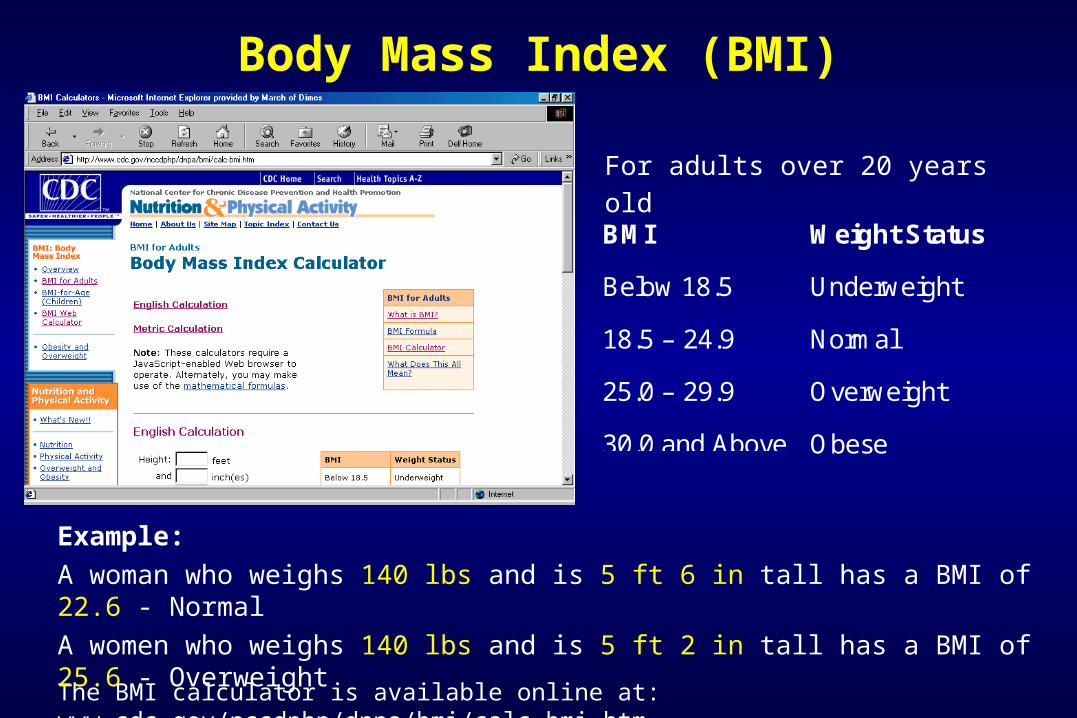
Body Mass Index (BMI)
The BMI calculator is available online at: www.cdc.gov/nccdphp/dnpa/bmi/calc-bmi.htm
Example:
A woman who weighs 140 lbs and is 5 ft 6 in tall has a BMI of 22.6 - Normal
A women who weighs 140 lbs and is 5 ft 2 in tall has a BMI of 25.6 - Overweight
For adults over 20 years old
BMI Weight Status
Below 18.5 Underweight
18.5 – 24.9 Normal
25.0 – 29.9 Overweight
30.0 and Above Obese
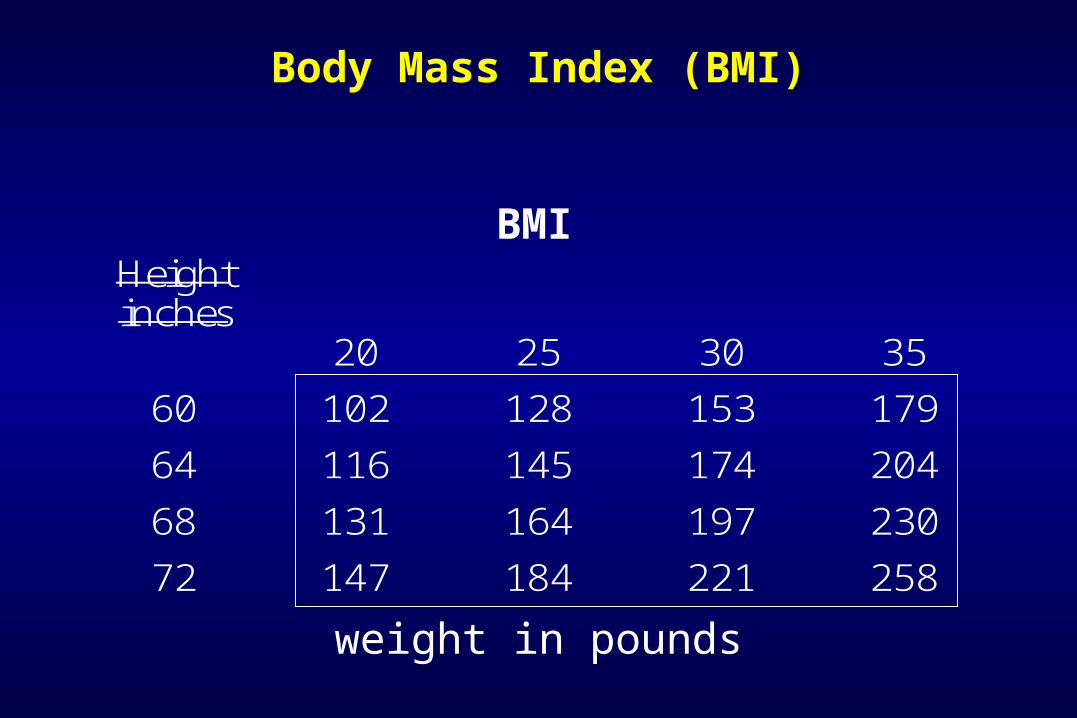
Body Mass Index (BMI)
Height inches
20 25 30 35
60 102 128 153 179
64 116 145 174 204
68 131 164 197 230
72 147 184 221 258
weight in pounds
BMI
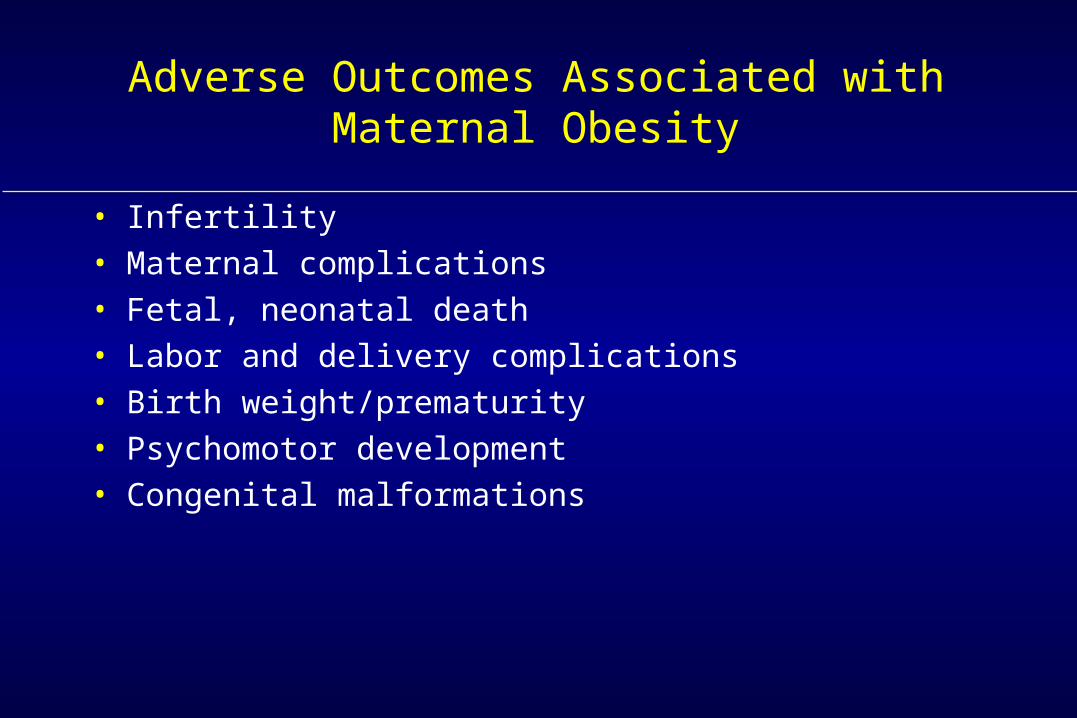
Adverse Outcomes Associated with Maternal Obesity
• Infertility• Maternal complications• Fetal, neonatal death• Labor and delivery complications• Birth weight/prematurity• Psychomotor development• Congenital malformations
0
1
2
3
4
5
Gestationaldiabetes
Preeclampsia Eclampsia
Ad
juste
d O
dd
s R
ati
o
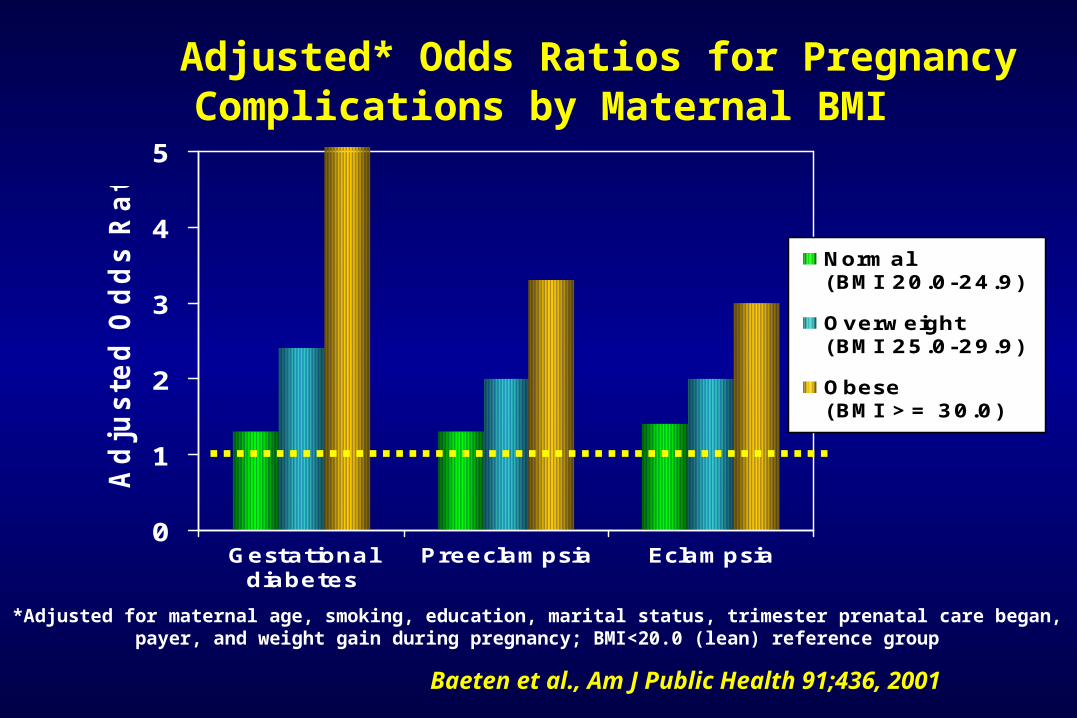
Normal (BMI 20.0-24.9)
Overweight (BMI 25.0-29.9)
Obese (BMI >= 30.0)
Adjusted* Odds Ratios for Pregnancy Complications by Maternal BMI
Baeten et al., Am J Public Health 91;436, 2001
*Adjusted for maternal age, smoking, education, marital status, trimester prenatal care began, payer, and weight gain during pregnancy; BMI<20.0 (lean) reference group
Maternal Morbid Obesity and Risk of Adverse Pregnancy Outcome
• Prospective population-based cohort study in Sweden 1992-2001
• Maternal height and weight recorded in early pregnancy on 805,275 women
• Perinatal outcome of singletons born to women without insulin-dependent diabetes mellitus evaluated
Cedergren, Obstet Gyn 103:219, 2004
• Large numbers of obese women
– 69,143 with mild obesity (BMI 29.1-35)
– 12,698 with moderate obesity (BMI 35.1-40)
– 3,480 with morbid obesity (BMI> 40)
• Normal weight category (BMI 19.8-26) used as referent
• Maternal age, parity, smoking, year of birth, and maternal education included as covariates
Cedergren, Obstet Gyn 103:219, 2004
Maternal Morbid Obesity and Risk of Adverse Pregnancy Outcome
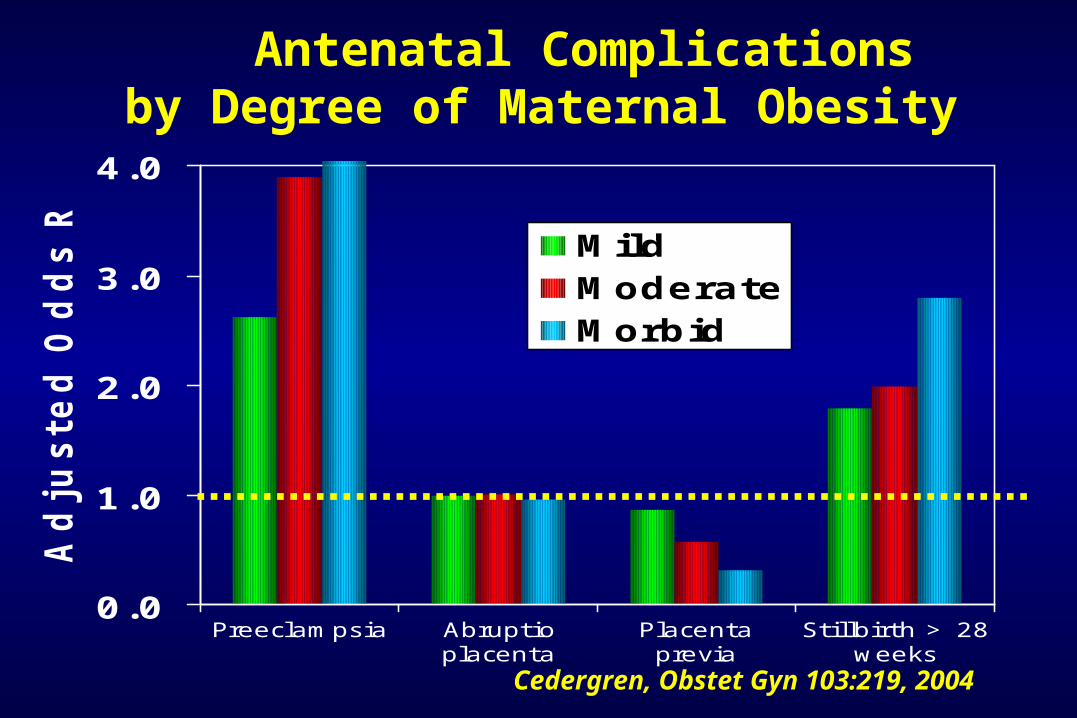
0.0
1.0
2.0
3.0
4.0
Preeclampsia Abruptioplacenta
Placentaprevia
Stillbirth > 28weeks
Ad
juste
d O
dd
s R
ati
o
MildModerateMorbid
Antenatal Complications by Degree of Maternal Obesity
Cedergren, Obstet Gyn 103:219, 2004
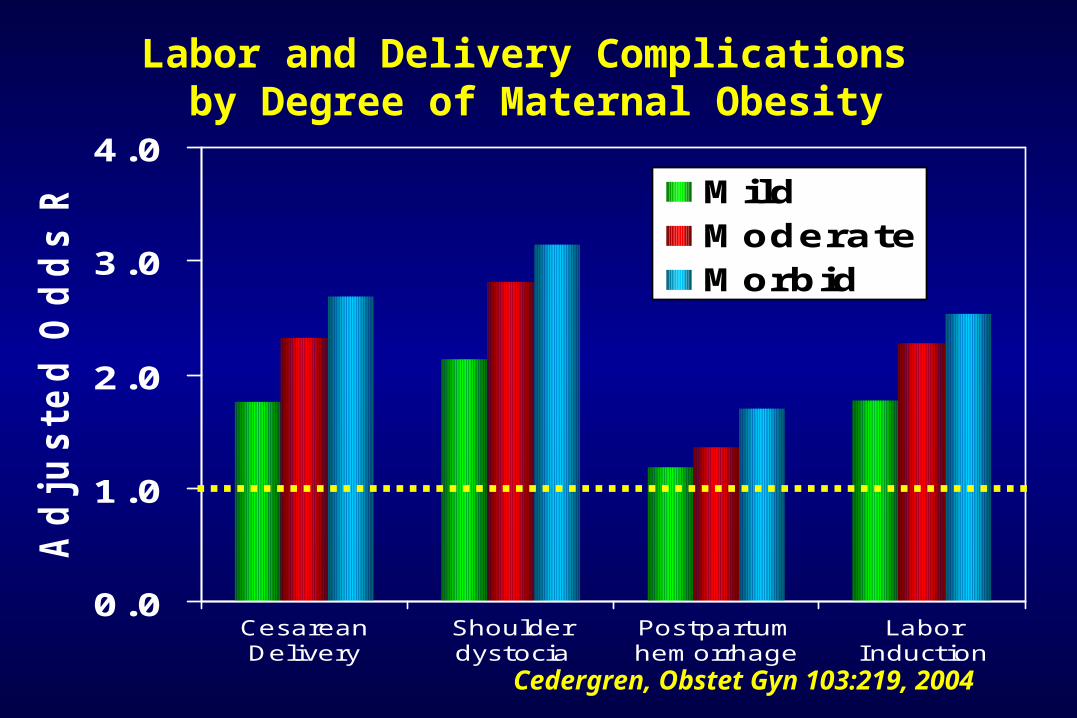
0.0
1.0
2.0
3.0
4.0
CesareanDelivery
Shoulderdystocia
Postpartumhemorrhage
LaborInduction
Ad
justed
Od
ds R
atio
MildModerateMorbid
Labor and Delivery Complications by Degree of Maternal Obesity
Cedergren, Obstet Gyn 103:219, 2004
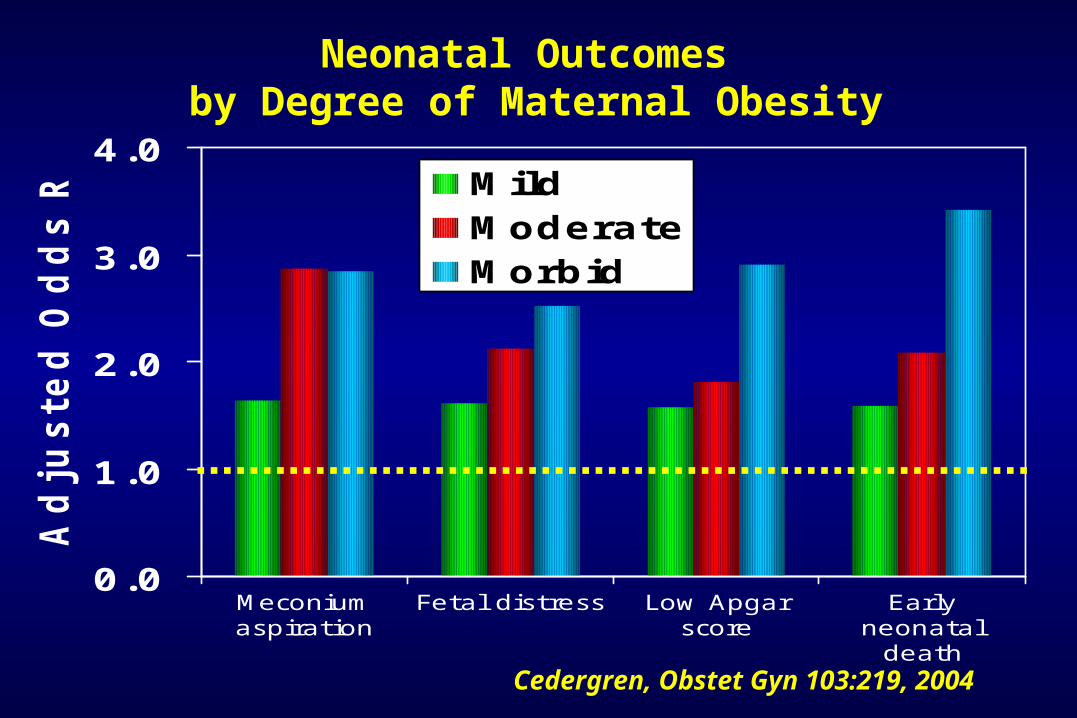
0.0
1.0
2.0
3.0
4.0
Meconiumaspiration
Fetal distress Low Apgarscore
Earlyneonatal
death
Ad
justed
Od
ds R
atio
MildModerateMorbid
Neonatal Outcomes by Degree of Maternal Obesity
Cedergren, Obstet Gyn 103:219, 2004
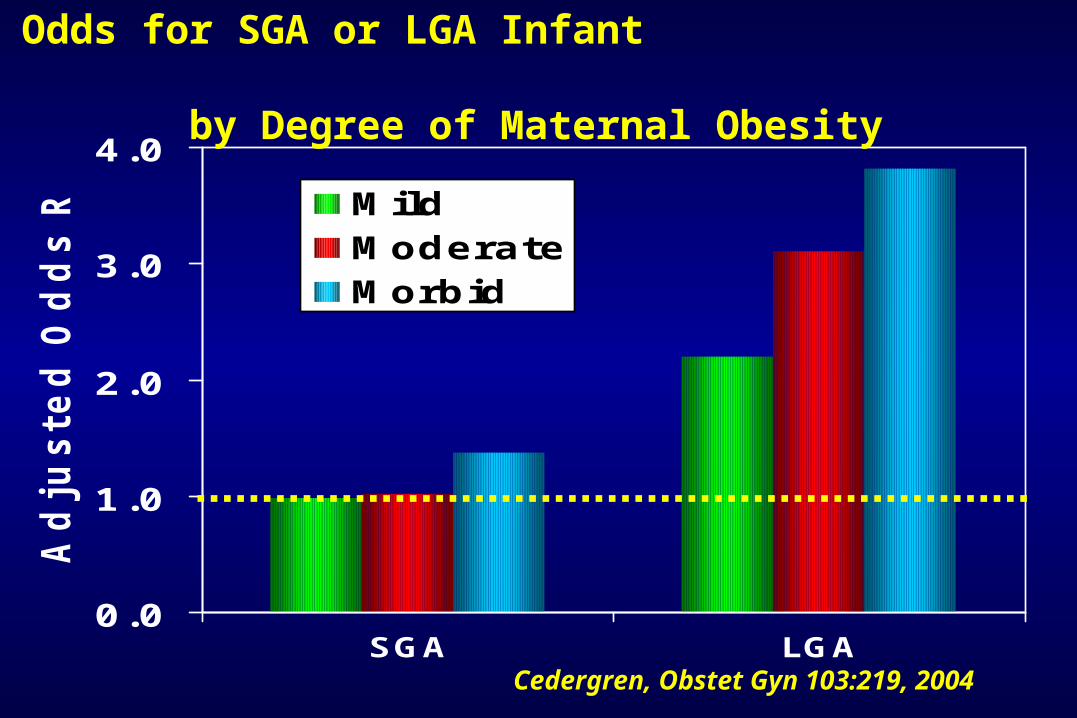
0.0
1.0
2.0
3.0
4.0
SGA LGA
Ad
justed
Od
ds R
atio
MildModerateMorbid
Odds for SGA or LGA Infant by Degree of Maternal Obesity
Cedergren, Obstet Gyn 103:219, 2004
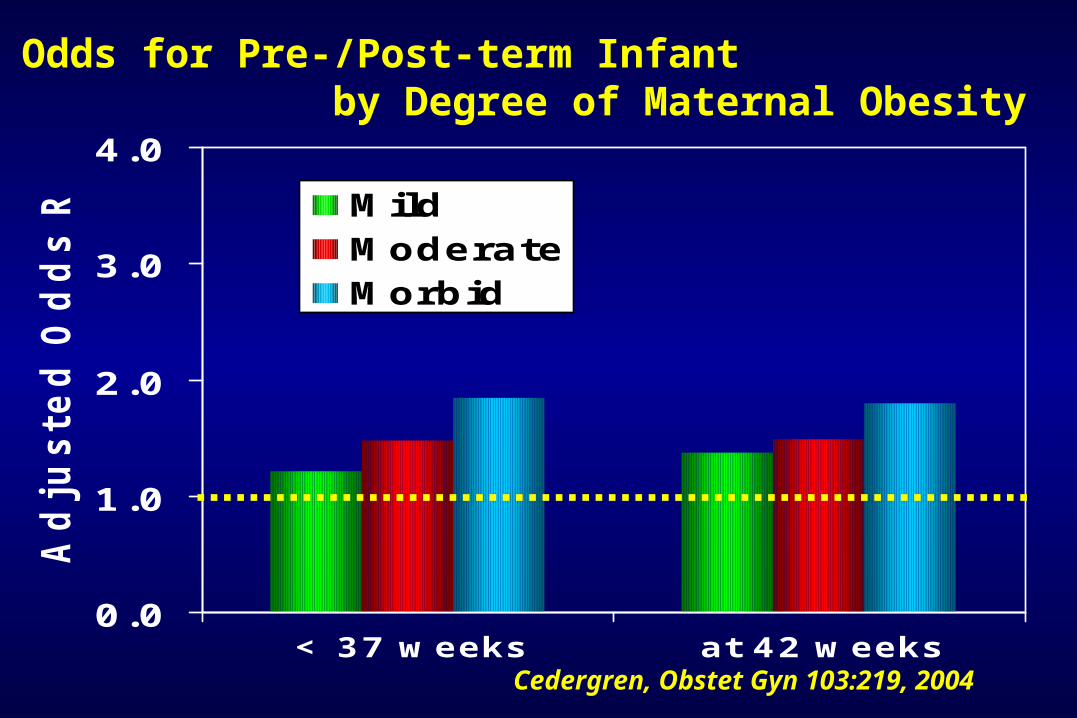
0.0
1.0
2.0
3.0
4.0
< 37 weeks at 42 weeks
Ad
justed
Od
ds R
atio
MildModerateMorbid
Odds for Pre-/Post-term Infant by Degree of Maternal Obesity
Cedergren, Obstet Gyn 103:219, 2004
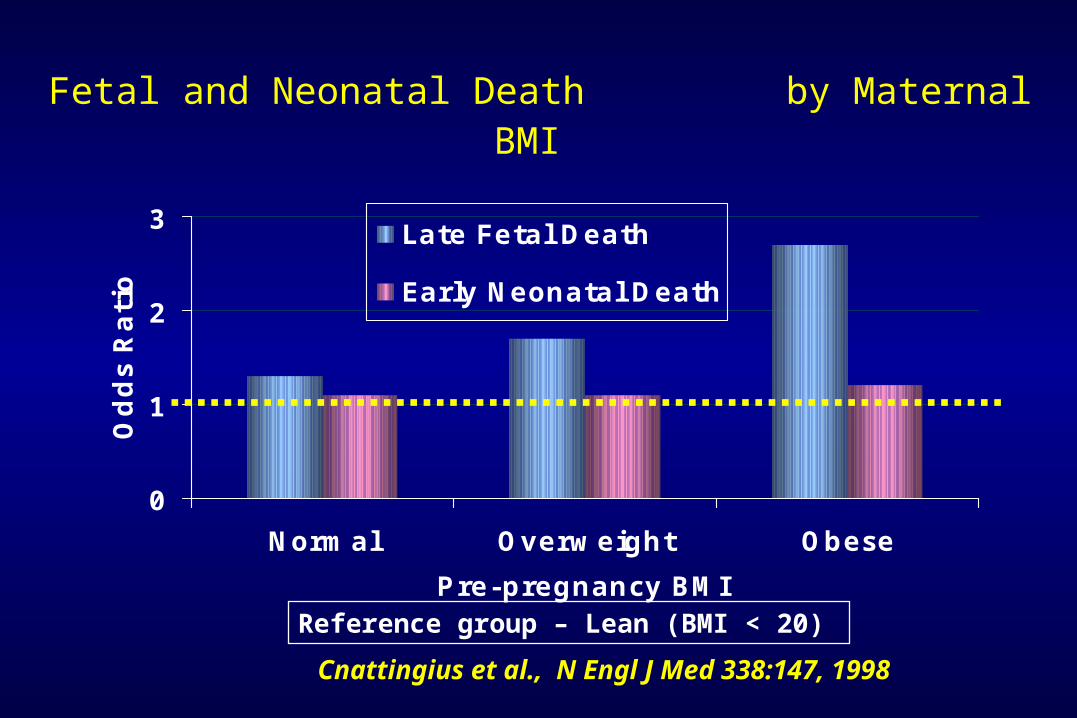
Fetal and Neonatal Death by Maternal BMI
0
1
2
3
Normal Overweight Obese
Pre-pregnancy BMI
Od
ds R
ati
o
Late Fetal Death
Early Neonatal Death
Cnattingius et al., N Engl J Med 338:147, 1998
Reference group – Lean (BMI < 20)
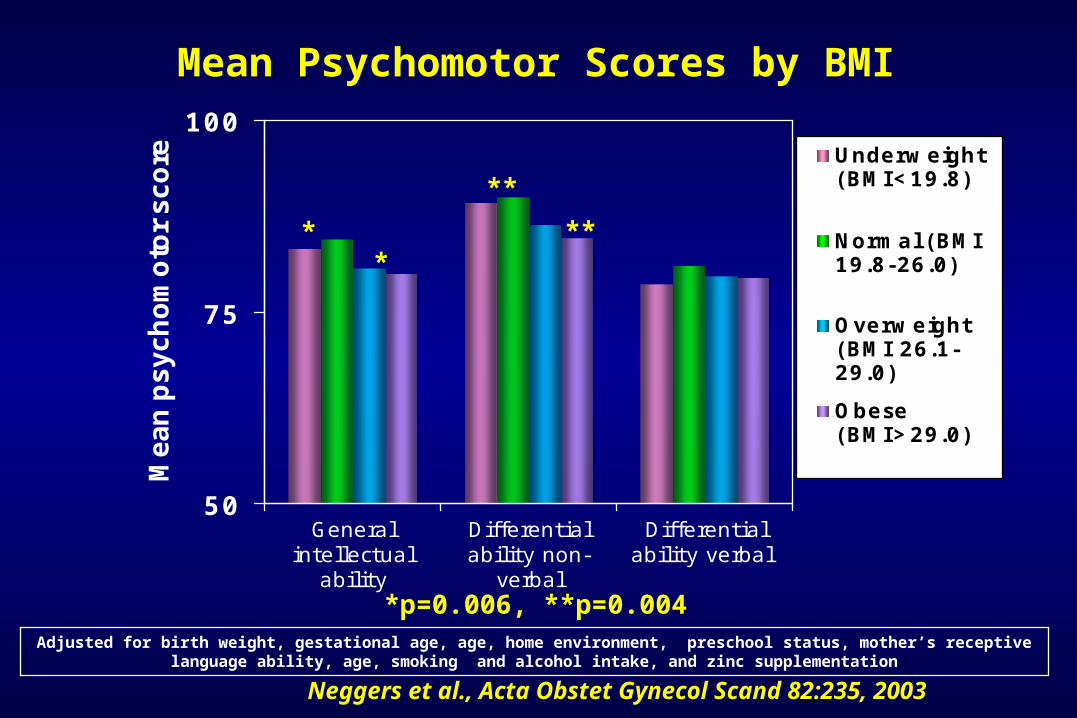
50
75
100
Generalintellectual
ability
Differentialability non-
verbal
Differentialability verbal
Me
an
ps
yc
ho
mo
tor
sc
ore Underweight
(BMI<19.8)
Normal (BMI19.8-26.0)
Overweight(BMI 26.1-29.0)
Obese(BMI>29.0)
Mean Psychomotor Scores by BMI
Neggers et al., Acta Obstet Gynecol Scand 82:235, 2003
**
**
**
*p=0.006, **p=0.004Adjusted for birth weight, gestational age, age, home environment, preschool status, mother’s receptive
language ability, age, smoking and alcohol intake, and zinc supplementation

Risk for Birth Defects
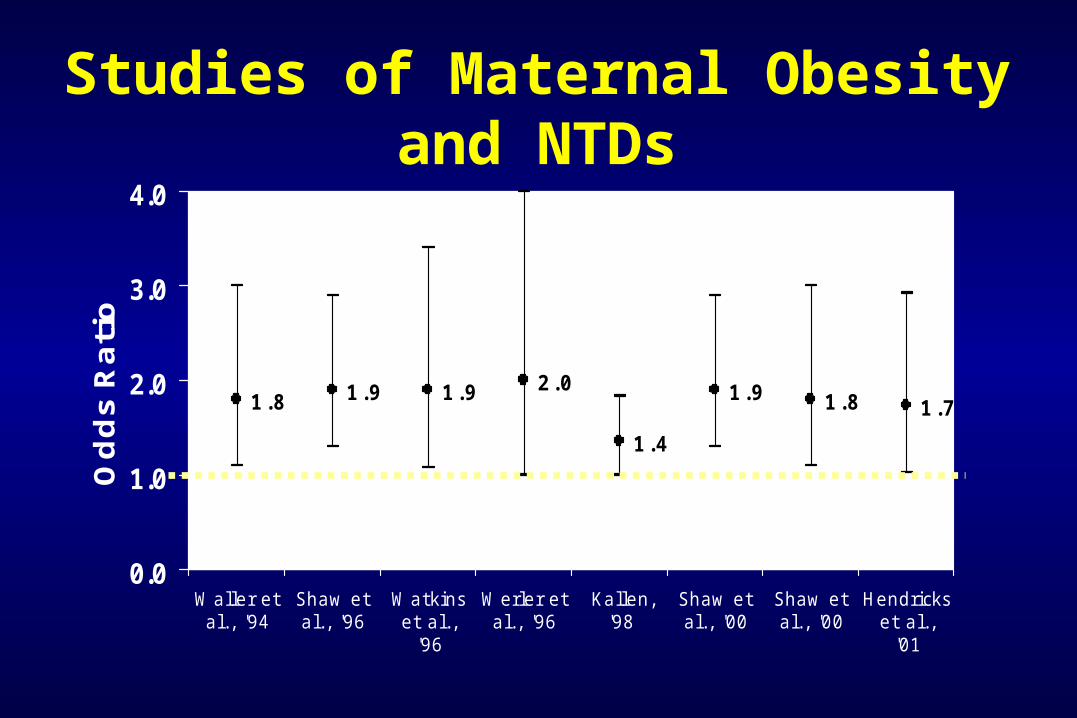
1.8 1.9 1.9 2.0
1.4
1.9 1.8 1.7
0.0
1.0
2.0
3.0
4.0
Waller etal., '94
Shaw etal., '96
Watkinset al.,
'96
Werler etal., '96
Kallen, '98
Shaw etal., '00
Shaw etal., '00
Hendrickset al.,
'01
Od
ds
Ra
tio
Studies of Maternal Obesity and NTDs
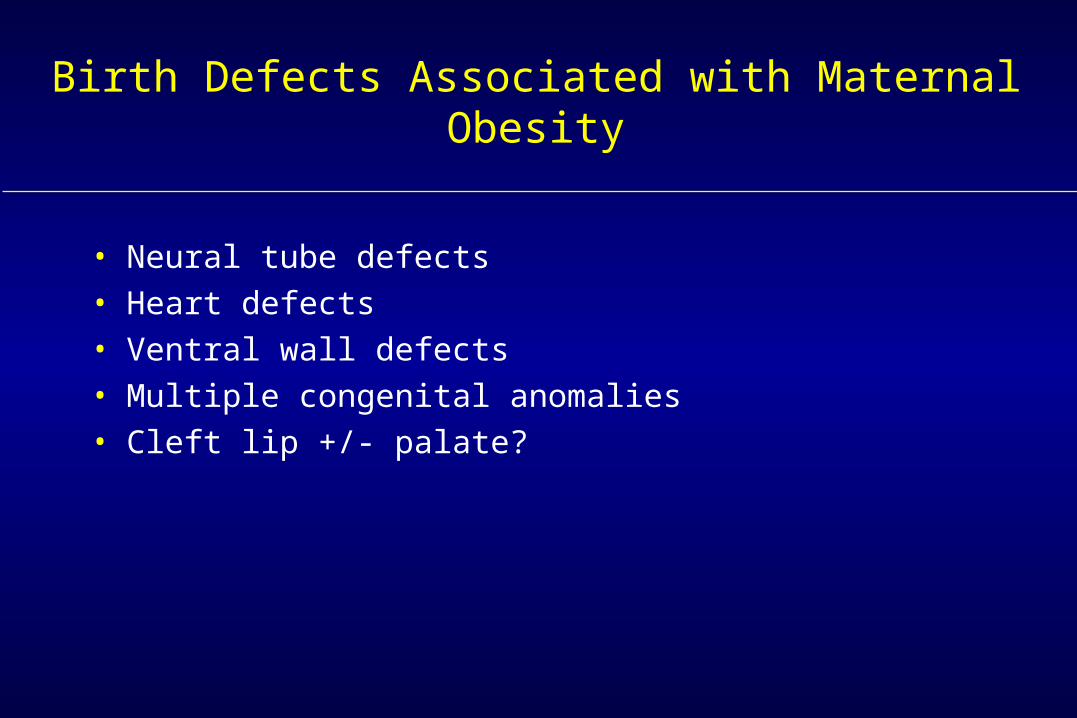
Birth Defects Associated with Maternal Obesity
• Neural tube defects• Heart defects• Ventral wall defects• Multiple congenital anomalies• Cleft lip +/- palate?
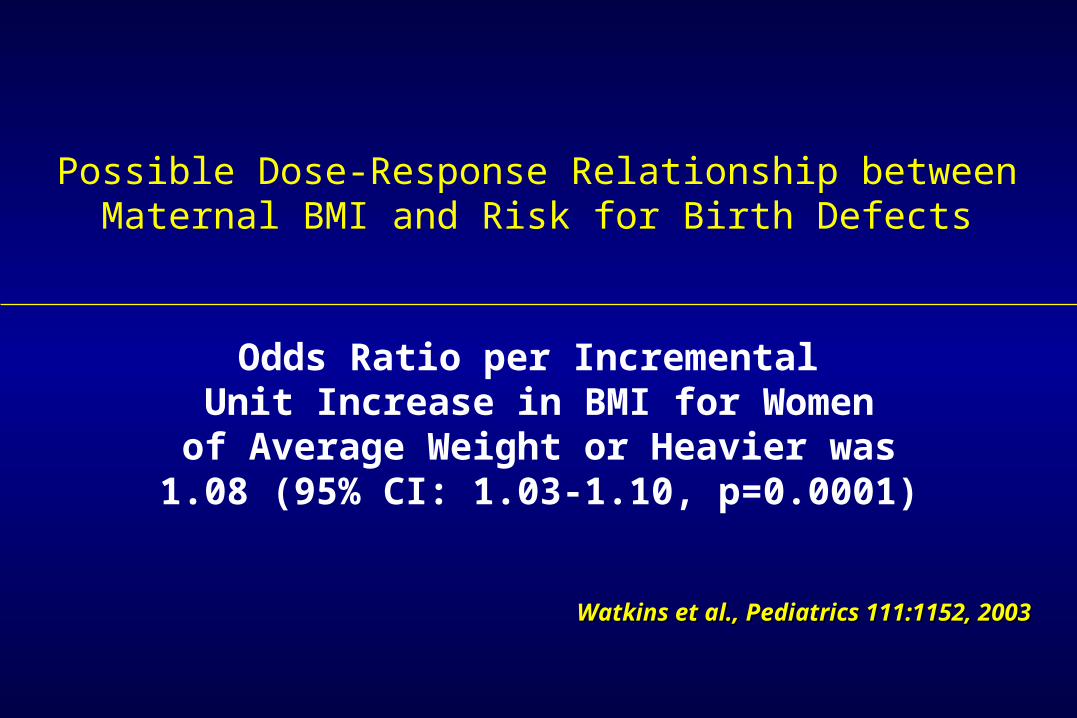
Possible Dose-Response Relationship between Maternal BMI and Risk for Birth Defects
Watkins et al., Pediatrics 111:1152, 2003Watkins et al., Pediatrics 111:1152, 2003
Odds Ratio per Incremental Unit Increase in BMI for Women
of Average Weight or Heavier was1.08 (95% CI: 1.03-1.10, p=0.0001)
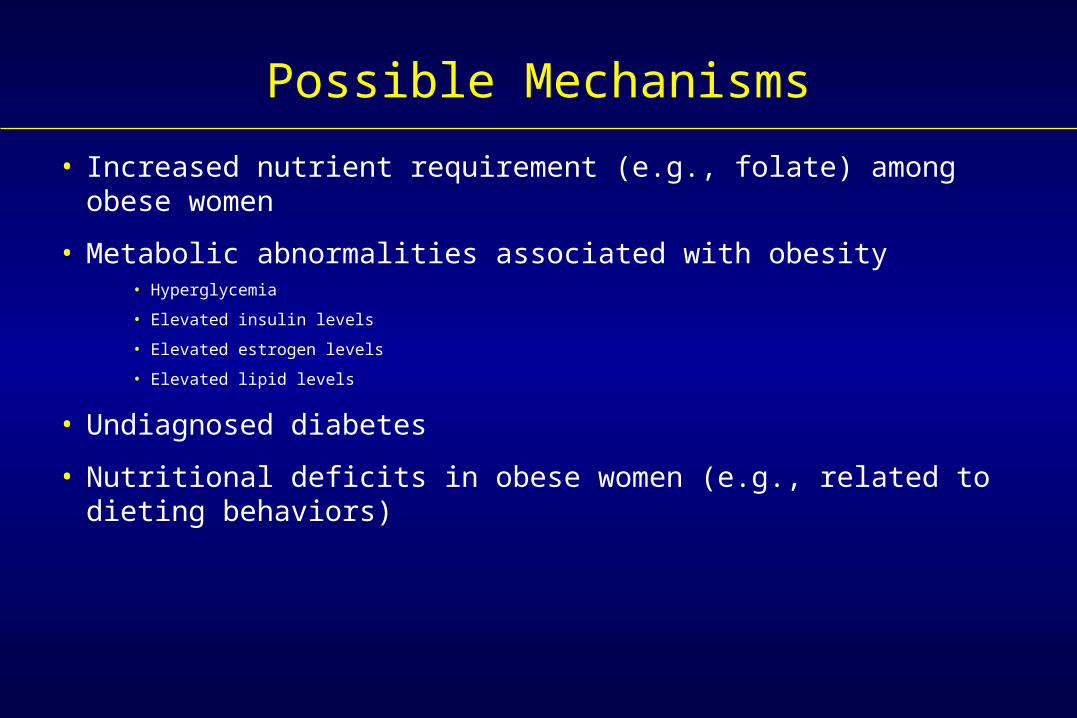
Possible Mechanisms
• Increased nutrient requirement (e.g., folate) among obese women
• Metabolic abnormalities associated with obesity• Hyperglycemia
• Elevated insulin levels
• Elevated estrogen levels
• Elevated lipid levels
• Undiagnosed diabetes
• Nutritional deficits in obese women (e.g., related to dieting behaviors)
Recommendations
WEIGHT MATTERS !!!
For your health and the health of your children
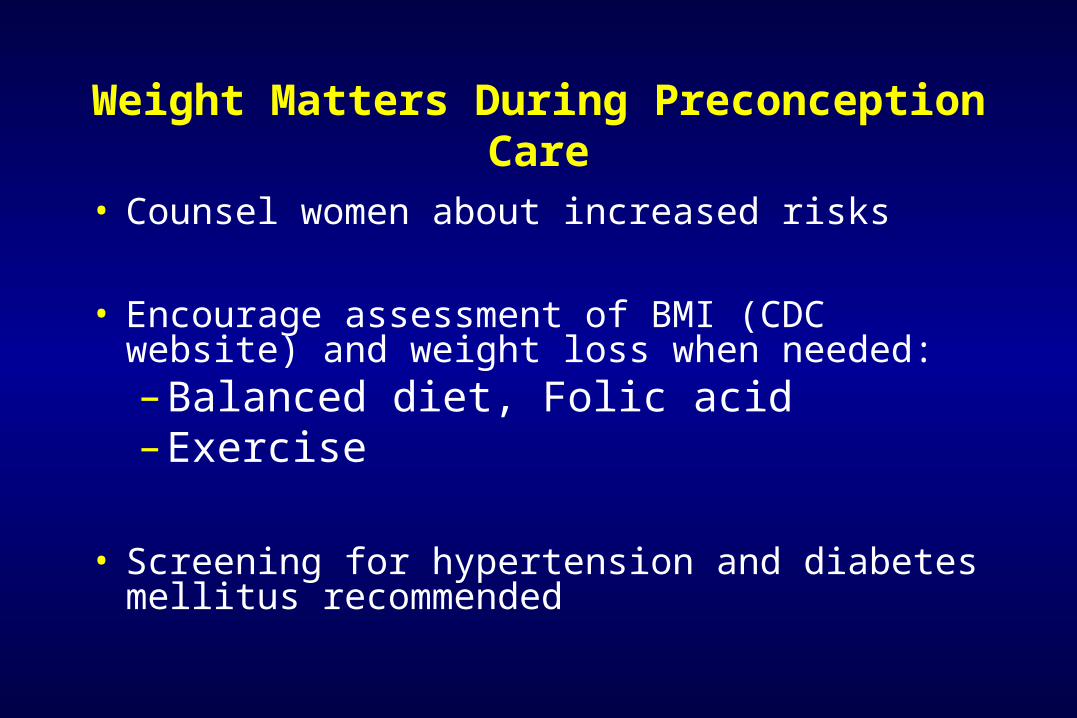
Weight Matters During Preconception Care
• Counsel women about increased risks
• Encourage assessment of BMI (CDC website) and weight loss when needed:– Balanced diet, Folic acid– Exercise
• Screening for hypertension and diabetes mellitus recommended
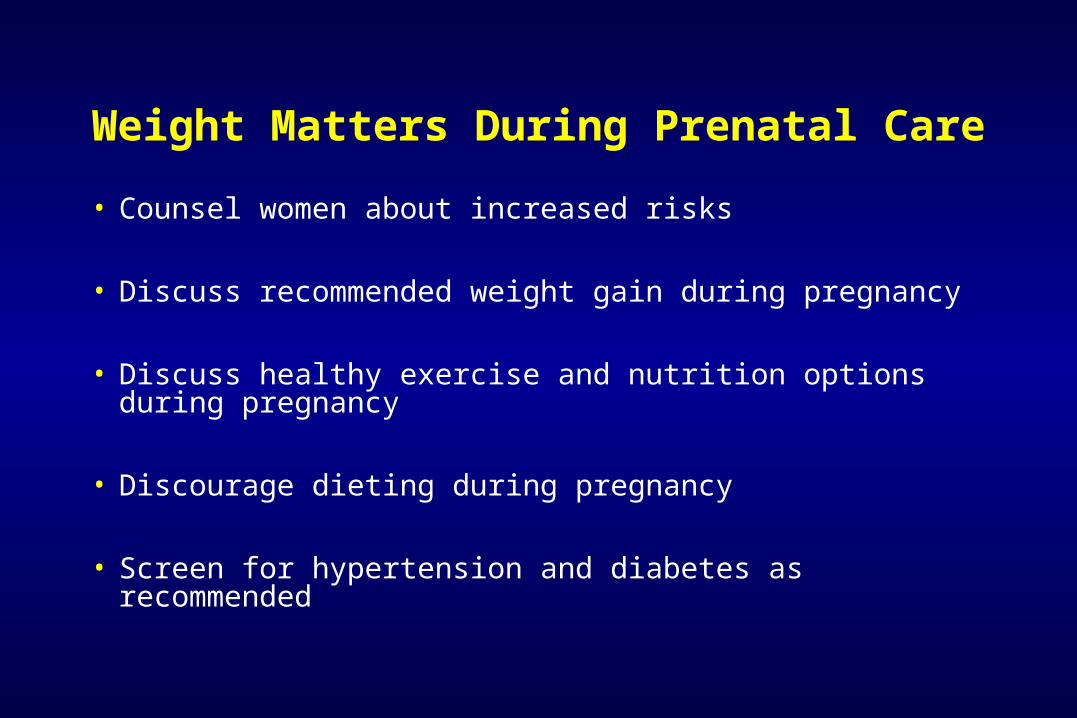
Weight Matters During Prenatal Care
• Counsel women about increased risks
• Discuss recommended weight gain during pregnancy
• Discuss healthy exercise and nutrition options during pregnancy
• Discourage dieting during pregnancy
• Screen for hypertension and diabetes as recommended
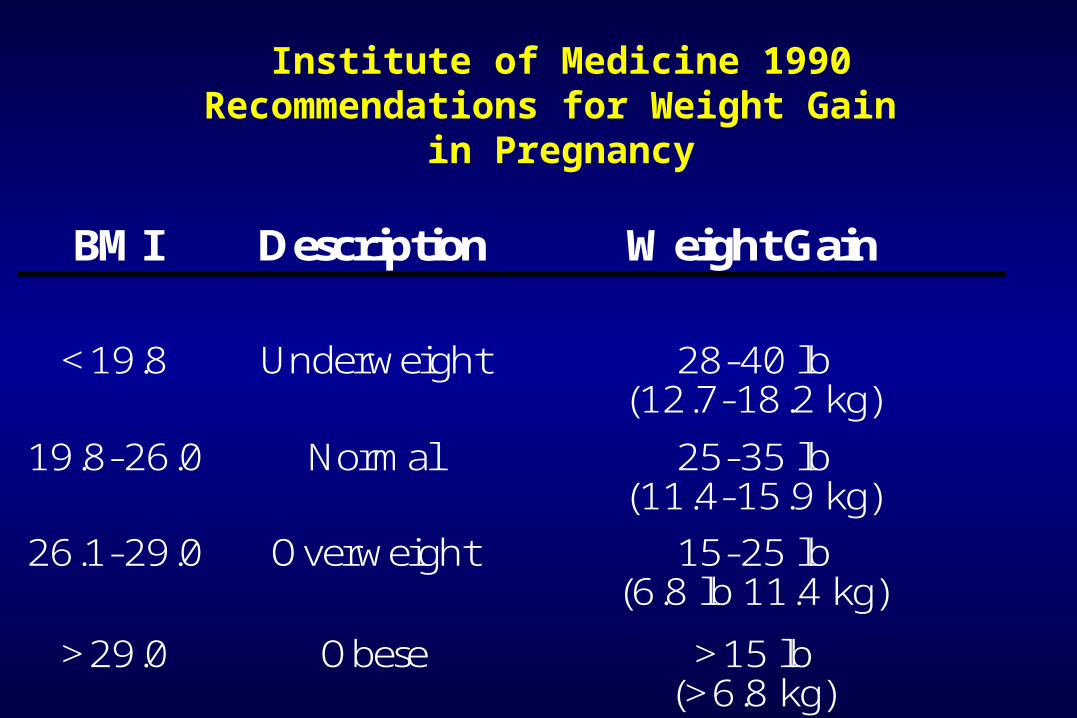
Institute of Medicine 1990Recommendations for Weight Gain
in Pregnancy
BMI Description Weight Gain
<19.8 Underweight 28-40 lb
(12.7-18.2 kg)
19.8-26.0 Normal 25-35 lb (11.4-15.9 kg)
26.1-29.0 Overweight 15-25 lb (6.8 lb 11.4 kg)
>29.0 Obese >15 lb (>6.8 kg)

This is not recommended!
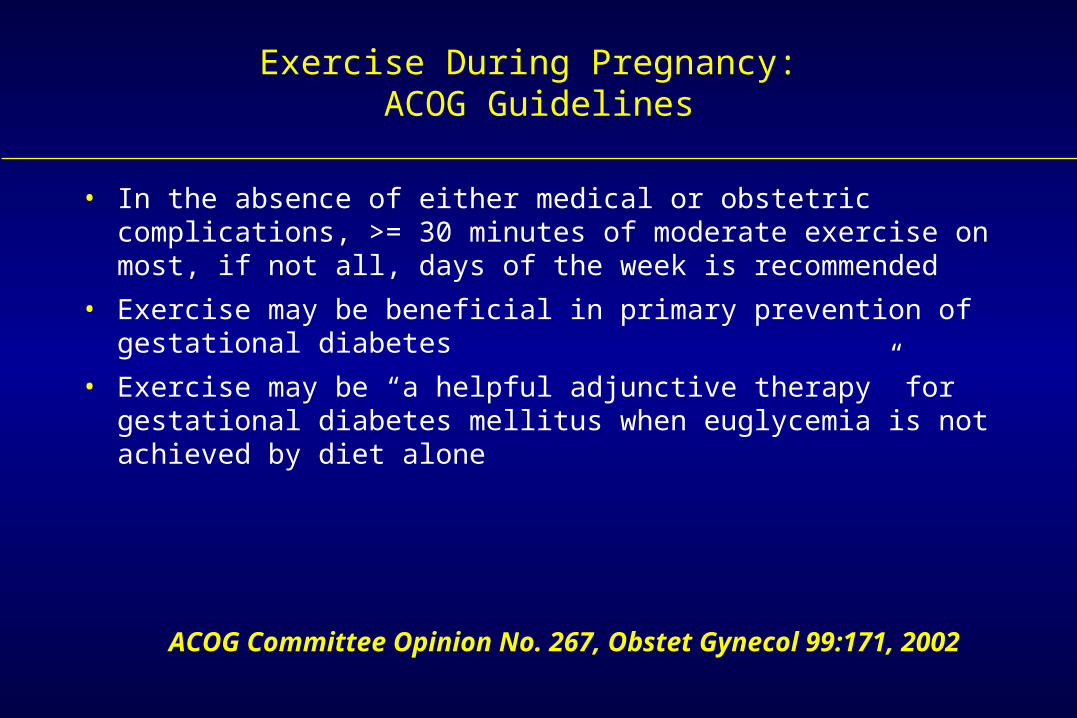
Exercise During Pregnancy: ACOG Guidelines
• In the absence of either medical or obstetric complications, >= 30 minutes of moderate exercise on most, if not all, days of the week is recommended
• Exercise may be beneficial in primary prevention of gestational diabetes
• Exercise may be “a helpful adjunctive therapy” for gestational diabetes mellitus when euglycemia is not achieved by diet alone
ACOG Committee Opinion No. 267, Obstet Gynecol 99:171, 2002
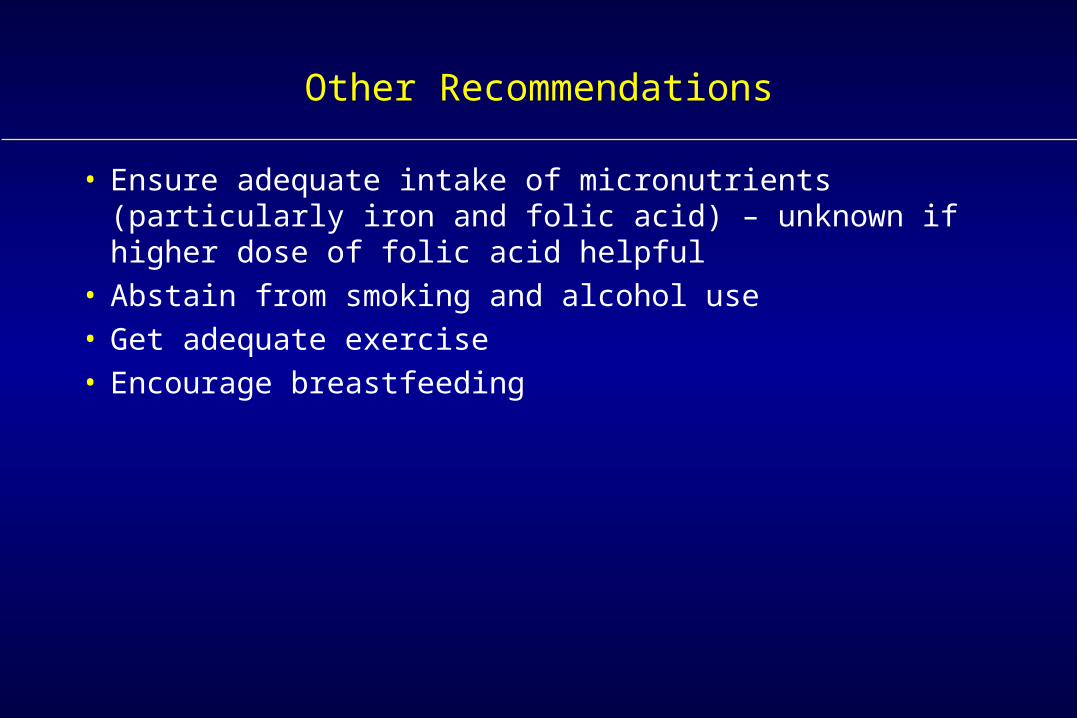
Other Recommendations
• Ensure adequate intake of micronutrients (particularly iron and folic acid) – unknown if higher dose of folic acid helpful
• Abstain from smoking and alcohol use• Get adequate exercise• Encourage breastfeeding

Special Thanks
Sonja A Rasmussen, MD, MSSonja A Rasmussen, MD, MSNational Center on Birth Defects and National Center on Birth Defects and
Developmental Disabilities, CDC, AtlantaDevelopmental Disabilities, CDC, Atlanta