Embed Size (px)
Citation preview

TECHNICAL REPORT #3 LATERAL SYSTEM ANLYSIS
CITY VISTA. BUILDING 2. 5TH AND K STREET . WASHINGTON D. C.
JULIE DAVIS
STRUCTURAL
DR. MEMARI
DECEMBER 3, 2007
1 | P a g e JULIE DAVIS CITY VISTA STRUCTURAL OPTION WASHINGTON D.C DECEMBER 3, 2007 ADVISOR: DR. MEMARI __________________________________________________________________________________________________________________
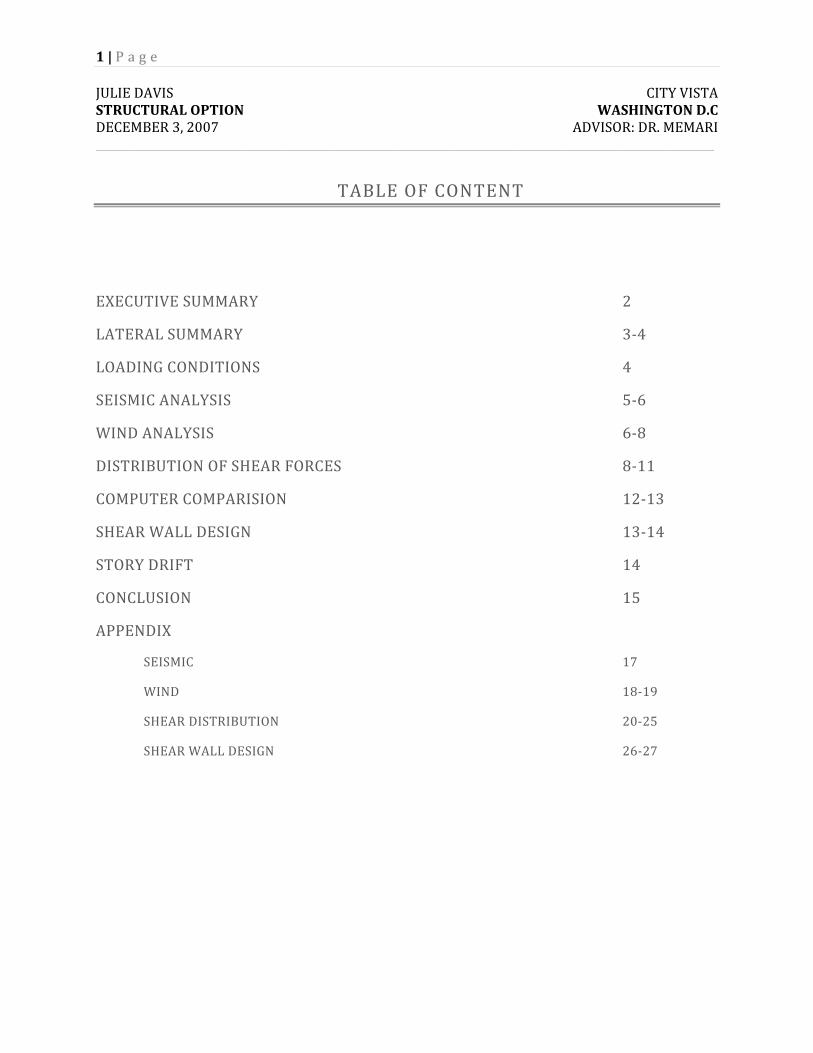
TABLE OF CONTENT
EXECUTIVE SUMMARY 2
LATERAL SUMMARY 3‐4
LOADING CONDITIONS 4
SEISMIC ANALYSIS 5‐6
WIND ANALYSIS 6‐8
DISTRIBUTION OF SHEAR FORCES 8‐11
COMPUTER COMPARISION 12‐13
SHEAR WALL DESIGN 13‐14
STORY DRIFT 14
CONCLUSION 15
APPENDIX
SEISMIC 17
WIND 18‐19
SHEAR DISTRIBUTION 20‐25
SHEAR WALL DESIGN 26‐27
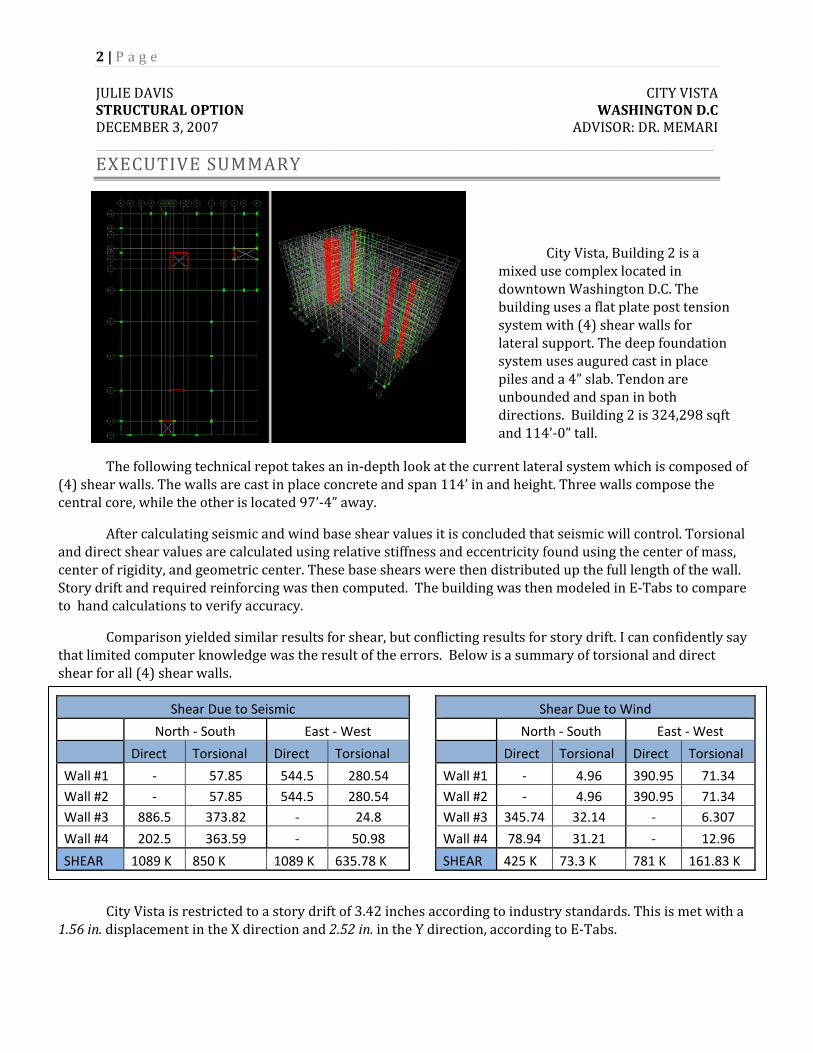
2 | P a g e JULIE DAVIS CITY VISTA STRUCTURAL OPTION WASHINGTON D.C DECEMBER 3, 2007 ADVISOR: DR. MEMARI __________________________________________________________________________________________________________________ EXECUTIVE SUMMARY
City Vista, Building 2 is a mixed use complex located in downtown Washington D.C. The building uses a flat plate post tension system with (4) shear walls for lateral support. The deep foundation system uses augured cast in place piles and a 4” slab. Tendon are unbounded and span in both directions. Building 2 is 324,298 sqft and 114’‐0” tall.
The following technical repot takes an in‐depth look at the current lateral system which is composed of (4) shear walls. The walls are cast in place concrete and span 114’ in and height. Three walls compose the central core, while the other is located 97’‐4” away.
After calculating seismic and wind base shear values it is concluded that seismic will control. Torsional and direct shear values are calculated using relative stiffness and eccentricity found using the center of mass, center of rigidity, and geometric center. These base shears were then distributed up the full length of the wall. Story drift and required reinforcing was then computed. The building was then modeled in E‐Tabs to compare to hand calculations to verify accuracy.
Comparison yielded similar results for shear, but conflicting results for story drift. I can confidently say that limited computer knowledge was the result of the errors. Below is a summary of torsional and direct shear for all (4) shear walls.
Shear Due to Seismic Shear Due to Wind
North ‐ South East ‐ West North ‐ South East ‐ West
Direct Torsional Direct Torsional Direct Torsional Direct Torsional
Wall #1 ‐ 57.85 544.5 280.54 Wall #1 ‐ 4.96 390.95 71.34 Wall #2 ‐ 57.85 544.5 280.54 Wall #2 ‐ 4.96 390.95 71.34 Wall #3 886.5 373.82 ‐ 24.8 Wall #3 345.74 32.14 ‐ 6.307
Wall #4 202.5 363.59 ‐ 50.98 Wall #4 78.94 31.21 ‐ 12.96
SHEAR 1089 K 850 K 1089 K 635.78 K SHEAR 425 K 73.3 K 781 K 161.83 K
City Vista is restricted to a story drift of 3.42 inches according to industry standards. This is met with a 1.56 in. displacement in the X direction and 2.52 in. in the Y direction, according to E‐Tabs.
3 | P a g e JULIE DASTRUCTUDECEMB___________
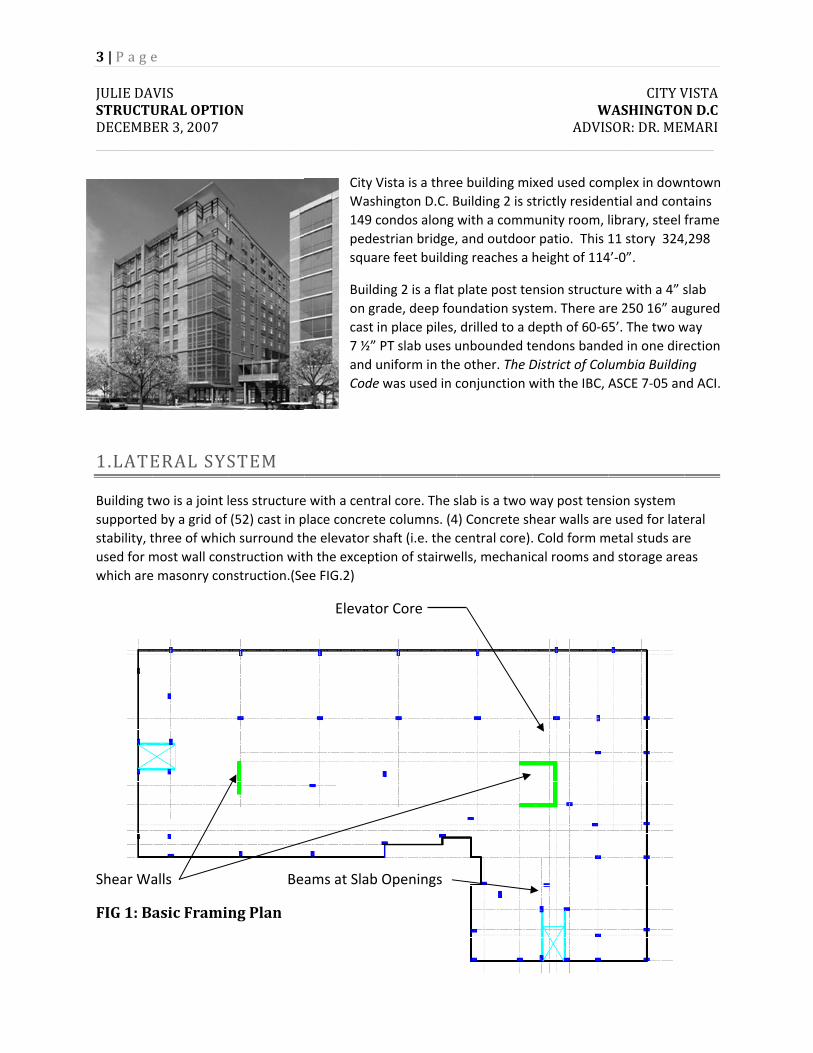
1.LATE
Building tsupportedstability, tused for mwhich are
Shear Wa
FIG 1: B
e
AVIS URAL OPTIOER 3, 2007 _______________
ERAL SYS
wo is a joint ld by a grid of three of whicmost wall cone masonry con
alls
asic Frami
ON
_______________
STEM
less structure(52) cast in ph surround thnstruction witnstruction.(Se
Be
ng Plan
_______________
e with a centrplace concretehe elevator shth the exceptee FIG.2)
Elevato
ams at Slab
City VWash149 cpedessquar
Buildon grcast i7 ½” and uCode
_______________
ral core. The se columns. (4haft (i.e. the cion of stairwe
or Core
Openings
Vista is a threhington D.C. Bcondos along strian bridge,re feet buildin
ing 2 is a flat ade, deep foun place piles,PT slab uses uuniform in thewas used in c
_______________
slab is a two w4) Concrete shcentral core).ells, mechanic
e building miBuilding 2 is swith a comm, and outdoorng reaches a
plate post teundation syst drilled to a dunbounded tee other. The Dconjunction w
WADVIS
_______________
way post tenshear walls are. Cold form mcal rooms and
xed used comtrictly residen
munity room, lr patio. This height of 114
nsion structutem. There ardepth of 60‐6endons bandDistrict of Colwith the IBC, A
CITY VWASHINGTONSOR: DR. MEM_______________
sion system e used for latemetal studs ard storage are
mplex in downntial and contlibrary, steel 11 story 3244’‐0”.
ure with a 4” sre 250 16” au5’. The two wed in one direumbia BuildinASCE 7‐05 an
VISTA N D.C MARI ______
eral e eas
ntown tains frame ,298
slab ugured way ection ng nd ACI.
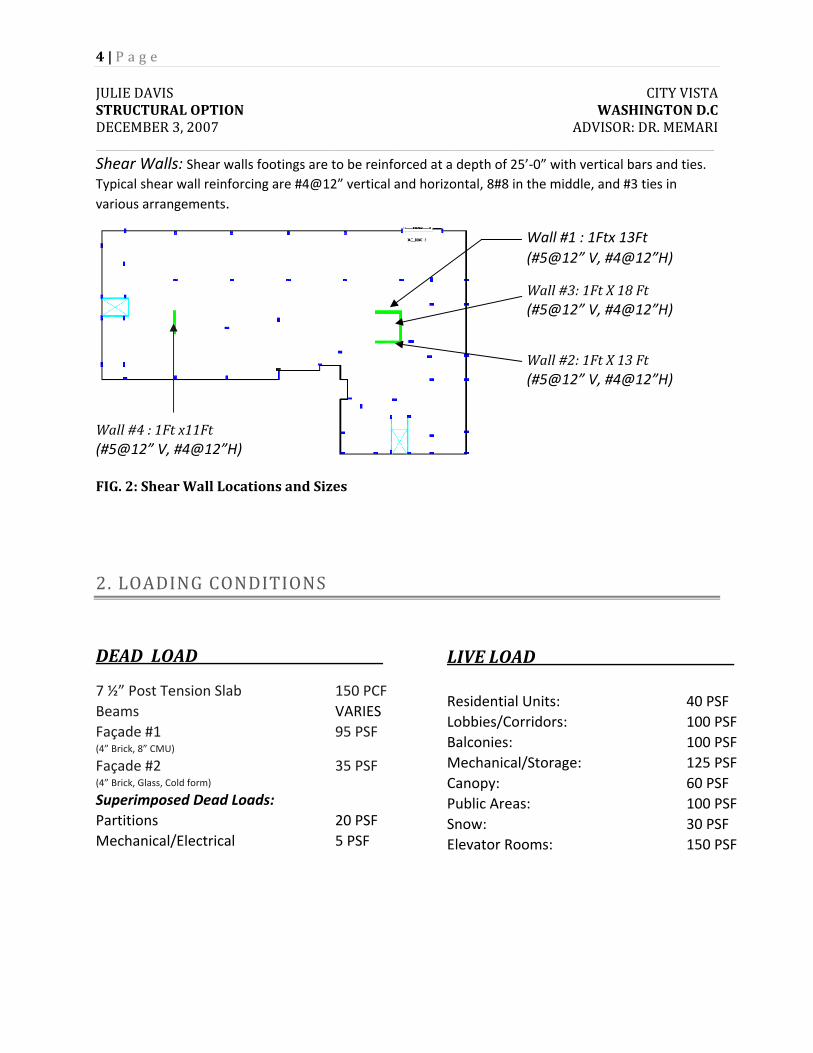
4 | P a g e JULIE DAVIS CITY VISTA STRUCTURAL OPTION WASHINGTON D.C DECEMBER 3, 2007 ADVISOR: DR. MEMARI __________________________________________________________________________________________________________________ Shear Walls: Shear walls footings are to be reinforced at a depth of 25’‐0” with vertical bars and ties. Typical shear wall reinforcing are #4@12” vertical and horizontal, 8#8 in the middle, and #3 ties in various arrangements.
Wall #1 : 1Ftx 13Ft (#5@12” V, #4@12”H)
Wall #3: 1Ft X 18 Ft (#5@12” V, #4@12”H)
Wall #2: 1Ft X 13 Ft (#5@12” V, #4@12”H)
Wall #4 : 1Ft x11Ft (#5@12” V, #4@12”H) FIG. 2: Shear Wall Locations and Sizes
2. LOADING CONDITIONS
DEAD LOAD
7 ½” Post Tension Slab 150 PCF Beams VARIES Façade #1 95 PSF (4” Brick, 8” CMU)
Façade #2 35 PSF (4” Brick, Glass, Cold form)
Superimposed Dead Loads: Partitions 20 PSF Mechanical/Electrical 5 PSF
LIVE LOAD Residential Units: 40 PSF Lobbies/Corridors: 100 PSF Balconies: 100 PSF Mechanical/Storage: 125 PSF Canopy: 60 PSF Public Areas: 100 PSF Snow: 30 PSF Elevator Rooms: 150 PSF
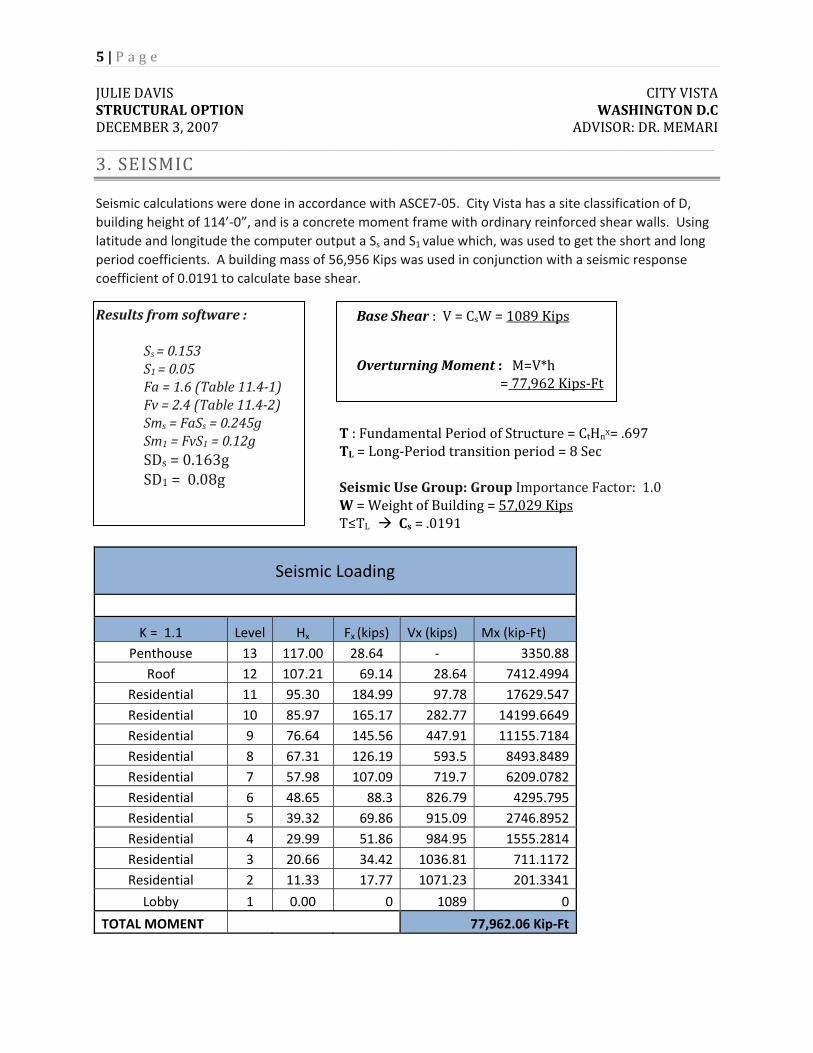
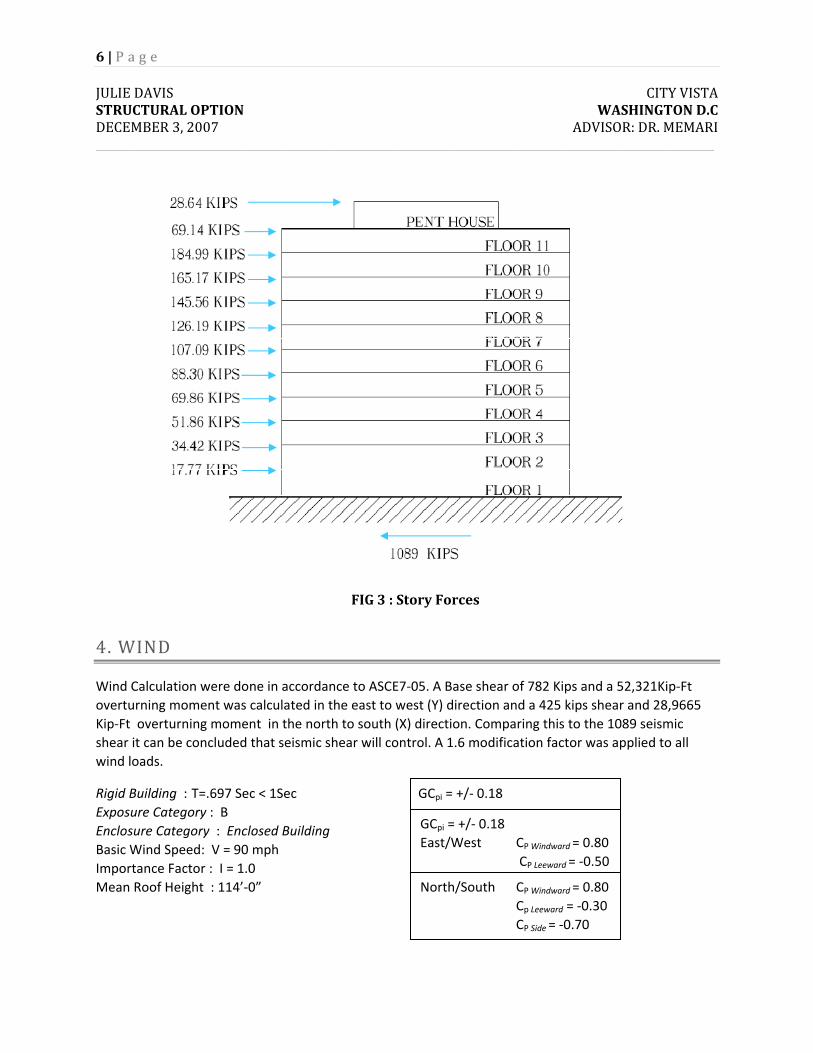
5 | P a g e JULIE DAVIS CITY VISTA STRUCTURAL OPTION WASHINGTON D.C DECEMBER 3, 2007 ADVISOR: DR. MEMARI __________________________________________________________________________________________________________________ 3. SEISMIC
Seismic calculations were done in accordance with ASCE7‐05. City Vista has a site classification of D, building height of 114’‐0”, and is a concrete moment frame with ordinary reinforced shear walls. Using latitude and longitude the computer output a Ss and S1 value which, was used to get the short and long period coefficients. A building mass of 56,956 Kips was used in conjunction with a seismic response coefficient of 0.0191 to calculate base shear. Results from software :
Ss = 0.153 S1 = 0.05
Fa = 1.6 (Table 11.41) Fv = 2.4 (Table 11.42) Sms = FaSs = 0.245g Sm1 = FvS1 = 0.12g SDs = 0.163g SD1 = 0.08g
Seismic Loading
K = 1.1 Level Hx Fx (kips) Vx (kips) Mx (kip‐Ft) Penthouse 13 117.00 28.64 ‐ 3350.88
Roof 12 107.21 69.14 28.64 7412.4994Residential 11 95.30 184.99 97.78 17629.547Residential 10 85.97 165.17 282.77 14199.6649Residential 9 76.64 145.56 447.91 11155.7184Residential 8 67.31 126.19 593.5 8493.8489Residential 7 57.98 107.09 719.7 6209.0782Residential 6 48.65 88.3 826.79 4295.795Residential 5 39.32 69.86 915.09 2746.8952Residential 4 29.99 51.86 984.95 1555.2814Residential 3 20.66 34.42 1036.81 711.1172Residential 2 11.33 17.77 1071.23 201.3341
Lobby 1 0.00 0 1089 0
TOTAL MOMENT 77,962.06 Kip‐Ft
T : Fundamental Period of Structure = CtHnx= .697 TL = Long‐Period transition period = 8 Sec Seismic Use Group: Group Importance Factor: 1.0 W = Weight of Building = 57,029 Kips T≤TL Cs = .0191
Base Shear : V = CsW = 1089 Kips
Overturning Moment : M=V*h = 77,962 Kips‐Ft
6 | P a g e JULIE DAVIS CITY VISTA STRUCTURAL OPTION WASHINGTON D.C DECEMBER 3, 2007 ADVISOR: DR. MEMARI __________________________________________________________________________________________________________________
FIG 3 : Story Forces
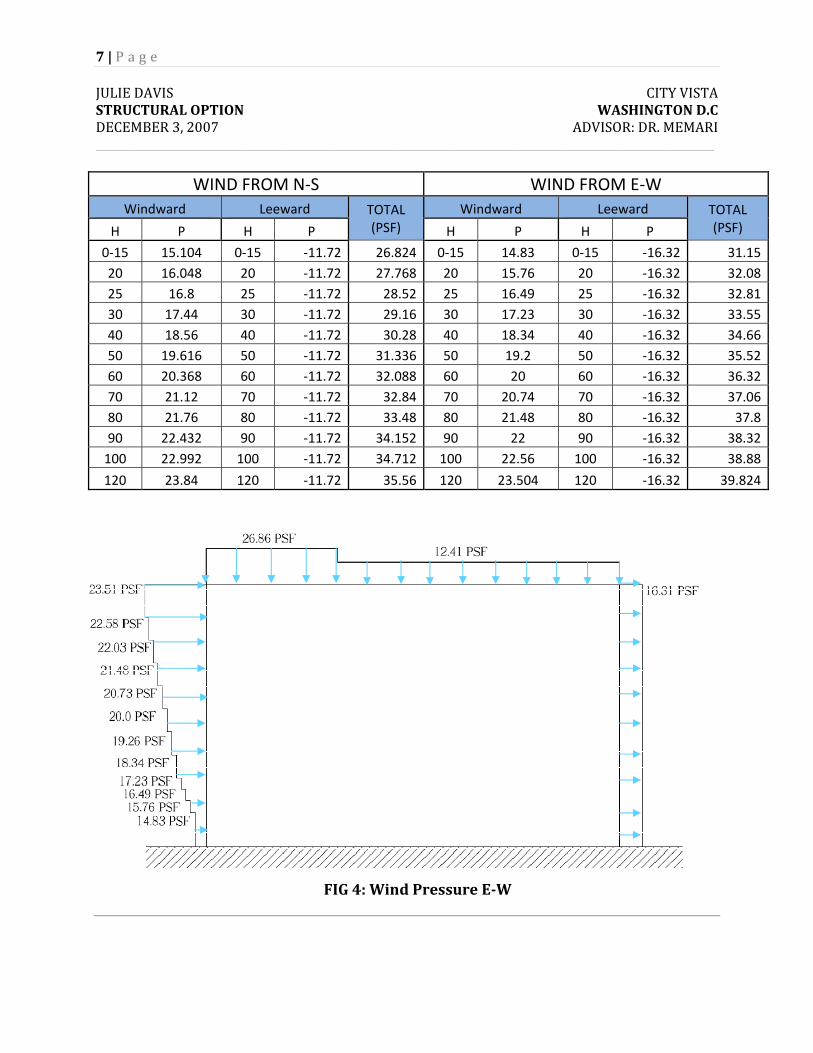
4. WIND
Wind Calculation were done in accordance to ASCE7‐05. A Base shear of 782 Kips and a 52,321Kip‐Ft overturning moment was calculated in the east to west (Y) direction and a 425 kips shear and 28,9665 Kip‐Ft overturning moment in the north to south (X) direction. Comparing this to the 1089 seismic shear it can be concluded that seismic shear will control. A 1.6 modification factor was applied to all wind loads.
Rigid Building : T=.697 Sec < 1Sec GCpi = +/‐ 0.18 Exposure Category : B Enclosure Category : Enclosed Building Basic Wind Speed: V = 90 mph Importance Factor : I = 1.0 Mean Roof Height : 114’‐0”
GCpi = +/‐ 0.18 East/West CP Windward = 0.80 CP Leeward = ‐0.50 CP Side = ‐0.70 North/South CP Windward = 0.80 Cp Leeward = ‐0.30 CP Side = ‐0.70
7 | P a g e JULIE DAVIS CITY VISTA STRUCTURAL OPTION WASHINGTON D.C DECEMBER 3, 2007 ADVISOR: DR. MEMARI __________________________________________________________________________________________________________________
WIND FROM N‐S WIND FROM E‐WWindward Leeward TOTAL
(PSF) Windward Leeward TOTAL
(PSF) H P H P H P H P
0‐15 15.104 0‐15 ‐11.72 26.824 0‐15 14.83 0‐15 ‐16.32 31.1520 16.048 20 ‐11.72 27.768 20 15.76 20 ‐16.32 32.0825 16.8 25 ‐11.72 28.52 25 16.49 25 ‐16.32 32.8130 17.44 30 ‐11.72 29.16 30 17.23 30 ‐16.32 33.5540 18.56 40 ‐11.72 30.28 40 18.34 40 ‐16.32 34.6650 19.616 50 ‐11.72 31.336 50 19.2 50 ‐16.32 35.5260 20.368 60 ‐11.72 32.088 60 20 60 ‐16.32 36.3270 21.12 70 ‐11.72 32.84 70 20.74 70 ‐16.32 37.0680 21.76 80 ‐11.72 33.48 80 21.48 80 ‐16.32 37.890 22.432 90 ‐11.72 34.152 90 22 90 ‐16.32 38.32100 22.992 100 ‐11.72 34.712 100 22.56 100 ‐16.32 38.88
120 23.84 120 ‐11.72 35.56 120 23.504 120 ‐16.32 39.824
FIG 4: Wind Pressure EW
8 | P a g e JULIE DAVIS CITY VISTA STRUCTURAL OPTION WASHINGTON D.C DECEMBER 3, 2007 ADVISOR: DR. MEMARI __________________________________________________________________________________________________________________
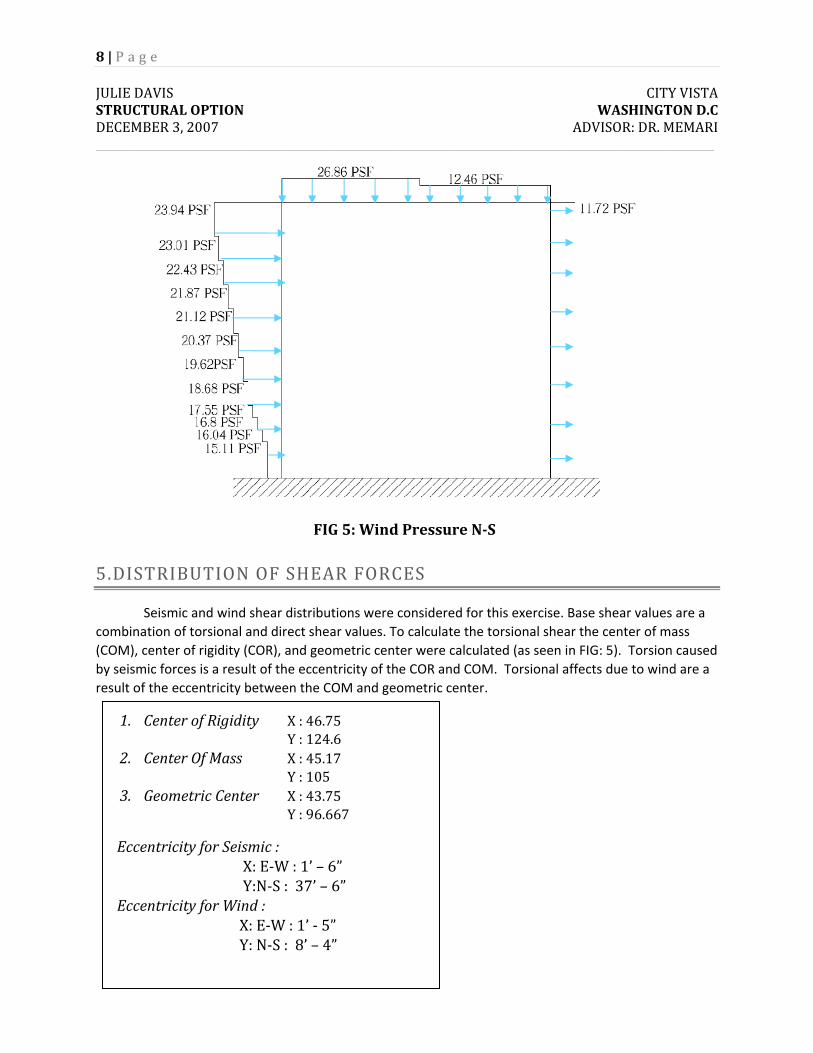
5.DISTRIBUTION OF SHEAR FORCES
Seismic and wind shear distributions were considered for this exercise. Base shear values are a combination of torsional and direct shear values. To calculate the torsional shear the center of mass (COM), center of rigidity (COR), and geometric center were calculated (as seen in FIG: 5). Torsion caused by seismic forces is a result of the eccentricity of the COR and COM. Torsional affects due to wind are a result of the eccentricity between the COM and geometric center.
1. Center of Rigidity X : 46.75 Y : 124.6
2. Center Of Mass X : 45.17 Y : 105
3. Geometric Center X : 43.75 Y : 96.667
Eccentricity for Seismic : X: E‐W : 1’ – 6” Y:N‐S : 37’ – 6”
Eccentricity for Wind : X: E‐W : 1’ ‐ 5”
Y: N‐S : 8’ – 4”
FIG 5: Wind Pressure NS
9 | P a g e JULIE DAVIS CITY VISTA STRUCTURAL OPTION WASHINGTON D.C DECEMBER 3, 2007 ADVISOR: DR. MEMARI __________________________________________________________________________________________________________________
(0,0)
Direct shear is calculated by dividing each walls rigidity by total rigidity and multiplying by base shear. (Full detail can be seen in the appendix page 19) Torsional shear is found by multiply the base shear by eccentricity, and wall rigidity then dividing by torsional rigidity .
Torsional Shear:
Vit = V*e*Di*Ri J
Direct Shear:
Vi = Ri * V R1+R2+R3+R4 FIG 5: Location of COM, COR, & GC
Shear Due to Seismic (KIPS) Shear Due to Wind (KIPS)
North – South (X) East – West (Y) North – South (X) East – West (Y)
Direct Torsional Direct Torsional Direct Torsional Direct Torsional
Wall #1 ‐ 57.85 544.5 280.54 Wall #1 ‐ 4.96 390.95 71.34 Wall #2 ‐ 57.85 544.5 280.54 Wall #2 ‐ 4.96 390.95 71.34 Wall #3 886.5 373.82 ‐ 24.8 Wall #3 345.74 32.14 ‐ 6.307
Wall #4 202.5 363.59 ‐ 50.98 Wall #4 78.94 31.21 ‐ 12.96
N
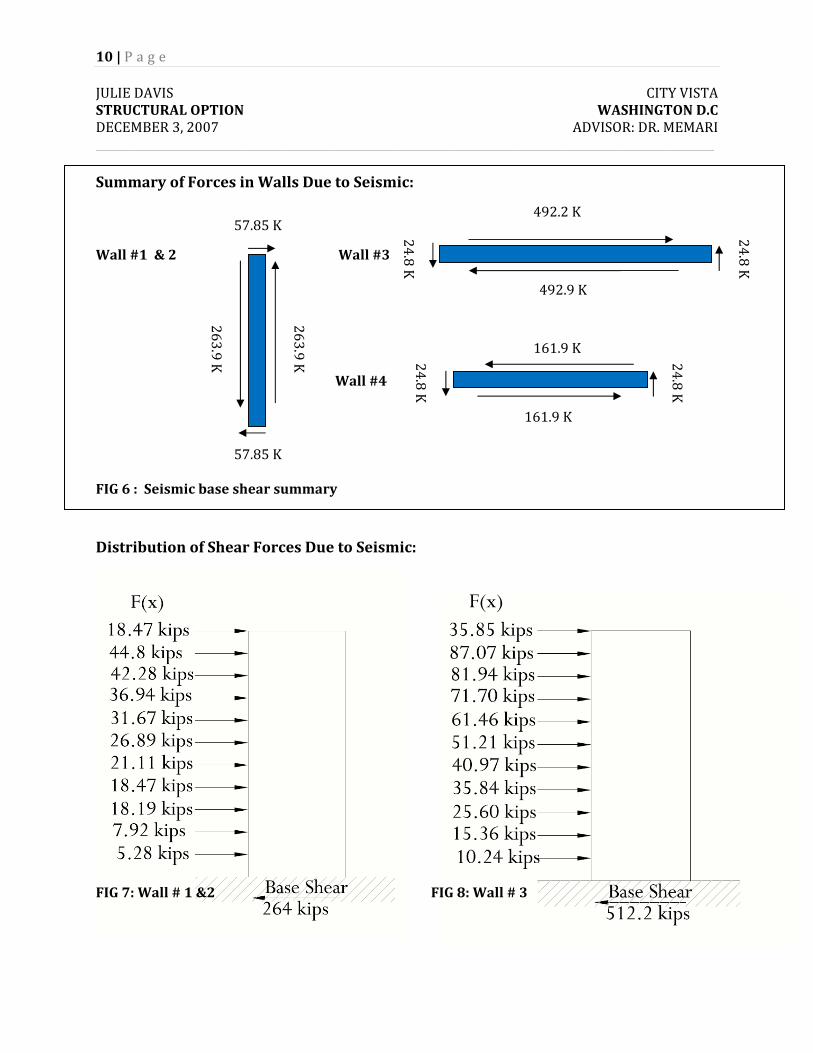
10 | P a g e JULIE DAVIS CITY VISTA STRUCTURAL OPTION WASHINGTON D.C DECEMBER 3, 2007 ADVISOR: DR. MEMARI __________________________________________________________________________________________________________________ Summary of Forces in Walls Due to Seismic:
Wall #1 & 2 Wall #3 Wall #4 FIG 6 : Seismic base shear summary Distribution of Shear Forces Due to Seismic:
FIG 7: Wall # 1 &2 FIG 8: Wall # 3
263.9 K
263.9 K
57.85 K
57.85 K 24.8 K
24.8 K
24.8 K
24.8 K
492.2 K
492.9 K
161.9 K
161.9 K
11 | P a g e JULIE DAVIS CITY VISTA STRUCTURAL OPTION WASHINGTON D.C DECEMBER 3, 2007 ADVISOR: DR. MEMARI __________________________________________________________________________________________________________________
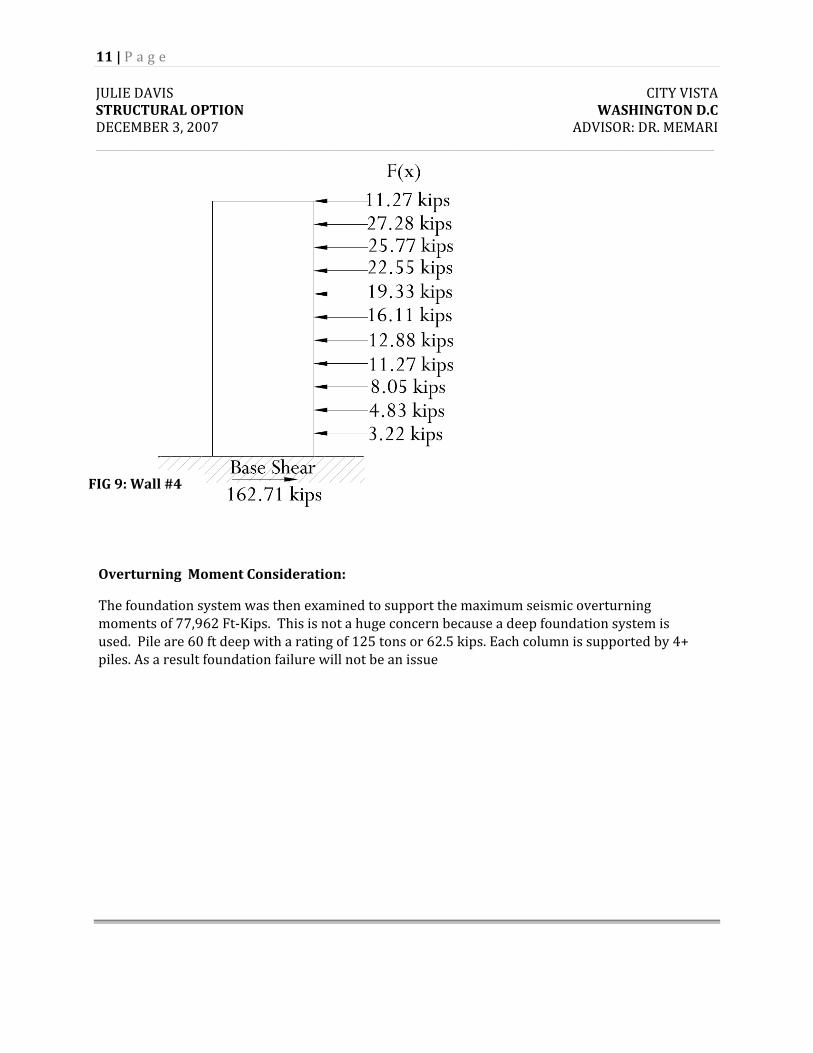
FIG 9: Wall #4
Overturning Moment Consideration:
The foundation system was then examined to support the maximum seismic overturning moments of 77,962 Ft‐Kips. This is not a huge concern because a deep foundation system is used. Pile are 60 ft deep with a rating of 125 tons or 62.5 kips. Each column is supported by 4+ piles. As a result foundation failure will not be an issue
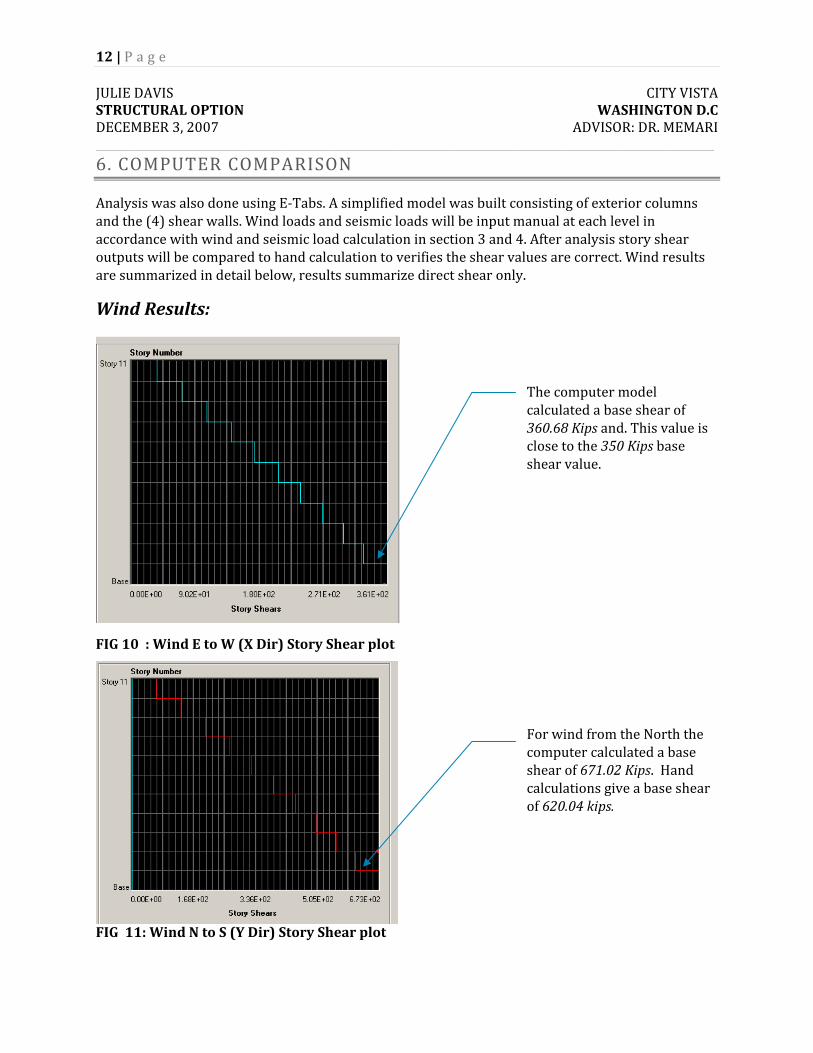
12 | P a g e JULIE DAVIS CITY VISTA STRUCTURAL OPTION WASHINGTON D.C DECEMBER 3, 2007 ADVISOR: DR. MEMARI __________________________________________________________________________________________________________________ 6. COMPUTER COMPARISON
Analysis was also done using E‐Tabs. A simplified model was built consisting of exterior columns and the (4) shear walls. Wind loads and seismic loads will be input manual at each level in accordance with wind and seismic load calculation in section 3 and 4. After analysis story shear outputs will be compared to hand calculation to verifies the shear values are correct. Wind results are summarized in detail below, results summarize direct shear only.
Wind Results:
The computer model calculated a base shear of 360.68 Kips and. This value is close to the 350 Kips base shear value.
FIG 10 : Wind E to W (X Dir) Story Shear plot
For wind from the North the computer calculated a base shear of 671.02 Kips. Hand calculations give a base shear of 620.04 kips.
FIG 11: Wind N to S (Y Dir) Story Shear plot

13 | P a g e JULIE DAVIS CITY VISTA STRUCTURAL OPTION WASHINGTON D.C DECEMBER 3, 2007 ADVISOR: DR. MEMARI __________________________________________________________________________________________________________________ Seismic Results: Computer Results: E to W (X Dir) = 1055 Kips N to S (Y Dir) = 1055 Kips Moment : 73,163 Kip‐Ft
Hand Results: E to W (X Dir) = 1088 Kips N to S (Y Dir) = 1088 Kips Moment: 77,962 Kip‐Ft
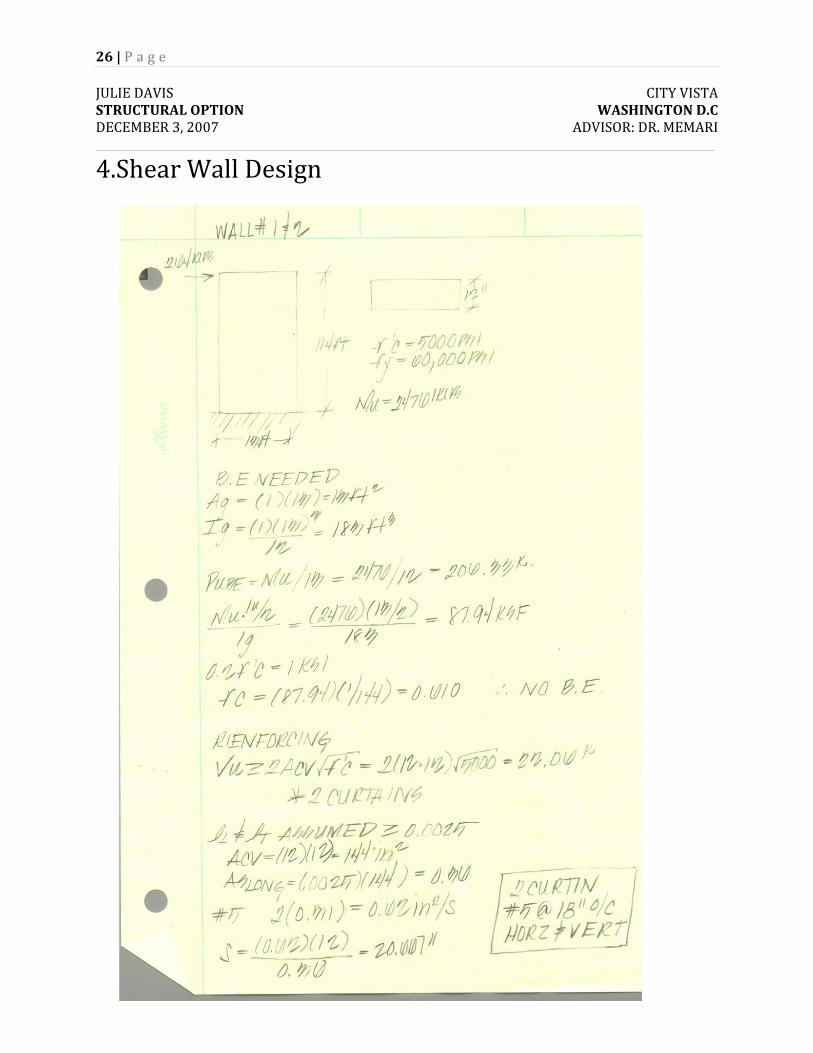
7. SHEAR WALL DESIGN
Shear walls were then designed to verify current designs stability using the hand calculated seismic shear values. Hand values were used because they consider tensional and direct shear. After calculating the required longitinal and transversal reinforcing the following was concluded. Wall 1&2 : Wall 3:
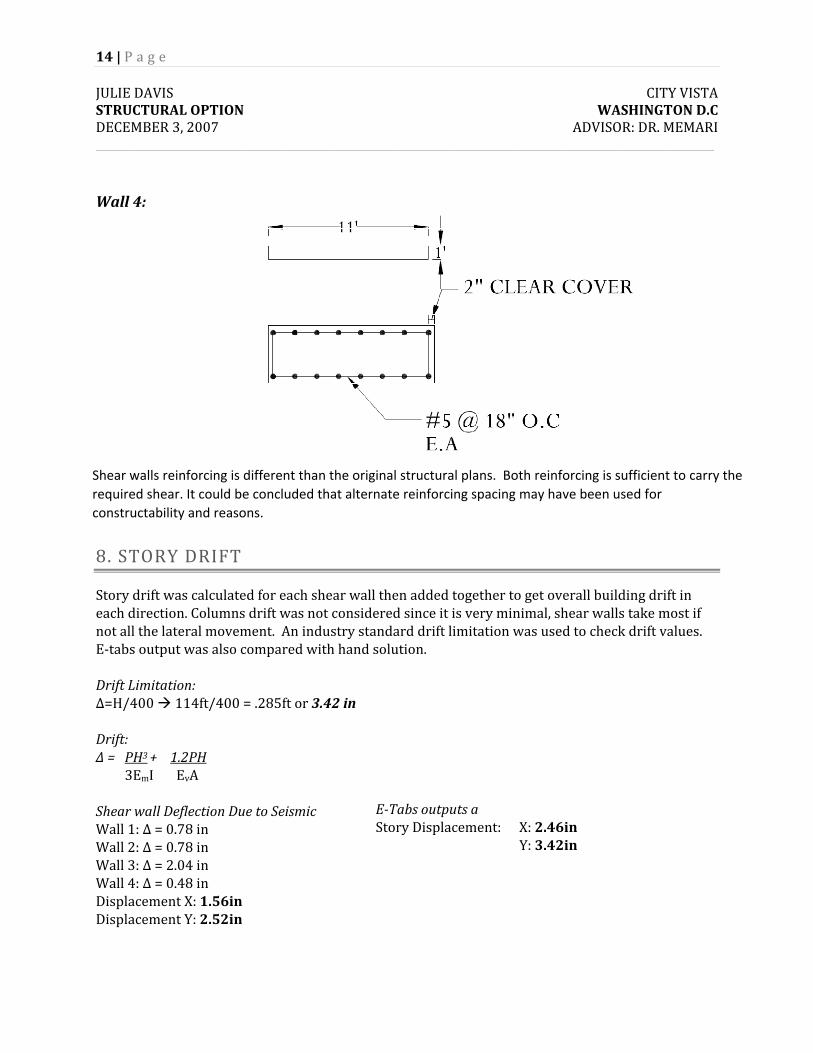
14 | P a g e JULIE DAVIS CITY VISTA STRUCTURAL OPTION WASHINGTON D.C DECEMBER 3, 2007 ADVISOR: DR. MEMARI __________________________________________________________________________________________________________________ Wall 4:
8. STORY DRIFT
Story drift was calculated for each shear wall then added together to get overall building drift in each direction. Columns drift was not considered since it is very minimal, shear walls take most if not all the lateral movement. An industry standard drift limitation was used to check drift values. E‐tabs output was also compared with hand solution. Drift Limitation: Δ=H/400 114ft/400 = .285ft or 3.42 in Drift: Δ = PH3 + 1.2PH 3EmI EvA Shear wall Deflection Due to Seismic Wall 1: Δ = 0.78 in Wall 2: Δ = 0.78 in Wall 3: Δ = 2.04 in Wall 4: Δ = 0.48 in Displacement X: 1.56in Displacement Y: 2.52in
Shear walls reinforcing is different than the original structural plans. Both reinforcing is sufficient to carry the required shear. It could be concluded that alternate reinforcing spacing may have been used for constructability and reasons.
ETabs outputs a Story Displacement: X: 2.46in
Y: 3.42in
15 | P a g e JULIE DAVIS CITY VISTA STRUCTURAL OPTION WASHINGTON D.C DECEMBER 3, 2007 ADVISOR: DR. MEMARI __________________________________________________________________________________________________________________
CONCLUSION
After detailed analysis of each shear wall and its direct and torsional affects it can be concluded the current lateral system is sufficient to resists seismic base shear. Seismic shear was calculated using ASCE7‐05.
Base Shear:
After detailed analysis of each shear wall and its direct and torsional affects it can be concluded the current lateral system is sufficient to resists the 1089 Kips seismic base shear. This was a slight concern because the center of rigidity and center of mass are at different locations causing eccentricity, resulting in torsional shears Overturning moment was calculated as well checked against the current foundation system for stability. The deep foundation is more than sufficient to resist the 77,962 Kips‐Ft overturning moment.
Story Drift:
Seismic story drift was calculated in each direction for each shear wall. Deflection in the X and Y direction both meet the industry standards of H/400. When values were compared with E‐Tabs deflections were not consistent. The difference can be attributed to several issues.
1. E‐Tabs includes diaphragm drift hand calculations only consider shear wall drift. 2. Modeling issues in E‐Tabs
16 | P a g e JULIE DAVIS CITY VISTA STRUCTURAL OPTION WASHINGTON D.C DECEMBER 3, 2007 ADVISOR: DR. MEMARI __________________________________________________________________________________________________________________
APPENDIX ADDITIONAL CALCULATIONS NOT INCLUDED
IN APPENDIX CAN BE OBTAINED BY REQUEST
17 | P a g e JULIE DAVIS CITY VISTA STRUCTURAL OPTION WASHINGTON D.C DECEMBER 3, 2007 ADVISOR: DR. MEMARI __________________________________________________________________________________________________________________
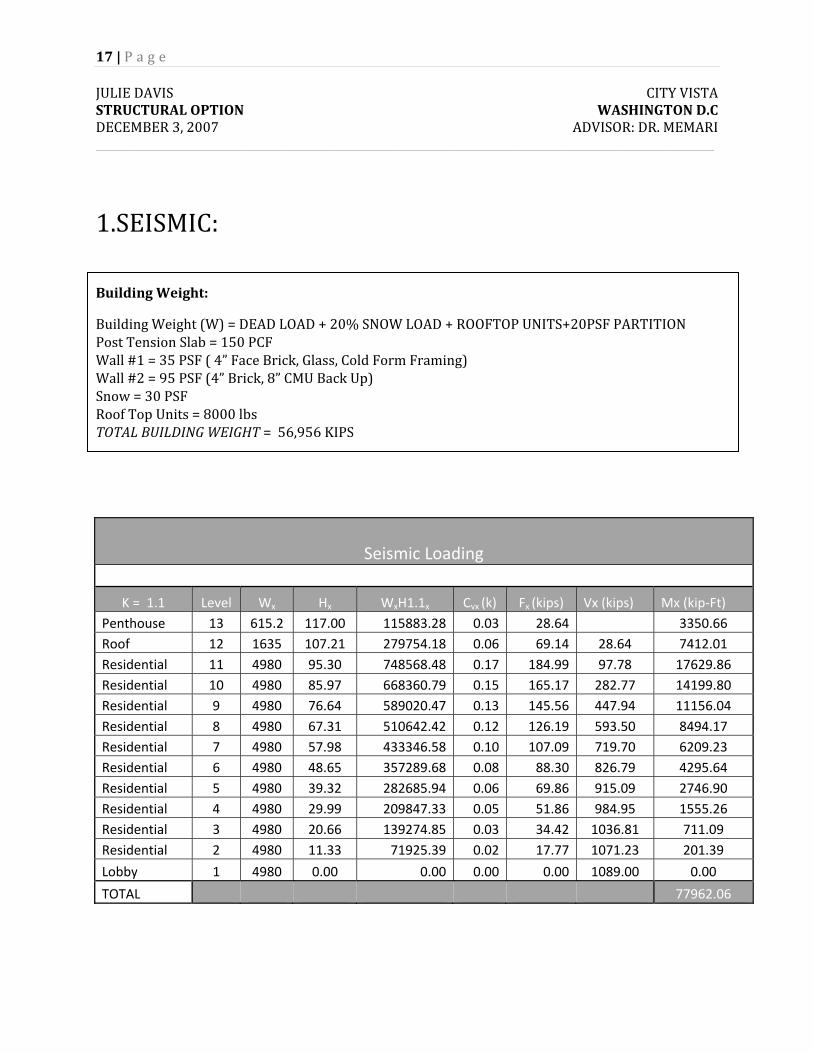
1.SEISMIC:
Building Weight:
Building Weight (W) = DEAD LOAD + 20% SNOW LOAD + ROOFTOP UNITS+20PSF PARTITION Post Tension Slab = 150 PCF Wall #1 = 35 PSF ( 4” Face Brick, Glass, Cold Form Framing) Wall #2 = 95 PSF (4” Brick, 8” CMU Back Up) Snow = 30 PSF Roof Top Units = 8000 lbs TOTAL BUILDING WEIGHT = 56,956 KIPS
Seismic Loading
K = 1.1 Level Wx Hx WxH1.1x Cvx (k) Fx (kips) Vx (kips) Mx (kip‐Ft) Penthouse 13 615.2 117.00 115883.28 0.03 28.64 3350.66 Roof 12 1635 107.21 279754.18 0.06 69.14 28.64 7412.01 Residential 11 4980 95.30 748568.48 0.17 184.99 97.78 17629.86 Residential 10 4980 85.97 668360.79 0.15 165.17 282.77 14199.80 Residential 9 4980 76.64 589020.47 0.13 145.56 447.94 11156.04 Residential 8 4980 67.31 510642.42 0.12 126.19 593.50 8494.17 Residential 7 4980 57.98 433346.58 0.10 107.09 719.70 6209.23 Residential 6 4980 48.65 357289.68 0.08 88.30 826.79 4295.64 Residential 5 4980 39.32 282685.94 0.06 69.86 915.09 2746.90 Residential 4 4980 29.99 209847.33 0.05 51.86 984.95 1555.26 Residential 3 4980 20.66 139274.85 0.03 34.42 1036.81 711.09 Residential 2 4980 11.33 71925.39 0.02 17.77 1071.23 201.39
Lobby 1 4980 0.00 0.00 0.00 0.00 1089.00 0.00
TOTAL 77962.06
18 | P a g e JULIE DAVIS CITY VISTA STRUCTURAL OPTION WASHINGTON D.C DECEMBER 3, 2007 ADVISOR: DR. MEMARI __________________________________________________________________________________________________________________
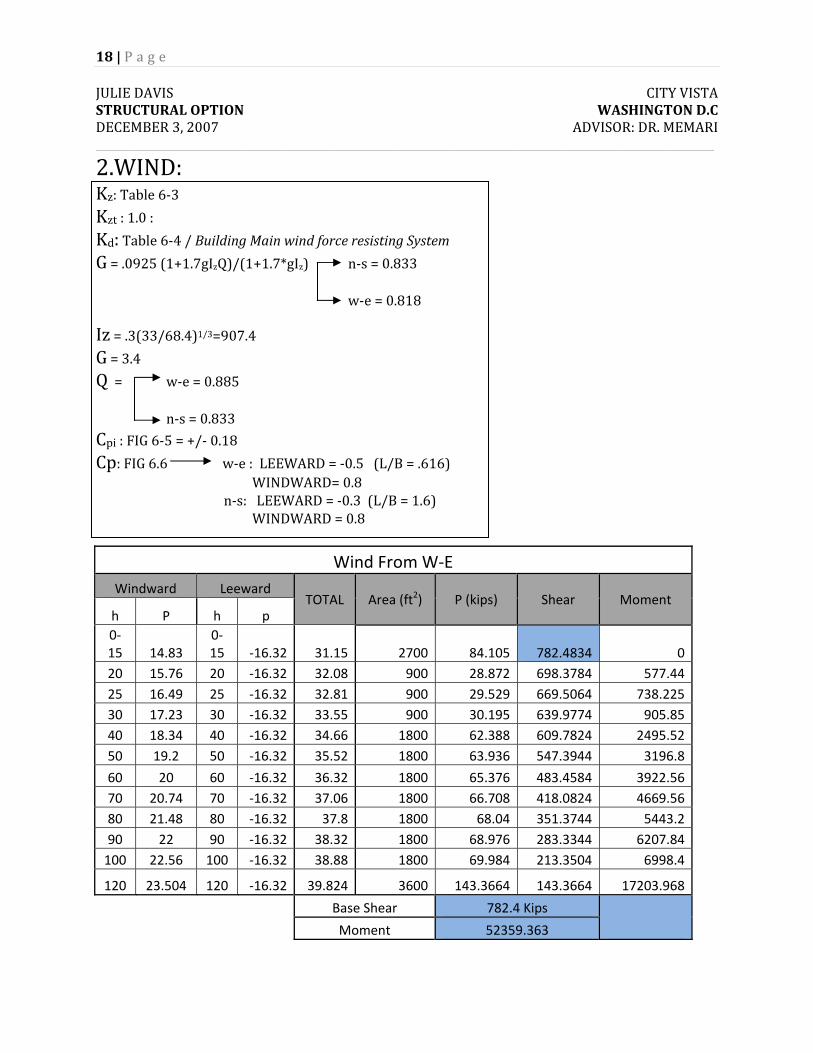
2.WIND: Kz: Table 6‐3 Kzt : 1.0 : Kd: Table 6‐4 / Building Main wind force resisting System G = .0925 (1+1.7gIzQ)/(1+1.7*gIz) n‐s = 0.833 w‐e = 0.818
Iz = .3(33/68.4)1/3=907.4 G = 3.4 Q = w‐e = 0.885 n‐s = 0.833 Cpi : FIG 6‐5 = +/‐ 0.18 Cp: FIG 6.6 w‐e : LEEWARD = ‐0.5 (L/B = .616) WINDWARD= 0.8 n‐s: LEEWARD = ‐0.3 (L/B = 1.6) WINDWARD = 0.8
Wind From W‐E Windward Leeward
TOTAL Area (ft2) P (kips) Shear Moment h P h p 0‐15 14.83
0‐15 ‐16.32 31.15 2700 84.105 782.4834 0
20 15.76 20 ‐16.32 32.08 900 28.872 698.3784 577.4425 16.49 25 ‐16.32 32.81 900 29.529 669.5064 738.22530 17.23 30 ‐16.32 33.55 900 30.195 639.9774 905.8540 18.34 40 ‐16.32 34.66 1800 62.388 609.7824 2495.5250 19.2 50 ‐16.32 35.52 1800 63.936 547.3944 3196.8
60 20 60 ‐16.32 36.32 1800 65.376 483.4584 3922.5670 20.74 70 ‐16.32 37.06 1800 66.708 418.0824 4669.5680 21.48 80 ‐16.32 37.8 1800 68.04 351.3744 5443.290 22 90 ‐16.32 38.32 1800 68.976 283.3344 6207.84100 22.56 100 ‐16.32 38.88 1800 69.984 213.3504 6998.4
120 23.504 120 ‐16.32 39.824 3600 143.3664 143.3664 17203.968
Base Shear 782.4 Kips
Moment 52359.363
19 | P a g e JULIE DAVIS CITY VISTA STRUCTURAL OPTION WASHINGTON D.C DECEMBER 3, 2007 ADVISOR: DR. MEMARI __________________________________________________________________________________________________________________
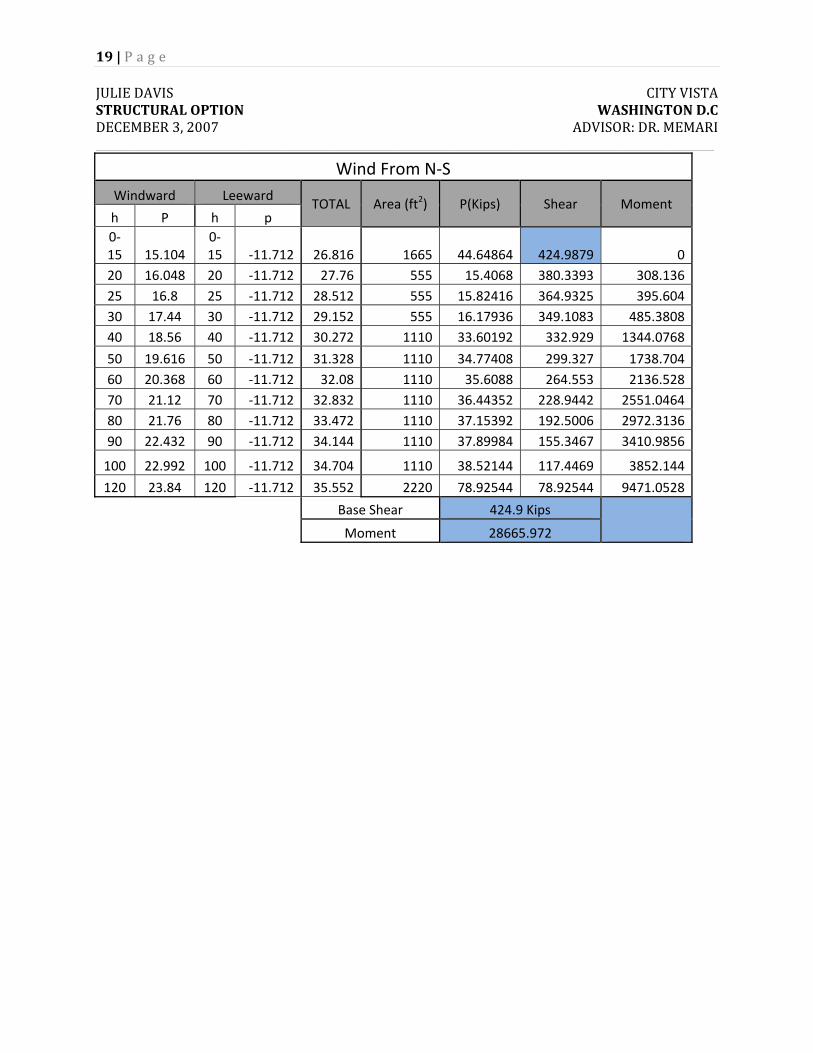
Wind From N‐S Windward Leeward
TOTAL Area (ft2) P(Kips) Shear Moment h P h p 0‐15 15.104
0‐15 ‐11.712 26.816 1665 44.64864 424.9879 0
20 16.048 20 ‐11.712 27.76 555 15.4068 380.3393 308.13625 16.8 25 ‐11.712 28.512 555 15.82416 364.9325 395.60430 17.44 30 ‐11.712 29.152 555 16.17936 349.1083 485.380840 18.56 40 ‐11.712 30.272 1110 33.60192 332.929 1344.0768
50 19.616 50 ‐11.712 31.328 1110 34.77408 299.327 1738.70460 20.368 60 ‐11.712 32.08 1110 35.6088 264.553 2136.52870 21.12 70 ‐11.712 32.832 1110 36.44352 228.9442 2551.046480 21.76 80 ‐11.712 33.472 1110 37.15392 192.5006 2972.313690 22.432 90 ‐11.712 34.144 1110 37.89984 155.3467 3410.9856
100 22.992 100 ‐11.712 34.704 1110 38.52144 117.4469 3852.144
120 23.84 120 ‐11.712 35.552 2220 78.92544 78.92544 9471.0528
Base Shear 424.9 Kips
Moment 28665.972
20 | P a g e JULIE DAVIS CITY VISTA STRUCTURAL OPTION WASHINGTON D.C DECEMBER 3, 2007 ADVISOR: DR. MEMARI __________________________________________________________________________________________________________________
(0,0)
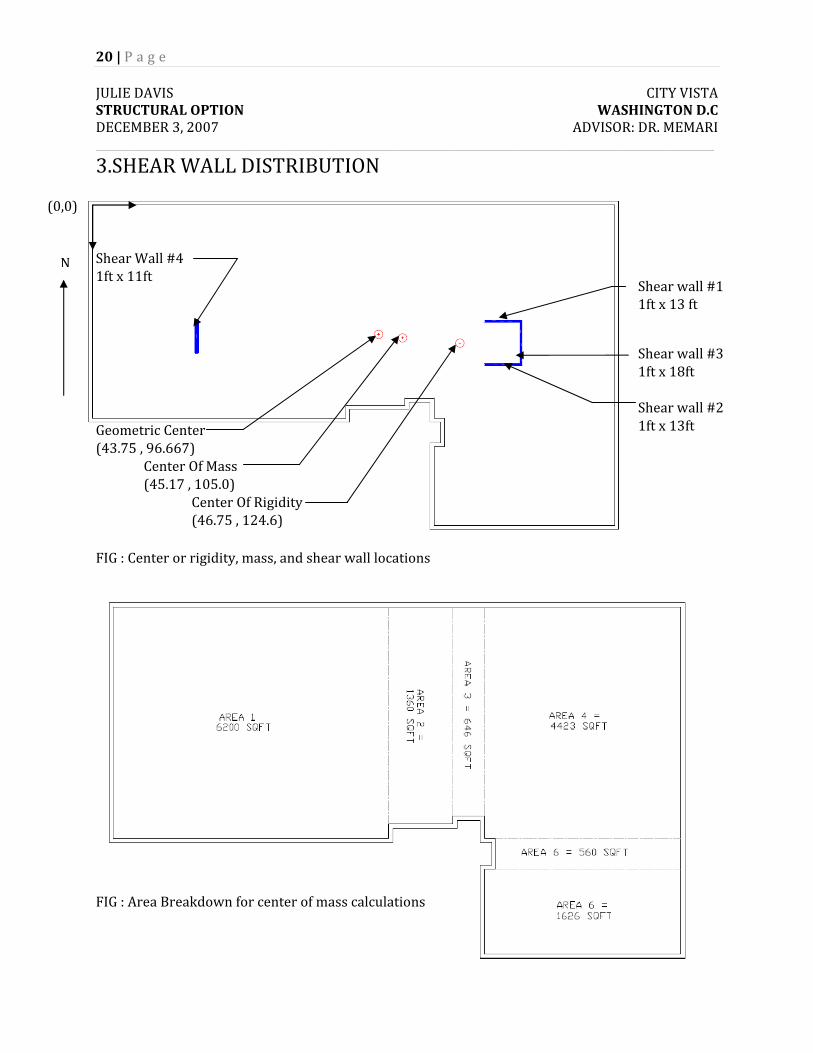
3.SHEAR WALL DISTRIBUTION
Shear Wall #4 1ft x 11ft Geometric Center (43.75 , 96.667)
Center Of Mass (45.17 , 105.0) Center Of Rigidity (46.75 , 124.6) FIG : Center or rigidity, mass, and shear wall locations FIG : Area Breakdown for center of mass calculations
Shear wall #1 1ft x 13 ft
Shear wall #3 1ft x 18ft Shear wall #2 1ft x 13ft
N
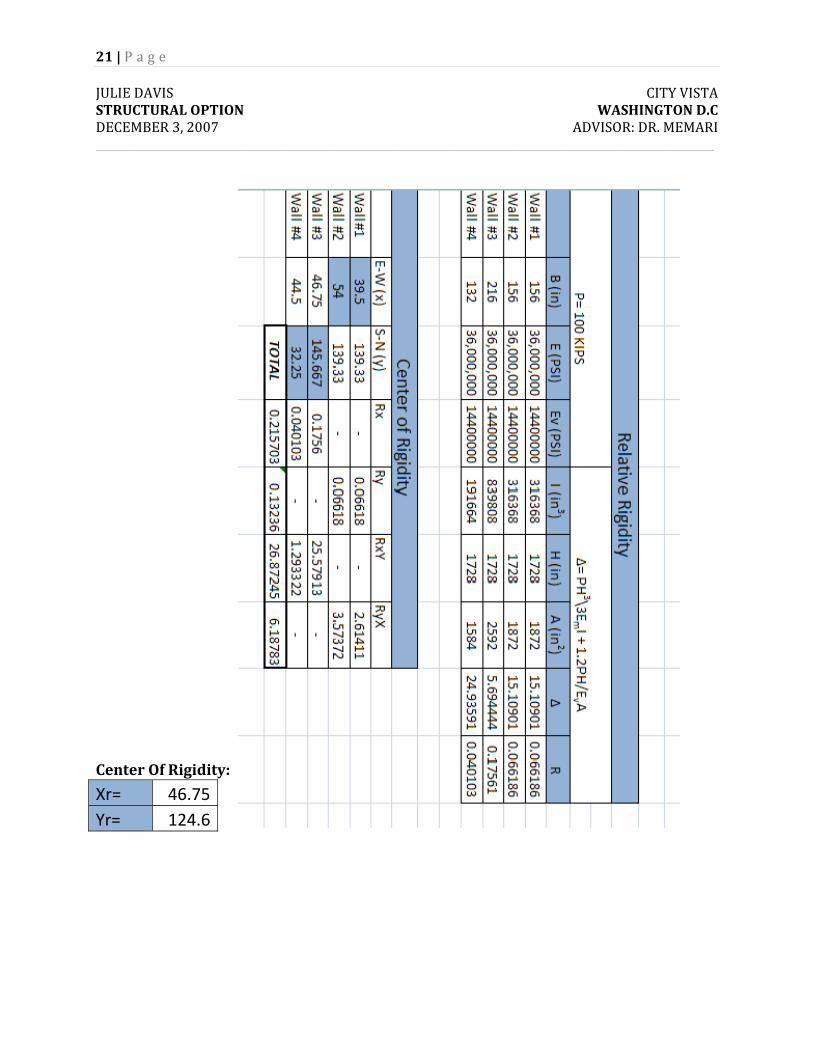
21 | P a g e JULIE DAVIS CITY VISTA STRUCTURAL OPTION WASHINGTON D.C DECEMBER 3, 2007 ADVISOR: DR. MEMARI __________________________________________________________________________________________________________________ Center Of Rigidity:
Xr= 46.75 Yr= 124.6
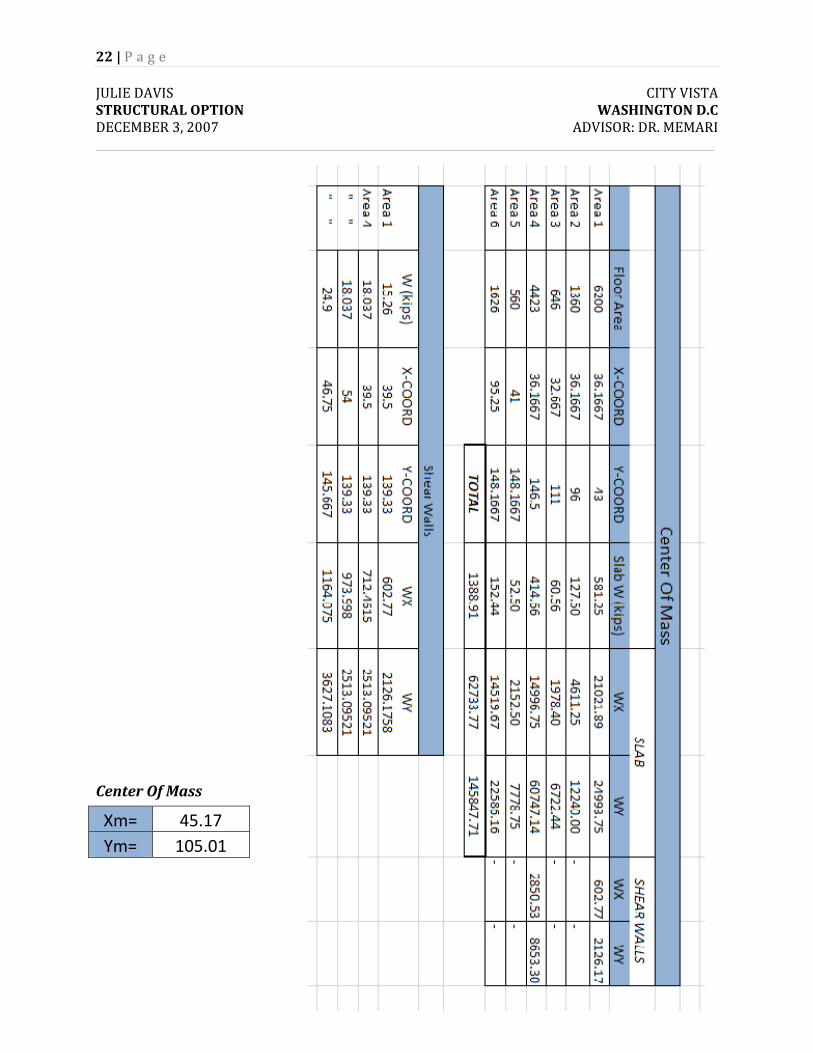
22 | P a g e JULIE DAVIS CITY VISTA STRUCTURAL OPTION WASHINGTON D.C DECEMBER 3, 2007 ADVISOR: DR. MEMARI __________________________________________________________________________________________________________________ Center Of Mass
Xm= 45.17 Ym= 105.01
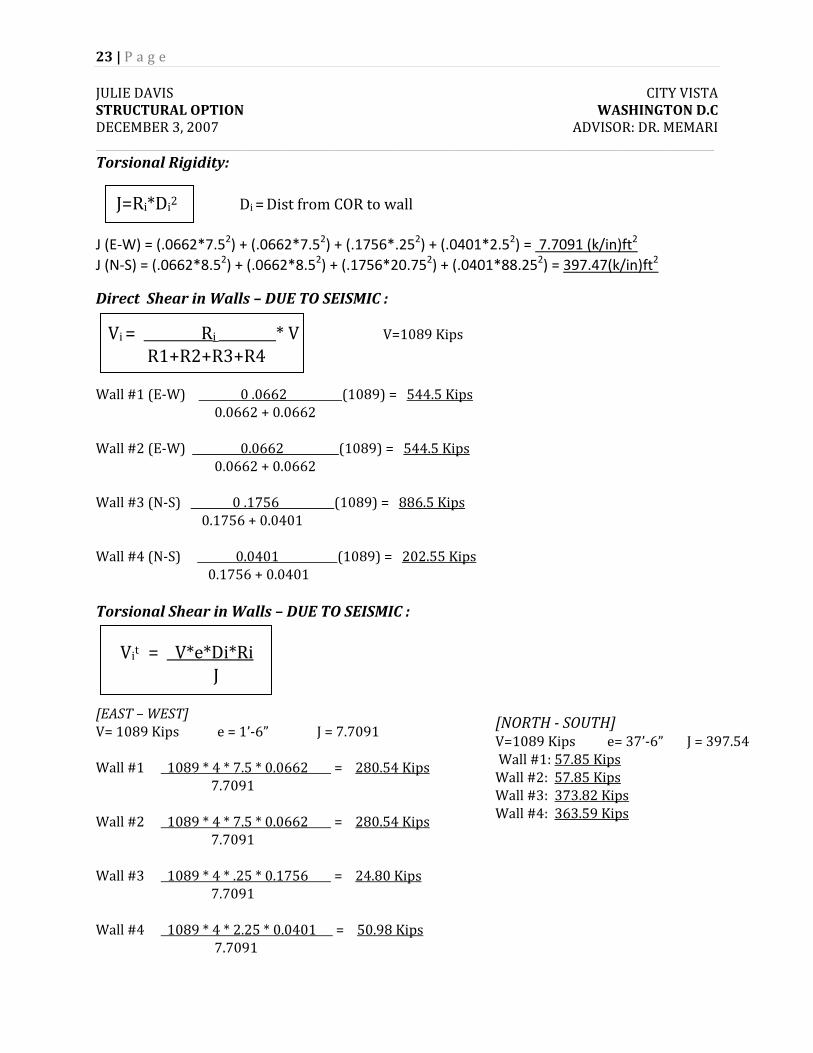
23 | P a g e JULIE DAVIS CITY VISTA STRUCTURAL OPTION WASHINGTON D.C DECEMBER 3, 2007 ADVISOR: DR. MEMARI __________________________________________________________________________________________________________________ Torsional Rigidity: J=Ri*Di2 Di = Dist from COR to wall
J (E‐W) = (.0662*7.52) + (.0662*7.52) + (.1756*.252) + (.0401*2.52) = 7.7091 (k/in)ft2 J (N‐S) = (.0662*8.52) + (.0662*8.52) + (.1756*20.752) + (.0401*88.252) = 397.47(k/in)ft2
Direct Shear in Walls – DUE TO SEISMIC :
Vi = Ri * V V=1089 Kips R1+R2+R3+R4
Wall #1 (E‐W) 0 .0662 (1089) = 544.5 Kips
0.0662 + 0.0662 Wall #2 (E‐W) 0.0662 (1089) = 544.5 Kips
0.0662 + 0.0662
Wall #3 (N‐S) 0 .1756 (1089) = 886.5 Kips 0.1756 + 0.0401
Wall #4 (N‐S) 0.0401 (1089) = 202.55 Kips 0.1756 + 0.0401
Torsional Shear in Walls – DUE TO SEISMIC : Vit = V*e*Di*Ri
J [EAST – WEST] V= 1089 Kips e = 1’‐6” J = 7.7091 Wall #1 1089 * 4 * 7.5 * 0.0662 = 280.54 Kips
7.7091
Wall #2 1089 * 4 * 7.5 * 0.0662 = 280.54 Kips 7.7091
Wall #3 1089 * 4 * .25 * 0.1756 = 24.80 Kips 7.7091
Wall #4 1089 * 4 * 2.25 * 0.0401 = 50.98 Kips 7.7091
[NORTH SOUTH] V=1089 Kips e= 37’‐6” J = 397.54 Wall #1: 57.85 Kips Wall #2: 57.85 Kips Wall #3: 373.82 Kips Wall #4: 363.59 Kips
24 | P a g e JULIE DAVIS CITY VISTA STRUCTURAL OPTION WASHINGTON D.C DECEMBER 3, 2007 ADVISOR: DR. MEMARI __________________________________________________________________________________________________________________
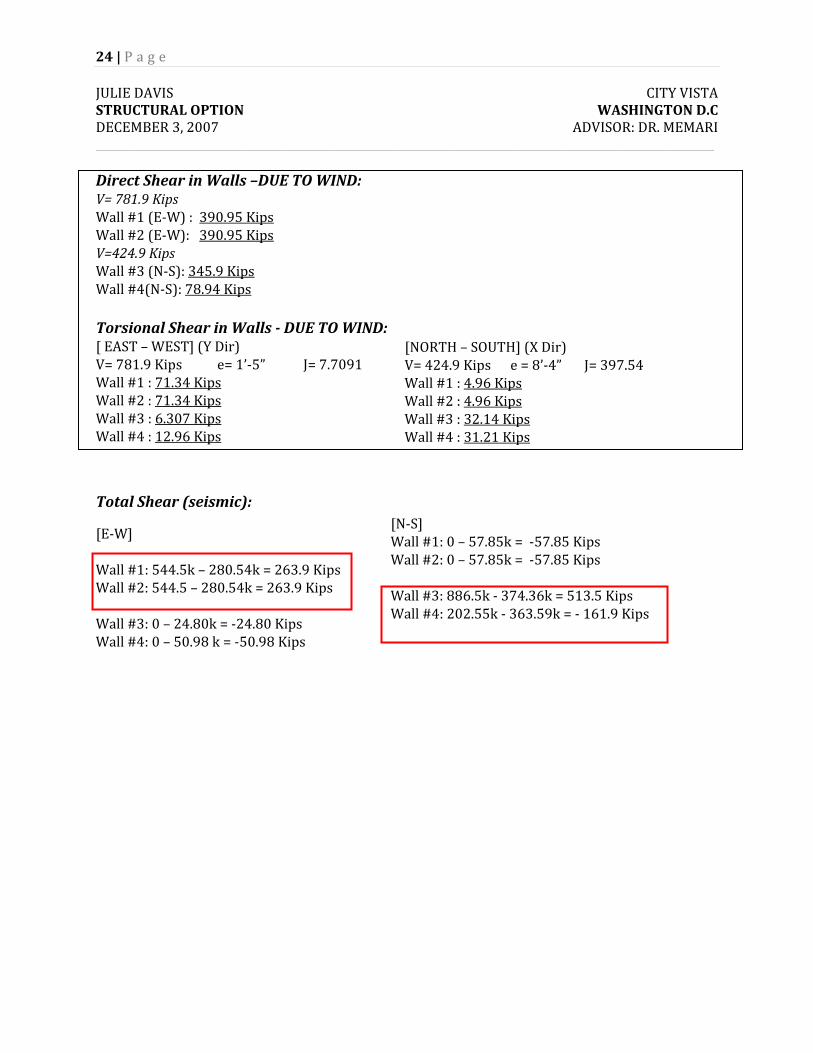
Direct Shear in Walls –DUE TO WIND: V= 781.9 Kips Wall #1 (E‐W) : 390.95 Kips Wall #2 (E‐W): 390.95 Kips V=424.9 Kips Wall #3 (N‐S): 345.9 Kips Wall #4(N‐S): 78.94 Kips Torsional Shear in Walls DUE TO WIND: [ EAST – WEST] (Y Dir) V= 781.9 Kips e= 1’‐5” J= 7.7091 Wall #1 : 71.34 Kips Wall #2 : 71.34 Kips Wall #3 : 6.307 Kips Wall #4 : 12.96 Kips
Total Shear (seismic):
[E‐W] Wall #1: 544.5k – 280.54k = 263.9 Kips Wall #2: 544.5 – 280.54k = 263.9 Kips Wall #3: 0 – 24.80k = ‐24.80 Kips Wall #4: 0 – 50.98 k = ‐50.98 Kips
[NORTH – SOUTH] (X Dir)V= 424.9 Kips e = 8’‐4” J= 397.54 Wall #1 : 4.96 Kips Wall #2 : 4.96 Kips Wall #3 : 32.14 Kips Wall #4 : 31.21 Kips
[N‐S] Wall #1: 0 – 57.85k = ‐57.85 Kips Wall #2: 0 – 57.85k = ‐57.85 Kips Wall #3: 886.5k ‐ 374.36k = 513.5 Kips Wall #4: 202.55k ‐ 363.59k = ‐ 161.9 Kips
25 | P a g e JULIE DAVIS CITY VISTA STRUCTURAL OPTION WASHINGTON D.C DECEMBER 3, 2007 ADVISOR: DR. MEMARI __________________________________________________________________________________________________________________
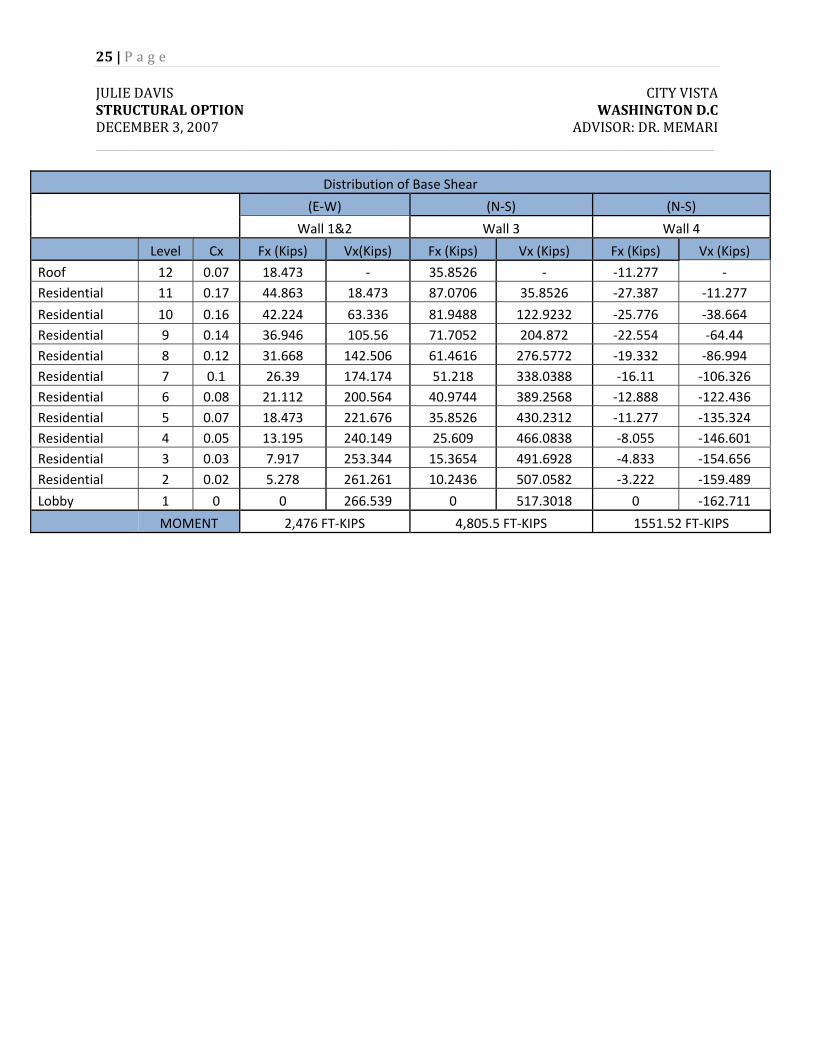
Distribution of Base Shear
(E‐W) (N‐S) (N‐S)
Wall 1&2 Wall 3 Wall 4
Level Cx Fx (Kips) Vx(Kips) Fx (Kips) Vx (Kips) Fx (Kips) Vx (Kips)
Roof 12 0.07 18.473 ‐ 35.8526 ‐ ‐11.277 ‐ Residential 11 0.17 44.863 18.473 87.0706 35.8526 ‐27.387 ‐11.277
Residential 10 0.16 42.224 63.336 81.9488 122.9232 ‐25.776 ‐38.664 Residential 9 0.14 36.946 105.56 71.7052 204.872 ‐22.554 ‐64.44 Residential 8 0.12 31.668 142.506 61.4616 276.5772 ‐19.332 ‐86.994 Residential 7 0.1 26.39 174.174 51.218 338.0388 ‐16.11 ‐106.326 Residential 6 0.08 21.112 200.564 40.9744 389.2568 ‐12.888 ‐122.436 Residential 5 0.07 18.473 221.676 35.8526 430.2312 ‐11.277 ‐135.324 Residential 4 0.05 13.195 240.149 25.609 466.0838 ‐8.055 ‐146.601 Residential 3 0.03 7.917 253.344 15.3654 491.6928 ‐4.833 ‐154.656 Residential 2 0.02 5.278 261.261 10.2436 507.0582 ‐3.222 ‐159.489
Lobby 1 0 0 266.539 0 517.3018 0 ‐162.711
MOMENT 2,476 FT‐KIPS 4,805.5 FT‐KIPS 1551.52 FT‐KIPS
26 | P a g e JULIE DAVIS CITY VISTA STRUCTURAL OPTION WASHINGTON D.C DECEMBER 3, 2007 ADVISOR: DR. MEMARI __________________________________________________________________________________________________________________
4.Shear Wall Design
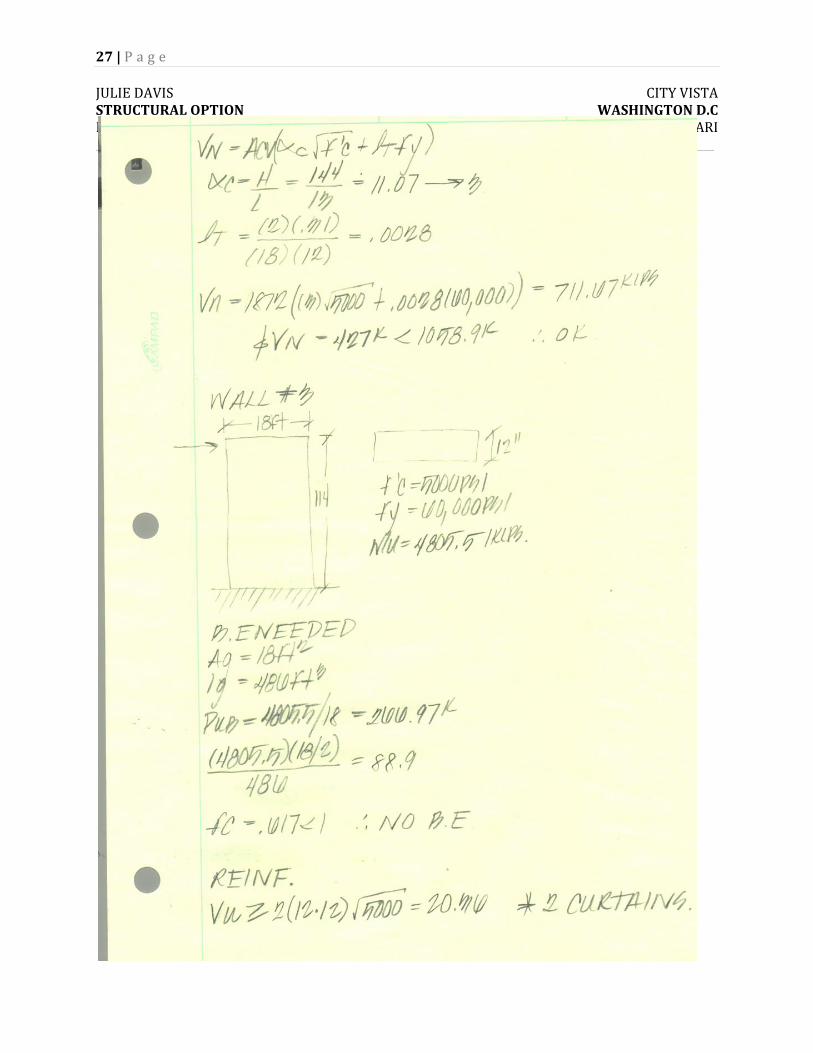
27 | P a g e JULIE DAVIS CITY VISTA STRUCTURAL OPTION WASHINGTON D.C DECEMBER 3, 2007 ADVISOR: DR. MEMARI __________________________________________________________________________________________________________________