Embed Size (px)
Citation preview
Anand Rathi Share and Stock Brokers Limited does and seeks to do business with companies covered in its research reports. Thus, investors should be aware that the firm may have a conflict of interest that could affect the objectivity of this report. Investors should consider this report as only a single factor in making their investment decision. Disclosures and analyst certifications are located in Appendix 1 Anand Rathi Research India Equities
Banks
Initiating CoverageIndia I Equities
20 March 2012
City Union Bank
Strong ties in south, rural & semi-urban India drive growth; Buy
City Union Bank’s (CUB) prudent loan growth, best-in-class productivity and superior asset quality are likely, in our view, to drive profitability and sustain an RoA of 1.7% over FY12-14. We initiate coverage on the stock with a Buy rating and a price target of `68.
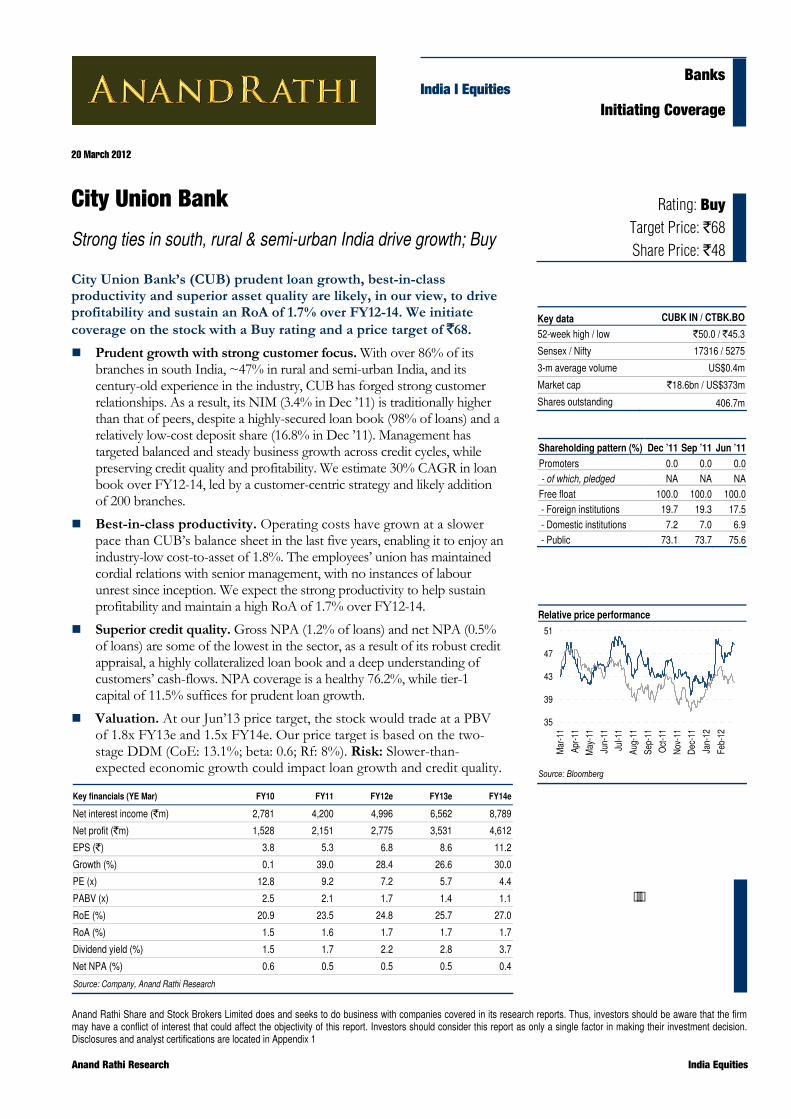
Prudent growth with strong customer focus. With over 86% of its branches in south India, ~47% in rural and semi-urban India, and its century-old experience in the industry, CUB has forged strong customer relationships. As a result, its NIM (3.4% in Dec ’11) is traditionally higher than that of peers, despite a highly-secured loan book (98% of loans) and a relatively low-cost deposit share (16.8% in Dec ’11). Management has targeted balanced and steady business growth across credit cycles, while preserving credit quality and profitability. We estimate 30% CAGR in loan book over FY12-14, led by a customer-centric strategy and likely addition of 200 branches.
Best-in-class productivity. Operating costs have grown at a slower pace than CUB’s balance sheet in the last five years, enabling it to enjoy an industry-low cost-to-asset of 1.8%. The employees’ union has maintained cordial relations with senior management, with no instances of labour unrest since inception. We expect the strong productivity to help sustain profitability and maintain a high RoA of 1.7% over FY12-14.
Superior credit quality. Gross NPA (1.2% of loans) and net NPA (0.5% of loans) are some of the lowest in the sector, as a result of its robust credit appraisal, a highly collateralized loan book and a deep understanding of customers’ cash-flows. NPA coverage is a healthy 76.2%, while tier-1 capital of 11.5% suffices for prudent loan growth.
Valuation. At our Jun’13 price target, the stock would trade at a PBV of 1.8x FY13e and 1.5x FY14e. Our price target is based on the two-stage DDM (CoE: 13.1%; beta: 0.6; Rf: 8%). Risk: Slower-than-expected economic growth could impact loan growth and credit quality.
Rating: Buy Target Price: `68 Share Price: `48
Relative price performance
35
39
43
47
51
Mar
-11
Apr-1
1
May
-11
Jun-
11
Jul-1
1
Aug-
11
Sep-
11
Oct
-11
Nov
-11
Dec
-11
Jan-
12
Feb-
12
Source: Bloomberg
Key data CUBK IN / CTBK.BO
52-week high / low `50.0 / `45.3
Sensex / Nifty 17316 / 5275
3-m average volume US$0.4m
Market cap `18.6bn / US$373m
Shares outstanding 406.7m
Shareholding pattern (%) Dec ’11 Sep ’11 Jun ’11Promoters 0.0 0.0 0.0 - of which, pledged NA NA NAFree float 100.0 100.0 100.0 - Foreign institutions 19.7 19.3 17.5 - Domestic institutions 7.2 7.0 6.9 - Public 73.1 73.7 75.6
Key financials (YE Mar) FY10 FY11 FY12e FY13e FY14e
Net interest income (`m) 2,781 4,200 4,996 6,562 8,789
Net profit (`m) 1,528 2,151 2,775 3,531 4,612
EPS (`) 3.8 5.3 6.8 8.6 11.2
Growth (%) 0.1 39.0 28.4 26.6 30.0
PE (x) 12.8 9.2 7.2 5.7 4.4
PABV (x) 2.5 2.1 1.7 1.4 1.1
RoE (%) 20.9 23.5 24.8 25.7 27.0
RoA (%) 1.5 1.6 1.7 1.7 1.7
Dividend yield (%) 1.5 1.7 2.2 2.8 3.7
Net NPA (%) 0.6 0.5 0.5 0.5 0.4
Source: Company, Anand Rathi Research
20 March 2012 City Union Bank – Strong ties in south, rural & semi-urban India drive growth; Buy
Anand Rathi Research 2
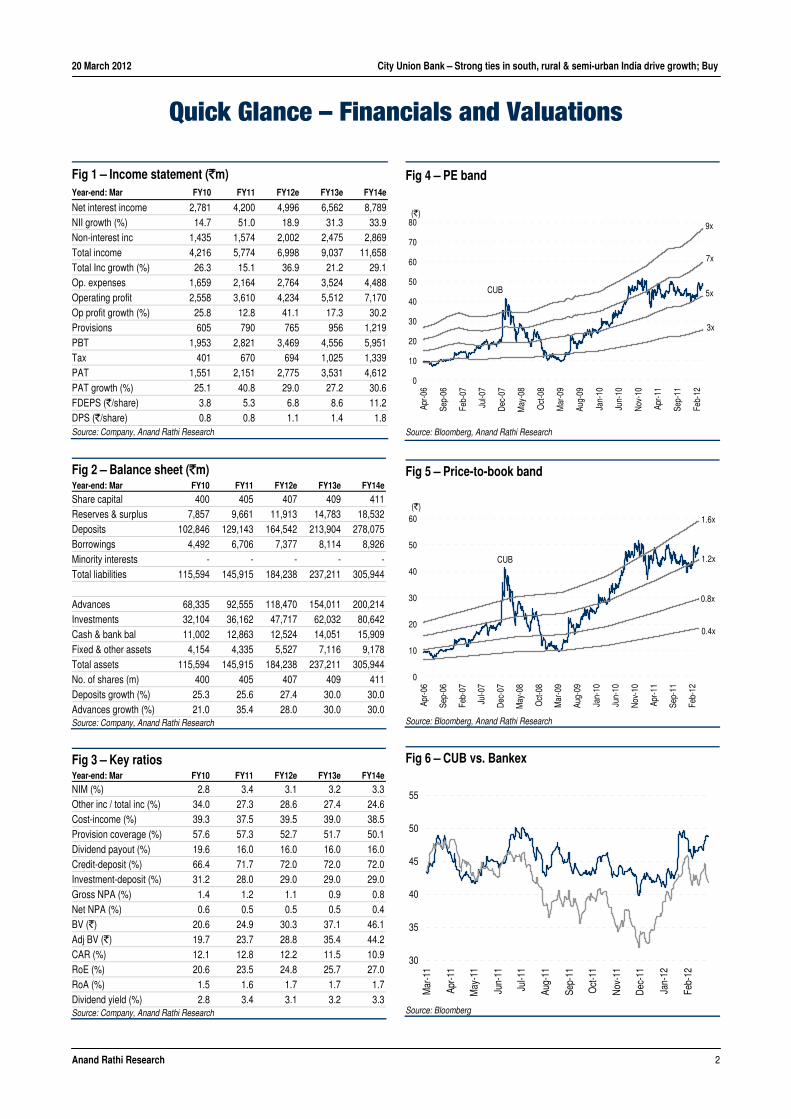
Quick Glance – Financials and Valuations Fig 1 – Income statement (`m)
Year-end: Mar FY10 FY11 FY12e FY13e FY14e
Net interest income 2,781 4,200 4,996 6,562 8,789 NII growth (%) 14.7 51.0 18.9 31.3 33.9 Non-interest inc 1,435 1,574 2,002 2,475 2,869 Total income 4,216 5,774 6,998 9,037 11,658 Total Inc growth (%) 26.3 15.1 36.9 21.2 29.1 Op. expenses 1,659 2,164 2,764 3,524 4,488 Operating profit 2,558 3,610 4,234 5,512 7,170 Op profit growth (%) 25.8 12.8 41.1 17.3 30.2 Provisions 605 790 765 956 1,219 PBT 1,953 2,821 3,469 4,556 5,951 Tax 401 670 694 1,025 1,339 PAT 1,551 2,151 2,775 3,531 4,612 PAT growth (%) 25.1 40.8 29.0 27.2 30.6 FDEPS (`/share) 3.8 5.3 6.8 8.6 11.2 DPS (`/share) 0.8 0.8 1.1 1.4 1.8 Source: Company, Anand Rathi Research
Fig 2 – Balance sheet (`m) Year-end: Mar FY10 FY11 FY12e FY13e FY14e
Share capital 400 405 407 409 411 Reserves & surplus 7,857 9,661 11,913 14,783 18,532 Deposits 102,846 129,143 164,542 213,904 278,075 Borrowings 4,492 6,706 7,377 8,114 8,926 Minority interests - - - - -Total liabilities 115,594 145,915 184,238 237,211 305,944 Advances 68,335 92,555 118,470 154,011 200,214 Investments 32,104 36,162 47,717 62,032 80,642 Cash & bank bal 11,002 12,863 12,524 14,051 15,909 Fixed & other assets 4,154 4,335 5,527 7,116 9,178 Total assets 115,594 145,915 184,238 237,211 305,944 No. of shares (m) 400 405 407 409 411Deposits growth (%) 25.3 25.6 27.4 30.0 30.0 Advances growth (%) 21.0 35.4 28.0 30.0 30.0 Source: Company, Anand Rathi Research
Fig 3 – Key ratios Year-end: Mar FY10 FY11 FY12e FY13e FY14e
NIM (%) 2.8 3.4 3.1 3.2 3.3 Other inc / total inc (%) 34.0 27.3 28.6 27.4 24.6 Cost-income (%) 39.3 37.5 39.5 39.0 38.5 Provision coverage (%) 57.6 57.3 52.7 51.7 50.1 Dividend payout (%) 19.6 16.0 16.0 16.0 16.0 Credit-deposit (%) 66.4 71.7 72.0 72.0 72.0 Investment-deposit (%) 31.2 28.0 29.0 29.0 29.0 Gross NPA (%) 1.4 1.2 1.1 0.9 0.8 Net NPA (%) 0.6 0.5 0.5 0.5 0.4 BV (`) 20.6 24.9 30.3 37.1 46.1 Adj BV (`) 19.7 23.7 28.8 35.4 44.2 CAR (%) 12.1 12.8 12.2 11.5 10.9 RoE (%) 20.6 23.5 24.8 25.7 27.0 RoA (%) 1.5 1.6 1.7 1.7 1.7 Dividend yield (%) 2.8 3.4 3.1 3.2 3.3 Source: Company, Anand Rathi Research
Fig 4 – PE band
CUB
BOB
3x
5x
7x
9x
0
10
20
30
40
50
60
70
80
Apr-0
6
Sep-
06
Feb-
07
Jul-0
7
Dec
-07
May
-08
Oct
-08
Mar
-09
Aug-
09
Jan-
10
Jun-
10
Nov
-10
Apr-1
1
Sep-
11
Feb-
12
(`)
Source: Bloomberg, Anand Rathi Research
Fig 5 – Price-to-book band
CUB
0.4x
0.8x
1.2x
1.6x
0
10
20
30
40
50
60
Apr-0
6
Sep-
06
Feb-
07
Jul-0
7
Dec
-07
May
-08
Oct
-08
Mar
-09
Aug-
09
Jan-
10
Jun-
10
Nov
-10
Apr-1
1
Sep-
11
Feb-
12
(`)
Source: Bloomberg, Anand Rathi Research
Fig 6 – CUB vs. Bankex
30
35
40
45
50
55
Mar
-11
Apr-1
1
May
-11
Jun-
11
Jul-1
1
Aug-
11
Sep-
11
Oct
-11
Nov
-11
Dec
-11
Jan-
12
Feb-
12
Source: Bloomberg
20 March 2012 City Union Bank – Strong ties in south, rural & semi-urban India drive growth; Buy
Anand Rathi Research 3
Investment Argument and Valuation We initiate coverage on City Union Bank (CUB) with a Buy rating and a price target of `68. We expect its balanced and conservative loan growth, best-in-class productivity and superior asset quality to drive profitability and sustain 1.7% RoA over FY12-14.
Prudent growth with strong customer focus With over 86% of branches in south India, ~47% in rural and semi-urban India, and its century-long experience in the business, CUB has forged strong customer relationships. As a result, its NIM (3.4% in Dec ’11) is traditionally higher than that of peers, despite a highly secured loan book (98% of loans) and relatively low-cost deposit share (16.8% in Dec ’11). Management has striven for balanced and steady business growth across credit cycles, while preserving credit quality and profitability. We estimate 30% CAGR in the loan book over FY12-14, led by the bank’s customer-centric strategy and the targeted addition of 200 branches.
Best-in-class productivity In the last five years, operating costs have grown slower than CUB’s balance-sheet, enabling the bank to enjoy an industry-low cost-to-asset of 1.8%. The employee union has maintained cordial relations with senior management, with no instances of labour unrest since inception. We estimate sustained cost-to-assets at 1.7% over FY12-14, led by improving core income. We expect strong productivity to help sustain profitability and high RoA of 1.7% over FY12-14.
Superior credit quality The bank’s gross NPA (1.2% of loans) and net NPA (0.5% of loans) are among the lowest in the sector, and are attributable to the robust credit appraisal, a highly collateralized loan book and a deep understanding of customers’ cash-flows. NPA coverage is a healthy 76.2%, while restructured loans are at a low 2.5% of loans. The capital adequacy of 12.4% (tier-1 capital of 11.5%) provides an adequate cushion for future growth and any further loan defaults.
Valuation We initiate coverage on City Union Bank with a Buy rating and a price target of `68. At our target price, the stock would trade at a PBV of 1.8x FY13e and 1.5x FY14e. Our price target is based on the two-stage DDM (CoE: 13.1%; beta: 0.6; Rf: 8%).
Our assumptions for normalised RoE are based on the bank’s long-term sustainable generation capacity, considering a steady core tier-1 ratio of 7% and risk weights based on the average loan profile. Our risk-free rate assumption is 8% and market-risk premium is 9%.
20 March 2012 City Union Bank – Strong ties in south, rural & semi-urban India drive growth; Buy
Anand Rathi Research 4
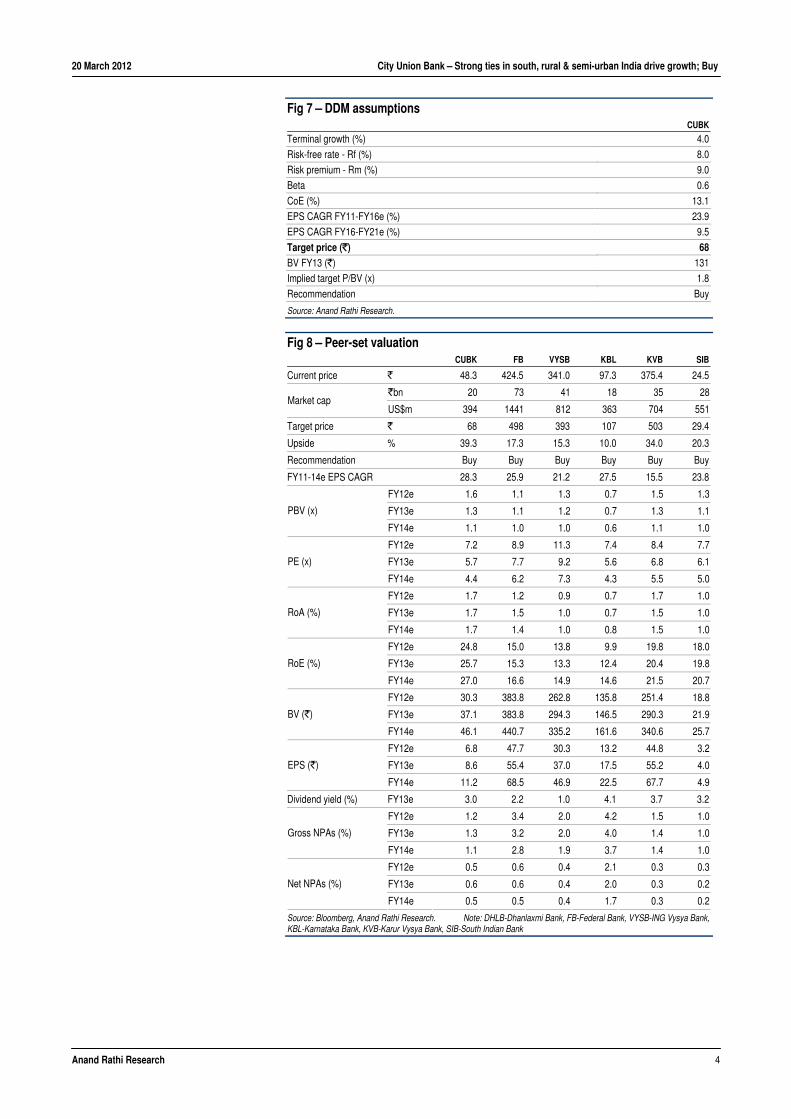
Fig 7 – DDM assumptions CUBK
Terminal growth (%) 4.0
Risk-free rate - Rf (%) 8.0
Risk premium - Rm (%) 9.0
Beta 0.6
CoE (%) 13.1
EPS CAGR FY11-FY16e (%) 23.9
EPS CAGR FY16-FY21e (%) 9.5
Target price (`) 68BV FY13 (`) 131
Implied target P/BV (x) 1.8
Recommendation Buy
Source: Anand Rathi Research.
Fig 8 – Peer-set valuation CUBK FB VYSB KBL KVB SIB
Current price ` 48.3 424.5 341.0 97.3 375.4 24.5
`bn 20 73 41 18 35 28Market cap
US$m 394 1441 812 363 704 551
Target price ` 68 498 393 107 503 29.4
Upside % 39.3 17.3 15.3 10.0 34.0 20.3
Recommendation Buy Buy Buy Buy Buy Buy
FY11-14e EPS CAGR 28.3 25.9 21.2 27.5 15.5 23.8
FY12e 1.6 1.1 1.3 0.7 1.5 1.3
FY13e 1.3 1.1 1.2 0.7 1.3 1.1 PBV (x)
FY14e 1.1 1.0 1.0 0.6 1.1 1.0
FY12e 7.2 8.9 11.3 7.4 8.4 7.7
FY13e 5.7 7.7 9.2 5.6 6.8 6.1 PE (x)
FY14e 4.4 6.2 7.3 4.3 5.5 5.0
FY12e 1.7 1.2 0.9 0.7 1.7 1.0
FY13e 1.7 1.5 1.0 0.7 1.5 1.0 RoA (%)
FY14e 1.7 1.4 1.0 0.8 1.5 1.0
FY12e 24.8 15.0 13.8 9.9 19.8 18.0
FY13e 25.7 15.3 13.3 12.4 20.4 19.8 RoE (%)
FY14e 27.0 16.6 14.9 14.6 21.5 20.7
FY12e 30.3 383.8 262.8 135.8 251.4 18.8
FY13e 37.1 383.8 294.3 146.5 290.3 21.9BV (`)
FY14e 46.1 440.7 335.2 161.6 340.6 25.7
FY12e 6.8 47.7 30.3 13.2 44.8 3.2
FY13e 8.6 55.4 37.0 17.5 55.2 4.0EPS (`)
FY14e 11.2 68.5 46.9 22.5 67.7 4.9
Dividend yield (%) FY13e 3.0 2.2 1.0 4.1 3.7 3.2
FY12e 1.2 3.4 2.0 4.2 1.5 1.0
FY13e 1.3 3.2 2.0 4.0 1.4 1.0Gross NPAs (%)
FY14e 1.1 2.8 1.9 3.7 1.4 1.0
FY12e 0.5 0.6 0.4 2.1 0.3 0.3
FY13e 0.6 0.6 0.4 2.0 0.3 0.2Net NPAs (%)
FY14e 0.5 0.5 0.4 1.7 0.3 0.2
Source: Bloomberg, Anand Rathi Research. Note: DHLB-Dhanlaxmi Bank, FB-Federal Bank, VYSB-ING Vysya Bank, KBL-Karnataka Bank, KVB-Karur Vysya Bank, SIB-South Indian Bank
20 March 2012 City Union Bank – Strong ties in south, rural & semi-urban India drive growth; Buy
Anand Rathi Research 5
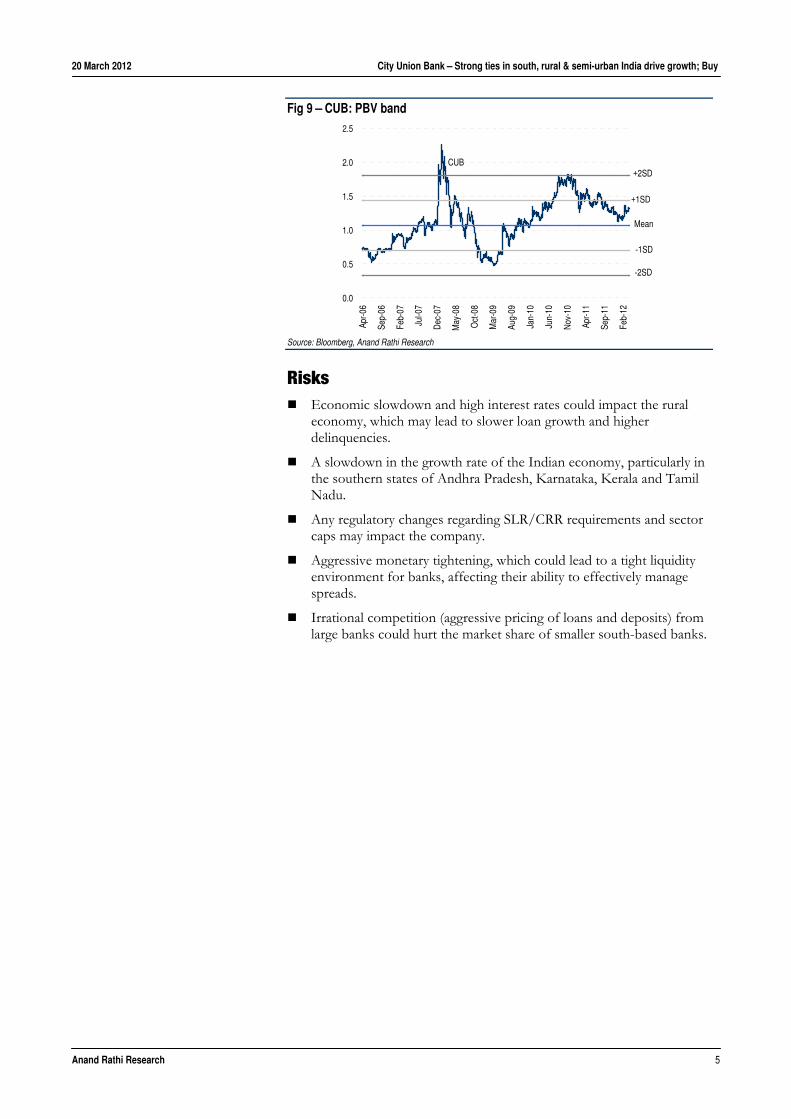
Fig 9 – CUB: PBV band
CUB
Mean
+1SD
-1SD
+2SD
-2SD
0.0
0.5
1.0
1.5
2.0
2.5
Apr-0
6
Sep-
06
Feb-
07
Jul-0
7
Dec
-07
May
-08
Oct
-08
Mar
-09
Aug-
09
Jan-
10
Jun-
10
Nov
-10
Apr-1
1
Sep-
11
Feb-
12
Source: Bloomberg, Anand Rathi Research
Risks Economic slowdown and high interest rates could impact the rural
economy, which may lead to slower loan growth and higher delinquencies.
A slowdown in the growth rate of the Indian economy, particularly in the southern states of Andhra Pradesh, Karnataka, Kerala and Tamil Nadu.
Any regulatory changes regarding SLR/CRR requirements and sector caps may impact the company.
Aggressive monetary tightening, which could lead to a tight liquidity environment for banks, affecting their ability to effectively manage spreads.
Irrational competition (aggressive pricing of loans and deposits) from large banks could hurt the market share of smaller south-based banks.
20 March 2012 City Union Bank – Strong ties in south, rural & semi-urban India drive growth; Buy
Anand Rathi Research 6
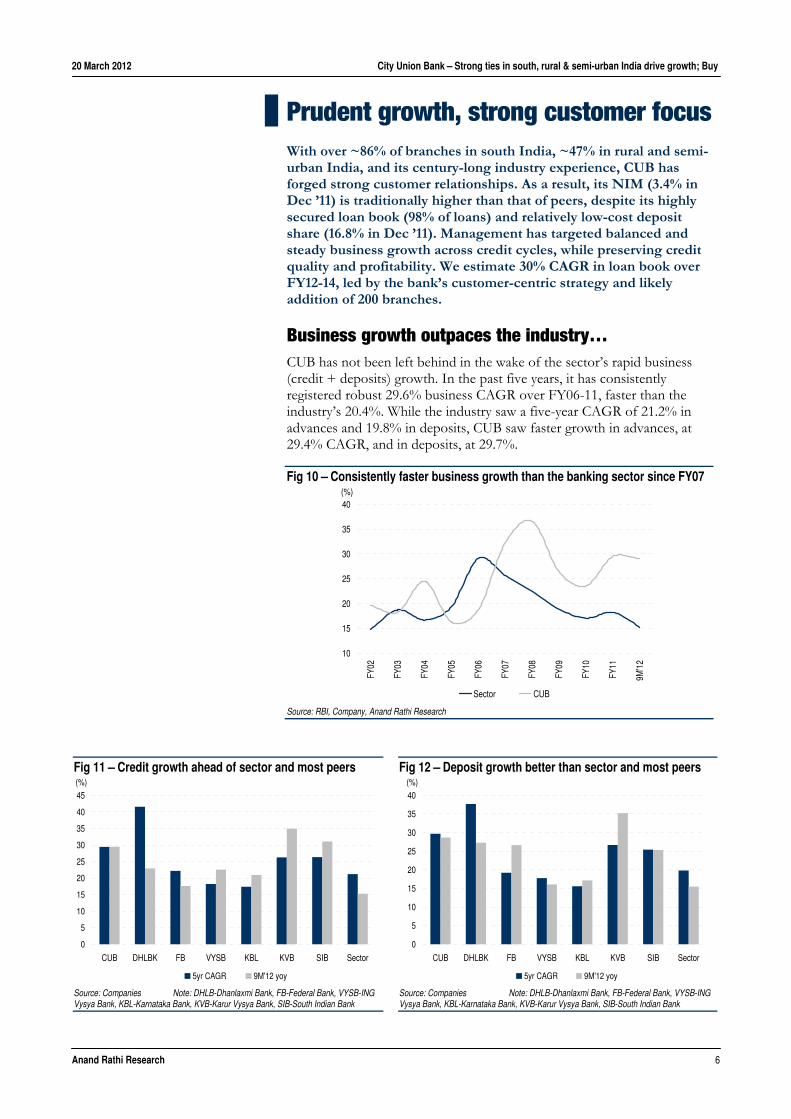
Prudent growth, strong customer focus With over ~86% of branches in south India, ~47% in rural and semi-urban India, and its century-long industry experience, CUB has forged strong customer relationships. As a result, its NIM (3.4% in Dec ’11) is traditionally higher than that of peers, despite its highly secured loan book (98% of loans) and relatively low-cost deposit share (16.8% in Dec ’11). Management has targeted balanced and steady business growth across credit cycles, while preserving credit quality and profitability. We estimate 30% CAGR in loan book over FY12-14, led by the bank’s customer-centric strategy and likely addition of 200 branches.
Business growth outpaces the industry… CUB has not been left behind in the wake of the sector’s rapid business (credit + deposits) growth. In the past five years, it has consistently registered robust 29.6% business CAGR over FY06-11, faster than the industry’s 20.4%. While the industry saw a five-year CAGR of 21.2% in advances and 19.8% in deposits, CUB saw faster growth in advances, at 29.4% CAGR, and in deposits, at 29.7%.
Fig 10 – Consistently faster business growth than the banking sector since FY07
10
15
20
25
30
35
40
FY02
FY03
FY04
FY05
FY06
FY07
FY08
FY09
FY10
FY11
9M'1
2
Sector CUB
(%)
Source: RBI, Company, Anand Rathi Research
Fig 11 – Credit growth ahead of sector and most peers
0
5
10
15
20
25
30
35
40
45
CUB DHLBK FB VYSB KBL KVB SIB Sector
5yr CAGR 9M'12 yoy
(%)
Source: Companies Note: DHLB-Dhanlaxmi Bank, FB-Federal Bank, VYSB-ING Vysya Bank, KBL-Karnataka Bank, KVB-Karur Vysya Bank, SIB-South Indian Bank
Fig 12 – Deposit growth better than sector and most peers
0
5
10
15
20
25
30
35
40
CUB DHLBK FB VYSB KBL KVB SIB Sector
5yr CAGR 9M'12 yoy
(%)
Source: Companies Note: DHLB-Dhanlaxmi Bank, FB-Federal Bank, VYSB-ING Vysya Bank, KBL-Karnataka Bank, KVB-Karur Vysya Bank, SIB-South Indian Bank
20 March 2012 City Union Bank – Strong ties in south, rural & semi-urban India drive growth; Buy
Anand Rathi Research 7
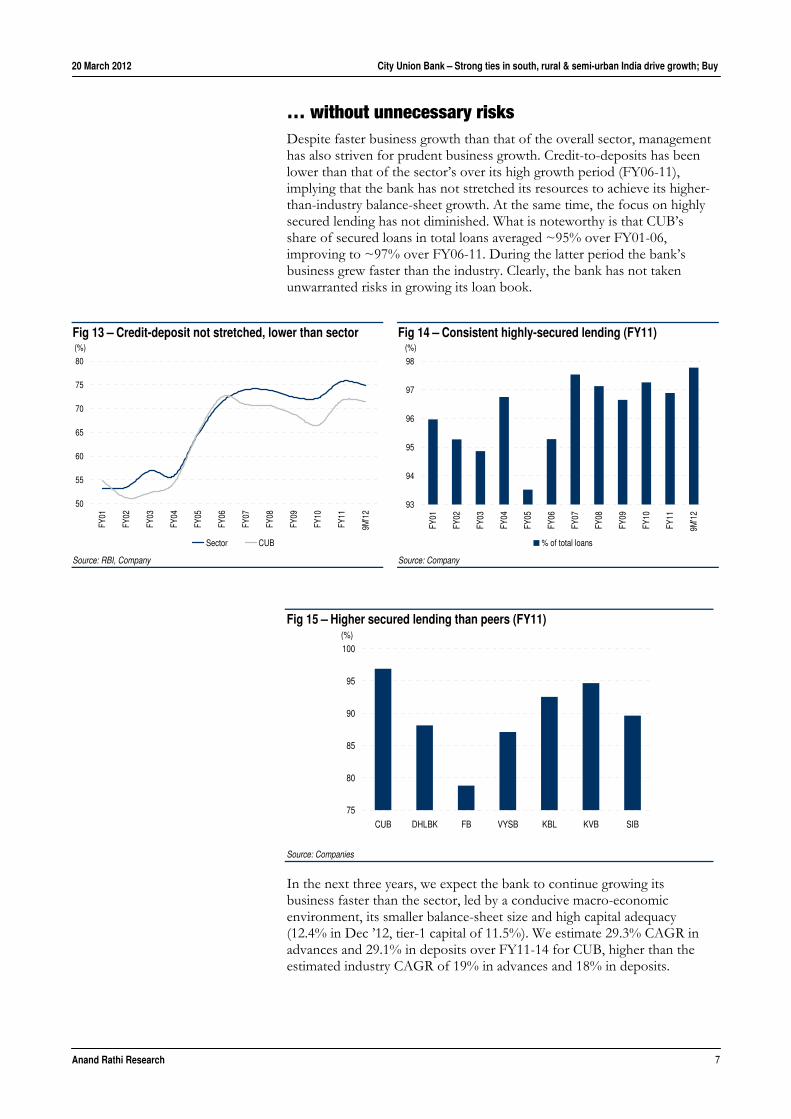
… without unnecessary risks Despite faster business growth than that of the overall sector, management has also striven for prudent business growth. Credit-to-deposits has been lower than that of the sector’s over its high growth period (FY06-11), implying that the bank has not stretched its resources to achieve its higher-than-industry balance-sheet growth. At the same time, the focus on highly secured lending has not diminished. What is noteworthy is that CUB’s share of secured loans in total loans averaged ~95% over FY01-06, improving to ~97% over FY06-11. During the latter period the bank’s business grew faster than the industry. Clearly, the bank has not taken unwarranted risks in growing its loan book.
Fig 15 – Higher secured lending than peers (FY11)
75
80
85
90
95
100
CUB DHLBK FB VYSB KBL KVB SIB
(%)
Source: Companies
In the next three years, we expect the bank to continue growing its business faster than the sector, led by a conducive macro-economic environment, its smaller balance-sheet size and high capital adequacy (12.4% in Dec ’12, tier-1 capital of 11.5%). We estimate 29.3% CAGR in advances and 29.1% in deposits over FY11-14 for CUB, higher than the estimated industry CAGR of 19% in advances and 18% in deposits.
Fig 13 – Credit-deposit not stretched, lower than sector
50
55
60
65
70
75
80
FY01
FY02
FY03
FY04
FY05
FY06
FY07
FY08
FY09
FY10
FY11
9M'1
2
Sector CUB
(%)
Source: RBI, Company
Fig 14 – Consistent highly-secured lending (FY11)
93
94
95
96
97
98
FY01
FY02
FY03
FY04
FY05
FY06
FY07
FY08
FY09
FY10
FY11
9M'1
2
% of total loans
(%)
Source: Company
20 March 2012 City Union Bank – Strong ties in south, rural & semi-urban India drive growth; Buy
Anand Rathi Research 8
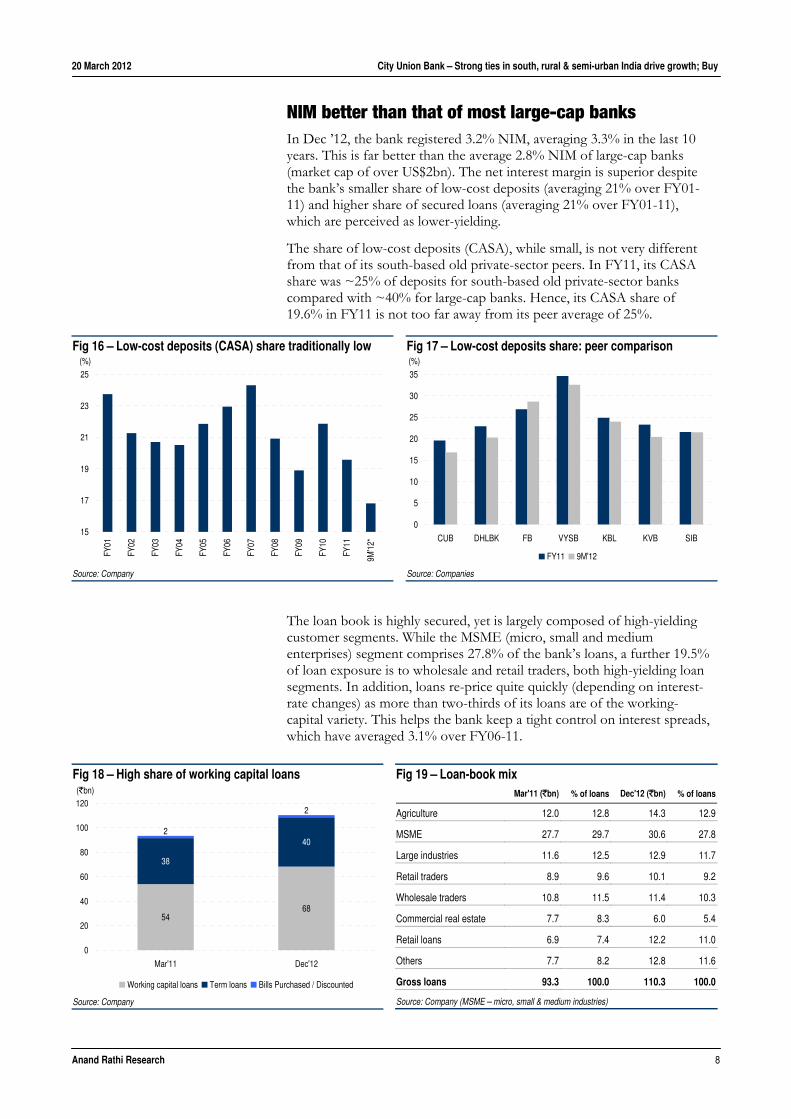
NIM better than that of most large-cap banks In Dec ’12, the bank registered 3.2% NIM, averaging 3.3% in the last 10 years. This is far better than the average 2.8% NIM of large-cap banks (market cap of over US$2bn). The net interest margin is superior despite the bank’s smaller share of low-cost deposits (averaging 21% over FY01-11) and higher share of secured loans (averaging 21% over FY01-11), which are perceived as lower-yielding.
The share of low-cost deposits (CASA), while small, is not very different from that of its south-based old private-sector peers. In FY11, its CASA share was ~25% of deposits for south-based old private-sector banks compared with ~40% for large-cap banks. Hence, its CASA share of 19.6% in FY11 is not too far away from its peer average of 25%.
The loan book is highly secured, yet is largely composed of high-yielding customer segments. While the MSME (micro, small and medium enterprises) segment comprises 27.8% of the bank’s loans, a further 19.5% of loan exposure is to wholesale and retail traders, both high-yielding loan segments. In addition, loans re-price quite quickly (depending on interest-rate changes) as more than two-thirds of its loans are of the working-capital variety. This helps the bank keep a tight control on interest spreads, which have averaged 3.1% over FY06-11.
Fig 16 – Low-cost deposits (CASA) share traditionally low
15
17
19
21
23
25
FY01
FY02
FY03
FY04
FY05
FY06
FY07
FY08
FY09
FY10
FY11
9M'1
2*(%)
Source: Company
Fig 17 – Low-cost deposits share: peer comparison
0
5
10
15
20
25
30
35
CUB DHLBK FB VYSB KBL KVB SIB
FY11 9M'12
(%)
Source: Companies
Fig 18 – High share of working capital loans
5468
38
40
2
2
0
20
40
60
80
100
120
Mar'11 Dec'12
Working capital loans Term loans Bills Purchased / Discounted
(`bn)
Source: Company
Fig 19 – Loan-book mix Mar'11 (`bn) % of loans Dec'12 (`bn) % of loans
Agriculture 12.0 12.8 14.3 12.9
MSME 27.7 29.7 30.6 27.8
Large industries 11.6 12.5 12.9 11.7
Retail traders 8.9 9.6 10.1 9.2
Wholesale traders 10.8 11.5 11.4 10.3
Commercial real estate 7.7 8.3 6.0 5.4
Retail loans 6.9 7.4 12.2 11.0
Others 7.7 8.2 12.8 11.6
Gross loans 93.3 100.0 110.3 100.0
Source: Company (MSME – micro, small & medium industries)
20 March 2012 City Union Bank – Strong ties in south, rural & semi-urban India drive growth; Buy
Anand Rathi Research 9
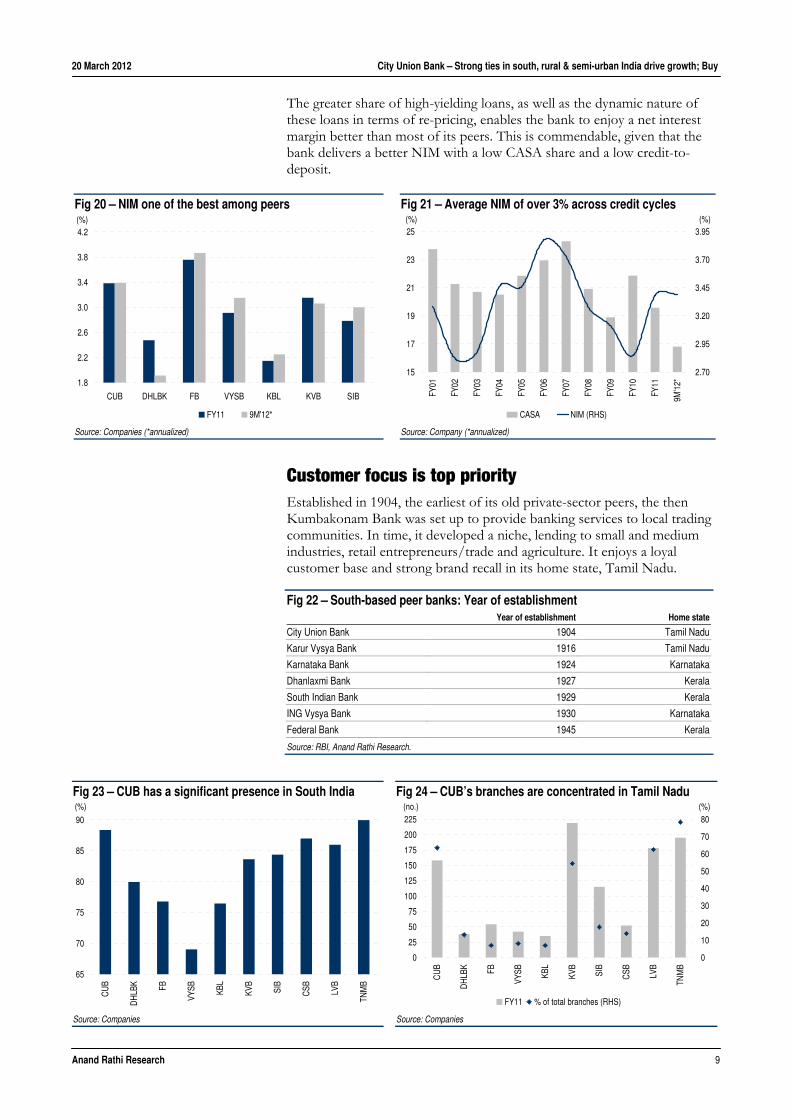
The greater share of high-yielding loans, as well as the dynamic nature of these loans in terms of re-pricing, enables the bank to enjoy a net interest margin better than most of its peers. This is commendable, given that the bank delivers a better NIM with a low CASA share and a low credit-to-deposit.
Customer focus is top priority Established in 1904, the earliest of its old private-sector peers, the then Kumbakonam Bank was set up to provide banking services to local trading communities. In time, it developed a niche, lending to small and medium industries, retail entrepreneurs/trade and agriculture. It enjoys a loyal customer base and strong brand recall in its home state, Tamil Nadu.
Fig 22 – South-based peer banks: Year of establishment Year of establishment Home state
City Union Bank 1904 Tamil Nadu
Karur Vysya Bank 1916 Tamil Nadu
Karnataka Bank 1924 Karnataka
Dhanlaxmi Bank 1927 Kerala
South Indian Bank 1929 Kerala
ING Vysya Bank 1930 Karnataka
Federal Bank 1945 Kerala
Source: RBI, Anand Rathi Research.
Fig 20 – NIM one of the best among peers
1.8
2.2
2.6
3.0
3.4
3.8
4.2
CUB DHLBK FB VYSB KBL KVB SIB
FY11 9M'12*
(%)
Source: Companies (*annualized)
Fig 21 – Average NIM of over 3% across credit cycles
15
17
19
21
23
25
FY01
FY02
FY03
FY04
FY05
FY06
FY07
FY08
FY09
FY10
FY11
9M'1
2*
2.70
2.95
3.20
3.45
3.70
3.95
CASA NIM (RHS)
(%) (%)
Source: Company (*annualized)
Fig 23 – CUB has a significant presence in South India
65
70
75
80
85
90
CU
B
DH
LBK FB
VYSB KB
L
KVB
SIB
CSB LV
B
TNM
B
(%)
Source: Companies
Fig 24 – CUB’s branches are concentrated in Tamil Nadu
0
25
50
75
100
125
150
175
200
225
CU
B
DH
LBK FB
VYSB KB
L
KVB
SIB
CSB LV
B
TNM
B
0
10
20
30
40
50
60
70
80
FY11 % of total branches (RHS)
(no.) (%)
Source: Companies
20 March 2012 City Union Bank – Strong ties in south, rural & semi-urban India drive growth; Buy
Anand Rathi Research 10
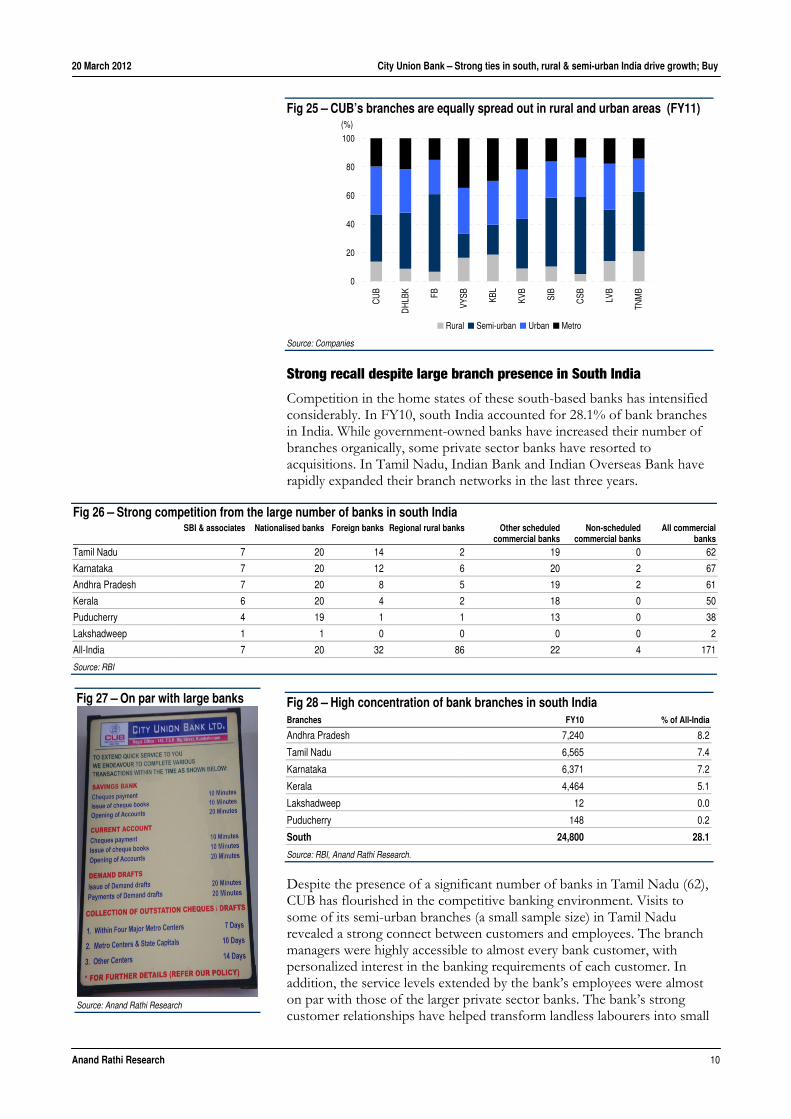
Fig 25 – CUB’s branches are equally spread out in rural and urban areas (FY11)
0
20
40
60
80
100
CU
B
DH
LBK FB
VYSB KB
L
KVB
SIB
CSB LV
B
TNM
B
Rural Semi-urban Urban Metro
(%)
Source: Companies
Strong recall despite large branch presence in South India
Competition in the home states of these south-based banks has intensified considerably. In FY10, south India accounted for 28.1% of bank branches in India. While government-owned banks have increased their number of branches organically, some private sector banks have resorted to acquisitions. In Tamil Nadu, Indian Bank and Indian Overseas Bank have rapidly expanded their branch networks in the last three years.
Fig 28 – High concentration of bank branches in south India Branches FY10 % of All-India
Andhra Pradesh 7,240 8.2
Tamil Nadu 6,565 7.4
Karnataka 6,371 7.2
Kerala 4,464 5.1
Lakshadweep 12 0.0
Puducherry 148 0.2
South 24,800 28.1
Source: RBI, Anand Rathi Research.
Despite the presence of a significant number of banks in Tamil Nadu (62), CUB has flourished in the competitive banking environment. Visits to some of its semi-urban branches (a small sample size) in Tamil Nadu revealed a strong connect between customers and employees. The branch managers were highly accessible to almost every bank customer, with personalized interest in the banking requirements of each customer. In addition, the service levels extended by the bank’s employees were almost on par with those of the larger private sector banks. The bank’s strong customer relationships have helped transform landless labourers into small
Fig 26 – Strong competition from the large number of banks in south India SBI & associates Nationalised banks Foreign banks Regional rural banks Other scheduled
commercial banks Non-scheduled
commercial banks All commercial
banksTamil Nadu 7 20 14 2 19 0 62
Karnataka 7 20 12 6 20 2 67
Andhra Pradesh 7 20 8 5 19 2 61
Kerala 6 20 4 2 18 0 50
Puducherry 4 19 1 1 13 0 38
Lakshadweep 1 1 0 0 0 0 2
All-India 7 20 32 86 22 4 171
Source: RBI
Fig 27 – On par with large banks
Source: Anand Rathi Research
20 March 2012 City Union Bank – Strong ties in south, rural & semi-urban India drive growth; Buy
Anand Rathi Research 11
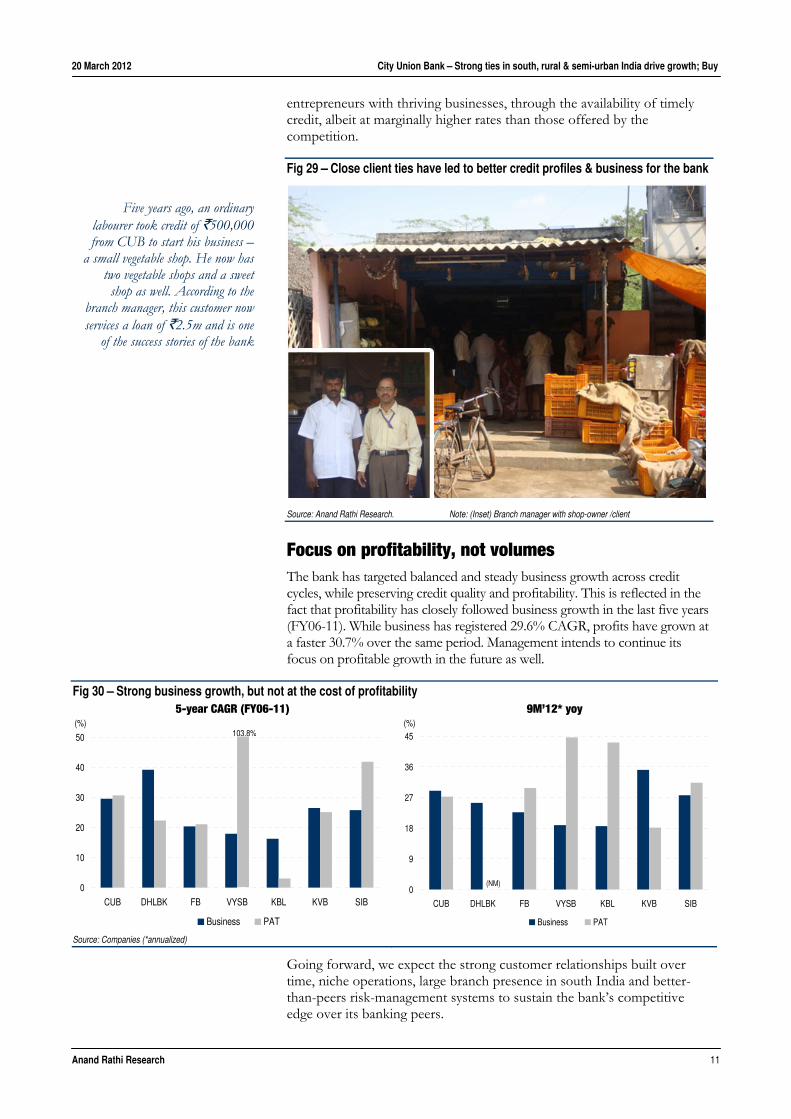
entrepreneurs with thriving businesses, through the availability of timely credit, albeit at marginally higher rates than those offered by the competition.
Fig 29 – Close client ties have led to better credit profiles & business for the bank
Source: Anand Rathi Research. Note: (Inset) Branch manager with shop-owner /client
Focus on profitability, not volumes The bank has targeted balanced and steady business growth across credit cycles, while preserving credit quality and profitability. This is reflected in the fact that profitability has closely followed business growth in the last five years (FY06-11). While business has registered 29.6% CAGR, profits have grown at a faster 30.7% over the same period. Management intends to continue its focus on profitable growth in the future as well.
Going forward, we expect the strong customer relationships built over time, niche operations, large branch presence in south India and better-than-peers risk-management systems to sustain the bank’s competitive edge over its banking peers.
Fig 30 – Strong business growth, but not at the cost of profitability 5-year CAGR (FY06-11)
0
10
20
30
40
50
CUB DHLBK FB VYSB KBL KVB SIB
Business PAT
(%)103.8%
Source: Companies (*annualized)
9M’12* yoy
0
9
18
27
36
45
CUB DHLBK FB VYSB KBL KVB SIB
Business PAT
(%)
(NM)
Five years ago, an ordinary labourer took credit of `500,000 from CUB to start his business –
a small vegetable shop. He now has two vegetable shops and a sweet shop as well. According to the
branch manager, this customer now services a loan of `2.5m and is one
of the success stories of the bank
20 March 2012 City Union Bank – Strong ties in south, rural & semi-urban India drive growth; Buy
Anand Rathi Research 12
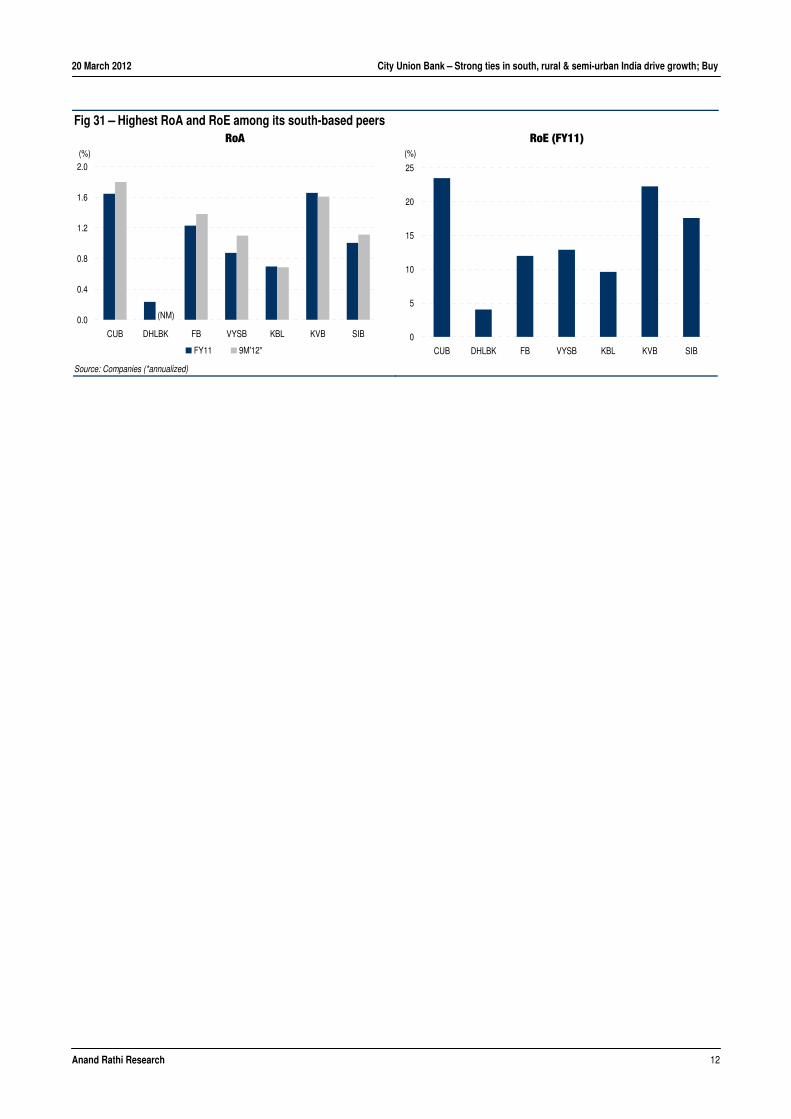
Fig 31 – Highest RoA and RoE among its south-based peers
RoA
0.0
0.4
0.8
1.2
1.6
2.0
CUB DHLBK FB VYSB KBL KVB SIB
FY11 9M'12*
(%)
(NM)
Source: Companies (*annualized)
RoE (FY11)
0
5
10
15
20
25
CUB DHLBK FB VYSB KBL KVB SIB
(%)
20 March 2012 City Union Bank – Strong ties in south, rural & semi-urban India drive growth; Buy
Anand Rathi Research 13
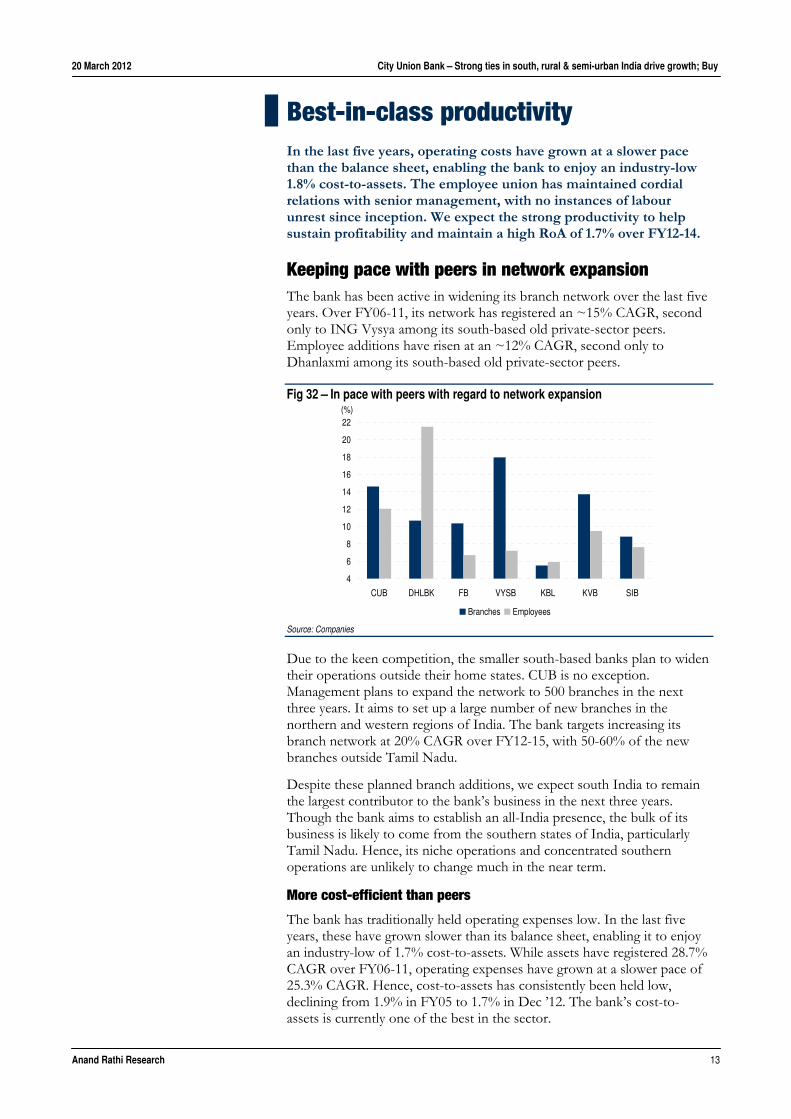
Best-in-class productivity In the last five years, operating costs have grown at a slower pace than the balance sheet, enabling the bank to enjoy an industry-low 1.8% cost-to-assets. The employee union has maintained cordial relations with senior management, with no instances of labour unrest since inception. We expect the strong productivity to help sustain profitability and maintain a high RoA of 1.7% over FY12-14.
Keeping pace with peers in network expansion The bank has been active in widening its branch network over the last five years. Over FY06-11, its network has registered an ~15% CAGR, second only to ING Vysya among its south-based old private-sector peers. Employee additions have risen at an ~12% CAGR, second only to Dhanlaxmi among its south-based old private-sector peers.
Fig 32 – In pace with peers with regard to network expansion
4
6
8
10
12
14
16
18
20
22
CUB DHLBK FB VYSB KBL KVB SIB
Branches Employees
(%)
Source: Companies
Due to the keen competition, the smaller south-based banks plan to widen their operations outside their home states. CUB is no exception. Management plans to expand the network to 500 branches in the next three years. It aims to set up a large number of new branches in the northern and western regions of India. The bank targets increasing its branch network at 20% CAGR over FY12-15, with 50-60% of the new branches outside Tamil Nadu.
Despite these planned branch additions, we expect south India to remain the largest contributor to the bank’s business in the next three years. Though the bank aims to establish an all-India presence, the bulk of its business is likely to come from the southern states of India, particularly Tamil Nadu. Hence, its niche operations and concentrated southern operations are unlikely to change much in the near term.
More cost-efficient than peers
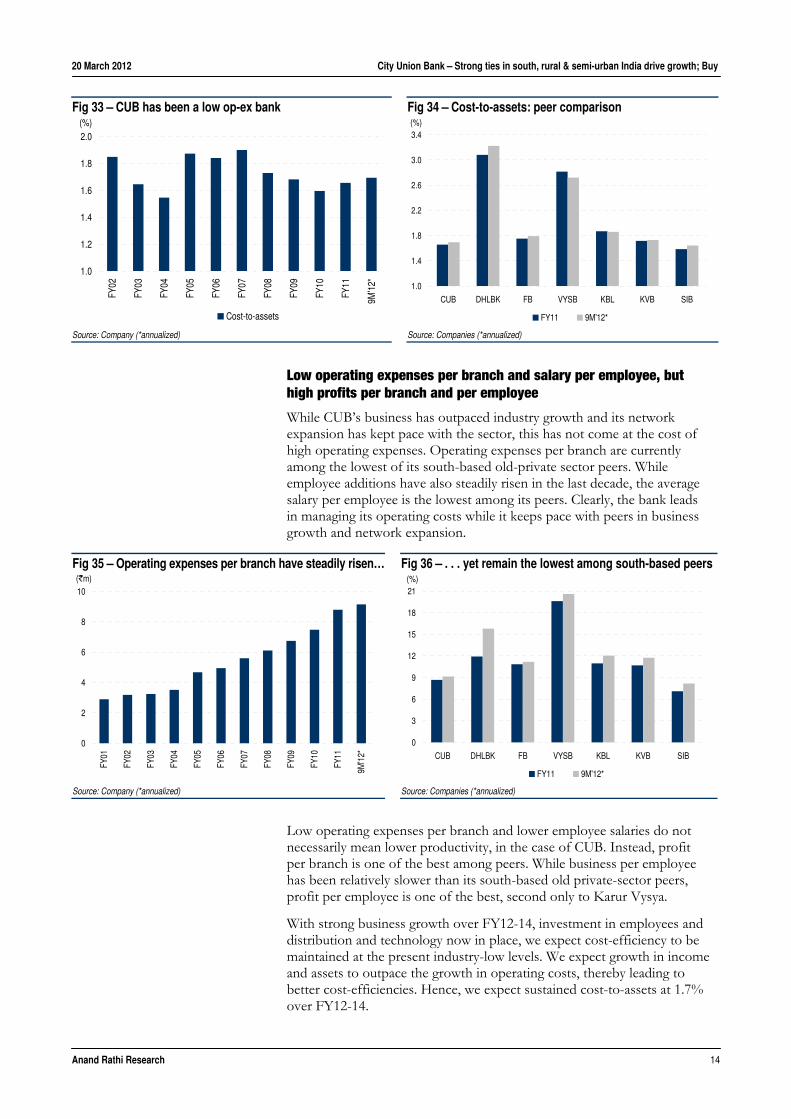
The bank has traditionally held operating expenses low. In the last five years, these have grown slower than its balance sheet, enabling it to enjoy an industry-low of 1.7% cost-to-assets. While assets have registered 28.7% CAGR over FY06-11, operating expenses have grown at a slower pace of 25.3% CAGR. Hence, cost-to-assets has consistently been held low, declining from 1.9% in FY05 to 1.7% in Dec ’12. The bank’s cost-to-assets is currently one of the best in the sector.
20 March 2012 City Union Bank – Strong ties in south, rural & semi-urban India drive growth; Buy
Anand Rathi Research 14
Low operating expenses per branch and salary per employee, but high profits per branch and per employee
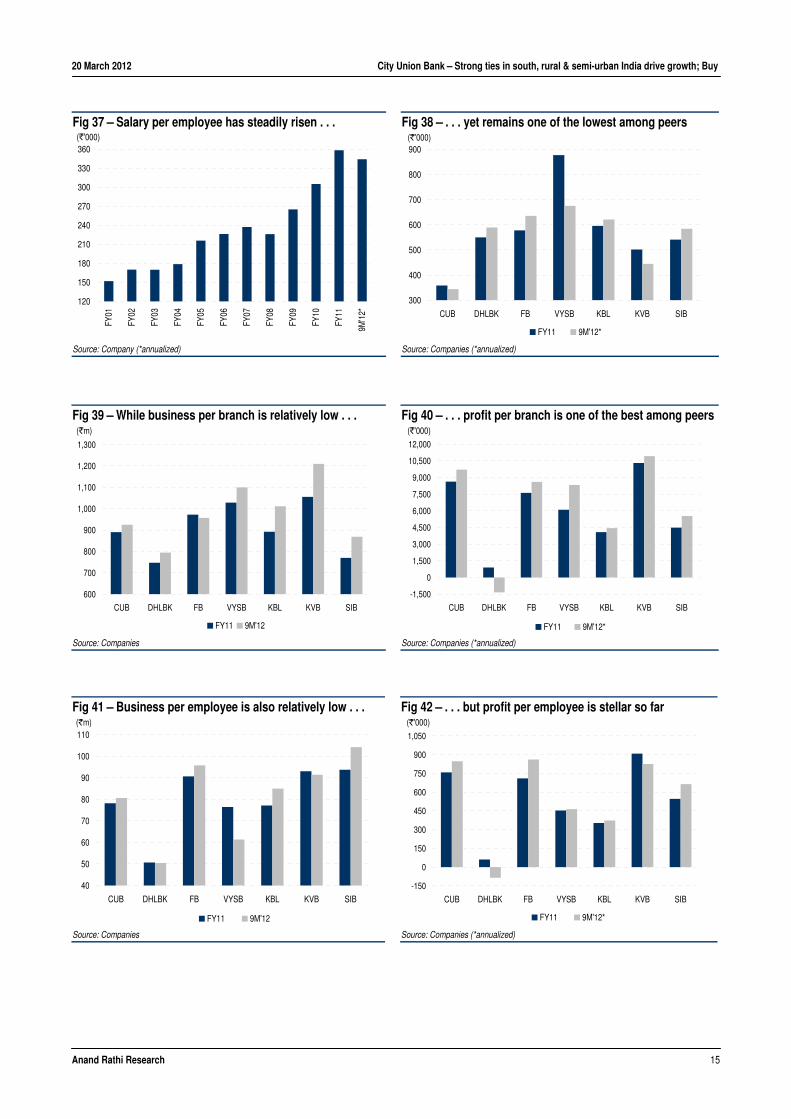
While CUB’s business has outpaced industry growth and its network expansion has kept pace with the sector, this has not come at the cost of high operating expenses. Operating expenses per branch are currently among the lowest of its south-based old-private sector peers. While employee additions have also steadily risen in the last decade, the average salary per employee is the lowest among its peers. Clearly, the bank leads in managing its operating costs while it keeps pace with peers in business growth and network expansion.
Low operating expenses per branch and lower employee salaries do not necessarily mean lower productivity, in the case of CUB. Instead, profit per branch is one of the best among peers. While business per employee has been relatively slower than its south-based old private-sector peers, profit per employee is one of the best, second only to Karur Vysya.
With strong business growth over FY12-14, investment in employees and distribution and technology now in place, we expect cost-efficiency to be maintained at the present industry-low levels. We expect growth in income and assets to outpace the growth in operating costs, thereby leading to better cost-efficiencies. Hence, we expect sustained cost-to-assets at 1.7% over FY12-14.
Fig 33 – CUB has been a low op-ex bank
1.0
1.2
1.4
1.6
1.8
2.0
FY02
FY03
FY04
FY05
FY06
FY07
FY08
FY09
FY10
FY11
9M'1
2*
Cost-to-assets
(%)
Source: Company (*annualized)
Fig 34 – Cost-to-assets: peer comparison
1.0
1.4
1.8
2.2
2.6
3.0
3.4
CUB DHLBK FB VYSB KBL KVB SIB
FY11 9M'12*
(%)
Source: Companies (*annualized)
Fig 35 – Operating expenses per branch have steadily risen…
0
2
4
6
8
10
FY01
FY02
FY03
FY04
FY05
FY06
FY07
FY08
FY09
FY10
FY11
9M'1
2*
(`m)
Source: Company (*annualized)
Fig 36 – . . . yet remain the lowest among south-based peers
0
3
6
9
12
15
18
21
CUB DHLBK FB VYSB KBL KVB SIB
FY11 9M'12*
(%)
Source: Companies (*annualized)
20 March 2012 City Union Bank – Strong ties in south, rural & semi-urban India drive growth; Buy
Anand Rathi Research 15
Fig 39 – While business per branch is relatively low . . .
600
700
800
900
1,000
1,100
1,200
1,300
CUB DHLBK FB VYSB KBL KVB SIB
FY11 9M'12
(`m)
Source: Companies
Fig 40 – . . . profit per branch is one of the best among peers
-1,500
0
1,500
3,000
4,500
6,000
7,500
9,000
10,500
12,000
CUB DHLBK FB VYSB KBL KVB SIB
FY11 9M'12*
(`'000)
Source: Companies (*annualized)
Fig 41 – Business per employee is also relatively low . . .
40
50
60
70
80
90
100
110
CUB DHLBK FB VYSB KBL KVB SIB
FY11 9M'12
(`m)
Source: Companies
Fig 42 – . . . but profit per employee is stellar so far
-150
0
150
300
450
600
750
900
1,050
CUB DHLBK FB VYSB KBL KVB SIB
FY11 9M'12*
(`'000)
Source: Companies (*annualized)
Fig 37 – Salary per employee has steadily risen . . .
120
150
180
210
240
270
300
330
360
FY01
FY02
FY03
FY04
FY05
FY06
FY07
FY08
FY09
FY10
FY11
9M'1
2*
(`'000)
Source: Company (*annualized)
Fig 38 – . . . yet remains one of the lowest among peers
300
400
500
600
700
800
900
CUB DHLBK FB VYSB KBL KVB SIB
FY11 9M'12*
(`'000)
Source: Companies (*annualized)
20 March 2012 City Union Bank – Strong ties in south, rural & semi-urban India drive growth; Buy
Anand Rathi Research 16
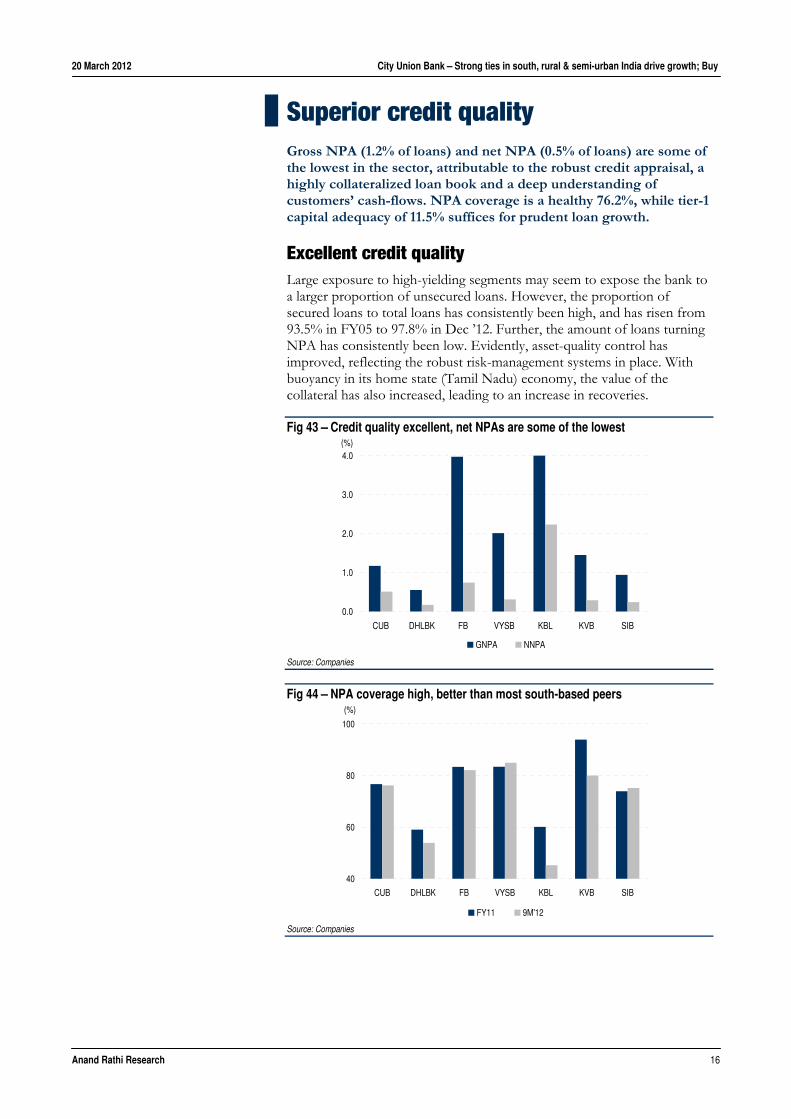
Superior credit quality Gross NPA (1.2% of loans) and net NPA (0.5% of loans) are some of the lowest in the sector, attributable to the robust credit appraisal, a highly collateralized loan book and a deep understanding of customers’ cash-flows. NPA coverage is a healthy 76.2%, while tier-1 capital adequacy of 11.5% suffices for prudent loan growth.
Excellent credit quality Large exposure to high-yielding segments may seem to expose the bank to a larger proportion of unsecured loans. However, the proportion of secured loans to total loans has consistently been high, and has risen from 93.5% in FY05 to 97.8% in Dec ’12. Further, the amount of loans turning NPA has consistently been low. Evidently, asset-quality control has improved, reflecting the robust risk-management systems in place. With buoyancy in its home state (Tamil Nadu) economy, the value of the collateral has also increased, leading to an increase in recoveries.
Fig 43 – Credit quality excellent, net NPAs are some of the lowest
0.0
1.0
2.0
3.0
4.0
CUB DHLBK FB VYSB KBL KVB SIB
GNPA NNPA
(%)
Source: Companies
Fig 44 – NPA coverage high, better than most south-based peers
40
60
80
100
CUB DHLBK FB VYSB KBL KVB SIB
FY11 9M'12
(%)
Source: Companies
20 March 2012 City Union Bank – Strong ties in south, rural & semi-urban India drive growth; Buy
Anand Rathi Research 17
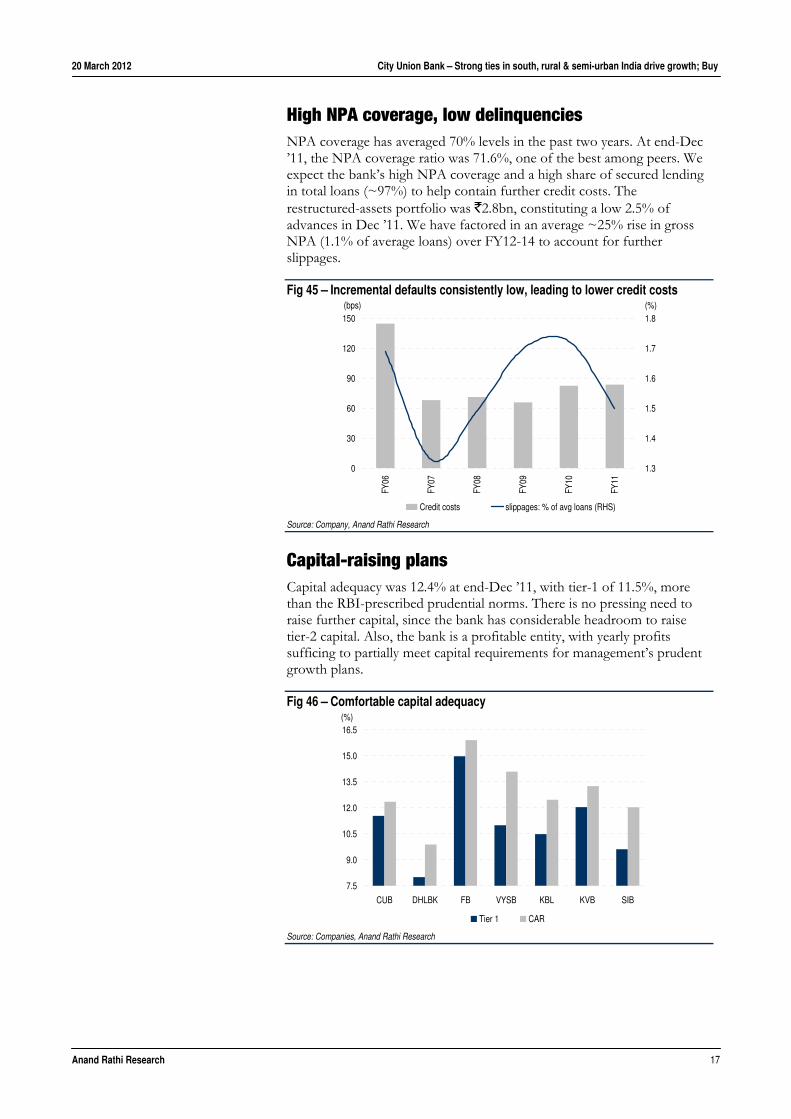
High NPA coverage, low delinquencies NPA coverage has averaged 70% levels in the past two years. At end-Dec ’11, the NPA coverage ratio was 71.6%, one of the best among peers. We expect the bank’s high NPA coverage and a high share of secured lending in total loans (~97%) to help contain further credit costs. The restructured-assets portfolio was `2.8bn, constituting a low 2.5% of advances in Dec ’11. We have factored in an average ~25% rise in gross NPA (1.1% of average loans) over FY12-14 to account for further slippages.
Fig 45 – Incremental defaults consistently low, leading to lower credit costs
0
30
60
90
120
150
FY06
FY07
FY08
FY09
FY10
FY11
1.3
1.4
1.5
1.6
1.7
1.8
Credit costs slippages: % of avg loans (RHS)
(%)(bps)
Source: Company, Anand Rathi Research
Capital-raising plans Capital adequacy was 12.4% at end-Dec ’11, with tier-1 of 11.5%, more than the RBI-prescribed prudential norms. There is no pressing need to raise further capital, since the bank has considerable headroom to raise tier-2 capital. Also, the bank is a profitable entity, with yearly profits sufficing to partially meet capital requirements for management’s prudent growth plans.
Fig 46 – Comfortable capital adequacy
7.5
9.0
10.5
12.0
13.5
15.0
16.5
CUB DHLBK FB VYSB KBL KVB SIB
Tier 1 CAR
(%)
Source: Companies, Anand Rathi Research
20 March 2012 City Union Bank – Strong ties in south, rural & semi-urban India drive growth; Buy
Anand Rathi Research 18
Financials We estimate 27.9% CAGR in net interest income over FY12-14, backed by strong business growth and NIM improvement. We expect productivity levels to be sustained at current industry-low levels, with cost-assets of 1.7% over FY12-14. Hence, we estimate earnings CAGR of 29% over FY12-14.
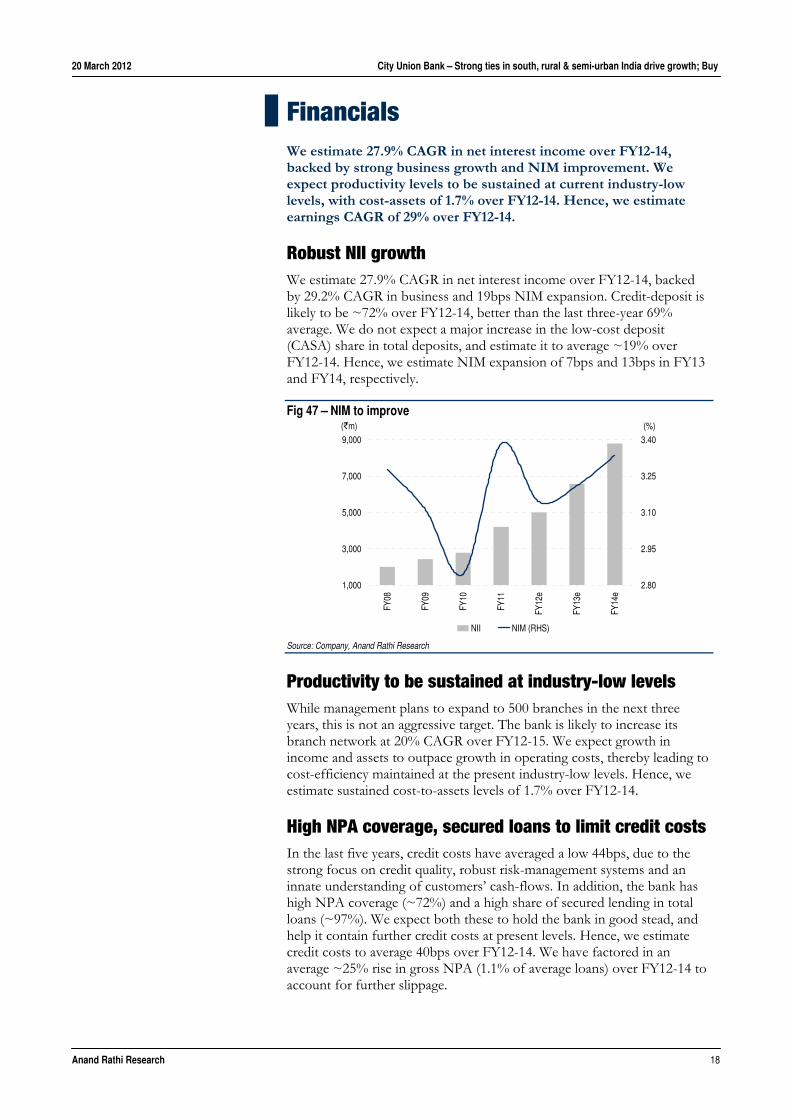
Robust NII growth We estimate 27.9% CAGR in net interest income over FY12-14, backed by 29.2% CAGR in business and 19bps NIM expansion. Credit-deposit is likely to be ~72% over FY12-14, better than the last three-year 69% average. We do not expect a major increase in the low-cost deposit (CASA) share in total deposits, and estimate it to average ~19% over FY12-14. Hence, we estimate NIM expansion of 7bps and 13bps in FY13 and FY14, respectively.
Fig 47 – NIM to improve
1,000
3,000
5,000
7,000
9,000
FY08
FY09
FY10
FY11
FY12
e
FY13
e
FY14
e
2.80
2.95
3.10
3.25
3.40
NII NIM (RHS)
(%)(`m)
Source: Company, Anand Rathi Research
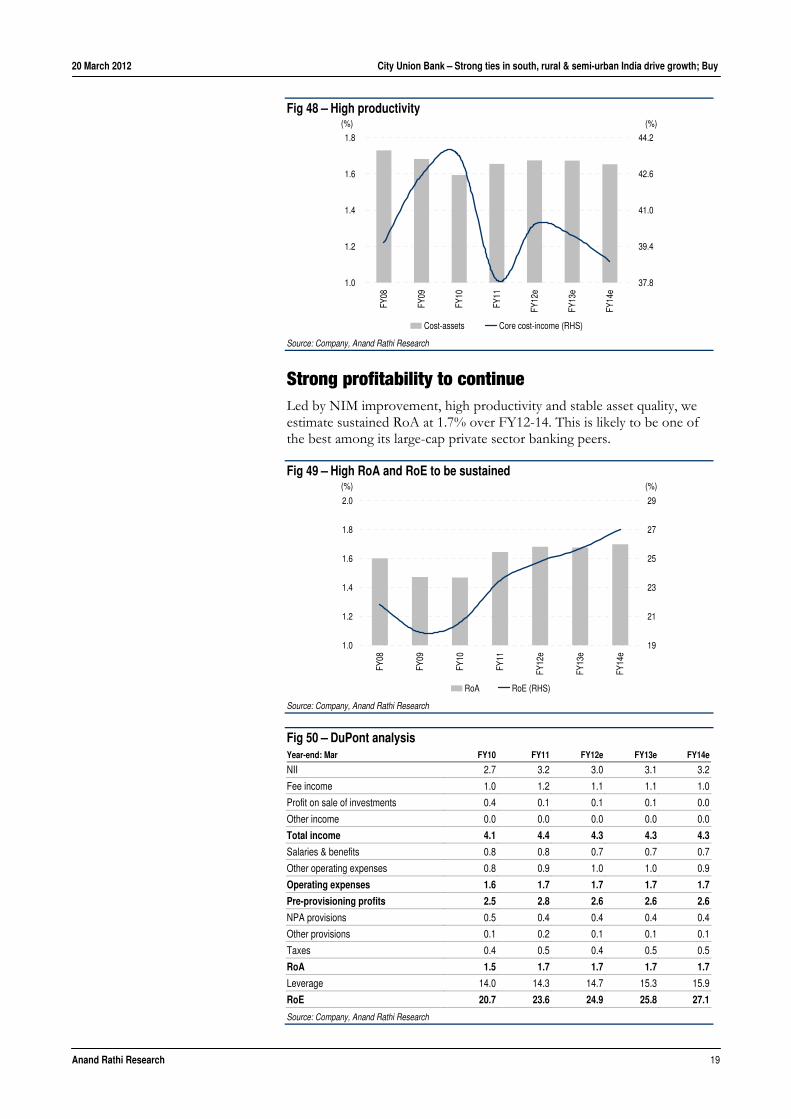
Productivity to be sustained at industry-low levels While management plans to expand to 500 branches in the next three years, this is not an aggressive target. The bank is likely to increase its branch network at 20% CAGR over FY12-15. We expect growth in income and assets to outpace growth in operating costs, thereby leading to cost-efficiency maintained at the present industry-low levels. Hence, we estimate sustained cost-to-assets levels of 1.7% over FY12-14.
High NPA coverage, secured loans to limit credit costs In the last five years, credit costs have averaged a low 44bps, due to the strong focus on credit quality, robust risk-management systems and an innate understanding of customers’ cash-flows. In addition, the bank has high NPA coverage (~72%) and a high share of secured lending in total loans (~97%). We expect both these to hold the bank in good stead, and help it contain further credit costs at present levels. Hence, we estimate credit costs to average 40bps over FY12-14. We have factored in an average ~25% rise in gross NPA (1.1% of average loans) over FY12-14 to account for further slippage.
20 March 2012 City Union Bank – Strong ties in south, rural & semi-urban India drive growth; Buy
Anand Rathi Research 19
Fig 48 – High productivity
1.0
1.2
1.4
1.6
1.8
FY08
FY09
FY10
FY11
FY12
e
FY13
e
FY14
e
37.8
39.4
41.0
42.6
44.2
Cost-assets Core cost-income (RHS)
(%)(%)
Source: Company, Anand Rathi Research
Strong profitability to continue Led by NIM improvement, high productivity and stable asset quality, we estimate sustained RoA at 1.7% over FY12-14. This is likely to be one of the best among its large-cap private sector banking peers.
Fig 49 – High RoA and RoE to be sustained
1.0
1.2
1.4
1.6
1.8
2.0
FY08
FY09
FY10
FY11
FY12
e
FY13
e
FY14
e
19
21
23
25
27
29
RoA RoE (RHS)
(%)(%)
Source: Company, Anand Rathi Research
Fig 50 – DuPont analysis Year-end: Mar FY10 FY11 FY12e FY13e FY14e
NII 2.7 3.2 3.0 3.1 3.2
Fee income 1.0 1.2 1.1 1.1 1.0
Profit on sale of investments 0.4 0.1 0.1 0.1 0.0
Other income 0.0 0.0 0.0 0.0 0.0
Total income 4.1 4.4 4.3 4.3 4.3
Salaries & benefits 0.8 0.8 0.7 0.7 0.7
Other operating expenses 0.8 0.9 1.0 1.0 0.9
Operating expenses 1.6 1.7 1.7 1.7 1.7
Pre-provisioning profits 2.5 2.8 2.6 2.6 2.6
NPA provisions 0.5 0.4 0.4 0.4 0.4
Other provisions 0.1 0.2 0.1 0.1 0.1
Taxes 0.4 0.5 0.4 0.5 0.5
RoA 1.5 1.7 1.7 1.7 1.7
Leverage 14.0 14.3 14.7 15.3 15.9
RoE 20.7 23.6 24.9 25.8 27.1
Source: Company, Anand Rathi Research
20 March 2012 City Union Bank – Strong ties in south, rural & semi-urban India drive growth; Buy
Anand Rathi Research 20
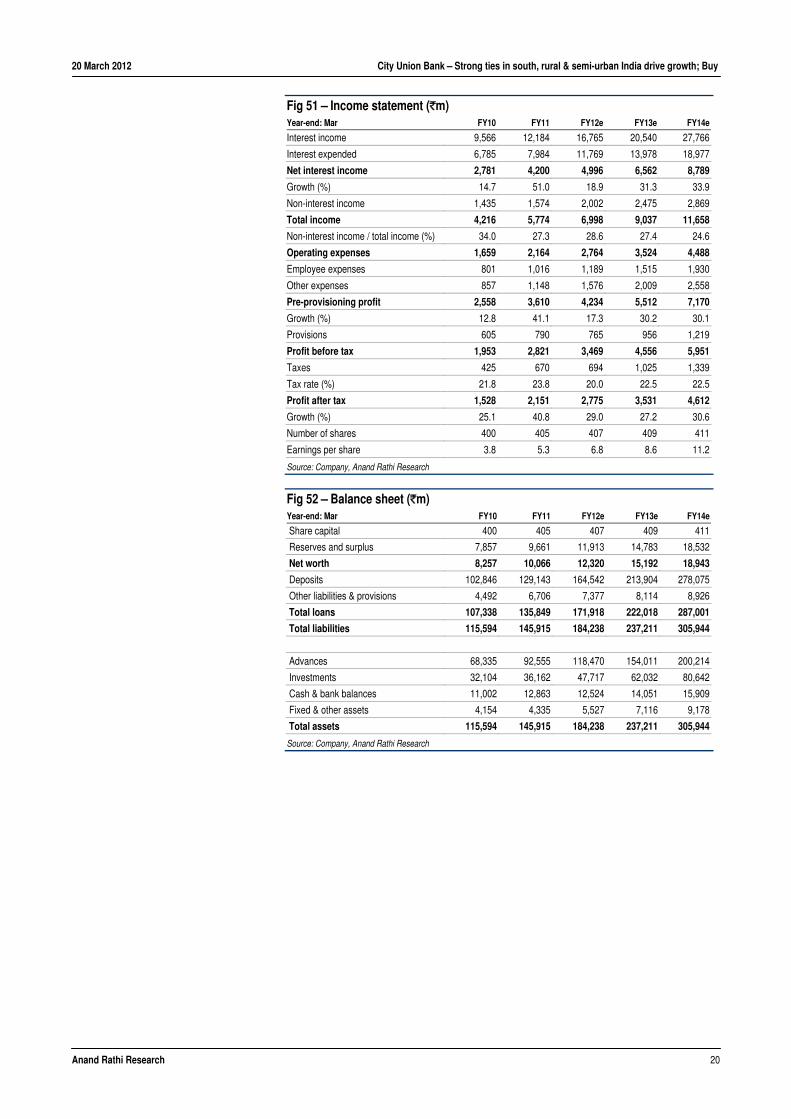
Fig 51 – Income statement (`m) Year-end: Mar FY10 FY11 FY12e FY13e FY14e
Interest income 9,566 12,184 16,765 20,540 27,766
Interest expended 6,785 7,984 11,769 13,978 18,977
Net interest income 2,781 4,200 4,996 6,562 8,789
Growth (%) 14.7 51.0 18.9 31.3 33.9
Non-interest income 1,435 1,574 2,002 2,475 2,869
Total income 4,216 5,774 6,998 9,037 11,658
Non-interest income / total income (%) 34.0 27.3 28.6 27.4 24.6
Operating expenses 1,659 2,164 2,764 3,524 4,488
Employee expenses 801 1,016 1,189 1,515 1,930
Other expenses 857 1,148 1,576 2,009 2,558
Pre-provisioning profit 2,558 3,610 4,234 5,512 7,170
Growth (%) 12.8 41.1 17.3 30.2 30.1
Provisions 605 790 765 956 1,219
Profit before tax 1,953 2,821 3,469 4,556 5,951
Taxes 425 670 694 1,025 1,339
Tax rate (%) 21.8 23.8 20.0 22.5 22.5
Profit after tax 1,528 2,151 2,775 3,531 4,612
Growth (%) 25.1 40.8 29.0 27.2 30.6
Number of shares 400 405 407 409 411
Earnings per share 3.8 5.3 6.8 8.6 11.2
Source: Company, Anand Rathi Research
Fig 52 – Balance sheet (`m) Year-end: Mar FY10 FY11 FY12e FY13e FY14e
Share capital 400 405 407 409 411
Reserves and surplus 7,857 9,661 11,913 14,783 18,532
Net worth 8,257 10,066 12,320 15,192 18,943
Deposits 102,846 129,143 164,542 213,904 278,075
Other liabilities & provisions 4,492 6,706 7,377 8,114 8,926
Total loans 107,338 135,849 171,918 222,018 287,001
Total liabilities 115,594 145,915 184,238 237,211 305,944
Advances 68,335 92,555 118,470 154,011 200,214
Investments 32,104 36,162 47,717 62,032 80,642
Cash & bank balances 11,002 12,863 12,524 14,051 15,909
Fixed & other assets 4,154 4,335 5,527 7,116 9,178
Total assets 115,594 145,915 184,238 237,211 305,944
Source: Company, Anand Rathi Research
20 March 2012 City Union Bank – Strong ties in south, rural & semi-urban India drive growth; Buy
Anand Rathi Research 21
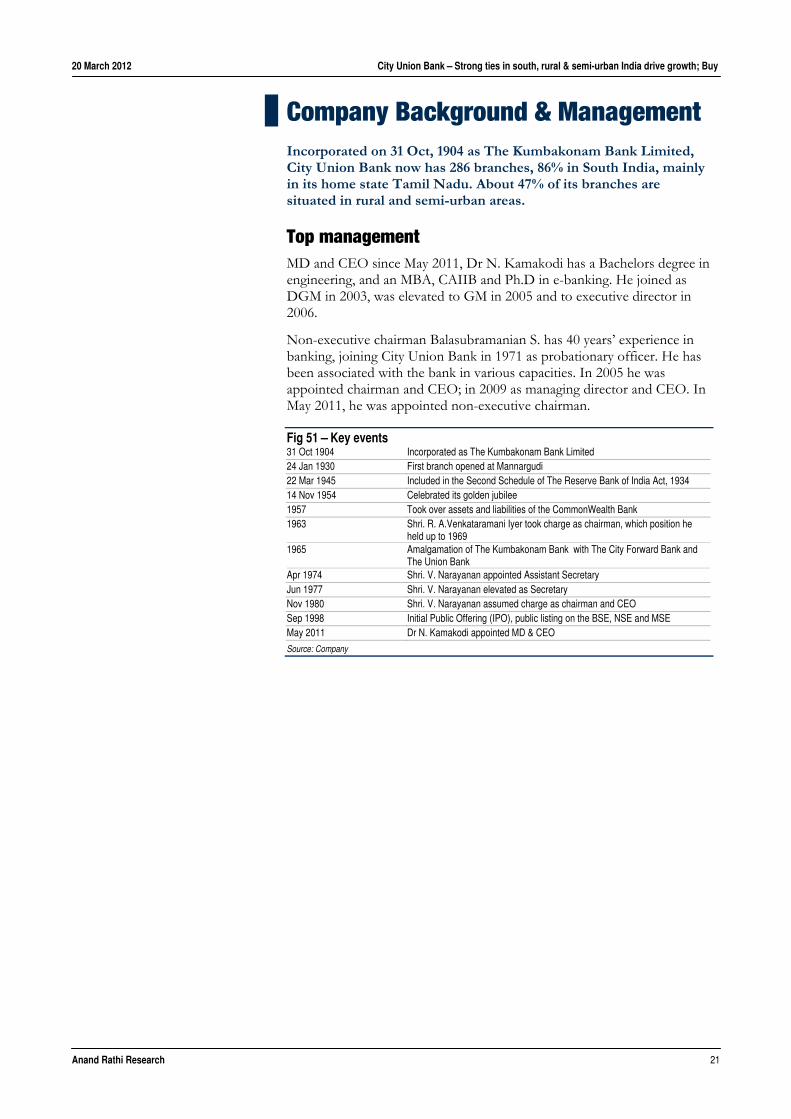
Company Background & Management Incorporated on 31 Oct, 1904 as The Kumbakonam Bank Limited, City Union Bank now has 286 branches, 86% in South India, mainly in its home state Tamil Nadu. About 47% of its branches are situated in rural and semi-urban areas.
Top management MD and CEO since May 2011, Dr N. Kamakodi has a Bachelors degree in engineering, and an MBA, CAIIB and Ph.D in e-banking. He joined as DGM in 2003, was elevated to GM in 2005 and to executive director in 2006.
Non-executive chairman Balasubramanian S. has 40 years’ experience in banking, joining City Union Bank in 1971 as probationary officer. He has been associated with the bank in various capacities. In 2005 he was appointed chairman and CEO; in 2009 as managing director and CEO. In May 2011, he was appointed non-executive chairman.
Fig 51 – Key events 31 Oct 1904 Incorporated as The Kumbakonam Bank Limited 24 Jan 1930 First branch opened at Mannargudi 22 Mar 1945 Included in the Second Schedule of The Reserve Bank of India Act, 1934 14 Nov 1954 Celebrated its golden jubilee 1957 Took over assets and liabilities of the CommonWealth Bank 1963 Shri. R. A.Venkataramani Iyer took charge as chairman, which position he
held up to 1969 1965 Amalgamation of The Kumbakonam Bank with The City Forward Bank and
The Union Bank Apr 1974 Shri. V. Narayanan appointed Assistant Secretary Jun 1977 Shri. V. Narayanan elevated as Secretary Nov 1980 Shri. V. Narayanan assumed charge as chairman and CEO Sep 1998 Initial Public Offering (IPO), public listing on the BSE, NSE and MSE May 2011 Dr N. Kamakodi appointed MD & CEO
Source: Company
Appendix 1 Analyst Certification The views expressed in this research report accurately reflect the personal views of the analyst(s) about the subject securities or issuers and no part of the compensation of the research analyst(s) was, is, or will be directly or indirectly related to the specific recommendations or views expressed by the research analyst(s) in this report. The research analysts, strategists, or research associates principally responsible for the preparation of Anand Rathi Research have received compensation based upon various factors, including quality of research, investor client feedback, stock picking, competitive factors, firm revenues and overall investment banking revenues.
Anand Rathi Ratings Definitions
Analysts’ ratings and the corresponding expected returns take into account our definitions of Large Caps (>US$1bn) and Mid/Small Caps (<US$1bn) as described in the Ratings Table below.
Ratings Guide Buy Hold Sell Large Caps (>US$1bn) >20% 5-20% <5% Mid/Small Caps (<US$1bn) >30% 10-30% <10%
Anand Rathi Research Ratings Distribution (as of 18 February 2012) Buy Hold Sell Anand Rathi Research stock coverage (138) 76% 12% 12% % who are investment banking clients 6% 6% 0% Other Disclosures This report has been issued by Anand Rathi Share & Stock Brokers Limited (ARSSBL), which is regulated by SEBI.
The information herein was obtained from various sources; we do not guarantee its accuracy or completeness. Neither the information nor any opinion expressed constitutes an offer, or an invitation to make an offer, to buy or sell any securities or any options, futures or other derivatives related to such securities ("related investments"). ARFSL and its affiliates may trade for their own accounts as market maker / jobber and/or arbitrageur in any securities of this issuer(s) or in related investments, and may be on the opposite side of public orders. ARSSBL, its affiliates, directors, officers, and employees may have a long or short position in any securities of this issuer(s) or in related investments. ARSSBL or its affiliates may from time to time perform investment banking or other services for, or solicit investment banking or other business from, any entity mentioned in this report. This research report is prepared for private circulation. It does not have regard to the specific investment objectives, financial situation and the particular needs of any specific person who may receive this report. Investors should seek financial advice regarding the appropriateness of investing in any securities or investment strategies discussed or recommended in this report and should understand that statements regarding future prospects may not be realized. Investors should note that income from such securities, if any, may fluctuate and that each security's price or value may rise or fall. Past performance is not necessarily a guide to future performance. Foreign currency rates of exchange may adversely affect the value, price or income of any security or related investment mentioned in this report.
This document is intended only for professional investors as defined under the relevant laws of Hong Kong and is not intended for the public in Hong Kong. The contents of this document have not been reviewed by any regulatory authority in Hong Kong. No action has been taken in Hong Kong to permit the distribution of this document. This document is distributed on a confidential basis. This document may not be reproduced in any form or transmitted to any person other than the person to whom it is addressed.
If this report is made available in Hong Kong by, or on behalf of, Anand Rathi Financial Services (HK) Limited., it is attributable to Anand Rathi Financial Services (HK) Limited., Unit 1211, Bank of America Tower, 12 Harcourt Road, Central, Hong Kong. Anand Rathi Financial Services (HK) Limited. is regulated by the Hong Kong Securities and Futures Commission.
Anand Rathi Financial Services Limited and Anand Rathi Share & Stock Brokers Limited are members of The Stock Exchange, Mumbai, and the National Stock Exchange of India.
© 2011 Anand Rathi Share & Stock Brokers Limited. All rights reserved. This report or any portion hereof may not be reprinted, sold or redistributed without the written consent of Anand Rathi Financial Services Limited.
Additional information on recommended securities/instruments is available on request.