Embed Size (px)
Citation preview

City Service Area Environmental and
Utility Services Mission: Delivering world class utility services and programs to improve our health, environment, and economy. The Sanitary Sewer System Capital Improvement Program (CIP) constructs sewer improvement projects that enhance sewer capacity to meet economic development goals and rehabilitates existing sewers to minimize sanitary sewer overflows.
The Storm Sewer System CIP continues to replace or rehabilitate pump stations to reduce the risk of local flooding during storm events and storm water quality improvements for regulatory compliance. The program addresses the drainage needs in residential neighborhoods, business districts, and walking routes to schools and public facilities.
The Water Pollution Control Plant (Plant) is a regional advanced wastewater treatment facility that serves the cities of San José, Santa Clara, and Milpitas, as well as the Cupertino Sanitary District, West Valley Sanitation District, County Sanitation Districts 2-3, and Burbank Sanitary District. The Plant is one of the largest tertiary wastewater treatment works in the western United States, serving more than 1.4 million residents and approximately 17,000 businesses. A major master planning effort was completed in late 2013, resulting in Environmental Impact Report certification and formal adoption of a 30-year master plan. The master plan provides the framework for over $1.0 billion in new construction at the Plant over the next 10 to 15 years, and responds to aging infrastructure, future regulations, population growth, and treatment technology improvements.
The Water Utility System CIP ensures reliable utility infrastructure for the San José Municipal Water System and includes the construction of new facilities, maintenance of existing infrastructure, and improvements to existing facilities.
CSA CAPITAL PROGRAMS
Sanitary Sewer System Storm Sewer System Water Pollution Control Plant Water Utility System
New Water Main Pipe Installation at Gumdrop Drive
Water Pollution Control Plant
V - 27
City Service Area Environmental and
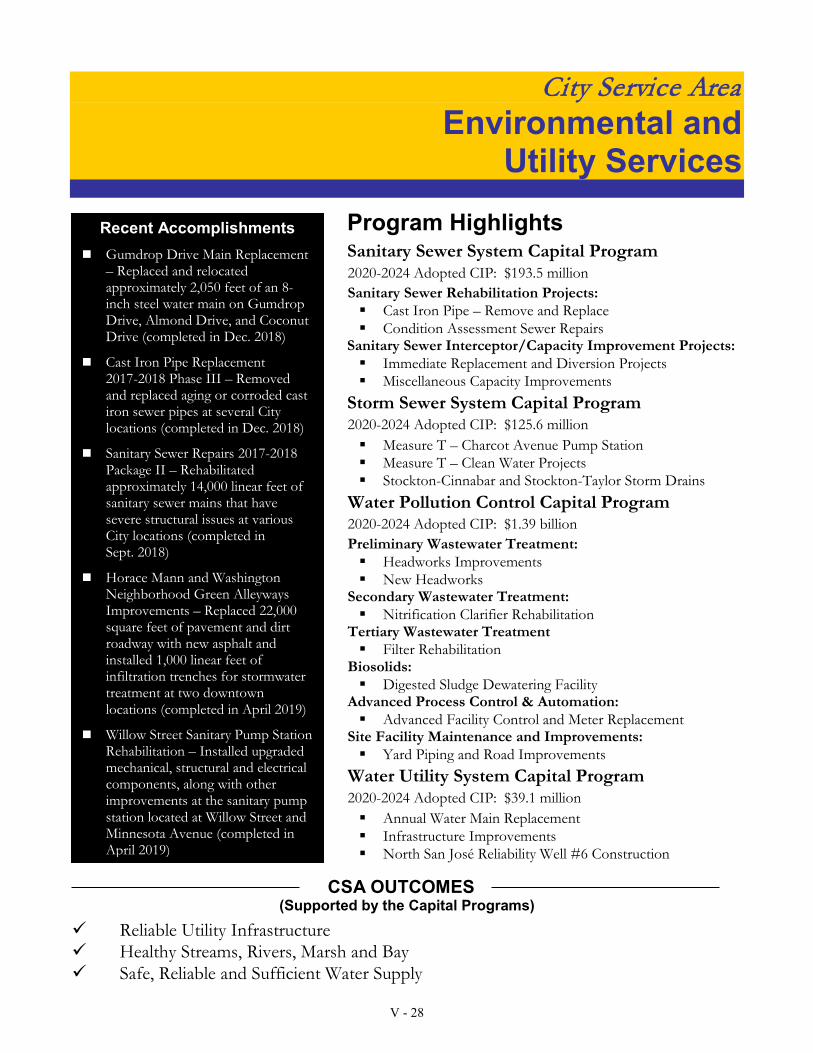
Utility Services Program Highlights Sanitary Sewer System Capital Program 2020-2024 Adopted CIP: $193.5 million Sanitary Sewer Rehabilitation Projects: Cast Iron Pipe – Remove and Replace Condition Assessment Sewer Repairs
Sanitary Sewer Interceptor/Capacity Improvement Projects: Immediate Replacement and Diversion Projects Miscellaneous Capacity Improvements
Storm Sewer System Capital Program 2020-2024 Adopted CIP: $125.6 million Measure T – Charcot Avenue Pump Station Measure T – Clean Water Projects Stockton-Cinnabar and Stockton-Taylor Storm Drains
Water Pollution Control Capital Program 2020-2024 Adopted CIP: $1.39 billion Preliminary Wastewater Treatment: Headworks Improvements New Headworks
Secondary Wastewater Treatment: Nitrification Clarifier Rehabilitation
Tertiary Wastewater Treatment Filter Rehabilitation
Biosolids: Digested Sludge Dewatering Facility
Advanced Process Control & Automation: Advanced Facility Control and Meter Replacement
Site Facility Maintenance and Improvements: Yard Piping and Road Improvements
Water Utility System Capital Program 2020-2024 Adopted CIP: $39.1 million Annual Water Main Replacement Infrastructure Improvements North San José Reliability Well #6 Construction
CSA OUTCOMES (Supported by the Capital Programs)
Reliable Utility Infrastructure Healthy Streams, Rivers, Marsh and Bay Safe, Reliable and Sufficient Water Supply
Recent Accomplishments Gumdrop Drive Main Replacement
– Replaced and relocatedapproximately 2,050 feet of an 8-inch steel water main on GumdropDrive, Almond Drive, and CoconutDrive (completed in Dec. 2018)
Cast Iron Pipe Replacement2017-2018 Phase III – Removedand replaced aging or corroded castiron sewer pipes at several Citylocations (completed in Dec. 2018)
Sanitary Sewer Repairs 2017-2018Package II – Rehabilitatedapproximately 14,000 linear feet ofsanitary sewer mains that havesevere structural issues at variousCity locations (completed inSept. 2018)
Horace Mann and WashingtonNeighborhood Green AlleywaysImprovements – Replaced 22,000square feet of pavement and dirtroadway with new asphalt andinstalled 1,000 linear feet ofinfiltration trenches for stormwatertreatment at two downtownlocations (completed in April 2019)
Willow Street Sanitary Pump StationRehabilitation – Installed upgradedmechanical, structural and electricalcomponents, along with otherimprovements at the sanitary pumpstation located at Willow Street andMinnesota Avenue (completed inApril 2019)
V - 28

City Service Area Environmental and
Utility Services
Performance Measures A set of consistent and comprehensive performance measurements along with targets and goals has been established for the entire capital program and adopted for each individual CSA. Measures focus on schedule (cycle time) and project delivery cost. Please see the Budget Guide section narrative for additional information on capital performance measurements.
1 The 2017-2018 Actual number of projects may vary from the 2017-2018 Adopted Budget Estimate as documented in the 2018-2019 Adopted Budget as a result of the date of the estimated beneficial use of the project being revised and the projects expected to be delivered in the following fiscal year. Also, the number of projects may change with the inclusion of projects in the 2017-2018 Actual not originally included in the 2017-2018 Adopted Budget Estimate due to incomplete project information at that time.
2 Projects are considered to be “delivered” when they are available for their intended use and are considered “on schedule” if delivered within two months of baseline schedule.
3 Projects are considered “completed” when final cost accounting has occurred and the project has been accepted. Projects are considered “on budget” when the total expenditures do not exceed 101% of the baseline budget.
In 2018-2019, the Environmental and Utility Services CSA delivered 18 of 27 (67%) projects within two months of the approved baseline schedule, which is below the performance target of 85%. Significant weather-related construction delays contributed to several projects being delivered beyond two months of baseline schedule. Some of the notable capital projects delivered in 2018-2019 include sanitary sewer improvements (Horace Mann and Washington Neighborhood Green Alleyways, Trimble Road and Amberwood Lane), sanitary sewer condition assessments at various locations, and the Willow Street Sanitary Pump Station Rehabilitation.
In 2018-2019, 33 of 36 (92%) projects were completed within their baseline budgets, which is above the one-year performance target of 90%. A few of the notable capital projects completed in 2018-2019 include the Horace Mann and Washington Neighborhood Green Alleyways, the Downer Canoas Injection Station Tank Replacement, the Willow Street Sanitary Pump Station Rehabilitation, and Headworks Critical Improvements at the San José-Santa Clara Regional Wastewater Facility. The CSA continues to work to strengthen the alignment of project scopes, schedules, and budgets, while also accounting for external market conditions that may affect the delivery of capital projects. Staff relies heavily on the cost estimating and tracking tools that are available through the City’s Capital Project Management System (CPMS). These tools allow project management staff to effectively track project costs on an ongoing basis and assist in ensuring that expenditures remain within budgeted levels.
Outcome: Quality CIP Projects Delivered On-Time and On-Budget Strategic Goals CSA Performance Measures 2017-2018
Actual 1 2018-2019
Target 2018-2019 Estimate
2019-2020 Target
5-YearGoal
Environmental and Utility Services CSA delivers quality Capital Improvement Program (CIP) projects on-time and on-budget
1. % of CIP projects delivered within 2months of approved baseline schedule 2
83% (25/30)
85% 67% (18/27)
85% 85%
2. % of CIP projects that are completedwithin the approved baseline budget 3
100% (33/33)
90% 92% (33/36)
90% 90%
V - 29

Capital Program Summary by City Service AreaEnvironmental and Utility Services
_____________________________________________________________________________________________________________________________________________________________________________
Total2019-2020 2020-2024 Budget
Budget CIP Budget (All Years) Start Date End DateSanitary Sewer System
60 inch Brick Interceptor, Phase VIA and VIB 1,600,000 2,000,000 44,719,270 3rd Qtr. 2009 2nd Qtr. 2021Almaden Supplement Sewer Rehabilitation (North) 3,130,000 3,130,000 3rd Qtr. 2020 2nd Qtr. 2022Bollinger Road - Moorpark Avenue - Williams Road Sanitary Sewer Improv 1,506,000 1,506,000 8,417,000 3rd Qtr. 2012 2nd Qtr. 2020Capital Program and Public Works Department Support Service Costs 1,899,000 9,308,000 * Ongoing OngoingCast Iron Pipe - Remove and Replace 5,000,000 25,000,000 * Ongoing OngoingCity Hall Debt Service Fund 336,000 1,700,000 * Ongoing OngoingCondition Assessment Sewer Repairs 6,000,000 30,000,000 * Ongoing OngoingFee Administration - Sanitary Sewer 85,000 425,000 * Ongoing OngoingFlow Monitoring Program (Master Planning) 900,000 4,500,000 * Ongoing OngoingFourth Major Interceptor, Phase VIIA 5,500,000 5,500,000 3rd Qtr. 2021 2nd Qtr. 2023Immediate Replacement and Diversion Projects 7,300,000 29,750,000 * Ongoing OngoingInflow and Infiltration Reduction 200,000 1,000,000 * Ongoing OngoingInfrastructure - Sanitary Sewer Condition Assessment 3,000,000 15,000,000 * Ongoing OngoingInfrastructure Management System 49,000 271,000 * Ongoing OngoingMaster Planning Updates 2,000,000 8,900,000 * Ongoing OngoingMcKee Avenue Sanitary Sewer Improvement 1,500,000 1,500,000 3rd Qtr. 2022 2nd Qtr. 2023Miscellaneous Capacity Improvements 1,500,000 1,500,000 1,500,000 3rd Qtr. 2019 2nd Qtr. 2020Montague Sanitary Sewer Pump Station Reserve 2,400,000 2,400,000 2,400,000 N/A N/APayments to West Valley Sanitation District 10,000 50,000 * Ongoing OngoingPermit Review and Inspection for Outside Agencies - Sanitary Sewer 25,000 125,000 * Ongoing OngoingPreliminary Engineering - Sanitary Sewer 950,000 4,750,000 * Ongoing OngoingProgram Management - Sanitary Sewer 300,000 1,500,000 * Ongoing OngoingPublic Art Allocation 48,000 522,000 * Ongoing OngoingPublic Works Engineering Services Equipment (Materials Lab) 40,000 200,000 * Ongoing OngoingRehabilitation of Sanitary Sewer Pump Stations 1,220,000 1,240,000 2,696,993 Ongoing OngoingReinforced Concrete Pipe Rehabilitation Program 500,000 2,500,000 * Ongoing OngoingRincon Avenue - Virginia Avenue Sanitary Sewer Improvements 300,000 300,000 5,176,000 3rd Qtr. 2017 4th Qtr. 2019Sierra Road Sanitary Sewer Improvement 1,200,000 1,200,000 3rd Qtr. 2020 2nd Qtr. 2021Technology Drive Sanitary Sewer Improvement 2,500,000 2,500,000 3rd Qtr. 2021 2nd Qtr. 2022
V - 30

Capital Program Summary by City Service AreaEnvironmental and Utility Services
_____________________________________________________________________________________________________________________________________________________________________________
Total2019-2020 2020-2024 Budget
Budget CIP Budget (All Years) Start Date End DateTrimble Road and Capewood Lane Sanitary Sewer Improvements 50,000 50,000 1,577,855 2nd Qtr. 2014 3rd Qtr. 2019Urgent Rehabilitation and Repair Projects 7,000,000 33,000,000 * Ongoing OngoingWestmont Avenue and Harriet Avenue Sanitary Sewer Improvements 516,000 516,000 5,461,000 3rd Qtr. 2017 2nd Qtr. 2020
Total: Construction/Non-Construction 44,734,000 191,843,000Ending Fund Balance 8,667,205 1,694,205 **Total: Sanitary Sewer System 53,401,205 193,537,205 **
Storm Sewer System
2017 Flood - Bailey Ave Storm Drain Inlet Repair 550,000 550,000 573,000 3rd Qtr. 2017 2nd Qtr. 2020Alviso Storm Pump Station 1,400,000 1,400,000 14,478,832 3rd Qtr. 2013 3rd Qtr. 2019Capital Program and Public Works Department Support Service Costs 807,000 3,980,000 * Ongoing OngoingCharcot Storm Pump Rental 300,000 1,500,000 * Ongoing OngoingCity Hall Debt Service Fund 216,000 1,092,000 * Ongoing OngoingCitywide Outfall Improvements 2,850,000 5,890,000 * Ongoing OngoingCondition Assessment Storm Sewer Repairs 750,000 1,350,000 * Ongoing OngoingFee Administration - Storm Sewer 25,000 125,000 * Ongoing OngoingFlow Monitoring Program 370,000 1,930,000 * Ongoing OngoingGeneral Fund - Interest Income 11,000 55,000 * Ongoing OngoingGreen Infrastructure Improvements 900,000 2,700,000 * Ongoing OngoingInfrastructure Management System 10,000 60,000 * Ongoing OngoingLarge Trash Capture Devices 1,885,000 1,885,000 8,319,775 3rd Qtr. 2014 4th Qtr. 2019Measure T - Charcot Avenue Pump Station 1,600,000 35,000,000 35,000,000 3rd Qtr. 2019 2nd Qtr. 2024Measure T - Clean Water Projects 1,300,000 25,000,000 25,000,000 3rd Qtr. 2019 2nd Qtr. 2024Permit Review and Inspection for Outside Agencies - Storm Sewer 50,000 250,000 * Ongoing OngoingPreliminary Engineering - Storm Sewer 180,000 900,000 * Ongoing OngoingProgram Management - Storm Sewer 150,000 750,000 * Ongoing OngoingPublic Art Allocation 34,000 92,000 * Ongoing OngoingSan Jose Watershed Invasive Species Removal and Engagement 400,000 1,200,000 * Ongoing OngoingStockton-Cinnabar and Stockton-Taylor Storm Drain System Improvement 500,000 15,000,000 15,000,000 3rd Qtr. 2019 2nd Qtr. 2024Storm Pump Station Rehabilitation and Replacement 1,500,000 7,500,000 * Ongoing Ongoing
V - 31

Capital Program Summary by City Service AreaEnvironmental and Utility Services
_____________________________________________________________________________________________________________________________________________________________________________
Total2019-2020 2020-2024 Budget
Budget CIP Budget (All Years) Start Date End DateStorm Sewer Improvements 800,000 2,800,000 * Ongoing OngoingStorm Sewer Master Plan - City-wide 1,370,000 6,590,000 * Ongoing OngoingUrgent Storm Drain Repair Projects 250,000 1,250,000 * Ongoing Ongoing
Total: Construction/Non-Construction 18,208,000 118,849,000Ending Fund Balance 21,096,848 6,763,848 **Total: Storm Sewer System 39,304,848 125,612,848 **
Water Pollution Control
Additional Digester Upgrades 10,520,000 64,475,000 3rd Qtr. 2021 2nd Qtr. 2028Advanced Facility Control and Meter Replacement 15,297,000 17,017,000 30,794,783 3rd Qtr. 2010 2nd Qtr. 2023Aeration Tanks and Blower Rehabilitation 10,888,000 75,362,000 123,746,341 2nd Qtr. 2015 2nd Qtr. 2028Capital Program and Public Works Department Support Service Costs 724,000 1,982,000 * Ongoing OngoingCity Hall Debt Service Fund 89,000 453,000 * Ongoing OngoingClean Water Financing Authority Debt Service Payment Fund 5,527,000 11,053,000 * Ongoing OngoingDebt Service Repayment for Plant Capital Improvement Projects 3,625,000 391,130,000 * Ongoing OngoingDigested Sludge Dewatering Facility 12,519,000 121,426,000 124,220,155 3rd Qtr. 2014 2nd Qtr. 2023Digester and Thickener Facilities Upgrade 6,931,000 8,806,000 110,957,332 3rd Qtr. 2006 2nd Qtr. 2021East Primary Rehabilitation, Seismic Retrofit, and Odor Control 1,000,000 107,785,000 112,888,212 3rd Qtr. 2010 3rd Qtr. 2028Energy Generation Improvements 3,627,000 4,364,000 92,032,878 1st Qtr. 2012 2nd Qtr. 2021Equipment Replacement 1,663,000 8,315,000 * Ongoing OngoingEquipment Replacement Reserve 5,000,000 5,000,000 5,000,000 N/A N/AFacility Wide Water Systems Improvements 3,561,000 14,500,000 15,824,244 3rd Qtr. 2014 2nd Qtr. 2024Filter Rehabilitation 36,065,000 39,755,000 43,108,106 3rd Qtr. 2014 2nd Qtr. 2023Final Effluent Pump Station & Stormwater Channel Improvements 902,000 47,164,000 47,358,000 3rd Qtr. 2019 3rd Qtr. 2025Flood Protection 1,489,000 10,004,000 11,460,732 3rd Qtr. 2017 2nd Qtr. 2023Headworks Improvements 15,839,000 16,475,000 18,109,961 1st Qtr. 2013 2nd Qtr. 2023Hydraulic Capacity Engineering 25,000 125,000 * Ongoing OngoingHydraulic Capacity Enhancements Reserve 3,666,000 3,666,000 * Ongoing OngoingMaster Plan Updates 1,500,000 1,500,000 3,000,000 3rd Qtr. 2018 2nd Qtr. 2021New Headworks 130,985,000 134,437,000 142,222,103 3rd Qtr. 2012 2nd Qtr. 2023
V - 32

Capital Program Summary by City Service AreaEnvironmental and Utility Services
_____________________________________________________________________________________________________________________________________________________________________________
Total2019-2020 2020-2024 Budget
Budget CIP Budget (All Years) Start Date End DateNitrification Clarifier Rehabilitation 54,316,000 92,440,000 96,936,975 3rd Qtr. 2009 4th Qtr. 2025Outfall Bridge and Levee Improvements 6,299,000 7,022,000 8,029,037 3rd Qtr. 2014 2nd Qtr. 2021Owner Controlled Insurance Program 6,424,000 16,497,000 17,844,000 2nd Qtr. 2017 2nd Qtr. 2023Payment for Clean Water Financing Authority Trustee 5,000 15,000 * Ongoing OngoingPlant Electrical Reliability 7,617,000 8,504,000 9,373,304 3rd Qtr. 2003 2nd Qtr. 2022Plant Infrastructure Improvements 1,770,000 5,770,000 * Ongoing OngoingPreliminary Engineering - Water Pollution Control 1,000,000 5,000,000 * Ongoing OngoingProgram Management - Water Pollution Control 10,628,000 51,298,000 * Ongoing OngoingPublic Art Allocation 20,000 20,000 * Ongoing OngoingSecondary Clarifier Rehabilitation 2,833,000 26,455,000 3rd Qtr. 2023 4th Qtr. 2028Storm Drain System Improvements 1,377,000 13,952,000 14,984,317 4th Qtr. 2017 2nd Qtr. 2023Support Building Improvements 14,552,000 17,746,000 55,470,408 2nd Qtr. 2015 1st Qtr. 2028Treatment Plant Distributed Control System 5,459,000 5,459,000 7,653,600 1st Qtr. 2012 2nd Qtr. 2020Urgent and Unscheduled Treatment Plant Rehabilitation 500,000 2,500,000 * Ongoing OngoingVarious Infrastructure Decommissioning 469,000 22,220,000 22,220,000 3rd Qtr. 2019 1st Qtr. 2025Yard Piping and Road Improvements 20,724,000 98,315,000 119,234,369 3rd Qtr. 2011 2nd Qtr 2028
Total: Construction/Non-Construction 392,082,000 1,380,430,000Ending Fund Balance 7,184,755 11,264,755 **Total: Water Pollution Control 399,266,755 1,391,694,755 **
Water Utility System
Advance System Design 200,000 1,000,000 * Ongoing OngoingAnnual Water Main Replacement 3,200,000 10,600,000 * Ongoing OngoingBackup Generator Replacement 200,000 200,000 * Ongoing OngoingCapital Program and Public Works Department Support Service Costs 22,000 99,000 * Ongoing OngoingCity Hall Debt Service Fund 6,000 30,000 * Ongoing OngoingFacility Sites Improvement 280,000 280,000 * Ongoing OngoingFowler Pump Station Replacement 2,633,000 2,633,000 2,795,000 3rd Qtr. 2017 2nd Qtr. 2020GIS Support 65,000 325,000 * Ongoing OngoingInfrastructure Improvements 810,000 4,150,000 * Ongoing Ongoing
V - 33

Capital Program Summary by City Service AreaEnvironmental and Utility Services
_____________________________________________________________________________________________________________________________________________________________________________
Total2019-2020 2020-2024 Budget
Budget CIP Budget (All Years) Start Date End DateMajor Facilities Fee Administration 15,000 75,000 * Ongoing OngoingMaster Plan Engineering 160,000 850,000 * Ongoing OngoingMeter Installations 50,000 250,000 * Ongoing OngoingNetwork System Flow Improvements 6,000 30,000 * Ongoing OngoingNorth Coyote Valley Water System Reserve 168,000 168,000 168,000 N/A N/ANorth San José Reliability Well #6 Construction 360,000 1,460,000 1,460,000 3rd Qtr. 2019 2nd Qtr. 2022North San José Well #5 Development and Construction 1,560,000 1,560,000 1,560,000 3rd Qtr. 2019 2nd Qtr. 2020Preliminary Engineering - Water 145,000 775,000 * Ongoing OngoingPublic Art Funding 16,000 24,000 * Ongoing OngoingSafety and Security Improvements 100,000 500,000 * Ongoing OngoingService Installations 200,000 1,000,000 * Ongoing OngoingSystem Growth Related Projects Reserve 1,600,000 1,600,000 1,600,000 N/A N/ASystem Maintenance/Repairs 740,000 3,820,000 * Ongoing OngoingSystem Rehabilitation/Replacement Reserve 3,100,000 4,338,000 4,338,000 N/A N/ATuers Road Site Improvements 170,000 170,000 510,000 3rd Qtr. 2018 2nd Qtr. 2020
Total: Construction/Non-Construction 15,806,000 35,937,000 12,431,000 257,687 269,715Ending Fund Balance 2,852,168 3,202,168 **Total: Water Utility System 18,658,168 39,139,168 ** 12,431,000 257,687 269,715
CSA Total: Construction/Non-Construction 470,830,000 1,727,059,000 **Ending Fund Balance 39,800,976 22,924,976 **
CSA Total: 510,630,976 1,749,983,976 **
* Total Budget information is not provided due to the ongoing nature of this project.
** The 2019-2020 through 2022-2023 Ending Balance are excluded from the FIVE-YEAR TOTAL USE OF FUNDS to avoid multiple counting of the same funds.
V - 34