Embed Size (px)
Citation preview

UNDERSTANDING AND MEASURING CITY RESILIENCE
C I T Y R E S I L I E N C E I N D E X

ACKNOWLEDGEMENTS
2 CITY RESILIENCE INDEX - THE ROCKEFELLER FOUNDATION | ARUP

© Arup
The development of the City Resilience Index has been possible as a result of the support provided by the Rockefeller Foundation. It has benefi tted from the valuable direction provided by Nancy Kete and Sundaa Bridgett-Jones throughout, as well as feedback from Rebuild by Design, Asian Cities Climate Change Resilience Network and 100 Resilient Cities programmes. In our quest to ensure that the City Resilience Index is relevant, practical and globally applicable, we have engaged directly with 10 cities. We would like to thank all those who participated in focus groups discussions, workshops and interviews, and our local partners: Fundación Alto Río (Concepción, Chile); GIP Pacífi co and Findeter (Cali, Colombia); City of New Orleans and the American Red Cross Southeast Louisiana Chapter (USA); Arup Cape Town (South Africa); I2UD (Arusha, Tanzania); ICLEI (Shimla, India); TARU Leading Edge (Surat, India); and Mercy Corps (Semarang, Indonesia) as well as municipalities and local government in these pioneering cities. Finally, our thanks go to the numerous Arup colleagues and experts from other organisations who provided input and feedback on the various iterations of the indicators and metrics based on their specifi c areas of expertise. It has truly been a team effort.
Jo da SilvaDirectorArup International Development
On behalf of Arup International Development’s study team: Sachin Bhoite, Kieran Birtill, Sarah Gillespie, Braulio Eduardo Morera, Jo da Silva, Samantha Stratton-Short
Unless specifi ed, all images are copyright Arup.
CITY RESILIENCE INDEX - THE ROCKEFELLER FOUNDATION | ARUP 3

FOREWORD
In 1958, Jane Jacobs, a community activist, received a Rockefeller Foundation grant to expand upon her ideas about how a city should look, feel, and work. The book she published three years later − The Death and Life of Great American Cities − transformed how city dwellers, urban academics and policy-makers think about cities and urban planning. Jacobs challenged the prevailing assumptions of what makes a city thrive. Over the past fi ve decades, the values and ideas put forward by Jacobs and others have been profoundly important as questions of identity, voice, inclusion, access and opportunity have been negotiated in the context of dynamic urban growth and globalisation.
This legacy of progressive urban thinking becomes even more crucial as we look to the future. Just as cities are hubs for innovations and investments that expand opportunities, they are also living laboratories forced to confront challenges of increasing complexity. Indeed, the role of cities has become
central in debates around our planetary boundaries, economic futures, social stability and climate change. What and who makes a city resilient – and not just liveable now or sustainable for the long term – has become an increasingly critical question, one we set out to answer in late 2012 with our partners at Arup through the creation of a City Resilience Index.
The Rockefeller Foundation has been pioneering work on climate resilience in both rural and urban regions for more than a decade. By 2012, the idea of resilience as the critical lens through which to consider not only climate change, but also disaster risk reduction more generally, including financial shocks, terrorism and slow-moving chronic stresses, was gaining traction globally. But, producing a meaningful index for something as complex as the resilience of a city is fraught with reputational, conceptual and execution risk. We stumbled again and again on major conceptual and practical challenges.
4 CITY RESILIENCE INDEX - THE ROCKEFELLER FOUNDATION | ARUP
We found potential partners ready to jump into the metrics and indicators, but few with the experience to work with us to understand what does and does not contribute to urban resilience. We risked investing in an index that measured and compared cities based on available data, but did not necessarily help cities better understand and assess their own resilience.
We found perspectives were siloed, shaped by experience and expertise in one or another aspect of resilience, disaster risk reduction, infrastructure resilience, climate change, national security or business continuity. What Arup has been able to bring is thought leadership and the capacity to create a comprehensive framework that refl ects reality. A city’s resilience depends on its physical assets as well as its policies, social capital and institutions.
This report presents the inclusive way for articulating city resilience that the Foundation was looking for, to underpin the City Resilience Index. It has already proven useful in the
agenda-setting workshops in cities across the globe that are participating in the 100 Resilient Cities Challenge. These workshops, in turn, have helped and will continue to help shape the framework and contribute to the fi nal phase, developing the indicators and variables that will comprise the City Resilience Index.
This index will form the basis of a tool that should enable all of us interested in city resilience to convene around a common understanding of that idea, and begin to ‘baseline’ what matters most for making cities more resilient. The index is intended to facilitate a process of engagement with and within cities that generates dialogue and deeper understanding. Ultimately, this will lead to new ideas and opportunities to engage new actors in civil society, government and business on what makes a city resilient.
Dr. Nancy Kete
Former Managing DirectorThe Rockefeller Foundation
CITY RESILIENCE INDEX - THE ROCKEFELLER FOUNDATION | ARUP 5

INTRODUCTION
6 CITY RESILIENCE INDEX - THE ROCKEFELLER FOUNDATION | ARUP
Urban populations are facing increasing challenges from numerous natural and man-made pressures such as rapid urbanisation, climate change, terrorism and increased risks from natural hazards. Cities must learn to adapt and thrive in the face of these diverse challenges - they must learn how to build resilience in an uncertain world. Armed with this knowledge and understanding, governments, donors, investors, policy makers, and the private sector will be able to develop effective strategies to foster more resilient cities.
Supported by the Rockefeller Foundation, the City Resilience Index (The Index) is being developed by Arup. The Index has been designed to enable cities to measure and monitor the multiple factors that contribute to their resilience. Its primary purpose is to diagnose strengths and weaknesses and measure relative performance over time. This provides a holistic articulation of city resilience, structured around four dimensions, 12 goals and 52 indicators that are critical for the resilience of our cities. This structure also forms the foundations of the Index, which through the online platform, cities will be able to access and operationalise.
CITY RESILIENCE INDEX - THE ROCKEFELLER FOUNDATION | ARUP 7

Who is the City Resilience Index for?
The Index will measure relative performance over time rather than comparison between cities. It will not deliver an overall single score for comparing performance between cities, neither will it provide a world ranking of the most resilient cities. However, it will provide a common basis of measurement and assessment to better facilitate dialogue and knowledge-sharing between cities.
It is envisaged that the Index will primarily be used by city governments who are in the best position to gather administrative data, but it can also be used by other interested organisations and individuals (for example, universities, non-governmental organisations, community groups).
It is intended that the process will also provide the means for cities to capture the views of the poor and vulnerable groups as they normally suffer more severely the impacts of disruptions and failures.
8 CITY RESILIENCE INDEX - THE ROCKEFELLER FOUNDATION | ARUP

STRUCTURE OF THE CITY RESILIENCE INDEX
52 INDICATORS
Research to develop the Framework and Index has identifi ed 52 indicators. The indicators add further defi nition to the 12 indicators and identify the critical factors that contribute towards the resilience of urban systems. The indicators also integrate the seven qualities of resilient systems (e.g. robust, inclusive, fl exible) that Arup’s empirical research has identifi ed as of vital importance.
12 GOALS
Underpinning these four dimensions, there are 12 Goals that each and every city should strive towards in order to achieve resilience. Our research tells us that universally these are what matters most when a city faces a wide range of chronic problems or a sudden catastrophe. However, it is recognised within the framework that the relative importance of each indicator and how they are realised will be unique for every city.
4 DIMENSIONS
Our research suggests that resilience of a city relates to four key dimensions:
Health and well-being, ensuring the health and wellbeing of everyone living and working in the city;
Economy and society, the social and fi nancial systems that enable urban populations to live peacefully, and act collectively;
Infrastructure and environment, man-made and natural systems that provide critical services, protect and connect urban citizens; and
Leadership and strategy, the need for informed, inclusive, integrated and iterative decision making in our cities.
CITY RESILIENCE INDEX - THE ROCKEFELLER FOUNDATION | ARUP 9
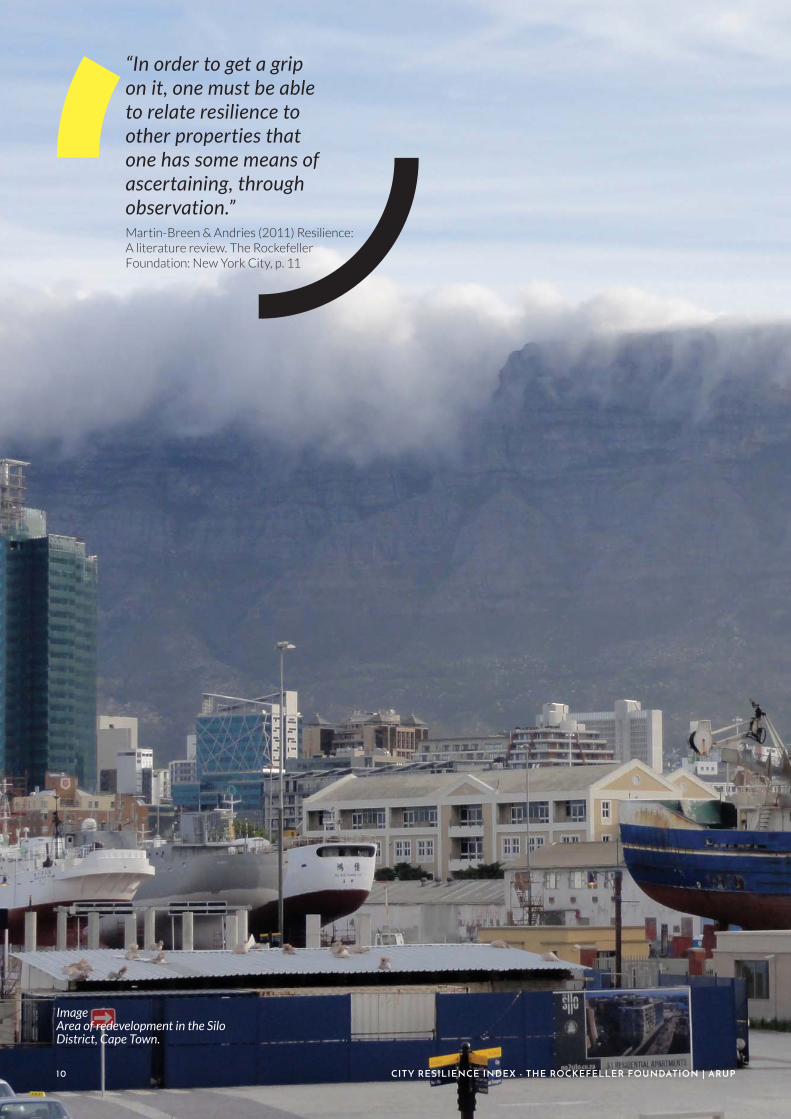
“In order to get a grip on it, one must be able to relate resilience to other properties that one has some means of ascertaining, through observation.” Martin-Breen & Andries (2011) Resilience: A literature review. The Rockefeller Foundation: New York City, p. 11
Image Area of redevelopment in the Silo District, Cape Town.
10 CITY RESILIENCE INDEX - THE ROCKEFELLER FOUNDATION | ARUP

UNDERSTANDING CITYRESILIENCE
WHY CITY RESILIENCE?
As the 21st century unfolds, an increasing majority of the world’s population will live in cities. Human wellbeing in cities relies on a complex web of interconnected institutions, infrastructure and information. People are drawn to cities as centres of economic activity, opportunity and innovation. But cities are also places where stresses accumulate or sudden shocks occur that may result in social breakdown, physical collapse or economic deprivation. That is, unless a city is resilient.
Cities have always faced risks, and many cities that have existed for centuries have demonstrated their resilience in the face of resource shortages, natural hazards, and confl ict. In the 21st century, global pressures that play out at a city scale − such as climate change, disease pandemics, economic fl uctuations, and terrorism − pose new challenges. The scale of urban risk is increasing due to the number of people living in cities. Risk is also increasingly unpredictable due to the complexity of city systems and the uncertainty associated with many hazards – notably climate change.
Risk assessments and measures to reduce specifi c foreseeable risks will continue to play an important role in urban planning. In addition, cities need to ensure that their development strategies and investment decisions enhance, rather than undermine, the city’s resilience. If governments, donors, investors, policy-makers, and the private sector are to collectively support and foster more resilient cities, there needs to be a common understanding of what constitutes a resilient city and how it can be achieved.
The Framework responds to this challenge by providing an accessible, evidence-based articulation of city resilience. Over the coming months, it will be further developed to create the City Resilience Index, which will introduce variables that provide a robust basis for measuring resilience at the city scale. The primary audience for this tool is municipal governments. But, the framework, indicators and variables are also intended to support dialogue between other stakeholders who contribute to building more resilient cities globally.
WHAT IS CITY RESILIENCE?
Defi nition | City resilience describes the capacity of cities to function, so that the people living and working in cities – particularly the poor and vulnerable – survive and thrive no matter what stresses or shocks they encounter.
Resilience is a term that emerged from the fi eld of ecology in the 1970s, to describe the capacity of a system to maintain or recover functionality in the event of disruption or disturbance. It is applicable to cities because they are complex systems that are constantly adapting to changing circumstances. The notion of a resilient city becomes conceptually relevant when chronic stresses or sudden shocks threaten widespread disruption or the collapse of physical or social systems. The conceptual limitation of resilience is that it does not necessarily account for the power dynamics that are inherent in the way cities function and cope with disruptions.
In the context of cities, resilience has helped to bridge the gap between disaster risk reduction and climate change adaptation. It moves away from traditional disaster risk management, which is founded on risk assessments that relate to specifi c hazards. Instead, it accepts the possibility that a wide range of disruptive events – both stresses and shocks – may occur but are not necessarily predictable. Resilience focuses on enhancing the performance of a system in the face of multiple hazards, rather than preventing or mitigating the loss of assets due to specifi c events.
“To articulate urban resilience in a measurable, evidence-based and accessible way that can inform urban planning, practice, and investment patterns which better enable urban communities (e.g. poor and vulnerable, businesses, coastal) to survive and thrive multiple shocks and stresses.” Opportunity statement (Rockefeller Grantee Workshop, New York City, February 2013)
CITY RESILIENCE INDEX - THE ROCKEFELLER FOUNDATION | ARUP 11

LEARNING FROM LITERATURE
Approaches | Various approaches have been taken to framing or assessing resilience. They focus either on urban assets or systems, and, to varying degrees, consider man-made infrastructure, the natural environment, urban management and human behaviour. Asset-based approaches tend to focus on physical assets, rather than considering intangible assets that infl uence human behaviour, such as culture, social networks and knowledge. They neglect the role that assets play in city systems, and, therefore, overlook the importance of assets outside the city boundary; for example, a reservoir that may be a critical part of the water supply or fl ood management system.
System-based approaches align more closely with the concept of resilience, and the long-standing notion of cities as ‘systems of systems’. Social systems determine human behaviour, which is also infl uenced by physical systems in the urban environment. Various approaches exist, but they mostly examine the resilience of individual sub-systems rather than attempting to consider the resilience of the city as a system in itself. This promotes a sectoral approach and means that interdependencies between different systems at different scales, and the governing structures that infl uence the way systems work, are not easily considered.
Finally, empirical evidence throughout the literature suggests that urban systems that exhibit particular qualities (or characteristics) are more likely to be resilient. The seven qualities summarised opposite are derived from published literature,
including the set of characteristics developed previously by Arup and the Institute for Social and Environmental Transition, as used by the Asian Cities Climate Change Resilience Network. These qualities apply at a city scale and to individual systems.
We concluded that what was missing is a comprehensive, holistic framework that combines the physical aspects of cities with the less tangible aspects associated with human behaviour; that is relevant in the context of economic, physical and social disruption; and that applies at the city scale rather than to individual systems within a city. Finally, it needs to incorporate the qualities that describe a resilient city (or system).
LEARNING FROM CASE STUDIES
Functions and failure | A performance-based approach, which defi nes resilience in terms of a city’s ability to fulfi l and sustain its core functions, offers a more comprehensive and holistic approach. As a city’s functions rely on a combination of assets, systems, practices and actions undertaken by multiple actors, a performance-based approach has greater potential to address questions of interdependency, power dynamics and scale.
Based on the literature review, a draft hypothesis was developed which proposed that urban resilience could be framed in relation to seven critical functions of a city. This was tested through a desk-based analysis of the ‘factors’ of resilience identifi ed from more than 150 sources, which examined cities experiencing shocks or stresses, together with recent guidance on urban resilience.
12 CITY RESILIENCE INDEX - THE ROCKEFELLER FOUNDATION | ARUP
SURAT NEW ORLEANSCONCEPCIÓN© Municipality of Concepción

Further information on our journey to understand city resilience is captured in the research reports:
• City Resilience Index: Research Report Volume I: Desk Study (Arup, April 2014)
• City Resilience Index: Research Report Volume II: Fieldwork and Primary Data Analysis (Arup, April 2014)
These are available on request - see back cover for contact information.
This analysis resulted in a refi ned list of eight city functions that are critical to resilience. The functions propose that a resilient city: delivers basic needs; safeguards human life; protects, maintains and enhances assets; facilitates human relationships and identity; promotes knowledge; defends the rule of law, justice and equity; supports livelihoods; stimulates economic prosperity. The city’s ability to perform these functions determines whether the city is resilient or not. Resilience could be perceived as good health, a safe environment, social harmony and prosperity. Conversely, a city that is not resilient would be identifi ed by ill-health or insecurity, an unsafe environment, confl ict and deprivation.
LEARNING FROM CITIES
Fieldwork | To ensure the framework is widely applicable and grounded in the experiences of cities, the second stage of research involved fi eldwork in six cities: Cali, Colombia; Concepción, Chile; New Orleans, USA; Cape Town, South Africa; Surat, India; and Semarang, Indonesia. These cities were selected as they had either recently experienced a major shock or are suffering chronic stresses, and as a group are geographically diverse.
The primary purpose of the fi eldwork was to understand what contributes to resilience in cities, and how resilience is understood from the perspective of different city stakeholder groups in different contexts. In each city, we carried out workshops, focus groups and key informant interviews with people from the municipal government, utility providers, business and civil
society. Across the six cities, we collected data from 450 consultees and identifi ed 1,546 factors. Factors are defi ned as things (physical) or practices/procedures or behaviours (non-physical) that, in the opinion of the consultees, contribute to the resilience of their cities.
A detailed analysis of the factors identifi ed 12 key themes: essential needs; health management; livelihood support; law enforcement; social harmonisation; information and knowledge management; capacity and coordination; critical infrastructure management; environmental management; urban strategy and planning; economic sustainability; accessibility. These themes represent what the city stakeholders perceived to be the key city functions relevant to improving resilience. They map very closely to the functions that were derived from the desk-top analysis, with the following exceptions:
Infrastructure + environment | Physical assets were least mentioned by consultees in the fi eld, whereas they feature very strongly in the literature review. In the fi eldwork research, emphasis was placed on proactive management and maintenance of infrastructure and the environment, rather than its presence. Consultees also talked about connecting people and enabling fl ows of information, goods, and services as a result of integrated transport and communications infrastructure.
Two new aspects of resilience were identifi ed:
Leadership + coordination | Consultees emphasised the critical importance of leadership, in the form
of a committed city government that takes decisions on the basis of sound evidence; engages with business, citizens and civil society groups; and aligns with other governing bodies at the regional and national level.
Urban planning + strategy | Consultees proposed that cities should have a holistic cross-sectoral city vision, strategy or plan underpinned by appropriate data and delivered via policy, regulations, standards and codes.
Every city perceived resilience-building to be an integrated, ongoing process involving a multitude of actions at different scales. Across the six cities, there was a clear distinction between those cities which had experienced shocks, and those which had not. Different groups within the same city had different perspectives on, and priorities for, what makes their city resilient. This highlights the importance of inclusive consultation in resilience planning. Further research is needed to specifi cally understand the factors that contribute to the resilience of lower income groups. Our research suggested that their concerns and priorities were very different to those of the government and the private sector.
CITY RESILIENCE INDEX - THE ROCKEFELLER FOUNDATION | ARUP 13
SEMARANG CALI CAPE TOWN

FLEXIBLE
R
EDUN
DANT
ROBUST
RESO
U
RCEFUL
REFL
ECTIVE
INCLU
SIVE
INTE
GRA
TED
14 CITY RESILIENCE INDEX - THE ROCKEFELLER FOUNDATION | ARUP

QUALITIES OF RESILIENT SYSTEMS
Refl ective
Refl ective systems are accepting of the inherent and ever-increasing uncertainty and change in today’s world. They have mechanisms to continuously evolve, and will modify standards or norms based on emerging evidence, rather than seeking permanent solutions based on the status quo. As a result, people and institutions examine and systematically learn from their past experiences, and leverage this learning to inform future decision-making.
Robust
Robust systems include well-conceived, constructed and managed physical assets, so that they can withstand the impacts of hazard events without signifi cant damage or loss of function. Robust design anticipates potential failures in systems, making provision to ensure failure is predictable, safe, and not disproportionate to the cause. Over-reliance on a single asset, cascading failure and design thresholds that might lead to catastrophic collapse if exceeded are actively avoided.
Redundant
Redundancy refers to spare capacity purposely created within systems so that they can accommodate disruption, extreme pressures or surges in demand. It includes diversity: the presence of multiple ways to achieve a given need or fulfi l a particular function. Examples include distributed infrastructure networks and resource reserves. Redundancies should be intentional, cost-effective and prioritised at a city-wide scale, and should not be an externality of ineffi cient design.
Flexible
Flexibility implies that systems can change, evolve and adapt in response to changing circumstances. This may favour decentralised and modular approaches to infrastructure or ecosystem management. Flexibility can be achieved through the introduction of new knowledge and technologies, as needed. It also means considering and incorporating indigenous or traditional knowledge and practices in new ways.
Resourceful
Resourcefulness implies that people and institutions are able to rapidly fi nd different ways to achieve their goals or meet their needs during a shock or when under stress. This may include investing in capacity to anticipate future conditions, set priorities, and respond, for example, by mobilising and coordinating wider human, fi nancial and physical resources. Resourcefulness is instrumental to a city’s ability to restore functionality of critical systems, potentially under severely constrained conditions.
Inclusive
Inclusion emphasises the need for broad consultation and engagement of communities, including the most vulnerable groups. Addressing the shocks or stresses faced by one sector, location, or community in isolation of others is an anathema to the notion of resilience. An inclusive approach contributes to a sense of shared ownership or a joint vision to build city resilience.
Integrated
Integration and alignment between city systems promotes consistency in decision-making and ensures that all investments are mutually supportive to a common outcome. Integration is evident within and between resilient systems, and across different scales of their operation. Exchange of information between systems enables them to function collectively and respond rapidly through shorter feedback loops throughout the city.
CITY RESILIENCE INDEX - THE ROCKEFELLER FOUNDATION | ARUP 15

16 CITY RESILIENCE INDEX - THE ROCKEFELLER FOUNDATION | ARUP
CONCEPCIÓN
NEW ORLEANS
SEATTLE
DETROIT
CALI
QUITO
LIMA
SAO PAULO
CAPE TOWN
BRAZZAVILLE
RIO DE JANEIRO
NEW YORK
ARUSHA
TEST CITIES
RESEARCH CITIES
DAR ES SALAAM
KAMPALA
DUBAISURAT
MADRID CHENGDU SHANGHAI
DOHA
LIVERPOOL
HONG KONGSHIMLA
HO CHI MINH CITY
SEMERANG
MELBOURNE
We set out to develop ‘a set of indicators, variables and metrics that can be used by cities to measure their resilience and compare their performance over time’. Our methodology has focussed on credibility and usability. We wanted to ensure that the Index is technically robust; based on evidence of what contributes to city resilience, as well as current best practice in urban measurement.
We also wanted it to be both relevant and accessible to cities globally irrespective of their size, capacity or location, since a common basis of measurement creates opportunity for peer-to-peer knowledge exchange between cities, including benchmarking performance and sharing best practice.
In addition, data from multiple assessments can be used to identify key issues and practices which can inform best practice globally.
The research included an extensive literature review of over 150 references, 45 frameworks, 14 case studies; primary data from 6 cities, expert consultation with 45 thematic experts, peer review in 4 salons, piloting in 5 cities, and city engagement.
City Resilience Index thus forms a comprehensive basis of measurement that is underpinned by rigorous research (evidence-based) that shows the factors that contribute to city resilience are universal, although their relative importance may vary.
16 CITY RESILIENCE INDEX - THE ROCKEFELLER FOUNDATION | ARUP

CITY RESILIENCE INDEX - THE ROCKEFELLER FOUNDATION | ARUP 17
Effectiv
e S
afegu
ard
s
to H
um
an H
ea
lth &
Life
Diverse Livelihood
& Employm
ent
Minimal Human Vulnerability
Integrated
Development Planning
Empow
ered
Stakehold
ers
Eff
ect
ive
Le
ader
ship
& M
an
age
men
t
Co
mm
un
ication
Re
liab
le M
ob
ility &
of Critical Services
Effective Provision
& Fragility
Reduced ExposureEconomySustainable
Rule
s of L
aw
Comprehensive S
ecurity
&
Mu
tual
Su
pp
ort
Co
llec
tive
Id
en
tity
&
LE
AD
ER
SH
IP
& S
TRATEGY
ECON
OM
Y &
SO
CIE
TY
INF
RA
ST
RU
CT
UR
E
& ECO
SYSTEMS
HEALTH &
WE
LL
BE
ING
FLEXIBLE
REDUN
DANT
ROBUST
RESO
U
RCEFUL
REFL
ECTIVE
INCLU
SIVE
INTE
GRA
TED
“Resilience is based on the shifting relationship between scales, and between autonomy on the one hand and connectivity on the other.”Allan, P. & Bryant, M. (2011) ‘Resilience as a framework for urbanism and recovery’. Journal of Landscape Architecture 6(2), p. 43
© Arup

18 CITY RESILIENCE INDEX - THE ROCKEFELLER FOUNDATION | ARUP
HEALTH & WELLBEING
Safe
&af
efo
rdab
le h
ou
sin
g
e A
dequ
ate
affo
rdab
le
up
ener
gy s
upp
ly
aIn
clus
ive
aacce
ssto
saf
e
wdr
inki
ng ww
ater
Effe
ctiv
es ss
anit
atio
nSu
f
ffor
dabl
e
food
supp
lyIn
clusi
ve la
bour
policie
sRele
vant skill
sng
& train
ing
Local usin
businusin
ess
pme
developm
epm
ent
vati
& innovati
vation
ive
Supportiveive
ism
mechanismisms
Diverse protection
of livelih
oods
following a shock
Robust pupublic
health systems
Adequate access to
quality healthcare
Emergency
medical care
Effective emergency
response services
Effective S
afegu
ard
s
to Hu
man
He
alth &
Life
Diverse Livelihood& Em
ployment
Minimal Human Vulnerability
HEALTH &
WE
LL
BE
ING
This dimension relates to people – the health and well-being of everyone living and working in the city. This dimension considers the extent to which the city enables everyone to meet their basic needs (food, water, and shelter), particularly in times of crisis. It considers how well the city supports diverse livelihood opportunities, including access to business investment and social welfare. Finally, it considers if a city is able to safeguard the health of its population through its normal and emergency healthcare provisions.

CITY RESILIENCE INDEX - THE ROCKEFELLER FOUNDATION | ARUP 19
Diverse livelihood opportunities and support mechanisms allow citizens to proactively respond to changing conditions within their city without undermining their wellbeing. Access to fi nance, skills training and business support enables individuals to pursue a range of options to secure the critical assets necessary to meet their basic needs. Long-term, secure livelihoods allow people to accrue personal savings that will support their development, as well as their survival during times of crisis.
This is facilitated by access to fi nance, ability to accrue savings, skills training, business support, and social welfare.
Minimising underlying human vulnerabilities enables individuals and households to achieve a standard of living which goes beyond mere survival. A basic level of wellbeing also allows people to deal with unforeseen circumstances. This is only possible once their physiological needs are met through a basic level of provision of food, water and sanitation, energy and shelter.
This relates to the extent to which everyone’s basic needs are met.
1. 2. 3.
Inclusive labour policies Inclusive labour policies and standards, with an effective welfare system for low income groups.
Relevant skills and training Effective mechanisms for matching skills to the current and emerging employment marketplace.
Local business development and innovation Thriving, adaptable and inclusive local business environment.
Supportive fi nancing mechanisms Inclusive and resourceful fi nance mechanisms to enable businesses to adapt to changing circumstances and put in place contingencies for shock events.
Diverse protection of livelihoods following a shock Resourceful and inclusive measures to support businesses and workers following a shock.
Robust public health systemsRobust monitoring and mitigation of public health risks.
Adequate access to quality healthcare Adequate and inclusive access to quality general healthcare.
Emergency medical careAdequately resourced emergency medical services.
Effective emergency response servicesAdequately resourced emergency response services.
Safe & affordable housing Safe housing that is affordable for all city residents.
Adequate affordableenergy supply Suffi cient and affordable energy supply for all.
Inclusive access to safe drinking water Access to an adequate supply of safe drinking water.
Effective sanitation Safe, reliable and affordable sanitation provided to all areas of the city.
Suffi cient affordable food supply Suffi cient and affordable food supplies for all.
1.1
1.2
1.3
1.4
1.5
2.1
2.2
2.3
2.4
2.5
3.1
3.2
3.3
3.4
Health systems are critical to the day-to-day prevention of illness and the spread of disease, as well as protecting the population during emergencies. They comprise a diverse suite of practices and infrastructure, which help to maintain public health and treat chronic and acute health problems.
This relies on integrated health facilities and services, and responsive emergency services.
MINIMAL HUMAN VULNERABILITY
DIVERSE LIVELIHOODS& EMPLOYMENT
EFFECTIVE SAFEGUARDS TO HUMAN HEALTH & LIFE

20 CITY RESILIENCE INDEX - THE ROCKEFELLER FOUNDATION | ARUP
Local mcommunitysupport
Cohesivecommunities
Strong city-wideidentity & cultureActivelyengaged citizens Effective sysysystems
cri
to deter cricrimeProactive corruption
tion
preventiontion
ent
Competent
ent policing
ble
Accessible
ble criminal
sti
& civil justi
stice
W
na
ell-mananaged
he
Com
prehehensive
businessty
continuityty planning
Diverse
ceconom
icc base
eA
ttractivee bu
siness
men
viron
mmen
t
Stron
g t
inttegratio
n
ow
ith regioo
nal &
oglo
bal ecoo
no
mies
EconomySustainable
Rule
s of L
aw
Comprehensive S
ecurity
&
Mu
tual
Su
pp
ort
Co
llec
tive
Id
en
tity
&
ECON
OM
Y
& S
OC
IET
Y
This dimension relates to the organisation of cities – how social and economic systems enable urban populations to live peacefully, and act collectively. Included within this dimension are the systems that enforce law and order and ensure fiscal management. The environment within a city that creates collective identity and mutual support is also considered – open spaces and cultural heritage play an important role in this circumstance. This is only possible once their physiological needs are met through a basic level of provision of food, water and sanitation, energy and shelter.
ECONOMY& SOCIETY

CITY RESILIENCE INDEX - THE ROCKEFELLER FOUNDATION | ARUP 21
Local community support Cohesive social structures providing support at individual, household and local community level.
Cohesive communities Cohesive, harmonised communities across the city.
Strong city-wide identity and cultureCohesive local identity and culture, in which all citizens feel a sense of belonging in the city.
Actively engaged citizens Citizens actively engage, express opinion and participate within society.
Effective systems to deter crimeIntegrated, collaborative and resourceful mechanisms to deter crime.
Proactive corruption prevention Fair and transparent systems to fi ght corruption and promote justice.
Competent policingEffective policing measures and systems for a safe and secure city.
Accessible criminal & civil justiceEffective, affordable, impartial and accessible mechanisms to promote justice and resolve civil disputes.
Well-managed public fi nancesRobust monitoring and mitigation of public health risks.
Comprehensive business continuity planning Resourceful, refl ective and fl exible business continuity planning across both public and private sectors.
Diverse economic baseRobust, flexible and diverse local economy.
Attractive business environmentDiverse and resourceful investments within the city, driven by a strong urban brand and economic and social environment.
Strong integration with regional and global economiesStrong integration between the city’s economy and wider economic systems.
Communities that are active, appropriately supported by the city government and well-connected with one another contribute to the bottom-up creation of a city with a strong identity and culture. This enables individuals, communities and the city government to trust and support each other, and face unforeseen circumstances together without civil unrest or violence.
This is observed as active community engagement, strong social networks and social integration.
A comprehensive and contextually appropriate approach to law enforcement facilitates the reduction and prevention of crime and corruption in a city. By instituting a transparent justice system based on ethical principles, cities can uphold the rule of law and promote citizenship in daily life. These norms are critical to maintaining order during times of stress. Well planned and resourced law enforcement facilitates peaceful recovery, and ensures a healthy population by reducing crime-related injury, fatality and stress.
This includes law enforcement, fair justice, and prevention of crimeand corruption.
A robust economic system is critical to sustaining the investment that a city needs to maintain its infrastructure and provide for its communities. It helps to create contingency funds that both the private and public sectors can use to respond to emergencies and unforeseen events. As a result, cities are better able to respond to changing economic conditions and pursue long-term prosperity.
This is observed in sound management of city fi nances, diverse revenue streams, and the ability to attract business investment, allocate capital, and build emergency funds.
4. 5. 6.COLLECTIVE IDENTITY & MUTUAL SUPPORT
COMPREHENSIVE SECURITY & RULE OF LAW
SUSTAINABLE ECONOMY
4.1
4.2
4.3
4.4
5.1
5.2
5.3
5.4
6.1
6.2
6.3
6.4
6.5
22 CITY RESILIENCE INDEX - THE ROCKEFELLER FOUNDATION | ARUP
INFRASTRUCTURE& ECOSYSTEMS
rreh
ensi
veprpr
Co
mpr
haz
ard
&ee
map
pin
gee
exp
osu
re
ppppro
pria
tepppp
App stst
anda
rds
ststco
des,
st
orce
orce
men
tor
cem
ent
oem
ent
oo&
enfooo
& e
nfooo
&en
fo
Efy
my
man
aged
ym
anag
edy
man
aged
fect
ivel
y m
yyfe
ctiv
ely
fect
ivel
y prprot
ecti
veprprpr coco
syst
ems
cocoeco
Rob
ust p
roprot
ecti
ve
pras
tas
truc
ture
infr
ast
Effect
ive
war
ward
ship
of
stew
arcoco
syst
ems
eco
Flexib
le
astastru
cture
infr
ast serv
ices
Retain
ed
re cre capacity
spare cDiligent
ainaintenance
main
&co
&continuity
& co
Adequate cocontinuity
co
tictical assets
for critic&& services
&
& a& a
Diverse & affordable
t nt networks
transport n
Effective transport
peperation &
opeainaintenance
main
Reliable
uunicationscommu
eechnologyte
Secure eechnologytenetworks
Co
mm
un
ication
Re
liab
le M
ob
ility &
of Critical Services
Effective Provision
& Fragility
Reduced Exposure
INF
RA
ST
RU
CT
UR
E
& ECO
SYSTEMS
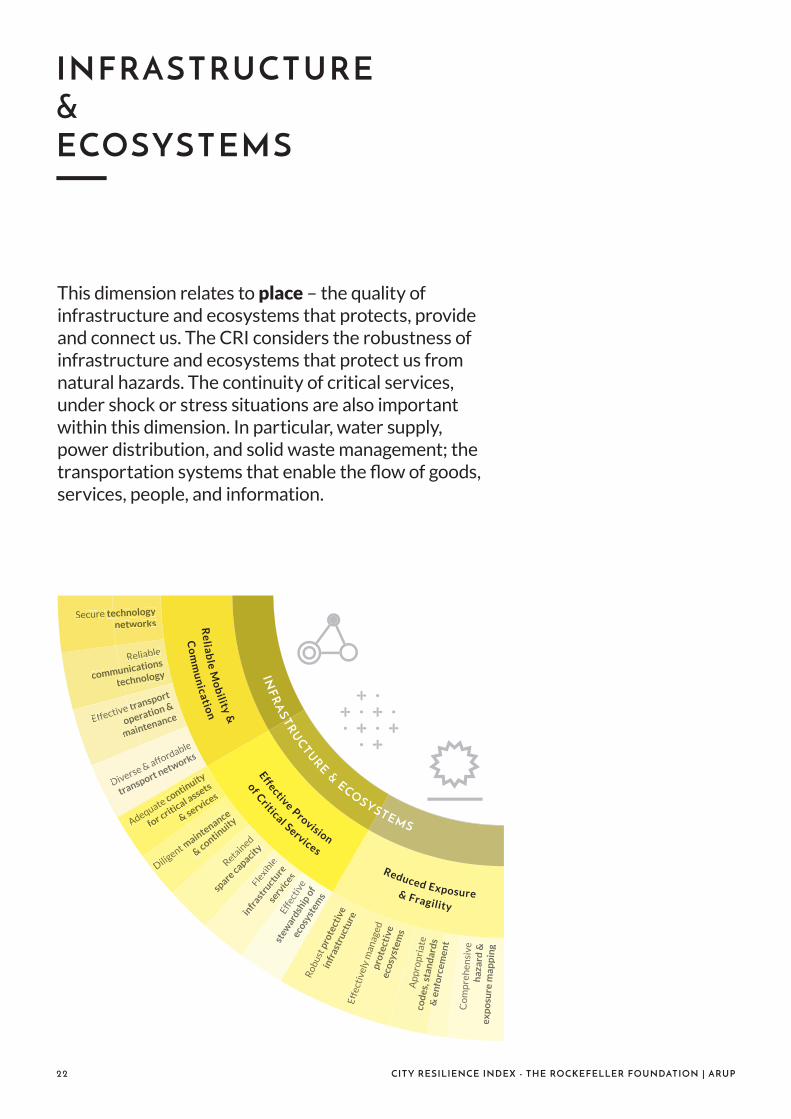
This dimension relates to place – the quality of infrastructure and ecosystems that protects, provide and connect us. The CRI considers the robustness of infrastructure and ecosystems that protect us from natural hazards. The continuity of critical services, under shock or stress situations are also important within this dimension. In particular, water supply, power distribution, and solid waste management; the transportation systems that enable the fl ow of goods, services, people, and information.
CITY RESILIENCE INDEX - THE ROCKEFELLER FOUNDATION | ARUP 23
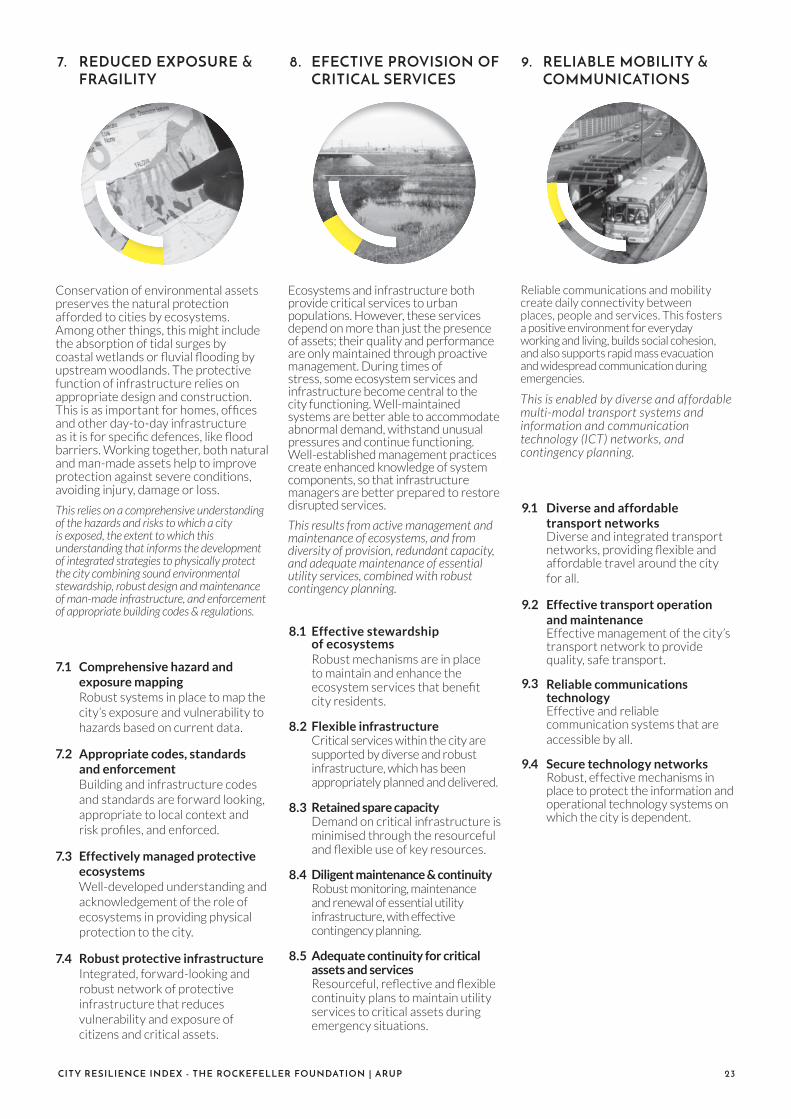
Comprehensive hazard and exposure mapping Robust systems in place to map the city’s exposure and vulnerability to hazards based on current data.
Appropriate codes, standards and enforcement Building and infrastructure codes and standards are forward looking, appropriate to local context and risk profi les, and enforced.
Effectively managed protective ecosystemsWell-developed understanding and acknowledgement of the role of ecosystems in providing physical protection to the city.
Robust protective infrastructure Integrated, forward-looking and robust network of protective infrastructure that reduces vulnerability and exposure of citizens and critical assets.
Effective stewardship of ecosystemsRobust mechanisms are in place to maintain and enhance the ecosystem services that benefi t city residents.
Flexible infrastructure Critical services within the city are supported by diverse and robust infrastructure, which has been appropriately planned and delivered.
Retained spare capacityDemand on critical infrastructure is minimised through the resourceful and fl exible use of key resources.
Diligent maintenance & continuityRobust monitoring, maintenance and renewal of essential utility infrastructure, with effective contingency planning.
Adequate continuity for critical assets and servicesResourceful, refl ective and fl exible continuity plans to maintain utility services to critical assets during emergency situations.
Diverse and affordable transport networksDiverse and integrated transport networks, providing fl exible and affordable travel around the city for all.
Effective transport operation and maintenanceEffective management of the city’s transport network to provide quality, safe transport.
Reliable communications technologyEffective and reliable communication systems that are accessible by all.
Secure technology networksRobust, effective mechanisms in place to protect the information and operational technology systems on which the city is dependent.
Conservation of environmental assets preserves the natural protection afforded to cities by ecosystems. Among other things, this might include the absorption of tidal surges by coastal wetlands or fl uvial fl ooding by upstream woodlands. The protective function of infrastructure relies on appropriate design and construction. This is as important for homes, offi ces and other day-to-day infrastructure as it is for specifi c defences, like fl ood barriers. Working together, both natural and man-made assets help to improve protection against severe conditions, avoiding injury, damage or loss.
This relies on a comprehensive understanding of the hazards and risks to which a city is exposed, the extent to which this understanding that informs the development of integrated strategies to physically protect the city combining sound environmental stewardship, robust design and maintenance of man-made infrastructure, and enforcement of appropriate building codes & regulations.
Ecosystems and infrastructure both provide critical services to urban populations. However, these services depend on more than just the presence of assets; their quality and performance are only maintained through proactive management. During times of stress, some ecosystem services and infrastructure become central to the city functioning. Well-maintained systems are better able to accommodate abnormal demand, withstand unusual pressures and continue functioning. Well-established management practices create enhanced knowledge of system components, so that infrastructure managers are better prepared to restore disrupted services.
This results from active management and maintenance of ecosystems, and from diversity of provision, redundant capacity, and adequate maintenance of essential utility services, combined with robust contingency planning.
Reliable communications and mobility create daily connectivity between places, people and services. This fosters a positive environment for everyday working and living, builds social cohesion, and also supports rapid mass evacuation and widespread communication during emergencies.
This is enabled by diverse and affordable multi-modal transport systems and information and communication technology (ICT) networks, and contingency planning.
8. 9.7. EFECTIVE PROVISION OF CRITICAL SERVICES
RELIABLE MOBILITY & COMMUNICATIONS
REDUCED EXPOSURE & FRAGILITY
8.1
8.2
8.3
8.4
8.5
9.1
9.2
9.3
9.4
7.1
7.2
7.3
7.4

24 CITY RESILIENCE INDEX - THE ROCKEFELLER FOUNDATION | ARUP
This dimension is underpinned by knowledge. A resilient city learns from the past and takes appropriate action based on evidence. This means a city must have effective leadership and urban management, characterised by inclusive governance involving the government, business and civil society, and evidence-based decision-making. A city must also empower its stakeholders by providing access to information and education, so that individuals and organisations can take appropriate action. It is equally important to ensure that the city develops in an integrated way that aligns the city’s vision with sectoral strategies and plans and individual projects.
LEADERSHIP&STRATEGY
pppropriateApoovernmentgooon-makingdecisio
Effective oordinationco-o
wwith otherweent bodies
governme
Proactiveaakeholder
multi-stalalaboration
colla
prprehensive
Comprmmonitoring
hazard msssessment
& risk as
mpmprehensive
Comptetemergency
government eananagement
man
Adequateededucation
ed
for all
Wid
Widespread
Widtyaw
tyawareness
community awrepareparedness
& prepa
Effectivem
em
echanisms
memm
mm
unities
for comm
to
ngngage with
engoveovernm
ent
gove
prehensive
Com
prpronitoring &
city monionananagem
ent
data man
nsultative
Connng process
planningng
ppropriateA
pppplan
d u
se
& zo
nin
g
t R
ob
ust
planning
val processapprova
Integrated
Development Planning
Empow
ered
Stakehold
ers
Eff
ect
ive
Le
ader
ship
& M
an
agem
ent L
EA
DE
RS
HIP
& S
TRATEGY
CITY RESILIENCE INDEX - THE ROCKEFELLER FOUNDATION | ARUP 25
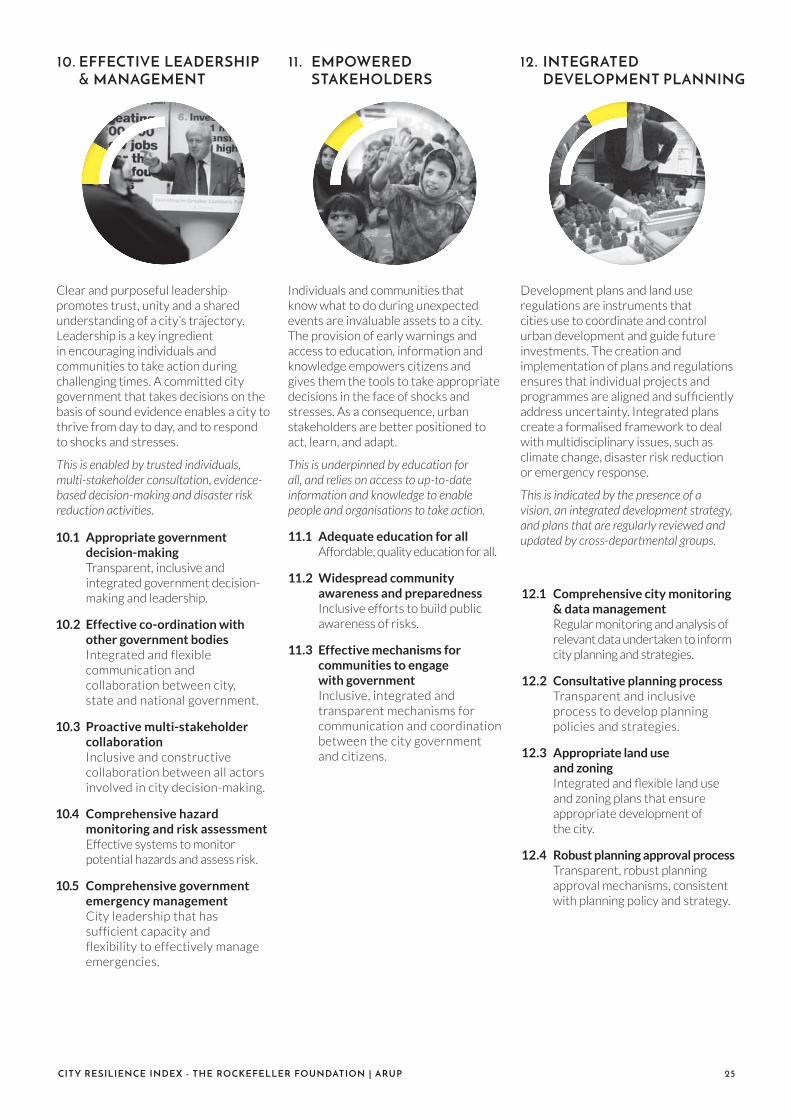
Appropriate government decision-making Transparent, inclusive and integrated government decision-making and leadership.
Effective co-ordination with other government bodiesIntegrated and flexible communication and collaboration between city, state and national government.
Proactive multi-stakeholder collaborationInclusive and constructive collaboration between all actors involved in city decision-making.
Comprehensive hazard monitoring and risk assessmentEffective systems to monitor potential hazards and assess risk.
Comprehensive government emergency managementCity leadership that has sufficient capacity and flexibility to effectively manage emergencies.
Comprehensive city monitoring & data managementRegular monitoring and analysis of relevant data undertaken to inform city planning and strategies.
Consultative planning processTransparent and inclusive process to develop planning policies and strategies.
Appropriate land use and zoningIntegrated and fl exible land use and zoning plans that ensure appropriate development of the city.
Robust planning approval processTransparent, robust planning approval mechanisms, consistent with planning policy and strategy.
Adequate education for allAffordable, quality education for all.
Widespread community awareness and preparedness Inclusive efforts to build public awareness of risks.
Effective mechanisms for communities to engage with governmentInclusive, integrated and transparent mechanisms for communication and coordination between the city government and citizens.
Clear and purposeful leadership promotes trust, unity and a shared understanding of a city’s trajectory. Leadership is a key ingredient in encouraging individuals and communities to take action during challenging times. A committed city government that takes decisions on the basis of sound evidence enables a city to thrive from day to day, and to respond to shocks and stresses.
This is enabled by trusted individuals, multi-stakeholder consultation, evidence-based decision-making and disaster risk reduction activities.
Individuals and communities that know what to do during unexpected events are invaluable assets to a city. The provision of early warnings and access to education, information and knowledge empowers citizens and gives them the tools to take appropriate decisions in the face of shocks and stresses. As a consequence, urban stakeholders are better positioned to act, learn, and adapt.
This is underpinned by education for all, and relies on access to up-to-date information and knowledge to enable people and organisations to take action.
Development plans and land use regulations are instruments that cities use to coordinate and control urban development and guide future investments. The creation and implementation of plans and regulations ensures that individual projects and programmes are aligned and suffi ciently address uncertainty. Integrated plans create a formalised framework to deal with multidisciplinary issues, such as climate change, disaster risk reduction or emergency response.
This is indicated by the presence of a vision, an integrated development strategy, and plans that are regularly reviewed and updated by cross-departmental groups.
10. 11. 12.EMPOWERED STAKEHOLDERS
INTEGRATED DEVELOPMENT PLANNING
EFFECTIVE LEADERSHIP & MANAGEMENT
10.1
10.2
10.3
10.4
10.5
12.1
12.2
12.3
12.4
11.1
11.2
11.3
26 CITY RESILIENCE INDEX - THE ROCKEFELLER FOUNDATION | ARUP
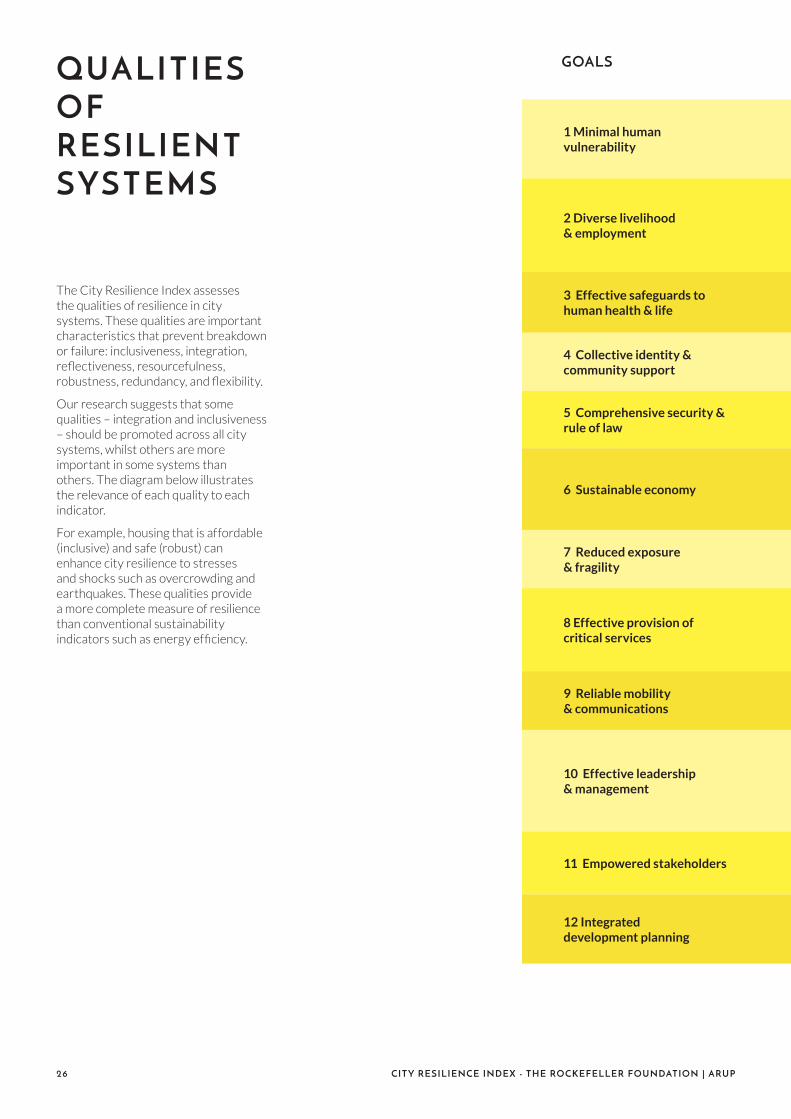
GOALS
1 Minimal human vulnerability
2 Diverse livelihood & employment
3 Effective safeguards to human health & life
4 Collective identity & community support
5 Comprehensive security & rule of law
6 Sustainable economy
7 Reduced exposure & fragility
8 Effective provision of critical services
9 Reliable mobility & communications
10 Effective leadership & management
11 Empowered stakeholders
12 Integrated development planning
QUALITIES OF RESILIENT SYSTEMS
The City Resilience Index assesses the qualities of resilience in city systems. These qualities are important characteristics that prevent breakdown or failure: inclusiveness, integration, refl ectiveness, resourcefulness, robustness, redundancy, and fl exibility.
Our research suggests that some qualities – integration and inclusiveness – should be promoted across all city systems, whilst others are more important in some systems than others. The diagram below illustrates the relevance of each quality to each indicator.
For example, housing that is affordable (inclusive) and safe (robust) can enhance city resilience to stresses and shocks such as overcrowding and earthquakes. These qualities provide a more complete measure of resilience than conventional sustainability indicators such as energy effi ciency.

CITY RESILIENCE INDEX - THE ROCKEFELLER FOUNDATION | ARUP 27
INTEGRATED INCLUSIVE REFLECTIVE RESOURCEFUL ROBUST REDUNDANT FLEXIBLE
1.1 Safe and affordable housing
1.2 Adequate affordable energy supply
1.3 Inclusive access to safe drinking water
1.4 Effective sanitation
1.5 Suffi cient affordable food supply
2.1 Inclusive labour policies
2.2 Relevant skills & training
2.3 Local business development and innovation
2.4 Supportive fi nancing mechanisms
2.5 Diverse protection of livelihoods following a shock
3.1 Robust public health systems
3.2 Adequate access to quality healthcare
3.3 Emergency medical care
3.4 Effective emergency response services
4.1 Local community support
4.2 Cohesive communities
4.3 Strong city-wide identity & culture
4.4 Actively engaged citizens
5.1 Effective systems to deter crime
5.2 Proactive corruption prevention
5.3 Competent policing
5.4 Accessible criminal and civil justice
6.1 Well-managed public fi nances
6.2 Comprehensive business continuity planning
6.3 Diverse economic base
6.4 Attractive business environment
6.5 Strong integration with regional &global economies
7.1 Comprehensive hazard and exposure mapping
7.2 Appropriate codes, standards & enforcement
7.3 Effectively managed protective ecosystems
7.4 Robust protective infrastructure
8.1 Effective stewardship of ecosystems
8.2 Flexible infrastructure services
8.3. Retained spare capacity
8.4 Diligent maintenance & continuity
8.5 Adequate continuity for critical assets& services
9.1 Diverse and affordable transport networks
9.2 Effective transport operation & maintenance
9.3 Reliable communications technology
9.4 Secure technology networks
10.1 Appropriate government decision-making
10.2 Effective co-ordination with othergovernment bodies
10.3 Proactive multi-stakeholder collaboration
10.4 Comprehensive hazard monitoring and risk assessment
10.5 Comprehensive government emergency management
11.1 Adequate education for all
11.2 Widespread community awareness& preparedness
11.3 Effective mechanisms for communities to engage with government
12.1 Comprehensive city monitoring & data management
12.2 Consultative planning process
12.3 Appropriate land use and zoning
12.4 Robust planning approval process
QUALITIESINDICATORS

28 CITY RESILIENCE INDEX - THE ROCKEFELLER FOUNDATION | ARUP
For example: Protection of livelihoods following a shock.
For example: Minimised human vulnerability, Sustainable economy.
52 INDICATORS
12 GOALS
BASIS OF ASSESSMENT AND MEASUREMENT
The Index provides a means to assess and measure the extent to which the city is achieving the 12 goals, based on 52 indicators. It will provide cities with a comprehensive, credible, and technically-robust means to assess and monitor their resilience in order to inform urban planning and investment decisions. In this way, cities will be better able to survive and thrive in the face of diverse stresses and shocks.
The Index enables cities to assess and measure their present-day performance
and also assess their trajectory towards a more resilient future. This is achieved through assessment and measurement of both qualitative and quantitative information.
Cities can to use the Index to identify and understand their trajectories towards resilience by considering what they are currently doing to improve their performance (within each sub-indicator area). As it is generally not possible to quantitatively measure future performance, the Index gathers
4 DIMENSIONS
qualitative data that will help signpost the city’s resilience trajectory. This assessment process involves the city contemplating their own performance (including the actions they are undertaking) against each sub-indicator, based on a series of qualitative questions. Cities assign a quantitative score based on guidance that defi nes what worst and best performance could look like.
Cities can also measure their present-day performance based on quantifi ed
For example: Health & Well-being; Infrastructure & Ecosystems. The four dimensions address factors related to people, organisation, place and knowledge in a city.
CITY RESILIENCE INDEX - THE ROCKEFELLER FOUNDATION | ARUP 29
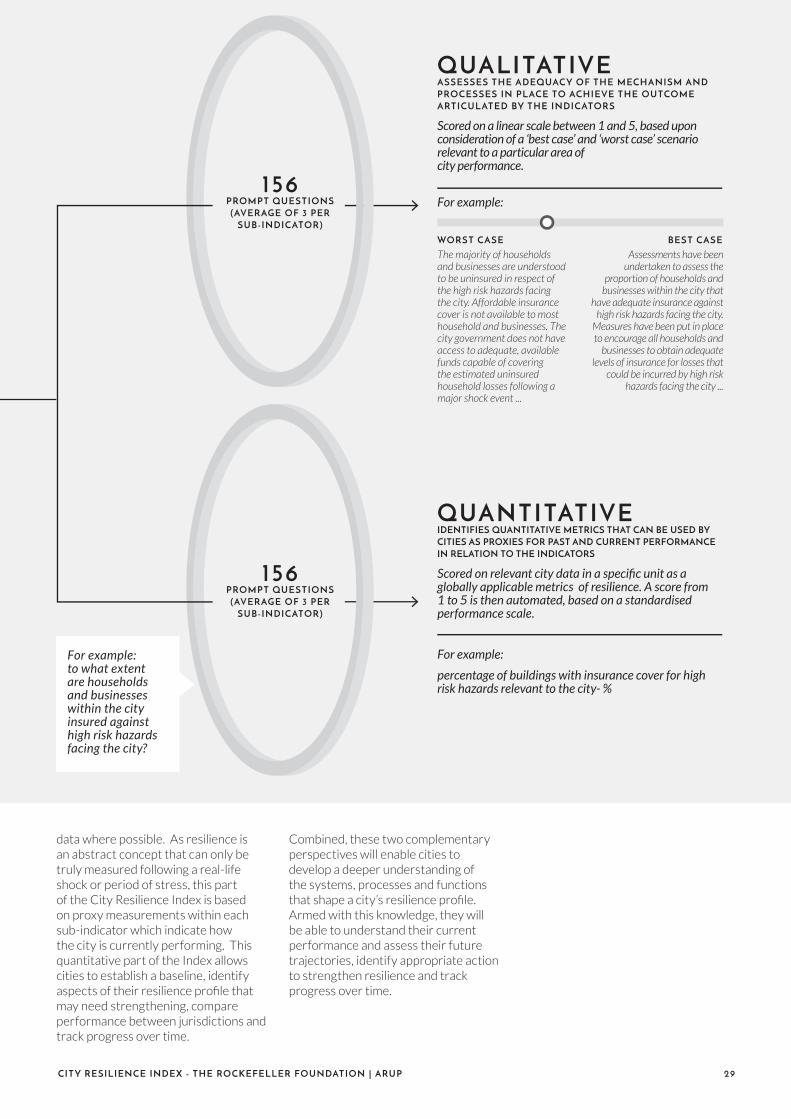
QUANTITATIVEIDENTIFIES QUANTITATIVE METRICS THAT CAN BE USED BY
CITIES AS PROXIES FOR PAST AND CURRENT PERFORMANCE
IN RELATION TO THE INDICATORS
Scored on relevant city data in a specifi c unit as a globally applicable metrics of resilience. A score from 1 to 5 is then automated, based on a standardised performance scale.
For example:
percentage of buildings with insurance cover for high risk hazards relevant to the city- %
156PROMPT QUESTIONS
(AVERAGE OF 3 PER
SUB-INDICATOR)
156PROMPT QUESTIONS
(AVERAGE OF 3 PER
SUB-INDICATOR)
BEST CASE
QUALITATIVEASSESSES THE ADEQUACY OF THE MECHANISM AND
PROCESSES IN PLACE TO ACHIEVE THE OUTCOME
ARTICULATED BY THE INDICATORS
Scored on a linear scale between 1 and 5, based upon consideration of a ‘best case’ and ‘worst case’ scenario relevant to a particular area ofcity performance.
For example:
The majority of households and businesses are understood to be uninsured in respect of the high risk hazards facing the city. Affordable insurance cover is not available to most household and businesses. The city government does not have access to adequate, available funds capable of covering the estimated uninsured household losses following a major shock event ...
Assessments have been undertaken to assess the
proportion of households and businesses within the city that
have adequate insurance against high risk hazards facing the city.
Measures have been put in place to encourage all households and
businesses to obtain adequate levels of insurance for losses that
could be incurred by high risk hazards facing the city ...
WORST CASE
data where possible. As resilience is an abstract concept that can only be truly measured following a real-life shock or period of stress, this part of the City Resilience Index is based on proxy measurements within each sub-indicator which indicate how the city is currently performing. This quantitative part of the Index allows cities to establish a baseline, identify aspects of their resilience profi le that may need strengthening, compare performance between jurisdictions and track progress over time.
Combined, these two complementary perspectives will enable cities to develop a deeper understanding of the systems, processes and functions that shape a city’s resilience profi le. Armed with this knowledge, they will be able to understand their current performance and assess their future trajectories, identify appropriate action to strengthen resilience and track progress over time.
For example: to what extent are households and businesses within the city insured against high risk hazards facing the city?

An online platform has been developed as a user-friendly, web-based tool to help collect and analyse data, generating a city’s resilience profi le. The platform has been developed primarily for use by city governments and their partners. It’s aimed at those who are in the best position to gather administrative data, to use fi ndings from the assessment to inform policy and planning decisions, and to track city progress over time.
Designed as a self-assessment, the platform generates a resilience profile that reveals a city’s specific strengths and weaknesses, creating a baseline to plan from and measure future progress against.
The research reports describing the development of the City Resilience Index and online platform designed for carrying out a city’s resilience assessment can be accessed at www.cityresilienceindex.org.
30 CITY RESILIENCE INDEX - THE ROCKEFELLER FOUNDATION | ARUP
ONLINE PLATFORM

CITY RESILIENCE INDEX - THE ROCKEFELLER FOUNDATION | ARUP 31
QUALITIES PROFILE
The qualities profile represents a set of qualities that describes the behaviour or performance of the urban systems in relation to resilience. These qualities enable cities to withstand, respond and adapt more readily to shocks and stresses.
City resilience profi le
The online platform is designed to facilitate data entry and generate resilience profi les – qualitative, quantitative, qualities - that illustrates performance against the 12 goals and 7 qualities, plus a dashboard that summarises performance in more detail in relation to the 52 indicators. Together they enable cities to understand and communicate their resilience, importantly to identify what action might be taken to improve their resilience, or their ability to measure their resilience.
In forthcoming developments of the online platform, city users will be able to link to relevant urban solutions that may infl uence a city’s actions to become more resilient.
INTEGRATED
INCLUSIVE
REFLECTIVE
RESOURCEFUL
ROBUST
REDUNDANT
FLEXIBLE
32 CITY RESILIENCE INDEX - THE ROCKEFELLER FOUNDATION | ARUP
Integrated
Development Planni
Empowere
d
Stakehold
ers
Effec
tive
Lea
ders
hip
& M
anag
emen
t
Com
munication
Reliable M
obility &
of Critical Services
Effective Provision
& Fragility
Reduced Exposure
LE
AD
ER
SH
IP
& S
TRATEGY
INF
RA
ST
RU
CT
UR
E
& ECO
SYSTEMS
Effective Safeguards
to Hum
an Health &
Life
Diverse Livelihood
& Employment
Minimal Human Vulnerability
Integrated
Development Planning
Empowere
d
Stakehold
ers
Effec
tive
Lea
ders
hip
& M
anag
emen
t
Com
munication
Reliable M
obility &
of Critical Services
Effective Provision
& Fragility
Reduced ExposureEconomySustainable
Rules of L
aw
Comprehensive Secu
rity
&
Mut
ual S
upp
ort
Colle
ctiv
e Id
enti
ty &
LE
AD
ER
SH
IP
& S
TRATEGY
ECON
OM
Y
& S
OC
IET
Y
INF
RA
ST
RU
CT
UR
E
& ECO
SYSTEMS
HEALTH &
WE
LL
BE
ING
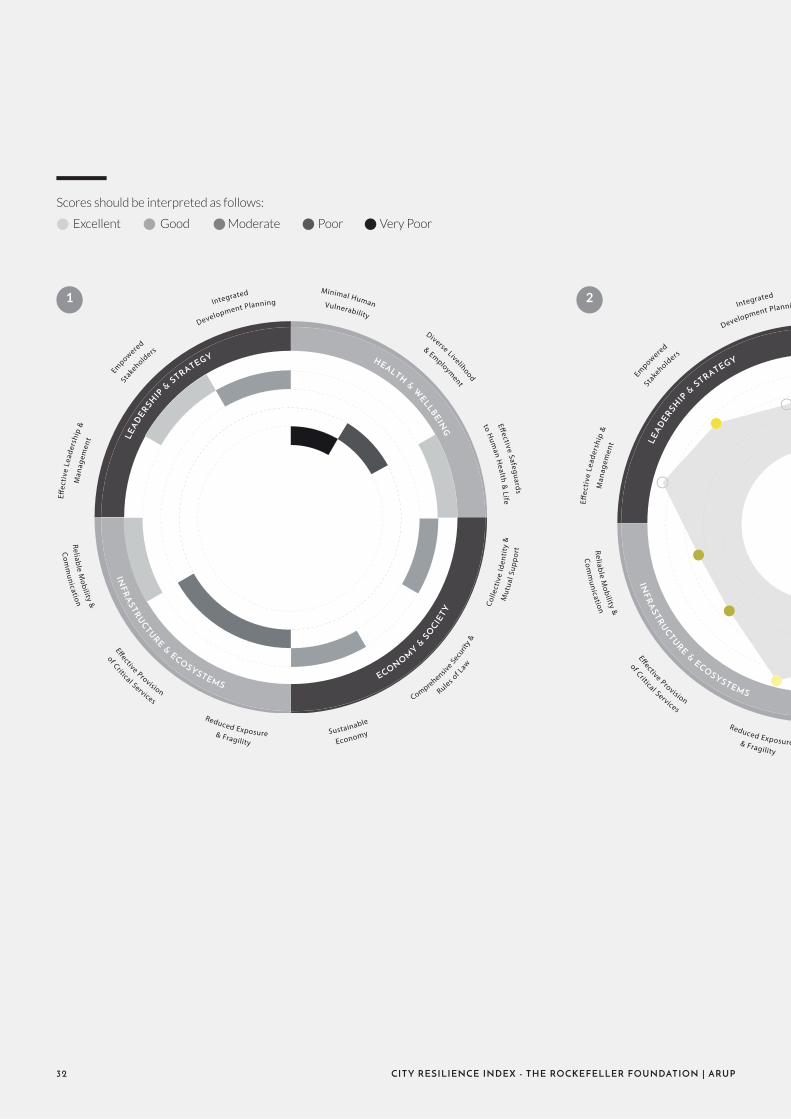
Scores should be interpreted as follows:
Excellent Good Moderate Poor Very Poor
1 2
CITY RESILIENCE INDEX - THE ROCKEFELLER FOUNDATION | ARUP 33
Effective Safeguards
to Hum
an Health &
Life
Diverse Livelihood
& Employment
Minimal Human Vulnerability
ng
eEconomySustainable
Rules of L
aw
Comprehensive Secu
rity
&
Mut
ual S
upp
ort
Colle
ctiv
e Id
enti
ty &
ECON
OM
Y
& S
OC
IET
Y
HEALTH &
WE
LL
BE
ING
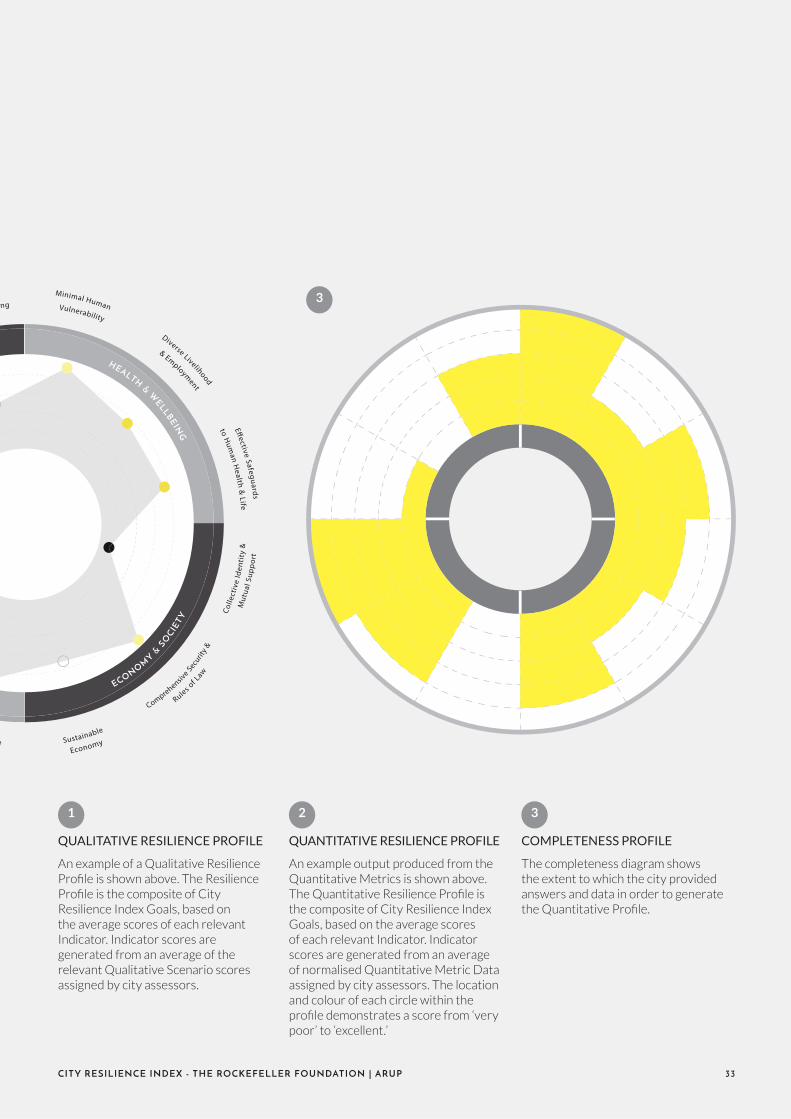
COMPLETENESS PROFILE
The completeness diagram shows the extent to which the city provided answers and data in order to generate the Quantitative Profi le.
QUANTITATIVE RESILIENCE PROFILE
An example output produced from the Quantitative Metrics is shown above. The Quantitative Resilience Profi le is the composite of City Resilience Index Goals, based on the average scores of each relevant Indicator. Indicator scores are generated from an average of normalised Quantitative Metric Data assigned by city assessors. The location and colour of each circle within the profi le demonstrates a score from ‘very poor’ to ‘excellent.’
QUALITATIVE RESILIENCE PROFILE
An example of a Qualitative Resilience Profi le is shown above. The Resilience Profi le is the composite of City Resilience Index Goals, based on the average scores of each relevant Indicator. Indicator scores are generated from an average of the relevant Qualitative Scenario scores assigned by city assessors.
1 2
3
3

34 CITY RESILIENCE INDEX - THE ROCKEFELLER FOUNDATION | ARUP
BUILDING RESILIENCE
BUILDING CROSS-SECTORAL LEADERSHIP FOR DISASTERS, SURAT
As the fastest growing city in India, and despite its economic prosperity, Surat struggles to keep up with demands on its infrastructure and services. It has experienced several shocks in recent decades, including fl oods, social unrest and an outbreak of the pneumonic plague. This has strongly infl uenced the city’s successful efforts to enhance resilience.
Surat is well-known for its fl ooding challenges. However, 20 years ago, a chain reaction following a fl ood permanently changed Surat’s approach to fl ood management. After the fl ood in 1994, poor sanitation in vulnerable communities is reasoned to have caused an outbreak of pneumonic plague. While the number of suspected cases was limited, the unexpected nature and fear of a relatively unknown disease caused panic which started locally but quickly spread nationally and internationally.
Following this catastrophe, a municipal commissioner was put in place to lead the city back to normality and rebuild trust internally and externally. There was a recognised need for improved infrastructure, such as sewerage and stormwater drainage, as well as better fl ood management to reduce
CIVIL HOSPITAL QUARATINED BY
INDIAN MILITARY OFFICIALS
© LAURIE GARETT
DOOR TO DOOR SOLID WASTE
COLLECTION © JNNURM
34 CITY RESILIENCE INDEX - THE ROCKEFELLER FOUNDATION | ARUP
the chances of a recurrence. This event also raised awareness of public health generally and the wellbeing of the workforce to contribute to economic prosperity. The local government put in place measures to prevent rapid disease spread, such as monitoring at household level, and provided local health centres in the most vulnerable areas to anticipate and respond to a disaster.
It took longer to restore trust in the security of Surat after the disaster than it did to clean up the streets and control the disease. This lack of trust delayed residents from returning to the city and impacted heavily on business continuity. In light of this, the business community, led by the Chamber of Commerce, now contributes strong leadership in planning for disasters and being on the ground during emergencies, helping to disseminate information and resources. This complements government recognition of the importance of providing fast, reliable information to the public about emergencies and their management.
CITY RESILIENCE INDEX - THE ROCKEFELLER FOUNDATION | ARUP 35
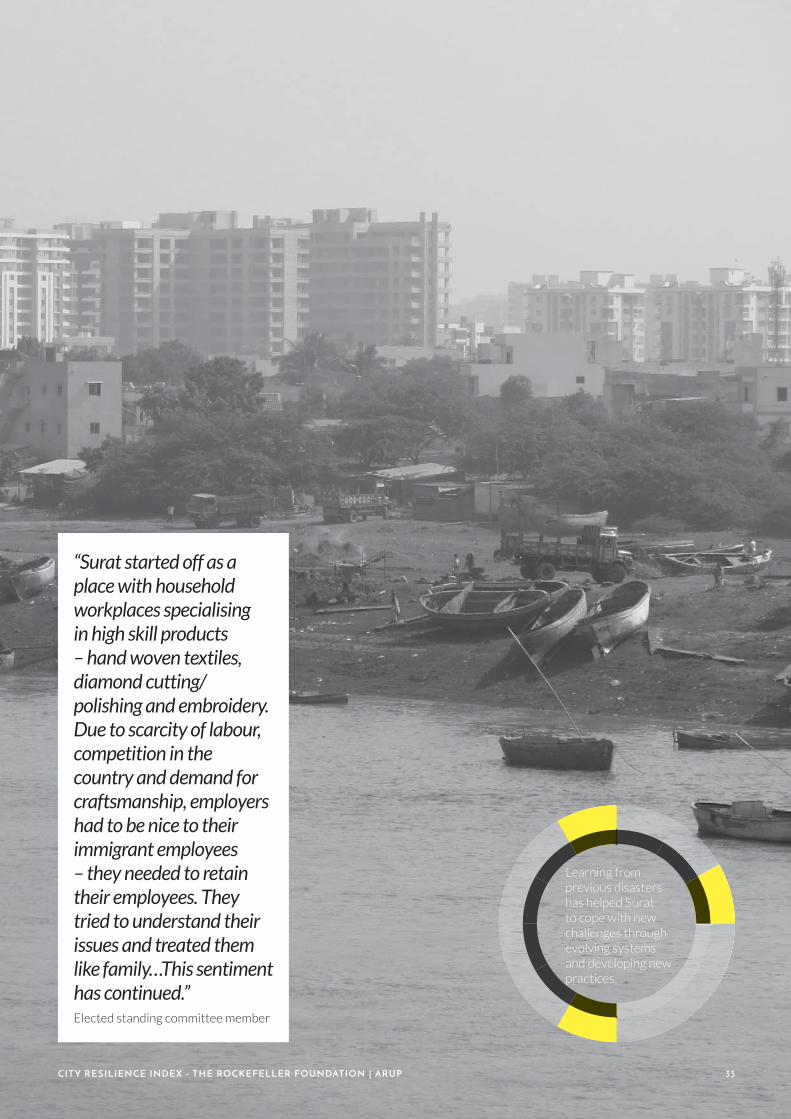
“Surat started off as a place with household workplaces specialising in high skill products – hand woven textiles, diamond cutting/polishing and embroidery. Due to scarcity of labour, competition in the country and demand for craftsmanship, employers had to be nice to their immigrant employees – they needed to retain their employees. They tried to understand their issues and treated them like family…This sentiment has continued.” Elected standing committee member
Learning from previous disasters has helped Surat to cope with new challenges through evolving systems and developing new practices.
CITY RESILIENCE INDEX - THE ROCKEFELLER FOUNDATION | ARUP 35

36 CITY RESILIENCE INDEX - THE ROCKEFELLER FOUNDATION | ARUP
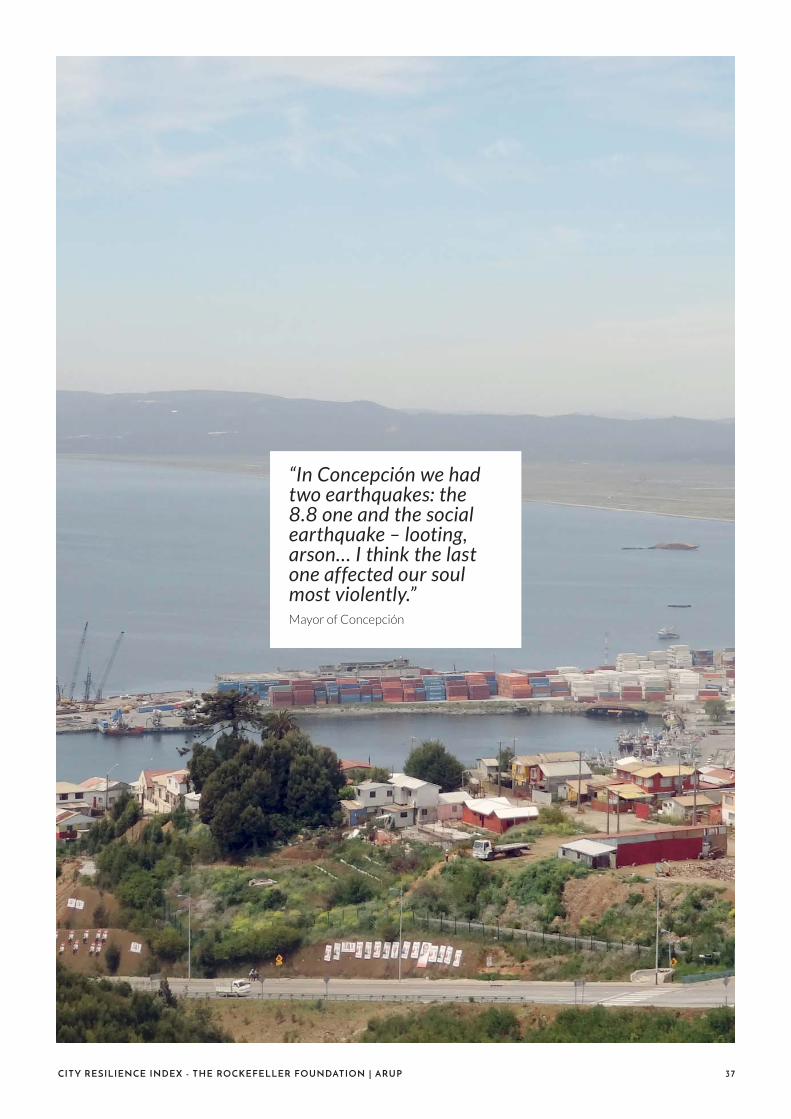
ADDRESSING SEISMIC RISK BEYOND BUILDING CODES, CONCEPCIÓN
Events following the massive 8.8 earthquake that hit Concepción’s metropolitan area on 27 February 2010 highlight the physical and social aspects of resilience. Due to the presence and enforcement of building codes in Chile, buildings sustained moderate damage and there was limited loss of life considering the magnitude of the earthquake. Critical services – electricity, water and sewerage networks – were disrupted and transport came to a standstill.
What was unexpected was the almost total breakdown of communication networks: internet, telephone and radio. Offi cials were unable to communicate with each other, obtain help from disaster management agencies in Santiago, or inform the public as to what was happening. Reports of food shortages, looting and arson led to rumours about gangs stealing from homes. An overriding sense of insecurity led to panic, which escalated into widespread looting and anxiety. Neighbours demonstrated community cohesiveness by joining forces to protect each other and setting up shifts to keep watch after dark and guard their home.
The only communication network that continued to function was Radio Bio Bio, thanks to its continuity planning and back-up systems. By providing the public with a source of information about what was happening and enabling residents to communicate with one another, the radio station became a centre point for keeping some level of social stability.
Order was gradually restored after the arrival of the military and the imposition of a curfew that was welcomed by the population. The level of social instability after the disaster, as well as its link to inadequate emergency communications, were key learning points for the city. The situation in Concepción after the earthquake demonstrates that it can take a city longer to recover from the social and human impacts of disasters than to restore the physical elements.
ARRIVAL OF MILITARY TO CORONEL,
GRAN CONCEPCIÓN © RADIO BIO BIO/
LEESLY LEAL
EMERGENCY DRILL AT CONCEPCIÓN
MUNICIPALITY
Social systems and communications were critical to allow a rapid response after a major earthquake in Concepción.
CITY RESILIENCE INDEX - THE ROCKEFELLER FOUNDATION | ARUP 37
“In Concepción we had two earthquakes: the 8.8 one and the social earthquake – looting, arson… I think the last one affected our soul most violently.” Mayor of Concepción

38 CITY RESILIENCE INDEX - THE ROCKEFELLER FOUNDATION | ARUP
ENHANCING RESILIENCE THROUGH COMMUNITY-LED ACTIONS, NEW ORLEANS
The city of New Orleans has endured two signifi cant disasters recently: Hurricane Katrina in 2005 and the BP oil spill in 2010. Located close to both the Gulf of Mexico and Lake Pontchartrain, many local residents rely on these water resources for their livelihoods in the fi shing and food processing industries. One such community is the city’s Vietnamese community in the neighbourhood of Versailles. Their proximity to open water has made the community particularly vulnerable to the recent disasters. Their response illustrates the importance of social aspects of resilience, particularly the fundamental role of strong, unifi ed communities.
Resumption of Catholic masses at the Mary Queen of Vietnam church – led by the priest who had displayed such leadership – helped to promote a sense of normality, and reminded residents of their shared religion, their common language (Vietnamese) and their collective identity and cultural heritage. Residents were encouraged to rebuild their homes by bartering their skills with one another. For example: local electricians helped to restore power to the homes of roofers; in exchange, the roofers helped to replace damaged tiles and roofs on the electricians’ homes.
In 2006, the Mary Queen of Vietnam Community Development Corporation (MQVN CDC) was founded to help local residents rebuild not only their homes but also their lives after Katrina. This organisation still exists, promoting redundancy by providing social services and care in the continued absence of health facilities in the neighbourhood, and also training residents in alternative livelihoods.
The Deepwater Horizon BP oil spill in 2010 polluted many of the fi shing waters that local fi sherfolk relied on for their livelihoods. The MQVN CDC now re-trains fi sherfolk in market gardening and aquaponics, providing them with alternative livelihood options. Katrina displaced almost the entire
population of Versailles; destroyed and damaged homes and businesses, including fi shing boats; forced the permanent closure of the nearest hospital and schools; and left the community temporarily without power or water. Galvanised by the leadership of the local Catholic priest, himself supported by a network of community leaders, evacuated residents began to return to Versailles a few weeks after Katrina. Learning that the government was unable to provide the necessary resources for the recovery as quickly as they were needed, the community rebuilt both its physical and social structures on its own.
RETAIL ACTIVITIES IN VERSAILLES
ORIGINAL HOMES OF THE FIRST
VIETNAMESE MIGRANTS IN NEW ORLEANS
(DAMAGED BY HURRICANE KATRINA)
“A lot of residents feel a strong sense of belonging here. They had a chance to evacuate and start a life somewhere else, but most of them chose to come back here because it reminded them of a little Vietnam. This really feels like a community – you can’t keep a secret here, people are so close.” Deputy Director of Mary Queen of Vietnam Community Development Corporation

CITY RESILIENCE INDEX - THE ROCKEFELLER FOUNDATION | ARUP 39
Communities unite behind strong neighbourhood identities in New Orleans to overcome disaster.
40 CITY RESILIENCE INDEX - THE ROCKEFELLER FOUNDATION | ARUP4040404004040400400 CITCITTCITTTTCITCITCITCICCICC Y RY RY RY RY RY RY RY RRY RY RRRY RRYYY RRRYY RY RY RRY RY Y RESIESIESIESESESESESISIESESESISSSSIIE LIELIELLIELIELIELILIEIEIEELIELIEL ELIELIELIEIL NCENCENCENNNCENCENCENCENCENCENCENNNN ININNININININININNNNNDEXDDDDEXDEXDEXDEXDEXDEXDEXDEXXDEXDEDDEX ---- THETHETHETHETHETHETHETHETHEE RORORORRORORORRRROOOROOOORROOCKECKECKECKECKECKECKEEEKEKEEEEEECKECKEFEFELFELFELFEFEEEFELELFELELFELFEFEEFEEELFEFEFEEELELF LLLLLELFELLLE LERLERLERLERLERLERLERLLLERLELERLLEEERERLELLELELELLLLLLEE FOFOFOOOOOOFOOFOOOOOOFOOFFFOFOOOUNUNUNUNUNUNDNDUNDNDNDNDUNDUNDUNUNDNUUNNDUNDUU DDUNUNUNNNDATATIATIATIATIATIAATATIATATIATATTATTIATATIAT OONOONONONONONNOOOONOONOONNONONONNO ||| AAAA| A| A| AA| A| AA|| RUPRUPRUPRUPURUPUUPUPRUPPPRUPRRUPUPR PPRRUPPRUPUPUURRRUP
BALANCING NATURAL RESOURCES UNDER CHALLENGING CONDITIONS, SEMARANG
nets in their ponds to reduce loses during fl oods. With the support of local universities, some fi shpond farmers have also experimented with cultivating mussels as an alternative crop, as they grow tethered to rocks rather than fl oating free in the water.
Close by, in Semarang Port, private- and state-owned businesses appear to be far less affected by coastal fl ooding. With larger fi nancial resources at their disposal, they have been able to invest in hard infrastructure – such as automatic pumping systems – to reduce operational disruption caused by fl ooding. Businesses have also improved their transport access to the Semarang Port area by laying a new road 50cm higher than the previous road level. This local adaptation enables access to the port to continue during coastal fl ooding events, allowing one of Semarang’s key economic assets to function. This ensures continuity in the availability of goods, services and jobs, which benefi ts the local communities, and the wider city.
Semarang suffers from regular fl ooding and landslides. These issues are made worse by inadequate basic services provided to some of the residents, which cause them to extract water locally. This is an example of the inter-relationships between stresses, which lead to further problems.
Drinking water in Semarang is not easily accessible for some communities. Despite their proximity to water, residents in Semarang’s coastal communities are often most affected by water shortages. They commonly purchase water of unknown quality from formal or informal vendors. Wells are another alternative water source for communities or individuals who cannot be supplied by water mains. However, in some coastal areas wells are becoming salinised, while wells in other parts of the city are running dry during periods of peak demand.
Forced to extract groundwater to meet its residents’ basic needs, Semarang is facing another signifi cant urban challenge. Land subsidence is a side-effect of groundwater extraction, taking place at a rate of up to 10cm a year according to some estimates. This environmental process has increased the city’s vulnerability to fl ooding by lowering the city’s ground level. Tidal fl ooding, which occurs on a daily basis in some communities, has signifi cant impacts on communities living along the coast. Homes, shops and roads are regularly fl ooded, and fi shpond farmers have had their fi sh stocks washed out to sea, affecting their livelihoods.
To prevent further damage to their homes, some coastal communities have installed fl oating fl oorboards in their houses, and put aside money every year to raise the height of their houses. Fishpond farmers now use
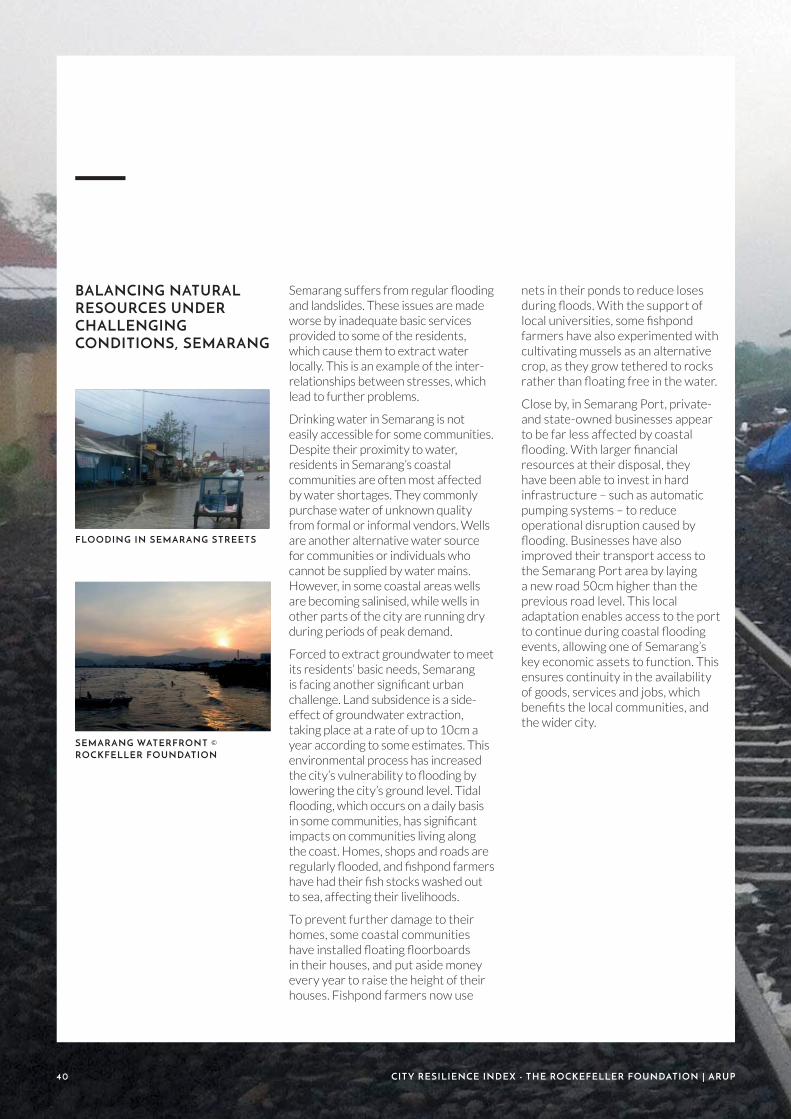
FLOODING IN SEMARANG STREETS
SEMARANG WATERFRONT ©
ROCKFELLER FOUNDATION
40 CITY RESILIENCE INDEX - THE ROCKEFELLER FOUNDATION | ARUP

CITY RESILIENCE INDEX - THE ROCKEFELLER FOUNDATION | ARUP 41CITCITCICIITITCITCITICICICICITCITCCITCITCI Y RY RYY RY RY RY RRRRRY RRRRY RRY Y ESIESIESIESESIESISIESISSIEE LIELIELIELIEELIELILIEELIELIELIEEEI NCENCENCENCENCENCENCEENCNCENCECECEE ININNINNNNINININININININIIINIINNINDEXDEXDEXDEXDEXEDEXEDEXEDEXDEXDEXDEDDEEE -- THETHETHETHETHETHETTHTHHEHEHEHHHEHEHEEEE ROROROROOOOOOOROOOOOOOOCKCCKEKCKKKEECKEKECKECCKEKCKECKKKKCKCKEKECKECKEEFELFFFELFFELFELFELFELFELFFFELFELELLFELLLLLLERLERLELERLERLERLELERLERRRRRRRERRRRR FFFOFOFOFOFOFOFOFOFOFOFOFOOOOUNDUNDUNDUNDUNDUNDUNDUNDNNDDUNDU DDDUNDDNNUNUNDUNUUNUN ATATTITIATITIIAATITIATAATAAATATAATTTIAAATIIIATAT ONONONONONNOONONONONNOONNOOO |||| AAAAAAAAA| AAAAAA| AAAAA| AAAA| A| A| AA AA| AA||| RUPRUPRUPRUPRURURURUUPPRURURUPRRRUPPPPPRUUPPPPPPPPPPP 4144414141444444444444144
“There are three water vendors in this area, including me… There is limited water and the well is getting dry.” Water vendor
Semarang works with, rather than against, nature to maintain its systems and assets, and to protect lives and livelihoods.
CITY RESILIENCE INDEX - THE ROCKEFELLER FOUNDATION | ARUP 41

42 CITY RESILIENCE INDEX - THE ROCKEFELLER FOUNDATION | ARUP
MINIMISING VULNERABILITIES THROUGH MULTIPLE APPROACHES, CALI
Cali is the third largest city in Colombia, located in the broad, fertile Cauca River valley. The city’s rapid growth since the 1970s has forced large numbers of people, often the poorest, to live in fl ood-prone areas, among them the Aguablanca district. To improve these vulnerable areas, the local government and grassroots groups have developed parallel and complementary approaches that serve as an example of creating resilience.
The fi rst levees to protect Aguablanca from river fl ooding were built around 30 years ago, but the structural integrity of the defences has been compromised over time. Local residents have placed pipes for domestic water supply through the levees and extracted materials for construction aggregates. To protect the levees, the city government, supported by national and international partners, is implementing a number of interventions. In this process, the municipality has recognised that ensuring the robustness of the infrastructure in the long term requires the engagement of the local communities.
Providing information about the risks associated with degrading infrastructure has ensured that communities can better appreciate the value of the fl ood defence and understand how it works. This integrated approach to community participation has also resulted in the
MAYOR OF CALI VISITING AGUABLANCA
DISTRICT © ALCALDÍA DE SANTIAGO DE CALI
COMMUNITY WORKSHOP AT FUNDACIÓN
PAZ Y BIEN
Multiple actors cooperate in Cali to create and strengthen vibrant communities, through actions which place community needs and capacities centre stage.
passive surveillance of public spaces and better control of illegal dumping next to the levees.
Grassroots organisations, such as Fundación Paz y Bien, have developed community-led approaches to address community vulnerabilities that have been challenging for the city government and threaten social breakdown. With the aim of empowering communities and diversifying livelihoods, Fundación Paz y Bien provides training, microfi nance and emotional support.
One of this organisation’s major achievements is the implementation of a popular microcredit programme in Aguablanca. Their deep understanding of the community’s problems has enabled the organisation’s members to develop a refl ective and inclusive approach that specifi cally targets needs identifi ed by the community itself. With this approach, Fundación Paz y Bien has helped to build a more cohesive community and has become a key point of support and guidance for families suffering the impacts of violence, extreme poverty, and economic instability in Aquablanca.
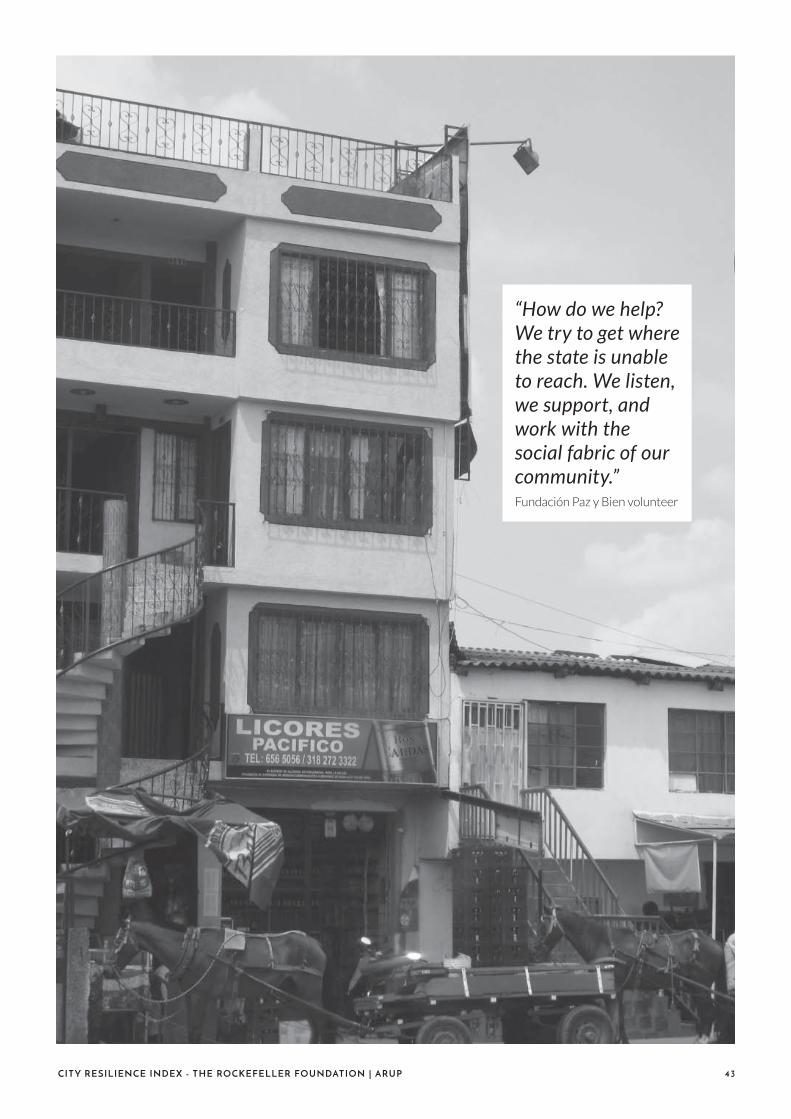
CITY RESILIENCE INDEX - THE ROCKEFELLER FOUNDATION | ARUP 43
“How do we help? We try to get where the state is unable to reach. We listen, we support, and work with the social fabric of our community.” Fundación Paz y Bien volunteer
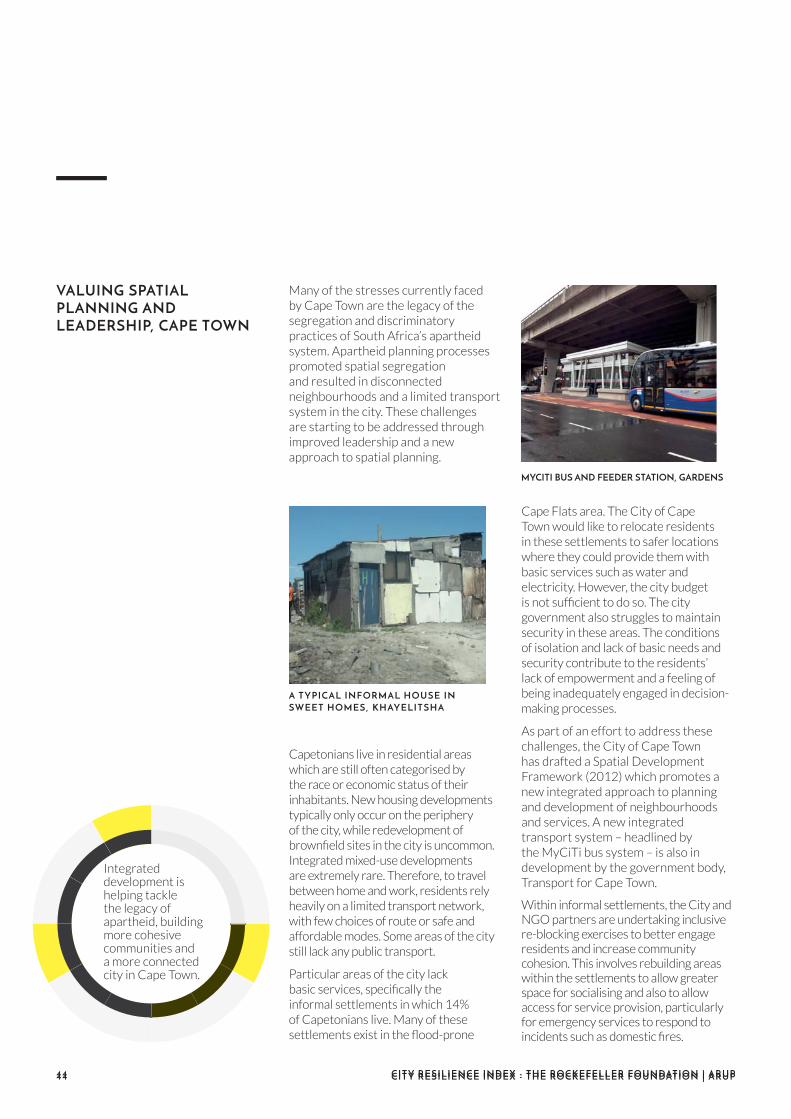
44 CITY RESILIENCE INDEX - THE ROCKEFELLER FOUNDATION | ARUP
Integrated development is helping tackle the legacy of apartheid, building more cohesive communities and a more connected city in Cape Town.
VALUING SPATIAL PLANNING AND LEADERSHIP, CAPE TOWN
Many of the stresses currently faced by Cape Town are the legacy of the segregation and discriminatory practices of South Africa’s apartheid system. Apartheid planning processes promoted spatial segregation and resulted in disconnected neighbourhoods and a limited transport system in the city. These challenges are starting to be addressed through improved leadership and a new approach to spatial planning.
A TYPICAL INFORMAL HOUSE IN
SWEET HOMES, KHAYELITSHA
MYCITI BUS AND FEEDER STATION, GARDENS
44 CITY RESILIENCE INDEX - THE ROCKEFELLER FOUNDATION | ARUP
Capetonians live in residential areas which are still often categorised by the race or economic status of their inhabitants. New housing developments typically only occur on the periphery of the city, while redevelopment of brownfi eld sites in the city is uncommon. Integrated mixed-use developments are extremely rare. Therefore, to travel between home and work, residents rely heavily on a limited transport network, with few choices of route or safe and affordable modes. Some areas of the city still lack any public transport.
Particular areas of the city lack basic services, specifi cally the informal settlements in which 14% of Capetonians live. Many of these settlements exist in the fl ood-prone
Cape Flats area. The City of Cape Town would like to relocate residents in these settlements to safer locations where they could provide them with basic services such as water and electricity. However, the city budget is not suffi cient to do so. The city government also struggles to maintain security in these areas. The conditions of isolation and lack of basic needs and security contribute to the residents’ lack of empowerment and a feeling of being inadequately engaged in decision-making processes.
As part of an effort to address these challenges, the City of Cape Town has drafted a Spatial Development Framework (2012) which promotes a new integrated approach to planning and development of neighbourhoods and services. A new integrated transport system – headlined by the MyCiTi bus system – is also in development by the government body, Transport for Cape Town.
Within informal settlements, the City and NGO partners are undertaking inclusive re-blocking exercises to better engage residents and increase community cohesion. This involves rebuilding areas within the settlements to allow greater space for socialising and also to allow access for service provision, particularly for emergency services to respond to incidents such as domestic fi res.

CITY RESILIENCE INDEX - THE ROCKEFELLER FOUNDATION | ARUP 45
“The city wasn’t designed by economic forces; instead it was designed by social engineering. Maybe we need social engineering to change it again?” Representative of the Cape Town Partnership
CITY RESILIENCE INDEX - THE ROCKEFELLER FOUNDATION | ARUP 45

46 CITY RESILIENCE INDEX - THE ROCKEFELLER FOUNDATION | ARUP46 CITY RESILIENCE INDEX - THE ROCKEFELLER FOUNDATION | ARUP
“The City Resilience Index is an excellent tool that highlights areas of improvement, identifies weaknesses and concentrates minds towards finding innovative ways to mitigate against risk. The international and flexible nature of the index enables a wider understanding beyond that of the usual local or national approach.”Mayor of Liverpool
“It has given direction to the discussion and helped to get us to where we are with understanding resilience in Glasgow quicker than we otherwise would have.”Head of Sustainability & the Environment & Chief Offi cer for Resilient, Glasgow
TESTIMONIALS

CITY RESILIENCE INDEX - THE ROCKEFELLER FOUNDATION | ARUP 47CITY RESILIENCE INDEX - THE ROCKEFELLER FOUNDATION | ARUP 47
“This ongoing research would help a city improve its parameters like infrastructure, economy, livelihood and employment, security, law and order. This will be included under our city’s development plan.”Deputy Mayor of Shimla
FOR MORE INFORMATION
Sundaa Bridgett-Jonese. [email protected]. +1 212 852 8506
Sachin Bhoitee. [email protected]. +44 20 7755 6702