Embed Size (px)
Citation preview

City, University of London Institutional Repository
Citation: Mergos, P.E. (2016). Optimum seismic design of reinforced concrete frames according to Eurocode 8 and fib Model Code 2010. Earthquake Engineering and Structural Dynamics, doi: 10.1002/eqe.2851
This is the accepted version of the paper.
This version of the publication may differ from the final published version.
Permanent repository link: http://openaccess.city.ac.uk/15826/
Link to published version: http://dx.doi.org/10.1002/eqe.2851
Copyright and reuse: City Research Online aims to make research outputs of City, University of London available to a wider audience. Copyright and Moral Rights remain with the author(s) and/or copyright holders. URLs from City Research Online may be freely distributed and linked to.
City Research Online: http://openaccess.city.ac.uk/ [email protected]
City Research Online

Optimum seismic design of reinforced concrete frames according
to Eurocode 8 and fib Model Code 2010
Panagiotis E. Mergos *
Research Centre for Civil Engineering Structures, Department of Civil Engineering,
City University London, London EC1V 0HB, UK
Abstract. Traditional seismic design, like the one adopted in Eurocode 8 (EC8), is force-based and examining a
single level of seismic action. In order to provide improved control of structural damage for different levels of
seismic action, the new fib Model Code 2010 (MC2010) includes a fully-fledged displacement- and performance-
based seismic design methodology. However, the level of complexity and computational effort of the MC2010
methodology is significantly increased. Hence, the use of automated optimization techniques for obtaining cost-
effective design solutions becomes appealing if not necessary. This study employs genetic algorithms to derive
and compare optimum seismic design solutions of reinforced concrete frames according to EC8 and MC2010.
This is important since MC2010 is meant to serve as a basis for future seismic design codes. It is found that
MC2010 drives to more cost-effective solutions than EC8 for regions of low seismicity and better or similar costs
for regions of moderate seismicity. For high seismicity regions, MC2010 may yield similar or increased structural
costs. This depends strongly on the provisions adopted for selecting the set of ground motions. In all cases,
MC2010 provides enhanced control of structural damage.
Keywords: Reinforced concrete; seismic design; Eurocodes; fib Model Code 2010; optimization; genetic-
algorithms
1 Introduction
Seismic design of reinforced concrete frames according to current codes, like Eurocode 8
(EC8) [1], is based on forces. Structural members (i.e. beams and columns) are dimensioned
to withstand internal forces at the Ultimate Limit State (ULS). Internal forces are calculated
by conducting an elastic analysis for seismic forces reduced by an empirical behaviour (force-
reduction) factor q representing the ability of the structural system to develop inelastic
response [2]. Then, prescriptive rules are used (i.e. member detailing rules, capacity design
principles) to ensure that the system is able to develop ductility capacity adequate to justify
the behaviour factor employed in the calculation of internal forces. This procedure is indirect
and opaque [3].
It is established that structural and non-structural damage is directly related to member
deformations and lateral drifts [4, 5]. Hence, displacement- or deformation-based design
represents a more rational and direct approach for controlling induced seismic damage. A
number of different deformation-based seismic design methodologies (e.g. [6-8]) have been
presented in the literature and an interesting comparative study of them can be found in [9].
In addition to the above, in traditional seismic design, as implemented in Eurocode 8, a
single level of seismic action is examined (typically with 10% probability of exceedance in 50
* Corresponding author. Panagiotis E. Mergos, Lecturer in Structural Engineering, Department of Civil Engineering, City
University London, EC1V 0HB, London, UK.
E-mail address: [email protected], Tel. 0044 (0) 207040 8417

years or return period of 475 years). Only non-structural elements are checked for a more
frequent seismic action at the Serviceability Limit State (SLS).
The need for improved control of structural damage for different levels of seismic action
has led to the development of performance-based seismic design [10]. Performance-based
seismic design is a transparent and direct design framework that requires a set of performance
levels to be met for different levels of seismic hazard. Performance levels are related to the
level of structural damage of the structure, which in turn is directly related to structural member
deformations and/or inter-story drifts.
The new fib Model Code 2010 (MC2010) includes a fully-fledged deformation- and
performance-based seismic design and assessment methodology for various levels of seismic
hazard [3, 11]. MC2010 will serve as a basis for future codes for concrete structures. It is worth
noting that EC8-Part 3 [12] has already adopted a performance and displacement-based
methodology similar to MC2010. However, EC8-Part 3 is solely directed to seismic
assessment of existing structures. MC2010 performance-based methodology covers both
seismic design of new and assessment of existing structures [3].
In MC2010, each performance limit state corresponds to a specific physical condition of
the structure and it is expressed in terms of deformation limits of the structural members
providing direct control of allowable structural damage. The levels of seismic hazard are
identified by their annual probability of being exceeded. Seismic actions are specified in terms
of acceleration time-histories of the ground motion components. The reference method for
determining seismic demands is the most rigorous inelastic response history analysis with step-
by-step integration of the equation of motion in the time domain [3].
In structural engineering, the need for cost-effective design solutions of complex problems
in limited time has led to the development of automated structural optimization methodologies.
These can be divided in two categories: gradient-based and heuristic. Heuristic algorithms (e.g.
Genetic Algorithms GA, Simulated Annealing SA, Particle Swarm Optimization PSO, Taboo
Search TS) are becoming more and more popular in structural optimization, because they can
handle more complicated structural problems and they don’t require calculation of derivatives
[13].
Extensive research has been conducted over the past decades on optimum seismic design
of structures (e.g. [14, 15]). However, only a small part of this research has been dedicated to
reinforced concrete structures. This can be partially attributed to the complex nature and
detailing of reinforced concrete structures that increases significantly the number of design
variables [16]. Early efforts to optimise seismic design of concrete structures were based on
traditional seismic design code approaches (e.g. [17]). The number of research studies on
optimization of performance- and deformation-based seismic design of reinforced concrete
structures is rather limited.
Ganzerli et al. [18] were the first, to the best of the author’s knowledge, to consider seismic
optimization with performance-based constraints. The constraints were expressed in terms of
plastic rotations at column and beam members ends based on FEMA-273 guidelines (FEMA
1997). Pushover analysis was used to calculate seismic demands. Material cost was defined as
the single design objective. Section dimensions and longitudinal reinforcing steel areas were
set as the design variables of the optimization problem. A simple portal frame case study was
examined.
Chan and Zou [19] examined optimum seismic design of reinforced concrete frames by
employing optimality criteria approach. The proposed solution is divided in two steps. First,
member section dimensions are selected to fulfill the serviceability performance level for
frequent earthquakes. Then, member steel reinforcement is designed to withstand demands of
rare earthquakes for the ultimate performance level. Pushover analysis is used to calculate
seismic demands.

Lagaros and Papadrakakis [20] compared the provisions of EC8 for seismic analysis of 3D
reinforced concrete structures with a performance-based seismic design methodology in the
framework of multi-objective optimization. For the latter approach, pushover analysis was
employed to determine demands for different levels of earthquake intensities. Storey drifts
were used as performance level indicators. Construction cost and storey drifts for the 10%
probability of exceedance in 50 years (10/50) hazard level were set as the two design
objectives. It was found that EC8 optimum designs are more vulnerable to future earthquakes
compared to optimum designs obtained by the performance-based methodology.
Fragiadakis and Papadrakakis [21] presented a performance-based optimum seismic design
methodology for reinforced concrete frames based on nonlinear time history analyses. Inter-
story drifts were used as performance criteria. Three performance levels (Immediate
Occupancy, Life Safety and Collapse Prevention) were considered. The sum of concrete and
steel material costs was set as the single design objective. Design variables were determined
by using tables of concrete sections and applying the concept of multi-database cascade
optimization. Both, a deterministic and a reliability-based approach, were implemented. It was
found that both approaches lead to structures of improved seismic resistance and reduced cost.
Furthermore, reliability-based optimization may provide further economy compared to the
deterministic solution.
Gencturk [22] investigated performance-based seismic design optimization of reinforced
concrete and reinforced engineered cementitious composites (ECC) frames, by using Taboo
Search optimization algorithm. Initial cost and seismic performance, in terms of inter-storey
drifts for the 10/50 hazard level, represent the design objectives. Initial cost accounts for both
material and labor costs. Performance levels are determined by inter-story drifts threshold
values. These values are taken either as constant, in accordance with FEMA-273 provisions,
or by mapping local strain limits to inter-story drifts after conducting sample pushover
analyses. The life-cycle cost is also calculated for the optimal solutions. It is concluded that
ECC can considerably improve life-cycle performance of buildings.
It can be concluded from the above, that no study has been conducted so far on optimization
of reinforced concrete frames in accordance with MC2010 seismic design provisions. To fill
this gap, this study presents optimum seismic design solutions of reinforced concrete frames
obtained by MC2010 and compares them with optimum designs following EC8 guidelines. To
serve this goal, a general computational optimization framework of reinforced concrete frames
is developed that makes use of a genetic algorithm able to track global optima of complicated
problems with discrete design variables.
The aim here is to examine if and to what extent MC2010 provides more cost effective and
safe design solutions with respect to EC8. This is important since MC2010 is meant to serve
as a basis for future Eurocodes. In addition, topics related to the complexity and computational
cost of performing seismic designs based on the two standards as well as some open issues in
the seismic design provisions of MC2010 are discussed.
2 Optimization of reinforced concrete frames with genetic algorithms
2.1 Introduction
In optimization problem formulations, the goal is to minimize an objective function C(x)
subject to m number of constraints gj(x)≤0 (j=1 to m). A design solution is represented by the
design vector x, which contains n number of independent design variables xi (i=1 to n). In
structural optimization the objective function C(x) is typically the initial cost of the structure.
Constraints gj are either related to engineering demand parameters (EDPs) (e.g. forces,

displacements, rotations, drifts) or to detailing rules set by design codes and construction
practice. Furthermore, to realistically represent construction practice, design variables xi
typically take values from discrete sets of values Di=(di1, di2, …, diki), where dip (p=1 to ki) is
the p-th possible discrete value of design variable xi and ki is the number of allowable discrete
values of xi. For reinforced concrete structures, design variables are generally related to
concrete section dimensions and steel reinforcement. The previous can be written as:
Minimize: 𝐶(𝒙)
Subject to: 𝑔𝑗(𝒙) ≤ 0, 𝑗 = 1 𝑡𝑜 𝑚 (1)
Where:
𝒙 = (𝑥1, 𝑥2, … , 𝑥𝑛)
𝑥𝑖 ∈ 𝐷𝑖 = (𝑑𝑖1, 𝑑𝑖2, … , 𝑑𝑖𝑘𝑖) , 𝑖 = 1 𝑡𝑜 𝑛
2.2 Genetic Algorithms (GA)
Genetic Algorithms (GA) [23] belong to the class of stochastic, nature-inspired heuristic
algorithms. They are based on Darwin’s theory of natural selection and evolution. GA can be
easily implemented and applied to advanced optimization problems since they don’t require
use of gradients of cost or constraints functions. Furthermore, they are able to identify global
optima as opposed to local optimum solutions [13].
GA iteratively modify populations (generations) of individuals in order to evolve toward an
optimum solution. An individual x (genome) represents a candidate solution to the
optimization problem. The values of the design variables xi (i=1 to n) forming each individual
are called genes. The best objective function of a generation is the smallest objective function
of all individuals of the generation. In order to create the next population, GA select certain
individuals in the current population (parents) and use them to create individuals in the next
generation (children).
The following are the basic steps of GA:
1. A random initial population is created.
2. New populations are generated successively by:
i) Calculating the objective functions of all individuals.
ii) Selecting parents based on their objective function.
iii) Making children from selected parents.
iv) Forming new population from children.
3. Algorithm is terminated when one stopping criterion is met.
Three types of children can be created by GA:
i) Elite children: These are the individuals with the best objective functions of the
current population. They progress unchanged to the next population.
ii) Cross-over children: They are derived by mixing the genes of a pair of parents.
iii) Mutation children: They are created by altering the genes of a single parent.
In this study, the mixed integer GA as implemented in MATLAB-R2015a [24] is employed.
This algorithm can handle both continuous and discrete design variables. To serve this goal,
special crossover and mutation functions are used to ensure that discrete variables take values
only from pre-determined discrete sets of values [25].
Furthermore, the algorithm is able to account for nonlinear constraints by using the penalty
function approach. According to this approach, GA minimize a penalty function that is equal
to the objective function plus a term accounting for constraints violation. More particularly,
the penalty function is equal to the objective function for feasible designs. For an unfeasible
design, however, the penalty function becomes equal to the maximum value of the objective
functions of all feasible individuals of the population plus a sum of the constraint violations of
the unfeasible design [26].
The genetic algorithm in this study is terminated when one of the following stopping criteria
is met:
i) Number of generations exceeds a pre-specified maximum number of generations.
ii) The mean relative variation of the best objective function value does not exceed a
pre-specified tolerance over a pre-specified number of generations.
2.3 Design parameters and variables
The input data of the optimization problem can be divided in design parameters and design
variables. Design parameters keep their values fixed in the optimization process. In this study,
as design parameters are assumed the geometry (number and lengths of bays, story heights and
member connectivity), loading and material properties of the reinforced concrete frames as
well as the concrete cover of the member sections.
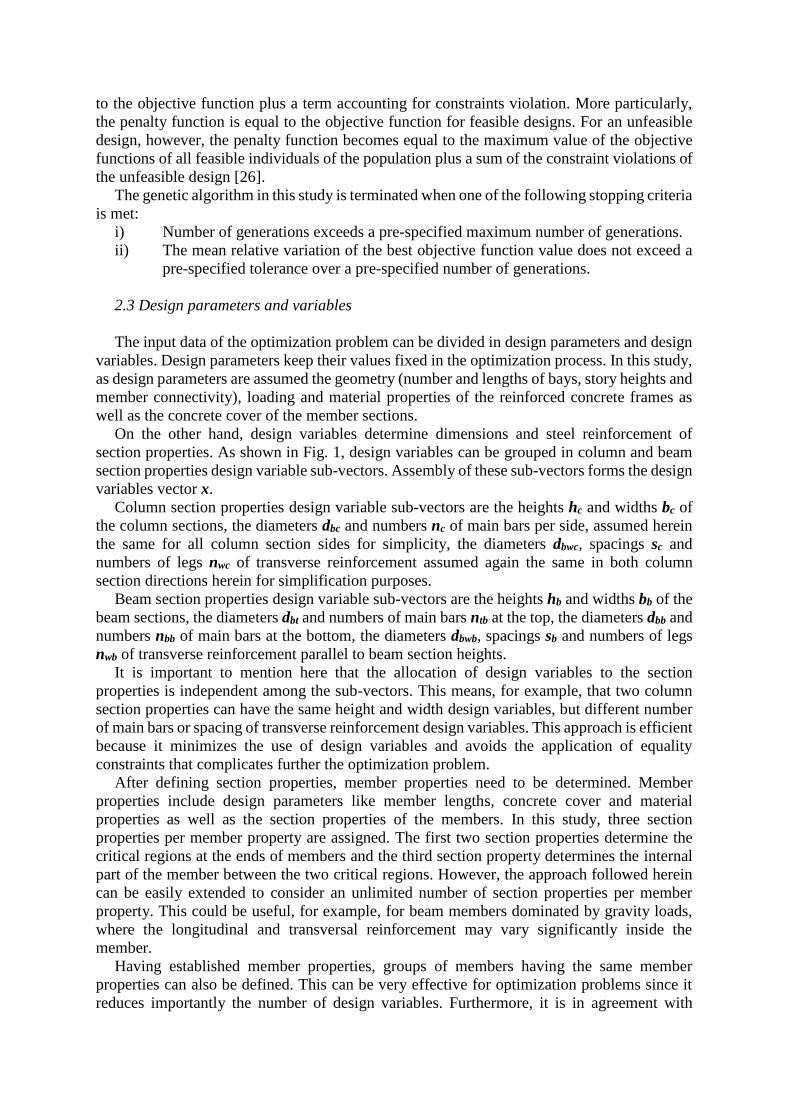
On the other hand, design variables determine dimensions and steel reinforcement of
section properties. As shown in Fig. 1, design variables can be grouped in column and beam
section properties design variable sub-vectors. Assembly of these sub-vectors forms the design
variables vector x.
Column section properties design variable sub-vectors are the heights hc and widths bc of
the column sections, the diameters dbc and numbers nc of main bars per side, assumed herein
the same for all column section sides for simplicity, the diameters dbwc, spacings sc and
numbers of legs nwc of transverse reinforcement assumed again the same in both column
section directions herein for simplification purposes.
Beam section properties design variable sub-vectors are the heights hb and widths bb of the
beam sections, the diameters dbt and numbers of main bars ntb at the top, the diameters dbb and
numbers nbb of main bars at the bottom, the diameters dbwb, spacings sb and numbers of legs
nwb of transverse reinforcement parallel to beam section heights.
It is important to mention here that the allocation of design variables to the section
properties is independent among the sub-vectors. This means, for example, that two column
section properties can have the same height and width design variables, but different number
of main bars or spacing of transverse reinforcement design variables. This approach is efficient
because it minimizes the use of design variables and avoids the application of equality
constraints that complicates further the optimization problem.
After defining section properties, member properties need to be determined. Member
properties include design parameters like member lengths, concrete cover and material
properties as well as the section properties of the members. In this study, three section
properties per member property are assigned. The first two section properties determine the
critical regions at the ends of members and the third section property determines the internal
part of the member between the two critical regions. However, the approach followed herein
can be easily extended to consider an unlimited number of section properties per member
property. This could be useful, for example, for beam members dominated by gravity loads,
where the longitudinal and transversal reinforcement may vary significantly inside the
member.
Having established member properties, groups of members having the same member
properties can also be defined. This can be very effective for optimization problems since it
reduces importantly the number of design variables. Furthermore, it is in agreement with

typical construction practice, where several members are constructed in the same way for
improving the efficiency of construction. On the other hand, this approach leads to increase of
the material cost since some members are over-designed. Thus, a balance between cost and
simplicity of construction is necessary.
Fig. 1: Design variables: a) column sections; b) beam sections
2.4 Objective function
In this study, the objective function C(x) is the material cost of the reinforced concrete
frames. The material cost consists of the cost of concrete, steel and the cost of the formworks
of beam and column members. Hence, the total construction cost is taken as
𝐶(𝑥) = ∑ 𝐶𝑐𝑖𝑛𝑐𝑜𝑙𝑠
𝑖=1 + ∑ 𝐶𝑏𝑖𝑛𝑏𝑒𝑎𝑚𝑠
𝑖=1 (2)
Where ncols and nbeams are the numbers of column and beam members and 𝐶𝑐𝑖 and 𝐶𝑏
𝑖 are the
costs of the ith column and beam member respectively. The cost of the ith column and/or beam
member can be determined as:
𝐶𝑚𝑖 = 𝐶𝑐𝑚
𝑖 + 𝐶𝑠𝑚𝑖 + 𝐶𝑓𝑚
𝑖 (3)
Where m stands for column or beam (m=c or m=b respectively), 𝐶𝑐𝑚𝑖 is the cost of concrete,
𝐶𝑠𝑚𝑖 the cost of reinforcing steel and 𝐶𝑓𝑚
𝑖 is the cost of formwork. The cost of concrete is
calculated by
𝐶𝑐𝑚𝑖 = ℎ𝑚
𝑖 ⋅ 𝑏𝑚𝑖 ⋅ 𝐿𝑚
𝑖 ⋅ 𝐶𝑐𝑢 (4)
Where 𝐿𝑚𝑖 is the member length and 𝐶𝑐𝑢 is the cost of concrete per unit volume (Euros/m3).
Furthermore, the cost of reinforcing steel is given by:
𝐶𝑠𝑚𝑖 = ∑ [(𝐴𝑠𝑗
𝑖 ⋅ 𝐿𝑗𝑖 ) + (𝑉𝑠𝑤𝑗
𝑖 ⋅ 𝐿𝑤𝑗𝑖 /𝑠𝑤𝑗
𝑖 )]3𝑗=1 ⋅ 𝐶𝑠𝑢 ⋅ 𝜌𝑠 (5)
Where 𝐴𝑠𝑗𝑖 and 𝐿𝑗
𝑖 are the area and development lengths of main reinforcing bars of section
j of member i. It is noted that the lengths 𝐿𝑗𝑖 of section main bars, in the case of beam members,
can be different for the top and bottom main reinforcing bars. For simplicity, it is assumed in
this study that the lengths 𝐿𝑗𝑖 are equal to 25% of member length for the two end sections and
50% of member length for the internal section.
nbb dbb bars bc
hc
nc dbc bars
nwc dbwc links
@ sc centers
nc dbc bars
nwc dbwc links
@ sc centers
hb
ntb dbt bars
nwb dbwb links
@ sb centers
bb

In addition, 𝑉𝑠𝑤𝑗𝑖 , 𝐿𝑤𝑗
𝑖 and 𝑠𝑤𝑗𝑖 are the volume, development length and spacing of
transverse reinforcement of section j of member i. 𝑉𝑠𝑤𝑗𝑖 is calculated by multiplying the total
length of transverse reinforcement at section j by the area of one shear reinforcement leg. 𝐶𝑠𝑢is
the cost of steel per unit mass (Euros/kg) and 𝜌𝑠is reinforcing steel density in kg/m3. 𝐿𝑤𝑗𝑖 is
taken equal to the lengths of the critical end regions for the two end sections and equal to
length of the member outside the critical end regions for the internal section.
The cost of formwork of each member is determined by the following relationship, where
𝐶𝑓𝑢 is the cost of formwork per unit area (Euros/m2).
𝐶𝑓𝑚𝑖 = 2 ⋅ (ℎ𝑚
𝑖 + 𝑏𝑚𝑖 ) ⋅ 𝐿𝑚
𝑖 ⋅ 𝐶𝑓𝑢 (6)
In the rest of this study, the following unit costs are assumed: 𝐶𝑐𝑢=100Euros/m3,
𝐶𝑠𝑢=1Euro/kg and 𝐶𝑓𝑢=15Euros/m2.
2.5 Design constraints
In seismic design of reinforced concrete frames, constraints gj(x) are either related to
engineering demand parameters (EDPs) (e.g. forces, displacements, rotations, drifts, etc.) or
to detailing rules set by design codes and construction practice. In the first case, an EDP must
remain below a limit value EDPcap. This type of constraints can be written in the following
normalized form
𝐸𝐷𝑃 ≤ 𝐸𝐷𝑃𝑐𝑎𝑝 →𝐸𝐷𝑃
𝐸𝐷𝑃𝑐𝑎𝑝− 1 ≤ 0 (7)
Regarding detailing requirements, the constraints can be expressed in terms of structural
design parameters SDPs. It is noted that a SDP can be a design variable itself (e.g. column
height, main bar diameter) or a simple function of the design variables like the volumetric
ratios of steel reinforcement.
In some cases, it is required that a SDP remains lower than or equal to a maximum value
SDPmax. This category of constraints is written in the following general form:
𝑆𝐷𝑃 ≤ 𝑆𝐷𝑃𝑚𝑎𝑥 →𝑆𝐷𝑃
𝑆𝐷𝑃𝑚𝑎𝑥− 1 ≤ 0 (8)
In the other cases, it is required that a SDP is greater than or equal to a minimum value
SDPmin. The latter family of constraints is expressed in the normalized form shown below:
𝑆𝐷𝑃 ≥ 𝑆𝐷𝑃𝑚𝑖𝑛 →𝑆𝐷𝑃𝑚𝑖𝑛
𝑆𝐷𝑃− 1 ≤ 0 (9)
In the following sections, the constraints set by the different design guidelines will be
described in more detail. In addition to them, constraints related to standard construction
practice should also be applied. Examples of these constraints are that the width of a beam
cannot be greater than the width of the adjacent column; section dimensions of the upper parts
of a column cannot be greater than section dimensions of the lower parts of the same column;
number of legs of shear reinforcement cannot be greater than the number of longitudinal bars
and others.

3 Optimum design of RC frames according to EC2
Prior to designing for seismic actions, RC frames must be designed to resist dead and live
loads. Eurocode 2 [27] provisions are applied in this study for designing against static loads.
EC2 provisions consist of a number of detailing rules and a number of requirements related to
EDPs.
Regarding detailing rules, design constraints of minimum volumetric ratio of longitudinal
reinforcement, minimum diameter of longitudinal and transverse reinforcement, minimum
distance between two longitudinal steel bars and minimum volumetric ratio of transverse
reinforcement are expressed in the general form of Eq. (9). On the other hand, constraints of
the maximum volumetric ratio of longitudinal reinforcement, maximum spacing of shear
reinforcement and maximum distance of unrestrained next to restrained main bars of columns
are written in the form of Eq. (8).
For the ULS, EDPs are member forces (moments and shear forces) derived by linear elastic
analysis for the following load combination, where Gk represents the characteristic value of
the permanent action and Qk stands for the characteristic value of the variable action.
𝑆𝑑 = 1.35𝐺𝑘 + 1.50𝑄𝑘 (10)
EDPs constraints are written in the general form of Eq. (7), where capacities are derived by
using characteristic material strengths divided by partial safety factors equal to γc=1.50 for
concrete and γs=1.15 for reinforcing steel. For bending moments of column members, moment
capacities are calculated for the axial load demand of the load combination under examination.
For beam deflections, the limiting span to depth ratio approach is used herein ensuring that
deflections are limited to span/250. Moreover, crack control is achieved by limiting maximum
bar size or spacing.
4 Optimum seismic design of RC frames according to EC8
In seismic design of reinforced concrete frames according to Eurocode 8 (EC8), structural
members are designed to meet the Life Safety (LS) performance level for a ‘rare’ earthquake
event with 10% probability of exceedance in 50 years (10/50) for ordinary structures. Collapse
Prevention (CP) limit state is later accomplished by a number of capacity design principles.
Seismic actions are defined through national zonation maps in terms of peak ground
accelerations on rock agR.
Seismic design according to EC8 can be performed either without provisions for energy
dissipation and ductility (Ductility Class Low – DCL) or with provisions for energy dissipation
and ductility (Ductility Classes Medium and High – DCM and DCH). DCM and DCH differ
in the levels of lateral strength and allowable inelastic response. DCH allows for further
reductions in seismic forces, but requires more demanding prescriptive rules for increasing
ductility capacities.
For DCL, all seismic EDPs are calculated from the seismic load combination shown below,
where design seismic actions Ed are calculated by the design response spectrum that is derived
from the elastic response spectrum reduced by the behaviour factor q. 𝜓2 is the quasi-
permanent load combination coefficient of the variable action. Reference analysis method of
EC8 is the modal response spectrum analysis. However, for regular buildings with unimportant
higher modes the linear elastic lateral force method can also be applied.
𝑆𝐸𝑑 = 𝐺𝑘 + 𝜓2 · 𝑄𝑘 + 𝐸𝑑 (11)

For DCM and DCH, first the dissipative zones of structural members (typically located at
the ends) are designed in bending under the seismic design load combination. Next, capacity
design principles are forced to ensure ductile structural response. In particular, column sections
are designed in bending following the strong column – weak beam capacity rule to prevent
soft storey failure mechanisms. Moreover, capacity design in shear is applied to beam and
column members to preclude brittle shear failures.
In addition to the above, RC frames are checked for a ‘frequent’ earthquake with 10%
probability of exceedance in 10 years (10/10) to satisfy the Damage Limitation (DL) limit
state. Checks verify that interstorey drifts developed for the ‘frequent’ earthquake are less than
limit values depending on the type of non-structural elements (e.g. 1% for non-structural
elements that don’t interfere with structural response).
P-delta (2nd order) effects are considered at the i storey level with calculating ratio 𝜃𝑖from
Eq. (12). In this equation, 𝑁𝑡𝑜𝑡𝑖 and 𝑉𝑡𝑜𝑡
𝑖 are the total vertical and shear load at the storey
respectively, ∆𝛿𝑖is interstorey drift and 𝐻𝑖is storey height. It is required that 𝜃𝑖never exceeds
0.2. Furthermore, if 𝜃𝑖exceeds 0.1 then 2nd order effects are taken into account by multiplying
1st order effects by the magnification factor 1/(1-𝜃𝑖).
𝜃𝑖 =𝑁𝑡𝑜𝑡
𝑖 ⋅∆𝛿𝑖
𝑉𝑡𝑜𝑡𝑖 ⋅𝐻𝑖 (12)
All previous requirements are regarded as EDPs constraints and are included in the
optimization problem in the general form of Eq. (7). The EDPs are member bending moments
and shear forces, interstorey drifts and 𝜃𝑖 ratios.
Apart from EDPs constraints and EC2 detailing rules, DCM and DCH necessitate
additional or stricter detailing rules in the critical regions to accommodate local ductility
demands. The additional column constraints of minimum cross-section sides, minimum
volumetric ratio of longitudinal reinforcement, minimum diameter of transverse
reinforcement, minimum number of bars per side and minimum confinement of transverse
reinforcement in critical regions are expressed in the general form of Eq. (9). The same holds
for the additional beam constraints in critical regions such as minimum volumetric ratio of
longitudinal reinforcement, minimum longitudinal bar diameter for DCH, minimum bottom
reinforcement at the supports and minimum longitudinal bar diameters crossing interior or
exterior joints.
On the other hand, the more demanding column constraints in critical regions for maximum
spacing between restrained main bars and spacing of transverse reinforcement are formulated
in accordance with Eq. (8). The same holds for the beam constraints of maximum longitudinal
reinforcement volumetric ratio and spacing of transverse reinforcement in the locations of the
critical regions.
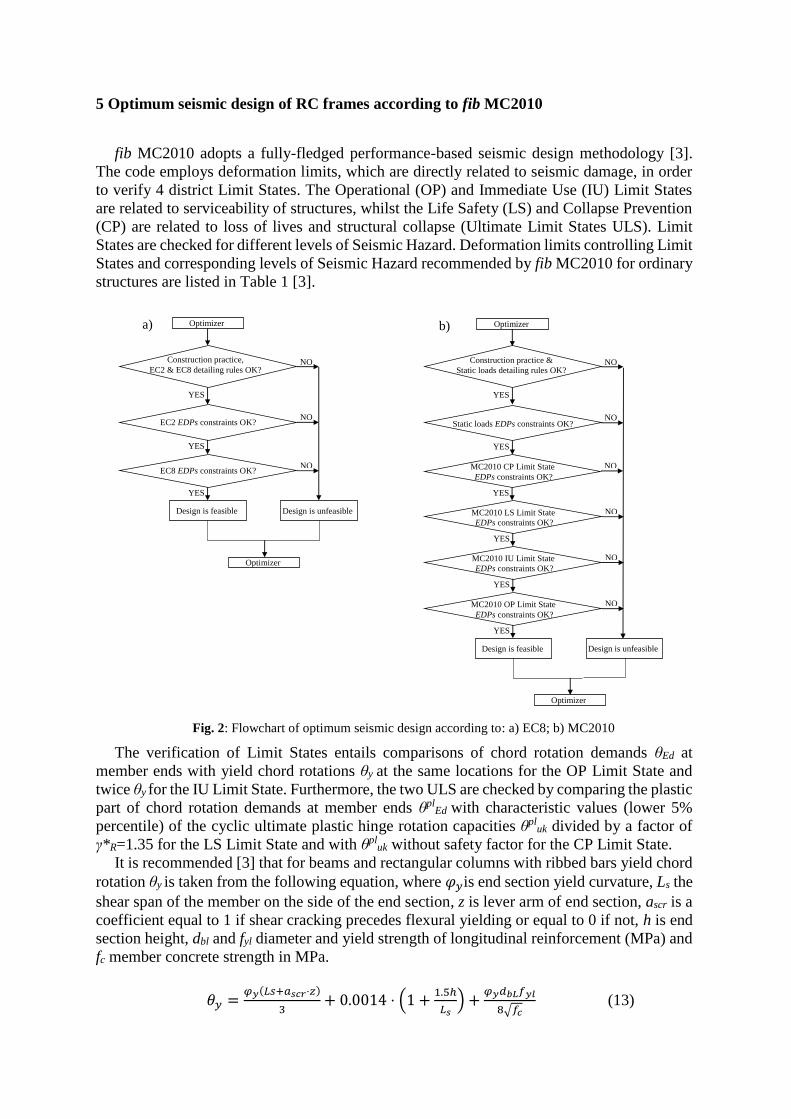
Fig. 2a presents the flowchart of the optimization solution adopted in this study for seismic
design of RC frames in accordance with EC8 provisions. It can be seen that design candidate
solutions are first checked for construction practice constraints and detailing constraints
according to EC2 and EC8 provisions. Detailing constraints are examined first because they
require less computational effort. If detailing constraints are not satisfied then EDPs
constraints are not checked to avoid the relatively high computational cost related to finite
element analyses of RC frames. In addition, if the candidate solutions are not adequate against
static loads in accordance with EC2 principles they are not examined for seismic loads to avoid
unnecessary analyses.
5 Optimum seismic design of RC frames according to fib MC2010
fib MC2010 adopts a fully-fledged performance-based seismic design methodology [3].
The code employs deformation limits, which are directly related to seismic damage, in order
to verify 4 district Limit States. The Operational (OP) and Immediate Use (IU) Limit States
are related to serviceability of structures, whilst the Life Safety (LS) and Collapse Prevention
(CP) are related to loss of lives and structural collapse (Ultimate Limit States ULS). Limit
States are checked for different levels of Seismic Hazard. Deformation limits controlling Limit
States and corresponding levels of Seismic Hazard recommended by fib MC2010 for ordinary
structures are listed in Table 1 [3].
Fig. 2: Flowchart of optimum seismic design according to: a) EC8; b) MC2010
The verification of Limit States entails comparisons of chord rotation demands θEd at
member ends with yield chord rotations θy at the same locations for the OP Limit State and
twice θy for the IU Limit State. Furthermore, the two ULS are checked by comparing the plastic
part of chord rotation demands at member ends θplEd with characteristic values (lower 5%
percentile) of the cyclic ultimate plastic hinge rotation capacities θpluk divided by a factor of
γ*R=1.35 for the LS Limit State and with θpluk without safety factor for the CP Limit State.
It is recommended [3] that for beams and rectangular columns with ribbed bars yield chord
rotation θy is taken from the following equation, where 𝜑𝑦is end section yield curvature, Ls the
shear span of the member on the side of the end section, z is lever arm of end section, ascr is a
coefficient equal to 1 if shear cracking precedes flexural yielding or equal to 0 if not, h is end
section height, dbl and fyl diameter and yield strength of longitudinal reinforcement (MPa) and
fc member concrete strength in MPa.
𝜃𝑦 =𝜑𝑦(𝐿𝑠+𝑎𝑠𝑐𝑟⋅𝑧)
3+ 0.0014 ⋅ (1 +
1.5ℎ
𝐿𝑠) +
𝜑𝑦𝑑𝑏𝐿𝑓𝑦𝑙
8√𝑓𝑐 (13)
Optimizer
Design is feasible
NO
YES
Construction practice,
EC2 & EC8 detailing rules OK?
NO
YES
EC2 EDPs constraints OK?
NO
YES
EC8 EDPs constraints OK?
Design is unfeasible
Optimizer
Optimizer
Design is feasible
NO
YES
Construction practice &
Static loads detailing rules OK?
NO
YES
Static loads EDPs constraints OK?
NO
YES
MC2010 CP Limit State
EDPs constraints OK?
Design is unfeasible
Optimizer
NO
YES
MC2010 LS Limit State
EDPs constraints OK?
NO
YES
MC2010 IU Limit State
EDPs constraints OK?
NO
YES
MC2010 OP Limit State
EDPs constraints OK?
a) b)

Furthermore, characteristic ultimate plastic hinge rotation capacity θplu,k is derived by the
respective mean value θplum divided by safety factor γRd. When θpl
u,m is calculated by the
following empirical relationship γRd can be taken equal to 1.75.
𝜃𝑢𝑚𝑝𝑙 = 0.0143 ⋅ 0.25𝑣 ⋅ 𝑓𝑐
0.2 ⋅ (max(0.01;𝜔2)
max(0.01;𝜔1))
0.3
⋅ (min (9;𝐿𝑠
ℎ))
0.35
⋅ 25(
𝑎𝜌𝑤𝑓𝑦𝑤
𝑓𝑐) (14)
In Eq. (14), 𝜔1 and 𝜔2 are mechanical ratios of reinforcement in tension and compression
zone respectively, 𝑣 is normalized axial load ratio, 𝑎 is confinement effectiveness factor and
𝜌𝑤and 𝑓𝑦𝑤are volumetric ratio and yield strength of transverse reinforcement. It is noted that
Eq. (14) is recommended for rectangular beams and columns with ductile steel reinforcement
and without diagonal reinforcement.
In addition to chord rotation checks, brittle shear failures are checked in terms of internal
shear force demands VEd and design shear force capacities VRd. VRd outside plastic hinge
regions is calculated as for static loadings. Inside plastic hinge regions, fib MC2010 specifies
a strut inclination of 45o when plastic rotation θpl exceeds 2·θy and 21.8o for elastic response
(θpl=0). Interpolation is allowed for intermediate values of θpl.
The reference analysis method of fib MC2010 is nonlinear response history analysis with
step-by-step integration of motion equations in the time domain. The finite element model
applied should use realistic estimates of the effective elastic stiffness of concrete members
EIeff. It is recommended in MC2010 that EIeff of concrete members is taken by the following
relationship, where My represents member end section yield moment and the other parameters
have been defined previously.
𝐸𝐼𝑒𝑓𝑓 =𝑀𝑦𝐿𝑠
3𝜃𝑦 (15)
Lumped plasticity finite elements with bilinear moment-rotation hysteretic models and
realistic rules for stiffness degradation during unloading and reloading may be employed to
model inelastic response of reinforced concrete members.
It is worth noting that when conducting nonlinear analysis both types of seismic demands
(i.e. deformations and forces) are obtained directly by the analytical solution without
additional considerations for brittle modes of failure (i.e. capacity design principles).
It is also important to clarify that no additional prescriptive rules, like detailing rules set by
EC8 for DCM and DCH, need to be applied when designing in accordance with MC2010 apart
from the detailing rules required for designing against static loads.
In MC2010, seismic actions are represented by acceleration time-histories of the ground
motions. At least seven ground motions are required to use average response values. All
acceleration time histories should be scaled such that their elastic response spectrum is not
lower than 90% of the target response spectrum for periods ranging between 0.2·T to 2·T,
where T is the fundamental period of the structure. As it will be shown later in this study, this
requirement set by MC2010 can be very onerous and may lead to important increases in the
structural cost. It is reminded that EC8 specifies that the mean spectrum of the set of ground
motions and not all spectra shouldn’t be less than 90% of the target response spectrum in the
same range of periods.
It is also noted that prior to designing, T is not known and cannot be estimated with accuracy
because it depends on steel reinforcement which affects members’ yield moments My and
consequently effective elastic stiffness EIeff as defined in Eq. (15). Hence, a post-design check
is required to verify that the set of ground motions satisfies the selection criteria of MC2010
based on the actual T of the design solution.

Table 1: Limit States, Seismic Hazard levels and Deformation Limits recommended by fib MC2010 for
ordinary structures
Limit State Seismic Hazard Deformation Limit
Operational (OP) Frequent with 70% probability of
exceedance in 50 years (70/50) Mean value of θy
Immediate Use (IU) Occasional with 40% probability of
exceedance in 50 years (40/50) Mean value of θy may be exceeded by a
factor of 2.0
Life Safety (LS) Rare with 10% probability of
exceedance in 50 years (10/50) Safety factor γ*R of 1.35 against θpl
u,k
Collapse Prevention (CP) Very rare with 2% probability of
exceedance in 50 years (2/50) θpl
u,k capacity may be reached (γ*R =1)
Fig. 2b presents the optimum design methodology adopted in this study for seismic design
of RC frames in accordance with MC2010. Initially, the design solutions are examined for
construction and static loads detailing rules and EDPs. This is done in a manner similar to
optimum design according to EC2. These constraints are checked first because they require
significantly less computational effort than the time consuming nonlinear response history
analyses. Later, the EDPs are examined successively for each Limit State of MC2010. If one
Limit State is not satisfied then the following ones are not examined to avoid unnecessary
response history analyses. All EDPs constraints are written in the general form of Eq. (7).
Even with this approach, it is clear that MC2010 requires a large number of inelastic
response history analyses to be conducted for each design solution. This increases grossly the
computational cost of the optimization task, where a significant number of trial designs need
to be examined in order to obtain the optimum solution.
Before closing this section, it is mentioned that no specifications of the MC2010 are
provided regarding serviceability checks of non-structural components as well as some
detailing rules concerning for example the length of the critical regions, where enhanced
ductility demands are expected. To fill this gap in this study, serviceability checks of non-
structural components are conducted according to EC8 recommendations and critical end
region lengths are calculated in accordance with EC8 DCM specifications.
6 Optimum seismic design of RC frames applications
In this section, applications of the optimum seismic design methodologies described
previously to RC plane frames are presented. In particular, a simple portal frame and a concrete
frame with 4 storeys and 2 bays are examined. The buildings are of ordinary importance and
rest on soil class B according to the classification of EC8. The frames are designed for 0.16g,
0.24g and 0.36g peak ground acceleration values for the 10/50 seismic hazard level in order to
examine the influence of the level of seismicity (low, moderate and high respectively) on the
optimum seismic design solutions. The elastic (target) response spectrum with 5% damping of
EC8 determined for the previous specifications and 0.24g peak ground acceleration is shown
in Fig. 3.
Peak ground accelerations for the other seismic hazard levels of MC2010 objectives are
calculated by multiplying the 10/50 values by the importance factor γI given by the following
equation proposed in EC8-Part 1, where PL is the target probability of exceedance in 50 years
and PLR is the reference probability of exceedance in 50 years (=10%).
𝛾𝐼 = (𝑃𝐿
𝑃𝐿𝑅)
−1/3
(15)

The frames are designed following the provisions of EC8 for all three ductility classes (i.e.
DCL, DCM and DCH) and in accordance with MC2010. In the latter case and in order to
evaluate the influence of ground motions selection specifications, two different cases are
examined. In the first case, designated as THA, the frames are designed for a set of 7 scaled
ground motion records satisfying EC8-Part 1 recommendations as described in the previous
section. In the second case, designated as THB, the frames are designed for a set of 7 scaled
ground motion records satisfying MC2010 specifications. The goal here is to examine to which
extent the conservative specifications of MC2010 on the selection of ground motion records,
described in section 5, can influence the cost of the optimal design solutions with respect to
EC8 ground motion selection provisions.
Figure 3a presents the scaled and mean elastic spectra with 5% damping of the set of 7
ground motions selected and scaled following EC8 provisions. In this case, selection and
scaling was performed by employing computer program REXEL [28]. Because the
fundamental period of the structures is unknown prior to their design it was decided to match
the mean and target spectrum for periods between 0.1s and 4s in order to capture most possible
solutions. The selected ground motion records can be seen in Table 2. They are all recorded
on soil type B and have magnitude Mw>5.5. It is evident in Fig. 3a that the mean spectrum
follows very closely the target spectrum.
Fig. 3: Elastic spectra with 5% damping for ground motion sets selected and scaled in accordance with a)
EC8; b) MC2010
No computer tools exist for selecting record sets according to MC2010 guidelines. To serve
this goal, in this study, a simplified procedure is applied. All records of the European Strong
Motion Database [29] on soil type B with Mw>5.5 are scaled so that their scaled 5% damping
spectra are not less than 90% of the target spectrum in periods ranging between 0.1s and 4s.
The scaled spectra are later ranked in accordance with their “goodness-of-fit” to the target
spectrum as quantified by the normalized root-mean-square-error [30]. The first 7 ground
motions comprise the set of records used herein (Table 2). Figure 3b presents the scaled and
mean elastic spectra with 5% damping of the set of 7 ground motions selected and scaled
following MC2010. It can be seen that the mean spectrum importantly exceeds the target
spectrum leading to serious overestimation of seismic demands. This reflects the level of
conservatism adopted in MC2010 specifications.
For the optimum designs, it is assumed that section dimensions hc, bc, hb, bb take values
from the following discrete set: (0.25m; 0.30m; 0.40m; … ; 1.5m). Furthermore, longitudinal
bars dbc, dbb, and dbt are defined in the following discrete values set: (12mm; 16mm; 20mm;
25mm). Transversal bars dbwc, and dbwb take values from: (8mm; 10mm; 12mm). Transverse
reinforcement spacing sc and/or sb may take the following values: (0.1m; 0.15m; 0.20m; 0.25m;
0.30m). Finally, numbers of main bars nc, ntb, nbb and legs of shear reinforcement nwc and nwb
may take any integer value greater than one.
a) b)

Table 2: Unscaled ground motions selected based on EC8 and MC2010 provisions Records selected based on EC8
Earthquake Name Station Year
Epicentral
Distance
R (km)
Magnitude
Mw
PGA
(g) Direction
Kalamata ST163 1986 11 5.9 0.24 X
Montenegro (aftershock) ST77 1979 20 6.2 0.06 Y
Izmit ST859 1999 73 7.6 0.12 Y
South Iceland ST2484 2000 7 6.5 0.51 Y
Umbria Marche ST83 1997 23 6 0.08 X
Friuli (aftershock) ST24 1976 14 6 0.34 Y
Aigion ST1330 1995 43 6.5 0.03 Y
Records selected based on MC2010
Earthquake Name Station Year
Epicentral
Distance
R (km)
Magnitude
Mw
PGA
(g) Direction
Kalamata ST163 1986 10 5.9 0.24 X
Kalamata ST164 1986 11 5.9 0.21 X
South Iceland ST2484 2000 7 6.5 0.51 Y
Campano Lucano ST99 1980 33 6.9 0.10 X
South Iceland ST2482 2000 15 6.5 0.48 Y
Ano Losia ST1257 1999 18 6 0.09 Y
Friuli ST14 1976 42 6.5 0.09 Y
6.1 Portal frame
In this section, a simple portal reinforced concrete frame (Fig. 4a) is optimally designed in
accordance with the methodologies described previously. The span of the frame is 4m and the
height 3m. Concrete C25/30 and reinforcing steel B500C in accordance with EC2
specifications are used. Concrete cover is assumed to be 30mm. Vertical symmetric
concentrated loads are applied at the joints equal to 120.0kN for permanent and 80.0kN for
live loading. Storey mass for the seismic combination is 29.4t.
The frame consists of two columns C1 and C2 and one beam B1. Due to symmetry, it is
assumed that C1 and C2 have exactly the same sections and reinforcement, B1 has the same
top and bottom longitudinal reinforcement and member end sections have the same transverse
reinforcement. Furthermore, due to construction reasons, it is assumed that the longitudinal
reinforcement does not vary along beam and column members. However, end and intermediate
sections may have different transverse reinforcement spacing to account for the additional
design requirements in the critical end regions.
Following these observations, two column and two beam sections are used as shown in Fig.
4a. Sections 1 are used for member end zones and sections 2 for the rest of the element.
Sections 1 and 2 have exactly the same detailing apart from spacing of transverse
reinforcement. In total, 16 (8 for columns and 8 for the beam) independent design variables
are used in this problem.
The results presented in the following were obtained by running GA with populations of 75
individuals. Iterations were terminated when the mean relative variation of the best fitness
value was negligible for 100 generations. MATLAB-R2015a default options were used for
GA operations. Furthermore, a significant number of different-independent GA runs for each
design solution were conducted and the minimum cost obtained is reported herein.
Figure 4b presents optimization histories of the designs obtained by MC2010 methodology
for the THA ground motion set and the three design peak ground accelerations. It can be seen
that optimum cost increases as design accelerations increase.
Figure 5a compares optimum costs in Euros obtained by all seismic design methodologies
for the three design peak ground accelerations for the 10/50 seismic hazard level. It can be
seen that in all cases costs increase as design accelerations increase. Designs according to EC8
DCL and DCM yield similar costs for all design PGA values. On the other hand, DCH yields
significantly increased costs. This occurred because of the enhanced detailing rules of this
ductility class and the discrete design variable sets assumed in this study. It is also worth noting
that the optimum costs of DCH remain essentially the same for all design PGA values. This

shows the influence of detailing requirements on the final costs of reinforced concrete
structures.
Fig. 4: a) Examined portal frame; b) Optimization histories of designs obtained by MC2010 methodology
for THA ground motion set and three different design PGAs
It is also evident that designs obtained by the MC2010 for both ground motion sets (THA
and THB) drive to significantly reduced design costs for the low 0.16g and moderate 0.24g
design accelerations. Furthermore, the MC2010 design with THA motion set yields slightly
smaller cost than the EC8 designs for 0.36g. However, the same design methodology with the
THB motion set drives to significantly greater design costs than all EC8 designs obtained for
0.36g. The direct comparison of optimum costs obtained by MC2010 methodology for the
THA and THB ground motion sets shows the importance of the applied accelerograms set. For
0.16g PGA both solutions yield same optimum costs. This is because the design in this case is
controlled by minimum detailing requirements. However, for higher seismicity levels the cost
derived by selecting a ground motion data set in accordance with MC2010 provisions is
significantly higher than the one derived by the EC8-Part 1 compatible set of accelerograms.
Figure 5b shows percentile contributions of construction cost components to the total cost
obtained by the different design methodologies for all design PGAs. It can be seen that for the
0.16g designs according to MC2010 concrete and formwork dominate structural cost.
However, this changes as design PGA increases and for the 0.36g design for THB motion set
the steel contributes more to the total cost. It is also worth noting the increased contribution of
transverse steel for the DCH design with respect to the other two EC8 ductility classes.
Table 3 presents section dimensions, longitudinal reinforcement ratio ρl and ratio of
transverse steel parallel with the shear force ρw of the optimum solutions. It can be seen in this
table that the THA design solutions have always smaller ρl values than the DCL solutions (for
similar section sizes) and smaller, similar or even larger ρl values than the DCM solutions.
Furthermore, they have equal or larger ρw values than the DCL solutions and smaller ρw values
than the DCM solutions. It is also worth noting that the THA solutions have the same
transverse reinforcement ratios inside and outside the critical end zones. This is the case
because the provided transverse reinforcement is adequate to satisfy the rotation and shear
force constraints at the member ends and no additional detailing and confinement requirements
are set by MC2010 inside the critical end regions.
Figure 6 presents MC2010 checks of rotation and shear force constraints (Eq. 7) for all
Limit States as obtained by subjecting all 0.36g PGA optimum design solutions to the THA
ground motion set. Column sections are defined by the column member number (e.g. C1) and
a letter designating the location of the section in the member (i.e. B=bottom and T=top).
Similarly, beam sections are defined by the beam member number (e.g. B1) and a letter
designating the location of the section in the member (i.e. L=left and R=right). Limit States
are stated by the acronyms shown in Table 1.
B1 1
1
2
1
1
2
4m
3m
C1 C2
1 1 2 a) b)

Fig. 5: Optimum costs obtained by different design methodologies and design PGAs a) in Euros; b)
percentile contributions
Table 3: Section properties of optimum design solutions Members Columns Beams
Sections Section 1 Section 2 Section 1 Section 2
Property hc bc l w hc bc l w hb bb l w hb bb l w Units m m % % m m % % m m % % m m % %
0.16g
DCL 0.3 0.25 2.41 0.40 0.3 0.25 2.41 0.40 0.3 0.25 0.80 0.27 0.3 0.25 0.80 0.27
DCM 0.3 0.3 1.79 0.50 0.3 0.3 1.79 0.33 0.4 0.25 0.23 0.40 0.4 0.25 0.23 0.16
DCH 0.4 0.4 1.57 0.59 0.4 0.4 1.57 0.29 0.4 0.25 0.40 0.40 0.4 0.25 0.40 0.16
THA 0.3 0.25 0.60 0.40 0.3 0.25 0.60 0.40 0.3 0.25 0.30 0.27 0.3 0.25 0.30 0.27
THB 0.3 0.25 0.60 0.40 0.3 0.25 0.60 0.40 0.3 0.25 0.30 0.27 0.3 0.25 0.30 0.27
0.24g
DCL 0.4 0.25 1.81 0.40 0.4 0.25 1.81 0.40 0.4 0.25 0.63 0.16 0.4 0.25 0.63 0.16
DCM 0.4 0.3 1.34 0.50 0.4 0.3 1.34 0.33 0.4 0.25 0.34 0.40 0.4 0.25 0.34 0.16
DCH 0.4 0.4 1.57 0.59 0.4 0.4 1.57 0.29 0.4 0.25 0.40 0.40 0.4 0.25 0.40 0.16
THA 0.4 0.25 0.45 0.40 0.4 0.25 0.45 0.40 0.3 0.25 0.30 0.27 0.3 0.25 0.30 0.27
THB 0.4 0.25 1.26 0.40 0.4 0.25 1.26 0.27 0.3 0.25 0.80 0.27 0.3 0.25 0.80 0.27
0.36g
DCL 0.5 0.25 1.93 0.27 0.5 0.25 1.93 0.27 0.4 0.25 0.79 0.16 0.4 0.25 0.79 0.16
DCM 0.4 0.3 1.34 0.50 0.4 0.3 1.34 0.33 0.6 0.25 0.27 0.40 0.6 0.25 0.27 0.13
DCH 0.4 0.4 1.57 0.59 0.4 0.4 1.57 0.29 0.5 0.25 0.32 0.40 0.5 0.25 0.32 0.13
THA 0.5 0.25 1.81 0.40 0.5 0.25 1.81 0.40 0.4 0.25 0.34 0.16 0.4 0.25 0.34 0.16
THB 0.5 0.25 3.01 0.80 0.5 0.25 3.01 0.54 0.5 0.25 0.80 0.30 0.5 0.25 0.80 0.30
Fig. 6: MC2010 rotation and shear force constraints of beam and column section optimum solutions
obtained by different design methodologies for 0.36g design PGA.
It can be concluded that all design solutions perform rather well. DCM and DCH designs
do not satisfy beam rotation constraints for the OP Limit State. It is recalled that EC8 does not
a) b)
have any provisions for the OP Limit State. Furthermore, it can be seen that the MC2010
design for THA motion set marginally satisfies beam and column rotation constraints at the
OP Limit State and column rotation constraints at the CP Limit State. This shows that these
where the controlling (active) constraints of this design. It is also evident that MC2010 design
for THB motion satisfies all constraints with a high level of conservatism.
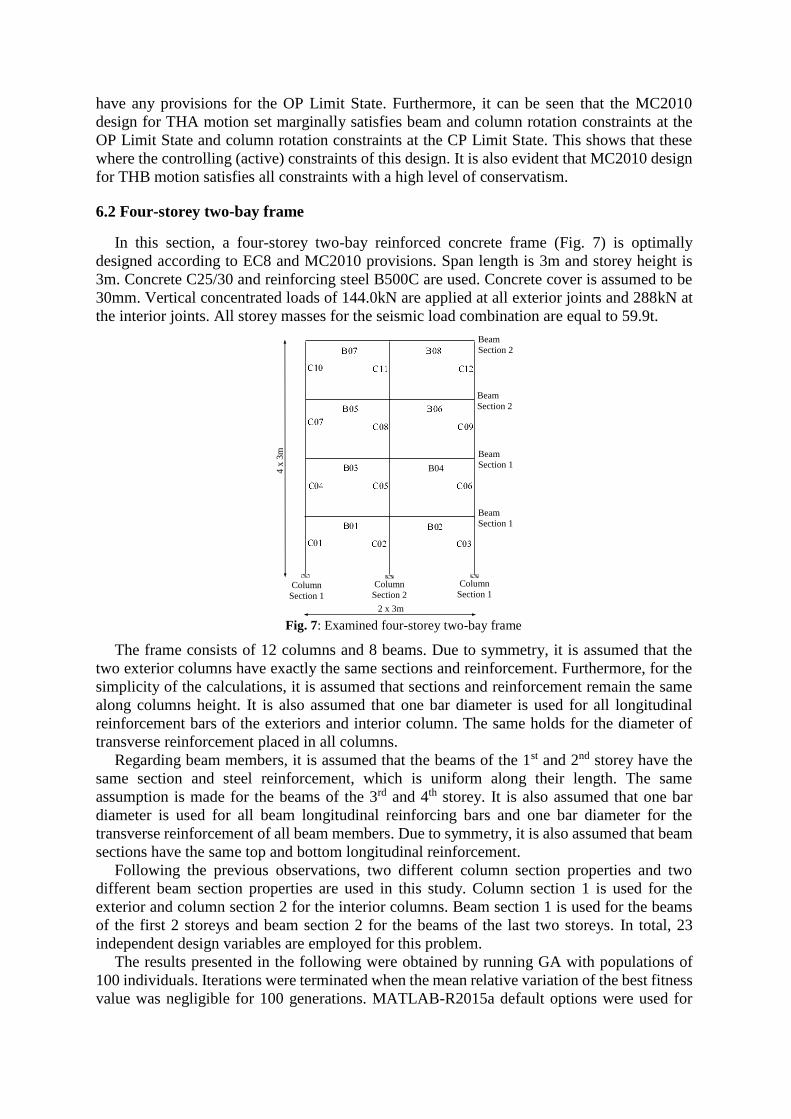
6.2 Four-storey two-bay frame
In this section, a four-storey two-bay reinforced concrete frame (Fig. 7) is optimally
designed according to EC8 and MC2010 provisions. Span length is 3m and storey height is
3m. Concrete C25/30 and reinforcing steel B500C are used. Concrete cover is assumed to be
30mm. Vertical concentrated loads of 144.0kN are applied at all exterior joints and 288kN at
the interior joints. All storey masses for the seismic load combination are equal to 59.9t.
Fig. 7: Examined four-storey two-bay frame
The frame consists of 12 columns and 8 beams. Due to symmetry, it is assumed that the
two exterior columns have exactly the same sections and reinforcement. Furthermore, for the
simplicity of the calculations, it is assumed that sections and reinforcement remain the same
along columns height. It is also assumed that one bar diameter is used for all longitudinal
reinforcement bars of the exteriors and interior column. The same holds for the diameter of
transverse reinforcement placed in all columns.
Regarding beam members, it is assumed that the beams of the 1st and 2nd storey have the
same section and steel reinforcement, which is uniform along their length. The same
assumption is made for the beams of the 3rd and 4th storey. It is also assumed that one bar
diameter is used for all beam longitudinal reinforcing bars and one bar diameter for the
transverse reinforcement of all beam members. Due to symmetry, it is also assumed that beam
sections have the same top and bottom longitudinal reinforcement.
Following the previous observations, two different column section properties and two
different beam section properties are used in this study. Column section 1 is used for the
exterior and column section 2 for the interior columns. Beam section 1 is used for the beams
of the first 2 storeys and beam section 2 for the beams of the last two storeys. In total, 23
independent design variables are employed for this problem.
The results presented in the following were obtained by running GA with populations of
100 individuals. Iterations were terminated when the mean relative variation of the best fitness
value was negligible for 100 generations. MATLAB-R2015a default options were used for
2 x 3m
4 x
3m
B04
Column
Section 1
Column
Section 1 Column
Section 2
Beam
Section 1
Beam
Section 1
Beam
Section 2
Beam
Section 2
GA operations. Furthermore, a significant number of different-independent GA runs for each
design solution were conducted and the minimum cost obtained is reported herein.
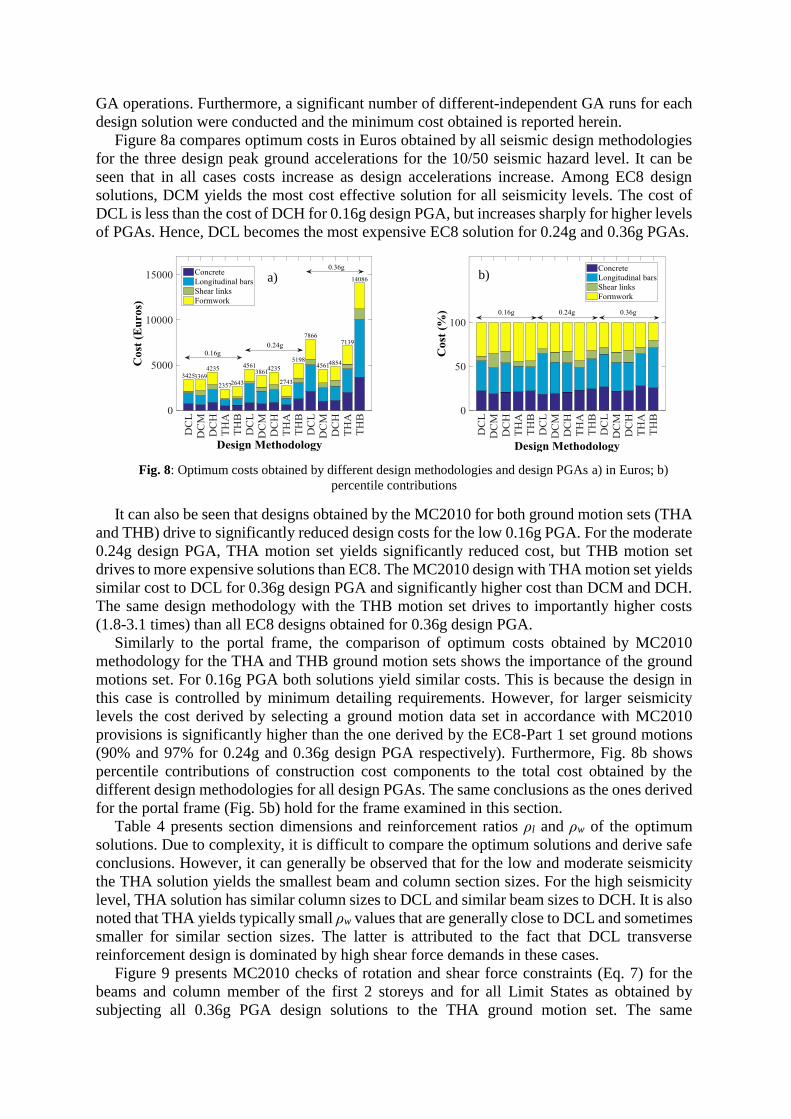
Figure 8a compares optimum costs in Euros obtained by all seismic design methodologies
for the three design peak ground accelerations for the 10/50 seismic hazard level. It can be
seen that in all cases costs increase as design accelerations increase. Among EC8 design
solutions, DCM yields the most cost effective solution for all seismicity levels. The cost of
DCL is less than the cost of DCH for 0.16g design PGA, but increases sharply for higher levels
of PGAs. Hence, DCL becomes the most expensive EC8 solution for 0.24g and 0.36g PGAs.
Fig. 8: Optimum costs obtained by different design methodologies and design PGAs a) in Euros; b)
percentile contributions
It can also be seen that designs obtained by the MC2010 for both ground motion sets (THA
and THB) drive to significantly reduced design costs for the low 0.16g PGA. For the moderate
0.24g design PGA, THA motion set yields significantly reduced cost, but THB motion set
drives to more expensive solutions than EC8. The MC2010 design with THA motion set yields
similar cost to DCL for 0.36g design PGA and significantly higher cost than DCM and DCH.
The same design methodology with the THB motion set drives to importantly higher costs
(1.8-3.1 times) than all EC8 designs obtained for 0.36g design PGA.
Similarly to the portal frame, the comparison of optimum costs obtained by MC2010
methodology for the THA and THB ground motion sets shows the importance of the ground
motions set. For 0.16g PGA both solutions yield similar costs. This is because the design in
this case is controlled by minimum detailing requirements. However, for larger seismicity
levels the cost derived by selecting a ground motion data set in accordance with MC2010
provisions is significantly higher than the one derived by the EC8-Part 1 set ground motions
(90% and 97% for 0.24g and 0.36g design PGA respectively). Furthermore, Fig. 8b shows
percentile contributions of construction cost components to the total cost obtained by the
different design methodologies for all design PGAs. The same conclusions as the ones derived
for the portal frame (Fig. 5b) hold for the frame examined in this section.
Table 4 presents section dimensions and reinforcement ratios ρl and ρw of the optimum
solutions. Due to complexity, it is difficult to compare the optimum solutions and derive safe
conclusions. However, it can generally be observed that for the low and moderate seismicity
the THA solution yields the smallest beam and column section sizes. For the high seismicity
level, THA solution has similar column sizes to DCL and similar beam sizes to DCH. It is also
noted that THA yields typically small ρw values that are generally close to DCL and sometimes
smaller for similar section sizes. The latter is attributed to the fact that DCL transverse
reinforcement design is dominated by high shear force demands in these cases.
Figure 9 presents MC2010 checks of rotation and shear force constraints (Eq. 7) for the
beams and column member of the first 2 storeys and for all Limit States as obtained by
subjecting all 0.36g PGA design solutions to the THA ground motion set. The same
a) b)

designations are used as in Fig. 6. It can be seen that EC8 solutions fail to satisfy a considerable
number of beam rotation constraints set by MC2010 and in one case (DCM) a column rotation
constraint. Regarding shear constraints, DCM and DCH provide safe designs due to shear
capacity design principles. However, DCL design solution violates in several cases shear force
constraints especially in the case of beam members. Regarding MC2010 design for the THA
ground motion set, it can be seen that the rotation constraints of beam members are in many
cases close to zero (still on the safe side), which means that they dominated this design
solution. MC2010 design for the THB motion set provides generally conservative results.
Fig. 9: MC2010 rotation and shear force constraints of beam and column sections of the first 2 storeys of the
optimum frame solutions obtained by different design methodologies for 0.36g design PGA.
Furthermore, Table 5 provides information regarding the fundamental period T and
maximum base shear Vmax of all the 0.36g design PGA optimum solutions. It can be seen that
the maximum Vmax and minimum T are developed for the DCL design and the opposite happens
for the DCH solution. It is noted that, for direct comparison reasons, all periods in Table 5 are
determined by using MC2010 specifications according to which member stiffness is
a)
b)
c)
d)
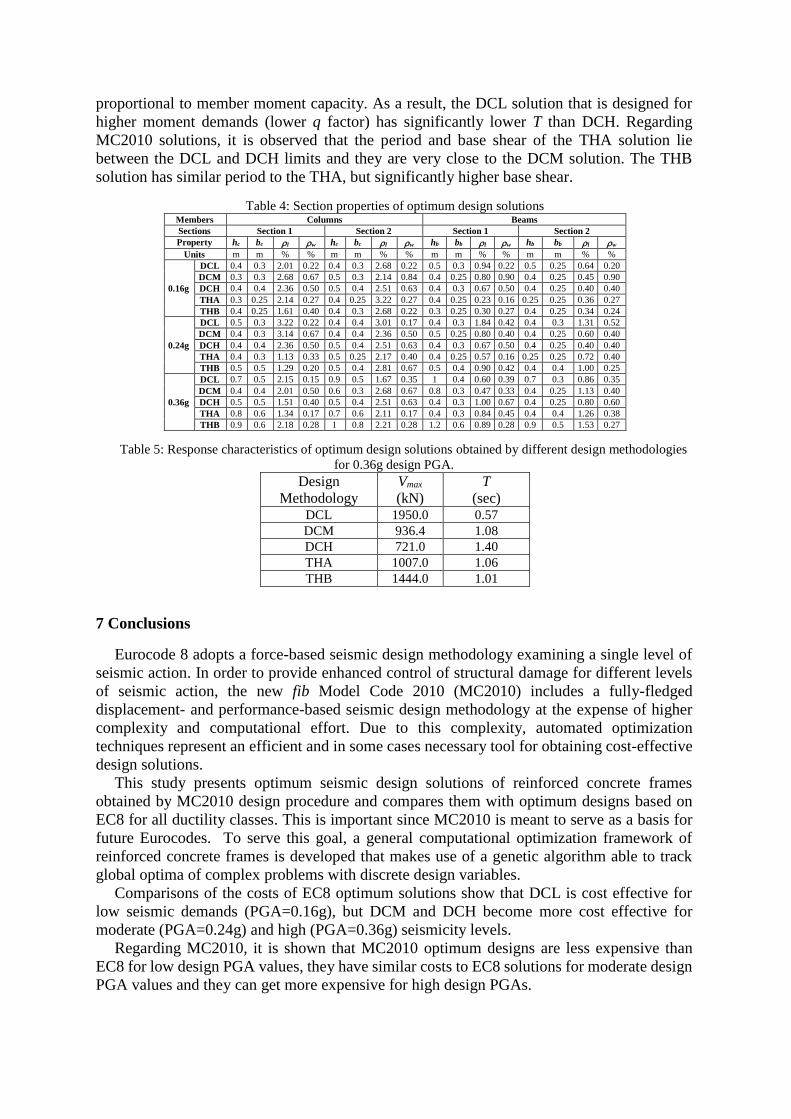
proportional to member moment capacity. As a result, the DCL solution that is designed for
higher moment demands (lower q factor) has significantly lower T than DCH. Regarding
MC2010 solutions, it is observed that the period and base shear of the THA solution lie
between the DCL and DCH limits and they are very close to the DCM solution. The THB
solution has similar period to the THA, but significantly higher base shear.
Table 4: Section properties of optimum design solutions Members Columns Beams
Sections Section 1 Section 2 Section 1 Section 2
Property hc bc l w hc bc l w hb bb l w hb bb l w Units m m % % m m % % m m % % m m % %
0.16g
DCL 0.4 0.3 2.01 0.22 0.4 0.3 2.68 0.22 0.5 0.3 0.94 0.22 0.5 0.25 0.64 0.20
DCM 0.3 0.3 2.68 0.67 0.5 0.3 2.14 0.84 0.4 0.25 0.80 0.90 0.4 0.25 0.45 0.90
DCH 0.4 0.4 2.36 0.50 0.5 0.4 2.51 0.63 0.4 0.3 0.67 0.50 0.4 0.25 0.40 0.40
THA 0.3 0.25 2.14 0.27 0.4 0.25 3.22 0.27 0.4 0.25 0.23 0.16 0.25 0.25 0.36 0.27
THB 0.4 0.25 1.61 0.40 0.4 0.3 2.68 0.22 0.3 0.25 0.30 0.27 0.4 0.25 0.34 0.24
0.24g
DCL 0.5 0.3 3.22 0.22 0.4 0.4 3.01 0.17 0.4 0.3 1.84 0.42 0.4 0.3 1.31 0.52
DCM 0.4 0.3 3.14 0.67 0.4 0.4 2.36 0.50 0.5 0.25 0.80 0.40 0.4 0.25 0.60 0.40
DCH 0.4 0.4 2.36 0.50 0.5 0.4 2.51 0.63 0.4 0.3 0.67 0.50 0.4 0.25 0.40 0.40
THA 0.4 0.3 1.13 0.33 0.5 0.25 2.17 0.40 0.4 0.25 0.57 0.16 0.25 0.25 0.72 0.40
THB 0.5 0.5 1.29 0.20 0.5 0.4 2.81 0.67 0.5 0.4 0.90 0.42 0.4 0.4 1.00 0.25
0.36g
DCL 0.7 0.5 2.15 0.15 0.9 0.5 1.67 0.35 1 0.4 0.60 0.39 0.7 0.3 0.86 0.35
DCM 0.4 0.4 2.01 0.50 0.6 0.3 2.68 0.67 0.8 0.3 0.47 0.33 0.4 0.25 1.13 0.40
DCH 0.5 0.5 1.51 0.40 0.5 0.4 2.51 0.63 0.4 0.3 1.00 0.67 0.4 0.25 0.80 0.60
THA 0.8 0.6 1.34 0.17 0.7 0.6 2.11 0.17 0.4 0.3 0.84 0.45 0.4 0.4 1.26 0.38
THB 0.9 0.6 2.18 0.28 1 0.8 2.21 0.28 1.2 0.6 0.89 0.28 0.9 0.5 1.53 0.27
Table 5: Response characteristics of optimum design solutions obtained by different design methodologies
for 0.36g design PGA.
Design
Methodology
Vmax
(kN)
T
(sec) DCL 1950.0 0.57
DCM 936.4 1.08
DCH 721.0 1.40
THA 1007.0 1.06
THB 1444.0 1.01
7 Conclusions
Eurocode 8 adopts a force-based seismic design methodology examining a single level of
seismic action. In order to provide enhanced control of structural damage for different levels
of seismic action, the new fib Model Code 2010 (MC2010) includes a fully-fledged
displacement- and performance-based seismic design methodology at the expense of higher
complexity and computational effort. Due to this complexity, automated optimization
techniques represent an efficient and in some cases necessary tool for obtaining cost-effective
design solutions.
This study presents optimum seismic design solutions of reinforced concrete frames
obtained by MC2010 design procedure and compares them with optimum designs based on
EC8 for all ductility classes. This is important since MC2010 is meant to serve as a basis for
future Eurocodes. To serve this goal, a general computational optimization framework of
reinforced concrete frames is developed that makes use of a genetic algorithm able to track
global optima of complex problems with discrete design variables.
Comparisons of the costs of EC8 optimum solutions show that DCL is cost effective for
low seismic demands (PGA=0.16g), but DCM and DCH become more cost effective for
moderate (PGA=0.24g) and high (PGA=0.36g) seismicity levels.
Regarding MC2010, it is shown that MC2010 optimum designs are less expensive than
EC8 for low design PGA values, they have similar costs to EC8 solutions for moderate design
PGA values and they can get more expensive for high design PGAs.

Examination of the rotation and shear force constraints set by MC2010 for all design
methodologies shows that in several cases the EC8 designs do not satisfy MC2010 constraints.
This observation shows that MC2010 provides better control of structural damage than EC8.
In this regard, the additional cost required in some cases by MC2010 for high seismicity
designs is justified by the fact that it provides enhanced control of structural damage. On the
other hand, the additional cost of EC8 solutions for low design PGAs can be seen as
unnecessary. Hence, it can be concluded that MC2010 ensures a more rational allocation of
structural costs.
Furthermore, it is observed that the optimum costs of MC2010 depend significantly on the
specifications applied for the selection of the ground motion set. If the set of accelerograms is
selected based on MC2010 conservative provisions, then optimum costs in high seismicity
regions can increase by more than 100% with respect to selecting ground motions according
to EC8 guidelines. It is also shown that the selection of ground motions according to MC2010
drives to over-conservative results in terms of EDPs. Therefore, the MC2010 specifications
for the selection of ground motions could be re-examined as they may undermine the ability
of the code to produce more cost-effective and sustainable structural solutions than EC8.
It is important to note that design according to MC2010 provisions involves high
computational effort. This is the case because a great number of time consuming nonlinear
response history analyses need to be conducted in order to verify that the design objectives are
met. This issue becomes more important in the framework of structural optimisation, where a
significant number of trial design solutions need to be examined in order to obtain the optimum
solution. Therefore, the use of alternative analysis methods like linear response history
analysis [3] or pushover analysis for the cases that they can provide reliable results needs to
be further explored.
Before closing, some open issues in the specifications of MC2010 are noted like the checks
of non-structural components and some detailing rules concerning the length of the critical
regions, where enhanced ductility capacity is required. These could be addressed in future
versions of the code.
References
[1] CEN. Eurocode 8: Design of structures for earthquake resistance. Part 1: General rules, seismic
actions and rules for buildings. European Standard EN 1998-1: Brussels, Belgium, 2004.
[2] Penelis G, Kappos A. Earthquake resistant concrete structures. E & FN SPON (Chapman &
Hall): London, 1997.
[3] Fardis MN. Performance- and displacemenent-based seismic design and assessment of concrete
structures in fib Model Code 2010. Structural Concrete 2013; 14(3): 215-229.
[4] Priestley MJN, Calvi GM, Kowalsky MJ. Direct displacement based seismic design of structures.
IUSS Press: Pavia, Italy, 2007.
[5] Fardis MN. Seismic design, assessment and retrofitting of concrete buildings. Springer:
Dordrecht, 2009.
[6] Priestley MJN, Kowalsky MJ. Direct-displacement based seismic design of concrete buildings.
Bulletin NZSEE 2000; 33(4): 421-444.
[7] Panagiotakos TB, Fardis MN. A displacement-based seismic design procedure of RC buildings
and comparison with EC8. Earthquake Engineering and Structural Dynamics 2001; 30(10):
1439-1462.
[8] Kappos AJ, Stefanidou S. A deformation-based seismic design method for 3D RC irregular
buildings using inelastic dynamic analysis. Bulletin of Earthquake Engineering 2010; 8(4): 875-
895.
[9] fib. Displacement-based seismic design of reinforced concrete buildings. fib Bulletin: Lausanne,
2003.
[10] FEMA. NEHRP guidelines for the seismic rehabilitation of buildings. FEMA-273: Washington
DC, 1997.

[11] fib. Model Code 2010. Bulletins Nos. 65/66, Federation Internationale du Beton: Lausanne, 2012.
[12] CEN. Eurocode 8: Design of structures for earthquake resistance. Part 3: Assessment and
retrofitting of structures. European Standard EN 1998-3: Brussels, Belgium, 2005.
[13] Arora JS. Introduction to optimum design. Elsevier: USA, 2012.
[14] Fragiadakis M, Lagaros ND. An overview to structural seismic design optimization frameworks.
Computers and Structures 2011; 89(11-12): 1155-1165.
[15] Gu Q, Barbato M, Conte JP, Gill PE, McKenna F. OpenSees-SNOPT framework for finite-
element-based optimization of structural and geotechnical systems. Journal of Structural
Engineering ASCE 2009; 138(6): 822-834.
[16] Sarma KC, Adeli H. Cost optimization of concrete structures. Journal of Structural Engineering
ASCE 1998; 124(5): 570-578.
[17] Kanagasundaram S, Karihaloo BL. Minimum-cost design of reinforced concrete structures.
Computers and Structures 1991; 41(6):1357-1364.
[18] Ganzerli S, Pantelides CP, Reaveley LD. Performance-based design using structural
optimization. Earthquake Engineering and Structural Dynamics 2000; 29(11): 1677-1690.
[19] Chan CM, Zou XK. Elastic and inelastic drift performance optimization for reinforced concrete
buildings under earthquake loads. Earthquake Engineering and Structural Dynamics 2004;
33(8): 929–950.
[20] Lagaros ND, Papadrakakis M. Seismic design of RC structures: A critical assessment in the
framework of multi-objective optimization. Earthquake Engineering and Structural Dynamics
2007; 36(12): 1623-1639.
[21] Fragiadakis M, Papadrakakis M. Performance-based optimum seismic design of reinforced
concrete structures. Earthquake Engineering and Structural Dynamics 2008; 37(6): 825-844.
[22] Gencturk B. Life-cycle cost assessment of RC and ECC frames using structural optimization.
Earthquake Engineering and Structural Dynamics 2013; 42(1): 61-79.
[23] Holland J. Adaptation in natural and artificial systems. University of Michigan Press: Ann
Arbor, MI, USA, 1975.
[24] MathWorks. MATLAB R2015a – Global Optimization Toolbox. The MathWorks Inc., Natick,
MA, USA; 2000
[25] Deep K, Singh KP, Kansal ML, Mohan C. A real coded genetic algorithm for solving integer and
mixed integer optimization problems. Applied Mathematics and Computation 2009; 212(2):
505–518.
[26] Deb K. An efficient constraint handling method for genetic algorithms. Computer Methods in
Applied Mechanics and Engineering 2000; 186(2–4): 311–338.
[27] CEN. Eurocode 2: Design of concrete structures. Part 1-1: General rules and rules for buildings.
European Standard EN 1992-1-1: Brussels, Belgium; 2000.
[28] Iervolino I, Galasso C, Cosenza E. REXEL: computer aided record selection for code-based
seismic structural analysis. Bulletin of Earthquake Engineering 2009; 8(2):339-362.
[29] Ambraseys NN, Douglas J, Rinaldis D, et al. Dissemination of European Strong Motion Data.
Vol. 2, Engineering and Physical Sciences Research Council, UK; 2004.
[30] Katsanos EI, Sextos AG. An integrated software environment for structure-specific earthquake
ground motion selection. Advances in Engineering Software 2013; 58: 70-85.

![RUNNING TIME ANALYSIS - GitHub Pages · Running time analysis of the iterative algorithm function F(n) Create an array fib[1..n] fib[1] = 1 fib[2] = 1 for i = 3 to n: fib[i] = fib[i-1]](https://img.pdfslide.us/doc/110x75/5e95ef9e965d8c2b7e7f1cbb/running-time-analysis-github-pages-running-time-analysis-of-the-iterative-algorithm.jpg)