Embed Size (px)
Citation preview
City, University of London Institutional Repository
Citation: Tsavdaridis, K. D., D'Mello, C. & Huo, B. Y. (2013). Experimental and computational study of the vertical shear behaviour of partially encased perforated steel beams. Engineering Structures, 56, pp. 805-822. doi: 10.1016/j.engstruct.2013.04.025
This is the accepted version of the paper.
This version of the publication may differ from the final published version.
Permanent repository link: http://openaccess.city.ac.uk/14017/
Link to published version: http://dx.doi.org/10.1016/j.engstruct.2013.04.025
Copyright and reuse: City Research Online aims to make research outputs of City, University of London available to a wider audience. Copyright and Moral Rights remain with the author(s) and/or copyright holders. URLs from City Research Online may be freely distributed and linked to.
City Research Online: http://openaccess.city.ac.uk/ [email protected]
City Research Online
EXPERIMENTAL AND COMPUTATIONAL STUDY OF THE VERTICAL SHEAR BEHAVIOUR OF PARTIALLY ENCASED PERFORATED STEEL BEAMS
Konstantinos Daniel Tsavdaridis1*
, Cedric D’Mello2
1School of Engineering and Mathematical Sciences, City University London, EC1V 0HB, UK, Office: C354, E-mail:
2 School of Engineering and Mathematical Sciences, City University London, EC1V 0HB, UK, Office: C173, E-mail:
1. Introduction
Structures such as high-rise buildings, benefit from shallow flooring systems since the floor-to-floor height
is a significant factor. The fact that a conventional composite beam is deeper than a reinforced concrete
beam is a strong disadvantage. Hence, in several situations it is important to reduce the overall depth of
the floor using partially encased composite beams [1]. These fully composite beams also have other
advantages such as increased fire resistance, load carrying capacity, local buckling stiffness and dramatic
increase in the bending stiffness compared to conventional beams. Moreover, a lower construction cost
compared to the reinforced concrete or the steel frame systems is achieved by using partially encased
composite beams eliminating the construction time and amount of formwork and scaffolding [2, 3, 4, 5].
Comparing conventional composite flooring systems and partially encased composite beams it is seen that
the concrete between flanges in the latter case increases the bending stiffness and reduces the vertical
displacements. Despite the advantages in terms of structural behaviour and cost, the behaviour of encased
perforated beam is not entirely understood yet.
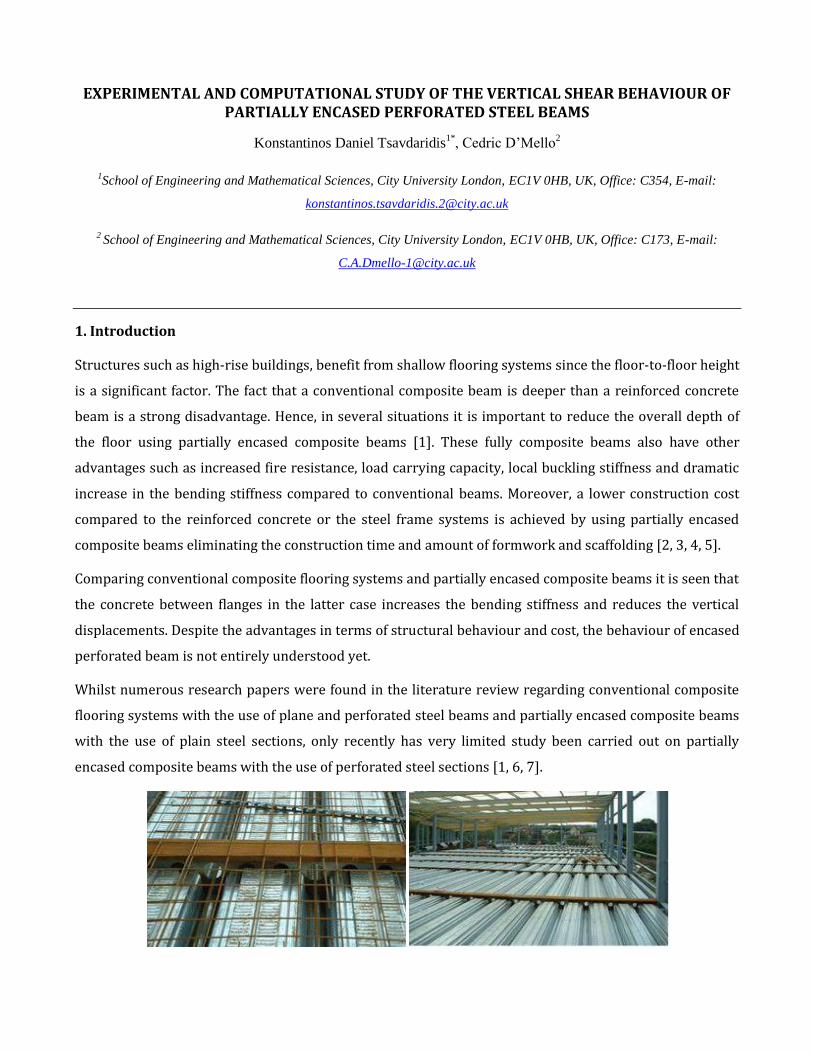
Whilst numerous research papers were found in the literature review regarding conventional composite
flooring systems with the use of plane and perforated steel beams and partially encased composite beams
with the use of plain steel sections, only recently has very limited study been carried out on partially
encased composite beams with the use of perforated steel sections [1, 6, 7].
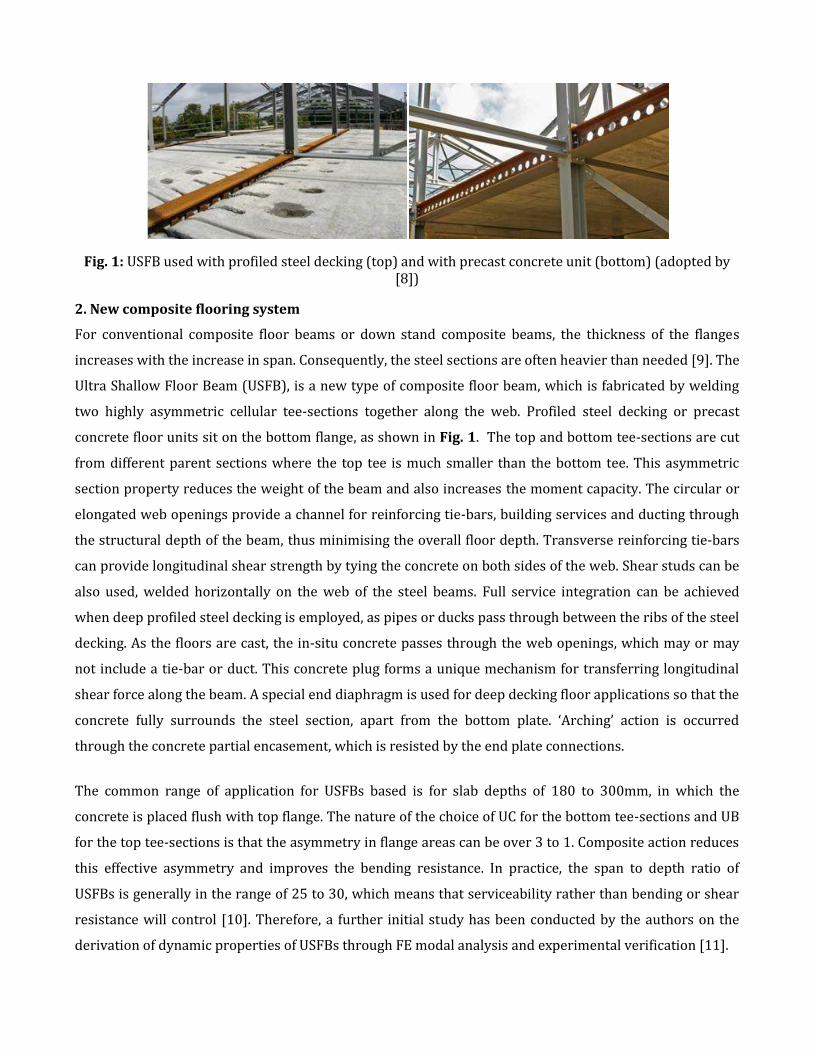
Fig. 1: USFB used with profiled steel decking (top) and with precast concrete unit (bottom) (adopted by [8])
2. New composite flooring system
For conventional composite floor beams or down stand composite beams, the thickness of the flanges
increases with the increase in span. Consequently, the steel sections are often heavier than needed [9]. The
Ultra Shallow Floor Beam (USFB), is a new type of composite floor beam, which is fabricated by welding
two highly asymmetric cellular tee-sections together along the web. Profiled steel decking or precast
concrete floor units sit on the bottom flange, as shown in Fig. 1. The top and bottom tee-sections are cut
from different parent sections where the top tee is much smaller than the bottom tee. This asymmetric
section property reduces the weight of the beam and also increases the moment capacity. The circular or
elongated web openings provide a channel for reinforcing tie-bars, building services and ducting through
the structural depth of the beam, thus minimising the overall floor depth. Transverse reinforcing tie-bars
can provide longitudinal shear strength by tying the concrete on both sides of the web. Shear studs can be
also used, welded horizontally on the web of the steel beams. Full service integration can be achieved
when deep profiled steel decking is employed, as pipes or ducks pass through between the ribs of the steel
decking. As the floors are cast, the in-situ concrete passes through the web openings, which may or may
not include a tie-bar or duct. This concrete plug forms a unique mechanism for transferring longitudinal
shear force along the beam. A special end diaphragm is used for deep decking floor applications so that the
concrete fully surrounds the steel section, apart from the bottom plate. ‘Arching’ action is occurred
through the concrete partial encasement, which is resisted by the end plate connections.
The common range of application for USFBs based is for slab depths of 180 to 300mm, in which the
concrete is placed flush with top flange. The nature of the choice of UC for the bottom tee-sections and UB
for the top tee-sections is that the asymmetry in flange areas can be over 3 to 1. Composite action reduces
this effective asymmetry and improves the bending resistance. In practice, the span to depth ratio of
USFBs is generally in the range of 25 to 30, which means that serviceability rather than bending or shear
resistance will control [10]. Therefore, a further initial study has been conducted by the authors on the
derivation of dynamic properties of USFBs through FE modal analysis and experimental verification [11].
3. Aim and objectives
The aim of this study is to investigate the contribution of concrete in perforated steel beams in resisting
the vertical shear when the concrete is cast between the flanges of the steel beam. It should be noted that
this experimental programme was intended to simulate a symmetric UB section without any mechanical
shear connectors. The percentage of the section enhancement and its additional shear capacity when the
web openings are in-filled with pure concrete was obtained. Consequently, the effect of the bond strength
of the interface between the steel and the concrete, as well as the bearing strength of the open web area
and the Vierendeel failure mechanism due to the confined concrete was explored in this research
programme.
The main task was to validate the new approach and develop an elaborate model so it could be used for
further studies such as vibration, dynamic analysis, etc. Hence, the sub-objectives of this research study
are listed as follows:
To demonstrate significant shear enhancement due to the concrete infill.
To provide a minimum concrete vertical shear contribution that can be applied in all cases of USFBs
based on the concrete encasement and the contact behaviour between the steel and the concrete.
To establish FE models which are capable of predicting the structural behaviour of simply supported
USFBs with large isolated circular web openings.
To examine both the load carrying capacities and the failure modes of the USFBs. Also, to study the
steel buckling behaviour, the concrete internal stresses (cracks), as well as the angles of the concrete
cracks, both experimentally and through the FE analyses.
To perform a sensitivity FE study based on both concrete and steel material properties and their
constitutive relationships.
To propose a simple design method of predicting the load carrying capacity of the particular steel-
concrete beam arrangement.
4. Experimental work
Four USFBs were tested in this research programme. These are directly comparable with other
experimental work conducted by the authors [12, 13]. Correspondingly, the web opening diameter, do, is
equal to 0.76h. For small web opening diameters, for instance 30% of the beams depth, it is easy to show
that a load path of 45o between flanges transfer the load across the web opening. However, for larger web
openings the load path is not so clear.
4.1 Test specimen and measurement devices
A UB305x165x40 with material physical properties shown in Table 1 was used. For precautionary
reasons it was decided to test all the beams at the 14th day of curing, aiming for between 25 to 30MPa (to
be no greater than 35MPa) concrete strength on the day of the test.
The load was applied through two hydraulic jacks and a spreader plate. The applied load and hence the
bending moments were obtained from the load cells connected to the jacks. High shear forces were
generated in the area of the web openings and so the existence of the concrete dramatically affected the
results.
To measure vertical deflection three dial gauges were placed under the tension steel flange and aligned
with the edge of the hole. Two dial gauges were applied at the high moment side (HMS) of each web
opening (Dial Gauge 1 and 3) and one dial gauge at mid-span of the test beams (Dial Gauge 2).
4.2 Test cubes procedure
In this research programme a desirable maximum compressive strength was required to determine the
possible section enhancement at low concrete strengths. The strength was determined from the 14th day
of curing to try and test at the minimum possible compressive strength used by the standards (i.e. 25MPa).
A mix design was necessary for this experimental programme. Compression tests were undertaken on
samples, removed from the forms and allowed to cure for predetermined periods such as 3, 7, 14 days etc..
The concrete strength tests are standardized and the method of making compressive specimens in the
field is covered under BS EN197:Part 1:2000 [14]. Based on the guidelines of BRE [15], the fourteen days
compressive strength is equal to 85% of the twenty-eight days compressive strength. Moreover, thirteen
days of air-cured concrete compressive strength is equal to 70% of the thirteen days water-cured concrete
compressive strength. The mix with the w/c ratio equal to 0.61 conformed to the requirements and this
was used for casting the composite beams.
4.3 Casting the USFBs
Four composite specimens were cast using Lafarge Blue Circle OPC CEM-I 42.5 N conforming to BS EN
197: Part 1 [14]. Sharp sand with a maximum size of 5mm was used as the fine aggregate. River gravel
with a maximum size of 10mm was used as the coarse aggregate to overcome the problems associated
with having to cast the specimen on one side (Fig. 2). Twenty-four hours (± 4 hours) later, the specimens
were de-moulded and left to air-cure in a storage room covered in sheeting for thirteen days. The storage
room’s temperature was 19 to 23oC at 50% to 60% relative humidity.
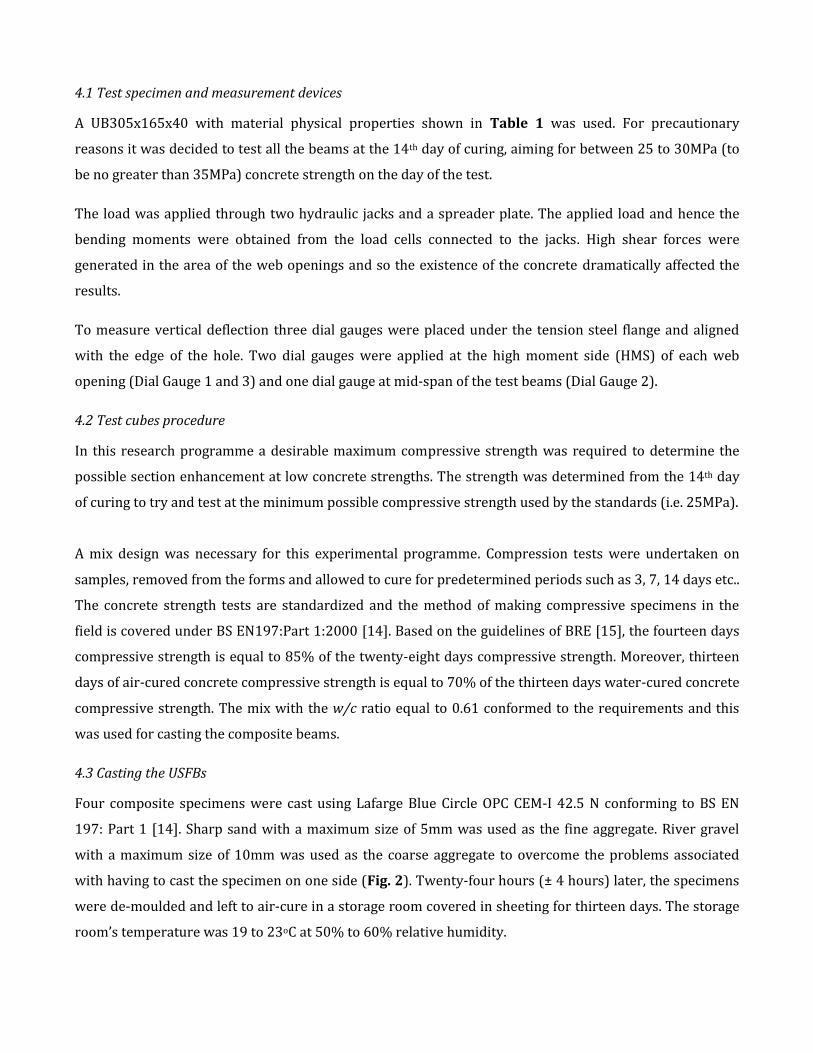
The casting of the composite beams was not routine because the bearing plates at the supports and the
web openings make the whole procedure more difficult. This was accomplished by casting the beams on
the floor and pouring the concrete through the web openings (Fig. 2). Vibrators were used to ensure that
the concrete was well compacted. The compaction of the concrete was also improved by the high water-
cement ratio (0.61). Silicon was used to avoid water leakage between the steel and the framework.
Fig. 2: Casting procedure of USFBs (i.e. USFB No. 1)
4.4 USFB with lower grade concrete
Three USFBs were cast with a w/c ratio equal to 0.61. Taking into consideration the usual uncertainties
caused by human or climate interferences which occur when the beams are cast in situ, another composite
section (USFB 4) was also cast with a slightly higher w/c ratio (and hence lower grade concrete).
Segregation was observed when the concrete cubes of the latter specimen were tested. An additional aim
of this test was to verify the percentage of the shear improvement and the failure mode due to concrete
infill (i.e. concrete is a path to the load), and to clarify whether it is the concrete strength or the concrete
itself that provides the enhancement to the perforated steel beam.
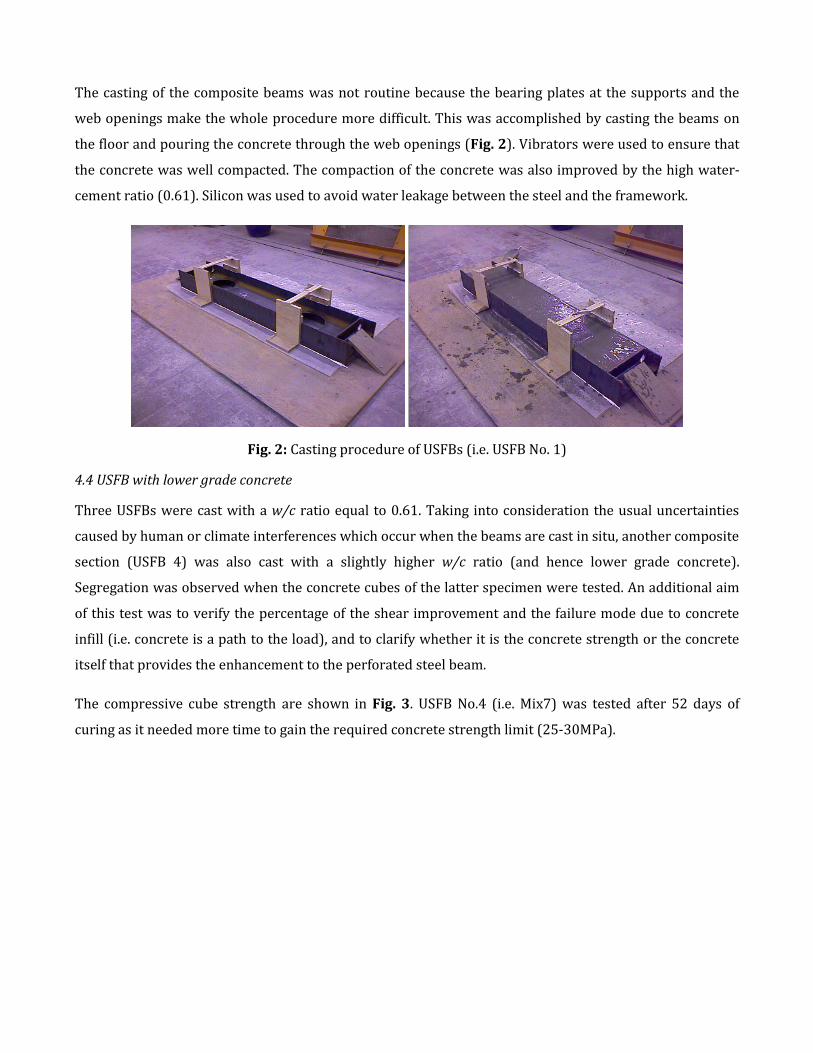
The compressive cube strength are shown in Fig. 3. USFB No.4 (i.e. Mix7) was tested after 52 days of
curing as it needed more time to gain the required concrete strength limit (25-30MPa).
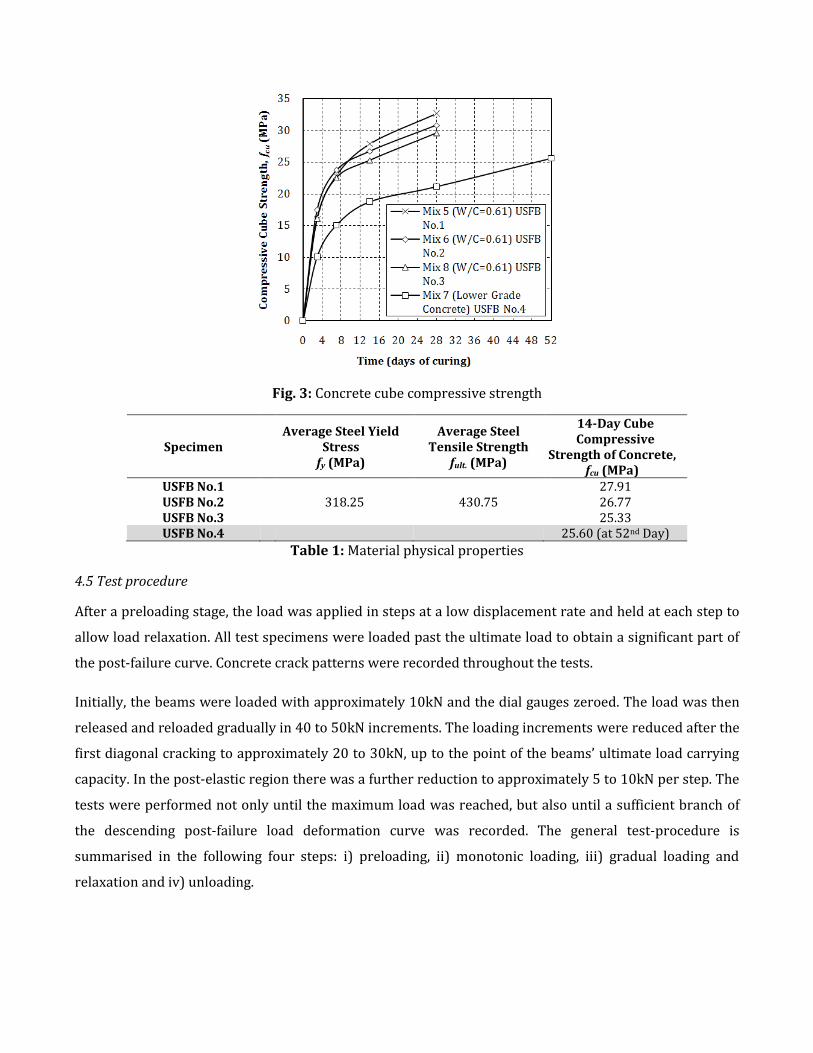
Fig. 3: Concrete cube compressive strength
Specimen Average Steel Yield
Stress fy (MPa)
Average Steel Tensile Strength
fult. (MPa)
14-Day Cube Compressive
Strength of Concrete, fcu (MPa)
USFB No.1 318.25 430.75
27.91 USFB No.2 26.77 USFB No.3 25.33 USFB No.4 25.60 (at 52nd Day)
Table 1: Material physical properties
4.5 Test procedure
After a preloading stage, the load was applied in steps at a low displacement rate and held at each step to
allow load relaxation. All test specimens were loaded past the ultimate load to obtain a significant part of
the post-failure curve. Concrete crack patterns were recorded throughout the tests.
Initially, the beams were loaded with approximately 10kN and the dial gauges zeroed. The load was then
released and reloaded gradually in 40 to 50kN increments. The loading increments were reduced after the
first diagonal cracking to approximately 20 to 30kN, up to the point of the beams’ ultimate load carrying
capacity. In the post-elastic region there was a further reduction to approximately 5 to 10kN per step. The
tests were performed not only until the maximum load was reached, but also until a sufficient branch of
the descending post-failure load deformation curve was recorded. The general test-procedure is
summarised in the following four steps: i) preloading, ii) monotonic loading, iii) gradual loading and
relaxation and iv) unloading.
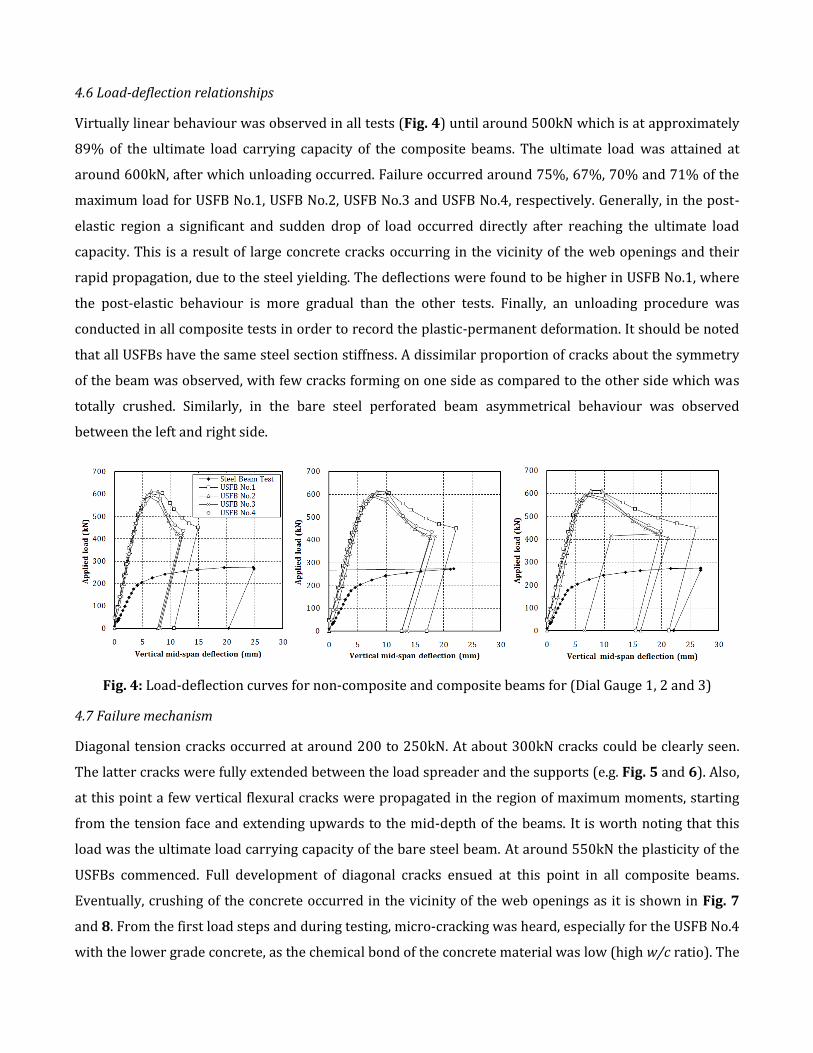
4.6 Load-deflection relationships
Virtually linear behaviour was observed in all tests (Fig. 4) until around 500kN which is at approximately
89% of the ultimate load carrying capacity of the composite beams. The ultimate load was attained at
around 600kN, after which unloading occurred. Failure occurred around 75%, 67%, 70% and 71% of the
maximum load for USFB No.1, USFB No.2, USFB No.3 and USFB No.4, respectively. Generally, in the post-
elastic region a significant and sudden drop of load occurred directly after reaching the ultimate load
capacity. This is a result of large concrete cracks occurring in the vicinity of the web openings and their
rapid propagation, due to the steel yielding. The deflections were found to be higher in USFB No.1, where
the post-elastic behaviour is more gradual than the other tests. Finally, an unloading procedure was
conducted in all composite tests in order to record the plastic-permanent deformation. It should be noted
that all USFBs have the same steel section stiffness. A dissimilar proportion of cracks about the symmetry
of the beam was observed, with few cracks forming on one side as compared to the other side which was
totally crushed. Similarly, in the bare steel perforated beam asymmetrical behaviour was observed
between the left and right side.
Fig. 4: Load-deflection curves for non-composite and composite beams for (Dial Gauge 1, 2 and 3)
4.7 Failure mechanism
Diagonal tension cracks occurred at around 200 to 250kN. At about 300kN cracks could be clearly seen.
The latter cracks were fully extended between the load spreader and the supports (e.g. Fig. 5 and 6). Also,
at this point a few vertical flexural cracks were propagated in the region of maximum moments, starting
from the tension face and extending upwards to the mid-depth of the beams. It is worth noting that this
load was the ultimate load carrying capacity of the bare steel beam. At around 550kN the plasticity of the
USFBs commenced. Full development of diagonal cracks ensued at this point in all composite beams.
Eventually, crushing of the concrete occurred in the vicinity of the web openings as it is shown in Fig. 7
and 8. From the first load steps and during testing, micro-cracking was heard, especially for the USFB No.4
with the lower grade concrete, as the chemical bond of the concrete material was low (high w/c ratio). The
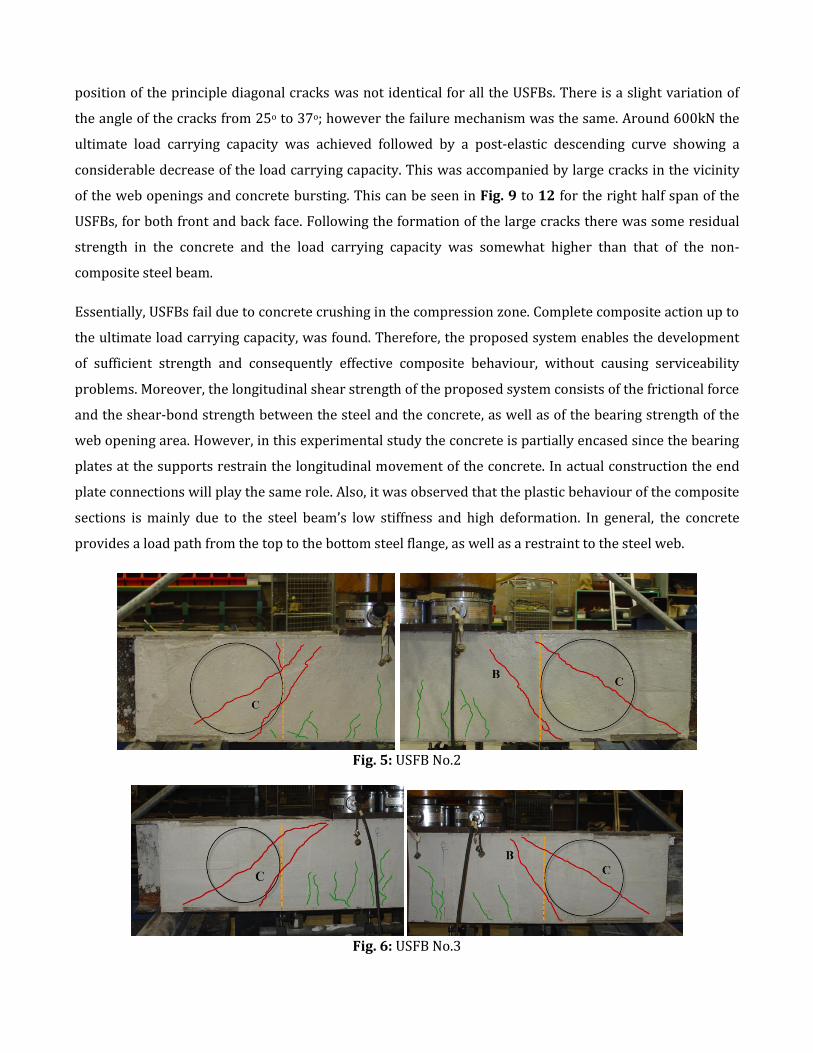
position of the principle diagonal cracks was not identical for all the USFBs. There is a slight variation of
the angle of the cracks from 25o to 37o; however the failure mechanism was the same. Around 600kN the
ultimate load carrying capacity was achieved followed by a post-elastic descending curve showing a
considerable decrease of the load carrying capacity. This was accompanied by large cracks in the vicinity
of the web openings and concrete bursting. This can be seen in Fig. 9 to 12 for the right half span of the
USFBs, for both front and back face. Following the formation of the large cracks there was some residual
strength in the concrete and the load carrying capacity was somewhat higher than that of the non-
composite steel beam.
Essentially, USFBs fail due to concrete crushing in the compression zone. Complete composite action up to
the ultimate load carrying capacity, was found. Therefore, the proposed system enables the development
of sufficient strength and consequently effective composite behaviour, without causing serviceability
problems. Moreover, the longitudinal shear strength of the proposed system consists of the frictional force
and the shear-bond strength between the steel and the concrete, as well as of the bearing strength of the
web opening area. However, in this experimental study the concrete is partially encased since the bearing
plates at the supports restrain the longitudinal movement of the concrete. In actual construction the end
plate connections will play the same role. Also, it was observed that the plastic behaviour of the composite
sections is mainly due to the steel beam’s low stiffness and high deformation. In general, the concrete
provides a load path from the top to the bottom steel flange, as well as a restraint to the steel web.
Fig. 5: USFB No.2
Fig. 6: USFB No.3
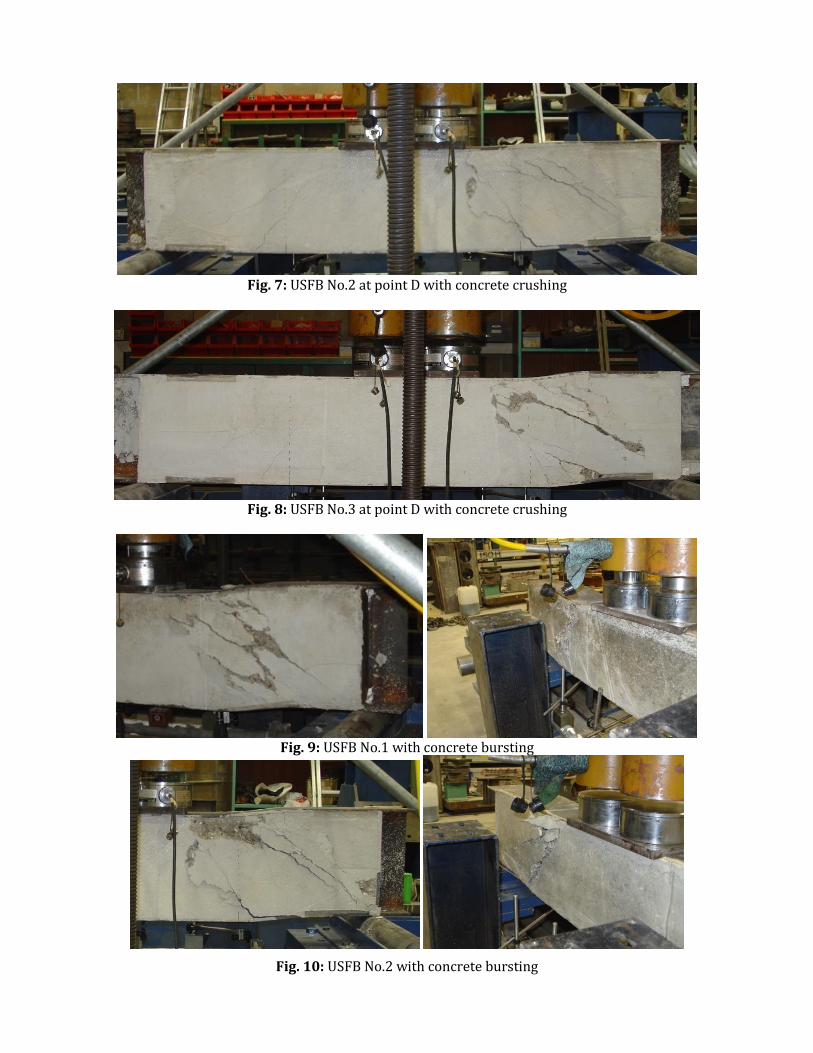
Fig. 7: USFB No.2 at point D with concrete crushing
Fig. 8: USFB No.3 at point D with concrete crushing
Fig. 9: USFB No.1 with concrete bursting
Fig. 10: USFB No.2 with concrete bursting
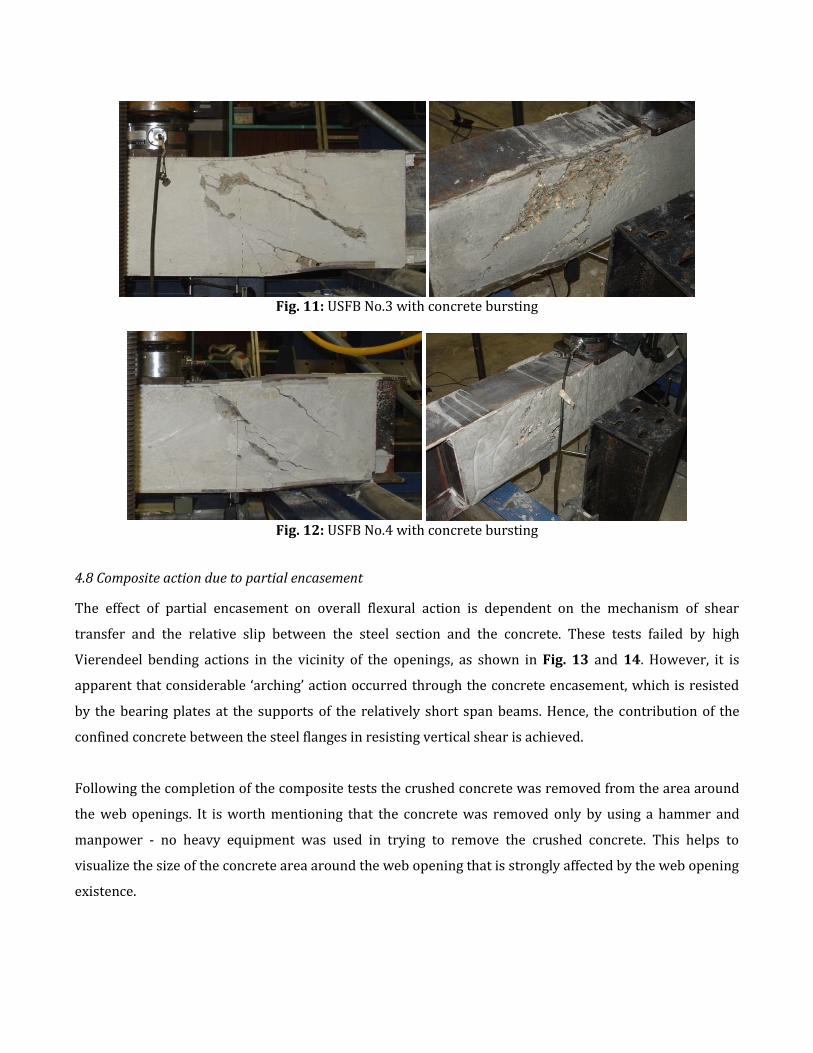
Fig. 11: USFB No.3 with concrete bursting
Fig. 12: USFB No.4 with concrete bursting
4.8 Composite action due to partial encasement
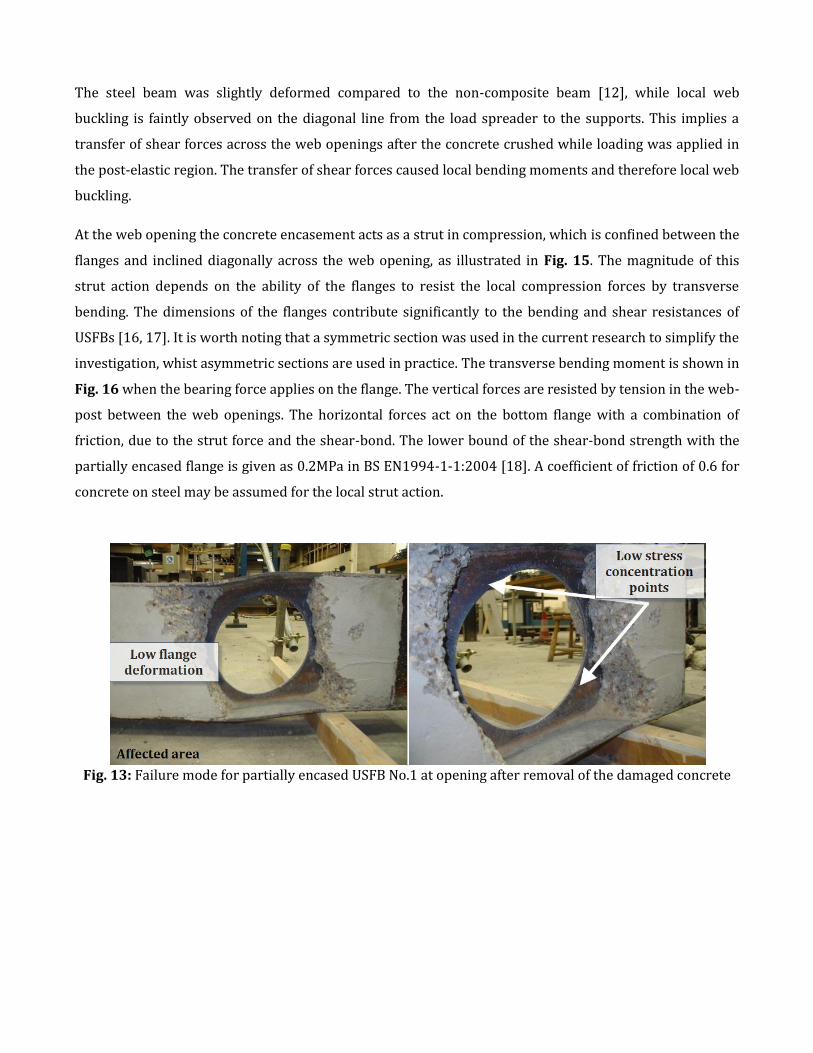
The effect of partial encasement on overall flexural action is dependent on the mechanism of shear
transfer and the relative slip between the steel section and the concrete. These tests failed by high
Vierendeel bending actions in the vicinity of the openings, as shown in Fig. 13 and 14. However, it is
apparent that considerable ‘arching’ action occurred through the concrete encasement, which is resisted
by the bearing plates at the supports of the relatively short span beams. Hence, the contribution of the
confined concrete between the steel flanges in resisting vertical shear is achieved.
Following the completion of the composite tests the crushed concrete was removed from the area around
the web openings. It is worth mentioning that the concrete was removed only by using a hammer and
manpower - no heavy equipment was used in trying to remove the crushed concrete. This helps to
visualize the size of the concrete area around the web opening that is strongly affected by the web opening
existence.
The steel beam was slightly deformed compared to the non-composite beam [12], while local web
buckling is faintly observed on the diagonal line from the load spreader to the supports. This implies a
transfer of shear forces across the web openings after the concrete crushed while loading was applied in
the post-elastic region. The transfer of shear forces caused local bending moments and therefore local web
buckling.
At the web opening the concrete encasement acts as a strut in compression, which is confined between the
flanges and inclined diagonally across the web opening, as illustrated in Fig. 15. The magnitude of this
strut action depends on the ability of the flanges to resist the local compression forces by transverse
bending. The dimensions of the flanges contribute significantly to the bending and shear resistances of
USFBs [16, 17]. It is worth noting that a symmetric section was used in the current research to simplify the
investigation, whist asymmetric sections are used in practice. The transverse bending moment is shown in
Fig. 16 when the bearing force applies on the flange. The vertical forces are resisted by tension in the web-
post between the web openings. The horizontal forces act on the bottom flange with a combination of
friction, due to the strut force and the shear-bond. The lower bound of the shear-bond strength with the
partially encased flange is given as 0.2MPa in BS EN1994-1-1:2004 [18]. A coefficient of friction of 0.6 for
concrete on steel may be assumed for the local strut action.
Fig. 13: Failure mode for partially encased USFB No.1 at opening after removal of the damaged concrete
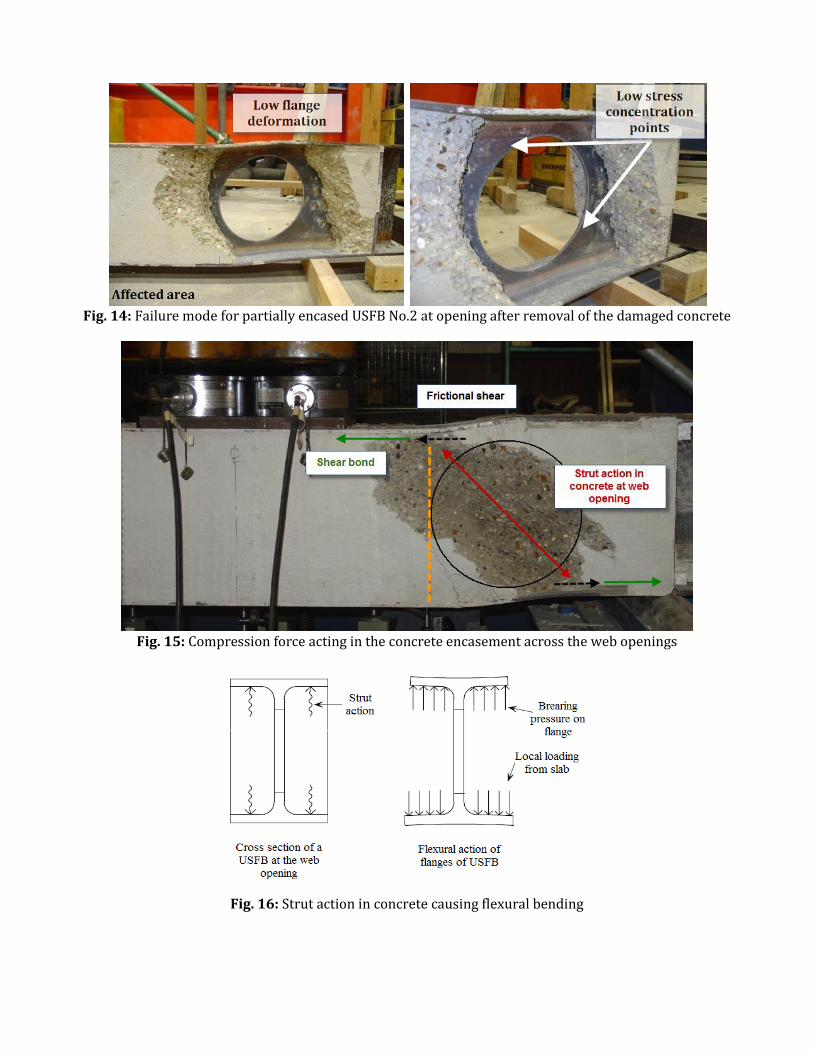
Fig. 14: Failure mode for partially encased USFB No.2 at opening after removal of the damaged concrete
Fig. 15: Compression force acting in the concrete encasement across the web openings
Fig. 16: Strut action in concrete causing flexural bending
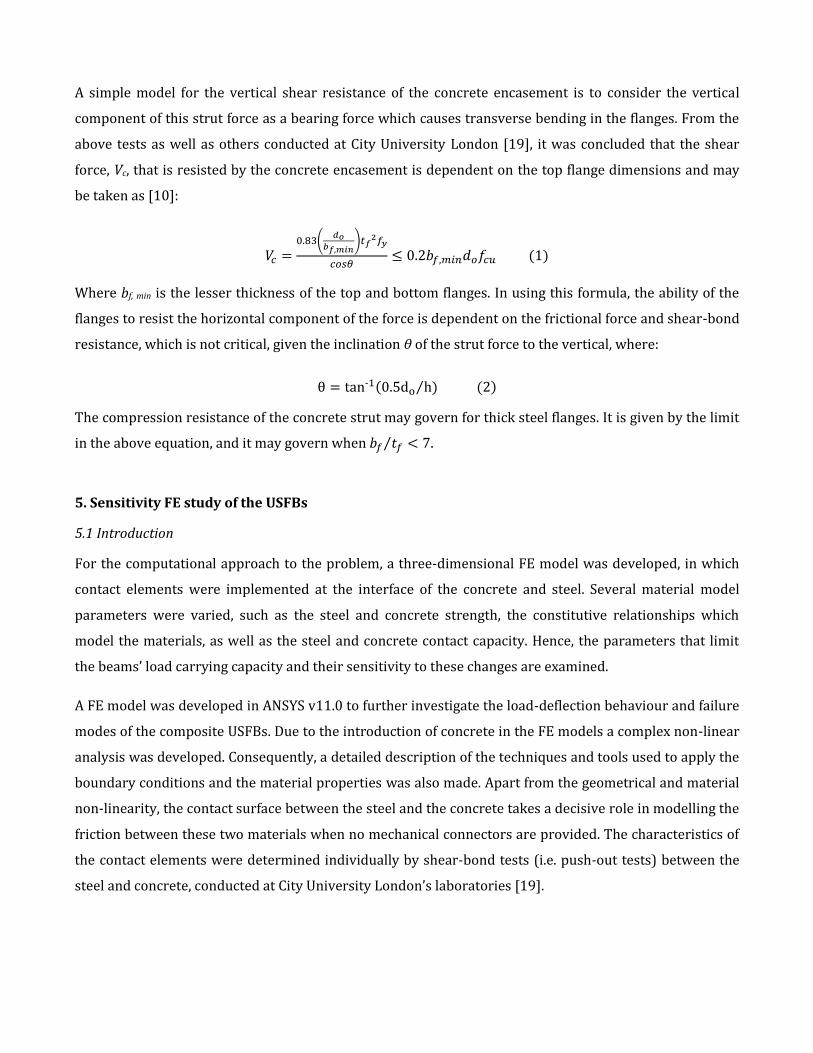
A simple model for the vertical shear resistance of the concrete encasement is to consider the vertical
component of this strut force as a bearing force which causes transverse bending in the flanges. From the
above tests as well as others conducted at City University London [19], it was concluded that the shear
force, Vc, that is resisted by the concrete encasement is dependent on the top flange dimensions and may
be taken as [10]:
(
)
Where bf, min is the lesser thickness of the top and bottom flanges. In using this formula, the ability of the
flanges to resist the horizontal component of the force is dependent on the frictional force and shear-bond
resistance, which is not critical, given the inclination θ of the strut force to the vertical, where:
- ⁄
The compression resistance of the concrete strut may govern for thick steel flanges. It is given by the limit
in the above equation, and it may govern when ⁄ .
5. Sensitivity FE study of the USFBs
5.1 Introduction
For the computational approach to the problem, a three-dimensional FE model was developed, in which
contact elements were implemented at the interface of the concrete and steel. Several material model
parameters were varied, such as the steel and concrete strength, the constitutive relationships which
model the materials, as well as the steel and concrete contact capacity. Hence, the parameters that limit
the beams’ load carrying capacity and their sensitivity to these changes are examined.
A FE model was developed in ANSYS v11.0 to further investigate the load-deflection behaviour and failure
modes of the composite USFBs. Due to the introduction of concrete in the FE models a complex non-linear
analysis was developed. Consequently, a detailed description of the techniques and tools used to apply the
boundary conditions and the material properties was also made. Apart from the geometrical and material
non-linearity, the contact surface between the steel and the concrete takes a decisive role in modelling the
friction between these two materials when no mechanical connectors are provided. The characteristics of
the contact elements were determined individually by shear-bond tests (i.e. push-out tests) between the
steel and concrete, conducted at City University London’s laboratories [19].
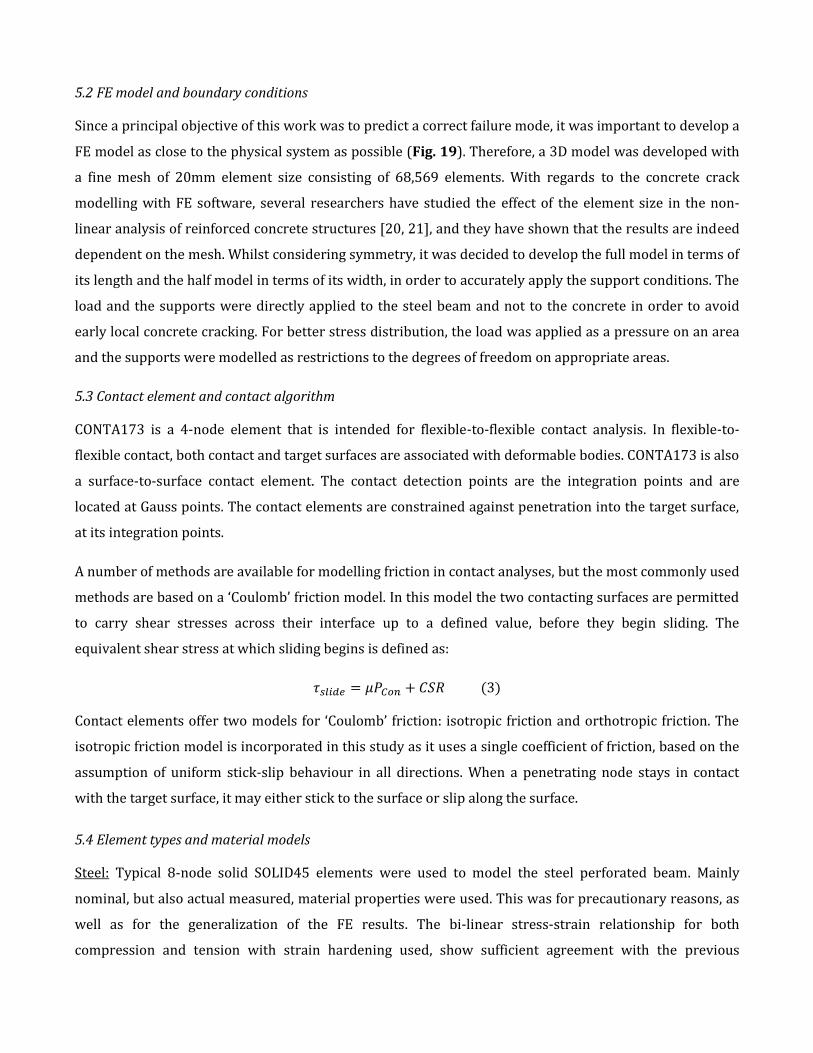
5.2 FE model and boundary conditions
Since a principal objective of this work was to predict a correct failure mode, it was important to develop a
FE model as close to the physical system as possible (Fig. 19). Therefore, a 3D model was developed with
a fine mesh of 20mm element size consisting of 68,569 elements. With regards to the concrete crack
modelling with FE software, several researchers have studied the effect of the element size in the non-
linear analysis of reinforced concrete structures [20, 21], and they have shown that the results are indeed
dependent on the mesh. Whilst considering symmetry, it was decided to develop the full model in terms of
its length and the half model in terms of its width, in order to accurately apply the support conditions. The
load and the supports were directly applied to the steel beam and not to the concrete in order to avoid
early local concrete cracking. For better stress distribution, the load was applied as a pressure on an area
and the supports were modelled as restrictions to the degrees of freedom on appropriate areas.
5.3 Contact element and contact algorithm
CONTA173 is a 4-node element that is intended for flexible-to-flexible contact analysis. In flexible-to-
flexible contact, both contact and target surfaces are associated with deformable bodies. CONTA173 is also
a surface-to-surface contact element. The contact detection points are the integration points and are
located at Gauss points. The contact elements are constrained against penetration into the target surface,
at its integration points.
A number of methods are available for modelling friction in contact analyses, but the most commonly used
methods are based on a ‘Coulomb’ friction model. In this model the two contacting surfaces are permitted
to carry shear stresses across their interface up to a defined value, before they begin sliding. The
equivalent shear stress at which sliding begins is defined as:
Contact elements offer two models for ‘Coulomb’ friction: isotropic friction and orthotropic friction. The
isotropic friction model is incorporated in this study as it uses a single coefficient of friction, based on the
assumption of uniform stick-slip behaviour in all directions. When a penetrating node stays in contact
with the target surface, it may either stick to the surface or slip along the surface.
5.4 Element types and material models
Steel: Typical 8-node solid SOLID45 elements were used to model the steel perforated beam. Mainly
nominal, but also actual measured, material properties were used. This was for precautionary reasons, as
well as for the generalization of the FE results. The bi-linear stress-strain relationship for both
compression and tension with strain hardening used, show sufficient agreement with the previous
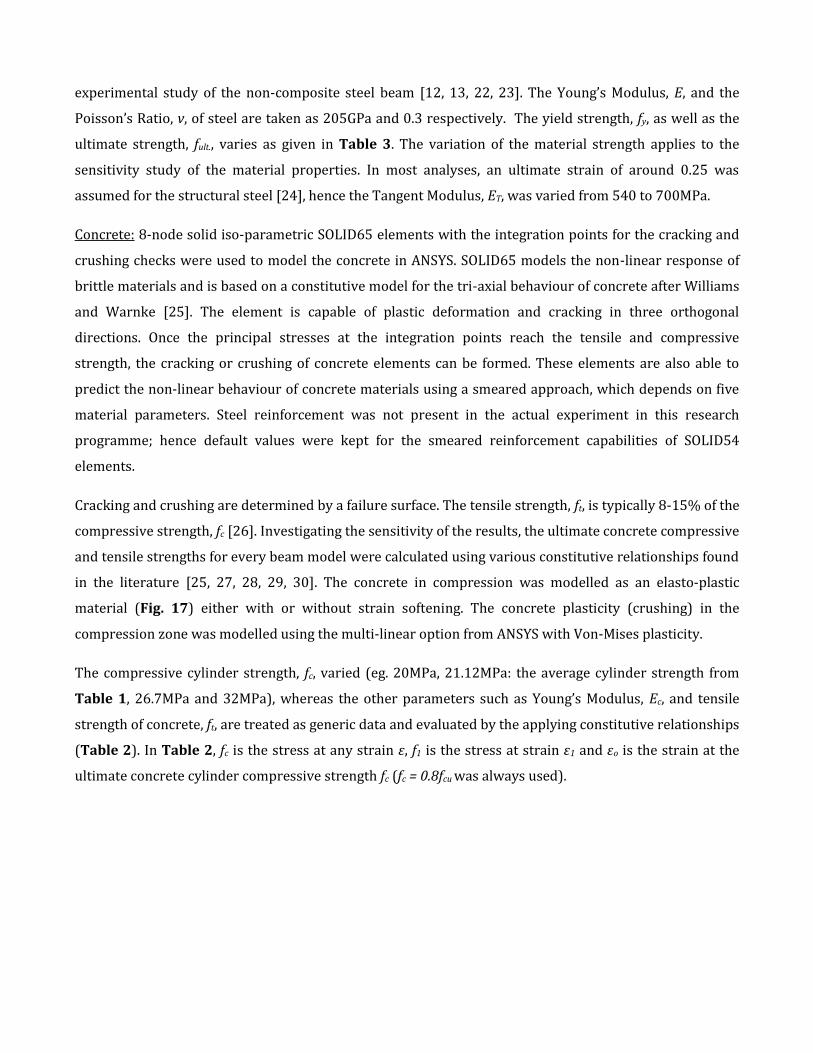
experimental study of the non-composite steel beam [12, 13, 22, 23]. The Young’s Modulus, E, and the
Poisson’s Ratio, v, of steel are taken as 205GPa and 0.3 respectively. The yield strength, fy, as well as the
ultimate strength, fult., varies as given in Table 3. The variation of the material strength applies to the
sensitivity study of the material properties. In most analyses, an ultimate strain of around 0.25 was
assumed for the structural steel [24], hence the Tangent Modulus, ET, was varied from 540 to 700MPa.
Concrete: 8-node solid iso-parametric SOLID65 elements with the integration points for the cracking and
crushing checks were used to model the concrete in ANSYS. SOLID65 models the non-linear response of
brittle materials and is based on a constitutive model for the tri-axial behaviour of concrete after Williams
and Warnke [25]. The element is capable of plastic deformation and cracking in three orthogonal
directions. Once the principal stresses at the integration points reach the tensile and compressive
strength, the cracking or crushing of concrete elements can be formed. These elements are also able to
predict the non-linear behaviour of concrete materials using a smeared approach, which depends on five
material parameters. Steel reinforcement was not present in the actual experiment in this research
programme; hence default values were kept for the smeared reinforcement capabilities of SOLID54
elements.
Cracking and crushing are determined by a failure surface. The tensile strength, ft, is typically 8-15% of the
compressive strength, fc [26]. Investigating the sensitivity of the results, the ultimate concrete compressive
and tensile strengths for every beam model were calculated using various constitutive relationships found
in the literature [25, 27, 28, 29, 30]. The concrete in compression was modelled as an elasto-plastic
material (Fig. 17) either with or without strain softening. The concrete plasticity (crushing) in the
compression zone was modelled using the multi-linear option from ANSYS with Von-Mises plasticity.
The compressive cylinder strength, fc, varied (eg. 20MPa, 21.12MPa: the average cylinder strength from
Table 1, 26.7MPa and 32MPa), whereas the other parameters such as Young’s Modulus, Ec, and tensile
strength of concrete, ft, are treated as generic data and evaluated by the applying constitutive relationships
(Table 2). In Table 2, fc is the stress at any strain ε, f1 is the stress at strain ε1 and εo is the strain at the
ultimate concrete cylinder compressive strength fc (fc = 0.8fcu was always used).
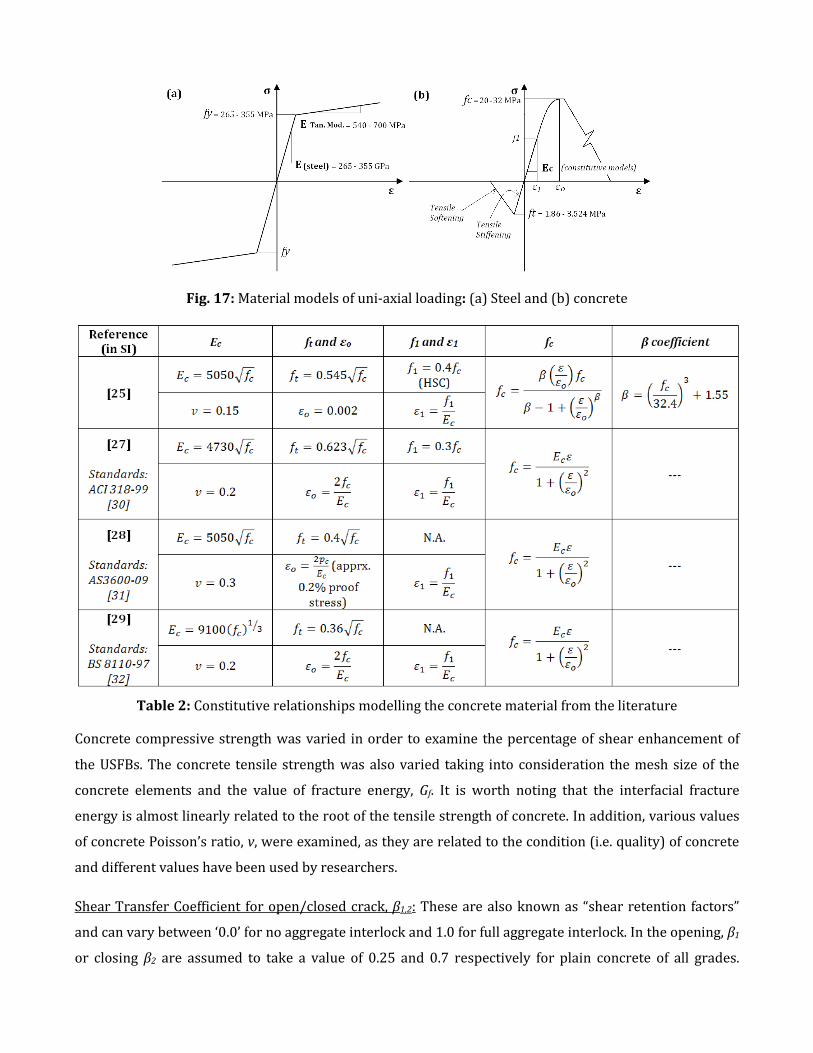
Fig. 17: Material models of uni-axial loading: (a) Steel and (b) concrete
Table 2: Constitutive relationships modelling the concrete material from the literature
Concrete compressive strength was varied in order to examine the percentage of shear enhancement of
the USFBs. The concrete tensile strength was also varied taking into consideration the mesh size of the
concrete elements and the value of fracture energy, Gf. It is worth noting that the interfacial fracture
energy is almost linearly related to the root of the tensile strength of concrete. In addition, various values
of concrete Poisson’s ratio, v, were examined, as they are related to the condition (i.e. quality) of concrete
and different values have been used by researchers.
Shear Transfer Coefficient for open/closed crack, β1,2: These are also known as “shear retention factors”
and can vary between ‘0.0’ for no aggregate interlock and 1.0 for full aggregate interlock. In the opening, β1
or closing β2 are assumed to take a value of 0.25 and 0.7 respectively for plain concrete of all grades.
Various shear transfer coefficients are used in this study for open cracks and closed cracks. High values
were taken for the closed crack (e.g. 0.9, 1.0) so as to prevent possible fictitious crushing of the concrete
before load transfer occurs through a closed crack.
Friction Coefficient, μ: Various friction coefficients were used in order to compare the results. The results
showed an increase of the stiffness in the strain of the compressive top flange for beam with higher bond,
but in the tensile flange the stiffness is nearly the same. A reason for this behaviour is the cracking of
concrete in tensile zone, which starts from the first load steps. In the experiments the bond strength is also
different in the compressive zone from that in the tensile zone of the composite beam, and this could be
another reason for possible discrepancy between the experimental and the FE results. The local bond
strength and the corresponding slip are almost linearly related to the tensile strength of concrete.
Solution Method: The full Newton-Raphson procedure was used, even though this requires the stiffness of
the structure to be re-calculated for every iteration. A large-displacement and static analysis was
implemented with the maximum number of sub-steps in a load step being 1,000-10,000 in order to apply
the load increments very smoothly where it is necessary. Failure of the beam occurs when convergence
fails, with a very small load increment. This method is comparable with the experimental data from
Buckhouse [33]. The vertical deflection at mid-span of the composite beams and the FE divergence load
was monitored.
5.5 FE results from sensitivity study
The failure loads obtained from this study are summarised in Table 3 and categorised mainly according to
the constitutive relationships used to model the material properties. Sub-categories are also indicated,
based on both the steel and concrete strengths.
It was observed that the numerical solutions are very sensitive to the steel strength in contrast to the
concrete strength and small changes lead to significantly different results. It is found that the USFBs with
steel yield strength of 265 to 285MPa compare well with the experimental behaviour, even though there is
a reduction of 16.8 to 10.5% in the average steel yield strength (i.e. fy=318.25MPa), as obtained from the
coupon tests. This applies to the increased stiffness of the 3D solid elements as well as the complex failure
mechanism of the USFBs. Essentially, it was verified that the ultimate load carrying capacity of the USFBs
is governed by the steel strength and in particular when the concrete strength is low.
Furthermore, it is apparent that apart from the steel and concrete strength, the shear transfer coefficients
and the coefficient of friction play a significant role in simulating the structural behaviour. It was found
that the most effective applicable factors for opened and closed cracks, β1 and β2, are 0.3 and 1.0,
respectively. Dramatic change of the divergence load is obtained when the coefficient of friction, µ, is
reduced significantly (eg. µ=0.4). For µ greater than 0.6 full cracks were recorded. Similarly, full cracks
were recorded when the yield strength of the steel is greater than 300MPa. The discrepancy for the value
of ultimate load obtained by means of the numerical solution and experiment was about 22.5% using solid
elements, while it was only 4.5% using shell elements. Observing the real tests it was found that no slip
occurred between the steel and the concrete up to the yield point. Subsequently, a value of 1.0 (i.e. perfect
bonding) was mainly used at the contact surface. For µ≠1.0, a significant interlocking between the steel
and the concrete exists after de-bonding due to the non-uniform strain across the section of the member.
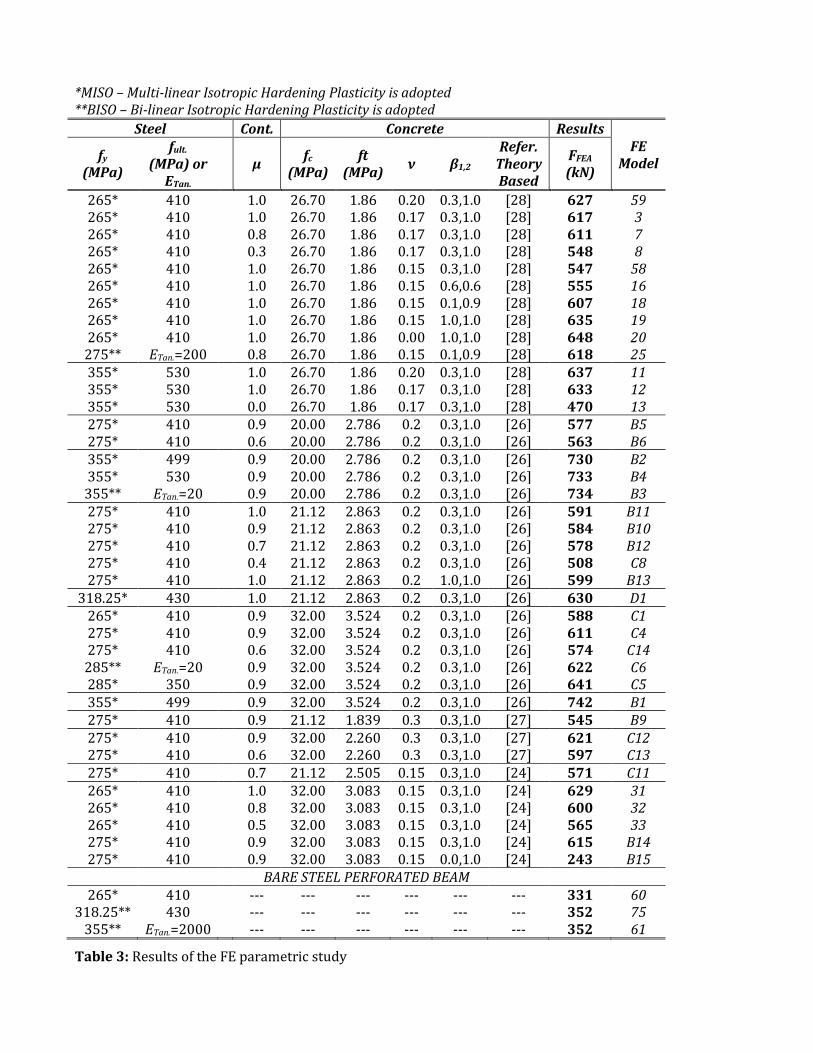
*MISO – Multi-linear Isotropic Hardening Plasticity is adopted **BISO – Bi-linear Isotropic Hardening Plasticity is adopted
Steel Cont. Concrete Results FE
Model fy
(MPa)
fult.
(MPa) or ETan.
μ fc
(MPa) ft
(MPa) ν β1,2
Refer. Theory Based
FFEA (kN)
265* 410 1.0 26.70 1.86 0.20 0.3,1.0 [28] 627 59 265* 410 1.0 26.70 1.86 0.17 0.3,1.0 [28] 617 3 265* 410 0.8 26.70 1.86 0.17 0.3,1.0 [28] 611 7 265* 410 0.3 26.70 1.86 0.17 0.3,1.0 [28] 548 8 265* 410 1.0 26.70 1.86 0.15 0.3,1.0 [28] 547 58 265* 410 1.0 26.70 1.86 0.15 0.6,0.6 [28] 555 16 265* 410 1.0 26.70 1.86 0.15 0.1,0.9 [28] 607 18 265* 410 1.0 26.70 1.86 0.15 1.0,1.0 [28] 635 19 265* 275**
410 ETan.=200
1.0 0.8
26.70 26.70
1.86 1.86
0.00 0.15
1.0,1.0 0.1,0.9
[28] [28]
648 618
20 25
355* 530 1.0 26.70 1.86 0.20 0.3,1.0 [28] 637 11 355* 530 1.0 26.70 1.86 0.17 0.3,1.0 [28] 633 12 355* 530 0.0 26.70 1.86 0.17 0.3,1.0 [28] 470 13 275* 410 0.9 20.00 2.786 0.2 0.3,1.0 [26] 577 B5 275* 410 0.6 20.00 2.786 0.2 0.3,1.0 [26] 563 B6 355* 499 0.9 20.00 2.786 0.2 0.3,1.0 [26] 730 B2 355* 530 0.9 20.00 2.786 0.2 0.3,1.0 [26] 733 B4 355** ETan.=20 0.9 20.00 2.786 0.2 0.3,1.0 [26] 734 B3 275* 410 1.0 21.12 2.863 0.2 0.3,1.0 [26] 591 B11 275* 410 0.9 21.12 2.863 0.2 0.3,1.0 [26] 584 B10 275* 410 0.7 21.12 2.863 0.2 0.3,1.0 [26] 578 B12 275* 410 0.4 21.12 2.863 0.2 0.3,1.0 [26] 508 C8 275* 410 1.0 21.12 2.863 0.2 1.0,1.0 [26] 599 B13
318.25* 430 1.0 21.12 2.863 0.2 0.3,1.0 [26] 630 D1 265* 410 0.9 32.00 3.524 0.2 0.3,1.0 [26] 588 C1 275* 410 0.9 32.00 3.524 0.2 0.3,1.0 [26] 611 C4 275* 410 0.6 32.00 3.524 0.2 0.3,1.0 [26] 574 C14 285** ETan.=20 0.9 32.00 3.524 0.2 0.3,1.0 [26] 622 C6 285* 350 0.9 32.00 3.524 0.2 0.3,1.0 [26] 641 C5 355* 499 0.9 32.00 3.524 0.2 0.3,1.0 [26] 742 B1 275* 410 0.9 21.12 1.839 0.3 0.3,1.0 [27] 545 B9 275* 410 0.9 32.00 2.260 0.3 0.3,1.0 [27] 621 C12 275* 410 0.6 32.00 2.260 0.3 0.3,1.0 [27] 597 C13 275* 410 0.7 21.12 2.505 0.15 0.3,1.0 [24] 571 C11 265* 410 1.0 32.00 3.083 0.15 0.3,1.0 [24] 629 31 265* 410 0.8 32.00 3.083 0.15 0.3,1.0 [24] 600 32 265* 275* 275*
410 410 410
0.5 0.9 0.9
32.00 32.00 32.00
3.083 3.083 3.083
0.15 0.15 0.15
0.3,1.0 0.3,1.0 0.0,1.0
[24] [24] [24]
565 615 243
33 B14 B15
BARE STEEL PERFORATED BEAM 265* 410 --- --- --- --- --- --- 331 60
318.25** 430 --- --- --- --- --- --- 352 75 355** ETan.=2000 --- --- --- --- --- --- 352 61
Table 3: Results of the FE parametric study
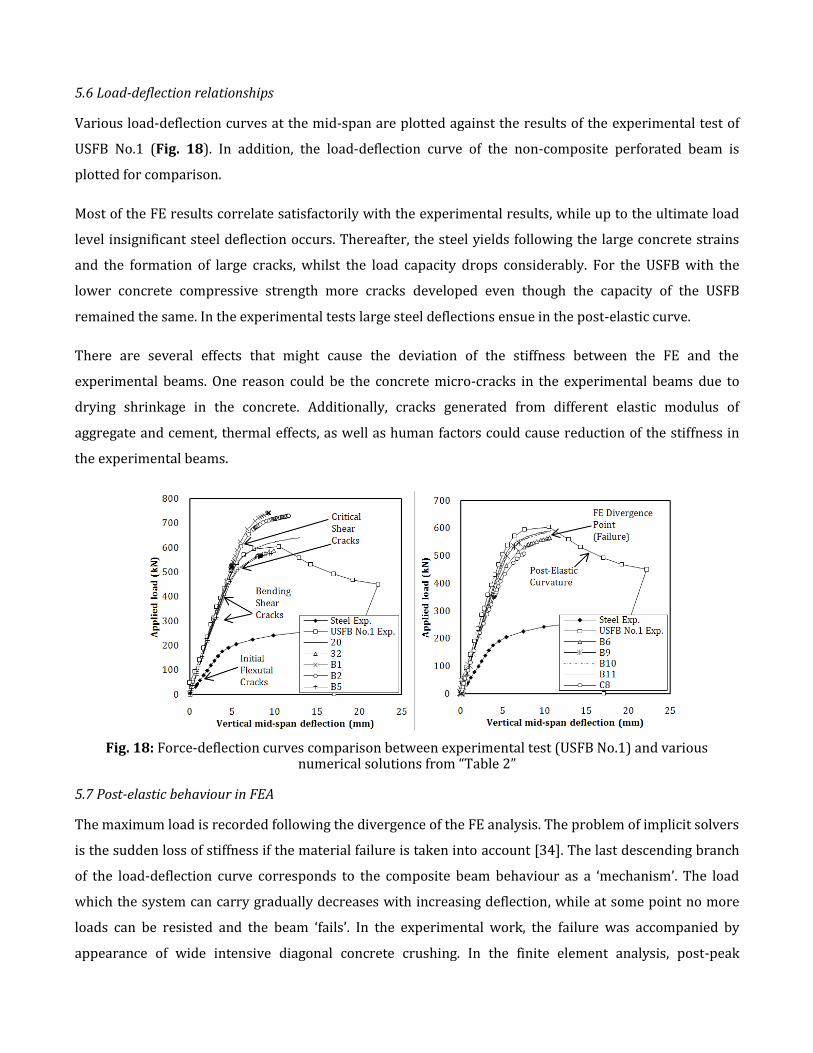
5.6 Load-deflection relationships
Various load-deflection curves at the mid-span are plotted against the results of the experimental test of
USFB No.1 (Fig. 18). In addition, the load-deflection curve of the non-composite perforated beam is
plotted for comparison.
Most of the FE results correlate satisfactorily with the experimental results, while up to the ultimate load
level insignificant steel deflection occurs. Thereafter, the steel yields following the large concrete strains
and the formation of large cracks, whilst the load capacity drops considerably. For the USFB with the
lower concrete compressive strength more cracks developed even though the capacity of the USFB
remained the same. In the experimental tests large steel deflections ensue in the post-elastic curve.
There are several effects that might cause the deviation of the stiffness between the FE and the
experimental beams. One reason could be the concrete micro-cracks in the experimental beams due to
drying shrinkage in the concrete. Additionally, cracks generated from different elastic modulus of
aggregate and cement, thermal effects, as well as human factors could cause reduction of the stiffness in
the experimental beams.
Fig. 18: Force-deflection curves comparison between experimental test (USFB No.1) and various numerical solutions from “Table 2”
5.7 Post-elastic behaviour in FEA
The maximum load is recorded following the divergence of the FE analysis. The problem of implicit solvers
is the sudden loss of stiffness if the material failure is taken into account [34]. The last descending branch
of the load-deflection curve corresponds to the composite beam behaviour as a ‘mechanism’. The load
which the system can carry gradually decreases with increasing deflection, while at some point no more
loads can be resisted and the beam ‘fails’. In the experimental work, the failure was accompanied by
appearance of wide intensive diagonal concrete crushing. In the finite element analysis, post-peak
softening usually means a localisation of failure. Hence, some special techniques such as non-local mode,
gradient or time dependent formulations (explicit solvers) need to be employed.
The Newton-Raphson method used in this research proved to be generally economical because much
larger incremental steps were possible. However, in the regions of peak loads on the load-deflection
response, numerical difficulties sometimes occurred and it is necessary to use the modified Newton-
Raphson iteration scheme under which the stiffness of the structure is calculated only at the beginning of
the increment, or the modified Riks (Arc-length) method in order to prevent local instabilities due to large
amounts of cracking.
To trace a post-peak response, either a quasi-static (transient), a stabilisation solver usually with an
energy dissipation factor, an arc-length method or a displacement load control is necessary. The most
widely utilised is the arc-length method in ANSYS, which controls the load level together with the length of
the displacement increment. This method permits to compute the post-critical load-deflection path.
5.8 Concrete crack patterns and failure modes
Thirty-nine numerical tests are presented simulating the particular USFB configuration using different
constitutive relationships and parameters. It is worth noting that in all cases the flexural and the diagonal
cracks were generated. Characteristic results of concrete cracks, slippage profiles and steel stresses at the
contact surface between the steel and the concrete are plotted. By examining the stress distribution, it was
seen that failure occurred due to substantial steel yielding, combined with concrete crushing.
In Fig. 19 the crack development is shown for four load steps. Nonlinear numerical solutions are capable
of replicating the full range of cracks including the pure flexural, flexural shear and the critical shear crack.
Smeared cracks are spread over the high shear stress region (Fig. 19 (c)) and occur mostly at the ends of
the beam between the support and loading area. The path of shear cracks follows the trajectory of the
principal stresses, as can also be seen in the experimental study. Depending on the geometric as well as
the material properties of the USFB, the critical crack might extend to the top of the compression concrete
fibres and then stabilise, as shown in Fig. 19 (d). At the ultimate load carrying capacity the vertical beam
deflections were not large.
Analytically, diagonal shear failure begins with the development of a few vertical flexural cracks at the
mid-span, followed by a break of the bond between the bottom steel flange and the concrete. A critical
shear diagonal crack develops in the vicinity of the web openings of the steel perforated beam. Very small
flexural cracks appear from the beginning of the test, while shear diagonal cracks are not developed until
the load level of approximately 400kN. Similar behaviour was observed at around 250 to 300kN, when the
experimental tests were conducted. By looking at the inside view of the FE model (Fig. 20), it was found
that the cracks begin at the mid-width of the beam section, where the concrete passes through the web
openings and more specific cracks are initiated as the steel web starts to deflect. These cracks are fully
developed in the vicinity of the web openings at approximately 450kN, while cracks move outwards (i.e.
transverse to the web). Crack propagation and the steel stresses at the mid-width of a USFB are shown in
Fig. 20.
The vertical deflection, contact stresses and the contact surface condition for the particular USFB FE
model, when using a friction coefficient, µ, equal to 0.9, are presented in Fig. 21. The Von-Mises stresses of
the steel beam for the particular USFB model are also presented in Fig. 21.
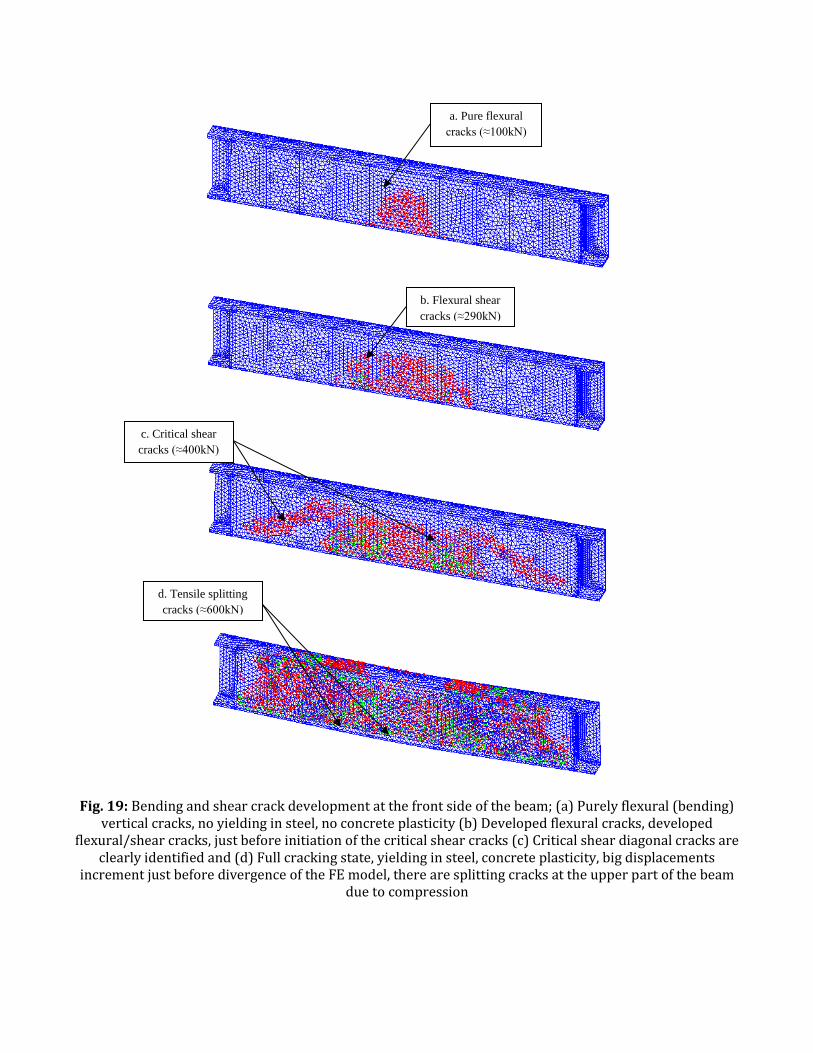
Fig. 19: Bending and shear crack development at the front side of the beam; (a) Purely flexural (bending) vertical cracks, no yielding in steel, no concrete plasticity (b) Developed flexural cracks, developed
flexural/shear cracks, just before initiation of the critical shear cracks (c) Critical shear diagonal cracks are clearly identified and (d) Full cracking state, yielding in steel, concrete plasticity, big displacements
increment just before divergence of the FE model, there are splitting cracks at the upper part of the beam due to compression
1
File: FINAL
MAR 15 2009
01:42:47
CRACKS AND CRUSHING
STEP=1
SUB =10
TIME=4
1
File: FINAL
MAR 15 2009
01:31:36
CRACKS AND CRUSHING
STEP=1
SUB =15
TIME=21.507
1
File: FINAL
MAR 15 2009
01:27:36
CRACKS AND CRUSHING
STEP=1
SUB =17
TIME=40.775
1
File: FINAL
MAR 22 2009
02:22:56
CRACKS AND CRUSHING
STEP=1
SUB =43
TIME=64.489
a. Pure flexural
cracks (≈100kN)
b. Flexural shear
cracks (≈290kN)
c. Critical shear
cracks (≈400kN)
d. Tensile splitting
cracks (≈600kN)
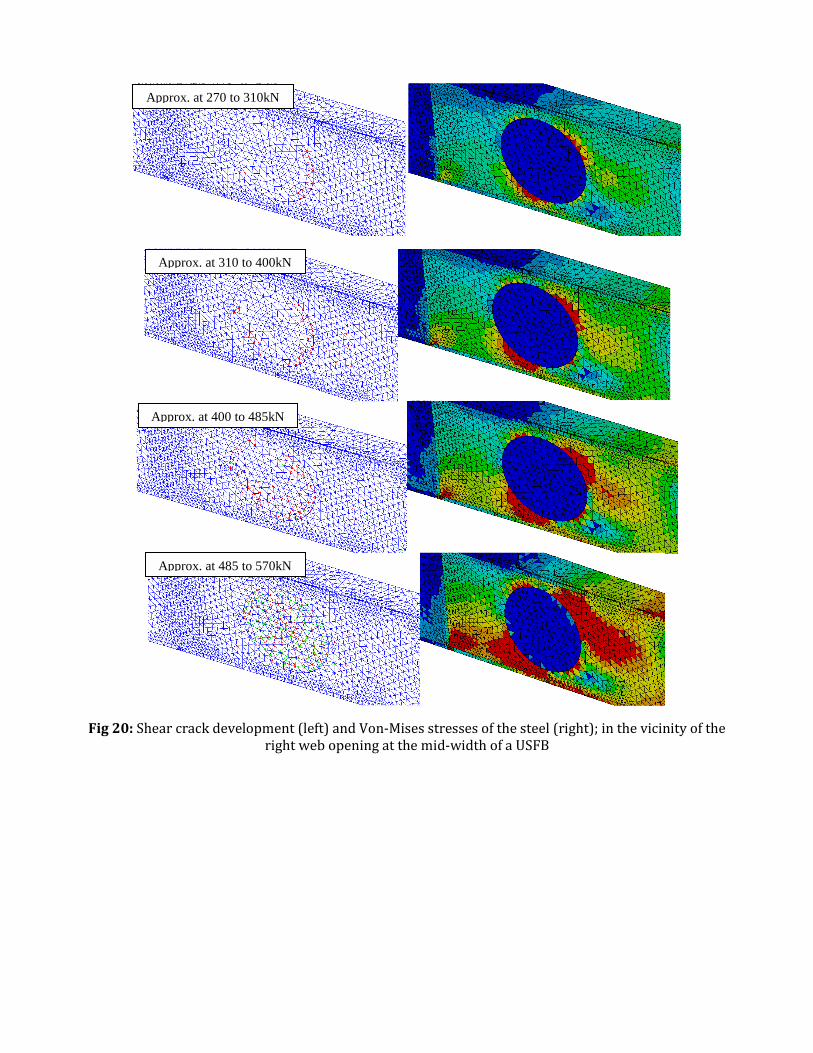
Fig 20: Shear crack development (left) and Von-Mises stresses of the steel (right); in the vicinity of the right web opening at the mid-width of a USFB
1
File: FINAL
JUN 30 2009
02:27:11
CRACKS AND CRUSHING
STEP=1
SUB =15
TIME=5.431
1
File: FINAL
.08561529.545
59.00488.464
117.923147.383
176.842206.302
235.761265.221
JUN 30 2009
02:37:00
ELEMENT SOLUTION
STEP=1
SUB =15
TIME=5.431
SEQV (NOAVG)
DMX =1.722
SMN =.085615
SMX =265.221
1
File: FINAL
JUN 30 2009
02:28:23
CRACKS AND CRUSHING
STEP=1
SUB =16
TIME=6.931
1
File: FINAL
.10725429.622
59.13888.653
118.168147.683
177.198206.713
236.228265.744
JUN 30 2009
02:35:46
ELEMENT SOLUTION
STEP=1
SUB =16
TIME=6.931
SEQV (NOAVG)
DMX =2.18
SMN =.107254
SMX =265.744
1
File: FINAL
JUN 30 2009
02:29:46
CRACKS AND CRUSHING
STEP=1
SUB =17
TIME=8.431
1
File: FINAL
.13758829.721
59.30588.888
118.472148.056
177.639207.223
236.806266.39
JUN 30 2009
02:34:29
ELEMENT SOLUTION
STEP=1
SUB =17
TIME=8.431
SEQV (NOAVG)
DMX =2.66
SMN =.137588
SMX =266.39
1
File: FINAL
JUN 30 2009
02:19:26
CRACKS AND CRUSHING
STEP=1
SUB =38
TIME=10.443
1
File: FINAL
.14826329.85
59.55289.254
118.956148.658
178.36208.062
237.764267.465
JUN 30 2009
02:38:25
ELEMENT SOLUTION
STEP=1
SUB =38
TIME=10.443
SEQV (NOAVG)
DMX =3.739
SMN =.148263
SMX =267.465
Approx. at 270 to 310kN
Approx. at 310 to 400kN
Approx. at 400 to 485kN
Approx. at 485 to 570kN
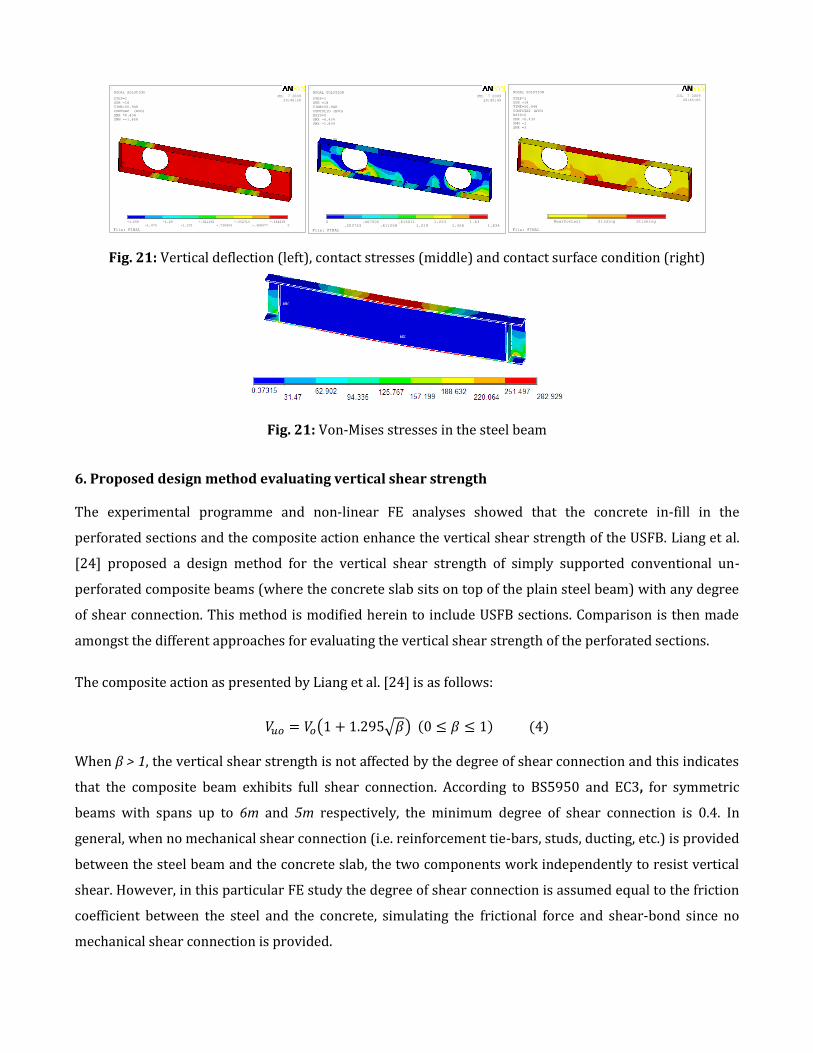
Fig. 21: Vertical deflection (left), contact stresses (middle) and contact surface condition (right)
Fig. 21: Von-Mises stresses in the steel beam
6. Proposed design method evaluating vertical shear strength
The experimental programme and non-linear FE analyses showed that the concrete in-fill in the
perforated sections and the composite action enhance the vertical shear strength of the USFB. Liang et al.
[24] proposed a design method for the vertical shear strength of simply supported conventional un-
perforated composite beams (where the concrete slab sits on top of the plain steel beam) with any degree
of shear connection. This method is modified herein to include USFB sections. Comparison is then made
amongst the different approaches for evaluating the vertical shear strength of the perforated sections.
The composite action as presented by Liang et al. [24] is as follows:
( √ )
When β > 1, the vertical shear strength is not affected by the degree of shear connection and this indicates
that the composite beam exhibits full shear connection. According to BS5950 and EC3, for symmetric
beams with spans up to 6m and 5m respectively, the minimum degree of shear connection is 0.4. In
general, when no mechanical shear connection (i.e. reinforcement tie-bars, studs, ducting, etc.) is provided
between the steel beam and the concrete slab, the two components work independently to resist vertical
shear. However, in this particular FE study the degree of shear connection is assumed equal to the friction
coefficient between the steel and the concrete, simulating the frictional force and shear-bond since no
mechanical shear connection is provided.
1
MN
MX
File: FINAL
-1.658-1.474
-1.29-1.105
-.921192-.736954
-.552715-.368477
-.1842380
JUL 7 2009
20:46:28
NODAL SOLUTION
STEP=1
SUB =18
TIME=50.948
CONTGAP (AVG)
DMX =6.434
SMN =-1.658
1
MN
MX
File: FINAL
0.203753
.407505.611258
.8150111.019
1.2231.426
1.631.834
JUL 7 2009
20:45:49
NODAL SOLUTION
STEP=1
SUB =18
TIME=50.948
CONTSLID (AVG)
RSYS=0
DMX =6.434
SMX =1.834
1
MN
MX
File: FINAL
NearContact Sliding Sticking
JUL 7 2009
20:45:05
NODAL SOLUTION
STEP=1
SUB =18
TIME=50.948
CONTSTAT (AVG)
RSYS=0
DMX =6.434
SMN =1
SMX =3
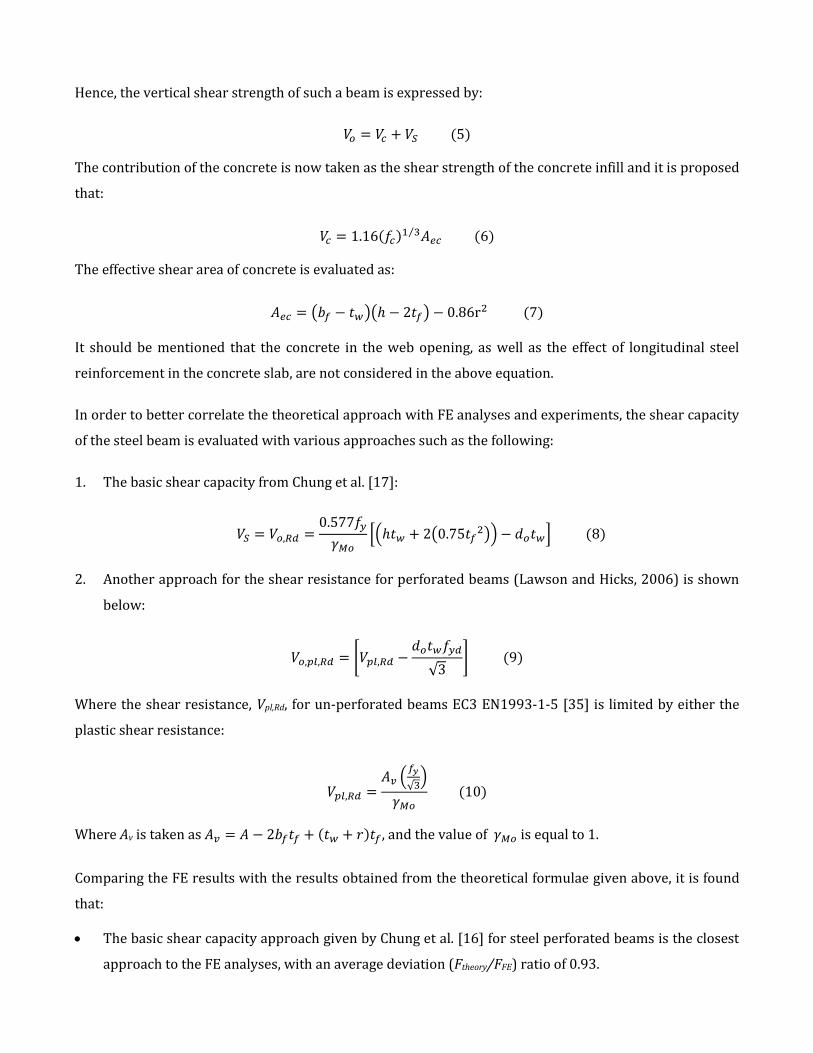
Hence, the vertical shear strength of such a beam is expressed by:
The contribution of the concrete is now taken as the shear strength of the concrete infill and it is proposed
that:
⁄
The effective shear area of concrete is evaluated as:
( )( )
It should be mentioned that the concrete in the web opening, as well as the effect of longitudinal steel
reinforcement in the concrete slab, are not considered in the above equation.
In order to better correlate the theoretical approach with FE analyses and experiments, the shear capacity
of the steel beam is evaluated with various approaches such as the following:
1. The basic shear capacity from Chung et al. [17]:
[( (
)) ]
2. Another approach for the shear resistance for perforated beams (Lawson and Hicks, 2006) is shown
below:
[
√ ]
Where the shear resistance, Vpl,Rd, for un-perforated beams EC3 EN1993-1-5 [35] is limited by either the
plastic shear resistance:
(
√ )
Where Av is taken as , and the value of is equal to 1.
Comparing the FE results with the results obtained from the theoretical formulae given above, it is found
that:
The basic shear capacity approach given by Chung et al. [16] for steel perforated beams is the closest
approach to the FE analyses, with an average deviation (Ftheory/FFE) ratio of 0.93.
The shear resistance approaches given by Lawson and Hicks [36] Eq. 7 and 8, slightly underestimate
the results compared to the FE analyses, with average deviation ratios of 0.90 and 0.86, respectively.
The most effective approach is when the shear resistance is limited by the plastic shear resistance for
the un-perforated section (Eq. 7).
The comparison leads to the following conclusions:
The smaller the degree of shear connection, β, used in the FE models, the greater the deviation ratio is.
For steel grade S275, the FE results are closer to the theoretical design values. In contrast, when steel
grade S355 is used, the FE results obtained are overestimated because of the increased stiffness of the
FE model with solid elements.
7. Conclusions
The USFB offers lower structural depth inversely to conventional composite beams, where the concrete
slab sits on top of the plain (or perforated) steel beam. The decrease of the structural depth for every floor,
and the ease of construction for large spans, as heavy propping is not needed, makes USFBs worth
studying. Although the capacity of the perforated beam is reduced by using large web openings (do=0.76h),
the designer can take advantage of the inherent double shear strength provided by the confined concrete
between the flanges and the bearing plates at the supports. Hence, increased flexural strength of the
composite beams as well as longitudinal shear strength due to the concrete passing throughout the web
openings is achieved.
The following conclusions can be drawn from this study:
With the concrete in-fill, the ultimate vertical load carrying capacity of the USFB increases by up to
108% (i.e. double the capacity) compared to the corresponding non-composite perforated steel beam.
This percentage is higher when the friction coefficient is closer to 1.0 (i.e. fully bonded). It is assumed
that there will be a lower concrete contribution if bearing plates are not provided at the supports.
All four experimentally tested USFBs showed consistent behaviour in terms of the failure mode,
stiffness and the ultimate load carrying capacity.
The failure mode of the non-composite beam changes when there is in-filled concrete between the
flanges.
The concrete failed first before any significant distortion of the steel web occurs.
The last descending post-elastic branch of the load-deflection curve corresponds to the composite
beam behaviour as a ‘mechanism’. Failure is accompanied with the appearance of wide diagonal
concrete crushing.
Following the formation of large diagonal cracks, there is some residual strength in the concrete
preventing local buckling of the perforated steel beams and the load carrying capacity is somewhat
higher than that on the non-composite beam.
The shear resistance of the USFB, without using any mechanical shear connectors, is provided mainly
of contributions from the concrete confinement and the steel flange thickness.
Strut action of the concrete confinement across the web openings reduces the Vierendeel bending
effects and improves the vertical shear transfer in the vicinity of the web openings. Hence, the vertical
shear force resisted by the concrete at a web opening is dependent on the on the flange dimensions.
The horizontal component of the strut action is dependent on the frictional force, shear-bond
resistance and the bearing strength of the web opening area.
In order to study the parameters affecting the structural behaviour of simply supported USFBs with larger
circular web openings, three-dimensional finite element models employing solid elements were
developed. The FE results are summarised below:
The FE models accurately simulate the structural behaviour of the USFBs tested up to the ultimate
load carrying capacity level. Comparison between the measured and the predicted load carrying
capacities against the Vierendeel mechanism was found to be close.
Various constitutive relationships modelling the concrete material properties were found from the
sensitivity-parametric studies to affect the load carrying capacity of USFBs differently.
As the composite beams examined did not contain confined reinforcement, the concrete tensile
strength played a major role in defining the divergence load.
All cracks in the FE models develop at a higher load compared to those observed in the experiments.
A design method for simply supported conventional un-perforated composite beams presented by
Liang et al. [24] was modified for the shear resistance of the both perforated sections and simply
supported USFBs with any degree of shear connection between the steel and the concrete. The results
compared well with those from the FE analyses.
Overall, it is shown that the FE models not only provide quantitative justification as to the structural
adequacy of the proposed design method, but also provide advanced computational-based analytical
and design tools for the detailed structural behaviour of USFBs.
Acknowledgements
The results from this research study are incorporated in ASD Westok’s Ltd. (2010) design software for
USFBs (USFB-AutoMate v1.0) developed and certified by the Steel Construction Institute (SCI). The
authors would like to thank the ASD Westok group for the supply of the steel perforated specimens and
the SCI for the approval of the experimental setup, structural arrangements and geometrical
configurations of the specimens.
Abbreviations
Aec Effective shear area of concrete
bf Width of the top flange of steel beam
CSR Specification of the Cohesion Sliding Resistance
do Web opening diameter
h Overall depth of the steel beam
PCon Contact pressure
r Root radius of steel UB section
tf Flange thickness
tw Web thickness
Vc Nominal shear strength (contribution of the concrete to the vertical shear strength)
Vo Shear strength of the beam in pure shear (with zero degree of shear connection)
VS Shear capacity of the web of the steel beam to the vertical shear strength
Vuo Ultimate shear strength of the composite beam in pure shear
μ Coefficient of friction
β Degree of shear connection at a cross-section
References
[1]De Nardin S, El Debs ALHC. Study of partially encased composite beams with innovative position of stud
bolts. Journal of Constructional Steel Research 2009; 65:342-350.
[2]Bernuzzi C, Zandonini R. In: Buckner, D. and Shahrooz, B.M. editors. Slim floor steel-concrete composite
systems, Composite construction in steel and concrete, vol. III. Germany: ASCE 1996; 486-99.
[3]Viest IM, Colaco JP. Composite construction design for buildings. ASCE, Reston, Va., 1997.
[4]Hegger J, Goralski C. Structural behaviour of partially concrete encased composite sections with high
strength concrete. 5th International conference in composite construction in steel and concrete, South
Africa, 2005; 346-55.
[5]Dipaola V, Prete F, Prete G. The elasto-plastic behaviour of encased composite beams for slim floors in
multi-storey buildings. 2nd International congress-Fib, Naples, FIB, 2006; (ID 5-24):1-12.
[6]Wang Y, Yang L, Shi Y, Zhang R. Loading capacity of composite slim frame beams. Journal of Steel
Constructional Research 2009; 65:650-661.
[7]Ju YK, Chun SC, Kim SD. Flexural test of a composite beam using asymmetric steel section with web
openings. Journal of Structural Engineering ASCE 2009; 448-458.
[8]ASD Westok Ltd. “http://www.asdwestok.co.uk/Applications/Ultra+Shallow/” 2011.
[9]Hicks S. Current trend in modern floor construction. The Steel Construction Institute 2003; (11)1:32-
32.
[10]Tsavdaridis KD, Giaralis A. Derivation of Dynamic Properties of Steel Perforated Ultra Shallow Floor
Beams (USFB) via Finite Element Modal Analysis and Experimental Verification. 7th National Conference
on Steel Structures, Volos, Greece 2011; (053)2:321-329.
[11]Tsavdaridis KD, D’Mello C. Optimisation of Novel Elliptically-Based Web Opening Shapes of Perforated
Steel Beams. The Journal of Constructional Steel Research, 2011, accepted.
[12]Tsavdaridis KD. Failure modes of composite and non-composite perforated steel beams sections with
various shapes and sizes of web openings. PhD thesis (supervised by Dr. C. D’Mello), School of Engineering
and Mathematical Sciences, City University, London, 2010.
[13]BS EN197:Part 1:2000. Cement. Composition, specifications and conformity criteria for common
cements, BSI, 2000.
[14]BRE Design of normal concrete mixes, BRE report, UK, 1988.
[15]Tsavdaridis KD, D’Mello C. Vierendeel Bending Study of Perforated Steel Beams with Various Novel
Shapes of Web Openings, through Non-linear Finite Element Analyses. The Journal of Structural
Engineering-ASCE, 2011, in revision.
[16]Chung KF, Liu TCH, Ko ACH. Steel beams with large web openings of various shapes and sizes: an
empirical design method using a generalized moment-shear interaction. Journal of Constructional Steel
Research 2003; 59:1117-1200.
[17]BS EN1994-1-1:2004 Eurocode 4. Design of composite steel and concrete structures. General rules
and rules for buildings, BSI, 2004.
[18]Yu Huo B, D’Mello C, Tsavdaridis KD. Experimental Study and Analytical Study of Push-out Shear Tests
in Ultra Shallow Floor Beams. 34th IABSE Symposium, Venice, Italy 2010, IABSE Press, pp. 31-38.
[19]Lawson M. Enhanced Design of Ultra Shallow Floor Beams. Technical Paper in New Steel Construction
(NSC) Magazine, June, 2011.
[20]Shayanfar MA, Kheyroddin A, Mirza M.S. Element size effects in nonlinear analysis of reinforced
concrete members. Computers & Structures 1997; (62)2:339-352.
[21]Choi CK, Kwak HG. The effect of finite element mesh size in nonlinear analysis of reinforced concrete
structures. Computers & Structures 1990; (36)5:807-815.
[22] Tsavdaridis KD, D’Mello C, Huo BY. Shear Capacity of Perforated Concrete-Steel Ultra Shallow Floor
Beams (USFB). 16th National Concrete Conference, Paphos, Cyprus 2009; Ref no: 201101, 159.
[23] Tsavdaridis KD, D’Mello C, Hawes M. Experimental Study of Ultra Shallow Floor Beams (USFB) with
Perforated Steel Sections. Nordic Steel Construction Conference - NSCC2009, Malmö, Sweden 2009, Ref.
no:128, 312-319.
[24]Liang QQ, Uy B, Bradford MA, Ronagh HR. Strength analysis of steel-concrete composite beams in
combined bending and shear. The Journal of Structural Engineering-ASCE 2005; (131)10: 1593-1600.
[25]William KJ, Warnke EP. Constitutive model for triaxial behaviour of concrete. International
Association of Bridge and Structural Engineering Conference, Bergamo, Italy 1974, ISMES Press; 19, 174.
[26]Kachlakev, Miller T. FE Modeling of Reinforced Concrete Structures Strengthened with FRP Laminates.
Final Report SPR 316, Oregon State University, Department of Transportation, 2001.
[27]Kaewunruen S, Remennikov A. Nonlinear finite element modelling of railway prestressed concrete
sleeper, 10th East Asia-Pacific Conference on Structural Engineering and Construction - Real Structures:
Bridges and Tall Buildings. Bangkok, Thailand 2006; 4:323-328.
[28]Parvanova SP, Kazakov KS, Kerelezova IG, Gospodinov GK, Nielsen MP. Modelling the nonlinear
behaviour of R/C beams with moderate shear span and without stirrups using ANSYS. Faculty of Civil
Engineering, Sofia, Research for the National Science Fund under the contract № TH-1406/04, Technical
Report, 2004.
[29]Bangash MYH. Concrete and concrete structures: Numerical modelling and applications Elsevier
Applied Science (London and New York), Book (ISBN 1851662944 ) 1989; PUB I:102-796-517.
[30] ACI Committee 318: Building Code Requirements for Reinforced Concrete. Detroit. American Concrete Institute. 1999.
[31]AS3600: Concrete Structures Standard. Standards Association of Australia, 2009.
[32] BS 8110-1:1997. Structural use of concrete, Code of practice for design and construction, BSI, 1997.
[33]Buckhouse ER. External Flexural Reinforcement of Existing Reinforced Concrete Beams using Bolted
Steel Channels. Master’s Thesis, Marquette University, Milwaukee, Wisconsin, 1997.
[34]Rust W, Schweizerhof K. Finite element limit load analysis of thin-walled structures by ANSYS
(implicit), LS-DYNA (explicit) and in Combination. Copyright 2002 Elsevier Science Ltd., Thin Walled
Structures, 2003; (41)2-3:227-244.
[35]EC3 EN1993-1-5: Design of steel structures – General rules; Supplementary rules for planar plated
structures without transverse loading, 1993.
[36]Lawson RM, Hicks SJ. Design of beams with large openings for services. Steel Construction Institute 2006; P-355.