Embed Size (px)
Citation preview

City, University of London Institutional Repository
Citation: Kiesel, F., Ries, J.M. and Tielmann, A. (2017). The impact of mergers and acquisitions on shareholders' wealth in the logistics service industry. International Journal of Production Economics, 193, pp. 781-797. doi: 10.1016/j.ijpe.2017.09.006
This is the accepted version of the paper.
This version of the publication may differ from the final published version.
Permanent repository link: http://openaccess.city.ac.uk/18483/
Link to published version: http://dx.doi.org/10.1016/j.ijpe.2017.09.006
Copyright and reuse: City Research Online aims to make research outputs of City, University of London available to a wider audience. Copyright and Moral Rights remain with the author(s) and/or copyright holders. URLs from City Research Online may be freely distributed and linked to.
City Research Online: http://openaccess.city.ac.uk/ [email protected]
City Research Online

The impact of mergers and acquisitions on shareholders’ wealth
in the logistics service industry
Florian Kiesel
Department of Law and Economics, Technische Universität Darmstadt
Jörg M. Ries
Cass Business School, City University London
Artur Tielmann
Department of Law and Economics, Technische Universität Darmstadt
Abstract: Logistic service providers are facing significant challenges in recent years due to
intensified competition and ever-increasing customer expectations for cohesive high-standard
services at low cost. To cope with these developments many companies aim for external growth
to realize operational efficiencies and exploit productive opportunities of new markets and
diversified services. Accordingly, 2015 has even become the most active year for mergers and
acquisitions in logistic service industry. However, studies examining the post-merger
performance effect and its determinants are scarce. Consequently, this paper takes up this issue
by analysing a sample of 826 transaction announcements taken place between 1996 and 2015
and their performance effect in terms of short- and long-term abnormal shareholder returns. The
results reveal, that although overall transactions exhibit significant positive abnormal returns,
post-merger performance for the acquiring companies differs considerably according to the
logistic services offered. In the short-term trucking, railway, 3PL and air cargo companies
experience significant positive abnormal returns of about 0.6%-2.6%, while sea freight carriers
realize only marginal effects and CEP companies do even not show any significant reaction. In
the long-term, railway and 3PL companies realize a significant abnormal return of about 20%-
24%, while trucking, sea freight and air cargo carriers do not exhibit significant returns and
CEP companies do even experience significant losses of about –17%. Overall, diversifying
transactions of established full-service providers outperform focus-increasing transactions of
specialised operators.
Keywords: Logistics, freight transportation, shareholders wealth, abnormal returns, event
study
Introduction
In the last decades, the demand for logistic services has increased considerably due to the
ongoing transformation of manufacturing involving its global dispersion and fragmentation. As
a result, the logistics industry has undergone significant changes in accordance to the market
developments towards more cohesive and global services. Simultaneously, freight rates,
especially in shipping, were declining continuously since almost a decade wherefore logistics
service providers (LSPs) find themselves in a situation in which costumers are expecting high-
standard services at a low cost (Meidutė-Kavaliauskienė et al., 2014). This situation has even
worsened with the emergence of the financial crisis and its impact on the world economy.
Particularly, logistics service providers in asset-intensive businesses were affected by fierce
competition following the decline in international trade. In 2009, for example, Hapag-Lloyd
had to be provided with a loan guarantee of up to $1.75 billion from the German government
to stay afloat. In fact, all of the world’s major shipping companies were struggling during the
crisis period and experienced significant losses (e.g. Maersk incurred a loss of $2.09 billion in
2009). Similarly, in 2008 and 2009 the airline industry was incurring losses of $26.1 billion and
1
$4.6 billion mainly due to the drop in freight cargo (IATA, 2016). Even in the years after the
crisis, logistics service providers were facing a high competitive pressure due to the constant
low growth rates in the world trade (Deutsche Bank, 2016). Besides, the accelerating pace of
digitization, will also create new challenges for the logistics service industry due to changing
customer expectations and the emergence of new competitors (PWC, 2016). Start-ups, like e.g.
Matternet1, Veritread2 or Postmates3, and even former customers (e.g. Görtz Retail GmbH or
JA Apparel Corporation) already entered the market and intensified competition. Therefore,
logistics service providers are required to develop concepts that take up these challenges. It
seems obvious that, in the market with estimated revenues of approximately $4.6 trillion, even
well-established companies have to go through a transformation process to claim their position
(PWC, 2016).
Beside internal changes and organic growth to cope with the outlined challenges, mergers and
acquisitions (M&A) are important vehicles influencing firms’ business, product and geographic
strategy (Ferreira et al., 2014). Indeed, 2015 has become one of the most active years for M&A
in the logistics service industry with a total deal value of approximately $178 billion (PWC,
2015). The majority of acquisitions made were of horizontal nature and served expansion
purposes in terms of geography and market positioning (cf. PWC, 2010 and see, for example,
BBA Aviation PLC’s acquisition of Landmark Aviation or XPO Logistics Inc.’s acquisition of
Norbert Dentressangle SA). However, M&A increasingly serve the need to expand intermodal
capabilities or services provided (Carbone and Stone, 2005) as e.g. XPO’s $335 million
acquisition of Pacer in early 2014 (PWC, 2015) or UPS’s $1.8 billion acquisition of Coyote
Logistics, a high-tech and asset-light start-up (KPMG, 2016). Aimed at covering entire value
chains by positioning as integrated logistic providers offering customized capabilities across
the spectrum of logistics services and serving customers all over the globe, M&A have become
an increasingly attractive option for logistic companies to pursue growth and thus represent an
integral part of their corporate strategy nowadays (Hertz and Alfredsson, 2003, Carbone and
Stone, 2005).
Nevertheless, successful M&A activities are challenging and impose significant financial and
operational risks (King et al., 2004). Previous research revealed that many M&A transactions
reduce shareholders’ wealth and miss the intended strategic objectives (Meyer, 2001).
Moreover, the post-merger performance seems highly dependent on the corresponding industry
(Campa and Hernando, 2004). The impact of M&A in the logistics service industry in terms of
stock market reaction after the announcement and post-merger performance however, has, with
the exception of Darkow et al. (2008) for the period 1991-2006 and Andreou et al. (2012) for
the U.S. market that both focus on short-term effects, not been considered so far. Consequently,
the paper at hand takes up this issue by analysing a sample of 826 transaction announcements
taken place between 1996 and 2015 and their performance effect in terms of short- and long-
term abnormal shareholder returns to identify the conditions for successful M&A in the logistics
service industry. This is done in two steps by examining the short-term announcement effects
on shareholders’ wealth using cumulative abnormal returns (CARs) and by investigating the
long-term stock performance of the newly formed enterprise during the integration period using
buy-and-hold abnormal returns (BHARs). This paper offers several contributions for
1 Matternet is a transportation system made up of Unmanned Aerial Vehicles (UAVs), landing stations and routing software.
For further information, see www.matternet.us.
2 Veritread is a heavy haul marketplace where shippers can connect with and get bids from trusted carriers. For further
information, see www.veritread.com.
3 Postmates offers an Urban Logistics platform that connects customers with local couriers who can deliver from any store or
restaurant on-demand. For further information, see www.postmates.com.

2
researchers as well as managers. Firstly, this is the first study to explore M&A in the global
logistics service industry which enables comparisons across different regions and services
offered. Secondly, apart from frequently considered announcement effects, we also reveal that
there are significant long-term effects during and after the integration period. Finally, we
provide a discussion of the boundary conditions for improving shareholders’ wealth using
regression analysis.
The remainder of this paper is organized as follows. Section 2 provides a structured overview
of related studies on the post-merger performance in general and in the logistics industry before
developing the research hypothesis for the following analysis. Section 3 outlines the
methodology including a description of the data sources, the data selection process and the
empirical models. The findings of the short-term and long-term event studies are presented in
Section 4 that also includes the results of cross-sectional regression analyses aimed at
identifying most influential factors of post-merger performance. Finally, Section 5 concludes
the paper by summarizing the results and discussing implications for managers and researchers.
Literature review and hypothesis development
Logistics literature on mergers and acquisitions
In the logistics service industry, M&A activity has seen a persistent growth over the past years
(cf. Figure 1) that is likely to continue given the increasing demand for efficient and specialised
services. Due to the ongoing transformation of manufacturing involving its global dispersion
and fragmentation, the strategic challenge of designing global value networks has become
predominantly an inter-firm activity (Brennan et al., 2015). This also requires logistic services
capable to integrate complex networks with global flows of goods and information (cf.
Christopher, 2016). As has been shown, interventions impeding international trade and thus
hindering integrated logistics services seem to exhibit significant negative valuation effects for
the affected companies (Tielmann and Schiereck, 2017). Besides its ever-increasing practical
importance, only few industry-specific M&A studies aimed at shedding light on transaction
rationales and performance implications for the involved logistic companies (cf. Table 1).
Although the motives for M&As are rather diverse, several categories of transaction rationales
have been discussed in literature ranging from value creation and managerial self-interest to
firm characteristics and environmental factors (see Trautwein, 1990, Seth et al., 2002 and
Haleblian et al., 2009). Most studies, however, refer to value creation motives and assume that
involved companies do either expect to benefit from synergistic gains by realizing operational
efficiencies and exploiting productive opportunities of new markets and products which will
induce gains for shareholders of acquiring and target companies (cf. Berkovitch and
Narayanan, 1993 and Seth et al., 2002) or aim at limiting competition by increasing market
power and facilitate collusion which is again expected to be beneficial for both shareholders
(cf. Trautwein, 1990 or Haleblian et al., 2009). Besides value creation, several studies have
examined managerial motives involved and emphasize opportunistic behaviour of the
management aimed at compensation and risk reduction or exaggerated self-confidence of
managers and overestimation of target values. Both, opportunism and overconfidence, is
assumed to induce falling shareholder values for the acquirer, rising shareholder values for the
target and zero total gains (see Seth et al., 2002).
Beginning in the early 1980s and mostly driven by geographical or service expansion, M&A
activity swept across the international logistics service industry including all types of transport
operators (Ojala, 1993). Liberalization of trade and deregulation of the transport markets has
fuelled the geographical expansion of multinational logistics service providers. Combined with
the rise of numerous new competitors from emerging countries after several waves of
privatization, this led to fierce competition in the logistics industry and consolidation trends in

3
emerging countries (PWC, 2010). In the light of this, M&A motives for leading multinational
logistics service providers targeting local providers in emerging countries are seen in expected
profits from improved geographical coverage as well as establishing domestic operations in
fast-growing markets. Financially-better equipped logistics service providers from emerging
countries, in contrast, rather aim for economies of scale in the strongly fragmented domestic
market (PWC, 2010). Studies from the European logistics market moreover reveal that the
degree of sectoral concentration in the logistics industry is not affected by M&A (cf. Hofmann
and Bachmann, 2010), wherefore market power and collusion do not seem to fuel transactions.4
In contrast, many of the mostly horizontal transactions in the European logistics market seem
to be driven by synergistic gains obtained from economies of scale and scope and geographical
expansion followed by access to specialized capabilities for higher-valued services in existing
markets (Hofmann and Bachmann, 2010). Analyzing the strategic development of European
Third Party Logistic Providers (3PL), it is revealed that external growth frequently aimed at
providing more cohesive services and/or better geographical coverage (Hertz and Alfredsson,
2003, Carbone and Stone, 2005). In addition, the increasing diversification towards more
extensive logistic services being pursued by traditional transport operators results in the
existence of multiple player, trying to find profitable strategic positions in the 3PL market.
However, only a few market leaders offer a wide range and scope of services, while most firms
focus on a diversified portfolio of services (Carbone and Stone, 2005). Similarly, it has been
shown that operational synergies are of especial importance for M&A of 3PL providers in the
U.S. (Wu and Cheng, 2006). Comparable results have also been found in the North American
trucking industry and the maritime transport industry, where transactions were mostly
motivated by the need to consolidate existing operations while at the same time they sought
geographic expansion (Brooks and Ritchie, 2005, 2006). Taken as a whole, previous studies of
M&A in the logistics service industry indicate strong synergistic motives aimed at realizing
operational efficiencies and exploiting new opportunities by acquiring physical, human,
information, knowledge and relational resources and then bundling them together to create
inimitable and firm-specific capabilities (Wong and Karia, 2010).
Although many M&A studies apparently refer to these value creation motives, the empirical
results of previous studies on the post-merger performance of acquiring and target firms remain
ambiguous (cf. Seth et al., 2002 and Nguyen et al., 2012). Early cross-industry studies, typically
examining the performance effect of transactions on the acquiring firm, suggest that
acquisitions did not enhance firm value either in the short-term (Dodd, 1980; Eckbo, 1983) or
in the long-term (Agrawal et al., 1992; Loderer & Martin, 1992). In some studies, acquisitions
were even found to corrupt acquiring firm value (Chatterjee, 1992; Seth et al., 2002). In addition
to the acquirer’s effects, analyses reveal that targets often experienced significant positive
returns (Asquith and Kim, 1982; Datta et al., 1992). These results have also been supported by
combined acquirer and target analyses revealing significantly positive joint outcomes which,
however, mostly originate from target gains while acquiring firms realize no or negative
abnormal returns (Housten et al., 2001; Carow et al., 2004). A comprehensive summary of post-
merger performance effects in cross-industry M&A studies can be found in Bruner (2002).
However, previous research has identified a significant degree of performance variation across
different industries (cf. Campa and Hernando, 2004) and the literature focussing on
performance implications of M&A in the logistics service industry remains scarce (cf. Andreou
et al., 2012 and see Table 1 for an overview of empirical studies on post-merger performance
implications in the logistics service industry or related sub-sections).
4 We note, however, that as the logistics industry is quite diverse, this may hold true for certain segments.

4
Author(s) (year) Industry sample Period Sample size Key findings
Alexandrou et al. (2014) Water transportation 1984-2011 1266 Positive abnormal average returns for shareholders of acquirer firms and
shareholder of target firms, whereby cross-border and focus-increasing
deals tend to outperform national and diversifying deals.
Acquirers’ shareholder gains vary significantly across maritime sectors and
regions but are generally driven by smaller acquirer size, higher acquirer
profitability, stock financing and cross-border deals.
Andreou et al. (2012) Freight transportation in
USA
1980-2009 289 Positive average synergistic deal value that accrues mostly to targets’
shareholders rather than to acquirers’ shareholders.
Tender offers have a positive impact on synergistic value whereas target
returns are positively influenced by diversifying transactions and acquirer
returns are positively influenced by friendly transactions.
Cortés et al. (2015) Air transportation in
South America
1996-2013 28 Target firms realize significant positive abnormal returns especially in
cases where transactions are considered to be strategic and the shareholders
expect the integration to create substantial synergies.
Acquirers’ shareholders do not realize significant abnormal changes in
stock returns around the transaction announcement.
Darkow et al. (2008) Freight transportation 1991-2006 200 Positive abnormal returns for shareholders of acquirer firms, target firms
and the combined entity, whereas cross-border transactions generate
significantly higher abnormal returns than national ones and transactions
with large volumes appear more successful than smaller ones.
From an acquirer’s perspective focusing transactions perform better than
diversifying ones from whereas diversifying transaction outperform
focusing ones from the target’s perspective.
Kammlott and Schiereck (2011) Water transportation 1980-2007 213 Negative abnormal returns for the acquirers’ shareholder simultaneously to
positive abnormal returns for the targets’ shareholders with distinctive
regional, temporal and direction-specific differences.
Transnational transactions exhibit significant negative abnormal returns for
acquirers with regional differences (e.g. European transactions are
evaluated significantly more successful than Asiatic) and transactions
before ORA (Ocean Shipping Reform Act) outperform transactions after
deregulation went into effect.
Levin and Weinberg (1979) Railroad transportation in
USA
1967-1971 221 Although there is wide variety in the efficiency of transactions, with regard
to geographical configuration horizontal mergers achieve higher gains in
market share than vertical, lateral or mixed transactions.

5
Given that gains in market share reflect underlying cost and service quality
improvements, merger-related cost savings and performance improvements
in terminal and interchange operations outweigh those in line-haul
operations.
Merikas et al. (2011) Water transportation 1995-2009 111 Most transactions in shipping can be traced back to growth motives realized
by investments in undervalued targets that are frequently less profitable
than the acquiring firms.
The likelihood of acquisition increases with decreasing profitability in
relation to assets and decreases with increasing levels of debt in relation to
the market value of the firm’s outstanding shares.
Samitas and Kenourgios (2007) Water transportation in
USA
2000-2007 15 The average cumulative abnormal return is significant and positive after the
announcement of the merger or the acquisition and remains stable for
different event windows.
Especially for tramp shipping firms that do not serve standardized routes
but operate on the basis of individual chartering, the announcement of
transactions have a direct positive impact on stock value.
Singal (1996) Air transportation in USA 1985-1988 14 Shareholder of acquiring and target firms earn significantly positive
abnormal returns in contrast to rival firms’ stockholders that on average
neither benefit nor lose from transactions due to contradictory effects of
more efficient operations and less competition.
Consolidating transactions in which both firms operate in the same
geographic market are expected to induce significantly higher efficiency
and market power gains than expanding transactions and abnormal stock
returns are correlated with profit changes due to market anticipation.
Slovin et al. (1991) Air transportation in USA 1965-1988 42 Shareholder of acquiring and target firms earn significantly positive
abnormal returns under and after CAB (Civil Aeronautics Board)
regulation, however, whereas abnormal returns for acquiring firms
decrease, abnormal returns for target firms increase after deregulation.
For the period of CAB regulation, rival firms earn positive average excess
returns for transactions with nontrivial changes in industry concentration,
but after deregulation, transactions have no significant valuation effects on
rival firms.
Table 1: Related studies analyzing mergers and acquisitions performance in the logistics service industry

6
Levin and Weinberg (1979) analyzed changes in market shares to measure the effect of U.S.
railroad mergers and found that horizontal mergers achieve higher gains in market share than
vertical, lateral or mixed transactions. Considering the share price reactions to horizontal
airline-acquisitions involving domestic interstate carriers traded on the New York or American
Stock Exchange, Slovin et al. (1991) showed that shareholders of acquiring and target firms
earn significantly positive abnormal returns before and after deregulation. These findings are
in line with Singal (1996) who also showed that rival firms’ stockholders neither benefit nor
lose from transactions due to contradictory effects of more efficient operations and less
competition. More recently, Cortés et al. (2015) revealed that in M&A of South American
airlines, target firms realize significant positive abnormal returns whereas there are no
significant abnormal changes in stock returns for acquirers’ shareholders. For the tramp
shipping industry in the U.S., Samitas and Kenourgios (2007) found that M&A have a direct
positive impact on shipping firms’ stock prices and increase financial value in the long run.
This finding is supported by Merikas et al. (2011) who considered a global sample of M&A
from the maritime transport industry. They revealed that transactions are supposed to enable
growth by investments in undervalued targets that are frequently less profitable than the
acquiring firms. Considering transactions in the global shipping market, Kammlott and
Schiereck (2011) found negative abnormal returns for the acquirers’ shareholders
simultaneously to positive abnormal returns for the targets’ shareholders with distinctive
regional, temporal and direction-specific differences. In a more recent study, Alexandrou et al.
(2014), however, showed positive abnormal average returns for shareholders of acquirer firms
and shareholders of target firms whereas acquirers’ shareholders gains vary significantly across
maritime sectors and regions. Darkow et al. (2008) are among the first to analyze the impact of
M&A in the logistics service industry as a whole. Considering 200 transactions between 1991
and 2006 they revealed significant positive abnormal returns for both, acquirer and target.
Similarly, Andreou et al. (2012) showed that for M&A of freight transportation firms in the
U.S., apart from these acquirer’s and target’s shareholder gains, the transactions also create
synergistic gains for the newly formed organization.
As there has been shown a significant degree of performance variation (cf. Campa and
Hernando, 2004) across industries which has, with the exception of Darkow et al (2008) for the
period 1991-2006 and Andreou et al. (2012) for the U.S. market, not been considered, a further
more in-depth analysis of the performance implications of M&A in the logistics service industry
can provide valuable insights for researchers and practitioners. In addition, a closer look at prior
studies on the performance implications of M&A in the logistics service industry reveals that
most empirical studies either consider local markets or focus on specific transport operators
(e.g., tramp or liner shipping, railroads and airlines). Consequently, these studies neither take
into account attempts to better geographical coverage by not considering a global transaction
sample that also enables regional comparisons nor cover recent trends towards providing more
cohesive and non-asset-based services which includes transactions across different groups of
logistics service providers. In addition, the analysis is usually only performed for the
announcement effect using a short time period and rather small sample sizes (cf. Table 1). For
instance, Singal (1996) examines M&A in the U.S. airline industry for the period 1985-1988
analyzing the stock market reactions for acquirers, targets and rivals. Cortés et al. (2015), in
contrast, considers the effect of transaction announcements taking place in South America in
the period 1996–2013, but the sample only contains 28 M&As. Finally, as most studies only
consider events prior to the financial crisis reaching its peak in 2008, they do not allow for pre-
and post-crisis comparisons. The paper at hand takes up these issues by examining 826 M&A
announcements from the global logistics service industry between 1996 and 2015 and analysing
their performance impact in terms of short-term and long-term stock price effects.

7
2.2. Theoretical expectations and hypothesis development
Given the limitations of specific theoretical frameworks for M&A in the logistics service
industry, we deduce our hypotheses with regard to the effects to acquirers’ and targets’
shareholders wealth and the underlying performance drivers based upon the general literature
and the findings from previously conducted local or service-specific studies. As outlined before,
a number of theories have been proposed to explain the general impact of M&A revealing
negative or insignificant transaction effects to the acquiring firm shareholders (cf. Eckbo, 1983;
Agrawal et al., 1992 or Seth et al., 2002), positive returns to the target firm shareholders (cf.
Datta et al., 1992) and positive joint outcomes in the short-term as well as in the long-term (cf.
Carow et al., 2004, Barber and Lyon, 1997 or Chakrabarti et al, 2009). Since for different
transport operators both positive and negative stock price effects to the acquiring companies
have been observed in the post-announcement period (cf. Kammlott and Schiereck, 2011 or
Alexandrou et al., 2014), our hypotheses are:
H1a. Mergers and acquisitions in the logistics service industry will not induce significant short-
term abnormal returns for the acquiring firms’ shareholders.
H1b. Mergers and acquisitions in the logistics service industry will induce significant short-
term positive abnormal returns for the target firms’ shareholders.
H1c. Mergers and acquisitions in the logistics service industry will induce significant positive
long-term abnormal returns for the joint firms’ shareholders.
Although the demand for logistics services is, apart from general trends, such as the global
dispersion and fragmentation of manufacturing (cf. Brennan et al., 2014), closely correlated
with the global economic development and international trade flows in the short run, the logistic
markets are quite diverse with regard to their regional structures. However, the general
economic conditions affect the scale of international trade, which has an impact on the logistics
industry (Alexandrou et al., 2014). Several studies show a positive correlation between the
volume of freight traffic and economic growth, measured by the total global GDP (e.g. Gao et
al., 2016; Nielsen et al., 2003). Therefore, in order to consider the impact of general
developments in global trade flows measured in changes of the GWP, our second hypothesis
is:
H2. Post-merger abnormal returns for the acquiring firms’ shareholders are significantly
higher in times of economic upturn.
As has been shown in previous studies, many transactions in the logistics service industry aim
for synergistic gains by exploiting productive opportunities of better geographical coverage or
utilisation of specialized capabilities for more cohesive and higher-valued services (see, for
example, Hertz and Alfredsson, 2003, Carbone and Stone, 2005). Whereas international
expansion is mostly driven by leading multinational logistics service providers targeting
emerging markets (PWC, 2010), diversification is pursued by traditional transport operators
(Carbone and Stone, 2005). Although international and diversifying transactions bear a high
risk of overpayments due to asymmetric information and cultural differences (Shimizu et al.,
2004), especially the leading logistics service providers targeting these transactions have often
already gained experience across service segments and international markets. Therefore, the
benefits of such expansions are highly likely to outperform the associated risks. Accordingly,
our hypotheses with respect to potential synergies are:

8
H3a. Diversified acquiring companies do realize significantly better post-merger abnormal
returns for its shareholders in the short- as well as in the long-term.
H3b. Diversifying transactions do realize significantly better post-merger abnormal returns for
the acquiring firms’ shareholders in the short- as well as in the long-term.
H3c. Cross-continental transactions do realize significantly better post-merger abnormal
returns for the acquiring firms’ shareholders in the short- as well as in the long-term.
Data and methodology
Sample construction
The sample of transactions for the event study is obtained from the Securities Data Corporation
(SDC) Platinum / Thomson Reuters database. It includes all M&A events announced between
January 1st, 1996, and December 31st, 2015. LSPs are identified by the four-digit Standard
Industrial Classification (SIC). In order to analyze the impact of transactions on stock
performance in more detail, we defined different categories of logistic service providers with
regard to scope of primarily services offered and related aspects. Table 2 provides an overview
of the categories, transportation carrier (TC LSP) including corresponding infrastructure
provider, courier, express and parcel provider (CEP LSP) and third-party logistics service
provider (3PL LSP), as well as their corresponding SIC codes (for a more detailed description
of classification criteria, see Hofmann and Lampe, 2013). Companies in the category TC LSP
are transport operators that haul products in the sub-categories sea freight, air cargo, railway or
trucking. In contrast, companies in the category CEP LSP offer more specific services and are
placed between transportation carriers and 3PL LSP. In general, 3PL LSP offer a bundle of
more customized services that go beyond basic transportation services. This may require
subcontracting transport carriers if they do not own transportation assets themselves (cf.
Berglund et al., 1999 or Hofmann and Lampe, 2013).
For consideration in the initial sample the transaction announced between January 1st, 1996,
and December 31st, 2015 had to meet the following criteria. First, at the time of the transaction
announcement the primary business activity of both the acquirer and the target were in the
logistic service industry (cf. SIC codes in Table 2). Second, after the completion of the
transaction, the acquirer intended to own a majority stake of at least 50% of the outstanding
shares or of the private equity. Third, the transaction had to be completed by the time of the
analysis. These criteria lead to an initial sample of 3,632 M&A transactions. In a next step, all
non-exchange listed acquirer companies were excluded from the sample and events with
insufficient stock data and/or weak trading pattern in the estimation and event period were
removed.5 If a company in eight of ten trading days in the year prior to the event was not actively
traded (equals non-zero-returns), the event was eliminated. The liquidity was checked to
estimate the beta more efficiently without too many zero-trading observations in the estimation
period. All relevant stock data was obtained from Thomson Reuters Financial Datastream.
LSP category SIC code
Transportation
carrier (TC LSP)
Sea freight 4412, 4424, 4432,
4449, 4491, 4499
Air cargo 4512, 4522, 4581
Railway 4011, 4013, 4741
5 Note that stock returns with sufficient trading volumes are a prerequisite for analyzing the impact of M&A deals on the
shareholders’ wealth.

9
Trucking 4212, 4213, 4231
Courier, express,
parcel (CEP LSP)
4215, 4513
Third party logistics
(3PL LSP)
4214, 4221, 4222,
4225, 4226, 4731,
4783, 4789
Table 2. Classification of logistic service providers using the four-digit Standard Industrial
Classification.
Events that were distorted by other M&A during the [–10; +10] event window were eliminated
to control for confounding events. This lead to the elimination of 584 events. In addition, we
eliminated all events that could be affected by announcements about alliance founding (e.g.
New World Alliance), open skies agreements (e.g. EU-US Open Skies Agreement), free trading
agreements (e.g. NAFTA) or granting cabotage rights (e.g. unrestricted cabotage permit for all
EU members) which lead to 51 additional confounding events. Following the outlined selection
criteria, a final sample of 826 M&A events in the logistic service industry between the years
1996 and 2015 was derived. Figure 1 illustrates the frequency of transactions for the different
LSP categories over time in comparison to the average deal value. After a sharp decline in 2007,
the number of transactions among logistic service providers increased up to the level before the
financial crisis.
The majority of transactions is undertaken by transport operators. Most of the deals in this
cluster were realized by trucking carriers (219), followed by sea freight carriers (182) and air
cargo carriers (114), whereas M&A announcements of railroad carriers are rare (43). The
second largest LSP category is 3PL (223) followed by CEP which shows, with a clear distance,
the smallest number of transactions (45). Most of the transaction partners are headquartered in
the U.S., followed by Europe and Asia. Acquirer from countries outside these regions (Rest of
World) are rather rare which is in line with previous observations that international expansion
into emerging markets is mostly driven by leading multinational logistics service providers
(PWC, 2010). Overall, in 310 transactions acquiring and target companies are from different
nations and in 146 transactions even from different continents which reveals a strong presence
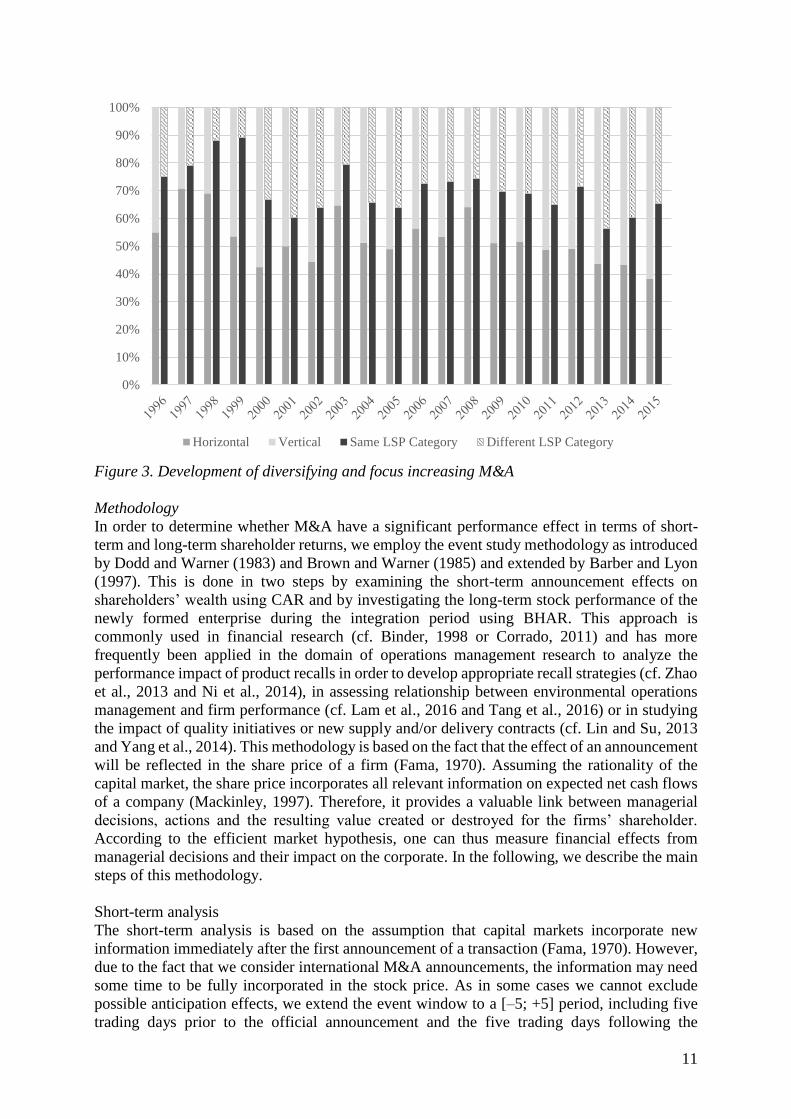
of geographic expansion within the industry (cf. Figure 2). Similarly, Figure 3 shows that there
is a strong tendency for diversification in recent years. In 408 transactions, the acquirer and the
target exhibit a different primary SIC code and in 252 transactions they are even found to be
from different LSP categories. This supports the argument that logistics service providers aim
for expanding their role from supportive primary functions to more cohesive customer-oriented
services such as inventory management, packaging or manufacturing (Chapman et al., 2003).
In the course of this, the business models of LSPs defined as the conceptual model of the
architecture of the firm and its network of partners expressing the company’s logic of creating
and delivering value (cf. Zott et al., 2011) no longer seek for efficiency rather than for new
knowledge, customer satisfaction and innovative services to meet customers’ evolving needs
(Chapman et al., 2003).

10
Figure 1. Development of acquirers and targets by year and region.
Figure 2. Development of domestic and international M&A
$0.00
$100.00
$200.00
$300.00
$400.00
$500.00
$600.00
$700.00
$800.00
$900.00
0
10
20
30
40
50
60
mil
lio
ns
Acquirer North America Acquirer Europe Acquirer Asia
Acq Rest of WorldW Target North America Target Europe
Target Asia Target Rest of World Average Deal Value
0%
10%
20%
30%
40%
50%
60%
70%
80%
90%
100%
Cross-Border National Cross-Continental Same Continent
11
Figure 3. Development of diversifying and focus increasing M&A
Methodology
In order to determine whether M&A have a significant performance effect in terms of short-
term and long-term shareholder returns, we employ the event study methodology as introduced
by Dodd and Warner (1983) and Brown and Warner (1985) and extended by Barber and Lyon
(1997). This is done in two steps by examining the short-term announcement effects on
shareholders’ wealth using CAR and by investigating the long-term stock performance of the
newly formed enterprise during the integration period using BHAR. This approach is
commonly used in financial research (cf. Binder, 1998 or Corrado, 2011) and has more
frequently been applied in the domain of operations management research to analyze the
performance impact of product recalls in order to develop appropriate recall strategies (cf. Zhao
et al., 2013 and Ni et al., 2014), in assessing relationship between environmental operations
management and firm performance (cf. Lam et al., 2016 and Tang et al., 2016) or in studying
the impact of quality initiatives or new supply and/or delivery contracts (cf. Lin and Su, 2013
and Yang et al., 2014). This methodology is based on the fact that the effect of an announcement
will be reflected in the share price of a firm (Fama, 1970). Assuming the rationality of the
capital market, the share price incorporates all relevant information on expected net cash flows
of a company (Mackinley, 1997). Therefore, it provides a valuable link between managerial
decisions, actions and the resulting value created or destroyed for the firms’ shareholder.
According to the efficient market hypothesis, one can thus measure financial effects from
managerial decisions and their impact on the corporate. In the following, we describe the main
steps of this methodology.
Short-term analysis
The short-term analysis is based on the assumption that capital markets incorporate new
information immediately after the first announcement of a transaction (Fama, 1970). However,
due to the fact that we consider international M&A announcements, the information may need
some time to be fully incorporated in the stock price. As in some cases we cannot exclude
possible anticipation effects, we extend the event window to a [–5; +5] period, including five
trading days prior to the official announcement and the five trading days following the
0%
10%
20%
30%
40%
50%
60%
70%
80%
90%
100%
Horizontal Vertical Same LSP Category Different LSP Category

12
announcement. Using extended event windows obviously reduces the power of the
methodology as one cannot exclude other possible announcement effects distorting the results.6
For each event, we then calculate the realized return and the ‘normal’ return.7 The normal return
is estimated using ordinary least squares estimates over a 252-trading day period (one whole
trading year) beginning 262 days prior to the event day (t=−262) ending 11 days prior to the
event day (t=−11).
Our variable of interest is the difference between the company’s realized return and the normal
return that we would expect on day i without the M&A announcement. In analogy to prior event
studies (cf. Binder, 1998 or Corrado, 2011), we use the market model to estimate the abnormal
return8:
𝐴𝑅𝑖,𝑡 = 𝑅𝑖,𝑡 − (�̂�𝑖 + �̂�𝑖𝑅𝑚,𝑡) (1)
where Ri,t is the return of company i on day t, Rm,t is the return of the benchmark index on day
t, �̂�𝑖 and �̂�𝑖 are the regression coefficients of company i. Datastream’s value-weighted total
return national stock market index of LSP i’s country of origin is used as the benchmark index.
The cumulative abnormal return (CAR) for stock i during the event window [τ1,τ2]ϵ[−5; +5] is
calculated as:
𝐶𝐴𝑅𝑖,[𝜏1,𝜏2] = ∑ [𝑅𝑖,𝑡 −
𝜏2
𝑡=𝜏1
(�̂�𝑖 + �̂�𝑖𝑅𝑚,𝑡)] (2)
Finally, for a sample of N transactions, the average CAR (ACAR) for a given event window is
derived by:
𝐴𝐶𝐴𝑅[𝜏1,𝜏2] = 1
𝑁 ∑ 𝐶𝐴𝑅𝑖,[𝜏1,𝜏2]
𝑁
𝑖=1
(3)
ACARs are calculated for the interval [τ1;τ2]ϵ[−5; +5].
Long-term analysis
In addition to the short-term event study, we use the BHAR method to measure the return
difference between the event firms compared to the benchmark market. Lyon et al. (1999) show
that the BHAR approach is robust, while other long-term approaches (e.g. the calendar time
method) are miss-specified in non-random samples. The long-term value creation (in the 36
months following the focal acquisition) was therefore assessed using the BHAR methodology
in analogy to Barber and Lyon (1997) and Mitchell and Stafford (2000). The BHAR approach
6 Note that we eliminated all major events from the sample that could have been affected by announcements about alliance
founding (e.g. New World Alliance), open skies agreements (e.g. EU-US Open Skies Agreement), free trading agreements
(e.g. NAFTA) or granting cabotage rights (e.g. unrestricted cabotage permit for all EU members) in the [5, +5] event window.
In total, we excluded 51 additional confounding events. These steps resulted in a substantial reduction of observation, but
helped to improve the quality of the dataset and the related results.
7 Note that this is the expected return without the announcement effect.
8 To control for robustness, we also applied the four-factor model by Carhart (1997). Fama and French (1993, 1996) extended
the single index model to a three-factor model which was further extended by Carhart (1997) who added a fourth factor that
captures the momentum effect as described by Jegadeesh and Titman (1993). The detailed results of the four-factor model
are found to be similar to the ones obtained from the market model and were therefore not provided in the paper.

13
allows the assessment of abnormal returns over a longer time horizon and overcomes the
limitations resulting of the use of narrow windows around the announcement dates that only
measures the expected cash flows. The 36-months return from a buy-and-hold strategy was
computed for the three years after the M&A announcement and was then referenced against the
world-wide benchmark. Consequently, the market-adjusted BHARs can be calculated as:
𝐵𝐻𝐴𝑅𝑖,[𝜏1,𝜏2] = Π𝜏1
𝜏2(1 + 𝑅𝑖,𝑡) − Π𝜏1
𝜏2(1 + 𝑅𝑚,𝑡) (4)
where Ri,t is the return of company i on day t and Rm,t is the return of the world-wide benchmark
index on day t.
Tests of significance
The outlined methodology allows us to calculate the abnormal return for each event. In a next
step, we analyse whether the vector of abnormal returns is significantly different from zero.
Therefore, we use two parametric test statistics and one non-parametric test statistic. First, we
apply the Boehmer et al. (1991) test. This test is commonly used for event studies as it is robust
against volatility-changing events and standardizes the abnormal returns. However, the more
recent test of Kolari and Pynnönen (2010), known as KP-test, indicates an overreaction of the
null-hypothesis for the BMP-test, if correlation is ignored. The KP-test adjusts the variance of
the mean abnormal return in the event period using the correlation of the residuals in the
estimation period and therefore accounts for cross-sectional correlation. We also apply the
nonparametric test statistic introduced by Corrado (1989), which was later refined by Corrado
and Zivney (1992), known as CZ-test. To assess significance of the long-term analysis, the
BHARs are tested for changes significantly from zero with the t-test and the skewness-adjusted
t-test, originally developed by Johnson (1978). As BHARs are positively skewed (e.g. Barber
and Lyon, 1997; Kothari and Warner, 1997), the Johnson (1978) test transforms the usual t-test
to eliminate this skewness bias.
3.2.4 Analysis of determinants
In order to identify the determinants of the stock market reactions following upon the
transaction announcements a cross-sectional regression analysis is conducted. The multivariate
ordinary least squares regression follows:
𝐴𝐶𝐴𝑅𝑖,[𝜏1,𝜏2] = 𝛽0 + ∑ 𝛽𝑗𝑉𝑎𝑟𝑗
𝑚
𝑖=1+ 𝜖 (5)
where ACARi,[−1; +1] is the abnormal return of firm i ∈ {1,…,m}, during the [−1; +1] event
window, β0 is the regression constant, βi are the regression coefficients for the independent
variables with j ∈ {1,…,m}, Varj are the independent variables with j ∈ {1,…,m}, and ε is the
error term. In order to explain the ACARs during the [−1; +1] and the event window,
macroeconomic, company specific and event specific variables are tested in the following
section. Similarly, OLS regressions based on the same independent variables are used to assess
the determinants for the long-term performance of the company, measured by the 36 months
buy-and-hold abnormal returns.
Empirical results
Short-term stock market analysis
In the following, we discuss the results of the short-term stock market analysis describing the
immediate effect at the time the M&A is announced. Table 3 reports the results for the acquirer
companies, whereas Table 4 provides the corresponding results for the target companies. Upon
the announcement of a transaction, acquirers earn a significant 1.31% abnormal return in the

14
[−1; +1] event-window around the announcement date. In absolute numbers, this equals an
average increase of $34.5 million in the market value of the acquirer’s equity. This gain in
company value is highly significant according to all test statistics. The positive effect is also
shown in larger event windows such as the [−5; +5] event window. In the 5 days prior to and 5
days subsequent to the M&A announcement, the value gain remains comparatively stable at
about 1%. This finding is in line with prior research (cf. Table 1), but reveals the exceptional
role of M&A in the logistics service industry. Unlike results from the majority of other
industries (cf. Eckbo, 1983; Agrawal et al., 1992; Seth et al., 2002), positive short-term returns
to acquirers represent the capital market’s perception of value-creating synergies and expected
future benefits of the transaction. Therefore, the results contradict our hypothesis H1a
postulating that M&A announcements do not have an impact on the acquirers’ company value
in short-term.
Event
window
ACAR Median
CAR BMP KP CZ Sample
CAR >0 (Z-score) (Z-score) (Z-Score) Size
[−5; +5] 0.98% 0.60% 54.36% 3.951*** 4.037*** 2.034*** 826
[−2; +2] 1.32% 0.81% 56.78% 6.447*** 6.310*** 4.375*** 826
[−1; +1] 1.31% 0.75% 58.23% 7.571*** 7.313*** 5.504*** 826
[0; 0] 0.60% 0.08% 51.82% 5.084*** 5.012*** 3.710*** 826
Table 3. Event study results for acquirer firms. This table summarizes the stock market reaction to M&A announcements of acquirer companies in the logistic
service industry. The CARs are calculated for acquirers over multiple event windows for firms in the logistic
service industry between 1996 and 2015. The sample includes 826 acquiring firms from the logistic service
industry. ACARs are tested for statistical significance using the parametric BMP and KP test procedure and the
nonparametric CZ rank test. ∗,∗∗,∗∗∗ denote statistical significance at the 10%, 5%, and 1% level, respectively.
Most of the target companies are private wherefore the sample size becomes much smaller.
However, our sample includes 40 listed target companies that will be analyzed in more detail.
The results clearly indicate that targets earn notably positive and highly significant abnormal
returns during the days surrounding the transaction. On the announcement day itself, the
company’s stock price increases by almost 15% and exhibits a positive trend. During the three
days around the announcement ([−1; +1] event window) the stock prices increase by more than
19%. The highest ACAR of 22% can even be found in the [−5; +5] event window. All results
are highly statistically significant and consistent with the findings of prior studies. For the
logistics service industry, similar but less pronounced positive effects of up to 14.8% have been
reported in Darkow et al. (2008) Other cross-industry studies on international transactions of
non-financial companies find that the targets’ shareholders realize an average abnormal return
of 20%-30% (cf. Bradley et al., 1983; Datta et al., 1992; Campa and Hernando, 2004). For
freight transportation companies Andreou et al. (2012) show that most of the synergistic gains
of the M&A accrue to the target companies’ shareholders. Our overall results for target
companies are thus in line with the prior findings and the expectations outlined in hypothesis
H1b.
Event
window
ACAR Median
CAR
BMP KP CZ Sample
CAR >0 (Z-score) (Z-score) (Z-Score) Size
[−5; +5] 22.00% 13.31% 75.00% 4.810*** 4.508*** 2.888*** 40
[−2; +2] 21.27% 12.40% 80.00% 5.295*** 5.015*** 4.486*** 40
[−1; +1] 19.02% 8.72% 82.50% 5.045*** 4.868*** 5.087*** 40
[0; 0] 14.93% 6.02% 80.00% 4.670*** 4.485*** 5.634*** 40

15
Table 4. Event study results for target firms. This table summarizes the stock market reaction to M&A announcements of target companies in the logistic
service industry. The CARs are calculated for targets over multiple event windows for firms in the logistic
service industry between 1996 and 2015. The sample includes 40 target firms from the logistic service industry.
ACARs are tested for statistical significance using the parametric BMP and KP test procedure and the
nonparametric CZ rank test. ∗,∗∗,∗∗∗ denote statistical significance at the 10%, 5%, and 1% level, respectively.
Summarizing, we find that the capital market reactions, and therefore the investors’
expectations, differ significantly, depending on whether the company is acquirer or target. In
contrast to prior literature, however, both companies can realize a positive effect. Therefore,
one can conclude that M&A announcements in the logistics service industry are expected to
induce financial advantages for acquirer and target companies alike. Consequently, unlike
shown in many cross-industry studies, companies in the logistics service industry gain a positive
shareholder wealth following an M&A announcement. These results are also highlighted in
Figure 4 that illustrates acquirers’ and targets’ shareholders gain in terms of positive abnormal
returns upon the announcement of a transaction. While acquirers’ shareholders exhibit a
comparatively small but positive effect, the target’s exhibit a significant abnormal stock returns
of more than 20%.
Figure 4. CAARs of the acquiring and target firms.
This figure illustrates the ACAR development of the acquirer and target companies in the logistic service industry
during the [−5; +5] day event window surrounding M&A announcement date t = 0. The acquirer sample consists
of 826 companies from the logistics service industry, the target sample includes 40 exchange-listed firms from the
logistics service industry.
Table 5 Panel A to Panel F similarly reports the event study results for the acquiring companies,
but accounts for the different LSP categories. Significant positive results of transaction
announcements can, in short-term, be obtained for trucking, railway, air cargo, and 3PL. With
regard to the [–1;+1] event window the average abnormal stock returns range from 1.3% to
2.6% and are higher for carriers in the asset-intense railway and air cargo industries than for
trucking and 3PL companies. In contrast to Alexandrou et al. (2014), we do not find significant
positive abnormal returns for sea freight carriers in most of the event windows. Only in the [–
1;+1] event window the ACAR is slightly positive with 0.6% and significant according to the
-5%
0%
5%
10%
15%
20%
25%
-5 -4 -3 -2 -1 0 1 2 3 4 5
Acquirer (N = 826) Target (N = 40)

16
BMP-test and the KP-test. However, extending the event window, we do not find more
significant results.9 In addition, the results indicate that CEP companies do not benefit from
M&A in the short-term. The ACAR is weakly significant for the [−1; +1] day event window,
but leaks in significance for all other event windows.
Event
window
ACAR Median
CAR
BMP KP CZ Sample
CAR >0 (Z-score) (Z-score) (Z-Score) Size
Panel A: Trucking [−5; +5] 0.91% 0.95% 55.71% 1.751* 1.820* 1.351 219
[−2; +2] 1.28% 0.59% 52.05% 2.940*** 2.777*** 2.153** 219
[−1; +1] 1.25% 0.57% 56.16% 3.525*** 3.141*** 2.736*** 219
[0; 0] 0.62% 0.05% 52.51% 2.692*** 2.503** 2.441** 219
Panel B: Railway
[−5; +5] 1.31% −0.18% 48.84% 1.422 1.676* 0.119 43
[−2; +2] 2.03% 1.09% 55.81% 2.699*** 2.937*** 1.541 43
[−1; +1] 2.00% 1.56% 67.44% 2.980*** 3.107*** 1.998** 43
[0; 0] 1.01% 0.22% 60.47% 2.122** 2.155** 1.825* 43
Panel C: Sea freight [−5; +5] –0.20% –0.44% 46.70% –0.179 0.021 −0.510 182
[−2; +2] 0.53% 0.54% 53.85% 1.391 1.505 0.512 182
[−1; +1] 0.64% 0.44% 55.49% 1.910* 1.989** 0.911 182
[0; 0] 0.11% −0.23% 43.96% 0.786 0.971 −0.318 182
Panel D: Air cargo [−5; +5] 2.45% 2.13% 58.77% 2.758*** 2.943*** 1.657* 114
[−2; +2] 2.39% 0.99% 63.16% 3.728*** 4.134*** 2.607*** 114
[−1; +1] 2.59% 1.39% 60.53% 4.291*** 4.883*** 4.095*** 114
[0; 0] 1.48% 0.58% 60.53% 3.551*** 4.201*** 3.877*** 114
Panel E: CEP
[−5; +5] −0.07% −0.60% 44.44% 0.194 0.489 0.345 45
[−2; +2] 0.55% 0.12% 51.11% 0.834 0.757 1.352 45
[−1; +1] 0.65% 0.37% 62.22% 1.548 1.907* 1.837* 45
[0; 0] −0.38% 0.10% 51.11% −0.957 −1.010 −0.765 45
Panel F: 3PL
[−5; +5] 1.39% 1.02% 60.09% 3.374*** 3.301*** 1.795* 223
[−2; +2] 1.47% 1.36% 61.88% 3.871*** 3.889*** 3.112*** 223
[−1; +1] 1.28% 0.89% 58.74% 4.187*** 4.185*** 3.055*** 223
[0; 0] 0.65% 0.07% 51.57% 2.976*** 2.969*** 2.164** 223
Table 5. Event study results for acquiring firms by LSP category. This table summarizes the stock market reaction to M&A announcements of acquirer companies in the logistic
service industry split into the LSP categories trucking, railway, shipping, air cargo, CEP, and 3PL. The CARs
are calculated for acquirers over multiple event windows for firms in the logistic service industry between 1996
and 2015. ACARs are tested for statistical significance using the parametric BMP and KP test procedure and
the nonparametric CZ rank test. ∗,∗∗,∗∗∗ denote statistical significance at the 10%, 5%, and 1% level, respectively.
For most of the LSP categories, the positive effect for the acquiring companies can be
confirmed. However, it is shown that the ACAR vary across the different LSP categories (cf.
Figure 5 for an overview of the abnormal returns for each LSP category). Overall, air cargo
companies seem to benefit most from M&A announcements. The ACAR in the [−5; +5] day
event window is 2.45% which can be traced back to increased market power and more efficient
operations of the involved airlines (cf. Singal, 1996). Other transportation carriers such as
railway and trucking companies similarly exhibit positive stock price effects in the short run
which are more distinct closely around the announcement date. While trucking companies
frequently strive for consolidation of existing operations and expansion at the same time to
9 Note that Alexandrou et al. (2014) provide only the [−3; +1] day event window which does not allow comparisons of extended
periods.

17
satisfy increasing customer demands (cf. Brooks and Ritchie, 2005), railway carriers rather
focus on leveraging synergistic gains from consolidation. The positive ACAR for 3PL
companies of 1.39% in the [−5; +5] day event window is likewise highly significant according
to BMP and KP test and can be attributed to improved offerings to new and existing customers
from more cohesive services and/or better geographical coverage (cf. Hertz and Alfredsson,
2003).
In contrast to the prior literature, these results indicate that M&A announcements lead to
positive abnormal short-term returns for acquirers’ and targets’ shareholders. In addition, we
find that the positive effect varies across the subcategories.
Figure 5. CAARs of the acquiring firms divided by LSP category.
This figure illustrates the ACAR development of the acquirer in the logistic service industry according to the LSP
categories during the [−5; +5] day event window surrounding the M&A announcement date t = 0. The six different
LSP categories are trucking, railway, sea freight, air cargo, CEP and 3PL.
Long-term stock market analysis
The short-term stock market reaction suggests that LSP companies do benefit from M&A
transactions which has also been indicated in the literature (cf. Darkow et al., 2008, Alexandrou
et al., 2014). However, as the realization of synergistic gains is highly dependent on the
integration process and may require more time to become effective (Häkkinen et al., 2005), we
extent the scope of this study by a long-term analysis. In the course of this, we measure the
stock performance of the combined company 6, 12, 24, and 36 months following the M&A
announcement using the BHAR approach. Table 6 presents the results of this long-term
analyses. As transactions require time for alignment and the adjustment of assets, processes, IT,
etc. in both companies, the performance does not change rapidly. However, we find that after
36 months the BHAR increase by 7.6% and are significant at the 5% level.10 LSP companies
seem to perform significantly better than their peers do. Therefore, we find evidence for
hypothesis H1c. Panel B to Panel G again take account for the different LSP categories. The
10 Note that due to the extended observation period the sample size is becoming smaller as events with insufficient data were
excluded from the analysis.
-1.0%
-0.5%
0.0%
0.5%
1.0%
1.5%
2.0%
2.5%
3.0%
-5 -4 -3 -2 -1 0 1 2 3 4 5
Trucking (N = 219) Railwail (N = 43) Shipping (N = 182)
Air cargo (N = 114) CEP (N = 45) 3PL (N = 223)

18
results indicate that in the long-term the success of the merger integration differs across the LSP
category. The overall positive effect is mainly pushed by two categories, 3PL and railway,
exhibiting 36 month BHAR of 24.2% and 20.0%, respectively. Whereas the BHAR of 3PL is
highly significant, the BHAR of railway companies is only of weak significance due to the
comparatively small sample size. In contrast, CEP and air cargo companies exhibit significant
negative results of –17.3% 36 month after the transaction and of –11.6% 24 month after the
transaction that dampen the positive effect for the overall sample. The results for the categories
trucking and sea freight remain insignificant.

19
Buy-and-Hold
Abnormal Return Student's t-test
Skewness-adjusted
Johnson test Sample
Mean t-value j-value size
Panel A: Overall sample
BHAR 6 1.304% 1.4375 1.4379 826
BHAR 12 0.481% 0.3502 0.3502 825
BHAR 24 2.642% 1.1885 1.1895 764
BHAR 36 7.567% 2.365** 2.3703** 714
Panel B: Trucking BHAR 6 0.654% 0.3552 0.3552 219
BHAR 12 −1.433% −0.5217 −0.5214 218
BHAR 24 2.831% 0.6275 0.6287 202
BHAR 36 4.089% 0.7264 0.7278 188
Panel C: Railway
BHAR 6 −2.426% −0.5287 −0.5358 43
BHAR 12 −3.125% −0.5287 −0.5345 43
BHAR 24 3.325% 0.4667 0.4686 40
BHAR 36 19.847% 1.8631* 1.8213* 38
Panel D: Sea freight BHAR 6 0.145% 0.0826 0.0831 182
BHAR 12 −0.680% −0.2467 −0.2466 182
BHAR 24 5.733% 1.1237 1.1292 172
BHAR 36 7.147% 1.0768 1.0799 163
Panel E: Air cargo
BHAR 6 2.323% 0.9236 0.9249 114
BHAR 12 −1.358% −0.3349 −0.3336 114
BHAR 24 −11.586% −2.0313** −2.0034** 104
BHAR 36 −11.125% −1.4201 −1.4077 99
Panel F: CEP
BHAR 6 −0.671% −0.2462 −0.2487 45
BHAR 12 −6.098% −1.5415 −1.5351 45
BHAR 24 −12.965% −1.6387 −1.6247 42
BHAR 36 −17.276% −1.8678* −1.8340* 40
Panel G: 3PL
BHAR 6 3.485% 1.9369* 1.9433** 223
BHAR 12 6.262% 2.3322** 2.3426** 223
BHAR 24 10.180% 2.4629** 2.4741** 204
BHAR 36 24.234% 3.2381*** 3.2950*** 186
Table 6. Long-term stock effect of mergers and acquisitions in logistics. This table provides the BHAR values of the transaction data sample. BHARs report abnormal buy-and-
hold returns 6, 12, 24, and 36 months after the M&A announcement. BHARs are tested for statistical
significance using the parametric student’s t-test and the skewness adjusted Johnson (1978) test. ***, **, *
denotes statistical significance at the 1%, 5%, and 10% level, respectively.
Figure 6 illustrates the overall BHAR development and the BHAR development for each LSP
category. It is revealed that 3PL companies seem to benefit earlier from the transaction. After
6 months the BHAR is already at 3.5%, and after 12 months around 6.3%. However, the largest
increase can be observed at the beginning of the third year after the transaction where the BHAR
increases from 10.2% to the 24.2%. Railways companies, in contrast, show abnormal negative
BHARs in the first year after the M&A. These companies start to benefit from the deal after
approximately two years and show a rapid increase in market value in the third year after the
announcement. In contrast, CEP and air cargo companies perform significantly worse than their
peers. However, this must be interpreted carefully due to the comparatively small sample size
of CEP, railway and air cargo companies. The BHAR of air cargo amounts to −11.6% 24
months after the M&A announcement and is significant at the 5% level. Moreover, the BHAR
also remains stable for the third year, but leaks significance. Schosser and Wittmer (2015) argue
that cost and revenue synergies are the two main determinants for airline mergers. Moreover,

20
in their analysis it is shown that the majority of M&A do not induce superior profitability which
may lead to poor stock performance in the post-merger period. CEP companies exhibit
negatively increasing but mostly insignificant abnormal returns. The BHAR of −17.3% 36
months after the announcement is weakly significant and indicates that CEP companies as
acquirer in M&A transactions are less successful than the average. According to the Global
CEP Market 2015-2019 report, intensified competition from vendors has led to reduced
revenues and shrinking margins. This encourages regional differentiation that is carried out by
series of rather small acquisitions (McKinsey, 2015) containing a high risk of overpayments.
For trucking and seas freight carriers the long-term abnormal returns are positive but not
statistically significant.
-20%
-15%
-10%
-5%
0%
5%
10%
15%
20%
25%
0 100 200 300 400 500 600 700 800
All 3PL Rail
-20%
-15%
-10%
-5%
0%
5%
10%
15%
20%
25%
0 100 200 300 400 500 600 700 800
All Sea Freight Trucking
-20%
-15%
-10%
-5%
0%
5%
10%
15%
20%
25%
0 100 200 300 400 500 600 700 800
All Air CEP

21
Figure 6. BHARs of the acquiring firms divided by LSP category. This figure illustrates the BHAR development of the acquirer in the logistic service industry according to the LSP
category during the 36 months after the M&A announcement date t=0. The six different LSP categories are
trucking, railway, sea freight, air cargo, CEP and 3PL.
Overall, we can find that the capital market reactions during the post-merger integration period
are significantly positive wherefore it can be concluded that M&A in the logistics service
industry can leverage synergistic gains and improve expected returns of newly formed
companies. But again, stock market developments differ significantly across the considered
LSP categories and the considered integration period. Based on the overall sample as well as
the LSP categories railway, air cargo and 3PL, we can conclude that successful integration
processes may require up to three years after the initial announcement to become effective and
to generate abnormal financial returns.11 The strong post-merger integration results of 3PL
companies that carry out several activities including management and execution of
transportation and warehousing (cf. Berglund, 1999), can be traced back to their competencies
in integrating physical and informational flows across the supply chain. However, whereas
some categories such as 3PL companies exhibit notable positive results, other such as CEP
companies do not seem to benefit at all or even exhibit significant losses 36 month after the
transaction announcement. In order to identify potential determinants of M&A performance in
short-term and long-term, the next section provides the results of several regression models.
Cross-sectional regression analysis
In order to gain further insights into potential dependencies, we conduct multiple cross-
sectional regression analyses. As part of this, we analyse the abnormal returns of the acquirer
in the short-term [−1; +1] event window to test the impact of different variables on the
acquirer’s company value. In addition, we examine the impact on the buy-and-hold returns 36
months after the initial M&A announcement using the same set of independent variables. The
considered variables are explained in the following sections and include macroeconomic
variables such as the GWP growth, acquirer-specific variables such as the location of the
headquarters, deal-specific variables such as the payment type and operational variables such
as the crude oil price growth. The variable definitions are summarized in Table 7.
For testing our hypotheses H2, H3a, H3b and H3c as well as the determinants of short-term
abnormal wealth effects for the acquiring company and of the long-term success of the
combined company, we define a set of 20 variables clustered in four sets: (i) macroeconomic
variables, (ii) acquirer-specific variables, (iii) deal-specific variables and (iv) operational
variables.
Macroeconomic variables
As the demand for logistics services is highly correlated to international trade, the revenue
growth rates of LSPs are strongly influenced by the total global economic development. GWP
GROWTH as the growth rate of gross world product in the year prior to the announcement is
intended to address hypothesis H2. The relevant data is obtained from the World Bank database.
In addition, the most eminent macroeconomic shock in the last decades without any doubt was
the global financial crisis. We control for this shock introducing the variable CRISIS, covering
the period from September 2007 to June 2009 (cf. National Bureau of Economic Research,
2010). Finally, we also control for regional differences. The variables NORTH AMERICA,
EUROPE and ROW describe whether the acquirer’s headquarter is located in this region or not
11 Note that as the time lag between the announcement and the start of the post-merger integration process is unknown, some
synergistic potential may be unlocked earlier

22
whereas Asia is remains our base category. ROW covers all countries that do not belong either
to North America, Europe or Asia.
Acquirer-specific variables
Prior literature provides evidence that, apart from macroeconomics factors, company
characteristics have a significant influence on the stock returns caused by M&A
announcements. Alexandrou et al. (2014), for example, show that smaller acquirers in the
shipping industry do benefit more from transactions than their larger peers. The size of an
acquirer is also an indicator of its bargaining power (cf. Moeller et al., 2005). Therefore, we
introduce the variable LN SIZE as the logarithm of the market capitalization of the acquirer in
US-Dollar. In order to prevent that the M&A announcement is already reflected in the market
capitalization, we consider the value on the last trading day one year prior to the event. In
addition, we control for the operating performance of the acquirer before the event. Whereas
earlier studies focused on changes in earnings per share, more recent research employs
operating income as a more appropriate performance measure (cf. Barber and Lyon, 1996). In
order to compare the performance across companies, the operating income, however, has to be
rescaled. Thus, return-on-assets (ROA) is commonly used as an indicator for the operating
performance of a company and is accordingly incorporated in our analysis. Furthermore,
transactions frequently aim for leveraging synergistic gains (cf. Section 2). As has been shown
in Singh and Montogomery (1987) and Lubatkin (1987), merging firms capture synergies
mostly through asset divesture and resource redeployment. Thus, the variable LN TOTAL
ASSETS is introduced as the logarithm of the acquirer’s total assets in US-Dollar on the last
trading day in the year prior to the event. Finally, we have introduced several variables
describing the company’s business scope. BUSINESS DIVERSITY is a proxy for the
diversification of the business before the announcement and is measured by the number of SIC
codes of the acquirer to address hypothesis H3a. Companies with only one SIC code are
assumed to be completely focused on one type of product or service whereas a higher number
of SIC codes indicates a more diversified business. As the previous results already revealed that
the success of transactions is also dependent on the LSP category of the acquirer, we also
include the dummy variables TRUCKING, RAILWAY, SEA FREIGHT, CEP, and 3PL in our
model, using the LSP category AIR CARGO as our reference.
Deal-specific variables
In order to consider transaction specifics, we also introduce several deal-specific variables in
our models such as DEAL VALUE KNOWN. We control for the data availability and the
complexity of evaluating the transaction by introducing this dummy variable that is defined as
1, if the deal value is public, and 0 otherwise. Although international and diversifying
transactions bear a high risk of overpayments due to asymmetric information and cultural
differences, especially the leading logistics service providers have often already gained
experience across service segments and international markets (cf. Carbone and Stone, 2005).
To control for these factors, we introduce the variables CROSS-CONTINENTAL and
HORIZONTAL. CROSS-CONTINENTAL is defined as 1, if the acquirer’s and the target’s
headquarter are not located on the same continent, and 0 otherwise, whereas HORIZONTAL is
defined as 1, if acquirer and target exhibit the same four-digit SIC code, and 0 otherwise. These
variables aim for addressing potential risks and benefits of diversification and geographical
expansion which is captured by hypothesis H3b and H3c, respectively. Finally, we control for
the payment type of the transaction, introducing the dummy variable CASH PAYMENT which
is defined as 1, if the transaction is fully paid in cash, and 0 otherwise. Prior literature reveals
that payments in cash can have significant positive effects on the acquirer’s stock returns (cf.
Travlos, 1987; Chang, 1998; Faccio and Masulis, 2005).

23
Operational variables
During the last decades, LSPs also faced huge operational challenges due to high volatile oil
prices and shrinking profit margins. Alternative energies are still not able to fulfil the demand
wherefore crude oil remains one of the principal energy sources. Consequently, operational
costs of LSP are heavily influenced by the oil price (beside personnel expenditures fuel cost
remain one of the major cost factors for logistic companies, cf. EU Commission, 2015). Hence,
LSPs have to improve their business activities and manage their assets more efficiently in times
of increasing oil prices also using M&A as a suitable instrument. We therefore introduce the
variable CRUDE OIL PRICE GROWTH, defined as the percentage change of the crude oil price
between one trading year before and ten trading days before the M&A announcement to control
whether the development of the average oil price has an impact on the performance of the
acquisition. Finally, to capture the development of the operational revenues we also included
the Baltic Dry Index in our analysis. The Baltic Exchange, based in London, issues the Baltic
Dry Index that provides information about sea freight rates for a wide range of commodities,
such as coal, iron, and grain. In analogy to crude oil price growth, the variable BALTIC DRY
INDEX GROWTH is defined as the percentage change of the Baltic Dry Index between the last
trading day one year and 10 days prior to the event. Table 7 summarizes the definitions and
source of data for each variable.
Variable Variable definition Source
Macroeconomic variables
GWP GROWTH Percentage change of the gross world product between the last
trading day two years and one year prior to the M&A announcement.
World Bank
CRISIS Dummy variable defined as 1, if the M&A was announced during
September 2007 and June 2009, 0 otherwise.
Securities Data
Corporation (SDC)
NORTH AMERICA Dummy variable defined as 1, if the company’s headquarter is
located in North America, 0 otherwise.
Datastream
EUROPE Dummy variable defined as 1, if the company’s headquarter is
located in Europe, 0 otherwise.
Datastream
ROW Dummy variable defined as 1, if the company’s headquarter is
located neither in Europe, North America or Asia, 0 otherwise.
Datastream
Acquirer-specific variables
LN SIZE Logarithm of the market capitalization in US-Dollar of the acquirer
on the last trading day in the year prior to the year of the event.
Datastream
ROA Return-on-assets of the acquirer according to the annual financial
report one year prior to the year of the event.
Datastream
LN TOTAL ASSETS Logarithm of the total assets in US-Dollar of the acquirer on the last
trading day in the year prior to the year of the event.
Datastream
BUSINESS
DIVERSITY
Acquirer’ business scope according to the amount of different four-
digit Standard Industry Classification codes.
Datastream
TRUCKING Dummy variable defined as 1, if a company’s main sector belongs
to trucking activity according to Standard Industry Classification
(codes 4212, 4213, 4231), 0 otherwise.
Datastream
RAILWAY Dummy variable defined as 1, if a company’s main sector belongs
to railway activity according to Standard Industry Classification
(codes 4011, 4013, 4741), 0 otherwise.
Datastream
SEA FREIGHT Dummy variable defined as 1, if a company’s main sector belongs
to sea freight activity according to Standard Industry Classification
(codes 4412, 4424, 4432, 4449, 4491, 4499), 0 otherwise.
Datastream
CEP Dummy variable defined as 1, if a company’s main sector belongs
to courier, express or parcel activity according to Standard Industry
Classification (codes 4215, 4513), 0 otherwise.
Datastream
3PL Dummy variable defined as 1, if a company’s main sector belongs
to third party logistics providers according to Standard Industry
Classification (codes 4214, 4221, 4222, 4225, 4226, 4731, 4783,
4789), 0 otherwise.
Datastream

24
Regression results for explaining the short-term effects
Table 8 summarizes the results of the multivariate cross-sectional regression analysis. In a first
step, we analyse the factors that potentially influence the cumulative abnormal returns observed
in the [−1; +1] event window. In a next step, we split the overall sample into the six different
LSP (sub-)categories trucking, railway, sea freight, air cargo, CEP and 3PL.
The results reveal that the variables GWP GROWTH and BUSINESS DIVERSITY lack of
significance. Therefore, we have to reject the hypotheses H2 and H3a in the short-term.
Moreover, we cannot identify a significant effect for the variable HORIZONTAL wherefore we
have to reject hypothesis H3b. In contrast to our expectations, the variable CROSS-
CONTINENTAL is weak significant and negative. Thus, we have to reject hypothesis H3c in
the short-term as well. However, the transaction performance seems to be dependent on the
location of the acquirers’ headquarters. NORTH AMERICA exhibits a weak significant positive
effect in the short term, whereas slightly higher significant positive returns can be identified for
companies from the rest of the world sample. On average, they realize 1.56% higher returns
compared to M&A announcements of Asian acquirers. The coefficient of the variable CRISIS
is negative but lacks of significance. Consequently, announcing transaction in the course of the
financial crisis inducing the potential need to merge, does not have an impact on the returns in
the short-term. This finding is in contrast to prior studies from other industries suggesting that
M&A during the financial crisis perform significantly better. Acharya et al. (2011), for
example, show that the acquirer gains positive abnormal returns due to the fire-sale prices.
However, this effect cannot be confirmed for the logistics service industry as a whole.
Considering the specifics of the different service offerings, the dummy variables reveal that the
results clearly differ across the LSP categories. Sea freight, trucking, CEP, and 3PL perform
significantly worse than the base category air cargo. Therefore, we split the sample into the
different LSP categories to analyse the determinants of each category in more detail in the
following paragraph. Transparency in terms of known deal values exhibits a highly significant
positive effect on the short-term success of the M&A as investors can assess the transaction
more precisely. In addition, it is easier to estimate whether the potential synergy effects may
exceed the premium for the acquisition itself (Perry and Herd, 2004). As expected, investment
decisions in other countries are viewed negatively by the capital market. Due to better
information availability, it is less likely that acquiring companies overpay for local targets
(Goergen and Renneboog, 2004). The results also indicate that the operational variables taking
account of changes in revenues or cost by analyzing crude oil price and Baltic Dry Index
Deal-specific variables
DEAL VALUE
KNOWN
Dummy variable defined as 1, if the deal value is reported, 0
otherwise.
Securities Data
Corporation (SDC)
CROSS-
CONTINENTAL
Dummy variable defined as 1, if the acquirer’s headquarters and the
target’s headquarters are located on different continents, 0
otherwise.
Securities Data
Corporation (SDC)
HORIZONTAL Dummy variable defined as 1, if the acquirer and target are in the
same LSP category according to the four-digit Standard Industry
Classification code, 0 otherwise.
Securities Data
Corporation (SDC)
CASH PAYMENT Dummy variable defined as 1, if the payment of the deal is fully
made with cash, 0 otherwise.
Securities Data
Corporation (SDC)
Operational variables
CRUDE OIL
PRICE GROWTH
Percentage change of the crude oil price growth between the last
trading day one years and 10 days prior to the M&A announcement.
Datastream
BALTIC DRY
INDEX GROWTH
Percentage change of the Baltic Dry Index between the last trading
one year and 10 days prior to the M&A announcement.
Datastream
Table 7. OLS regression variable definitions. This table summarizes the definition and the source of the variables for the cross-sectional regression analysis.

25
developments do not have any effect on the cumulative abnormal returns in the short term.
Thus, potential changes in revenue or cost of the acquirer in the period before the M&A
announcement seem not to impact the M&A success.
In a further step, we split the sample according to the different LSP categories to take account
for structural differences. For trucking companies, acquirer located in North America realize
significant higher returns from M&A than their peers. The CARs are on average 2.57% higher
than for trucking companies headquartered in Asia. Analyzing the North American trucking
market, Brooks and Ritchie (2005) emphasized that there are no ownership restrictions
impeding cross-border acquisitions, wherefore Canadian firms use M&A as a tool to access
route densities in the U.S. market. The results also reveal that transparency in terms of known
deal values has a significant positive effect on the abnormal returns. Known deal values
facilitate the comparison between the synergy estimates and the paid premium and therefore
allow to control whether the transaction is expected to be beneficial or not. The analysis of
determinants for the short-term stock performance of railway and sea freight carriers remains
inconclusive. This indicates that railway carriers, operating in a highly regulated and country
specific environment (Laurino et al., 2015), and shipping are unique industries in which the
short-term M&A performance may not be explained by the identified logistic-relevant factors.
Air cargo exhibits a negative and significant coefficient for the variable CRISIS. As airlines
were heavily influenced by the financial crisis experiencing losses of around $31 billion in
2008/09, transactions during the crisis period show by 9.84% lower abnormal returns than the
average. For CEP companies, in contrast, that are operating around the globe, the results suggest
that the short-term performance measured by the abnormal returns is highly dependent on the
GWP growth in the year prior to the transaction. An increasing expected demand for parcel
services in a soaring world economy, seems to fuel transaction outcomes in terms of higher
abnormal returns. This may be explained by the need to acquire additional resources, to expand
geographically or to enter new product markets in the presence of increased customer demands
(see Brooks and Ritchie, 2005, for a similar explanation in the trucking industry).
Counterintuitive is the result for the positive and significant crude oil price growth. However,
if the oil price increased before the M&A announcement, the management of the acquirer has
less cash flow and may have to select the investments more carefully (cf. Lang et al., 1991).
This leads to selective behaviour when deciding on potential targets which results in higher cost
savings and better synergies. Furthermore, in contrast to air cargo, 3PL companies benefit from
M&A announcements during the financial crisis period. This can be interpreted similarly to the
positive effect of crude oil prices affecting CEP companies. The management has less cash flow
wherefore M&A decisions require more careful evaluation. In these periods, acquirers may also
benefit from fire-sale prices in the M&A market (cf. Acharya et al., 2011). Finally, 3PL
companies with better operating performance show significantly positive abnormal returns
around the announcement date. This can be interpreted again as the ongoing perception of the
investors.
Summarizing, the short-term performance of M&A announcements can be explained by several
macroeconomic and deal-specific factors, such as the GWP development or presence of an
economic downturn, the country of origin of the acquirer as well as the transparency of deal
values or the assumed rigor in selecting potential candidates. However, the respective LSP
categories exhibit significant differences that underline the heterogeneity of the logistics service
industry.
CAR[−1; +1] Overall Trucking Railway Sea
freight
Air cargo CEP 3PL
Macroeconomic variables

26
GWP GROWTH −0.0041
(−1.40)
0.0003
(0.12)
0.0015
(0.15)
−0.0022
(−0.71)
−0.0183
(−1.62)
0.0118***
(3.26)
−0.0021
(−0.73)
CRISIS −0.0075
(−0.63)
0.0114
(0.93)
−0.0123
(−0.31)
0.0101
(0.65)
−0.0984**
(−2.39)
0.0140
(0.84)
0.0667**
(2.35)
NORTH
AMERICA
0.0121*
(1.83)
0.0257**
(2.34)
−0.0352
(−1.37)
0.0155
(1.18)
0.0157
(0.85)
0.0587
(1.23)
0.0087
(0.81)
EUROPE 0.0047
(1.02)
0.0081
(0.94)
N/A 0.0054
(0.65)
0.0200
(1.52)
0.0239
(0.81)
0.0129
(1.16)
ROW 0.0156**
(2.28)
0.0248
(1.34)
N/A 0.0108
(0.86)
0.0524
(1.29)
N/A 0.0107
(1.04)
Acquirer-specific variables
LN SIZE −0.0005
(−0.19)
0.0049
(0.60)
0.0108
(0.57)
0.0027
(0.50)
0.0129
(1.32)
−0.0135
(−1.16)
−0.0078
(−1.55)
ROA 0.0004
(1.36)
−0.0012
(−0.84)
−0.0051
(−1.66)
−0.0009
(−1.05)
0.0016***
(2.66)
0.0038*
(1.75)
0.0010**
(1.99)
LN TOTAL
ASSETS
0.0001
(0.05)
−0.0049
(−0.56)
−0.0107
(−0.52)
−0.0010
(−0.18)
−0.0073
(−0.75)
0.0009
(0.16)
0.0017
(0.26)
BUSINESS
DIVERSITY
−0.0000
(−0.08)
0.0010
(0.94)
0.0029
(0.49)
−0.0010
(−1.01)
0.0001
(0.05)
0.0094
(1.69)
0.0022
(1.24)
TRUCKING −0.0143*
(−1.68)
RAILWAY −0.0141
(−1.16)
SEA FREIGHT −0.0176**
(−2.30)
CEP −0.0171*
(−1.75)
3PL −0.0176**
(−2.12)
Deal-specific variables
DEAL VALUE
KNOWN
0.0147***
(3.23)
0.0193*
(1.80)
0.0099
(0.76)
0.0076
(0.83)
0.0071
(0.48)
−0.0103
(−0.57)
0.0080
(0.9)
CROSS-
CONTINENTAL
−0.0075*
(−1.76)
−0.0040
(−0.35)
−0.0364
(−0.93)
−0.0072
(−0.95)
−0.0211
(−1.59)
−0.0134
(−1.00)
0.0024
(0.32)
HORIZONTAL 0.0008
(0.23)
−0.0030
(−0.37)
0.0098
(0.52)
0.0117
(1.50)
0.0064
(0.55)
−0.0122
(−0.64)
−0.0098
(−1.4)
CASH PAYMENT −0.0045
(−0.84)
−0.0046
(−0.38)
0.0079
(0.35)
0.0072
(0.61)
−0.0057
(−0.36)
−0.0052
(−0.27)
−0.0051
(−0.55)
Operational variables
CRUDE OIL PRICE
GROWTH
0.0000
(1.51)
0.0000
(0.41)
0.0000
(0.00)
0.0000
(0.22)
0.0003
(1.38)
0.0005**
(2.44)
0.0001
(1.27)
BALTIC DRY
INDEX GROWTH
−0.0023
(−1.04)
−0.0075*
(−1.83)
0.0000
(0.01)
−0.0003
(−0.10)
0.0078
(1.01)
−0.0051
(−0.99)
−0.0067
(−1.50)
CONSTANT 0.0263
(0.89)
−0.0077
(−0.13)
0.0579
(0.48)
−0.0252
(−0.48)
−0.0714
(−0.74)
0.1090
(0.86)
0.1057
(1.50)
Sample size 754 187 41 172 106 44 204
R2 0.0610 0.0895 0.1302 0.0909 0.2314 0.3423 0.1303
Adjusted R2 0.0353 0.0097 −0.2886 0.0035 0.1033 0.0248 0.0609
Table 8. Results of the cross-sectional OLS regression for the short-term effects. This table summarizes the OLS regressions of the cumulative abnormal returns (CARs) of firms in the LSP
industry that announced an M&A between 1996 and 2015. The dependent variable is the CAR in the [−1; +1]
event window. The sample includes 754 companies and is further divided into the six LSP categories trucking,
railway, sea freight, air cargo, CEP, and 3PL. The t-statistics for testing the significance of the coefficients using
robust standard errors are given in parentheses. ***, **, * denotes statistical significance at the 1%, 5%, and 10%
level, respectively.
Regression results for explaining the long-term effects
The results of the univariate analysis reveal that the short-term and long-term success of M&A
differ significantly across the considered LSP categories. In order to analyse potential
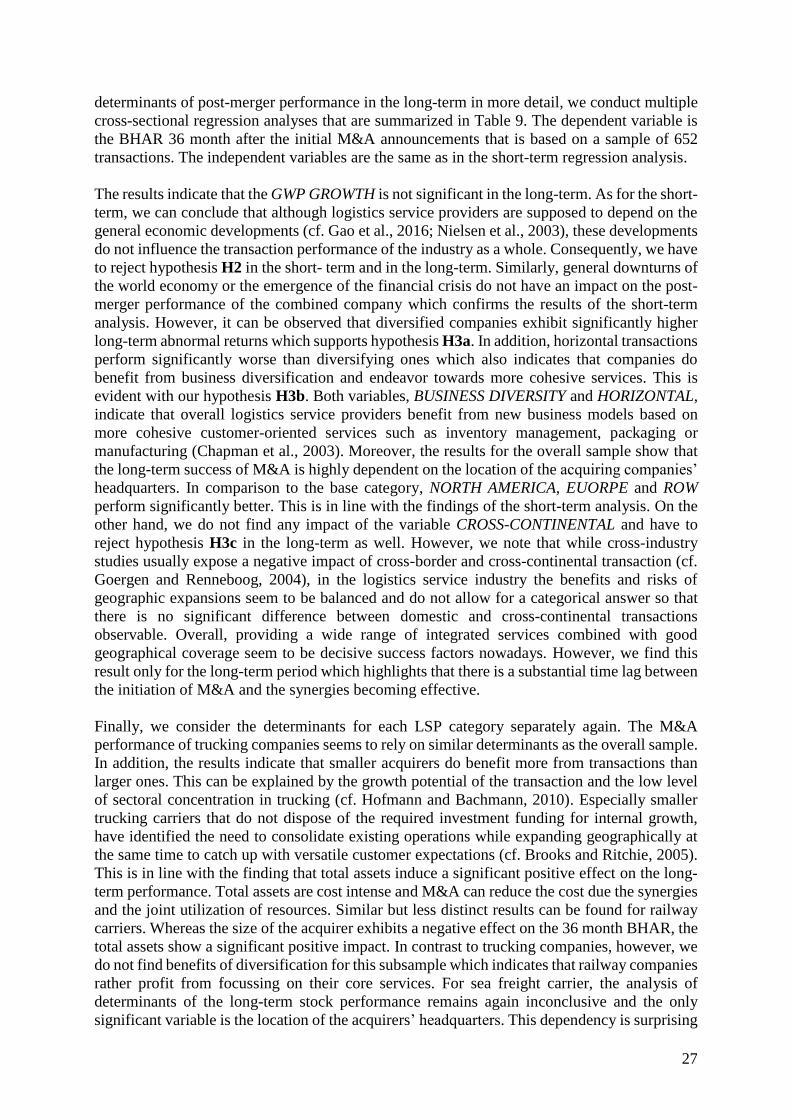
27
determinants of post-merger performance in the long-term in more detail, we conduct multiple
cross-sectional regression analyses that are summarized in Table 9. The dependent variable is
the BHAR 36 month after the initial M&A announcements that is based on a sample of 652
transactions. The independent variables are the same as in the short-term regression analysis.
The results indicate that the GWP GROWTH is not significant in the long-term. As for the short-
term, we can conclude that although logistics service providers are supposed to depend on the
general economic developments (cf. Gao et al., 2016; Nielsen et al., 2003), these developments
do not influence the transaction performance of the industry as a whole. Consequently, we have
to reject hypothesis H2 in the short- term and in the long-term. Similarly, general downturns of
the world economy or the emergence of the financial crisis do not have an impact on the post-
merger performance of the combined company which confirms the results of the short-term
analysis. However, it can be observed that diversified companies exhibit significantly higher
long-term abnormal returns which supports hypothesis H3a. In addition, horizontal transactions
perform significantly worse than diversifying ones which also indicates that companies do
benefit from business diversification and endeavor towards more cohesive services. This is
evident with our hypothesis H3b. Both variables, BUSINESS DIVERSITY and HORIZONTAL,
indicate that overall logistics service providers benefit from new business models based on
more cohesive customer-oriented services such as inventory management, packaging or
manufacturing (Chapman et al., 2003). Moreover, the results for the overall sample show that
the long-term success of M&A is highly dependent on the location of the acquiring companies’
headquarters. In comparison to the base category, NORTH AMERICA, EUORPE and ROW
perform significantly better. This is in line with the findings of the short-term analysis. On the
other hand, we do not find any impact of the variable CROSS-CONTINENTAL and have to
reject hypothesis H3c in the long-term as well. However, we note that while cross-industry
studies usually expose a negative impact of cross-border and cross-continental transaction (cf.
Goergen and Renneboog, 2004), in the logistics service industry the benefits and risks of
geographic expansions seem to be balanced and do not allow for a categorical answer so that
there is no significant difference between domestic and cross-continental transactions
observable. Overall, providing a wide range of integrated services combined with good
geographical coverage seem to be decisive success factors nowadays. However, we find this
result only for the long-term period which highlights that there is a substantial time lag between
the initiation of M&A and the synergies becoming effective.
Finally, we consider the determinants for each LSP category separately again. The M&A
performance of trucking companies seems to rely on similar determinants as the overall sample.
In addition, the results indicate that smaller acquirers do benefit more from transactions than
larger ones. This can be explained by the growth potential of the transaction and the low level
of sectoral concentration in trucking (cf. Hofmann and Bachmann, 2010). Especially smaller
trucking carriers that do not dispose of the required investment funding for internal growth,
have identified the need to consolidate existing operations while expanding geographically at
the same time to catch up with versatile customer expectations (cf. Brooks and Ritchie, 2005).
This is in line with the finding that total assets induce a significant positive effect on the long-
term performance. Total assets are cost intense and M&A can reduce the cost due the synergies
and the joint utilization of resources. Similar but less distinct results can be found for railway
carriers. Whereas the size of the acquirer exhibits a negative effect on the 36 month BHAR, the
total assets show a significant positive impact. In contrast to trucking companies, however, we
do not find benefits of diversification for this subsample which indicates that railway companies
rather profit from focussing on their core services. For sea freight carrier, the analysis of
determinants of the long-term stock performance remains again inconclusive and the only
significant variable is the location of the acquirers’ headquarters. This dependency is surprising

28
as most sea freight companies operate in an international environment. In contrast to trucking
and railway carriers, for air cargo carrier the size of the acquirer exhibits a positive effect on
the 36 month BHAR, whereas the total assets show a significant negative impact. These results
are in line with the findings of Singal (1996) who reveals that for airline M&A the market power
is an important factor and therefore larger companies realize higher revenues in the future.
Lowering assets, on the other hand, does also improve profitability given that revenues remain
stable. Moreover, market transparency in terms of publicly known deal values has a negative
influence on the post-merger performance of air cargo carriers. This strongly indicates that
acquiring private firms is better than established ones which can be explained by the fact that
private carrier generally operate more efficient in terms of personnel and aircraft utilization
than public ones (cf. Backx et al., 2002). Similarly to the short-term findings, for CEP
companies the long-term stock performance is highly dependent on the GWP development. In
times of economic prosperity, more parcel and courier services are required. Finally, 3PL
companies that traditionally offer a broader range of international services, also exhibit a
positive correlation with GWP GROWTH in the long term. As those companies usually require
a critical size to be reliable but have less assets than traditional carriers, they do strongly benefit
from offering integrated solutions and their competencies in managing international networks
(cf. Berglund et al., 1999). The requirement of integrating high asset companies, however,
strongly prevents leveraging synergistic gains and thus significantly lowers the post-merger
stock performance.
Overall, we can summarize that diversification is one of the most important post-merger
performance determinant for logistics service providers in our study. We find strong support
for hypotheses H3a and H3b. The fact that geographic expansion does not exhibit significance
may result from more balanced occurrence of benefits and drawback in internationalization than
it has been shown in other industry or cross-industry studies. Again, the respective LSP
categories exhibit significant differences that underline the heterogeneity of the logistics service
industry. While traditional carriers such as trucking or railroad service providers (with the
exception of air cargo companies) seem to benefit from consolidating smaller but asset-intense
operations to provide better services, system integrators rather rely on merging larger operations
with less assets. In addition, it becomes evident that especially the parcel segment is in the long-
term much more dependent on the general economic development than transportation carriers.
BHAR Overall Trucking Railway Shipping Air cargo CEP 3PL
Macroeconomic variables
GWP
GROWTH
0.0409
(1.59)
0.0152
(0.34)
0.0622
(0.50)
0.0327
(0.50)
−0.0418
(−0.60)
0.1545***
(3.00)
0.0987**
(2.18)
CRISIS 0.0933
(0.70)
−0.0593
(−0.25)
0.3190
(0.65)
−0.0197
(−0.07)
0.1522
(0.45)
−0.1051
(−0.31)
0.7190
(1.56)
NORTH
AMERICA
0.2863***
(2.68)
0.7384***
(4.07)
1.6338***
(4.25)
0.0128
(0.07)
−0.0604
(−0.31)
0.2952
(1.14)
−0.1857
(−0.54)
EUROPE 0.3369***
(3.61)
0.5263***
(3.37)
N/A 0.4869***
(3.01)
−0.1764
(−0.79)
N/A 0.2159
(0.72)
ROW 0.6289***
(3.2)
0.2150
(0.60)
N/A 0.6344**
(2.46)
−0.0175
(−0.05)
N/A 0.4013
(1.04)
Acquirer-specific variables
LN SIZE 0.0385
(0.83)
−0.2681**
(−2.41)
−0.5061*
(−1.85)
0.0888
(0.86)
0.2005**
(2.16)
−0.0222
(−0.18)
0.2461*
(1.88)
ROA −0.0025
(−0.49)
0.0068
(0.59)
−0.0002
(−0.01)
−0.0093
(−0.63)
0.0077
(0.84)
−0.0205
(−0.86)
−0.0140
(−1.29)
LN TOTAL
ASSETS
−0.0660
(−1.37)
0.3447**
(2.59)
0.5543*
(1.80)
−0.0556
(−0.52)
−0.2764***
(−3.18)
0.0860
(0.72)
−0.5223***
(−3.24)
BUSINESS
DIVERSITY
0.0416***
(3.52)
0.0385**
(2.32)
−0.0131
(−0.16)
0.0290
(1.30)
−0.0196
(−0.54)
0.0397
(0.55)
0.0769
(1.63)
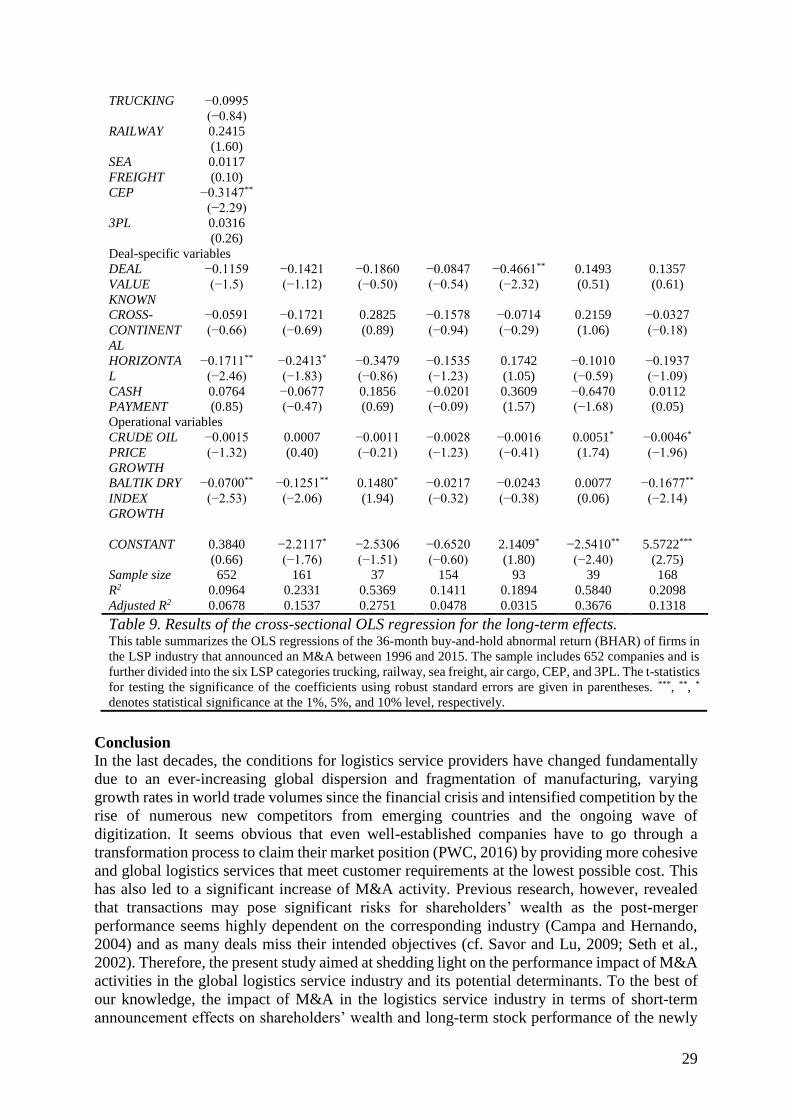
29
TRUCKING −0.0995
(−0.84)
RAILWAY 0.2415
(1.60)
SEA
FREIGHT
0.0117
(0.10)
CEP −0.3147**
(−2.29)
3PL 0.0316
(0.26)
Deal-specific variables
DEAL
VALUE
KNOWN
−0.1159
(−1.5)
−0.1421
(−1.12)
−0.1860
(−0.50)
−0.0847
(−0.54)
−0.4661**
(−2.32)
0.1493
(0.51)
0.1357
(0.61)
CROSS-
CONTINENT
AL
−0.0591
(−0.66)
−0.1721
(−0.69)
0.2825
(0.89)
−0.1578
(−0.94)
−0.0714
(−0.29)
0.2159
(1.06)
−0.0327
(−0.18)
HORIZONTA
L
−0.1711**
(−2.46)
−0.2413*
(−1.83)
−0.3479
(−0.86)
−0.1535
(−1.23)
0.1742
(1.05)
−0.1010
(−0.59)
−0.1937
(−1.09)
CASH
PAYMENT
0.0764
(0.85)
−0.0677
(−0.47)
0.1856
(0.69)
−0.0201
(−0.09)
0.3609
(1.57)
−0.6470
(−1.68)
0.0112
(0.05)
Operational variables
CRUDE OIL
PRICE
GROWTH
−0.0015
(−1.32)
0.0007
(0.40)
−0.0011
(−0.21)
−0.0028
(−1.23)
−0.0016
(−0.41)
0.0051*
(1.74)
−0.0046*
(−1.96)
BALTIK DRY
INDEX
GROWTH
−0.0700**
(−2.53)
−0.1251**
(−2.06)
0.1480*
(1.94)
−0.0217
(−0.32)
−0.0243
(−0.38)
0.0077
(0.06)
−0.1677**
(−2.14)
CONSTANT 0.3840
(0.66)
−2.2117*
(−1.76)
−2.5306
(−1.51)
−0.6520
(−0.60)
2.1409*
(1.80)
−2.5410**
(−2.40)
5.5722***
(2.75)
Sample size 652 161 37 154 93 39 168
R2 0.0964 0.2331 0.5369 0.1411 0.1894 0.5840 0.2098
Adjusted R2 0.0678 0.1537 0.2751 0.0478 0.0315 0.3676 0.1318
Table 9. Results of the cross-sectional OLS regression for the long-term effects. This table summarizes the OLS regressions of the 36-month buy-and-hold abnormal return (BHAR) of firms in
the LSP industry that announced an M&A between 1996 and 2015. The sample includes 652 companies and is
further divided into the six LSP categories trucking, railway, sea freight, air cargo, CEP, and 3PL. The t-statistics
for testing the significance of the coefficients using robust standard errors are given in parentheses. ***, **, *
denotes statistical significance at the 1%, 5%, and 10% level, respectively.
Conclusion
In the last decades, the conditions for logistics service providers have changed fundamentally
due to an ever-increasing global dispersion and fragmentation of manufacturing, varying
growth rates in world trade volumes since the financial crisis and intensified competition by the
rise of numerous new competitors from emerging countries and the ongoing wave of
digitization. It seems obvious that even well-established companies have to go through a
transformation process to claim their market position (PWC, 2016) by providing more cohesive
and global logistics services that meet customer requirements at the lowest possible cost. This
has also led to a significant increase of M&A activity. Previous research, however, revealed
that transactions may pose significant risks for shareholders’ wealth as the post-merger
performance seems highly dependent on the corresponding industry (Campa and Hernando,
2004) and as many deals miss their intended objectives (cf. Savor and Lu, 2009; Seth et al.,
2002). Therefore, the present study aimed at shedding light on the performance impact of M&A
activities in the global logistics service industry and its potential determinants. To the best of
our knowledge, the impact of M&A in the logistics service industry in terms of short-term
announcement effects on shareholders’ wealth and long-term stock performance of the newly

30
formed company has, with the exception of the short-term analysis provided in Darkow et al.
(2008) for the period 1991-2006 and Andreou et al. (2012) for the U.S. market, not been
considered in the literature so far.
Managerial implications
The results reveal that unlike in the majority of other industries, both, acquiring and target
companies can realize a positive effect in the short term. Therefore, it can be concluded that
M&A announcements in the logistics service industry are expected to induce value-creating
synergies beneficial for acquiring and target companies alike. It is also shown that the capital
market reactions during the post-merger integration period are significantly positive which
indicates that the transactions can leverage synergistic gains and improve expected returns of
newly formed entities in the long run. However, a successful integration processes may require
up to three years after the initial announcement to become effective and to generate abnormal
financial returns. In addition, considering the different categories of services provided, the
abnormal returns in the short term and in the long term are highly divers. While trucking,
railway, air cargo and 3PL companies obtain significantly positive abnormal returns in the days
surrounding the M&A announcement, sea freight carrier and CEP companies do not exhibit any
significant effect in short-term. Overall, the short-term performance of M&A announcements
seems to be governed by macroeconomic and deal-specific factors such as the general economic
development or presence of an economic downturn, the location of the acquirers’ headquarters
or the existence of market transparency in terms of known deal values. Considering the long-
term effect 36 months after the M&A announcement, the difference between the LSP categories
is even more distinct. While railway and 3PL companies realize an abnormal return between
20% and 24%, air cargo and CEP companies experience losses between –11% and –17% in the
same period. In the long-term, traditional carriers such as trucking or railroad service providers
seem to benefit from consolidating smaller but asset-intense operations to provide better
services, whereas system integrators rather rely on merging larger operations with less assets.
It also becomes apparent that especially the parcel segment is in the long-term much more
dependent on the general economic development than traditional transportation carriers. In
addition, it can be concluded that diversification is one of the most important post-merger
performance determinant for logistics service providers in the long term. The fact that
geographic expansion does not exhibit significance may result from a balanced occurrence of
benefits and drawback of internationalization than it has been shown in other industry or cross-
industry studies. At the same time, managers must be aware that not all acquisitions generate
positive returns. The results reveal that horizontal deals in the long-term lead to significant
losses. Therefore, it seems to be essential for LSPs to broaden their service portfolios in order
to meet varying customer expectations. This can be supported by acquisitions supporting
geographic expansion and business diversification.
Research implications
Considering the importance of M&A in the logistics service industry for realizing synergistic
gains in the presence of fierce competition and ever-increasing customer expectations and the
lack of comprehensive research on this subject, we hope that the provided results will enable
further research in this area. We examined M&A performance for the logistics service industry
over a period of 20 years from a shareholder’s perspective. However, some limitations of the
proposed approach have to be considered. Firstly, the generation of the subsamples is based on
the primary SIC only. Different selection criteria might have been the geographical focus of
offered services, asset intensity of the considered companies, markets, or customers’ industry
to get other perspectives on M&A in the logistics service industry. On the other hand,
categorizing LSPs requires cluster information, which can be difficult to obtain. Secondly, most
of the LSPs operate in more than one category. Therefore, it is possible that some of the
31
companies in our sample could have been allocated to other categories if the information would
had been interpreted differently.
In addition, the results revealed that the stock market reactions can differ significantly across
the six LSP categories which indicates a high level of heterogeneity among the companies.
Therefore, a more granular analysis especially investigating the long-term implications for each
of the LSP categories seems promising for further research. Especially the categories trucking,
railway and CEP lack of in depth analyses of M&A rationales and outcomes. Moreover, using
operational indicators as proxies for the long-term performance in the post-merger integration
period may be beneficial to investigate the correlation between abnormal changes in stock
returns and future operating results in the logistics industry. Finally, as the realization of
synergistic gains is highly dependent on the integration process and may require more time to
become effective (Häkkinen et al., 2005), further research should also examine the impact of
integration processes and potential barriers on the post-merger performance in the logistics
service industry.
References
Acharya, V. V., Shin, H. S., Yorulmazer, T., 2011. Crisis resolution and bank liquidity. Review
of Financial Studies, 24(6), 2166-2205.
Agrawal, A., Jaffe, J. F., Mandelker, G. N., 1992. The post‐merger performance of acquiring
firms: a re‐examination of an anomaly. The Journal of Finance, 47(4), 1605-1621.
Alexandrou, G., Gounopoulos, D., Thomas, H. M., 2014. Mergers and acquisitions in shipping.
Transportation Research Part E: Logistics and Transportation Review, 61, 212-234.
Andreou, P. C., Louca, C., Panayides, P. M., 2012. Valuation effects of mergers and
acquisitions in freight transportation. Transportation Research Part E: Logistics and
Transportation Review, 48(6), 1221-1234.
Asquith, P., Kim, E., 1982. The impact of merger bids on the participating firms' security
holders. The Journal of Finance, 37(5), 1209-1228.
Backx, M., Carney, M., Gedajlovic, E., 2002. Public, private and mixed ownership and the
performance of international airlines. Journal of Air Transport Management, 8(4), 213-220.
Barber, B. M., Lyon, J. D., 1996. Detecting abnormal operating performance: The empirical
power and specification of test statistics. Journal of Financial Economics, 41(3), 359-399.
Barber, B. M., Lyon, J. D., 1997. Detecting long-run abnormal stock returns: The empirical
power and specification of test statistics. Journal of Financial Economics, 43(3), 341-372.
Berglund, M., Laarhoven, P.v., Sharman, G., Wandel, S., 1999, Third-party logistics: Is there a
future? The International Journal of Logistics Management, 10(1) pp. 59-70.
Berkovitch, E., Narayanan, M. P., 1993. Motives for takeovers: An empirical investigation.
Journal of Financial and Quantitative Analysis, 28(03), 347-362.
Binder, J., 1998. The event study methodology since 1969. Review of Quantitative Finance and
Accounting, 11(2), 111-137.
Boehmer, E., Musumeci, J., Poulsen, A. B., 1991. Event-study methodology under conditions
of event-induced variance. Journal of Financial Economics, 30(2), 253-272.
Bradley, M., Desai, A., Kim, E. H., 1983. The rationale behind interfirm tender offers:
Information or synergy? Journal of Financial Economics, 11(1-4), 183-206.
Brennan, L., Ferdows, K., Godsell, J., Golini, R., Keegan, R., Kinkel, S., Srai. J.S., Taylor, M.,
2015. Manufacturing in the world: where next? International Journal of Operations &
Production Management, 35, 1253-1274.
Brooks, M. R., Ritchie, P., 2005. Trucking mergers and acquisitions in Canada and the US since
NAFTA. Transportation Journal, 23-38.
Brooks, M. R., Ritchie, P., 2006. Mergers and acquisitions in the maritime transport industry
1996-2000. Transportation Journal, 45(2)7-22.

32
Brown, S. J., Warner, J. B., 1985. Using daily stock returns: The case of event studies. Journal
of Financial Economics, 14(1), 3-31.
Bruner, R. F., 2002. Does M&A pay? A survey of evidence for the decision-maker. Journal of
Applied Finance, 12(1), 48-68.
Campa, J. M., Hernando, I., 2004. Shareholder value creation in European M&As. European
financial management, 10(1), 47-81.Carbone, V., Stone, M. A., 2005. Growth and relational
strategies used by the European logistics service providers: Rationale and outcomes.
Transportation Research Part E: Logistics and Transportation Review, 41(6), 495-510.
Carhart, M. M., 1997. On persistence in mutual fund performance. The Journal of Finance,
52(1), 57-82.
Carow, K., Heron, R., Saxton, T., 2004. Do early birds get the returns? An empirical
investigation of early‐mover advantages in acquisitions. Strategic Management Journal,
25(6), 563-585.
Chakrabarti, R., Gupta-Mukherjee, S., & Jayaraman, N. 2009. Mars–Venus marriages: Culture
and cross-border M&A. Journal of International Business Studies, 40(2), 216-236.
Chang, S. (1998). Takeovers of privately held targets, methods of payment, and bidder returns.
The Journal of Finance, 53(2), 773-784.
Chapman, R. L., Soosay, C., Kandampully, J. (2003). Innovation in logistic services and the
new business model: a conceptual framework. International Journal of Physical Distribution
& Logistics Management, 33(7), 630-650.
Chatterjee, S., 1992. Sources of value in takeovers: Synergy or restructuring–implications for
target and bidder firms. Strategic Management Journal, 13(4), 267-286.
Christopher, M., 2016. Logistics & Supply Chain Management. 5 Ed., Pearson Education
Limited, London.
Corrado, C. J., 1989. A nonparametric test for abnormal security-price performance in event
studies. Journal of Financial Economics, 23(2), 385-395.
Corrado, C. J., 2011. Event studies: A methodology review. Accounting & Finance, 51(1), 207-
234.
Corrado, C. J., Zivney, T. L., 1992. The specification and power of the sign test in event study
hypothesis tests using daily stock returns. Journal of Financial and Quantitative Analysis,
27(3), 465-478.
Cortés, L. M., García, J. J., Agudelo, D., 2015. Effects of mergers and acquisitions on
shareholder wealth: Event study for Latin American airlines. Latin American Business
Review, 16(3), 205-226.
Darkow, I. L., Kaup, C., Schiereck, D., 2008. Determinants of Merger & Acquisition success
in global logistics. International Journal of Logistics: Research and Applications, 11(5),
333-345.
Datta, D. K., Pinches, G. E., Narayanan, V. K., 1992. Factors influencing wealth creation from
mergers and acquisitions: A meta‐analysis. Strategic Management Journal, 13(1), 67-84.
Deutsche Bank, 2016. Logistik: Schwaches Umfeld – Trendwende nicht in Sicht.
Dodd, P., 1980. Merger proposals, management discretion and stockholder wealth. Journal of
Financial Economics, 8(2), 105-137.
Dodd, P., Warner, J. B., 1983. On corporate governance: A study of proxy contests. Journal of
Financial Economics, 11(1-4), 401-438.
Eckbo, B. E., 1983. Horizontal mergers, collusion, and stockholder wealth. Journal of Financial
Economics, 11(1), 241-273.
EU Commission, 2015. Fact-finding studies in support of the development of an EU strategy
for freight transport logistics. Lot 1: Analysis of the EU logistics sector. Retrieved from:
https://ec.europa.eu/transport/sites/transport/files/themes/strategies/studies/doc/2015-01-
freight-logistics-lot1-logistics-sector.pdf.

33
Faccio, M., & Masulis, R. W. (2005). The choice of payment method in European mergers and
acquisitions. The Journal of Finance, 60(3), 1345-1388.
Fama, E.F., 1970. Efficient capital markets: A review of theory and empirical work. The
Journal of Finance, 25(2), 383-417.
Fama, E. F., & French, K. R., 1993. Common risk factors in the returns on stocks and bonds.
Journal of Financial Economics, 33(1), 3-56.
Fama, E. F., & French, K. R., 1996. Multifactor explanations of asset pricing anomalies. The
Journal of Finance, 51(1), 55-84.
Ferreira, M. P., Santos, J. C., de Almeida, M. I. R., Reis, N. R., 2014. Mergers & acquisitions
research: A bibliometric study of top strategy and international business journals, 1980–
2010. Journal of Business Research, 67(12), 2550-2558.
Gao, Y., Zhang, Y., Li, H., Peng, T., & Hao, S. (2016). Study on the Relationship between
Comprehensive Transportation Freight Index and GDP in China. Procedia Engineering,
137, 571-580.
Goergen, M., Renneboog, L., 2004. Shareholder wealth effects of European domestic and
cross‐ border takeover bids. European Financial Management, 10(1), 9-45.
Häkkinen, L., Hilmola, O.P., 2005. Integration and synergies of operations in horizontal M&A.
International Journal of Management and Enterprise Development, 2 (3/4), 288-305.
Haleblian, J., Devers, C. E., McNamara, G., Carpenter, M. A., Davison, R. B., 2009. Taking
stock of what we know about mergers and acquisitions: A review and research agenda.
Journal of Management, 35(3), 469-502.
Hertz, S., Alfredsson, M., 2003. Strategic development of third party logistics providers.
Industrial Marketing Management, 32(2), 139-149.
Hofmann, E., Bachmann, H., 2010. Mergers & Acquisitions von Logistikunternehmen:
Bedeutung, Struktur und Auswirkungen auf die Branchenkonzentration. Zeitschrift für
Verkehrswissenschaft, 81(1), pp. 55-72.
Hofmann, E., Lampe, K., 2013. Financial statement analysis of logistics service providers:
Ways of enhancing performance. International Journal of Physical Distribution & Logistics
Management, 43(4), 321-342.
IATA, 2016. Fact sheet industry statistics.
Jegadeesh, N., & Titman, S., 1993. Returns to buying winners and selling losers: Implications
for stock market efficiency. The Journal of Finance, 48(1), 65-91.
Johnson, N. J., 1978. Modified t tests and confidence intervals for asymmetrical populations.
Journal of the American Statistical Association, 73(363), 536-544.
Kammlott, C., Schiereck, D., 2011. Ship of fools or passage to profit? – The value implications
of M&A in the international shipping industry. International Journal of Economics and
Research, 2(3), 56-69.
King, D. R., Dalton, D. R., Daily, C. M., Covin, J. G., 2004. Meta‐analyses of post‐acquisition
performance: Indications of unidentified moderators. Strategic management journal, 25(2),
187-200.
Kolari, J. W., Pynnönen, S., 2010. Event study testing with cross-sectional correlation of
abnormal returns. Review of Financial Studies, 23(11), 3996-4025.
Kothari, S. P., Warner, J. B., 1997. Measuring long-horizon security price performance. Journal
of Financial Economics, 43(3), 301-339.
KPMG, 2016. KPMG transport tracker. Global transport – Market trends and views.
Lam, H.K.S., Yeung, A.C.L., Cheng, T.C.E., Humphreys, P.K., 2016. Corporate environmental
initiatives in the Chinese context: Performance implications and contextual factors.
International Journal of Production Economics, 180, 48-56.
Lang, L. H., Stulz, R., Walkling, R. A., 1991. A test of the free cash flow hypothesis: The case
of bidder returns. Journal of Financial Economics, 29(2), 315-335.

34
Laurino, A., Ramella, F., & Beria, P. (2015). The economic regulation of railway networks: A
worldwide survey. Transportation Research Part A: Policy and Practice, 77, 202-212.
Levin, R.C., Weinberg, D.H., 1979. Alternatives for restructuring the railroads: End-to-end or
parallel mergers. Economic Inquiry. 17(3), 371-388.
Lin, C.-S., Su, C.-T., 2013. The Taiwan national quality award and market value of the firms:
An empirical study. International Journal of Production Economics, 144 (1), 57-67.
Loderer, C., Martin, K., 1997. Executive stock ownership and performance tracking faint traces.
Journal of Financial Economics, 45(2), 223-255.
Lubatkin, M., 1987. Merger strategies and stockholder value. Strategic Management Journal,
8(1), 39-53.
Lyon, J. D., Barber, B. M., Tsai, C. L., 1999. Improved methods for tests of long‐run abnormal
stock returns. The Journal of Finance, 54(1), 165-201.
MacKinlay, A. C., 1997. Event studies in economics and finance. Journal of Economic
Literature, 35(1), 13-39.
McKinsey, 2015. Pathway to value creation.
Meidutė-Kavaliauskienė, I., Aranskis, A., Litvinenko, M., 2014. Consumer satisfaction with
the quality of logistics services. Procedia - Social and Behavioral Sciences, 110, 330-340.
Merikas, A. G., Polemis, D., Triantafyllou, A., 2011. Mergers and acquisitions in the shipping
industry. Journal of Applied Business Research, 27(4), 9-22.
Meyer, C. B., 2001. Allocation processes in mergers and acquisitions: An organizational justice
perspective. British Journal of Management, 12(1), 47-66.
Mitchell, M. L., Stafford, E., 2000. Managerial decisions and long‐term stock price
performance. The Journal of Business, 73(3), 287-329.
Moeller, S. B., Schlingemann, F. P., Stulz, R. M., 2005. Wealth destruction on a massive scale?
A study of acquiring‐firm returns in the recent merger wave. The Journal of Finance, 60(2),
757-782.
National Bureau of Economic Research, 2010. Business Cycle Dating Committee, National
Bureau of Economic Research. Available at https://www.nber.org/cycles/sept2010.html.
Nguyen, H. T., Yung, K., Sun, Q., 2012. Motives for mergers and acquisitions: Ex‐post market
evidence from the US. Journal of Business Finance & Accounting, 39(9‐10), 1357-1375.
Nielsen, L. D., Jespersen, P. H., Petersen, T., & Hansen, L. G. (2003). Freight transport growth–
–a theoretical and methodological framework. 295-305.
Ni, J.Z., Flynn, B.B., Jacobs, F.R., 2014. Impact of product recall announcements on retailers'
financial value. International Journal of Production Economics, 153, 309–322.
Ojala, L., 1993. Changing logistical patterns and policies in Northern Europe. The International
Journal of Logistics Management, 4(2), 25-40.
Perry, J. S., & Herd, T. J. (2004). Reducing M&A risk through improved due diligence. Strategy
& Leadership, 32(2), 12-19.
PWC, 2010. Transportation & Logistics 2030. Volume 3: Emerging markets – New hubs, new
spokes, new industry leaders?
PWC, 2015. Second-quarter 2015 global transportation and logistics industry mergers and
acquisitions analysis.
PWC, 2016. The future of the logistics industry.
Samitas, A.G., Kenourgios, 2007. Impact of mergers and acquisitions on stock returns of tramp
shipping firms. International Journal of Financial Service Management, 2(4), 327-343.
Savor, P. G., Lu, Q., 2009. Do stock mergers create value for acquirers? The Journal of Finance,
64(3), 1061-1097.
Schosser, M., & Wittmer, A., 2015. Cost and revenue synergies in airline mergers–Examining
geographical differences. Journal of Air Transport Management, 47, 142-153.

35
Seth, A., Song, K. P., Pettit, R. R., 2002. Value creation and destruction in cross-border
acquisitions: An empirical analysis of foreign acquisitions of US firms. Strategic
Management Journal, 23(10), 921-940.
Shimizu, K., Hitt, M. A., Vaidyanath, D., & Pisano, V. (2004). Theoretical foundations of cross-
border mergers and acquisitions: A review of current research and recommendations for the
future. Journal of International Management, 10(3), 307-353.
Singal, V., 1996. Airline Mergers and Competition: An integration of stock and product price
effects. Journal of Business, 69(2), 233-268.
Singh, H., Montgomery, C. A., 1987. Corporate acquisition strategies and economic
performance. Strategic Management Journal, 8(4), 377-386.
Slovin, M. B., Sushka, M. E., Hudson, C. D., 1991. Deregulation, contestability, and airline
acquisitions. Journal of Financial Economics, 30(2), 231-251.
Tang, A.K.Y., Lay, K., Cheng, T.C.E., 2016. A multi-research-method approach to studying
environmental sustainability in retail operations. International Journal of Production
Economics, 171 (3), 394-404.
Tielmann, A., Schiereck, D., 2017. Arising borders and the value of logistic companies:
Evidence from the Brexit referendum in Great Britain. Finance Research Letters, 20, 22-28.
Trautwein, F., 1990. Merger motives and merger prescriptions. Strategic Management Journal,
11(4), 283-295.
Travlos, N. G., 1987. Corporate takeover bids, methods of payment, and bidding firms’ stock
returns. The Journal of Finance, 42(4), 943-963.
Wong, C. Y., Karia, N., 2010. Explaining the competitive advantage of logistics service
providers: a resource-based view approach. International Journal of Production Economics,
128(1), 51-67.
Wu, Y. C. J., Cheng, M. J., 2006. Mergers and acquisitions synergies for US third-party
logistics providers. International Journal of Services Operations and Informatics, 1(3), 253-
272.
Yang, J., Lu, W., Zhao, C., 2014. The immediate impact of purchasing/sales contract
announcements on the market value of firms: An empirical study in China. International
Journal of Production Economics, 156, 169-179.
Zhao, X., Li, Y., Flynn, B.B., 2013. The financial impact of product recall announcements in
China. International Journal of Production Economics, 142(1), 115-123.
Zott, C., Amit, R., Massa, L., 2011. The business model: Recent developments and future
research. Journal of Management, 37(4), 1019–1042.