Embed Size (px)
Citation preview
Final Report
City of San Antonio Sustainable Urban Economics Tool Prepared for: City of San Antonio Office of Environmental Policy Paid for by: U.S. Department of Energy (DOE) Energy Efficiency and Conservation Block Grant Funds Prepared by: Economic & Planning Systems, Inc. September 9, 2011
EPS #20840
Table of Contents
1. INTRODUCTION.................................................................................................... 1
Purpose ...................................................................................................................1
Organization of Report...............................................................................................2
Application of Findings...............................................................................................2
Project Team............................................................................................................3
Project Funding ........................................................................................................3
2. EXECUTIVE SUMMARY ............................................................................................ 4
Project Background ...................................................................................................4
Sustainability ...........................................................................................................5
San Antonio Sustainable Policy Goals ..........................................................................6
Model Components....................................................................................................6
Model Relationships...................................................................................................8
Model Outputs ..........................................................................................................9
Model Research ........................................................................................................9
Summary of Findings and Results ............................................................................. 10
Next Steps ............................................................................................................. 13
3. POLICY IMPACTS ................................................................................................ 14
Reduction in VMT .................................................................................................... 14
Increase in Compact Development ............................................................................ 17
Increase in Renewable Electric Power Generation........................................................ 20
Increase in Household Energy Efficiency .................................................................... 23
Reduction in Household Water Consumption............................................................... 25
4. USER MANUAL................................................................................................... 27
Model Structure ...................................................................................................... 27
Model Instructions .................................................................................................. 34
5. CASE STUDIES AND BASELINE INVENTORIES ................................................................ 39
Energy Use by Density............................................................................................. 39
Water Use by Density .............................................................................................. 39
Vehicle Miles Traveled by Density.............................................................................. 39
Baseline and Compact Development Densities ............................................................ 40
Trips by Transportation Mode Inventory..................................................................... 40
Vehicle Miles Traveled Inventory............................................................................... 40
VMT Impact Summary ............................................................................................. 40
Transit................................................................................................................... 40
Greenhouse Gas (GHG) Inventory by Source.............................................................. 41
Water Consumption................................................................................................. 41
Water Pumpage by Consumption .............................................................................. 42
Household Water Consumption Cost Estimator ........................................................... 42
Energy Use in Water Cycle ....................................................................................... 43
Renewable Energy Revenue ..................................................................................... 43
Energy Generation Costs.......................................................................................... 43
Household Energy Efficiency Cost Estimator ............................................................... 43
Household Energy Cost by Energy Type ..................................................................... 45
Average Household Expenditures Baseline ................................................................. 45
Economic Impact Factors ......................................................................................... 46
Obesity Rate Impact................................................................................................ 46
Diabetes Risk Impact .............................................................................................. 47
Diabetic Death Impact ............................................................................................. 47
Health Impact Factors ............................................................................................. 47
Household Health Expenditures Impact...................................................................... 48
Mortality Baseline Factors ........................................................................................ 48
Waste Disposal and Landfill Capacity Impact .............................................................. 48
Household Automobile Expenditure Factors ................................................................ 49
Employment Base ................................................................................................... 49
Census Data: Housing, Basic Demographics, Economic................................................ 49
Baseline Inventory .................................................................................................. 49
Secondary Factor Calculator ..................................................................................... 49
Model Factors and Sources....................................................................................... 50
List of Tables
Table 1 Summary of Results ....................................................................................... 12
Table 2 Summary of VMT Results ................................................................................ 16
Table 3 Summary of Compact Development Results ...................................................... 19
Table 4 Summary of Renewable Energy Generation Results ............................................ 22
Table 5 Summary of Household Energy Efficiency Results............................................... 24
Table 6 Summary of Household Water Consumption Results ........................................... 26
Economic & Planning Systems, Inc. 1 20840-FinalRpt 9-09-11 Final
1. INTRODUCTION
Purpose
The Sustainable Urban Economics Tool is a dynamic model built by Economic & Planning Systems (EPS) for the City of San Antonio Office of Environmental Policy. The purpose of the model is to enable the City to look into its future and set sustainable policies today that expand options for future generations, such as:
• Increase the number of jobs that are high quality, green, and diverse.
• Provide healthier ways of living, leading to reduction in disease, greater longevity, and stronger social systems.
• Reduce environmental impacts and enable San Antonio to stretch its natural resources further.
A unique component of the model is its emphasis on economic conditions and the integration of the local economic system with environmental and social components. The economic issues have been central to the research and construction of the model, with key areas including job creation, green jobs, regional economic value added, dollar flow, and resulting impacts to City fiscal revenues. The long term vision, and elements captured by the model, call for a change in household expenditure patterns, establishing the link between sustainable policy and improved quality of economic well-being for residents at different income levels.
Environmental and social issues are incorporated into the breadth of the model. The tool quantifies the change in greenhouse gas emissions, water consumption, energy consumption, and the amount of land conserved based on the type and density of future development. Social factors address household expenditures and the relative change in household discretionary dollars, based on sustainable polices. The evaluation of social factors also includes health, specifically obesity, diabetic risk and annual fatalities attributed to diabetes, as well as the potential reduction in worker absenteeism based on improved health conditions across the community.
Changing the way in which a community operates is not easily accomplished. For example, a scenario that reduces vehicle miles traveled (VMT) requires changes in community behavior, including greater transit ridership and use of alternative transportation modes such as walking or biking. Accordingly, the results reflect a change in behavior from several entities including policy decision-makers, as well as community residents. The purpose of this model is to estimate the degree of potential benefit if the City successfully pursues one or more of the policies tested, and to underpin a vision for actions the City will consider.
City of San Antonio Sustainable Urban Economics Tool September 9, 2011
Economic & Planning Systems, Inc. 2 Final Report
Orga n iza t ion o f Repor t
This report is organized with the following sections:
• Executive Summary – Overview of the project background, summary of the five policies identified by the City for evaluation, explanation of model components, description of the functionality, and a summary and comparison of results.
• Expanded Analysis of Results – For each of the five policies tested, EPS has provided a detailed description of the analysis and results. This includes an introductory overview with an expanded map of relationships, enabling readers to understand the linkages that stem from a given action.
As will be discussed in greater detail, the model includes quantified factors that trace each policy action across economic, environmental, and social systems. The diagram maps document the progression, noting how a given link has a positive or negative change within the system.
Additional information includes a list of key assumptions, detailed tables of the output, and charts that depict the data graphically. Finally, EPS has provided an explanation of the most significant results.
• User Manual – This section provides step-by-step directions for using the model. The goal is to enable City staff and community members to test various scenarios, applying different assumptions to policy goals and assumptions. EPS has provided a description of each of the spreadsheets in the model as well as a description of each of the 28 case studies and baseline inventories used to establish the linkages.
App l i ca t ion o f F ind ings
There are a number of ways to apply the findings from this model to future efforts. A central use of the model is to quantify benefits with detailed analysis that provide elected and appointed officials with a greater understanding of policy impacts. Because the systems that have been studied and quantified in this model cross jurisdictional and management boundaries, different organizations will need to collaborate to be most effective. The model can be used to show how a given action by one entity affects others, how both can benefit, and what actions and budget commitments are needed from each for the region to succeed in becoming more sustainable.
Benchmarking sustainable conditions is the first place to start. The data provided in the model enables City staff to document current conditions based on the most recent data available for Bexar County. From this point moving forward, the community can measure its progress against the current conditions based on the sustainable policies.
The Department of Housing and Urban Development (HUD), the Department of Transportation (DOT), and the Environmental Protection Agency (EPA), as well as other Federal agencies including the Department of Energy (DOE) and the Federal Transit Administration (FTA) have recently adopted sustainability criteria that grant recipients must incorporate in their funded programs. The criteria call for communities to take actions similar to those tested by this model which, in turn, can be used to quantify livability. Given the City’s ability to measure impacts and quantify benefit, the model may help the City secure future Federal grants.
City of San Antonio Sustainable Urban Economics Tool September 9, 2011
Economic & Planning Systems, Inc. 3 Final Report
A significant element of the model is the ability to test how various sustainable policies play out across different household income levels. Not all households have the same level of financial resources. Accordingly, the costs and benefits of sustainable activity will differ. The model has been calibrated to enable the City to understand how impacts accrue by income level.
Finally, given that the expanding local economic activity is a central goal to any economic development effort, the model includes an IMPLAN interface that estimates job creation, total economic output, and the component of value added that occurs within Bexar County under any scenario tested. Value added economic activity enables users to differentiate total economic activity from that which directly contributes to the county’s economy.
Pro jec t Team
The project manager for the Urban Economics Sustainability Model is Bill Barker, AICP, from the Office of Environmental Policy for the City of San Antonio. The project was funded by a grant by the Department of Energy. The consultant team includes Economic & Planning Systems, the University of Texas at San Antonio, and Balanced Solutions.
Pro jec t Fund ing
The model was funded by a Department of Energy (DOE) Energy Efficiency and Conservation Block Grant (EECBG). This program is funded by the American Recovery and Reinvestment Act (Recovery Act) of 2009 and represents a Federal priority to deploy the “cheapest, cleanest, and
most reliable energy technologies” available.1 It is intended to assist U.S. cities, counties, states, territories, and Indian tribes to develop, promote, implement, and manage energy efficiency and conservation projects and programs designed to:
• Reduce fossil fuel emissions; • Reduce the total energy use of the eligible entities; • Improve energy efficiency in the transportation, building, and other appropriate sectors; • Create and retain jobs.
1 http://www1.eere.energy.gov/wip/eecbg.html
Economic & Planning Systems, Inc. 4 20840-FinalRpt 9-09-11 Final
2. EXECUTIVE SUMMARY
Pro jec t Background
To address sustainability issues and create a long-term vision of a sustainable San Antonio, the Office of Environmental Policy (OEP) created Mission Verde, a plan to guide sustainability and energy efficiency efforts within both city operations and the community. The plan was formally adopted in February of 2010. Mission Verde identified 11 citywide initiatives across six areas of interest including energy infrastructure, clean and green technology development, sustainable buildings, transportation and land use, community outreach, and citywide leadership. These initiatives are rooted in the desires of the City to take a more comprehensive approach to sustainability. As stated in Mission Verde, “it is more than an environmental policy; it is an economic one. Saving energy saves money. Renewable energy creates economic self-reliance. Fewer cars on the road mean less pollution, which carries its own economic costs. A green
infrastructure, powered by green technology, creates jobs.” 2 Thus, through this vision San Antonio seeks to bring about not only environmental change, but economic and social as well.
In an effort to highlight the magnitude of these goals to a larger audience, as well as to evaluate future goals and priorities, the Office of Environmental Policy (OEP) engaged Economic & Planning Systems (EPS) in partnership with the University of Texas at San Antonio (UTSA) to construct a “Sustainable Urban Economics Tool” that quantifies policy impacts across a range of metrics, including environmental, economic, and social. This tool enables the City to test a variety of sustainability goals against their impacts to air, water, waste, energy, the local economy (including economic output, jobs, and “green” jobs), and social systems, including household spending patterns and personal health. Through this tool the City can prioritize its resources based on an understanding of the whole impact of a particular policy, not simply its stand-alone benefits documented through conventional methods.
This effort coincides with an increased emphasis on quantifiable metrics as required by the DOE EECBG reporting requirements and the DOE Sustainability Performance Office, as well as highlighted in the recent Partnership for Sustainable Communities between HUD, the EPA, and USDOT. As stated in the agreement, the partnership has begun to “develop livability measures and tools” that can be “adopted in subsequent integrated planning efforts to benchmark existing
conditions, measure progress toward achieving community visions, and increase accountability.”3
The Sustainable Urban Economics Tool developed by EPS not only generates sustainable metrics that can be benchmarked against policy, but takes this concept one step further by quantifying the implied benefits of these benchmarks through the chain of sustainable systems. The tool will also enable city staff to enhance presentations to elected officials, civic groups, and other entities, providing greater understanding and importance of citywide initiatives to specific interest groups.
2 Mission Verde: Building a 21st Century Economy. City of San Antonio Office of Mayor Phil Hardberger. January 28th 2009 3 http://www.epa.gov/dced/partnership/index.html
City of San Antonio Sustainable Urban Economics Tool September 9, 2011
Economic & Planning Systems, Inc. 5 Final Report
Sus ta inab i l i t y
Sustainability is an effort to simplify complex interrelated systems. For the Department of Energy (DOE), these interrelated systems overlap in its efforts to “discover the solutions to
power and secure America’s future.”4 Similarly, San Antonio’s definition of sustainability is also focused on its future. According to Mission Verde, sustainability is based on the principle that the current needs of the population cannot adversely affect the ability of future generations to
meet their needs.5 Such a vision requires a “triple bottom line” approach to policy that considers ecological and social systems in addition to traditional economic impacts. Externalities like pollution and waste are no longer mortgaged for future generations, and the health and welfare of citizens become part of the policy equation. The value of this approach enables a community like San Antonio to maintain stock of human and natural capital, thereby enhancing prosperity into the future. By efficiently managing assets that include natural resources, human resources, and economic capital, San Antonio can ensure that the next set of economic opportunities, as well as future generations, are provided with adequate resources to thrive.
For the Partnership for Sustainable Communities, sustainability is achieved through six “livability” principles. These principles include:
• Provide more transportation choices • Promote equitable and affordable housing • Enhance economic competitiveness • Support existing communities • Coordinate and leverage federal policies and investment • Value communities and neighborhoods
Thus, sustainable communities are places that put importance on the interconnectedness of environmental, economic, and social systems. They are places that are healthy, safe, and walkable with a variety of housing and transportation choice and destinations close to home. They are places that tend to have lower transportation costs, reduced air pollution, decreased
infrastructure costs, preserved natural resources, and economic resiliency.6 Sustainable communities take place in rural, suburban, and urban settings; however, sustainable strategies will look different in each place depending on a community’s character, context, and needs. Thus, developing more sustainable communities is aligned with our nation’s federal policies of strengthening the economy through job creation, providing a foundation for lasting prosperity, using energy more efficiently to secure energy independence, and protecting our natural
environment and human health.7
4 Strategic Sustainability Performance Plan. Department of Energy. September 2010. 5 Mission Verde: Building a 21st Century Economy. City of San Antonio Office of Mayor Phil Hardberger. January 28th 2009 6 http://www.sustainablecommunities.gov/ 7 Ibid
City of San Antonio Sustainable Urban Economics Tool September 9, 2011
Economic & Planning Systems, Inc. 6 Final Report
San Anton io Sus ta inab le P o l i c y Goa ls
As part of this project, the City will evaluate a number of different policy alternatives and determine, with the aid of the model, how to best employ its resources. Better administration of assets can lead to an expansion of employment sectors, with potential to increase the number of green jobs. An integrated model that documents the degree of change to the economy, the environment, and the social fabric will result in fewer wasted resources, healthier citizens, and a vibrant community that cares about its future.
The City of San Antonio Office of Environmental Policy asked EPS to test a number of identifiable policy goals generated out of Mission Verde. These policy goals include:
• A reduction of household automobile vehicle miles of travel (VMT) • An increase in new compact development • An increase in the generation of elective power by renewable energy sources • An increase in the energy efficiency of the existing housing stock • A reduction in household water consumption
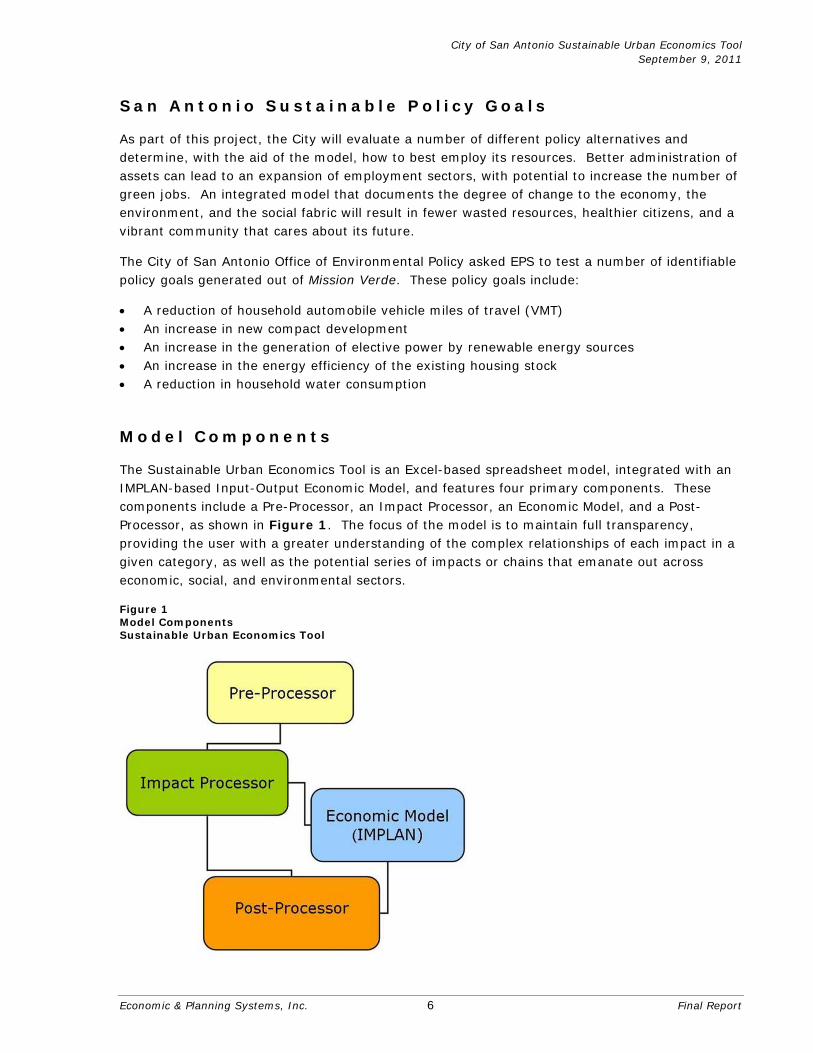
Mode l Components
The Sustainable Urban Economics Tool is an Excel-based spreadsheet model, integrated with an IMPLAN-based Input-Output Economic Model, and features four primary components. These components include a Pre-Processor, an Impact Processor, an Economic Model, and a Post-Processor, as shown in Figure 1. The focus of the model is to maintain full transparency, providing the user with a greater understanding of the complex relationships of each impact in a given category, as well as the potential series of impacts or chains that emanate out across economic, social, and environmental sectors.
Figure 1 Model Components Sustainable Urban Economics Tool
City of San Antonio Sustainable Urban Economics Tool September 9, 2011
Economic & Planning Systems, Inc. 7 Final Report
Pre-Processor
The Pre-Processor serves as the primary user interface of the model for the user and features all model inputs to be tested including the identified policy goal, goal magnitude, and a set of custom model “dials” which allow key assumptions in the model to be modified for more customized results. Examples of these dials include changes to fuel prices, the type of transit options, and future growth scenarios. The user is given default values for goal magnitude of each policy and for each dial. The default values are used by the model if changes are not made to the goal magnitude or “dials”.
Impact Processor
The Impact Processor features the bulk of the model calculations based on inputs from the Pre-Processor. The Impact Processor is organized by the three sustainable systems (environmental, economic, and social) and generates a corresponding set of impacts for use in the Economic Model and Post-Processor. The primary function of the Impact Processor is to establish and categorize the impacts generated from the inputs derived in the Pre-Processor. Many of the factors and calculations used in the Impact Processor were derived from “Case Studies” that are included in the back of the model.
Economic Model
The Impact Processor generates a number of direct economic impacts. These direct impacts generate indirect and induced economic impacts throughout the region. Indirect impacts include economic activity generated from expansion/contraction of the suppliers and services necessary to create economic outputs. Induced economic impacts represent the expansion/contraction of goods and services generated as a result of the wages and household incomes of the employees of the direct and indirect industries. The economic impact outputs generated by the Impact Processor are entered into the IMPLAN Economic Model, creating a set of additional economic impacts for the Post-Processor.
The IMPLAN Economic Model is an input-output modeling software that uses an approach first developed by the United States Forest Service in 1979, and now supported by the Minnesota IMPLAN Group. The model incorporates benchmark tables provided by the Bureau of Economic Analysis, as well as other statistical data to model transactions occurring within the metropolitan area. IMPLAN is, in a sense, a general accounting system of the economic transactions taking place between industries, businesses, and consumers in an economy and estimates the impacts on total output, which can be translated into employment estimates. Through the use of IMPLAN, a more complete picture can be painted of the local/regional economic impacts of various environmental and social transactions to specific economic industries.
Post-Processor
The Post-Processor combines the results of the Economic Model with the Impact Processor results and summarizes these findings in both annual and one-time impacts, as well as generates a series of graphs and tables, or model outputs. These graphs and tables were designed specifically to enhance the user’s understanding of the model, as well as to communicate the findings to other audiences.
City of San Antonio Sustainable Urban Economics Tool September 9, 2011
Economic & Planning Systems, Inc. 8 Final Report
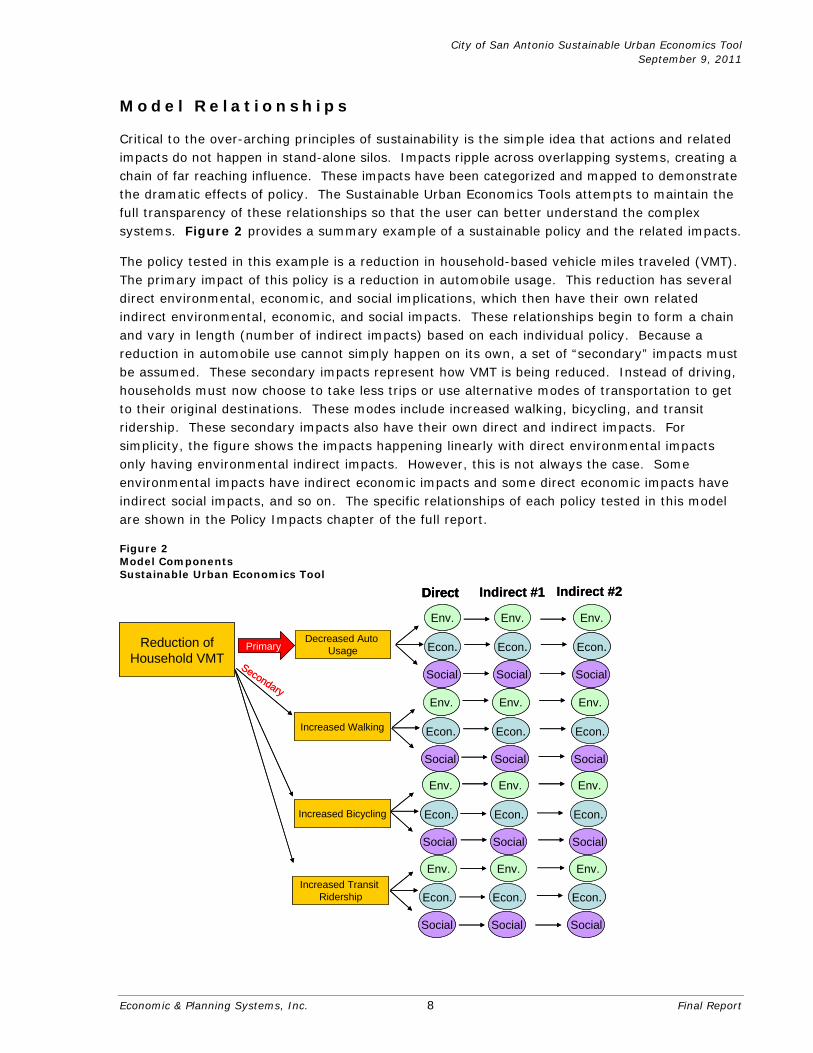
Mode l Re la t ions h ips
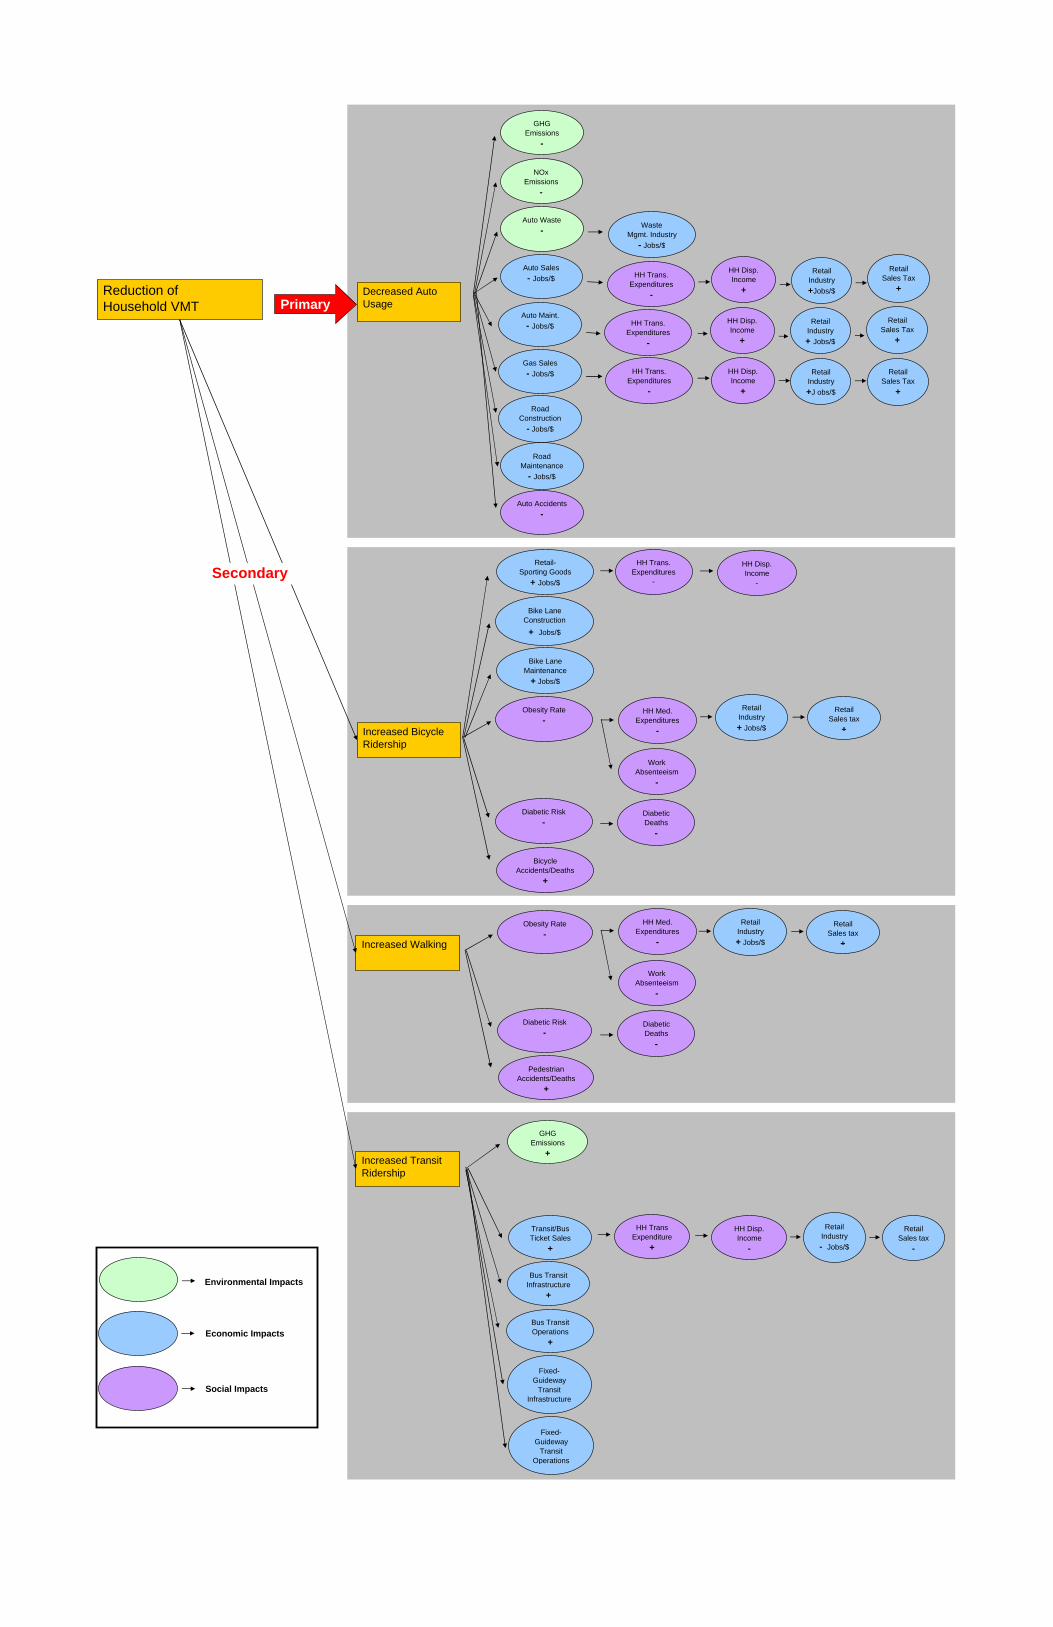
Critical to the over-arching principles of sustainability is the simple idea that actions and related impacts do not happen in stand-alone silos. Impacts ripple across overlapping systems, creating a chain of far reaching influence. These impacts have been categorized and mapped to demonstrate the dramatic effects of policy. The Sustainable Urban Economics Tools attempts to maintain the full transparency of these relationships so that the user can better understand the complex systems. Figure 2 provides a summary example of a sustainable policy and the related impacts.
The policy tested in this example is a reduction in household-based vehicle miles traveled (VMT). The primary impact of this policy is a reduction in automobile usage. This reduction has several direct environmental, economic, and social implications, which then have their own related indirect environmental, economic, and social impacts. These relationships begin to form a chain and vary in length (number of indirect impacts) based on each individual policy. Because a reduction in automobile use cannot simply happen on its own, a set of “secondary” impacts must be assumed. These secondary impacts represent how VMT is being reduced. Instead of driving, households must now choose to take less trips or use alternative modes of transportation to get to their original destinations. These modes include increased walking, bicycling, and transit ridership. These secondary impacts also have their own direct and indirect impacts. For simplicity, the figure shows the impacts happening linearly with direct environmental impacts only having environmental indirect impacts. However, this is not always the case. Some environmental impacts have indirect economic impacts and some direct economic impacts have indirect social impacts, and so on. The specific relationships of each policy tested in this model are shown in the Policy Impacts chapter of the full report.
Figure 2 Model Components Sustainable Urban Economics Tool
Reduction ofHousehold VMT
Econ.PrimaryDecreased Auto
Usage
Social
Env.
Direct
Econ.
Env.
Social
Econ.
Env.
Social
Econ.
Env.
Social
Indirect #1
Econ.
Env.
Social
Econ.
Env.
Social
Econ.
Env.
Social
Econ.
Env.
Social
Indirect #2
Econ.
Env.
Social
Econ.
Env.
Social
Econ.
Env.
Social
Econ.
Env.
Social
Increased Walking
Increased Bicycling
Increased Transit Ridership
Secondary
Reduction ofHousehold VMT
Econ.PrimaryDecreased Auto
Usage
Social
Env.
Direct
Env.
Direct
Econ.
Env.
Social
Econ.
Env.
Social
Econ.
Env.
Social
Indirect #1
Econ.
Env.
Social
Econ.
Env.
Social
Econ.
Env.
Social
Econ.
Env.
Social
Indirect #2
Econ.
Env.
Social
Econ.
Env.
Social
Econ.
Env.
Social
Econ.
Env.
Social
Increased Walking
Increased Bicycling
Increased Transit Ridership
Secondary
City of San Antonio Sustainable Urban Economics Tool September 9, 2011
Economic & Planning Systems, Inc. 9 Final Report
Mode l Outputs
Model outputs were selected based on input from the OEP and available data sources. These impacts are generated for Bexar County and represent both one-time and annual impacts. In addition to the magnitude of change in each output, the model summarizes these impacts through the Post-Processor in a series of graphs and tables to provide greater understanding as well as for potential use in staff presentations. The outputs generated by the model are far reaching and include:
• Environmental
— Air (GHG Emissions, NOx Emissions) — Water (Water Consumption, Water Pumpage, Pumpage Impact to Aquifer Levels) — Waste (Waste Production) — Energy (Electricity Consumption, Natural Gas Consumption) — Land (Land Consumption)
• Economic (One-Time and Annual)
— Employment (Employment - full and part-time, Green Employment) — Economic Output (Dollars of Economic Activity) — Value Added Output (Dollars of Regional Income Gain/Loss) — Fiscal Impacts (Tax Dollars to State and Local Agencies)
• Social
— Household Spending (Changes in Household Spending Patterns and Disposable Income by Household Income Quartile)
— Health (Deaths, Obesity, Diabetic Risk, Work Absenteeism)
Mode l Research
The underlying data used in the model is from a combination of local and national sources. The majority of factors were extracted from local sources, national databases, and/or research publications spanning the fields of planning, transportation, economics, energy (local providers), public health, and environmental science. Other factors were customized and calculated by EPS for this specific model using baseline data. EPS included the full range of relationships for which relevant data was discovered or could be calculated. However, EPS acknowledges that additional relationships likely exist for which relevant data was not discovered in its research. EPS was assisted in its research by the City of San Antonio Office of Environmental Policy and Balanced Solutions, LLC. A full list of sources is provided in the model. Factors derived from the research are summarized in the Case Studies and Baseline Inventories chapter of this report.
The Case Studies and Baseline Inventories chapter of this report includes summary case studies of several of the factors or relationship chains that were calculated for this model. These case studies illustrate how primary research was used to derive local factors in order to test the policies included in this model. Some of the case studies show a series of as many as four to five calculations or steps in order to derive one factor. EPS ensured that the factors derived for the model could be used to directly calculate impacts. In the event that a definitive link between a policy and a potential factor was lacking, it was not included in the model. The case studies show the depth and breadth of research necessary to test the policies in this model.
City of San Antonio Sustainable Urban Economics Tool September 9, 2011
Economic & Planning Systems, Inc. 10 Final Report
Summary o f F ind ings and Resu l t s
An overview of the findings is provided below, with the results for each policy shown in Table 1 on page 12. The table shows the impact each policy has on the range of economic, environmental, and social systems in San Antonio.
Reduction in VMT
• A 10 percent reduction of VMT results in the greatest amount of GHG Emissions reductions of all the policies tested.
• Waste generated by automobiles was only major waste generator discovered in the model research. As a result, a reduction in VMT is the only impact to reduce waste production.
• Assuming new transit improvements, a reduction of VMT results in the second largest one-time economic impact and largest annual ongoing economic impact of all the policies tested
• A 10 percent reduction in VMT also has the greatest impact on household disposable income, as well as health impacts.
Increase in compact development
• Because an increase in compact development is only applied to new annual growth in Bexar County, the impacts of this policy are much smaller in magnitude.
• Despite this size of change, compact development impacts the most outputs of all the policies.
• Because compact development is based on new annual development, the annual impacts triggered by this policy will have an exponential effect over time.
Increase in renewable electric power generation
• While energy through coal production is the largest emitter of GHG emissions in the County, a 5.0 percent increase in renewable energy has a relatively small amount of GHG reduction impact to Bexar County.
• Because renewable energy is more expensive to residential customers, a 5.0 percent increase in renewable energy production reduces disposable household income.
Increase in household energy efficiency
• A 5.0 percent increase in household energy efficiency generates the second highest amount of GHG reductions of all the policies tested.
• Not surprisingly, an increase in household energy efficiency results in the most reduction in energy consumption of all the policies tested.
• As a result of household improvements that must be made to increase energy efficiency, a 5.0 percent increase in household energy efficiency generates the most one-time economic impact of all the policies tested.
• The energy savings resulting from this policy generates the second most positive impact to household disposable income of all the policies tested.
City of San Antonio Sustainable Urban Economics Tool September 9, 2011
Economic & Planning Systems, Inc. 11 Final Report
Reduction in household water consumption
• A 5.0 percent reduction in household water consumptions has the smallest impact to GHG emissions reduction.
• Not surprisingly, a decrease in household water consumption results in the most reduction of water consumption of all the policies tested.
• Because of the amount of electricity used for water pumpage, a 5.0 percent reduction in household water consumption results in the second highest reduction in electricity usage.
• A positive one-time economic impact is generated through the household improvements that must be made in increase water efficiency.
• Because a reduction in water consumption creates a contraction in the water distribution industry, annual ongoing impacts are relatively low.
• A 5.0 percent reduction in household water consumption results in greater household disposable income.
City of San Antonio Sustainable Urban Economics Tool September 9, 2011
Economic & Planning Systems, Inc. 12 Final Report
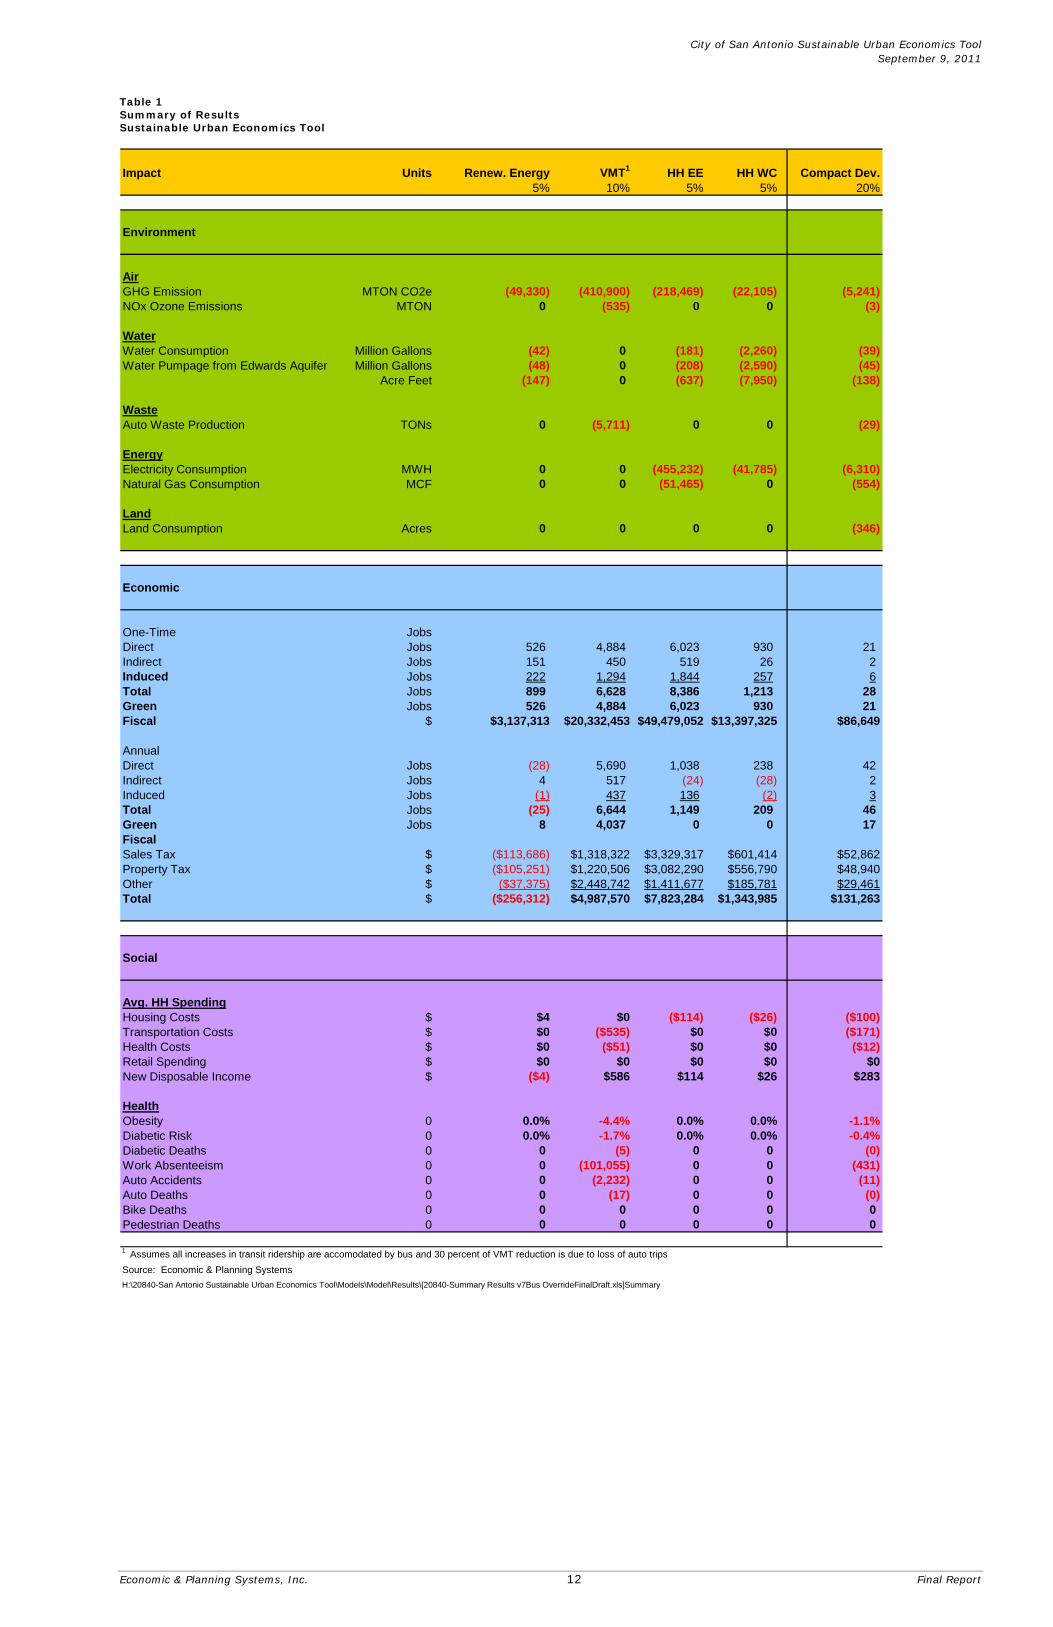
Table 1 Summary of Results Sustainable Urban Economics Tool
Impact Units Renew. Energy VMT1 HH EE HH WC Compact Dev.5% 10% 5% 5% 20%
Environment
AirGHG Emission MTON CO2e (49,330) (410,900) (218,469) (22,105) (5,241)NOx Ozone Emissions MTON 0 (535) 0 0 (3)
WaterWater Consumption Million Gallons (42) 0 (181) (2,260) (39)Water Pumpage from Edwards Aquifer Million Gallons (48) 0 (208) (2,590) (45)
Acre Feet (147) 0 (637) (7,950) (138)
WasteAuto Waste Production TONs 0 (5,711) 0 0 (29)
EnergyElectricity Consumption MWH 0 0 (455,232) (41,785) (6,310)Natural Gas Consumption MCF 0 0 (51,465) 0 (554)
LandLand Consumption Acres 0 0 0 0 (346)
Economic
One-Time JobsDirect Jobs 526 4,884 6,023 930 21Indirect Jobs 151 450 519 26 2Induced Jobs 222 1,294 1,844 257 6Total Jobs 899 6,628 8,386 1,213 28Green Jobs 526 4,884 6,023 930 21Fiscal $ $3,137,313 $20,332,453 $49,479,052 $13,397,325 $86,649
AnnualDirect Jobs (28) 5,690 1,038 238 42Indirect Jobs 4 517 (24) (28) 2Induced Jobs (1) 437 136 (2) 3Total Jobs (25) 6,644 1,149 209 46Green Jobs 8 4,037 0 0 17FiscalSales Tax $ ($113,686) $1,318,322 $3,329,317 $601,414 $52,862Property Tax $ ($105,251) $1,220,506 $3,082,290 $556,790 $48,940Other $ ($37,375) $2,448,742 $1,411,677 $185,781 $29,461Total $ ($256,312) $4,987,570 $7,823,284 $1,343,985 $131,263
Social
Avg. HH SpendingHousing Costs $ $4 $0 ($114) ($26) ($100)Transportation Costs $ $0 ($535) $0 $0 ($171)Health Costs $ $0 ($51) $0 $0 ($12)Retail Spending $ $0 $0 $0 $0 $0New Disposable Income $ ($4) $586 $114 $26 $283
HealthObesity 0 0.0% -4.4% 0.0% 0.0% -1.1%Diabetic Risk 0 0.0% -1.7% 0.0% 0.0% -0.4%Diabetic Deaths 0 0 (5) 0 0 (0)Work Absenteeism 0 0 (101,055) 0 0 (431)Auto Accidents 0 0 (2,232) 0 0 (11)Auto Deaths 0 0 (17) 0 0 (0)Bike Deaths 0 0 0 0 0 0Pedestrian Deaths 0 0 0 0 0 0
1 Assumes all increases in transit ridership are accomodated by bus and 30 percent of VMT reduction is due to loss of auto tripsSource: Economic & Planning SystemsH:\20840-San Antonio Sustainable Urban Economics Tool\Models\Model\Results\[20840-Summary Results v7Bus OverrideFinalDraft.xls]Summary
City of San Antonio Sustainable Urban Economics Tool September 9, 2011
Economic & Planning Systems, Inc. 13 Final Report
Potent ia l Nex t S teps
The results and conclusions of this analysis lead to a number of potential next steps for San Antonio. The presentation of the tool and its results generated substantial interest from a range of community stakeholders. Stakeholder ideas and suggestions for a potential broader application of the tool are summarized below.
1) Expand the model to the 12-county San Antonio Region. The model was developed with Bexar County as the primary geography of study. However, the Alamo Area Council of Governments (AACOG) serves a 12-county region. These counties include Frio, Atascosa, Karnes, Wilson, Medina, Guadalupe, Comal, Bandera, Kendall, Kerr, and Gillespie. A potential next step may include expanding the analysis to include the surrounding counties and measure the impacts of policy to the entire region.
2) Expand the model to include Commercial and Industrial uses. The model was developed with the primary focus of impact at the household level. However, many or all of the policies could also be applied to commercial and industrial businesses and property. While likely more difficult to implement, the inclusion of these use would dramatically increase the magnitude of impact to the region.
3) Business Incentives for more sustainable Commercial and Industrial uses. In order to incent commercial and industrial uses to become more sustainable the City could potentially offer business incentives in the form of tax abatement, loans, and/or permit waivers. Potential policies to be adopted by businesses and commercial development include developing in a low-impact manner, including green building materials, and/or implementing energy and water conservation strategies. Incentives for the adoption of these standards could be incorporated in the model to estimate their net benefit to the region.
4) Stormwater Impacts. The model does not currently include the impacts of stormwater runoff and related water quality from the implementation of the tested policies. Because stormwater is dependent on location specific variables such as development materials, vegetation, slopes, and watersheds, typical quantitative methodologies are difficult to apply on a regional scale. The City is currently engaged in ongoing efforts to evaluate sustainability at the parcel level. Potential may exist to utilize this microdata in order to evaluate the effects of best management practices (BMPs) such as sustainable stormwater infrastructure and low impact development (LID) standards on total stormwater runoff and water quality in the region.
5) Climate Change Impacts. Man-made changes to global climate patterns are well-documented. The model currently assumes a static climate environment on which many of the underlying assumptions are based. Depending on available research, model dials could be included to adjust for changes in average temperature and/or rainfall. These dials would allow users to estimate changes in household consumption of water and electricity, as well as future water supply and aquifer levels based on established relationships of environmental conditions and household behavior.
Economic & Planning Systems, Inc. 14 20840-FinalRpt 9-09-11 Final
3. POLICY IMPACTS
This section of the report provides greater detail of the impacts on each policy goal, including a brief summary of each policy, key base assumptions, impact relationships, summary of results, and model outputs.
Reduct ion in VMT
Introduction
Transportation accounts for a full third of CO2 emissions in the United States and is the fastest-growing sector of greenhouse gas emissions. Research has revealed that technological improvements in vehicles and fuels alone will likely be offset by the continued growth of driving in the U.S. Automobile vehicle miles traveled (VMT) is the most frequently used measure of driving in planning research fields. The amount of driving in a region depends on a number of factors but is primarily driven by a combination of land use patterns and available choices in alternative modes of transportation.
A variety of policies and actions can be used in an attempt to reduce VMT. These strategies include pricing strategies, land use and smart growth strategies, non-motorized transportation strategies, public transportation improvement strategies, regional ride-sharing, car-sharing, and
commuting strategies, and regulatory strategies.8 This analysis assumes an investment in alternative modes of transportation, including bicycle infrastructure, an expansion of existing bus transit, and (if tested) an expansion to new public transportation systems to reduce annual auto VMT in Bexar County.
Key Base Assumptions
• Only household-based VMT is examined in this analysis.
• A reduction in VMT results in an equal shift to other transportation modes including transit, bicycling, and walking based on existing mode splits in Bexar County.
• Under default settings, no loss of miles is assumed, only a shift in modes. However, the user can enter an estimate for the amount of VMT reduction attributable to a loss of trips through carpooling, combining non-work trips and/or behavior change in the amount to auto trips taken in the model dials. This has the net effect of reducing the shift of trips to alternative modes.
• The results shown on the following tables assume that VMT is reduced by a transfer of trips to existing bus service, walking, or bicycling. The model can also test results based on the addition of fixed-guideway transit. Under default settings, the increased passenger miles allocated to transit are split 75 percent to bus and 25 percent to fixed-guideway transit. This is generally representative of smaller scale fixed-guideway systems. The user can change
8Cambridge Systematics; Moving Cooler: An Analysis of Transportation Strategies to Reduce Greenhouse Gas Emissions. Urban Land Institute. 2009
City of San Antonio Sustainable Urban Economics Tool September 9, 2011
Economic & Planning Systems, Inc. 15 Final Report
this allocation in the model dials. For the purposes of result tabulations, VMT results are based on a 100% bus-based transit system.
• For scenarios in which fixed-guideway transit is included, an increase in electricity is required to power the transit; thus, emissions at the tailpipe are captured in addition to upstream impacts at the power plant.
• The increased production of electricity in turn requires increased water consumption.
• The expansion of transit systems is shown as a one-time capital investment, most likely covered by money from outside the region, such as FTA New Starts funds.
• Alternative modes such as walking and bicycling generate positive health impacts to individuals.
• All reductions in household spending from reduced utilities, transportation, medical expenses, etc. are assumed to translate to increased retail spending for the purposes of economic impact modeling.
Reduction ofHousehold VMT Primary
Decreased Auto Usage
Auto Waste-
NOx Emissions
-
GHG Emissions
-
Auto Sales- Jobs/$
Auto Maint.- Jobs/$
Gas Sales- Jobs/$
Road Construction
- Jobs/$
RoadMaintenance
- Jobs/$
Auto Accidents-
Waste Mgmt. Industry
- Jobs/$
HH Trans.Expenditures
-
HH Trans.Expenditures
-
HH Trans.Expenditures
-
HH Disp.Income
+
HH Disp.Income
+
HH Disp.Income
+
Retail Industry+J obs/$
Retail Industry+ Jobs/$
Retail Industry+Jobs/$
Retail Sales Tax
+
Retail Sales Tax
+
RetailSales Tax
+
Increased BicycleRidership
Bike LaneMaintenance
+ Jobs/$
Bike LaneConstruction+ Jobs/$
Retail-Sporting Goods
+ Jobs/$
Obesity Rate-
Diabetic Risk-
Bicycle Accidents/Deaths
+
Diabetic Deaths
-
HH Med.Expenditures
-
HH Trans.Expenditures
-
WorkAbsenteeism
-
HH Disp.Income
-
Retail Industry+ Jobs/$
RetailSales tax
+
Increased Transit Ridership
Increased Walking
Obesity Rate-
Diabetic Risk-
Pedestrian Accidents/Deaths
+
Diabetic Deaths
-
HH Med.Expenditures
-
WorkAbsenteeism
-
Retail Industry+ Jobs/$
RetailSales tax
+
Secondary
GHG Emissions
+
Transit/Bus Ticket Sales
+
Bus Transit Operations
+
Fixed-Guideway
Transit Infrastructure
Bus Transit Infrastructure
+
Fixed-Guideway
Transit Operations
HH TransExpenditure
+
HH Disp.Income
-
Retail Industry- Jobs/$
RetailSales tax
-
Environmental Impacts
Economic Impacts
Social Impacts
City of San Antonio Sustainable Urban Economics Tool September 9, 2011
Economic & Planning Systems, Inc. 16 Final Report
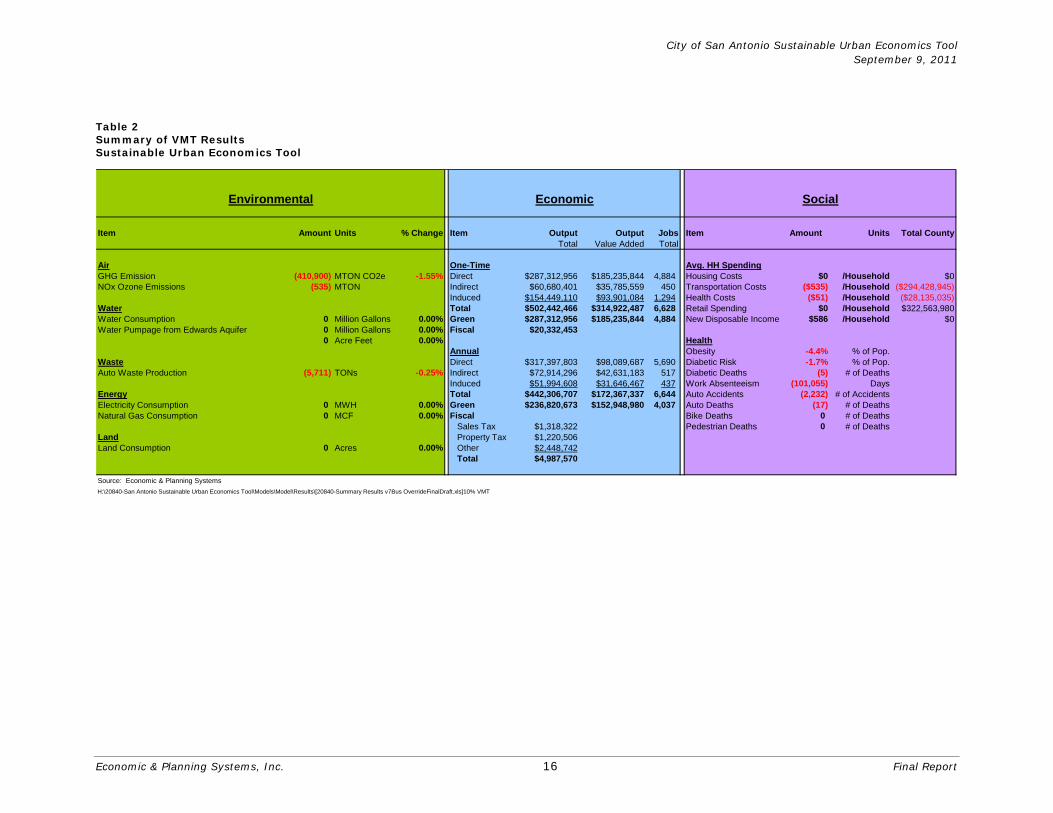
Table 2 Summary of VMT Results Sustainable Urban Economics Tool
Item Amount Units % Change Item Output Output Jobs Item Amount Units Total CountyTotal Value Added Total
Air One-Time Avg. HH SpendingGHG Emission (410,900) MTON CO2e -1.55% Direct $287,312,956 $185,235,844 4,884 Housing Costs $0 /Household $0NOx Ozone Emissions (535) MTON Indirect $60,680,401 $35,785,559 450 Transportation Costs ($535) /Household ($294,428,945)
Induced $154,449,110 $93,901,084 1,294 Health Costs ($51) /Household ($28,135,035)Water Total $502,442,466 $314,922,487 6,628 Retail Spending $0 /Household $322,563,980Water Consumption 0 Million Gallons 0.00% Green $287,312,956 $185,235,844 4,884 New Disposable Income $586 /Household $0Water Pumpage from Edwards Aquifer 0 Million Gallons 0.00% Fiscal $20,332,453
0 Acre Feet 0.00% HealthAnnual Obesity -4.4% % of Pop.
Waste Direct $317,397,803 $98,089,687 5,690 Diabetic Risk -1.7% % of Pop.Auto Waste Production (5,711) TONs -0.25% Indirect $72,914,296 $42,631,183 517 Diabetic Deaths (5) # of Deaths
Induced $51,994,608 $31,646,467 437 Work Absenteeism (101,055) DaysEnergy Total $442,306,707 $172,367,337 6,644 Auto Accidents (2,232) # of AccidentsElectricity Consumption 0 MWH 0.00% Green $236,820,673 $152,948,980 4,037 Auto Deaths (17) # of DeathsNatural Gas Consumption 0 MCF 0.00% Fiscal Bike Deaths 0 # of Deaths
Sales Tax $1,318,322 Pedestrian Deaths 0 # of DeathsLand Property Tax $1,220,506Land Consumption 0 Acres 0.00% Other $2,448,742
Total $4,987,570
Source: Economic & Planning SystemsH:\20840-San Antonio Sustainable Urban Economics Tool\Models\Model\Results\[20840-Summary Results v7Bus OverrideFinalDraft.xls]10% VMT
Economic SocialEnvironmental
City of San Antonio Sustainable Urban Economics Tool September 9, 2011
Economic & Planning Systems, Inc. 17 Final Report
Inc rease in Compac t Deve lopment
Introduction
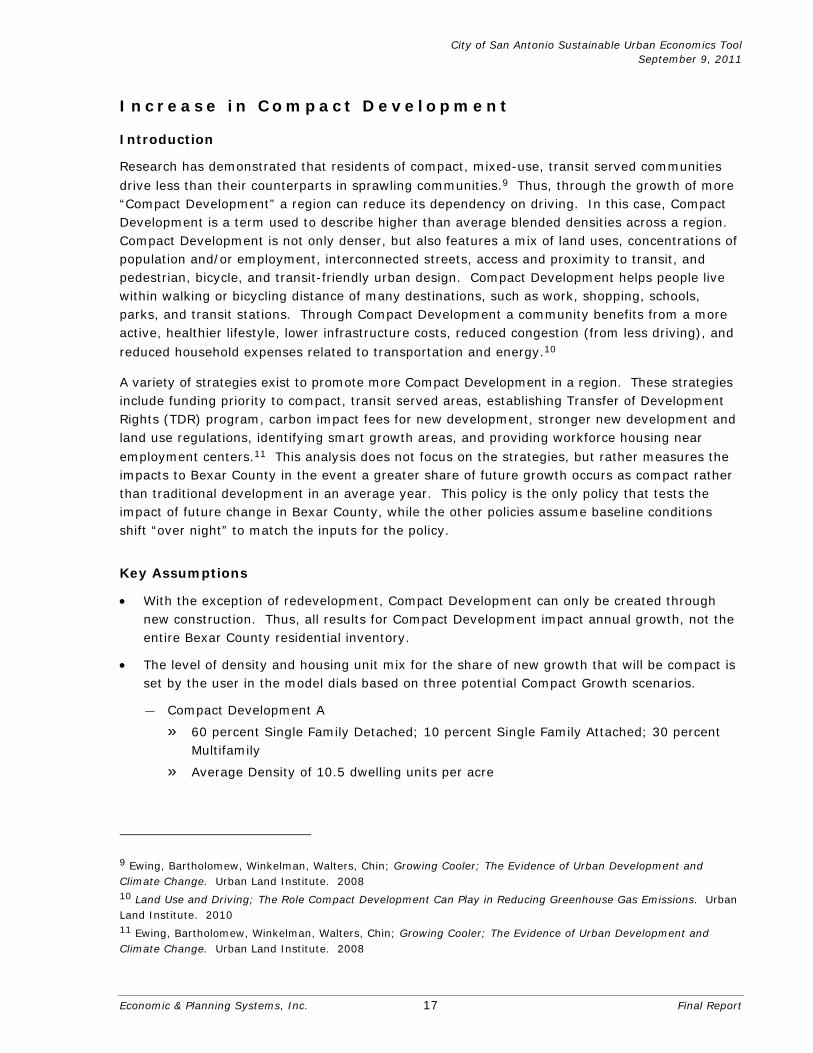
Research has demonstrated that residents of compact, mixed-use, transit served communities
drive less than their counterparts in sprawling communities.9 Thus, through the growth of more “Compact Development” a region can reduce its dependency on driving. In this case, Compact Development is a term used to describe higher than average blended densities across a region. Compact Development is not only denser, but also features a mix of land uses, concentrations of population and/or employment, interconnected streets, access and proximity to transit, and pedestrian, bicycle, and transit-friendly urban design. Compact Development helps people live within walking or bicycling distance of many destinations, such as work, shopping, schools, parks, and transit stations. Through Compact Development a community benefits from a more active, healthier lifestyle, lower infrastructure costs, reduced congestion (from less driving), and
reduced household expenses related to transportation and energy.10
A variety of strategies exist to promote more Compact Development in a region. These strategies include funding priority to compact, transit served areas, establishing Transfer of Development Rights (TDR) program, carbon impact fees for new development, stronger new development and land use regulations, identifying smart growth areas, and providing workforce housing near
employment centers.11 This analysis does not focus on the strategies, but rather measures the impacts to Bexar County in the event a greater share of future growth occurs as compact rather than traditional development in an average year. This policy is the only policy that tests the impact of future change in Bexar County, while the other policies assume baseline conditions shift “over night” to match the inputs for the policy.
Key Assumptions
• With the exception of redevelopment, Compact Development can only be created through new construction. Thus, all results for Compact Development impact annual growth, not the entire Bexar County residential inventory.
• The level of density and housing unit mix for the share of new growth that will be compact is set by the user in the model dials based on three potential Compact Growth scenarios.
— Compact Development A
» 60 percent Single Family Detached; 10 percent Single Family Attached; 30 percent Multifamily
» Average Density of 10.5 dwelling units per acre
9 Ewing, Bartholomew, Winkelman, Walters, Chin; Growing Cooler; The Evidence of Urban Development and Climate Change. Urban Land Institute. 2008 10 Land Use and Driving; The Role Compact Development Can Play in Reducing Greenhouse Gas Emissions. Urban Land Institute. 2010 11 Ewing, Bartholomew, Winkelman, Walters, Chin; Growing Cooler; The Evidence of Urban Development and Climate Change. Urban Land Institute. 2008
City of San Antonio Sustainable Urban Economics Tool September 9, 2011
Economic & Planning Systems, Inc. 18 Final Report
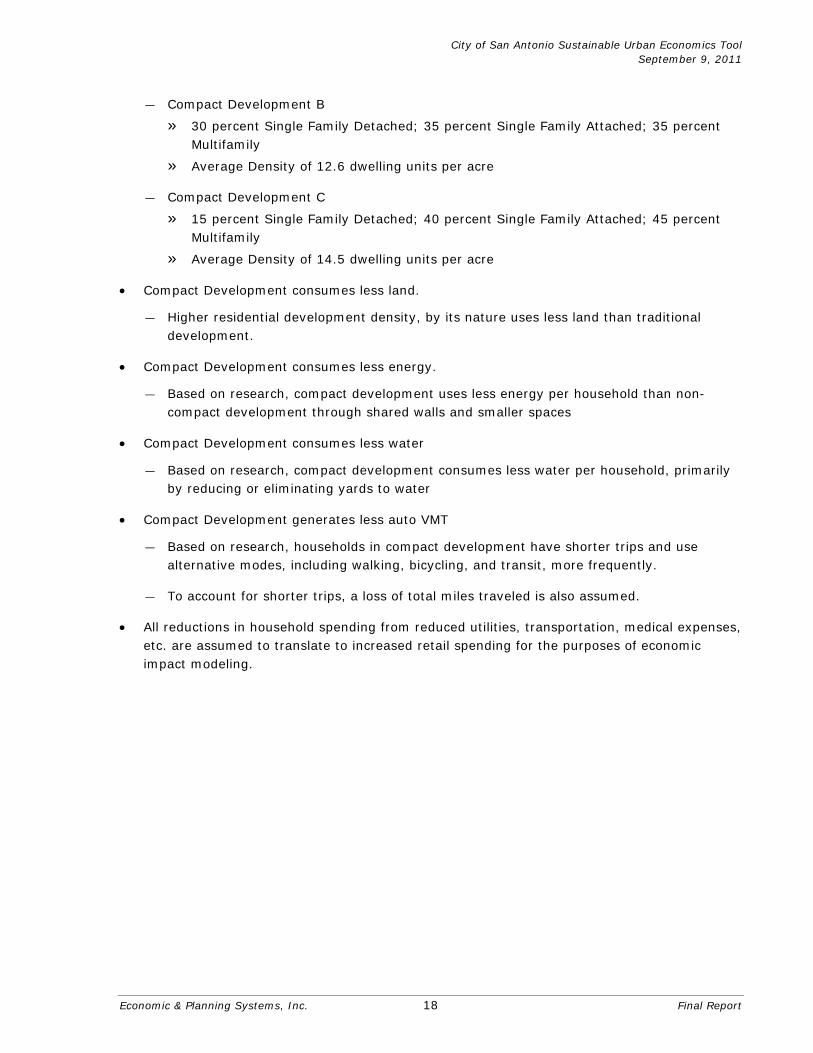
— Compact Development B
» 30 percent Single Family Detached; 35 percent Single Family Attached; 35 percent Multifamily
» Average Density of 12.6 dwelling units per acre
— Compact Development C
» 15 percent Single Family Detached; 40 percent Single Family Attached; 45 percent Multifamily
» Average Density of 14.5 dwelling units per acre
• Compact Development consumes less land.
— Higher residential development density, by its nature uses less land than traditional development.
• Compact Development consumes less energy.
— Based on research, compact development uses less energy per household than non-compact development through shared walls and smaller spaces
• Compact Development consumes less water
— Based on research, compact development consumes less water per household, primarily by reducing or eliminating yards to water
• Compact Development generates less auto VMT
— Based on research, households in compact development have shorter trips and use alternative modes, including walking, bicycling, and transit, more frequently.
— To account for shorter trips, a loss of total miles traveled is also assumed.
• All reductions in household spending from reduced utilities, transportation, medical expenses, etc. are assumed to translate to increased retail spending for the purposes of economic impact modeling.
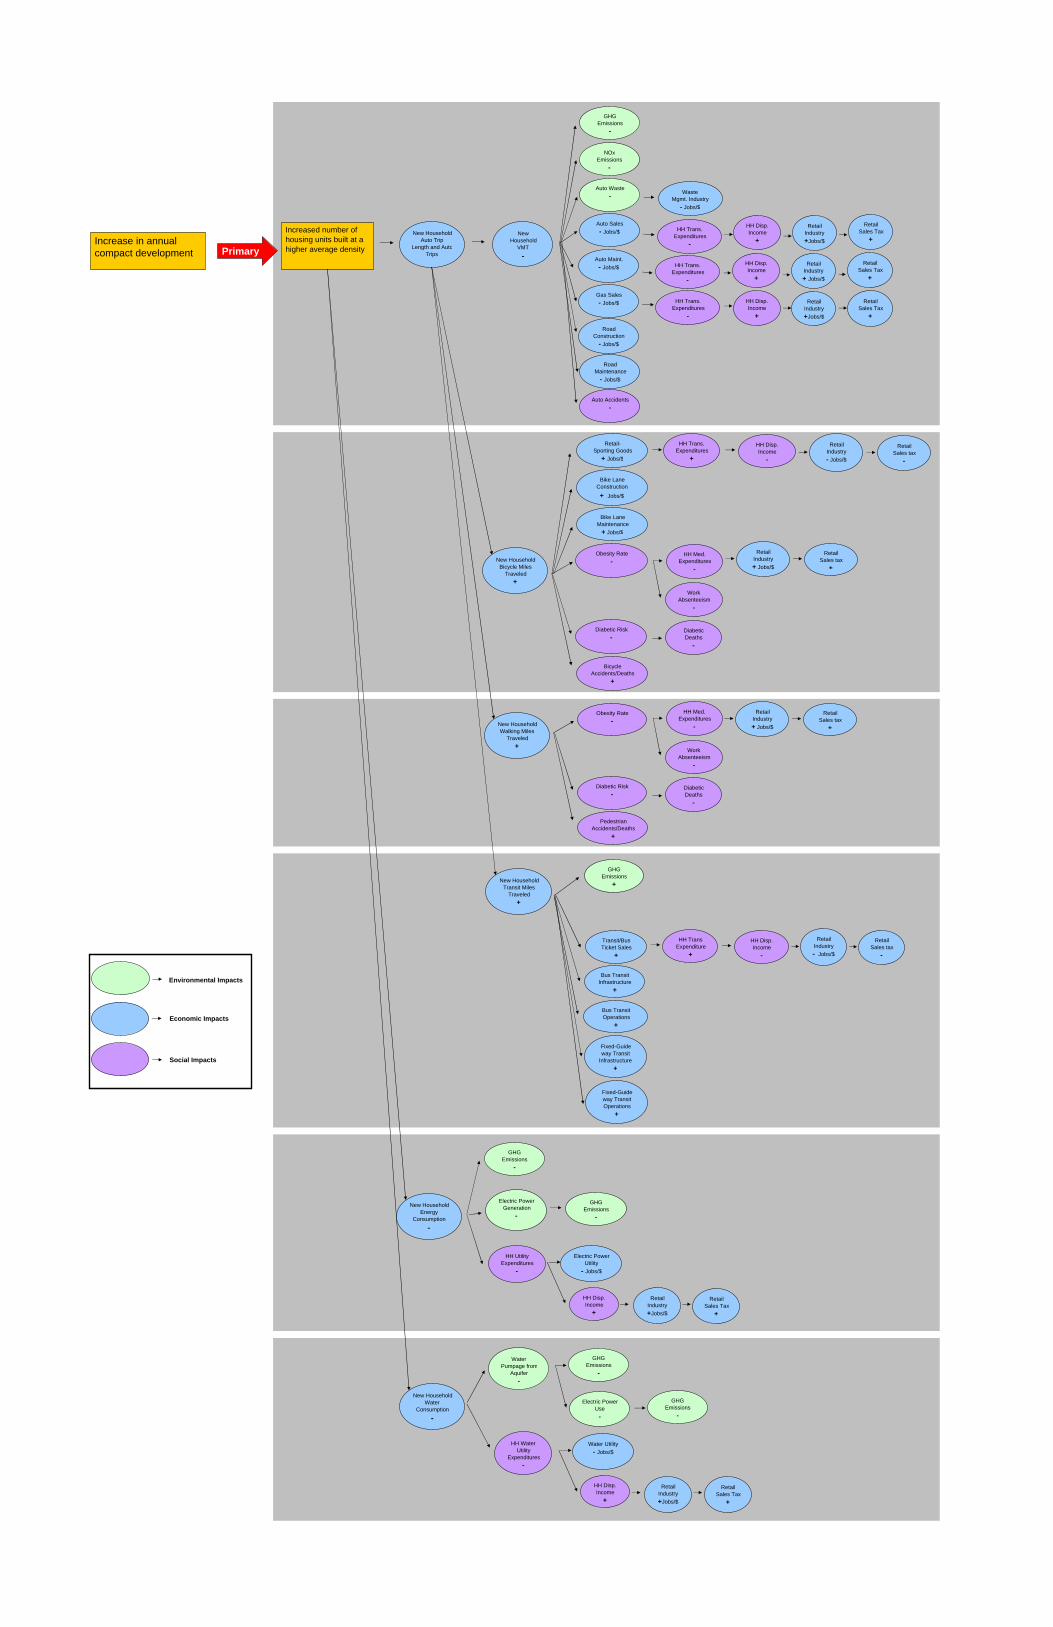
Increase in annual compact development Primary
Increased number of housing units built at a higher average density
Auto Waste-
NOx Emissions
-
GHG Emissions
-
Auto Sales- Jobs/$
Auto Maint.- Jobs/$
Gas Sales- Jobs/$
Road Construction
- Jobs/$
RoadMaintenance
- Jobs/$
Auto Accidents-
Waste Mgmt. Industry
- Jobs/$
HH Trans.Expenditures
-
HH Trans.Expenditures
-
HH Trans.Expenditures
-
HH Disp.Income
+
HH Disp.Income
+
HH Disp.Income
+
Retail Industry+Jobs/$
Retail Industry+ Jobs/$
Retail Industry+Jobs/$
Retail Sales Tax
+
Retail Sales Tax
+
RetailSales Tax
+
Bike LaneMaintenance
+ Jobs/$
Bike LaneConstruction+ Jobs/$
Retail-Sporting Goods
+ Jobs/$
Obesity Rate-
Diabetic Risk-
Bicycle Accidents/Deaths
+
Diabetic Deaths
-
HH Med.Expenditures
-
HH Trans.Expenditures
+
WorkAbsenteeism
-
HH Disp.Income
-
Retail Industry+ Jobs/$
RetailSales tax
+
Obesity Rate-
Diabetic Risk-
Pedestrian Accidents/Deaths
+
Diabetic Deaths
-
HH Med.Expenditures
-
WorkAbsenteeism
-
Retail Industry+ Jobs/$
RetailSales tax
+
GHG Emissions
+
Transit/Bus Ticket Sales
+
Bus Transit Operations
+
Fixed-Guide way Transit
Infrastructure +
Bus Transit Infrastructure
+
Fixed-Guide way Transit Operations
+
HH TransExpenditure
+
HH Disp.Income
-
Retail Industry- Jobs/$
RetailSales tax
-
Environmental Impacts
Economic Impacts
Social Impacts
New HouseholdAuto Trip
Length and AutoTrips
New Household
VMT-
Retail Industry- Jobs/$
RetailSales tax
-
New HouseholdBicycle Miles
Traveled+
New HouseholdWalking Miles
Traveled+
New HouseholdTransit Miles
Traveled+
New HouseholdEnergy
Consumption-
GHG Emissions
-
Electric Power Utility
- Jobs/$
HH UtilityExpenditures
-
HH Disp.Income
+
Retail Industry+Jobs/$
Retail Sales Tax
+
GHG Emissions
-
Electric Power Generation
-
Water Pumpage from
Aquifer-
HH Water Utility
Expenditures-
Electric Power Use
-
GHG Emissions
-
GHG Emissions
-
Water Utility- Jobs/$
HH Disp.Income
+
Retail Industry+Jobs/$
Retail Sales Tax
+
New HouseholdWater
Consumption-

City of San Antonio Sustainable Urban Economics Tool September 9, 2011
Economic & Planning Systems, Inc. 19 Final Report
Table 3 Summary of Compact Development Results Sustainable Urban Economics Tool
Item Amount Units % Change Item Output Output Jobs Item Amount Units Total CountyTotal Value Added Total
Air One-Time Avg. HH SpendingGHG Emission (5,241) MTON CO2e -5.11% Direct $1,224,415 $789,402 21 Housing Costs ($100) /Household ($972,710)NOx Ozone Emissions (3) MTON Indirect $258,596 $152,504 2 Transportation Costs ($171) /Household ($1,658,480)
Induced $658,201 $400,169 6 Health Costs ($12) /Household ($119,900)Water Total $2,141,212 $1,342,075 28 Retail Spending $0 /Household $2,751,090Water Consumption (39) Million Gallons -4.62% Green $1,224,415 $789,402 21 New Disposable Income $283 /Household $0Water Pumpage from Edwards Aquifer (45) Million Gallons -4.62% Fiscal $86,649
(138) Acre Feet -4.62% HealthAnnual Obesity -1.1% % of Pop.
Waste Direct $889,197 $745,135 42 Diabetic Risk -0.4% % of Pop.Auto Waste Production (29) TONs -2.91% Indirect $227,490 $134,049 2 Diabetic Deaths (0) # of Deaths
Induced $360,811 $219,048 3 Work Absenteeism (431) DaysEnergy Total $1,477,498 $1,098,231 46 Auto Accidents (11) # of AccidentsElectricity Consumption (6,310) MWH -3.54% Green $1,009,236 $651,808 17 Auto Deaths (0) # of DeathsNatural Gas Consumption (554) MCF -3.05% Fiscal Bike Deaths 0 # of Deaths
Sales Tax $52,862 Pedestrian Deaths 0 # of DeathsLand Property Tax $48,940Land Consumption (346) Acres -12.81% Other $29,461
Total $131,263
Source: Economic & Planning SystemsH:\20840-San Antonio Sustainable Urban Economics Tool\Models\Model\Results\[20840-Summary Results v7Bus OverrideFinalDraft.xls]20 % Compact Dev
Economic SocialEnvironmental
City of San Antonio Sustainable Urban Economics Tool September 9, 2011
Economic & Planning Systems, Inc. 20 Final Report
Inc rease in Renewa b le E lec t r i c Power Genera t ion
Introduction
Bexar County and the City of San Antonio are fortunate to have an energy provider that is part of their local government and provides all of the power to the region. CPS Energy is a quasi-municipal entity directed by a board of directors, which are appointed by the City. San Antonio and Bexar County have the ability to influence the decisions made by CPS and also work with CPS collaboratively in sustainable efforts.
The majority of the electric power used by Bexar County is generated in Bexar County. The major locally generated power is from coal and natural gas power plants, which account for 57.2 percent of the power generated by CPS. The other major electric power source is from a nuclear power plant outside of Bexar County, but it is part owned by CPS. The nuclear power plant accounts for 35.4 percent of the annual power generated.
Despite the majority of power being generated locally in Bexar County, the fuel used to generate power comes from outside Bexar County and the region. Alternatively, renewable energy sources provide a power source that can be generated locally without the need of outside fuel sources, and CPS Energy has a reasonable portfolio of renewable energy power. Currently, 7.5 percent of power generated by CPS is from a renewable source. CPS is planning to double its renewable energy power by 2020. The major renewable power source for CPS is wind power, which is unfortunately generated outside of Bexar County, along the Texas coastline. Wind power accounts for 90 percent of the renewable power CPS provides. The other renewable power sources that CPS has are a solar power plant and a landfill gas power plant, both of which are in Bexar County. The demand for renewable energy is growing, but the cost to provide renewable power is still far greater than conventional power sources. The cost to provide renewable energy falls on the consumers, and an increase in renewable power produced locally, while providing significant environmental and economic benefits to Bexar County, comes with an increased cost burden for consumers.
This policy was modeled to determine the impact of locally generated renewable energy. By showing an increase or decrease in renewable power generated, San Antonio, Bexar County and CPS can understand the relative impact on the environment and economy of renewable energy. The results from the testing of this policy can provide insight into the cost and benefits of producing more power locally and from renewable sources and provide a platform for increased investment into renewable energy. The default policy goal tested by EPS is an increase of 5 percent of renewable energy that is produced locally.
Key Assumptions
• CPS Energy is the provider of electricity to Bexar County.
• All increases in renewable electric power generation are produced reflecting CPS Energy’s stated renewable energy source mix goal.
• All renewable energy is purchased or produced locally in Bexar County.
• Capital cost for new renewable energy infrastructure is paid for by private energy firms. Most renewable energy power is bought by CPS through power purchase agreements from
City of San Antonio Sustainable Urban Economics Tool September 9, 2011
Economic & Planning Systems, Inc. 21 Final Report
private firms who build and maintain the renewable power plants. Therefore, one-time capital costs for renewable power are shown as one-time investment into the economy.
• CPS Energy incurs different operating costs (cost to purchase power) for the provision of renewable energy, as well, charges different rates to consumers due to varying costs of renewable sources.
• Because renewable energy costs more to generate, CPS passes the premium through to consumers accordingly. Reductions in household spending from increased utility costs are assumed to translate to reduced retail spending for the purposes of economic impact modeling.
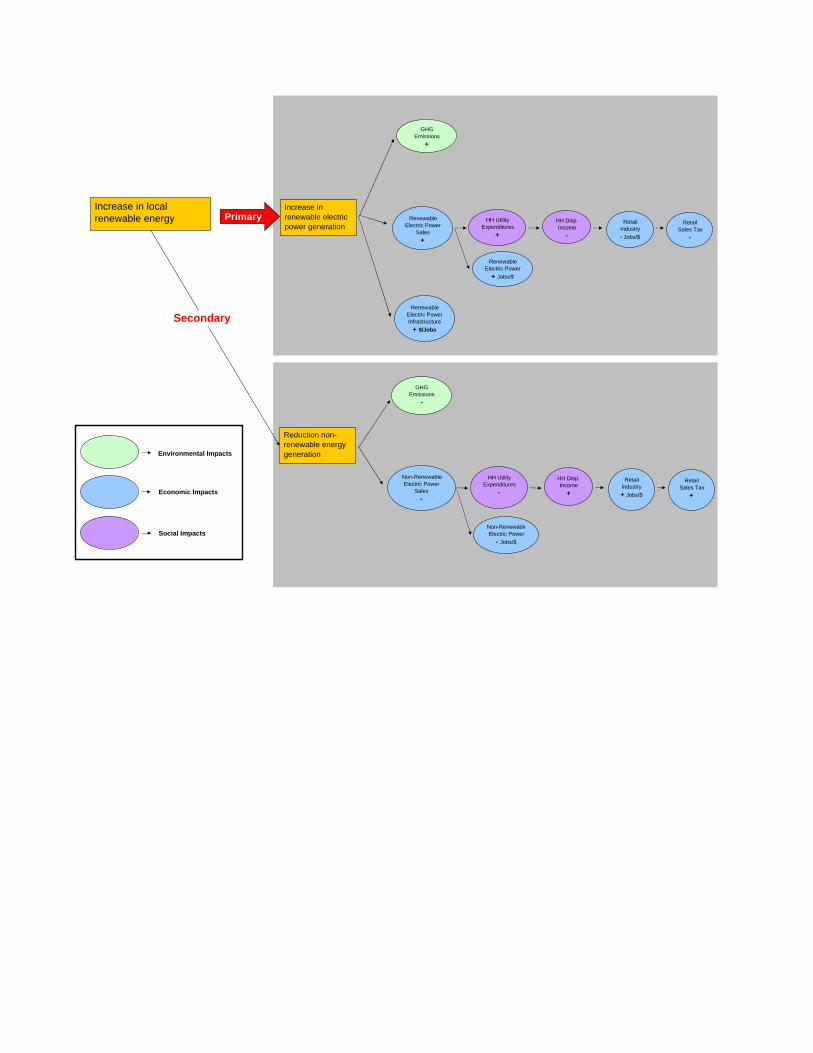
Increase in local renewable energy Primary
Increase in renewable electric power generation
Renewable Electric Power Infrastructure
+ $/Jobs
Reduction non-renewable energy generation
Secondary
Environmental Impacts
Economic Impacts
Social Impacts
GHG Emissions
-
Renewable Electric Power
Sales+
Renewable Electric Power
+ Jobs/$
HH UtilityExpenditures
+
HH Disp.Income
-
Retail Industry- Jobs/$
Retail Sales Tax
-
GHG Emissions
+
Non-Renewable Electric Power
Sales-
Non-RenewableElectric Power
- Jobs/$
HH UtilityExpenditures
-
HH Disp.Income
+
Retail Industry+ Jobs/$
Retail Sales Tax
+
City of San Antonio Sustainable Urban Economics Tool September 9, 2011
Economic & Planning Systems, Inc. 22 Final Report
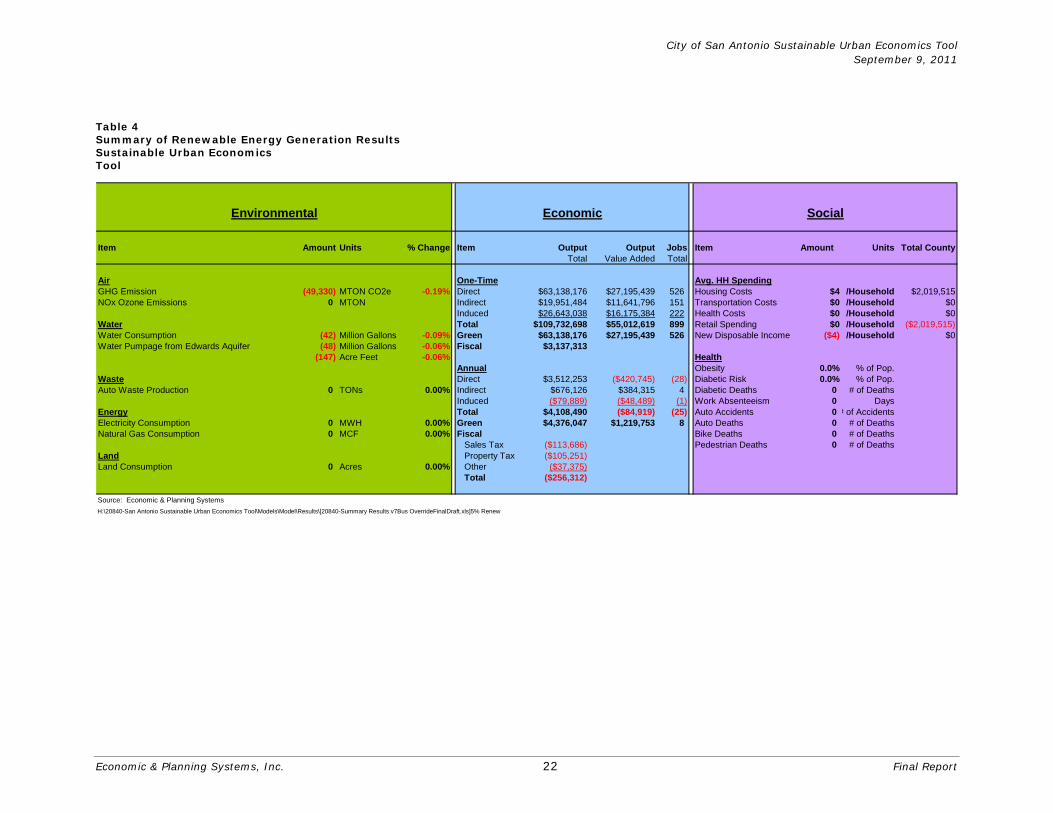
Table 4 Summary of Renewable Energy Generation Results Sustainable Urban Economics Tool
Item Amount Units % Change Item Output Output Jobs Item Amount Units Total CountyTotal Value Added Total
Air One-Time Avg. HH SpendingGHG Emission (49,330) MTON CO2e -0.19% Direct $63,138,176 $27,195,439 526 Housing Costs $4 /Household $2,019,515NOx Ozone Emissions 0 MTON Indirect $19,951,484 $11,641,796 151 Transportation Costs $0 /Household $0
Induced $26,643,038 $16,175,384 222 Health Costs $0 /Household $0Water Total $109,732,698 $55,012,619 899 Retail Spending $0 /Household ($2,019,515)Water Consumption (42) Million Gallons -0.09% Green $63,138,176 $27,195,439 526 New Disposable Income ($4) /Household $0Water Pumpage from Edwards Aquifer (48) Million Gallons -0.06% Fiscal $3,137,313
(147) Acre Feet -0.06% HealthAnnual Obesity 0.0% % of Pop.
Waste Direct $3,512,253 ($420,745) (28) Diabetic Risk 0.0% % of Pop.Auto Waste Production 0 TONs 0.00% Indirect $676,126 $384,315 4 Diabetic Deaths 0 # of Deaths
Induced ($79,889) ($48,489) (1) Work Absenteeism 0 DaysEnergy Total $4,108,490 ($84,919) (25) Auto Accidents 0 # of AccidentsElectricity Consumption 0 MWH 0.00% Green $4,376,047 $1,219,753 8 Auto Deaths 0 # of DeathsNatural Gas Consumption 0 MCF 0.00% Fiscal Bike Deaths 0 # of Deaths
Sales Tax ($113,686) Pedestrian Deaths 0 # of DeathsLand Property Tax ($105,251)Land Consumption 0 Acres 0.00% Other ($37,375)
Total ($256,312)
Source: Economic & Planning SystemsH:\20840-San Antonio Sustainable Urban Economics Tool\Models\Model\Results\[20840-Summary Results v7Bus OverrideFinalDraft.xls]5% Renew
Economic SocialEnvironmental
City of San Antonio Sustainable Urban Economics Tool September 9, 2011
Economic & Planning Systems, Inc. 23 Final Report
Inc rea se in Hous eho ld Energy E f f i c i ency
Introduction
Reducing energy usage is the most effective strategy addressing energy issues. Increasing the efficiency of households is essential to reducing regional energy consumption and can be accomplished relatively inexpensively. Household investments in energy saving improvements have a variety of positive effects on the region. Housing costs are reduced through energy savings, while making investments into the economy.
Reducing energy consumption is a key part of CPS’s corporate sustainability plan. The Save for Tomorrow Energy Plan (STEP) is CPS’s plan to incorporate energy efficiency and conservation into its long term energy goals. CPS’s goal is to reduce growth in projected peak electrical demand by 771 megawatts by 2020. CPS Energy offers a variety of residential programs to reduce energy demand including: weatherization for low income households, research on “peak performance homes”, air conditioner rebates, air flow performance rebates, CFL rebates, free peak saver thermostats, and others. In order to show the impact on the region, a policy goal of increased household energy efficiency of 5 percent (a reduction of 5 percent of residential energy use) was tested.
Key Assumptions
• Impacts tested are based on an average single family household not currently practicing energy efficiency techniques.
• Household energy efficiency is achieved in two ways
— Behavioral change of consciously consuming less energy
— Household improvements, including energy efficient appliances, new insulation, etc.
• An average household can reduce its energy use by 2.5 percent by using cost free approaches such as turning of lights and unplugging electronics/appliances while not in use.
• Household energy consumption includes both electricity and natural gas.
• The cost of household improvements for energy efficiency is paid for out of a household savings account and/or rebate/grant program. Thus, it does not affect their annual household expenditures.
• The average cost to reduce one kWh was calculated using a mixture of approaches to energy efficiency. The best practices to increasing household efficiency were inventoried and assigned a price and an average energy savings.
• Energy efficiency approaches are split between two types of investments: retail investments (i.e. energy efficient appliances) and installation investments requiring hiring an outsider to perform (i.e. having new insulation installed). The approaches impact different economic industries so they are split to reflect investment in the proper industries.
• Because water is required in energy production, reduced energy consumption results in reduced water consumption.
• All reductions in household spending from reduced utilities, transportation, medical expenses, etc. are assumed to translate to increased retail spending for the purposes of economic impact modeling.
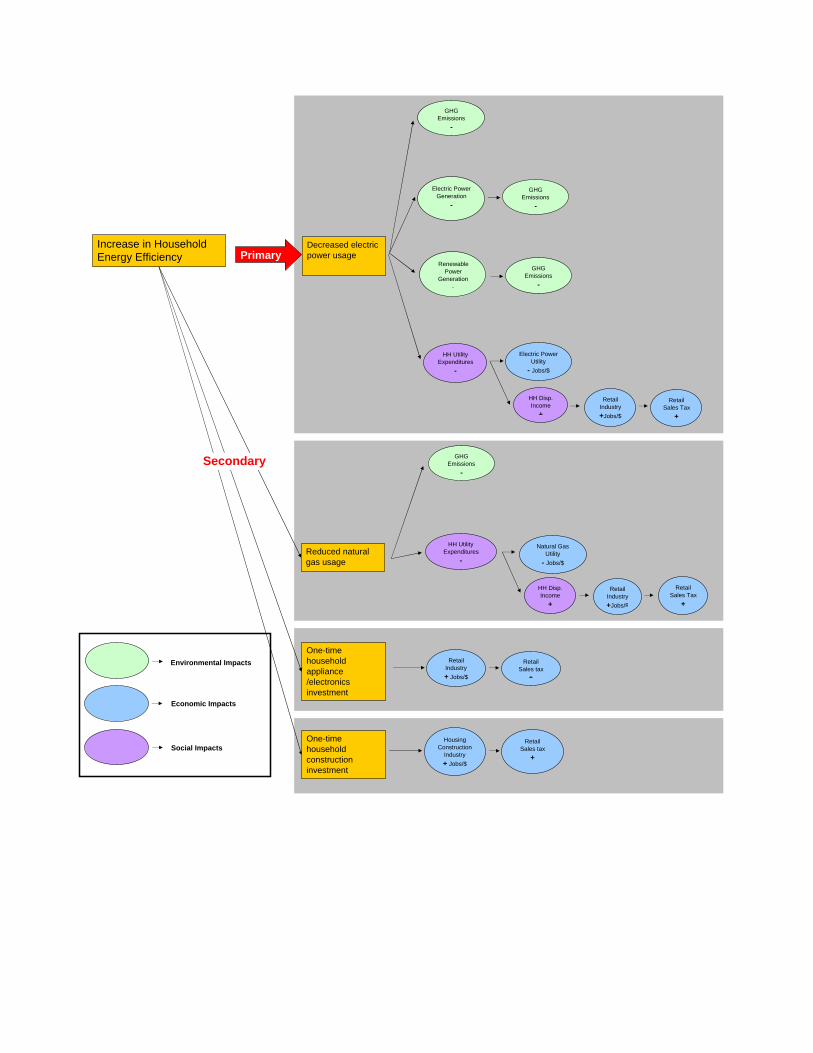
Increase in Household Energy Efficiency Primary
Decreased electric power usage
Electric Power Generation
-
GHG Emissions
-
Renewable Power
Generation-
Electric Power Utility
- Jobs/$
HH UtilityExpenditures
-
HH Disp.Income
+
Retail Industry+Jobs/$
Retail Sales Tax
+
Reduced natural gas usage
One-time household appliance /electronics investment
Retail Industry+ Jobs/$
RetailSales tax
+
Secondary
Environmental Impacts
Economic Impacts
Social ImpactsOne-time household construction investment
GHG Emissions
-
GHG Emissions
-
GHG Emissions
-
HH UtilityExpenditures
-
HH Disp.Income
+
Retail Industry+Jobs/$
Retail Sales Tax
+
Natural Gas Utility
- Jobs/$
Housing Construction
Industry+ Jobs/$
RetailSales tax
+
City of San Antonio Sustainable Urban Economics Tool September 9, 2011
Economic & Planning Systems, Inc. 24 Final Report
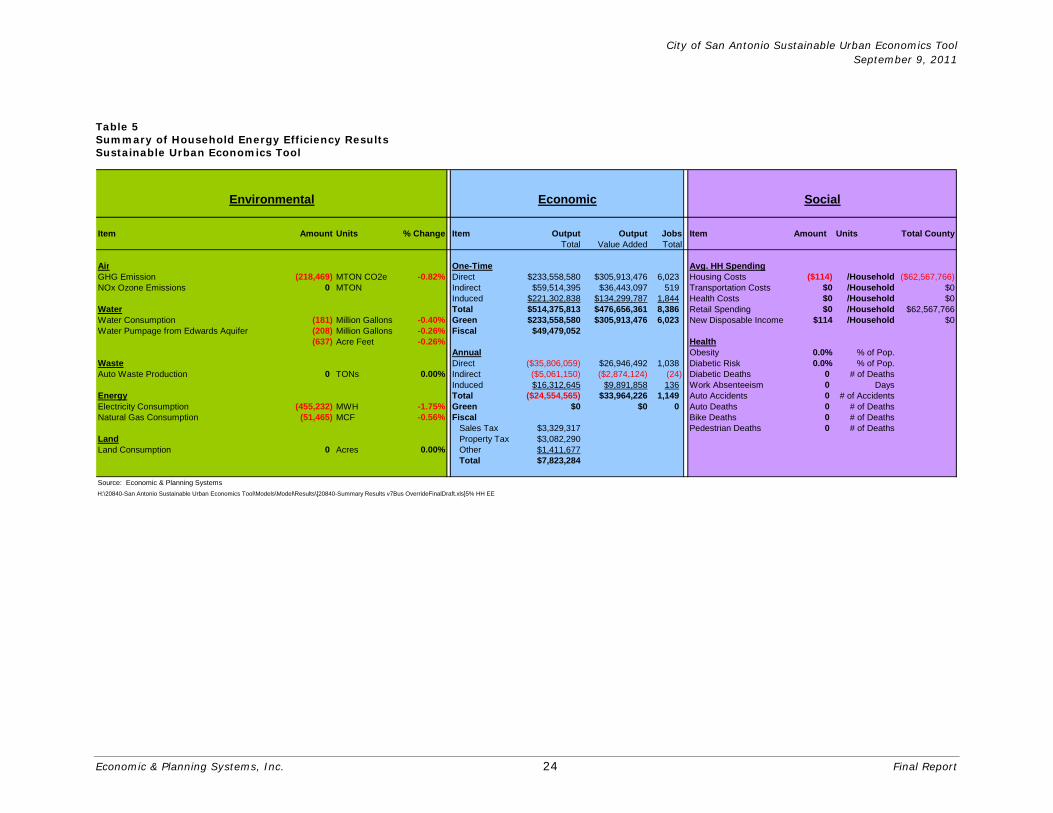
Table 5 Summary of Household Energy Efficiency Results Sustainable Urban Economics Tool
Item Amount Units % Change Item Output Output Jobs Item Amount Units Total CountyTotal Value Added Total
Air One-Time Avg. HH SpendingGHG Emission (218,469) MTON CO2e -0.82% Direct $233,558,580 $305,913,476 6,023 Housing Costs ($114) /Household ($62,567,766)NOx Ozone Emissions 0 MTON Indirect $59,514,395 $36,443,097 519 Transportation Costs $0 /Household $0
Induced $221,302,838 $134,299,787 1,844 Health Costs $0 /Household $0Water Total $514,375,813 $476,656,361 8,386 Retail Spending $0 /Household $62,567,766Water Consumption (181) Million Gallons -0.40% Green $233,558,580 $305,913,476 6,023 New Disposable Income $114 /Household $0Water Pumpage from Edwards Aquifer (208) Million Gallons -0.26% Fiscal $49,479,052
(637) Acre Feet -0.26% HealthAnnual Obesity 0.0% % of Pop.
Waste Direct ($35,806,059) $26,946,492 1,038 Diabetic Risk 0.0% % of Pop.Auto Waste Production 0 TONs 0.00% Indirect ($5,061,150) ($2,874,124) (24) Diabetic Deaths 0 # of Deaths
Induced $16,312,645 $9,891,858 136 Work Absenteeism 0 DaysEnergy Total ($24,554,565) $33,964,226 1,149 Auto Accidents 0 # of AccidentsElectricity Consumption (455,232) MWH -1.75% Green $0 $0 0 Auto Deaths 0 # of DeathsNatural Gas Consumption (51,465) MCF -0.56% Fiscal Bike Deaths 0 # of Deaths
Sales Tax $3,329,317 Pedestrian Deaths 0 # of DeathsLand Property Tax $3,082,290Land Consumption 0 Acres 0.00% Other $1,411,677
Total $7,823,284
Source: Economic & Planning SystemsH:\20840-San Antonio Sustainable Urban Economics Tool\Models\Model\Results\[20840-Summary Results v7Bus OverrideFinalDraft.xls]5% HH EE
Economic SocialEnvironmental
City of San Antonio Sustainable Urban Economics Tool September 9, 2011
Economic & Planning Systems, Inc. 25 Final Report
Reduct ion in Househo ld W ater C ons um pt ion
Introduction
The Edwards Aquifer is the major water supply for Bexar County and the San Antonio area. Protecting the aquifer is a main aspect of sustainability plans for several agencies in the area. Maintaining the aquifer level, not only ensures adequate water supply for current and future residents, it also maintains and ensures natural habitats for plants and wildlife. The most cost effective way to ensure adequate water supply for the region is to conserve water and reduce water use. Water conservation at the household level is an effective approach to reducing water usage. Retrofitting houses and redesigning landscapes to require less water is the most effective approach to water conservation and stimulates the economy through investment in home improvement items and local contractors to create xeriscapes and drought resistant landscapes.
The San Antonio Water System (SAWS) and Bexar County Water District are the main water providers in Bexar County. SAWS has the H2OME program that provides rebates aimed at water conservation for homeowners. SAWS’ goal is to achieve conservation of 116 gallons per-person-per-day. To achieve this, SAWS offers a variety of rebates to encourage water use reduction including: irrigation and landscape design rebates, water efficient toilet rebates, on-demand hot water heating system rebates, and others. In order to show the impact on the region, a policy goal of reduced residential water consumption of 5 percent was tested.
Key Assumptions
• Household water consumption is reduced in two ways
— Behavioral change of consciously consuming less water
— Household improvements, including water efficient appliances, plumbing, etc.
• The cost of household improvements for water consumption is paid for out of a household savings account and/or rebate/grant program. Thus, it does not affect their annual household expenditures.
• An average household can reduce is water consumption by 2.5 percent using cost free methods, such as watering less and at correct times of day, limiting shower length, etc. Investments needed to reduce water use are not required until 2.5 percent of water use is reduced.
• The best practices for water consumption reduction were inventoried with cost and water saving information in order to derive a cost per gallon of water saved factor.
• The reduced consumption of water results in reduced water pumpage from the Edwards Aquifer, the main source of water in Bexar County.
• Because water and service requires energy, reduced water pumpage results in reduced energy consumption and GHG emissions.
• All reductions in household spending from reduced utilities, transportation, medical expenses, etc. are assumed to translate to increased retail spending for the purposes of economic impact modeling.
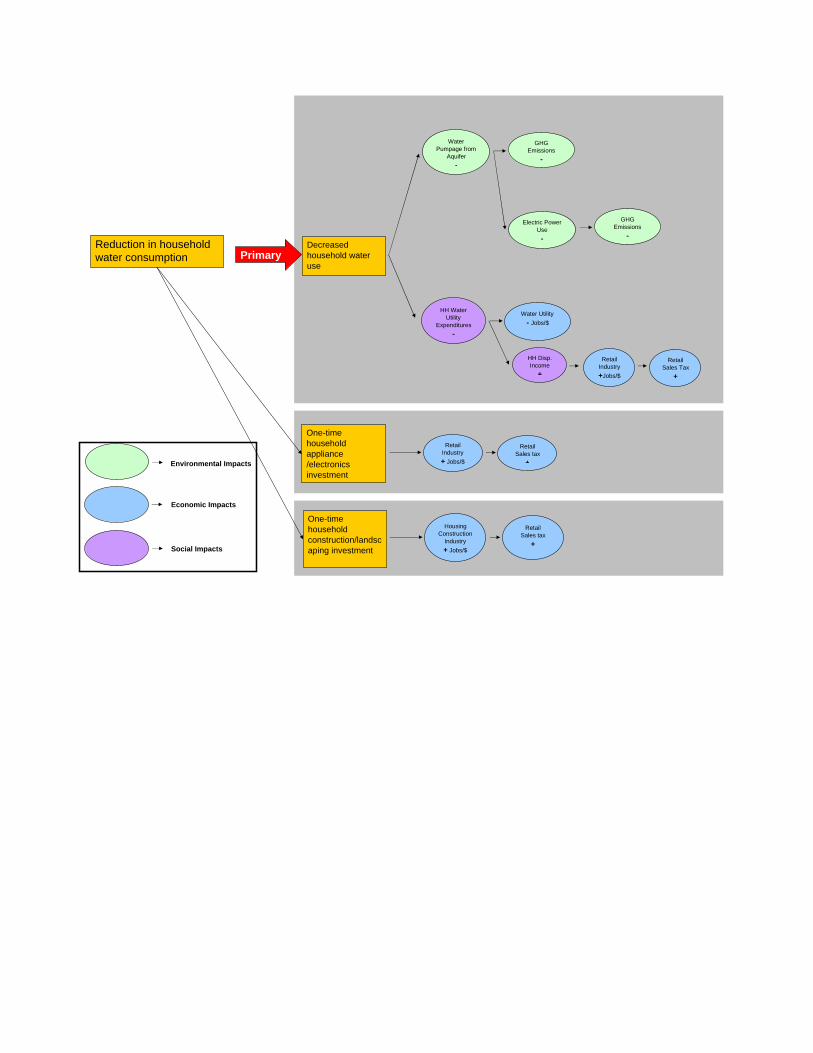
Reduction in household water consumption Primary
Decreased household water use
Water Pumpage from
Aquifer-
HH Water Utility
Expenditures-
One-time household appliance /electronics investment
Retail Industry+ Jobs/$
RetailSales tax
+Environmental Impacts
Economic Impacts
Social Impacts
One-time household construction/landscaping investment
Electric Power Use
-
GHG Emissions
-
GHG Emissions
-
Water Utility- Jobs/$
HH Disp.Income
+
Retail Industry+Jobs/$
Retail Sales Tax
+
Housing Construction
Industry+ Jobs/$
RetailSales tax
+

City of San Antonio Sustainable Urban Economics Tool September 9, 2011
Economic & Planning Systems, Inc. 26 Final Report
Table 6 Summary of Household Water Consumption Results Sustainable Urban Economics Tool
Item Amount Units % Change Item Output Output Jobs Item Amount Units Total CountyTotal Value Added Total
Air One-Time Avg. HH SpendingGHG Emission (22,105) MTON CO2e -0.08% Direct $22,030,260 $58,710,832 930 Housing Costs ($26) /Household ($14,535,193)NOx Ozone Emissions 0 MTON Indirect $3,820,900 $2,274,379 26 Transportation Costs $0 /Household $0
Induced $30,864,432 $18,720,565 257 Health Costs $0 /Household $0Water Total $56,715,592 $79,705,776 1,213 Retail Spending $0 /Household $14,535,193Water Consumption (2,260) Million Gallons -5.02% Green $22,030,260 $58,710,832 930 New Disposable Income $26 /Household $0Water Pumpage from Edwards Aquifer (2,590) Million Gallons -3.26% Fiscal $13,397,325
(7,950) Acre Feet -3.26% HealthAnnual Obesity 0.0% % of Pop.
Waste Direct ($8,318,149) $1,656,969 238 Diabetic Risk 0.0% % of Pop.Auto Waste Production 0 TONs 0.00% Indirect ($3,193,760) ($1,853,374) (28) Diabetic Deaths 0 # of Deaths
Induced ($162,829) ($109,048) (2) Work Absenteeism 0 DaysEnergy Total ($11,674,737) ($305,452) 209 Auto Accidents 0 # of AccidentsElectricity Consumption (41,785) MWH -0.16% Green $0 $0 0 Auto Deaths 0 # of DeathsNatural Gas Consumption 0 MCF 0.00% Fiscal Bike Deaths 0 # of Deaths
Sales Tax $601,414 Pedestrian Deaths 0 # of DeathsLand Property Tax $556,790Land Consumption 0 Acres 0.00% Other $185,781
Total $1,343,985
Source: Economic & Planning SystemsH:\20840-San Antonio Sustainable Urban Economics Tool\Models\Model\Results\[20840-Summary Results v7Bus OverrideFinalDraft.xls]5% HH WC
Economic SocialEnvironmental
Economic & Planning Systems, Inc. 27 Final Report
4. USER MANUAL
The User Manual first includes a description of the Model Structure and then a step by step instruction manual for use of the model. The user should read the model structure to gain a better understanding of the Model Components and specific tabs. The user should then read the model instructions to test each policy.
Mode l S t ruc ture
The Sustainable Urban Economics Tool is composed of four main components as identified in the Executive Summary. These components include the Pre Processor, the Impact Processor, the Economic Model, and the Post-Processor. Following the Post-Processor is a series of case studies and baseline data points used in the calculations of the Impact Processor. All of the components are linked together and can be navigated by using the hyperlink buttons provided on each page or by clicking the worksheet tab at the bottom of the screen. The following provides a more detailed description of the sub-components of each major component.
Pre Processor
The Pre Processor features just one tab called “Inputs.” This tab works as the model’s user interface and is divided into four subsections: “Primary,” “Secondary,” “Base Assumptions (Model Dials),” and “Directory”.
In the Primary subsection, the user selects the policy to be tested from a drop list of policies provided at the top. The user then inputs the magnitude of change (as a percent) in the cell below it, and a resulting primary impact, or result, is generated.
In the Secondary subsection, a set of secondary assumptions are generated and calculated based on the inputs in the Primary subsection. Secondary assumptions are assumptions made by the model related to how the Primary assumption or policy is accomplished. These secondary assumptions are automatically calculated by the model.
The Base Assumptions subsection allows the user to customize the results of the model by changing underlying assumptions. Where no new base assumptions are entered, the model assumes default values. The base assumptions or “Model Dials” included in this subsection include:
• % of Auto VMT Loss from Trip Loss – Allows user to enter the amount of VMT loss (as a percent of total loss) attributable to an overall reduction in auto trips through carpooling, combining trips, and/or conscious decisions to make fewer trips.
• Gas Fuel Price - Allows user to change the assumed gas price.
• Diesel Fuel Price - Allows user to change the assumed Diesel gas price (changes transit fuel costs).
City of San Antonio Sustainable Urban Economics Tool September 9, 2011
Economic & Planning Systems, Inc. 28 Final Report
• Average Auto Miles/Gallon - Allows user to change the assumed automobile fuel economy.
• Average Transit Fare - Allows user to change the average assumed price per one-way fare. This is a blended rate across all transit users, not simply the retail price of a ticket.
• New Transit Ridership - Allows user to change the allocation of new transit ridership between bus and fixed-guideway. The sum of each allocation should be 100 percent.
• Compact Growth Scenario - Allows the user the change the assumed housing types and blended density of compact growth.
The Directory provides the user with four options to proceed:
• “Back” returns to the Pre Processor “Title Screen”
• “Next” takes the user to the Impact Processor
• “Impact Processor Results” takes the user to the Outputs of the Impact Processor
• “Final Results” takes the user to the Post-Processor Final Results, including economic data generated in the Economic Model
Impact Processor
The Impact Processor features the bulk of the model calculations based on inputs from the Pre Processor. The Impact Processor is organized by the three sustainable systems (environmental, economic, and social) and generates a corresponding set of impacts for use in the Economic Model and Post-Processor. The primary function of the Impact Processor is to establish, categorize, and calculate the impacts generated from the inputs derived in the Pre-Processor.
Environment
Air
This Air tab calculates each policy’s impact to GHG emissions. GHG emissions are primarily composed of CO2, CH4, and N20 and are generally measured in metric tons (or million metric tons) of CO2 equivalent (CO2e). Factors were derived using baseline data from various local sources, including the Bexar County GHG Emissions Inventory and feature GHGs generated by auto, bus, coal energy production, renewable energy production, waste, water pumping, and household natural gas consumption. Each of these factors is applied to changes in behaviors resulting from the policy tested to arrive at the total GHG impact to Bexar County. Details for GHG generation by type was not available for some factors. In addition, the amount of NOx emissions generated by automobiles is calculated. Data on NOx emissions generated by other sources was not available.
Waste
Waste production is affected by many factors. However, for the purposes of this model, the only waste generator impacted by policy is the annual waste from automobiles. This waste includes annual disposal of tires, oil, other auto parts, etc.
City of San Antonio Sustainable Urban Economics Tool September 9, 2011
Economic & Planning Systems, Inc. 29 Final Report
Water
This Water tab calculates the impact on water consumption, pumpage, and related impacts to aquifer levels. The primary impact to water consumption is at the household level. Energy production is also a large user of water. For the purposes of this model, renewable energy production is assumed to have no impact to water consumption. Based on data from San Antonio Water Supply (SAWS), water consumption is translated to increase or decreases in water pumpage. The Edwards Aquifer is the primary water source for Bexar County. Water pumpage is translated to water pumped from the Edwards Aquifer in both gallons and acre feet.
Energy
The Energy tab calculates the impact to energy consumption and production. Energy includes both electric power and natural gas consumption. The model calculates the impact on consumption of energy at the household level, as a result of new light rail transit operations (if assumed) and as a result of power necessary to pump water for consumption. Electricity is required to run light rail transit. Factors for electricity necessary for light rail transit operations are taken from the Journal of Transportation and are driven by new passenger miles. Factors for water pumpage were derived using a case study method.
For the purposes of this model, impacts to consumption are assumed to have equal impacts to production on a one to one basis. CPS is the primary energy provider for Bexar County. CPS currently produces energy with a mix of sources that includes 92.5 percent non-renewable (nearly half of this from coal) and 7.5 percent renewable. For all policies except renewable energy production, the same mix is assumed for increases or decreases in production. For changes in the renewable energy production, a new mix is generated based on the amount of renewable energy increase that the user assumes and the stated goals of CPS’s future renewable energy mix.
Land
The Land tab calculates the impact to annual land consumption (acres of developed land) from policy change. For the purposes of this model, only Compact Development is assumed to impact land consumption in the county. The amount of annual land consumed is dependent the overall density of new development, which is driven by the amount of new development assumed to be Compact (entered by the user), as well as the Compact Development scenario assumed by the user in the model dials subsection of the Pre Processor.
Economic
The economic system of the model features one tab that calculates all of the potential direct economic impacts to Bexar County. Each economic impact is calculated using factors derived from other impact processor subcomponents, case studies, or direct factors from research sources. Impacts are categorized as either One-Time (impacts that happen once as a result of policy change) or Annual (ongoing impacts that happen annually in perpetuity as a result of policy change). These direct economic impacts are used as inputs in the Economic Model to calculate their indirect and induced impacts to Bexar County.
City of San Antonio Sustainable Urban Economics Tool September 9, 2011
Economic & Planning Systems, Inc. 30 Final Report
Social
Household Spending Impacts
Each policy change has the potential to impact household spending patterns. These potential changes in how households spend their incomes are modeled in the social system of the model. Four household spending patterns are calculated in this section, each on different tabs, to show the impact to households at different income levels. The income levels modeled include the average household of Bexar County, households earning 120 percent of average household income, households earning 80 percent of average household income, and households earning 60 percent of household income.
Data on household spending is based on a variety of factors from local and national sources. The primary areas of spending include taxes, housing costs, transportation costs, health spending, retail spending, and other.
• Taxes include federal and state income taxes
• Housing costs include spending on rent or mortgage payments and annual utility costs including water, electric, and gas bills.
• Transportation costs include annual spending on automobile purchases, auto maintenance, auto fuel costs, bicycles, and transit fares.
• Health costs include annual health insurance costs and non insurance spending including medical services and prescription drugs.
• Retail spending includes annual purchases made in nine retail categories (include eating and drinking establishments).
• Other spending includes annual savings, credit card interest charges, cash contributions, other insurance, etc.
For each income level, a base case is first established, followed by a net change in spending and a new resulting household spending pattern. Related economic impacts to the county are calculated by multiplying net impacts to household income by the total number of households in the county (or new annual household growth for the Compact Development policy). All cost savings are shown as increases in disposable income. For the purposes of economic modeling, increases in disposable income are assumed as increases in retail spending.
Household spending patterns by income group are calculated by relationships established from the national BLS Consumer Expenditure Survey. Only impacts from the average household income are used in the economic model. All other impacts are simply provided to demonstrate the impacts to different income groups.
Health Impacts
Personal and/or household health is impacted by changes in exercise habits generated by policy, such as increased walking or bicycling. The Health tab calculates all related health impacts from policy change. Impacts include automobile accidents, deaths, pedestrian and bicycling deaths, impacts to obesity and diabetic risk, and work absenteeism. Impacts are summarized as totals or as percent of population depending on the impact.
City of San Antonio Sustainable Urban Economics Tool September 9, 2011
Economic & Planning Systems, Inc. 31 Final Report
Impact Processor Results
The Impact Processor Results table (IP Output) summarizes the results generated by the Impact Processor. Results are categorized by each sustainability system (environmental, economic, and social). Economic outputs are classified as Annual and One-Time for input into the Economic Model.
Economic Model
The Impact Processor generates a number of direct economic impacts. These direct impacts generate indirect and induced economic impacts throughout the region. Indirect impacts include economic activity generated from expansion/contraction of the suppliers and services necessary to create economic outputs. Induced economic impacts represent the expansion/contraction of goods and services generated as a result of the wages and household incomes of the employees of the direct and indirect industries. The economic impact outputs generated by the Impact Processor are entered into the IMPLAN Economic Model, creating a set of additional economic impacts for the Post-Processor.
The IMPLAN Economic Model is an input-output modeling software that uses an approach first developed by the United States Forest Service in 1979, and now supported by the Minnesota IMPLAN Group. The model incorporates benchmark tables provided by the Bureau of Economic Analysis as well as other statistical data to model transactions occurring within the metropolitan area. IMPLAN is, in a sense, a general accounting system of the economic transactions taking place between industries, businesses, and consumers in an economy and estimates the impacts on total output, which can be translated into employment estimates. Through the use of IMPLAN, a more complete picture can be painted of the local/regional economic impacts of various environmental and social transactions to specific economic industries.
The Sustainable Urban Economics Tool utilizes four primary impacts generated from the Economic Model:
• Economic Output - Output represents the value of industry production or economic activity. For Retail and wholesale trade, output = gross margin and not gross sales.
• Economic Value Added - Value Added is a measure of the contribution to the regions GDP. It is an industry’s total output less the cost of its intermediate inputs.
• Employment - Jobs generated in each sector. Includes full and part-time jobs.
• Fiscal - Direct and indirect state and local personal and business taxes.
City of San Antonio Sustainable Urban Economics Tool September 9, 2011
Economic & Planning Systems, Inc. 32 Final Report
Economic Impact Inputs
The Model Inputs tab is used to populate the necessary activity templates for use in IMPLAN. This tab further classifies the direct economic impacts calculated by the Impact Processor into IMPLAN’s 440 economic sectors. The tab classifies each impact by type of activity (Industry Change/Event), One-Time, and Annual. It is this tab that is directly linked to the One-Time and Annual activity templates that will be imported into IMPLAN as inputs for analysis.
IMPLAN Results (PASTE section)
The IMPLAN Results section includes eight grey tabs. These tabs are provided to paste the results from IMPLAN back into the model for final incorporation. Four tabs are included for One-Time model results, including employment, value added, output, and fiscal. Another four tabs are included for Annual model results, including employment, value added, output, and fiscal. See Model Instructions for more detail on how to use these tabs.
Economic Impact Outputs
Model Outputs Total
This tab is directly linked to the IMPLAN Results tabs and simply totals results, as well as classifies Green Jobs. For the purposes of this model, Green Jobs are any increase in jobs as a result of policy change that are in sectors with positive environmental benefits to the County.
Model Outputs Fiscal
This tab categorizes and sums the fiscal results generated by IMPLAN by sales tax, property tax, and other business taxes.
Model Outputs-NAICS
This tab categorizes the economic results from IMPLAN sectors to 2-digit NAICS classifications.
Post-Processor
The Post-Processor combines the results of the Economic Model with the Impact Processor results and summarizes these findings in both annual and one-time impacts, as well as generates a series of graphs and tables, or model outputs. These graphs and tables were designed specifically to enhance the user’s understanding of the model, as well as to communicate the findings to other audiences.
Final Results
Similar to the Impact Processor Results, the Post-Processor Final Results table summarizes the results generated by the Impact Processor with the impacts generated from the Economic Model. Results are categorized by each sustainability system (environmental, economic, and social). Economic outputs are classified as One-Time or Annual. Economic outputs include economic output, value added, and employment in terms of the total and the percent defined as green jobs. Economic outputs also include fiscal impacts generated form the Economic Model.
City of San Antonio Sustainable Urban Economics Tool September 9, 2011
Economic & Planning Systems, Inc. 33 Final Report
Model Outputs
Environment
This output generates four bar graphs for comparison. These graphs include Air Impacts, Waste Impacts, Water Impacts, and Energy Impacts. The percent change for each comparison is also generated. It should be noted that the percent change for Compact Development is related to the increase or decrease from a compact scenario versus a non compact growth scenario. Thus, it does not correspond to the base figures provided in the graphs.
Environment 2
This output generates a bar graph with the impacts shown as percent changes over baseline conditions for GHG, Water Consumption, Waste Production, and Electricity Consumption.
Economic Results
This output shows a bar graph of total employment impacts on both a one-time and annual ongoing basis. Green Jobs are also included in this output.
Economic Results 2
This output shows a bar graph of total employment by industry (2-digit NAICS) for Green and Non-green jobs.
Household Results
This output shows a detailed comparison of spending patterns for households earning the average income in Bexar County. Changes in disposable income are highlighted in yellow and represent the economic impact flowing to the retail industry as a result of policy change. The distribution of spending is also shown in pie chart form at the bottom.
Household Results 2
This output shows a comparison of the percent change of household spending categories for both the 100 percent of average household income and the 60 percent of average household income.
Health Results
This output shows the percent change over baseline conditions for a number of health-related impacts.
Model Case Studies
The final section of the model is a series of case studies and data baselines. These case studies feed the Impact Processor with necessary data points, as well as some detailed calculations. Greater detail on these case studies is provided in the Case Studies Chapter of the report.
City of San Antonio Sustainable Urban Economics Tool September 9, 2011
Economic & Planning Systems, Inc. 34 Final Report
Mode l Ins t ruc t ions
A list of step –by-step instructions is included to guide the user through the use of the model.
1. Open the model using Excel
2. Click “Next” on the model title screen.
3. Click “Next” on the Pre Processor title screen.
4. Select the policy to be tested from the drop down list in Cell C9.
5. Enter the magnitude (as a percent) of change in Cell C11
a. The following should be entered as negative values for reductions:
i. Annual Household VMT
ii. Annual Household Water Consumption
iii. Annual Household Energy Efficiency (Consumption)
b. The following should be entered as a positive values
i. Renewable Energy Production
ii. Compact Development
1. Note: for this policy the user is entering the percent of new growth that will be developed as Compact Development
c. The resulting change is generated in Cell C13
d. The related secondary assumptions triggered by this change are generated in cells C19 through C21
6. Enter any changes to the base assumptions in the model in cells C27 through C44. These cells are known as the “model dials” and allow the user to customize model results using additional information if desired or when available. If nothing is entered in these cells, the default values shown in cells E27 through E44 are assumed. See Pre Processor in the Model Components section on pages 26-27 for a definition of each dial.
7. The user has one of three options:
a. Click to the Impact Processor
i. Takes user to the Title screen of the Impact Processor. From here the user can click through to each subcomponent of the Impact Processor.
b. Click to the Impact Processor Results
i. Takes user to the initial Impact Processor Results. These results are all the impacts generated by the Impact Processor, but do not include any results from the Economic Model.

City of San Antonio Sustainable Urban Economics Tool September 9, 2011
Economic & Planning Systems, Inc. 35 Final Report
c. Click to the Final Results
i. Takes user to the Final Results generated in the Post-Processor. These results include any impacts generated from the Economic Model as well as impacts from the Impact Processor.
ii. Important Note: Any change in policies or base assumptions will not trigger a change in the Economic Model results. Because the Economic Model is a separate process that must be run in IMPLAN for every result, the user must follow the Steps 14 and 15 before accurate Economic Model results are incorporated.
8. At this point, it is assumed the user has chosen Impact Processor Results as the next destination. Otherwise, the user should click “Next” through each Impact Processor subcomponent until the Impact Processor Results are reached. Click “Next” to the Economic Model Title screen.
9. Click “Next” to the Economic Model Inputs page.
10. In addition to the Model file, two additional files are included with the Model. These files are the import templates for use in IMPLAN. Keep these files in the same folder as the Model file. Open the file One-Time Import Activity and Annual Import Activity files on your computer.
11. If prompted, click “Yes” to update the file.
a. These files are externally linked to the Sustainable Urban Economic Tool and are therefore automatically populated with changes in the model when open.
12. Save each file and close.
a. These files are now updated with numbers generated by the Impact Processor for the specific policy being tested.
13. Open the IMPLAN software on your computer
14. IMPLAN directions
a. To use the IMPLAN software, the user needs to have a copy of the latest version of IMPLAN, as well as the purchased (and downloaded) data for Bexar County from the IMPLAN website.
b. The user will need to do two model runs in IMPLAN to account for the separate “One-Time” economic impacts and the “Annual” economic impacts. These impacts have already been separated by the Sustainable Urban Economics Tool.
c. Click “New Model” on the task bar on the left. If a model for Bexar County has already been created, select “Open Model” and select the saved model.
d. Choose a name for the New Model and click “Save”
City of San Antonio Sustainable Urban Economics Tool September 9, 2011
Economic & Planning Systems, Inc. 36 Final Report
e. In the pop up menu “Select Model Data Files”, choose the downloaded Bexar County data. The data used in the analysis of this report was Bexar County 2009 data. If data does not appear navigate to the folder that contains the data.
f. After highlighting the Bexar County data, Click “Select Data File” and “Continue.” IMPLAN then builds the economic model with Bexar County data. You should next see a menu that reads “IMPLAN Model Economic Overview.”
g. Click “Setup Activities” under “Analyze” on the left task bar. This is where the user inputs the economic activities to be analyzed.
h. Rather than clicking “New Activity,” select “Activity Options” from the “Activities” toolbar and “Import” from the drop down menu. Select “From Excel” from the drop down menu.
i. Find the recently updated “One-Time Import Activity” in the folder that contains the Sustainable Urban Economics Model. Click Open. Select Industry Change as the Activity Type and then “Import.” Data from the Import should then be imported into IMPLAN. Click through error messages that may occur. If the Import is successful, you should receive the message “Activity Import was successful.” Click OK. The import process will likely take a few minutes.
j. The user should now be able to view an Activity listed in the panel above entitled “Industry Purchases” and a set of Events listed by Sector under the Events menu. The user can check to see if these match the data in the One-Time Import Activity file or proceed by clicking “Next” in the lower right-hand corner or “Analyze Scenarios” from the Analyze menu in the taskbar on the left. These both proceed to the same screen.
k. The next step is to run an impact “Scenario.” The screen first asks the user to name the scenario. Select a name and click “Save.” Leave the default Scenario Level at 1.
l. Choose the “Industry Purchases” on the left of the menu and click “Select.” The scenario should move to the right side of the menu. Click “Analyze Single Region.”
m. IMPLAN should proceed to run the scenario until the user receives the message “Analysis Complete.” Click “Yes” to view the results.
n. The user should see a summary of results. Click on the tab “Detailed Results.’’ This presents the results by sector. The user can view the various results by category by selecting each from the “View By” drop down option.
o. Click on “Export”, “All Detail Reports to Excel.”
p. Save the Export in an appropriate folder with a name referring to One-Time, the policy tested, and date, such as “One TimeVMT123111” or another file name.
q. To export the fiscal impacts of the scenario, click on the “Tax Impacts” menu tab in the Scenario Results and export this file with a file name such as “One Time VMTTax123111” or other name.
City of San Antonio Sustainable Urban Economics Tool September 9, 2011
Economic & Planning Systems, Inc. 37 Final Report
r. At this point the user has successfully generated the One-Time Impacts for the policy tested. The user can return to import a new activity by clicking “Setup Activities” under the Tasks bar on the left. To avoid confusing new imports with old imports, it is best to delete the old activity before importing a new one. The process should be replicated for Annual Impacts, resulting in four Excel export files:
i. One-Time Economic ii. One Time Fiscal iii. Annual Economic iv. Annual Fiscal
15. Return to the Model Inputs tab in the Economic Model of the Sustainable Urban Economics Tool. The next eight tabs are in gray. The user needs to copy and paste four tabs from each IMPLAN export file.
a. If not already open, open the One-Time export file you just created.
b. Click on the “Employment” tab in the One-Time IMPLAN export.
c. Right click on the uppermost left corner of the worksheet. All rows and columns should be highlighted.
d. Select “Copy” from the right click drop down menu.
e. Return to the Sustainable Urban Economics Tool PASTE_One-Time Emp. tab.
f. Right click on the uppermost corner of the worksheet. All rows and columns should be highlighted.
g. Select “Paste” from the right click drop down menu.
h. The IMPLAN results should now be pasted into the worksheet.
i. Repeat this process for the Output, and Value Added tabs of the file.
j. Next, open the One-Time Tax export. Right click on the uppermost left corner of the worksheet and copy and paste this worksheet into the PASTE_One-Time Fiscal of the model.
k. You are now finished integrating the One-Time export data.
l. Repeat the same process for the Annual export and Annual Tax export.
m. Once finished, check to make sure each economic outputs page in the model looks exactly the same as each Export page. The Model links to these cells and automatically populates the necessary tables in the Post-Processor.
16. Click through each Economic Model Outputs tabs until the Post-Processor Title Screen appears.
17. Click “Next” to the Final Results tab. This tab summarizes all of the impacts.
City of San Antonio Sustainable Urban Economics Tool September 9, 2011
Economic & Planning Systems, Inc. 38 Final Report
18. Continue to click “Next” to view each of the Outputs Tab to view the summary of results graphically. Post-Processor Output tabs include:
a. Environ b. Environ 2 c. Econ Results d. Econ Results 2 e. HH Results f. HH Results 2 g. Health Results
19. The model will be repopulated each time a new policy is changed, however because the economic results are pasted in, these results will not change. The IMPLAN and paste process must be repeated each time a new policy is tested.
20. To save the specific results from a model run, click File, Save As and save the file with a selected name for future use. However, do not use this file for future testing as the Activity Template Imports are only linked to the original model file.
Economic & Planning Systems, Inc. 39 Final Report
5. CASE STUDIES AND BASELINE INVENTORIES
Energy Us e by Dens i t y
(Tab Label: Water-Energy by Density)
To calculate the impact on energy consumption from Compact Development, EPS used research from the Journal of Urban Planning and Development. The Journal of Planning and Development estimates that single-family detached units use 11 percent more energy than an average household, while a multifamily units use only 33 percent of the energy consumed by an average household. EPS assigned densities to these descriptions and used the information to calculate implied energy consumption by single family attached units. EPS then applied these factors to the average household energy consumption in Bexar County (estimated from CPS Energy and census data on total households) to calculate the estimated energy consumed by density in Bexar County. To estimate the impact of Compact Development, EPS calculated the difference in density between zero percent of average annual growth as compact and the percent of compact growth entered by the user. EPS then applied the established energy consumption by density factors to this difference to estimate the impact of new Compact Development.
Water Use by Dens i t y
(Tab Label: Water-Energy by Density)
EPS used the same process as energy use by density to estimate household water use by density. Data from the EPA Smart Growth Program was utilized for the baseline factors and applied to the resulting difference in overall density entered by the user.
Veh ic le M i l es T rave led by Dens i t y
(Tab Label: VMT by Density)
EPS used the same process as energy and water use by density to estimate household VMT by density. Data from the Moving Cooler Report published by the Collaborative Strategies Group, LLC out of Washington DC was utilized for the baseline factors and applied to the resulting difference in overall density entered by the user. A portion of the VMT reduction from Compact Development is attributable to shorter trip lengths. To estimate this loss of miles, EPS divided the estimated average length of transit trips by the estimated average length of automobile trips provided by Bexar County. As a result, 42 percent of VMT reduction is attributable to shorter trip lengths and 58 percent is attributable to alternative modes of transportation. Alternative modes are allocated using the base trip allocation provided by Bexar County.
City of San Antonio Sustainable Urban Economics Tool September 9, 2011
Economic & Planning Systems, Inc. 40 Final Report
Base l ine and Compac t Deve lopment Dens i t i es
(Tab Label: Density Key)
EPS used housing unit data from the U.S. Census and zoned land inventory provided by the City of San Antonio to identify baseline residential density in Bexar County. To estimate annual development trends, EPS used building permit data from the State of the Cities Database. Future Compact Development scenarios were designed by EPS to represent three potential compact development densities. Based on user inputs and the selected growth scenario, a new blended overall density is estimated. Baseline density is subtracted from this estimated blended density to estimate the impact to overall residential density in the county based on the Compact Development policy.
Tr ips by T ranspor ta t ion Mode Inventory
(Tab Label: Trips by Mode)
The Trips by Transportation Mode Inventory was compiled from data provided by the City of San Antonio for Bexar County. This inventory is used to define the mode splits used for allocating automobile travel to alternative modes of transportation, including transit, walking, and bicycling. Trips are converted to vehicle miles by applying a vehicle occupancy factor. The baseline auto VMT for Bexar County is estimated with this method. In addition, the case study estimates the impact of trip reduction entered by the user in the model dials, as well as the corresponding shift to alternative modes of transportation.
Veh ic le M i l es T rave led Inventory
(Tab Label: VMT Base)
The VMT Inventory was compiled from the Bexar County Greenhouse Gas Emissions Inventory and represents the existing VMT patterns by vehicle type. This was used in data comparisons with the Trips by Transportation Mode Inventory.
VMT Impact Summa ry
(Tab Label: VMT Impact)
The VMT Impact case study summarizes the resulting changes in miles by mode of transportation and policy inputs for both Bexar County and for Bexar County growth (for Compact Development Policy).
Tra ns i t
(Tab Label: Transit)
The Transit case study calculates the ridership and associated operating and capital costs of new transit service in Bexar County. In order to calculate these costs, EPS first calculated the
City of San Antonio Sustainable Urban Economics Tool September 9, 2011
Economic & Planning Systems, Inc. 41 Final Report
allocation of transit trips/passengers to bus and fixed-guideway transit. The default allocation of 75 percent bus- 25 percent fixed-guideway is based on National Transit Database data of the current allocation of bus to fixed guideway ridership in Denver, a city with a small to mid-size transit system that could be attained in San Antonio. However, as stated, the user can override this allocation through the model dials in the Pre Processor. Once this allocation is performed, passenger miles are translated to passengers based on the average length of transit trip provided by Bexar County. Bus passengers can then be translated to vehicle miles using National Transit Database data on the number of passengers per vehicle mile in San Antonio’s existing system operated by VIA. Fixed-guideway passengers are translated to fixed-guideway vehicle miles using National Transit Database data on the number of passengers per new vehicle mile in Denver’s existing system.
Bus operating and capital costs can then be calculated based on the estimate of new vehicle miles. To estimate capital costs, or in this case the purchase of new buses, EPS applied the existing VIA ratio of annual vehicle miles per vehicle for the National Transit Database to the number of new vehicle miles. The FTA estimates the average cost of a new diesel bus to be $320,000. Thus, estimated capital costs are $320,000 times the number of new vehicles. To estimate operating costs, EPS applied the existing VIA ratio of operating costs per vehicle mile provided by the National Transit Database.
Fixed-guideway operating and capital costs are also calculated based on the estimate of new vehicle miles. To estimate capital costs, EPS first translated new vehicle miles of fixed-guideway transit to miles of fixed-guideway transit using Denver’s ratio of vehicle miles to fixed-guideway miles. EPS then applied the San Antonio MPO’s estimate of capital and annual operating costs per mile of fixed-guideway transit
Greenhouse Gas (GHG) Inventory by Source
(Tab Label: GHG Base)
The baseline Greenhouse Gas Inventory was extracted from the Bexar County Greenhouse Gas Inventory performed by the Alamo Council of Governments in 2005. The model utilizes total Greenhouse Gases, as well as Greenhouse Gases from specific sources including Transportation, Energy Production, Waste, Water, and Residential Combustion.
Water Consumpt ion
(Tab Label: Water Cons. Base)
Annual household water consumption is calculated by summing total residential (residential plus apartments) water consumption in both the SAWS and Bexar Metro Water Districts and dividing by estimated residential customers. Because connections to multifamily buildings are based on buildings and not units, total Bexar County households estimated by the U.S. Census is used.
City of San Antonio Sustainable Urban Economics Tool September 9, 2011
Economic & Planning Systems, Inc. 42 Final Report
Water Pumpage by Consumpt ion
(Tab Label: Water Pumpage)
To estimate the impact to aquifer levels, EPS compiled the inventory of water sources in Bexar County by total gallons and acre feet. The Edwards Aquifer is the largest water source in the county and the only aquifer. EPS then estimated the amount water of pumped from the aquifer for residential purposes based on the percent of water consumed for water for residential uses. The result is the amount of annual water pumped from the Edwards Aquifer. The established relationships of consumption, pumpage, and pumpage from the Edward aquifer are used in the water impact calculation of the Impact Processor.
Househo ld W ater C ons um pt ion Cos t E s t imator
(Tab Label: WC Cost Calc)
To calculate the impacts of reduced household water consumption a case study was made to estimate the cost to a household to reduce water usage. The most cost effective approaches to water conservation for households are methods that are cost free to households. Practices like limiting shower times, watering your lawn at the correct time of day, etc. have a significant impact on water use. For this case study, EPS assumed that water use in an average household can be reduced by 2.5 percent using cost free methods to water conservation. If a user tests the impact of a 2.5 percent reduction in household water use, there will be no direct economic impact from household expenditures on water saving methods.
Once a reduction greater than 2.5 percent is tested, a cost per gallon water saved factor is applied to estimate the expenditures needed from households to achieve this reduction in water use. The factor used was created by inventorying the best practices to conserving water in households by the amount of water saved annually and the cost of each water conservation tactic. The list includes purchases of low cost solutions such as low-flow showerheads (average cost of $50 and annual water savings of 2,300 gallons of water) and more expensive solutions such as water conserving toilets (average cost of $150 and annual water savings of 11,000 gallons of water). The average cost per gallon of water saved was calculated for each item inventoried and then a weighted average of the cost per gallon of water saved was calculated for use in the model. The water conservation items were inventoried by researching suggested practices from SWAS and the Environmental Protection Agency (EPA).
The calculated cost per reduction of one gallon of water is $0.06. The cost to a household to save the target policy for water conservation is calculated using this factor multiplied by the needed reduction in gallons used by a household. This calculation results in the economic investment into hardware and appliance retail spending per household in the economy to achieve this policy goal, which is then multiplied by the total households in Bexar County. This case study shows the total cost to the household and also the estimated “payback” period for households based on reduced water bills from the water use reduction. For the default setting of 5 percent reduction in household water consumption, the average cost to a household to achieve this goal is $123, which has a payback period of 4.6 years.
City of San Antonio Sustainable Urban Economics Tool September 9, 2011
Economic & Planning Systems, Inc. 43 Final Report
Energy Us e in Wate r Cyc le
(Tab Label: Energy for Water)
The factor used to calculate the impact on energy use from increased or decreased water use is shown in this tab. A study titled The Carbon Footprint of Water by Bevan Griffiths-Sattenspiel and Wendy Wilson from May 2009 for the River Network organization was the source for his factor. The table on this tab shows a range (low and high) of energy use for five stages of the water cycle. A median value for each cycle was calculated and summed to create a kWh used per million gallons factor.
Renewab le Energy Revenue
(Tab Label: Ran. Energy Rev)
This case study calculates the change in residential rate for electricity based on the amount of renewable energy CPS Energy is providing. To calculate the increased rate or premium for renewable energy, EPS used utility bill premiums reported by CPS. CPS provided EPS with the average monthly increase in electricity bills for residential customers for renewable energy. This average monthly premium of $5.40 for the current renewable energy portfolio was translated into a per kWh premium using the average monthly electricity usage per household. The cost per kWh for wind generated electricity is $0.06, $0.16 for solar generated electricity, and $0.11 for land fill gas generated electricity. The amount of renewably generated electricity provided to each household matches the percent of renewable energy CPS generates. An increase in renewable energy produced by CPS will cause an increase in household electricity bills based on the increase of renewable energy by type.
Energy Genera t ion Cos ts
(Tab Label: Energy Gen. Costs)
This case study is used to calculate the increased operating costs for renewable energy generation and the capital cost to build renewable energy power plants. The costs for renewable energy for wind, solar, and geothermal power were calculated using factors from US Energy Information Administration Report, November 2010 "Update Capital Cost Estimates for Electricity Generation Plants". The operating cost for renewable energy generation for CPS Energy is the cost to purchase the energy produced from a private owner of the power generating plants.
Househo ld E nergy E f f i c i ency C os t Es t imator
(Tab Label: EE Cost Calculator)
To calculate the impacts of reduced household energy use (increase in energy efficiency) a case study was made to estimate the cost to a household to reduce energy use. The most cost effective approaches to energy conservation for households are methods that are cost free to households. Practices like turning off lights in empty rooms, unplugging unused appliances, etc. have a significant impact on energy use. For this case study, EPS assumed that energy use in an
City of San Antonio Sustainable Urban Economics Tool September 9, 2011
Economic & Planning Systems, Inc. 44 Final Report
average household can be reduced by 2.5 percent using cost free methods to energy conservation. If a user tests the impact of a 2.5 percent increase household energy efficiency (or a reduction in energy use), there will be no direct economic impact from household expenditures on energy saving methods.
Once a reduction greater than 2.5 percent is tested, a cost per kilowatt hour (kWh) of electricity saved factor is applied to estimate the expenditures needed from households to achieve this reduction in electricity use. The factor was created by inventorying the best practices used to conserve electricity in households by the amount of electricity saved annually and the cost of this energy conservation tactic. Two types of methods were inventoried and used in the calculation of a cost per kWh saved factored. The two types were energy savings methods that require purchases of appliances, electronics, and other items from stores, and methods that require installations or repairs to a home, which are most often performed by a hired contractor. The list of retail purchases includes purchase of low cost solutions such as installing compact florescent light bulbs (CFLs) (average cost of $3.00 per bulb and annual energy savings of 43 kWh) and more expensive solutions such as an energy star rated efficient air conditioner (minimum cost of $1,200 and annual energy use reduction of 6 percent from the cooling system). The installations and repairs inventoried included things like installing insulation in attics to a R-30 rating (average cost $1,000 and an annual energy savings of 4 percent) to easy solutions like installing a programmable thermostat (average cost $50, free to homeowners through rebate programs and an annual energy savings of 3 percent). The average cost per kWh saved was calculated for each retail item inventoried and household installation and then a weighted average of the cost per kWh of electricity saved was calculated for use in the model. The associated natural gas savings from the techniques used to calculate electricity use were also calculated as a secondary impact. The reduction of CCF’s of natural gas used is included in the model but is driven by the reduction in electricity use. The energy efficiency methods inventoried were determine by using the Home Energy Saver Report generated by the web-based energy audit tool developed by the U.S. Department of Energy’s Lawrence Berkeley National Laboratory (http://hes.lbl.gov) and suggested practices from CPS Energy (www.cpsenergy.com).
Household installations or repairs are the more cost effective methods to energy efficiency, so the use of these methods was weighted higher than retail purchases. A split of 73 percent of energy savings coming from repairs/installations and 27 percent from retail purchases was used. The two methods have a separate cost per kWh saved factor. The calculated cost per reduction of one kWh of electricity is $3.28 for appliance/electronics approaches and $0.94 for installation and repair approaches. The cost to a household to save the target for energy efficiency is calculated using these factors multiplied by the needed reduction in kWh used by a household. This calculation results in the economic investment of $776 per household in the economy to achieve this policy goal, which is then multiplied by the total households in Bexar County. This case study shows the total cost to the household and also the estimated “payback” period for households based on reduced energy bills from the energy use reduction. For the default setting of 5 percent reduction in household energy use, the average cost to a household to achieve this goal is $776. The reduction in energy use results in an annual savings of $114 per household, which equates to a payback period of 6.8 years.
City of San Antonio Sustainable Urban Economics Tool September 9, 2011
Economic & Planning Systems, Inc. 45 Final Report
Househo ld Energy Cos t by Energy Type
(Tab Label: HH Energy)
This tab is used to calculate the impact of increased energy from renewable sources on households. The average annual household electricity use is 16,541 kilowatt hours. This average kWh amount is split by the percent of electricity generated by source. An increase in renewable energy will create an increase in energy cost to the household. A factor for the net per kWh cost for each type of renewable energy is used to calculate the increased cost. In order to derive the net cost per kWh for renewable energy, EPS used factors from CPS Energy for the increased cost to householders on their monthly energy bill. CPS Energy reports that customers pay an additional $5.60 per month for the renewable energy provided by CPS. Per month cost factors for each type of CPS renewable energy were divided by the average household electricity use to derive a per kWh factor.
Average Hous eho ld Expend i tu res Base l ine
(Tab Label: HH Exp.)
This case study serves as the bases for all average household related impacts. The calculations used in the model are on model tab “Avg. HHI” in the “social” section of the Impact Processor. The “Avg. HHI” tab also references the “Econ Base” tab in the Case Studies section of the model. This tab summarizes the research completed to create an snapshot of an average Bexar County household in terms of there household expenditures and spending. The composition of annual expenditures and spending from an average Bexar County household was created using a variety of data sources to tailor specific costs to the categories impacted by the policies tested in this model. The average household spending was based on an average household income for Bexar County of $61,801. Some of the expenditures are based on percentages while others are specific costs that are not related to income. The major categories of expenditures are: income tax (a fixed percentage based on 2008 IRS average tax as percent of average gross income for the State of Texas), housing costs, transportation costs, health costs, retail spending and other.
Housing costs were split between mortgage/rent costs and utility costs. An average annual mortgage/rent cost was calculated using the U.S. Census’ American Community Survey for Bexar County, which reports average monthly rent for renter occupied households and average monthly mortgage payments for owner occupied households. A weighted average rent/mortgage cost was calculated using the average rent and mortgage payments weighted by the split between renter households and owner households. Utility costs are fixed average costs based on the average utility bills for residential costumers for SWAS (Water) and CPS Energy (Electricity and Gas).
Transportation costs shown on this tab are factors gained from the Housing and Transportation Index created by the Brookings Institute, as part of an effort between the Center for Neighborhood Technology and the Center for Transit Oriented Development. The purpose of this group and its website (www.htaindex.cnt.org) was to research and determine what factors matter the most in the affordability of housing and transit for households in the U.S. This website offers a wealth of knowledge and information and is useful for quick comparisons of both differences in one area or comparing various different areas in the country. None of the factors
City of San Antonio Sustainable Urban Economics Tool September 9, 2011
Economic & Planning Systems, Inc. 46 Final Report
from H and T index were ultimately used in the model calculations. Transportation costs for households were based largely off of research by the America Automobile Association (AAA) and factors can be reference on the “Econ Base” tab in the case studies section of the model. Household annual transit and bicycle cost factors are shown on the “Econ Base” tab. Factors shown in this case study are from other sources not used in the model.
Health spending costs for a household are split between health insurance, medical services and drugs, prescriptions, and medical supplies. Average household insurance and medical services costs are based off of a percentage of household income, 3.6 percent for insurance and 1.5 percent for medical services. These factors were obtained from the US Bureau of Labor Statistics’ (BLS) Consumer Expenditure Survey from 2009 (http://www.bls.gov/cex). The factor for household spending on drugs, prescriptions, and medical supplies is also calculated by using a percent of household income. The percentage of household spending on these items was gained from the U.S. Census’ Economic Census from 2007 (http://www.census.gov/econ/census07).
The sales in retail NAICS categories for the State of Texas were divided by the households to get a per-household factor for each retail category. One of the retail categories is health and personal care items.
Household retail spending factors were derived the same way as the drugs, prescription and medical supply factor was calculated. The U.S. Economic Census total sales per NAICS retail categories for Texas are divided by households in Texas to give approximation of average household spending on retail goods by NAICS category. The average Texas household spends 38.1 percent of their income on retail goods and services (including food and beverage purchases from restaurants, which categorized by a different NAICS code as retail goods).
Economic Im pac t Fac to rs
(Tab Label: Econ. Base)
This tab is the inventory of factors used to derive the economic impacts for the model. These factors are derived in other case studies or are shown here with the source noted in the table. These factors are used to calculate the total investments that are put into IMPLAN to derive the total economic impacts of the policies tested. For policies that are based of an existing inventory, the baseline total is shown with the corresponding factor to the right. The source of the factors and baseline inventories are noted on this table as well. Please refer to the factor inventory table on the “Model Factors and Sources” tab for the specific source of each economic impact factor.
Obes i t y Ra te Impac t
(Tab Label: Obesity)
This case study is used to calculate the reduction in the Bexar County obesity rate based on policies tested in the model. The basis for the calculations is that increased walking and biking will lead to a decrease in weight of area residents. The estimated amount of weight lost will be correlated into an estimated reduction in the number of people who are obese. The obesity rate for the State of Texas in 2009 was 29.5 percent. Using the average height and weight profiles for Americans, the average number of pounds an obese person is away from being considered at
City of San Antonio Sustainable Urban Economics Tool September 9, 2011
Economic & Planning Systems, Inc. 47 Final Report
healthy weight was calculated. This average number of pounds (46 lbs) is used to calculate the total “obese pounds” in Bexar County. Using standard calorie burn rates from walking and biking, a reduction in pounds was calculated. The total pounds lost from biking and walking are divided by the average “obese pounds” to calculate the number of people no longer obese. Sources from the calculations are shown in the table on this tab.
Diabe tes R i s k Impa c t
(Tab Label: Diabetes to BMI)
A study published in the Diabetes Care Journal in June of 2007 (Volume 30, Number 6) by the American Diabetes Association included research on diabetes risk rates by a person’s body mass index (BMI). The study entitled the Effect of BMI on Lifetime Risk for Diabetes in the U.S. provided the baseline risk rate for people by BMI level used in this case study. The risk rates by BMI are shown in the table on this tab. These risk rates were used to determine a risk rate for people considered obese (a BMI of over 30) or non-obese (a BMI under 30). The obesity rate for the State of Texas, obtained from the U.S. Center for Disease Control, was used to determine the estimated number of obese people at risk for type 2 diabetes and the number of non-obese people at risk for type 2 diabetes. Any policy in the model that has an impact on obesity will derive an impact on diabetes risk. A reduction in obese people from the policy tested will reduce the number of people in Bexar County that are at risk for diabetes because a reduction in BMI has direct connection to a reduced risk rate for diabetes.
Diabe t i c Death Impa c t
(Tab Label: Diabetes Deaths)
A U.S. Center for Disease Control study found that increase in exercise activity as simple as walking two hours per day can greatly reduce death rates among people living with type 2 diabetes. The study found that for every 62 people with type 2 diabetes that walked at least two hours a week, one death was prevented. Any policy tested in the model that impacts exercise activity with increases in either walking or biking has impact on the death rate of diabetics. The Texas Department of State Health Services’ Center for Health Statistics found in 2007 that 4.2 percent of deaths in Texas are from complications with type 2 diabetes. An estimated 426 people die from complications with type 2 diabetes in Bexar County each year. This case study calculates the number of increased or decreased walking and biking miles that type 2 diabetics will have due to policies tested. An increase in walking and biking will increase the amount of activity for people with type 2 diabetes in Bexar County, which will decrease the mortality rate among this group.
Hea l th Impac t Fac to rs
(Tab Label: Health Base)
This tab is a list of the health related factors used in the model. The factor, source of the factors, type of source (local or nation) and year of the source factor are shown. The factors are related to auto accidents, diabetes, obesity, work absenteeism, and medical costs. One factor
City of San Antonio Sustainable Urban Economics Tool September 9, 2011
Economic & Planning Systems, Inc. 48 Final Report
not mentioned or used in the other case studies, but used in the model, is the rate of work absenteeism from obese people. An obese person misses an average of 1.4 days more of work than a person of healthy weight. This factor is used to calculate changes in work absenteeism for policies that impact the obesity rate.
Househo ld Hea l th E xpend i tu res Impact
(Tab Label: Healthcare Cost)
The health spending factors for average households are shown in this tab. Factors shown in the Health Impact Factors tab are used in this case study to calculate the increased annual medical costs for obese people versus people of healthy weight. A study by the Dove Press in 2010, titled the Economic Impact of Obesity, found that an obese person pays on average 36 percent more for medical services and medical supplies than the average person. The increased costs for obese people are calculated based on this study’s findings. Also shown on this tab is the calculation of estimated medical costs by different household income levels. The changes in spending by household AMI level is calculated using the percent of total income spent on medical insurance, supplies and services of an average household (these average numbers are shown in the Household Expenditure Tab).
Mor ta l i t y Base l ine Fac to rs
(Tab Label: Mortality Base)
This tab shows the number of annual deaths for Bexar County. The Texas Department of State Health Services’ Center for Health Statistics has inventoried the number of deaths in Bexar County by cause of death. The mortality rates and factors used in this model are deaths from transportation accidents (mainly automobile accidents), and various diseases. The average number of deaths for Bexar County is used to derive factors for the model. The number of deaths from auto accidents, bike accidents and pedestrian accidents per 100 million vehicle miles traveled are used to calculate the impact of reduced VMT on deaths. Heart disease and respiratory disease deaths are in this tab but are not used or calculated in the model.
Waste D i sposa l a nd Land f i l l Capac i ty Impac t
(Tab Label: Waste Base)
This tab is an inventory of the disposal of waste into Bexar County landfills in 2007 and the estimated remaining capacity in each landfill. The source of this information is the Alamo Area Council of Governments’ Individual MSW Landfill Facility Data. The remaining years of capacity are calculated as the measure of the impact of waste reduction from policies tested.
City of San Antonio Sustainable Urban Economics Tool September 9, 2011
Economic & Planning Systems, Inc. 49 Final Report
Househo ld Automob i le Ex pend i tu re Fa c to rs
(Tab Label: Auto Econ Base)
Factors to estimate the households spending on automobiles are based off of data from the American Automobile Association (AAA). The AAA 2010 travel survey has variable auto cost per mile and fixed cost per car. These factors were used to derive the per mile cost factors for both fixed and variable costs. For the model, EPS used 15,000 miles as the average miles a car is used per year.
Employment Base
(Tab Label: Employ Base)
This tab is the 2009 wage and salary employment by industrial sector for Bexar County.
Cens us Data : Hous ing , Bas i c Dem ograph ics , Ec onom ic
(Tab Labels: Housing: Demographic: Economic)
There are three census data tabs containing the summary file 1 (SF 1) data for Bexar County from the 2007 American Community Survey. Information such as households, average household income, etc. is used in various calculations and case studies.
Base l ine Inventory
(Tab Label: Summary Baselines)
The baseline inventory tab contains the totals for the items each of the five policies tested. The baseline inventories for Bexar County include: total vehicle miles traveled, current housing density, the total household electricity use, the total gallons of water used by households, and total amount of renewable energy generated by CPS Energy. This information is shown on the Input Tab at the beginning of the model but the calculations are made on this tab.
Secondary Fa c tor C a l cu la to r
(Tab Label: Secondary)
This tab is the calculation of the secondary impacts of each policy based on the change from the primary impact. This information is shown on the Input Tab at the beginning of the model but the calculations are made on this tab.
City of San Antonio Sustainable Urban Economics Tool September 9, 2011
Economic & Planning Systems, Inc. 50 Final Report
Mode l Fac to rs and Sources
(Tab Label: Sources)
This tab is a complete inventory of factors used in the model and the source of the factor by the impact the factor tests, and the category and system the factor is used for. This is a summary and compilation of all the research used in the model and serves an index for factors.