Embed Size (px)
Citation preview

City of Salinas
Report of Waste Discharge
Order No. R3-2012-0005 NPDES Permit No. CA0049981
November 2016

This page intentionally left blank.

City of Salinas
Report of Waste Discharge
November 2016 i
Table of Contents
ROWD Application Explanations .................................................................................................................. xii II. Type of Discharge .............................................................................................................................. xii III. Location of the Facility .................................................................................................................... xiii VI. Other Required Information ............................................................................................................ xv VII. Other .............................................................................................................................................. xvi
1 Introduction ......................................................................................................................................... 1-1 1.1 Program Improvement Needs ................................................................................................... 1-2
2 Public Education .................................................................................................................................. 2-1 2.1 ROWD Requirement .................................................................................................................. 2-1 2.2 Recommendations ..................................................................................................................... 2-7
3 Sources of Sediment ............................................................................................................................ 3-1 3.1 ROWD Requirement .................................................................................................................. 3-1 3.2 Discussion .................................................................................................................................. 3-1 3.3 Recommendations ..................................................................................................................... 3-5
4 Street Sweeping and Cleaning Schedule ............................................................................................. 4-1 4.1 ROWD Requirement .................................................................................................................. 4-1
4.2 Discussion .................................................................................................................................. 4-2
4.3 Volumes ..................................................................................................................................... 4-8
4.4 Disposal of Street Sweeper Waste Material .............................................................................. 4-8
4.5 Recommendations ..................................................................................................................... 4-9
5 Industrial Facility Target Pollutant Reduction ..................................................................................... 5-1
5.1 ROWD Requirement .................................................................................................................. 5-1
5.2 Discussion .................................................................................................................................. 5-1
5.3 Recommendations ..................................................................................................................... 5-2
6 Riparian Protection .............................................................................................................................. 6-1
6.1 ROWD Requirement .................................................................................................................. 6-1
6.2 Discussion .................................................................................................................................. 6-2
6.3 Recommendations ..................................................................................................................... 6-2
7 Pollutant Load Quantification ............................................................................................................. 7-1
7.1 ROWD Requirement .................................................................................................................. 7-1
7.2 Discussion .................................................................................................................................. 7-4
7.3 Recommendations ..................................................................................................................... 7-6
8 Trash Quantification ............................................................................................................................ 8-1
8.1 ROWD Requirement .................................................................................................................. 8-1
8.2 Discussion .................................................................................................................................. 8-6
8.3 Recommendations ..................................................................................................................... 8-8
9 Runoff Volume Quantification ............................................................................................................ 9-1
9.1 ROWD Requirement .................................................................................................................. 9-1
9.2 Discussion .................................................................................................................................. 9-4
9.3 Recommendations ..................................................................................................................... 9-8

City of Salinas
Report of Waste Discharge
November 2016 ii
10 Stormwater Discharge Trend Monitoring ......................................................................................... 10-1
10.1 ROWD Requirement ................................................................................................................ 10-1
10.2 Monitoring Program ................................................................................................................ 10-1
10.3 Recommendations ................................................................................................................. 10-13
11 Receiving Water Monitoring ............................................................................................................. 11-1
11.1 ROWD Requirement ................................................................................................................ 11-1
11.2 Monitoring Sites ...................................................................................................................... 11-1
11.3 Discussion ................................................................................................................................ 11-3
11.4 Recommendations ................................................................................................................... 11-3
12 Program Effectiveness Ratings .......................................................................................................... 12-1
12.1 ROWD Requirement ................................................................................................................ 12-1
12.2 Discussion ................................................................................................................................ 12-2
12.3 Urban Subwatershed Program Effectiveness Rating ............................................................. 12-15
Figures
Figure 1-1: Map of the City of Salinas’ Urban Subwatersheds ................................................................... xiv Figure 1-2 : Land use designations for the City of Salinas ......................................................................... xvii Figure 4-1: Residential Street Sweeping Routes ........................................................................................ 4-5 Figure 4-2: Commercial/Industrial Street Sweeping Routes ...................................................................... 4-6 Figure 4-3: New Proposed RouteSmart Street Sweeping Routes .............................................................. 4-7 Figure 8-1: Rapid Trash Assessment Scores over time .............................................................................. 8-7 Figure 8-2: Amount of Observed Trash During Rapid Trash Assessments ................................................ 8-7 Figure 12-1: Potential stormwater recharge management areas ......................................................... 12-13
Tables
Table 1-1: Report of Waste Discharge Requirements of Salinas MS4 Permit ........................................... 1-1 Table 2-1: Municipal Staff Training Assessment Results of Test Score Ranges ......................................... 2-5 Table 2-2: Municipal Staff Assessment Results of Employees with a score of 80% or greater ................. 2-5 Table 2-3: Average Assessment Scores per Topic of Training ................................................................... 2-6 Table 2-4: Public Education and Outreach Methods ................................................................................. 2-8 Table 3-1: Summary of Catch Basin Cleaning Sediment/Debris Totals ..................................................... 3-2 Table 3-2: Average Annual Pollutant Loads and Load Reduction by Structural BMPs .............................. 3-3 Table 3-3: RAM scorings and definitions ................................................................................................... 3-4 Table 3-4: Municipal Structural BMP RAM Scoring and Recommendations ............................................. 3-5 Table 4-1: Parked Cars Curb Mile Survey ................................................................................................... 4-3 Table 4-2: Volume of Solids Collected during Permit Year Dry Seasons (cubic yards) .............................. 4-8 Table 5-1: Average annual number of exceedances per industrial facility ................................................ 5-1 Table 5-2: BMPs implemented by the City to Address Industrial Facilities ............................................... 5-2 Table 6-1: Development projects that applied for a riparian setback variance ........................................ 6-2 Table 7-1: Average Annual Pollutant Loads (from Year 4) ......................................................................... 7-4 Table 7-2: Average Annual Pollutant Load Reduction – Structural BMP ................................................... 7-5 Table 7-3: Average Annual Pollutant Loads (from Year 1) ......................................................................... 7-5 Table 7-4: Reduction in Average Annual Pollutant Loads from Year 1 to Year 4 ...................................... 7-6

City of Salinas
Report of Waste Discharge
November 2016 iii
(includes reductions from structural BMPS ............................................................................................... 7-6 Table 8-1: Baseline trash load (lbs) ............................................................................................................ 8-2 Table 8-2: Baseline Trash Load (cubic feet) ............................................................................................... 8-3 Table 8-3: Trash Load Reduction Estimate ................................................................................................ 8-5 Table 8-4: Locations of Rapid Trash Assessment ....................................................................................... 8-6 Table 9-1: Rates of Runoff Reduction from Structural BMPs (CWP, 2008) ............................................... 9-4 Table 9-2: Pre-Developed Annual Runoff Volume ..................................................................................... 9-5 Table 9-3: Existing Annual Runoff Volume................................................................................................. 9-5 Table 9-4: Percent Change in Runoff Volume for all Storm Events (Pre-developed vs. Existing
Condition) ............................................................................................................................... 9-6 Table 9-5: Percent Change in Runoff Volume for 85th Percentile Storm Event (Pre-developed Vs. Existing
Condition) ............................................................................................................................... 9-7 Table 9-6: Prioritization of Urban Subwatersheds ..................................................................................... 9-7 Table 9-7: Comparison of runoff volumes from Years 1 and Year 4 of the current permit....................... 9-8 Table 10-1: City of Salinas SSMP Monitoring Site Descriptions and Locations* ...................................... 10-2 Table 10-2: Stormwater Discharge Trend Monitoring Statistical Results (Current Permit Term) ........... 10-4 Table 10-3: Monitoring Statistical Results (Previous and Current Permit Term) .................................... 10-6 Table 10-4: Urban Catchment Action Plan Pilot Project Monitoring Results (Current Permit Term) ..... 10-7 Table 11-1: 85th Percentiles for Wet and Dry Events in Background and Receiving Water Sites: Current
Permit Term .......................................................................................................................... 11-5 Table 11-2: SWAMP Physical Habitat Characteristics for the 309 ALD Receiving Water ........................ 11-2 Table 12-1: Total Volumes Removed by Storm Drain Maintenance Area during Municipal Facilities
Operations for the Year 1 – Year 4 Permit Terms ................................................................ 12-3 Table 12-2: Exceedances Identified at Industrial Facilities ...................................................................... 12-6 Table 12-3. Estimated impervious area by subwatershed ..................................................................... 12-14
October 2016 iv Michael Baker International
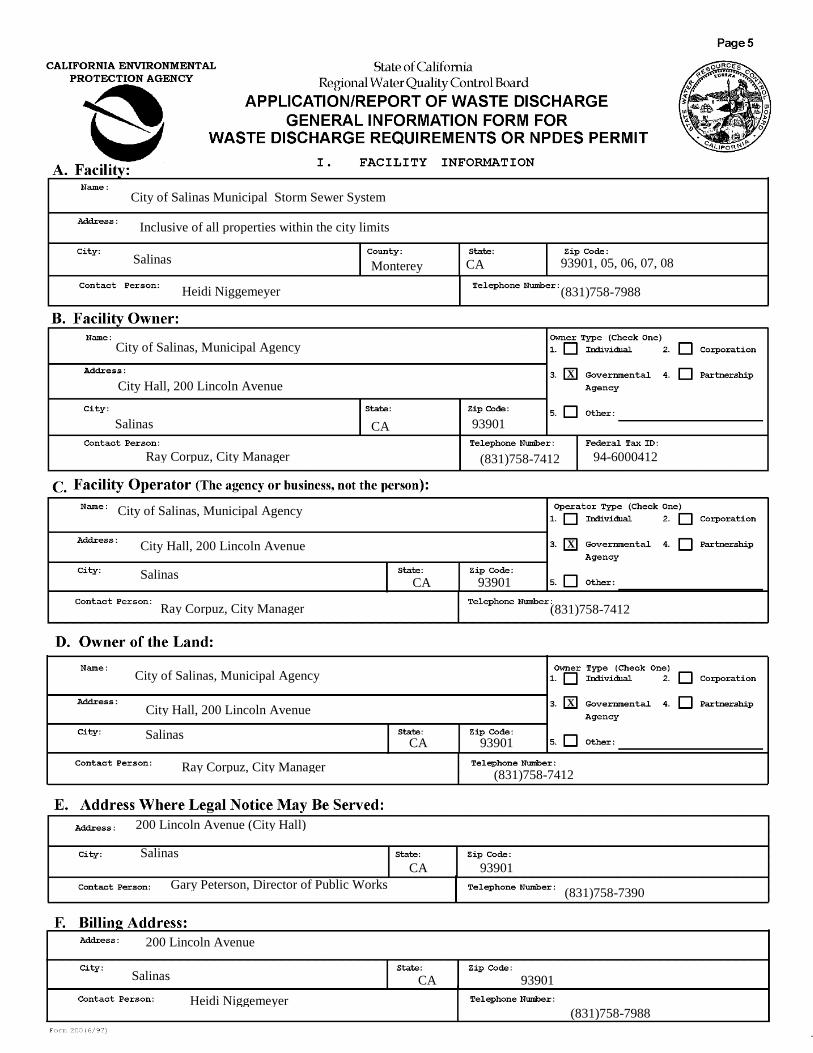
City of Salinas Municipal Storm Sewer System
X
X
X
Inclusive of all properties within the city limits
Salinas
Heidi Niggemeyer
City of Salinas, Municipal Agency
City Hall, 200 Lincoln Avenue
Salinas
City of Salinas, Municipal Agency
City Hall, 200 Lincoln Avenue
Salinas
200 Lincoln Avenue (City Hall)
Salinas
Gary Peterson, Director of Public Works
Heidi Niggemeyer
200 Lincoln Avenue
Ray Corpuz, City Manager
Monterey CA 93901, 05, 06, 07, 08
(831)758-7988
CA 93901
(831)758-7412
94-6000412
CA 93901
CA 93901
(831)758-7412
CA 93901
(831)758-7390
Salinas CA 93901
(831)758-7988
City of Salinas, Municipal Agency
City Hall, 200 Lincoln Avenue
Salinas
Ray Corpuz, City Manager
Ray Corpuz, City Manager (831)758-7412

X
See Figure 1-1 See Section III See Section III
X
City of Salinas
X
Public Resources Code, Division 13, Chpt. 3., 2100 et seq in accord, CWC 13389
X
Notice of Exemption dated
September 17, 2009
(included hereafter)


City of Salinas
Report of Waste Discharge
November 2016 xii
ROWD Application Explanations
II. Type of Discharge
The Salinas storm sewer system is comprised of dedicated pipelines and detention facilities that discharge to the receiving waters described later of this Application. There are municipal separate storm sewer systems discharging within the incorporated area of the city that are not owned or operated by the Permittee. Some of the systems are owned or operated by Caltrans and Monterey County. Monterey County Water Resources Agency also owns and operates the Reclamation Ditch 1665. Some commercial/discharges are issued through separate NPDES Permits through the Regional Board. There are portions of Salinas that are agricultural and are exempt from the requirements of Order R3-2012-005, NPDES NO. CA 0049981. They are, however, subject to the requirements of the Conditional Waiver of Waste Discharge Requirements and/or Discharges from Irrigated Lands, Order No. R3-2012-0001, adopted on March 15, 2012 by the Central Coast Water Board and upheld by Order WQ 2013-0101 adopted by the State Water Resources Control Board on September 24, 2013.
Land Discharge
The City of Salinas storm water discharge flows to surface waters of the Salinas Valley and to detention features in parks and open spaces. Detention basins are employed throughout the City as part of its flood control and storm drain system. The basins serve to detain overflow storm water during significant storm events that exceed the storm system's ability to readily discharge the flow. Flow is detained within the basins and the system is designed to feed water back into the storm drains as water levels subside.
Surface Water Discharge
The City of Salinas is situated in northern Salinas Valley in Monterey County, approximately ten miles east of the Pacific Ocean and near the Salinas River. Stormwater runoff is generated from various land uses in the Permit coverage area and discharges into receiving waters, which in turn flow into Monterey Bay. Four major creeks and several minor tributaries pass through the Salinas area and receive stormwater discharges from the Permit coverage area northeast and adjacent to Highway 101. Santa Rita Creek carries stormwater discharges from a small portion of the Permit coverage area to the Espinosa Slough. The three other major creeks—Natividad, Gabilan, and Alisal Creeks—are interconnected. Alisal Creek becomes the Reclamation Ditch. Natividad and Gabilan Creeks flow through the northeastern portion of the City to Carr Lake, which covers over 400 acres in the center of the City. Carr Lake is often dry and is utilized for farming, but also functions to detain stormwater flows. The area tributary to Carr Lake is about 101 square miles. This 101 square-mile watershed is approximately eight percent impervious. During large storms, runoff from the upper watershed accumulates in Carr Lake when inflow exceeds the capacity of the culverts downstream from the lake. Carr Lake typically drains over a period of a few days after a significant storm event. Due to the low velocities in Carr Lake relative to the velocities in the tributary streams, sediment

City of Salinas
Report of Waste Discharge
November 2016 xiii
deposition occurs in Carr Lake and the channels that pass through it. Gabilan Creek covers nearly 45 square-miles of the Carr Lake watershed, and the Natividad Creek watershed covers about 10 square-miles of the area tributary to Carr Lake. Flows leaving Carr Lake discharge to the Reclamation Ditch. The Reclamation Ditch flows west from the Permit coverage area, paralleling the Alisal Slough and eventually discharges to the Tembladero Slough. Espinosa and Tembladero Sloughs discharge to the Old Salinas River. Three watersheds west of the Carr Lake watershed also receive runoff from the City. These include the watersheds of: Reclamation Ditch West, Markley Swamp, and Santa Rita Creek. These watersheds cover almost 17 square-miles and are approximately 20 percent impervious. Sediment transport into the Reclamation Ditch from the Markley Swamp and Reclamation Ditch West subwatersheds and is limited by the existing detention in these areas causing areas of low flow velocities. The total incorporated area that drains to the Reclamation Ditch system is approximately thirteen square miles. On the northern boundary of Salinas is Santa Rita Creek. Santa Rita Creek flows generally from the northeast to southwest through the northwestern part of the City, and conveys drainage from agricultural and residential areas upstream of the City. It drains its own minor sub-watershed and flows through a small portion of Salinas before flowing through a detention area and pump station that discharges into a ditch through agricultural areas that connects to the Reclamation Ditch below the City limits. Stormwater from the southernmost portion of the City flows to a pump station which discharges to the Salinas River. The Salinas River, like Espinosa and Tembladero Sloughs, discharges to the Old Salinas River during low-flow periods, and directly to Monterey Bay during high flows. The Old Salinas River discharges into the Pacific Ocean at the downstream end of the Elkhorn Slough and Moro Cojo Slough estuary system near Moss Landing. During periods of low flow, a sandbar forms across the mouth of the Salinas River and flows drain through a gated structure into the Old Salinas River channel toward Moss Landing Harbor. During the first high flows each year, water builds up against the sandbar and the sandbar is mechanically breached to direct Salinas River flows into Monterey bay.
III. Location of the Facility
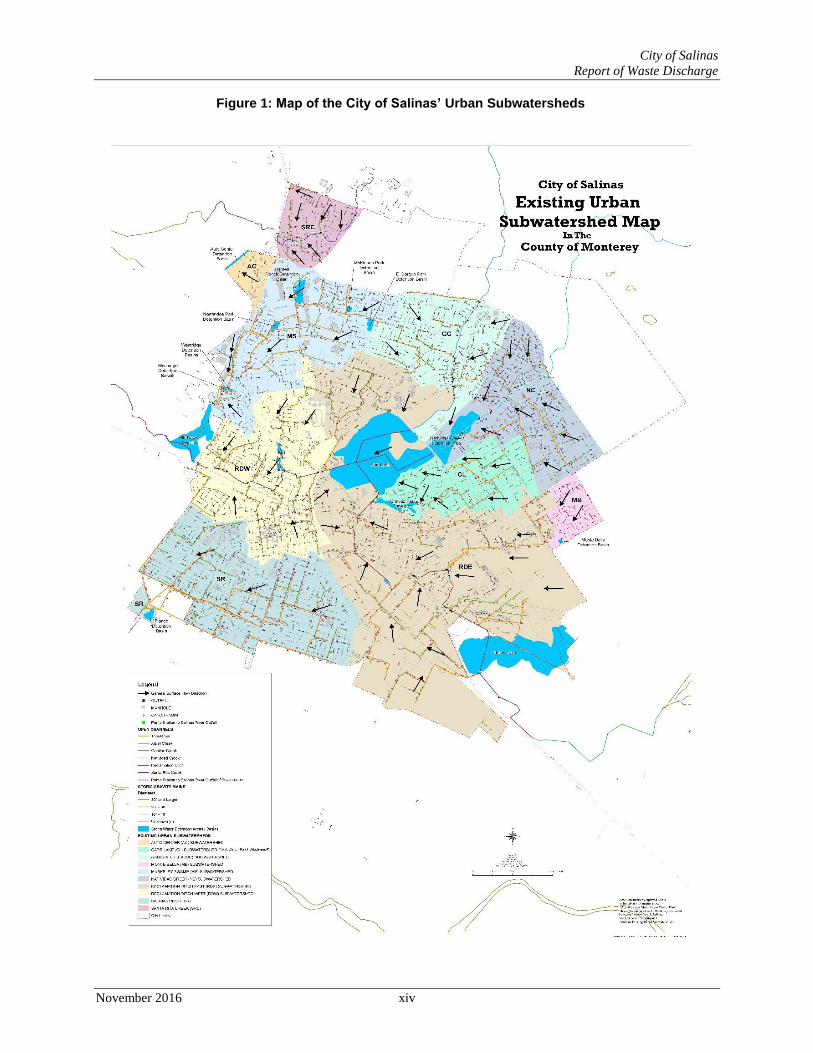
The City of Salinas, county seat and largest city in Monterey County, is located in the northwest part of the Salinas Valley about 60 miles south of San Jose and ten miles inland from Monterey Bay. The latitude is 36.68 north and longitude is 121.64 west. The map coordinates are 36 degrees 40' 40" N 121 degrees 39'20" W. The city is 23 square miles. It is located ten miles east-southeast of the Salinas River, at elevations between 52 feet and 59 feet above sea level and is located at the mouth of the Salinas Valley roughly ten miles from the Pacific Ocean. The Gabilan and Santa Lucia mountain ranges border the Salinas Valley to the east and west, respectively. A map of the City’s MS4 is included in Figure 1.
City of Salinas
Report of Waste Discharge
November 2016 xiv
Figure 1: Map of the City of Salinas’ Urban Subwatersheds

City of Salinas
Report of Waste Discharge
November 2016 xv
VI. Other Required Information
Characterization of Discharge
Background
As identified in the current NPDES Permit, development and urbanization typically increase pollutant load, volume, and discharge velocity over background levels. Urbanization reduces natural vegetation and pervious ground cover when it is converted to impervious surfaces such as paved streets, rooftops and parking lots. Adoption and implementation of the Storm Water Development Standards is an expression of the City's commitment to effective source control measures. The City of Salinas storm drain system is designed to carry wet weather storm flows from the streets and other areas that are not equipped with storm system retention/detention systems. Through the Salinas Storm Water Development Standards (SWDS), Salinas now requires on-site source control features in new development and applicable redevelopment projects.
Discharge Prohibitions
Discharge prohibitions are identified in Order No. R3-2012-0005 as follows:
1. Discharges from MS4s in a manner causing, or threatening to cause, a condition of pollution, contamination, or nuisance (as defined in the California Water Code 13050) in waters of the State of California.
2. Discharges of waste that are prohibited by the Statewide Water Quality Control Plans or the Water Quality Control Plan, Central Coast Region (Basin Plan) are prohibited.
3. Discharges that cause or contribute to the violation of water quality objectives or water quality standards.
4. Discharges containing pollutants that have not been reduced to the Maximum Extent Practicable (MEP).
5. Discharges that are not authorized by a separate NPDES Permit. Dry weather flows are attributable to both allowable non-stormwater discharges and illicit discharges. The following categories of non-stormwater discharges are allowed provided any significant pollutant discharges and significant impacts are identified and appropriate control measures are implemented to minimize identified significant pollutant discharges or impacts of those discharges:
a. Diverted stream flows b. Rising ground water c. Uncontaminated ground water infiltration d. Uncontaminated pumped ground water e. Foundation drains f. Springs g. Water from crawl space pumps h. Footing drains i. Air conditioning condensate
City of Salinas
Report of Waste Discharge
November 2016 xvi
j. Flows from riparian habitats and wetlands k. Water line flushing l. Discharges from potable water sources m. De-chlorinated or debrominated swimming pool water n. Individual residential car washing o. Incidental runoff from landscape irrigation and lawn watering p. Discharges from firefighting activities that are not significant sources of pollutants
Illicit discharges such as commercial carwash runoff, gray water from residential developments, industrial/commercial wash operations, well purging operations, liquid by-products associated with manufacturing operations, agricultural irrigation runoff or process water, leaking pipes and cross connections with sanitary sewer systems also add flows to receiving waters.
Constituents of Concern
Potential urban pollutants sources that have been identified that are responsible for the degradation of storm water quality include sediment, detergents, oils, pesticides, sewage, trash, organic materials, metals and fertilizers. Specific constituents of concern include pathogens, petroleum hydrocarbons, polycyclic aromatic hydrocarbons, residual chlorine, nitrates, ammonia, orthophosphates, zinc, copper, E-Coli, fecal coliform, total coliform, organic carbon, and total dissolved solids. No stormwater waste treatment plant services the City of Salinas. Natural vegetated soil absorbs rainwater and removes pollutants through an effective natural purification process. Salinas stormwater is treated through this natural biofiltration process within stormwater detention facilities, the root systems of native plants in the waterways, and degradation through other natural processes such as solarization. With the requirement for implementation of LID features in new development and applicable redevelopment as well as retrofits and urban greening, on-site source control utilizes treatment in bio-swales and flow/volume control through other LID features. Salinas' Storm Water Management Plan, Grading Standards, General Plan and Storm Water Development Standards implement Best Management Practices (BMPs) that address the requirements for enhanced source control of stormwater. This enhances Salinas' ability for on-site treatment through a series of policies and practices.
VII. Other
Land Use
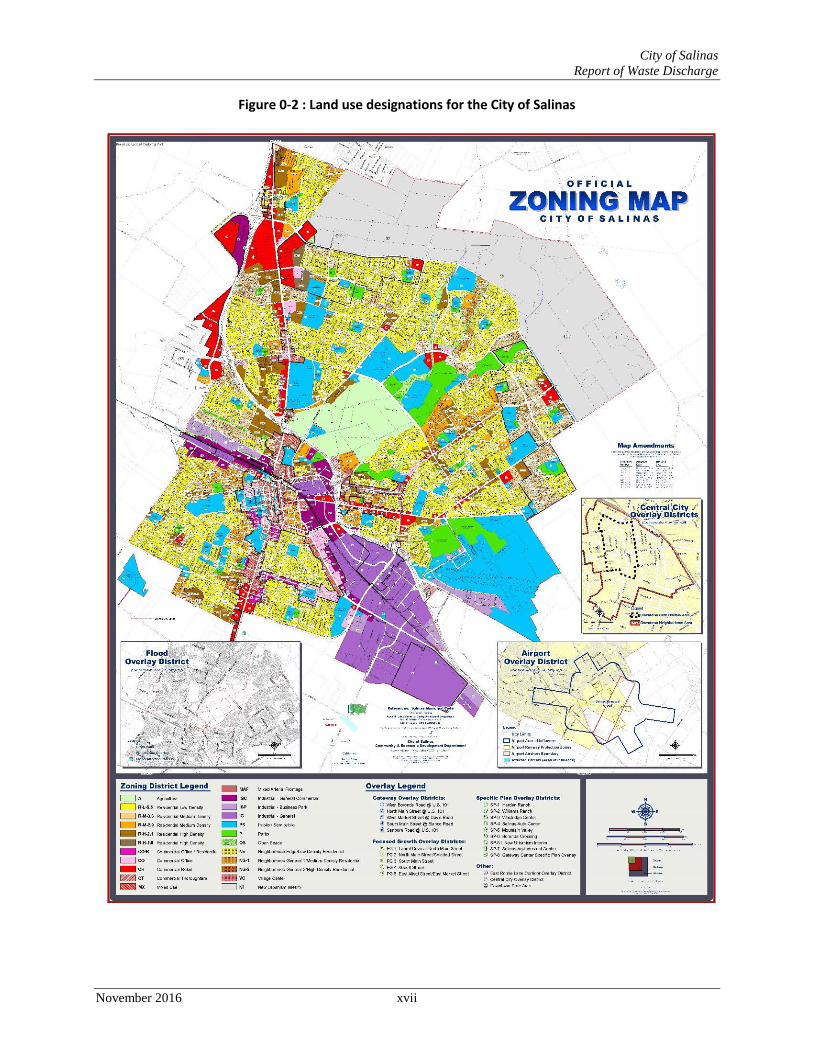
The land use based on zoning is shown in Figure 0-2Figure 1-2.
City of Salinas
Report of Waste Discharge
November 2016 xvii
Figure 0-2 : Land use designations for the City of Salinas
City of Salinas
Report of Waste Discharge
November 2016 1-1
1 Introduction
This Report of Waste Discharge (ROWD) is a requirement of Order No. R3-2012-0005, National Pollutant Discharge Elimination System (NPDES) Permit No. CA0049981, Waste Discharge Requirements for City of Salinas Municipal Stormwater Discharges (Salinas Phase I Municipal Stormwater Permit or Salinas MS4 Permit). The Salinas Phase I Municipal Stormwater Permit was renewed on May 3, 2012. The renewed permit became effective on June 17, 2012. Order No. R3-2012-0005 requires this ROWD to include, at a minimum, the following:
Any revisions to the City of Salinas SWMP and Quality Assurance Project Plan including, but not limited to, all the activities the Permittee proposes to undertake during the next order coverage period, justification, goals and objectives of such activities, an evaluation of the need for additional source control and/or structural BMPs;
Items identified in Section P of the Salinas MS4 Permit (Monitoring, Effectiveness Assessment and Program Improvement) to be included with the Report of Waste Discharge;
Changes in land use and/or population including map updates;
Any significant changes to the MS4, outfalls, detention or retention basins or dams, or other urban runoff controls including map updates of the MS4; and
New or revised elements and compliance schedules necessary to comply with Section C of the Salinas MS4 Permit (Receiving Water Limitations).
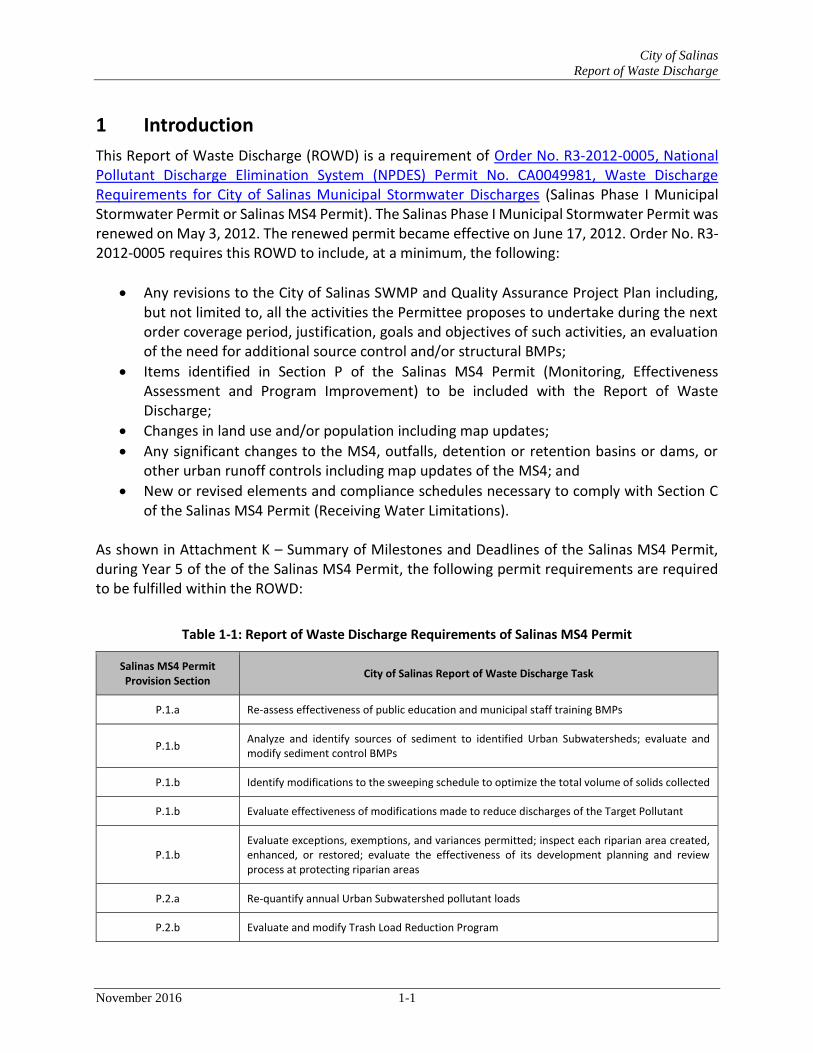
As shown in Attachment K – Summary of Milestones and Deadlines of the Salinas MS4 Permit, during Year 5 of the of the Salinas MS4 Permit, the following permit requirements are required to be fulfilled within the ROWD:
Table 1-1: Report of Waste Discharge Requirements of Salinas MS4 Permit
Salinas MS4 Permit Provision Section
City of Salinas Report of Waste Discharge Task
P.1.a Re-assess effectiveness of public education and municipal staff training BMPs
P.1.b Analyze and identify sources of sediment to identified Urban Subwatersheds; evaluate and modify sediment control BMPs
P.1.b Identify modifications to the sweeping schedule to optimize the total volume of solids collected
P.1.b Evaluate effectiveness of modifications made to reduce discharges of the Target Pollutant
P.1.b Evaluate exceptions, exemptions, and variances permitted; inspect each riparian area created, enhanced, or restored; evaluate the effectiveness of its development planning and review process at protecting riparian areas
P.2.a Re-quantify annual Urban Subwatershed pollutant loads
P.2.b Evaluate and modify Trash Load Reduction Program

City of Salinas
Report of Waste Discharge
November 2016 1-2
Salinas MS4 Permit Provision Section
City of Salinas Report of Waste Discharge Task
P.2.c Re-quantify Pre-developed, Developed, and 24-Hour 85th Percentile Storm Event runoff volume
P.4.d Analyze Stormwater Discharge Trend Monitoring data for stormwater discharge quality trends
P.5 Analyze Receiving Water Monitoring data for receiving water quality trends
P.6 Determine Urban Subwatershed Program Effectiveness Ratings
P.7 Identify Urban Subwatershed Stormwater Management Program improvements needed
U.1 Report of Waste Discharge application for renewal of waste discharge requirements.
1.1 Program Improvement Needs
During the preparation of the Report of Waste Discharge, each task was performed or evaluated and a program effectiveness rating was designated for each urban subwatershed. This analysis revealed areas that were not as effective as they could be and recommended improvements were identified. The recommended program improvements that were identified for each task or evaluation are summarized with their topical section.

City of Salinas
Report of Waste Discharge
November 2016 2-1
2 Public Education
This section assesses the effectiveness of public education and municipal staff training best management practices (BMPs) as required by Section P.1.a of the Salinas MS4 Permit. It includes a description of the process used to evaluate the effectiveness of public education and municipal staff training BMPs, including:
A description of BMPs evaluated;
The results of modifications identified and implemented after Year 2; and
The results of the evaluation.
2.1 ROWD Requirement
The City is required to conduct a follow-up assessment of the effectiveness of the City’s public education and municipal staff training efforts using quantitative assessment measures developed per the Permit.
2.1.1 Education
The goal of the City’s Public Education and Involvement program is to promote changes in behavior through increased knowledge, leading to greater responsibility and enhanced protection of local water resources. The City strives to achieve this goal through three principal strategies. The first strategy is the implementation of an integrated watershed systems approach to address water quality. Second, Salinas educates the public about local natural water systems, the urban communities in which they live, and how their actions impact water quality. The last strategy is seeking active education and outreach partnerships/collaborations in promoting watershed health. The City of Salinas evaluates the following public education and municipal staff BMPs:
1. Implement effective comprehensive education program; 2. Research and develop collaborative opportunities for public education and outreach with
regional stakeholders; 3. Identify a minimum of six highest priority Stormwater Issues ; 4. Identify target audiences for each identified Priority Stormwater Issue; 5. Measurably increase knowledge and measurably change behavior; 6. Assess effectiveness of public education efforts; 7. Incorporate use of Community-Based Social Marketing techniques; 8. Plan Stormwater controls for New Development; 9. Implement a public involvement process; 10. Maintain an up-to-date stormwater website; 11. Report summaries of education efforts and accomplishments for land development
planning and stormwater controls
City of Salinas
Report of Waste Discharge
November 2016 2-2
At the end of Year 2, the City of Salinas developed a program to assess the effectiveness of public education and municipal staff training BMPs. The program was created to provide quantitative information on changes in knowledge about the impacts of stormwater discharges, changes in behavior of specific target audiences, and proficiency of the municipal staff at performing stormwater related responsibilities. The process for evaluation of the educational program centered around the use of Community-Based Social Marketing (CBSM). Consistent with its Permit, Salinas incorporated CBSM techniques into its education strategies and conducted one trial program and multiple pilot programs in Year 3. The two primary market focuses of the trial and pilot programs were: 1. trash/litter as a high-priority pollutant, and 2. school children as a target audience.
2.1.1.1 Trash and Litter Abatement
One pilot program implemented in Year 3 was the adoption of a law prohibiting single-use plastic bags. The law was adopted after an extensive collaborative campaign with Save Our Shores, the Salinas Valley Solid Waste Authority, Sustainable Salinas, retail stores, and the media. As a part of the plastic bag ban, the City designed, prepared and distributed point of purchase information signs to all storefronts to help the transition go smoothly. Salinas also conducted a reusable bag distribution/education program in English and Spanish. Changes in behavior from this program were positive – over 90% of stores changed their behavior based upon City legislation. As a part of the City’s trash reduction focus in Year 3, the City also conducted a pilot program campaign regarding litter and trash reduction that included an educational component, followed by an assessment. The City first sent out information packets to over 1,200 businesses. The packets included BMP information tailored by business type. City staff subsequently performed a Rapid Assessment of trash management and other practices with over 300 businesses to determine the success of the educational outreach. Over 92% of industrial businesses passed the Rapid Assessment. Over 82% of commercial businesses passed the Rapid Assessment. The City also conducted a trial project targeting trash and litter in Year 3 utilizing CBSM techniques to measure the overall effectiveness. In the trial program, the City conducted a field analysis that revealed that an inadequate number of trash and recyclable waste bins were likely a contributing factor to the amount of trash in the park. Based on the analysis, the City provided additional waste bins for trash and recyclables. Reduction of trash and litter in the park in Year 3 led to the expansion of the study in Year 4 to a full pilot program in Natividad Creek Park, a larger regional park. Litter abatement continued to be a focus for the City during Year 4. Salinas conducted follow-up measurements in the FY 2015-2016 to the Year 3 CBSM program implementation in parks. Based upon the positive results in the trial program and expansion study in Natividad Creek Park, the city determined that the success of the pilot program warranted an expansion of the anti-litter program to over a dozen other parks. In Year 4, the City also began to target bulky waste as a part of the education activities. In Year 4, surveys were conducted to determine how residents perceive the cleanliness of their community
City of Salinas
Report of Waste Discharge
November 2016 2-3
and to gain an understanding of barriers associated with proper disposal of bulk items. Only 12.2% of the respondents in the survey had ever utilized the Salinas Valley Solid Waste Authority and Republic Services’ bulky waste curbside collection service. Respondents also identified three main barriers that influence their disposal of bulk items: transportation, cost, and lack of awareness of services and drop off locations. As a result of the surveys, a pilot implementation project was developed to educate the community about bulky waste. The outreach efforts for the pilot focused on the delivery of posters and flyers to commercial business, public buildings, and multi-family complexes. The implementation of the pilot program was considered a success: posters were distributed to over 90 business and multi-family complexes in the city.
2.1.1.2 Public and In-school Education
During Year 3, the City chose school education to be the focus of one pilot program, acknowledging the advantage of formal classroom settings as well as the potential for school children to bridge the gap between the broad English-speaking community and the dominant sub-culture Spanish-speaking community. In addition, the City reasoned that school children are most predisposed to grab onto new ideas and accept/create cultural norms. For the pilot program, measurements of children’s existing knowledge and behavior were assessed several days prior to conducting the educational activity. Post-assessments were conducted immediately after the training. The results of the two assessments were compared. Results showed an overall 25% increase in students’ knowledge. In Year 4, the City found that the developing in-class education program continued to thrive. Measuring effectiveness included conducting an assessment several days prior to the lesson and giving a post-class assessment on the day of the lesson. All of the students in grades 3-6 showed an increase in their knowledge of basic watershed and stormwater principles. Students in grades five and six showed the greatest growth. Salinas also expanded and refined its classroom program to 49 classrooms, implemented new teaching materials, and trained two new teachers. Results from Year 4’s in-school program indicated that some improvements to the assessment were needed; the survey’s length and wording may have made it more difficult for the students to complete. The education component of the commercial and industrial inspection program continued to be effective in Year 4 as well. During the City’s business inspections, businesses were provided a review of required BMPs and outreach materials the City developed to support compliance. Businesses that achieved a “C” or less during the inspection were rescheduled for a follow-up inspection. Changes needed were confirmed on-site. All businesses showed an increased knowledge and change in behavior and achieved full compliance with City BMPs either during the inspection or after the first follow-up visit by City staff. The City participates in a multi-media advertising collaboration with the Monterey Peninsula/ Santa Cruz communities. The stormwater media campaign has focused on basic stormwater information, e.g. stormwater flows downstream untreated, using the fun “rubber ducky” video created by San Diego. The City has employed the message from San Diego’s Think Blue innovative “Rubber Ducky” video in television and movie theater advertisements individ-ually and in

City of Salinas
Report of Waste Discharge
November 2016 2-4
partnership with Monterey Regional. While the number of gross impressions from prior and recent past years has revealed that a lot of people are hearing messages, the message may not be effectively conveyed to the disenfranchised target audiences in Salinas. In Year 4, Salinas implemented an extensive assessment of community behavior, values and knowledge. A telephone survey of 400 people in Salinas was conducted to investigate the effectiveness of the multi-media “Rubber Ducky” campaign and to determine people’s behavior and awareness. The survey had a 95% confidence level with a 5% margin of error. Results from the telephone survey revealed several interesting points:
Regardless of language, the vast majority of residents rely on television to get information. There is a large disparity in getting news online, with English speakers far more likely to seek out online sources. Television messages effective for reaching most residents.
In the opinion of those surveyed, drought was the most important environmental issue facing Salinas.
Most residents have a basic understanding of what stormwater is, but the majority do not understand more detailed information, such as what the main pollutants in stormwater are or whether stormwater is treated.
Many residents care for their own yard.
Dog owners regularly clean up their pet waste from public areas and dispose of it in the trash.
Very few residents change their own oil. Among those that do, most report regularly cleaning up spills and using drip pans. More research needs to occur to determine how residents actually dispose of their waste oil.
Only a quarter of residents recall recently hearing about the topic of stormwater pollution in Salinas.
Younger residents and white residents are more likely to have heard a stormwater pollution prevention message.
71% understand that storm water and sanitary sewer water are different, yet most do not understand how they are different.
2.1.2 Municipal Staff Training
Salinas requires annual stormwater training and assessment of all municipal staff whose jobs are related to implementing municipal maintenance requirements of the Permit Order. This is to ensure that the staff have the knowledge and understanding necessary to effectively comply with the Permit, including an assessment of trained municipal staff’s knowledge of municipal stormwater program implementation.
2.1.2.1 Municipal Staff BMP Implementation and Evaluation
The Municipal Staff BMP training, at a minimum, includes the items listed below:
The requirements of the Permit that relate to the municipal staff’s job duties
The connection between municipal operations and water quality impacts
City of Salinas
Report of Waste Discharge
November 2016 2-5
How to effectively implement municipal BMPs specific to the municipal staff’s job duties
The administrative requirements of this Order, such as reporting and tracking
For street sweeper operators: training to enhance operations for water quality benefit
For municipal staff or contractors applying or storing pesticides or fertilizers: training in Integrated Pest Management techniques and BMPs for pesticide, herbicide, and fertilizer application, storage, and disposal
For inspectors: the knowledge to readily identify deficiencies and valuate the appropriateness and effectiveness of deployed BMPs and SWPPPs
Illicit discharge training
Refresher training for existing municipal staff each year to fill any knowledge gaps identified in the annual training assessment and to update municipal staff on preferred BMPs, regulation changes, order updates, and policy or standards updates
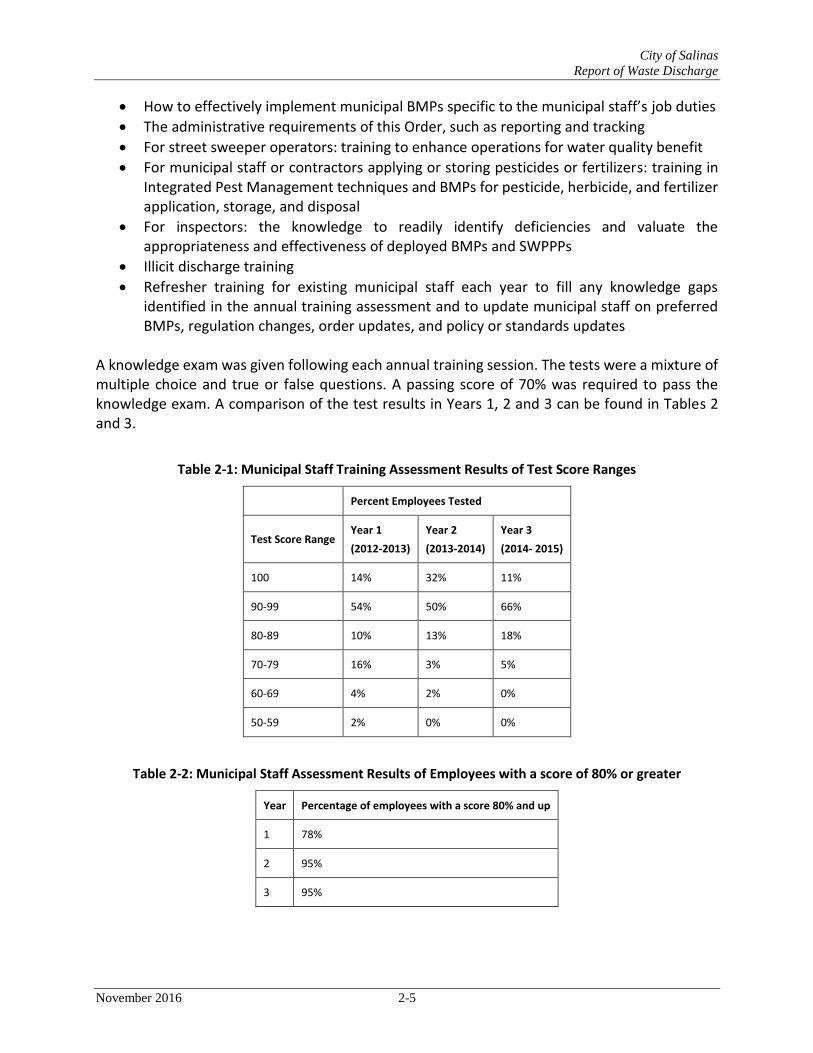
A knowledge exam was given following each annual training session. The tests were a mixture of multiple choice and true or false questions. A passing score of 70% was required to pass the knowledge exam. A comparison of the test results in Years 1, 2 and 3 can be found in Tables 2 and 3.
Table 2-1: Municipal Staff Training Assessment Results of Test Score Ranges
Percent Employees Tested
Test Score Range Year 1
(2012-2013)
Year 2
(2013-2014)
Year 3
(2014- 2015)
100 14% 32% 11%
90-99 54% 50% 66%
80-89 10% 13% 18%
70-79 16% 3% 5%
60-69 4% 2% 0%
50-59 2% 0% 0%
Table 2-2: Municipal Staff Assessment Results of Employees with a score of 80% or greater
Year Percentage of employees with a score 80% and up
1 78%
2 95%
3 95%
City of Salinas
Report of Waste Discharge
November 2016 2-6
There was a reduction in employees trained in Year 3 as a result in the loss of employees from furloughs, retirements, and unfilled positions due to budget constraints. Temporary employees were included in the training for Year 2 and Year 3. In Year 3, all municipal personnel achieved a passing score. Overall, employee knowledge was shown to improve annually and significantly since Year 1, indicating that the municipal maintenance training was effective. In Year 4, staff involved in implementing a Permittee's maintenance program received annual training on the following topics:
Requirements of local stormwater ordinances
Requirements of the Permit
Source control BMPs
Fertilizer and pesticide management
Illicit discharges and Illegal Connections
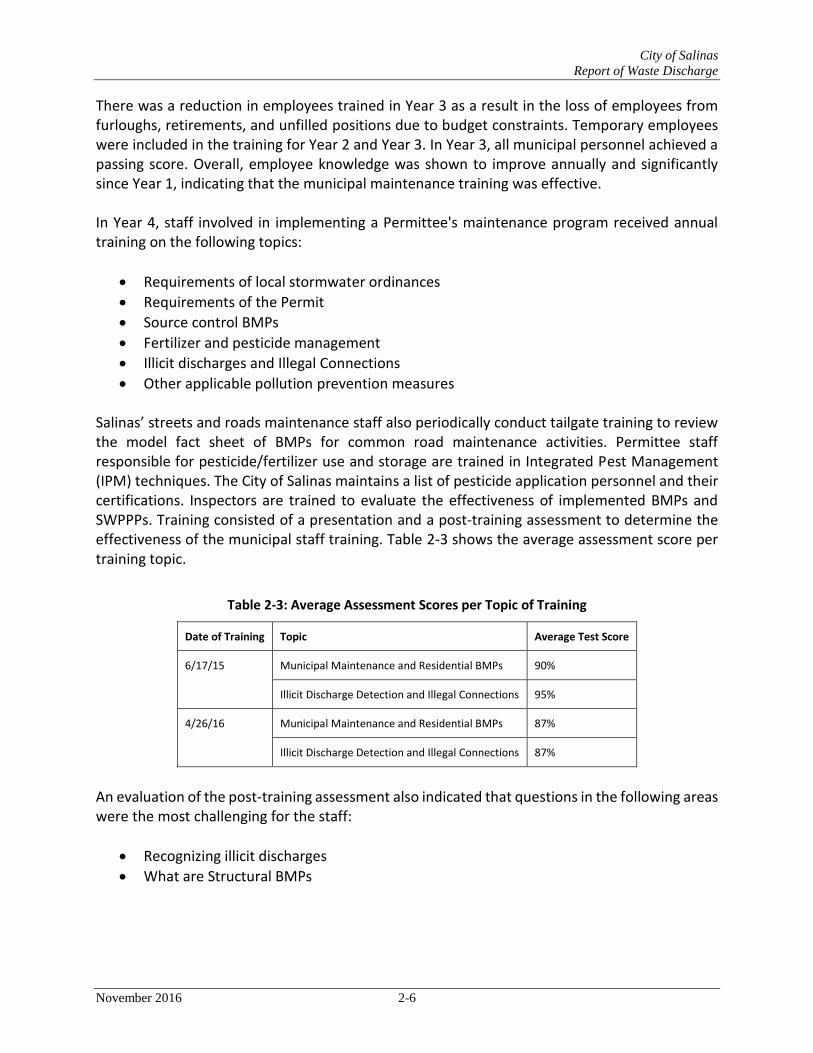
Other applicable pollution prevention measures Salinas’ streets and roads maintenance staff also periodically conduct tailgate training to review the model fact sheet of BMPs for common road maintenance activities. Permittee staff responsible for pesticide/fertilizer use and storage are trained in Integrated Pest Management (IPM) techniques. The City of Salinas maintains a list of pesticide application personnel and their certifications. Inspectors are trained to evaluate the effectiveness of implemented BMPs and SWPPPs. Training consisted of a presentation and a post-training assessment to determine the effectiveness of the municipal staff training. Table 2-3 shows the average assessment score per training topic.
Table 2-3: Average Assessment Scores per Topic of Training
Date of Training Topic Average Test Score
6/17/15 Municipal Maintenance and Residential BMPs 90%
Illicit Discharge Detection and Illegal Connections 95%
4/26/16 Municipal Maintenance and Residential BMPs 87%
Illicit Discharge Detection and Illegal Connections 87%
An evaluation of the post-training assessment also indicated that questions in the following areas were the most challenging for the staff:
Recognizing illicit discharges
What are Structural BMPs
City of Salinas
Report of Waste Discharge
November 2016 2-7
2.2 Recommendations
2.2.1 Proposed Revisions to Public Education BMPs
To support a comprehensive regional MS4 program, the City of Salinas proposes the following actions:
The City of Salinas will continue to update and distribute targeted BMP guidance developed for restaurants, industrial facilities, construction sites, automotive service centers and gasoline service stations, and residential properties (including pet ownership, landscape and swimming pool maintenance, septic tank maintenance, and outdoor cleaning activities).
The City of Salinas proposes that the CBSM Program will continue to utilize public awareness surveys at events to educate residents and gage the effectiveness of the program, and utilize the existing website, advertisements, promotional materials, brochures, and other media and outreach channels to increase stormwater awareness.
The City of Salinas will continue to distribute public education materials to encourage the public to report clogged drainage lines or sewer system overflows (SSOs), faded or missing catch basin stencils, illegal dumping from residential, industrial, construction and commercial sites into public streets, and the accumulation of trash/litter.
The City of Salinas will continue to partner with other municipal agencies and/or NGOs, where possible, to promote stormwater pollution prevention and environmental awareness.
The City of Salinas will continue to incorporate public involvement in the stormwater program development and implementation process.
The City of Salinas will revise length and wording of in-school assessment surveys.
The City of Salinas will continue to review results of telephone outreach survey, increase sampling size to better represent the City population and discuss the survey results with its regional media partners.
The City of Salinas will expand implementation of bulky waste outreach program to include single-family homes and quantitatively evaluate multi-family complex outreach.
The City of Salinas will expand the outreach program to include a broader audience. Table 2-4 identifies various audiences and outreach methods for the three categories of the Public Education and Outreach Program.

City of Salinas
Report of Waste Discharge
November 2016 2-8
Table 2-4: Public Education and Outreach Methods
Category Audience Potential Outreach Methods
Public Behavior
Residents; General Public
Pamphlets, brochures, radio, TV/cable, billboards, utility bill inserts, door hangers, newspaper inserts, direct mail, advertisements, community events, surveys, community presentations, internet website messaging, outreach events, hotel/tourist messaging
Students Classroom presentations, DVDs and videos, workbook materials, children’s workshops, contests, internet website messaging
Home Gardeners Focused brochures, posters, composting/IPM workshops, newspaper inserts, home and garden shows, flower shows
Business Activity
Commercial; Industrial (restaurants, automotive service centers, gasoline service stations, pavement cutting, etc.)
Brochures, posters, site inspections, trade shows
Mobile Operators (auto maintenance; vehicle washing; mobile carpet, drape, and furniture cleaning, mobile steam cleaning)
Brochures, information at public permit counters, site inspections (base of operations), trade shows, Chamber of Commerce messaging, business license counter information, TV/radio ads, media ads
Groundskeepers, landscape installation, nurseries, greenhouses
Focused brochures, posters, IPM/green gardener workshops, newspaper inserts, outreach events addressing IPM, shelf talkers
Architects; Developers Focused brochures, information at public permit counters, Stormwater Development Stds (SWDS) workshops, information at public planning counters, LID BMP Design handbook links
General contractors; Construction contractors
Focused brochures, information at public permit counters, site inspections, BMP implementation workshops
Potential Pollutants
Users or generators of fertilizers, pesticides, chemicals, and other pollutants
Pamphlets, brochures, TV/cable, utility bill inserts, newspaper inserts, advertisements, community events, community presentations, surveys, internet messaging
2.2.2 Proposed Revisions to Municipal Staff BMPs
To support a comprehensive, region-wide MS4 program, the City of Salinas proposes the following actions:
The City of Salinas has developed maintenance schedules for their MS4 facilities, and will continue to implement those maintenance schedules. BMPs utilized during MS4 maintenance will be described in each Permittee's SWMP. A manual containing Standard Operating Procedures (SOPs) for High Priority Maintenance Operations will be reviewed and updated
The City of Salinas will continue to utilize the developed list of potential Source Control BMPs to address any potential impacts to water quality which may result from City
City of Salinas
Report of Waste Discharge
November 2016 2-9
activities. City of Salinas will also consult other sources of BMP information and consider implementation of additional methods and measures, as appropriate.
The City of Salinas will continue to provide stormwater training to municipal and field operations staff, as well as contractors, on fertilizer and pesticide management, proper maintenance procedures for pollution prevention, local stormwater ordinances, MS4 Permit requirements, and other pollution control measures.
The City of Salinas will review and update training and education programs for their employees within 12 months of adoption of the next MS4 Permit. A training matrix for Salinas staff will also be developed. In the future trainings, more clarity and information will be provided, specifically when addressing illicit discharges and structural BMPs.
The City has determined that the requirement to annually inspect all municipal facilities that are not High Priority is an excessive burden to staff and does not provide a real benefit to water quality. It is recommended that all municipal facilities, those owned or operated by the City, be re-evaluated to determine their potential to impact water quality, and only those that show a water quality impact nexus be held to the annual inspection requirement.
The City recommends development of a program within the Public Works Maintenance Department to require an evaluation of more environmentally-friendly chemicals prior to purchase and use of materials at the Yard. This will facilitate meeting the requirements in the current NPDES permit.
Due to staffing levels, it is recommended that biweekly visual inspections of municipal parking lots replace the daily requirement in the current NPDES permit.
Attachment G needs to be re-evaluated and corrected. It is not satisfactory for a facility with a High Pollutant Discharge Risk that is in compliance have a rating of “---“ or any facility at any pollutant discharge risk level that is in compliance receive any rating lower than a “B”. The inspection rating program as it currently stands assigns a “D” to a facility with moderate pollutant discharge risk level and a minor-noncompliance. This is not reasonable. This entire section needs to be re-evaluated to provide a more reasonable inspection rating protocol.
City of Salinas
Report of Waste Discharge
November 2016 3-1
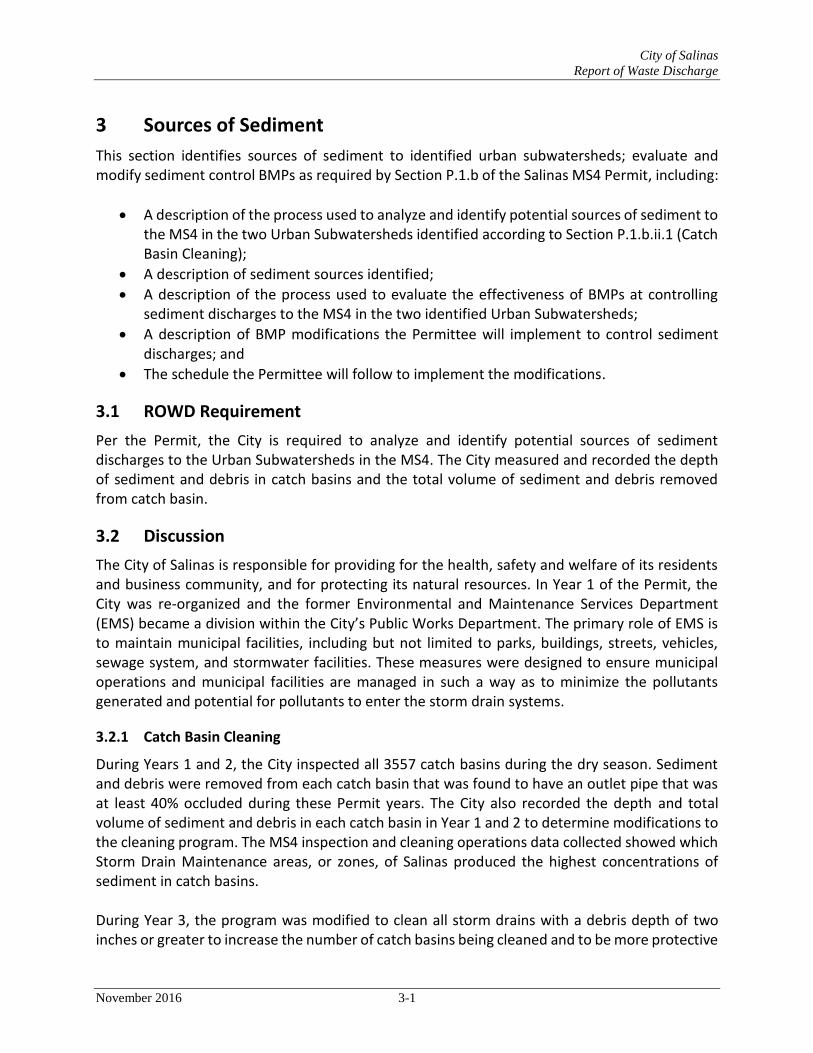
3 Sources of Sediment
This section identifies sources of sediment to identified urban subwatersheds; evaluate and modify sediment control BMPs as required by Section P.1.b of the Salinas MS4 Permit, including:
A description of the process used to analyze and identify potential sources of sediment to the MS4 in the two Urban Subwatersheds identified according to Section P.1.b.ii.1 (Catch Basin Cleaning);
A description of sediment sources identified;
A description of the process used to evaluate the effectiveness of BMPs at controlling sediment discharges to the MS4 in the two identified Urban Subwatersheds;
A description of BMP modifications the Permittee will implement to control sediment discharges; and
The schedule the Permittee will follow to implement the modifications.
3.1 ROWD Requirement
Per the Permit, the City is required to analyze and identify potential sources of sediment discharges to the Urban Subwatersheds in the MS4. The City measured and recorded the depth of sediment and debris in catch basins and the total volume of sediment and debris removed from catch basin.
3.2 Discussion
The City of Salinas is responsible for providing for the health, safety and welfare of its residents and business community, and for protecting its natural resources. In Year 1 of the Permit, the City was re-organized and the former Environmental and Maintenance Services Department (EMS) became a division within the City’s Public Works Department. The primary role of EMS is to maintain municipal facilities, including but not limited to parks, buildings, streets, vehicles, sewage system, and stormwater facilities. These measures were designed to ensure municipal operations and municipal facilities are managed in such a way as to minimize the pollutants generated and potential for pollutants to enter the storm drain systems.
3.2.1 Catch Basin Cleaning
During Years 1 and 2, the City inspected all 3557 catch basins during the dry season. Sediment and debris were removed from each catch basin that was found to have an outlet pipe that was at least 40% occluded during these Permit years. The City also recorded the depth and total volume of sediment and debris in each catch basin in Year 1 and 2 to determine modifications to the cleaning program. The MS4 inspection and cleaning operations data collected showed which Storm Drain Maintenance areas, or zones, of Salinas produced the highest concentrations of sediment in catch basins. During Year 3, the program was modified to clean all storm drains with a debris depth of two inches or greater to increase the number of catch basins being cleaned and to be more protective

City of Salinas
Report of Waste Discharge
November 2016 3-2
of water quality objectives. In addition, inspection modifications were made by dividing the City into five groups using the number of drains were zone to get close to the same number of inspections for each year. Priority for inspections in Year 3 were based on addressing inspections zones with the most debris collected in Year 2, with all catch basins in the City’s inventory to be inspected over a 5-year cycle per Permit requirements. Zones 18, 6, and 5 were inspected and cleaned in Year 3. In turn, the catch basins that met the two inch threshold level in Year 3 were considered High Priority for cleaning in Year 4, in addition to the catch basins in the new zones being cleaned. The program modifications made in Year 3 to clean all catch basins with a debris depth of two inches or greater actually resulted in a reduced amount of debris was being removed in Year 4, as there were less catch basins that met the threshold level. However, in addition to the High Priority cleanings, maintenance of the catch basins in Zones 1 – 4 were inspected and cleaned. In Zones 1, 2, 3, and 4 there were 618 catch basins requiring inspection. There were 581 high priority catch basins for inspection from previous years’ inspections (in various zones). Total catch basins inspected were 1199 with 439 catch basins cleaned. Catch basins that contained trash of any amount were cleaned in addition to catch basins that met or exceeded the two- inch cleaning threshold. Catch basins with a debris level of two inches or greater became high priority catch basins for inspection in Year 5, in addition to the Zones scheduled to be inspected and cleaned that year.
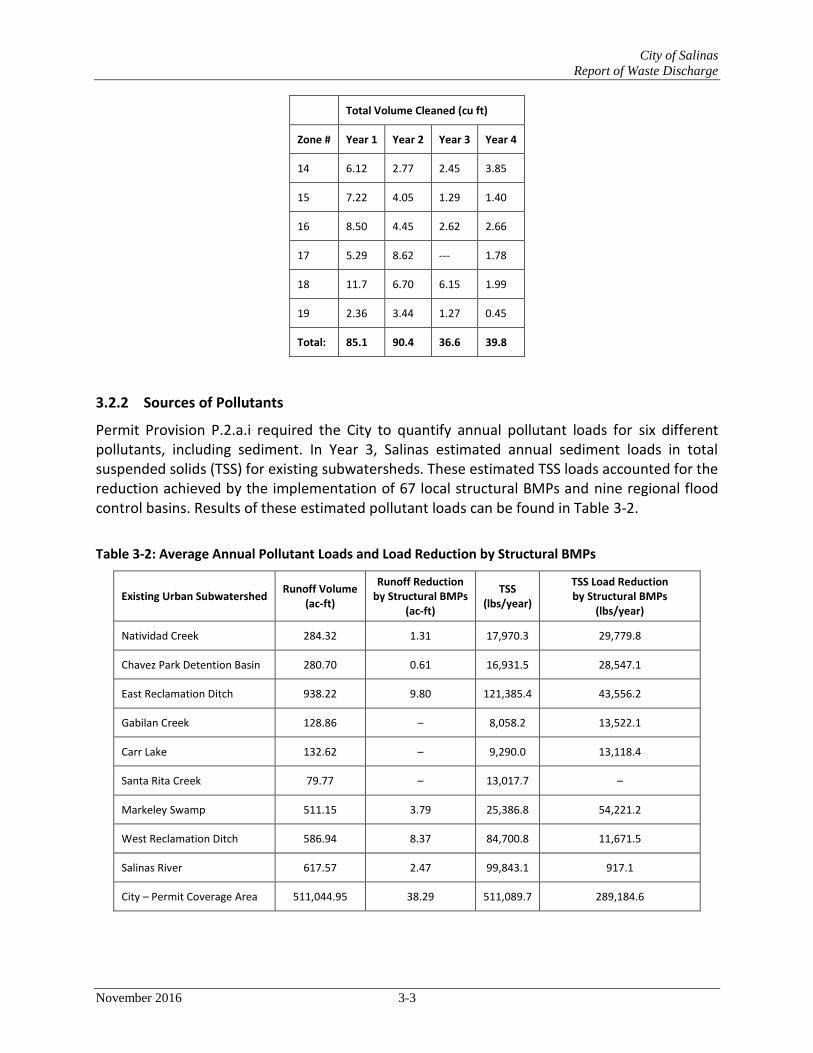
Table 3-1: Summary of Catch Basin Cleaning Sediment/Debris Totals
Total Volume Cleaned (cu ft)
Zone # Year 1 Year 2 Year 3 Year 4
1 0.32 0.65 0.53 1.11
2 4.62 3.48 2.03 2.79
3 0.68 3.98 1.04 4.71
4 5.48 4.11 2.82 3.10
5 6.80 9.76 0.30 8.12
6 3.92 10.0 5.67 3.32
8 1.08 4.85 1.04 0.66
9 4.84 4.30 2.35 0.39
10 7.06 4.98 2.59 0.24
11 2.86 6.69 0.41 0.61
12 3.79 3.64 1.26 1.40
13 2.48 3.97 2.76 1.22
City of Salinas
Report of Waste Discharge
November 2016 3-3
Total Volume Cleaned (cu ft)
Zone # Year 1 Year 2 Year 3 Year 4
14 6.12 2.77 2.45 3.85
15 7.22 4.05 1.29 1.40
16 8.50 4.45 2.62 2.66
17 5.29 8.62 --- 1.78
18 11.7 6.70 6.15 1.99
19 2.36 3.44 1.27 0.45
Total: 85.1 90.4 36.6 39.8
3.2.2 Sources of Pollutants
Permit Provision P.2.a.i required the City to quantify annual pollutant loads for six different pollutants, including sediment. In Year 3, Salinas estimated annual sediment loads in total suspended solids (TSS) for existing subwatersheds. These estimated TSS loads accounted for the reduction achieved by the implementation of 67 local structural BMPs and nine regional flood control basins. Results of these estimated pollutant loads can be found in Table 3-2.
Table 3-2: Average Annual Pollutant Loads and Load Reduction by Structural BMPs
Existing Urban Subwatershed Runoff Volume
(ac-ft)
Runoff Reduction by Structural BMPs
(ac-ft)
TSS (lbs/year)
TSS Load Reduction by Structural BMPs
(lbs/year)
Natividad Creek 284.32 1.31 17,970.3 29,779.8
Chavez Park Detention Basin 280.70 0.61 16,931.5 28,547.1
East Reclamation Ditch 938.22 9.80 121,385.4 43,556.2
Gabilan Creek 128.86 – 8,058.2 13,522.1
Carr Lake 132.62 – 9,290.0 13,118.4
Santa Rita Creek 79.77 – 13,017.7 –
Markeley Swamp 511.15 3.79 25,386.8 54,221.2
West Reclamation Ditch 586.94 8.37 84,700.8 11,671.5
Salinas River 617.57 2.47 99,843.1 917.1
City – Permit Coverage Area 511,044.95 38.29 511,089.7 289,184.6

City of Salinas
Report of Waste Discharge
November 2016 3-4
TSS load reductions are prominent in each existing subwatershed, with the exception of the Santa Rita Creek subwatershed, located in the northernmost section of the City of Salinas. A plausible explanation for the lack of TSS load reduction in Santa Rita Creek subwatershed may be the result of the undeveloped land around it. There is a substantial area of land, approximately 2,480 acres, that remains undeveloped on the northern side of Salinas, inside the City limits. The direction of general surface flow in the Santa Rita Creek subwatershed comes from the undeveloped area, as well as from undeveloped area outside the city limits, increasing the potential for TSS/sediment loading. The East Reclamation Ditch subwatershed had the largest estimated average annual pollutant load with 121,385.4 pounds of TSS per year. The large TSS concentrations may be attributed to the size of the East Reclamation Ditch subwatershed, whose area consists of almost half of the City’s area and is the largest subwatershed in the City.
3.2.3 Effectiveness of BMPs
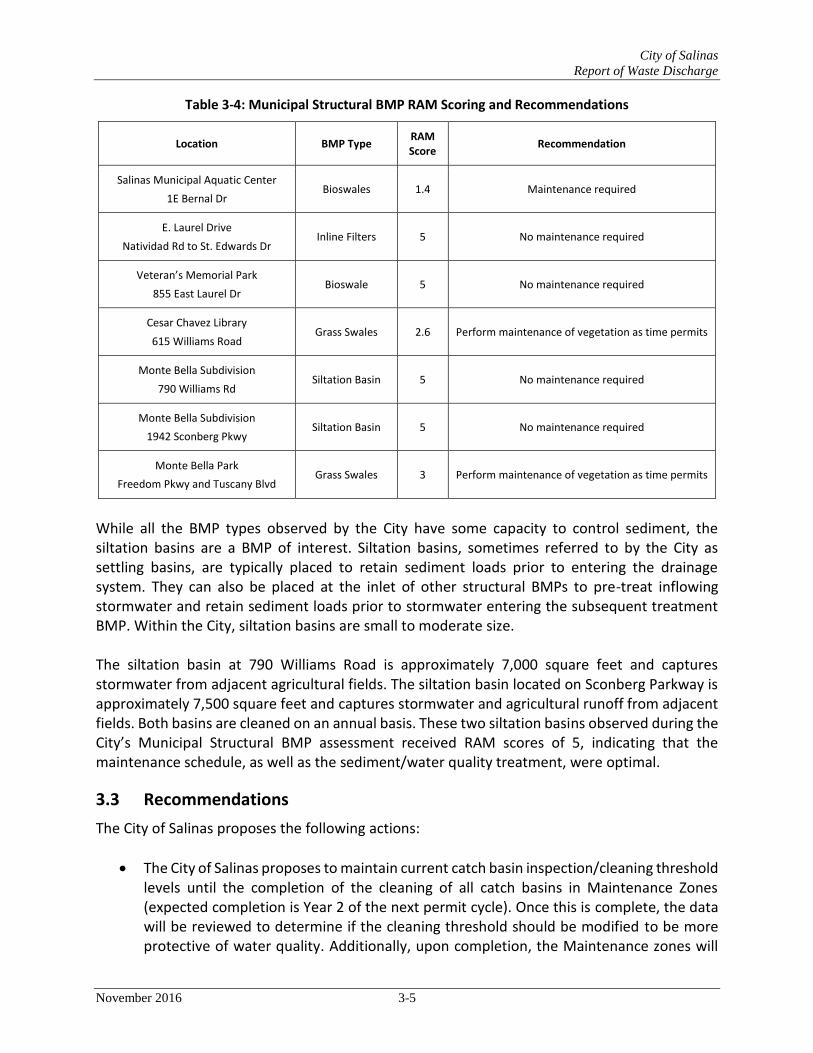
In Year 3, the City of Salinas conducted their first Municipal Structural BMP Assessment following the City of Salinas’ BMP Rapid Assessment Methodology (RAM). Seven locations in which municipal Structural BMPs were in place were identified; flood control devices were not counted as water quality BMPs, so they were not assessed using the RAM. For each existing municipal structural BMP, the City established benchmark and threshold values; benchmark values refer to the desired and achievable treatment BMP condition, while threshold values represent the treatment BMP condition that the City determined to be no longer acceptable from a water quality treatment perspective. Site visits were conducted to the seven locations in September 2014 to establish appropriate benchmark and threshold values, as well as to conduct the first- year RAM as required by the City’s stormwater permit. RAM scores were calculated based on field observation results, benchmark values and threshold values for each of the structural BMPs. An outline of the BMP RAM scores are outlined in Table 3-3. The results of the field observations and benchmark values were then input into the City’s RAM database. The scoring results and recommendations are summarized in Table 3-4.
Table 3-3: RAM scorings and definitions
Score Condition Maintenance
Urgency Description
0 – 1.0 Failure Required Little to no water quality benefit. Maintenance required immediately.
1.1 – 2.0 Unacceptable Required Water quality benefit is unacceptable. Maintenance is required prior to next runoff event.
2.1 – 3.0 Acceptable Moderate Water quality benefit is acceptable. Maintenance should be performed if time and resources permit.
3.1 – 5.0 Acceptable Low Water quality benefit acceptable. No immediate maintenance required.
City of Salinas
Report of Waste Discharge
November 2016 3-5
Table 3-4: Municipal Structural BMP RAM Scoring and Recommendations
Location BMP Type RAM Score
Recommendation
Salinas Municipal Aquatic Center
1E Bernal Dr Bioswales 1.4 Maintenance required
E. Laurel Drive
Natividad Rd to St. Edwards Dr Inline Filters 5 No maintenance required
Veteran’s Memorial Park
855 East Laurel Dr Bioswale 5 No maintenance required
Cesar Chavez Library
615 Williams Road Grass Swales 2.6 Perform maintenance of vegetation as time permits
Monte Bella Subdivision
790 Williams Rd Siltation Basin 5 No maintenance required
Monte Bella Subdivision
1942 Sconberg Pkwy Siltation Basin 5 No maintenance required
Monte Bella Park
Freedom Pkwy and Tuscany Blvd Grass Swales 3 Perform maintenance of vegetation as time permits
While all the BMP types observed by the City have some capacity to control sediment, the siltation basins are a BMP of interest. Siltation basins, sometimes referred to by the City as settling basins, are typically placed to retain sediment loads prior to entering the drainage system. They can also be placed at the inlet of other structural BMPs to pre-treat inflowing stormwater and retain sediment loads prior to stormwater entering the subsequent treatment BMP. Within the City, siltation basins are small to moderate size. The siltation basin at 790 Williams Road is approximately 7,000 square feet and captures stormwater from adjacent agricultural fields. The siltation basin located on Sconberg Parkway is approximately 7,500 square feet and captures stormwater and agricultural runoff from adjacent fields. Both basins are cleaned on an annual basis. These two siltation basins observed during the City’s Municipal Structural BMP assessment received RAM scores of 5, indicating that the maintenance schedule, as well as the sediment/water quality treatment, were optimal.
3.3 Recommendations
The City of Salinas proposes the following actions:
The City of Salinas proposes to maintain current catch basin inspection/cleaning threshold levels until the completion of the cleaning of all catch basins in Maintenance Zones (expected completion is Year 2 of the next permit cycle). Once this is complete, the data will be reviewed to determine if the cleaning threshold should be modified to be more protective of water quality. Additionally, upon completion, the Maintenance zones will

City of Salinas
Report of Waste Discharge
November 2016 3-6
be realigned to coincide with the current subwatershed boundaries to better facilitate analysis of debris and trash accumulation on a subwatershed basis.
The City of Salinas will implement annual municipal structural BMP assessments and private structural BMP assessments once every five years using the RAM procedure to determine the effectiveness level and maintenance needs of the structural BMPs located within the City permit boundary.
The City of Salinas will utilize the BMP RAM program by 2N to document the dates, times, sediment levels, and other comments recorded during each structural BMP assessment and cleaning/restoration.
If necessary, the City of Salinas will determine the sources of sediment pollution by conducting source investigations around municipal structural BMPs that experience the highest levels of sediment pollution loading.
Utilizing a pollutant loading reduction model, the City will investigate sources of pollutants in subwatersheds with high levels of TSS (i.e. East Reclamation Basin) with the intention of installing more structural BMPs as the City sees fit or possible.
City of Salinas
Report of Waste Discharge
November 2016 4-1
4 Street Sweeping and Cleaning Schedule
This section identifies modifications to the street sweeping and cleaning schedule to optimize the total volume of solids collected as required by Section P.1.b of the Salinas MS4 Permit. This includes a description of the process used to analyze information collected in preceding years per Section E.6.b, including a summary of the information and modifications to the sweeping schedule proposed by the City to optimize the total volume of solids collected during the dry season for all routes for the same total number of route miles.
4.1 ROWD Requirement
The City developed and implemented BMPs for daily sweeping of roads and parking lots undergoing maintenance operations that produce or disturb sediment or debris. The City also developed a street sweeping map that indicates the location of all municipal parking lots swept in accordance with Salinas MS4 Permit Provision Section E.6.i. The sweeping routes were integrated into the City’s subwatershed map, which indicates all sweeping routes, all City-owned or operated streets, and the priority designation of each route.
4.1.1 Street Sweeping and Cleaning
The City tracked the number of route miles swept for each sweeping event for each route; tracked the volume of solids collected for each sweeping event during the dry season for each route; tracked the total volume of solids collected for all sweeping events during the dry season for each route; tracked the total volume of solids collected for all sweeping events during the dry season for all routes; tracked the percentage of curb miles covered by sweeping routes that are actually swept during sweeping operations; and developed and implemented a procedure to dispose of street sweeper waste materials. The City calculated the average volume of solids collected per route mile swept during the dry season each year for each of the 24 routes the City currently sweeps biweekly.
4.1.2 Sweeping Frequency
The City swept all sweeping routes in accordance with their existing frequency as specified in the most recently approved SWMP for Order No. R3-2012-0005. In areas where street sweeping was technically infeasible, the City hand swept the areas and increased implementation of other trash/litter BMP procedures to minimize pollutant discharges to storm drains and water bodies. These areas are shown on the street sweeping map.
4.1.3 Sweeping Equipment Selection and Operation
When replacing existing sweeping equipment, the City selected and operated high-performing sweepers that are efficient in removing pollutants, including fine particulates, from impervious surfaces. The City tracked equipment design performance specifications to ensure that street sweeping equipment was operated at the proper equipment design speed with appropriate verification, and that equipment was properly maintained. The City operated sweepers to optimize pollutant removal by providing sweepers access to the curb using parking restrictions

City of Salinas
Report of Waste Discharge
November 2016 4-2
that clear the curb or through effective public outreach to inform citizens of sweeping days and times so that voluntary curb clearing could occur. The City estimated the percentage of curb miles covered by sweeping routes that were actually swept during sweeping operations. The estimate excluded curb miles that the sweeping equipment was unable to access due to parked cars or trash cans. The estimate was supported by data and, in some cases, was based on assessments provided by equipment operators.
4.1.4 Sweeper Waste Material Disposal
The City developed and implemented an effective procedure to properly dispose of street sweeper waste material. This procedure ensures that water and material will not reenter the MS4 or enter water bodies.
4.1.5 Tracking of Dirt and Other Debris onto Streets
The City implemented the progressive Enforcement Response Plan (Salinas MS4 Permit Provision Section S.2 [Legal Authority: Enforcement Measures and Tracking]) and took all necessary follow-up actions (e.g., warnings, notices, escalated enforcement, follow-up) to bring operations into compliance. The City responded to and documented all complaints received from third-parties and documented any required corrective actions and the implementation of corrective actions. The City used the reporting system described in Salinas MS4 Permit Provision Section H.4 (Illicit Discharge Detection and Elimination: Illicit Discharge Reporting System) to facilitate third-party complaints of tracking of dirt and other debris onto streets.
4.1.6 Parking Lots
The City swept the following municipal parking lots on a weekly basis: Lots #1, #2, #3, #5, #8, #10, #12, #15, #16, #17, #18, #19, #20, and the Intermodal Transit Station (ITC); the Salinas Street Garage (upper and lower); and the Monterey Street Garage (all stories). The City swept the Union Pacific Transit Center parking monthly. The City also conducted daily visually inspections of all municipal parking lots and removed visible trash, litter, and debris during each inspection.
4.2 Discussion
As a part of the EMS department’s responsibility to minimize the pollutants generated and potential for pollutants to enter the storm drain systems, the City closely conducts and monitors street sweeping and cleaning. The City of Salinas street sweeping is divided into three categories: residential, commercial, and industrial sweeping. The City street sweepers are too large for parking lot sweeping, therefore the City contracts parking lot sweeping to a vendor with smaller equipment that is specific for parking lot sweeping. When an operator is on vacation or sick leave, they are relieved by other qualified operators from the Wastewater staff. Street sweeping does not take place during inclement weather that produces a rain event that results in runoff.
4.2.1 Curb Access
During Years 1 and 2, the City performed car counts to determine areas where sweepers were unable to access the curbs.
City of Salinas
Report of Waste Discharge
November 2016 4-3
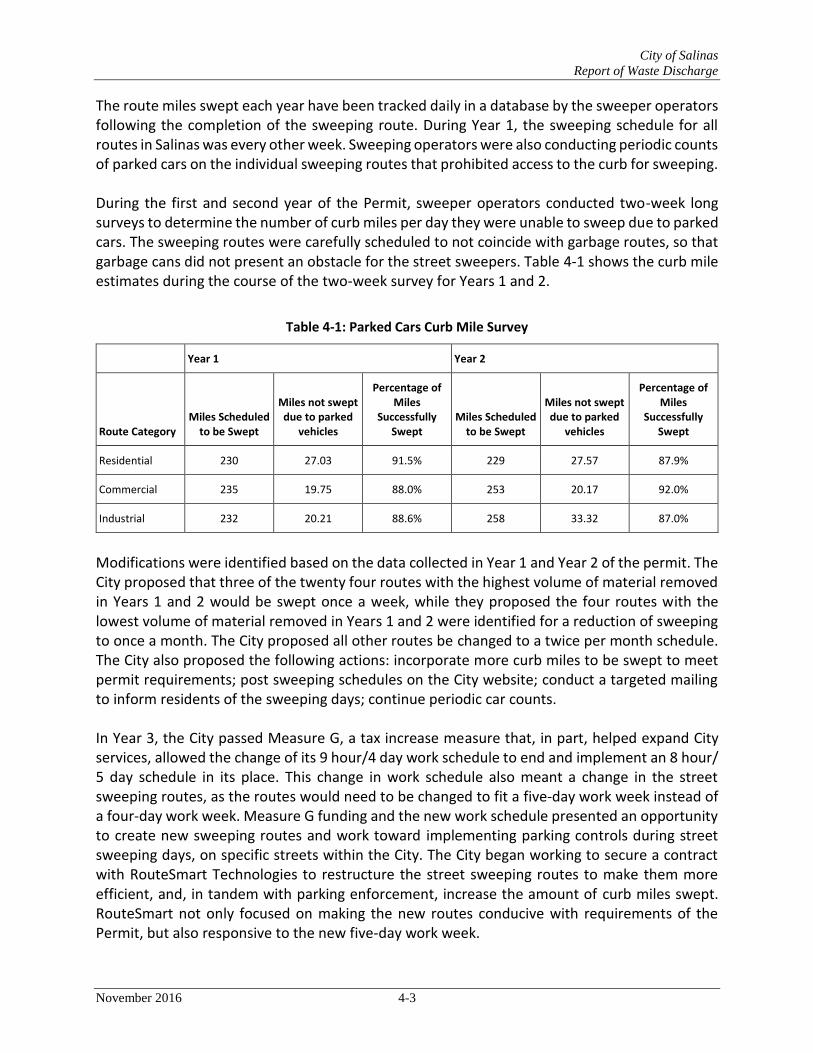
The route miles swept each year have been tracked daily in a database by the sweeper operators following the completion of the sweeping route. During Year 1, the sweeping schedule for all routes in Salinas was every other week. Sweeping operators were also conducting periodic counts of parked cars on the individual sweeping routes that prohibited access to the curb for sweeping. During the first and second year of the Permit, sweeper operators conducted two-week long surveys to determine the number of curb miles per day they were unable to sweep due to parked cars. The sweeping routes were carefully scheduled to not coincide with garbage routes, so that garbage cans did not present an obstacle for the street sweepers. Table 4-1 shows the curb mile estimates during the course of the two-week survey for Years 1 and 2.
Table 4-1: Parked Cars Curb Mile Survey
Year 1 Year 2
Route Category Miles Scheduled
to be Swept
Miles not swept due to parked
vehicles
Percentage of Miles
Successfully Swept
Miles Scheduled to be Swept
Miles not swept due to parked
vehicles
Percentage of Miles
Successfully Swept
Residential 230 27.03 91.5% 229 27.57 87.9%
Commercial 235 19.75 88.0% 253 20.17 92.0%
Industrial 232 20.21 88.6% 258 33.32 87.0%
Modifications were identified based on the data collected in Year 1 and Year 2 of the permit. The City proposed that three of the twenty four routes with the highest volume of material removed in Years 1 and 2 would be swept once a week, while they proposed the four routes with the lowest volume of material removed in Years 1 and 2 were identified for a reduction of sweeping to once a month. The City proposed all other routes be changed to a twice per month schedule. The City also proposed the following actions: incorporate more curb miles to be swept to meet permit requirements; post sweeping schedules on the City website; conduct a targeted mailing to inform residents of the sweeping days; continue periodic car counts. In Year 3, the City passed Measure G, a tax increase measure that, in part, helped expand City services, allowed the change of its 9 hour/4 day work schedule to end and implement an 8 hour/ 5 day schedule in its place. This change in work schedule also meant a change in the street sweeping routes, as the routes would need to be changed to fit a five-day work week instead of a four-day work week. Measure G funding and the new work schedule presented an opportunity to create new sweeping routes and work toward implementing parking controls during street sweeping days, on specific streets within the City. The City began working to secure a contract with RouteSmart Technologies to restructure the street sweeping routes to make them more efficient, and, in tandem with parking enforcement, increase the amount of curb miles swept. RouteSmart not only focused on making the new routes conducive with requirements of the Permit, but also responsive to the new five-day work week.
City of Salinas
Report of Waste Discharge
November 2016 4-4
During this evaluation of new sweeping routes and the implementation of parking enforcement, Permit Years 3 and 4 requirements to develop a methodology for increasing curb miles swept were not implemented. Car counts discontinued due to sweeper operator safety issues. However, a parking enforcement company was contracted in Year 4 to assist with the final development of the street sweeping/parking signage enforcement program.
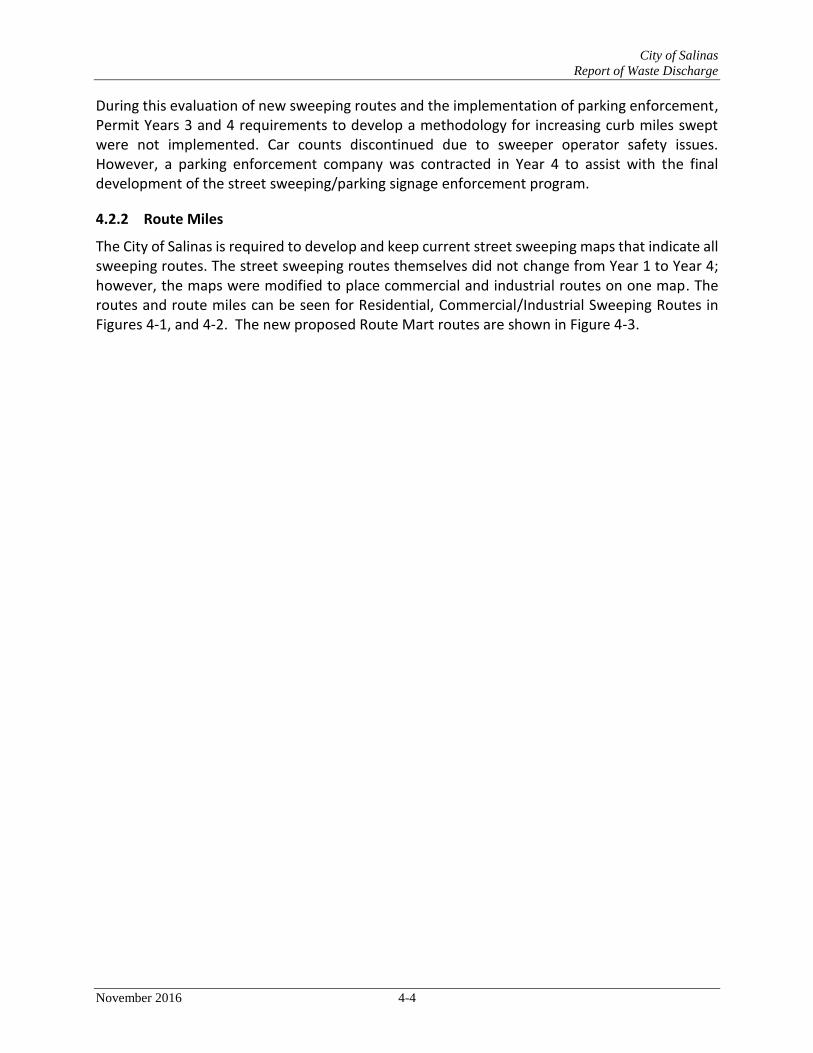
4.2.2 Route Miles
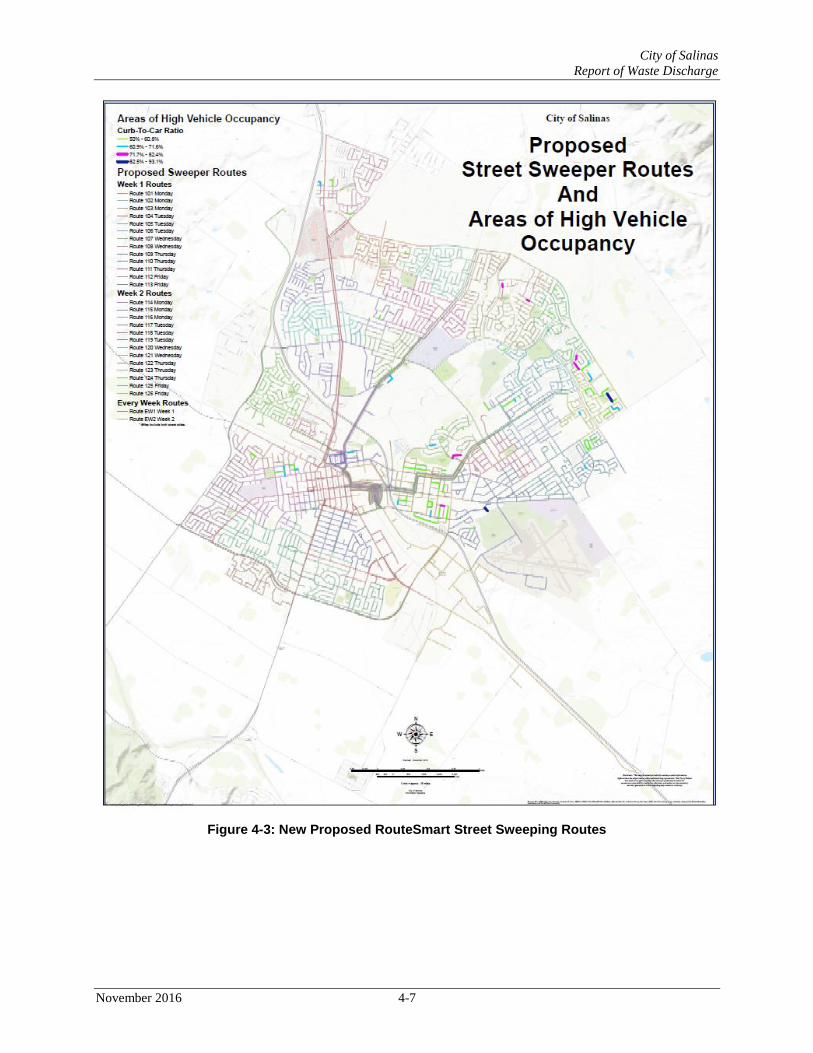
The City of Salinas is required to develop and keep current street sweeping maps that indicate all sweeping routes. The street sweeping routes themselves did not change from Year 1 to Year 4; however, the maps were modified to place commercial and industrial routes on one map. The routes and route miles can be seen for Residential, Commercial/Industrial Sweeping Routes in Figures 4-1, and 4-2. The new proposed Route Mart routes are shown in Figure 4-3.
City of Salinas
Report of Waste Discharge
November 2016 4-5
Figure 4-1: Residential Street Sweeping Routes

City of Salinas
Report of Waste Discharge
November 2016 4-6
Figure 4-2: Commercial/Industrial Street Sweeping Routes
City of Salinas
Report of Waste Discharge
November 2016 4-7
Figure 4-3: New Proposed RouteSmart Street Sweeping Routes
City of Salinas
Report of Waste Discharge
November 2016 4-8
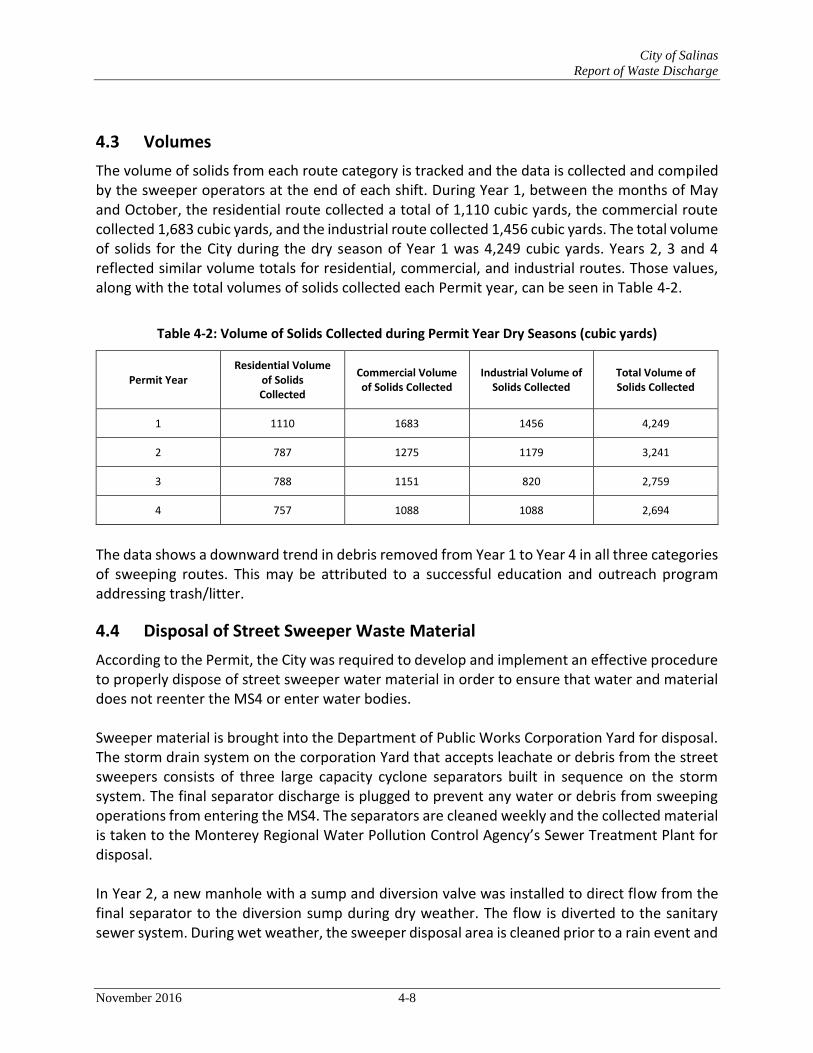
4.3 Volumes
The volume of solids from each route category is tracked and the data is collected and compiled by the sweeper operators at the end of each shift. During Year 1, between the months of May and October, the residential route collected a total of 1,110 cubic yards, the commercial route collected 1,683 cubic yards, and the industrial route collected 1,456 cubic yards. The total volume of solids for the City during the dry season of Year 1 was 4,249 cubic yards. Years 2, 3 and 4 reflected similar volume totals for residential, commercial, and industrial routes. Those values, along with the total volumes of solids collected each Permit year, can be seen in Table 4-2.
Table 4-2: Volume of Solids Collected during Permit Year Dry Seasons (cubic yards)
Permit Year Residential Volume
of Solids Collected
Commercial Volume of Solids Collected
Industrial Volume of Solids Collected
Total Volume of Solids Collected
1 1110 1683 1456 4,249
2 787 1275 1179 3,241
3 788 1151 820 2,759
4 757 1088 1088 2,694
The data shows a downward trend in debris removed from Year 1 to Year 4 in all three categories of sweeping routes. This may be attributed to a successful education and outreach program addressing trash/litter.
4.4 Disposal of Street Sweeper Waste Material
According to the Permit, the City was required to develop and implement an effective procedure to properly dispose of street sweeper water material in order to ensure that water and material does not reenter the MS4 or enter water bodies. Sweeper material is brought into the Department of Public Works Corporation Yard for disposal. The storm drain system on the corporation Yard that accepts leachate or debris from the street sweepers consists of three large capacity cyclone separators built in sequence on the storm system. The final separator discharge is plugged to prevent any water or debris from sweeping operations from entering the MS4. The separators are cleaned weekly and the collected material is taken to the Monterey Regional Water Pollution Control Agency’s Sewer Treatment Plant for disposal. In Year 2, a new manhole with a sump and diversion valve was installed to direct flow from the final separator to the diversion sump during dry weather. The flow is diverted to the sanitary sewer system. During wet weather, the sweeper disposal area is cleaned prior to a rain event and

City of Salinas
Report of Waste Discharge
November 2016 4-9
sweeping operations stopped. The diversion valve is switched to the stormwater system during the rain event.
4.5 Recommendations
The City of Salinas proposes the following actions:
The City of Salinas proposes to increase sweeping efficiency with new street sweeping routes and new signage to enforce no parking on street sweeping days.
The City of Salinas will maintain weekly sweeping schedule for those routes initially required to be swept weekly per the permit, and analyze the sweeping schedule for potential improvements.
The City of Salinas will conduct studies to determine reason for reduction in debris collected annually. A new method for evaluation of curb miles actually swept will be developed following the adoption of the new street sweeping routes and the parking enforcement program.
The City of Salinas proposes to document the amount of debris and trash removed by hand-sweeping and by contracted sweepers in surface lots and parking structures, if applicable.
The City of Salinas will evaluate the current sweeper waste protocol used at the Public Works Corporation Yard and revise if necessary to ensure leachate water is directed to the sanitary sewer and waste is picked up for landfill disposal by Republic Services.
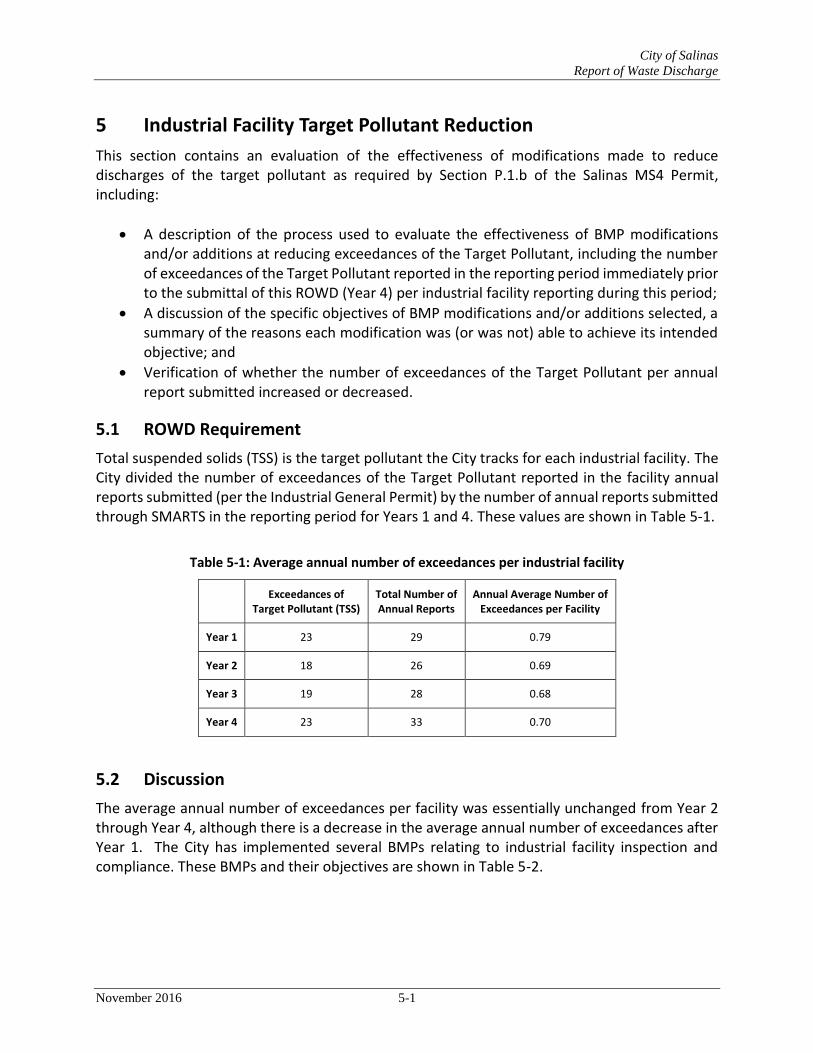
City of Salinas
Report of Waste Discharge
November 2016 5-1
5 Industrial Facility Target Pollutant Reduction
This section contains an evaluation of the effectiveness of modifications made to reduce discharges of the target pollutant as required by Section P.1.b of the Salinas MS4 Permit, including:
A description of the process used to evaluate the effectiveness of BMP modifications and/or additions at reducing exceedances of the Target Pollutant, including the number of exceedances of the Target Pollutant reported in the reporting period immediately prior to the submittal of this ROWD (Year 4) per industrial facility reporting during this period;
A discussion of the specific objectives of BMP modifications and/or additions selected, a summary of the reasons each modification was (or was not) able to achieve its intended objective; and
Verification of whether the number of exceedances of the Target Pollutant per annual report submitted increased or decreased.
5.1 ROWD Requirement
Total suspended solids (TSS) is the target pollutant the City tracks for each industrial facility. The City divided the number of exceedances of the Target Pollutant reported in the facility annual reports submitted (per the Industrial General Permit) by the number of annual reports submitted through SMARTS in the reporting period for Years 1 and 4. These values are shown in Table 5-1.
Table 5-1: Average annual number of exceedances per industrial facility
Exceedances of
Target Pollutant (TSS) Total Number of Annual Reports
Annual Average Number of Exceedances per Facility
Year 1 23 29 0.79
Year 2 18 26 0.69
Year 3 19 28 0.68
Year 4 23 33 0.70
5.2 Discussion
The average annual number of exceedances per facility was essentially unchanged from Year 2 through Year 4, although there is a decrease in the average annual number of exceedances after Year 1. The City has implemented several BMPs relating to industrial facility inspection and compliance. These BMPs and their objectives are shown in Table 5-2.

City of Salinas
Report of Waste Discharge
November 2016 5-2
Table 5-2: BMPs implemented by the City to Address Industrial Facilities
City BMP Implemented Objective
Recording information in Trak-it which allows cross referencing of information gathered by various City Departments i.e. (Code enforcement, Fire, Building, Planning Dept. and Permits etc.). Trak-it can be used to view current and historical information regarding activities and enforcement actions that are associated with a business or facility.
Track inspections, implementation, and enforcement on a City-wide level and allow sharing of information across City Departments
Contracted with a consultant to evaluate the monitoring data. Assess the monitoring data of facilities enrolled in the IGP
Issued Notice of Violations and all offending parties brought their sites into compliance without further action
Ensure facility compliance with City SWMP requirements
Mailed packets of required BMPs to industrial facilities Educate industrial facility operators about appropriate site-level BMPs
Annual inspections of industrial sites with those meeting the criteria of “High Priority” requiring a follow-up inspection
Ensure facility compliance with City SWMP requirements
Evaluated deficiencies in IGP annual reporting and issued letters to each offending party with recommendations for corrective actions.
Ensure facility compliance with IGP requirements
Evaluated the list of industries and business enrolled in the IGP
Create a comprehensive listing of all industries that may be enrolled in the IGP or apply for NEC certification to ensure compliance with IGP requirements.
Each of these BMPs was implemented to help the industrial facilities achieve compliance. An evaluation of the exceedances of the target pollutant reveals that, on average, only about half of the reporting facilities had exceedances of the target pollutant, but these facilities averaged two exceedances each. Only 39 of 64 industrial facilities in Salinas were registered on SMARTS. Of these, only 33 submitted monitoring data.
5.3 Recommendations
To reduce the annual exceedance rate of the target pollutant (TSS) from the industrial facilities, the City may provide education and outreach about pre-rain event good housekeeping practices including proper materials management, sweeping the facility, and other onsite BMPs.
The City of Salinas proposes to improve education and outreach to industrial facilities. With the new Industrial General Permit that went into effect in July 2015, there was an opportunity to continue education and outreach to facilities regarding new requirements of the State’s IGP including the more stringent monitoring and reporting requirements.
The City of Salinas is evaluating the listing of industries and businesses in the City permit area determined to be “light industry” and determine if there any that are not currently covered and may require IGP coverage or NEC certification.
City of Salinas
Report of Waste Discharge
November 2016 6-1
6 Riparian Protection
This section contains the following, as required by Section P.1.b of the Salinas MS4 Permit:
An evaluation of exceptions, exemptions, and variances permitted;
The results of an inspection of each riparian area created, enhanced, or restored; and
An evaluation of the effectiveness of the development planning and review process at protecting riparian areas, including:
o The total area of encroachment permitted into riparian buffers established by this Order, for the Permit coverage area as a whole and for each Urban Subwatershed;
o The total amount of riparian area created, restored, or enhanced as mitigation for the permitted encroachments, for the Permit coverage area as a whole and for each Urban Subwatershed;
o A tabular summary of the results of inspection of each riparian area created, restored, or enhanced as mitigation for the permitted encroachments, including the size and quality of each mitigation area compared with the original mitigation requirements and the value of the riparian area lost or damaged by the permitted encroachment, whether each mitigation area complies with the original mitigation requirements, and whether each mitigation area successfully replaces the riparian values lost or damaged;
o A description of the evaluation of the development planning and review process at protecting riparian habitat, including an analysis of the number and scope of exceptions, exemptions, and variances permitted, the amount of riparian area lost or reduced in quality, and potential impacts to water quality and beneficial uses from the encroachments.
6.1 ROWD Requirement
The City has adopted 30- and 100-foot riparian buffers consistent with Section L.2.d of the Salinas MS4 permit. The City may grant exceptions, exemptions, or variations for passive recreation uses such as trails, playfields, or picnic areas within the 30- and 100- foot setback under certain conditions. The City may also approve development activities within the setback if a biotic resources study finds that the encroachment would have no adverse impact on the riparian and/or wetland resources’ capacity to attenuate the effects of urban storm runoff on the receiving water, or the implementation of alternative mitigation measures will achieve comparable or better attenuation of the effects of urban storm runoff than the strict application of the 30- and 100-foot setback. Projects proposing to encroach in the setbacks should be forwarded to the CCWB for review 15 days prior to approval of new development within the setback.
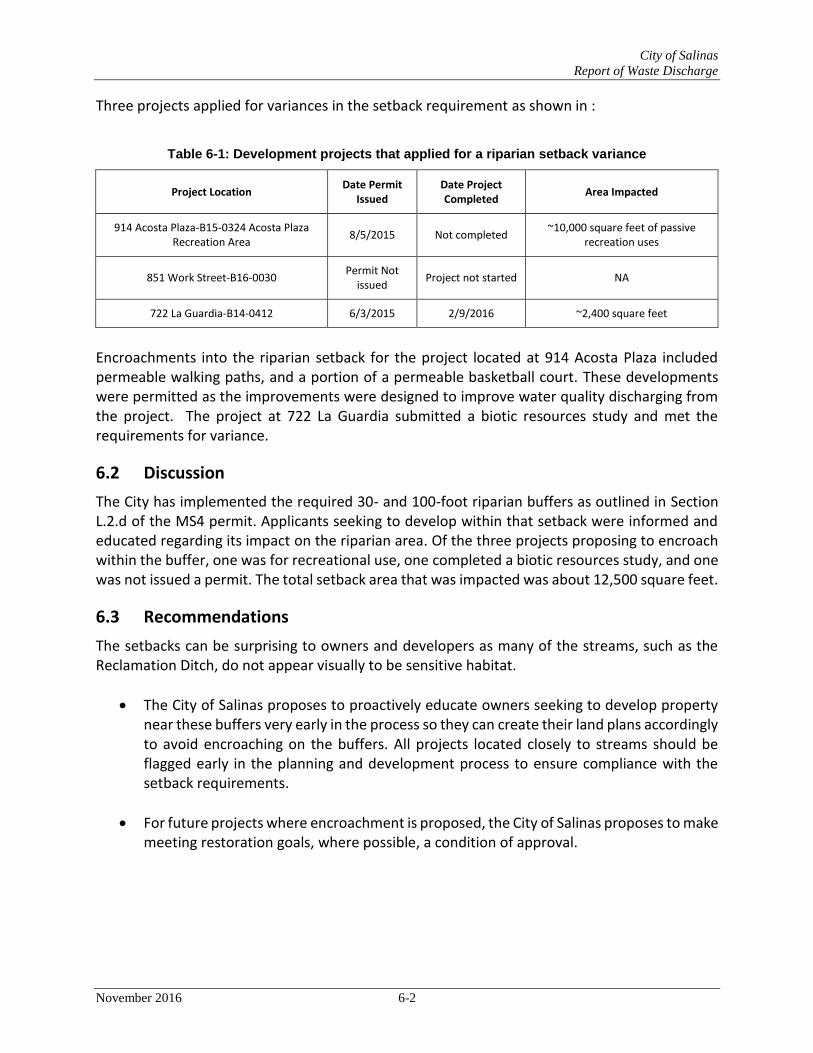
City of Salinas
Report of Waste Discharge
November 2016 6-2
Three projects applied for variances in the setback requirement as shown in :
Table 6-1: Development projects that applied for a riparian setback variance
Project Location Date Permit
Issued Date Project Completed
Area Impacted
914 Acosta Plaza-B15-0324 Acosta Plaza Recreation Area
8/5/2015 Not completed ~10,000 square feet of passive
recreation uses
851 Work Street-B16-0030 Permit Not
issued Project not started NA
722 La Guardia-B14-0412 6/3/2015 2/9/2016 ~2,400 square feet
Encroachments into the riparian setback for the project located at 914 Acosta Plaza included permeable walking paths, and a portion of a permeable basketball court. These developments were permitted as the improvements were designed to improve water quality discharging from the project. The project at 722 La Guardia submitted a biotic resources study and met the requirements for variance.
6.2 Discussion
The City has implemented the required 30- and 100-foot riparian buffers as outlined in Section L.2.d of the MS4 permit. Applicants seeking to develop within that setback were informed and educated regarding its impact on the riparian area. Of the three projects proposing to encroach within the buffer, one was for recreational use, one completed a biotic resources study, and one was not issued a permit. The total setback area that was impacted was about 12,500 square feet.
6.3 Recommendations
The setbacks can be surprising to owners and developers as many of the streams, such as the Reclamation Ditch, do not appear visually to be sensitive habitat.
The City of Salinas proposes to proactively educate owners seeking to develop property near these buffers very early in the process so they can create their land plans accordingly to avoid encroaching on the buffers. All projects located closely to streams should be flagged early in the planning and development process to ensure compliance with the setback requirements.
For future projects where encroachment is proposed, the City of Salinas proposes to make meeting restoration goals, where possible, a condition of approval.
City of Salinas
Report of Waste Discharge
November 2016 7-1
7 Pollutant Load Quantification
This section contains a re-quantification of annual urban subwatershed pollutant loads as required by Section P.2.a of the Salinas MS4 Permit, including:
A discussion of all assumptions used to quantify pollutant loads and pollutant load reductions, including a discussion of how Stormwater Discharge Trend Monitoring data and other data collected according to this Section were used to modify the assumptions;
A discussion of the results of Pollutant Load Quantification, including annual loads calculated for each pollutant for the entire Permit coverage area and for each Urban Subwatershed; and
A comparison of annual loads calculated prior to the submittal of the Permittee’s Report of Waste Discharge with annual loads calculated in Year 1.
7.1 ROWD Requirement
7.1.1 Quantification of Pollutant Load
The City quantified its annual urban subwatershed pollutant loads using the “integrated Watershed Assessment Tool for Restoration (iWATR)” developed by Michael Baker International (formerly RBF Consulting). The Central Coast Regional Water Quality Control Board approved the use of iWATR to estimate annual pollutant loads and pollutant load reductions based on annual average rainfall in a letter dated April 29, 2013. iWATR is an integrated assessment tool for analyzing, planning, designing, and constructing structural BMPs that aim at restoring the beneficial uses of a watershed. The iWATR process incorporates a GIS Watershed Analysis Tool and a Water Quality Modeling component that are designed to estimate pollutant loads from delineated drainage areas. The tool estimates the average annual runoff for a specific drainage area or watershed based on an average annual rainfall, imperviousness, and the distribution of land uses within the drainage area. The estimated pollutant concentrations per land use type is derived from the National Stormwater Quality Database (NSQD, 2008). Pollutant load reductions that are achieved by existing structural BMPs are estimated based on the expected effluent concentrations for each type of structural BMP, as identified in the 2012 International Stormwater BMP Database. The iWATR pollutant loading spreadsheet model is based on equivalent modeling equations, the same types of structural BMPs, and land use inputs as embedded in the CWP Watershed Treatment Model. Michael Baker International has completed, on behalf of the City of Salinas, the quantification efforts. This section briefly identifies the approaches and justified assumptions that were made to perform the estimates. The National Stormwater Quality Database Version 1.1 (2005) associates expected influent concentrations for each of the six pollutants of concern to specific land use types. An area-weighted influent pollutant concentration was computed for each catchment, urban subwatershed, and the entire permitted area on the basis of the distribution of land uses within
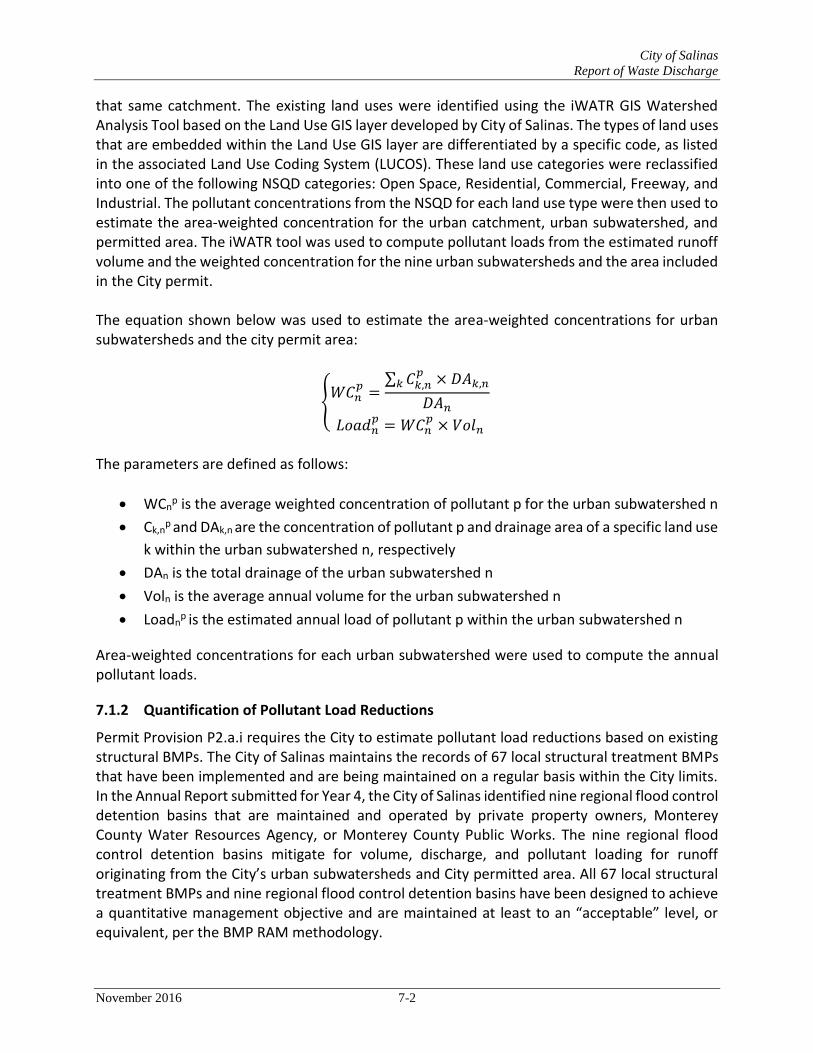
City of Salinas
Report of Waste Discharge
November 2016 7-2
that same catchment. The existing land uses were identified using the iWATR GIS Watershed Analysis Tool based on the Land Use GIS layer developed by City of Salinas. The types of land uses that are embedded within the Land Use GIS layer are differentiated by a specific code, as listed in the associated Land Use Coding System (LUCOS). These land use categories were reclassified into one of the following NSQD categories: Open Space, Residential, Commercial, Freeway, and Industrial. The pollutant concentrations from the NSQD for each land use type were then used to estimate the area-weighted concentration for the urban catchment, urban subwatershed, and permitted area. The iWATR tool was used to compute pollutant loads from the estimated runoff volume and the weighted concentration for the nine urban subwatersheds and the area included in the City permit. The equation shown below was used to estimate the area-weighted concentrations for urban subwatersheds and the city permit area:
{𝑊𝐶𝑛
𝑝 =∑ 𝐶𝑘,𝑛
𝑝 × 𝐷𝐴𝑘,𝑛𝑘
𝐷𝐴𝑛𝐿𝑜𝑎𝑑𝑛
𝑝 = 𝑊𝐶𝑛𝑝 × 𝑉𝑜𝑙𝑛
The parameters are defined as follows:
WCnp is the average weighted concentration of pollutant p for the urban subwatershed n
Ck,np
and DAk,n are the concentration of pollutant p and drainage area of a specific land use
k within the urban subwatershed n, respectively
DAn is the total drainage of the urban subwatershed n
Voln is the average annual volume for the urban subwatershed n
Loadnp is the estimated annual load of pollutant p within the urban subwatershed n
Area-weighted concentrations for each urban subwatershed were used to compute the annual pollutant loads.
7.1.2 Quantification of Pollutant Load Reductions
Permit Provision P2.a.i requires the City to estimate pollutant load reductions based on existing structural BMPs. The City of Salinas maintains the records of 67 local structural treatment BMPs that have been implemented and are being maintained on a regular basis within the City limits. In the Annual Report submitted for Year 4, the City of Salinas identified nine regional flood control detention basins that are maintained and operated by private property owners, Monterey County Water Resources Agency, or Monterey County Public Works. The nine regional flood control detention basins mitigate for volume, discharge, and pollutant loading for runoff originating from the City’s urban subwatersheds and City permitted area. All 67 local structural treatment BMPs and nine regional flood control detention basins have been designed to achieve a quantitative management objective and are maintained at least to an “acceptable” level, or equivalent, per the BMP RAM methodology.

City of Salinas
Report of Waste Discharge
November 2016 7-3
The annual BMP pollutant load reduction was estimated for each catchment within the urban subwatersheds and the permitted area. The iWATR GIS Watershed Analysis Tool was used to estimate the drainage area tributary to each structural BMP. Land use types were identified within each tributary drainage area using the iWATR tool, and reclassified into one of the five NSQD categories to identify pollutant concentrations for runoff from each land use type. BMP influent concentrations from the NSQD were used to determine the area-weighted pollutant concentrations. Reductions in concentration associated with each structural BMP were estimated based on the International Stormwater BMP Database (2012). For each expected influent concentration and type of BMP, the expected effluent concentration was selected from the database. Pollutant reduction at each structural BMP includes a volumetric reduction as well as a reduction associated with the biological, chemical, and physical processes within the BMP. The expected runoff reduction for each structural BMP was determined from the Runoff Reduction Method (Technical Memorandum, page 17 – CWP 2008). The following equation accounts for these two cumulative load reductions that may occur at each of the 67 local structural LID BMPs and nine regional flood control detention basins:
𝐿𝑜𝑎𝑑𝑛 = 𝑉𝑖⌈(𝐼𝑛 ∗ 𝐶𝑖𝑛) + (1 − 𝐼𝑛) ∗ 𝐶𝑒𝑓𝑓⌉
The parameters are defined as follows:
Loadn is the load reduction estimated for each BMP
Vi is the total annual runoff volume for the BMP
In is the expected fraction of runoff reduction for BMP n
Cin is the influent concentration for BMP n
Ceff is the effluent concentration for BMP n
The iWATR GIS Analysis Tool identified the urban catchment or urban subwatershed, if any, in which the structural BMP is located. Load reductions from these structural BMPs were subsequently accounted for in the annual pollutant load estimates. In addition, several assumptions were made when estimating the reductions specific to a BMP:
Results from the 2012 International Stormwater BMP Database show that some types of BMPs do not exhibit any reduction in concentration for specific pollutants of concern. In such occurrence, these quantification efforts did not account for any reduction.
In some occurrences, a regional flood control basin may be located downstream of another structural treatment system, thus forming a treatment train configuration. The iWATR GIS Analysis Tool identified all existing treatment trains. Pollutant load reductions accounted for the specificities of these treatment trains and avoided potential double counting in pollutant load reductions.
The parcel footprint was capped at 10-acre for those larger parcels to mimic realistic treatment capacities of the structural BMPs.

City of Salinas
Report of Waste Discharge
November 2016 7-4
7.2 Discussion
The results presented in Tables 7-1 and 7-2 satisfy the requirement set forth in Provision P.2.a.i of the MS4 Permit. Annual pollutant loads and reductions are summarized for each of the ten urban subwatersheds, as well as for the entire City. Pollutant loads for the entire City of Salinas are aggregated under the “City-Permit Coverage Area” category, which includes pollutant loads from all ten urban subwatersheds, as well as pollutant loads from areas within the City limits that are not identified as being part of any urban subwatershed. The estimated annual pollutant loads listed account for the reduction achieved by the implementation of the 67 public structural BMPs and nine regional flood control basins referenced by the City of Salinas.
Flood control detention basins were considered to function as detention ponds, allowing sediment and sediment-attached pollutants to settle during both dynamic and quiescent regimes of the basins, thus providing a water quality benefit. Carr Lake and Heinz Lake are historic lakebeds that were drained for agricultural use nearly a century ago. The Reclamation Ditch drains through Heinz Lake, then through an urban portion of Salinas (the East Reclamation Ditch Urban Subwatershed), then through Carr Lake, then through additional urban area (the West Reclamation Ditch Urban Subwatershed) before draining past Markley Swamp, away from the City. The channels within, and outlet controls from, Carr Lake and Heinz Lake are not configured to provide significant water quality benefit. Though some water quality benefit and runoff reduction would occur during major storm events, quantification of these benefits is not within the scope of work required to provide the analysis specified in the City’s NPDES Permit and is not necessary to provide a baseline to assess benefits of future projects. Markley Swamp, which functions as wetlands, is offline from the Reclamation Ditch system and is configured in a way that it would be expected to provide some water quality benefit at low flows and, therefore, has been considered in the analysis.
Table 7-1: Average Annual Pollutant Loads (from Year 4)
Existing Urban Subwatershed
Runoff Volume (ac-ft)
TSS (lbs/yr)
Fecal Coliform (MPN/yr)
Total Nitrogen (lbs/yr)
Total Cu (lbs/yr)
Total Pb (lbs/yr)
Total Zn (lbs/yr)
Carr Lake 108.13 16,502.8 8.27997E+12 747.1 4.5 4.1 26.9
Chavez Park Detention Basin 297.74 48,913.3 2.06906E+13 2,127.6 14.2 12.4 85.7
East Reclamation Ditch 986.90 152,827.7 6.65845E+13 6,857.9 45.5 42.2 302.5
Gabilan Creek 172.74 31,649.4 1.06666E+13 1,288.4 9.6 7.9 56.4
Markely Swamp 550.12 90,884.2 3.81965E+13 3,944.0 26.3 22.9 158.5
Natividad Creek 304.28 51,807.3 2.06743E+13 2,200.1 15.1 12.9 89.5
Salinas River 658.53 109,634.3 4.47806E+13 4,746.7 32.2 27.9 195.5
Santa Rita Creek 84.39 13,907.3 5.88758E+12 604.3 4.0 3.5 24.2
West Reclamation Ditch 640.81 105,681.6 4.3028E+13 4,602.5 31.4 27.5 194.0
City – Permit Coverage Area* 5195.36 614,952.5 2.63E+14 28,480.5 188.9 162.3 1,171.2
*Includes area within urban subwatersheds as well as areas within the City limits not identified as being part of an urban subwatershed

City of Salinas
Report of Waste Discharge
November 2016 7-5
Table 7-2: Average Annual Pollutant Load Reduction – Structural BMP
Urban Subwatershed
Annual Runoff
Reduction (ac-ft)
TSS (lbs/yr)
Fecal Coliform (MPN/yr)
Total Nitrogen (lbs/yr)
Total Cu (lbs/yr)
Total Pb (lbs/yr)
Total Zn (lbs/yr)
Carr Lake - - 0.00E+00 - - - -
Chavez Park Detention Basin 0.61 35,228.2 1.64E+13 1,046.3 9.9 10.0 70.4
East Reclamation Ditch 9.80 14,956.1 4.18E+12 344.9 3.0 4.1 23.1
Gabilan Creek - 263.6 0.00E+00 4.1 0.1 0.1 1.0
Markley Swamp 3.79 65,526.8 1.25E+13 2,005.3 19.6 20.4 140.7
Natividad Creek 1.31 37,434.0 1.58E+13 1,082.2 10.8 10.6 75.3
Salinas River 2.47 917.1 1.48E+11 41.3 0.4 0.5 3.5
Santa Rita Creek - - 0.00E+00 - - - -
West Reclamation Ditch 8.37 11,671.5 2.59E+12 633.4 3.8 5.1 42.6
City – Permit Coverage Area* 38.29 203,095.2 7.56E+13 6,006.0 55.9 61.0 414.8
*Includes area within urban subwatersheds as well as areas within the City limits not identified as being part
The average annual pollutant loads computed in Year 4 were compared to the average annual pollutant loads that were computed in Year 1. The Year 1 pollutant loads are shown in Table 7-3. The difference between Year 1 and Year 4 pollutant loadings, including the reductions in pollutants from structural BMPs are shown in Table 7-4.
7.2.1 Comparison to Year 1 Pollutant Loads
Table 7-3: Average Annual Pollutant Loads (from Year 1)
Existing Urban Subwatershed
Runoff Volume (ac-ft)
TSS (lbs/yr)
Fecal Coliform (MPN/yr)
Total Nitrogen (lbs/yr)
Total Copper (lbs/yr)
Total Lead
(lbs/yr)
Total Zinc (lbs/yr)
Carr Lake 132.62 22,408.40 8.76E+12 967.1 6.7 5.8 41.1
Chavez Park Detention Basin 280.7 45,309.30 1.87E+13 2,010.40 13.7 12 86.3
East Reclamation Ditch 938.22 149,985.50 4.31E+13 6,217.00 49.7 45.3 358.9
Gabilan Creek 128.86 21,316.70 8.38E+12 920.70 6.4 5.5 39.5
Markeley Swamp 511.15 78,676.90 3.25E+13 3,619.50 24.9 22.4 166.1
Natividad Creek 284.32 47,370.80 1.81E+13 2,059.10 14.6 12.6 91.4
Salinas River 617.57 99,843.10 3.95E+13 4,448.60 30.9 27.1 197.9
Santa Rita Creek 79.77 13,017.70 5.50E+12 570.6 3.8 3.3 23.4
West Reclamation Ditch 586.94 84,700.80 3.35E+13 3,585.90 26.5 21.9 157.4
City – Permit Coverage Area* 5044.95 597,149.10 3.22E+14 32,447.20 231 207.2 1,470.90
*Includes area within urban subwatersheds as well as areas within the City limits not identified as being part

City of Salinas
Report of Waste Discharge
November 2016 7-6
Table 7-4: Reduction in Average Annual Pollutant Loads from Year 1 to Year 4 (includes reductions from structural BMPS
Existing Urban Subwatershed Runoff Volume (ac-ft)
TSS (lbs/yr) Fecal Coliform
(MPN/yr)
Total Nitrogen (lbs/yr)
Total Copper (lbs/yr)
Total Lead
(lbs/yr)
Total Zinc (lbs/yr)
Carr Lake (24.49) (5,905.6) 4.80E+11 (220.0) -2.2 (1.7) (14.2)
Chavez Park Detention Basin 16.43 3,434.8 1.92E+12 109.0 0.5 0.4 (0.8)
East Reclamation Ditch 38.88 (12,113.9) 1.93E+13 315.9 (7.0) (7.1) (78.2)
Gabilan Creek 43.88 10,069.1 2.29E+12 363.6 3.1 2.3 15.9
Markeley Swamp 35.18 11,276.1 5.48E+12 269.8 1.1 0.1 (11.1)
Natividad Creek 18.65 4,057.3 2.42E+12 130.9 0.4 0.2 (2.3)
Salinas River 38.49 8,874.1 5.13E+12 256.8 0.9 0.3 (5.9)
Santa Rita Creek 4.62 889.6 3.88E+11 33.7 0.2 0.2 0.8
West Reclamation Ditch 45.50 9,309.3 6.94E+12 383.2 1.1 0.5 (6.0)
City – Permit Coverage Area* 112.12 (185,291.8) (6.73E+13) (5181.5) (50.5) (56.3) (380.9)
*Includes area within urban subwatersheds as well as areas within the City limits not identified as being part of an urban subwatershed
7.3 Recommendations
The City has quantified pollutant loadings based on the iWATR GIS Analysis Tool.
The City of Salinas proposes to map and track via the BMP RAM tool the implementation and maintenance of all structural BMPs, public and private, and any other retrofit or urban greening projects that may reduce the pollutant loading on the subwatersheds.
The City proposes using a pollutant load reduction model in tandem with the BMP RAM tool to determine pollutant loading on an urban catchment basis; utilizing this process will allow the City to determine the areas of maximum watershed water quality benefit for installation of structural BMPs.
The City of Salinas proposes adjusting the pollutant loading estimates as more monitoring data becomes available. A revised Monitoring and Reporting Program (MRP) has been recommended by the City. Once this new monitoring program is developed, the data from this new program can be incorporated into the pollutant load reduction model used to provide a more accurate picture of Salinas’ subwatershed health.

City of Salinas
Report of Waste Discharge
November 2016 8-1
8 Trash Quantification
This section contains an evaluation and modification of the Trash Load Reduction Program as required by Section P.2.b of the Salinas MS4 Permit, including:
A description of short-term and long-term Trash Load Reduction objectives developed according to Section P.2.b (Trash Quantification); and
A description of the process used to evaluate the effectiveness of the Trash Load Reduction program at achieving increasing trash load reductions over time, the results of the evaluation, and a description of program modifications the Permittee will implement to achieve such a decreasing trend over time, and the schedule the Permittee will follow to implement the modifications.
8.1 ROWD Requirement
The City determined the baseline trash load, created a methodology to quantify the effectiveness of the City’s trash reduction efforts and determined the trash load reduction achieved from the BMPs that have been implemented. Using the trash generation rates found in Section P.2.b.2.a of the City’s NPDES permit, the baseline trash load was computed as a function of land use as shown in Table 8-1.

City of Salinas
Report of Waste Discharge
November 2016 8-2
8.1.1 Trash Load Quantification
Table 8-1: Baseline trash load (lbs)
Land Use Category 1 Total Area
(acres) Land Use Category from MS4
Permit 2 Trash Generation Rate
3 (lbs/acre/year) Trash Load (lbs/year)
Vacant 354 Open Space/Parks 4 5.27 1,866
Agriculture 2,722 Open Space/Parks 4 5.27 14,345
Open Space/Parks 1,019 Open Space/Parks4 5.27 5,370
Single-Family Residential 3,461 High Density Residential5 5.98 20,697
Multi-Family Residential 1,175 High Density Residential5 5.98 7,027
Retail and Wholesale 467 Commercial6 16.90 7,892
Commercial 951 Commercial6 16.90 16,072
Transportation/Parking 3,076 Industrial7 13.45 41,372
Industrial 650 Industrial7 13.45 8,743
Public 870 Industrial 7 13.45 11,702
Baseline Load 135,084 lbs/year
1 From GIS Data for the City of Salinas. 2 Land use categories used in the MS4 Permit for the City of Salinas (Order No. R3-2012-0005 NPDES Permit No. CA0049981). 3 Trash Generation rates as provided in the City MS4 Permit (Page 105) 4 Per the MS4 permit, Open Space/Parks includes golf courses, local and regional parks and recreation facilities, cemeteries, wildlife preserves and sanctuaries, designated open space, botanical gardens, agriculture, and animal intensive operations. 5 The MS4 Permit includes High Density Residential as all residential uses having two or more houses per acre. 6 Per the MS4 Permit, Commercial includes retail stores, shopping centers and districts, restaurants, hotels, personal services, business services, financial services, movie theaters, building materials sites, and wholesale stores open to the public. Per the MS4 Permit, Industrial includes automobile dealerships and repair shops, light manufacturing, distribution, warehousing, large wholesale stores not open to the public, public facilities, medical care facilities, libraries, large religious facilities, museums, community centers, public auditoriums, observatories, live indoor and outdoor theaters, convention centers, communication facilities, utility facilities (electrical, solid waste, liquid waste, water storage and water transfer, natural gas, and petroleum), educational facilities, preschools and daycare centers, trade schools (including police and fire training academies), transportation facilities (airports, railroads, freeways and major roads, park and ride lots, bus terminals and yards, truck terminals, mixed transportation, and mixed transportation and utility), mixed urban (mixed commercial, industrial, and/or residential), business parks, offices (professional, legal, medical, financial, administrative, research and development, corporate, and general business).
The use of a weight-based metric for trash quantification can be problematic for a variety of reasons. First, the weight of trash is highly dependent on the moisture content, which can vary dramatically for the same volume of trash. For example, trash collected immediately following a storm will have a higher weight than trash collected several days after the storm. A volume-based metric minimizes/eliminates the influence of moisture on measurements and provides a better frame of reference in assessing aesthetic impairment so frequently associated with the presence of trash. Further, volume based measurements are generally more common when quantifying the amount of trash removed from specific activity.

City of Salinas
Report of Waste Discharge
November 2016 8-3
To this end, a baseline volumetric load was calculated based on the trash loading rates calculated by the Bay Area Stormwater Management Agencies Association (BASMAA) during the Baseline Trash Generation Rates study (2012b). The study was a collaborative effort conducted by co-permittees in the San Francisco region and included a review of literature, sampling, and the development of a trash-loading model to estimate trash generation rates. Sampling data were collected from over 130 monitored sites during two storm events. The trash measured was collected by full capture treatment devices downstream of different land use types. The land use designations were assigned to land use categories used in the BASMAA study. The corresponding loading rates were used to estimate volumetric trash loads for each land use by multiplying the trash generation rate by the area for each land use and then summing the total. Table 8-2 below presents the volumetric trash load estimates for the City of Salinas. The table also shows the land use designations from GIS data and the correlating land use categories from the permit.
Table 8-2: Baseline Trash Load (cubic feet)
Land Use Category 1 Total Area
(acres) Land Use from Study by BASMAA 2
Trash Generation Rate 2
(cu ft/ acre/ year)
Trash Load (cu ft/year)
Vacant 354 Urban Parks 2.14 758
Agriculture 2,722 Urban Parks 2.14 5,825
Open Space/Parks 1,019 Urban Parks 2.14 2,181
Single-Family Residential 3 3,461 High Density Residential 17.04 58,975
Multi-Family Residential 1,175 High Density Residential 17.04 20,022
Retail and Wholesale 467 Retail and Wholesale 29.99 14,005
Commercial 951 Commercial and Industrial 7.08 6,733
Transportation/Parking 3,076 Commercial and Industrial 7.08 21,778
Industrial 650 Commercial and Industrial 7.08 4,602
Public 870 Commercial and Industrial 7.08 6,160
Baseline Load 141,039 cu ft/year
1 From GIS Data for the City of Salinas 2 Land use categories and Trash Generation Rate from the Baseline Load Estimate Study by BASMAA (2012b) 3 The MS4 Permit for the City of Salinas includes High Density Residential as all residential uses having two or more houses per acre.

City of Salinas
Report of Waste Discharge
November 2016 8-4
8.1.2 Trash Load Reduction
Table 8-3 provides estimates of the load reductions that have been achieved by the City of Salinas for BMPs discussed in the previous section. Where available, estimates of the actual trash collected by the City during the specific activity were used. Where the City did not have information available on actual amount of trash reduced by an activity, other sources have been cited, such as the BASMAA Trash Load Reduction Methodology (2012a). Measurements of trash load reductions for certain BMPs were collected as volumes in certain cases and by mass for others. An analysis of the Los Angeles Study on which the mass-based trash loading includes values for both weight and mass so that an approximate unit weight can be derived. The average unit weight of varies from 1.5 to 3.1 lbs/gallon (0.20 to 0.42 lb/cu ft). An approximate average unit weight of 0.33 lb/cu ft was used to convert between mass and volume. It should be noted that any unit weight of trash is subjective because of the non-homogenous nature of trash as well as the variable moisture content.
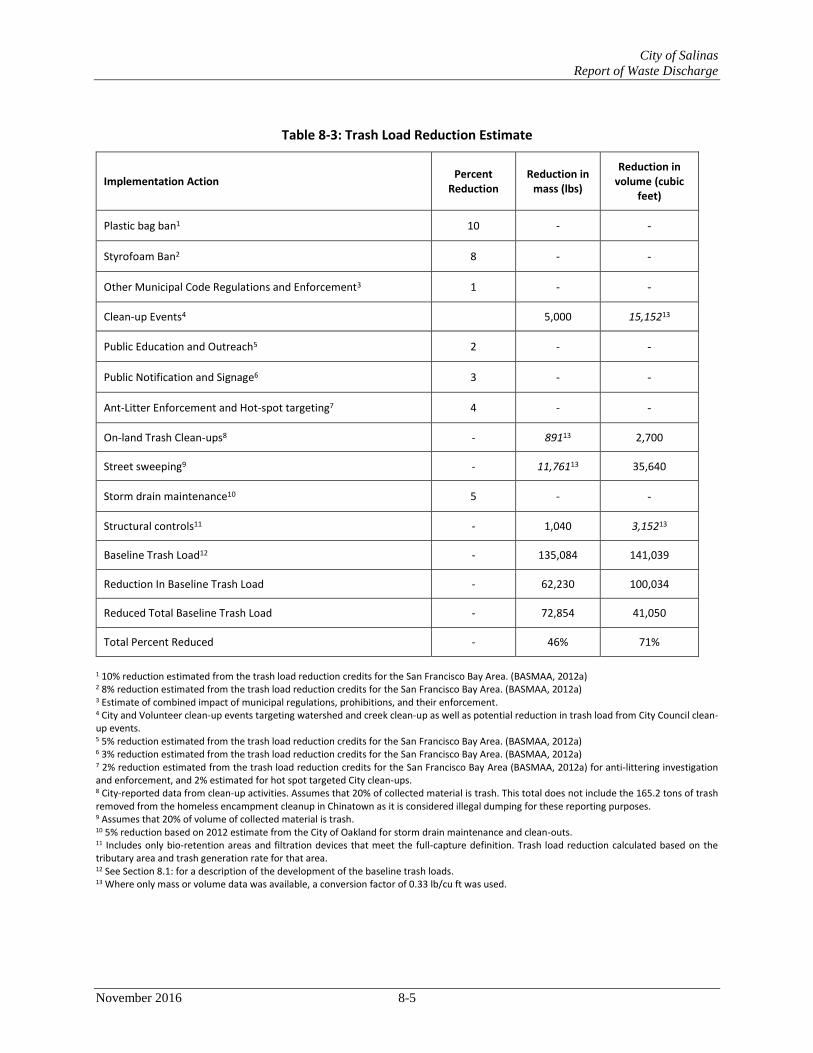
City of Salinas
Report of Waste Discharge
November 2016 8-5
Table 8-3: Trash Load Reduction Estimate
Implementation Action Percent
Reduction Reduction in
mass (lbs)
Reduction in volume (cubic
feet)
Plastic bag ban1 10 - -
Styrofoam Ban2 8 - -
Other Municipal Code Regulations and Enforcement3 1 - -
Clean-up Events4 5,000 15,15213
Public Education and Outreach5 2 - -
Public Notification and Signage6 3 - -
Ant-Litter Enforcement and Hot-spot targeting7 4 - -
On-land Trash Clean-ups8 - 89113 2,700
Street sweeping9 - 11,76113 35,640
Storm drain maintenance10 5 - -
Structural controls11 - 1,040 3,15213
Baseline Trash Load12 - 135,084 141,039
Reduction In Baseline Trash Load - 62,230 100,034
Reduced Total Baseline Trash Load - 72,854 41,050
Total Percent Reduced - 46% 71%
1 10% reduction estimated from the trash load reduction credits for the San Francisco Bay Area. (BASMAA, 2012a) 2 8% reduction estimated from the trash load reduction credits for the San Francisco Bay Area. (BASMAA, 2012a) 3 Estimate of combined impact of municipal regulations, prohibitions, and their enforcement. 4 City and Volunteer clean-up events targeting watershed and creek clean-up as well as potential reduction in trash load from City Council clean-up events. 5 5% reduction estimated from the trash load reduction credits for the San Francisco Bay Area. (BASMAA, 2012a) 6 3% reduction estimated from the trash load reduction credits for the San Francisco Bay Area. (BASMAA, 2012a) 7 2% reduction estimated from the trash load reduction credits for the San Francisco Bay Area (BASMAA, 2012a) for anti-littering investigation and enforcement, and 2% estimated for hot spot targeted City clean-ups. 8 City-reported data from clean-up activities. Assumes that 20% of collected material is trash. This total does not include the 165.2 tons of trash removed from the homeless encampment cleanup in Chinatown as it is considered illegal dumping for these reporting purposes. 9 Assumes that 20% of volume of collected material is trash. 10 5% reduction based on 2012 estimate from the City of Oakland for storm drain maintenance and clean-outs. 11 Includes only bio-retention areas and filtration devices that meet the full-capture definition. Trash load reduction calculated based on the tributary area and trash generation rate for that area. 12 See Section 8.1: for a description of the development of the baseline trash loads. 13 Where only mass or volume data was available, a conversion factor of 0.33 lb/cu ft was used.
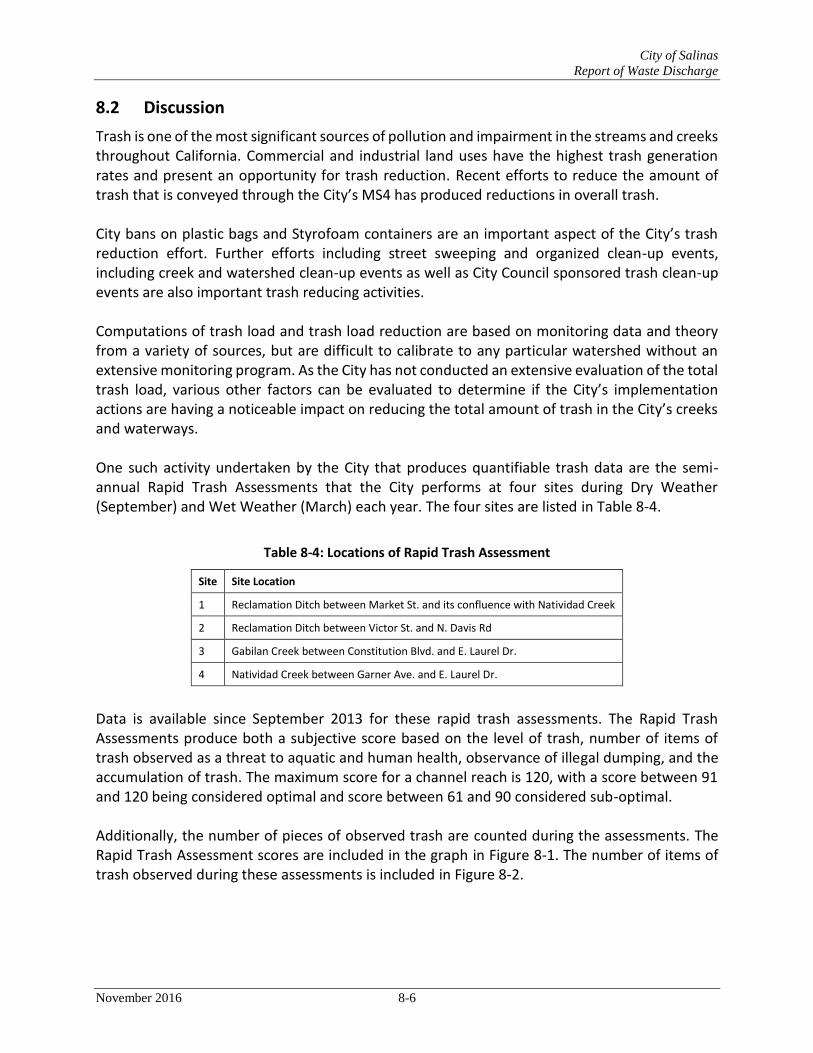
City of Salinas
Report of Waste Discharge
November 2016 8-6
8.2 Discussion
Trash is one of the most significant sources of pollution and impairment in the streams and creeks throughout California. Commercial and industrial land uses have the highest trash generation rates and present an opportunity for trash reduction. Recent efforts to reduce the amount of trash that is conveyed through the City’s MS4 has produced reductions in overall trash. City bans on plastic bags and Styrofoam containers are an important aspect of the City’s trash reduction effort. Further efforts including street sweeping and organized clean-up events, including creek and watershed clean-up events as well as City Council sponsored trash clean-up events are also important trash reducing activities. Computations of trash load and trash load reduction are based on monitoring data and theory from a variety of sources, but are difficult to calibrate to any particular watershed without an extensive monitoring program. As the City has not conducted an extensive evaluation of the total trash load, various other factors can be evaluated to determine if the City’s implementation actions are having a noticeable impact on reducing the total amount of trash in the City’s creeks and waterways. One such activity undertaken by the City that produces quantifiable trash data are the semi-annual Rapid Trash Assessments that the City performs at four sites during Dry Weather (September) and Wet Weather (March) each year. The four sites are listed in Table 8-4.
Table 8-4: Locations of Rapid Trash Assessment
Site Site Location
1 Reclamation Ditch between Market St. and its confluence with Natividad Creek
2 Reclamation Ditch between Victor St. and N. Davis Rd
3 Gabilan Creek between Constitution Blvd. and E. Laurel Dr.
4 Natividad Creek between Garner Ave. and E. Laurel Dr.
Data is available since September 2013 for these rapid trash assessments. The Rapid Trash Assessments produce both a subjective score based on the level of trash, number of items of trash observed as a threat to aquatic and human health, observance of illegal dumping, and the accumulation of trash. The maximum score for a channel reach is 120, with a score between 91 and 120 being considered optimal and score between 61 and 90 considered sub-optimal. Additionally, the number of pieces of observed trash are counted during the assessments. The Rapid Trash Assessment scores are included in the graph in Figure 8-1. The number of items of trash observed during these assessments is included in Figure 8-2.

City of Salinas
Report of Waste Discharge
November 2016 8-7
Figure 8-1: Rapid Trash Assessment Scores over time
Figure 8-2: Amount of Observed Trash During Rapid Trash Assessments
City of Salinas
Report of Waste Discharge
November 2016 8-8
Overall, there is a slight increase in the average Rapid Trash Assessment Score over time. The number of items of trash observed during the assessment has shown a consistent reduction over time. Using the number of items of trash observed as a proxy for total trash load, the rapid trash assessments indicate a reduction in trash at the four sites of about 40% - 80% over the last three years. Quantifiable data indicates that the actions implemented to reduce trash are having a noticeable impact on the amount of trash in the watershed that correlates to the estimated trash load reduction. Further assessment and evaluation is recommended to verify that the implemented structural and non-structural trash reduction BMPs are having the intended impact of reducing the total trash load.
8.3 Recommendations
The City has taken important steps to reduce the amount of trash that is captured and conveyed through its storm drain system that ultimately ends up in the regions streams and creeks.
The City of Salinas proposes several adjustments and enhancements to its street sweeping program as described in Section 4.5 to more effectively capture trash in the gutters and streets.
The City of Salinas proposes to work with non-governmental organizations and community-based groups to conduct more creek and watershed clean-up events.
The City of Salinas has completed the Priority Land Use Map as specified in the new Trash Amendments. A method for performing City-wide trash assessments to “truth” the Priority Land Use map for high trash accumulation areas is being developed. The City recommends the regional water board staff and the State provide guidance around the use of full-capture devices and implementation of Track 1 in the new Trash Amendments.
The City of Salinas proposes to develop an ArcGIS application to provide “trash tracking” capabilities via handheld devices to staff in the field. This would provide more “real time” data regarding trash accumulation locations. Once the trash assessments are complete, the City will determine potential locations for full-capture trash devices. Once the Trash RAM tool is developed by 2N, the use of that tool will be considered by the City of Salinas.
Because the Regional Joint Effort has been so successful in addressing post-construction requirements for the Phase 2 agencies, it is recommended that the region consider creating something similar for the implementation of the Trash Amendments. This would provide more clarity around regional water board and state compliance expectations and what is deemed acceptable for Track 1 or track 2 implementation.
City of Salinas
Report of Waste Discharge
November 2016 9-1
9 Runoff Volume Quantification
This section contains a re-quantification of pre-developed, developed, and 24-hour 85th percentile storm event runoff volume as required by Section P.2.c of the Salinas MS4 Permit, including:
A description of the model used to quantify Developed Runoff Volume according to Section P.2.c (Runoff Volume Quantification), including a discussion of all assumptions used to quantify runoff volume and runoff volume reductions;
The Pre-Developed Runoff, Developed Runoff before subtracting runoff volume reductions, and Developed Runoff after subtracting runoff volume reductions for the Permit coverage area as a whole and for each Urban Subwatershed;
The Percent Change in Runoff Volume for each Urban Subwatershed;
The change in Developed Runoff Volume, including volume reductions associated with BMPs and other program elements, over time for the Permit coverage area as a whole and for each Urban Subwatershed;
The runoff volume from the 24-hour, 85th percentile storm event, determined according to Section P.2.c (Runoff Volume Quantification), for the Permit coverage area as a whole and for each Urban Subwatershed; and
The change in runoff volume from the 24-hour, 85th percentile storm event, including volume reductions associated with BMPs and other program elements, over time for the Permit coverage area as a whole and for each Urban Subwatershed.
9.1 ROWD Requirement
The City quantified pre-developed, developed, and 24-hour 85th percentile storm event runoff volume. The City recalculated the Developed Runoff Volume, the Percent Change in Runoff Volume, and the runoff from the 24-hour, 85th percentile storm event for each Urban Subwatershed using land conditions existing in the Permit coverage area. The average annual runoff volume was computed for each urban subwatershed and the entire Permit coverage area based on the Urban Runoff Quality Management Approach (WEF Manual of Practice No. 23, 1998). The approach estimates an average runoff volume based on the average annual rainfall and the specific distribution of land uses within the evaluated drainage area.
Existing land use conditions were derived from the City of Salinas Land Use GIS layer that was developed to assist with the development of plans by the Community Development Department. A summary of the Land Use Coding System (LUCOS) identifies the classified categories of land uses that are embedded within the GIS layer. The iWATR GIS Watershed Analysis Tool identified the existing distribution of land uses within each urban catchment, urban subwatershed, and the entire city. The pre-developed land uses within the entire permitted area were represented as vacant (undeveloped) land.
A measure of imperviousness is associated to each land use type that is consistent with those defined on page 3-8 of the 2004 City of Salinas Storm Water Master Plan.
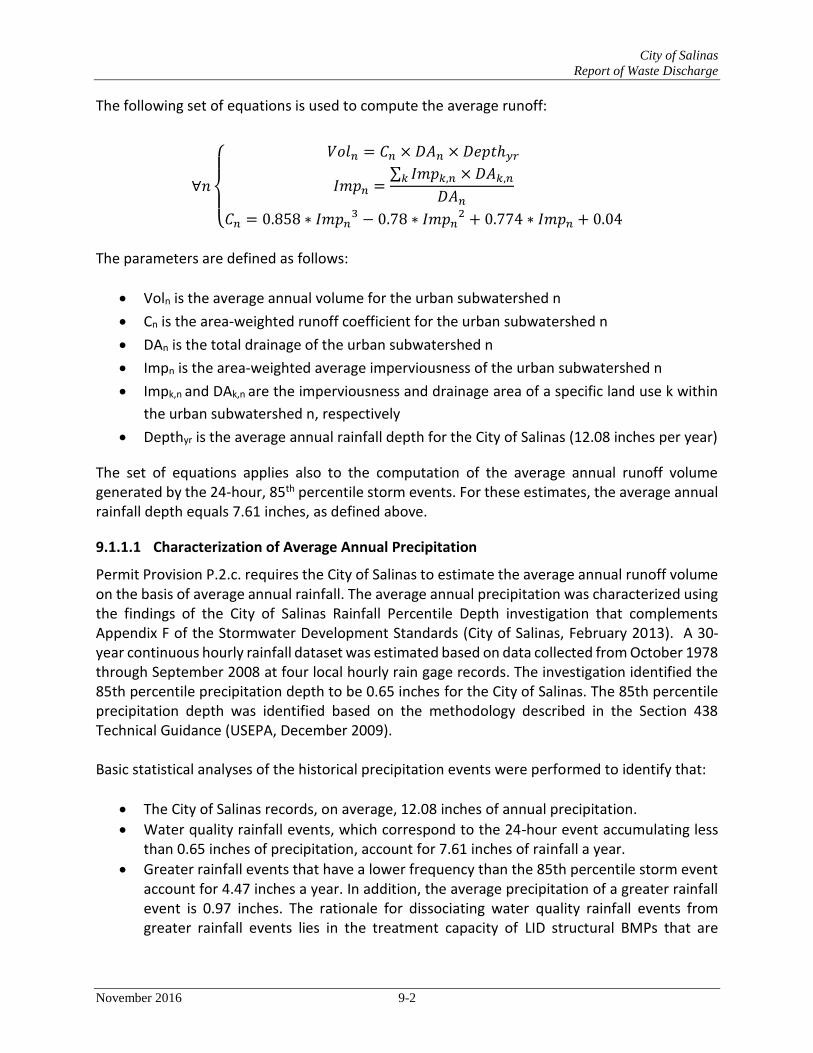
City of Salinas
Report of Waste Discharge
November 2016 9-2
The following set of equations is used to compute the average runoff:
∀𝑛
{
𝑉𝑜𝑙𝑛 = 𝐶𝑛 × 𝐷𝐴𝑛 × 𝐷𝑒𝑝𝑡ℎ𝑦𝑟
𝐼𝑚𝑝𝑛 =∑ 𝐼𝑚𝑝𝑘,𝑛 × 𝐷𝐴𝑘,𝑛𝑘
𝐷𝐴𝑛𝐶𝑛 = 0.858 ∗ 𝐼𝑚𝑝𝑛
3 − 0.78 ∗ 𝐼𝑚𝑝𝑛2 + 0.774 ∗ 𝐼𝑚𝑝𝑛 + 0.04
The parameters are defined as follows:
Voln is the average annual volume for the urban subwatershed n
Cn is the area-weighted runoff coefficient for the urban subwatershed n
DAn is the total drainage of the urban subwatershed n
Impn is the area-weighted average imperviousness of the urban subwatershed n
Impk,n and DAk,n are the imperviousness and drainage area of a specific land use k within
the urban subwatershed n, respectively
Depthyr is the average annual rainfall depth for the City of Salinas (12.08 inches per year)
The set of equations applies also to the computation of the average annual runoff volume generated by the 24-hour, 85th percentile storm events. For these estimates, the average annual rainfall depth equals 7.61 inches, as defined above.
9.1.1.1 Characterization of Average Annual Precipitation
Permit Provision P.2.c. requires the City of Salinas to estimate the average annual runoff volume on the basis of average annual rainfall. The average annual precipitation was characterized using the findings of the City of Salinas Rainfall Percentile Depth investigation that complements Appendix F of the Stormwater Development Standards (City of Salinas, February 2013). A 30-year continuous hourly rainfall dataset was estimated based on data collected from October 1978 through September 2008 at four local hourly rain gage records. The investigation identified the 85th percentile precipitation depth to be 0.65 inches for the City of Salinas. The 85th percentile precipitation depth was identified based on the methodology described in the Section 438 Technical Guidance (USEPA, December 2009). Basic statistical analyses of the historical precipitation events were performed to identify that:
The City of Salinas records, on average, 12.08 inches of annual precipitation.
Water quality rainfall events, which correspond to the 24-hour event accumulating less than 0.65 inches of precipitation, account for 7.61 inches of rainfall a year.
Greater rainfall events that have a lower frequency than the 85th percentile storm event account for 4.47 inches a year. In addition, the average precipitation of a greater rainfall event is 0.97 inches. The rationale for dissociating water quality rainfall events from greater rainfall events lies in the treatment capacity of LID structural BMPs that are

City of Salinas
Report of Waste Discharge
November 2016 9-3
typically designed to treat the runoff generated in the tributary drainage area from the 85th percentile event.
9.1.1.2 Volumetric Reduction Induced by Structural BMPs
As of May 2016, the City of Salinas maintains the records of 67 local structural treatment BMPs that have been implemented and are being maintained on a regular basis within the City limits. Records are also summarized in the Annual Report that is submitted annually to the Regional Board. The City of Salinas identified nine regional flood control detention basins that are maintained and operated by private property owners, Monterey County Water Resources Agency, or Monterey County Public Works. The nine regional flood control detention basins mitigate for volume, discharge, and pollutant loading for runoff originating from the City’s urban subwatersheds and City permitted area. All 67 local structural treatment BMPs and nine regional flood control detention basins have been designed to achieve a quantitative management objective and are maintained at least to an “acceptable” level, or equivalent, per the BMP RAM methodology. Several of the LID BMPs incorporate an infiltration and/or an evapotranspiration component, which ultimately translates into a volumetric reduction of the runoff being treated. Several assumptions were made to estimate these volumetric reductions, including: The parcel number or APN, and the associated urban subwatershed, if any, in which each structural BMP is located, were identified using the iWATR GIS Watershed Analysis Tool. In most cases, the methodology assumed that the existing structural BMPs are designed to treat the runoff generated by the drainage area defined by the parcel footprint for the 24-hour 85th percentile storm event. In some occurrences, the parcel footprint was capped at 10-acres for those larger parcels to mimic realistic treatment capacities of LID BMPs. BMP descriptions identified that several of the LID BMPs are specifically implemented to treat runoff from adjacent streets and roadways. In this particular case, the methodology assumed that the existing structural BMPs are designed to treat the runoff generated by the drainage area defined by the tributary street or roadway segment for the 24-hour 85th percentile storm event. The runoff coefficient for each parcel being treated was estimated based on the land uses, i.e. imperviousness, that comprise the parcel. Land uses were identified per the iWATR GIS Watershed Analysis Tool. The Center for Watershed Protection performed a literature review that identified expected rates of runoff reduction associated with each type of structural BMP (CWP, 2008). The reduction rates are based on monitoring data collected for numerous BMPs throughout the United States. Reductions listed on page 17 of the 2008 CWP Technical Memorandum, The Runoff Reduction Method, were used to estimate the annual runoff reductions that occurred at each structural BMP. The BMPs implemented by the City of Salinas were each assigned a reduction efficiency according to the BMP descriptions provided in the BMP database, and were based on best professional judgment. Typical runoff reductions are summarized in Table 9-1.

City of Salinas
Report of Waste Discharge
November 2016 9-4
Table 9-1: Rates of Runoff Reduction from Structural BMPs (CWP, 2008)
Practice Median Runoff Reduction (%)
Green Roof 45%
Rooftop Disconnection 25%
Rain Tanks and Cisterns 40%
Permeable Pavement 45%
Grass Channel 10%
Bioretention 40%
Dry Swale 40%
Wet Swale 0%
Infiltration 50%
ED Pond 0%
Soil Amendments 50%
Sheet Flow to Open Space 50%
Filtering Practice 0%
Constructed Wetlands 0%
Wet Pond 0%
LID treatment BMPs are assumed to be designed to treat runoff generated by the 24-hour 85th percentile storm event. For rainfall events greater than the 24-hour 85th percentile storm event, the runoff volume that exceeds that of the 24-hour 85th percentile storm event was assumed not to be treated.
9.2 Discussion
The quantification of the annual and 24-hour 85th percentile storm event runoff volumes was completed by the City of Salinas.
9.2.1 Quantification of Average Annual Runoff
Table 9-2 summarizes the annual runoff volumes for pre-development, naturally occurring, conditions. This includes the annual storm volumes estimated from the average annual rainfall, as well as the average annual rainfall associated with 85th percentile 24-hour storm events.

City of Salinas
Report of Waste Discharge
November 2016 9-5
Table 9-2: Pre-Developed Annual Runoff Volume
Existing Urban Subwatershed
Total Area (ac)
Imperviousness Runoff
C
Annual Runoff Volume for All Storms (ac-ft)
Annual Runoff Volume for 85th Percentile
Storms (ac-ft)
Carr Lake 364.74 0.10 0.11 40.56 25.55
Chavez Park 753.28 0.10 0.11 83.76 52.77
Reclamation Ditch East 2,074.56 0.10 0.11 230.68 145.32
Gabilan Creek 359.97 0.10 0.11 40.03 25.22
Markley Swamp 1,245.70 0.10 0.11 138.51 87.26
Natividad Creek 785.69 0.10 0.11 87.36 55.04
Salinas River 1,635.99 0.10 0.11 181.91 114.60
Santa Rita Creek 199.84 0.10 0.11 22.22 14.00
Reclamation Ditch West 1,528.90 0.10 0.11 170.00 107.10
City – Permit Coverage Area* 14,745.59 0.10 0.11 1,639.63 1,032.91
*Includes area within urban subwatersheds as well as areas within the City limits not identified as being part of an urban subwatershed
Table 9-3 summarizes the annual runoff volumes for the existing conditions. This includes the annual storm volumes estimated from the average annual rainfall, as well as the average annual rainfall associated with 85th percentile 24-hour storm events and the annual reduction from structural BMPs.
Table 9-3: Existing Annual Runoff Volume
Existing Urban Subwatershed
Imperviousness Runoff
C
Structural BMP Annual Runoff
Reduction (ac-ft)
Annual Runoff Volume for All Storms (ac-ft)
Annual Runoff Volume for 85th
Percentile Storms (ac-ft)
Carr Lake 0.46 0.33 - 108.13 63.88
Chavez Park 0.53 0.38 0.61 297.74 182.29
Reclamation Ditch East 0.56 0.41 9.80 986.90 545.48
Gabilan Creek 0.55 0.40 - 172.74 104.94
Markley Swamp 0.51 0.37 3.79 550.12 292.65
Natividad Creek 0.51 0.37 1.31 304.28 183.41
Salinas River 0.53 0.38 2.47 658.53 398.22
Santa Rita Creek 0.53 0.38 - 84.39 48.27
Reclamation Ditch West 0.54 0.39 8.37 640.81 377.66
City – Permit Coverage Area* 0.51 0.35 38.29 5,195.36 3272.91

City of Salinas
Report of Waste Discharge
November 2016 9-6
*Includes area within urban subwatersheds as well as areas within the City limits not identified as being part of an urban subwatershed
Table 9-4 compares the average annual runoff volume between pre-developed and existing conditions, thus identifies the percent change in runoff volume due to urbanization in each urban subwatershed. As required per Permit Provision P.2.c.ii.2, the list of urban subwatersheds is ranked in order of priority in Table 9-6. The City of Salinas will use this prioritization list to identify candidate retrofit projects within these urban subwatersheds.
Table 9-4: Percent Change in Runoff Volume for all Storm Events (Pre-developed vs. Existing Condition)
ID Priority Ranking
Existing Urban Subwatershed
Pre-developed Annual Runoff Volume (ac-ft)
Existing Condition Annual Runoff Volume
(ac-ft)
Percent Change in Runoff Volume
1 8 Natividad Creek 87.36 304.28 248%
2 7 Chavez Park 83.76 297.74 255%
3 2 Reclamation Ditch East 230.68 986.90 327%
4 1 Gabilan Creek 40.03 172.74 331%
5 9 Carr Lake 40.56 108.13 167%
6 4 Santa Rita Creek 22.22 84.39 280%
7 3 Markeley Swamp 138.51 550.12 297%
8 5 Reclamation Ditch West 170.00 640.81 277%
9 6 Salinas River 181.91 658.53 262%
City 10 City – Permit Coverage Area* 1,639.63 5195.36 217%
*Includes area within urban subwatersheds as well as areas within the City limits not identified as being part of an urban subwatershed

City of Salinas
Report of Waste Discharge
November 2016 9-7
Table 9-5: Percent Change in Runoff Volume for 85th Percentile Storm Event (Pre-developed Vs. Existing Condition)
Existing Urban Subwatershed
Pre-developed Annual Runoff Volume (ac-ft)
Existing Condition Annual Runoff Volume (ac-ft)
Percent Change in Runoff Volume
Natividad Creek 55.04 183.41 233%
Chavez Park 52.77 182.29 245%
Reclamation Ditch East 145.32 545.48 275%
Gabilan Creek 25.22 104.94 316%
Carr Lake 25.55 63.88 150%
Santa Rita Creek 14.00 48.27 245%
Markeley Swamp 87.26 292.65 235%
Reclamation Ditch West 107.10 377.66 253%
Salinas River 114.60 398.22 247%
City – Permit Coverage Area* 1,032.91 3272.91 217%
*Includes area within urban subwatersheds as well as areas within the City limits not identified as being part of an urban subwatershed
Table 9-6: Prioritization of Urban Subwatersheds
Priority Ranking
Existing Urban Subwatershed
Pre-developed Annual Runoff Volume (ac-ft)
Existing Condition Annual Runoff Volume (ac-ft)
Percent Change in Runoff Volume
1 Gabilan Creek 40.03 172.74 331%
2 Reclamation Ditch East 230.68 986.90 327%
3 Markley Swamp 138.51 550.12 297%
4 Santa Rita Creek 22.22 84.39 280%
5 Reclamation Ditch West 170.00 640.81 277%
6 Salinas River 181.91 658.53 262%
7 Chavez Park 83.76 297.74 255%
8 Natividad Creek 87.36 304.28 248%
9 Carr Lake 40.56 108.13 167%
10 City – Permit Coverage Area* 1,639.63 5195.36 217%
*Includes area within urban subwatersheds as well as areas within the City limits not identified as being part of an urban subwatershed

City of Salinas
Report of Waste Discharge
November 2016 9-8
Table 9-7 contains a comparison of the annual and 85th percentile runoff volumes between Year 1 and Year 4 (the most recent permit year available at the time of this ROWD).
Table 9-7: Comparison of runoff volumes from Years 1 and Year 4 of the current permit
Existing Urban Subwatershed
Year 4 Annual Runoff
Volume for All Storms
(ac-ft)
Year 4 Annual Runoff Volume
for 85th Percentile
Storms (ac-ft)
Year 1 Annual Runoff Volume (ac-ft)
Year 1 85th
Percentile Runoff Volume (ac-ft)
Difference Between Year 4
and Year 1 Annual Runoff (ac-ft)
Difference Between Year 4 and Year 1 85th
Percentile Runoff (ac-ft)
Carr Lake 108.13 63.88 132.62 83.55 (24.49) (19.67)
Chavez Park 297.74 182.29 280.7 176.78 17.04 5.51
Reclamation Ditch East 986.9 545.48 938.22 591.59 48.68 (46.11)
Gabilan Creek 172.74 104.94 128.86 81.18 43.88 23.76
Markley Swamp 550.12 292.65 511.15 321.67 38.97 (29.02)
Natividad Creek 304.28 183.41 284.32 179 19.96 4.41
Salinas River 658.53 398.22 617.57 388.83 40.96 9.39
Santa Rita Creek 84.39 48.27 79.77 50.25 4.62 (1.98)
Reclamation Ditch West 640.81 377.66 586.94 369.25 53.87 8.41
City – Permit Coverage Area*
5,195.36 3272.91 5,071.30 3,192.09 124.06 80.82
*Includes area within urban subwatersheds as well as areas within the City limits not identified as being part of an urban subwatershed
The difference can be attributed to minor revisions to the watershed delineations, application of structural BMPs, and development in the watersheds.
9.3 Recommendations
The City of Salinas proposes to track the impact of development and structural BMPs in reducing runoff by utilizing a pollutant load reduction model to assess the loading status of each subwatershed.
The City of Salinas has a proposed the Reclamation Ditch Diversion and the Blanco Drain Diversion projects to divert stormwater flows into a capture/recycling system that will reduce dry weather flows and remove some percentage of the annual runoff from the pollutant load on the Salinas River. The City proposes to quantify the impact of this project on reducing annual runoff volumes via a pollutant load reduction model.

City of Salinas
Report of Waste Discharge
November 2016 10-1
10 Stormwater Discharge Trend Monitoring
This section contains an analysis of stormwater discharge trend monitoring data for water quality trends as required by Section P.4.d of the Salinas MS4 Permit.
10.1 ROWD Requirement
The City of Salinas NPDES Permit requires assessment of the water quality trends within the Stormwater Discharge Monitoring Sites. The data analysis and tasks associated with this requirement include the following:
Assessment of water quality trends, using nonparametric approaches such as the Mann-
Kendall test, multiple regression models including exogenous variables (e.g.,
precipitation, flow), or other applicable statistical approaches, for each parameter listed
in Table Attachment D.3 (Stormwater Discharge Trend Monitoring Parameters), where
supported by the data;
Evaluation of stormwater discharge water quality pollutant loads, concentrations, and
trends generated through Urban Catchment Action Level Pilot Projects Monitoring and
Stormwater Discharge Trend Monitoring, relative to upstream land uses, population,
sources, and stormwater management activities, using tools such as multiple linear
regression, correlation analysis, and/or other applicable univariate and multivariate
statistical approaches;
Assessment of the time-based relationship between precipitation (rainfall hyetograph)
and discharge (runoff hydrograph);
Extrapolation of the results of analysis of Stormwater Discharge Trend Monitoring data
to other Urban Subwatersheds, as appropriate; and
A discussion on the conclusions reached.
10.2 Monitoring Program
The City of Salinas Stormwater Monitoring Program (SSMP) was developed in accordance to the requirements in the NPDES Permit (No. CA0049981, Order R3-2012-0005) for the City of Salinas Municipal Storm Water Discharges. The SSMP is a comprehensive program to monitor stormwater discharges from the City of Salinas. This monitoring program was designed by the Central Coast Water Board staff. The SSMP Monitoring and Reporting Program (MRP) is designed to assess water quality within the urban subwatersheds and receiving waters downstream. The SSMP MRP requires the collection of samples for analyses and evaluation of conventional water quality constituents, aquatic toxicity, sediment toxicity, and benthic invertebrates. The City of Salinas has contracted Pacific EcoRisk (PER) to manage the SSMP. The SSMP monitoring network consists of 16 monitoring sites: three background sites (one city and two agricultural), one receiving water site, one stormwater discharge trend site, one stormwater discharge outfall, four urban catchment
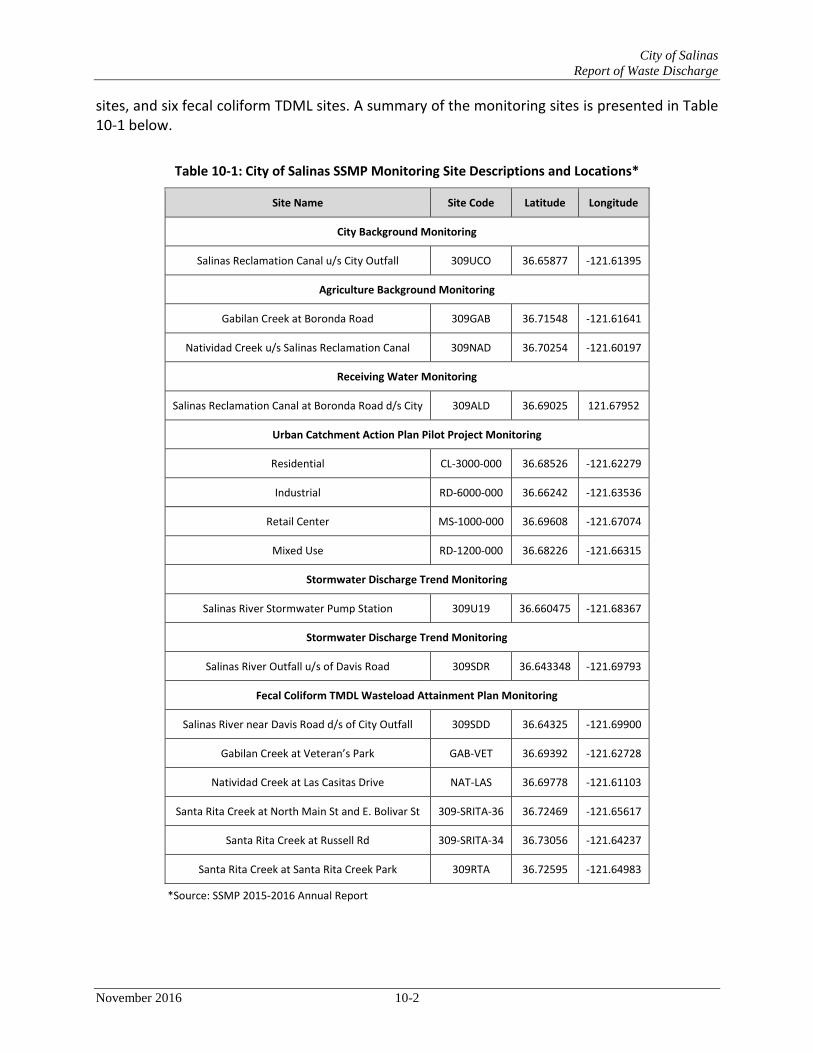
City of Salinas
Report of Waste Discharge
November 2016 10-2
sites, and six fecal coliform TDML sites. A summary of the monitoring sites is presented in Table 10-1 below.
Table 10-1: City of Salinas SSMP Monitoring Site Descriptions and Locations*
Site Name Site Code Latitude Longitude
City Background Monitoring
Salinas Reclamation Canal u/s City Outfall 309UCO 36.65877 -121.61395
Agriculture Background Monitoring
Gabilan Creek at Boronda Road 309GAB 36.71548 -121.61641
Natividad Creek u/s Salinas Reclamation Canal 309NAD 36.70254 -121.60197
Receiving Water Monitoring
Salinas Reclamation Canal at Boronda Road d/s City 309ALD 36.69025 121.67952
Urban Catchment Action Plan Pilot Project Monitoring
Residential CL-3000-000 36.68526 -121.62279
Industrial RD-6000-000 36.66242 -121.63536
Retail Center MS-1000-000 36.69608 -121.67074
Mixed Use RD-1200-000 36.68226 -121.66315
Stormwater Discharge Trend Monitoring
Salinas River Stormwater Pump Station 309U19 36.660475 -121.68367
Stormwater Discharge Trend Monitoring
Salinas River Outfall u/s of Davis Road 309SDR 36.643348 -121.69793
Fecal Coliform TMDL Wasteload Attainment Plan Monitoring
Salinas River near Davis Road d/s of City Outfall 309SDD 36.64325 -121.69900
Gabilan Creek at Veteran’s Park GAB-VET 36.69392 -121.62728
Natividad Creek at Las Casitas Drive NAT-LAS 36.69778 -121.61103
Santa Rita Creek at North Main St and E. Bolivar St 309-SRITA-36 36.72469 -121.65617
Santa Rita Creek at Russell Rd 309-SRITA-34 36.73056 -121.64237
Santa Rita Creek at Santa Rita Creek Park 309RTA 36.72595 -121.64983
*Source: SSMP 2015-2016 Annual Report
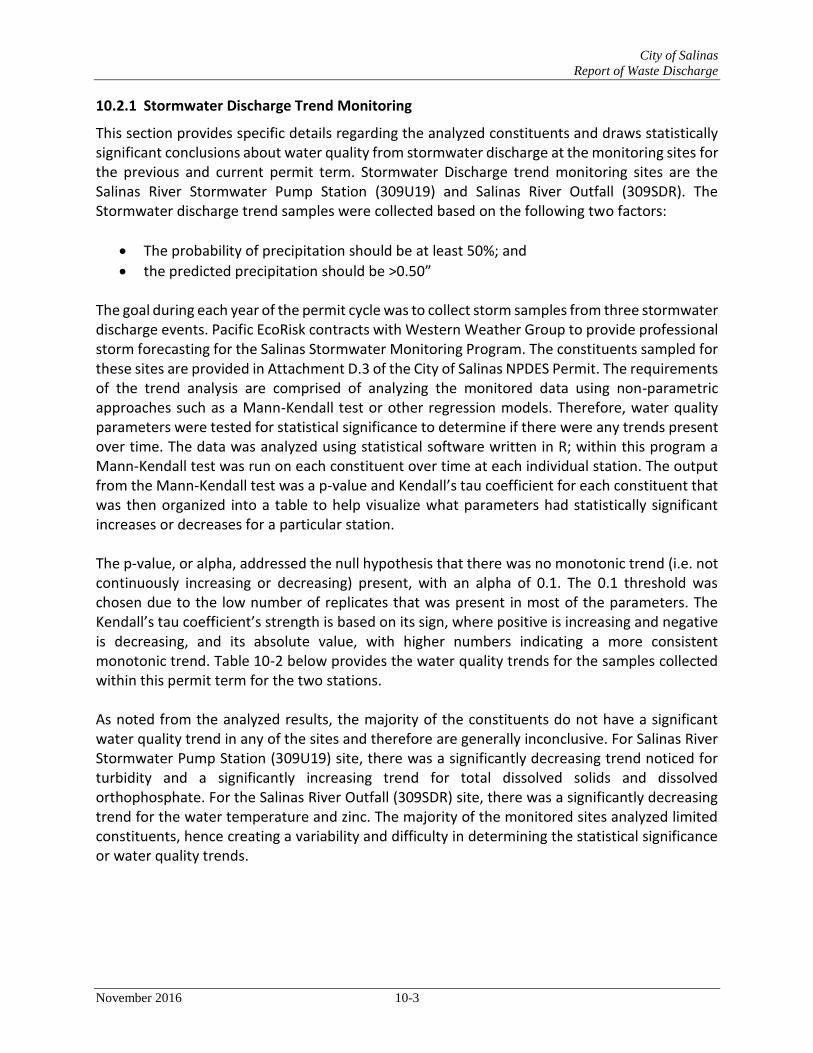
City of Salinas
Report of Waste Discharge
November 2016 10-3
10.2.1 Stormwater Discharge Trend Monitoring
This section provides specific details regarding the analyzed constituents and draws statistically significant conclusions about water quality from stormwater discharge at the monitoring sites for the previous and current permit term. Stormwater Discharge trend monitoring sites are the Salinas River Stormwater Pump Station (309U19) and Salinas River Outfall (309SDR). The Stormwater discharge trend samples were collected based on the following two factors:
The probability of precipitation should be at least 50%; and
the predicted precipitation should be >0.50” The goal during each year of the permit cycle was to collect storm samples from three stormwater discharge events. Pacific EcoRisk contracts with Western Weather Group to provide professional storm forecasting for the Salinas Stormwater Monitoring Program. The constituents sampled for these sites are provided in Attachment D.3 of the City of Salinas NPDES Permit. The requirements of the trend analysis are comprised of analyzing the monitored data using non-parametric approaches such as a Mann-Kendall test or other regression models. Therefore, water quality parameters were tested for statistical significance to determine if there were any trends present over time. The data was analyzed using statistical software written in R; within this program a Mann-Kendall test was run on each constituent over time at each individual station. The output from the Mann-Kendall test was a p-value and Kendall’s tau coefficient for each constituent that was then organized into a table to help visualize what parameters had statistically significant increases or decreases for a particular station. The p-value, or alpha, addressed the null hypothesis that there was no monotonic trend (i.e. not continuously increasing or decreasing) present, with an alpha of 0.1. The 0.1 threshold was chosen due to the low number of replicates that was present in most of the parameters. The Kendall’s tau coefficient’s strength is based on its sign, where positive is increasing and negative is decreasing, and its absolute value, with higher numbers indicating a more consistent monotonic trend. Table 10-2 below provides the water quality trends for the samples collected within this permit term for the two stations. As noted from the analyzed results, the majority of the constituents do not have a significant water quality trend in any of the sites and therefore are generally inconclusive. For Salinas River Stormwater Pump Station (309U19) site, there was a significantly decreasing trend noticed for turbidity and a significantly increasing trend for total dissolved solids and dissolved orthophosphate. For the Salinas River Outfall (309SDR) site, there was a significantly decreasing trend for the water temperature and zinc. The majority of the monitored sites analyzed limited constituents, hence creating a variability and difficulty in determining the statistical significance or water quality trends.
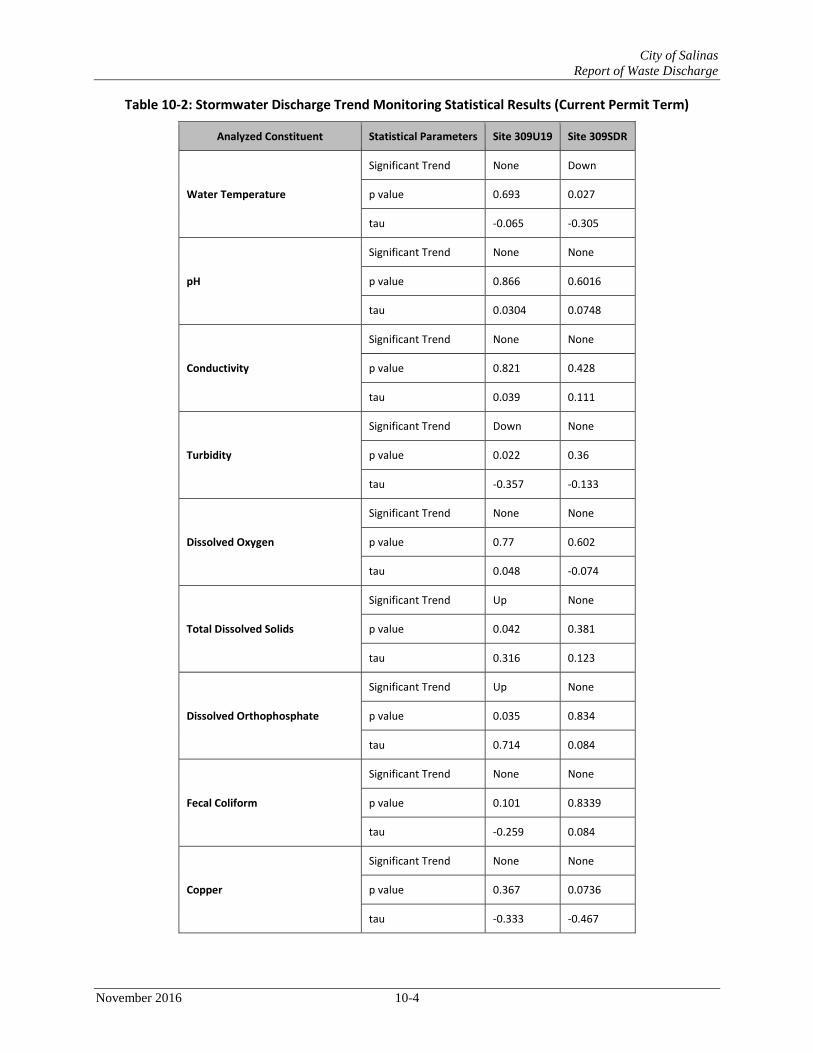
City of Salinas
Report of Waste Discharge
November 2016 10-4
Table 10-2: Stormwater Discharge Trend Monitoring Statistical Results (Current Permit Term)
Analyzed Constituent Statistical Parameters Site 309U19 Site 309SDR
Water Temperature
Significant Trend None Down
p value 0.693 0.027
tau -0.065 -0.305
pH
Significant Trend None None
p value 0.866 0.6016
tau 0.0304 0.0748
Conductivity
Significant Trend None None
p value 0.821 0.428
tau 0.039 0.111
Turbidity
Significant Trend Down None
p value 0.022 0.36
tau -0.357 -0.133
Dissolved Oxygen
Significant Trend None None
p value 0.77 0.602
tau 0.048 -0.074
Total Dissolved Solids
Significant Trend Up None
p value 0.042 0.381
tau 0.316 0.123
Dissolved Orthophosphate
Significant Trend Up None
p value 0.035 0.834
tau 0.714 0.084
Fecal Coliform
Significant Trend None None
p value 0.101 0.8339
tau -0.259 0.084
Copper
Significant Trend None None
p value 0.367 0.0736
tau -0.333 -0.467

City of Salinas
Report of Waste Discharge
November 2016 10-5
Analyzed Constituent Statistical Parameters Site 309U19 Site 309SDR
Zinc
Significant Trend None Down
p value 0.367 0.0318
tau -0.333 -0.556
Total Nitrate + Nitrite (as N)
Significant Trend None None
p value 0.229 0.598
tau 0.429 0.171
Total Ammonia as N
Significant Trend None None
p value 0.171 0.598
tau 0.488 0.171
Total Hardness
Significant Trend None None
p value 0.171 1
tau 0.488 0
Bifenthrin
Significant Trend None None
p value 0.763 0.583
tau 0.143 -0.183
Total Nitrogen (Calculation)
Significant Trend None None
p value 0.367 0.466
tau 0.333 0.222
Unionized Ammonia (Calculation)
Significant Trend None None
p value 1 0.239
tau 0.0476 0.354
Total Coliform
Significant Trend None None
p value 0.0715 0.72
tau 0.619 -0.111
An analysis was also completed for the data collected between 2004-2016 for six constituents and six sites. These water quality trends were more conclusive than the previous data concerning only the current permit term. Table 10-3 below provides the water quality trend analysis for the six sites monitored over the previous and current permit term.

City of Salinas
Report of Waste Discharge
November 2016 10-6
Turbidity analyzed over the previous and current permit term seemed to have a significant decreasing trend for sites 309GAB and 309SDD. A reduction is turbidity is also noted for all other sites in accordance with the tau coefficient, although this data is not fully significant. There is a significantly increasing trend in nitrate and orthophosphate concentrations over the two permit terms for sites 309UCO and 309ALD. On the other hand, there was a significantly decreasing trend noticed for orthophosphate at sites 309GAB and 309U19. The trends noticed in fecal coliform reflected an increase at site 309GAB and a decrease at site 309U19.
Table 10-3: Monitoring Statistical Results (Previous and Current Permit Term)
Analyzed Constituent
Statistical Parameters
Site 309GAB
Site 309NAD
Site 309UCO
Site 309ALD
Site 309U19
Site 309SDD
Orthophosphate
Significant Trend Down None Up Up Down -
p value 0.019 0.71 0.005 0.019 0.0139 -
tau -0.341 0.041 0.276 0.239 -0.266 -
Nitrate
Significant Trend None None Up Up None -
p value 0.551 0.097 0.0165 0.025 0.499 -
tau 0.091 -0.18 0.238 0.231 0.133 -
Fecal Coliform
Significant Trend Up None None None Down None
p value 0.011 0.855 0.971 0.499 0.025 0.207
tau 0.315 0.018 -0.004 0.061 -0.295 0.17
Turbidity
Significant Trend Down None None None None Down
p value 0.0049 0.192 0.13 0.247 0.241 0.023
tau -0.336 -0.108 -0.12 -0.094 -0.116 -0.255
Copper
Significant Trend None None None None None -
p value 0.695 0.266 0.471 0.122 0.18 -
tau -0.067 0.126 0.075 0.161 0.268 -
Zinc
Significant Trend None None None None None -
p value 0.456 0.553 0.577 0.322 0.276 -
tau -0.126 0.067 0.0586 0.105 0.219 -
Over the two sets of analyses completed, the site that overlapped between datasets (309U19) presented conflicting results for the different sets of data that were analyzed. For the data set analyzed from 2004-2016, site 309U19 had a decreasing trend in concentrations for orthophosphate. However, for the data analyzed for the current permit term of 2012-2016, the
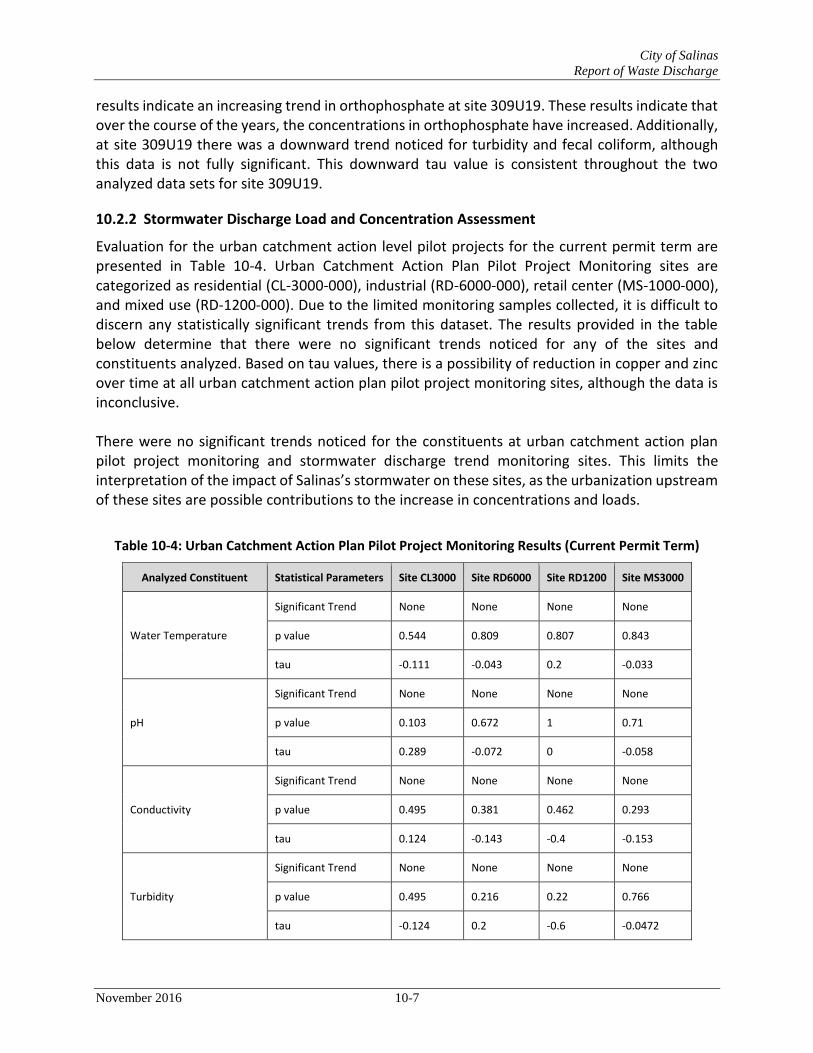
City of Salinas
Report of Waste Discharge
November 2016 10-7
results indicate an increasing trend in orthophosphate at site 309U19. These results indicate that over the course of the years, the concentrations in orthophosphate have increased. Additionally, at site 309U19 there was a downward trend noticed for turbidity and fecal coliform, although this data is not fully significant. This downward tau value is consistent throughout the two analyzed data sets for site 309U19.
10.2.2 Stormwater Discharge Load and Concentration Assessment
Evaluation for the urban catchment action level pilot projects for the current permit term are presented in Table 10-4. Urban Catchment Action Plan Pilot Project Monitoring sites are categorized as residential (CL-3000-000), industrial (RD-6000-000), retail center (MS-1000-000), and mixed use (RD-1200-000). Due to the limited monitoring samples collected, it is difficult to discern any statistically significant trends from this dataset. The results provided in the table below determine that there were no significant trends noticed for any of the sites and constituents analyzed. Based on tau values, there is a possibility of reduction in copper and zinc over time at all urban catchment action plan pilot project monitoring sites, although the data is inconclusive. There were no significant trends noticed for the constituents at urban catchment action plan pilot project monitoring and stormwater discharge trend monitoring sites. This limits the interpretation of the impact of Salinas’s stormwater on these sites, as the urbanization upstream of these sites are possible contributions to the increase in concentrations and loads.
Table 10-4: Urban Catchment Action Plan Pilot Project Monitoring Results (Current Permit Term)
Analyzed Constituent Statistical Parameters Site CL3000 Site RD6000 Site RD1200 Site MS3000
Water Temperature
Significant Trend None None None None
p value 0.544 0.809 0.807 0.843
tau -0.111 -0.043 0.2 -0.033
pH
Significant Trend None None None None
p value 0.103 0.672 1 0.71
tau 0.289 -0.072 0 -0.058
Conductivity
Significant Trend None None None None
p value 0.495 0.381 0.462 0.293
tau 0.124 -0.143 -0.4 -0.153
Turbidity
Significant Trend None None None None
p value 0.495 0.216 0.22 0.766
tau -0.124 0.2 -0.6 -0.0472

City of Salinas
Report of Waste Discharge
November 2016 10-8
Analyzed Constituent Statistical Parameters Site CL3000 Site RD6000 Site RD1200 Site MS3000
Dissolved Oxygen
Significant Trend None None None None
p value 0.544 0.608 0.462 0.286
tau 0.111 0.086 0.4 0.159
Total Dissolved Solids
Significant Trend None None None None
p value 0.65 0.833 0.22 0.244
tau -0.085 0.038 -0.6 0.174
Dissolved Orthophosphate
Significant Trend None None None None
p value 0.26 0.707 0.433 0.613
tau 0.467 0.2 -0.447 0.316
Fecal Coliform
Significant Trend None None None None
p value 0.424 0.276 0.562 0.128
tau 0.146 0.177 0.4 -0.224
Copper
Significant Trend None None None None
p value 0.26 0.26 0.22 0.0864
tau -0.467 -0.467 -0.6 -0.8
Zinc
Significant Trend None None None None
p value 0.71 0.133 0.22 0.462
tau -0.2 -0.6 -0.6 -0.4
10.2.3 Assessment of Precipitation and Discharge
A time-series relationship between flow rate and precipitation was investigated by imposing graphs for both these parameters at all the sites that had flow data available (309GAB, 309NAD, 309UCO, 309ALD, CL3000, RD6000, MS 3000, RD1200). The flow data was determined from the data collected by the City of Salinas and historical precipitation data was determined from Weather Underground. Graphs were then examined to determine relationships between rain events and subsequent runoff flow. The urban catchment sites did not show any trends due to lack of flow data except MS 3000 which shows a correlation in precipitation and flow from 10/31/14 to 12/02/14. A visual assessment of the remaining sites displayed a correlation of precipitation and flow in 309NAD, 309UCO, and 309ALD, where peak flow rates and peak rainfall coincided around the same date. The time-based graphs with precipitation and flow data for each of the analyzed sites are presented below.
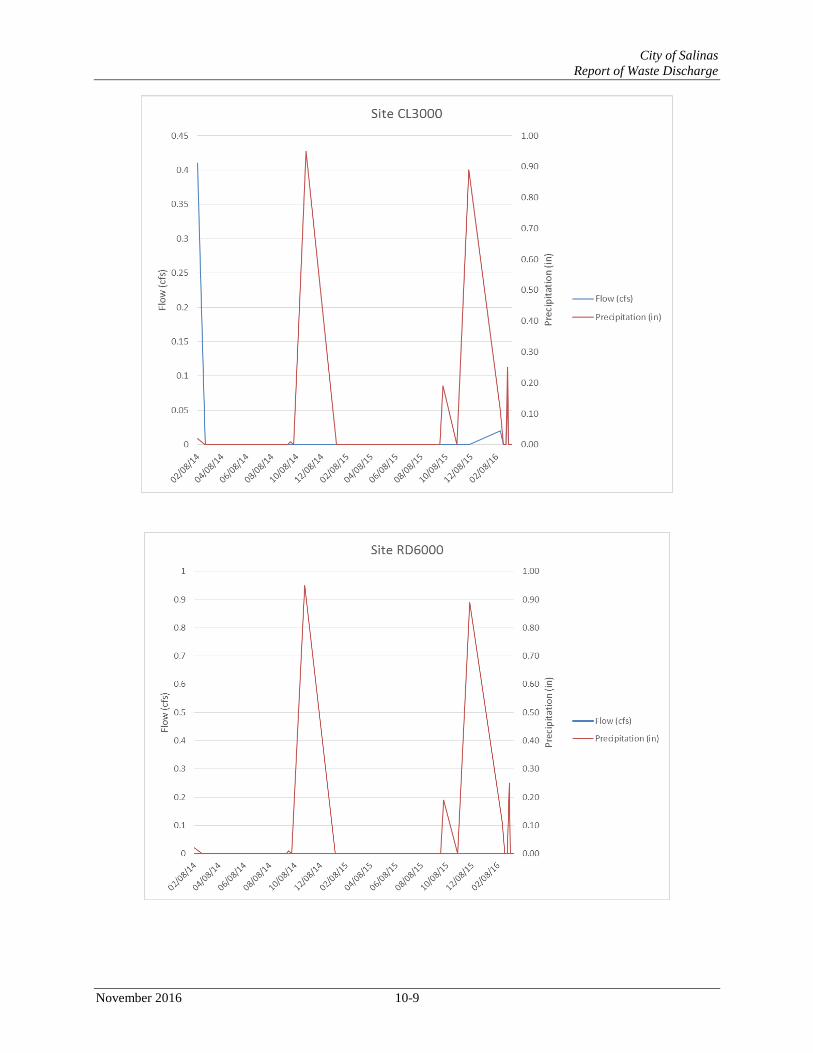
City of Salinas
Report of Waste Discharge
November 2016 10-9
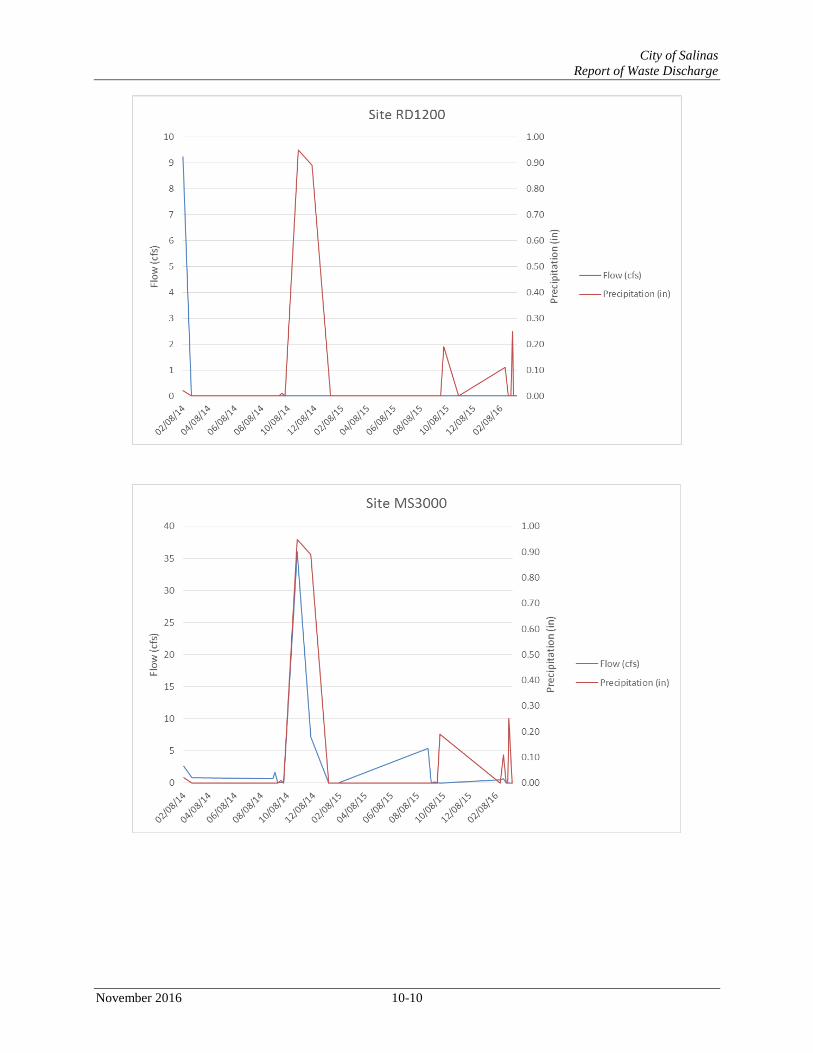
City of Salinas
Report of Waste Discharge
November 2016 10-10
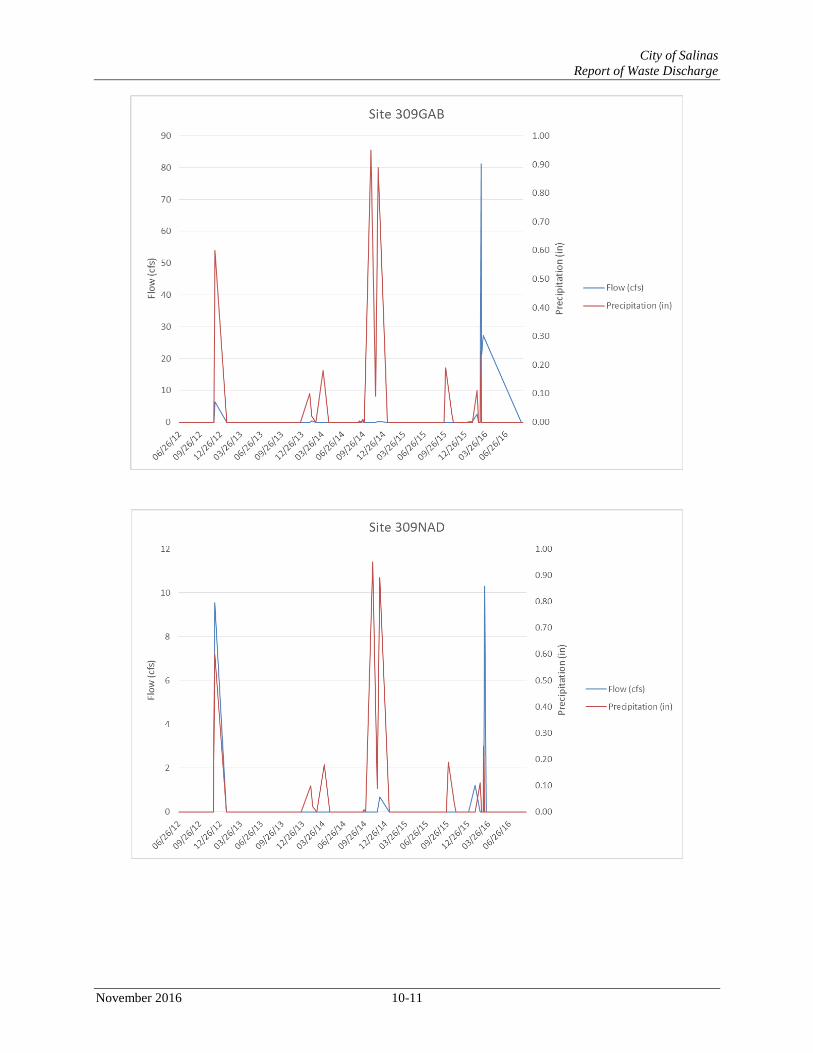
City of Salinas
Report of Waste Discharge
November 2016 10-11

City of Salinas
Report of Waste Discharge
November 2016 10-12

City of Salinas
Report of Waste Discharge
November 2016 10-13
10.2.4 Discussions
In summary, trends during the current permit term are generally inconclusive since limited constituents showed any significance for the stormwater discharge monitoring sites. There were no statistically significant trends noticed at any of the urban catchment sites. Many of the monitored sites analyzed limited constituents with limited samples collected, hence creating variability and difficulty in determining the statistical significance of water quality trends. The variability in the constituents monitored, the timing of sample collection, and the availability of comparable data sets have shown to be inconclusive regarding the contribution of pollutants from the City of Salinas.
10.3 Recommendations
Due to the limitations and inconclusive results of determining the water quality trends and significance at the sites of concern within this permit term, a revised methodology for analyzing monitored data is proposed as described in the Year 4 Annual Report. In the upcoming permit, there should be clarification to analyze data and loads specific for dry event and wet events. This will help the City assess the increasing or decreasing trends for pollutants of concern due to urbanization. The program should also focus on monitoring additional events and analyzing all constituents as specified in the permit for a sampled event. With additional data available for the permit term, the statistical tests shall present better water quality trends for the City of Salinas. It is also recommended that the monitoring program be revised. The current monitoring program as required by the Permit does not provide adequate water quality information to determine City sources of pollutants. The frequency, constituents being sampled and sampling locations do not coincide and therefore cannot be compared in real time to determine any useful information. The only useful information we can determine, other than just presence of pollutants, is the pollutant load coming into the City is higher than leaving the City. Why? This cannot accurately be determined from the data obtained from the current monitoring program. The City respectfully suggests a different sampling program be developed which provides meaningful data for the City to assess and manage its MS4 stormwater program. The City respectfully suggests the program concentrate sampling/data acquisition in a few targeted subwatersheds at a time (rotating watershed basis) to help determine the processes in each watershed that either contribute to, or reduce pollutant loads. The sampling would be concentrated on the major watercourse and City outfalls/discharges in each subwatershed. Samples would be taken during flow from the upstream end of the watercourse and proceeding downstream at strategic locations like major outfalls, riparian areas, or similar in order to try and sample approximately the same slug of water as it proceeds downstream. In this manner the water quality can be tracked as it proceeds downstream, changes in water quality can be attributed to items such as loads from outfalls and/or marginally housed encampments located between sampling locations. If loadings decrease, the City can analyze issues like potential dilution from comparatively cleaner flows from outfalls, existence of riparian vegetation cleansing the flow or similar processes.
City of Salinas
Report of Waste Discharge
November 2016 10-14
Several different entities (City, Ag Cooperative, CCAMP) perform duplicative sampling for different programs at the same locations. Some of the data is not shared due to fears data will be misused or misrepresented or used against the entity. The City respectfully suggests that all sampling programs be coordinated to reduce duplication of effort and provide cost efficiencies.

City of Salinas
Report of Waste Discharge
November 2016 11-1
11 Receiving Water Monitoring
This section contains an analysis of receiving water monitoring data for receiving water quality trends as required by Section P.5 of the Salinas MS4 Permit.
11.1 ROWD Requirement
The Salinas NPDES Permit requires that the city to analyze receiving water monitoring and background receiving water monitoring data for receiving water quality trends. In addition, the city is required to evaluate all data collected and managed per the Salinas NPDES Permit. The data and tasks associated with this requirement include the following:
Analysis of Receiving Water Monitoring results over the term of this Order, including identification and discussion of short-term patterns and long-term trends in receiving water quality and beneficial use protection;
Assessment of trends in the change in pollutant load between the Background Receiving Water Monitoring sites and the Receiving Water Monitoring site for the identified parameters;
An evaluation of all pesticide and toxicity analyses results;
An evaluation of all bioassessment results;
Extrapolation of the results of analysis to other receiving waters, as appropriate; and
A discussion of conclusions reached.
11.2 Monitoring Sites
Section 10 describes the monitoring program within the City of Salinas along with the monitoring site locations. This section provides specific details regarding the analyzed constituents and provides conclusions for receiving water monitoring for the current permit term. The overall data assessment in this section includes a comparison of data from Background sites to data from a Receiving Water site that receives discharge from the City of Salinas.
11.2.1 Receiving Water Monitoring
Receiving water was sampled from the Reclamation Ditch downstream of urban influences at the monitoring site 309ALD, as required by the Central Coast Water Board. At this downstream receiving water site an evaluation was performed of the 85th percentile of the data for six constituents for both wet and dry events and compared to the Agriculture and City background sites during the current permit term. The six constituents analyzed were turbidity, nitrate, orthophosphate, total zinc, total copper, and fecal coliform. The city collected monthly samples from November through May, including any significant storm events for this permit term. In all cases, Receiving Water Monitoring was coordinated with the Background Receiving Water Monitoring to achieve sampling at the upstream and downstream sampling sites over a period of a few hours.

City of Salinas
Report of Waste Discharge
November 2016 11-2
11.2.1.1 Turbidity
The 85th percentile for turbidity at the receiving water site was much lower during dry events than wet events during this permit term, but still exceeded the water quality objective of 126 NTU. There is no clear pattern in turbidity concentration between the upstream background sites and receiving water site. However, it was noticed that increased flow in muddy and shallow creeks clearly results in additional suspended particles in water. For the current permit term, the trend analysis determined there is an increasing trend in turbidity values with majority of samples being below the water quality objective for site 309ALD.
11.2.1.2 Nitrate
In the current permit term, the 85th percentiles for nitrate during wet and dry events did not exceed the objective for the receiving water site. The United States Environmental Protection Agency (USEPA) has set the nitrate objective to 10 mg/L to protect the MUN beneficial uses. It is hard to determine the cause of elevated nitrate + nitrite concentrations in the receiving water site, as the upstream site (background sites) also consist of elevated nitrate + nitrite concentrations as well. Therefore, it is challenging to directly associate the City’s stormwater inputs, agriculture inputs or other upstream conditions to the elevated nitrate + nitrite concentrations at the downstream receiving water site. For the current permit term, the trend analysis determined there is an increasing trend in nitrate values at the receiving water site.
11.2.1.3 Fecal Coliform
All 85th percentiles for fecal coliform exceeded the objective of 400 MPN/100 mL, although it was noticed that the dry events were much lower than the wet events in the current permit term. It is unclear if the receiving water site exceedances are caused by the background sources, because the fecal coliform targets are exceeded within the city background monitoring sites as well. According to the trend analysis, it was determined that there is an increasing trend of fecal coliform concentrations at all sites within this permit term. This may be attributable to homeless encampments or application of manure to agricultural fields.
11.2.1.4 Total Zinc
The 85th percentile for total zinc at a sample hardness <100 mg/L was almost two orders of magnitude lower during dry events for the receiving water samples when compared to wet events, and the 85th percentile during dry events was below the objective; a similar pattern occurred for samples with a hardness >100 mg/L. The presence of elevated total zinc levels in background site waters limits the interpretation of the impact of Salinas stormwater on the receiving water sites, as it is unclear if the total zinc in the receiving waters is due to background conditions, Salinas stormwater inputs, agricultural input from Carr Lake, or all of the above. In general, there is a slight decreasing trend in total zinc concentrations at all sites over the current permit term.
City of Salinas
Report of Waste Discharge
November 2016 11-3
11.2.1.5 Total Copper
The 85th percentile for total copper at a sample hardness >100 mg/L was an order of magnitude lower during dry events for the receiving water samples when compared to wet events, and the 85th percentile during dry events was below the objective. Also, the copper 85th percentiles were below the objective during dry events, but were above the objectives for wet events. Similar to other constituents analyzed, it is unclear if the elevated concentrations of total copper within the receiving water sites is from the background conditions or Salinas stormwater inputs because the concentration are also elevated at upstream monitoring sites (City and Agriculture Sites). In general, there is a slight decreasing trend in total copper concentrations at all sites over the current permit term.
11.2.1.6 Orthophosphate
As there is no Basin Plan objective for orthophosphate, an action level of 0.12 mg/L orthophosphate as P was used. It is important to note that this action level is not a water quality objective, but rather is useful for identifying which sites may have sources of elevated orthophosphate concentrations. Elevated orthophosphate concentrations were noticed within the receiving water sites, however it is unclear if the contribution is from the Salinas stormwater discharge or other background conditions. There were no consistent trends noticed from wet to dry events for orthophosphate. The design of this monitoring program prohibits a true identification of the City’s contribution to receiving waters. The upstream Agriculture and City background sites contribute to pollutant concentrations at the downstream receiving water site and there are only a few sampling points along the way to identify pollutant sources from the City. The outfalls and urban catchment sites sampled within the City do not require the same monitoring frequency or constituent requirements as the Agriculture and City background sites and the receiving water site. Therefore, it is challenging to directly isolate exceedances observed in background sites from those observed in the receiving water site.
11.2.2 Background Receiving Water Monitoring
Background receiving water monitoring was conducted from two agricultural sites, Gabilan Creek (309GAB) and Natividad Creek (309NAD), and one city site, the Reclamation Ditch (309UCO). The city collected Monthly samples are collected from November through May, including any significant storm events. As discussed earlier, Background Receiving Water Monitoring was coordinated with the Receiving Water Monitoring to achieve sampling at the upstream and downstream sampling sites over a period of a few hours. Table 11-1 below provides an evaluation of the 85th percentiles of the data for six constituents (i.e., turbidity, nitrate, orthophosphate, total zinc, total copper, and fecal coliform) that were sampled during wet events and dry events over the current permit term. As seen, background sites monitored for the wet events exceeded water quality objectives for all constituents except turbidity. In the current permit term, the 85th percentiles for nitrate during wet and dry events at the background sites exceeded the objective of 10 mg/L. The total zinc 85th percentiles for

City of Salinas
Report of Waste Discharge
November 2016 11-4
samples with a hardness >100 mg/L were lower at the background sites when compared to the receiving water site for both wet and dry events. The total copper concentrations were higher for the wet events than the dry events and the water quality objective was exceeded for copper during the wet events only. Pollutant loads were calculated for TSS, orthophosphate, fecal coliform, total nitrogen, total copper, and total zinc using 2012-2016 monitoring data. The trends of the pollutants varied based on pollutant concentrations. Therefore, it was noticed that due to the decrease in total copper and total zinc concentrations for the 85th percentile analysis there is a reduction in total copper and total zinc loads over the current permit term for the background sites. It is unclear to determine the trend for nitrate + nitrite and orthophosphate loads in the background receiving waters as the three monitored sites provide different trends in concentrations over the current permit term. The presence of elevated concentrations and loads in background site waters limits the interpretation of the impact of Salinas’s stormwater on the receiving water sites, as there are clearly significant contributions to the receiving waters that are due to background conditions.

City of Salinas
Report of Waste Discharge
November 2016 11-5
Table 11-1: 85th Percentiles for Wet and Dry Events in Background and Receiving Water Sites: Current Permit Term
Wet Events – Background Sites
Wet Events – Receiving Water (309ALD)
Dry Events – Background Sites Dry Events – Receiving Water
(309ALD) WQO
(309GAB, 309NAD, 309UCO) (309GAB, 309NAD, 309UCO)
Analyte Units # Samples Max
Value 85th
Percentile # Samples
Max Value
85th Percentile
# Samples Max
Value 85th
Percentile # Samples
Max Value
85th Percentile
Turbidity NTU 21 3000 2897 7 1652 1331.6 111 3000 297.5 42 775 140.91 126 NTU
Nitrate mg/L 21 90 20.9 7 4.6 4.42 71 150 33.5 25 39 2.1 10 mg/L
Orthophosphate mg/L 21 1.9 1.29 7 0.87 0.69 71 3.2 0.995 30 1.3 0.896 0.12 mg/L
Total Zinc (Hardness
<100 mg/L) μg/L 1 97.2 N/A 3 166 159.4 N/A N/A N/A 1 2.86 N/A 4 μg/L
Total Zinc (Hardness
>100 mg/L) μg/L 19 280 143.45 4 293 207.5 63 224 26.92 28 88.6 35.03 200 μg/L
Total Copper (Hardness
<100 mg/L) μg/L 1 52.2 N/A 3 48.3 44.1 N/A N/A N/A 1 2.09 N/A 10 μg/L
Total Copper (Hardness
>100 mg/L) μg/L 19 97.9 52.13 4 71.2 53.07 63 158 18.16 28 41.7 13.5 30 μg/L
Fecal Coliform MPN/
100 mL 21 160000 92000 7 160000 47500 103 160000 2400 43 35000 9140
400 MPN/
100 mL
Source: SSMP 2015-2016 Annual Report

City of Salinas
Report of Waste Discharge
November 2016 11-1
11.2.3 Pesticides and Toxicity Evaluation and Results
11.2.3.1 Aquatic Toxicity
Three freshwater species were tested to evaluate the toxicity of the SSMP ambient waters:
a green algae (Selenastrum capricornutum);
an invertebrate (Ceriodaphnia dubia); and
a fish (the fathead minnow). Basin Plan narrative objective requires that there be no toxicity (i.e., typically defined as a statistically significant reduction in organism response compared to the Lab Control). During the 2012-2016 monitoring, toxicity testing of ambient water was conducted only at the Reclamation Canal receiving water site. There was no toxicity to Selenastrum growth in the current Year 1 – Year 4 permit cycle. There was toxicity to Ceriodaphnia survival during two sampling events (2014 and 2015 wet season events) and to reproduction during four sampling events (Year 3 and Year 4 wet and dry season events). There was no toxicity to fathead minnow survival in the current Year 1 – Year 4 permit cycle; however, there was toxicity to fathead minnow growth during one sampling event (2014 wet season). Given that water toxicity testing was not conducted for the upstream background sites, it is unclear if the toxicity observed for the receiving water site was due to background conditions, Salinas stormwater inputs, agricultural inputs from Carr Lake, or all of the above.
11.2.3.2 Sediment Toxicity
The 10-day Hyalella azteca sediment toxicity test is required for the SSMP. The Basin Plan narrative objective requires that there be no toxicity. During the 2012-2016 monitoring, sediment toxicity was observed at the Reclamation Canal receiving water site; however, this is the only site that was monitored for sediment toxicity. Given that sediment toxicity testing was not conducted for the upstream background sites, it is unclear if the reductions in Hyalella survival and growth were due to background conditions, Salinas stormwater inputs, agricultural inputs from Carr Lake, or all of the above.
11.2.4 Bioassessment Evaluation and Results
11.2.4.1 Bioassessment Data
Bioassessment monitoring was conducted annually during the spring for 2012-2015 at the Reclamation Canal receiving water site only as required in the MRP. The habitat and benthic macroinvertebrate (BMI) results are compared to the results obtained in 2008 and 2011 monitoring. Algae sampling started in 2012, so there is no data for historical comparisons.
11.2.4.2 Physical Habitat Parameters
During monitoring from 2008-2015, the 309ALD receiving water site ranked as “poor” to “suboptimal” for physical habitat characteristics, primarily due to the presence of limited
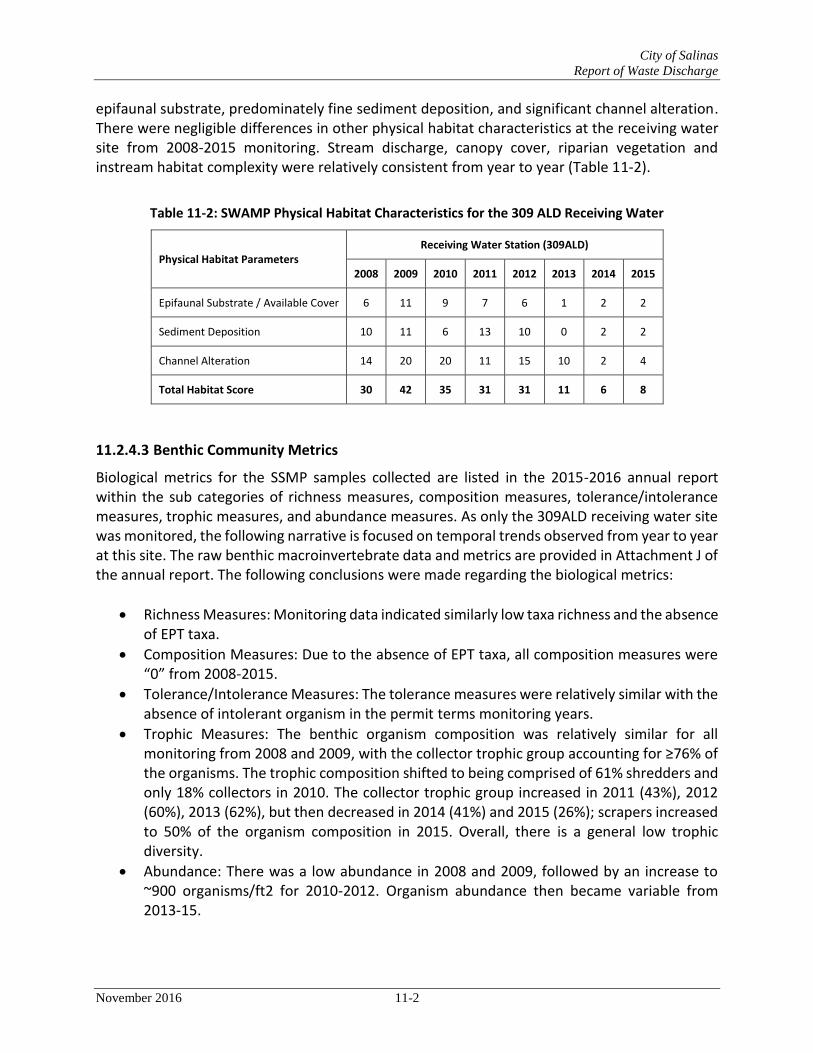
City of Salinas
Report of Waste Discharge
November 2016 11-2
epifaunal substrate, predominately fine sediment deposition, and significant channel alteration. There were negligible differences in other physical habitat characteristics at the receiving water site from 2008-2015 monitoring. Stream discharge, canopy cover, riparian vegetation and instream habitat complexity were relatively consistent from year to year (Table 11-2).
Table 11-2: SWAMP Physical Habitat Characteristics for the 309 ALD Receiving Water
Physical Habitat Parameters Receiving Water Station (309ALD)
2008 2009 2010 2011 2012 2013 2014 2015
Epifaunal Substrate / Available Cover 6 11 9 7 6 1 2 2
Sediment Deposition 10 11 6 13 10 0 2 2
Channel Alteration 14 20 20 11 15 10 2 4
Total Habitat Score 30 42 35 31 31 11 6 8
11.2.4.3 Benthic Community Metrics
Biological metrics for the SSMP samples collected are listed in the 2015-2016 annual report within the sub categories of richness measures, composition measures, tolerance/intolerance measures, trophic measures, and abundance measures. As only the 309ALD receiving water site was monitored, the following narrative is focused on temporal trends observed from year to year at this site. The raw benthic macroinvertebrate data and metrics are provided in Attachment J of the annual report. The following conclusions were made regarding the biological metrics:
Richness Measures: Monitoring data indicated similarly low taxa richness and the absence of EPT taxa.
Composition Measures: Due to the absence of EPT taxa, all composition measures were “0” from 2008-2015.
Tolerance/Intolerance Measures: The tolerance measures were relatively similar with the absence of intolerant organism in the permit terms monitoring years.
Trophic Measures: The benthic organism composition was relatively similar for all monitoring from 2008 and 2009, with the collector trophic group accounting for ≥76% of the organisms. The trophic composition shifted to being comprised of 61% shredders and only 18% collectors in 2010. The collector trophic group increased in 2011 (43%), 2012 (60%), 2013 (62%), but then decreased in 2014 (41%) and 2015 (26%); scrapers increased to 50% of the organism composition in 2015. Overall, there is a general low trophic diversity.
Abundance: There was a low abundance in 2008 and 2009, followed by an increase to ~900 organisms/ft2 for 2010-2012. Organism abundance then became variable from 2013-15.
City of Salinas
Report of Waste Discharge
November 2016 11-3
Typically, select biological metrics are combined (or integrated) to develop a benchmark for determining if the benthic community is in relatively good or poor shape. The SoCal Index of Biological Integrity (IBI) has been developed for low gradient streams of Southern California, but is applied to the City of Salinas stormwater program per Regional Board guidance. The 309ALD receiving water site score is 15.71, which rates as “very poor”.
11.3 Discussion
In summary, the presence of exceedances in background site waters limits the interpretation of the impact of Salinas stormwater on the receiving water sites, as it is unclear if the exceedances in the receiving waters are due to background (i.e., upstream) conditions, stormwater inputs, agricultural inputs at Carr Lake, or all of the above. The exceedances were noticed for pH, dissolved oxygen, turbidity, nitrate, orthophosphate, total copper, total zinc, and fecal coliform at the background sites and the receiving water sites. The Exceedances for un-ionized ammonia, water column toxicity, and sediment toxicity occurred only at the receiving water site (Reclamation Ditch); it is important to note that un-ionized ammonia and toxicity samples are not collected at the background sites.
11.4 Recommendations
Due to the limitations of determining the impacts to receiving water quality through the monitoring program identified within this permit term, it is important to implement a new monitoring program geared towards analyzing the City’s subwatersheds impacts on the downstream waterbody. The program should focus on monitoring at the upstream sites, sites within the city and downstream most sites to assess the impacts of City’s background sources (stormwater, agriculture, etc.) to the water quality of the receiving water. The City of Salinas proposes that a revised monitoring program concentrate sampling/data acquisition in a few targeted subwatersheds at a time (rotating watershed basis) to help determine the processes in each watershed that either contribute to, or reduce pollutant loads. (See Section 10.3). Additionally, the program should consider eliminating the testing of the standard “3-species” chronic toxicity tests of water samples and replace these species with a water-only exposures using Hyalella and Chironomus. The proposal was specifically designed to target organisms that are sensitive to the pesticide classes that are used in the suburban/urban setting (e.g., pyrethroids and fipronil), as the current species being tested are significantly less sensitive to these pesticides than Hyalella and Chironomus. Furthermore, there has been limited toxicity observed to Selenastrum and the fathead minnow.
City of Salinas
Report of Waste Discharge
November 2016 12-1
12 Program Effectiveness Ratings
12.1 ROWD Requirement
The Salinas NPDES Permit requires that the city rate the overall effectiveness of the Stormwater Management Program in protecting, maintaining, and/or restoring beneficial uses and watershed processes affected by urban runoff. In addition, the city is required to evaluate all information collected, compiled, and managed per the Salinas NPDES Permit and establish Urban Subwatershed Program Effectiveness Ratings that will be based on the risk of impact to, and degree of alteration of, watershed processes and the beneficial uses in each urban subwatershed. Afterwards, the city must then apply the Urban Subwatershed Program Effectiveness Rating in a consistent manner across all urban subwatersheds. The data and tasks associated with this requirement include an evaluation of the following:
Risk of Impact to Watershed Processes and Beneficial Uses to Establish an Urban Subwatershed Program Effectiveness Rating, and
Extent and Degree of Alteration to Watershed Processes and Beneficial Uses.
12.1.1 Risk of Impact to Watershed Processes and Beneficial Uses Evaluation
The Salinas NPDES Permit describes several specific tasks to complete this evaluation, including:
Identifying Stormwater Pollutant Source-Generating Land Uses and Sites, using the quantitative data developed and tracked for the following:
o Municipally Owned and/or Operative High Priority Facilities, Operations, and Events;
o Illicit Discharge Detection and Elimination (IDDE) Priority Areas; o Commercial and Industrial Facilities and Operations; o Industrial Sites/Sources, including sites/sources and the number of reported
exceedances reported each year at industrial facilities; and o High Priority Construction Sites.
Quantifying the Pollutant Load, including data from the following: o The pollutant loads developed according to Sections P.2.a (Pollutant Load
Quantification), P.2.b (Trash Quantification), P.4.c (Stormwater Discharge Trend Monitoring), and P.4.d.c;
o The action Level exceedance data to extrapolate target pollutants and loading characteristics from Pilot Project Urban Subwatersheds to other Urban Subwatersheds;
o The Stormwater Discharge Trend Monitoring extrapolated data that was developed according to Sections P.4.c (Stormwater Discharge Trend Monitoring) and P.4.d, to estimate target pollutants and loading characteristics to other Urban Subwatersheds; and
o The Urban Subwatersheds that are significant sources of trash.
City of Salinas
Report of Waste Discharge
November 2016 12-2
Estimating the Exposure of Receiving Waters to Pollutant Delivery, using the following: o Urban Subwatershed runoff volume attributed to development; o Distribution and number of outfalls and channels conveying stormwater, plugs
and diversions, and related attributes of the storm drain system that indicate exposure.
Identifying the Zones of Hydrologic Continuity between Surface and Groundwater by considering the location and condition of undeveloped, pervious land, groundwater recharge areas, floodplains and other areas that provide opportunities for surface runoff to infiltrate into groundwater basins.
Quantifying the Development Potential within the City of Salinas, including the acreage of undeveloped parcels zoned for developed (non-open space) uses.
12.1.2 Extent and Degree of Alteration to Watershed Processes and Beneficial Uses Evaluation
After the risk of impact to watershed processes and beneficial uses is complete, an evaluation of the extent and degree of alteration must be performed. The city must establish a single gradient of alteration from low to high, based on the information collected and gathered during the previous step. The Salinas NPDES Permit also describes the essential tasks for this evaluation, including the following:
Determine the area of imperviousness within the entire city, and the percentage of imperviousness within each Urban Subwatershed;
Evaluate the existing and potential extent of riparian habitat and vegetation through an aerial analysis of first and second order streams developed per the Salinas NPDES Permit; and,
Evaluate the stream condition of each Urban Subwatershed by quantifying the total stream area and/or length in various conditions as determined by the required assessment of stream conditions by the Salinas NPDES Permit.
12.2 Discussion
The approach for this analysis focused on evaluating the Salinas NPDES Permit implementation and then applying a program effectiveness rating to each urban subwatershed. To accomplish this task, the city reviewed all of the data that was collected and compiled where available during the Salinas NPDES Permit term. This task also included the results of other ROWD tasks, Identifying Stormwater Pollutant Source-Generating Land Uses and Sites
12.2.1.1 Municipally Owned and/or Operative High Priority Facilities, Operations, and Events
The municipal activities performed during the Salinas NPDES Permit term were reviewed for quantitative data that could be used for the analysis. Of the data available, the following categories were determined to be applicable to this part of the analysis:
Catch Basin Cleaning – Debris Removed
Street Sweeping and Cleaning
Structural BMP/Surface Water Maintenance

City of Salinas
Report of Waste Discharge
November 2016 12-3
All the data from these activities were compiled and the urban subwatersheds were designated based on the Storm Drain Maintenance Areas where the activities were performed. A majority of the data sets included the total volume of material that was extracted or removed from the facilities during these activities. The quantities were distributed evenly between the urban subwatersheds within the Storm Drain Maintenance Areas. After the data was calculated for each Storm Drain Maintenance Area, the top six areas were ranked High, the next six were ranked Medium, and the last six were ranked Low based on the total volumes removed. Table 12-1 summarizes the results of this analysis.
Table 12-1: Total Volumes Removed by Storm Drain Maintenance Area during Municipal Facilities Operations for the Year 1 – Year 4 Permit Terms
Storm Drain Maintenance Area
Total Volume (cubic yards)
Priority Urban
Subwatersheds
1 1,625 High Santa Rita Creek
Markeley Swamp
2 673 Low Auto Center
Markeley Swamp
3 884 Low Markeley Swamp
Reclamation Ditch West
4 891 Medium Reclamation Ditch West
Salinas River
5 904 Low Reclamation Ditch West
Salinas River
6 1,207 Medium Salinas River
8 883 Low Markeley Swamp
9 887 Medium Markeley Swamp
Gabilan Creek
Reclamation Ditch East
10 1,375 High Gabilan Creek
Reclamation Ditch East
Natividad Creek
11 1,372 High Gabilan Creek
Natividad Creek
12 1,029 Medium Natividad Creek
Carr Lake

City of Salinas
Report of Waste Discharge
November 2016 12-4
Storm Drain Maintenance Area
Total Volume (cubic yards)
Priority Urban
Subwatersheds
13 1,188 Medium Reclamation Ditch East
Reclamation Ditch West
14 1,401 High Natividad Creek
Carr Lake
Reclamation Ditch East
15 1,256 High Natividad Creek
Carr Lake
Reclamation Ditch East
Monte Bella
16 1,041 Medium Reclamation Ditch West
Salinas River
Reclamation Ditch East
17 1,395 High Reclamation Ditch East
18 627 Low Salinas River
Reclamation Ditch East
19 482 Low Reclamation Ditch East
Total 19,120
12.2.1.2 Illicit Discharge Detection and Elimination (IDDE) Priority Areas
Illicit Discharges are defined by the Salinas NPDES Permit as
“[a]ll non-stormwater discharges except those authorized under a separate NPDES permit or Section A (Discharge Prohibitions) of the Order. Any discharge that is prohibited under local, state, or federal statutes, ordinances, codes, regulations...” (Central Coast RWQCB, 2012).
Through the implementation of the IDDE program, the city’s goal is to prevent discharges that may contain potential pollutants from entering the storm drain system. Such discharges are intentional or unintentional (accidental). Its primary objectives are to prohibit non-storm water discharges and investigate and remediate illicit discharges and improper disposal into the MS4. During the Salinas NPDES Permit term, the city implemented the IDDE program by developing and implementing the Best Management Practices for this program, including the following that are related to IDDE priority areas:
Mapping – Create a map of all inlets and outfalls with an associated inventory that identifies priority areas for illicit discharges;

City of Salinas
Report of Waste Discharge
November 2016 12-5
Illicit Discharge Reporting System – Using a publicized hotline phone number for the reporting of illicit discharges and illegal dumping, and documenting the investigation results for all notifications received to the hotline;
Illicit Discharge Identification – Inspections throughout the city performed by maintenance personnel and/or commercial/industrial inspectors through drive-by inspections;
Outfall Screening – Inspecting outfalls during the dry-weather season on an annual basis, and containment, control, and response to spills.
The data available for IDDE priority areas consisted of quantitative information that could not be associated with an urban subwatershed. The activities performed in IDDE Priority Areas during the permit term included identifying 29% of the city as High Priority IDDE areas, which exceeded the permit requirement of 20%. Further efforts can be made to develop communication between Monterey County’s OES and the City of Salinas’ Public Works Maintenance staff regarding notification of illicit discharges. There were times when OES had responded to an illicit discharge call in the City of Salinas and the City was unaware of the event until documentation was forwarded to the City from Monterey County.
12.2.1.3 Commercial and Industrial Facilities and Operations Activities
The Salinas NPDES Permit requires that the city achieve the following during the permit term:
Develop an inventory of the commercial and industrial facilities within its jurisdiction
Develop minimum BMPs for facilities and operations
Notify the facilities about their stormwater requirements
Perform inspections of the facilities and operations
Track and analyze the monitoring data from industrial facilities
Establish an information management system to track this information
Train municipal staff on the industrial and commercial requirements These activities were performed as prescribed by the Salinas NPDES Permit and the data associated with them was reviewed. In particular, the exceedance monitoring data from industrial facilities were compiled and reviewed. The number of exceedances for each industrial facility were totaled during the permit term. Those facilities that had a total of 10 or more exceedances during the permit term were classified as High. For facilities that had between four and nine exceedances, they were classified as Medium. If a facility had between zero and three exceedances, it was classified as Low.

City of Salinas
Report of Waste Discharge
November 2016 12-6
Table 12-2: Exceedances Identified at Industrial Facilities
Industrial Facility Name
Address Watershed Year 1 (2011-12)
Number of Exceedances
Year 2 (2012-13) Number of
Exceedances
Year 3 (2013-14) Number of
Exceedances
Year 4 (2014-15) Number of
Exceedances
Total Number of Exceedances
Priority Ranking
Accu Chem Conversion
1111 Abbott St Reclamation
Ditch East No data
No Annual Report Data Past Due
3 2 5 Medium
Allisal Union School District
1205 E Market St
Reclamation Ditch East
0 1 0 1 2 Medium
Americold 950 S. Sanborn
Rd. Reclamation
Ditch East
No Data due to Enrollment Year Not
Applicable
No Data due to Enrollment Year Not Applicable
1 No Annual Report Data
Past Due 1 Medium
Cal Pacific Specialty Foods
950 S. Sanborn Rd.
Reclamation Ditch East
Not Applicable Not Applicable No Data due to enrollment year
2 2 Medium
CEMEX Construction
Material Pacific LLC
54 Summer St Reclamation
Ditch East No Annual Report Data
Past Due Facility Closing NOT
to be submitted IGP Status
Terminated IGP Status Terminated
(2013-2014) 0 Low
Coca Cola Bottling Co of CA
715 Vandenberg St
Reclamation Ditch East
0
No Sampling Performed No Qualifying Rain
Event
0 0 0 Low
Cool Pacific 1160 Terven
Ave Reclamation
Ditch East No Sampling Performed No Qualifying Rain Event
No Sampling Performed No Qualifying Rain
Event
No Sampling Performed No Qualifying Rain
Event
0 0 Low
County of Monterey
855 E Laurel Dr # A
Gabilan Creek 3 5 2 4 14 High
Dandy Cooling Co.
1252 Growers St
Reclamation Ditch East
5 Group Monitoring
See: Growers Ice Co 2 7* 14 High
Fed Ex Freight Salinas
670 Work St Reclamation
Ditch East No Sampling Performed No Qualifying Rain Event
No Sampling Performed No Qualifying Rain
Event
No Sampling Performed No Qualifying Rain
Event
No Sampling Performed No Qualifying Rain
Event 0 Low
Fresh Express Inc. 607 Brunken
Ave Reclamation
Ditch East 1
No Annual Report Data Past Due
3 No Annual Report Data
Past Due 4 Medium

City of Salinas
Report of Waste Discharge
November 2016 12-7
Table 12-2: Exceedances Identified at Industrial Facilities
Industrial Facility Name
Address Watershed Year 1 (2011-12)
Number of Exceedances
Year 2 (2012-13) Number of
Exceedances
Year 3 (2013-14) Number of
Exceedances
Year 4 (2014-15) Number of
Exceedances
Total Number of Exceedances
Priority Ranking
Golden Gate Petroleum
1020 Terven Ave
Reclamation Ditch East
No Annual Report Data Past Due
No Annual Report Data Past Due
No Annual Report Data Past Due
IGP Status Terminated 0 Low
Georgia Pacific Corp
741 Verin Ave. Reclamation
Ditch East Not Applicable Not Applicable Not Applicable
No Annual Report data Past Due
0 Low
Salinas Hot Mix Asphalt Plant
(Granite Construction)
721 Work St Reclamation
Ditch East 5 4 3 2 14 High
Growers Ice Company
1200 Merrill St and 1060
Growers St (same wtrshd)
Reclamation Ditch East
5 7 2 7* 21 High
International Paper Co.
1345 Harkins Rd and 1215
Hansen St (same wtrshd)
Reclamation Ditch East
1 Group Monitoring See: RockTenn CP
LLC
Group Monitoring See: RockTenn CP
LLC 0 1 Low
Mann Packing Co. Inc.
1333 Schilling Pl
Reclamation Ditch East
20 16 2 17 55 High
Monterey Fish Co.
960 S. Sanborn Rd.
Reclamation Ditch East
Not Applicable Not Applicable Not Applicable No Annual Report data
Past Due 0 Low
Monterey Salinas Transit
110 Salinas St Reclamation Ditch West
3 4
No Sampling Performed No Qualifying Rain
Event
1 8 Medium
MV Transportation
Division 86
1375 Burton Ave
Reclamation Ditch East
2 0 2 1 5 Medium
Nielsen Trucking Co Union Pac
42 W Lake St Reclamation Ditch West
No Sampling Performed No Qualifying Rain Event
0
No Sampling Performed No Qualifying Rain
Event
No Sampling Performed No Qualifying Rain
Event 0 Low
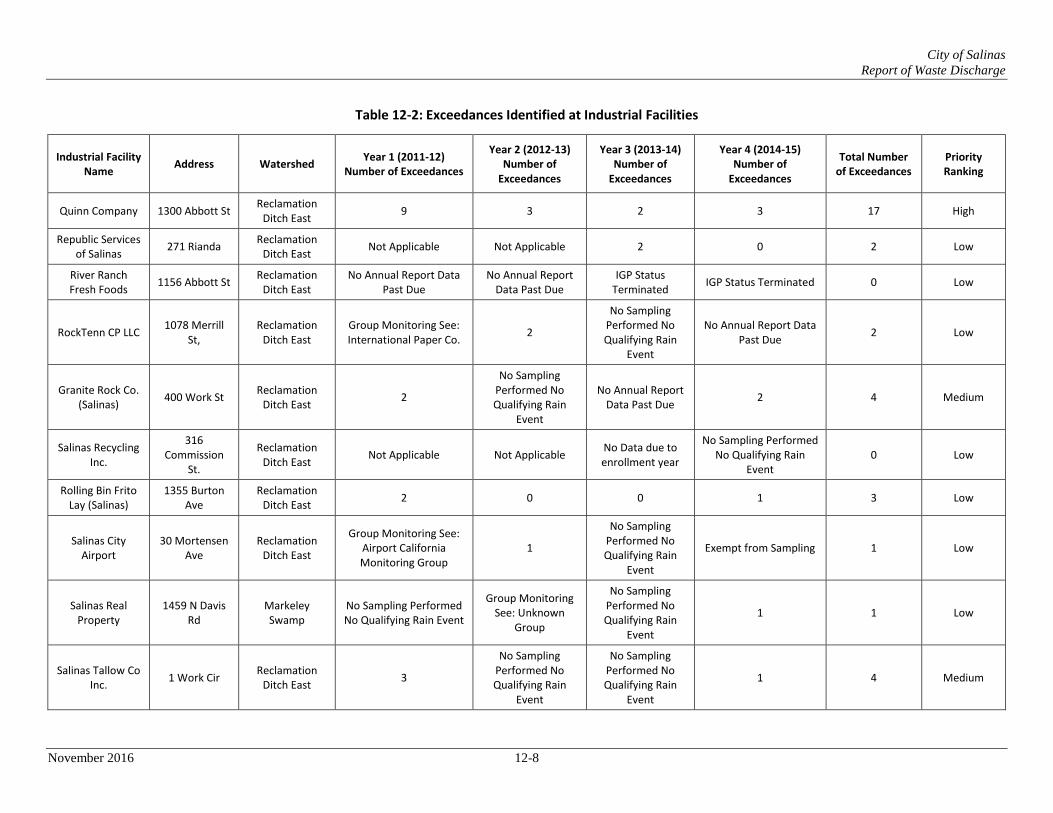
City of Salinas
Report of Waste Discharge
November 2016 12-8
Table 12-2: Exceedances Identified at Industrial Facilities
Industrial Facility Name
Address Watershed Year 1 (2011-12)
Number of Exceedances
Year 2 (2012-13) Number of
Exceedances
Year 3 (2013-14) Number of
Exceedances
Year 4 (2014-15) Number of
Exceedances
Total Number of Exceedances
Priority Ranking
Quinn Company 1300 Abbott St Reclamation
Ditch East 9 3 2 3 17 High
Republic Services of Salinas
271 Rianda Reclamation
Ditch East Not Applicable Not Applicable 2 0 2 Low
River Ranch Fresh Foods
1156 Abbott St Reclamation
Ditch East No Annual Report Data
Past Due No Annual Report
Data Past Due IGP Status
Terminated IGP Status Terminated 0 Low
RockTenn CP LLC 1078 Merrill
St, Reclamation
Ditch East Group Monitoring See: International Paper Co.
2
No Sampling Performed No Qualifying Rain
Event
No Annual Report Data Past Due
2 Low
Granite Rock Co. (Salinas)
400 Work St Reclamation
Ditch East 2
No Sampling Performed No Qualifying Rain
Event
No Annual Report Data Past Due
2 4 Medium
Salinas Recycling Inc.
316 Commission
St.
Reclamation Ditch East
Not Applicable Not Applicable No Data due to enrollment year
No Sampling Performed No Qualifying Rain
Event 0 Low
Rolling Bin Frito Lay (Salinas)
1355 Burton Ave
Reclamation Ditch East
2 0 0 1 3 Low
Salinas City Airport
30 Mortensen Ave
Reclamation Ditch East
Group Monitoring See: Airport California Monitoring Group
1
No Sampling Performed No Qualifying Rain
Event
Exempt from Sampling 1 Low
Salinas Real Property
1459 N Davis Rd
Markeley Swamp
No Sampling Performed No Qualifying Rain Event
Group Monitoring See: Unknown
Group
No Sampling Performed No Qualifying Rain
Event
1 1 Low
Salinas Tallow Co Inc.
1 Work Cir Reclamation
Ditch East 3
No Sampling Performed No Qualifying Rain
Event
No Sampling Performed No Qualifying Rain
Event
1 4 Medium
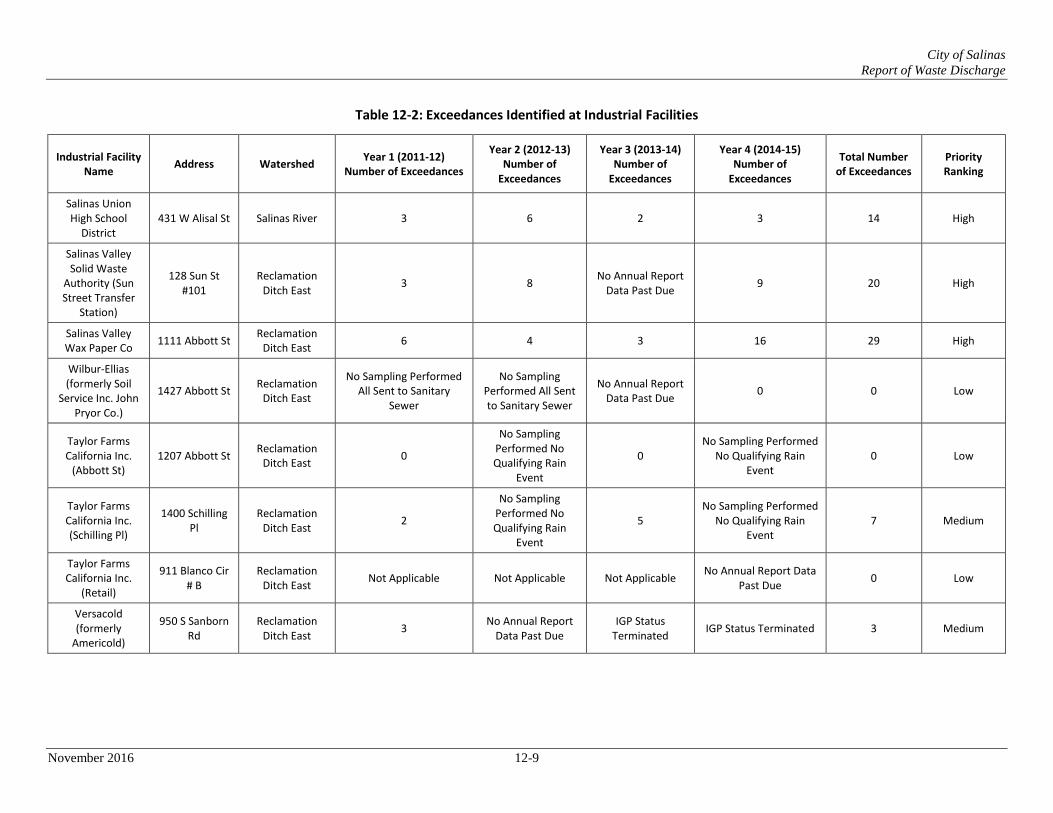
City of Salinas
Report of Waste Discharge
November 2016 12-9
Table 12-2: Exceedances Identified at Industrial Facilities
Industrial Facility Name
Address Watershed Year 1 (2011-12)
Number of Exceedances
Year 2 (2012-13) Number of
Exceedances
Year 3 (2013-14) Number of
Exceedances
Year 4 (2014-15) Number of
Exceedances
Total Number of Exceedances
Priority Ranking
Salinas Union High School
District 431 W Alisal St Salinas River 3 6 2 3 14 High
Salinas Valley Solid Waste
Authority (Sun Street Transfer
Station)
128 Sun St #101
Reclamation Ditch East
3 8 No Annual Report
Data Past Due 9 20 High
Salinas Valley Wax Paper Co
1111 Abbott St Reclamation
Ditch East 6 4 3 16 29 High
Wilbur-Ellias (formerly Soil
Service Inc. John Pryor Co.)
1427 Abbott St Reclamation
Ditch East
No Sampling Performed All Sent to Sanitary
Sewer
No Sampling Performed All Sent to Sanitary Sewer
No Annual Report Data Past Due
0 0 Low
Taylor Farms California Inc.
(Abbott St) 1207 Abbott St
Reclamation Ditch East
0
No Sampling Performed No Qualifying Rain
Event
0 No Sampling Performed
No Qualifying Rain Event
0 Low
Taylor Farms California Inc. (Schilling Pl)
1400 Schilling Pl
Reclamation Ditch East
2
No Sampling Performed No Qualifying Rain
Event
5 No Sampling Performed
No Qualifying Rain Event
7 Medium
Taylor Farms California Inc.
(Retail)
911 Blanco Cir # B
Reclamation Ditch East
Not Applicable Not Applicable Not Applicable No Annual Report Data
Past Due 0 Low
Versacold (formerly
Americold)
950 S Sanborn Rd
Reclamation Ditch East
3 No Annual Report
Data Past Due IGP Status
Terminated IGP Status Terminated 3 Medium
City of Salinas
Report of Waste Discharge
November 2016 12-10
12.2.2 High Priority Construction Sites
The Salinas NPDES Permit requested that the city identify criteria for high priority construction sites, implement the minimum requirements for high priority construction sites, and perform inspections of high priority construction sites. The data associated with these activities were reviewed to confirm their implementation. These activities were implemented, but their occurrence in urban subwatersheds could not be identified. Additionally, inspection ratings were not being assigned to construction inspections until Year 4 so the required data for data analysis was not available to assess.
12.2.3 Quantifying the Pollutant Load
12.2.3.1 Pollutant Loads Developed
Pollutant and trash load quantification is described in Sections 7 and 8, respectively, of this report. Pollutant loads were developed from literature values using the iWATR GIS analysis tool. Trash loads were developed using the trash loading rates from Section P.2.b.2.a of the permit and from recent studies performed in the San Francisco Bay area. The estimated pollutant loading could not be verified with the monitoring data due to very small sample sizes and limited applicable data. Additionally, monitoring data of receiving waters will need to consider pollutant loading of water entering the City that carries pollutants generated from the runoff of agricultural areas upstream from the City of Salinas. The reduction in trash loading corresponds at least in part to rapid trash assessments performed at four locations within the City. Continued evaluation of rapid trash assessments and the amount of trash collected through various programs and outreach efforts may help refine the baseline trash loading rates as well as the trash reduction rates.
12.2.3.2 Action Level Exceedance Data from Urban Catchment Action Level Pilot Project
As discussed in Section 10.2.2 of this report, there were no significant trends noticed for the constituents at the monitoring locations. This was primarily due to a very small sample size and very limited data. This limits the interpretation of the impact of Salinas’s stormwater on these sites, as the urbanization upstream of these sites is a possible contributor to the increase in concentrations and loads.
12.2.3.3 Stormwater Discharge Trend Monitoring Data
Due to the limitations and inconclusive results of determining the water quality trends and significance at the sites of concern for this permit term, it is difficult to estimate target pollutants and loading characteristics within the Urban Subwatersheds.

City of Salinas
Report of Waste Discharge
November 2016 12-11
12.2.4 Estimating the Exposure of Receiving Waters to Pollutant Delivery
12.2.4.1 Urban Subwatershed Runoff Volume Attributed to Development
As described in Section 9 of this report, the annual and 85th percentile runoff volumes were developed for predevelopment and existing conditions (See Tables 9-2, 9-3, 9-4, and 9-5). For both the annual and 85th percentile storm events, the runoff volume has increased an estimated 217% from predevelopment to existing conditions.
12.2.4.2 Storm Drain System Exposure Indicators
The limitations of this monitoring program prohibit identification of the urban subwatersheds contribution to the receiving waters. Though based on several agricultural and City’s monitoring stations, it is determined that the City background sites are a potential source of pollutant contamination at the downstream receiving water. Although, it is challenging to directly associate pollutant exceedances observed in background sites from those observed in the receiving water site.
12.2.5 Zones of Hydrologic Continuity between Surface and Groundwater
As described in the Year 4 Annual Report, the City, currently working with the Big Sur Land Trust, is acquiring 72+/- acres of the 500+/- acre Carr Lake, a currently intermittently inundated lake bed that has been drained by the Reclamation Ditch since the 1920’s. The City’s vision is to acquire most, if not all, of Carr Lake. Part of the City’s intent is to restore natural wetlands which once existed within Carr Lake to facilitate groundwater recharge, infiltration and improve water quality through the use of beneficial wetlands for treatment of existing runoff. Funding for land acquisition is part of the Prop. 1 funds the City is requesting. Per the Pure Water Monterey EIR Section 4.10.3.3, for the Salinas Valley Groundwater Basin, which is part of the Greater Monterey County IRWM region, the Central Coast RWQCB is currently conducting a study that is assessing salt and nutrient surface and groundwater levels, sources, and pathways in the lower Salinas River and Reclamation Ditch watersheds under a grant from the EPA. This work will include development of a simplified salt and nutrient groundwater/ surface water model of the lower Salinas River watershed and groundwater basins. Figure 12-1Figure 12-1 delineates the surface soils’ ability to infiltrate stormwater runoff to underlying strata based on typical characteristics of National Resource Conservation Service hydrologic soils groups and contains the locations of existing stormwater detention/retention ponds operated and maintained by the City. Retention ponds hold stormwater runoff and infiltrate/evapotranspire the pond volume and do not release the design storm volume. Detention ponds hold the design pond volume and meter the release of the stormwater runoff entering the pond for at a rate not exceeding the pre-existing rate of the site.

City of Salinas
Report of Waste Discharge
November 2016 12-12
The exhibit also shows historical lake/”swamps” within or adjacent to the City of Salinas which are inundated during the rainy season once the capacity of downstream creeks/ditches/culverts have been reached and the underlying ground has been saturated to the point of the flow into the area exceeding the in situ infiltration rate. The north of Boronda Future Growth Area will be required by the City of Salinas to provide site/parcel based Post-Construction Best Management Practices (PCBMPs) to the Maximum Extent Practicable (MEP). The PCBMPs will be supplemented by detention/retention ponds located along Gabilan and Natividad Creeks to enhance groundwater re-charge. These ponds will be located in the area best suited for infiltration (along both creeks). The ponds will restore watershed processes for base flow and groundwater re-charge and will be landscaped in a manner to promote water quality through natural filtering.
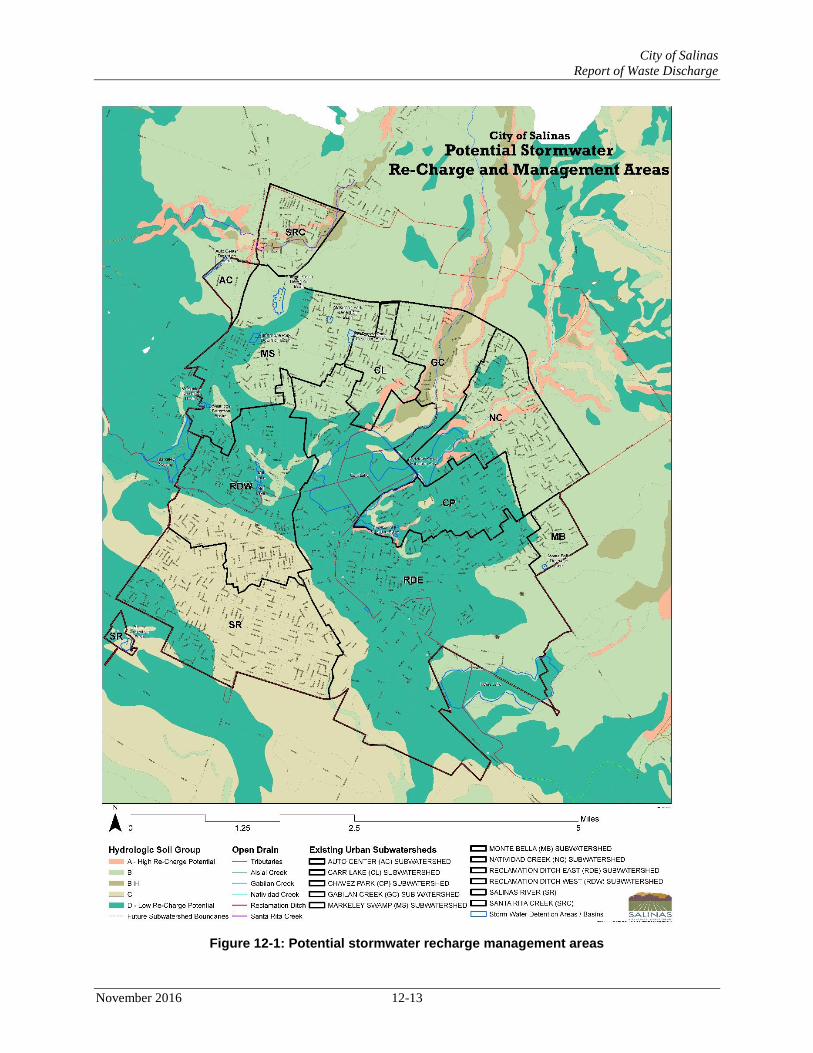
City of Salinas
Report of Waste Discharge
November 2016 12-13
Figure 12-1: Potential stormwater recharge management areas
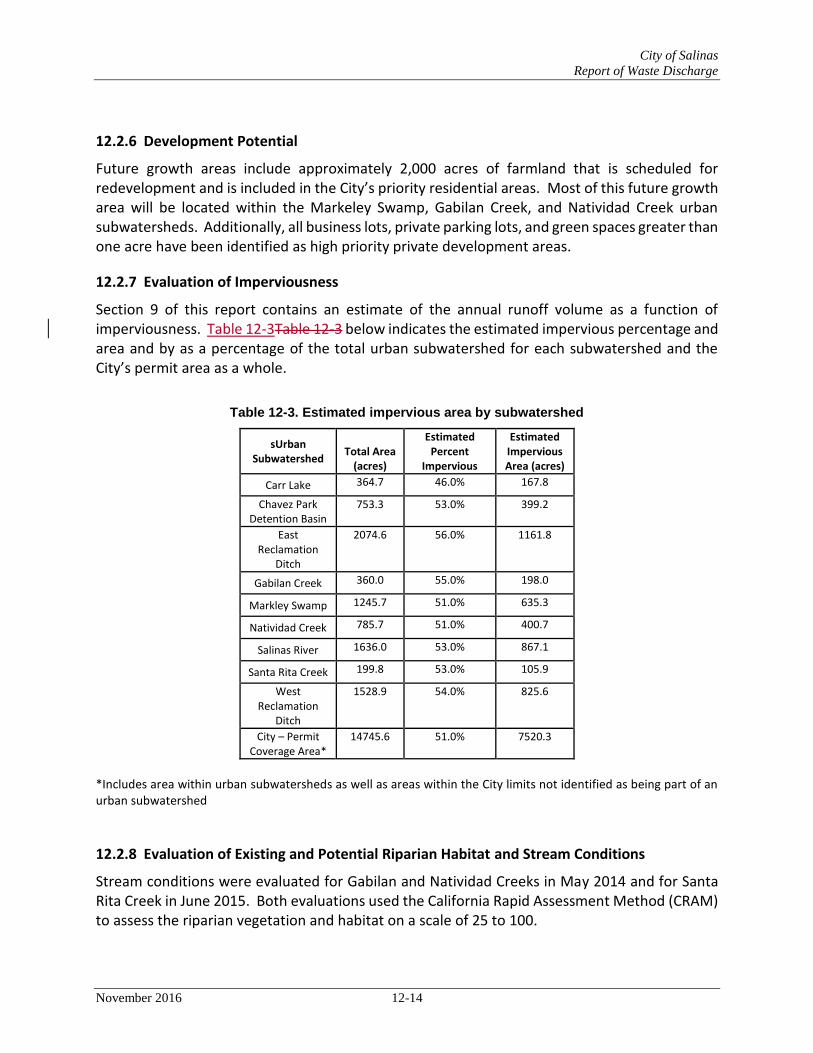
City of Salinas
Report of Waste Discharge
November 2016 12-14
12.2.6 Development Potential
Future growth areas include approximately 2,000 acres of farmland that is scheduled for redevelopment and is included in the City’s priority residential areas. Most of this future growth area will be located within the Markeley Swamp, Gabilan Creek, and Natividad Creek urban subwatersheds. Additionally, all business lots, private parking lots, and green spaces greater than one acre have been identified as high priority private development areas.
12.2.7 Evaluation of Imperviousness
Section 9 of this report contains an estimate of the annual runoff volume as a function of imperviousness. Table 12-3Table 12-3 below indicates the estimated impervious percentage and area and by as a percentage of the total urban subwatershed for each subwatershed and the City’s permit area as a whole.
Table 12-3. Estimated impervious area by subwatershed
sUrban Subwatershed
Total Area (acres)
Estimated Percent
Impervious
Estimated Impervious Area (acres)
Carr Lake 364.7 46.0% 167.8
Chavez Park Detention Basin
753.3 53.0% 399.2
East Reclamation
Ditch
2074.6 56.0% 1161.8
Gabilan Creek 360.0 55.0% 198.0
Markley Swamp 1245.7 51.0% 635.3
Natividad Creek 785.7 51.0% 400.7
Salinas River 1636.0 53.0% 867.1
Santa Rita Creek 199.8 53.0% 105.9
West Reclamation
Ditch
1528.9 54.0% 825.6
City – Permit Coverage Area*
14745.6 51.0% 7520.3
*Includes area within urban subwatersheds as well as areas within the City limits not identified as being part of an urban subwatershed
12.2.8 Evaluation of Existing and Potential Riparian Habitat and Stream Conditions
Stream conditions were evaluated for Gabilan and Natividad Creeks in May 2014 and for Santa Rita Creek in June 2015. Both evaluations used the California Rapid Assessment Method (CRAM) to assess the riparian vegetation and habitat on a scale of 25 to 100.

City of Salinas
Report of Waste Discharge
November 2016 12-15
CRAM scores for Gabilan Creek ranged from 51 to 73 with 76% of the studied reaches being rated as “good” condition and 34% as “fair condition. For Natividad Creek, 54% was determined to be “fair” and 46% “poor” condition. Scores for Santa Rita Creek ranged from 27 to 54 with 52% of the stream in the “fair” category and 48% in the poor category. The report also indicated that there is a high potential for creek restoration that would greatly improve the ecological condition of Santa Rita Creek. The Santa Rita Creek evaluation also stated that “The Reclamation Ditch, which is a highly modified section of Alisal Creek that flows through the City, was not assessed due to the extensive management of the creek and riparian area, and low restoration potential.”
12.3 Urban Subwatershed Program Effectiveness Rating
Each urban subwatershed was rated “Low” or “High” concerning risk of impact to watershed processes and beneficial uses and the extended and degree of alteration of watershed processes and beneficial uses based on the data and information presented in this ROWD. Significant factors that impacted the ratings included degree of imperviousness, number of industrial facility exceedance events, stream assessment findings, pollutant loadings, etc.
Urban Subwatershed
Risk of Impact to Watershed Processes and Beneficial Uses
Extent and Degree of Alteration of Watershed Processes and Beneficial
Uses
Category
Carr Lake Low Low 1 (Low Risk/Low Alteration)
Chavez Park High High 4 (High Risk/High Alteration)
Reclamation Ditch East High High 4 (High Risk/High Alteration)
Gabilan Creek High Low 3 High Risk/Low Alteration)
Markley Swamp High High 4 (High Risk/High Alteration)
Natividad Creek High High 4 (High Risk/High Alteration)
Salinas River Low Low 1 (Low Risk/Low Alteration)
Santa Rita Creek High High 4 (High Risk/High Alteration)
Reclamation Ditch West High High 4 (High Risk/High Alteration)