Embed Size (px)
Citation preview
City of Saint Paul Minnesota
Comprehensive Annual Financial Report For the Fiscal Year Ended
December 31, 2005
Office of Financial Services Matt Smith, Director
City of Saint Paul
Comprehensive Annual Financial Report For the Fiscal Year Ended December 31, 2005
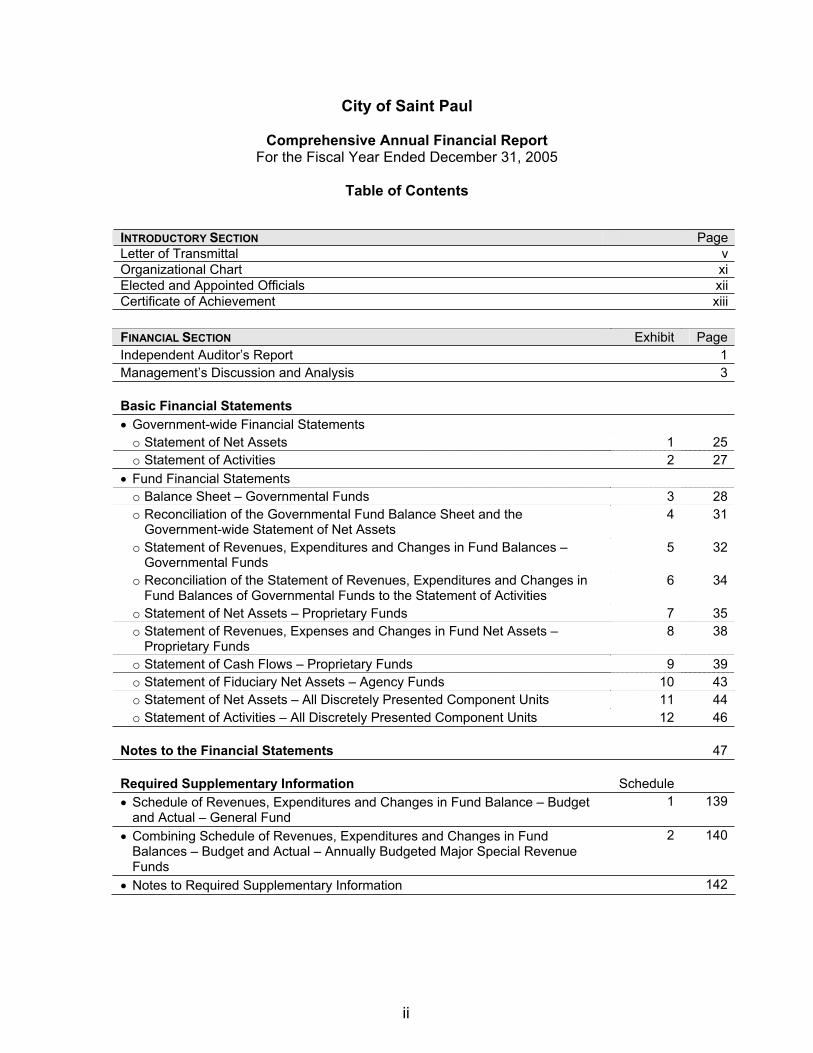
Table of Contents
INTRODUCTORY SECTION PageLetter of Transmittal vOrganizational Chart xiElected and Appointed Officials xiiCertificate of Achievement xiii
FINANCIAL SECTION Exhibit PageIndependent Auditor’s Report 1 Management’s Discussion and Analysis 3
Basic Financial Statements Government-wide Financial Statements o Statement of Net Assets 1 25 o Statement of Activities 2 27
Fund Financial Statements o Balance Sheet – Governmental Funds 3 28 o Reconciliation of the Governmental Fund Balance Sheet and the
Government-wide Statement of Net Assets 4 31
o Statement of Revenues, Expenditures and Changes in Fund Balances – Governmental Funds
5 32
o Reconciliation of the Statement of Revenues, Expenditures and Changes in Fund Balances of Governmental Funds to the Statement of Activities
6 34
o Statement of Net Assets – Proprietary Funds 7 35 o Statement of Revenues, Expenses and Changes in Fund Net Assets –
Proprietary Funds 8 38
o Statement of Cash Flows – Proprietary Funds 9 39 o Statement of Fiduciary Net Assets – Agency Funds 10 43 o Statement of Net Assets – All Discretely Presented Component Units 11 44 o Statement of Activities – All Discretely Presented Component Units 12 46
Notes to the Financial Statements 47
Required Supplementary Information Schedule Schedule of Revenues, Expenditures and Changes in Fund Balance – Budget and Actual – General Fund
1 139
Combining Schedule of Revenues, Expenditures and Changes in Fund Balances – Budget and Actual – Annually Budgeted Major Special Revenue Funds
2 140
Notes to Required Supplementary Information 142
ii
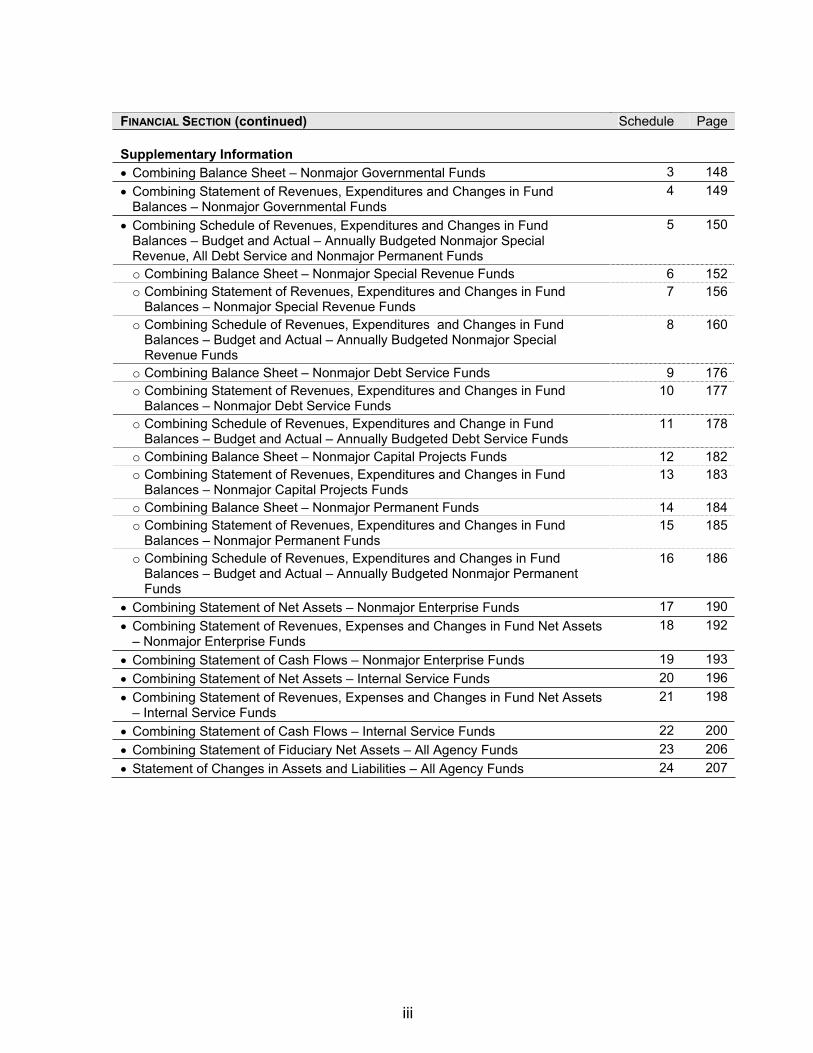
FINANCIAL SECTION (continued) Schedule Page
Supplementary Information Combining Balance Sheet – Nonmajor Governmental Funds 3 148 Combining Statement of Revenues, Expenditures and Changes in Fund Balances – Nonmajor Governmental Funds
4 149
Combining Schedule of Revenues, Expenditures and Changes in Fund Balances – Budget and Actual – Annually Budgeted Nonmajor Special Revenue, All Debt Service and Nonmajor Permanent Funds
5 150
o Combining Balance Sheet – Nonmajor Special Revenue Funds 6 152 o Combining Statement of Revenues, Expenditures and Changes in Fund
Balances – Nonmajor Special Revenue Funds 7 156
o Combining Schedule of Revenues, Expenditures and Changes in Fund Balances – Budget and Actual – Annually Budgeted Nonmajor Special Revenue Funds
8 160
o Combining Balance Sheet – Nonmajor Debt Service Funds 9 176 o Combining Statement of Revenues, Expenditures and Changes in Fund
Balances – Nonmajor Debt Service Funds 10 177
o Combining Schedule of Revenues, Expenditures and Change in Fund Balances – Budget and Actual – Annually Budgeted Debt Service Funds
11 178
o Combining Balance Sheet – Nonmajor Capital Projects Funds 12 182 o Combining Statement of Revenues, Expenditures and Changes in Fund
Balances – Nonmajor Capital Projects Funds 13 183
o Combining Balance Sheet – Nonmajor Permanent Funds 14 184 o Combining Statement of Revenues, Expenditures and Changes in Fund
Balances – Nonmajor Permanent Funds 15 185
o Combining Schedule of Revenues, Expenditures and Changes in Fund Balances – Budget and Actual – Annually Budgeted Nonmajor Permanent Funds
16 186
Combining Statement of Net Assets – Nonmajor Enterprise Funds 17 190 Combining Statement of Revenues, Expenses and Changes in Fund Net Assets – Nonmajor Enterprise Funds
18 192
Combining Statement of Cash Flows – Nonmajor Enterprise Funds 19 193 Combining Statement of Net Assets – Internal Service Funds 20 196 Combining Statement of Revenues, Expenses and Changes in Fund Net Assets – Internal Service Funds
21 198
Combining Statement of Cash Flows – Internal Service Funds 22 200 Combining Statement of Fiduciary Net Assets – All Agency Funds 23 206 Statement of Changes in Assets and Liabilities – All Agency Funds 24 207
iii
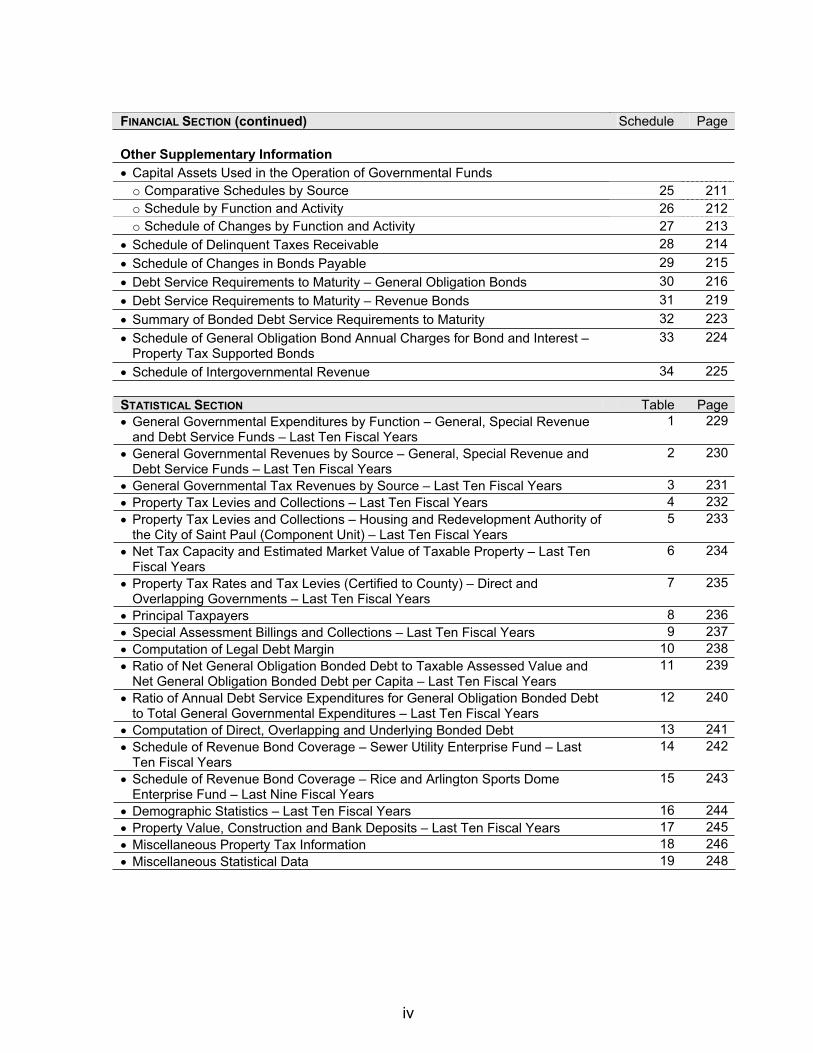
FINANCIAL SECTION (continued) Schedule Page
Other Supplementary Information Capital Assets Used in the Operation of Governmental Funds o Comparative Schedules by Source 25 211 o Schedule by Function and Activity 26 212 o Schedule of Changes by Function and Activity 27 213
Schedule of Delinquent Taxes Receivable 28 214 Schedule of Changes in Bonds Payable 29 215 Debt Service Requirements to Maturity – General Obligation Bonds 30 216 Debt Service Requirements to Maturity – Revenue Bonds 31 219 Summary of Bonded Debt Service Requirements to Maturity 32 223 Schedule of General Obligation Bond Annual Charges for Bond and Interest – Property Tax Supported Bonds
33 224
Schedule of Intergovernmental Revenue 34 225
STATISTICAL SECTION Table Page General Governmental Expenditures by Function – General, Special Revenue and Debt Service Funds – Last Ten Fiscal Years
1 229
General Governmental Revenues by Source – General, Special Revenue and Debt Service Funds – Last Ten Fiscal Years
2 230
General Governmental Tax Revenues by Source – Last Ten Fiscal Years 3 231 Property Tax Levies and Collections – Last Ten Fiscal Years 4 232 Property Tax Levies and Collections – Housing and Redevelopment Authority of the City of Saint Paul (Component Unit) – Last Ten Fiscal Years
5 233
Net Tax Capacity and Estimated Market Value of Taxable Property – Last Ten Fiscal Years
6 234
Property Tax Rates and Tax Levies (Certified to County) – Direct and Overlapping Governments – Last Ten Fiscal Years
7 235
Principal Taxpayers 8 236 Special Assessment Billings and Collections – Last Ten Fiscal Years 9 237 Computation of Legal Debt Margin 10 238 Ratio of Net General Obligation Bonded Debt to Taxable Assessed Value and Net General Obligation Bonded Debt per Capita – Last Ten Fiscal Years
11 239
Ratio of Annual Debt Service Expenditures for General Obligation Bonded Debt to Total General Governmental Expenditures – Last Ten Fiscal Years
12 240
Computation of Direct, Overlapping and Underlying Bonded Debt 13 241 Schedule of Revenue Bond Coverage – Sewer Utility Enterprise Fund – Last Ten Fiscal Years
14 242
Schedule of Revenue Bond Coverage – Rice and Arlington Sports Dome Enterprise Fund – Last Nine Fiscal Years
15 243
Demographic Statistics – Last Ten Fiscal Years 16 244 Property Value, Construction and Bank Deposits – Last Ten Fiscal Years 17 245 Miscellaneous Property Tax Information 18 246 Miscellaneous Statistical Data 19 248
iv

INTRODUCTORY SECTION
C I T Y O F S A I N T P A U L C O M P R E H E N S I V E A N N U A L F I N A N C I A L R E P O R T
AA-ADA-EEO Employer
Office of the Mayor Office of Financial Services
Matt Smith, Director
City of Saint Paul 700 City Hall Telephone: (651) 266-8800 Mayor Christopher B. Coleman 15 West Kellogg Boulevard Facsimile: (651) 266-8541 Saint Paul, Minnesota 55102-1658
June 30, 2006
To the Honorable Mayor, Members of the City Council, and Citizens of Saint Paul:
The City of Saint Paul’s Comprehensive Annual Financial Report (CAFR) for the fiscal year ended December 31, 2005 is hereby submitted. The purpose of this report is to provide the Mayor, City Council, City Staff, citizens, bondholders and other interested parties with useful information concerning the City’s operations and financial position. Responsibility for both the accuracy of data and the completeness and fairness of the presentation, including all disclosures, rests with the City.
The CAFR is presented in three main sections:
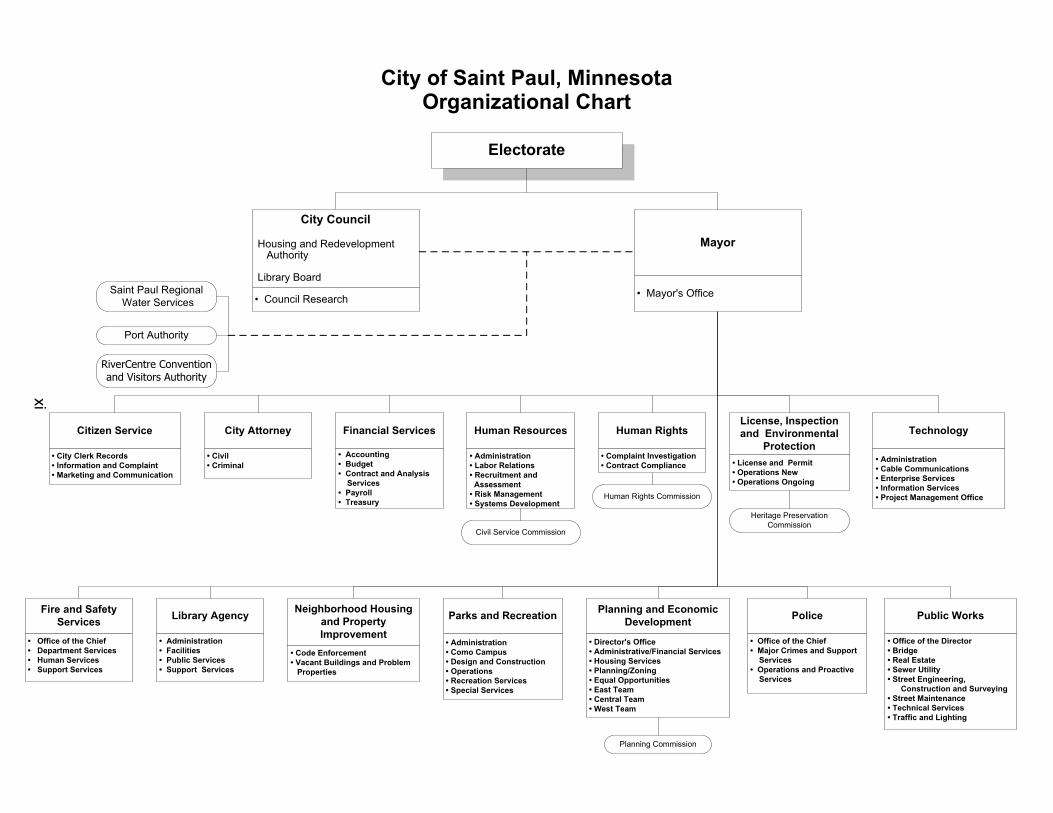
1. Introductory Section - includes this transmittal letter, the City’s organizational chart and a list of principal officials.
2. Financial Section - includes the independent auditor’s report, Management’s Discussion and Analysis (MD&A), the basic financial statements, notes to the financial statements and supplementary information.
3. Statistical Section - contains selected financial and demographic information presented on a multi-year basis.
Generally Accepted Accounting Principles (GAAP) require that the City provide a narrative introduction, overview and analysis to accompany the basic financial statements in the form of Management’s Discussion and Analysis (MD&A). This letter of transmittal is designed to complement the MD&A and should be read in conjunction with it. The City of Saint Paul’s MD&A can be found immediately following the report of the independent auditors.
INTERNAL CONTROL
To provide a reasonable basis for making these representations, the City of Saint Paul has established a comprehensive internal control framework that is designed to protect the government’s assets from loss, theft or misuse and to compile sufficient reliable information for the preparation of the City of Saint Paul’s financial statements in conformity with Generally Accepted Accounting Principles. Because the cost of internal controls should not outweigh their benefits, the City of Saint Paul’s comprehensive framework of internal controls has been designed to provide a reasonable, rather than absolute, assurance that the financial statements will be free from material misstatement. All internal control evaluations occur within this framework. To the best of our knowledge and belief, this financial report is complete and reliable in all material respects.
v
INDEPENDENT AUDIT
State law requires the State Auditor to perform an annual audit of the City and other cities of the first class in Minnesota. The goal of the independent audit is to provide reasonable assurance that the financial statements of the City of Saint Paul for the fiscal year ended December 30, 2005 are free of material misstatement. The independent audit involved examining, on a test basis, evidence supporting the amounts and disclosures in the financial statements, assessing the accounting principles used and significant estimates made by the City, and evaluating the overall financial statement presentation. The independent auditor concluded, based upon the audit, that there was a reasonable basis for rendering an unqualified opinion that the City of Saint Paul’s financial statements for the fiscal year ended December 31, 2005 are fairly presented in conformity with GAAP.The State Auditor’s report is presented as the first component of the financial section of this report. As part of their examination, the State Auditor is also issuing a Management and Compliance letter covering the review of the City’s system of internal control over financial reporting and tests of compliance with certain provisions of laws, regulations, contracts, grant agreements and other matters. The Management and Compliance letter will not modify or affect, in any way, this report.
The City is required to undergo an annual single audit in conformity with the provisions of the Single Audit Act Amendments of 1996 and U.S. Office of Management and Budget Circular A-133, Audits of States, Local Governments, and Non-Profit Organizations. Information related to this single auditCincluding the schedule of expenditures of federal awards, findings and recommendations, and auditor’s reports on internal control over financial reporting and tests of compliance with certain provisions of laws, regulations, contracts and grantsCwillbe included in the State Auditor’s separately-issued Management and Compliance letter.
PROFILE OF THE GOVERNMENT
The City of Saint Paul has been a municipal corporation since 1854. Saint Paul is the state capital and Minnesota’s second largest city. The City covers an area of 56 square miles and is situated wholly in Ramsey County. Saint Paul’s 2004 population, per the Metropolitan Council, is 287,410. Data recorded by the Metropolitan Council indicates that the number of households in the City has remained relatively stable, and is 112,668 for 2004, a 2.2% increase from 1990.
The City of Saint Paul, Minnesota has a Mayor-Council form of government. The Mayor is elected by the voters of the City at large for four years on a full-time basis. The City is divided into seven wards. Voters of each ward elect a member of the City Council for four years on a part-time basis. Executive power is vested in the Mayor; legislative power is vested in the Council. The Mayor has veto power, which the Council may override with a vote of five members.
City services include: police, fire, street, sewer and bridge maintenance, parks and recreation centers, libraries, licensing, building and housing code inspections, planning and economic development, zoning, public improvements and general administration.
REPORTING ENTITY
The City’s financial statements include all funds of the City (primary government) and its component units. The primary government represents all funds under the ultimate control of the Mayor and City Council. The Library Agency and Housing and Redevelopment Authority (HRA) are legally separate; however they both function in essence as a department of the City of Saint Paul and, therefore, have been included as an integral part of the City of Saint Paul’s financial statements. The City of Saint Paul is also financially accountable for the legally separate Saint Paul RiverCentre Convention & Visitors Authority, Saint Paul Regional Water Services and the Port Authority of the City of Saint Paul, all of which are reported separately as component units within the City of Saint Paul’s financial statements. The nature of the activities of these organizations and the specific justification and methods for inclusion as component units of the City are discussed in the notes to the financial statements.
vi
BUDGET CONTROL
The annual budget serves as a foundation for the City of Saint Paul’s financial planning and control. In August of each year, the Mayor presents the budget to the City Council for the following calendar year. The budget includes proposed expenditures and means of financing them. The Council then holds a public hearing to obtain taxpayer comments. The budget is legally adopted through the passage of a Council resolution.
City budget amendments that authorize an increase in total fund spending require approval of the City Council. In addition, City Council approval is required for budget amendments transferring appropriations between departments within the General Fund.
Budget-to-actual comparisons are provided in this report for each individual governmental fund for which an appropriated annual budget has been adopted. For the General Fund, Library Agency and the HRA General Fund, this is presented on pages 139-141 as part of the required supplementary comparison information. For other governmental funds with appropriated annual budgets, this comparison is presented in the governmental fund subsection of this report, which starts on page 148.
ECONOMIC OUTLOOK
Saint Paul is an important part of the overall strong Twin Cities metro area economy, and is poised for solid growth as the national economic recovery continues.
Saint Paul compares favorably when ranked among the 20 largest northeast and Midwest cities on certain economic and social factors1.
2nd lowest in unemployment rate 2nd lowest in percent of people below poverty level (13.9%) 3rd highest in percent of population over 25 years with a bachelor’s degree (33.6%) 6th highest in percent of housing that is owner occupied (55%) 6th highest in median value of owner-occupied houses ($173,204) 8th highest in median household income ($38,731)
Over the years, Saint Paul has consistently registered a lower unemployment rate than that of the U.S. as a whole.For 2005, the City’s 4.4% unemployment rate was lower than the U.S. rate of 5.1%. Saint Paul’s employment is spread among twelve “super-sectors,” with the largest employers being education and health services (48,640 jobs in 2004; 28% of total). The average annual wage in 2005 was $43,784.
Similarly, tax base growth has been strong and sustained: From Pay 2002 to Pay 2006, Saint Paul’s taxable market values have increased 65%. Relatively high incomes and moderate housing costs combine to rank Saint Paul comparatively high in overall housing affordability.
1 The cities are Baltimore, Boston, Buffalo, Chicago, Cincinnati, Cleveland, Columbus, Detroit, Indianapolis, Kansas City, Milwaukee,Minneapolis, New York, Newark, Omaha, Philadelphia, Pittsburgh, St. Louis and Toledo.
vii
MAJOR INITIATIVES
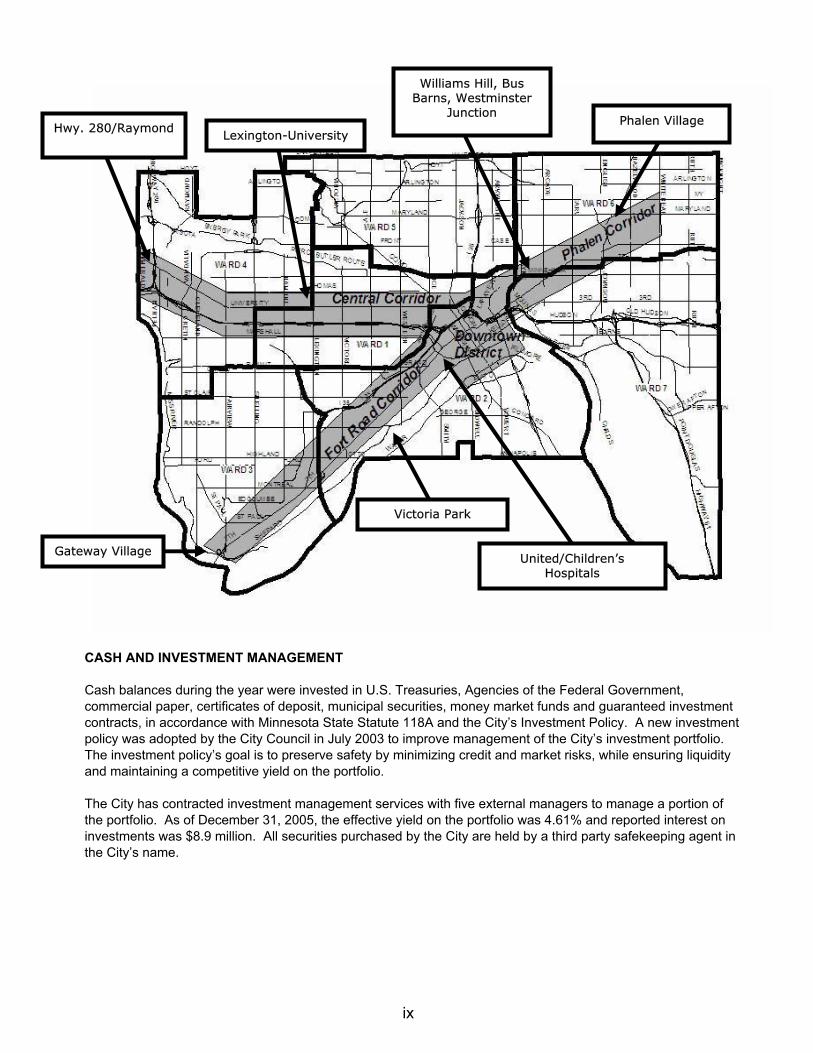
Economic Development To maintain this economic growth, the City will continue to develop and implement strategic plans to encourage private investment in housing and economic development projects in Saint Paul, the results of which can be seen below.
Citywide housing development: Four years ago, with vacancy rates hovering around 1%, the City established the Housing 5000 Program to accelerate housing development. The ambitious goal was the closing on the financing for 5,000 units of new and substantially rehabilitated housing by the end of 2005, 1,000 of which would be affordable. When the Program ended, it had closed on the financing for 5,370 new and substantially rehabilitated units and closed on the financing for 1,173 affordable units.
Phalen Corridor revitalization: The formerly-blighted Phalen Corridor, which runs northeast from downtown to the Phalen Village neighborhood, has been transformed. The last section of the new 2.5-mile, $61 million Phalen Boulevard opened last fall, connecting the East Side directly to Interstate 35E. At Phalen Village on the east end, more than 1,000 units of housing have been developed or rehabilitated, a failed shopping center has been demolished, commercial uses have been repositioned onto Maryland Avenue, and a $60 million building for the State Bureau of Criminal Apprehension has been built. At Williams Hill on the west end, the Williams Hill Business Center, the Metro Transit bus barns and Westminster Junction Business Center have been developed, which together have almost 1,500 new jobs. With most of the blighting influences in the Phalen Corridor removed, hundreds of units of new ownership and rental housing are being built in the adjacent neighborhoods.
Central Corridor revitalization: The Central Corridor, running along University Avenue from the State Capitol to Minneapolis, has attracted significant investment in the past few years, and stands to attract more in the future if Light Rail Transit (LRT) is developed on University Avenue in the next few years. At the western edge of the Central Corridor, 575 units of new housing have been built or are being developed, and Saint Paul’s state-designated Bioscience Zone is operating, the centerpiece of which is the $24 million, 125,000 square foot, state-of-the-art bioscience incubator operated by University Enterprise Laboratories. Just to the east of Highway 280, construction has started on the Carleton Place Lofts, with 169 units of rental housing being developed out of three vacant warehouses. At the southwest corner of Fairview and University, Episcopal Homes has developed two new senior housing buildings. The southwest corner of Lexington and University is being redeveloped for commercial and residential uses, with Aldi’s grocery and TCF Bank now open and the Wilder Foundation headquarters and Episcopal Homes senior housing on the drawing boards. At the southwest corner of Dale and University, a $24 million, four-story, mixed use project with the Rondo Library on the first floor and 98 affordable residential rental units above, will open this summer.
Fort Road: Running southwest from downtown to Fort Snelling, Fort Road has seen significant development in the past few years. At Gateway Village across from Fort Snelling, 578 units of new rental and ownership housing have been developed. To the east at Victoria Park, 245 housing units for all incomes and life cycles will be built on the bluffs overlooking the Mississippi River. At the western edge of the downtown, United and Children’s Hospitals are nearing the end of their decade-long $41 million expansion, which has already added most of the projected 800 jobs to the existing base of 3,000 medical workers.
The Central Business District: The downtown extends from the State Capitol campus on the north to the West Side Flats across the river. RiverCentre opened in 1998, the Xcel Hockey Arena opened in 2000, and the RiverCentre tunnel, which links both of them to the skyway system and downtown hotels, opened in 2002.Important headquarters companies have expanded downtown, including the Saint Paul Companies, Minnesota Mutual and Ecolab. In 2003, US Bancorp moved its downtown employees into a new 350,000 square foot. back office operations center across the river. In 2005, the State of Minnesota completed two new downtown office buildings adjacent to Interstate 94. The north edge of downtown has grown into a cultural district with the McNally-Smith Music College, a new Minnesota Public Radio building, the Fitzgerald Theater and the Minnesota Business Academy, all within a block of Fitzgerald Park. Since 2002, about 1,400 new housing units have been, and are being developed in new and rehabilitated buildings in four downtown neighborhoods: Lowertown, the North Quadrant, the Upper Landing and the West Side Flats. Some of these units have been in obsolete office buildings converted into apartments and condominiums, which has helped reduce the amount of uncompetitive Class C office space.
viii
CASH AND INVESTMENT MANAGEMENT
Cash balances during the year were invested in U.S. Treasuries, Agencies of the Federal Government, commercial paper, certificates of deposit, municipal securities, money market funds and guaranteed investment contracts, in accordance with Minnesota State Statute 118A and the City’s Investment Policy. A new investment policy was adopted by the City Council in July 2003 to improve management of the City’s investment portfolio.The investment policy’s goal is to preserve safety by minimizing credit and market risks, while ensuring liquidity and maintaining a competitive yield on the portfolio.
The City has contracted investment management services with five external managers to manage a portion of the portfolio. As of December 31, 2005, the effective yield on the portfolio was 4.61% and reported interest on investments was $8.9 million. All securities purchased by the City are held by a third party safekeeping agent in the City’s name.
Hwy. 280/Raymond Phalen Village
Victoria Park
United/Children’s Hospitals
Lexington-University
Williams Hill, Bus Barns, Westminster
Junction
Gateway Village
ix
DEBT MANAGEMENT
The City of Saint Paul partners with Ramsey County and Independent School District #625 (Saint Paul Public Schools) as members of the Joint Property Tax Advisory Committee (JPTAC). The JPTAC, created by Minnesota law, is charged with the obligation to reduce the overall tax burden on the citizens of Saint Paul. The Joint Debt Advisory Committee (JDAC), a subcommittee of JPTAC, is charged with overseeing and reporting to the public on joint debt activities. This group evaluates compliance by the jurisdictions within the adopted target ranges for satisfactory debt management and releases its findings in the Joint Debt Book, which is published every two years. The 2005 Joint Debt Report is currently under production and will be released later this year.
The City maintained its AAA bond rating from Standard & Poor’s and Aa2 bond rating from Moody’s due to strong management and financial performance. In addition to the interest cost savings from having a high bond rating, the City took advantage of low interest rates to refund the 1996 Recreational Facilities Gross Revenue Bonds and the 1995 General Obligation Taxable Tax Increment Bonds, resulting in net present value benefits of $246,971 and $977,430, respectively.
The City also entered into its first interest rate swap agreement as a debt management tool to lower interest rate costs on the 1999 Sales Tax Revenue Bonds, with estimated savings of approximately $500,000 per year beginning in 2009.
RISK MANAGEMENT
The City has a centralized Risk and Employee Benefit Management Division within the Office of Human Resources that provides direction, management, coordination and planning services for risk, insurance and employee benefit programs. The risk management effort covers significant loss exposures, applies effective and reasonable risk controls and suggests funding arrangements for both insured and self-funded risks to ensure that the financial integrity of the City is not impaired after a loss.
The Risk and Employee Benefit Management Division also provides administrative and management services in the areas of health and welfare benefits, tort liability, workers’ compensation, occupational health, loss control and safety, emergency preparedness, contract review and property insurance. Additional information on the City of Saint Paul’s risk management activities can be found in Note VIII. C. of the notes to the financial statements.
AWARDS AND ACKNOWLEDGMENTS
The Government Finance Officers Association of the United States and Canada (GFOA) awarded a Certificate of Achievement for Excellence in Financial Reporting to the City of Saint Paul, Minnesota for its Comprehensive Annual Financial Report (CAFR) for the fiscal year ended December 31, 2004. This was the 29th consecutive year that the City has received this prestigious award. In order to be awarded a Certificate of Achievement, a government must publish an easily readable and efficiently-organized Comprehensive Annual Financial Report.This report must satisfy both generally accepted accounting principles and applicable legal requirements.
A Certificate of Achievement is valid for a period of one year only. We believe our current Comprehensive Annual Financial Report continues to meet the Certificate of Achievement Program’s requirements and we are submitting it to the GFOA to determine its eligibility for another certificate.
The preparation of the 2005 Comprehensive Annual Financial Report was accomplished through the combined efforts of the Office of Financial Services’ accounting staff and departmental accountants. The State Auditor’s cooperation in scheduling staff to review statements as they were prepared was very helpful and appreciated.
Cordially,
Matt Smith, Director Office of Financial Services
x
City of Saint Paul, Minnesota
Electorate
City Council
Housing and Redevelopment Authority
Library Board
Mayor
License, Inspection and Environmental
Protection• License and Permit• Operations New• Operations Ongoing
City Attorney
• Civil• Criminal
Human RightsHuman Resources
• Administration• Labor Relations• Recruitment and Assessment • Risk Management• Systems Development
Technology
• Administration• Cable Communications• Enterprise Services• Information Services• Project Management Office
Fire and Safety Services
• Office of the Chief• Department Services• Human Services• Support Services
Library Agency
• Administration• Facilities• Public Services• Support Services
Parks and Recreation
• Administration• Como Campus• Design and Construction• Operations• Recreation Services• Special Services
Planning and Economic Development Police
• Office of the Chief• Major Crimes and Support Services• Operations and Proactive Services
Public Works
• Office of the Director• Bridge• Real Estate• Sewer Utility• Street Engineering, Construction and Surveying• Street Maintenance• Technical Services• Traffic and Lighting
• Director's Office• Administrative/Financial Services• Housing Services • Planning/Zoning• Equal Opportunities• East Team• Central Team• West Team
Citizen Service
• City Clerk Records• Information and Complaint• Marketing and Communication
Civil Service Commission
Human Rights Commission
Saint Paul Regional Water Services
Port Authority
RiverCentre Convention and Visitors Authority
• Complaint Investigation• Contract Compliance
Planning Commission
Heritage Preservation Commission
Organizational Chart
Financial Services
• Accounting• Budget• Contract and Analysis Services• Payroll• Treasury
• Council Research • Mayor's Office
Neighborhood Housing and Property Improvement
• Code Enforcement• Vacant Buildings and Problem Properties
xi
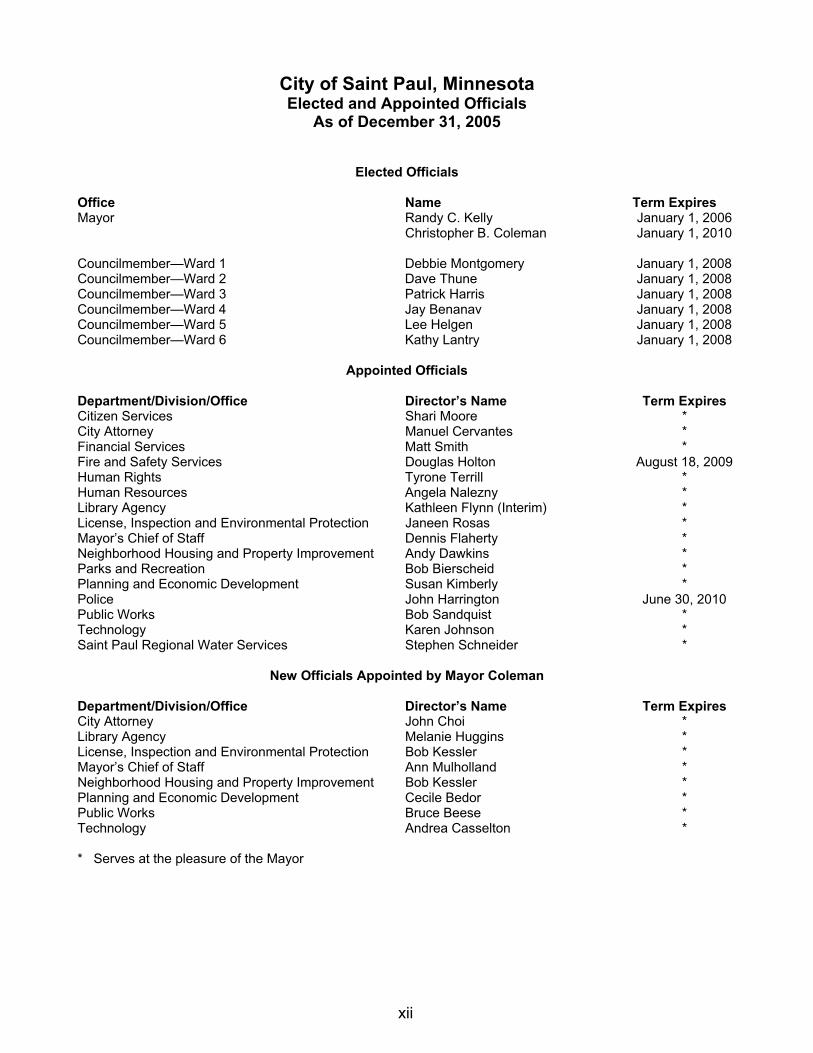
City of Saint Paul, Minnesota Elected and Appointed Officials
As of December 31, 2005
Elected Officials Office Name Term Expires Mayor Randy C. Kelly January 1, 2006 Christopher B. Coleman January 1, 2010 Councilmember—Ward 1 Debbie Montgomery January 1, 2008 Councilmember—Ward 2 Dave Thune January 1, 2008 Councilmember—Ward 3 Patrick Harris January 1, 2008 Councilmember—Ward 4 Jay Benanav January 1, 2008 Councilmember—Ward 5 Lee Helgen January 1, 2008 Councilmember—Ward 6 Kathy Lantry January 1, 2008
Appointed Officials Department/Division/Office Director’s Name Term Expires Citizen Services Shari Moore * City Attorney Manuel Cervantes * Financial Services Matt Smith * Fire and Safety Services Douglas Holton August 18, 2009 Human Rights Tyrone Terrill * Human Resources Angela Nalezny * Library Agency Kathleen Flynn (Interim) * License, Inspection and Environmental Protection Janeen Rosas * Mayor’s Chief of Staff Dennis Flaherty * Neighborhood Housing and Property Improvement Andy Dawkins * Parks and Recreation Bob Bierscheid * Planning and Economic Development Susan Kimberly * Police John Harrington June 30, 2010 Public Works Bob Sandquist * Technology Karen Johnson * Saint Paul Regional Water Services Stephen Schneider *
New Officials Appointed by Mayor Coleman Department/Division/Office Director’s Name Term Expires City Attorney John Choi * Library Agency Melanie Huggins * License, Inspection and Environmental Protection Bob Kessler * Mayor’s Chief of Staff Ann Mulholland * Neighborhood Housing and Property Improvement Bob Kessler * Planning and Economic Development Cecile Bedor * Public Works Bruce Beese * Technology Andrea Casselton * * Serves at the pleasure of the Mayor
xii
Certificate of
Presented to
City of Saint Paul,
For its Comprehensive Annual
December 31, 2004
President
Executive Director
Financial Reportfor the Fiscal Year Ended
Reportingin Financial
for ExcellenceAchievement
Text38: Minnesota
A Certificate of Achievement for Excellence in FinancialReporting is presented by the Government Finance Officers
Association of the United States and Canada togovernment units and public employee retirement
systems whose comprehensive annual financialreports (CAFRs) achieve the higheststandards in government accounting
and financial reporting.

FINANCIAL SECTION
C I T Y O F S A I N T P A U L C O M P R E H E N S I V E A N N U A L F I N A N C I A L R E P O R T
An Equal Opportunity Employer
PATRICIA ANDERSON STATE AUDITOR
STATE OF MINNESOTAOFFICE OF THE STATE AUDITOR
SUITE 500 525 PARK STREET
SAINT PAUL, MN 55103-2139
(651) 296-2551 (Voice) (651) 296-4755 (Fax)
[email protected] (E-mail) 1-800-627-3529 (Relay Service)
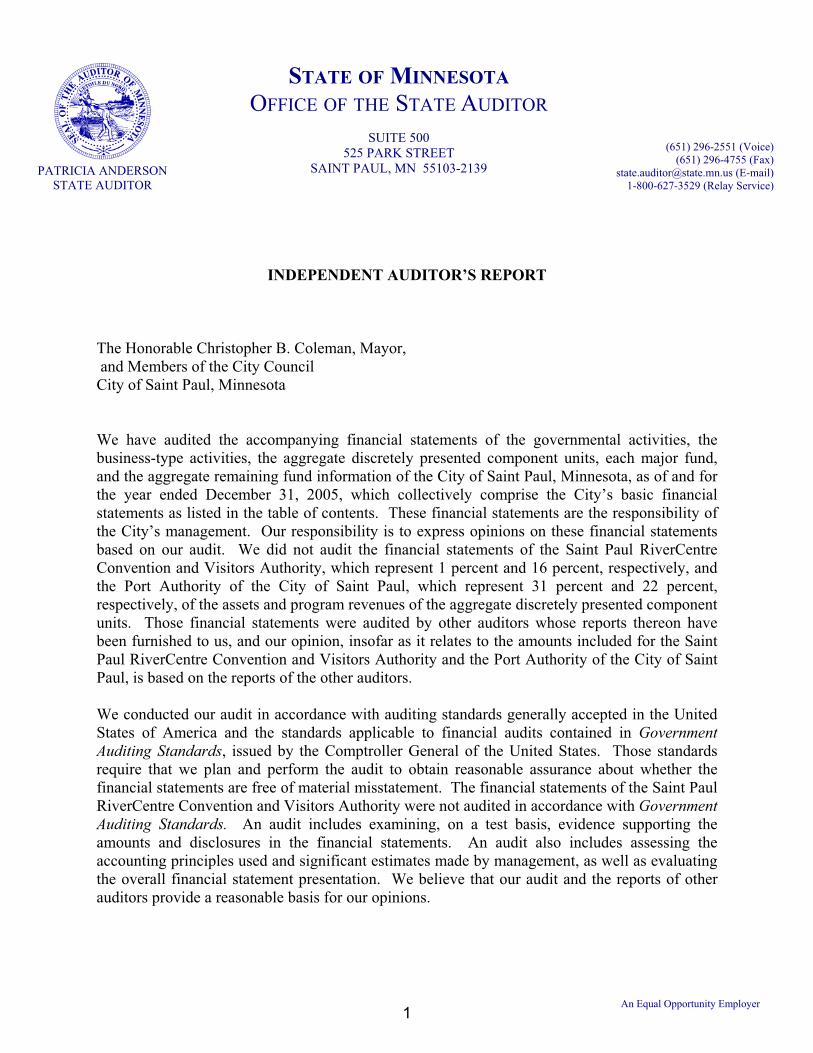
INDEPENDENT AUDITOR’S REPORT
The Honorable Christopher B. Coleman, Mayor, and Members of the City Council City of Saint Paul, Minnesota
We have audited the accompanying financial statements of the governmental activities, the business-type activities, the aggregate discretely presented component units, each major fund, and the aggregate remaining fund information of the City of Saint Paul, Minnesota, as of and for the year ended December 31, 2005, which collectively comprise the City’s basic financial statements as listed in the table of contents. These financial statements are the responsibility of the City’s management. Our responsibility is to express opinions on these financial statements based on our audit. We did not audit the financial statements of the Saint Paul RiverCentre Convention and Visitors Authority, which represent 1 percent and 16 percent, respectively, and the Port Authority of the City of Saint Paul, which represent 31 percent and 22 percent, respectively, of the assets and program revenues of the aggregate discretely presented component units. Those financial statements were audited by other auditors whose reports thereon have been furnished to us, and our opinion, insofar as it relates to the amounts included for the Saint Paul RiverCentre Convention and Visitors Authority and the Port Authority of the City of Saint Paul, is based on the reports of the other auditors.
We conducted our audit in accordance with auditing standards generally accepted in the United States of America and the standards applicable to financial audits contained in GovernmentAuditing Standards, issued by the Comptroller General of the United States. Those standards require that we plan and perform the audit to obtain reasonable assurance about whether the financial statements are free of material misstatement. The financial statements of the Saint Paul RiverCentre Convention and Visitors Authority were not audited in accordance with GovernmentAuditing Standards. An audit includes examining, on a test basis, evidence supporting the amounts and disclosures in the financial statements. An audit also includes assessing the accounting principles used and significant estimates made by management, as well as evaluating the overall financial statement presentation. We believe that our audit and the reports of other auditors provide a reasonable basis for our opinions.
1
In our opinion, based on our audit and the reports of other auditors, the financial statements referred to above present fairly, in all material respects, the respective financial position of the governmental activities, the business-type activities, the aggregate discretely presented component units, each major fund, and the aggregate remaining fund information of the City of Saint Paul as of December 31, 2005, and the respective changes in financial position and cash flows, where applicable, thereof for the year then ended in conformity with accounting principles generally accepted in the United States of America.
As discussed in Note III. C. to the financial statements, the City of Saint Paul changed its reporting entity. The Saint Paul RiverCentre Convention and Visitors Authority was created during the year ended December 31, 2005, and is a discretely presented component unit of the City of Saint Paul.
The Management’s Discussion and Analysis and the required supplementary information listed in the table of contents are not a required part of the basic financial statements but are supplementary information required by the Governmental Accounting Standards Board. We have applied certain limited procedures, which consisted principally of inquiries of management regarding the methods of measurement and presentation of the required supplementary information. However, we did not audit the information and express no opinion on it.
Our audit was made for the purpose of forming opinions on the financial statements that collectively comprise the City of Saint Paul’s basic financial statements. The supplementary information and the other supplementary information listed in the table of contents is presented for purposes of additional analysis and is not a required part of the basic financial statements. Such information has been subjected to the auditing procedures applied in the audit of the basic financial statements and, in our opinion, is fairly presented in all material respects in relation to the basic financial statements taken as a whole.
In accordance with Government Auditing Standards, we are also issuing a report dated June 23, 2006, on our consideration of the City of Saint Paul’s internal control over financial reporting and on our tests of its compliance with certain provisions of laws, regulations, contracts, and grant agreements and other matters. The purpose of that report is to describe the scope of our testing of internal control over financial reporting and compliance and the results of that testing, and not to provide an opinion on the internal control over financial reporting or on compliance. That report is an integral part of an audit performed in accordance with Government Auditing Standards and should be considered in assessing the results of our audit. It does not include the Saint Paul RiverCentre Convention and Visitors Authority or the Port Authority of the City of Saint Paul, which were audited by other auditors.
PATRICIA ANDERSON GREG HIERLINGER, CPA STATE AUDITOR DEPUTY STATE AUDITOR
End of Fieldwork: June 23, 2006
2
FINANCIAL SECTION
MANAGEMENT’S DISCUSSION AND ANALYSIS
C I T Y O F S A I N T P A U L C O M P R E H E N S I V E A N N U A L F I N A N C I A L R E P O R T
CITY OF SAINT PAUL, MINNESOTA
MANAGEMENT’S DISCUSSION AND ANALYSISFor Year Ended December 31, 2005
As management of the City of Saint Paul, we offer readers of the City’s financial statement this narrative overview and analysis of the financial activities of the City for the fiscal year ended December 31, 2005. We encourage readers to consider the information presented here in conjunction with the City’s financial statements and the additional information that we have furnished in our letter of transmittal, which can be found on pages v-x of this report.
FINANCIAL HIGHLIGHTS
The assets of the City of Saint Paul exceeded its liabilities at the close of the most recent fiscal year by $1,246.1 million (net assets). Of this amount, $122.3 million (unrestricted net assets) may be used to meet the government’s obligations to citizens and creditors; $39.6 million is restricted for specific purposes and $1,084.2 million is invested in capital assets net of related debt. The total net assets include all major infrastructure networks.
The City’s total net assets decreased by $7.3 million. Governmental activities decreased by $16.9 million, whereas business-type activities increased by $9.5 million.
The City of Saint Paul’s governmental funds reported combined ending fund balances of $190.2 million, a decrease of $27.1 million in comparison with the prior year. Approximately 84.3% of this amount, $160.3 million, is unreserved and available for use within the City’s designations and policies.
The City adopted a fund balance policy for the General and General Debt Service Funds. The policy established specific goals and guidance for future decisions regarding the appropriate level and use of fund balance. The General Fund balance should be maintained at 15% of the next year’s planned budget for the General Fund and part of the Library Agency Fund which is financed by property taxes and local government aid. The General Debt Service fund balance should maintain an amount equal to the first half of the subsequent year’s debt service, plus 7.5%, in addition to any reserves required by bond indentures, covenants, ordinances, other debt obligations and any net unrealized gains or losses associated with the fair value of investments.
At the end of the fiscal year, fund balance for the General Fund was $27.3 million or 15.1% of the budgeted 2006 General Fund expenditures of $166.8 million plus four Library Agency activities expenditures of $13.5 million.
At the end of the fiscal year, fund balance for the General Debt Service Fund was $24.2 million or 107% of the 2006 budgeted annual debt service payments, which includes principal and interest of $22.6 million.
The City’s total long-term bonds and notes decreased by $2.1 million, a 0.4% decrease from 2004 for a total outstanding on December 31, 2005 of $557.7 million.
In October 2005, the RiverCentre Authority, whose operating fund was reported as a major enterprise fund of the City of Saint Paul, merged with the Saint Paul Convention and Visitors Bureau and the Saint Paul Convention and Visitors Bureau Foundation. This combined organization has been renamed the Saint Paul RiverCentre Convention & Visitors Authority (RVCA). In accordance with Governmental Accounting Standards Board (GASB) Statement No 14 – The Financial Reporting Entity, it has been determined that the new RCVA should be reported as a discretely presented component unit.
3
CITY OF SAINT PAUL, MINNESOTA
MANAGEMENT’S DISCUSSION AND ANALYSISFor Year Ended December 31, 2005
OVERVIEW OF THE FINANCIAL STATEMENTS
This discussion and analysis is intended to serve as an introduction to the City’s basic financial statements. The City’s basic financial statements are comprised of three components: 1) government-wide financial statements, 2) fund financial statements and 3) notes to the financial statements. This report also contains other supplementary information in addition to the basic financial statements themselves.
Government-Wide Financial Statements
The government-wide financial statements are designed to provide readers with a broad overview of the City’s finances, in a manner similar to a private-sector business.
The Statement of Net Assets presents information on all of the City’s assets and liabilities, with the difference between the two reported as net assets. Over time, increases or decreases in net assets may serve as a useful indicator of whether the financial position of the City is improving or deteriorating. To assess the overall health of the City, one needs to consider additional non-financial factors such as changes in the City’s property tax base and the condition of the City’s infrastructure.
The Statement of Activities presents information showing how the City’s net assets changed during the fiscal year. All changes in net assets are reported when the underlying event giving rise to the change occurs, regardless of the timing of the related cash flows. Thus, revenues and expenses are reported in this statement for some items that will only result in cash flows in the future fiscal periods (e.g., uncollected taxes and earned but unused compensated absences).
Both of the government-wide financial statements distinguish functions of the City that are principally supported by taxes and intergovernmental revenues (governmental activities) from functions that are intended to recover all or a significant portion of their costs through user fees and charges (business-type activities). The governmental activities of the City include general government, public safety, highways and streets, sanitation, health, culture and recreation, and housing and economic development. The business-type activities of the City of Saint Paul include sewer; development loan programs; parking; parks, recreation and athletics; impound lot; and printing.
The government-wide financial statements include not only the City of Saint Paul itself (known as the primary government), but also Saint Paul RiverCentre Convention & Visitors Authority (RCVA), Saint Paul Regional Water Services (SPRWS) and Port Authority of the City of Saint Paul, which are separate legal entities for which the City of Saint Paul is financially accountable. Financial information for these component units is reported separately from the financial information presented for the primary government itself. The Housing and RedevelopmentAuthority of the City of Saint Paul (HRA) and the Saint Paul Library Agency, although legally separate, function for all practical purposes as departments of the City of Saint Paul; and therefore, have been included as an integral part of the primary government.
The government-wide financial statements can be found on pages 25-27of this report.
4
CITY OF SAINT PAUL, MINNESOTA
MANAGEMENT’S DISCUSSION AND ANALYSISFor Year Ended December 31, 2005
OVERVIEW OF THE FINANCIAL STATEMENTS
Fund Financial Statements
A fund is a grouping of related accounts that is used to maintain control over resources that have been segregated for specific activities or objectives. The City, like other state and local governments, uses fund accounting to ensure and demonstrate compliance with finance-related legal requirements. All of the funds of the City can be divided into three categories: governmental funds, proprietary funds and fiduciary funds.
Governmental Funds – Governmental funds are used to account for essentially the same functions reported as governmental activities in the government-wide financial statements. However, unlike the government-wide financial statements, governmental fund financial statements focus on near-term inflows and outflows of spendable resources, as well as on balances of spendable resources available at the end of the fiscal year. Such information may be useful in evaluating a government’s near-term financing requirements.
Because the focus of governmental funds is narrower than that of the government-wide financial statements, it is useful to compare the information presented for governmental funds with similar information presented for governmental activities in the government-wide financial statements. By doing so, readers may better understand the long-term impact of the government’s near-term financing decisions. Both the governmental fund balance sheet and the governmental fund statement of revenues, expenditures and changes in fund balances provide a reconciliation to facilitate this comparison between governmental funds and governmental activities.
The City maintains 51 individual governmental funds. Information is presented separately in the governmental fund balance sheet and in the governmental fund statement of revenues, expenditures and changes in fund balances for the General, Library Agency, HRA General, General Debt Service, HRA General Debt Service and Capital Improvement Projects funds, all of which are considered to be major funds. Data from the other governmental funds are combined into a single, aggregated presentation. Individual fund data for each of these non-major governmental funds is provided in the form of combining statements elsewhere in this report.
The basic governmental fund financial statements can be found on pages 28-34 of this report.
Proprietary Funds – The City maintains two different types of proprietary funds. Enterprise funds are used to report the same functions presented as business-type activities in the government-wide financial statements. The City uses enterprise funds to account for its Sewer Utility, HRA Loan Enterprise, HRA Parking, Special Services, Rice and Arlington Sports Dome, Watergate Marina, Impounding Lot and RiverPrint Saint Paul/Ramsey County activities. Internal service funds are an accounting device used to accumulate and allocate costs internally among the City’s various functions. The City uses its internal service funds to account for City Attorney-Outside Services, Risk Management Retention, Internal Borrowing, Purchasing’s Value Added Services, Real Estate Management, Information Systems, City-Wide Data Processing, Equipment Services Fire-Police, Public Works Engineering, Public Works Traffic, Signal and Lighting Maintenance, Asphalt Plant, Public Works Equipment, Public Works Administration, Parks and Recreation Special Projects, Parks and Recreation Supply and Maintenance, and Planning and Economic Development Administration. The services provided by these funds predominately benefit the governmental rather than the business-type functions. They have been included within governmental activities in the government-wide financial statements.
5
CITY OF SAINT PAUL, MINNESOTA
MANAGEMENT’S DISCUSSION AND ANALYSISFor Year Ended December 31, 2005
OVERVIEW OF THE FINANCIAL STATEMENTS
Proprietary funds provide the same type of information as the government-wide financial statements, only in more detail. The proprietary fund financial statements provide separate information for the Sewer Utility, HRA Loan Enterprise and HRA Parking funds, since they are considered to be major funds of the City. Data from the other enterprise funds are combined into a single aggregated presentation. All internal service funds are combined into a separate single aggregated presentation in the proprietary fund financial statements. Individual fund data for the internal service funds is provided in the form of combining statements elsewhere in this report.
The basic proprietary fund financial statements can be found on pages 35-41 of this report.
Fiduciary Funds – Fiduciary funds are used to account for resources held for the benefit of parties outside the government. Fiduciary funds are not reflected in the government-wide financial statements because the resources of those funds are not available to support the City’s own programs. The accounting used for fiduciary funds is much like that used for proprietary funds.
The basic fiduciary fund financial statements can be found on page 43 of this report.
Notes to the Financial Statements
The notes provide additional information that is essential to a full understanding of the data provided in the government-wide and fund financial statements. The notes to the financial statements can be found on pages 47-138 of this report.
Other Supplementary Information
In addition to the basic financial statements and accompanying notes, Required Supplementary Information, presents a detailed budgetary comparison schedule for the General Fund, Library Agency and the HRA General Fund to demonstrate compliance with the budget. These schedules can be found on pages 139-142 of this report. The combining statements referred to earlier in connection with nonmajor governmental funds, proprietary funds, internal service funds and other information related to the individual funds are presented immediately following the required supplementary information. Combining and individual statements and schedules can be found on pages 148-204 of this report.
6
CITY OF SAINT PAUL, MINNESOTA
MANAGEMENT’S DISCUSSION AND ANALYSISFor Year Ended December 31, 2005
FINANCIAL ANALYSIS OF THE GOVERNMENT AS A WHOLE
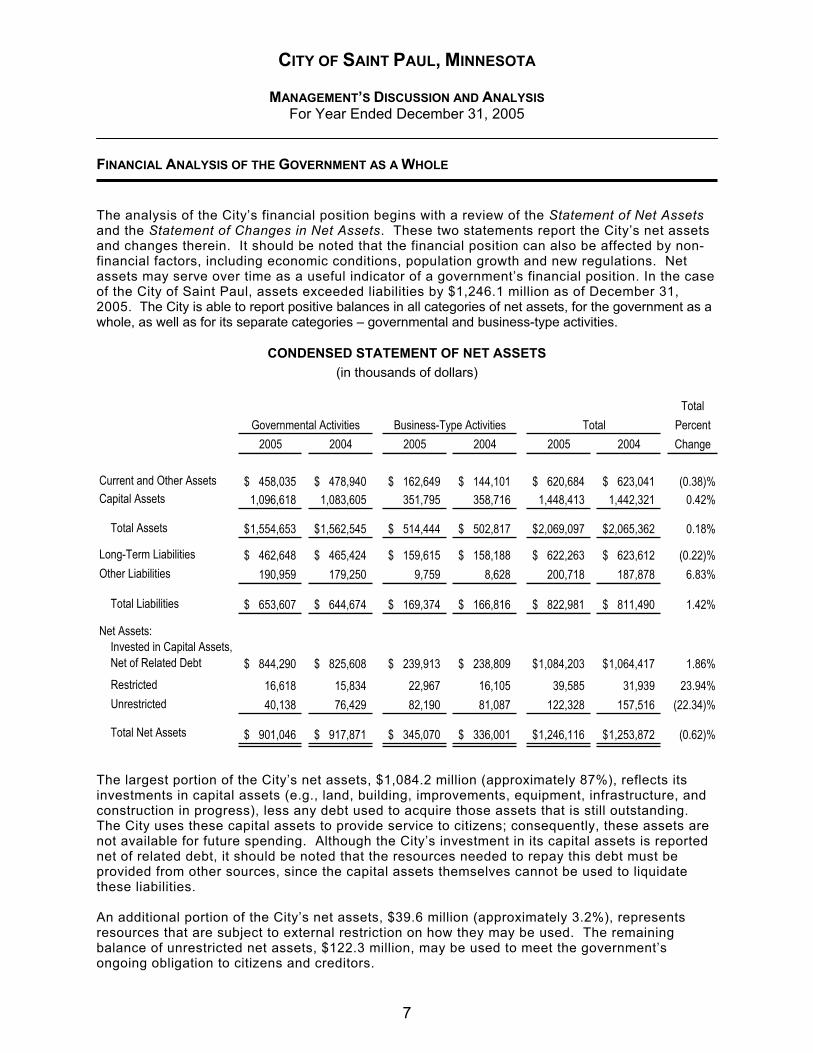
The analysis of the City’s financial position begins with a review of the Statement of Net Assetsand the Statement of Changes in Net Assets. These two statements report the City’s net assets and changes therein. It should be noted that the financial position can also be affected by non-financial factors, including economic conditions, population growth and new regulations. Net assets may serve over time as a useful indicator of a government’s financial position. In the case of the City of Saint Paul, assets exceeded liabilities by $1,246.1 million as of December 31, 2005. The City is able to report positive balances in all categories of net assets, for the government as a whole, as well as for its separate categories – governmental and business-type activities.
CONDENSED STATEMENT OF NET ASSETS (in thousands of dollars)
TotalPercent
2005 2004 2005 2004 2005 2004 Change
Current and Other Assets 458,035$ 478,940$ 162,649$ 144,101$ 620,684$ 623,041$ (0.38)%Capital Assets 1,096,618 1,083,605 351,795 358,716 1,448,413 1,442,321 0.42%
Total Assets 1,554,653$ 1,562,545$ 514,444$ 502,817$ 2,069,097$ 2,065,362$ 0.18%
Long-Term Liabilities 462,648$ 465,424$ 159,615$ 158,188$ 622,263$ 623,612$ (0.22)%Other Liabilities 190,959 179,250 9,759 8,628 200,718 187,878 6.83%
Total Liabilities 653,607$ 644,674$ 169,374$ 166,816$ 822,981$ 811,490$ 1.42%
Net Assets:Invested in Capital Assets, Net of Related Debt 844,290$ 825,608$ 239,913$ 238,809$ 1,084,203$ 1,064,417$ 1.86%
Restricted 16,618 15,834 22,967 16,105 39,585 31,939 23.94% Unrestricted 40,138 76,429 82,190 81,087 122,328 157,516 (22.34)%
Total Net Assets 901,046$ 917,871$ 345,070$ 336,001$ 1,246,116$ 1,253,872$ (0.62)%
Governmental Activities Business-Type Activities Total
The largest portion of the City’s net assets, $1,084.2 million (approximately 87%), reflects its investments in capital assets (e.g., land, building, improvements, equipment, infrastructure, and construction in progress), less any debt used to acquire those assets that is still outstanding. The City uses these capital assets to provide service to citizens; consequently, these assets are not available for future spending. Although the City’s investment in its capital assets is reported net of related debt, it should be noted that the resources needed to repay this debt must be provided from other sources, since the capital assets themselves cannot be used to liquidate these liabilities.
An additional portion of the City’s net assets, $39.6 million (approximately 3.2%), represents resources that are subject to external restriction on how they may be used. The remaining balance of unrestricted net assets, $122.3 million, may be used to meet the government’s ongoing obligation to citizens and creditors.
7
CITY OF SAINT PAUL, MINNESOTA
MANAGEMENT’S DISCUSSION AND ANALYSISFor Year Ended December 31, 2005
FINANCIAL ANALYSIS OF THE GOVERNMENT AS A WHOLE
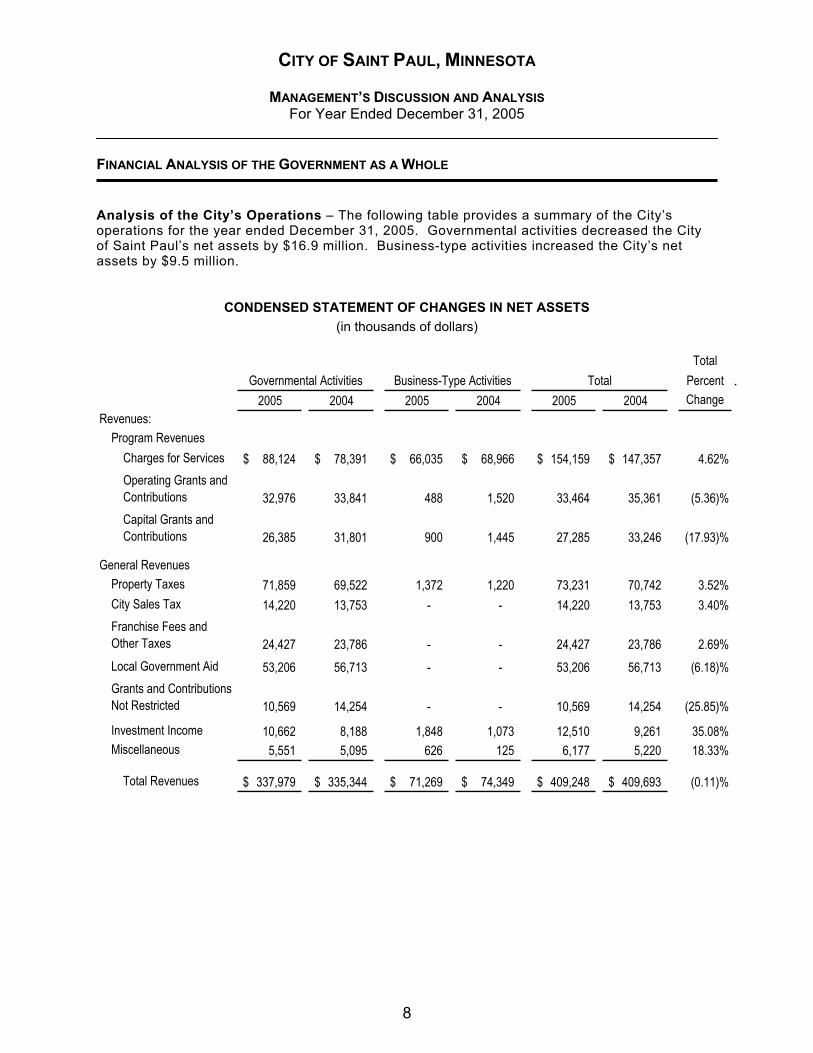
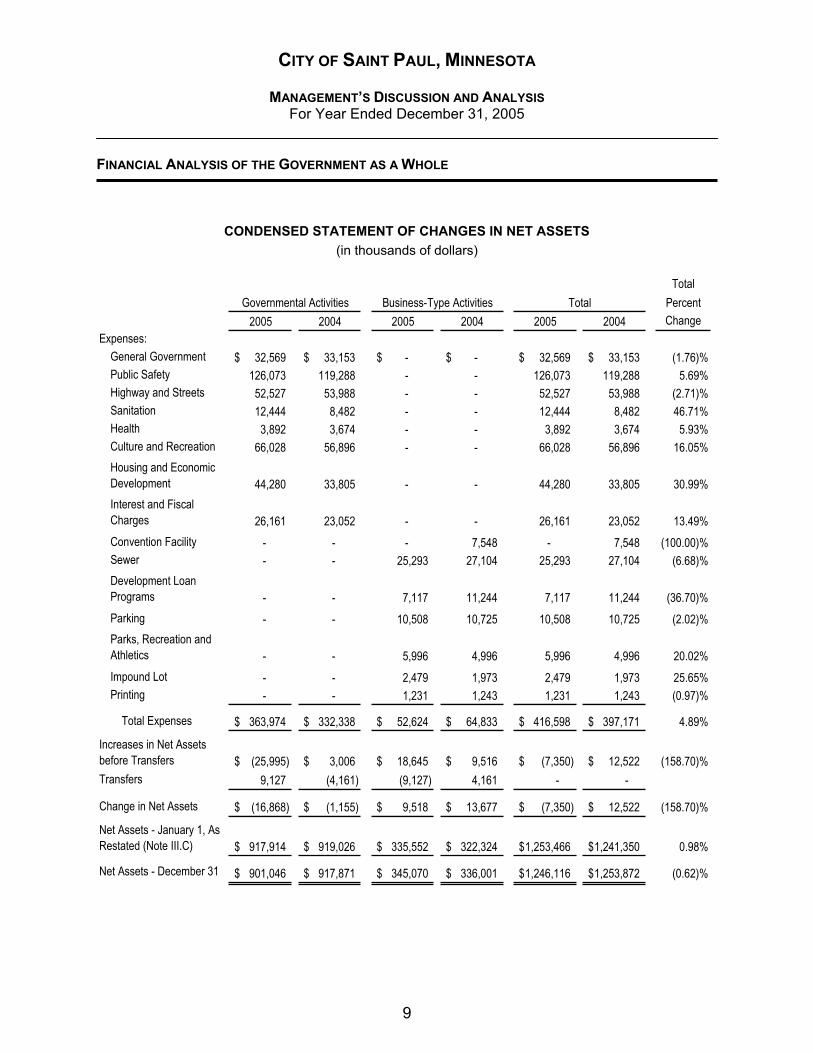
Analysis of the City’s Operations – The following table provides a summary of the City’s operations for the year ended December 31, 2005. Governmental activities decreased the City of Saint Paul’s net assets by $16.9 million. Business-type activities increased the City’s net assets by $9.5 million.
CONDENSED STATEMENT OF CHANGES IN NET ASSETS (in thousands of dollars)
TotalPercent .
2005 2004 2005 2004 2005 2004 ChangeRevenues:
Program RevenuesCharges for Services 88,124$ 78,391$ 66,035$ 68,966$ 154,159$ 147,357$ 4.62%Operating Grants and Contributions 32,976 33,841 488 1,520 33,464 35,361 (5.36)%Capital Grants and Contributions 26,385 31,801 900 1,445 27,285 33,246 (17.93)%
General RevenuesProperty Taxes 71,859 69,522 1,372 1,220 73,231 70,742 3.52%City Sales Tax 14,220 13,753 - - 14,220 13,753 3.40%Franchise Fees and Other Taxes 24,427 23,786 - - 24,427 23,786 2.69%Local Government Aid 53,206 56,713 - - 53,206 56,713 (6.18)%Grants and Contributions Not Restricted 10,569 14,254 - - 10,569 14,254 (25.85)%
Investment Income 10,662 8,188 1,848 1,073 12,510 9,261 35.08%Miscellaneous 5,551 5,095 626 125 6,177 5,220 18.33%
Total Revenues 337,979$ 335,344$ 71,269$ 74,349$ 409,248$ 409,693$ (0.11)%
Governmental Activities Business-Type Activities Total
8
CITY OF SAINT PAUL, MINNESOTA
MANAGEMENT’S DISCUSSION AND ANALYSISFor Year Ended December 31, 2005
FINANCIAL ANALYSIS OF THE GOVERNMENT AS A WHOLE
CONDENSED STATEMENT OF CHANGES IN NET ASSETS (in thousands of dollars)
TotalPercent
2005 2004 2005 2004 2005 2004 ChangeExpenses:
General Government 32,569$ 33,153$ - $ - $ 32,569$ 33,153$ (1.76)%Public Safety 126,073 119,288 - - 126,073 119,288 5.69%Highway and Streets 52,527 53,988 - - 52,527 53,988 (2.71)%Sanitation 12,444 8,482 - - 12,444 8,482 46.71%Health 3,892 3,674 - - 3,892 3,674 5.93%Culture and Recreation 66,028 56,896 - - 66,028 56,896 16.05%Housing and Economic Development 44,280 33,805 - - 44,280 33,805 30.99%Interest and Fiscal Charges 26,161 23,052 - - 26,161 23,052 13.49%Convention Facility - - - 7,548 - 7,548 (100.00)%Sewer - - 25,293 27,104 25,293 27,104 (6.68)%Development Loan Programs - - 7,117 11,244 7,117 11,244 (36.70)%Parking - - 10,508 10,725 10,508 10,725 (2.02)%Parks, Recreation and Athletics - - 5,996 4,996 5,996 4,996 20.02%Impound Lot - - 2,479 1,973 2,479 1,973 25.65%Printing - - 1,231 1,243 1,231 1,243 (0.97)%
Total Expenses 363,974$ 332,338$ 52,624$ 64,833$ 416,598$ 397,171$ 4.89%
Increases in Net Assets before Transfers (25,995)$ 3,006$ 18,645$ 9,516$ (7,350)$ 12,522$ (158.70)%Transfers 9,127 (4,161) (9,127) 4,161 - -
Change in Net Assets (16,868)$ (1,155)$ 9,518$ 13,677$ (7,350)$ 12,522$ (158.70)%
Net Assets - January 1, As Restated (Note III.C) 917,914$ 919,026$ 335,552$ 322,324$ 1,253,466$ 1,241,350$ 0.98%
Net Assets - December 31 901,046$ 917,871$ 345,070$ 336,001$ 1,246,116$ 1,253,872$ (0.62)%
Governmental Activities Business-Type Activities Total
9
CITY OF SAINT PAUL, MINNESOTA
MANAGEMENT’S DISCUSSION AND ANALYSISFor Year Ended December 31, 2005
FINANCIAL ANALYSIS OF THE GOVERNMENT AS A WHOLE
Governmental Activities
Governmental activities decreased the City’s net assets by $16.9 million. Revenues were stable, increasing by $2.6 million, which is less than one percent. Transfers In increased by $13.3 million and expenses increased by $31.6 million, or 9.5% compared to the previous year.
Three governmental functions contributed to the majority of the increase in expenses: public safety, $6.8 million; culture and recreation, $9.1 million; and housing and economic development, $10.5 million.
Included in the increase in these expenses are:
Salaries and fringe benefits paid to public safety personnel $5.7 million
Expenses in the parks department for 1) the opening of a new visitors center; 2) a new tree maintenance service provided to private property owners; and 3) increased expenses in the general operation of the parks and recreation centers
$2.2 million
Construction of a building for the Neighborhood House, a nonprofit entity $5.0 million
Community development block grant expenditures $3.0 million
Housing and development project expenditures $7.0 million
Business -Type Activities
Business type activities had a positive result in 2005 and increased net assets by $9.5 million. Revenues decreased by $3.1 million, whereas, net transfers made to governmental activities increased by $13.3 million and expenses decreased by $12.2 million, providing a net decrease in the change of net assets of $4.2 million as compared to the 2004 change in net assets.
The majority of reduction in the business type revenues and expenses is due to the change in reporting entity of the RiverCentre Operating Enterprise fund to a discretely presented component unit. The 2004 fund’s expenses reported as convention facility business activity was at $7.6 million and the associated revenues were $7.6 million. The development loan program expenses decreased in 2005 by $4.1 million mainly due to decreasing expenses involving the Housing Land Assembly program which is part of the Housing 5000 Initiative completed in 2005.
10
CITY OF SAINT PAUL, MINNESOTA
MANAGEMENT’S DISCUSSION AND ANALYSISFor Year Ended December 31, 2005
FINANCIAL ANALYSIS OF THE GOVERNMENT AS A WHOLE
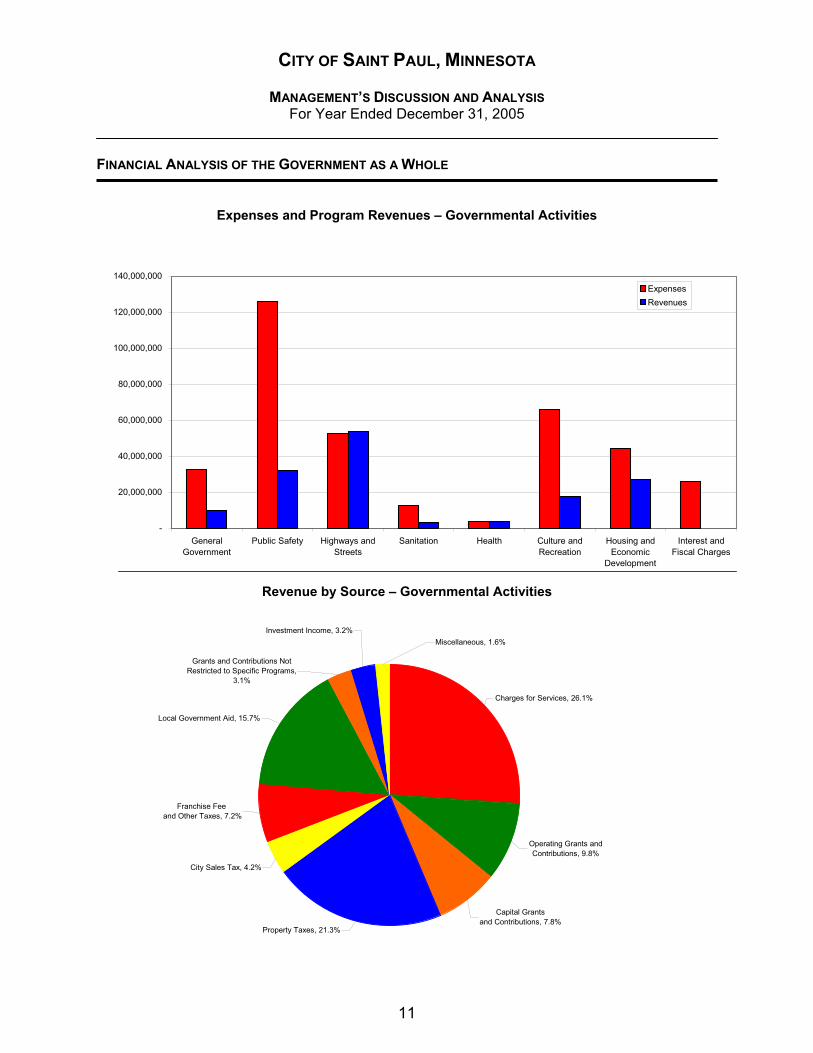
Expenses and Program Revenues – Governmental Activities
-
20,000,000
40,000,000
60,000,000
80,000,000
100,000,000
120,000,000
140,000,000
GeneralGovernment
Public Safety Highways andStreets
Sanitation Health Culture andRecreation
Housing andEconomic
Development
Interest andFiscal Charges
ExpensesRevenues
Revenue by Source – Governmental Activities
Property Taxes, 21.3%
City Sales Tax, 4.2%
Local Government Aid, 15.7%
Grants and Contributions Not Restricted to Specific Programs,
3.1%
Investment Income, 3.2%
Capital Grantsand Contributions, 7.8%
Charges for Services, 26.1%
Operating Grants and Contributions, 9.8%
Franchise Fee and Other Taxes, 7.2%
Miscellaneous, 1.6%
11
CITY OF SAINT PAUL, MINNESOTA
MANAGEMENT’S DISCUSSION AND ANALYSISFor Year Ended December 31, 2005
FINANCIAL ANALYSIS OF THE GOVERNMENT AS A WHOLE
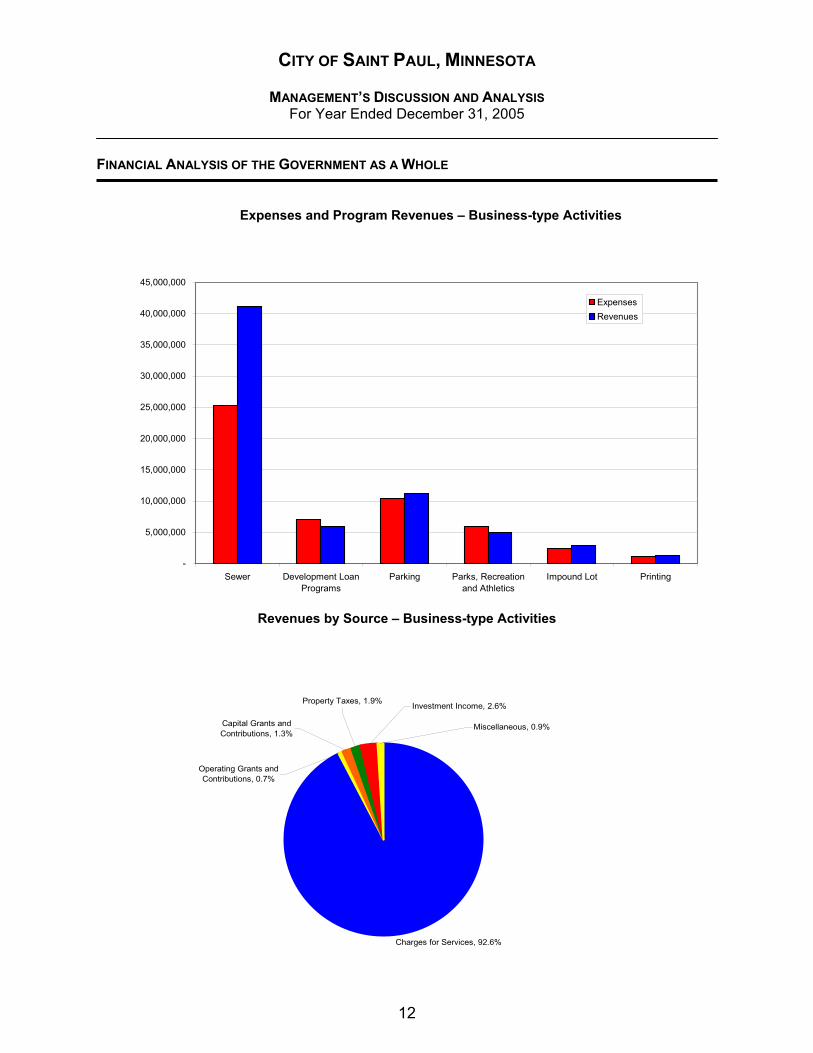
Expenses and Program Revenues – Business-type Activities
-
5,000,000
10,000,000
15,000,000
20,000,000
25,000,000
30,000,000
35,000,000
40,000,000
45,000,000
Sewer Development LoanPrograms
Parking Parks, Recreationand Athletics
Impound Lot Printing
ExpensesRevenues
Revenues by Source – Business-type Activities
Charges for Services, 92.6%
Miscellaneous, 0.9%
Operating Grants and Contributions, 0.7%
Investment Income, 2.6%Property Taxes, 1.9%
Capital Grants and Contributions, 1.3%
12
CITY OF SAINT PAUL, MINNESOTA
MANAGEMENT’S DISCUSSION AND ANALYSISFor Year Ended December 31, 2005
FINANCIAL ANALYSIS OF THE GOVERNMENT’S FUNDS
Governmental Funds
The focus of the City of Saint Paul’s governmental funds is to provide information on near-term inflows, outflows, and balances of spendable resources. Such information is useful in assessing the City’s financing requirements. In particular, unreserved fund balance may serve as a useful measure of the government’s net resources available for spending at the end of the fiscal year.
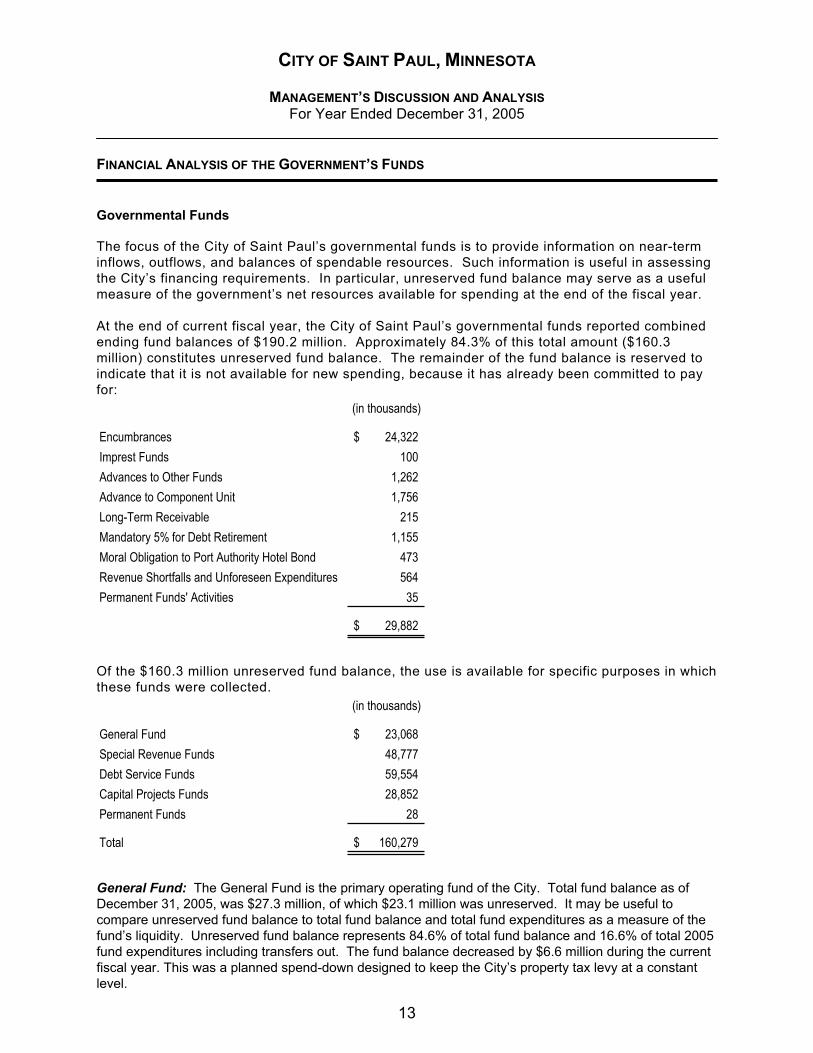
At the end of current fiscal year, the City of Saint Paul’s governmental funds reported combined ending fund balances of $190.2 million. Approximately 84.3% of this total amount ($160.3 million) constitutes unreserved fund balance. The remainder of the fund balance is reserved to indicate that it is not available for new spending, because it has already been committed to pay for:
(in thousands)
Encumbrances 24,322$Imprest Funds 100 Advances to Other Funds 1,262 Advance to Component Unit 1,756 Long-Term Receivable 215 Mandatory 5% for Debt Retirement 1,155 Moral Obligation to Port Authority Hotel Bond 473 Revenue Shortfalls and Unforeseen Expenditures 564 Permanent Funds' Activities 35
29,882$
Of the $160.3 million unreserved fund balance, the use is available for specific purposes in which these funds were collected.
(in thousands)
General Fund 23,068$Special Revenue Funds 48,777Debt Service Funds 59,554Capital Projects Funds 28,852Permanent Funds 28
Total 160,279$
General Fund: The General Fund is the primary operating fund of the City. Total fund balance as of December 31, 2005, was $27.3 million, of which $23.1 million was unreserved. It may be useful to compare unreserved fund balance to total fund balance and total fund expenditures as a measure of the fund’s liquidity. Unreserved fund balance represents 84.6% of total fund balance and 16.6% of total 2005 fund expenditures including transfers out. The fund balance decreased by $6.6 million during the current fiscal year. This was a planned spend-down designed to keep the City’s property tax levy at a constant level.
13
CITY OF SAINT PAUL, MINNESOTA
MANAGEMENT’S DISCUSSION AND ANALYSISFor Year Ended December 31, 2005
FINANCIAL ANALYSIS OF THE GOVERNMENT’S FUNDS
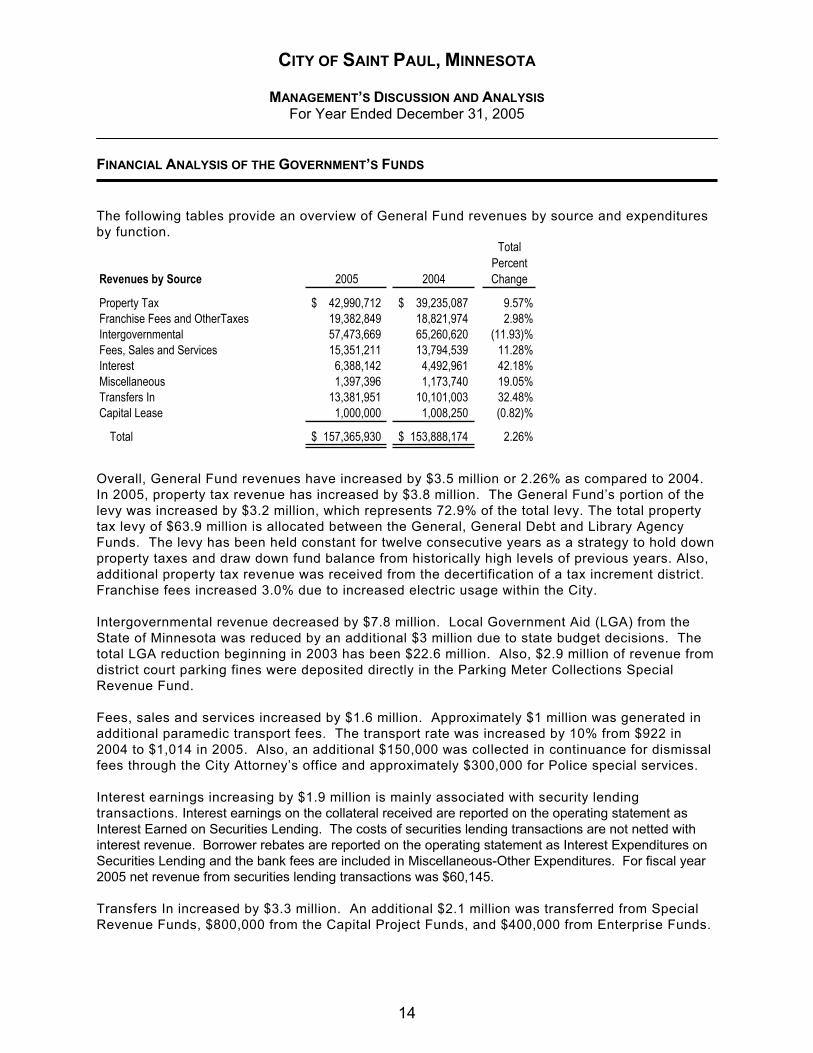
The following tables provide an overview of General Fund revenues by source and expenditures by function.
Total Percent
Revenues by Source 2005 2004 Change
Property Tax 42,990,712$ 39,235,087$ 9.57%Franchise Fees and OtherTaxes 19,382,849 18,821,974 2.98%Intergovernmental 57,473,669 65,260,620 (11.93)%Fees, Sales and Services 15,351,211 13,794,539 11.28%Interest 6,388,142 4,492,961 42.18%Miscellaneous 1,397,396 1,173,740 19.05%Transfers In 13,381,951 10,101,003 32.48%Capital Lease 1,000,000 1,008,250 (0.82)%
Total 157,365,930$ 153,888,174$ 2.26%
Overall, General Fund revenues have increased by $3.5 million or 2.26% as compared to 2004. In 2005, property tax revenue has increased by $3.8 million. The General Fund’s portion of the levy was increased by $3.2 million, which represents 72.9% of the total levy. The total property tax levy of $63.9 million is allocated between the General, General Debt and Library Agency Funds. The levy has been held constant for twelve consecutive years as a strategy to hold down property taxes and draw down fund balance from historically high levels of previous years. Also, additional property tax revenue was received from the decertification of a tax increment district. Franchise fees increased 3.0% due to increased electric usage within the City.
Intergovernmental revenue decreased by $7.8 million. Local Government Aid (LGA) from the State of Minnesota was reduced by an additional $3 million due to state budget decisions. The total LGA reduction beginning in 2003 has been $22.6 million. Also, $2.9 million of revenue from district court parking fines were deposited directly in the Parking Meter Collections Special Revenue Fund.
Fees, sales and services increased by $1.6 million. Approximately $1 million was generated in additional paramedic transport fees. The transport rate was increased by 10% from $922 in 2004 to $1,014 in 2005. Also, an additional $150,000 was collected in continuance for dismissal fees through the City Attorney’s office and approximately $300,000 for Police special services.
Interest earnings increasing by $1.9 million is mainly associated with security lending transactions. Interest earnings on the collateral received are reported on the operating statement as Interest Earned on Securities Lending. The costs of securities lending transactions are not netted with interest revenue. Borrower rebates are reported on the operating statement as Interest Expenditures on Securities Lending and the bank fees are included in Miscellaneous-Other Expenditures. For fiscal year 2005 net revenue from securities lending transactions was $60,145.
Transfers In increased by $3.3 million. An additional $2.1 million was transferred from Special Revenue Funds, $800,000 from the Capital Project Funds, and $400,000 from Enterprise Funds.
14
CITY OF SAINT PAUL, MINNESOTA
MANAGEMENT’S DISCUSSION AND ANALYSISFor Year Ended December 31, 2005
FINANCIAL ANALYSIS OF THE GOVERNMENT’S FUNDS
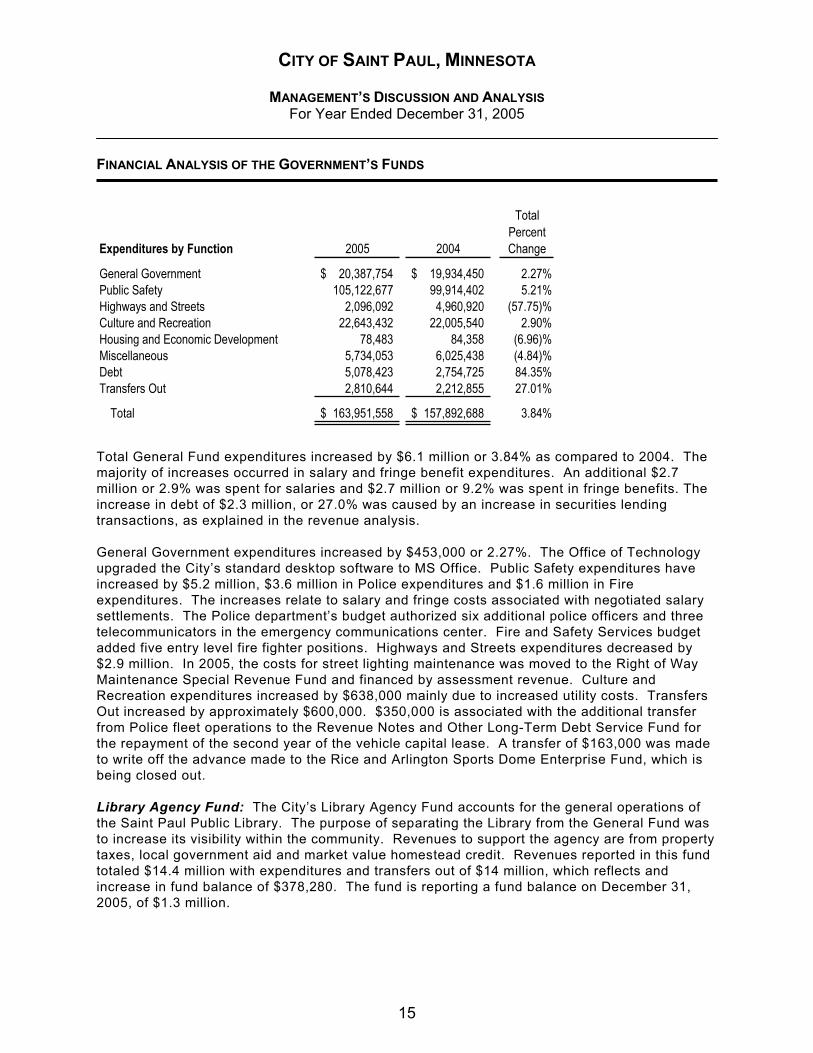
Total Percent
Expenditures by Function 2005 2004 Change
General Government 20,387,754$ 19,934,450$ 2.27%Public Safety 105,122,677 99,914,402 5.21%Highways and Streets 2,096,092 4,960,920 (57.75)%Culture and Recreation 22,643,432 22,005,540 2.90%Housing and Economic Development 78,483 84,358 (6.96)%Miscellaneous 5,734,053 6,025,438 (4.84)%Debt 5,078,423 2,754,725 84.35%Transfers Out 2,810,644 2,212,855 27.01%
Total 163,951,558$ 157,892,688$ 3.84%
Total General Fund expenditures increased by $6.1 million or 3.84% as compared to 2004. The majority of increases occurred in salary and fringe benefit expenditures. An additional $2.7 million or 2.9% was spent for salaries and $2.7 million or 9.2% was spent in fringe benefits. The increase in debt of $2.3 million, or 27.0% was caused by an increase in securities lending transactions, as explained in the revenue analysis.
General Government expenditures increased by $453,000 or 2.27%. The Office of Technology upgraded the City’s standard desktop software to MS Office. Public Safety expenditures have increased by $5.2 million, $3.6 million in Police expenditures and $1.6 million in Fire expenditures. The increases relate to salary and fringe costs associated with negotiated salary settlements. The Police department’s budget authorized six additional police officers and three telecommunicators in the emergency communications center. Fire and Safety Services budget added five entry level fire fighter positions. Highways and Streets expenditures decreased by $2.9 million. In 2005, the costs for street lighting maintenance was moved to the Right of Way Maintenance Special Revenue Fund and financed by assessment revenue. Culture and Recreation expenditures increased by $638,000 mainly due to increased utility costs. Transfers Out increased by approximately $600,000. $350,000 is associated with the additional transfer from Police fleet operations to the Revenue Notes and Other Long-Term Debt Service Fund for the repayment of the second year of the vehicle capital lease. A transfer of $163,000 was made to write off the advance made to the Rice and Arlington Sports Dome Enterprise Fund, which is being closed out.
Library Agency Fund: The City’s Library Agency Fund accounts for the general operations of the Saint Paul Public Library. The purpose of separating the Library from the General Fund was to increase its visibility within the community. Revenues to support the agency are from property taxes, local government aid and market value homestead credit. Revenues reported in this fund totaled $14.4 million with expenditures and transfers out of $14 million, which reflects and increase in fund balance of $378,280. The fund is reporting a fund balance on December 31, 2005, of $1.3 million.
15
CITY OF SAINT PAUL, MINNESOTA
MANAGEMENT’S DISCUSSION AND ANALYSISFor Year Ended December 31, 2005
FINANCIAL ANALYSIS OF THE GOVERNMENT’S FUNDS
HRA General Fund: The HRA General Fund is the chief operating fund of the HRA. Revenues include the HRA property tax levy, fees from conduit revenue bond issues, property rentals, land sale proceeds and investment earnings. The major spending activities are for staff administration of HRA programs, maintenance of HRA properties and professional services for HRA programs and projects. The fund balance in the HRA General Fund increased during 2005 by $2.8 million to a total of $8.1 million at December 31, 2005. The increase was primarily due to revenues from the sale of the 1000 Westgate development property in 2005.
General Debt Service Fund: The City’s General Debt Service Fund accounts for the revenues and expenditures relating to the City’s general obligation debt that is supported by property tax revenues. During 2005, $7.2 million was received in taxes and $13.2 million in transfers for a total of $20.4 million. The expenditures made on debt payments during 2005 totaled $22.3 million resulting in a planned decrease in fund balance of $1.4 million. The remaining fund balance of $24.1 million at the end of the fiscal year is to be used for future debt service payments.
HRA General Debt Service Fund: The HRA General Debt Service Fund accumulates resources and pays debt service for the HRA debt that is not financed by its two enterprise funds. Debt service on the bonds is financed by property tax increments, City sales taxes, lease payments from the City and investment earnings. At December 31, 2005, the fund balance was $19.5 million, which is reserved for future debt service. Total debt spending during 2005 was $21.2 million. The total fund balance decreased in 2005 by $6.1 million primarily due to the retirement of tax increment revenue bonds with existing funds and the decertification of tax increment financing districts resulting in existing funds being remitted to Ramsey County for subsequent disbursement to the City, County and St. Paul School District.
Capital Improvement Projects Fund: The City’s Capital Improvement Projects Fund accounts for the major capital improvement projects relating to City-owned capital assets. Total expenditures reported by this fund in 2005 were $59.2 million. The fund reported reserves for existing contracts of $16.1 million. The total fund balance at December 31, 2005 was a negative $5.1 million. The negative fund balance will be resolved as money is received for capital projects financed by grants upon their completion. The City’s Residential Street Vitality Program, Sewer Rehabilitation, Phalen Boulevard Project, Paul and Sheila Wellstone Center and the construction of Fire Station No. 8 were among the projects with the largest amount of expenditures in 2005.
16
CITY OF SAINT PAUL, MINNESOTA
MANAGEMENT’S DISCUSSION AND ANALYSISFor Year Ended December 31, 2005
FINANCIAL ANALYSIS OF THE GOVERNMENT’S FUNDS
Proprietary Funds
The City of Saint Paul’s proprietary funds provide the same type of information found in the government-wide financial statements, but in more detail.
Sewer Utility Fund: The Sewer Utility Enterprise Fund had another year of strong performance in 2005, with an unrestricted net asset balance of $22.6 million at December 31, 2005. Operating cash is being maintained in the $24-$26 million range. Revenues continue their consistent trend with a one and a half percent (1.5%) increase in both storm and sanitary rates, which was recommended by the Mayor and adopted by the City Council in late 2005 for implementation January 1, 2006.
In the next couple of years the Sewer Utility Enterprise Fund anticipates a decrease in unrestricted net assets as a result of the Ford Motor Plant closing, implementation of an Inflow / Infiltration program, major reconstruction of storm sewer tunnels, and other construction repair work.
HRA Loan Enterprise Fund: The HRA Loan Enterprise Fund accounts for loans issued and related servicing for various housing and economic development programs and projects. The Fund has unrestricted net assets totaling $48.5 million at December 31, 2005. The assets of the Fund include loans receivable, which are reported at $21.6 million (net of allowance) and, in many cases, have long repayment terms before there will be liquidation to cash. Cash and investments are reported at $47.6 million at December 31, 2005, which includes the Housing 5000 Land Assembly Bond program of $24.2 million. The Fund had an operating loss in 2005 of $570,000.
HRA Parking Fund: The HRA Parking Fund accounts for the operation of HRA-owned parking facilities in Saint Paul. The Fund had unrestricted net assets of $11.4 million at December 31, 2005. Assets in the Fund include capital assets for parking facilities reported at the depreciated amount of $85.2 million. Long-term debt used for financing the construction of the parking facilities is $103.9 million in principal outstanding at December 31, 2005. The Fund had operating income of $4.3 million during 2005. After interest on long-term debt and other nonoperating revenues and expenses are applied, the Fund had a net income of $365,000.
17
CITY OF SAINT PAUL, MINNESOTA
MANAGEMENT’S DISCUSSION AND ANALYSISFor Year Ended December 31, 2005
GENERAL FUND BUDGETARY HIGHLIGHTS
The final amended budget for the General Fund includes the original adopted budget, plus any previously appropriated funds set aside for the purpose of honoring legally-incurred obligations (prior year encumbrances and commitments), plus any additional supplemental appropriations that were legislated by City Council during the year. The total original adopted budget including transfers out was $158.3 million, plus reserved for encumbrances carried forward of $2.1 million, for total original appropriations of $160.4 million. This compared to final appropriations of $167.6 million, is $7.2 million greater than the original budget. The 2005 final General Fund appropriations are $5.3 million more than 2004 final appropriations of $162.3 million.
The majority of the difference between the adopted and final budget was related to the following items:
$4.1 million additional interest expense relating to security lending transactions which was offset by interest earnings of $4.2 million.
$1.7 million year end adjustment, recognizing increased tax increment revenue from a decertified district, fees, police and fire pension and disability aid and interest revenues to cover additional costs associated with termination and tort liability settlements, police overtime, utility and motor fuel costs and summary nuisance abatement activity.
$1 million increase in capital outlay to account for the capital lease for Police vehicles.
2005 actual spending including transfers out was $163.9 million, as compared to final budget of $167.6 million resulted in a $3.7 million positive variance. Actual expenditures were 97.8% of the final budgeted amount. Over the past ten years, the City’s actual expenditures compared to budget have averaged 96.3%.
18
CITY OF SAINT PAUL, MINNESOTA
MANAGEMENT’S DISCUSSION AND ANALYSISFor Year Ended December 31, 2005
CAPITAL ASSETS
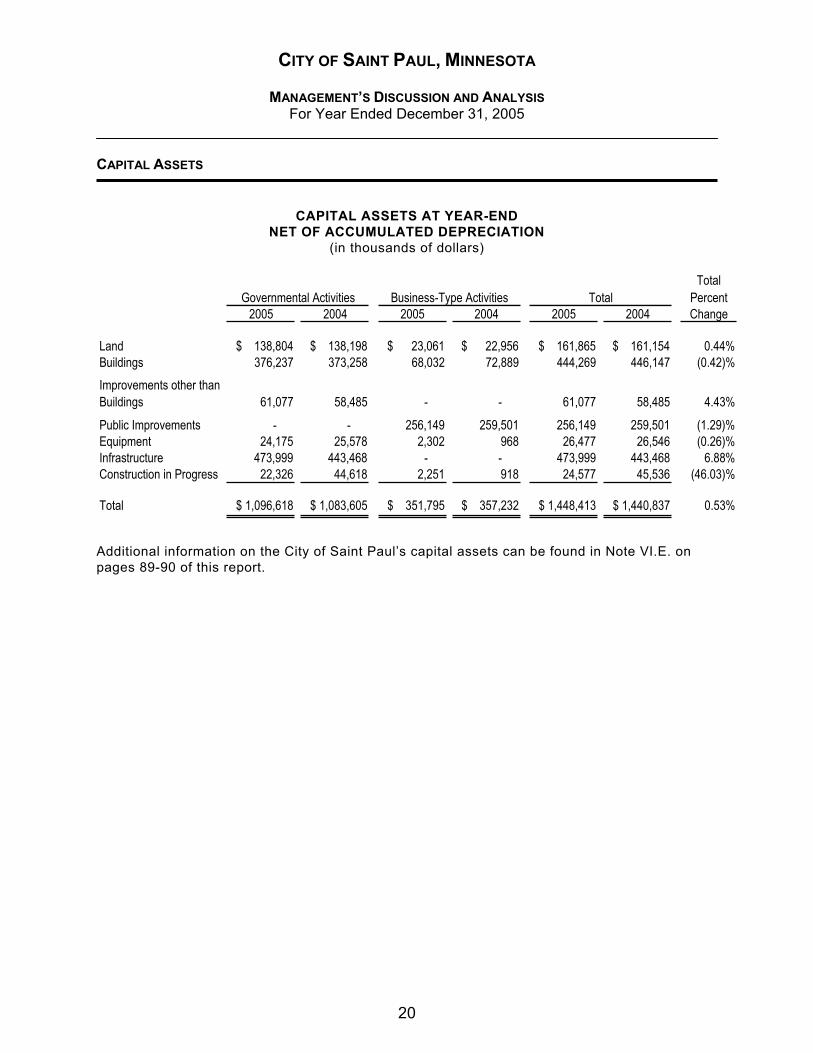
At the end of 2005, the City had invested a total of $1,448.4 million in capital assets (net of accumulated depreciation). This investment in capital assets includes land, buildings, improvements, equipment, infrastructure and construction in progress of the City, including the capital assets recorded for the City’s internal service funds which have a depreciated value of $10.5 million.
Major capital asset events during the current fiscal year included the following:
Public Works completed its tenth year of the Residential Street Vitality Program (RSVP) by completing the Edmund/Galtier project during 2005 in the amount of $1.9 million. In addition, two projects that will span 2005 and 2006 were begun. These projects are the Arlington/Pascal RSVP in the amount of $9.1 million and the Baker/Bellows RSVP in the amount of $4.8 million.
The Sewer System Rehabilitation program is now in its eighth year. The City awarded contracts for the State/University Sewer Relining in the amount of $1.2 million, the Citywide Sewer Relining project in the amount of $1.2 million, the Summit/Wheeler Sewer Relining project in the amount of $1.3 and the Eastside Sewer Relining project in the amount of $1.0 million. All projects have an estimated completion date of November 30, 2006.
Public Works substantially completed the construction of the second phase of Phalen Boulevard in 2005. Construction of the third phase of Phalen Boulevard was started in 2005 with completion expected in 2006.
The Saint Paul Public Library Agency sold its first bond issue in the spring of 2004 in the amount of $12,280,000. The issue included $9.3 million for the construction of a new library at Dale Street and University Avenue to replace the existing Lexington Outreach Library. Completion of the new library is scheduled for June of 2006.
Upper Landing Park, a $2.9 million improvement on the banks of the Mississippi was completed in 2005. Features of the park include a large lawn area, fountains, sculptures, sitting walls and direct connections to the river’s edge.
Wacouta Commons, a new neighborhood park on the northern edge of downtown was opened. The park includes a play area, a lawn for field play, a fountain, gardens and a dog walking area.
Construction continues on the Tropical Encounters Exhibit in the Como Park Visitor’s Center. This $2.5 million project will create an environment where plants and animals can co-exit together in their native habitat and is scheduled to open to the public in the fall of 2006.
Fire Station No. 8 was substantially completed during 2005 at a cost of $4.0 million. The fire station is housed in the new State of Minnesota Human Services Building and is expected to be occupied by May of 2006.
19
CITY OF SAINT PAUL, MINNESOTA
MANAGEMENT’S DISCUSSION AND ANALYSISFor Year Ended December 31, 2005
CAPITAL ASSETS
CAPITAL ASSETS AT YEAR-END NET OF ACCUMULATED DEPRECIATION
(in thousands of dollars)
TotalPercent
2005 2004 2005 2004 2005 2004 Change
Land $ 138,804 $ 138,198 $ 23,061 $ 22,956 $ 161,865 $ 161,154 0.44%Buildings 376,237 373,258 68,032 72,889 444,269 446,147 (0.42)%Improvements other than Buildings 61,077 58,485 - - 61,077 58,485 4.43%
Public Improvements - - 256,149 259,501 256,149 259,501 (1.29)%Equipment 24,175 25,578 2,302 968 26,477 26,546 (0.26)%Infrastructure 473,999 443,468 - - 473,999 443,468 6.88%Construction in Progress 22,326 44,618 2,251 918 24,577 45,536 (46.03)%
Total $ 1,096,618 $ 1,083,605 $ 351,795 $ 357,232 $ 1,448,413 $ 1,440,837 0.53%
Governmental Activities Business-Type Activities Total
Additional information on the City of Saint Paul’s capital assets can be found in Note VI.E. on pages 89-90 of this report.
20
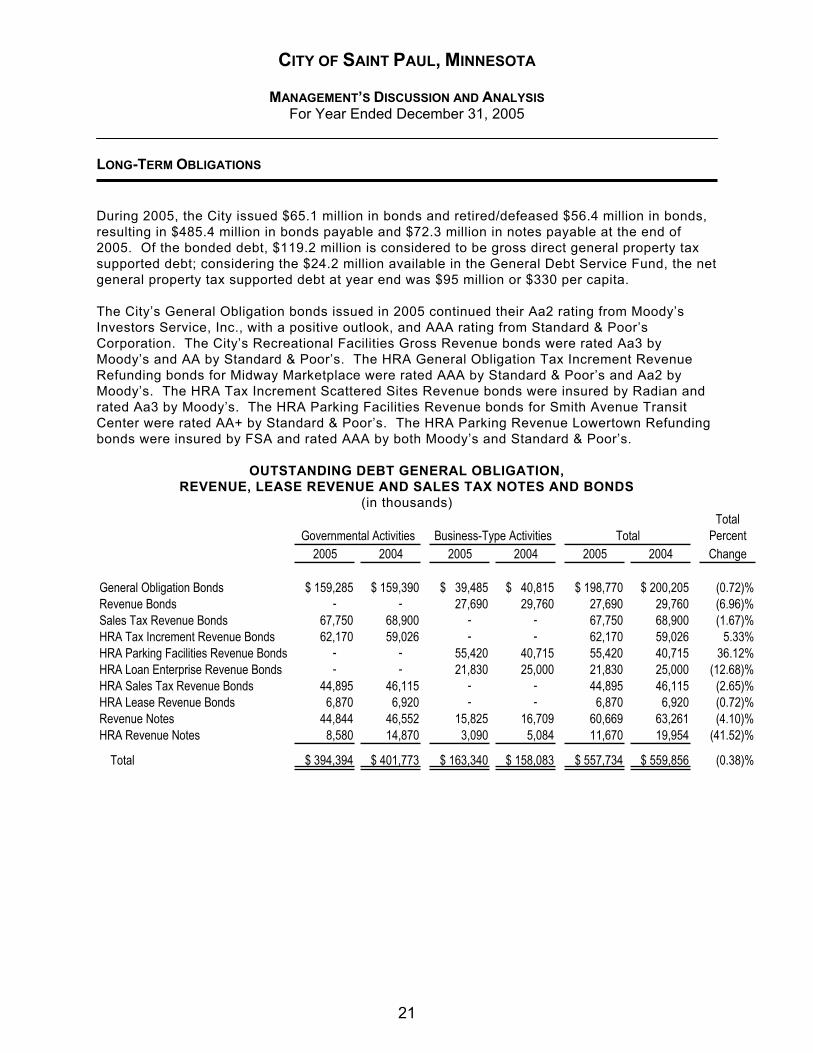
CITY OF SAINT PAUL, MINNESOTA
MANAGEMENT’S DISCUSSION AND ANALYSISFor Year Ended December 31, 2005
LONG-TERM OBLIGATIONS
During 2005, the City issued $65.1 million in bonds and retired/defeased $56.4 million in bonds, resulting in $485.4 million in bonds payable and $72.3 million in notes payable at the end of 2005. Of the bonded debt, $119.2 million is considered to be gross direct general property tax supported debt; considering the $24.2 million available in the General Debt Service Fund, the net general property tax supported debt at year end was $95 million or $330 per capita.
The City’s General Obligation bonds issued in 2005 continued their Aa2 rating from Moody’s Investors Service, Inc., with a positive outlook, and AAA rating from Standard & Poor’s Corporation. The City’s Recreational Facilities Gross Revenue bonds were rated Aa3 by Moody’s and AA by Standard & Poor’s. The HRA General Obligation Tax Increment Revenue Refunding bonds for Midway Marketplace were rated AAA by Standard & Poor’s and Aa2 by Moody’s. The HRA Tax Increment Scattered Sites Revenue bonds were insured by Radian and rated Aa3 by Moody’s. The HRA Parking Facilities Revenue bonds for Smith Avenue Transit Center were rated AA+ by Standard & Poor’s. The HRA Parking Revenue Lowertown Refunding bonds were insured by FSA and rated AAA by both Moody’s and Standard & Poor’s.
OUTSTANDING DEBT GENERAL OBLIGATION, REVENUE, LEASE REVENUE AND SALES TAX NOTES AND BONDS
(in thousands) Total
Percent 2005 2004 2005 2004 2005 2004 Change
General Obligation Bonds $ 159,285 $ 159,390 $ 39,485 $ 40,815 $ 198,770 $ 200,205 (0.72)%Revenue Bonds - - 27,690 29,760 27,690 29,760 (6.96)%Sales Tax Revenue Bonds 67,750 68,900 - - 67,750 68,900 (1.67)%HRA Tax Increment Revenue Bonds 62,170 59,026 - - 62,170 59,026 5.33%HRA Parking Facilities Revenue Bonds - - 55,420 40,715 55,420 40,715 36.12%HRA Loan Enterprise Revenue Bonds - - 21,830 25,000 21,830 25,000 (12.68)%HRA Sales Tax Revenue Bonds 44,895 46,115 - - 44,895 46,115 (2.65)%HRA Lease Revenue Bonds 6,870 6,920 - - 6,870 6,920 (0.72)%Revenue Notes 44,844 46,552 15,825 16,709 60,669 63,261 (4.10)%HRA Revenue Notes 8,580 14,870 3,090 5,084 11,670 19,954 (41.52)%
Total $ 394,394 $ 401,773 $ 163,340 $ 158,083 $ 557,734 $ 559,856 (0.38)%
Business-Type Activities TotalGovernmental Activities
21
CITY OF SAINT PAUL, MINNESOTA
MANAGEMENT’S DISCUSSION AND ANALYSISFor Year Ended December 31, 2005
CURRENTLY KNOWN FACTS/ECONOMIC CONDITIONS
Financial Outlook
The City's budget, and in particular the General, Library Agency and General Debt Service funds, remain heavily influenced by state budget decisions of previous years to reduce Local Government Aid payments, and subsequent City budget management decisions which, to date, have not completely restored an ongoing balance between annual operating revenues and expenditures.
State aid payments are an important component of the City's General Fund budget. In the 2006 adopted budget, state aid including Local Government Aid (LGA—the largest program), is the single largest financing source at over 38% of the total (by comparison, property taxes provide 26% of financing in 2006). In the 2003 legislative session, the state resolved its budget deficit in part by reducing aid payments to local governments. In Saint Paul, this had the effect of reducing LGA payments for 2006 by 21.8% ($16.6 million) below the originally-certified 2003 level.
While the City made significant mid-year spending adjustments in 2003 (including elimination of approximately 139 budgeted positions) that carried forward into the 2004 budget year, permanent revenue and spending adjustments have not completely offset the loss of state aid payments. While the 2006 adopted budget uses no financing from the General Fund fund balance (consistent with the City's newly-adopted fund balance policy), it does rely considerably on one-time financing and transfers from a number of other sources.
The 2005 and 2006 sessions of the Minnesota Legislature adjourned without any action to restore the state aid cuts enacted in 2003. The major task that will confront the City over the next several years will be to find a combination of permanent revenue and spending adjustments necessary to adapt to what likely will be permanently-reduced levels of financial assistance from the state.
Employment Outlook
The 2005 annual average unemployment rate for the City of Saint Paul was reported by the Minnesota Department of Employment and Economic Development at 4.4%. This compares to a state unemployment rate of 4% and a U.S. average rate of 5.1%. Saint Paul has a balanced, diversified employment base with no single industry sector dominating. Education and Health Services, Professional and Business Services, and Trade, Transportation and Utilities, and Government (local, state and federal combined) each supplied more than 10% of total employment in 2005.
The third quarter 2005 annual average wage in Saint Paul was $43,784, compared to $46,696 in the metro area and $41,028 in Minnesota.
22
CITY OF SAINT PAUL, MINNESOTA
MANAGEMENT’S DISCUSSION AND ANALYSISFor Year Ended December 31, 2005
REQUESTS FOR INFORMATION
The financial report is designed to provide our citizens, customers, investors and creditors with general overview of the City’s finances. If you have questions about this report or need any additional information, contact the Office of Financial Services, Attn: Lori Lee, at 15 W. Kellogg Blvd., Room 700; Saint Paul, Minnesota 55102, call 651-266-8822, or e-mail [email protected].
General information relating to the City of Saint Paul, Minnesota, can be found at the City’s website, www.ci.stpaul.mn.us.
23

This page left blank intentionally
24

FINANCIAL SECTION
BASIC FINANCIAL STATEMENTS
C I T Y O F S A I N T P A U L C O M P R E H E N S I V E A N N U A L F I N A N C I A L R E P O R T
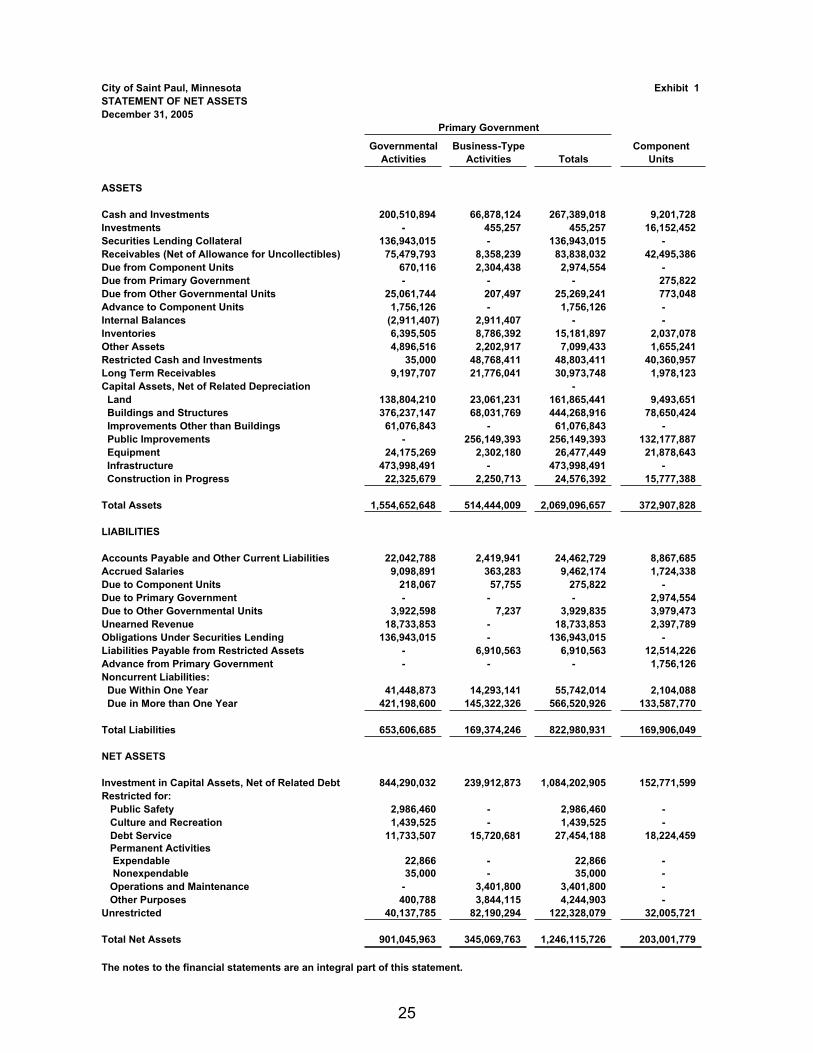
City of Saint Paul, Minnesota Exhibit 1STATEMENT OF NET ASSETSDecember 31, 2005
Primary Government
GovernmentalActivities
Business-TypeActivities Totals
ComponentUnits
ASSETS
Cash and Investments 200,510,894 66,878,124 267,389,018 9,201,728 Investments - 455,257 455,257 16,152,452 Securities Lending Collateral 136,943,015 - 136,943,015 - Receivables (Net of Allowance for Uncollectibles) 75,479,793 8,358,239 83,838,032 42,495,386 Due from Component Units 670,116 2,304,438 2,974,554 - Due from Primary Government - - - 275,822 Due from Other Governmental Units 25,061,744 207,497 25,269,241 773,048 Advance to Component Units 1,756,126 - 1,756,126 - Internal Balances (2,911,407) 2,911,407 - - Inventories 6,395,505 8,786,392 15,181,897 2,037,078 Other Assets 4,896,516 2,202,917 7,099,433 1,655,241 Restricted Cash and Investments 35,000 48,768,411 48,803,411 40,360,957 Long Term Receivables 9,197,707 21,776,041 30,973,748 1,978,123 Capital Assets, Net of Related Depreciation - Land 138,804,210 23,061,231 161,865,441 9,493,651 Buildings and Structures 376,237,147 68,031,769 444,268,916 78,650,424 Improvements Other than Buildings 61,076,843 - 61,076,843 - Public Improvements - 256,149,393 256,149,393 132,177,887 Equipment 24,175,269 2,302,180 26,477,449 21,878,643 Infrastructure 473,998,491 - 473,998,491 - Construction in Progress 22,325,679 2,250,713 24,576,392 15,777,388
Total Assets 1,554,652,648 514,444,009 2,069,096,657 372,907,828
LIABILITIES
Accounts Payable and Other Current Liabilities 22,042,788 2,419,941 24,462,729 8,867,685 Accrued Salaries 9,098,891 363,283 9,462,174 1,724,338 Due to Component Units 218,067 57,755 275,822 - Due to Primary Government - - - 2,974,554 Due to Other Governmental Units 3,922,598 7,237 3,929,835 3,979,473 Unearned Revenue 18,733,853 - 18,733,853 2,397,789 Obligations Under Securities Lending 136,943,015 - 136,943,015 - Liabilities Payable from Restricted Assets - 6,910,563 6,910,563 12,514,226 Advance from Primary Government - - - 1,756,126 Noncurrent Liabilities: Due Within One Year 41,448,873 14,293,141 55,742,014 2,104,088 Due in More than One Year 421,198,600 145,322,326 566,520,926 133,587,770
Total Liabilities 653,606,685 169,374,246 822,980,931 169,906,049
NET ASSETS
Investment in Capital Assets, Net of Related Debt 844,290,032 239,912,873 1,084,202,905 152,771,599 Restricted for: Public Safety 2,986,460 - 2,986,460 - Culture and Recreation 1,439,525 - 1,439,525 - Debt Service 11,733,507 15,720,681 27,454,188 18,224,459 Permanent Activities Expendable 22,866 - 22,866 - Nonexpendable 35,000 - 35,000 - Operations and Maintenance - 3,401,800 3,401,800 - Other Purposes 400,788 3,844,115 4,244,903 - Unrestricted 40,137,785 82,190,294 122,328,079 32,005,721
Total Net Assets 901,045,963 345,069,763 1,246,115,726 203,001,779
The notes to the financial statements are an integral part of this statement.
25

This page left blank intentionally
26
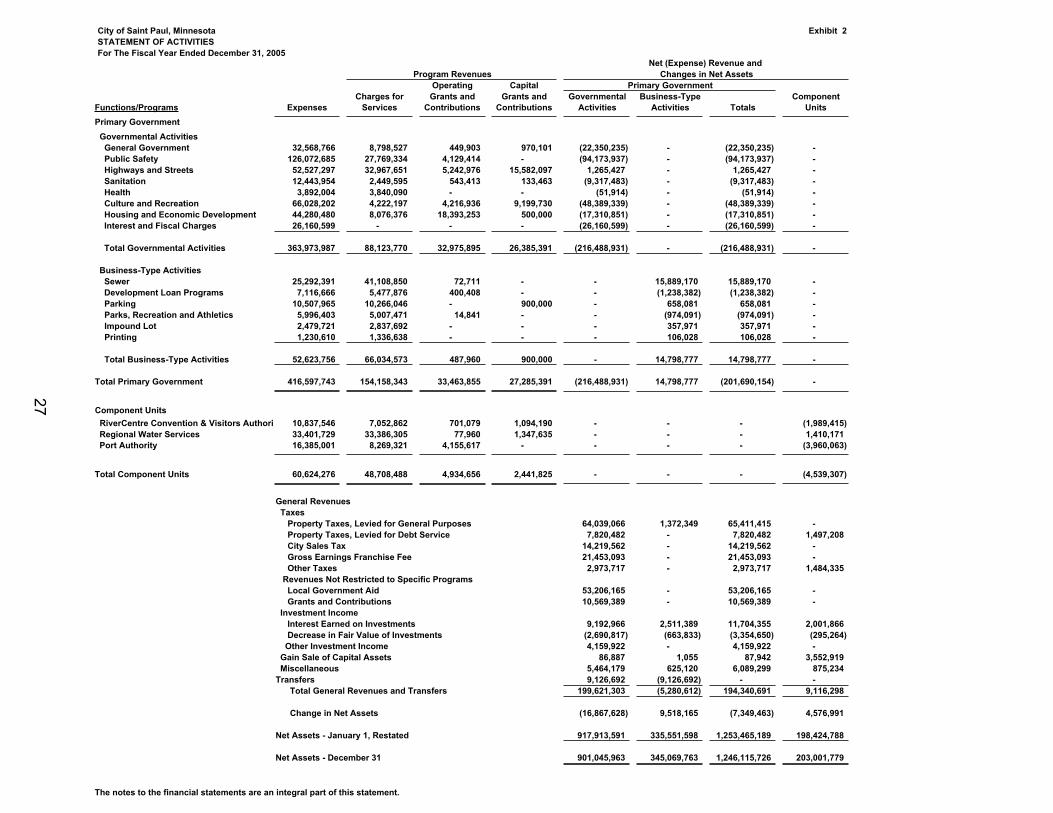
City of Saint Paul, Minnesota Exhibit 2STATEMENT OF ACTIVITIESFor The Fiscal Year Ended December 31, 2005
Net (Expense) Revenue and Program Revenues Changes in Net Assets
Operating CapitalCharges for Grants and Grants and Governmental Business-Type Component
Functions/Programs Expenses Services Contributions Contributions Activities Activities Totals UnitsPrimary Government Governmental Activities General Government 32,568,766 8,798,527 449,903 970,101 (22,350,235) - (22,350,235) - Public Safety 126,072,685 27,769,334 4,129,414 - (94,173,937) - (94,173,937) - Highways and Streets 52,527,297 32,967,651 5,242,976 15,582,097 1,265,427 - 1,265,427 - Sanitation 12,443,954 2,449,595 543,413 133,463 (9,317,483) - (9,317,483) - Health 3,892,004 3,840,090 - - (51,914) - (51,914) - Culture and Recreation 66,028,202 4,222,197 4,216,936 9,199,730 (48,389,339) - (48,389,339) - Housing and Economic Development 44,280,480 8,076,376 18,393,253 500,000 (17,310,851) - (17,310,851) - Interest and Fiscal Charges 26,160,599 - - - (26,160,599) - (26,160,599) -
Total Governmental Activities 363,973,987 88,123,770 32,975,895 26,385,391 (216,488,931) - (216,488,931) -
Business-Type Activities Sewer 25,292,391 41,108,850 72,711 - - 15,889,170 15,889,170 - Development Loan Programs 7,116,666 5,477,876 400,408 - - (1,238,382) (1,238,382) - Parking 10,507,965 10,266,046 - 900,000 - 658,081 658,081 - Parks, Recreation and Athletics 5,996,403 5,007,471 14,841 - - (974,091) (974,091) - Impound Lot 2,479,721 2,837,692 - - - 357,971 357,971 - Printing 1,230,610 1,336,638 - - - 106,028 106,028 -
Total Business-Type Activities 52,623,756 66,034,573 487,960 900,000 - 14,798,777 14,798,777 -
Total Primary Government 416,597,743 154,158,343 33,463,855 27,285,391 (216,488,931) 14,798,777 (201,690,154) -
Component Units RiverCentre Convention & Visitors Authorit 10,837,546 7,052,862 701,079 1,094,190 - - - (1,989,415) Regional Water Services 33,401,729 33,386,305 77,960 1,347,635 - - - 1,410,171 Port Authority 16,385,001 8,269,321 4,155,617 - - - - (3,960,063)
Total Component Units 60,624,276 48,708,488 4,934,656 2,441,825 - - - (4,539,307)
General Revenues Taxes Property Taxes, Levied for General Purposes 64,039,066 1,372,349 65,411,415 - Property Taxes, Levied for Debt Service 7,820,482 - 7,820,482 1,497,208 City Sales Tax 14,219,562 - 14,219,562 - Gross Earnings Franchise Fee 21,453,093 - 21,453,093 - Other Taxes 2,973,717 - 2,973,717 1,484,335 Revenues Not Restricted to Specific Programs Local Government Aid 53,206,165 - 53,206,165 - Grants and Contributions 10,569,389 - 10,569,389 - Investment Income Interest Earned on Investments 9,192,966 2,511,389 11,704,355 2,001,866 Decrease in Fair Value of Investments (2,690,817) (663,833) (3,354,650) (295,264) Other Investment Income 4,159,922 - 4,159,922 - Gain Sale of Capital Assets 86,887 1,055 87,942 3,552,919 Miscellaneous 5,464,179 625,120 6,089,299 875,234Transfers 9,126,692 (9,126,692) - - Total General Revenues and Transfers 199,621,303 (5,280,612) 194,340,691 9,116,298
Change in Net Assets (16,867,628) 9,518,165 (7,349,463) 4,576,991
Net Assets - January 1, Restated 917,913,591 335,551,598 1,253,465,189 198,424,788
Net Assets - December 31 901,045,963 345,069,763 1,246,115,726 203,001,779
The notes to the financial statements are an integral part of this statement.
Primary Government
27
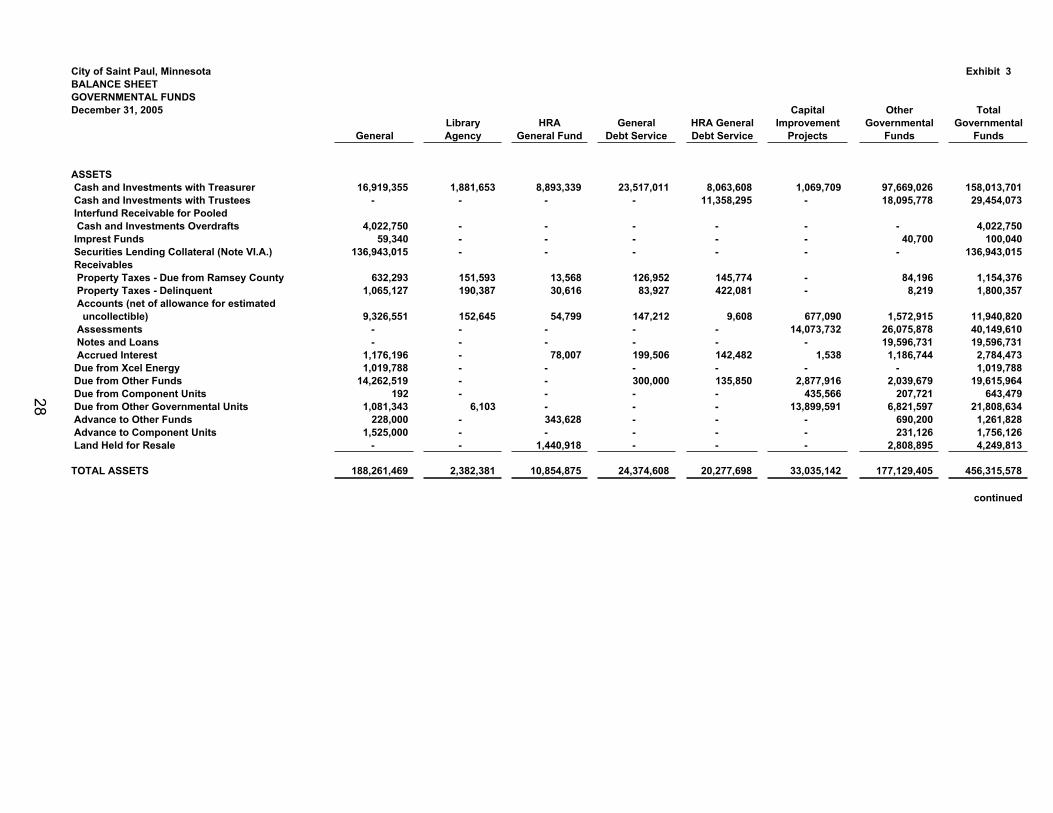
City of Saint Paul, Minnesota Exhibit 3BALANCE SHEETGOVERNMENTAL FUNDSDecember 31, 2005 Capital Other Total
Library HRA General HRA General Improvement Governmental GovernmentalGeneral Agency General Fund Debt Service Debt Service Projects Funds Funds
ASSETS Cash and Investments with Treasurer 16,919,355 1,881,653 8,893,339 23,517,011 8,063,608 1,069,709 97,669,026 158,013,701 Cash and Investments with Trustees - - - - 11,358,295 - 18,095,778 29,454,073 Interfund Receivable for Pooled Cash and Investments Overdrafts 4,022,750 - - - - - - 4,022,750 Imprest Funds 59,340 - - - - - 40,700 100,040 Securities Lending Collateral (Note VI.A.) 136,943,015 - - - - - - 136,943,015 Receivables Property Taxes - Due from Ramsey County 632,293 151,593 13,568 126,952 145,774 - 84,196 1,154,376 Property Taxes - Delinquent 1,065,127 190,387 30,616 83,927 422,081 - 8,219 1,800,357 Accounts (net of allowance for estimated uncollectible) 9,326,551 152,645 54,799 147,212 9,608 677,090 1,572,915 11,940,820 Assessments - - - - - 14,073,732 26,075,878 40,149,610 Notes and Loans - - - - - - 19,596,731 19,596,731 Accrued Interest 1,176,196 - 78,007 199,506 142,482 1,538 1,186,744 2,784,473 Due from Xcel Energy 1,019,788 - - - - - - 1,019,788 Due from Other Funds 14,262,519 - - 300,000 135,850 2,877,916 2,039,679 19,615,964 Due from Component Units 192 - - - - 435,566 207,721 643,479 Due from Other Governmental Units 1,081,343 6,103 - - - 13,899,591 6,821,597 21,808,634 Advance to Other Funds 228,000 - 343,628 - - - 690,200 1,261,828 Advance to Component Units 1,525,000 - - - - - 231,126 1,756,126 Land Held for Resale - - 1,440,918 - - - 2,808,895 4,249,813
TOTAL ASSETS 188,261,469 2,382,381 10,854,875 24,374,608 20,277,698 33,035,142 177,129,405 456,315,578
continued
28
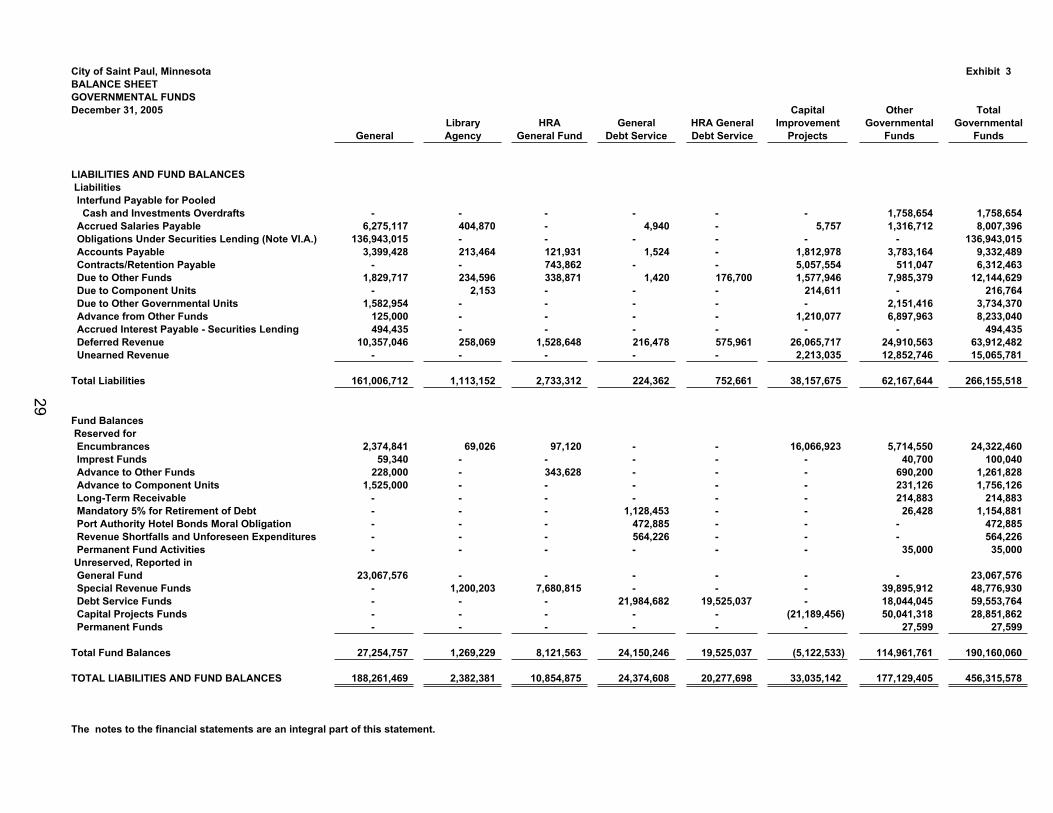
City of Saint Paul, Minnesota Exhibit 3BALANCE SHEETGOVERNMENTAL FUNDSDecember 31, 2005 Capital Other Total
Library HRA General HRA General Improvement Governmental GovernmentalGeneral Agency General Fund Debt Service Debt Service Projects Funds Funds
LIABILITIES AND FUND BALANCES Liabilities Interfund Payable for Pooled Cash and Investments Overdrafts - - - - - - 1,758,654 1,758,654 Accrued Salaries Payable 6,275,117 404,870 - 4,940 - 5,757 1,316,712 8,007,396 Obligations Under Securities Lending (Note VI.A.) 136,943,015 - - - - - - 136,943,015 Accounts Payable 3,399,428 213,464 121,931 1,524 - 1,812,978 3,783,164 9,332,489 Contracts/Retention Payable - - 743,862 - - 5,057,554 511,047 6,312,463 Due to Other Funds 1,829,717 234,596 338,871 1,420 176,700 1,577,946 7,985,379 12,144,629 Due to Component Units - 2,153 - - - 214,611 - 216,764 Due to Other Governmental Units 1,582,954 - - - - - 2,151,416 3,734,370 Advance from Other Funds 125,000 - - - - 1,210,077 6,897,963 8,233,040 Accrued Interest Payable - Securities Lending 494,435 - - - - - - 494,435 Deferred Revenue 10,357,046 258,069 1,528,648 216,478 575,961 26,065,717 24,910,563 63,912,482 Unearned Revenue - - - - - 2,213,035 12,852,746 15,065,781
Total Liabilities 161,006,712 1,113,152 2,733,312 224,362 752,661 38,157,675 62,167,644 266,155,518
Fund Balances Reserved for Encumbrances 2,374,841 69,026 97,120 - - 16,066,923 5,714,550 24,322,460 Imprest Funds 59,340 - - - - - 40,700 100,040 Advance to Other Funds 228,000 - 343,628 - - - 690,200 1,261,828 Advance to Component Units 1,525,000 - - - - - 231,126 1,756,126 Long-Term Receivable - - - - - - 214,883 214,883 Mandatory 5% for Retirement of Debt - - - 1,128,453 - - 26,428 1,154,881 Port Authority Hotel Bonds Moral Obligation - - - 472,885 - - - 472,885 Revenue Shortfalls and Unforeseen Expenditures - - - 564,226 - - - 564,226 Permanent Fund Activities - - - - - - 35,000 35,000 Unreserved, Reported in General Fund 23,067,576 - - - - - - 23,067,576 Special Revenue Funds - 1,200,203 7,680,815 - - - 39,895,912 48,776,930 Debt Service Funds - - - 21,984,682 19,525,037 - 18,044,045 59,553,764 Capital Projects Funds - - - - - (21,189,456) 50,041,318 28,851,862 Permanent Funds - - - - - - 27,599 27,599
Total Fund Balances 27,254,757 1,269,229 8,121,563 24,150,246 19,525,037 (5,122,533) 114,961,761 190,160,060
TOTAL LIABILITIES AND FUND BALANCES 188,261,469 2,382,381 10,854,875 24,374,608 20,277,698 33,035,142 177,129,405 456,315,578
The notes to the financial statements are an integral part of this statement.
29

This page left blank intentionally
30
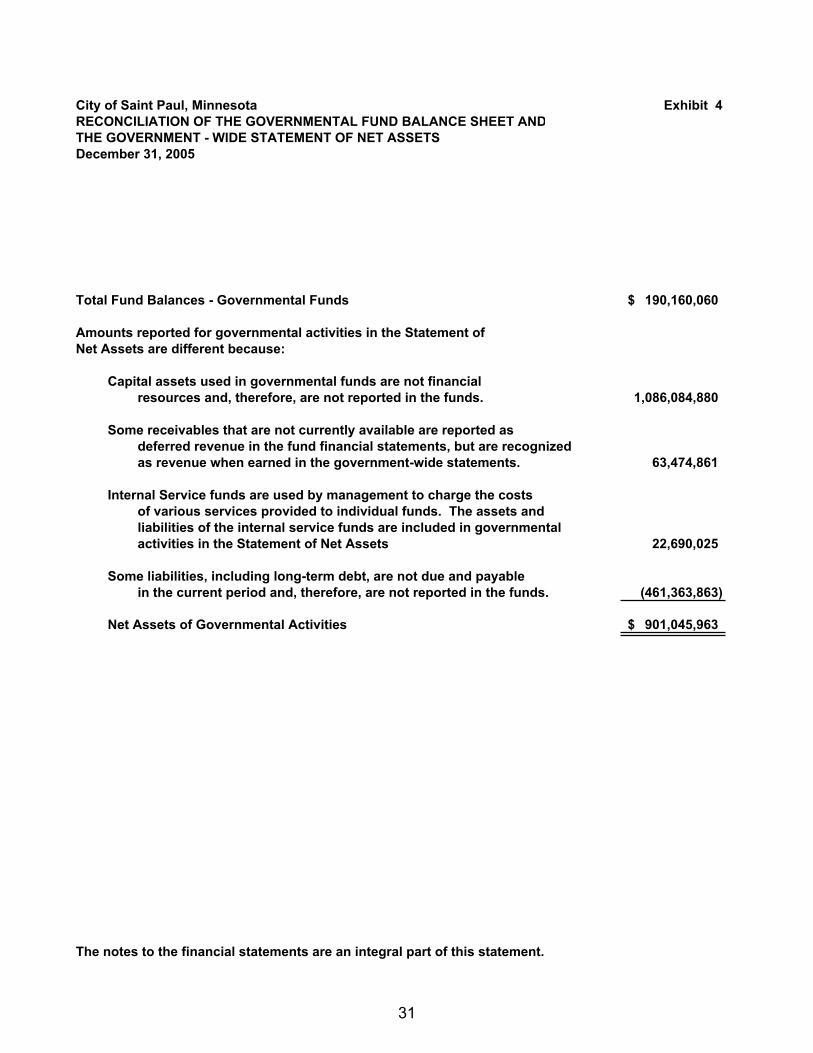
City of Saint Paul, Minnesota Exhibit 4RECONCILIATION OF THE GOVERNMENTAL FUND BALANCE SHEET ANDTHE GOVERNMENT - WIDE STATEMENT OF NET ASSETSDecember 31, 2005
Total Fund Balances - Governmental Funds 190,160,060$
Amounts reported for governmental activities in the Statement ofNet Assets are different because:
Capital assets used in governmental funds are not financialresources and, therefore, are not reported in the funds. 1,086,084,880
Some receivables that are not currently available are reported as deferred revenue in the fund financial statements, but are recognized as revenue when earned in the government-wide statements. 63,474,861
Internal Service funds are used by management to charge the costsof various services provided to individual funds. The assets and liabilities of the internal service funds are included in governmental activities in the Statement of Net Assets 22,690,025
Some liabilities, including long-term debt, are not due and payable in the current period and, therefore, are not reported in the funds. (461,363,863)
Net Assets of Governmental Activities 901,045,963$
The notes to the financial statements are an integral part of this statement.
31
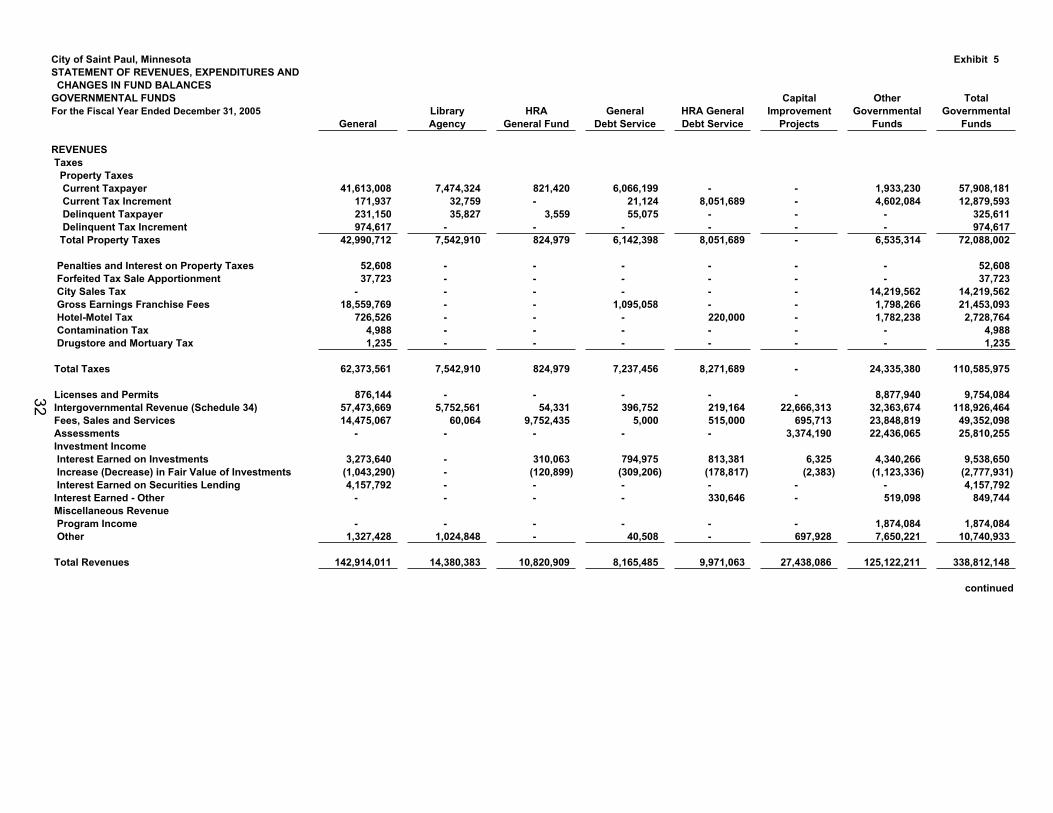
City of Saint Paul, Minnesota Exhibit 5STATEMENT OF REVENUES, EXPENDITURES AND CHANGES IN FUND BALANCESGOVERNMENTAL FUNDS Capital Other TotalFor the Fiscal Year Ended December 31, 2005 Library HRA General HRA General Improvement Governmental Governmental
General Agency General Fund Debt Service Debt Service Projects Funds Funds
REVENUES Taxes Property Taxes Current Taxpayer 41,613,008 7,474,324 821,420 6,066,199 - - 1,933,230 57,908,181 Current Tax Increment 171,937 32,759 - 21,124 8,051,689 - 4,602,084 12,879,593 Delinquent Taxpayer 231,150 35,827 3,559 55,075 - - - 325,611 Delinquent Tax Increment 974,617 - - - - - - 974,617 Total Property Taxes 42,990,712 7,542,910 824,979 6,142,398 8,051,689 - 6,535,314 72,088,002
Penalties and Interest on Property Taxes 52,608 - - - - - - 52,608 Forfeited Tax Sale Apportionment 37,723 - - - - - - 37,723 City Sales Tax - - - - - - 14,219,562 14,219,562 Gross Earnings Franchise Fees 18,559,769 - - 1,095,058 - - 1,798,266 21,453,093 Hotel-Motel Tax 726,526 - - - 220,000 - 1,782,238 2,728,764 Contamination Tax 4,988 - - - - - - 4,988 Drugstore and Mortuary Tax 1,235 - - - - - - 1,235
Total Taxes 62,373,561 7,542,910 824,979 7,237,456 8,271,689 - 24,335,380 110,585,975
Licenses and Permits 876,144 - - - - - 8,877,940 9,754,084 Intergovernmental Revenue (Schedule 34) 57,473,669 5,752,561 54,331 396,752 219,164 22,666,313 32,363,674 118,926,464 Fees, Sales and Services 14,475,067 60,064 9,752,435 5,000 515,000 695,713 23,848,819 49,352,098 Assessments - - - - - 3,374,190 22,436,065 25,810,255 Investment Income Interest Earned on Investments 3,273,640 - 310,063 794,975 813,381 6,325 4,340,266 9,538,650 Increase (Decrease) in Fair Value of Investments (1,043,290) - (120,899) (309,206) (178,817) (2,383) (1,123,336) (2,777,931) Interest Earned on Securities Lending 4,157,792 - - - - - - 4,157,792 Interest Earned - Other - - - - 330,646 - 519,098 849,744 Miscellaneous Revenue Program Income - - - - - - 1,874,084 1,874,084 Other 1,327,428 1,024,848 - 40,508 - 697,928 7,650,221 10,740,933
Total Revenues 142,914,011 14,380,383 10,820,909 8,165,485 9,971,063 27,438,086 125,122,211 338,812,148 continued
32
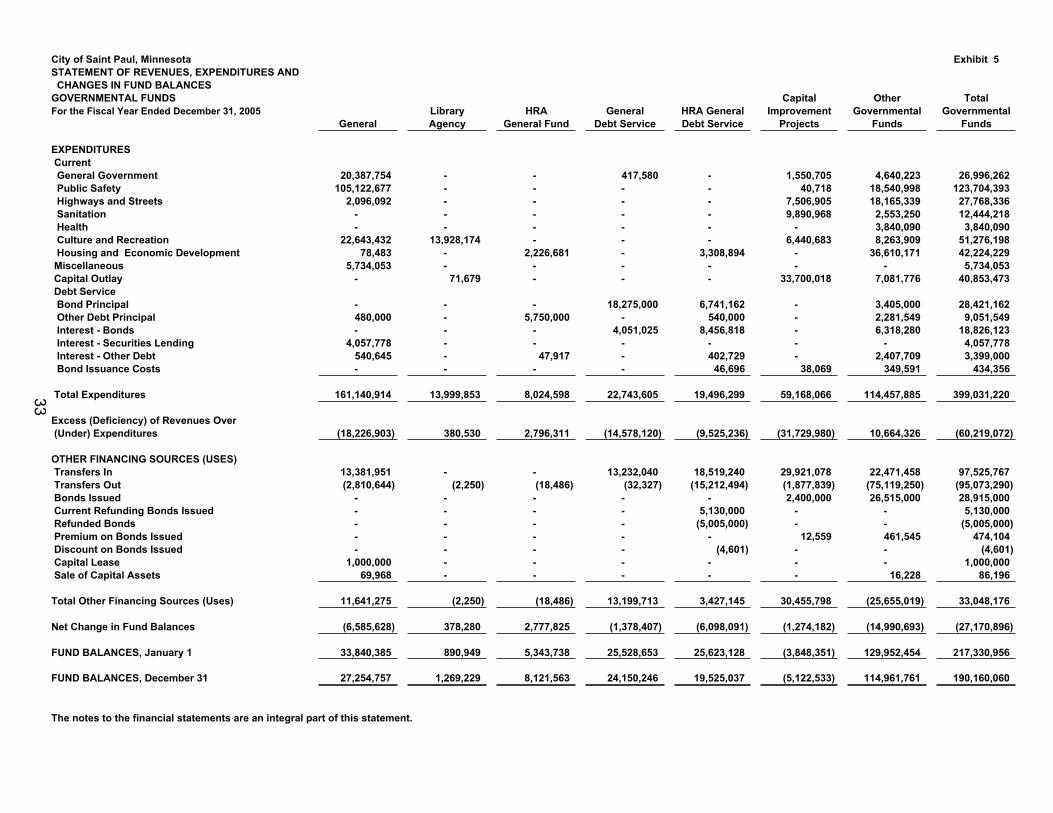
City of Saint Paul, Minnesota Exhibit 5STATEMENT OF REVENUES, EXPENDITURES AND CHANGES IN FUND BALANCESGOVERNMENTAL FUNDS Capital Other TotalFor the Fiscal Year Ended December 31, 2005 Library HRA General HRA General Improvement Governmental Governmental
General Agency General Fund Debt Service Debt Service Projects Funds Funds
EXPENDITURES Current General Government 20,387,754 - - 417,580 - 1,550,705 4,640,223 26,996,262 Public Safety 105,122,677 - - - - 40,718 18,540,998 123,704,393 Highways and Streets 2,096,092 - - - - 7,506,905 18,165,339 27,768,336 Sanitation - - - - - 9,890,968 2,553,250 12,444,218 Health - - - - - - 3,840,090 3,840,090 Culture and Recreation 22,643,432 13,928,174 - - - 6,440,683 8,263,909 51,276,198 Housing and Economic Development 78,483 - 2,226,681 - 3,308,894 - 36,610,171 42,224,229 Miscellaneous 5,734,053 - - - - - - 5,734,053 Capital Outlay - 71,679 - - - 33,700,018 7,081,776 40,853,473 Debt Service Bond Principal - - - 18,275,000 6,741,162 - 3,405,000 28,421,162 Other Debt Principal 480,000 - 5,750,000 - 540,000 - 2,281,549 9,051,549 Interest - Bonds - - - 4,051,025 8,456,818 - 6,318,280 18,826,123 Interest - Securities Lending 4,057,778 - - - - - - 4,057,778 Interest - Other Debt 540,645 - 47,917 - 402,729 - 2,407,709 3,399,000 Bond Issuance Costs - - - - 46,696 38,069 349,591 434,356
Total Expenditures 161,140,914 13,999,853 8,024,598 22,743,605 19,496,299 59,168,066 114,457,885 399,031,220
Excess (Deficiency) of Revenues Over (Under) Expenditures (18,226,903) 380,530 2,796,311 (14,578,120) (9,525,236) (31,729,980) 10,664,326 (60,219,072)
OTHER FINANCING SOURCES (USES) Transfers In 13,381,951 - - 13,232,040 18,519,240 29,921,078 22,471,458 97,525,767 Transfers Out (2,810,644) (2,250) (18,486) (32,327) (15,212,494) (1,877,839) (75,119,250) (95,073,290) Bonds Issued - - - - - 2,400,000 26,515,000 28,915,000 Current Refunding Bonds Issued - - - - 5,130,000 - - 5,130,000 Refunded Bonds - - - - (5,005,000) - - (5,005,000) Premium on Bonds Issued - - - - - 12,559 461,545 474,104 Discount on Bonds Issued - - - - (4,601) - - (4,601) Capital Lease 1,000,000 - - - - - - 1,000,000 Sale of Capital Assets 69,968 - - - - - 16,228 86,196
Total Other Financing Sources (Uses) 11,641,275 (2,250) (18,486) 13,199,713 3,427,145 30,455,798 (25,655,019) 33,048,176
Net Change in Fund Balances (6,585,628) 378,280 2,777,825 (1,378,407) (6,098,091) (1,274,182) (14,990,693) (27,170,896)
FUND BALANCES, January 1 33,840,385 890,949 5,343,738 25,528,653 25,623,128 (3,848,351) 129,952,454 217,330,956
FUND BALANCES, December 31 27,254,757 1,269,229 8,121,563 24,150,246 19,525,037 (5,122,533) 114,961,761 190,160,060
The notes to the financial statements are an integral part of this statement.
33
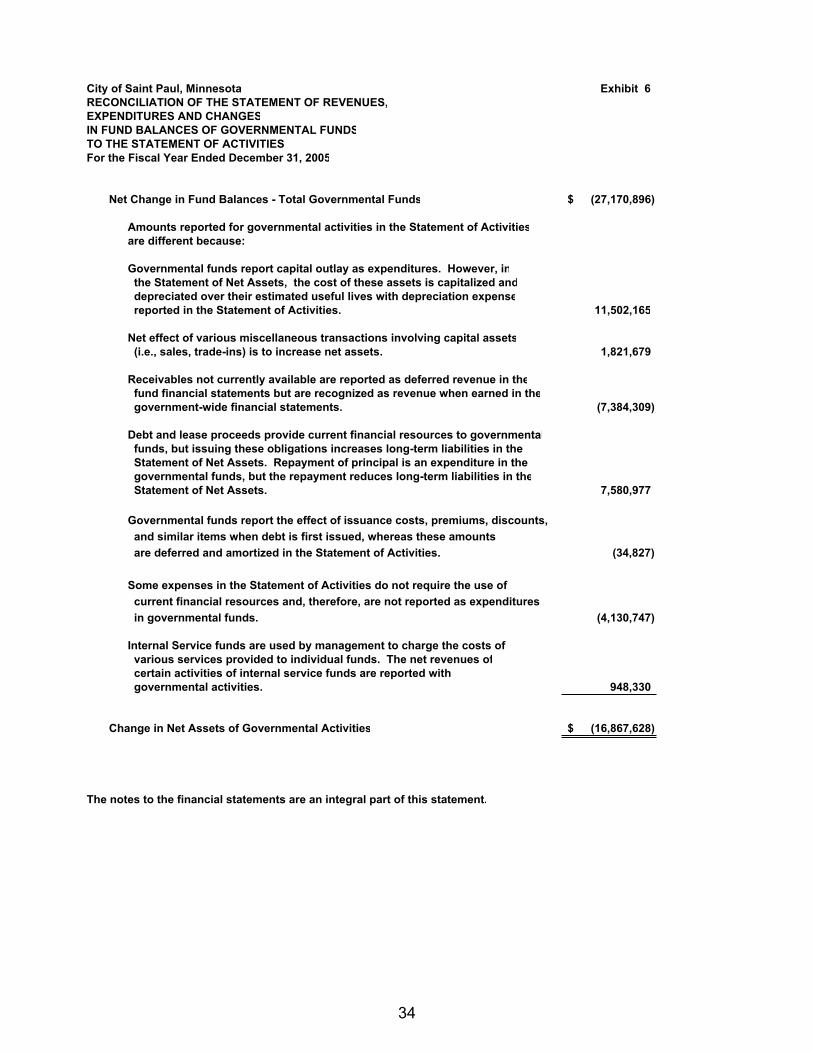
City of Saint Paul, Minnesota Exhibit 6RECONCILIATION OF THE STATEMENT OF REVENUES,EXPENDITURES AND CHANGESIN FUND BALANCES OF GOVERNMENTAL FUNDSTO THE STATEMENT OF ACTIVITIESFor the Fiscal Year Ended December 31, 2005
Net Change in Fund Balances - Total Governmental Funds (27,170,896)$
Amounts reported for governmental activities in the Statement of Activitiesare different because:
Governmental funds report capital outlay as expenditures. However, in the Statement of Net Assets, the cost of these assets is capitalized and depreciated over their estimated useful lives with depreciation expense reported in the Statement of Activities. 11,502,165
Net effect of various miscellaneous transactions involving capital assets (i.e., sales, trade-ins) is to increase net assets. 1,821,679
Receivables not currently available are reported as deferred revenue in the fund financial statements but are recognized as revenue when earned in the government-wide financial statements. (7,384,309)
Debt and lease proceeds provide current financial resources to governmental funds, but issuing these obligations increases long-term liabilities in the Statement of Net Assets. Repayment of principal is an expenditure in the governmental funds, but the repayment reduces long-term liabilities in the Statement of Net Assets. 7,580,977
Governmental funds report the effect of issuance costs, premiums, discounts, and similar items when debt is first issued, whereas these amounts are deferred and amortized in the Statement of Activities. (34,827)
Some expenses in the Statement of Activities do not require the use of current financial resources and, therefore, are not reported as expenditures in governmental funds. (4,130,747)
Internal Service funds are used by management to charge the costs of various services provided to individual funds. The net revenues of certain activities of internal service funds are reported with governmental activities. 948,330
Change in Net Assets of Governmental Activities (16,867,628)$
The notes to the financial statements are an integral part of this statement.
34
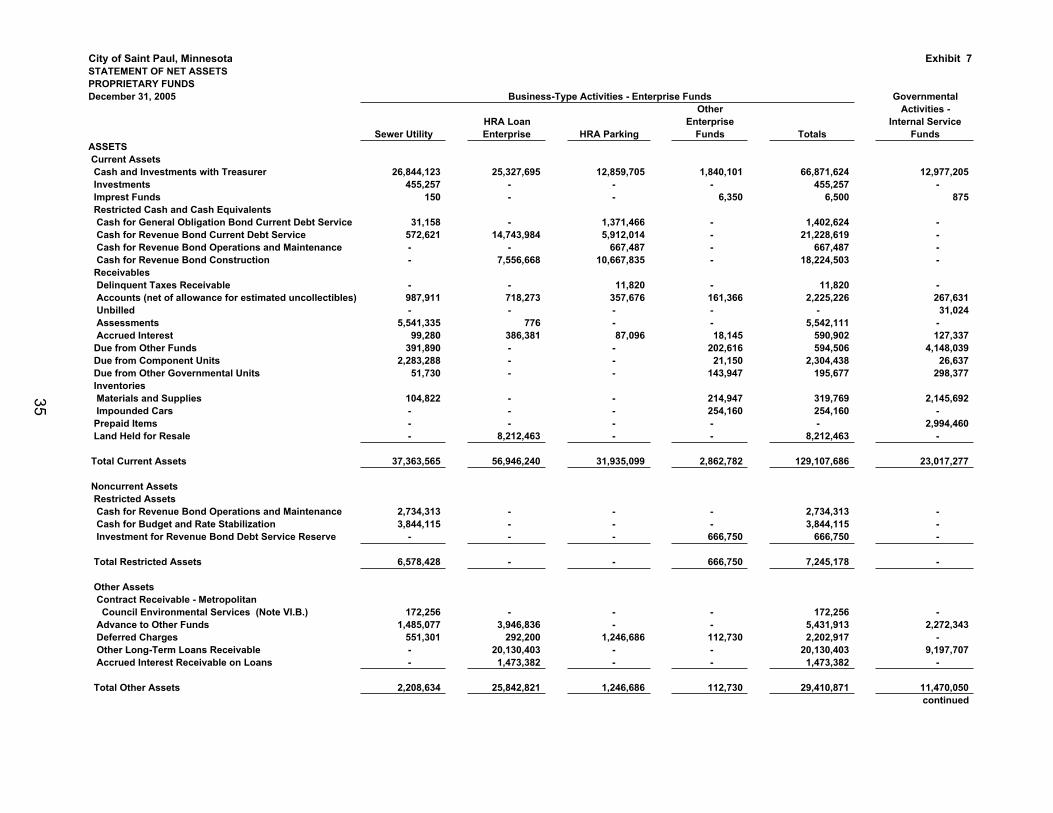
City of Saint Paul, Minnesota Exhibit 7STATEMENT OF NET ASSETSPROPRIETARY FUNDSDecember 31, 2005 Governmental
Other Activities -HRA Loan Enterprise Internal Service
Sewer Utility Enterprise HRA Parking Funds Totals FundsASSETS Current Assets Cash and Investments with Treasurer 26,844,123 25,327,695 12,859,705 1,840,101 66,871,624 12,977,205 Investments 455,257 - - - 455,257 - Imprest Funds 150 - - 6,350 6,500 875 Restricted Cash and Cash Equivalents Cash for General Obligation Bond Current Debt Service 31,158 - 1,371,466 - 1,402,624 - Cash for Revenue Bond Current Debt Service 572,621 14,743,984 5,912,014 - 21,228,619 - Cash for Revenue Bond Operations and Maintenance - - 667,487 - 667,487 - Cash for Revenue Bond Construction - 7,556,668 10,667,835 - 18,224,503 - Receivables Delinquent Taxes Receivable - - 11,820 - 11,820 - Accounts (net of allowance for estimated uncollectibles) 987,911 718,273 357,676 161,366 2,225,226 267,631 Unbilled - - - - - 31,024 Assessments 5,541,335 776 - - 5,542,111 - Accrued Interest 99,280 386,381 87,096 18,145 590,902 127,337 Due from Other Funds 391,890 - - 202,616 594,506 4,148,039 Due from Component Units 2,283,288 - - 21,150 2,304,438 26,637 Due from Other Governmental Units 51,730 - - 143,947 195,677 298,377 Inventories Materials and Supplies 104,822 - - 214,947 319,769 2,145,692 Impounded Cars - - - 254,160 254,160 - Prepaid Items - - - - - 2,994,460 Land Held for Resale - 8,212,463 - - 8,212,463 -
Total Current Assets 37,363,565 56,946,240 31,935,099 2,862,782 129,107,686 23,017,277
Noncurrent Assets Restricted Assets Cash for Revenue Bond Operations and Maintenance 2,734,313 - - - 2,734,313 - Cash for Budget and Rate Stabilization 3,844,115 - - - 3,844,115 - Investment for Revenue Bond Debt Service Reserve - - - 666,750 666,750 -
Total Restricted Assets 6,578,428 - - 666,750 7,245,178 -
Other Assets Contract Receivable - Metropolitan Council Environmental Services (Note VI.B.) 172,256 - - - 172,256 - Advance to Other Funds 1,485,077 3,946,836 - - 5,431,913 2,272,343 Deferred Charges 551,301 292,200 1,246,686 112,730 2,202,917 - Other Long-Term Loans Receivable - 20,130,403 - - 20,130,403 9,197,707 Accrued Interest Receivable on Loans - 1,473,382 - - 1,473,382 -
Total Other Assets 2,208,634 25,842,821 1,246,686 112,730 29,410,871 11,470,050 continued
Business-Type Activities - Enterprise Funds
35
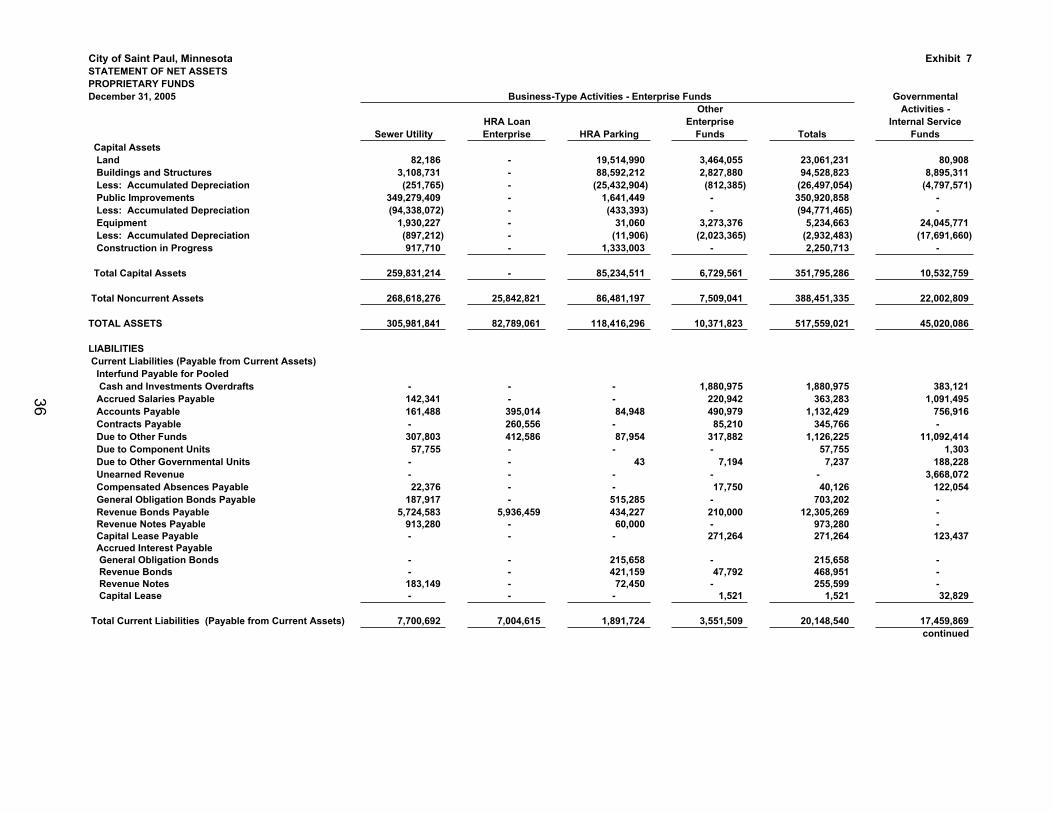
City of Saint Paul, Minnesota Exhibit 7STATEMENT OF NET ASSETSPROPRIETARY FUNDSDecember 31, 2005 Governmental
Other Activities -HRA Loan Enterprise Internal Service
Sewer Utility Enterprise HRA Parking Funds Totals Funds
Business-Type Activities - Enterprise Funds
Capital Assets Land 82,186 - 19,514,990 3,464,055 23,061,231 80,908 Buildings and Structures 3,108,731 - 88,592,212 2,827,880 94,528,823 8,895,311 Less: Accumulated Depreciation (251,765) - (25,432,904) (812,385) (26,497,054) (4,797,571) Public Improvements 349,279,409 - 1,641,449 - 350,920,858 - Less: Accumulated Depreciation (94,338,072) - (433,393) - (94,771,465) - Equipment 1,930,227 - 31,060 3,273,376 5,234,663 24,045,771 Less: Accumulated Depreciation (897,212) - (11,906) (2,023,365) (2,932,483) (17,691,660) Construction in Progress 917,710 - 1,333,003 - 2,250,713 -
Total Capital Assets 259,831,214 - 85,234,511 6,729,561 351,795,286 10,532,759
Total Noncurrent Assets 268,618,276 25,842,821 86,481,197 7,509,041 388,451,335 22,002,809
TOTAL ASSETS 305,981,841 82,789,061 118,416,296 10,371,823 517,559,021 45,020,086
LIABILITIES Current Liabilities (Payable from Current Assets) Interfund Payable for Pooled Cash and Investments Overdrafts - - - 1,880,975 1,880,975 383,121 Accrued Salaries Payable 142,341 - - 220,942 363,283 1,091,495 Accounts Payable 161,488 395,014 84,948 490,979 1,132,429 756,916 Contracts Payable - 260,556 - 85,210 345,766 - Due to Other Funds 307,803 412,586 87,954 317,882 1,126,225 11,092,414 Due to Component Units 57,755 - - - 57,755 1,303 Due to Other Governmental Units - - 43 7,194 7,237 188,228 Unearned Revenue - - - - - 3,668,072 Compensated Absences Payable 22,376 - - 17,750 40,126 122,054 General Obligation Bonds Payable 187,917 - 515,285 - 703,202 - Revenue Bonds Payable 5,724,583 5,936,459 434,227 210,000 12,305,269 - Revenue Notes Payable 913,280 - 60,000 - 973,280 - Capital Lease Payable - - - 271,264 271,264 123,437 Accrued Interest Payable General Obligation Bonds - - 215,658 - 215,658 - Revenue Bonds - - 421,159 47,792 468,951 - Revenue Notes 183,149 - 72,450 - 255,599 - Capital Lease - - - 1,521 1,521 32,829
Total Current Liabilities (Payable from Current Assets) 7,700,692 7,004,615 1,891,724 3,551,509 20,148,540 17,459,869 continued
36
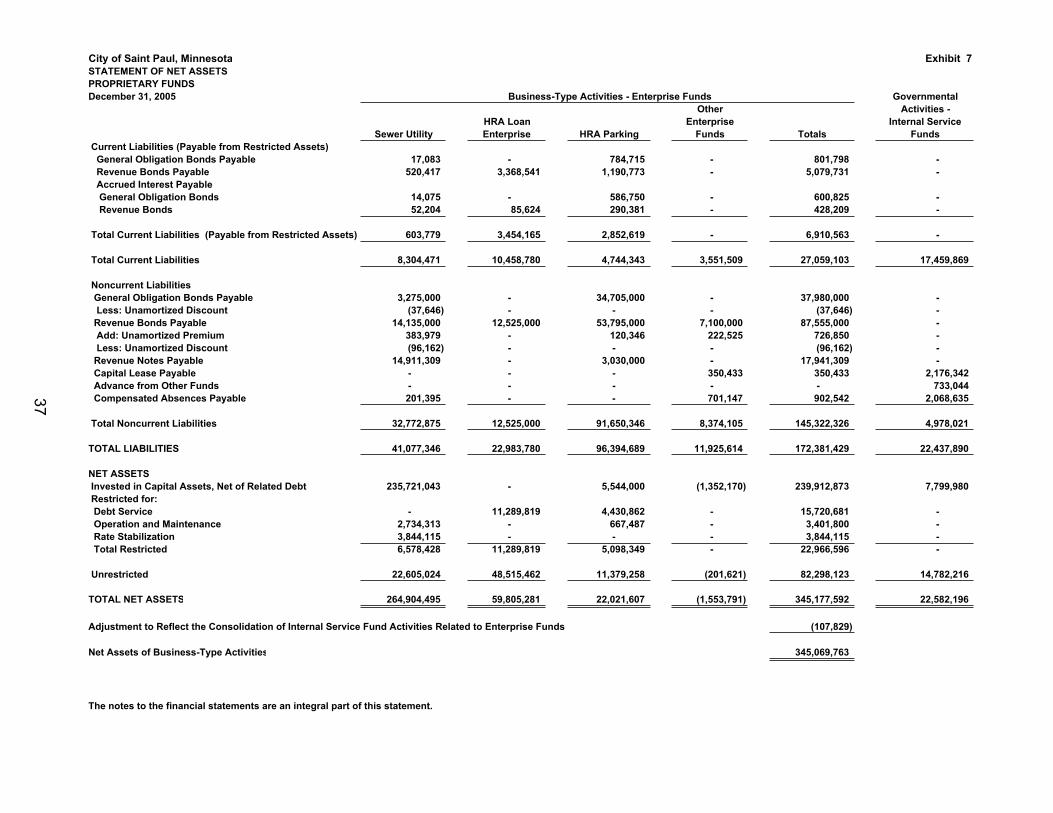
City of Saint Paul, Minnesota Exhibit 7STATEMENT OF NET ASSETSPROPRIETARY FUNDSDecember 31, 2005 Governmental
Other Activities -HRA Loan Enterprise Internal Service
Sewer Utility Enterprise HRA Parking Funds Totals Funds
Business-Type Activities - Enterprise Funds
Current Liabilities (Payable from Restricted Assets) General Obligation Bonds Payable 17,083 - 784,715 - 801,798 - Revenue Bonds Payable 520,417 3,368,541 1,190,773 - 5,079,731 - Accrued Interest Payable General Obligation Bonds 14,075 - 586,750 - 600,825 - Revenue Bonds 52,204 85,624 290,381 - 428,209 -
Total Current Liabilities (Payable from Restricted Assets) 603,779 3,454,165 2,852,619 - 6,910,563 -
Total Current Liabilities 8,304,471 10,458,780 4,744,343 3,551,509 27,059,103 17,459,869
Noncurrent Liabilities General Obligation Bonds Payable 3,275,000 - 34,705,000 - 37,980,000 - Less: Unamortized Discount (37,646) - - - (37,646) - Revenue Bonds Payable 14,135,000 12,525,000 53,795,000 7,100,000 87,555,000 - Add: Unamortized Premium 383,979 - 120,346 222,525 726,850 - Less: Unamortized Discount (96,162) - - - (96,162) - Revenue Notes Payable 14,911,309 - 3,030,000 - 17,941,309 - Capital Lease Payable - - - 350,433 350,433 2,176,342 Advance from Other Funds - - - - - 733,044 Compensated Absences Payable 201,395 - - 701,147 902,542 2,068,635
Total Noncurrent Liabilities 32,772,875 12,525,000 91,650,346 8,374,105 145,322,326 4,978,021
TOTAL LIABILITIES 41,077,346 22,983,780 96,394,689 11,925,614 172,381,429 22,437,890
NET ASSETS Invested in Capital Assets, Net of Related Debt 235,721,043 - 5,544,000 (1,352,170) 239,912,873 7,799,980 Restricted for: Debt Service - 11,289,819 4,430,862 - 15,720,681 - Operation and Maintenance 2,734,313 - 667,487 - 3,401,800 - Rate Stabilization 3,844,115 - - - 3,844,115 - Total Restricted 6,578,428 11,289,819 5,098,349 - 22,966,596 -
Unrestricted 22,605,024 48,515,462 11,379,258 (201,621) 82,298,123 14,782,216
TOTAL NET ASSETS 264,904,495 59,805,281 22,021,607 (1,553,791) 345,177,592 22,582,196
Adjustment to Reflect the Consolidation of Internal Service Fund Activities Related to Enterprise Funds (107,829)
Net Assets of Business-Type Activities 345,069,763
The notes to the financial statements are an integral part of this statement.
37
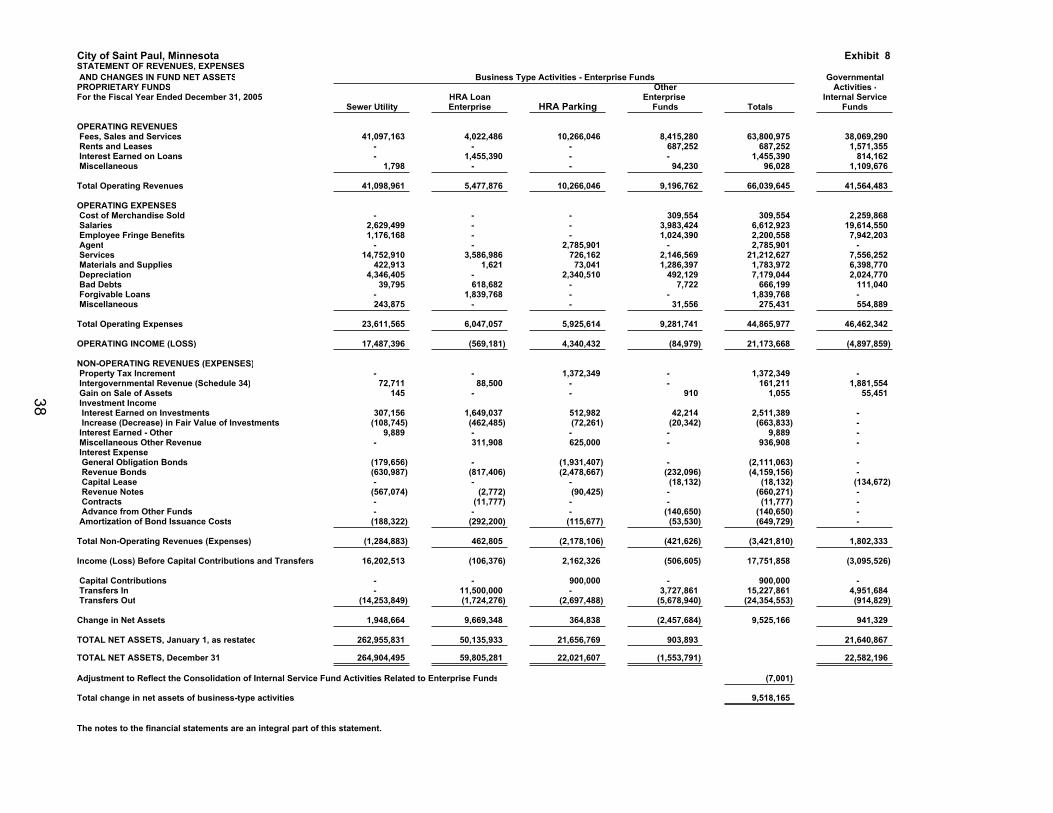
City of Saint Paul, Minnesota Exhibit 8STATEMENT OF REVENUES, EXPENSES AND CHANGES IN FUND NET ASSETS GovernmentalPROPRIETARY FUNDS Other Activities -For the Fiscal Year Ended December 31, 2005 HRA Loan Enterprise Internal Service
Sewer Utility Enterprise HRA Parking Funds Totals Funds
OPERATING REVENUES Fees, Sales and Services 41,097,163 4,022,486 10,266,046 8,415,280 63,800,975 38,069,290 Rents and Leases - - - 687,252 687,252 1,571,355 Interest Earned on Loans - 1,455,390 - - 1,455,390 814,162 Miscellaneous 1,798 - - 94,230 96,028 1,109,676
Total Operating Revenues 41,098,961 5,477,876 10,266,046 9,196,762 66,039,645 41,564,483
OPERATING EXPENSES Cost of Merchandise Sold - - - 309,554 309,554 2,259,868 Salaries 2,629,499 - - 3,983,424 6,612,923 19,614,550 Employee Fringe Benefits 1,176,168 - - 1,024,390 2,200,558 7,942,203 Agent - - 2,785,901 - 2,785,901 - Services 14,752,910 3,586,986 726,162 2,146,569 21,212,627 7,556,252 Materials and Supplies 422,913 1,621 73,041 1,286,397 1,783,972 6,398,770 Depreciation 4,346,405 - 2,340,510 492,129 7,179,044 2,024,770 Bad Debts 39,795 618,682 - 7,722 666,199 111,040 Forgivable Loans - 1,839,768 - - 1,839,768 - Miscellaneous 243,875 - - 31,556 275,431 554,889
Total Operating Expenses 23,611,565 6,047,057 5,925,614 9,281,741 44,865,977 46,462,342
OPERATING INCOME (LOSS) 17,487,396 (569,181) 4,340,432 (84,979) 21,173,668 (4,897,859)
NON-OPERATING REVENUES (EXPENSES) Property Tax Increment - - 1,372,349 - 1,372,349 - Intergovernmental Revenue (Schedule 34) 72,711 88,500 - - 161,211 1,881,554 Gain on Sale of Assets 145 - - 910 1,055 55,451 Investment Income Interest Earned on Investments 307,156 1,649,037 512,982 42,214 2,511,389 - Increase (Decrease) in Fair Value of Investments (108,745) (462,485) (72,261) (20,342) (663,833) - Interest Earned - Other 9,889 - - - 9,889 - Miscellaneous Other Revenue - 311,908 625,000 - 936,908 - Interest Expense General Obligation Bonds (179,656) - (1,931,407) - (2,111,063) - Revenue Bonds (630,987) (817,406) (2,478,667) (232,096) (4,159,156) - Capital Lease - - - (18,132) (18,132) (134,672) Revenue Notes (567,074) (2,772) (90,425) - (660,271) - Contracts - (11,777) - - (11,777) - Advance from Other Funds - - - (140,650) (140,650) - Amortization of Bond Issuance Costs (188,322) (292,200) (115,677) (53,530) (649,729) -
Total Non-Operating Revenues (Expenses) (1,284,883) 462,805 (2,178,106) (421,626) (3,421,810) 1,802,333
Income (Loss) Before Capital Contributions and Transfers 16,202,513 (106,376) 2,162,326 (506,605) 17,751,858 (3,095,526)
Capital Contributions - - 900,000 - 900,000 - Transfers In - 11,500,000 - 3,727,861 15,227,861 4,951,684 Transfers Out (14,253,849) (1,724,276) (2,697,488) (5,678,940) (24,354,553) (914,829)
Change in Net Assets 1,948,664 9,669,348 364,838 (2,457,684) 9,525,166 941,329
TOTAL NET ASSETS, January 1, as restated 262,955,831 50,135,933 21,656,769 903,893 21,640,867
TOTAL NET ASSETS, December 31 264,904,495 59,805,281 22,021,607 (1,553,791) 22,582,196
Adjustment to Reflect the Consolidation of Internal Service Fund Activities Related to Enterprise Funds (7,001)
Total change in net assets of business-type activities 9,518,165
The notes to the financial statements are an integral part of this statement.
Business Type Activities - Enterprise Funds
38
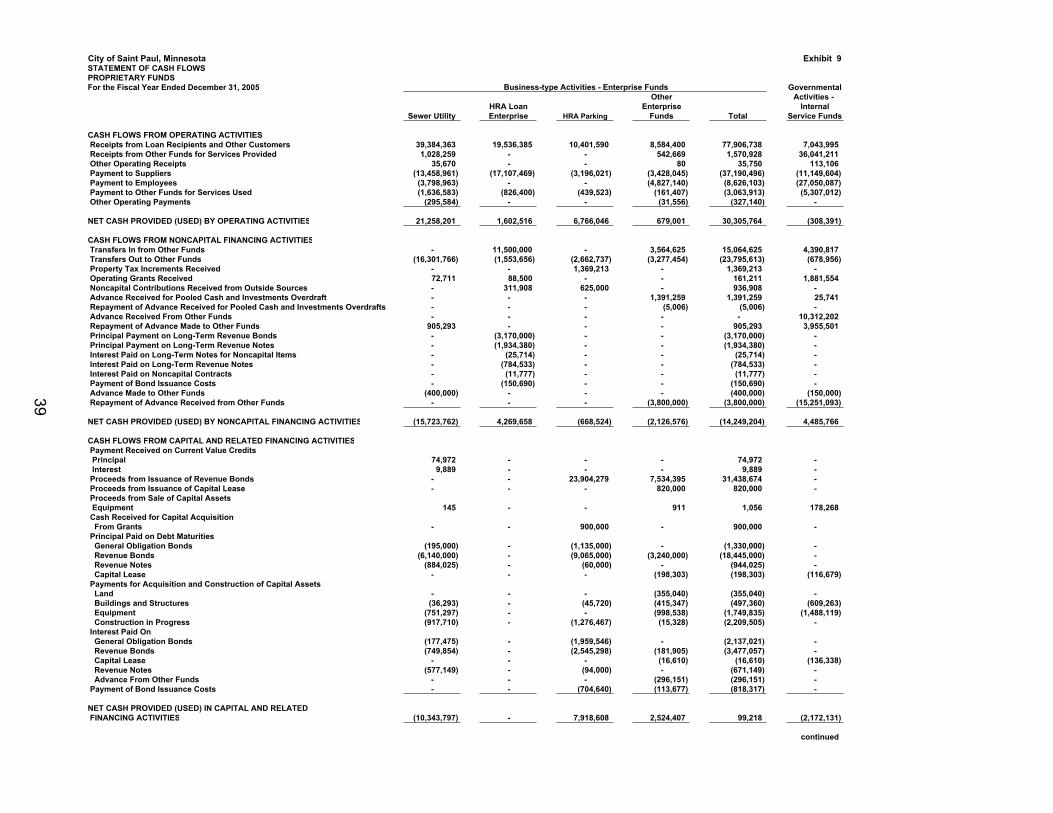
City of Saint Paul, Minnesota Exhibit 9STATEMENT OF CASH FLOWS PROPRIETARY FUNDSFor the Fiscal Year Ended December 31, 2005 Governmental
Other Activities - HRA Loan Enterprise Internal
Sewer Utility Enterprise HRA Parking Funds Total Service Funds
CASH FLOWS FROM OPERATING ACTIVITIES Receipts from Loan Recipients and Other Customers 39,384,363 19,536,385 10,401,590 8,584,400 77,906,738 7,043,995 Receipts from Other Funds for Services Provided 1,028,259 - - 542,669 1,570,928 36,041,211 Other Operating Receipts 35,670 - - 80 35,750 113,106 Payment to Suppliers (13,458,961) (17,107,469) (3,196,021) (3,428,045) (37,190,496) (11,149,604) Payment to Employees (3,798,963) - - (4,827,140) (8,626,103) (27,050,087) Payment to Other Funds for Services Used (1,636,583) (826,400) (439,523) (161,407) (3,063,913) (5,307,012) Other Operating Payments (295,584) - - (31,556) (327,140) -
NET CASH PROVIDED (USED) BY OPERATING ACTIVITIES 21,258,201 1,602,516 6,766,046 679,001 30,305,764 (308,391)
CASH FLOWS FROM NONCAPITAL FINANCING ACTIVITIES Transfers In from Other Funds - 11,500,000 - 3,564,625 15,064,625 4,390,817 Transfers Out to Other Funds (16,301,766) (1,553,656) (2,662,737) (3,277,454) (23,795,613) (678,956) Property Tax Increments Received - - 1,369,213 - 1,369,213 - Operating Grants Received 72,711 88,500 - - 161,211 1,881,554 Noncapital Contributions Received from Outside Sources - 311,908 625,000 - 936,908 - Advance Received for Pooled Cash and Investments Overdraft - - - 1,391,259 1,391,259 25,741 Repayment of Advance Received for Pooled Cash and Investments Overdrafts - - - (5,006) (5,006) - Advance Received From Other Funds - - - - - 10,312,202 Repayment of Advance Made to Other Funds 905,293 - - - 905,293 3,955,501 Principal Payment on Long-Term Revenue Bonds - (3,170,000) - - (3,170,000) - Principal Payment on Long-Term Revenue Notes - (1,934,380) - - (1,934,380) - Interest Paid on Long-Term Notes for Noncapital Items - (25,714) - - (25,714) - Interest Paid on Long-Term Revenue Notes - (784,533) - - (784,533) - Interest Paid on Noncapital Contracts - (11,777) - - (11,777) - Payment of Bond Issuance Costs - (150,690) - - (150,690) - Advance Made to Other Funds (400,000) - - - (400,000) (150,000) Repayment of Advance Received from Other Funds - - - (3,800,000) (3,800,000) (15,251,093)
NET CASH PROVIDED (USED) BY NONCAPITAL FINANCING ACTIVITIES (15,723,762) 4,269,658 (668,524) (2,126,576) (14,249,204) 4,485,766
CASH FLOWS FROM CAPITAL AND RELATED FINANCING ACTIVITIES Payment Received on Current Value Credits Principal 74,972 - - - 74,972 - Interest 9,889 - - - 9,889 - Proceeds from Issuance of Revenue Bonds - - 23,904,279 7,534,395 31,438,674 - Proceeds from Issuance of Capital Lease - - - 820,000 820,000 - Proceeds from Sale of Capital Assets Equipment 145 - - 911 1,056 178,268 Cash Received for Capital Acquisition From Grants - - 900,000 - 900,000 - Principal Paid on Debt Maturities General Obligation Bonds (195,000) - (1,135,000) - (1,330,000) - Revenue Bonds (6,140,000) - (9,065,000) (3,240,000) (18,445,000) - Revenue Notes (884,025) - (60,000) - (944,025) - Capital Lease - - - (198,303) (198,303) (116,679) Payments for Acquisition and Construction of Capital Assets Land - - - (355,040) (355,040) - Buildings and Structures (36,293) - (45,720) (415,347) (497,360) (609,263) Equipment (751,297) - - (998,538) (1,749,835) (1,488,119) Construction in Progress (917,710) - (1,276,467) (15,328) (2,209,505) - Interest Paid On General Obligation Bonds (177,475) - (1,959,546) - (2,137,021) - Revenue Bonds (749,854) - (2,545,298) (181,905) (3,477,057) - Capital Lease - - - (16,610) (16,610) (136,338) Revenue Notes (577,149) - (94,000) - (671,149) - Advance From Other Funds - - - (296,151) (296,151) - Payment of Bond Issuance Costs - - (704,640) (113,677) (818,317) -
NET CASH PROVIDED (USED) IN CAPITAL AND RELATED FINANCING ACTIVITIES (10,343,797) - 7,918,608 2,524,407 99,218 (2,172,131)
continued
Business-type Activities - Enterprise Funds
39
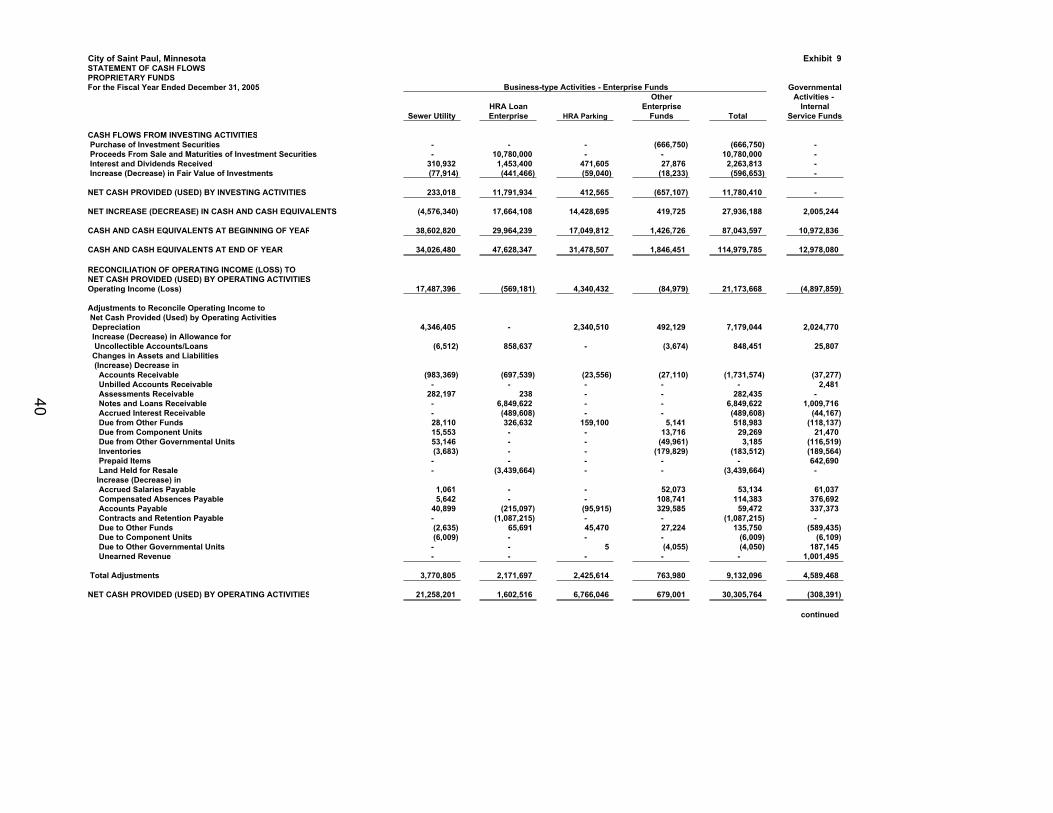
City of Saint Paul, Minnesota Exhibit 9STATEMENT OF CASH FLOWS PROPRIETARY FUNDSFor the Fiscal Year Ended December 31, 2005 Governmental
Other Activities - HRA Loan Enterprise Internal
Sewer Utility Enterprise HRA Parking Funds Total Service Funds
Business-type Activities - Enterprise Funds
CASH FLOWS FROM INVESTING ACTIVITIES Purchase of Investment Securities - - - (666,750) (666,750) - Proceeds From Sale and Maturities of Investment Securities - 10,780,000 - - 10,780,000 - Interest and Dividends Received 310,932 1,453,400 471,605 27,876 2,263,813 - Increase (Decrease) in Fair Value of Investments (77,914) (441,466) (59,040) (18,233) (596,653) -
NET CASH PROVIDED (USED) BY INVESTING ACTIVITIES 233,018 11,791,934 412,565 (657,107) 11,780,410 -
NET INCREASE (DECREASE) IN CASH AND CASH EQUIVALENTS (4,576,340) 17,664,108 14,428,695 419,725 27,936,188 2,005,244
CASH AND CASH EQUIVALENTS AT BEGINNING OF YEAR 38,602,820 29,964,239 17,049,812 1,426,726 87,043,597 10,972,836
CASH AND CASH EQUIVALENTS AT END OF YEAR 34,026,480 47,628,347 31,478,507 1,846,451 114,979,785 12,978,080
RECONCILIATION OF OPERATING INCOME (LOSS) TO NET CASH PROVIDED (USED) BY OPERATING ACTIVITIES Operating Income (Loss) 17,487,396 (569,181) 4,340,432 (84,979) 21,173,668 (4,897,859)
Adjustments to Reconcile Operating Income to Net Cash Provided (Used) by Operating Activities Depreciation 4,346,405 - 2,340,510 492,129 7,179,044 2,024,770 Increase (Decrease) in Allowance for Uncollectible Accounts/Loans (6,512) 858,637 - (3,674) 848,451 25,807 Changes in Assets and Liabilities (Increase) Decrease in Accounts Receivable (983,369) (697,539) (23,556) (27,110) (1,731,574) (37,277) Unbilled Accounts Receivable - - - - - 2,481 Assessments Receivable 282,197 238 - - 282,435 - Notes and Loans Receivable - 6,849,622 - - 6,849,622 1,009,716 Accrued Interest Receivable - (489,608) - - (489,608) (44,167) Due from Other Funds 28,110 326,632 159,100 5,141 518,983 (118,137) Due from Component Units 15,553 - - 13,716 29,269 21,470 Due from Other Governmental Units 53,146 - - (49,961) 3,185 (116,519) Inventories (3,683) - - (179,829) (183,512) (189,564) Prepaid Items - - - - - 642,690 Land Held for Resale - (3,439,664) - - (3,439,664) - Increase (Decrease) in Accrued Salaries Payable 1,061 - - 52,073 53,134 61,037 Compensated Absences Payable 5,642 - - 108,741 114,383 376,692 Accounts Payable 40,899 (215,097) (95,915) 329,585 59,472 337,373 Contracts and Retention Payable - (1,087,215) - - (1,087,215) - Due to Other Funds (2,635) 65,691 45,470 27,224 135,750 (589,435) Due to Component Units (6,009) - - - (6,009) (6,109) Due to Other Governmental Units - - 5 (4,055) (4,050) 187,145 Unearned Revenue - - - - - 1,001,495
Total Adjustments 3,770,805 2,171,697 2,425,614 763,980 9,132,096 4,589,468
NET CASH PROVIDED (USED) BY OPERATING ACTIVITIES 21,258,201 1,602,516 6,766,046 679,001 30,305,764 (308,391)
continued
40
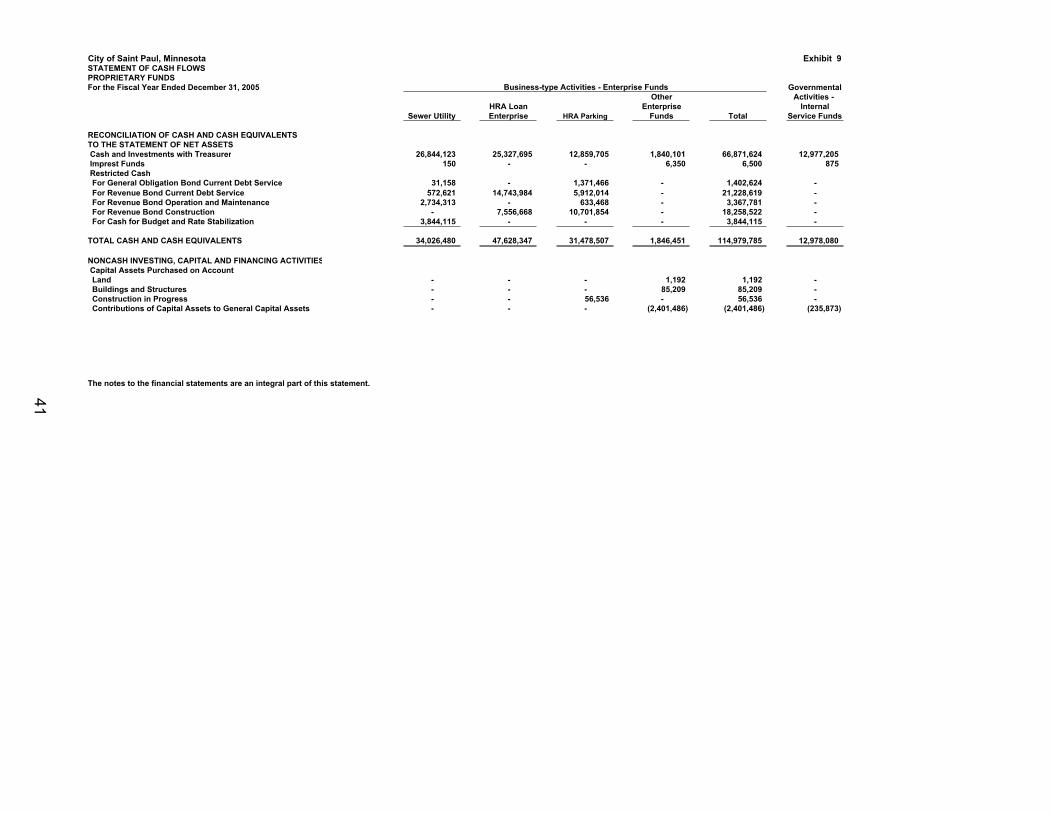
City of Saint Paul, Minnesota Exhibit 9STATEMENT OF CASH FLOWS PROPRIETARY FUNDSFor the Fiscal Year Ended December 31, 2005 Governmental
Other Activities - HRA Loan Enterprise Internal
Sewer Utility Enterprise HRA Parking Funds Total Service Funds
Business-type Activities - Enterprise Funds
RECONCILIATION OF CASH AND CASH EQUIVALENTS TO THE STATEMENT OF NET ASSETS Cash and Investments with Treasurer 26,844,123 25,327,695 12,859,705 1,840,101 66,871,624 12,977,205 Imprest Funds 150 - - 6,350 6,500 875 Restricted Cash For General Obligation Bond Current Debt Service 31,158 - 1,371,466 - 1,402,624 - For Revenue Bond Current Debt Service 572,621 14,743,984 5,912,014 - 21,228,619 - For Revenue Bond Operation and Maintenance 2,734,313 - 633,468 - 3,367,781 - For Revenue Bond Construction - 7,556,668 10,701,854 - 18,258,522 - For Cash for Budget and Rate Stabilization 3,844,115 - - - 3,844,115 -
TOTAL CASH AND CASH EQUIVALENTS 34,026,480 47,628,347 31,478,507 1,846,451 114,979,785 12,978,080
NONCASH INVESTING, CAPITAL AND FINANCING ACTIVITIES Capital Assets Purchased on Account Land - - - 1,192 1,192 - Buildings and Structures - - - 85,209 85,209 - Construction in Progress - - 56,536 - 56,536 - Contributions of Capital Assets to General Capital Assets - - - (2,401,486) (2,401,486) (235,873)
The notes to the financial statements are an integral part of this statement.
41

This page left blank intentionally
42
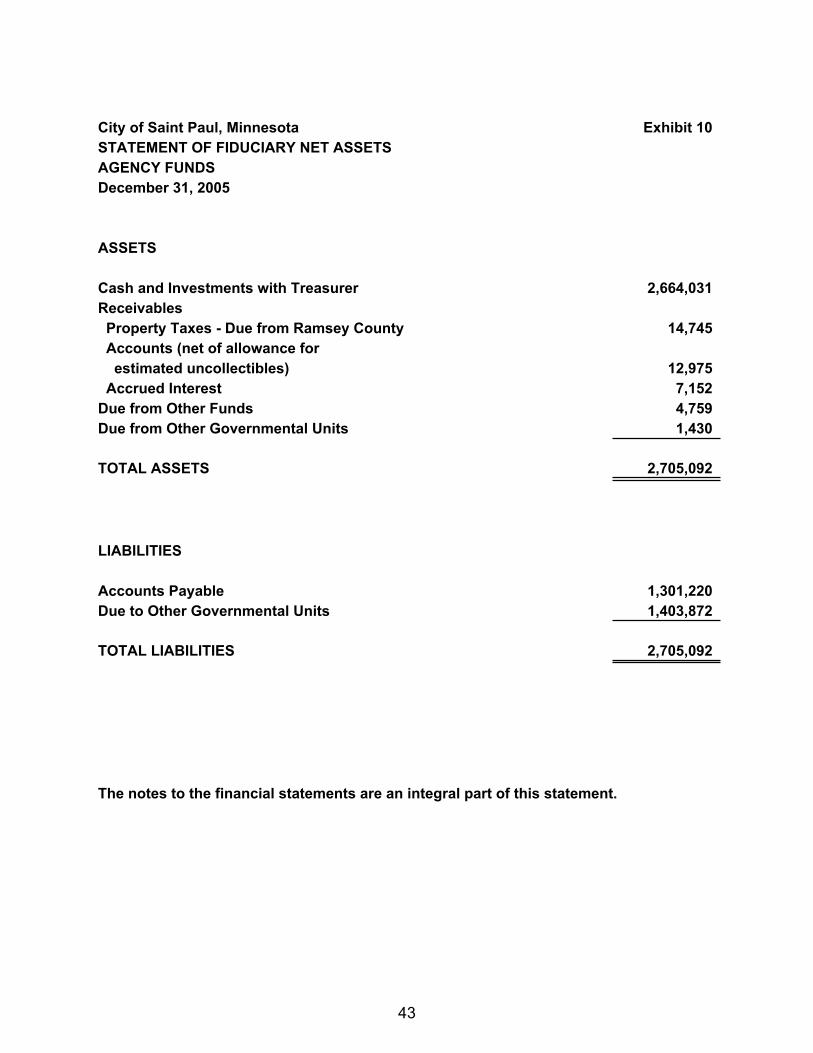
City of Saint Paul, Minnesota Exhibit 10STATEMENT OF FIDUCIARY NET ASSETSAGENCY FUNDSDecember 31, 2005
ASSETS
Cash and Investments with Treasurer 2,664,031 Receivables Property Taxes - Due from Ramsey County 14,745 Accounts (net of allowance for estimated uncollectibles) 12,975 Accrued Interest 7,152 Due from Other Funds 4,759 Due from Other Governmental Units 1,430
TOTAL ASSETS 2,705,092
LIABILITIES
Accounts Payable 1,301,220 Due to Other Governmental Units 1,403,872
TOTAL LIABILITIES 2,705,092
The notes to the financial statements are an integral part of this statement.
43
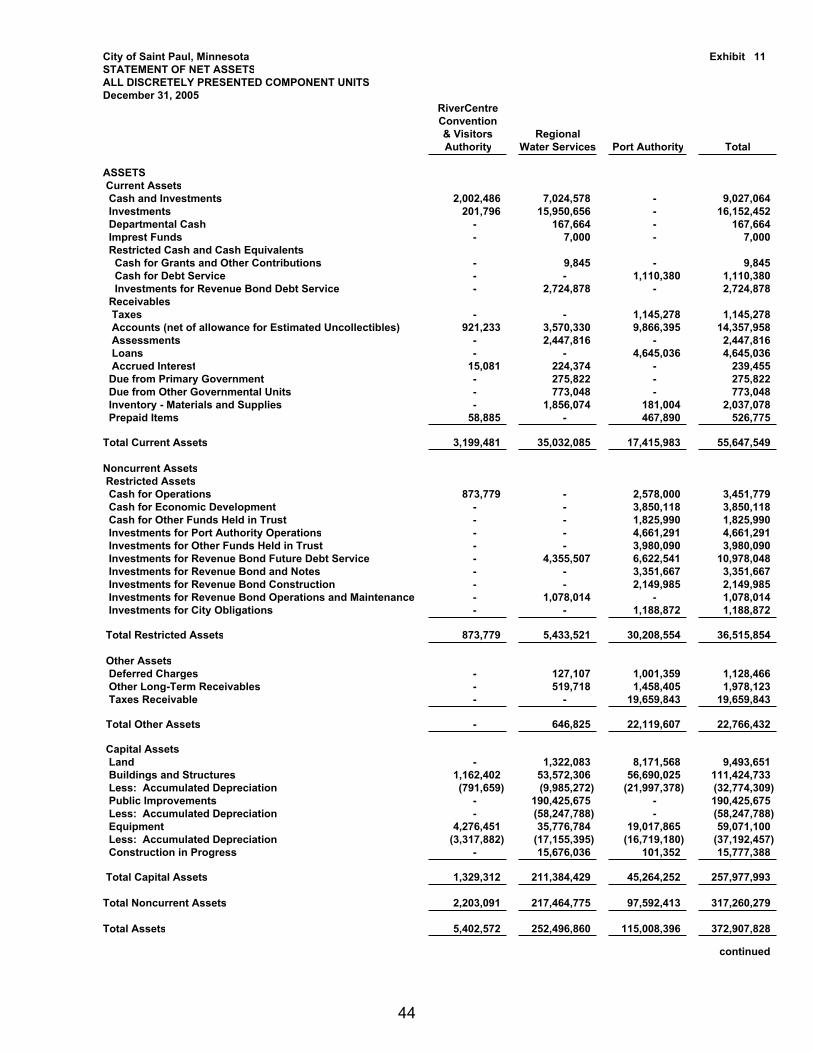
City of Saint Paul, Minnesota Exhibit 11STATEMENT OF NET ASSETSALL DISCRETELY PRESENTED COMPONENT UNITSDecember 31, 2005
RiverCentreConvention& Visitors RegionalAuthority Water Services Port Authority Total
ASSETS Current Assets Cash and Investments 2,002,486 7,024,578 - 9,027,064 Investments 201,796 15,950,656 - 16,152,452 Departmental Cash - 167,664 - 167,664 Imprest Funds - 7,000 - 7,000 Restricted Cash and Cash Equivalents Cash for Grants and Other Contributions - 9,845 - 9,845 Cash for Debt Service - - 1,110,380 1,110,380 Investments for Revenue Bond Debt Service - 2,724,878 - 2,724,878 Receivables Taxes - - 1,145,278 1,145,278 Accounts (net of allowance for Estimated Uncollectibles) 921,233 3,570,330 9,866,395 14,357,958 Assessments - 2,447,816 - 2,447,816 Loans - - 4,645,036 4,645,036 Accrued Interest 15,081 224,374 - 239,455 Due from Primary Government - 275,822 - 275,822 Due from Other Governmental Units - 773,048 - 773,048 Inventory - Materials and Supplies - 1,856,074 181,004 2,037,078 Prepaid Items 58,885 - 467,890 526,775
Total Current Assets 3,199,481 35,032,085 17,415,983 55,647,549
Noncurrent Assets Restricted Assets Cash for Operations 873,779 - 2,578,000 3,451,779 Cash for Economic Development - - 3,850,118 3,850,118 Cash for Other Funds Held in Trust - - 1,825,990 1,825,990 Investments for Port Authority Operations - - 4,661,291 4,661,291 Investments for Other Funds Held in Trust - - 3,980,090 3,980,090 Investments for Revenue Bond Future Debt Service - 4,355,507 6,622,541 10,978,048 Investments for Revenue Bond and Notes - - 3,351,667 3,351,667 Investments for Revenue Bond Construction - - 2,149,985 2,149,985 Investments for Revenue Bond Operations and Maintenance - 1,078,014 - 1,078,014 Investments for City Obligations - - 1,188,872 1,188,872
Total Restricted Assets 873,779 5,433,521 30,208,554 36,515,854
Other Assets Deferred Charges - 127,107 1,001,359 1,128,466 Other Long-Term Receivables - 519,718 1,458,405 1,978,123 Taxes Receivable - - 19,659,843 19,659,843
Total Other Assets - 646,825 22,119,607 22,766,432
Capital Assets Land - 1,322,083 8,171,568 9,493,651 Buildings and Structures 1,162,402 53,572,306 56,690,025 111,424,733 Less: Accumulated Depreciation (791,659) (9,985,272) (21,997,378) (32,774,309) Public Improvements - 190,425,675 - 190,425,675 Less: Accumulated Depreciation - (58,247,788) - (58,247,788) Equipment 4,276,451 35,776,784 19,017,865 59,071,100 Less: Accumulated Depreciation (3,317,882) (17,155,395) (16,719,180) (37,192,457) Construction in Progress - 15,676,036 101,352 15,777,388
Total Capital Assets 1,329,312 211,384,429 45,264,252 257,977,993
Total Noncurrent Assets 2,203,091 217,464,775 97,592,413 317,260,279
Total Assets 5,402,572 252,496,860 115,008,396 372,907,828
continued
44
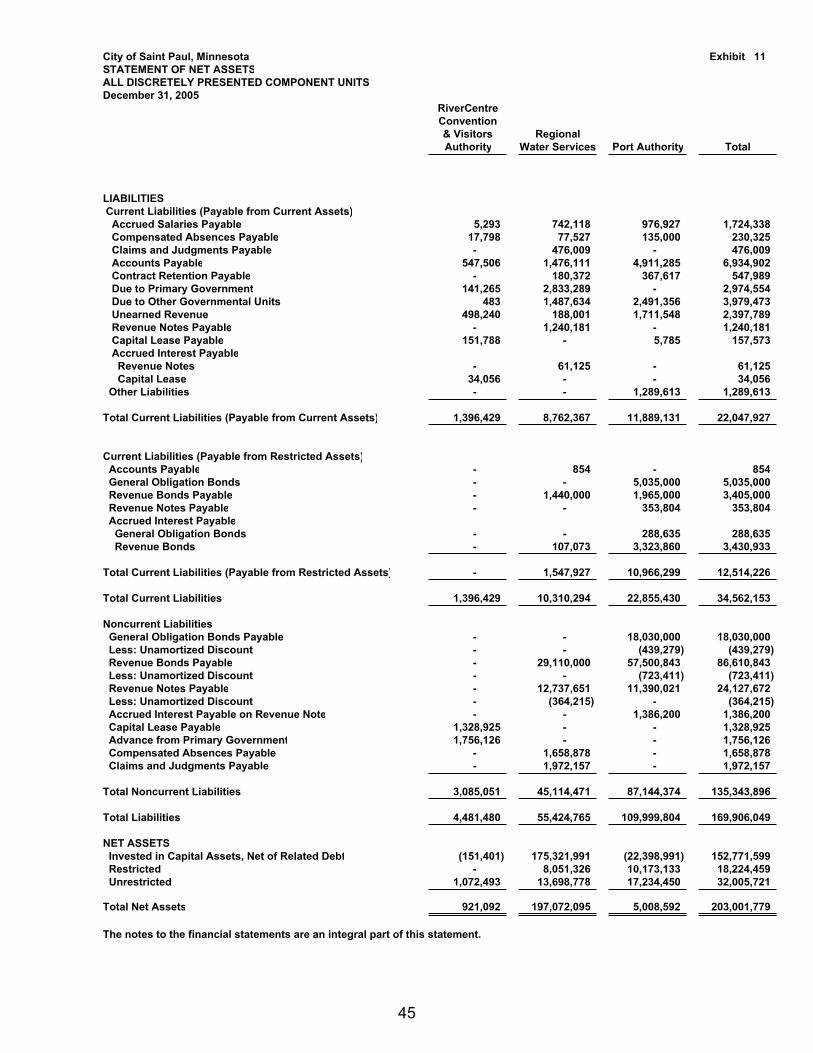
City of Saint Paul, Minnesota Exhibit 11STATEMENT OF NET ASSETSALL DISCRETELY PRESENTED COMPONENT UNITSDecember 31, 2005
RiverCentreConvention& Visitors RegionalAuthority Water Services Port Authority Total
LIABILITIES Current Liabilities (Payable from Current Assets) Accrued Salaries Payable 5,293 742,118 976,927 1,724,338 Compensated Absences Payable 17,798 77,527 135,000 230,325 Claims and Judgments Payable - 476,009 - 476,009 Accounts Payable 547,506 1,476,111 4,911,285 6,934,902 Contract Retention Payable - 180,372 367,617 547,989 Due to Primary Government 141,265 2,833,289 - 2,974,554 Due to Other Governmental Units 483 1,487,634 2,491,356 3,979,473 Unearned Revenue 498,240 188,001 1,711,548 2,397,789 Revenue Notes Payable - 1,240,181 - 1,240,181 Capital Lease Payable 151,788 - 5,785 157,573 Accrued Interest Payable Revenue Notes - 61,125 - 61,125 Capital Lease 34,056 - - 34,056 Other Liabilities - - 1,289,613 1,289,613
Total Current Liabilities (Payable from Current Assets) 1,396,429 8,762,367 11,889,131 22,047,927
Current Liabilities (Payable from Restricted Assets) Accounts Payable - 854 - 854 General Obligation Bonds - - 5,035,000 5,035,000 Revenue Bonds Payable - 1,440,000 1,965,000 3,405,000 Revenue Notes Payable - - 353,804 353,804 Accrued Interest Payable General Obligation Bonds - - 288,635 288,635 Revenue Bonds - 107,073 3,323,860 3,430,933
Total Current Liabilities (Payable from Restricted Assets) - 1,547,927 10,966,299 12,514,226
Total Current Liabilities 1,396,429 10,310,294 22,855,430 34,562,153
Noncurrent Liabilities General Obligation Bonds Payable - - 18,030,000 18,030,000 Less: Unamortized Discount - - (439,279) (439,279) Revenue Bonds Payable - 29,110,000 57,500,843 86,610,843 Less: Unamortized Discount - - (723,411) (723,411) Revenue Notes Payable - 12,737,651 11,390,021 24,127,672 Less: Unamortized Discount - (364,215) - (364,215) Accrued Interest Payable on Revenue Note - - 1,386,200 1,386,200 Capital Lease Payable 1,328,925 - - 1,328,925 Advance from Primary Government 1,756,126 - - 1,756,126 Compensated Absences Payable - 1,658,878 - 1,658,878 Claims and Judgments Payable - 1,972,157 - 1,972,157
Total Noncurrent Liabilities 3,085,051 45,114,471 87,144,374 135,343,896
Total Liabilities 4,481,480 55,424,765 109,999,804 169,906,049
NET ASSETS Invested in Capital Assets, Net of Related Debt (151,401) 175,321,991 (22,398,991) 152,771,599 Restricted - 8,051,326 10,173,133 18,224,459 Unrestricted 1,072,493 13,698,778 17,234,450 32,005,721
Total Net Assets 921,092 197,072,095 5,008,592 203,001,779
The notes to the financial statements are an integral part of this statement.
45
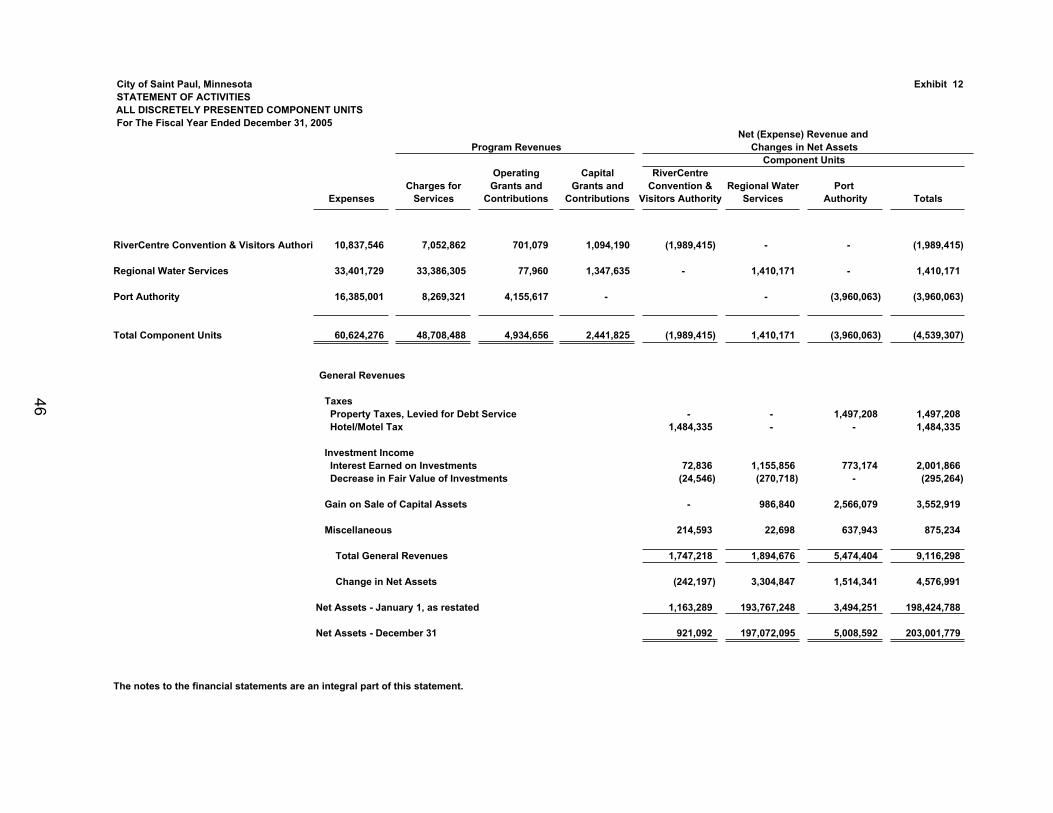
City of Saint Paul, Minnesota Exhibit 12STATEMENT OF ACTIVITIES
ALL DISCRETELY PRESENTED COMPONENT UNITSFor The Fiscal Year Ended December 31, 2005
Program Revenues
Operating Capital RiverCentreCharges for Grants and Grants and Convention & Regional Water Port
Expenses Services Contributions Contributions Visitors Authority Services Authority Totals
RiverCentre Convention & Visitors Authorit 10,837,546 7,052,862 701,079 1,094,190 (1,989,415) - - (1,989,415)
Regional Water Services 33,401,729 33,386,305 77,960 1,347,635 - 1,410,171 - 1,410,171
Port Authority 16,385,001 8,269,321 4,155,617 - - (3,960,063) (3,960,063)
Total Component Units 60,624,276 48,708,488 4,934,656 2,441,825 (1,989,415) 1,410,171 (3,960,063) (4,539,307)
General Revenues
Taxes Property Taxes, Levied for Debt Service - - 1,497,208 1,497,208 Hotel/Motel Tax 1,484,335 - - 1,484,335
Investment Income Interest Earned on Investments 72,836 1,155,856 773,174 2,001,866 Decrease in Fair Value of Investments (24,546) (270,718) - (295,264)
Gain on Sale of Capital Assets - 986,840 2,566,079 3,552,919
Miscellaneous 214,593 22,698 637,943 875,234
Total General Revenues 1,747,218 1,894,676 5,474,404 9,116,298
Change in Net Assets (242,197) 3,304,847 1,514,341 4,576,991
Net Assets - January 1, as restated 1,163,289 193,767,248 3,494,251 198,424,788
Net Assets - December 31 921,092 197,072,095 5,008,592 203,001,779
The notes to the financial statements are an integral part of this statement.
Net (Expense) Revenue and Changes in Net Assets
Component Units
46

FINANCIAL SECTION
NOTES TO THE FINANCIAL STATEMENTS
C I T Y O F S A I N T P A U L C O M P R E H E N S I V E A N N U A L F I N A N C I A L R E P O R T
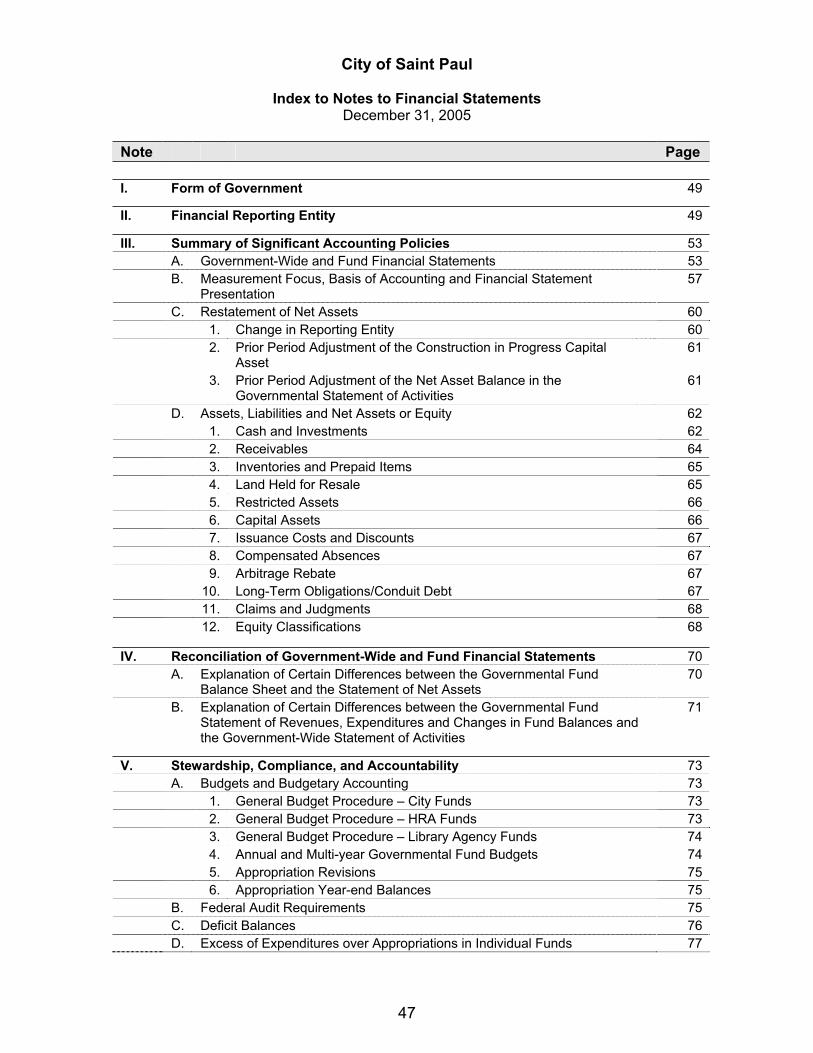
City of Saint Paul
Index to Notes to Financial Statements December 31, 2005
Note Page
I. Form of Government 49
II. Financial Reporting Entity 49
III. Summary of Significant Accounting Policies 53 A. Government-Wide and Fund Financial Statements 53 B. Measurement Focus, Basis of Accounting and Financial Statement
Presentation57
C. Restatement of Net Assets 60 1. Change in Reporting Entity 60 2. Prior Period Adjustment of the Construction in Progress Capital
Asset 61
3. Prior Period Adjustment of the Net Asset Balance in the Governmental Statement of Activities
61
D. Assets, Liabilities and Net Assets or Equity 62 1. Cash and Investments 62 2. Receivables 64 3. Inventories and Prepaid Items 65 4. Land Held for Resale 65 5. Restricted Assets 66 6. Capital Assets 66 7. Issuance Costs and Discounts 67 8. Compensated Absences 67 9. Arbitrage Rebate 67 10. Long-Term Obligations/Conduit Debt 67 11. Claims and Judgments 68 12. Equity Classifications 68
IV. Reconciliation of Government-Wide and Fund Financial Statements 70 A. Explanation of Certain Differences between the Governmental Fund
Balance Sheet and the Statement of Net Assets 70
B. Explanation of Certain Differences between the Governmental Fund Statement of Revenues, Expenditures and Changes in Fund Balances and the Government-Wide Statement of Activities
71
V. Stewardship, Compliance, and Accountability 73 A. Budgets and Budgetary Accounting 73 1. General Budget Procedure – City Funds 73 2. General Budget Procedure – HRA Funds 73 3. General Budget Procedure – Library Agency Funds 74 4. Annual and Multi-year Governmental Fund Budgets 74 5. Appropriation Revisions 75 6. Appropriation Year-end Balances 75 B. Federal Audit Requirements 75 C. Deficit Balances 76 D. Excess of Expenditures over Appropriations in Individual Funds 77
47
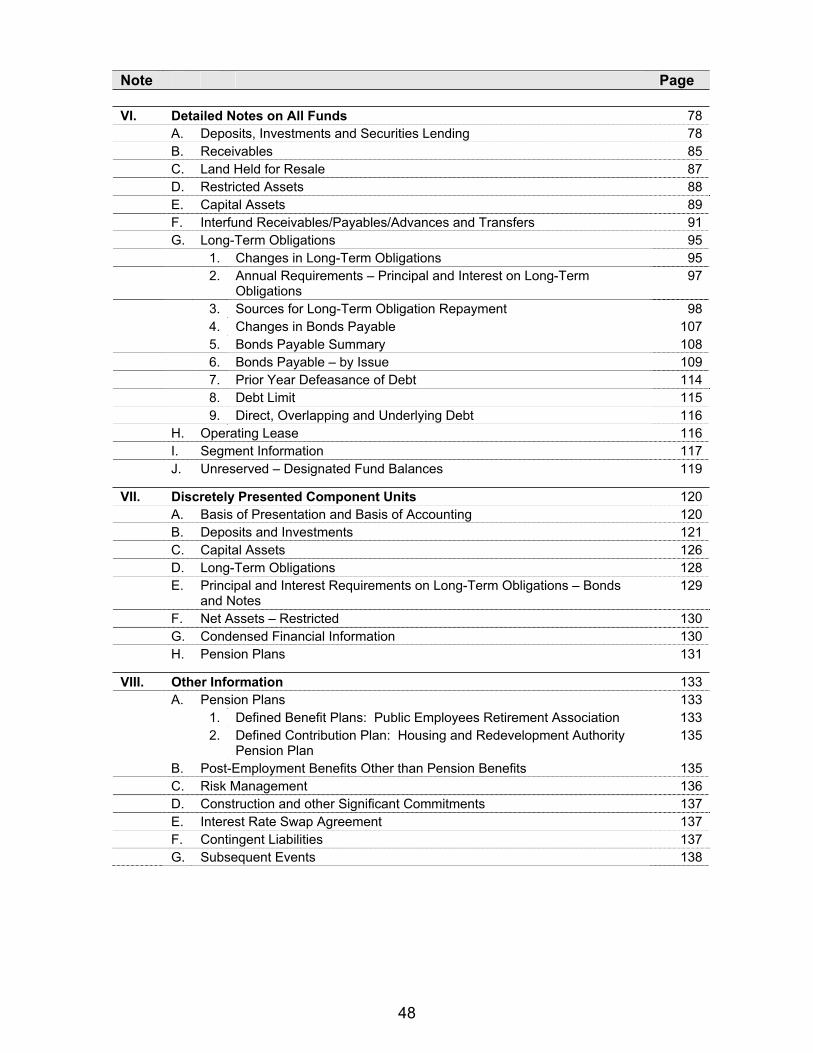
Note Page
VI. Detailed Notes on All Funds 78 A. Deposits, Investments and Securities Lending 78 B. Receivables 85 C. Land Held for Resale 87 D. Restricted Assets 88 E. Capital Assets 89 F. Interfund Receivables/Payables/Advances and Transfers 91 G. Long-Term Obligations 95 1. Changes in Long-Term Obligations 95 2. Annual Requirements – Principal and Interest on Long-Term
Obligations97
3. Sources for Long-Term Obligation Repayment 98 4. Changes in Bonds Payable 107 5. Bonds Payable Summary 108 6. Bonds Payable – by Issue 109 7. Prior Year Defeasance of Debt 114 8. Debt Limit 115 9. Direct, Overlapping and Underlying Debt 116 H. Operating Lease 116 I. Segment Information 117 J. Unreserved – Designated Fund Balances 119
VII. Discretely Presented Component Units 120 A. Basis of Presentation and Basis of Accounting 120 B. Deposits and Investments 121 C. Capital Assets 126 D. Long-Term Obligations 128 E. Principal and Interest Requirements on Long-Term Obligations – Bonds
and Notes 129
F. Net Assets – Restricted 130 G. Condensed Financial Information 130 H. Pension Plans 131
VIII. Other Information 133 A. Pension Plans 133 1. Defined Benefit Plans: Public Employees Retirement Association 133 2. Defined Contribution Plan: Housing and Redevelopment Authority
Pension Plan 135
B. Post-Employment Benefits Other than Pension Benefits 135 C. Risk Management 136 D. Construction and other Significant Commitments 137 E. Interest Rate Swap Agreement 137 F. Contingent Liabilities 137 G. Subsequent Events 138
48
City of Saint Paul, Minnesota Notes to the Financial Statements For the Fiscal Year Ended December 31, 2005
Note I. Form of Government The City of Saint Paul, Minnesota has a mayor-council form of government. The mayor is elected by the voters of the City at large for four years on a full-time basis. The City is divided into seven wards. Voters of each ward elect a member of the City Council for four years on a part-time basis. Executive power is vested in the mayor; legislative power is vested in the Council. The mayor has veto power, which the Council may override with a vote of five members.
Note II. Financial Reporting Entity In accordance with Governmental Accounting Standards Board (GASB) Statement No. 14 – TheFinancial Reporting Entity, the City’s financial reporting entity consists of (a) the primary government, (b) organizations for which the primary government is financially accountable, and (c) other organizations for which the nature and significance of their relationship with the primary government are such that exclusion would cause the reporting entity’s financial statements to be misleading or incomplete. Component units are legally separate organizations for which the elected officials of the primary government are financially accountable. The primary government is financially accountable for the component unit if it appoints a voting majority of the component unit’s governing body and is able to impose its will on the component unit or there is a potential for the component unit to provide specific financial benefits to, or impose specific financial burdens on, the primary government.
As required by generally accepted accounting principles, the financial statements of the reporting entity include those of the City of Saint Paul (the primary government) and its component units (legally separate organizations). The component units discussed below are included in the City’s reporting entity because of the significance of their operational or financial relationship with the City.
In conformity with generally accepted accounting principles, the financial statements of component units have been included in the City’s reporting entity either as blended component units or as discretely presented component units. Blended component units’ financial data is reported as part of the primary government and are reported with similar funds of the primary government. Discretely presented component units’ financial data is reported in a column separate from the financial data of the primary government to emphasize that they are legally separate from the City.
Blended Component Units. The following component units have been presented as blended component units because the component units’ governing bodies are the same as the governing body of the City.
Housing and Redevelopment Authority of the City of Saint Paul (HRA)
The Housing and Redevelopment Authority of the City of Saint Paul (HRA) was established to undertake urban renewal programs. These programs strive to redevelop the residential, commercial and industrial areas of the City of Saint Paul and to provide adequate jobs, a sound fiscal base and a variety of affordable housing for City residents. The City of Saint Paul’s City Councilmembers act as the HRA Board. The Authority’s budget and tax levy are approved by the City Council. The City has a general obligation pledge on certain HRA debt. Separate financial statements for the HRA can be obtained from the City of Saint Paul, Department of Planning and Economic Development, 1400 City Hall Annex, 25 West Fourth Street, Saint Paul, MN 55102.
49
City of Saint Paul, Minnesota Note II Notes to the Financial Statements Financial Reporting EntityFor the Fiscal Year Ended December 31, 2005
Saint Paul Library Agency
The Saint Paul Library Agency was established in 2003 and is responsible for operating the City’s public library system. This system provides reading materials to meet the interests of all ages, responds to the community’s need for information and facilitates lifelong learning to enrich the quality of life in the community. The City of Saint Paul’s City Councilmembers act as the Library Board. The agency’s budget is approved by the Board. The agency’s tax levy is approved by City Council. The City has a general obligation pledge on Library debt. The Library Agency consists of an operating fund, debt service fund and a capital improvement fund. These funds are incorporated into the City’s financial report.
Discretely Presented Component Units. The component unit columns in the government-wide financial statements includes the financial data of the City’s other component units. The governing bodies of these component units are not substantively the same as the governing body of the primary government and the component units do not provide services exclusively to the primary government.
RiverCentre Convention & Visitors Authority
The Saint Paul RiverCentre Convention & Visitors Authority (RCVA), a Minnesota non-profit corporation, was organized to equip, maintain, manage and operate the RiverCentre Convention Center, Roy Wilkins Auditorium, RiverCentre Parking Ramp and pedestrian connection and operate a convention bureau to market and promote the City as a tourist and convention destination. The Mayor appoints the President and CEO. There are nineteen individuals on the Board of Directors. Ten directors are designated by the Mayor with the approval of City Council, three are City Councilmembers and six directors are members of the RCVA who represent the business community. Debt obligations have been issued on behalf of the RCVA and the operational revenues have been committed to the repayment of those obligations. However, ultimately, the City of Saint Paul or the Saint Paul Housing Redevelopment Authority would be obligated to pay those debt obligations if the RCVA’s revenues were insufficient to meet debt service. Separate financial statements for the RCVA can be obtained from the Saint Paul RiverCentre Convention & Visitors Authority; 175 West Kellogg Boulevard; Suite 502; Saint Paul, MN 55102.
Saint Paul Regional Water Services
The Saint Paul Regional Water Services provides safe quality water to Saint Paul and surrounding communities at a reasonable price. The Board of Water Commissioners consists of seven members. Five board members are appointed by the Mayor with the consent of the City Council, three of whom are City Councilmembers and two are citizens. The remaining two board members are appointed by suburban city councils. The City Council approves the Regional Water Services’ water rates and the City has issued general obligation bonded debt on behalf of Regional Water Services. As part of the annual audit of the City performed by the State Auditor’s Office, the Regional Water Services’ financial statements have been included in their audit. Separate financial statements can be obtained from the Regional Water Services; Business Division; 1900 Rice Street; Saint Paul, MN 55113.
50
City of Saint Paul, Minnesota Note II Notes to the Financial Statements Financial Reporting EntityFor the Fiscal Year Ended December 31, 2005
Port Authority of the City of Saint Paul
The Port Authority of the City of Saint Paul was established to increase the volume of commerce in the City through the creation of development districts and the acquisition and construction of industrial, commercial and other revenue-producing projects. The Port Authority finances this development in order to expand the tax base and create job opportunities. The Mayor appoints the Port Authority’s board of commissioners with the consent of the City Council. Two of the seven board of commissioners are City Councilmembers. The Port Authority has issued general obligation debt and the Authority’s development activities are financed in part with tax increment financing. It should be noted that other debt issued by the Port Authority, including industrial development revenue bonds, are not liabilities of the City of Saint Paul. The Port Authority considers these bonds as no-commitment debt, and they are excluded from its financial statements. The Authority defines no-commitment debt as debt for which the Authority has no further financial obligation. The industrial development bonds do not constitute indebtedness of the City and are secured solely by revenues from the commercial organizations on whose behalf the bonds are issued.
The Port Authority’s component unit, Capital City Properties (CCP), is a Minnesota not-for-profit corporation established in 1991 for the purpose of performing the functions and carrying out the public purposes of the Port Authority. All of the members of the board of directors of CCP are either commissioners or staff of the Port Authority. CCP operates the Radisson Riverfront Hotel St. Paul, Radisson City Center Hotel St. Paul and Capital City Plaza Parking Garage St. Paul. CCP sold the Riverfront and City Center hotels subsequent to December 31, 2005. The operating results of CCP are included in the Port Authority financial statements.
The City assumes no responsibility for the day-to-day operations of the Port Authority, nor is it responsible for financing deficits. Separate financial statements can be obtained from the Port Authority of the City of Saint Paul; Chief Financial Officer; 1900 Landmark Towers; 345 St. Peter Street; Saint Paul, MN 55102.
Related Organizations. The City’s officials are also responsible for appointing the members of the boards of other organizations, but the City’s accountability for these organizations does not extend beyond making the appointments. Related organizations are not included in the City’s reporting entity.
The Public Housing Agency of the City of Saint Paul owns and operates housing projects for low income, elderly and handicapped families. The commissioners of the Public Housing Agency are appointed by the City Council. The City does not provide funding, has no obligation for the debt of the Agency, and cannot impose its will on the Agency.
The Riverfront Redevelopment Corporation was established to effect the planning and implementation of the development and preservation of the Mississippi River Corridor within Saint Paul. The operations of the Redevelopment Corporation are managed by a board of directors consisting of not less than eight, nor more than seventeen members. All members of the board of directors are appointed by the Mayor with the consent of the City Council. Four of the directors of the corporation are designated as the “City representatives.” These are (1) Mayor or the Mayor’s designee, (2) two members of the City Council and (3) the Director of the City of Saint Paul, Department of Planning and Economic Development. The City has no ability to impose its will to significantly influence the programs, projects or level of services performed or provided by the Riverfront Redevelopment Corporation. The City is not responsible for funding debts, operating deficiencies and/or disposing of surpluses.
51
City of Saint Paul, Minnesota Note II Notes to the Financial Statements Financial Reporting EntityFor the Fiscal Year Ended December 31, 2005
Joint Venture. The Minneapolis/Saint Paul Housing Finance Board (the Board) was established in accordance with a Joint Powers Agreement entered into between the Housing and Redevelopment Authority of the City of Saint Paul (HRA), the Minneapolis Community Development Agency (MCDA), and accepted by the cities of Minneapolis and Saint Paul under State of Minnesota laws. The governing bodies of the HRA and the MCDA each appoint three of the six members of the Board. The Board was created for the public purpose of providing decent, safe, sanitary and affordable housing to the residents of the City of Saint Paul and the City of Minneapolis. The powers exercised by the Board include the power to undertake financing programs to implement individual components of the housing plan for each city and to issue revenue bonds to finance such programs. All bonds are special limited obligations of the Board and shall be payable only out of funds specifically pledged for each issue. Total net assets at December 31, 2005, was $11,317,380. The 2005 operations resulted in a decrease of $2,484,165 to net assets.
During 2005, distributions were made from the HRA and the MCDA to the Board in the total amount of $1,087,062. These distributions resulted from surplus funds remaining from the closed-out Board-issued revenue bonds. There was no effect to HRA assets or net assets as a result of these distributions.
Upon dissolution of the Board, all properties acquired by the Board and any surplus monies shall be distributed to the HRA and the MCDA in the proportion and otherwise pursuant to directions provided in the related indenture of trust or other bond documents. If properties acquired by the Board and any surplus monies are not traceable to a particular bond issue or the indenture is silent as to distribution of the assets upon discharge of the issue, the assets shall be distributed on the basis of the amount of funds each entity has contributed that would affect those assets. The respective percentage shares of the HRA and the MCDA in the Board’s assets, liabilities and equity were not determined at December 31, 2005. There has been no investment made by the HRA in the joint venture. Thus, the financial statements do not reflect an equity interest in the joint venture. Complete financial statements of the Board can be obtained from the MCDA; Suite 700; Crown Roller Mill; 105 Fifth Avenue South; Minneapolis, MN 55401.
(The remainder of this page left blank intentionally)
52
City of Saint Paul, Minnesota Note III Notes to the Financial Statements Summary of SignificantFor the Fiscal Year Ended December 31, 2005 Accounting Policies
Note III. Summary of Significant Accounting Policies The financial statements of the City of Saint Paul have been prepared in conformity with generally accepted accounting principles (GAAP) as applied to government units. The Governmental Accounting Standards Board (GASB) is the accepted standard-setting body for establishing governmental accounting and financial reporting principles. The more significant of the City’s accounting policies are described below.
A. Government-Wide and Fund Financial Statements
Government-Wide Financial Statements
The statement of net assets and statement of activities display information about the reporting government as a whole. They include all funds of the reporting entity except for fiduciary funds. The statements distinguish between governmental and business-type activities and are prepared on the full accrual basis. Governmental activities generally are financed through taxes, intergovernmental revenues and other nonexchange revenues. Business-type activities are financed in whole or in part by fees charged to external parties for goods or services. Likewise, the primary government is reported separately from certain legally separate component units for which the primary government is financially accountable.
The statement of activities demonstrates the degree to which the direct expenses of a given function or segment are offset by program revenues. Direct expenses are those that are clearly identifiable with a specific function or segment. The City allocates indirect expenses to functions in the statement of activities. Program revenues include 1) charges to customers or applicants who purchase, use or directly benefit from goods, services or privileges provided by a given function or segment, and 2) grants and contributions that are restricted to meeting the operational or capital requirements of a particular function or segment. Taxes and other items not included among program revenues are reported as general revenues.
Fund Financial Statements
Financial statements of the reporting entity are organized into funds, each of which is considered to be a separate accounting entity. Each fund is accounted for by providing a separate set of self-balancing accounts, which constitute its assets, liabilities, fund equity/net assets, revenues and expenditures/expenses. The modified accrual basis of accounting continues to be the appropriate basis of accounting for governmental activity fund financial statements.
Separate financial statements are provided for governmental funds, proprietary funds and fiduciary funds, even though the latter are excluded from the government-wide financial statements. Major individual governmental funds and major individual enterprise funds are reported as separate columns in the fund financial statements.
53
City of Saint Paul, Minnesota Note III Notes to the Financial Statements Summary of SignificantFor the Fiscal Year Ended December 31, 2005 Accounting Policies
Funds are organized as major funds or non-major funds within the governmental and proprietary statements. An emphasis is placed on major funds within the governmental and proprietary categories. A fund is considered major if it is the primary operating fund of the City or meets the following criteria:
1. Total assets, liabilities, revenues or expenditures/expenses of that individual governmental or enterprise fund are at least 10 percent of the corresponding total for all funds of that category or type; and
2. The same element of the individual governmental fund or enterprise fund that met the 10 percent test is at least 5 percent of the corresponding total for all governmental and enterprise funds combined.
3. In addition, any other governmental or enterprise fund that the City believes is particularly important to financial statement users may be reported as a major fund.
The City reports the following major governmental funds:
Major Governmental Funds General Fund – accounts for the City’s primary operating activities. It is used to account for all
financial resources except those required to be accounted for in another fund. Library Agency – accounts for the primary operating activities of the Library to provide a full
range of library services. HRA General Fund – accounts for the HRA’s primary operating activities. It is used to account
for all financial resources except those required to be accounted for in another fund. General Debt Service – accounts for resources accumulated and payments made for principal
and interest on long-term obligations other than tax increment district or enterprise fund debt. HRA General Debt Service – accounts for HRA resources accumulated and payments made for
principal and interest on long-term obligations other than enterprise fund debt. Capital Improvement Projects – accounts for proceeds from long-term borrowing and other
resources to be used for capital improvement projects.
The City reports the following major enterprise funds:
Major Enterprise Funds Sewer Utility – accounts for all fees collected from the customers connected to the City sewer
system and for all expenses of operating this system. HRA Loan Enterprise – accounts for loans issued under HRA housing and business programs. HRA Parking – accounts for parking revenues which are used for acquisition, construction,
operation and maintenance of HRA-owned parking facilities.
54
City of Saint Paul, Minnesota Note III Notes to the Financial Statements Summary of SignificantFor the Fiscal Year Ended December 31, 2005 Accounting Policies
The City reports the following non-major governmental and enterprise funds:
Non-Major Governmental Funds
Special Revenue Funds are used to account for the proceeds of specific revenue sources (other than major capital projects) that are legally restricted to expenditures for specified purposes. Special Projects – General Government Finance Special Projects Cable Communications Charitable Gambling Enforcement Debt – Capital Improvement Utilities Rate Investigation Administration Property Code Enforcement License and Permit Police Services – Pension Assets Crime Laboratory Parking Enforcement Special Projects Police Police Officers Clothing Fire Responsive Services Fire Fighting Equipment Fire Protection Clothing Right of Way Maintenance Parking Meter Collections Lighting Maintenance Assessment Districts Solid Waste and Recycling Special Projects – Division of Health Municipal Stadium Forestry Special Como Campus Special Recreation Activities Municipal Athletic Programming Charitable Gambling Parks and Recreation Opportunity Parks and Recreation Grants and Aids Rella Havens Memorial Fund Community Development Block Grant State Grant Programs HRA Federal and State Programs Section 108 Programs
55
City of Saint Paul, Minnesota Note III Notes to the Financial Statements Summary of SignificantFor the Fiscal Year Ended December 31, 2005 Accounting Policies
Debt Service Funds are used to account for the accumulation of resources for, and the payment of, general long-term debt principal, interest and related costs. G.O. Special Assessment – Streets City Revenue Bonds and Other Long-Term Debt Library Debt Revenue Notes and Other Long-Term Debt
Capital Projects Funds are used to account for financial resources to be used for the acquisition or construction of equipment and/or major capital facilities. Capital Improvement Bonds City Sales Tax Library Capital Projects City Downtown Capital Projects HRA Tax Increment
Permanent Funds are used to report resources that are legally restricted to the extent that only earnings, and not principal, may be used for purposes that support the reporting government’s programs; that is, for the benefit of the government or its citizenry. Japanese Gardens Hoffman Memorial
Non-Major Enterprise Funds
Enterprise Funds are used to report any activity for which a fee is charged to external users of goods or services, and must be used for activities which meet certain debt or cost-recovery criteria. Special Services Rice and Arlington Sports Dome Watergate Marina Impounding Lot RiverPrint Saint Paul/Ramsey County
In addition, the City reports the following fund types:
Internal Service Funds are used to account for the financing of goods or services provided by one department or agency to other departments or agencies of the City, or to other governmental units, on a cost-reimbursement basis, including attorney, purchasing, technology, equipment, engineering and administrative services.
Agency Funds are used to account for assets held by the City in a trustee capacity or as an agent for individuals, private organizations, and/or other governmental units. These funds include employee withholding; funds payable to the State of Minnesota for sales and use tax, building permit surcharge and unclaimed property; and others.
56
City of Saint Paul, Minnesota Note III Notes to the Financial Statements Summary of SignificantFor the Fiscal Year Ended December 31, 2005 Accounting Policies
B. Measurement Focus, Basis of Accounting and Financial Statement Presentation Government-Wide Financial Statements
The government-wide statement of net assets and statement of activities are reported using the economic resources measurement focus and the accrual basis of accounting. Under the accrual basis of accounting, revenues are recognized when earned and expenses are recorded when the liability is incurred or economic asset used. Revenues, expenses, gains, losses, assets and liabilities resulting from exchange and exchange-like transactions are recognized when the exchange takes place. Property taxes are recognized as revenues in the year for which they are levied. Grants and similar items are recognized as revenue as soon as all eligibility requirements imposed by the provider are met. Special assessments are recorded as revenue when earned. Unbilled receivables are recorded as revenues when services are provided.
As a general rule, the effect of interfund activity has been eliminated from the government-wide financial statements. Exceptions to this general rule are charges between the City’s enterprise funds and various other functions of the government. Elimination of these charges would distort the direct costs and program revenues reported for the various functions concerned.
Fund Financial Statements – Governmental Funds
Governmental funds are reported using the current financial resources measurement focus and the modified accrual basis of accounting.
Revenues
Governmental fund revenues are recognized in the accounting period in which they become susceptible to accrual; that is, when they become both measurable and available to finance the expenditures of the fiscal period. “Available” means collectible within the current period or soon enough thereafter to be used to pay liabilities of the current period. Revenues for nonexchange transactions are recognized based on the principal characteristics of the revenue. Exchange transactions are recognized as revenue when the exchange occurs.
Nonexchange Transactions
Derived tax revenue transactions result from assessments imposed by governments on exchange transactions. Hotel-motel tax and City sales tax are reported as revenue when the underlying exchange occurs and the receivable amount is available.
Imposed nonexchange transactions result from assessments by governments on nongovernmental entities and individuals. Property taxes, franchise fees and capital improvement special assessments are imposed nonexchange transactions. Revenues from property taxes and capital improvement special assessments are recognized in the period for which they were levied, to the extent they are collected in the current period or soon enough thereafter to be used to pay liabilities of the current period.
Property taxes, franchise fees and capital improvement special assessments receivable which are not available are reported as deferred revenue, and will be recognized as revenue in the fiscal year that they become available. The City considers these revenues as available if they are collected within sixty days after year end.
57
City of Saint Paul, Minnesota Note III Notes to the Financial Statements Summary of SignificantFor the Fiscal Year Ended December 31, 2005 Accounting Policies
Government-mandated nonexchange transactions occur when a government at one level provides resources to a government at another level and requires that government to use them for a specific purpose. The provider government establishes purpose restrictions and may also establish time requirements. Federal and state grants mandating the City perform particular programs are government-mandated nonexchange transactions. Revenues are recognized when the eligibility and time requirements are met, usually when the corresponding expenditure is incurred, using the guidelines of the legal and contractual requirements of the individual programs.
Voluntary nonexchange transactions result from legislative or contractual agreements, such as grants, entitlements, appropriations and donations. The provider may establish purpose restrictions and eligibility requirements. Revenues are recognized in the year to which they apply according to statute or contract. Gifts and contributions from individuals and miscellaneous revenues are also considered voluntary nonexchange transactions, and are generally recognized when received in cash because they are not measurable until received. Tax credits paid by the state (included in intergovernmental revenue) are recognized as revenue in the fiscal year that they become available. The City considers revenues from tax credits paid by the state as available if they are collected within sixty days after year end.
Exchange Transactions
Exchange transactions include revenues such as interest earned, service-type special assessments, fees, sales and services, licenses and permits. Sales and services, interest earned and service-type special assessments are reported as revenue when they become both measurable and available to finance expenditures of the fiscal period. The City considers these revenues as available if they are collected within sixty days after year end. Licenses, permits and fees are reported as revenue when received in cash, because they are usually not measurable until received.
Expenditures
Expenditures are recorded under the modified accrual method when the fund liability is incurred, except for unmatured interest on general long-term debt which is recognized when due, and certain compensated absences, claims and judgments which are recognized when the obligations are expected to be liquidated with expendable available financial resources.
Fund Financial Statements – Proprietary Funds and Fiduciary Funds
Proprietary funds, consisting of enterprise and internal service funds, are reported using the economic resources measurement focus and the accrual basis of accounting. Their revenues are recognized when they are earned, and their expenses are recognized when they are incurred. Material unbilled accounts receivables are recorded at year end.
The proprietary funds distinguish operating revenues and expenses from nonoperating items. Operating revenues and expenses generally result from providing services and producing and delivering goods in connection with a proprietary fund’s principal ongoing operations. The principal operating revenues of the proprietary funds are charges to customers for sales and services. Operating expenses for proprietary funds include the cost of sales and services, administrative expenses, and depreciation on capital assets. All revenues and expenses not meeting this definition are reported as nonoperating revenues and expenses.
58
City of Saint Paul, Minnesota Note III Notes to the Financial Statements Summary of SignificantFor the Fiscal Year Ended December 31, 2005 Accounting Policies
Private-sector standards of accounting and financial reporting issued prior to December 1, 1989, generally are followed in both the government-wide and proprietary fund financial statements to the extent that those standards do not conflict with or contradict guidance of the Governmental Accounting Standards Board. Governments also have the option of following subsequent private-sector guidance for their business-type activities and enterprise funds, subject to this same limitation. The City has elected not to follow subsequent private-sector guidance.
The City’s Fiduciary Funds consist solely of Agency Funds. Agency Funds do not have a measurement focus, but are reported on an accrual basis of accounting.
Fund Financial Statements – All Funds
The preparation of financial statements in conformity with generally accepted accounting principles requires management to make estimates and assumptions that affect the reported amounts of assets and liabilities and disclosure of contingent assets and liabilities at the date of the financial statements and the reported amounts of revenues and expenditures/expenses during the reporting period. Actual results could differ from those estimates.
(The remainder of this page left blank intentionally)
59
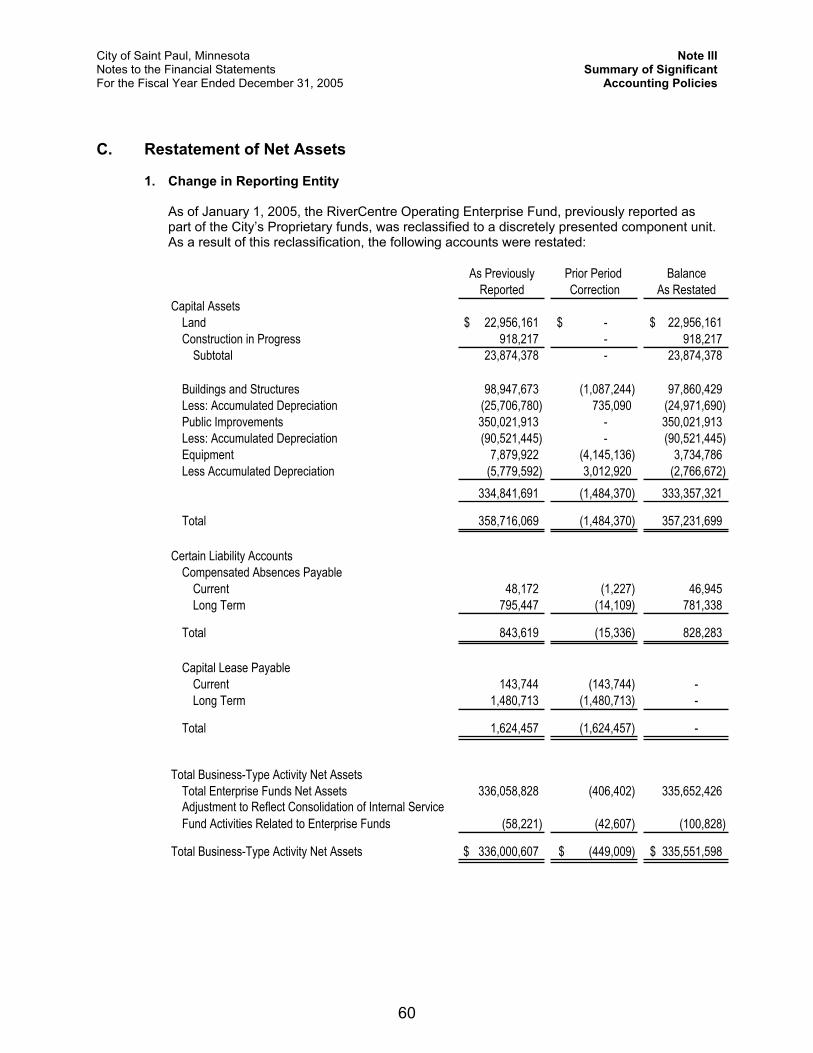
City of Saint Paul, Minnesota Note III Notes to the Financial Statements Summary of SignificantFor the Fiscal Year Ended December 31, 2005 Accounting Policies
C. Restatement of Net Assets
1. Change in Reporting Entity
As of January 1, 2005, the RiverCentre Operating Enterprise Fund, previously reported as part of the City’s Proprietary funds, was reclassified to a discretely presented component unit. As a result of this reclassification, the following accounts were restated:
As Previously Prior Period BalanceReported Correction As Restated
Capital AssetsLand 22,956,161$ -$ 22,956,161$Construction in Progress 918,217 - 918,217
Subtotal 23,874,378 - 23,874,378
Buildings and Structures 98,947,673 (1,087,244) 97,860,429 Less: Accumulated Depreciation (25,706,780) 735,090 (24,971,690)Public Improvements 350,021,913 - 350,021,913Less: Accumulated Depreciation (90,521,445) - (90,521,445)Equipment 7,879,922 (4,145,136) 3,734,786 Less Accumulated Depreciation (5,779,592) 3,012,920 (2,766,672)
334,841,691 (1,484,370) 333,357,321
Total 358,716,069 (1,484,370) 357,231,699
Certain Liability AccountsCompensated Absences Payable
Current 48,172 (1,227) 46,945 Long Term 795,447 (14,109) 781,338
Total 843,619 (15,336) 828,283
Capital Lease PayableCurrent 143,744 (143,744) - Long Term 1,480,713 (1,480,713) -
Total 1,624,457 (1,624,457) -
Total Business-Type Activity Net AssetsTotal Enterprise Funds Net Assets 336,058,828 (406,402) 335,652,426Adjustment to Reflect Consolidation of Internal Service Fund Activities Related to Enterprise Funds (58,221) (42,607) (100,828)
Total Business-Type Activity Net Assets 336,000,607$ (449,009)$ 335,551,598$
60
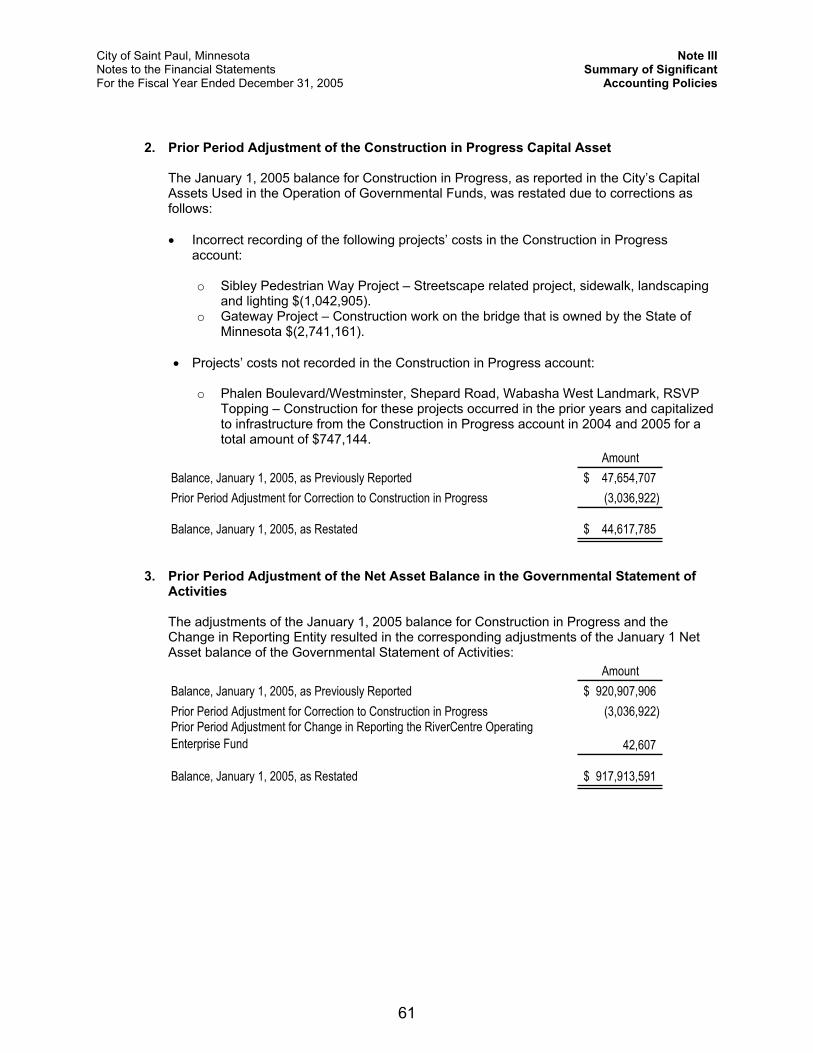
City of Saint Paul, Minnesota Note III Notes to the Financial Statements Summary of SignificantFor the Fiscal Year Ended December 31, 2005 Accounting Policies
2. Prior Period Adjustment of the Construction in Progress Capital Asset
The January 1, 2005 balance for Construction in Progress, as reported in the City’s Capital Assets Used in the Operation of Governmental Funds, was restated due to corrections as follows:
Incorrect recording of the following projects’ costs in the Construction in Progress account:
o Sibley Pedestrian Way Project – Streetscape related project, sidewalk, landscaping and lighting $(1,042,905).
o Gateway Project – Construction work on the bridge that is owned by the State of Minnesota $(2,741,161).
Projects’ costs not recorded in the Construction in Progress account:
o Phalen Boulevard/Westminster, Shepard Road, Wabasha West Landmark, RSVP Topping – Construction for these projects occurred in the prior years and capitalized to infrastructure from the Construction in Progress account in 2004 and 2005 for a total amount of $747,144.
AmountBalance, January 1, 2005, as Previously Reported 47,654,707$ Prior Period Adjustment for Correction to Construction in Progress (3,036,922)
Balance, January 1, 2005, as Restated 44,617,785$
3. Prior Period Adjustment of the Net Asset Balance in the Governmental Statement of Activities
The adjustments of the January 1, 2005 balance for Construction in Progress and the Change in Reporting Entity resulted in the corresponding adjustments of the January 1 Net Asset balance of the Governmental Statement of Activities:
AmountBalance, January 1, 2005, as Previously Reported 920,907,906$Prior Period Adjustment for Correction to Construction in Progress (3,036,922) Prior Period Adjustment for Change in Reporting the RiverCentre OperatingEnterprise Fund 42,607
Balance, January 1, 2005, as Restated 917,913,591$
61
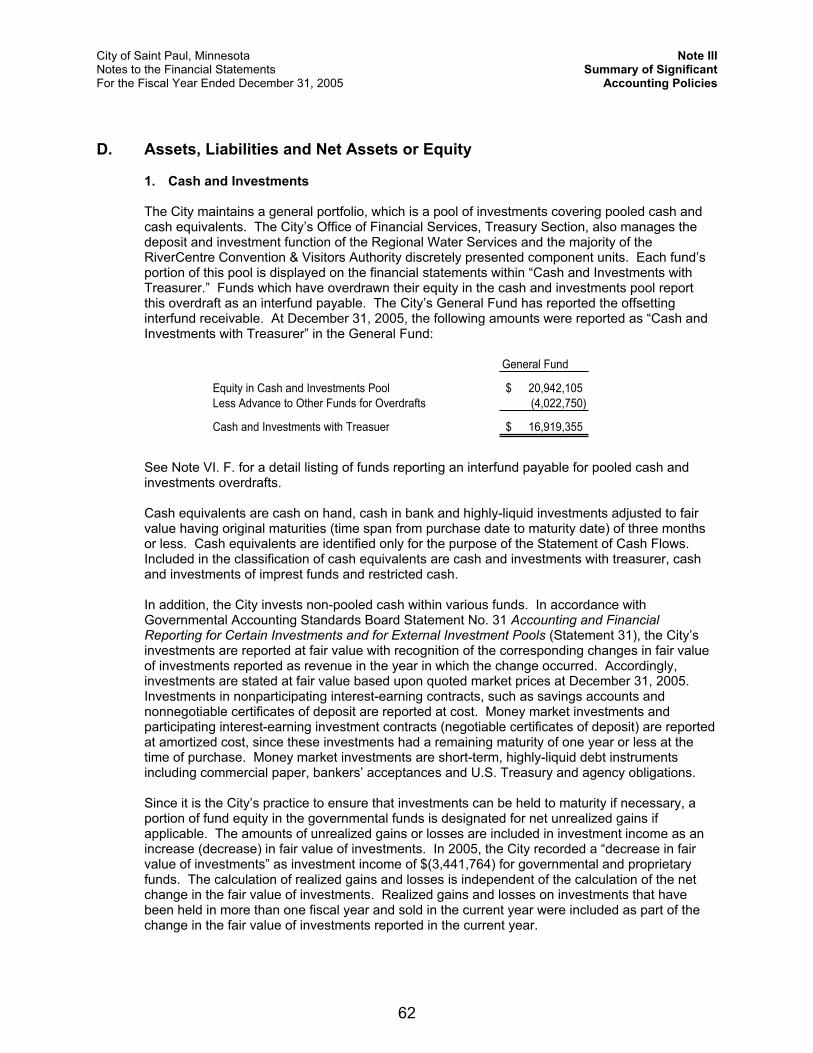
City of Saint Paul, Minnesota Note III Notes to the Financial Statements Summary of SignificantFor the Fiscal Year Ended December 31, 2005 Accounting Policies
D. Assets, Liabilities and Net Assets or Equity
1. Cash and Investments
The City maintains a general portfolio, which is a pool of investments covering pooled cash and cash equivalents. The City’s Office of Financial Services, Treasury Section, also manages the deposit and investment function of the Regional Water Services and the majority of the RiverCentre Convention & Visitors Authority discretely presented component units. Each fund’s portion of this pool is displayed on the financial statements within “Cash and Investments with Treasurer.” Funds which have overdrawn their equity in the cash and investments pool report this overdraft as an interfund payable. The City’s General Fund has reported the offsetting interfund receivable. At December 31, 2005, the following amounts were reported as “Cash and Investments with Treasurer” in the General Fund:
General Fund
Equity in Cash and Investments Pool 20,942,105$Less Advance to Other Funds for Overdrafts (4,022,750)
Cash and Investments with Treasuer 16,919,355$
See Note VI. F. for a detail listing of funds reporting an interfund payable for pooled cash and investments overdrafts.
Cash equivalents are cash on hand, cash in bank and highly-liquid investments adjusted to fair value having original maturities (time span from purchase date to maturity date) of three months or less. Cash equivalents are identified only for the purpose of the Statement of Cash Flows. Included in the classification of cash equivalents are cash and investments with treasurer, cash and investments of imprest funds and restricted cash.
In addition, the City invests non-pooled cash within various funds. In accordance with Governmental Accounting Standards Board Statement No. 31 Accounting and Financial Reporting for Certain Investments and for External Investment Pools (Statement 31), the City’s investments are reported at fair value with recognition of the corresponding changes in fair value of investments reported as revenue in the year in which the change occurred. Accordingly, investments are stated at fair value based upon quoted market prices at December 31, 2005. Investments in nonparticipating interest-earning contracts, such as savings accounts and nonnegotiable certificates of deposit are reported at cost. Money market investments and participating interest-earning investment contracts (negotiable certificates of deposit) are reported at amortized cost, since these investments had a remaining maturity of one year or less at the time of purchase. Money market investments are short-term, highly-liquid debt instruments including commercial paper, bankers’ acceptances and U.S. Treasury and agency obligations.
Since it is the City’s practice to ensure that investments can be held to maturity if necessary, a portion of fund equity in the governmental funds is designated for net unrealized gains if applicable. The amounts of unrealized gains or losses are included in investment income as an increase (decrease) in fair value of investments. In 2005, the City recorded a “decrease in fair value of investments” as investment income of $(3,441,764) for governmental and proprietary funds. The calculation of realized gains and losses is independent of the calculation of the net change in the fair value of investments. Realized gains and losses on investments that have been held in more than one fiscal year and sold in the current year were included as part of the change in the fair value of investments reported in the current year.
62
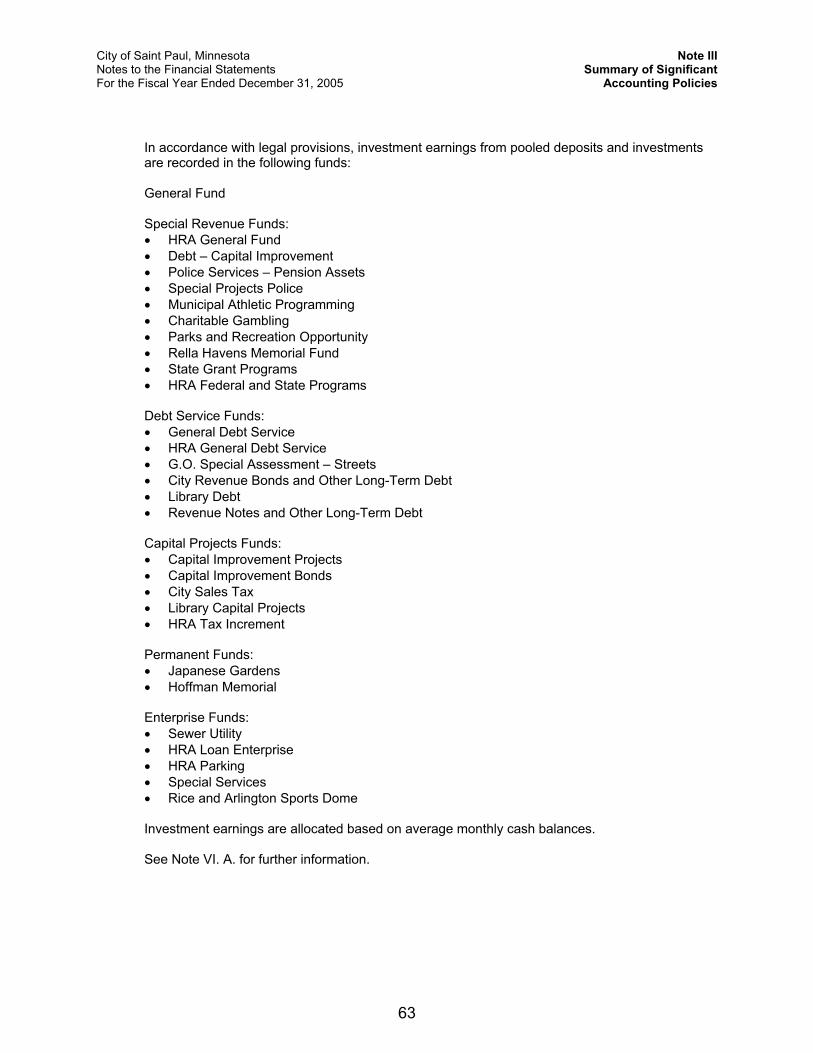
City of Saint Paul, Minnesota Note III Notes to the Financial Statements Summary of SignificantFor the Fiscal Year Ended December 31, 2005 Accounting Policies
In accordance with legal provisions, investment earnings from pooled deposits and investments are recorded in the following funds:
General Fund
Special Revenue Funds: HRA General Fund Debt – Capital Improvement Police Services – Pension Assets Special Projects Police Municipal Athletic Programming Charitable Gambling Parks and Recreation Opportunity Rella Havens Memorial Fund State Grant Programs HRA Federal and State Programs
Debt Service Funds: General Debt Service HRA General Debt Service G.O. Special Assessment – Streets City Revenue Bonds and Other Long-Term Debt Library Debt Revenue Notes and Other Long-Term Debt
Capital Projects Funds: Capital Improvement Projects Capital Improvement Bonds City Sales Tax Library Capital Projects HRA Tax Increment
Permanent Funds: Japanese Gardens Hoffman Memorial
Enterprise Funds: Sewer Utility HRA Loan Enterprise HRA Parking Special Services Rice and Arlington Sports Dome
Investment earnings are allocated based on average monthly cash balances.
See Note VI. A. for further information.
63
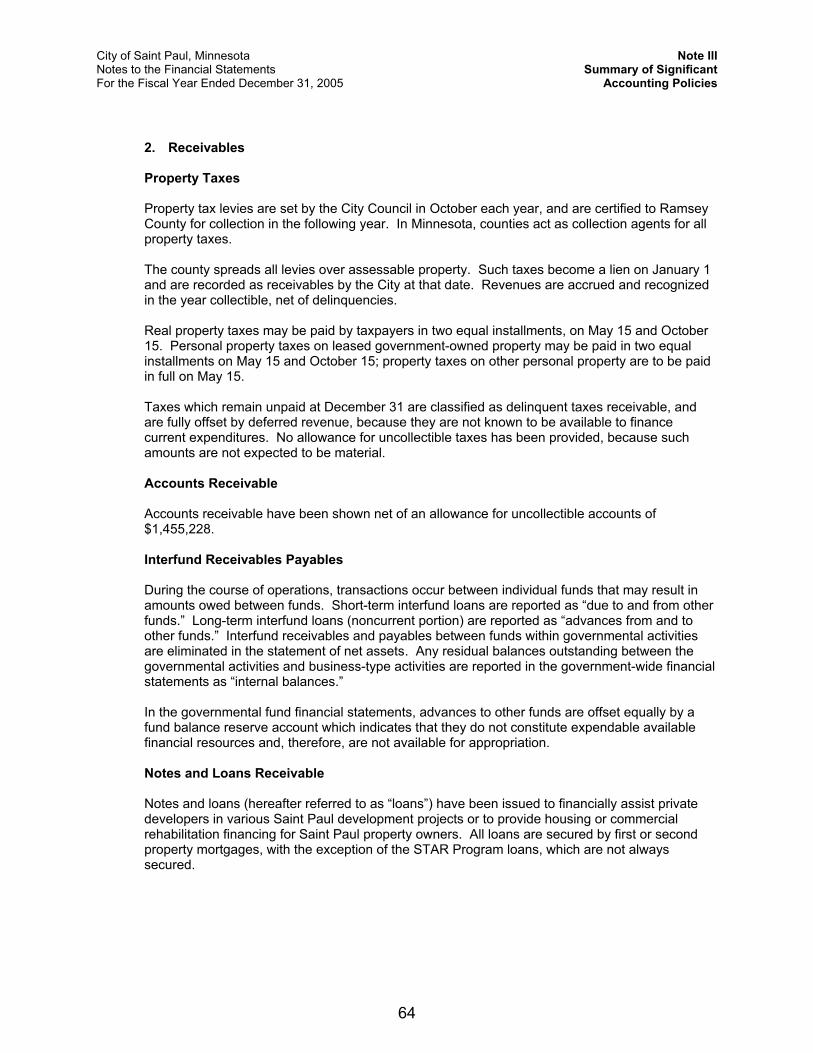
City of Saint Paul, Minnesota Note III Notes to the Financial Statements Summary of SignificantFor the Fiscal Year Ended December 31, 2005 Accounting Policies
2. Receivables
Property Taxes
Property tax levies are set by the City Council in October each year, and are certified to Ramsey County for collection in the following year. In Minnesota, counties act as collection agents for all property taxes.
The county spreads all levies over assessable property. Such taxes become a lien on January 1 and are recorded as receivables by the City at that date. Revenues are accrued and recognized in the year collectible, net of delinquencies.
Real property taxes may be paid by taxpayers in two equal installments, on May 15 and October 15. Personal property taxes on leased government-owned property may be paid in two equal installments on May 15 and October 15; property taxes on other personal property are to be paid in full on May 15.
Taxes which remain unpaid at December 31 are classified as delinquent taxes receivable, and are fully offset by deferred revenue, because they are not known to be available to finance current expenditures. No allowance for uncollectible taxes has been provided, because such amounts are not expected to be material.
Accounts Receivable
Accounts receivable have been shown net of an allowance for uncollectible accounts of $1,455,228.
Interfund Receivables Payables
During the course of operations, transactions occur between individual funds that may result in amounts owed between funds. Short-term interfund loans are reported as “due to and from other funds.” Long-term interfund loans (noncurrent portion) are reported as “advances from and to other funds.” Interfund receivables and payables between funds within governmental activities are eliminated in the statement of net assets. Any residual balances outstanding between the governmental activities and business-type activities are reported in the government-wide financial statements as “internal balances.”
In the governmental fund financial statements, advances to other funds are offset equally by a fund balance reserve account which indicates that they do not constitute expendable available financial resources and, therefore, are not available for appropriation.
Notes and Loans Receivable
Notes and loans (hereafter referred to as “loans”) have been issued to financially assist private developers in various Saint Paul development projects or to provide housing or commercial rehabilitation financing for Saint Paul property owners. All loans are secured by first or second property mortgages, with the exception of the STAR Program loans, which are not always secured.
64
City of Saint Paul, Minnesota Note III Notes to the Financial Statements Summary of SignificantFor the Fiscal Year Ended December 31, 2005 Accounting Policies
Loans receivable in governmental funds are reported as an asset in the amount of loan proceeds disbursed less collections on principal. In order to satisfy federal grant reporting requirements, deferred revenue of an equal amount to the asset is also reported on the respective governmental fund balance sheet and revenues are reported when principal payments are received from the loan recipient. An allowance for uncollectible loans, which offsets the total gross loans receivables, is recognized for the amount of loans receivable for which collection is doubtful or questionable.
Deferred revenue is also reduced by the amount of the allowance for uncollectible loans. At the time of the disbursement of the loan, expenditures and loans receivable are debited in the amount of the loan issued, with the loans receivable being offset by a credit to deferred revenue. In the HRA Federal and State Programs Special Revenue Fund, in order to satisfy federal grant reporting requirements, deferred revenue of an equal amount to the asset is also reported in the balance sheet and revenues are reported when principal payments are received from the loan recipient. However, in the case of the loan receivable from Central Towers Limited Partnership in the amount of $2,100,000, an equal amount of $2,100,000 is reported as “due to other governmental units” on the balance sheet, since any payments on this loan receivable are owing to the U.S. Department of Housing and Urban Development.
For enterprise funds, loans receivable are reported as an asset in the amount of loan proceeds disbursed less collections on principal. An allowance for uncollectible loans, which offsets the total gross loans receivable, is recognized for the amount of loans receivable for which collection is doubtful or questionable.
The allowance for uncollectible loans is based upon an analysis of credit risk and payment delinquency.
3. Inventories and Prepaid Items
Inventories are valued at cost, which approximates market, using the first-in, first-out (FIFO) method. Proprietary fund inventories are generally used for construction, for operation and maintenance work. They are not for resale. They are valued at cost based on weighted average, and charged to construction, operation and maintenance expense when used.
Certain payments to vendors which reflect costs applicable to future accounting periods are recorded as prepaid items in both government-wide and fund financial statements.
4. Land Held for Resale
Land is acquired by the HRA for subsequent resale for redevelopment purposes and not as an investment program. In order to entice development, the land is often resold at prices substantially lower than the HRA’s cost. Land Held for Resale is reported as an asset at the net realizable value in the fund which acquired it. Deferred revenue of an equal amount is also reported on the respective governmental fund balance sheet. In governmental funds, in order to satisfy federal grant reporting requirements, land acquired is reported as an expenditure in the amount of the acquisition cost and as federal revenue for the same amount. When the land is subsequently sold, miscellaneous program income is recognized for the sale amount. Future draw downs from the federal government for reimbursement of expenditures incurred are adjusted by program income available at that date.
65
City of Saint Paul, Minnesota Note III Notes to the Financial Statements Summary of SignificantFor the Fiscal Year Ended December 31, 2005 Accounting Policies
5. Restricted Assets
Mandatory segregations of assets are presented as restricted assets. Such segregations are required by bond agreements and other external parties. Current liabilities payable from these restricted assets are so classified. The excess of restricted assets over current liabilities payable from restricted assets will be used first for retirement of related long-term debt.
6. Capital Assets
Government-Wide Financial Statements
Capital assets, which include land, buildings and structures, improvements, equipment and infrastructure (e.g., streets, bridges and sewers), are defined by the City as assets with an initial cost of more than $5,000 for general capital assets and $100,000 for infrastructure assets, and an estimated useful life of at least three years. Such assets are recorded at historical cost. Donated capital assets are recorded at estimated fair value on the date received. Certain assets for which actual costs are not available have been valued on the basis of a professional valuation that determined their approximate historical cost. The costs of normal maintenance and repairs that do not add to the value of the asset or materially extend asset lives are not capitalized.
Prior to January 1, 2002, infrastructure assets of governmental funds were not capitalized. Upon implementing Statement 34, governmental units are required to account for all capital assets, including infrastructure, in the government-wide statements prospectively from the date of implementation. Retroactive reporting of all major general infrastructure assets is encouraged, but not required until January 1, 2006, when Statement 34 required the City to retroactively report all major general infrastructure assets acquired since January 1, 1980. For the year ended December 31, 2005, the City has retroactively reported all major infrastructure networks (streets and bridges).
Additions to and replacements of capital assets of business-type activities are recorded at original cost, which includes material, labor, overhead and an allowance for the cost of funds used during construction when significant. For tax-exempt debt, the amount of interest capitalized equals the interest expense incurred during construction netted against any interest revenue from temporary investment of borrowed fund proceeds. The cost of renewals and betterments relating to retirement units is added to related capital asset accounts. The cost of property replaced, retired or otherwise disposed of, is deducted from capital asset accounts and, generally, together with removal costs less salvage, is charged to accumulated depreciation.
Depreciation of all exhaustible capital assets is recorded as an allocated expense in the statements of activities, with accumulated depreciation reflected in the statement of net assets. Depreciation is spread over the assets’ estimated useful lives using the straight line method of depreciation. The range of estimated useful lives and method of depreciation by type of asset is as follows:
Asset Method Years
Buildings and Structures Straight-line 15-75Public Improvements Straight-line 15-30Equipment Straight-line 3-20Infrastructure Straight-line 20-100
66
City of Saint Paul, Minnesota Note III Notes to the Financial Statements Summary of SignificantFor the Fiscal Year Ended December 31, 2005 Accounting Policies
Fund Financial Statements
In the fund financial statements, capital assets used in governmental fund operations are accounted for as capital outlay expenditures of the governmental fund upon acquisition. Capital assets used in proprietary fund operations are accounted for the same way as in the government-wide statements.
7. Issuance Costs and Discounts
In governmental funds, debt issuance costs and bond discounts are recognized as expenditures in the current period. For the government-wide and the proprietary fund type financial statements, debt issuance costs are deferred and amortized on a straight-line basis over the term of the debt issue.
8. Compensated Absences
The compensated absences liability includes earned but unpaid vacation and compensatory time, vested sick leave, an estimate of current vesting sick leave that will eventually vest, and salary-related payments (fringe benefits) associated with the payment of vacation and sick leave balances.
Employees earn vacation based on years of service and their bargaining unit. Vacation must be used in the year it is earned, except for 15 days, which may be carried over to the following year. Employees are paid 100% of their accumulated vacation pay when they terminate their employment.
Sick leave is earned at the rate of .0576 hours per hour up to a maximum of 15 days per year and may be accumulated indefinitely. Terminated employees receive severance pay based upon unused vested sick leave. Eligibility requirements and maximum allowable amounts vary depending upon an employee’s bargaining unit.
All vested vacation is accrued when incurred in the government-wide, proprietary and fiduciary fund financial statements. A liability for these amounts is reported in governmental funds only if they have matured; for example, as a result of employee resignations and retirements, or are payable with expendable available resources.
9. Arbitrage Rebate
Expenditures/expenses for arbitrage rebate are recognized annually in the appropriate funds at the time of the interest payment closest to the date of the bonds. For the fiscal year ended December 31, 2005, the City reported $280,000 of expenditures relating to arbitrage rebate. These amounts are set aside in the Arbitrage Rebate Agency Fund for subsequent payment to the federal government.
10. Long-Term Obligations/Conduit Debt
All long-term obligations to be repaid from governmental and business-type resources are reported as liabilities in the government-wide statements. The long-term obligations consist primarily of notes and bonds payable, and accrued compensated absences.
67
City of Saint Paul, Minnesota Note III Notes to the Financial Statements Summary of SignificantFor the Fiscal Year Ended December 31, 2005 Accounting Policies
Long-term obligations for governmental funds are not reported as liabilities in the fund financial statements. The face value of the debt (plus any premiums) is reported as other financing sources and payments of principal and interest are reported as expenditures. The accounting in proprietary funds is the same as it is in the government-wide statements.
The HRA has issued Commercial/Industrial Development, Homeownership Mortgage and Rental Housing Revenue Bonds to assist developers, businesses and low- to moderate-income homeowners in projects which improve the economic and housing conditions of the City. The bonds are secured by the financed property and are payable solely from the revenues of the individual commercial/industrial or housing projects. The bonds do not constitute a charge, lien or encumbrance, legal or equitable, upon any property or funds of the HRA, nor is the HRA subject to any liability thereon. Accordingly, the bonds are not reported as liabilities in the accompanying financial statements.
Conduit bonds issued subsequent to January 1, 1996 have an outstanding principal balance of $1.525 billion at December 31, 2005. The aggregate principal amount payable for conduit bonds issued prior to January 1, 1996 could not be determined; however, their original issue amounts totaled $2.9 billion. There were 185 conduit bonds issued prior to January 1, 1996 and 87 conduit bonds issued subsequent to January 1, 1996.
11. Claims and Judgments
Claims and judgments are recorded as liabilities if all the conditions of Governmental Accounting Standards Board pronouncements are met. Claims and judgments that would normally be liquidated with expendable available financial resources are recorded during the year as expenditures in the governmental funds. If they are not to be liquidated with expendable available financial resources, no liability is recognized in the governmental fund statements. The related expenditure is recognized when the liability is liquidated. Claims and judgments are recorded in the government-wide statements and proprietary funds as expenses when the related liabilities are incurred.
12. Equity Classifications
Government-Wide Financial Statements
Equity is classified as net assets and displayed in three components:
a. Invested in capital assets, net of related debt – Consists of capital assets including infrastructure, net of accumulated depreciation and reduced by the outstanding balances of any bonds, mortgages, notes or other borrowings that are attributable to the acquisition, construction or improvement of those assets.
b. Restricted net assets – Consists of net assets with constraints placed on their use either by 1) external groups such as creditors, grantors, contributors, or laws or regulations of other governments or 2) law through constitutional provisions or enabling legislation.
c. Unrestricted net assets – All other net assets that do not meet the definition of “restricted” or “invested in capital assets, net of related debt.”
When both restricted and unrestricted resources are available for use, it is the City’s policy to use restricted resources first, then unrestricted resources as they are needed.
68
City of Saint Paul, Minnesota Note III Notes to the Financial Statements Summary of SignificantFor the Fiscal Year Ended December 31, 2005 Accounting Policies
Fund Financial Statements
Governmental fund equity is classified as fund balance. Fund balance is further classified as reserved and unreserved. Reserved fund balance amounts are not available for appropriation or are legally restricted by outside parties for a specific purpose. Unreserved fund balance includes funds set aside by management for specific uses, which are labeled “designated.” The balance of unreserved fund balance is labeled “undesignated,” which indicates it is available for appropriation. Proprietary fund equity is classified the same as in the government-wide statements.
(The remainder of this page left blank intentionally)
69
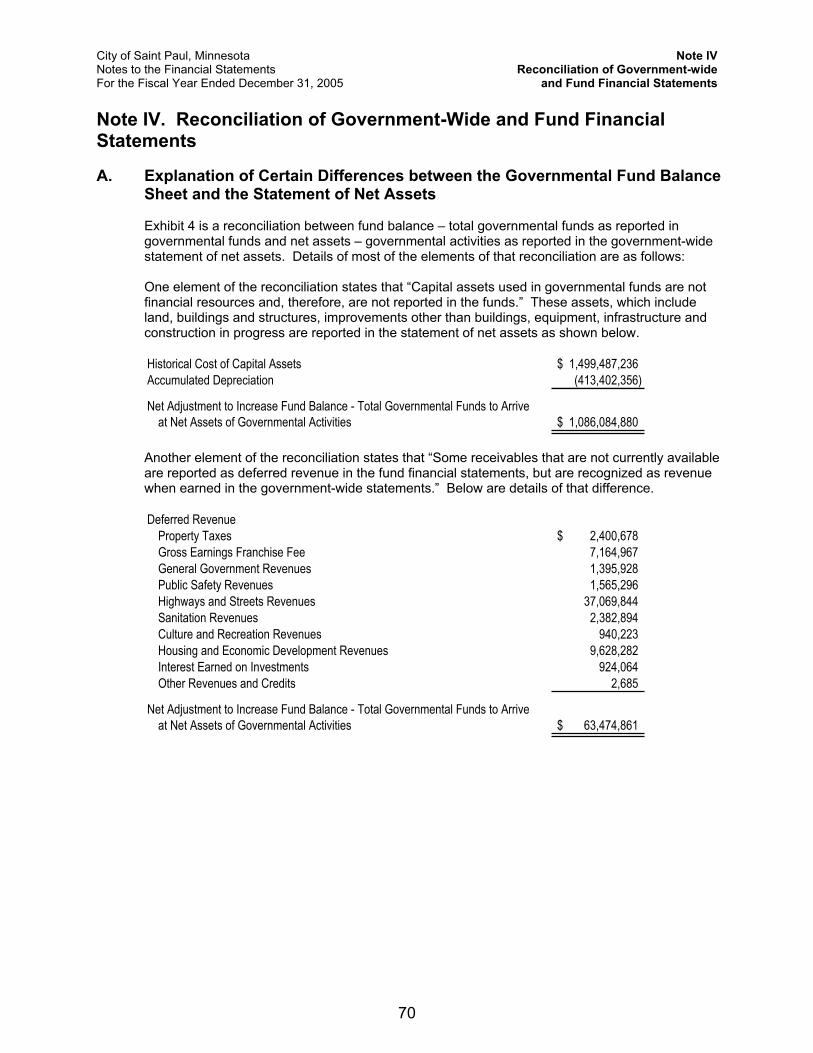
City of Saint Paul, Minnesota Note IV Notes to the Financial Statements Reconciliation of Government-wideFor the Fiscal Year Ended December 31, 2005 and Fund Financial Statements
Note IV. Reconciliation of Government-Wide and Fund Financial Statements
A. Explanation of Certain Differences between the Governmental Fund Balance Sheet and the Statement of Net Assets
Exhibit 4 is a reconciliation between fund balance – total governmental funds as reported in governmental funds and net assets – governmental activities as reported in the government-wide statement of net assets. Details of most of the elements of that reconciliation are as follows:
One element of the reconciliation states that “Capital assets used in governmental funds are not financial resources and, therefore, are not reported in the funds.” These assets, which include land, buildings and structures, improvements other than buildings, equipment, infrastructure and construction in progress are reported in the statement of net assets as shown below.
Historical Cost of Capital Assets 1,499,487,236$Accumulated Depreciation (413,402,356)
Net Adjustment to Increase Fund Balance - Total Governmental Funds to Arriveat Net Assets of Governmental Activities 1,086,084,880$
Another element of the reconciliation states that “Some receivables that are not currently available are reported as deferred revenue in the fund financial statements, but are recognized as revenue when earned in the government-wide statements.” Below are details of that difference.
Deferred RevenueProperty Taxes 2,400,678$ Gross Earnings Franchise Fee 7,164,967General Government Revenues 1,395,928Public Safety Revenues 1,565,296Highways and Streets Revenues 37,069,844Sanitation Revenues 2,382,894Culture and Recreation Revenues 940,223Housing and Economic Development Revenues 9,628,282Interest Earned on Investments 924,064Other Revenues and Credits 2,685
Net Adjustment to Increase Fund Balance - Total Governmental Funds to Arriveat Net Assets of Governmental Activities 63,474,861$
70
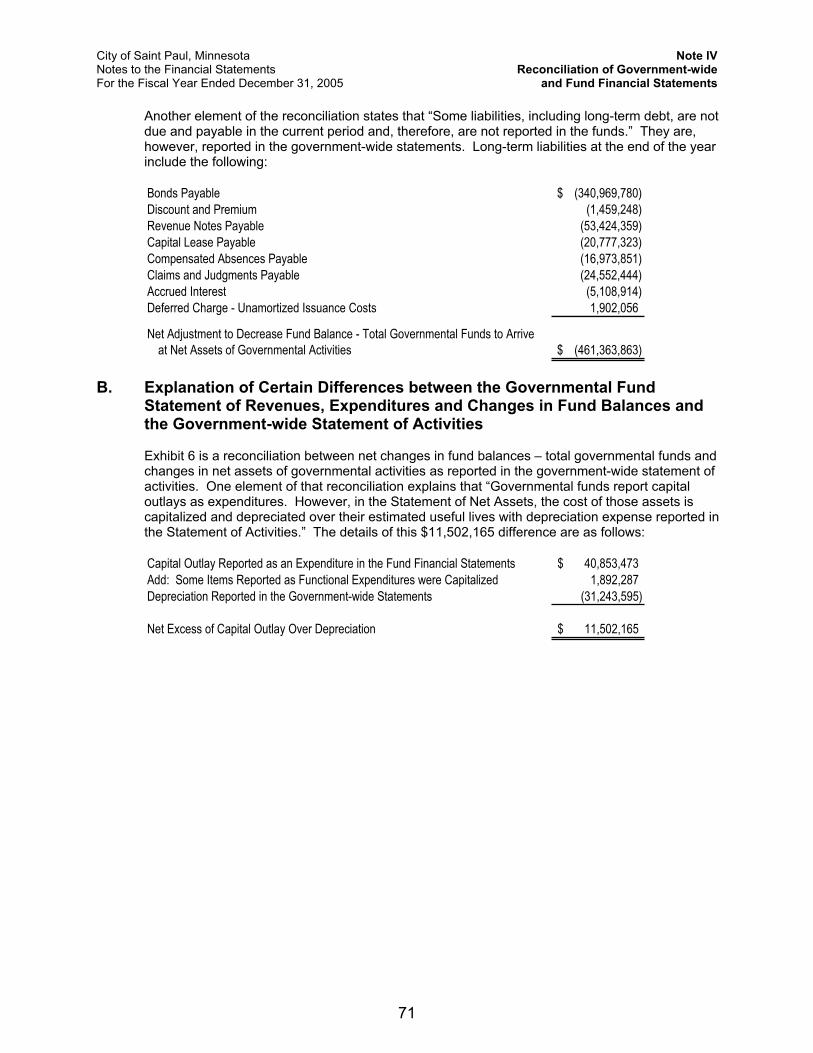
City of Saint Paul, Minnesota Note IV Notes to the Financial Statements Reconciliation of Government-wideFor the Fiscal Year Ended December 31, 2005 and Fund Financial Statements
Another element of the reconciliation states that “Some liabilities, including long-term debt, are not due and payable in the current period and, therefore, are not reported in the funds.” They are, however, reported in the government-wide statements. Long-term liabilities at the end of the year include the following:
Bonds Payable (340,969,780)$Discount and Premium (1,459,248)Revenue Notes Payable (53,424,359)Capital Lease Payable (20,777,323)Compensated Absences Payable (16,973,851)Claims and Judgments Payable (24,552,444)Accrued Interest (5,108,914)Deferred Charge - Unamortized Issuance Costs 1,902,056
Net Adjustment to Decrease Fund Balance - Total Governmental Funds to Arriveat Net Assets of Governmental Activities (461,363,863)$
B. Explanation of Certain Differences between the Governmental Fund Statement of Revenues, Expenditures and Changes in Fund Balances and the Government-wide Statement of Activities
Exhibit 6 is a reconciliation between net changes in fund balances – total governmental funds and changes in net assets of governmental activities as reported in the government-wide statement of activities. One element of that reconciliation explains that “Governmental funds report capital outlays as expenditures. However, in the Statement of Net Assets, the cost of those assets is capitalized and depreciated over their estimated useful lives with depreciation expense reported in the Statement of Activities.” The details of this $11,502,165 difference are as follows:
Capital Outlay Reported as an Expenditure in the Fund Financial Statements 40,853,473$Add: Some Items Reported as Functional Expenditures were Capitalized 1,892,287Depreciation Reported in the Government-wide Statements (31,243,595)
Net Excess of Capital Outlay Over Depreciation 11,502,165$
71
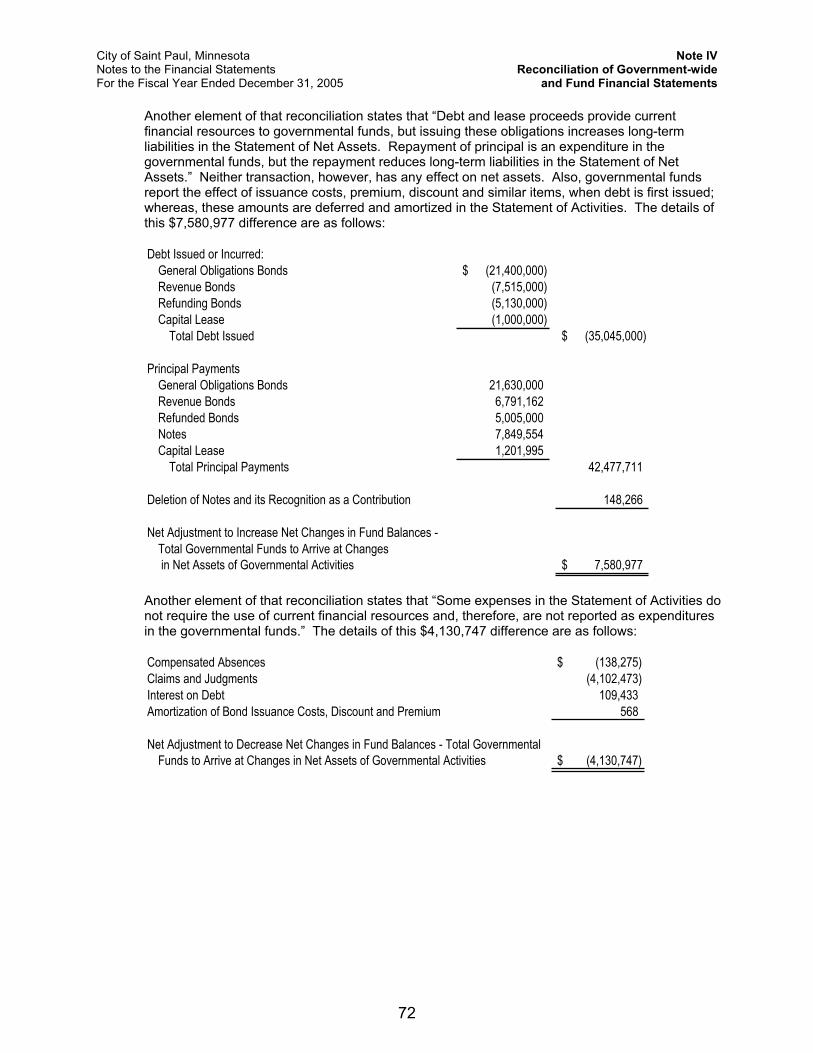
City of Saint Paul, Minnesota Note IV Notes to the Financial Statements Reconciliation of Government-wideFor the Fiscal Year Ended December 31, 2005 and Fund Financial Statements
Another element of that reconciliation states that “Debt and lease proceeds provide current financial resources to governmental funds, but issuing these obligations increases long-term liabilities in the Statement of Net Assets. Repayment of principal is an expenditure in the governmental funds, but the repayment reduces long-term liabilities in the Statement of Net Assets.” Neither transaction, however, has any effect on net assets. Also, governmental funds report the effect of issuance costs, premium, discount and similar items, when debt is first issued; whereas, these amounts are deferred and amortized in the Statement of Activities. The details of this $7,580,977 difference are as follows:
Debt Issued or Incurred:General Obligations Bonds (21,400,000)$ Revenue Bonds (7,515,000) Refunding Bonds (5,130,000) Capital Lease (1,000,000)
Total Debt Issued (35,045,000)$
Principal PaymentsGeneral Obligations Bonds 21,630,000 Revenue Bonds 6,791,162 Refunded Bonds 5,005,000 Notes 7,849,554 Capital Lease 1,201,995
Total Principal Payments 42,477,711
Deletion of Notes and its Recognition as a Contribution 148,266
Net Adjustment to Increase Net Changes in Fund Balances - Total Governmental Funds to Arrive at Changes in Net Assets of Governmental Activities 7,580,977$
Another element of that reconciliation states that “Some expenses in the Statement of Activities do not require the use of current financial resources and, therefore, are not reported as expenditures in the governmental funds.” The details of this $4,130,747 difference are as follows:
Compensated Absences (138,275)$ Claims and Judgments (4,102,473) Interest on Debt 109,433 Amortization of Bond Issuance Costs, Discount and Premium 568
Net Adjustment to Decrease Net Changes in Fund Balances - Total GovernmentalFunds to Arrive at Changes in Net Assets of Governmental Activities (4,130,747)$
72
City of Saint Paul, Minnesota Note V Notes to the Financial Statements Stewardship, ComplianceFor the Fiscal Year Ended December 31, 2005 and Accountability
Note V. Stewardship, Compliance and Accountability
A. Budgets and Budgetary Accounting
Budget Control
Appropriations are controlled administratively at the activity level within multi-year budgeted funds. Governmental funds with annually-adopted budgets are controlled administratively at the activity level within the following major object levels of expenditure: salaries, fringes, debt service, other spending and transfers out. Proprietary funds with annually-adopted budgets are controlled administratively at the fund level within the same major object levels of expenditure as in governmental funds. The legal level of budgetary control (that is, the level at which expenditures cannot legally exceed the appropriated amount) is at the fund level, except for the General Fund, which is at the department/office level.
1. General Budget Procedure – City Funds
The City Council followed these procedures in establishing the 2005 budgets:
a. On August 11, 2004, the Mayor presented his budget to the City Council for the following calendar year. The budget included proposed expenditures and advances and the means of financing them.
b. The City Council held a public hearing on December 7, 2004, to obtain taxpayer comments.
c. The budget was legally adopted through passage of council resolution #04-1174 during the City Council meeting on December 15, 2004.
City budget amendments that authorize an increase in total fund spending require the approval of the City Council. In addition, City Council approval is required for budget amendments transferring appropriations between departments within the General Fund.
2. General Budget Procedure – HRA Funds
The Housing and Redevelopment Authority (HRA) followed these procedures in establishing the 2005 budgets:
a. On August 15, 2004, the Executive Director presented her proposed budget to the HRA Board of Commissioners for the fiscal year commencing the following January 1. This budget included proposed expenditures and other uses and the means of financing them.
b. Upon approval by the HRA Board, the Executive Director submitted the HRA budget to the Mayor of the City of Saint Paul, who submitted this budget to the City Council for consideration, approval and certification.
c. The budget was approved through passage of council resolution #04-1181.
HRA budget amendments that authorize an increase in total fund spending require the approval of the HRA Board of Commissioners.
73
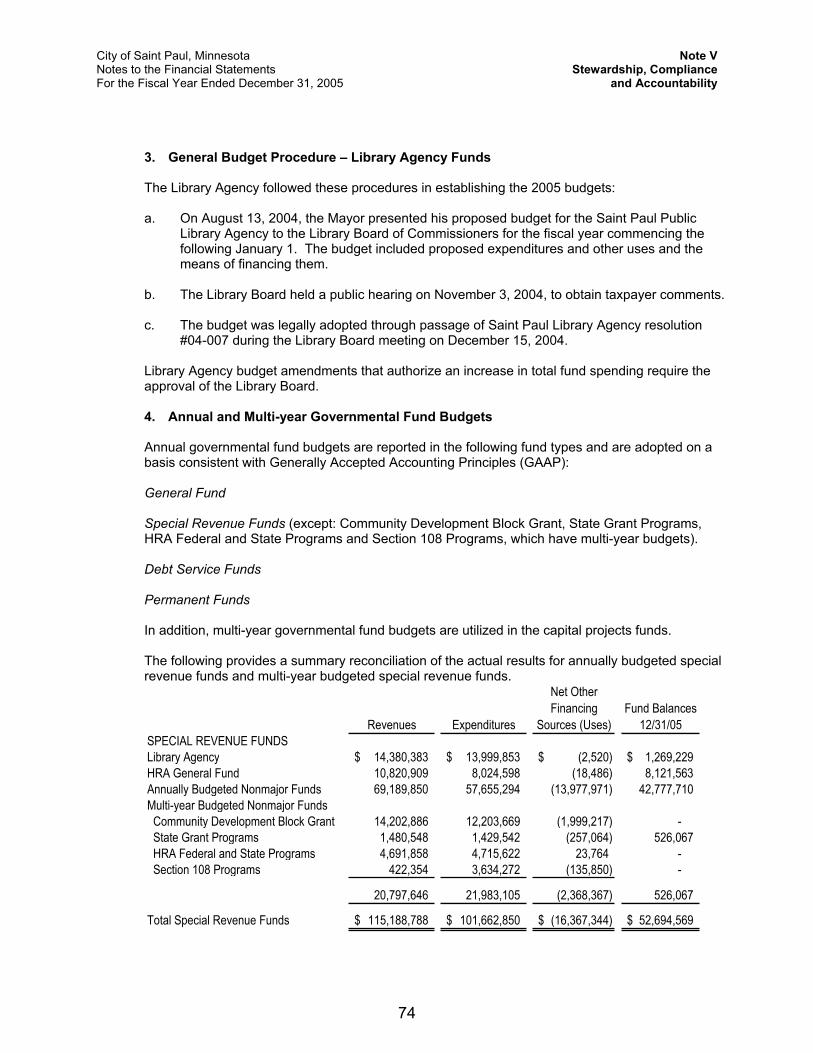
City of Saint Paul, Minnesota Note V Notes to the Financial Statements Stewardship, ComplianceFor the Fiscal Year Ended December 31, 2005 and Accountability
3. General Budget Procedure – Library Agency Funds
The Library Agency followed these procedures in establishing the 2005 budgets:
a. On August 13, 2004, the Mayor presented his proposed budget for the Saint Paul Public Library Agency to the Library Board of Commissioners for the fiscal year commencing the following January 1. The budget included proposed expenditures and other uses and the means of financing them.
b. The Library Board held a public hearing on November 3, 2004, to obtain taxpayer comments.
c. The budget was legally adopted through passage of Saint Paul Library Agency resolution #04-007 during the Library Board meeting on December 15, 2004.
Library Agency budget amendments that authorize an increase in total fund spending require the approval of the Library Board.
4. Annual and Multi-year Governmental Fund Budgets
Annual governmental fund budgets are reported in the following fund types and are adopted on a basis consistent with Generally Accepted Accounting Principles (GAAP):
General Fund
Special Revenue Funds (except: Community Development Block Grant, State Grant Programs, HRA Federal and State Programs and Section 108 Programs, which have multi-year budgets).
Debt Service Funds
Permanent Funds
In addition, multi-year governmental fund budgets are utilized in the capital projects funds.
The following provides a summary reconciliation of the actual results for annually budgeted special revenue funds and multi-year budgeted special revenue funds.
Revenues Expenditures
Net Other Financing
Sources (Uses)Fund Balances
12/31/05SPECIAL REVENUE FUNDSLibrary Agency 14,380,383$ 13,999,853$ (2,520)$ 1,269,229$HRA General Fund 10,820,909 8,024,598 (18,486) 8,121,563 Annually Budgeted Nonmajor Funds 69,189,850 57,655,294 (13,977,971) 42,777,710 Multi-year Budgeted Nonmajor Funds Community Development Block Grant 14,202,886 12,203,669 (1,999,217) - State Grant Programs 1,480,548 1,429,542 (257,064) 526,067 HRA Federal and State Programs 4,691,858 4,715,622 23,764 - Section 108 Programs 422,354 3,634,272 (135,850) -
20,797,646 21,983,105 (2,368,367) 526,067
Total Special Revenue Funds 115,188,788$ 101,662,850$ (16,367,344)$ 52,694,569$
74
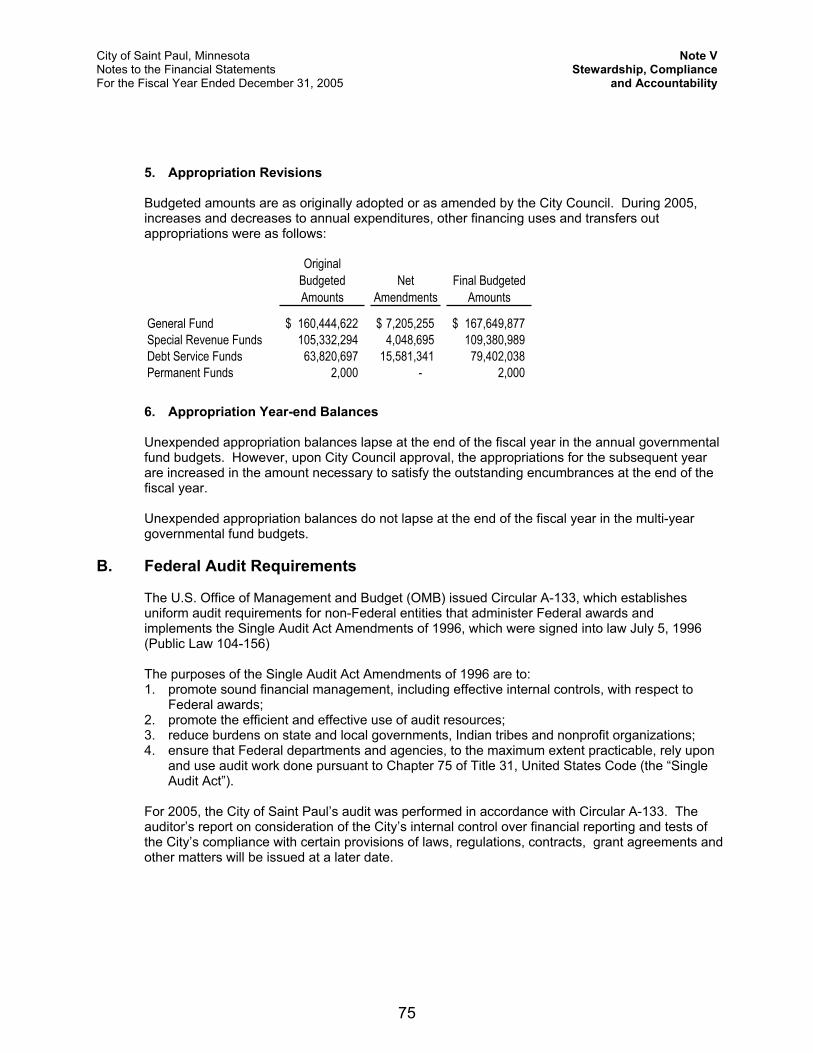
City of Saint Paul, Minnesota Note V Notes to the Financial Statements Stewardship, ComplianceFor the Fiscal Year Ended December 31, 2005 and Accountability
5. Appropriation Revisions
Budgeted amounts are as originally adopted or as amended by the City Council. During 2005, increases and decreases to annual expenditures, other financing uses and transfers out appropriations were as follows:
Original Budgeted Amounts
NetAmendments
Final Budgeted Amounts
General Fund 160,444,622$ 7,205,255$ 167,649,877$Special Revenue Funds 105,332,294 4,048,695 109,380,989Debt Service Funds 63,820,697 15,581,341 79,402,038 Permanent Funds 2,000 - 2,000
6. Appropriation Year-end Balances
Unexpended appropriation balances lapse at the end of the fiscal year in the annual governmental fund budgets. However, upon City Council approval, the appropriations for the subsequent year are increased in the amount necessary to satisfy the outstanding encumbrances at the end of the fiscal year.
Unexpended appropriation balances do not lapse at the end of the fiscal year in the multi-year governmental fund budgets.
B. Federal Audit Requirements
The U.S. Office of Management and Budget (OMB) issued Circular A-133, which establishes uniform audit requirements for non-Federal entities that administer Federal awards and implements the Single Audit Act Amendments of 1996, which were signed into law July 5, 1996 (Public Law 104-156)
The purposes of the Single Audit Act Amendments of 1996 are to: 1. promote sound financial management, including effective internal controls, with respect to
Federal awards;2. promote the efficient and effective use of audit resources; 3. reduce burdens on state and local governments, Indian tribes and nonprofit organizations; 4. ensure that Federal departments and agencies, to the maximum extent practicable, rely upon
and use audit work done pursuant to Chapter 75 of Title 31, United States Code (the “Single Audit Act”).
For 2005, the City of Saint Paul’s audit was performed in accordance with Circular A-133. The auditor’s report on consideration of the City’s internal control over financial reporting and tests of the City’s compliance with certain provisions of laws, regulations, contracts, grant agreements and other matters will be issued at a later date.
75
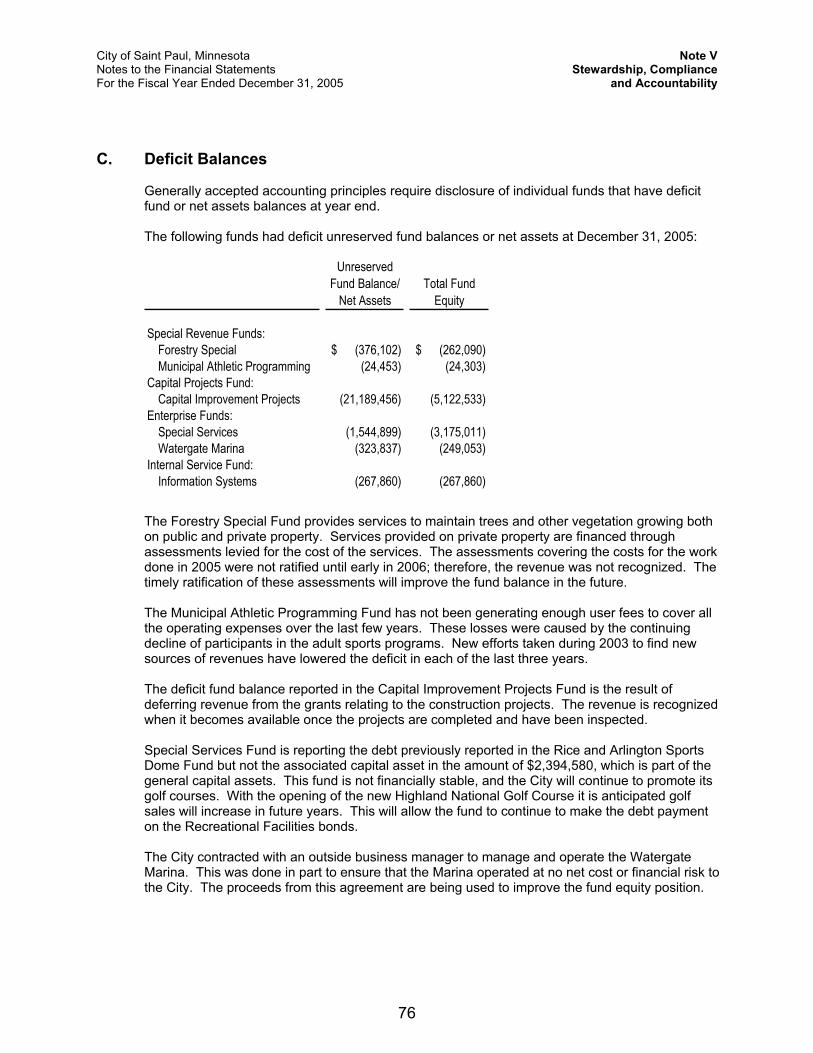
City of Saint Paul, Minnesota Note V Notes to the Financial Statements Stewardship, ComplianceFor the Fiscal Year Ended December 31, 2005 and Accountability
C. Deficit Balances
Generally accepted accounting principles require disclosure of individual funds that have deficit fund or net assets balances at year end.
The following funds had deficit unreserved fund balances or net assets at December 31, 2005:
Unreserved Fund Balance/
Net AssetsTotal Fund
Equity
Special Revenue Funds:Forestry Special (376,102)$ (262,090)$ Municipal Athletic Programming (24,453) (24,303)
Capital Projects Fund:Capital Improvement Projects (21,189,456) (5,122,533)
Enterprise Funds:Special Services (1,544,899) (3,175,011) Watergate Marina (323,837) (249,053)
Internal Service Fund:Information Systems (267,860) (267,860)
The Forestry Special Fund provides services to maintain trees and other vegetation growing both on public and private property. Services provided on private property are financed through assessments levied for the cost of the services. The assessments covering the costs for the work done in 2005 were not ratified until early in 2006; therefore, the revenue was not recognized. The timely ratification of these assessments will improve the fund balance in the future.
The Municipal Athletic Programming Fund has not been generating enough user fees to cover all the operating expenses over the last few years. These losses were caused by the continuing decline of participants in the adult sports programs. New efforts taken during 2003 to find new sources of revenues have lowered the deficit in each of the last three years.
The deficit fund balance reported in the Capital Improvement Projects Fund is the result of deferring revenue from the grants relating to the construction projects. The revenue is recognized when it becomes available once the projects are completed and have been inspected.
Special Services Fund is reporting the debt previously reported in the Rice and Arlington Sports Dome Fund but not the associated capital asset in the amount of $2,394,580, which is part of the general capital assets. This fund is not financially stable, and the City will continue to promote its golf courses. With the opening of the new Highland National Golf Course it is anticipated golf sales will increase in future years. This will allow the fund to continue to make the debt payment on the Recreational Facilities bonds.
The City contracted with an outside business manager to manage and operate the Watergate Marina. This was done in part to ensure that the Marina operated at no net cost or financial risk to the City. The proceeds from this agreement are being used to improve the fund equity position.
76
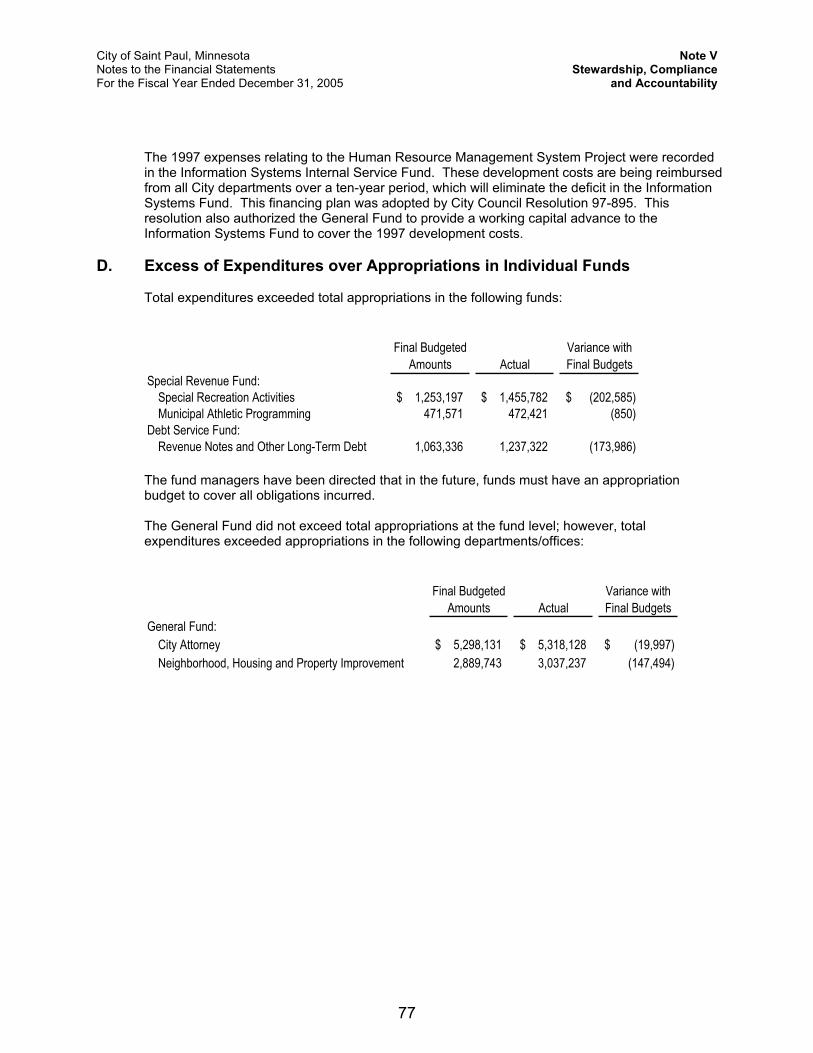
City of Saint Paul, Minnesota Note V Notes to the Financial Statements Stewardship, ComplianceFor the Fiscal Year Ended December 31, 2005 and Accountability
The 1997 expenses relating to the Human Resource Management System Project were recorded in the Information Systems Internal Service Fund. These development costs are being reimbursed from all City departments over a ten-year period, which will eliminate the deficit in the Information Systems Fund. This financing plan was adopted by City Council Resolution 97-895. This resolution also authorized the General Fund to provide a working capital advance to the Information Systems Fund to cover the 1997 development costs.
D. Excess of Expenditures over Appropriations in Individual Funds
Total expenditures exceeded total appropriations in the following funds:
Final BudgetedAmounts Actual
Variance with Final Budgets
Special Revenue Fund:Special Recreation Activities 1,253,197$ 1,455,782$ (202,585)$ Municipal Athletic Programming 471,571 472,421 (850)
Debt Service Fund:Revenue Notes and Other Long-Term Debt 1,063,336 1,237,322 (173,986)
The fund managers have been directed that in the future, funds must have an appropriation budget to cover all obligations incurred.
The General Fund did not exceed total appropriations at the fund level; however, total expenditures exceeded appropriations in the following departments/offices:
Final BudgetedAmounts Actual
Variance with Final Budgets
General Fund:City Attorney 5,298,131$ 5,318,128$ (19,997)$Neighborhood, Housing and Property Improvement 2,889,743 3,037,237 (147,494)
77
City of Saint Paul, Minnesota Note VI Notes to the Financial Statements Detailed NotesFor the Fiscal Year Ended December 31, 2005 on All Funds
Note VI. Detailed Notes on All Funds
A. Deposits, Investments and Securities Lending
Deposits
In accordance with Minn. Stat. §118A.02 and 118A.04, the City maintains deposits at financial institutions authorized by the City Council.
Minn. Stat. §118A.03 further requires that all City deposits be protected by insurance, surety bond, collateral or an irrevocable letter of credit issued by Federal Home Loan Banks. The market value of collateral pledged must equal 110% of the deposits not covered by insurance or bonds.
Authorized collateral includes treasury bills, notes and bonds; issues of U.S. government agencies; general obligations rated “A” or better, revenue obligations rated “AA” or better; irrevocable standard letters of credit issued by the Federal Home Loan Bank; and certificates of deposit. Minnesota Statutes require that securities pledged as collateral be held in safekeeping in a restricted account at the Federal Reserve Bank or in an account at a trust department of a commercial bank or other financial institution that is not owned or controlled by the financial institution furnishing the collateral.
Custodial Credit Risk
Custodial credit risk is the risk that, in the event of a financial institution failure, the City’s deposits may not be returned to it. The City’s policy for custodial credit risk for deposits is to maintain compliance with Minnesota Statutes that require the City’s deposits be protected by insurance, surety bond or pledged collateral.
As of December 31, 2005, the City’s bank balance of checking and interest-bearing accounts and certificates of deposit totaled $28,566,819. Of this amount, $13,086 was uninsured and uncollateralized. The carrying amount of these balances was $16,111,800.
Imprest Funds on Hand
At December 31, 2005, the total imprest funds were $107,415. Of this amount, the City had $74,375 on hand. The remaining $33,040 were in various bank accounts and are included with the collateralized deposits.
Investments
General
The City’s Investment Policy Statement governs the investment portfolio of the City of Saint Paul. The goals of the City for the Portfolio are to preserve financial assets for future operating expenses, maintain reserves to fund unplanned shortfalls and generate income to support the activities of the City. The portfolio is managed in three components as follows:
1. Daily Portfolio: The daily component represents current operating funds on which draws are made frequently, requiring daily liquidity and preservation of principal. The time horizon on the Daily Portfolio is within a 12-month period.
78
City of Saint Paul, Minnesota Note VI Notes to the Financial Statements Detailed NotesFor the Fiscal Year Ended December 31, 2005 on All Funds
2. Short Term Portfolio: A short-term component serves as a cushion to provide liquidity for possible shortfalls in the Daily Portfolio. Draws against the short-term portfolio are expected to be infrequent. The time horizon on the Short Term Portfolio is between one and three years.
3. Intermediate Term Portfolio: The balance of the Portfolio represents the intermediate term component, which serves as a reserve for unplanned shortfalls. In general, the Intermediate Term Portfolio is not expected to experience withdrawals and the time horizon on the Intermediate Portfolio is longer than three years. A portion of the Intermediate Term Portfolio is managed internally and the balance is managed by external managers.
Minnesota Statutes §§ 118A.04 and 118A.05 authorize the following types of investments for local governments:
a. securities, which are direct obligations or are guaranteed or insured issues of the United States, its agencies, its instrumentalities, or organizations created by an act of Congress, except mortgage-backed securities defined as “high risk” by Minnesota Statutes Section 118A.04, subd. 6;
b. in shares of an investment company registered under the Federal Investment Company Act of 1940, provided the mutual fund receives certain ratings depending on its investments.
c. general obligations of the State of Minnesota and its municipalities and in any security which is a general obligation of any state or local government with taxing powers which is rated “A” or better by a national bond rating service.
d. in bankers acceptances of United States Banks, or in commercial paper issued by United States corporations or their Canadian subsidiaries that is rated in the highest quality category by two nationally recognized rating agencies and matures in 270 days or less.
e. Repurchase agreements may be entered into with:
1. a bank qualified as a depository;
2. any national or state bank in the United States which is a member of the Federal Reserve System and whose combined capital and surplus equals or exceeds $10,000,000;
3. primary reporting dealer in United States government securities to the Federal Reserve Bank of New York; or
4. a securities broker-dealer, licensed pursuant to Chapter 80A, or an affiliate of it, regulated by the Securities and Exchange Commission and maintaining a combined capital and surplus of $40,000,000 or more, exclusive of subordinated debt.
f. Securities lending agreements, and Guaranteed investment contracts
Credit Risk
Generally, credit risk is the risk that an issuer of an investment will not fulfill its obligation to the holder of the investment. This is measured by the assignment of a rating by a nationally recognized statistical rating organization. It is the City’s policy to invest only in securities that meet the ratings requirements set by state statute.
79
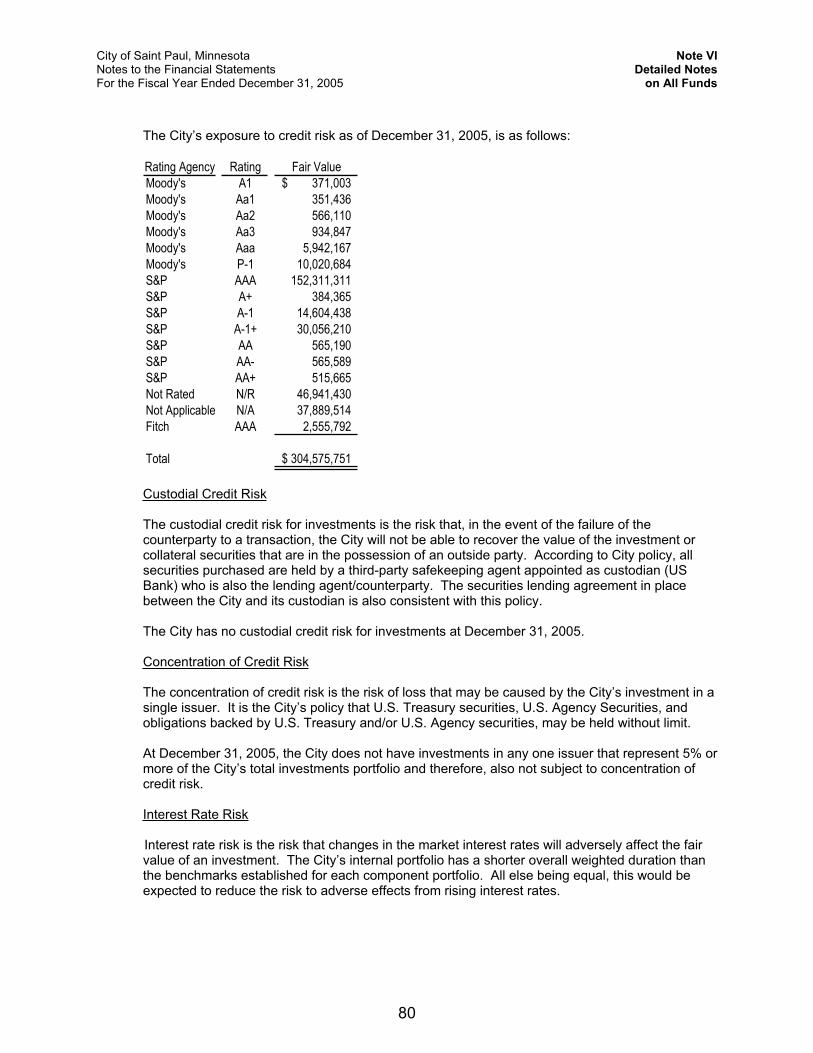
City of Saint Paul, Minnesota Note VI Notes to the Financial Statements Detailed NotesFor the Fiscal Year Ended December 31, 2005 on All Funds
The City’s exposure to credit risk as of December 31, 2005, is as follows:
Rating Agency Rating Fair ValueMoody's A1 371,003$ Moody's Aa1 351,436 Moody's Aa2 566,110 Moody's Aa3 934,847 Moody's Aaa 5,942,167Moody's P-1 10,020,684S&P AAA 152,311,311S&P A+ 384,365 S&P A-1 14,604,438S&P A-1+ 30,056,210S&P AA 565,190 S&P AA- 565,589 S&P AA+ 515,665 Not Rated N/R 46,941,430Not Applicable N/A 37,889,514Fitch AAA 2,555,792
Total 304,575,751$
Custodial Credit Risk
The custodial credit risk for investments is the risk that, in the event of the failure of the counterparty to a transaction, the City will not be able to recover the value of the investment or collateral securities that are in the possession of an outside party. According to City policy, all securities purchased are held by a third-party safekeeping agent appointed as custodian (US Bank) who is also the lending agent/counterparty. The securities lending agreement in place between the City and its custodian is also consistent with this policy.
The City has no custodial credit risk for investments at December 31, 2005.
Concentration of Credit Risk
The concentration of credit risk is the risk of loss that may be caused by the City’s investment in a single issuer. It is the City’s policy that U.S. Treasury securities, U.S. Agency Securities, and obligations backed by U.S. Treasury and/or U.S. Agency securities, may be held without limit.
At December 31, 2005, the City does not have investments in any one issuer that represent 5% or more of the City’s total investments portfolio and therefore, also not subject to concentration of credit risk.
Interest Rate Risk
Interest rate risk is the risk that changes in the market interest rates will adversely affect the fair value of an investment. The City’s internal portfolio has a shorter overall weighted duration than the benchmarks established for each component portfolio. All else being equal, this would be expected to reduce the risk to adverse effects from rising interest rates.
80
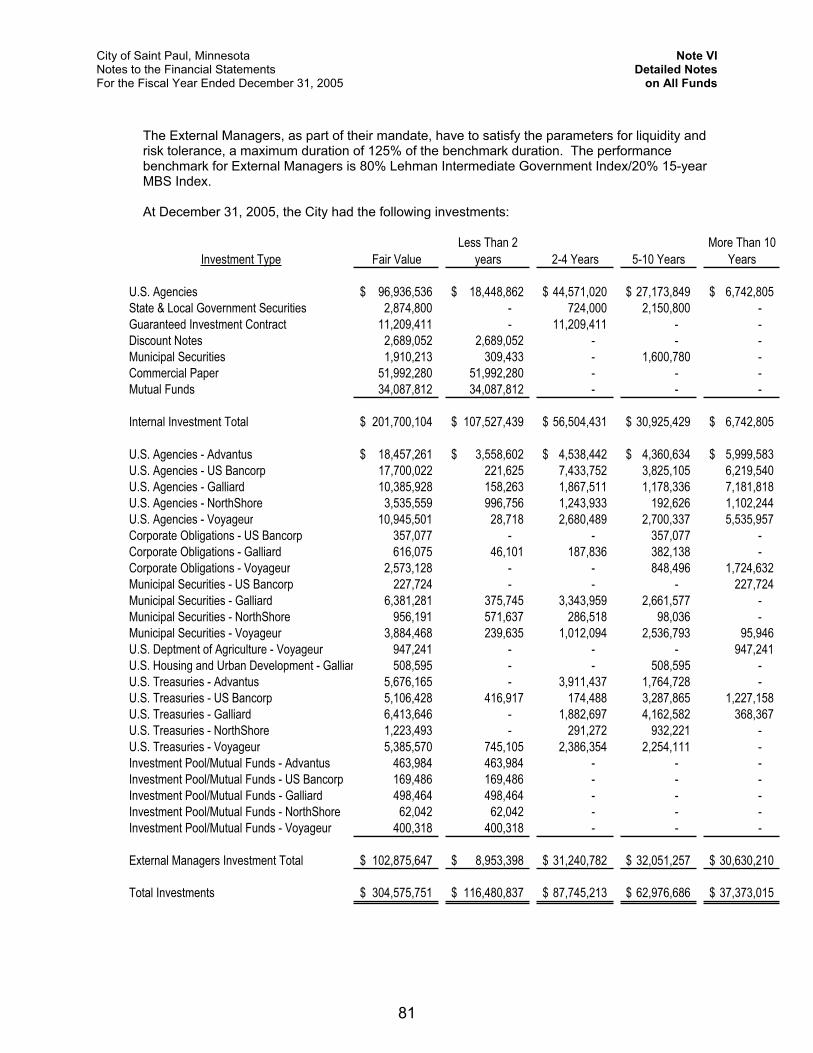
City of Saint Paul, Minnesota Note VI Notes to the Financial Statements Detailed NotesFor the Fiscal Year Ended December 31, 2005 on All Funds
The External Managers, as part of their mandate, have to satisfy the parameters for liquidity and risk tolerance, a maximum duration of 125% of the benchmark duration. The performance benchmark for External Managers is 80% Lehman Intermediate Government Index/20% 15-year MBS Index.
At December 31, 2005, the City had the following investments:
Investment Type Fair ValueLess Than 2
years 2-4 Years 5-10 YearsMore Than 10
Years
U.S. Agencies 96,936,536$ 18,448,862$ 44,571,020$ 27,173,849$ 6,742,805$State & Local Government Securities 2,874,800 - 724,000 2,150,800 - Guaranteed Investment Contract 11,209,411 - 11,209,411 - - Discount Notes 2,689,052 2,689,052 - - - Municipal Securities 1,910,213 309,433 - 1,600,780 - Commercial Paper 51,992,280 51,992,280 - - - Mutual Funds 34,087,812 34,087,812 - - -
Internal Investment Total 201,700,104$ 107,527,439$ 56,504,431$ 30,925,429$ 6,742,805$
U.S. Agencies - Advantus 18,457,261$ 3,558,602$ 4,538,442$ 4,360,634$ 5,999,583$U.S. Agencies - US Bancorp 17,700,022 221,625 7,433,752 3,825,105 6,219,540U.S. Agencies - Galliard 10,385,928 158,263 1,867,511 1,178,336 7,181,818U.S. Agencies - NorthShore 3,535,559 996,756 1,243,933 192,626 1,102,244U.S. Agencies - Voyageur 10,945,501 28,718 2,680,489 2,700,337 5,535,957Corporate Obligations - US Bancorp 357,077 - - 357,077 - Corporate Obligations - Galliard 616,075 46,101 187,836 382,138 - Corporate Obligations - Voyageur 2,573,128 - - 848,496 1,724,632Municipal Securities - US Bancorp 227,724 - - - 227,724Municipal Securities - Galliard 6,381,281 375,745 3,343,959 2,661,577 - Municipal Securities - NorthShore 956,191 571,637 286,518 98,036 - Municipal Securities - Voyageur 3,884,468 239,635 1,012,094 2,536,793 95,946U.S. Deptment of Agriculture - Voyageur 947,241 - - - 947,241U.S. Housing and Urban Development - Galliar 508,595 - - 508,595 - U.S. Treasuries - Advantus 5,676,165 - 3,911,437 1,764,728 - U.S. Treasuries - US Bancorp 5,106,428 416,917 174,488 3,287,865 1,227,158U.S. Treasuries - Galliard 6,413,646 - 1,882,697 4,162,582 368,367U.S. Treasuries - NorthShore 1,223,493 - 291,272 932,221 - U.S. Treasuries - Voyageur 5,385,570 745,105 2,386,354 2,254,111 - Investment Pool/Mutual Funds - Advantus 463,984 463,984 - - - Investment Pool/Mutual Funds - US Bancorp 169,486 169,486 - - - Investment Pool/Mutual Funds - Galliard 498,464 498,464 - - - Investment Pool/Mutual Funds - NorthShore 62,042 62,042 - - - Investment Pool/Mutual Funds - Voyageur 400,318 400,318 - - -
External Managers Investment Total 102,875,647$ 8,953,398$ 31,240,782$ 32,051,257$ 30,630,210$
Total Investments 304,575,751$ 116,480,837$ 87,745,213$ 62,976,686$ 37,373,015$
81
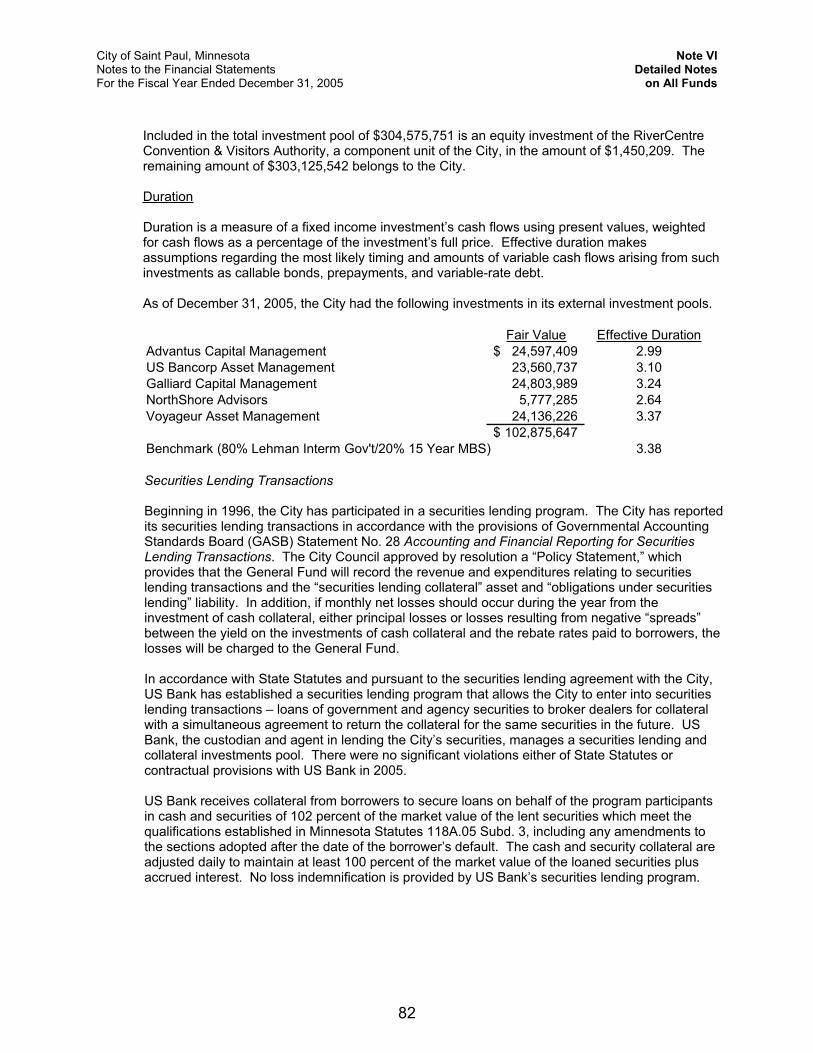
City of Saint Paul, Minnesota Note VI Notes to the Financial Statements Detailed NotesFor the Fiscal Year Ended December 31, 2005 on All Funds
Included in the total investment pool of $304,575,751 is an equity investment of the RiverCentre Convention & Visitors Authority, a component unit of the City, in the amount of $1,450,209. The remaining amount of $303,125,542 belongs to the City.
Duration
Duration is a measure of a fixed income investment’s cash flows using present values, weighted for cash flows as a percentage of the investment’s full price. Effective duration makes assumptions regarding the most likely timing and amounts of variable cash flows arising from such investments as callable bonds, prepayments, and variable-rate debt.
As of December 31, 2005, the City had the following investments in its external investment pools.
Fair Value Effective DurationAdvantus Capital Management 24,597,409$ 2.99US Bancorp Asset Management 23,560,737 3.10Galliard Capital Management 24,803,989 3.24NorthShore Advisors 5,777,285 2.64Voyageur Asset Management 24,136,226 3.37
102,875,647$Benchmark (80% Lehman Interm Gov't/20% 15 Year MBS) 3.38
Securities Lending Transactions
Beginning in 1996, the City has participated in a securities lending program. The City has reported its securities lending transactions in accordance with the provisions of Governmental Accounting Standards Board (GASB) Statement No. 28 Accounting and Financial Reporting for Securities Lending Transactions. The City Council approved by resolution a “Policy Statement,” which provides that the General Fund will record the revenue and expenditures relating to securities lending transactions and the “securities lending collateral” asset and “obligations under securities lending” liability. In addition, if monthly net losses should occur during the year from the investment of cash collateral, either principal losses or losses resulting from negative “spreads” between the yield on the investments of cash collateral and the rebate rates paid to borrowers, the losses will be charged to the General Fund.
In accordance with State Statutes and pursuant to the securities lending agreement with the City, US Bank has established a securities lending program that allows the City to enter into securities lending transactions – loans of government and agency securities to broker dealers for collateral with a simultaneous agreement to return the collateral for the same securities in the future. US Bank, the custodian and agent in lending the City’s securities, manages a securities lending and collateral investments pool. There were no significant violations either of State Statutes or contractual provisions with US Bank in 2005.
US Bank receives collateral from borrowers to secure loans on behalf of the program participants in cash and securities of 102 percent of the market value of the lent securities which meet the qualifications established in Minnesota Statutes 118A.05 Subd. 3, including any amendments to the sections adopted after the date of the borrower’s default. The cash and security collateral are adjusted daily to maintain at least 100 percent of the market value of the loaned securities plus accrued interest. No loss indemnification is provided by US Bank’s securities lending program.
82
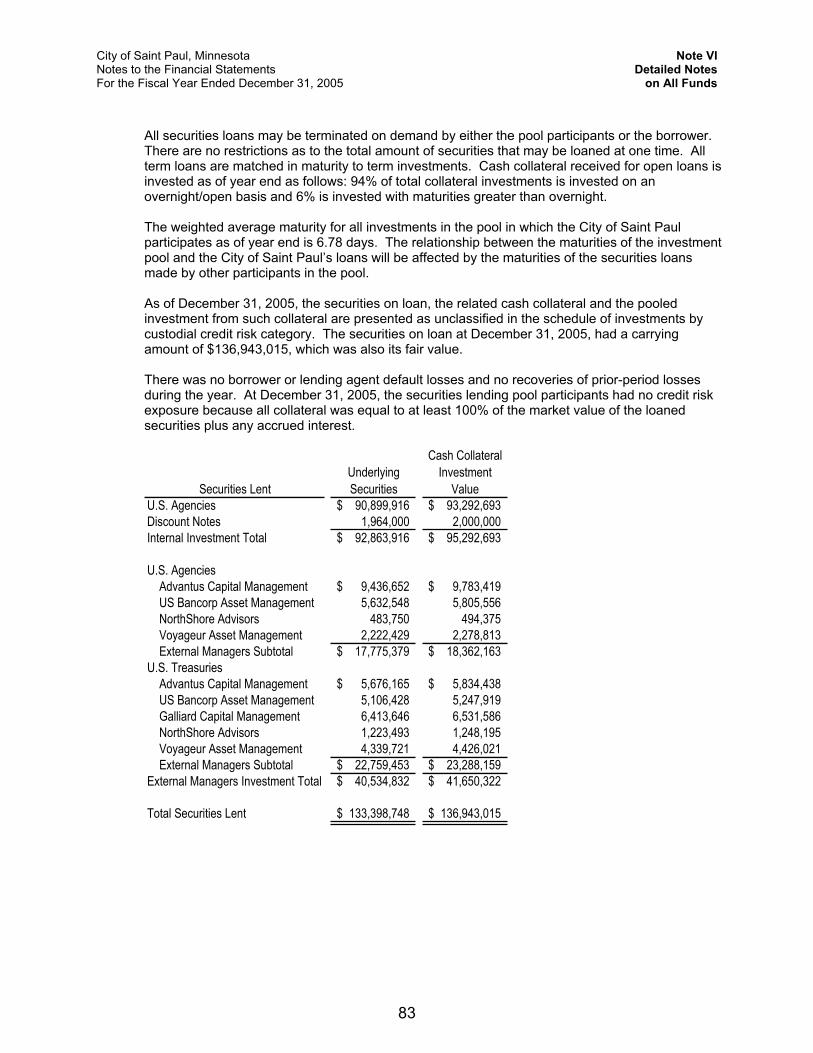
City of Saint Paul, Minnesota Note VI Notes to the Financial Statements Detailed NotesFor the Fiscal Year Ended December 31, 2005 on All Funds
All securities loans may be terminated on demand by either the pool participants or the borrower. There are no restrictions as to the total amount of securities that may be loaned at one time. All term loans are matched in maturity to term investments. Cash collateral received for open loans is invested as of year end as follows: 94% of total collateral investments is invested on an overnight/open basis and 6% is invested with maturities greater than overnight.
The weighted average maturity for all investments in the pool in which the City of Saint Paul participates as of year end is 6.78 days. The relationship between the maturities of the investment pool and the City of Saint Paul’s loans will be affected by the maturities of the securities loans made by other participants in the pool.
As of December 31, 2005, the securities on loan, the related cash collateral and the pooled investment from such collateral are presented as unclassified in the schedule of investments by custodial credit risk category. The securities on loan at December 31, 2005, had a carrying amount of $136,943,015, which was also its fair value.
There was no borrower or lending agent default losses and no recoveries of prior-period losses during the year. At December 31, 2005, the securities lending pool participants had no credit risk exposure because all collateral was equal to at least 100% of the market value of the loaned securities plus any accrued interest.
Securities LentUnderlyingSecurities
Cash Collateral Investment
ValueU.S. Agencies 90,899,916$ 93,292,693$Discount Notes 1,964,000 2,000,000Internal Investment Total 92,863,916$ 95,292,693$
U.S. Agencies Advantus Capital Management 9,436,652$ 9,783,419$ US Bancorp Asset Management 5,632,548 5,805,556 NorthShore Advisors 483,750 494,375 Voyageur Asset Management 2,222,429 2,278,813 External Managers Subtotal 17,775,379$ 18,362,163$U.S. Treasuries Advantus Capital Management 5,676,165$ 5,834,438$ US Bancorp Asset Management 5,106,428 5,247,919 Galliard Capital Management 6,413,646 6,531,586 NorthShore Advisors 1,223,493 1,248,195 Voyageur Asset Management 4,339,721 4,426,021 External Managers Subtotal 22,759,453$ 23,288,159$External Managers Investment Total 40,534,832$ 41,650,322$
Total Securities Lent 133,398,748$ 136,943,015$
83
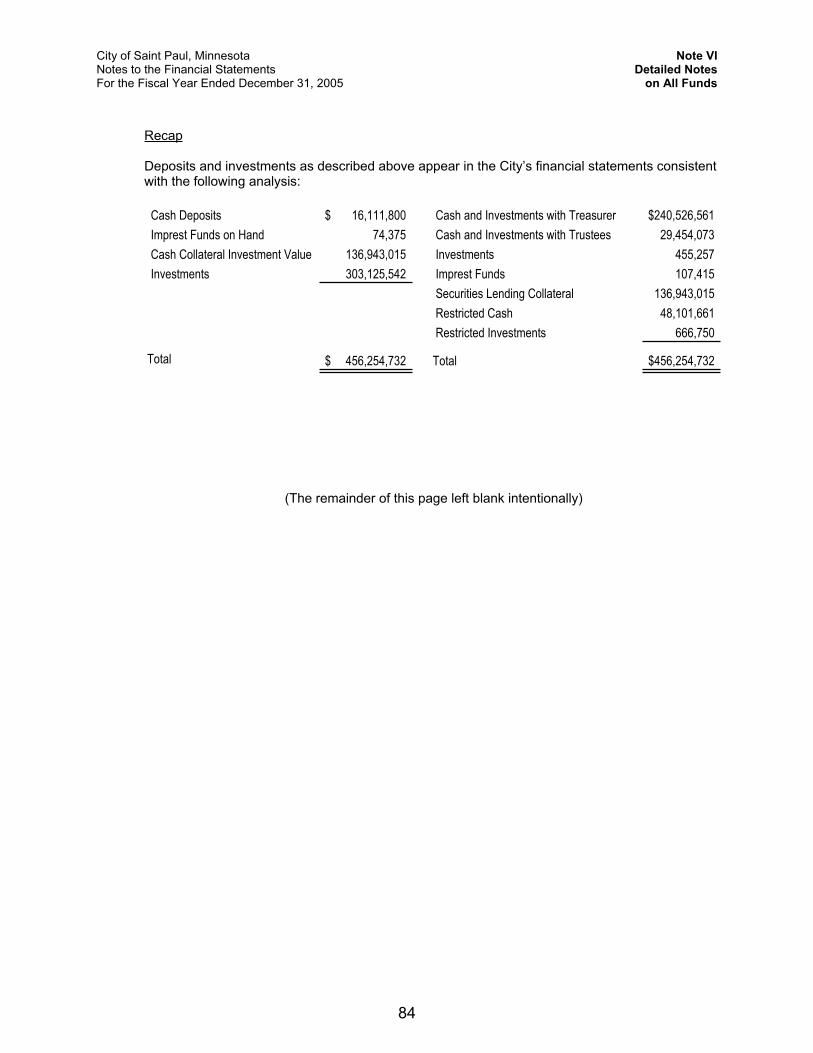
City of Saint Paul, Minnesota Note VI Notes to the Financial Statements Detailed NotesFor the Fiscal Year Ended December 31, 2005 on All Funds
Recap
Deposits and investments as described above appear in the City’s financial statements consistent with the following analysis:
Cash Deposits 16,111,800$ Cash and Investments with Treasurer 240,526,561$Imprest Funds on Hand 74,375 Cash and Investments with Trustees 29,454,073Cash Collateral Investment Value 136,943,015 Investments 455,257Investments 303,125,542 Imprest Funds 107,415
Securities Lending Collateral 136,943,015 Restricted Cash 48,101,661 Restricted Investments 666,750
Total 456,254,732$ Total 456,254,732$
(The remainder of this page left blank intentionally)
84
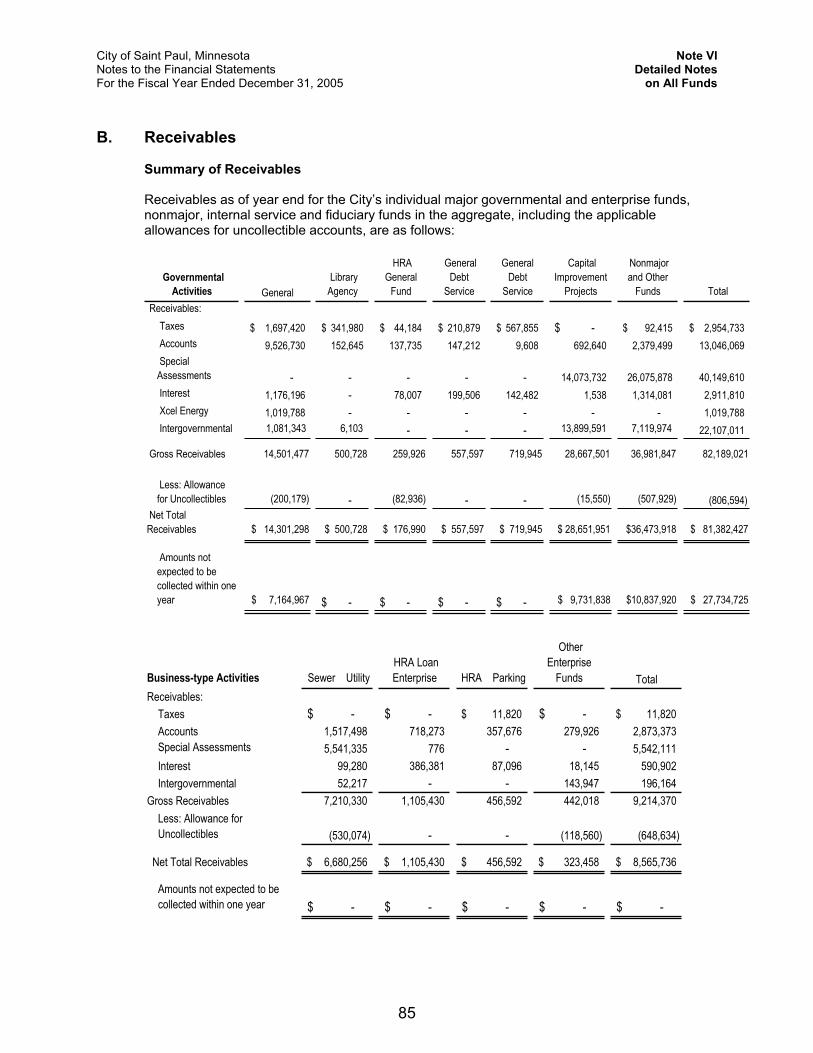
City of Saint Paul, Minnesota Note VI Notes to the Financial Statements Detailed NotesFor the Fiscal Year Ended December 31, 2005 on All Funds
B. Receivables
Summary of Receivables
Receivables as of year end for the City’s individual major governmental and enterprise funds, nonmajor, internal service and fiduciary funds in the aggregate, including the applicable allowances for uncollectible accounts, are as follows:
Governmental Activities General
Library Agency
HRA General
Fund
General Debt
Service
General Debt
Service
Capital Improvement
Projects
Nonmajor and Other
Funds Total Receivables:
Taxes 1,697,420$ 341,980$ 44,184$ 210,879$ 567,855$ -$ 92,415$ 2,954,733$ Accounts 9,526,730 152,645 137,735 147,212 9,608 692,640 2,379,499 13,046,069 Special Assessments - - - - - 14,073,732 26,075,878 40,149,610 Interest 1,176,196 - 78,007 199,506 142,482 1,538 1,314,081 2,911,810 Xcel Energy 1,019,788 - - - - - - 1,019,788 Intergovernmental 1,081,343 6,103 - - - 13,899,591 7,119,974 22,107,011
Gross Receivables 14,501,477 500,728 259,926 557,597 719,945 28,667,501 36,981,847 82,189,021
Less: Allowance for Uncollectibles (200,179) - (82,936) - - (15,550) (507,929) (806,594)
Net Total Receivables $ 14,301,298 $ 500,728 $ 176,990 $ 557,597 $ 719,945 $ 28,651,951 $36,473,918 $ 81,382,427
Amounts not expected to be collected within oneyear $ 7,164,967 -$ -$ -$ -$ $ 9,731,838 $10,837,920 $ 27,734,725
Business-type Activities Sewer Utility HRA Loan Enterprise HRA Parking
Other Enterprise
Funds TotalReceivables:
Taxes -$ -$ 11,820$ -$ 11,820$ Accounts 1,517,498 718,273 357,676 279,926 2,873,373 Special Assessments 5,541,335 776 - - 5,542,111 Interest 99,280 386,381 87,096 18,145 590,902 Intergovernmental 52,217 - - 143,947 196,164
Gross Receivables 7,210,330 1,105,430 456,592 442,018 9,214,370 Less: Allowance for Uncollectibles (530,074) - - (118,560) (648,634)
Net Total Receivables 6,680,256$ 1,105,430$ 456,592$ 323,458$ 8,565,736$
Amounts not expected to be collected within one year -$ -$ -$ -$ -$
85
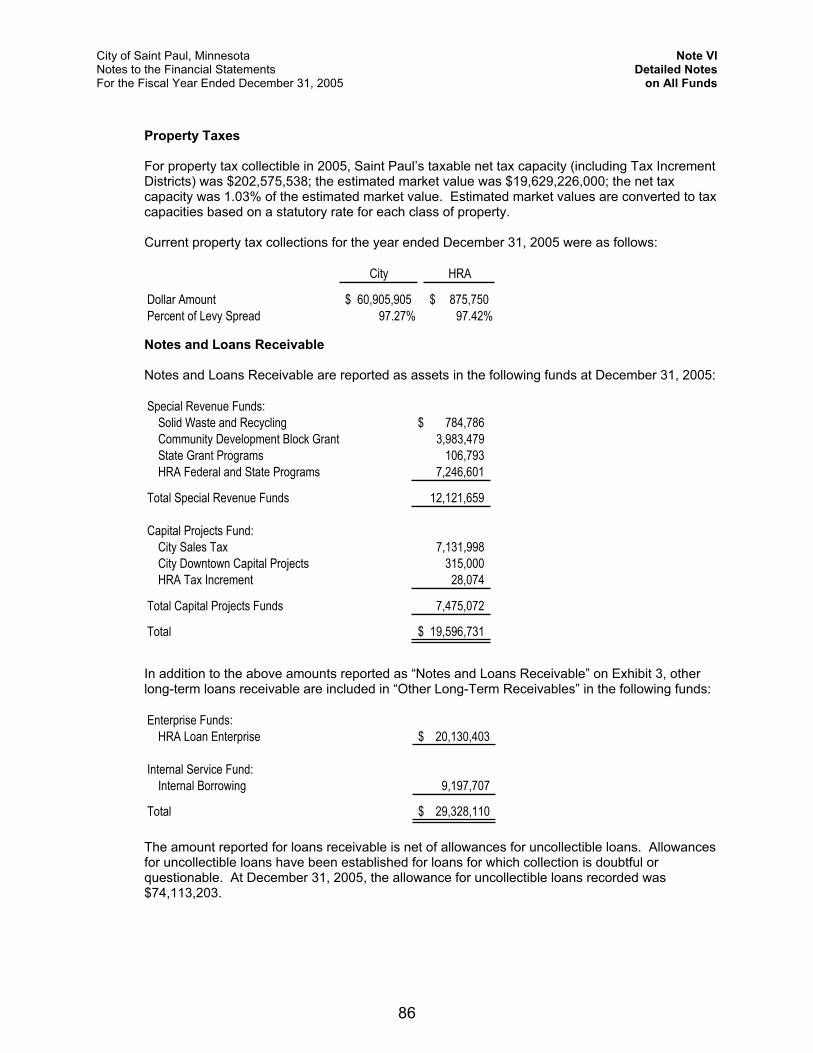
City of Saint Paul, Minnesota Note VI Notes to the Financial Statements Detailed NotesFor the Fiscal Year Ended December 31, 2005 on All Funds
Property Taxes
For property tax collectible in 2005, Saint Paul’s taxable net tax capacity (including Tax Increment Districts) was $202,575,538; the estimated market value was $19,629,226,000; the net tax capacity was 1.03% of the estimated market value. Estimated market values are converted to tax capacities based on a statutory rate for each class of property.
Current property tax collections for the year ended December 31, 2005 were as follows:
City HRA
Dollar Amount 60,905,905$ 875,750$ Percent of Levy Spread 97.27% 97.42%
Notes and Loans Receivable
Notes and Loans Receivable are reported as assets in the following funds at December 31, 2005:
Special Revenue Funds:Solid Waste and Recycling 784,786$ Community Development Block Grant 3,983,479State Grant Programs 106,793HRA Federal and State Programs 7,246,601
Total Special Revenue Funds 12,121,659
Capital Projects Fund:City Sales Tax 7,131,998City Downtown Capital Projects 315,000HRA Tax Increment 28,074
Total Capital Projects Funds 7,475,072
Total 19,596,731$
In addition to the above amounts reported as “Notes and Loans Receivable” on Exhibit 3, other long-term loans receivable are included in “Other Long-Term Receivables” in the following funds:
Enterprise Funds:HRA Loan Enterprise 20,130,403$
Internal Service Fund:Internal Borrowing 9,197,707
Total 29,328,110$
The amount reported for loans receivable is net of allowances for uncollectible loans. Allowances for uncollectible loans have been established for loans for which collection is doubtful or questionable. At December 31, 2005, the allowance for uncollectible loans recorded was $74,113,203.
86
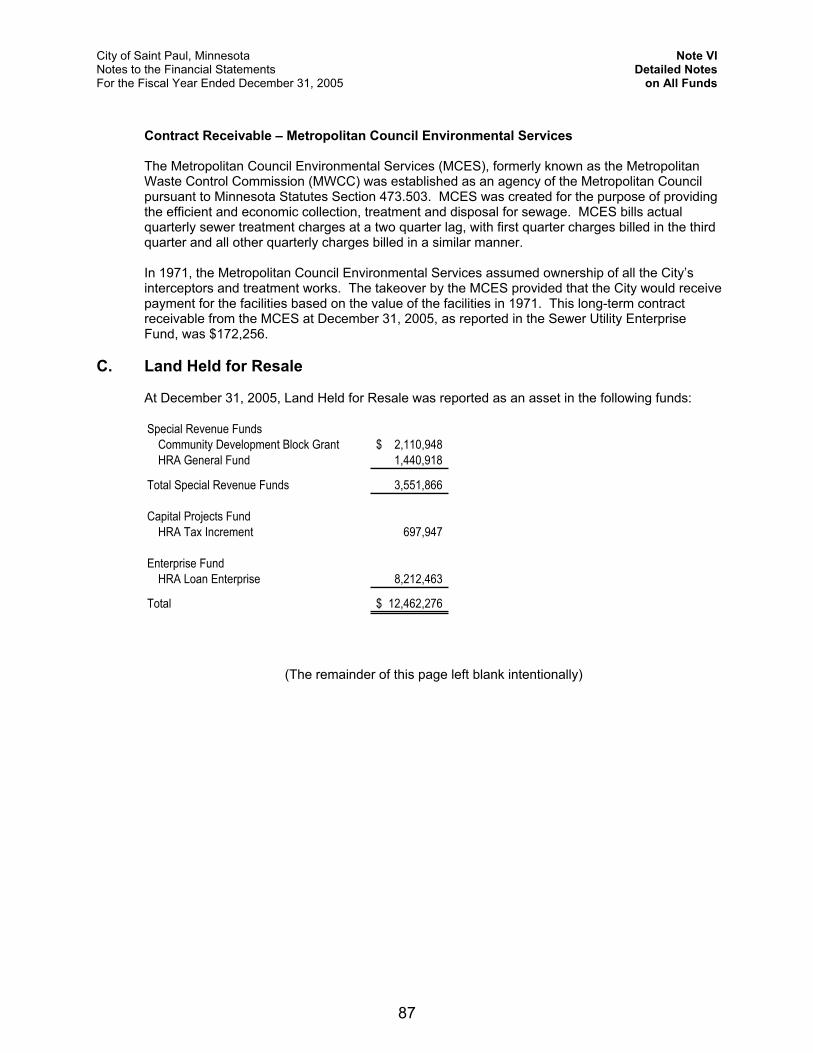
City of Saint Paul, Minnesota Note VI Notes to the Financial Statements Detailed NotesFor the Fiscal Year Ended December 31, 2005 on All Funds
Contract Receivable – Metropolitan Council Environmental Services
The Metropolitan Council Environmental Services (MCES), formerly known as the Metropolitan Waste Control Commission (MWCC) was established as an agency of the Metropolitan Council pursuant to Minnesota Statutes Section 473.503. MCES was created for the purpose of providing the efficient and economic collection, treatment and disposal for sewage. MCES bills actual quarterly sewer treatment charges at a two quarter lag, with first quarter charges billed in the third quarter and all other quarterly charges billed in a similar manner.
In 1971, the Metropolitan Council Environmental Services assumed ownership of all the City’s interceptors and treatment works. The takeover by the MCES provided that the City would receive payment for the facilities based on the value of the facilities in 1971. This long-term contract receivable from the MCES at December 31, 2005, as reported in the Sewer Utility Enterprise Fund, was $172,256.
C. Land Held for Resale
At December 31, 2005, Land Held for Resale was reported as an asset in the following funds:
Special Revenue FundsCommunity Development Block Grant 2,110,948$HRA General Fund 1,440,918
Total Special Revenue Funds 3,551,866
Capital Projects FundHRA Tax Increment 697,947
Enterprise FundHRA Loan Enterprise 8,212,463
Total 12,462,276$
(The remainder of this page left blank intentionally)
87
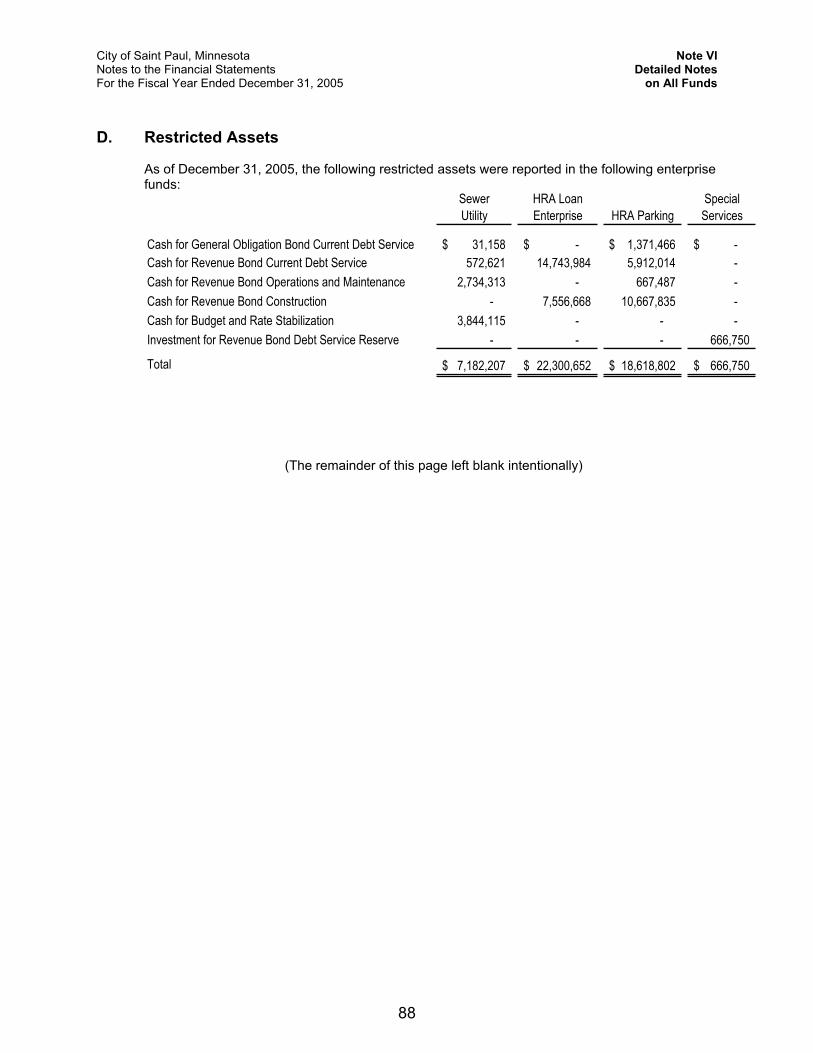
City of Saint Paul, Minnesota Note VI Notes to the Financial Statements Detailed NotesFor the Fiscal Year Ended December 31, 2005 on All Funds
D. Restricted Assets
As of December 31, 2005, the following restricted assets were reported in the following enterprise funds:
Sewer Utility
HRA Loan Enterprise HRA Parking
SpecialServices
Cash for General Obligation Bond Current Debt Service 31,158$ -$ 1,371,466$ -$Cash for Revenue Bond Current Debt Service 572,621 14,743,984 5,912,014 - Cash for Revenue Bond Operations and Maintenance 2,734,313 - 667,487 - Cash for Revenue Bond Construction - 7,556,668 10,667,835 - Cash for Budget and Rate Stabilization 3,844,115 - - - Investment for Revenue Bond Debt Service Reserve - - - 666,750
Total 7,182,207$ 22,300,652$ 18,618,802$ 666,750$
(The remainder of this page left blank intentionally)
88
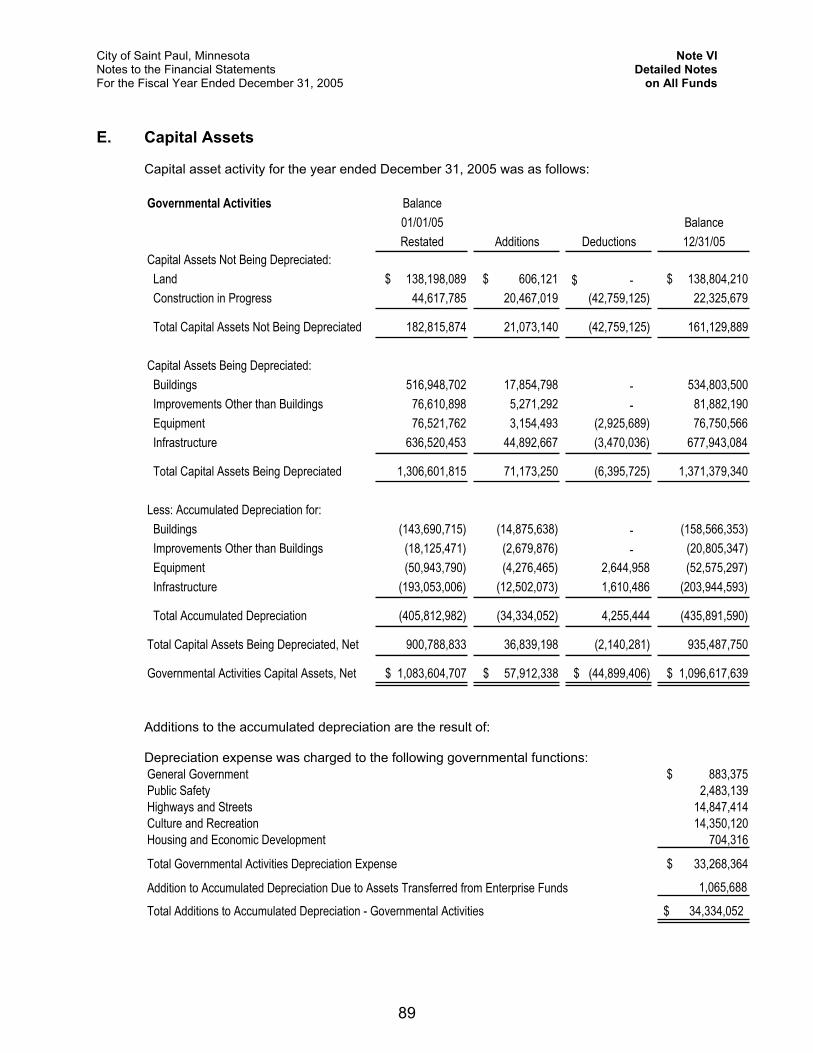
City of Saint Paul, Minnesota Note VI Notes to the Financial Statements Detailed NotesFor the Fiscal Year Ended December 31, 2005 on All Funds
E. Capital Assets
Capital asset activity for the year ended December 31, 2005 was as follows:
Governmental Activities Balance01/01/05 BalanceRestated Additions Deductions 12/31/05
Capital Assets Not Being Depreciated: Land $ 138,198,089 $ 606,121 -$ $ 138,804,210 Construction in Progress 44,617,785 20,467,019 (42,759,125) 22,325,679
Total Capital Assets Not Being Depreciated 182,815,874 21,073,140 (42,759,125) 161,129,889
Capital Assets Being Depreciated: Buildings 516,948,702 17,854,798 - 534,803,500 Improvements Other than Buildings 76,610,898 5,271,292 - 81,882,190 Equipment 76,521,762 3,154,493 (2,925,689) 76,750,566 Infrastructure 636,520,453 44,892,667 (3,470,036) 677,943,084
Total Capital Assets Being Depreciated 1,306,601,815 71,173,250 (6,395,725) 1,371,379,340
Less: Accumulated Depreciation for: Buildings (143,690,715) (14,875,638) - (158,566,353) Improvements Other than Buildings (18,125,471) (2,679,876) - (20,805,347) Equipment (50,943,790) (4,276,465) 2,644,958 (52,575,297) Infrastructure (193,053,006) (12,502,073) 1,610,486 (203,944,593)
Total Accumulated Depreciation (405,812,982) (34,334,052) 4,255,444 (435,891,590)
Total Capital Assets Being Depreciated, Net 900,788,833 36,839,198 (2,140,281) 935,487,750
Governmental Activities Capital Assets, Net $ 1,083,604,707 $ 57,912,338 $ (44,899,406) $ 1,096,617,639
Additions to the accumulated depreciation are the result of:
Depreciation expense was charged to the following governmental functions: General Government $ 883,375 Public Safety 2,483,139 Highways and Streets 14,847,414 Culture and Recreation 14,350,120 Housing and Economic Development 704,316
Total Governmental Activities Depreciation Expense $ 33,268,364
1,065,688
34,334,052$
Addition to Accumulated Depreciation Due to Assets Transferred from Enterprise Funds
Total Additions to Accumulated Depreciation - Governmental Activities
89
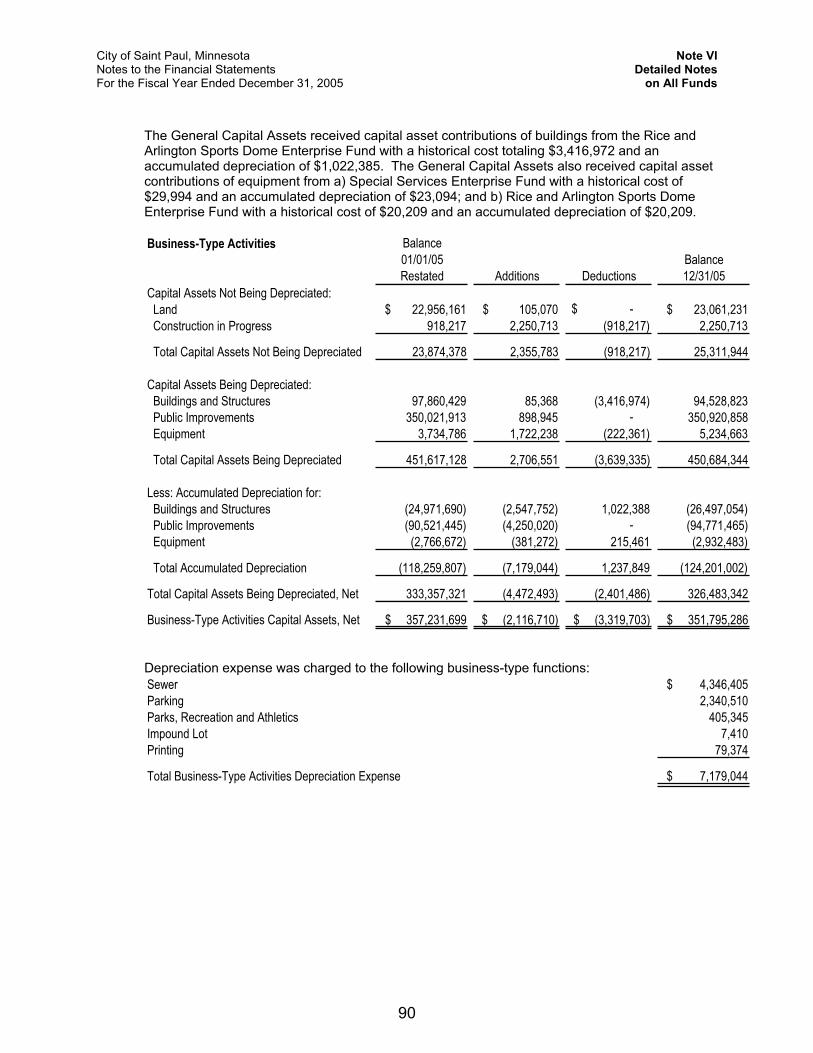
City of Saint Paul, Minnesota Note VI Notes to the Financial Statements Detailed NotesFor the Fiscal Year Ended December 31, 2005 on All Funds
The General Capital Assets received capital asset contributions of buildings from the Rice and Arlington Sports Dome Enterprise Fund with a historical cost totaling $3,416,972 and an accumulated depreciation of $1,022,385. The General Capital Assets also received capital asset contributions of equipment from a) Special Services Enterprise Fund with a historical cost of $29,994 and an accumulated depreciation of $23,094; and b) Rice and Arlington Sports Dome Enterprise Fund with a historical cost of $20,209 and an accumulated depreciation of $20,209.
Business-Type Activities Balance01/01/05 BalanceRestated Additions Deductions 12/31/05
Capital Assets Not Being Depreciated: Land $ 22,956,161 $ 105,070 -$ $ 23,061,231 Construction in Progress 918,217 2,250,713 (918,217) 2,250,713
Total Capital Assets Not Being Depreciated 23,874,378 2,355,783 (918,217) 25,311,944
Capital Assets Being Depreciated: Buildings and Structures 97,860,429 85,368 (3,416,974) 94,528,823 Public Improvements 350,021,913 898,945 - 350,920,858 Equipment 3,734,786 1,722,238 (222,361) 5,234,663
Total Capital Assets Being Depreciated 451,617,128 2,706,551 (3,639,335) 450,684,344
Less: Accumulated Depreciation for: Buildings and Structures (24,971,690) (2,547,752) 1,022,388 (26,497,054) Public Improvements (90,521,445) (4,250,020) - (94,771,465) Equipment (2,766,672) (381,272) 215,461 (2,932,483)
Total Accumulated Depreciation (118,259,807) (7,179,044) 1,237,849 (124,201,002)
Total Capital Assets Being Depreciated, Net 333,357,321 (4,472,493) (2,401,486) 326,483,342
Business-Type Activities Capital Assets, Net $ 357,231,699 $ (2,116,710) $ (3,319,703) $ 351,795,286
Depreciation expense was charged to the following business-type functions: Sewer $ 4,346,405 Parking 2,340,510 Parks, Recreation and Athletics 405,345 Impound Lot 7,410 Printing 79,374
Total Business-Type Activities Depreciation Expense $ 7,179,044
90
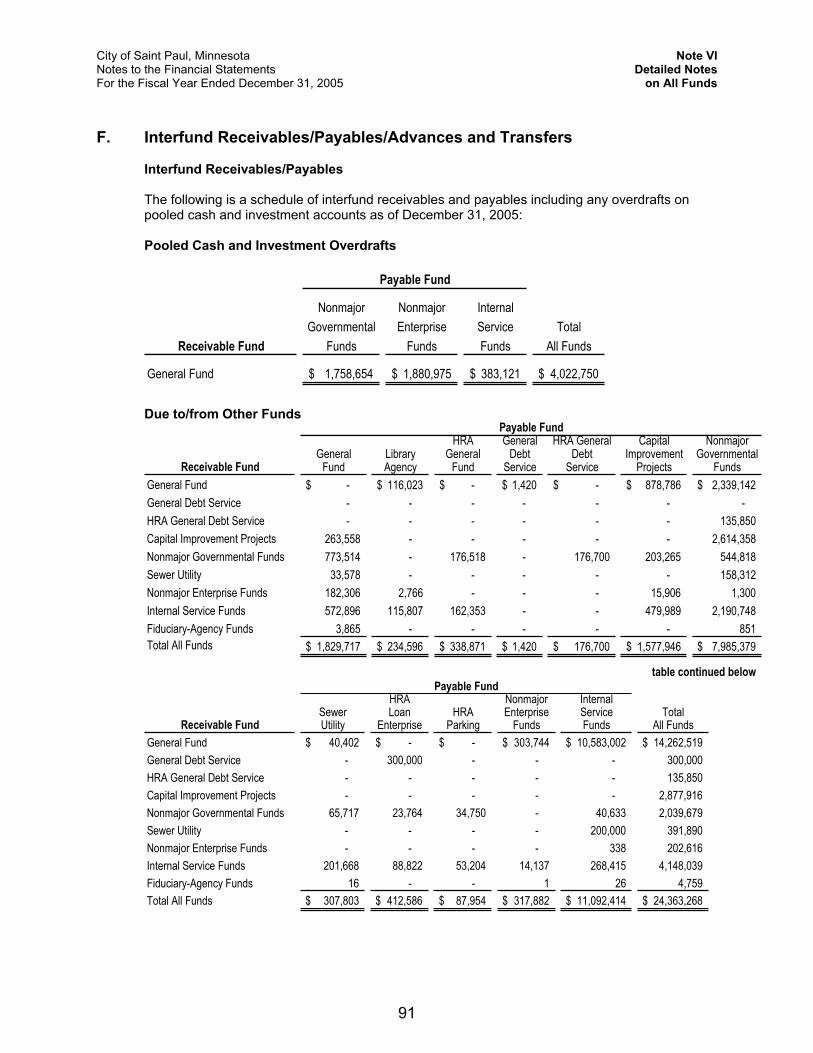
City of Saint Paul, Minnesota Note VI Notes to the Financial Statements Detailed NotesFor the Fiscal Year Ended December 31, 2005 on All Funds
F. Interfund Receivables/Payables/Advances and Transfers
Interfund Receivables/Payables
The following is a schedule of interfund receivables and payables including any overdrafts on pooled cash and investment accounts as of December 31, 2005:
Pooled Cash and Investment Overdrafts
Nonmajor Nonmajor InternalGovernmental Enterprise Service Total
Receivable Fund Funds Funds Funds All Funds
General Fund 1,758,654$ 1,880,975$ 383,121$ 4,022,750$
Payable Fund
Due to/from Other Funds
HRA General HRA General Capital NonmajorGeneral Library General Debt Debt Improvement Governmental
Receivable Fund Fund Agency Fund Service Service Projects FundsGeneral Fund -$ 116,023$ -$ 1,420$ -$ 878,786$ 2,339,142$ General Debt Service - - - - - - - HRA General Debt Service - - - - - - 135,850 Capital Improvement Projects 263,558 - - - - - 2,614,358 Nonmajor Governmental Funds 773,514 - 176,518 - 176,700 203,265 544,818 Sewer Utility 33,578 - - - - - 158,312 Nonmajor Enterprise Funds 182,306 2,766 - - - 15,906 1,300 Internal Service Funds 572,896 115,807 162,353 - - 479,989 2,190,748 Fiduciary-Agency Funds 3,865 - - - - - 851 Total All Funds 1,829,717$ 234,596$ 338,871$ 1,420$ 176,700$ 1,577,946$ 7,985,379$
table continued below
Payable Fund
HRA Nonmajor InternalSewer Loan HRA Enterprise Service Total
Receivable Fund Utility Enterprise Parking Funds Funds All FundsGeneral Fund 40,402$ -$ -$ 303,744$ 10,583,002$ 14,262,519$ General Debt Service - 300,000 - - - 300,000 HRA General Debt Service - - - - - 135,850 Capital Improvement Projects - - - - - 2,877,916 Nonmajor Governmental Funds 65,717 23,764 34,750 - 40,633 2,039,679 Sewer Utility - - - - 200,000 391,890 Nonmajor Enterprise Funds - - - - 338 202,616 Internal Service Funds 201,668 88,822 53,204 14,137 268,415 4,148,039 Fiduciary-Agency Funds 16 - - 1 26 4,759 Total All Funds 307,803$ 412,586$ 87,954$ 317,882$ 11,092,414$ 24,363,268$
Payable Fund
91
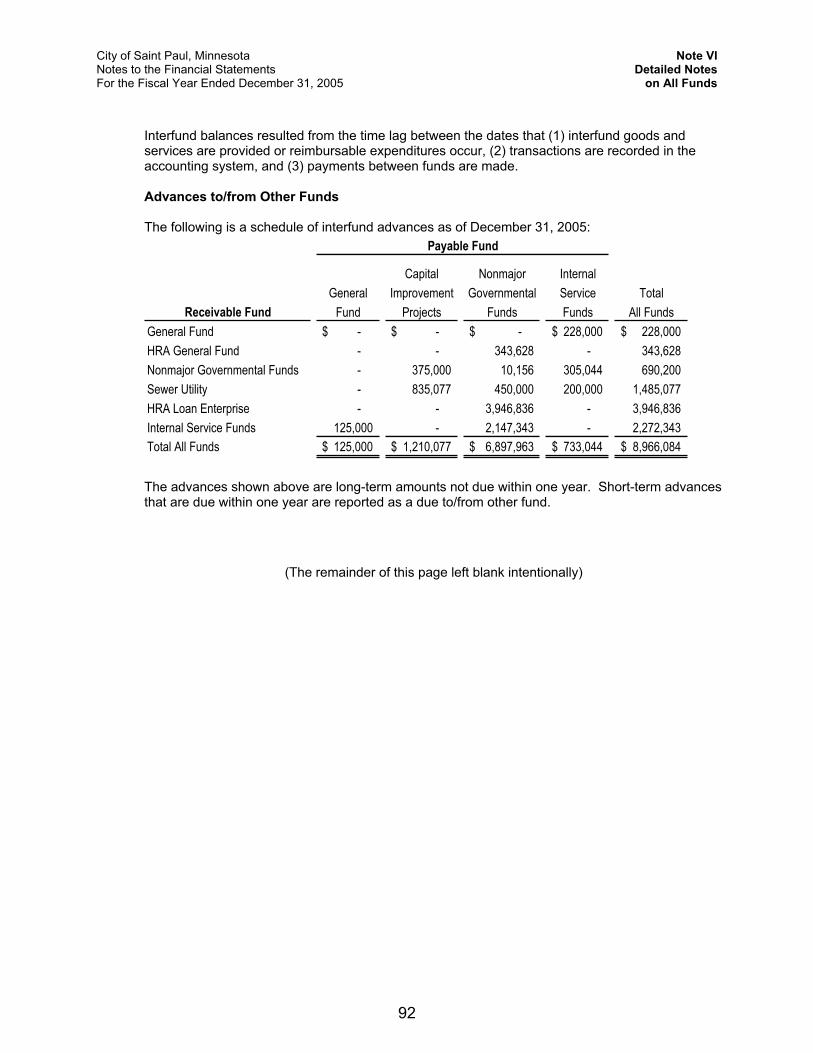
City of Saint Paul, Minnesota Note VI Notes to the Financial Statements Detailed NotesFor the Fiscal Year Ended December 31, 2005 on All Funds
Interfund balances resulted from the time lag between the dates that (1) interfund goods and services are provided or reimbursable expenditures occur, (2) transactions are recorded in the accounting system, and (3) payments between funds are made.
Advances to/from Other Funds
The following is a schedule of interfund advances as of December 31, 2005:
Capital Nonmajor InternalGeneral Improvement Governmental Service Total
Receivable Fund Fund Projects Funds Funds All FundsGeneral Fund -$ -$ -$ 228,000$ 228,000$HRA General Fund - - 343,628 - 343,628Nonmajor Governmental Funds - 375,000 10,156 305,044 690,200Sewer Utility - 835,077 450,000 200,000 1,485,077HRA Loan Enterprise - - 3,946,836 - 3,946,836Internal Service Funds 125,000 - 2,147,343 - 2,272,343Total All Funds 125,000$ 1,210,077$ 6,897,963$ 733,044$ 8,966,084$
Payable Fund
The advances shown above are long-term amounts not due within one year. Short-term advances that are due within one year are reported as a due to/from other fund.
(The remainder of this page left blank intentionally)
92
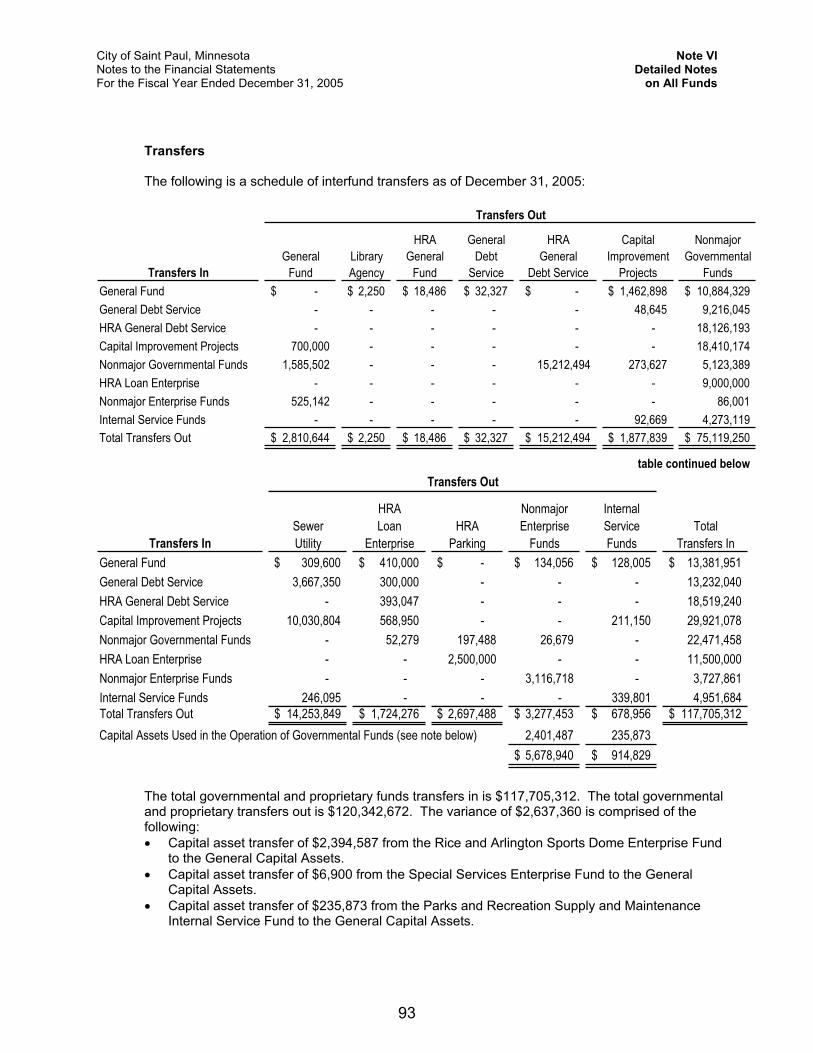
City of Saint Paul, Minnesota Note VI Notes to the Financial Statements Detailed NotesFor the Fiscal Year Ended December 31, 2005 on All Funds
Transfers
The following is a schedule of interfund transfers as of December 31, 2005:
HRA General HRA Capital NonmajorGeneral Library General Debt General Improvement Governmental
Transfers In Fund Agency Fund Service Debt Service Projects FundsGeneral Fund -$ 2,250$ 18,486$ 32,327$ -$ 1,462,898$ 10,884,329$General Debt Service - - - - - 48,645 9,216,045 HRA General Debt Service - - - - - - 18,126,193 Capital Improvement Projects 700,000 - - - - - 18,410,174 Nonmajor Governmental Funds 1,585,502 - - - 15,212,494 273,627 5,123,389 HRA Loan Enterprise - - - - - - 9,000,000 Nonmajor Enterprise Funds 525,142 - - - - - 86,001 Internal Service Funds - - - - - 92,669 4,273,119 Total Transfers Out 2,810,644$ 2,250$ 18,486$ 32,327$ 15,212,494$ 1,877,839$ 75,119,250$
table continued below
Transfers Out
HRA Nonmajor InternalSewer Loan HRA Enterprise Service Total
Transfers In Utility Enterprise Parking Funds Funds Transfers InGeneral Fund 309,600$ 410,000$ -$ 134,056$ 128,005$ 13,381,951$ General Debt Service 3,667,350 300,000 - - - 13,232,040 HRA General Debt Service - 393,047 - - - 18,519,240 Capital Improvement Projects 10,030,804 568,950 - - 211,150 29,921,078 Nonmajor Governmental Funds - 52,279 197,488 26,679 - 22,471,458 HRA Loan Enterprise - - 2,500,000 - - 11,500,000 Nonmajor Enterprise Funds - - - 3,116,718 - 3,727,861 Internal Service Funds 246,095 - - - 339,801 4,951,684 Total Transfers Out 14,253,849$ 1,724,276$ 2,697,488$ 3,277,453$ 678,956$ 117,705,312$
2,401,487 235,8735,678,940$ 914,829$
Transfers Out
Capital Assets Used in the Operation of Governmental Funds (see note below)
The total governmental and proprietary funds transfers in is $117,705,312. The total governmental and proprietary transfers out is $120,342,672. The variance of $2,637,360 is comprised of the following: Capital asset transfer of $2,394,587 from the Rice and Arlington Sports Dome Enterprise Fund
to the General Capital Assets. Capital asset transfer of $6,900 from the Special Services Enterprise Fund to the General
Capital Assets. Capital asset transfer of $235,873 from the Parks and Recreation Supply and Maintenance
Internal Service Fund to the General Capital Assets.
93
City of Saint Paul, Minnesota Note VI Notes to the Financial Statements Detailed NotesFor the Fiscal Year Ended December 31, 2005 on All Funds
Generally, transfers are used to (1) move revenues from the fund that collects them to the fund that the budget requires to expend them, (2) move receipts restricted to debt service from the funds collecting the receipts to a debt service fund, and (3) use unrestricted revenues collected in the General Fund to finance various programs accounted for in other funds in accordance with budgetary authorizations.
(The remainder of this page left blank intentionally)
94
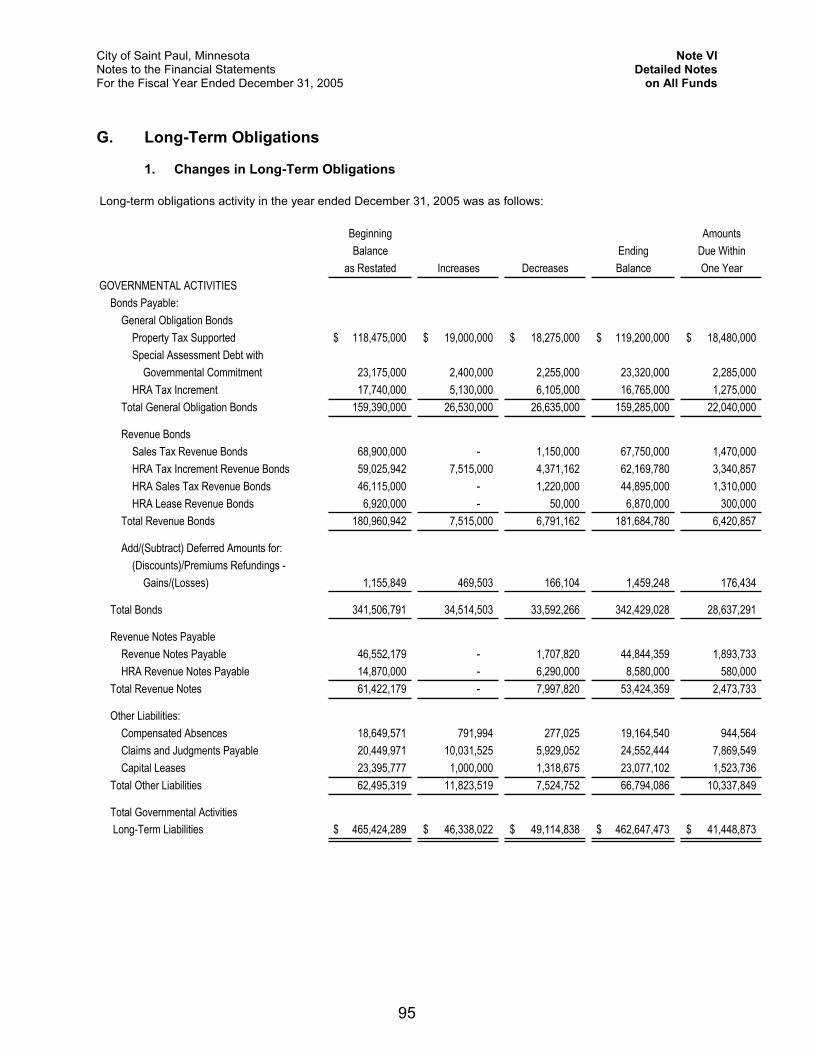
City of Saint Paul, Minnesota Note VI Notes to the Financial Statements Detailed NotesFor the Fiscal Year Ended December 31, 2005 on All Funds
G. Long-Term Obligations
1. Changes in Long-Term Obligations
Beginning AmountsBalance Ending Due Within
as Restated Increases Decreases Balance One YearGOVERNMENTAL ACTIVITIES
Bonds Payable:General Obligation Bonds
Property Tax Supported 118,475,000$ 19,000,000$ 18,275,000$ 119,200,000$ 18,480,000$ Special Assessment Debt with
Governmental Commitment 23,175,000 2,400,000 2,255,000 23,320,000 2,285,000 HRA Tax Increment 17,740,000 5,130,000 6,105,000 16,765,000 1,275,000
Total General Obligation Bonds 159,390,000 26,530,000 26,635,000 159,285,000 22,040,000
Revenue BondsSales Tax Revenue Bonds 68,900,000 - 1,150,000 67,750,000 1,470,000 HRA Tax Increment Revenue Bonds 59,025,942 7,515,000 4,371,162 62,169,780 3,340,857 HRA Sales Tax Revenue Bonds 46,115,000 - 1,220,000 44,895,000 1,310,000 HRA Lease Revenue Bonds 6,920,000 - 50,000 6,870,000 300,000
Total Revenue Bonds 180,960,942 7,515,000 6,791,162 181,684,780 6,420,857
Add/(Subtract) Deferred Amounts for:(Discounts)/Premiums Refundings -
Gains/(Losses) 1,155,849 469,503 166,104 1,459,248 176,434
Total Bonds 341,506,791 34,514,503 33,592,266 342,429,028 28,637,291
Revenue Notes PayableRevenue Notes Payable 46,552,179 - 1,707,820 44,844,359 1,893,733 HRA Revenue Notes Payable 14,870,000 - 6,290,000 8,580,000 580,000
Total Revenue Notes 61,422,179 - 7,997,820 53,424,359 2,473,733
Other Liabilities:Compensated Absences 18,649,571 791,994 277,025 19,164,540 944,564 Claims and Judgments Payable 20,449,971 10,031,525 5,929,052 24,552,444 7,869,549 Capital Leases 23,395,777 1,000,000 1,318,675 23,077,102 1,523,736
Total Other Liabilities 62,495,319 11,823,519 7,524,752 66,794,086 10,337,849
Total Governmental Activities Long-Term Liabilities 465,424,289$ 46,338,022$ 49,114,838$ 462,647,473$ 41,448,873$
Long-term obligations activity in the year ended December 31, 2005 was as follows:
95
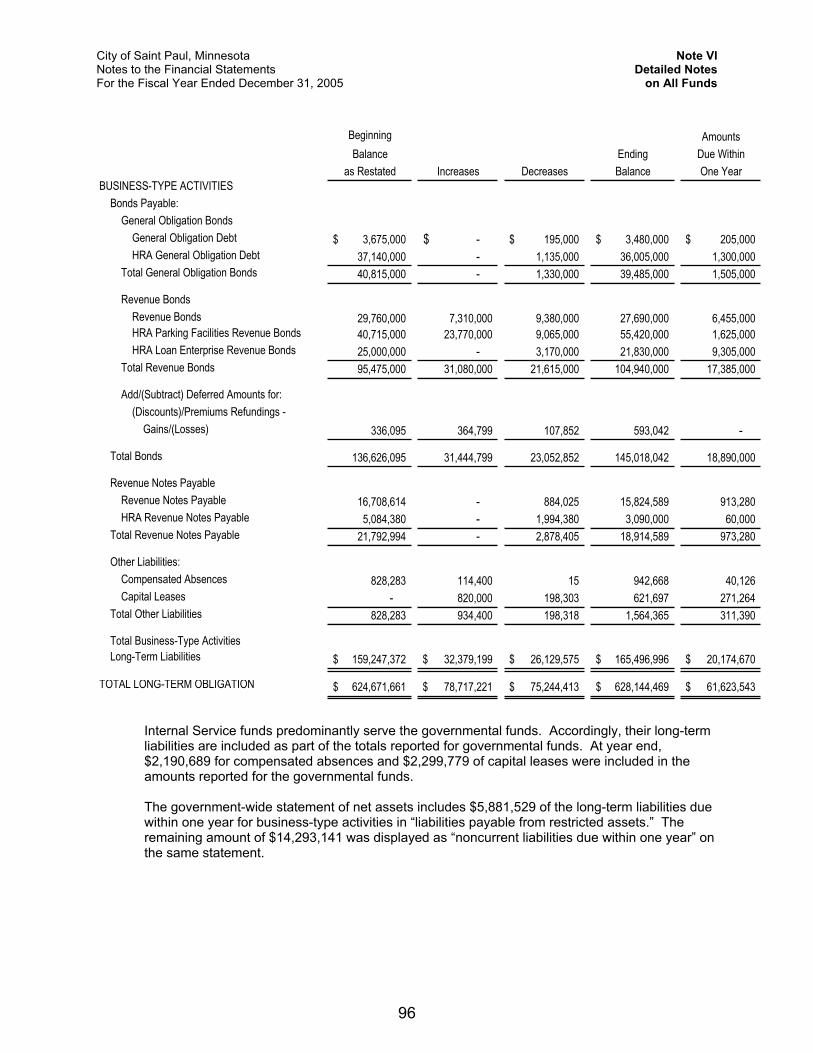
City of Saint Paul, Minnesota Note VI Notes to the Financial Statements Detailed NotesFor the Fiscal Year Ended December 31, 2005 on All Funds
Beginning AmountsBalance Ending Due Within
as Restated Increases Decreases Balance One YearBUSINESS-TYPE ACTIVITIES
Bonds Payable:General Obligation Bonds
General Obligation Debt 3,675,000$ -$ 195,000$ 3,480,000$ 205,000$ HRA General Obligation Debt 37,140,000 - 1,135,000 36,005,000 1,300,000
Total General Obligation Bonds 40,815,000 - 1,330,000 39,485,000 1,505,000
Revenue BondsRevenue Bonds 29,760,000 7,310,000 9,380,000 27,690,000 6,455,000 HRA Parking Facilities Revenue Bonds 40,715,000 23,770,000 9,065,000 55,420,000 1,625,000 HRA Loan Enterprise Revenue Bonds 25,000,000 - 3,170,000 21,830,000 9,305,000
Total Revenue Bonds 95,475,000 31,080,000 21,615,000 104,940,000 17,385,000
Add/(Subtract) Deferred Amounts for:(Discounts)/Premiums Refundings -
Gains/(Losses) 336,095 364,799 107,852 593,042 -
Total Bonds 136,626,095 31,444,799 23,052,852 145,018,042 18,890,000
Revenue Notes PayableRevenue Notes Payable 16,708,614 - 884,025 15,824,589 913,280 HRA Revenue Notes Payable 5,084,380 - 1,994,380 3,090,000 60,000
Total Revenue Notes Payable 21,792,994 - 2,878,405 18,914,589 973,280
Other Liabilities:Compensated Absences 828,283 114,400 15 942,668 40,126 Capital Leases - 820,000 198,303 621,697 271,264
Total Other Liabilities 828,283 934,400 198,318 1,564,365 311,390
Total Business-Type ActivitiesLong-Term Liabilities 159,247,372$ 32,379,199$ 26,129,575$ 165,496,996$ 20,174,670$
TOTAL LONG-TERM OBLIGATION 624,671,661$ 78,717,221$ 75,244,413$ 628,144,469$ 61,623,543$
Internal Service funds predominantly serve the governmental funds. Accordingly, their long-term liabilities are included as part of the totals reported for governmental funds. At year end, $2,190,689 for compensated absences and $2,299,779 of capital leases were included in the amounts reported for the governmental funds.
The government-wide statement of net assets includes $5,881,529 of the long-term liabilities due within one year for business-type activities in “liabilities payable from restricted assets.” The remaining amount of $14,293,141 was displayed as “noncurrent liabilities due within one year” on the same statement.
96
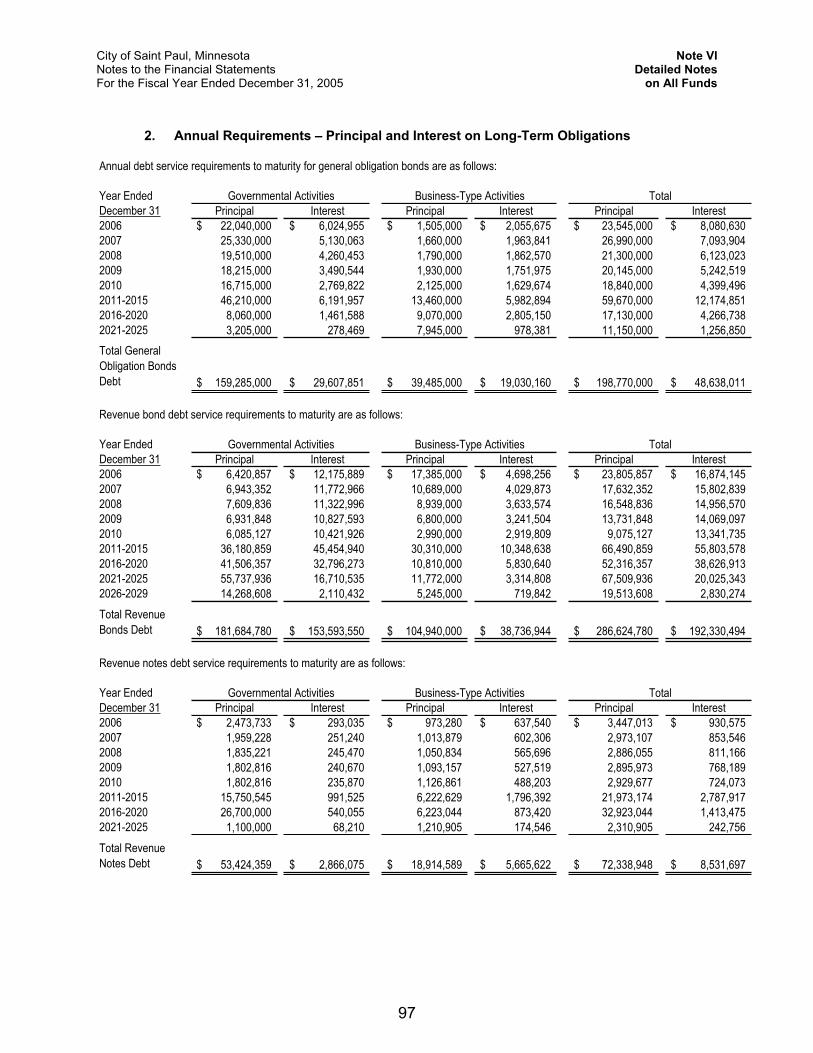
City of Saint Paul, Minnesota Note VI Notes to the Financial Statements Detailed NotesFor the Fiscal Year Ended December 31, 2005 on All Funds
2. Annual Requirements – Principal and Interest on Long-Term Obligations
Year EndedDecember 31 Principal Interest Principal Interest Principal Interest2006 22,040,000$ 6,024,955$ 1,505,000$ 2,055,675$ 23,545,000$ 8,080,630$ 2007 25,330,000 5,130,063 1,660,000 1,963,841 26,990,000 7,093,904 2008 19,510,000 4,260,453 1,790,000 1,862,570 21,300,000 6,123,023 2009 18,215,000 3,490,544 1,930,000 1,751,975 20,145,000 5,242,519 2010 16,715,000 2,769,822 2,125,000 1,629,674 18,840,000 4,399,496 2011-2015 46,210,000 6,191,957 13,460,000 5,982,894 59,670,000 12,174,851 2016-2020 8,060,000 1,461,588 9,070,000 2,805,150 17,130,000 4,266,738 2021-2025 3,205,000 278,469 7,945,000 978,381 11,150,000 1,256,850 Total General Obligation Bonds Debt 159,285,000$ 29,607,851$ 39,485,000$ 19,030,160$ 198,770,000$ 48,638,011$
Year EndedDecember 31 Principal Interest Principal Interest Principal Interest2006 6,420,857$ 12,175,889$ 17,385,000$ 4,698,256$ 23,805,857$ 16,874,145$ 2007 6,943,352 11,772,966 10,689,000 4,029,873 17,632,352 15,802,839 2008 7,609,836 11,322,996 8,939,000 3,633,574 16,548,836 14,956,570 2009 6,931,848 10,827,593 6,800,000 3,241,504 13,731,848 14,069,097 2010 6,085,127 10,421,926 2,990,000 2,919,809 9,075,127 13,341,735 2011-2015 36,180,859 45,454,940 30,310,000 10,348,638 66,490,859 55,803,578 2016-2020 41,506,357 32,796,273 10,810,000 5,830,640 52,316,357 38,626,913 2021-2025 55,737,936 16,710,535 11,772,000 3,314,808 67,509,936 20,025,343 2026-2029 14,268,608 2,110,432 5,245,000 719,842 19,513,608 2,830,274 Total Revenue Bonds Debt 181,684,780$ 153,593,550$ 104,940,000$ 38,736,944$ 286,624,780$ 192,330,494$
Year EndedDecember 31 Principal Interest Principal Interest Principal Interest2006 2,473,733$ 293,035$ 973,280$ 637,540$ 3,447,013$ 930,575$ 2007 1,959,228 251,240 1,013,879 602,306 2,973,107 853,546 2008 1,835,221 245,470 1,050,834 565,696 2,886,055 811,166 2009 1,802,816 240,670 1,093,157 527,519 2,895,973 768,189 2010 1,802,816 235,870 1,126,861 488,203 2,929,677 724,073 2011-2015 15,750,545 991,525 6,222,629 1,796,392 21,973,174 2,787,917 2016-2020 26,700,000 540,055 6,223,044 873,420 32,923,044 1,413,475 2021-2025 1,100,000 68,210 1,210,905 174,546 2,310,905 242,756 Total Revenue Notes Debt 53,424,359$ 2,866,075$ 18,914,589$ 5,665,622$ 72,338,948$ 8,531,697$
Revenue notes debt service requirements to maturity are as follows:
Governmental Activities Business-Type Activities Total
Business-Type Activities Total
Annual debt service requirements to maturity for general obligation bonds are as follows:
Revenue bond debt service requirements to maturity are as follows:
Governmental Activities Business-Type Activities Total
Governmental Activities
97
City of Saint Paul, Minnesota Note VI Notes to the Financial Statements Detailed NotesFor the Fiscal Year Ended December 31, 2005 on All Funds
3. Sources for Long-Term Obligations Repayment
Governmental Activity Long-Term Obligations
General Obligation Bonds In 2005, the City issued General Obligation Capital Improvement Bonds, Series 2005A in the amount of $19,000,000; General Obligation Special Assessment Debit with Governmental Commitment, Series 2005B in the amount of $2,400,000; and General Obligation Taxable Tax Increment Refunding Bonds (Snelling-University Tax Increment Refunding Bonds), Series 2005C in the amount of $5,130,000; for a total of $26,530,000.
$159,285,000 of General Obligation Bonds is payable from the Debt Service Funds. The related interest requirement on this debt was $29,607,851. These bonds are backed by the full faith and credit of the City.
General Obligation Bonds – Property Tax Supported Of the $159,285,000 of General Obligation Bonds, $119,200,000 is property tax supported debt to be paid primarily from property taxes levied and collected. The related interest requirement on this debt was $21,405,576.
General Obligation Special Assessment Debt with Governmental Commitment Of the $159,285,000 of General Obligation Bonds, $23,320,000 are payable from special assessments to be levied and collected for local improvements and are backed by the full faith and credit of the City. The general credit of the City is obligated only to the extent that liens foreclosed against properties involved in special assessments districts are insufficient to retire outstanding bonds. These bonds (and related interest of $5,027,556) are being serviced by the G.O. Special Assessment – Streets Debt Service Fund.
General Obligation HRA Tax Increment Bonds
During March 2005, the City issued General Obligation Snelling-University Tax Increment Refunding Bonds, Series 2005C in the amount of $5,130,000 to currently refund the Midway Marketplace Tax Increment Bonds, Series 1995A. This current refunding was done to take advantage of lower interest rates and reduce debt service payments by $1,307,315. The current refunding resulted in an economic gain (difference between the present value of the debt services payments of the refunded and the refunding bonds) of $977,430. HRA tax increment revenues from the Snelling-University Tax Increment District are to be used to retire the Series 2005C Bonds. The 2005C Bonds had a balance of $5,130,000 as of December 31, 2005.
During March 2004, the City issued General Obligation Temporary Bonds, Series 2004C in the amount of $3,950,000 to finance the cost of public infrastructure improvements incurred by the Housing and Redevelopment Authority of the City of Saint Paul within its Koch/Mobil Tax Increment Financing District. The bonds have a City general obligation pledge and will be retired using tax increment revenues or proceeds from a future HRA tax increment bond issue. Prior to the March 1, 2007 final maturity date, the Series 2004C Bonds are expected to be refinanced with a second three-year temporary bond issue. The 2004C Bonds had a balance of $3,950,000 outstanding as of December 31, 2005.
During November 2000, the City issued General Obligation Riverfront Tax Increment Bonds, Series 2000D in the amount of $8,335,000 to currently refund the Riverfront Tax Increment Bonds, Series 1993C in order that debt service requirements for the Riverfront Tax Increment Financing District could be reduced through a lower interest rate. The Series 2000D Bonds had a balance of $5,920,000 as of December 31, 2005.
98
City of Saint Paul, Minnesota Note VI Notes to the Financial Statements Detailed NotesFor the Fiscal Year Ended December 31, 2005 on All Funds
The Riverfront Tax Increment General Obligation Refunding Bonds, Series 2002C were issued in March 2002 in the amount of $2,335,000 to currently refund the Riverfront Tax Increment Bonds, Series 1993D to take advantage of lower interest rates and reduce debt service payments. The Series 2002C Bonds had a balance of $1,765,000 outstanding as of December 31, 2005.
The total General Obligation HRA Tax Increment Bonds as of December 31, 2005 was $16,765,000. The related interest requirement on this debt was $3,174,719.
Revenue BondsSales Tax Revenue Bonds In 1999, the City issued $72,570,000 of Sales Tax Revenue Bonds to finance a portion of the costs of demolishing an existing arena facility located in the downtown area of the City and constructing a new multipurpose sports and entertainment arena adjacent and connected to the Saint Paul RiverCentre complex. The debt on these Sales Tax Revenue Bonds is being serviced by the City Revenue Bonds and Other Long-Term Debt – Debt Service Fund. The 1999A Bonds had a balance of $67,750,000 outstanding as of December 31, 2005. The related interest requirement on this debt was $64,684,244.
HRA Tax Increment Revenue Bonds
The Neighborhood Scattered Site Tax Increment Bonds, Series 2005 were issued in April 2005 in the amount of $7,515,000 to provide financing for development in the Neighborhood Scattered Site Tax Increment District. The bonds are to be retired using tax increment revenues from this same district. The 2005 Bonds had a balance of $7,200,000 as of December 31, 2005.
In January 1998, the HRA issued $24,295,000 in Downtown Tax Increment Refunding Bonds, Series 1998 to advance refunding to the Downtown and Seventh Place Tax Increment Bonds, Series 1993. At December 31, 2005, $8,585,000 of the 1998 HRA Downtown Tax Increment Refunding Bonds was outstanding.
The Spruce Tree Tax Increment Refunding Bonds, Series 2003 were issued in March 2003 in the amount of $1,890,000, and along with existing funds of the HRA, currently refunded the Spruce Tree Tax Increment Bonds, Series 1988. HRA tax increment revenues from the Spruce Tree/Metz District are to be used to retire the Series 2003 Bonds. The 2003 Bonds had a balance of $1,600,780 outstanding as of December 31, 2005.
The North Quadrant Tax Increment Refunding Bonds, Series 2002 were issued in April 2002 in the amount of $1,089,000 to currently refund the North Quadrant Tax Increment Bonds, Series 2000 issued in November 2000 in the amount of $1,283,000. HRA tax increment revenues from the North Quadrant District are to be used to retire the Series 2002 Bonds. The 2002 Bonds had a balance of $1,059,000 outstanding as of December 31, 2005.
The North Quadrant Phase II Tax Increment Bonds, Series 2002 were issued in June 2002 in the amount of $1,140,000 to provide financing for development in the North Quadrant Tax Increment District. The bonds are to be retired using tax increment revenue from the North Quadrant District. The 2002 Bonds had a balance of $1,140,000 as of December 31, 2005.
The US Bank Tax Increment Bonds, Series 2001, were issued in August 2001 in the amount of $12,000,000 to provide a portion of the financing for the construction of a US Bank Operations Center in the HRA Riverfront Renaissance Tax Increment Financing District. The bonds are to be retired using tax increment revenue from the Riverfront Renaissance District. At December 31, 2005, $11,875,000 of Series 2001 Bonds was outstanding.
99
City of Saint Paul, Minnesota Note VI Notes to the Financial Statements Detailed NotesFor the Fiscal Year Ended December 31, 2005 on All Funds
The Upper Landing Tax Increment Bonds, Series 2002A, Series 2002B-1 and Series 2002B-2 were issued in October 2002 in the amount of $19,130,000 to provide financing for development of the Upper Landing area in the HRA Riverfront Renaissance Tax Increment District. The bonds are to be retired using tax increment revenue from the Riverfront Renaissance District. At December 31, 2005, $19,130,000 of the bonds was outstanding.
The Drake Marble Tax Increment Bonds, Series 2002 were issued in November 2002 in the amount of $1,800,000 to provide financing for renovation of the Drake Marble building in the Riverfront Renaissance Tax Increment District. The bonds are to be retired using tax increment revenue from the Riverfront Renaissance District. At December 31, 2005, $1,745,000 of Series 2002 was outstanding.
The Gateway Tax Increment Bonds, Series 2003C and Series 2003D were issued in the amount of $4,820,000 to provide financing for the Gateway Apartments project. The Bonds were issued at a variable rate of one percent plus prime. The Bonds are to be retired solely through HRA tax increment revenues from the Shepard-Davern Tax Increment Financing District. At December 31, 2005, $4,820,000 of Series 2003C and 2003D was outstanding.
The 9th Street Lofts Tax Increment Bonds, Series 2004, were issued in April 2004 in the amount of $1,335,000 to provide financing for a rental housing development in the North Quadrant Tax Increment District. The bonds are to be retired using tax increment revenues from the North Quadrant District. At December 31, 2005, $1,335,000 of the Series 2005 Bonds was outstanding.
The J.J. Hill Tax Increment Bonds, Series 2004, were issued in November 2004 in the amount of $3,660,000 to provide financing for an owner-occupied housing development in the J.J. Hill Tax Increment District. The bonds are to be retired using tax increment revenues from the J.J. Hill Tax Increment District. At December 31, 2005, $3,660,000 of Series 2004 Bonds was outstanding.
The HRA Tax Increment Revenue Bonds do not constitute a general obligation of the City and are not backed by the City’s full faith and credit. At December 31, 2005, $62,169,780 of HRA Tax Increment Revenue Bonds was outstanding. The related interest requirement on this debt was $50,663,622.
HRA Sales Tax Revenue Bonds In April 1996, the HRA issued $55,865,000 in Sales Tax Revenue Advance Refunding Bonds, Series 1996 to advance refund the Sales Tax Revenue Bonds, Series 1993. At December 31, 2005, $44,895,000 of HRA Sales Tax Revenue Advance Refunding Bonds was outstanding.
HRA Lease Revenue Bonds The RiverCentre Parking Facility Lease Revenue Bonds, Series 2000 were issued in May 2000 in the amount of $7,240,000 to finance improvements to the RiverCentre Parking Ramp, which is owned by the City of Saint Paul. The bonds are payable from payments made by the City to the HRA for leasing the improvements. The outstanding balance was $6,870,000 as of December 31, 2005.
The total Revenue Bonds as of December 31, 2005 was $181,684,780. The related interest requirement on this debt was $153,593,550.
100
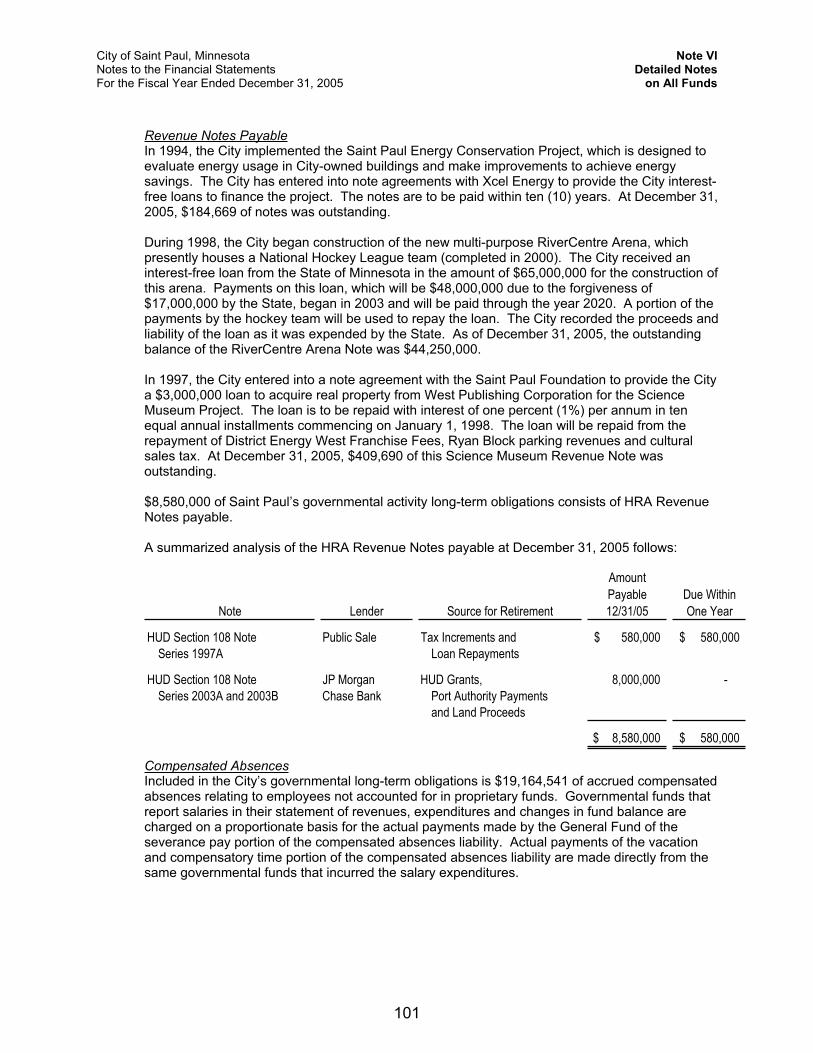
City of Saint Paul, Minnesota Note VI Notes to the Financial Statements Detailed NotesFor the Fiscal Year Ended December 31, 2005 on All Funds
Revenue Notes PayableIn 1994, the City implemented the Saint Paul Energy Conservation Project, which is designed to evaluate energy usage in City-owned buildings and make improvements to achieve energy savings. The City has entered into note agreements with Xcel Energy to provide the City interest-free loans to finance the project. The notes are to be paid within ten (10) years. At December 31, 2005, $184,669 of notes was outstanding.
During 1998, the City began construction of the new multi-purpose RiverCentre Arena, which presently houses a National Hockey League team (completed in 2000). The City received an interest-free loan from the State of Minnesota in the amount of $65,000,000 for the construction of this arena. Payments on this loan, which will be $48,000,000 due to the forgiveness of $17,000,000 by the State, began in 2003 and will be paid through the year 2020. A portion of the payments by the hockey team will be used to repay the loan. The City recorded the proceeds and liability of the loan as it was expended by the State. As of December 31, 2005, the outstanding balance of the RiverCentre Arena Note was $44,250,000.
In 1997, the City entered into a note agreement with the Saint Paul Foundation to provide the City a $3,000,000 loan to acquire real property from West Publishing Corporation for the Science Museum Project. The loan is to be repaid with interest of one percent (1%) per annum in ten equal annual installments commencing on January 1, 1998. The loan will be repaid from the repayment of District Energy West Franchise Fees, Ryan Block parking revenues and cultural sales tax. At December 31, 2005, $409,690 of this Science Museum Revenue Note was outstanding.
$8,580,000 of Saint Paul’s governmental activity long-term obligations consists of HRA Revenue Notes payable.
A summarized analysis of the HRA Revenue Notes payable at December 31, 2005 follows:
Note Lender Source for Retirement
Amount Payable12/31/05
Due Within One Year
HUD Section 108 Note Public Sale Tax Increments and 580,000$ 580,000$ Series 1997A Loan Repayments
HUD Section 108 Note JP Morgan HUD Grants, 8,000,000 - Series 2003A and 2003B Chase Bank Port Authority Payments
and Land Proceeds
8,580,000$ 580,000$
Compensated AbsencesIncluded in the City’s governmental long-term obligations is $19,164,541 of accrued compensated absences relating to employees not accounted for in proprietary funds. Governmental funds that report salaries in their statement of revenues, expenditures and changes in fund balance are charged on a proportionate basis for the actual payments made by the General Fund of the severance pay portion of the compensated absences liability. Actual payments of the vacation and compensatory time portion of the compensated absences liability are made directly from the same governmental funds that incurred the salary expenditures.
101
City of Saint Paul, Minnesota Note VI Notes to the Financial Statements Detailed NotesFor the Fiscal Year Ended December 31, 2005 on All Funds
Claims and Judgments PayableClaim and judgment expenditures and liabilities are reported when it is probable that a loss has occurred and the amount of the loss can be reasonably estimated. These liabilities include an estimate of claims that have been incurred but not reported (IBNR). Claim expenditures relating to tort liabilities are paid from the General Fund. Workers’ Compensation claim expenditures are recorded in the General Fund and are allocated to other City funds based upon a fringe benefit rate applied to each fund’s actual salaries. The liability for claims and judgments is reported in the government-wide financial statements. At December 31, 2005, the claims and judgments liability was $24,552,444.
Capital LeasesOn July 1, 2004 the City entered into an agreement with Banc of America Leasing & Capital, LLC to provide tax-exempt lease financing for 50 police cars for a three-year period ending June 1, 2007. The related equipment capital asset of $1,008,250 is reported in the City’s Government-wide Statement of Net Assets and the Capital Assets Used in the Operation of Governmental Funds. A capital lease payable of $512,882 was outstanding at December 31, 2005. Annual liquidation of this capital lease liability is reported in the City’s General Fund.
On July 6, 2005 the City amended the master equipment lease agreement with Banc of America Leasing & Capital, LLC to provide an additional $1,000,000 tax exempt lease financing for public safety vehicles for a three-year period ending June 1, 2008. The related equipment capital asset of $1,000,000 is reported in the City’s Government-wide Statement of Net Assets and the Capital Assets Used in the Operation of Governmental Funds. A capital lease payable of $837,140 was outstanding at December 31, 2005.
On July 1, 2003 the City entered into an agreement with Professional Parking Systems to provide services and leased equipment for a police electronic citation issuance system for a three-year period beginning September 15, 2005. The related equipment capital asset of $216,100 is reported in the City’s Government-wide Statement of Net Assets and Capital Assets Used in the Operation of Governmental Funds. A capital lease payable of $125,301 was outstanding at December 31, 2005. Annual liquidation of this capital lease liability is reported in the Parking Enforcement Special Revenue Fund.
A 20-year lease agreement in the amount of $3,000,000, dated October 14, 1998, was entered into to finance the acquisition and renovation of expanded heating, ventilation and air conditioning systems, electrical and fire suppression systems, and workstations for the City Hall Annex. The related equipment of $315,998 and building of $2,684,002 are included as capital assets. A capital lease payable of $2,299,779 was outstanding at December 31, 2005, and reported in the Public Works Administration Internal Service Fund.
A 30-year RiverCentre Pedestrian Link Cooperative Agreement dated May 23, 2002 was entered into with Ramsey County to finance the designing and construction of a pedestrian connection between the RiverCentre Complex and the existing skyway system in Landmark Tower. The related improvement other than building capital asset of $6,872,000 is reported in the City’s Government-wide Statement of Net Assets and Capital Assets Used in Operation of Governmental Funds. A capital lease payable of $6,407,000 was outstanding at December 31, 2005. Annual liquidation of this capital lease liability is reported in the Revenue Notes and Other Long-Term Debt Service Fund.
102
City of Saint Paul, Minnesota Note VI Notes to the Financial Statements Detailed NotesFor the Fiscal Year Ended December 31, 2005 on All Funds
A 20-year lease agreement in the amount of $13,845,000 was entered into with Ramsey County on December 16, 2002 to finance the repair, renovation and remodeling of the Saint Paul Police Headquarters Facility through the use of proceeds of the sale of revenue bonds in the year 2003. The City agreed to reimburse the County for the expense incurred for issuance and repayment of the bonds through rent payments beginning in 2005. The related building capital asset of $13,845,000 is reported in the City’s Government-wide Statement of Net Assets and Capital Assets Used in the Operation of Governmental Funds. A capital lease payable of $12,895,000 was outstanding as of December 31, 2005. Annual liquidation of this capital lease liability is reported in the City’s General Fund.
The following is a schedule by years of future minimum lease payments under this capital lease, together with the present value of the net minimum lease payments of December 31, 2005.
Capital Leases – Governmental Activity
Year Ended December 31
2006 $ 253,017 $ 395,011 $ 1,048,542 $ 350,269 $ 349,106 $ 79,598 2007 253,017 394,088 1,046,217 175,133 349,106 53,066 2008 253,017 392,985 1,048,368 - 174,553 - 2009 253,017 396,702 1,049,818 - - - 2010 253,017 395,061 1,055,568 - - - Thereafter 2,024,135 7,826,780 13,838,470 - - -
Total Minimum LeasePayments 3,289,220 9,800,627 19,086,983 525,402 872,765 132,664 Less Amount RepresentingInterest (989,441) (3,393,627) (6,191,983) (12,520) (35,625) (7,363)Present Valueof Future Capital Lease Payments $ 2,299,779 $ 6,407,000 $ 12,895,000 $ 512,882 $ 837,140 $ 125,301
2005 Saint Paul Police
Vehicle Lease
Parking Enforcement
Citation Issuance
System Lease City Hall Annex Improvements
RiverCentre Pedestrian Link
Saint Paul Police
Headquarters Facility Lease
2004 Saint Paul Police
Vehicle Lease
103
City of Saint Paul, Minnesota Note VI Notes to the Financial Statements Detailed NotesFor the Fiscal Year Ended December 31, 2005 on All Funds
Business-Type Activity Long-Term Obligations
General Obligation BondsIncluded in the City’s business-type activity long-term obligations are Sewer Utility General Obligation Bonds issued in 1998. The proceeds of these bonds are being used for sewer rehabilitation construction. At December 31, 2005, $3,480,000 of outstanding bonds was recorded as a liability in the Sewer Utility Enterprise Fund.
General Obligation HRA Tax Increment Bonds During 1998, the City of Saint Paul issued Block 39 Tax Increment General Obligation Bonds, Series 1998A and Series 1998B in the amount of $21,255,000 and $18,745,000, respectively. Proceeds from the Series 1998A and Series 1998B are being used to finance the acquisition of Block 39 properties in the downtown area and to construct a parking facility and retail space. The Bonds have a City general obligation pledge, but are to be retired using tax increments from the HRA Block 39 Lawson/Arena District and revenues from the parking facility. The total amount of these bonds outstanding at December 31, 2005 was $21,255,000 and $14,750,000 and recognized as a liability in the HRA Parking Enterprise Fund.
Revenue BondsIn March 2004, the City issued Sewer Revenue Bonds, Series 2004E in the amount of $6,300,000 to finance improvements to the City’s sewer system, payable from revenues of the Sewer Utility Enterprise Fund. At December 31, 2005 $5,750,000 of outstanding bonds was recorded as a liability in the Sewer Utility Enterprise Fund.
The Sewer Utility issued $26,280,000 of Revenue Refunding Bonds in March 2003, payable from revenues of the Sewer Utility Enterprise Fund. The proceeds of this issue, combined with funds in the 1993 Debt Service Account and the 1993 Debt Service Reserve were used to current refund the 2004-2008 maturities, whose amount totaled $28,435,000, of the Utility’s Sewer Revenue Refunding Bonds, Series 1993 on June 1, 2003. At December 31, 2005, $14,630,000 of Sewer Revenue Refunding Bonds, Series 2003D was outstanding.
The Special Services Enterprise Fund is reporting $7,310,000 of revenue bonds outstanding at December 31, 2005. The Recreational Facilities Gross Revenue Bonds (Highland National Project), Series 2005 were issued on October 27, 2005 in the amount of $7,310,000. Bond proceeds in the amount of $2,955,000, together with other funds on hand, were used to refund the Recreational Facilities Gross Revenue Bonds (Sports Dome Project) on December 1, 2005, while the balance of $4,355,000 was used to pay for the reconstruction of the Highland National Golf Course. A bond reserve in the amount of $666,750 has also been established. The sale resulted in the Net Present Value Benefit (NPV) of $246,971 from the retirement of the Sports Dome Bonds.
HRA Loan Enterprise Revenue Bonds Housing 5000 Land Assembly Bonds, Series 2004, were issued in January 2004 in the amount of $25,000,000 to provide financing for the acquisition and improvement of land to be used in connection with the HRA Housing 5000 Initiative. It is intended that the bonds will be retired through the sale of the acquired land to developers as part of the initiative. The bonds are secured by a letter of credit in the original amount of $25,369,863 issued by U.S. Bank to the bond trustee for the account of the HRA. The HRA is also required to set aside cash and cash equivalents in the amount of 10% of the principal outstanding on the bonds. In accordance with this requirement, the HRA has restricted cash for the Housing 5000 Land Assembly Bond debt service in the amount of $2,183,000 in the HRA Parking Enterprise Fund. The outstanding balance of The Series 2004 Bonds as of December 31, 2005 was $21,830,000.
104
City of Saint Paul, Minnesota Note VI Notes to the Financial Statements Detailed NotesFor the Fiscal Year Ended December 31, 2005 on All Funds
HRA Parking System Revenue Bonds
The Parking Revenue Refunding Bonds, Series 2005A were issued in February 2005 in the amount of $7,790,000 to currently refund the Parking Revenue Bonds, Series 1995A. This current refunding was done to take advantage of lower interest rates and reduce debt service payments. Total debt service payments decreased by $411,804. The current refunding resulted in an economic gain of $401,496. The reacquisition price and the net carrying amount of the refunded bonds were both $7,590,000. Parking revenues from various HRA parking facilities are to be used to retire the Series 2005A Bonds. The outstanding balance of December 31, 2005 was $7,100,000.
The Parking Revenue Bonds (Smith Avenue Transit Center), Series 2005 were issued in June 2005 in the amount of $15,980,000 to provide financing for the construction of the Smith Avenue Transit Center, which includes a 600-stall parking ramp and transit facility. The bonds are to be retired using revenues from the Transit Center. The outstanding balance as of December 31, 2005 was $15,980,000.
The Parking Revenue Bonds include the Parking Revenue Refunding Bonds, Series 2001A, which were issued in March 2001 in the amount of $6,755,000 to currently refund the Variable Rate Demand Parking Revenue Bonds, Series 1995B. At December 31, 2005, $5,160,000 of the Series 2001A Refunding Bonds was outstanding.
In addition, $8,635,000 of HRA World Trade Center Ramp Bonds, Series 1997A was outstanding at December 31, 2005.
The Parking Revenue Bonds, Series 2002A and Series 2002B were issued in May 2002 in the total amount of $18,545,000 to provide financing for the construction of a 1,044-space parking ramp located on Block 19 in the downtown area. The bond proceeds were deposited into the HRA Parking Enterprise Fund and the bonds will be retired using parking revenues in the same enterprise fund. The outstanding balance as of December 31, 2005 was $18,545,000.
The total amount of HRA Parking System Revenue Bonds outstanding as of December 31, 2005 was $55,420,000, and is recognized in the HRA Parking Enterprise Fund. The related interest requirement on this debt was $26,756,131.
Revenue NotesFrom 1993 through 2002, the Department of Public Works entered into loan agreements with the State of Minnesota, Department of Trade and Economic Development, Public Facilities Authority, for long-term notes. The total principal amount of the long-term portion of the loans at December 31, 2005 was $15,824,589. The proceeds of these loans were used to construct sewer facilities which reduce the amount of groundwater “inflow and infiltration” entering the City’s sanitary sewer system, thereby decreasing the cost of sewage treatment. The notes are payable from the Sewer Utility Enterprise Fund.
The RiverCentre Exhibit Hall Parking Ramp Notes were issued in 1995 in the amount of $1,500,000. The outstanding balance as of December 31, 2005 was $1,090,000. City parking revenues are used to retire the notes, which are recognized as a liability in the HRA Parking Enterprise Fund.
The Block 39 Municipal Parking Ramp Notes were issued in 1999 in the amount of $2,000,000. The ramp revenues will be used to retire the notes beginning 2017. The notes are recognized as a liability in the HRA Parking Enterprise Fund.
105
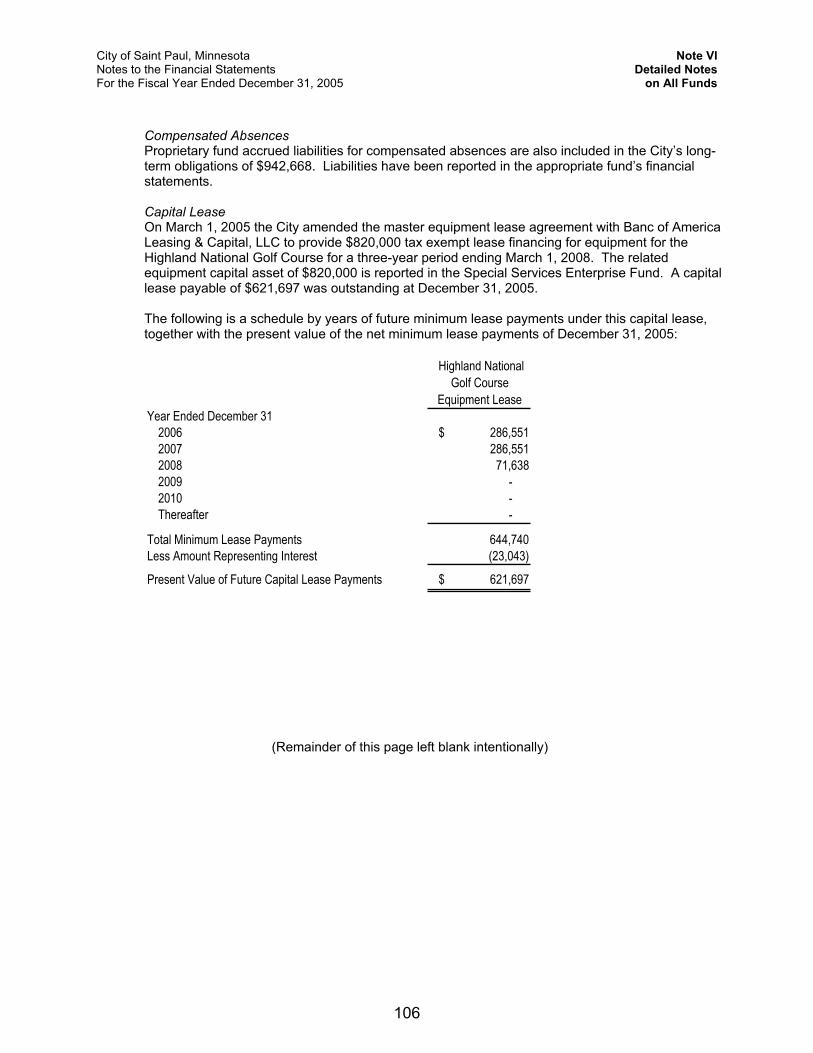
City of Saint Paul, Minnesota Note VI Notes to the Financial Statements Detailed NotesFor the Fiscal Year Ended December 31, 2005 on All Funds
Compensated Absences Proprietary fund accrued liabilities for compensated absences are also included in the City’s long-term obligations of $942,668. Liabilities have been reported in the appropriate fund’s financial statements.
Capital Lease On March 1, 2005 the City amended the master equipment lease agreement with Banc of America Leasing & Capital, LLC to provide $820,000 tax exempt lease financing for equipment for the Highland National Golf Course for a three-year period ending March 1, 2008. The related equipment capital asset of $820,000 is reported in the Special Services Enterprise Fund. A capital lease payable of $621,697 was outstanding at December 31, 2005.
The following is a schedule by years of future minimum lease payments under this capital lease, together with the present value of the net minimum lease payments of December 31, 2005:
Highland National Golf Course
Equipment Lease Year Ended December 31
2006 $ 286,551 2007 286,551 2008 71,638 2009 - 2010 - Thereafter -
Total Minimum Lease Payments 644,740 Less Amount Representing Interest (23,043)
Present Value of Future Capital Lease Payments $ 621,697
(Remainder of this page left blank intentionally)
106
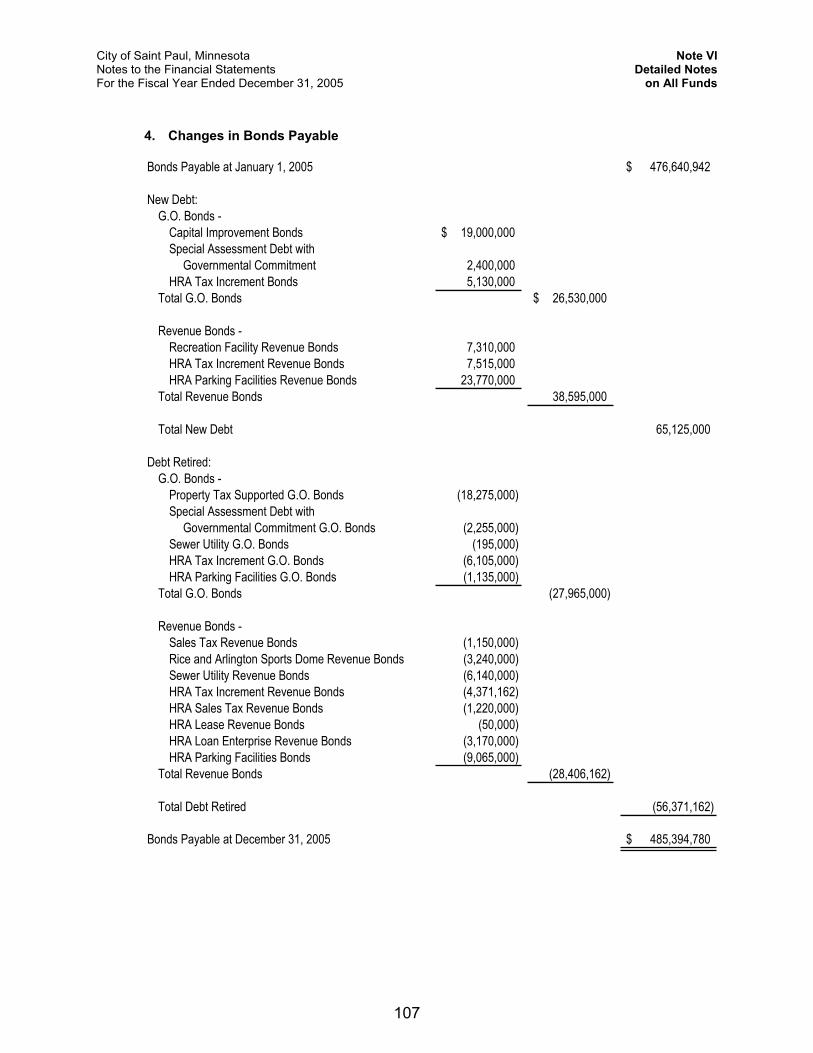
City of Saint Paul, Minnesota Note VI Notes to the Financial Statements Detailed NotesFor the Fiscal Year Ended December 31, 2005 on All Funds
4. Changes in Bonds Payable
Bonds Payable at January 1, 2005 476,640,942$
New Debt:G.O. Bonds -
Capital Improvement Bonds 19,000,000$Special Assessment Debt with
Governmental Commitment 2,400,000HRA Tax Increment Bonds 5,130,000
Total G.O. Bonds 26,530,000$
Revenue Bonds -Recreation Facility Revenue Bonds 7,310,000HRA Tax Increment Revenue Bonds 7,515,000HRA Parking Facilities Revenue Bonds 23,770,000
Total Revenue Bonds 38,595,000
Total New Debt 65,125,000
Debt Retired:G.O. Bonds -
Property Tax Supported G.O. Bonds (18,275,000)Special Assessment Debt with
Governmental Commitment G.O. Bonds (2,255,000)Sewer Utility G.O. Bonds (195,000)HRA Tax Increment G.O. Bonds (6,105,000)HRA Parking Facilities G.O. Bonds (1,135,000)
Total G.O. Bonds (27,965,000)
Revenue Bonds -Sales Tax Revenue Bonds (1,150,000)Rice and Arlington Sports Dome Revenue Bonds (3,240,000)Sewer Utility Revenue Bonds (6,140,000)HRA Tax Increment Revenue Bonds (4,371,162)HRA Sales Tax Revenue Bonds (1,220,000)HRA Lease Revenue Bonds (50,000)HRA Loan Enterprise Revenue Bonds (3,170,000)HRA Parking Facilities Bonds (9,065,000)
Total Revenue Bonds (28,406,162)
Total Debt Retired (56,371,162)
Bonds Payable at December 31, 2005 485,394,780$
107
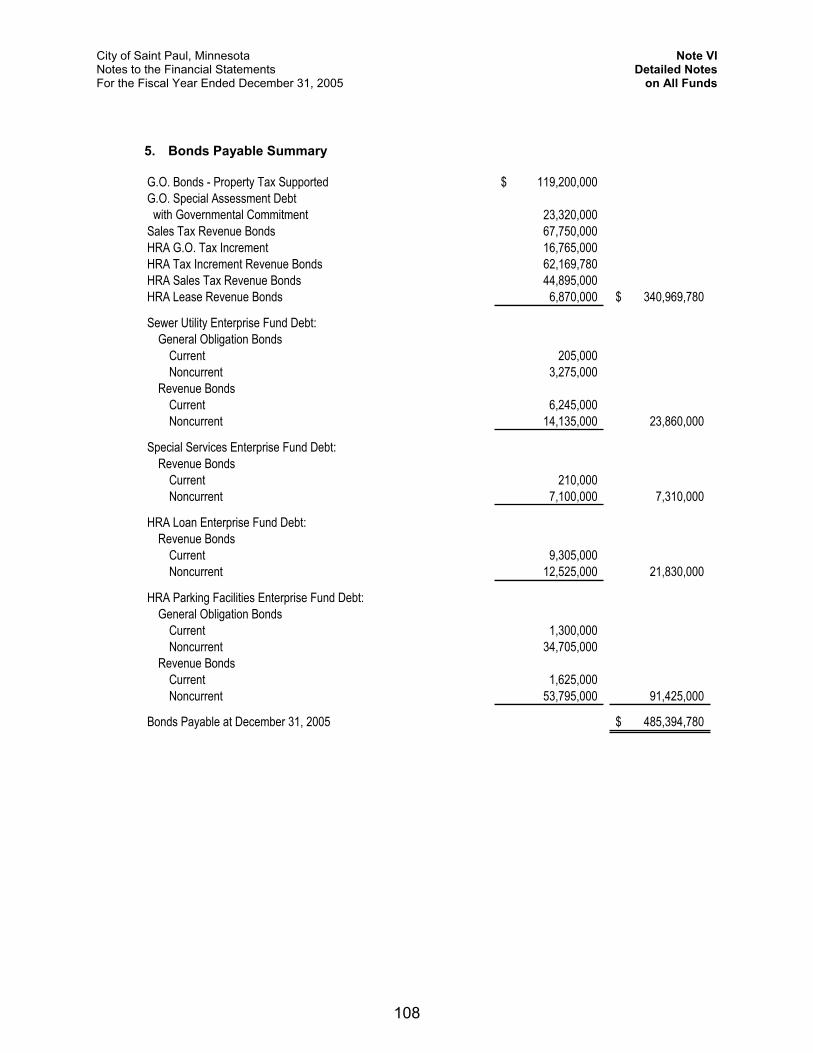
City of Saint Paul, Minnesota Note VI Notes to the Financial Statements Detailed NotesFor the Fiscal Year Ended December 31, 2005 on All Funds
5. Bonds Payable Summary
G.O. Bonds - Property Tax Supported 119,200,000$ G.O. Special Assessment Debt with Governmental Commitment 23,320,000Sales Tax Revenue Bonds 67,750,000HRA G.O. Tax Increment 16,765,000HRA Tax Increment Revenue Bonds 62,169,780HRA Sales Tax Revenue Bonds 44,895,000HRA Lease Revenue Bonds 6,870,000 340,969,780$
Sewer Utility Enterprise Fund Debt:General Obligation Bonds
Current 205,000Noncurrent 3,275,000
Revenue BondsCurrent 6,245,000Noncurrent 14,135,000 23,860,000
Special Services Enterprise Fund Debt:Revenue Bonds
Current 210,000Noncurrent 7,100,000 7,310,000
HRA Loan Enterprise Fund Debt:Revenue Bonds
Current 9,305,000Noncurrent 12,525,000 21,830,000
HRA Parking Facilities Enterprise Fund Debt:General Obligation Bonds
Current 1,300,000Noncurrent 34,705,000
Revenue BondsCurrent 1,625,000Noncurrent 53,795,000 91,425,000
Bonds Payable at December 31, 2005 485,394,780$
108
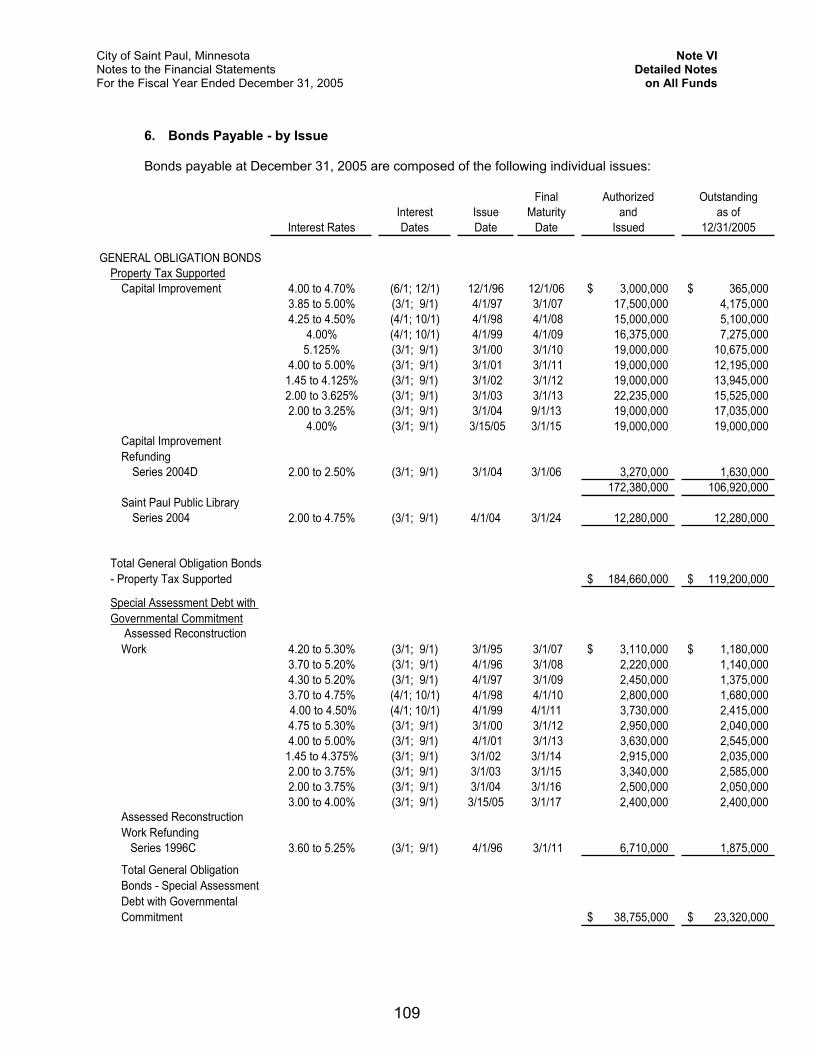
City of Saint Paul, Minnesota Note VI Notes to the Financial Statements Detailed NotesFor the Fiscal Year Ended December 31, 2005 on All Funds
6. Bonds Payable - by Issue
Bonds payable at December 31, 2005 are composed of the following individual issues:
Final Authorized OutstandingInterest Issue Maturity and as of
Interest Rates Dates Date Date Issued 12/31/2005
GENERAL OBLIGATION BONDSProperty Tax Supported
Capital Improvement 4.00 to 4.70% (6/1; 12/1) 12/1/96 12/1/06 3,000,000$ 365,000$ 3.85 to 5.00% (3/1; 9/1) 4/1/97 3/1/07 17,500,000 4,175,0004.25 to 4.50% (4/1; 10/1) 4/1/98 4/1/08 15,000,000 5,100,000
4.00% (4/1; 10/1) 4/1/99 4/1/09 16,375,000 7,275,0005.125% (3/1; 9/1) 3/1/00 3/1/10 19,000,000 10,675,000
4.00 to 5.00% (3/1; 9/1) 3/1/01 3/1/11 19,000,000 12,195,0001.45 to 4.125% (3/1; 9/1) 3/1/02 3/1/12 19,000,000 13,945,0002.00 to 3.625% (3/1; 9/1) 3/1/03 3/1/13 22,235,000 15,525,0002.00 to 3.25% (3/1; 9/1) 3/1/04 9/1/13 19,000,000 17,035,000
4.00% (3/1; 9/1) 3/15/05 3/1/15 19,000,000 19,000,000 Capital Improvement Refunding
Series 2004D 2.00 to 2.50% (3/1; 9/1) 3/1/04 3/1/06 3,270,000 1,630,000172,380,000 106,920,000
Saint Paul Public LibrarySeries 2004 2.00 to 4.75% (3/1; 9/1) 4/1/04 3/1/24 12,280,000 12,280,000
Total General Obligation Bonds- Property Tax Supported 184,660,000$ 119,200,000$
Special Assessment Debt with Governmental Commitment
Assessed Reconstruction Work 4.20 to 5.30% (3/1; 9/1) 3/1/95 3/1/07 3,110,000$ 1,180,000$
3.70 to 5.20% (3/1; 9/1) 4/1/96 3/1/08 2,220,000 1,140,0004.30 to 5.20% (3/1; 9/1) 4/1/97 3/1/09 2,450,000 1,375,0003.70 to 4.75% (4/1; 10/1) 4/1/98 4/1/10 2,800,000 1,680,000 4.00 to 4.50% (4/1; 10/1) 4/1/99 4/1/11 3,730,000 2,415,0004.75 to 5.30% (3/1; 9/1) 3/1/00 3/1/12 2,950,000 2,040,0004.00 to 5.00% (3/1; 9/1) 4/1/01 3/1/13 3,630,000 2,545,000
1.45 to 4.375% (3/1; 9/1) 3/1/02 3/1/14 2,915,000 2,035,0002.00 to 3.75% (3/1; 9/1) 3/1/03 3/1/15 3,340,000 2,585,0002.00 to 3.75% (3/1; 9/1) 3/1/04 3/1/16 2,500,000 2,050,0003.00 to 4.00% (3/1; 9/1) 3/15/05 3/1/17 2,400,000 2,400,000
Assessed Reconstruction Work Refunding Series 1996C 3.60 to 5.25% (3/1; 9/1) 4/1/96 3/1/11 6,710,000 1,875,000
Total General Obligation Bonds - Special Assessment Debt with Governmental Commitment 38,755,000$ 23,320,000$
109
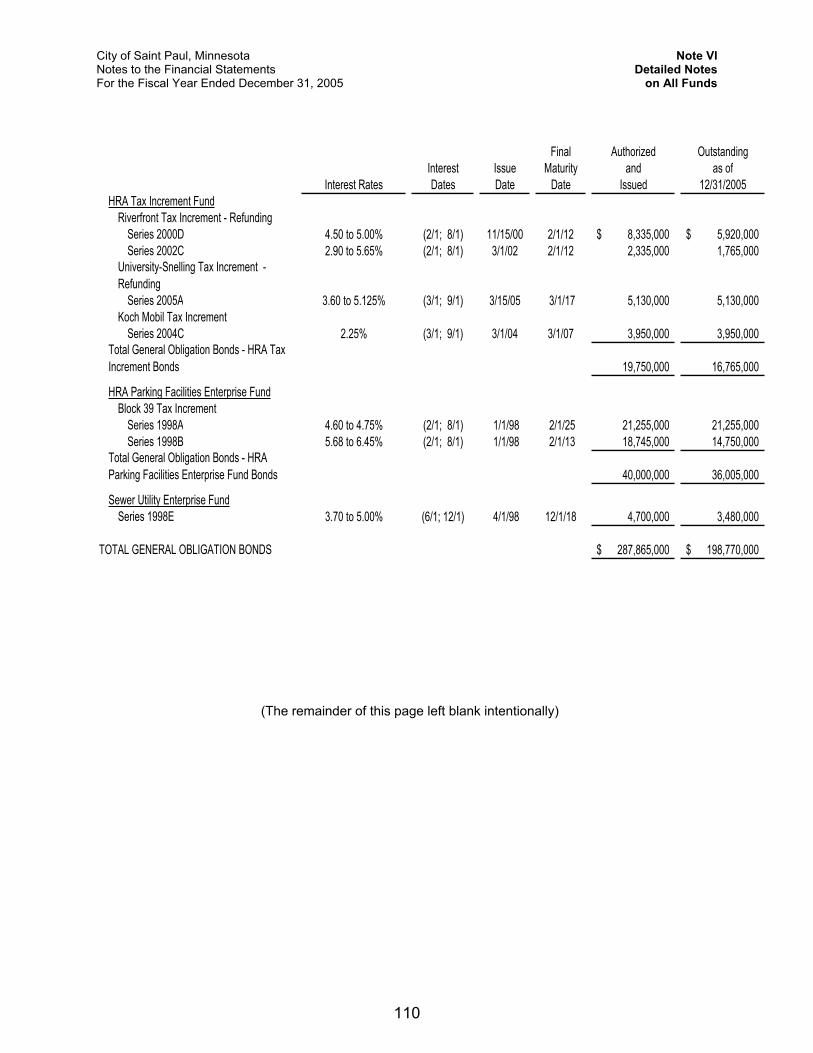
City of Saint Paul, Minnesota Note VI Notes to the Financial Statements Detailed NotesFor the Fiscal Year Ended December 31, 2005 on All Funds
Final Authorized OutstandingInterest Issue Maturity and as of
Interest Rates Dates Date Date Issued 12/31/2005HRA Tax Increment Fund
Riverfront Tax Increment - RefundingSeries 2000D 4.50 to 5.00% (2/1; 8/1) 11/15/00 2/1/12 8,335,000$ 5,920,000$ Series 2002C 2.90 to 5.65% (2/1; 8/1) 3/1/02 2/1/12 2,335,000 1,765,000
University-Snelling Tax Increment - Refunding
Series 2005A 3.60 to 5.125% (3/1; 9/1) 3/15/05 3/1/17 5,130,000 5,130,000 Koch Mobil Tax Increment
Series 2004C 2.25% (3/1; 9/1) 3/1/04 3/1/07 3,950,000 3,950,000 Total General Obligation Bonds - HRA Tax Increment Bonds 19,750,000 16,765,000
HRA Parking Facilities Enterprise FundBlock 39 Tax Increment
Series 1998A 4.60 to 4.75% (2/1; 8/1) 1/1/98 2/1/25 21,255,000 21,255,000 Series 1998B 5.68 to 6.45% (2/1; 8/1) 1/1/98 2/1/13 18,745,000 14,750,000
Total General Obligation Bonds - HRA Parking Facilities Enterprise Fund Bonds 40,000,000 36,005,000
Sewer Utility Enterprise FundSeries 1998E 3.70 to 5.00% (6/1; 12/1) 4/1/98 12/1/18 4,700,000 3,480,000
TOTAL GENERAL OBLIGATION BONDS 287,865,000$ 198,770,000$
(The remainder of this page left blank intentionally)
110
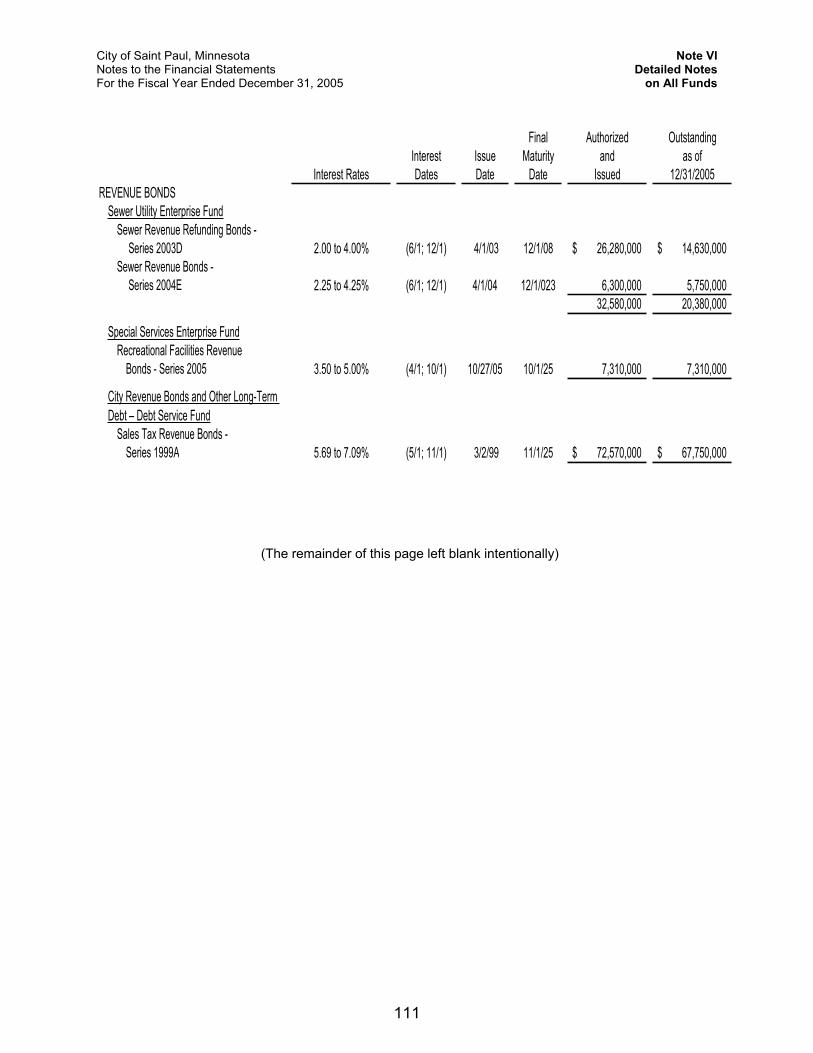
City of Saint Paul, Minnesota Note VI Notes to the Financial Statements Detailed NotesFor the Fiscal Year Ended December 31, 2005 on All Funds
Final Authorized OutstandingInterest Issue Maturity and as of
Interest Rates Dates Date Date Issued 12/31/2005REVENUE BONDS
Sewer Utility Enterprise FundSewer Revenue Refunding Bonds -
Series 2003D 2.00 to 4.00% (6/1; 12/1) 4/1/03 12/1/08 26,280,000$ 14,630,000$ Sewer Revenue Bonds -
Series 2004E 2.25 to 4.25% (6/1; 12/1) 4/1/04 12/1/023 6,300,000 5,750,000 32,580,000 20,380,000
Special Services Enterprise FundRecreational Facilities Revenue
Bonds - Series 2005 3.50 to 5.00% (4/1; 10/1) 10/27/05 10/1/25 7,310,000 7,310,000
City Revenue Bonds and Other Long-Term Debt – Debt Service Fund
Sales Tax Revenue Bonds -Series 1999A 5.69 to 7.09% (5/1; 11/1) 3/2/99 11/1/25 72,570,000$ 67,750,000$
(The remainder of this page left blank intentionally)
111
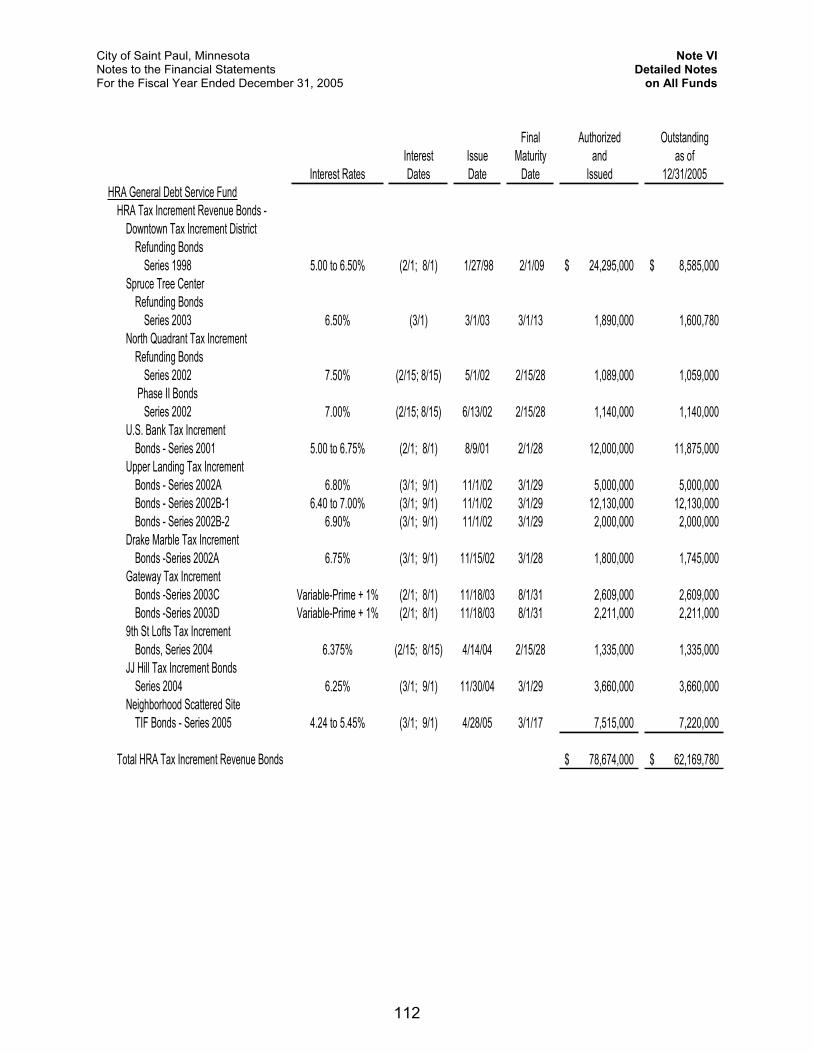
City of Saint Paul, Minnesota Note VI Notes to the Financial Statements Detailed NotesFor the Fiscal Year Ended December 31, 2005 on All Funds
Final Authorized OutstandingInterest Issue Maturity and as of
Interest Rates Dates Date Date Issued 12/31/2005HRA General Debt Service Fund
HRA Tax Increment Revenue Bonds -Downtown Tax Increment District
Refunding BondsSeries 1998 5.00 to 6.50% (2/1; 8/1) 1/27/98 2/1/09 24,295,000$ 8,585,000$
Spruce Tree CenterRefunding Bonds
Series 2003 6.50% (3/1) 3/1/03 3/1/13 1,890,000 1,600,780 North Quadrant Tax Increment
Refunding BondsSeries 2002 7.50% (2/15; 8/15) 5/1/02 2/15/28 1,089,000 1,059,000
Phase II BondsSeries 2002 7.00% (2/15; 8/15) 6/13/02 2/15/28 1,140,000 1,140,000
U.S. Bank Tax IncrementBonds - Series 2001 5.00 to 6.75% (2/1; 8/1) 8/9/01 2/1/28 12,000,000 11,875,000
Upper Landing Tax IncrementBonds - Series 2002A 6.80% (3/1; 9/1) 11/1/02 3/1/29 5,000,000 5,000,000 Bonds - Series 2002B-1 6.40 to 7.00% (3/1; 9/1) 11/1/02 3/1/29 12,130,000 12,130,000 Bonds - Series 2002B-2 6.90% (3/1; 9/1) 11/1/02 3/1/29 2,000,000 2,000,000
Drake Marble Tax IncrementBonds -Series 2002A 6.75% (3/1; 9/1) 11/15/02 3/1/28 1,800,000 1,745,000
Gateway Tax IncrementBonds -Series 2003C Variable-Prime + 1% (2/1; 8/1) 11/18/03 8/1/31 2,609,000 2,609,000 Bonds -Series 2003D Variable-Prime + 1% (2/1; 8/1) 11/18/03 8/1/31 2,211,000 2,211,000
9th St Lofts Tax IncrementBonds, Series 2004 6.375% (2/15; 8/15) 4/14/04 2/15/28 1,335,000 1,335,000
JJ Hill Tax Increment BondsSeries 2004 6.25% (3/1; 9/1) 11/30/04 3/1/29 3,660,000 3,660,000
Neighborhood Scattered SiteTIF Bonds - Series 2005 4.24 to 5.45% (3/1; 9/1) 4/28/05 3/1/17 7,515,000 7,220,000
Total HRA Tax Increment Revenue Bonds 78,674,000$ 62,169,780$
112
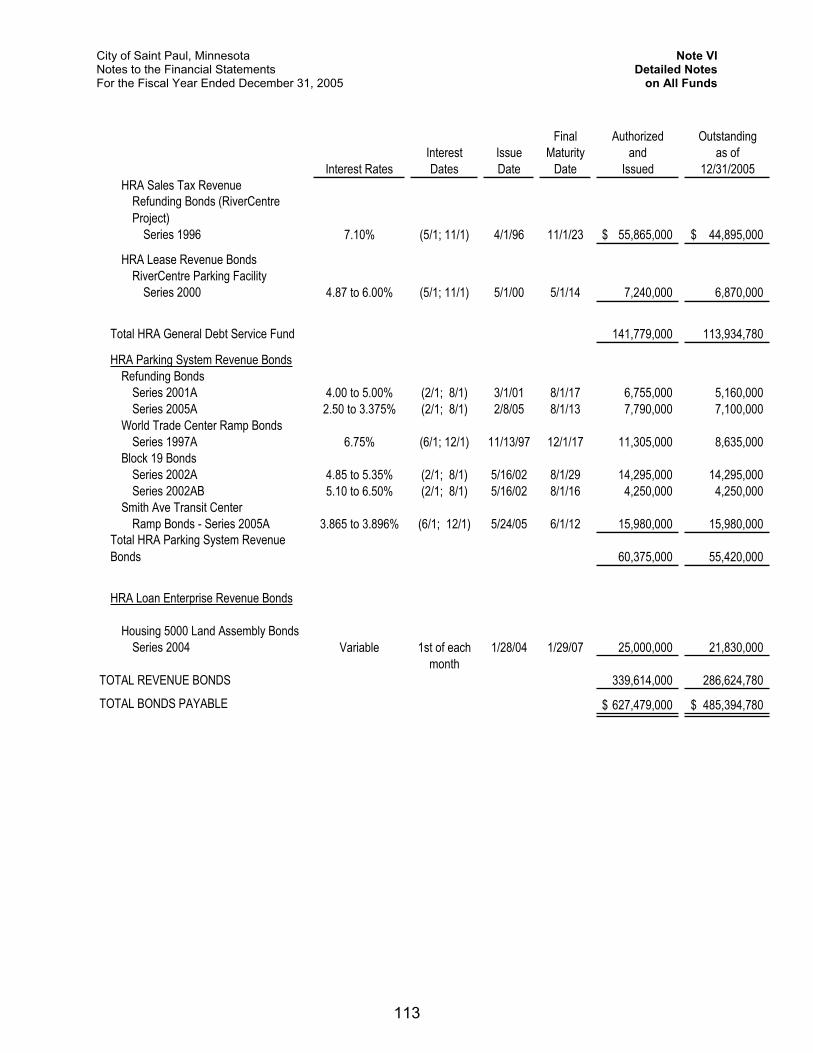
City of Saint Paul, Minnesota Note VI Notes to the Financial Statements Detailed NotesFor the Fiscal Year Ended December 31, 2005 on All Funds
Final Authorized OutstandingInterest Issue Maturity and as of
Interest Rates Dates Date Date Issued 12/31/2005HRA Sales Tax Revenue
Refunding Bonds (RiverCentre Project)
Series 1996 7.10% (5/1; 11/1) 4/1/96 11/1/23 55,865,000$ 44,895,000$
HRA Lease Revenue BondsRiverCentre Parking Facility
Series 2000 4.87 to 6.00% (5/1; 11/1) 5/1/00 5/1/14 7,240,000 6,870,000
Total HRA General Debt Service Fund 141,779,000 113,934,780
HRA Parking System Revenue BondsRefunding Bonds
Series 2001A 4.00 to 5.00% (2/1; 8/1) 3/1/01 8/1/17 6,755,000 5,160,000 Series 2005A 2.50 to 3.375% (2/1; 8/1) 2/8/05 8/1/13 7,790,000 7,100,000
World Trade Center Ramp BondsSeries 1997A 6.75% (6/1; 12/1) 11/13/97 12/1/17 11,305,000 8,635,000
Block 19 BondsSeries 2002A 4.85 to 5.35% (2/1; 8/1) 5/16/02 8/1/29 14,295,000 14,295,000 Series 2002AB 5.10 to 6.50% (2/1; 8/1) 5/16/02 8/1/16 4,250,000 4,250,000
Smith Ave Transit CenterRamp Bonds - Series 2005A 3.865 to 3.896% (6/1; 12/1) 5/24/05 6/1/12 15,980,000 15,980,000
Total HRA Parking System Revenue Bonds 60,375,000 55,420,000
HRA Loan Enterprise Revenue Bonds
Housing 5000 Land Assembly BondsSeries 2004 Variable 1st of each 1/28/04 1/29/07 25,000,000 21,830,000
monthTOTAL REVENUE BONDS 339,614,000 286,624,780
TOTAL BONDS PAYABLE 627,479,000$ 485,394,780$
113
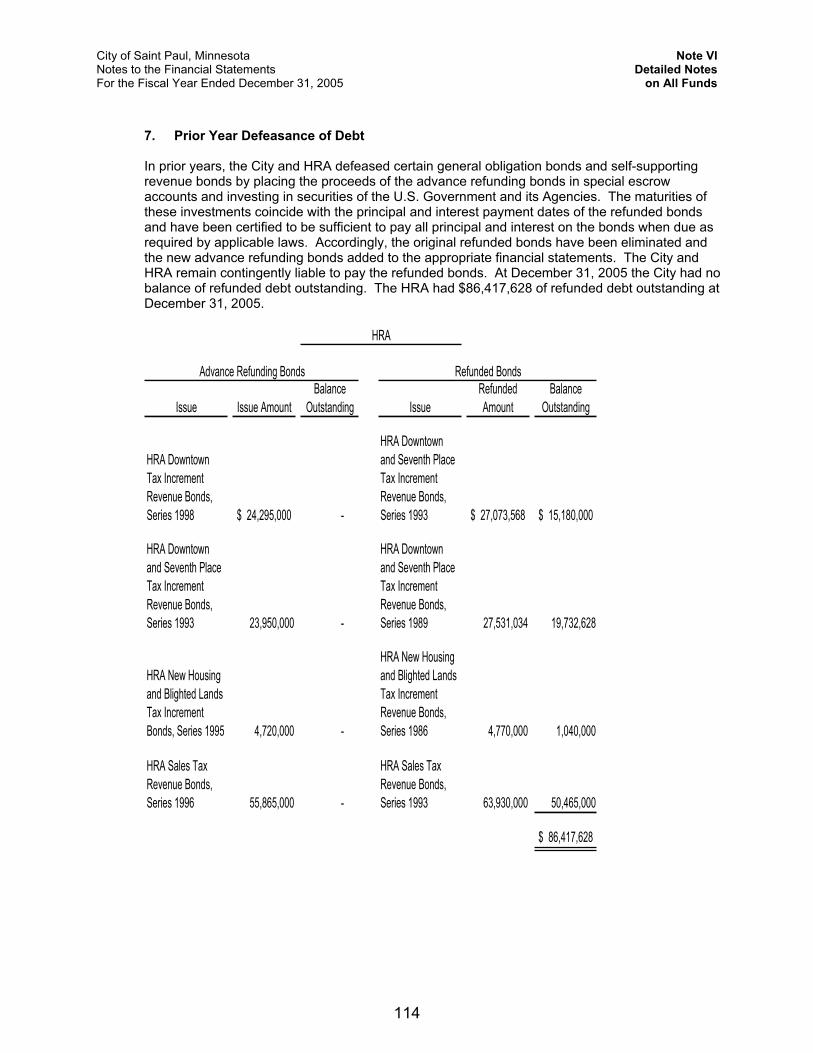
City of Saint Paul, Minnesota Note VI Notes to the Financial Statements Detailed NotesFor the Fiscal Year Ended December 31, 2005 on All Funds
7. Prior Year Defeasance of Debt
In prior years, the City and HRA defeased certain general obligation bonds and self-supporting revenue bonds by placing the proceeds of the advance refunding bonds in special escrow accounts and investing in securities of the U.S. Government and its Agencies. The maturities of these investments coincide with the principal and interest payment dates of the refunded bonds and have been certified to be sufficient to pay all principal and interest on the bonds when due as required by applicable laws. Accordingly, the original refunded bonds have been eliminated and the new advance refunding bonds added to the appropriate financial statements. The City and HRA remain contingently liable to pay the refunded bonds. At December 31, 2005 the City had no balance of refunded debt outstanding. The HRA had $86,417,628 of refunded debt outstanding at December 31, 2005.
Issue Issue AmountBalance
Outstanding IssueRefunded Amount
Balance Outstanding
HRA Downtown Tax Increment Revenue Bonds, Series 1998 $ 24,295,000 -
HRA Downtown and Seventh Place Tax Increment Revenue Bonds, Series 1993 $ 27,073,568 $ 15,180,000
HRA Downtown and Seventh Place Tax Increment Revenue Bonds, Series 1993 23,950,000 -
HRA Downtown and Seventh Place Tax Increment Revenue Bonds, Series 1989 27,531,034 19,732,628
HRA New Housing and Blighted Lands Tax Increment Bonds, Series 1995 4,720,000 -
HRA New Housing and Blighted Lands Tax Increment Revenue Bonds, Series 1986 4,770,000 1,040,000
HRA Sales Tax Revenue Bonds, Series 1996 55,865,000 -
HRA Sales Tax Revenue Bonds, Series 1993 63,930,000 50,465,000
$ 86,417,628
Advance Refunding Bonds Refunded Bonds
HRA
114
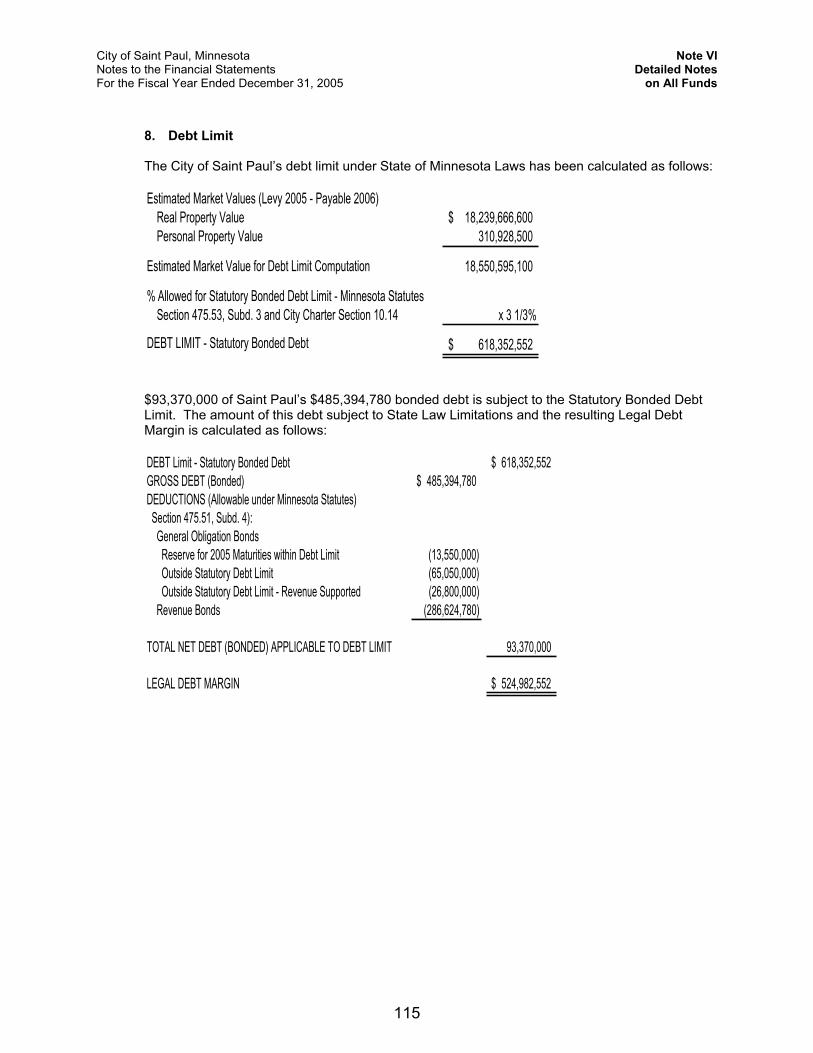
City of Saint Paul, Minnesota Note VI Notes to the Financial Statements Detailed NotesFor the Fiscal Year Ended December 31, 2005 on All Funds
8. Debt Limit
The City of Saint Paul’s debt limit under State of Minnesota Laws has been calculated as follows:
Estimated Market Values (Levy 2005 - Payable 2006)Real Property Value 18,239,666,600$Personal Property Value 310,928,500
Estimated Market Value for Debt Limit Computation 18,550,595,100
% Allowed for Statutory Bonded Debt Limit - Minnesota StatutesSection 475.53, Subd. 3 and City Charter Section 10.14 x 3 1/3%
DEBT LIMIT - Statutory Bonded Debt 618,352,552$
$93,370,000 of Saint Paul’s $485,394,780 bonded debt is subject to the Statutory Bonded Debt Limit. The amount of this debt subject to State Law Limitations and the resulting Legal Debt Margin is calculated as follows:
DEBT Limit - Statutory Bonded Debt 618,352,552$GROSS DEBT (Bonded) 485,394,780$DEDUCTIONS (Allowable under Minnesota Statutes) Section 475.51, Subd. 4): General Obligation Bonds Reserve for 2005 Maturities within Debt Limit (13,550,000) Outside Statutory Debt Limit (65,050,000) Outside Statutory Debt Limit - Revenue Supported (26,800,000) Revenue Bonds (286,624,780)
TOTAL NET DEBT (BONDED) APPLICABLE TO DEBT LIMIT 93,370,000
LEGAL DEBT MARGIN 524,982,552$
115
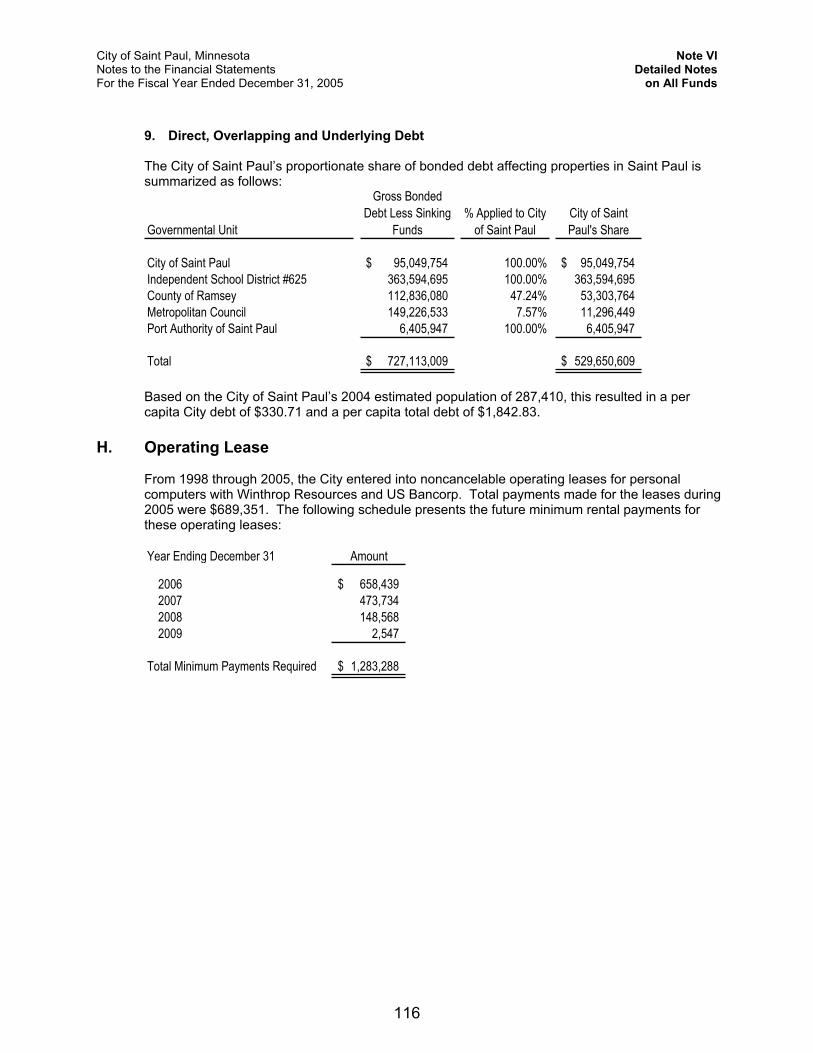
City of Saint Paul, Minnesota Note VI Notes to the Financial Statements Detailed NotesFor the Fiscal Year Ended December 31, 2005 on All Funds
9. Direct, Overlapping and Underlying Debt
The City of Saint Paul’s proportionate share of bonded debt affecting properties in Saint Paul is summarized as follows:
Governmental Unit
Gross Bonded Debt Less Sinking
Funds% Applied to City
of Saint PaulCity of Saint Paul's Share
City of Saint Paul 95,049,754$ 100.00% 95,049,754$ Independent School District #625 363,594,695 100.00% 363,594,695County of Ramsey 112,836,080 47.24% 53,303,764Metropolitan Council 149,226,533 7.57% 11,296,449Port Authority of Saint Paul 6,405,947 100.00% 6,405,947
Total 727,113,009$ 529,650,609$
Based on the City of Saint Paul’s 2004 estimated population of 287,410, this resulted in a per capita City debt of $330.71 and a per capita total debt of $1,842.83.
H. Operating Lease
From 1998 through 2005, the City entered into noncancelable operating leases for personal computers with Winthrop Resources and US Bancorp. Total payments made for the leases during 2005 were $689,351. The following schedule presents the future minimum rental payments for these operating leases:
Year Ending December 31 Amount
2006 658,439$2007 473,7342008 148,5682009 2,547
Total Minimum Payments Required 1,283,288$
116
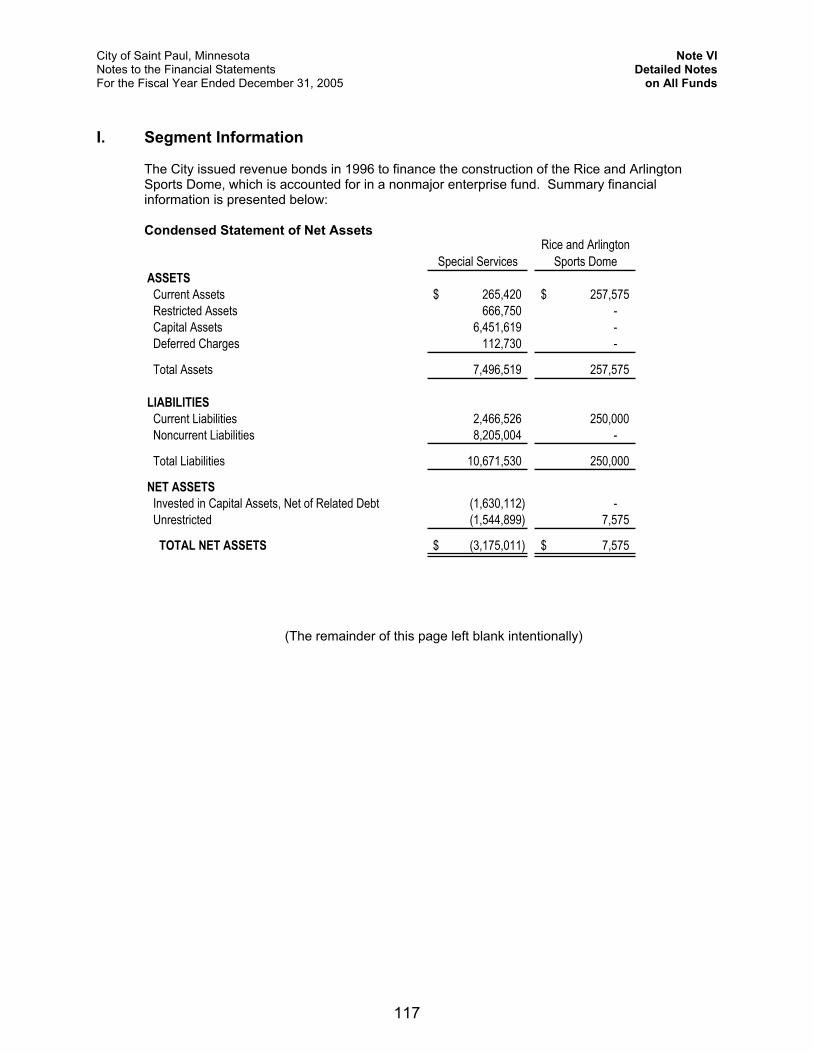
City of Saint Paul, Minnesota Note VI Notes to the Financial Statements Detailed NotesFor the Fiscal Year Ended December 31, 2005 on All Funds
I. Segment Information
The City issued revenue bonds in 1996 to finance the construction of the Rice and Arlington Sports Dome, which is accounted for in a nonmajor enterprise fund. Summary financial information is presented below:
Condensed Statement of Net Assets
Special ServicesRice and Arlington
Sports DomeASSETS Current Assets 265,420$ 257,575$ Restricted Assets 666,750 - Capital Assets 6,451,619 - Deferred Charges 112,730 -
Total Assets 7,496,519 257,575
LIABILITIES Current Liabilities 2,466,526 250,000 Noncurrent Liabilities 8,205,004 -
Total Liabilities 10,671,530 250,000
NET ASSETS Invested in Capital Assets, Net of Related Debt (1,630,112) - Unrestricted (1,544,899) 7,575
TOTAL NET ASSETS (3,175,011)$ 7,575$
(The remainder of this page left blank intentionally)
117
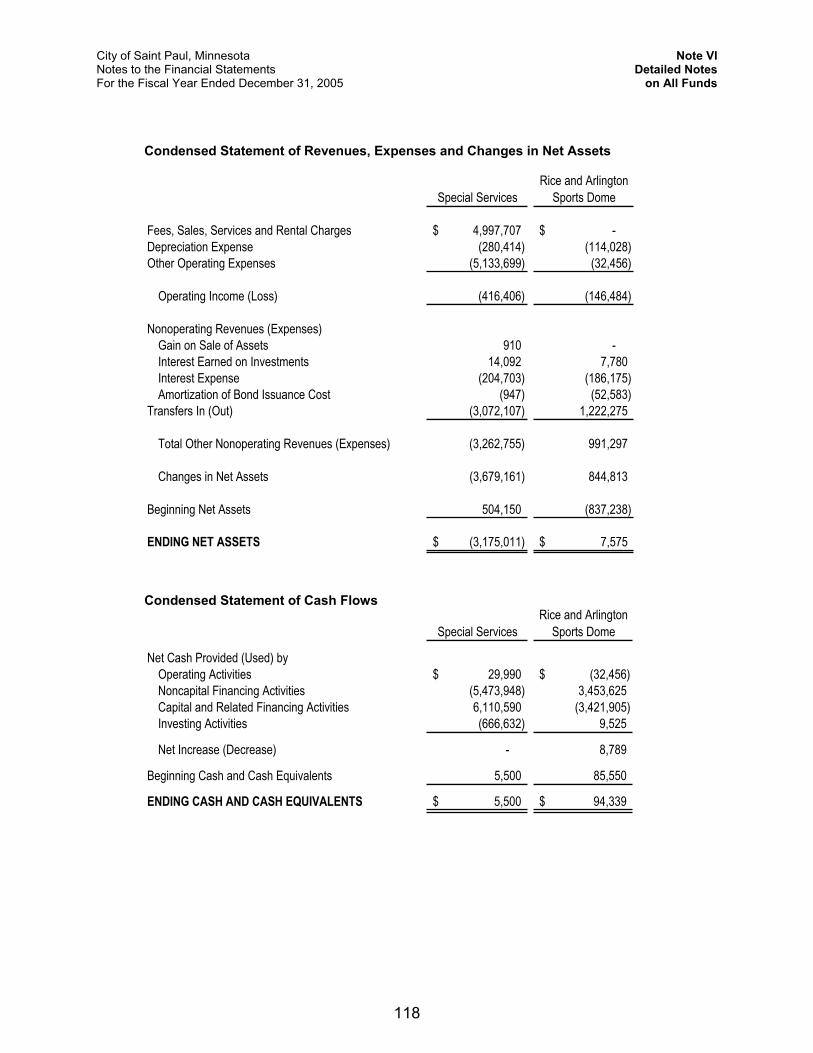
City of Saint Paul, Minnesota Note VI Notes to the Financial Statements Detailed NotesFor the Fiscal Year Ended December 31, 2005 on All Funds
Condensed Statement of Revenues, Expenses and Changes in Net Assets
Special ServicesRice and Arlington
Sports Dome
Fees, Sales, Services and Rental Charges 4,997,707$ -$ Depreciation Expense (280,414) (114,028) Other Operating Expenses (5,133,699) (32,456)
Operating Income (Loss) (416,406) (146,484)
Nonoperating Revenues (Expenses)Gain on Sale of Assets 910 - Interest Earned on Investments 14,092 7,780 Interest Expense (204,703) (186,175) Amortization of Bond Issuance Cost (947) (52,583)
Transfers In (Out) (3,072,107) 1,222,275
Total Other Nonoperating Revenues (Expenses) (3,262,755) 991,297
Changes in Net Assets (3,679,161) 844,813
Beginning Net Assets 504,150 (837,238)
ENDING NET ASSETS (3,175,011)$ 7,575$
Condensed Statement of Cash Flows
Special ServicesRice and Arlington
Sports Dome
Net Cash Provided (Used) byOperating Activities 29,990$ (32,456)$ Noncapital Financing Activities (5,473,948) 3,453,625 Capital and Related Financing Activities 6,110,590 (3,421,905)Investing Activities (666,632) 9,525
Net Increase (Decrease) - 8,789
Beginning Cash and Cash Equivalents 5,500 85,550
ENDING CASH AND CASH EQUIVALENTS 5,500$ 94,339$
118
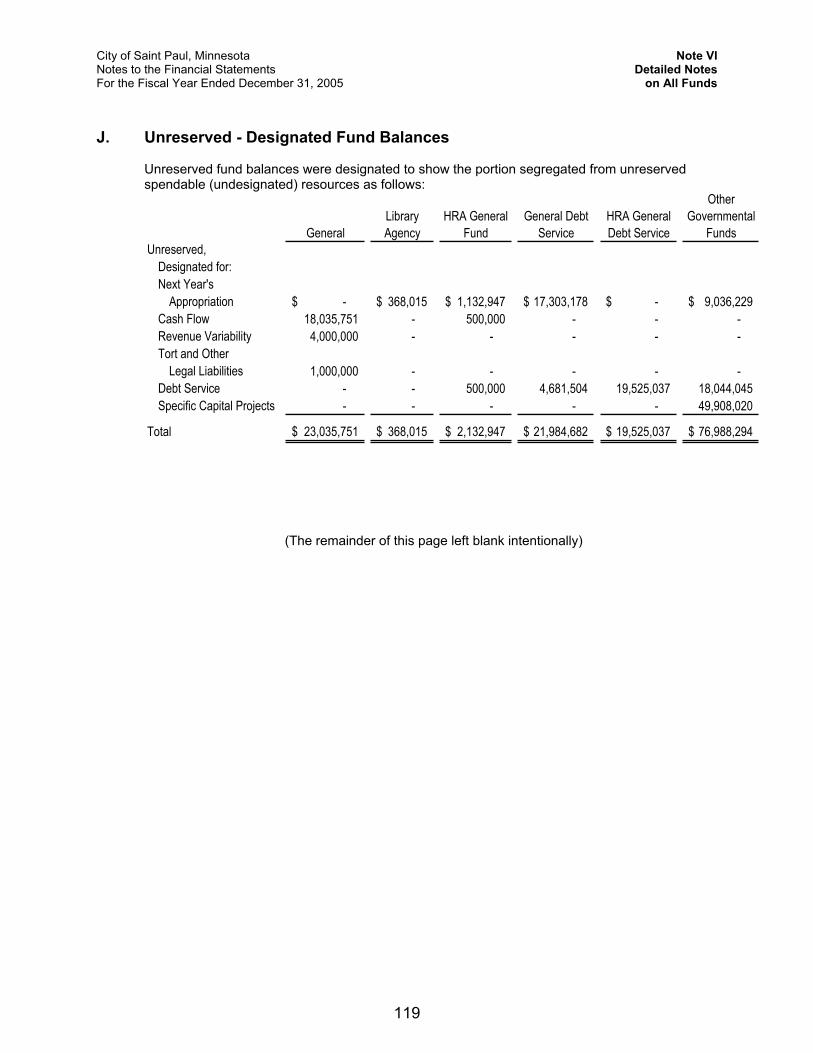
City of Saint Paul, Minnesota Note VI Notes to the Financial Statements Detailed NotesFor the Fiscal Year Ended December 31, 2005 on All Funds
J. Unreserved - Designated Fund Balances
Unreserved fund balances were designated to show the portion segregated from unreserved spendable (undesignated) resources as follows:
GeneralLibraryAgency
HRA General Fund
General Debt Service
HRA General Debt Service
OtherGovernmental
FundsUnreserved,
Designated for:Next Year's
Appropriation -$ 368,015$ 1,132,947$ 17,303,178$ -$ 9,036,229$Cash Flow 18,035,751 - 500,000 - - - Revenue Variability 4,000,000 - - - - - Tort and Other
Legal Liabilities 1,000,000 - - - - - Debt Service - - 500,000 4,681,504 19,525,037 18,044,045Specific Capital Projects - - - - - 49,908,020
Total 23,035,751$ 368,015$ 2,132,947$ 21,984,682$ 19,525,037$ 76,988,294$
(The remainder of this page left blank intentionally)
119
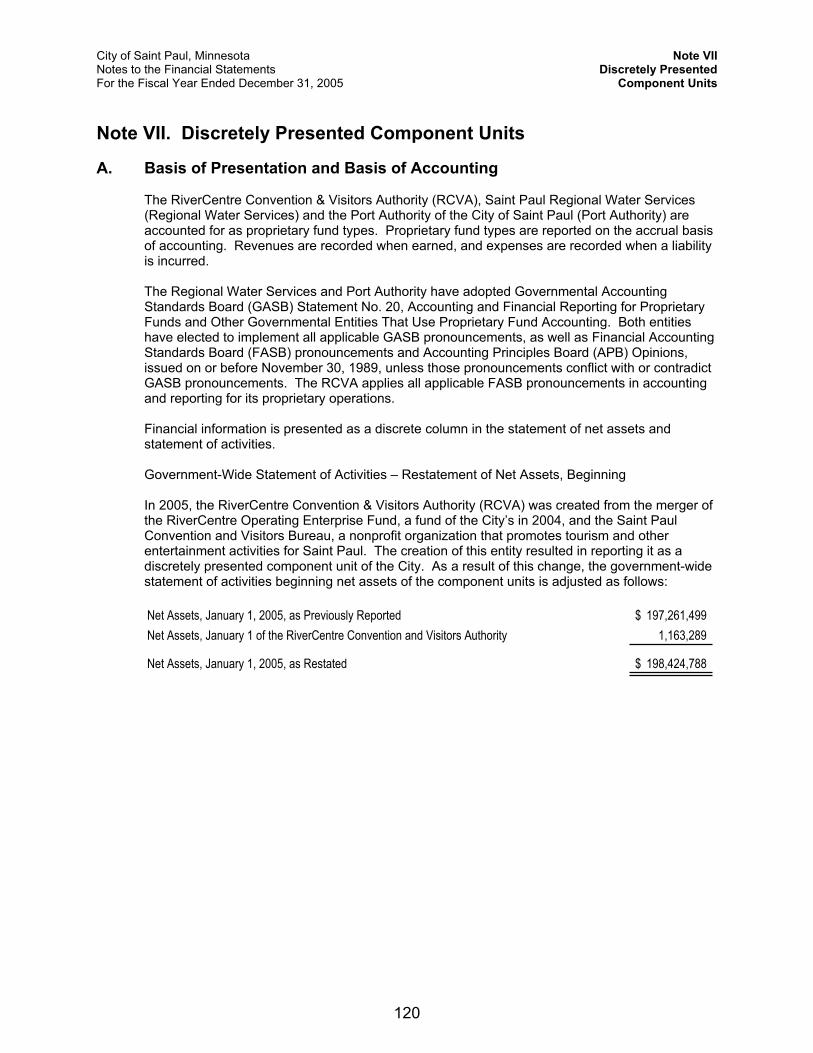
City of Saint Paul, Minnesota Note VII Notes to the Financial Statements Discretely PresentedFor the Fiscal Year Ended December 31, 2005 Component Units
Note VII. Discretely Presented Component Units
A. Basis of Presentation and Basis of Accounting
The RiverCentre Convention & Visitors Authority (RCVA), Saint Paul Regional Water Services (Regional Water Services) and the Port Authority of the City of Saint Paul (Port Authority) are accounted for as proprietary fund types. Proprietary fund types are reported on the accrual basis of accounting. Revenues are recorded when earned, and expenses are recorded when a liability is incurred.
The Regional Water Services and Port Authority have adopted Governmental Accounting Standards Board (GASB) Statement No. 20, Accounting and Financial Reporting for Proprietary Funds and Other Governmental Entities That Use Proprietary Fund Accounting. Both entities have elected to implement all applicable GASB pronouncements, as well as Financial Accounting Standards Board (FASB) pronouncements and Accounting Principles Board (APB) Opinions, issued on or before November 30, 1989, unless those pronouncements conflict with or contradict GASB pronouncements. The RCVA applies all applicable FASB pronouncements in accounting and reporting for its proprietary operations.
Financial information is presented as a discrete column in the statement of net assets and statement of activities.
Government-Wide Statement of Activities – Restatement of Net Assets, Beginning
In 2005, the RiverCentre Convention & Visitors Authority (RCVA) was created from the merger of the RiverCentre Operating Enterprise Fund, a fund of the City’s in 2004, and the Saint Paul Convention and Visitors Bureau, a nonprofit organization that promotes tourism and other entertainment activities for Saint Paul. The creation of this entity resulted in reporting it as a discretely presented component unit of the City. As a result of this change, the government-wide statement of activities beginning net assets of the component units is adjusted as follows:
Net Assets, January 1, 2005, as Previously Reported 197,261,499$Net Assets, January 1 of the RiverCentre Convention and Visitors Authority 1,163,289
Net Assets, January 1, 2005, as Restated 198,424,788$
120
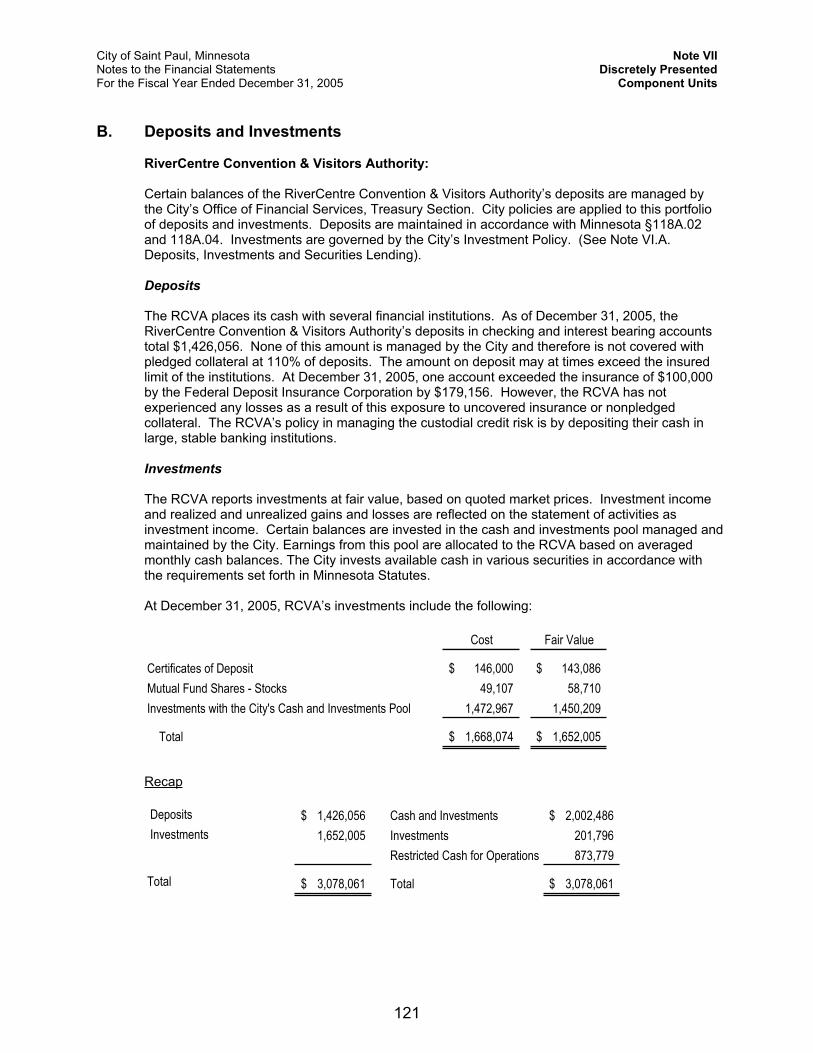
City of Saint Paul, Minnesota Note VII Notes to the Financial Statements Discretely PresentedFor the Fiscal Year Ended December 31, 2005 Component Units
B. Deposits and Investments
RiverCentre Convention & Visitors Authority:
Certain balances of the RiverCentre Convention & Visitors Authority’s deposits are managed by the City’s Office of Financial Services, Treasury Section. City policies are applied to this portfolio of deposits and investments. Deposits are maintained in accordance with Minnesota §118A.02 and 118A.04. Investments are governed by the City’s Investment Policy. (See Note VI.A.Deposits, Investments and Securities Lending).
Deposits
The RCVA places its cash with several financial institutions. As of December 31, 2005, the RiverCentre Convention & Visitors Authority’s deposits in checking and interest bearing accounts total $1,426,056. None of this amount is managed by the City and therefore is not covered with pledged collateral at 110% of deposits. The amount on deposit may at times exceed the insured limit of the institutions. At December 31, 2005, one account exceeded the insurance of $100,000 by the Federal Deposit Insurance Corporation by $179,156. However, the RCVA has not experienced any losses as a result of this exposure to uncovered insurance or nonpledged collateral. The RCVA’s policy in managing the custodial credit risk is by depositing their cash in large, stable banking institutions.
Investments
The RCVA reports investments at fair value, based on quoted market prices. Investment income and realized and unrealized gains and losses are reflected on the statement of activities as investment income. Certain balances are invested in the cash and investments pool managed and maintained by the City. Earnings from this pool are allocated to the RCVA based on averaged monthly cash balances. The City invests available cash in various securities in accordance with the requirements set forth in Minnesota Statutes.
At December 31, 2005, RCVA’s investments include the following:
Cost Fair Value
Certificates of Deposit 146,000$ 143,086$ Mutual Fund Shares - Stocks 49,107 58,710 Investments with the City's Cash and Investments Pool 1,472,967 1,450,209
Total 1,668,074$ 1,652,005$
Recap
Deposits 1,426,056$ Cash and Investments 2,002,486$ Investments 1,652,005 Investments 201,796
Restricted Cash for Operations 873,779
Total 3,078,061$ Total 3,078,061$
121
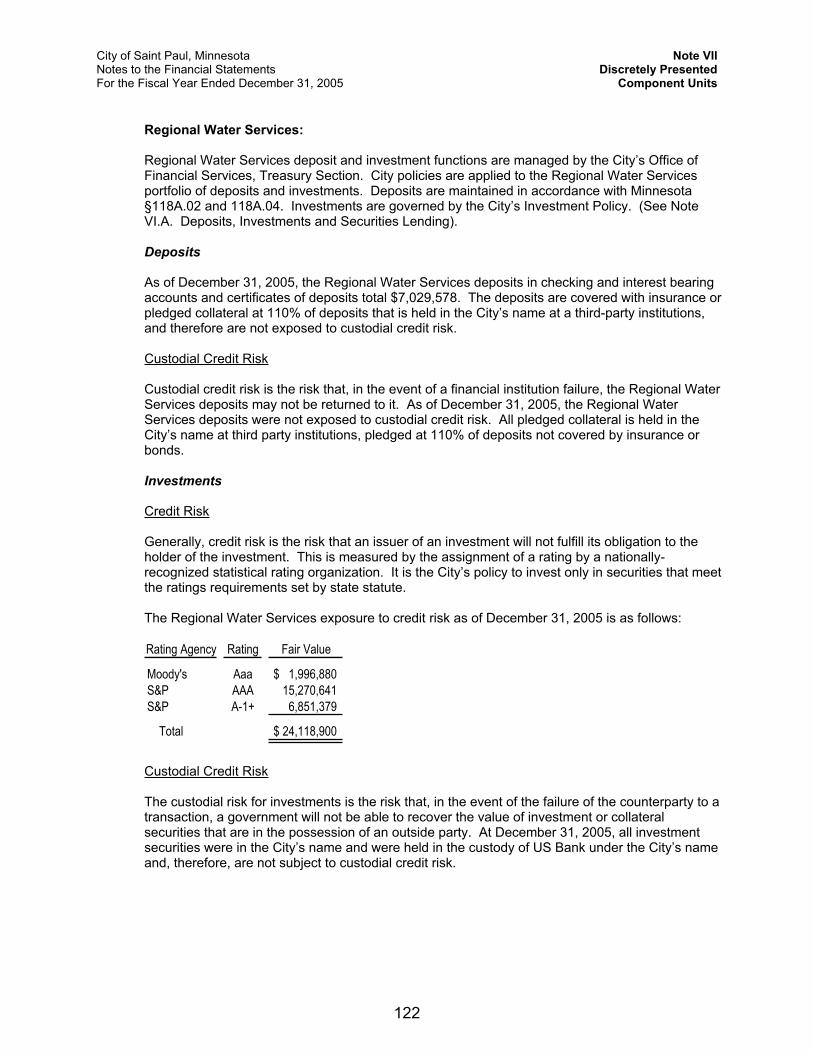
City of Saint Paul, Minnesota Note VII Notes to the Financial Statements Discretely PresentedFor the Fiscal Year Ended December 31, 2005 Component Units
Regional Water Services:
Regional Water Services deposit and investment functions are managed by the City’s Office of Financial Services, Treasury Section. City policies are applied to the Regional Water Services portfolio of deposits and investments. Deposits are maintained in accordance with Minnesota §118A.02 and 118A.04. Investments are governed by the City’s Investment Policy. (See Note VI.A. Deposits, Investments and Securities Lending).
Deposits
As of December 31, 2005, the Regional Water Services deposits in checking and interest bearing accounts and certificates of deposits total $7,029,578. The deposits are covered with insurance or pledged collateral at 110% of deposits that is held in the City’s name at a third-party institutions, and therefore are not exposed to custodial credit risk.
Custodial Credit Risk
Custodial credit risk is the risk that, in the event of a financial institution failure, the Regional Water Services deposits may not be returned to it. As of December 31, 2005, the Regional Water Services deposits were not exposed to custodial credit risk. All pledged collateral is held in the City’s name at third party institutions, pledged at 110% of deposits not covered by insurance or bonds.
Investments
Credit Risk
Generally, credit risk is the risk that an issuer of an investment will not fulfill its obligation to the holder of the investment. This is measured by the assignment of a rating by a nationally-recognized statistical rating organization. It is the City’s policy to invest only in securities that meet the ratings requirements set by state statute.
The Regional Water Services exposure to credit risk as of December 31, 2005 is as follows:
Rating Agency Rating Fair Value
Moody's Aaa 1,996,880$S&P AAA 15,270,641S&P A-1+ 6,851,379
Total 24,118,900$
Custodial Credit Risk
The custodial risk for investments is the risk that, in the event of the failure of the counterparty to a transaction, a government will not be able to recover the value of investment or collateral securities that are in the possession of an outside party. At December 31, 2005, all investment securities were in the City’s name and were held in the custody of US Bank under the City’s name and, therefore, are not subject to custodial credit risk.
122
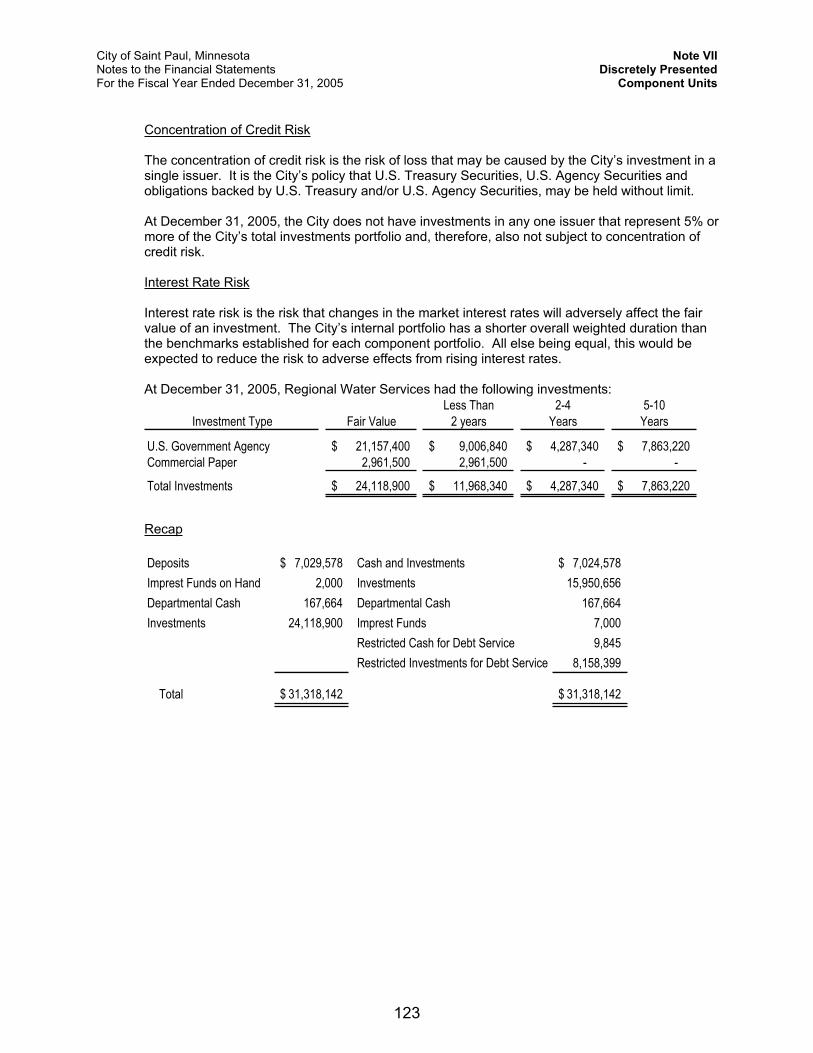
City of Saint Paul, Minnesota Note VII Notes to the Financial Statements Discretely PresentedFor the Fiscal Year Ended December 31, 2005 Component Units
Concentration of Credit Risk
The concentration of credit risk is the risk of loss that may be caused by the City’s investment in a single issuer. It is the City’s policy that U.S. Treasury Securities, U.S. Agency Securities and obligations backed by U.S. Treasury and/or U.S. Agency Securities, may be held without limit.
At December 31, 2005, the City does not have investments in any one issuer that represent 5% or more of the City’s total investments portfolio and, therefore, also not subject to concentration of credit risk.
Interest Rate Risk
Interest rate risk is the risk that changes in the market interest rates will adversely affect the fair value of an investment. The City’s internal portfolio has a shorter overall weighted duration than the benchmarks established for each component portfolio. All else being equal, this would be expected to reduce the risk to adverse effects from rising interest rates.
At December 31, 2005, Regional Water Services had the following investments: Less Than 2-4 5-10
Investment Type Fair Value 2 years Years Years
U.S. Government Agency 21,157,400$ 9,006,840$ 4,287,340$ 7,863,220$Commercial Paper 2,961,500 2,961,500 - -
Total Investments 24,118,900$ 11,968,340$ 4,287,340$ 7,863,220$
Recap
Deposits 7,029,578$ Cash and Investments 7,024,578$Imprest Funds on Hand 2,000 Investments 15,950,656 Departmental Cash 167,664 Departmental Cash 167,664 Investments 24,118,900 Imprest Funds 7,000
Restricted Cash for Debt Service 9,845 Restricted Investments for Debt Service 8,158,399
Total 31,318,142$ 31,318,142$
123
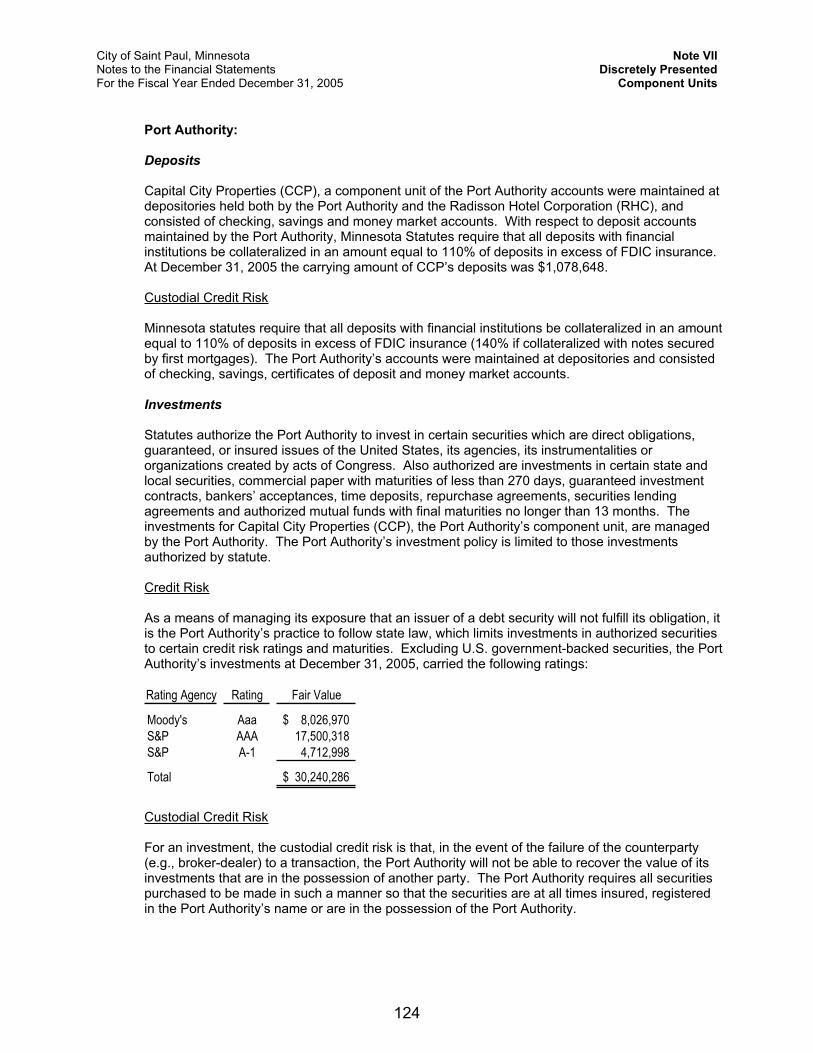
City of Saint Paul, Minnesota Note VII Notes to the Financial Statements Discretely PresentedFor the Fiscal Year Ended December 31, 2005 Component Units
Port Authority:
Deposits
Capital City Properties (CCP), a component unit of the Port Authority accounts were maintained at depositories held both by the Port Authority and the Radisson Hotel Corporation (RHC), and consisted of checking, savings and money market accounts. With respect to deposit accounts maintained by the Port Authority, Minnesota Statutes require that all deposits with financial institutions be collateralized in an amount equal to 110% of deposits in excess of FDIC insurance.At December 31, 2005 the carrying amount of CCP’s deposits was $1,078,648.
Custodial Credit Risk
Minnesota statutes require that all deposits with financial institutions be collateralized in an amount equal to 110% of deposits in excess of FDIC insurance (140% if collateralized with notes secured by first mortgages). The Port Authority’s accounts were maintained at depositories and consisted of checking, savings, certificates of deposit and money market accounts.
Investments
Statutes authorize the Port Authority to invest in certain securities which are direct obligations, guaranteed, or insured issues of the United States, its agencies, its instrumentalities or organizations created by acts of Congress. Also authorized are investments in certain state and local securities, commercial paper with maturities of less than 270 days, guaranteed investment contracts, bankers’ acceptances, time deposits, repurchase agreements, securities lending agreements and authorized mutual funds with final maturities no longer than 13 months. The investments for Capital City Properties (CCP), the Port Authority’s component unit, are managed by the Port Authority. The Port Authority’s investment policy is limited to those investments authorized by statute.
Credit Risk
As a means of managing its exposure that an issuer of a debt security will not fulfill its obligation, it is the Port Authority’s practice to follow state law, which limits investments in authorized securities to certain credit risk ratings and maturities. Excluding U.S. government-backed securities, the Port Authority’s investments at December 31, 2005, carried the following ratings:
Rating Agency Rating Fair Value
Moody's Aaa 8,026,970$S&P AAA 17,500,318S&P A-1 4,712,998
Total 30,240,286$
Custodial Credit Risk
For an investment, the custodial credit risk is that, in the event of the failure of the counterparty (e.g., broker-dealer) to a transaction, the Port Authority will not be able to recover the value of its investments that are in the possession of another party. The Port Authority requires all securities purchased to be made in such a manner so that the securities are at all times insured, registered in the Port Authority’s name or are in the possession of the Port Authority.
124
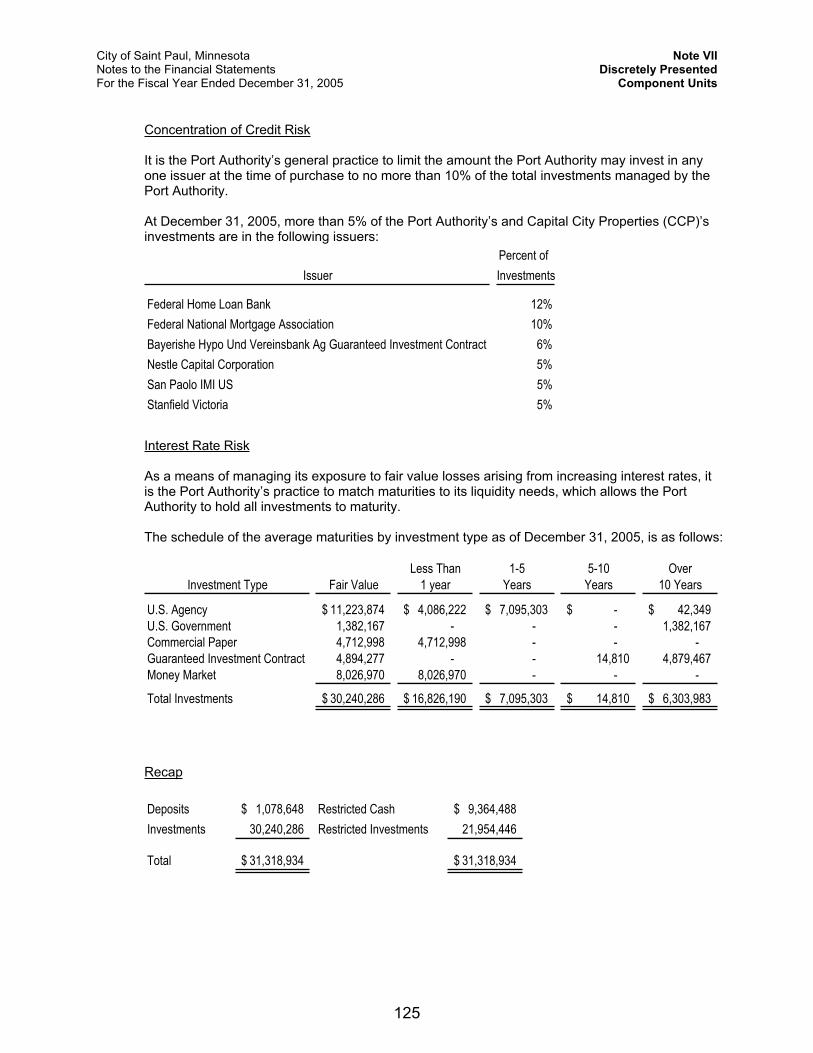
City of Saint Paul, Minnesota Note VII Notes to the Financial Statements Discretely PresentedFor the Fiscal Year Ended December 31, 2005 Component Units
Concentration of Credit Risk
It is the Port Authority’s general practice to limit the amount the Port Authority may invest in any one issuer at the time of purchase to no more than 10% of the total investments managed by the Port Authority.
At December 31, 2005, more than 5% of the Port Authority’s and Capital City Properties (CCP)’s investments are in the following issuers:
Percent ofIssuer Investments
Federal Home Loan Bank 12%Federal National Mortgage Association 10%Bayerishe Hypo Und Vereinsbank Ag Guaranteed Investment Contract 6%Nestle Capital Corporation 5%San Paolo IMI US 5%Stanfield Victoria 5%
Interest Rate Risk
As a means of managing its exposure to fair value losses arising from increasing interest rates, it is the Port Authority’s practice to match maturities to its liquidity needs, which allows the Port Authority to hold all investments to maturity.
The schedule of the average maturities by investment type as of December 31, 2005, is as follows:
Less Than 1-5 5-10 OverInvestment Type Fair Value 1 year Years Years 10 Years
U.S. Agency 11,223,874$ 4,086,222$ 7,095,303$ -$ 42,349$ U.S. Government 1,382,167 - - - 1,382,167Commercial Paper 4,712,998 4,712,998 - - - Guaranteed Investment Contract 4,894,277 - - 14,810 4,879,467Money Market 8,026,970 8,026,970 - - -
Total Investments 30,240,286$ 16,826,190$ 7,095,303$ 14,810$ 6,303,983$
Recap
Deposits 1,078,648$ Restricted Cash 9,364,488$ Investments 30,240,286 Restricted Investments 21,954,446
Total 31,318,934$ 31,318,934$
125
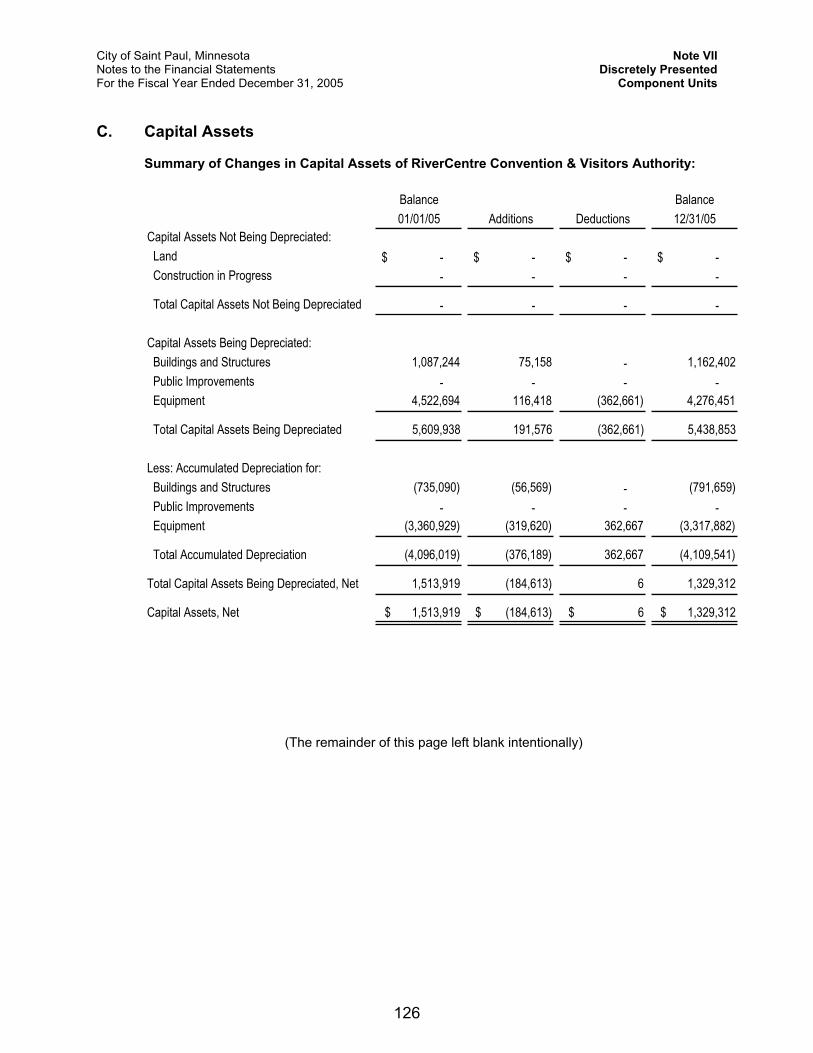
City of Saint Paul, Minnesota Note VII Notes to the Financial Statements Discretely PresentedFor the Fiscal Year Ended December 31, 2005 Component Units
C. Capital Assets
Summary of Changes in Capital Assets of RiverCentre Convention & Visitors Authority:
Balance Balance01/01/05 Additions Deductions 12/31/05
Capital Assets Not Being Depreciated: Land -$ -$ -$ -$ Construction in Progress - - - -
Total Capital Assets Not Being Depreciated - - - -
Capital Assets Being Depreciated: Buildings and Structures 1,087,244 75,158 - 1,162,402 Public Improvements - - - - Equipment 4,522,694 116,418 (362,661) 4,276,451
Total Capital Assets Being Depreciated 5,609,938 191,576 (362,661) 5,438,853
Less: Accumulated Depreciation for: Buildings and Structures (735,090) (56,569) - (791,659) Public Improvements - - - - Equipment (3,360,929) (319,620) 362,667 (3,317,882)
Total Accumulated Depreciation (4,096,019) (376,189) 362,667 (4,109,541)
Total Capital Assets Being Depreciated, Net 1,513,919 (184,613) 6 1,329,312
Capital Assets, Net $ 1,513,919 $ (184,613) $ 6 $ 1,329,312
(The remainder of this page left blank intentionally)
126
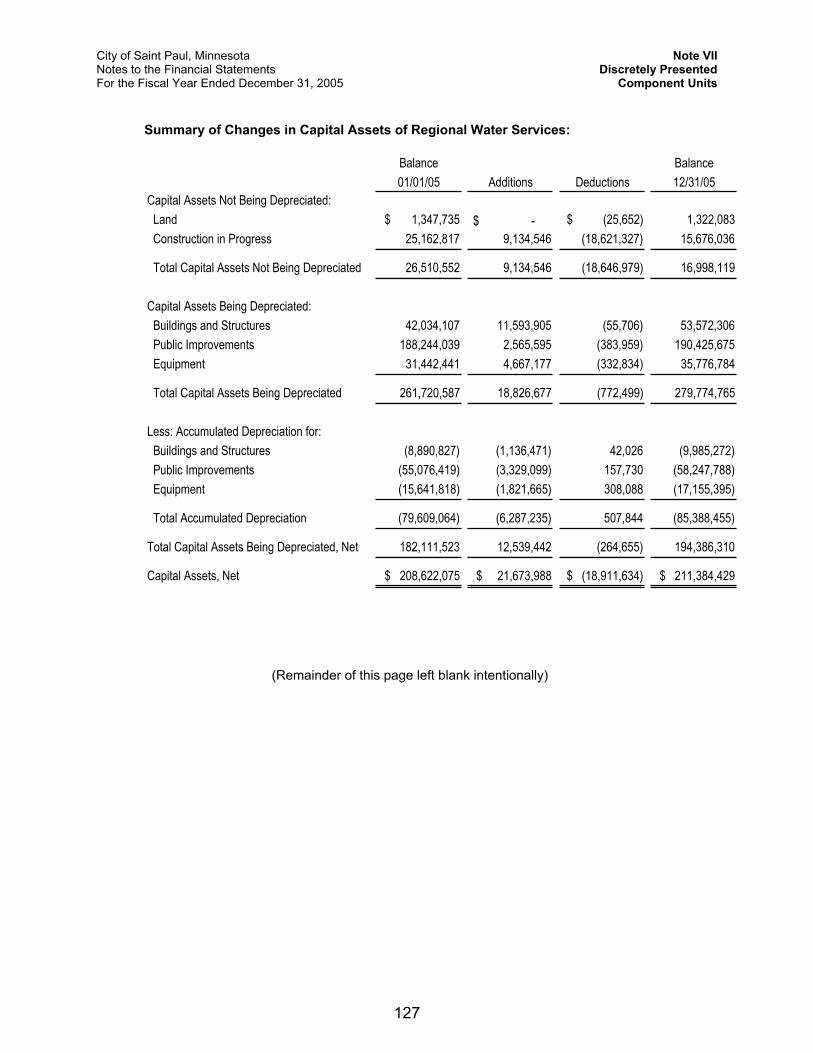
City of Saint Paul, Minnesota Note VII Notes to the Financial Statements Discretely PresentedFor the Fiscal Year Ended December 31, 2005 Component Units
Summary of Changes in Capital Assets of Regional Water Services:
Balance Balance01/01/05 Additions Deductions 12/31/05
Capital Assets Not Being Depreciated: Land $ 1,347,735 -$ $ (25,652) 1,322,083 Construction in Progress 25,162,817 9,134,546 (18,621,327) 15,676,036
Total Capital Assets Not Being Depreciated 26,510,552 9,134,546 (18,646,979) 16,998,119
Capital Assets Being Depreciated: Buildings and Structures 42,034,107 11,593,905 (55,706) 53,572,306 Public Improvements 188,244,039 2,565,595 (383,959) 190,425,675 Equipment 31,442,441 4,667,177 (332,834) 35,776,784
Total Capital Assets Being Depreciated 261,720,587 18,826,677 (772,499) 279,774,765
Less: Accumulated Depreciation for: Buildings and Structures (8,890,827) (1,136,471) 42,026 (9,985,272) Public Improvements (55,076,419) (3,329,099) 157,730 (58,247,788) Equipment (15,641,818) (1,821,665) 308,088 (17,155,395)
Total Accumulated Depreciation (79,609,064) (6,287,235) 507,844 (85,388,455)
Total Capital Assets Being Depreciated, Net 182,111,523 12,539,442 (264,655) 194,386,310
Capital Assets, Net $ 208,622,075 $ 21,673,988 $ (18,911,634) $ 211,384,429
(Remainder of this page left blank intentionally)
127
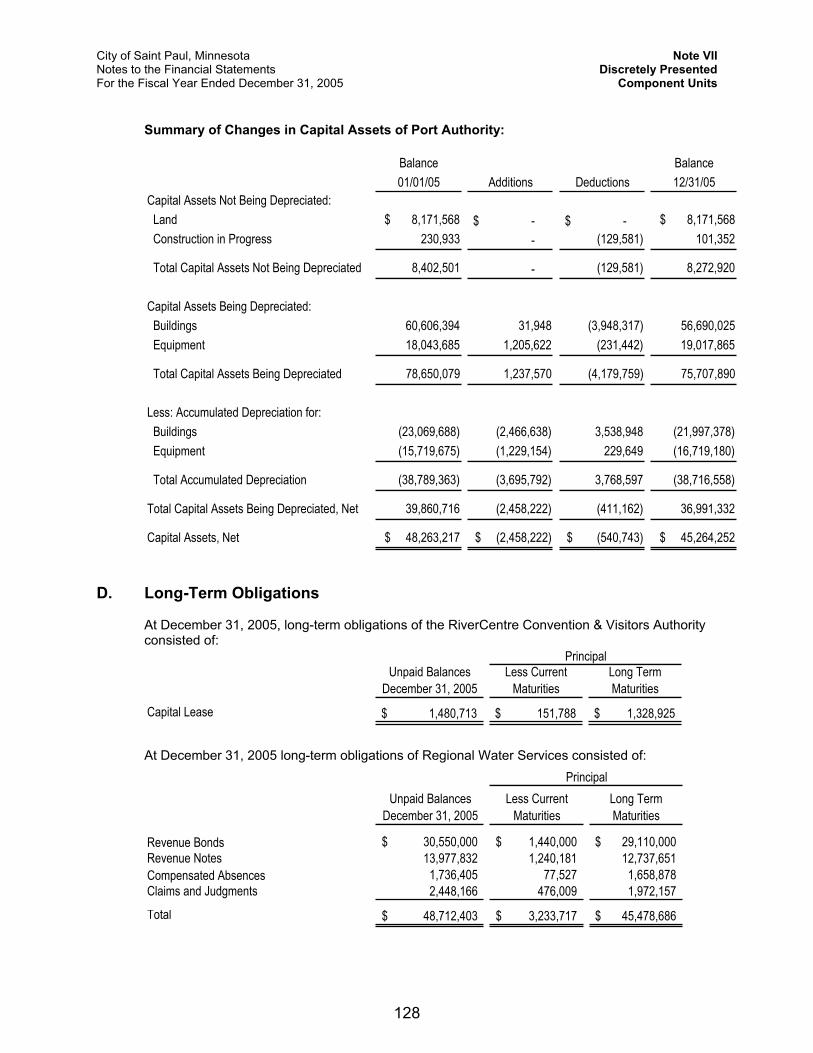
City of Saint Paul, Minnesota Note VII Notes to the Financial Statements Discretely PresentedFor the Fiscal Year Ended December 31, 2005 Component Units
Summary of Changes in Capital Assets of Port Authority:
Balance Balance01/01/05 Additions Deductions 12/31/05
Capital Assets Not Being Depreciated: Land $ 8,171,568 -$ -$ $ 8,171,568 Construction in Progress 230,933 - (129,581) 101,352
Total Capital Assets Not Being Depreciated 8,402,501 - (129,581) 8,272,920
Capital Assets Being Depreciated: Buildings 60,606,394 31,948 (3,948,317) 56,690,025 Equipment 18,043,685 1,205,622 (231,442) 19,017,865
Total Capital Assets Being Depreciated 78,650,079 1,237,570 (4,179,759) 75,707,890
Less: Accumulated Depreciation for: Buildings (23,069,688) (2,466,638) 3,538,948 (21,997,378) Equipment (15,719,675) (1,229,154) 229,649 (16,719,180)
Total Accumulated Depreciation (38,789,363) (3,695,792) 3,768,597 (38,716,558)
Total Capital Assets Being Depreciated, Net 39,860,716 (2,458,222) (411,162) 36,991,332
Capital Assets, Net $ 48,263,217 $ (2,458,222) $ (540,743) $ 45,264,252
D. Long-Term Obligations
At December 31, 2005, long-term obligations of the RiverCentre Convention & Visitors Authority consisted of:
Unpaid Balances December 31, 2005
Less Current Maturities
Long Term Maturities
Capital Lease 1,480,713$ 151,788$ 1,328,925$
Principal
At December 31, 2005 long-term obligations of Regional Water Services consisted of:
Unpaid Balances December 31, 2005
Less Current Maturities
Long Term Maturities
Revenue Bonds 30,550,000$ 1,440,000$ 29,110,000$ Revenue Notes 13,977,832 1,240,181 12,737,651Compensated Absences 1,736,405 77,527 1,658,878Claims and Judgments 2,448,166 476,009 1,972,157
Total 48,712,403$ 3,233,717$ 45,478,686$
Principal
128
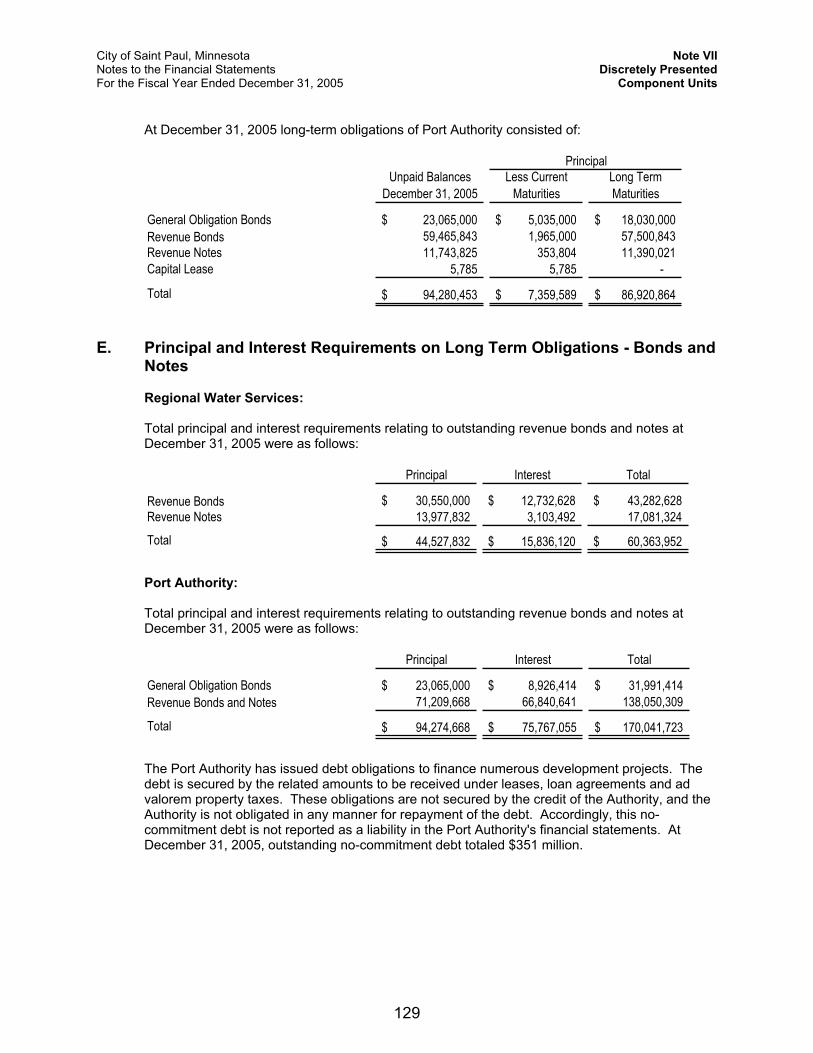
City of Saint Paul, Minnesota Note VII Notes to the Financial Statements Discretely PresentedFor the Fiscal Year Ended December 31, 2005 Component Units
At December 31, 2005 long-term obligations of Port Authority consisted of:
Unpaid Balances December 31, 2005
Less Current Maturities
Long Term Maturities
General Obligation Bonds 23,065,000$ 5,035,000$ 18,030,000$ Revenue Bonds 59,465,843 1,965,000 57,500,843 Revenue Notes 11,743,825 353,804 11,390,021 Capital Lease 5,785 5,785 -
Total 94,280,453$ 7,359,589$ 86,920,864$
Principal
E. Principal and Interest Requirements on Long Term Obligations - Bonds and Notes
Regional Water Services:
Total principal and interest requirements relating to outstanding revenue bonds and notes at December 31, 2005 were as follows:
Principal Interest Total
Revenue Bonds 30,550,000$ 12,732,628$ 43,282,628$Revenue Notes 13,977,832 3,103,492 17,081,324
Total 44,527,832$ 15,836,120$ 60,363,952$
Port Authority:
Total principal and interest requirements relating to outstanding revenue bonds and notes at December 31, 2005 were as follows:
Principal Interest Total
General Obligation Bonds 23,065,000$ 8,926,414$ 31,991,414$ Revenue Bonds and Notes 71,209,668 66,840,641 138,050,309
Total 94,274,668$ 75,767,055$ 170,041,723$
The Port Authority has issued debt obligations to finance numerous development projects. The debt is secured by the related amounts to be received under leases, loan agreements and ad valorem property taxes. These obligations are not secured by the credit of the Authority, and the Authority is not obligated in any manner for repayment of the debt. Accordingly, this no-commitment debt is not reported as a liability in the Port Authority's financial statements. At December 31, 2005, outstanding no-commitment debt totaled $351 million.
129
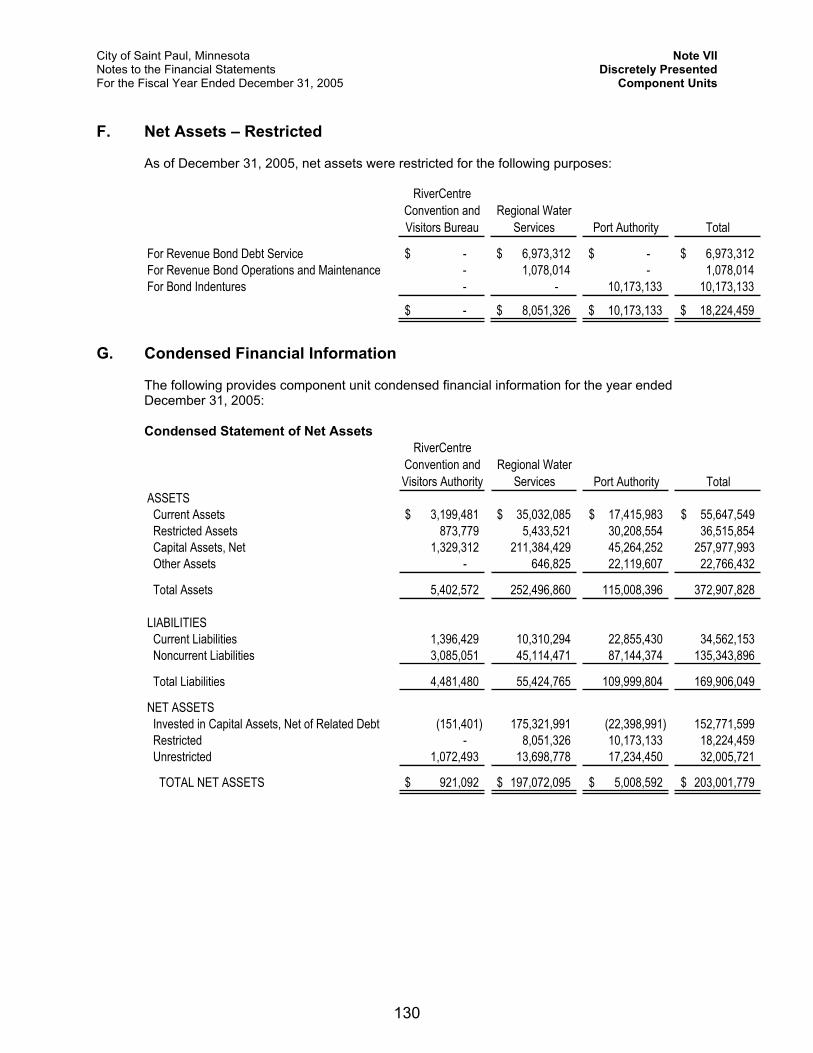
City of Saint Paul, Minnesota Note VII Notes to the Financial Statements Discretely PresentedFor the Fiscal Year Ended December 31, 2005 Component Units
F. Net Assets – Restricted
As of December 31, 2005, net assets were restricted for the following purposes:
RiverCentre Convention and Visitors Bureau
Regional Water Services Port Authority Total
For Revenue Bond Debt Service -$ 6,973,312$ -$ 6,973,312$ For Revenue Bond Operations and Maintenance - 1,078,014 - 1,078,014 For Bond Indentures - - 10,173,133 10,173,133
-$ 8,051,326$ 10,173,133$ 18,224,459$
G. Condensed Financial Information
The following provides component unit condensed financial information for the year ended December 31, 2005:
Condensed Statement of Net AssetsRiverCentre
Convention and Visitors Authority
Regional Water Services Port Authority Total
ASSETS Current Assets 3,199,481$ 35,032,085$ 17,415,983$ 55,647,549$ Restricted Assets 873,779 5,433,521 30,208,554 36,515,854 Capital Assets, Net 1,329,312 211,384,429 45,264,252 257,977,993 Other Assets - 646,825 22,119,607 22,766,432
Total Assets 5,402,572 252,496,860 115,008,396 372,907,828
LIABILITIES Current Liabilities 1,396,429 10,310,294 22,855,430 34,562,153 Noncurrent Liabilities 3,085,051 45,114,471 87,144,374 135,343,896
Total Liabilities 4,481,480 55,424,765 109,999,804 169,906,049
NET ASSETS Invested in Capital Assets, Net of Related Debt (151,401) 175,321,991 (22,398,991) 152,771,599 Restricted - 8,051,326 10,173,133 18,224,459 Unrestricted 1,072,493 13,698,778 17,234,450 32,005,721
TOTAL NET ASSETS 921,092$ 197,072,095$ 5,008,592$ 203,001,779$
130
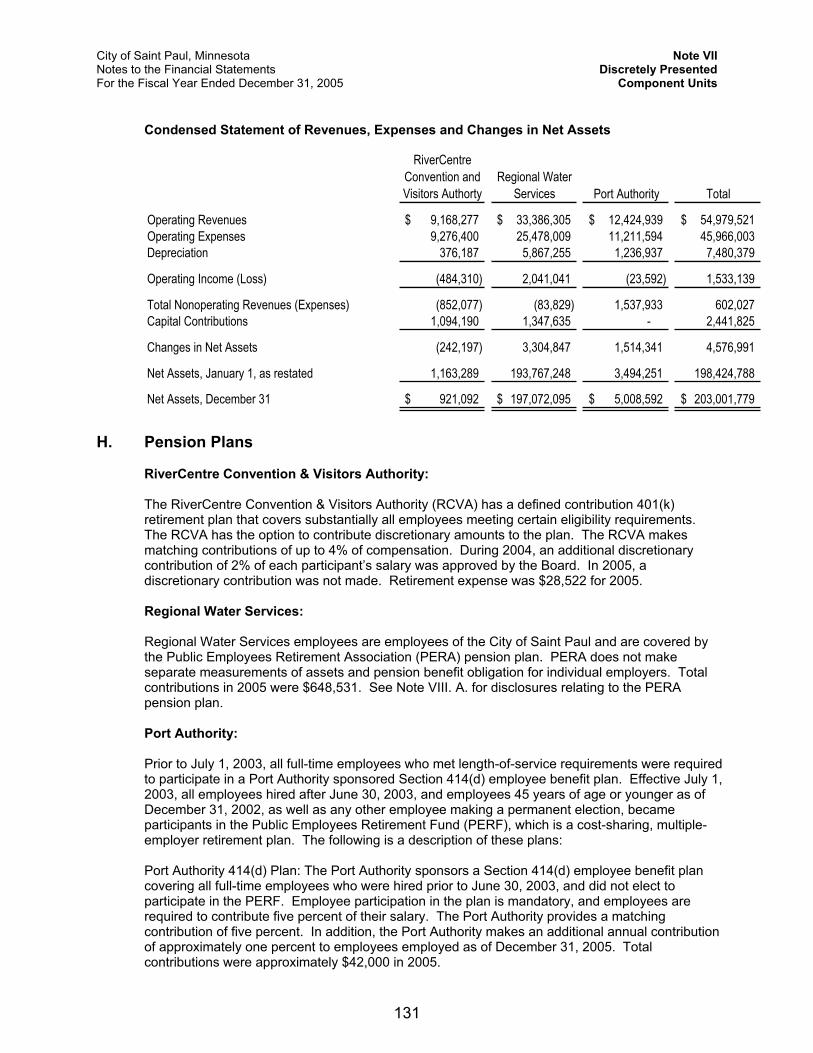
City of Saint Paul, Minnesota Note VII Notes to the Financial Statements Discretely PresentedFor the Fiscal Year Ended December 31, 2005 Component Units
Condensed Statement of Revenues, Expenses and Changes in Net Assets
RiverCentreConvention and Visitors Authorty
Regional Water Services Port Authority Total
Operating Revenues 9,168,277$ 33,386,305$ 12,424,939$ 54,979,521$Operating Expenses 9,276,400 25,478,009 11,211,594 45,966,003Depreciation 376,187 5,867,255 1,236,937 7,480,379
Operating Income (Loss) (484,310) 2,041,041 (23,592) 1,533,139
Total Nonoperating Revenues (Expenses) (852,077) (83,829) 1,537,933 602,027Capital Contributions 1,094,190 1,347,635 - 2,441,825
Changes in Net Assets (242,197) 3,304,847 1,514,341 4,576,991
Net Assets, January 1, as restated 1,163,289 193,767,248 3,494,251 198,424,788
Net Assets, December 31 921,092$ 197,072,095$ 5,008,592$ 203,001,779$
H. Pension Plans
RiverCentre Convention & Visitors Authority:
The RiverCentre Convention & Visitors Authority (RCVA) has a defined contribution 401(k) retirement plan that covers substantially all employees meeting certain eligibility requirements. The RCVA has the option to contribute discretionary amounts to the plan. The RCVA makes matching contributions of up to 4% of compensation. During 2004, an additional discretionary contribution of 2% of each participant’s salary was approved by the Board. In 2005, a discretionary contribution was not made. Retirement expense was $28,522 for 2005.
Regional Water Services:
Regional Water Services employees are employees of the City of Saint Paul and are covered by the Public Employees Retirement Association (PERA) pension plan. PERA does not make separate measurements of assets and pension benefit obligation for individual employers. Total contributions in 2005 were $648,531. See Note VIII. A. for disclosures relating to the PERA pension plan.
Port Authority:
Prior to July 1, 2003, all full-time employees who met length-of-service requirements were required to participate in a Port Authority sponsored Section 414(d) employee benefit plan. Effective July 1, 2003, all employees hired after June 30, 2003, and employees 45 years of age or younger as of December 31, 2002, as well as any other employee making a permanent election, became participants in the Public Employees Retirement Fund (PERF), which is a cost-sharing, multiple-employer retirement plan. The following is a description of these plans:
Port Authority 414(d) Plan: The Port Authority sponsors a Section 414(d) employee benefit plan covering all full-time employees who were hired prior to June 30, 2003, and did not elect to participate in the PERF. Employee participation in the plan is mandatory, and employees are required to contribute five percent of their salary. The Port Authority provides a matching contribution of five percent. In addition, the Port Authority makes an additional annual contribution of approximately one percent to employees employed as of December 31, 2005. Total contributions were approximately $42,000 in 2005.
131
City of Saint Paul, Minnesota Note VII Notes to the Financial Statements Discretely PresentedFor the Fiscal Year Ended December 31, 2005 Component Units
Public Employees Retirement Fund (PERF): All full-time and certain part-time employees of the Port Authority who were hired after June 30, 2003, and those employees hired prior to June 30, 2003, who were required to or elected to participate in PERF are covered by defined benefit plans administered by the Public Employees Retirement Association of Minnesota (PERA). PERA administers the PERF, which is a cost-sharing, multiple-employer retirement plan. This plan is established and administered in accordance with Minnesota Statutes, Chapters 353 and 356.
PERF members belong to the Coordinated Plan. All participating employees of the Port Authority are Coordinated Plan members and are covered by Social Security.
(The remainder of this page left blank intentionally)
132
City of Saint Paul, Minnesota Note VIII Notes to the Financial Statements Other InformationFor the Fiscal Year Ended December 31, 2005
Note VIII. Other Information
A. Pension Plans
1. Defined Benefit Plans: Public Employees Retirement Association
a. Plan Descriptions
All full-time and certain part-time employees of the City of Saint Paul who are not participants of the Housing and Redevelopment Authority Pension Plan are covered by retirement plans administered by the Public Employees Retirement Association of Minnesota (PERA). PERA administers the Public Employees Retirement Fund (PERF) and the Public Employees Police and Fire Fund (PEPFF), which are cost-sharing, multiple-employer retirement plans. These plans are established and administered in accordance with Minnesota Statutes, Chapters 353 and 356.
PERF members belong to either the Coordinated Plan or the Basic Plan. Coordinated Plan members are covered by Social Security and the Basic Plan members are not. All new members must participate in the Coordinated Plan. All police officers, fire fighters and peace officers who qualify for membership by statute are covered by the PEPFF.
PERA provides retirement benefits as well as disability benefits to members, and benefits to survivors upon death of eligible members. Benefits are established by State Statute, and vest after three years of credited service. The defined retirement benefits are based on a member's highest average salary for any five successive years of allowable service, age and years of credit at termination of service.
Two methods are used to compute benefits for Coordinated and Basic Plan members. The retiring member receives the higher of a step-rate benefit accrual formula (Method 1) or a level accrual formula (Method 2). Under Method 1, the annuity accrual rate for a Basic Plan member is 2.2 percent of average salary for each of the first ten years of service and 2.7 percent for each remaining year. The annuity accrual rate for a Coordinated Plan member is 1.2 percent of average salary for each of the first ten years and 1.7 percent for each remaining year. Under Method 2, the annuity accrual rate is 2.7 percent of average salary for Basic Plan members and 1.7 percent for Coordinated Plan members for each year of service. For PEPFF members, the annuity accrual rate is 3.0 percent of average salary for each year of service.
For all PEPFF members and for PERF members hired prior to July 1, 1989, whose annuity is calculated using Method 1, a full annuity is available when age plus years of service equal 90. Normal retirement age is 55 for PEPFF members and 65 for Basic and Coordinated members hired prior to July 1, 1989. Normal retirement age is the age for unreduced Social Security benefits capped at 66 for Coordinated members hired on or after July 1, 1989. A reduced retirement annuity is also available to eligible members seeking early retirement.
There are different types of annuities available to members upon retirement. A single annuity is a lifetime annuity that ceases upon the death of the retiree; no survivor annuity is payable. Also available are various types of joint and survivor annuity options that will be payable over joint lives. Members may also leave their contributions in the fund upon termination of public service in order to qualify for a deferred annuity at retirement age. Refunds of contributions are available at any time to members who leave public service, but before retirement benefits begin.
The benefit provisions stated in the previous paragraphs of this section are current provisions and apply to active plan participants. Vested, terminated employees who are entitled to benefits but are not receiving them yet are bound by the provisions in effect at the time they last terminated their public service.
133
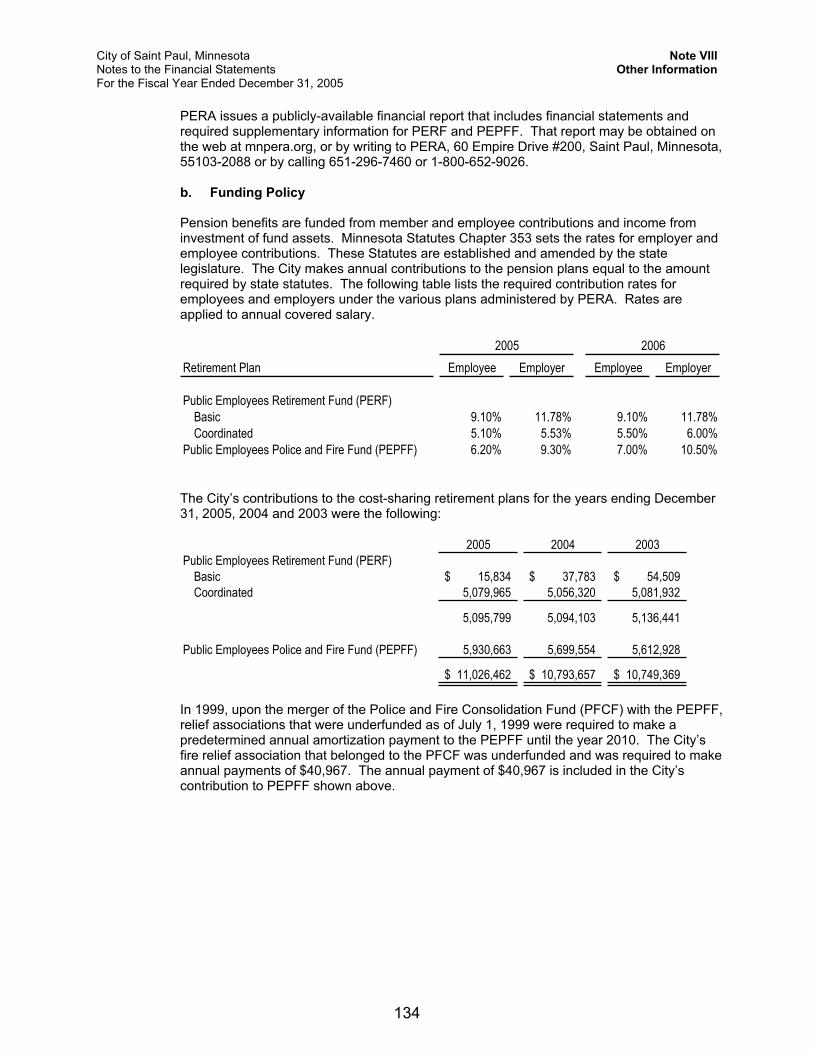
City of Saint Paul, Minnesota Note VIII Notes to the Financial Statements Other InformationFor the Fiscal Year Ended December 31, 2005
PERA issues a publicly-available financial report that includes financial statements and required supplementary information for PERF and PEPFF. That report may be obtained on the web at mnpera.org, or by writing to PERA, 60 Empire Drive #200, Saint Paul, Minnesota, 55103-2088 or by calling 651-296-7460 or 1-800-652-9026.
b. Funding Policy
Pension benefits are funded from member and employee contributions and income from investment of fund assets. Minnesota Statutes Chapter 353 sets the rates for employer and employee contributions. These Statutes are established and amended by the state legislature. The City makes annual contributions to the pension plans equal to the amount required by state statutes. The following table lists the required contribution rates for employees and employers under the various plans administered by PERA. Rates are applied to annual covered salary.
Retirement Plan Employee Employer Employee Employer
Public Employees Retirement Fund (PERF)Basic 9.10% 11.78% 9.10% 11.78%Coordinated 5.10% 5.53% 5.50% 6.00%
Public Employees Police and Fire Fund (PEPFF) 6.20% 9.30% 7.00% 10.50%
2005 2006
The City’s contributions to the cost-sharing retirement plans for the years ending December 31, 2005, 2004 and 2003 were the following:
2005 2004 2003Public Employees Retirement Fund (PERF)
Basic 15,834$ 37,783$ 54,509$ Coordinated 5,079,965 5,056,320 5,081,932
5,095,799 5,094,103 5,136,441
Public Employees Police and Fire Fund (PEPFF) 5,930,663 5,699,554 5,612,928
11,026,462$ 10,793,657$ 10,749,369$
In 1999, upon the merger of the Police and Fire Consolidation Fund (PFCF) with the PEPFF, relief associations that were underfunded as of July 1, 1999 were required to make a predetermined annual amortization payment to the PEPFF until the year 2010. The City’s fire relief association that belonged to the PFCF was underfunded and was required to make annual payments of $40,967. The annual payment of $40,967 is included in the City’s contribution to PEPFF shown above.
134
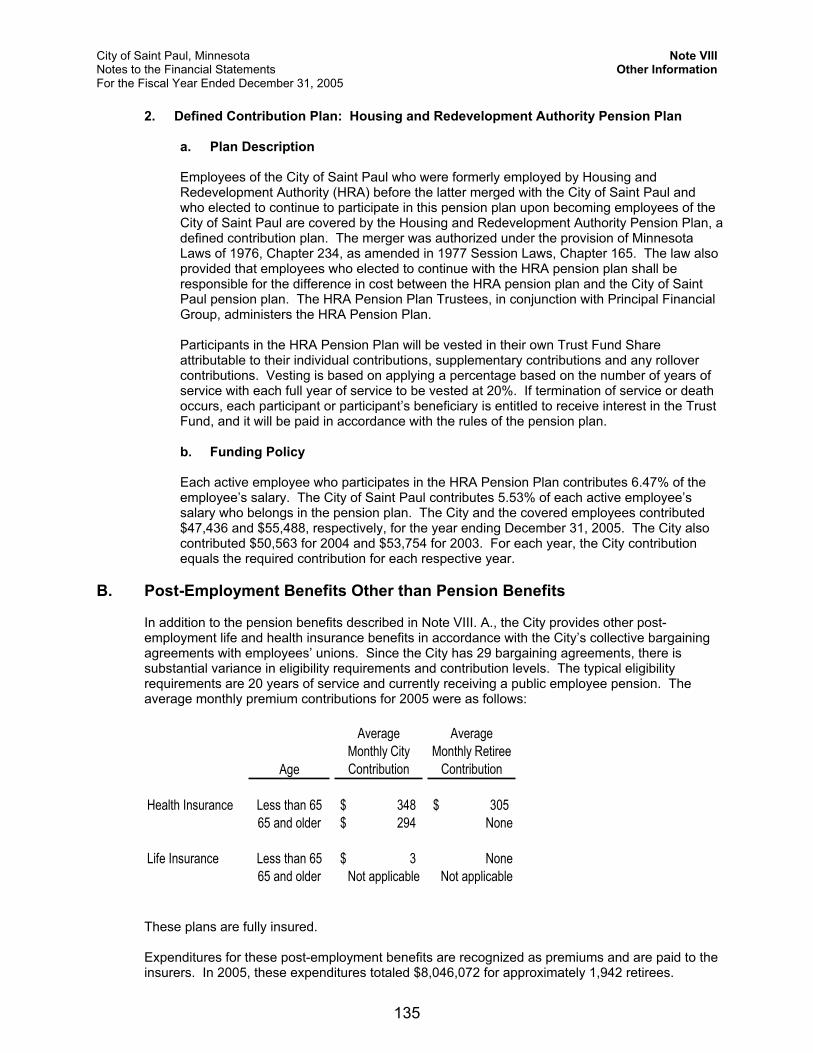
City of Saint Paul, Minnesota Note VIII Notes to the Financial Statements Other InformationFor the Fiscal Year Ended December 31, 2005
2. Defined Contribution Plan: Housing and Redevelopment Authority Pension Plan
a. Plan Description
Employees of the City of Saint Paul who were formerly employed by Housing and Redevelopment Authority (HRA) before the latter merged with the City of Saint Paul and who elected to continue to participate in this pension plan upon becoming employees of the City of Saint Paul are covered by the Housing and Redevelopment Authority Pension Plan, a defined contribution plan. The merger was authorized under the provision of Minnesota Laws of 1976, Chapter 234, as amended in 1977 Session Laws, Chapter 165. The law also provided that employees who elected to continue with the HRA pension plan shall be responsible for the difference in cost between the HRA pension plan and the City of Saint Paul pension plan. The HRA Pension Plan Trustees, in conjunction with Principal Financial Group, administers the HRA Pension Plan.
Participants in the HRA Pension Plan will be vested in their own Trust Fund Share attributable to their individual contributions, supplementary contributions and any rollover contributions. Vesting is based on applying a percentage based on the number of years of service with each full year of service to be vested at 20%. If termination of service or death occurs, each participant or participant’s beneficiary is entitled to receive interest in the Trust Fund, and it will be paid in accordance with the rules of the pension plan.
b. Funding Policy
Each active employee who participates in the HRA Pension Plan contributes 6.47% of the employee’s salary. The City of Saint Paul contributes 5.53% of each active employee’s salary who belongs in the pension plan. The City and the covered employees contributed $47,436 and $55,488, respectively, for the year ending December 31, 2005. The City also contributed $50,563 for 2004 and $53,754 for 2003. For each year, the City contribution equals the required contribution for each respective year.
B. Post-Employment Benefits Other than Pension Benefits
In addition to the pension benefits described in Note VIII. A., the City provides other post-employment life and health insurance benefits in accordance with the City’s collective bargaining agreements with employees’ unions. Since the City has 29 bargaining agreements, there is substantial variance in eligibility requirements and contribution levels. The typical eligibility requirements are 20 years of service and currently receiving a public employee pension. The average monthly premium contributions for 2005 were as follows:
Age
Average Monthly City Contribution
Average Monthly Retiree
Contribution
Health Insurance Less than 65 348$ 305$ 65 and older 294$ None
Life Insurance Less than 65 3$ None65 and older Not applicable Not applicable
These plans are fully insured.
Expenditures for these post-employment benefits are recognized as premiums and are paid to the insurers. In 2005, these expenditures totaled $8,046,072 for approximately 1,942 retirees.
135
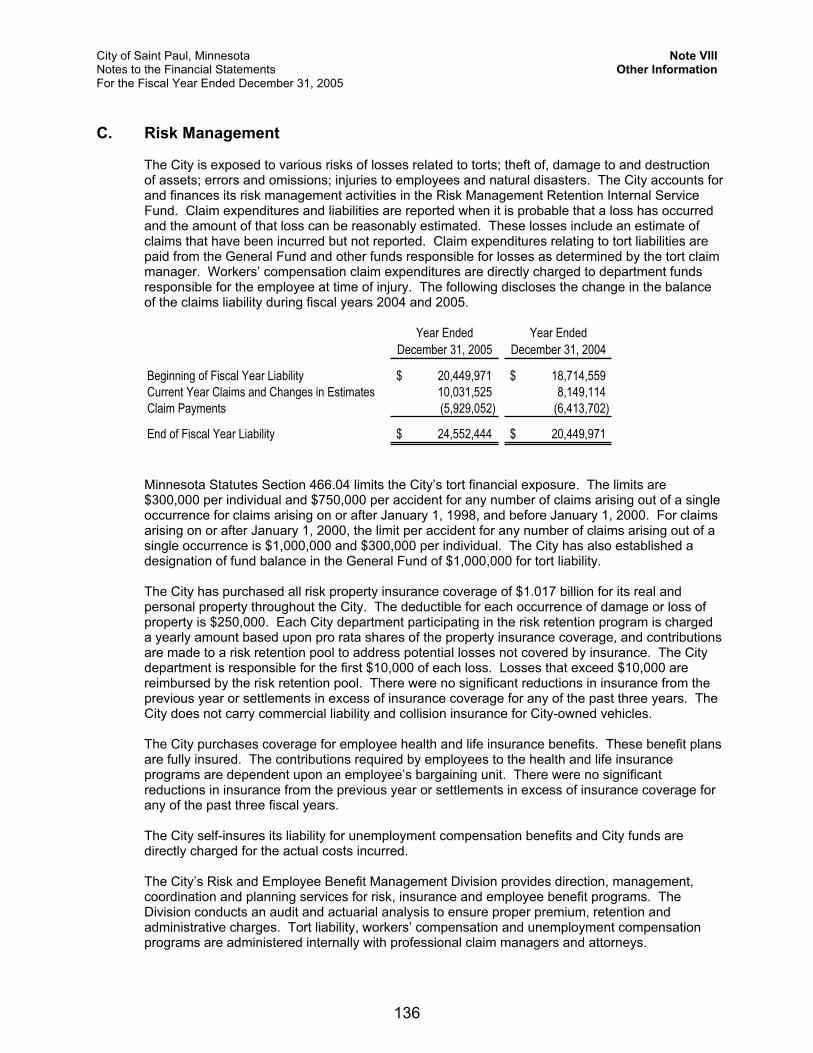
City of Saint Paul, Minnesota Note VIII Notes to the Financial Statements Other InformationFor the Fiscal Year Ended December 31, 2005
C. Risk Management
The City is exposed to various risks of losses related to torts; theft of, damage to and destruction of assets; errors and omissions; injuries to employees and natural disasters. The City accounts for and finances its risk management activities in the Risk Management Retention Internal Service Fund. Claim expenditures and liabilities are reported when it is probable that a loss has occurred and the amount of that loss can be reasonably estimated. These losses include an estimate of claims that have been incurred but not reported. Claim expenditures relating to tort liabilities are paid from the General Fund and other funds responsible for losses as determined by the tort claim manager. Workers’ compensation claim expenditures are directly charged to department funds responsible for the employee at time of injury. The following discloses the change in the balance of the claims liability during fiscal years 2004 and 2005.
Year Ended December 31, 2005
Year Ended December 31, 2004
Beginning of Fiscal Year Liability 20,449,971$ 18,714,559$Current Year Claims and Changes in Estimates 10,031,525 8,149,114Claim Payments (5,929,052) (6,413,702)
End of Fiscal Year Liability 24,552,444$ 20,449,971$
Minnesota Statutes Section 466.04 limits the City’s tort financial exposure. The limits are $300,000 per individual and $750,000 per accident for any number of claims arising out of a single occurrence for claims arising on or after January 1, 1998, and before January 1, 2000. For claims arising on or after January 1, 2000, the limit per accident for any number of claims arising out of a single occurrence is $1,000,000 and $300,000 per individual. The City has also established a designation of fund balance in the General Fund of $1,000,000 for tort liability.
The City has purchased all risk property insurance coverage of $1.017 billion for its real and personal property throughout the City. The deductible for each occurrence of damage or loss of property is $250,000. Each City department participating in the risk retention program is charged a yearly amount based upon pro rata shares of the property insurance coverage, and contributions are made to a risk retention pool to address potential losses not covered by insurance. The City department is responsible for the first $10,000 of each loss. Losses that exceed $10,000 are reimbursed by the risk retention pool. There were no significant reductions in insurance from the previous year or settlements in excess of insurance coverage for any of the past three years. The City does not carry commercial liability and collision insurance for City-owned vehicles.
The City purchases coverage for employee health and life insurance benefits. These benefit plans are fully insured. The contributions required by employees to the health and life insurance programs are dependent upon an employee’s bargaining unit. There were no significant reductions in insurance from the previous year or settlements in excess of insurance coverage for any of the past three fiscal years.
The City self-insures its liability for unemployment compensation benefits and City funds are directly charged for the actual costs incurred.
The City’s Risk and Employee Benefit Management Division provides direction, management, coordination and planning services for risk, insurance and employee benefit programs. The Division conducts an audit and actuarial analysis to ensure proper premium, retention and administrative charges. Tort liability, workers’ compensation and unemployment compensation programs are administered internally with professional claim managers and attorneys.
136
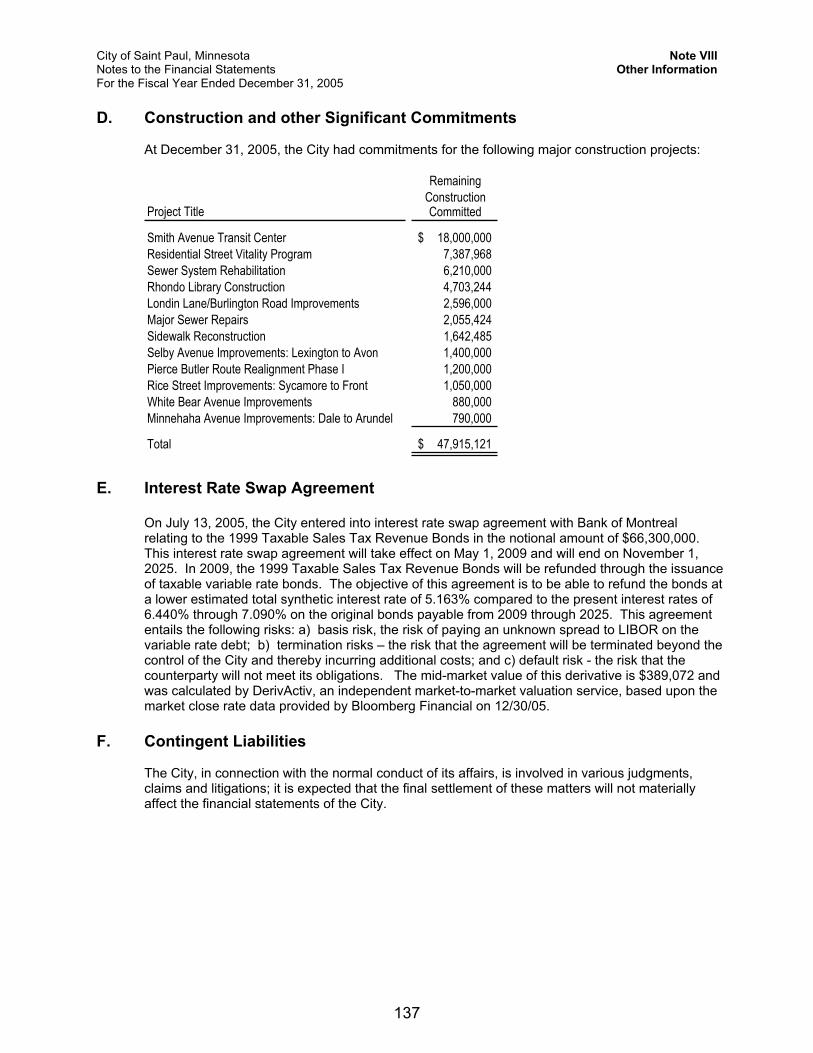
City of Saint Paul, Minnesota Note VIII Notes to the Financial Statements Other InformationFor the Fiscal Year Ended December 31, 2005
D. Construction and other Significant Commitments
At December 31, 2005, the City had commitments for the following major construction projects:
RemainingConstruction
Project Title Committed
Smith Avenue Transit Center 18,000,000$ Residential Street Vitality Program 7,387,968 Sewer System Rehabilitation 6,210,000 Rhondo Library Construction 4,703,244 Londin Lane/Burlington Road Improvements 2,596,000 Major Sewer Repairs 2,055,424 Sidewalk Reconstruction 1,642,485 Selby Avenue Improvements: Lexington to Avon 1,400,000 Pierce Butler Route Realignment Phase I 1,200,000 Rice Street Improvements: Sycamore to Front 1,050,000 White Bear Avenue Improvements 880,000 Minnehaha Avenue Improvements: Dale to Arundel 790,000
Total 47,915,121$
E. Interest Rate Swap Agreement
On July 13, 2005, the City entered into interest rate swap agreement with Bank of Montreal relating to the 1999 Taxable Sales Tax Revenue Bonds in the notional amount of $66,300,000. This interest rate swap agreement will take effect on May 1, 2009 and will end on November 1, 2025. In 2009, the 1999 Taxable Sales Tax Revenue Bonds will be refunded through the issuance of taxable variable rate bonds. The objective of this agreement is to be able to refund the bonds at a lower estimated total synthetic interest rate of 5.163% compared to the present interest rates of 6.440% through 7.090% on the original bonds payable from 2009 through 2025. This agreement entails the following risks: a) basis risk, the risk of paying an unknown spread to LIBOR on the variable rate debt; b) termination risks – the risk that the agreement will be terminated beyond the control of the City and thereby incurring additional costs; and c) default risk - the risk that the counterparty will not meet its obligations. The mid-market value of this derivative is $389,072 and was calculated by DerivActiv, an independent market-to-market valuation service, based upon the market close rate data provided by Bloomberg Financial on 12/30/05.
F. Contingent Liabilities
The City, in connection with the normal conduct of its affairs, is involved in various judgments, claims and litigations; it is expected that the final settlement of these matters will not materially affect the financial statements of the City.
137
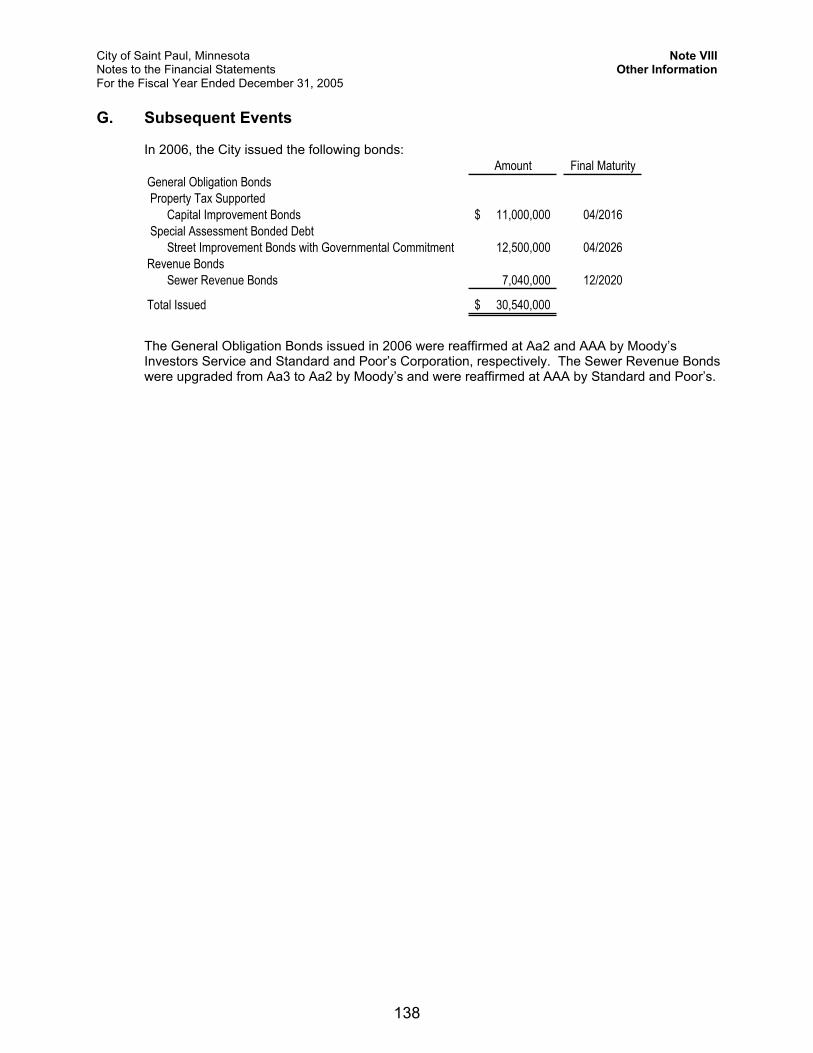
City of Saint Paul, Minnesota Note VIII Notes to the Financial Statements Other InformationFor the Fiscal Year Ended December 31, 2005
G. Subsequent Events
In 2006, the City issued the following bonds: Amount Final Maturity
General Obligation Bonds Property Tax Supported
Capital Improvement Bonds 11,000,000$ 04/2016 Special Assessment Bonded Debt
Street Improvement Bonds with Governmental Commitment 12,500,000 04/2026Revenue Bonds
Sewer Revenue Bonds 7,040,000 12/2020
Total Issued 30,540,000$
The General Obligation Bonds issued in 2006 were reaffirmed at Aa2 and AAA by Moody’s Investors Service and Standard and Poor’s Corporation, respectively. The Sewer Revenue Bonds were upgraded from Aa3 to Aa2 by Moody’s and were reaffirmed at AAA by Standard and Poor’s.
138
FINANCIAL SECTION
REQUIRED SUPPLEMENTARY INFORMATION
C I T Y O F S A I N T P A U L C O M P R E H E N S I V E A N N U A L F I N A N C I A L R E P O R T
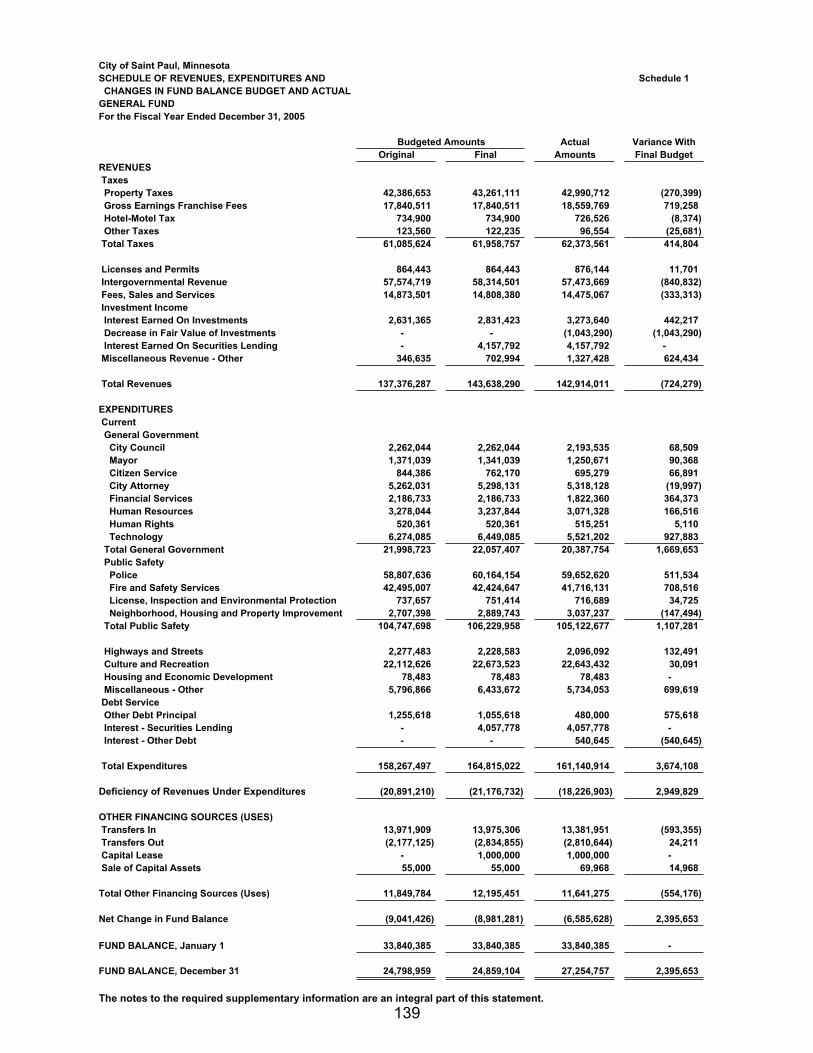
City of Saint Paul, MinnesotaSCHEDULE OF REVENUES, EXPENDITURES AND Schedule 1 CHANGES IN FUND BALANCE BUDGET AND ACTUALGENERAL FUNDFor the Fiscal Year Ended December 31, 2005
Budgeted Amounts Actual Variance WithOriginal Final Amounts Final Budget
REVENUES Taxes Property Taxes 42,386,653 43,261,111 42,990,712 (270,399) Gross Earnings Franchise Fees 17,840,511 17,840,511 18,559,769 719,258 Hotel-Motel Tax 734,900 734,900 726,526 (8,374) Other Taxes 123,560 122,235 96,554 (25,681) Total Taxes 61,085,624 61,958,757 62,373,561 414,804
Licenses and Permits 864,443 864,443 876,144 11,701 Intergovernmental Revenue 57,574,719 58,314,501 57,473,669 (840,832) Fees, Sales and Services 14,873,501 14,808,380 14,475,067 (333,313) Investment Income Interest Earned On Investments 2,631,365 2,831,423 3,273,640 442,217 Decrease in Fair Value of Investments - - (1,043,290) (1,043,290) Interest Earned On Securities Lending - 4,157,792 4,157,792 - Miscellaneous Revenue - Other 346,635 702,994 1,327,428 624,434
Total Revenues 137,376,287 143,638,290 142,914,011 (724,279)
EXPENDITURES Current General Government City Council 2,262,044 2,262,044 2,193,535 68,509 Mayor 1,371,039 1,341,039 1,250,671 90,368 Citizen Service 844,386 762,170 695,279 66,891 City Attorney 5,262,031 5,298,131 5,318,128 (19,997) Financial Services 2,186,733 2,186,733 1,822,360 364,373 Human Resources 3,278,044 3,237,844 3,071,328 166,516 Human Rights 520,361 520,361 515,251 5,110 Technology 6,274,085 6,449,085 5,521,202 927,883 Total General Government 21,998,723 22,057,407 20,387,754 1,669,653 Public Safety Police 58,807,636 60,164,154 59,652,620 511,534 Fire and Safety Services 42,495,007 42,424,647 41,716,131 708,516 License, Inspection and Environmental Protection 737,657 751,414 716,689 34,725 Neighborhood, Housing and Property Improvement 2,707,398 2,889,743 3,037,237 (147,494) Total Public Safety 104,747,698 106,229,958 105,122,677 1,107,281
Highways and Streets 2,277,483 2,228,583 2,096,092 132,491 Culture and Recreation 22,112,626 22,673,523 22,643,432 30,091 Housing and Economic Development 78,483 78,483 78,483 - Miscellaneous - Other 5,796,866 6,433,672 5,734,053 699,619 Debt Service Other Debt Principal 1,255,618 1,055,618 480,000 575,618 Interest - Securities Lending - 4,057,778 4,057,778 - Interest - Other Debt - - 540,645 (540,645)
Total Expenditures 158,267,497 164,815,022 161,140,914 3,674,108
Deficiency of Revenues Under Expenditures (20,891,210) (21,176,732) (18,226,903) 2,949,829
OTHER FINANCING SOURCES (USES) Transfers In 13,971,909 13,975,306 13,381,951 (593,355) Transfers Out (2,177,125) (2,834,855) (2,810,644) 24,211 Capital Lease - 1,000,000 1,000,000 - Sale of Capital Assets 55,000 55,000 69,968 14,968
Total Other Financing Sources (Uses) 11,849,784 12,195,451 11,641,275 (554,176)
Net Change in Fund Balance (9,041,426) (8,981,281) (6,585,628) 2,395,653
FUND BALANCE, January 1 33,840,385 33,840,385 33,840,385 -
FUND BALANCE, December 31 24,798,959 24,859,104 27,254,757 2,395,653
The notes to the required supplementary information are an integral part of this statement.139
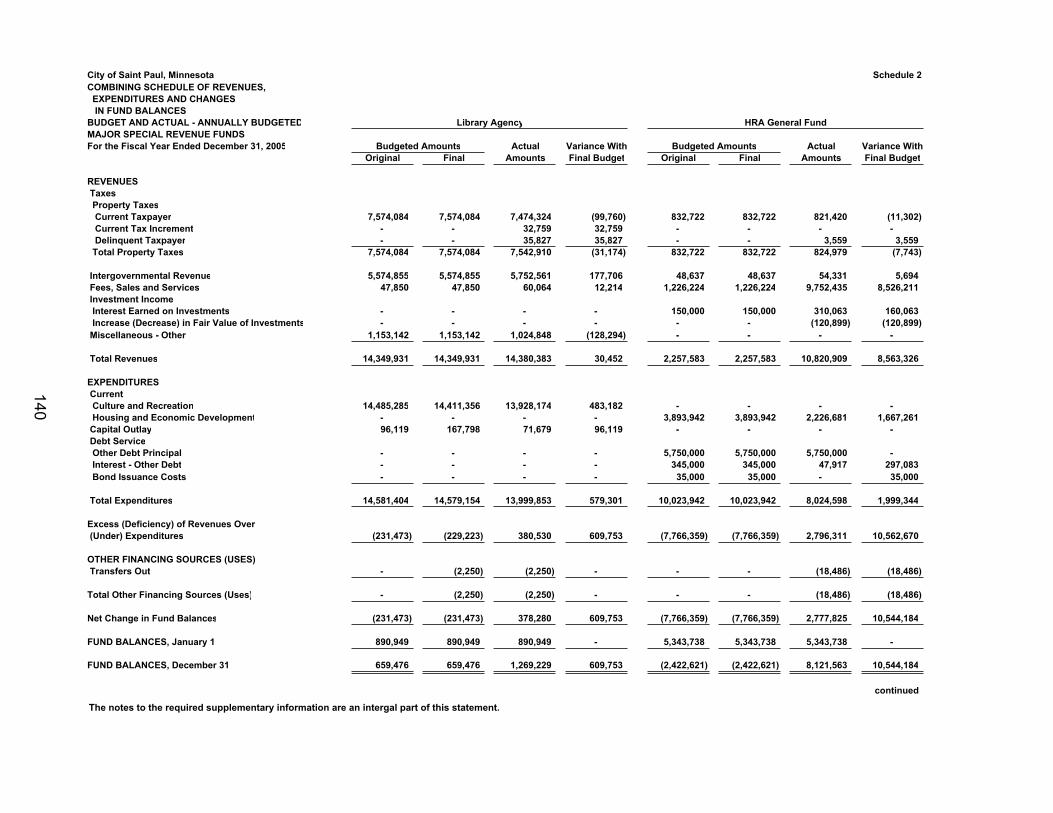
City of Saint Paul, Minnesota Schedule 2COMBINING SCHEDULE OF REVENUES, EXPENDITURES AND CHANGES IN FUND BALANCESBUDGET AND ACTUAL - ANNUALLY BUDGETED Library Agency HRA General FundMAJOR SPECIAL REVENUE FUNDSFor the Fiscal Year Ended December 31, 2005 Budgeted Amounts Actual Variance With Budgeted Amounts Actual Variance With
Original Final Amounts Final Budget Original Final Amounts Final Budget
REVENUES Taxes Property Taxes Current Taxpayer 7,574,084 7,574,084 7,474,324 (99,760) 832,722 832,722 821,420 (11,302) Current Tax Increment - - 32,759 32,759 - - - - Delinquent Taxpayer - - 35,827 35,827 - - 3,559 3,559 Total Property Taxes 7,574,084 7,574,084 7,542,910 (31,174) 832,722 832,722 824,979 (7,743)
Intergovernmental Revenue 5,574,855 5,574,855 5,752,561 177,706 48,637 48,637 54,331 5,694 Fees, Sales and Services 47,850 47,850 60,064 12,214 1,226,224 1,226,224 9,752,435 8,526,211 Investment Income Interest Earned on Investments - - - - 150,000 150,000 310,063 160,063 Increase (Decrease) in Fair Value of Investments - - - - - - (120,899) (120,899) Miscellaneous - Other 1,153,142 1,153,142 1,024,848 (128,294) - - - -
Total Revenues 14,349,931 14,349,931 14,380,383 30,452 2,257,583 2,257,583 10,820,909 8,563,326
EXPENDITURES Current Culture and Recreation 14,485,285 14,411,356 13,928,174 483,182 - - - - Housing and Economic Development - - - - 3,893,942 3,893,942 2,226,681 1,667,261 Capital Outlay 96,119 167,798 71,679 96,119 - - - - Debt Service Other Debt Principal - - - - 5,750,000 5,750,000 5,750,000 - Interest - Other Debt - - - - 345,000 345,000 47,917 297,083 Bond Issuance Costs - - - - 35,000 35,000 - 35,000
Total Expenditures 14,581,404 14,579,154 13,999,853 579,301 10,023,942 10,023,942 8,024,598 1,999,344
Excess (Deficiency) of Revenues Over (Under) Expenditures (231,473) (229,223) 380,530 609,753 (7,766,359) (7,766,359) 2,796,311 10,562,670
OTHER FINANCING SOURCES (USES) Transfers Out - (2,250) (2,250) - - - (18,486) (18,486)
Total Other Financing Sources (Uses) - (2,250) (2,250) - - - (18,486) (18,486)
Net Change in Fund Balances (231,473) (231,473) 378,280 609,753 (7,766,359) (7,766,359) 2,777,825 10,544,184
FUND BALANCES, January 1 890,949 890,949 890,949 - 5,343,738 5,343,738 5,343,738 -
FUND BALANCES, December 31 659,476 659,476 1,269,229 609,753 (2,422,621) (2,422,621) 8,121,563 10,544,184
continued
The notes to the required supplementary information are an intergal part of this statement.
140
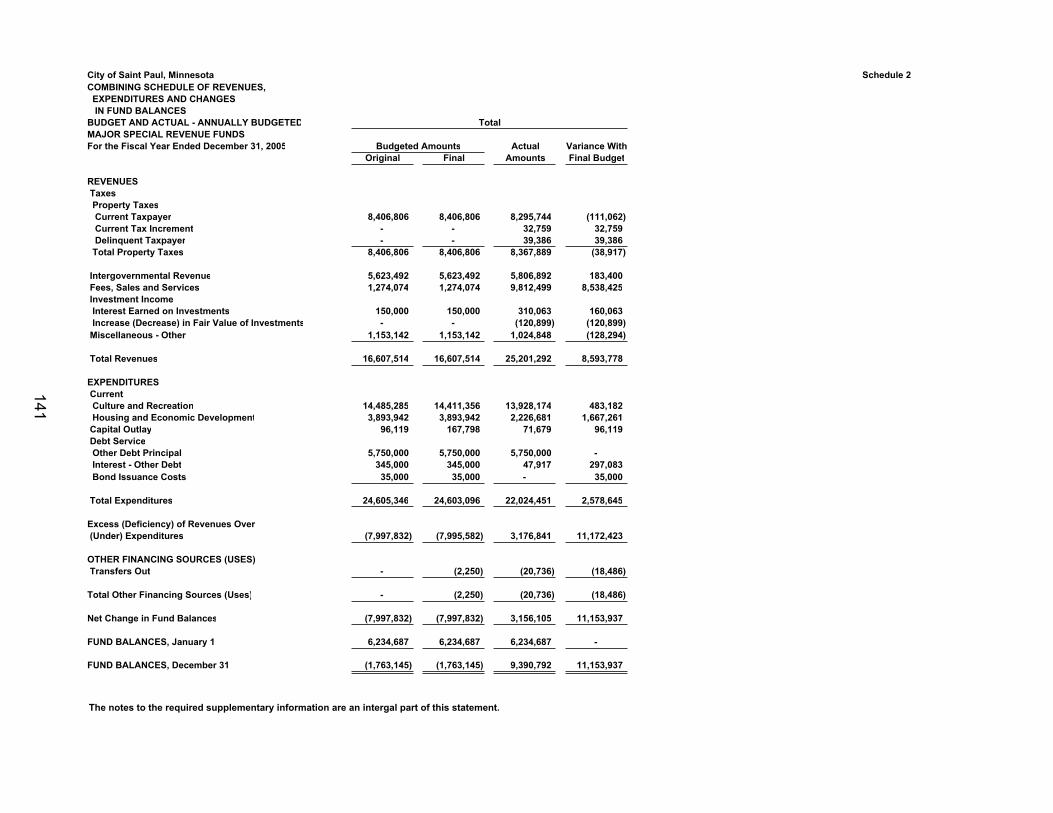
City of Saint Paul, MinnesotaCOMBINING SCHEDULE OF REVENUES, EXPENDITURES AND CHANGES IN FUND BALANCESBUDGET AND ACTUAL - ANNUALLY BUDGETEDMAJOR SPECIAL REVENUE FUNDSFor the Fiscal Year Ended December 31, 2005
REVENUES Taxes Property Taxes Current Taxpayer Current Tax Increment Delinquent Taxpayer Total Property Taxes
Intergovernmental Revenue Fees, Sales and Services Investment Income Interest Earned on Investments Increase (Decrease) in Fair Value of Investments Miscellaneous - Other
Total Revenues
EXPENDITURES Current Culture and Recreation Housing and Economic Development Capital Outlay Debt Service Other Debt Principal Interest - Other Debt Bond Issuance Costs
Total Expenditures
Excess (Deficiency) of Revenues Over (Under) Expenditures
OTHER FINANCING SOURCES (USES) Transfers Out
Total Other Financing Sources (Uses)
Net Change in Fund Balances
FUND BALANCES, January 1
FUND BALANCES, December 31
Schedule 2
Total
Budgeted Amounts Actual Variance WithOriginal Final Amounts Final Budget
8,406,806 8,406,806 8,295,744 (111,062)- - 32,759 32,759- - 39,386 39,386
8,406,806 8,406,806 8,367,889 (38,917)
5,623,492 5,623,492 5,806,892 183,4001,274,074 1,274,074 9,812,499 8,538,425
150,000 150,000 310,063 160,063- - (120,899) (120,899)
1,153,142 1,153,142 1,024,848 (128,294)
16,607,514 16,607,514 25,201,292 8,593,778
14,485,285 14,411,356 13,928,174 483,1823,893,942 3,893,942 2,226,681 1,667,261
96,119 167,798 71,679 96,119
5,750,000 5,750,000 5,750,000 - 345,000 345,000 47,917 297,08335,000 35,000 - 35,000
24,605,346 24,603,096 22,024,451 2,578,645
(7,997,832) (7,995,582) 3,176,841 11,172,423
- (2,250) (20,736) (18,486)
- (2,250) (20,736) (18,486)
(7,997,832) (7,997,832) 3,156,105 11,153,937
6,234,687 6,234,687 6,234,687 -
(1,763,145) (1,763,145) 9,390,792 11,153,937
The notes to the required supplementary information are an intergal part of this statement.
141
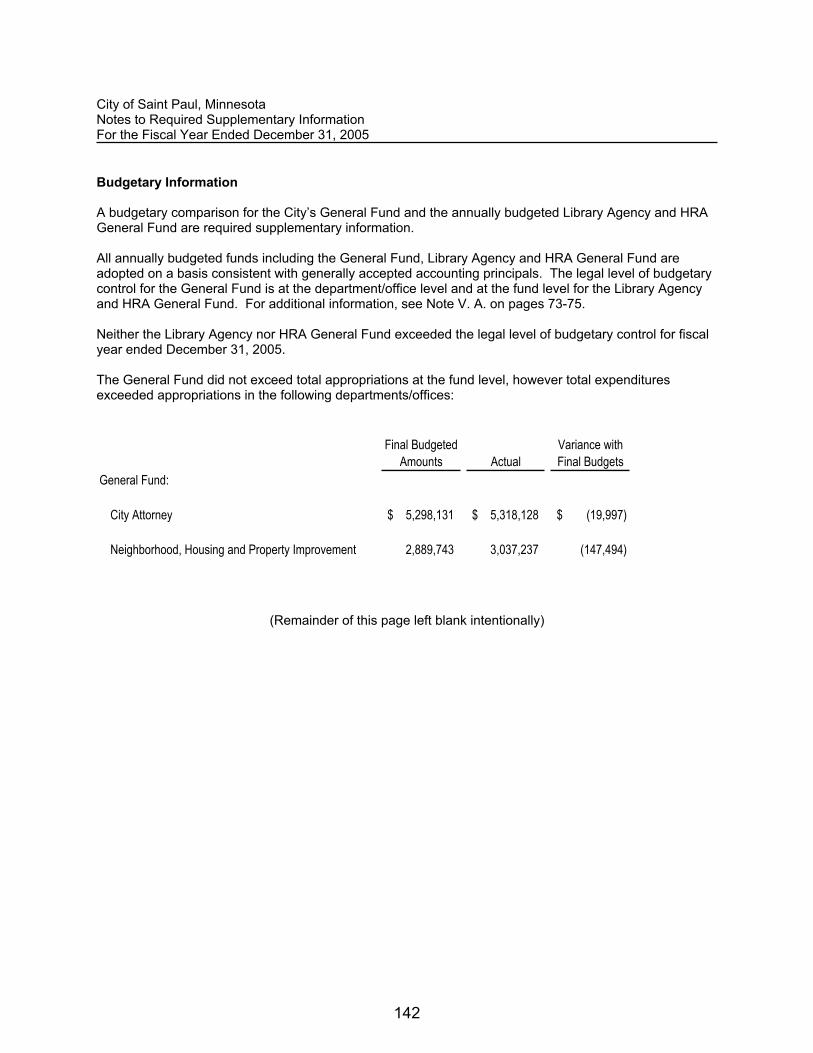
City of Saint Paul, Minnesota Notes to Required Supplementary Information For the Fiscal Year Ended December 31, 2005
Budgetary Information
A budgetary comparison for the City’s General Fund and the annually budgeted Library Agency and HRA General Fund are required supplementary information.
All annually budgeted funds including the General Fund, Library Agency and HRA General Fund are adopted on a basis consistent with generally accepted accounting principals. The legal level of budgetary control for the General Fund is at the department/office level and at the fund level for the Library Agency and HRA General Fund. For additional information, see Note V. A. on pages 73-75.
Neither the Library Agency nor HRA General Fund exceeded the legal level of budgetary control for fiscal year ended December 31, 2005.
The General Fund did not exceed total appropriations at the fund level, however total expenditures exceeded appropriations in the following departments/offices:
Final BudgetedAmounts Actual
Variance with Final Budgets
General Fund:
City Attorney 5,298,131$ 5,318,128$ (19,997)$
Neighborhood, Housing and Property Improvement 2,889,743 3,037,237 (147,494)
(Remainder of this page left blank intentionally)
142
FINANCIAL SECTION
SUPPLEMENTARY INFORMATION
C I T Y O F S A I N T P A U L C O M P R E H E N S I V E A N N U A L F I N A N C I A L R E P O R T
Nonmajor Governmental Funds
Special Revenue FundsSpecial revenue funds account for proceeds of specific revenue sources (other than major capital projects) that are legally restricted to expenditures for specified purposes.
Special Projects - General Government - to account for monies received from hotel-motel taxes, interest earnings, the city-wide indirect cost recovery plan and other sources, and expended on various general government activities.
Finance Special Projects - to collect assessment service fees to provide administration of street maintenance, storm sewer system charges and various public improvement projects.
Cable Communications - to account for cable television franchise fees utilized to monitor and evaluate the cable television franchise and provide city video programming.
Charitable Gambling Enforcement - to account for 2 ½ percent tax on charitable gambling net receipts to process, monitor and review all lawful gambling activities and to ensure the integrity of operations as required by state law.
Debt - Capital Improvement - to account for proceeds of the sale of city property for which there is no outstanding debt and use remaining proceeds to finance projects in the capital improvement budget.
Utilities Rate Investigation Administration - to account for proceeds from District Energy and Energy Park to be used for city rate investigation expenses.
Property Code Enforcement - to finance the activities of the Truth-In-Sale of Housing, Nuisance Housing Abatement, Code Enforcement Grants, and Rental Registration programs.
License and Permit - to account for revenue received from business and trade licenses, building permits, plan examination, certificate of competency and other fees related to ensuring public safety by monitoring construction activity and businesses.
Police Services - Pension Assets - to account for the over funded portion of police pension assets returned to the city from the Public Employees Retirement Association (PERA) following the merging of the city’s police pension funds. The returned monies are to be spent solely on police expenditures.
Crime Laboratory - to account for the revenue received from the General Fund and outside agencies billed for services provided that is used to support the crime laboratory.
continued
143
Parking Enforcement - to account for utilization of parking enforcement officers’ response to citizen complaints for parking violations and to issue parking citations.
Special Projects Police - to account for monies received from various grants, contributions, and other sources to perform various miscellaneous police functions.
Police Officers Clothing - to account for the clothing allowance for police officers, communications center personnel and radio shop personnel in the Police Department.
Fire Responsive Services - to account for monies received by the Department of Fire and Safety Services to perform various fire functions.
Fire Fighting Equipment - to account for monies received from other governmental units, private corporations and individuals for fire protection outside the city and to account for the purchase of fire equipment.
Fire Protection Clothing - to account for the clothing allowance for each uniformed firefighter.
Right of Way Maintenance - to account for revenues received from right-of-way assessments, municipal state aid, county aid, and trunk highway funds for summer street repair and maintenance, winter street activities, boulevard tree maintenance and trimming, sidewalk maintenance, and streetlight maintenance.
Parking Meter Collections - to account for city parking meter and parking fine revenue which support maintenance and enforcement.
Lighting Maintenance Assessment Districts - to account for levied assessments used to operate above standard (ornamental) street lighting systems in various areas of the city, installed at the request of adjacent property owners.
Solid Waste and Recycling - to account for monies received for the city’s recycling programs. The recycling programs include the coordinated efforts of the City of Saint Paul, Ramsey County, State of Minnesota, Neighborhood Energy Consortium, Macalester/Groveland District Council and the citizens of Saint Paul.
Special Projects - Division of Health - to account for monies received from federal and state agencies to operate specified public health programs.
Municipal Stadium - to account for the use of revenue from facility rental and other sources to be used for the operation of the Municipal Stadium.
Forestry Special - to account for the services provided to maintain and upkeep the trees and other vegetation growing in the public right-of-way and on private property when requested, which helps maintain a safe traffic corridor for pedestrians and vehicles.
continued
144
Como Campus - to account for proceeds from education programs, commissions and donations from outside parties, to be appropriated for volunteer recruitment and training, purchase of animals, maintenance of zoo and conservatory and other related costs.
Special Recreation Activities - to account for user fees used to provide city-wide recreational programs such as concerts, day-camp, field trips, tennis tournaments, special events and in-services.
Municipal Athletic Programming - to account for user fees used to coordinate the operation of a city-wide municipal athletic program.
Charitable Gambling - to account for the administration of charitable gambling receipts in conformance with City Council action for the support of youth athletics or otherwise as legally determined.
Parks and Recreation Opportunity - to account for donations and contributions given to the Department of Parks and Recreation for services, supplies, and/or facilities.
Parks and Recreation Grants and Aids - to account for intergovernmental grants and aids received from various federal, state, county and other agencies, and other revenues received to operate specified Parks and Recreation projects.
Rella Havens Memorial Fund - to account for the portion of an estate left to the city’s public library system by a former library employee, to be administered at the discretion of the library administrator.
Community Development Block Grant - to account for monies received from the U.S. Department of Housing and Urban Development under the Community Development Block Grant Program, and other miscellaneous revenues derived from projects operated under this program. These monies are to be expended for the development of a viable urban community, by providing decent housing and a suitable living environment and expanded economic opportunities, principally for persons of low and moderate income.
State Grant Programs - to account for various grants received from the State of Minnesota to be used for urban development.
HRA Federal and State Programs - to account for intergovernmental revenues provided to the HRA from the federal, state and local governments.
Section 108 Programs - to account for monies received under the U.S. Department of Housing and Urban Development Section 108 Loan Guaranty Program.
continued
145
Debt Service FundsDebt service funds account for financial resources used for the payment of general long-term debt principal, interest and related costs.
G.O. Special Assessment - Streets - to account for monies received from property tax assessments, to be used for the repayment of the principal and interest on special assessment debt with governmental commitment.
City Revenue Bonds and Other Long-Term Debt - to account for monies received from various sources for the payment of principal and interest on city issued revenue bonds and other long-term debt.
Library Debt - to account for the monies received from property taxes and other various sources for the repayment of principal and interest on city issued general obligation bonds for Library Agency capital projects.
Revenue Notes and Other Long-Term Debt - to account for monies received from various sources for the payment of principal and interest on city issued revenue notes and other long-term debt.
Capital Projects Funds Capital projects funds account for financial resources used for the acquisition or construction of major capital facilities other than those financed by proprietary funds and trust funds.
Capital Improvement Bonds - to account for monies received from the sale of general obligation bonds, which are subsequently transferred to the Capital Improvement Projects Fund which accounts for the expenditure of the construction projects.
City Sales Tax - to account for the monies received from the one-half percent city sales tax which are used for major RiverCentre capital expenditures, other capital expenditures as determined by the City Council, and the transfer to the HRA General Debt Service Fund for financing the debt service on the HRA Sales Tax Revenue Bonds.
Library Capital Projects - to account for monies received from the sale of general obligation bonds for the construction of Library projects.
City Downtown Capital Projects - to account for development and capital expenditures primarily in Saint Paul’s downtown area. The main source of financing for these expenditures is transfers from the HRA General Debt Service Fund under the Downtown and Seventh Place Redevelopment Project Subordinated Tax Increment Revenue Note.
continued
146
HRA Tax Increment - to account for development and capital expenditures primarily in Saint Paul’s Tax Increment Districts using financing from bond proceeds, tax increment revenues, and other sources.
Permanent Funds Permanent funds account for resources that are legally restricted to the extent that only earnings, not principal, may be used for purposes that support specific programs.
Japanese Gardens - to account for donations from the Ordway Family for the construction of the Japanese Garden in Como Park.
Hoffman Memorial - to account for the principal of a trust fund and disbursement of interest derived from donation for perpetual maintenance of a memorial located at Como Park Conservatory.
147
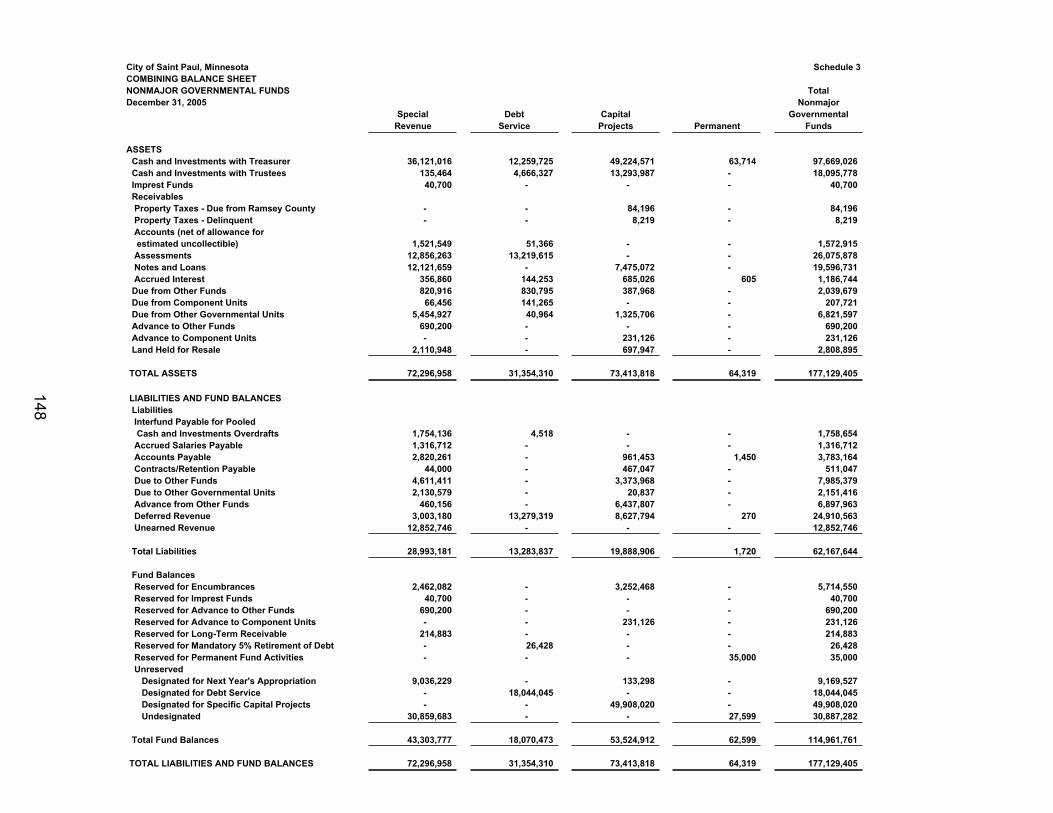
City of Saint Paul, Minnesota Schedule 3COMBINING BALANCE SHEETNONMAJOR GOVERNMENTAL FUNDS TotalDecember 31, 2005 Nonmajor
Special Debt Capital GovernmentalRevenue Service Projects Permanent Funds
ASSETS Cash and Investments with Treasurer 36,121,016 12,259,725 49,224,571 63,714 97,669,026 Cash and Investments with Trustees 135,464 4,666,327 13,293,987 - 18,095,778 Imprest Funds 40,700 - - - 40,700 Receivables Property Taxes - Due from Ramsey County - - 84,196 - 84,196 Property Taxes - Delinquent - - 8,219 - 8,219 Accounts (net of allowance for estimated uncollectible) 1,521,549 51,366 - - 1,572,915 Assessments 12,856,263 13,219,615 - - 26,075,878 Notes and Loans 12,121,659 - 7,475,072 - 19,596,731 Accrued Interest 356,860 144,253 685,026 605 1,186,744 Due from Other Funds 820,916 830,795 387,968 - 2,039,679 Due from Component Units 66,456 141,265 - - 207,721 Due from Other Governmental Units 5,454,927 40,964 1,325,706 - 6,821,597 Advance to Other Funds 690,200 - - - 690,200 Advance to Component Units - - 231,126 - 231,126 Land Held for Resale 2,110,948 - 697,947 - 2,808,895
TOTAL ASSETS 72,296,958 31,354,310 73,413,818 64,319 177,129,405
LIABILITIES AND FUND BALANCES Liabilities Interfund Payable for Pooled Cash and Investments Overdrafts 1,754,136 4,518 - - 1,758,654 Accrued Salaries Payable 1,316,712 - - - 1,316,712 Accounts Payable 2,820,261 - 961,453 1,450 3,783,164 Contracts/Retention Payable 44,000 - 467,047 - 511,047 Due to Other Funds 4,611,411 - 3,373,968 - 7,985,379 Due to Other Governmental Units 2,130,579 - 20,837 - 2,151,416 Advance from Other Funds 460,156 - 6,437,807 - 6,897,963 Deferred Revenue 3,003,180 13,279,319 8,627,794 270 24,910,563 Unearned Revenue 12,852,746 - - - 12,852,746
Total Liabilities 28,993,181 13,283,837 19,888,906 1,720 62,167,644
Fund Balances Reserved for Encumbrances 2,462,082 - 3,252,468 - 5,714,550 Reserved for Imprest Funds 40,700 - - - 40,700 Reserved for Advance to Other Funds 690,200 - - - 690,200 Reserved for Advance to Component Units - - 231,126 - 231,126 Reserved for Long-Term Receivable 214,883 - - - 214,883 Reserved for Mandatory 5% Retirement of Debt - 26,428 - - 26,428 Reserved for Permanent Fund Activities - - - 35,000 35,000 Unreserved Designated for Next Year's Appropriation 9,036,229 - 133,298 - 9,169,527 Designated for Debt Service - 18,044,045 - - 18,044,045 Designated for Specific Capital Projects - - 49,908,020 - 49,908,020 Undesignated 30,859,683 - - 27,599 30,887,282
Total Fund Balances 43,303,777 18,070,473 53,524,912 62,599 114,961,761
TOTAL LIABILITIES AND FUND BALANCES 72,296,958 31,354,310 73,413,818 64,319 177,129,405
148
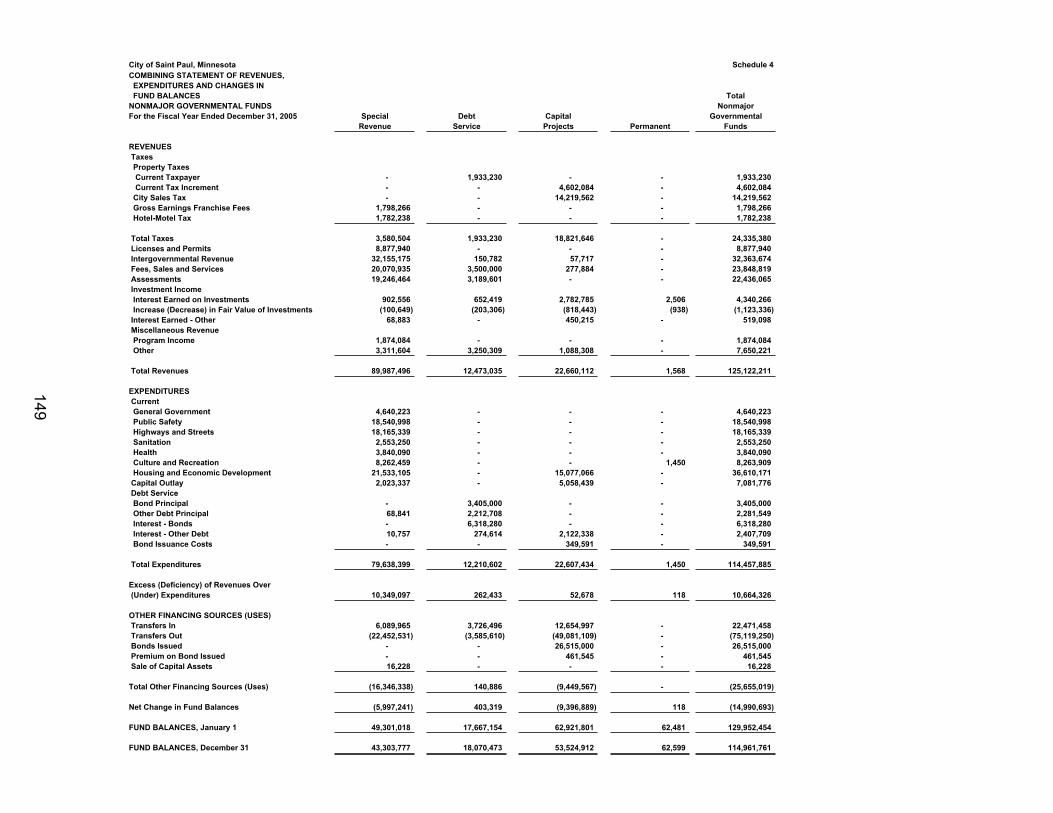
City of Saint Paul, MinnesotaCOMBINING STATEMENT OF REVENUES, EXPENDITURES AND CHANGES IN FUND BALANCESNONMAJOR GOVERNMENTAL FUNDSFor the Fiscal Year Ended December 31, 2005
REVENUES Taxes Property Taxes Current Taxpayer Current Tax Increment City Sales Tax Gross Earnings Franchise Fees Hotel-Motel Tax
Total Taxes Licenses and Permits Intergovernmental Revenue Fees, Sales and Services Assessments Investment Income Interest Earned on Investments Increase (Decrease) in Fair Value of Investments Interest Earned - Other Miscellaneous Revenue Program Income Other
Total Revenues
EXPENDITURES Current General Government Public Safety Highways and Streets Sanitation Health Culture and Recreation Housing and Economic Development Capital Outlay Debt Service Bond Principal Other Debt Principal Interest - Bonds Interest - Other Debt Bond Issuance Costs
Total Expenditures
Excess (Deficiency) of Revenues Over (Under) Expenditures
OTHER FINANCING SOURCES (USES) Transfers In Transfers Out Bonds Issued Premium on Bond Issued Sale of Capital Assets
Total Other Financing Sources (Uses)
Net Change in Fund Balances
FUND BALANCES, January 1
FUND BALANCES, December 31
Schedule 4
TotalNonmajor
Special Debt Capital GovernmentalRevenue Service Projects Permanent Funds
- 1,933,230 - - 1,933,230 - - 4,602,084 - 4,602,084 - - 14,219,562 - 14,219,562
1,798,266 - - - 1,798,266 1,782,238 - - - 1,782,238
3,580,504 1,933,230 18,821,646 - 24,335,380 8,877,940 - - - 8,877,940
32,155,175 150,782 57,717 - 32,363,674 20,070,935 3,500,000 277,884 - 23,848,819 19,246,464 3,189,601 - - 22,436,065
902,556 652,419 2,782,785 2,506 4,340,266 (100,649) (203,306) (818,443) (938) (1,123,336)
68,883 - 450,215 - 519,098
1,874,084 - - - 1,874,084 3,311,604 3,250,309 1,088,308 - 7,650,221
89,987,496 12,473,035 22,660,112 1,568 125,122,211
4,640,223 - - - 4,640,223 18,540,998 - - - 18,540,998 18,165,339 - - - 18,165,339 2,553,250 - - - 2,553,250 3,840,090 - - - 3,840,090 8,262,459 - - 1,450 8,263,909
21,533,105 - 15,077,066 - 36,610,171 2,023,337 - 5,058,439 - 7,081,776
- 3,405,000 - - 3,405,000 68,841 2,212,708 - - 2,281,549 - 6,318,280 - - 6,318,280 10,757 274,614 2,122,338 - 2,407,709 - - 349,591 - 349,591
79,638,399 12,210,602 22,607,434 1,450 114,457,885
10,349,097 262,433 52,678 118 10,664,326
6,089,965 3,726,496 12,654,997 - 22,471,458 (22,452,531) (3,585,610) (49,081,109) - (75,119,250)
- - 26,515,000 - 26,515,000 - - 461,545 - 461,545 16,228 - - - 16,228
(16,346,338) 140,886 (9,449,567) - (25,655,019)
(5,997,241) 403,319 (9,396,889) 118 (14,990,693)
49,301,018 17,667,154 62,921,801 62,481 129,952,454
43,303,777 18,070,473 53,524,912 62,599 114,961,761
149
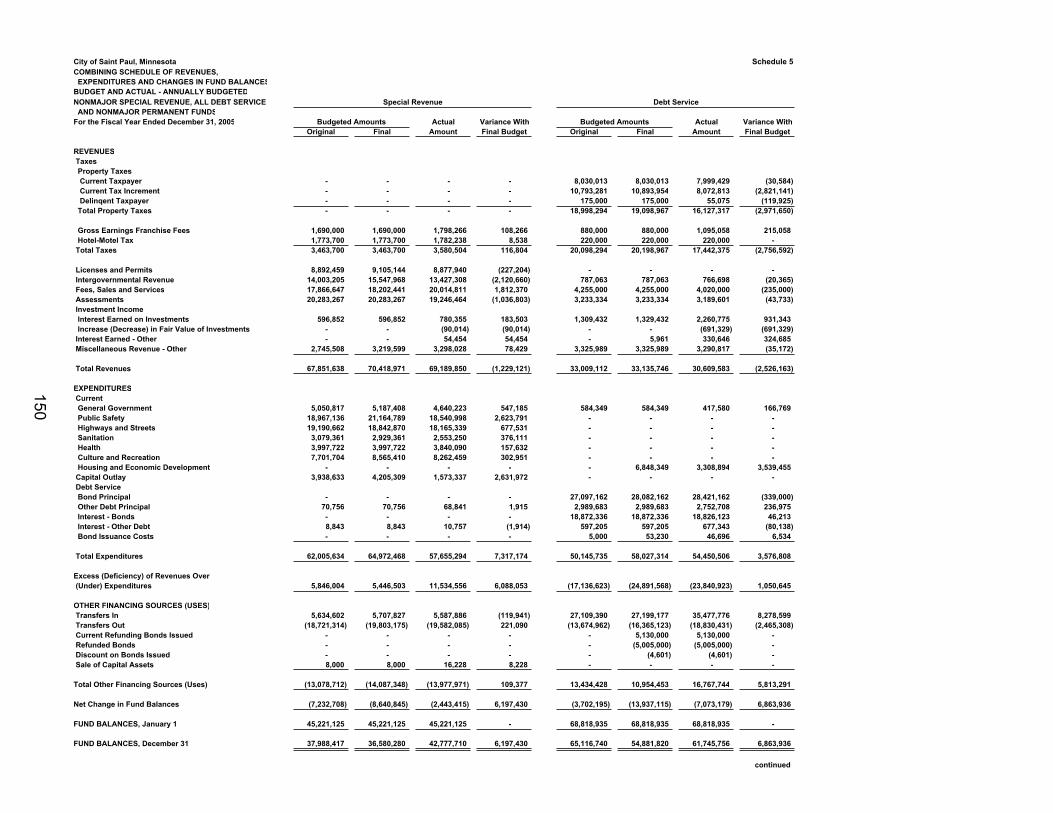
City of Saint Paul, Minnesota Schedule 5COMBINING SCHEDULE OF REVENUES, EXPENDITURES AND CHANGES IN FUND BALANCESBUDGET AND ACTUAL - ANNUALLY BUDGETEDNONMAJOR SPECIAL REVENUE, ALL DEBT SERVICE Special Revenue Debt Service AND NONMAJOR PERMANENT FUNDSFor the Fiscal Year Ended December 31, 2005 Budgeted Amounts Actual Variance With Budgeted Amounts Actual Variance With
Original Final Amount Final Budget Original Final Amount Final Budget
REVENUES Taxes Property Taxes Current Taxpayer - - - - 8,030,013 8,030,013 7,999,429 (30,584) Current Tax Increment - - - - 10,793,281 10,893,954 8,072,813 (2,821,141) Delinqent Taxpayer - - - - 175,000 175,000 55,075 (119,925) Total Property Taxes - - - - 18,998,294 19,098,967 16,127,317 (2,971,650)
Gross Earnings Franchise Fees 1,690,000 1,690,000 1,798,266 108,266 880,000 880,000 1,095,058 215,058 Hotel-Motel Tax 1,773,700 1,773,700 1,782,238 8,538 220,000 220,000 220,000 - Total Taxes 3,463,700 3,463,700 3,580,504 116,804 20,098,294 20,198,967 17,442,375 (2,756,592)
Licenses and Permits 8,892,459 9,105,144 8,877,940 (227,204) - - - - Intergovernmental Revenue 14,003,205 15,547,968 13,427,308 (2,120,660) 787,063 787,063 766,698 (20,365) Fees, Sales and Services 17,866,647 18,202,441 20,014,811 1,812,370 4,255,000 4,255,000 4,020,000 (235,000) Assessments 20,283,267 20,283,267 19,246,464 (1,036,803) 3,233,334 3,233,334 3,189,601 (43,733) Investment Income Interest Earned on Investments 596,852 596,852 780,355 183,503 1,309,432 1,329,432 2,260,775 931,343 Increase (Decrease) in Fair Value of Investments - - (90,014) (90,014) - - (691,329) (691,329) Interest Earned - Other - - 54,454 54,454 - 5,961 330,646 324,685 Miscellaneous Revenue - Other 2,745,508 3,219,599 3,298,028 78,429 3,325,989 3,325,989 3,290,817 (35,172)
Total Revenues 67,851,638 70,418,971 69,189,850 (1,229,121) 33,009,112 33,135,746 30,609,583 (2,526,163)
EXPENDITURES Current General Government 5,050,817 5,187,408 4,640,223 547,185 584,349 584,349 417,580 166,769 Public Safety 18,967,136 21,164,789 18,540,998 2,623,791 - - - - Highways and Streets 19,190,662 18,842,870 18,165,339 677,531 - - - - Sanitation 3,079,361 2,929,361 2,553,250 376,111 - - - - Health 3,997,722 3,997,722 3,840,090 157,632 - - - - Culture and Recreation 7,701,704 8,565,410 8,262,459 302,951 - - - - Housing and Economic Development - - - - - 6,848,349 3,308,894 3,539,455 Capital Outlay 3,938,633 4,205,309 1,573,337 2,631,972 - - - - Debt Service Bond Principal - - - - 27,097,162 28,082,162 28,421,162 (339,000) Other Debt Principal 70,756 70,756 68,841 1,915 2,989,683 2,989,683 2,752,708 236,975 Interest - Bonds - - - - 18,872,336 18,872,336 18,826,123 46,213 Interest - Other Debt 8,843 8,843 10,757 (1,914) 597,205 597,205 677,343 (80,138) Bond Issuance Costs - - - - 5,000 53,230 46,696 6,534
Total Expenditures 62,005,634 64,972,468 57,655,294 7,317,174 50,145,735 58,027,314 54,450,506 3,576,808
Excess (Deficiency) of Revenues Over (Under) Expenditures 5,846,004 5,446,503 11,534,556 6,088,053 (17,136,623) (24,891,568) (23,840,923) 1,050,645
OTHER FINANCING SOURCES (USES) Transfers In 5,634,602 5,707,827 5,587,886 (119,941) 27,109,390 27,199,177 35,477,776 8,278,599 Transfers Out (18,721,314) (19,803,175) (19,582,085) 221,090 (13,674,962) (16,365,123) (18,830,431) (2,465,308) Current Refunding Bonds Issued - - - - - 5,130,000 5,130,000 - Refunded Bonds - - - - - (5,005,000) (5,005,000) - Discount on Bonds Issued - - - - - (4,601) (4,601) - Sale of Capital Assets 8,000 8,000 16,228 8,228 - - - -
Total Other Financing Sources (Uses) (13,078,712) (14,087,348) (13,977,971) 109,377 13,434,428 10,954,453 16,767,744 5,813,291
Net Change in Fund Balances (7,232,708) (8,640,845) (2,443,415) 6,197,430 (3,702,195) (13,937,115) (7,073,179) 6,863,936
FUND BALANCES, January 1 45,221,125 45,221,125 45,221,125 - 68,818,935 68,818,935 68,818,935 -
FUND BALANCES, December 31 37,988,417 36,580,280 42,777,710 6,197,430 65,116,740 54,881,820 61,745,756 6,863,936
continued
150
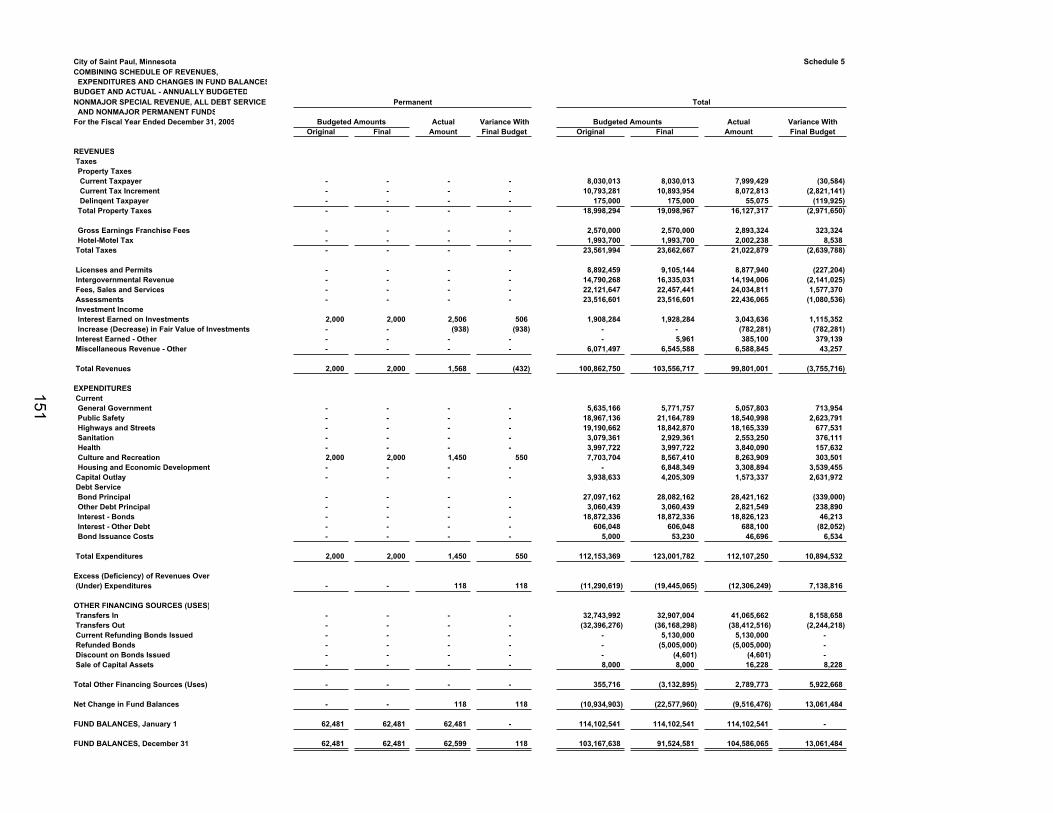
City of Saint Paul, MinnesotaCOMBINING SCHEDULE OF REVENUES, EXPENDITURES AND CHANGES IN FUND BALANCESBUDGET AND ACTUAL - ANNUALLY BUDGETEDNONMAJOR SPECIAL REVENUE, ALL DEBT SERVICE AND NONMAJOR PERMANENT FUNDSFor the Fiscal Year Ended December 31, 2005
REVENUES Taxes Property Taxes Current Taxpayer Current Tax Increment Delinqent Taxpayer Total Property Taxes
Gross Earnings Franchise Fees Hotel-Motel Tax Total Taxes
Licenses and Permits Intergovernmental Revenue Fees, Sales and Services Assessments Investment Income Interest Earned on Investments Increase (Decrease) in Fair Value of Investments Interest Earned - Other Miscellaneous Revenue - Other
Total Revenues
EXPENDITURES Current General Government Public Safety Highways and Streets Sanitation Health Culture and Recreation Housing and Economic Development Capital Outlay Debt Service Bond Principal Other Debt Principal Interest - Bonds Interest - Other Debt Bond Issuance Costs
Total Expenditures
Excess (Deficiency) of Revenues Over (Under) Expenditures
OTHER FINANCING SOURCES (USES) Transfers In Transfers Out Current Refunding Bonds Issued Refunded Bonds Discount on Bonds Issued Sale of Capital Assets
Total Other Financing Sources (Uses)
Net Change in Fund Balances
FUND BALANCES, January 1
FUND BALANCES, December 31
Schedule 5
Total
Budgeted Amounts Actual Variance With Budgeted Amounts Actual Variance WithOriginal Final Amount Final Budget Original Final Amount Final Budget
- - - - 8,030,013 8,030,013 7,999,429 (30,584)- - - - 10,793,281 10,893,954 8,072,813 (2,821,141)- - - - 175,000 175,000 55,075 (119,925)- - - - 18,998,294 19,098,967 16,127,317 (2,971,650)
- - - - 2,570,000 2,570,000 2,893,324 323,324- - - - 1,993,700 1,993,700 2,002,238 8,538- - - - 23,561,994 23,662,667 21,022,879 (2,639,788)
- - - - 8,892,459 9,105,144 8,877,940 (227,204)- - - - 14,790,268 16,335,031 14,194,006 (2,141,025)- - - - 22,121,647 22,457,441 24,034,811 1,577,370- - - - 23,516,601 23,516,601 22,436,065 (1,080,536)
2,000 2,000 2,506 506 1,908,284 1,928,284 3,043,636 1,115,352- - (938) (938) - - (782,281) (782,281)- - - - - 5,961 385,100 379,139- - - - 6,071,497 6,545,588 6,588,845 43,257
2,000 2,000 1,568 (432) 100,862,750 103,556,717 99,801,001 (3,755,716)
- - - - 5,635,166 5,771,757 5,057,803 713,954- - - - 18,967,136 21,164,789 18,540,998 2,623,791- - - - 19,190,662 18,842,870 18,165,339 677,531- - - - 3,079,361 2,929,361 2,553,250 376,111- - - - 3,997,722 3,997,722 3,840,090 157,6322,000 2,000 1,450 550 7,703,704 8,567,410 8,263,909 303,501- - - - - 6,848,349 3,308,894 3,539,455- - - - 3,938,633 4,205,309 1,573,337 2,631,972
- - - - 27,097,162 28,082,162 28,421,162 (339,000)- - - - 3,060,439 3,060,439 2,821,549 238,890- - - - 18,872,336 18,872,336 18,826,123 46,213- - - - 606,048 606,048 688,100 (82,052)- - - - 5,000 53,230 46,696 6,534
2,000 2,000 1,450 550 112,153,369 123,001,782 112,107,250 10,894,532
- - 118 118 (11,290,619) (19,445,065) (12,306,249) 7,138,816
- - - - 32,743,992 32,907,004 41,065,662 8,158,658- - - - (32,396,276) (36,168,298) (38,412,516) (2,244,218)- - - - - 5,130,000 5,130,000 - - - - - - (5,005,000) (5,005,000) - - - - - - (4,601) (4,601) - - - - - 8,000 8,000 16,228 8,228
- - - - 355,716 (3,132,895) 2,789,773 5,922,668
- - 118 118 (10,934,903) (22,577,960) (9,516,476) 13,061,484
62,481 62,481 62,481 - 114,102,541 114,102,541 114,102,541 -
62,481 62,481 62,599 118 103,167,638 91,524,581 104,586,065 13,061,484
Permanent
151
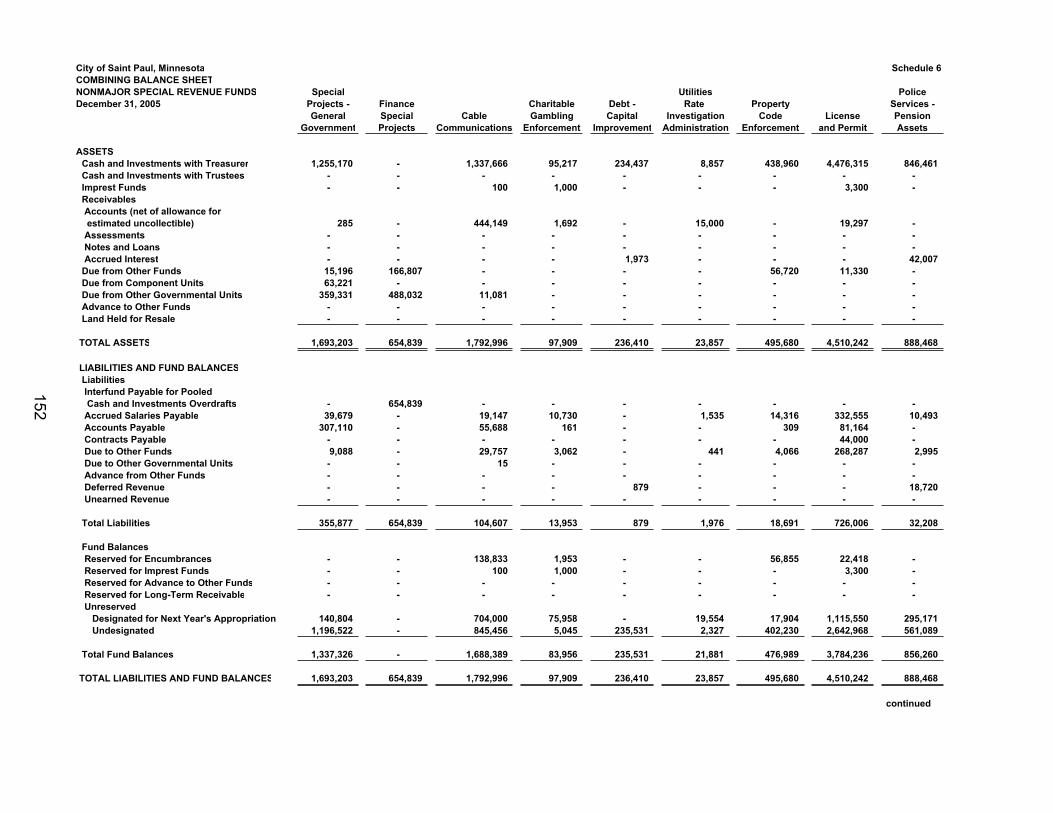
City of Saint Paul, Minnesota Schedule 6COMBINING BALANCE SHEETNONMAJOR SPECIAL REVENUE FUNDS Special Utilities PoliceDecember 31, 2005 Projects - Finance Charitable Debt - Rate Property Services -
General Special Cable Gambling Capital Investigation Code License PensionGovernment Projects Communications Enforcement Improvement Administration Enforcement and Permit Assets
ASSETS Cash and Investments with Treasurer 1,255,170 - 1,337,666 95,217 234,437 8,857 438,960 4,476,315 846,461 Cash and Investments with Trustees - - - - - - - - - Imprest Funds - - 100 1,000 - - - 3,300 - Receivables Accounts (net of allowance for estimated uncollectible) 285 - 444,149 1,692 - 15,000 - 19,297 - Assessments - - - - - - - - - Notes and Loans - - - - - - - - - Accrued Interest - - - - 1,973 - - - 42,007 Due from Other Funds 15,196 166,807 - - - - 56,720 11,330 - Due from Component Units 63,221 - - - - - - - - Due from Other Governmental Units 359,331 488,032 11,081 - - - - - - Advance to Other Funds - - - - - - - - - Land Held for Resale - - - - - - - - -
TOTAL ASSETS 1,693,203 654,839 1,792,996 97,909 236,410 23,857 495,680 4,510,242 888,468
LIABILITIES AND FUND BALANCES Liabilities Interfund Payable for Pooled Cash and Investments Overdrafts - 654,839 - - - - - - - Accrued Salaries Payable 39,679 - 19,147 10,730 - 1,535 14,316 332,555 10,493 Accounts Payable 307,110 - 55,688 161 - - 309 81,164 - Contracts Payable - - - - - - - 44,000 - Due to Other Funds 9,088 - 29,757 3,062 - 441 4,066 268,287 2,995 Due to Other Governmental Units - - 15 - - - - - - Advance from Other Funds - - - - - - - - - Deferred Revenue - - - - 879 - - - 18,720 Unearned Revenue - - - - - - - - -
Total Liabilities 355,877 654,839 104,607 13,953 879 1,976 18,691 726,006 32,208
Fund Balances Reserved for Encumbrances - - 138,833 1,953 - - 56,855 22,418 - Reserved for Imprest Funds - - 100 1,000 - - - 3,300 - Reserved for Advance to Other Funds - - - - - - - - - Reserved for Long-Term Receivable - - - - - - - - - Unreserved Designated for Next Year's Appropriation 140,804 - 704,000 75,958 - 19,554 17,904 1,115,550 295,171 Undesignated 1,196,522 - 845,456 5,045 235,531 2,327 402,230 2,642,968 561,089
Total Fund Balances 1,337,326 - 1,688,389 83,956 235,531 21,881 476,989 3,784,236 856,260
TOTAL LIABILITIES AND FUND BALANCES 1,693,203 654,839 1,792,996 97,909 236,410 23,857 495,680 4,510,242 888,468
continued
152
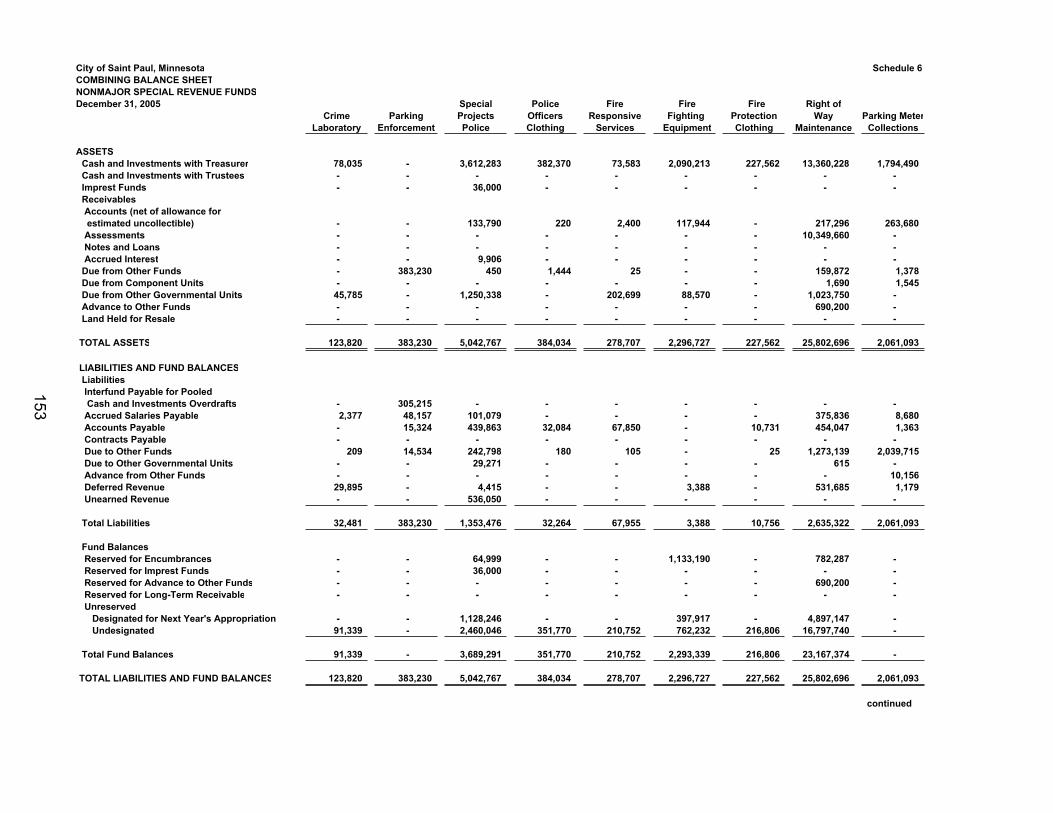
City of Saint Paul, MinnesotaCOMBINING BALANCE SHEETNONMAJOR SPECIAL REVENUE FUNDSDecember 31, 2005
ASSETS Cash and Investments with Treasurer Cash and Investments with Trustees Imprest Funds Receivables Accounts (net of allowance for estimated uncollectible) Assessments Notes and Loans Accrued Interest Due from Other Funds Due from Component Units Due from Other Governmental Units Advance to Other Funds Land Held for Resale
TOTAL ASSETS
LIABILITIES AND FUND BALANCES Liabilities Interfund Payable for Pooled Cash and Investments Overdrafts Accrued Salaries Payable Accounts Payable Contracts Payable Due to Other Funds Due to Other Governmental Units Advance from Other Funds Deferred Revenue Unearned Revenue
Total Liabilities
Fund Balances Reserved for Encumbrances Reserved for Imprest Funds Reserved for Advance to Other Funds Reserved for Long-Term Receivable Unreserved Designated for Next Year's Appropriation Undesignated
Total Fund Balances
TOTAL LIABILITIES AND FUND BALANCES
Schedule 6
Special Police Fire Fire Fire Right ofCrime Parking Projects Officers Responsive Fighting Protection Way Parking Meter
Laboratory Enforcement Police Clothing Services Equipment Clothing Maintenance Collections
78,035 - 3,612,283 382,370 73,583 2,090,213 227,562 13,360,228 1,794,490- - - - - - - - - - - 36,000 - - - - - -
- - 133,790 220 2,400 117,944 - 217,296 263,680- - - - - - - 10,349,660 - - - - - - - - - - - - 9,906 - - - - - - - 383,230 450 1,444 25 - - 159,872 1,378- - - - - - - 1,690 1,545
45,785 - 1,250,338 - 202,699 88,570 - 1,023,750 - - - - - - - - 690,200 - - - - - - - - - -
123,820 383,230 5,042,767 384,034 278,707 2,296,727 227,562 25,802,696 2,061,093
- 305,215 - - - - - - - 2,377 48,157 101,079 - - - - 375,836 8,680- 15,324 439,863 32,084 67,850 - 10,731 454,047 1,363- - - - - - - - -
209 14,534 242,798 180 105 - 25 1,273,139 2,039,715- - 29,271 - - - - 615 - - - - - - - - - 10,156
29,895 - 4,415 - - 3,388 - 531,685 1,179- - 536,050 - - - - - -
32,481 383,230 1,353,476 32,264 67,955 3,388 10,756 2,635,322 2,061,093
- - 64,999 - - 1,133,190 - 782,287 - - - 36,000 - - - - - - - - - - - - - 690,200 - - - - - - - - - -
- - 1,128,246 - - 397,917 - 4,897,147 - 91,339 - 2,460,046 351,770 210,752 762,232 216,806 16,797,740 -
91,339 - 3,689,291 351,770 210,752 2,293,339 216,806 23,167,374 -
123,820 383,230 5,042,767 384,034 278,707 2,296,727 227,562 25,802,696 2,061,093
continued
153
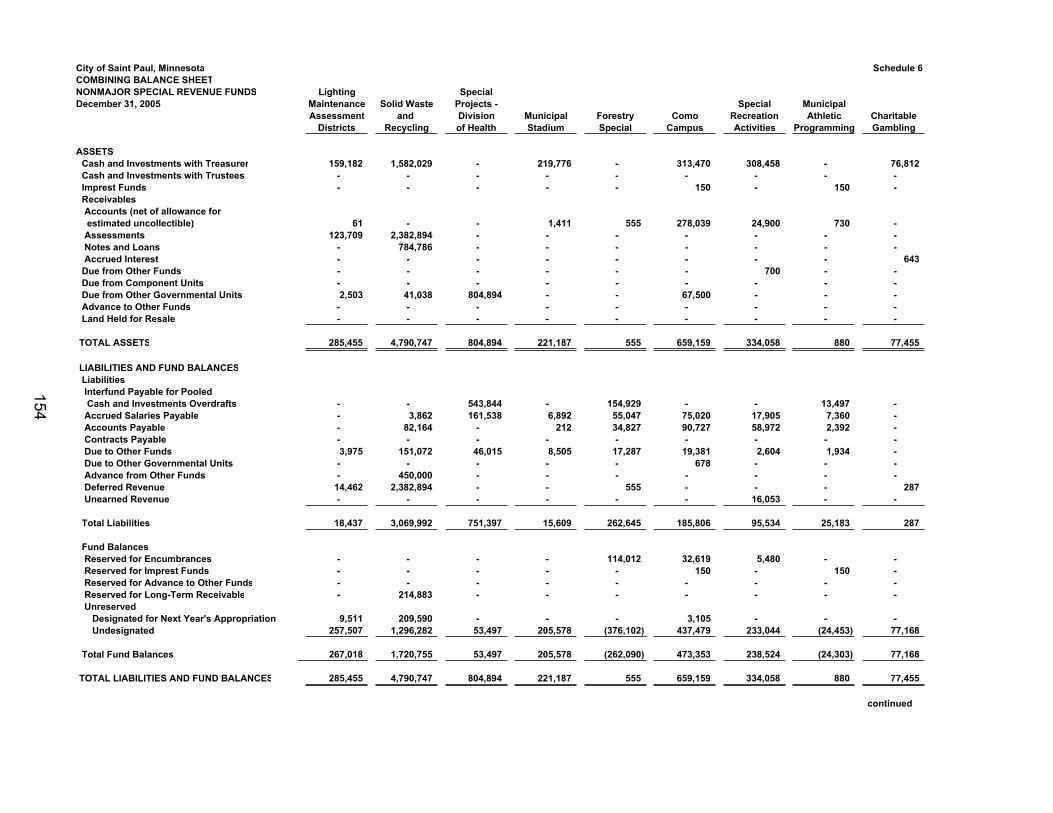
City of Saint Paul, MinnesotaCOMBINING BALANCE SHEETNONMAJOR SPECIAL REVENUE FUNDSDecember 31, 2005
ASSETS Cash and Investments with Treasurer Cash and Investments with Trustees Imprest Funds Receivables Accounts (net of allowance for estimated uncollectible) Assessments Notes and Loans Accrued Interest Due from Other Funds Due from Component Units Due from Other Governmental Units Advance to Other Funds Land Held for Resale
TOTAL ASSETS
LIABILITIES AND FUND BALANCES Liabilities Interfund Payable for Pooled Cash and Investments Overdrafts Accrued Salaries Payable Accounts Payable Contracts Payable Due to Other Funds Due to Other Governmental Units Advance from Other Funds Deferred Revenue Unearned Revenue
Total Liabilities
Fund Balances Reserved for Encumbrances Reserved for Imprest Funds Reserved for Advance to Other Funds Reserved for Long-Term Receivable Unreserved Designated for Next Year's Appropriation Undesignated
Total Fund Balances
TOTAL LIABILITIES AND FUND BALANCES
Schedule 6
Lighting SpecialMaintenance Solid Waste Projects - Special Municipal
r Assessment and Division Municipal Forestry Como Recreation Athletic CharitableDistricts Recycling of Health Stadium Special Campus Activities Programming Gambling
159,182 1,582,029 - 219,776 - 313,470 308,458 - 76,812- - - - - - - - - - - - - - 150 - 150 -
61 - - 1,411 555 278,039 24,900 730 - 123,709 2,382,894 - - - - - - -
- 784,786 - - - - - - - - - - - - - - - 643- - - - - - 700 - - - - - - - - - - - 2,503 41,038 804,894 - - 67,500 - - -
- - - - - - - - - - - - - - - - - -
285,455 4,790,747 804,894 221,187 555 659,159 334,058 880 77,455
- - 543,844 - 154,929 - - 13,497 - - 3,862 161,538 6,892 55,047 75,020 17,905 7,360 - - 82,164 - 212 34,827 90,727 58,972 2,392 - - - - - - - - - - 3,975 151,072 46,015 8,505 17,287 19,381 2,604 1,934 - - - - - - 678 - - - - 450,000 - - - - - - -
14,462 2,382,894 - - 555 - - - 287- - - - - - 16,053 - -
18,437 3,069,992 751,397 15,609 262,645 185,806 95,534 25,183 287
- - - - 114,012 32,619 5,480 - - - - - - - 150 - 150 - - - - - - - - - - - 214,883 - - - - - - -
9,511 209,590 - - - 3,105 - - - 257,507 1,296,282 53,497 205,578 (376,102) 437,479 233,044 (24,453) 77,168
267,018 1,720,755 53,497 205,578 (262,090) 473,353 238,524 (24,303) 77,168
285,455 4,790,747 804,894 221,187 555 659,159 334,058 880 77,455
continued
154
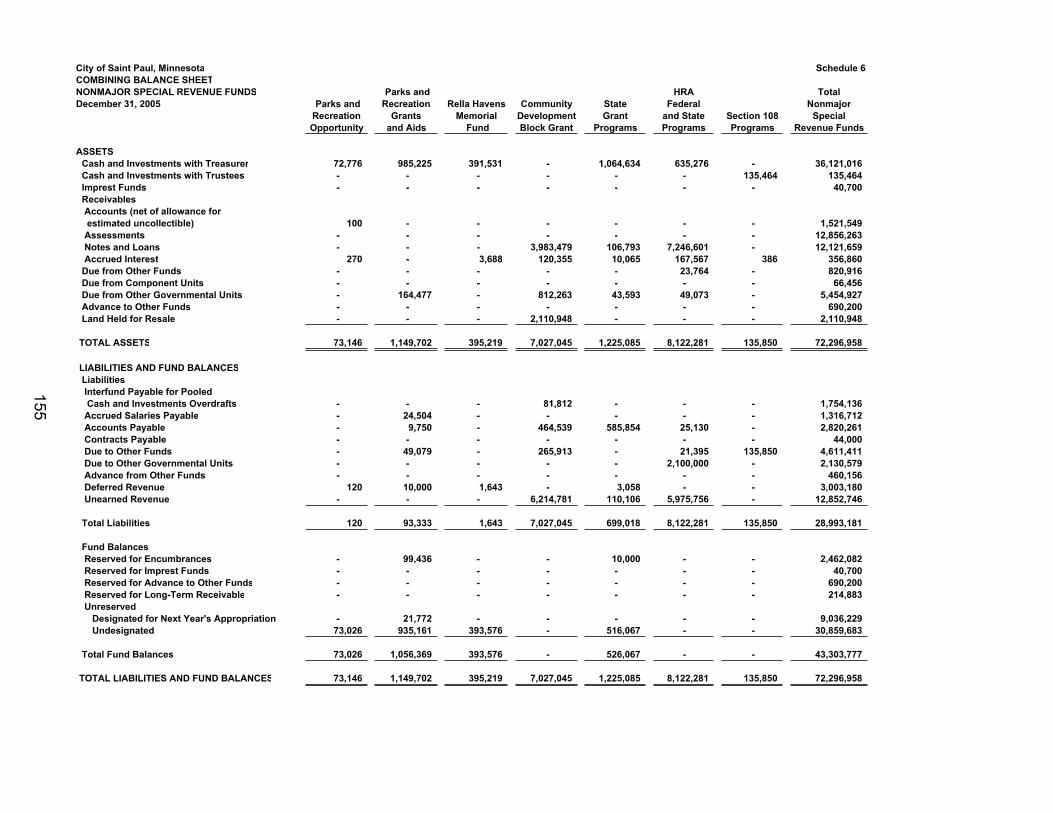
City of Saint Paul, MinnesotaCOMBINING BALANCE SHEETNONMAJOR SPECIAL REVENUE FUNDSDecember 31, 2005
ASSETS Cash and Investments with Treasurer Cash and Investments with Trustees Imprest Funds Receivables Accounts (net of allowance for estimated uncollectible) Assessments Notes and Loans Accrued Interest Due from Other Funds Due from Component Units Due from Other Governmental Units Advance to Other Funds Land Held for Resale
TOTAL ASSETS
LIABILITIES AND FUND BALANCES Liabilities Interfund Payable for Pooled Cash and Investments Overdrafts Accrued Salaries Payable Accounts Payable Contracts Payable Due to Other Funds Due to Other Governmental Units Advance from Other Funds Deferred Revenue Unearned Revenue
Total Liabilities
Fund Balances Reserved for Encumbrances Reserved for Imprest Funds Reserved for Advance to Other Funds Reserved for Long-Term Receivable Unreserved Designated for Next Year's Appropriation Undesignated
Total Fund Balances
TOTAL LIABILITIES AND FUND BALANCES
Schedule 6
Parks and HRA Total Parks and Recreation Rella Havens Community State Federal NonmajorRecreation Grants Memorial Development Grant and State Section 108 SpecialOpportunity and Aids Fund Block Grant Programs Programs Programs Revenue Funds
72,776 985,225 391,531 - 1,064,634 635,276 - 36,121,016- - - - - - 135,464 135,464- - - - - - - 40,700
100 - - - - - - 1,521,549- - - - - - - 12,856,263- - - 3,983,479 106,793 7,246,601 - 12,121,659
270 - 3,688 120,355 10,065 167,567 386 356,860- - - - - 23,764 - 820,916- - - - - - - 66,456- 164,477 - 812,263 43,593 49,073 - 5,454,927- - - - - - - 690,200- - - 2,110,948 - - - 2,110,948
73,146 1,149,702 395,219 7,027,045 1,225,085 8,122,281 135,850 72,296,958
- - - 81,812 - - - 1,754,136- 24,504 - - - - - 1,316,712- 9,750 - 464,539 585,854 25,130 - 2,820,261- - - - - - - 44,000- 49,079 - 265,913 - 21,395 135,850 4,611,411- - - - - 2,100,000 - 2,130,579- - - - - - - 460,156
120 10,000 1,643 - 3,058 - - 3,003,180- - - 6,214,781 110,106 5,975,756 - 12,852,746
120 93,333 1,643 7,027,045 699,018 8,122,281 135,850 28,993,181
- 99,436 - - 10,000 - - 2,462,082- - - - - - - 40,700- - - - - - - 690,200- - - - - - - 214,883
- 21,772 - - - - - 9,036,22973,026 935,161 393,576 - 516,067 - - 30,859,683
73,026 1,056,369 393,576 - 526,067 - - 43,303,777
73,146 1,149,702 395,219 7,027,045 1,225,085 8,122,281 135,850 72,296,958
155
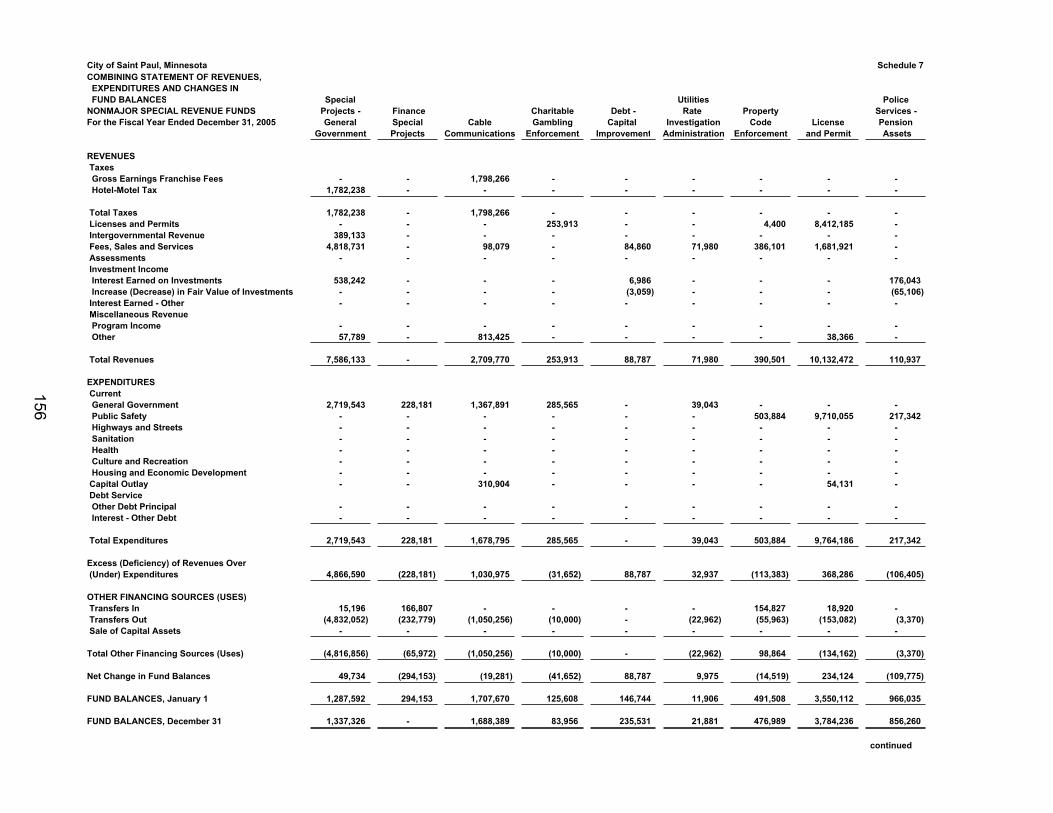
City of Saint Paul, MinnesotaCOMBINING STATEMENT OF REVENUES, EXPENDITURES AND CHANGES IN FUND BALANCESNONMAJOR SPECIAL REVENUE FUNDSFor the Fiscal Year Ended December 31, 2005
REVENUES Taxes Gross Earnings Franchise Fees Hotel-Motel Tax
Total Taxes Licenses and Permits Intergovernmental Revenue Fees, Sales and Services Assessments Investment Income Interest Earned on Investments Increase (Decrease) in Fair Value of Investments Interest Earned - Other Miscellaneous Revenue Program Income Other
Total Revenues
EXPENDITURES Current General Government Public Safety Highways and Streets Sanitation Health Culture and Recreation Housing and Economic Development Capital Outlay Debt Service Other Debt Principal Interest - Other Debt
Total Expenditures
Excess (Deficiency) of Revenues Over (Under) Expenditures
OTHER FINANCING SOURCES (USES) Transfers In Transfers Out Sale of Capital Assets
Total Other Financing Sources (Uses)
Net Change in Fund Balances
FUND BALANCES, January 1
FUND BALANCES, December 31
Schedule 7
Special Utilities PoliceProjects - Finance Charitable Debt - Rate Property Services -General Special Cable Gambling Capital Investigation Code License Pension
Government Projects Communications Enforcement Improvement Administration Enforcement and Permit Assets
- - 1,798,266 - - - - - - 1,782,238 - - - - - - - -
1,782,238 - 1,798,266 - - - - - - - - - 253,913 - - 4,400 8,412,185 -
389,133 - - - - - - - - 4,818,731 - 98,079 - 84,860 71,980 386,101 1,681,921 -
- - - - - - - - -
538,242 - - - 6,986 - - - 176,043- - - - (3,059) - - - (65,106)- - - - - - - - -
- - - - - - - - - 57,789 - 813,425 - - - - 38,366 -
7,586,133 - 2,709,770 253,913 88,787 71,980 390,501 10,132,472 110,937
2,719,543 228,181 1,367,891 285,565 - 39,043 - - - - - - - - - 503,884 9,710,055 217,342- - - - - - - - - - - - - - - - - - - - - - - - - - - - - - - - - - - - - - - - - - - - - - - 310,904 - - - - 54,131 -
- - - - - - - - - - - - - - - - - -
2,719,543 228,181 1,678,795 285,565 - 39,043 503,884 9,764,186 217,342
4,866,590 (228,181) 1,030,975 (31,652) 88,787 32,937 (113,383) 368,286 (106,405)
15,196 166,807 - - - - 154,827 18,920 - (4,832,052) (232,779) (1,050,256) (10,000) - (22,962) (55,963) (153,082) (3,370)
- - - - - - - - -
(4,816,856) (65,972) (1,050,256) (10,000) - (22,962) 98,864 (134,162) (3,370)
49,734 (294,153) (19,281) (41,652) 88,787 9,975 (14,519) 234,124 (109,775)
1,287,592 294,153 1,707,670 125,608 146,744 11,906 491,508 3,550,112 966,035
1,337,326 - 1,688,389 83,956 235,531 21,881 476,989 3,784,236 856,260
continued
156
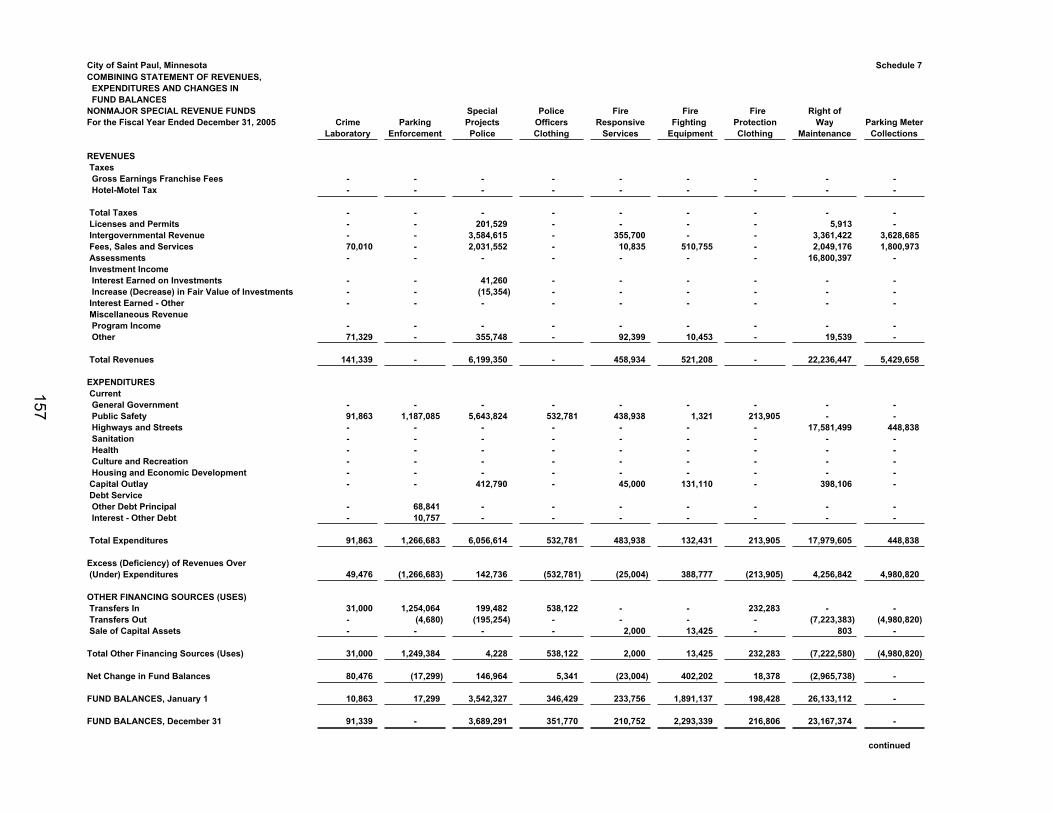
City of Saint Paul, MinnesotaCOMBINING STATEMENT OF REVENUES, EXPENDITURES AND CHANGES IN FUND BALANCESNONMAJOR SPECIAL REVENUE FUNDSFor the Fiscal Year Ended December 31, 2005
REVENUES Taxes Gross Earnings Franchise Fees Hotel-Motel Tax
Total Taxes Licenses and Permits Intergovernmental Revenue Fees, Sales and Services Assessments Investment Income Interest Earned on Investments Increase (Decrease) in Fair Value of Investments Interest Earned - Other Miscellaneous Revenue Program Income Other
Total Revenues
EXPENDITURES Current General Government Public Safety Highways and Streets Sanitation Health Culture and Recreation Housing and Economic Development Capital Outlay Debt Service Other Debt Principal Interest - Other Debt
Total Expenditures
Excess (Deficiency) of Revenues Over (Under) Expenditures
OTHER FINANCING SOURCES (USES) Transfers In Transfers Out Sale of Capital Assets
Total Other Financing Sources (Uses)
Net Change in Fund Balances
FUND BALANCES, January 1
FUND BALANCES, December 31
Schedule 7
Special Police Fire Fire Fire Right ofCrime Parking Projects Officers Responsive Fighting Protection Way Parking Meter
Laboratory Enforcement Police Clothing Services Equipment Clothing Maintenance Collections
- - - - - - - - - - - - - - - - - -
- - - - - - - - - - - 201,529 - - - - 5,913 - - - 3,584,615 - 355,700 - - 3,361,422 3,628,68570,010 - 2,031,552 - 10,835 510,755 - 2,049,176 1,800,973- - - - - - - 16,800,397 -
- - 41,260 - - - - - - - - (15,354) - - - - - - - - - - - - - - -
- - - - - - - - - 71,329 - 355,748 - 92,399 10,453 - 19,539 -
141,339 - 6,199,350 - 458,934 521,208 - 22,236,447 5,429,658
- - - - - - - - - 91,863 1,187,085 5,643,824 532,781 438,938 1,321 213,905 - - - - - - - - - 17,581,499 448,838- - - - - - - - - - - - - - - - - - - - - - - - - - - - - - - - - - - - - - 412,790 - 45,000 131,110 - 398,106 -
- 68,841 - - - - - - - - 10,757 - - - - - - -
91,863 1,266,683 6,056,614 532,781 483,938 132,431 213,905 17,979,605 448,838
49,476 (1,266,683) 142,736 (532,781) (25,004) 388,777 (213,905) 4,256,842 4,980,820
31,000 1,254,064 199,482 538,122 - - 232,283 - - - (4,680) (195,254) - - - - (7,223,383) (4,980,820)- - - - 2,000 13,425 - 803 -
31,000 1,249,384 4,228 538,122 2,000 13,425 232,283 (7,222,580) (4,980,820)
80,476 (17,299) 146,964 5,341 (23,004) 402,202 18,378 (2,965,738) -
10,863 17,299 3,542,327 346,429 233,756 1,891,137 198,428 26,133,112 -
91,339 - 3,689,291 351,770 210,752 2,293,339 216,806 23,167,374 -
continued
157
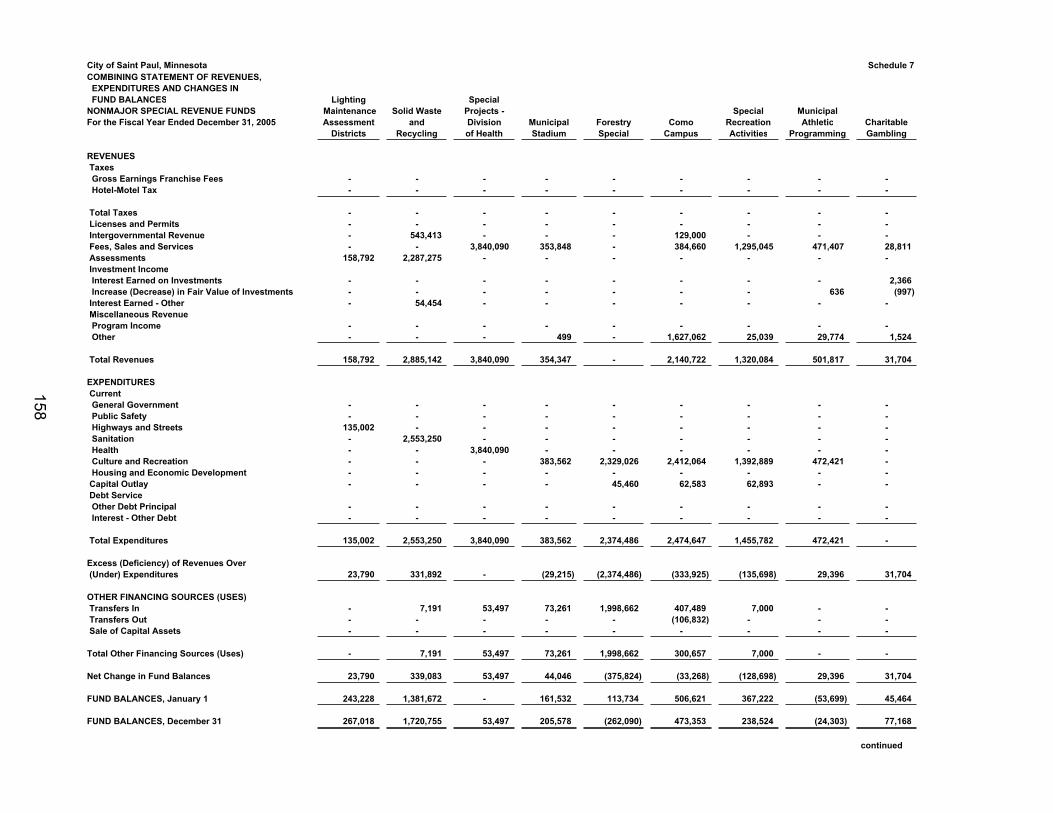
City of Saint Paul, MinnesotaCOMBINING STATEMENT OF REVENUES, EXPENDITURES AND CHANGES IN FUND BALANCESNONMAJOR SPECIAL REVENUE FUNDSFor the Fiscal Year Ended December 31, 2005
REVENUES Taxes Gross Earnings Franchise Fees Hotel-Motel Tax
Total Taxes Licenses and Permits Intergovernmental Revenue Fees, Sales and Services Assessments Investment Income Interest Earned on Investments Increase (Decrease) in Fair Value of Investments Interest Earned - Other Miscellaneous Revenue Program Income Other
Total Revenues
EXPENDITURES Current General Government Public Safety Highways and Streets Sanitation Health Culture and Recreation Housing and Economic Development Capital Outlay Debt Service Other Debt Principal Interest - Other Debt
Total Expenditures
Excess (Deficiency) of Revenues Over (Under) Expenditures
OTHER FINANCING SOURCES (USES) Transfers In Transfers Out Sale of Capital Assets
Total Other Financing Sources (Uses)
Net Change in Fund Balances
FUND BALANCES, January 1
FUND BALANCES, December 31
Schedule 7
Lighting Special Maintenance Solid Waste Projects - Special MunicipalAssessment and Division Municipal Forestry Como Recreation Athletic Charitable
Districts Recycling of Health Stadium Special Campus Activities Programming Gambling
- - - - - - - - - - - - - - - - - -
- - - - - - - - - - - - - - - - - - - 543,413 - - - 129,000 - - - - - 3,840,090 353,848 - 384,660 1,295,045 471,407 28,811
158,792 2,287,275 - - - - - - -
- - - - - - - - 2,366- - - - - - - 636 (997)- 54,454 - - - - - - -
- - - - - - - - - - - - 499 - 1,627,062 25,039 29,774 1,524
158,792 2,885,142 3,840,090 354,347 - 2,140,722 1,320,084 501,817 31,704
- - - - - - - - - - - - - - - - - -
135,002 - - - - - - - - - 2,553,250 - - - - - - - - - 3,840,090 - - - - - - - - - 383,562 2,329,026 2,412,064 1,392,889 472,421 - - - - - - - - - - - - - - 45,460 62,583 62,893 - -
- - - - - - - - - - - - - - - - - -
135,002 2,553,250 3,840,090 383,562 2,374,486 2,474,647 1,455,782 472,421 -
23,790 331,892 - (29,215) (2,374,486) (333,925) (135,698) 29,396 31,704
- 7,191 53,497 73,261 1,998,662 407,489 7,000 - - - - - - - (106,832) - - - - - - - - - - - -
- 7,191 53,497 73,261 1,998,662 300,657 7,000 - -
23,790 339,083 53,497 44,046 (375,824) (33,268) (128,698) 29,396 31,704
243,228 1,381,672 - 161,532 113,734 506,621 367,222 (53,699) 45,464
267,018 1,720,755 53,497 205,578 (262,090) 473,353 238,524 (24,303) 77,168
continued
158
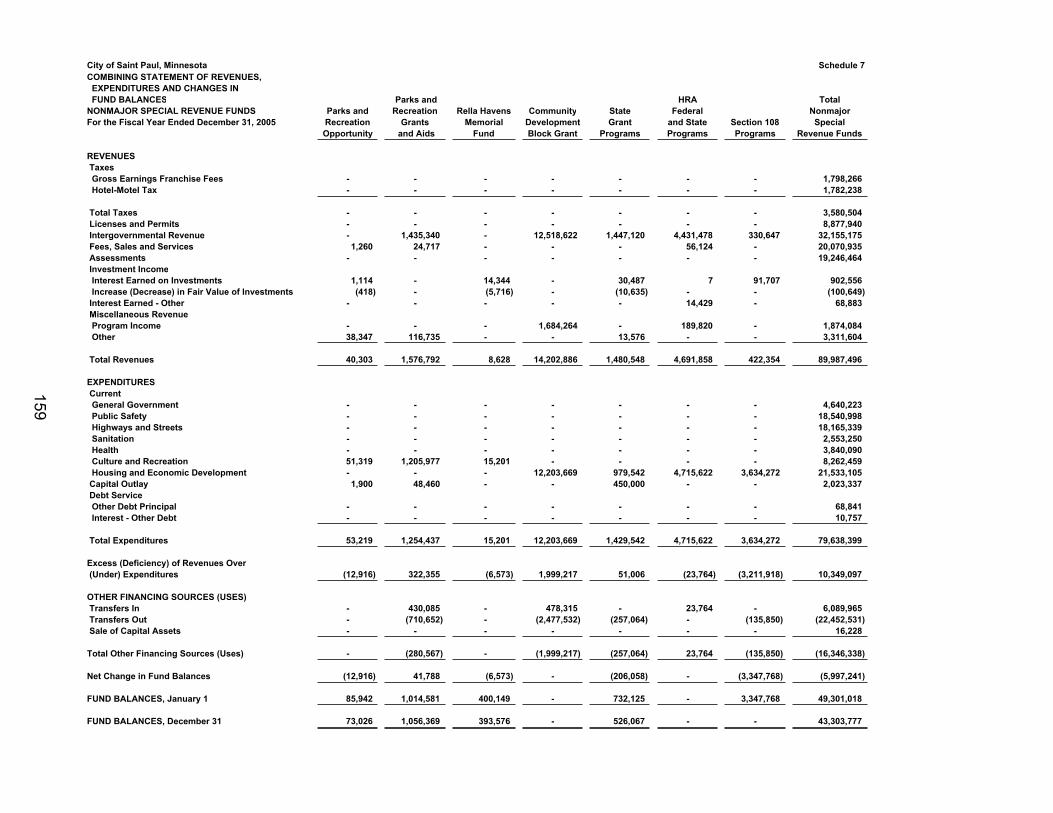
City of Saint Paul, MinnesotaCOMBINING STATEMENT OF REVENUES, EXPENDITURES AND CHANGES IN FUND BALANCESNONMAJOR SPECIAL REVENUE FUNDSFor the Fiscal Year Ended December 31, 2005
REVENUES Taxes Gross Earnings Franchise Fees Hotel-Motel Tax
Total Taxes Licenses and Permits Intergovernmental Revenue Fees, Sales and Services Assessments Investment Income Interest Earned on Investments Increase (Decrease) in Fair Value of Investments Interest Earned - Other Miscellaneous Revenue Program Income Other
Total Revenues
EXPENDITURES Current General Government Public Safety Highways and Streets Sanitation Health Culture and Recreation Housing and Economic Development Capital Outlay Debt Service Other Debt Principal Interest - Other Debt
Total Expenditures
Excess (Deficiency) of Revenues Over (Under) Expenditures
OTHER FINANCING SOURCES (USES) Transfers In Transfers Out Sale of Capital Assets
Total Other Financing Sources (Uses)
Net Change in Fund Balances
FUND BALANCES, January 1
FUND BALANCES, December 31
Schedule 7
Parks and HRA TotalParks and Recreation Rella Havens Community State Federal NonmajorRecreation Grants Memorial Development Grant and State Section 108 SpecialOpportunity and Aids Fund Block Grant Programs Programs Programs Revenue Funds
- - - - - - - 1,798,266- - - - - - - 1,782,238
- - - - - - - 3,580,504- - - - - - - 8,877,940- 1,435,340 - 12,518,622 1,447,120 4,431,478 330,647 32,155,1751,260 24,717 - - - 56,124 - 20,070,935
- - - - - - - 19,246,464
1,114 - 14,344 - 30,487 7 91,707 902,556(418) - (5,716) - (10,635) - - (100,649)
- - - - - 14,429 - 68,883
- - - 1,684,264 - 189,820 - 1,874,08438,347 116,735 - - 13,576 - - 3,311,604
40,303 1,576,792 8,628 14,202,886 1,480,548 4,691,858 422,354 89,987,496
- - - - - - - 4,640,223- - - - - - - 18,540,998- - - - - - - 18,165,339- - - - - - - 2,553,250- - - - - - - 3,840,09051,319 1,205,977 15,201 - - - - 8,262,459- - - 12,203,669 979,542 4,715,622 3,634,272 21,533,1051,900 48,460 - - 450,000 - - 2,023,337
- - - - - - - 68,841- - - - - - - 10,757
53,219 1,254,437 15,201 12,203,669 1,429,542 4,715,622 3,634,272 79,638,399
(12,916) 322,355 (6,573) 1,999,217 51,006 (23,764) (3,211,918) 10,349,097
- 430,085 - 478,315 - 23,764 - 6,089,965- (710,652) - (2,477,532) (257,064) - (135,850) (22,452,531)- - - - - - - 16,228
- (280,567) - (1,999,217) (257,064) 23,764 (135,850) (16,346,338)
(12,916) 41,788 (6,573) - (206,058) - (3,347,768) (5,997,241)
85,942 1,014,581 400,149 - 732,125 - 3,347,768 49,301,018
73,026 1,056,369 393,576 - 526,067 - - 43,303,777
159
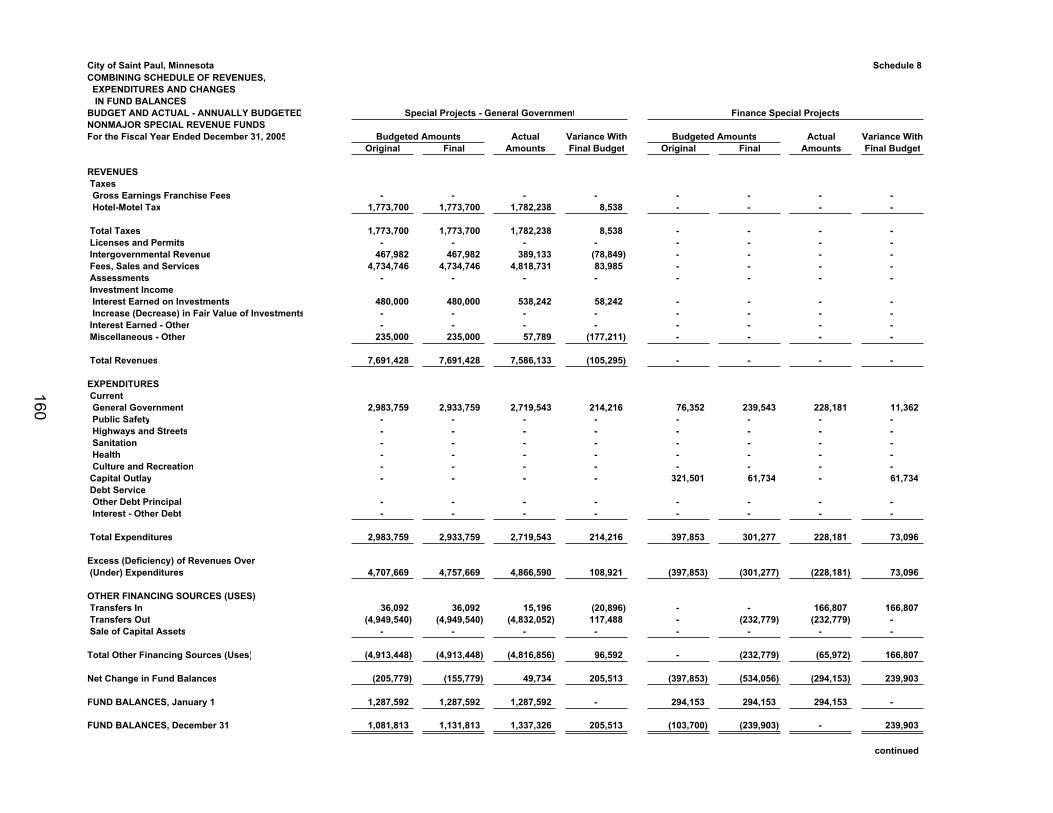
City of Saint Paul, Minnesota Schedule 8COMBINING SCHEDULE OF REVENUES, EXPENDITURES AND CHANGES IN FUND BALANCESBUDGET AND ACTUAL - ANNUALLY BUDGETED Special Projects - General Government Finance Special ProjectsNONMAJOR SPECIAL REVENUE FUNDSFor the Fiscal Year Ended December 31, 2005 Budgeted Amounts Actual Variance With Budgeted Amounts Actual Variance With
Original Final Amounts Final Budget Original Final Amounts Final Budget
REVENUES Taxes Gross Earnings Franchise Fees - - - - - - - - Hotel-Motel Tax 1,773,700 1,773,700 1,782,238 8,538 - - - -
Total Taxes 1,773,700 1,773,700 1,782,238 8,538 - - - - Licenses and Permits - - - - - - - - Intergovernmental Revenue 467,982 467,982 389,133 (78,849) - - - - Fees, Sales and Services 4,734,746 4,734,746 4,818,731 83,985 - - - - Assessments - - - - - - - - Investment Income Interest Earned on Investments 480,000 480,000 538,242 58,242 - - - - Increase (Decrease) in Fair Value of Investments - - - - - - - - Interest Earned - Other - - - - - - - - Miscellaneous - Other 235,000 235,000 57,789 (177,211) - - - -
Total Revenues 7,691,428 7,691,428 7,586,133 (105,295) - - - -
EXPENDITURES Current General Government 2,983,759 2,933,759 2,719,543 214,216 76,352 239,543 228,181 11,362 Public Safety - - - - - - - - Highways and Streets - - - - - - - - Sanitation - - - - - - - - Health - - - - - - - - Culture and Recreation - - - - - - - - Capital Outlay - - - - 321,501 61,734 - 61,734 Debt Service Other Debt Principal - - - - - - - - Interest - Other Debt - - - - - - - -
Total Expenditures 2,983,759 2,933,759 2,719,543 214,216 397,853 301,277 228,181 73,096
Excess (Deficiency) of Revenues Over (Under) Expenditures 4,707,669 4,757,669 4,866,590 108,921 (397,853) (301,277) (228,181) 73,096
OTHER FINANCING SOURCES (USES) Transfers In 36,092 36,092 15,196 (20,896) - - 166,807 166,807 Transfers Out (4,949,540) (4,949,540) (4,832,052) 117,488 - (232,779) (232,779) - Sale of Capital Assets - - - - - - - -
Total Other Financing Sources (Uses) (4,913,448) (4,913,448) (4,816,856) 96,592 - (232,779) (65,972) 166,807
Net Change in Fund Balances (205,779) (155,779) 49,734 205,513 (397,853) (534,056) (294,153) 239,903
FUND BALANCES, January 1 1,287,592 1,287,592 1,287,592 - 294,153 294,153 294,153 -
FUND BALANCES, December 31 1,081,813 1,131,813 1,337,326 205,513 (103,700) (239,903) - 239,903
continued
160
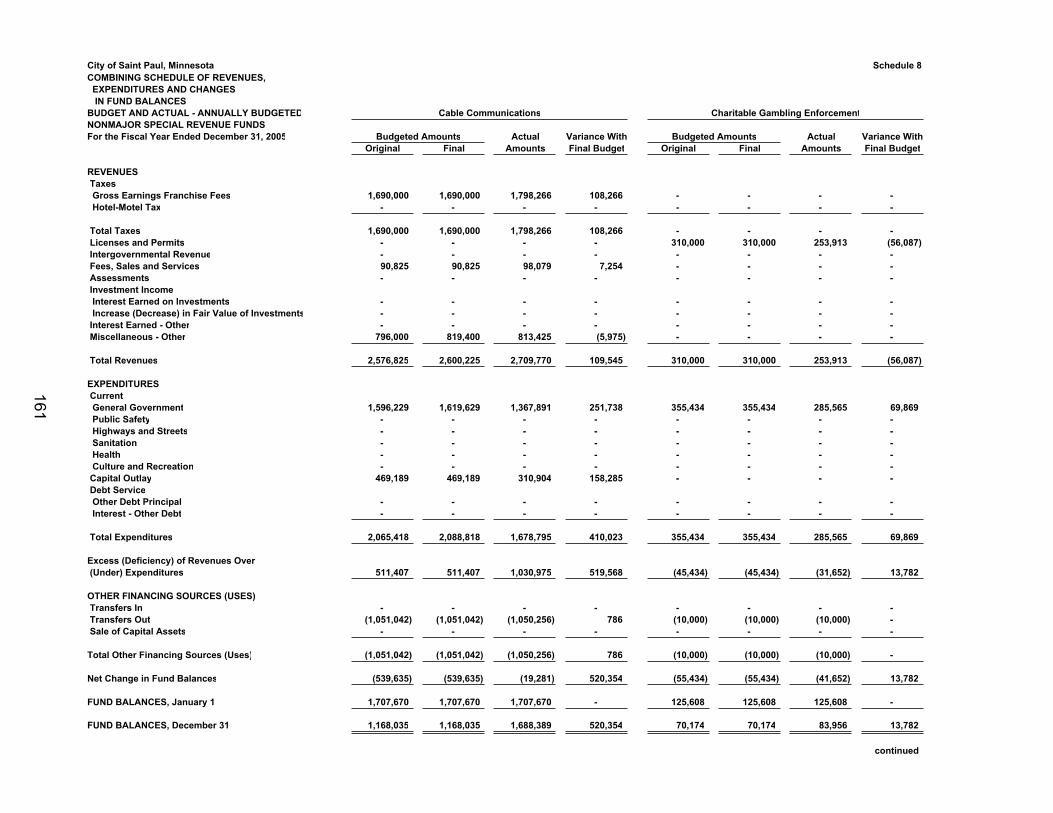
City of Saint Paul, MinnesotaCOMBINING SCHEDULE OF REVENUES, EXPENDITURES AND CHANGES IN FUND BALANCESBUDGET AND ACTUAL - ANNUALLY BUDGETEDNONMAJOR SPECIAL REVENUE FUNDSFor the Fiscal Year Ended December 31, 2005
REVENUES Taxes Gross Earnings Franchise Fees Hotel-Motel Tax
Total Taxes Licenses and Permits Intergovernmental Revenue Fees, Sales and Services Assessments Investment Income Interest Earned on Investments Increase (Decrease) in Fair Value of Investments Interest Earned - Other Miscellaneous - Other
Total Revenues
EXPENDITURES Current General Government Public Safety Highways and Streets Sanitation Health Culture and Recreation Capital Outlay Debt Service Other Debt Principal Interest - Other Debt
Total Expenditures
Excess (Deficiency) of Revenues Over (Under) Expenditures
OTHER FINANCING SOURCES (USES) Transfers In Transfers Out Sale of Capital Assets
Total Other Financing Sources (Uses)
Net Change in Fund Balances
FUND BALANCES, January 1
FUND BALANCES, December 31
Schedule 8
Cable Communications Charitable Gambling Enforcement
Budgeted Amounts Actual Variance With Budgeted Amounts Actual Variance WithOriginal Final Amounts Final Budget Original Final Amounts Final Budget
1,690,000 1,690,000 1,798,266 108,266 - - - - - - - - - - - -
1,690,000 1,690,000 1,798,266 108,266 - - - - - - - - 310,000 310,000 253,913 (56,087)- - - - - - - - 90,825 90,825 98,079 7,254 - - - - - - - - - - - -
- - - - - - - - - - - - - - - - - - - - - - - -
796,000 819,400 813,425 (5,975) - - - -
2,576,825 2,600,225 2,709,770 109,545 310,000 310,000 253,913 (56,087)
1,596,229 1,619,629 1,367,891 251,738 355,434 355,434 285,565 69,869- - - - - - - - - - - - - - - - - - - - - - - - - - - - - - - - - - - - - - - -
469,189 469,189 310,904 158,285 - - - -
- - - - - - - - - - - - - - - -
2,065,418 2,088,818 1,678,795 410,023 355,434 355,434 285,565 69,869
511,407 511,407 1,030,975 519,568 (45,434) (45,434) (31,652) 13,782
- - - - - - - - (1,051,042) (1,051,042) (1,050,256) 786 (10,000) (10,000) (10,000) -
- - - - - - - -
(1,051,042) (1,051,042) (1,050,256) 786 (10,000) (10,000) (10,000) -
(539,635) (539,635) (19,281) 520,354 (55,434) (55,434) (41,652) 13,782
1,707,670 1,707,670 1,707,670 - 125,608 125,608 125,608 -
1,168,035 1,168,035 1,688,389 520,354 70,174 70,174 83,956 13,782
continued
161
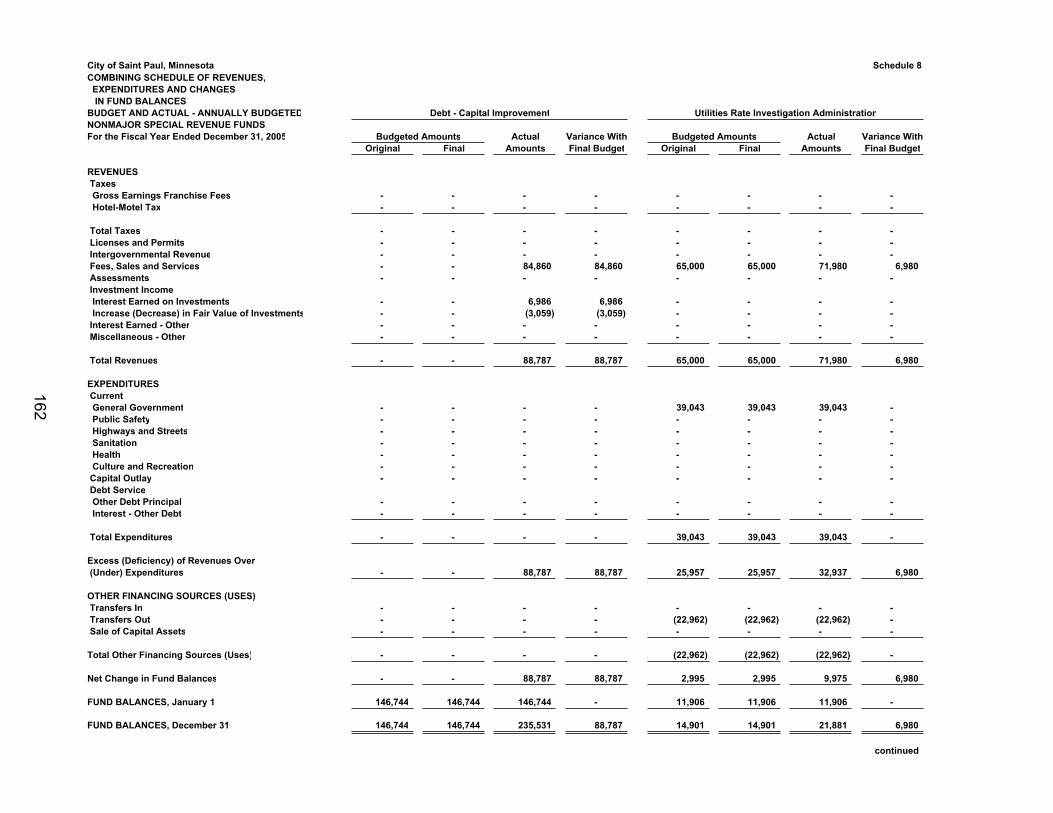
City of Saint Paul, MinnesotaCOMBINING SCHEDULE OF REVENUES, EXPENDITURES AND CHANGES IN FUND BALANCESBUDGET AND ACTUAL - ANNUALLY BUDGETEDNONMAJOR SPECIAL REVENUE FUNDSFor the Fiscal Year Ended December 31, 2005
REVENUES Taxes Gross Earnings Franchise Fees Hotel-Motel Tax
Total Taxes Licenses and Permits Intergovernmental Revenue Fees, Sales and Services Assessments Investment Income Interest Earned on Investments Increase (Decrease) in Fair Value of Investments Interest Earned - Other Miscellaneous - Other
Total Revenues
EXPENDITURES Current General Government Public Safety Highways and Streets Sanitation Health Culture and Recreation Capital Outlay Debt Service Other Debt Principal Interest - Other Debt
Total Expenditures
Excess (Deficiency) of Revenues Over (Under) Expenditures
OTHER FINANCING SOURCES (USES) Transfers In Transfers Out Sale of Capital Assets
Total Other Financing Sources (Uses)
Net Change in Fund Balances
FUND BALANCES, January 1
FUND BALANCES, December 31
Schedule 8
Debt - Capital Improvement Utilities Rate Investigation Administration
Budgeted Amounts Actual Variance With Budgeted Amounts Actual Variance WithOriginal Final Amounts Final Budget Original Final Amounts Final Budget
- - - - - - - - - - - - - - - -
- - - - - - - - - - - - - - - - - - - - - - - - - - 84,860 84,860 65,000 65,000 71,980 6,980- - - - - - - -
- - 6,986 6,986 - - - - - - (3,059) (3,059) - - - - - - - - - - - - - - - - - - - -
- - 88,787 88,787 65,000 65,000 71,980 6,980
- - - - 39,043 39,043 39,043 - - - - - - - - - - - - - - - - - - - - - - - - - - - - - - - - - - - - - - - - - - - - - - - - -
- - - - - - - - - - - - - - - -
- - - - 39,043 39,043 39,043 -
- - 88,787 88,787 25,957 25,957 32,937 6,980
- - - - - - - - - - - - (22,962) (22,962) (22,962) - - - - - - - - -
- - - - (22,962) (22,962) (22,962) -
- - 88,787 88,787 2,995 2,995 9,975 6,980
146,744 146,744 146,744 - 11,906 11,906 11,906 -
146,744 146,744 235,531 88,787 14,901 14,901 21,881 6,980
continued
162
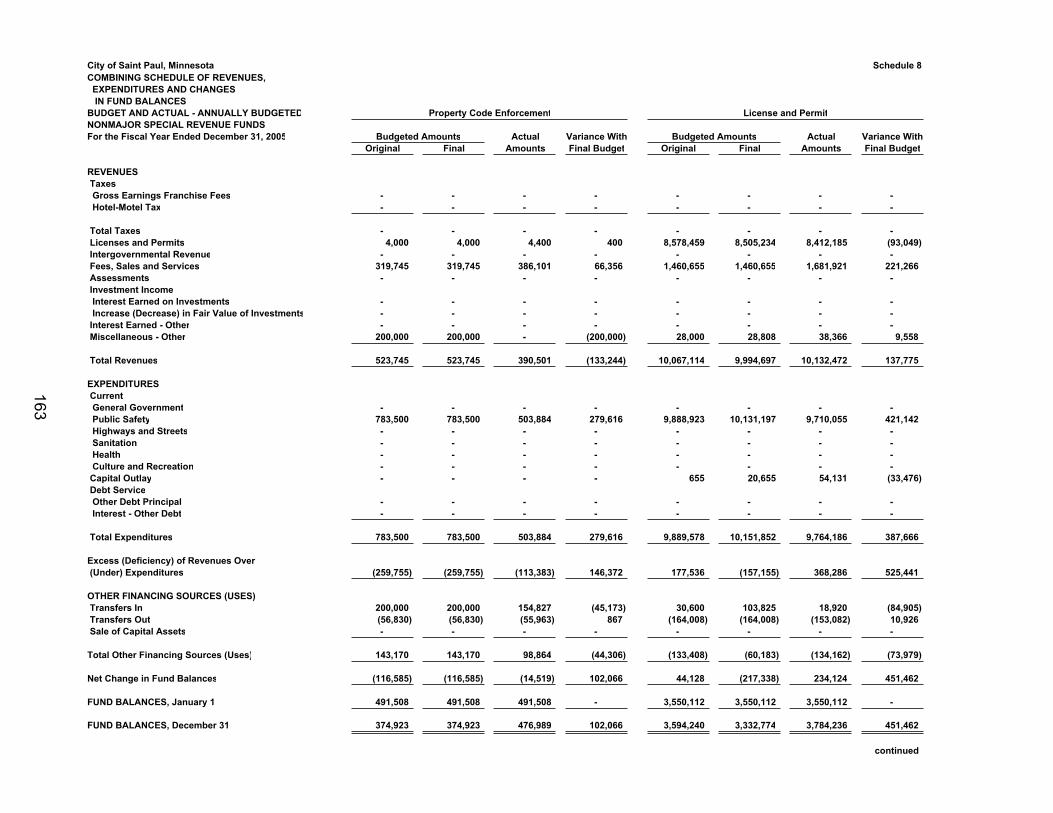
City of Saint Paul, MinnesotaCOMBINING SCHEDULE OF REVENUES, EXPENDITURES AND CHANGES IN FUND BALANCESBUDGET AND ACTUAL - ANNUALLY BUDGETEDNONMAJOR SPECIAL REVENUE FUNDSFor the Fiscal Year Ended December 31, 2005
REVENUES Taxes Gross Earnings Franchise Fees Hotel-Motel Tax
Total Taxes Licenses and Permits Intergovernmental Revenue Fees, Sales and Services Assessments Investment Income Interest Earned on Investments Increase (Decrease) in Fair Value of Investments Interest Earned - Other Miscellaneous - Other
Total Revenues
EXPENDITURES Current General Government Public Safety Highways and Streets Sanitation Health Culture and Recreation Capital Outlay Debt Service Other Debt Principal Interest - Other Debt
Total Expenditures
Excess (Deficiency) of Revenues Over (Under) Expenditures
OTHER FINANCING SOURCES (USES) Transfers In Transfers Out Sale of Capital Assets
Total Other Financing Sources (Uses)
Net Change in Fund Balances
FUND BALANCES, January 1
FUND BALANCES, December 31
Schedule 8
Property Code Enforcement License and Permit
Budgeted Amounts Actual Variance With Budgeted Amounts Actual Variance WithOriginal Final Amounts Final Budget Original Final Amounts Final Budget
- - - - - - - - - - - - - - - -
- - - - - - - - 4,000 4,000 4,400 400 8,578,459 8,505,234 8,412,185 (93,049)
- - - - - - - - 319,745 319,745 386,101 66,356 1,460,655 1,460,655 1,681,921 221,266- - - - - - - -
- - - - - - - - - - - - - - - - - - - - - - - -
200,000 200,000 - (200,000) 28,000 28,808 38,366 9,558
523,745 523,745 390,501 (133,244) 10,067,114 9,994,697 10,132,472 137,775
- - - - - - - - 783,500 783,500 503,884 279,616 9,888,923 10,131,197 9,710,055 421,142- - - - - - - - - - - - - - - - - - - - - - - - - - - - - - - - - - - - 655 20,655 54,131 (33,476)
- - - - - - - - - - - - - - - -
783,500 783,500 503,884 279,616 9,889,578 10,151,852 9,764,186 387,666
(259,755) (259,755) (113,383) 146,372 177,536 (157,155) 368,286 525,441
200,000 200,000 154,827 (45,173) 30,600 103,825 18,920 (84,905)(56,830) (56,830) (55,963) 867 (164,008) (164,008) (153,082) 10,926- - - - - - - -
143,170 143,170 98,864 (44,306) (133,408) (60,183) (134,162) (73,979)
(116,585) (116,585) (14,519) 102,066 44,128 (217,338) 234,124 451,462
491,508 491,508 491,508 - 3,550,112 3,550,112 3,550,112 -
374,923 374,923 476,989 102,066 3,594,240 3,332,774 3,784,236 451,462
continued
163
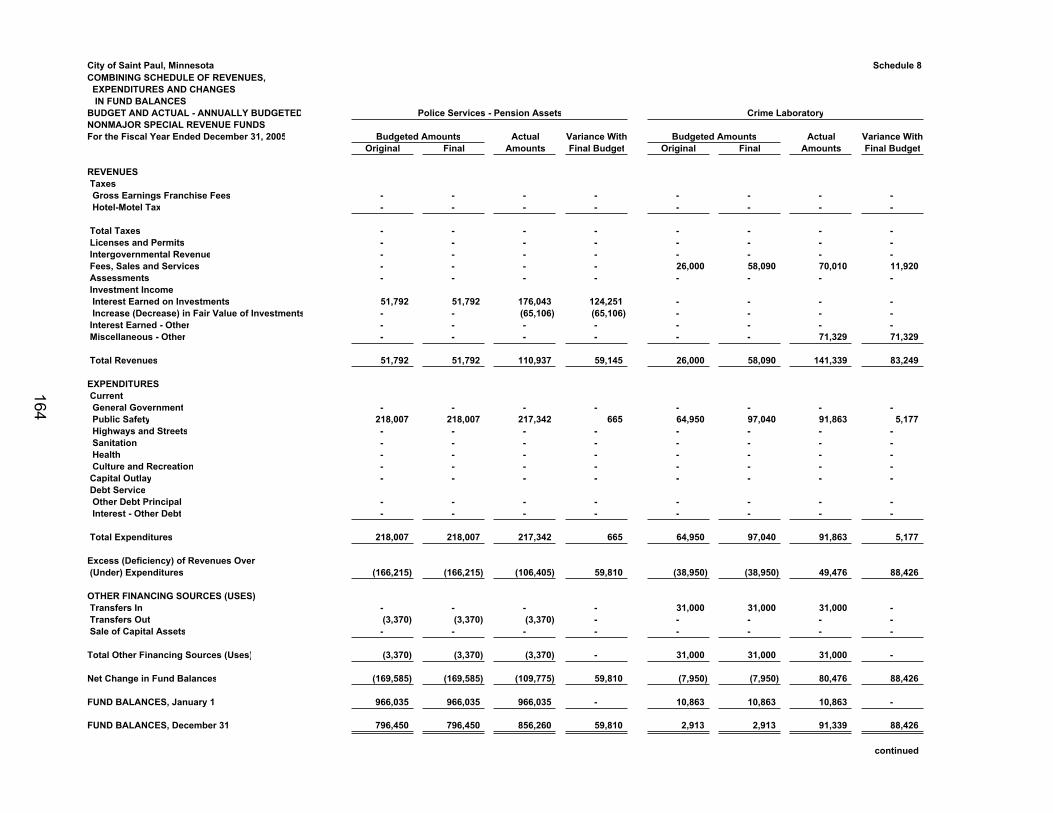
City of Saint Paul, MinnesotaCOMBINING SCHEDULE OF REVENUES, EXPENDITURES AND CHANGES IN FUND BALANCESBUDGET AND ACTUAL - ANNUALLY BUDGETEDNONMAJOR SPECIAL REVENUE FUNDSFor the Fiscal Year Ended December 31, 2005
REVENUES Taxes Gross Earnings Franchise Fees Hotel-Motel Tax
Total Taxes Licenses and Permits Intergovernmental Revenue Fees, Sales and Services Assessments Investment Income Interest Earned on Investments Increase (Decrease) in Fair Value of Investments Interest Earned - Other Miscellaneous - Other
Total Revenues
EXPENDITURES Current General Government Public Safety Highways and Streets Sanitation Health Culture and Recreation Capital Outlay Debt Service Other Debt Principal Interest - Other Debt
Total Expenditures
Excess (Deficiency) of Revenues Over (Under) Expenditures
OTHER FINANCING SOURCES (USES) Transfers In Transfers Out Sale of Capital Assets
Total Other Financing Sources (Uses)
Net Change in Fund Balances
FUND BALANCES, January 1
FUND BALANCES, December 31
Schedule 8
Police Services - Pension Assets Crime Laboratory
Budgeted Amounts Actual Variance With Budgeted Amounts Actual Variance WithOriginal Final Amounts Final Budget Original Final Amounts Final Budget
- - - - - - - - - - - - - - - -
- - - - - - - - - - - - - - - - - - - - - - - - - - - - 26,000 58,090 70,010 11,920- - - - - - - -
51,792 51,792 176,043 124,251 - - - - - - (65,106) (65,106) - - - - - - - - - - - - - - - - - - 71,329 71,329
51,792 51,792 110,937 59,145 26,000 58,090 141,339 83,249
- - - - - - - - 218,007 218,007 217,342 665 64,950 97,040 91,863 5,177- - - - - - - - - - - - - - - - - - - - - - - - - - - - - - - - - - - - - - - -
- - - - - - - - - - - - - - - -
218,007 218,007 217,342 665 64,950 97,040 91,863 5,177
(166,215) (166,215) (106,405) 59,810 (38,950) (38,950) 49,476 88,426
- - - - 31,000 31,000 31,000 - (3,370) (3,370) (3,370) - - - - - - - - - - - - -
(3,370) (3,370) (3,370) - 31,000 31,000 31,000 -
(169,585) (169,585) (109,775) 59,810 (7,950) (7,950) 80,476 88,426
966,035 966,035 966,035 - 10,863 10,863 10,863 -
796,450 796,450 856,260 59,810 2,913 2,913 91,339 88,426
continued
164
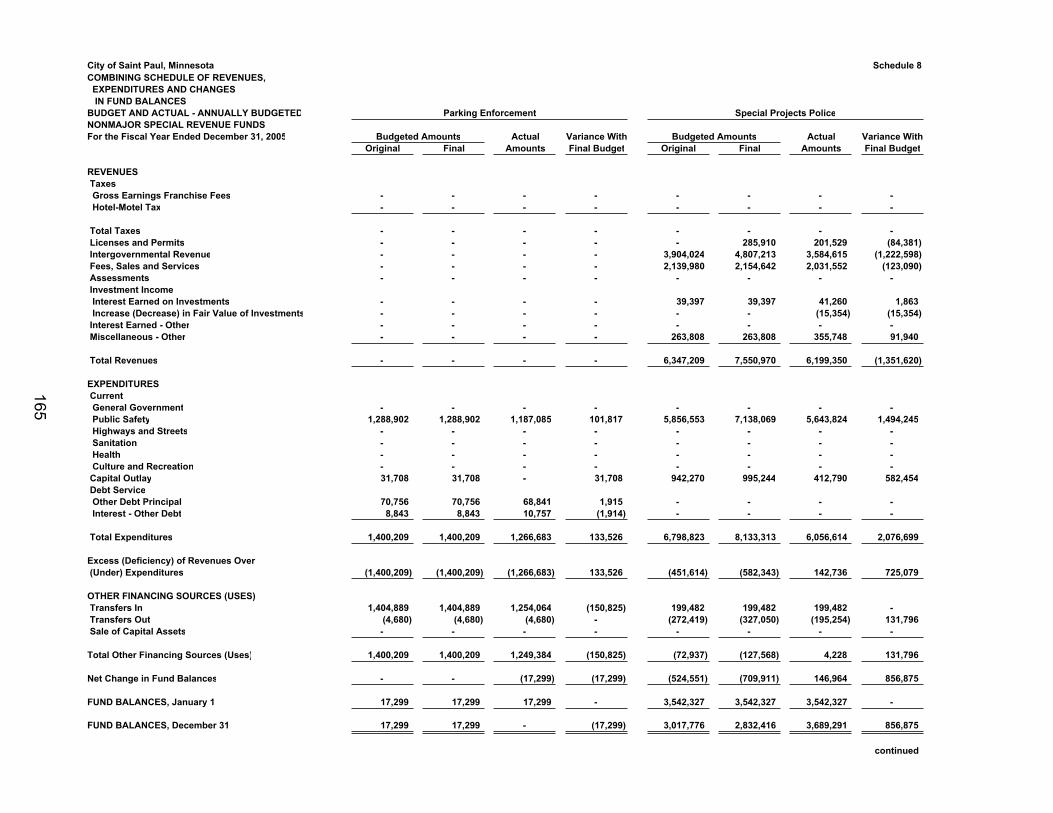
City of Saint Paul, MinnesotaCOMBINING SCHEDULE OF REVENUES, EXPENDITURES AND CHANGES IN FUND BALANCESBUDGET AND ACTUAL - ANNUALLY BUDGETEDNONMAJOR SPECIAL REVENUE FUNDSFor the Fiscal Year Ended December 31, 2005
REVENUES Taxes Gross Earnings Franchise Fees Hotel-Motel Tax
Total Taxes Licenses and Permits Intergovernmental Revenue Fees, Sales and Services Assessments Investment Income Interest Earned on Investments Increase (Decrease) in Fair Value of Investments Interest Earned - Other Miscellaneous - Other
Total Revenues
EXPENDITURES Current General Government Public Safety Highways and Streets Sanitation Health Culture and Recreation Capital Outlay Debt Service Other Debt Principal Interest - Other Debt
Total Expenditures
Excess (Deficiency) of Revenues Over (Under) Expenditures
OTHER FINANCING SOURCES (USES) Transfers In Transfers Out Sale of Capital Assets
Total Other Financing Sources (Uses)
Net Change in Fund Balances
FUND BALANCES, January 1
FUND BALANCES, December 31
Schedule 8
Parking Enforcement Special Projects Police
Budgeted Amounts Actual Variance With Budgeted Amounts Actual Variance WithOriginal Final Amounts Final Budget Original Final Amounts Final Budget
- - - - - - - - - - - - - - - -
- - - - - - - - - - - - - 285,910 201,529 (84,381)- - - - 3,904,024 4,807,213 3,584,615 (1,222,598)- - - - 2,139,980 2,154,642 2,031,552 (123,090)- - - - - - - -
- - - - 39,397 39,397 41,260 1,863- - - - - - (15,354) (15,354)- - - - - - - - - - - - 263,808 263,808 355,748 91,940
- - - - 6,347,209 7,550,970 6,199,350 (1,351,620)
- - - - - - - - 1,288,902 1,288,902 1,187,085 101,817 5,856,553 7,138,069 5,643,824 1,494,245
- - - - - - - - - - - - - - - - - - - - - - - - - - - - - - - - 31,708 31,708 - 31,708 942,270 995,244 412,790 582,454
70,756 70,756 68,841 1,915 - - - - 8,843 8,843 10,757 (1,914) - - - -
1,400,209 1,400,209 1,266,683 133,526 6,798,823 8,133,313 6,056,614 2,076,699
(1,400,209) (1,400,209) (1,266,683) 133,526 (451,614) (582,343) 142,736 725,079
1,404,889 1,404,889 1,254,064 (150,825) 199,482 199,482 199,482 - (4,680) (4,680) (4,680) - (272,419) (327,050) (195,254) 131,796- - - - - - - -
1,400,209 1,400,209 1,249,384 (150,825) (72,937) (127,568) 4,228 131,796
- - (17,299) (17,299) (524,551) (709,911) 146,964 856,875
17,299 17,299 17,299 - 3,542,327 3,542,327 3,542,327 -
17,299 17,299 - (17,299) 3,017,776 2,832,416 3,689,291 856,875
continued
165
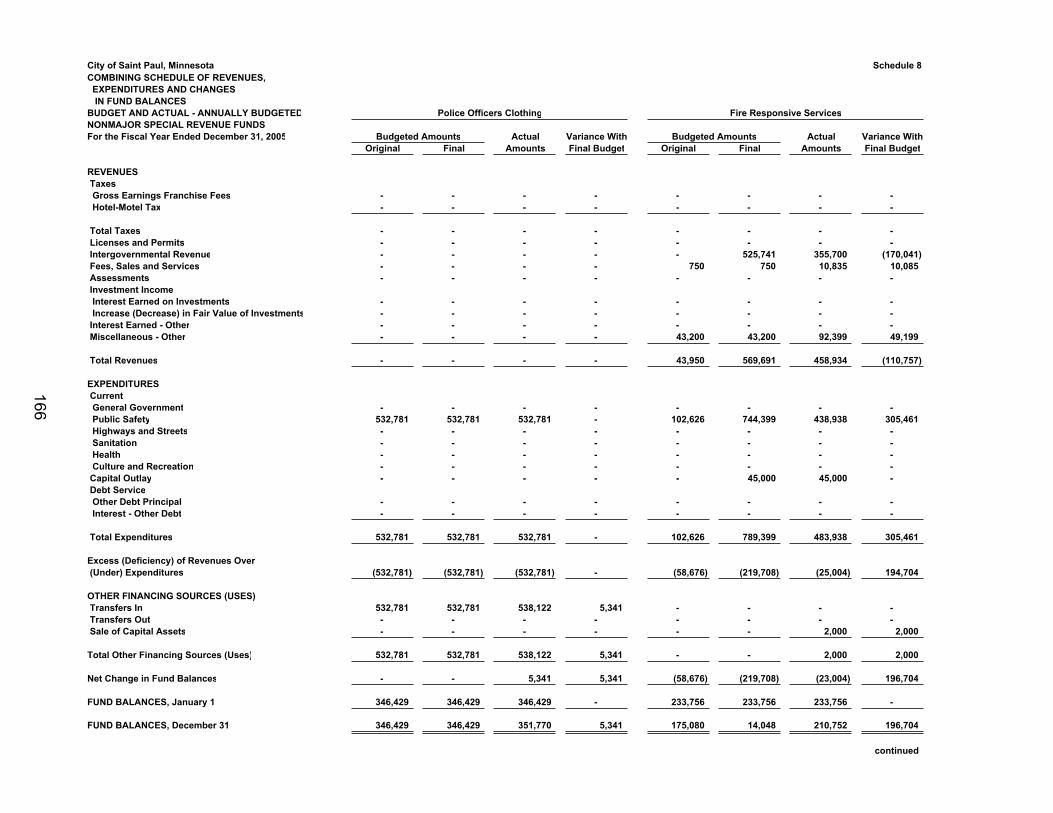
City of Saint Paul, MinnesotaCOMBINING SCHEDULE OF REVENUES, EXPENDITURES AND CHANGES IN FUND BALANCESBUDGET AND ACTUAL - ANNUALLY BUDGETEDNONMAJOR SPECIAL REVENUE FUNDSFor the Fiscal Year Ended December 31, 2005
REVENUES Taxes Gross Earnings Franchise Fees Hotel-Motel Tax
Total Taxes Licenses and Permits Intergovernmental Revenue Fees, Sales and Services Assessments Investment Income Interest Earned on Investments Increase (Decrease) in Fair Value of Investments Interest Earned - Other Miscellaneous - Other
Total Revenues
EXPENDITURES Current General Government Public Safety Highways and Streets Sanitation Health Culture and Recreation Capital Outlay Debt Service Other Debt Principal Interest - Other Debt
Total Expenditures
Excess (Deficiency) of Revenues Over (Under) Expenditures
OTHER FINANCING SOURCES (USES) Transfers In Transfers Out Sale of Capital Assets
Total Other Financing Sources (Uses)
Net Change in Fund Balances
FUND BALANCES, January 1
FUND BALANCES, December 31
Schedule 8
Police Officers Clothing Fire Responsive Services
Budgeted Amounts Actual Variance With Budgeted Amounts Actual Variance WithOriginal Final Amounts Final Budget Original Final Amounts Final Budget
- - - - - - - - - - - - - - - -
- - - - - - - - - - - - - - - - - - - - - 525,741 355,700 (170,041)- - - - 750 750 10,835 10,085- - - - - - - -
- - - - - - - - - - - - - - - - - - - - - - - - - - - - 43,200 43,200 92,399 49,199
- - - - 43,950 569,691 458,934 (110,757)
- - - - - - - - 532,781 532,781 532,781 - 102,626 744,399 438,938 305,461- - - - - - - - - - - - - - - - - - - - - - - - - - - - - - - - - - - - - 45,000 45,000 -
- - - - - - - - - - - - - - - -
532,781 532,781 532,781 - 102,626 789,399 483,938 305,461
(532,781) (532,781) (532,781) - (58,676) (219,708) (25,004) 194,704
532,781 532,781 538,122 5,341 - - - - - - - - - - - - - - - - - - 2,000 2,000
532,781 532,781 538,122 5,341 - - 2,000 2,000
- - 5,341 5,341 (58,676) (219,708) (23,004) 196,704
346,429 346,429 346,429 - 233,756 233,756 233,756 -
346,429 346,429 351,770 5,341 175,080 14,048 210,752 196,704
continued
166
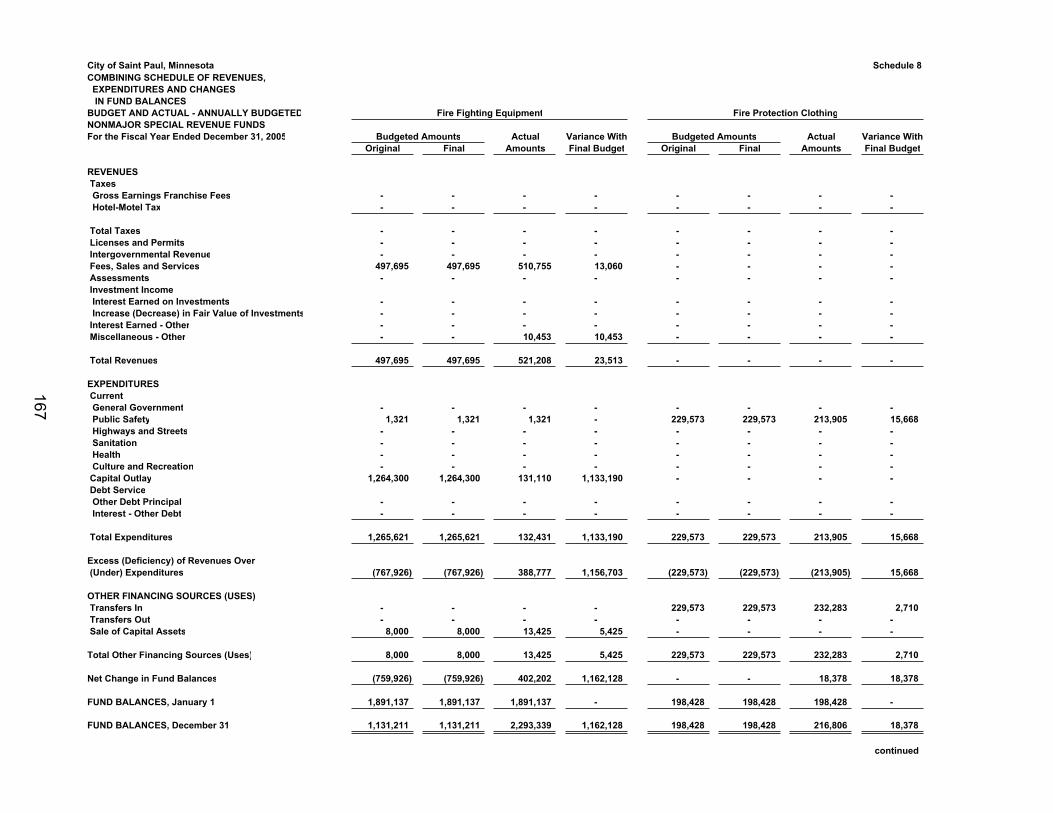
City of Saint Paul, MinnesotaCOMBINING SCHEDULE OF REVENUES, EXPENDITURES AND CHANGES IN FUND BALANCESBUDGET AND ACTUAL - ANNUALLY BUDGETEDNONMAJOR SPECIAL REVENUE FUNDSFor the Fiscal Year Ended December 31, 2005
REVENUES Taxes Gross Earnings Franchise Fees Hotel-Motel Tax
Total Taxes Licenses and Permits Intergovernmental Revenue Fees, Sales and Services Assessments Investment Income Interest Earned on Investments Increase (Decrease) in Fair Value of Investments Interest Earned - Other Miscellaneous - Other
Total Revenues
EXPENDITURES Current General Government Public Safety Highways and Streets Sanitation Health Culture and Recreation Capital Outlay Debt Service Other Debt Principal Interest - Other Debt
Total Expenditures
Excess (Deficiency) of Revenues Over (Under) Expenditures
OTHER FINANCING SOURCES (USES) Transfers In Transfers Out Sale of Capital Assets
Total Other Financing Sources (Uses)
Net Change in Fund Balances
FUND BALANCES, January 1
FUND BALANCES, December 31
Schedule 8
Fire Fighting Equipment Fire Protection Clothing
Budgeted Amounts Actual Variance With Budgeted Amounts Actual Variance WithOriginal Final Amounts Final Budget Original Final Amounts Final Budget
- - - - - - - - - - - - - - - -
- - - - - - - - - - - - - - - - - - - - - - - -
497,695 497,695 510,755 13,060 - - - - - - - - - - - -
- - - - - - - - - - - - - - - - - - - - - - - - - - 10,453 10,453 - - - -
497,695 497,695 521,208 23,513 - - - -
- - - - - - - - 1,321 1,321 1,321 - 229,573 229,573 213,905 15,668
- - - - - - - - - - - - - - - - - - - - - - - - - - - - - - - -
1,264,300 1,264,300 131,110 1,133,190 - - - -
- - - - - - - - - - - - - - - -
1,265,621 1,265,621 132,431 1,133,190 229,573 229,573 213,905 15,668
(767,926) (767,926) 388,777 1,156,703 (229,573) (229,573) (213,905) 15,668
- - - - 229,573 229,573 232,283 2,710- - - - - - - -
8,000 8,000 13,425 5,425 - - - -
8,000 8,000 13,425 5,425 229,573 229,573 232,283 2,710
(759,926) (759,926) 402,202 1,162,128 - - 18,378 18,378
1,891,137 1,891,137 1,891,137 - 198,428 198,428 198,428 -
1,131,211 1,131,211 2,293,339 1,162,128 198,428 198,428 216,806 18,378
continued
167
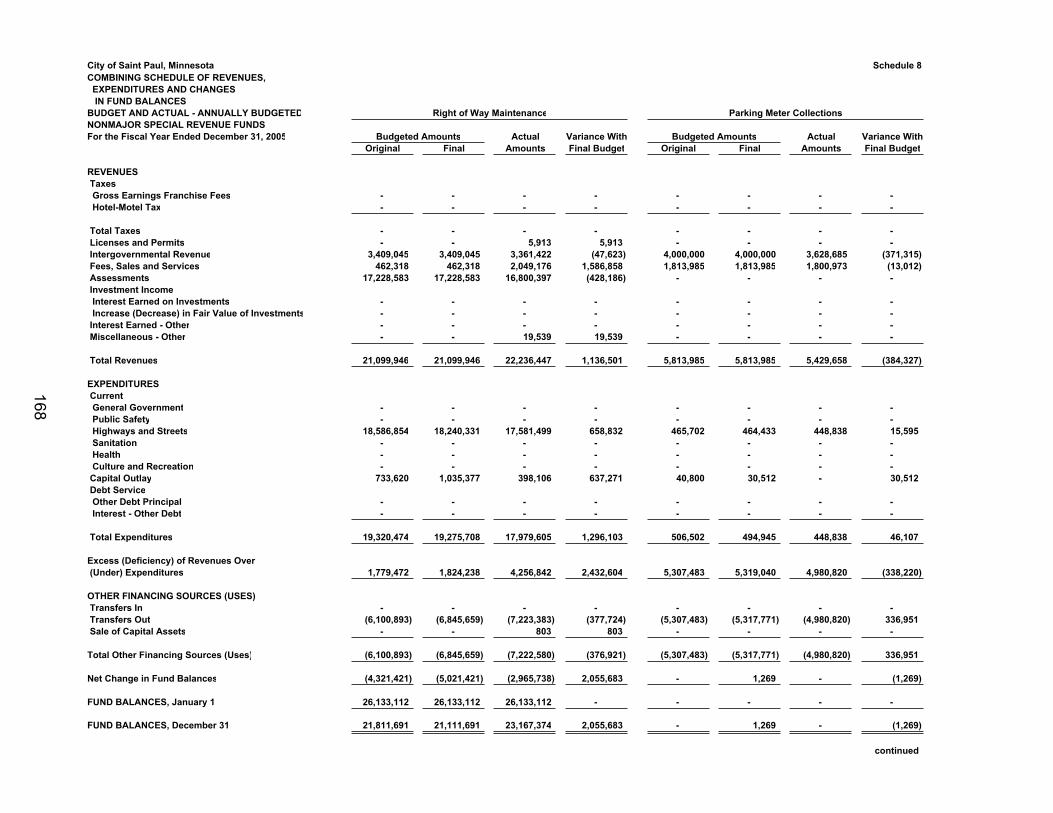
City of Saint Paul, MinnesotaCOMBINING SCHEDULE OF REVENUES, EXPENDITURES AND CHANGES IN FUND BALANCESBUDGET AND ACTUAL - ANNUALLY BUDGETEDNONMAJOR SPECIAL REVENUE FUNDSFor the Fiscal Year Ended December 31, 2005
REVENUES Taxes Gross Earnings Franchise Fees Hotel-Motel Tax
Total Taxes Licenses and Permits Intergovernmental Revenue Fees, Sales and Services Assessments Investment Income Interest Earned on Investments Increase (Decrease) in Fair Value of Investments Interest Earned - Other Miscellaneous - Other
Total Revenues
EXPENDITURES Current General Government Public Safety Highways and Streets Sanitation Health Culture and Recreation Capital Outlay Debt Service Other Debt Principal Interest - Other Debt
Total Expenditures
Excess (Deficiency) of Revenues Over (Under) Expenditures
OTHER FINANCING SOURCES (USES) Transfers In Transfers Out Sale of Capital Assets
Total Other Financing Sources (Uses)
Net Change in Fund Balances
FUND BALANCES, January 1
FUND BALANCES, December 31
Schedule 8
Right of Way Maintenance Parking Meter Collections
Budgeted Amounts Actual Variance With Budgeted Amounts Actual Variance WithOriginal Final Amounts Final Budget Original Final Amounts Final Budget
- - - - - - - - - - - - - - - -
- - - - - - - - - - 5,913 5,913 - - - -
3,409,045 3,409,045 3,361,422 (47,623) 4,000,000 4,000,000 3,628,685 (371,315)462,318 462,318 2,049,176 1,586,858 1,813,985 1,813,985 1,800,973 (13,012)
17,228,583 17,228,583 16,800,397 (428,186) - - - -
- - - - - - - - - - - - - - - - - - - - - - - - - - 19,539 19,539 - - - -
21,099,946 21,099,946 22,236,447 1,136,501 5,813,985 5,813,985 5,429,658 (384,327)
- - - - - - - - - - - - - - - -
18,586,854 18,240,331 17,581,499 658,832 465,702 464,433 448,838 15,595- - - - - - - - - - - - - - - - - - - - - - - -
733,620 1,035,377 398,106 637,271 40,800 30,512 - 30,512
- - - - - - - - - - - - - - - -
19,320,474 19,275,708 17,979,605 1,296,103 506,502 494,945 448,838 46,107
1,779,472 1,824,238 4,256,842 2,432,604 5,307,483 5,319,040 4,980,820 (338,220)
- - - - - - - - (6,100,893) (6,845,659) (7,223,383) (377,724) (5,307,483) (5,317,771) (4,980,820) 336,951
- - 803 803 - - - -
(6,100,893) (6,845,659) (7,222,580) (376,921) (5,307,483) (5,317,771) (4,980,820) 336,951
(4,321,421) (5,021,421) (2,965,738) 2,055,683 - 1,269 - (1,269)
26,133,112 26,133,112 26,133,112 - - - - -
21,811,691 21,111,691 23,167,374 2,055,683 - 1,269 - (1,269)
continued
168
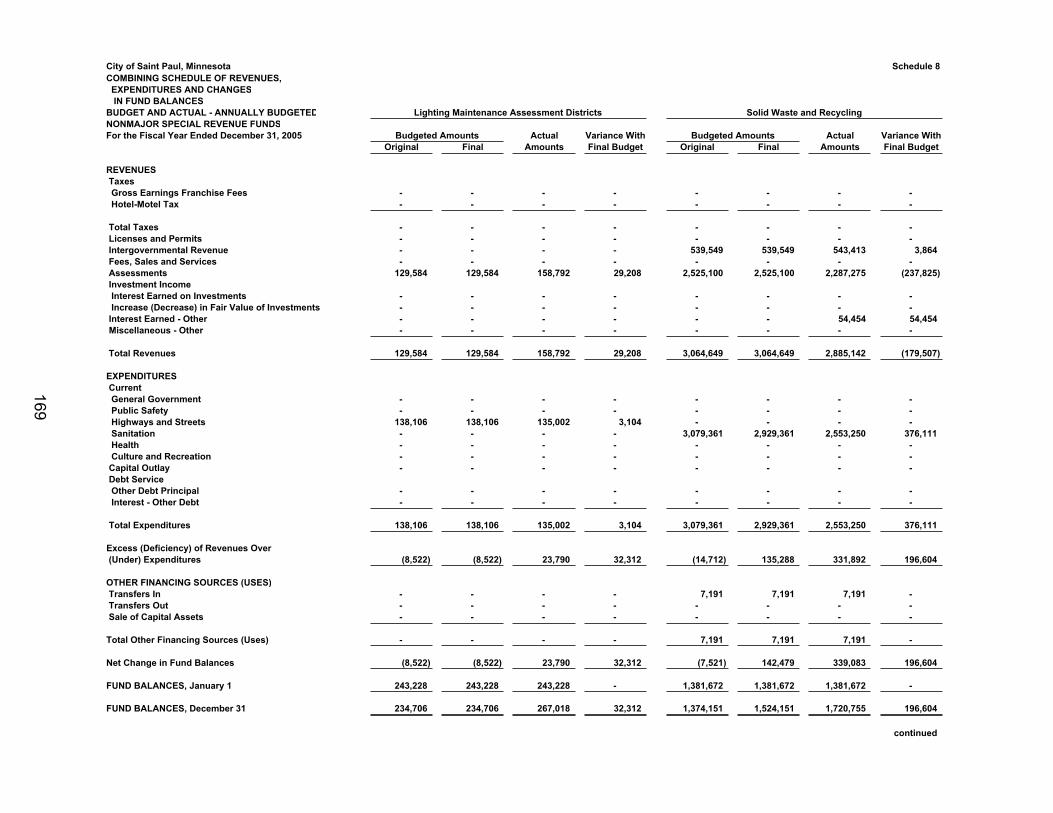
City of Saint Paul, Minnesota Schedule 8COMBINING SCHEDULE OF REVENUES, EXPENDITURES AND CHANGES IN FUND BALANCESBUDGET AND ACTUAL - ANNUALLY BUDGETED Lighting Maintenance Assessment Districts Solid Waste and RecyclingNONMAJOR SPECIAL REVENUE FUNDSFor the Fiscal Year Ended December 31, 2005 Budgeted Amounts Actual Variance With Budgeted Amounts Actual Variance With
Original Final Amounts Final Budget Original Final Amounts Final Budget
REVENUES Taxes Gross Earnings Franchise Fees - - - - - - - - Hotel-Motel Tax - - - - - - - -
Total Taxes - - - - - - - - Licenses and Permits - - - - - - - - Intergovernmental Revenue - - - - 539,549 539,549 543,413 3,864 Fees, Sales and Services - - - - - - - - Assessments 129,584 129,584 158,792 29,208 2,525,100 2,525,100 2,287,275 (237,825) Investment Income Interest Earned on Investments - - - - - - - - Increase (Decrease) in Fair Value of Investments - - - - - - - - Interest Earned - Other - - - - - - 54,454 54,454 Miscellaneous - Other - - - - - - - -
Total Revenues 129,584 129,584 158,792 29,208 3,064,649 3,064,649 2,885,142 (179,507)
EXPENDITURES Current General Government - - - - - - - - Public Safety - - - - - - - - Highways and Streets 138,106 138,106 135,002 3,104 - - - - Sanitation - - - - 3,079,361 2,929,361 2,553,250 376,111 Health - - - - - - - - Culture and Recreation - - - - - - - - Capital Outlay - - - - - - - - Debt Service Other Debt Principal - - - - - - - - Interest - Other Debt - - - - - - - -
Total Expenditures 138,106 138,106 135,002 3,104 3,079,361 2,929,361 2,553,250 376,111
Excess (Deficiency) of Revenues Over (Under) Expenditures (8,522) (8,522) 23,790 32,312 (14,712) 135,288 331,892 196,604
OTHER FINANCING SOURCES (USES) Transfers In - - - - 7,191 7,191 7,191 - Transfers Out - - - - - - - - Sale of Capital Assets - - - - - - - -
Total Other Financing Sources (Uses) - - - - 7,191 7,191 7,191 -
Net Change in Fund Balances (8,522) (8,522) 23,790 32,312 (7,521) 142,479 339,083 196,604
FUND BALANCES, January 1 243,228 243,228 243,228 - 1,381,672 1,381,672 1,381,672 -
FUND BALANCES, December 31 234,706 234,706 267,018 32,312 1,374,151 1,524,151 1,720,755 196,604
continued
169
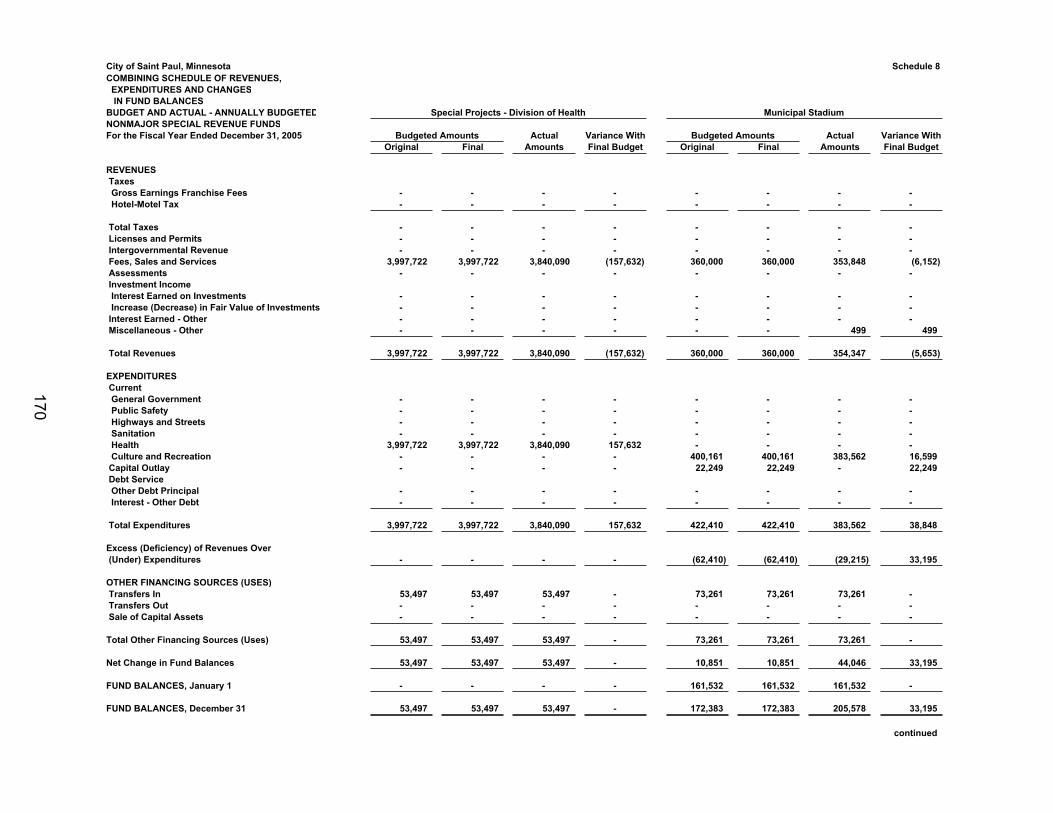
City of Saint Paul, MinnesotaCOMBINING SCHEDULE OF REVENUES, EXPENDITURES AND CHANGES IN FUND BALANCESBUDGET AND ACTUAL - ANNUALLY BUDGETEDNONMAJOR SPECIAL REVENUE FUNDSFor the Fiscal Year Ended December 31, 2005
REVENUES Taxes Gross Earnings Franchise Fees Hotel-Motel Tax
Total Taxes Licenses and Permits Intergovernmental Revenue Fees, Sales and Services Assessments Investment Income Interest Earned on Investments Increase (Decrease) in Fair Value of Investments Interest Earned - Other Miscellaneous - Other
Total Revenues
EXPENDITURES Current General Government Public Safety Highways and Streets Sanitation Health Culture and Recreation Capital Outlay Debt Service Other Debt Principal Interest - Other Debt
Total Expenditures
Excess (Deficiency) of Revenues Over (Under) Expenditures
OTHER FINANCING SOURCES (USES) Transfers In Transfers Out Sale of Capital Assets
Total Other Financing Sources (Uses)
Net Change in Fund Balances
FUND BALANCES, January 1
FUND BALANCES, December 31
Schedule 8
Special Projects - Division of Health Municipal Stadium
Budgeted Amounts Actual Variance With Budgeted Amounts Actual Variance WithOriginal Final Amounts Final Budget Original Final Amounts Final Budget
- - - - - - - - - - - - - - - -
- - - - - - - - - - - - - - - - - - - - - - - -
3,997,722 3,997,722 3,840,090 (157,632) 360,000 360,000 353,848 (6,152)- - - - - - - -
- - - - - - - - - - - - - - - - - - - - - - - - - - - - - - 499 499
3,997,722 3,997,722 3,840,090 (157,632) 360,000 360,000 354,347 (5,653)
- - - - - - - - - - - - - - - - - - - - - - - - - - - - - - - -
3,997,722 3,997,722 3,840,090 157,632 - - - - - - - - 400,161 400,161 383,562 16,599- - - - 22,249 22,249 - 22,249
- - - - - - - - - - - - - - - -
3,997,722 3,997,722 3,840,090 157,632 422,410 422,410 383,562 38,848
- - - - (62,410) (62,410) (29,215) 33,195
53,497 53,497 53,497 - 73,261 73,261 73,261 - - - - - - - - - - - - - - - - -
53,497 53,497 53,497 - 73,261 73,261 73,261 -
53,497 53,497 53,497 - 10,851 10,851 44,046 33,195
- - - - 161,532 161,532 161,532 -
53,497 53,497 53,497 - 172,383 172,383 205,578 33,195
continued
170
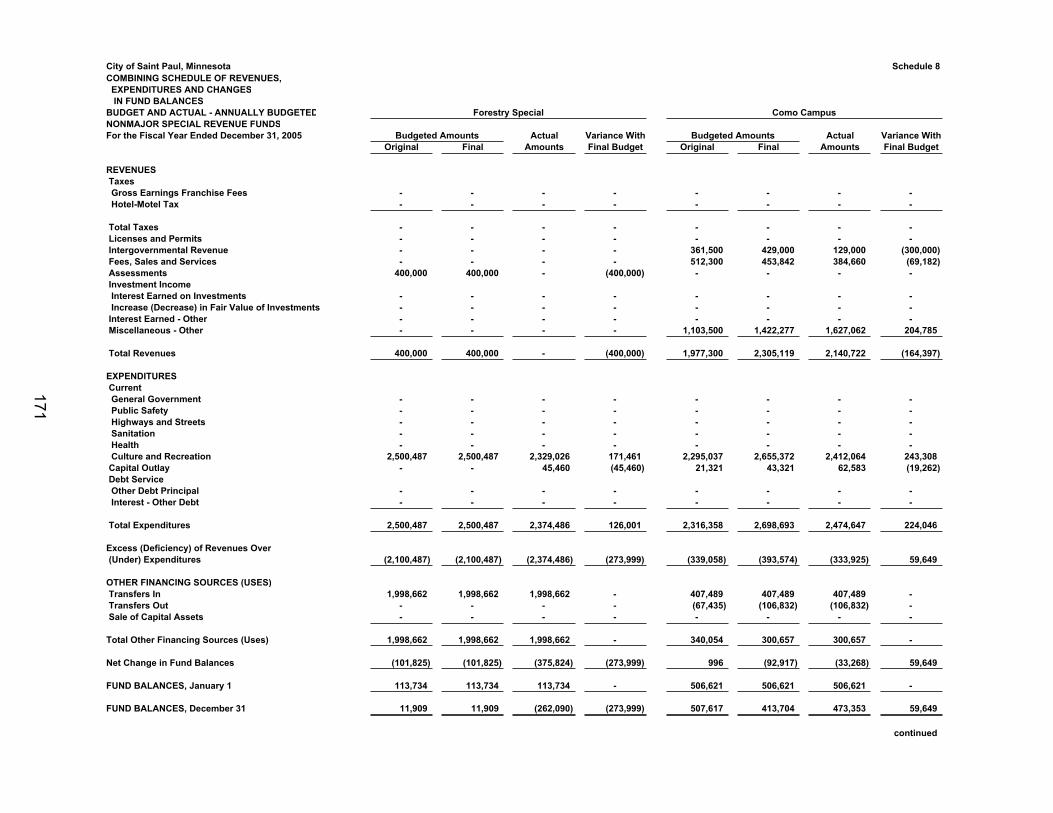
City of Saint Paul, MinnesotaCOMBINING SCHEDULE OF REVENUES, EXPENDITURES AND CHANGES IN FUND BALANCESBUDGET AND ACTUAL - ANNUALLY BUDGETEDNONMAJOR SPECIAL REVENUE FUNDSFor the Fiscal Year Ended December 31, 2005
REVENUES Taxes Gross Earnings Franchise Fees Hotel-Motel Tax
Total Taxes Licenses and Permits Intergovernmental Revenue Fees, Sales and Services Assessments Investment Income Interest Earned on Investments Increase (Decrease) in Fair Value of Investments Interest Earned - Other Miscellaneous - Other
Total Revenues
EXPENDITURES Current General Government Public Safety Highways and Streets Sanitation Health Culture and Recreation Capital Outlay Debt Service Other Debt Principal Interest - Other Debt
Total Expenditures
Excess (Deficiency) of Revenues Over (Under) Expenditures
OTHER FINANCING SOURCES (USES) Transfers In Transfers Out Sale of Capital Assets
Total Other Financing Sources (Uses)
Net Change in Fund Balances
FUND BALANCES, January 1
FUND BALANCES, December 31
Schedule 8
Forestry Special Como Campus
Budgeted Amounts Actual Variance With Budgeted Amounts Actual Variance WithOriginal Final Amounts Final Budget Original Final Amounts Final Budget
- - - - - - - - - - - - - - - -
- - - - - - - - - - - - - - - - - - - - 361,500 429,000 129,000 (300,000)- - - - 512,300 453,842 384,660 (69,182)
400,000 400,000 - (400,000) - - - -
- - - - - - - - - - - - - - - - - - - - - - - - - - - - 1,103,500 1,422,277 1,627,062 204,785
400,000 400,000 - (400,000) 1,977,300 2,305,119 2,140,722 (164,397)
- - - - - - - - - - - - - - - - - - - - - - - - - - - - - - - - - - - - - - - -
2,500,487 2,500,487 2,329,026 171,461 2,295,037 2,655,372 2,412,064 243,308- - 45,460 (45,460) 21,321 43,321 62,583 (19,262)
- - - - - - - - - - - - - - - -
2,500,487 2,500,487 2,374,486 126,001 2,316,358 2,698,693 2,474,647 224,046
(2,100,487) (2,100,487) (2,374,486) (273,999) (339,058) (393,574) (333,925) 59,649
1,998,662 1,998,662 1,998,662 - 407,489 407,489 407,489 - - - - - (67,435) (106,832) (106,832) - - - - - - - - -
1,998,662 1,998,662 1,998,662 - 340,054 300,657 300,657 -
(101,825) (101,825) (375,824) (273,999) 996 (92,917) (33,268) 59,649
113,734 113,734 113,734 - 506,621 506,621 506,621 -
11,909 11,909 (262,090) (273,999) 507,617 413,704 473,353 59,649
continued
171
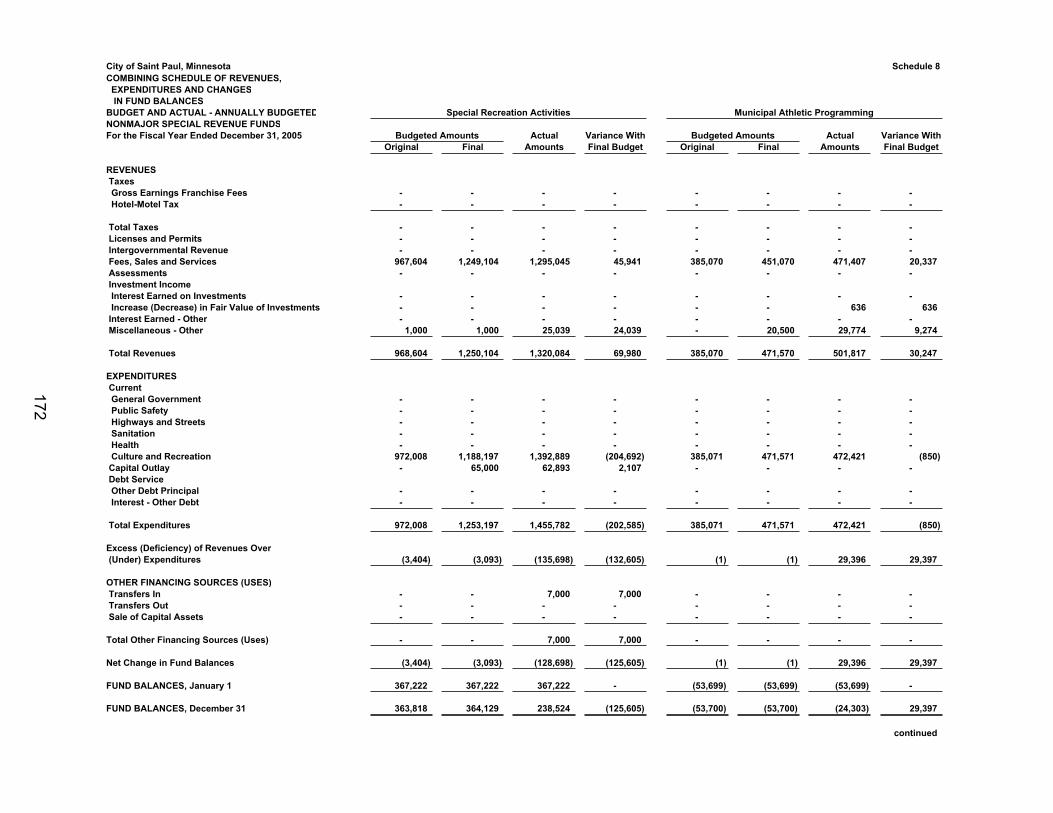
City of Saint Paul, MinnesotaCOMBINING SCHEDULE OF REVENUES, EXPENDITURES AND CHANGES IN FUND BALANCESBUDGET AND ACTUAL - ANNUALLY BUDGETEDNONMAJOR SPECIAL REVENUE FUNDSFor the Fiscal Year Ended December 31, 2005
REVENUES Taxes Gross Earnings Franchise Fees Hotel-Motel Tax
Total Taxes Licenses and Permits Intergovernmental Revenue Fees, Sales and Services Assessments Investment Income Interest Earned on Investments Increase (Decrease) in Fair Value of Investments Interest Earned - Other Miscellaneous - Other
Total Revenues
EXPENDITURES Current General Government Public Safety Highways and Streets Sanitation Health Culture and Recreation Capital Outlay Debt Service Other Debt Principal Interest - Other Debt
Total Expenditures
Excess (Deficiency) of Revenues Over (Under) Expenditures
OTHER FINANCING SOURCES (USES) Transfers In Transfers Out Sale of Capital Assets
Total Other Financing Sources (Uses)
Net Change in Fund Balances
FUND BALANCES, January 1
FUND BALANCES, December 31
Schedule 8
Special Recreation Activities Municipal Athletic Programming
Budgeted Amounts Actual Variance With Budgeted Amounts Actual Variance WithOriginal Final Amounts Final Budget Original Final Amounts Final Budget
- - - - - - - - - - - - - - - -
- - - - - - - - - - - - - - - - - - - - - - - -
967,604 1,249,104 1,295,045 45,941 385,070 451,070 471,407 20,337- - - - - - - -
- - - - - - - - - - - - - - 636 636- - - - - - - -
1,000 1,000 25,039 24,039 - 20,500 29,774 9,274
968,604 1,250,104 1,320,084 69,980 385,070 471,570 501,817 30,247
- - - - - - - - - - - - - - - - - - - - - - - - - - - - - - - - - - - - - - - -
972,008 1,188,197 1,392,889 (204,692) 385,071 471,571 472,421 (850)- 65,000 62,893 2,107 - - - -
- - - - - - - - - - - - - - - -
972,008 1,253,197 1,455,782 (202,585) 385,071 471,571 472,421 (850)
(3,404) (3,093) (135,698) (132,605) (1) (1) 29,396 29,397
- - 7,000 7,000 - - - - - - - - - - - - - - - - - - - -
- - 7,000 7,000 - - - -
(3,404) (3,093) (128,698) (125,605) (1) (1) 29,396 29,397
367,222 367,222 367,222 - (53,699) (53,699) (53,699) -
363,818 364,129 238,524 (125,605) (53,700) (53,700) (24,303) 29,397
continued
172
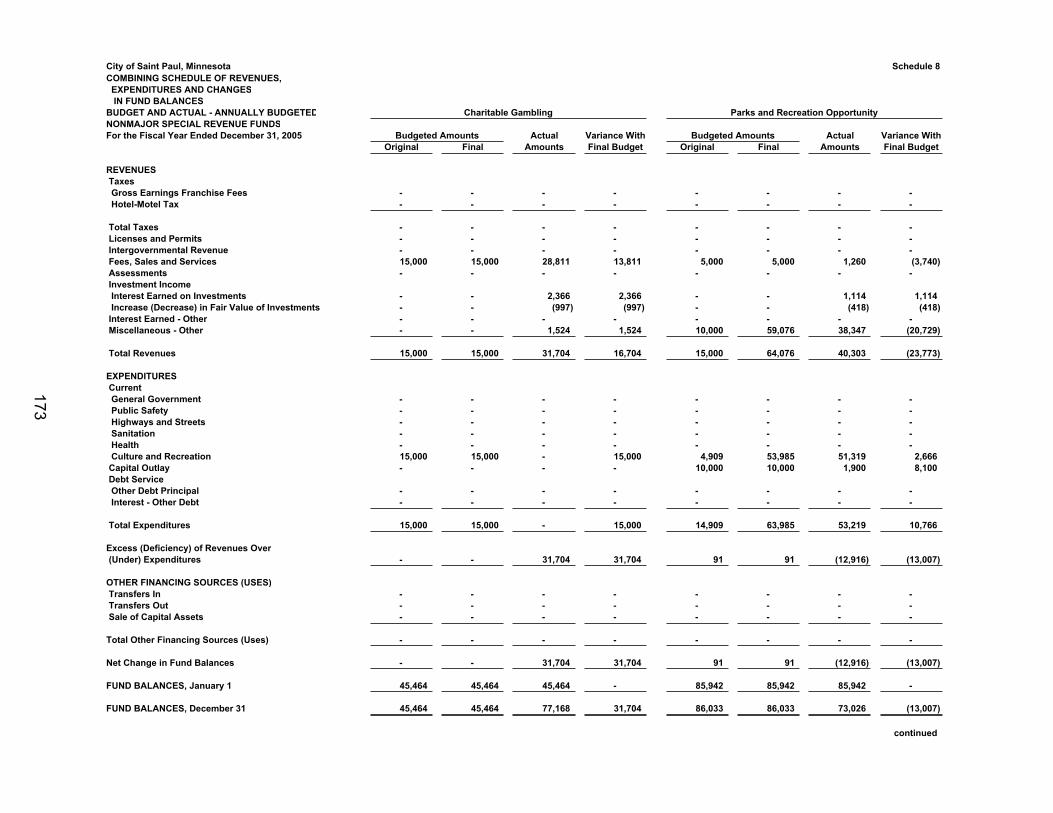
City of Saint Paul, MinnesotaCOMBINING SCHEDULE OF REVENUES, EXPENDITURES AND CHANGES IN FUND BALANCESBUDGET AND ACTUAL - ANNUALLY BUDGETEDNONMAJOR SPECIAL REVENUE FUNDSFor the Fiscal Year Ended December 31, 2005
REVENUES Taxes Gross Earnings Franchise Fees Hotel-Motel Tax
Total Taxes Licenses and Permits Intergovernmental Revenue Fees, Sales and Services Assessments Investment Income Interest Earned on Investments Increase (Decrease) in Fair Value of Investments Interest Earned - Other Miscellaneous - Other
Total Revenues
EXPENDITURES Current General Government Public Safety Highways and Streets Sanitation Health Culture and Recreation Capital Outlay Debt Service Other Debt Principal Interest - Other Debt
Total Expenditures
Excess (Deficiency) of Revenues Over (Under) Expenditures
OTHER FINANCING SOURCES (USES) Transfers In Transfers Out Sale of Capital Assets
Total Other Financing Sources (Uses)
Net Change in Fund Balances
FUND BALANCES, January 1
FUND BALANCES, December 31
Schedule 8
Charitable Gambling Parks and Recreation Opportunity
Budgeted Amounts Actual Variance With Budgeted Amounts Actual Variance WithOriginal Final Amounts Final Budget Original Final Amounts Final Budget
- - - - - - - - - - - - - - - -
- - - - - - - - - - - - - - - - - - - - - - - - 15,000 15,000 28,811 13,811 5,000 5,000 1,260 (3,740)- - - - - - - -
- - 2,366 2,366 - - 1,114 1,114- - (997) (997) - - (418) (418)- - - - - - - - - - 1,524 1,524 10,000 59,076 38,347 (20,729)
15,000 15,000 31,704 16,704 15,000 64,076 40,303 (23,773)
- - - - - - - - - - - - - - - - - - - - - - - - - - - - - - - - - - - - - - - - 15,000 15,000 - 15,000 4,909 53,985 51,319 2,666- - - - 10,000 10,000 1,900 8,100
- - - - - - - - - - - - - - - -
15,000 15,000 - 15,000 14,909 63,985 53,219 10,766
- - 31,704 31,704 91 91 (12,916) (13,007)
- - - - - - - - - - - - - - - - - - - - - - - -
- - - - - - - -
- - 31,704 31,704 91 91 (12,916) (13,007)
45,464 45,464 45,464 - 85,942 85,942 85,942 -
45,464 45,464 77,168 31,704 86,033 86,033 73,026 (13,007)
continued
173
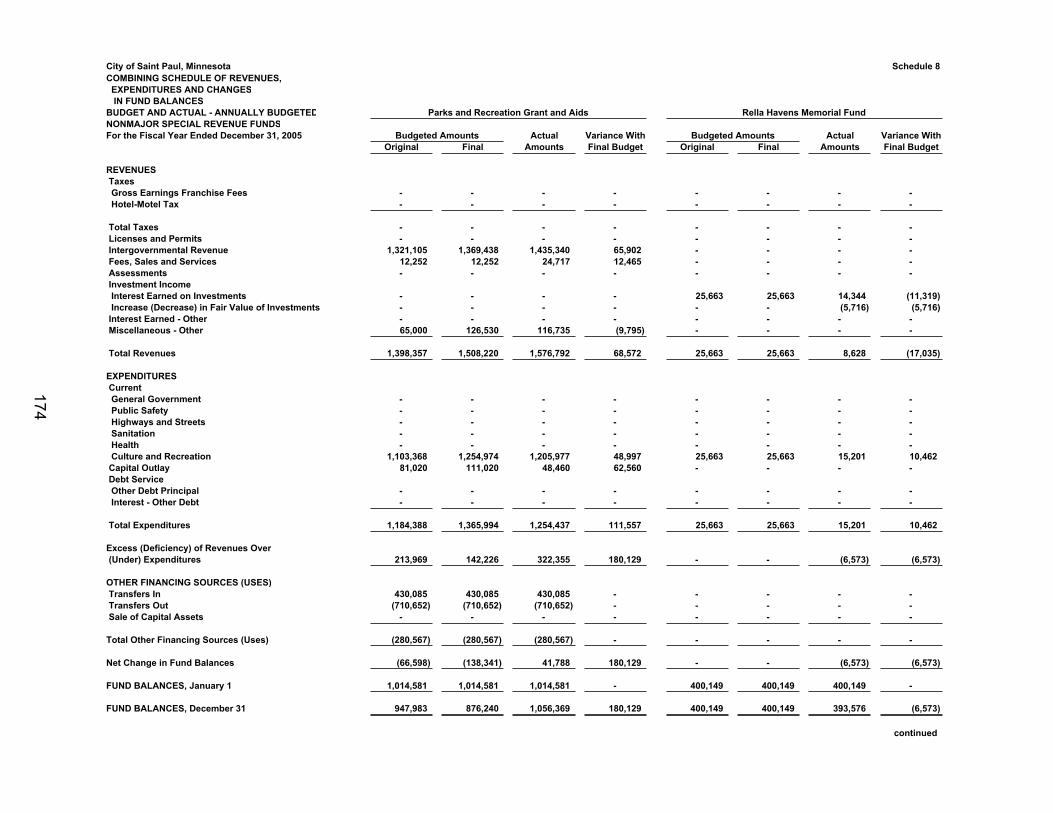
City of Saint Paul, MinnesotaCOMBINING SCHEDULE OF REVENUES, EXPENDITURES AND CHANGES IN FUND BALANCESBUDGET AND ACTUAL - ANNUALLY BUDGETEDNONMAJOR SPECIAL REVENUE FUNDSFor the Fiscal Year Ended December 31, 2005
REVENUES Taxes Gross Earnings Franchise Fees Hotel-Motel Tax
Total Taxes Licenses and Permits Intergovernmental Revenue Fees, Sales and Services Assessments Investment Income Interest Earned on Investments Increase (Decrease) in Fair Value of Investments Interest Earned - Other Miscellaneous - Other
Total Revenues
EXPENDITURES Current General Government Public Safety Highways and Streets Sanitation Health Culture and Recreation Capital Outlay Debt Service Other Debt Principal Interest - Other Debt
Total Expenditures
Excess (Deficiency) of Revenues Over (Under) Expenditures
OTHER FINANCING SOURCES (USES) Transfers In Transfers Out Sale of Capital Assets
Total Other Financing Sources (Uses)
Net Change in Fund Balances
FUND BALANCES, January 1
FUND BALANCES, December 31
Schedule 8
Parks and Recreation Grant and Aids Rella Havens Memorial Fund
Budgeted Amounts Actual Variance With Budgeted Amounts Actual Variance WithOriginal Final Amounts Final Budget Original Final Amounts Final Budget
- - - - - - - - - - - - - - - -
- - - - - - - - - - - - - - - -
1,321,105 1,369,438 1,435,340 65,902 - - - - 12,252 12,252 24,717 12,465 - - - - - - - - - - - -
- - - - 25,663 25,663 14,344 (11,319)- - - - - - (5,716) (5,716)- - - - - - - - 65,000 126,530 116,735 (9,795) - - - -
1,398,357 1,508,220 1,576,792 68,572 25,663 25,663 8,628 (17,035)
- - - - - - - - - - - - - - - - - - - - - - - - - - - - - - - - - - - - - - - -
1,103,368 1,254,974 1,205,977 48,997 25,663 25,663 15,201 10,46281,020 111,020 48,460 62,560 - - - -
- - - - - - - - - - - - - - - -
1,184,388 1,365,994 1,254,437 111,557 25,663 25,663 15,201 10,462
213,969 142,226 322,355 180,129 - - (6,573) (6,573)
430,085 430,085 430,085 - - - - - (710,652) (710,652) (710,652) - - - - -
- - - - - - - -
(280,567) (280,567) (280,567) - - - - -
(66,598) (138,341) 41,788 180,129 - - (6,573) (6,573)
1,014,581 1,014,581 1,014,581 - 400,149 400,149 400,149 -
947,983 876,240 1,056,369 180,129 400,149 400,149 393,576 (6,573)
continued
174
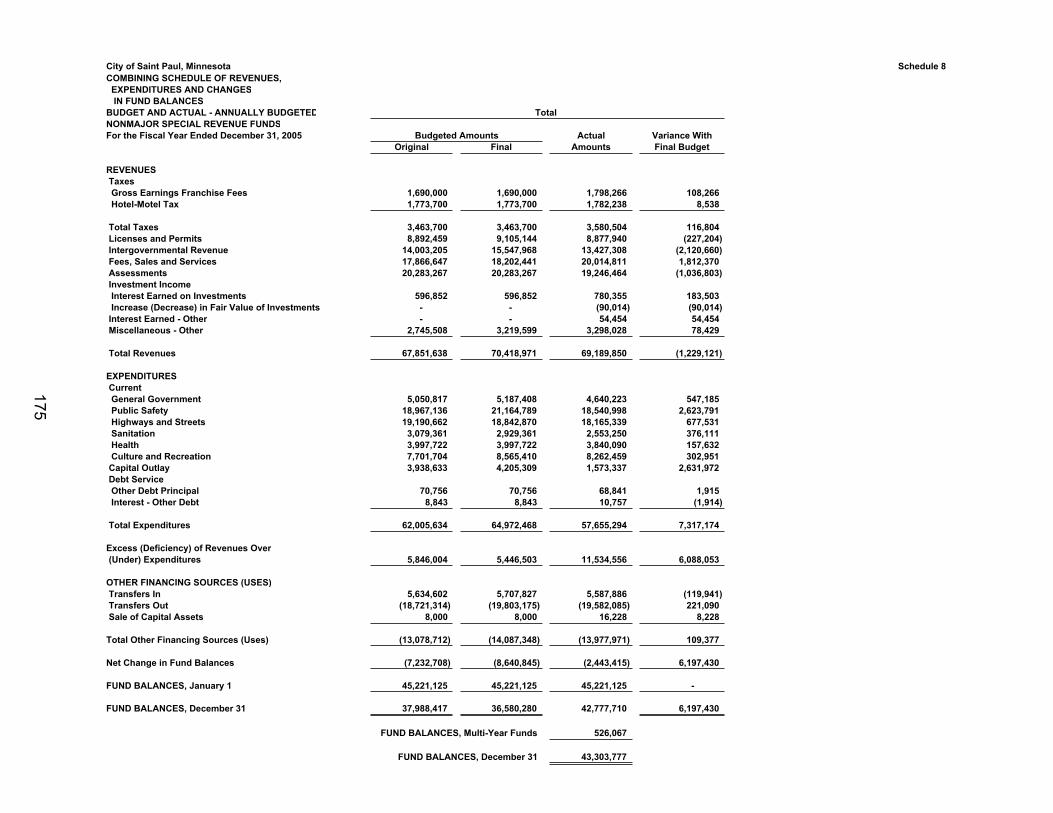
City of Saint Paul, MinnesotaCOMBINING SCHEDULE OF REVENUES, EXPENDITURES AND CHANGES IN FUND BALANCESBUDGET AND ACTUAL - ANNUALLY BUDGETEDNONMAJOR SPECIAL REVENUE FUNDSFor the Fiscal Year Ended December 31, 2005
REVENUES Taxes Gross Earnings Franchise Fees Hotel-Motel Tax
Total Taxes Licenses and Permits Intergovernmental Revenue Fees, Sales and Services Assessments Investment Income Interest Earned on Investments Increase (Decrease) in Fair Value of Investments Interest Earned - Other Miscellaneous - Other
Total Revenues
EXPENDITURES Current General Government Public Safety Highways and Streets Sanitation Health Culture and Recreation Capital Outlay Debt Service Other Debt Principal Interest - Other Debt
Total Expenditures
Excess (Deficiency) of Revenues Over (Under) Expenditures
OTHER FINANCING SOURCES (USES) Transfers In Transfers Out Sale of Capital Assets
Total Other Financing Sources (Uses)
Net Change in Fund Balances
FUND BALANCES, January 1
FUND BALANCES, December 31
Schedule 8
Total
Budgeted Amounts Actual Variance WithOriginal Final Amounts Final Budget
1,690,000 1,690,000 1,798,266 108,2661,773,700 1,773,700 1,782,238 8,538
3,463,700 3,463,700 3,580,504 116,8048,892,459 9,105,144 8,877,940 (227,204)
14,003,205 15,547,968 13,427,308 (2,120,660)17,866,647 18,202,441 20,014,811 1,812,37020,283,267 20,283,267 19,246,464 (1,036,803)
596,852 596,852 780,355 183,503- - (90,014) (90,014)- - 54,454 54,454
2,745,508 3,219,599 3,298,028 78,429
67,851,638 70,418,971 69,189,850 (1,229,121)
5,050,817 5,187,408 4,640,223 547,18518,967,136 21,164,789 18,540,998 2,623,79119,190,662 18,842,870 18,165,339 677,531
3,079,361 2,929,361 2,553,250 376,1113,997,722 3,997,722 3,840,090 157,6327,701,704 8,565,410 8,262,459 302,9513,938,633 4,205,309 1,573,337 2,631,972
70,756 70,756 68,841 1,9158,843 8,843 10,757 (1,914)
62,005,634 64,972,468 57,655,294 7,317,174
5,846,004 5,446,503 11,534,556 6,088,053
5,634,602 5,707,827 5,587,886 (119,941)(18,721,314) (19,803,175) (19,582,085) 221,090
8,000 8,000 16,228 8,228
(13,078,712) (14,087,348) (13,977,971) 109,377
(7,232,708) (8,640,845) (2,443,415) 6,197,430
45,221,125 45,221,125 45,221,125 -
37,988,417 36,580,280 42,777,710 6,197,430
FUND BALANCES, Multi-Year Funds 526,067
FUND BALANCES, December 31 43,303,777
175
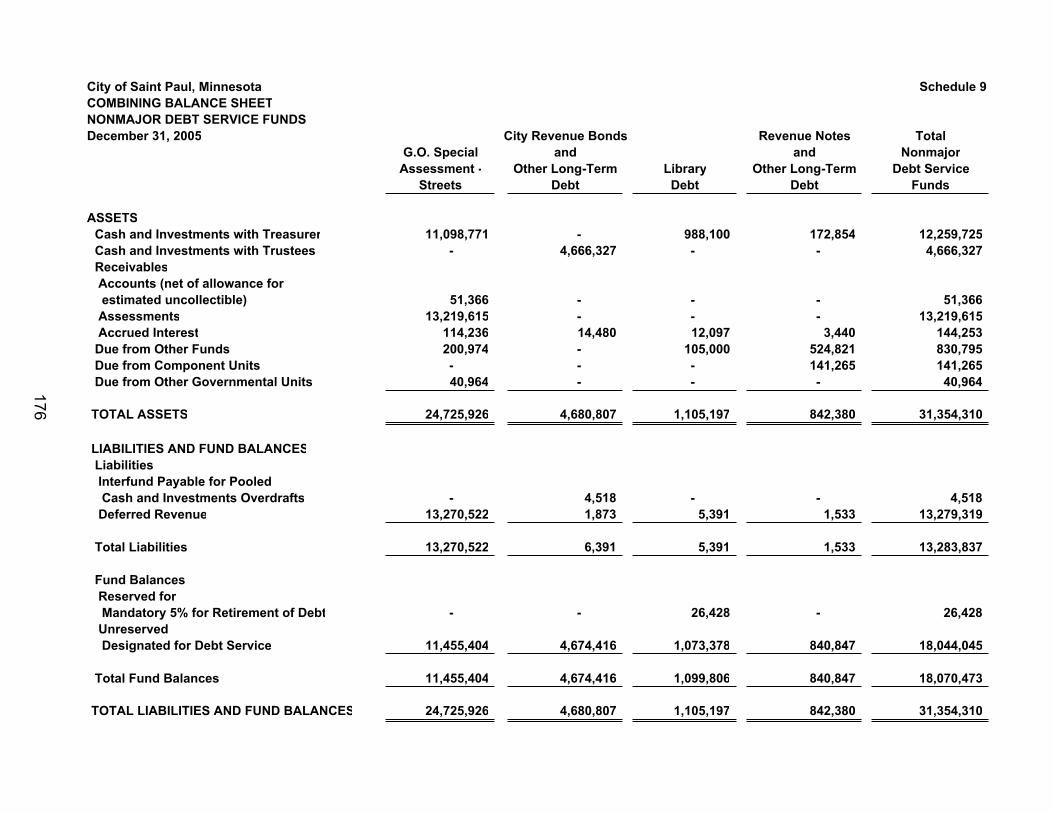
City of Saint Paul, Minnesota Schedule 9COMBINING BALANCE SHEETNONMAJOR DEBT SERVICE FUNDSDecember 31, 2005 City Revenue Bonds Revenue Notes Total
G.O. Special and and NonmajorAssessment - Other Long-Term Library Other Long-Term Debt Service
Streets Debt Debt Debt Funds
ASSETS Cash and Investments with Treasurer 11,098,771 - 988,100 172,854 12,259,725 Cash and Investments with Trustees - 4,666,327 - - 4,666,327 Receivables Accounts (net of allowance for estimated uncollectible) 51,366 - - - 51,366 Assessments 13,219,615 - - - 13,219,615 Accrued Interest 114,236 14,480 12,097 3,440 144,253 Due from Other Funds 200,974 - 105,000 524,821 830,795 Due from Component Units - - - 141,265 141,265 Due from Other Governmental Units 40,964 - - - 40,964
TOTAL ASSETS 24,725,926 4,680,807 1,105,197 842,380 31,354,310
LIABILITIES AND FUND BALANCES Liabilities Interfund Payable for Pooled Cash and Investments Overdrafts - 4,518 - - 4,518 Deferred Revenue 13,270,522 1,873 5,391 1,533 13,279,319
Total Liabilities 13,270,522 6,391 5,391 1,533 13,283,837
Fund Balances Reserved for Mandatory 5% for Retirement of Debt - - 26,428 - 26,428 Unreserved Designated for Debt Service 11,455,404 4,674,416 1,073,378 840,847 18,044,045
Total Fund Balances 11,455,404 4,674,416 1,099,806 840,847 18,070,473
TOTAL LIABILITIES AND FUND BALANCES 24,725,926 4,680,807 1,105,197 842,380 31,354,310
176
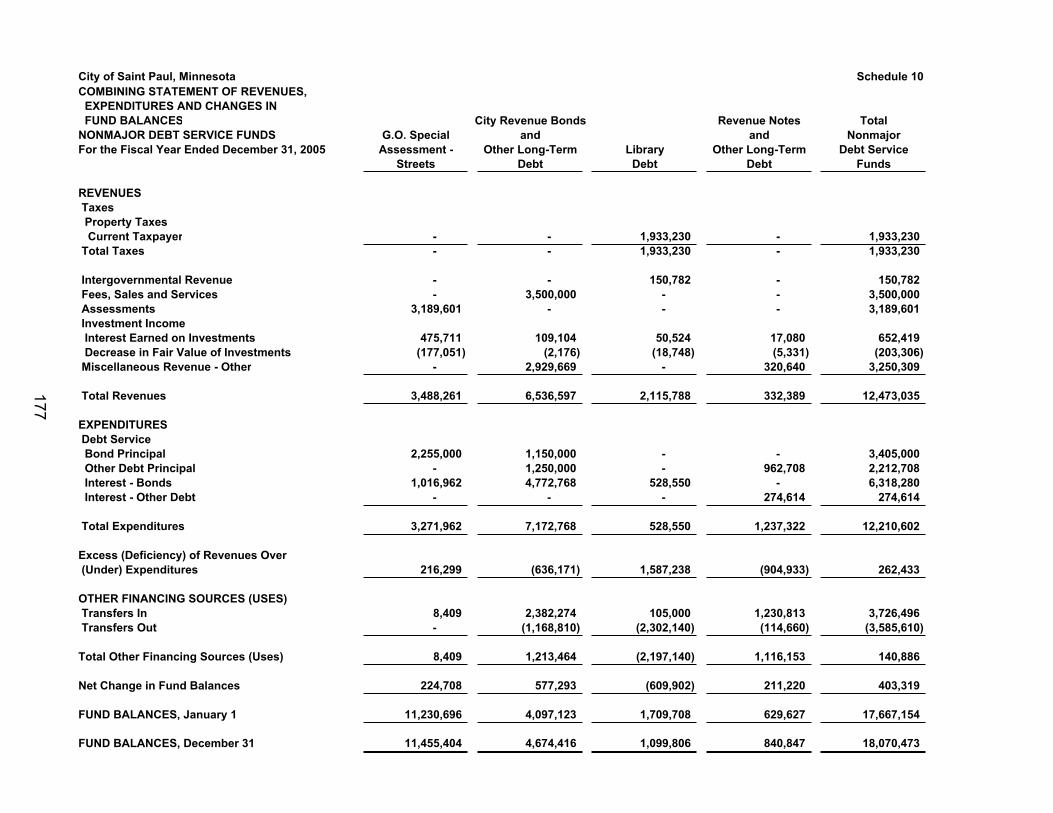
City of Saint Paul, MinnesotaCOMBINING STATEMENT OF REVENUES, EXPENDITURES AND CHANGES IN FUND BALANCESNONMAJOR DEBT SERVICE FUNDSFor the Fiscal Year Ended December 31, 2005
REVENUES Taxes Property Taxes Current Taxpayer Total Taxes
Intergovernmental Revenue Fees, Sales and Services Assessments Investment Income Interest Earned on Investments Decrease in Fair Value of Investments Miscellaneous Revenue - Other
Total Revenues
EXPENDITURES Debt Service Bond Principal Other Debt Principal Interest - Bonds Interest - Other Debt
Total Expenditures
Excess (Deficiency) of Revenues Over (Under) Expenditures
OTHER FINANCING SOURCES (USES) Transfers In Transfers Out
Total Other Financing Sources (Uses)
Net Change in Fund Balances
FUND BALANCES, January 1
FUND BALANCES, December 31
Schedule 10
City Revenue Bonds Revenue Notes TotalG.O. Special and and Nonmajor
Assessment - Other Long-Term Library Other Long-Term Debt ServiceStreets Debt Debt Debt Funds
- - 1,933,230 - 1,933,230- - 1,933,230 - 1,933,230
- - 150,782 - 150,782- 3,500,000 - - 3,500,000
3,189,601 - - - 3,189,601
475,711 109,104 50,524 17,080 652,419(177,051) (2,176) (18,748) (5,331) (203,306)
- 2,929,669 - 320,640 3,250,309
3,488,261 6,536,597 2,115,788 332,389 12,473,035
2,255,000 1,150,000 - - 3,405,000- 1,250,000 - 962,708 2,212,708
1,016,962 4,772,768 528,550 - 6,318,280- - - 274,614 274,614
3,271,962 7,172,768 528,550 1,237,322 12,210,602
216,299 (636,171) 1,587,238 (904,933) 262,433
8,409 2,382,274 105,000 1,230,813 3,726,496- (1,168,810) (2,302,140) (114,660) (3,585,610)
8,409 1,213,464 (2,197,140) 1,116,153 140,886
224,708 577,293 (609,902) 211,220 403,319
11,230,696 4,097,123 1,709,708 629,627 17,667,154
11,455,404 4,674,416 1,099,806 840,847 18,070,473
177
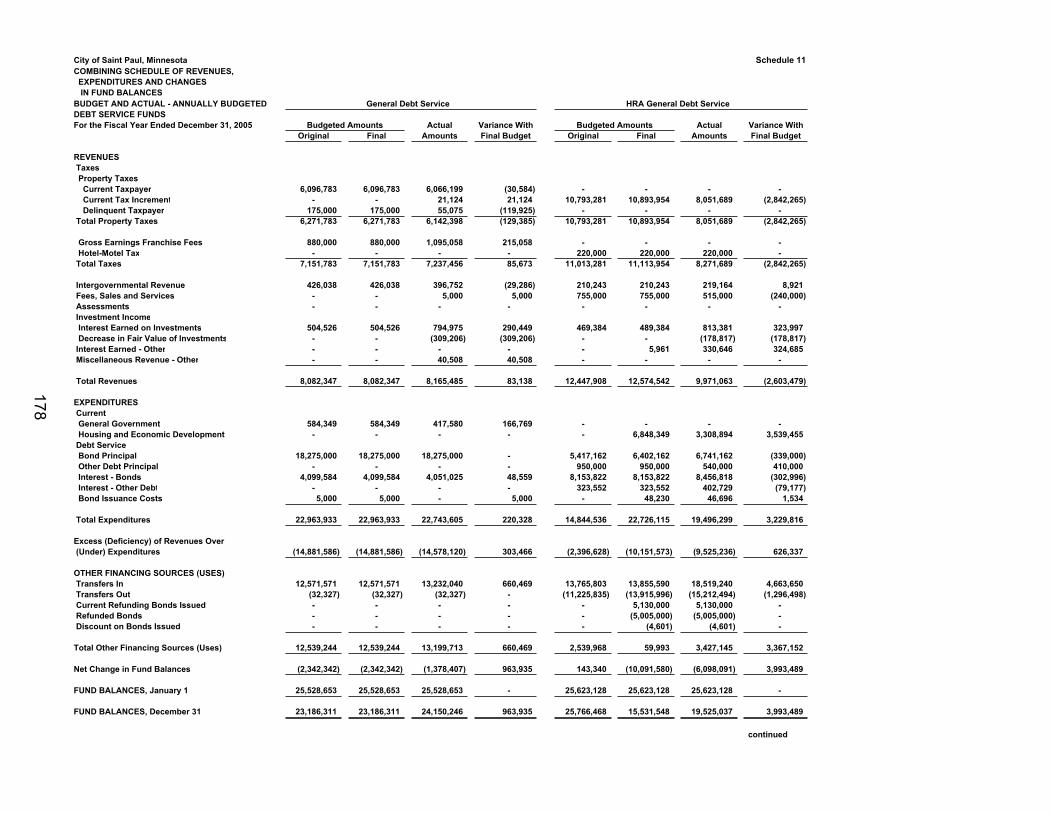
City of Saint Paul, Minnesota Schedule 11COMBINING SCHEDULE OF REVENUES, EXPENDITURES AND CHANGES IN FUND BALANCESBUDGET AND ACTUAL - ANNUALLY BUDGETED General Debt Service HRA General Debt ServiceDEBT SERVICE FUNDSFor the Fiscal Year Ended December 31, 2005 Budgeted Amounts Actual Variance With Budgeted Amounts Actual Variance With
Original Final Amounts Final Budget Original Final Amounts Final Budget
REVENUES Taxes Property Taxes Current Taxpayer 6,096,783 6,096,783 6,066,199 (30,584) - - - - Current Tax Increment - - 21,124 21,124 10,793,281 10,893,954 8,051,689 (2,842,265) Delinquent Taxpayer 175,000 175,000 55,075 (119,925) - - - - Total Property Taxes 6,271,783 6,271,783 6,142,398 (129,385) 10,793,281 10,893,954 8,051,689 (2,842,265)
Gross Earnings Franchise Fees 880,000 880,000 1,095,058 215,058 - - - - Hotel-Motel Tax - - - - 220,000 220,000 220,000 - Total Taxes 7,151,783 7,151,783 7,237,456 85,673 11,013,281 11,113,954 8,271,689 (2,842,265)
Intergovernmental Revenue 426,038 426,038 396,752 (29,286) 210,243 210,243 219,164 8,921 Fees, Sales and Services - - 5,000 5,000 755,000 755,000 515,000 (240,000) Assessments - - - - - - - - Investment Income Interest Earned on Investments 504,526 504,526 794,975 290,449 469,384 489,384 813,381 323,997 Decrease in Fair Value of Investments - - (309,206) (309,206) - - (178,817) (178,817) Interest Earned - Other - - - - - 5,961 330,646 324,685 Miscellaneous Revenue - Other - - 40,508 40,508 - - - -
Total Revenues 8,082,347 8,082,347 8,165,485 83,138 12,447,908 12,574,542 9,971,063 (2,603,479)
EXPENDITURES Current General Government 584,349 584,349 417,580 166,769 - - - - Housing and Economic Development - - - - - 6,848,349 3,308,894 3,539,455 Debt Service Bond Principal 18,275,000 18,275,000 18,275,000 - 5,417,162 6,402,162 6,741,162 (339,000) Other Debt Principal - - - - 950,000 950,000 540,000 410,000 Interest - Bonds 4,099,584 4,099,584 4,051,025 48,559 8,153,822 8,153,822 8,456,818 (302,996) Interest - Other Debt - - - - 323,552 323,552 402,729 (79,177) Bond Issuance Costs 5,000 5,000 - 5,000 - 48,230 46,696 1,534
Total Expenditures 22,963,933 22,963,933 22,743,605 220,328 14,844,536 22,726,115 19,496,299 3,229,816
Excess (Deficiency) of Revenues Over (Under) Expenditures (14,881,586) (14,881,586) (14,578,120) 303,466 (2,396,628) (10,151,573) (9,525,236) 626,337
OTHER FINANCING SOURCES (USES) Transfers In 12,571,571 12,571,571 13,232,040 660,469 13,765,803 13,855,590 18,519,240 4,663,650 Transfers Out (32,327) (32,327) (32,327) - (11,225,835) (13,915,996) (15,212,494) (1,296,498) Current Refunding Bonds Issued - - - - - 5,130,000 5,130,000 - Refunded Bonds - - - - - (5,005,000) (5,005,000) - Discount on Bonds Issued - - - - - (4,601) (4,601) -
Total Other Financing Sources (Uses) 12,539,244 12,539,244 13,199,713 660,469 2,539,968 59,993 3,427,145 3,367,152
Net Change in Fund Balances (2,342,342) (2,342,342) (1,378,407) 963,935 143,340 (10,091,580) (6,098,091) 3,993,489
FUND BALANCES, January 1 25,528,653 25,528,653 25,528,653 - 25,623,128 25,623,128 25,623,128 -
FUND BALANCES, December 31 23,186,311 23,186,311 24,150,246 963,935 25,766,468 15,531,548 19,525,037 3,993,489
continued
178
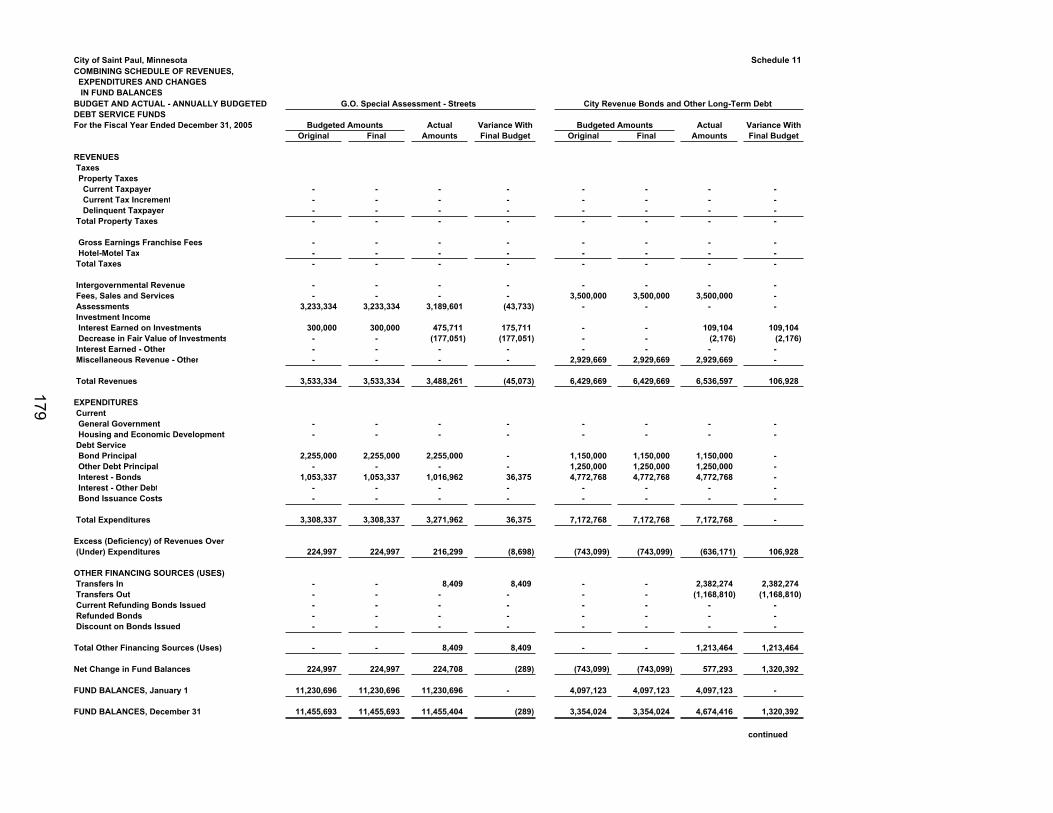
City of Saint Paul, MinnesotaCOMBINING SCHEDULE OF REVENUES, EXPENDITURES AND CHANGES IN FUND BALANCESBUDGET AND ACTUAL - ANNUALLY BUDGETEDDEBT SERVICE FUNDSFor the Fiscal Year Ended December 31, 2005
REVENUES Taxes Property Taxes Current Taxpayer Current Tax Increment Delinquent Taxpayer Total Property Taxes
Gross Earnings Franchise Fees Hotel-Motel Tax Total Taxes
Intergovernmental Revenue Fees, Sales and Services Assessments Investment Income Interest Earned on Investments Decrease in Fair Value of Investments Interest Earned - Other Miscellaneous Revenue - Other
Total Revenues
EXPENDITURES Current General Government Housing and Economic Development Debt Service Bond Principal Other Debt Principal Interest - Bonds Interest - Other Debt Bond Issuance Costs
Total Expenditures
Excess (Deficiency) of Revenues Over (Under) Expenditures
OTHER FINANCING SOURCES (USES) Transfers In Transfers Out Current Refunding Bonds Issued Refunded Bonds Discount on Bonds Issued
Total Other Financing Sources (Uses)
Net Change in Fund Balances
FUND BALANCES, January 1
FUND BALANCES, December 31
Schedule 11
G.O. Special Assessment - Streets City Revenue Bonds and Other Long-Term Debt
Budgeted Amounts Actual Variance With Budgeted Amounts Actual Variance WithOriginal Final Amounts Final Budget Original Final Amounts Final Budget
- - - - - - - - - - - - - - - - - - - - - - - - - - - - - - - -
- - - - - - - - - - - - - - - - - - - - - - - -
- - - - - - - - - - - - 3,500,000 3,500,000 3,500,000 -
3,233,334 3,233,334 3,189,601 (43,733) - - - -
300,000 300,000 475,711 175,711 - - 109,104 109,104- - (177,051) (177,051) - - (2,176) (2,176)- - - - - - - - - - - - 2,929,669 2,929,669 2,929,669 -
3,533,334 3,533,334 3,488,261 (45,073) 6,429,669 6,429,669 6,536,597 106,928
- - - - - - - - - - - - - - - -
2,255,000 2,255,000 2,255,000 - 1,150,000 1,150,000 1,150,000 - - - - - 1,250,000 1,250,000 1,250,000 -
1,053,337 1,053,337 1,016,962 36,375 4,772,768 4,772,768 4,772,768 - - - - - - - - - - - - - - - - -
3,308,337 3,308,337 3,271,962 36,375 7,172,768 7,172,768 7,172,768 -
224,997 224,997 216,299 (8,698) (743,099) (743,099) (636,171) 106,928
- - 8,409 8,409 - - 2,382,274 2,382,274- - - - - - (1,168,810) (1,168,810)- - - - - - - - - - - - - - - - - - - - - - - -
- - 8,409 8,409 - - 1,213,464 1,213,464
224,997 224,997 224,708 (289) (743,099) (743,099) 577,293 1,320,392
11,230,696 11,230,696 11,230,696 - 4,097,123 4,097,123 4,097,123 -
11,455,693 11,455,693 11,455,404 (289) 3,354,024 3,354,024 4,674,416 1,320,392
continued
179
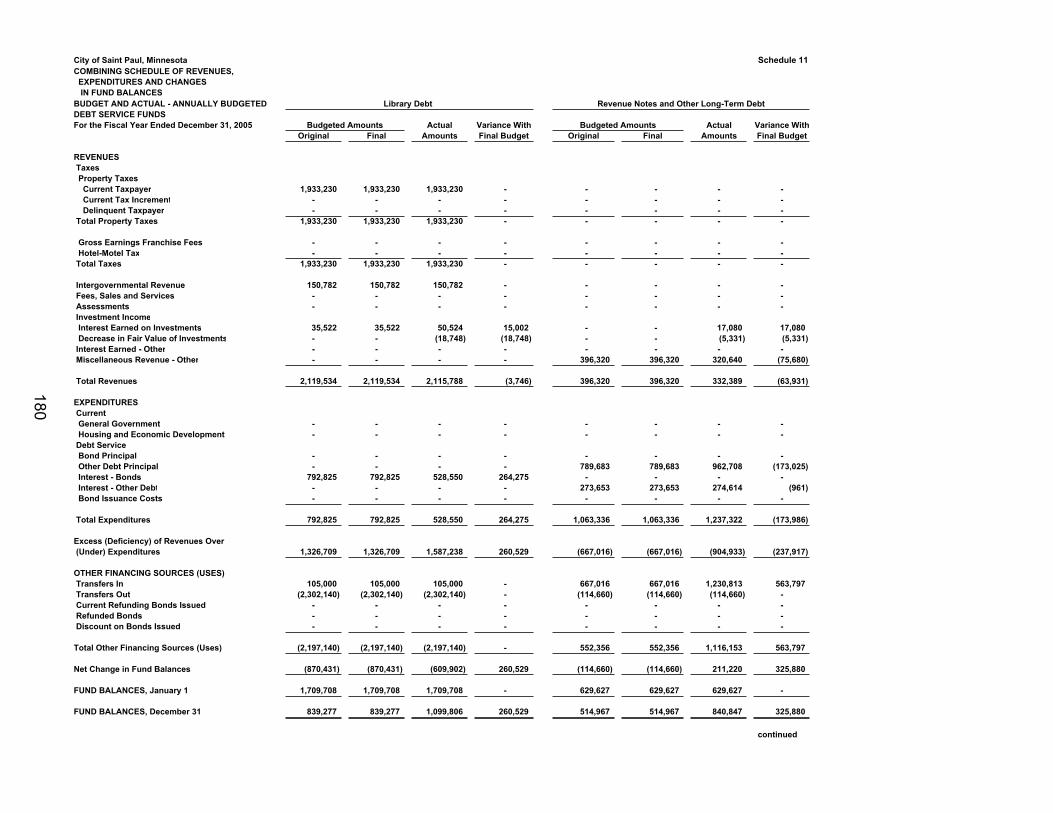
City of Saint Paul, MinnesotaCOMBINING SCHEDULE OF REVENUES, EXPENDITURES AND CHANGES IN FUND BALANCESBUDGET AND ACTUAL - ANNUALLY BUDGETEDDEBT SERVICE FUNDSFor the Fiscal Year Ended December 31, 2005
REVENUES Taxes Property Taxes Current Taxpayer Current Tax Increment Delinquent Taxpayer Total Property Taxes
Gross Earnings Franchise Fees Hotel-Motel Tax Total Taxes
Intergovernmental Revenue Fees, Sales and Services Assessments Investment Income Interest Earned on Investments Decrease in Fair Value of Investments Interest Earned - Other Miscellaneous Revenue - Other
Total Revenues
EXPENDITURES Current General Government Housing and Economic Development Debt Service Bond Principal Other Debt Principal Interest - Bonds Interest - Other Debt Bond Issuance Costs
Total Expenditures
Excess (Deficiency) of Revenues Over (Under) Expenditures
OTHER FINANCING SOURCES (USES) Transfers In Transfers Out Current Refunding Bonds Issued Refunded Bonds Discount on Bonds Issued
Total Other Financing Sources (Uses)
Net Change in Fund Balances
FUND BALANCES, January 1
FUND BALANCES, December 31
Schedule 11
Library Debt
Budgeted Amounts Actual Variance With Budgeted Amounts Actual Variance WithOriginal Final Amounts Final Budget Original Final Amounts Final Budget
1,933,230 1,933,230 1,933,230 - - - - - - - - - - - - - - - - - - - - -
1,933,230 1,933,230 1,933,230 - - - - -
- - - - - - - - - - - - - - - -
1,933,230 1,933,230 1,933,230 - - - - -
150,782 150,782 150,782 - - - - - - - - - - - - - - - - - - - - -
35,522 35,522 50,524 15,002 - - 17,080 17,080- - (18,748) (18,748) - - (5,331) (5,331)- - - - - - - - - - - - 396,320 396,320 320,640 (75,680)
2,119,534 2,119,534 2,115,788 (3,746) 396,320 396,320 332,389 (63,931)
- - - - - - - - - - - - - - - -
- - - - - - - - - - - - 789,683 789,683 962,708 (173,025)
792,825 792,825 528,550 264,275 - - - - - - - - 273,653 273,653 274,614 (961)- - - - - - - -
792,825 792,825 528,550 264,275 1,063,336 1,063,336 1,237,322 (173,986)
1,326,709 1,326,709 1,587,238 260,529 (667,016) (667,016) (904,933) (237,917)
105,000 105,000 105,000 - 667,016 667,016 1,230,813 563,797(2,302,140) (2,302,140) (2,302,140) - (114,660) (114,660) (114,660) -
- - - - - - - - - - - - - - - - - - - - - - - -
(2,197,140) (2,197,140) (2,197,140) - 552,356 552,356 1,116,153 563,797
(870,431) (870,431) (609,902) 260,529 (114,660) (114,660) 211,220 325,880
1,709,708 1,709,708 1,709,708 - 629,627 629,627 629,627 -
839,277 839,277 1,099,806 260,529 514,967 514,967 840,847 325,880
continued
Revenue Notes and Other Long-Term Debt
180
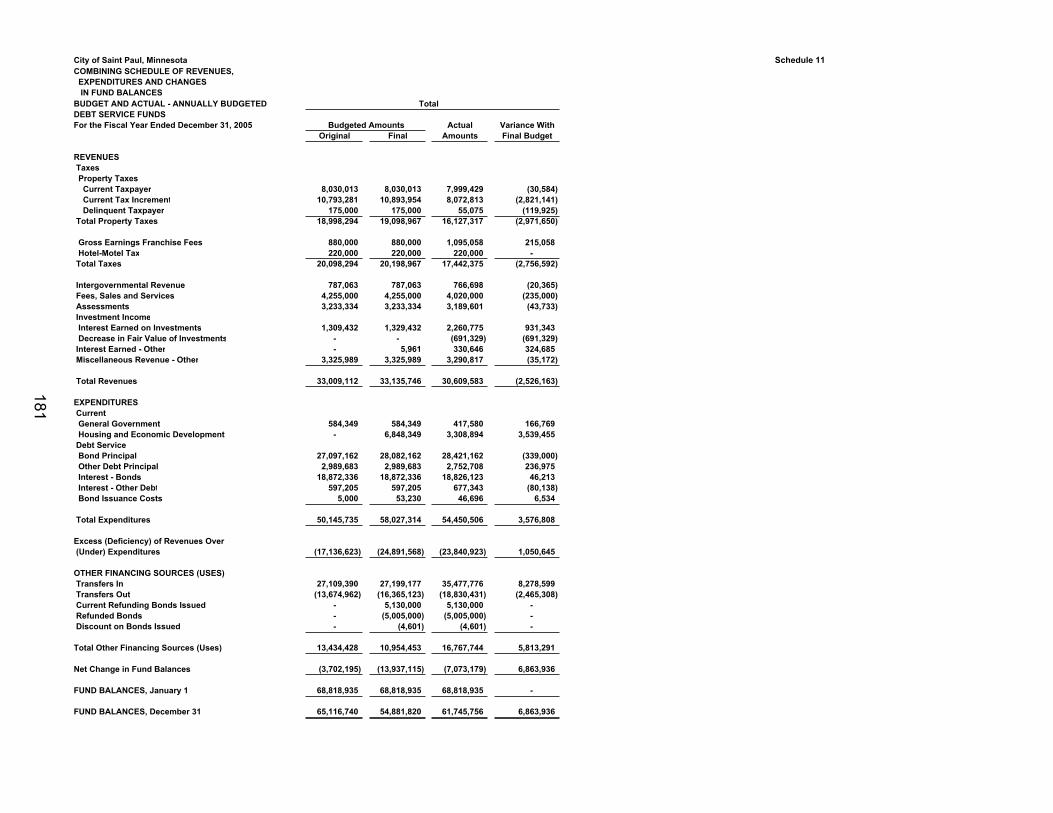
City of Saint Paul, MinnesotaCOMBINING SCHEDULE OF REVENUES, EXPENDITURES AND CHANGES IN FUND BALANCESBUDGET AND ACTUAL - ANNUALLY BUDGETEDDEBT SERVICE FUNDSFor the Fiscal Year Ended December 31, 2005
REVENUES Taxes Property Taxes Current Taxpayer Current Tax Increment Delinquent Taxpayer Total Property Taxes
Gross Earnings Franchise Fees Hotel-Motel Tax Total Taxes
Intergovernmental Revenue Fees, Sales and Services Assessments Investment Income Interest Earned on Investments Decrease in Fair Value of Investments Interest Earned - Other Miscellaneous Revenue - Other
Total Revenues
EXPENDITURES Current General Government Housing and Economic Development Debt Service Bond Principal Other Debt Principal Interest - Bonds Interest - Other Debt Bond Issuance Costs
Total Expenditures
Excess (Deficiency) of Revenues Over (Under) Expenditures
OTHER FINANCING SOURCES (USES) Transfers In Transfers Out Current Refunding Bonds Issued Refunded Bonds Discount on Bonds Issued
Total Other Financing Sources (Uses)
Net Change in Fund Balances
FUND BALANCES, January 1
FUND BALANCES, December 31
Schedule 11
Total
Budgeted Amounts Actual Variance WithOriginal Final Amounts Final Budget
8,030,013 8,030,013 7,999,429 (30,584)10,793,281 10,893,954 8,072,813 (2,821,141)
175,000 175,000 55,075 (119,925)18,998,294 19,098,967 16,127,317 (2,971,650)
880,000 880,000 1,095,058 215,058220,000 220,000 220,000 -
20,098,294 20,198,967 17,442,375 (2,756,592)
787,063 787,063 766,698 (20,365)4,255,000 4,255,000 4,020,000 (235,000)3,233,334 3,233,334 3,189,601 (43,733)
1,309,432 1,329,432 2,260,775 931,343- - (691,329) (691,329)- 5,961 330,646 324,685
3,325,989 3,325,989 3,290,817 (35,172)
33,009,112 33,135,746 30,609,583 (2,526,163)
584,349 584,349 417,580 166,769- 6,848,349 3,308,894 3,539,455
27,097,162 28,082,162 28,421,162 (339,000)2,989,683 2,989,683 2,752,708 236,975
18,872,336 18,872,336 18,826,123 46,213597,205 597,205 677,343 (80,138)
5,000 53,230 46,696 6,534
50,145,735 58,027,314 54,450,506 3,576,808
(17,136,623) (24,891,568) (23,840,923) 1,050,645
27,109,390 27,199,177 35,477,776 8,278,599(13,674,962) (16,365,123) (18,830,431) (2,465,308)
- 5,130,000 5,130,000 - - (5,005,000) (5,005,000) - - (4,601) (4,601) -
13,434,428 10,954,453 16,767,744 5,813,291
(3,702,195) (13,937,115) (7,073,179) 6,863,936
68,818,935 68,818,935 68,818,935 -
65,116,740 54,881,820 61,745,756 6,863,936
181
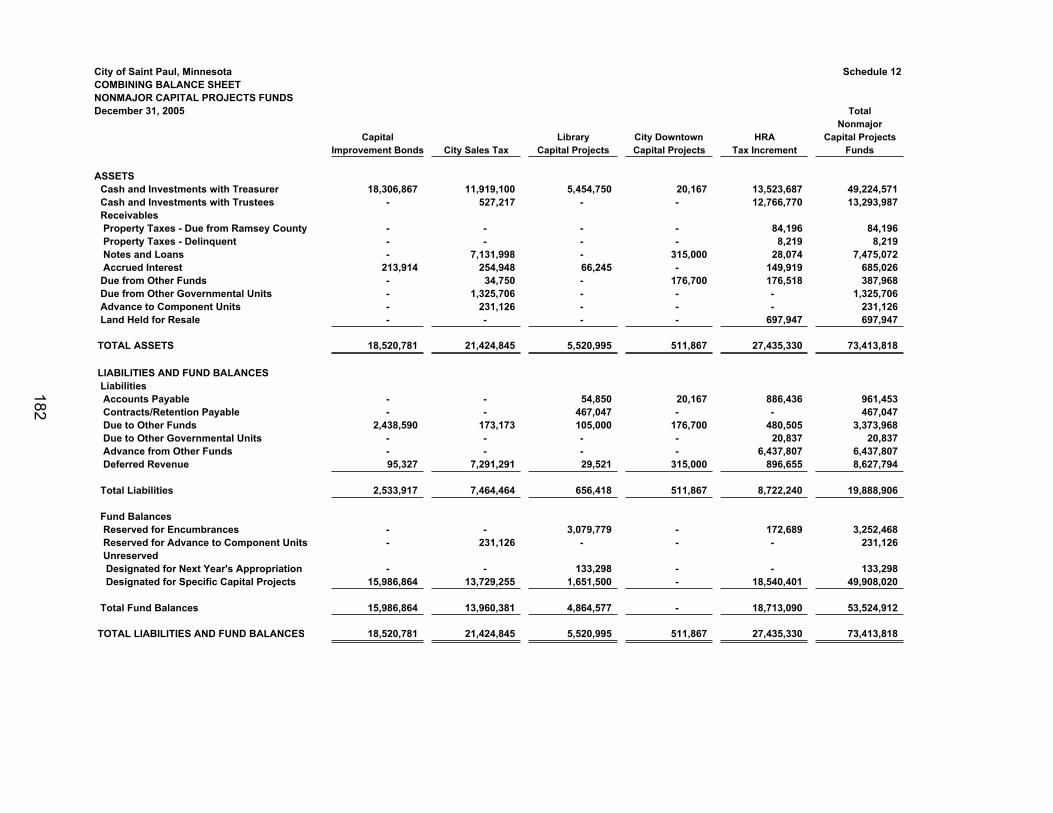
City of Saint Paul, Minnesota Schedule 12COMBINING BALANCE SHEETNONMAJOR CAPITAL PROJECTS FUNDSDecember 31, 2005 Total
NonmajorCapital Library City Downtown HRA Capital Projects
Improvement Bonds City Sales Tax Capital Projects Capital Projects Tax Increment Funds
ASSETS Cash and Investments with Treasurer 18,306,867 11,919,100 5,454,750 20,167 13,523,687 49,224,571 Cash and Investments with Trustees - 527,217 - - 12,766,770 13,293,987 Receivables Property Taxes - Due from Ramsey County - - - - 84,196 84,196 Property Taxes - Delinquent - - - - 8,219 8,219 Notes and Loans - 7,131,998 - 315,000 28,074 7,475,072 Accrued Interest 213,914 254,948 66,245 - 149,919 685,026 Due from Other Funds - 34,750 - 176,700 176,518 387,968 Due from Other Governmental Units - 1,325,706 - - - 1,325,706 Advance to Component Units - 231,126 - - - 231,126 Land Held for Resale - - - - 697,947 697,947
TOTAL ASSETS 18,520,781 21,424,845 5,520,995 511,867 27,435,330 73,413,818
LIABILITIES AND FUND BALANCES Liabilities Accounts Payable - - 54,850 20,167 886,436 961,453 Contracts/Retention Payable - - 467,047 - - 467,047 Due to Other Funds 2,438,590 173,173 105,000 176,700 480,505 3,373,968 Due to Other Governmental Units - - - - 20,837 20,837 Advance from Other Funds - - - - 6,437,807 6,437,807 Deferred Revenue 95,327 7,291,291 29,521 315,000 896,655 8,627,794
Total Liabilities 2,533,917 7,464,464 656,418 511,867 8,722,240 19,888,906
Fund Balances Reserved for Encumbrances - - 3,079,779 - 172,689 3,252,468 Reserved for Advance to Component Units - 231,126 - - - 231,126 Unreserved Designated for Next Year's Appropriation - - 133,298 - - 133,298 Designated for Specific Capital Projects 15,986,864 13,729,255 1,651,500 - 18,540,401 49,908,020
Total Fund Balances 15,986,864 13,960,381 4,864,577 - 18,713,090 53,524,912
TOTAL LIABILITIES AND FUND BALANCES 18,520,781 21,424,845 5,520,995 511,867 27,435,330 73,413,818
182
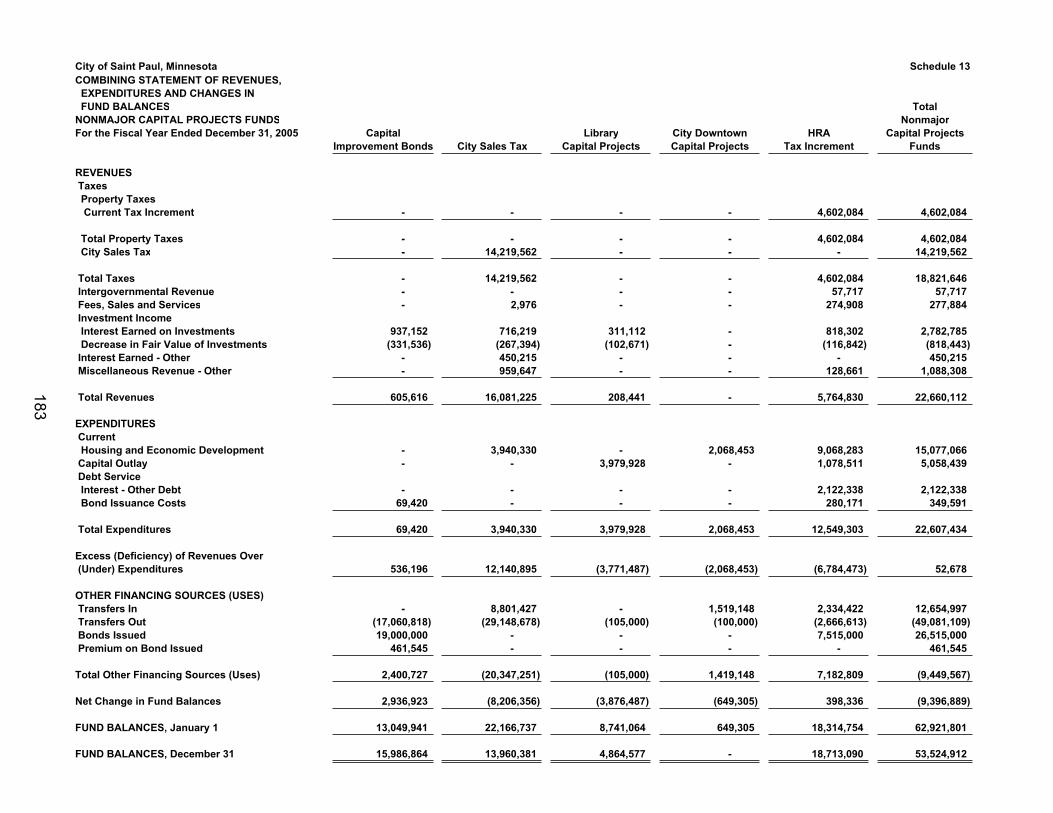
City of Saint Paul, MinnesotaCOMBINING STATEMENT OF REVENUES, EXPENDITURES AND CHANGES IN FUND BALANCESNONMAJOR CAPITAL PROJECTS FUNDSFor the Fiscal Year Ended December 31, 2005
REVENUES Taxes Property Taxes Current Tax Increment
Total Property Taxes City Sales Tax
Total Taxes Intergovernmental Revenue Fees, Sales and Services Investment Income Interest Earned on Investments Decrease in Fair Value of Investments Interest Earned - Other Miscellaneous Revenue - Other
Total Revenues
EXPENDITURES Current Housing and Economic Development Capital Outlay Debt Service Interest - Other Debt Bond Issuance Costs
Total Expenditures
Excess (Deficiency) of Revenues Over (Under) Expenditures
OTHER FINANCING SOURCES (USES) Transfers In Transfers Out Bonds Issued Premium on Bond Issued
Total Other Financing Sources (Uses)
Net Change in Fund Balances
FUND BALANCES, January 1
FUND BALANCES, December 31
Schedule 13
TotalNonmajor
Capital Library City Downtown HRA Capital ProjectsImprovement Bonds City Sales Tax Capital Projects Capital Projects Tax Increment Funds
- - - - 4,602,084 4,602,084
- - - - 4,602,084 4,602,084- 14,219,562 - - - 14,219,562
- 14,219,562 - - 4,602,084 18,821,646- - - - 57,717 57,717- 2,976 - - 274,908 277,884
937,152 716,219 311,112 - 818,302 2,782,785(331,536) (267,394) (102,671) - (116,842) (818,443)
- 450,215 - - - 450,215- 959,647 - - 128,661 1,088,308
605,616 16,081,225 208,441 - 5,764,830 22,660,112
- 3,940,330 - 2,068,453 9,068,283 15,077,066- - 3,979,928 - 1,078,511 5,058,439
- - - - 2,122,338 2,122,33869,420 - - - 280,171 349,591
69,420 3,940,330 3,979,928 2,068,453 12,549,303 22,607,434
536,196 12,140,895 (3,771,487) (2,068,453) (6,784,473) 52,678
- 8,801,427 - 1,519,148 2,334,422 12,654,997(17,060,818) (29,148,678) (105,000) (100,000) (2,666,613) (49,081,109)19,000,000 - - - 7,515,000 26,515,000
461,545 - - - - 461,545
2,400,727 (20,347,251) (105,000) 1,419,148 7,182,809 (9,449,567)
2,936,923 (8,206,356) (3,876,487) (649,305) 398,336 (9,396,889)
13,049,941 22,166,737 8,741,064 649,305 18,314,754 62,921,801
15,986,864 13,960,381 4,864,577 - 18,713,090 53,524,912
183
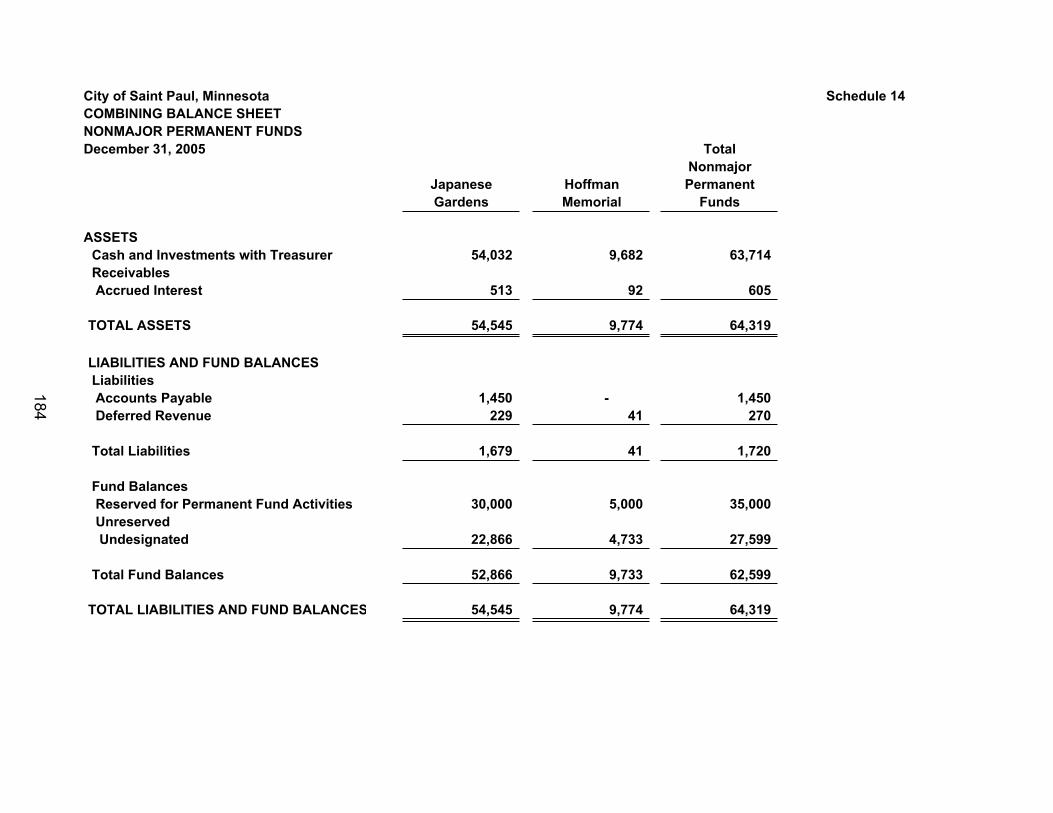
City of Saint Paul, Minnesota Schedule 14COMBINING BALANCE SHEETNONMAJOR PERMANENT FUNDSDecember 31, 2005 Total
NonmajorJapanese Hoffman PermanentGardens Memorial Funds
ASSETS Cash and Investments with Treasurer 54,032 9,682 63,714 Receivables Accrued Interest 513 92 605
TOTAL ASSETS 54,545 9,774 64,319
LIABILITIES AND FUND BALANCES Liabilities Accounts Payable 1,450 - 1,450 Deferred Revenue 229 41 270
Total Liabilities 1,679 41 1,720
Fund Balances Reserved for Permanent Fund Activities 30,000 5,000 35,000 Unreserved Undesignated 22,866 4,733 27,599
Total Fund Balances 52,866 9,733 62,599
TOTAL LIABILITIES AND FUND BALANCES 54,545 9,774 64,319
184
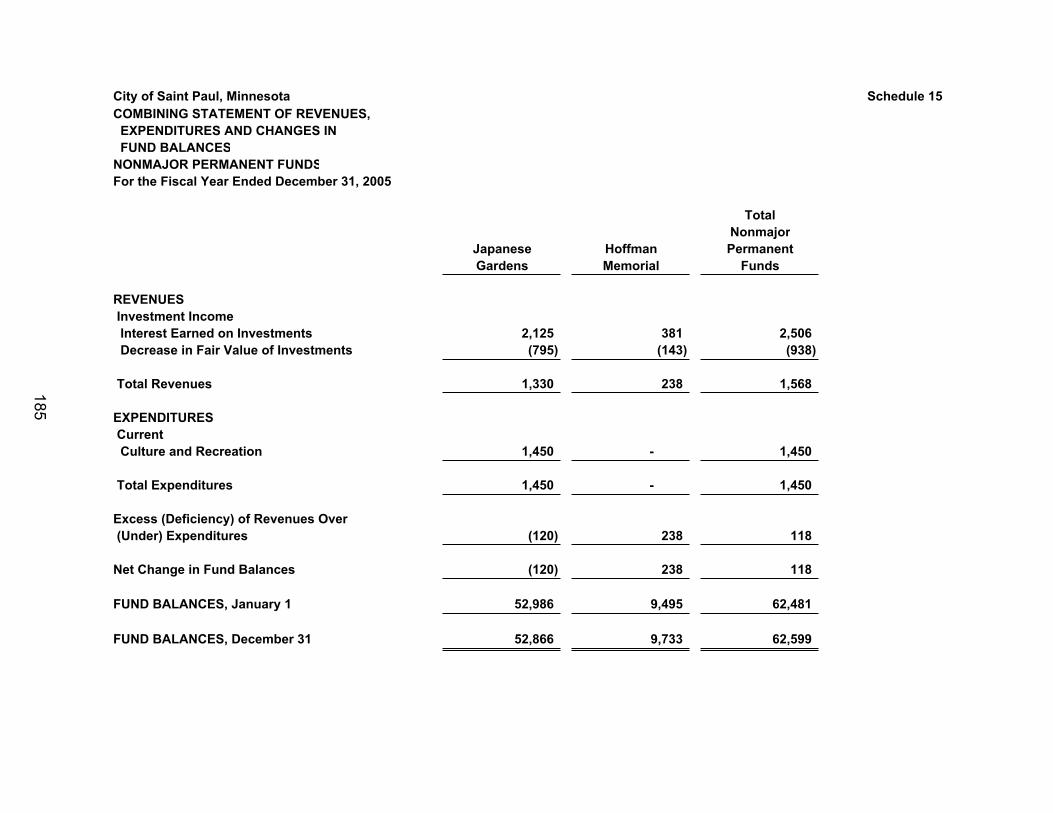
City of Saint Paul, Minnesota Schedule 15COMBINING STATEMENT OF REVENUES, EXPENDITURES AND CHANGES IN FUND BALANCESNONMAJOR PERMANENT FUNDSFor the Fiscal Year Ended December 31, 2005
TotalNonmajor
Japanese Hoffman PermanentGardens Memorial Funds
REVENUES Investment Income Interest Earned on Investments 2,125 381 2,506 Decrease in Fair Value of Investments (795) (143) (938)
Total Revenues 1,330 238 1,568
EXPENDITURES Current Culture and Recreation 1,450 - 1,450
Total Expenditures 1,450 - 1,450
Excess (Deficiency) of Revenues Over (Under) Expenditures (120) 238 118
Net Change in Fund Balances (120) 238 118
FUND BALANCES, January 1 52,986 9,495 62,481
FUND BALANCES, December 31 52,866 9,733 62,599
185
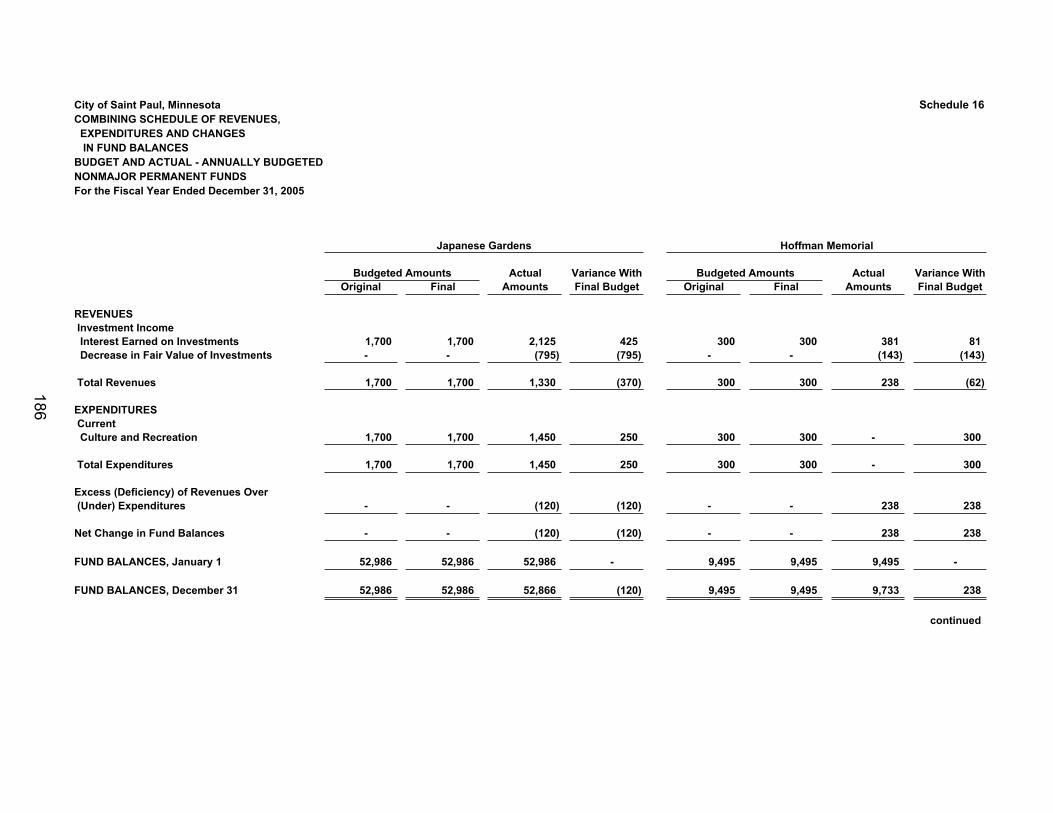
City of Saint Paul, MinnesotaCOMBINING SCHEDULE OF REVENUES, EXPENDITURES AND CHANGES IN FUND BALANCESBUDGET AND ACTUAL - ANNUALLY BUDGETEDNONMAJOR PERMANENT FUNDSFor the Fiscal Year Ended December 31, 2005
REVENUES Investment Income Interest Earned on Investments Decrease in Fair Value of Investments
Total Revenues
EXPENDITURES Current Culture and Recreation
Total Expenditures
Excess (Deficiency) of Revenues Over (Under) Expenditures
Net Change in Fund Balances
FUND BALANCES, January 1
FUND BALANCES, December 31
Schedule 16
Japanese Gardens
Budgeted Amounts Actual Variance With Budgeted Amounts Actual Variance WithOriginal Final Amounts Final Budget Original Final Amounts Final Budget
1,700 1,700 2,125 425 300 300 381 81- - (795) (795) - - (143) (143)
1,700 1,700 1,330 (370) 300 300 238 (62)
1,700 1,700 1,450 250 300 300 - 300
1,700 1,700 1,450 250 300 300 - 300
- - (120) (120) - - 238 238
- - (120) (120) - - 238 238
52,986 52,986 52,986 - 9,495 9,495 9,495 -
52,986 52,986 52,866 (120) 9,495 9,495 9,733 238
continued
Hoffman Memorial
186
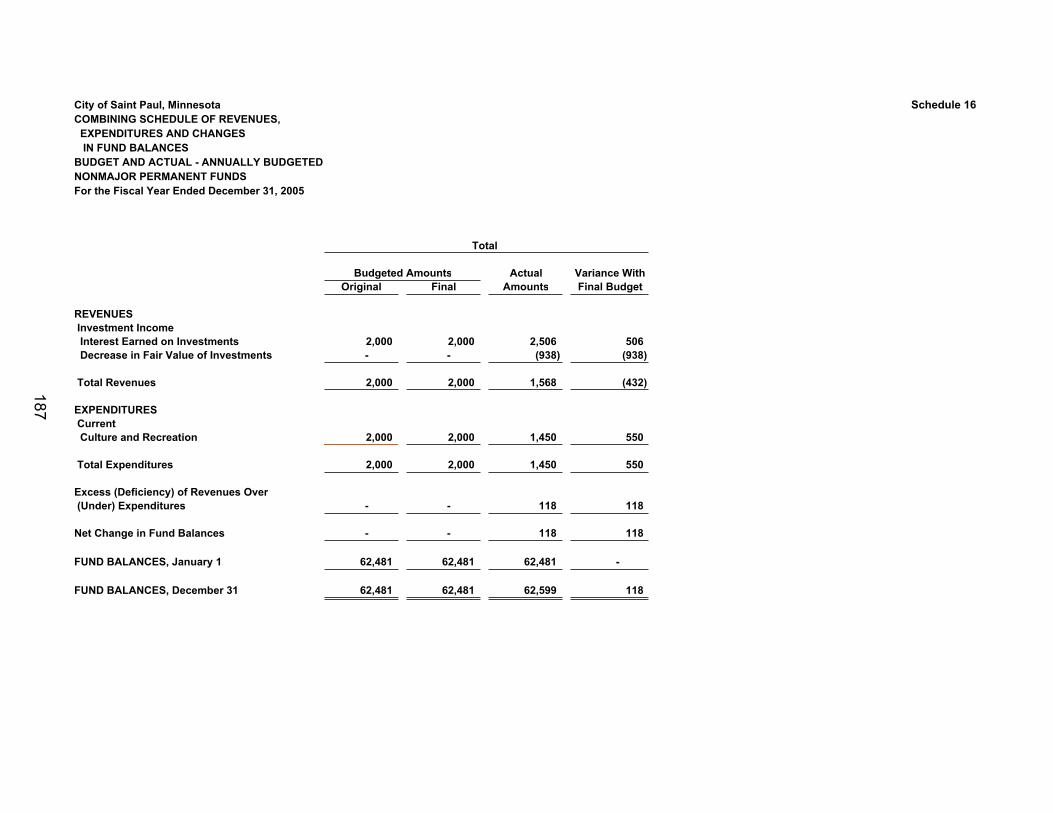
City of Saint Paul, MinnesotaCOMBINING SCHEDULE OF REVENUES, EXPENDITURES AND CHANGES IN FUND BALANCESBUDGET AND ACTUAL - ANNUALLY BUDGETEDNONMAJOR PERMANENT FUNDSFor the Fiscal Year Ended December 31, 2005
REVENUES Investment Income Interest Earned on Investments Decrease in Fair Value of Investments
Total Revenues
EXPENDITURES Current Culture and Recreation
Total Expenditures
Excess (Deficiency) of Revenues Over (Under) Expenditures
Net Change in Fund Balances
FUND BALANCES, January 1
FUND BALANCES, December 31
Schedule 16
Total
Budgeted Amounts Actual Variance WithOriginal Final Amounts Final Budget
2,000 2,000 2,506 506 - - (938) (938)
2,000 2,000 1,568 (432)
2,000 2,000 1,450 550
2,000 2,000 1,450 550
- - 118 118
- - 118 118
62,481 62,481 62,481 -
62,481 62,481 62,599 118
187

This page left blank intentionally
188
Nonmajor Enterprise Funds
Enterprise Funds Enterprise funds account for operations (a) that are financed and operated in a manner similar to private business enterprises - where the intent of the governing body is that the costs (expenses, including depreciation) of providing goods and services to the general public on a continuing basis be financed or recovered primarily through user charges; or (b) where the governing body has decided that periodic determination of revenues earned, expenses incurred and/or net income is appropriate.
Special Services - to account for the operations of park pavilions, refreshment stands, golf courses, canoe and boat rentals, swimming pools and beaches, tennis instructions, ski instructions, and ski facilities.
Rice and Arlington Sports Dome - to account for the operation and maintenance of the Rice and Arlington Sports Dome.
Watergate Marina - to account for the operation and maintenance of the Marina.
Impounding Lot - to account for the city’s vehicle impounding operations. Charges are made for the towing and storage of impounded vehicles and are collected when vehicles are claimed. Unclaimed vehicles are sold at public auction and proceeds retained. Funds are also received from the salvage of vehicles junked.
River Print Saint Paul/Ramsey County - to account for printing services rendered to city departments, offices, and other governmental units.
189
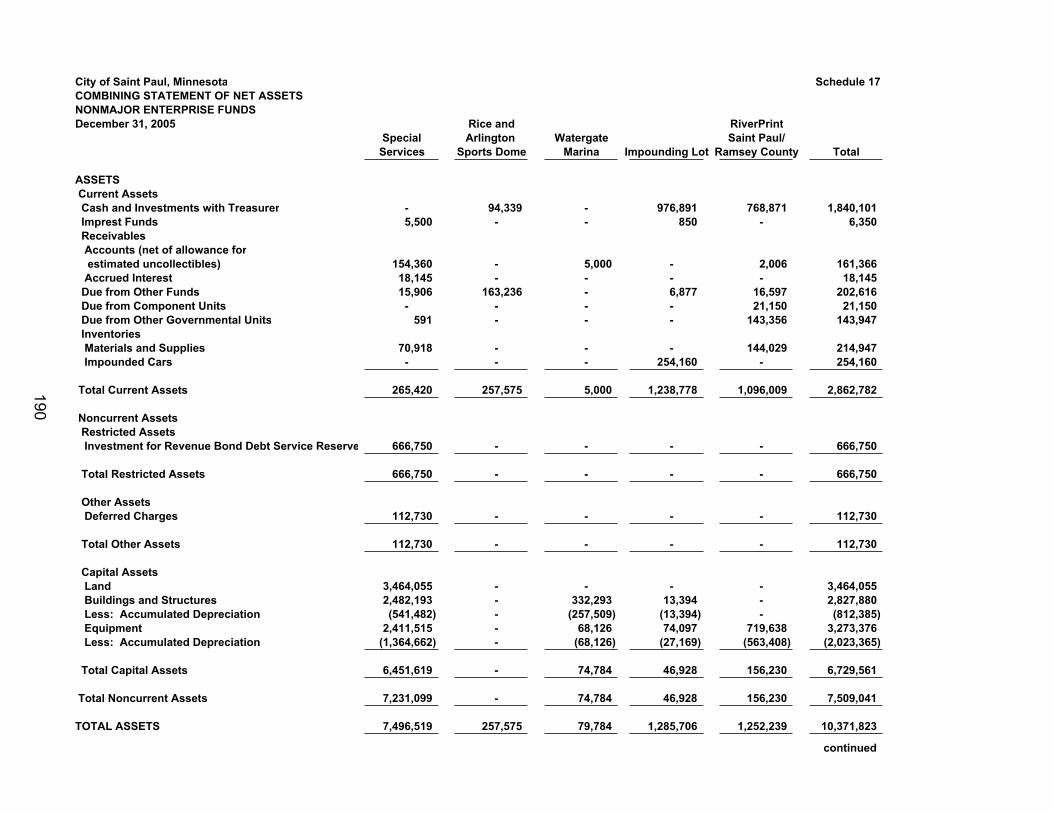
City of Saint Paul, Minnesota Schedule 17COMBINING STATEMENT OF NET ASSETSNONMAJOR ENTERPRISE FUNDSDecember 31, 2005 Rice and RiverPrint
Special Arlington Watergate Saint Paul/Services Sports Dome Marina Impounding Lot Ramsey County Total
ASSETS Current Assets Cash and Investments with Treasurer - 94,339 - 976,891 768,871 1,840,101 Imprest Funds 5,500 - - 850 - 6,350 Receivables Accounts (net of allowance for estimated uncollectibles) 154,360 - 5,000 - 2,006 161,366 Accrued Interest 18,145 - - - - 18,145 Due from Other Funds 15,906 163,236 - 6,877 16,597 202,616 Due from Component Units - - - - 21,150 21,150 Due from Other Governmental Units 591 - - - 143,356 143,947 Inventories Materials and Supplies 70,918 - - - 144,029 214,947 Impounded Cars - - - 254,160 - 254,160
Total Current Assets 265,420 257,575 5,000 1,238,778 1,096,009 2,862,782
Noncurrent Assets Restricted Assets Investment for Revenue Bond Debt Service Reserve 666,750 - - - - 666,750
Total Restricted Assets 666,750 - - - - 666,750
Other Assets Deferred Charges 112,730 - - - - 112,730
Total Other Assets 112,730 - - - - 112,730
Capital Assets Land 3,464,055 - - - - 3,464,055 Buildings and Structures 2,482,193 - 332,293 13,394 - 2,827,880 Less: Accumulated Depreciation (541,482) - (257,509) (13,394) - (812,385) Equipment 2,411,515 - 68,126 74,097 719,638 3,273,376 Less: Accumulated Depreciation (1,364,662) - (68,126) (27,169) (563,408) (2,023,365)
Total Capital Assets 6,451,619 - 74,784 46,928 156,230 6,729,561
Total Noncurrent Assets 7,231,099 - 74,784 46,928 156,230 7,509,041
TOTAL ASSETS 7,496,519 257,575 79,784 1,285,706 1,252,239 10,371,823
continued
190
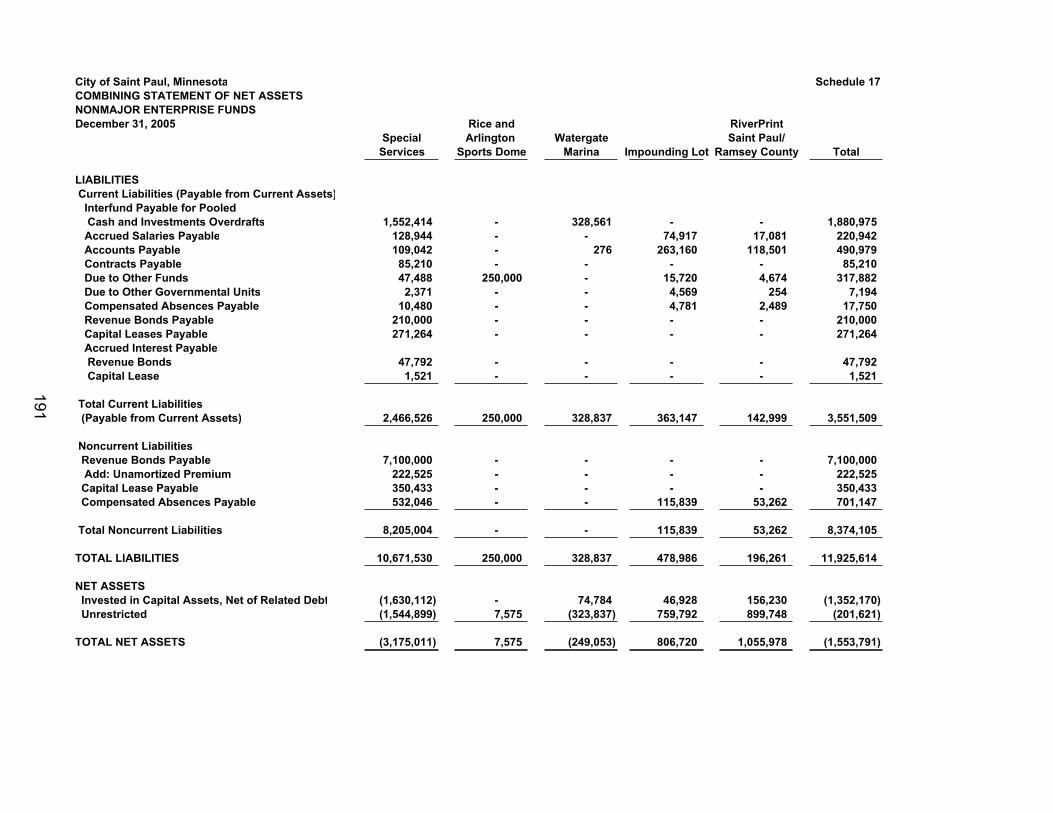
City of Saint Paul, Minnesota Schedule 17COMBINING STATEMENT OF NET ASSETSNONMAJOR ENTERPRISE FUNDSDecember 31, 2005 Rice and RiverPrint
Special Arlington Watergate Saint Paul/Services Sports Dome Marina Impounding Lot Ramsey County Total
LIABILITIES Current Liabilities (Payable from Current Assets) Interfund Payable for Pooled Cash and Investments Overdrafts 1,552,414 - 328,561 - - 1,880,975 Accrued Salaries Payable 128,944 - - 74,917 17,081 220,942 Accounts Payable 109,042 - 276 263,160 118,501 490,979 Contracts Payable 85,210 - - - - 85,210 Due to Other Funds 47,488 250,000 - 15,720 4,674 317,882 Due to Other Governmental Units 2,371 - - 4,569 254 7,194 Compensated Absences Payable 10,480 - - 4,781 2,489 17,750 Revenue Bonds Payable 210,000 - - - - 210,000 Capital Leases Payable 271,264 - - - - 271,264 Accrued Interest Payable Revenue Bonds 47,792 - - - - 47,792 Capital Lease 1,521 - - - - 1,521
Total Current Liabilities (Payable from Current Assets) 2,466,526 250,000 328,837 363,147 142,999 3,551,509
Noncurrent Liabilities Revenue Bonds Payable 7,100,000 - - - - 7,100,000 Add: Unamortized Premium 222,525 - - - - 222,525 Capital Lease Payable 350,433 - - - - 350,433 Compensated Absences Payable 532,046 - - 115,839 53,262 701,147
Total Noncurrent Liabilities 8,205,004 - - 115,839 53,262 8,374,105
TOTAL LIABILITIES 10,671,530 250,000 328,837 478,986 196,261 11,925,614
NET ASSETS Invested in Capital Assets, Net of Related Debt (1,630,112) - 74,784 46,928 156,230 (1,352,170) Unrestricted (1,544,899) 7,575 (323,837) 759,792 899,748 (201,621)
TOTAL NET ASSETS (3,175,011) 7,575 (249,053) 806,720 1,055,978 (1,553,791)
191
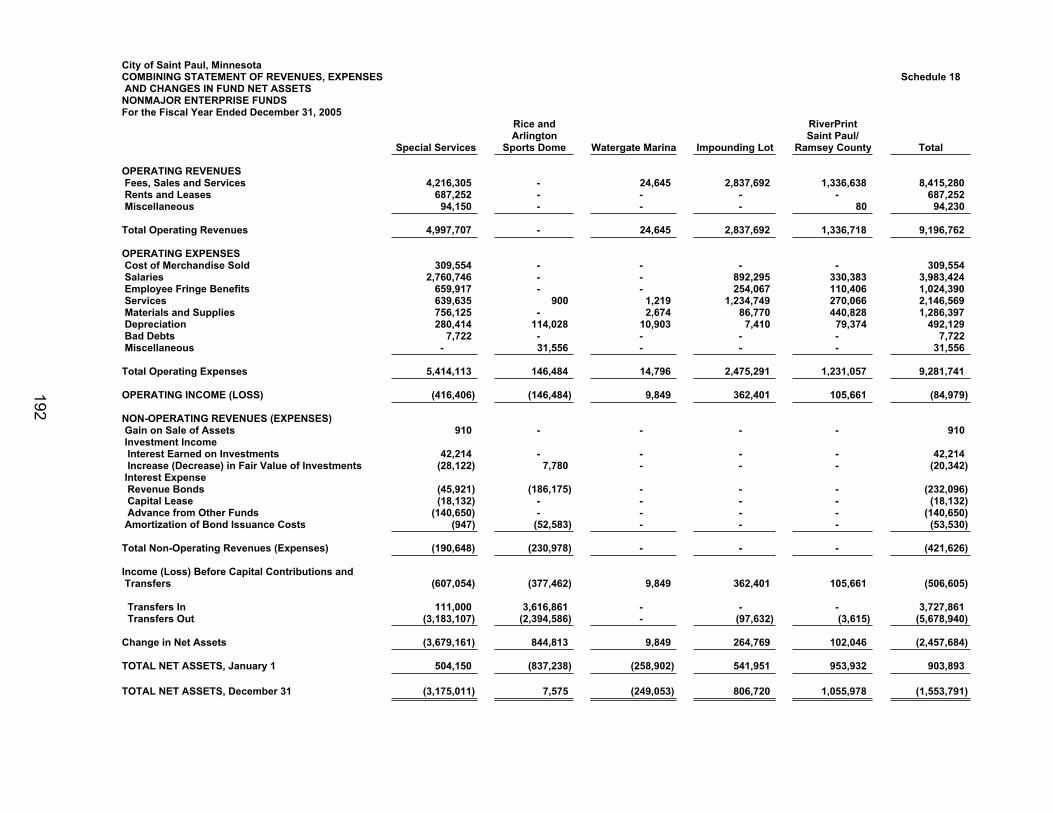
City of Saint Paul, MinnesotaCOMBINING STATEMENT OF REVENUES, EXPENSES Schedule 18 AND CHANGES IN FUND NET ASSETSNONMAJOR ENTERPRISE FUNDSFor the Fiscal Year Ended December 31, 2005
Rice and RiverPrintArlington Saint Paul/
Special Services Sports Dome Watergate Marina Impounding Lot Ramsey County Total
OPERATING REVENUES Fees, Sales and Services 4,216,305 - 24,645 2,837,692 1,336,638 8,415,280 Rents and Leases 687,252 - - - - 687,252 Miscellaneous 94,150 - - - 80 94,230
Total Operating Revenues 4,997,707 - 24,645 2,837,692 1,336,718 9,196,762
OPERATING EXPENSES Cost of Merchandise Sold 309,554 - - - - 309,554 Salaries 2,760,746 - - 892,295 330,383 3,983,424 Employee Fringe Benefits 659,917 - - 254,067 110,406 1,024,390 Services 639,635 900 1,219 1,234,749 270,066 2,146,569 Materials and Supplies 756,125 - 2,674 86,770 440,828 1,286,397 Depreciation 280,414 114,028 10,903 7,410 79,374 492,129 Bad Debts 7,722 - - - - 7,722 Miscellaneous - 31,556 - - - 31,556
Total Operating Expenses 5,414,113 146,484 14,796 2,475,291 1,231,057 9,281,741
OPERATING INCOME (LOSS) (416,406) (146,484) 9,849 362,401 105,661 (84,979)
NON-OPERATING REVENUES (EXPENSES) Gain on Sale of Assets 910 - - - - 910 Investment Income Interest Earned on Investments 42,214 - - - - 42,214 Increase (Decrease) in Fair Value of Investments (28,122) 7,780 - - - (20,342) Interest Expense Revenue Bonds (45,921) (186,175) - - - (232,096) Capital Lease (18,132) - - - - (18,132) Advance from Other Funds (140,650) - - - - (140,650) Amortization of Bond Issuance Costs (947) (52,583) - - - (53,530)
Total Non-Operating Revenues (Expenses) (190,648) (230,978) - - - (421,626)
Income (Loss) Before Capital Contributions and Transfers (607,054) (377,462) 9,849 362,401 105,661 (506,605)
Transfers In 111,000 3,616,861 - - - 3,727,861 Transfers Out (3,183,107) (2,394,586) - (97,632) (3,615) (5,678,940)
Change in Net Assets (3,679,161) 844,813 9,849 264,769 102,046 (2,457,684)
TOTAL NET ASSETS, January 1 504,150 (837,238) (258,902) 541,951 953,932 903,893
TOTAL NET ASSETS, December 31 (3,175,011) 7,575 (249,053) 806,720 1,055,978 (1,553,791)
192
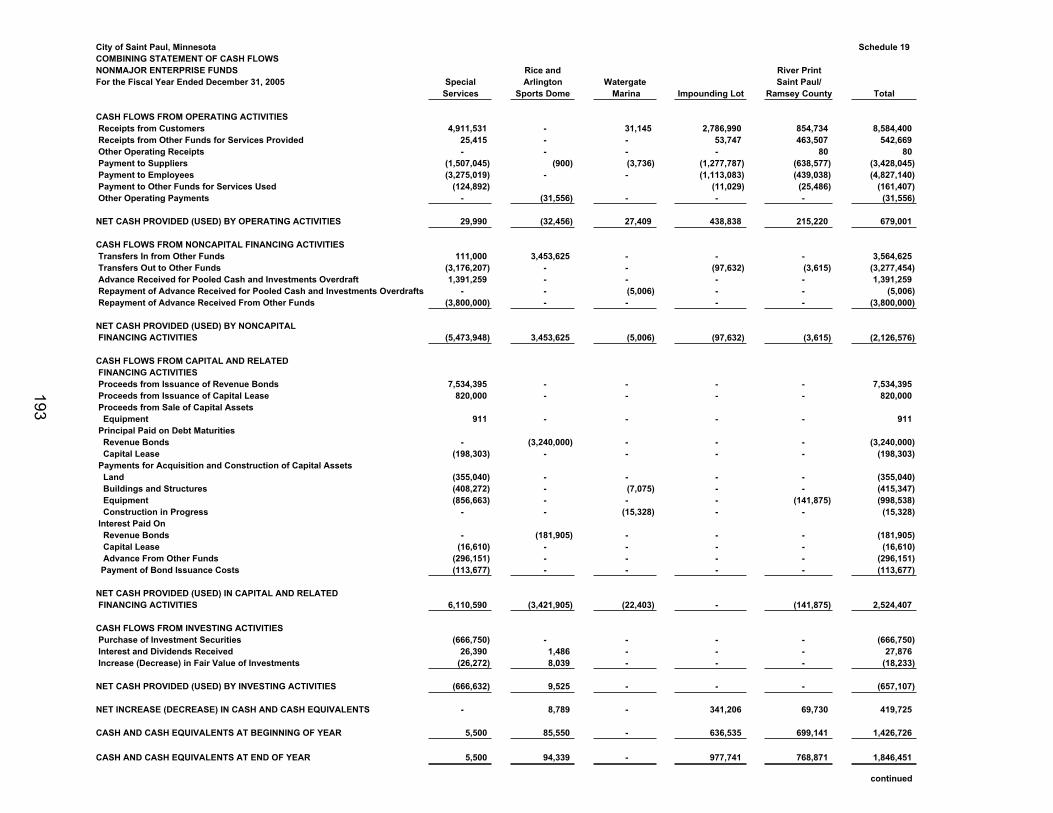
City of Saint Paul, Minnesota Schedule 19COMBINING STATEMENT OF CASH FLOWS NONMAJOR ENTERPRISE FUNDS Rice and River PrintFor the Fiscal Year Ended December 31, 2005 Special Arlington Watergate Saint Paul/
Services Sports Dome Marina Impounding Lot Ramsey County Total
CASH FLOWS FROM OPERATING ACTIVITIES Receipts from Customers 4,911,531 - 31,145 2,786,990 854,734 8,584,400 Receipts from Other Funds for Services Provided 25,415 - - 53,747 463,507 542,669 Other Operating Receipts - - - - 80 80 Payment to Suppliers (1,507,045) (900) (3,736) (1,277,787) (638,577) (3,428,045) Payment to Employees (3,275,019) - - (1,113,083) (439,038) (4,827,140) Payment to Other Funds for Services Used (124,892) (11,029) (25,486) (161,407) Other Operating Payments - (31,556) - - - (31,556)
NET CASH PROVIDED (USED) BY OPERATING ACTIVITIES 29,990 (32,456) 27,409 438,838 215,220 679,001
CASH FLOWS FROM NONCAPITAL FINANCING ACTIVITIES Transfers In from Other Funds 111,000 3,453,625 - - - 3,564,625 Transfers Out to Other Funds (3,176,207) - - (97,632) (3,615) (3,277,454) Advance Received for Pooled Cash and Investments Overdraft 1,391,259 - - - - 1,391,259 Repayment of Advance Received for Pooled Cash and Investments Overdrafts - - (5,006) - - (5,006) Repayment of Advance Received From Other Funds (3,800,000) - - - - (3,800,000)
NET CASH PROVIDED (USED) BY NONCAPITAL FINANCING ACTIVITIES (5,473,948) 3,453,625 (5,006) (97,632) (3,615) (2,126,576)
CASH FLOWS FROM CAPITAL AND RELATED FINANCING ACTIVITIES Proceeds from Issuance of Revenue Bonds 7,534,395 - - - - 7,534,395 Proceeds from Issuance of Capital Lease 820,000 - - - - 820,000 Proceeds from Sale of Capital Assets Equipment 911 - - - - 911 Principal Paid on Debt Maturities Revenue Bonds - (3,240,000) - - - (3,240,000) Capital Lease (198,303) - - - - (198,303) Payments for Acquisition and Construction of Capital Assets Land (355,040) - - - - (355,040) Buildings and Structures (408,272) - (7,075) - - (415,347) Equipment (856,663) - - - (141,875) (998,538) Construction in Progress - - (15,328) - - (15,328) Interest Paid On Revenue Bonds - (181,905) - - - (181,905) Capital Lease (16,610) - - - - (16,610) Advance From Other Funds (296,151) - - - - (296,151) Payment of Bond Issuance Costs (113,677) - - - - (113,677)
NET CASH PROVIDED (USED) IN CAPITAL AND RELATED FINANCING ACTIVITIES 6,110,590 (3,421,905) (22,403) - (141,875) 2,524,407
CASH FLOWS FROM INVESTING ACTIVITIES Purchase of Investment Securities (666,750) - - - - (666,750) Interest and Dividends Received 26,390 1,486 - - - 27,876 Increase (Decrease) in Fair Value of Investments (26,272) 8,039 - - - (18,233)
NET CASH PROVIDED (USED) BY INVESTING ACTIVITIES (666,632) 9,525 - - - (657,107)
NET INCREASE (DECREASE) IN CASH AND CASH EQUIVALENTS - 8,789 - 341,206 69,730 419,725
CASH AND CASH EQUIVALENTS AT BEGINNING OF YEAR 5,500 85,550 - 636,535 699,141 1,426,726
CASH AND CASH EQUIVALENTS AT END OF YEAR 5,500 94,339 - 977,741 768,871 1,846,451
continued
193
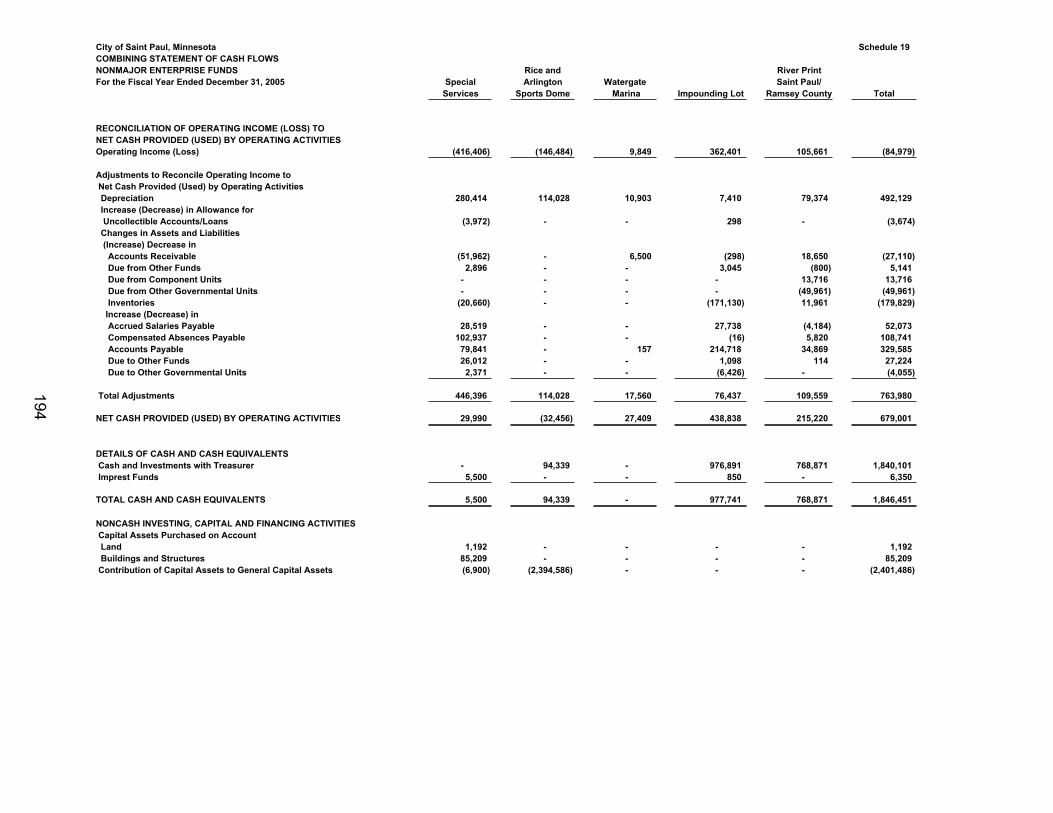
City of Saint Paul, Minnesota Schedule 19COMBINING STATEMENT OF CASH FLOWS NONMAJOR ENTERPRISE FUNDS Rice and River PrintFor the Fiscal Year Ended December 31, 2005 Special Arlington Watergate Saint Paul/
Services Sports Dome Marina Impounding Lot Ramsey County Total
RECONCILIATION OF OPERATING INCOME (LOSS) TO NET CASH PROVIDED (USED) BY OPERATING ACTIVITIESOperating Income (Loss) (416,406) (146,484) 9,849 362,401 105,661 (84,979)
Adjustments to Reconcile Operating Income to Net Cash Provided (Used) by Operating Activities Depreciation 280,414 114,028 10,903 7,410 79,374 492,129 Increase (Decrease) in Allowance for Uncollectible Accounts/Loans (3,972) - - 298 - (3,674) Changes in Assets and Liabilities (Increase) Decrease in Accounts Receivable (51,962) - 6,500 (298) 18,650 (27,110) Due from Other Funds 2,896 - - 3,045 (800) 5,141 Due from Component Units - - - - 13,716 13,716 Due from Other Governmental Units - - - - (49,961) (49,961) Inventories (20,660) - - (171,130) 11,961 (179,829) Increase (Decrease) in Accrued Salaries Payable 28,519 - - 27,738 (4,184) 52,073 Compensated Absences Payable 102,937 - - (16) 5,820 108,741 Accounts Payable 79,841 - 157 214,718 34,869 329,585 Due to Other Funds 26,012 - - 1,098 114 27,224 Due to Other Governmental Units 2,371 - - (6,426) - (4,055)
Total Adjustments 446,396 114,028 17,560 76,437 109,559 763,980
NET CASH PROVIDED (USED) BY OPERATING ACTIVITIES 29,990 (32,456) 27,409 438,838 215,220 679,001
DETAILS OF CASH AND CASH EQUIVALENTS Cash and Investments with Treasurer - 94,339 - 976,891 768,871 1,840,101 Imprest Funds 5,500 - - 850 - 6,350
TOTAL CASH AND CASH EQUIVALENTS 5,500 94,339 - 977,741 768,871 1,846,451
NONCASH INVESTING, CAPITAL AND FINANCING ACTIVITIES Capital Assets Purchased on Account Land 1,192 - - - - 1,192 Buildings and Structures 85,209 - - - - 85,209 Contribution of Capital Assets to General Capital Assets (6,900) (2,394,586) - - - (2,401,486)
194
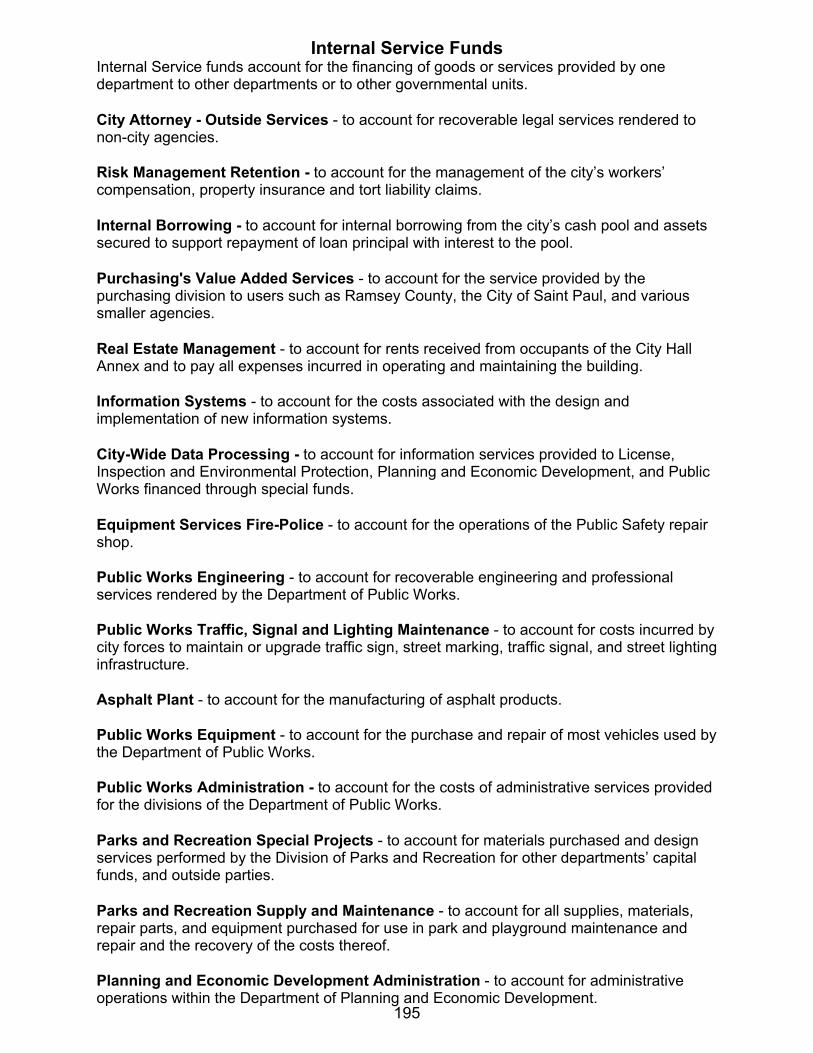
Internal Service FundsInternal Service funds account for the financing of goods or services provided by one department to other departments or to other governmental units.
City Attorney - Outside Services - to account for recoverable legal services rendered to non-city agencies.
Risk Management Retention - to account for the management of the city’s workers’ compensation, property insurance and tort liability claims.
Internal Borrowing - to account for internal borrowing from the city’s cash pool and assets secured to support repayment of loan principal with interest to the pool.
Purchasing's Value Added Services - to account for the service provided by the purchasing division to users such as Ramsey County, the City of Saint Paul, and various smaller agencies.
Real Estate Management - to account for rents received from occupants of the City Hall Annex and to pay all expenses incurred in operating and maintaining the building.
Information Systems - to account for the costs associated with the design and implementation of new information systems.
City-Wide Data Processing - to account for information services provided to License, Inspection and Environmental Protection, Planning and Economic Development, and Public Works financed through special funds.
Equipment Services Fire-Police - to account for the operations of the Public Safety repair shop.
Public Works Engineering - to account for recoverable engineering and professional services rendered by the Department of Public Works.
Public Works Traffic, Signal and Lighting Maintenance - to account for costs incurred by city forces to maintain or upgrade traffic sign, street marking, traffic signal, and street lighting infrastructure.
Asphalt Plant - to account for the manufacturing of asphalt products.
Public Works Equipment - to account for the purchase and repair of most vehicles used by the Department of Public Works.
Public Works Administration - to account for the costs of administrative services provided for the divisions of the Department of Public Works.
Parks and Recreation Special Projects - to account for materials purchased and design services performed by the Division of Parks and Recreation for other departments’ capital funds, and outside parties.
Parks and Recreation Supply and Maintenance - to account for all supplies, materials, repair parts, and equipment purchased for use in park and playground maintenance and repair and the recovery of the costs thereof.
Planning and Economic Development Administration - to account for administrative operations within the Department of Planning and Economic Development.
195
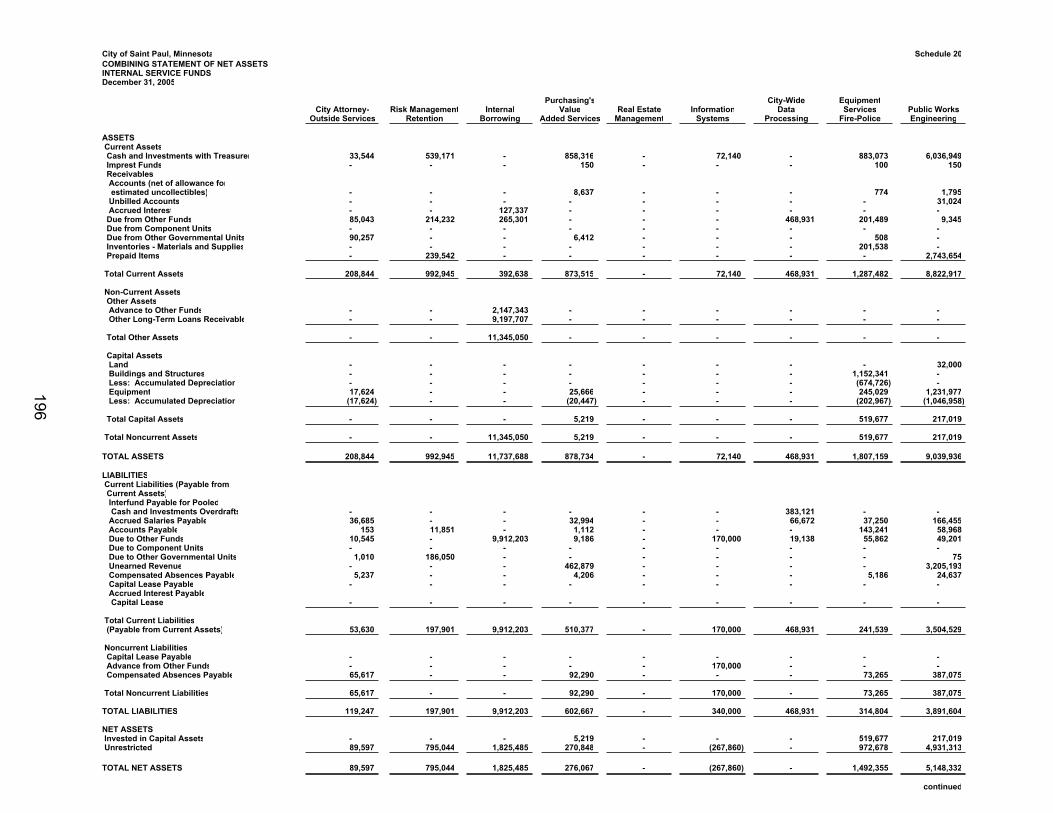
City of Saint Paul, Minnesota Schedule 20COMBINING STATEMENT OF NET ASSETSINTERNAL SERVICE FUNDSDecember 31, 2005
Purchasing's City-Wide EquipmentCity Attorney- Risk Management Internal Value Real Estate Information Data Services Public Works
Outside Services Retention Borrowing Added Services Management Systems Processing Fire-Police Engineering
ASSETS Current Assets Cash and Investments with Treasurer 33,544 539,171 - 858,316 - 72,140 - 883,073 6,036,949 Imprest Funds - - - 150 - - - 100 150 Receivables Accounts (net of allowance for estimated uncollectibles) - - - 8,637 - - - 774 1,795 Unbilled Accounts - - - - - - - - 31,024 Accrued Interest - - 127,337 - - - - - - Due from Other Funds 85,043 214,232 265,301 - - - 468,931 201,489 9,345 Due from Component Units - - - - - - - - - Due from Other Governmental Units 90,257 - - 6,412 - - - 508 - Inventories - Materials and Supplies - - - - - - - 201,538 - Prepaid Items - 239,542 - - - - - - 2,743,654
Total Current Assets 208,844 992,945 392,638 873,515 - 72,140 468,931 1,287,482 8,822,917
Non-Current Assets Other Assets Advance to Other Funds - - 2,147,343 - - - - - - Other Long-Term Loans Receivable - - 9,197,707 - - - - - -
Total Other Assets - - 11,345,050 - - - - - -
Capital Assets Land - - - - - - - - 32,000 Buildings and Structures - - - - - - - 1,152,341 - Less: Accumulated Depreciation - - - - - - - (674,726) - Equipment 17,624 - - 25,666 - - - 245,029 1,231,977 Less: Accumulated Depreciation (17,624) - - (20,447) - - - (202,967) (1,046,958)
Total Capital Assets - - - 5,219 - - - 519,677 217,019
Total Noncurrent Assets - - 11,345,050 5,219 - - - 519,677 217,019
TOTAL ASSETS 208,844 992,945 11,737,688 878,734 - 72,140 468,931 1,807,159 9,039,936
LIABILITIES Current Liabilities (Payable from Current Assets) Interfund Payable for Pooled Cash and Investments Overdrafts - - - - - - 383,121 - - Accrued Salaries Payable 36,685 - - 32,994 - - 66,672 37,250 166,455 Accounts Payable 153 11,851 - 1,112 - - - 143,241 58,968 Due to Other Funds 10,545 - 9,912,203 9,186 - 170,000 19,138 55,862 49,201 Due to Component Units - - - - - - - - - Due to Other Governmental Units 1,010 186,050 - - - - - - 75 Unearned Revenue - - - 462,879 - - - - 3,205,193 Compensated Absences Payable 5,237 - - 4,206 - - - 5,186 24,637 Capital Lease Payable - - - - - - - - - Accrued Interest Payable Capital Lease - - - - - - - - -
Total Current Liabilities (Payable from Current Assets) 53,630 197,901 9,912,203 510,377 - 170,000 468,931 241,539 3,504,529
Noncurrent Liabilities Capital Lease Payable - - - - - - - - - Advance from Other Funds - - - - - 170,000 - - - Compensated Absences Payable 65,617 - - 92,290 - - - 73,265 387,075
Total Noncurrent Liabilities 65,617 - - 92,290 - 170,000 - 73,265 387,075
TOTAL LIABILITIES 119,247 197,901 9,912,203 602,667 - 340,000 468,931 314,804 3,891,604
NET ASSETS Invested in Capital Assets - - - 5,219 - - - 519,677 217,019 Unrestricted 89,597 795,044 1,825,485 270,848 - (267,860) - 972,678 4,931,313
TOTAL NET ASSETS 89,597 795,044 1,825,485 276,067 - (267,860) - 1,492,355 5,148,332
continued
196
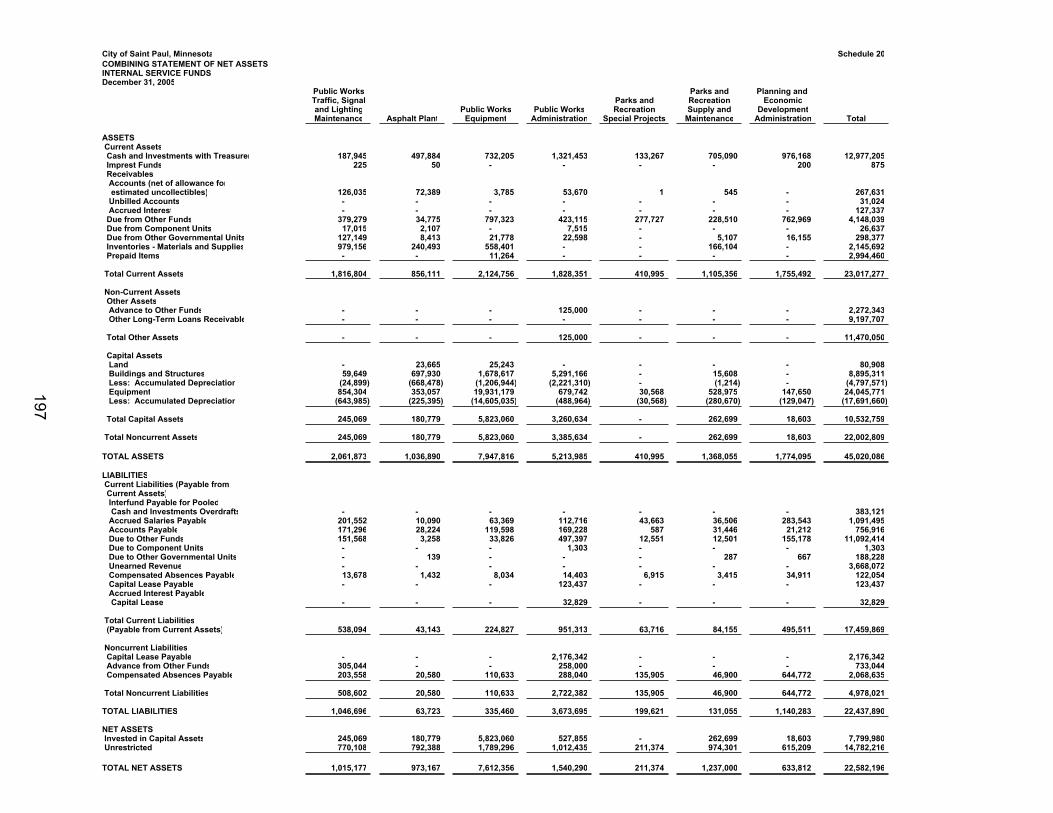
City of Saint Paul, MinnesotaCOMBINING STATEMENT OF NET ASSETSINTERNAL SERVICE FUNDSDecember 31, 2005
ASSETS Current Assets Cash and Investments with Treasurer Imprest Funds Receivables Accounts (net of allowance for estimated uncollectibles) Unbilled Accounts Accrued Interest Due from Other Funds Due from Component Units Due from Other Governmental Units Inventories - Materials and Supplies Prepaid Items
Total Current Assets
Non-Current Assets Other Assets Advance to Other Funds Other Long-Term Loans Receivable
Total Other Assets
Capital Assets Land Buildings and Structures Less: Accumulated Depreciation Equipment Less: Accumulated Depreciation
Total Capital Assets
Total Noncurrent Assets
TOTAL ASSETS
LIABILITIES Current Liabilities (Payable from Current Assets) Interfund Payable for Pooled Cash and Investments Overdrafts Accrued Salaries Payable Accounts Payable Due to Other Funds Due to Component Units Due to Other Governmental Units Unearned Revenue Compensated Absences Payable Capital Lease Payable Accrued Interest Payable Capital Lease
Total Current Liabilities (Payable from Current Assets)
Noncurrent Liabilities Capital Lease Payable Advance from Other Funds Compensated Absences Payable
Total Noncurrent Liabilities
TOTAL LIABILITIES
NET ASSETS Invested in Capital Assets Unrestricted
TOTAL NET ASSETS
Schedule 20
Public Works Parks and Planning and Traffic, Signal Parks and Recreation Economicand Lighting Public Works Public Works Recreation Supply and DevelopmentMaintenance Asphalt Plant Equipment Administration Special Projects Maintenance Administration Total
187,945 497,884 732,205 1,321,453 133,267 705,090 976,168 12,977,205225 50 - - - - 200 875
126,035 72,389 3,785 53,670 1 545 - 267,631- - - - - - - 31,024- - - - - - - 127,337
379,279 34,775 797,323 423,115 277,727 228,510 762,969 4,148,03917,015 2,107 - 7,515 - - - 26,637
127,149 8,413 21,778 22,598 - 5,107 16,155 298,377979,156 240,493 558,401 - - 166,104 - 2,145,692- - 11,264 - - - - 2,994,460
1,816,804 856,111 2,124,756 1,828,351 410,995 1,105,356 1,755,492 23,017,277
- - - 125,000 - - - 2,272,343- - - - - - - 9,197,707
- - - 125,000 - - - 11,470,050
- 23,665 25,243 - - - - 80,90859,649 697,930 1,678,617 5,291,166 - 15,608 - 8,895,311
(24,899) (668,478) (1,206,944) (2,221,310) - (1,214) - (4,797,571)854,304 353,057 19,931,179 679,742 30,568 528,975 147,650 24,045,771
(643,985) (225,395) (14,605,035) (488,964) (30,568) (280,670) (129,047) (17,691,660)
245,069 180,779 5,823,060 3,260,634 - 262,699 18,603 10,532,759
245,069 180,779 5,823,060 3,385,634 - 262,699 18,603 22,002,809
2,061,873 1,036,890 7,947,816 5,213,985 410,995 1,368,055 1,774,095 45,020,086
- - - - - - - 383,121201,552 10,090 63,369 112,716 43,663 36,506 283,543 1,091,495171,296 28,224 119,598 169,228 587 31,446 21,212 756,916151,568 3,258 33,826 497,397 12,551 12,501 155,178 11,092,414- - - 1,303 - - - 1,303- 139 - - - 287 667 188,228- - - - - - - 3,668,07213,678 1,432 8,034 14,403 6,915 3,415 34,911 122,054- - - 123,437 - - - 123,437
- - - 32,829 - - - 32,829
538,094 43,143 224,827 951,313 63,716 84,155 495,511 17,459,869
- - - 2,176,342 - - - 2,176,342305,044 - - 258,000 - - - 733,044203,558 20,580 110,633 288,040 135,905 46,900 644,772 2,068,635
508,602 20,580 110,633 2,722,382 135,905 46,900 644,772 4,978,021
1,046,696 63,723 335,460 3,673,695 199,621 131,055 1,140,283 22,437,890
245,069 180,779 5,823,060 527,855 - 262,699 18,603 7,799,980770,108 792,388 1,789,296 1,012,435 211,374 974,301 615,209 14,782,216
1,015,177 973,167 7,612,356 1,540,290 211,374 1,237,000 633,812 22,582,196
197
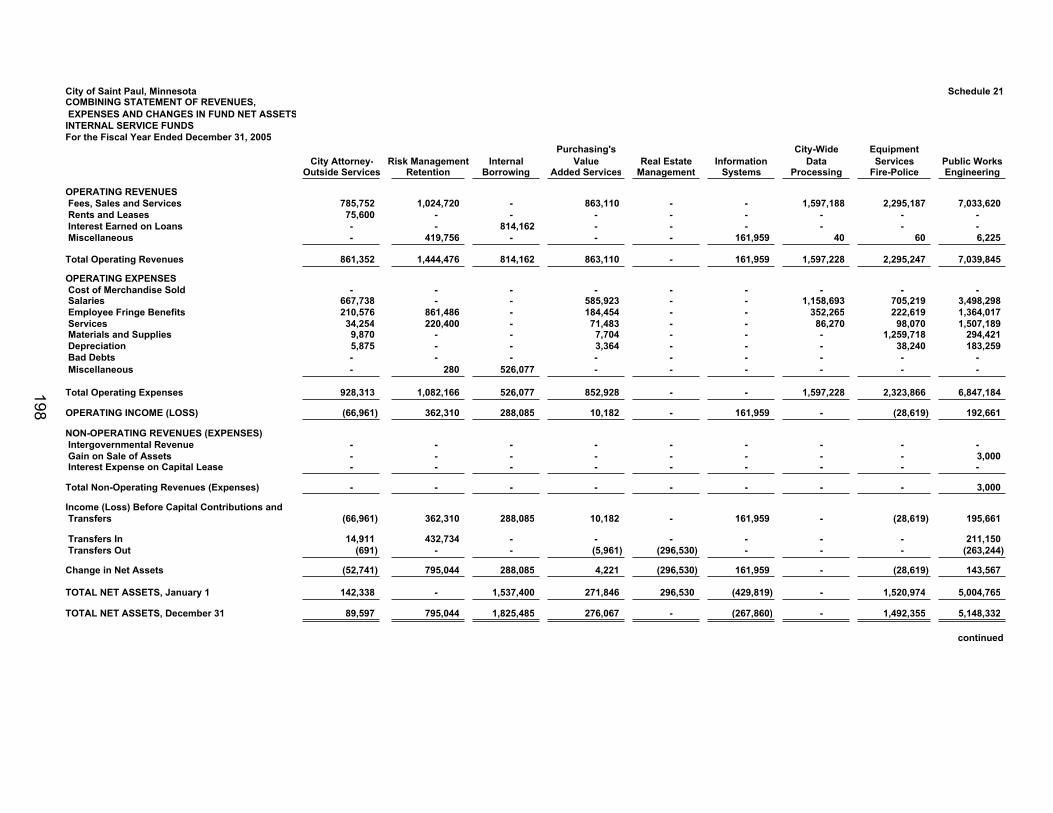
City of Saint Paul, Minnesota Schedule 21COMBINING STATEMENT OF REVENUES, EXPENSES AND CHANGES IN FUND NET ASSETSINTERNAL SERVICE FUNDSFor the Fiscal Year Ended December 31, 2005
Purchasing's City-Wide EquipmentCity Attorney- Risk Management Internal Value Real Estate Information Data Services Public Works
Outside Services Retention Borrowing Added Services Management Systems Processing Fire-Police Engineering
OPERATING REVENUES Fees, Sales and Services 785,752 1,024,720 - 863,110 - - 1,597,188 2,295,187 7,033,620 Rents and Leases 75,600 - - - - - - - - Interest Earned on Loans - - 814,162 - - - - - - Miscellaneous - 419,756 - - - 161,959 40 60 6,225
Total Operating Revenues 861,352 1,444,476 814,162 863,110 - 161,959 1,597,228 2,295,247 7,039,845
OPERATING EXPENSES Cost of Merchandise Sold - - - - - - - - - Salaries 667,738 - - 585,923 - - 1,158,693 705,219 3,498,298 Employee Fringe Benefits 210,576 861,486 - 184,454 - - 352,265 222,619 1,364,017 Services 34,254 220,400 - 71,483 - - 86,270 98,070 1,507,189 Materials and Supplies 9,870 - - 7,704 - - - 1,259,718 294,421 Depreciation 5,875 - - 3,364 - - - 38,240 183,259 Bad Debts - - - - - - - - - Miscellaneous - 280 526,077 - - - - - -
Total Operating Expenses 928,313 1,082,166 526,077 852,928 - - 1,597,228 2,323,866 6,847,184
OPERATING INCOME (LOSS) (66,961) 362,310 288,085 10,182 - 161,959 - (28,619) 192,661
NON-OPERATING REVENUES (EXPENSES) Intergovernmental Revenue - - - - - - - - - Gain on Sale of Assets - - - - - - - - 3,000 Interest Expense on Capital Lease - - - - - - - - -
Total Non-Operating Revenues (Expenses) - - - - - - - - 3,000
Income (Loss) Before Capital Contributions and Transfers (66,961) 362,310 288,085 10,182 - 161,959 - (28,619) 195,661
Transfers In 14,911 432,734 - - - - - - 211,150 Transfers Out (691) - - (5,961) (296,530) - - - (263,244)
Change in Net Assets (52,741) 795,044 288,085 4,221 (296,530) 161,959 - (28,619) 143,567
TOTAL NET ASSETS, January 1 142,338 - 1,537,400 271,846 296,530 (429,819) - 1,520,974 5,004,765
TOTAL NET ASSETS, December 31 89,597 795,044 1,825,485 276,067 - (267,860) - 1,492,355 5,148,332
continued
198
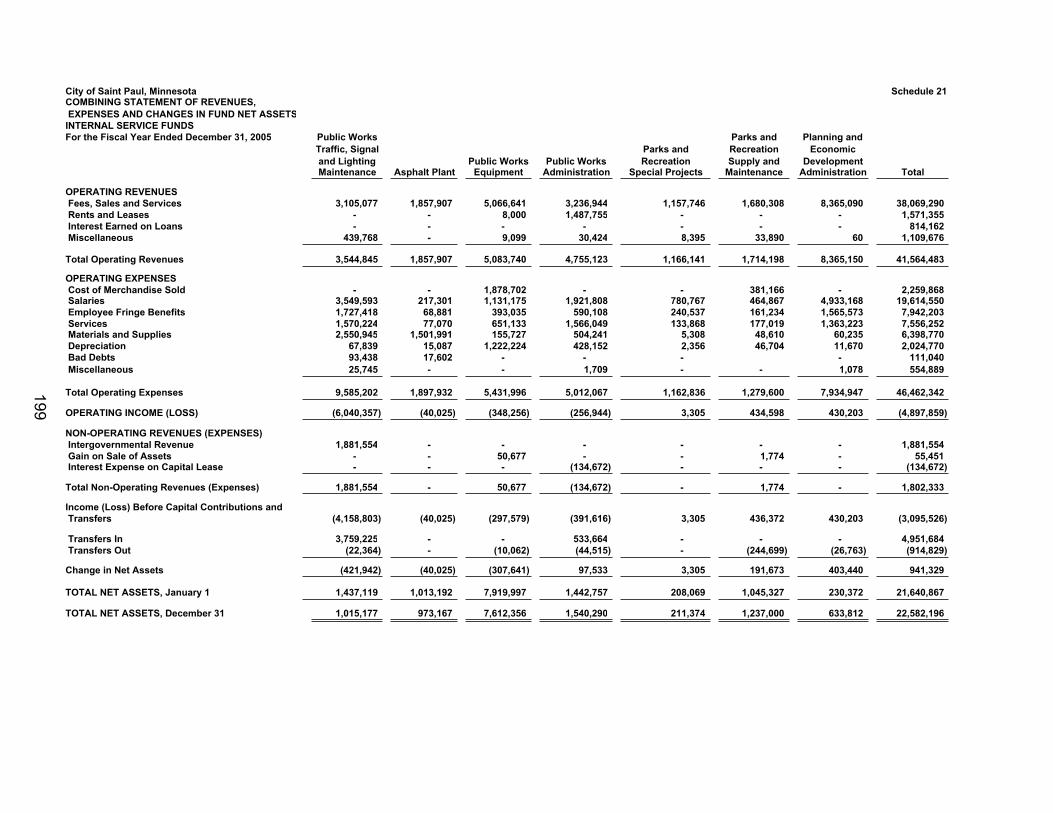
City of Saint Paul, MinnesotaCOMBINING STATEMENT OF REVENUES, EXPENSES AND CHANGES IN FUND NET ASSETSINTERNAL SERVICE FUNDSFor the Fiscal Year Ended December 31, 2005
O
OPERATING REVENUES Fees, Sales and Services Rents and Leases Interest Earned on Loans Miscellaneous
Total Operating Revenues
OPERATING EXPENSES Cost of Merchandise Sold Salaries Employee Fringe Benefits Services Materials and Supplies Depreciation Bad Debts Miscellaneous
Total Operating Expenses
OPERATING INCOME (LOSS)
NON-OPERATING REVENUES (EXPENSES) Intergovernmental Revenue Gain on Sale of Assets Interest Expense on Capital Lease
Total Non-Operating Revenues (Expenses)
Income (Loss) Before Capital Contributions and Transfers
Transfers In Transfers Out
Change in Net Assets
TOTAL NET ASSETS, January 1
TOTAL NET ASSETS, December 31
Schedule 21
Public Works Parks and Planning andTraffic, Signal Parks and Recreation Economicand Lighting Public Works Public Works Recreation Supply and DevelopmentMaintenance Asphalt Plant Equipment Administration Special Projects Maintenance Administration Total
3,105,077 1,857,907 5,066,641 3,236,944 1,157,746 1,680,308 8,365,090 38,069,290- - 8,000 1,487,755 - - - 1,571,355- - - - - - - 814,162
439,768 - 9,099 30,424 8,395 33,890 60 1,109,676
3,544,845 1,857,907 5,083,740 4,755,123 1,166,141 1,714,198 8,365,150 41,564,483
- - 1,878,702 - - 381,166 - 2,259,8683,549,593 217,301 1,131,175 1,921,808 780,767 464,867 4,933,168 19,614,5501,727,418 68,881 393,035 590,108 240,537 161,234 1,565,573 7,942,2031,570,224 77,070 651,133 1,566,049 133,868 177,019 1,363,223 7,556,2522,550,945 1,501,991 155,727 504,241 5,308 48,610 60,235 6,398,770
67,839 15,087 1,222,224 428,152 2,356 46,704 11,670 2,024,77093,438 17,602 - - - - 111,04025,745 - - 1,709 - - 1,078 554,889
9,585,202 1,897,932 5,431,996 5,012,067 1,162,836 1,279,600 7,934,947 46,462,342
(6,040,357) (40,025) (348,256) (256,944) 3,305 434,598 430,203 (4,897,859)
1,881,554 - - - - - - 1,881,554- - 50,677 - - 1,774 - 55,451- - - (134,672) - - - (134,672)
1,881,554 - 50,677 (134,672) - 1,774 - 1,802,333
(4,158,803) (40,025) (297,579) (391,616) 3,305 436,372 430,203 (3,095,526)
3,759,225 - - 533,664 - - - 4,951,684(22,364) - (10,062) (44,515) - (244,699) (26,763) (914,829)
(421,942) (40,025) (307,641) 97,533 3,305 191,673 403,440 941,329
1,437,119 1,013,192 7,919,997 1,442,757 208,069 1,045,327 230,372 21,640,867
1,015,177 973,167 7,612,356 1,540,290 211,374 1,237,000 633,812 22,582,196
199
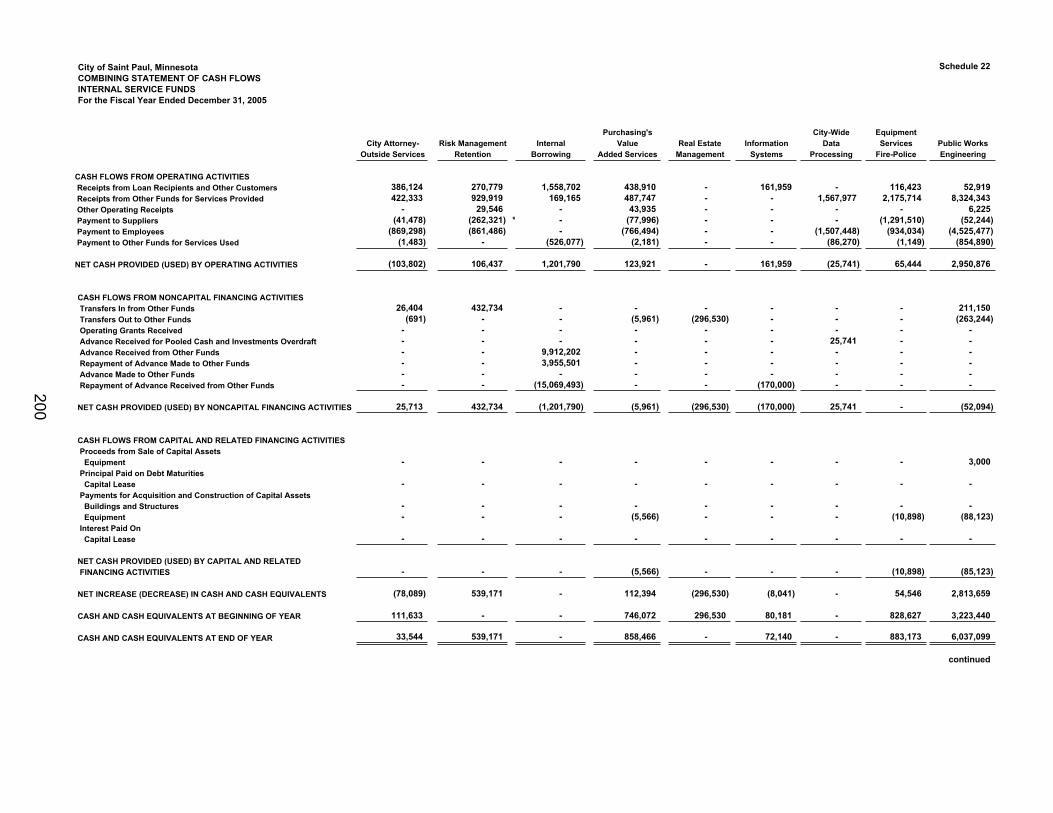
City of Saint Paul, Minnesota Schedule 22COMBINING STATEMENT OF CASH FLOWS INTERNAL SERVICE FUNDSFor the Fiscal Year Ended December 31, 2005
Purchasing's City-Wide EquipmentCity Attorney- Risk Management Internal Value Real Estate Information Data Services Public Works
Outside Services Retention Borrowing Added Services Management Systems Processing Fire-Police Engineering
CASH FLOWS FROM OPERATING ACTIVITIES Receipts from Loan Recipients and Other Customers 386,124 270,779 1,558,702 438,910 - 161,959 - 116,423 52,919 Receipts from Other Funds for Services Provided 422,333 929,919 169,165 487,747 - - 1,567,977 2,175,714 8,324,343 Other Operating Receipts - 29,546 - 43,935 - - - - 6,225 Payment to Suppliers (41,478) (262,321) * - (77,996) - - - (1,291,510) (52,244) Payment to Employees (869,298) (861,486) - (766,494) - - (1,507,448) (934,034) (4,525,477) Payment to Other Funds for Services Used (1,483) - (526,077) (2,181) - - (86,270) (1,149) (854,890)
NET CASH PROVIDED (USED) BY OPERATING ACTIVITIES (103,802) 106,437 1,201,790 123,921 - 161,959 (25,741) 65,444 2,950,876
CASH FLOWS FROM NONCAPITAL FINANCING ACTIVITIES Transfers In from Other Funds 26,404 432,734 - - - - - - 211,150 Transfers Out to Other Funds (691) - - (5,961) (296,530) - - - (263,244) Operating Grants Received - - - - - - - - - Advance Received for Pooled Cash and Investments Overdraft - - - - - - 25,741 - - Advance Received from Other Funds - - 9,912,202 - - - - - - Repayment of Advance Made to Other Funds - - 3,955,501 - - - - - - Advance Made to Other Funds - - - - - - - - - Repayment of Advance Received from Other Funds - - (15,069,493) - - (170,000) - - -
NET CASH PROVIDED (USED) BY NONCAPITAL FINANCING ACTIVITIES 25,713 432,734 (1,201,790) (5,961) (296,530) (170,000) 25,741 - (52,094)
CASH FLOWS FROM CAPITAL AND RELATED FINANCING ACTIVITIES Proceeds from Sale of Capital Assets Equipment - - - - - - - - 3,000 Principal Paid on Debt Maturities Capital Lease - - - - - - - - - Payments for Acquisition and Construction of Capital Assets Buildings and Structures - - - - - - - - - Equipment - - - (5,566) - - - (10,898) (88,123) Interest Paid On Capital Lease - - - - - - - - -
NET CASH PROVIDED (USED) BY CAPITAL AND RELATED FINANCING ACTIVITIES - - - (5,566) - - - (10,898) (85,123)
NET INCREASE (DECREASE) IN CASH AND CASH EQUIVALENTS (78,089) 539,171 - 112,394 (296,530) (8,041) - 54,546 2,813,659
CASH AND CASH EQUIVALENTS AT BEGINNING OF YEAR 111,633 - - 746,072 296,530 80,181 - 828,627 3,223,440
CASH AND CASH EQUIVALENTS AT END OF YEAR 33,544 539,171 - 858,466 - 72,140 - 883,173 6,037,099
continued
200
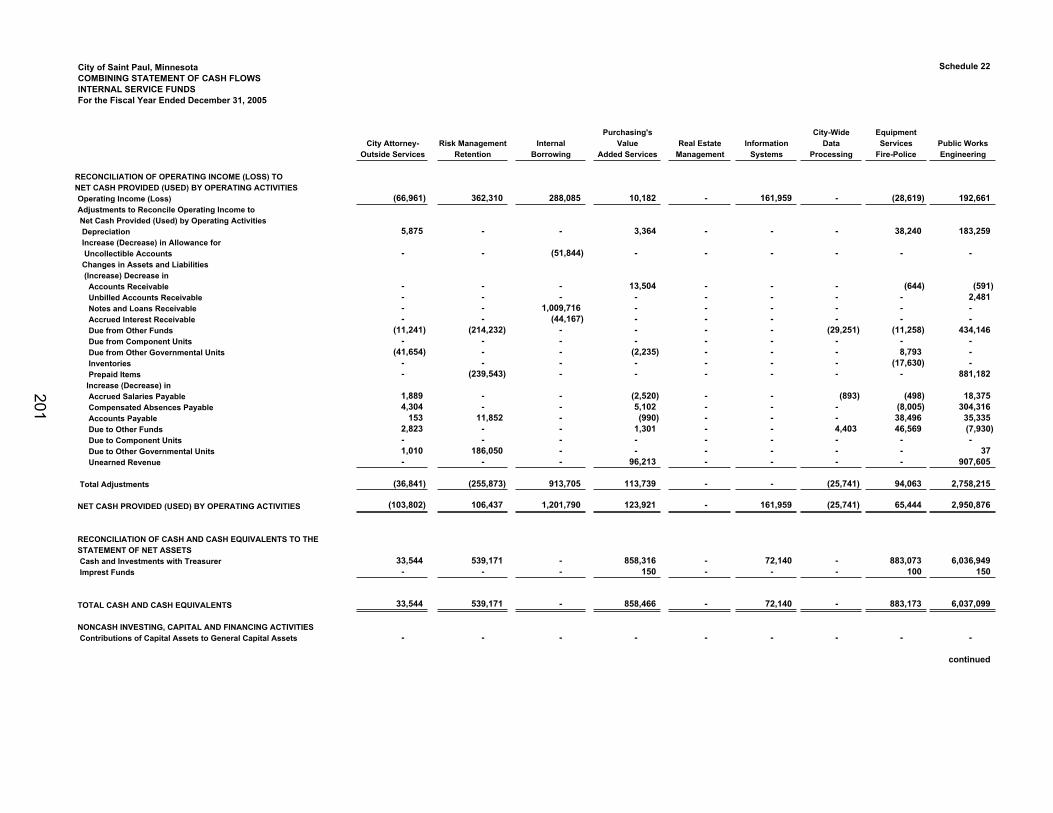
City of Saint Paul, Minnesota Schedule 22COMBINING STATEMENT OF CASH FLOWS INTERNAL SERVICE FUNDSFor the Fiscal Year Ended December 31, 2005
Purchasing's City-Wide EquipmentCity Attorney- Risk Management Internal Value Real Estate Information Data Services Public Works
Outside Services Retention Borrowing Added Services Management Systems Processing Fire-Police Engineering
RECONCILIATION OF OPERATING INCOME (LOSS) TO NET CASH PROVIDED (USED) BY OPERATING ACTIVITIES Operating Income (Loss) (66,961) 362,310 288,085 10,182 - 161,959 - (28,619) 192,661Adjustments to Reconcile Operating Income to Net Cash Provided (Used) by Operating Activities Depreciation 5,875 - - 3,364 - - - 38,240 183,259 Increase (Decrease) in Allowance for Uncollectible Accounts - - (51,844) - - - - - - Changes in Assets and Liabilities (Increase) Decrease in Accounts Receivable - - - 13,504 - - - (644) (591) Unbilled Accounts Receivable - - - - - - - - 2,481 Notes and Loans Receivable - - 1,009,716 - - - - - - Accrued Interest Receivable - - (44,167) - - - - - - Due from Other Funds (11,241) (214,232) - - - - (29,251) (11,258) 434,146 Due from Component Units - - - - - - - - - Due from Other Governmental Units (41,654) - - (2,235) - - - 8,793 - Inventories - - - - - - - (17,630) - Prepaid Items - (239,543) - - - - - - 881,182 Increase (Decrease) in Accrued Salaries Payable 1,889 - - (2,520) - - (893) (498) 18,375 Compensated Absences Payable 4,304 - - 5,102 - - - (8,005) 304,316 Accounts Payable 153 11,852 - (990) - - - 38,496 35,335 Due to Other Funds 2,823 - - 1,301 - - 4,403 46,569 (7,930) Due to Component Units - - - - - - - - - Due to Other Governmental Units 1,010 186,050 - - - - - - 37 Unearned Revenue - - - 96,213 - - - - 907,605
Total Adjustments (36,841) (255,873) 913,705 113,739 - - (25,741) 94,063 2,758,215
NET CASH PROVIDED (USED) BY OPERATING ACTIVITIES (103,802) 106,437 1,201,790 123,921 - 161,959 (25,741) 65,444 2,950,876
RECONCILIATION OF CASH AND CASH EQUIVALENTS TO THESTATEMENT OF NET ASSETS Cash and Investments with Treasurer 33,544 539,171 - 858,316 - 72,140 - 883,073 6,036,949 Imprest Funds - - - 150 - - - 100 150
TOTAL CASH AND CASH EQUIVALENTS 33,544 539,171 - 858,466 - 72,140 - 883,173 6,037,099
NONCASH INVESTING, CAPITAL AND FINANCING ACTIVITIES Contributions of Capital Assets to General Capital Assets - - - - - - - - -
continued
201
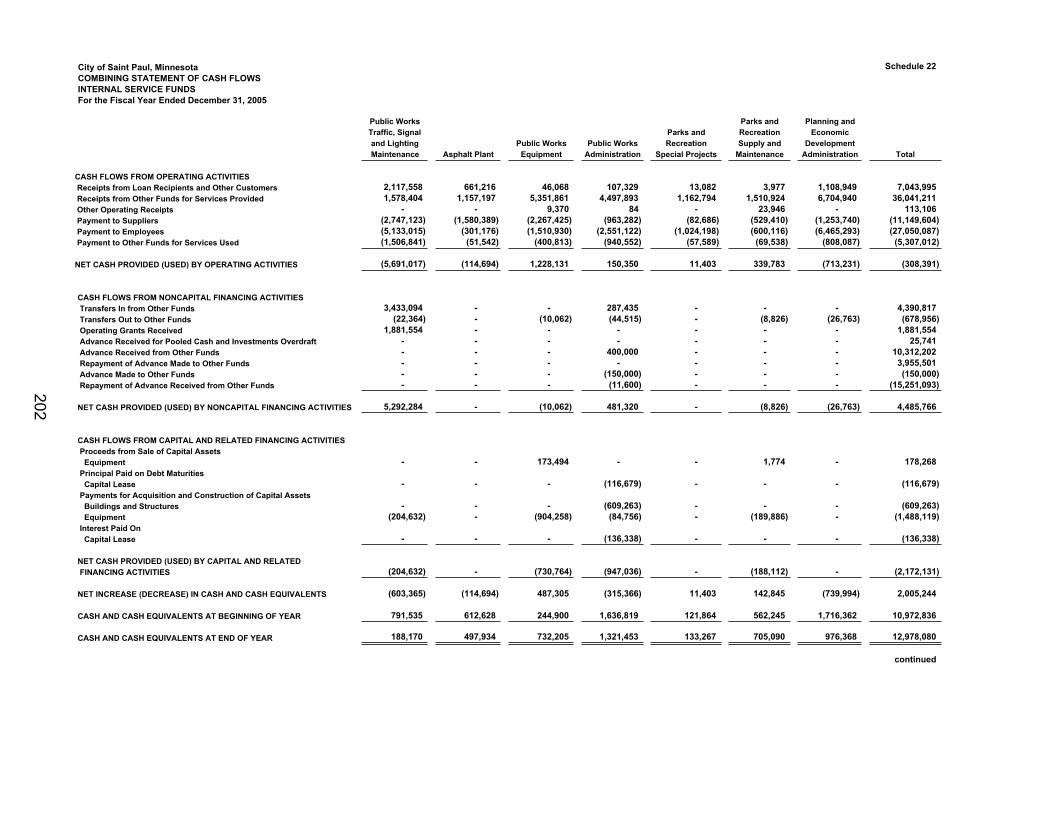
City of Saint Paul, MinnesotaCOMBINING STATEMENT OF CASH FLOWS INTERNAL SERVICE FUNDSFor the Fiscal Year Ended December 31, 2005
CASH FLOWS FROM OPERATING ACTIVITIES Receipts from Loan Recipients and Other Customers Receipts from Other Funds for Services Provided Other Operating Receipts Payment to Suppliers Payment to Employees Payment to Other Funds for Services Used
NET CASH PROVIDED (USED) BY OPERATING ACTIVITIES
CASH FLOWS FROM NONCAPITAL FINANCING ACTIVITIES Transfers In from Other Funds Transfers Out to Other Funds Operating Grants Received Advance Received for Pooled Cash and Investments Overdraft Advance Received from Other Funds Repayment of Advance Made to Other Funds Advance Made to Other Funds Repayment of Advance Received from Other Funds
NET CASH PROVIDED (USED) BY NONCAPITAL FINANCING ACTIVITIES
CASH FLOWS FROM CAPITAL AND RELATED FINANCING ACTIVITIES Proceeds from Sale of Capital Assets Equipment Principal Paid on Debt Maturities Capital Lease Payments for Acquisition and Construction of Capital Assets Buildings and Structures Equipment Interest Paid On Capital Lease
NET CASH PROVIDED (USED) BY CAPITAL AND RELATED FINANCING ACTIVITIES
NET INCREASE (DECREASE) IN CASH AND CASH EQUIVALENTS
CASH AND CASH EQUIVALENTS AT BEGINNING OF YEAR
CASH AND CASH EQUIVALENTS AT END OF YEAR
Schedule 22
Public Works Parks and Planning andTraffic, Signal Parks and Recreation Economicand Lighting Public Works Public Works Recreation Supply and DevelopmentMaintenance Asphalt Plant Equipment Administration Special Projects Maintenance Administration Total
2,117,558 661,216 46,068 107,329 13,082 3,977 1,108,949 7,043,9951,578,404 1,157,197 5,351,861 4,497,893 1,162,794 1,510,924 6,704,940 36,041,211
- - 9,370 84 - 23,946 - 113,106(2,747,123) (1,580,389) (2,267,425) (963,282) (82,686) (529,410) (1,253,740) (11,149,604)(5,133,015) (301,176) (1,510,930) (2,551,122) (1,024,198) (600,116) (6,465,293) (27,050,087)(1,506,841) (51,542) (400,813) (940,552) (57,589) (69,538) (808,087) (5,307,012)
(5,691,017) (114,694) 1,228,131 150,350 11,403 339,783 (713,231) (308,391)
3,433,094 - - 287,435 - - - 4,390,817(22,364) - (10,062) (44,515) - (8,826) (26,763) (678,956)
1,881,554 - - - - - - 1,881,554- - - - - - - 25,741- - - 400,000 - - - 10,312,202- - - - - - - 3,955,501- - - (150,000) - - - (150,000)- - - (11,600) - - - (15,251,093)
5,292,284 - (10,062) 481,320 - (8,826) (26,763) 4,485,766
- - 173,494 - - 1,774 - 178,268
- - - (116,679) - - - (116,679)
- - - (609,263) - - - (609,263)(204,632) - (904,258) (84,756) - (189,886) - (1,488,119)
- - - (136,338) - - - (136,338)
(204,632) - (730,764) (947,036) - (188,112) - (2,172,131)
(603,365) (114,694) 487,305 (315,366) 11,403 142,845 (739,994) 2,005,244
791,535 612,628 244,900 1,636,819 121,864 562,245 1,716,362 10,972,836
188,170 497,934 732,205 1,321,453 133,267 705,090 976,368 12,978,080
continued
202
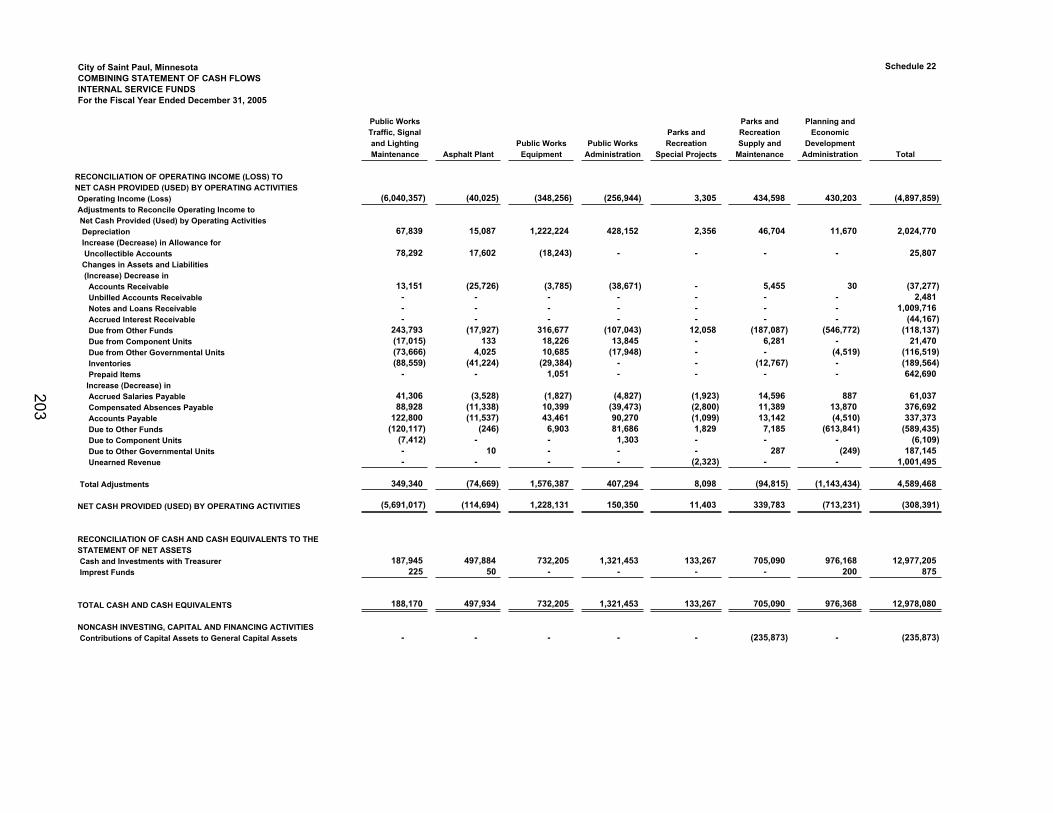
City of Saint Paul, MinnesotaCOMBINING STATEMENT OF CASH FLOWS INTERNAL SERVICE FUNDSFor the Fiscal Year Ended December 31, 2005
RECONCILIATION OF OPERATING INCOME (LOSS) TO NET CASH PROVIDED (USED) BY OPERATING ACTIVITIES Operating Income (Loss)Adjustments to Reconcile Operating Income to Net Cash Provided (Used) by Operating Activities Depreciation Increase (Decrease) in Allowance for Uncollectible Accounts Changes in Assets and Liabilities (Increase) Decrease in Accounts Receivable Unbilled Accounts Receivable Notes and Loans Receivable Accrued Interest Receivable Due from Other Funds Due from Component Units Due from Other Governmental Units Inventories Prepaid Items Increase (Decrease) in Accrued Salaries Payable Compensated Absences Payable Accounts Payable Due to Other Funds Due to Component Units Due to Other Governmental Units Unearned Revenue
Total Adjustments
NET CASH PROVIDED (USED) BY OPERATING ACTIVITIES
RECONCILIATION OF CASH AND CASH EQUIVALENTS TO THESTATEMENT OF NET ASSETS Cash and Investments with Treasurer Imprest Funds
TOTAL CASH AND CASH EQUIVALENTS
NONCASH INVESTING, CAPITAL AND FINANCING ACTIVITIES Contributions of Capital Assets to General Capital Assets
Schedule 22
Public Works Parks and Planning andTraffic, Signal Parks and Recreation Economicand Lighting Public Works Public Works Recreation Supply and DevelopmentMaintenance Asphalt Plant Equipment Administration Special Projects Maintenance Administration Total
(6,040,357) (40,025) (348,256) (256,944) 3,305 434,598 430,203 (4,897,859)
67,839 15,087 1,222,224 428,152 2,356 46,704 11,670 2,024,770
78,292 17,602 (18,243) - - - - 25,807
13,151 (25,726) (3,785) (38,671) - 5,455 30 (37,277)- - - - - - - 2,481- - - - - - - 1,009,716- - - - - - - (44,167)
243,793 (17,927) 316,677 (107,043) 12,058 (187,087) (546,772) (118,137)(17,015) 133 18,226 13,845 - 6,281 - 21,470(73,666) 4,025 10,685 (17,948) - - (4,519) (116,519)(88,559) (41,224) (29,384) - - (12,767) - (189,564)
- - 1,051 - - - - 642,690
41,306 (3,528) (1,827) (4,827) (1,923) 14,596 887 61,03788,928 (11,338) 10,399 (39,473) (2,800) 11,389 13,870 376,692
122,800 (11,537) 43,461 90,270 (1,099) 13,142 (4,510) 337,373(120,117) (246) 6,903 81,686 1,829 7,185 (613,841) (589,435)
(7,412) - - 1,303 - - - (6,109)- 10 - - - 287 (249) 187,145- - - - (2,323) - - 1,001,495
349,340 (74,669) 1,576,387 407,294 8,098 (94,815) (1,143,434) 4,589,468
(5,691,017) (114,694) 1,228,131 150,350 11,403 339,783 (713,231) (308,391)
187,945 497,884 732,205 1,321,453 133,267 705,090 976,168 12,977,205225 50 - - - - 200 875
188,170 497,934 732,205 1,321,453 133,267 705,090 976,368 12,978,080
- - - - - (235,873) - (235,873)
203

This page left blank intentionally
204
Fiduciary Funds
Agency FundsAgency funds account for assets held in a custodial capacity for others and/or other funds.
Employee Withholding - to account for monies withheld from employees’ salaries and remitted to governmental and outside agencies.
Miscellaneous - to account for proceeds from Comcast for distribution relating to the city’s Cable Access Program and to account for taxes levied and collected by Ramsey County and remitted to the Port Authority of the City of Saint Paul.
Unclaimed Property - to account for outstanding checks, which have been written off and are being held under the Minnesota Uniform Disposition of Unclaimed Property Act.
Suspense - to account for receipts and disbursements for which proper accounting cannot be made at time of transaction.
Minnesota Selective Excise Tax Collection - to account for receipts and disbursements of sales tax as required by the Tax Reform and Relief Act.
Building Permits - State Surcharge - to account for city collection of building permit surcharge.
Confiscated and Unclaimed Monies - to account for cash received by the Police Department that is lost, unclaimed, or contraband collected during the course of Police business.
Arbitrage Rebate - to account for the arbitrage rebate due to the Federal Government on the city’s bond issues.
205
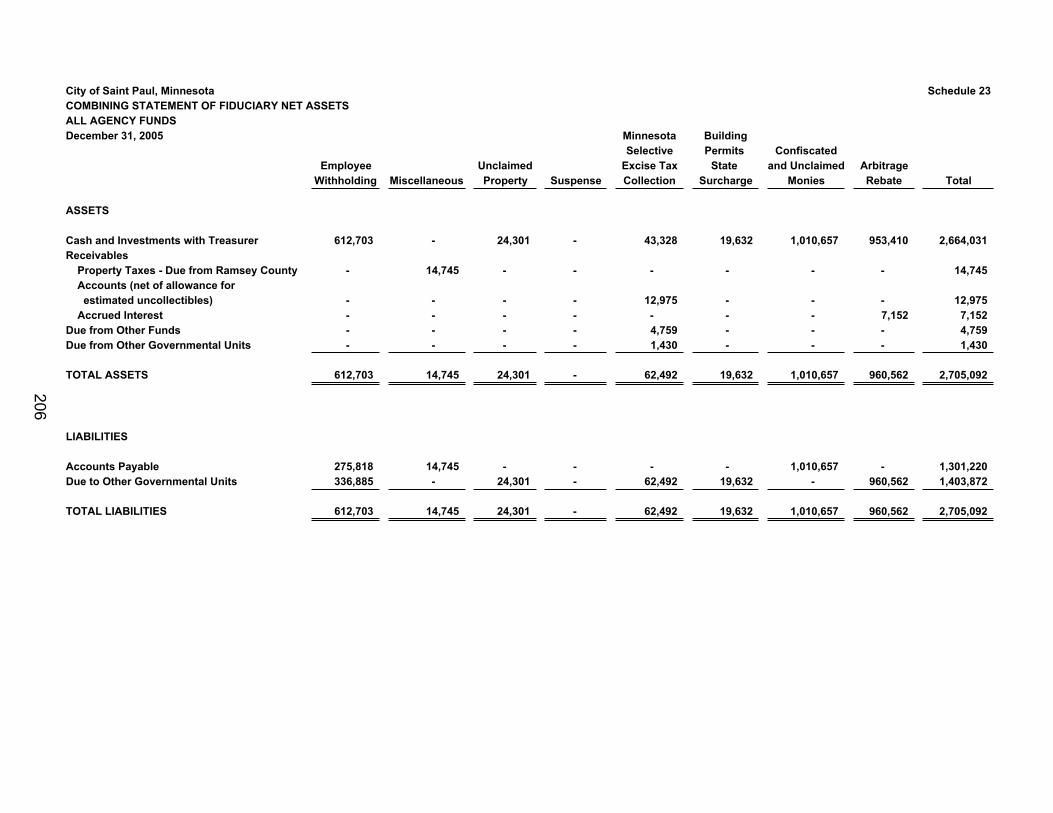
City of Saint Paul, Minnesota Schedule 23COMBINING STATEMENT OF FIDUCIARY NET ASSETSALL AGENCY FUNDSDecember 31, 2005 Minnesota Building
Selective Permits ConfiscatedEmployee Unclaimed Excise Tax State and Unclaimed Arbitrage
Withholding Miscellaneous Property Suspense Collection Surcharge Monies Rebate Total
ASSETS
Cash and Investments with Treasurer 612,703 - 24,301 - 43,328 19,632 1,010,657 953,410 2,664,031Receivables
Property Taxes - Due from Ramsey County - 14,745 - - - - - - 14,745 Accounts (net of allowance for estimated uncollectibles) - - - - 12,975 - - - 12,975 Accrued Interest - - - - - - - 7,152 7,152
Due from Other Funds - - - - 4,759 - - - 4,759 Due from Other Governmental Units - - - - 1,430 - - - 1,430
TOTAL ASSETS 612,703 14,745 24,301 - 62,492 19,632 1,010,657 960,562 2,705,092
LIABILITIES
Accounts Payable 275,818 14,745 - - - - 1,010,657 - 1,301,220Due to Other Governmental Units 336,885 - 24,301 - 62,492 19,632 - 960,562 1,403,872
TOTAL LIABILITIES 612,703 14,745 24,301 - 62,492 19,632 1,010,657 960,562 2,705,092
206
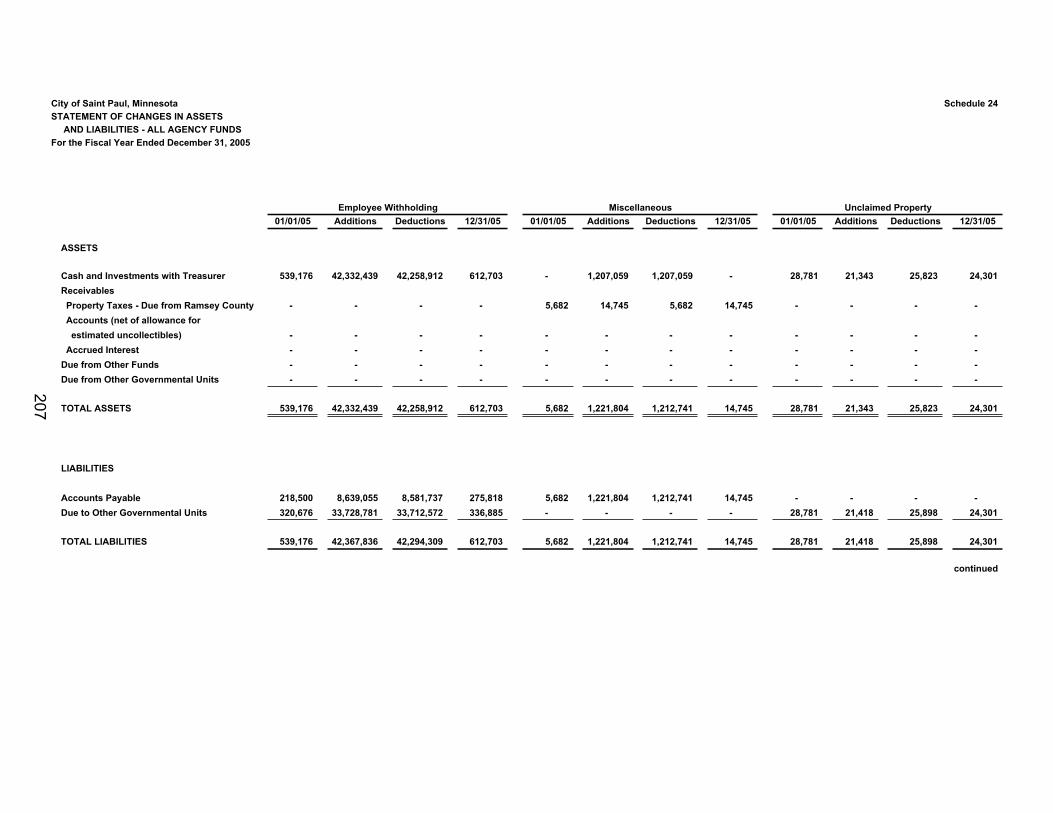
City of Saint Paul, Minnesota Schedule 24STATEMENT OF CHANGES IN ASSETS
AND LIABILITIES - ALL AGENCY FUNDSFor the Fiscal Year Ended December 31, 2005
01/01/05 Additions Deductions 12/31/05 01/01/05 Additions Deductions 12/31/05 01/01/05 Additions Deductions 12/31/05
ASSETS
Cash and Investments with Treasurer 539,176 42,332,439 42,258,912 612,703 - 1,207,059 1,207,059 - 28,781 21,343 25,823 24,301 Receivables Property Taxes - Due from Ramsey County - - - - 5,682 14,745 5,682 14,745 - - - - Accounts (net of allowance for estimated uncollectibles) - - - - - - - - - - - - Accrued Interest - - - - - - - - - - - - Due from Other Funds - - - - - - - - - - - - Due from Other Governmental Units - - - - - - - - - - - -
TOTAL ASSETS 539,176 42,332,439 42,258,912 612,703 5,682 1,221,804 1,212,741 14,745 28,781 21,343 25,823 24,301
LIABILITIES
Accounts Payable 218,500 8,639,055 8,581,737 275,818 5,682 1,221,804 1,212,741 14,745 - - - - Due to Other Governmental Units 320,676 33,728,781 33,712,572 336,885 - - - - 28,781 21,418 25,898 24,301
TOTAL LIABILITIES 539,176 42,367,836 42,294,309 612,703 5,682 1,221,804 1,212,741 14,745 28,781 21,418 25,898 24,301
continued
Employee Withholding Miscellaneous Unclaimed Property
207
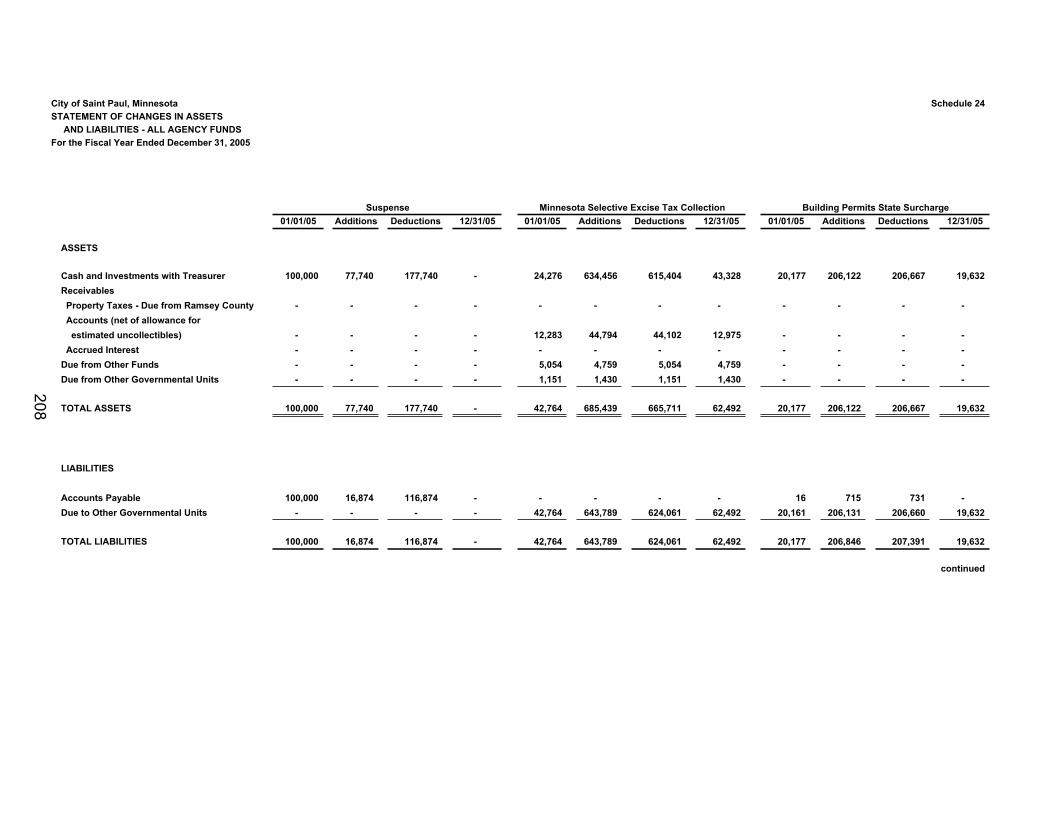
City of Saint Paul, MinnesotaSTATEMENT OF CHANGES IN ASSETS
AND LIABILITIES - ALL AGENCY FUNDSFor the Fiscal Year Ended December 31, 2005
ASSETS
Cash and Investments with TreasurerReceivables Property Taxes - Due from Ramsey County Accounts (net of allowance for estimated uncollectibles) Accrued Interest Due from Other FundsDue from Other Governmental Units
TOTAL ASSETS
LIABILITIES
Accounts PayableDue to Other Governmental Units
TOTAL LIABILITIES
Schedule 24
01/01/05 Additions Deductions 12/31/05 01/01/05 Additions Deductions 12/31/05 01/01/05 Additions Deductions 12/31/05
100,000 77,740 177,740 - 24,276 634,456 615,404 43,328 20,177 206,122 206,667 19,632
- - - - - - - - - - - -
- - - - 12,283 44,794 44,102 12,975 - - - - - - - - - - - - - - - - - - - - 5,054 4,759 5,054 4,759 - - - - - - - - 1,151 1,430 1,151 1,430 - - - -
100,000 77,740 177,740 - 42,764 685,439 665,711 62,492 20,177 206,122 206,667 19,632
100,000 16,874 116,874 - - - - - 16 715 731 - - - - - 42,764 643,789 624,061 62,492 20,161 206,131 206,660 19,632
100,000 16,874 116,874 - 42,764 643,789 624,061 62,492 20,177 206,846 207,391 19,632
continued
Minnesota Selective Excise Tax Collection Building Permits State SurchargeSuspense
208
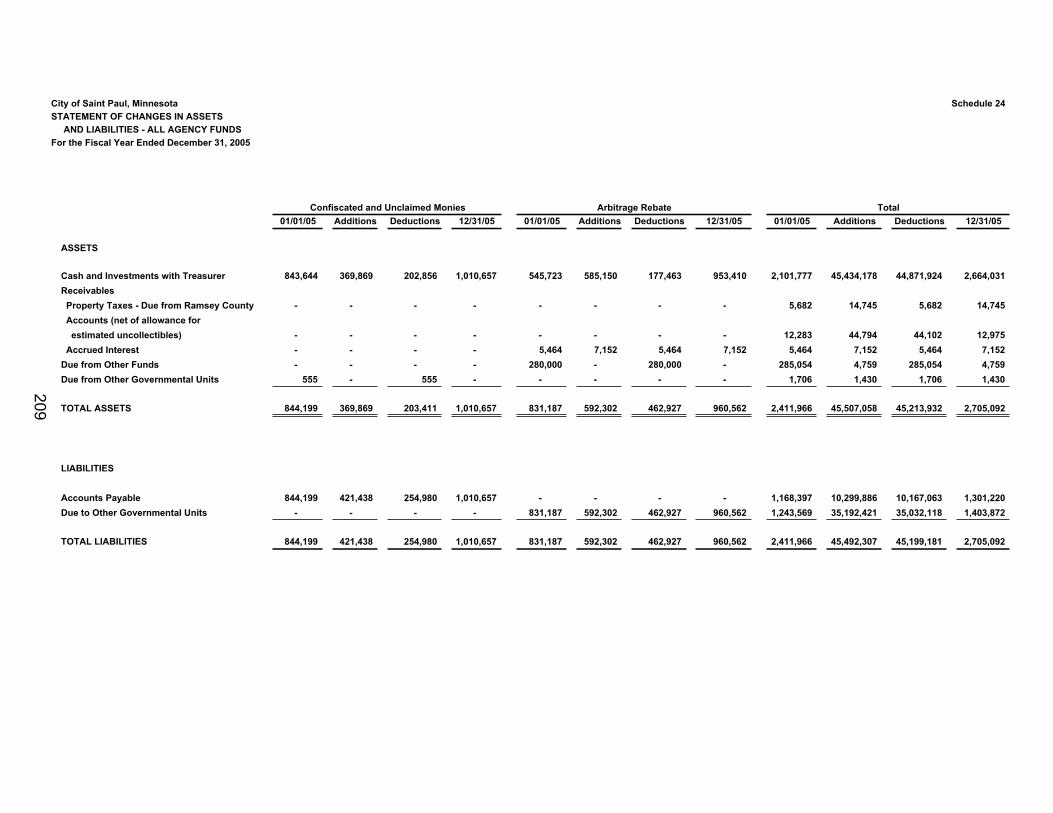
City of Saint Paul, MinnesotaSTATEMENT OF CHANGES IN ASSETS
AND LIABILITIES - ALL AGENCY FUNDSFor the Fiscal Year Ended December 31, 2005
ASSETS
Cash and Investments with TreasurerReceivables Property Taxes - Due from Ramsey County Accounts (net of allowance for estimated uncollectibles) Accrued Interest Due from Other FundsDue from Other Governmental Units
TOTAL ASSETS
LIABILITIES
Accounts PayableDue to Other Governmental Units
TOTAL LIABILITIES
Schedule 24
01/01/05 Additions Deductions 12/31/05 01/01/05 Additions Deductions 12/31/05 01/01/05 Additions Deductions 12/31/05
843,644 369,869 202,856 1,010,657 545,723 585,150 177,463 953,410 2,101,777 45,434,178 44,871,924 2,664,031
- - - - - - - - 5,682 14,745 5,682 14,745
- - - - - - - - 12,283 44,794 44,102 12,975 - - - - 5,464 7,152 5,464 7,152 5,464 7,152 5,464 7,152 - - - - 280,000 - 280,000 - 285,054 4,759 285,054 4,759
555 - 555 - - - - - 1,706 1,430 1,706 1,430
844,199 369,869 203,411 1,010,657 831,187 592,302 462,927 960,562 2,411,966 45,507,058 45,213,932 2,705,092
844,199 421,438 254,980 1,010,657 - - - - 1,168,397 10,299,886 10,167,063 1,301,220- - - - 831,187 592,302 462,927 960,562 1,243,569 35,192,421 35,032,118 1,403,872
844,199 421,438 254,980 1,010,657 831,187 592,302 462,927 960,562 2,411,966 45,492,307 45,199,181 2,705,092
TotalConfiscated and Unclaimed Monies Arbitrage Rebate
209

This page left blank intentionally
210
FINANCIAL SECTION
OTHER SUPPLEMENTARY INFORMATION
C I T Y O F S A I N T P A U L C O M P R E H E N S I V E A N N U A L F I N A N C I A L R E P O R T
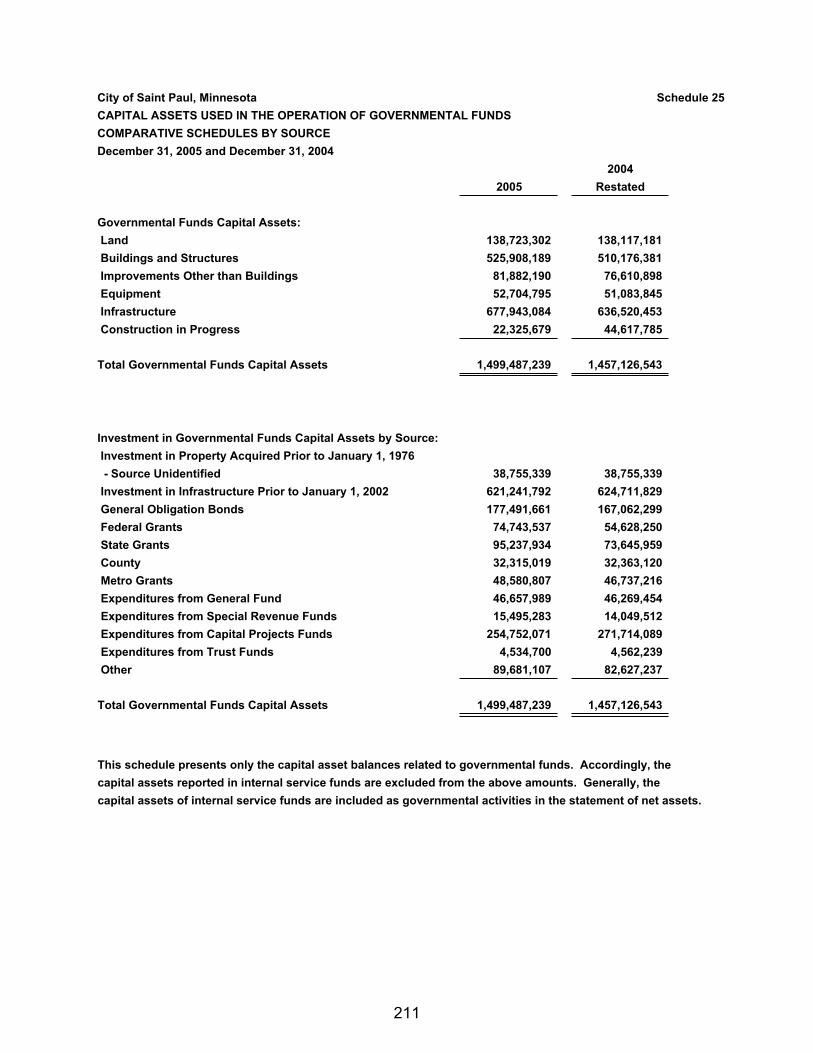
City of Saint Paul, Minnesota Schedule 25CAPITAL ASSETS USED IN THE OPERATION OF GOVERNMENTAL FUNDSCOMPARATIVE SCHEDULES BY SOURCEDecember 31, 2005 and December 31, 2004
20042005 Restated
Governmental Funds Capital Assets: Land 138,723,302 138,117,181 Buildings and Structures 525,908,189 510,176,381 Improvements Other than Buildings 81,882,190 76,610,898 Equipment 52,704,795 51,083,845 Infrastructure 677,943,084 636,520,453 Construction in Progress 22,325,679 44,617,785
Total Governmental Funds Capital Assets 1,499,487,239 1,457,126,543
Investment in Governmental Funds Capital Assets by Source: Investment in Property Acquired Prior to January 1, 1976 - Source Unidentified 38,755,339 38,755,339 Investment in Infrastructure Prior to January 1, 2002 621,241,792 624,711,829 General Obligation Bonds 177,491,661 167,062,299 Federal Grants 74,743,537 54,628,250 State Grants 95,237,934 73,645,959 County 32,315,019 32,363,120 Metro Grants 48,580,807 46,737,216 Expenditures from General Fund 46,657,989 46,269,454 Expenditures from Special Revenue Funds 15,495,283 14,049,512 Expenditures from Capital Projects Funds 254,752,071 271,714,089 Expenditures from Trust Funds 4,534,700 4,562,239 Other 89,681,107 82,627,237
Total Governmental Funds Capital Assets 1,499,487,239 1,457,126,543
This schedule presents only the capital asset balances related to governmental funds. Accordingly, thecapital assets reported in internal service funds are excluded from the above amounts. Generally, the capital assets of internal service funds are included as governmental activities in the statement of net assets.
211
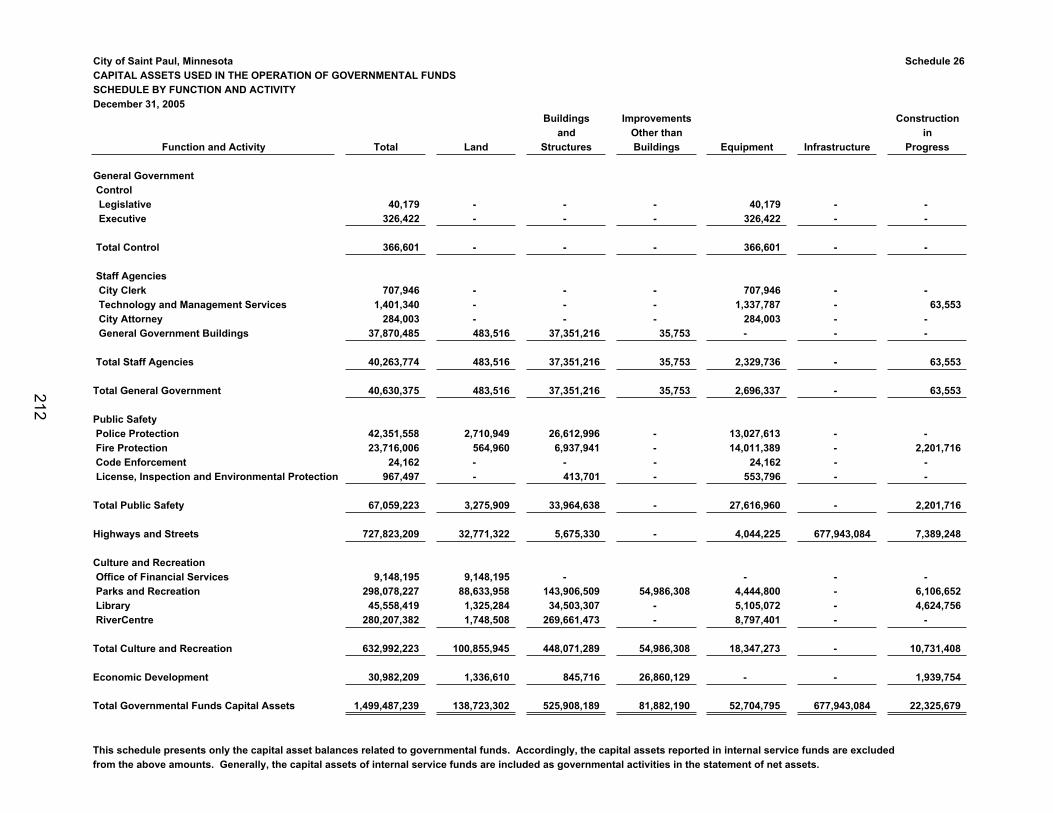
City of Saint Paul, Minnesota Schedule 26CAPITAL ASSETS USED IN THE OPERATION OF GOVERNMENTAL FUNDSSCHEDULE BY FUNCTION AND ACTIVITYDecember 31, 2005
Buildings Improvements Constructionand Other than in
Function and Activity Total Land Structures Buildings Equipment Infrastructure Progress
General Government Control Legislative 40,179 - - - 40,179 - - Executive 326,422 - - - 326,422 - -
Total Control 366,601 - - - 366,601 - -
Staff Agencies City Clerk 707,946 - - - 707,946 - - Technology and Management Services 1,401,340 - - - 1,337,787 - 63,553 City Attorney 284,003 - - - 284,003 - - General Government Buildings 37,870,485 483,516 37,351,216 35,753 - - -
Total Staff Agencies 40,263,774 483,516 37,351,216 35,753 2,329,736 - 63,553
Total General Government 40,630,375 483,516 37,351,216 35,753 2,696,337 - 63,553
Public Safety Police Protection 42,351,558 2,710,949 26,612,996 - 13,027,613 - - Fire Protection 23,716,006 564,960 6,937,941 - 14,011,389 - 2,201,716 Code Enforcement 24,162 - - - 24,162 - - License, Inspection and Environmental Protection 967,497 - 413,701 - 553,796 - -
Total Public Safety 67,059,223 3,275,909 33,964,638 - 27,616,960 - 2,201,716
Highways and Streets 727,823,209 32,771,322 5,675,330 - 4,044,225 677,943,084 7,389,248
Culture and Recreation Office of Financial Services 9,148,195 9,148,195 - - - - Parks and Recreation 298,078,227 88,633,958 143,906,509 54,986,308 4,444,800 - 6,106,652 Library 45,558,419 1,325,284 34,503,307 - 5,105,072 - 4,624,756 RiverCentre 280,207,382 1,748,508 269,661,473 - 8,797,401 - -
Total Culture and Recreation 632,992,223 100,855,945 448,071,289 54,986,308 18,347,273 - 10,731,408
Economic Development 30,982,209 1,336,610 845,716 26,860,129 - - 1,939,754
Total Governmental Funds Capital Assets 1,499,487,239 138,723,302 525,908,189 81,882,190 52,704,795 677,943,084 22,325,679
This schedule presents only the capital asset balances related to governmental funds. Accordingly, the capital assets reported in internal service funds are excluded from the above amounts. Generally, the capital assets of internal service funds are included as governmental activities in the statement of net assets.
212
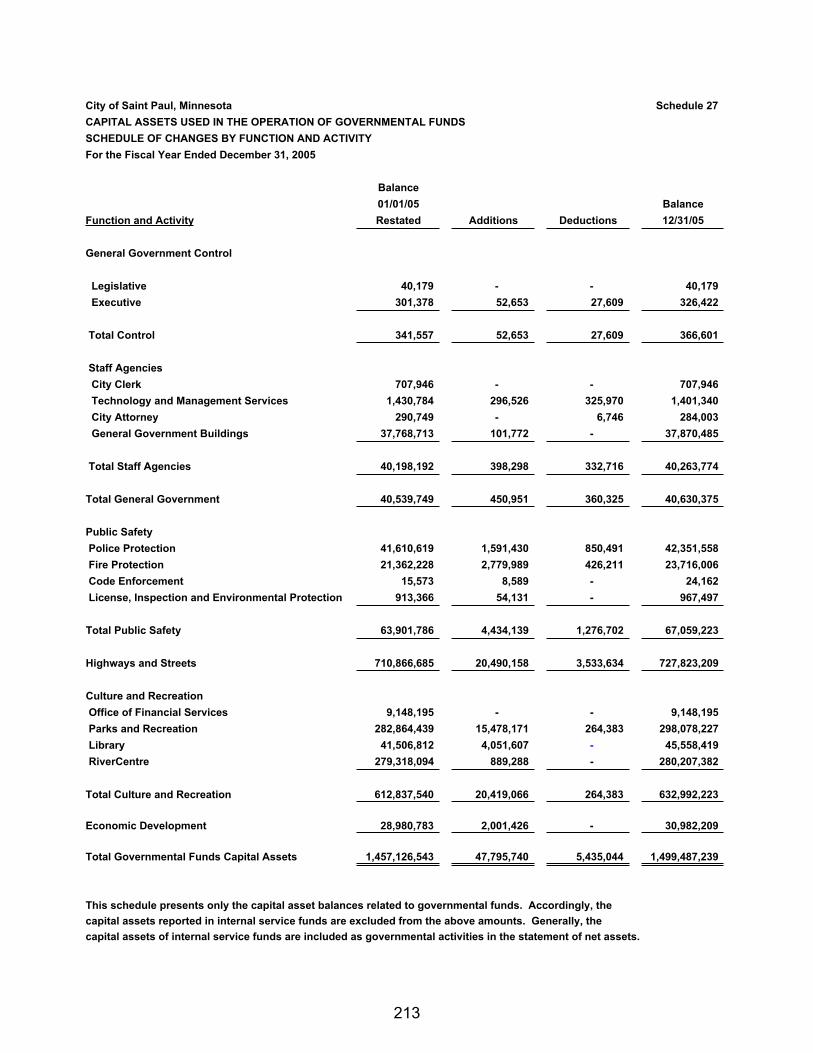
City of Saint Paul, Minnesota Schedule 27CAPITAL ASSETS USED IN THE OPERATION OF GOVERNMENTAL FUNDSSCHEDULE OF CHANGES BY FUNCTION AND ACTIVITYFor the Fiscal Year Ended December 31, 2005
Balance01/01/05 Balance
Function and Activity Restated Additions Deductions 12/31/05
General Government Control
Legislative 40,179 - - 40,179 Executive 301,378 52,653 27,609 326,422
Total Control 341,557 52,653 27,609 366,601
Staff Agencies City Clerk 707,946 - - 707,946 Technology and Management Services 1,430,784 296,526 325,970 1,401,340 City Attorney 290,749 - 6,746 284,003 General Government Buildings 37,768,713 101,772 - 37,870,485
Total Staff Agencies 40,198,192 398,298 332,716 40,263,774
Total General Government 40,539,749 450,951 360,325 40,630,375
Public Safety Police Protection 41,610,619 1,591,430 850,491 42,351,558 Fire Protection 21,362,228 2,779,989 426,211 23,716,006 Code Enforcement 15,573 8,589 - 24,162 License, Inspection and Environmental Protection 913,366 54,131 - 967,497
Total Public Safety 63,901,786 4,434,139 1,276,702 67,059,223
Highways and Streets 710,866,685 20,490,158 3,533,634 727,823,209
Culture and Recreation Office of Financial Services 9,148,195 - - 9,148,195 Parks and Recreation 282,864,439 15,478,171 264,383 298,078,227 Library 41,506,812 4,051,607 - 45,558,419 RiverCentre 279,318,094 889,288 - 280,207,382
Total Culture and Recreation 612,837,540 20,419,066 264,383 632,992,223
Economic Development 28,980,783 2,001,426 - 30,982,209
Total Governmental Funds Capital Assets 1,457,126,543 47,795,740 5,435,044 1,499,487,239
This schedule presents only the capital asset balances related to governmental funds. Accordingly, thecapital assets reported in internal service funds are excluded from the above amounts. Generally, the capital assets of internal service funds are included as governmental activities in the statement of net assets.
213
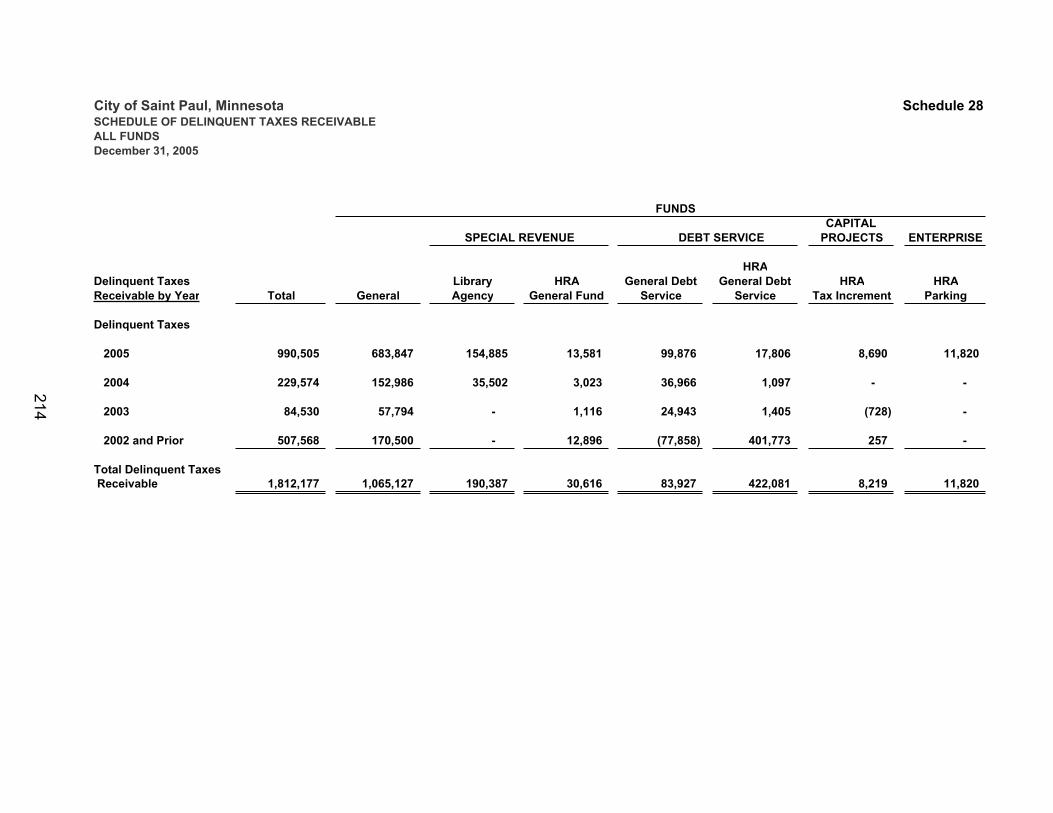
City of Saint Paul, Minnesota Schedule 28SCHEDULE OF DELINQUENT TAXES RECEIVABLEALL FUNDSDecember 31, 2005
CAPITALPROJECTS ENTERPRISE
HRADelinquent Taxes Library HRA General Debt General Debt HRA HRAReceivable by Year Total General Agency General Fund Service Service Tax Increment Parking
Delinquent Taxes
2005 990,505 683,847 154,885 13,581 99,876 17,806 8,690 11,820
2004 229,574 152,986 35,502 3,023 36,966 1,097 - -
2003 84,530 57,794 - 1,116 24,943 1,405 (728) -
2002 and Prior 507,568 170,500 - 12,896 (77,858) 401,773 257 -
Total Delinquent Taxes Receivable 1,812,177 1,065,127 190,387 30,616 83,927 422,081 8,219 11,820
DEBT SERVICESPECIAL REVENUE
FUNDS
214
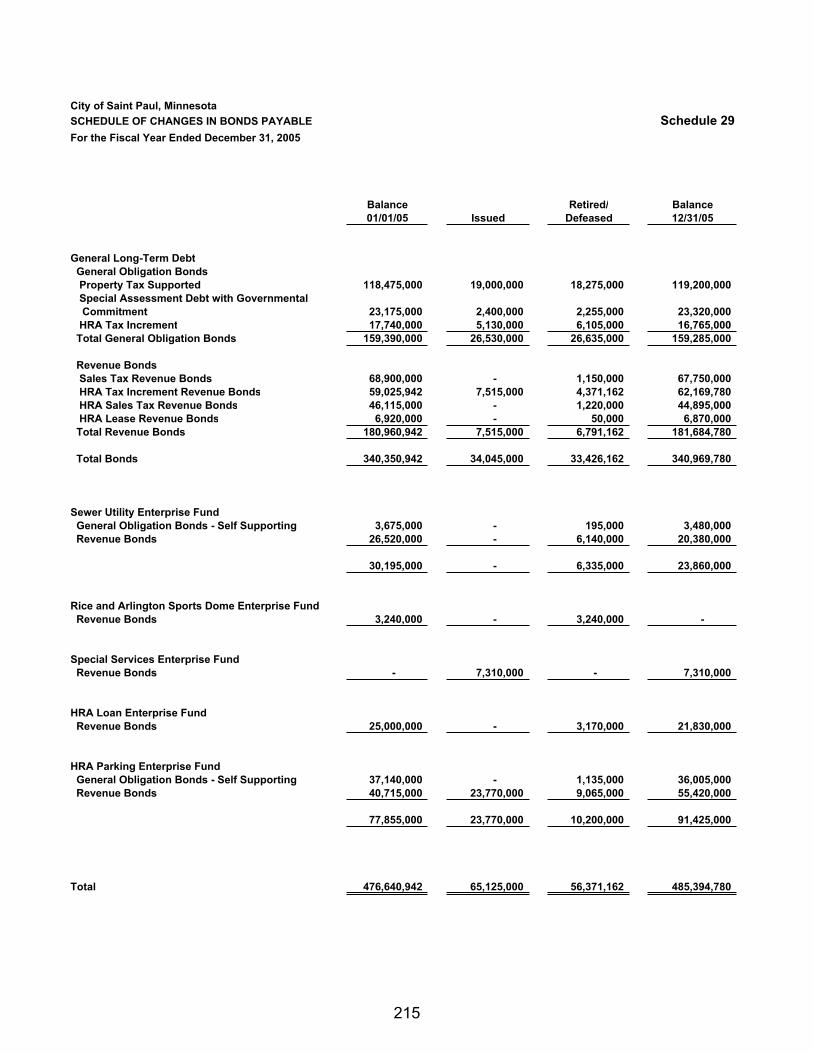
City of Saint Paul, MinnesotaSCHEDULE OF CHANGES IN BONDS PAYABLE Schedule 29For the Fiscal Year Ended December 31, 2005
Balance Retired/ Balance01/01/05 Issued Defeased 12/31/05
General Long-Term Debt General Obligation Bonds Property Tax Supported 118,475,000 19,000,000 18,275,000 119,200,000 Special Assessment Debt with Governmental Commitment 23,175,000 2,400,000 2,255,000 23,320,000 HRA Tax Increment 17,740,000 5,130,000 6,105,000 16,765,000 Total General Obligation Bonds 159,390,000 26,530,000 26,635,000 159,285,000
Revenue Bonds Sales Tax Revenue Bonds 68,900,000 - 1,150,000 67,750,000 HRA Tax Increment Revenue Bonds 59,025,942 7,515,000 4,371,162 62,169,780 HRA Sales Tax Revenue Bonds 46,115,000 - 1,220,000 44,895,000 HRA Lease Revenue Bonds 6,920,000 - 50,000 6,870,000 Total Revenue Bonds 180,960,942 7,515,000 6,791,162 181,684,780
Total Bonds 340,350,942 34,045,000 33,426,162 340,969,780
Sewer Utility Enterprise Fund General Obligation Bonds - Self Supporting 3,675,000 - 195,000 3,480,000 Revenue Bonds 26,520,000 - 6,140,000 20,380,000
30,195,000 - 6,335,000 23,860,000
Rice and Arlington Sports Dome Enterprise Fund Revenue Bonds 3,240,000 - 3,240,000 -
Special Services Enterprise Fund Revenue Bonds - 7,310,000 - 7,310,000
HRA Loan Enterprise Fund Revenue Bonds 25,000,000 - 3,170,000 21,830,000
HRA Parking Enterprise Fund General Obligation Bonds - Self Supporting 37,140,000 - 1,135,000 36,005,000 Revenue Bonds 40,715,000 23,770,000 9,065,000 55,420,000
77,855,000 23,770,000 10,200,000 91,425,000
Total 476,640,942 65,125,000 56,371,162 485,394,780
215
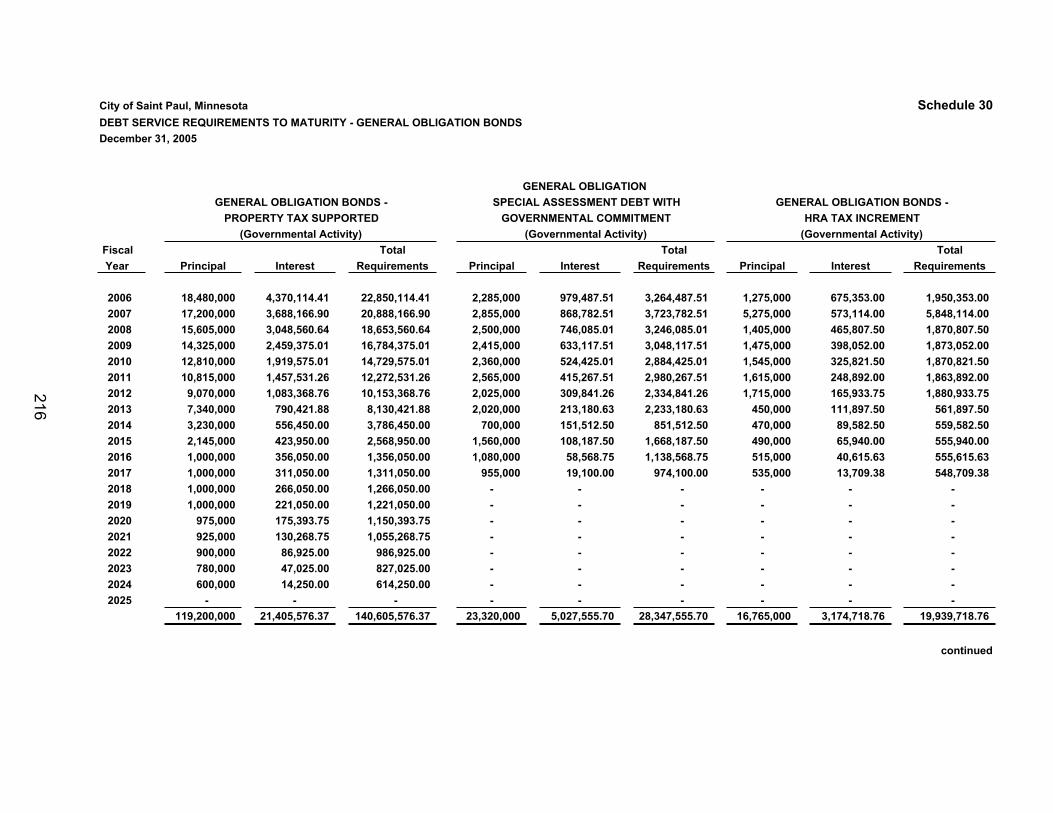
City of Saint Paul, Minnesota Schedule 30DEBT SERVICE REQUIREMENTS TO MATURITY - GENERAL OBLIGATION BONDSDecember 31, 2005
GENERAL OBLIGATION GENERAL OBLIGATION BONDS - SPECIAL ASSESSMENT DEBT WITH GENERAL OBLIGATION BONDS -
PROPERTY TAX SUPPORTED GOVERNMENTAL COMMITMENT HRA TAX INCREMENT(Governmental Activity) (Governmental Activity) (Governmental Activity)
Fiscal Total Total Total Year Principal Interest Requirements Principal Interest Requirements Principal Interest Requirements
2006 18,480,000 4,370,114.41 22,850,114.41 2,285,000 979,487.51 3,264,487.51 1,275,000 675,353.00 1,950,353.002007 17,200,000 3,688,166.90 20,888,166.90 2,855,000 868,782.51 3,723,782.51 5,275,000 573,114.00 5,848,114.002008 15,605,000 3,048,560.64 18,653,560.64 2,500,000 746,085.01 3,246,085.01 1,405,000 465,807.50 1,870,807.502009 14,325,000 2,459,375.01 16,784,375.01 2,415,000 633,117.51 3,048,117.51 1,475,000 398,052.00 1,873,052.002010 12,810,000 1,919,575.01 14,729,575.01 2,360,000 524,425.01 2,884,425.01 1,545,000 325,821.50 1,870,821.502011 10,815,000 1,457,531.26 12,272,531.26 2,565,000 415,267.51 2,980,267.51 1,615,000 248,892.00 1,863,892.002012 9,070,000 1,083,368.76 10,153,368.76 2,025,000 309,841.26 2,334,841.26 1,715,000 165,933.75 1,880,933.752013 7,340,000 790,421.88 8,130,421.88 2,020,000 213,180.63 2,233,180.63 450,000 111,897.50 561,897.502014 3,230,000 556,450.00 3,786,450.00 700,000 151,512.50 851,512.50 470,000 89,582.50 559,582.502015 2,145,000 423,950.00 2,568,950.00 1,560,000 108,187.50 1,668,187.50 490,000 65,940.00 555,940.002016 1,000,000 356,050.00 1,356,050.00 1,080,000 58,568.75 1,138,568.75 515,000 40,615.63 555,615.632017 1,000,000 311,050.00 1,311,050.00 955,000 19,100.00 974,100.00 535,000 13,709.38 548,709.382018 1,000,000 266,050.00 1,266,050.00 - - - - - -2019 1,000,000 221,050.00 1,221,050.00 - - - - - -2020 975,000 175,393.75 1,150,393.75 - - - - - -2021 925,000 130,268.75 1,055,268.75 - - - - - -2022 900,000 86,925.00 986,925.00 - - - - - -2023 780,000 47,025.00 827,025.00 - - - - - -2024 600,000 14,250.00 614,250.00 - - - - - -2025 - - - - - - - - -
119,200,000 21,405,576.37 140,605,576.37 23,320,000 5,027,555.70 28,347,555.70 16,765,000 3,174,718.76 19,939,718.76
continued
216
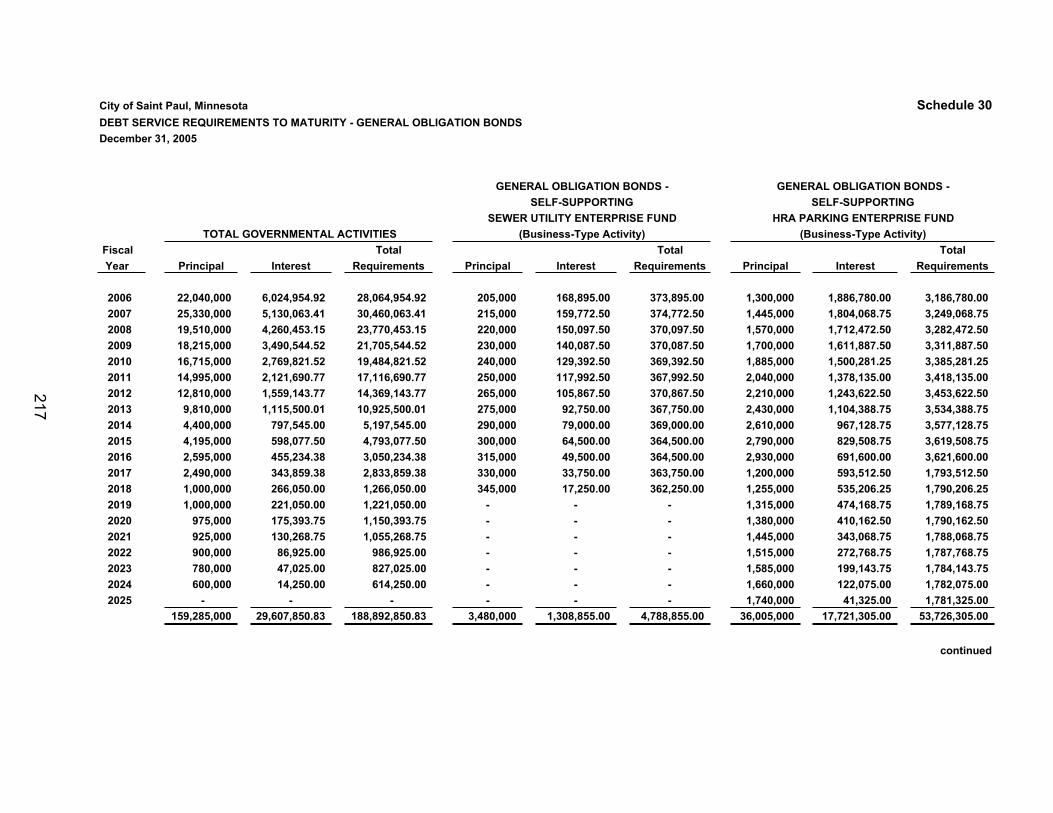
City of Saint Paul, Minnesota Schedule 30DEBT SERVICE REQUIREMENTS TO MATURITY - GENERAL OBLIGATION BONDSDecember 31, 2005
GENERAL OBLIGATION BONDS - GENERAL OBLIGATION BONDS -SELF-SUPPORTING SELF-SUPPORTING
SEWER UTILITY ENTERPRISE FUND HRA PARKING ENTERPRISE FUNDTOTAL GOVERNMENTAL ACTIVITIES (Business-Type Activity) (Business-Type Activity)
Fiscal Total Total Total Year Principal Interest Requirements Principal Interest Requirements Principal Interest Requirements
2006 22,040,000 6,024,954.92 28,064,954.92 205,000 168,895.00 373,895.00 1,300,000 1,886,780.00 3,186,780.002007 25,330,000 5,130,063.41 30,460,063.41 215,000 159,772.50 374,772.50 1,445,000 1,804,068.75 3,249,068.752008 19,510,000 4,260,453.15 23,770,453.15 220,000 150,097.50 370,097.50 1,570,000 1,712,472.50 3,282,472.502009 18,215,000 3,490,544.52 21,705,544.52 230,000 140,087.50 370,087.50 1,700,000 1,611,887.50 3,311,887.502010 16,715,000 2,769,821.52 19,484,821.52 240,000 129,392.50 369,392.50 1,885,000 1,500,281.25 3,385,281.252011 14,995,000 2,121,690.77 17,116,690.77 250,000 117,992.50 367,992.50 2,040,000 1,378,135.00 3,418,135.002012 12,810,000 1,559,143.77 14,369,143.77 265,000 105,867.50 370,867.50 2,210,000 1,243,622.50 3,453,622.502013 9,810,000 1,115,500.01 10,925,500.01 275,000 92,750.00 367,750.00 2,430,000 1,104,388.75 3,534,388.752014 4,400,000 797,545.00 5,197,545.00 290,000 79,000.00 369,000.00 2,610,000 967,128.75 3,577,128.752015 4,195,000 598,077.50 4,793,077.50 300,000 64,500.00 364,500.00 2,790,000 829,508.75 3,619,508.752016 2,595,000 455,234.38 3,050,234.38 315,000 49,500.00 364,500.00 2,930,000 691,600.00 3,621,600.002017 2,490,000 343,859.38 2,833,859.38 330,000 33,750.00 363,750.00 1,200,000 593,512.50 1,793,512.502018 1,000,000 266,050.00 1,266,050.00 345,000 17,250.00 362,250.00 1,255,000 535,206.25 1,790,206.252019 1,000,000 221,050.00 1,221,050.00 - - - 1,315,000 474,168.75 1,789,168.752020 975,000 175,393.75 1,150,393.75 - - - 1,380,000 410,162.50 1,790,162.502021 925,000 130,268.75 1,055,268.75 - - - 1,445,000 343,068.75 1,788,068.752022 900,000 86,925.00 986,925.00 - - - 1,515,000 272,768.75 1,787,768.752023 780,000 47,025.00 827,025.00 - - - 1,585,000 199,143.75 1,784,143.752024 600,000 14,250.00 614,250.00 - - - 1,660,000 122,075.00 1,782,075.002025 - - - - - - 1,740,000 41,325.00 1,781,325.00
159,285,000 29,607,850.83 188,892,850.83 3,480,000 1,308,855.00 4,788,855.00 36,005,000 17,721,305.00 53,726,305.00
continued
217
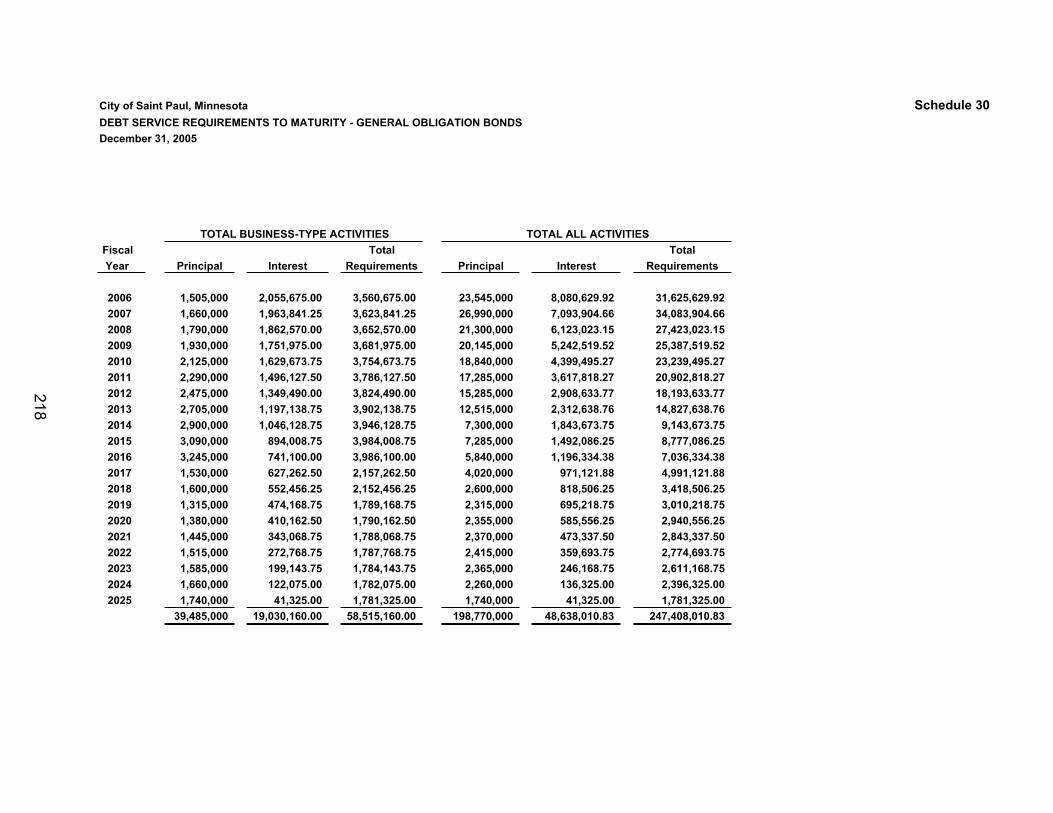
City of Saint Paul, Minnesota Schedule 30DEBT SERVICE REQUIREMENTS TO MATURITY - GENERAL OBLIGATION BONDSDecember 31, 2005
TOTAL BUSINESS-TYPE ACTIVITIES TOTAL ALL ACTIVITIES Fiscal Total Total Year Principal Interest Requirements Principal Interest Requirements
2006 1,505,000 2,055,675.00 3,560,675.00 23,545,000 8,080,629.92 31,625,629.922007 1,660,000 1,963,841.25 3,623,841.25 26,990,000 7,093,904.66 34,083,904.662008 1,790,000 1,862,570.00 3,652,570.00 21,300,000 6,123,023.15 27,423,023.152009 1,930,000 1,751,975.00 3,681,975.00 20,145,000 5,242,519.52 25,387,519.522010 2,125,000 1,629,673.75 3,754,673.75 18,840,000 4,399,495.27 23,239,495.272011 2,290,000 1,496,127.50 3,786,127.50 17,285,000 3,617,818.27 20,902,818.272012 2,475,000 1,349,490.00 3,824,490.00 15,285,000 2,908,633.77 18,193,633.772013 2,705,000 1,197,138.75 3,902,138.75 12,515,000 2,312,638.76 14,827,638.762014 2,900,000 1,046,128.75 3,946,128.75 7,300,000 1,843,673.75 9,143,673.752015 3,090,000 894,008.75 3,984,008.75 7,285,000 1,492,086.25 8,777,086.252016 3,245,000 741,100.00 3,986,100.00 5,840,000 1,196,334.38 7,036,334.382017 1,530,000 627,262.50 2,157,262.50 4,020,000 971,121.88 4,991,121.882018 1,600,000 552,456.25 2,152,456.25 2,600,000 818,506.25 3,418,506.252019 1,315,000 474,168.75 1,789,168.75 2,315,000 695,218.75 3,010,218.752020 1,380,000 410,162.50 1,790,162.50 2,355,000 585,556.25 2,940,556.252021 1,445,000 343,068.75 1,788,068.75 2,370,000 473,337.50 2,843,337.502022 1,515,000 272,768.75 1,787,768.75 2,415,000 359,693.75 2,774,693.752023 1,585,000 199,143.75 1,784,143.75 2,365,000 246,168.75 2,611,168.752024 1,660,000 122,075.00 1,782,075.00 2,260,000 136,325.00 2,396,325.002025 1,740,000 41,325.00 1,781,325.00 1,740,000 41,325.00 1,781,325.00
39,485,000 19,030,160.00 58,515,160.00 198,770,000 48,638,010.83 247,408,010.83
218
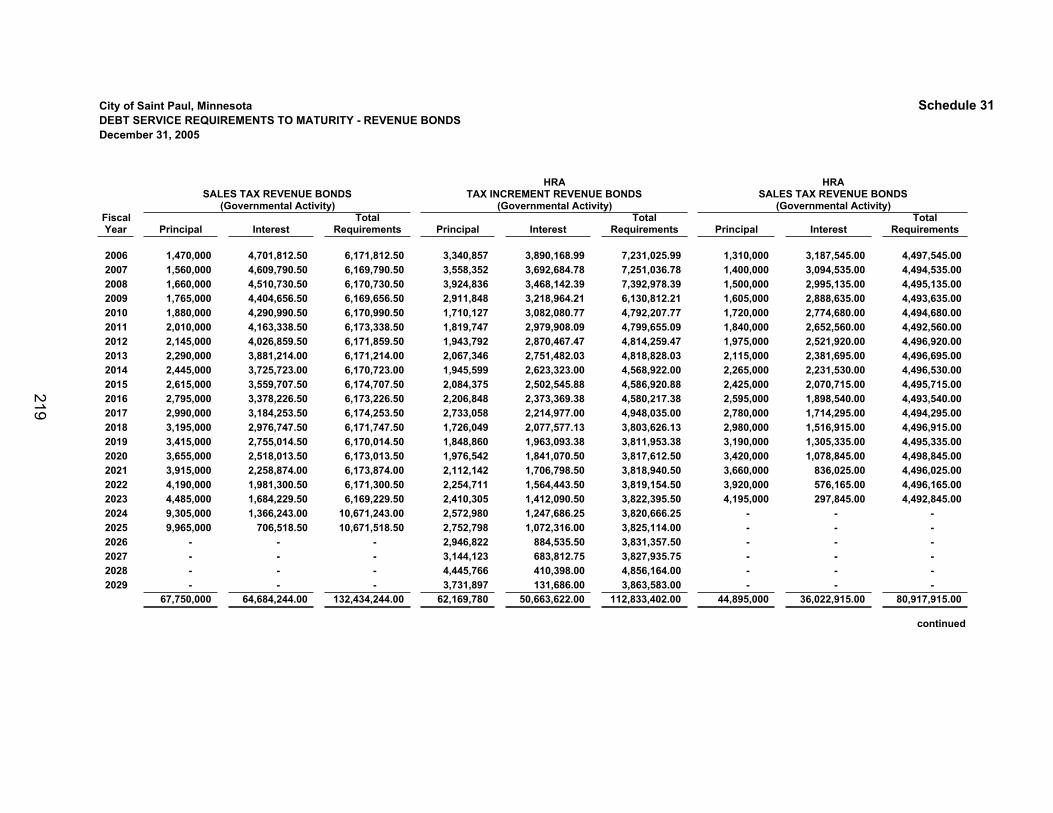
City of Saint Paul, Minnesota Schedule 31DEBT SERVICE REQUIREMENTS TO MATURITY - REVENUE BONDSDecember 31, 2005
Fiscal Total Total Total Year Principal Interest Requirements Principal Interest Requirements Principal Interest Requirements
2006 1,470,000 4,701,812.50 6,171,812.50 3,340,857 3,890,168.99 7,231,025.99 1,310,000 3,187,545.00 4,497,545.002007 1,560,000 4,609,790.50 6,169,790.50 3,558,352 3,692,684.78 7,251,036.78 1,400,000 3,094,535.00 4,494,535.002008 1,660,000 4,510,730.50 6,170,730.50 3,924,836 3,468,142.39 7,392,978.39 1,500,000 2,995,135.00 4,495,135.002009 1,765,000 4,404,656.50 6,169,656.50 2,911,848 3,218,964.21 6,130,812.21 1,605,000 2,888,635.00 4,493,635.002010 1,880,000 4,290,990.50 6,170,990.50 1,710,127 3,082,080.77 4,792,207.77 1,720,000 2,774,680.00 4,494,680.002011 2,010,000 4,163,338.50 6,173,338.50 1,819,747 2,979,908.09 4,799,655.09 1,840,000 2,652,560.00 4,492,560.002012 2,145,000 4,026,859.50 6,171,859.50 1,943,792 2,870,467.47 4,814,259.47 1,975,000 2,521,920.00 4,496,920.002013 2,290,000 3,881,214.00 6,171,214.00 2,067,346 2,751,482.03 4,818,828.03 2,115,000 2,381,695.00 4,496,695.002014 2,445,000 3,725,723.00 6,170,723.00 1,945,599 2,623,323.00 4,568,922.00 2,265,000 2,231,530.00 4,496,530.002015 2,615,000 3,559,707.50 6,174,707.50 2,084,375 2,502,545.88 4,586,920.88 2,425,000 2,070,715.00 4,495,715.002016 2,795,000 3,378,226.50 6,173,226.50 2,206,848 2,373,369.38 4,580,217.38 2,595,000 1,898,540.00 4,493,540.002017 2,990,000 3,184,253.50 6,174,253.50 2,733,058 2,214,977.00 4,948,035.00 2,780,000 1,714,295.00 4,494,295.002018 3,195,000 2,976,747.50 6,171,747.50 1,726,049 2,077,577.13 3,803,626.13 2,980,000 1,516,915.00 4,496,915.002019 3,415,000 2,755,014.50 6,170,014.50 1,848,860 1,963,093.38 3,811,953.38 3,190,000 1,305,335.00 4,495,335.002020 3,655,000 2,518,013.50 6,173,013.50 1,976,542 1,841,070.50 3,817,612.50 3,420,000 1,078,845.00 4,498,845.002021 3,915,000 2,258,874.00 6,173,874.00 2,112,142 1,706,798.50 3,818,940.50 3,660,000 836,025.00 4,496,025.002022 4,190,000 1,981,300.50 6,171,300.50 2,254,711 1,564,443.50 3,819,154.50 3,920,000 576,165.00 4,496,165.002023 4,485,000 1,684,229.50 6,169,229.50 2,410,305 1,412,090.50 3,822,395.50 4,195,000 297,845.00 4,492,845.002024 9,305,000 1,366,243.00 10,671,243.00 2,572,980 1,247,686.25 3,820,666.25 - - - 2025 9,965,000 706,518.50 10,671,518.50 2,752,798 1,072,316.00 3,825,114.00 - - - 2026 - - - 2,946,822 884,535.50 3,831,357.50 - - - 2027 - - - 3,144,123 683,812.75 3,827,935.75 - - - 2028 - - - 4,445,766 410,398.00 4,856,164.00 - - - 2029 - - - 3,731,897 131,686.00 3,863,583.00 - - -
67,750,000 64,684,244.00 132,434,244.00 62,169,780 50,663,622.00 112,833,402.00 44,895,000 36,022,915.00 80,917,915.00
continued
SALES TAX REVENUE BONDS(Governmental Activity) (Governmental Activity)
SALES TAX REVENUE BONDSHRA
TAX INCREMENT REVENUE BONDSHRA
(Governmental Activity)
219
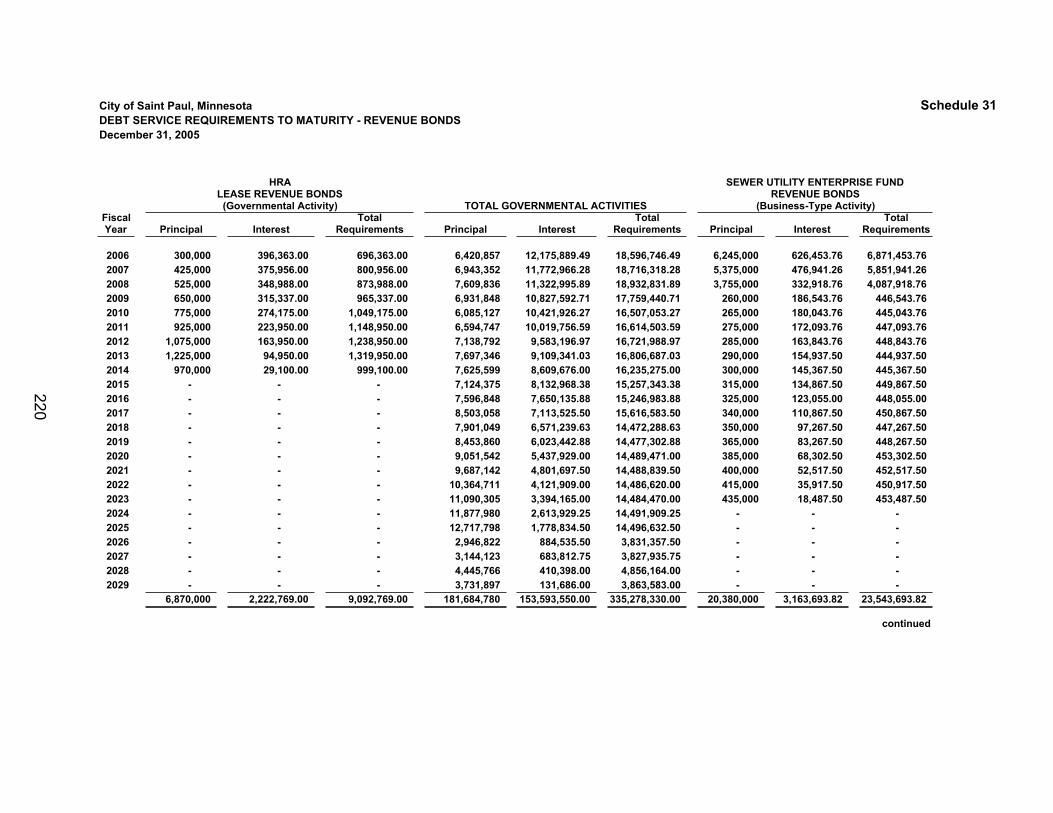
City of Saint Paul, Minnesota Schedule 31DEBT SERVICE REQUIREMENTS TO MATURITY - REVENUE BONDSDecember 31, 2005
Fiscal Total Total Total Year Principal Interest Requirements Principal Interest Requirements Principal Interest Requirements
2006 300,000 396,363.00 696,363.00 6,420,857 12,175,889.49 18,596,746.49 6,245,000 626,453.76 6,871,453.762007 425,000 375,956.00 800,956.00 6,943,352 11,772,966.28 18,716,318.28 5,375,000 476,941.26 5,851,941.262008 525,000 348,988.00 873,988.00 7,609,836 11,322,995.89 18,932,831.89 3,755,000 332,918.76 4,087,918.762009 650,000 315,337.00 965,337.00 6,931,848 10,827,592.71 17,759,440.71 260,000 186,543.76 446,543.762010 775,000 274,175.00 1,049,175.00 6,085,127 10,421,926.27 16,507,053.27 265,000 180,043.76 445,043.762011 925,000 223,950.00 1,148,950.00 6,594,747 10,019,756.59 16,614,503.59 275,000 172,093.76 447,093.762012 1,075,000 163,950.00 1,238,950.00 7,138,792 9,583,196.97 16,721,988.97 285,000 163,843.76 448,843.762013 1,225,000 94,950.00 1,319,950.00 7,697,346 9,109,341.03 16,806,687.03 290,000 154,937.50 444,937.502014 970,000 29,100.00 999,100.00 7,625,599 8,609,676.00 16,235,275.00 300,000 145,367.50 445,367.502015 - - - 7,124,375 8,132,968.38 15,257,343.38 315,000 134,867.50 449,867.502016 - - - 7,596,848 7,650,135.88 15,246,983.88 325,000 123,055.00 448,055.002017 - - - 8,503,058 7,113,525.50 15,616,583.50 340,000 110,867.50 450,867.502018 - - - 7,901,049 6,571,239.63 14,472,288.63 350,000 97,267.50 447,267.502019 - - - 8,453,860 6,023,442.88 14,477,302.88 365,000 83,267.50 448,267.502020 - - - 9,051,542 5,437,929.00 14,489,471.00 385,000 68,302.50 453,302.502021 - - - 9,687,142 4,801,697.50 14,488,839.50 400,000 52,517.50 452,517.502022 - - - 10,364,711 4,121,909.00 14,486,620.00 415,000 35,917.50 450,917.502023 - - - 11,090,305 3,394,165.00 14,484,470.00 435,000 18,487.50 453,487.502024 - - - 11,877,980 2,613,929.25 14,491,909.25 - - - 2025 - - - 12,717,798 1,778,834.50 14,496,632.50 - - - 2026 - - - 2,946,822 884,535.50 3,831,357.50 - - - 2027 - - - 3,144,123 683,812.75 3,827,935.75 - - - 2028 - - - 4,445,766 410,398.00 4,856,164.00 - - - 2029 - - - 3,731,897 131,686.00 3,863,583.00 - - -
6,870,000 2,222,769.00 9,092,769.00 181,684,780 153,593,550.00 335,278,330.00 20,380,000 3,163,693.82 23,543,693.82
continued
HRALEASE REVENUE BONDS
(Governmental Activity) TOTAL GOVERNMENTAL ACTIVITIES
SEWER UTILITY ENTERPRISE FUNDREVENUE BONDS
(Business-Type Activity)
220
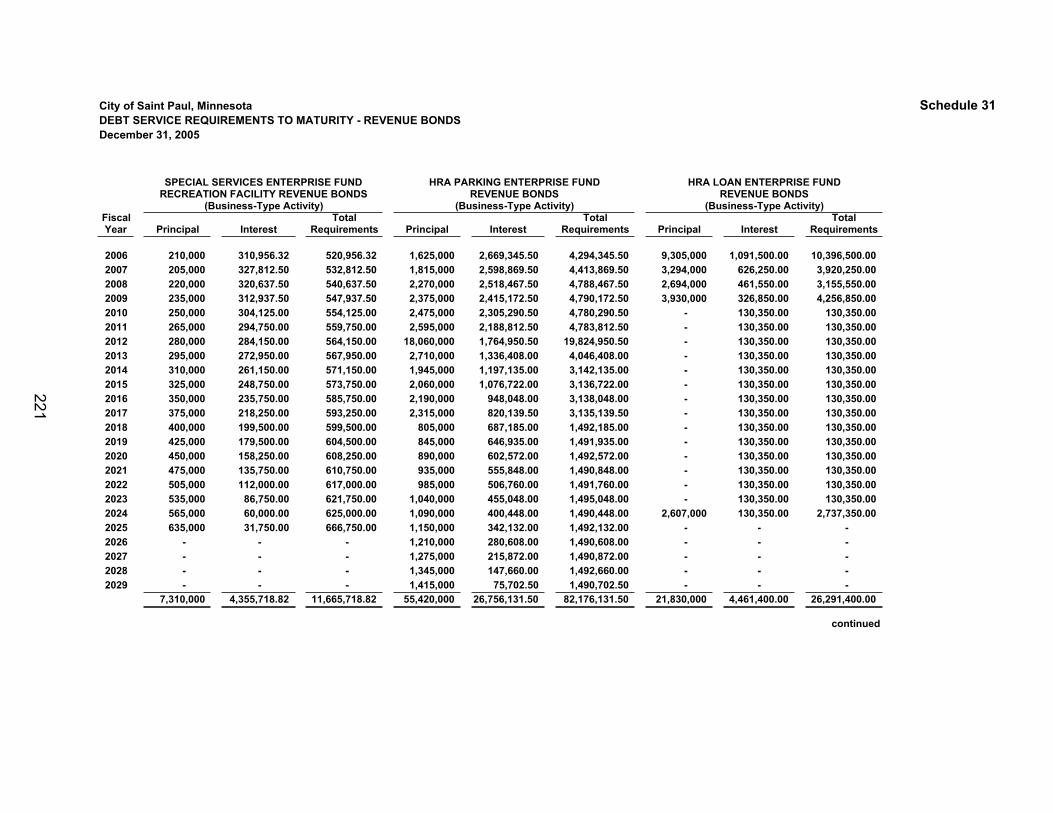
City of Saint Paul, Minnesota Schedule 31DEBT SERVICE REQUIREMENTS TO MATURITY - REVENUE BONDSDecember 31, 2005
SPECIAL SERVICES ENTERPRISE FUND HRA PARKING ENTERPRISE FUND HRA LOAN ENTERPRISE FUNDRECREATION FACILITY REVENUE BONDS REVENUE BONDS REVENUE BONDS
(Business-Type Activity) (Business-Type Activity) (Business-Type Activity) Fiscal Total Total Total Year Principal Interest Requirements Principal Interest Requirements Principal Interest Requirements
2006 210,000 310,956.32 520,956.32 1,625,000 2,669,345.50 4,294,345.50 9,305,000 1,091,500.00 10,396,500.002007 205,000 327,812.50 532,812.50 1,815,000 2,598,869.50 4,413,869.50 3,294,000 626,250.00 3,920,250.00 2008 220,000 320,637.50 540,637.50 2,270,000 2,518,467.50 4,788,467.50 2,694,000 461,550.00 3,155,550.00 2009 235,000 312,937.50 547,937.50 2,375,000 2,415,172.50 4,790,172.50 3,930,000 326,850.00 4,256,850.00 2010 250,000 304,125.00 554,125.00 2,475,000 2,305,290.50 4,780,290.50 - 130,350.00 130,350.00 2011 265,000 294,750.00 559,750.00 2,595,000 2,188,812.50 4,783,812.50 - 130,350.00 130,350.00 2012 280,000 284,150.00 564,150.00 18,060,000 1,764,950.50 19,824,950.50 - 130,350.00 130,350.00 2013 295,000 272,950.00 567,950.00 2,710,000 1,336,408.00 4,046,408.00 - 130,350.00 130,350.00 2014 310,000 261,150.00 571,150.00 1,945,000 1,197,135.00 3,142,135.00 - 130,350.00 130,350.00 2015 325,000 248,750.00 573,750.00 2,060,000 1,076,722.00 3,136,722.00 - 130,350.00 130,350.00 2016 350,000 235,750.00 585,750.00 2,190,000 948,048.00 3,138,048.00 - 130,350.00 130,350.00 2017 375,000 218,250.00 593,250.00 2,315,000 820,139.50 3,135,139.50 - 130,350.00 130,350.00 2018 400,000 199,500.00 599,500.00 805,000 687,185.00 1,492,185.00 - 130,350.00 130,350.00 2019 425,000 179,500.00 604,500.00 845,000 646,935.00 1,491,935.00 - 130,350.00 130,350.00 2020 450,000 158,250.00 608,250.00 890,000 602,572.00 1,492,572.00 - 130,350.00 130,350.00 2021 475,000 135,750.00 610,750.00 935,000 555,848.00 1,490,848.00 - 130,350.00 130,350.00 2022 505,000 112,000.00 617,000.00 985,000 506,760.00 1,491,760.00 - 130,350.00 130,350.00 2023 535,000 86,750.00 621,750.00 1,040,000 455,048.00 1,495,048.00 - 130,350.00 130,350.00 2024 565,000 60,000.00 625,000.00 1,090,000 400,448.00 1,490,448.00 2,607,000 130,350.00 2,737,350.00 2025 635,000 31,750.00 666,750.00 1,150,000 342,132.00 1,492,132.00 - - - 2026 - - - 1,210,000 280,608.00 1,490,608.00 - - - 2027 - - - 1,275,000 215,872.00 1,490,872.00 - - - 2028 - - - 1,345,000 147,660.00 1,492,660.00 - - - 2029 - - - 1,415,000 75,702.50 1,490,702.50 - - -
7,310,000 4,355,718.82 11,665,718.82 55,420,000 26,756,131.50 82,176,131.50 21,830,000 4,461,400.00 26,291,400.00
continued
221
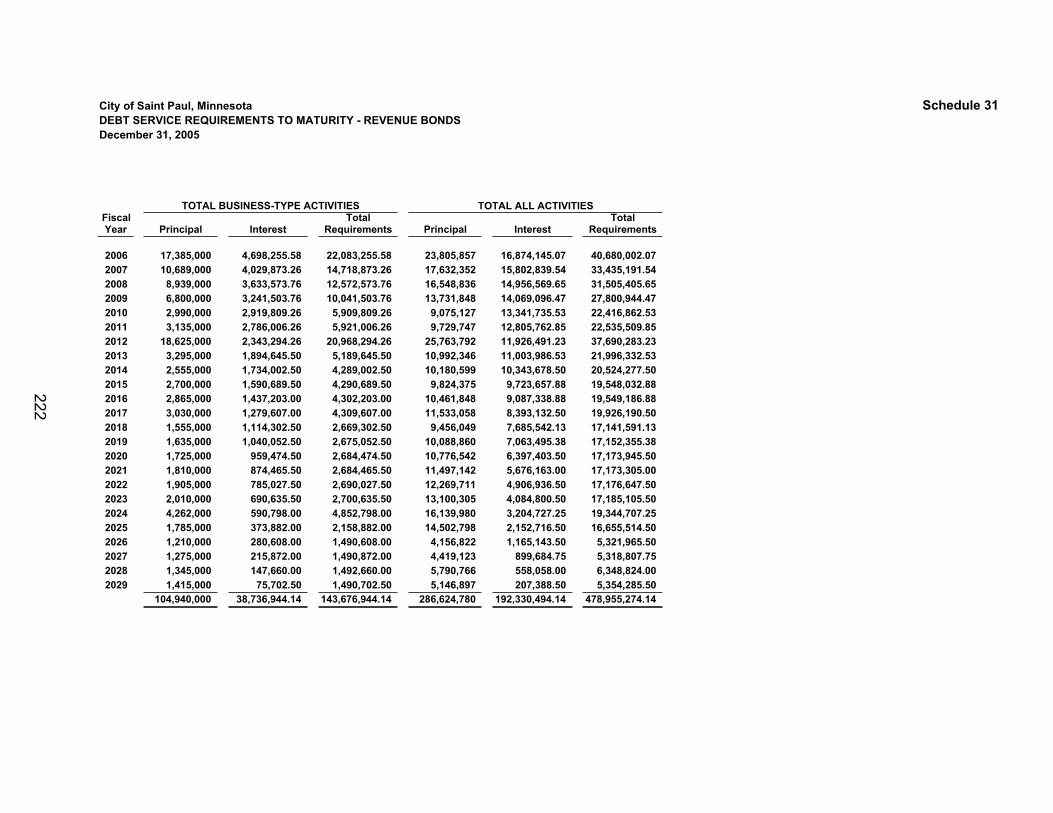
City of Saint Paul, Minnesota Schedule 31DEBT SERVICE REQUIREMENTS TO MATURITY - REVENUE BONDSDecember 31, 2005
TOTAL ALL ACTIVITIES Fiscal Total Total Year Principal Interest Requirements Principal Interest Requirements
2006 17,385,000 4,698,255.58 22,083,255.58 23,805,857 16,874,145.07 40,680,002.072007 10,689,000 4,029,873.26 14,718,873.26 17,632,352 15,802,839.54 33,435,191.542008 8,939,000 3,633,573.76 12,572,573.76 16,548,836 14,956,569.65 31,505,405.652009 6,800,000 3,241,503.76 10,041,503.76 13,731,848 14,069,096.47 27,800,944.472010 2,990,000 2,919,809.26 5,909,809.26 9,075,127 13,341,735.53 22,416,862.532011 3,135,000 2,786,006.26 5,921,006.26 9,729,747 12,805,762.85 22,535,509.852012 18,625,000 2,343,294.26 20,968,294.26 25,763,792 11,926,491.23 37,690,283.232013 3,295,000 1,894,645.50 5,189,645.50 10,992,346 11,003,986.53 21,996,332.532014 2,555,000 1,734,002.50 4,289,002.50 10,180,599 10,343,678.50 20,524,277.502015 2,700,000 1,590,689.50 4,290,689.50 9,824,375 9,723,657.88 19,548,032.882016 2,865,000 1,437,203.00 4,302,203.00 10,461,848 9,087,338.88 19,549,186.882017 3,030,000 1,279,607.00 4,309,607.00 11,533,058 8,393,132.50 19,926,190.502018 1,555,000 1,114,302.50 2,669,302.50 9,456,049 7,685,542.13 17,141,591.132019 1,635,000 1,040,052.50 2,675,052.50 10,088,860 7,063,495.38 17,152,355.382020 1,725,000 959,474.50 2,684,474.50 10,776,542 6,397,403.50 17,173,945.502021 1,810,000 874,465.50 2,684,465.50 11,497,142 5,676,163.00 17,173,305.002022 1,905,000 785,027.50 2,690,027.50 12,269,711 4,906,936.50 17,176,647.502023 2,010,000 690,635.50 2,700,635.50 13,100,305 4,084,800.50 17,185,105.502024 4,262,000 590,798.00 4,852,798.00 16,139,980 3,204,727.25 19,344,707.252025 1,785,000 373,882.00 2,158,882.00 14,502,798 2,152,716.50 16,655,514.502026 1,210,000 280,608.00 1,490,608.00 4,156,822 1,165,143.50 5,321,965.502027 1,275,000 215,872.00 1,490,872.00 4,419,123 899,684.75 5,318,807.752028 1,345,000 147,660.00 1,492,660.00 5,790,766 558,058.00 6,348,824.002029 1,415,000 75,702.50 1,490,702.50 5,146,897 207,388.50 5,354,285.50
104,940,000 38,736,944.14 143,676,944.14 286,624,780 192,330,494.14 478,955,274.14
TOTAL BUSINESS-TYPE ACTIVITIES
222
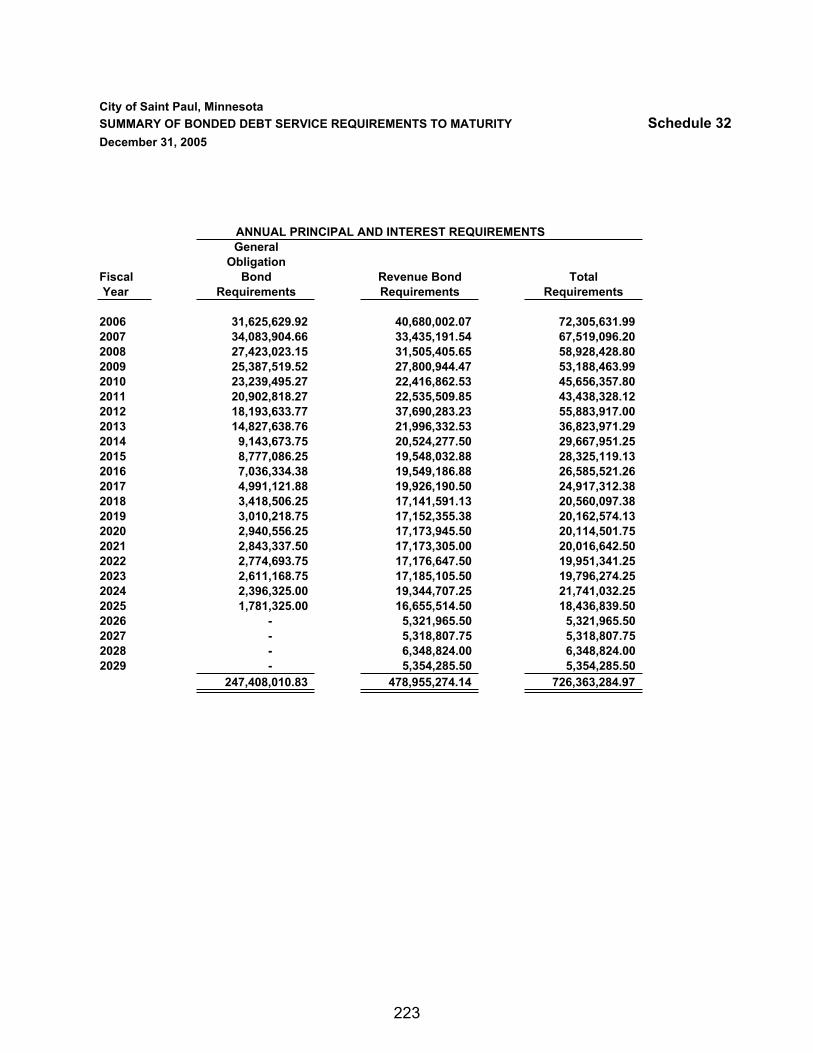
City of Saint Paul, MinnesotaSUMMARY OF BONDED DEBT SERVICE REQUIREMENTS TO MATURITY Schedule 32December 31, 2005
ANNUAL PRINCIPAL AND INTEREST REQUIREMENTSGeneral
ObligationFiscal Bond Revenue Bond Total Year Requirements Requirements Requirements
2006 31,625,629.92 40,680,002.07 72,305,631.992007 34,083,904.66 33,435,191.54 67,519,096.202008 27,423,023.15 31,505,405.65 58,928,428.802009 25,387,519.52 27,800,944.47 53,188,463.992010 23,239,495.27 22,416,862.53 45,656,357.802011 20,902,818.27 22,535,509.85 43,438,328.122012 18,193,633.77 37,690,283.23 55,883,917.002013 14,827,638.76 21,996,332.53 36,823,971.292014 9,143,673.75 20,524,277.50 29,667,951.252015 8,777,086.25 19,548,032.88 28,325,119.132016 7,036,334.38 19,549,186.88 26,585,521.262017 4,991,121.88 19,926,190.50 24,917,312.382018 3,418,506.25 17,141,591.13 20,560,097.382019 3,010,218.75 17,152,355.38 20,162,574.132020 2,940,556.25 17,173,945.50 20,114,501.752021 2,843,337.50 17,173,305.00 20,016,642.502022 2,774,693.75 17,176,647.50 19,951,341.252023 2,611,168.75 17,185,105.50 19,796,274.252024 2,396,325.00 19,344,707.25 21,741,032.252025 1,781,325.00 16,655,514.50 18,436,839.502026 - 5,321,965.50 5,321,965.502027 - 5,318,807.75 5,318,807.752028 - 6,348,824.00 6,348,824.002029 - 5,354,285.50 5,354,285.50
247,408,010.83 478,955,274.14 726,363,284.97
223
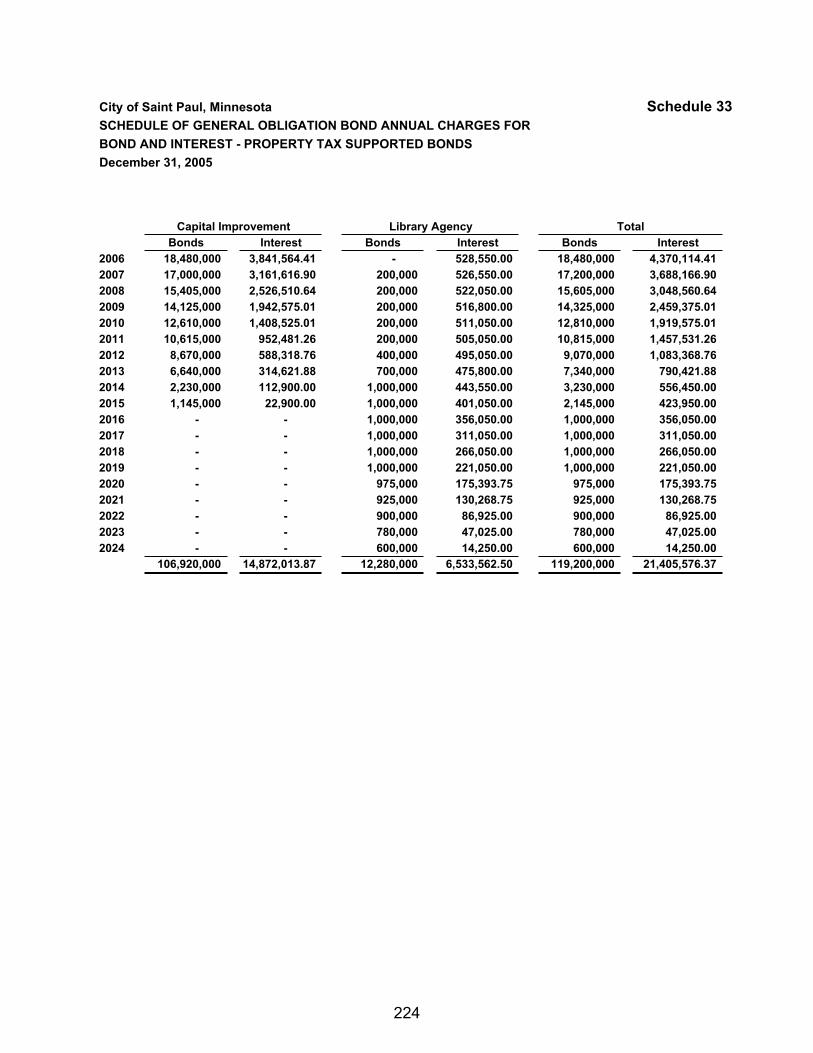
City of Saint Paul, Minnesota Schedule 33SCHEDULE OF GENERAL OBLIGATION BOND ANNUAL CHARGES FOR BOND AND INTEREST - PROPERTY TAX SUPPORTED BONDSDecember 31, 2005
Capital Improvement Library AgencyBonds Interest Bonds Interest Bonds Interest
2006 18,480,000 3,841,564.41 - 528,550.00 18,480,000 4,370,114.412007 17,000,000 3,161,616.90 200,000 526,550.00 17,200,000 3,688,166.902008 15,405,000 2,526,510.64 200,000 522,050.00 15,605,000 3,048,560.642009 14,125,000 1,942,575.01 200,000 516,800.00 14,325,000 2,459,375.012010 12,610,000 1,408,525.01 200,000 511,050.00 12,810,000 1,919,575.012011 10,615,000 952,481.26 200,000 505,050.00 10,815,000 1,457,531.262012 8,670,000 588,318.76 400,000 495,050.00 9,070,000 1,083,368.762013 6,640,000 314,621.88 700,000 475,800.00 7,340,000 790,421.882014 2,230,000 112,900.00 1,000,000 443,550.00 3,230,000 556,450.002015 1,145,000 22,900.00 1,000,000 401,050.00 2,145,000 423,950.002016 - - 1,000,000 356,050.00 1,000,000 356,050.002017 - - 1,000,000 311,050.00 1,000,000 311,050.002018 - - 1,000,000 266,050.00 1,000,000 266,050.002019 - - 1,000,000 221,050.00 1,000,000 221,050.002020 - - 975,000 175,393.75 975,000 175,393.752021 - - 925,000 130,268.75 925,000 130,268.752022 - - 900,000 86,925.00 900,000 86,925.002023 - - 780,000 47,025.00 780,000 47,025.002024 - - 600,000 14,250.00 600,000 14,250.00
106,920,000 14,872,013.87 12,280,000 6,533,562.50 119,200,000 21,405,576.37
Total
224
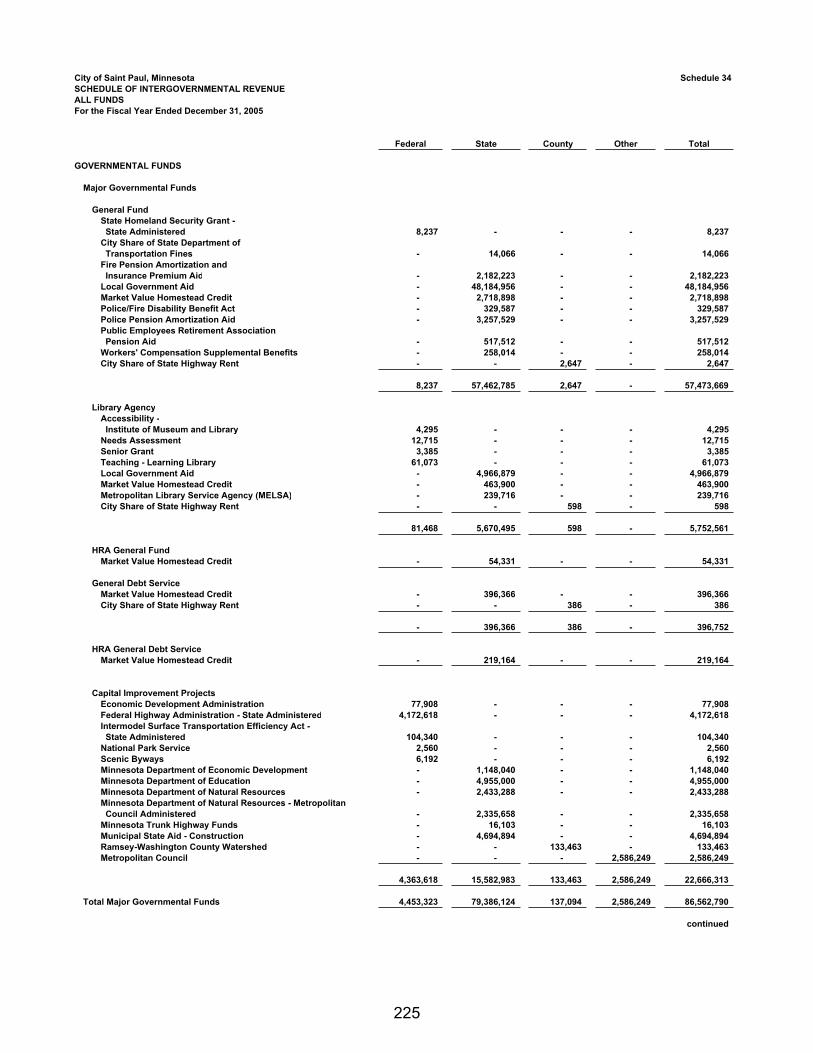
City of Saint Paul, Minnesota Schedule 34SCHEDULE OF INTERGOVERNMENTAL REVENUEALL FUNDSFor the Fiscal Year Ended December 31, 2005
Federal State County Other Total
GOVERNMENTAL FUNDS
Major Governmental Funds
General FundState Homeland Security Grant - State Administered 8,237 - - - 8,237City Share of State Department of Transportation Fines - 14,066 - - 14,066Fire Pension Amortization and Insurance Premium Aid - 2,182,223 - - 2,182,223Local Government Aid - 48,184,956 - - 48,184,956Market Value Homestead Credit - 2,718,898 - - 2,718,898Police/Fire Disability Benefit Act - 329,587 - - 329,587Police Pension Amortization Aid - 3,257,529 - - 3,257,529Public Employees Retirement Association Pension Aid - 517,512 - - 517,512Workers' Compensation Supplemental Benefits - 258,014 - - 258,014City Share of State Highway Rent - - 2,647 - 2,647
8,237 57,462,785 2,647 - 57,473,669
Library AgencyAccessibility - Institute of Museum and Library 4,295 - - - 4,295Needs Assessment 12,715 - - - 12,715Senior Grant 3,385 - - - 3,385Teaching - Learning Library 61,073 - - - 61,073Local Government Aid - 4,966,879 - - 4,966,879Market Value Homestead Credit - 463,900 - - 463,900Metropolitan Library Service Agency (MELSA) - 239,716 - - 239,716City Share of State Highway Rent - - 598 - 598
81,468 5,670,495 598 - 5,752,561
HRA General FundMarket Value Homestead Credit - 54,331 - - 54,331
General Debt ServiceMarket Value Homestead Credit - 396,366 - - 396,366City Share of State Highway Rent - - 386 - 386
- 396,366 386 - 396,752
HRA General Debt ServiceMarket Value Homestead Credit - 219,164 - - 219,164
Capital Improvement ProjectsEconomic Development Administration 77,908 - - - 77,908Federal Highway Administration - State Administered 4,172,618 - - - 4,172,618Intermodel Surface Transportation Efficiency Act - State Administered 104,340 - - - 104,340National Park Service 2,560 - - - 2,560Scenic Byways 6,192 - - - 6,192Minnesota Department of Economic Development - 1,148,040 - - 1,148,040Minnesota Department of Education - 4,955,000 - - 4,955,000Minnesota Department of Natural Resources - 2,433,288 - - 2,433,288Minnesota Department of Natural Resources - Metropolitan Council Administered - 2,335,658 - - 2,335,658Minnesota Trunk Highway Funds - 16,103 - - 16,103Municipal State Aid - Construction - 4,694,894 - - 4,694,894Ramsey-Washington County Watershed - - 133,463 - 133,463Metropolitan Council - - - 2,586,249 2,586,249
4,363,618 15,582,983 133,463 2,586,249 22,666,313
Total Major Governmental Funds 4,453,323 79,386,124 137,094 2,586,249 86,562,790
continued
225
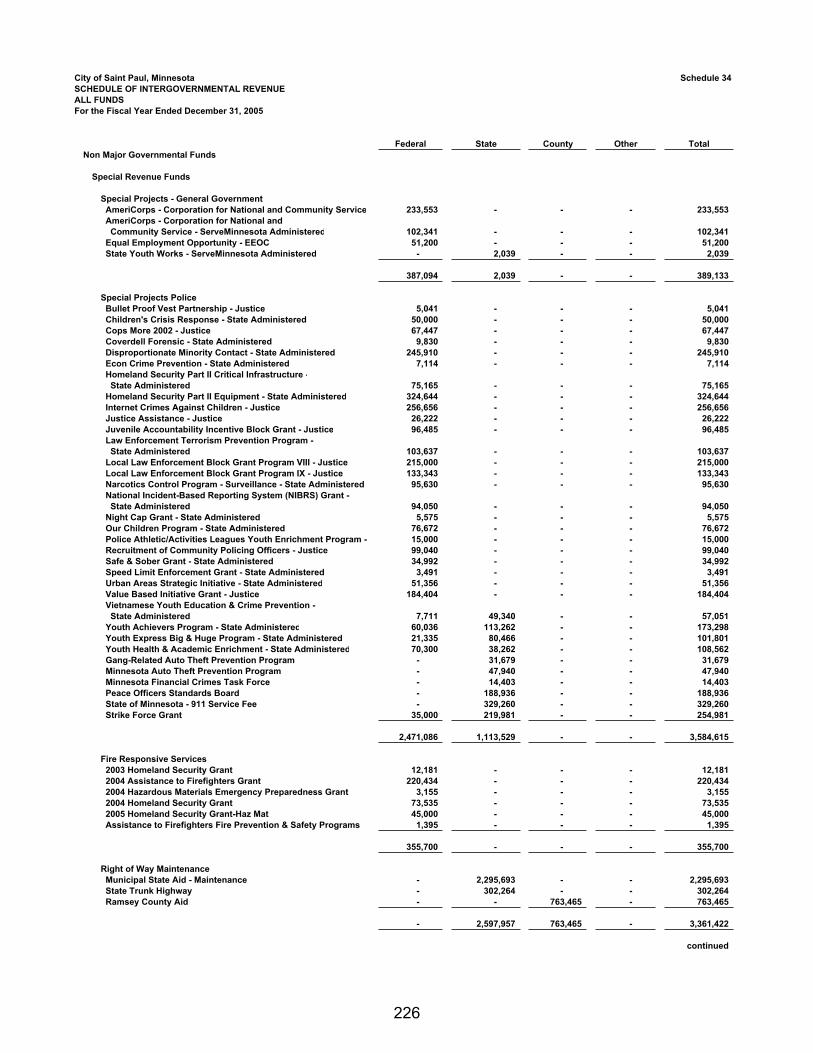
City of Saint Paul, Minnesota Schedule 34SCHEDULE OF INTERGOVERNMENTAL REVENUEALL FUNDSFor the Fiscal Year Ended December 31, 2005
Federal State County Other TotalNon Major Governmental Funds
Special Revenue Funds
Special Projects - General Government AmeriCorps - Corporation for National and Community Service 233,553 - - - 233,553 AmeriCorps - Corporation for National and Community Service - ServeMinnesota Administered 102,341 - - - 102,341 Equal Employment Opportunity - EEOC 51,200 - - - 51,200 State Youth Works - ServeMinnesota Administered - 2,039 - - 2,039
387,094 2,039 - - 389,133
Special Projects Police Bullet Proof Vest Partnership - Justice 5,041 - - - 5,041 Children's Crisis Response - State Administered 50,000 - - - 50,000 Cops More 2002 - Justice 67,447 - - - 67,447 Coverdell Forensic - State Administered 9,830 - - - 9,830 Disproportionate Minority Contact - State Administered 245,910 - - - 245,910 Econ Crime Prevention - State Administered 7,114 - - - 7,114 Homeland Security Part II Critical Infrastructure - State Administered 75,165 - - - 75,165 Homeland Security Part II Equipment - State Administered 324,644 - - - 324,644 Internet Crimes Against Children - Justice 256,656 - - - 256,656 Justice Assistance - Justice 26,222 - - - 26,222 Juvenile Accountability Incentive Block Grant - Justice 96,485 - - - 96,485 Law Enforcement Terrorism Prevention Program - State Administered 103,637 - - - 103,637 Local Law Enforcement Block Grant Program VIII - Justice 215,000 - - - 215,000 Local Law Enforcement Block Grant Program IX - Justice 133,343 - - - 133,343 Narcotics Control Program - Surveillance - State Administered 95,630 - - - 95,630 National Incident-Based Reporting System (NIBRS) Grant - State Administered 94,050 - - - 94,050 Night Cap Grant - State Administered 5,575 - - - 5,575 Our Children Program - State Administered 76,672 - - - 76,672 Police Athletic/Activities Leagues Youth Enrichment Program - 15,000 - - - 15,000 Recruitment of Community Policing Officers - Justice 99,040 - - - 99,040 Safe & Sober Grant - State Administered 34,992 - - - 34,992 Speed Limit Enforcement Grant - State Administered 3,491 - - - 3,491 Urban Areas Strategic Initiative - State Administered 51,356 - - - 51,356 Value Based Initiative Grant - Justice 184,404 - - - 184,404 Vietnamese Youth Education & Crime Prevention - State Administered 7,711 49,340 - - 57,051 Youth Achievers Program - State Administered 60,036 113,262 - - 173,298 Youth Express Big & Huge Program - State Administered 21,335 80,466 - - 101,801 Youth Health & Academic Enrichment - State Administered 70,300 38,262 - - 108,562 Gang-Related Auto Theft Prevention Program - 31,679 - - 31,679 Minnesota Auto Theft Prevention Program - 47,940 - - 47,940 Minnesota Financial Crimes Task Force - 14,403 - - 14,403 Peace Officers Standards Board - 188,936 - - 188,936 State of Minnesota - 911 Service Fee - 329,260 - - 329,260 Strike Force Grant 35,000 219,981 - - 254,981
2,471,086 1,113,529 - - 3,584,615
Fire Responsive Services 2003 Homeland Security Grant 12,181 - - - 12,181 2004 Assistance to Firefighters Grant 220,434 - - - 220,434 2004 Hazardous Materials Emergency Preparedness Grant 3,155 - - - 3,155 2004 Homeland Security Grant 73,535 - - - 73,535 2005 Homeland Security Grant-Haz Mat 45,000 - - - 45,000 Assistance to Firefighters Fire Prevention & Safety Programs 1,395 - - - 1,395
355,700 - - - 355,700
Right of Way Maintenance Municipal State Aid - Maintenance - 2,295,693 - - 2,295,693 State Trunk Highway - 302,264 - - 302,264 Ramsey County Aid - - 763,465 - 763,465
- 2,597,957 763,465 - 3,361,422
continued
226
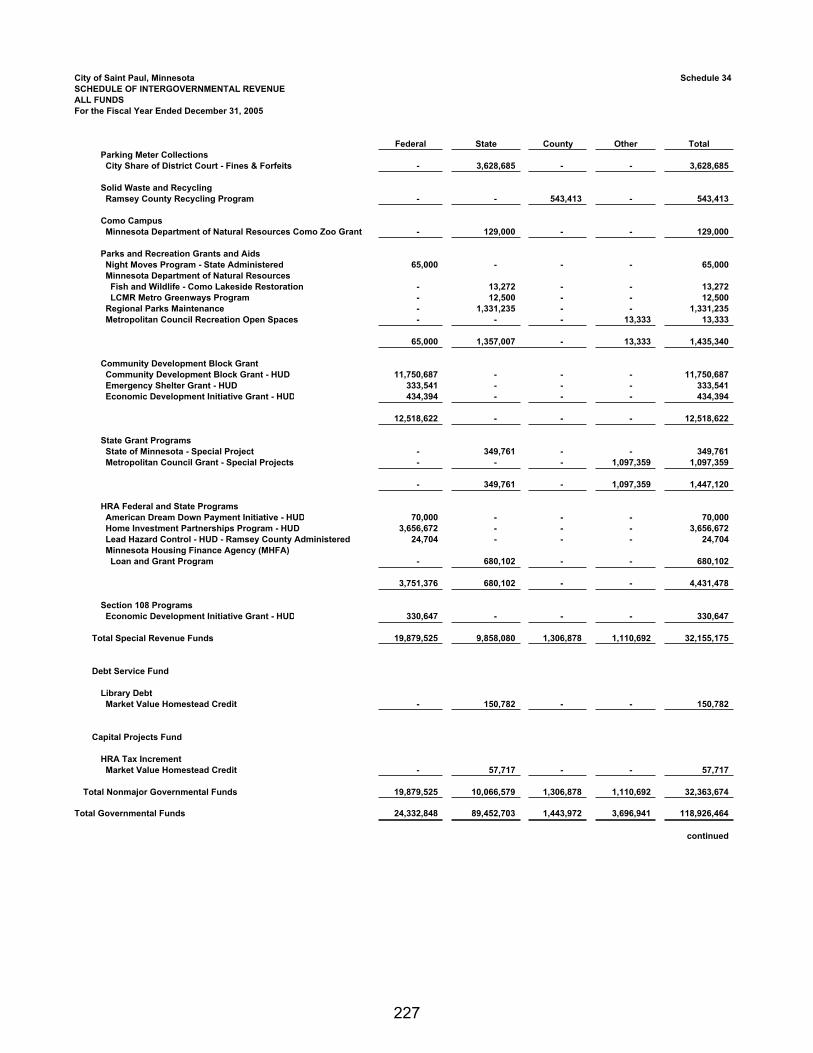
City of Saint Paul, Minnesota Schedule 34SCHEDULE OF INTERGOVERNMENTAL REVENUEALL FUNDSFor the Fiscal Year Ended December 31, 2005
Federal State County Other TotalParking Meter Collections City Share of District Court - Fines & Forfeits - 3,628,685 - - 3,628,685
Solid Waste and Recycling Ramsey County Recycling Program - - 543,413 - 543,413
Como Campus Minnesota Department of Natural Resources Como Zoo Grant - 129,000 - - 129,000
Parks and Recreation Grants and Aids Night Moves Program - State Administered 65,000 - - - 65,000 Minnesota Department of Natural Resources Fish and Wildlife - Como Lakeside Restoration - 13,272 - - 13,272 LCMR Metro Greenways Program - 12,500 - - 12,500 Regional Parks Maintenance - 1,331,235 - - 1,331,235 Metropolitan Council Recreation Open Spaces - - - 13,333 13,333
65,000 1,357,007 - 13,333 1,435,340
Community Development Block Grant Community Development Block Grant - HUD 11,750,687 - - - 11,750,687 Emergency Shelter Grant - HUD 333,541 - - - 333,541 Economic Development Initiative Grant - HUD 434,394 - - - 434,394
12,518,622 - - - 12,518,622
State Grant Programs State of Minnesota - Special Project - 349,761 - - 349,761 Metropolitan Council Grant - Special Projects - - - 1,097,359 1,097,359
- 349,761 - 1,097,359 1,447,120
HRA Federal and State Programs American Dream Down Payment Initiative - HUD 70,000 - - - 70,000 Home Investment Partnerships Program - HUD 3,656,672 - - - 3,656,672 Lead Hazard Control - HUD - Ramsey County Administered 24,704 - - - 24,704 Minnesota Housing Finance Agency (MHFA) Loan and Grant Program - 680,102 - - 680,102
3,751,376 680,102 - - 4,431,478
Section 108 Programs Economic Development Initiative Grant - HUD 330,647 - - - 330,647
Total Special Revenue Funds 19,879,525 9,858,080 1,306,878 1,110,692 32,155,175
Debt Service Fund
Library Debt Market Value Homestead Credit - 150,782 - - 150,782
Capital Projects Fund
HRA Tax Increment Market Value Homestead Credit - 57,717 - - 57,717
Total Nonmajor Governmental Funds 19,879,525 10,066,579 1,306,878 1,110,692 32,363,674
Total Governmental Funds 24,332,848 89,452,703 1,443,972 3,696,941 118,926,464
continued
227
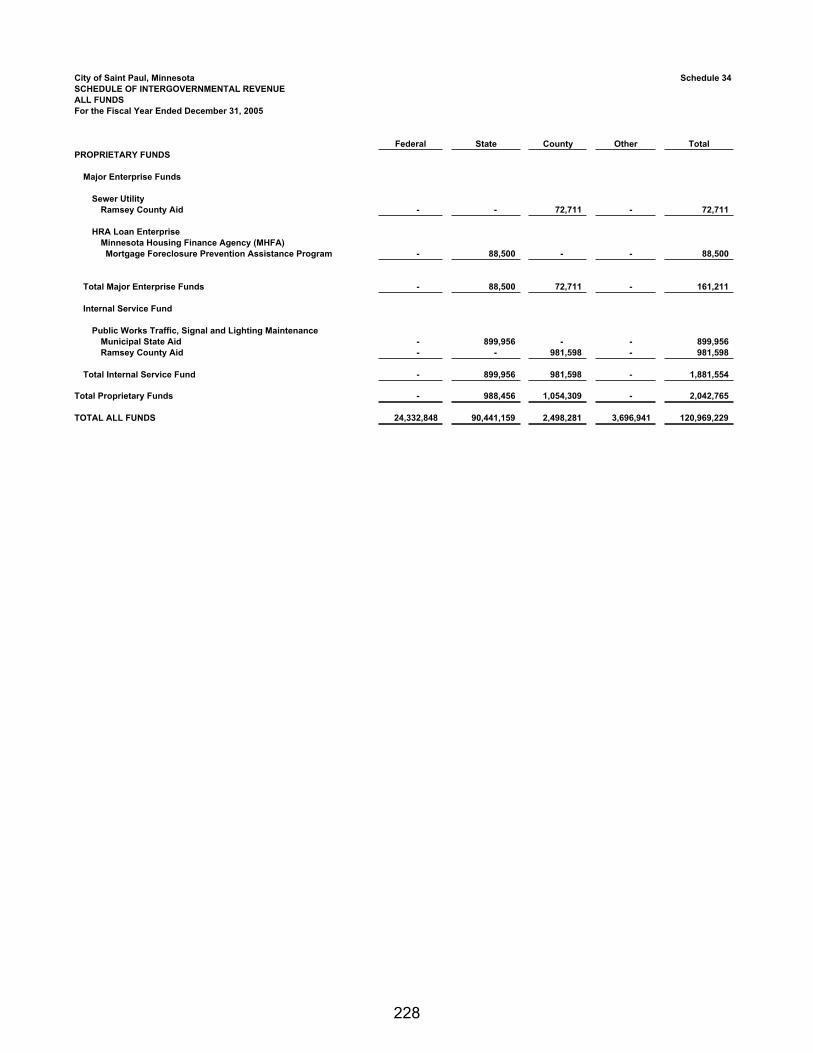
City of Saint Paul, Minnesota Schedule 34SCHEDULE OF INTERGOVERNMENTAL REVENUEALL FUNDSFor the Fiscal Year Ended December 31, 2005
Federal State County Other TotalPROPRIETARY FUNDS
Major Enterprise Funds
Sewer UtilityRamsey County Aid - - 72,711 - 72,711
HRA Loan EnterpriseMinnesota Housing Finance Agency (MHFA) Mortgage Foreclosure Prevention Assistance Program - 88,500 - - 88,500
Total Major Enterprise Funds - 88,500 72,711 - 161,211
Internal Service Fund
Public Works Traffic, Signal and Lighting MaintenanceMunicipal State Aid - 899,956 - - 899,956Ramsey County Aid - - 981,598 - 981,598
Total Internal Service Fund - 899,956 981,598 - 1,881,554
Total Proprietary Funds - 988,456 1,054,309 - 2,042,765
TOTAL ALL FUNDS 24,332,848 90,441,159 2,498,281 3,696,941 120,969,229
228
STATISTICAL SECTION
C I T Y O F S A I N T P A U L C O M P R E H E N S I V E A N N U A L F I N A N C I A L R E P O R T
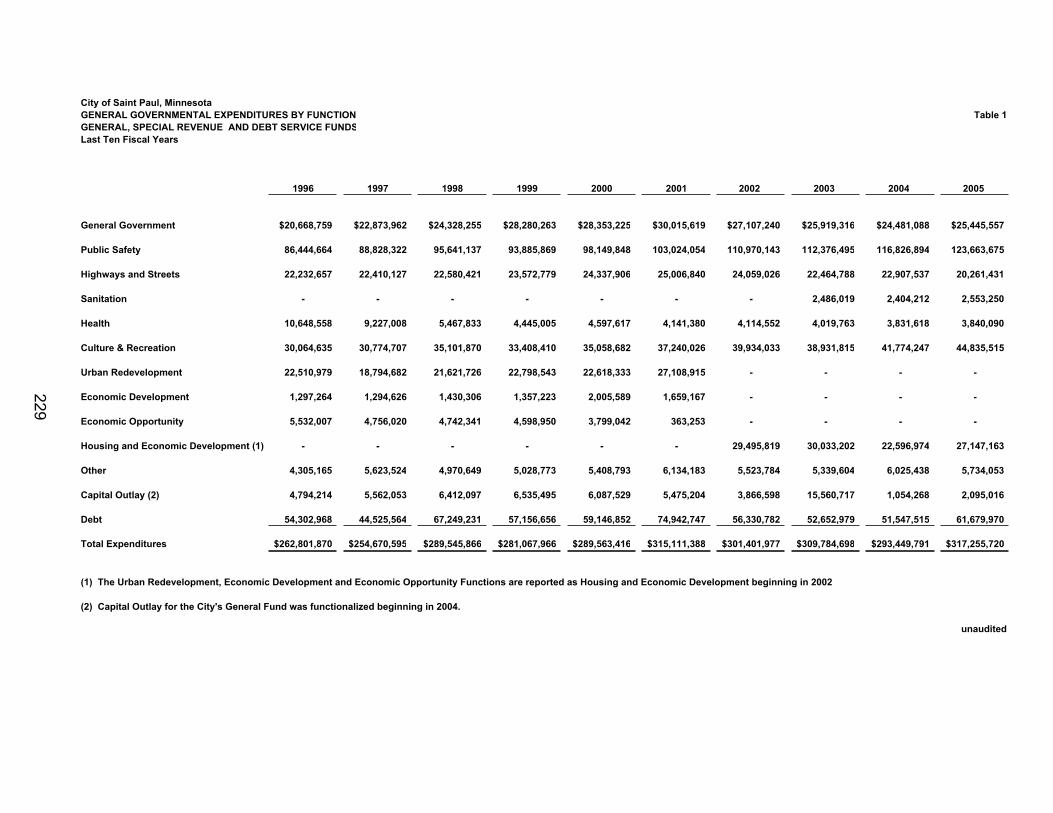
City of Saint Paul, MinnesotaGENERAL GOVERNMENTAL EXPENDITURES BY FUNCTION Table 1GENERAL, SPECIAL REVENUE AND DEBT SERVICE FUNDSLast Ten Fiscal Years
1996 1997 1998 1999 2000 2001 2002 2003 2004 2005
General Government $20,668,759 $22,873,962 $24,328,255 $28,280,263 $28,353,225 $30,015,619 $27,107,240 $25,919,316 $24,481,088 $25,445,557
Public Safety 86,444,664 88,828,322 95,641,137 93,885,869 98,149,848 103,024,054 110,970,143 112,376,495 116,826,894 123,663,675
Highways and Streets 22,232,657 22,410,127 22,580,421 23,572,779 24,337,906 25,006,840 24,059,026 22,464,788 22,907,537 20,261,431
Sanitation - - - - - - - 2,486,019 2,404,212 2,553,250
Health 10,648,558 9,227,008 5,467,833 4,445,005 4,597,617 4,141,380 4,114,552 4,019,763 3,831,618 3,840,090
Culture & Recreation 30,064,635 30,774,707 35,101,870 33,408,410 35,058,682 37,240,026 39,934,033 38,931,815 41,774,247 44,835,515
Urban Redevelopment 22,510,979 18,794,682 21,621,726 22,798,543 22,618,333 27,108,915 - - - -
Economic Development 1,297,264 1,294,626 1,430,306 1,357,223 2,005,589 1,659,167 - - - -
Economic Opportunity 5,532,007 4,756,020 4,742,341 4,598,950 3,799,042 363,253 - - - -
Housing and Economic Development (1) - - - - - - 29,495,819 30,033,202 22,596,974 27,147,163
Other 4,305,165 5,623,524 4,970,649 5,028,773 5,408,793 6,134,183 5,523,784 5,339,604 6,025,438 5,734,053
Capital Outlay (2) 4,794,214 5,562,053 6,412,097 6,535,495 6,087,529 5,475,204 3,866,598 15,560,717 1,054,268 2,095,016
Debt 54,302,968 44,525,564 67,249,231 57,156,656 59,146,852 74,942,747 56,330,782 52,652,979 51,547,515 61,679,970
Total Expenditures $262,801,870 $254,670,595 $289,545,866 $281,067,966 $289,563,416 $315,111,388 $301,401,977 $309,784,698 $293,449,791 $317,255,720
(1) The Urban Redevelopment, Economic Development and Economic Opportunity Functions are reported as Housing and Economic Development beginning in 2002
(2) Capital Outlay for the City's General Fund was functionalized beginning in 2004.
unaudited
229
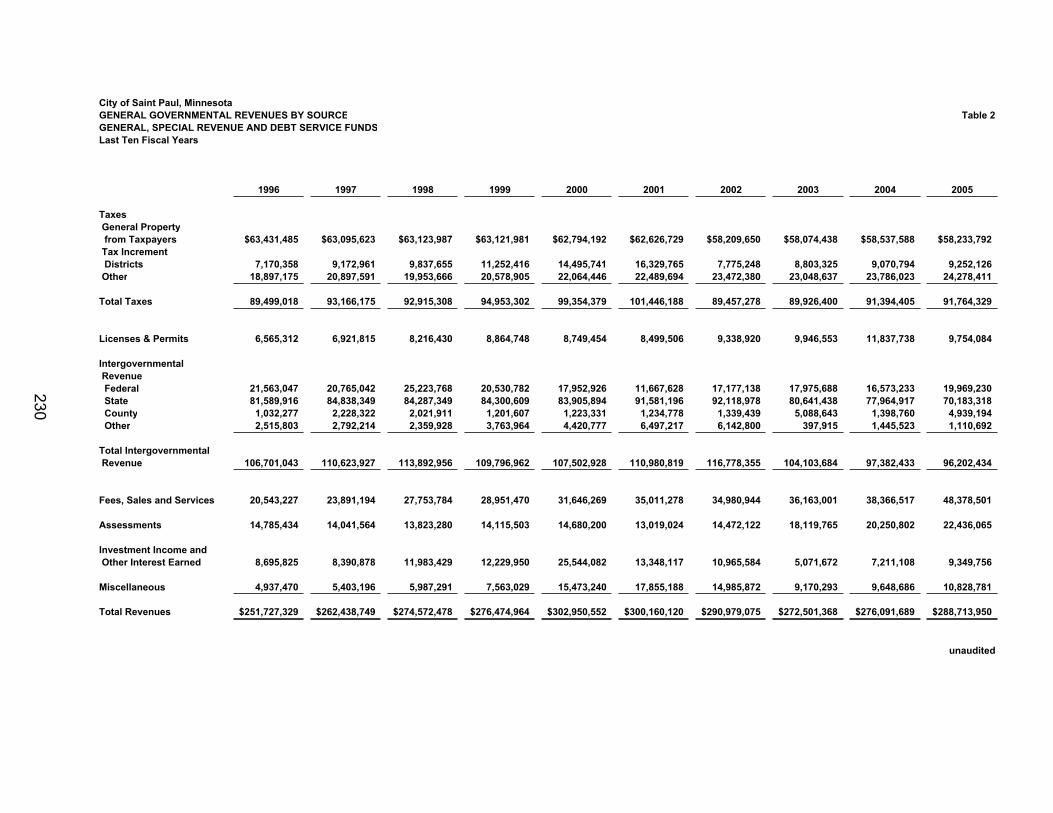
City of Saint Paul, MinnesotaGENERAL GOVERNMENTAL REVENUES BY SOURCE Table 2GENERAL, SPECIAL REVENUE AND DEBT SERVICE FUNDSLast Ten Fiscal Years
1996 1997 1998 1999 2000 2001 2002 2003 2004 2005
Taxes General Property from Taxpayers $63,431,485 $63,095,623 $63,123,987 $63,121,981 $62,794,192 $62,626,729 $58,209,650 $58,074,438 $58,537,588 $58,233,792 Tax Increment Districts 7,170,358 9,172,961 9,837,655 11,252,416 14,495,741 16,329,765 7,775,248 8,803,325 9,070,794 9,252,126 Other 18,897,175 20,897,591 19,953,666 20,578,905 22,064,446 22,489,694 23,472,380 23,048,637 23,786,023 24,278,411
Total Taxes 89,499,018 93,166,175 92,915,308 94,953,302 99,354,379 101,446,188 89,457,278 89,926,400 91,394,405 91,764,329
Licenses & Permits 6,565,312 6,921,815 8,216,430 8,864,748 8,749,454 8,499,506 9,338,920 9,946,553 11,837,738 9,754,084
Intergovernmental Revenue Federal 21,563,047 20,765,042 25,223,768 20,530,782 17,952,926 11,667,628 17,177,138 17,975,688 16,573,233 19,969,230 State 81,589,916 84,838,349 84,287,349 84,300,609 83,905,894 91,581,196 92,118,978 80,641,438 77,964,917 70,183,318 County 1,032,277 2,228,322 2,021,911 1,201,607 1,223,331 1,234,778 1,339,439 5,088,643 1,398,760 4,939,194 Other 2,515,803 2,792,214 2,359,928 3,763,964 4,420,777 6,497,217 6,142,800 397,915 1,445,523 1,110,692
Total Intergovernmental Revenue 106,701,043 110,623,927 113,892,956 109,796,962 107,502,928 110,980,819 116,778,355 104,103,684 97,382,433 96,202,434
Fees, Sales and Services 20,543,227 23,891,194 27,753,784 28,951,470 31,646,269 35,011,278 34,980,944 36,163,001 38,366,517 48,378,501
Assessments 14,785,434 14,041,564 13,823,280 14,115,503 14,680,200 13,019,024 14,472,122 18,119,765 20,250,802 22,436,065
Investment Income and Other Interest Earned 8,695,825 8,390,878 11,983,429 12,229,950 25,544,082 13,348,117 10,965,584 5,071,672 7,211,108 9,349,756
Miscellaneous 4,937,470 5,403,196 5,987,291 7,563,029 15,473,240 17,855,188 14,985,872 9,170,293 9,648,686 10,828,781
Total Revenues $251,727,329 $262,438,749 $274,572,478 $276,474,964 $302,950,552 $300,160,120 $290,979,075 $272,501,368 $276,091,689 $288,713,950
unaudited
230
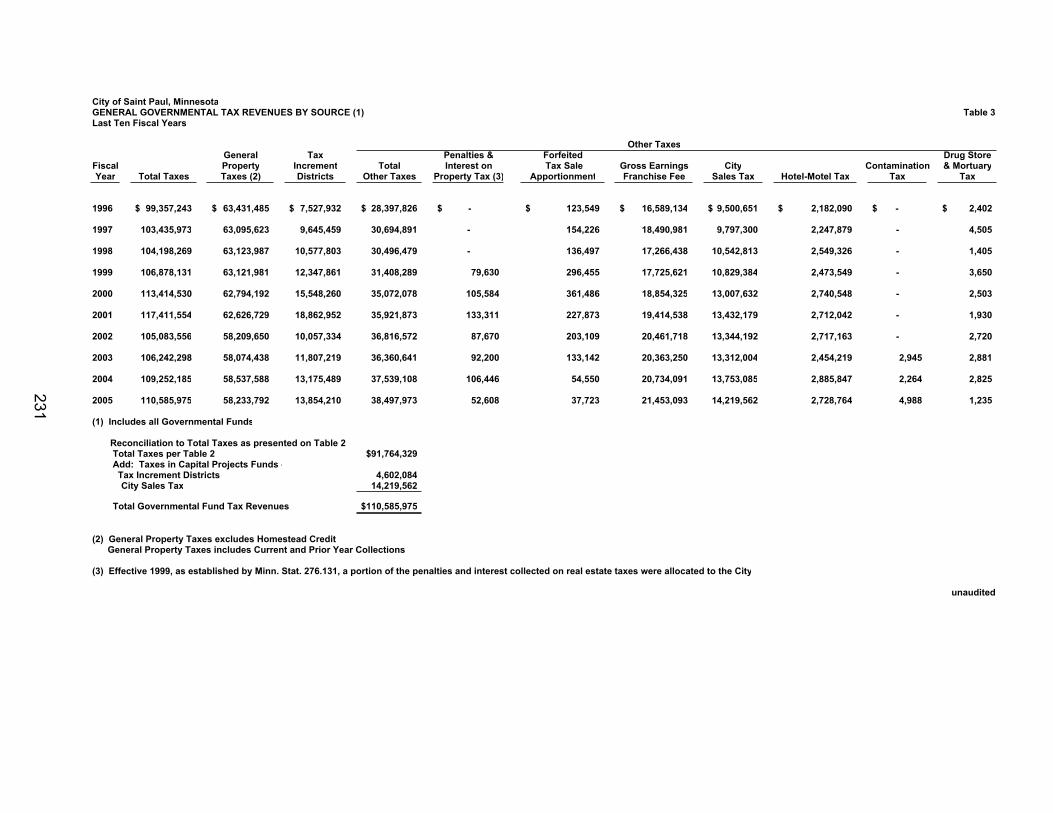
City of Saint Paul, MinnesotaGENERAL GOVERNMENTAL TAX REVENUES BY SOURCE (1) Table 3Last Ten Fiscal Years
Other TaxesGeneral Tax Penalties & Forfeited Drug Store
Fiscal Property Increment Total Interest on Tax Sale Gross Earnings City Contamination & MortuaryYear Total Taxes Taxes (2) Districts Other Taxes Property Tax (3) Apportionment Franchise Fee Sales Tax Hotel-Motel Tax Tax Tax
1996 99,357,243$ 63,431,485$ 7,527,932$ 28,397,826$ $ - 123,549$ 16,589,134$ 9,500,651$ 2,182,090$ $ - 2,402$
1997 103,435,973 63,095,623 9,645,459 30,694,891 - 154,226 18,490,981 9,797,300 2,247,879 - 4,505
1998 104,198,269 63,123,987 10,577,803 30,496,479 - 136,497 17,266,438 10,542,813 2,549,326 - 1,405
1999 106,878,131 63,121,981 12,347,861 31,408,289 79,630 296,455 17,725,621 10,829,384 2,473,549 - 3,650
2000 113,414,530 62,794,192 15,548,260 35,072,078 105,584 361,486 18,854,325 13,007,632 2,740,548 - 2,503
2001 117,411,554 62,626,729 18,862,952 35,921,873 133,311 227,873 19,414,538 13,432,179 2,712,042 - 1,930
2002 105,083,556 58,209,650 10,057,334 36,816,572 87,670 203,109 20,461,718 13,344,192 2,717,163 - 2,720
2003 106,242,298 58,074,438 11,807,219 36,360,641 92,200 133,142 20,363,250 13,312,004 2,454,219 2,945 2,881
2004 109,252,185 58,537,588 13,175,489 37,539,108 106,446 54,550 20,734,091 13,753,085 2,885,847 2,264 2,825
2005 110,585,975 58,233,792 13,854,210 38,497,973 52,608 37,723 21,453,093 14,219,562 2,728,764 4,988 1,235
(1) Includes all Governmental Funds
Reconciliation to Total Taxes as presented on Table 2: Total Taxes per Table 2 $91,764,329 Add: Taxes in Capital Projects Funds - Tax Increment Districts 4,602,084 City Sales Tax 14,219,562
Total Governmental Fund Tax Revenues $110,585,975
(2) General Property Taxes excludes Homestead Credit. General Property Taxes includes Current and Prior Year Collections
(3) Effective 1999, as established by Minn. Stat. 276.131, a portion of the penalties and interest collected on real estate taxes were allocated to the City
unaudited
231
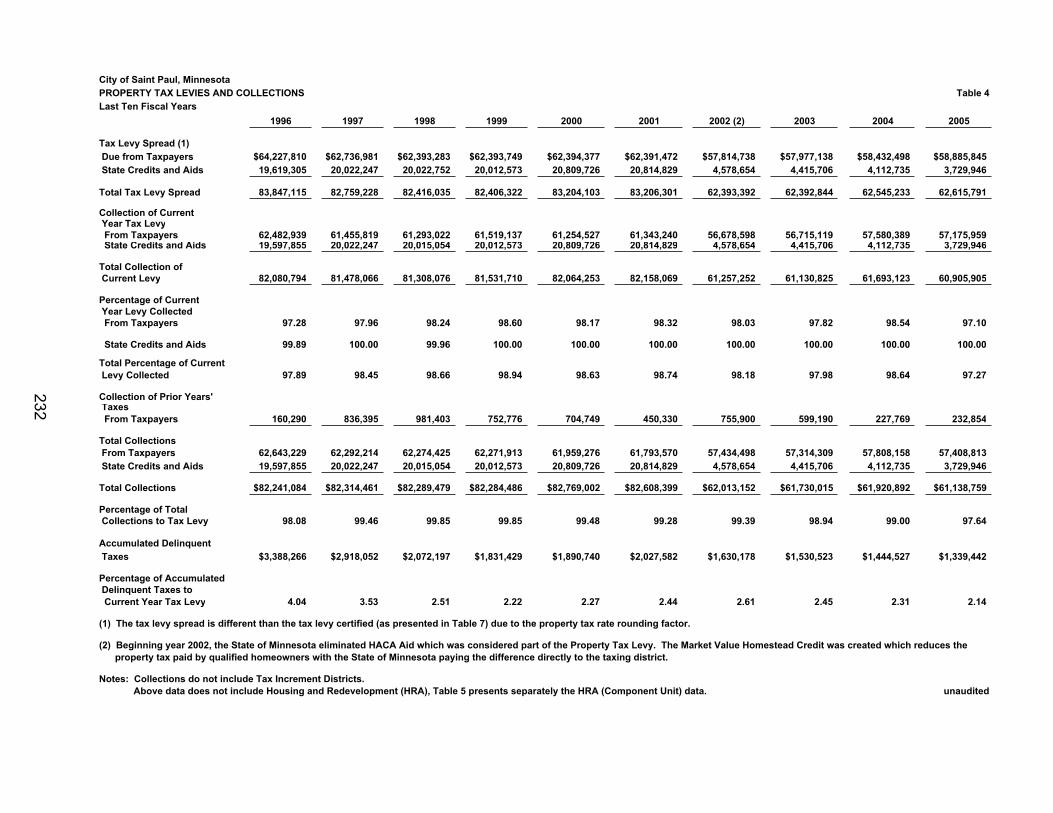
City of Saint Paul, MinnesotaPROPERTY TAX LEVIES AND COLLECTIONS Table 4Last Ten Fiscal Years
1996 1997 1998 1999 2000 2001 2002 (2) 2003 2004 2005
Tax Levy Spread (1) Due from Taxpayers $64,227,810 $62,736,981 $62,393,283 $62,393,749 $62,394,377 $62,391,472 $57,814,738 $57,977,138 $58,432,498 $58,885,845 State Credits and Aids 19,619,305 20,022,247 20,022,752 20,012,573 20,809,726 20,814,829 4,578,654 4,415,706 4,112,735 3,729,946
Total Tax Levy Spread 83,847,115 82,759,228 82,416,035 82,406,322 83,204,103 83,206,301 62,393,392 62,392,844 62,545,233 62,615,791
Collection of Current Year Tax Levy From Taxpayers 62,482,939 61,455,819 61,293,022 61,519,137 61,254,527 61,343,240 56,678,598 56,715,119 57,580,389 57,175,959State Credits and Aids 19,597,855 20,022,247 20,015,054 20,012,573 20,809,726 20,814,829 4,578,654 4,415,706 4,112,735 3,729,946
Total Collection of Current Levy 82,080,794 81,478,066 81,308,076 81,531,710 82,064,253 82,158,069 61,257,252 61,130,825 61,693,123 60,905,905
Percentage of Current Year Levy Collected From Taxpayers 97.28 97.96 98.24 98.60 98.17 98.32 98.03 97.82 98.54 97.10
State Credits and Aids 99.89 100.00 99.96 100.00 100.00 100.00 100.00 100.00 100.00 100.00
Total Percentage of Current Levy Collected 97.89 98.45 98.66 98.94 98.63 98.74 98.18 97.98 98.64 97.27
Collection of Prior Years'Taxes
From Taxpayers 160,290 836,395 981,403 752,776 704,749 450,330 755,900 599,190 227,769 232,854
Total Collections From Taxpayers 62,643,229 62,292,214 62,274,425 62,271,913 61,959,276 61,793,570 57,434,498 57,314,309 57,808,158 57,408,813 State Credits and Aids 19,597,855 20,022,247 20,015,054 20,012,573 20,809,726 20,814,829 4,578,654 4,415,706 4,112,735 3,729,946
Total Collections $82,241,084 $82,314,461 $82,289,479 $82,284,486 $82,769,002 $82,608,399 $62,013,152 $61,730,015 $61,920,892 $61,138,759
Percentage of Total Collections to Tax Levy 98.08 99.46 99.85 99.85 99.48 99.28 99.39 98.94 99.00 97.64
Accumulated Delinquent Taxes $3,388,266 $2,918,052 $2,072,197 $1,831,429 $1,890,740 $2,027,582 $1,630,178 $1,530,523 $1,444,527 $1,339,442
Percentage of Accumulated Delinquent Taxes to Current Year Tax Levy 4.04 3.53 2.51 2.22 2.27 2.44 2.61 2.45 2.31 2.14
(1) The tax levy spread is different than the tax levy certified (as presented in Table 7) due to the property tax rate rounding factor.
(2) Beginning year 2002, the State of Minnesota eliminated HACA Aid which was considered part of the Property Tax Levy. The Market Value Homestead Credit was created which reduces the property tax paid by qualified homeowners with the State of Minnesota paying the difference directly to the taxing district.
Notes: Collections do not include Tax Increment Districts. Above data does not include Housing and Redevelopment (HRA), Table 5 presents separately the HRA (Component Unit) data. unaudited
232
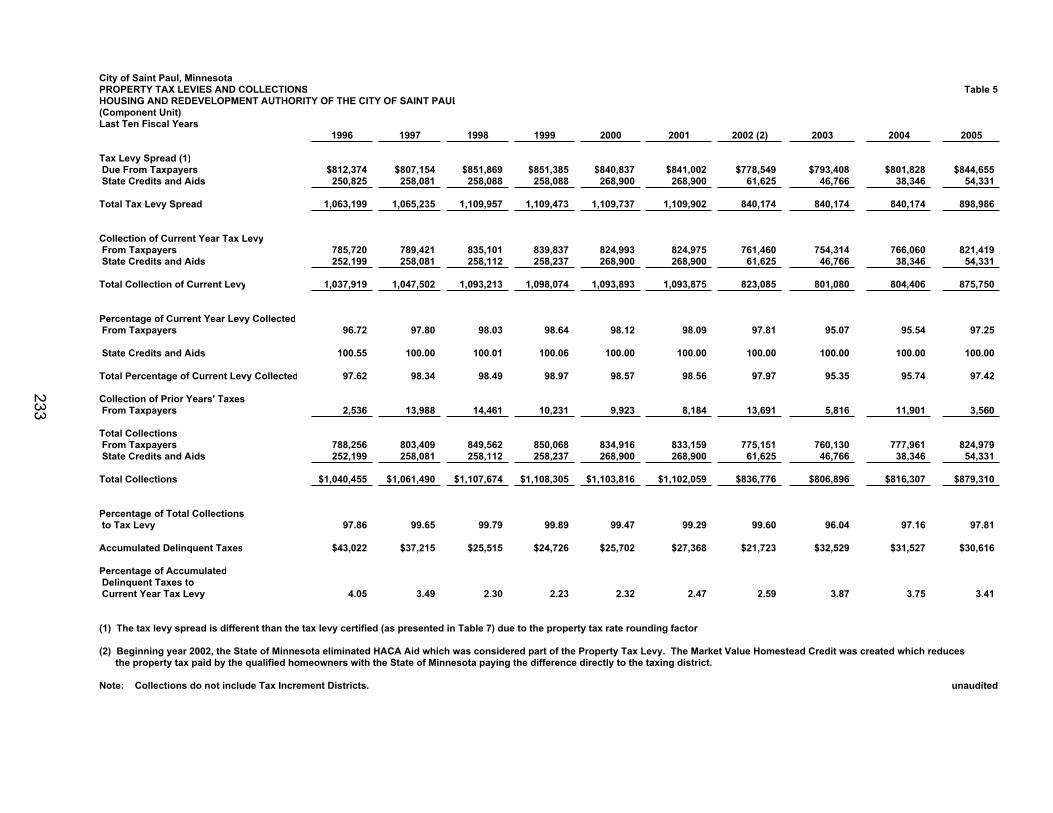
City of Saint Paul, MinnesotaPROPERTY TAX LEVIES AND COLLECTIONS Table 5HOUSING AND REDEVELOPMENT AUTHORITY OF THE CITY OF SAINT PAUL(Component Unit)Last Ten Fiscal Years
1996 1997 1998 1999 2000 2001 2002 (2) 2003 2004 2005
Tax Levy Spread (1) Due From Taxpayers $812,374 $807,154 $851,869 $851,385 $840,837 $841,002 $778,549 $793,408 $801,828 $844,655 State Credits and Aids 250,825 258,081 258,088 258,088 268,900 268,900 61,625 46,766 38,346 54,331
Total Tax Levy Spread 1,063,199 1,065,235 1,109,957 1,109,473 1,109,737 1,109,902 840,174 840,174 840,174 898,986
Collection of Current Year Tax Levy From Taxpayers 785,720 789,421 835,101 839,837 824,993 824,975 761,460 754,314 766,060 821,419 State Credits and Aids 252,199 258,081 258,112 258,237 268,900 268,900 61,625 46,766 38,346 54,331
Total Collection of Current Levy 1,037,919 1,047,502 1,093,213 1,098,074 1,093,893 1,093,875 823,085 801,080 804,406 875,750
Percentage of Current Year Levy Collected From Taxpayers 96.72 97.80 98.03 98.64 98.12 98.09 97.81 95.07 95.54 97.25
State Credits and Aids 100.55 100.00 100.01 100.06 100.00 100.00 100.00 100.00 100.00 100.00
Total Percentage of Current Levy Collected 97.62 98.34 98.49 98.97 98.57 98.56 97.97 95.35 95.74 97.42
Collection of Prior Years' Taxes From Taxpayers 2,536 13,988 14,461 10,231 9,923 8,184 13,691 5,816 11,901 3,560
Total Collections From Taxpayers 788,256 803,409 849,562 850,068 834,916 833,159 775,151 760,130 777,961 824,979 State Credits and Aids 252,199 258,081 258,112 258,237 268,900 268,900 61,625 46,766 38,346 54,331
Total Collections $1,040,455 $1,061,490 $1,107,674 $1,108,305 $1,103,816 $1,102,059 $836,776 $806,896 $816,307 $879,310
Percentage of Total Collections to Tax Levy 97.86 99.65 99.79 99.89 99.47 99.29 99.60 96.04 97.16 97.81
Accumulated Delinquent Taxes $43,022 $37,215 $25,515 $24,726 $25,702 $27,368 $21,723 $32,529 $31,527 $30,616
Percentage of Accumulated Delinquent Taxes to Current Year Tax Levy 4.05 3.49 2.30 2.23 2.32 2.47 2.59 3.87 3.75 3.41
(1) The tax levy spread is different than the tax levy certified (as presented in Table 7) due to the property tax rate rounding factor
(2) Beginning year 2002, the State of Minnesota eliminated HACA Aid which was considered part of the Property Tax Levy. The Market Value Homestead Credit was created which reduces the property tax paid by the qualified homeowners with the State of Minnesota paying the difference directly to the taxing district.
Note: Collections do not include Tax Increment Districts. unaudited
233
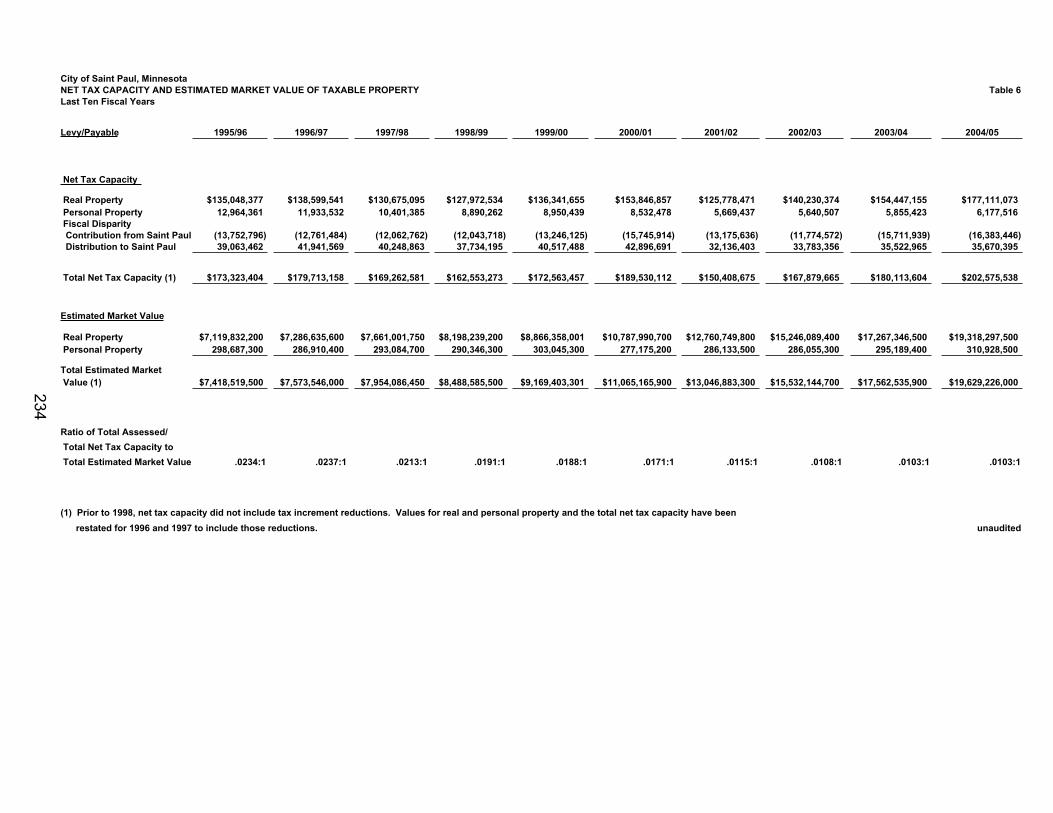
City of Saint Paul, MinnesotaNET TAX CAPACITY AND ESTIMATED MARKET VALUE OF TAXABLE PROPERTY Table 6Last Ten Fiscal Years
Levy/Payable 1995/96 1996/97 1997/98 1998/99 1999/00 2000/01 2001/02 2002/03 2003/04 2004/05
Net Tax Capacity
Real Property $135,048,377 $138,599,541 $130,675,095 $127,972,534 $136,341,655 $153,846,857 $125,778,471 $140,230,374 $154,447,155 $177,111,073 Personal Property 12,964,361 11,933,532 10,401,385 8,890,262 8,950,439 8,532,478 5,669,437 5,640,507 5,855,423 6,177,516 Fiscal Disparity Contribution from Saint Paul (13,752,796) (12,761,484) (12,062,762) (12,043,718) (13,246,125) (15,745,914) (13,175,636) (11,774,572) (15,711,939) (16,383,446) Distribution to Saint Paul 39,063,462 41,941,569 40,248,863 37,734,195 40,517,488 42,896,691 32,136,403 33,783,356 35,522,965 35,670,395
Total Net Tax Capacity (1) $173,323,404 $179,713,158 $169,262,581 $162,553,273 $172,563,457 $189,530,112 $150,408,675 $167,879,665 $180,113,604 $202,575,538
Estimated Market Value
Real Property $7,119,832,200 $7,286,635,600 $7,661,001,750 $8,198,239,200 $8,866,358,001 $10,787,990,700 $12,760,749,800 $15,246,089,400 $17,267,346,500 $19,318,297,500 Personal Property 298,687,300 286,910,400 293,084,700 290,346,300 303,045,300 277,175,200 286,133,500 286,055,300 295,189,400 310,928,500
Total Estimated Market Value (1) $7,418,519,500 $7,573,546,000 $7,954,086,450 $8,488,585,500 $9,169,403,301 $11,065,165,900 $13,046,883,300 $15,532,144,700 $17,562,535,900 $19,629,226,000
Ratio of Total Assessed/ Total Net Tax Capacity to Total Estimated Market Value .0234:1 .0237:1 .0213:1 .0191:1 .0188:1 .0171:1 .0115:1 .0108:1 .0103:1 .0103:1
(1) Prior to 1998, net tax capacity did not include tax increment reductions. Values for real and personal property and the total net tax capacity have been restated for 1996 and 1997 to include those reductions. unaudited
234
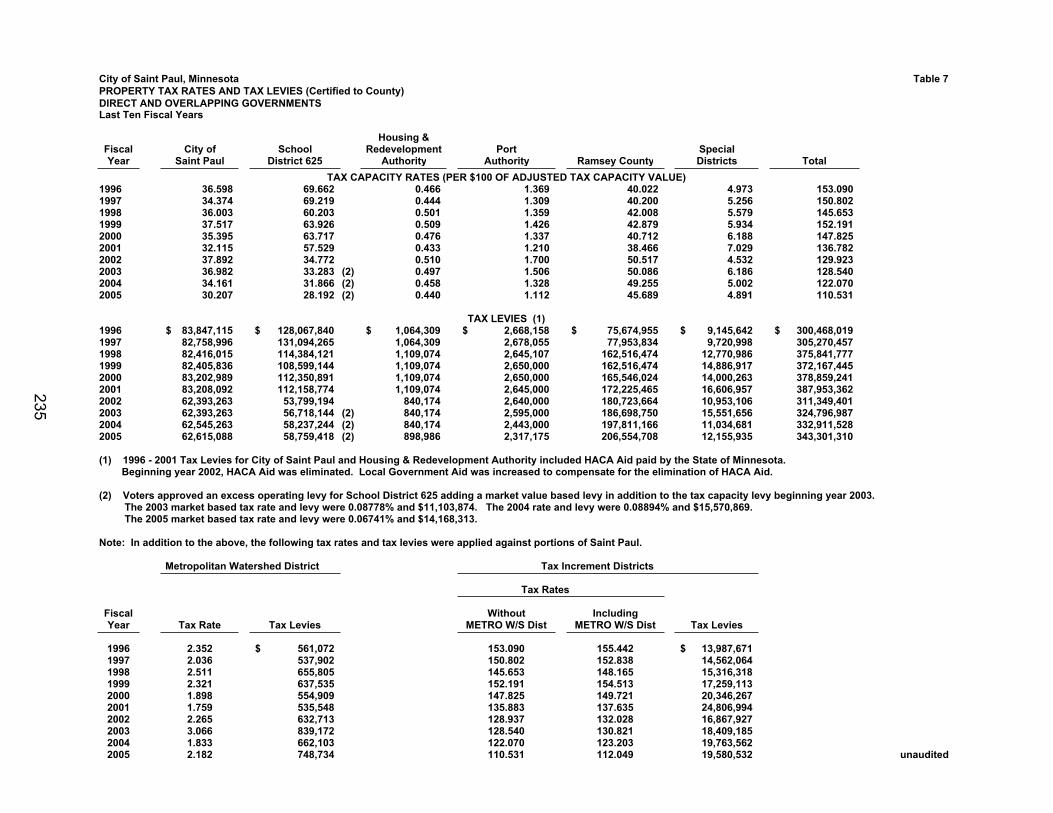
City of Saint Paul, Minnesota Table 7PROPERTY TAX RATES AND TAX LEVIES (Certified to County)DIRECT AND OVERLAPPING GOVERNMENTSLast Ten Fiscal Years
Housing &Fiscal City of School Redevelopment Port SpecialYear Saint Paul District 625 Authority Authority Ramsey County Districts Total
TAX CAPACITY RATES (PER $100 OF ADJUSTED TAX CAPACITY VALUE)1996 36.598 69.662 0.466 1.369 40.022 4.973 153.0901997 34.374 69.219 0.444 1.309 40.200 5.256 150.8021998 36.003 60.203 0.501 1.359 42.008 5.579 145.6531999 37.517 63.926 0.509 1.426 42.879 5.934 152.1912000 35.395 63.717 0.476 1.337 40.712 6.188 147.8252001 32.115 57.529 0.433 1.210 38.466 7.029 136.7822002 37.892 34.772 0.510 1.700 50.517 4.532 129.9232003 36.982 33.283 (2) 0.497 1.506 50.086 6.186 128.5402004 34.161 31.866 (2) 0.458 1.328 49.255 5.002 122.0702005 30.207 28.192 (2) 0.440 1.112 45.689 4.891 110.531
TAX LEVIES (1)1996 83,847,115$ 128,067,840$ 1,064,309$ 2,668,158$ 75,674,955$ 9,145,642$ 300,468,019$1997 82,758,996 131,094,265 1,064,309 2,678,055 77,953,834 9,720,998 305,270,4571998 82,416,015 114,384,121 1,109,074 2,645,107 162,516,474 12,770,986 375,841,7771999 82,405,836 108,599,144 1,109,074 2,650,000 162,516,474 14,886,917 372,167,4452000 83,202,989 112,350,891 1,109,074 2,650,000 165,546,024 14,000,263 378,859,2412001 83,208,092 112,158,774 1,109,074 2,645,000 172,225,465 16,606,957 387,953,3622002 62,393,263 53,799,194 840,174 2,640,000 180,723,664 10,953,106 311,349,4012003 62,393,263 56,718,144 (2) 840,174 2,595,000 186,698,750 15,551,656 324,796,9872004 62,545,263 58,237,244 (2) 840,174 2,443,000 197,811,166 11,034,681 332,911,5282005 62,615,088 58,759,418 (2) 898,986 2,317,175 206,554,708 12,155,935 343,301,310
(1) 1996 - 2001 Tax Levies for City of Saint Paul and Housing & Redevelopment Authority included HACA Aid paid by the State of Minnesota. Beginning year 2002, HACA Aid was eliminated. Local Government Aid was increased to compensate for the elimination of HACA Aid.
(2) Voters approved an excess operating levy for School District 625 adding a market value based levy in addition to the tax capacity levy beginning year 2003. The 2003 market based tax rate and levy were 0.08778% and $11,103,874. The 2004 rate and levy were 0.08894% and $15,570,869. The 2005 market based tax rate and levy were 0.06741% and $14,168,313.
Note: In addition to the above, the following tax rates and tax levies were applied against portions of Saint Paul.
Metropolitan Watershed District Tax Increment Districts
Tax Rates
Fiscal Without IncludingYear Tax Rate Tax Levies METRO W/S Dist METRO W/S Dist Tax Levies
1996 2.352 561,072$ 153.090 155.442 13,987,671$1997 2.036 537,902 150.802 152.838 14,562,0641998 2.511 655,805 145.653 148.165 15,316,3181999 2.321 637,535 152.191 154.513 17,259,1132000 1.898 554,909 147.825 149.721 20,346,2672001 1.759 535,548 135.883 137.635 24,806,9942002 2.265 632,713 128.937 132.028 16,867,9272003 3.066 839,172 128.540 130.821 18,409,1852004 1.833 662,103 122.070 123.203 19,763,5622005 2.182 748,734 110.531 112.049 19,580,532 unaudited
235
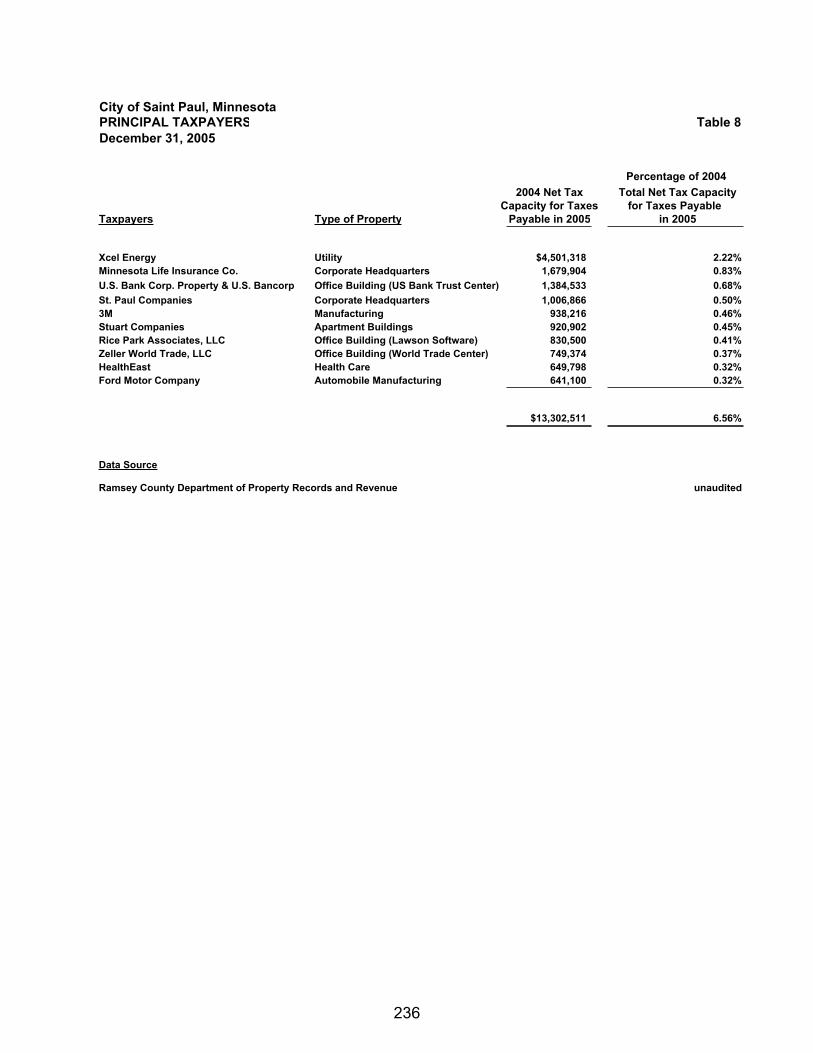
City of Saint Paul, MinnesotaPRINCIPAL TAXPAYERS Table 8December 31, 2005
Percentage of 20042004 Net Tax Total Net Tax Capacity
Capacity for Taxes for Taxes Payable Taxpayers Type of Property Payable in 2005 in 2005
Xcel Energy Utility $4,501,318 2.22%Minnesota Life Insurance Co. Corporate Headquarters 1,679,904 0.83%U.S. Bank Corp. Property & U.S. Bancorp Office Building (US Bank Trust Center) 1,384,533 0.68%St. Paul Companies Corporate Headquarters 1,006,866 0.50%3M Manufacturing 938,216 0.46%Stuart Companies Apartment Buildings 920,902 0.45%Rice Park Associates, LLC Office Building (Lawson Software) 830,500 0.41%Zeller World Trade, LLC Office Building (World Trade Center) 749,374 0.37%HealthEast Health Care 649,798 0.32%Ford Motor Company Automobile Manufacturing 641,100 0.32%
$13,302,511 6.56%
Data Source
Ramsey County Department of Property Records and Revenue unaudited
236
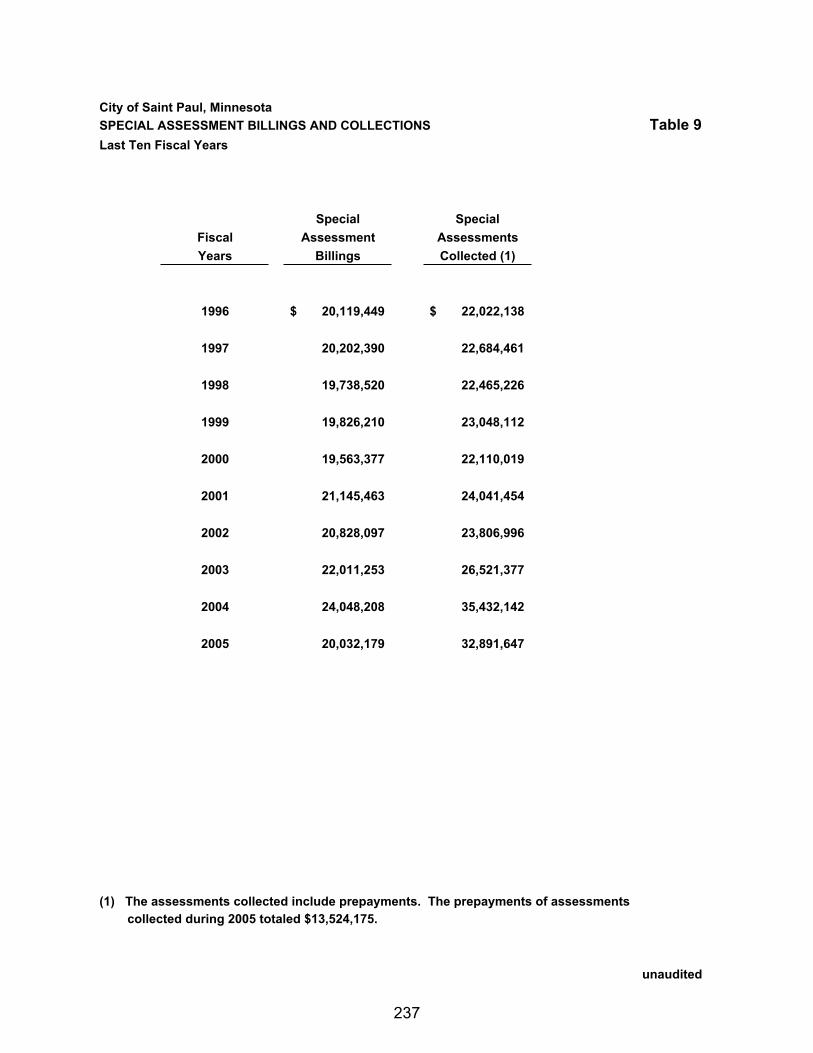
City of Saint Paul, MinnesotaSPECIAL ASSESSMENT BILLINGS AND COLLECTIONS Table 9Last Ten Fiscal Years
Special SpecialFiscal Assessment AssessmentsYears Billings Collected (1)
1996 20,119,449$ 22,022,138$
1997 20,202,390 22,684,461
1998 19,738,520 22,465,226
1999 19,826,210 23,048,112
2000 19,563,377 22,110,019
2001 21,145,463 24,041,454
2002 20,828,097 23,806,996
2003 22,011,253 26,521,377
2004 24,048,208 35,432,142
2005 20,032,179 32,891,647
(1) The assessments collected include prepayments. The prepayments of assessments collected during 2005 totaled $13,524,175.
unaudited
237
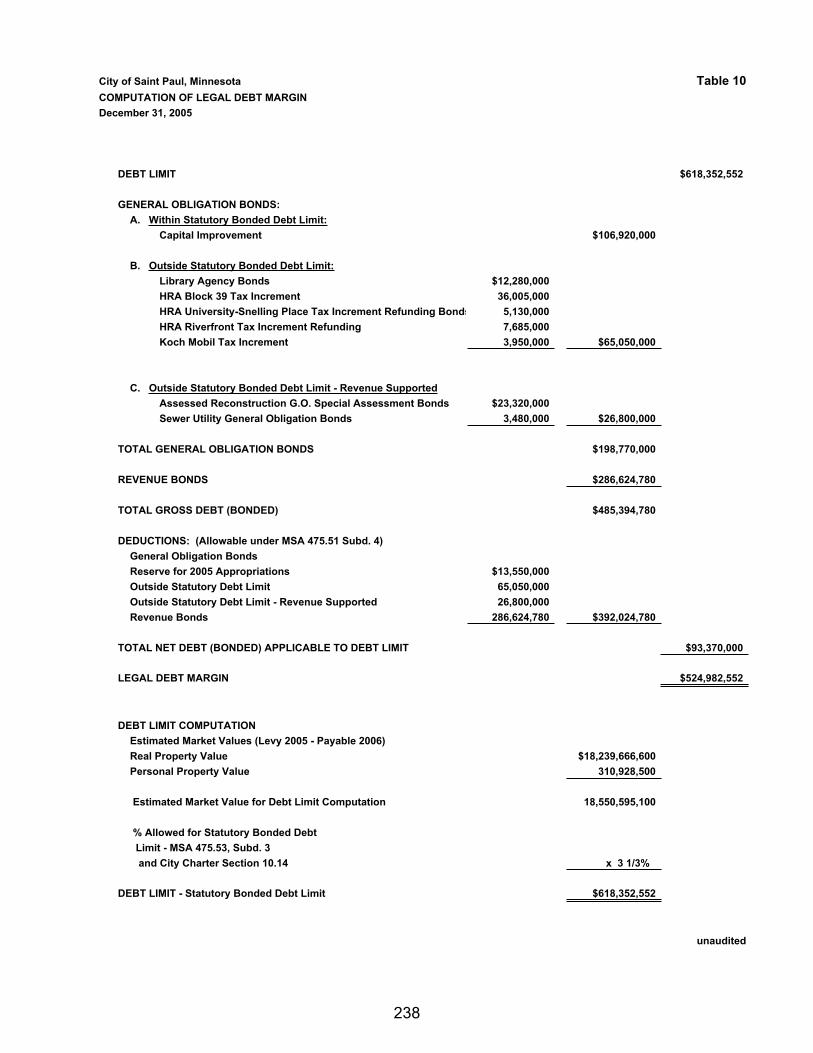
City of Saint Paul, Minnesota Table 10COMPUTATION OF LEGAL DEBT MARGINDecember 31, 2005
DEBT LIMIT $618,352,552
GENERAL OBLIGATION BONDS:A. Within Statutory Bonded Debt Limit:
Capital Improvement $106,920,000
B. Outside Statutory Bonded Debt Limit:Library Agency Bonds $12,280,000HRA Block 39 Tax Increment 36,005,000HRA University-Snelling Place Tax Increment Refunding Bonds 5,130,000HRA Riverfront Tax Increment Refunding 7,685,000Koch Mobil Tax Increment 3,950,000 $65,050,000
C. Outside Statutory Bonded Debt Limit - Revenue SupportedAssessed Reconstruction G.O. Special Assessment Bonds $23,320,000Sewer Utility General Obligation Bonds 3,480,000 $26,800,000
TOTAL GENERAL OBLIGATION BONDS $198,770,000
REVENUE BONDS $286,624,780
TOTAL GROSS DEBT (BONDED) $485,394,780
DEDUCTIONS: (Allowable under MSA 475.51 Subd. 4)General Obligation BondsReserve for 2005 Appropriations $13,550,000Outside Statutory Debt Limit 65,050,000Outside Statutory Debt Limit - Revenue Supported 26,800,000Revenue Bonds 286,624,780 $392,024,780
TOTAL NET DEBT (BONDED) APPLICABLE TO DEBT LIMIT $93,370,000
LEGAL DEBT MARGIN $524,982,552
DEBT LIMIT COMPUTATIONEstimated Market Values (Levy 2005 - Payable 2006)Real Property Value $18,239,666,600Personal Property Value 310,928,500
Estimated Market Value for Debt Limit Computation 18,550,595,100
% Allowed for Statutory Bonded Debt Limit - MSA 475.53, Subd. 3 and City Charter Section 10.14 x 3 1/3%
DEBT LIMIT - Statutory Bonded Debt Limit $618,352,552
unaudited
238
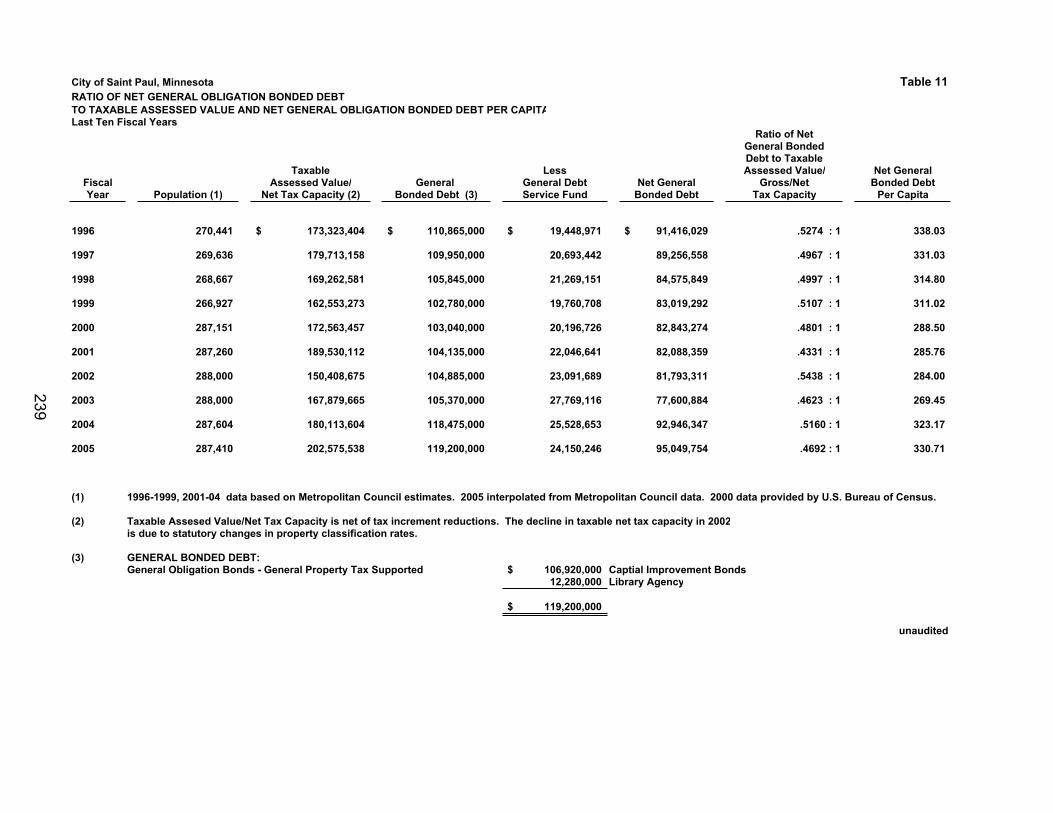
City of Saint Paul, Minnesota Table 11RATIO OF NET GENERAL OBLIGATION BONDED DEBTTO TAXABLE ASSESSED VALUE AND NET GENERAL OBLIGATION BONDED DEBT PER CAPITALast Ten Fiscal Years
Ratio of NetGeneral BondedDebt to Taxable
Taxable Less Assessed Value/ Net GeneralFiscal Assessed Value/ General General Debt Net General Gross/Net Bonded DebtYear Population (1) Net Tax Capacity (2) Bonded Debt (3) Service Fund Bonded Debt Tax Capacity Per Capita
1996 270,441 173,323,404$ 110,865,000$ 19,448,971$ 91,416,029$ .5274 : 1 338.03
1997 269,636 179,713,158 109,950,000 20,693,442 89,256,558 .4967 : 1 331.03
1998 268,667 169,262,581 105,845,000 21,269,151 84,575,849 .4997 : 1 314.80
1999 266,927 162,553,273 102,780,000 19,760,708 83,019,292 .5107 : 1 311.02
2000 287,151 172,563,457 103,040,000 20,196,726 82,843,274 .4801 : 1 288.50
2001 287,260 189,530,112 104,135,000 22,046,641 82,088,359 .4331 : 1 285.76
2002 288,000 150,408,675 104,885,000 23,091,689 81,793,311 .5438 : 1 284.00
2003 288,000 167,879,665 105,370,000 27,769,116 77,600,884 .4623 : 1 269.45
2004 287,604 180,113,604 118,475,000 25,528,653 92,946,347 .5160 : 1 323.17
2005 287,410 202,575,538 119,200,000 24,150,246 95,049,754 .4692 : 1 330.71
(1) 1996-1999, 2001-04 data based on Metropolitan Council estimates. 2005 interpolated from Metropolitan Council data. 2000 data provided by U.S. Bureau of Census.
(2) Taxable Assesed Value/Net Tax Capacity is net of tax increment reductions. The decline in taxable net tax capacity in 2002is due to statutory changes in property classification rates.
(3) GENERAL BONDED DEBT:General Obligation Bonds - General Property Tax Supported 106,920,000$ Captial Improvement Bonds
12,280,000 Library Agency
119,200,000$
unaudited
239
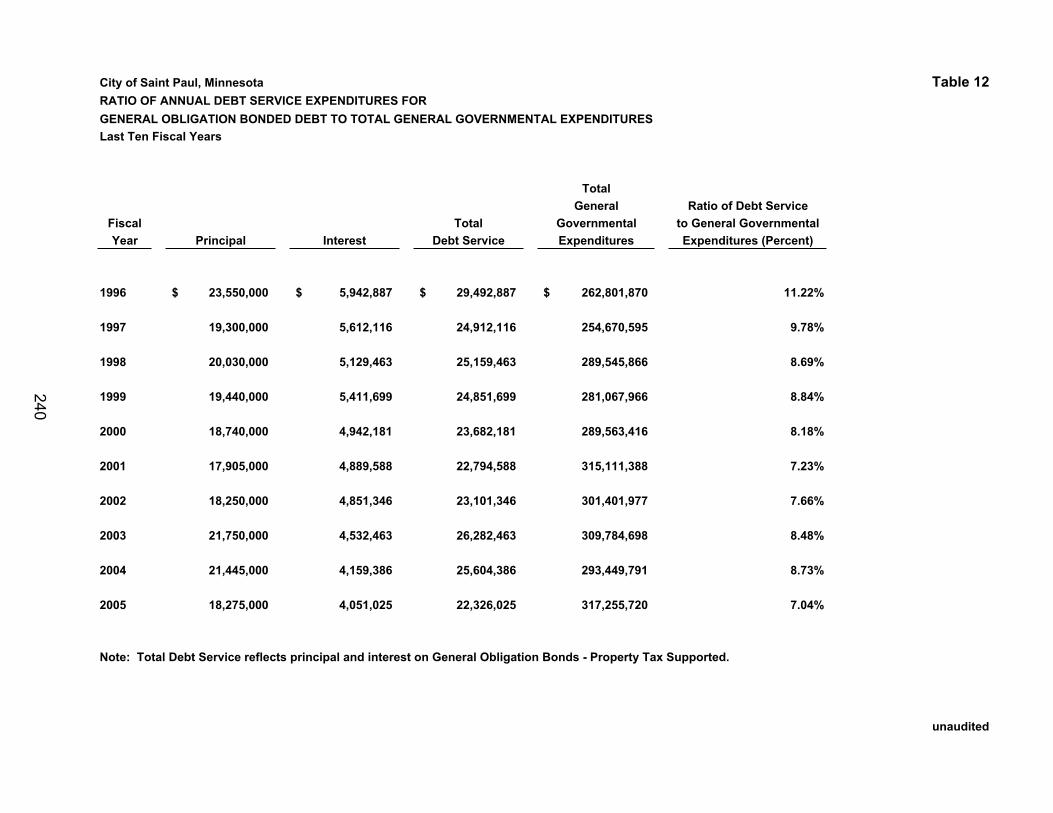
City of Saint Paul, Minnesota Table 12RATIO OF ANNUAL DEBT SERVICE EXPENDITURES FORGENERAL OBLIGATION BONDED DEBT TO TOTAL GENERAL GOVERNMENTAL EXPENDITURESLast Ten Fiscal Years
TotalGeneral Ratio of Debt Service
Fiscal Total Governmental to General GovernmentalYear Principal Interest Debt Service Expenditures Expenditures (Percent)
1996 23,550,000$ 5,942,887$ 29,492,887$ 262,801,870$ 11.22%
1997 19,300,000 5,612,116 24,912,116 254,670,595 9.78%
1998 20,030,000 5,129,463 25,159,463 289,545,866 8.69%
1999 19,440,000 5,411,699 24,851,699 281,067,966 8.84%
2000 18,740,000 4,942,181 23,682,181 289,563,416 8.18%
2001 17,905,000 4,889,588 22,794,588 315,111,388 7.23%
2002 18,250,000 4,851,346 23,101,346 301,401,977 7.66%
2003 21,750,000 4,532,463 26,282,463 309,784,698 8.48%
2004 21,445,000 4,159,386 25,604,386 293,449,791 8.73%
2005 18,275,000 4,051,025 22,326,025 317,255,720 7.04%
Note: Total Debt Service reflects principal and interest on General Obligation Bonds - Property Tax Supported.
unaudited
240
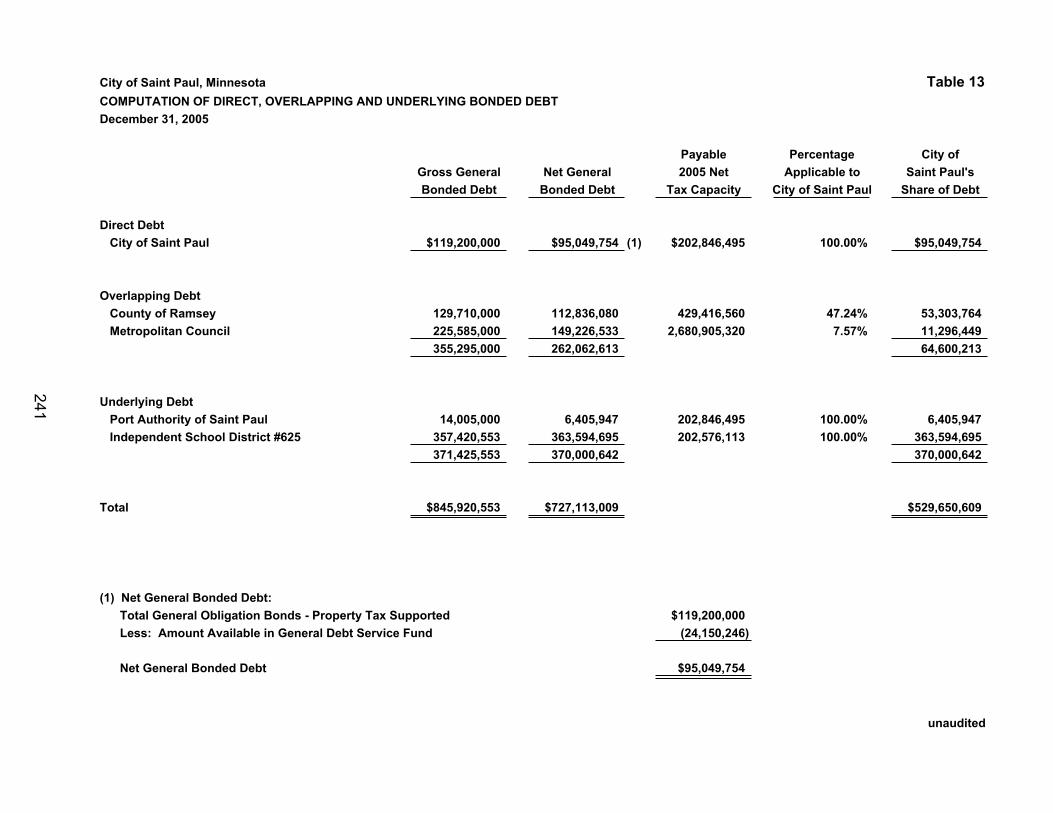
City of Saint Paul, Minnesota Table 13COMPUTATION OF DIRECT, OVERLAPPING AND UNDERLYING BONDED DEBTDecember 31, 2005
Payable Percentage City ofGross General Net General 2005 Net Applicable to Saint Paul'sBonded Debt Bonded Debt Tax Capacity City of Saint Paul Share of Debt
Direct Debt City of Saint Paul $119,200,000 $95,049,754 (1) $202,846,495 100.00% $95,049,754
Overlapping Debt County of Ramsey 129,710,000 112,836,080 429,416,560 47.24% 53,303,764 Metropolitan Council 225,585,000 149,226,533 2,680,905,320 7.57% 11,296,449
355,295,000 262,062,613 64,600,213
Underlying Debt Port Authority of Saint Paul 14,005,000 6,405,947 202,846,495 100.00% 6,405,947 Independent School District #625 357,420,553 363,594,695 202,576,113 100.00% 363,594,695
371,425,553 370,000,642 370,000,642
Total $845,920,553 $727,113,009 $529,650,609
(1) Net General Bonded Debt: Total General Obligation Bonds - Property Tax Supported $119,200,000 Less: Amount Available in General Debt Service Fund (24,150,246)
Net General Bonded Debt $95,049,754
unaudited
241
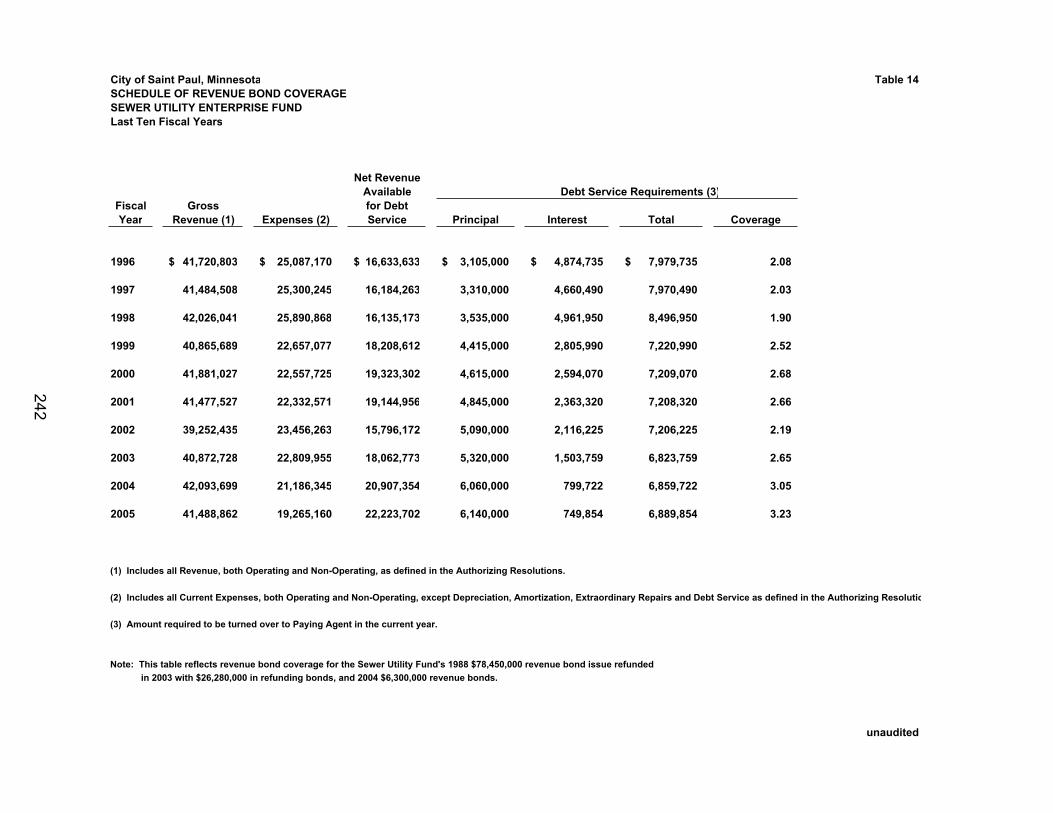
City of Saint Paul, Minnesota Table 14SCHEDULE OF REVENUE BOND COVERAGESEWER UTILITY ENTERPRISE FUNDLast Ten Fiscal Years
Net RevenueAvailable Debt Service Requirements (3)
Fiscal Gross for DebtYear Revenue (1) Expenses (2) Service Principal Interest Total Coverage
1996 41,720,803$ 25,087,170$ 16,633,633$ 3,105,000$ 4,874,735$ 7,979,735$ 2.08
1997 41,484,508 25,300,245 16,184,263 3,310,000 4,660,490 7,970,490 2.03
1998 42,026,041 25,890,868 16,135,173 3,535,000 4,961,950 8,496,950 1.90
1999 40,865,689 22,657,077 18,208,612 4,415,000 2,805,990 7,220,990 2.52
2000 41,881,027 22,557,725 19,323,302 4,615,000 2,594,070 7,209,070 2.68
2001 41,477,527 22,332,571 19,144,956 4,845,000 2,363,320 7,208,320 2.66
2002 39,252,435 23,456,263 15,796,172 5,090,000 2,116,225 7,206,225 2.19
2003 40,872,728 22,809,955 18,062,773 5,320,000 1,503,759 6,823,759 2.65
2004 42,093,699 21,186,345 20,907,354 6,060,000 799,722 6,859,722 3.05
2005 41,488,862 19,265,160 22,223,702 6,140,000 749,854 6,889,854 3.23
(1) Includes all Revenue, both Operating and Non-Operating, as defined in the Authorizing Resolutions.
(2) Includes all Current Expenses, both Operating and Non-Operating, except Depreciation, Amortization, Extraordinary Repairs and Debt Service as defined in the Authorizing Resolutio
(3) Amount required to be turned over to Paying Agent in the current year.
Note: This table reflects revenue bond coverage for the Sewer Utility Fund's 1988 $78,450,000 revenue bond issue refunded in 2003 with $26,280,000 in refunding bonds, and 2004 $6,300,000 revenue bonds.
unaudited
242
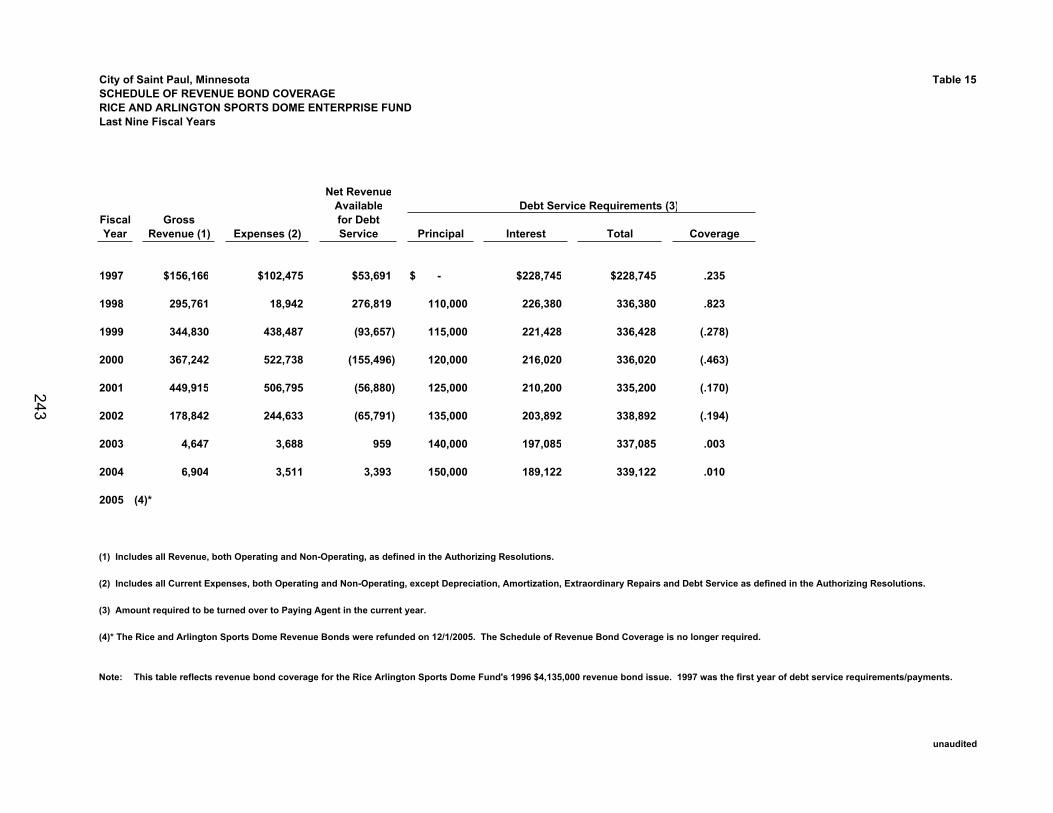
City of Saint Paul, Minnesota Table 15SCHEDULE OF REVENUE BOND COVERAGERICE AND ARLINGTON SPORTS DOME ENTERPRISE FUNDLast Nine Fiscal Years
Net RevenueAvailable Debt Service Requirements (3)
Fiscal Gross for DebtYear Revenue (1) Expenses (2) Service Principal Interest Total Coverage
1997 $156,166 $102,475 $53,691 $ - $228,745 $228,745 .235
1998 295,761 18,942 276,819 110,000 226,380 336,380 .823
1999 344,830 438,487 (93,657) 115,000 221,428 336,428 (.278)
2000 367,242 522,738 (155,496) 120,000 216,020 336,020 (.463)
2001 449,915 506,795 (56,880) 125,000 210,200 335,200 (.170)
2002 178,842 244,633 (65,791) 135,000 203,892 338,892 (.194)
2003 4,647 3,688 959 140,000 197,085 337,085 .003
2004 6,904 3,511 3,393 150,000 189,122 339,122 .010
2005 (4)*
(1) Includes all Revenue, both Operating and Non-Operating, as defined in the Authorizing Resolutions.
(2) Includes all Current Expenses, both Operating and Non-Operating, except Depreciation, Amortization, Extraordinary Repairs and Debt Service as defined in the Authorizing Resolutions.
(3) Amount required to be turned over to Paying Agent in the current year.
(4)* The Rice and Arlington Sports Dome Revenue Bonds were refunded on 12/1/2005. The Schedule of Revenue Bond Coverage is no longer required.
Note: This table reflects revenue bond coverage for the Rice Arlington Sports Dome Fund's 1996 $4,135,000 revenue bond issue. 1997 was the first year of debt service requirements/payments.
unaudited
243
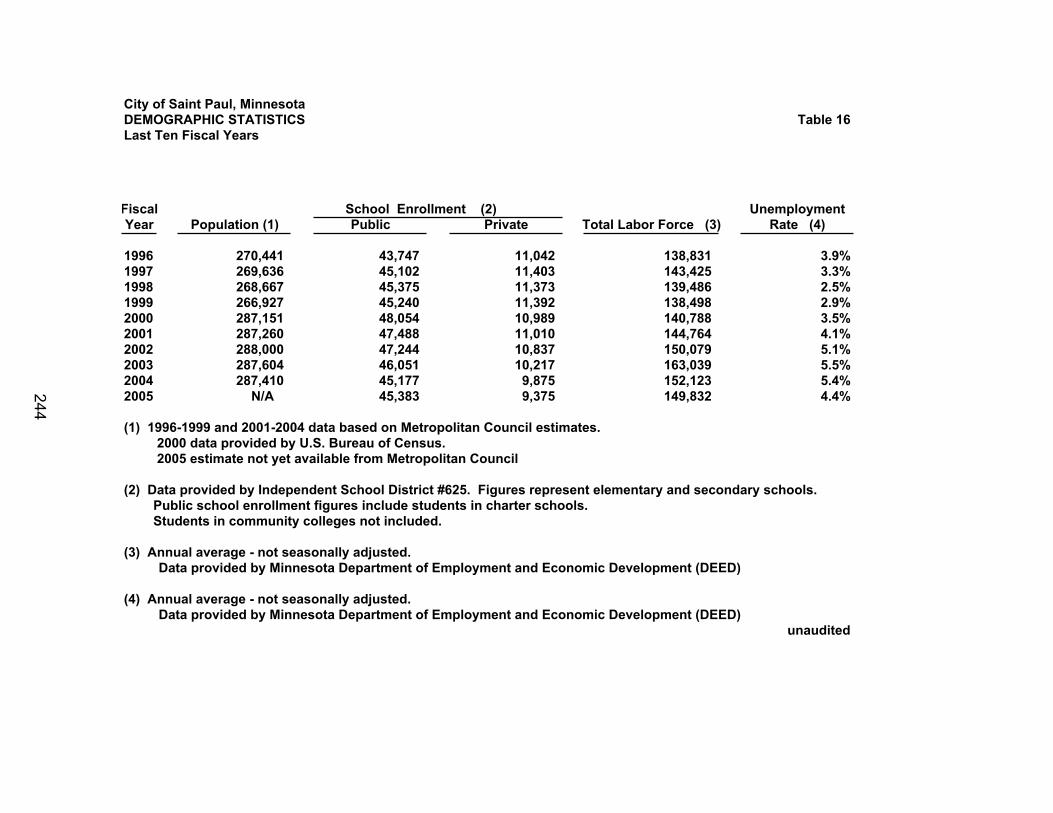
City of Saint Paul, MinnesotaDEMOGRAPHIC STATISTICS Table 16Last Ten Fiscal Years
Fiscal School Enrollment (2) UnemploymentYear Population (1) Public Private Total Labor Force (3) Rate (4)
1996 270,441 43,747 11,042 138,831 3.9%1997 269,636 45,102 11,403 143,425 3.3%1998 268,667 45,375 11,373 139,486 2.5%1999 266,927 45,240 11,392 138,498 2.9%2000 287,151 48,054 10,989 140,788 3.5%2001 287,260 47,488 11,010 144,764 4.1%2002 288,000 47,244 10,837 150,079 5.1%2003 287,604 46,051 10,217 163,039 5.5%2004 287,410 45,177 9,875 152,123 5.4%2005 N/A 45,383 9,375 149,832 4.4%
(1) 1996-1999 and 2001-2004 data based on Metropolitan Council estimates. 2000 data provided by U.S. Bureau of Census. 2005 estimate not yet available from Metropolitan Council
(2) Data provided by Independent School District #625. Figures represent elementary and secondary schools. Public school enrollment figures include students in charter schools. Students in community colleges not included.
(3) Annual average - not seasonally adjusted.Data provided by Minnesota Department of Employment and Economic Development (DEED)
(4) Annual average - not seasonally adjusted.Data provided by Minnesota Department of Employment and Economic Development (DEED)
unaudited
244
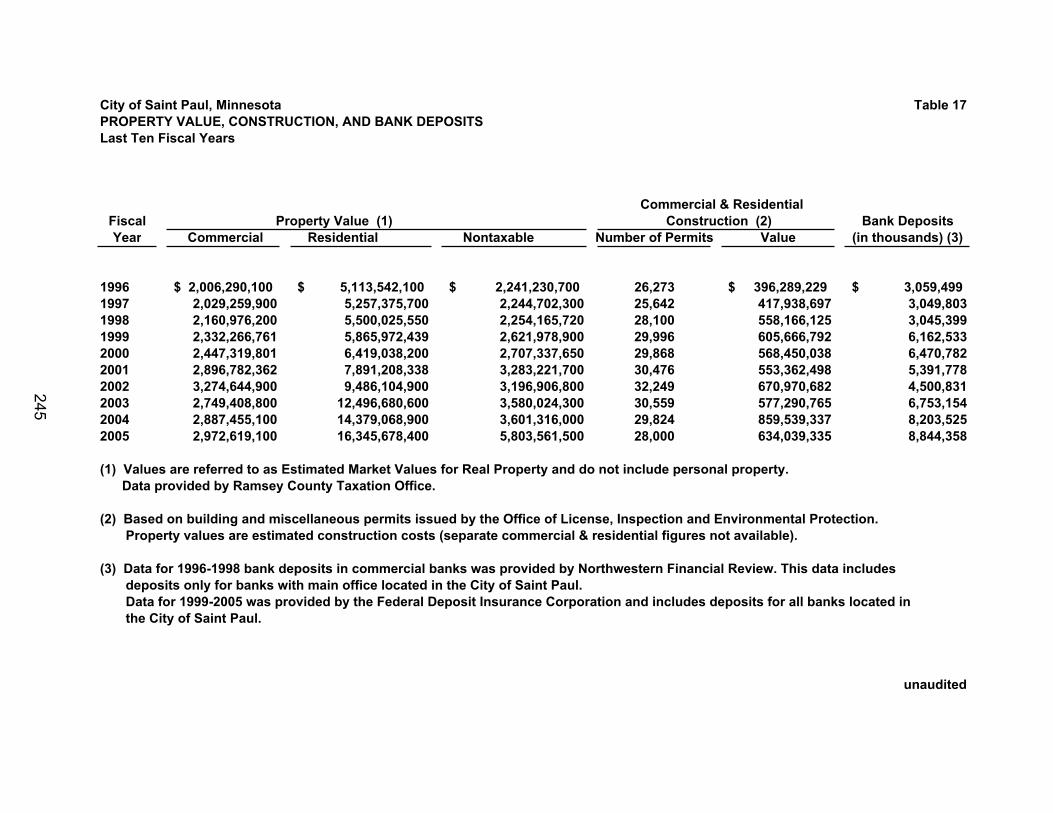
City of Saint Paul, Minnesota Table 17PROPERTY VALUE, CONSTRUCTION, AND BANK DEPOSITS Last Ten Fiscal Years
Commercial & ResidentialFiscal Property Value (1) Construction (2) Bank DepositsYear Commercial Residential Nontaxable Number of Permits Value (in thousands) (3)
1996 2,006,290,100$ 5,113,542,100$ 2,241,230,700$ 26,273 396,289,229$ 3,059,499$1997 2,029,259,900 5,257,375,700 2,244,702,300 25,642 417,938,697 3,049,8031998 2,160,976,200 5,500,025,550 2,254,165,720 28,100 558,166,125 3,045,3991999 2,332,266,761 5,865,972,439 2,621,978,900 29,996 605,666,792 6,162,5332000 2,447,319,801 6,419,038,200 2,707,337,650 29,868 568,450,038 6,470,7822001 2,896,782,362 7,891,208,338 3,283,221,700 30,476 553,362,498 5,391,7782002 3,274,644,900 9,486,104,900 3,196,906,800 32,249 670,970,682 4,500,8312003 2,749,408,800 12,496,680,600 3,580,024,300 30,559 577,290,765 6,753,1542004 2,887,455,100 14,379,068,900 3,601,316,000 29,824 859,539,337 8,203,5252005 2,972,619,100 16,345,678,400 5,803,561,500 28,000 634,039,335 8,844,358
(1) Values are referred to as Estimated Market Values for Real Property and do not include personal property. Data provided by Ramsey County Taxation Office.
(2) Based on building and miscellaneous permits issued by the Office of License, Inspection and Environmental Protection. Property values are estimated construction costs (separate commercial & residential figures not available).
(3) Data for 1996-1998 bank deposits in commercial banks was provided by Northwestern Financial Review. This data includes deposits only for banks with main office located in the City of Saint Paul. Data for 1999-2005 was provided by the Federal Deposit Insurance Corporation and includes deposits for all banks located in the City of Saint Paul.
unaudited
245
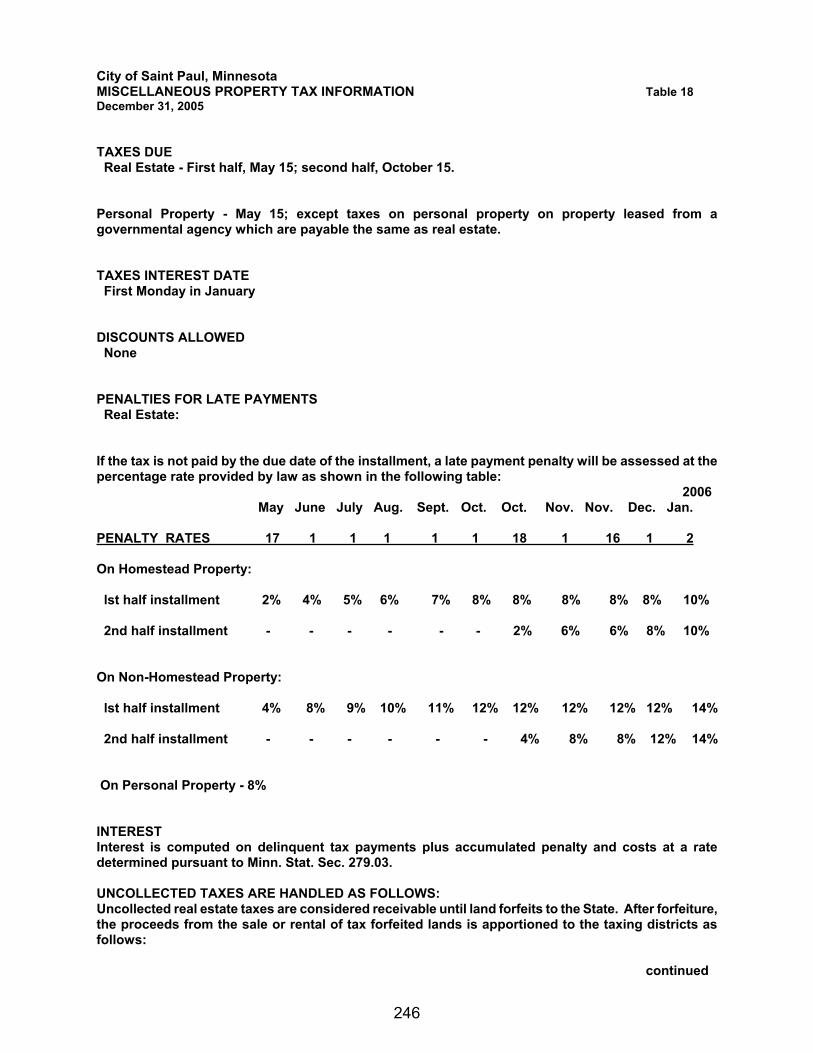
City of Saint Paul, Minnesota MISCELLANEOUS PROPERTY TAX INFORMATION Table 18 December 31, 2005
TAXES DUE Real Estate - First half, May 15; second half, October 15.
Personal Property - May 15; except taxes on personal property on property leased from a governmental agency which are payable the same as real estate.
TAXES INTEREST DATE First Monday in January
DISCOUNTS ALLOWED None
PENALTIES FOR LATE PAYMENTS Real Estate:
If the tax is not paid by the due date of the installment, a late payment penalty will be assessed at the percentage rate provided by law as shown in the following table:
2006 May June July Aug. Sept. Oct. Oct. Nov. Nov. Dec. Jan.
PENALTY RATES 17 1 1 1 1 1 18 1 16 1 2
On Homestead Property:
lst half installment 2% 4% 5% 6% 7% 8% 8% 8% 8% 8% 10%
2nd half installment - - - - - - 2% 6% 6% 8% 10%
On Non-Homestead Property:
lst half installment 4% 8% 9% 10% 11% 12% 12% 12% 12% 12% 14%
2nd half installment - - - - - - 4% 8% 8% 12% 14%
On Personal Property - 8%
INTERESTInterest is computed on delinquent tax payments plus accumulated penalty and costs at a rate determined pursuant to Minn. Stat. Sec. 279.03.
UNCOLLECTED TAXES ARE HANDLED AS FOLLOWS: Uncollected real estate taxes are considered receivable until land forfeits to the State. After forfeiture, the proceeds from the sale or rental of tax forfeited lands is apportioned to the taxing districts as follows:
continued
246
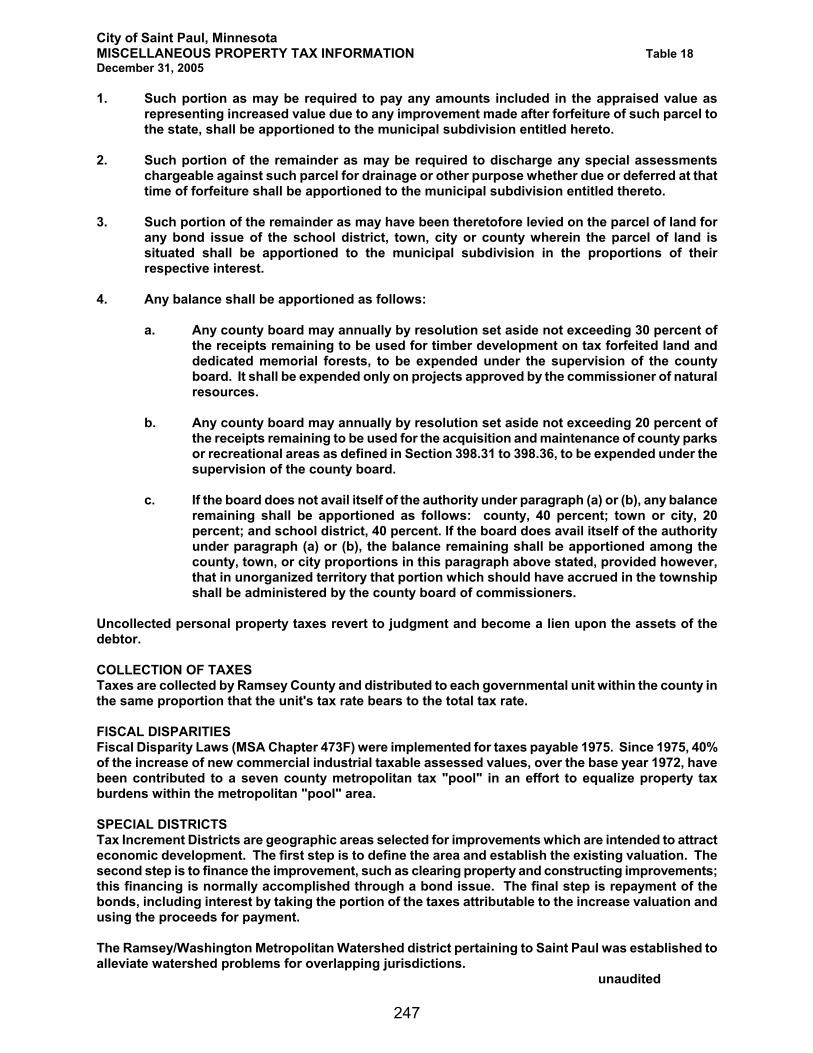
City of Saint Paul, Minnesota MISCELLANEOUS PROPERTY TAX INFORMATION Table 18 December 31, 2005
1. Such portion as may be required to pay any amounts included in the appraised value as representing increased value due to any improvement made after forfeiture of such parcel to the state, shall be apportioned to the municipal subdivision entitled hereto.
2. Such portion of the remainder as may be required to discharge any special assessments chargeable against such parcel for drainage or other purpose whether due or deferred at that time of forfeiture shall be apportioned to the municipal subdivision entitled thereto.
3. Such portion of the remainder as may have been theretofore levied on the parcel of land for any bond issue of the school district, town, city or county wherein the parcel of land is situated shall be apportioned to the municipal subdivision in the proportions of their respective interest.
4. Any balance shall be apportioned as follows:
a. Any county board may annually by resolution set aside not exceeding 30 percent of the receipts remaining to be used for timber development on tax forfeited land and dedicated memorial forests, to be expended under the supervision of the county board. It shall be expended only on projects approved by the commissioner of natural resources.
b. Any county board may annually by resolution set aside not exceeding 20 percent of the receipts remaining to be used for the acquisition and maintenance of county parks or recreational areas as defined in Section 398.31 to 398.36, to be expended under the supervision of the county board.
c. If the board does not avail itself of the authority under paragraph (a) or (b), any balance remaining shall be apportioned as follows: county, 40 percent; town or city, 20 percent; and school district, 40 percent. If the board does avail itself of the authority under paragraph (a) or (b), the balance remaining shall be apportioned among the county, town, or city proportions in this paragraph above stated, provided however, that in unorganized territory that portion which should have accrued in the township shall be administered by the county board of commissioners.
Uncollected personal property taxes revert to judgment and become a lien upon the assets of the debtor.
COLLECTION OF TAXES Taxes are collected by Ramsey County and distributed to each governmental unit within the county in the same proportion that the unit's tax rate bears to the total tax rate.
FISCAL DISPARITIES Fiscal Disparity Laws (MSA Chapter 473F) were implemented for taxes payable 1975. Since 1975, 40% of the increase of new commercial industrial taxable assessed values, over the base year 1972, have been contributed to a seven county metropolitan tax "pool" in an effort to equalize property tax burdens within the metropolitan "pool" area.
SPECIAL DISTRICTS Tax Increment Districts are geographic areas selected for improvements which are intended to attract economic development. The first step is to define the area and establish the existing valuation. The second step is to finance the improvement, such as clearing property and constructing improvements; this financing is normally accomplished through a bond issue. The final step is repayment of the bonds, including interest by taking the portion of the taxes attributable to the increase valuation and using the proceeds for payment.
The Ramsey/Washington Metropolitan Watershed district pertaining to Saint Paul was established to alleviate watershed problems for overlapping jurisdictions.
unaudited
247
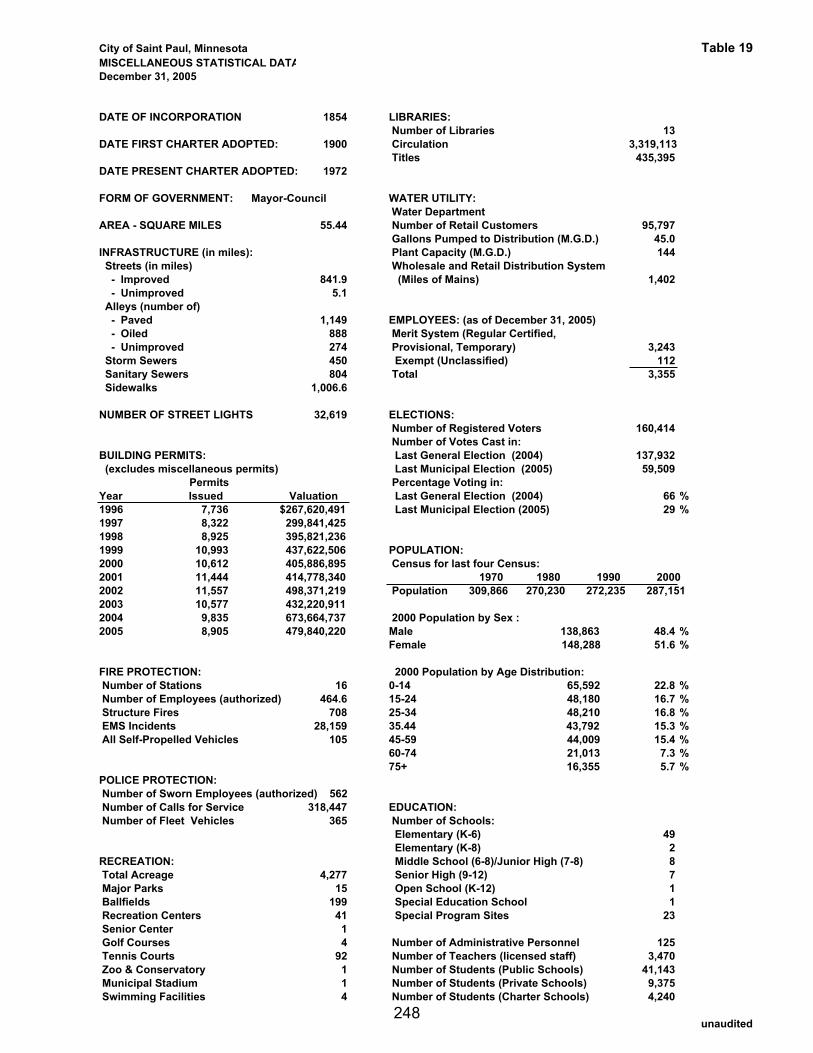
City of Saint Paul, Minnesota Table 19MISCELLANEOUS STATISTICAL DATADecember 31, 2005
DATE OF INCORPORATION 1854 LIBRARIES:Number of Libraries 13
DATE FIRST CHARTER ADOPTED: 1900 Circulation 3,319,113Titles 435,395
DATE PRESENT CHARTER ADOPTED: 1972
FORM OF GOVERNMENT: Mayor-Council WATER UTILITY:Water Department
AREA - SQUARE MILES 55.44 Number of Retail Customers 95,797Gallons Pumped to Distribution (M.G.D.) 45.0
INFRASTRUCTURE (in miles): Plant Capacity (M.G.D.) 144 Streets (in miles) Wholesale and Retail Distribution System - Improved 841.9 (Miles of Mains) 1,402 - Unimproved 5.1 Alleys (number of) - Paved 1,149 EMPLOYEES: (as of December 31, 2005) - Oiled 888 Merit System (Regular Certified, - Unimproved 274 Provisional, Temporary) 3,243 Storm Sewers 450 Exempt (Unclassified) 112 Sanitary Sewers 804 Total 3,355 Sidewalks 1,006.6
NUMBER OF STREET LIGHTS 32,619 ELECTIONS: Number of Registered Voters 160,414Number of Votes Cast in:
BUILDING PERMITS: Last General Election (2004) 137,932 (excludes miscellaneous permits) Last Municipal Election (2005) 59,509 Permits Percentage Voting in:Year Issued Valuation Last General Election (2004) 66 %1996 7,736 $267,620,491 Last Municipal Election (2005) 29 %1997 8,322 299,841,4251998 8,925 395,821,2361999 10,993 437,622,506 POPULATION:2000 10,612 405,886,895 Census for last four Census:2001 11,444 414,778,340 1970 1980 1990 20002002 11,557 498,371,219 Population 309,866 270,230 272,235 287,1512003 10,577 432,220,9112004 9,835 673,664,737 2000 Population by Sex :2005 8,905 479,840,220 Male 138,863 48.4 %
Female 148,288 51.6 %
FIRE PROTECTION: 2000 Population by Age Distribution: Number of Stations 16 0-14 65,592 22.8 % Number of Employees (authorized) 464.6 15-24 48,180 16.7 % Structure Fires 708 25-34 48,210 16.8 % EMS Incidents 28,159 35.44 43,792 15.3 % All Self-Propelled Vehicles 105 45-59 44,009 15.4 %
60-74 21,013 7.3 %75+ 16,355 5.7 %
POLICE PROTECTION: Number of Sworn Employees (authorized) 562 Number of Calls for Service 318,447 EDUCATION: Number of Fleet Vehicles 365 Number of Schools:
Elementary (K-6) 49 Elementary (K-8) 2
RECREATION: Middle School (6-8)/Junior High (7-8) 8 Total Acreage 4,277 Senior High (9-12) 7 Major Parks 15 Open School (K-12) 1 Ballfields 199 Special Education School 1 Recreation Centers 41 Special Program Sites 23 Senior Center 1 Golf Courses 4 Number of Administrative Personnel 125 Tennis Courts 92 Number of Teachers (licensed staff) 3,470 Zoo & Conservatory 1 Number of Students (Public Schools) 41,143 Municipal Stadium 1 Number of Students (Private Schools) 9,375 Swimming Facilities 4 Number of Students (Charter Schools) 4,240
unaudited248