Embed Size (px)
Citation preview

C:\Users\r8r\Desktop\Riverside_Decomm_Cover.doc
City of Riverside February 29, 2016
The City of Riverside
Report Section Performance Summary & Detail 1 Yield History 2 Maturity Distribution 3 Fixed Income Distribution 4 Portfolio Summary 5 Fixed Income Holdings 6 Transaction Summary 7 Interest Earnings 8
Table of Contents
Clients should receive periodic statements from the bank, trust department, or qualified custodian that holds and maintains client’s investment assets. BLX urges clients to carefully review such statements and compare such official custodial records to the account reports and statements BLX provides. Our statements may vary from custodial statements based on accounting procedures, reporting dates, or valuation methodologies of certain securities. Please contact BLX with any questions or concerns about differences or discrepancies between reports provided by BLX and statements provided by your account custodian.
Boston Dallas Denver Los Angeles New York Phoenix Tampa * 02/29/08 represents the first recorded month of performance.
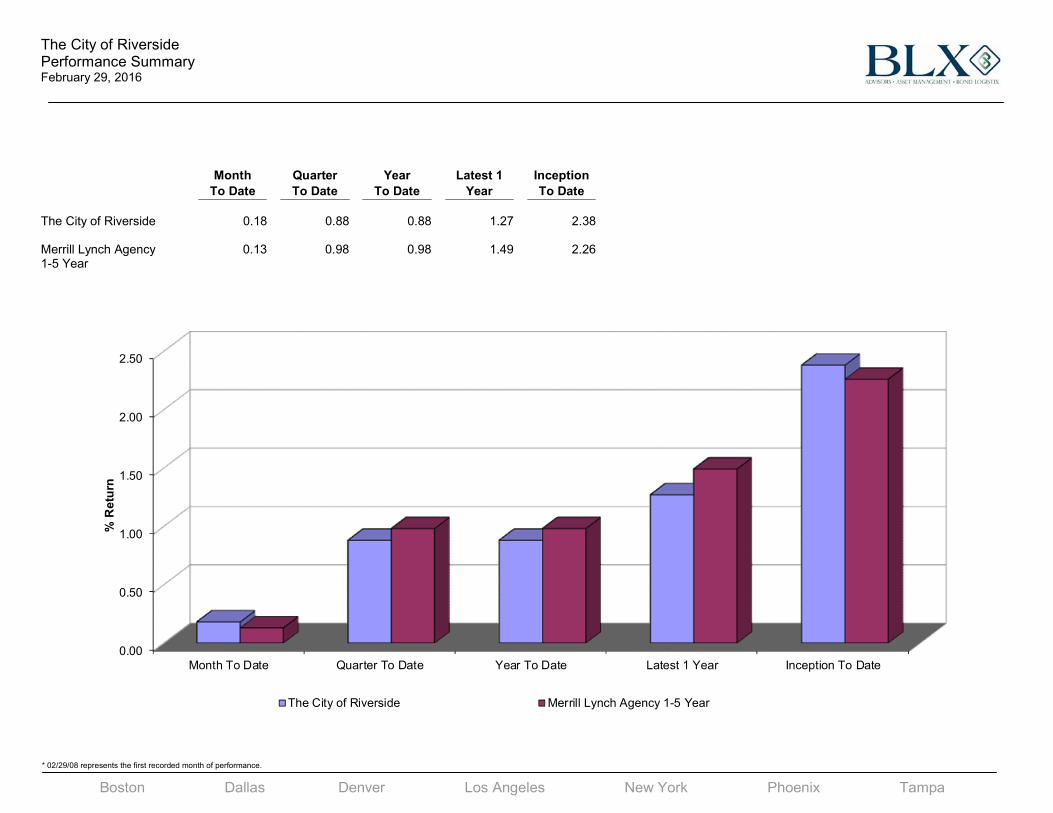
The City of RiversidePerformance SummaryFebruary 29, 2016
Month Quarter Year Latest 1 InceptionTo Date To Date To Date Year To Date
The City of Riverside 0.18 0.88 0.88 1.27 2.38
Merrill Lynch Agency 1-5 Year
0.13 0.98 0.98 1.49 2.26
0.00
0.50
1.00
1.50
2.00
2.50
Month To Date Quarter To Date Year To Date Latest 1 Year Inception To Date
% R
etur
n
The City of Riverside Merrill Lynch Agency 1-5 Year

Boston Dallas Denver Los Angeles New York Phoenix Tampa * 02/29/08 represents the first recorded month of performance.
The City of RiversidePerformance DetailFebruary 29, 2016
PORTFOLIO COMPOSITION CHANGE IN PORTFOLIO
Market Pct.Value Assets Yield
Cash 0.00 0.0 - Portfolio Value on 01-31-16 397,208,979.70Equity 0.00 0.0 - Accrued Interest 1,524,467.27Fixed Income 400,207,349.04 100.0 0.9 Net Additions/Withdrawals 775,043.97Other 0.00 0.0 - Realized Gains -31.79
Unrealized Gains 179,865.84 Income Received 470,956.03Change in Accrued Interest 48,068.03Portfolio Value on 02-29-16 398,634,813.75Accrued Interest 1,572,535.30
Total 400,207,349.04 100.0 0.9 400,207,349.04
TIME WEIGHTED RETURN
AnnualizedMonth Quarter Year Last 12 Inception
To Date To Date To Date Months To Date
The City of Riverside 0.18 0.88 0.88 1.27 2.38
Merrill Lynch Agency 1-5 Year
0.13 0.98 0.98 1.49 2.26
0.000
1.000
2.000
3.000
4.000
5.000
6.000
7.000
8.000
Feb-
10
May
-10
Aug
-10
Nov
-10
Feb-
11
May
-11
Aug
-11
Nov
-11
Feb-
12
May
-12
Aug
-12
Nov
-12
Feb-
13
May
-13
Aug
-13
Nov
-13
Feb-
14
May
-14
Aug
-14
Nov
-14
Feb-
15
May
-15
Aug
-15
Nov
-15
Feb-
16
% Y
ield
Weighted Average Yield at Cost
City of Riverside Portfolio (Total) City of Riverside Portfolio (Core) 12-Month Avg. of 2-Year Treasury Yield
Monthly Annualized Effective Yield (Total) Test
Source: Bloomberg, L.P.
Boston Dallas Denver Los Angeles New York Phoenix Tampa
* 01/31/03 represents the first recorded month of portfolio yield for the total portfolio. * 02/29/08 represents the first recorded month of portfolio yield for the core portfolio. * As of 06/30/14, additional checking/money market fund balances have been included in calculations for the total portfolio.
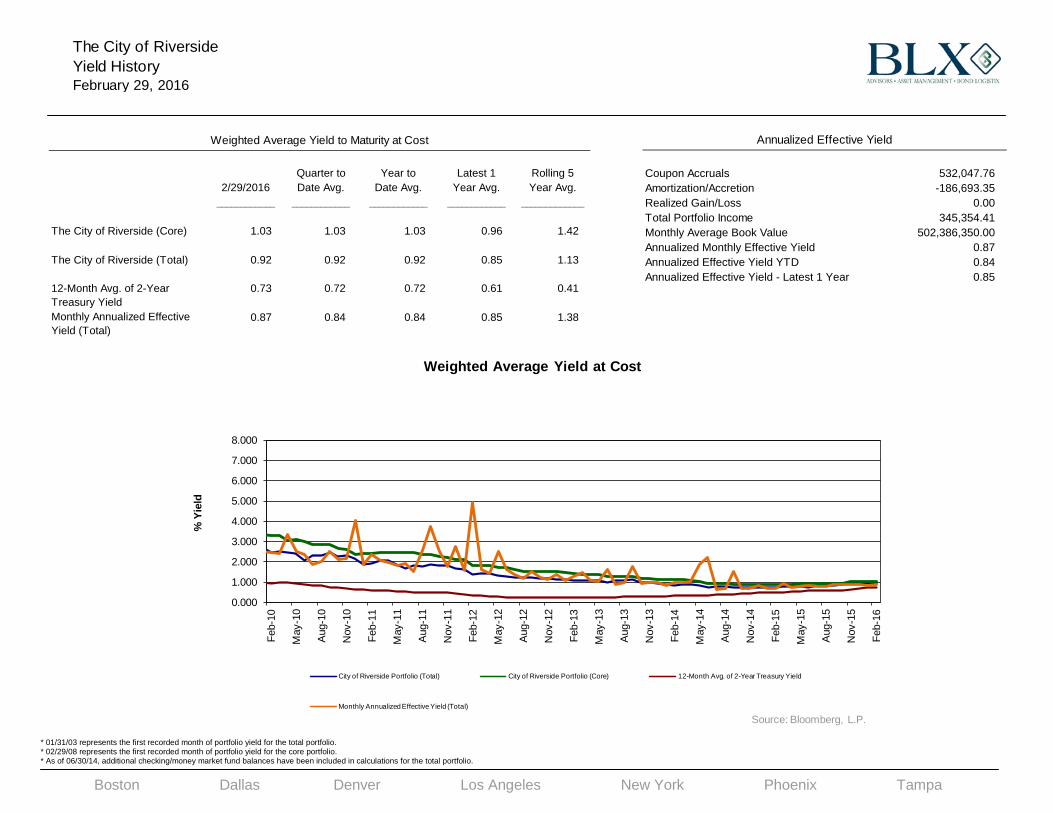
The City of RiversideYield HistoryFebruary 29, 2016
Weighted Average Yield to Maturity at Cost
Quarter to Year to Latest 1 Rolling 52/29/2016 Date Avg. Date Avg. Year Avg. Year Avg.
____________ ____________ ____________ ____________ _____________
The City of Riverside (Core) 1.03 1.03 1.03 0.96 1.42
The City of Riverside (Total) 0.92 0.92 0.92 0.85 1.13
0.73 0.72 0.72 0.61 0.41
0.87 0.84 0.84 0.85 1.38
12-Month Avg. of 2-Year Treasury YieldMonthly Annualized Effective Yield (Total)
Annualized Effective Yield
Coupon Accruals 532,047.76Amortization/Accretion -186,693.35Realized Gain/Loss 0.00Total Portfolio Income 345,354.41Monthly Average Book Value 502,386,350.00Annualized Monthly Effective Yield 0.87Annualized Effective Yield YTD 0.84Annualized Effective Yield - Latest 1 Year 0.85
Boston Dallas Denver Los Angeles New York Phoenix Tampa
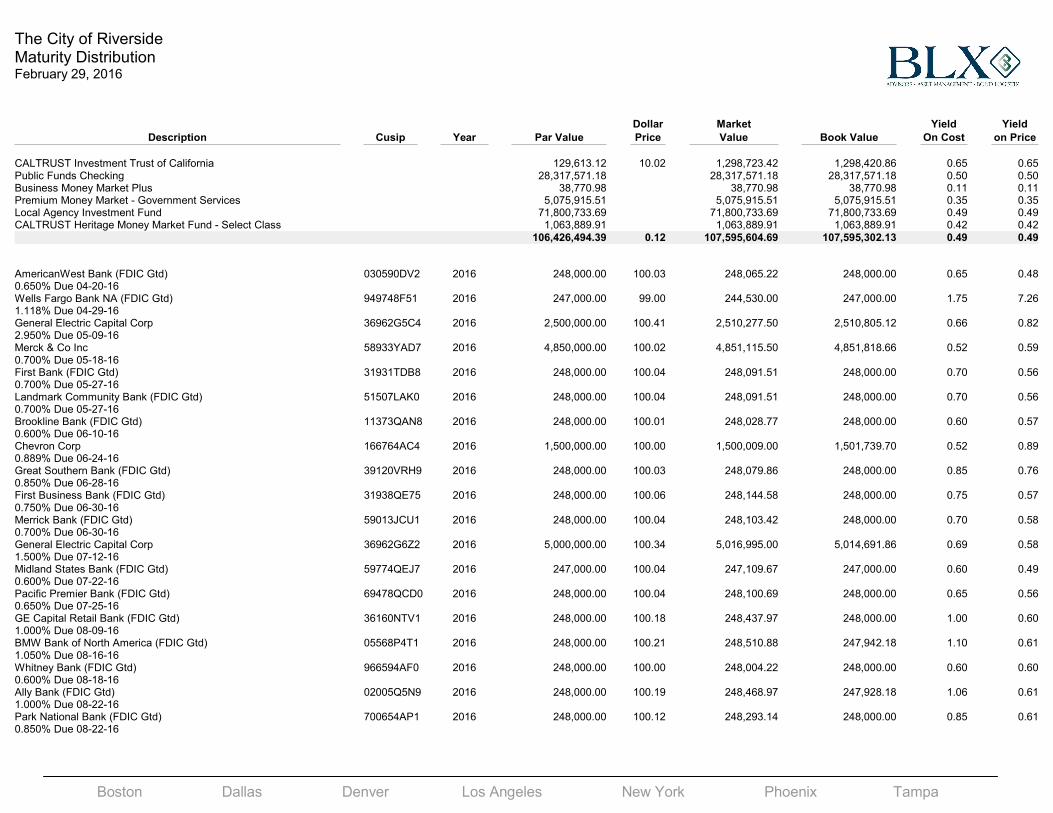
The City of RiversideMaturity Distribution February 29, 2016
Dollar Market Yield Yield
Description Cusip Year Par Value Price Value Book Value On Cost on Price
CALTRUST Investment Trust of California 129,613.12 10.02 1,298,723.42 1,298,420.86 0.65 0.65Public Funds Checking 28,317,571.18 28,317,571.18 28,317,571.18 0.50 0.50Business Money Market Plus 38,770.98 38,770.98 38,770.98 0.11 0.11Premium Money Market - Government Services 5,075,915.51 5,075,915.51 5,075,915.51 0.35 0.35Local Agency Investment Fund 71,800,733.69 71,800,733.69 71,800,733.69 0.49 0.49CALTRUST Heritage Money Market Fund - Select Class 1,063,889.91 1,063,889.91 1,063,889.91 0.42 0.42
106,426,494.39 0.12 107,595,604.69 107,595,302.13 0.49 0.49
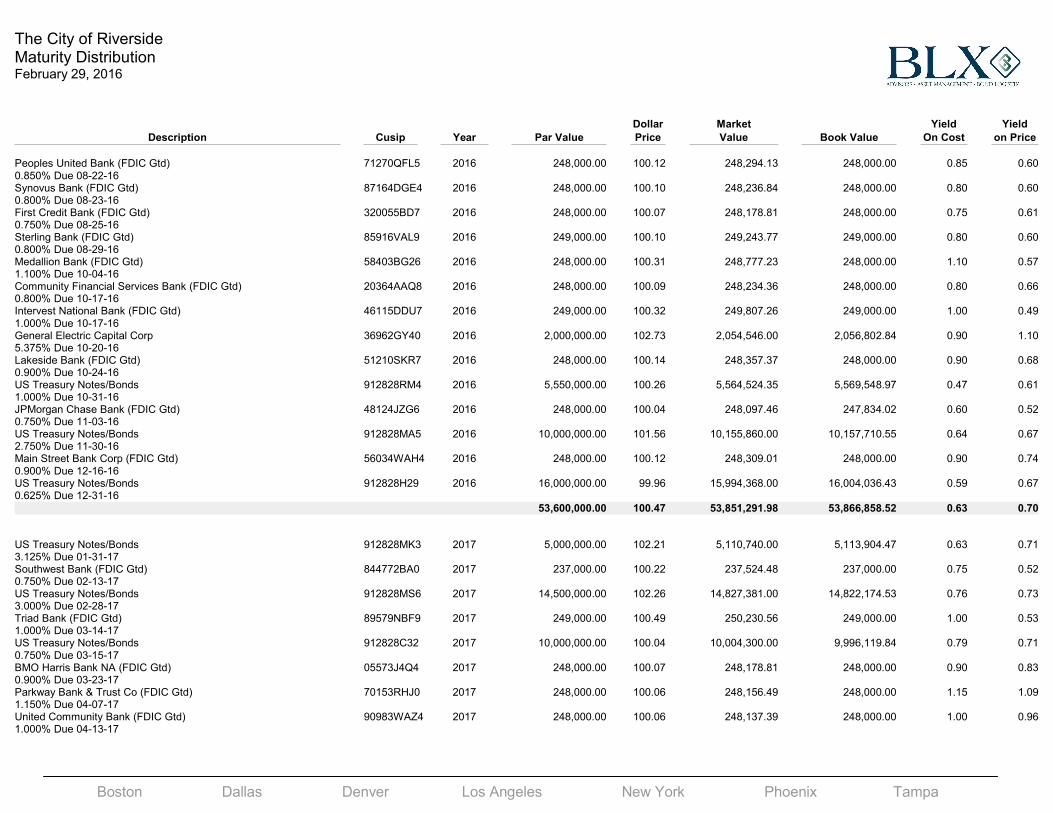
AmericanWest Bank (FDIC Gtd) 030590DV2 2016 248,000.00 100.03 248,065.22 248,000.00 0.65 0.480.650% Due 04-20-16Wells Fargo Bank NA (FDIC Gtd) 949748F51 2016 247,000.00 99.00 244,530.00 247,000.00 1.75 7.261.118% Due 04-29-16General Electric Capital Corp 36962G5C4 2016 2,500,000.00 100.41 2,510,277.50 2,510,805.12 0.66 0.822.950% Due 05-09-16Merck & Co Inc 58933YAD7 2016 4,850,000.00 100.02 4,851,115.50 4,851,818.66 0.52 0.590.700% Due 05-18-16First Bank (FDIC Gtd) 31931TDB8 2016 248,000.00 100.04 248,091.51 248,000.00 0.70 0.560.700% Due 05-27-16Landmark Community Bank (FDIC Gtd) 51507LAK0 2016 248,000.00 100.04 248,091.51 248,000.00 0.70 0.560.700% Due 05-27-16Brookline Bank (FDIC Gtd) 11373QAN8 2016 248,000.00 100.01 248,028.77 248,000.00 0.60 0.570.600% Due 06-10-16Chevron Corp 166764AC4 2016 1,500,000.00 100.00 1,500,009.00 1,501,739.70 0.52 0.890.889% Due 06-24-16Great Southern Bank (FDIC Gtd) 39120VRH9 2016 248,000.00 100.03 248,079.86 248,000.00 0.85 0.760.850% Due 06-28-16First Business Bank (FDIC Gtd) 31938QE75 2016 248,000.00 100.06 248,144.58 248,000.00 0.75 0.570.750% Due 06-30-16Merrick Bank (FDIC Gtd) 59013JCU1 2016 248,000.00 100.04 248,103.42 248,000.00 0.70 0.580.700% Due 06-30-16General Electric Capital Corp 36962G6Z2 2016 5,000,000.00 100.34 5,016,995.00 5,014,691.86 0.69 0.581.500% Due 07-12-16Midland States Bank (FDIC Gtd) 59774QEJ7 2016 247,000.00 100.04 247,109.67 247,000.00 0.60 0.490.600% Due 07-22-16Pacific Premier Bank (FDIC Gtd) 69478QCD0 2016 248,000.00 100.04 248,100.69 248,000.00 0.65 0.560.650% Due 07-25-16GE Capital Retail Bank (FDIC Gtd) 36160NTV1 2016 248,000.00 100.18 248,437.97 248,000.00 1.00 0.601.000% Due 08-09-16BMW Bank of North America (FDIC Gtd) 05568P4T1 2016 248,000.00 100.21 248,510.88 247,942.18 1.10 0.611.050% Due 08-16-16Whitney Bank (FDIC Gtd) 966594AF0 2016 248,000.00 100.00 248,004.22 248,000.00 0.60 0.600.600% Due 08-18-16Ally Bank (FDIC Gtd) 02005Q5N9 2016 248,000.00 100.19 248,468.97 247,928.18 1.06 0.611.000% Due 08-22-16Park National Bank (FDIC Gtd) 700654AP1 2016 248,000.00 100.12 248,293.14 248,000.00 0.85 0.610.850% Due 08-22-16
Boston Dallas Denver Los Angeles New York Phoenix Tampa
The City of RiversideMaturity Distribution February 29, 2016
Dollar Market Yield Yield
Description Cusip Year Par Value Price Value Book Value On Cost on Price
Peoples United Bank (FDIC Gtd) 71270QFL5 2016 248,000.00 100.12 248,294.13 248,000.00 0.85 0.600.850% Due 08-22-16Synovus Bank (FDIC Gtd) 87164DGE4 2016 248,000.00 100.10 248,236.84 248,000.00 0.80 0.600.800% Due 08-23-16First Credit Bank (FDIC Gtd) 320055BD7 2016 248,000.00 100.07 248,178.81 248,000.00 0.75 0.610.750% Due 08-25-16Sterling Bank (FDIC Gtd) 85916VAL9 2016 249,000.00 100.10 249,243.77 249,000.00 0.80 0.600.800% Due 08-29-16Medallion Bank (FDIC Gtd) 58403BG26 2016 248,000.00 100.31 248,777.23 248,000.00 1.10 0.571.100% Due 10-04-16Community Financial Services Bank (FDIC Gtd) 20364AAQ8 2016 248,000.00 100.09 248,234.36 248,000.00 0.80 0.660.800% Due 10-17-16Intervest National Bank (FDIC Gtd) 46115DDU7 2016 249,000.00 100.32 249,807.26 249,000.00 1.00 0.491.000% Due 10-17-16General Electric Capital Corp 36962GY40 2016 2,000,000.00 102.73 2,054,546.00 2,056,802.84 0.90 1.105.375% Due 10-20-16Lakeside Bank (FDIC Gtd) 51210SKR7 2016 248,000.00 100.14 248,357.37 248,000.00 0.90 0.680.900% Due 10-24-16US Treasury Notes/Bonds 912828RM4 2016 5,550,000.00 100.26 5,564,524.35 5,569,548.97 0.47 0.611.000% Due 10-31-16JPMorgan Chase Bank (FDIC Gtd) 48124JZG6 2016 248,000.00 100.04 248,097.46 247,834.02 0.60 0.520.750% Due 11-03-16US Treasury Notes/Bonds 912828MA5 2016 10,000,000.00 101.56 10,155,860.00 10,157,710.55 0.64 0.672.750% Due 11-30-16Main Street Bank Corp (FDIC Gtd) 56034WAH4 2016 248,000.00 100.12 248,309.01 248,000.00 0.90 0.740.900% Due 12-16-16US Treasury Notes/Bonds 912828H29 2016 16,000,000.00 99.96 15,994,368.00 16,004,036.43 0.59 0.670.625% Due 12-31-16
53,600,000.00 100.47 53,851,291.98 53,866,858.52 0.63 0.70
US Treasury Notes/Bonds 912828MK3 2017 5,000,000.00 102.21 5,110,740.00 5,113,904.47 0.63 0.713.125% Due 01-31-17Southwest Bank (FDIC Gtd) 844772BA0 2017 237,000.00 100.22 237,524.48 237,000.00 0.75 0.520.750% Due 02-13-17US Treasury Notes/Bonds 912828MS6 2017 14,500,000.00 102.26 14,827,381.00 14,822,174.53 0.76 0.733.000% Due 02-28-17Triad Bank (FDIC Gtd) 89579NBF9 2017 249,000.00 100.49 250,230.56 249,000.00 1.00 0.531.000% Due 03-14-17US Treasury Notes/Bonds 912828C32 2017 10,000,000.00 100.04 10,004,300.00 9,996,119.84 0.79 0.710.750% Due 03-15-17BMO Harris Bank NA (FDIC Gtd) 05573J4Q4 2017 248,000.00 100.07 248,178.81 248,000.00 0.90 0.830.900% Due 03-23-17Parkway Bank & Trust Co (FDIC Gtd) 70153RHJ0 2017 248,000.00 100.06 248,156.49 248,000.00 1.15 1.091.150% Due 04-07-17United Community Bank (FDIC Gtd) 90983WAZ4 2017 248,000.00 100.06 248,137.39 248,000.00 1.00 0.961.000% Due 04-13-17
Boston Dallas Denver Los Angeles New York Phoenix Tampa
The City of RiversideMaturity Distribution February 29, 2016
Dollar Market Yield Yield
Description Cusip Year Par Value Price Value Book Value On Cost on Price
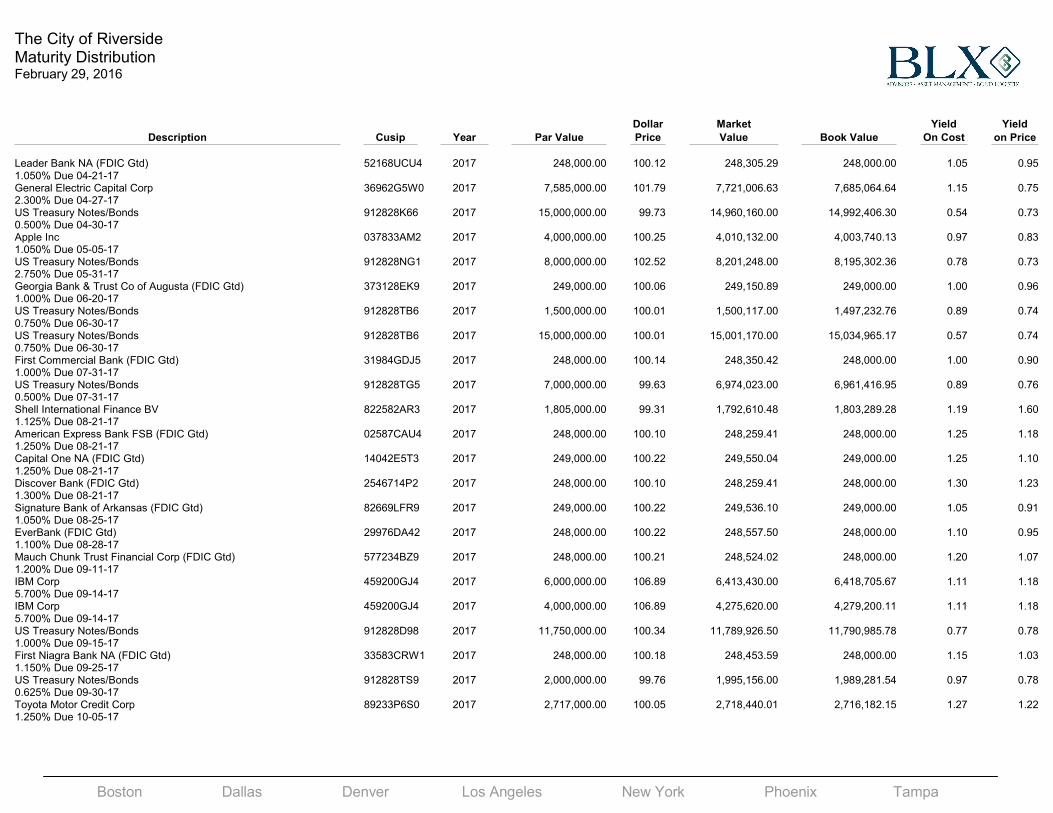
Leader Bank NA (FDIC Gtd) 52168UCU4 2017 248,000.00 100.12 248,305.29 248,000.00 1.05 0.951.050% Due 04-21-17General Electric Capital Corp 36962G5W0 2017 7,585,000.00 101.79 7,721,006.63 7,685,064.64 1.15 0.752.300% Due 04-27-17US Treasury Notes/Bonds 912828K66 2017 15,000,000.00 99.73 14,960,160.00 14,992,406.30 0.54 0.730.500% Due 04-30-17Apple Inc 037833AM2 2017 4,000,000.00 100.25 4,010,132.00 4,003,740.13 0.97 0.831.050% Due 05-05-17US Treasury Notes/Bonds 912828NG1 2017 8,000,000.00 102.52 8,201,248.00 8,195,302.36 0.78 0.732.750% Due 05-31-17Georgia Bank & Trust Co of Augusta (FDIC Gtd) 373128EK9 2017 249,000.00 100.06 249,150.89 249,000.00 1.00 0.961.000% Due 06-20-17US Treasury Notes/Bonds 912828TB6 2017 1,500,000.00 100.01 1,500,117.00 1,497,232.76 0.89 0.740.750% Due 06-30-17US Treasury Notes/Bonds 912828TB6 2017 15,000,000.00 100.01 15,001,170.00 15,034,965.17 0.57 0.740.750% Due 06-30-17First Commercial Bank (FDIC Gtd) 31984GDJ5 2017 248,000.00 100.14 248,350.42 248,000.00 1.00 0.901.000% Due 07-31-17US Treasury Notes/Bonds 912828TG5 2017 7,000,000.00 99.63 6,974,023.00 6,961,416.95 0.89 0.760.500% Due 07-31-17Shell International Finance BV 822582AR3 2017 1,805,000.00 99.31 1,792,610.48 1,803,289.28 1.19 1.601.125% Due 08-21-17American Express Bank FSB (FDIC Gtd) 02587CAU4 2017 248,000.00 100.10 248,259.41 248,000.00 1.25 1.181.250% Due 08-21-17Capital One NA (FDIC Gtd) 14042E5T3 2017 249,000.00 100.22 249,550.04 249,000.00 1.25 1.101.250% Due 08-21-17Discover Bank (FDIC Gtd) 2546714P2 2017 248,000.00 100.10 248,259.41 248,000.00 1.30 1.231.300% Due 08-21-17Signature Bank of Arkansas (FDIC Gtd) 82669LFR9 2017 249,000.00 100.22 249,536.10 249,000.00 1.05 0.911.050% Due 08-25-17EverBank (FDIC Gtd) 29976DA42 2017 248,000.00 100.22 248,557.50 248,000.00 1.10 0.951.100% Due 08-28-17Mauch Chunk Trust Financial Corp (FDIC Gtd) 577234BZ9 2017 248,000.00 100.21 248,524.02 248,000.00 1.20 1.071.200% Due 09-11-17IBM Corp 459200GJ4 2017 6,000,000.00 106.89 6,413,430.00 6,418,705.67 1.11 1.185.700% Due 09-14-17IBM Corp 459200GJ4 2017 4,000,000.00 106.89 4,275,620.00 4,279,200.11 1.11 1.185.700% Due 09-14-17US Treasury Notes/Bonds 912828D98 2017 11,750,000.00 100.34 11,789,926.50 11,790,985.78 0.77 0.781.000% Due 09-15-17First Niagra Bank NA (FDIC Gtd) 33583CRW1 2017 248,000.00 100.18 248,453.59 248,000.00 1.15 1.031.150% Due 09-25-17US Treasury Notes/Bonds 912828TS9 2017 2,000,000.00 99.76 1,995,156.00 1,989,281.54 0.97 0.780.625% Due 09-30-17Toyota Motor Credit Corp 89233P6S0 2017 2,717,000.00 100.05 2,718,440.01 2,716,182.15 1.27 1.221.250% Due 10-05-17
Boston Dallas Denver Los Angeles New York Phoenix Tampa
The City of RiversideMaturity Distribution February 29, 2016
Dollar Market Yield Yield
Description Cusip Year Par Value Price Value Book Value On Cost on Price
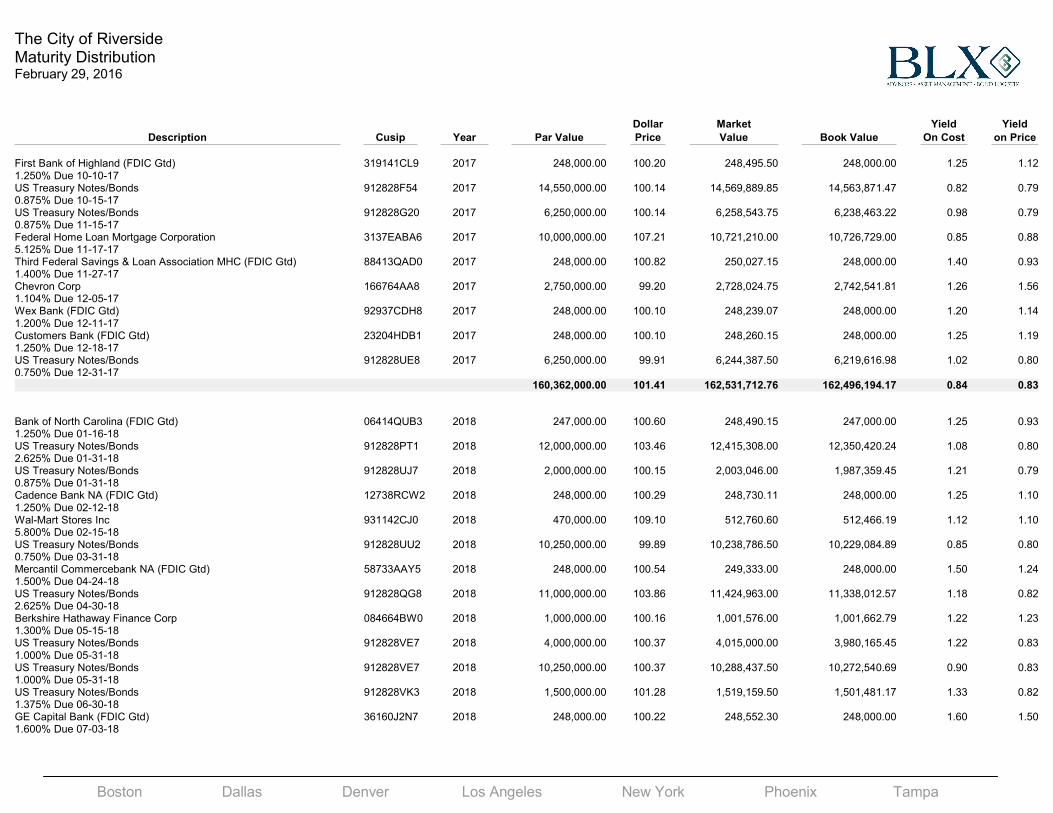
First Bank of Highland (FDIC Gtd) 319141CL9 2017 248,000.00 100.20 248,495.50 248,000.00 1.25 1.121.250% Due 10-10-17US Treasury Notes/Bonds 912828F54 2017 14,550,000.00 100.14 14,569,889.85 14,563,871.47 0.82 0.790.875% Due 10-15-17US Treasury Notes/Bonds 912828G20 2017 6,250,000.00 100.14 6,258,543.75 6,238,463.22 0.98 0.790.875% Due 11-15-17Federal Home Loan Mortgage Corporation 3137EABA6 2017 10,000,000.00 107.21 10,721,210.00 10,726,729.00 0.85 0.885.125% Due 11-17-17Third Federal Savings & Loan Association MHC (FDIC Gtd) 88413QAD0 2017 248,000.00 100.82 250,027.15 248,000.00 1.40 0.931.400% Due 11-27-17Chevron Corp 166764AA8 2017 2,750,000.00 99.20 2,728,024.75 2,742,541.81 1.26 1.561.104% Due 12-05-17Wex Bank (FDIC Gtd) 92937CDH8 2017 248,000.00 100.10 248,239.07 248,000.00 1.20 1.141.200% Due 12-11-17Customers Bank (FDIC Gtd) 23204HDB1 2017 248,000.00 100.10 248,260.15 248,000.00 1.25 1.191.250% Due 12-18-17US Treasury Notes/Bonds 912828UE8 2017 6,250,000.00 99.91 6,244,387.50 6,219,616.98 1.02 0.800.750% Due 12-31-17
160,362,000.00 101.41 162,531,712.76 162,496,194.17 0.84 0.83
Bank of North Carolina (FDIC Gtd) 06414QUB3 2018 247,000.00 100.60 248,490.15 247,000.00 1.25 0.931.250% Due 01-16-18US Treasury Notes/Bonds 912828PT1 2018 12,000,000.00 103.46 12,415,308.00 12,350,420.24 1.08 0.802.625% Due 01-31-18US Treasury Notes/Bonds 912828UJ7 2018 2,000,000.00 100.15 2,003,046.00 1,987,359.45 1.21 0.790.875% Due 01-31-18Cadence Bank NA (FDIC Gtd) 12738RCW2 2018 248,000.00 100.29 248,730.11 248,000.00 1.25 1.101.250% Due 02-12-18Wal-Mart Stores Inc 931142CJ0 2018 470,000.00 109.10 512,760.60 512,466.19 1.12 1.105.800% Due 02-15-18US Treasury Notes/Bonds 912828UU2 2018 10,250,000.00 99.89 10,238,786.50 10,229,084.89 0.85 0.800.750% Due 03-31-18Mercantil Commercebank NA (FDIC Gtd) 58733AAY5 2018 248,000.00 100.54 249,333.00 248,000.00 1.50 1.241.500% Due 04-24-18US Treasury Notes/Bonds 912828QG8 2018 11,000,000.00 103.86 11,424,963.00 11,338,012.57 1.18 0.822.625% Due 04-30-18Berkshire Hathaway Finance Corp 084664BW0 2018 1,000,000.00 100.16 1,001,576.00 1,001,662.79 1.22 1.231.300% Due 05-15-18US Treasury Notes/Bonds 912828VE7 2018 4,000,000.00 100.37 4,015,000.00 3,980,165.45 1.22 0.831.000% Due 05-31-18US Treasury Notes/Bonds 912828VE7 2018 10,250,000.00 100.37 10,288,437.50 10,272,540.69 0.90 0.831.000% Due 05-31-18US Treasury Notes/Bonds 912828VK3 2018 1,500,000.00 101.28 1,519,159.50 1,501,481.17 1.33 0.821.375% Due 06-30-18GE Capital Bank (FDIC Gtd) 36160J2N7 2018 248,000.00 100.22 248,552.30 248,000.00 1.60 1.501.600% Due 07-03-18
Boston Dallas Denver Los Angeles New York Phoenix Tampa
The City of RiversideMaturity Distribution February 29, 2016
Dollar Market Yield Yield
Description Cusip Year Par Value Price Value Book Value On Cost on Price
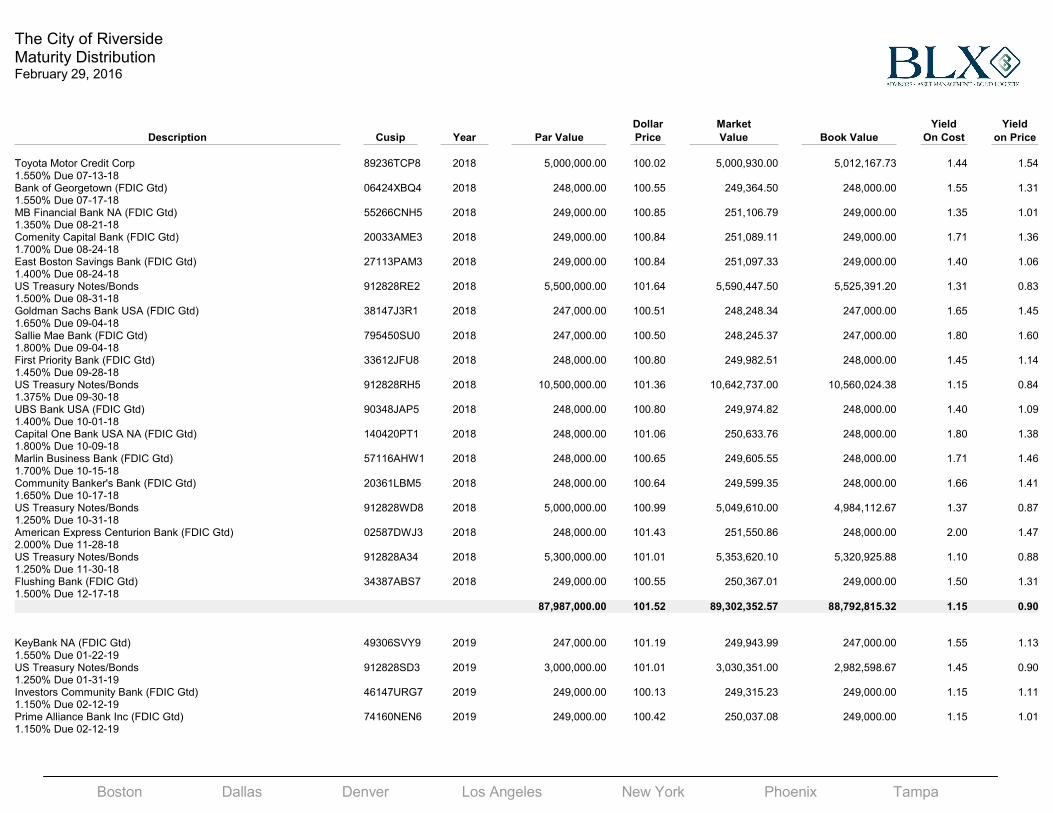
Toyota Motor Credit Corp 89236TCP8 2018 5,000,000.00 100.02 5,000,930.00 5,012,167.73 1.44 1.541.550% Due 07-13-18Bank of Georgetown (FDIC Gtd) 06424XBQ4 2018 248,000.00 100.55 249,364.50 248,000.00 1.55 1.311.550% Due 07-17-18MB Financial Bank NA (FDIC Gtd) 55266CNH5 2018 249,000.00 100.85 251,106.79 249,000.00 1.35 1.011.350% Due 08-21-18Comenity Capital Bank (FDIC Gtd) 20033AME3 2018 249,000.00 100.84 251,089.11 249,000.00 1.71 1.361.700% Due 08-24-18East Boston Savings Bank (FDIC Gtd) 27113PAM3 2018 249,000.00 100.84 251,097.33 249,000.00 1.40 1.061.400% Due 08-24-18US Treasury Notes/Bonds 912828RE2 2018 5,500,000.00 101.64 5,590,447.50 5,525,391.20 1.31 0.831.500% Due 08-31-18Goldman Sachs Bank USA (FDIC Gtd) 38147J3R1 2018 247,000.00 100.51 248,248.34 247,000.00 1.65 1.451.650% Due 09-04-18Sallie Mae Bank (FDIC Gtd) 795450SU0 2018 247,000.00 100.50 248,245.37 247,000.00 1.80 1.601.800% Due 09-04-18First Priority Bank (FDIC Gtd) 33612JFU8 2018 248,000.00 100.80 249,982.51 248,000.00 1.45 1.141.450% Due 09-28-18US Treasury Notes/Bonds 912828RH5 2018 10,500,000.00 101.36 10,642,737.00 10,560,024.38 1.15 0.841.375% Due 09-30-18UBS Bank USA (FDIC Gtd) 90348JAP5 2018 248,000.00 100.80 249,974.82 248,000.00 1.40 1.091.400% Due 10-01-18Capital One Bank USA NA (FDIC Gtd) 140420PT1 2018 248,000.00 101.06 250,633.76 248,000.00 1.80 1.381.800% Due 10-09-18Marlin Business Bank (FDIC Gtd) 57116AHW1 2018 248,000.00 100.65 249,605.55 248,000.00 1.71 1.461.700% Due 10-15-18Community Banker's Bank (FDIC Gtd) 20361LBM5 2018 248,000.00 100.64 249,599.35 248,000.00 1.66 1.411.650% Due 10-17-18US Treasury Notes/Bonds 912828WD8 2018 5,000,000.00 100.99 5,049,610.00 4,984,112.67 1.37 0.871.250% Due 10-31-18American Express Centurion Bank (FDIC Gtd) 02587DWJ3 2018 248,000.00 101.43 251,550.86 248,000.00 2.00 1.472.000% Due 11-28-18US Treasury Notes/Bonds 912828A34 2018 5,300,000.00 101.01 5,353,620.10 5,320,925.88 1.10 0.881.250% Due 11-30-18Flushing Bank (FDIC Gtd) 34387ABS7 2018 249,000.00 100.55 250,367.01 249,000.00 1.50 1.311.500% Due 12-17-18
87,987,000.00 101.52 89,302,352.57 88,792,815.32 1.15 0.90
KeyBank NA (FDIC Gtd) 49306SVY9 2019 247,000.00 101.19 249,943.99 247,000.00 1.55 1.131.550% Due 01-22-19US Treasury Notes/Bonds 912828SD3 2019 3,000,000.00 101.01 3,030,351.00 2,982,598.67 1.45 0.901.250% Due 01-31-19Investors Community Bank (FDIC Gtd) 46147URG7 2019 249,000.00 100.13 249,315.23 249,000.00 1.15 1.111.150% Due 02-12-19Prime Alliance Bank Inc (FDIC Gtd) 74160NEN6 2019 249,000.00 100.42 250,037.08 249,000.00 1.15 1.011.150% Due 02-12-19
Boston Dallas Denver Los Angeles New York Phoenix Tampa
The City of RiversideMaturity Distribution February 29, 2016
Dollar Market Yield Yield
Description Cusip Year Par Value Price Value Book Value On Cost on Price
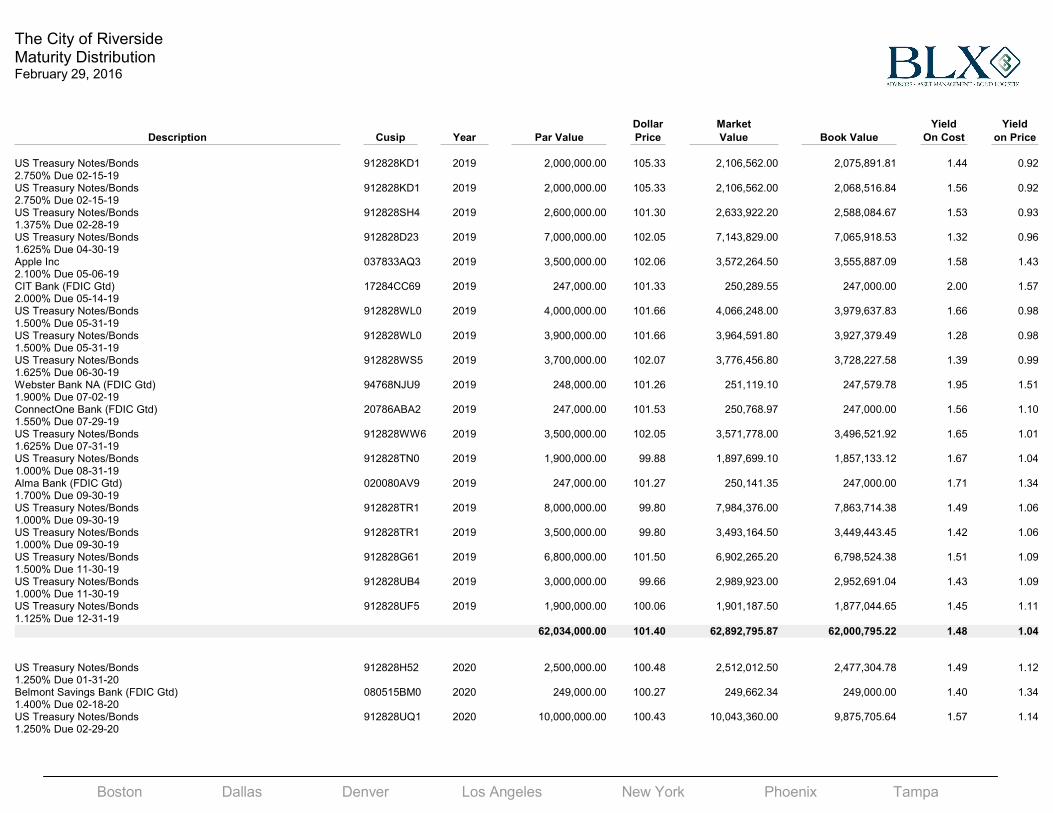
US Treasury Notes/Bonds 912828KD1 2019 2,000,000.00 105.33 2,106,562.00 2,075,891.81 1.44 0.922.750% Due 02-15-19US Treasury Notes/Bonds 912828KD1 2019 2,000,000.00 105.33 2,106,562.00 2,068,516.84 1.56 0.922.750% Due 02-15-19US Treasury Notes/Bonds 912828SH4 2019 2,600,000.00 101.30 2,633,922.20 2,588,084.67 1.53 0.931.375% Due 02-28-19US Treasury Notes/Bonds 912828D23 2019 7,000,000.00 102.05 7,143,829.00 7,065,918.53 1.32 0.961.625% Due 04-30-19Apple Inc 037833AQ3 2019 3,500,000.00 102.06 3,572,264.50 3,555,887.09 1.58 1.432.100% Due 05-06-19CIT Bank (FDIC Gtd) 17284CC69 2019 247,000.00 101.33 250,289.55 247,000.00 2.00 1.572.000% Due 05-14-19US Treasury Notes/Bonds 912828WL0 2019 4,000,000.00 101.66 4,066,248.00 3,979,637.83 1.66 0.981.500% Due 05-31-19US Treasury Notes/Bonds 912828WL0 2019 3,900,000.00 101.66 3,964,591.80 3,927,379.49 1.28 0.981.500% Due 05-31-19US Treasury Notes/Bonds 912828WS5 2019 3,700,000.00 102.07 3,776,456.80 3,728,227.58 1.39 0.991.625% Due 06-30-19Webster Bank NA (FDIC Gtd) 94768NJU9 2019 248,000.00 101.26 251,119.10 247,579.78 1.95 1.511.900% Due 07-02-19ConnectOne Bank (FDIC Gtd) 20786ABA2 2019 247,000.00 101.53 250,768.97 247,000.00 1.56 1.101.550% Due 07-29-19US Treasury Notes/Bonds 912828WW6 2019 3,500,000.00 102.05 3,571,778.00 3,496,521.92 1.65 1.011.625% Due 07-31-19US Treasury Notes/Bonds 912828TN0 2019 1,900,000.00 99.88 1,897,699.10 1,857,133.12 1.67 1.041.000% Due 08-31-19Alma Bank (FDIC Gtd) 020080AV9 2019 247,000.00 101.27 250,141.35 247,000.00 1.71 1.341.700% Due 09-30-19US Treasury Notes/Bonds 912828TR1 2019 8,000,000.00 99.80 7,984,376.00 7,863,714.38 1.49 1.061.000% Due 09-30-19US Treasury Notes/Bonds 912828TR1 2019 3,500,000.00 99.80 3,493,164.50 3,449,443.45 1.42 1.061.000% Due 09-30-19US Treasury Notes/Bonds 912828G61 2019 6,800,000.00 101.50 6,902,265.20 6,798,524.38 1.51 1.091.500% Due 11-30-19US Treasury Notes/Bonds 912828UB4 2019 3,000,000.00 99.66 2,989,923.00 2,952,691.04 1.43 1.091.000% Due 11-30-19US Treasury Notes/Bonds 912828UF5 2019 1,900,000.00 100.06 1,901,187.50 1,877,044.65 1.45 1.111.125% Due 12-31-19
62,034,000.00 101.40 62,892,795.87 62,000,795.22 1.48 1.04
US Treasury Notes/Bonds 912828H52 2020 2,500,000.00 100.48 2,512,012.50 2,477,304.78 1.49 1.121.250% Due 01-31-20Belmont Savings Bank (FDIC Gtd) 080515BM0 2020 249,000.00 100.27 249,662.34 249,000.00 1.40 1.341.400% Due 02-18-20US Treasury Notes/Bonds 912828UQ1 2020 10,000,000.00 100.43 10,043,360.00 9,875,705.64 1.57 1.141.250% Due 02-29-20
Boston Dallas Denver Los Angeles New York Phoenix Tampa
The City of RiversideMaturity Distribution February 29, 2016
Dollar Market Yield Yield
Description Cusip Year Par Value Price Value Book Value On Cost on Price
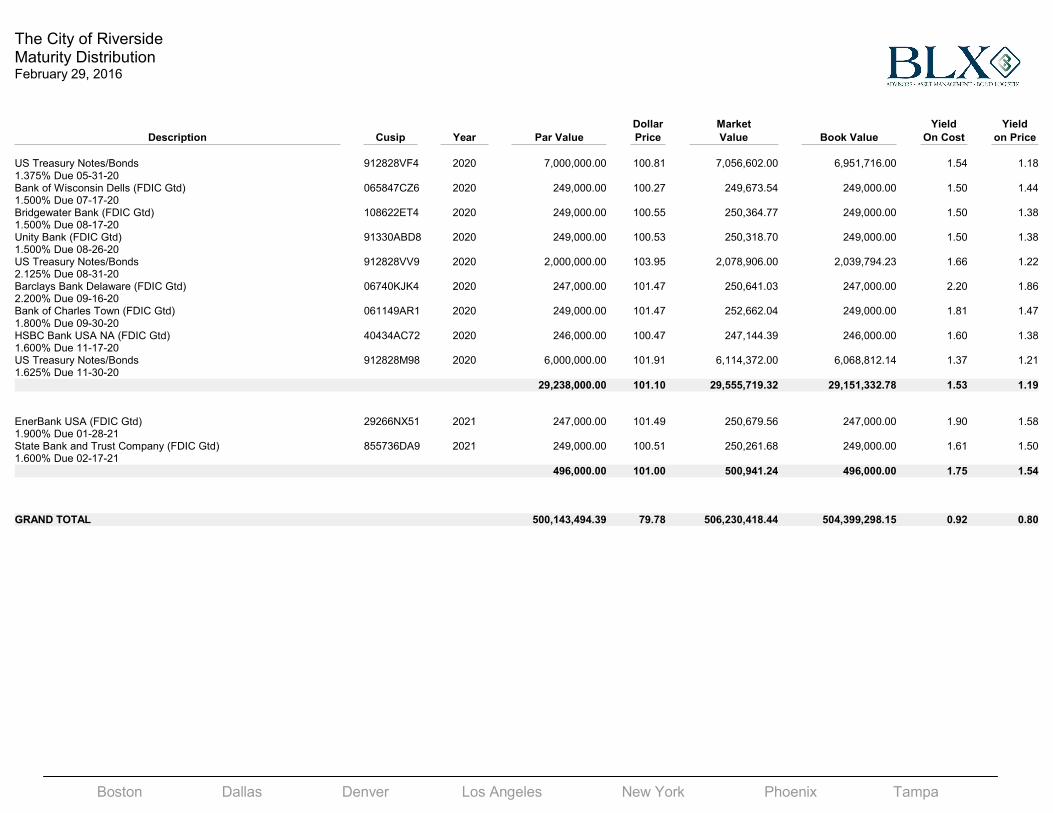
US Treasury Notes/Bonds 912828VF4 2020 7,000,000.00 100.81 7,056,602.00 6,951,716.00 1.54 1.181.375% Due 05-31-20Bank of Wisconsin Dells (FDIC Gtd) 065847CZ6 2020 249,000.00 100.27 249,673.54 249,000.00 1.50 1.441.500% Due 07-17-20Bridgewater Bank (FDIC Gtd) 108622ET4 2020 249,000.00 100.55 250,364.77 249,000.00 1.50 1.381.500% Due 08-17-20Unity Bank (FDIC Gtd) 91330ABD8 2020 249,000.00 100.53 250,318.70 249,000.00 1.50 1.381.500% Due 08-26-20US Treasury Notes/Bonds 912828VV9 2020 2,000,000.00 103.95 2,078,906.00 2,039,794.23 1.66 1.222.125% Due 08-31-20Barclays Bank Delaware (FDIC Gtd) 06740KJK4 2020 247,000.00 101.47 250,641.03 247,000.00 2.20 1.862.200% Due 09-16-20Bank of Charles Town (FDIC Gtd) 061149AR1 2020 249,000.00 101.47 252,662.04 249,000.00 1.81 1.471.800% Due 09-30-20HSBC Bank USA NA (FDIC Gtd) 40434AC72 2020 246,000.00 100.47 247,144.39 246,000.00 1.60 1.381.600% Due 11-17-20US Treasury Notes/Bonds 912828M98 2020 6,000,000.00 101.91 6,114,372.00 6,068,812.14 1.37 1.211.625% Due 11-30-20
29,238,000.00 101.10 29,555,719.32 29,151,332.78 1.53 1.19
EnerBank USA (FDIC Gtd) 29266NX51 2021 247,000.00 101.49 250,679.56 247,000.00 1.90 1.581.900% Due 01-28-21State Bank and Trust Company (FDIC Gtd) 855736DA9 2021 249,000.00 100.51 250,261.68 249,000.00 1.61 1.501.600% Due 02-17-21
496,000.00 101.00 500,941.24 496,000.00 1.75 1.54
GRAND TOTAL 500,143,494.39 79.78 506,230,418.44 504,399,298.15 0.92 0.80
Boston Dallas Denver Los Angeles New York Phoenix Tampa
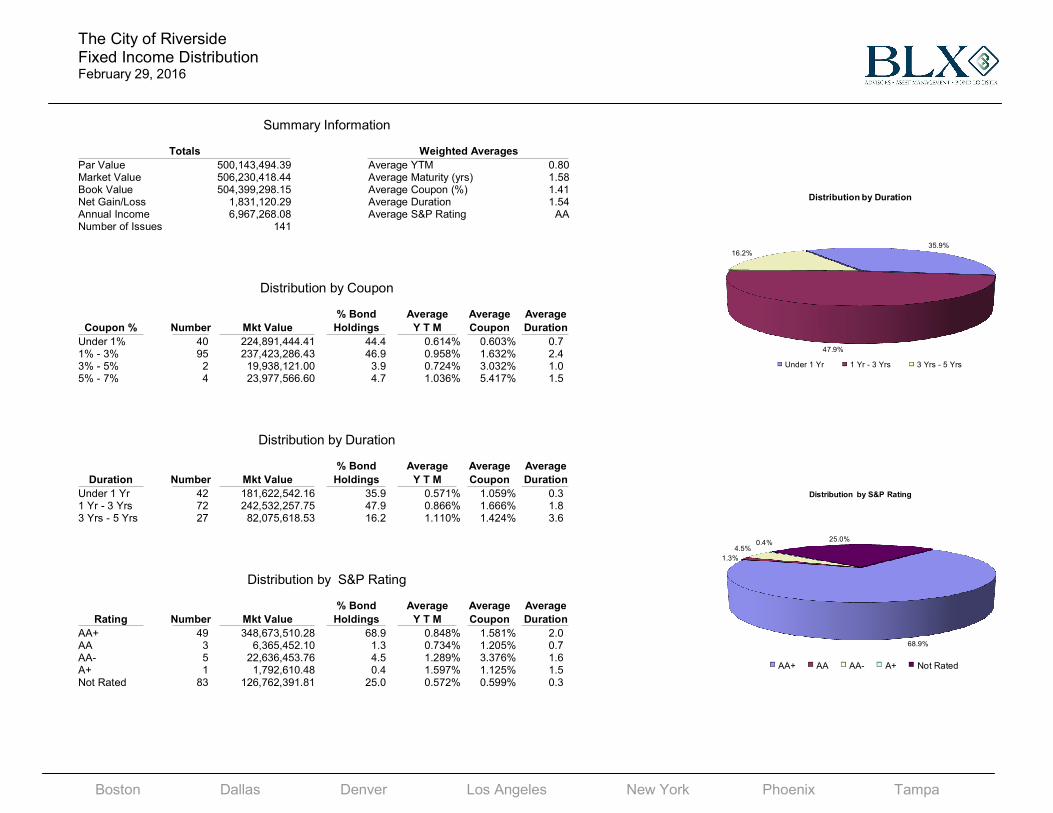
35.9%
47.9%
16.2%
Distribution by Duration
Under 1 Yr 1 Yr - 3 Yrs 3 Yrs - 5 Yrs
68.9%
1.3%
4.5% 0.4%
25.0%
Distribution by S&P Rating
AA+ AA AA- A+ Not Rated
The City of RiversideFixed Income DistributionFebruary 29, 2016
Summary Information
Totals Weighted Averages
Par Value 500,143,494.39 Average YTM 0.80Market Value 506,230,418.44 Average Maturity (yrs) 1.58Book Value 504,399,298.15 Average Coupon (%) 1.41Net Gain/Loss 1,831,120.29 Average Duration 1.54Annual Income 6,967,268.08 Average S&P Rating AANumber of Issues 141
Distribution by Coupon
% Bond Average Average Average
Coupon % Number Mkt Value Holdings Y T M Coupon Duration
Under 1% 40 224,891,444.41 44.4 0.614% 0.603% 0.71% - 3% 95 237,423,286.43 46.9 0.958% 1.632% 2.43% - 5% 2 19,938,121.00 3.9 0.724% 3.032% 1.05% - 7% 4 23,977,566.60 4.7 1.036% 5.417% 1.5
Distribution by Duration
% Bond Average Average Average
Duration Number Mkt Value Holdings Y T M Coupon Duration
Under 1 Yr 42 181,622,542.16 35.9 0.571% 1.059% 0.31 Yr - 3 Yrs 72 242,532,257.75 47.9 0.866% 1.666% 1.83 Yrs - 5 Yrs 27 82,075,618.53 16.2 1.110% 1.424% 3.6
Distribution by S&P Rating
% Bond Average Average Average
Rating Number Mkt Value Holdings Y T M Coupon Duration
AA+ 49 348,673,510.28 68.9 0.848% 1.581% 2.0AA 3 6,365,452.10 1.3 0.734% 1.205% 0.7AA- 5 22,636,453.76 4.5 1.289% 3.376% 1.6A+ 1 1,792,610.48 0.4 1.597% 1.125% 1.5Not Rated 83 126,762,391.81 25.0 0.572% 0.599% 0.3
Boston Dallas Denver Los Angeles New York Phoenix Tampa
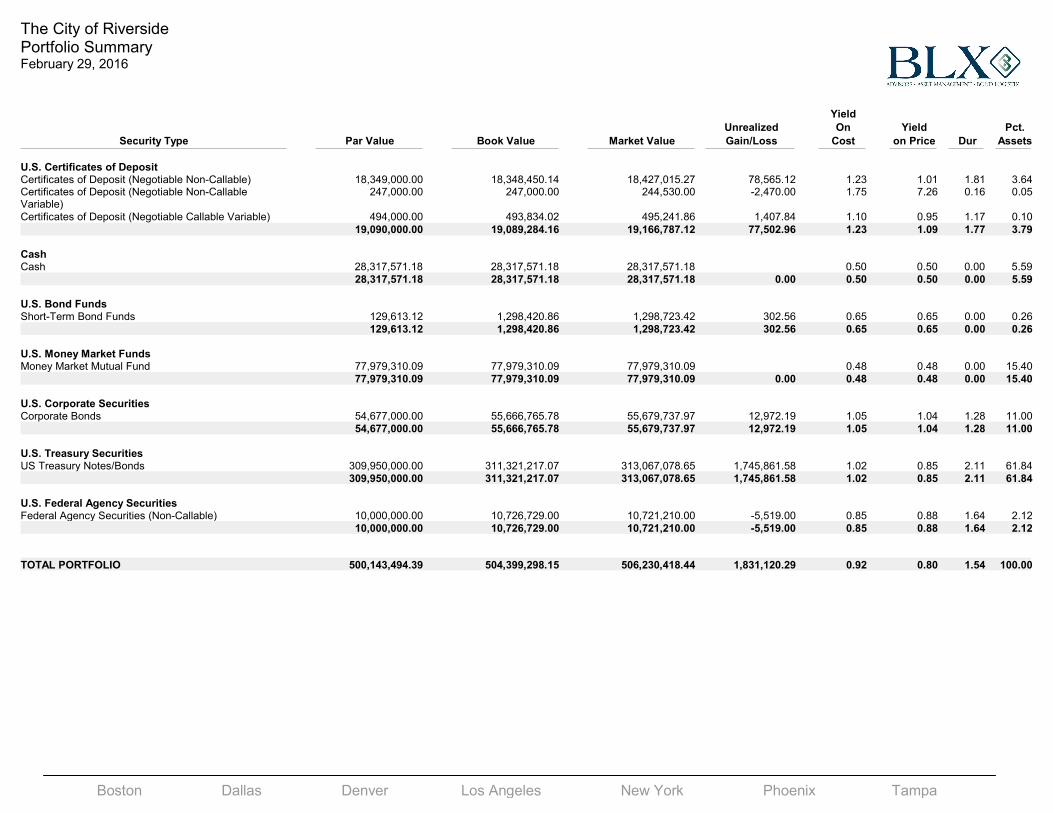
The City of RiversidePortfolio Summary February 29, 2016
Yield
Unrealized On Yield Pct.
Security Type Par Value Book Value Market Value Gain/Loss Cost on Price Dur Assets
U.S. Certificates of DepositCertificates of Deposit (Negotiable Non-Callable) 18,349,000.00 18,348,450.14 18,427,015.27 78,565.12 1.23 1.01 1.81 3.64Certificates of Deposit (Negotiable Non-Callable Variable)
247,000.00 247,000.00 244,530.00 -2,470.00 1.75 7.26 0.16 0.05
Certificates of Deposit (Negotiable Callable Variable) 494,000.00 493,834.02 495,241.86 1,407.84 1.10 0.95 1.17 0.10
19,090,000.00 19,089,284.16 19,166,787.12 77,502.96 1.23 1.09 1.77 3.79
CashCash 28,317,571.18 28,317,571.18 28,317,571.18 0.50 0.50 0.00 5.59
28,317,571.18 28,317,571.18 28,317,571.18 0.00 0.50 0.50 0.00 5.59
U.S. Bond FundsShort-Term Bond Funds 129,613.12 1,298,420.86 1,298,723.42 302.56 0.65 0.65 0.00 0.26
129,613.12 1,298,420.86 1,298,723.42 302.56 0.65 0.65 0.00 0.26
U.S. Money Market FundsMoney Market Mutual Fund 77,979,310.09 77,979,310.09 77,979,310.09 0.48 0.48 0.00 15.40
77,979,310.09 77,979,310.09 77,979,310.09 0.00 0.48 0.48 0.00 15.40
U.S. Corporate SecuritiesCorporate Bonds 54,677,000.00 55,666,765.78 55,679,737.97 12,972.19 1.05 1.04 1.28 11.00
54,677,000.00 55,666,765.78 55,679,737.97 12,972.19 1.05 1.04 1.28 11.00
U.S. Treasury SecuritiesUS Treasury Notes/Bonds 309,950,000.00 311,321,217.07 313,067,078.65 1,745,861.58 1.02 0.85 2.11 61.84
309,950,000.00 311,321,217.07 313,067,078.65 1,745,861.58 1.02 0.85 2.11 61.84
U.S. Federal Agency SecuritiesFederal Agency Securities (Non-Callable) 10,000,000.00 10,726,729.00 10,721,210.00 -5,519.00 0.85 0.88 1.64 2.12
10,000,000.00 10,726,729.00 10,721,210.00 -5,519.00 0.85 0.88 1.64 2.12
TOTAL PORTFOLIO 500,143,494.39 504,399,298.15 506,230,418.44 1,831,120.29 0.92 0.80 1.54 100.00
Boston Dallas Denver Los Angeles New York Phoenix Tampa
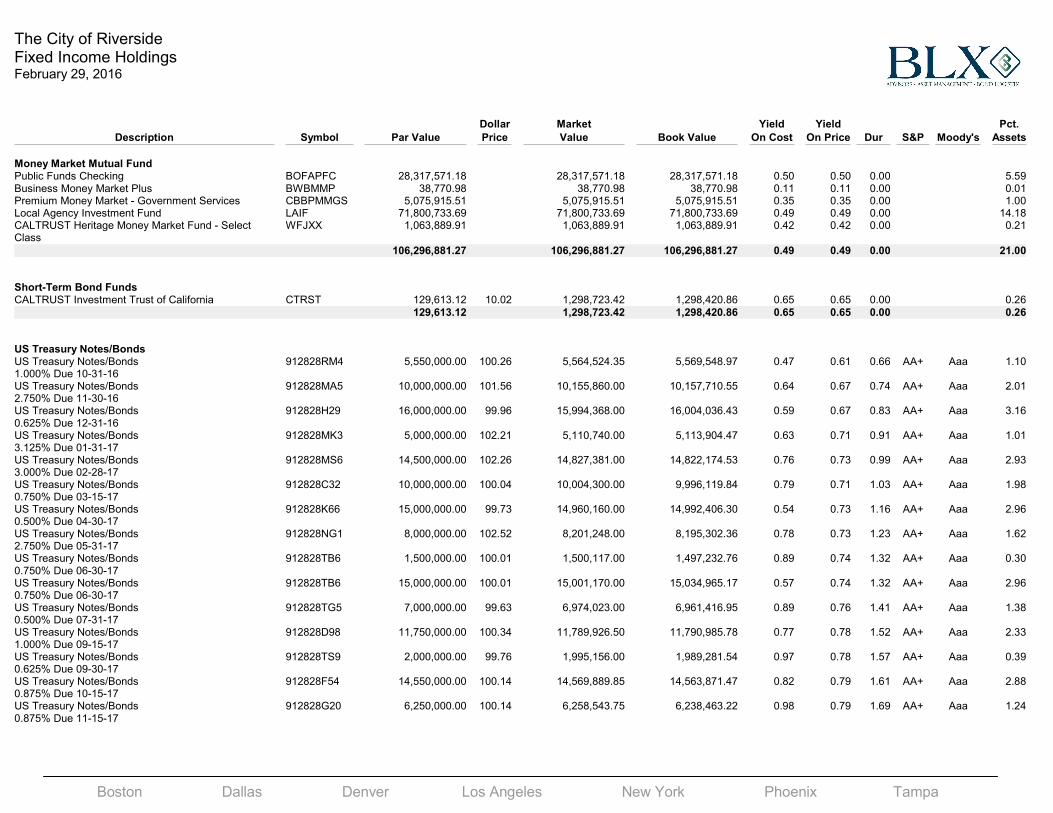
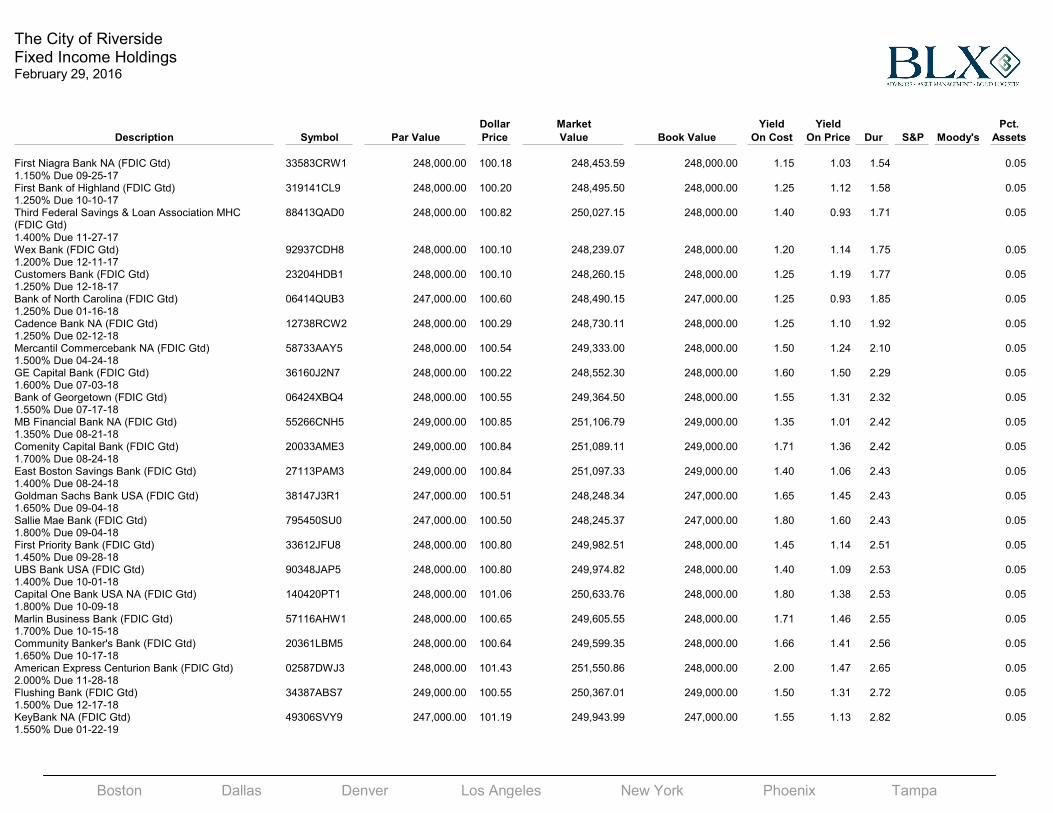
The City of RiversideFixed Income HoldingsFebruary 29, 2016
Dollar Market Yield Yield Pct.
Description Symbol Par Value Price Value Book Value On Cost On Price Dur S&P Moody's Assets
Money Market Mutual FundPublic Funds Checking BOFAPFC 28,317,571.18 28,317,571.18 28,317,571.18 0.50 0.50 0.00 5.59Business Money Market Plus BWBMMP 38,770.98 38,770.98 38,770.98 0.11 0.11 0.00 0.01Premium Money Market - Government Services CBBPMMGS 5,075,915.51 5,075,915.51 5,075,915.51 0.35 0.35 0.00 1.00Local Agency Investment Fund LAIF 71,800,733.69 71,800,733.69 71,800,733.69 0.49 0.49 0.00 14.18CALTRUST Heritage Money Market Fund - Select Class
WFJXX 1,063,889.91 1,063,889.91 1,063,889.91 0.42 0.42 0.00 0.21
106,296,881.27 106,296,881.27 106,296,881.27 0.49 0.49 0.00 21.00
Short-Term Bond FundsCALTRUST Investment Trust of California CTRST 129,613.12 10.02 1,298,723.42 1,298,420.86 0.65 0.65 0.00 0.26
129,613.12 1,298,723.42 1,298,420.86 0.65 0.65 0.00 0.26
US Treasury Notes/BondsUS Treasury Notes/Bonds 912828RM4 5,550,000.00 100.26 5,564,524.35 5,569,548.97 0.47 0.61 0.66 AA+ Aaa 1.101.000% Due 10-31-16US Treasury Notes/Bonds 912828MA5 10,000,000.00 101.56 10,155,860.00 10,157,710.55 0.64 0.67 0.74 AA+ Aaa 2.012.750% Due 11-30-16US Treasury Notes/Bonds 912828H29 16,000,000.00 99.96 15,994,368.00 16,004,036.43 0.59 0.67 0.83 AA+ Aaa 3.160.625% Due 12-31-16US Treasury Notes/Bonds 912828MK3 5,000,000.00 102.21 5,110,740.00 5,113,904.47 0.63 0.71 0.91 AA+ Aaa 1.013.125% Due 01-31-17US Treasury Notes/Bonds 912828MS6 14,500,000.00 102.26 14,827,381.00 14,822,174.53 0.76 0.73 0.99 AA+ Aaa 2.933.000% Due 02-28-17US Treasury Notes/Bonds 912828C32 10,000,000.00 100.04 10,004,300.00 9,996,119.84 0.79 0.71 1.03 AA+ Aaa 1.980.750% Due 03-15-17US Treasury Notes/Bonds 912828K66 15,000,000.00 99.73 14,960,160.00 14,992,406.30 0.54 0.73 1.16 AA+ Aaa 2.960.500% Due 04-30-17US Treasury Notes/Bonds 912828NG1 8,000,000.00 102.52 8,201,248.00 8,195,302.36 0.78 0.73 1.23 AA+ Aaa 1.622.750% Due 05-31-17US Treasury Notes/Bonds 912828TB6 1,500,000.00 100.01 1,500,117.00 1,497,232.76 0.89 0.74 1.32 AA+ Aaa 0.300.750% Due 06-30-17US Treasury Notes/Bonds 912828TB6 15,000,000.00 100.01 15,001,170.00 15,034,965.17 0.57 0.74 1.32 AA+ Aaa 2.960.750% Due 06-30-17US Treasury Notes/Bonds 912828TG5 7,000,000.00 99.63 6,974,023.00 6,961,416.95 0.89 0.76 1.41 AA+ Aaa 1.380.500% Due 07-31-17US Treasury Notes/Bonds 912828D98 11,750,000.00 100.34 11,789,926.50 11,790,985.78 0.77 0.78 1.52 AA+ Aaa 2.331.000% Due 09-15-17US Treasury Notes/Bonds 912828TS9 2,000,000.00 99.76 1,995,156.00 1,989,281.54 0.97 0.78 1.57 AA+ Aaa 0.390.625% Due 09-30-17US Treasury Notes/Bonds 912828F54 14,550,000.00 100.14 14,569,889.85 14,563,871.47 0.82 0.79 1.61 AA+ Aaa 2.880.875% Due 10-15-17US Treasury Notes/Bonds 912828G20 6,250,000.00 100.14 6,258,543.75 6,238,463.22 0.98 0.79 1.69 AA+ Aaa 1.240.875% Due 11-15-17
Boston Dallas Denver Los Angeles New York Phoenix Tampa
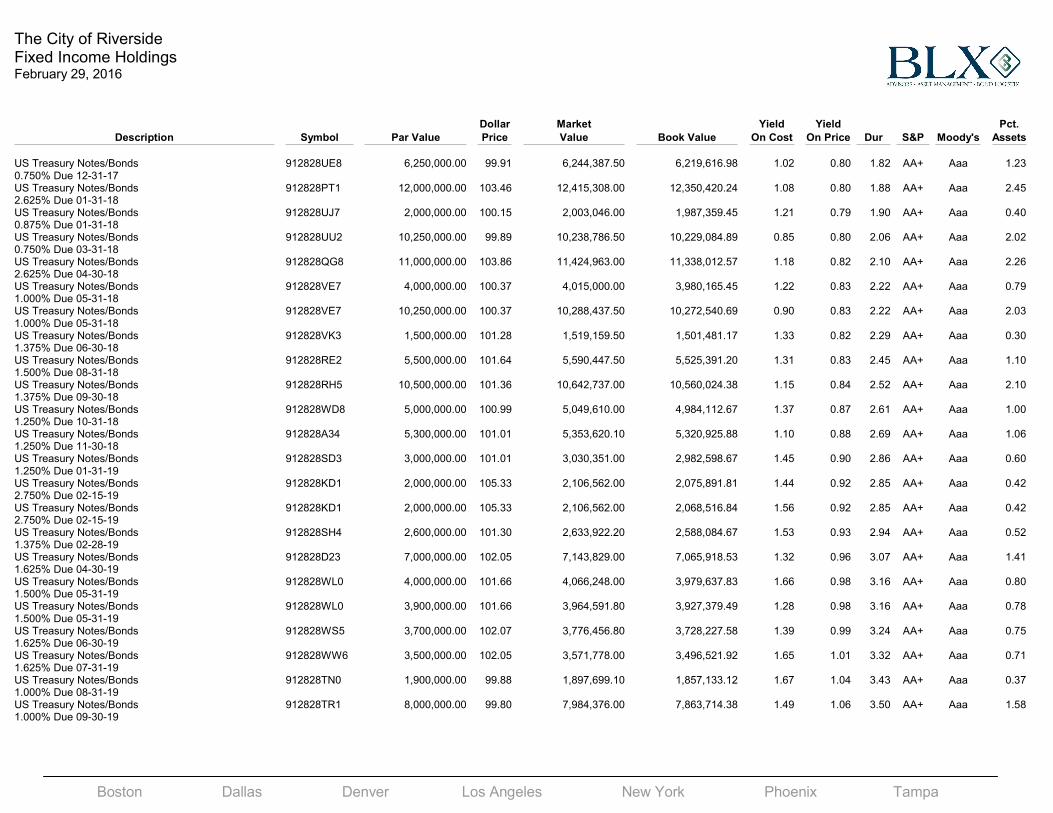
The City of RiversideFixed Income HoldingsFebruary 29, 2016
Dollar Market Yield Yield Pct.
Description Symbol Par Value Price Value Book Value On Cost On Price Dur S&P Moody's Assets
US Treasury Notes/Bonds 912828UE8 6,250,000.00 99.91 6,244,387.50 6,219,616.98 1.02 0.80 1.82 AA+ Aaa 1.230.750% Due 12-31-17US Treasury Notes/Bonds 912828PT1 12,000,000.00 103.46 12,415,308.00 12,350,420.24 1.08 0.80 1.88 AA+ Aaa 2.452.625% Due 01-31-18US Treasury Notes/Bonds 912828UJ7 2,000,000.00 100.15 2,003,046.00 1,987,359.45 1.21 0.79 1.90 AA+ Aaa 0.400.875% Due 01-31-18US Treasury Notes/Bonds 912828UU2 10,250,000.00 99.89 10,238,786.50 10,229,084.89 0.85 0.80 2.06 AA+ Aaa 2.020.750% Due 03-31-18US Treasury Notes/Bonds 912828QG8 11,000,000.00 103.86 11,424,963.00 11,338,012.57 1.18 0.82 2.10 AA+ Aaa 2.262.625% Due 04-30-18US Treasury Notes/Bonds 912828VE7 4,000,000.00 100.37 4,015,000.00 3,980,165.45 1.22 0.83 2.22 AA+ Aaa 0.791.000% Due 05-31-18US Treasury Notes/Bonds 912828VE7 10,250,000.00 100.37 10,288,437.50 10,272,540.69 0.90 0.83 2.22 AA+ Aaa 2.031.000% Due 05-31-18US Treasury Notes/Bonds 912828VK3 1,500,000.00 101.28 1,519,159.50 1,501,481.17 1.33 0.82 2.29 AA+ Aaa 0.301.375% Due 06-30-18US Treasury Notes/Bonds 912828RE2 5,500,000.00 101.64 5,590,447.50 5,525,391.20 1.31 0.83 2.45 AA+ Aaa 1.101.500% Due 08-31-18US Treasury Notes/Bonds 912828RH5 10,500,000.00 101.36 10,642,737.00 10,560,024.38 1.15 0.84 2.52 AA+ Aaa 2.101.375% Due 09-30-18US Treasury Notes/Bonds 912828WD8 5,000,000.00 100.99 5,049,610.00 4,984,112.67 1.37 0.87 2.61 AA+ Aaa 1.001.250% Due 10-31-18US Treasury Notes/Bonds 912828A34 5,300,000.00 101.01 5,353,620.10 5,320,925.88 1.10 0.88 2.69 AA+ Aaa 1.061.250% Due 11-30-18US Treasury Notes/Bonds 912828SD3 3,000,000.00 101.01 3,030,351.00 2,982,598.67 1.45 0.90 2.86 AA+ Aaa 0.601.250% Due 01-31-19US Treasury Notes/Bonds 912828KD1 2,000,000.00 105.33 2,106,562.00 2,075,891.81 1.44 0.92 2.85 AA+ Aaa 0.422.750% Due 02-15-19US Treasury Notes/Bonds 912828KD1 2,000,000.00 105.33 2,106,562.00 2,068,516.84 1.56 0.92 2.85 AA+ Aaa 0.422.750% Due 02-15-19US Treasury Notes/Bonds 912828SH4 2,600,000.00 101.30 2,633,922.20 2,588,084.67 1.53 0.93 2.94 AA+ Aaa 0.521.375% Due 02-28-19US Treasury Notes/Bonds 912828D23 7,000,000.00 102.05 7,143,829.00 7,065,918.53 1.32 0.96 3.07 AA+ Aaa 1.411.625% Due 04-30-19US Treasury Notes/Bonds 912828WL0 4,000,000.00 101.66 4,066,248.00 3,979,637.83 1.66 0.98 3.16 AA+ Aaa 0.801.500% Due 05-31-19US Treasury Notes/Bonds 912828WL0 3,900,000.00 101.66 3,964,591.80 3,927,379.49 1.28 0.98 3.16 AA+ Aaa 0.781.500% Due 05-31-19US Treasury Notes/Bonds 912828WS5 3,700,000.00 102.07 3,776,456.80 3,728,227.58 1.39 0.99 3.24 AA+ Aaa 0.751.625% Due 06-30-19US Treasury Notes/Bonds 912828WW6 3,500,000.00 102.05 3,571,778.00 3,496,521.92 1.65 1.01 3.32 AA+ Aaa 0.711.625% Due 07-31-19US Treasury Notes/Bonds 912828TN0 1,900,000.00 99.88 1,897,699.10 1,857,133.12 1.67 1.04 3.43 AA+ Aaa 0.371.000% Due 08-31-19US Treasury Notes/Bonds 912828TR1 8,000,000.00 99.80 7,984,376.00 7,863,714.38 1.49 1.06 3.50 AA+ Aaa 1.581.000% Due 09-30-19
Boston Dallas Denver Los Angeles New York Phoenix Tampa
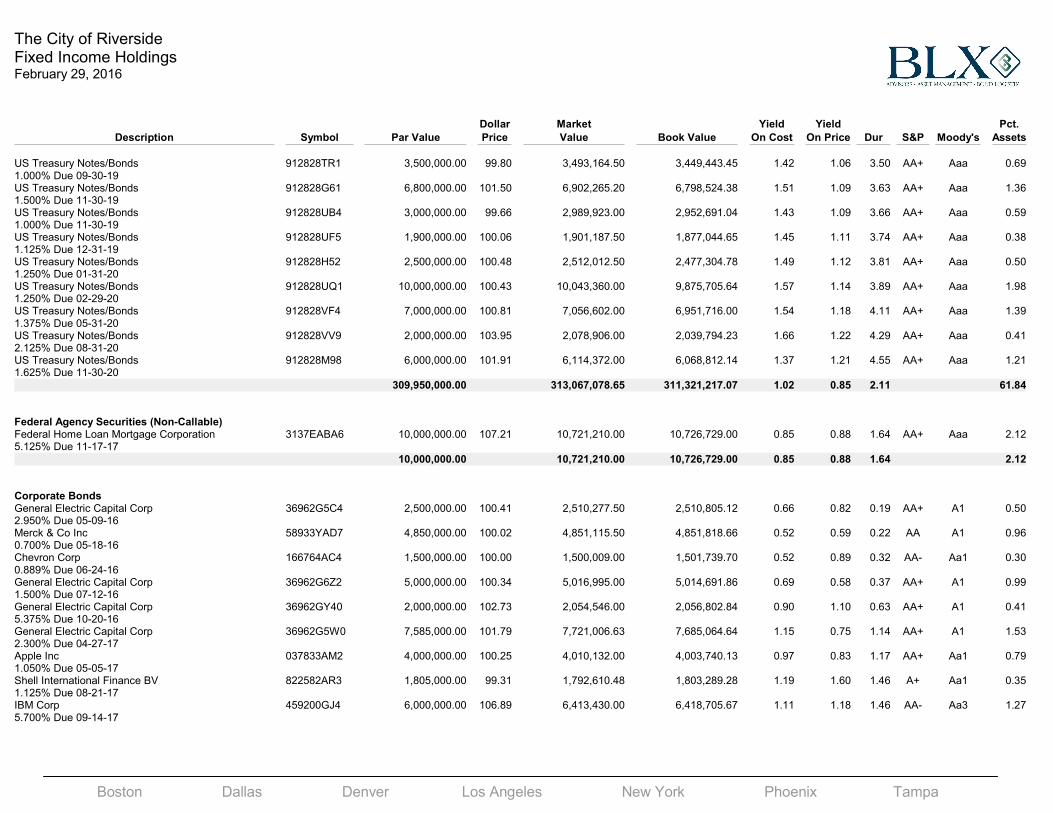
The City of RiversideFixed Income HoldingsFebruary 29, 2016
Dollar Market Yield Yield Pct.
Description Symbol Par Value Price Value Book Value On Cost On Price Dur S&P Moody's Assets
US Treasury Notes/Bonds 912828TR1 3,500,000.00 99.80 3,493,164.50 3,449,443.45 1.42 1.06 3.50 AA+ Aaa 0.691.000% Due 09-30-19US Treasury Notes/Bonds 912828G61 6,800,000.00 101.50 6,902,265.20 6,798,524.38 1.51 1.09 3.63 AA+ Aaa 1.361.500% Due 11-30-19US Treasury Notes/Bonds 912828UB4 3,000,000.00 99.66 2,989,923.00 2,952,691.04 1.43 1.09 3.66 AA+ Aaa 0.591.000% Due 11-30-19US Treasury Notes/Bonds 912828UF5 1,900,000.00 100.06 1,901,187.50 1,877,044.65 1.45 1.11 3.74 AA+ Aaa 0.381.125% Due 12-31-19US Treasury Notes/Bonds 912828H52 2,500,000.00 100.48 2,512,012.50 2,477,304.78 1.49 1.12 3.81 AA+ Aaa 0.501.250% Due 01-31-20US Treasury Notes/Bonds 912828UQ1 10,000,000.00 100.43 10,043,360.00 9,875,705.64 1.57 1.14 3.89 AA+ Aaa 1.981.250% Due 02-29-20US Treasury Notes/Bonds 912828VF4 7,000,000.00 100.81 7,056,602.00 6,951,716.00 1.54 1.18 4.11 AA+ Aaa 1.391.375% Due 05-31-20US Treasury Notes/Bonds 912828VV9 2,000,000.00 103.95 2,078,906.00 2,039,794.23 1.66 1.22 4.29 AA+ Aaa 0.412.125% Due 08-31-20US Treasury Notes/Bonds 912828M98 6,000,000.00 101.91 6,114,372.00 6,068,812.14 1.37 1.21 4.55 AA+ Aaa 1.211.625% Due 11-30-20
309,950,000.00 313,067,078.65 311,321,217.07 1.02 0.85 2.11 61.84
Federal Agency Securities (Non-Callable)Federal Home Loan Mortgage Corporation 3137EABA6 10,000,000.00 107.21 10,721,210.00 10,726,729.00 0.85 0.88 1.64 AA+ Aaa 2.125.125% Due 11-17-17
10,000,000.00 10,721,210.00 10,726,729.00 0.85 0.88 1.64 2.12
Corporate BondsGeneral Electric Capital Corp 36962G5C4 2,500,000.00 100.41 2,510,277.50 2,510,805.12 0.66 0.82 0.19 AA+ A1 0.502.950% Due 05-09-16Merck & Co Inc 58933YAD7 4,850,000.00 100.02 4,851,115.50 4,851,818.66 0.52 0.59 0.22 AA A1 0.960.700% Due 05-18-16Chevron Corp 166764AC4 1,500,000.00 100.00 1,500,009.00 1,501,739.70 0.52 0.89 0.32 AA- Aa1 0.300.889% Due 06-24-16General Electric Capital Corp 36962G6Z2 5,000,000.00 100.34 5,016,995.00 5,014,691.86 0.69 0.58 0.37 AA+ A1 0.991.500% Due 07-12-16General Electric Capital Corp 36962GY40 2,000,000.00 102.73 2,054,546.00 2,056,802.84 0.90 1.10 0.63 AA+ A1 0.415.375% Due 10-20-16General Electric Capital Corp 36962G5W0 7,585,000.00 101.79 7,721,006.63 7,685,064.64 1.15 0.75 1.14 AA+ A1 1.532.300% Due 04-27-17Apple Inc 037833AM2 4,000,000.00 100.25 4,010,132.00 4,003,740.13 0.97 0.83 1.17 AA+ Aa1 0.791.050% Due 05-05-17Shell International Finance BV 822582AR3 1,805,000.00 99.31 1,792,610.48 1,803,289.28 1.19 1.60 1.46 A+ Aa1 0.351.125% Due 08-21-17IBM Corp 459200GJ4 6,000,000.00 106.89 6,413,430.00 6,418,705.67 1.11 1.18 1.46 AA- Aa3 1.275.700% Due 09-14-17
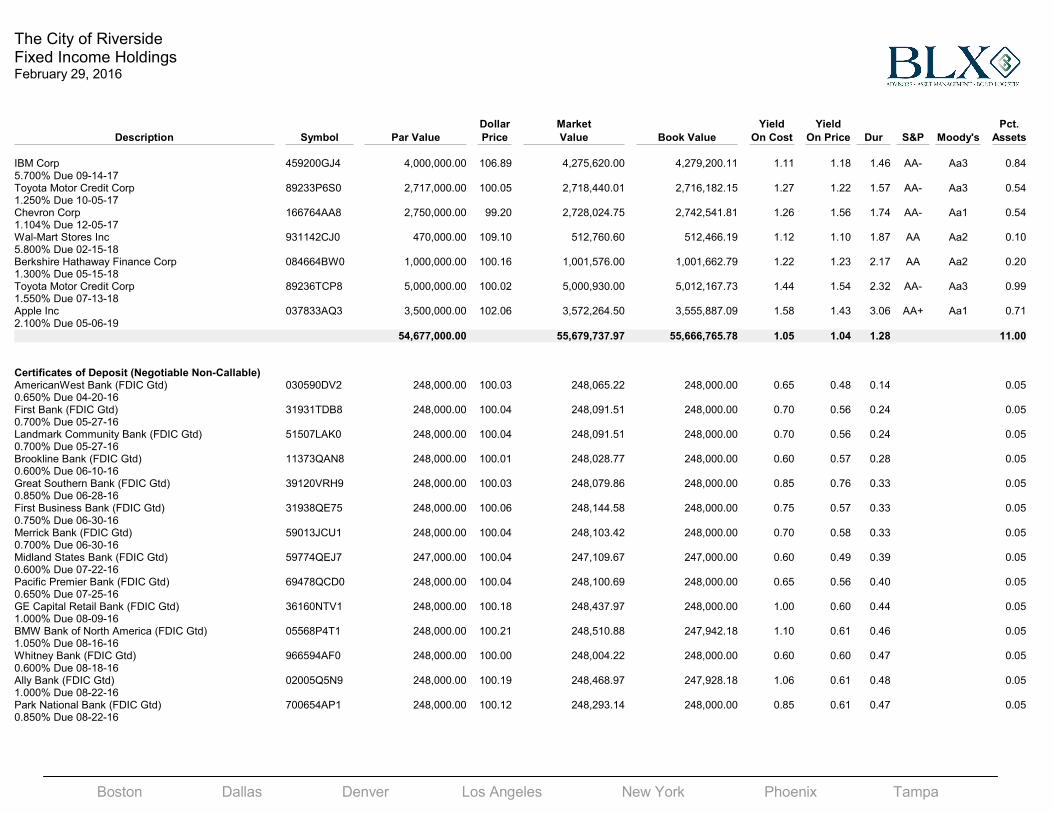
Boston Dallas Denver Los Angeles New York Phoenix Tampa
The City of RiversideFixed Income HoldingsFebruary 29, 2016
Dollar Market Yield Yield Pct.
Description Symbol Par Value Price Value Book Value On Cost On Price Dur S&P Moody's Assets
IBM Corp 459200GJ4 4,000,000.00 106.89 4,275,620.00 4,279,200.11 1.11 1.18 1.46 AA- Aa3 0.845.700% Due 09-14-17Toyota Motor Credit Corp 89233P6S0 2,717,000.00 100.05 2,718,440.01 2,716,182.15 1.27 1.22 1.57 AA- Aa3 0.541.250% Due 10-05-17Chevron Corp 166764AA8 2,750,000.00 99.20 2,728,024.75 2,742,541.81 1.26 1.56 1.74 AA- Aa1 0.541.104% Due 12-05-17Wal-Mart Stores Inc 931142CJ0 470,000.00 109.10 512,760.60 512,466.19 1.12 1.10 1.87 AA Aa2 0.105.800% Due 02-15-18Berkshire Hathaway Finance Corp 084664BW0 1,000,000.00 100.16 1,001,576.00 1,001,662.79 1.22 1.23 2.17 AA Aa2 0.201.300% Due 05-15-18Toyota Motor Credit Corp 89236TCP8 5,000,000.00 100.02 5,000,930.00 5,012,167.73 1.44 1.54 2.32 AA- Aa3 0.991.550% Due 07-13-18Apple Inc 037833AQ3 3,500,000.00 102.06 3,572,264.50 3,555,887.09 1.58 1.43 3.06 AA+ Aa1 0.712.100% Due 05-06-19
54,677,000.00 55,679,737.97 55,666,765.78 1.05 1.04 1.28 11.00
Certificates of Deposit (Negotiable Non-Callable)AmericanWest Bank (FDIC Gtd) 030590DV2 248,000.00 100.03 248,065.22 248,000.00 0.65 0.48 0.14 0.050.650% Due 04-20-16First Bank (FDIC Gtd) 31931TDB8 248,000.00 100.04 248,091.51 248,000.00 0.70 0.56 0.24 0.050.700% Due 05-27-16Landmark Community Bank (FDIC Gtd) 51507LAK0 248,000.00 100.04 248,091.51 248,000.00 0.70 0.56 0.24 0.050.700% Due 05-27-16Brookline Bank (FDIC Gtd) 11373QAN8 248,000.00 100.01 248,028.77 248,000.00 0.60 0.57 0.28 0.050.600% Due 06-10-16Great Southern Bank (FDIC Gtd) 39120VRH9 248,000.00 100.03 248,079.86 248,000.00 0.85 0.76 0.33 0.050.850% Due 06-28-16First Business Bank (FDIC Gtd) 31938QE75 248,000.00 100.06 248,144.58 248,000.00 0.75 0.57 0.33 0.050.750% Due 06-30-16Merrick Bank (FDIC Gtd) 59013JCU1 248,000.00 100.04 248,103.42 248,000.00 0.70 0.58 0.33 0.050.700% Due 06-30-16Midland States Bank (FDIC Gtd) 59774QEJ7 247,000.00 100.04 247,109.67 247,000.00 0.60 0.49 0.39 0.050.600% Due 07-22-16Pacific Premier Bank (FDIC Gtd) 69478QCD0 248,000.00 100.04 248,100.69 248,000.00 0.65 0.56 0.40 0.050.650% Due 07-25-16GE Capital Retail Bank (FDIC Gtd) 36160NTV1 248,000.00 100.18 248,437.97 248,000.00 1.00 0.60 0.44 0.051.000% Due 08-09-16BMW Bank of North America (FDIC Gtd) 05568P4T1 248,000.00 100.21 248,510.88 247,942.18 1.10 0.61 0.46 0.051.050% Due 08-16-16Whitney Bank (FDIC Gtd) 966594AF0 248,000.00 100.00 248,004.22 248,000.00 0.60 0.60 0.47 0.050.600% Due 08-18-16Ally Bank (FDIC Gtd) 02005Q5N9 248,000.00 100.19 248,468.97 247,928.18 1.06 0.61 0.48 0.051.000% Due 08-22-16Park National Bank (FDIC Gtd) 700654AP1 248,000.00 100.12 248,293.14 248,000.00 0.85 0.61 0.47 0.050.850% Due 08-22-16

Boston Dallas Denver Los Angeles New York Phoenix Tampa
The City of RiversideFixed Income HoldingsFebruary 29, 2016
Dollar Market Yield Yield Pct.
Description Symbol Par Value Price Value Book Value On Cost On Price Dur S&P Moody's Assets
Peoples United Bank (FDIC Gtd) 71270QFL5 248,000.00 100.12 248,294.13 248,000.00 0.85 0.60 0.48 0.050.850% Due 08-22-16Synovus Bank (FDIC Gtd) 87164DGE4 248,000.00 100.10 248,236.84 248,000.00 0.80 0.60 0.48 0.050.800% Due 08-23-16First Credit Bank (FDIC Gtd) 320055BD7 248,000.00 100.07 248,178.81 248,000.00 0.75 0.61 0.48 0.050.750% Due 08-25-16Sterling Bank (FDIC Gtd) 85916VAL9 249,000.00 100.10 249,243.77 249,000.00 0.80 0.60 0.50 0.050.800% Due 08-29-16Medallion Bank (FDIC Gtd) 58403BG26 248,000.00 100.31 248,777.23 248,000.00 1.10 0.57 0.59 0.051.100% Due 10-04-16Community Financial Services Bank (FDIC Gtd) 20364AAQ8 248,000.00 100.09 248,234.36 248,000.00 0.80 0.66 0.63 0.050.800% Due 10-17-16Intervest National Bank (FDIC Gtd) 46115DDU7 249,000.00 100.32 249,807.26 249,000.00 1.00 0.49 0.63 0.051.000% Due 10-17-16Lakeside Bank (FDIC Gtd) 51210SKR7 248,000.00 100.14 248,357.37 248,000.00 0.90 0.68 0.65 0.050.900% Due 10-24-16Main Street Bank Corp (FDIC Gtd) 56034WAH4 248,000.00 100.12 248,309.01 248,000.00 0.90 0.74 0.79 0.050.900% Due 12-16-16Southwest Bank (FDIC Gtd) 844772BA0 237,000.00 100.22 237,524.48 237,000.00 0.75 0.52 0.95 0.050.750% Due 02-13-17Triad Bank (FDIC Gtd) 89579NBF9 249,000.00 100.49 250,230.56 249,000.00 1.00 0.53 1.03 0.051.000% Due 03-14-17BMO Harris Bank NA (FDIC Gtd) 05573J4Q4 248,000.00 100.07 248,178.81 248,000.00 0.90 0.83 1.05 0.050.900% Due 03-23-17Parkway Bank & Trust Co (FDIC Gtd) 70153RHJ0 248,000.00 100.06 248,156.49 248,000.00 1.15 1.09 1.09 0.051.150% Due 04-07-17United Community Bank (FDIC Gtd) 90983WAZ4 248,000.00 100.06 248,137.39 248,000.00 1.00 0.96 1.11 0.051.000% Due 04-13-17Leader Bank NA (FDIC Gtd) 52168UCU4 248,000.00 100.12 248,305.29 248,000.00 1.05 0.95 1.13 0.051.050% Due 04-21-17Georgia Bank & Trust Co of Augusta (FDIC Gtd) 373128EK9 249,000.00 100.06 249,150.89 249,000.00 1.00 0.96 1.29 0.051.000% Due 06-20-17First Commercial Bank (FDIC Gtd) 31984GDJ5 248,000.00 100.14 248,350.42 248,000.00 1.00 0.90 1.40 0.051.000% Due 07-31-17American Express Bank FSB (FDIC Gtd) 02587CAU4 248,000.00 100.10 248,259.41 248,000.00 1.25 1.18 1.46 0.051.250% Due 08-21-17Capital One NA (FDIC Gtd) 14042E5T3 249,000.00 100.22 249,550.04 249,000.00 1.25 1.10 1.46 0.051.250% Due 08-21-17Discover Bank (FDIC Gtd) 2546714P2 248,000.00 100.10 248,259.41 248,000.00 1.30 1.23 1.46 0.051.300% Due 08-21-17Signature Bank of Arkansas (FDIC Gtd) 82669LFR9 249,000.00 100.22 249,536.10 249,000.00 1.05 0.91 1.47 0.051.050% Due 08-25-17EverBank (FDIC Gtd) 29976DA42 248,000.00 100.22 248,557.50 248,000.00 1.10 0.95 1.48 0.051.100% Due 08-28-17Mauch Chunk Trust Financial Corp (FDIC Gtd) 577234BZ9 248,000.00 100.21 248,524.02 248,000.00 1.20 1.07 1.51 0.051.200% Due 09-11-17
Boston Dallas Denver Los Angeles New York Phoenix Tampa
The City of RiversideFixed Income HoldingsFebruary 29, 2016
Dollar Market Yield Yield Pct.
Description Symbol Par Value Price Value Book Value On Cost On Price Dur S&P Moody's Assets
First Niagra Bank NA (FDIC Gtd) 33583CRW1 248,000.00 100.18 248,453.59 248,000.00 1.15 1.03 1.54 0.051.150% Due 09-25-17First Bank of Highland (FDIC Gtd) 319141CL9 248,000.00 100.20 248,495.50 248,000.00 1.25 1.12 1.58 0.051.250% Due 10-10-17Third Federal Savings & Loan Association MHC (FDIC Gtd)
88413QAD0 248,000.00 100.82 250,027.15 248,000.00 1.40 0.93 1.71 0.05
1.400% Due 11-27-17Wex Bank (FDIC Gtd) 92937CDH8 248,000.00 100.10 248,239.07 248,000.00 1.20 1.14 1.75 0.051.200% Due 12-11-17Customers Bank (FDIC Gtd) 23204HDB1 248,000.00 100.10 248,260.15 248,000.00 1.25 1.19 1.77 0.051.250% Due 12-18-17Bank of North Carolina (FDIC Gtd) 06414QUB3 247,000.00 100.60 248,490.15 247,000.00 1.25 0.93 1.85 0.051.250% Due 01-16-18Cadence Bank NA (FDIC Gtd) 12738RCW2 248,000.00 100.29 248,730.11 248,000.00 1.25 1.10 1.92 0.051.250% Due 02-12-18Mercantil Commercebank NA (FDIC Gtd) 58733AAY5 248,000.00 100.54 249,333.00 248,000.00 1.50 1.24 2.10 0.051.500% Due 04-24-18GE Capital Bank (FDIC Gtd) 36160J2N7 248,000.00 100.22 248,552.30 248,000.00 1.60 1.50 2.29 0.051.600% Due 07-03-18Bank of Georgetown (FDIC Gtd) 06424XBQ4 248,000.00 100.55 249,364.50 248,000.00 1.55 1.31 2.32 0.051.550% Due 07-17-18MB Financial Bank NA (FDIC Gtd) 55266CNH5 249,000.00 100.85 251,106.79 249,000.00 1.35 1.01 2.42 0.051.350% Due 08-21-18Comenity Capital Bank (FDIC Gtd) 20033AME3 249,000.00 100.84 251,089.11 249,000.00 1.71 1.36 2.42 0.051.700% Due 08-24-18East Boston Savings Bank (FDIC Gtd) 27113PAM3 249,000.00 100.84 251,097.33 249,000.00 1.40 1.06 2.43 0.051.400% Due 08-24-18Goldman Sachs Bank USA (FDIC Gtd) 38147J3R1 247,000.00 100.51 248,248.34 247,000.00 1.65 1.45 2.43 0.051.650% Due 09-04-18Sallie Mae Bank (FDIC Gtd) 795450SU0 247,000.00 100.50 248,245.37 247,000.00 1.80 1.60 2.43 0.051.800% Due 09-04-18First Priority Bank (FDIC Gtd) 33612JFU8 248,000.00 100.80 249,982.51 248,000.00 1.45 1.14 2.51 0.051.450% Due 09-28-18UBS Bank USA (FDIC Gtd) 90348JAP5 248,000.00 100.80 249,974.82 248,000.00 1.40 1.09 2.53 0.051.400% Due 10-01-18Capital One Bank USA NA (FDIC Gtd) 140420PT1 248,000.00 101.06 250,633.76 248,000.00 1.80 1.38 2.53 0.051.800% Due 10-09-18Marlin Business Bank (FDIC Gtd) 57116AHW1 248,000.00 100.65 249,605.55 248,000.00 1.71 1.46 2.55 0.051.700% Due 10-15-18Community Banker's Bank (FDIC Gtd) 20361LBM5 248,000.00 100.64 249,599.35 248,000.00 1.66 1.41 2.56 0.051.650% Due 10-17-18American Express Centurion Bank (FDIC Gtd) 02587DWJ3 248,000.00 101.43 251,550.86 248,000.00 2.00 1.47 2.65 0.052.000% Due 11-28-18Flushing Bank (FDIC Gtd) 34387ABS7 249,000.00 100.55 250,367.01 249,000.00 1.50 1.31 2.72 0.051.500% Due 12-17-18KeyBank NA (FDIC Gtd) 49306SVY9 247,000.00 101.19 249,943.99 247,000.00 1.55 1.13 2.82 0.051.550% Due 01-22-19

Boston Dallas Denver Los Angeles New York Phoenix Tampa
The City of RiversideFixed Income HoldingsFebruary 29, 2016
Dollar Market Yield Yield Pct.
Description Symbol Par Value Price Value Book Value On Cost On Price Dur S&P Moody's Assets
Investors Community Bank (FDIC Gtd) 46147URG7 249,000.00 100.13 249,315.23 249,000.00 1.15 1.11 2.88 0.051.150% Due 02-12-19Prime Alliance Bank Inc (FDIC Gtd) 74160NEN6 249,000.00 100.42 250,037.08 249,000.00 1.15 1.01 2.89 0.051.150% Due 02-12-19CIT Bank (FDIC Gtd) 17284CC69 247,000.00 101.33 250,289.55 247,000.00 2.00 1.57 3.08 0.052.000% Due 05-14-19Webster Bank NA (FDIC Gtd) 94768NJU9 248,000.00 101.26 251,119.10 247,579.78 1.95 1.51 3.22 0.051.900% Due 07-02-19ConnectOne Bank (FDIC Gtd) 20786ABA2 247,000.00 101.53 250,768.97 247,000.00 1.56 1.10 3.31 0.051.550% Due 07-29-19Alma Bank (FDIC Gtd) 020080AV9 247,000.00 101.27 250,141.35 247,000.00 1.71 1.34 3.46 0.051.700% Due 09-30-19Belmont Savings Bank (FDIC Gtd) 080515BM0 249,000.00 100.27 249,662.34 249,000.00 1.40 1.34 3.83 0.051.400% Due 02-18-20Bank of Wisconsin Dells (FDIC Gtd) 065847CZ6 249,000.00 100.27 249,673.54 249,000.00 1.50 1.44 4.10 0.051.500% Due 07-17-20Bridgewater Bank (FDIC Gtd) 108622ET4 249,000.00 100.55 250,364.77 249,000.00 1.50 1.38 4.29 0.051.500% Due 08-17-20Unity Bank (FDIC Gtd) 91330ABD8 249,000.00 100.53 250,318.70 249,000.00 1.50 1.38 4.31 0.051.500% Due 08-26-20Barclays Bank Delaware (FDIC Gtd) 06740KJK4 247,000.00 101.47 250,641.03 247,000.00 2.20 1.86 4.27 0.052.200% Due 09-16-20Bank of Charles Town (FDIC Gtd) 061149AR1 249,000.00 101.47 252,662.04 249,000.00 1.81 1.47 4.37 0.051.800% Due 09-30-20EnerBank USA (FDIC Gtd) 29266NX51 247,000.00 101.49 250,679.56 247,000.00 1.90 1.58 4.67 0.051.900% Due 01-28-21State Bank and Trust Company (FDIC Gtd) 855736DA9 249,000.00 100.51 250,261.68 249,000.00 1.61 1.50 4.74 0.051.600% Due 02-17-21
18,349,000.00 18,427,015.27 18,348,450.14 1.23 1.01 1.81 3.64
Certificates of Deposit (Negotiable Non-Callable Variable)Wells Fargo Bank NA (FDIC Gtd) 949748F51 247,000.00 99.00 244,530.00 247,000.00 1.75 7.26 0.16 0.051.118% Due 04-29-16
247,000.00 244,530.00 247,000.00 1.75 7.26 0.16 0.05
Certificates of Deposit (Negotiable Callable Variable)JPMorgan Chase Bank (FDIC Gtd) 48124JZG6 248,000.00 100.04 248,097.46 247,834.02 0.60 0.52 0.18 0.050.750% Due 11-03-16HSBC Bank USA NA (FDIC Gtd) 40434AC72 246,000.00 100.47 247,144.39 246,000.00 1.60 1.38 2.16 0.051.600% Due 11-17-20
494,000.00 495,241.86 493,834.02 1.10 0.95 1.17 0.10
GRAND TOTAL 500,143,494.39 79.78 506,230,418.44 504,399,298.15 0.92 0.80 1.54 100.00
Boston Dallas Denver Los Angeles New York Phoenix Tampa
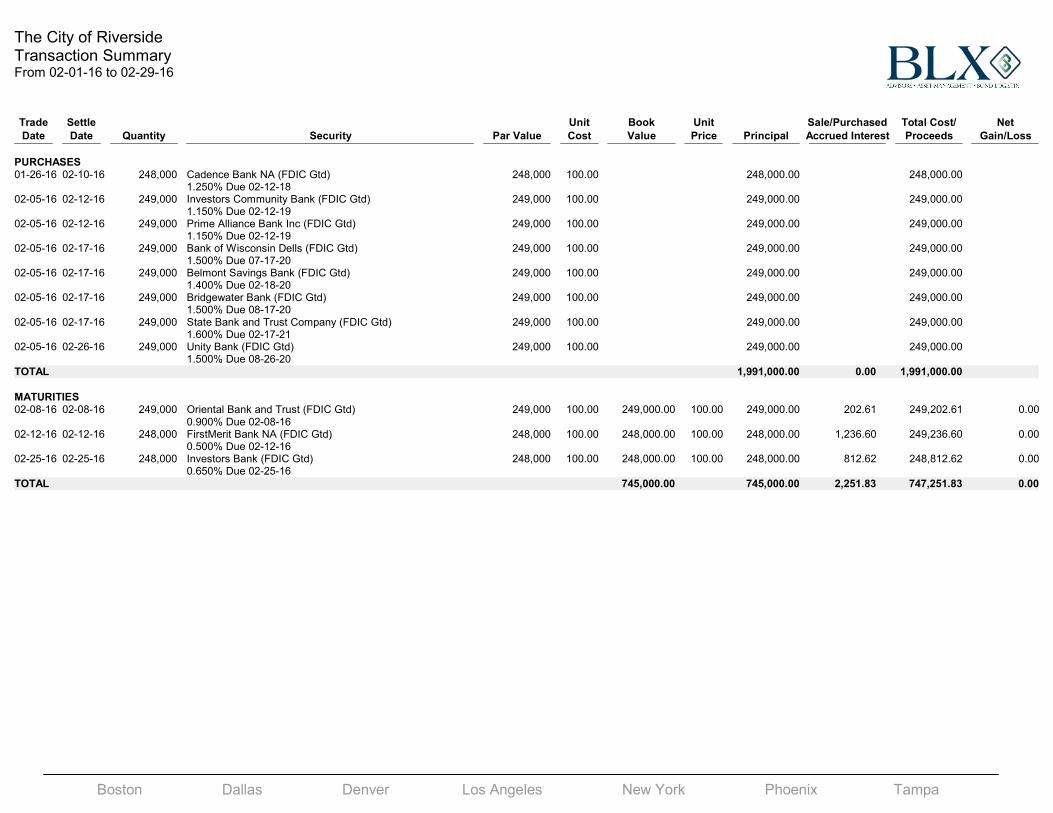
The City of RiversideTransaction Summary ON SETTLEMENT DATEFrom 02-01-16 to 02-29-16
Trade Settle Unit Book Unit Sale/Purchased Total Cost/ NetDate Date Quantity Security Par Value Cost Value Price Principal Accrued Interest Proceeds Gain/Loss
PURCHASES01-26-16 02-10-16 248,000 Cadence Bank NA (FDIC Gtd) 248,000 100.00 248,000.00 248,000.00
1.250% Due 02-12-1802-05-16 02-12-16 249,000 Investors Community Bank (FDIC Gtd) 249,000 100.00 249,000.00 249,000.00
1.150% Due 02-12-1902-05-16 02-12-16 249,000 Prime Alliance Bank Inc (FDIC Gtd) 249,000 100.00 249,000.00 249,000.00
1.150% Due 02-12-1902-05-16 02-17-16 249,000 Bank of Wisconsin Dells (FDIC Gtd) 249,000 100.00 249,000.00 249,000.00
1.500% Due 07-17-2002-05-16 02-17-16 249,000 Belmont Savings Bank (FDIC Gtd) 249,000 100.00 249,000.00 249,000.00
1.400% Due 02-18-2002-05-16 02-17-16 249,000 Bridgewater Bank (FDIC Gtd) 249,000 100.00 249,000.00 249,000.00
1.500% Due 08-17-2002-05-16 02-17-16 249,000 State Bank and Trust Company (FDIC Gtd) 249,000 100.00 249,000.00 249,000.00
1.600% Due 02-17-2102-05-16 02-26-16 249,000 Unity Bank (FDIC Gtd) 249,000 100.00 249,000.00 249,000.00
1.500% Due 08-26-20TOTAL 1,991,000.00 0.00 1,991,000.00
MATURITIES02-08-16 02-08-16 249,000 Oriental Bank and Trust (FDIC Gtd) 249,000 100.00 249,000.00 100.00 249,000.00 202.61 249,202.61 0.00
0.900% Due 02-08-1602-12-16 02-12-16 248,000 FirstMerit Bank NA (FDIC Gtd) 248,000 100.00 248,000.00 100.00 248,000.00 1,236.60 249,236.60 0.00
0.500% Due 02-12-1602-25-16 02-25-16 248,000 Investors Bank (FDIC Gtd) 248,000 100.00 248,000.00 100.00 248,000.00 812.62 248,812.62 0.00
0.650% Due 02-25-16TOTAL 745,000.00 745,000.00 2,251.83 747,251.83 0.00
Boston Dallas Denver Los Angeles New York Phoenix Tampa
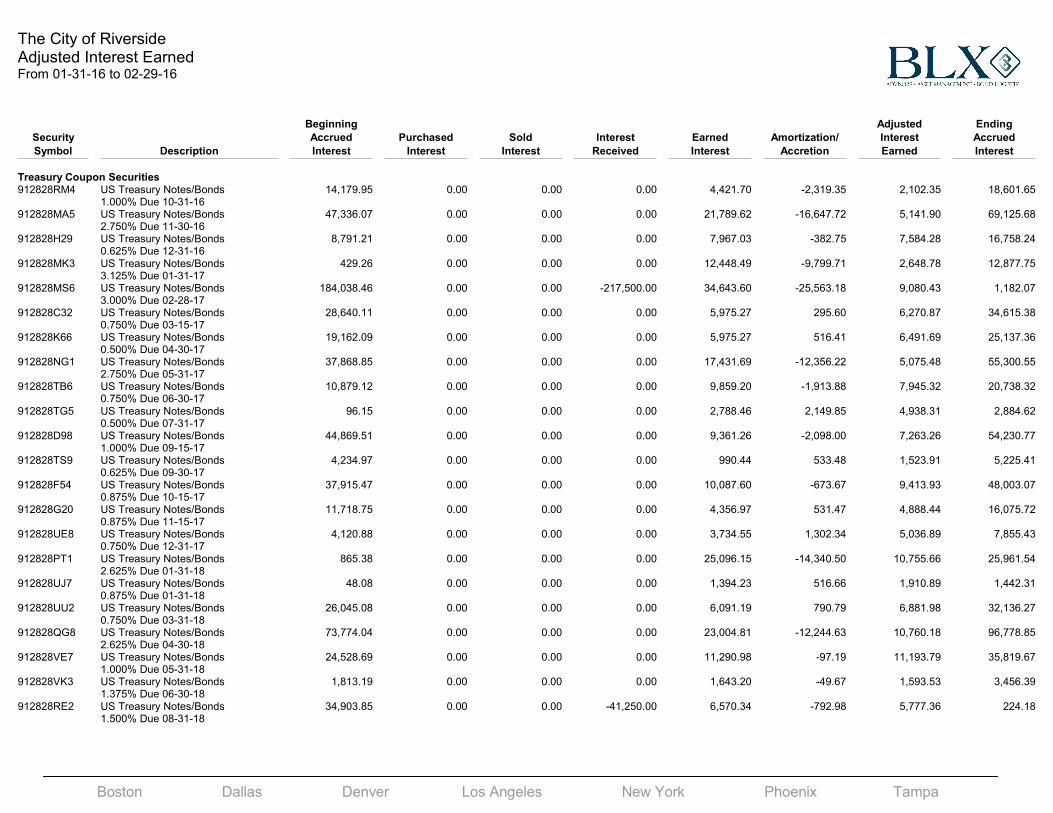
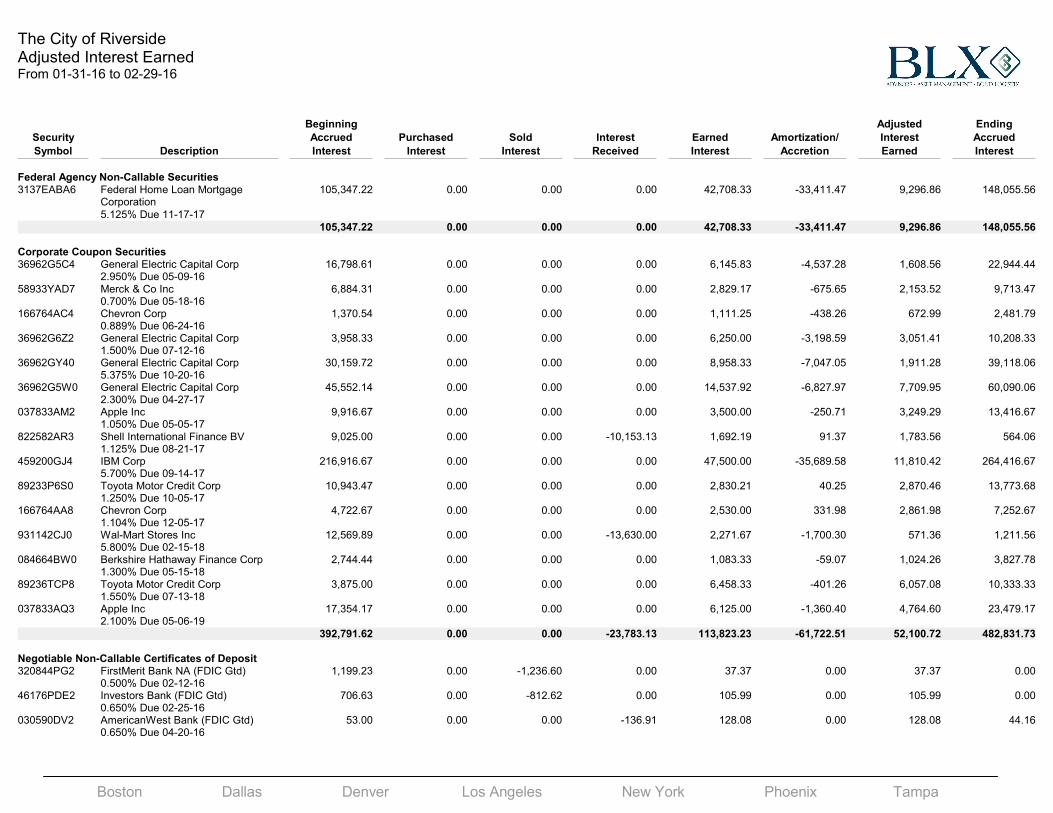
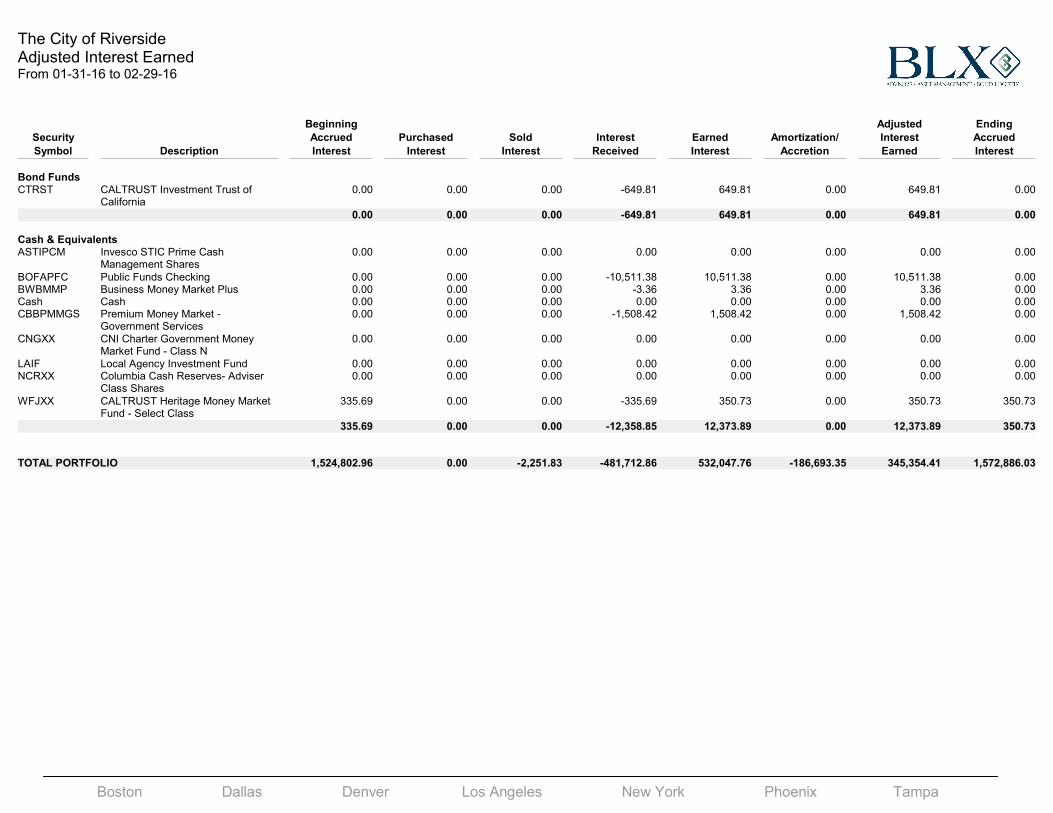
The City of RiversideAdjusted Interest EarnedFrom 01-31-16 to 02-29-16
Beginning Adjusted Ending
Security Accrued Purchased Sold Interest Earned Amortization/ Interest Accrued
Symbol Description Interest Interest Interest Received Interest Accretion Earned Interest
Treasury Coupon Securities912828RM4 US Treasury Notes/Bonds 14,179.95 0.00 0.00 0.00 4,421.70 -2,319.35 2,102.35 18,601.65
1.000% Due 10-31-16912828MA5 US Treasury Notes/Bonds 47,336.07 0.00 0.00 0.00 21,789.62 -16,647.72 5,141.90 69,125.68
2.750% Due 11-30-16912828H29 US Treasury Notes/Bonds 8,791.21 0.00 0.00 0.00 7,967.03 -382.75 7,584.28 16,758.24
0.625% Due 12-31-16912828MK3 US Treasury Notes/Bonds 429.26 0.00 0.00 0.00 12,448.49 -9,799.71 2,648.78 12,877.75
3.125% Due 01-31-17912828MS6 US Treasury Notes/Bonds 184,038.46 0.00 0.00 -217,500.00 34,643.60 -25,563.18 9,080.43 1,182.07
3.000% Due 02-28-17912828C32 US Treasury Notes/Bonds 28,640.11 0.00 0.00 0.00 5,975.27 295.60 6,270.87 34,615.38
0.750% Due 03-15-17912828K66 US Treasury Notes/Bonds 19,162.09 0.00 0.00 0.00 5,975.27 516.41 6,491.69 25,137.36
0.500% Due 04-30-17912828NG1 US Treasury Notes/Bonds 37,868.85 0.00 0.00 0.00 17,431.69 -12,356.22 5,075.48 55,300.55
2.750% Due 05-31-17912828TB6 US Treasury Notes/Bonds 10,879.12 0.00 0.00 0.00 9,859.20 -1,913.88 7,945.32 20,738.32
0.750% Due 06-30-17912828TG5 US Treasury Notes/Bonds 96.15 0.00 0.00 0.00 2,788.46 2,149.85 4,938.31 2,884.62
0.500% Due 07-31-17912828D98 US Treasury Notes/Bonds 44,869.51 0.00 0.00 0.00 9,361.26 -2,098.00 7,263.26 54,230.77
1.000% Due 09-15-17912828TS9 US Treasury Notes/Bonds 4,234.97 0.00 0.00 0.00 990.44 533.48 1,523.91 5,225.41
0.625% Due 09-30-17912828F54 US Treasury Notes/Bonds 37,915.47 0.00 0.00 0.00 10,087.60 -673.67 9,413.93 48,003.07
0.875% Due 10-15-17912828G20 US Treasury Notes/Bonds 11,718.75 0.00 0.00 0.00 4,356.97 531.47 4,888.44 16,075.72
0.875% Due 11-15-17912828UE8 US Treasury Notes/Bonds 4,120.88 0.00 0.00 0.00 3,734.55 1,302.34 5,036.89 7,855.43
0.750% Due 12-31-17912828PT1 US Treasury Notes/Bonds 865.38 0.00 0.00 0.00 25,096.15 -14,340.50 10,755.66 25,961.54
2.625% Due 01-31-18912828UJ7 US Treasury Notes/Bonds 48.08 0.00 0.00 0.00 1,394.23 516.66 1,910.89 1,442.31
0.875% Due 01-31-18912828UU2 US Treasury Notes/Bonds 26,045.08 0.00 0.00 0.00 6,091.19 790.79 6,881.98 32,136.27
0.750% Due 03-31-18912828QG8 US Treasury Notes/Bonds 73,774.04 0.00 0.00 0.00 23,004.81 -12,244.63 10,760.18 96,778.85
2.625% Due 04-30-18912828VE7 US Treasury Notes/Bonds 24,528.69 0.00 0.00 0.00 11,290.98 -97.19 11,193.79 35,819.67
1.000% Due 05-31-18912828VK3 US Treasury Notes/Bonds 1,813.19 0.00 0.00 0.00 1,643.20 -49.67 1,593.53 3,456.39
1.375% Due 06-30-18912828RE2 US Treasury Notes/Bonds 34,903.85 0.00 0.00 -41,250.00 6,570.34 -792.98 5,777.36 224.18
1.500% Due 08-31-18
Boston Dallas Denver Los Angeles New York Phoenix Tampa
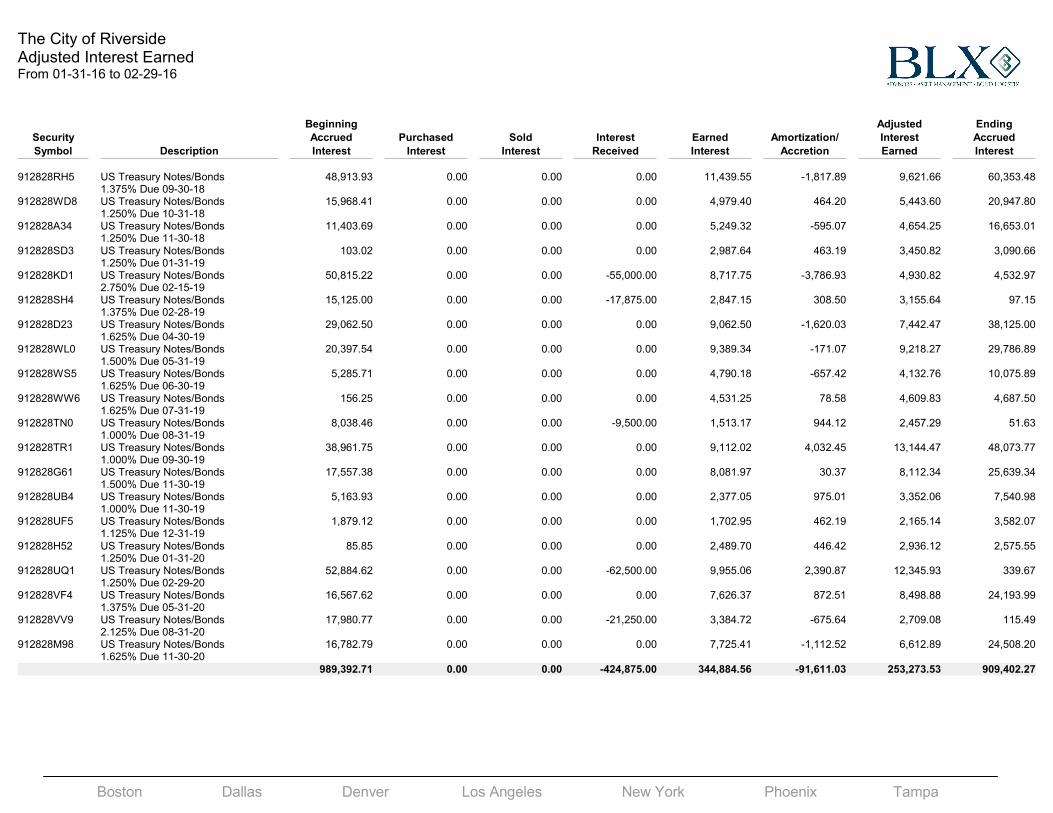
The City of RiversideAdjusted Interest EarnedFrom 01-31-16 to 02-29-16
Beginning Adjusted Ending
Security Accrued Purchased Sold Interest Earned Amortization/ Interest Accrued
Symbol Description Interest Interest Interest Received Interest Accretion Earned Interest
912828RH5 US Treasury Notes/Bonds 48,913.93 0.00 0.00 0.00 11,439.55 -1,817.89 9,621.66 60,353.481.375% Due 09-30-18
912828WD8 US Treasury Notes/Bonds 15,968.41 0.00 0.00 0.00 4,979.40 464.20 5,443.60 20,947.801.250% Due 10-31-18
912828A34 US Treasury Notes/Bonds 11,403.69 0.00 0.00 0.00 5,249.32 -595.07 4,654.25 16,653.011.250% Due 11-30-18
912828SD3 US Treasury Notes/Bonds 103.02 0.00 0.00 0.00 2,987.64 463.19 3,450.82 3,090.661.250% Due 01-31-19
912828KD1 US Treasury Notes/Bonds 50,815.22 0.00 0.00 -55,000.00 8,717.75 -3,786.93 4,930.82 4,532.972.750% Due 02-15-19
912828SH4 US Treasury Notes/Bonds 15,125.00 0.00 0.00 -17,875.00 2,847.15 308.50 3,155.64 97.151.375% Due 02-28-19
912828D23 US Treasury Notes/Bonds 29,062.50 0.00 0.00 0.00 9,062.50 -1,620.03 7,442.47 38,125.001.625% Due 04-30-19
912828WL0 US Treasury Notes/Bonds 20,397.54 0.00 0.00 0.00 9,389.34 -171.07 9,218.27 29,786.891.500% Due 05-31-19
912828WS5 US Treasury Notes/Bonds 5,285.71 0.00 0.00 0.00 4,790.18 -657.42 4,132.76 10,075.891.625% Due 06-30-19
912828WW6 US Treasury Notes/Bonds 156.25 0.00 0.00 0.00 4,531.25 78.58 4,609.83 4,687.501.625% Due 07-31-19
912828TN0 US Treasury Notes/Bonds 8,038.46 0.00 0.00 -9,500.00 1,513.17 944.12 2,457.29 51.631.000% Due 08-31-19
912828TR1 US Treasury Notes/Bonds 38,961.75 0.00 0.00 0.00 9,112.02 4,032.45 13,144.47 48,073.771.000% Due 09-30-19
912828G61 US Treasury Notes/Bonds 17,557.38 0.00 0.00 0.00 8,081.97 30.37 8,112.34 25,639.341.500% Due 11-30-19
912828UB4 US Treasury Notes/Bonds 5,163.93 0.00 0.00 0.00 2,377.05 975.01 3,352.06 7,540.981.000% Due 11-30-19
912828UF5 US Treasury Notes/Bonds 1,879.12 0.00 0.00 0.00 1,702.95 462.19 2,165.14 3,582.071.125% Due 12-31-19
912828H52 US Treasury Notes/Bonds 85.85 0.00 0.00 0.00 2,489.70 446.42 2,936.12 2,575.551.250% Due 01-31-20
912828UQ1 US Treasury Notes/Bonds 52,884.62 0.00 0.00 -62,500.00 9,955.06 2,390.87 12,345.93 339.671.250% Due 02-29-20
912828VF4 US Treasury Notes/Bonds 16,567.62 0.00 0.00 0.00 7,626.37 872.51 8,498.88 24,193.991.375% Due 05-31-20
912828VV9 US Treasury Notes/Bonds 17,980.77 0.00 0.00 -21,250.00 3,384.72 -675.64 2,709.08 115.492.125% Due 08-31-20
912828M98 US Treasury Notes/Bonds 16,782.79 0.00 0.00 0.00 7,725.41 -1,112.52 6,612.89 24,508.201.625% Due 11-30-20
989,392.71 0.00 0.00 -424,875.00 344,884.56 -91,611.03 253,273.53 909,402.27
Boston Dallas Denver Los Angeles New York Phoenix Tampa
The City of RiversideAdjusted Interest EarnedFrom 01-31-16 to 02-29-16
Beginning Adjusted Ending
Security Accrued Purchased Sold Interest Earned Amortization/ Interest Accrued
Symbol Description Interest Interest Interest Received Interest Accretion Earned Interest
Federal Agency Non-Callable Securities3137EABA6 Federal Home Loan Mortgage
Corporation105,347.22 0.00 0.00 0.00 42,708.33 -33,411.47 9,296.86 148,055.56
5.125% Due 11-17-17
105,347.22 0.00 0.00 0.00 42,708.33 -33,411.47 9,296.86 148,055.56
Corporate Coupon Securities36962G5C4 General Electric Capital Corp 16,798.61 0.00 0.00 0.00 6,145.83 -4,537.28 1,608.56 22,944.44
2.950% Due 05-09-1658933YAD7 Merck & Co Inc 6,884.31 0.00 0.00 0.00 2,829.17 -675.65 2,153.52 9,713.47
0.700% Due 05-18-16166764AC4 Chevron Corp 1,370.54 0.00 0.00 0.00 1,111.25 -438.26 672.99 2,481.79
0.889% Due 06-24-1636962G6Z2 General Electric Capital Corp 3,958.33 0.00 0.00 0.00 6,250.00 -3,198.59 3,051.41 10,208.33
1.500% Due 07-12-1636962GY40 General Electric Capital Corp 30,159.72 0.00 0.00 0.00 8,958.33 -7,047.05 1,911.28 39,118.06
5.375% Due 10-20-1636962G5W0 General Electric Capital Corp 45,552.14 0.00 0.00 0.00 14,537.92 -6,827.97 7,709.95 60,090.06
2.300% Due 04-27-17037833AM2 Apple Inc 9,916.67 0.00 0.00 0.00 3,500.00 -250.71 3,249.29 13,416.67
1.050% Due 05-05-17822582AR3 Shell International Finance BV 9,025.00 0.00 0.00 -10,153.13 1,692.19 91.37 1,783.56 564.06
1.125% Due 08-21-17459200GJ4 IBM Corp 216,916.67 0.00 0.00 0.00 47,500.00 -35,689.58 11,810.42 264,416.67
5.700% Due 09-14-1789233P6S0 Toyota Motor Credit Corp 10,943.47 0.00 0.00 0.00 2,830.21 40.25 2,870.46 13,773.68
1.250% Due 10-05-17166764AA8 Chevron Corp 4,722.67 0.00 0.00 0.00 2,530.00 331.98 2,861.98 7,252.67
1.104% Due 12-05-17931142CJ0 Wal-Mart Stores Inc 12,569.89 0.00 0.00 -13,630.00 2,271.67 -1,700.30 571.36 1,211.56
5.800% Due 02-15-18084664BW0 Berkshire Hathaway Finance Corp 2,744.44 0.00 0.00 0.00 1,083.33 -59.07 1,024.26 3,827.78
1.300% Due 05-15-1889236TCP8 Toyota Motor Credit Corp 3,875.00 0.00 0.00 0.00 6,458.33 -401.26 6,057.08 10,333.33
1.550% Due 07-13-18037833AQ3 Apple Inc 17,354.17 0.00 0.00 0.00 6,125.00 -1,360.40 4,764.60 23,479.17
2.100% Due 05-06-19
392,791.62 0.00 0.00 -23,783.13 113,823.23 -61,722.51 52,100.72 482,831.73
Negotiable Non-Callable Certificates of Deposit320844PG2 FirstMerit Bank NA (FDIC Gtd) 1,199.23 0.00 -1,236.60 0.00 37.37 0.00 37.37 0.00
0.500% Due 02-12-1646176PDE2 Investors Bank (FDIC Gtd) 706.63 0.00 -812.62 0.00 105.99 0.00 105.99 0.00
0.650% Due 02-25-16030590DV2 AmericanWest Bank (FDIC Gtd) 53.00 0.00 0.00 -136.91 128.08 0.00 128.08 44.16
0.650% Due 04-20-16

Boston Dallas Denver Los Angeles New York Phoenix Tampa
The City of RiversideAdjusted Interest EarnedFrom 01-31-16 to 02-29-16
Beginning Adjusted Ending
Security Accrued Purchased Sold Interest Earned Amortization/ Interest Accrued
Symbol Description Interest Interest Interest Received Interest Accretion Earned Interest
31931TDB8 First Bank (FDIC Gtd) 23.78 0.00 0.00 -147.44 137.93 0.00 137.93 14.270.700% Due 05-27-16
51507LAK0 Landmark Community Bank (FDIC Gtd)
23.78 0.00 0.00 -147.44 137.93 0.00 137.93 14.27
0.700% Due 05-27-1611373QAN8 Brookline Bank (FDIC Gtd) 89.69 0.00 0.00 -126.38 118.23 0.00 118.23 81.53
0.600% Due 06-10-1639120VRH9 Great Southern Bank (FDIC Gtd) 23.10 0.00 0.00 -179.04 167.49 0.00 167.49 11.55
0.850% Due 06-28-1631938QE75 First Business Bank (FDIC Gtd) 168.16 0.00 0.00 0.00 147.78 0.00 147.78 315.95
0.750% Due 06-30-1659013JCU1 Merrick Bank (FDIC Gtd) 9.51 0.00 0.00 -142.68 137.92 0.00 137.92 4.76
0.700% Due 06-30-1659774QEJ7 Midland States Bank (FDIC Gtd) 40.60 0.00 0.00 -125.87 117.75 0.00 117.75 32.48
0.600% Due 07-22-1669478QCD0 Pacific Premier Bank (FDIC Gtd) 35.33 0.00 0.00 -136.91 128.08 0.00 128.08 26.50
0.650% Due 07-25-1636160NTV1 GE Capital Retail Bank (FDIC Gtd) 1,195.84 0.00 0.00 -1,250.19 197.04 0.00 197.04 142.68
1.000% Due 08-09-1605568P4T1 BMW Bank of North America (FDIC
Gtd)1,205.69 0.00 0.00 -1,312.70 206.89 9.95 216.84 99.88
1.050% Due 08-16-16966594AF0 Whitney Bank (FDIC Gtd) 680.81 0.00 0.00 -750.12 118.23 0.00 118.23 48.92
0.600% Due 08-18-1602005Q5N9 Ally Bank (FDIC Gtd) 1,114.30 0.00 0.00 -1,250.19 197.04 11.93 208.97 61.15
1.000% Due 08-22-16700654AP1 Park National Bank (FDIC Gtd) 57.75 0.00 0.00 -179.04 167.49 0.00 167.49 46.20
0.850% Due 08-22-1671270QFL5 Peoples United Bank (FDIC Gtd) 952.93 0.00 0.00 -1,062.66 167.48 0.00 167.48 57.75
0.850% Due 08-22-1687164DGE4 Synovus Bank (FDIC Gtd) 217.42 0.00 0.00 0.00 157.63 0.00 157.63 375.06
0.800% Due 08-23-16320055BD7 First Credit Bank (FDIC Gtd) 35.67 0.00 0.00 -157.97 147.78 0.00 147.78 25.48
0.750% Due 08-25-1685916VAL9 Sterling Bank (FDIC Gtd) 851.38 0.00 0.00 -1,004.19 158.27 0.00 158.27 5.46
0.800% Due 08-29-1658403BG26 Medallion Bank (FDIC Gtd) 896.88 0.00 0.00 0.00 216.75 0.00 216.75 1,113.62
1.100% Due 10-04-1620364AAQ8 Community Financial Services Bank
(FDIC Gtd)81.53 0.00 0.00 -168.50 157.63 0.00 157.63 70.66
0.800% Due 10-17-1646115DDU7 Intervest National Bank (FDIC Gtd) 102.33 0.00 0.00 -211.48 197.84 0.00 197.84 88.68
1.000% Due 10-17-1651210SKR7 Lakeside Bank (FDIC Gtd) 55.04 0.00 0.00 -189.57 177.34 0.00 177.34 42.81
0.900% Due 10-24-16
Boston Dallas Denver Los Angeles New York Phoenix Tampa
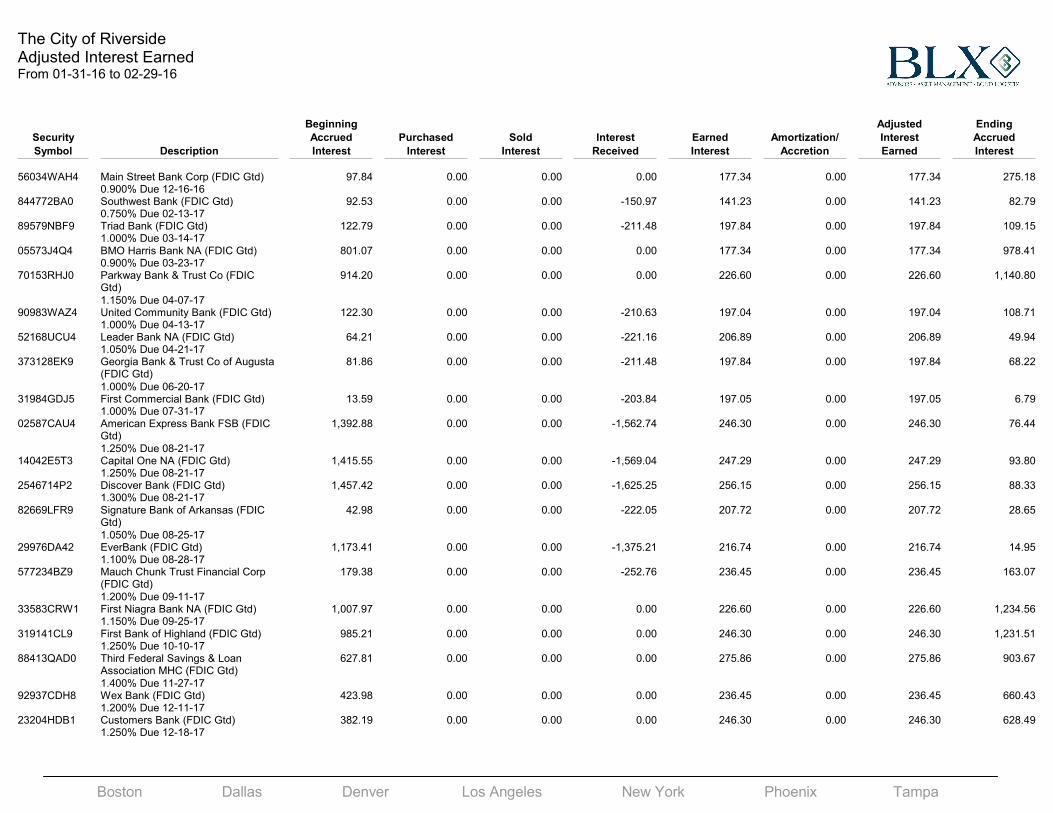
The City of RiversideAdjusted Interest EarnedFrom 01-31-16 to 02-29-16
Beginning Adjusted Ending
Security Accrued Purchased Sold Interest Earned Amortization/ Interest Accrued
Symbol Description Interest Interest Interest Received Interest Accretion Earned Interest
56034WAH4 Main Street Bank Corp (FDIC Gtd) 97.84 0.00 0.00 0.00 177.34 0.00 177.34 275.180.900% Due 12-16-16
844772BA0 Southwest Bank (FDIC Gtd) 92.53 0.00 0.00 -150.97 141.23 0.00 141.23 82.790.750% Due 02-13-17
89579NBF9 Triad Bank (FDIC Gtd) 122.79 0.00 0.00 -211.48 197.84 0.00 197.84 109.151.000% Due 03-14-17
05573J4Q4 BMO Harris Bank NA (FDIC Gtd) 801.07 0.00 0.00 0.00 177.34 0.00 177.34 978.410.900% Due 03-23-17
70153RHJ0 Parkway Bank & Trust Co (FDIC Gtd)
914.20 0.00 0.00 0.00 226.60 0.00 226.60 1,140.80
1.150% Due 04-07-1790983WAZ4 United Community Bank (FDIC Gtd) 122.30 0.00 0.00 -210.63 197.04 0.00 197.04 108.71
1.000% Due 04-13-1752168UCU4 Leader Bank NA (FDIC Gtd) 64.21 0.00 0.00 -221.16 206.89 0.00 206.89 49.94
1.050% Due 04-21-17373128EK9 Georgia Bank & Trust Co of Augusta
(FDIC Gtd)81.86 0.00 0.00 -211.48 197.84 0.00 197.84 68.22
1.000% Due 06-20-1731984GDJ5 First Commercial Bank (FDIC Gtd) 13.59 0.00 0.00 -203.84 197.05 0.00 197.05 6.79
1.000% Due 07-31-1702587CAU4 American Express Bank FSB (FDIC
Gtd)1,392.88 0.00 0.00 -1,562.74 246.30 0.00 246.30 76.44
1.250% Due 08-21-1714042E5T3 Capital One NA (FDIC Gtd) 1,415.55 0.00 0.00 -1,569.04 247.29 0.00 247.29 93.80
1.250% Due 08-21-172546714P2 Discover Bank (FDIC Gtd) 1,457.42 0.00 0.00 -1,625.25 256.15 0.00 256.15 88.33
1.300% Due 08-21-1782669LFR9 Signature Bank of Arkansas (FDIC
Gtd)42.98 0.00 0.00 -222.05 207.72 0.00 207.72 28.65
1.050% Due 08-25-1729976DA42 EverBank (FDIC Gtd) 1,173.41 0.00 0.00 -1,375.21 216.74 0.00 216.74 14.95
1.100% Due 08-28-17577234BZ9 Mauch Chunk Trust Financial Corp
(FDIC Gtd)179.38 0.00 0.00 -252.76 236.45 0.00 236.45 163.07
1.200% Due 09-11-1733583CRW1 First Niagra Bank NA (FDIC Gtd) 1,007.97 0.00 0.00 0.00 226.60 0.00 226.60 1,234.56
1.150% Due 09-25-17319141CL9 First Bank of Highland (FDIC Gtd) 985.21 0.00 0.00 0.00 246.30 0.00 246.30 1,231.51
1.250% Due 10-10-1788413QAD0 Third Federal Savings & Loan
Association MHC (FDIC Gtd)627.81 0.00 0.00 0.00 275.86 0.00 275.86 903.67
1.400% Due 11-27-1792937CDH8 Wex Bank (FDIC Gtd) 423.98 0.00 0.00 0.00 236.45 0.00 236.45 660.43
1.200% Due 12-11-1723204HDB1 Customers Bank (FDIC Gtd) 382.19 0.00 0.00 0.00 246.30 0.00 246.30 628.49
1.250% Due 12-18-17
Boston Dallas Denver Los Angeles New York Phoenix Tampa
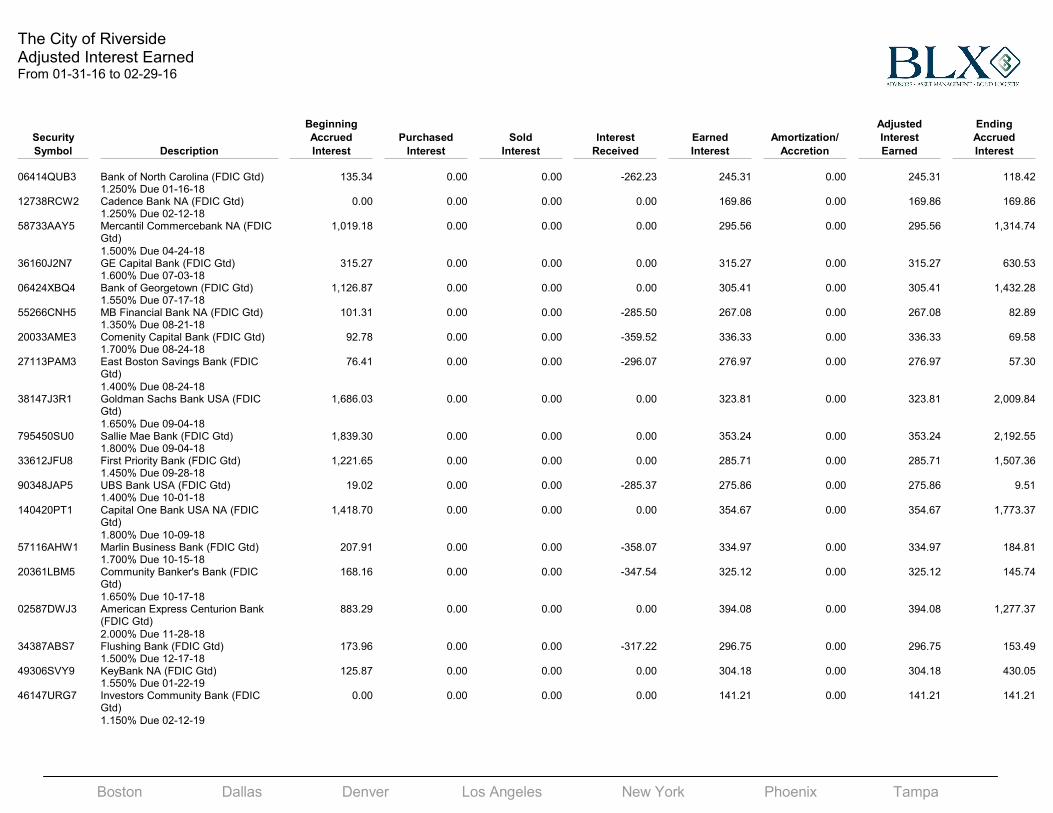
The City of RiversideAdjusted Interest EarnedFrom 01-31-16 to 02-29-16
Beginning Adjusted Ending
Security Accrued Purchased Sold Interest Earned Amortization/ Interest Accrued
Symbol Description Interest Interest Interest Received Interest Accretion Earned Interest
06414QUB3 Bank of North Carolina (FDIC Gtd) 135.34 0.00 0.00 -262.23 245.31 0.00 245.31 118.421.250% Due 01-16-18
12738RCW2 Cadence Bank NA (FDIC Gtd) 0.00 0.00 0.00 0.00 169.86 0.00 169.86 169.861.250% Due 02-12-18
58733AAY5 Mercantil Commercebank NA (FDIC Gtd)
1,019.18 0.00 0.00 0.00 295.56 0.00 295.56 1,314.74
1.500% Due 04-24-1836160J2N7 GE Capital Bank (FDIC Gtd) 315.27 0.00 0.00 0.00 315.27 0.00 315.27 630.53
1.600% Due 07-03-1806424XBQ4 Bank of Georgetown (FDIC Gtd) 1,126.87 0.00 0.00 0.00 305.41 0.00 305.41 1,432.28
1.550% Due 07-17-1855266CNH5 MB Financial Bank NA (FDIC Gtd) 101.31 0.00 0.00 -285.50 267.08 0.00 267.08 82.89
1.350% Due 08-21-1820033AME3 Comenity Capital Bank (FDIC Gtd) 92.78 0.00 0.00 -359.52 336.33 0.00 336.33 69.58
1.700% Due 08-24-1827113PAM3 East Boston Savings Bank (FDIC
Gtd)76.41 0.00 0.00 -296.07 276.97 0.00 276.97 57.30
1.400% Due 08-24-1838147J3R1 Goldman Sachs Bank USA (FDIC
Gtd)1,686.03 0.00 0.00 0.00 323.81 0.00 323.81 2,009.84
1.650% Due 09-04-18795450SU0 Sallie Mae Bank (FDIC Gtd) 1,839.30 0.00 0.00 0.00 353.24 0.00 353.24 2,192.55
1.800% Due 09-04-1833612JFU8 First Priority Bank (FDIC Gtd) 1,221.65 0.00 0.00 0.00 285.71 0.00 285.71 1,507.36
1.450% Due 09-28-1890348JAP5 UBS Bank USA (FDIC Gtd) 19.02 0.00 0.00 -285.37 275.86 0.00 275.86 9.51
1.400% Due 10-01-18140420PT1 Capital One Bank USA NA (FDIC
Gtd)1,418.70 0.00 0.00 0.00 354.67 0.00 354.67 1,773.37
1.800% Due 10-09-1857116AHW1 Marlin Business Bank (FDIC Gtd) 207.91 0.00 0.00 -358.07 334.97 0.00 334.97 184.81
1.700% Due 10-15-1820361LBM5 Community Banker's Bank (FDIC
Gtd)168.16 0.00 0.00 -347.54 325.12 0.00 325.12 145.74
1.650% Due 10-17-1802587DWJ3 American Express Centurion Bank
(FDIC Gtd)883.29 0.00 0.00 0.00 394.08 0.00 394.08 1,277.37
2.000% Due 11-28-1834387ABS7 Flushing Bank (FDIC Gtd) 173.96 0.00 0.00 -317.22 296.75 0.00 296.75 153.49
1.500% Due 12-17-1849306SVY9 KeyBank NA (FDIC Gtd) 125.87 0.00 0.00 0.00 304.18 0.00 304.18 430.05
1.550% Due 01-22-1946147URG7 Investors Community Bank (FDIC
Gtd)0.00 0.00 0.00 0.00 141.21 0.00 141.21 141.21
1.150% Due 02-12-19
Boston Dallas Denver Los Angeles New York Phoenix Tampa
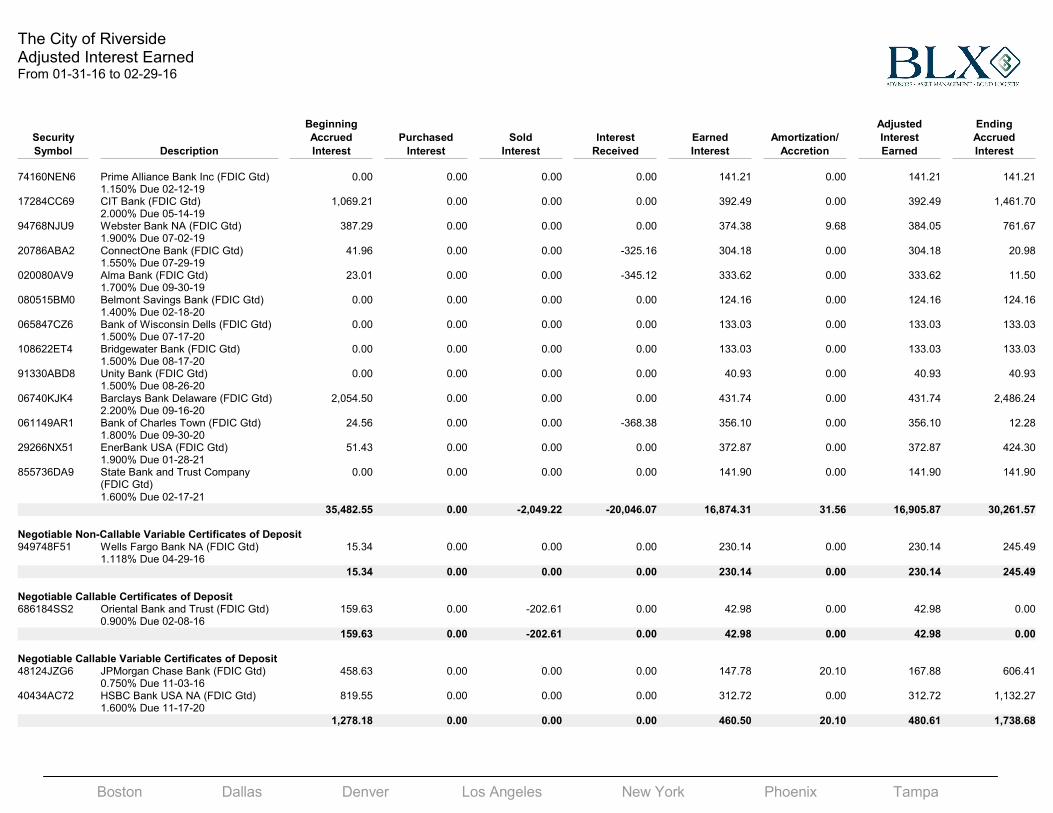
The City of RiversideAdjusted Interest EarnedFrom 01-31-16 to 02-29-16
Beginning Adjusted Ending
Security Accrued Purchased Sold Interest Earned Amortization/ Interest Accrued
Symbol Description Interest Interest Interest Received Interest Accretion Earned Interest
74160NEN6 Prime Alliance Bank Inc (FDIC Gtd) 0.00 0.00 0.00 0.00 141.21 0.00 141.21 141.211.150% Due 02-12-19
17284CC69 CIT Bank (FDIC Gtd) 1,069.21 0.00 0.00 0.00 392.49 0.00 392.49 1,461.702.000% Due 05-14-19
94768NJU9 Webster Bank NA (FDIC Gtd) 387.29 0.00 0.00 0.00 374.38 9.68 384.05 761.671.900% Due 07-02-19
20786ABA2 ConnectOne Bank (FDIC Gtd) 41.96 0.00 0.00 -325.16 304.18 0.00 304.18 20.981.550% Due 07-29-19
020080AV9 Alma Bank (FDIC Gtd) 23.01 0.00 0.00 -345.12 333.62 0.00 333.62 11.501.700% Due 09-30-19
080515BM0 Belmont Savings Bank (FDIC Gtd) 0.00 0.00 0.00 0.00 124.16 0.00 124.16 124.161.400% Due 02-18-20
065847CZ6 Bank of Wisconsin Dells (FDIC Gtd) 0.00 0.00 0.00 0.00 133.03 0.00 133.03 133.031.500% Due 07-17-20
108622ET4 Bridgewater Bank (FDIC Gtd) 0.00 0.00 0.00 0.00 133.03 0.00 133.03 133.031.500% Due 08-17-20
91330ABD8 Unity Bank (FDIC Gtd) 0.00 0.00 0.00 0.00 40.93 0.00 40.93 40.931.500% Due 08-26-20
06740KJK4 Barclays Bank Delaware (FDIC Gtd) 2,054.50 0.00 0.00 0.00 431.74 0.00 431.74 2,486.242.200% Due 09-16-20
061149AR1 Bank of Charles Town (FDIC Gtd) 24.56 0.00 0.00 -368.38 356.10 0.00 356.10 12.281.800% Due 09-30-20
29266NX51 EnerBank USA (FDIC Gtd) 51.43 0.00 0.00 0.00 372.87 0.00 372.87 424.301.900% Due 01-28-21
855736DA9 State Bank and Trust Company (FDIC Gtd)
0.00 0.00 0.00 0.00 141.90 0.00 141.90 141.90
1.600% Due 02-17-21
35,482.55 0.00 -2,049.22 -20,046.07 16,874.31 31.56 16,905.87 30,261.57
Negotiable Non-Callable Variable Certificates of Deposit949748F51 Wells Fargo Bank NA (FDIC Gtd) 15.34 0.00 0.00 0.00 230.14 0.00 230.14 245.49
1.118% Due 04-29-16
15.34 0.00 0.00 0.00 230.14 0.00 230.14 245.49
Negotiable Callable Certificates of Deposit686184SS2 Oriental Bank and Trust (FDIC Gtd) 159.63 0.00 -202.61 0.00 42.98 0.00 42.98 0.00
0.900% Due 02-08-16
159.63 0.00 -202.61 0.00 42.98 0.00 42.98 0.00
Negotiable Callable Variable Certificates of Deposit48124JZG6 JPMorgan Chase Bank (FDIC Gtd) 458.63 0.00 0.00 0.00 147.78 20.10 167.88 606.41
0.750% Due 11-03-1640434AC72 HSBC Bank USA NA (FDIC Gtd) 819.55 0.00 0.00 0.00 312.72 0.00 312.72 1,132.27
1.600% Due 11-17-20
1,278.18 0.00 0.00 0.00 460.50 20.10 480.61 1,738.68
Boston Dallas Denver Los Angeles New York Phoenix Tampa
The City of RiversideAdjusted Interest EarnedFrom 01-31-16 to 02-29-16
Beginning Adjusted Ending
Security Accrued Purchased Sold Interest Earned Amortization/ Interest Accrued
Symbol Description Interest Interest Interest Received Interest Accretion Earned Interest
Bond FundsCTRST CALTRUST Investment Trust of
California0.00 0.00 0.00 -649.81 649.81 0.00 649.81 0.00
0.00 0.00 0.00 -649.81 649.81 0.00 649.81 0.00
Cash & EquivalentsASTIPCM Invesco STIC Prime Cash
Management Shares0.00 0.00 0.00 0.00 0.00 0.00 0.00 0.00
BOFAPFC Public Funds Checking 0.00 0.00 0.00 -10,511.38 10,511.38 0.00 10,511.38 0.00BWBMMP Business Money Market Plus 0.00 0.00 0.00 -3.36 3.36 0.00 3.36 0.00Cash Cash 0.00 0.00 0.00 0.00 0.00 0.00 0.00 0.00CBBPMMGS Premium Money Market -
Government Services0.00 0.00 0.00 -1,508.42 1,508.42 0.00 1,508.42 0.00
CNGXX CNI Charter Government Money Market Fund - Class N
0.00 0.00 0.00 0.00 0.00 0.00 0.00 0.00
LAIF Local Agency Investment Fund 0.00 0.00 0.00 0.00 0.00 0.00 0.00 0.00NCRXX Columbia Cash Reserves- Adviser
Class Shares0.00 0.00 0.00 0.00 0.00 0.00 0.00 0.00
WFJXX CALTRUST Heritage Money Market Fund - Select Class
335.69 0.00 0.00 -335.69 350.73 0.00 350.73 350.73
335.69 0.00 0.00 -12,358.85 12,373.89 0.00 12,373.89 350.73
TOTAL PORTFOLIO 1,524,802.96 0.00 -2,251.83 -481,712.86 532,047.76 -186,693.35 345,354.41 1,572,886.03