Embed Size (px)
Citation preview
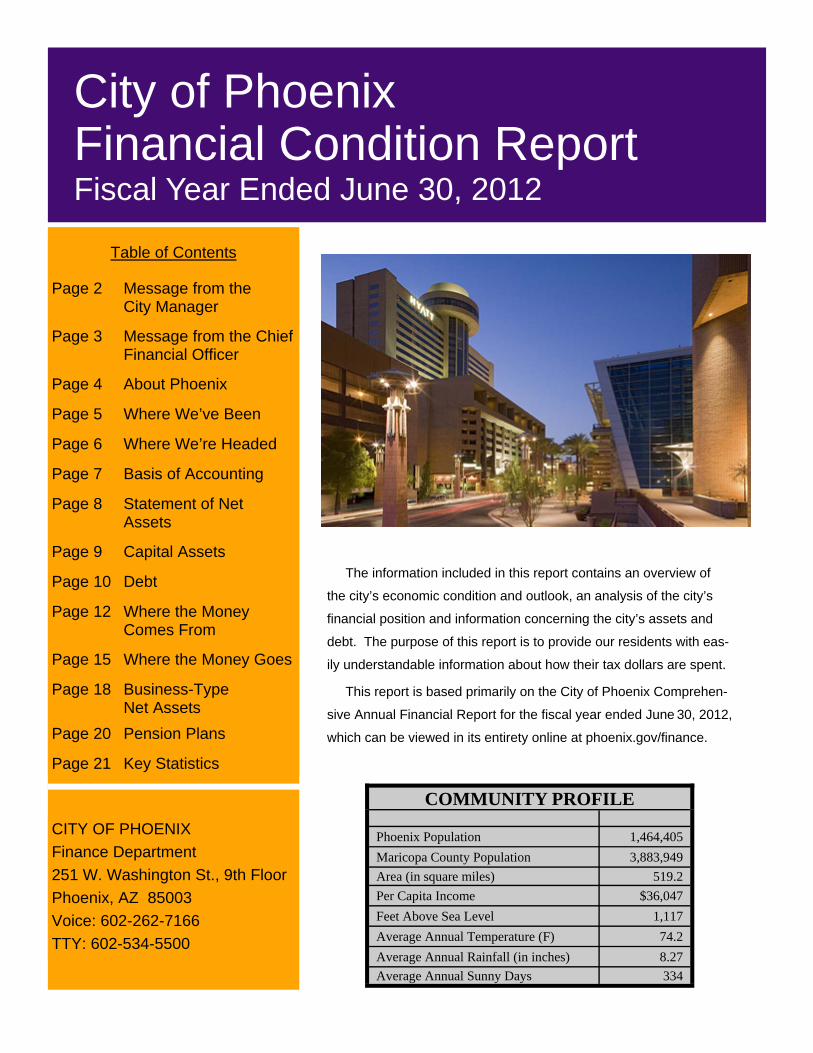
The information included in this report contains an overview of
the city’s economic condition and outlook, an analysis of the city’s
financial position and information concerning the city’s assets and
debt. The purpose of this report is to provide our residents with eas-
ily understandable information about how their tax dollars are spent.
This report is based primarily on the City of Phoenix Comprehen-
sive Annual Financial Report for the fiscal year ended June 30, 2012,
which can be viewed in its entirety online at phoenix.gov/finance.
CITY OF PHOENIX Finance Department 251 W. Washington St., 9th Floor Phoenix, AZ 85003 Voice: 602-262-7166 TTY: 602-534-5500
COMMUNITY PROFILE Phoenix Population 1,464,405 Maricopa County Population 3,883,949 Area (in square miles) 519.2 Per Capita Income $36,047 Feet Above Sea Level 1,117 Average Annual Temperature (F) 74.2 Average Annual Rainfall (in inches) 8.27 Average Annual Sunny Days 334
Table of Contents
Page 2 Message from the City Manager
Page 3 Message from the Chief Financial Officer
Page 4 About Phoenix
Page 5 Where We’ve Been
Page 6 Where We’re Headed
Page 7 Basis of Accounting
Page 8 Statement of Net Assets
Page 9 Capital Assets
Page 12 Where the Money Comes From
Page 15 Where the Money Goes
Page 18 Business-Type Net Assets
Page 20 Pension Plans
Page 21 Key Statistics
Page 10 Debt
City of Phoenix Financial Condition Report Fiscal Year Ended June 30, 2012
City of Phoenix Financial Condition Report Page 2 For the Fiscal Year Ended June 30, 2012
Message From the City Manager
David Cavazos, City Manager
Seven Pillars of Fiscal Strength: 1) Strong Employee Relations and Employee Sacrifices - The city of Phoenix’s success is based chiefly on its dedicated employees; illustrated daily as staff dependably, profession-ally and efficiently provides high quality services resulting in outstanding resident ratings. 2) Doing More With Less - Organizational reviews in all departments resulted in reducing management positions by 22 percent, twice the rate of employees overall. The overall staffing level has been reduced to 10.2 employees per 1,000 residents, the lowest in 40 years.
3) Enhanced Compliance and Accurate Esti-mates - The city’s revenue outlook is reaping the benefits of an enhanced emphasis on com-pliance regarding payment of taxes, fines and fees, ensuring the General Fund receives what is owed. 4) Focus on Innovation and Efficiency - The Innovation and Efficiency Task Force has spurred improvements that have produced more than $59.7 million in citywide savings in the last three years. 5) Responsible Financial Management - The Finance Department has prudently managed debt, investments and revenue collection which has allowed the city to maintain uncommonly high municipal bond ratings.
6) Keeping Public Safety Our Number One Priority - The proportion of the 2011-12 General Fund budget allocated to Police, Fire, Municipal Court, City Prosecutor and Public Defender remains high at 70 percent.
7) Reduced Tax Collections in Adverse Times - Taxes that support the General Fund are down about $102 million since 2007-2008, an 11 percent decrease. The 2011-12 budget included no new or increased user fees.
Greetings: This marks our second annual City of Phoenix Financial Condition Report, which will provide an overview of the city’s financial outlook, financial position, assets and debt for the fiscal year ending June 30, 2012. When the 2011-12 budget was set, a deficit of $59 million was identified. This is well below the $277 million deficit in fiscal year 2010-11 and demonstrated continuing improvement in the economy and responsible actions taken by the Mayor and City Council, city management and city staff. For the first time in three years, the city was able to follow its regular budget schedule and gained valuable input as expressed by the community at 15 budget hearings. This much improved budget situation can be attributed to seven important pillars of fiscal strength: 1. Strong employee relations and employee sacrifices (2nd year of pay
reductions). 2. Doing more with less. 3. Accurate estimates in revenue and expenditure forecasts and enhanced
compliance to ensure all businesses pay their fair share. 4. Focus on innovation and efficiency achieving over $59 million in
annual savings in the last 3 years. 5. Responsible financial management (increase contingency funds,
refinance debt and maintain high bond ratings). 6. Keeping Public Safety our number one priority. 7. Reduced tax collections in adverse times to minimize impacts on our
residents. These actions allowed us to bridge the $59 million budget gap and end 2011-12 with reduced debt service, and stable net assets and cash compared to the prior year. As a result we were able to restore 1/2 of the employee pay reductions and restore programs in the 2012-13 budget. I want to thank the Mayor and City Council for their leadership, and by working with our community and city employees, I am optimistic about our city’s financial future and dedicated to providing outstanding services to our residents. Sincerely, David Cavazos City Manager
City of Phoenix Financial Condition Report Page 3 For the Fiscal Year Ended June 30, 2012
Message From the Chief Financial Officer
Finance Department Mission: Stewardship, Integrity,
Innovation in service to our customers
Jeff DeWitt, Chief Financial Officer
Dear Reader: I am pleased to submit to residents the City of Phoenix Financial Condition Report for the fiscal year ending June 30, 2012. This is our second year of producing a report that is intended to provide a simple but comprehensive view of the financial status of the city. The intent is to be fully transparent in a brief overview of the city with full and detailed information available in the City of Phoenix Comprehensive Annual Financial Report (CAFR). The CAFR is available in its entirety online at phoenix.gov/finance. This report focuses on the entire financial picture of the city for all functions provided to our residents. The report includes information about city management, an overview of the city’s economic outlook and key financial information concerning the city’s revenues, expenditures, capital assets and debt. I hope that you find the information helpful and I encourage you to access our audited CAFR on the city’s website for more detailed information on the city’s finances. Your questions, comments and suggestions regarding this report are welcome. You can contact the Finance Department at 602-262-7166. Sincerely, Jeff DeWitt Chief Financial Officer
Financial Excellence Strategic Plan • Maintain high bond ratings • Develop capital and funding
plans for critical infrastructure • Provide accurate and reliable
revenue and expenditure forecasting
• Maintain a transparent financial environment, free of fraud, waste and abuse
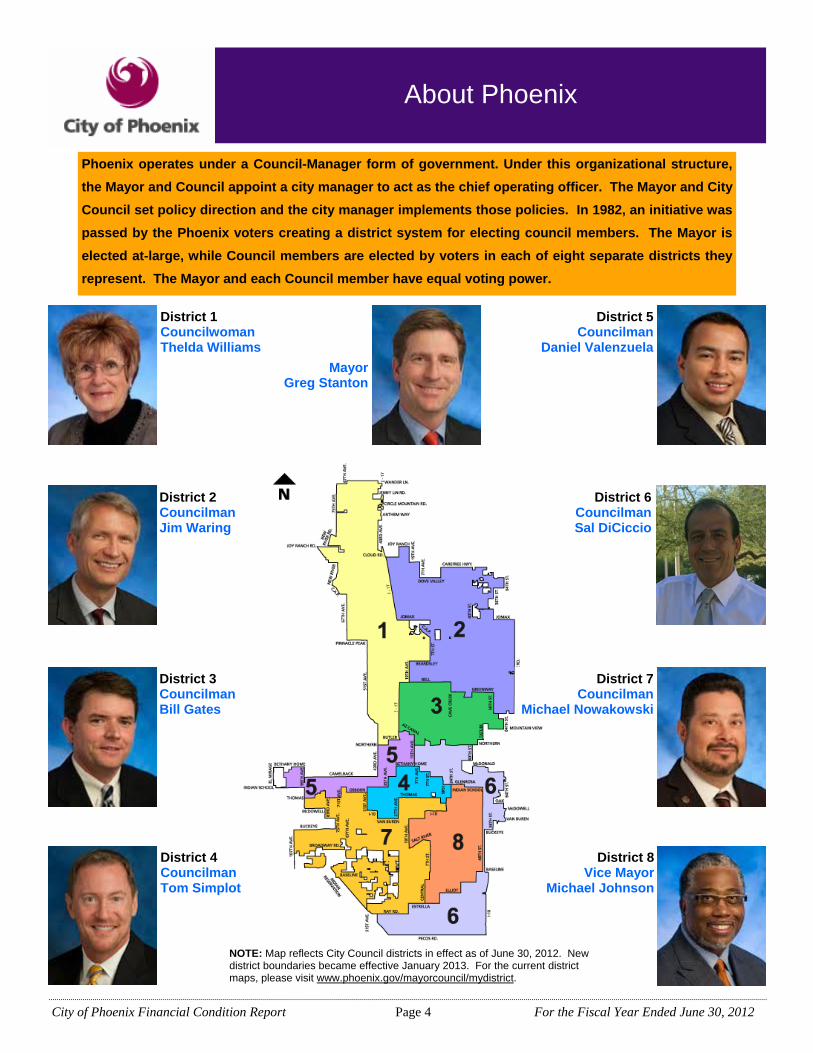
Calvin C. Goode Municipal Building
City of Phoenix Financial Condition Report Page 4 For the Fiscal Year Ended June 30, 2012
About Phoenix
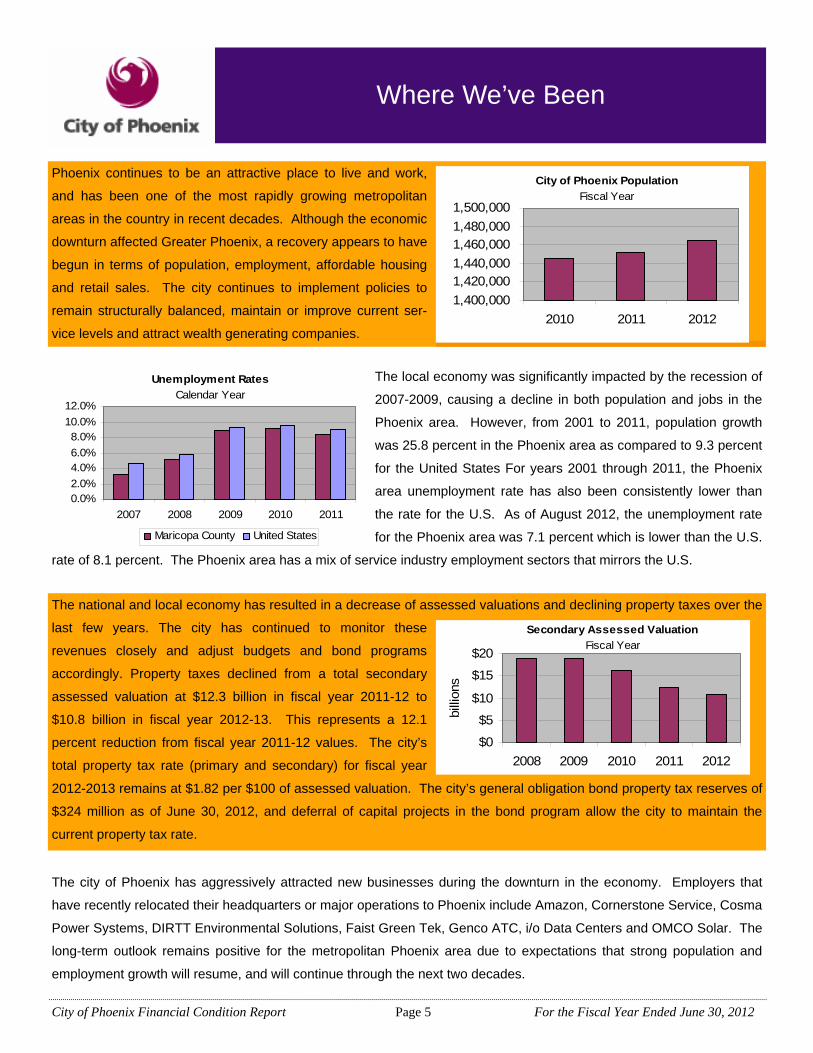
Phoenix operates under a Council-Manager form of government. Under this organizational structure, the Mayor and Council appoint a city manager to act as the chief operating officer. The Mayor and City Council set policy direction and the city manager implements those policies. In 1982, an initiative was passed by the Phoenix voters creating a district system for electing council members. The Mayor is elected at-large, while Council members are elected by voters in each of eight separate districts they represent. The Mayor and each Council member have equal voting power.
District 8 Vice Mayor
Michael Johnson
District 7 Councilman
Michael Nowakowski
District 5 Councilman
Daniel Valenzuela
District 6 Councilman Sal DiCiccio
District 1 Councilwoman Thelda Williams
District 2 Councilman Jim Waring
District 3 Councilman Bill Gates
District 4 Councilman Tom Simplot
NOTE: Map reflects City Council districts in effect as of June 30, 2012. New district boundaries became effective January 2013. For the current district maps, please visit www.phoenix.gov/mayorcouncil/mydistrict.
Mayor Greg Stanton
City of Phoenix Financial Condition Report Page 5 For the Fiscal Year Ended June 30, 2012
The local economy was significantly impacted by the recession of
2007-2009, causing a decline in both population and jobs in the
Phoenix area. However, from 2001 to 2011, population growth
was 25.8 percent in the Phoenix area as compared to 9.3 percent
for the United States For years 2001 through 2011, the Phoenix
area unemployment rate has also been consistently lower than
the rate for the U.S. As of August 2012, the unemployment rate
for the Phoenix area was 7.1 percent which is lower than the U.S.
rate of 8.1 percent. The Phoenix area has a mix of service industry employment sectors that mirrors the U.S.
Where We’ve Been
Phoenix continues to be an attractive place to live and work,
and has been one of the most rapidly growing metropolitan
areas in the country in recent decades. Although the economic
downturn affected Greater Phoenix, a recovery appears to have
begun in terms of population, employment, affordable housing
and retail sales. The city continues to implement policies to
remain structurally balanced, maintain or improve current ser-
vice levels and attract wealth generating companies.
The national and local economy has resulted in a decrease of assessed valuations and declining property taxes over the
last few years. The city has continued to monitor these
revenues closely and adjust budgets and bond programs
accordingly. Property taxes declined from a total secondary
assessed valuation at $12.3 billion in fiscal year 2011-12 to
$10.8 billion in fiscal year 2012-13. This represents a 12.1
percent reduction from fiscal year 2011-12 values. The city’s
total property tax rate (primary and secondary) for fiscal year
2012-2013 remains at $1.82 per $100 of assessed valuation. The city’s general obligation bond property tax reserves of
$324 million as of June 30, 2012, and deferral of capital projects in the bond program allow the city to maintain the
current property tax rate.
City of Phoenix PopulationFiscal Year
1,400,0001,420,0001,440,0001,460,0001,480,0001,500,000
2010 2011 2012
Unemployment RatesCalendar Year
0.0%2.0%4.0%6.0%8.0%
10.0%12.0%
2007 2008 2009 2010 2011
Maricopa County United States
Secondary Assessed ValuationFiscal Year
$0
$5
$10
$15
$20
2008 2009 2010 2011 2012
billi
ons
The city of Phoenix has aggressively attracted new businesses during the downturn in the economy. Employers that
have recently relocated their headquarters or major operations to Phoenix include Amazon, Cornerstone Service, Cosma
Power Systems, DIRTT Environmental Solutions, Faist Green Tek, Genco ATC, i/o Data Centers and OMCO Solar. The
long-term outlook remains positive for the metropolitan Phoenix area due to expectations that strong population and
employment growth will resume, and will continue through the next two decades.
City of Phoenix Financial Condition Report Page 6 For the Fiscal Year Ended June 30, 2012
A major effort initiated by the City Manager and approved by the Mayor and City Council to ensure city government is
operating as efficiently as possible was the creation of the Innovation and Efficiency Task Force. The task force,
initiated in December 2009, is comprised of private sector members appointed by the Mayor and City Council, and city
staff. The objective of the task force is to explore, develop and implement innovative processes that will result in a more
efficient delivery of city services and maximize the use of limited taxpayer dollars. Since its inception, Innovation and
Efficiency Task Force suggestions have achieved $59.7 million in citywide savings in less than three years. The city has
eliminated 635 positions over the last two years and a new goal of $100 million in savings has been set by the City
Manager to be achieved by 2015.
The city continues to improve and modernize its transit/light rail system. Valley Metro’s Northwest Extension is an
expansion of light rail service that will eventually travel to the area near Interstate 17 and Dunlap Avenue. Phase I of the
construction project is a 3.2-mile extension that will extend light rail north on 19th Avenue from Montebello to Dunlap
Avenue and serve 5,000 riders per day. Construction begins in January 2013. This extension is scheduled to open in
late 2015/early 2016 and will support nearly 20,000 residents and another 20,000 employees. It will serve as an
essential means of travel in an area where 14 percent of households are dependent on transit compared to 7 percent
countywide.
Where We’re Headed
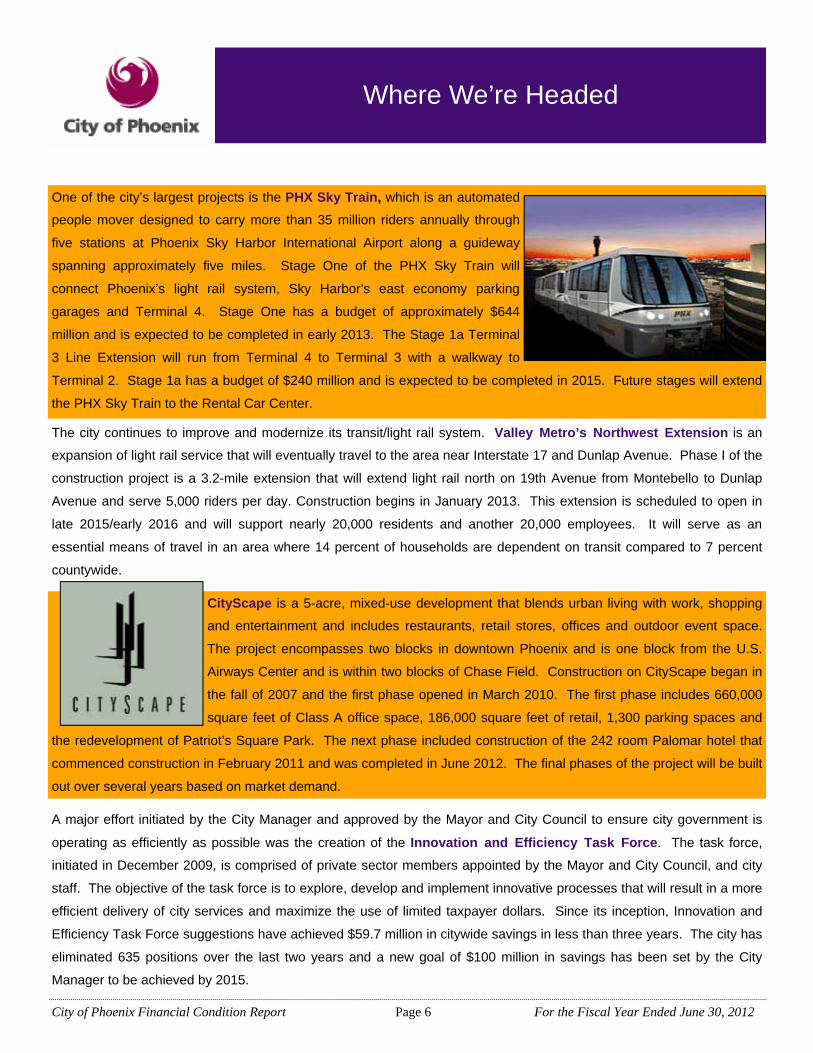
One of the city’s largest projects is the PHX Sky Train, which is an automated
people mover designed to carry more than 35 million riders annually through
five stations at Phoenix Sky Harbor International Airport along a guideway
spanning approximately five miles. Stage One of the PHX Sky Train will
connect Phoenix’s light rail system, Sky Harbor’s east economy parking
garages and Terminal 4. Stage One has a budget of approximately $644
million and is expected to be completed in early 2013. The Stage 1a Terminal
3 Line Extension will run from Terminal 4 to Terminal 3 with a walkway to
Terminal 2. Stage 1a has a budget of $240 million and is expected to be completed in 2015. Future stages will extend
the PHX Sky Train to the Rental Car Center.
CityScape is a 5-acre, mixed-use development that blends urban living with work, shopping
and entertainment and includes restaurants, retail stores, offices and outdoor event space.
The project encompasses two blocks in downtown Phoenix and is one block from the U.S.
Airways Center and is within two blocks of Chase Field. Construction on CityScape began in
the fall of 2007 and the first phase opened in March 2010. The first phase includes 660,000
square feet of Class A office space, 186,000 square feet of retail, 1,300 parking spaces and
the redevelopment of Patriot’s Square Park. The next phase included construction of the 242 room Palomar hotel that
commenced construction in February 2011 and was completed in June 2012. The final phases of the project will be built
out over several years based on market demand.
City of Phoenix Financial Condition Report Page 7 For the Fiscal Year Ended June 30, 2012
The term “basis of accounting” is used to describe the timing of recognition, or when the effects of trans-
actions or events should be recognized. The financial statements presented in this report were prepared
using the Generally Accepted Accounting Principles (GAAP) basis of accounting. Other reports issued by the
city may use the budget basis of accounting.
The city maintains budgetary controls, which are designed to ensure compliance
with legal provisions of the annual budget adopted by the City Council. An
operating budget is legally adopted by ordinance each fiscal year and sets limits
on the amount the city is able to spend on city functions. Some reports issued
by the city use the budget basis of accounting to compare city financial activities
to the adopted budget. Most of the statements in this report
were taken from the city’s Comprehensive Annual Financial
Report, which is prepared using the GAAP basis of accounting.
The timing of revenue and expenditures may be different under the GAAP basis of
accounting than under the budgetary basis of accounting. For exam-
ple in GAAP accounting, revenues are recognized in governmental
funds as soon as they are both measurable and available. Under the budgetary basis of
accounting, revenue may be deferred until amounts are actually received in cash.
Another difference occurs in the recognition of an encumbrance, which is an amount for which there is a legal
obligation to spend in the future, such as entering into a contract with a business to supply the
city a product or service. Under the budgetary basis of accounting, the encumbered amount
can be classified as an expense when the contract is signed, but under the GAAP
basis of accounting encumbrances are never classified as expenditures until the
service has been performed.
Basis of Accounting
City of Phoenix Financial Condition Report Page 8 For the Fiscal Year Ended June 30, 2012
Statement of Net Assets
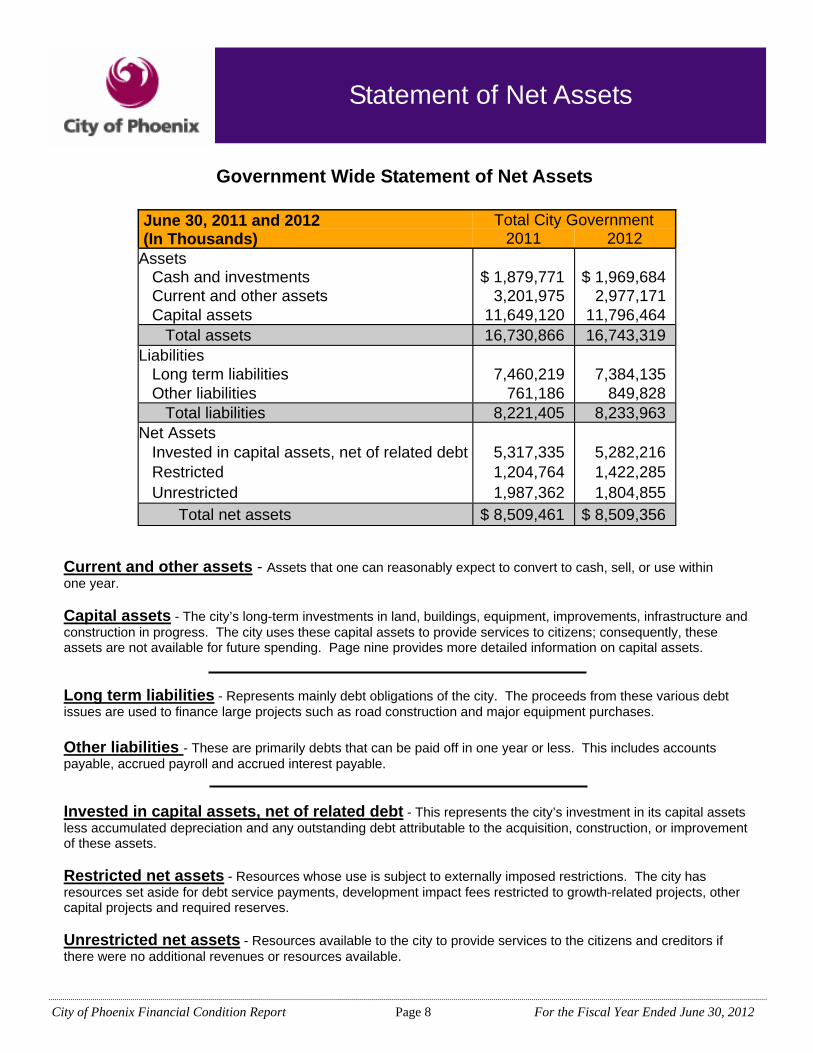
June 30, 2011 and 2012 Total City Government (In Thousands) 2011 2012 Assets Cash and investments $ 1,879,771 $ 1,969,684 Current and other assets 3,201,975 2,977,171 Capital assets 11,649,120 11,796,464 Total assets 16,730,866 16,743,319 Liabilities Long term liabilities 7,460,219 7,384,135 Other liabilities 761,186 849,828 Total liabilities 8,221,405 8,233,963 Net Assets Invested in capital assets, net of related debt 5,317,335 5,282,216 Restricted 1,204,764 1,422,285 Unrestricted 1,987,362 1,804,855 Total net assets $ 8,509,461 $ 8,509,356
Government Wide Statement of Net Assets
Current and other assets - Assets that one can reasonably expect to convert to cash, sell, or use within one year. Capital assets - The city’s long-term investments in land, buildings, equipment, improvements, infrastructure and construction in progress. The city uses these capital assets to provide services to citizens; consequently, these assets are not available for future spending. Page nine provides more detailed information on capital assets. Long term liabilities - Represents mainly debt obligations of the city. The proceeds from these various debt issues are used to finance large projects such as road construction and major equipment purchases. Other liabilities - These are primarily debts that can be paid off in one year or less. This includes accounts payable, accrued payroll and accrued interest payable. Invested in capital assets, net of related debt - This represents the city’s investment in its capital assets less accumulated depreciation and any outstanding debt attributable to the acquisition, construction, or improvement of these assets. Restricted net assets - Resources whose use is subject to externally imposed restrictions. The city has resources set aside for debt service payments, development impact fees restricted to growth-related projects, other capital projects and required reserves. Unrestricted net assets - Resources available to the city to provide services to the citizens and creditors if there were no additional revenues or resources available.
City of Phoenix Financial Condition Report Page 9 For the Fiscal Year Ended June 30, 2012
Capital Assets
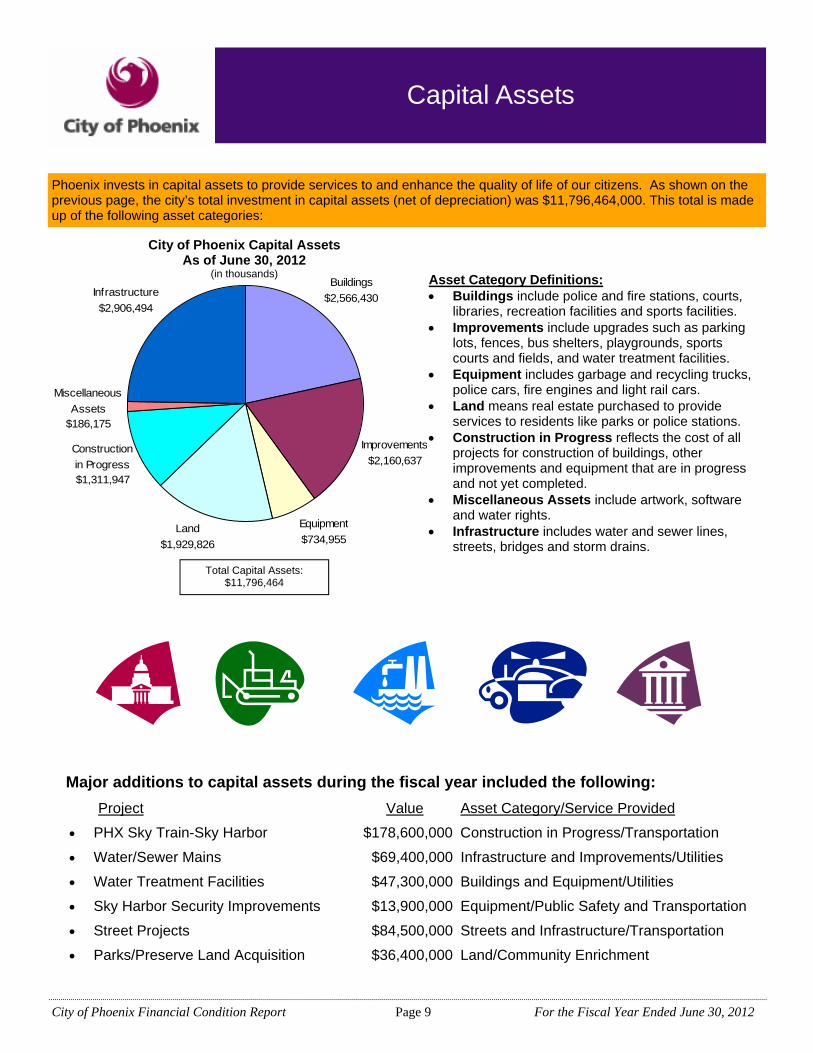
Phoenix invests in capital assets to provide services to and enhance the quality of life of our citizens. As shown on the previous page, the city’s total investment in capital assets (net of depreciation) was $11,796,464,000. This total is made up of the following asset categories:
Asset Category Definitions: • Buildings include police and fire stations, courts,
libraries, recreation facilities and sports facilities. • Improvements include upgrades such as parking
lots, fences, bus shelters, playgrounds, sports courts and fields, and water treatment facilities.
• Equipment includes garbage and recycling trucks, police cars, fire engines and light rail cars.
• Land means real estate purchased to provide services to residents like parks or police stations.
• Construction in Progress reflects the cost of all projects for construction of buildings, other improvements and equipment that are in progress and not yet completed.
• Miscellaneous Assets include artwork, software and water rights.
• Infrastructure includes water and sewer lines, streets, bridges and storm drains.
Major additions to capital assets during the fiscal year included the following: Project Value Asset Category/Service Provided
• PHX Sky Train-Sky Harbor $178,600,000 Construction in Progress/Transportation
• Water/Sewer Mains $69,400,000 Infrastructure and Improvements/Utilities
• Water Treatment Facilities $47,300,000 Buildings and Equipment/Utilities
• Sky Harbor Security Improvements $13,900,000 Equipment/Public Safety and Transportation
• Street Projects $84,500,000 Streets and Infrastructure/Transportation
• Parks/Preserve Land Acquisition $36,400,000 Land/Community Enrichment
Total Capital Assets: $11,796,464
Construction in Progress $1,311,947
Miscellaneous Assets
$186,175
Infrastructure $2,906,494
Improvements$2,160,637
Equipment $734,955
Land $1,929,826
Buildings $2,566,430
City of Phoenix Capital Assets As of June 30, 2012
(in thousands)
City of Phoenix Financial Condition Report Page 10 For the Fiscal Year Ended June 30, 2012
Debt
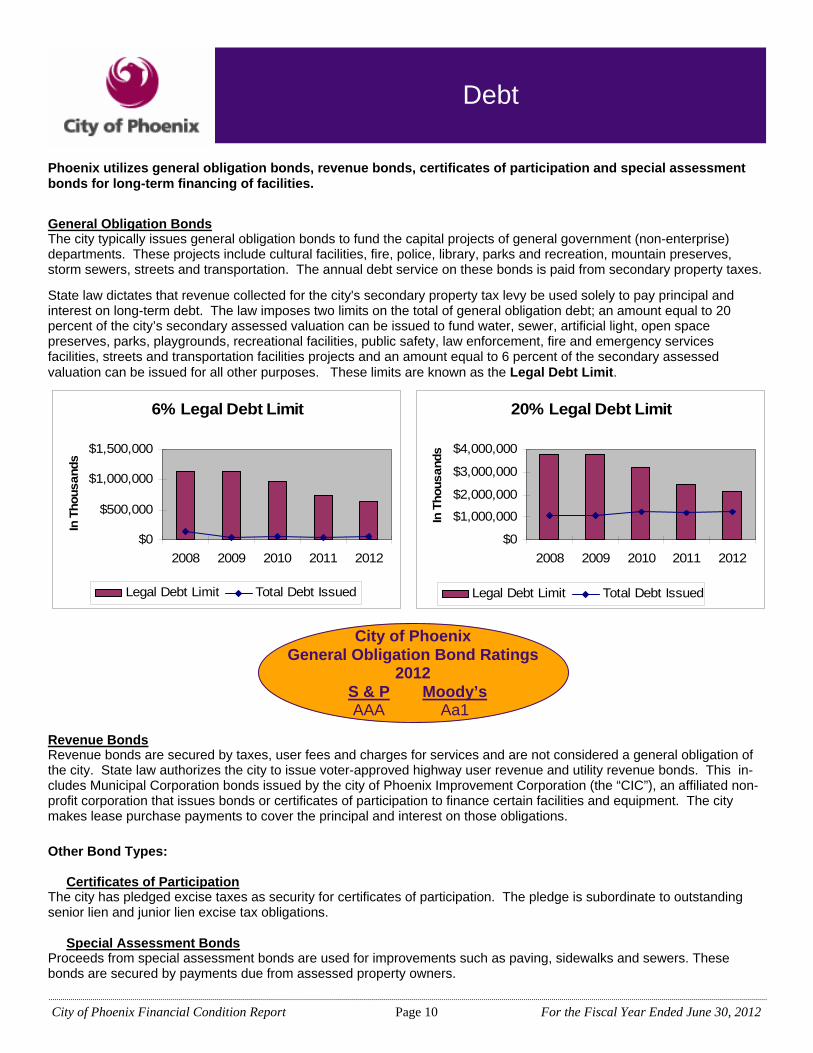
Phoenix utilizes general obligation bonds, revenue bonds, certificates of participation and special assessment bonds for long-term financing of facilities.
General Obligation Bonds The city typically issues general obligation bonds to fund the capital projects of general government (non-enterprise) departments. These projects include cultural facilities, fire, police, library, parks and recreation, mountain preserves, storm sewers, streets and transportation. The annual debt service on these bonds is paid from secondary property taxes.
State law dictates that revenue collected for the city's secondary property tax levy be used solely to pay principal and interest on long-term debt. The law imposes two limits on the total of general obligation debt; an amount equal to 20 percent of the city’s secondary assessed valuation can be issued to fund water, sewer, artificial light, open space preserves, parks, playgrounds, recreational facilities, public safety, law enforcement, fire and emergency services facilities, streets and transportation facilities projects and an amount equal to 6 percent of the secondary assessed valuation can be issued for all other purposes. These limits are known as the Legal Debt Limit.
Revenue Bonds Revenue bonds are secured by taxes, user fees and charges for services and are not considered a general obligation of the city. State law authorizes the city to issue voter-approved highway user revenue and utility revenue bonds. This in-cludes Municipal Corporation bonds issued by the city of Phoenix Improvement Corporation (the “CIC”), an affiliated non-profit corporation that issues bonds or certificates of participation to finance certain facilities and equipment. The city makes lease purchase payments to cover the principal and interest on those obligations.
Certificates of Participation The city has pledged excise taxes as security for certificates of participation. The pledge is subordinate to outstanding senior lien and junior lien excise tax obligations. Special Assessment Bonds Proceeds from special assessment bonds are used for improvements such as paving, sidewalks and sewers. These bonds are secured by payments due from assessed property owners.
Other Bond Types:
City of Phoenix
2012 S & P Moody’s AAA Aa1
General Obligation Bond Ratings
6% Legal Debt Limit
$0
$500,000
$1,000,000
$1,500,000
2008 2009 2010 2011 2012
In T
hous
ands
Legal Debt Limit Total Debt Issued
20% Legal Debt Limit
$0
$1,000,000
$2,000,000
$3,000,000
$4,000,000
2008 2009 2010 2011 2012
In T
hous
ands
Legal Debt Limit Total Debt Issued
City of Phoenix Financial Condition Report Page 11 For the Fiscal Year Ended June 30, 2012
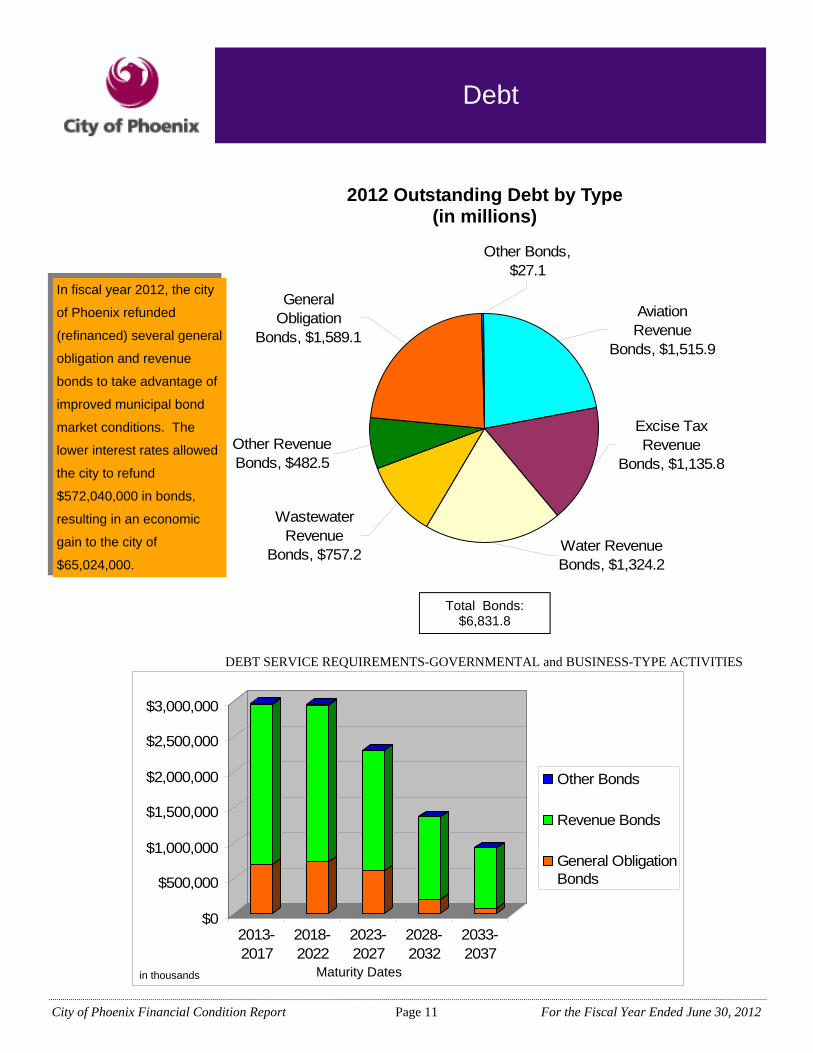
Wastewater Revenue
Bonds, $757.2
Other Revenue Bonds, $482.5
Aviation Revenue
Bonds, $1,515.9
Excise Tax Revenue
Bonds, $1,135.8
Water Revenue Bonds, $1,324.2
Other Bonds, $27.1
General Obligation
Bonds, $1,589.1
$0
$500,000
$1,000,000
$1,500,000
$2,000,000
$2,500,000
$3,000,000
2013-2017
2018-2022
2023-2027
2028-2032
2033-2037
Other Bonds
Revenue Bonds
General ObligationBonds
Debt
Maturity Dates
Total Bonds: $6,831.8
2012 Outstanding Debt by Type (in millions)
in thousands
DEBT SERVICE REQUIREMENTS-GOVERNMENTAL and BUSINESS-TYPE ACTIVITIES
In fiscal year 2012, the city
of Phoenix refunded
(refinanced) several general
obligation and revenue
bonds to take advantage of
improved municipal bond
market conditions. The
lower interest rates allowed
the city to refund
$572,040,000 in bonds,
resulting in an economic
gain to the city of
$65,024,000.
City of Phoenix Financial Condition Report Page 12 For the Fiscal Year Ended June 30, 2012
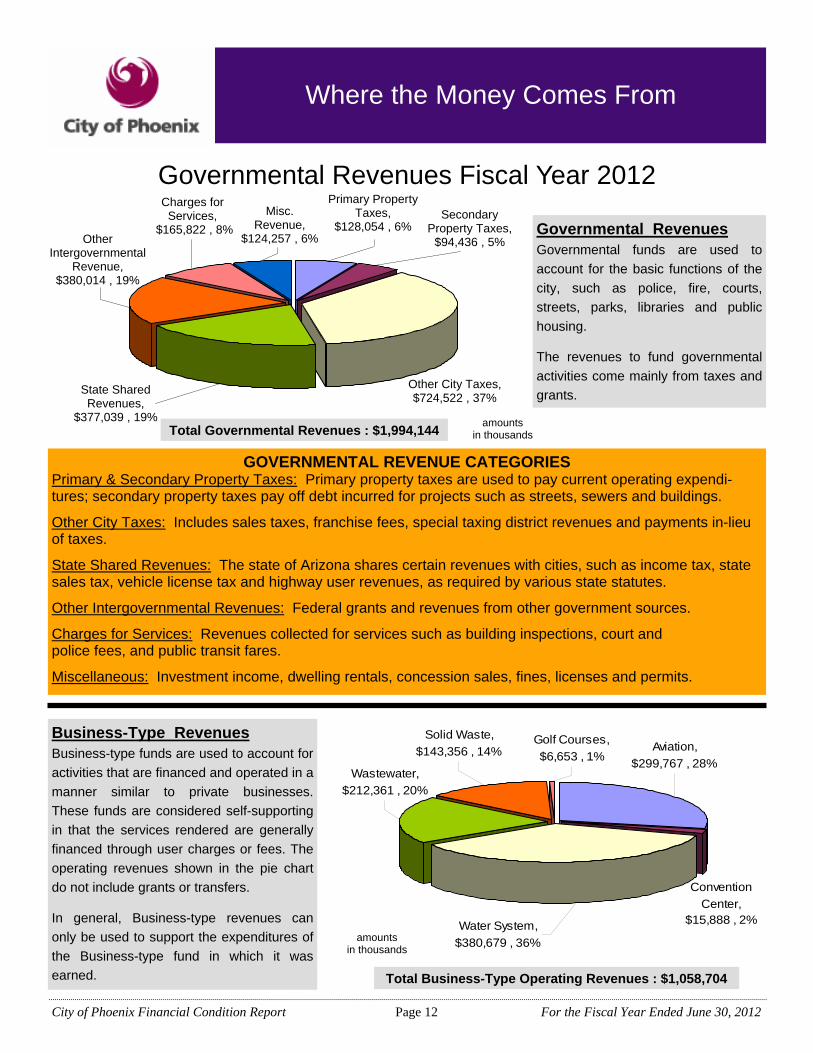
Primary Property Taxes,
$128,054 , 6% Misc.
Revenue, $124,257 , 6%
Convention Center,
$15,888 , 2%
Aviation, $299,767 , 28%
Golf Courses, $6,653 , 1%
Solid Waste, $143,356 , 14%
Water System, $380,679 , 36%
Wastewater, $212,361 , 20%
Where the Money Comes From
Governmental Revenues Fiscal Year 2012
GOVERNMENTAL REVENUE CATEGORIES Primary & Secondary Property Taxes: Primary property taxes are used to pay current operating expendi-tures; secondary property taxes pay off debt incurred for projects such as streets, sewers and buildings.
Other City Taxes: Includes sales taxes, franchise fees, special taxing district revenues and payments in-lieu of taxes.
State Shared Revenues: The state of Arizona shares certain revenues with cities, such as income tax, state sales tax, vehicle license tax and highway user revenues, as required by various state statutes.
Other Intergovernmental Revenues: Federal grants and revenues from other government sources.
Charges for Services: Revenues collected for services such as building inspections, court and police fees, and public transit fares.
Miscellaneous: Investment income, dwelling rentals, concession sales, fines, licenses and permits.
Total Business-Type Operating Revenues : $1,058,704
Business-Type Revenues Business-type funds are used to account for activities that are financed and operated in a manner similar to private businesses. These funds are considered self-supporting in that the services rendered are generally financed through user charges or fees. The operating revenues shown in the pie chart do not include grants or transfers.
In general, Business-type revenues can only be used to support the expenditures of the Business-type fund in which it was earned.
amounts in thousands
Governmental Revenues Governmental funds are used to account for the basic functions of the city, such as police, fire, courts, streets, parks, libraries and public housing.
The revenues to fund governmental activities come mainly from taxes and grants.
amounts in thousands Total Governmental Revenues : $1,994,144
Charges for Services,
$165,822 , 8% Secondary
Property Taxes, $94,436 , 5%
State Shared Revenues,
$377,039 , 19%
Other Intergovernmental
Revenue, $380,014 , 19%
Other City Taxes, $724,522 , 37%
City of Phoenix Financial Condition Report Page 13 For the Fiscal Year Ended June 30, 2012
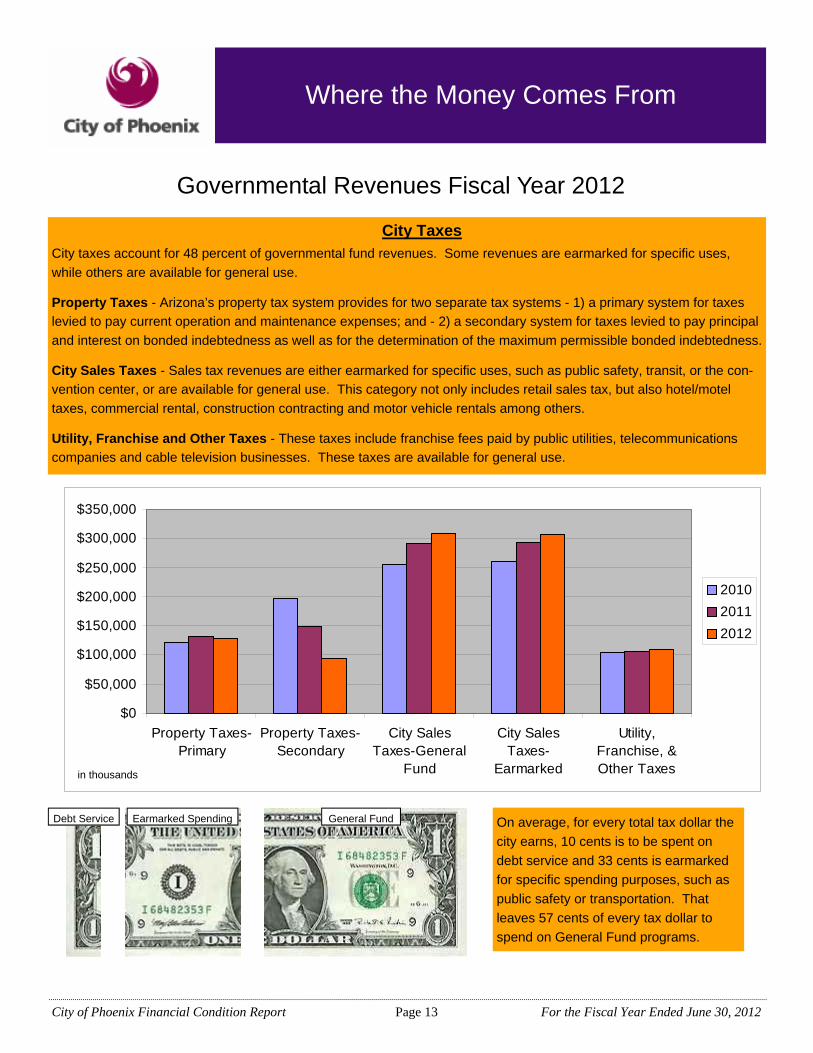
$0
$50,000
$100,000
$150,000
$200,000
$250,000
$300,000
$350,000
Property Taxes-Primary
Property Taxes-Secondary
City SalesTaxes-General
Fund
City SalesTaxes-
Earmarked
Utility,Franchise, &Other Taxes
201020112012
Where the Money Comes From
City Taxes
City taxes account for 48 percent of governmental fund revenues. Some revenues are earmarked for specific uses, while others are available for general use.
Property Taxes - Arizona’s property tax system provides for two separate tax systems - 1) a primary system for taxes levied to pay current operation and maintenance expenses; and - 2) a secondary system for taxes levied to pay principal and interest on bonded indebtedness as well as for the determination of the maximum permissible bonded indebtedness.
City Sales Taxes - Sales tax revenues are either earmarked for specific uses, such as public safety, transit, or the con-vention center, or are available for general use. This category not only includes retail sales tax, but also hotel/motel taxes, commercial rental, construction contracting and motor vehicle rentals among others.
Utility, Franchise and Other Taxes - These taxes include franchise fees paid by public utilities, telecommunications companies and cable television businesses. These taxes are available for general use.
Governmental Revenues Fiscal Year 2012
On average, for every total tax dollar the city earns, 10 cents is to be spent on debt service and 33 cents is earmarked for specific spending purposes, such as public safety or transportation. That leaves 57 cents of every tax dollar to spend on General Fund programs.
Debt Service Earmarked Spending General Fund
in thousands
City of Phoenix Financial Condition Report Page 14 For the Fiscal Year Ended June 30, 2012
$0
$100,000
$200,000
$300,000
$400,000
$500,000
$600,000
$700,000
$800,000
2003
2004
2005
2006
2007
2008
2009
2010
2011
2012
Other Tax CategoriesConstruction ContractingRestaurants & BarsCommercial RentalUtilities & TelecommunicationsRetail Sales Tax
$0
$100,000
$200,000
$300,000
$400,000
$500,000
$600,000
$700,000
$800,000
2003 2004 2005 2006 2007 2008 2009 2010 2011 2012
Total Privilege TaxesRetail Sales Taxes
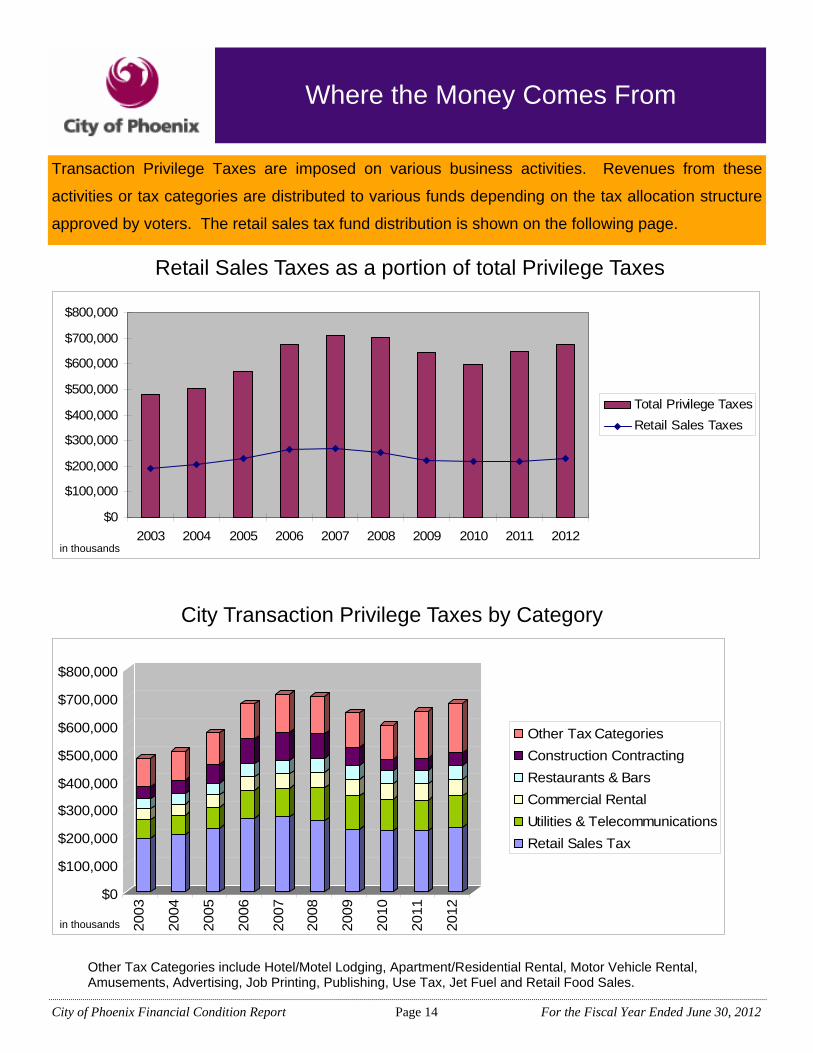
Where the Money Comes From
Transaction Privilege Taxes are imposed on various business activities. Revenues from these
activities or tax categories are distributed to various funds depending on the tax allocation structure
approved by voters. The retail sales tax fund distribution is shown on the following page.
Retail Sales Taxes as a portion of total Privilege Taxes
City Transaction Privilege Taxes by Category
Other Tax Categories include Hotel/Motel Lodging, Apartment/Residential Rental, Motor Vehicle Rental, Amusements, Advertising, Job Printing, Publishing, Use Tax, Jet Fuel and Retail Food Sales.
in thousands
in thousands
City of Phoenix Financial Condition Report Page 15 For the Fiscal Year Ended June 30, 2012
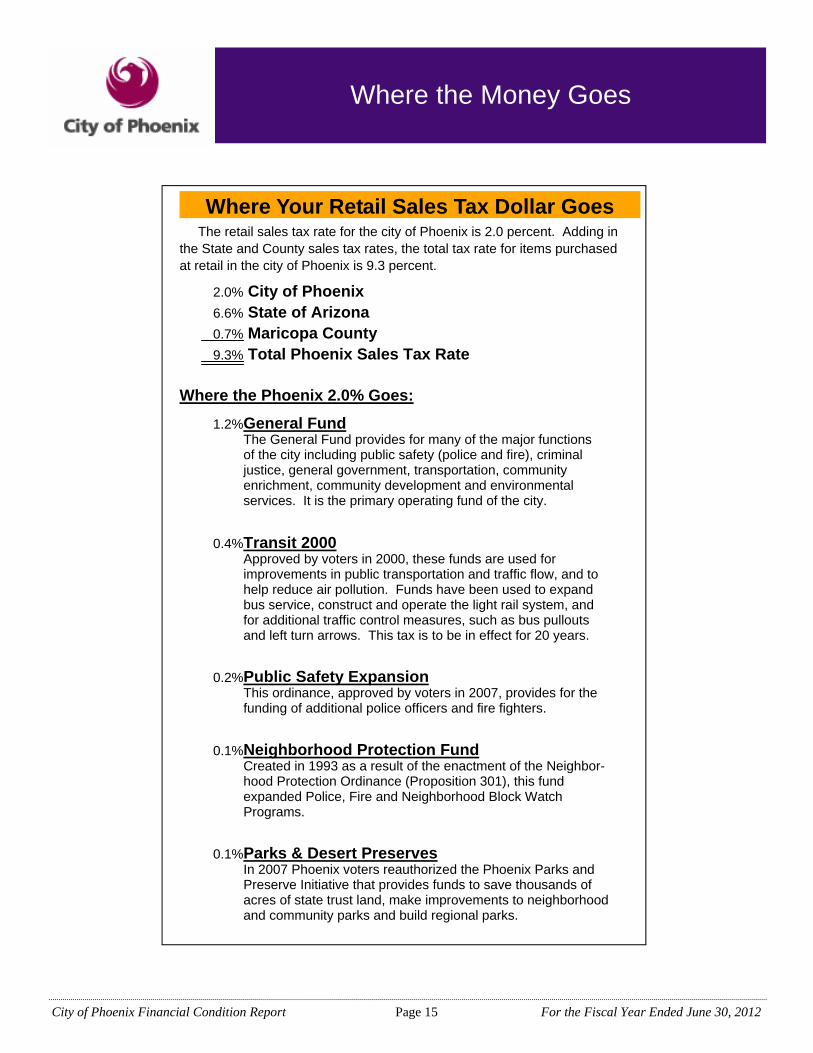
Where the Money Goes
Where Your Retail Sales Tax Dollar Goes The retail sales tax rate for the city of Phoenix is 2.0 percent. Adding in the State and County sales tax rates, the total tax rate for items purchased at retail in the city of Phoenix is 9.3 percent.
2.0% City of Phoenix 6.6% State of Arizona 0.7% Maricopa County 9.3% Total Phoenix Sales Tax Rate
Where the Phoenix 2.0% Goes:
0.4% Transit 2000 Approved by voters in 2000, these funds are used for
improvements in public transportation and traffic flow, and to help reduce air pollution. Funds have been used to expand bus service, construct and operate the light rail system, and for additional traffic control measures, such as bus pullouts and left turn arrows. This tax is to be in effect for 20 years.
0.2% Public Safety Expansion This ordinance, approved by voters in 2007, provides for the
funding of additional police officers and fire fighters.
0.1% Neighborhood Protection Fund Created in 1993 as a result of the enactment of the Neighbor-
hood Protection Ordinance (Proposition 301), this fund expanded Police, Fire and Neighborhood Block Watch Programs.
0.1% Parks & Desert Preserves In 2007 Phoenix voters reauthorized the Phoenix Parks and
Preserve Initiative that provides funds to save thousands of acres of state trust land, make improvements to neighborhood and community parks and build regional parks.
1.2% General Fund The General Fund provides for many of the major functions
of the city including public safety (police and fire), criminal justice, general government, transportation, community enrichment, community development and environmental services. It is the primary operating fund of the city.
City of Phoenix Financial Condition Report Page 16 For the Fiscal Year Ended June 30, 2012
People, 1,475.9 45%
Capital, 1,058.3 33%
Goods, 153.4 5%
Services, 546.3 17%
435.
7
421.
7
361.
8
245.
7
218.
8
178.
3
133.
4
109.
4
103.
4
88.2
42.3
35.7
8.9
850.
6
0.0
100.0
200.0300.0
400.0
500.0
600.0700.0
800.0
900.0
Publ
ic S
afet
y
Avia
tion
Tran
spor
tatio
n
Wat
er S
ervi
ces
Com
mun
ity E
nric
hmen
t
Com
mun
ity D
evel
opm
ent
Was
tew
ater
Ser
vice
s
Solid
Was
te
Long
-Ter
m In
tere
st
Con
vent
ion
Cen
ter
Gen
eral
Sup
port
Activ
ities
Envi
ronm
enta
l Ser
vice
s
Crim
inal
Jus
tice
Gol
f Cou
rses
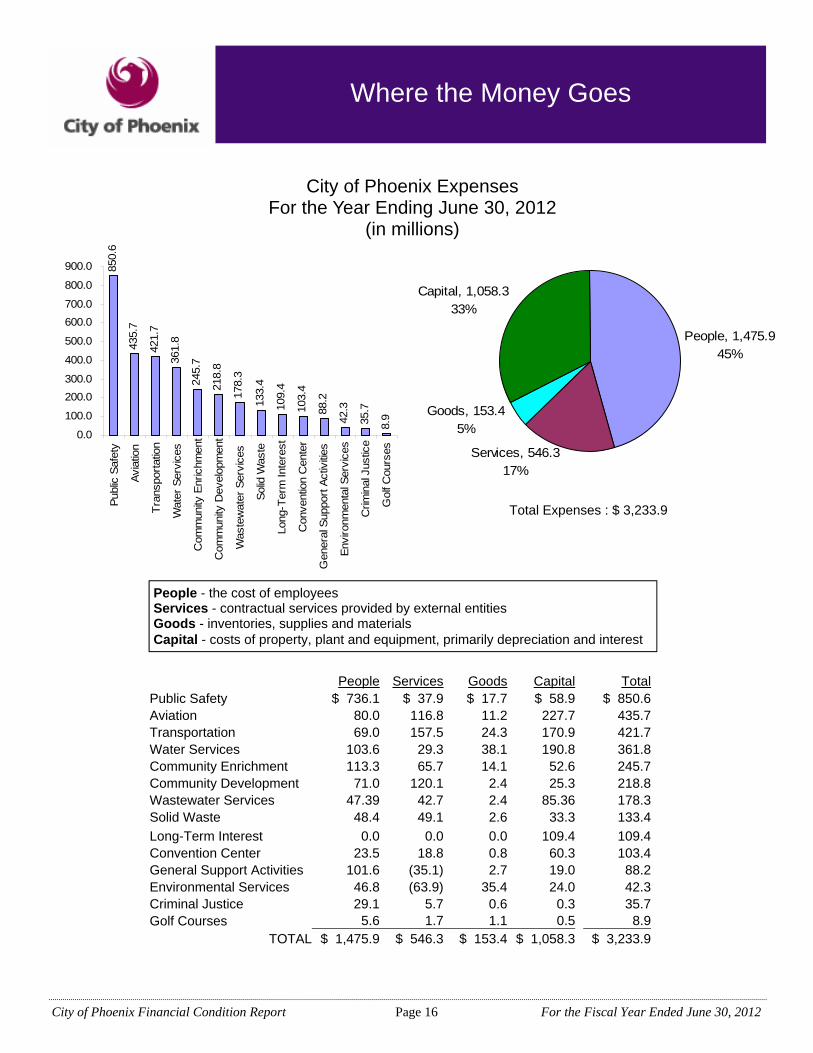
Where the Money Goes
City of Phoenix Expenses For the Year Ending June 30, 2012
(in millions)
Total Expenses : $ 3,233.9
People Services Goods Capital Total Public Safety $ 736.1 $ 37.9 $ 17.7 $ 58.9 $ 850.6 Aviation 80.0 116.8 11.2 227.7 435.7 Transportation 69.0 157.5 24.3 170.9 421.7 Water Services 103.6 29.3 38.1 190.8 361.8 Community Enrichment 113.3 65.7 14.1 52.6 245.7 Community Development 71.0 120.1 2.4 25.3 218.8 Wastewater Services 47.39 42.7 2.4 85.36 178.3 Solid Waste 48.4 49.1 2.6 33.3 133.4 Long-Term Interest 0.0 0.0 0.0 109.4 109.4 Convention Center 23.5 18.8 0.8 60.3 103.4 General Support Activities 101.6 (35.1) 2.7 19.0 88.2 Environmental Services 46.8 (63.9) 35.4 24.0 42.3 Criminal Justice 29.1 5.7 0.6 0.3 35.7 Golf Courses 5.6 1.7 1.1 0.5 8.9
TOTAL $ 1,475.9 $ 546.3 $ 153.4 $ 1,058.3 $ 3,233.9
People - the cost of employees Services - contractual services provided by external entities Goods - inventories, supplies and materials Capital - costs of property, plant and equipment, primarily depreciation and interest
City of Phoenix Financial Condition Report Page 17 For the Fiscal Year Ended June 30, 2012
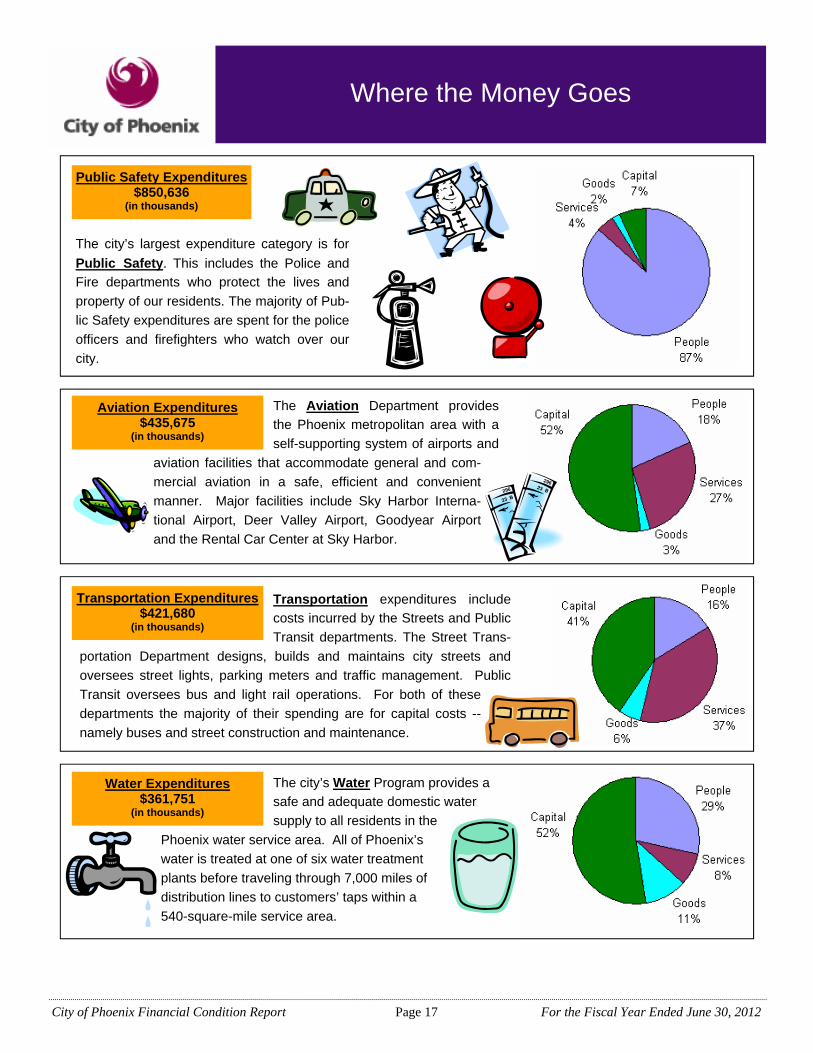
Water Expenditures $361,751
(in thousands)
Where the Money Goes
The city’s largest expenditure category is for Public Safety. This includes the Police and Fire departments who protect the lives and property of our residents. The majority of Pub-lic Safety expenditures are spent for the police officers and firefighters who watch over our city.
Public Safety Expenditures $850,636
(in thousands)
Aviation Expenditures $435,675
(in thousands)
The Aviation Department provides the Phoenix metropolitan area with a self-supporting system of airports and
aviation facilities that accommodate general and com-mercial aviation in a safe, efficient and convenient manner. Major facilities include Sky Harbor Interna-tional Airport, Deer Valley Airport, Goodyear Airport and the Rental Car Center at Sky Harbor.
Transportation Expenditures $421,680
(in thousands)
Transportation expenditures include costs incurred by the Streets and Public Transit departments. The Street Trans-
portation Department designs, builds and maintains city streets and oversees street lights, parking meters and traffic management. Public Transit oversees bus and light rail operations. For both of these departments the majority of their spending are for capital costs -- namely buses and street construction and maintenance.
The city’s Water Program provides a safe and adequate domestic water supply to all residents in the
Phoenix water service area. All of Phoenix’s water is treated at one of six water treatment plants before traveling through 7,000 miles of distribution lines to customers’ taps within a 540-square-mile service area.
City of Phoenix Financial Condition Report Page 18 For the Fiscal Year Ended June 30, 2012
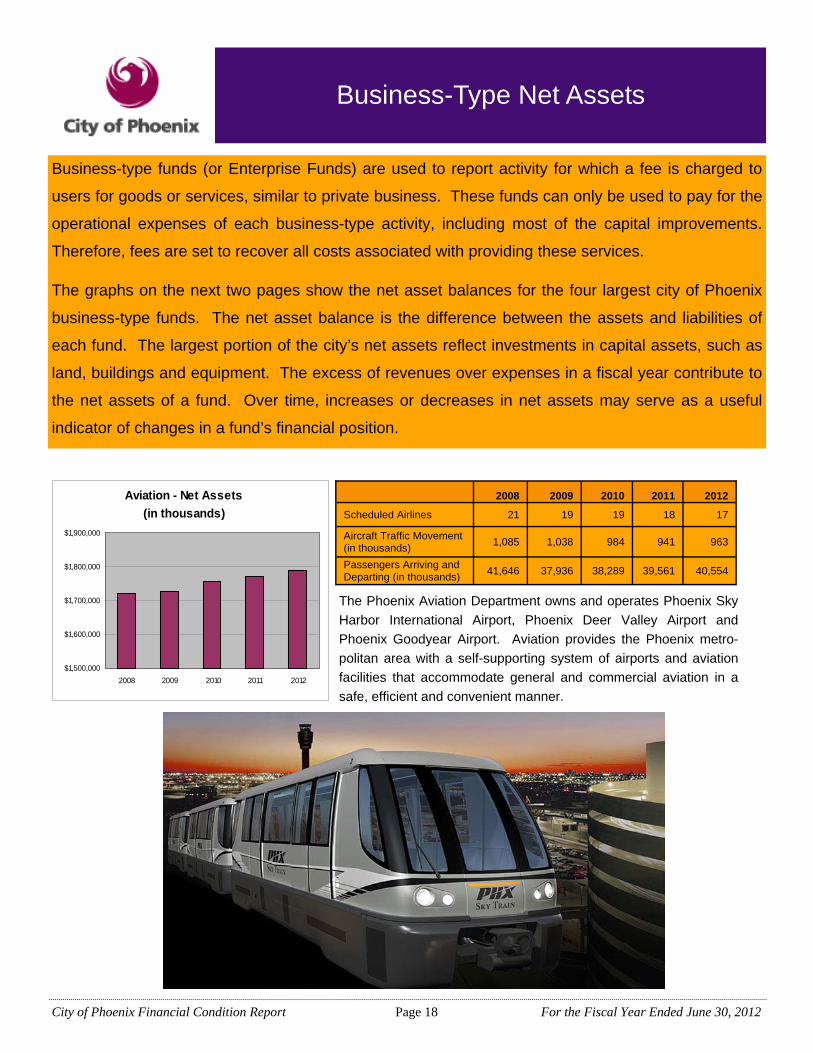
Business-Type Net Assets
Business-type funds (or Enterprise Funds) are used to report activity for which a fee is charged to
users for goods or services, similar to private business. These funds can only be used to pay for the
operational expenses of each business-type activity, including most of the capital improvements.
Therefore, fees are set to recover all costs associated with providing these services.
The graphs on the next two pages show the net asset balances for the four largest city of Phoenix
business-type funds. The net asset balance is the difference between the assets and liabilities of
each fund. The largest portion of the city’s net assets reflect investments in capital assets, such as
land, buildings and equipment. The excess of revenues over expenses in a fiscal year contribute to
the net assets of a fund. Over time, increases or decreases in net assets may serve as a useful
indicator of changes in a fund’s financial position.
2008 2009 2010 2011 2012
Scheduled Airlines 21 19 19 18 17
Aircraft Traffic Movement (in thousands) 1,085 1,038 984 941 963
Passengers Arriving and Departing (in thousands) 41,646 37,936 38,289 39,561 40,554
The Phoenix Aviation Department owns and operates Phoenix Sky Harbor International Airport, Phoenix Deer Valley Airport and Phoenix Goodyear Airport. Aviation provides the Phoenix metro-politan area with a self-supporting system of airports and aviation facilities that accommodate general and commercial aviation in a safe, efficient and convenient manner.
Aviation - Net Assets(in thousands)
$1,500,000
$1,600,000
$1,700,000
$1,800,000
$1,900,000
2008 2009 2010 2011 2012
City of Phoenix Financial Condition Report Page 19 For the Fiscal Year Ended June 30, 2012
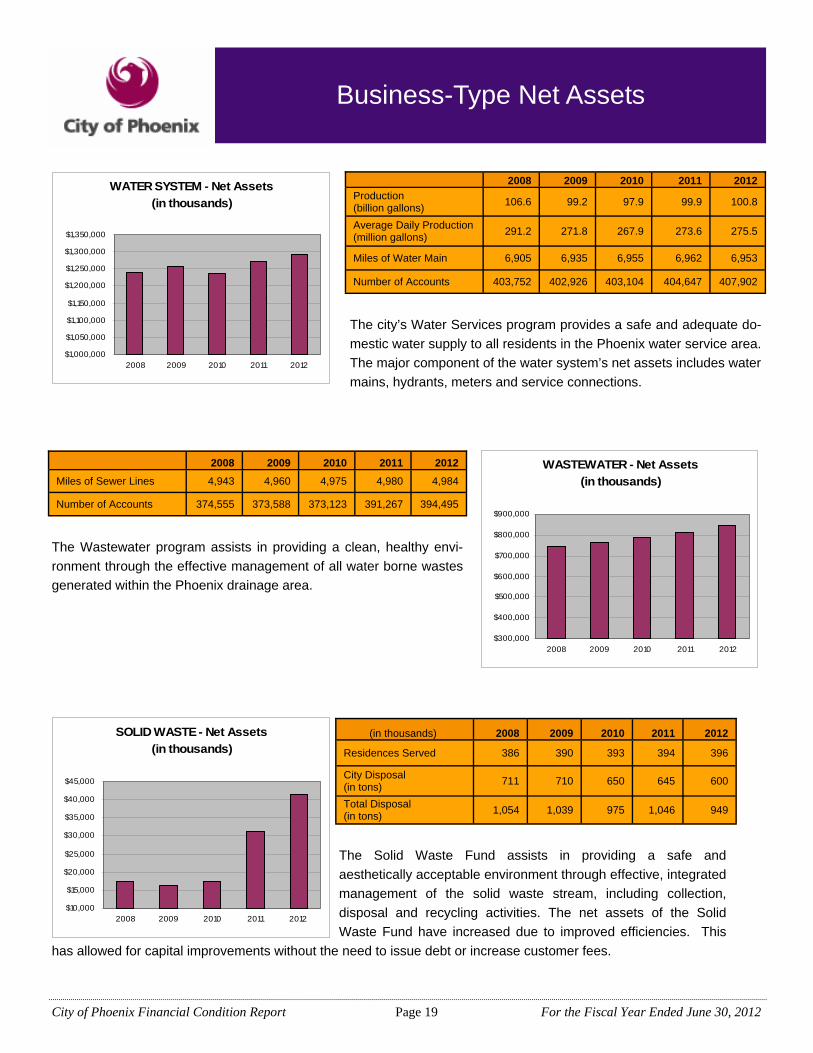
Business-Type Net Assets
(in thousands) 2008 2009 2010 2011 2012
Residences Served 386 390 393 394 396
City Disposal (in tons) 711 710 650 645 600
Total Disposal (in tons) 1,054 1,039 975 1,046 949
2008 Miles of Sewer Lines 4,943
Number of Accounts 374,555
2009 4,960
373,588
2010 4,975
373,123
2011 4,980
391,267
2012 4,984
394,495
The Wastewater program assists in providing a clean, healthy envi-ronment through the effective management of all water borne wastes generated within the Phoenix drainage area.
The Solid Waste Fund assists in providing a safe and aesthetically acceptable environment through effective, integrated management of the solid waste stream, including collection, disposal and recycling activities. The net assets of the Solid Waste Fund have increased due to improved efficiencies. This
has allowed for capital improvements without the need to issue debt or increase customer fees.
2008 Production (billion gallons) 106.6
Average Daily Production (million gallons) 291.2
2009
99.2
271.8
2010
97.9
267.9
2011
99.9
273.6
2012
100.8
275.5
Miles of Water Main 6,905 6,935 6,955 6,962 6,953
Number of Accounts 403,752 402,926 403,104 404,647 407,902
The city’s Water Services program provides a safe and adequate do-mestic water supply to all residents in the Phoenix water service area. The major component of the water system’s net assets includes water mains, hydrants, meters and service connections.
WATER SYSTEM - Net Assets(in thousands)
$1,000,000
$1,050,000
$1,100,000
$1,150,000
$1,200,000
$1,250,000
$1,300,000
$1,350,000
2008 2009 2010 2011 2012
WASTEWATER - Net Assets(in thousands)
$300,000
$400,000
$500,000
$600,000
$700,000
$800,000
$900,000
2008 2009 2010 2011 2012
SOLID WASTE - Net Assets(in thousands)
$10,000
$15,000
$20,000
$25,000
$30,000
$35,000
$40,000
$45,000
2008 2009 2010 2011 2012
City of Phoenix Financial Condition Report Page 20 For the Fiscal Year Ended June 30, 2012
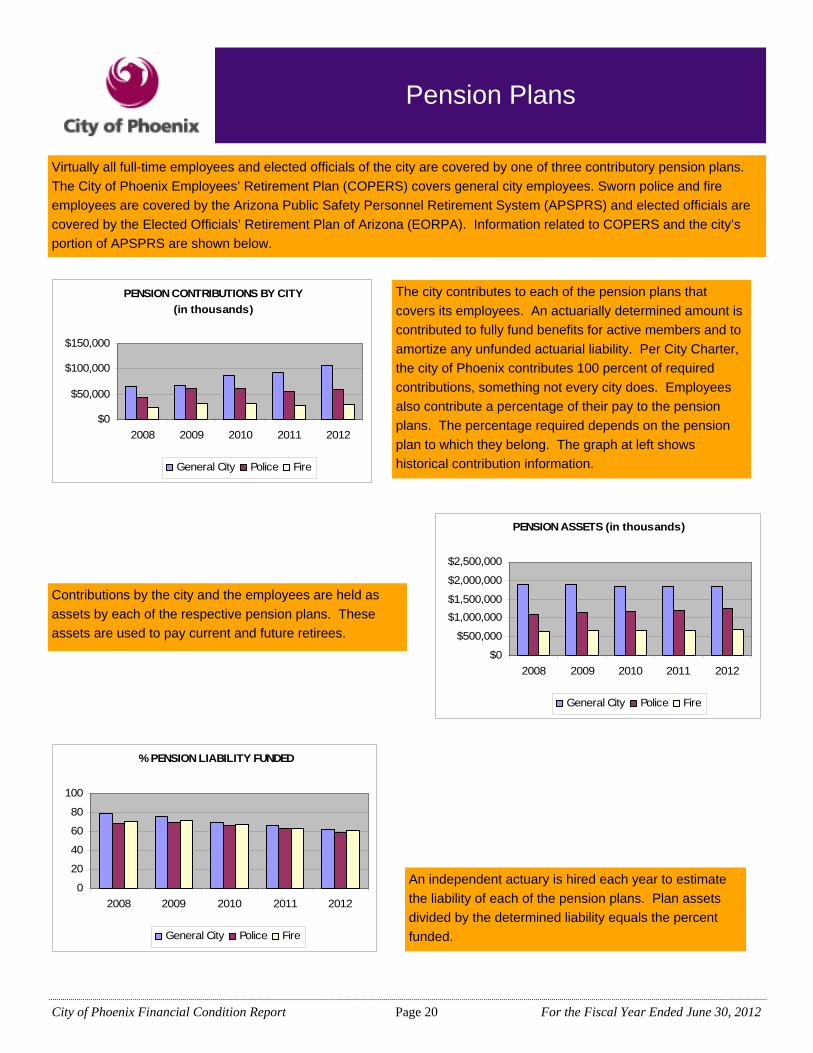
Pension Plans
Virtually all full-time employees and elected officials of the city are covered by one of three contributory pension plans. The City of Phoenix Employees’ Retirement Plan (COPERS) covers general city employees. Sworn police and fire employees are covered by the Arizona Public Safety Personnel Retirement System (APSPRS) and elected officials are covered by the Elected Officials’ Retirement Plan of Arizona (EORPA). Information related to COPERS and the city’s portion of APSPRS are shown below.
The city contributes to each of the pension plans that covers its employees. An actuarially determined amount is contributed to fully fund benefits for active members and to amortize any unfunded actuarial liability. Per City Charter, the city of Phoenix contributes 100 percent of required contributions, something not every city does. Employees also contribute a percentage of their pay to the pension plans. The percentage required depends on the pension plan to which they belong. The graph at left shows historical contribution information.
Contributions by the city and the employees are held as assets by each of the respective pension plans. These assets are used to pay current and future retirees.
An independent actuary is hired each year to estimate the liability of each of the pension plans. Plan assets divided by the determined liability equals the percent funded.
PENSION ASSETS (in thousands)
$0
$500,000
$1,000,000$1,500,000
$2,000,000
$2,500,000
2008 2009 2010 2011 2012
General City Police Fire
% PENSION LIABILITY FUNDED
0
20
40
60
80
100
2008 2009 2010 2011 2012
General City Police Fire
PENSION CONTRIBUTIONS BY CITY (in thousands)
$0
$50,000
$100,000
$150,000
2008 2009 2010 2011 2012
General City Police Fire
City of Phoenix Financial Condition Report Page 21 For the Fiscal Year Ended June 30, 2012
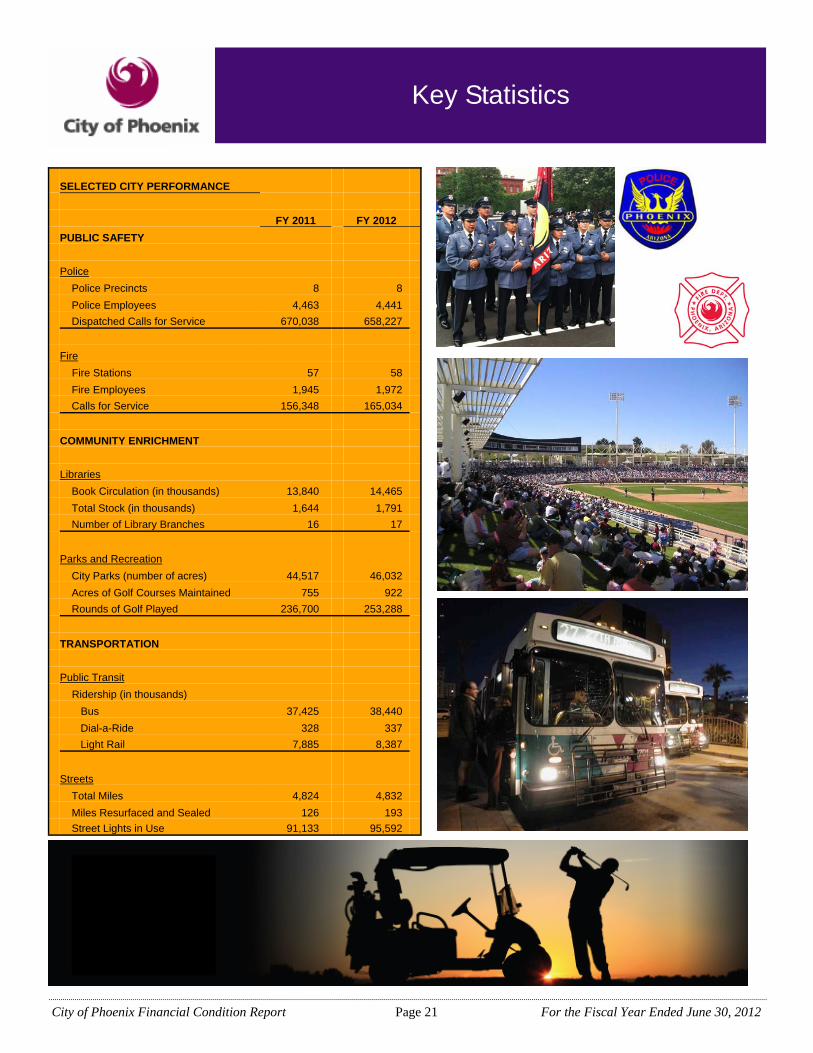
Key Statistics
SELECTED CITY PERFORMANCE FY 2011 FY 2012 PUBLIC SAFETY Police Police Precincts 8 8 Police Employees 4,463 4,441 Dispatched Calls for Service 670,038 658,227 Fire Fire Stations 57 58 Fire Employees 1,945 1,972 Calls for Service 156,348 165,034 COMMUNITY ENRICHMENT Libraries Book Circulation (in thousands) 13,840 14,465 Total Stock (in thousands) 1,644 1,791 Number of Library Branches 16 17 Parks and Recreation City Parks (number of acres) 44,517 46,032 Acres of Golf Courses Maintained 755 922 Rounds of Golf Played 236,700 253,288 TRANSPORTATION Public Transit Ridership (in thousands) Bus 37,425 38,440 Dial-a-Ride 328 337 Light Rail 7,885 8,387 Streets Total Miles 4,824 4,832 Miles Resurfaced and Sealed 126 193 Street Lights in Use 91,133 95,592