Embed Size (px)
Citation preview

2013 A NNU A L O P E R AT IN G B U D G E T
CITY OF
NEW ORLEANS

The Mayor’s Budget Message 9
City Council Members & Council District Map 11
Governmental Structure 13
Profile of the City of New Orleans 14
History 14
Form of Government 14
Recovery 14
Demographics 15
Economic Development 17
Hurricane Katrina 18
Overview of the Budget Process 25
The Mayor’s Executive Order Related to the Annual Budgeting Process 25
Purpose of the Strategic Framework 29
City Vision 29
City Mission 29
City Values 30
Result Maps 31
Budgeting for Outcomes 35
Budgeting for Outcomes Process 35
Results Based on Citizen Priorities 35
Allocating Resources to Result Areas 36
Submitting Offers to Achieve Results 37
Prioritizing the Offers 37
Monitor the Results 38
Public Safety 39
Children & Families 41
Economic Development 43
Sustainable Communities 45
Open & Effective Government 47
Innovation 49
The 2013 Budget Calendar 51
Budget Adoption & Amendment Process 54
Capital Budget 54
Summary of Adopted 2013 General Fund Budget 56
Financial Overview 57
Where the Money Comes From 57
Where the Money Goes 58
Overview of Revenues and Expenditures 59
General Fund Revenue Detailed Description 62
General Fund Revenues 65
Detailed Description of Revenues – All Funds 66
Description of Revenues – CDBG Funds 67
2013 Millage Rates 71
Fund Balance 73
Statement of Revenues 74
Statement of Expenditures 79
Citywide Work Years (Full-Time Equivalent to Employees) 82
2013 Capital Budget Summary
94
The Capital Improvement Program (CIP) 94
The Capital Budget 94
2013 Capital Budget 95
Capital Improvement Expenditures 96
Statement of Debt 97
Department of Finance, Debt Service – Operating Debt 97
Board of Liquidation, City Debt – General Obligation Debt 97
City Debt 98
Financial Policies 110
Departmental Budgets City Council 116
Mayor’s Office 126
Mayor's Office 126
Office of Criminal Justice Coordination 142
Homeland Security 150
Community Development 158
Chief Administrative Office 168
Information Technology & Innovation 174
Homeland Security (OEP) 178
Law Department 192
Fire Department 202
Safety & Permits 214
Police Department 224
Sanitation 244
Health 252
Health - Emergency Medical Services 258
Human Services/Youth Study Center 270
Finance 280
Property Management 292
Civil Service 304
Public Works 312
Parks & Parkways 324
Library 336
Historic Districts & Landmarks Commission 346
Vieux Carré Commission 346
Alcoholic Beverage Control Board 360
City Planning Commission 366
Mosquito, Termite, & Rodent Control Board 374
New Orleans Museum of Art 382
Miscellaneous 390
New Orleans Recreation Development Commission 398
Service & Innovation 402
Office of Performance & Accountability 406
General Services 416
Office of Community Development 424
Code Enforcement & Hearings Bureau 430
District Attorney 456
Coroner 462
Juvenile Court 470
First City Court 478
Civil Court 484
Municipal Court 490
Traffic Court 498
Criminal District Court 506
Sheriff’s Office 512
Clerk of Criminal District Court 518
Registrar of Voters 528
Judicial Retirement 534
Enterprise Funds 540
Glossary of Terms 560 Appendix 563
Adopted 2013 Operating Budget
Prepared and Submitted by:
Andrew D. Kopplin, First Deputy Mayor and Chief Administrative Officer Judy Reese Morse, Deputy Mayor and Chief of Staff
Cedric S. Grant, Deputy Mayor of Facilities, Infrastructure and Community Development
Emily Arata, Deputy Mayor of External Affairs Lt. Col. Jerry Sneed, Deputy Mayor of Public Safety Michelle L. Thomas, Deputy Mayor for Operations Cary M. Grant, Director of Budget & Planning Norman S. Foster, Chief Financial Officer Angelica M. Hayes, Asst. Budget Administrator Brian D. Firstley, Budget Administrator
Madeline F. Murphy, Budget Analyst
Tammy M. Broussard, Budget Analyst Seleigh S. Taylor, Budget Analyst Yulbritton D. Shy, Budget Analyst
Additional Support from:
The PFM Group

January 1, 2012
For the
PRESENTED TO
Beginning
City of New Orleans
President Executive Director
Fiscal Year
Louisiana

The Government Finance Officers Association of the United States and Canada (GFOA) presented a Distinguished Budget Presentation Award to City of New Orleans, Louisiana for its annual budget for the fiscal year beginning January 1, 2012. In order to receive this award, a governmental unit must publish a budget document that meets program criteria as a policy document, as an operations guide, as a financial plan, and as a communications device.
This award is valid for a period of one year only. We believe our current budget continues to conform to program requirements, and we are submitting it to GFOA to determine its eligibility for another award.
THE MAYOR’S BUDGET MESSAGE
MITCHELL J. LANDRIEU, MAYOR
CITY OF NEW ORLEANS
October 29, 2012
To My Fellow New Orleanians:
Since coming into office over two and a half years ago, I have spoken often of our hopes for New Orleans and our desire to build the city we want to become. We strive to be a safe city, where every resident can get a good-paying job and where every child has access to an excellent public education; and a city whose government is open and honest.
I have been Mayor for 912 days and can tell you we’ve made remarkable progress- one day at a time. In 2010, we pulled the city back from the fiscal cliff and every year since have lived within a balanced budget.
Our budget philosophy is grounded in my belief that government—at all levels—must be honest, efficient and deliver high-quality services. It’s actually pretty simple- cut smart with a scalpel not a hatchet- reorganize the mousetrap of government so people can get the services they need, and take the savings and invest in what matters most.
By 2011, our first full year in office, with the help of the City Council and with unprecedented levels of citizen input, we created a structurally sound budget. We listened to citizen priorities and invested more in public safety, more in recreation, more in job creation, more in blight reduction, and still cut spending by over 8 percent.
In 2011, and again in 2012, we shrunk government, cutting the budget by over 8 percent, spending $40 million less, all while delivering better services.
I said at this time last year that we were on the right track and that we needed to stay the course. And that is exactly what we have done.
In partnership with the Department of Justice, we are continuing to reform our police department and building a robust force to fight crime in close partnership with the community. In 2012, we launched the NOLA FOR LIFE strategy to reduce murders.
Since taking office, we focused on the worst, most dangerous blight across the city. Recently, the Greater New Orleans Community Data Center has shown that blight has been reduced overall by nearly 8,000 properties since 2010. We are well on our way to hit our target of remediating 10,000 blighted properties in 2014. We’re also tackling other quality of life issues like fixing streetlights and filling potholes.
The NOLA Business Alliance continues to work with us to create jobs throughout the city. Since taking office, we have helped generate over 3,400 new jobs, including high paying IT jobs with GE Capital and Gameloft. And we’ve brought retail back with major projects like Costco and Walmart stores in Gentilly and New Orleans East.
Page 9
And perhaps most importantly, in 2012, more kids participated in NORDC athletic, aquatic and cultural programs than in previous years. Our children deserve the best and we need them to be the best so our city can grow and thrive in the 21st century.
These successes, to a large degree, can be attributed to the sound budgets we have created since taking office.
We’re on the right track, but there’s more to do.
We have over $50 million in new obligations related to the NOPD consent decree, and costs continue to rise across the board for employee health care, pensions, and workers compensation claims.
In 2013, we must again cut smartly, reorganize, and invest. In 2013, we will tighten our belts.
But this 2013 budget protects public safety and invests $7 million in the consent decree to completely reform the New Orleans Police Department.
Most other departments will see some reduction from their 2012 budget allocation. I remain committed to continue to invest in your priorities—public safety, job creation, blight reduction, and in recreation opportunities for our kids.
We just need to keep our nose to the grindstone and keep improving the services we’re delivering to the public.
Since taking office, we’ve created a more flexible, more entrepreneurial, better and faster city government. This budget will help keep us moving forward.
We are one team, one fight, one voice, one city.
Yours,
Page 10
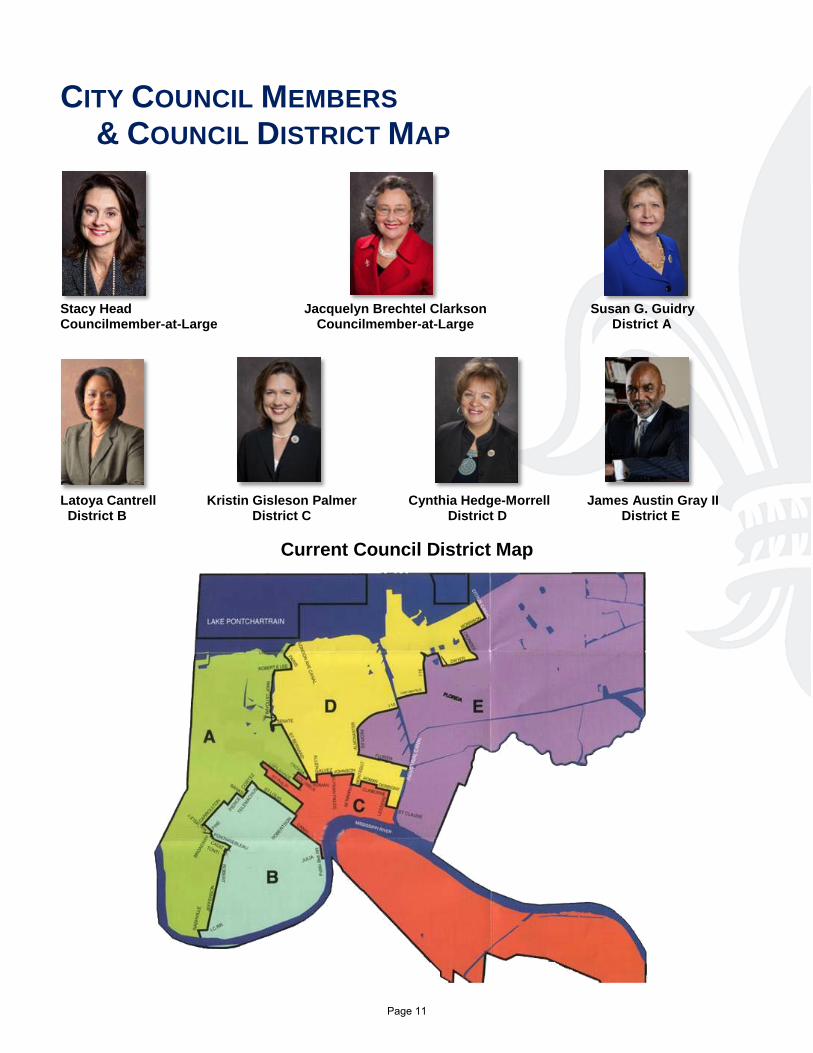
CITY COUNCIL MEMBERS & COUNCIL DISTRICT MAP
Stacy Head Jacquelyn Brechtel Clarkson Susan G. Guidry Councilmember-at-Large Councilmember-at-Large District A
Latoya Cantrell Kristin Gisleson Palmer Cynthia Hedge-Morrell James Austin Gray II District B District C District D District E
Current Council District Map
Page 11

Page 12
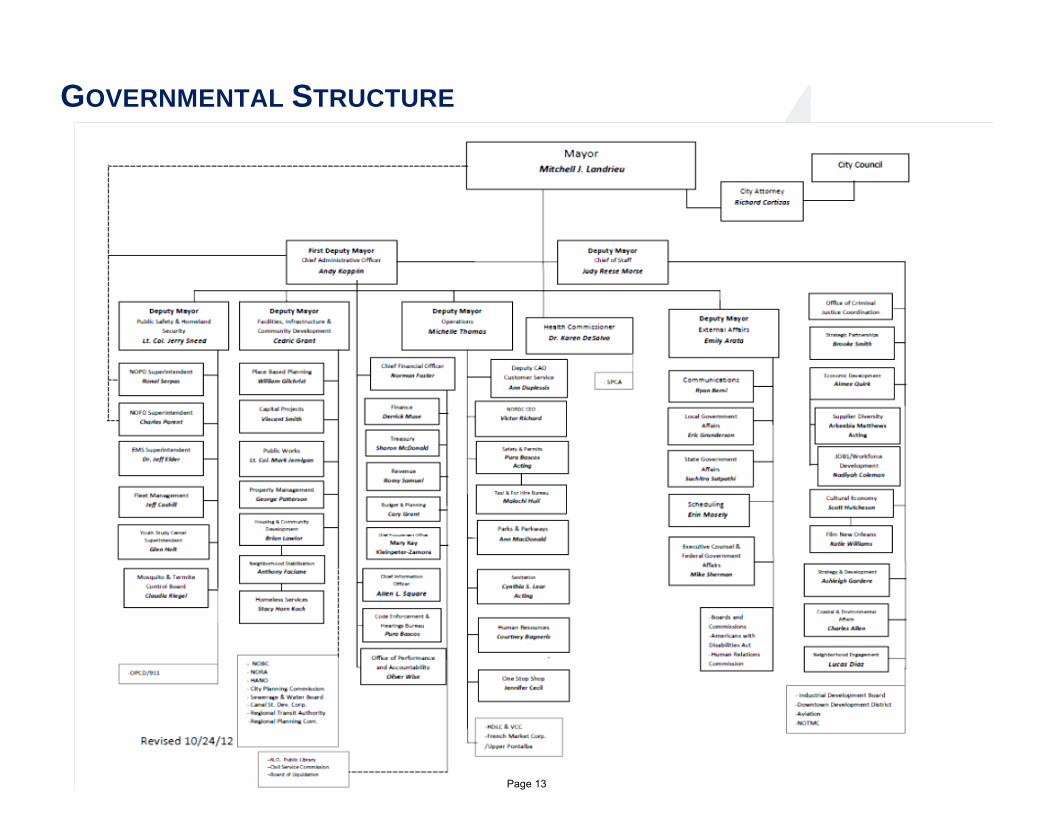
GOVERNMENTAL STRUCTURE
Page 13
PROFILE OF THE CITY OF NEW ORLEANS
HISTORY Founded by the French in 1718, New Orleans is one of the country’s oldest and most unique cities. Named for the Duke of Orleans, acting Regent of France for the infant King Louis XV, the city was established at a bend in the Mississippi River south of Lake Pontchartrain. This strategic location gave it access to trade with most of North America through the Mississippi River and the rest of the world through the Gulf of Mexico. The city’s location remains important to this day, with its access to the Mississippi, major railways, and close proximity to the Louis Armstrong New Orleans International Airport enabling much of its commerce. The city now occupies 180 square miles including the urban center, residential neighborhoods on both sides of the Mississippi River, and the country’s largest urban nature reserve in Bayou Sauvage. New Orleans was already a thriving city in 1803 when Napoleon Bonaparte sold the Louisiana Territory to President Thomas Jefferson for the bargain price of $15 million, or four cents an acre. The city has been under French, Spanish, and American rule, and it bears evidence of each country in its culture, architecture, and cuisine. West Africans, Haitians, and free people of color and waves of Italian and Irish immigrants helped New Orleans grow and contributed traditions and customs. It is from this diverse mix of peoples that the culture of New Orleans emerged, making it one of the most unique cities in the world. New Orleans is a complex, cosmopolitan city with modern skyscrapers, centuries-old mansions, five-star restaurants, world-class shopping, abundant live music, breathtaking natural beauty, and a famous spirit. FORM OF GOVERNMENT Over the course of its nearly 300 year history, New Orleans has had multiple forms of government. Under the 1956 City Charter, the city is organized under a Mayor-Council government. There are seven City Councilmembers. Five represent geographical City Council Districts, and two represent the city at-large. The Council approves the operating and capital budgets each year, as recommended by the Mayor. The Council takes up zoning and land-use issues, regulates the city’s public utilities, and considers and enacts all municipal laws. The Mayor oversees the executive branch of government, appointing department heads and managing the public safety functions of City government. All ordinances passed by the Council must be approved by the mayor in order to become law, and the mayor presents the Council with an operating and capital budget recommendation every year. In 2010, Mayor Landrieu instituted a deputy mayor government structure that spreads responsibilities historically concentrated in a chief administrative officer to multiple deputy mayors. The City of New Orleans has the exact same boundaries as Orleans Parish, and the City government operates as the Parish’s unit of government. This organization is unique to Louisiana. RECOVERY New Orleans is still recovering from one of the worst disasters in American history. On August 29, 2005, the costliest and fifth deadliest hurricane in United States history struck the Gulf Coast. Hurricane Katrina made landfall on Monday morning as a category-three storm. Later that day, the federal levee system in
Page 14
and around New Orleans failed and waters from Lake Pontchartrain and various canals poured into the city. Eighty percent of the city was flooded, as well as vast areas of other coastal communities. Over 1400 Louisiana residents died in the flood. The City of New Orleans continues to work with its state and federal partners to rebuild and recreate this historic city. In the last two years alone, FEMA has obligated an additional $500 million for rebuilding efforts in the city. According to the U.S. Census Bureau, the city’s population was estimated at 360,740 in 2011. The population growth in New Orleans post-Katrina earned the title of the U.S. Census Bureau’s “Fastest-Growing Major City in the United States.” The City of New Orleans has become the nation’s most immediate laboratory for innovation and change by creating models of reform across government. In education, school performance is up across New Orleans and the city has become a leader in school reform. Nearly 80% of students are attending charter schools. The health care delivery system has reorganized and is growing, due to deliberate planning and policymaking to ensure the city’s workforce and healthcare access remains strong. The greater New Orleans area has 102 primary care clinics for uninsured, under-insured and low-income residents, representing a mix of providers delivering care to the highest need populations in innovative, strategic ways. Housing is being redeveloped using a place based development and urban blighted properties are being eradicated at a record rate. The City’s blight reduction strategy has been recognized as a national model for dealing with distressed housing. Cities from across Louisiana and the country are working to replicate the success of New Orleans. And billions of recovery dollars are still being invested in housing, schools, hospitals, parks and playgrounds, roads and vital hurricane protection. The U.S. Army Corps of Engineers completed $14 billion of work on the Hurricane and Storm Damage Risk Reduction System. The Corps strengthened and improved virtually all of the levees, floodwalls, pump stations and surge barriers that form the 133-mile Greater New Orleans perimeter system. The new system is capable of defending against a 100-year level storm. Most recently, the system was tested during Hurricane Isaac in August of 2012. The improved levees and flood gates held and the pumping stations did their jobs. DEMOGRAPHICS According to the U.S. Census Bureau, there are 360,740 residents in New Orleans. This is 26% lower than the pre-Katrina 2000 Census of 484,674 residents. However, the city’s population has been growing steadily since its low point of 208,548 after Hurricane Katrina.
Page 15
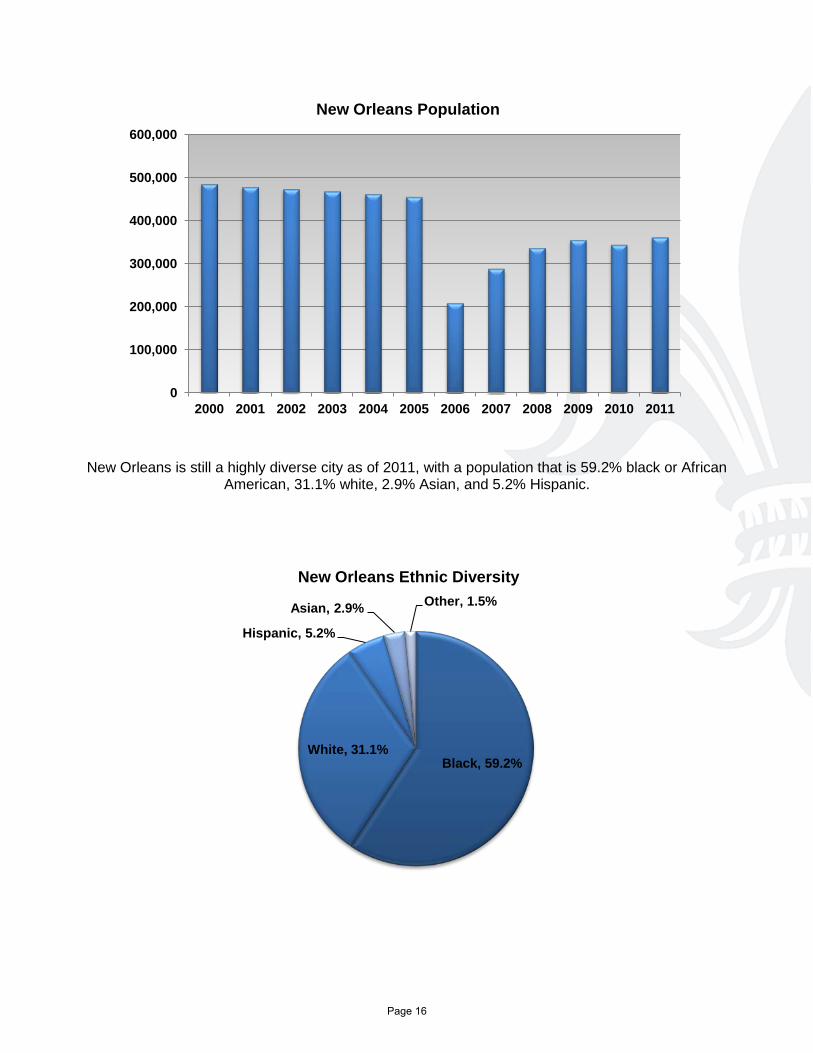
New Orleans is still a highly diverse city as of 2011, with a population that is 59.2% black or African American, 31.1% white, 2.9% Asian, and 5.2% Hispanic.
0
100,000
200,000
300,000
400,000
500,000
600,000
2000 2001 2002 2003 2004 2005 2006 2007 2008 2009 2010 2011
New Orleans Population
Black, 59.2% White, 31.1%
Hispanic, 5.2%
Asian, 2.9% Other, 1.5%
New Orleans Ethnic Diversity
Page 16
ECONOMIC DEVELOPMENT Despite a slowed pace of national economic recovery, the City of New Orleans shows continued progress toward economic success in 2012. The New Orleans economy was partially shielded from the national recession due to the unprecedented rebuilding effort that linked local, state, and federal resources and south Louisiana’s robust oil and gas industry. The Brookings Institution named the New Orleans Metropolitan area number one for overall economic recovery for the first quarter and second quarters of 2012 based on employment, unemployment, output (gross metropolitan product), and house prices. The City created a public private partnership with the NOLA Business Alliance, which has worked to attract businesses and retail to the city, aid small business development, and create a more business-friendly atmosphere. NOLA Business Alliance is working to implement a citywide economic development strategic plan on behalf of the City of New Orleans in 2013. With this new partnership and 2 years in to the Landrieu Administration, 3,400 new jobs have been created including 300 high tech, high paying jobs at GE Capital—a show of confidence by an international business leader in our city's business climate. Over the past two years, the world has taken notice of New Orleans’ on-going recovery, including:
• US Census: Fastest Growing City • Brookings Institute: #1 for overall economic recovery in 1Q 2012 • Forbes Magazine: “Biggest Brain Magnet” • Forbes Magazine: “#1 Metro for IT Job Growth in USA” and “#2 Best Big City for a Job” • Wall Street Journal: Most Improved Metro in 2011 • Under30CEO.com: Top City for Young Entrepreneurs 2011 • Wall Street Journal’s Market Watch: Most improved city for business • Reuters: “Silicon Valley on the Bayou” • Fordham Institute: #1 for Educational Reform • US News & World Report: Tulane #1in total number of in college applications • Travel & Leisure: #1 Nightlife Destination in the World
New major retailers have been approved and signed on to occupy spaces previously dormant since Hurricane Katrina – Walmart in Gentilly and New Orleans East will each bring an estimated 300 jobs expected in 2014 and the Costco Wholesale Corporation on Carrolton Avenue will bring an estimated 200 jobs expected in 2013. These three sites will bring temporary and permanent jobs to previously blighted areas as well as a full line of fresh foods and products missing in both areas since 2005. In 2011, $531 million was spent locally in the film industry during both filming and post-production, contributing significantly to the New Orleans economy by creating jobs. More movies are filmed in Louisiana now than anywhere else in the country besides California and New York. The State of Louisiana and the Veterans Administration are coordinating to build a $2 billion medical complex, anchoring a biosciences corridor in Mid City. Ground has been broken on the VA and University Medical Center properties. This development will create 10,000 short-term construction jobs and long-term health care and health care support jobs. This is a huge federal and state investment that will provide New Orleans with state of the art health care facilities and an influx of economic activity. New Orleans continues to diversify its economy while still supporting its traditionally robust health care, hospitality, education, natural resources, and shipping industries. Residents trained at the city’s universities, community colleges, and trade schools will meet the needs of both traditional industry and the new information economy.
Page 17
HURRICANE KATRINA
New Orleans is still recovering from one of the worst disasters in American history. On August 29, 2005, the costliest and fifth deadliest hurricane in United States history struck the Gulf Coast. Hurricane Katrina made landfall on Monday morning as a category-three storm. Later that day, the federal levee system in and around New Orleans failed and waters from Lake Pontchartrain and various canals poured into the City. 80% of the City was flooded, as well as vast areas of other coastal communities. Nearly 1,600 Louisianians died in the flood.
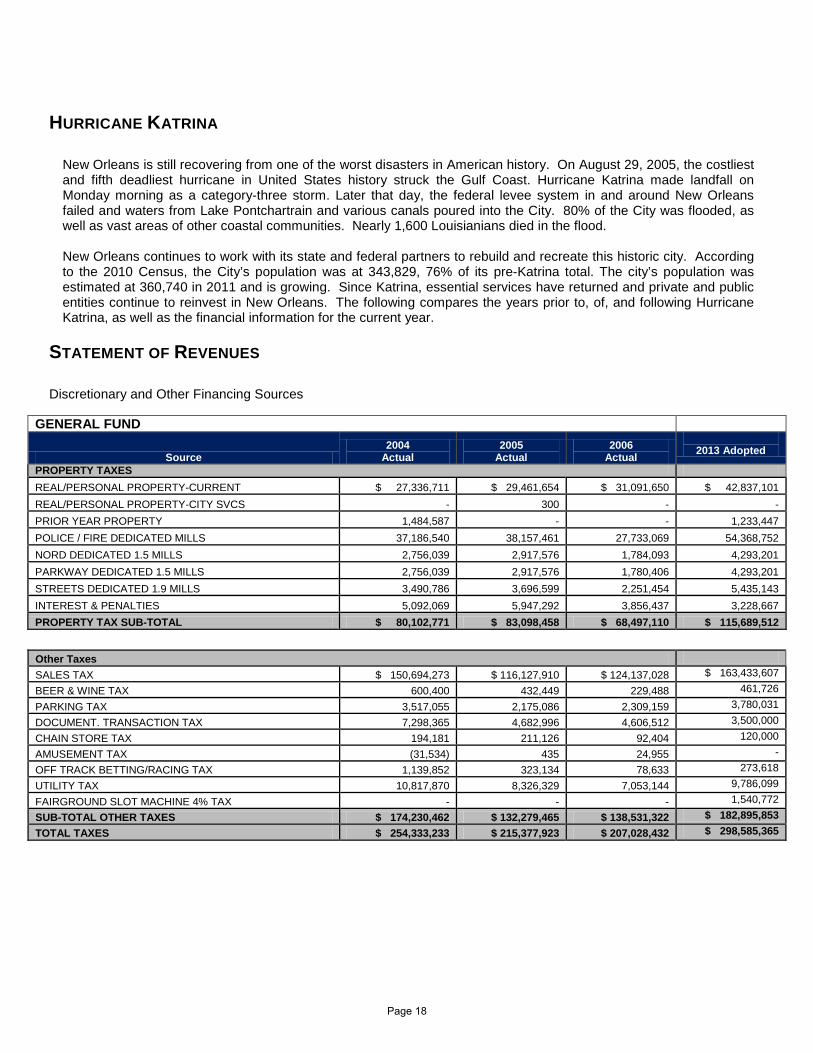
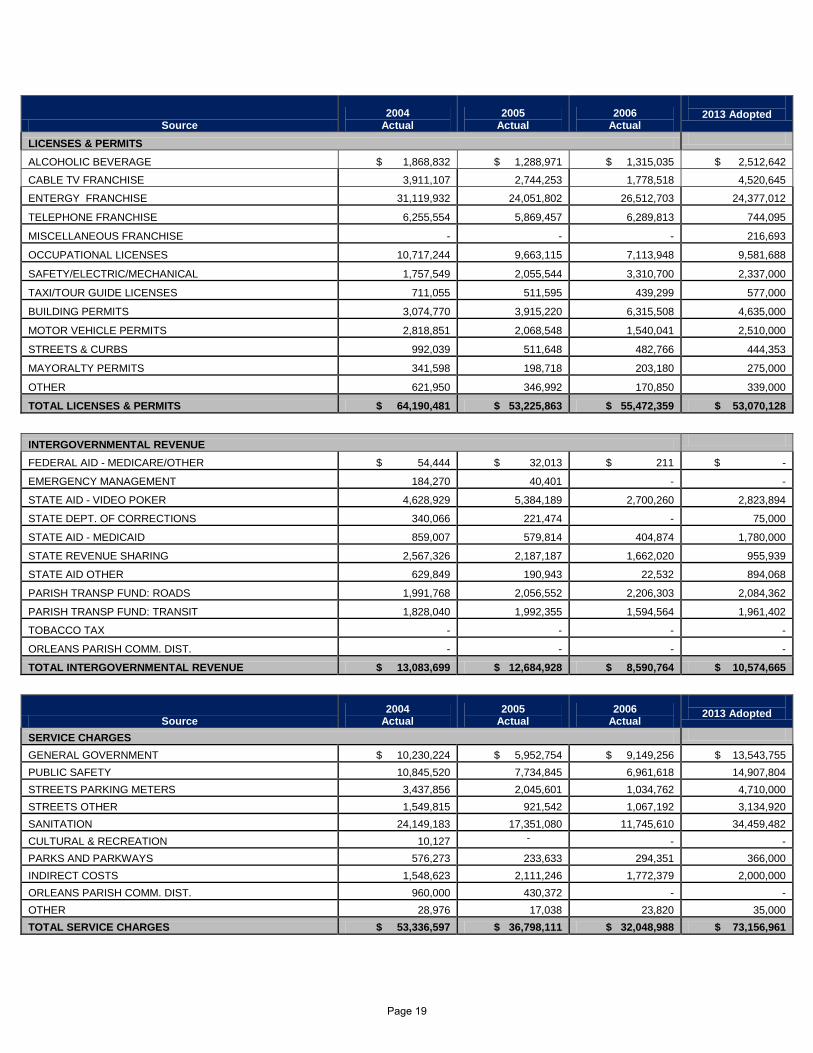
New Orleans continues to work with its state and federal partners to rebuild and recreate this historic city. According to the 2010 Census, the City’s population was at 343,829, 76% of its pre-Katrina total. The city’s population was estimated at 360,740 in 2011 and is growing. Since Katrina, essential services have returned and private and public entities continue to reinvest in New Orleans. The following compares the years prior to, of, and following Hurricane Katrina, as well as the financial information for the current year.
STATEMENT OF REVENUES
Discretionary and Other Financing Sources
GENERAL FUND
Source 2004
Actual 2005
Actual 2006
Actual
2013 Adopted
PROPERTY TAXES REAL/PERSONAL PROPERTY-CURRENT $ 27,336,711 $ 29,461,654 $ 31,091,650 $ 42,837,101 REAL/PERSONAL PROPERTY-CITY SVCS - 300 - - PRIOR YEAR PROPERTY 1,484,587 - - 1,233,447 POLICE / FIRE DEDICATED MILLS 37,186,540 38,157,461 27,733,069 54,368,752 NORD DEDICATED 1.5 MILLS 2,756,039 2,917,576 1,784,093 4,293,201 PARKWAY DEDICATED 1.5 MILLS 2,756,039 2,917,576 1,780,406 4,293,201 STREETS DEDICATED 1.9 MILLS 3,490,786 3,696,599 2,251,454 5,435,143 INTEREST & PENALTIES 5,092,069 5,947,292 3,856,437 3,228,667 PROPERTY TAX SUB-TOTAL $ 80,102,771 $ 83,098,458 $ 68,497,110 $ 115,689,512
Other Taxes SALES TAX $ 150,694,273 $ 116,127,910 $ 124,137,028 $ 163,433,607
BEER & WINE TAX 600,400 432,449 229,488 461,726
PARKING TAX 3,517,055 2,175,086 2,309,159 3,780,031
DOCUMENT. TRANSACTION TAX 7,298,365 4,682,996 4,606,512 3,500,000
CHAIN STORE TAX 194,181 211,126 92,404 120,000
AMUSEMENT TAX (31,534) 435 24,955 -
OFF TRACK BETTING/RACING TAX 1,139,852 323,134 78,633 273,618
UTILITY TAX 10,817,870 8,326,329 7,053,144 9,786,099
FAIRGROUND SLOT MACHINE 4% TAX - - - 1,540,772
SUB-TOTAL OTHER TAXES $ 174,230,462 $ 132,279,465 $ 138,531,322 $ 182,895,853 TOTAL TAXES $ 254,333,233 $ 215,377,923 $ 207,028,432 $ 298,585,365
Page 18
Source 2004
Actual 2005
Actual 2006
Actual
2013 Adopted
LICENSES & PERMITS
ALCOHOLIC BEVERAGE $ 1,868,832 $ 1,288,971 $ 1,315,035 $ 2,512,642
CABLE TV FRANCHISE 3,911,107 2,744,253 1,778,518 4,520,645
ENTERGY FRANCHISE 31,119,932 24,051,802 26,512,703 24,377,012
TELEPHONE FRANCHISE 6,255,554 5,869,457 6,289,813 744,095
MISCELLANEOUS FRANCHISE - - - 216,693
OCCUPATIONAL LICENSES 10,717,244 9,663,115 7,113,948 9,581,688
SAFETY/ELECTRIC/MECHANICAL 1,757,549 2,055,544 3,310,700 2,337,000
TAXI/TOUR GUIDE LICENSES 711,055 511,595 439,299 577,000
BUILDING PERMITS 3,074,770 3,915,220 6,315,508 4,635,000
MOTOR VEHICLE PERMITS 2,818,851 2,068,548 1,540,041 2,510,000
STREETS & CURBS 992,039 511,648 482,766 444,353
MAYORALTY PERMITS 341,598 198,718 203,180 275,000
OTHER 621,950 346,992 170,850 339,000
TOTAL LICENSES & PERMITS $ 64,190,481 $ 53,225,863 $ 55,472,359 $ 53,070,128
INTERGOVERNMENTAL REVENUE
FEDERAL AID - MEDICARE/OTHER $ 54,444 $ 32,013 $ 211 $ -
EMERGENCY MANAGEMENT 184,270 40,401 - -
STATE AID - VIDEO POKER 4,628,929 5,384,189 2,700,260 2,823,894
STATE DEPT. OF CORRECTIONS 340,066 221,474 - 75,000
STATE AID - MEDICAID 859,007 579,814 404,874 1,780,000
STATE REVENUE SHARING 2,567,326 2,187,187 1,662,020 955,939
STATE AID OTHER 629,849 190,943 22,532 894,068
PARISH TRANSP FUND: ROADS 1,991,768 2,056,552 2,206,303 2,084,362
PARISH TRANSP FUND: TRANSIT 1,828,040 1,992,355 1,594,564 1,961,402
TOBACCO TAX - - - -
ORLEANS PARISH COMM. DIST. - - - -
TOTAL INTERGOVERNMENTAL REVENUE $ 13,083,699 $ 12,684,928 $ 8,590,764 $ 10,574,665
Source 2004
Actual 2005
Actual 2006
Actual
2013 Adopted
SERVICE CHARGES
GENERAL GOVERNMENT $ 10,230,224 $ 5,952,754 $ 9,149,256 $ 13,543,755 PUBLIC SAFETY 10,845,520 7,734,845 6,961,618 14,907,804 STREETS PARKING METERS 3,437,856 2,045,601 1,034,762 4,710,000 STREETS OTHER 1,549,815 921,542 1,067,192 3,134,920 SANITATION 24,149,183 17,351,080 11,745,610 34,459,482 CULTURAL & RECREATION 10,127 - - - PARKS AND PARKWAYS 576,273 233,633 294,351 366,000 INDIRECT COSTS 1,548,623 2,111,246 1,772,379 2,000,000 ORLEANS PARISH COMM. DIST. 960,000 430,372 - - OTHER 28,976 17,038 23,820 35,000 TOTAL SERVICE CHARGES $ 53,336,597 $ 36,798,111 $ 32,048,988 $ 73,156,961
Page 19
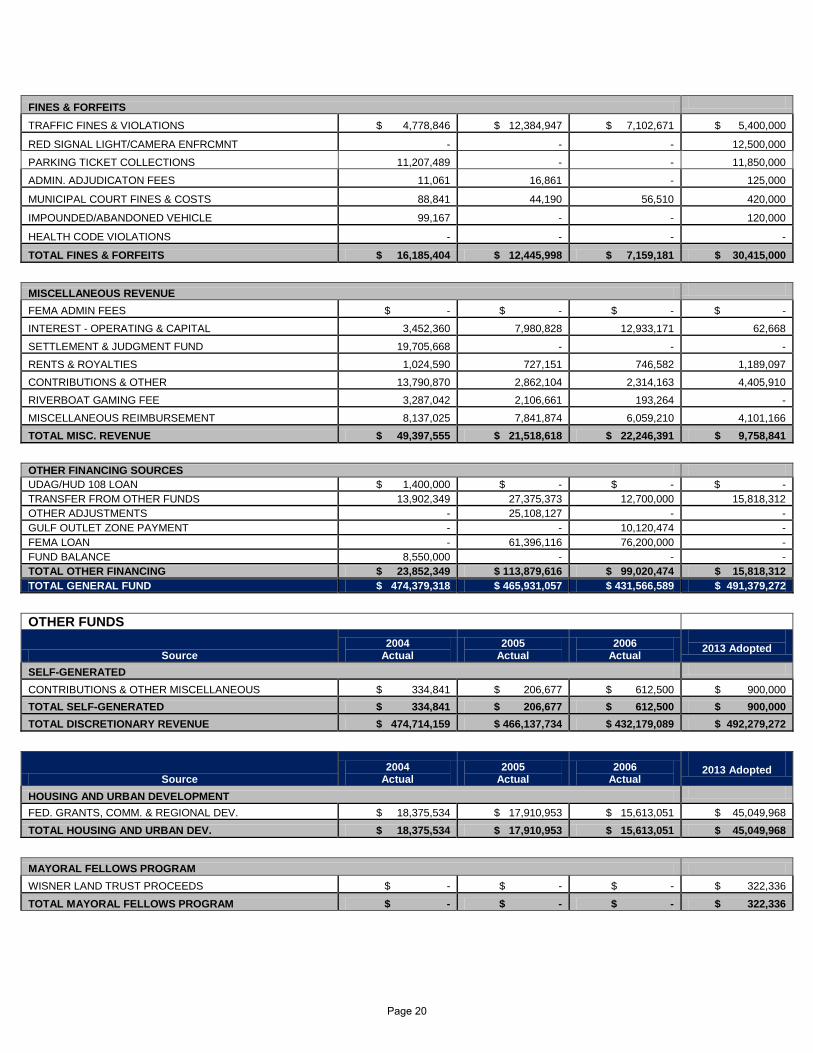
FINES & FORFEITS
TRAFFIC FINES & VIOLATIONS $ 4,778,846 $ 12,384,947 $ 7,102,671 $ 5,400,000
RED SIGNAL LIGHT/CAMERA ENFRCMNT - - - 12,500,000
PARKING TICKET COLLECTIONS 11,207,489 - - 11,850,000
ADMIN. ADJUDICATON FEES 11,061 16,861 - 125,000
MUNICIPAL COURT FINES & COSTS 88,841 44,190 56,510 420,000
IMPOUNDED/ABANDONED VEHICLE 99,167 - - 120,000
HEALTH CODE VIOLATIONS - - - -
TOTAL FINES & FORFEITS $ 16,185,404 $ 12,445,998 $ 7,159,181 $ 30,415,000
MISCELLANEOUS REVENUE
FEMA ADMIN FEES $ - $ - $ - $ -
INTEREST - OPERATING & CAPITAL 3,452,360 7,980,828 12,933,171 62,668
SETTLEMENT & JUDGMENT FUND 19,705,668 - - -
RENTS & ROYALTIES 1,024,590 727,151 746,582 1,189,097
CONTRIBUTIONS & OTHER 13,790,870 2,862,104 2,314,163 4,405,910
RIVERBOAT GAMING FEE 3,287,042 2,106,661 193,264 -
MISCELLANEOUS REIMBURSEMENT 8,137,025 7,841,874 6,059,210 4,101,166 TOTAL MISC. REVENUE $ 49,397,555 $ 21,518,618 $ 22,246,391 $ 9,758,841
OTHER FINANCING SOURCES UDAG/HUD 108 LOAN $ 1,400,000 $ - $ - $ - TRANSFER FROM OTHER FUNDS 13,902,349 27,375,373 12,700,000 15,818,312 OTHER ADJUSTMENTS - 25,108,127 - - GULF OUTLET ZONE PAYMENT - - 10,120,474 - FEMA LOAN - 61,396,116 76,200,000 - FUND BALANCE 8,550,000 - - - TOTAL OTHER FINANCING $ 23,852,349 $ 113,879,616 $ 99,020,474 $ 15,818,312 TOTAL GENERAL FUND $ 474,379,318 $ 465,931,057 $ 431,566,589 $ 491,379,272
OTHER FUNDS
Source 2004
Actual 2005
Actual 2006
Actual
2013 Adopted
SELF-GENERATED
CONTRIBUTIONS & OTHER MISCELLANEOUS $ 334,841 $ 206,677 $ 612,500 $ 900,000 TOTAL SELF-GENERATED $ 334,841 $ 206,677 $ 612,500 $ 900,000 TOTAL DISCRETIONARY REVENUE $ 474,714,159 $ 466,137,734 $ 432,179,089 $ 492,279,272
Source 2004
Actual 2005
Actual 2006
Actual
2013 Adopted
HOUSING AND URBAN DEVELOPMENT
FED. GRANTS, COMM. & REGIONAL DEV. $ 18,375,534 $ 17,910,953 $ 15,613,051 $ 45,049,968 TOTAL HOUSING AND URBAN DEV. $ 18,375,534 $ 17,910,953 $ 15,613,051 $ 45,049,968
MAYORAL FELLOWS PROGRAM WISNER LAND TRUST PROCEEDS $ - $ - $ - $ 322,336
TOTAL MAYORAL FELLOWS PROGRAM $ - $ - $ - $ 322,336
Page 20
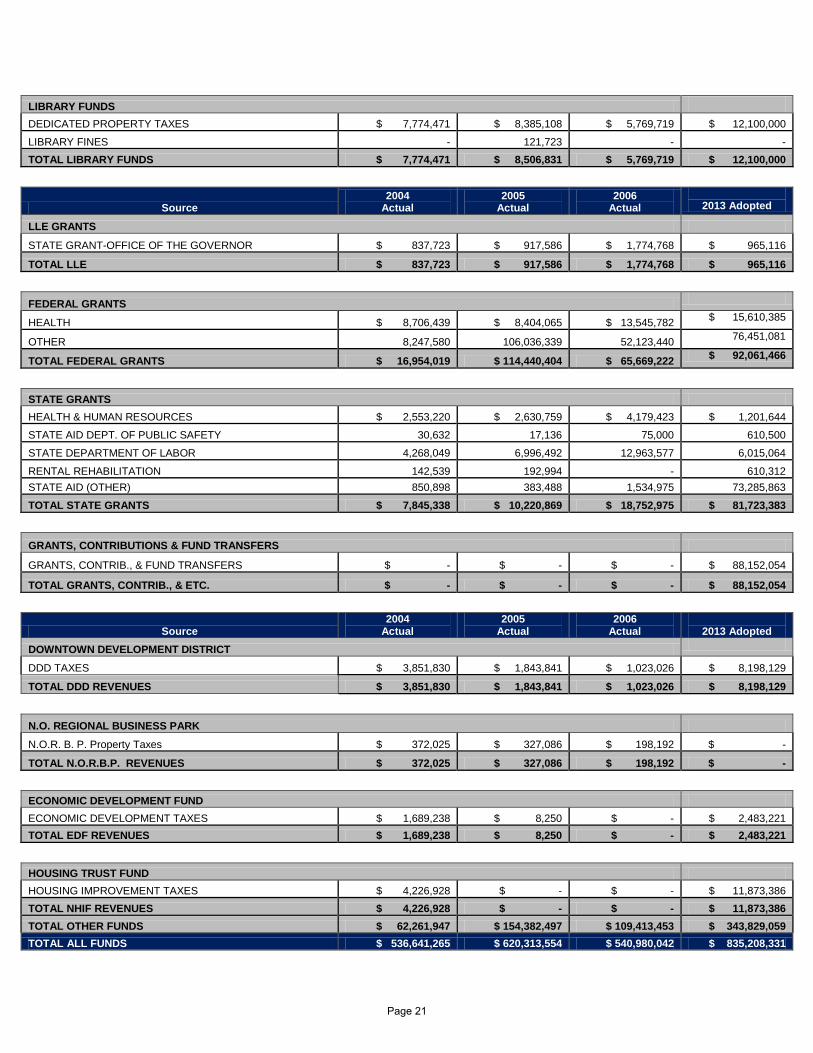
LIBRARY FUNDS DEDICATED PROPERTY TAXES $ 7,774,471 $ 8,385,108 $ 5,769,719 $ 12,100,000
LIBRARY FINES - 121,723 - - TOTAL LIBRARY FUNDS $ 7,774,471 $ 8,506,831 $ 5,769,719 $ 12,100,000
Source 2004
Actual 2005
Actual 2006
Actual
2013 Adopted
LLE GRANTS
STATE GRANT-OFFICE OF THE GOVERNOR $ 837,723 $ 917,586 $ 1,774,768 $ 965,116
TOTAL LLE $ 837,723 $ 917,586 $ 1,774,768 $ 965,116
FEDERAL GRANTS
HEALTH $ 8,706,439 $ 8,404,065 $ 13,545,782 $ 15,610,385
OTHER 8,247,580 106,036,339 52,123,440 76,451,081
TOTAL FEDERAL GRANTS $ 16,954,019 $ 114,440,404 $ 65,669,222 $ 92,061,466
STATE GRANTS HEALTH & HUMAN RESOURCES $ 2,553,220 $ 2,630,759 $ 4,179,423 $ 1,201,644
STATE AID DEPT. OF PUBLIC SAFETY 30,632 17,136 75,000 610,500
STATE DEPARTMENT OF LABOR 4,268,049 6,996,492 12,963,577 6,015,064
RENTAL REHABILITATION 142,539 192,994 - 610,312 STATE AID (OTHER) 850,898 383,488 1,534,975 73,285,863
TOTAL STATE GRANTS $ 7,845,338 $ 10,220,869 $ 18,752,975 $ 81,723,383
GRANTS, CONTRIBUTIONS & FUND TRANSFERS
GRANTS, CONTRIB., & FUND TRANSFERS $ - $ - $ - $ 88,152,054
TOTAL GRANTS, CONTRIB., & ETC. $ - $ - $ - $ 88,152,054
Source 2004
Actual 2005
Actual 2006
Actual
2013 Adopted DOWNTOWN DEVELOPMENT DISTRICT
DDD TAXES $ 3,851,830 $ 1,843,841 $ 1,023,026 $ 8,198,129
TOTAL DDD REVENUES $ 3,851,830 $ 1,843,841 $ 1,023,026 $ 8,198,129
N.O. REGIONAL BUSINESS PARK N.O.R. B. P. Property Taxes $ 372,025 $ 327,086 $ 198,192 $ -
TOTAL N.O.R.B.P. REVENUES $ 372,025 $ 327,086 $ 198,192 $ -
ECONOMIC DEVELOPMENT FUND ECONOMIC DEVELOPMENT TAXES $ 1,689,238 $ 8,250 $ - $ 2,483,221 TOTAL EDF REVENUES $ 1,689,238 $ 8,250 $ - $ 2,483,221
HOUSING TRUST FUND HOUSING IMPROVEMENT TAXES $ 4,226,928 $ - $ - $ 11,873,386 TOTAL NHIF REVENUES $ 4,226,928 $ - $ - $ 11,873,386 TOTAL OTHER FUNDS $ 62,261,947 $ 154,382,497 $ 109,413,453 $ 343,829,059 TOTAL ALL FUNDS $ 536,641,265 $ 620,313,554 $ 540,980,042 $ 835,208,331
Page 21
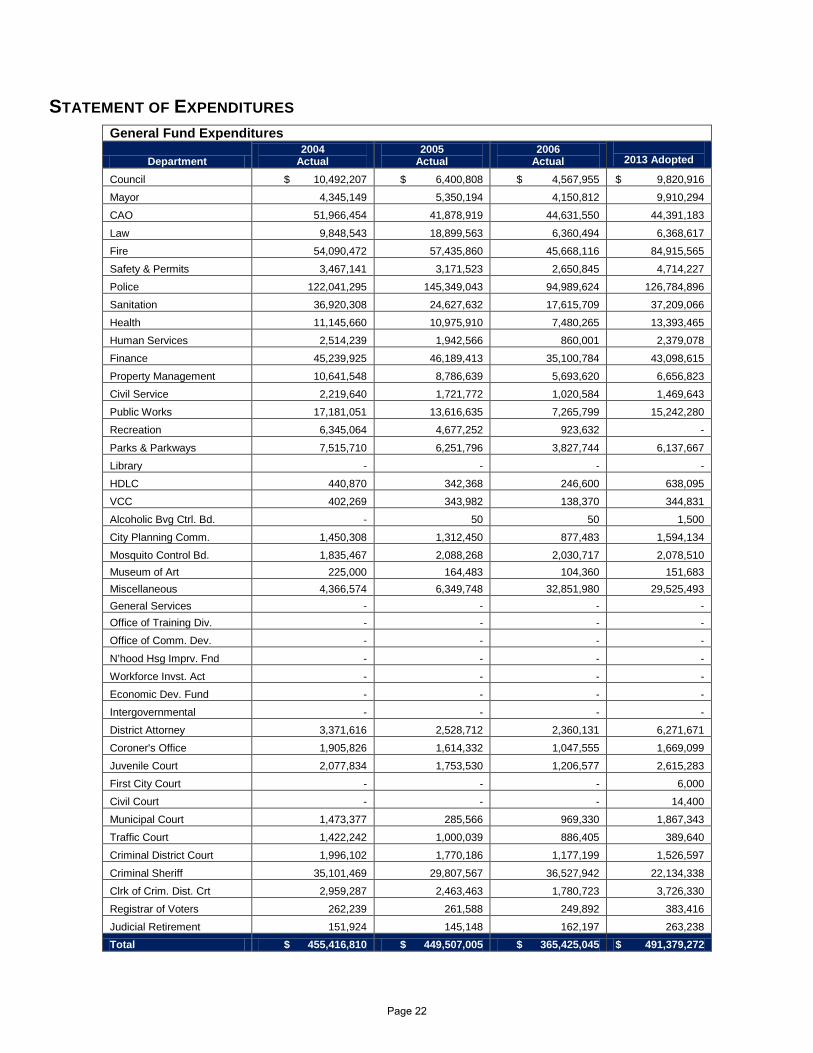
STATEMENT OF EXPENDITURES General Fund Expenditures
Department 2004
Actual 2005
Actual 2006
Actual
2013 Adopted
Council $ 10,492,207 $ 6,400,808 $ 4,567,955 $ 9,820,916
Mayor 4,345,149 5,350,194 4,150,812 9,910,294
CAO 51,966,454 41,878,919 44,631,550 44,391,183
Law 9,848,543 18,899,563 6,360,494 6,368,617
Fire 54,090,472 57,435,860 45,668,116 84,915,565
Safety & Permits 3,467,141 3,171,523 2,650,845 4,714,227
Police 122,041,295 145,349,043 94,989,624 126,784,896
Sanitation 36,920,308 24,627,632 17,615,709 37,209,066
Health 11,145,660 10,975,910 7,480,265 13,393,465
Human Services 2,514,239 1,942,566 860,001 2,379,078
Finance 45,239,925 46,189,413 35,100,784 43,098,615
Property Management 10,641,548 8,786,639 5,693,620 6,656,823
Civil Service 2,219,640 1,721,772 1,020,584 1,469,643
Public Works 17,181,051 13,616,635 7,265,799 15,242,280
Recreation 6,345,064 4,677,252 923,632 -
Parks & Parkways 7,515,710 6,251,796 3,827,744 6,137,667
Library - - - -
HDLC 440,870 342,368 246,600 638,095
VCC 402,269 343,982 138,370 344,831
Alcoholic Bvg Ctrl. Bd. - 50 50 1,500
City Planning Comm. 1,450,308 1,312,450 877,483 1,594,134
Mosquito Control Bd. 1,835,467 2,088,268 2,030,717 2,078,510 Museum of Art 225,000 164,483 104,360 151,683 Miscellaneous 4,366,574 6,349,748 32,851,980 29,525,493 General Services - - - - Office of Training Div. - - - -
Office of Comm. Dev. - - - -
N’hood Hsg Imprv. Fnd - - - -
Workforce Invst. Act - - - -
Economic Dev. Fund - - - -
Intergovernmental - - - -
District Attorney 3,371,616 2,528,712 2,360,131 6,271,671
Coroner's Office 1,905,826 1,614,332 1,047,555 1,669,099
Juvenile Court 2,077,834 1,753,530 1,206,577 2,615,283
First City Court - - - 6,000
Civil Court - - - 14,400
Municipal Court 1,473,377 285,566 969,330 1,867,343
Traffic Court 1,422,242 1,000,039 886,405 389,640
Criminal District Court 1,996,102 1,770,186 1,177,199 1,526,597
Criminal Sheriff 35,101,469 29,807,567 36,527,942 22,134,338
Clrk of Crim. Dist. Crt 2,959,287 2,463,463 1,780,723 3,726,330
Registrar of Voters 262,239 261,588 249,892 383,416
Judicial Retirement 151,924 145,148 162,197 263,238 Total $ 455,416,810 $ 449,507,005 $ 365,425,045 $ 491,379,272
Page 22
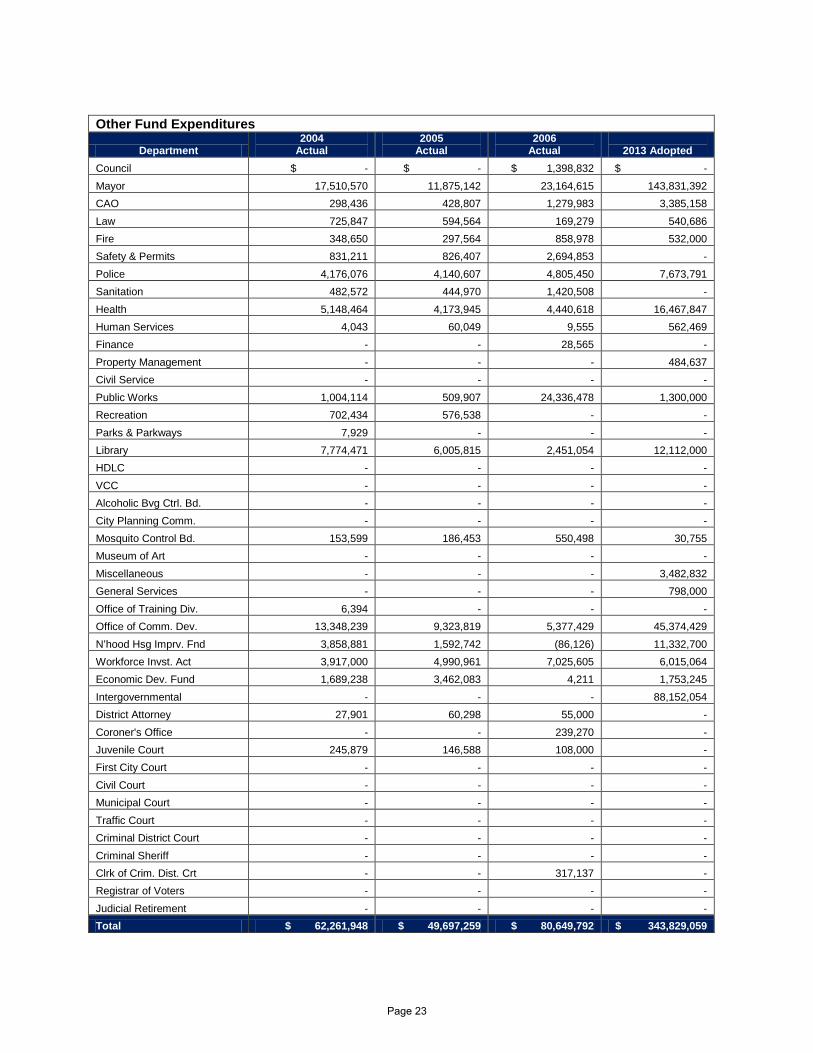
Other Fund Expenditures
Department 2004
Actual 2005
Actual 2006
Actual
2013 Adopted Council $ - $ - $ 1,398,832 $ - Mayor 17,510,570 11,875,142 23,164,615 143,831,392 CAO 298,436 428,807 1,279,983 3,385,158 Law 725,847 594,564 169,279 540,686 Fire 348,650 297,564 858,978 532,000 Safety & Permits 831,211 826,407 2,694,853 - Police 4,176,076 4,140,607 4,805,450 7,673,791 Sanitation 482,572 444,970 1,420,508 - Health 5,148,464 4,173,945 4,440,618 16,467,847 Human Services 4,043 60,049 9,555 562,469 Finance - - 28,565 - Property Management - - - 484,637 Civil Service - - - - Public Works 1,004,114 509,907 24,336,478 1,300,000 Recreation 702,434 576,538 - - Parks & Parkways 7,929 - - - Library 7,774,471 6,005,815 2,451,054 12,112,000 HDLC - - - - VCC - - - - Alcoholic Bvg Ctrl. Bd. - - - - City Planning Comm. - - - - Mosquito Control Bd. 153,599 186,453 550,498 30,755 Museum of Art - - - - Miscellaneous - - - 3,482,832 General Services - - - 798,000 Office of Training Div. 6,394 - - - Office of Comm. Dev. 13,348,239 9,323,819 5,377,429 45,374,429 N’hood Hsg Imprv. Fnd 3,858,881 1,592,742 (86,126) 11,332,700 Workforce Invst. Act 3,917,000 4,990,961 7,025,605 6,015,064 Economic Dev. Fund 1,689,238 3,462,083 4,211 1,753,245 Intergovernmental - - - 88,152,054 District Attorney 27,901 60,298 55,000 - Coroner's Office - - 239,270 - Juvenile Court 245,879 146,588 108,000 - First City Court - - - - Civil Court - - - - Municipal Court - - - - Traffic Court - - - - Criminal District Court - - - - Criminal Sheriff - - - - Clrk of Crim. Dist. Crt - - 317,137 - Registrar of Voters - - - - Judicial Retirement - - - - Total $ 62,261,948 $ 49,697,259 $ 80,649,792 $ 343,829,059
Page 23
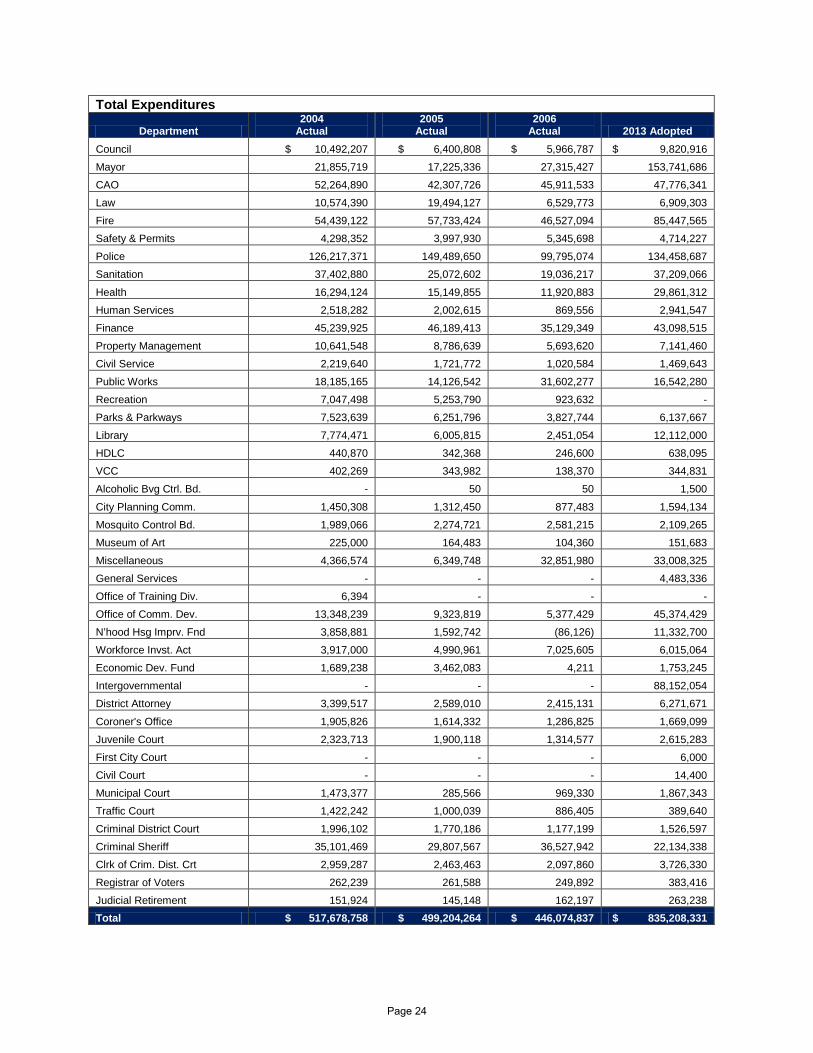
Total Expenditures
Department 2004
Actual 2005
Actual 2006
Actual 2013 Adopted Council $ 10,492,207 $ 6,400,808 $ 5,966,787 $ 9,820,916
Mayor 21,855,719 17,225,336 27,315,427 153,741,686
CAO 52,264,890 42,307,726 45,911,533 47,776,341
Law 10,574,390 19,494,127 6,529,773 6,909,303
Fire 54,439,122 57,733,424 46,527,094 85,447,565
Safety & Permits 4,298,352 3,997,930 5,345,698 4,714,227
Police 126,217,371 149,489,650 99,795,074 134,458,687
Sanitation 37,402,880 25,072,602 19,036,217 37,209,066
Health 16,294,124 15,149,855 11,920,883 29,861,312
Human Services 2,518,282 2,002,615 869,556 2,941,547
Finance 45,239,925 46,189,413 35,129,349 43,098,515
Property Management 10,641,548 8,786,639 5,693,620 7,141,460
Civil Service 2,219,640 1,721,772 1,020,584 1,469,643
Public Works 18,185,165 14,126,542 31,602,277 16,542,280
Recreation 7,047,498 5,253,790 923,632 -
Parks & Parkways 7,523,639 6,251,796 3,827,744 6,137,667
Library 7,774,471 6,005,815 2,451,054 12,112,000
HDLC 440,870 342,368 246,600 638,095
VCC 402,269 343,982 138,370 344,831
Alcoholic Bvg Ctrl. Bd. - 50 50 1,500
City Planning Comm. 1,450,308 1,312,450 877,483 1,594,134
Mosquito Control Bd. 1,989,066 2,274,721 2,581,215 2,109,265
Museum of Art 225,000 164,483 104,360 151,683
Miscellaneous 4,366,574 6,349,748 32,851,980 33,008,325
General Services - - - 4,483,336
Office of Training Div. 6,394 - - -
Office of Comm. Dev. 13,348,239 9,323,819 5,377,429 45,374,429
N’hood Hsg Imprv. Fnd 3,858,881 1,592,742 (86,126) 11,332,700
Workforce Invst. Act 3,917,000 4,990,961 7,025,605 6,015,064
Economic Dev. Fund 1,689,238 3,462,083 4,211 1,753,245
Intergovernmental - - - 88,152,054
District Attorney 3,399,517 2,589,010 2,415,131 6,271,671
Coroner's Office 1,905,826 1,614,332 1,286,825 1,669,099
Juvenile Court 2,323,713 1,900,118 1,314,577 2,615,283
First City Court - - - 6,000
Civil Court - - - 14,400
Municipal Court 1,473,377 285,566 969,330 1,867,343
Traffic Court 1,422,242 1,000,039 886,405 389,640
Criminal District Court 1,996,102 1,770,186 1,177,199 1,526,597
Criminal Sheriff 35,101,469 29,807,567 36,527,942 22,134,338
Clrk of Crim. Dist. Crt 2,959,287 2,463,463 2,097,860 3,726,330
Registrar of Voters 262,239 261,588 249,892 383,416
Judicial Retirement 151,924 145,148 162,197 263,238 Total $ 517,678,758 $ 499,204,264 $ 446,074,837 $ 835,208,331
Page 24
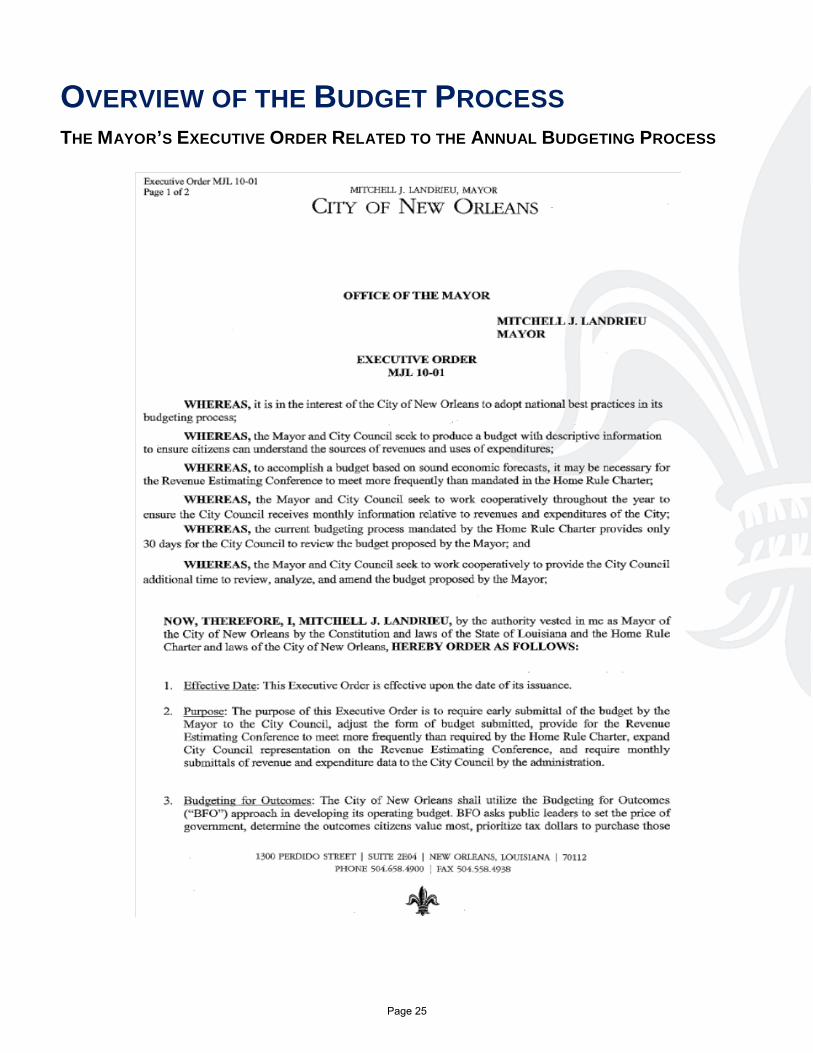
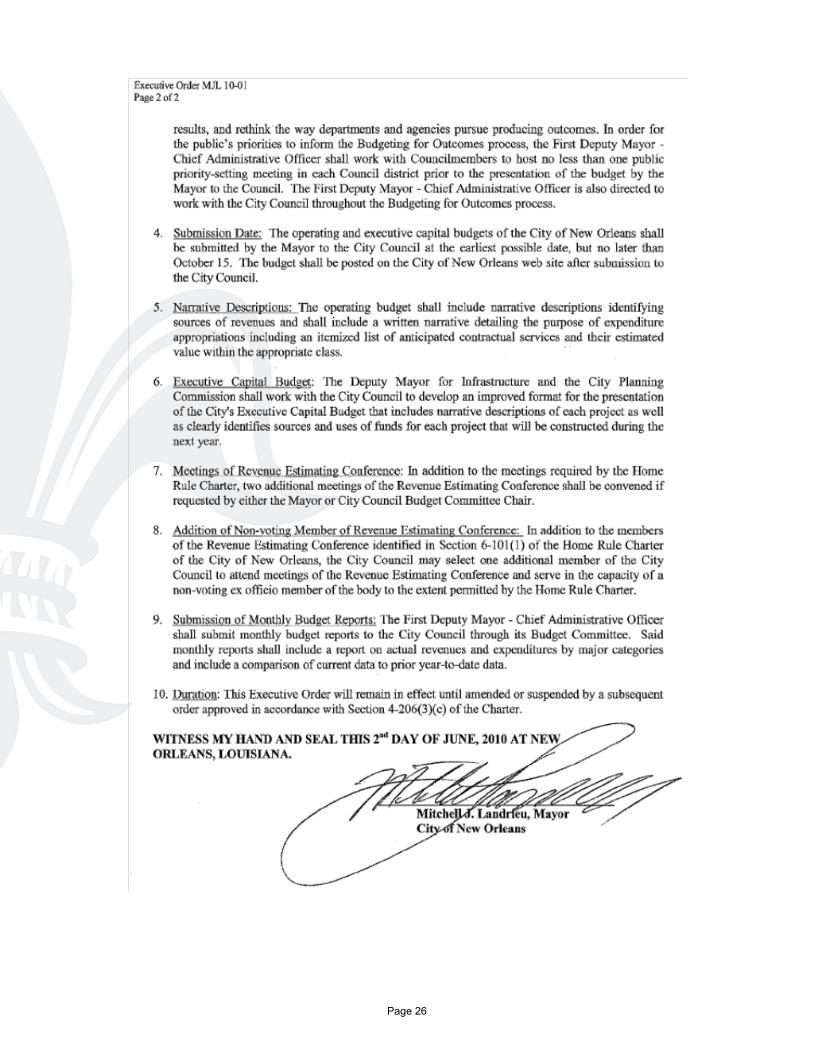
OVERVIEW OF THE BUDGET PROCESS
THE MAYOR’S EXECUTIVE ORDER RELATED TO THE ANNUAL BUDGETING PROCESS
Page 25
Page 26
Page 27

Page 28
PURPOSE OF THE STRATEGIC FRAMEWORK The Landrieu Administration’s strategic framework was designed to map out the City’s overall direction and serve as the foundation for budgeting and performance management. Best practices demonstrate the importance of having a strategic framework linking City services to achievement of desired outcomes. In 2012, the Administration developed Results Maps, linking services, programs, strategies, objectives, and goals to the City’s mission, values, and vision, and incorporating new outcome measures to assess performance. The Results Maps are used to align resources, foster the development of realistic departmental operational (“business”) plans, guide decision-making to attain goals and improve outcomes, and serve as a communication tool for City employees and the public.
CITY VISION
New Orleans is a model city. We demonstrate to the world the power of strong leadership in the halls of City government and on streets. With resilience, we transform challenges into instruments of progress with the belief and assurance that change is possible.
We are a unified city where municipal employees and engaged citizens work together to create equitable, thriving communities for all. The City of New Orleans leverages the transformative power of our people to build safe neighborhoods and foster educational, economic and cultural opportunities.
We are a creative city. We recognize limitless opportunity and appreciate the shared benefit of our neighbor’s success. The richness of diversity is manifested clearly in our culture-a beautiful mosaic that only New Orleans is able to create. Our commitment to excellence, coupled with timeless cultural heritage and creative vision ensures New Orleans’ greatness for generations to come.
CITY MISSION
The City of New Orleans delivers excellent service to its citizens with courage, competence and compassion. We provide unbeatable customer service driven by sound fiscal management. As good stewards of our resources, we ensure safe neighborhoods, excellent schools, good-paying jobs and a clean environment for our citizens.
We facilitate partnerships, link strong leaders and new ideas and leverage critical resources to move New Orleans forward. Our decisions are informed by effective communication and active citizen involvement. We responsibly manage and preserve our city’s natural resources.
Page 29
CITY VALUES
Our service is driven by core values that define and inspire how we work in the City of New Orleans.
Integrity: We are committed to serving the citizens of New Orleans, not ourselves. We are honest and trustworthy. We continually strive to improve efficiency and cost-effectiveness.
Excellence: We deliver high-quality City services focused on better outcomes for all New Orleanians. We raise and exceed the expectations of our citizens. Our service inspires others to deliver their best.
Transparency: We are clear and honest in public decision-making, provision of data and delivery of City services.
Teamwork: We work across departments, programs and services to deliver better results for our citizens. We are passionate about our work, have fun doing it and celebrate a job well done.
Responsiveness: We are eager to respond to citizen requests and committed to delivering solutions in a timely manner.
Innovation: We build partnerships across City agencies and with community partners to create new solutions to the City’s most intractable problems.
Diversity and Inclusion: We seek a city where all people, irrespective of race, religion, gender or sexual orientation, share opportunity and responsibility, risk and reward, political power and economic prosperity.
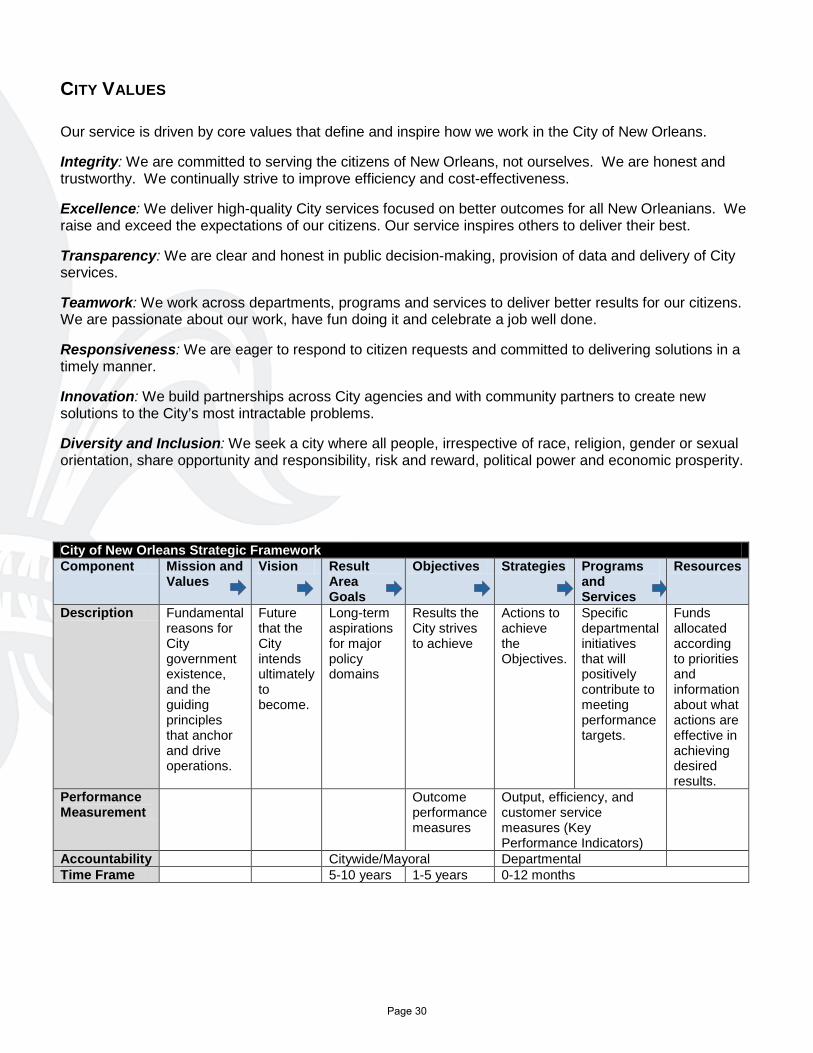
City of New Orleans Strategic Framework Component Mission and
Values Vision Result
Area Goals
Objectives Strategies Programs and Services
Resources
Description Fundamental reasons for City government existence, and the guiding principles that anchor and drive operations.
Future that the City intends ultimately to become.
Long-term aspirations for major policy domains
Results the City strives to achieve
Actions to achieve the Objectives.
Specific departmental initiatives that will positively contribute to meeting performance targets.
Funds allocated according to priorities and information about what actions are effective in achieving desired results.
Performance Measurement
Outcome performance measures
Output, efficiency, and customer service measures (Key Performance Indicators)
Accountability Citywide/Mayoral Departmental Time Frame 5-10 years 1-5 years 0-12 months
Page 30
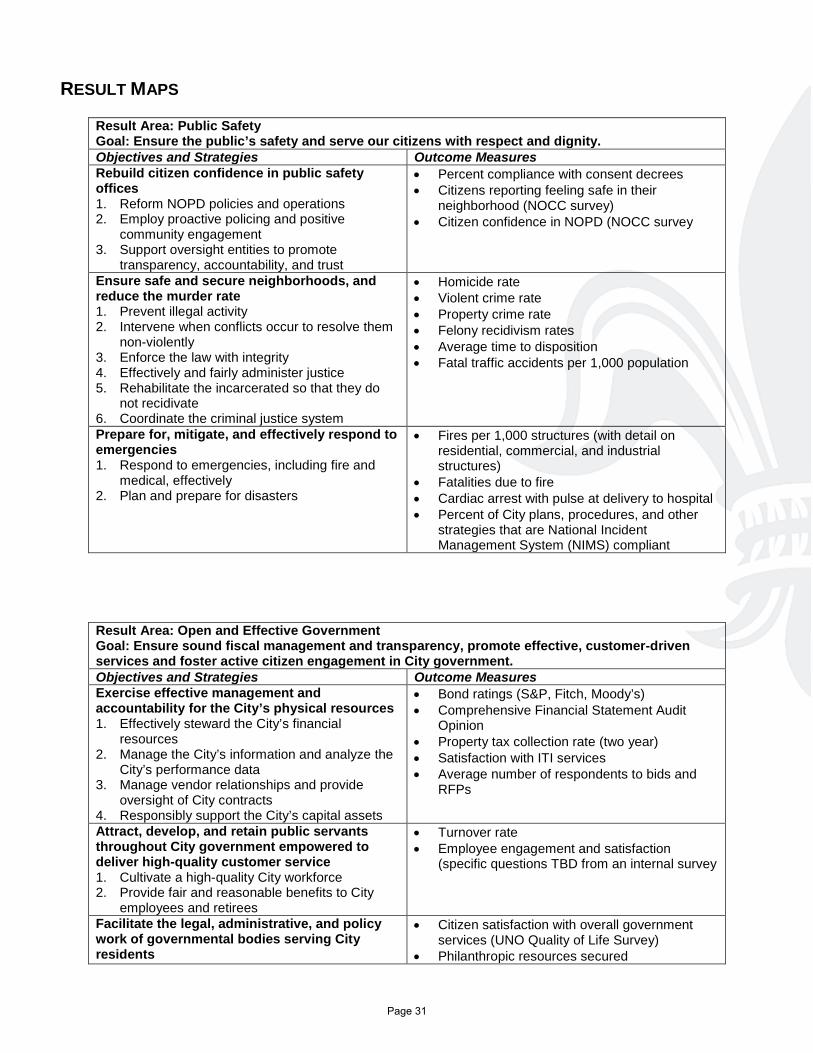
RESULT MAPS
Result Area: Public Safety Goal: Ensure the public’s safety and serve our citizens with respect and dignity. Objectives and Strategies Outcome Measures Rebuild citizen confidence in public safety offices 1. Reform NOPD policies and operations 2. Employ proactive policing and positive
community engagement 3. Support oversight entities to promote
transparency, accountability, and trust
• Percent compliance with consent decrees • Citizens reporting feeling safe in their
neighborhood (NOCC survey) • Citizen confidence in NOPD (NOCC survey
Ensure safe and secure neighborhoods, and reduce the murder rate 1. Prevent illegal activity 2. Intervene when conflicts occur to resolve them
non-violently 3. Enforce the law with integrity 4. Effectively and fairly administer justice 5. Rehabilitate the incarcerated so that they do
not recidivate 6. Coordinate the criminal justice system
• Homicide rate • Violent crime rate • Property crime rate • Felony recidivism rates • Average time to disposition • Fatal traffic accidents per 1,000 population
Prepare for, mitigate, and effectively respond to emergencies 1. Respond to emergencies, including fire and
medical, effectively 2. Plan and prepare for disasters
• Fires per 1,000 structures (with detail on residential, commercial, and industrial structures)
• Fatalities due to fire • Cardiac arrest with pulse at delivery to hospital • Percent of City plans, procedures, and other
strategies that are National Incident Management System (NIMS) compliant
Result Area: Open and Effective Government Goal: Ensure sound fiscal management and transparency, promote effective, customer-driven services and foster active citizen engagement in City government. Objectives and Strategies Outcome Measures Exercise effective management and accountability for the City’s physical resources 1. Effectively steward the City’s financial
resources 2. Manage the City’s information and analyze the
City’s performance data 3. Manage vendor relationships and provide
oversight of City contracts 4. Responsibly support the City’s capital assets
• Bond ratings (S&P, Fitch, Moody’s) • Comprehensive Financial Statement Audit
Opinion • Property tax collection rate (two year) • Satisfaction with ITI services • Average number of respondents to bids and
RFPs
Attract, develop, and retain public servants throughout City government empowered to deliver high-quality customer service 1. Cultivate a high-quality City workforce 2. Provide fair and reasonable benefits to City
employees and retirees
• Turnover rate • Employee engagement and satisfaction
(specific questions TBD from an internal survey
Facilitate the legal, administrative, and policy work of governmental bodies serving City residents
• Citizen satisfaction with overall government services (UNO Quality of Life Survey)
• Philanthropic resources secured
Page 31
1. Govern the City with integrity and accountability
2. Defend the City’s legal interests 3. Promote civic engagement 4. Facilitate, link, and leverage resources with
external organizations
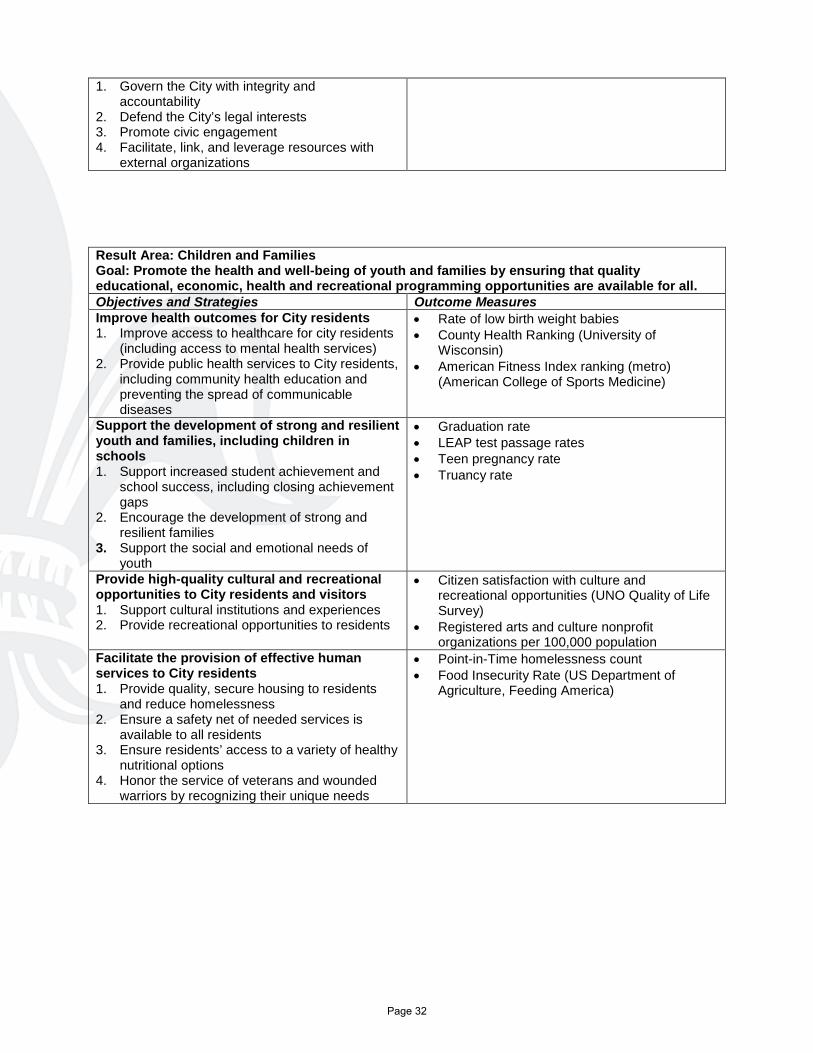
Result Area: Children and Families Goal: Promote the health and well-being of youth and families by ensuring that quality educational, economic, health and recreational programming opportunities are available for all. Objectives and Strategies Outcome Measures Improve health outcomes for City residents 1. Improve access to healthcare for city residents
(including access to mental health services) 2. Provide public health services to City residents,
including community health education and preventing the spread of communicable diseases
• Rate of low birth weight babies • County Health Ranking (University of
Wisconsin) • American Fitness Index ranking (metro)
(American College of Sports Medicine)
Support the development of strong and resilient youth and families, including children in schools 1. Support increased student achievement and
school success, including closing achievement gaps
2. Encourage the development of strong and resilient families
3. Support the social and emotional needs of youth
• Graduation rate • LEAP test passage rates • Teen pregnancy rate • Truancy rate
Provide high-quality cultural and recreational opportunities to City residents and visitors 1. Support cultural institutions and experiences 2. Provide recreational opportunities to residents
• Citizen satisfaction with culture and recreational opportunities (UNO Quality of Life Survey)
• Registered arts and culture nonprofit organizations per 100,000 population
Facilitate the provision of effective human services to City residents 1. Provide quality, secure housing to residents
and reduce homelessness 2. Ensure a safety net of needed services is
available to all residents 3. Ensure residents’ access to a variety of healthy
nutritional options 4. Honor the service of veterans and wounded
warriors by recognizing their unique needs
• Point-in-Time homelessness count • Food Insecurity Rate (US Department of
Agriculture, Feeding America)
Page 32
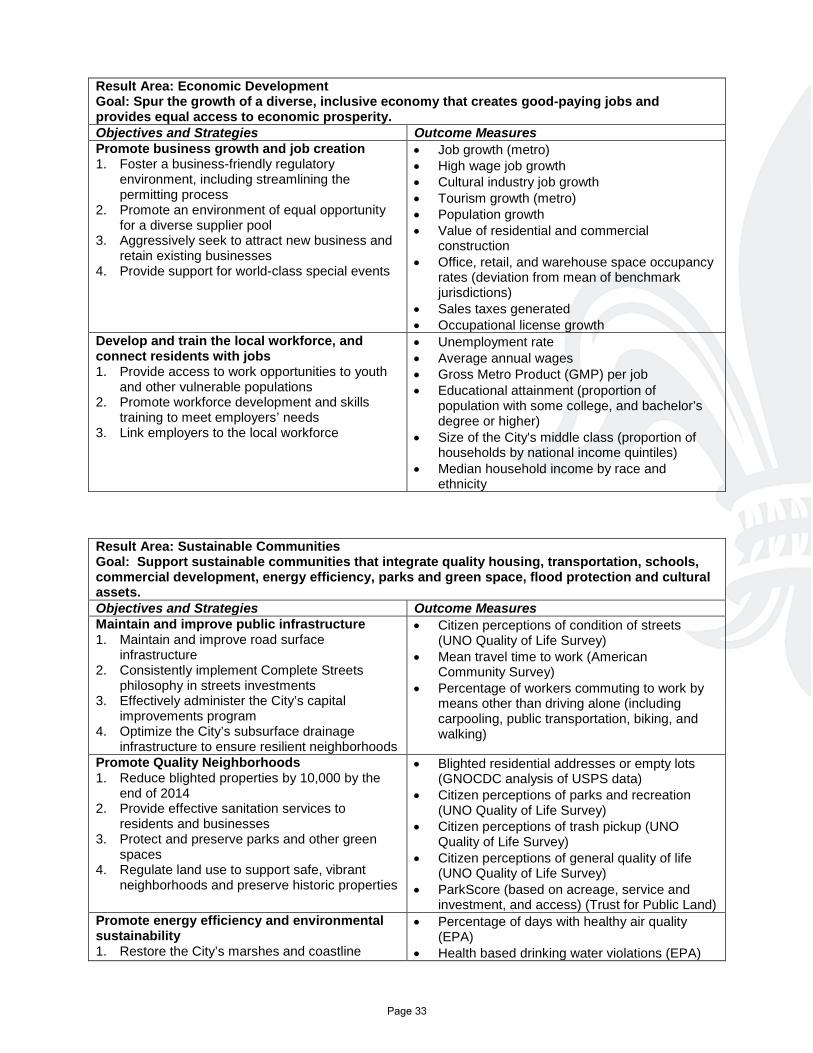
Result Area: Economic Development Goal: Spur the growth of a diverse, inclusive economy that creates good-paying jobs and provides equal access to economic prosperity. Objectives and Strategies Outcome Measures Promote business growth and job creation 1. Foster a business-friendly regulatory
environment, including streamlining the permitting process
2. Promote an environment of equal opportunity for a diverse supplier pool
3. Aggressively seek to attract new business and retain existing businesses
4. Provide support for world-class special events
• Job growth (metro) • High wage job growth • Cultural industry job growth • Tourism growth (metro) • Population growth • Value of residential and commercial
construction • Office, retail, and warehouse space occupancy
rates (deviation from mean of benchmark jurisdictions)
• Sales taxes generated • Occupational license growth
Develop and train the local workforce, and connect residents with jobs 1. Provide access to work opportunities to youth
and other vulnerable populations 2. Promote workforce development and skills
training to meet employers’ needs 3. Link employers to the local workforce
• Unemployment rate • Average annual wages • Gross Metro Product (GMP) per job • Educational attainment (proportion of
population with some college, and bachelor’s degree or higher)
• Size of the City's middle class (proportion of households by national income quintiles)
• Median household income by race and ethnicity
Result Area: Sustainable Communities Goal: Support sustainable communities that integrate quality housing, transportation, schools, commercial development, energy efficiency, parks and green space, flood protection and cultural assets. Objectives and Strategies Outcome Measures Maintain and improve public infrastructure 1. Maintain and improve road surface
infrastructure 2. Consistently implement Complete Streets
philosophy in streets investments 3. Effectively administer the City’s capital
improvements program 4. Optimize the City’s subsurface drainage
infrastructure to ensure resilient neighborhoods
• Citizen perceptions of condition of streets (UNO Quality of Life Survey)
• Mean travel time to work (American Community Survey)
• Percentage of workers commuting to work by means other than driving alone (including carpooling, public transportation, biking, and walking)
Promote Quality Neighborhoods 1. Reduce blighted properties by 10,000 by the
end of 2014 2. Provide effective sanitation services to
residents and businesses 3. Protect and preserve parks and other green
spaces 4. Regulate land use to support safe, vibrant
neighborhoods and preserve historic properties
• Blighted residential addresses or empty lots (GNOCDC analysis of USPS data)
• Citizen perceptions of parks and recreation (UNO Quality of Life Survey)
• Citizen perceptions of trash pickup (UNO Quality of Life Survey)
• Citizen perceptions of general quality of life (UNO Quality of Life Survey)
• ParkScore (based on acreage, service and investment, and access) (Trust for Public Land)
Promote energy efficiency and environmental sustainability 1. Restore the City’s marshes and coastline
• Percentage of days with healthy air quality (EPA)
• Health based drinking water violations (EPA)
Page 33
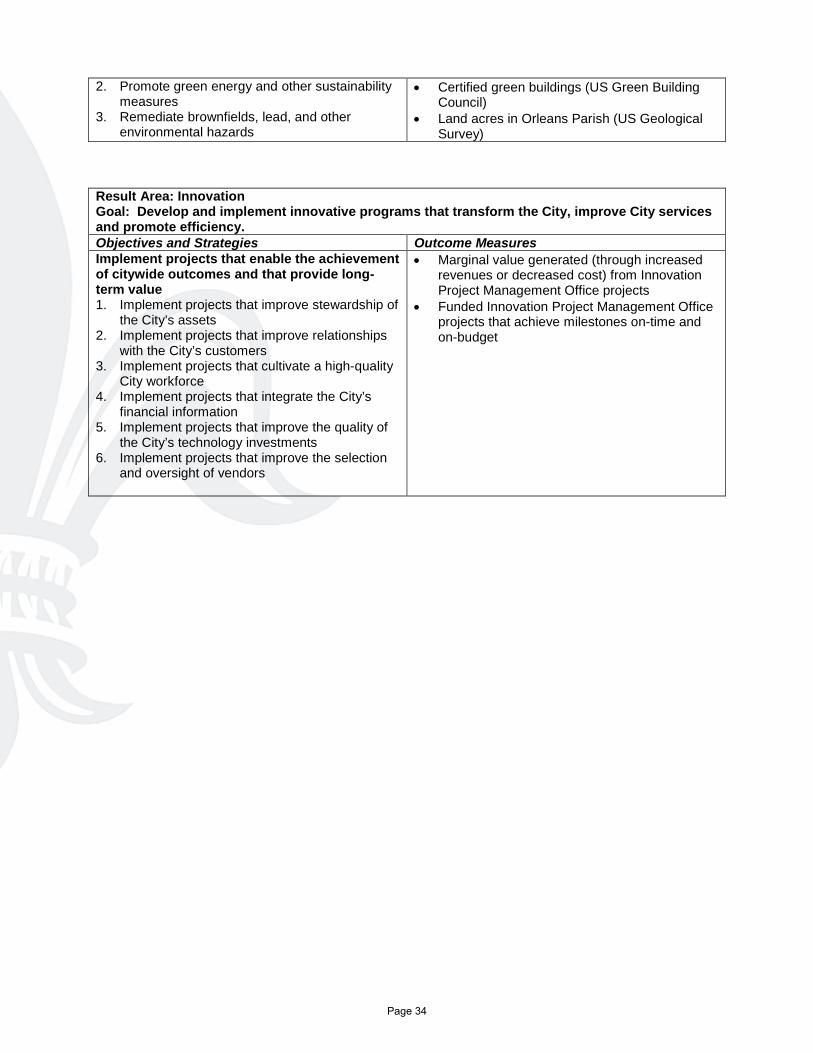
2. Promote green energy and other sustainability measures
3. Remediate brownfields, lead, and other environmental hazards
• Certified green buildings (US Green Building Council)
• Land acres in Orleans Parish (US Geological Survey)
Result Area: Innovation Goal: Develop and implement innovative programs that transform the City, improve City services and promote efficiency. Objectives and Strategies Outcome Measures Implement projects that enable the achievement of citywide outcomes and that provide long-term value 1. Implement projects that improve stewardship of
the City’s assets 2. Implement projects that improve relationships
with the City’s customers 3. Implement projects that cultivate a high-quality
City workforce 4. Implement projects that integrate the City’s
financial information 5. Implement projects that improve the quality of
the City’s technology investments 6. Implement projects that improve the selection
and oversight of vendors
• Marginal value generated (through increased revenues or decreased cost) from Innovation Project Management Office projects
• Funded Innovation Project Management Office projects that achieve milestones on-time and on-budget
Page 34
OVERVIEW OF THE BUDGET PROCESS BUDGETING FOR OUTCOMES
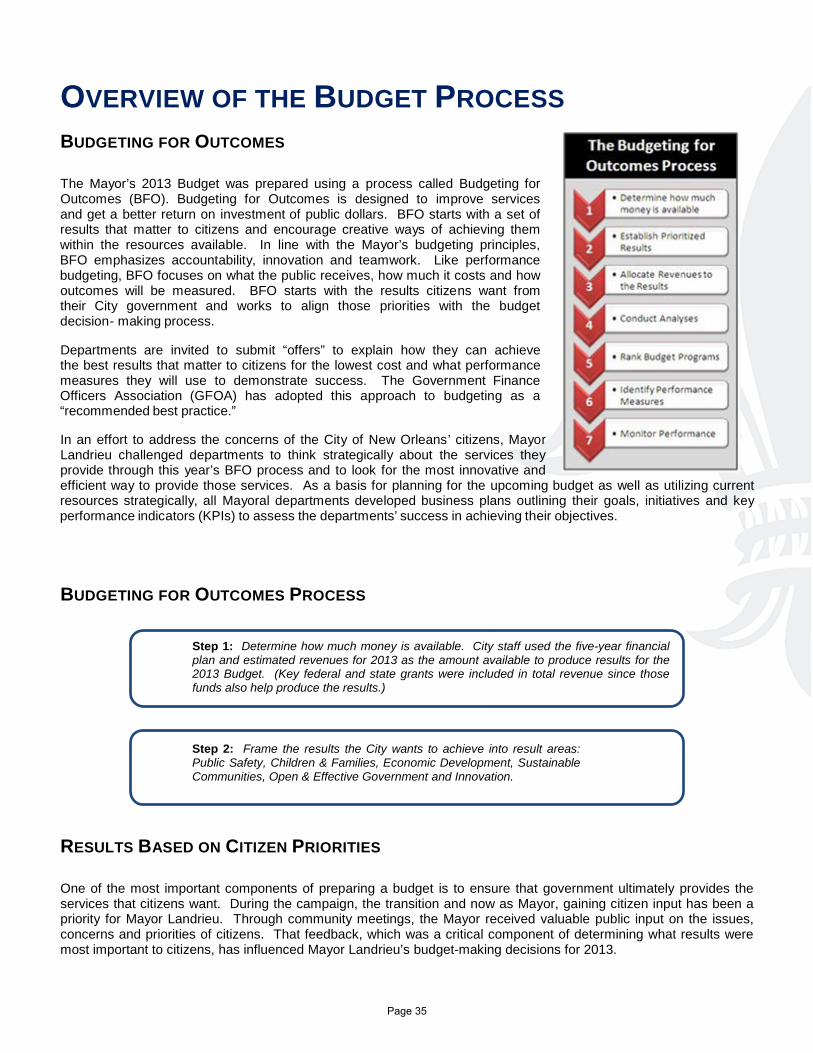
The Mayor’s 2013 Budget was prepared using a process called Budgeting for Outcomes (BFO). Budgeting for Outcomes is designed to improve services and get a better return on investment of public dollars. BFO starts with a set of results that matter to citizens and encourage creative ways of achieving them within the resources available. In line with the Mayor’s budgeting principles, BFO emphasizes accountability, innovation and teamwork. Like performance budgeting, BFO focuses on what the public receives, how much it costs and how outcomes will be measured. BFO starts with the results citizens want from their City government and works to align those priorities with the budget decision- making process.
Departments are invited to submit “offers” to explain how they can achieve the best results that matter to citizens for the lowest cost and what performance measures they will use to demonstrate success. The Government Finance Officers Association (GFOA) has adopted this approach to budgeting as a “recommended best practice.”
In an effort to address the concerns of the City of New Orleans’ citizens, Mayor Landrieu challenged departments to think strategically about the services they provide through this year’s BFO process and to look for the most innovative and efficient way to provide those services. As a basis for planning for the upcoming budget as well as utilizing current resources strategically, all Mayoral departments developed business plans outlining their goals, initiatives and key performance indicators (KPIs) to assess the departments’ success in achieving their objectives.
BUDGETING FOR OUTCOMES PROCESS
RESULTS BASED ON CITIZEN PRIORITIES
One of the most important components of preparing a budget is to ensure that government ultimately provides the services that citizens want. During the campaign, the transition and now as Mayor, gaining citizen input has been a priority for Mayor Landrieu. Through community meetings, the Mayor received valuable public input on the issues, concerns and priorities of citizens. That feedback, which was a critical component of determining what results were most important to citizens, has influenced Mayor Landrieu’s budget-making decisions for 2013.
Step 2: Frame the results the City wants to achieve into result areas: Public Safety, Children & Families, Economic Development, Sustainable Communities, Open & Effective Government and Innovation.
Step 1: Determine how much money is available. City staff used the five-year financial plan and estimated revenues for 2013 as the amount available to produce results for the 2013 Budget. (Key federal and state grants were included in total revenue since those funds also help produce the results.)
Page 35
• 2013 Budget Community Meetings: During August and September 2012, community meetings were held
in every Council District, five total, to discuss those issues most important to citizens. This feedback helped prioritize key results to be achieved, and where public money will be spent in the Mayor’s 2013 Budget.
The result areas (results to be achieved) were developed to align with the vision, mission and values within the Landrieu Administration’s strategic framework. In 2012, the Administration developed Results Maps to further map out the City’s overall direction and serve as the foundation for budgeting and performance management. The Results Maps are used to align resources, foster the development of realistic departmental operational (“business”) plans, guide decision-making to attain goals and improve outcomes, and serve as a communication tool for City employees and the public. This strategic framework was refined, and strategies prioritized based on citizen feedback from the budget community meetings. The result areas are described as follows:
• Public Safety - Ensures the public's safety and serves our citizens with respect and integrity.
• Children and Families - Promote the health and well-being of youth and families by ensuring that quality educational, economic, health and recreational programming opportunities are available for all.
• Economic Development - Spurs the growth of a diverse economy that creates good-paying jobs and provides equal access to economic prosperity.
• Sustainable Communities - Supports sustainable communities that integrate quality housing, transportation, schools, commercial development, energy efficiency, parks and green space, flood protection and cultural assets.
• Open and Effective Government - Ensures sound fiscal management and transparency, promotes effective, customer-driven services and fosters active citizen engagement in City government.
• Innovation - Develops and implements innovative programs that transform City government, improve City services and promote efficiency.
ALLOCATING RESOURCES TO RESULT AREAS
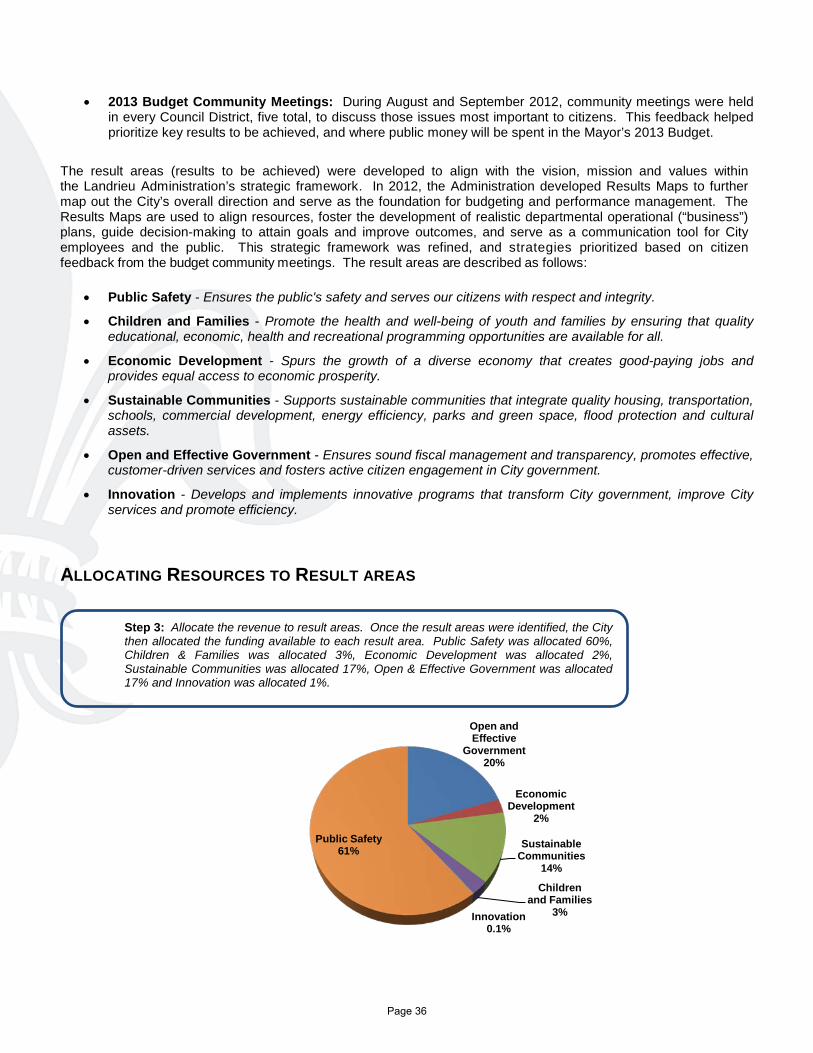
Step 3: Allocate the revenue to result areas. Once the result areas were identified, the City then allocated the funding available to each result area. Public Safety was allocated 60%, Children & Families was allocated 3%, Economic Development was allocated 2%, Sustainable Communities was allocated 17%, Open & Effective Government was allocated 17% and Innovation was allocated 1%.
Open and Effective
Government 20%
Economic Development
2%
Sustainable Communities
14%
Children and Families
3% Innovation 0.1%
Public Safety 61%
Page 36
SUBMITTING OFFERS TO ACHIEVE RESULTS
Leaders from across City government participated on Result Teams for each of the six result areas. Result Team responsibilities included choosing outcome measures to track progress in each result area, identifying budget strategies to achieve those results and encouraging departments to generate innovative and creative budget offers to achieve results that reflected the Mayor’s values and evaluating and ranking the offers for funding. Departments were asked to submit budget offers that explained how each dollar in the operating budget achieved results for citizens. As a resource for developing offers, departments leveraged information developed in their business plans, such as key initiatives. Preparing the budget in this way allowed the Result Teams to review operations and organizational structure to identify opportunities to streamline processes, improve customer service, save money, adopt best practices and focus limited resources on citizen priorities.
PRIORITIZING THE OFFERS
The Result Teams reviewed all offers and ranked them twice. The first ranking was to provide departments feedback to improve their offers, and to indicate whether the offer was above or below the funding line (offers are ranked in priority order and a line is drawn when the allocated funding for that Result area runs out). In addition, departments received support, as needed, to refine and develop their offers. The second ranking done by Result Teams was submitted to the BFO Management Team for review. The rankings were then reviewed with the Mayor. The rankings are listed in priority order, with the offer that promises to achieve the most results at the top of the list and the offers likely to achieve the least results at the bottom of the list. The amount of money available for each result is allocated to the offers beginning at the top of the ranked list. Offers are purchased with the allocated funding until it runs out. Then, a line is drawn. Everything above the line is recommended to be funded. Everything below the line is recommended not to be funded. An advantage to this process is transparency in the inevitable tradeoffs involved in budgeting. Each of the programs that are not funded is listed in priority order - according to how well they achieve results. If anyone wants to fund an item that is below the line and not funded, something that is currently above the line and funded needs to be dropped below the line to offset the cost or the offers need to be revised to reflect reduced costs. The only other option would be to raise additional revenue to fund something that is not funded. This process allows all decision-makers to see the impact of the budget decisions.
Step 5: Budget available dollars to the programs and activities that promise to produce the best results that are most important to citizens for the lowest cost. The Results Teams and then the BFO Management Team (senior executives, chaired by the Chief Administrative Officer) ranked all offers. Departments submitted more than 300 offers for consideration to produce results.
Step 4: Departments submit offers for programs that align with the strategic framework. Offers identify the purpose of the program, a description, the staffing and funding needed, performance measures to track progress in achieving results, planned levels of performance, and the return on investment citizens could expect from their investment of tax dollars.
Budget offers will be evaluated in the context of the Mayor’s values with emphasis on:
• Achieving Results • Customer-focus • Leveraging Other
Resources/Funds • Efficiency • Effectiveness • Excellence
Page 37
MONITOR THE RESULTS
These priorities are the basis for the budget that is submitted to the City Council for review and approval. Once the budget is approved, the next steps in Budgeting for Outcomes are to:
Step 6: Finalize performance measures and targets. Step 7: Measure performance to monitor progress and track results
In conjunction with the development of the Results Maps, the Result Teams selected outcome measures to track changes in citywide attitudes, behaviors, or conditions in each result area. All departments, for each budget offer submitted, developed key performance indicators (KPIs), measures of outputs, efficiency, or customer service, demonstrating alignment of department activities and resources to achieve the City’s desired outcomes. For each KPI, departments developed quarterly targets that communicate the extent of planned program accomplishment. The KPIs are used to monitor, review, and assess progress towards strategic goals as outlined in the Results Maps, and make adjustments to department operational plans, as appropriate. To account to the citizens of New Orleans and the City Council for the spending of resources provided, performance results are publically communicated each quarter in the ResultsNOLA reports, available at www.nola.gov/opa. In addition to ResultsNOLA, the Office of Performance and Accountability develops and implements Stat programs for key cross-departmental initiatives, such as blight reduction, quality of life improvement, revenue collection and contracting. In Stat meetings, senior leaders meet with key department heads and program managers on a monthly basis to review data to understand what works, what doesn’t and what steps need to be taken to improve. These meetings are open to the public, and the presentations prepared for the meetings are posted on www.nola.gov/opa.
Page 38
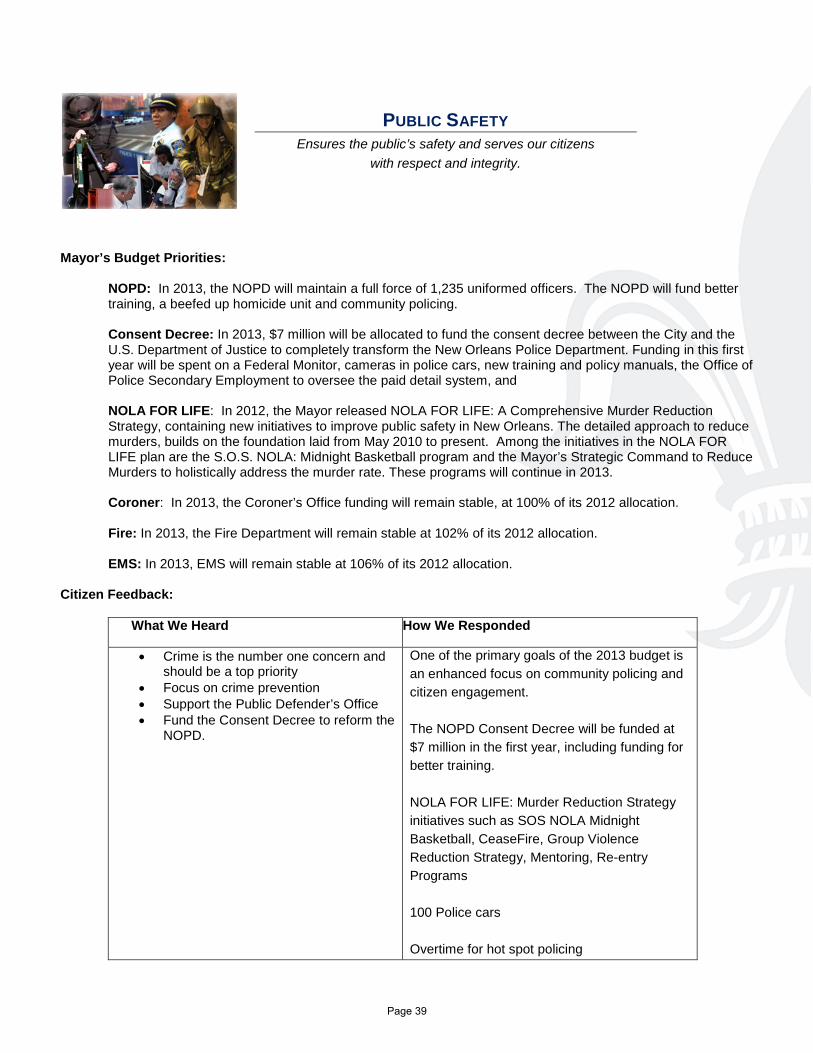
PUBLIC SAFETY Ensures the public’s safety and serves our citizens
with respect and integrity.
Mayor’s Budget Priorities:
NOPD: In 2013, the NOPD will maintain a full force of 1,235 uniformed officers. The NOPD will fund better training, a beefed up homicide unit and community policing. Consent Decree: In 2013, $7 million will be allocated to fund the consent decree between the City and the U.S. Department of Justice to completely transform the New Orleans Police Department. Funding in this first year will be spent on a Federal Monitor, cameras in police cars, new training and policy manuals, the Office of Police Secondary Employment to oversee the paid detail system, and NOLA FOR LIFE: In 2012, the Mayor released NOLA FOR LIFE: A Comprehensive Murder Reduction Strategy, containing new initiatives to improve public safety in New Orleans. The detailed approach to reduce murders, builds on the foundation laid from May 2010 to present. Among the initiatives in the NOLA FOR LIFE plan are the S.O.S. NOLA: Midnight Basketball program and the Mayor’s Strategic Command to Reduce Murders to holistically address the murder rate. These programs will continue in 2013. Coroner: In 2013, the Coroner’s Office funding will remain stable, at 100% of its 2012 allocation. Fire: In 2013, the Fire Department will remain stable at 102% of its 2012 allocation. EMS: In 2013, EMS will remain stable at 106% of its 2012 allocation.
Citizen Feedback:
What We Heard How We Responded
• Crime is the number one concern and should be a top priority
• Focus on crime prevention • Support the Public Defender’s Office • Fund the Consent Decree to reform the
NOPD.
One of the primary goals of the 2013 budget is an enhanced focus on community policing and citizen engagement. The NOPD Consent Decree will be funded at $7 million in the first year, including funding for better training. NOLA FOR LIFE: Murder Reduction Strategy initiatives such as SOS NOLA Midnight Basketball, CeaseFire, Group Violence Reduction Strategy, Mentoring, Re-entry Programs 100 Police cars Overtime for hot spot policing
Page 39
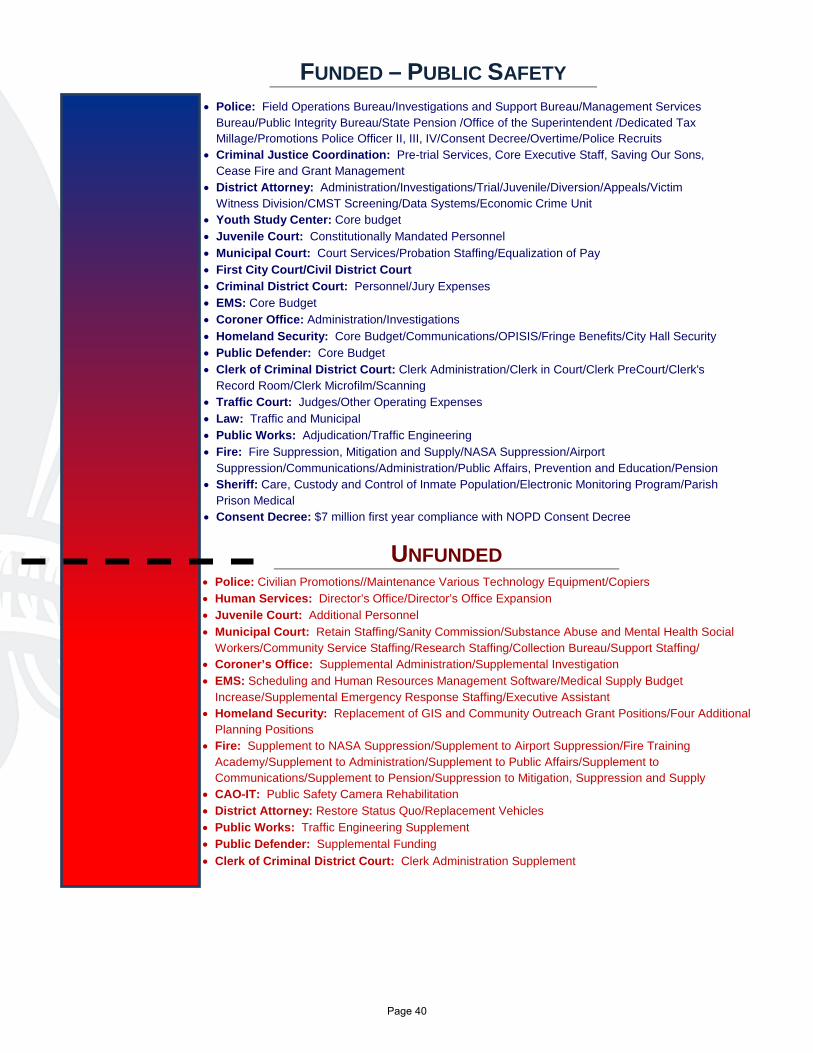
• Police: Field Operations Bureau/Investigations and Support Bureau/Management Services Bureau/Public Integrity Bureau/State Pension /Office of the Superintendent /Dedicated Tax Millage/Promotions Police Officer II, III, IV/Consent Decree/Overtime/Police Recruits
• Criminal Justice Coordination: Pre-trial Services, Core Executive Staff, Saving Our Sons, Cease Fire and Grant Management
• District Attorney: Administration/Investigations/Trial/Juvenile/Diversion/Appeals/Victim Witness Division/CMST Screening/Data Systems/Economic Crime Unit
• Youth Study Center: Core budget • Juvenile Court: Constitutionally Mandated Personnel • Municipal Court: Court Services/Probation Staffing/Equalization of Pay • First City Court/Civil District Court • Criminal District Court: Personnel/Jury Expenses • EMS: Core Budget • Coroner Office: Administration/Investigations • Homeland Security: Core Budget/Communications/OPISIS/Fringe Benefits/City Hall Security • Public Defender: Core Budget • Clerk of Criminal District Court: Clerk Administration/Clerk in Court/Clerk PreCourt/Clerk's
Record Room/Clerk Microfilm/Scanning • Traffic Court: Judges/Other Operating Expenses • Law: Traffic and Municipal • Public Works: Adjudication/Traffic Engineering • Fire: Fire Suppression, Mitigation and Supply/NASA Suppression/Airport
Suppression/Communications/Administration/Public Affairs, Prevention and Education/Pension • Sheriff: Care, Custody and Control of Inmate Population/Electronic Monitoring Program/Parish
Prison Medical • Consent Decree: $7 million first year compliance with NOPD Consent Decree
• Police: Civilian Promotions//Maintenance Various Technology Equipment/Copiers • Human Services: Director’s Office/Director’s Office Expansion • Juvenile Court: Additional Personnel • Municipal Court: Retain Staffing/Sanity Commission/Substance Abuse and Mental Health Social
Workers/Community Service Staffing/Research Staffing/Collection Bureau/Support Staffing/ • Coroner’s Office: Supplemental Administration/Supplemental Investigation • EMS: Scheduling and Human Resources Management Software/Medical Supply Budget
Increase/Supplemental Emergency Response Staffing/Executive Assistant • Homeland Security: Replacement of GIS and Community Outreach Grant Positions/Four Additional
Planning Positions • Fire: Supplement to NASA Suppression/Supplement to Airport Suppression/Fire Training
Academy/Supplement to Administration/Supplement to Public Affairs/Supplement to Communications/Supplement to Pension/Suppression to Mitigation, Suppression and Supply
• CAO-IT: Public Safety Camera Rehabilitation • District Attorney: Restore Status Quo/Replacement Vehicles • Public Works: Traffic Engineering Supplement • Public Defender: Supplemental Funding • Clerk of Criminal District Court: Clerk Administration Supplement
UNFUNDED
FUNDED – PUBLIC SAFETY
Page 40
CHILDREN & FAMILIES Promotes the health and well-being of youth and families by
ensuring that quality educational, economic, health and recreational programming opportunities are available for all.
Mayor’s Budget Priorities:
NORDC: Beginning in 2011, the New Orleans Recreation Development Commission (NORDC), formerly the New Orleans Recreation Department, was established. The purpose of this public private partnership is to enhance recreational opportunities throughout the City. The City will continue to support popular programs such as “Movies in the Park.”
Restructuring of Mayor’s JOB 1 Earn and Learn Summer Youth Program: This eight week program provides Career Exploration to at-risk youth ages 14-24 in an effort to enrich the lives of the participants. In 2012, the program provided opportunities more than 2,300 youth.
Health Department: In 2013, the Health Department will continue its process of restructuring with an increased focus on access to care, public health, wellness and education. As the department has refocused its mission on public health policy, in lieu of the delivery of services, citizens have benefited from an increased focus on healthy outcomes from fitness and obesity to Healthy Start and murder reduction.
Citizen Feedback:
What We Heard How We Responded
• Provide more opportunities for our youth, especially recreation opportunities
• Provide summer job opportunities • Enhance pest and rodent control • Fund Senior Centers, programming
and services through the Council on Aging
Over $9.6 million in funding will continue to be dedicated for NORDC. The Mayor’s JOB 1 Earn and Learn Summer Youth Employment Program more than doubled over previous funding levels, thereby providing job opportunities for New Orleans youth. Over $2 million in funding for Mosquito, Termite and Rodent Control Board The New Orleans Council on Aging is funded with $562,952 in general fund and $414,964 in CDBG funds for a total of$977,916.
Page 41
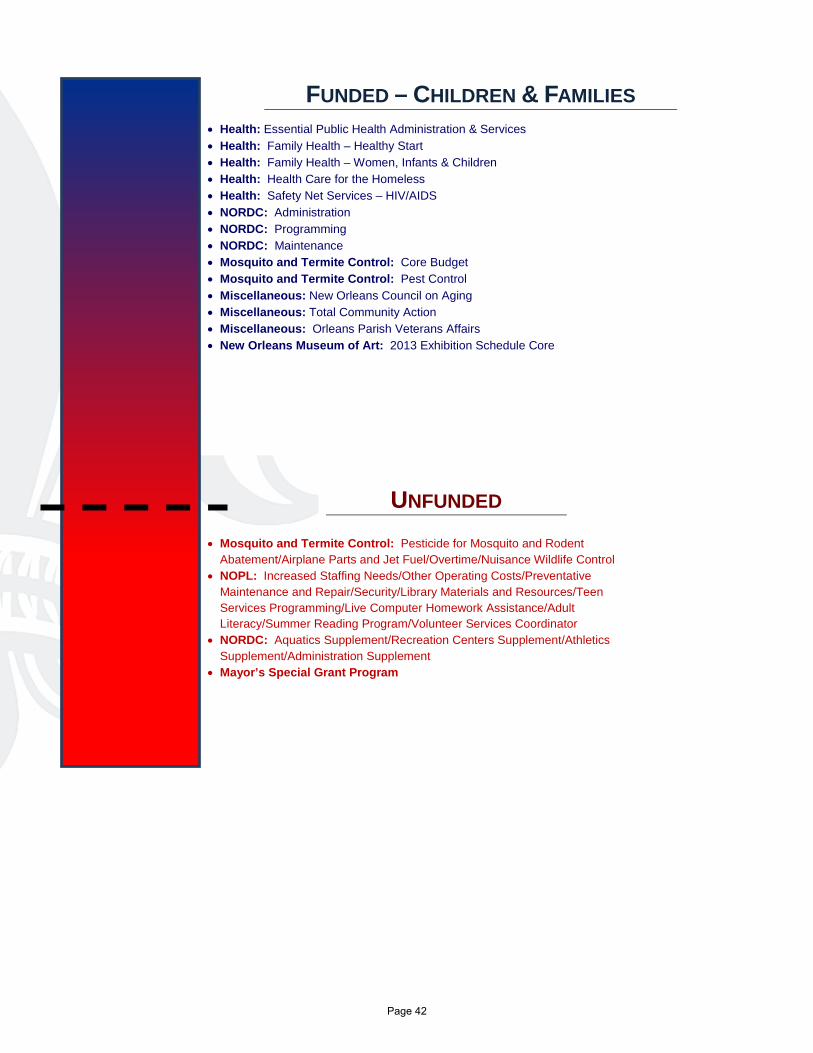
• Health: Essential Public Health Administration & Services • Health: Family Health – Healthy Start • Health: Family Health – Women, Infants & Children • Health: Health Care for the Homeless • Health: Safety Net Services – HIV/AIDS • NORDC: Administration • NORDC: Programming • NORDC: Maintenance • Mosquito and Termite Control: Core Budget • Mosquito and Termite Control: Pest Control • Miscellaneous: New Orleans Council on Aging • Miscellaneous: Total Community Action • Miscellaneous: Orleans Parish Veterans Affairs • New Orleans Museum of Art: 2013 Exhibition Schedule Core
• Mosquito and Termite Control: Pesticide for Mosquito and Rodent Abatement/Airplane Parts and Jet Fuel/Overtime/Nuisance Wildlife Control
• NOPL: Increased Staffing Needs/Other Operating Costs/Preventative Maintenance and Repair/Security/Library Materials and Resources/Teen Services Programming/Live Computer Homework Assistance/Adult Literacy/Summer Reading Program/Volunteer Services Coordinator
• NORDC: Aquatics Supplement/Recreation Centers Supplement/Athletics Supplement/Administration Supplement
• Mayor’s Special Grant Program
UNFUNDED
FUNDED – CHILDREN & FAMILIES
Page 42

ECONOMIC DEVELOPMENT Spurs the growth of a diverse economy that creates good-
paying jobs and provides equal access to economic prosperity.
Mayor’s Budget Priorities: Business/Retail Development: The NOLA Business Alliance provides business retention and expansion services; assists companies with relocation to the City and attracts retailers to the local market.
Promoting Cultural Economy: Programs to support the growing film industry, to bring higher paying jobs to local residents in the film industry and to reform the licensing and permitting processes associated with cultural economy industries. Equal Business Opportunity Programs: Programs that support the utilization of local and minority-owned businesses in the procurement of goods and services by the City of New Orleans. Supplier Diversity: In 2012, through the work of the Office of Supplier Diversity the City met or exceeded DBE goals in each of the first three quarters. Workforce Development: Investments to provide year-round and summer job development opportunities to job seekers, including our City’s youth.
Citizen Feedback:
What We Heard How We Responded • Promote business development and
diversity of retail stores • Promote small business development • Ensure compliance with DBE goals
The Mayor has a number of initiatives to promote economic growth and a diverse economy. These include the NOLA Business Alliance and promoting partnerships among businesses, nonprofits, intergovernmental organizations and government such as the Small Business Assistance Fund and the Fresh Food Retailer Initiative. The City will again fully fund the Office of Supplier Diversity to help Disadvantaged Business Enterprise (DBE) firms improve access to the financing tools they need to grow.
Page 43
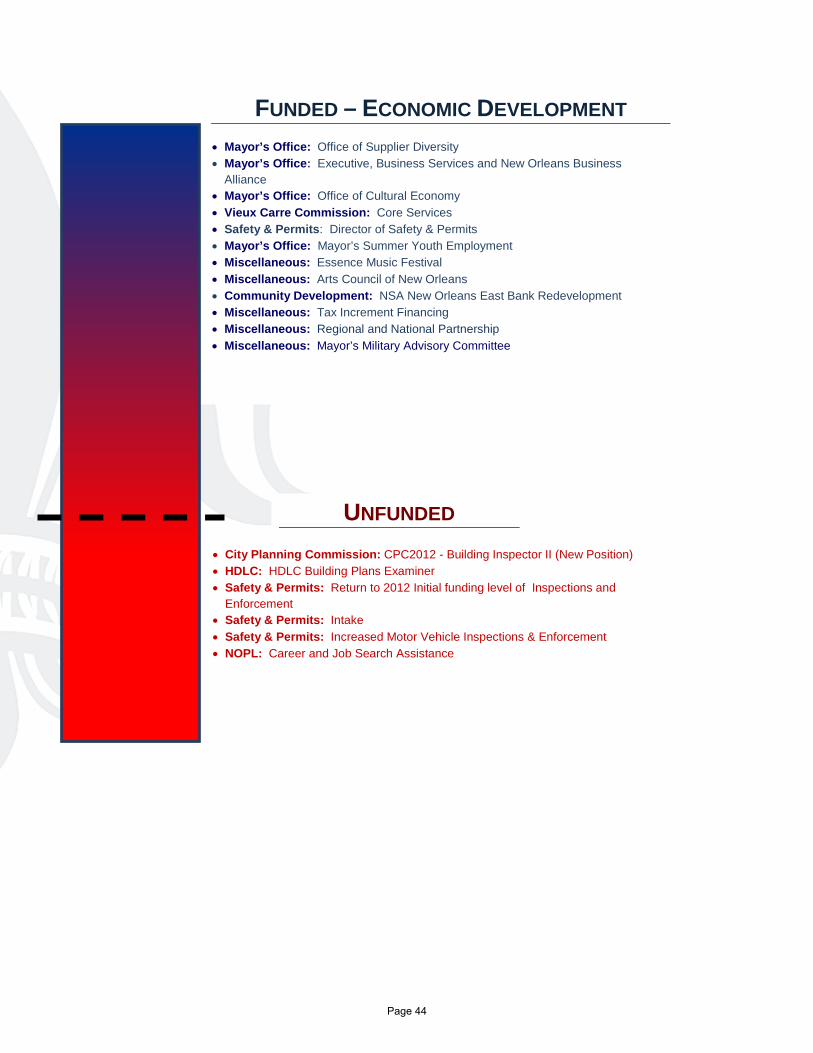
• Mayor’s Office: Office of Supplier Diversity • Mayor’s Office: Executive, Business Services and New Orleans Business
Alliance • Mayor’s Office: Office of Cultural Economy • Vieux Carre Commission: Core Services • Safety & Permits: Director of Safety & Permits • Mayor’s Office: Mayor’s Summer Youth Employment • Miscellaneous: Essence Music Festival • Miscellaneous: Arts Council of New Orleans • Community Development: NSA New Orleans East Bank Redevelopment • Miscellaneous: Tax Increment Financing • Miscellaneous: Regional and National Partnership • Miscellaneous: Mayor’s Military Advisory Committee
• City Planning Commission: CPC2012 - Building Inspector II (New Position) • HDLC: HDLC Building Plans Examiner • Safety & Permits: Return to 2012 Initial funding level of Inspections and
Enforcement • Safety & Permits: Intake • Safety & Permits: Increased Motor Vehicle Inspections & Enforcement • NOPL: Career and Job Search Assistance
UNFUNDED
FUNDED – ECONOMIC DEVELOPMENT
Page 44
SUSTAINABLE COMMUNITIES Supports sustainable communities that integrate quality
housing, transportation, schools, commercial development, energy efficiency, parks and green space, flood protection
and cultural assets.
Mayor’s Budget Priorities:
Eliminate Blight: The Mayor’s goal is to eliminate 10,000 blighted properties by 2014. According to the Greater New Orleans Community Data Center, the City has removed nearly 8,000 blighted properties. The 2013 budget will continue to support an aggressive blight reduction strategy.
Potholes: The 2013 budget will fund roadway maintenance, which will result in tens of thousands of potholes filled. In 2012, the City has exceeded its goal to date, filling over 44,000 potholes in the first three quarters.
Streetlights: Streetlights improve public safety and quality of life. In 2012, the Mayor dedicated $8 million in one-time federal recovery dollars to fixing streetlights. Since taking office, the City replaced nearly 20,000 streetlights, and by the end of the year, it will have repaired close to 10,000 repairs in 2012 alone. More one-time money is scheduled to be budgeted in 2013. Alternatively, the Mayor is proposing a permanent solution to fixing the streetlights. Streetscapes: Enhancing our streetscapes provides a public benefit to the entire community and help trigger private investment for these neighborhoods still recovering from Hurricane Katrina. There are a total of 24 streetscape projects currently underway or planned by the City of New Orleans.
Citizen Feedback:
What We Heard How We Responded • Blight is a huge problem • Repair streetlights • Fix potholes • Improve drainage • Ensure grass is cut on public parks and
spaces
Based on citizen feedback, the Mayor implemented an aggressive blight strategy. Funding for that program will continue at a similar pace in 2013. The Mayor is proposing a permanent funding solution for replacing and repairing all city streetlights. Even with some reductions, Parks and Parkways crews will be able to maintain its regular 3-week cutting schedule with neutral grounds and public spaces.
Page 45
• Public Works: Roadway Maintenance/ Street Light Maintenance/ Administration/ Engineering / Parking Division
• CAO: Capital Projects • Parks & Parkways: Management, Planning and Operations/Grounds Maintenance/Urban
Forestry Operations/Major Park Operations/Golf Course Operations/Special Operations • Mayor-Coastal and Environmental Affairs: Brownfields Grant – Revolving Loan Fund
Program/Coastal Zone Management/Solar America Cities/General Fund Administrative Budget/Orleans Land Bridge Project
• Sanitation: Core Budget • Neighborhood Housing Improvement: Core Budget • Public Works: Engineering and Administration/Maintenance/Parking • HDLC: Core Budget • City Planning Commission: Core Budget • Law: Housing and Finance Unit/Adjudication • Community Development: Energy Efficiency Conservation Block Grant Program/Core
Budget/NORA Planning and Revitalization Opportunity Development • Miscellaneous: Louisiana SPCA/Regional Planning Commission • Miscellaneous: LSU AgCenter and Southern AgCenter
• Public Works: Off-System Bridge Maintenance System/Supplemental
Maintenance/Complete Streets Program/Parking Supplemental • Parks & Parkways: Overtime Funds and Supply Increases in Special Operations/GIS
Public Tree Inventory/Additional Grounds Maintenance Staff and Contractual Cutting and Spraying Funds/Additional Forestry Staff and Contractual Tree Trimming and Stump Removal/Additional Major Park Security and Maintenance Staff
• City Planning Commission: Senior City Planner Position/Orientation and Continuous Training/Neighborhood Participation Program/ITS Position
• Sanitation: Florida Avenue Transfer Station – Restart • Safety & Permits: Continuing Education – Inspections and Plan Review/Increased
Building Inspections and Enforcement/Adjudication Enforcement • Neighborhood Housing Improvement: Staffing for Efficiency and Productivity • Vieux Carre Commission: Resume Inspection and Enforcement Activities
FUNDED – SUSTAINABLE COMMUNITIES
UNFUNDED
Page 46
OPEN & EFFECTIVE GOVERNMENT Ensures sound fiscal management and transparency, promotes effective, customer-driven services and fosters active citizen engagement in City
government.
Mayor’s Budget Priorities:
NOLA 311: In 2012, the new 311 call center launched. The fully-staffed center operates five days a week. For 31 different city services, residents can now get answers, report a problem, and get a tracking number through NOLA 311. By the end of 2012, NOLA 311 will go a step further with mobile applications. For the first time, citizens will be able to report problems online at our newly-redesigned nola.gov. The City will expand 311 services further in 2013. Public Information: In 2012, Communications and Information Technology and Innovation launched a series of upgrades to the City’s website. Among the changes were links to essential city services directly on the new homepage of www.nola.gov, including online payments, public meetings, latest news, data, maps and performance reports.
Accountability and Transparency: The 2013 budget maintains funding for the Office of Performance and Accountability so that the City can continue its performance management programs like BlightStat, Reqto CheckStat, QualityofLifeStat, BottomLineStat and ResultsNOLA, to make City government more accountable, transparent, and efficient.
Citizen Feedback:
What We Heard How We Responded • Transparency and accountability in
government • More city hall services available online • Better coordination of City
Departments
Transparency and integrity are part of the Mayor’s values. The 2013 budget proposes several initiatives to continue to improve transparency and accountability in City government. In 2013, the City will expand 311 services to include more departments and service requests. The City will fully implement One Stop Shop for permitting
Page 47
• Mayor's Office: Executive and Administrative/ Intergovernmental Affairs/Communications/Contingency Fund/International Relations/Strategic Opportunity Grant Match Fund/Office of Neighborhood Engagement
• City Council: New Orleans City Council • CAO: Executive Office/Election Expense/City Utilities/Personnel/Benefit
Administration/Municipal Training Administration/Mailroom/Budget Office/Employee Relations
• CAO-IT: ITI Core Operations/Copiers/NOLA311/Enterprise Wide Applications • Finance: Bureau of Accounting/Business Tax Collection/Cash Management & Tax
Administration/Procurement/PTF-Transit/Director’s Office/City of New Orleans Employees’ Retirement System –Core/Debt Service Payments
• Law: Law Administration/Police Litigation/Civil Litigation • Property Management: Director’s Office/Facilities Maintenance/Facilities
Maintenance Administration • Civil Service: Civil Service Administration/Fire Testing Administration • Community Development: Office of Federal And State Programs • Judicial Retirement Fund: Judicial Retirement System • Miscellaneous: Deputy Mayor for Operations/Office of Performance and
Accountability/Risk Management • Clerk of Criminal District Court: Polling Sites • Registrar of Voters: Effective and Efficient Government • CAO-EMD: EMD General Maintenance/EMD Fuel Services • Alcoholic Beverage Control Board: Alcoholic Beverage Control Board
• Miscellaneous: Risk Management Workers’ Compensation Settlements • CAO: Executive Office – City Finances/Financial Management • Finance: City of New Orleans Employees’ Retirement System – Annual Benefit Statements/Sales
Tax Payment Processing – Banking Services/Sales Tax Audit Program – External Firms/City of New Orleans Employees’ Retirement System – Additional Staff/Printing Postage Services – Sales Tax Forms, Delinquent Billing/Upgrade Cashier System
• CAO-EMD: EMD Additional Maintenance/EMD Additional Staff/EMD Deferred Repairs/New Vehicle Acquisition/EMD Fleet Management Information System
• CAO-IT: Enterprise Document & Content Management System/Geographically Diverse Disaster Recovery Site/Enterprise Resource Planning/Intelligent Operations Center
• Property Management: Facilities Maintenance Supplemental Grass Cutting at Cemeteries/Facilities Maintenance Administration Supplemental/Preventative Maintenance/Gallier Hall Support Staff/Real Estate Leasing Staff/Facilities Maintenance Supplemental Job Order Contracting Building Repairs
• Civil Service: Appeal Processing Administration/Employment Record Conversion/Enhanced Recruitment Efforts/Police Sergeant Test Development and Administration/Public Records Processing/Restoration of Deputy Personnel Director/Restoration of Contractual Legal Service Levels and Appeal Processing/Performance Appraisal Process Software
• Traffic Court: Traffic Court Technology Update
UNFUNDED
FUNDED – OPEN AND EFFECTIVE GOVERNMENT
Page 48
INNOVATION Develops and implements innovative programs that transform the City,
improve City services and promote efficiency.
Mayor’s Budget Priorities:
Enterprise-Wide Applications: The City will fund a number of initiatives designed to promote efficiency in analysis and information sharing as well as improve information and services available to customers. Potential projects for 2013 could include an improved collection strategy, property management leases and investing in our employees through an improved performance evaluation system.
Citizen Feedback:
What We Heard How We Responded • Better coordination of City departments • Improve collections
• Through enhanced IT infrastructure, revised policies/procedures and centralized services, such as permitting, the City will support better coordination which will lead to enhanced services for citizens.
• Investment in enhanced sales tax collection system
Page 49
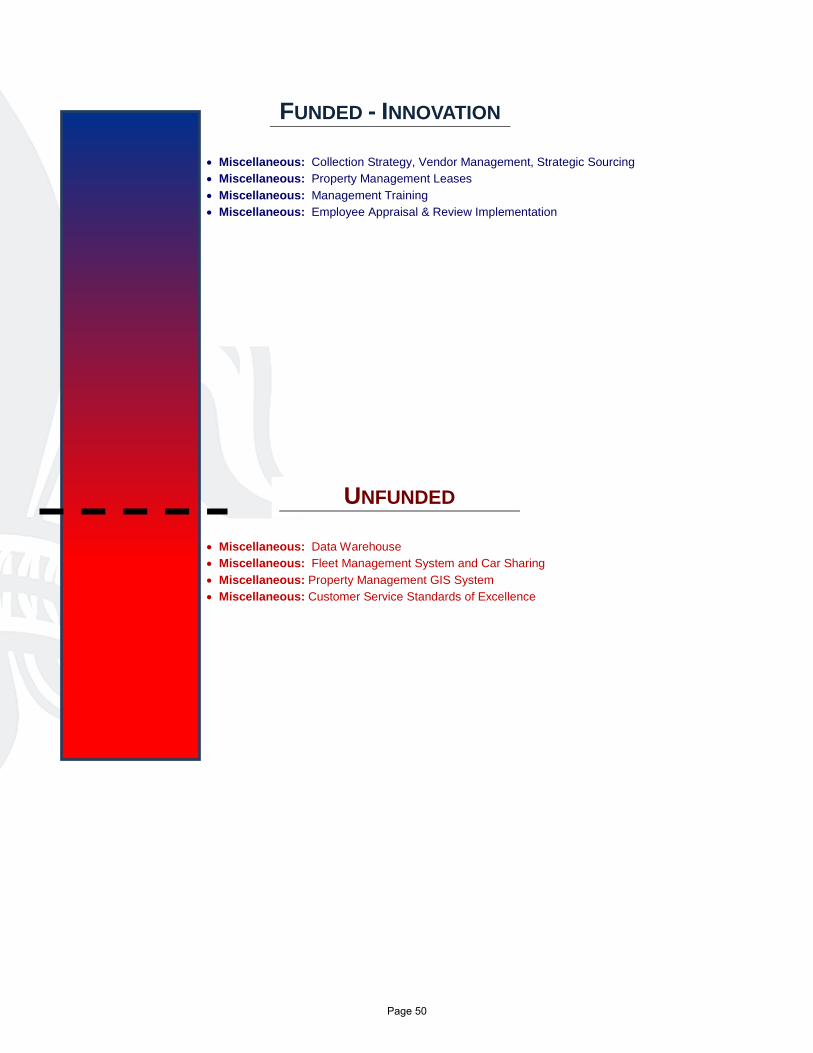
• Miscellaneous: Data Warehouse • Miscellaneous: Fleet Management System and Car Sharing • Miscellaneous: Property Management GIS System • Miscellaneous: Customer Service Standards of Excellence
• Miscellaneous: Collection Strategy, Vendor Management, Strategic Sourcing • Miscellaneous: Property Management Leases • Miscellaneous: Management Training • Miscellaneous: Employee Appraisal & Review Implementation
FUNDED - INNOVATION
UNFUNDED
Page 50
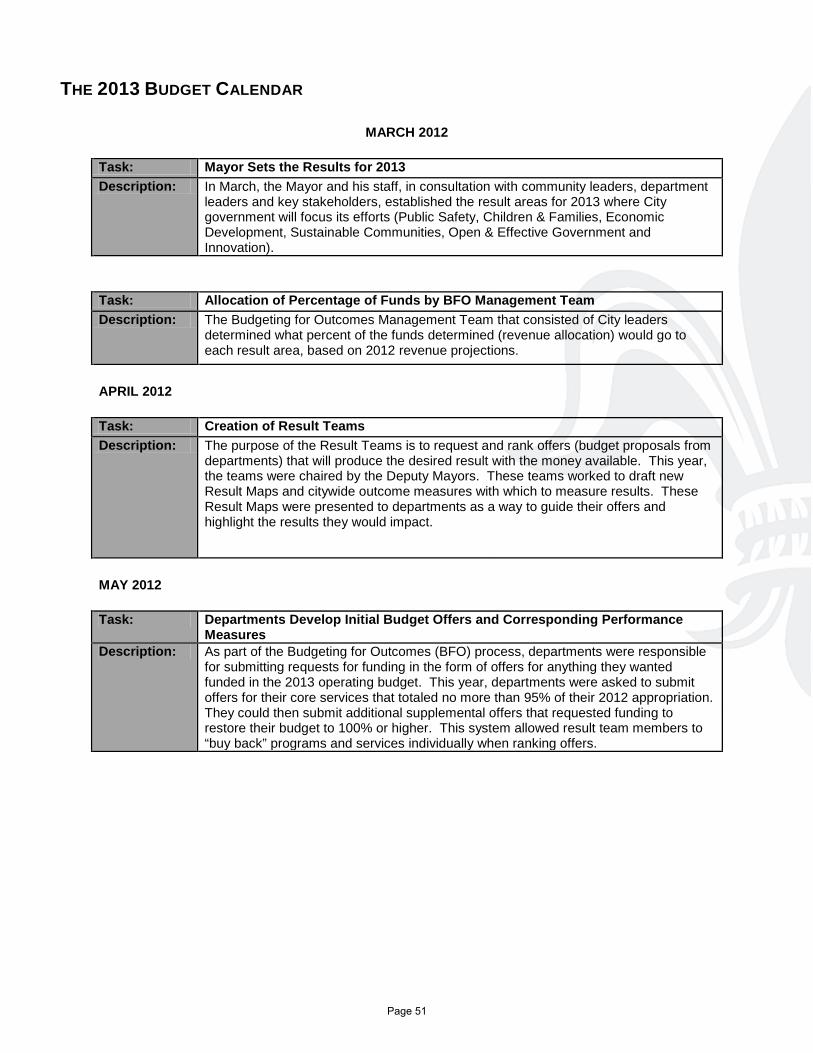
THE 2013 BUDGET CALENDAR
MARCH 2012
Task: Mayor Sets the Results for 2013 Description: In March, the Mayor and his staff, in consultation with community leaders, department
leaders and key stakeholders, established the result areas for 2013 where City government will focus its efforts (Public Safety, Children & Families, Economic Development, Sustainable Communities, Open & Effective Government and Innovation).
Task: Allocation of Percentage of Funds by BFO Management Team Description: The Budgeting for Outcomes Management Team that consisted of City leaders
determined what percent of the funds determined (revenue allocation) would go to each result area, based on 2012 revenue projections.
APRIL 2012
Task: Creation of Result Teams Description: The purpose of the Result Teams is to request and rank offers (budget proposals from
departments) that will produce the desired result with the money available. This year, the teams were chaired by the Deputy Mayors. These teams worked to draft new Result Maps and citywide outcome measures with which to measure results. These Result Maps were presented to departments as a way to guide their offers and highlight the results they would impact.
MAY 2012
Task: Departments Develop Initial Budget Offers and Corresponding Performance Measures
Description: As part of the Budgeting for Outcomes (BFO) process, departments were responsible for submitting requests for funding in the form of offers for anything they wanted funded in the 2013 operating budget. This year, departments were asked to submit offers for their core services that totaled no more than 95% of their 2012 appropriation. They could then submit additional supplemental offers that requested funding to restore their budget to 100% or higher. This system allowed result team members to “buy back” programs and services individually when ranking offers.
Page 51
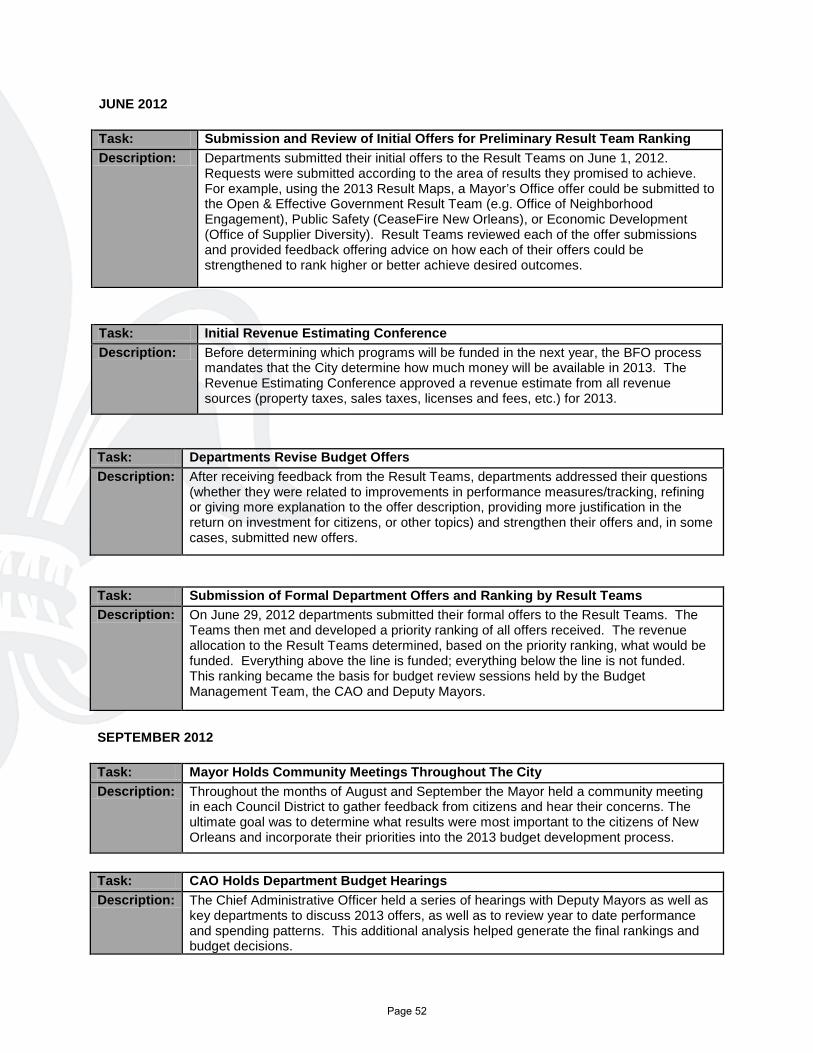
JUNE 2012
Task: Submission and Review of Initial Offers for Preliminary Result Team Ranking Description: Departments submitted their initial offers to the Result Teams on June 1, 2012.
Requests were submitted according to the area of results they promised to achieve. For example, using the 2013 Result Maps, a Mayor’s Office offer could be submitted to the Open & Effective Government Result Team (e.g. Office of Neighborhood Engagement), Public Safety (CeaseFire New Orleans), or Economic Development (Office of Supplier Diversity). Result Teams reviewed each of the offer submissions and provided feedback offering advice on how each of their offers could be strengthened to rank higher or better achieve desired outcomes.
Task: Initial Revenue Estimating Conference Description: Before determining which programs will be funded in the next year, the BFO process
mandates that the City determine how much money will be available in 2013. The Revenue Estimating Conference approved a revenue estimate from all revenue sources (property taxes, sales taxes, licenses and fees, etc.) for 2013.
Task: Departments Revise Budget Offers Description: After receiving feedback from the Result Teams, departments addressed their questions
(whether they were related to improvements in performance measures/tracking, refining or giving more explanation to the offer description, providing more justification in the return on investment for citizens, or other topics) and strengthen their offers and, in some cases, submitted new offers.
Task: Submission of Formal Department Offers and Ranking by Result Teams Description: On June 29, 2012 departments submitted their formal offers to the Result Teams. The
Teams then met and developed a priority ranking of all offers received. The revenue allocation to the Result Teams determined, based on the priority ranking, what would be funded. Everything above the line is funded; everything below the line is not funded. This ranking became the basis for budget review sessions held by the Budget Management Team, the CAO and Deputy Mayors.
SEPTEMBER 2012
Task: Mayor Holds Community Meetings Throughout The City Description: Throughout the months of August and September the Mayor held a community meeting
in each Council District to gather feedback from citizens and hear their concerns. The ultimate goal was to determine what results were most important to the citizens of New Orleans and incorporate their priorities into the 2013 budget development process.
Task: CAO Holds Department Budget Hearings Description: The Chief Administrative Officer held a series of hearings with Deputy Mayors as well as
key departments to discuss 2013 offers, as well as to review year to date performance and spending patterns. This additional analysis helped generate the final rankings and budget decisions.
Page 52
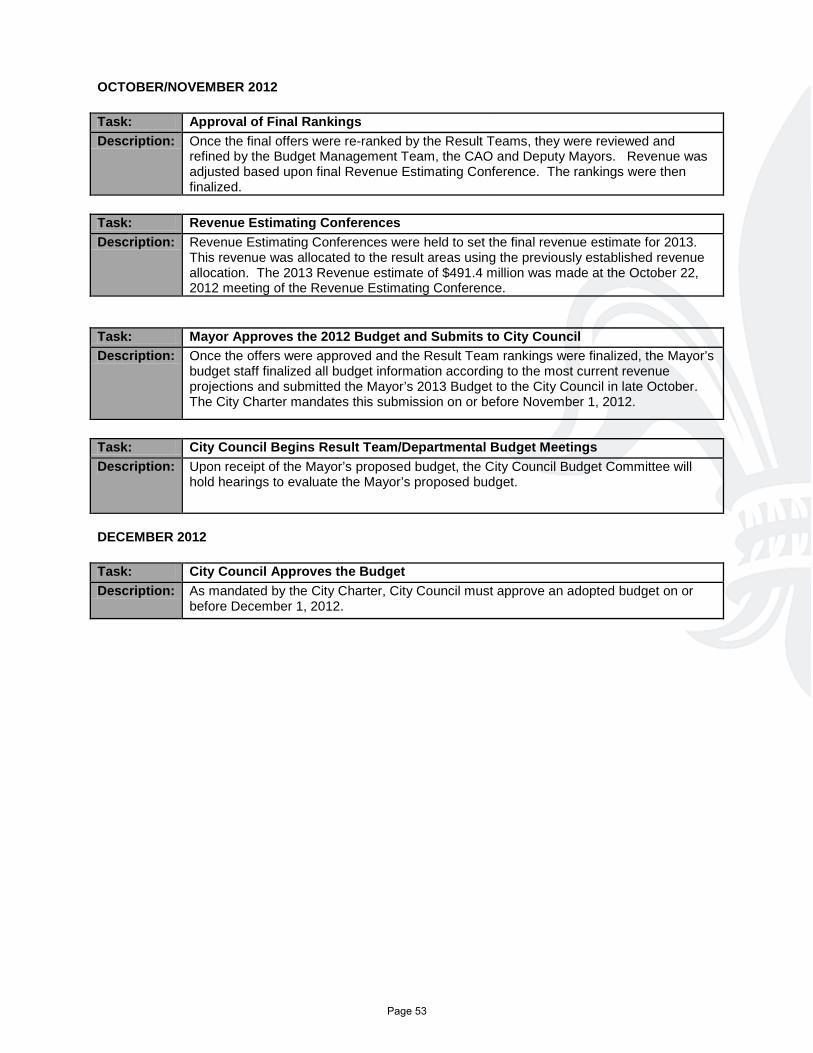
OCTOBER/NOVEMBER 2012
Task: Approval of Final Rankings Description: Once the final offers were re-ranked by the Result Teams, they were reviewed and
refined by the Budget Management Team, the CAO and Deputy Mayors. Revenue was adjusted based upon final Revenue Estimating Conference. The rankings were then finalized.
Task: Revenue Estimating Conferences Description: Revenue Estimating Conferences were held to set the final revenue estimate for 2013.
This revenue was allocated to the result areas using the previously established revenue allocation. The 2013 Revenue estimate of $491.4 million was made at the October 22, 2012 meeting of the Revenue Estimating Conference.
Task: Mayor Approves the 2012 Budget and Submits to City Council Description: Once the offers were approved and the Result Team rankings were finalized, the Mayor’s
budget staff finalized all budget information according to the most current revenue projections and submitted the Mayor’s 2013 Budget to the City Council in late October. The City Charter mandates this submission on or before November 1, 2012.
Task: City Council Begins Result Team/Departmental Budget Meetings Description: Upon receipt of the Mayor’s proposed budget, the City Council Budget Committee will
hold hearings to evaluate the Mayor’s proposed budget.
DECEMBER 2012
Task: City Council Approves the Budget Description: As mandated by the City Charter, City Council must approve an adopted budget on or
before December 1, 2012.
Page 53
BUDGET ADOPTION & AMENDMENT PROCESS
Budget Adoption By Executive Order, Mayor Landrieu mandated that the City’s budget proposal would be submitted to the City Council on October 29, 2012, due to the impact of Hurricane Isaac. While the date is later than the previous two years, it still meets the City Charter requirement of submitting the budget to the Council “not later than the first day of November” as required by Section 6-102. During the months of October and November, the City Council will hold public hearings on the budget and shall publish notice of the dates, times and locations of hearings in accordance with the City Charter. During the public hearings, all interested persons shall be given an opportunity to be heard on the Budget as submitted. The Budget shall be finally adopted by the City Council no later than December 1. Upon final adoption, the Budget shall be in effect for the fiscal year and copies shall be filed in accordance with State and local statutes. The Budget will be posted on the City’s website, www.nola.gov. Budget Amendment The City Charter provides that the City Council may amend the Mayor’s Proposed Budget; it may increase, decrease or delete any item of appropriation proposed by the Mayor. By a two-thirds vote of its members, the Council may add new items of appropriation. Appropriations for Personal Services must be made as lump sums, not by specific positions or rates of pay. Once the Budget has been adopted, adjustments are made by ordinance.
CAPITAL BUDGET
In accordance with the New Orleans City Charter, the City Planning Commission prepares a recommendation to the City Council each year of the capital improvements needed during the next five-year period to facilitate the City's infrastructure, facility and maintenance needs. This recommendation is contained in the Capital Improvements Plan, which is submitted to the City Council before the adoption of the annual budget. Council approves appropriations for these capital improvements in the Capital Budget.
PRESENTATION OF BUDGET INFORMATION
As a guide to the information presented in the following budget reports, the City notes the following information: • FY 2011 Actual Data is unaudited. • Special taxing districts, Downtown Development District and N. O. Regional Business Park, do not reflect
expenditures, only the dedicated millage. • Contributions and Fund Transfers are funds set aside to off-set grant revenue and are only accounted for as
they are used.
Page 54
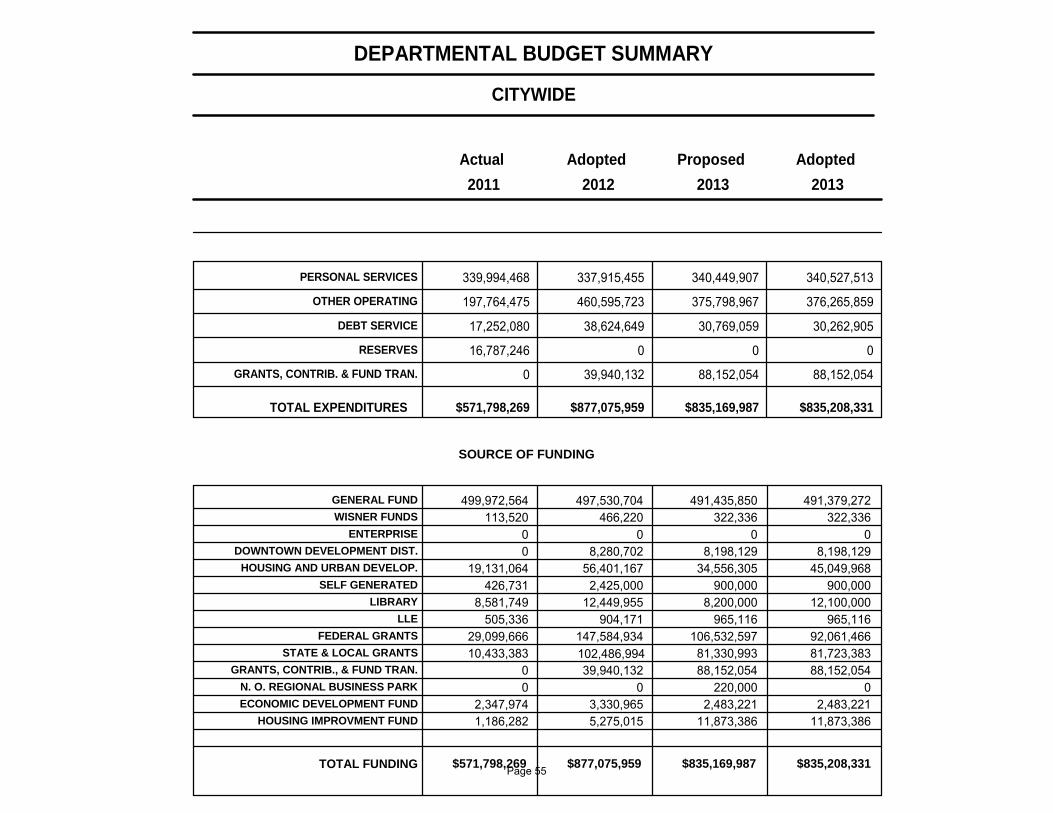
CITYWIDE
DEPARTMENTAL BUDGET SUMMARY
Adopted Proposed Adopted Actual
2013 2012 2011 2013
PERSONAL SERVICES 339,994,468 337,915,455 340,449,907 340,527,513 OTHER OPERATING 197,764,475 460,595,723 375,798,967 376,265,859
DEBT SERVICE 17,252,080 38,624,649 30,769,059 30,262,905 RESERVES 16,787,246 0 0 0
GRANTS, CONTRIB. & FUND TRAN. 0 39,940,132 88,152,054 88,152,054
$571,798,269 $877,075,959 $835,169,987 TOTAL EXPENDITURES $835,208,331
GENERAL FUND 499,972,564 497,530,704 491,435,850 491,379,272 WISNER FUNDS 113,520 466,220 322,336 322,336
ENTERPRISE 0 0 0 0 DOWNTOWN DEVELOPMENT DIST. 0 8,280,702 8,198,129 8,198,129
HOUSING AND URBAN DEVELOP. 19,131,064 56,401,167 34,556,305 45,049,968 SELF GENERATED 426,731 2,425,000 900,000 900,000
LIBRARY 8,581,749 12,449,955 8,200,000 12,100,000 LLE 505,336 904,171 965,116 965,116
FEDERAL GRANTS 29,099,666 147,584,934 106,532,597 92,061,466 STATE & LOCAL GRANTS 10,433,383 102,486,994 81,330,993 81,723,383
GRANTS, CONTRIB., & FUND TRAN. 0 39,940,132 88,152,054 88,152,054 N. O. REGIONAL BUSINESS PARK 0 0 220,000 0 ECONOMIC DEVELOPMENT FUND 2,347,974 3,330,965 2,483,221 2,483,221
HOUSING IMPROVMENT FUND 1,186,282 5,275,015 11,873,386 11,873,386
$571,798,269 $877,075,959 $835,169,987 TOTAL FUNDING $835,208,331
SOURCE OF FUNDING
Page 55
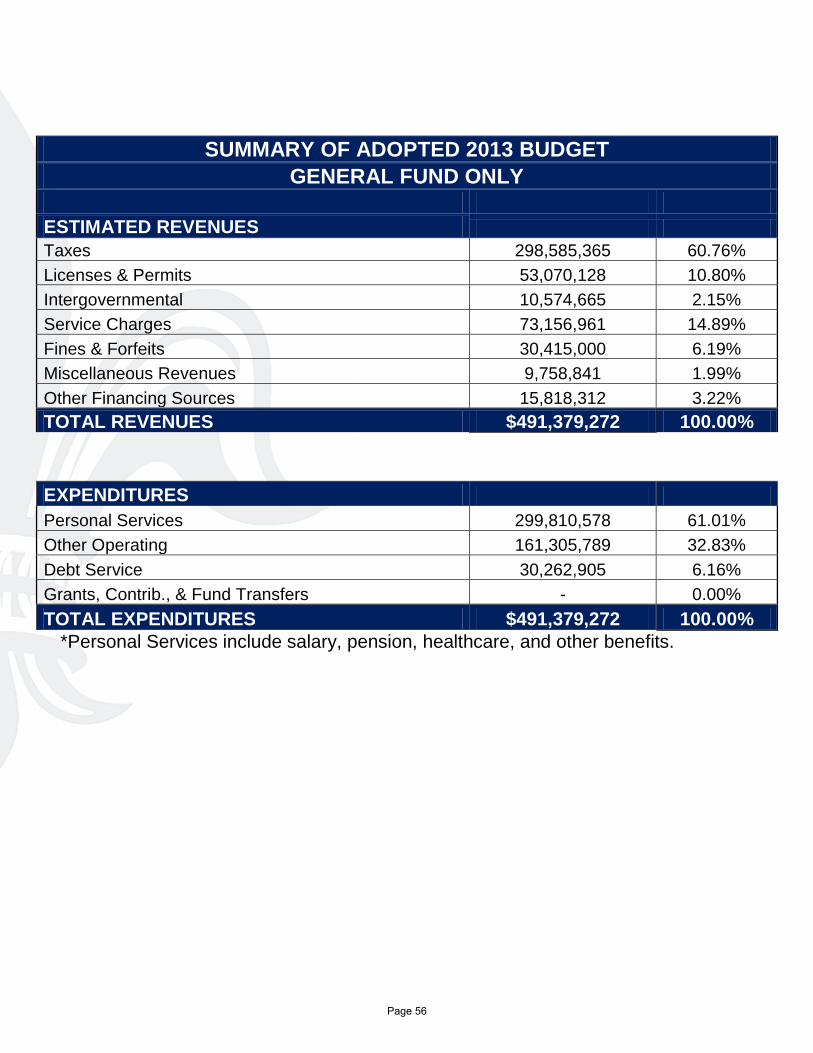
SUMMARY OF ADOPTED 2013 BUDGET GENERAL FUND ONLY
ESTIMATED REVENUES Taxes 298,585,365 60.76% Licenses & Permits 53,070,128 10.80% Intergovernmental 10,574,665 2.15% Service Charges 73,156,961 14.89% Fines & Forfeits 30,415,000 6.19% Miscellaneous Revenues 9,758,841 1.99% Other Financing Sources 15,818,312 3.22% TOTAL REVENUES $491,379,272 100.00%
EXPENDITURES Personal Services 299,810,578 61.01% Other Operating 161,305,789 32.83% Debt Service 30,262,905 6.16% Grants, Contrib., & Fund Transfers - 0.00% TOTAL EXPENDITURES $491,379,272 100.00%
*Personal Services include salary, pension, healthcare, and other benefits.
Page 56
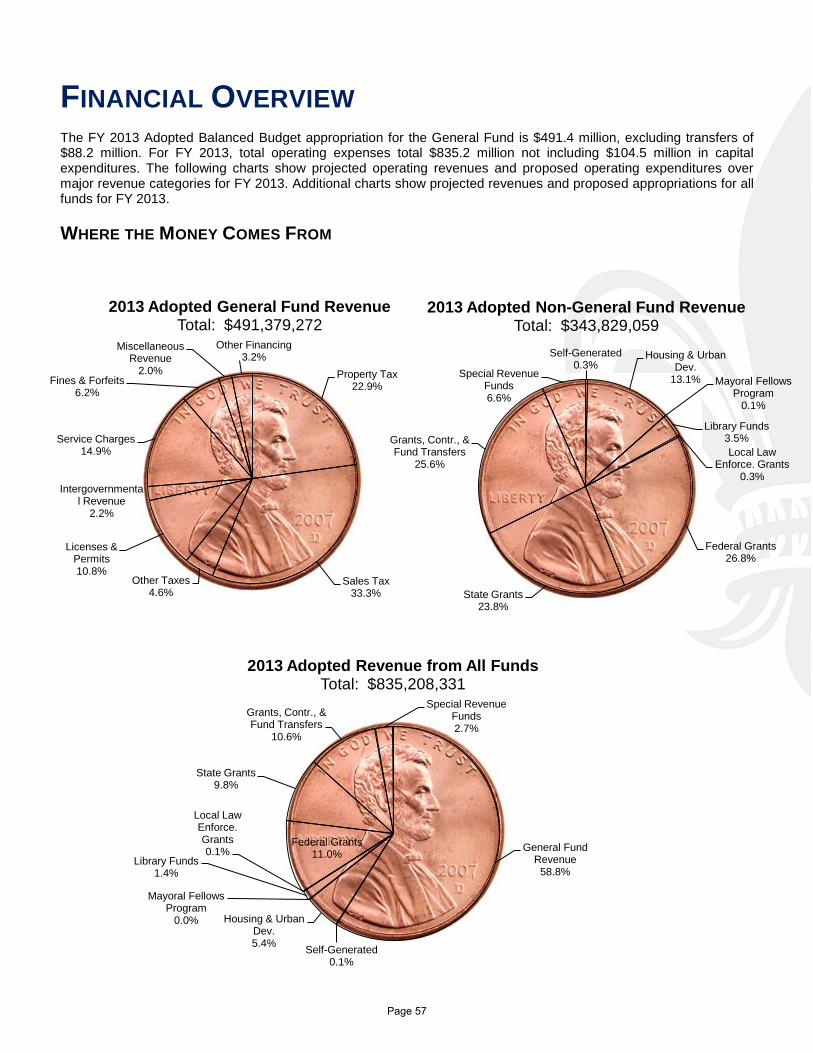
FINANCIAL OVERVIEW The FY 2013 Adopted Balanced Budget appropriation for the General Fund is $491.4 million, excluding transfers of $88.2 million. For FY 2013, total operating expenses total $835.2 million not including $104.5 million in capital expenditures. The following charts show projected operating revenues and proposed operating expenditures over major revenue categories for FY 2013. Additional charts show projected revenues and proposed appropriations for all funds for FY 2013.
WHERE THE MONEY COMES FROM
Property Tax 22.9%
Sales Tax 33.3%
Other Taxes 4.6%
Licenses & Permits 10.8%
Intergovernmental Revenue
2.2%
Service Charges 14.9%
Fines & Forfeits 6.2%
Miscellaneous Revenue
2.0%
Other Financing 3.2%
2013 Adopted General Fund Revenue Total: $491,379,272
Self-Generated 0.3%
Housing & Urban Dev.
13.1% Mayoral Fellows Program
0.1%
Library Funds 3.5% Local Law
Enforce. Grants 0.3%
Federal Grants 26.8%
State Grants 23.8%
Grants, Contr., & Fund Transfers
25.6%
Special Revenue Funds 6.6%
2013 Adopted Non-General Fund Revenue Total: $343,829,059
General Fund Revenue
58.8%
Self-Generated 0.1%
Housing & Urban Dev. 5.4%
Mayoral Fellows Program
0.0%
Library Funds 1.4%
Local Law Enforce. Grants 0.1%
Federal Grants 11.0%
State Grants 9.8%
Grants, Contr., & Fund Transfers
10.6%
Special Revenue Funds 2.7%
2013 Adopted Revenue from All Funds Total: $835,208,331
Page 57
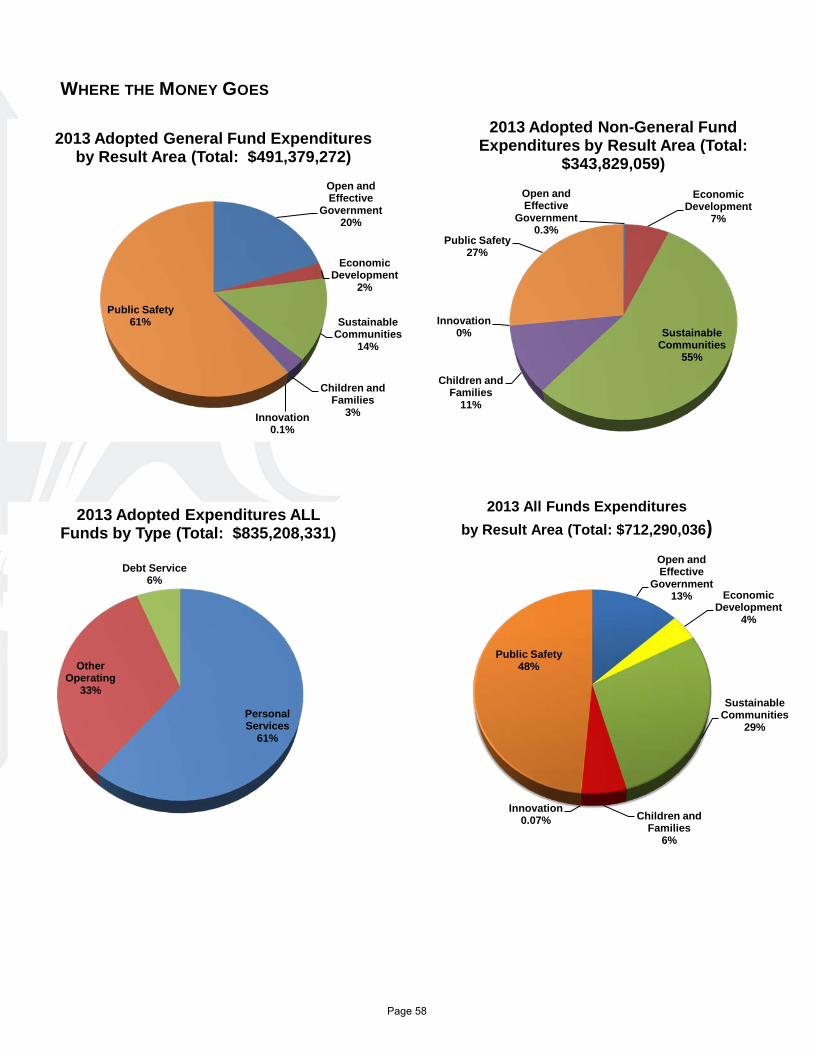
WHERE THE MONEY GOES
Open and Effective
Government 20%
Economic Development
2%
Sustainable Communities
14%
Children and Families
3% Innovation 0.1%
Public Safety 61%
2013 Adopted General Fund Expenditures by Result Area (Total: $491,379,272)
Open and Effective
Government 0.3%
Economic Development
7%
Sustainable Communities
55%
Children and Families
11%
Innovation 0%
Public Safety 27%
2013 Adopted Non-General Fund Expenditures by Result Area (Total:
$343,829,059)
Personal Services
61%
Other Operating
33%
Debt Service 6%
2013 Adopted Expenditures ALL Funds by Type (Total: $835,208,331)
Open and Effective
Government 13% Economic
Development 4%
Sustainable Communities
29%
Children and Families
6%
Innovation 0.07%
Public Safety 48%
2013 All Funds Expenditures by Result Area (Total: $712,290,036)
Page 58
OVERVIEW OF REVENUES AND EXPENDITURES Summary One purpose of the City's budget is to project how current spending trends will impact future budget choices. To accomplish this, a projection is made of future year revenues, together with expenditure trends, debt service obligations, and fund balance policies regarding reserves for emergencies. General Fund revenues are projected by trend or by specific circumstances that are anticipated to occur during the forecast period. The expenditure projection is developed using the proposed level of services provided by the City. Debt service is estimated using current obligations for principal and interest repayments. Expenditures for 2012 are based on the modified adopted budget, together with adjustments to debt service obligations for 2012 as a result of recent bond refinancings. Methodology During the development of the 2013 Budget, the City developed a multi-year revenue forecast for the General Fund. The forecast considered key factors such as expected economic growth, construction outlook, employment trends, and other factors. Major revenue sources such as sales tax were forecasted using national and local projections of economic activity and historic trends and patterns of revenue collection. Sources used in developing these projections include national economic forecasts for inflation, growth in real GDP, employment levels, and unemployment rates. Additionally, adjustments were made for unusually events in 2013 expected to affect revenues in a material way, such as the hosting of the Super Bowl in New Orleans. Revenue Assumptions City General Fund revenues are forecast to grow from the October 2012 Revenue Estimating Conference forecast for FY2012 by 1.6 percent for FY2013, to $491.4 million. Revenue for all funds is proposed at $835.2 million for FY2013, compared to an adopted level for FY2012 of $876.3 million. From the level proposed in the Mayor's 2013 budget, General Fund revenues are forecast to grow modestly for the years 2014 to 2017, at a rate of about 2 percent per year. Expenditure Assumptions Spending for personnel costs, other operating, and all other non-debt obligations, is projected to grow at a rate of 2.0 percent per year from the level proposed for FY2013. Debt service is forecasted for 2013 to 2017 to include the City's outstanding obligations for: - Certificates of Indebtedness - 2012 refunding bonds - Economic development related obligations - GO Zone repayments (note that the 2013 obligations will be addressed using non-GF sources)
Page 59
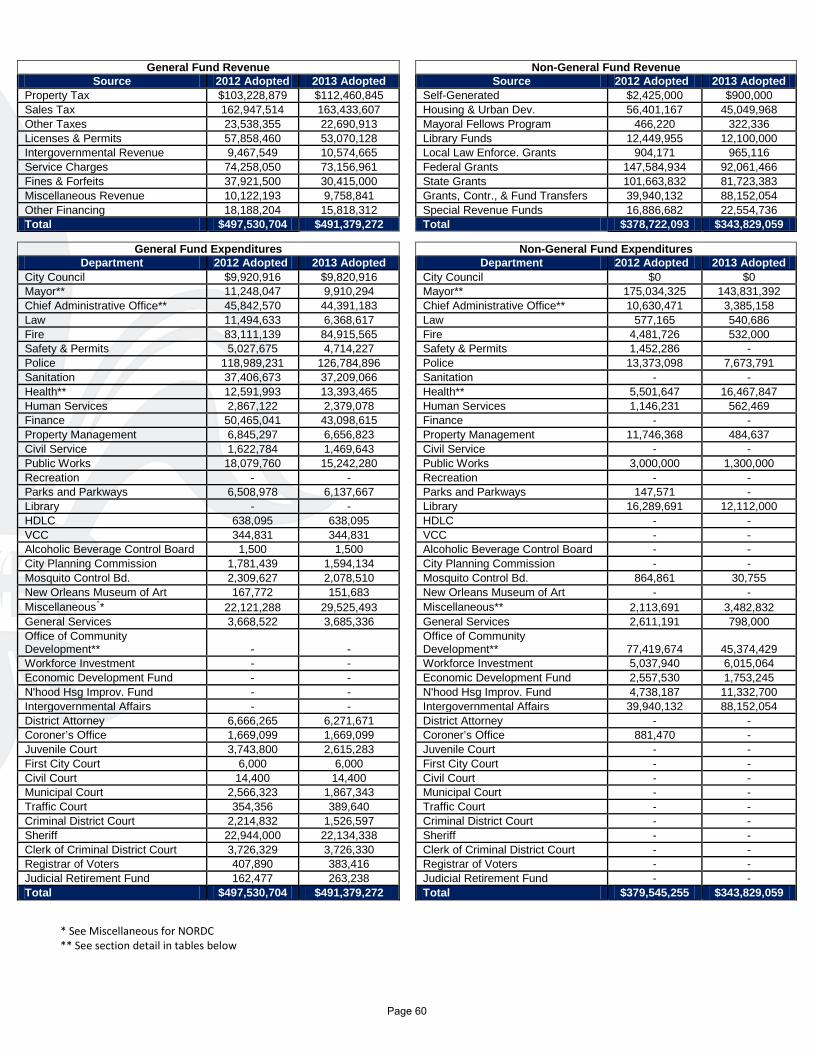
* See Miscellaneous for NORDC ** See section detail in tables below
General Fund Revenue
Non-General Fund Revenue Source 2012 Adopted 2013 Adopted
Source 2012 Adopted 2013 Adopted
Property Tax $103,228,879 $112,460,845
Self-Generated $2,425,000 $900,000 Sales Tax 162,947,514 163,433,607
Housing & Urban Dev. 56,401,167 45,049,968
Other Taxes 23,538,355 22,690,913
Mayoral Fellows Program 466,220 322,336 Licenses & Permits 57,858,460 53,070,128
Library Funds 12,449,955 12,100,000
Intergovernmental Revenue 9,467,549 10,574,665
Local Law Enforce. Grants 904,171 965,116 Service Charges 74,258,050 73,156,961
Federal Grants 147,584,934 92,061,466
Fines & Forfeits 37,921,500 30,415,000
State Grants 101,663,832 81,723,383 Miscellaneous Revenue 10,122,193 9,758,841
Grants, Contr., & Fund Transfers 39,940,132 88,152,054
Other Financing 18,188,204 15,818,312
Special Revenue Funds 16,886,682 22,554,736 Total $497,530,704 $491,379,272
Total $378,722,093 $343,829,059
General Fund Expenditures
Non-General Fund Expenditures Department 2012 Adopted 2013 Adopted
Department 2012 Adopted 2013 Adopted
City Council $9,920,916 $9,820,916
City Council $0 $0 Mayor** 11,248,047 9,910,294
Mayor** 175,034,325 143,831,392
Chief Administrative Office** 45,842,570 44,391,183
Chief Administrative Office** 10,630,471 3,385,158 Law 11,494,633 6,368,617
Law 577,165 540,686
Fire 83,111,139 84,915,565
Fire 4,481,726 532,000 Safety & Permits 5,027,675 4,714,227
Safety & Permits 1,452,286 -
Police 118,989,231 126,784,896
Police 13,373,098 7,673,791 Sanitation 37,406,673 37,209,066
Sanitation - -
Health** 12,591,993 13,393,465
Health** 5,501,647 16,467,847 Human Services 2,867,122 2,379,078
Human Services 1,146,231 562,469
Finance 50,465,041 43,098,615
Finance - - Property Management 6,845,297 6,656,823
Property Management 11,746,368 484,637
Civil Service 1,622,784 1,469,643
Civil Service - - Public Works 18,079,760 15,242,280
Public Works 3,000,000 1,300,000
Recreation - -
Recreation - - Parks and Parkways 6,508,978 6,137,667
Parks and Parkways 147,571 -
Library - -
Library 16,289,691 12,112,000 HDLC 638,095 638,095
HDLC - -
VCC 344,831 344,831
VCC - - Alcoholic Beverage Control Board 1,500 1,500
Alcoholic Beverage Control Board - -
City Planning Commission 1,781,439 1,594,134
City Planning Commission - - Mosquito Control Bd. 2,309,627 2,078,510
Mosquito Control Bd. 864,861 30,755
New Orleans Museum of Art 167,772 151,683
New Orleans Museum of Art - - Miscellaneous** 22,121,288 29,525,493
Miscellaneous** 2,113,691 3,482,832
General Services 3,668,522 3,685,336
General Services 2,611,191 798,000 Office of Community Development** - -
Office of Community Development** 77,419,674 45,374,429
Workforce Investment - -
Workforce Investment 5,037,940 6,015,064 Economic Development Fund - -
Economic Development Fund 2,557,530 1,753,245
N'hood Hsg Improv. Fund - -
N'hood Hsg Improv. Fund 4,738,187 11,332,700 Intergovernmental Affairs - -
Intergovernmental Affairs 39,940,132 88,152,054
District Attorney 6,666,265 6,271,671
District Attorney - - Coroner’s Office 1,669,099 1,669,099
Coroner’s Office 881,470 -
Juvenile Court 3,743,800 2,615,283
Juvenile Court - - First City Court 6,000 6,000
First City Court - -
Civil Court 14,400 14,400
Civil Court - - Municipal Court 2,566,323 1,867,343
Municipal Court - -
Traffic Court 354,356 389,640
Traffic Court - - Criminal District Court 2,214,832 1,526,597
Criminal District Court - -
Sheriff 22,944,000 22,134,338
Sheriff - - Clerk of Criminal District Court 3,726,329 3,726,330
Clerk of Criminal District Court - -
Registrar of Voters 407,890 383,416
Registrar of Voters - - Judicial Retirement Fund 162,477 263,238
Judicial Retirement Fund - -
Total $497,530,704 $491,379,272
Total $379,545,255 $343,829,059
Page 60
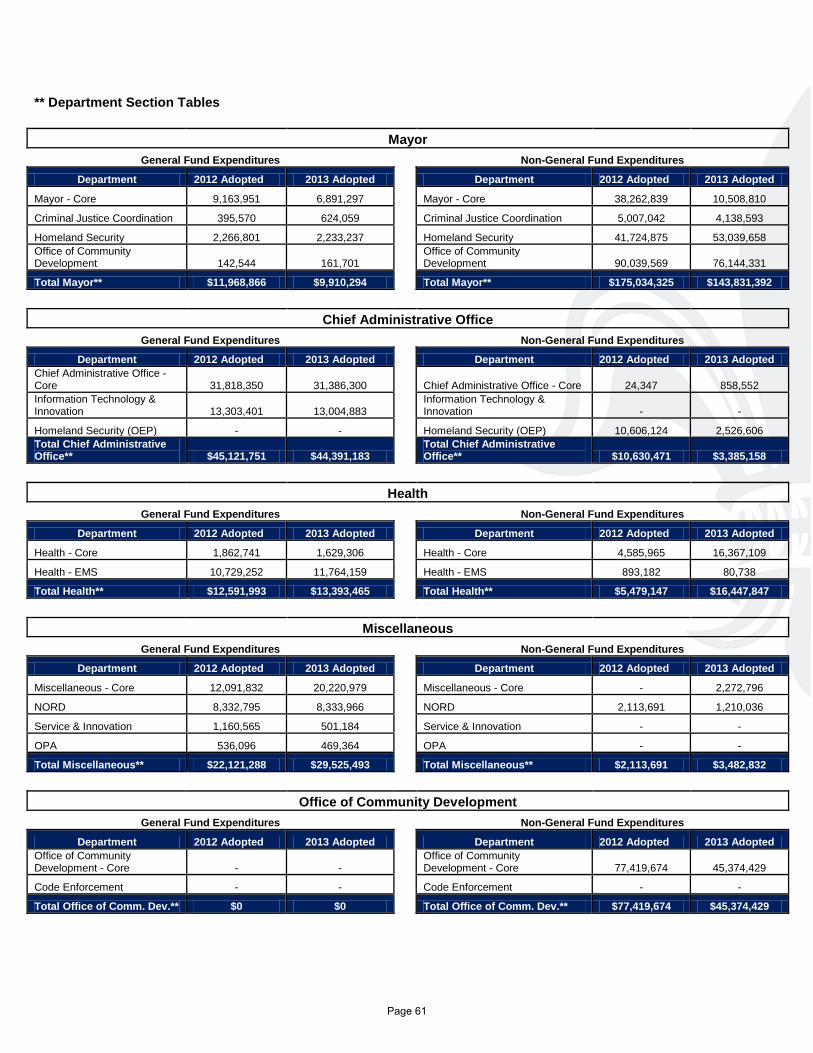
** Department Section Tables
Mayor
General Fund Expenditures
Non-General Fund Expenditures
Department 2012 Adopted 2013 Adopted
Department 2012 Adopted 2013 Adopted
Mayor - Core 9,163,951 6,891,297
Mayor - Core 38,262,839 10,508,810
Criminal Justice Coordination 395,570 624,059
Criminal Justice Coordination 5,007,042 4,138,593
Homeland Security 2,266,801 2,233,237
Homeland Security 41,724,875 53,039,658 Office of Community Development 142,544 161,701
Office of Community Development 90,039,569 76,144,331
Total Mayor** $11,968,866 $9,910,294
Total Mayor** $175,034,325 $143,831,392
Chief Administrative Office General Fund Expenditures
Non-General Fund Expenditures
Department 2012 Adopted 2013 Adopted
Department 2012 Adopted 2013 Adopted Chief Administrative Office - Core 31,818,350 31,386,300
Chief Administrative Office - Core 24,347 858,552
Information Technology & Innovation 13,303,401 13,004,883
Information Technology & Innovation - -
Homeland Security (OEP) - -
Homeland Security (OEP) 10,606,124 2,526,606 Total Chief Administrative Office** $45,121,751 $44,391,183
Total Chief Administrative Office** $10,630,471 $3,385,158
Health General Fund Expenditures
Non-General Fund Expenditures
Department 2012 Adopted 2013 Adopted
Department 2012 Adopted 2013 Adopted
Health - Core 1,862,741 1,629,306
Health - Core 4,585,965 16,367,109
Health - EMS 10,729,252 11,764,159
Health - EMS 893,182 80,738
Total Health** $12,591,993 $13,393,465
Total Health** $5,479,147 $16,447,847
Miscellaneous General Fund Expenditures
Non-General Fund Expenditures
Department 2012 Adopted 2013 Adopted
Department 2012 Adopted 2013 Adopted
Miscellaneous - Core 12,091,832 20,220,979
Miscellaneous - Core - 2,272,796
NORD 8,332,795 8,333,966
NORD 2,113,691 1,210,036
Service & Innovation 1,160,565 501,184
Service & Innovation - -
OPA 536,096 469,364
OPA - -
Total Miscellaneous** $22,121,288 $29,525,493
Total Miscellaneous** $2,113,691 $3,482,832
Office of Community Development General Fund Expenditures
Non-General Fund Expenditures
Department 2012 Adopted 2013 Adopted
Department 2012 Adopted 2013 Adopted Office of Community Development - Core - -
Office of Community Development - Core 77,419,674 45,374,429
Code Enforcement - -
Code Enforcement - -
Total Office of Comm. Dev.** $0 $0
Total Office of Comm. Dev.** $77,419,674 $45,374,429
Page 61
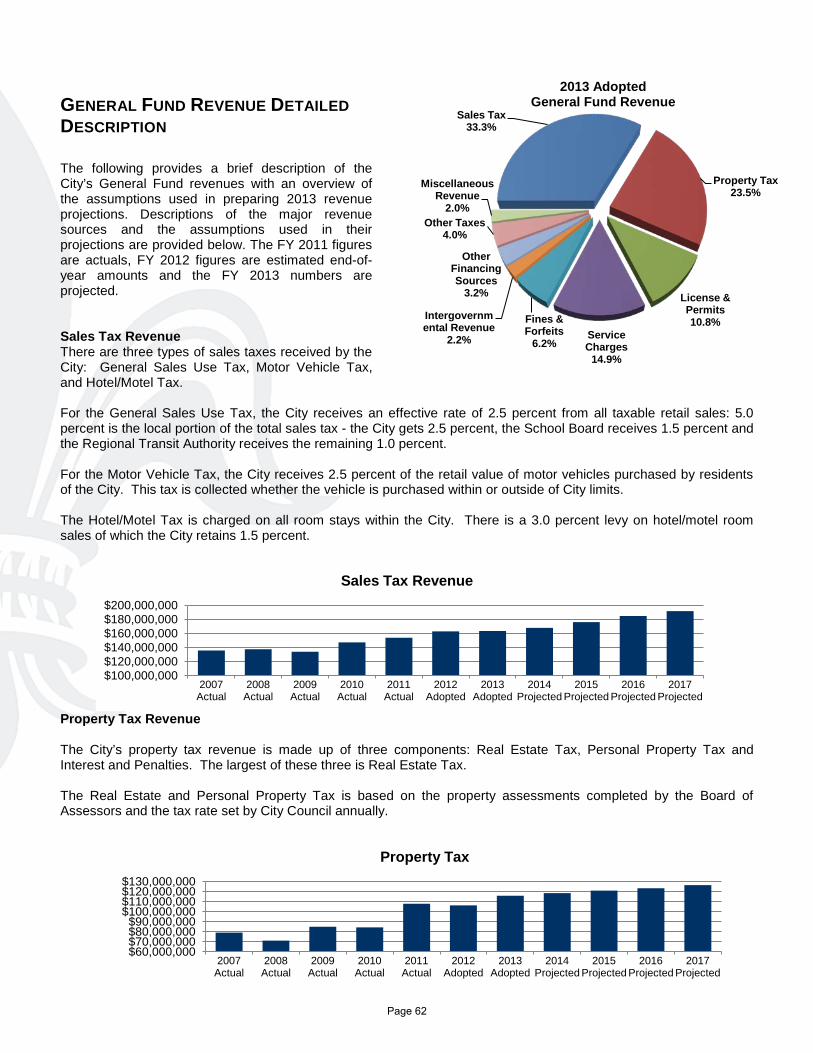
Sales Tax 33.3%
Property Tax 23.5%
License & Permits 10.8%
Service Charges
14.9%
Fines & Forfeits
6.2%
Intergovernmental Revenue
2.2%
Other Financing Sources
3.2%
Other Taxes 4.0%
Miscellaneous Revenue
2.0%
2013 Adopted General Fund Revenue
$100,000,000 $120,000,000 $140,000,000 $160,000,000 $180,000,000 $200,000,000
2007 Actual
2008 Actual
2009 Actual
2010 Actual
2011 Actual
2012 Adopted
2013 Adopted
2014 Projected
2015 Projected
2016 Projected
2017 Projected
Sales Tax Revenue
GENERAL FUND REVENUE DETAILED DESCRIPTION
The following provides a brief description of the City’s General Fund revenues with an overview of the assumptions used in preparing 2013 revenue projections. Descriptions of the major revenue sources and the assumptions used in their projections are provided below. The FY 2011 figures are actuals, FY 2012 figures are estimated end-of-year amounts and the FY 2013 numbers are projected. Sales Tax Revenue There are three types of sales taxes received by the City: General Sales Use Tax, Motor Vehicle Tax, and Hotel/Motel Tax. For the General Sales Use Tax, the City receives an effective rate of 2.5 percent from all taxable retail sales: 5.0 percent is the local portion of the total sales tax - the City gets 2.5 percent, the School Board receives 1.5 percent and the Regional Transit Authority receives the remaining 1.0 percent. For the Motor Vehicle Tax, the City receives 2.5 percent of the retail value of motor vehicles purchased by residents of the City. This tax is collected whether the vehicle is purchased within or outside of City limits. The Hotel/Motel Tax is charged on all room stays within the City. There is a 3.0 percent levy on hotel/motel room sales of which the City retains 1.5 percent.
Property Tax Revenue The City’s property tax revenue is made up of three components: Real Estate Tax, Personal Property Tax and Interest and Penalties. The largest of these three is Real Estate Tax. The Real Estate and Personal Property Tax is based on the property assessments completed by the Board of Assessors and the tax rate set by City Council annually.
$60,000,000 $70,000,000 $80,000,000 $90,000,000
$100,000,000 $110,000,000 $120,000,000 $130,000,000
2007 Actual
2008 Actual
2009 Actual
2010 Actual
2011 Actual
2012 Adopted
2013 Adopted
2014 Projected
2015 Projected
2016 Projected
2017 Projected
Property Tax
Page 62
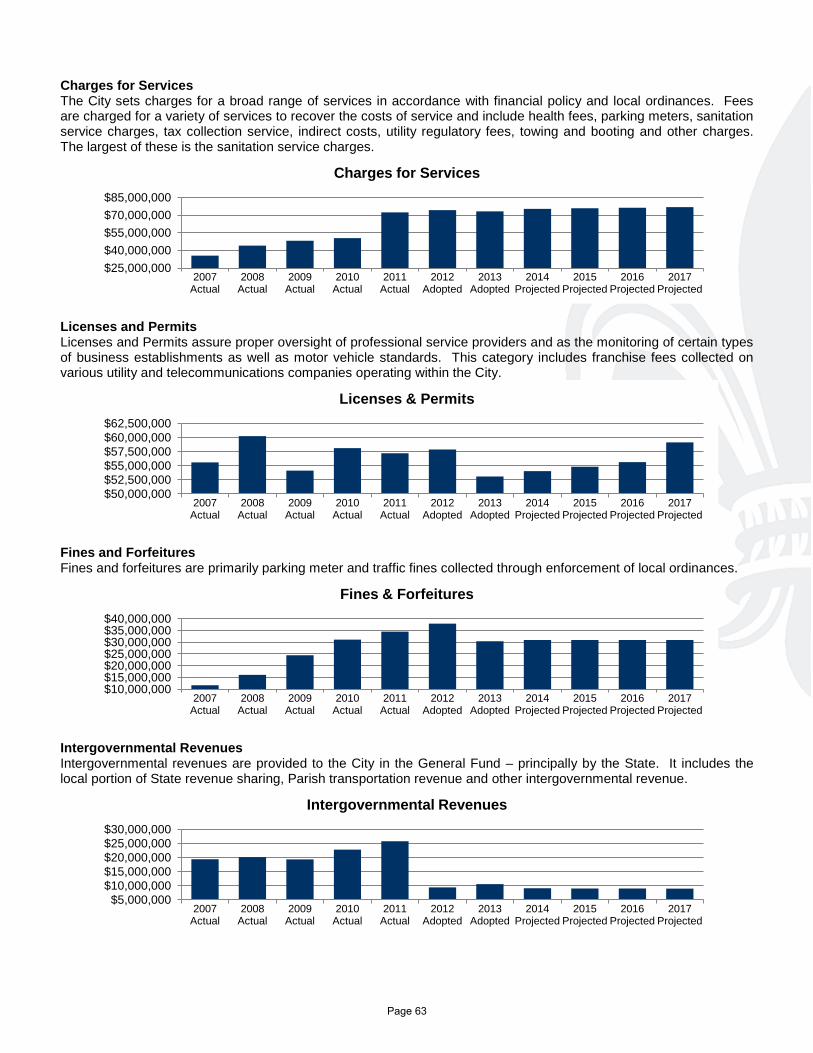
Charges for Services The City sets charges for a broad range of services in accordance with financial policy and local ordinances. Fees are charged for a variety of services to recover the costs of service and include health fees, parking meters, sanitation service charges, tax collection service, indirect costs, utility regulatory fees, towing and booting and other charges. The largest of these is the sanitation service charges.
Licenses and Permits Licenses and Permits assure proper oversight of professional service providers and as the monitoring of certain types of business establishments as well as motor vehicle standards. This category includes franchise fees collected on various utility and telecommunications companies operating within the City.
Fines and Forfeitures Fines and forfeitures are primarily parking meter and traffic fines collected through enforcement of local ordinances.
Intergovernmental Revenues Intergovernmental revenues are provided to the City in the General Fund – principally by the State. It includes the local portion of State revenue sharing, Parish transportation revenue and other intergovernmental revenue.
$25,000,000 $40,000,000 $55,000,000 $70,000,000 $85,000,000
2007 Actual
2008 Actual
2009 Actual
2010 Actual
2011 Actual
2012 Adopted
2013 Adopted
2014 Projected
2015 Projected
2016 Projected
2017 Projected
Charges for Services
$50,000,000 $52,500,000 $55,000,000 $57,500,000 $60,000,000 $62,500,000
2007 Actual
2008 Actual
2009 Actual
2010 Actual
2011 Actual
2012 Adopted
2013 Adopted
2014 Projected
2015 Projected
2016 Projected
2017 Projected
Licenses & Permits
$10,000,000 $15,000,000 $20,000,000 $25,000,000 $30,000,000 $35,000,000 $40,000,000
2007 Actual
2008 Actual
2009 Actual
2010 Actual
2011 Actual
2012 Adopted
2013 Adopted
2014 Projected
2015 Projected
2016 Projected
2017 Projected
Fines & Forfeitures
$5,000,000 $10,000,000 $15,000,000 $20,000,000 $25,000,000 $30,000,000
2007 Actual
2008 Actual
2009 Actual
2010 Actual
2011 Actual
2012 Adopted
2013 Adopted
2014 Projected
2015 Projected
2016 Projected
2017 Projected
Intergovernmental Revenues
Page 63
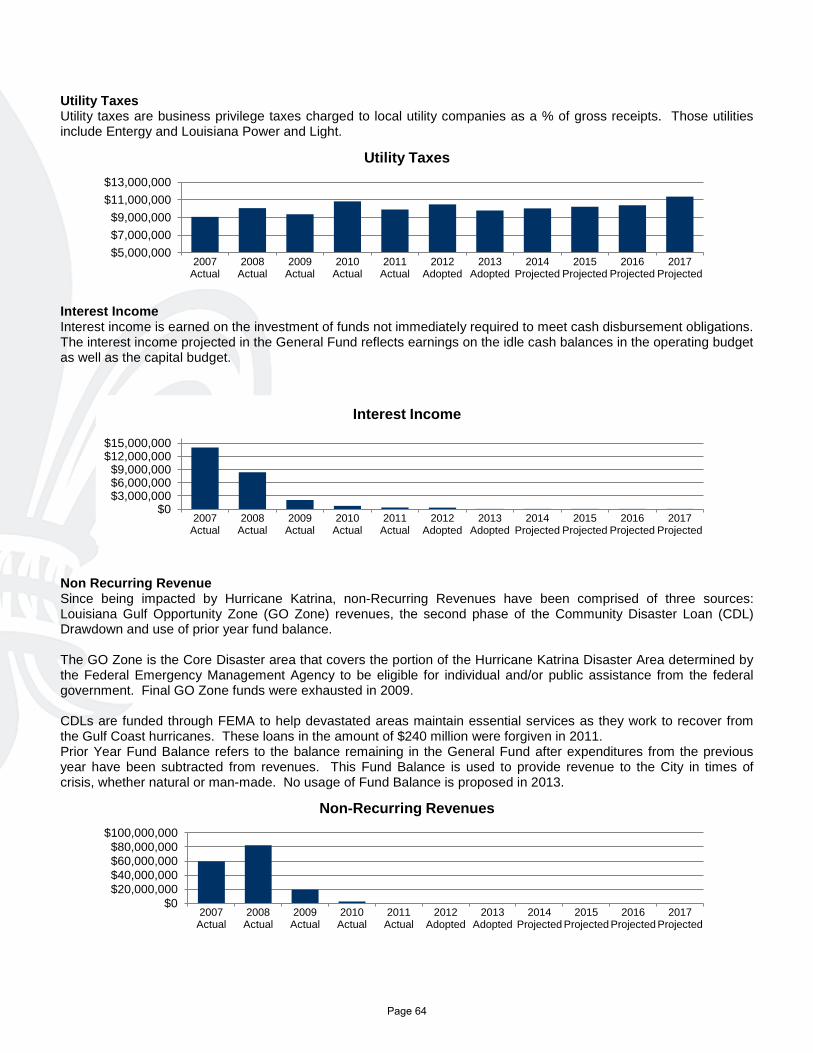
Utility Taxes Utility taxes are business privilege taxes charged to local utility companies as a % of gross receipts. Those utilities include Entergy and Louisiana Power and Light.
Interest Income Interest income is earned on the investment of funds not immediately required to meet cash disbursement obligations. The interest income projected in the General Fund reflects earnings on the idle cash balances in the operating budget as well as the capital budget.
Non Recurring Revenue Since being impacted by Hurricane Katrina, non-Recurring Revenues have been comprised of three sources: Louisiana Gulf Opportunity Zone (GO Zone) revenues, the second phase of the Community Disaster Loan (CDL) Drawdown and use of prior year fund balance. The GO Zone is the Core Disaster area that covers the portion of the Hurricane Katrina Disaster Area determined by the Federal Emergency Management Agency to be eligible for individual and/or public assistance from the federal government. Final GO Zone funds were exhausted in 2009. CDLs are funded through FEMA to help devastated areas maintain essential services as they work to recover from the Gulf Coast hurricanes. These loans in the amount of $240 million were forgiven in 2011. Prior Year Fund Balance refers to the balance remaining in the General Fund after expenditures from the previous year have been subtracted from revenues. This Fund Balance is used to provide revenue to the City in times of crisis, whether natural or man-made. No usage of Fund Balance is proposed in 2013.
$5,000,000 $7,000,000 $9,000,000
$11,000,000 $13,000,000
2007 Actual
2008 Actual
2009 Actual
2010 Actual
2011 Actual
2012 Adopted
2013 Adopted
2014 Projected
2015 Projected
2016 Projected
2017 Projected
Utility Taxes
$0 $3,000,000 $6,000,000 $9,000,000
$12,000,000 $15,000,000
2007 Actual
2008 Actual
2009 Actual
2010 Actual
2011 Actual
2012 Adopted
2013 Adopted
2014 Projected
2015 Projected
2016 Projected
2017 Projected
Interest Income
$0 $20,000,000 $40,000,000 $60,000,000 $80,000,000
$100,000,000
2007 Actual
2008 Actual
2009 Actual
2010 Actual
2011 Actual
2012 Adopted
2013 Adopted
2014 Projected
2015 Projected
2016 Projected
2017 Projected
Non-Recurring Revenues
Page 64
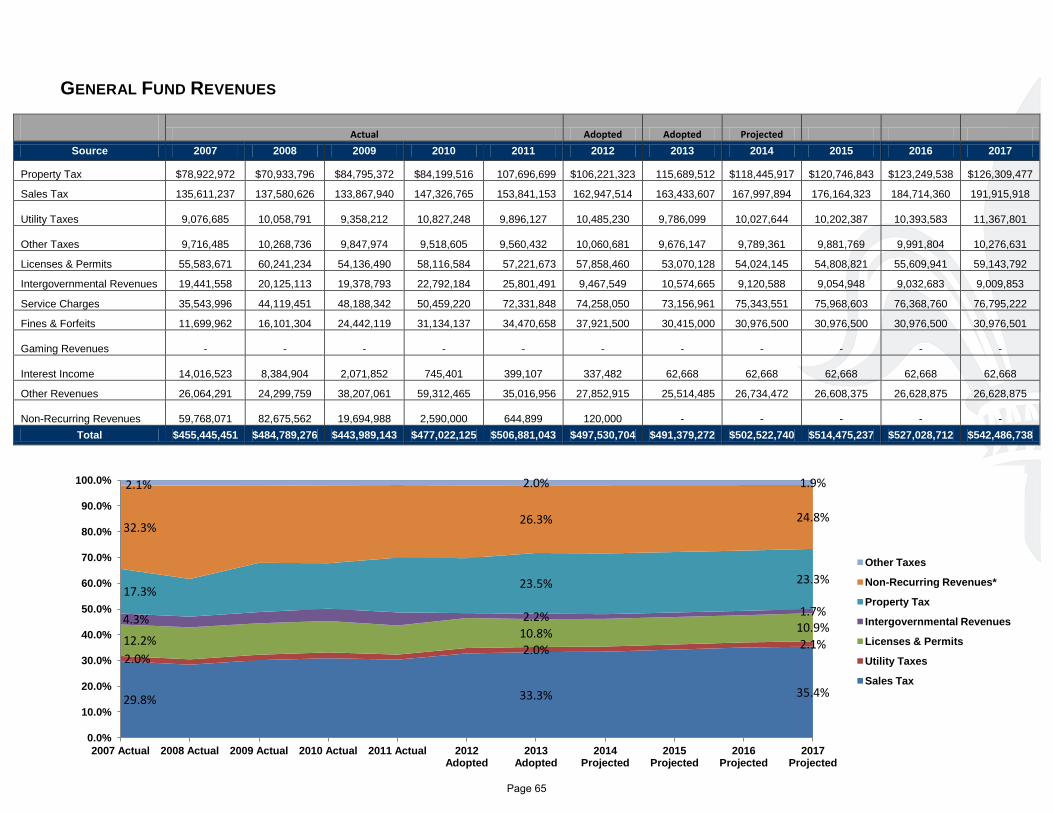
GENERAL FUND REVENUES
Actual Adopted Adopted Projected
Source 2007 2008 2009 2010 2011 2012 2013 2014 2015 2016 2017
Property Tax $78,922,972 $70,933,796 $84,795,372 $84,199,516 107,696,699 $106,221,323 115,689,512 $118,445,917 $120,746,843 $123,249,538 $126,309,477
Sales Tax 135,611,237 137,580,626 133,867,940 147,326,765 153,841,153 162,947,514 163,433,607 167,997,894 176,164,323 184,714,360 191,915,918
Utility Taxes 9,076,685 10,058,791 9,358,212 10,827,248
9,896,127 10,485,230
9,786,099 10,027,644 10,202,387 10,393,583 11,367,801
Other Taxes 9,716,485 10,268,736 9,847,974 9,518,605
9,560,432 10,060,681
9,676,147 9,789,361 9,881,769 9,991,804 10,276,631
Licenses & Permits 55,583,671 60,241,234 54,136,490 58,116,584 57,221,673 57,858,460 53,070,128 54,024,145 54,808,821 55,609,941 59,143,792
Intergovernmental Revenues 19,441,558 20,125,113 19,378,793 22,792,184 25,801,491 9,467,549 10,574,665 9,120,588 9,054,948 9,032,683 9,009,853
Service Charges 35,543,996 44,119,451 48,188,342 50,459,220 72,331,848 74,258,050 73,156,961 75,343,551 75,968,603 76,368,760 76,795,222
Fines & Forfeits 11,699,962 16,101,304 24,442,119 31,134,137 34,470,658 37,921,500 30,415,000 30,976,500 30,976,500 30,976,500 30,976,501
Gaming Revenues - - - - - -
- - - - -
Interest Income 14,016,523 8,384,904 2,071,852 745,401
399,107 337,482
62,668 62,668 62,668 62,668 62,668
Other Revenues 26,064,291 24,299,759 38,207,061 59,312,465 35,016,956 27,852,915 25,514,485 26,734,472 26,608,375 26,628,875 26,628,875
Non-Recurring Revenues 59,768,071 82,675,562 19,694,988 2,590,000 644,899 120,000 - - - - -
Total $455,445,451 $484,789,276 $443,989,143 $477,022,125 $506,881,043 $497,530,704 $491,379,272 $502,522,740 $514,475,237 $527,028,712 $542,486,738
29.8% 33.3% 35.4%
2.0% 2.0% 2.1% 12.2% 10.8% 10.9%
4.3% 2.2% 1.7%
17.3% 23.5% 23.3%
32.3% 26.3% 24.8%
2.1% 2.0% 1.9%
0.0%
10.0%
20.0%
30.0%
40.0%
50.0%
60.0%
70.0%
80.0%
90.0%
100.0%
2007 Actual 2008 Actual 2009 Actual 2010 Actual 2011 Actual 2012 Adopted
2013 Adopted
2014 Projected
2015 Projected
2016 Projected
2017 Projected
Other Taxes
Non-Recurring Revenues*
Property Tax
Intergovernmental Revenues
Licenses & Permits
Utility Taxes
Sales Tax
Page 65
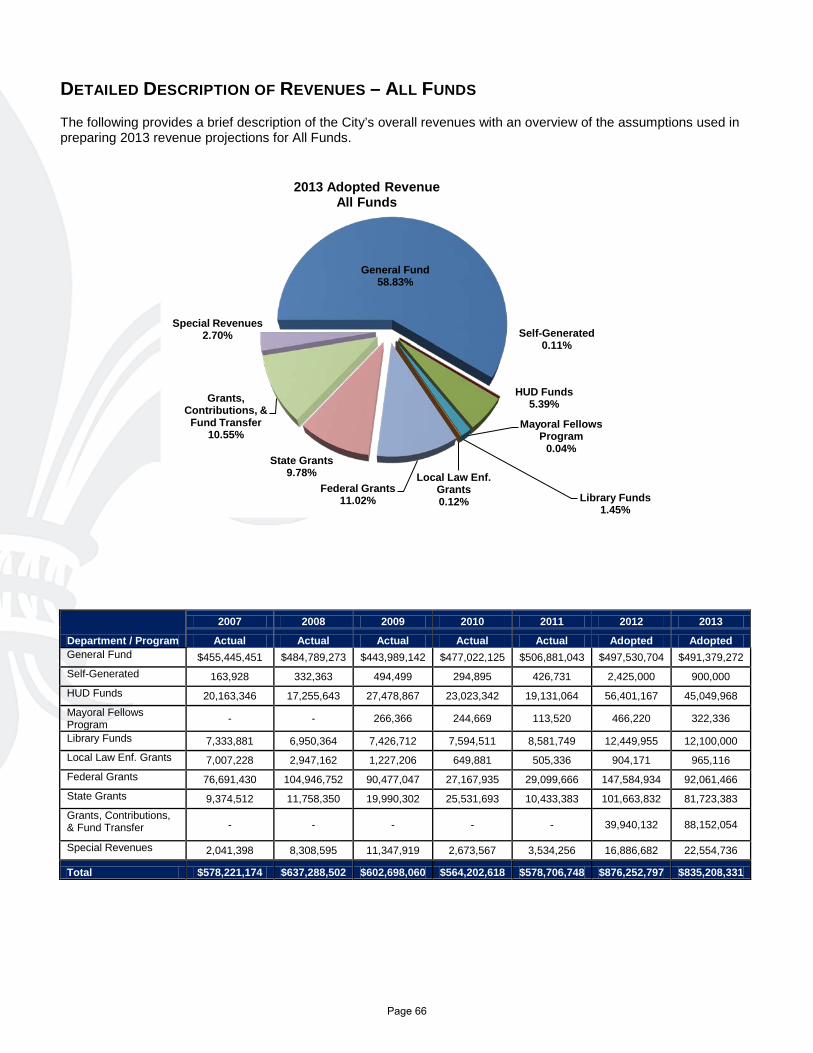
DETAILED DESCRIPTION OF REVENUES – ALL FUNDS The following provides a brief description of the City’s overall revenues with an overview of the assumptions used in preparing 2013 revenue projections for All Funds.
Department / Program
2007 2008 2009 2010 2011 2012 2013
Actual Actual Actual Actual Actual Adopted Adopted General Fund $455,445,451 $484,789,273 $443,989,142 $477,022,125 $506,881,043 $497,530,704 $491,379,272 Self-Generated 163,928 332,363 494,499 294,895 426,731 2,425,000 900,000 HUD Funds 20,163,346 17,255,643 27,478,867 23,023,342 19,131,064 56,401,167 45,049,968 Mayoral Fellows Program - - 266,366 244,669 113,520 466,220 322,336
Library Funds 7,333,881 6,950,364 7,426,712 7,594,511 8,581,749 12,449,955 12,100,000 Local Law Enf. Grants 7,007,228 2,947,162 1,227,206 649,881 505,336 904,171 965,116 Federal Grants 76,691,430 104,946,752 90,477,047 27,167,935 29,099,666 147,584,934 92,061,466 State Grants 9,374,512 11,758,350 19,990,302 25,531,693 10,433,383 101,663,832 81,723,383 Grants, Contributions, & Fund Transfer - - - - - 39,940,132 88,152,054
Special Revenues 2,041,398 8,308,595 11,347,919 2,673,567 3,534,256 16,886,682 22,554,736
Total $578,221,174 $637,288,502 $602,698,060 $564,202,618 $578,706,748 $876,252,797 $835,208,331
General Fund 58.83%
Self-Generated 0.11%
HUD Funds 5.39%
Mayoral Fellows Program
0.04%
Library Funds 1.45%
Local Law Enf. Grants 0.12%
Federal Grants 11.02%
State Grants 9.78%
Grants, Contributions, &
Fund Transfer 10.55%
Special Revenues 2.70%
2013 Adopted Revenue All Funds
Page 66
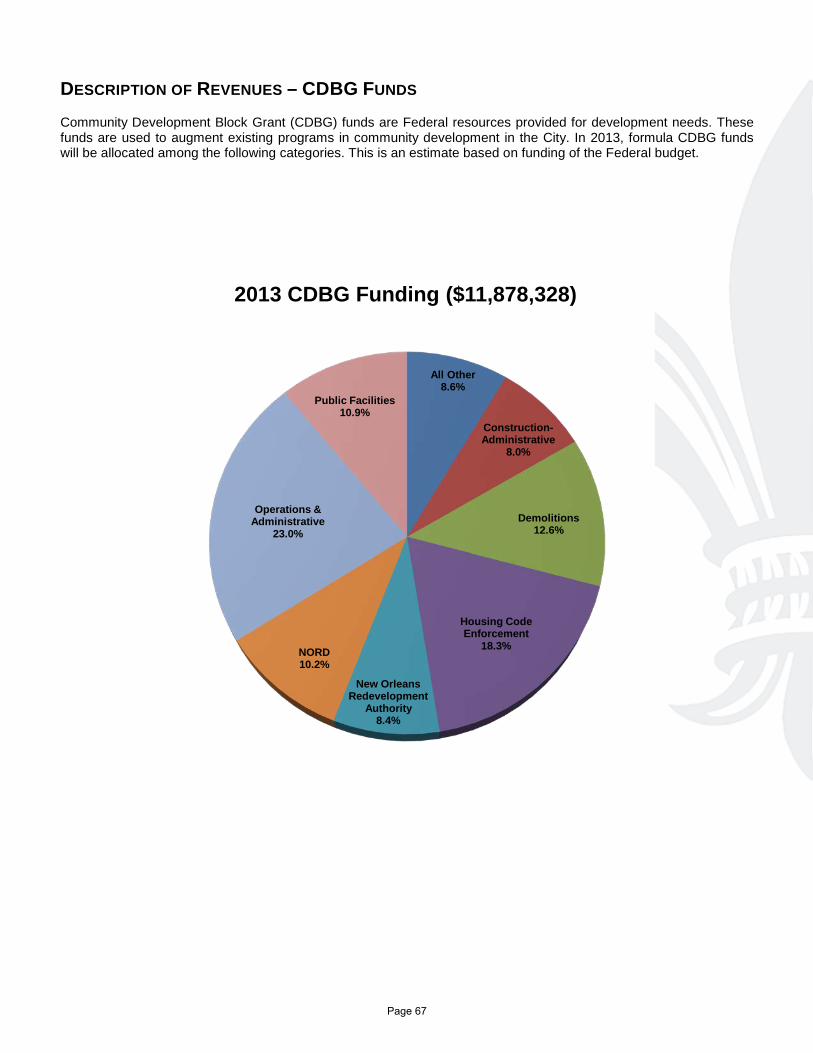
DESCRIPTION OF REVENUES – CDBG FUNDS Community Development Block Grant (CDBG) funds are Federal resources provided for development needs. These funds are used to augment existing programs in community development in the City. In 2013, formula CDBG funds will be allocated among the following categories. This is an estimate based on funding of the Federal budget.
All Other 8.6%
Construction-Administrative
8.0%
Demolitions 12.6%
Housing Code Enforcement
18.3%
New Orleans Redevelopment
Authority 8.4%
NORD 10.2%
Operations & Administrative
23.0%
Public Facilities 10.9%
2013 CDBG Funding ($11,878,328)
Page 67
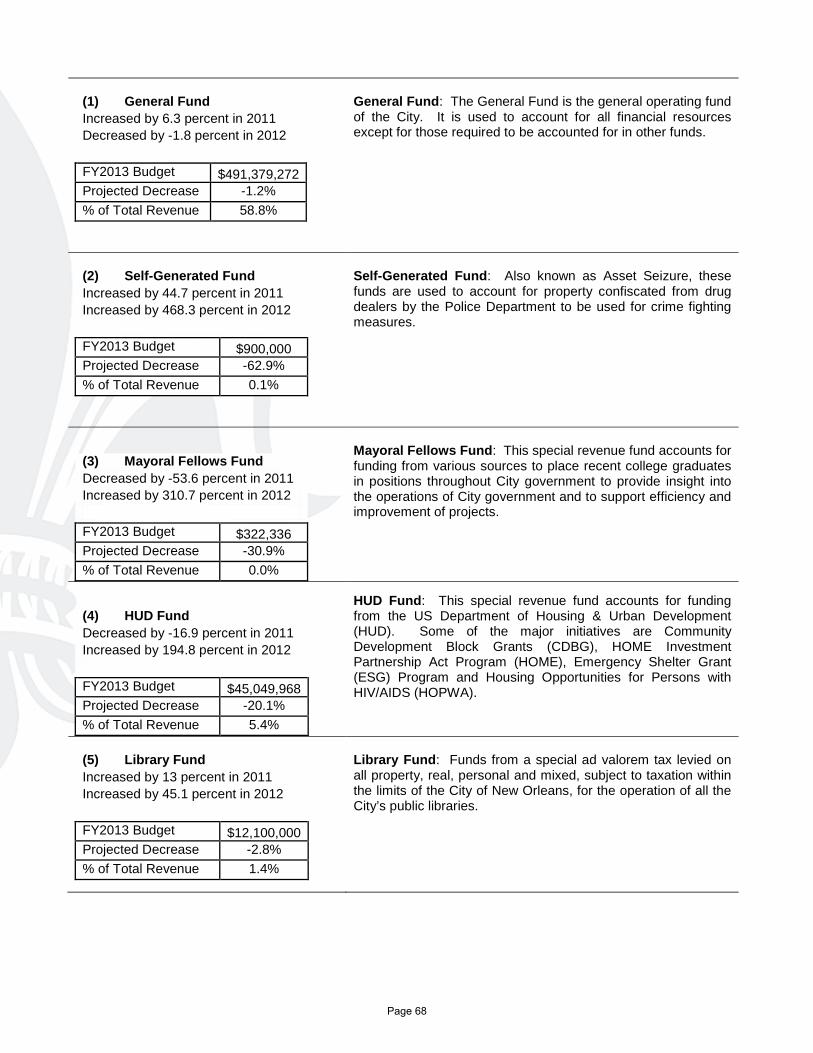
(1) General Fund Increased by 6.3 percent in 2011 Decreased by -1.8 percent in 2012 FY2013 Budget $491,379,272 Projected Decrease -1.2% % of Total Revenue 58.8%
General Fund: The General Fund is the general operating fund of the City. It is used to account for all financial resources except for those required to be accounted for in other funds.
(2) Self-Generated Fund Increased by 44.7 percent in 2011 Increased by 468.3 percent in 2012 FY2013 Budget $900,000 Projected Decrease -62.9% % of Total Revenue 0.1%
Self-Generated Fund: Also known as Asset Seizure, these funds are used to account for property confiscated from drug dealers by the Police Department to be used for crime fighting measures.
(3) Mayoral Fellows Fund Decreased by -53.6 percent in 2011 Increased by 310.7 percent in 2012 FY2013 Budget $322,336 Projected Decrease -30.9% % of Total Revenue 0.0%
Mayoral Fellows Fund: This special revenue fund accounts for funding from various sources to place recent college graduates in positions throughout City government to provide insight into the operations of City government and to support efficiency and improvement of projects.
(4) HUD Fund Decreased by -16.9 percent in 2011 Increased by 194.8 percent in 2012 FY2013 Budget $45,049,968 Projected Decrease -20.1% % of Total Revenue 5.4%
HUD Fund: This special revenue fund accounts for funding from the US Department of Housing & Urban Development (HUD). Some of the major initiatives are Community Development Block Grants (CDBG), HOME Investment Partnership Act Program (HOME), Emergency Shelter Grant (ESG) Program and Housing Opportunities for Persons with HIV/AIDS (HOPWA).
(5) Library Fund Increased by 13 percent in 2011 Increased by 45.1 percent in 2012 FY2013 Budget $12,100,000 Projected Decrease -2.8% % of Total Revenue 1.4%
Library Fund: Funds from a special ad valorem tax levied on all property, real, personal and mixed, subject to taxation within the limits of the City of New Orleans, for the operation of all the City’s public libraries.
Page 68
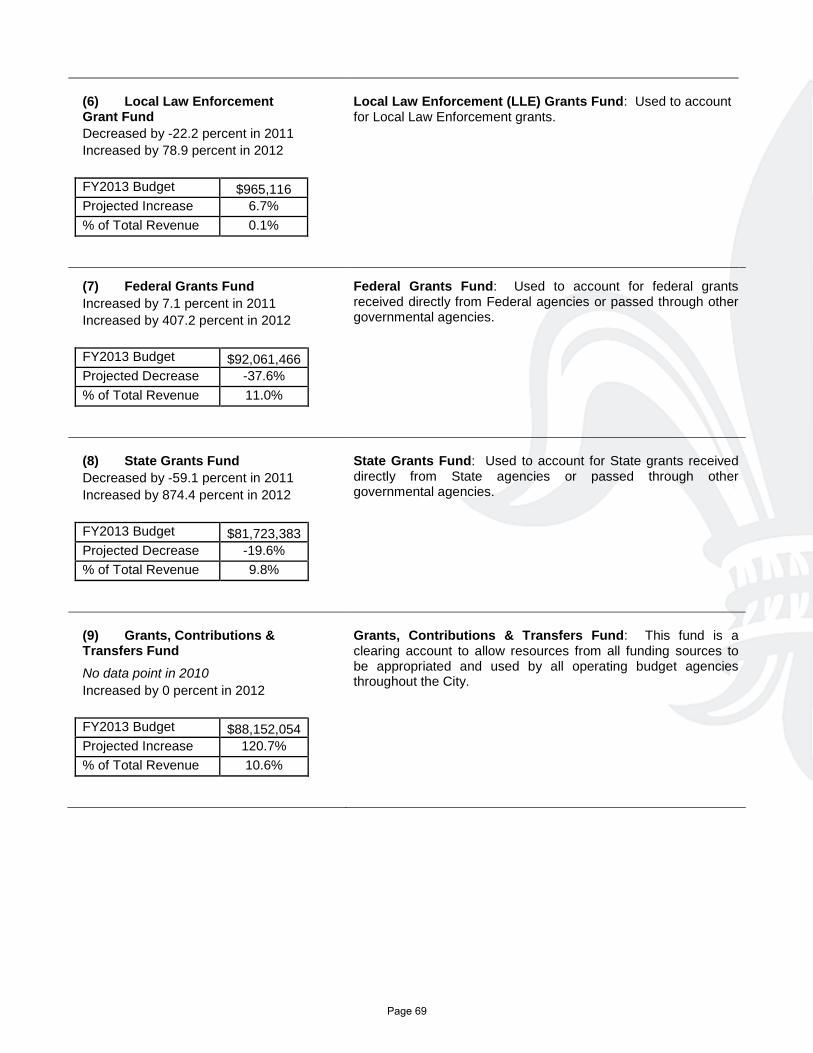
(6) Local Law Enforcement Grant Fund Decreased by -22.2 percent in 2011 Increased by 78.9 percent in 2012 FY2013 Budget $965,116 Projected Increase 6.7% % of Total Revenue 0.1%
Local Law Enforcement (LLE) Grants Fund: Used to account for Local Law Enforcement grants.
(7) Federal Grants Fund Increased by 7.1 percent in 2011 Increased by 407.2 percent in 2012 FY2013 Budget $92,061,466 Projected Decrease -37.6% % of Total Revenue 11.0%
Federal Grants Fund: Used to account for federal grants received directly from Federal agencies or passed through other governmental agencies.
(8) State Grants Fund Decreased by -59.1 percent in 2011 Increased by 874.4 percent in 2012 FY2013 Budget $81,723,383 Projected Decrease -19.6% % of Total Revenue 9.8%
State Grants Fund: Used to account for State grants received directly from State agencies or passed through other governmental agencies.
(9) Grants, Contributions & Transfers Fund No data point in 2010 Increased by 0 percent in 2012 FY2013 Budget $88,152,054 Projected Increase 120.7% % of Total Revenue 10.6%
Grants, Contributions & Transfers Fund: This fund is a clearing account to allow resources from all funding sources to be appropriated and used by all operating budget agencies throughout the City.
Page 69
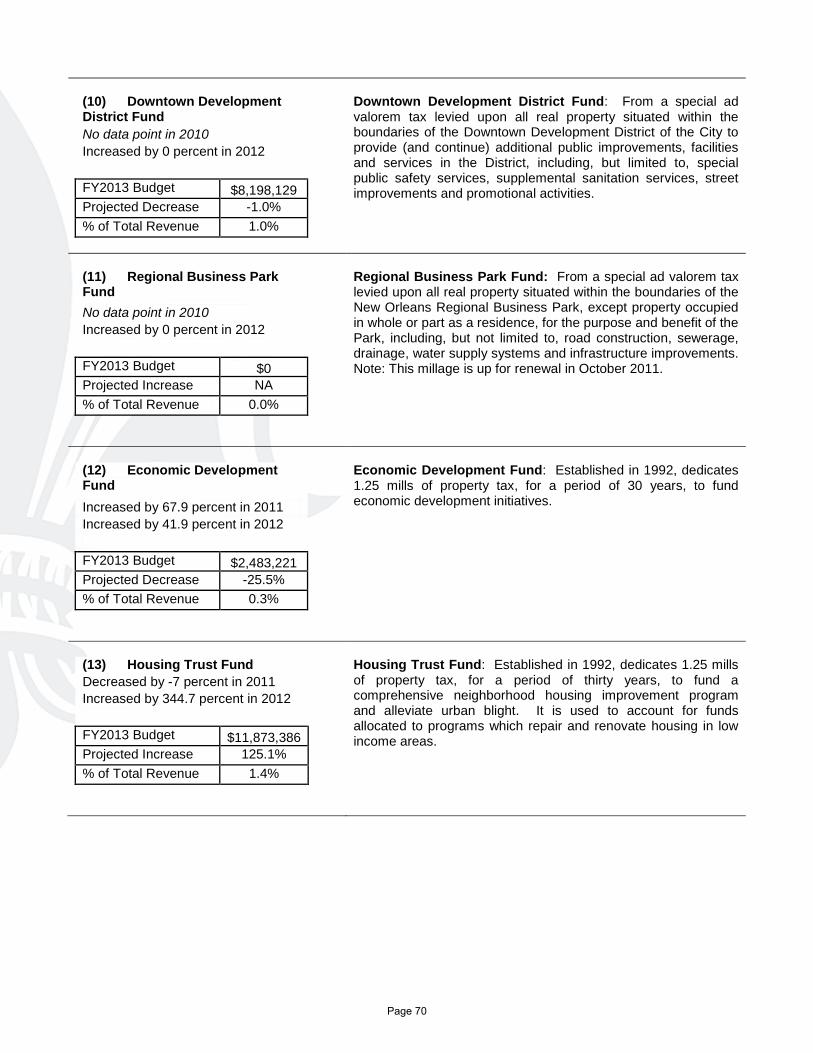
(10) Downtown Development District Fund No data point in 2010 Increased by 0 percent in 2012 FY2013 Budget $8,198,129 Projected Decrease -1.0% % of Total Revenue 1.0%
Downtown Development District Fund: From a special ad valorem tax levied upon all real property situated within the boundaries of the Downtown Development District of the City to provide (and continue) additional public improvements, facilities and services in the District, including, but limited to, special public safety services, supplemental sanitation services, street improvements and promotional activities.
(11) Regional Business Park Fund No data point in 2010 Increased by 0 percent in 2012 FY2013 Budget $0 Projected Increase NA % of Total Revenue 0.0%
Regional Business Park Fund: From a special ad valorem tax levied upon all real property situated within the boundaries of the New Orleans Regional Business Park, except property occupied in whole or part as a residence, for the purpose and benefit of the Park, including, but not limited to, road construction, sewerage, drainage, water supply systems and infrastructure improvements. Note: This millage is up for renewal in October 2011.
(12) Economic Development Fund Increased by 67.9 percent in 2011 Increased by 41.9 percent in 2012 FY2013 Budget $2,483,221 Projected Decrease -25.5% % of Total Revenue 0.3%
Economic Development Fund: Established in 1992, dedicates 1.25 mills of property tax, for a period of 30 years, to fund economic development initiatives.
(13) Housing Trust Fund Decreased by -7 percent in 2011 Increased by 344.7 percent in 2012 FY2013 Budget $11,873,386 Projected Increase 125.1% % of Total Revenue 1.4%
Housing Trust Fund: Established in 1992, dedicates 1.25 mills of property tax, for a period of thirty years, to fund a comprehensive neighborhood housing improvement program and alleviate urban blight. It is used to account for funds allocated to programs which repair and renovate housing in low income areas.
Page 70
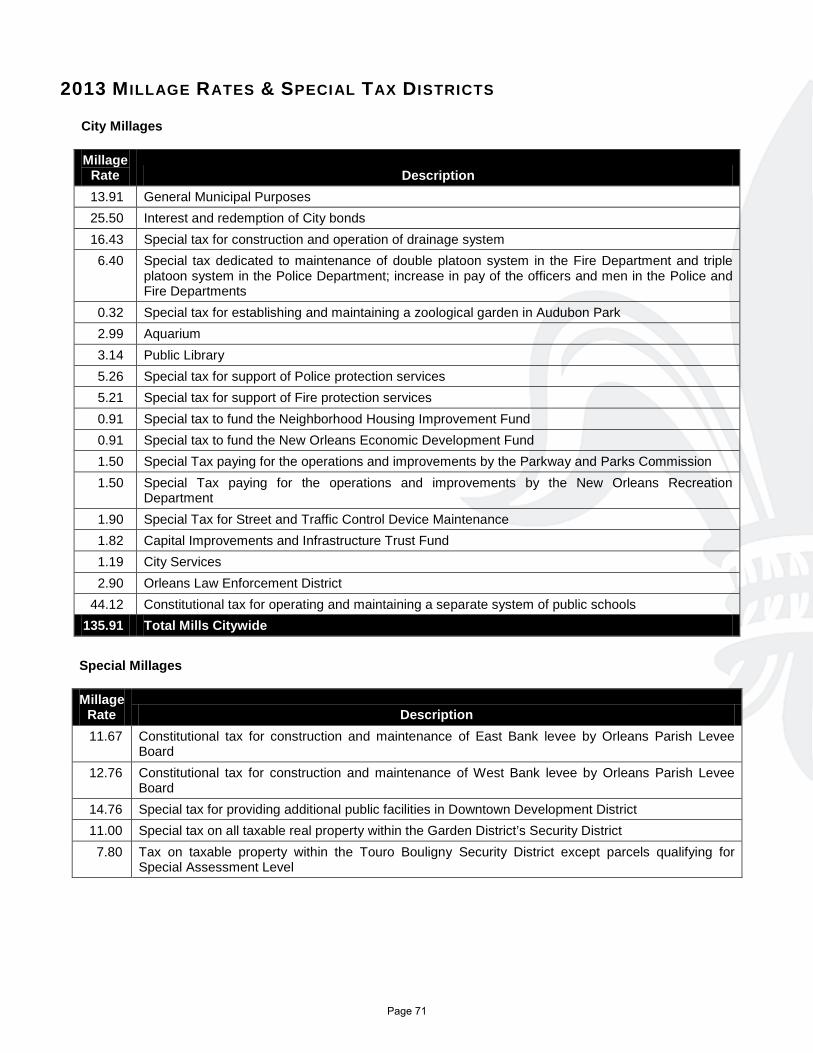
2013 MILLAGE RATES & SPECIAL TAX DISTRICTS
City Millages Millage
Rate Description 13.91 General Municipal Purposes 25.50 Interest and redemption of City bonds 16.43 Special tax for construction and operation of drainage system 6.40 Special tax dedicated to maintenance of double platoon system in the Fire Department and triple
platoon system in the Police Department; increase in pay of the officers and men in the Police and Fire Departments
0.32 Special tax for establishing and maintaining a zoological garden in Audubon Park 2.99 Aquarium 3.14 Public Library 5.26 Special tax for support of Police protection services 5.21 Special tax for support of Fire protection services 0.91 Special tax to fund the Neighborhood Housing Improvement Fund 0.91 Special tax to fund the New Orleans Economic Development Fund 1.50 Special Tax paying for the operations and improvements by the Parkway and Parks Commission 1.50 Special Tax paying for the operations and improvements by the New Orleans Recreation
Department 1.90 Special Tax for Street and Traffic Control Device Maintenance 1.82 Capital Improvements and Infrastructure Trust Fund 1.19 City Services 2.90 Orleans Law Enforcement District 44.12 Constitutional tax for operating and maintaining a separate system of public schools 135.91 Total Mills Citywide Special Millages Millage
Rate Description 11.67 Constitutional tax for construction and maintenance of East Bank levee by Orleans Parish Levee
Board 12.76 Constitutional tax for construction and maintenance of West Bank levee by Orleans Parish Levee
Board 14.76 Special tax for providing additional public facilities in Downtown Development District 11.00 Special tax on all taxable real property within the Garden District’s Security District 7.80 Tax on taxable property within the Touro Bouligny Security District except parcels qualifying for
Special Assessment Level
Page 71
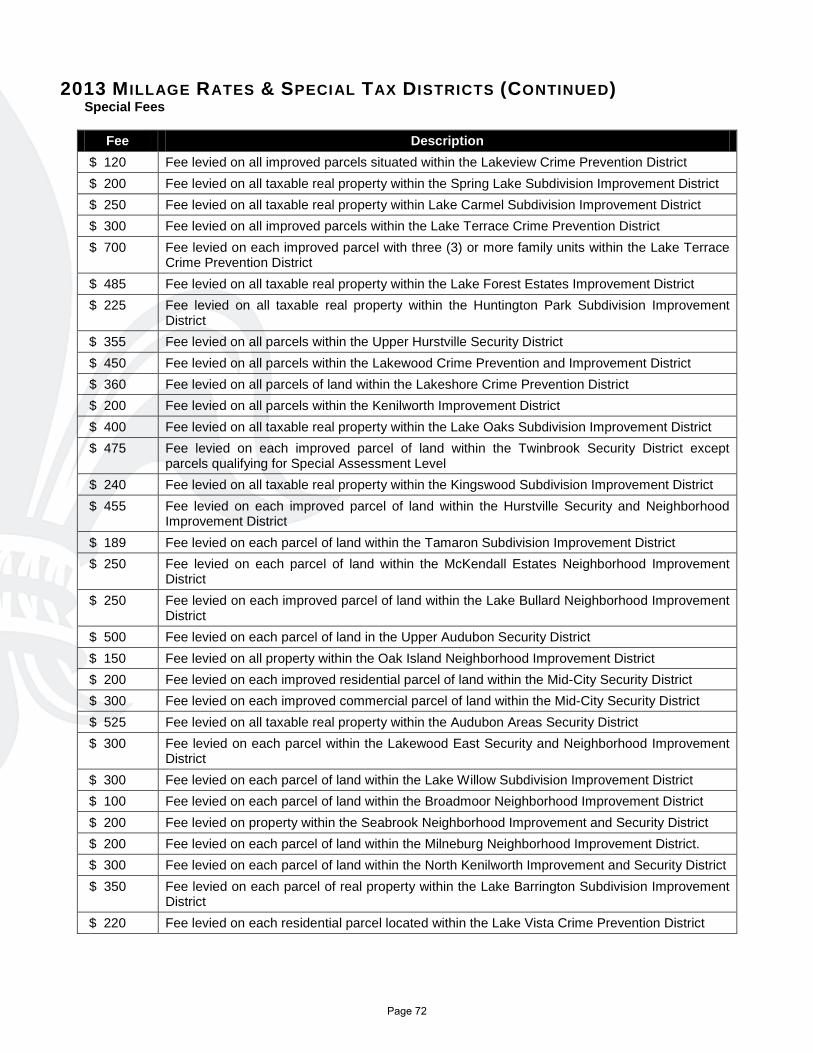
2013 MILLAGE RATES & SPECIAL TAX DISTRICTS (CONTINUED) Special Fees
Fee Description $ 120 Fee levied on all improved parcels situated within the Lakeview Crime Prevention District $ 200 Fee levied on all taxable real property within the Spring Lake Subdivision Improvement District $ 250 Fee levied on all taxable real property within Lake Carmel Subdivision Improvement District $ 300 Fee levied on all improved parcels within the Lake Terrace Crime Prevention District $ 700 Fee levied on each improved parcel with three (3) or more family units within the Lake Terrace
Crime Prevention District $ 485 Fee levied on all taxable real property within the Lake Forest Estates Improvement District $ 225 Fee levied on all taxable real property within the Huntington Park Subdivision Improvement
District $ 355 Fee levied on all parcels within the Upper Hurstville Security District $ 450 Fee levied on all parcels within the Lakewood Crime Prevention and Improvement District $ 360 Fee levied on all parcels of land within the Lakeshore Crime Prevention District $ 200 Fee levied on all parcels within the Kenilworth Improvement District $ 400 Fee levied on all taxable real property within the Lake Oaks Subdivision Improvement District $ 475 Fee levied on each improved parcel of land within the Twinbrook Security District except
parcels qualifying for Special Assessment Level $ 240 Fee levied on all taxable real property within the Kingswood Subdivision Improvement District $ 455 Fee levied on each improved parcel of land within the Hurstville Security and Neighborhood
Improvement District $ 189 Fee levied on each parcel of land within the Tamaron Subdivision Improvement District $ 250 Fee levied on each parcel of land within the McKendall Estates Neighborhood Improvement
District $ 250 Fee levied on each improved parcel of land within the Lake Bullard Neighborhood Improvement
District $ 500 Fee levied on each parcel of land in the Upper Audubon Security District $ 150 Fee levied on all property within the Oak Island Neighborhood Improvement District $ 200 Fee levied on each improved residential parcel of land within the Mid-City Security District $ 300 Fee levied on each improved commercial parcel of land within the Mid-City Security District $ 525 Fee levied on all taxable real property within the Audubon Areas Security District $ 300 Fee levied on each parcel within the Lakewood East Security and Neighborhood Improvement
District $ 300 Fee levied on each parcel of land within the Lake Willow Subdivision Improvement District $ 100 Fee levied on each parcel of land within the Broadmoor Neighborhood Improvement District $ 200 Fee levied on property within the Seabrook Neighborhood Improvement and Security District $ 200 Fee levied on each parcel of land within the Milneburg Neighborhood Improvement District. $ 300 Fee levied on each parcel of land within the North Kenilworth Improvement and Security District $ 350 Fee levied on each parcel of real property within the Lake Barrington Subdivision Improvement
District $ 220 Fee levied on each residential parcel located within the Lake Vista Crime Prevention District
Page 72
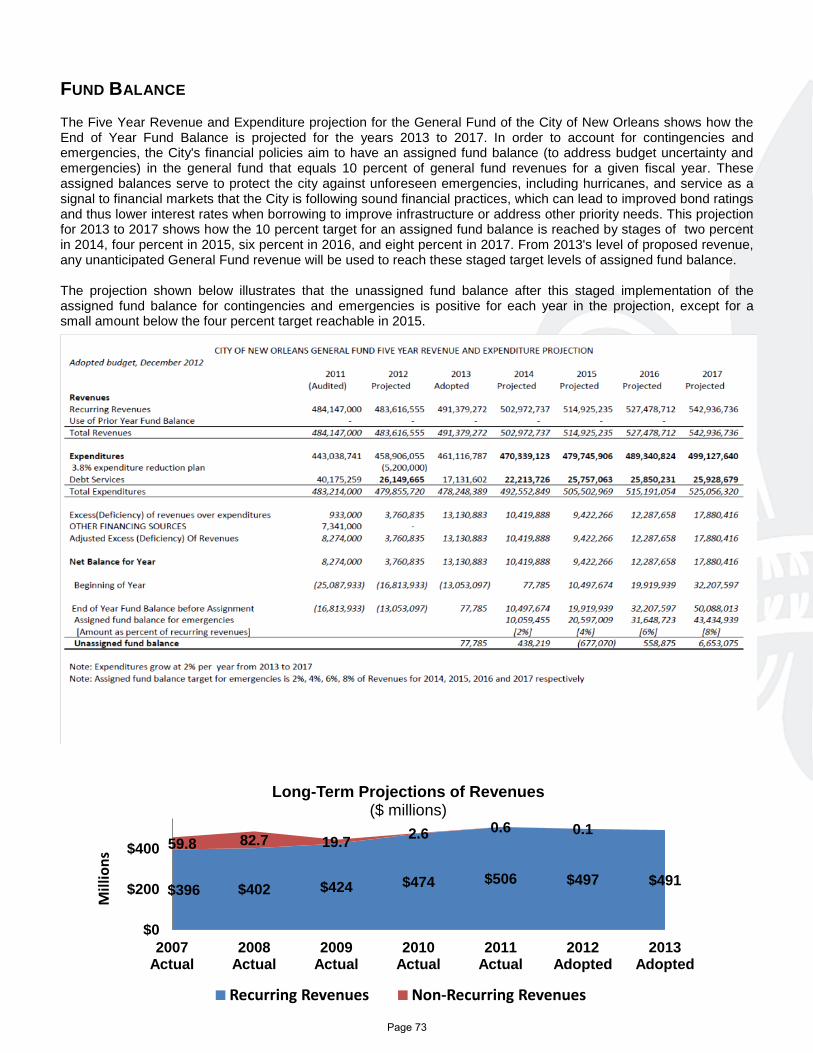
FUND BALANCE The Five Year Revenue and Expenditure projection for the General Fund of the City of New Orleans shows how the End of Year Fund Balance is projected for the years 2013 to 2017. In order to account for contingencies and emergencies, the City's financial policies aim to have an assigned fund balance (to address budget uncertainty and emergencies) in the general fund that equals 10 percent of general fund revenues for a given fiscal year. These assigned balances serve to protect the city against unforeseen emergencies, including hurricanes, and service as a signal to financial markets that the City is following sound financial practices, which can lead to improved bond ratings and thus lower interest rates when borrowing to improve infrastructure or address other priority needs. This projection for 2013 to 2017 shows how the 10 percent target for an assigned fund balance is reached by stages of two percent in 2014, four percent in 2015, six percent in 2016, and eight percent in 2017. From 2013's level of proposed revenue, any unanticipated General Fund revenue will be used to reach these staged target levels of assigned fund balance. The projection shown below illustrates that the unassigned fund balance after this staged implementation of the assigned fund balance for contingencies and emergencies is positive for each year in the projection, except for a small amount below the four percent target reachable in 2015.
$396 $402 $424 $474 $506 $497 $491
59.8 82.7 19.7 2.6 0.6 0.1
$0
$200
$400
2007 Actual
2008 Actual
2009 Actual
2010 Actual
2011 Actual
2012 Adopted
2013 Adopted
Mill
ions
Long-Term Projections of Revenues ($ millions)
Recurring Revenues Non-Recurring Revenues
Page 73
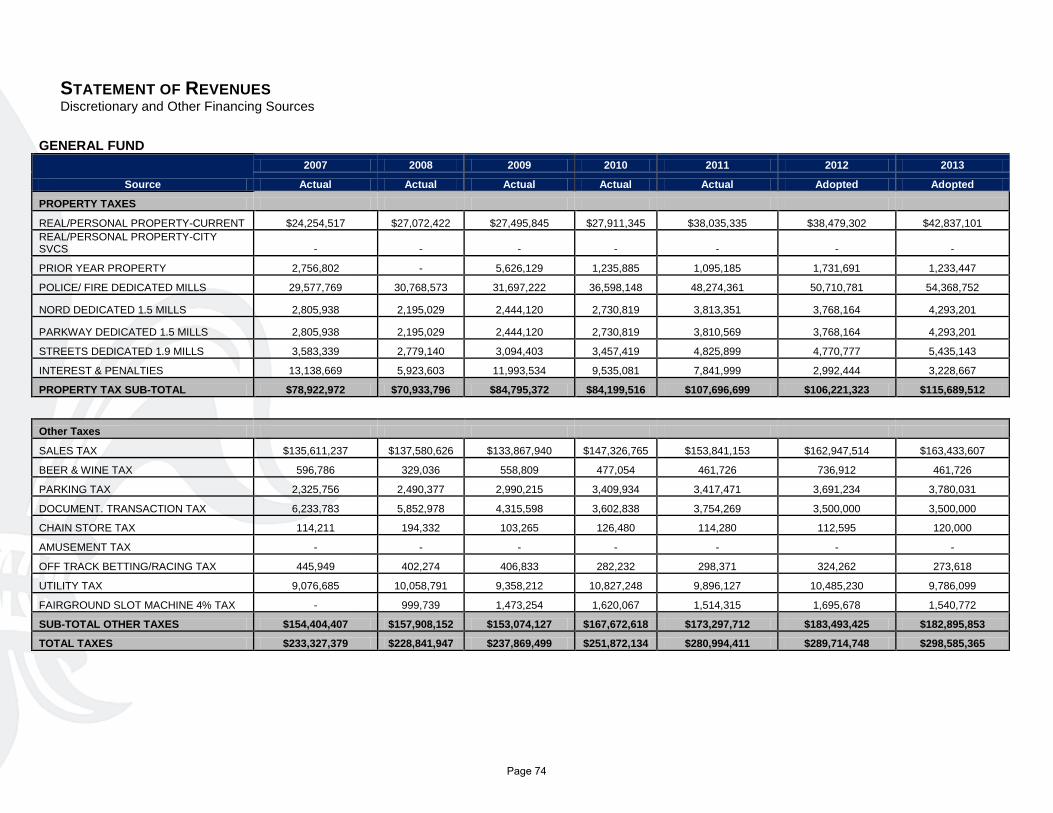
STATEMENT OF REVENUES Discretionary and Other Financing Sources
GENERAL FUND
Source
2007 2008 2009 2010 2011 2012 2013
Actual Actual Actual Actual Actual Adopted Adopted
PROPERTY TAXES
REAL/PERSONAL PROPERTY-CURRENT $24,254,517 $27,072,422 $27,495,845 $27,911,345 $38,035,335 $38,479,302 $42,837,101 REAL/PERSONAL PROPERTY-CITY SVCS - - - - - - -
PRIOR YEAR PROPERTY 2,756,802 - 5,626,129 1,235,885 1,095,185 1,731,691 1,233,447
POLICE/ FIRE DEDICATED MILLS 29,577,769 30,768,573 31,697,222 36,598,148 48,274,361 50,710,781 54,368,752
NORD DEDICATED 1.5 MILLS 2,805,938 2,195,029 2,444,120 2,730,819 3,813,351 3,768,164 4,293,201
PARKWAY DEDICATED 1.5 MILLS 2,805,938 2,195,029 2,444,120 2,730,819 3,810,569 3,768,164 4,293,201
STREETS DEDICATED 1.9 MILLS 3,583,339 2,779,140 3,094,403 3,457,419 4,825,899 4,770,777 5,435,143
INTEREST & PENALTIES 13,138,669 5,923,603 11,993,534 9,535,081 7,841,999 2,992,444 3,228,667
PROPERTY TAX SUB-TOTAL $78,922,972 $70,933,796 $84,795,372 $84,199,516 $107,696,699 $106,221,323 $115,689,512
Other Taxes
SALES TAX $135,611,237 $137,580,626 $133,867,940 $147,326,765 $153,841,153 $162,947,514 $163,433,607
BEER & WINE TAX 596,786 329,036 558,809 477,054 461,726 736,912 461,726
PARKING TAX 2,325,756 2,490,377 2,990,215 3,409,934 3,417,471 3,691,234 3,780,031
DOCUMENT. TRANSACTION TAX 6,233,783 5,852,978 4,315,598 3,602,838 3,754,269 3,500,000 3,500,000
CHAIN STORE TAX 114,211 194,332 103,265 126,480 114,280 112,595 120,000
AMUSEMENT TAX - - - - - - -
OFF TRACK BETTING/RACING TAX 445,949 402,274 406,833 282,232 298,371 324,262 273,618
UTILITY TAX 9,076,685 10,058,791 9,358,212 10,827,248 9,896,127 10,485,230 9,786,099
FAIRGROUND SLOT MACHINE 4% TAX - 999,739 1,473,254 1,620,067 1,514,315 1,695,678 1,540,772
SUB-TOTAL OTHER TAXES $154,404,407 $157,908,152 $153,074,127 $167,672,618 $173,297,712 $183,493,425 $182,895,853
TOTAL TAXES $233,327,379 $228,841,947 $237,869,499 $251,872,134 $280,994,411 $289,714,748 $298,585,365
Page 74
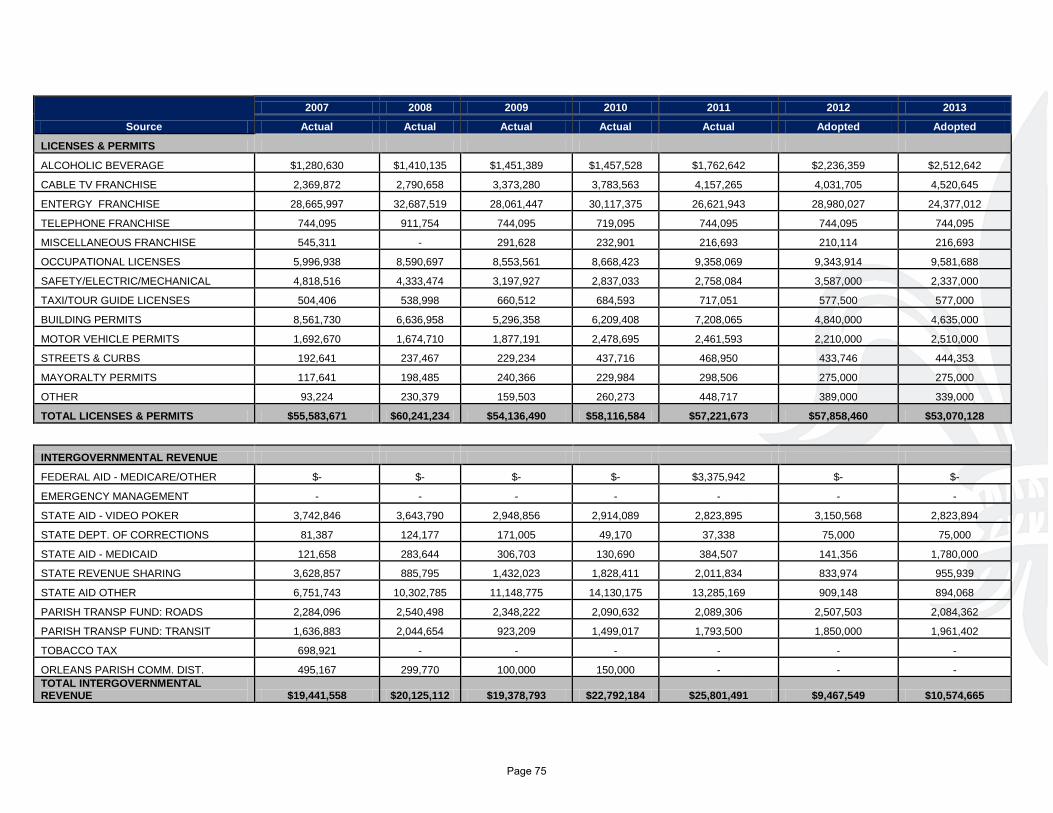
Source
2007 2008 2009 2010 2011 2012 2013
Actual Actual Actual Actual Actual Adopted Adopted
LICENSES & PERMITS
ALCOHOLIC BEVERAGE $1,280,630 $1,410,135 $1,451,389 $1,457,528 $1,762,642 $2,236,359 $2,512,642
CABLE TV FRANCHISE 2,369,872 2,790,658 3,373,280 3,783,563 4,157,265 4,031,705 4,520,645
ENTERGY FRANCHISE 28,665,997 32,687,519 28,061,447 30,117,375 26,621,943 28,980,027 24,377,012
TELEPHONE FRANCHISE 744,095 911,754 744,095 719,095 744,095 744,095 744,095
MISCELLANEOUS FRANCHISE 545,311 - 291,628 232,901 216,693 210,114 216,693
OCCUPATIONAL LICENSES 5,996,938 8,590,697 8,553,561 8,668,423 9,358,069 9,343,914 9,581,688
SAFETY/ELECTRIC/MECHANICAL 4,818,516 4,333,474 3,197,927 2,837,033 2,758,084 3,587,000 2,337,000
TAXI/TOUR GUIDE LICENSES 504,406 538,998 660,512 684,593 717,051 577,500 577,000
BUILDING PERMITS 8,561,730 6,636,958 5,296,358 6,209,408 7,208,065 4,840,000 4,635,000
MOTOR VEHICLE PERMITS 1,692,670 1,674,710 1,877,191 2,478,695 2,461,593 2,210,000 2,510,000
STREETS & CURBS 192,641 237,467 229,234 437,716 468,950 433,746 444,353
MAYORALTY PERMITS 117,641 198,485 240,366 229,984 298,506 275,000 275,000
OTHER 93,224 230,379 159,503 260,273 448,717 389,000 339,000
TOTAL LICENSES & PERMITS $55,583,671 $60,241,234 $54,136,490 $58,116,584 $57,221,673 $57,858,460 $53,070,128
INTERGOVERNMENTAL REVENUE
FEDERAL AID - MEDICARE/OTHER $- $- $- $- $3,375,942 $- $-
EMERGENCY MANAGEMENT - - - - - - -
STATE AID - VIDEO POKER 3,742,846 3,643,790 2,948,856 2,914,089 2,823,895 3,150,568 2,823,894
STATE DEPT. OF CORRECTIONS 81,387 124,177 171,005 49,170 37,338 75,000 75,000
STATE AID - MEDICAID 121,658 283,644 306,703 130,690 384,507 141,356 1,780,000
STATE REVENUE SHARING 3,628,857 885,795 1,432,023 1,828,411 2,011,834 833,974 955,939
STATE AID OTHER 6,751,743 10,302,785 11,148,775 14,130,175 13,285,169 909,148 894,068
PARISH TRANSP FUND: ROADS 2,284,096 2,540,498 2,348,222 2,090,632 2,089,306 2,507,503 2,084,362
PARISH TRANSP FUND: TRANSIT 1,636,883 2,044,654 923,209 1,499,017 1,793,500 1,850,000 1,961,402
TOBACCO TAX 698,921 - - - - - -
ORLEANS PARISH COMM. DIST. 495,167 299,770 100,000 150,000 - - - TOTAL INTERGOVERNMENTAL REVENUE $19,441,558 $20,125,112 $19,378,793 $22,792,184 $25,801,491 $9,467,549 $10,574,665
Page 75
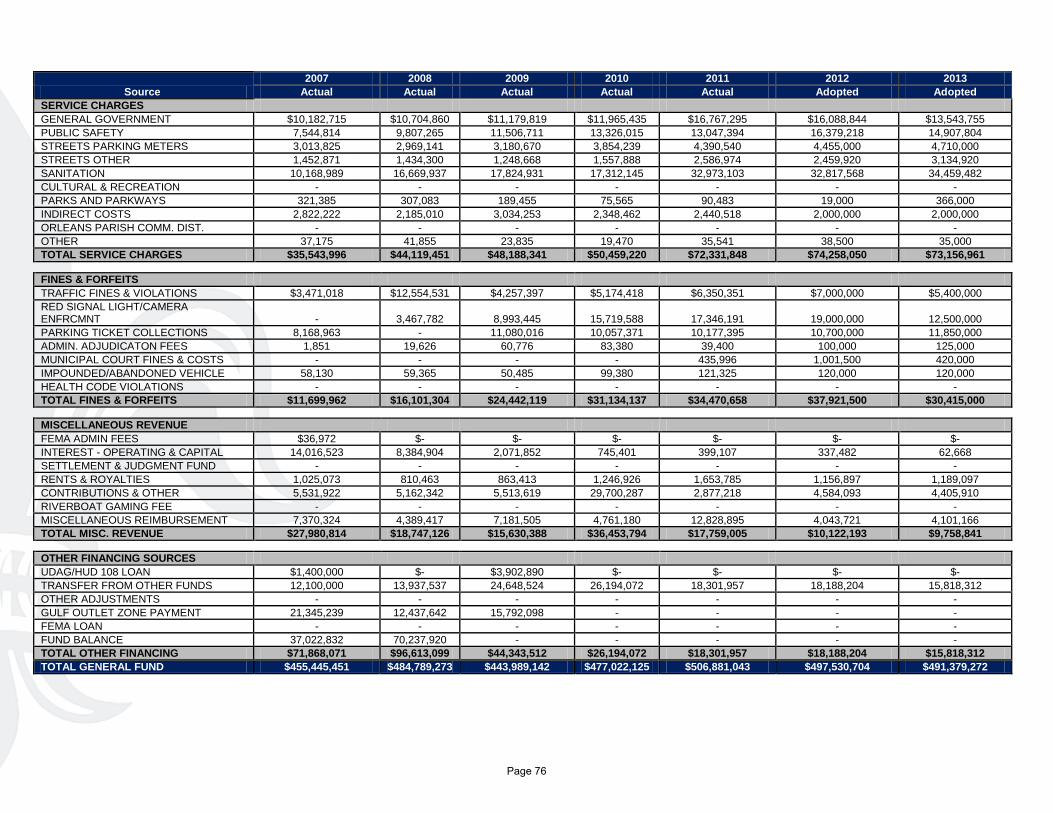
Source 2007 2008 2009 2010 2011 2012 2013
Actual Actual Actual Actual Actual Adopted Adopted SERVICE CHARGES GENERAL GOVERNMENT $10,182,715 $10,704,860 $11,179,819 $11,965,435 $16,767,295 $16,088,844 $13,543,755 PUBLIC SAFETY 7,544,814 9,807,265 11,506,711 13,326,015 13,047,394 16,379,218 14,907,804 STREETS PARKING METERS 3,013,825 2,969,141 3,180,670 3,854,239 4,390,540 4,455,000 4,710,000 STREETS OTHER 1,452,871 1,434,300 1,248,668 1,557,888 2,586,974 2,459,920 3,134,920 SANITATION 10,168,989 16,669,937 17,824,931 17,312,145 32,973,103 32,817,568 34,459,482 CULTURAL & RECREATION - - - - - - - PARKS AND PARKWAYS 321,385 307,083 189,455 75,565 90,483 19,000 366,000 INDIRECT COSTS 2,822,222 2,185,010 3,034,253 2,348,462 2,440,518 2,000,000 2,000,000 ORLEANS PARISH COMM. DIST. - - - - - - - OTHER 37,175 41,855 23,835 19,470 35,541 38,500 35,000 TOTAL SERVICE CHARGES $35,543,996 $44,119,451 $48,188,341 $50,459,220 $72,331,848 $74,258,050 $73,156,961
FINES & FORFEITS TRAFFIC FINES & VIOLATIONS $3,471,018 $12,554,531 $4,257,397 $5,174,418 $6,350,351 $7,000,000 $5,400,000 RED SIGNAL LIGHT/CAMERA ENFRCMNT - 3,467,782 8,993,445 15,719,588 17,346,191 19,000,000 12,500,000 PARKING TICKET COLLECTIONS 8,168,963 - 11,080,016 10,057,371 10,177,395 10,700,000 11,850,000 ADMIN. ADJUDICATON FEES 1,851 19,626 60,776 83,380 39,400 100,000 125,000 MUNICIPAL COURT FINES & COSTS - - - - 435,996 1,001,500 420,000 IMPOUNDED/ABANDONED VEHICLE 58,130 59,365 50,485 99,380 121,325 120,000 120,000 HEALTH CODE VIOLATIONS - - - - - - - TOTAL FINES & FORFEITS $11,699,962 $16,101,304 $24,442,119 $31,134,137 $34,470,658 $37,921,500 $30,415,000
MISCELLANEOUS REVENUE FEMA ADMIN FEES $36,972 $- $- $- $- $- $- INTEREST - OPERATING & CAPITAL 14,016,523 8,384,904 2,071,852 745,401 399,107 337,482 62,668 SETTLEMENT & JUDGMENT FUND - - - - - - - RENTS & ROYALTIES 1,025,073 810,463 863,413 1,246,926 1,653,785 1,156,897 1,189,097 CONTRIBUTIONS & OTHER 5,531,922 5,162,342 5,513,619 29,700,287 2,877,218 4,584,093 4,405,910 RIVERBOAT GAMING FEE - - - - - - - MISCELLANEOUS REIMBURSEMENT 7,370,324 4,389,417 7,181,505 4,761,180 12,828,895 4,043,721 4,101,166 TOTAL MISC. REVENUE $27,980,814 $18,747,126 $15,630,388 $36,453,794 $17,759,005 $10,122,193 $9,758,841
OTHER FINANCING SOURCES UDAG/HUD 108 LOAN $1,400,000 $- $3,902,890 $- $- $- $- TRANSFER FROM OTHER FUNDS 12,100,000 13,937,537 24,648,524 26,194,072 18,301,957 18,188,204 15,818,312 OTHER ADJUSTMENTS - - - - - - - GULF OUTLET ZONE PAYMENT 21,345,239 12,437,642 15,792,098 - - - - FEMA LOAN - - - - - - - FUND BALANCE 37,022,832 70,237,920 - - - - - TOTAL OTHER FINANCING $71,868,071 $96,613,099 $44,343,512 $26,194,072 $18,301,957 $18,188,204 $15,818,312 TOTAL GENERAL FUND $455,445,451 $484,789,273 $443,989,142 $477,022,125 $506,881,043 $497,530,704 $491,379,272
Page 76
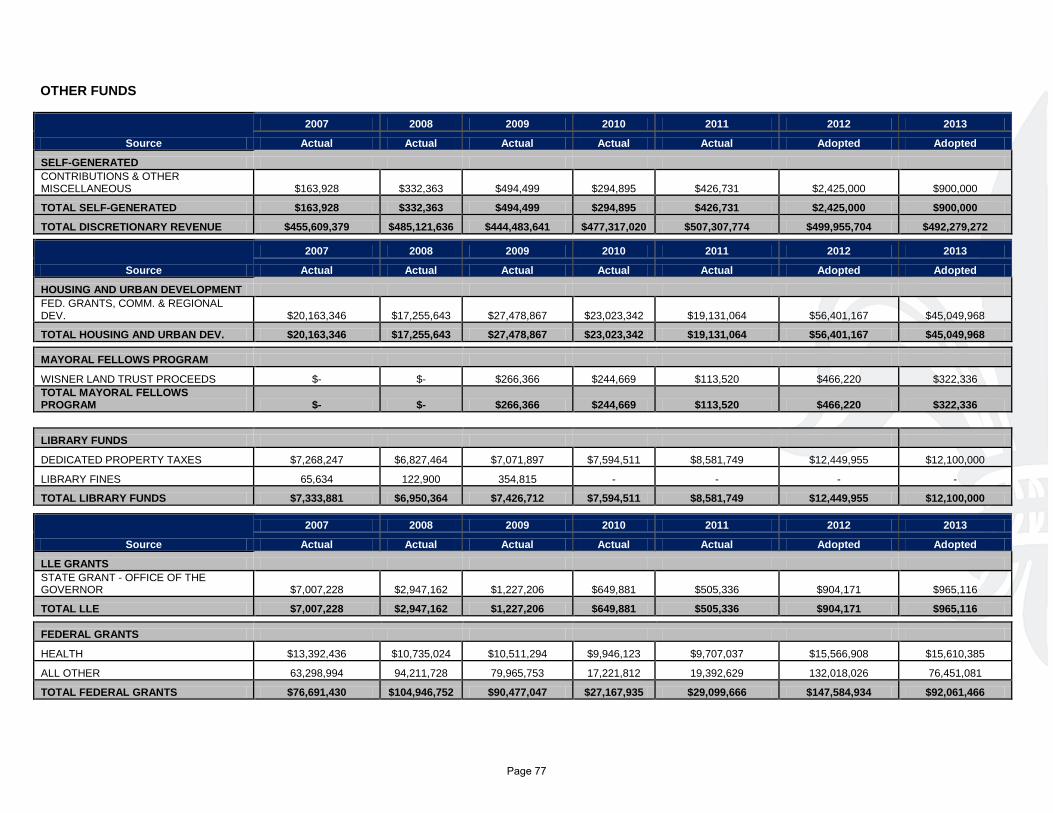
OTHER FUNDS
Source
2007 2008 2009 2010 2011 2012 2013
Actual Actual Actual Actual Actual Adopted Adopted
SELF-GENERATED CONTRIBUTIONS & OTHER MISCELLANEOUS $163,928 $332,363 $494,499 $294,895 $426,731 $2,425,000 $900,000
TOTAL SELF-GENERATED $163,928 $332,363 $494,499 $294,895 $426,731 $2,425,000 $900,000
TOTAL DISCRETIONARY REVENUE $455,609,379 $485,121,636 $444,483,641 $477,317,020 $507,307,774 $499,955,704 $492,279,272
Source
2007 2008 2009 2010 2011 2012 2013
Actual Actual Actual Actual Actual Adopted Adopted
HOUSING AND URBAN DEVELOPMENT FED. GRANTS, COMM. & REGIONAL DEV. $20,163,346 $17,255,643 $27,478,867 $23,023,342 $19,131,064 $56,401,167 $45,049,968
TOTAL HOUSING AND URBAN DEV. $20,163,346 $17,255,643 $27,478,867 $23,023,342 $19,131,064 $56,401,167 $45,049,968
MAYORAL FELLOWS PROGRAM
WISNER LAND TRUST PROCEEDS $- $- $266,366 $244,669 $113,520 $466,220 $322,336 TOTAL MAYORAL FELLOWS PROGRAM $- $- $266,366 $244,669 $113,520 $466,220 $322,336
LIBRARY FUNDS
DEDICATED PROPERTY TAXES $7,268,247 $6,827,464 $7,071,897 $7,594,511 $8,581,749 $12,449,955 $12,100,000
LIBRARY FINES 65,634 122,900 354,815 - - - -
TOTAL LIBRARY FUNDS $7,333,881 $6,950,364 $7,426,712 $7,594,511 $8,581,749 $12,449,955 $12,100,000
Source
2007 2008 2009 2010 2011 2012 2013
Actual Actual Actual Actual Actual Adopted Adopted
LLE GRANTS STATE GRANT - OFFICE OF THE GOVERNOR $7,007,228 $2,947,162 $1,227,206 $649,881 $505,336 $904,171 $965,116
TOTAL LLE $7,007,228 $2,947,162 $1,227,206 $649,881 $505,336 $904,171 $965,116
FEDERAL GRANTS
HEALTH $13,392,436 $10,735,024 $10,511,294 $9,946,123 $9,707,037 $15,566,908 $15,610,385
ALL OTHER 63,298,994 94,211,728 79,965,753 17,221,812 19,392,629 132,018,026 76,451,081
TOTAL FEDERAL GRANTS $76,691,430 $104,946,752 $90,477,047 $27,167,935 $29,099,666 $147,584,934 $92,061,466
Page 77
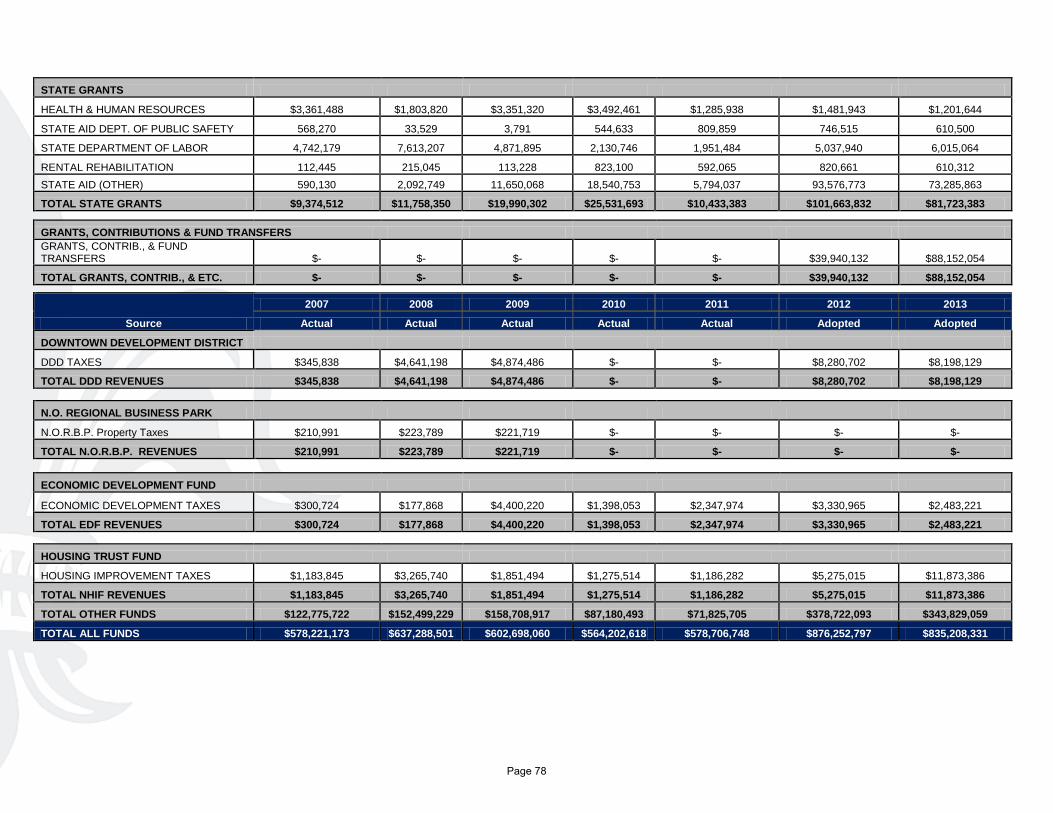
STATE GRANTS
HEALTH & HUMAN RESOURCES $3,361,488 $1,803,820 $3,351,320 $3,492,461 $1,285,938 $1,481,943 $1,201,644
STATE AID DEPT. OF PUBLIC SAFETY 568,270 33,529 3,791 544,633 809,859 746,515 610,500
STATE DEPARTMENT OF LABOR 4,742,179 7,613,207 4,871,895 2,130,746 1,951,484 5,037,940 6,015,064
RENTAL REHABILITATION 112,445 215,045 113,228 823,100 592,065 820,661 610,312 STATE AID (OTHER) 590,130 2,092,749 11,650,068 18,540,753 5,794,037 93,576,773 73,285,863
TOTAL STATE GRANTS $9,374,512 $11,758,350 $19,990,302 $25,531,693 $10,433,383 $101,663,832 $81,723,383
GRANTS, CONTRIBUTIONS & FUND TRANSFERS GRANTS, CONTRIB., & FUND TRANSFERS $- $- $- $- $- $39,940,132 $88,152,054
TOTAL GRANTS, CONTRIB., & ETC. $- $- $- $- $- $39,940,132 $88,152,054
Source
2007 2008 2009 2010 2011 2012 2013
Actual Actual Actual Actual Actual Adopted Adopted
DOWNTOWN DEVELOPMENT DISTRICT
DDD TAXES $345,838 $4,641,198 $4,874,486 $- $- $8,280,702 $8,198,129
TOTAL DDD REVENUES $345,838 $4,641,198 $4,874,486 $- $- $8,280,702 $8,198,129
N.O. REGIONAL BUSINESS PARK
N.O.R.B.P. Property Taxes $210,991 $223,789 $221,719 $- $- $- $-
TOTAL N.O.R.B.P. REVENUES $210,991 $223,789 $221,719 $- $- $- $-
ECONOMIC DEVELOPMENT FUND
ECONOMIC DEVELOPMENT TAXES $300,724 $177,868 $4,400,220 $1,398,053 $2,347,974 $3,330,965 $2,483,221
TOTAL EDF REVENUES $300,724 $177,868 $4,400,220 $1,398,053 $2,347,974 $3,330,965 $2,483,221
HOUSING TRUST FUND
HOUSING IMPROVEMENT TAXES $1,183,845 $3,265,740 $1,851,494 $1,275,514 $1,186,282 $5,275,015 $11,873,386
TOTAL NHIF REVENUES $1,183,845 $3,265,740 $1,851,494 $1,275,514 $1,186,282 $5,275,015 $11,873,386
TOTAL OTHER FUNDS $122,775,722 $152,499,229 $158,708,917 $87,180,493 $71,825,705 $378,722,093 $343,829,059
TOTAL ALL FUNDS $578,221,173 $637,288,501 $602,698,060 $564,202,618 $578,706,748 $876,252,797 $835,208,331
Page 78
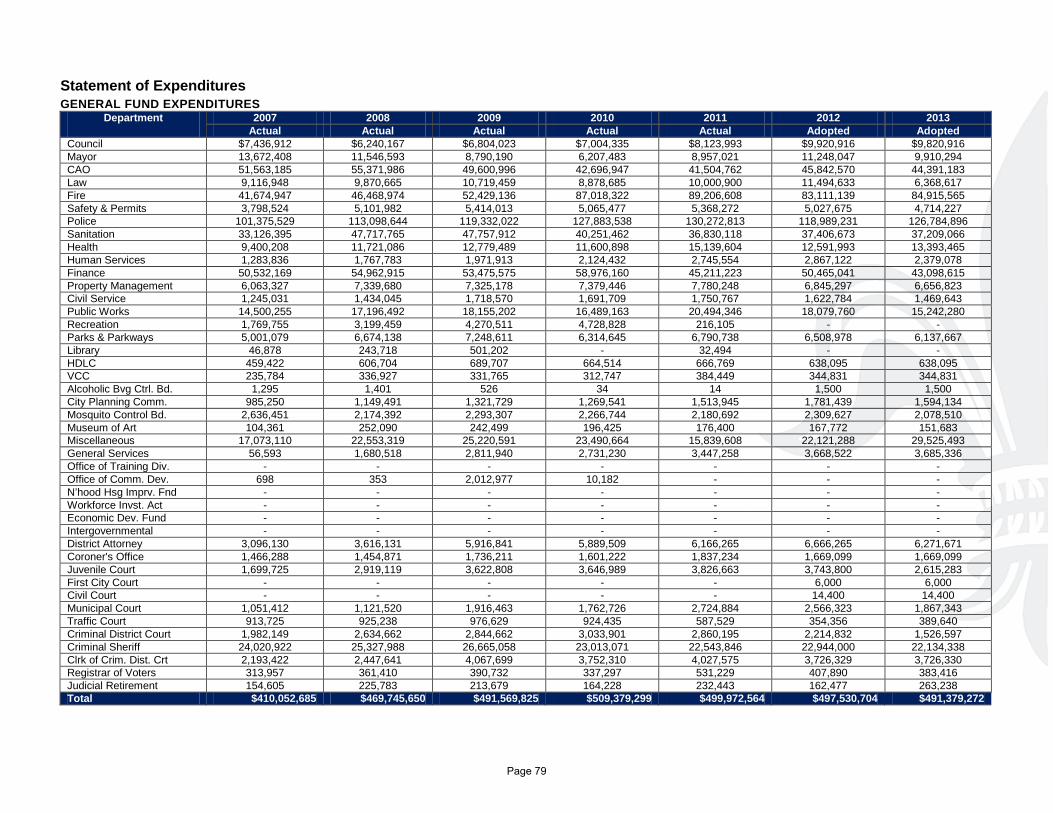
Statement of Expenditures GENERAL FUND EXPENDITURES
Department 2007 2008 2009 2010 2011 2012 2013 Actual Actual Actual Actual Actual Adopted Adopted
Council $7,436,912 $6,240,167 $6,804,023 $7,004,335 $8,123,993 $9,920,916 $9,820,916 Mayor 13,672,408 11,546,593 8,790,190 6,207,483 8,957,021 11,248,047 9,910,294 CAO 51,563,185 55,371,986 49,600,996 42,696,947 41,504,762 45,842,570 44,391,183 Law 9,116,948 9,870,665 10,719,459 8,878,685 10,000,900 11,494,633 6,368,617 Fire 41,674,947 46,468,974 52,429,136 87,018,322 89,206,608 83,111,139 84,915,565 Safety & Permits 3,798,524 5,101,982 5,414,013 5,065,477 5,368,272 5,027,675 4,714,227 Police 101,375,529 113,098,644 119,332,022 127,883,538 130,272,813 118,989,231 126,784,896 Sanitation 33,126,395 47,717,765 47,757,912 40,251,462 36,830,118 37,406,673 37,209,066 Health 9,400,208 11,721,086 12,779,489 11,600,898 15,139,604 12,591,993 13,393,465 Human Services 1,283,836 1,767,783 1,971,913 2,124,432 2,745,554 2,867,122 2,379,078 Finance 50,532,169 54,962,915 53,475,575 58,976,160 45,211,223 50,465,041 43,098,615 Property Management 6,063,327 7,339,680 7,325,178 7,379,446 7,780,248 6,845,297 6,656,823 Civil Service 1,245,031 1,434,045 1,718,570 1,691,709 1,750,767 1,622,784 1,469,643 Public Works 14,500,255 17,196,492 18,155,202 16,489,163 20,494,346 18,079,760 15,242,280 Recreation 1,769,755 3,199,459 4,270,511 4,728,828 216,105 - - Parks & Parkways 5,001,079 6,674,138 7,248,611 6,314,645 6,790,738 6,508,978 6,137,667 Library 46,878 243,718 501,202 - 32,494 - - HDLC 459,422 606,704 689,707 664,514 666,769 638,095 638,095 VCC 235,784 336,927 331,765 312,747 384,449 344,831 344,831 Alcoholic Bvg Ctrl. Bd. 1,295 1,401 526 34 14 1,500 1,500 City Planning Comm. 985,250 1,149,491 1,321,729 1,269,541 1,513,945 1,781,439 1,594,134 Mosquito Control Bd. 2,636,451 2,174,392 2,293,307 2,266,744 2,180,692 2,309,627 2,078,510 Museum of Art 104,361 252,090 242,499 196,425 176,400 167,772 151,683 Miscellaneous 17,073,110 22,553,319 25,220,591 23,490,664 15,839,608 22,121,288 29,525,493 General Services 56,593 1,680,518 2,811,940 2,731,230 3,447,258 3,668,522 3,685,336 Office of Training Div. - - - - - - - Office of Comm. Dev. 698 353 2,012,977 10,182 - - - N’hood Hsg Imprv. Fnd - - - - - - - Workforce Invst. Act - - - - - - - Economic Dev. Fund - - - - - - - Intergovernmental - - - - - - - District Attorney 3,096,130 3,616,131 5,916,841 5,889,509 6,166,265 6,666,265 6,271,671 Coroner's Office 1,466,288 1,454,871 1,736,211 1,601,222 1,837,234 1,669,099 1,669,099 Juvenile Court 1,699,725 2,919,119 3,622,808 3,646,989 3,826,663 3,743,800 2,615,283 First City Court - - - - - 6,000 6,000 Civil Court - - - - - 14,400 14,400 Municipal Court 1,051,412 1,121,520 1,916,463 1,762,726 2,724,884 2,566,323 1,867,343 Traffic Court 913,725 925,238 976,629 924,435 587,529 354,356 389,640 Criminal District Court 1,982,149 2,634,662 2,844,662 3,033,901 2,860,195 2,214,832 1,526,597 Criminal Sheriff 24,020,922 25,327,988 26,665,058 23,013,071 22,543,846 22,944,000 22,134,338 Clrk of Crim. Dist. Crt 2,193,422 2,447,641 4,067,699 3,752,310 4,027,575 3,726,329 3,726,330 Registrar of Voters 313,957 361,410 390,732 337,297 531,229 407,890 383,416 Judicial Retirement 154,605 225,783 213,679 164,228 232,443 162,477 263,238 Total $410,052,685 $469,745,650 $491,569,825 $509,379,299 $499,972,564 $497,530,704 $491,379,272
Page 79
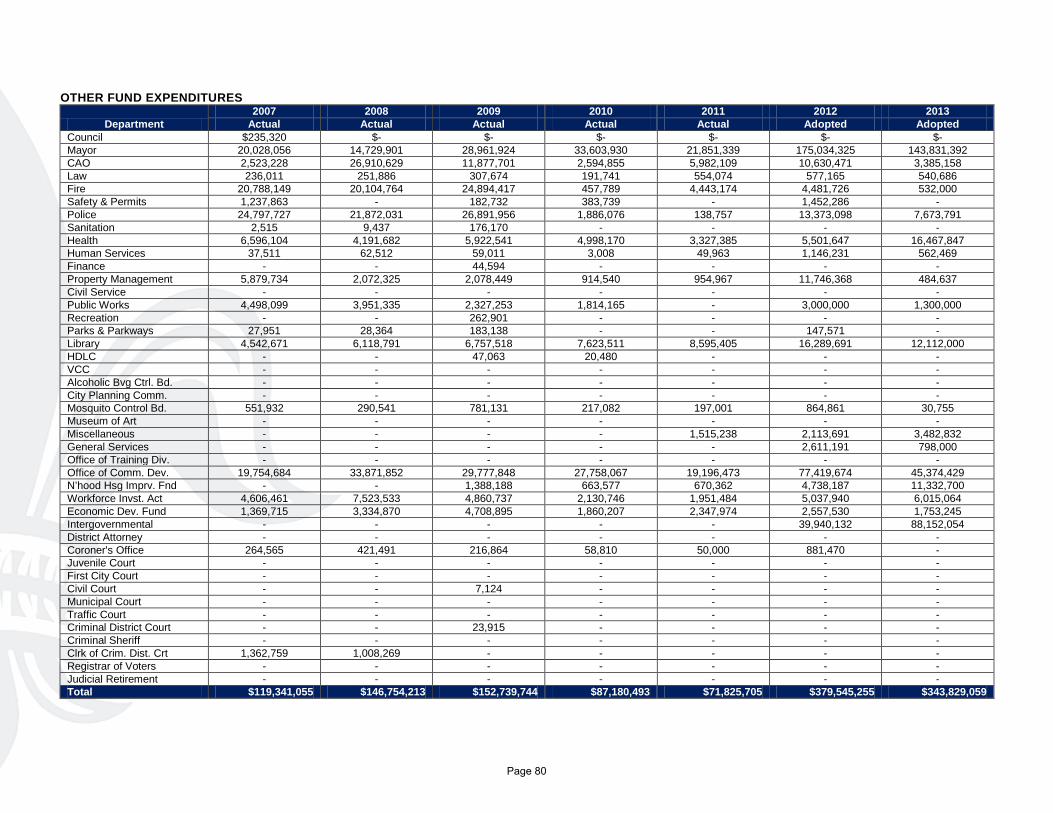
OTHER FUND EXPENDITURES
Department 2007 2008 2009 2010 2011 2012 2013
Actual Actual Actual Actual Actual Adopted Adopted Council $235,320 $- $- $- $- $- $- Mayor 20,028,056 14,729,901 28,961,924 33,603,930 21,851,339 175,034,325 143,831,392 CAO 2,523,228 26,910,629 11,877,701 2,594,855 5,982,109 10,630,471 3,385,158 Law 236,011 251,886 307,674 191,741 554,074 577,165 540,686 Fire 20,788,149 20,104,764 24,894,417 457,789 4,443,174 4,481,726 532,000 Safety & Permits 1,237,863 - 182,732 383,739 - 1,452,286 - Police 24,797,727 21,872,031 26,891,956 1,886,076 138,757 13,373,098 7,673,791 Sanitation 2,515 9,437 176,170 - - - - Health 6,596,104 4,191,682 5,922,541 4,998,170 3,327,385 5,501,647 16,467,847 Human Services 37,511 62,512 59,011 3,008 49,963 1,146,231 562,469 Finance - - 44,594 - - - - Property Management 5,879,734 2,072,325 2,078,449 914,540 954,967 11,746,368 484,637 Civil Service - - - - - - - Public Works 4,498,099 3,951,335 2,327,253 1,814,165 - 3,000,000 1,300,000 Recreation - - 262,901 - - - - Parks & Parkways 27,951 28,364 183,138 - - 147,571 - Library 4,542,671 6,118,791 6,757,518 7,623,511 8,595,405 16,289,691 12,112,000 HDLC - - 47,063 20,480 - - - VCC - - - - - - - Alcoholic Bvg Ctrl. Bd. - - - - - - - City Planning Comm. - - - - - - - Mosquito Control Bd. 551,932 290,541 781,131 217,082 197,001 864,861 30,755 Museum of Art - - - - - - - Miscellaneous - - - - 1,515,238 2,113,691 3,482,832 General Services - - - - - 2,611,191 798,000 Office of Training Div. - - - - - - - Office of Comm. Dev. 19,754,684 33,871,852 29,777,848 27,758,067 19,196,473 77,419,674 45,374,429 N’hood Hsg Imprv. Fnd - - 1,388,188 663,577 670,362 4,738,187 11,332,700 Workforce Invst. Act 4,606,461 7,523,533 4,860,737 2,130,746 1,951,484 5,037,940 6,015,064 Economic Dev. Fund 1,369,715 3,334,870 4,708,895 1,860,207 2,347,974 2,557,530 1,753,245 Intergovernmental - - - - - 39,940,132 88,152,054 District Attorney - - - - - - - Coroner's Office 264,565 421,491 216,864 58,810 50,000 881,470 - Juvenile Court - - - - - - - First City Court - - - - - - - Civil Court - - 7,124 - - - - Municipal Court - - - - - - - Traffic Court - - - - - - - Criminal District Court - - 23,915 - - - - Criminal Sheriff - - - - - - - Clrk of Crim. Dist. Crt 1,362,759 1,008,269 - - - - - Registrar of Voters - - - - - - - Judicial Retirement - - - - - - - Total $119,341,055 $146,754,213 $152,739,744 $87,180,493 $71,825,705 $379,545,255 $343,829,059
Page 80
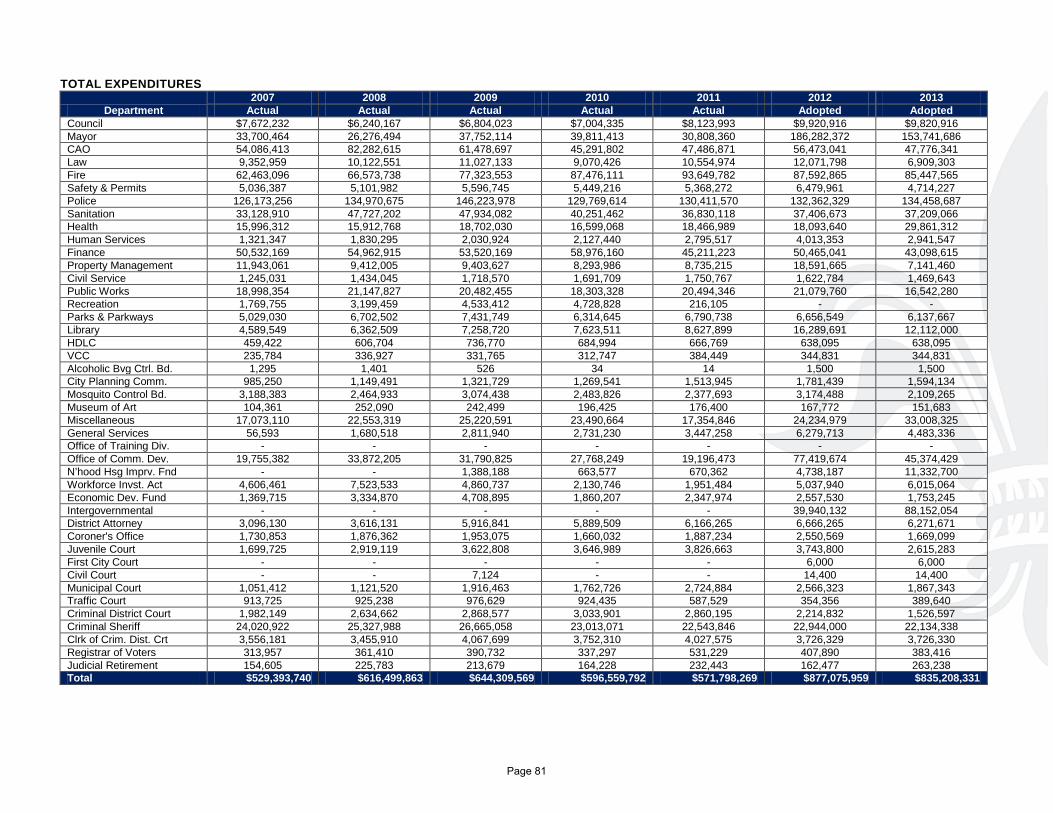
TOTAL EXPENDITURES
Department 2007 2008 2009 2010 2011 2012 2013
Actual Actual Actual Actual Actual Adopted Adopted Council $7,672,232 $6,240,167 $6,804,023 $7,004,335 $8,123,993 $9,920,916 $9,820,916 Mayor 33,700,464 26,276,494 37,752,114 39,811,413 30,808,360 186,282,372 153,741,686 CAO 54,086,413 82,282,615 61,478,697 45,291,802 47,486,871 56,473,041 47,776,341 Law 9,352,959 10,122,551 11,027,133 9,070,426 10,554,974 12,071,798 6,909,303 Fire 62,463,096 66,573,738 77,323,553 87,476,111 93,649,782 87,592,865 85,447,565 Safety & Permits 5,036,387 5,101,982 5,596,745 5,449,216 5,368,272 6,479,961 4,714,227 Police 126,173,256 134,970,675 146,223,978 129,769,614 130,411,570 132,362,329 134,458,687 Sanitation 33,128,910 47,727,202 47,934,082 40,251,462 36,830,118 37,406,673 37,209,066 Health 15,996,312 15,912,768 18,702,030 16,599,068 18,466,989 18,093,640 29,861,312 Human Services 1,321,347 1,830,295 2,030,924 2,127,440 2,795,517 4,013,353 2,941,547 Finance 50,532,169 54,962,915 53,520,169 58,976,160 45,211,223 50,465,041 43,098,615 Property Management 11,943,061 9,412,005 9,403,627 8,293,986 8,735,215 18,591,665 7,141,460 Civil Service 1,245,031 1,434,045 1,718,570 1,691,709 1,750,767 1,622,784 1,469,643 Public Works 18,998,354 21,147,827 20,482,455 18,303,328 20,494,346 21,079,760 16,542,280 Recreation 1,769,755 3,199,459 4,533,412 4,728,828 216,105 - - Parks & Parkways 5,029,030 6,702,502 7,431,749 6,314,645 6,790,738 6,656,549 6,137,667 Library 4,589,549 6,362,509 7,258,720 7,623,511 8,627,899 16,289,691 12,112,000 HDLC 459,422 606,704 736,770 684,994 666,769 638,095 638,095 VCC 235,784 336,927 331,765 312,747 384,449 344,831 344,831 Alcoholic Bvg Ctrl. Bd. 1,295 1,401 526 34 14 1,500 1,500 City Planning Comm. 985,250 1,149,491 1,321,729 1,269,541 1,513,945 1,781,439 1,594,134 Mosquito Control Bd. 3,188,383 2,464,933 3,074,438 2,483,826 2,377,693 3,174,488 2,109,265 Museum of Art 104,361 252,090 242,499 196,425 176,400 167,772 151,683 Miscellaneous 17,073,110 22,553,319 25,220,591 23,490,664 17,354,846 24,234,979 33,008,325 General Services 56,593 1,680,518 2,811,940 2,731,230 3,447,258 6,279,713 4,483,336 Office of Training Div. - - - - - - - Office of Comm. Dev. 19,755,382 33,872,205 31,790,825 27,768,249 19,196,473 77,419,674 45,374,429 N’hood Hsg Imprv. Fnd - - 1,388,188 663,577 670,362 4,738,187 11,332,700 Workforce Invst. Act 4,606,461 7,523,533 4,860,737 2,130,746 1,951,484 5,037,940 6,015,064 Economic Dev. Fund 1,369,715 3,334,870 4,708,895 1,860,207 2,347,974 2,557,530 1,753,245 Intergovernmental - - - - - 39,940,132 88,152,054 District Attorney 3,096,130 3,616,131 5,916,841 5,889,509 6,166,265 6,666,265 6,271,671 Coroner's Office 1,730,853 1,876,362 1,953,075 1,660,032 1,887,234 2,550,569 1,669,099 Juvenile Court 1,699,725 2,919,119 3,622,808 3,646,989 3,826,663 3,743,800 2,615,283 First City Court - - - - - 6,000 6,000 Civil Court - - 7,124 - - 14,400 14,400 Municipal Court 1,051,412 1,121,520 1,916,463 1,762,726 2,724,884 2,566,323 1,867,343 Traffic Court 913,725 925,238 976,629 924,435 587,529 354,356 389,640 Criminal District Court 1,982,149 2,634,662 2,868,577 3,033,901 2,860,195 2,214,832 1,526,597 Criminal Sheriff 24,020,922 25,327,988 26,665,058 23,013,071 22,543,846 22,944,000 22,134,338 Clrk of Crim. Dist. Crt 3,556,181 3,455,910 4,067,699 3,752,310 4,027,575 3,726,329 3,726,330 Registrar of Voters 313,957 361,410 390,732 337,297 531,229 407,890 383,416 Judicial Retirement 154,605 225,783 213,679 164,228 232,443 162,477 263,238 Total $529,393,740 $616,499,863 $644,309,569 $596,559,792 $571,798,269 $877,075,959 $835,208,331
Page 81
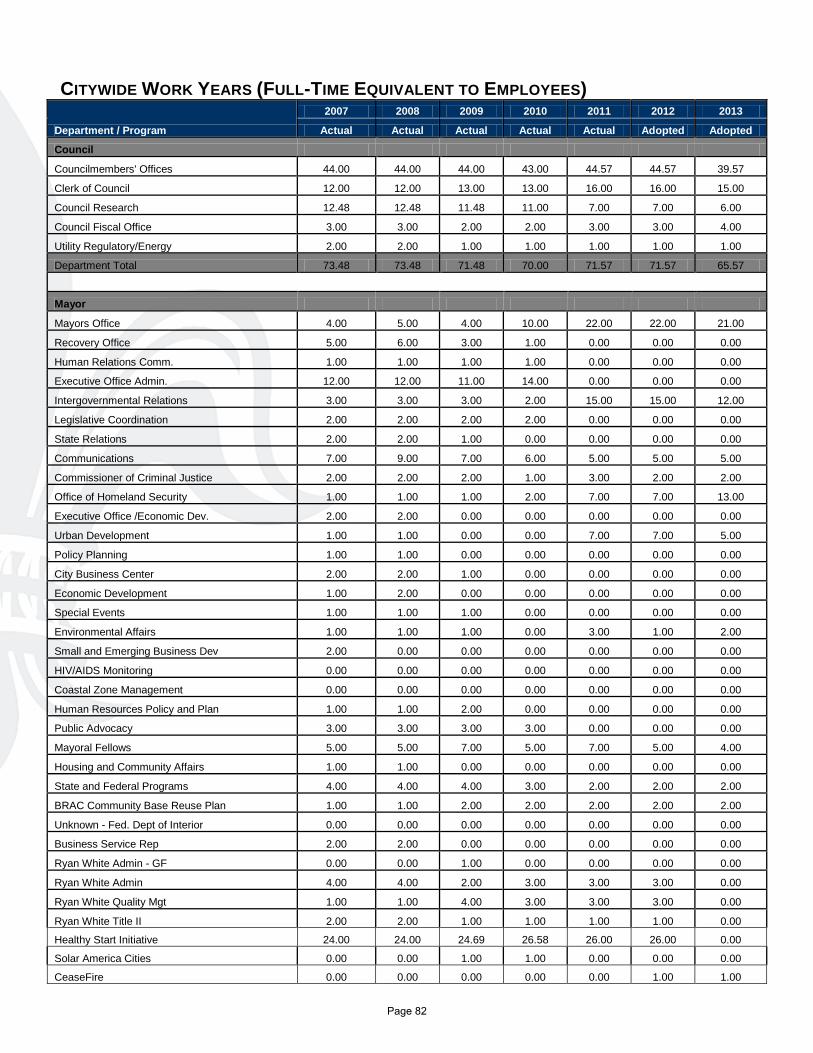
CITYWIDE WORK YEARS (FULL-TIME EQUIVALENT TO EMPLOYEES)
Department / Program
2007 2008 2009 2010 2011 2012 2013
Actual Actual Actual Actual Actual Adopted Adopted
Council
Councilmembers' Offices 44.00 44.00 44.00 43.00 44.57 44.57 39.57
Clerk of Council 12.00 12.00 13.00 13.00 16.00 16.00 15.00
Council Research 12.48 12.48 11.48 11.00 7.00 7.00 6.00
Council Fiscal Office 3.00 3.00 2.00 2.00 3.00 3.00 4.00
Utility Regulatory/Energy 2.00 2.00 1.00 1.00 1.00 1.00 1.00
Department Total 73.48 73.48 71.48 70.00 71.57 71.57 65.57
Mayor
Mayors Office 4.00 5.00 4.00 10.00 22.00 22.00 21.00
Recovery Office 5.00 6.00 3.00 1.00 0.00 0.00 0.00
Human Relations Comm. 1.00 1.00 1.00 1.00 0.00 0.00 0.00
Executive Office Admin. 12.00 12.00 11.00 14.00 0.00 0.00 0.00
Intergovernmental Relations 3.00 3.00 3.00 2.00 15.00 15.00 12.00
Legislative Coordination 2.00 2.00 2.00 2.00 0.00 0.00 0.00
State Relations 2.00 2.00 1.00 0.00 0.00 0.00 0.00
Communications 7.00 9.00 7.00 6.00 5.00 5.00 5.00
Commissioner of Criminal Justice 2.00 2.00 2.00 1.00 3.00 2.00 2.00
Office of Homeland Security 1.00 1.00 1.00 2.00 7.00 7.00 13.00
Executive Office /Economic Dev. 2.00 2.00 0.00 0.00 0.00 0.00 0.00
Urban Development 1.00 1.00 0.00 0.00 7.00 7.00 5.00
Policy Planning 1.00 1.00 0.00 0.00 0.00 0.00 0.00
City Business Center 2.00 2.00 1.00 0.00 0.00 0.00 0.00
Economic Development 1.00 2.00 0.00 0.00 0.00 0.00 0.00
Special Events 1.00 1.00 1.00 0.00 0.00 0.00 0.00
Environmental Affairs 1.00 1.00 1.00 0.00 3.00 1.00 2.00
Small and Emerging Business Dev 2.00 0.00 0.00 0.00 0.00 0.00 0.00
HIV/AIDS Monitoring 0.00 0.00 0.00 0.00 0.00 0.00 0.00
Coastal Zone Management 0.00 0.00 0.00 0.00 0.00 0.00 0.00
Human Resources Policy and Plan 1.00 1.00 2.00 0.00 0.00 0.00 0.00
Public Advocacy 3.00 3.00 3.00 3.00 0.00 0.00 0.00
Mayoral Fellows 5.00 5.00 7.00 5.00 7.00 5.00 4.00
Housing and Community Affairs 1.00 1.00 0.00 0.00 0.00 0.00 0.00
State and Federal Programs 4.00 4.00 4.00 3.00 2.00 2.00 2.00
BRAC Community Base Reuse Plan 1.00 1.00 2.00 2.00 2.00 2.00 2.00
Unknown - Fed. Dept of Interior 0.00 0.00 0.00 0.00 0.00 0.00 0.00
Business Service Rep 2.00 2.00 0.00 0.00 0.00 0.00 0.00
Ryan White Admin - GF 0.00 0.00 1.00 0.00 0.00 0.00 0.00
Ryan White Admin 4.00 4.00 2.00 3.00 3.00 3.00 0.00
Ryan White Quality Mgt 1.00 1.00 4.00 3.00 3.00 3.00 0.00
Ryan White Title II 2.00 2.00 1.00 1.00 1.00 1.00 0.00
Healthy Start Initiative 24.00 24.00 24.69 26.58 26.00 26.00 0.00
Solar America Cities 0.00 0.00 1.00 1.00 0.00 0.00 0.00
CeaseFire 0.00 0.00 0.00 0.00 0.00 1.00 1.00
Page 82
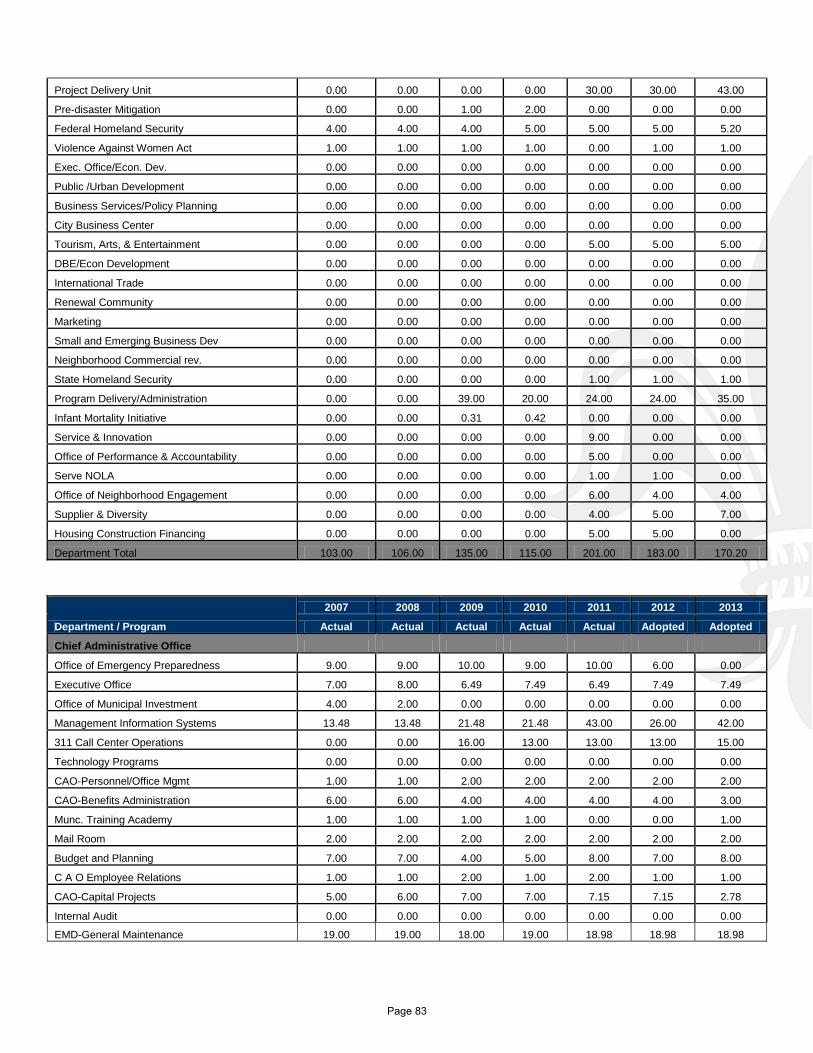
Project Delivery Unit 0.00 0.00 0.00 0.00 30.00 30.00 43.00
Pre-disaster Mitigation 0.00 0.00 1.00 2.00 0.00 0.00 0.00
Federal Homeland Security 4.00 4.00 4.00 5.00 5.00 5.00 5.20
Violence Against Women Act 1.00 1.00 1.00 1.00 0.00 1.00 1.00
Exec. Office/Econ. Dev. 0.00 0.00 0.00 0.00 0.00 0.00 0.00
Public /Urban Development 0.00 0.00 0.00 0.00 0.00 0.00 0.00
Business Services/Policy Planning 0.00 0.00 0.00 0.00 0.00 0.00 0.00
City Business Center 0.00 0.00 0.00 0.00 0.00 0.00 0.00
Tourism, Arts, & Entertainment 0.00 0.00 0.00 0.00 5.00 5.00 5.00
DBE/Econ Development 0.00 0.00 0.00 0.00 0.00 0.00 0.00
International Trade 0.00 0.00 0.00 0.00 0.00 0.00 0.00
Renewal Community 0.00 0.00 0.00 0.00 0.00 0.00 0.00
Marketing 0.00 0.00 0.00 0.00 0.00 0.00 0.00
Small and Emerging Business Dev 0.00 0.00 0.00 0.00 0.00 0.00 0.00
Neighborhood Commercial rev. 0.00 0.00 0.00 0.00 0.00 0.00 0.00
State Homeland Security 0.00 0.00 0.00 0.00 1.00 1.00 1.00
Program Delivery/Administration 0.00 0.00 39.00 20.00 24.00 24.00 35.00
Infant Mortality Initiative 0.00 0.00 0.31 0.42 0.00 0.00 0.00
Service & Innovation 0.00 0.00 0.00 0.00 9.00 0.00 0.00
Office of Performance & Accountability 0.00 0.00 0.00 0.00 5.00 0.00 0.00
Serve NOLA 0.00 0.00 0.00 0.00 1.00 1.00 0.00
Office of Neighborhood Engagement 0.00 0.00 0.00 0.00 6.00 4.00 4.00
Supplier & Diversity 0.00 0.00 0.00 0.00 4.00 5.00 7.00
Housing Construction Financing 0.00 0.00 0.00 0.00 5.00 5.00 0.00
Department Total 103.00 106.00 135.00 115.00 201.00 183.00 170.20
Department / Program
2007 2008 2009 2010 2011 2012 2013
Actual Actual Actual Actual Actual Adopted Adopted
Chief Administrative Office
Office of Emergency Preparedness 9.00 9.00 10.00 9.00 10.00 6.00 0.00
Executive Office 7.00 8.00 6.49 7.49 6.49 7.49 7.49
Office of Municipal Investment 4.00 2.00 0.00 0.00 0.00 0.00 0.00
Management Information Systems 13.48 13.48 21.48 21.48 43.00 26.00 42.00
311 Call Center Operations 0.00 0.00 16.00 13.00 13.00 13.00 15.00
Technology Programs 0.00 0.00 0.00 0.00 0.00 0.00 0.00
CAO-Personnel/Office Mgmt 1.00 1.00 2.00 2.00 2.00 2.00 2.00
CAO-Benefits Administration 6.00 6.00 4.00 4.00 4.00 4.00 3.00
Munc. Training Academy 1.00 1.00 1.00 1.00 0.00 0.00 1.00
Mail Room 2.00 2.00 2.00 2.00 2.00 2.00 2.00
Budget and Planning 7.00 7.00 4.00 5.00 8.00 7.00 8.00
C A O Employee Relations 1.00 1.00 2.00 1.00 2.00 1.00 1.00
CAO-Capital Projects 5.00 6.00 7.00 7.00 7.15 7.15 2.78
Internal Audit 0.00 0.00 0.00 0.00 0.00 0.00 0.00
EMD-General Maintenance 19.00 19.00 18.00 19.00 18.98 18.98 18.98
Page 83
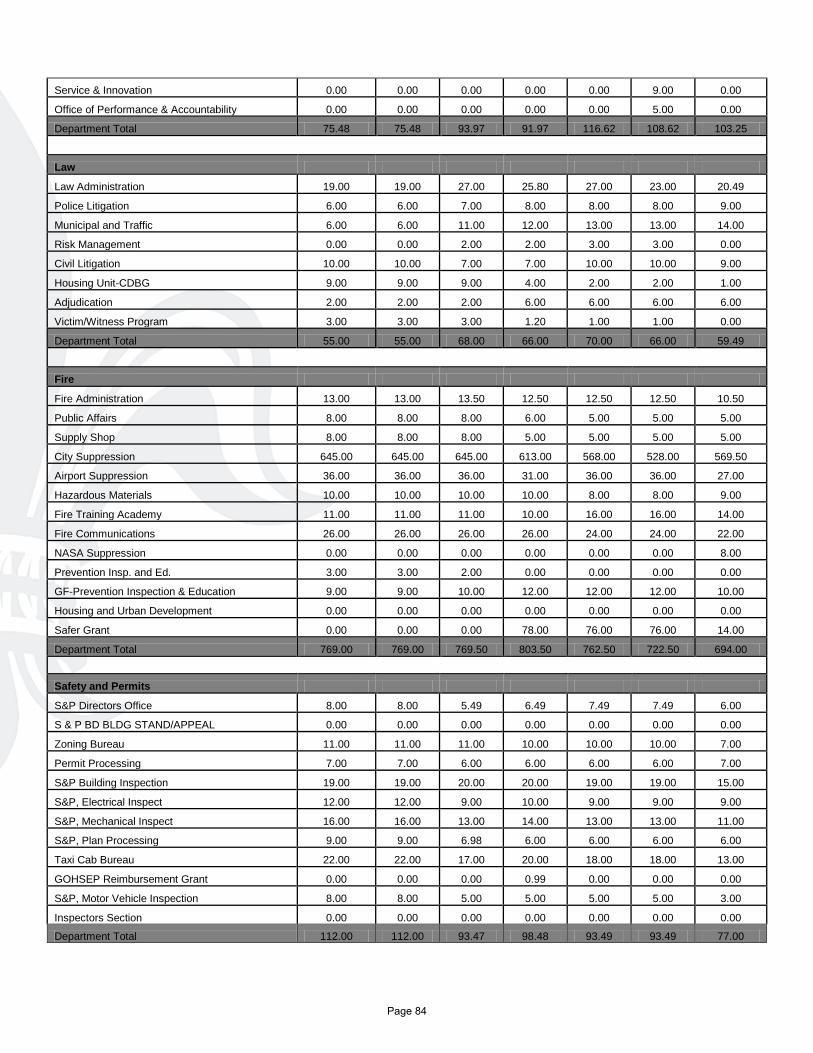
Service & Innovation 0.00 0.00 0.00 0.00 0.00 9.00 0.00
Office of Performance & Accountability 0.00 0.00 0.00 0.00 0.00 5.00 0.00
Department Total 75.48 75.48 93.97 91.97 116.62 108.62 103.25
Law
Law Administration 19.00 19.00 27.00 25.80 27.00 23.00 20.49
Police Litigation 6.00 6.00 7.00 8.00 8.00 8.00 9.00
Municipal and Traffic 6.00 6.00 11.00 12.00 13.00 13.00 14.00
Risk Management 0.00 0.00 2.00 2.00 3.00 3.00 0.00
Civil Litigation 10.00 10.00 7.00 7.00 10.00 10.00 9.00
Housing Unit-CDBG 9.00 9.00 9.00 4.00 2.00 2.00 1.00
Adjudication 2.00 2.00 2.00 6.00 6.00 6.00 6.00
Victim/Witness Program 3.00 3.00 3.00 1.20 1.00 1.00 0.00
Department Total 55.00 55.00 68.00 66.00 70.00 66.00 59.49
Fire
Fire Administration 13.00 13.00 13.50 12.50 12.50 12.50 10.50
Public Affairs 8.00 8.00 8.00 6.00 5.00 5.00 5.00
Supply Shop 8.00 8.00 8.00 5.00 5.00 5.00 5.00
City Suppression 645.00 645.00 645.00 613.00 568.00 528.00 569.50
Airport Suppression 36.00 36.00 36.00 31.00 36.00 36.00 27.00
Hazardous Materials 10.00 10.00 10.00 10.00 8.00 8.00 9.00
Fire Training Academy 11.00 11.00 11.00 10.00 16.00 16.00 14.00
Fire Communications 26.00 26.00 26.00 26.00 24.00 24.00 22.00
NASA Suppression 0.00 0.00 0.00 0.00 0.00 0.00 8.00
Prevention Insp. and Ed. 3.00 3.00 2.00 0.00 0.00 0.00 0.00
GF-Prevention Inspection & Education 9.00 9.00 10.00 12.00 12.00 12.00 10.00
Housing and Urban Development 0.00 0.00 0.00 0.00 0.00 0.00 0.00
Safer Grant 0.00 0.00 0.00 78.00 76.00 76.00 14.00
Department Total 769.00 769.00 769.50 803.50 762.50 722.50 694.00
Safety and Permits
S&P Directors Office 8.00 8.00 5.49 6.49 7.49 7.49 6.00
S & P BD BLDG STAND/APPEAL 0.00 0.00 0.00 0.00 0.00 0.00 0.00
Zoning Bureau 11.00 11.00 11.00 10.00 10.00 10.00 7.00
Permit Processing 7.00 7.00 6.00 6.00 6.00 6.00 7.00
S&P Building Inspection 19.00 19.00 20.00 20.00 19.00 19.00 15.00
S&P, Electrical Inspect 12.00 12.00 9.00 10.00 9.00 9.00 9.00
S&P, Mechanical Inspect 16.00 16.00 13.00 14.00 13.00 13.00 11.00
S&P, Plan Processing 9.00 9.00 6.98 6.00 6.00 6.00 6.00
Taxi Cab Bureau 22.00 22.00 17.00 20.00 18.00 18.00 13.00
GOHSEP Reimbursement Grant 0.00 0.00 0.00 0.99 0.00 0.00 0.00
S&P, Motor Vehicle Inspection 8.00 8.00 5.00 5.00 5.00 5.00 3.00
Inspectors Section 0.00 0.00 0.00 0.00 0.00 0.00 0.00
Department Total 112.00 112.00 93.47 98.48 93.49 93.49 77.00
Page 84
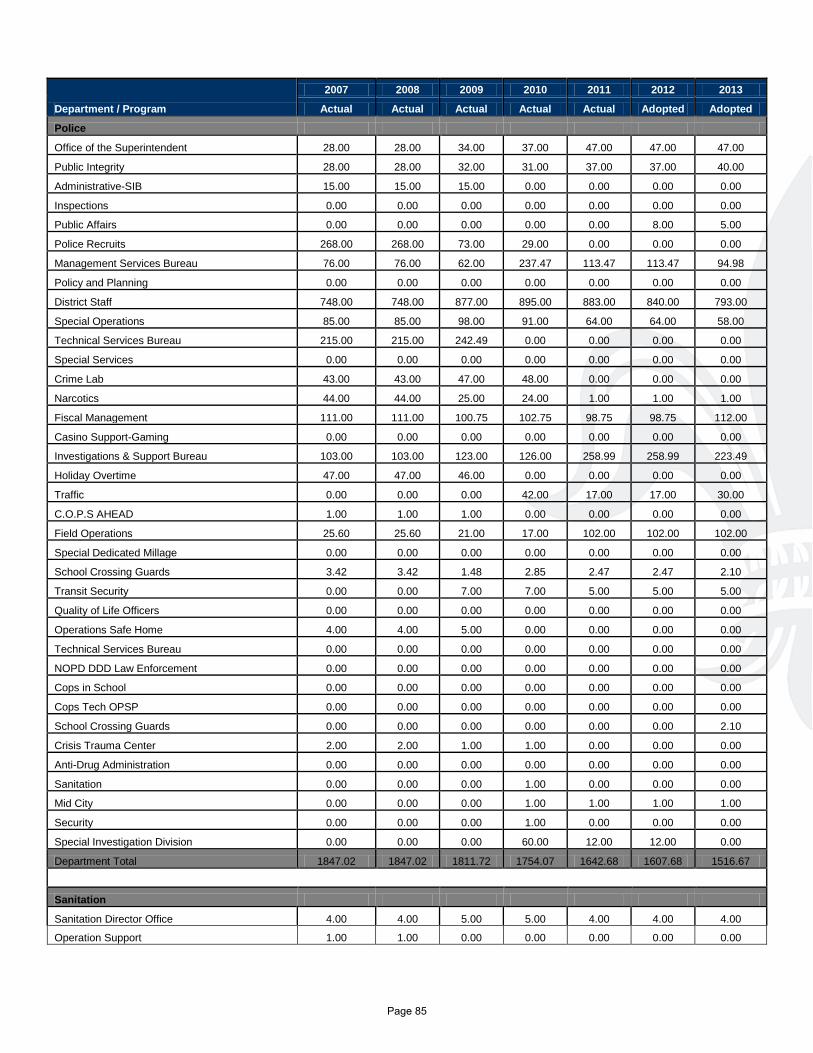
Department / Program
2007 2008 2009 2010 2011 2012 2013
Actual Actual Actual Actual Actual Adopted Adopted
Police
Office of the Superintendent 28.00 28.00 34.00 37.00 47.00 47.00 47.00
Public Integrity 28.00 28.00 32.00 31.00 37.00 37.00 40.00
Administrative-SIB 15.00 15.00 15.00 0.00 0.00 0.00 0.00
Inspections 0.00 0.00 0.00 0.00 0.00 0.00 0.00
Public Affairs 0.00 0.00 0.00 0.00 0.00 8.00 5.00
Police Recruits 268.00 268.00 73.00 29.00 0.00 0.00 0.00
Management Services Bureau 76.00 76.00 62.00 237.47 113.47 113.47 94.98
Policy and Planning 0.00 0.00 0.00 0.00 0.00 0.00 0.00
District Staff 748.00 748.00 877.00 895.00 883.00 840.00 793.00
Special Operations 85.00 85.00 98.00 91.00 64.00 64.00 58.00
Technical Services Bureau 215.00 215.00 242.49 0.00 0.00 0.00 0.00
Special Services 0.00 0.00 0.00 0.00 0.00 0.00 0.00
Crime Lab 43.00 43.00 47.00 48.00 0.00 0.00 0.00
Narcotics 44.00 44.00 25.00 24.00 1.00 1.00 1.00
Fiscal Management 111.00 111.00 100.75 102.75 98.75 98.75 112.00
Casino Support-Gaming 0.00 0.00 0.00 0.00 0.00 0.00 0.00
Investigations & Support Bureau 103.00 103.00 123.00 126.00 258.99 258.99 223.49
Holiday Overtime 47.00 47.00 46.00 0.00 0.00 0.00 0.00
Traffic 0.00 0.00 0.00 42.00 17.00 17.00 30.00
C.O.P.S AHEAD 1.00 1.00 1.00 0.00 0.00 0.00 0.00
Field Operations 25.60 25.60 21.00 17.00 102.00 102.00 102.00
Special Dedicated Millage 0.00 0.00 0.00 0.00 0.00 0.00 0.00
School Crossing Guards 3.42 3.42 1.48 2.85 2.47 2.47 2.10
Transit Security 0.00 0.00 7.00 7.00 5.00 5.00 5.00
Quality of Life Officers 0.00 0.00 0.00 0.00 0.00 0.00 0.00
Operations Safe Home 4.00 4.00 5.00 0.00 0.00 0.00 0.00
Technical Services Bureau 0.00 0.00 0.00 0.00 0.00 0.00 0.00
NOPD DDD Law Enforcement 0.00 0.00 0.00 0.00 0.00 0.00 0.00
Cops in School 0.00 0.00 0.00 0.00 0.00 0.00 0.00
Cops Tech OPSP 0.00 0.00 0.00 0.00 0.00 0.00 0.00
School Crossing Guards 0.00 0.00 0.00 0.00 0.00 0.00 2.10
Crisis Trauma Center 2.00 2.00 1.00 1.00 0.00 0.00 0.00
Anti-Drug Administration 0.00 0.00 0.00 0.00 0.00 0.00 0.00
Sanitation 0.00 0.00 0.00 1.00 0.00 0.00 0.00
Mid City 0.00 0.00 0.00 1.00 1.00 1.00 1.00
Security 0.00 0.00 0.00 1.00 0.00 0.00 0.00
Special Investigation Division 0.00 0.00 0.00 60.00 12.00 12.00 0.00
Department Total 1847.02 1847.02 1811.72 1754.07 1642.68 1607.68 1516.67
Sanitation
Sanitation Director Office 4.00 4.00 5.00 5.00 4.00 4.00 4.00
Operation Support 1.00 1.00 0.00 0.00 0.00 0.00 0.00
Page 85
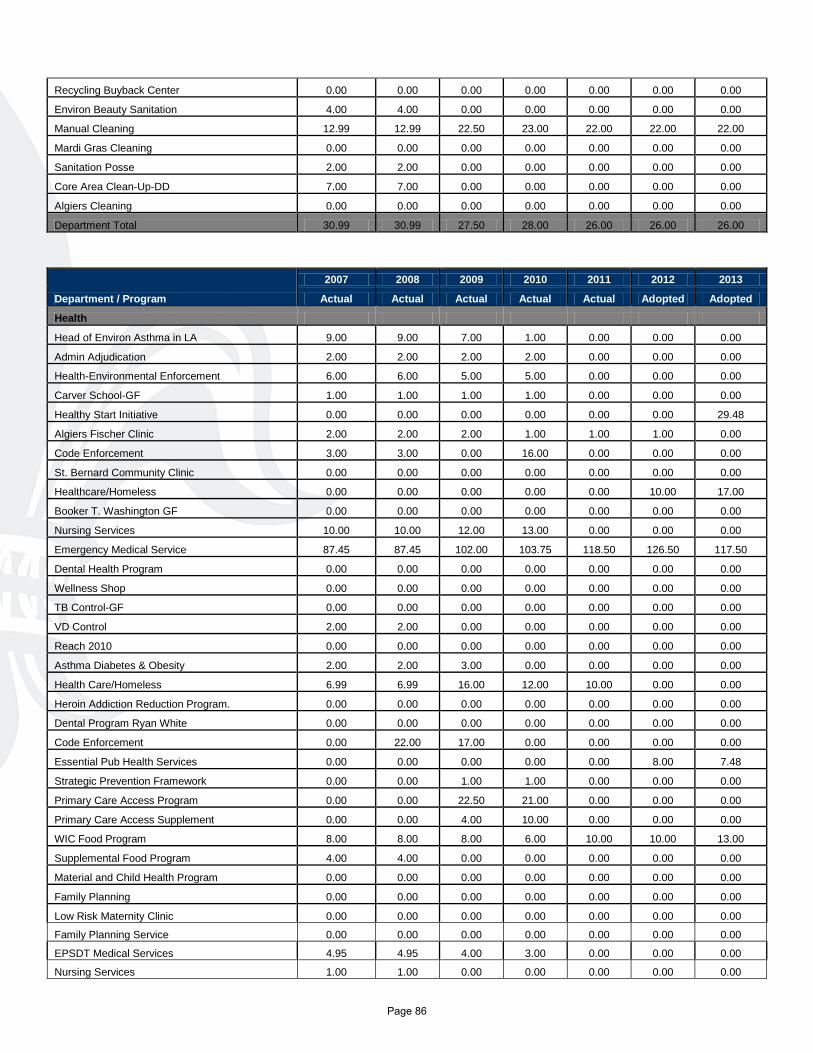
Recycling Buyback Center 0.00 0.00 0.00 0.00 0.00 0.00 0.00
Environ Beauty Sanitation 4.00 4.00 0.00 0.00 0.00 0.00 0.00
Manual Cleaning 12.99 12.99 22.50 23.00 22.00 22.00 22.00
Mardi Gras Cleaning 0.00 0.00 0.00 0.00 0.00 0.00 0.00
Sanitation Posse 2.00 2.00 0.00 0.00 0.00 0.00 0.00
Core Area Clean-Up-DD 7.00 7.00 0.00 0.00 0.00 0.00 0.00
Algiers Cleaning 0.00 0.00 0.00 0.00 0.00 0.00 0.00
Department Total 30.99 30.99 27.50 28.00 26.00 26.00 26.00
Department / Program
2007 2008 2009 2010 2011 2012 2013
Actual Actual Actual Actual Actual Adopted Adopted
Health
Head of Environ Asthma in LA 9.00 9.00 7.00 1.00 0.00 0.00 0.00
Admin Adjudication 2.00 2.00 2.00 2.00 0.00 0.00 0.00
Health-Environmental Enforcement 6.00 6.00 5.00 5.00 0.00 0.00 0.00
Carver School-GF 1.00 1.00 1.00 1.00 0.00 0.00 0.00
Healthy Start Initiative 0.00 0.00 0.00 0.00 0.00 0.00 29.48
Algiers Fischer Clinic 2.00 2.00 2.00 1.00 1.00 1.00 0.00
Code Enforcement 3.00 3.00 0.00 16.00 0.00 0.00 0.00
St. Bernard Community Clinic 0.00 0.00 0.00 0.00 0.00 0.00 0.00
Healthcare/Homeless 0.00 0.00 0.00 0.00 0.00 10.00 17.00
Booker T. Washington GF 0.00 0.00 0.00 0.00 0.00 0.00 0.00
Nursing Services 10.00 10.00 12.00 13.00 0.00 0.00 0.00
Emergency Medical Service 87.45 87.45 102.00 103.75 118.50 126.50 117.50
Dental Health Program 0.00 0.00 0.00 0.00 0.00 0.00 0.00
Wellness Shop 0.00 0.00 0.00 0.00 0.00 0.00 0.00
TB Control-GF 0.00 0.00 0.00 0.00 0.00 0.00 0.00
VD Control 2.00 2.00 0.00 0.00 0.00 0.00 0.00
Reach 2010 0.00 0.00 0.00 0.00 0.00 0.00 0.00
Asthma Diabetes & Obesity 2.00 2.00 3.00 0.00 0.00 0.00 0.00
Health Care/Homeless 6.99 6.99 16.00 12.00 10.00 0.00 0.00
Heroin Addiction Reduction Program. 0.00 0.00 0.00 0.00 0.00 0.00 0.00
Dental Program Ryan White 0.00 0.00 0.00 0.00 0.00 0.00 0.00
Code Enforcement 0.00 22.00 17.00 0.00 0.00 0.00 0.00
Essential Pub Health Services 0.00 0.00 0.00 0.00 0.00 8.00 7.48
Strategic Prevention Framework 0.00 0.00 1.00 1.00 0.00 0.00 0.00
Primary Care Access Program 0.00 0.00 22.50 21.00 0.00 0.00 0.00
Primary Care Access Supplement 0.00 0.00 4.00 10.00 0.00 0.00 0.00
WIC Food Program 8.00 8.00 8.00 6.00 10.00 10.00 13.00
Supplemental Food Program 4.00 4.00 0.00 0.00 0.00 0.00 0.00
Material and Child Health Program 0.00 0.00 0.00 0.00 0.00 0.00 0.00
Family Planning 0.00 0.00 0.00 0.00 0.00 0.00 0.00
Low Risk Maternity Clinic 0.00 0.00 0.00 0.00 0.00 0.00 0.00
Family Planning Service 0.00 0.00 0.00 0.00 0.00 0.00 0.00
EPSDT Medical Services 4.95 4.95 4.00 3.00 0.00 0.00 0.00
Nursing Services 1.00 1.00 0.00 0.00 0.00 0.00 0.00
Page 86
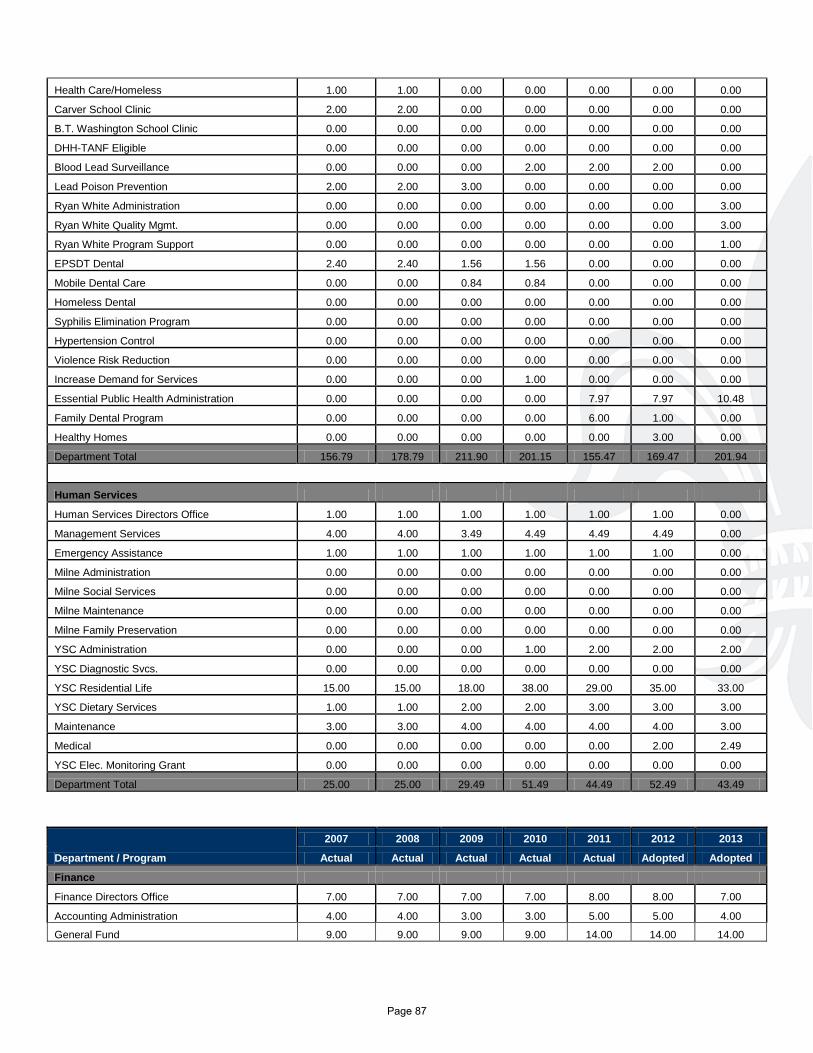
Health Care/Homeless 1.00 1.00 0.00 0.00 0.00 0.00 0.00
Carver School Clinic 2.00 2.00 0.00 0.00 0.00 0.00 0.00
B.T. Washington School Clinic 0.00 0.00 0.00 0.00 0.00 0.00 0.00
DHH-TANF Eligible 0.00 0.00 0.00 0.00 0.00 0.00 0.00
Blood Lead Surveillance 0.00 0.00 0.00 2.00 2.00 2.00 0.00
Lead Poison Prevention 2.00 2.00 3.00 0.00 0.00 0.00 0.00
Ryan White Administration 0.00 0.00 0.00 0.00 0.00 0.00 3.00
Ryan White Quality Mgmt. 0.00 0.00 0.00 0.00 0.00 0.00 3.00
Ryan White Program Support 0.00 0.00 0.00 0.00 0.00 0.00 1.00
EPSDT Dental 2.40 2.40 1.56 1.56 0.00 0.00 0.00
Mobile Dental Care 0.00 0.00 0.84 0.84 0.00 0.00 0.00
Homeless Dental 0.00 0.00 0.00 0.00 0.00 0.00 0.00
Syphilis Elimination Program 0.00 0.00 0.00 0.00 0.00 0.00 0.00
Hypertension Control 0.00 0.00 0.00 0.00 0.00 0.00 0.00
Violence Risk Reduction 0.00 0.00 0.00 0.00 0.00 0.00 0.00
Increase Demand for Services 0.00 0.00 0.00 1.00 0.00 0.00 0.00
Essential Public Health Administration 0.00 0.00 0.00 0.00 7.97 7.97 10.48
Family Dental Program 0.00 0.00 0.00 0.00 6.00 1.00 0.00
Healthy Homes 0.00 0.00 0.00 0.00 0.00 3.00 0.00
Department Total 156.79 178.79 211.90 201.15 155.47 169.47 201.94
Human Services
Human Services Directors Office 1.00 1.00 1.00 1.00 1.00 1.00 0.00
Management Services 4.00 4.00 3.49 4.49 4.49 4.49 0.00
Emergency Assistance 1.00 1.00 1.00 1.00 1.00 1.00 0.00
Milne Administration 0.00 0.00 0.00 0.00 0.00 0.00 0.00
Milne Social Services 0.00 0.00 0.00 0.00 0.00 0.00 0.00
Milne Maintenance 0.00 0.00 0.00 0.00 0.00 0.00 0.00
Milne Family Preservation 0.00 0.00 0.00 0.00 0.00 0.00 0.00
YSC Administration 0.00 0.00 0.00 1.00 2.00 2.00 2.00
YSC Diagnostic Svcs. 0.00 0.00 0.00 0.00 0.00 0.00 0.00
YSC Residential Life 15.00 15.00 18.00 38.00 29.00 35.00 33.00
YSC Dietary Services 1.00 1.00 2.00 2.00 3.00 3.00 3.00
Maintenance 3.00 3.00 4.00 4.00 4.00 4.00 3.00
Medical 0.00 0.00 0.00 0.00 0.00 2.00 2.49
YSC Elec. Monitoring Grant 0.00 0.00 0.00 0.00 0.00 0.00 0.00
Department Total 25.00 25.00 29.49 51.49 44.49 52.49 43.49
Department / Program
2007 2008 2009 2010 2011 2012 2013
Actual Actual Actual Actual Actual Adopted Adopted
Finance
Finance Directors Office 7.00 7.00 7.00 7.00 8.00 8.00 7.00
Accounting Administration 4.00 4.00 3.00 3.00 5.00 5.00 4.00
General Fund 9.00 9.00 9.00 9.00 14.00 14.00 14.00
Page 87
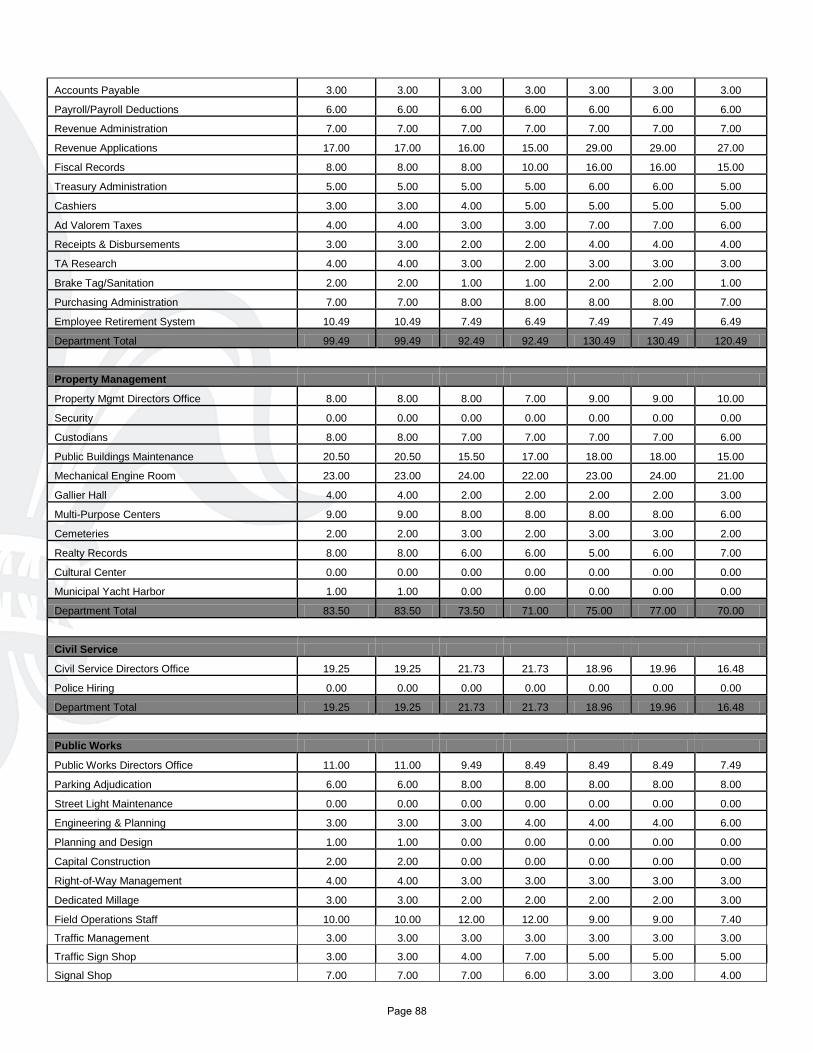
Accounts Payable 3.00 3.00 3.00 3.00 3.00 3.00 3.00
Payroll/Payroll Deductions 6.00 6.00 6.00 6.00 6.00 6.00 6.00
Revenue Administration 7.00 7.00 7.00 7.00 7.00 7.00 7.00
Revenue Applications 17.00 17.00 16.00 15.00 29.00 29.00 27.00
Fiscal Records 8.00 8.00 8.00 10.00 16.00 16.00 15.00
Treasury Administration 5.00 5.00 5.00 5.00 6.00 6.00 5.00
Cashiers 3.00 3.00 4.00 5.00 5.00 5.00 5.00
Ad Valorem Taxes 4.00 4.00 3.00 3.00 7.00 7.00 6.00
Receipts & Disbursements 3.00 3.00 2.00 2.00 4.00 4.00 4.00
TA Research 4.00 4.00 3.00 2.00 3.00 3.00 3.00
Brake Tag/Sanitation 2.00 2.00 1.00 1.00 2.00 2.00 1.00
Purchasing Administration 7.00 7.00 8.00 8.00 8.00 8.00 7.00
Employee Retirement System 10.49 10.49 7.49 6.49 7.49 7.49 6.49
Department Total 99.49 99.49 92.49 92.49 130.49 130.49 120.49
Property Management
Property Mgmt Directors Office 8.00 8.00 8.00 7.00 9.00 9.00 10.00
Security 0.00 0.00 0.00 0.00 0.00 0.00 0.00
Custodians 8.00 8.00 7.00 7.00 7.00 7.00 6.00
Public Buildings Maintenance 20.50 20.50 15.50 17.00 18.00 18.00 15.00
Mechanical Engine Room 23.00 23.00 24.00 22.00 23.00 24.00 21.00
Gallier Hall 4.00 4.00 2.00 2.00 2.00 2.00 3.00
Multi-Purpose Centers 9.00 9.00 8.00 8.00 8.00 8.00 6.00
Cemeteries 2.00 2.00 3.00 2.00 3.00 3.00 2.00
Realty Records 8.00 8.00 6.00 6.00 5.00 6.00 7.00
Cultural Center 0.00 0.00 0.00 0.00 0.00 0.00 0.00
Municipal Yacht Harbor 1.00 1.00 0.00 0.00 0.00 0.00 0.00
Department Total 83.50 83.50 73.50 71.00 75.00 77.00 70.00
Civil Service
Civil Service Directors Office 19.25 19.25 21.73 21.73 18.96 19.96 16.48
Police Hiring 0.00 0.00 0.00 0.00 0.00 0.00 0.00
Department Total 19.25 19.25 21.73 21.73 18.96 19.96 16.48
Public Works
Public Works Directors Office 11.00 11.00 9.49 8.49 8.49 8.49 7.49
Parking Adjudication 6.00 6.00 8.00 8.00 8.00 8.00 8.00
Street Light Maintenance 0.00 0.00 0.00 0.00 0.00 0.00 0.00
Engineering & Planning 3.00 3.00 3.00 4.00 4.00 4.00 6.00
Planning and Design 1.00 1.00 0.00 0.00 0.00 0.00 0.00
Capital Construction 2.00 2.00 0.00 0.00 0.00 0.00 0.00
Right-of-Way Management 4.00 4.00 3.00 3.00 3.00 3.00 3.00
Dedicated Millage 3.00 3.00 2.00 2.00 2.00 2.00 3.00
Field Operations Staff 10.00 10.00 12.00 12.00 9.00 9.00 7.40
Traffic Management 3.00 3.00 3.00 3.00 3.00 3.00 3.00
Traffic Sign Shop 3.00 3.00 4.00 7.00 5.00 5.00 5.00
Signal Shop 7.00 7.00 7.00 6.00 3.00 3.00 4.00
Page 88
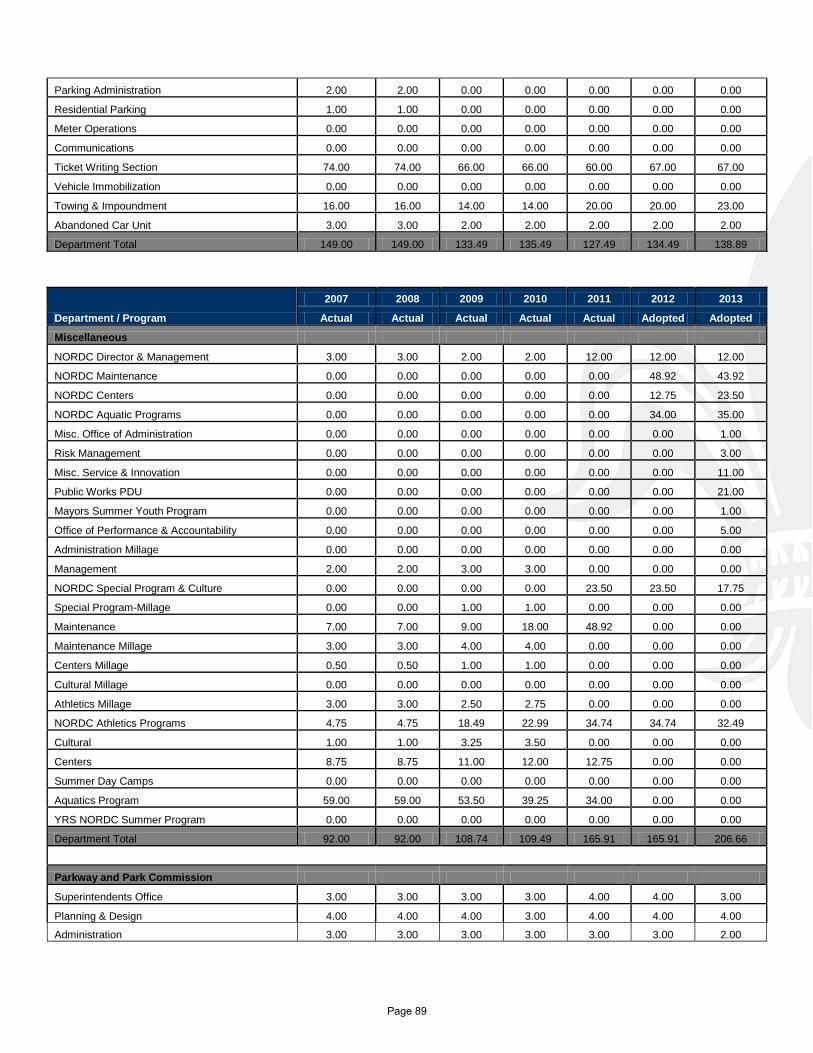
Parking Administration 2.00 2.00 0.00 0.00 0.00 0.00 0.00
Residential Parking 1.00 1.00 0.00 0.00 0.00 0.00 0.00
Meter Operations 0.00 0.00 0.00 0.00 0.00 0.00 0.00
Communications 0.00 0.00 0.00 0.00 0.00 0.00 0.00
Ticket Writing Section 74.00 74.00 66.00 66.00 60.00 67.00 67.00
Vehicle Immobilization 0.00 0.00 0.00 0.00 0.00 0.00 0.00
Towing & Impoundment 16.00 16.00 14.00 14.00 20.00 20.00 23.00
Abandoned Car Unit 3.00 3.00 2.00 2.00 2.00 2.00 2.00
Department Total 149.00 149.00 133.49 135.49 127.49 134.49 138.89
Department / Program
2007 2008 2009 2010 2011 2012 2013
Actual Actual Actual Actual Actual Adopted Adopted
Miscellaneous
NORDC Director & Management 3.00 3.00 2.00 2.00 12.00 12.00 12.00
NORDC Maintenance 0.00 0.00 0.00 0.00 0.00 48.92 43.92
NORDC Centers 0.00 0.00 0.00 0.00 0.00 12.75 23.50
NORDC Aquatic Programs 0.00 0.00 0.00 0.00 0.00 34.00 35.00
Misc. Office of Administration 0.00 0.00 0.00 0.00 0.00 0.00 1.00
Risk Management 0.00 0.00 0.00 0.00 0.00 0.00 3.00
Misc. Service & Innovation 0.00 0.00 0.00 0.00 0.00 0.00 11.00
Public Works PDU 0.00 0.00 0.00 0.00 0.00 0.00 21.00
Mayors Summer Youth Program 0.00 0.00 0.00 0.00 0.00 0.00 1.00
Office of Performance & Accountability 0.00 0.00 0.00 0.00 0.00 0.00 5.00
Administration Millage 0.00 0.00 0.00 0.00 0.00 0.00 0.00
Management 2.00 2.00 3.00 3.00 0.00 0.00 0.00
NORDC Special Program & Culture 0.00 0.00 0.00 0.00 23.50 23.50 17.75
Special Program-Millage 0.00 0.00 1.00 1.00 0.00 0.00 0.00
Maintenance 7.00 7.00 9.00 18.00 48.92 0.00 0.00
Maintenance Millage 3.00 3.00 4.00 4.00 0.00 0.00 0.00
Centers Millage 0.50 0.50 1.00 1.00 0.00 0.00 0.00
Cultural Millage 0.00 0.00 0.00 0.00 0.00 0.00 0.00
Athletics Millage 3.00 3.00 2.50 2.75 0.00 0.00 0.00
NORDC Athletics Programs 4.75 4.75 18.49 22.99 34.74 34.74 32.49
Cultural 1.00 1.00 3.25 3.50 0.00 0.00 0.00
Centers 8.75 8.75 11.00 12.00 12.75 0.00 0.00
Summer Day Camps 0.00 0.00 0.00 0.00 0.00 0.00 0.00
Aquatics Program 59.00 59.00 53.50 39.25 34.00 0.00 0.00
YRS NORDC Summer Program 0.00 0.00 0.00 0.00 0.00 0.00 0.00
Department Total 92.00 92.00 108.74 109.49 165.91 165.91 206.66
Parkway and Park Commission
Superintendents Office 3.00 3.00 3.00 3.00 4.00 4.00 3.00
Planning & Design 4.00 4.00 4.00 3.00 4.00 4.00 4.00
Administration 3.00 3.00 3.00 3.00 3.00 3.00 2.00
Page 89
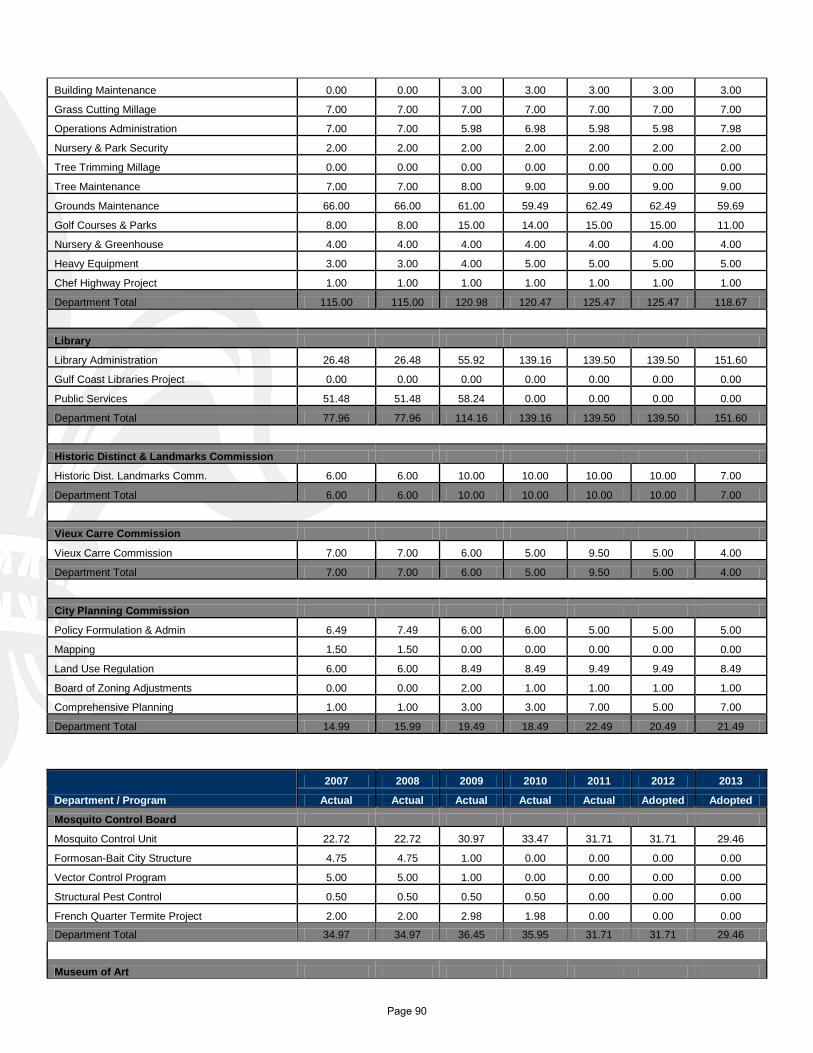
Building Maintenance 0.00 0.00 3.00 3.00 3.00 3.00 3.00
Grass Cutting Millage 7.00 7.00 7.00 7.00 7.00 7.00 7.00
Operations Administration 7.00 7.00 5.98 6.98 5.98 5.98 7.98
Nursery & Park Security 2.00 2.00 2.00 2.00 2.00 2.00 2.00
Tree Trimming Millage 0.00 0.00 0.00 0.00 0.00 0.00 0.00
Tree Maintenance 7.00 7.00 8.00 9.00 9.00 9.00 9.00
Grounds Maintenance 66.00 66.00 61.00 59.49 62.49 62.49 59.69
Golf Courses & Parks 8.00 8.00 15.00 14.00 15.00 15.00 11.00
Nursery & Greenhouse 4.00 4.00 4.00 4.00 4.00 4.00 4.00
Heavy Equipment 3.00 3.00 4.00 5.00 5.00 5.00 5.00
Chef Highway Project 1.00 1.00 1.00 1.00 1.00 1.00 1.00
Department Total 115.00 115.00 120.98 120.47 125.47 125.47 118.67
Library
Library Administration 26.48 26.48 55.92 139.16 139.50 139.50 151.60
Gulf Coast Libraries Project 0.00 0.00 0.00 0.00 0.00 0.00 0.00
Public Services 51.48 51.48 58.24 0.00 0.00 0.00 0.00
Department Total 77.96 77.96 114.16 139.16 139.50 139.50 151.60
Historic Distinct & Landmarks Commission
Historic Dist. Landmarks Comm. 6.00 6.00 10.00 10.00 10.00 10.00 7.00
Department Total 6.00 6.00 10.00 10.00 10.00 10.00 7.00
Vieux Carre Commission
Vieux Carre Commission 7.00 7.00 6.00 5.00 9.50 5.00 4.00
Department Total 7.00 7.00 6.00 5.00 9.50 5.00 4.00
City Planning Commission
Policy Formulation & Admin 6.49 7.49 6.00 6.00 5.00 5.00 5.00
Mapping 1.50 1.50 0.00 0.00 0.00 0.00 0.00
Land Use Regulation 6.00 6.00 8.49 8.49 9.49 9.49 8.49
Board of Zoning Adjustments 0.00 0.00 2.00 1.00 1.00 1.00 1.00
Comprehensive Planning 1.00 1.00 3.00 3.00 7.00 5.00 7.00
Department Total 14.99 15.99 19.49 18.49 22.49 20.49 21.49
Department / Program
2007 2008 2009 2010 2011 2012 2013
Actual Actual Actual Actual Actual Adopted Adopted
Mosquito Control Board
Mosquito Control Unit 22.72 22.72 30.97 33.47 31.71 31.71 29.46
Formosan-Bait City Structure 4.75 4.75 1.00 0.00 0.00 0.00 0.00
Vector Control Program 5.00 5.00 1.00 0.00 0.00 0.00 0.00
Structural Pest Control 0.50 0.50 0.50 0.50 0.00 0.00 0.00
French Quarter Termite Project 2.00 2.00 2.98 1.98 0.00 0.00 0.00
Department Total 34.97 34.97 36.45 35.95 31.71 31.71 29.46
Museum of Art
Page 90
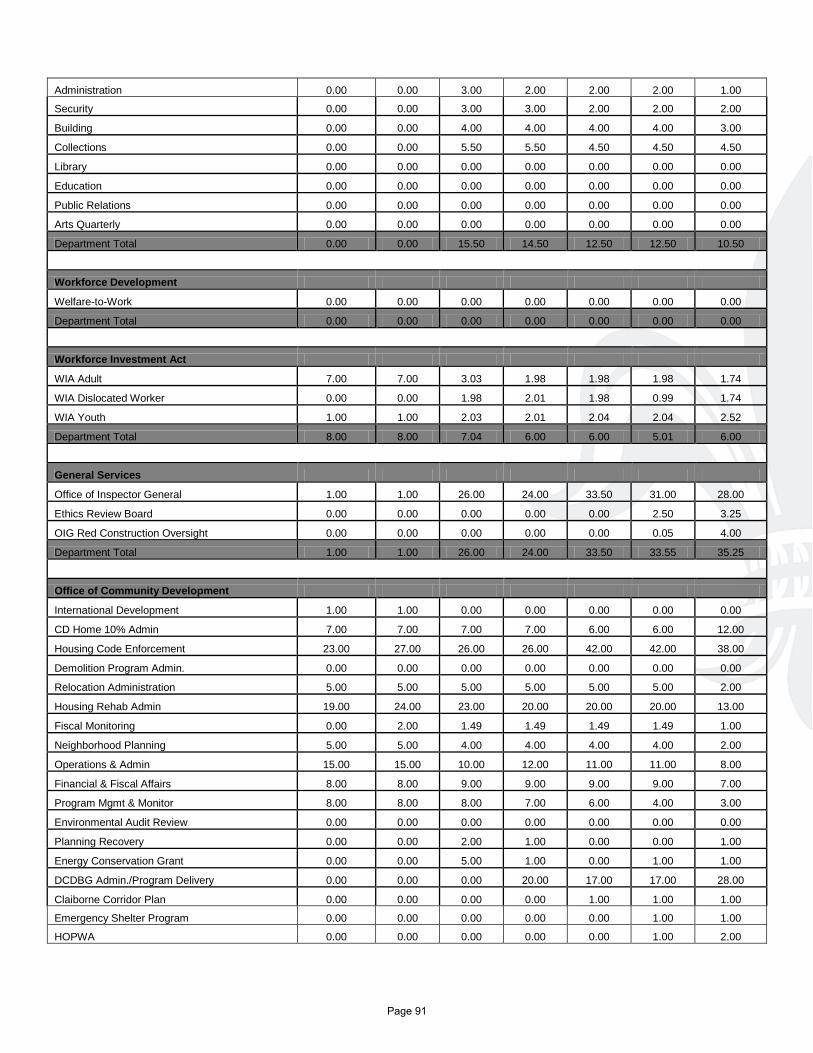
Administration 0.00 0.00 3.00 2.00 2.00 2.00 1.00
Security 0.00 0.00 3.00 3.00 2.00 2.00 2.00
Building 0.00 0.00 4.00 4.00 4.00 4.00 3.00
Collections 0.00 0.00 5.50 5.50 4.50 4.50 4.50
Library 0.00 0.00 0.00 0.00 0.00 0.00 0.00
Education 0.00 0.00 0.00 0.00 0.00 0.00 0.00
Public Relations 0.00 0.00 0.00 0.00 0.00 0.00 0.00
Arts Quarterly 0.00 0.00 0.00 0.00 0.00 0.00 0.00
Department Total 0.00 0.00 15.50 14.50 12.50 12.50 10.50
Workforce Development
Welfare-to-Work 0.00 0.00 0.00 0.00 0.00 0.00 0.00
Department Total 0.00 0.00 0.00 0.00 0.00 0.00 0.00
Workforce Investment Act
WIA Adult 7.00 7.00 3.03 1.98 1.98 1.98 1.74
WIA Dislocated Worker 0.00 0.00 1.98 2.01 1.98 0.99 1.74
WIA Youth 1.00 1.00 2.03 2.01 2.04 2.04 2.52
Department Total 8.00 8.00 7.04 6.00 6.00 5.01 6.00
General Services
Office of Inspector General 1.00 1.00 26.00 24.00 33.50 31.00 28.00
Ethics Review Board 0.00 0.00 0.00 0.00 0.00 2.50 3.25
OIG Red Construction Oversight 0.00 0.00 0.00 0.00 0.00 0.05 4.00
Department Total 1.00 1.00 26.00 24.00 33.50 33.55 35.25
Office of Community Development
International Development 1.00 1.00 0.00 0.00 0.00 0.00 0.00
CD Home 10% Admin 7.00 7.00 7.00 7.00 6.00 6.00 12.00
Housing Code Enforcement 23.00 27.00 26.00 26.00 42.00 42.00 38.00
Demolition Program Admin. 0.00 0.00 0.00 0.00 0.00 0.00 0.00
Relocation Administration 5.00 5.00 5.00 5.00 5.00 5.00 2.00
Housing Rehab Admin 19.00 24.00 23.00 20.00 20.00 20.00 13.00
Fiscal Monitoring 0.00 2.00 1.49 1.49 1.49 1.49 1.00
Neighborhood Planning 5.00 5.00 4.00 4.00 4.00 4.00 2.00
Operations & Admin 15.00 15.00 10.00 12.00 11.00 11.00 8.00
Financial & Fiscal Affairs 8.00 8.00 9.00 9.00 9.00 9.00 7.00
Program Mgmt & Monitor 8.00 8.00 8.00 7.00 6.00 4.00 3.00
Environmental Audit Review 0.00 0.00 0.00 0.00 0.00 0.00 0.00
Planning Recovery 0.00 0.00 2.00 1.00 0.00 0.00 1.00
Energy Conservation Grant 0.00 0.00 5.00 1.00 0.00 1.00 1.00
DCDBG Admin./Program Delivery 0.00 0.00 0.00 20.00 17.00 17.00 28.00
Claiborne Corridor Plan 0.00 0.00 0.00 0.00 1.00 1.00 1.00
Emergency Shelter Program 0.00 0.00 0.00 0.00 0.00 1.00 1.00
HOPWA 0.00 0.00 0.00 0.00 0.00 1.00 2.00
Page 91
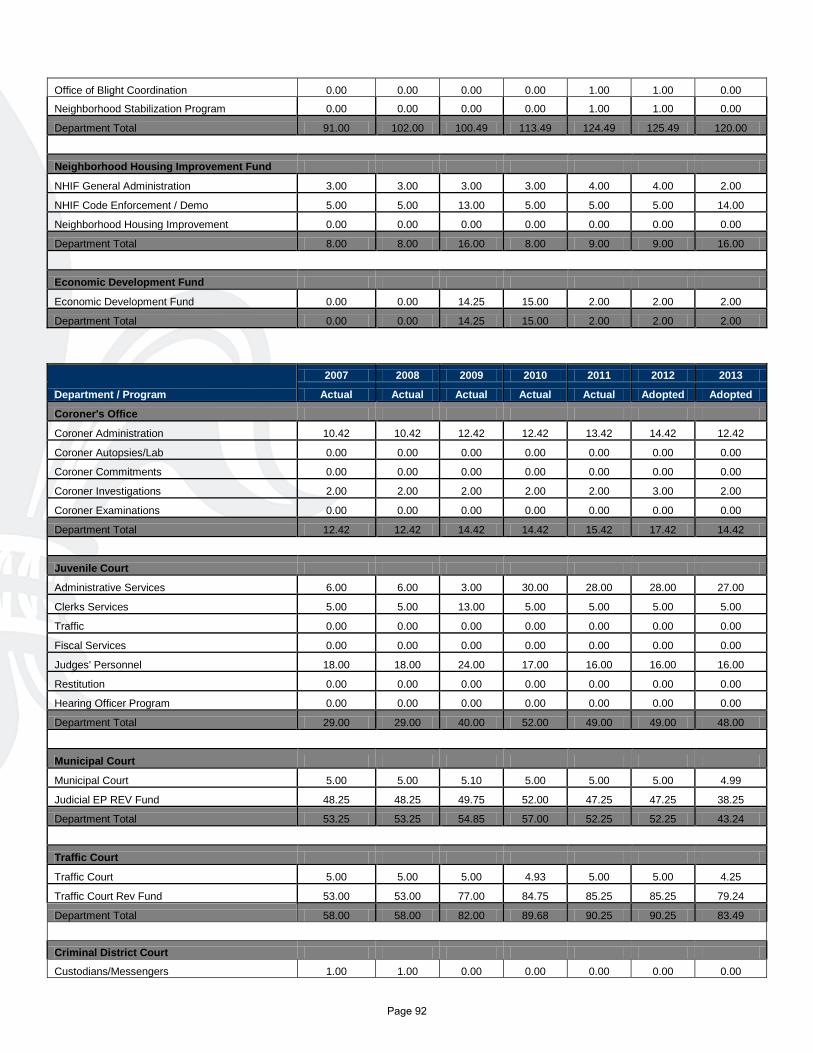
Office of Blight Coordination 0.00 0.00 0.00 0.00 1.00 1.00 0.00
Neighborhood Stabilization Program 0.00 0.00 0.00 0.00 1.00 1.00 0.00
Department Total 91.00 102.00 100.49 113.49 124.49 125.49 120.00
Neighborhood Housing Improvement Fund
NHIF General Administration 3.00 3.00 3.00 3.00 4.00 4.00 2.00
NHIF Code Enforcement / Demo 5.00 5.00 13.00 5.00 5.00 5.00 14.00
Neighborhood Housing Improvement 0.00 0.00 0.00 0.00 0.00 0.00 0.00
Department Total 8.00 8.00 16.00 8.00 9.00 9.00 16.00
Economic Development Fund
Economic Development Fund 0.00 0.00 14.25 15.00 2.00 2.00 2.00
Department Total 0.00 0.00 14.25 15.00 2.00 2.00 2.00
Department / Program
2007 2008 2009 2010 2011 2012 2013
Actual Actual Actual Actual Actual Adopted Adopted
Coroner's Office
Coroner Administration 10.42 10.42 12.42 12.42 13.42 14.42 12.42
Coroner Autopsies/Lab 0.00 0.00 0.00 0.00 0.00 0.00 0.00
Coroner Commitments 0.00 0.00 0.00 0.00 0.00 0.00 0.00
Coroner Investigations 2.00 2.00 2.00 2.00 2.00 3.00 2.00
Coroner Examinations 0.00 0.00 0.00 0.00 0.00 0.00 0.00
Department Total 12.42 12.42 14.42 14.42 15.42 17.42 14.42
Juvenile Court
Administrative Services 6.00 6.00 3.00 30.00 28.00 28.00 27.00
Clerks Services 5.00 5.00 13.00 5.00 5.00 5.00 5.00
Traffic 0.00 0.00 0.00 0.00 0.00 0.00 0.00
Fiscal Services 0.00 0.00 0.00 0.00 0.00 0.00 0.00
Judges' Personnel 18.00 18.00 24.00 17.00 16.00 16.00 16.00
Restitution 0.00 0.00 0.00 0.00 0.00 0.00 0.00
Hearing Officer Program 0.00 0.00 0.00 0.00 0.00 0.00 0.00
Department Total 29.00 29.00 40.00 52.00 49.00 49.00 48.00
Municipal Court
Municipal Court 5.00 5.00 5.10 5.00 5.00 5.00 4.99
Judicial EP REV Fund 48.25 48.25 49.75 52.00 47.25 47.25 38.25
Department Total 53.25 53.25 54.85 57.00 52.25 52.25 43.24
Traffic Court
Traffic Court 5.00 5.00 5.00 4.93 5.00 5.00 4.25
Traffic Court Rev Fund 53.00 53.00 77.00 84.75 85.25 85.25 79.24
Department Total 58.00 58.00 82.00 89.68 90.25 90.25 83.49
Criminal District Court
Custodians/Messengers 1.00 1.00 0.00 0.00 0.00 0.00 0.00
Page 92
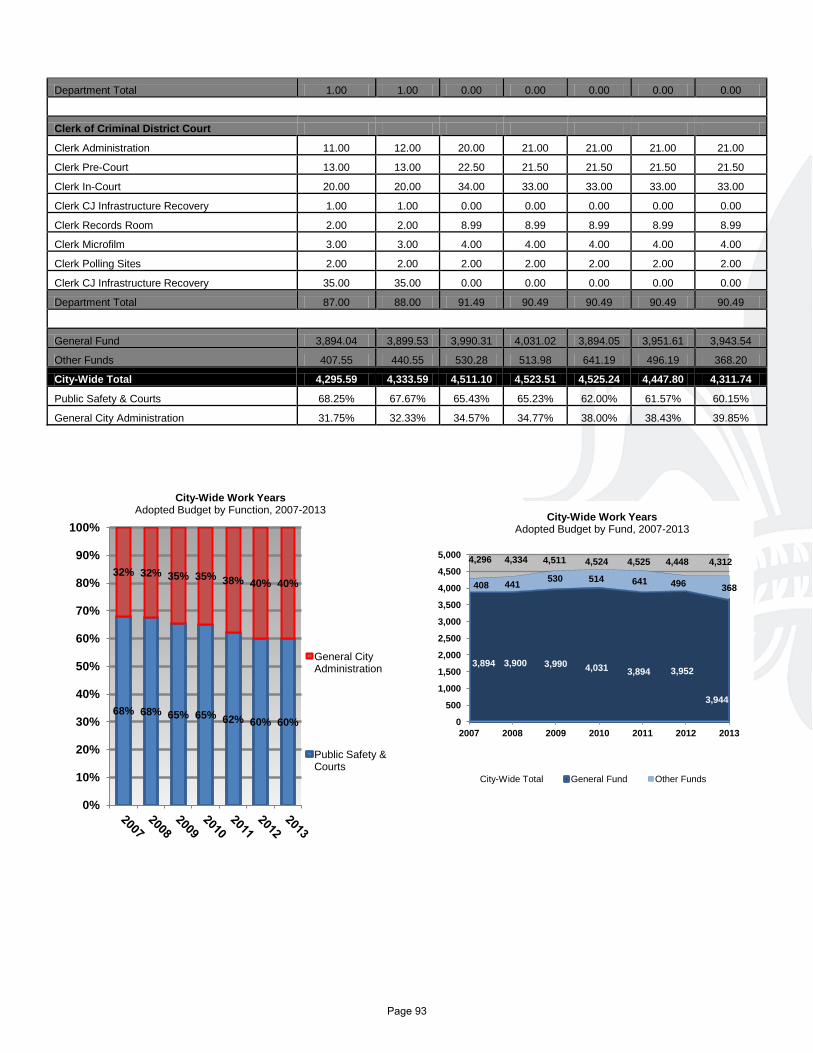
Department Total 1.00 1.00 0.00 0.00 0.00 0.00 0.00
Clerk of Criminal District Court
Clerk Administration 11.00 12.00 20.00 21.00 21.00 21.00 21.00
Clerk Pre-Court 13.00 13.00 22.50 21.50 21.50 21.50 21.50
Clerk In-Court 20.00 20.00 34.00 33.00 33.00 33.00 33.00
Clerk CJ Infrastructure Recovery 1.00 1.00 0.00 0.00 0.00 0.00 0.00
Clerk Records Room 2.00 2.00 8.99 8.99 8.99 8.99 8.99
Clerk Microfilm 3.00 3.00 4.00 4.00 4.00 4.00 4.00
Clerk Polling Sites 2.00 2.00 2.00 2.00 2.00 2.00 2.00
Clerk CJ Infrastructure Recovery 35.00 35.00 0.00 0.00 0.00 0.00 0.00
Department Total 87.00 88.00 91.49 90.49 90.49 90.49 90.49
General Fund 3,894.04 3,899.53 3,990.31 4,031.02 3,894.05 3,951.61 3,943.54
Other Funds 407.55 440.55 530.28 513.98 641.19 496.19 368.20
City-Wide Total 4,295.59 4,333.59 4,511.10 4,523.51 4,525.24 4,447.80 4,311.74
Public Safety & Courts 68.25% 67.67% 65.43% 65.23% 62.00% 61.57% 60.15%
General City Administration 31.75% 32.33% 34.57% 34.77% 38.00% 38.43% 39.85%
68% 68% 65% 65% 62% 60% 60%
32% 32% 35% 35% 38% 40% 40%
0%
10%
20%
30%
40%
50%
60%
70%
80%
90%
100%
City-Wide Work Years Adopted Budget by Function, 2007-2013
General City Administration
Public Safety & Courts
4,296 4,334 4,511 4,524 4,525 4,448 4,312
3,894 3,900 3,990 4,031 3,894 3,952
3,944
408 441 530 514 641 496 368
0
500
1,000
1,500
2,000
2,500
3,000
3,500
4,000
4,500
5,000
2007 2008 2009 2010 2011 2012 2013
City-Wide Work Years Adopted Budget by Fund, 2007-2013
City-Wide Total General Fund Other Funds
Page 93
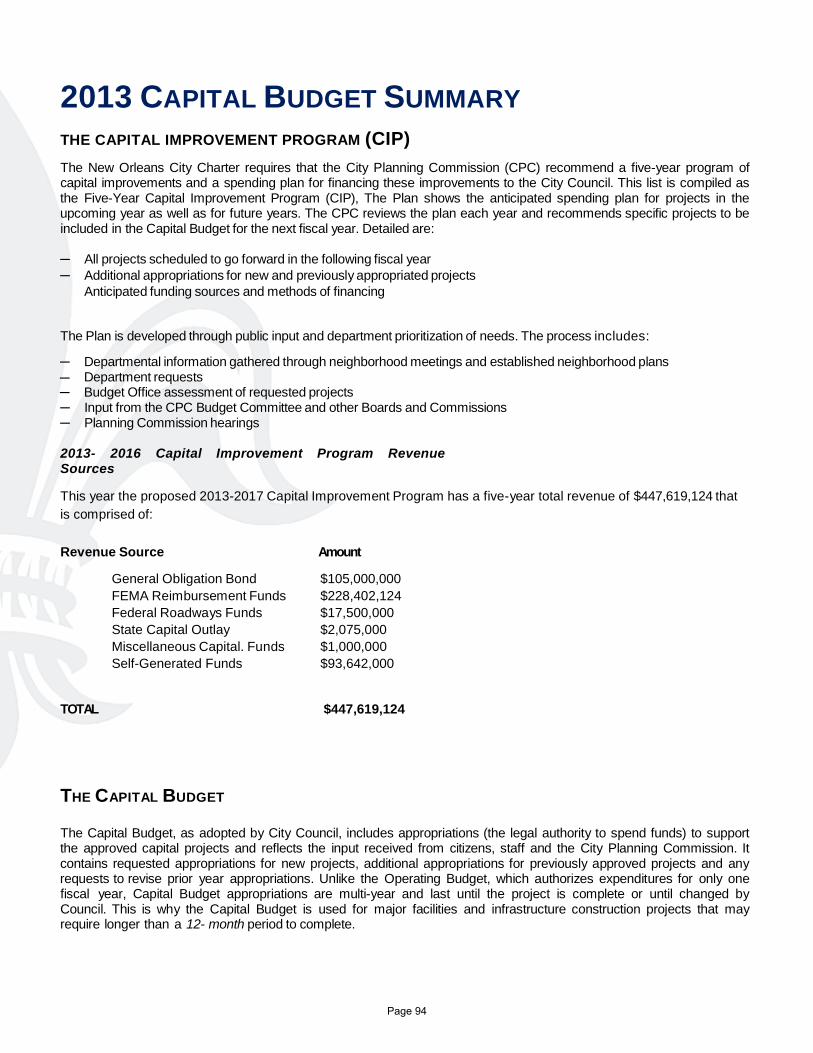
2013 CAPITAL BUDGET SUMMARY THE CAPITAL IMPROVEMENT PROGRAM (CIP) The New Orleans City Charter requires that the City Planning Commission (CPC) recommend a five-year program of capital improvements and a spending plan for financing these improvements to the City Council. This list is compiled as the Five-Year Capital Improvement Program (CIP), The Plan shows the anticipated spending plan for projects in the upcoming year as well as for future years. The CPC reviews the plan each year and recommends specific projects to be included in the Capital Budget for the next fiscal year. Detailed are: ─ All projects scheduled to go forward in the following fiscal year ─ Additional appropriations for new and previously appropriated projects
Anticipated funding sources and methods of financing
The Plan is developed through public input and department prioritization of needs. The process includes:
─ Departmental information gathered through neighborhood meetings and established neighborhood plans ─ Department requests ─ Budget Office assessment of requested projects ─ Input from the CPC Budget Committee and other Boards and Commissions ─ Planning Commission hearings 2013- 2016 Capital Improvement Program Revenue Sources This year the proposed 2013-2017 Capital Improvement Program has a five-year total revenue of $447,619,124 that is comprised of: Revenue Source Amount
General Obligation Bond $105,000,000 FEMA Reimbursement Funds $228,402,124 Federal Roadways Funds $17,500,000 State Capital Outlay $2,075,000 Miscellaneous Capital. Funds $1,000,000 Self-Generated Funds $93,642,000
TOTAL $447,619,124
THE CAPITAL BUDGET The Capital Budget, as adopted by City Council, includes appropriations (the legal authority to spend funds) to support the approved capital projects and reflects the input received from citizens, staff and the City Planning Commission. It contains requested appropriations for new projects, additional appropriations for previously approved projects and any requests to revise prior year appropriations. Unlike the Operating Budget, which authorizes expenditures for only one fiscal year, Capital Budget appropriations are multi-year and last until the project is complete or until changed by Council. This is why the Capital Budget is used for major facilities and infrastructure construction projects that may require longer than a 12- month period to complete.
Page 94
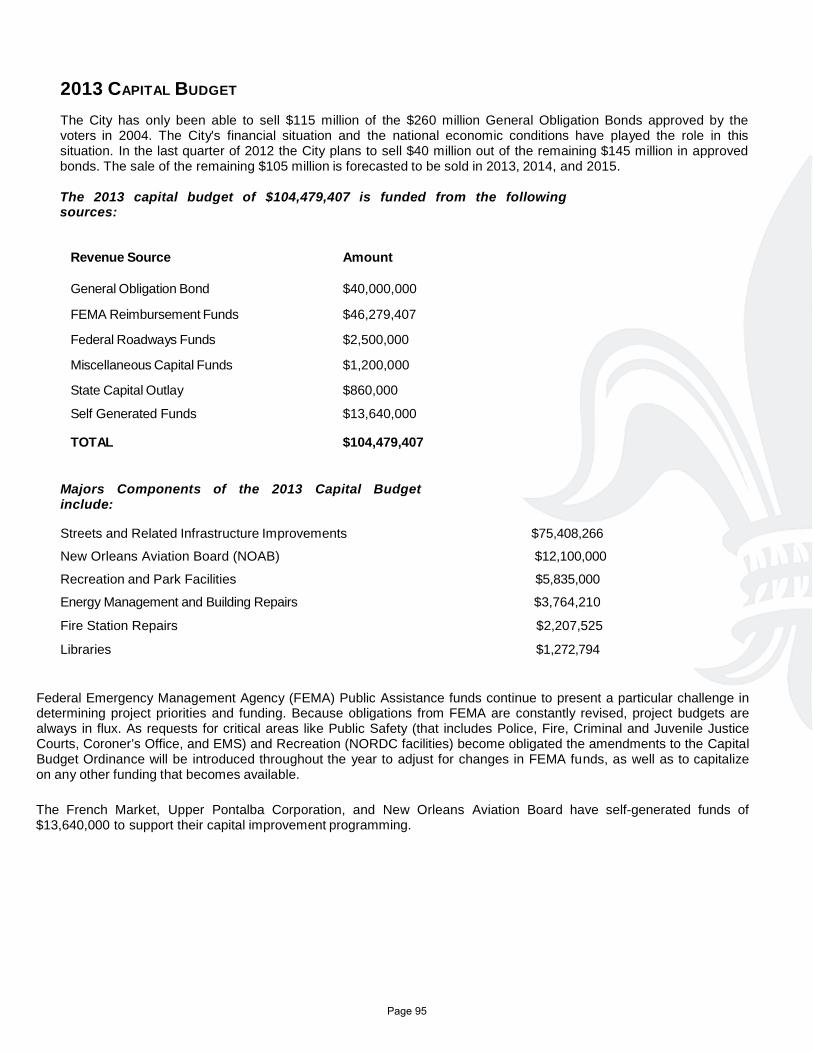
2013 CAPITAL BUDGET The City has only been able to sell $115 million of the $260 million General Obligation Bonds approved by the voters in 2004. The City's financial situation and the national economic conditions have played the role in this situation. In the last quarter of 2012 the City plans to sell $40 million out of the remaining $145 million in approved bonds. The sale of the remaining $105 million is forecasted to be sold in 2013, 2014, and 2015. The 2013 capital budget of $104,479,407 is funded from the following sources:
Revenue Source General Obligation Bond
Amount $40,000,000
FEMA Reimbursement Funds $46,279,407 Federal Roadways Funds $2,500,000 Miscellaneous Capital Funds $1,200,000 State Capital Outlay $860,000 Self Generated Funds $13,640,000 TOTAL
$104,479,407
Majors Components of the 2013 Capital Budget include: Streets and Related Infrastructure Improvements $75,408,266
New Orleans Aviation Board (NOAB) $12,100,000
Recreation and Park Facilities $5,835,000
Energy Management and Building Repairs $3,764,210
Fire Station Repairs $2,207,525
Libraries $1,272,794
Federal Emergency Management Agency (FEMA) Public Assistance funds continue to present a particular challenge in determining project priorities and funding. Because obligations from FEMA are constantly revised, project budgets are always in flux. As requests for critical areas like Public Safety (that includes Police, Fire, Criminal and Juvenile Justice Courts, Coroner’s Office, and EMS) and Recreation (NORDC facilities) become obligated the amendments to the Capital Budget Ordinance will be introduced throughout the year to adjust for changes in FEMA funds, as well as to capitalize on any other funding that becomes available. The French Market, Upper Pontalba Corporation, and New Orleans Aviation Board have self-generated funds of $13,640,000 to support their capital improvement programming.
Page 95
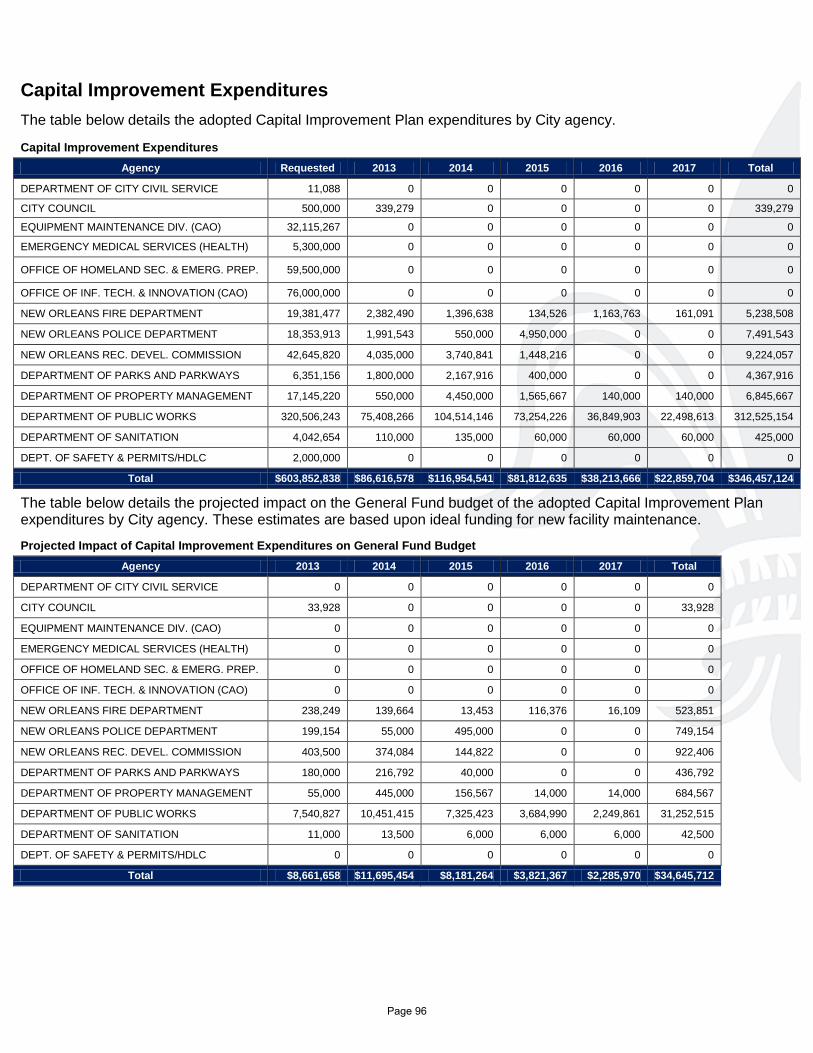
Capital Improvement Expenditures
The table below details the adopted Capital Improvement Plan expenditures by City agency.
Capital Improvement Expenditures Agency Requested 2013 2014 2015 2016 2017 Total
DEPARTMENT OF CITY CIVIL SERVICE 11,088 0 0 0 0 0 0
CITY COUNCIL 500,000 339,279 0 0 0 0 339,279
EQUIPMENT MAINTENANCE DIV. (CAO) 32,115,267 0 0 0 0 0 0
EMERGENCY MEDICAL SERVICES (HEALTH) 5,300,000 0 0 0 0 0 0
OFFICE OF HOMELAND SEC. & EMERG. PREP. 59,500,000 0 0 0 0 0 0
OFFICE OF INF. TECH. & INNOVATION (CAO) 76,000,000 0 0 0 0 0 0
NEW ORLEANS FIRE DEPARTMENT 19,381,477 2,382,490 1,396,638 134,526 1,163,763 161,091 5,238,508
NEW ORLEANS POLICE DEPARTMENT 18,353,913 1,991,543 550,000 4,950,000 0 0 7,491,543
NEW ORLEANS REC. DEVEL. COMMISSION 42,645,820 4,035,000 3,740,841 1,448,216 0 0 9,224,057
DEPARTMENT OF PARKS AND PARKWAYS 6,351,156 1,800,000 2,167,916 400,000 0 0 4,367,916
DEPARTMENT OF PROPERTY MANAGEMENT 17,145,220 550,000 4,450,000 1,565,667 140,000 140,000 6,845,667
DEPARTMENT OF PUBLIC WORKS 320,506,243 75,408,266 104,514,146 73,254,226 36,849,903 22,498,613 312,525,154
DEPARTMENT OF SANITATION 4,042,654 110,000 135,000 60,000 60,000 60,000 425,000
DEPT. OF SAFETY & PERMITS/HDLC 2,000,000 0 0 0 0 0 0
Total $603,852,838 $86,616,578 $116,954,541 $81,812,635 $38,213,666 $22,859,704 $346,457,124
The table below details the projected impact on the General Fund budget of the adopted Capital Improvement Plan expenditures by City agency. These estimates are based upon ideal funding for new facility maintenance. Projected Impact of Capital Improvement Expenditures on General Fund Budget
Agency 2013 2014 2015 2016 2017 Total
DEPARTMENT OF CITY CIVIL SERVICE 0 0 0 0 0 0
CITY COUNCIL 33,928 0 0 0 0 33,928
EQUIPMENT MAINTENANCE DIV. (CAO) 0 0 0 0 0 0
EMERGENCY MEDICAL SERVICES (HEALTH) 0 0 0 0 0 0
OFFICE OF HOMELAND SEC. & EMERG. PREP. 0 0 0 0 0 0
OFFICE OF INF. TECH. & INNOVATION (CAO) 0 0 0 0 0 0
NEW ORLEANS FIRE DEPARTMENT 238,249 139,664 13,453 116,376 16,109 523,851
NEW ORLEANS POLICE DEPARTMENT 199,154 55,000 495,000 0 0 749,154
NEW ORLEANS REC. DEVEL. COMMISSION 403,500 374,084 144,822 0 0 922,406
DEPARTMENT OF PARKS AND PARKWAYS 180,000 216,792 40,000 0 0 436,792
DEPARTMENT OF PROPERTY MANAGEMENT 55,000 445,000 156,567 14,000 14,000 684,567
DEPARTMENT OF PUBLIC WORKS 7,540,827 10,451,415 7,325,423 3,684,990 2,249,861 31,252,515
DEPARTMENT OF SANITATION 11,000 13,500 6,000 6,000 6,000 42,500
DEPT. OF SAFETY & PERMITS/HDLC 0 0 0 0 0 0
Total $8,661,658 $11,695,454 $8,181,264 $3,821,367 $2,285,970 $34,645,712
Page 96
STATEMENT OF DEBT
Introduction The City’s debt obligations can be divided into two categories: operating debt and general obligation debt. These categories are managed by the Department of Finance and the Board of Liquidation.
Department of Finance, Debt Service – Operating Debt The City’s operating debt is supported through General Fund appropriations managed by the Department of Finance. The department is responsible for the effective management of the General Fund Debt Service appropriation to fund the City’s debt obligations. The policies followed by the Department of Finance are intended to maintain sound fiscal management of the City’s financial obligations.
Board of Liquidation, City Debt – General Obligation Debt The City Charter, Section 5-501, establishes a Board of Liquidation, City Debt, (Board) composed of six members and three ex-officio members, who shall be the Mayor and the two Council members at –large. The Board was created by the Louisiana Legislature in 1880, and made a “body corporate,” separate and distinct from the City of New Orleans, in 1890. The Board’s debt policies are designed to address the use of long term debt as well as policies for selling debt and managing investments.
Under guidelines established in the City Charter and sound financial oversight, general obligation debt will not be utilized for the funding of current operations of the City or its agencies. The Board has exclusive control and direction of all matters related to the issuance and repayment of the City’s general obligation bonds. Because the Board exists, the repayment of New Orleans general obligation bonds is separated and excluded from the City’s operating budget, and a dedicated source and security for the payment of the City’s general obligation bonds is maintained.
In addition, all ad valorem taxes levied by the City for the payment of its general obligation bonds are transferred to the Board. Furthermore, these property tax receipts must be applied exclusively to the payment of debt service on the City’s outstanding general obligation bonds. Taxes levied by the City for the payment of its general obligations bonds cannot be applied to pay the City’s operating expenses or for any other purpose. The Board has never defaulted in the payment of the City’s general obligation bonds.
In the event of any default in the imposition and collection of any taxes required for the repayment of general obligation bonds, the Board has the statutory power to levy and collect taxes in the amount required. The Board is required to certify the rate and necessity therefore and cause the same to be imposed and collected at the same time and in the same manner as other taxes are imposed and collected in the City.
Page 97
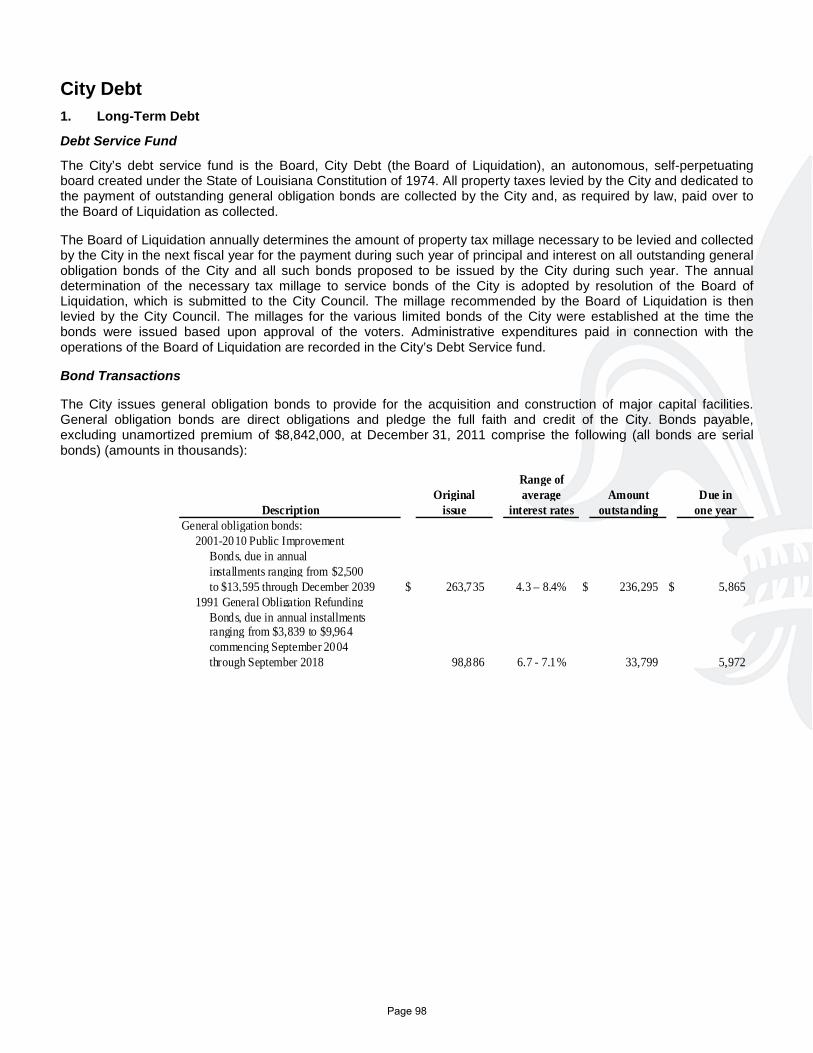
City Debt 1. Long-Term Debt
Debt Service Fund
The City’s debt service fund is the Board, City Debt (the Board of Liquidation), an autonomous, self-perpetuating board created under the State of Louisiana Constitution of 1974. All property taxes levied by the City and dedicated to the payment of outstanding general obligation bonds are collected by the City and, as required by law, paid over to the Board of Liquidation as collected.
The Board of Liquidation annually determines the amount of property tax millage necessary to be levied and collected by the City in the next fiscal year for the payment during such year of principal and interest on all outstanding general obligation bonds of the City and all such bonds proposed to be issued by the City during such year. The annual determination of the necessary tax millage to service bonds of the City is adopted by resolution of the Board of Liquidation, which is submitted to the City Council. The millage recommended by the Board of Liquidation is then levied by the City Council. The millages for the various limited bonds of the City were established at the time the bonds were issued based upon approval of the voters. Administrative expenditures paid in connection with the operations of the Board of Liquidation are recorded in the City’s Debt Service fund.
Bond Transactions
The City issues general obligation bonds to provide for the acquisition and construction of major capital facilities. General obligation bonds are direct obligations and pledge the full faith and credit of the City. Bonds payable, excluding unamortized premium of $8,842,000, at December 31, 2011 comprise the following (all bonds are serial bonds) (amounts in thousands):
Range ofOriginal average Amount Due in
Description issue interest rates outstanding one yearGeneral obligation bonds:
2001-2010 Public ImprovementBonds, due in annualinstallments ranging from $2,500to $13,595 through December 2039 $ 263,735 4.3 – 8.4% $ 236,295 $ 5,865
1991 General Obligation RefundingBonds, due in annual installmentsranging from $3,839 to $9,964 commencing September 2004 through September 2018 98,886 6.7 - 7.1% 33,799 5,972
Page 98
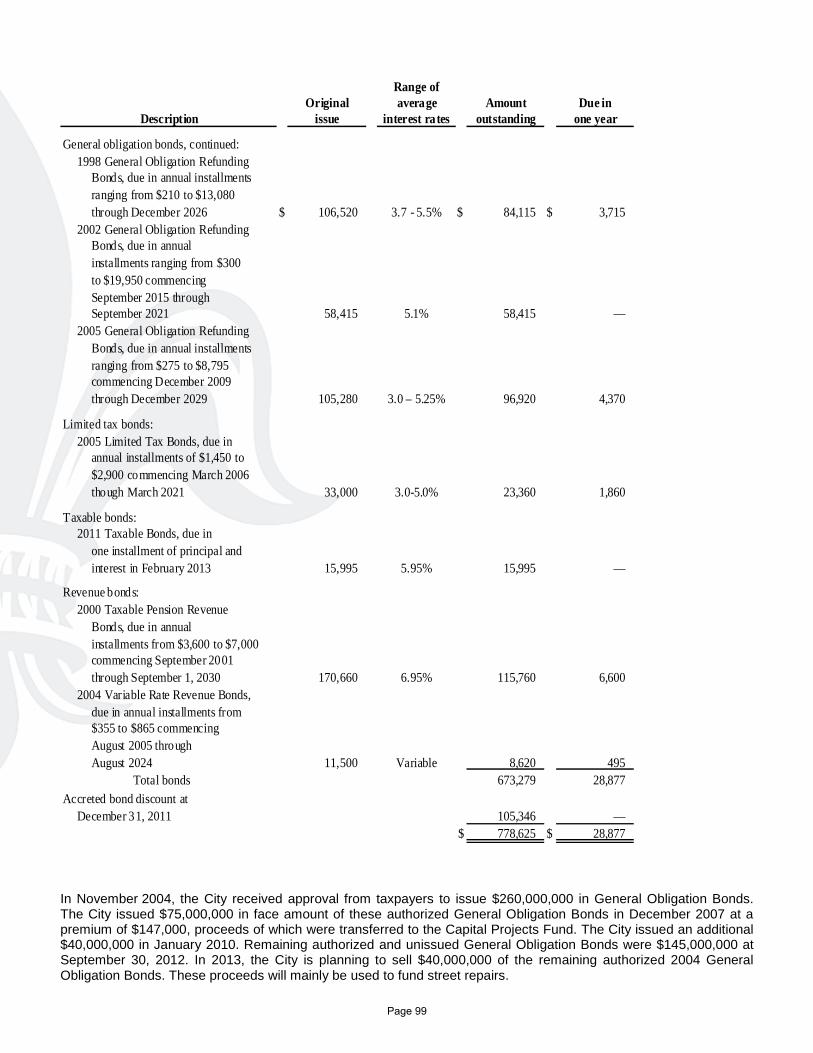
Range ofOriginal average Amount Due in
Description issue interest rates outstanding one year
General obligation bonds, continued:1998 General Obligation Refunding
Bonds, due in annual installmentsranging from $210 to $13,080through December 2026 $ 106,520 3.7 - 5.5% $ 84,115 $ 3,715
2002 General Obligation RefundingBonds, due in annualinstallments ranging from $300to $19,950 commencingSeptember 2015 throughSeptember 2021 58,415 5.1% 58,415 —
2005 General Obligation RefundingBonds, due in annual installments ranging from $275 to $8,795 commencing December 2009through December 2029 105,280 3.0 – 5.25% 96,920 4,370
Limited tax bonds:2005 Limited Tax Bonds, due in
annual installments of $1,450 to$2,900 commencing March 2006though March 2021 33,000 3.0-5.0% 23,360 1,860
Taxable bonds:2011 Taxable Bonds, due in
one installment of principal andinterest in February 2013 15,995 5.95% 15,995 —
Revenue bonds:2000 Taxable Pension Revenue
Bonds, due in annualinstallments from $3,600 to $7,000commencing September 2001through September 1, 2030 170,660 6.95% 115,760 6,600
2004 Variable Rate Revenue Bonds,due in annual installments from$355 to $865 commencingAugust 2005 throughAugust 2024 11,500 Variable 8,620 495
Total bonds 673,279 28,877 Accreted bond discount at
December 31, 2011 105,346 — $ 778,625 $ 28,877
In November 2004, the City received approval from taxpayers to issue $260,000,000 in General Obligation Bonds. The City issued $75,000,000 in face amount of these authorized General Obligation Bonds in December 2007 at a premium of $147,000, proceeds of which were transferred to the Capital Projects Fund. The City issued an additional $40,000,000 in January 2010. Remaining authorized and unissued General Obligation Bonds were $145,000,000 at September 30, 2012. In 2013, the City is planning to sell $40,000,000 of the remaining authorized 2004 General Obligation Bonds. These proceeds will mainly be used to fund street repairs.
Page 99
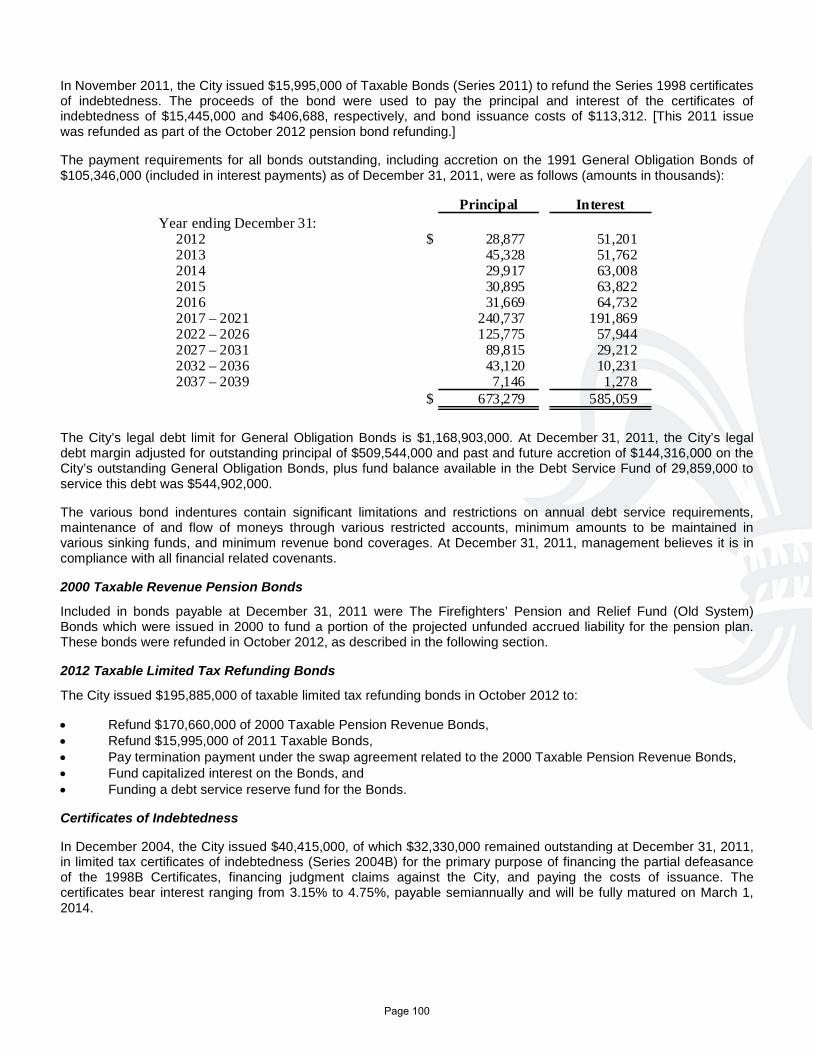
In November 2011, the City issued $15,995,000 of Taxable Bonds (Series 2011) to refund the Series 1998 certificates of indebtedness. The proceeds of the bond were used to pay the principal and interest of the certificates of indebtedness of $15,445,000 and $406,688, respectively, and bond issuance costs of $113,312. [This 2011 issue was refunded as part of the October 2012 pension bond refunding.]
The payment requirements for all bonds outstanding, including accretion on the 1991 General Obligation Bonds of $105,346,000 (included in interest payments) as of December 31, 2011, were as follows (amounts in thousands):
Principal InterestYear ending December 31:
2012 $ 28,877 51,201 2013 45,328 51,762 2014 29,917 63,008 2015 30,895 63,822 2016 31,669 64,732 2017 – 2021 240,737 191,869 2022 – 2026 125,775 57,944 2027 – 2031 89,815 29,212 2032 – 2036 43,120 10,231 2037 – 2039 7,146 1,278
$ 673,279 585,059
The City’s legal debt limit for General Obligation Bonds is $1,168,903,000. At December 31, 2011, the City’s legal debt margin adjusted for outstanding principal of $509,544,000 and past and future accretion of $144,316,000 on the City’s outstanding General Obligation Bonds, plus fund balance available in the Debt Service Fund of 29,859,000 to service this debt was $544,902,000.
The various bond indentures contain significant limitations and restrictions on annual debt service requirements, maintenance of and flow of moneys through various restricted accounts, minimum amounts to be maintained in various sinking funds, and minimum revenue bond coverages. At December 31, 2011, management believes it is in compliance with all financial related covenants.
2000 Taxable Revenue Pension Bonds
Included in bonds payable at December 31, 2011 were The Firefighters’ Pension and Relief Fund (Old System) Bonds which were issued in 2000 to fund a portion of the projected unfunded accrued liability for the pension plan. These bonds were refunded in October 2012, as described in the following section.
2012 Taxable Limited Tax Refunding Bonds
The City issued $195,885,000 of taxable limited tax refunding bonds in October 2012 to:
• Refund $170,660,000 of 2000 Taxable Pension Revenue Bonds, • Refund $15,995,000 of 2011 Taxable Bonds, • Pay termination payment under the swap agreement related to the 2000 Taxable Pension Revenue Bonds, • Fund capitalized interest on the Bonds, and • Funding a debt service reserve fund for the Bonds.
Certificates of Indebtedness
In December 2004, the City issued $40,415,000, of which $32,330,000 remained outstanding at December 31, 2011, in limited tax certificates of indebtedness (Series 2004B) for the primary purpose of financing the partial defeasance of the 1998B Certificates, financing judgment claims against the City, and paying the costs of issuance. The certificates bear interest ranging from 3.15% to 4.75%, payable semiannually and will be fully matured on March 1, 2014.
Page 100
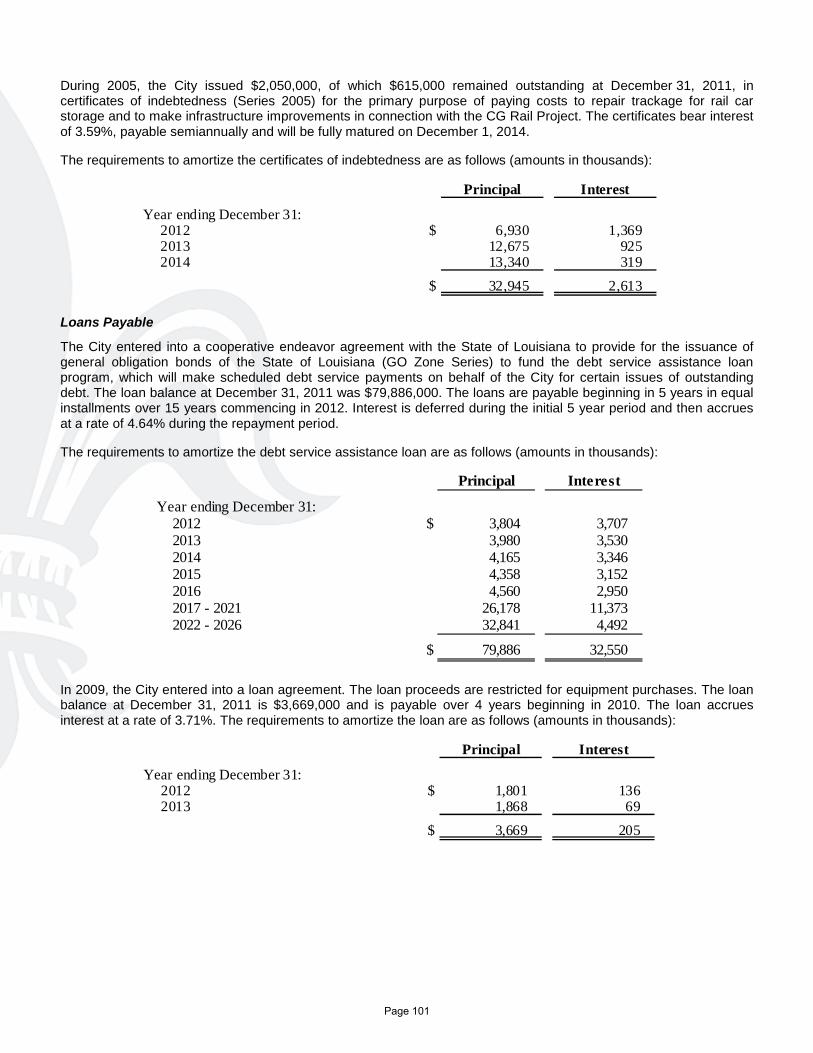
During 2005, the City issued $2,050,000, of which $615,000 remained outstanding at December 31, 2011, in certificates of indebtedness (Series 2005) for the primary purpose of paying costs to repair trackage for rail car storage and to make infrastructure improvements in connection with the CG Rail Project. The certificates bear interest of 3.59%, payable semiannually and will be fully matured on December 1, 2014.
The requirements to amortize the certificates of indebtedness are as follows (amounts in thousands):
Principal Interest
Year ending December 31:2012 $ 6,930 1,369 2013 12,675 925 2014 13,340 319
$ 32,945 2,613
Loans Payable
The City entered into a cooperative endeavor agreement with the State of Louisiana to provide for the issuance of general obligation bonds of the State of Louisiana (GO Zone Series) to fund the debt service assistance loan program, which will make scheduled debt service payments on behalf of the City for certain issues of outstanding debt. The loan balance at December 31, 2011 was $79,886,000. The loans are payable beginning in 5 years in equal installments over 15 years commencing in 2012. Interest is deferred during the initial 5 year period and then accrues at a rate of 4.64% during the repayment period.
The requirements to amortize the debt service assistance loan are as follows (amounts in thousands):
Principal Interest
Year ending December 31:2012 $ 3,804 3,707 2013 3,980 3,530 2014 4,165 3,346 2015 4,358 3,152 2016 4,560 2,950 2017 - 2021 26,178 11,373 2022 - 2026 32,841 4,492
$ 79,886 32,550
In 2009, the City entered into a loan agreement. The loan proceeds are restricted for equipment purchases. The loan balance at December 31, 2011 is $3,669,000 and is payable over 4 years beginning in 2010. The loan accrues interest at a rate of 3.71%. The requirements to amortize the loan are as follows (amounts in thousands):
Principal Interest
Year ending December 31:2012 $ 1,801 136 2013 1,868 69
$ 3,669 205
Page 101
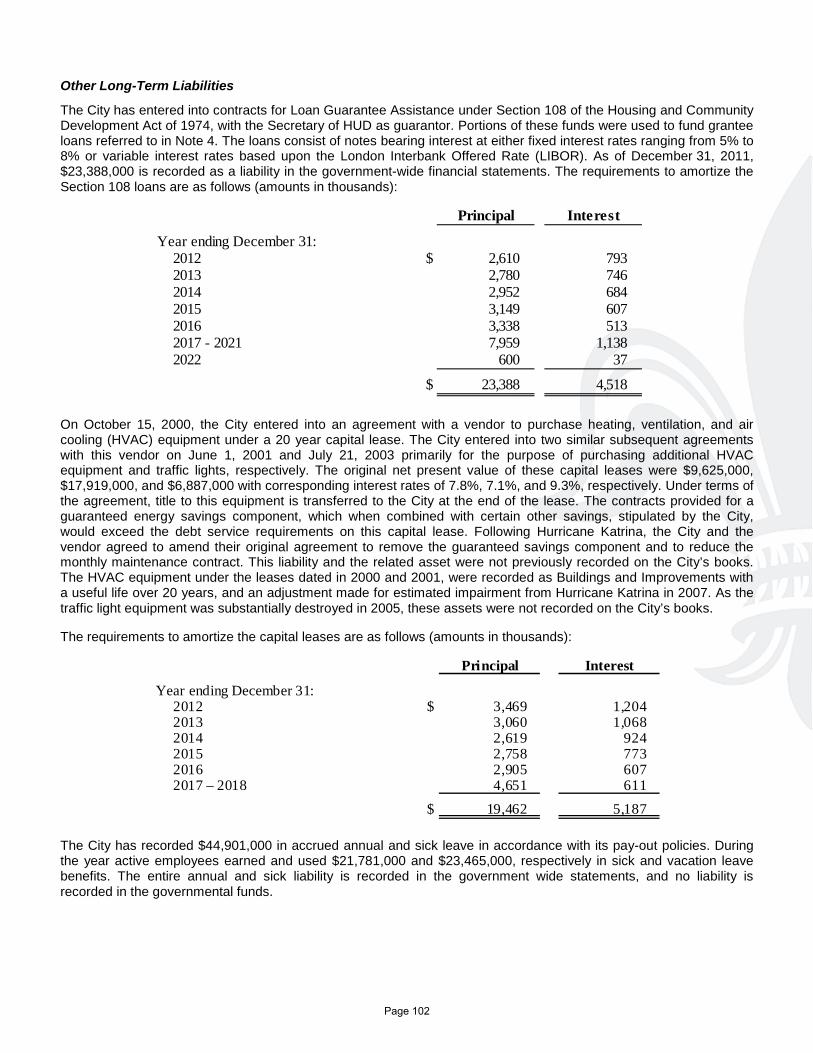
Other Long-Term Liabilities
The City has entered into contracts for Loan Guarantee Assistance under Section 108 of the Housing and Community Development Act of 1974, with the Secretary of HUD as guarantor. Portions of these funds were used to fund grantee loans referred to in Note 4. The loans consist of notes bearing interest at either fixed interest rates ranging from 5% to 8% or variable interest rates based upon the London Interbank Offered Rate (LIBOR). As of December 31, 2011, $23,388,000 is recorded as a liability in the government-wide financial statements. The requirements to amortize the Section 108 loans are as follows (amounts in thousands):
Principal Interest
Year ending December 31:2012 $ 2,610 793 2013 2,780 746 2014 2,952 684 2015 3,149 607 2016 3,338 513 2017 - 2021 7,959 1,138 2022 600 37
$ 23,388 4,518
On October 15, 2000, the City entered into an agreement with a vendor to purchase heating, ventilation, and air cooling (HVAC) equipment under a 20 year capital lease. The City entered into two similar subsequent agreements with this vendor on June 1, 2001 and July 21, 2003 primarily for the purpose of purchasing additional HVAC equipment and traffic lights, respectively. The original net present value of these capital leases were $9,625,000, $17,919,000, and $6,887,000 with corresponding interest rates of 7.8%, 7.1%, and 9.3%, respectively. Under terms of the agreement, title to this equipment is transferred to the City at the end of the lease. The contracts provided for a guaranteed energy savings component, which when combined with certain other savings, stipulated by the City, would exceed the debt service requirements on this capital lease. Following Hurricane Katrina, the City and the vendor agreed to amend their original agreement to remove the guaranteed savings component and to reduce the monthly maintenance contract. This liability and the related asset were not previously recorded on the City’s books. The HVAC equipment under the leases dated in 2000 and 2001, were recorded as Buildings and Improvements with a useful life over 20 years, and an adjustment made for estimated impairment from Hurricane Katrina in 2007. As the traffic light equipment was substantially destroyed in 2005, these assets were not recorded on the City’s books.
The requirements to amortize the capital leases are as follows (amounts in thousands):
Principal Interest
Year ending December 31:2012 $ 3,469 1,204 2013 3,060 1,068 2014 2,619 924 2015 2,758 773 2016 2,905 607 2017 – 2018 4,651 611
$ 19,462 5,187
The City has recorded $44,901,000 in accrued annual and sick leave in accordance with its pay-out policies. During the year active employees earned and used $21,781,000 and $23,465,000, respectively in sick and vacation leave benefits. The entire annual and sick liability is recorded in the government wide statements, and no liability is recorded in the governmental funds.
Page 102
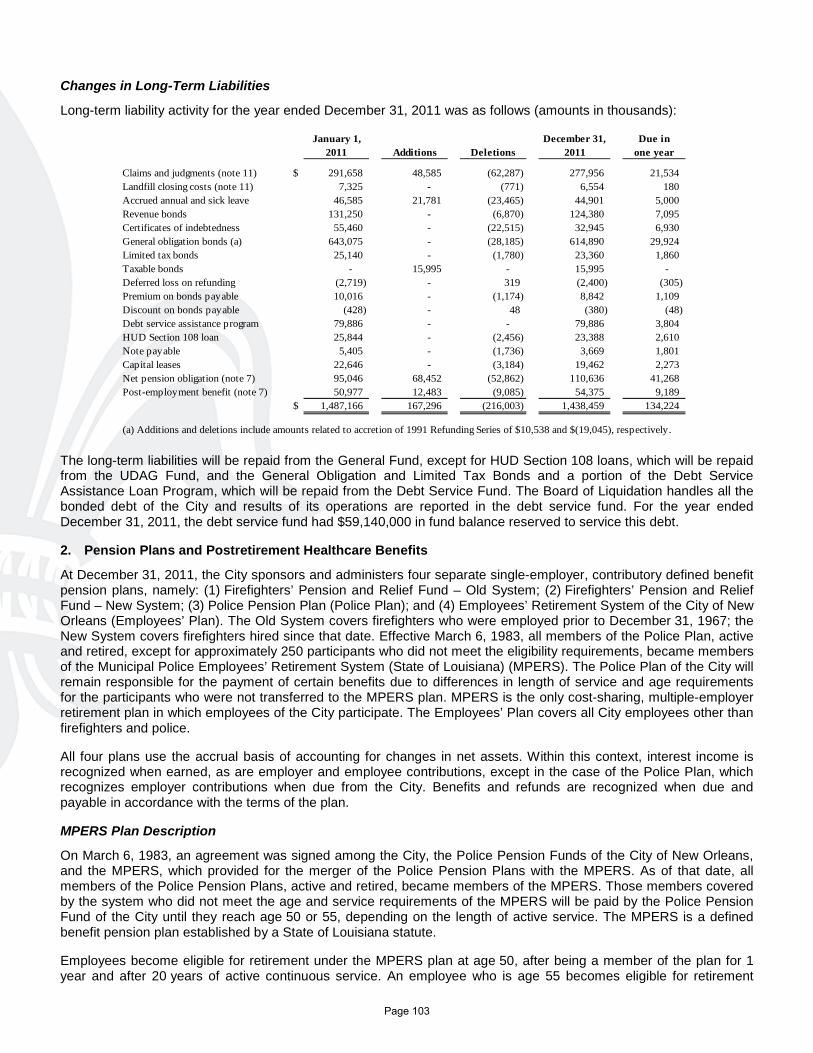
Changes in Long-Term Liabilities
Long-term liability activity for the year ended December 31, 2011 was as follows (amounts in thousands):
January 1, December 31, Due in2011 Additions Deletions 2011 one year
Claims and judgments (note 11) $ 291,658 48,585 (62,287) 277,956 21,534 Landfill closing costs (note 11) 7,325 - (771) 6,554 180 Accrued annual and sick leave 46,585 21,781 (23,465) 44,901 5,000 Revenue bonds 131,250 - (6,870) 124,380 7,095 Certificates of indebtedness 55,460 - (22,515) 32,945 6,930 General obligation bonds (a) 643,075 - (28,185) 614,890 29,924 Limited tax bonds 25,140 - (1,780) 23,360 1,860 Taxable bonds - 15,995 - 15,995 - Deferred loss on refunding (2,719) - 319 (2,400) (305) Premium on bonds payable 10,016 - (1,174) 8,842 1,109 Discount on bonds payable (428) - 48 (380) (48) Debt service assistance program 79,886 - - 79,886 3,804 HUD Section 108 loan 25,844 - (2,456) 23,388 2,610 Note payable 5,405 - (1,736) 3,669 1,801 Capital leases 22,646 - (3,184) 19,462 2,273 Net pension obligation (note 7) 95,046 68,452 (52,862) 110,636 41,268 Post-employment benefit (note 7) 50,977 12,483 (9,085) 54,375 9,189
$ 1,487,166 167,296 (216,003) 1,438,459 134,224
(a) Additions and deletions include amounts related to accretion of 1991 Refunding Series of $10,538 and $(19,045), respectively.
The long-term liabilities will be repaid from the General Fund, except for HUD Section 108 loans, which will be repaid from the UDAG Fund, and the General Obligation and Limited Tax Bonds and a portion of the Debt Service Assistance Loan Program, which will be repaid from the Debt Service Fund. The Board of Liquidation handles all the bonded debt of the City and results of its operations are reported in the debt service fund. For the year ended December 31, 2011, the debt service fund had $59,140,000 in fund balance reserved to service this debt.
2. Pension Plans and Postretirement Healthcare Benefits
At December 31, 2011, the City sponsors and administers four separate single-employer, contributory defined benefit pension plans, namely: (1) Firefighters’ Pension and Relief Fund – Old System; (2) Firefighters’ Pension and Relief Fund – New System; (3) Police Pension Plan (Police Plan); and (4) Employees’ Retirement System of the City of New Orleans (Employees’ Plan). The Old System covers firefighters who were employed prior to December 31, 1967; the New System covers firefighters hired since that date. Effective March 6, 1983, all members of the Police Plan, active and retired, except for approximately 250 participants who did not meet the eligibility requirements, became members of the Municipal Police Employees’ Retirement System (State of Louisiana) (MPERS). The Police Plan of the City will remain responsible for the payment of certain benefits due to differences in length of service and age requirements for the participants who were not transferred to the MPERS plan. MPERS is the only cost-sharing, multiple-employer retirement plan in which employees of the City participate. The Employees’ Plan covers all City employees other than firefighters and police.
All four plans use the accrual basis of accounting for changes in net assets. Within this context, interest income is recognized when earned, as are employer and employee contributions, except in the case of the Police Plan, which recognizes employer contributions when due from the City. Benefits and refunds are recognized when due and payable in accordance with the terms of the plan.
MPERS Plan Description
On March 6, 1983, an agreement was signed among the City, the Police Pension Funds of the City of New Orleans, and the MPERS, which provided for the merger of the Police Pension Plans with the MPERS. As of that date, all members of the Police Pension Plans, active and retired, became members of the MPERS. Those members covered by the system who did not meet the age and service requirements of the MPERS will be paid by the Police Pension Fund of the City until they reach age 50 or 55, depending on the length of active service. The MPERS is a defined benefit pension plan established by a State of Louisiana statute.
Employees become eligible for retirement under the MPERS plan at age 50, after being a member of the plan for 1 year and after 20 years of active continuous service. An employee who is age 55 becomes eligible for retirement
Page 103
benefits after 16 years of active continuous service. The plan also provides death and disability benefits. Authority to establish and amend benefit provisions is provided under the laws of the State of Louisiana. The MPERS issues a publicly available financial report that includes financial statements and required supplementary information for the MPERS. That report may be obtained by writing to the Municipal Police Employees’ Retirement System, 8401 United Plaza Boulevard, Room 270, Baton Rouge, Louisiana 70809, or by calling (800) 443-4248.
Employees’ Plan, Police Plan, Firefighters’ Pension and Relief Fund – Old and New System Descriptions
Each plan is a defined benefit pension plan established by the State of Louisiana statute, which provide retirement, disability, and death benefits, and annual cost-of-living adjustments to plan members and beneficiaries. Authority to establish and amend benefit provisions is provided under the laws of the State of Louisiana. Each plan issues a publicly available financial report that includes financial statements and required supplementary information for that plan. Those reports may be obtained by writing or calling the plan.
Employees’ Retirement System of the City of New Orleans 1300 Perdido Street, Suite 1E12 New Orleans, Louisiana 70112 (504) 658-1850
Police Pension Fund of the City of New Orleans 715 S. Broad, Room B23 New Orleans, Louisiana 70119 (504) 826-2900
Firefighters’ Pension and Relief Fund of the City of New Orleans (Old and New Systems) 329 S. Dorgenois Street New Orleans, Louisiana 70119 (504) 821-4671
Funding Policies and Annual Pension Costs
The employer contributions for the MPERS and the Firefighters’ Pension and Relief Fund (New System) are based on actuarially determined amounts. The employer contribution for the Police Pension Fund is based on amounts necessary to cover administrative costs and payments of pensions and benefits, as certified by the board of trustees of the Fund. The employer contribution for the Firefighters’ Pension and Relief Fund (Old System) is based on amounts necessary to pay current expenses, and, in effect, is being funded on a “pay-as-you-go” basis. In December 2000, the City issued $170,660,000 of taxable pension revenue bonds to fund the projected unfunded accrued liability of the Firefighters’ Pension and Relief Fund (Old System). These bonds were refunded in 2012. Debt service is to be paid from the General Fund. Employees covered under the MPERS contribute 10% of their earnable compensation to the plan in excess of $1,200 per year. Employees covered under the Firefighters’ Pension and Relief Fund of the City of New Orleans (Old and New Systems) contribute 6% of salary for the first 20 years of employment.
As a result of the merger contract with the MPERS to transfer all active policemen who were participating in the City’s Police Pension Fund to MPERS, there were no active participants in the plan and therefore the only contributions by employees to the plan related to retirees’ contributions for the purchase of military service credit. The City’s annual pension cost for the current year and related actuarial methods and assumptions for each plan is as follows (amounts in thousands):
Page 104
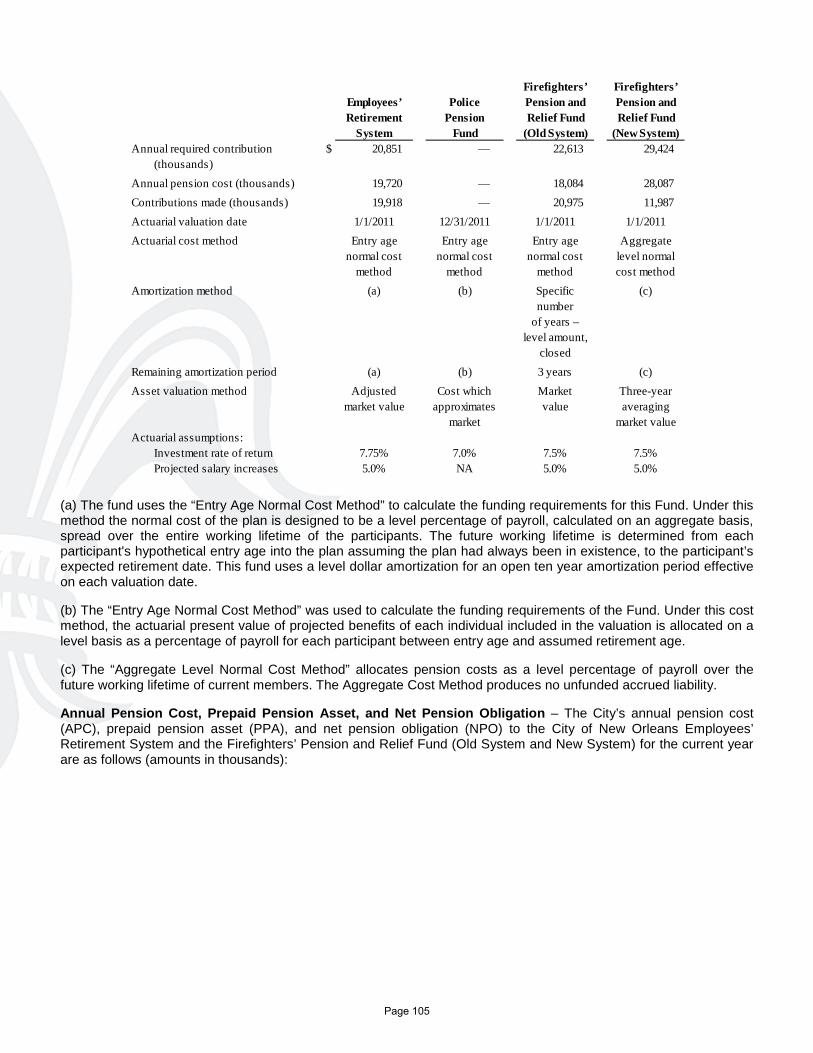
Firefighters’ Firefighters’Employees’ Police Pension and Pension andRetirement Pension Relief Fund Relief Fund
System Fund (Old System) (New System)Annual required contribution $ 20,851 — 22,613 29,424
(thousands)Annual pension cost (thousands) 19,720 — 18,084 28,087 Contributions made (thousands) 19,918 — 20,975 11,987 Actuarial valuation date 1/1/2011 12/31/2011 1/1/2011 1/1/2011Actuarial cost method Entry age Entry age Entry age Aggregate
normal cost normal cost normal cost level normalmethod method method cost method
Amortization method (a) (b) Specific (c)number
of years –level amount,
closedRemaining amortization period (a) (b) 3 years (c)Asset valuation method Adjusted Cost which Market Three-year
market value approximates value averagingmarket market value
Actuarial assumptions:Investment rate of return 7.75% 7.0% 7.5% 7.5%Projected salary increases 5.0% NA 5.0% 5.0%
(a) The fund uses the “Entry Age Normal Cost Method” to calculate the funding requirements for this Fund. Under this method the normal cost of the plan is designed to be a level percentage of payroll, calculated on an aggregate basis, spread over the entire working lifetime of the participants. The future working lifetime is determined from each participant's hypothetical entry age into the plan assuming the plan had always been in existence, to the participant’s expected retirement date. This fund uses a level dollar amortization for an open ten year amortization period effective on each valuation date.
(b) The “Entry Age Normal Cost Method” was used to calculate the funding requirements of the Fund. Under this cost method, the actuarial present value of projected benefits of each individual included in the valuation is allocated on a level basis as a percentage of payroll for each participant between entry age and assumed retirement age.
(c) The “Aggregate Level Normal Cost Method” allocates pension costs as a level percentage of payroll over the future working lifetime of current members. The Aggregate Cost Method produces no unfunded accrued liability.
Annual Pension Cost, Prepaid Pension Asset, and Net Pension Obligation – The City’s annual pension cost (APC), prepaid pension asset (PPA), and net pension obligation (NPO) to the City of New Orleans Employees’ Retirement System and the Firefighters’ Pension and Relief Fund (Old System and New System) for the current year are as follows (amounts in thousands):
Page 105
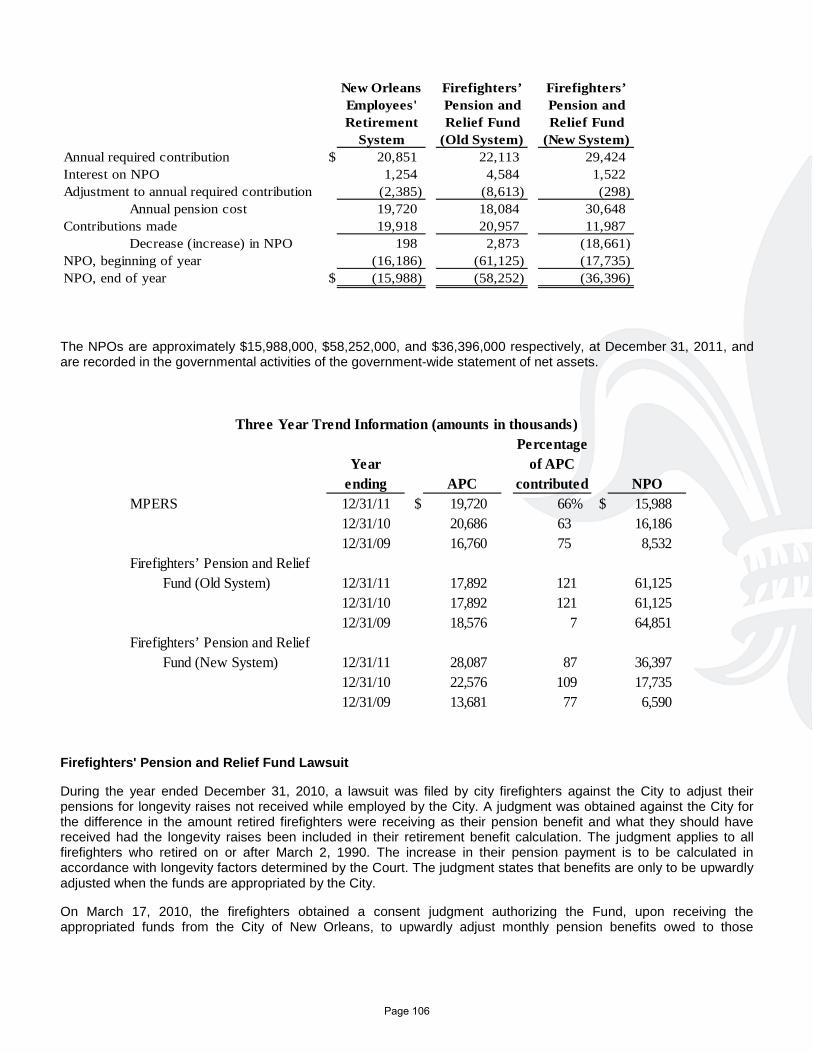
New Orleans Firefighters’ Firefighters’Employees' Pension and Pension andRetirement Relief Fund Relief Fund
System (Old System) (New System)Annual required contribution $ 20,851 22,113 29,424Interest on NPO 1,254 4,584 1,522Adjustment to annual required contribution (2,385) (8,613) (298)
Annual pension cost 19,720 18,084 30,648Contributions made 19,918 20,957 11,987
Decrease (increase) in NPO 198 2,873 (18,661)NPO, beginning of year (16,186) (61,125) (17,735)NPO, end of year $ (15,988) (58,252) (36,396)
The NPOs are approximately $15,988,000, $58,252,000, and $36,396,000 respectively, at December 31, 2011, and are recorded in the governmental activities of the government-wide statement of net assets.
Three Year Trend Information (amounts in thousands)Percentage
Year of APCending APC contributed NPO
MPERS 12/31/11 $ 19,720 66% $ 15,988 12/31/10 20,686 63 16,186 12/31/09 16,760 75 8,532
Firefighters’ Pension and ReliefFund (Old System) 12/31/11 17,892 121 61,125
12/31/10 17,892 121 61,125 12/31/09 18,576 7 64,851
Firefighters’ Pension and ReliefFund (New System) 12/31/11 28,087 87 36,397
12/31/10 22,576 109 17,735 12/31/09 13,681 77 6,590
Firefighters' Pension and Relief Fund Lawsuit
During the year ended December 31, 2010, a lawsuit was filed by city firefighters against the City to adjust their pensions for longevity raises not received while employed by the City. A judgment was obtained against the City for the difference in the amount retired firefighters were receiving as their pension benefit and what they should have received had the longevity raises been included in their retirement benefit calculation. The judgment applies to all firefighters who retired on or after March 2, 1990. The increase in their pension payment is to be calculated in accordance with longevity factors determined by the Court. The judgment states that benefits are only to be upwardly adjusted when the funds are appropriated by the City.
On March 17, 2010, the firefighters obtained a consent judgment authorizing the Fund, upon receiving the appropriated funds from the City of New Orleans, to upwardly adjust monthly pension benefits owed to those
Page 106
members who retired on or after March 2, 1990, starting on January 1, 2010 in accordance with the longevity factors determined by the Court. During the year ended December 31, 2010, the City appropriated funds necessary to pay the increased benefit to those members currently receiving cash benefits.
As of December 31, 2011, the City has not appropriated funds to pay the increased benefit owed to members prior to December 31, 2009. The Fund is currently in the process of determining the amount of the increased benefit owed to members for pensions prior to December 31, 2009.
Member Deferred Retirement Option Plan (DROP) and Partial Lump-Sum Option Plan (PLOP) accounts were not increased during the year ended December 31, 2011 since the City appropriation received did not cover these accounts.
The NOFF has calculated the increased benefit owed to the members in their DROP and PLOP accounts. As of December 31, 2011, the amount of DROP benefits owed to members is estimated to be $15,809,790 and $3,149,017 for the New and Old Systems, respectively. As of December 31, 2011, the amount of PLOP benefits owed to these members is estimated to be $11,290,212 and $1,412,022 for the New and Old Systems, respectively.
In 2012, a lawsuit was filed by a number of fire retirement board trustees regarding the adequacy of the City’s funding of the New and Old fire pension plans. The City has responded that any underfunding was the result of several factors in addition to the City’s contribution level.
Firefighters' Pension and Relief Fund Investment Receivable
The NOFF invested in Series N shares of the FIA Leveraged Fund, an open ended investment fund which is registered as a mutual fund. FIA Leveraged Fund is a feeder fund to the master fund – Fletcher International, Ltd. During the year, the NOFF requested a redemption of their shares in FIA Leveraged Fund in accordance with their agreement. FIA Leveraged Fund failed to provide the NOFF with confirmation on the value of their shares in the Fund and full payment. As a result, a lawsuit was filed. The lawsuit was filed in the Grand Court, Financial Services Division, Cayman Island and sought an order from the Grand Court that FIA Leveraged Fund be wound up (liquidated). The Fund was awarded on April 5, 2012 a winding up judgment. Liquidators were appointed over the FIA Leveraged Fund to fulfill the redemption. The receivable as of December 31, 2011 is valued at $18,425,727.
Postretirement Healthcare Benefits
Plan Description
The City of New Orleans’ medical benefits are provided through a self-insured comprehensive health benefit program and are made available to employees upon retirement. Full details are contained in the official plan documents. Medical benefits are provided to employees upon actual retirement (that is, at the end of the DROP period, if applicable) according to the retirement eligibility provisions of the System by which the employee is covered. The vast majority of City employees are covered by one of three primary systems: the Employees' Retirement System of the City of New Orleans (NOMERS), the Louisiana State Municipal Police Retirement System (MPERS), and the New Orleans Firefighters' Pension and Relief Fund (NOFF). The maximum DROP period is five years in NOMERS and NOFF and three years in MPERS. Retirement (DROP entry) eligibility is as follows: in NOMERS, the earliest of 30 years of service at any age; age 60 and 10 years of service; age 65 and 20 years of service; or, satisfaction of the "Rule of 80" (age plus service equals or exceeds 80); in MPRS, the earlier of 25 years of service and age 50 and 20 years of service (in MPERS, DROP entry requires age 55 and 12 years of service or 20 years of service and eligibility to retire); in NOFF, age 50 and 12 years of service. However, because of the "back-loaded" benefit formula in the NOFF plan relative to years of service, the retirement assumption used for that plan was the earliest of age 50 and 30 years of service, age 55 and 25 years of service, and age 60 and 12 years of service.
Contribution Rates
Employees do not contribute to their post employment benefits costs until they become retirees and begin receiving those benefits. The plan provisions and contribution rates are contained in the official plan documents.
Fund Policy
Until 2007, the City recognized the cost of providing post-employment medical benefits (the City’s portion of the retiree medical benefit premiums) as an expense when the benefit premiums were due and thus financed the cost of the post-employment benefits on a pay-as-you-go basis. Effective with the fiscal year beginning January 1, 2007, the
Page 107
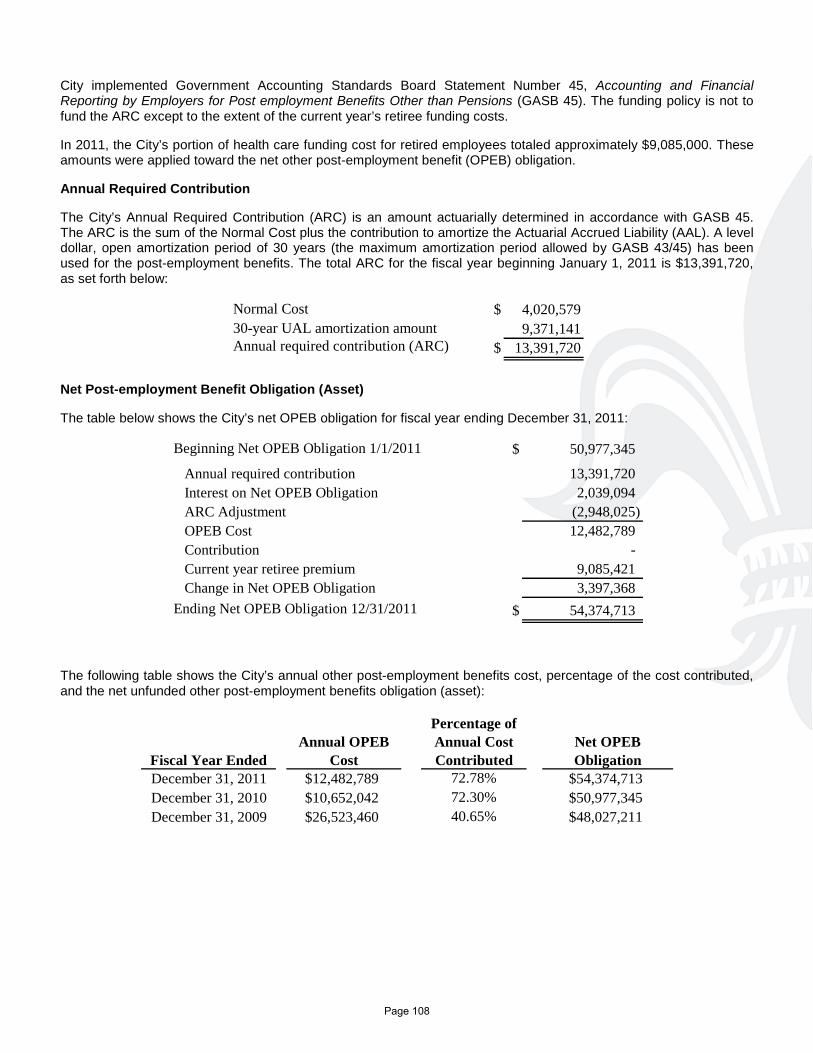
City implemented Government Accounting Standards Board Statement Number 45, Accounting and Financial Reporting by Employers for Post employment Benefits Other than Pensions (GASB 45). The funding policy is not to fund the ARC except to the extent of the current year’s retiree funding costs.
In 2011, the City’s portion of health care funding cost for retired employees totaled approximately $9,085,000. These amounts were applied toward the net other post-employment benefit (OPEB) obligation.
Annual Required Contribution
The City’s Annual Required Contribution (ARC) is an amount actuarially determined in accordance with GASB 45. The ARC is the sum of the Normal Cost plus the contribution to amortize the Actuarial Accrued Liability (AAL). A level dollar, open amortization period of 30 years (the maximum amortization period allowed by GASB 43/45) has been used for the post-employment benefits. The total ARC for the fiscal year beginning January 1, 2011 is $13,391,720, as set forth below:
Normal Cost $ 4,020,57930-year UAL amortization amount 9,371,141Annual required contribution (ARC) $ 13,391,720
Net Post-employment Benefit Obligation (Asset)
The table below shows the City’s net OPEB obligation for fiscal year ending December 31, 2011:
Beginning Net OPEB Obligation 1/1/2011 $ 50,977,345
Annual required contribution 13,391,720 Interest on Net OPEB Obligation 2,039,094 ARC Adjustment (2,948,025) OPEB Cost 12,482,789 Contribution - Current year retiree premium 9,085,421 Change in Net OPEB Obligation 3,397,368
Ending Net OPEB Obligation 12/31/2011 $ 54,374,713
The following table shows the City’s annual other post-employment benefits cost, percentage of the cost contributed, and the net unfunded other post-employment benefits obligation (asset):
December 31, 2011 $12,482,789 72.78% $54,374,713December 31, 2010 $10,652,042 72.30% $50,977,345December 31, 2009 $26,523,460 40.65% $48,027,211
Fiscal Year EndedAnnual OPEB
Cost
Percentage of Annual Cost Contributed
Net OPEB Obligation
Page 108
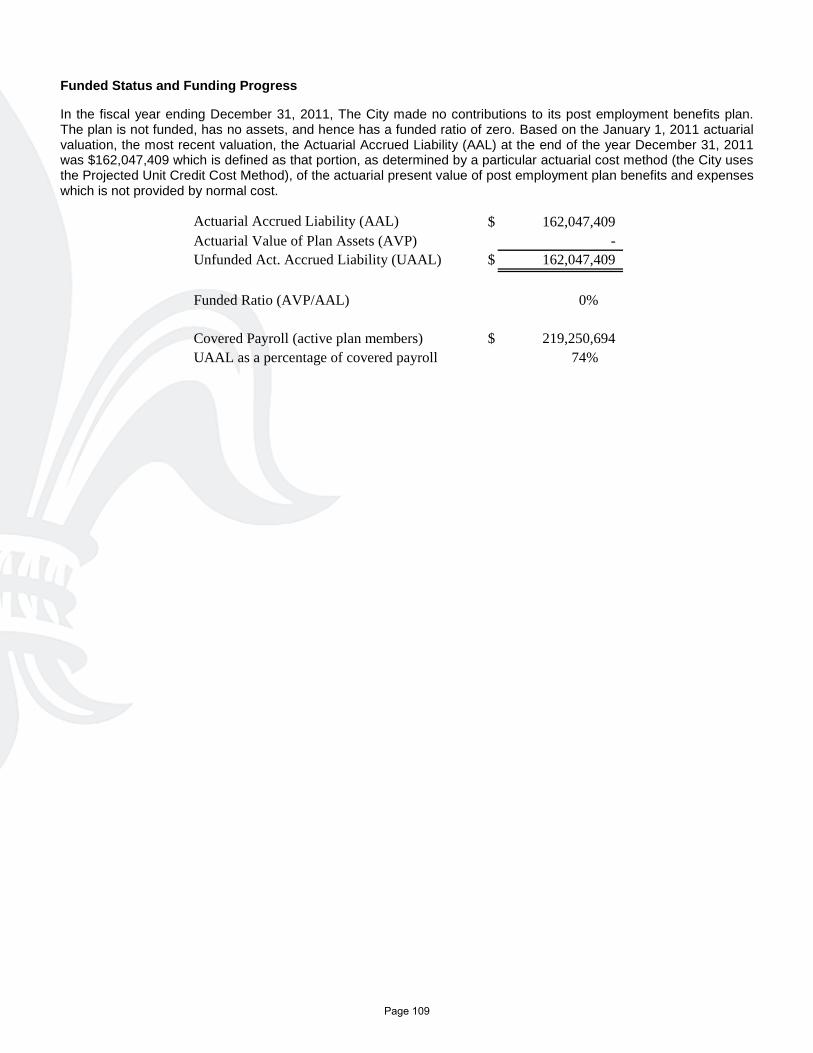
Funded Status and Funding Progress
In the fiscal year ending December 31, 2011, The City made no contributions to its post employment benefits plan. The plan is not funded, has no assets, and hence has a funded ratio of zero. Based on the January 1, 2011 actuarial valuation, the most recent valuation, the Actuarial Accrued Liability (AAL) at the end of the year December 31, 2011 was $162,047,409 which is defined as that portion, as determined by a particular actuarial cost method (the City uses the Projected Unit Credit Cost Method), of the actuarial present value of post employment plan benefits and expenses which is not provided by normal cost.
Actuarial Accrued Liability (AAL) $ 162,047,409 Actuarial Value of Plan Assets (AVP) - Unfunded Act. Accrued Liability (UAAL) $ 162,047,409
Funded Ratio (AVP/AAL) 0%
Covered Payroll (active plan members) $ 219,250,694 UAAL as a percentage of covered payroll 74%
Page 109
FINANCIAL POLICIES
1. GENERAL FINANCIAL POLICIES
The budget as a policy document
• The budget reflects the public policy goals of the Mayor and City Council. The budget should include a coherent statement of results the City will produce for the public.
• The City of New Orleans shall utilize the Budgeting for Outcomes (“BFO”) approach in developing its operating budget. BFO asks public leaders to set the price of government, determine the outcomes citizens value most, prioritize tax dollars to purchase those results and rethink the way departments and agencies pursue producing outcomes. The budget should describe and address the City’s short-term goals and initiatives that guide the development of the budget in the coming year.
The budget as a financial plan
• The budget includes a financial planning projection for the next five years. This projection is based on the five year revenue forecast for the proposed budget that is presented to the Revenue Estimating Conference. Expenditure projections for the five year financial planning projection conform with the revenue forecast and the fund balance policy.
Fund balance
• The General Fund will have two fund balance goals, an unreserved fund balance account and an emergency reserve account.
• The target level for the unreserved fund balance is two percent of the expenditures in the adopted budget.
• The target level for the emergency reserve account is eight percent of the expenditures in the adopted budget. The emergency reserve will be used only for natural disasters, revenue shortfalls as recognized by the Revenue Estimating Conference and other major emergencies that disrupt revenue sources or require substantial unanticipated expenses to address.
• Any unanticipated net General Fund revenue will be used to first fully fund the unreserved fund balance account.
• Once the unreserved fund balance account is funded at its target level, any additional unanticipated General Fund revenue will be used to fund the emergency reserve account, at a rate of at least two percentage points per year, until it reaches its target level.
• If drawn upon, the emergency reserve account will be replenished to appropriate levels in subsequent years.
Performance measurement and management principles
• The budget contains Key Performance Indicators (KPIs) that are used to track the performance of City departments on their primary activities and programs. These KPIs are identified in the City’s Budgeting for Outcomes process, in business plans and throughout the year.
• KPIs are reviewed on at least a quarterly basis by department heads, deputy mayors and other key City staff and are published in the ResultsNOLA report.
• The Office of Performance and Accountability is the City’s primary office in charge of overseeing the City’s performance management system.
Revenue policies
• Property in New Orleans will be re-assessed every four years for the purpose of establishing property taxes.
Page 110
• Fees and charges for specific services should be set so as to not significantly under-recover or over-recover costs. Fees and charges should be reviewed periodically to compare the % of cost recovery and to develop recommendations regarding adjustments that should be considered. Service costs should be estimated to include all significant direct and indirect costs of providing the service, and both operating and capital costs should be analyzed.
2. LEGAL REQUIREMENTS
• The City of New Orleans is a municipal corporation governed by the Mayor and City Council.
• Annual budgets are adopted for the General, Special Revenue and Debt Service Funds with a level of legal budgetary control established by the City Council.
• The City Charter, Section 6-106, establishes the fiscal year for the budget as the calendar year.
• The City Charter, Section 3-116, requires the budget to be balanced.
• The City Charter, Section 6-108 (1), states that, “the Council shall execute an agreement with a Certified Public Accountant or firm of Certified Public Accountants for the purpose of securing an audit of the accounts of the City.”
• The City Charter, Section 6-108 (2), requires the independent audit to be completed no later than six months after the close of the fiscal year just completed.
3. ADOPTION OF THE BUDGET
• The City Charter, Section 6-101, establishes a Revenue Estimating Conference to prepare and publish the official forecast revenue estimates. The Revenue Estimating Conference members are the Mayor (who serves as chair), the Chief Administrative Officer, the Director of Finance, a member of the City Council and a faculty member of a college or university in New Orleans who has expertise in forecasting revenues or in a related field. In addition to the members of the Revenue Estimating Conference identified in Section 6-101(1) of the Home Rule Charter of the City of New Orleans, the City Council may select one additional member of the City Council to attend meetings of the Revenue Estimating Conference and serve in the capacity of a non-voting ex-officio member of the body to the extent permitted by the Home Rule Charter.
• The City Charter, Section 4-206(1)(f), states that the Mayor submits the operating and capital budgets annually to the City Council.
• The City Charter, Section 3-115(2), establishes that the City Council adopts the annual budget no later than the first day of December before the fiscal year begins.
• The City Charter, Section 6-104 states that the City Planning Commission before October 15 each year will prepare and submit to the Mayor a capital program for the next five years.
• The Mayor will submit a capital budget to the City Council no later than November first of each year.
• A number of changes have been made, including those in the Mayor’s Executive Order (MJL 10-01: Budget Process Reform):
─ Submission of the budget will be on or before October 15
─ Revenue changes in a Mayor’s Budget submission will be clearly and separately reviewed by the Revenue Estimating Conference
─ In order for the public’s priorities to inform the Budgeting for Outcomes process, the Chief Administrative Officer shall work with Council members to host no less than one public priority-setting meeting in each Council district prior to the presentation of the budget by the Mayor to the Council. The Chief Administrative Officer is also directed to work with the City Council throughout the Budgeting for Outcomes process.
4. MANAGING THE ENACTED BUDGET
• The legal level of budgetary control is at the department level within a fund, separated into appropriations for three categories of cost object classifications: personal services, other operating expenses and debt service.
Page 111
• After the initial budget is adopted, it may be amended for interdepartmental transfers of appropriations with the approval of the Budget Committee of the City Council and the City Council.
• Intradepartmental transfers of appropriation among individual budgetary accounts may be initiated by a department head with the approval of the Chief Administrative Officer.
• Total appropriations for any fund may be increased, if, during the year, sources of revenue become available to the City in excess of original anticipations, and these amounts are anticipated by the Budget Committee of the City Council and subsequently approved by the City Council. For the General Fund, unanticipated revenues should first be used to reach the appropriate target levels for the unreserved fund balance account and the emergency reserve account.
• Significant changes in anticipated General Fund revenues or expenditures during the budget year will necessitate formal amendments being proposed to Budget Committee of the City Council and the City Council to amend the annual budget as appropriate.
Encumbrances
• Encumbrance accounting, under which purchase orders and contracts are recorded to reserve that portion of the applicable appropriation, is employed as an extension of the formal budgetary process. Contractually encumbered appropriations and certain requisition commitments in the General Fund do not lapse, but are carried forward to the ensuing budget year.
• All General Fund appropriations, except for those in the unreserved fund balance and emergency reserve, lapse at the end of the year.
Interfund transfers
• If expense items in grants are not reimbursed and are considered uncollectible, the General Fund needs to cover them.
• Transfers need to be clearly documented.
Budget monitoring and reporting • The budget will be monitored monthly after the first quarter of the fiscal year. A monthly report will be
prepared and distributed to the Mayor, Budget Committee and City Council, Chief Administrative Officer, the Director of Finance and the City departments and offices.
• The Chief Administrative Officer shall submit monthly budget reports to the City Council through its Budget Committee. Said monthly reports shall include a report on actual revenues and expenditures by major categories and include a comparison of current data to prior year-to-date data.
5. ACCOUNTING PRINCIPLES
• The accounting principles of the City of New Orleans conform to generally accepted accounting principles (GAAP) applicable to governmental entities.
• The Governmental Accounting Standards Board (GASB) is the accepted standards setting body for establishing governmental accounting and financial reporting principles.
• The City’s budget is prepared on a modified accrual basis and in conformity with U.S. generally accepted accounting principles (GAAP) for local government units as prescribed by the Governmental Accounting Standards Board (GASB). The City uses a modified accrual basis of accounting for its budget and audited financial statements.
• The City Charter, Section 3-116(3), requires revenues to be estimated using generally accepted accounting principles defined by the Governmental Accounting Standards Board (GASB).
• The City Charter, Section 6-108 (1), states that, “the Council shall execute an agreement with a Certified Public Accountant or firm of Certified Public Accountants for the purpose of securing an audit of the accounts of the City.”
Page 112
• The City Charter, Section 6-108 (2), requires the independent audit to be completed no later than six months after the close of the fiscal year just completed.
• The City is required to undergo an annual single audit in conformity with the U.S. Office of Management and Budget Circular A-133, “Audit of States, Local Governments, and Not-for-Profit Organizations.”
6. DEBT
City debt
• The City Charter, Section 5-101, establishes a Board of Liquidation, City Debt, to issue City debt, composed of six members and three ex-officio members, who shall be the Mayor and the two Council members at large. The debt policies of the Board of Liquidation are put in place to address the use of long-term debt, policy for selling debt and how to manage investments, as described in the following sections.
Use of long-term debt
• Under the City Charter and prudent financial management, long-term debt will not be used to finance current operations of the City or its agencies.
• Long-term borrowing will only be used for capital improvement projects and equipment that cannot be financed from current revenue sources.
• The investment of capital funds is governed by State statute, City code and Board of Liquidation policy. According to State law, capital project funds of the City may be invested only in:
a) Securities guaranteed for both principal and interest by the federal government;
b) Collateralized certificates of deposit from banks whose collateral consists of securities of the United States that guarantees both principal and interest. The use of derivative investments will generally not be permitted.
• Financing debt for capital projects by issuing bonds will be paid back in a period not exceeding the expected life of those projects.
• The Board will seek level or declining debt repayment schedules and will avoid issuing debt that provides for balloon principal payments reserved at the end of the term of the issue.
• The Board will maintain good communications with bond rating agencies about its financial condition and will follow a policy of full disclosure on every financial report and bond prospectus.
Policy for selling City debt
• The Board of Liquidation will generally issue its bonds through what is commonly called a competitive sale. However, the Board may utilize what is commonly called a negotiated sale under one or more of the following conditions:
─ The debt issue is, or contains, a refinancing that is dependent on market/interest rate factors.
─ At the time of issuance, the interest rate environment or economic factors that affect the debt issue are volatile.
─ The nature of the debt issue is unique and requires particular skills from the investment banks involved.
─ The debt issue is bound by a closing deadline.
• In some cases, a group of investment bankers will be selected that have been subjected to a competitive review by the Board of their qualifications, recent performance and capitalization. The services of an independent financial advisor may be employed to oversee the work of the investment bankers.
• The Board will not be obligated to any investment banking firm bringing proposals to other City Agencies for which the Board issues bonds.
Page 113
• The Financial Advisor to the Board will keep the Board periodically advised of any current or advance refunds that could result in savings to the City and/or City agencies in debt service payments.
Investment policy of the Board of Liquidation City debt
• The policy of the Board of Liquidation, City Debt, is to invest the tax receipts dedicated to Debt Service as they are received from the City of New Orleans Bureau of the Treasury. The Debt Service funds are invested to mature on the dates Debt Service payments are due. The receipts are generally invested in collateralized Certificates of Deposit, after competitive bids have been received for the banks in the City that have depository agreements with the Board.
• If the bids received are not competitive with Direct U. S. Government Securities, investments are made in these government securities.
• Debt Service funds and Debt Service Reserve funds are invested to mature within one year of receipt in order to meet the debt service requirements as they become due.
• Custodial Funds which are held by the Board are invested to meet the requirements of the agencies entitled to receive these funds and are generally invested as described above or as may be required by the applicable bond documents.
Page 114

Page 115

City Council
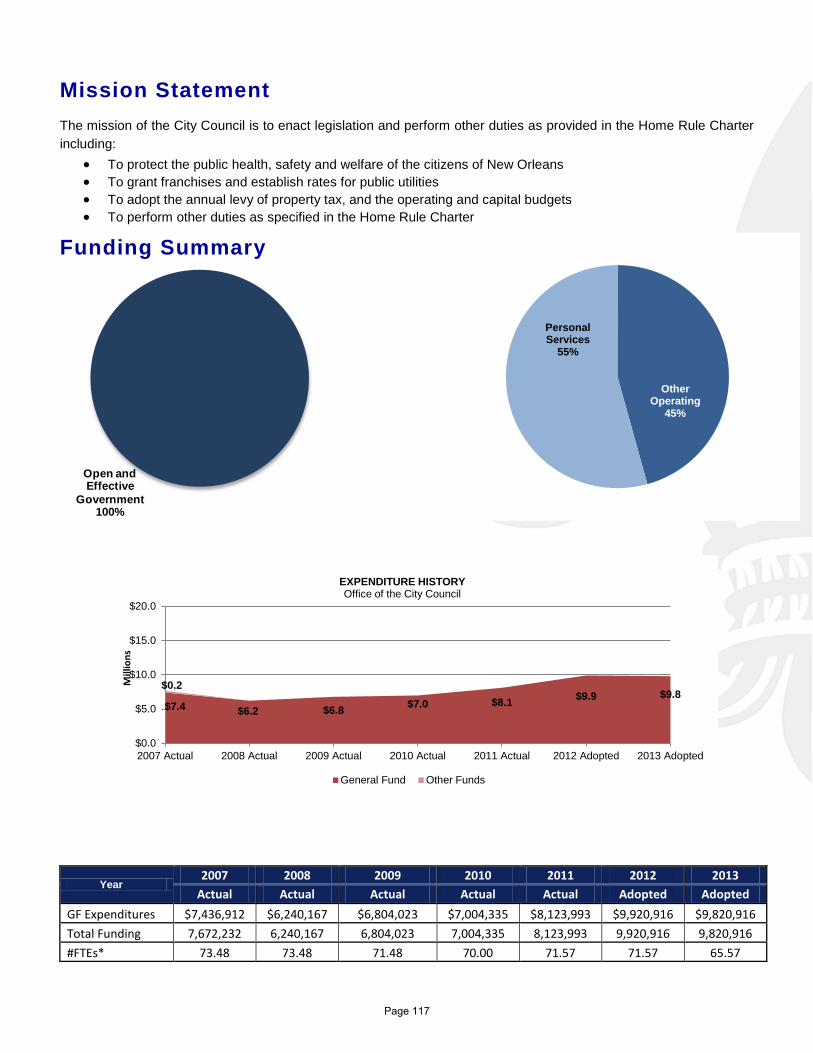
Other Operating
45%
Personal Services
55%
Mission Statement The mission of the City Council is to enact legislation and perform other duties as provided in the Home Rule Charter including:
• To protect the public health, safety and welfare of the citizens of New Orleans • To grant franchises and establish rates for public utilities • To adopt the annual levy of property tax, and the operating and capital budgets • To perform other duties as specified in the Home Rule Charter
Funding Summary
Year 2007 2008 2009 2010 2011 2012 2013
Actual Actual Actual Actual Actual Adopted Adopted GF Expenditures $7,436,912 $6,240,167 $6,804,023 $7,004,335 $8,123,993 $9,920,916 $9,820,916 Total Funding 7,672,232 6,240,167 6,804,023 7,004,335 8,123,993 9,920,916 9,820,916 #FTEs* 73.48 73.48 71.48 70.00 71.57 71.57 65.57
Open and Effective
Government100%
$7.4 $6.2 $6.8 $7.0 $8.1 $9.9 $9.8 $0.2
$0.0
$5.0
$10.0
$15.0
$20.0
2007 Actual 2008 Actual 2009 Actual 2010 Actual 2011 Actual 2012 Adopted 2013 Adopted
Mill
ions
EXPENDITURE HISTORY Office of the City Council
General Fund Other Funds
Page 117
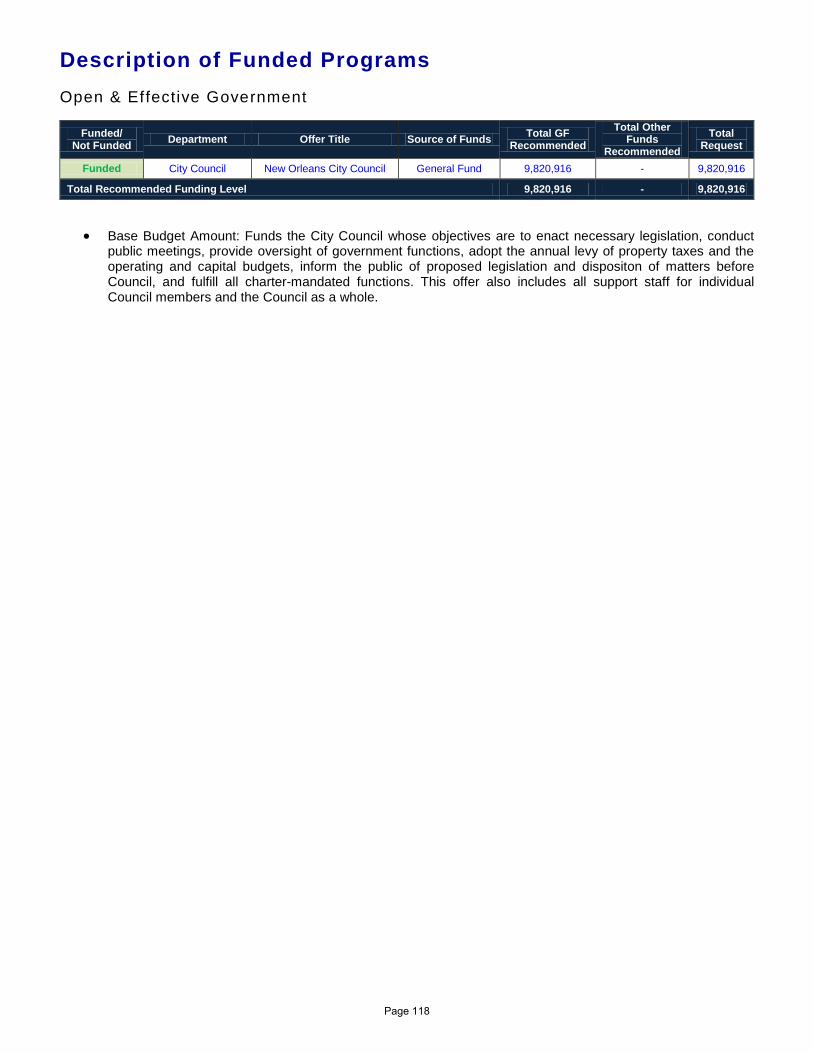
Description of Funded Programs Open & Effective Government
Funded/ Not Funded Department Offer Title Source of Funds Total GF
Recommended Total Other
Funds Recommended
Total Request
Funded City Council New Orleans City Council General Fund 9,820,916 - 9,820,916
Total Recommended Funding Level 9,820,916 - 9,820,916
• Base Budget Amount: Funds the City Council whose objectives are to enact necessary legislation, conduct public meetings, provide oversight of government functions, adopt the annual levy of property taxes and the operating and capital budgets, inform the public of proposed legislation and dispositon of matters before Council, and fulfill all charter-mandated functions. This offer also includes all support staff for individual Council members and the Council as a whole.
Page 118
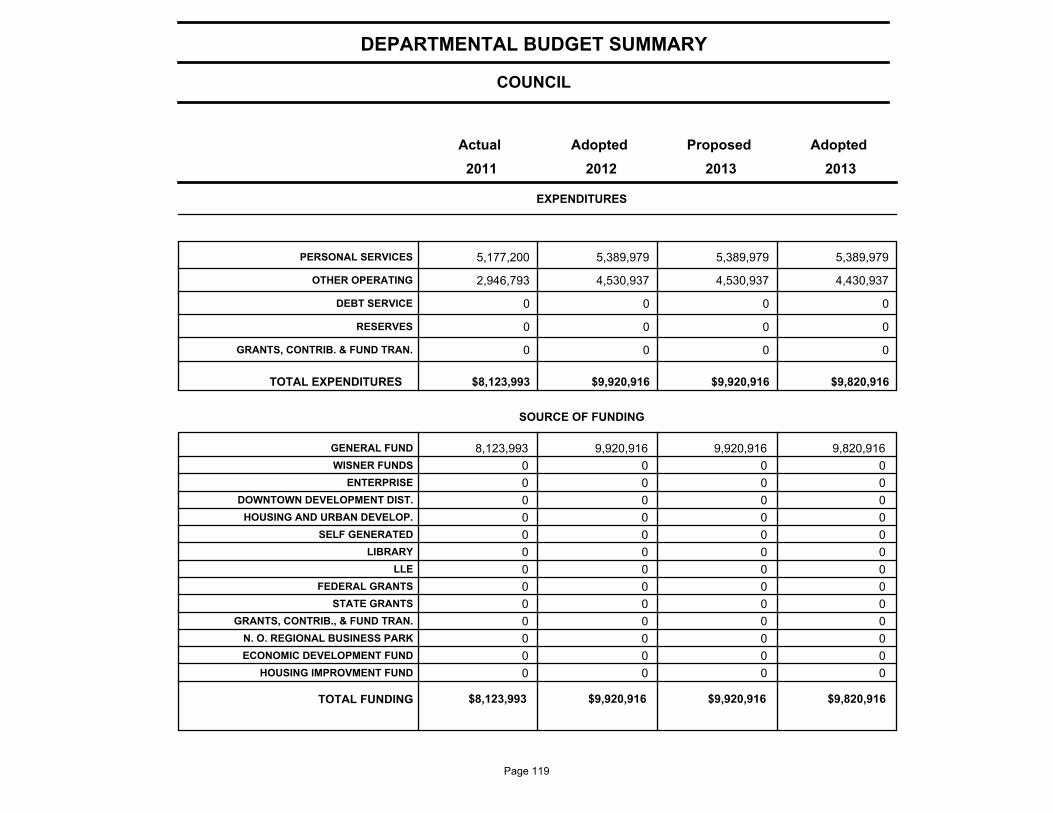
COUNCIL
DEPARTMENTAL BUDGET SUMMARY
AdoptedProposedAdoptedActual
EXPENDITURES
2013 2012 2011 2013
PERSONAL SERVICES 5,177,200 5,389,979 5,389,979 5,389,979
OTHER OPERATING 2,946,793 4,530,937 4,530,937 4,430,937
DEBT SERVICE 0 0 0 0
RESERVES 0 0 0 0
GRANTS, CONTRIB. & FUND TRAN. 0 0 0 0
$8,123,993 $9,920,916 $9,920,916 TOTAL EXPENDITURES $9,820,916
SOURCE OF FUNDING
GENERAL FUND 8,123,993 9,920,916 9,920,916 9,820,916
WISNER FUNDS 0 0 0 0
ENTERPRISE 0 0 0 0
DOWNTOWN DEVELOPMENT DIST. 0 0 0 0
HOUSING AND URBAN DEVELOP. 0 0 0 0
SELF GENERATED 0 0 0 0
LIBRARY 0 0 0 0
LLE 0 0 0 0
FEDERAL GRANTS 0 0 0 0
STATE GRANTS 0 0 0 0
GRANTS, CONTRIB., & FUND TRAN. 0 0 0 0
N. O. REGIONAL BUSINESS PARK 0 0 0 0
ECONOMIC DEVELOPMENT FUND 0 0 0 0
HOUSING IMPROVMENT FUND 0 0 0 0
$8,123,993 $9,920,916 $9,920,916 TOTAL FUNDING $9,820,916
Page 119
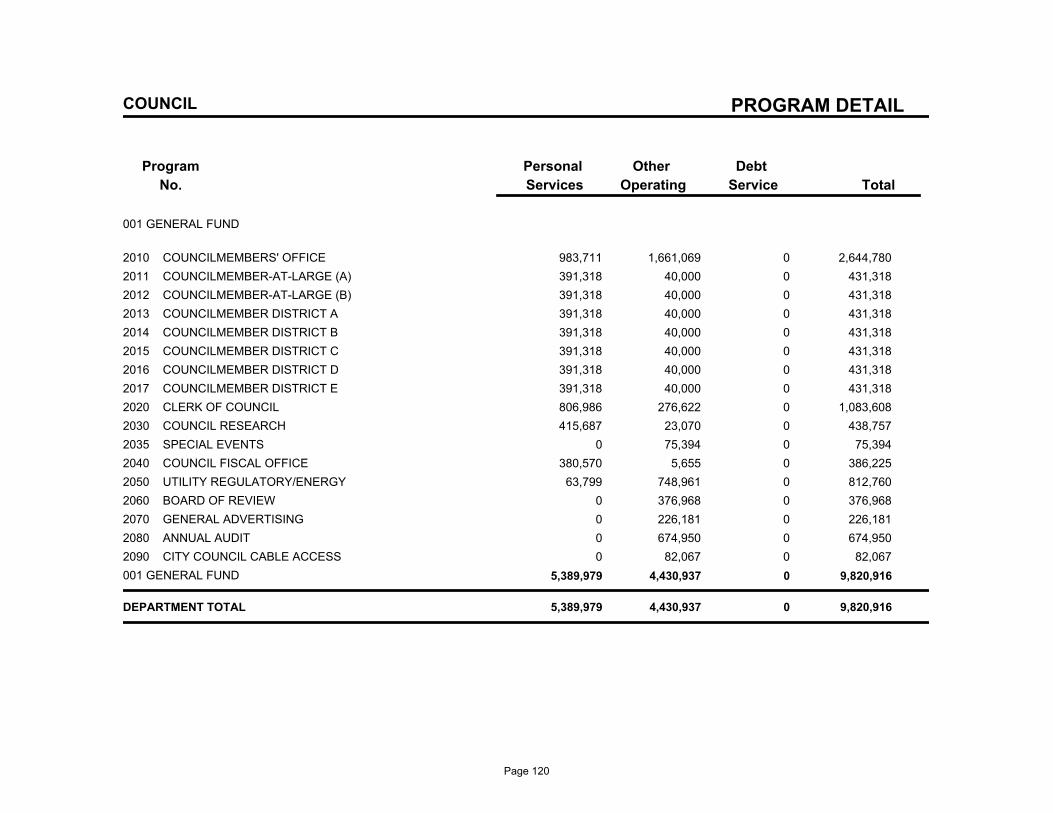
PROGRAM DETAIL
Program
No.
Debt
Service
Other
Operating
Personal
Services Total
COUNCIL
001 GENERAL FUND
2010 COUNCILMEMBERS' OFFICE 983,711 1,661,069 0 2,644,780
2011 COUNCILMEMBER-AT-LARGE (A) 391,318 40,000 0 431,318
2012 COUNCILMEMBER-AT-LARGE (B) 391,318 40,000 0 431,318
2013 COUNCILMEMBER DISTRICT A 391,318 40,000 0 431,318
2014 COUNCILMEMBER DISTRICT B 391,318 40,000 0 431,318
2015 COUNCILMEMBER DISTRICT C 391,318 40,000 0 431,318
2016 COUNCILMEMBER DISTRICT D 391,318 40,000 0 431,318
2017 COUNCILMEMBER DISTRICT E 391,318 40,000 0 431,318
2020 CLERK OF COUNCIL 806,986 276,622 0 1,083,608
2030 COUNCIL RESEARCH 415,687 23,070 0 438,757
2035 SPECIAL EVENTS 0 75,394 0 75,394
2040 COUNCIL FISCAL OFFICE 380,570 5,655 0 386,225
2050 UTILITY REGULATORY/ENERGY 63,799 748,961 0 812,760
2060 BOARD OF REVIEW 0 376,968 0 376,968
2070 GENERAL ADVERTISING 0 226,181 0 226,181
2080 ANNUAL AUDIT 0 674,950 0 674,950
2090 CITY COUNCIL CABLE ACCESS 0 82,067 0 82,067
001 GENERAL FUND 5,389,979 4,430,937 0 9,820,916
DEPARTMENT TOTAL 5,389,979 4,430,937 0 9,820,916
Page 120
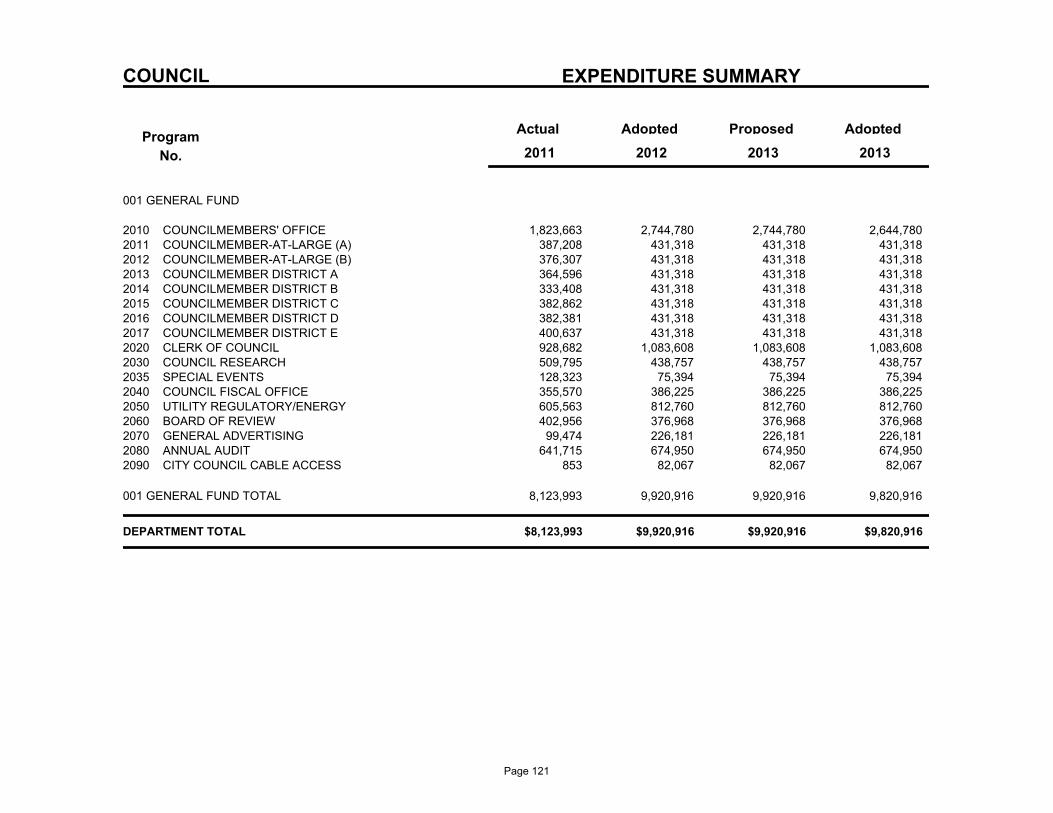
COUNCIL EXPENDITURE SUMMARY
Program
No.
Actual AdoptedProposedAdopted
2013 2011 2012 2013
001 GENERAL FUND
1,823,663 2,744,780 2,744,780 COUNCILMEMBERS' OFFICE2010 2,644,780 387,208 431,318 431,318 COUNCILMEMBER-AT-LARGE (A)2011 431,318 376,307 431,318 431,318 COUNCILMEMBER-AT-LARGE (B)2012 431,318 364,596 431,318 431,318 COUNCILMEMBER DISTRICT A2013 431,318 333,408 431,318 431,318 COUNCILMEMBER DISTRICT B2014 431,318 382,862 431,318 431,318 COUNCILMEMBER DISTRICT C2015 431,318 382,381 431,318 431,318 COUNCILMEMBER DISTRICT D2016 431,318 400,637 431,318 431,318 COUNCILMEMBER DISTRICT E2017 431,318 928,682 1,083,608 1,083,608 CLERK OF COUNCIL2020 1,083,608 509,795 438,757 438,757 COUNCIL RESEARCH2030 438,757 128,323 75,394 75,394 SPECIAL EVENTS2035 75,394 355,570 386,225 386,225 COUNCIL FISCAL OFFICE2040 386,225 605,563 812,760 812,760 UTILITY REGULATORY/ENERGY2050 812,760 402,956 376,968 376,968 BOARD OF REVIEW2060 376,968
99,474 226,181 226,181 GENERAL ADVERTISING2070 226,181 641,715 674,950 674,950 ANNUAL AUDIT2080 674,950
853 82,067 82,067 CITY COUNCIL CABLE ACCESS2090 82,067
8,123,993 9,920,916 9,920,916 9,820,916 001 GENERAL FUND TOTAL
$8,123,993 $9,920,916 $9,920,916 $9,820,916 DEPARTMENT TOTAL
Page 121
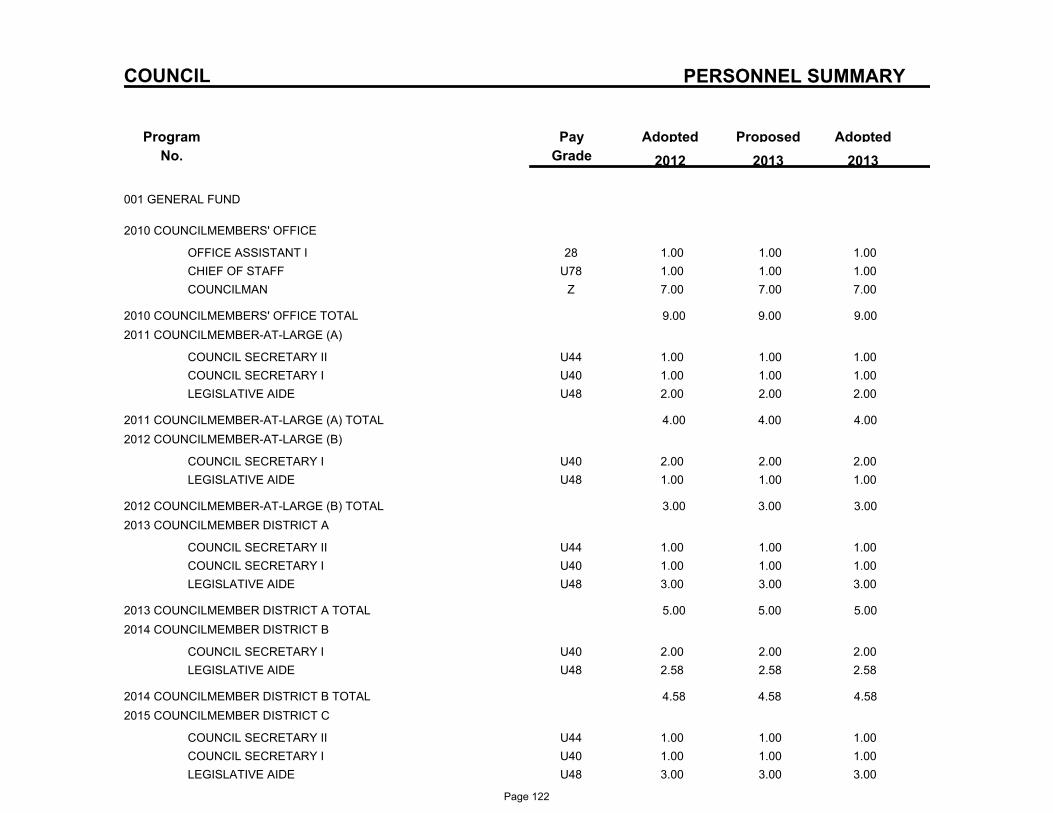
PERSONNEL SUMMARY
Program
No.
ProposedAdoptedPay
Grade
Adopted
2013 2012 2013
COUNCIL
001 GENERAL FUND
2010 COUNCILMEMBERS' OFFICE
28OFFICE ASSISTANT I 1.00 1.00 1.00
U78CHIEF OF STAFF 1.00 1.00 1.00
ZCOUNCILMAN 7.00 7.00 7.00
2010 COUNCILMEMBERS' OFFICE TOTAL 9.00 9.00 9.00
2011 COUNCILMEMBER-AT-LARGE (A)
U44COUNCIL SECRETARY II 1.00 1.00 1.00
U40COUNCIL SECRETARY I 1.00 1.00 1.00
U48LEGISLATIVE AIDE 2.00 2.00 2.00
2011 COUNCILMEMBER-AT-LARGE (A) TOTAL 4.00 4.00 4.00
2012 COUNCILMEMBER-AT-LARGE (B)
U40COUNCIL SECRETARY I 2.00 2.00 2.00
U48LEGISLATIVE AIDE 1.00 1.00 1.00
2012 COUNCILMEMBER-AT-LARGE (B) TOTAL 3.00 3.00 3.00
2013 COUNCILMEMBER DISTRICT A
U44COUNCIL SECRETARY II 1.00 1.00 1.00
U40COUNCIL SECRETARY I 1.00 1.00 1.00
U48LEGISLATIVE AIDE 3.00 3.00 3.00
2013 COUNCILMEMBER DISTRICT A TOTAL 5.00 5.00 5.00
2014 COUNCILMEMBER DISTRICT B
U40COUNCIL SECRETARY I 2.00 2.00 2.00
U48LEGISLATIVE AIDE 2.58 2.58 2.58
2014 COUNCILMEMBER DISTRICT B TOTAL 4.58 4.58 4.58
2015 COUNCILMEMBER DISTRICT C
U44COUNCIL SECRETARY II 1.00 1.00 1.00
U40COUNCIL SECRETARY I 1.00 1.00 1.00
U48LEGISLATIVE AIDE 3.00 3.00 3.00
Page 122
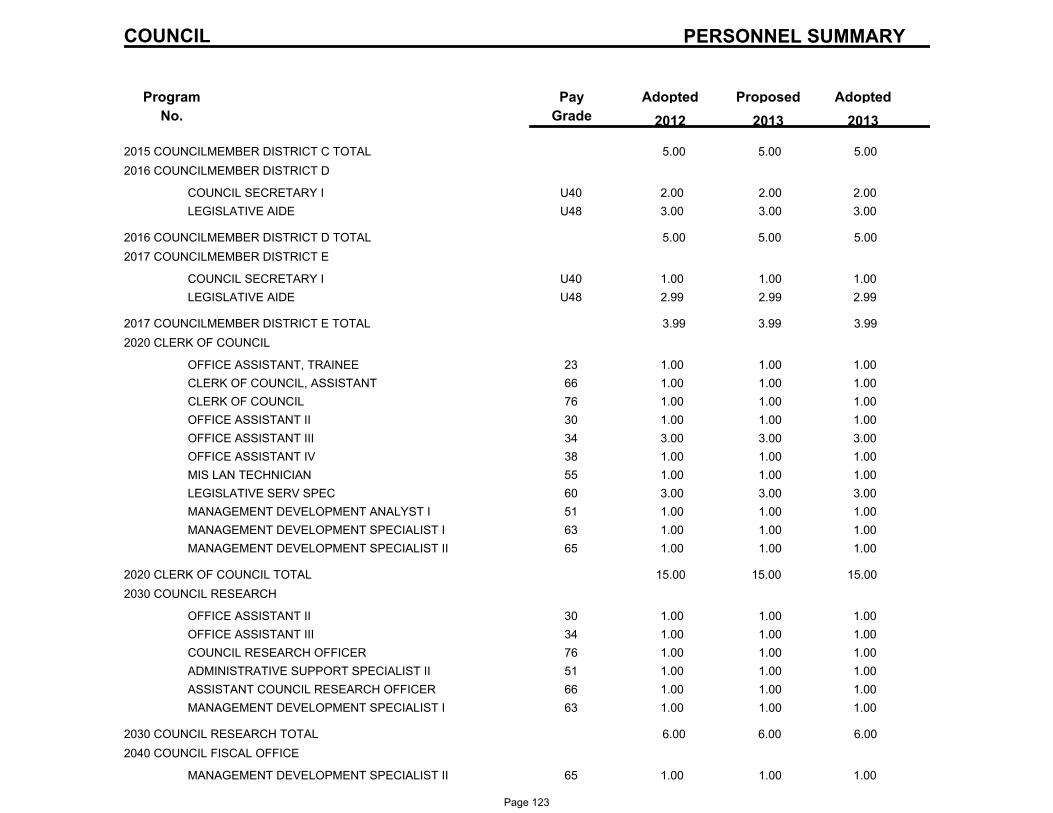
PERSONNEL SUMMARY
Program
No.
ProposedAdoptedPay
Grade
Adopted
2013 2012 2013
COUNCIL
2015 COUNCILMEMBER DISTRICT C TOTAL 5.00 5.00 5.00
2016 COUNCILMEMBER DISTRICT D
U40COUNCIL SECRETARY I 2.00 2.00 2.00
U48LEGISLATIVE AIDE 3.00 3.00 3.00
2016 COUNCILMEMBER DISTRICT D TOTAL 5.00 5.00 5.00
2017 COUNCILMEMBER DISTRICT E
U40COUNCIL SECRETARY I 1.00 1.00 1.00
U48LEGISLATIVE AIDE 2.99 2.99 2.99
2017 COUNCILMEMBER DISTRICT E TOTAL 3.99 3.99 3.99
2020 CLERK OF COUNCIL
23OFFICE ASSISTANT, TRAINEE 1.00 1.00 1.00
66CLERK OF COUNCIL, ASSISTANT 1.00 1.00 1.00
76CLERK OF COUNCIL 1.00 1.00 1.00
30OFFICE ASSISTANT II 1.00 1.00 1.00
34OFFICE ASSISTANT III 3.00 3.00 3.00
38OFFICE ASSISTANT IV 1.00 1.00 1.00
55MIS LAN TECHNICIAN 1.00 1.00 1.00
60LEGISLATIVE SERV SPEC 3.00 3.00 3.00
51MANAGEMENT DEVELOPMENT ANALYST I 1.00 1.00 1.00
63MANAGEMENT DEVELOPMENT SPECIALIST I 1.00 1.00 1.00
65MANAGEMENT DEVELOPMENT SPECIALIST II 1.00 1.00 1.00
2020 CLERK OF COUNCIL TOTAL 15.00 15.00 15.00
2030 COUNCIL RESEARCH
30OFFICE ASSISTANT II 1.00 1.00 1.00
34OFFICE ASSISTANT III 1.00 1.00 1.00
76COUNCIL RESEARCH OFFICER 1.00 1.00 1.00
51ADMINISTRATIVE SUPPORT SPECIALIST II 1.00 1.00 1.00
66ASSISTANT COUNCIL RESEARCH OFFICER 1.00 1.00 1.00
63MANAGEMENT DEVELOPMENT SPECIALIST I 1.00 1.00 1.00
2030 COUNCIL RESEARCH TOTAL 6.00 6.00 6.00
2040 COUNCIL FISCAL OFFICE
65MANAGEMENT DEVELOPMENT SPECIALIST II 1.00 1.00 1.00
Page 123
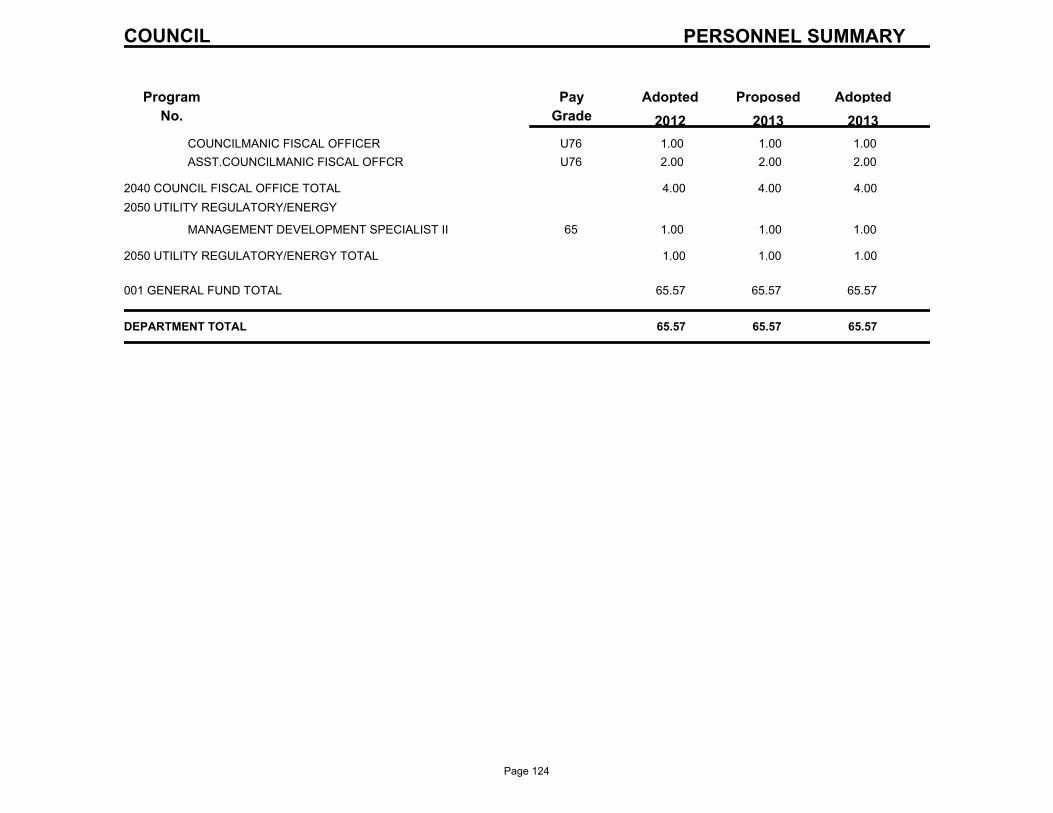
PERSONNEL SUMMARY
Program
No.
ProposedAdoptedPay
Grade
Adopted
2013 2012 2013
COUNCIL
U76COUNCILMANIC FISCAL OFFICER 1.00 1.00 1.00
U76ASST.COUNCILMANIC FISCAL OFFCR 2.00 2.00 2.00
2040 COUNCIL FISCAL OFFICE TOTAL 4.00 4.00 4.00
2050 UTILITY REGULATORY/ENERGY
65MANAGEMENT DEVELOPMENT SPECIALIST II 1.00 1.00 1.00
2050 UTILITY REGULATORY/ENERGY TOTAL 1.00 1.00 1.00
001 GENERAL FUND TOTAL 65.57 65.57 65.57
DEPARTMENT TOTAL 65.57 65.57 65.57
Page 124

Page 125

Mayor’s Office
Mission Statement The City of New Orleans delivers excellent service to its citizens with courage, competence and compassion. We provide unbeatable customer service driven by sound fiscal management. As good stewards of our resources, we ensure safe neighborhoods, excellent schools, good-paying jobs and a clean environment for our citizens.
We facilitate partnerships, link strong leaders and new ideas, and leverage critical resources to move New Orleans forward. Our decisions are informed by effective communication and active citizen involvement.
We responsibly manage and preserve our City’s natural resources.
Vision Statement New Orleans is a model city. We demonstrate to the world the power of strong leadership in the halls of City government and on streets of hope. With resilience, we transform challenges into instruments of progress with the belief and assurance that change is possible.
We are a unified city where municipal employees and engaged citizens work together to create equitable, thriving communities for all. The City of New Orleans leverages the transformative power of our people to build safe neighborhoods and foster educational, economic and cultural opportunities.
We are a creative city. We recognize limitless opportunity and appreciate the shared benefit of our neighbor’s success. The richness of diversity is manifest so clearly in our culture—a beautiful mosaic that only New Orleans is able to create. Our commitment to excellence, coupled with timeless cultural heritage and creative vision ensures New Orleans’ greatness for generations to come.
Page 127
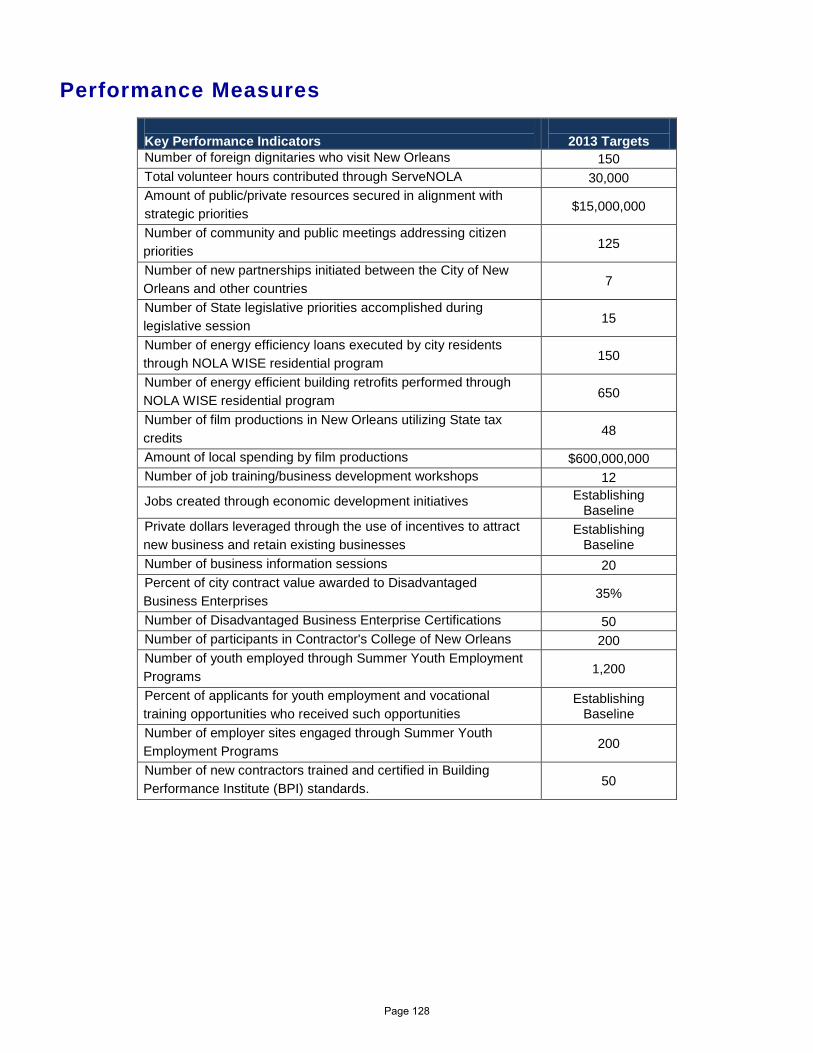
Performance Measures Key Performance Indicators
2013 Targets
Number of foreign dignitaries who visit New Orleans 150 Total volunteer hours contributed through ServeNOLA 30,000 Amount of public/private resources secured in alignment with strategic priorities $15,000,000
Number of community and public meetings addressing citizen priorities 125
Number of new partnerships initiated between the City of New Orleans and other countries 7
Number of State legislative priorities accomplished during legislative session 15
Number of energy efficiency loans executed by city residents through NOLA WISE residential program 150
Number of energy efficient building retrofits performed through NOLA WISE residential program 650
Number of film productions in New Orleans utilizing State tax credits 48
Amount of local spending by film productions $600,000,000 Number of job training/business development workshops 12
Jobs created through economic development initiatives Establishing Baseline
Private dollars leveraged through the use of incentives to attract new business and retain existing businesses
Establishing Baseline
Number of business information sessions 20 Percent of city contract value awarded to Disadvantaged Business Enterprises 35%
Number of Disadvantaged Business Enterprise Certifications 50 Number of participants in Contractor's College of New Orleans 200 Number of youth employed through Summer Youth Employment Programs 1,200
Percent of applicants for youth employment and vocational training opportunities who received such opportunities
Establishing Baseline
Number of employer sites engaged through Summer Youth Employment Programs 200
Number of new contractors trained and certified in Building Performance Institute (BPI) standards. 50
Page 128
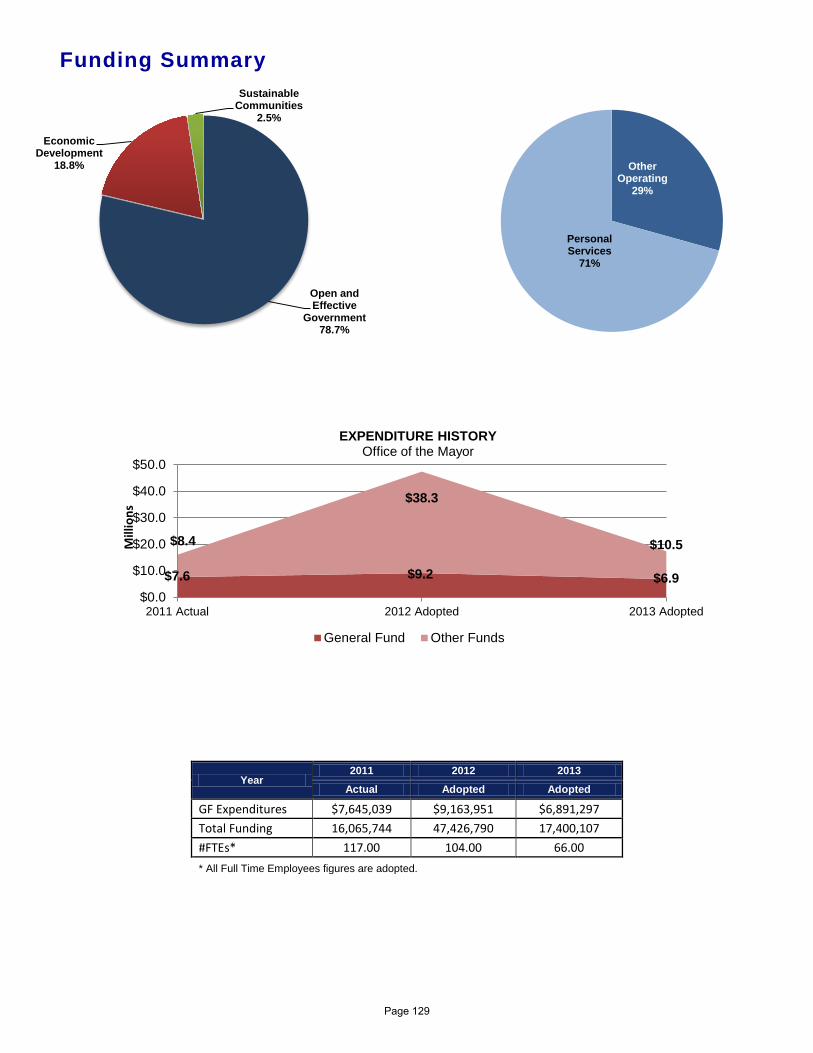
Funding Summary
Year 2011 2012 2013
Actual Adopted Adopted
GF Expenditures $7,645,039 $9,163,951 $6,891,297 Total Funding 16,065,744 47,426,790 17,400,107 #FTEs* 117.00 104.00 66.00 * All Full Time Employees figures are adopted.
$7.6 $9.2 $6.9
$8.4
$38.3
$10.5
$0.0
$10.0
$20.0
$30.0
$40.0
$50.0
2011 Actual 2012 Adopted 2013 Adopted
Mill
ions
EXPENDITURE HISTORY Office of the Mayor
General Fund Other Funds
Other Operating
29%
Personal Services
71%
Open and Effective
Government 78.7%
Economic Development
18.8%
Sustainable Communities
2.5%
Page 129
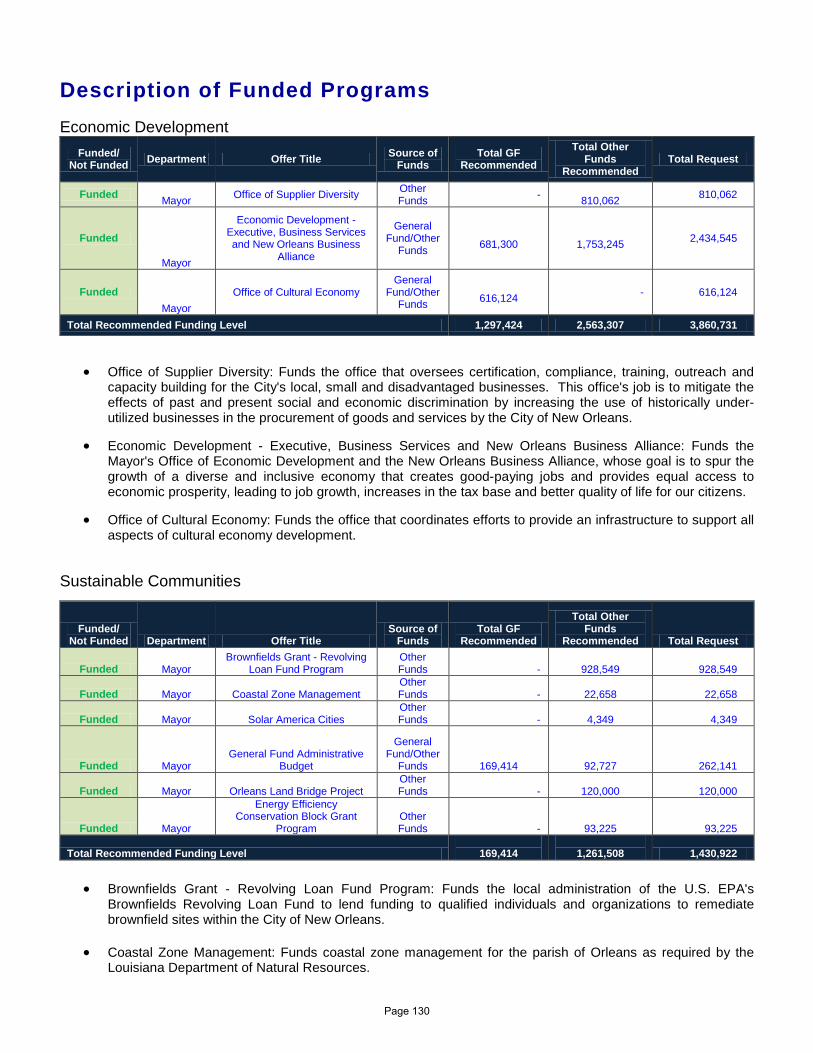
Description of Funded Programs Economic Development
Funded/ Not Funded Department Offer Title Source of
Funds Total GF
Recommended Total Other
Funds Recommended
Total Request
Funded Mayor Office of Supplier Diversity Other Funds -
810,062 810,062
Funded
Mayor
Economic Development - Executive, Business Services and New Orleans Business
Alliance
General Fund/Other
Funds
681,300
1,753,245 2,434,545
Funded Mayor
Office of Cultural Economy General
Fund/Other Funds
616,124 - 616,124
Total Recommended Funding Level 1,297,424 2,563,307 3,860,731
• Office of Supplier Diversity: Funds the office that oversees certification, compliance, training, outreach and capacity building for the City's local, small and disadvantaged businesses. This office's job is to mitigate the effects of past and present social and economic discrimination by increasing the use of historically under-utilized businesses in the procurement of goods and services by the City of New Orleans.
• Economic Development - Executive, Business Services and New Orleans Business Alliance: Funds the Mayor's Office of Economic Development and the New Orleans Business Alliance, whose goal is to spur the growth of a diverse and inclusive economy that creates good-paying jobs and provides equal access to economic prosperity, leading to job growth, increases in the tax base and better quality of life for our citizens.
• Office of Cultural Economy: Funds the office that coordinates efforts to provide an infrastructure to support all aspects of cultural economy development.
Sustainable Communities
Funded/ Not Funded Department Offer Title
Source of Funds
Total GF Recommended
Total Other Funds
Recommended Total Request
Funded Mayor Brownfields Grant - Revolving
Loan Fund Program Other Funds -
928,549 928,549
Funded Mayor Coastal Zone Management Other Funds -
22,658 22,658
Funded Mayor Solar America Cities Other Funds -
4,349 4,349
Funded Mayor General Fund Administrative
Budget
General Fund/Other
Funds
169,414
92,727 262,141
Funded Mayor Orleans Land Bridge Project Other Funds -
120,000 120,000
Funded Mayor
Energy Efficiency Conservation Block Grant
Program Other Funds -
93,225 93,225
Total Recommended Funding Level
169,414
1,261,508 1,430,922
• Brownfields Grant - Revolving Loan Fund Program: Funds the local administration of the U.S. EPA's Brownfields Revolving Loan Fund to lend funding to qualified individuals and organizations to remediate brownfield sites within the City of New Orleans.
• Coastal Zone Management: Funds coastal zone management for the parish of Orleans as required by the Louisiana Department of Natural Resources.
Page 130
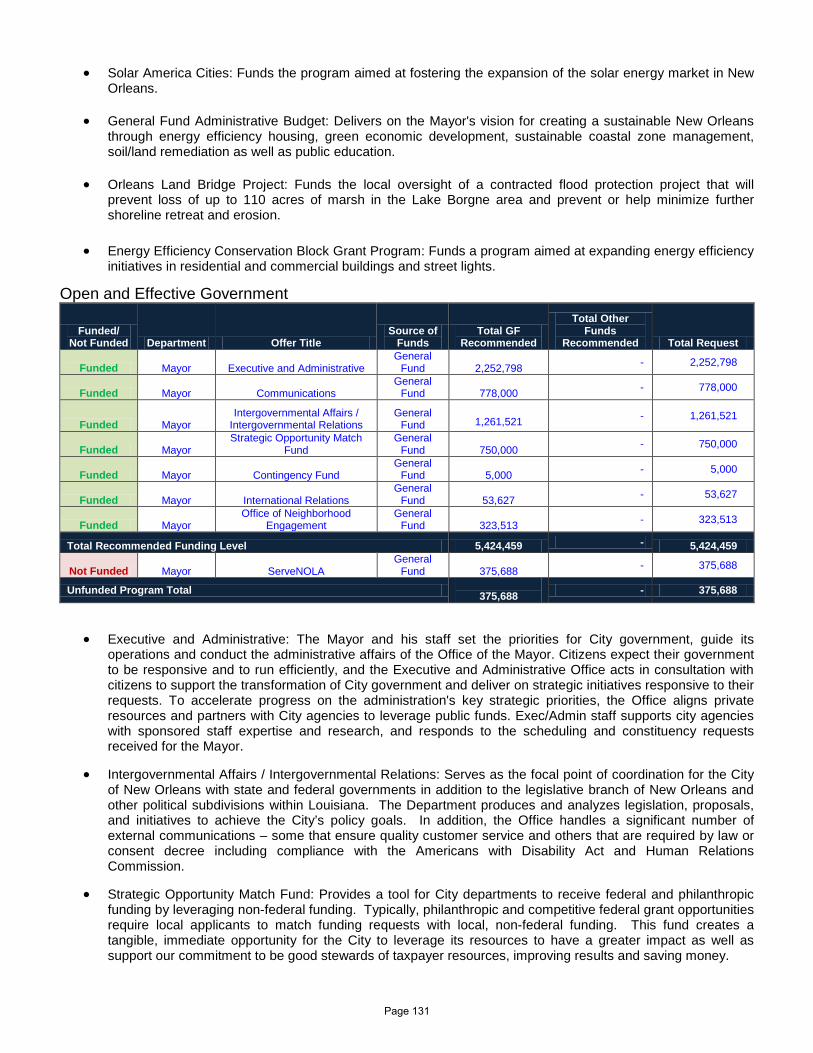
• Solar America Cities: Funds the program aimed at fostering the expansion of the solar energy market in New
Orleans.
• General Fund Administrative Budget: Delivers on the Mayor's vision for creating a sustainable New Orleans through energy efficiency housing, green economic development, sustainable coastal zone management, soil/land remediation as well as public education.
• Orleans Land Bridge Project: Funds the local oversight of a contracted flood protection project that will prevent loss of up to 110 acres of marsh in the Lake Borgne area and prevent or help minimize further shoreline retreat and erosion.
• Energy Efficiency Conservation Block Grant Program: Funds a program aimed at expanding energy efficiency initiatives in residential and commercial buildings and street lights.
Open and Effective Government
Funded/ Not Funded Department Offer Title
Source of Funds
Total GF Recommended
Total Other Funds
Recommended Total Request
Funded Mayor Executive and Administrative General
Fund
2,252,798 - 2,252,798
Funded Mayor Communications General
Fund
778,000 - 778,000
Funded Mayor Intergovernmental Affairs /
Intergovernmental Relations General
Fund
1,261,521 - 1,261,521
Funded Mayor Strategic Opportunity Match
Fund General
Fund
750,000 - 750,000
Funded Mayor Contingency Fund General
Fund
5,000 - 5,000
Funded Mayor International Relations General
Fund
53,627 - 53,627
Funded Mayor Office of Neighborhood
Engagement General
Fund
323,513 - 323,513
Total Recommended Funding Level 5,424,459 - 5,424,459
Not Funded Mayor ServeNOLA General
Fund
375,688 - 375,688
Unfunded Program Total 375,688 - 375,688
• Executive and Administrative: The Mayor and his staff set the priorities for City government, guide its operations and conduct the administrative affairs of the Office of the Mayor. Citizens expect their government to be responsive and to run efficiently, and the Executive and Administrative Office acts in consultation with citizens to support the transformation of City government and deliver on strategic initiatives responsive to their requests. To accelerate progress on the administration's key strategic priorities, the Office aligns private resources and partners with City agencies to leverage public funds. Exec/Admin staff supports city agencies with sponsored staff expertise and research, and responds to the scheduling and constituency requests received for the Mayor.
• Intergovernmental Affairs / Intergovernmental Relations: Serves as the focal point of coordination for the City of New Orleans with state and federal governments in addition to the legislative branch of New Orleans and other political subdivisions within Louisiana. The Department produces and analyzes legislation, proposals, and initiatives to achieve the City’s policy goals. In addition, the Office handles a significant number of external communications – some that ensure quality customer service and others that are required by law or consent decree including compliance with the Americans with Disability Act and Human Relations Commission.
• Strategic Opportunity Match Fund: Provides a tool for City departments to receive federal and philanthropic funding by leveraging non-federal funding. Typically, philanthropic and competitive federal grant opportunities require local applicants to match funding requests with local, non-federal funding. This fund creates a tangible, immediate opportunity for the City to leverage its resources to have a greater impact as well as support our commitment to be good stewards of taxpayer resources, improving results and saving money.
Page 131
• Contingency Fund: City Charter mandated for emergency purposes.
• International Relations: Promotes the City’s economy by leveraging national and international resources. Citizens benefit from increased economic development opportunities, support for sister-city relationships, and access to cultural as well as educational exchanges.
• Office of Neighborhood Engagement: Supports the operations of the Neighborhood Engagement Office, which is the only office in City government that concerns itself with all issues pertaining to public participation, including the development of Neighborhood Participation Plans for NORDC, CPC and Capital Projects. Critical to the success of any city initiative is a meaningful, well-planned, and well-executed public participation strategy. The Neighborhood Engagement Office develops implements, evaluates and improves all public participation strategies across every agency initiative, from blight to public safety, health and economic development. The Neighborhood Engagement Office ensures best practices within and across departments to yield improved trust, partnership and delivery of service for and with the general community. Additionally, the Neighborhood Engagement Office helps build consensus on actions affecting the general public.
Page 132
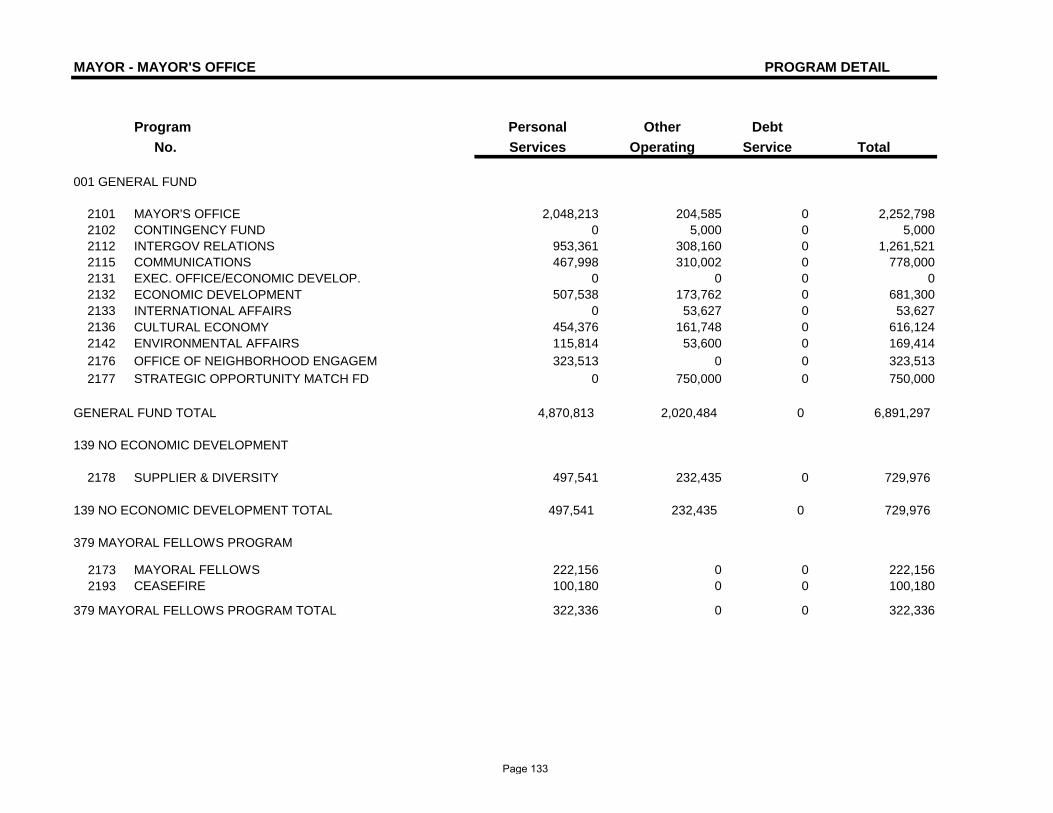
MAYOR - MAYOR'S OFFICE PROGRAM DETAIL
Program Personal Other Debt No. Services Operating Service Total
001 GENERAL FUND
2101 MAYOR'S OFFICE 2,048,213 204,585 0 2,252,798 2102 CONTINGENCY FUND 0 5,000 0 5,000 2112 INTERGOV RELATIONS 953,361 308,160 0 1,261,521 2115 COMMUNICATIONS 467,998 310,002 0 778,000 2131 EXEC. OFFICE/ECONOMIC DEVELOP. 0 0 0 0 2132 ECONOMIC DEVELOPMENT 507,538 173,762 0 681,300 2133 INTERNATIONAL AFFAIRS 0 53,627 0 53,627 2136 CULTURAL ECONOMY 454,376 161,748 0 616,124 2142 ENVIRONMENTAL AFFAIRS 115,814 53,600 0 169,414 2176 OFFICE OF NEIGHBORHOOD ENGAGEM 323,513 0 0 323,513 2177 STRATEGIC OPPORTUNITY MATCH FD 0 750,000 0 750,000
GENERAL FUND TOTAL 4,870,813 2,020,484 0 6,891,297
139 NO ECONOMIC DEVELOPMENT
2178 SUPPLIER & DIVERSITY 497,541 232,435 0 729,976
139 NO ECONOMIC DEVELOPMENT TOTAL 497,541 232,435 0 729,976
379 MAYORAL FELLOWS PROGRAM
2173 MAYORAL FELLOWS 222,156 0 0 222,156 2193 CEASEFIRE 100,180 0 0 100,180
379 MAYORAL FELLOWS PROGRAM TOTAL 322,336 0 0 322,336
Page 133
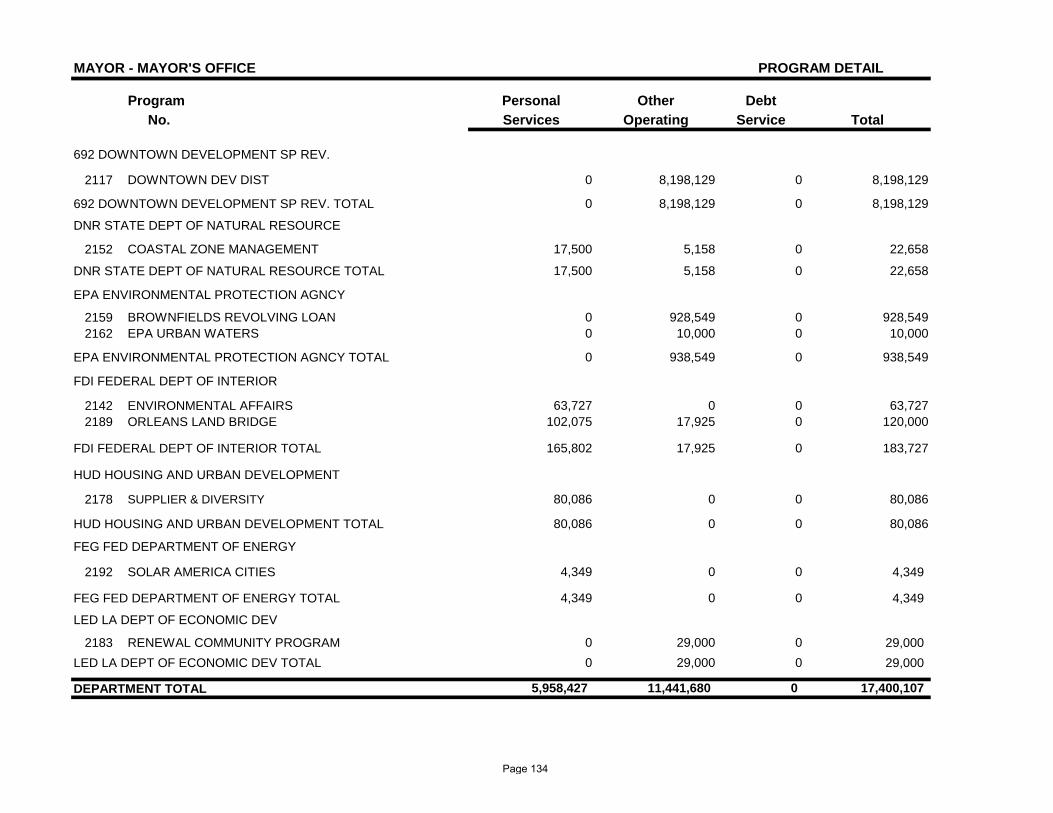
MAYOR - MAYOR'S OFFICE PROGRAM DETAIL
Program Personal Other Debt No. Services Operating Service Total
692 DOWNTOWN DEVELOPMENT SP REV.
2117 DOWNTOWN DEV DIST 0 8,198,129 0 8,198,129
692 DOWNTOWN DEVELOPMENT SP REV. TOTAL 0 8,198,129 0 8,198,129
DNR STATE DEPT OF NATURAL RESOURCE
2152 COASTAL ZONE MANAGEMENT 17,500 5,158 0 22,658
DNR STATE DEPT OF NATURAL RESOURCE TOTAL 17,500 5,158 0 22,658
EPA ENVIRONMENTAL PROTECTION AGNCY
2159 BROWNFIELDS REVOLVING LOAN 0 928,549 0 928,549 2162 EPA URBAN WATERS 0 10,000 0 10,000
EPA ENVIRONMENTAL PROTECTION AGNCY TOTAL 0 938,549 0 938,549
FDI FEDERAL DEPT OF INTERIOR
2142 ENVIRONMENTAL AFFAIRS 63,727 0 0 63,727 2189 ORLEANS LAND BRIDGE 102,075 17,925 0 120,000
FDI FEDERAL DEPT OF INTERIOR TOTAL 165,802 17,925 0 183,727
HUD HOUSING AND URBAN DEVELOPMENT
2178 SUPPLIER & DIVERSITY 80,086 0 0 80,086
HUD HOUSING AND URBAN DEVELOPMENT TOTAL 80,086 0 0 80,086
FEG FED DEPARTMENT OF ENERGY
2192 SOLAR AMERICA CITIES 4,349 0 0 4,349
FEG FED DEPARTMENT OF ENERGY TOTAL 4,349 0 0 4,349
LED LA DEPT OF ECONOMIC DEV
2183 RENEWAL COMMUNITY PROGRAM 0 29,000 0 29,000LED LA DEPT OF ECONOMIC DEV TOTAL 0 29,000 0 29,000
DEPARTMENT TOTAL 5,958,427 11,441,680 0 17,400,107
Page 134
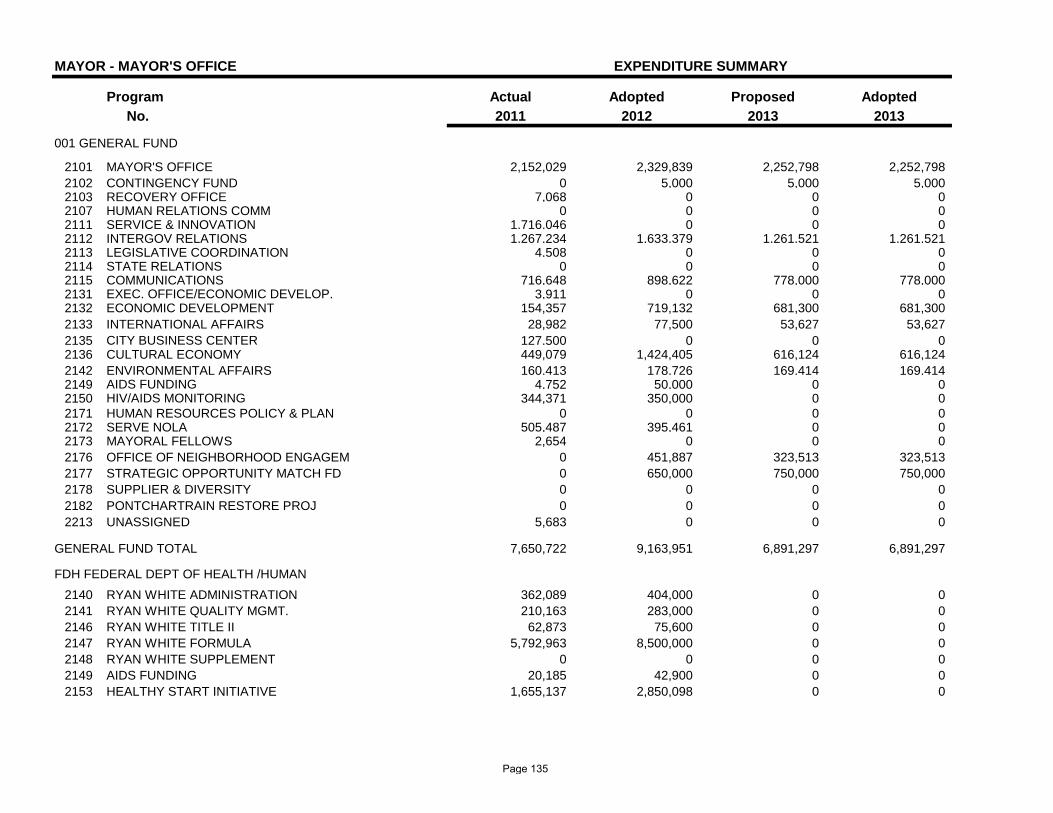
MAYOR - MAYOR'S OFFICE EXPENDITURE SUMMARY
Program Actual Adopted Proposed AdoptedNo. 2011 2012 2013 2013
001 GENERAL FUND
2101 MAYOR'S OFFICE 2,152,029 2,329,839 2,252,798 2,252,7982102 CONTINGENCY FUND 0 5,000 5,000 5,0002103 RECOVERY OFFICE 7,068 0 0 02107 HUMAN RELATIONS COMM 0 0 0 02111 SERVICE & INNOVATION 1,716,046 0 0 02112 INTERGOV RELATIONS 1,267,234 1,633,379 1,261,521 1,261,5212113 LEGISLATIVE COORDINATION 4,508 0 0 02114 STATE RELATIONS 0 0 0 02115 COMMUNICATIONS 716,648 898,622 778,000 778,0002131 EXEC. OFFICE/ECONOMIC DEVELOP. 3,911 0 0 02132 ECONOMIC DEVELOPMENT 154,357 719,132 681,300 681,3002133 INTERNATIONAL AFFAIRS 28,982 77,500 53,627 53,6272135 CITY BUSINESS CENTER 127,500 0 0 02136 CULTURAL ECONOMY 449,079 1,424,405 616,124 616,1242142 ENVIRONMENTAL AFFAIRS 160,413 178,726 169,414 169,4142149 AIDS FUNDING 4,752 50,000 0 02150 HIV/AIDS MONITORING 344,371 350,000 0 02171 HUMAN RESOURCES POLICY & PLAN 0 0 0 02172 SERVE NOLA 505,487 395,461 0 02173 MAYORAL FELLOWS 2,654 0 0 02176 OFFICE OF NEIGHBORHOOD ENGAGEM 0 451,887 323,513 323,5132177 STRATEGIC OPPORTUNITY MATCH FD 0 650,000 750,000 750,0002178 SUPPLIER & DIVERSITY 0 0 0 02182 PONTCHARTRAIN RESTORE PROJ 0 0 0 02213 UNASSIGNED 5,683 0 0 0
GENERAL FUND TOTAL 7,650,722 9,163,951 6,891,297 6,891,297
FDH FEDERAL DEPT OF HEALTH /HUMAN2140 RYAN WHITE ADMINISTRATION 362,089 404,000 0 02141 RYAN WHITE QUALITY MGMT. 210,163 283,000 0 02146 RYAN WHITE TITLE II 62,873 75,600 0 02147 RYAN WHITE FORMULA 5,792,963 8,500,000 0 02148 RYAN WHITE SUPPLEMENT 0 0 0 02149 AIDS FUNDING 20,185 42,900 0 02153 HEALTHY START INITIATIVE 1,655,137 2,850,098 0 0
Page 135
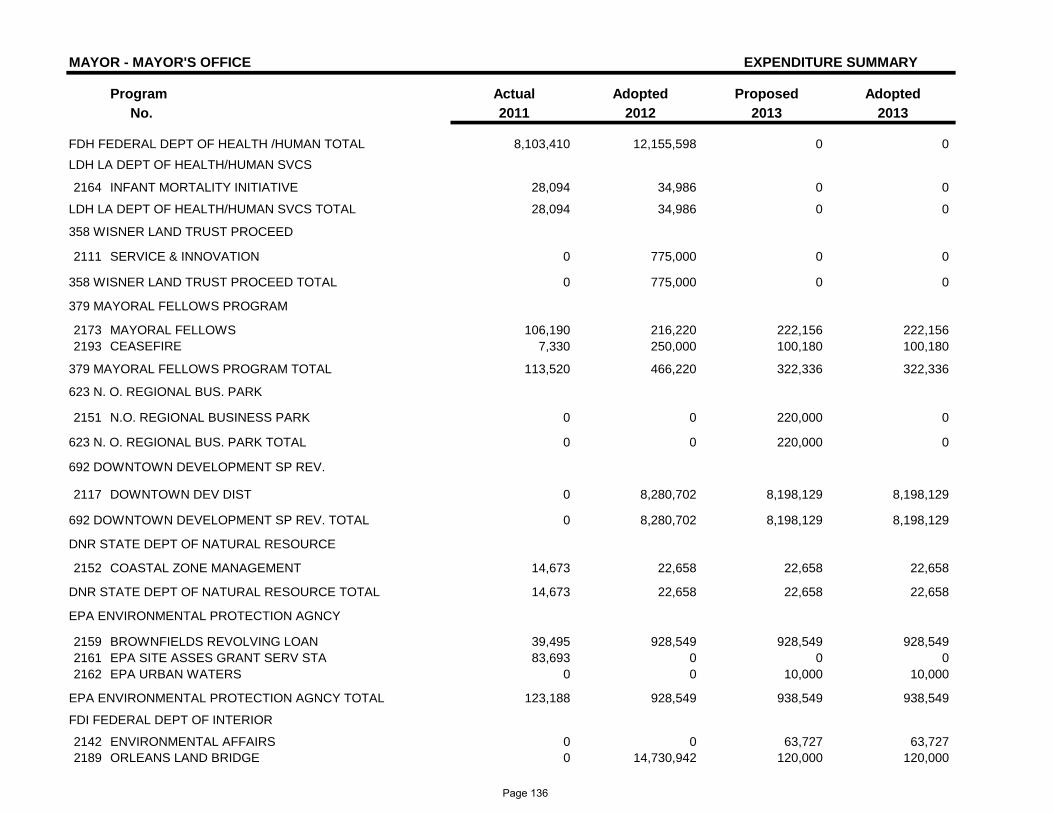
MAYOR - MAYOR'S OFFICE EXPENDITURE SUMMARY
Program Actual Adopted Proposed AdoptedNo. 2011 2012 2013 2013
FDH FEDERAL DEPT OF HEALTH /HUMAN TOTAL 8,103,410 12,155,598 0 0LDH LA DEPT OF HEALTH/HUMAN SVCS
2164 INFANT MORTALITY INITIATIVE 28,094 34,986 0 0
LDH LA DEPT OF HEALTH/HUMAN SVCS TOTAL 28,094 34,986 0 0
358 WISNER LAND TRUST PROCEED
2111 SERVICE & INNOVATION 0 775,000 0 0
358 WISNER LAND TRUST PROCEED TOTAL 0 775,000 0 0
379 MAYORAL FELLOWS PROGRAM
2173 MAYORAL FELLOWS 106,190 216,220 222,156 222,1562193 CEASEFIRE 7,330 250,000 100,180 100,180
379 MAYORAL FELLOWS PROGRAM TOTAL 113,520 466,220 322,336 322,336
623 N. O. REGIONAL BUS. PARK
2151 N.O. REGIONAL BUSINESS PARK 0 0 220,000 0
623 N. O. REGIONAL BUS. PARK TOTAL 0 0 220,000 0
692 DOWNTOWN DEVELOPMENT SP REV.
2117 DOWNTOWN DEV DIST 0 8,280,702 8,198,129 8,198,129
692 DOWNTOWN DEVELOPMENT SP REV. TOTAL 0 8,280,702 8,198,129 8,198,129
DNR STATE DEPT OF NATURAL RESOURCE
2152 COASTAL ZONE MANAGEMENT 14,673 22,658 22,658 22,658
DNR STATE DEPT OF NATURAL RESOURCE TOTAL 14,673 22,658 22,658 22,658
EPA ENVIRONMENTAL PROTECTION AGNCY
2159 BROWNFIELDS REVOLVING LOAN 39,495 928,549 928,549 928,5492161 EPA SITE ASSES GRANT SERV STA 83,693 0 0 02162 EPA URBAN WATERS 0 0 10,000 10,000
EPA ENVIRONMENTAL PROTECTION AGNCY TOTAL 123,188 928,549 938,549 938,549
FDI FEDERAL DEPT OF INTERIOR
2142 ENVIRONMENTAL AFFAIRS 0 0 63,727 63,7272189 ORLEANS LAND BRIDGE 0 14,730,942 120,000 120,000
Page 136
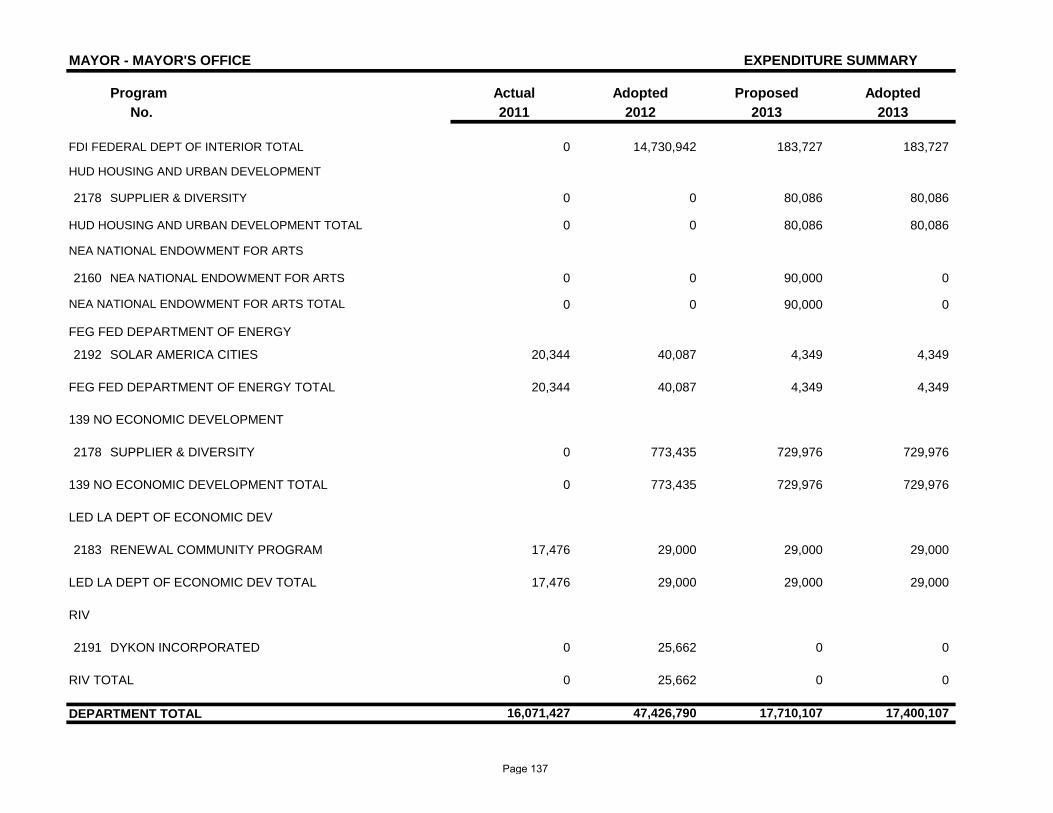
MAYOR - MAYOR'S OFFICE EXPENDITURE SUMMARY
Program Actual Adopted Proposed AdoptedNo. 2011 2012 2013 2013
FDI FEDERAL DEPT OF INTERIOR TOTAL 0 14,730,942 183,727 183,727
HUD HOUSING AND URBAN DEVELOPMENT
2178 SUPPLIER & DIVERSITY 0 0 80,086 80,086
HUD HOUSING AND URBAN DEVELOPMENT TOTAL 0 0 80,086 80,086
NEA NATIONAL ENDOWMENT FOR ARTS
2160 NEA NATIONAL ENDOWMENT FOR ARTS 0 0 90,000 0
NEA NATIONAL ENDOWMENT FOR ARTS TOTAL 0 0 90,000 0
FEG FED DEPARTMENT OF ENERGY
2192 SOLAR AMERICA CITIES 20,344 40,087 4,349 4,349
FEG FED DEPARTMENT OF ENERGY TOTAL 20,344 40,087 4,349 4,349
139 NO ECONOMIC DEVELOPMENT
2178 SUPPLIER & DIVERSITY 0 773,435 729,976 729,976
139 NO ECONOMIC DEVELOPMENT TOTAL 0 773,435 729,976 729,976
LED LA DEPT OF ECONOMIC DEV
2183 RENEWAL COMMUNITY PROGRAM 17,476 29,000 29,000 29,000
LED LA DEPT OF ECONOMIC DEV TOTAL 17,476 29,000 29,000 29,000
RIV
2191 DYKON INCORPORATED 0 25,662 0 0
RIV TOTAL 0 25,662 0 0
DEPARTMENT TOTAL 16,071,427 47,426,790 17,710,107 17,400,107
Page 137
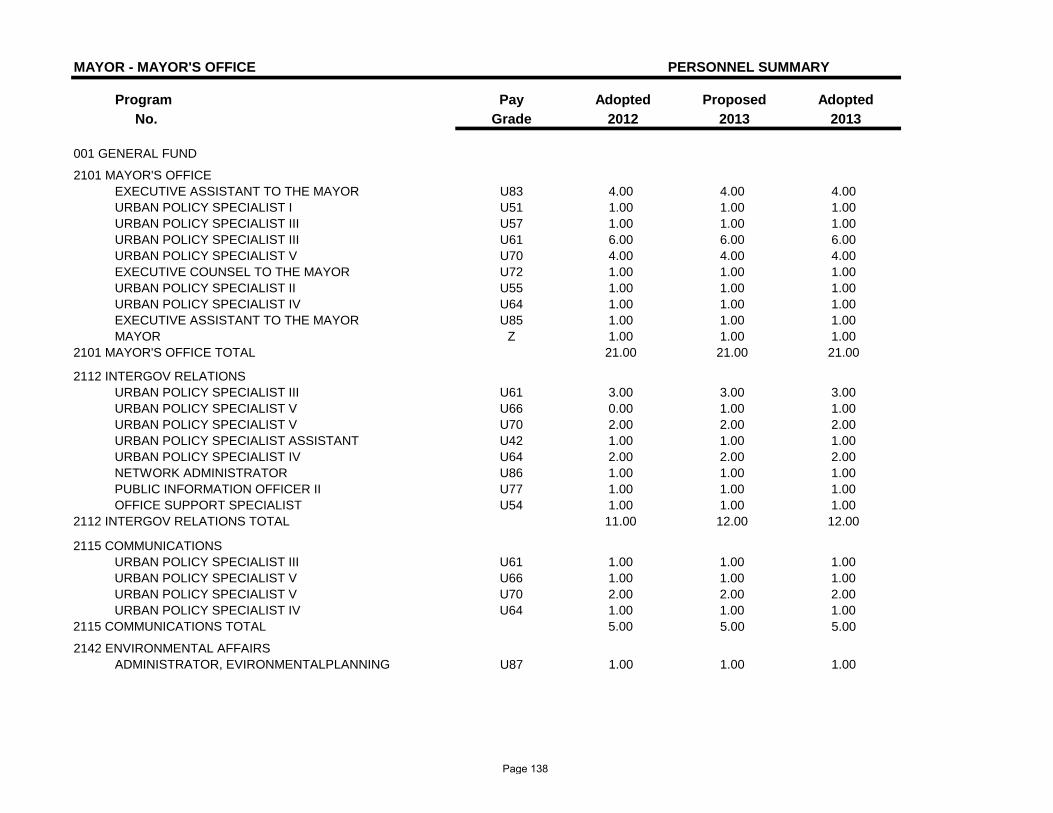
MAYOR - MAYOR'S OFFICE PERSONNEL SUMMARY
Program Pay Adopted Proposed AdoptedNo. Grade 2012 2013 2013
001 GENERAL FUND
2101 MAYOR'S OFFICE EXECUTIVE ASSISTANT TO THE MAYOR U83 4.00 4.00 4.00URBAN POLICY SPECIALIST I U51 1.00 1.00 1.00URBAN POLICY SPECIALIST III U57 1.00 1.00 1.00URBAN POLICY SPECIALIST III U61 6.00 6.00 6.00URBAN POLICY SPECIALIST V U70 4.00 4.00 4.00EXECUTIVE COUNSEL TO THE MAYOR U72 1.00 1.00 1.00URBAN POLICY SPECIALIST II U55 1.00 1.00 1.00URBAN POLICY SPECIALIST IV U64 1.00 1.00 1.00EXECUTIVE ASSISTANT TO THE MAYOR U85 1.00 1.00 1.00MAYOR Z 1.00 1.00 1.00
2101 MAYOR'S OFFICE TOTAL 21.00 21.00 21.00
2112 INTERGOV RELATIONS URBAN POLICY SPECIALIST III U61 3.00 3.00 3.00URBAN POLICY SPECIALIST V U66 0.00 1.00 1.00URBAN POLICY SPECIALIST V U70 2.00 2.00 2.00URBAN POLICY SPECIALIST ASSISTANT U42 1.00 1.00 1.00URBAN POLICY SPECIALIST IV U64 2.00 2.00 2.00NETWORK ADMINISTRATOR U86 1.00 1.00 1.00PUBLIC INFORMATION OFFICER II U77 1.00 1.00 1.00OFFICE SUPPORT SPECIALIST U54 1.00 1.00 1.00
2112 INTERGOV RELATIONS TOTAL 11.00 12.00 12.00
2115 COMMUNICATIONS URBAN POLICY SPECIALIST III U61 1.00 1.00 1.00URBAN POLICY SPECIALIST V U66 1.00 1.00 1.00URBAN POLICY SPECIALIST V U70 2.00 2.00 2.00URBAN POLICY SPECIALIST IV U64 1.00 1.00 1.00
2115 COMMUNICATIONS TOTAL 5.00 5.00 5.00
2142 ENVIRONMENTAL AFFAIRS ADMINISTRATOR, EVIRONMENTALPLANNING U87 1.00 1.00 1.00
Page 138
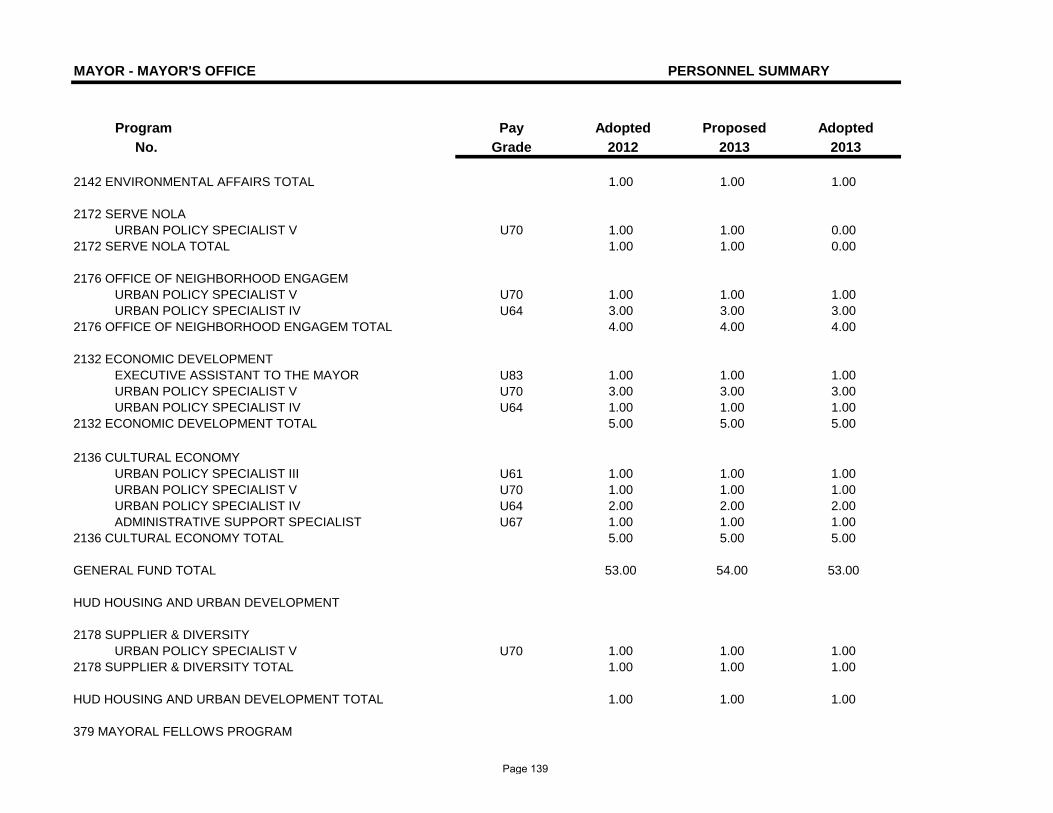
MAYOR - MAYOR'S OFFICE PERSONNEL SUMMARY
Program Pay Adopted Proposed AdoptedNo. Grade 2012 2013 2013
2142 ENVIRONMENTAL AFFAIRS TOTAL 1.00 1.00 1.00
2172 SERVE NOLA URBAN POLICY SPECIALIST V U70 1.00 1.00 0.00
2172 SERVE NOLA TOTAL 1.00 1.00 0.00
2176 OFFICE OF NEIGHBORHOOD ENGAGEM URBAN POLICY SPECIALIST V U70 1.00 1.00 1.00URBAN POLICY SPECIALIST IV U64 3.00 3.00 3.00
2176 OFFICE OF NEIGHBORHOOD ENGAGEM TOTAL 4.00 4.00 4.00
2132 ECONOMIC DEVELOPMENT EXECUTIVE ASSISTANT TO THE MAYOR U83 1.00 1.00 1.00URBAN POLICY SPECIALIST V U70 3.00 3.00 3.00URBAN POLICY SPECIALIST IV U64 1.00 1.00 1.00
2132 ECONOMIC DEVELOPMENT TOTAL 5.00 5.00 5.00
2136 CULTURAL ECONOMYURBAN POLICY SPECIALIST III U61 1.00 1.00 1.00URBAN POLICY SPECIALIST V U70 1.00 1.00 1.00URBAN POLICY SPECIALIST IV U64 2.00 2.00 2.00ADMINISTRATIVE SUPPORT SPECIALIST U67 1.00 1.00 1.00
2136 CULTURAL ECONOMY TOTAL 5.00 5.00 5.00
GENERAL FUND TOTAL 53.00 54.00 53.00
HUD HOUSING AND URBAN DEVELOPMENT
2178 SUPPLIER & DIVERSITY URBAN POLICY SPECIALIST V U70 1.00 1.00 1.00
2178 SUPPLIER & DIVERSITY TOTAL 1.00 1.00 1.00
HUD HOUSING AND URBAN DEVELOPMENT TOTAL 1.00 1.00 1.00
379 MAYORAL FELLOWS PROGRAM
Page 139
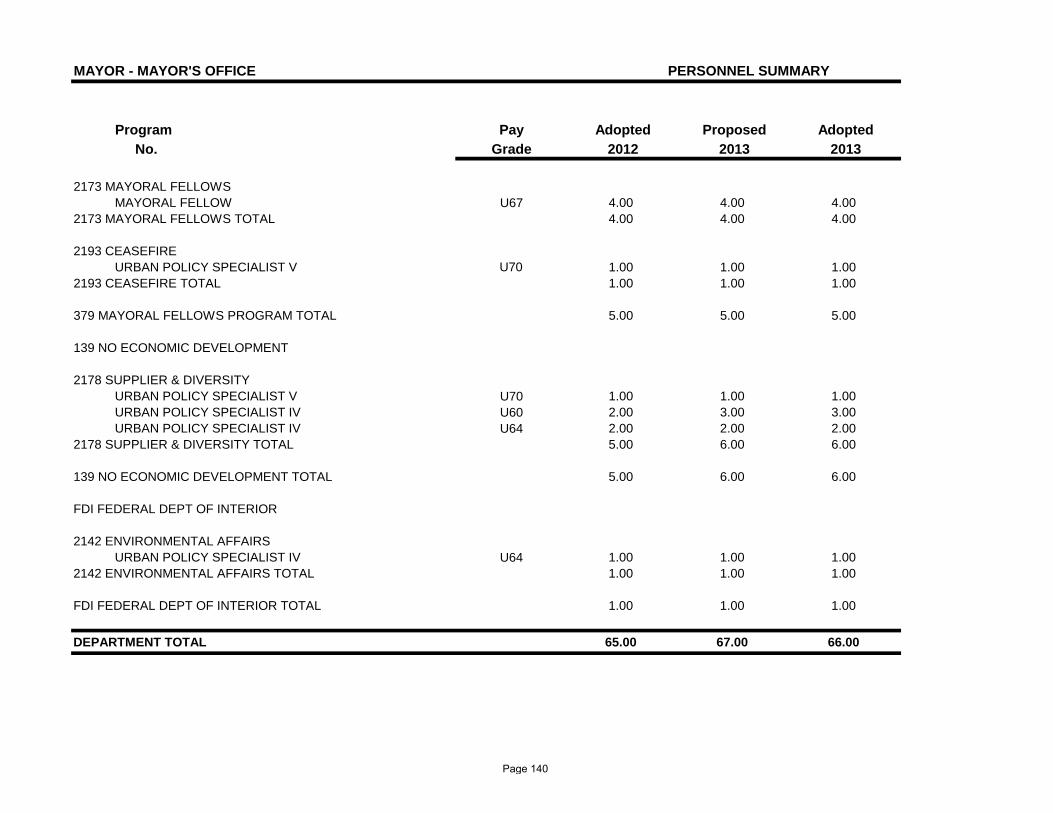
MAYOR - MAYOR'S OFFICE PERSONNEL SUMMARY
Program Pay Adopted Proposed AdoptedNo. Grade 2012 2013 2013
2173 MAYORAL FELLOWS MAYORAL FELLOW U67 4.00 4.00 4.00
2173 MAYORAL FELLOWS TOTAL 4.00 4.00 4.00
2193 CEASEFIRE URBAN POLICY SPECIALIST V U70 1.00 1.00 1.00
2193 CEASEFIRE TOTAL 1.00 1.00 1.00
379 MAYORAL FELLOWS PROGRAM TOTAL 5.00 5.00 5.00
139 NO ECONOMIC DEVELOPMENT
2178 SUPPLIER & DIVERSITY URBAN POLICY SPECIALIST V U70 1.00 1.00 1.00URBAN POLICY SPECIALIST IV U60 2.00 3.00 3.00URBAN POLICY SPECIALIST IV U64 2.00 2.00 2.00
2178 SUPPLIER & DIVERSITY TOTAL 5.00 6.00 6.00
139 NO ECONOMIC DEVELOPMENT TOTAL 5.00 6.00 6.00
FDI FEDERAL DEPT OF INTERIOR
2142 ENVIRONMENTAL AFFAIRSURBAN POLICY SPECIALIST IV U64 1.00 1.00 1.00
2142 ENVIRONMENTAL AFFAIRS TOTAL 1.00 1.00 1.00
FDI FEDERAL DEPT OF INTERIOR TOTAL 1.00 1.00 1.00
DEPARTMENT TOTAL 65.00 67.00 66.00
Page 140

Page 141

Criminal Justice Coordination
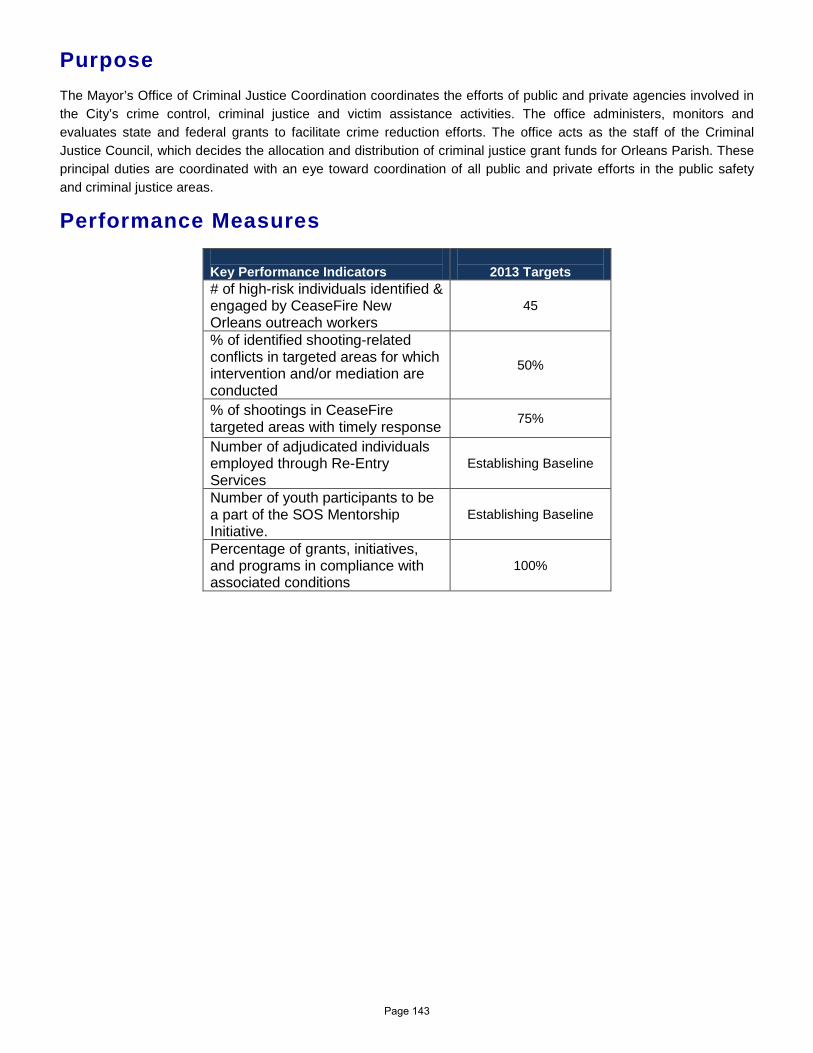
Purpose The Mayor’s Office of Criminal Justice Coordination coordinates the efforts of public and private agencies involved in the City’s crime control, criminal justice and victim assistance activities. The office administers, monitors and evaluates state and federal grants to facilitate crime reduction efforts. The office acts as the staff of the Criminal Justice Council, which decides the allocation and distribution of criminal justice grant funds for Orleans Parish. These principal duties are coordinated with an eye toward coordination of all public and private efforts in the public safety and criminal justice areas.
Performance Measures Key Performance Indicators
2013 Targets
# of high-risk individuals identified & engaged by CeaseFire New Orleans outreach workers
45
% of identified shooting-related conflicts in targeted areas for which intervention and/or mediation are conducted
50%
% of shootings in CeaseFire targeted areas with timely response 75%
Number of adjudicated individuals employed through Re-Entry Services
Establishing Baseline
Number of youth participants to be a part of the SOS Mentorship Initiative.
Establishing Baseline
Percentage of grants, initiatives, and programs in compliance with associated conditions
100%
Page 143
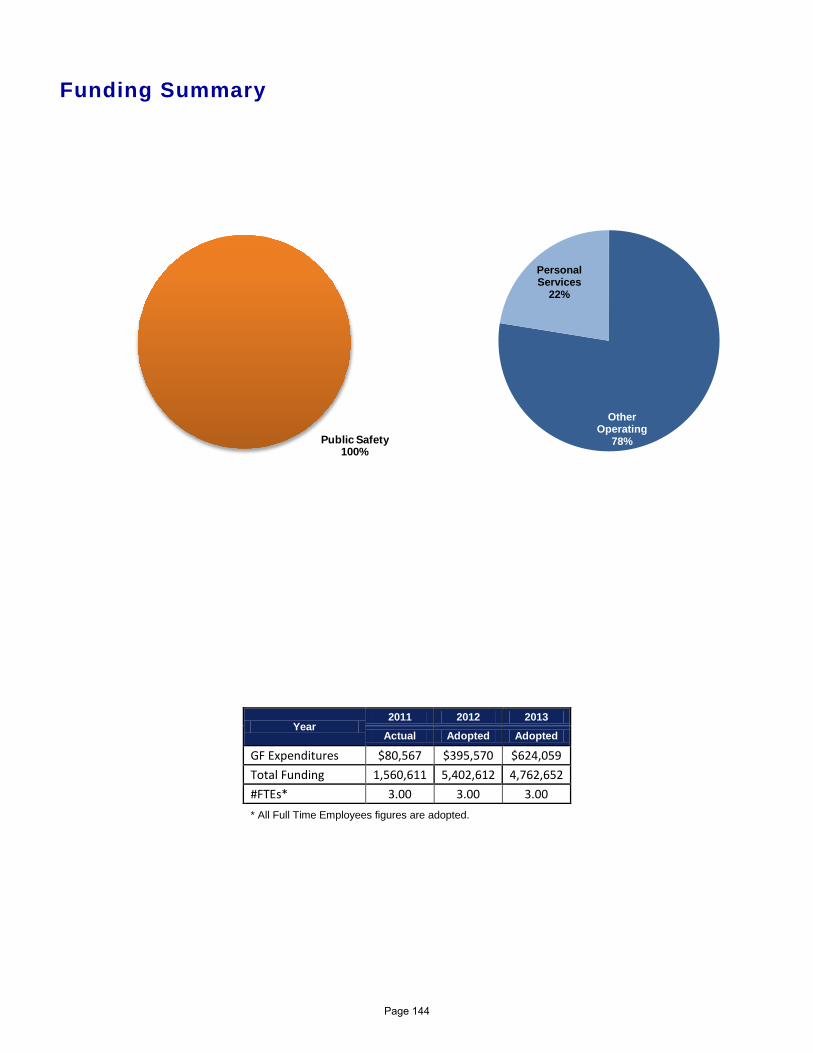
Funding Summary
Year 2011 2012 2013
Actual Adopted Adopted
GF Expenditures $80,567 $395,570 $624,059 Total Funding 1,560,611 5,402,612 4,762,652 #FTEs* 3.00 3.00 3.00 * All Full Time Employees figures are adopted.
Public Safety100%
Other Operating
78%
Personal Services
22%
Page 144
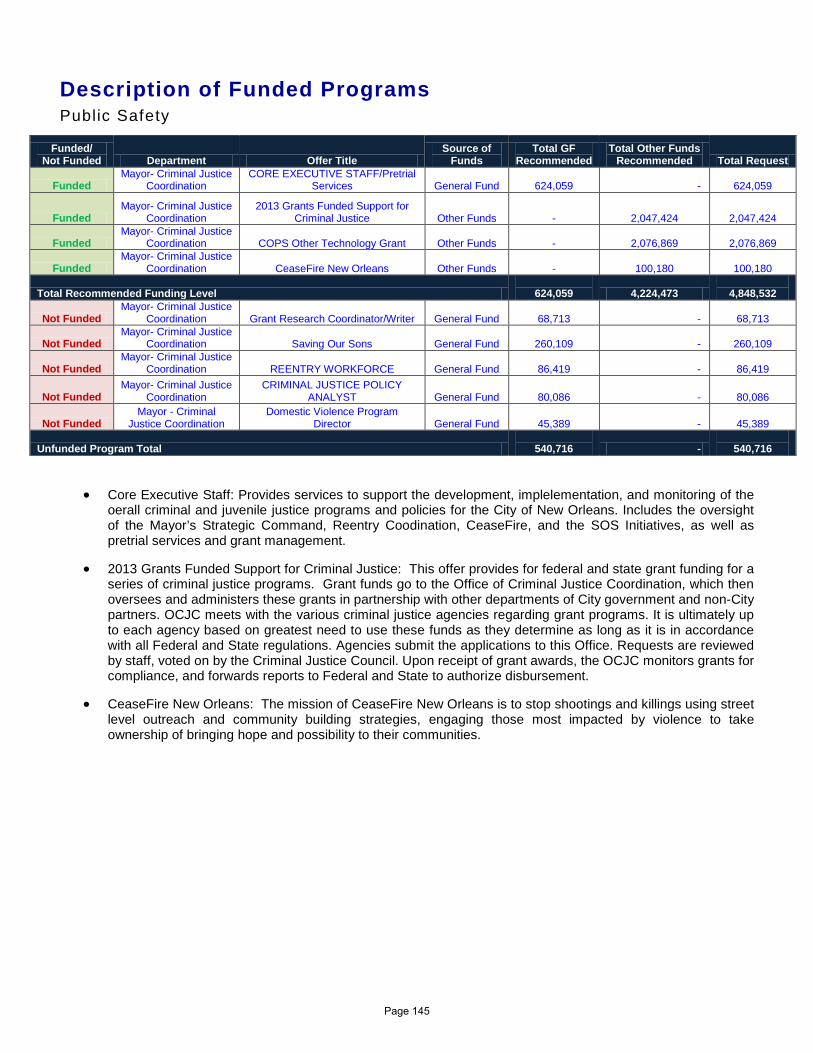
Description of Funded Programs Public Safety
Funded/ Not Funded Department Offer Title
Source of Funds
Total GF Recommended
Total Other Funds Recommended Total Request
Funded Mayor- Criminal Justice
Coordination CORE EXECUTIVE STAFF/Pretrial
Services General Fund
624,059 -
624,059
Funded Mayor- Criminal Justice
Coordination 2013 Grants Funded Support for
Criminal Justice Other Funds -
2,047,424
2,047,424
Funded Mayor- Criminal Justice
Coordination COPS Other Technology Grant Other Funds -
2,076,869
2,076,869
Funded Mayor- Criminal Justice
Coordination CeaseFire New Orleans Other Funds -
100,180
100,180
Total Recommended Funding Level
624,059 4,224,473
4,848,532
Not Funded Mayor- Criminal Justice
Coordination Grant Research Coordinator/Writer General Fund
68,713 -
68,713
Not Funded Mayor- Criminal Justice
Coordination Saving Our Sons General Fund
260,109 -
260,109
Not Funded Mayor- Criminal Justice
Coordination REENTRY WORKFORCE General Fund
86,419 -
86,419
Not Funded Mayor- Criminal Justice
Coordination CRIMINAL JUSTICE POLICY
ANALYST General Fund
80,086 -
80,086
Not Funded Mayor - Criminal
Justice Coordination Domestic Violence Program
Director General Fund
45,389 -
45,389
Unfunded Program Total
540,716 -
540,716
• Core Executive Staff: Provides services to support the development, implelementation, and monitoring of the oerall criminal and juvenile justice programs and policies for the City of New Orleans. Includes the oversight of the Mayor’s Strategic Command, Reentry Coodination, CeaseFire, and the SOS Initiatives, as well as pretrial services and grant management.
• 2013 Grants Funded Support for Criminal Justice: This offer provides for federal and state grant funding for a series of criminal justice programs. Grant funds go to the Office of Criminal Justice Coordination, which then oversees and administers these grants in partnership with other departments of City government and non-City partners. OCJC meets with the various criminal justice agencies regarding grant programs. It is ultimately up to each agency based on greatest need to use these funds as they determine as long as it is in accordance with all Federal and State regulations. Agencies submit the applications to this Office. Requests are reviewed by staff, voted on by the Criminal Justice Council. Upon receipt of grant awards, the OCJC monitors grants for compliance, and forwards reports to Federal and State to authorize disbursement.
• CeaseFire New Orleans: The mission of CeaseFire New Orleans is to stop shootings and killings using street level outreach and community building strategies, engaging those most impacted by violence to take ownership of bringing hope and possibility to their communities.
[Type
Page 145
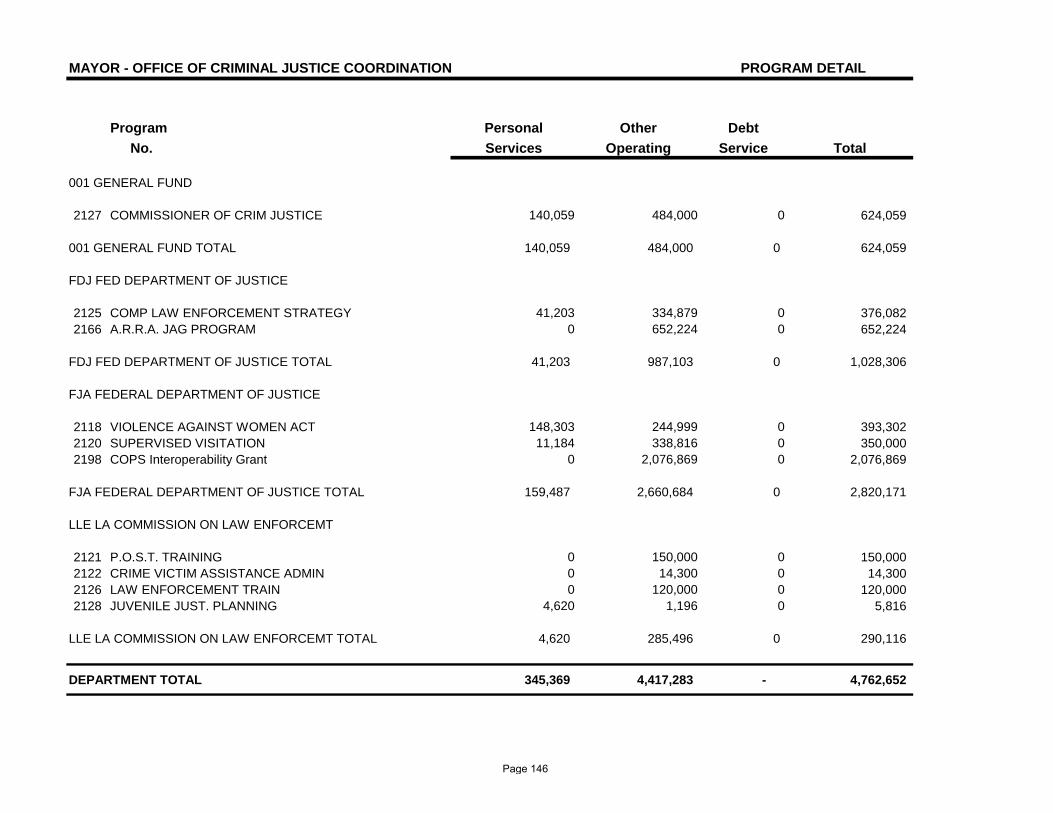
MAYOR - OFFICE OF CRIMINAL JUSTICE COORDINATION PROGRAM DETAIL
Program Personal Other Debt No. Services Operating Service Total
001 GENERAL FUND
2127 COMMISSIONER OF CRIM JUSTICE 140,059 484,000 0 624,059
001 GENERAL FUND TOTAL 140,059 484,000 0 624,059
FDJ FED DEPARTMENT OF JUSTICE
2125 COMP LAW ENFORCEMENT STRATEGY 41,203 334,879 0 376,0822166 A.R.R.A. JAG PROGRAM 0 652,224 0 652,224
FDJ FED DEPARTMENT OF JUSTICE TOTAL 41,203 987,103 0 1,028,306
FJA FEDERAL DEPARTMENT OF JUSTICE
2118 VIOLENCE AGAINST WOMEN ACT 148,303 244,999 0 393,3022120 SUPERVISED VISITATION 11,184 338,816 0 350,0002198 COPS Interoperability Grant 0 2,076,869 0 2,076,869
FJA FEDERAL DEPARTMENT OF JUSTICE TOTAL 159,487 2,660,684 0 2,820,171
LLE LA COMMISSION ON LAW ENFORCEMT
2121 P.O.S.T. TRAINING 0 150,000 0 150,0002122 CRIME VICTIM ASSISTANCE ADMIN 0 14,300 0 14,3002126 LAW ENFORCEMENT TRAIN 0 120,000 0 120,0002128 JUVENILE JUST. PLANNING 4,620 1,196 0 5,816
LLE LA COMMISSION ON LAW ENFORCEMT TOTAL 4,620 285,496 0 290,116
DEPARTMENT TOTAL 345,369 4,417,283 - 4,762,652
Page 146
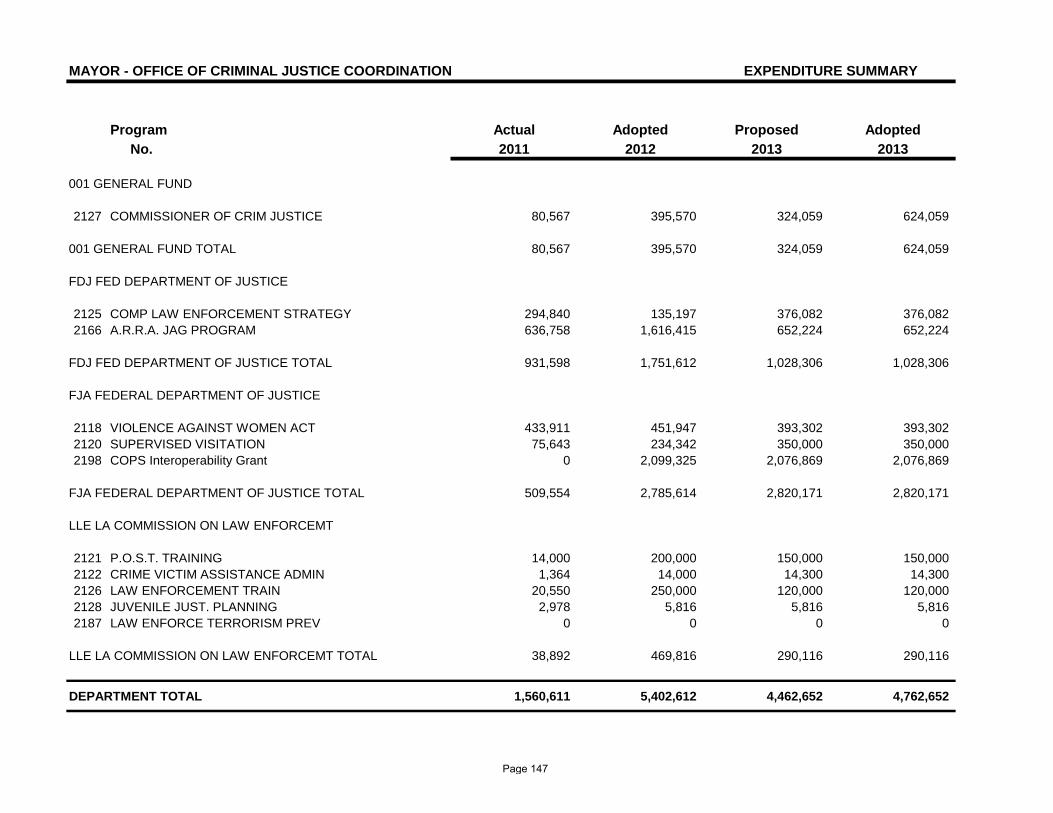
MAYOR - OFFICE OF CRIMINAL JUSTICE COORDINATION EXPENDITURE SUMMARY
Program Actual Adopted Proposed AdoptedNo. 2011 2012 2013 2013
001 GENERAL FUND
2127 COMMISSIONER OF CRIM JUSTICE 80,567 395,570 324,059 624,059
001 GENERAL FUND TOTAL 80,567 395,570 324,059 624,059
FDJ FED DEPARTMENT OF JUSTICE
2125 COMP LAW ENFORCEMENT STRATEGY 294,840 135,197 376,082 376,0822166 A.R.R.A. JAG PROGRAM 636,758 1,616,415 652,224 652,224
FDJ FED DEPARTMENT OF JUSTICE TOTAL 931,598 1,751,612 1,028,306 1,028,306
FJA FEDERAL DEPARTMENT OF JUSTICE
2118 VIOLENCE AGAINST WOMEN ACT 433,911 451,947 393,302 393,3022120 SUPERVISED VISITATION 75,643 234,342 350,000 350,0002198 COPS Interoperability Grant 0 2,099,325 2,076,869 2,076,869
FJA FEDERAL DEPARTMENT OF JUSTICE TOTAL 509,554 2,785,614 2,820,171 2,820,171
LLE LA COMMISSION ON LAW ENFORCEMT
2121 P.O.S.T. TRAINING 14,000 200,000 150,000 150,0002122 CRIME VICTIM ASSISTANCE ADMIN 1,364 14,000 14,300 14,3002126 LAW ENFORCEMENT TRAIN 20,550 250,000 120,000 120,0002128 JUVENILE JUST. PLANNING 2,978 5,816 5,816 5,8162187 LAW ENFORCE TERRORISM PREV 0 0 0 0
LLE LA COMMISSION ON LAW ENFORCEMT TOTAL 38,892 469,816 290,116 290,116
DEPARTMENT TOTAL 1,560,611 5,402,612 4,462,652 4,762,652
Page 147
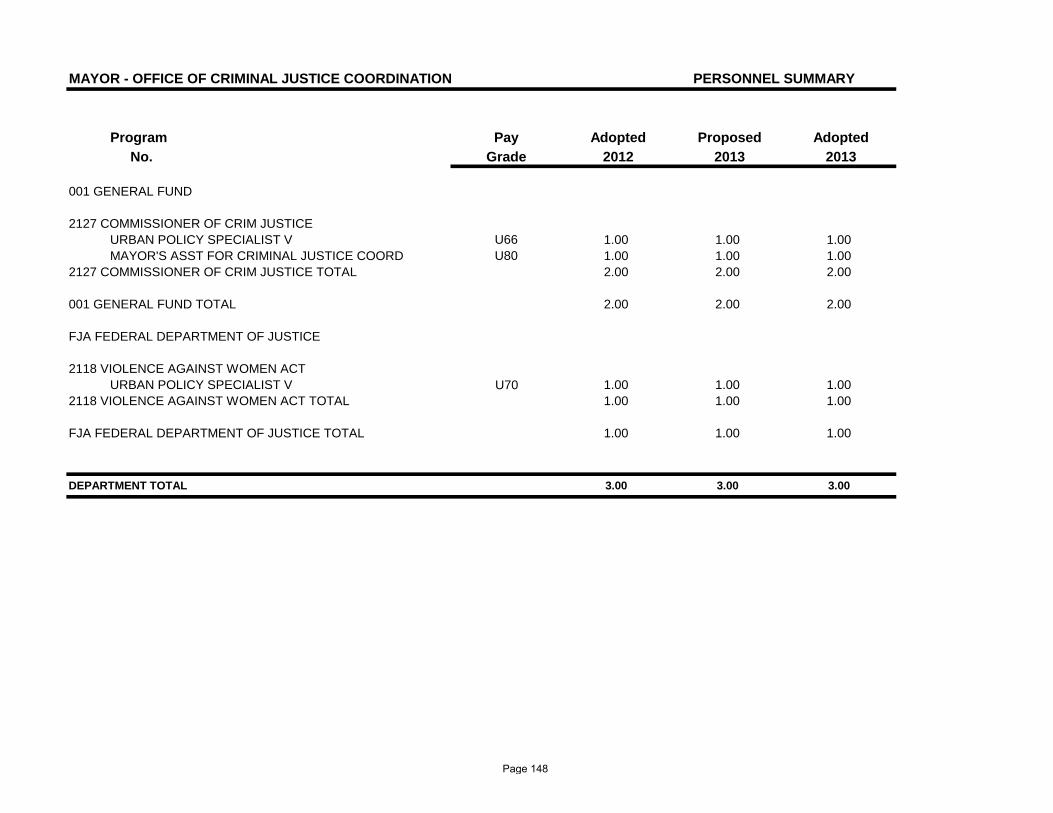
MAYOR - OFFICE OF CRIMINAL JUSTICE COORDINATION PERSONNEL SUMMARY
Program Pay Adopted Proposed AdoptedNo. Grade 2012 2013 2013
001 GENERAL FUND
2127 COMMISSIONER OF CRIM JUSTICE URBAN POLICY SPECIALIST V U66 1.00 1.00 1.00MAYOR'S ASST FOR CRIMINAL JUSTICE COORD U80 1.00 1.00 1.00
2127 COMMISSIONER OF CRIM JUSTICE TOTAL 2.00 2.00 2.00
001 GENERAL FUND TOTAL 2.00 2.00 2.00
FJA FEDERAL DEPARTMENT OF JUSTICE
2118 VIOLENCE AGAINST WOMEN ACT URBAN POLICY SPECIALIST V U70 1.00 1.00 1.00
2118 VIOLENCE AGAINST WOMEN ACT TOTAL 1.00 1.00 1.00
FJA FEDERAL DEPARTMENT OF JUSTICE TOTAL 1.00 1.00 1.00
DEPARTMENT TOTAL 3.00 3.00 3.00
Page 148

Page 149

Homeland Security
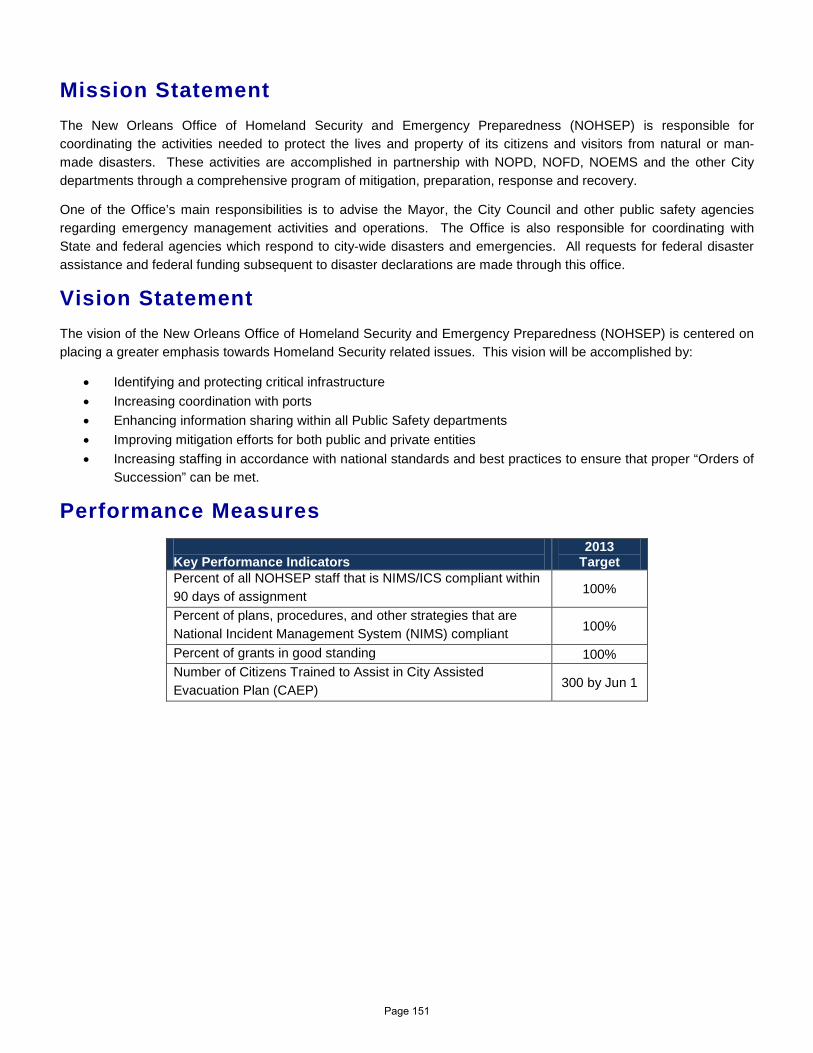
Mission Statement The New Orleans Office of Homeland Security and Emergency Preparedness (NOHSEP) is responsible for coordinating the activities needed to protect the lives and property of its citizens and visitors from natural or man-made disasters. These activities are accomplished in partnership with NOPD, NOFD, NOEMS and the other City departments through a comprehensive program of mitigation, preparation, response and recovery.
One of the Office’s main responsibilities is to advise the Mayor, the City Council and other public safety agencies regarding emergency management activities and operations. The Office is also responsible for coordinating with State and federal agencies which respond to city-wide disasters and emergencies. All requests for federal disaster assistance and federal funding subsequent to disaster declarations are made through this office.
Vision Statement The vision of the New Orleans Office of Homeland Security and Emergency Preparedness (NOHSEP) is centered on placing a greater emphasis towards Homeland Security related issues. This vision will be accomplished by:
• Identifying and protecting critical infrastructure • Increasing coordination with ports • Enhancing information sharing within all Public Safety departments • Improving mitigation efforts for both public and private entities • Increasing staffing in accordance with national standards and best practices to ensure that proper “Orders of
Succession” can be met.
Performance Measures Key Performance Indicators
2013 Target
Percent of all NOHSEP staff that is NIMS/ICS compliant within 90 days of assignment 100%
Percent of plans, procedures, and other strategies that are National Incident Management System (NIMS) compliant 100%
Percent of grants in good standing 100% Number of Citizens Trained to Assist in City Assisted Evacuation Plan (CAEP) 300 by Jun 1
Page 151
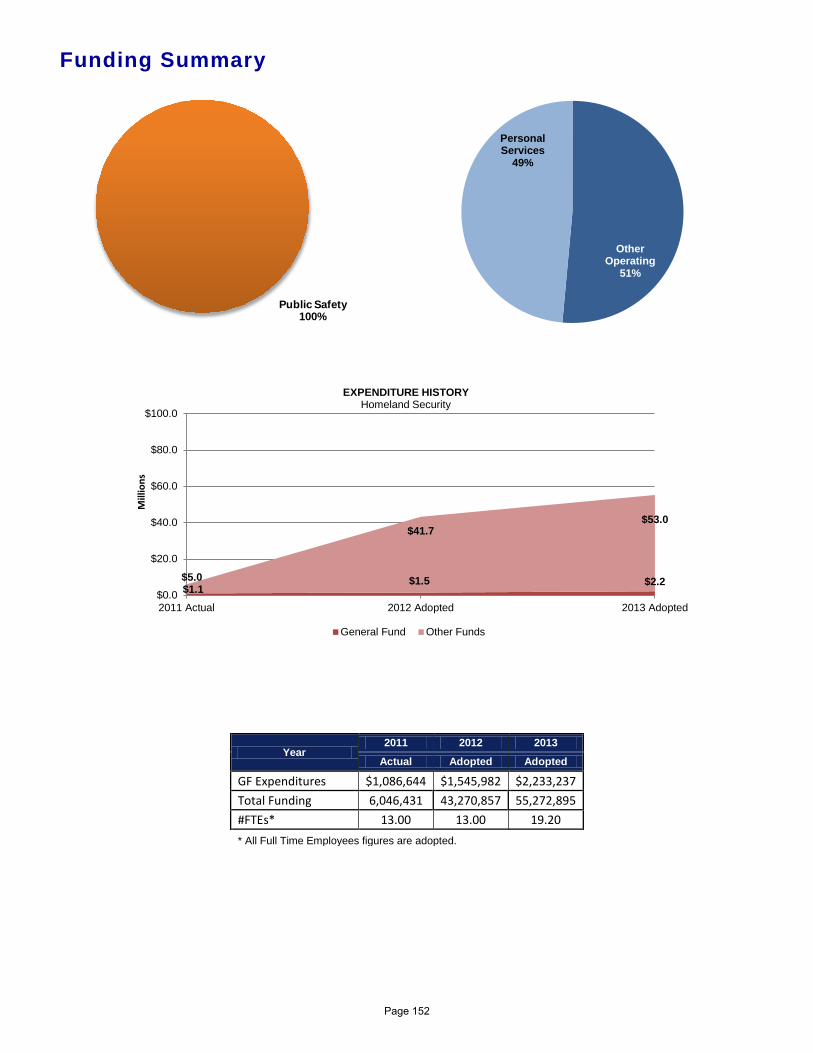
Funding Summary
Year 2011 2012 2013
Actual Adopted Adopted
GF Expenditures $1,086,644 $1,545,982 $2,233,237 Total Funding 6,046,431 43,270,857 55,272,895 #FTEs* 13.00 13.00 19.20 * All Full Time Employees figures are adopted.
Public Safety100%
Other Operating
51%
Personal Services
49%
$1.1 $1.5 $2.2 $5.0
$41.7 $53.0
$0.0
$20.0
$40.0
$60.0
$80.0
$100.0
2011 Actual 2012 Adopted 2013 Adopted
Mill
ions
EXPENDITURE HISTORY Homeland Security
General Fund Other Funds
Page 152
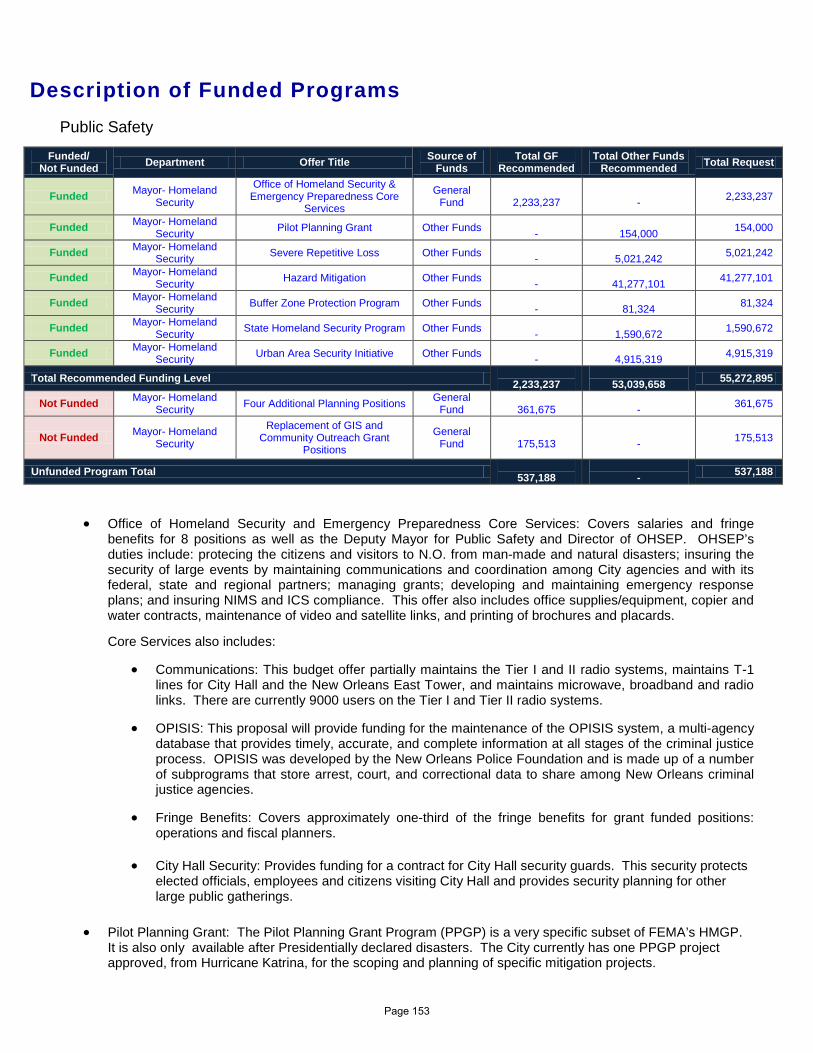
Description of Funded Programs Public Safety
Funded/ Not Funded Department Offer Title Source of
Funds Total GF
Recommended Total Other Funds
Recommended Total Request
Funded Mayor- Homeland Security
Office of Homeland Security & Emergency Preparedness Core
Services
General Fund
2,233,237
- 2,233,237
Funded Mayor- Homeland Security Pilot Planning Grant Other Funds
-
154,000 154,000
Funded Mayor- Homeland Security Severe Repetitive Loss Other Funds
-
5,021,242 5,021,242
Funded Mayor- Homeland Security Hazard Mitigation Other Funds
-
41,277,101 41,277,101
Funded Mayor- Homeland Security Buffer Zone Protection Program Other Funds
-
81,324 81,324
Funded Mayor- Homeland Security State Homeland Security Program Other Funds
-
1,590,672 1,590,672
Funded Mayor- Homeland Security Urban Area Security Initiative Other Funds
-
4,915,319 4,915,319
Total Recommended Funding Level 2,233,237
53,039,658 55,272,895
Not Funded Mayor- Homeland Security Four Additional Planning Positions General
Fund
361,675 - 361,675
Not Funded Mayor- Homeland Security
Replacement of GIS and Community Outreach Grant
Positions
General Fund
175,513
- 175,513
Unfunded Program Total 537,188
- 537,188
• Office of Homeland Security and Emergency Preparedness Core Services: Covers salaries and fringe benefits for 8 positions as well as the Deputy Mayor for Public Safety and Director of OHSEP. OHSEP’s duties include: protecing the citizens and visitors to N.O. from man-made and natural disasters; insuring the security of large events by maintaining communications and coordination among City agencies and with its federal, state and regional partners; managing grants; developing and maintaining emergency response plans; and insuring NIMS and ICS compliance. This offer also includes office supplies/equipment, copier and water contracts, maintenance of video and satellite links, and printing of brochures and placards.
Core Services also includes:
• Communications: This budget offer partially maintains the Tier I and II radio systems, maintains T-1 lines for City Hall and the New Orleans East Tower, and maintains microwave, broadband and radio links. There are currently 9000 users on the Tier I and Tier II radio systems.
• OPISIS: This proposal will provide funding for the maintenance of the OPISIS system, a multi-agency database that provides timely, accurate, and complete information at all stages of the criminal justice process. OPISIS was developed by the New Orleans Police Foundation and is made up of a number of subprograms that store arrest, court, and correctional data to share among New Orleans criminal justice agencies.
• Fringe Benefits: Covers approximately one-third of the fringe benefits for grant funded positions: operations and fiscal planners.
• City Hall Security: Provides funding for a contract for City Hall security guards. This security protects elected officials, employees and citizens visiting City Hall and provides security planning for other large public gatherings.
• Pilot Planning Grant: The Pilot Planning Grant Program (PPGP) is a very specific subset of FEMA’s HMGP.
It is also only available after Presidentially declared disasters. The City currently has one PPGP project approved, from Hurricane Katrina, for the scoping and planning of specific mitigation projects.
Page 153
• Severe Repetitive Loss: The Severe Repetitive Loss Grant Program (SRL) is an annually funded (i.e. not
disaster specific) FEMA mitigation grant program. The National Flood Insurance Program (NFIP) tracks repetitive flood damage and this program is designed to reduce the risk these properties face from floods. Only residential properties are eligible for the SRL program and the Hazard Mitigation Office hopes to have one two dozen SRL projects underway in any given year, depending on the federal budgeting for SRL.
• Hazard Mitigation: : The Hazard Mitigation Grant Program is a FEMA mitigation grant available only after Presidentially declared disasters. The City currently has HMGP projects for Hurricanes Katrina, Rita, and Gustav. This money is awarded to specific project applications for a variety of projects with the express purpose of avoiding or minimizing risk from predictable hazards.
• Buffer Zone Protection Program: This will be the last year to receive the Buffer Zone Protection Program (BZPP) funding since the program is being eliminated by DHS. It provides funding through the state for the protection of private sector owned critical infrastructure and key resources. It has funded vulnerability and risk assessments, planning and protective equipment for facilities identified by DHS as critical to the economic survival of the nation.
• State Homeland Security Grant: The State Homeland Security Grant Program helps fund the interoperable communications system equipment and planner, citizen outreach contractor and activities, emergency preparedness coordination, equipment and supplies. We received FY 2011 and 2012 grant funding at about 40% of our normal funding.
• Urban Area Security Initiative: The Urban Area Security Initiative grant (UASI) designates New Orleans as the core city of the 4-parish urban area --Orleans, Jefferson, Plaquemines and St. Bernard parishes. Funds are allocated by the to each parish and to the region. The City is the financial agent for the regional funds. The UASI grant provides funding to improve first responder planning, training, equipment and exercise. The program funds 3 employees, a community outreach contractor and an interoperable communications contractor.
Page 154
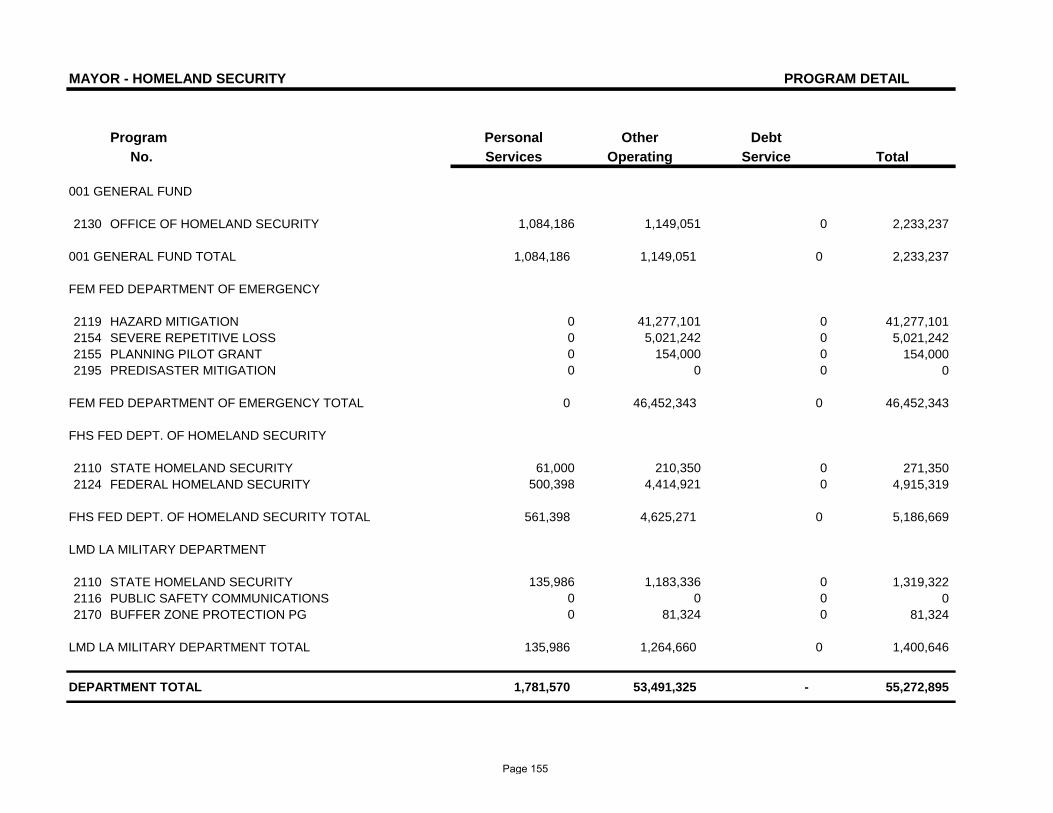
MAYOR - HOMELAND SECURITY PROGRAM DETAIL
Program Personal Other Debt No. Services Operating Service Total
001 GENERAL FUND
2130 OFFICE OF HOMELAND SECURITY 1,084,186 1,149,051 0 2,233,237
001 GENERAL FUND TOTAL 1,084,186 1,149,051 0 2,233,237
FEM FED DEPARTMENT OF EMERGENCY
2119 HAZARD MITIGATION 0 41,277,101 0 41,277,1012154 SEVERE REPETITIVE LOSS 0 5,021,242 0 5,021,2422155 PLANNING PILOT GRANT 0 154,000 0 154,0002195 PREDISASTER MITIGATION 0 0 0 0
FEM FED DEPARTMENT OF EMERGENCY TOTAL 0 46,452,343 0 46,452,343
FHS FED DEPT. OF HOMELAND SECURITY
2110 STATE HOMELAND SECURITY 61,000 210,350 0 271,3502124 FEDERAL HOMELAND SECURITY 500,398 4,414,921 0 4,915,319
FHS FED DEPT. OF HOMELAND SECURITY TOTAL 561,398 4,625,271 0 5,186,669
LMD LA MILITARY DEPARTMENT
2110 STATE HOMELAND SECURITY 135,986 1,183,336 0 1,319,3222116 PUBLIC SAFETY COMMUNICATIONS 0 0 0 02170 BUFFER ZONE PROTECTION PG 0 81,324 0 81,324
LMD LA MILITARY DEPARTMENT TOTAL 135,986 1,264,660 0 1,400,646
DEPARTMENT TOTAL 1,781,570 53,491,325 - 55,272,895
Page 155
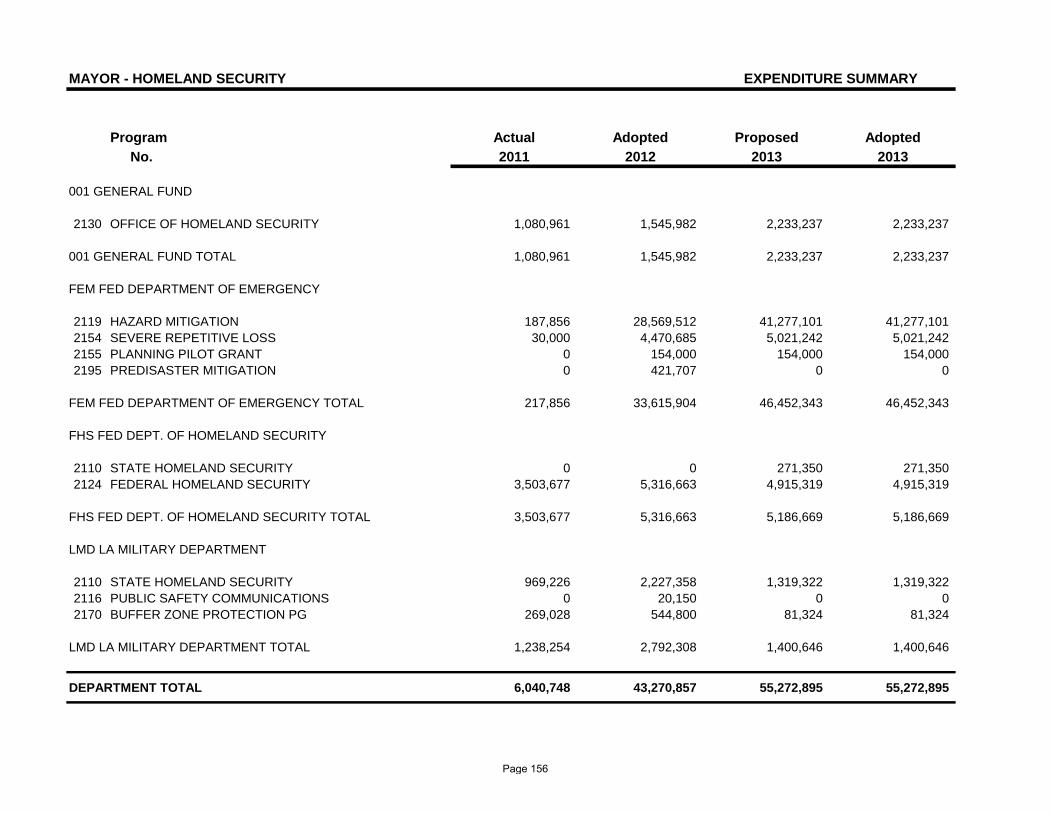
MAYOR - HOMELAND SECURITY EXPENDITURE SUMMARY
Program Actual Adopted Proposed AdoptedNo. 2011 2012 2013 2013
001 GENERAL FUND
2130 OFFICE OF HOMELAND SECURITY 1,080,961 1,545,982 2,233,237 2,233,237
001 GENERAL FUND TOTAL 1,080,961 1,545,982 2,233,237 2,233,237
FEM FED DEPARTMENT OF EMERGENCY
2119 HAZARD MITIGATION 187,856 28,569,512 41,277,101 41,277,1012154 SEVERE REPETITIVE LOSS 30,000 4,470,685 5,021,242 5,021,2422155 PLANNING PILOT GRANT 0 154,000 154,000 154,0002195 PREDISASTER MITIGATION 0 421,707 0 0
FEM FED DEPARTMENT OF EMERGENCY TOTAL 217,856 33,615,904 46,452,343 46,452,343
FHS FED DEPT. OF HOMELAND SECURITY
2110 STATE HOMELAND SECURITY 0 0 271,350 271,3502124 FEDERAL HOMELAND SECURITY 3,503,677 5,316,663 4,915,319 4,915,319
FHS FED DEPT. OF HOMELAND SECURITY TOTAL 3,503,677 5,316,663 5,186,669 5,186,669
LMD LA MILITARY DEPARTMENT
2110 STATE HOMELAND SECURITY 969,226 2,227,358 1,319,322 1,319,3222116 PUBLIC SAFETY COMMUNICATIONS 0 20,150 0 02170 BUFFER ZONE PROTECTION PG 269,028 544,800 81,324 81,324
LMD LA MILITARY DEPARTMENT TOTAL 1,238,254 2,792,308 1,400,646 1,400,646
DEPARTMENT TOTAL 6,040,748 43,270,857 55,272,895 55,272,895
Page 156
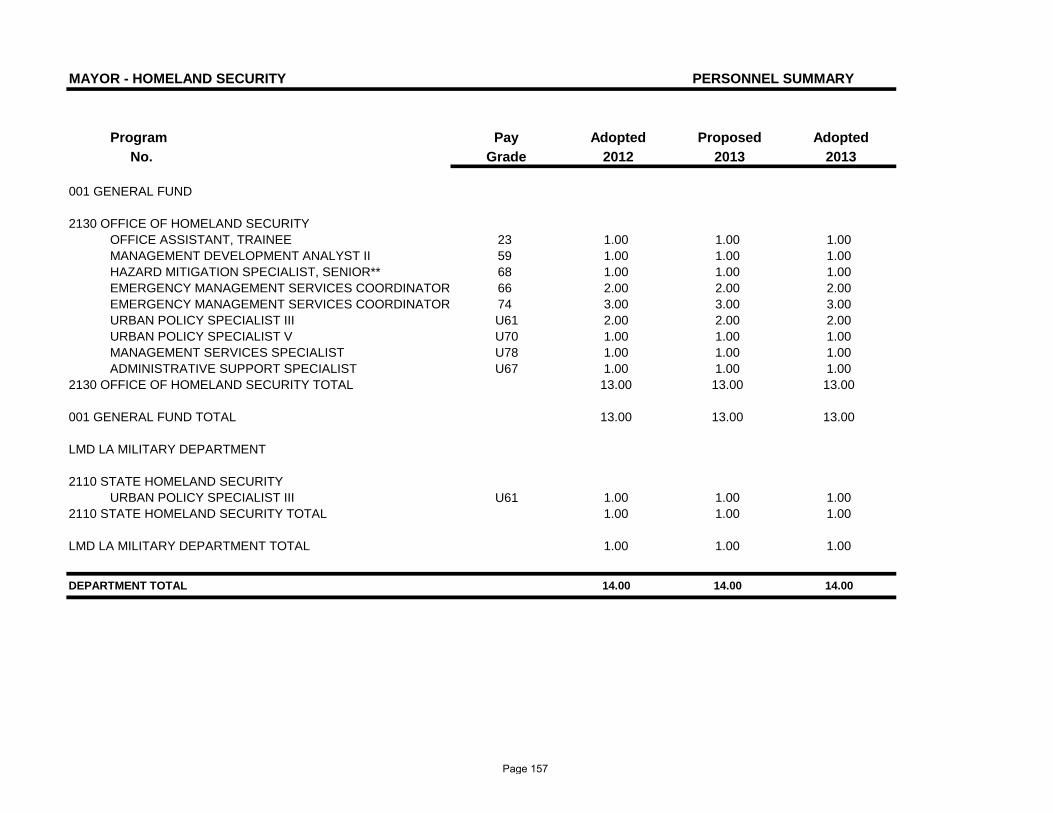
MAYOR - HOMELAND SECURITY PERSONNEL SUMMARY
Program Pay Adopted Proposed AdoptedNo. Grade 2012 2013 2013
001 GENERAL FUND
2130 OFFICE OF HOMELAND SECURITY OFFICE ASSISTANT, TRAINEE 23 1.00 1.00 1.00MANAGEMENT DEVELOPMENT ANALYST II 59 1.00 1.00 1.00HAZARD MITIGATION SPECIALIST, SENIOR** 68 1.00 1.00 1.00EMERGENCY MANAGEMENT SERVICES COORDINATOR 66 2.00 2.00 2.00EMERGENCY MANAGEMENT SERVICES COORDINATOR 74 3.00 3.00 3.00URBAN POLICY SPECIALIST III U61 2.00 2.00 2.00URBAN POLICY SPECIALIST V U70 1.00 1.00 1.00MANAGEMENT SERVICES SPECIALIST U78 1.00 1.00 1.00ADMINISTRATIVE SUPPORT SPECIALIST U67 1.00 1.00 1.00
2130 OFFICE OF HOMELAND SECURITY TOTAL 13.00 13.00 13.00
001 GENERAL FUND TOTAL 13.00 13.00 13.00
LMD LA MILITARY DEPARTMENT
2110 STATE HOMELAND SECURITY URBAN POLICY SPECIALIST III U61 1.00 1.00 1.00
2110 STATE HOMELAND SECURITY TOTAL 1.00 1.00 1.00
LMD LA MILITARY DEPARTMENT TOTAL 1.00 1.00 1.00
DEPARTMENT TOTAL 14.00 14.00 14.00
Page 157

Office of Community Development
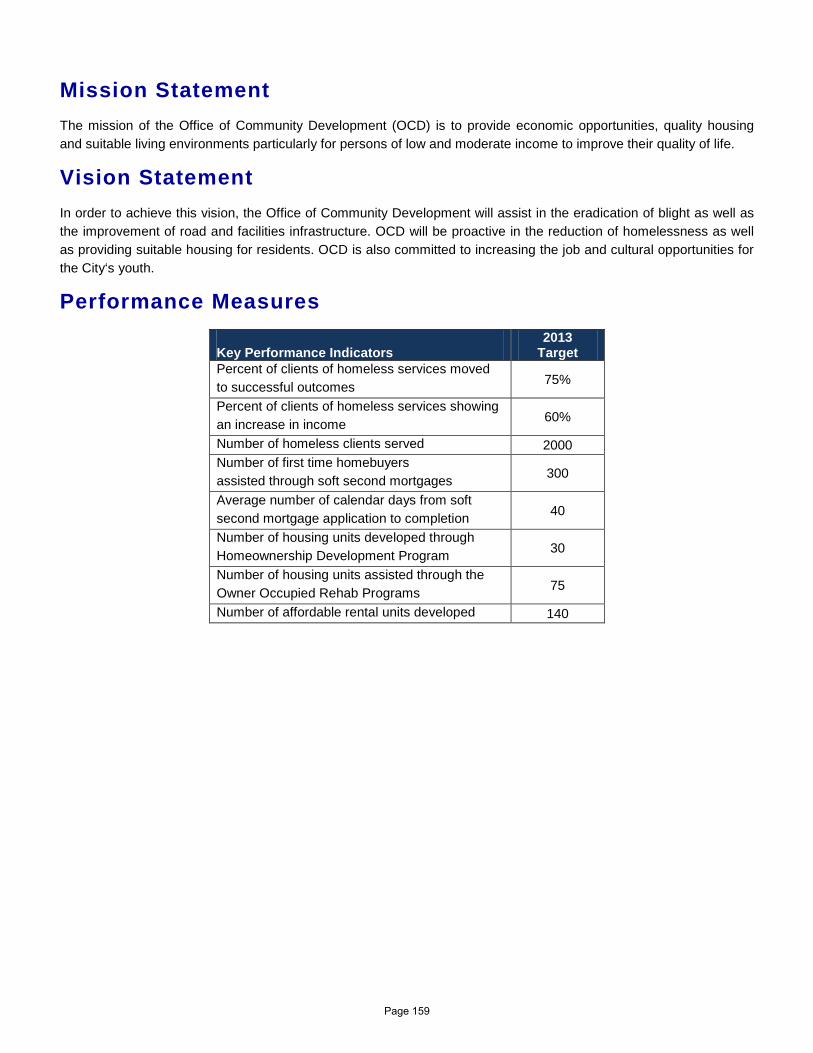
Mission Statement The mission of the Office of Community Development (OCD) is to provide economic opportunities, quality housing and suitable living environments particularly for persons of low and moderate income to improve their quality of life.
Vision Statement In order to achieve this vision, the Office of Community Development will assist in the eradication of blight as well as the improvement of road and facilities infrastructure. OCD will be proactive in the reduction of homelessness as well as providing suitable housing for residents. OCD is also committed to increasing the job and cultural opportunities for the City‘s youth.
Performance Measures Key Performance Indicators
2013 Target
Percent of clients of homeless services moved to successful outcomes 75%
Percent of clients of homeless services showing an increase in income 60%
Number of homeless clients served 2000 Number of first time homebuyers assisted through soft second mortgages 300
Average number of calendar days from soft second mortgage application to completion 40
Number of housing units developed through Homeownership Development Program 30
Number of housing units assisted through the Owner Occupied Rehab Programs 75
Number of affordable rental units developed 140
Page 159
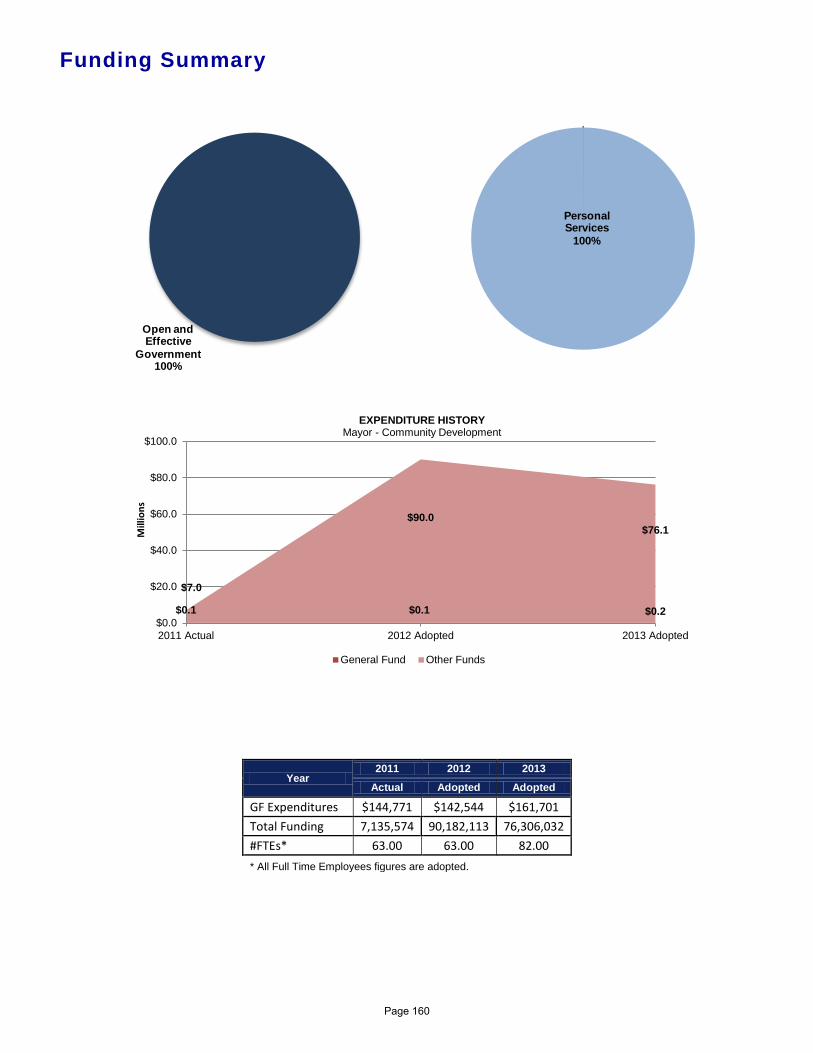
Funding Summary
Year 2011 2012 2013
Actual Adopted Adopted
GF Expenditures $144,771 $142,544 $161,701 Total Funding 7,135,574 90,182,113 76,306,032 #FTEs* 63.00 63.00 82.00 * All Full Time Employees figures are adopted.
Open and Effective
Government100%
$0.1 $0.1 $0.2
$7.0
$90.0 $76.1
$0.0
$20.0
$40.0
$60.0
$80.0
$100.0
2011 Actual 2012 Adopted 2013 Adopted
Mill
ions
EXPENDITURE HISTORY Mayor - Community Development
General Fund Other Funds
Personal Services
100%
Page 160
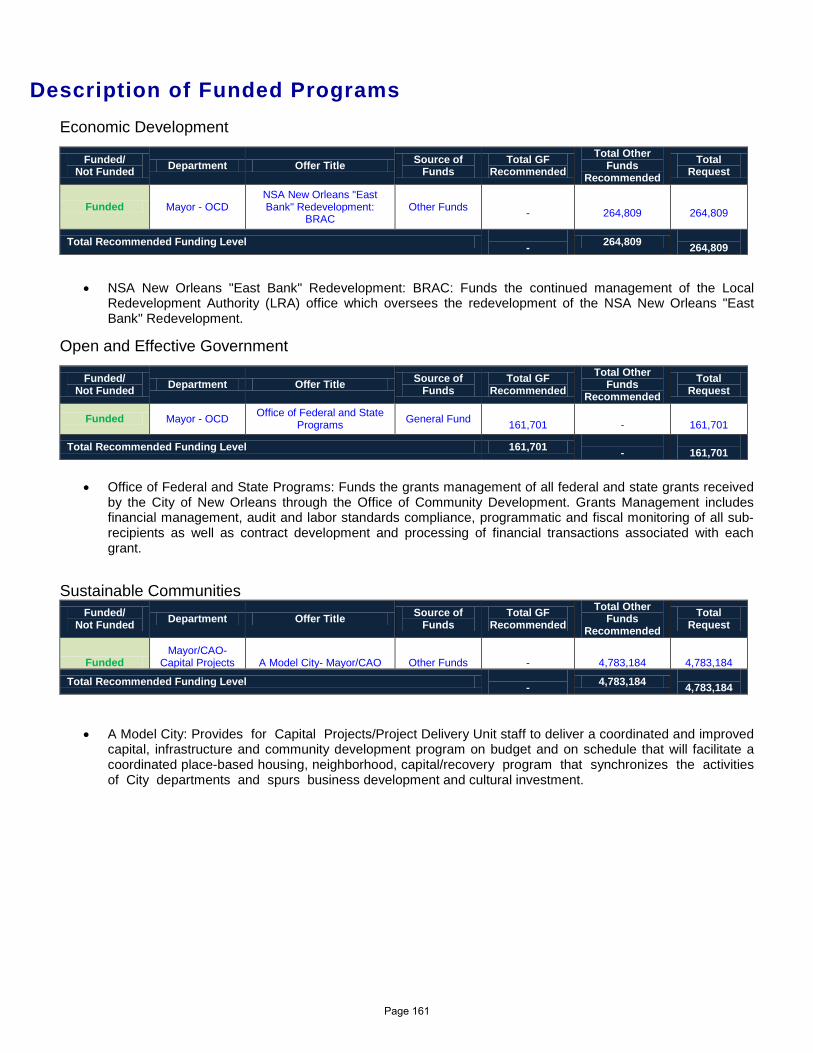
Description of Funded Programs Economic Development
Funded/ Not Funded Department Offer Title Source of
Funds Total GF
Recommended Total Other
Funds Recommended
Total Request
Funded Mayor - OCD NSA New Orleans "East Bank" Redevelopment:
BRAC Other Funds
-
264,809
264,809
Total Recommended Funding Level - 264,809
264,809
• NSA New Orleans "East Bank" Redevelopment: BRAC: Funds the continued management of the Local Redevelopment Authority (LRA) office which oversees the redevelopment of the NSA New Orleans "East Bank" Redevelopment.
Open and Effective Government
Funded/ Not Funded Department Offer Title Source of
Funds Total GF
Recommended Total Other
Funds Recommended
Total Request
Funded Mayor - OCD Office of Federal and State Programs General Fund
161,701 -
161,701
Total Recommended Funding Level 161,701 -
161,701
• Office of Federal and State Programs: Funds the grants management of all federal and state grants received
by the City of New Orleans through the Office of Community Development. Grants Management includes financial management, audit and labor standards compliance, programmatic and fiscal monitoring of all sub-recipients as well as contract development and processing of financial transactions associated with each grant.
Sustainable Communities
Funded/ Not Funded Department Offer Title Source of
Funds Total GF
Recommended Total Other
Funds Recommended
Total Request
Funded Mayor/CAO-
Capital Projects A Model City- Mayor/CAO Other Funds -
4,783,184
4,783,184
Total Recommended Funding Level - 4,783,184
4,783,184
• A Model City: Provides for Capital Projects/Project Delivery Unit staff to deliver a coordinated and improved
capital, infrastructure and community development program on budget and on schedule that will facilitate a coordinated place-based housing, neighborhood, capital/recovery program that synchronizes the activities of City departments and spurs business development and cultural investment.
[Type
Page 161
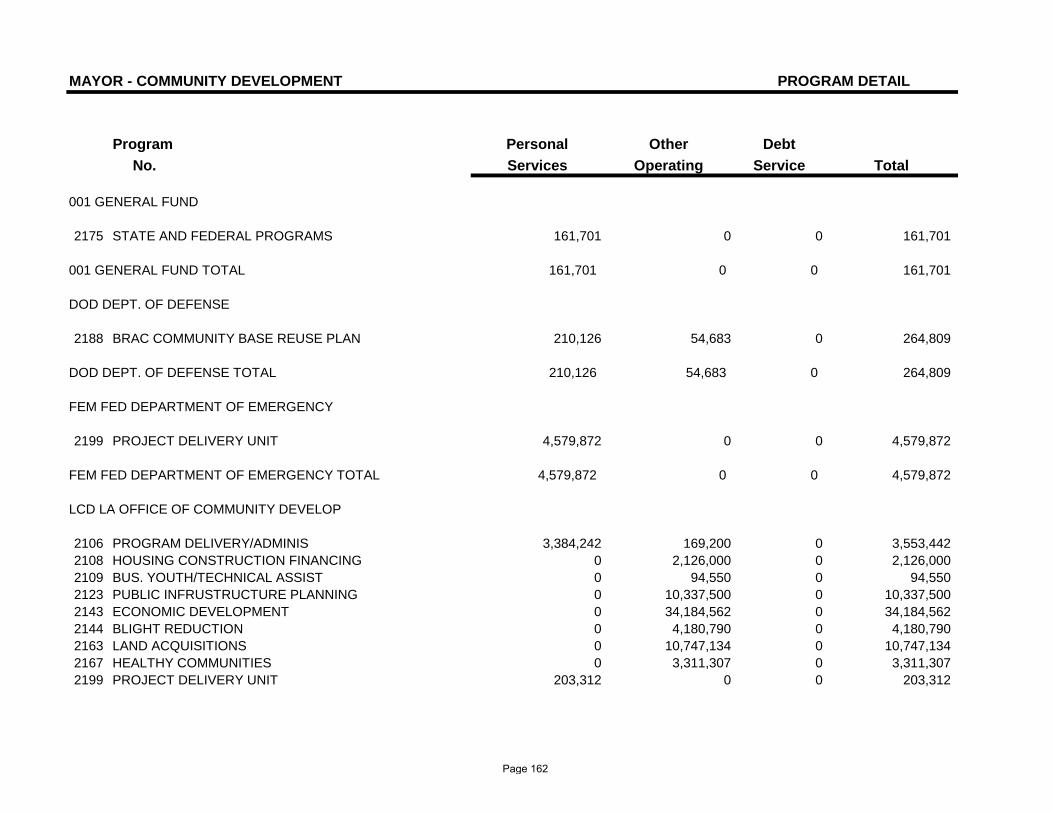
MAYOR - COMMUNITY DEVELOPMENT PROGRAM DETAIL
Program Personal Other Debt No. Services Operating Service Total
001 GENERAL FUND
2175 STATE AND FEDERAL PROGRAMS 161,701 0 0 161,701
001 GENERAL FUND TOTAL 161,701 0 0 161,701
DOD DEPT. OF DEFENSE
2188 BRAC COMMUNITY BASE REUSE PLAN 210,126 54,683 0 264,809
DOD DEPT. OF DEFENSE TOTAL 210,126 54,683 0 264,809
FEM FED DEPARTMENT OF EMERGENCY
2199 PROJECT DELIVERY UNIT 4,579,872 0 0 4,579,872
FEM FED DEPARTMENT OF EMERGENCY TOTAL 4,579,872 0 0 4,579,872
LCD LA OFFICE OF COMMUNITY DEVELOP
2106 PROGRAM DELIVERY/ADMINIS 3,384,242 169,200 0 3,553,4422108 HOUSING CONSTRUCTION FINANCING 0 2,126,000 0 2,126,0002109 BUS. YOUTH/TECHNICAL ASSIST 0 94,550 0 94,5502123 PUBLIC INFRUSTRUCTURE PLANNING 0 10,337,500 0 10,337,5002143 ECONOMIC DEVELOPMENT 0 34,184,562 0 34,184,5622144 BLIGHT REDUCTION 0 4,180,790 0 4,180,7902163 LAND ACQUISITIONS 0 10,747,134 0 10,747,1342167 HEALTHY COMMUNITIES 0 3,311,307 0 3,311,3072199 PROJECT DELIVERY UNIT 203,312 0 0 203,312
Page 162
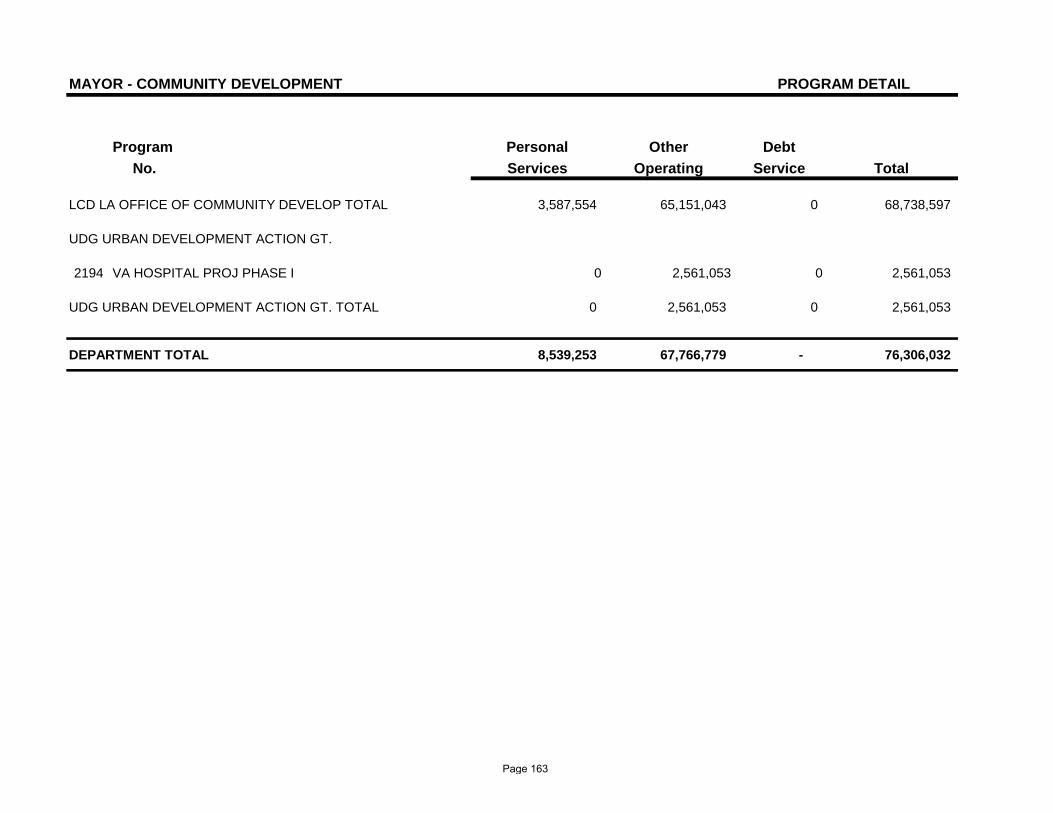
MAYOR - COMMUNITY DEVELOPMENT PROGRAM DETAIL
Program Personal Other Debt No. Services Operating Service Total
LCD LA OFFICE OF COMMUNITY DEVELOP TOTAL 3,587,554 65,151,043 0 68,738,597
UDG URBAN DEVELOPMENT ACTION GT.
2194 VA HOSPITAL PROJ PHASE I 0 2,561,053 0 2,561,053
UDG URBAN DEVELOPMENT ACTION GT. TOTAL 0 2,561,053 0 2,561,053
DEPARTMENT TOTAL 8,539,253 67,766,779 - 76,306,032
Page 163
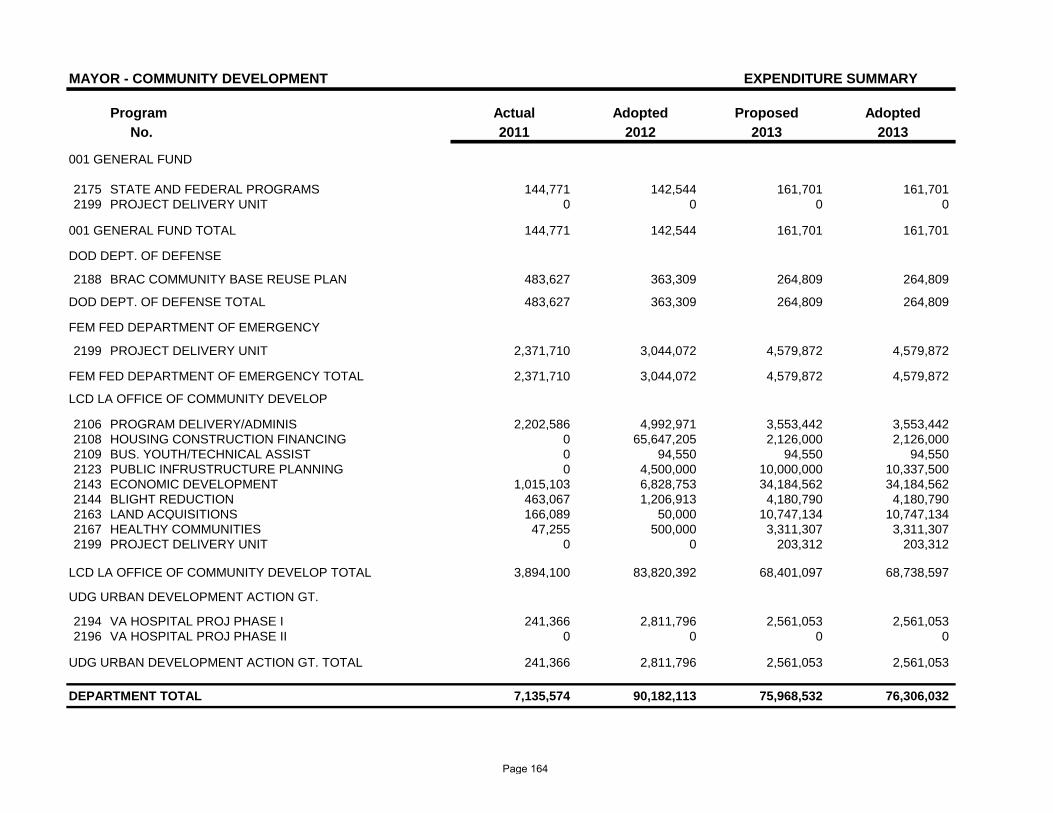
MAYOR - COMMUNITY DEVELOPMENT EXPENDITURE SUMMARY
Program Actual Adopted Proposed AdoptedNo. 2011 2012 2013 2013
001 GENERAL FUND
2175 STATE AND FEDERAL PROGRAMS 144,771 142,544 161,701 161,7012199 PROJECT DELIVERY UNIT 0 0 0 0
001 GENERAL FUND TOTAL 144,771 142,544 161,701 161,701
DOD DEPT. OF DEFENSE
2188 BRAC COMMUNITY BASE REUSE PLAN 483,627 363,309 264,809 264,809
DOD DEPT. OF DEFENSE TOTAL 483,627 363,309 264,809 264,809
FEM FED DEPARTMENT OF EMERGENCY
2199 PROJECT DELIVERY UNIT 2,371,710 3,044,072 4,579,872 4,579,872
FEM FED DEPARTMENT OF EMERGENCY TOTAL 2,371,710 3,044,072 4,579,872 4,579,872
LCD LA OFFICE OF COMMUNITY DEVELOP
2106 PROGRAM DELIVERY/ADMINIS 2,202,586 4,992,971 3,553,442 3,553,4422108 HOUSING CONSTRUCTION FINANCING 0 65,647,205 2,126,000 2,126,0002109 BUS. YOUTH/TECHNICAL ASSIST 0 94,550 94,550 94,5502123 PUBLIC INFRUSTRUCTURE PLANNING 0 4,500,000 10,000,000 10,337,5002143 ECONOMIC DEVELOPMENT 1,015,103 6,828,753 34,184,562 34,184,5622144 BLIGHT REDUCTION 463,067 1,206,913 4,180,790 4,180,7902163 LAND ACQUISITIONS 166,089 50,000 10,747,134 10,747,1342167 HEALTHY COMMUNITIES 47,255 500,000 3,311,307 3,311,3072199 PROJECT DELIVERY UNIT 0 0 203,312 203,312
LCD LA OFFICE OF COMMUNITY DEVELOP TOTAL 3,894,100 83,820,392 68,401,097 68,738,597
UDG URBAN DEVELOPMENT ACTION GT.
2194 VA HOSPITAL PROJ PHASE I 241,366 2,811,796 2,561,053 2,561,0532196 VA HOSPITAL PROJ PHASE II 0 0 0 0
UDG URBAN DEVELOPMENT ACTION GT. TOTAL 241,366 2,811,796 2,561,053 2,561,053
DEPARTMENT TOTAL 7,135,574 90,182,113 75,968,532 76,306,032
Page 164
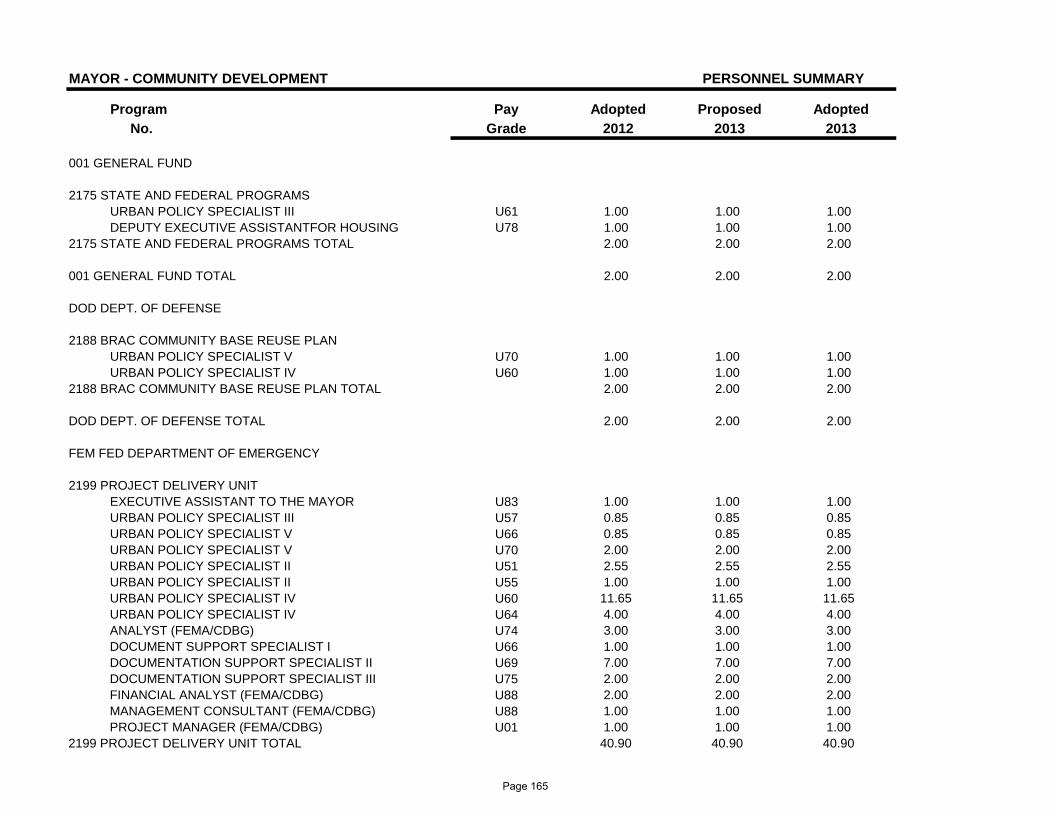
MAYOR - COMMUNITY DEVELOPMENT PERSONNEL SUMMARY
Program Pay Adopted Proposed AdoptedNo. Grade 2012 2013 2013
001 GENERAL FUND
2175 STATE AND FEDERAL PROGRAMS URBAN POLICY SPECIALIST III U61 1.00 1.00 1.00DEPUTY EXECUTIVE ASSISTANTFOR HOUSING U78 1.00 1.00 1.00
2175 STATE AND FEDERAL PROGRAMS TOTAL 2.00 2.00 2.00
001 GENERAL FUND TOTAL 2.00 2.00 2.00
DOD DEPT. OF DEFENSE
2188 BRAC COMMUNITY BASE REUSE PLAN URBAN POLICY SPECIALIST V U70 1.00 1.00 1.00URBAN POLICY SPECIALIST IV U60 1.00 1.00 1.00
2188 BRAC COMMUNITY BASE REUSE PLAN TOTAL 2.00 2.00 2.00
DOD DEPT. OF DEFENSE TOTAL 2.00 2.00 2.00
FEM FED DEPARTMENT OF EMERGENCY
2199 PROJECT DELIVERY UNIT EXECUTIVE ASSISTANT TO THE MAYOR U83 1.00 1.00 1.00URBAN POLICY SPECIALIST III U57 0.85 0.85 0.85URBAN POLICY SPECIALIST V U66 0.85 0.85 0.85URBAN POLICY SPECIALIST V U70 2.00 2.00 2.00URBAN POLICY SPECIALIST II U51 2.55 2.55 2.55URBAN POLICY SPECIALIST II U55 1.00 1.00 1.00URBAN POLICY SPECIALIST IV U60 11.65 11.65 11.65URBAN POLICY SPECIALIST IV U64 4.00 4.00 4.00ANALYST (FEMA/CDBG) U74 3.00 3.00 3.00DOCUMENT SUPPORT SPECIALIST I U66 1.00 1.00 1.00DOCUMENTATION SUPPORT SPECIALIST II U69 7.00 7.00 7.00DOCUMENTATION SUPPORT SPECIALIST III U75 2.00 2.00 2.00FINANCIAL ANALYST (FEMA/CDBG) U88 2.00 2.00 2.00MANAGEMENT CONSULTANT (FEMA/CDBG) U88 1.00 1.00 1.00PROJECT MANAGER (FEMA/CDBG) U01 1.00 1.00 1.00
2199 PROJECT DELIVERY UNIT TOTAL 40.90 40.90 40.90
Page 165
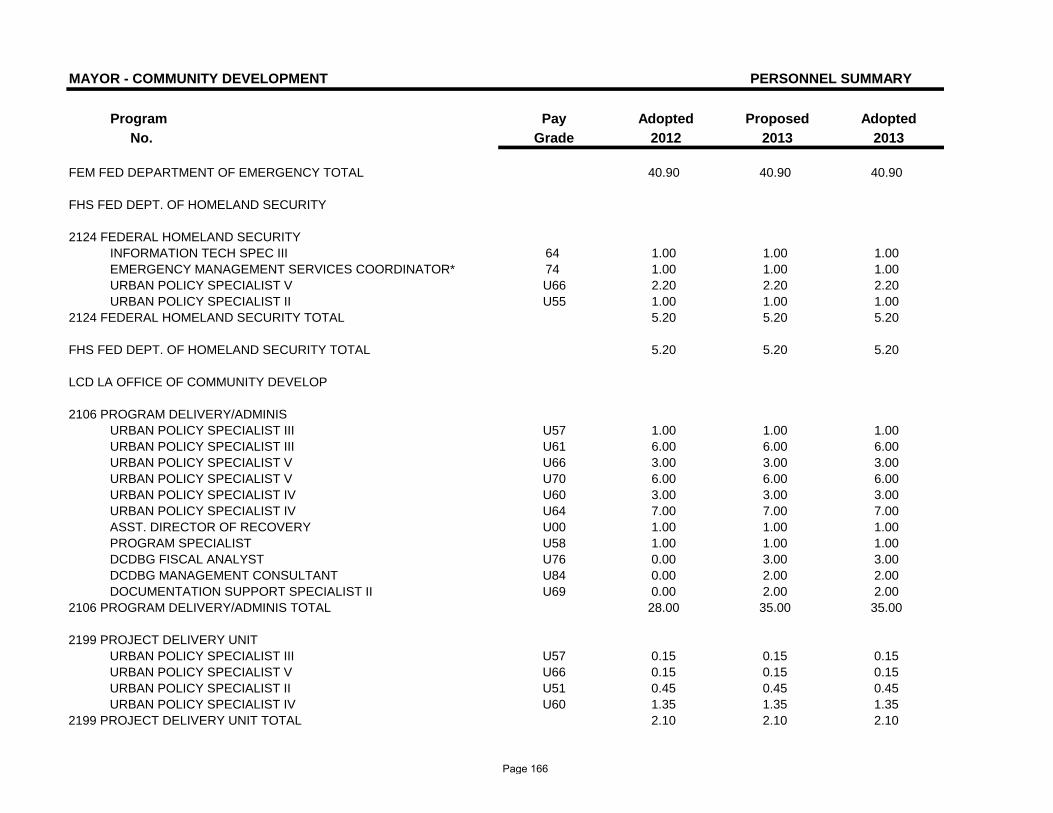
MAYOR - COMMUNITY DEVELOPMENT PERSONNEL SUMMARY
Program Pay Adopted Proposed AdoptedNo. Grade 2012 2013 2013
FEM FED DEPARTMENT OF EMERGENCY TOTAL 40.90 40.90 40.90
FHS FED DEPT. OF HOMELAND SECURITY
2124 FEDERAL HOMELAND SECURITY INFORMATION TECH SPEC III 64 1.00 1.00 1.00EMERGENCY MANAGEMENT SERVICES COORDINATOR* 74 1.00 1.00 1.00URBAN POLICY SPECIALIST V U66 2.20 2.20 2.20URBAN POLICY SPECIALIST II U55 1.00 1.00 1.00
2124 FEDERAL HOMELAND SECURITY TOTAL 5.20 5.20 5.20
FHS FED DEPT. OF HOMELAND SECURITY TOTAL 5.20 5.20 5.20
LCD LA OFFICE OF COMMUNITY DEVELOP
2106 PROGRAM DELIVERY/ADMINIS URBAN POLICY SPECIALIST III U57 1.00 1.00 1.00URBAN POLICY SPECIALIST III U61 6.00 6.00 6.00URBAN POLICY SPECIALIST V U66 3.00 3.00 3.00URBAN POLICY SPECIALIST V U70 6.00 6.00 6.00URBAN POLICY SPECIALIST IV U60 3.00 3.00 3.00URBAN POLICY SPECIALIST IV U64 7.00 7.00 7.00ASST. DIRECTOR OF RECOVERY U00 1.00 1.00 1.00PROGRAM SPECIALIST U58 1.00 1.00 1.00DCDBG FISCAL ANALYST U76 0.00 3.00 3.00DCDBG MANAGEMENT CONSULTANT U84 0.00 2.00 2.00DOCUMENTATION SUPPORT SPECIALIST II U69 0.00 2.00 2.00
2106 PROGRAM DELIVERY/ADMINIS TOTAL 28.00 35.00 35.00
2199 PROJECT DELIVERY UNIT URBAN POLICY SPECIALIST III U57 0.15 0.15 0.15URBAN POLICY SPECIALIST V U66 0.15 0.15 0.15URBAN POLICY SPECIALIST II U51 0.45 0.45 0.45URBAN POLICY SPECIALIST IV U60 1.35 1.35 1.35
2199 PROJECT DELIVERY UNIT TOTAL 2.10 2.10 2.10
Page 166
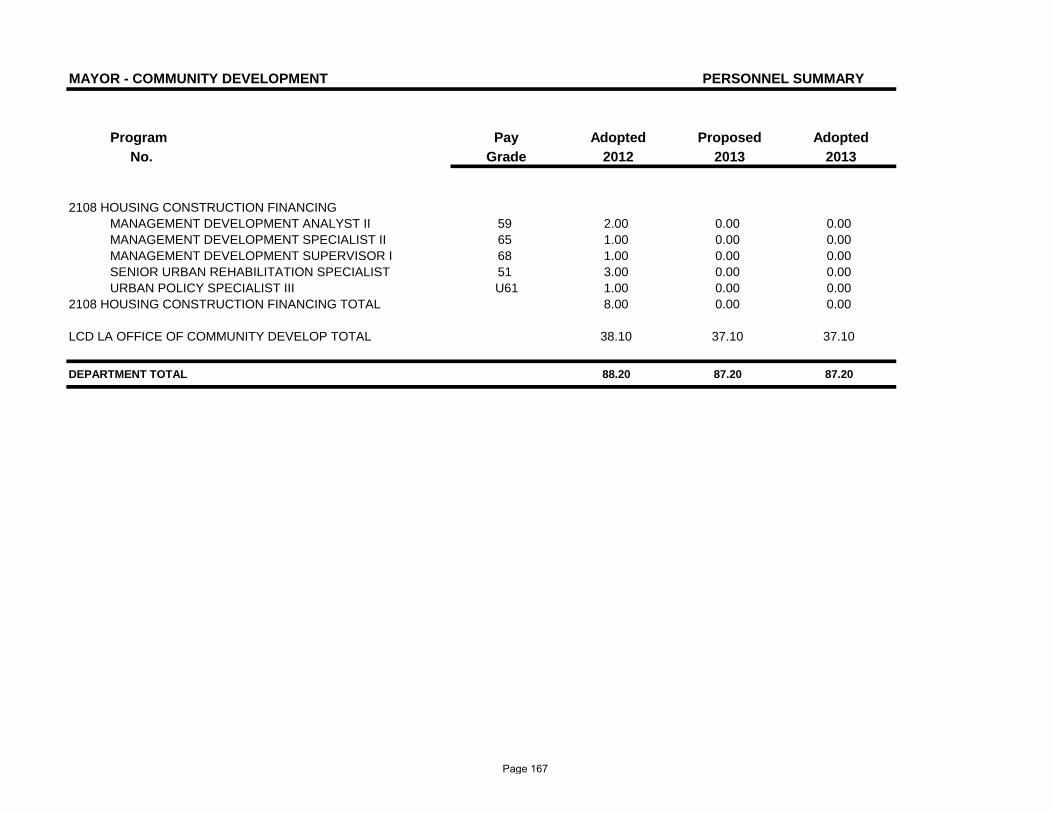
MAYOR - COMMUNITY DEVELOPMENT PERSONNEL SUMMARY
Program Pay Adopted Proposed AdoptedNo. Grade 2012 2013 2013
2108 HOUSING CONSTRUCTION FINANCING MANAGEMENT DEVELOPMENT ANALYST II 59 2.00 0.00 0.00MANAGEMENT DEVELOPMENT SPECIALIST II 65 1.00 0.00 0.00MANAGEMENT DEVELOPMENT SUPERVISOR I 68 1.00 0.00 0.00SENIOR URBAN REHABILITATION SPECIALIST 51 3.00 0.00 0.00URBAN POLICY SPECIALIST III U61 1.00 0.00 0.00
2108 HOUSING CONSTRUCTION FINANCING TOTAL 8.00 0.00 0.00
LCD LA OFFICE OF COMMUNITY DEVELOP TOTAL 38.10 37.10 37.10
DEPARTMENT TOTAL 88.20 87.20 87.20
Page 167

Chief Administrative Office
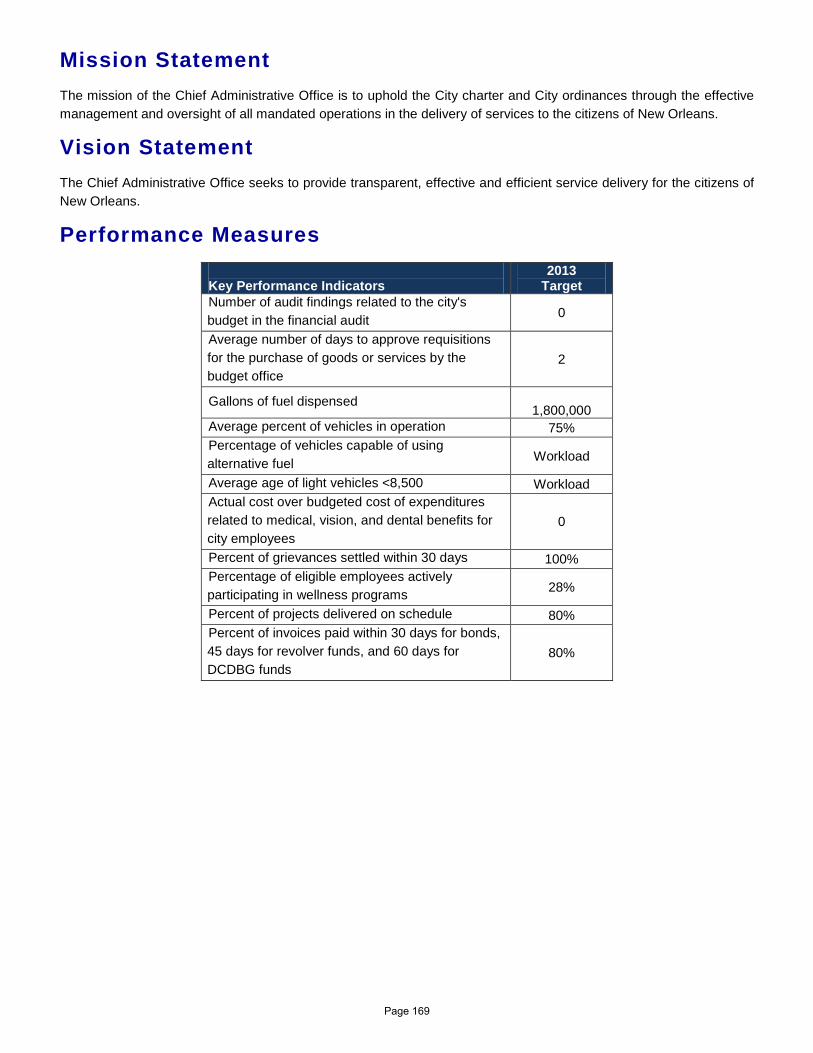
Mission Statement The mission of the Chief Administrative Office is to uphold the City charter and City ordinances through the effective management and oversight of all mandated operations in the delivery of services to the citizens of New Orleans.
Vision Statement The Chief Administrative Office seeks to provide transparent, effective and efficient service delivery for the citizens of New Orleans.
Performance Measures Key Performance Indicators
2013 Target
Number of audit findings related to the city's budget in the financial audit 0
Average number of days to approve requisitions for the purchase of goods or services by the budget office
2
Gallons of fuel dispensed 1,800,000
Average percent of vehicles in operation 75% Percentage of vehicles capable of using alternative fuel Workload
Average age of light vehicles <8,500 Workload Actual cost over budgeted cost of expenditures related to medical, vision, and dental benefits for city employees
0
Percent of grievances settled within 30 days 100% Percentage of eligible employees actively participating in wellness programs 28%
Percent of projects delivered on schedule 80% Percent of invoices paid within 30 days for bonds, 45 days for revolver funds, and 60 days for DCDBG funds
80%
Page 169
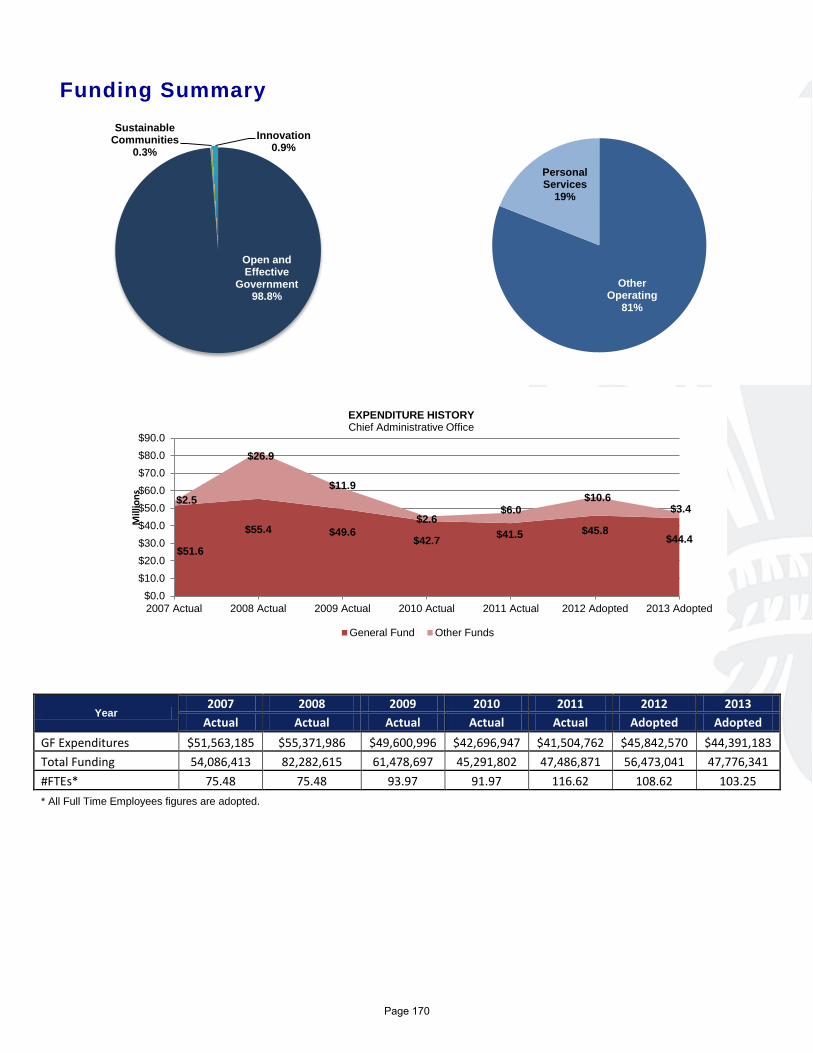
Funding Summary
Year 2007 2008 2009 2010 2011 2012 2013
Actual Actual Actual Actual Actual Adopted Adopted GF Expenditures $51,563,185 $55,371,986 $49,600,996 $42,696,947 $41,504,762 $45,842,570 $44,391,183 Total Funding 54,086,413 82,282,615 61,478,697 45,291,802 47,486,871 56,473,041 47,776,341 #FTEs* 75.48 75.48 93.97 91.97 116.62 108.62 103.25 * All Full Time Employees figures are adopted.
$51.6
$55.4 $49.6 $42.7 $41.5 $45.8
$44.4
$2.5
$26.9
$11.9
$2.6 $6.0
$10.6 $3.4
$0.0$10.0$20.0$30.0$40.0$50.0$60.0$70.0$80.0$90.0
2007 Actual 2008 Actual 2009 Actual 2010 Actual 2011 Actual 2012 Adopted 2013 Adopted
Mill
ions
EXPENDITURE HISTORY Chief Administrative Office
General Fund Other Funds
Open and Effective
Government 98.8%
Sustainable Communities
0.3% Innovation
0.9%
Other Operating
81%
Personal Services
19%
Page 170
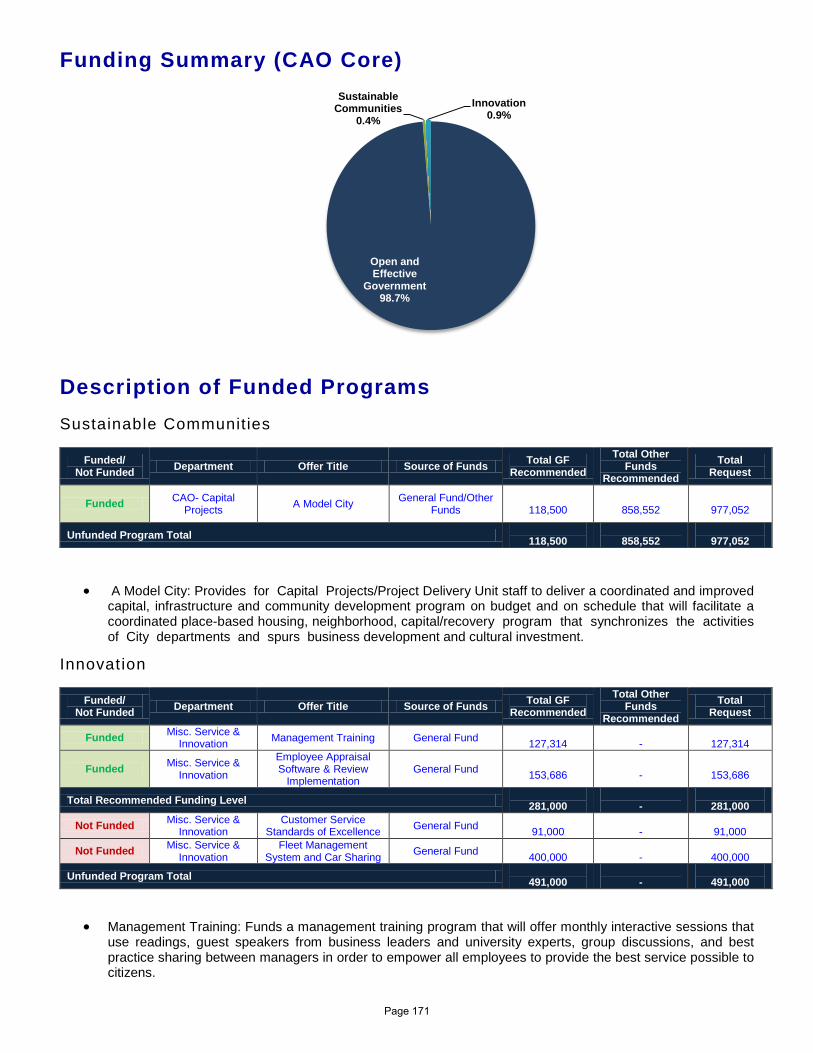
Funding Summary (CAO Core)
Description of Funded Programs Sustainable Communities
Funded/ Not Funded Department Offer Title Source of Funds Total GF
Recommended Total Other
Funds Recommended
Total Request
Funded CAO- Capital Projects A Model City General Fund/Other
Funds
118,500
858,552
977,052
Unfunded Program Total 118,500
858,552
977,052
• A Model City: Provides for Capital Projects/Project Delivery Unit staff to deliver a coordinated and improved capital, infrastructure and community development program on budget and on schedule that will facilitate a coordinated place-based housing, neighborhood, capital/recovery program that synchronizes the activities of City departments and spurs business development and cultural investment.
Innovation
Funded/ Not Funded Department Offer Title Source of Funds Total GF
Recommended Total Other
Funds Recommended
Total Request
Funded Misc. Service & Innovation Management Training General Fund
127,314 -
127,314
Funded Misc. Service & Innovation
Employee Appraisal Software & Review
Implementation General Fund
153,686 -
153,686
Total Recommended Funding Level 281,000
-
281,000
Not Funded Misc. Service & Innovation
Customer Service Standards of Excellence General Fund
91,000 -
91,000
Not Funded Misc. Service & Innovation
Fleet Management System and Car Sharing General Fund
400,000 -
400,000
Unfunded Program Total 491,000
-
491,000
• Management Training: Funds a management training program that will offer monthly interactive sessions that use readings, guest speakers from business leaders and university experts, group discussions, and best practice sharing between managers in order to empower all employees to provide the best service possible to citizens.
Open and Effective
Government 98.7%
Sustainable Communities
0.4% Innovation
0.9%
Page 171
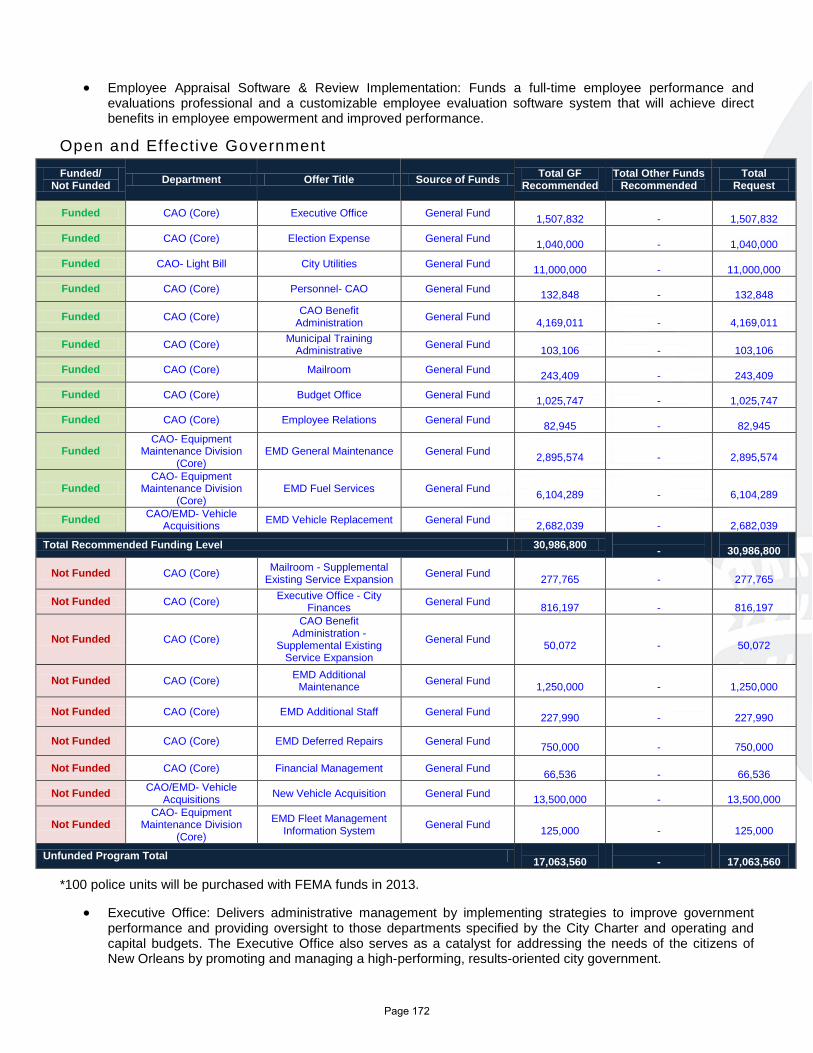
• Employee Appraisal Software & Review Implementation: Funds a full-time employee performance and evaluations professional and a customizable employee evaluation software system that will achieve direct benefits in employee empowerment and improved performance.
Open and Effective Government
Funded/ Not Funded Department Offer Title Source of Funds Total GF
Recommended Total Other Funds
Recommended Total
Request
Funded CAO (Core) Executive Office General Fund 1,507,832
-
1,507,832
Funded CAO (Core) Election Expense General Fund 1,040,000
-
1,040,000
Funded CAO- Light Bill City Utilities General Fund 11,000,000
-
11,000,000
Funded CAO (Core) Personnel- CAO General Fund 132,848
-
132,848
Funded CAO (Core) CAO Benefit Administration General Fund
4,169,011 -
4,169,011
Funded CAO (Core) Municipal Training Administrative General Fund
103,106 -
103,106
Funded CAO (Core) Mailroom General Fund 243,409
-
243,409
Funded CAO (Core) Budget Office General Fund 1,025,747
-
1,025,747
Funded CAO (Core) Employee Relations General Fund 82,945
-
82,945
Funded CAO- Equipment
Maintenance Division (Core)
EMD General Maintenance General Fund 2,895,574
-
2,895,574
Funded CAO- Equipment
Maintenance Division (Core)
EMD Fuel Services General Fund 6,104,289
-
6,104,289
Funded CAO/EMD- Vehicle Acquisitions EMD Vehicle Replacement General Fund
2,682,039 -
2,682,039
Total Recommended Funding Level 30,986,800 -
30,986,800
Not Funded CAO (Core) Mailroom - Supplemental Existing Service Expansion General Fund
277,765 -
277,765
Not Funded CAO (Core) Executive Office - City Finances General Fund
816,197 -
816,197
Not Funded CAO (Core)
CAO Benefit Administration -
Supplemental Existing Service Expansion
General Fund 50,072
-
50,072
Not Funded CAO (Core) EMD Additional Maintenance General Fund
1,250,000 -
1,250,000
Not Funded CAO (Core) EMD Additional Staff General Fund 227,990
-
227,990
Not Funded CAO (Core) EMD Deferred Repairs General Fund 750,000
-
750,000
Not Funded CAO (Core) Financial Management General Fund 66,536
-
66,536
Not Funded CAO/EMD- Vehicle Acquisitions New Vehicle Acquisition General Fund
13,500,000 -
13,500,000
Not Funded CAO- Equipment
Maintenance Division (Core)
EMD Fleet Management Information System General Fund
125,000 -
125,000
Unfunded Program Total 17,063,560
-
17,063,560
*100 police units will be purchased with FEMA funds in 2013.
• Executive Office: Delivers administrative management by implementing strategies to improve government performance and providing oversight to those departments specified by the City Charter and operating and capital budgets. The Executive Office also serves as a catalyst for addressing the needs of the citizens of New Orleans by promoting and managing a high-performing, results-oriented city government.
Page 172
• Election Expense: Provides for the City's portion of City-related elections of local, state, and federal offices.
• City Utilities: Provides for the City’s current utility costs.
• Personnel: Provides for the citywide support of the Unclassified Plan offering technical development of classifications to all departments, boards, agencies and commissions to recruit and retain the best qualified applicants for municipal government service.
• CAO Benefit Administration: Funds the Hospitalization Division which manages the City's self-funded group healthcare, vision and dental plan for active employees, dependents and retirees. This division develops and manages wellness, disease management, intervention and mental health programs.
• Municipal Training Administrative: The Municipal Training Academy provides facilities for use by the NOPD, NOFD and Safety & Permits for the purpose of recruit training and taxi cab inspections, simulations and emergency scenario training directly impacting the quality of Public Safety employees. The facility also provides for the ability to assess code compliance of taxi cab operators.
• Mailroom: Provides an inter-office pick-up and delivery system for the City and processes and pays all postage costs for out-going mail via the U.S. Postal Service.
• Budget Office: Supports the development and oversight of all City departments to produce a balanced budget that most effectively uses resources to deliver results for the citizens of New Orleans. The fiscal guidance provided by this office contributes to renewed citizen confidence in the City of New Orleans’ ability to provide vital government services, maintain its commitment to the betterment of New Orleans, and demonstrate New Orleans’ status as a model city.
• Employee Relations: Funds the division responsible for ensuring the City maintains compliance with Labor and Employment laws.
• EMD General Maintenance: Provides fleet administration, management and maintenance services for the City’s fleet of vehicles and equipment.
• EMD Fuel Services: Allocates comprehensive fuel services for the City's fleet of vehicles and equipment as required by City departments to meet their operational needs and program goals.
• EMD Vehicle Replacement: Ensures systematic vehicle replacement services for the City's fleet of vehicles and equipment as required by City departments to meet their operational needs and program goals as well as provides vehicles that are more reliable and available for service.
Page 173

Information Technology & Innovation
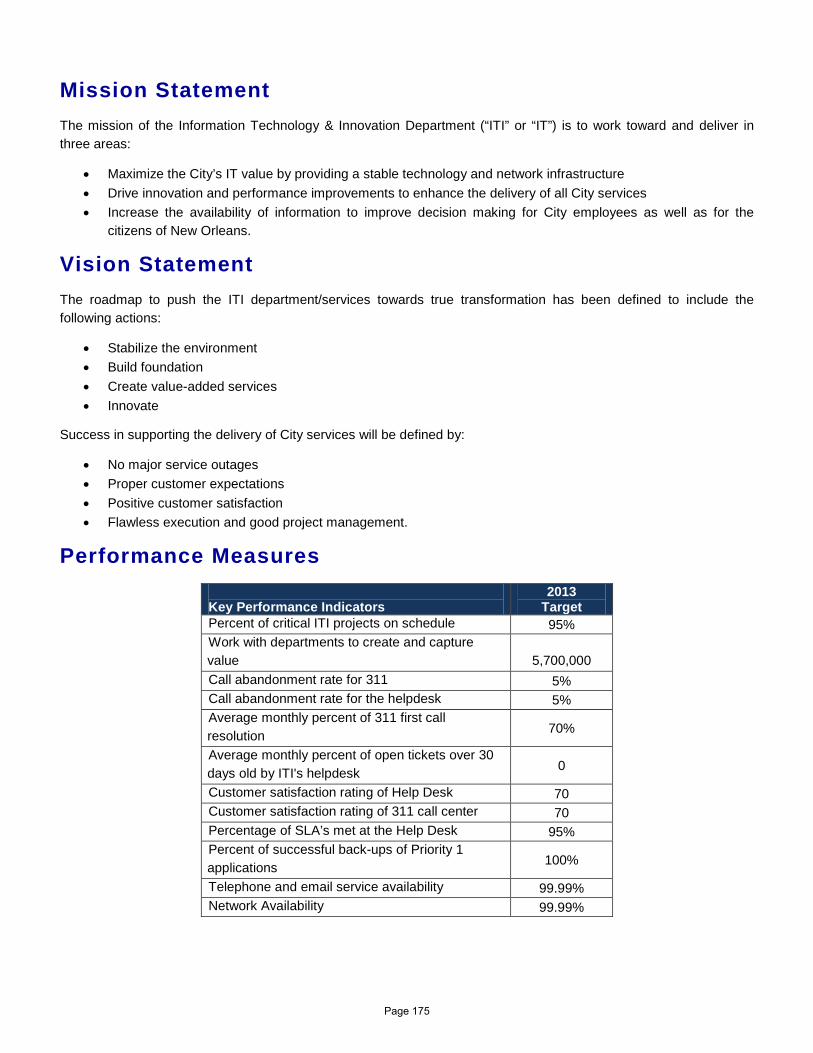
Mission Statement The mission of the Information Technology & Innovation Department (“ITI” or “IT”) is to work toward and deliver in three areas:
• Maximize the City’s IT value by providing a stable technology and network infrastructure • Drive innovation and performance improvements to enhance the delivery of all City services • Increase the availability of information to improve decision making for City employees as well as for the
citizens of New Orleans.
Vision Statement The roadmap to push the ITI department/services towards true transformation has been defined to include the following actions:
• Stabilize the environment • Build foundation • Create value-added services • Innovate
Success in supporting the delivery of City services will be defined by:
• No major service outages • Proper customer expectations • Positive customer satisfaction • Flawless execution and good project management.
Performance Measures Key Performance Indicators
2013 Target
Percent of critical ITI projects on schedule 95% Work with departments to create and capture value
5,700,000
Call abandonment rate for 311 5% Call abandonment rate for the helpdesk 5% Average monthly percent of 311 first call resolution 70%
Average monthly percent of open tickets over 30 days old by ITI's helpdesk 0
Customer satisfaction rating of Help Desk 70 Customer satisfaction rating of 311 call center 70 Percentage of SLA’s met at the Help Desk 95% Percent of successful back-ups of Priority 1 applications 100%
Telephone and email service availability 99.99% Network Availability 99.99%
Page 175
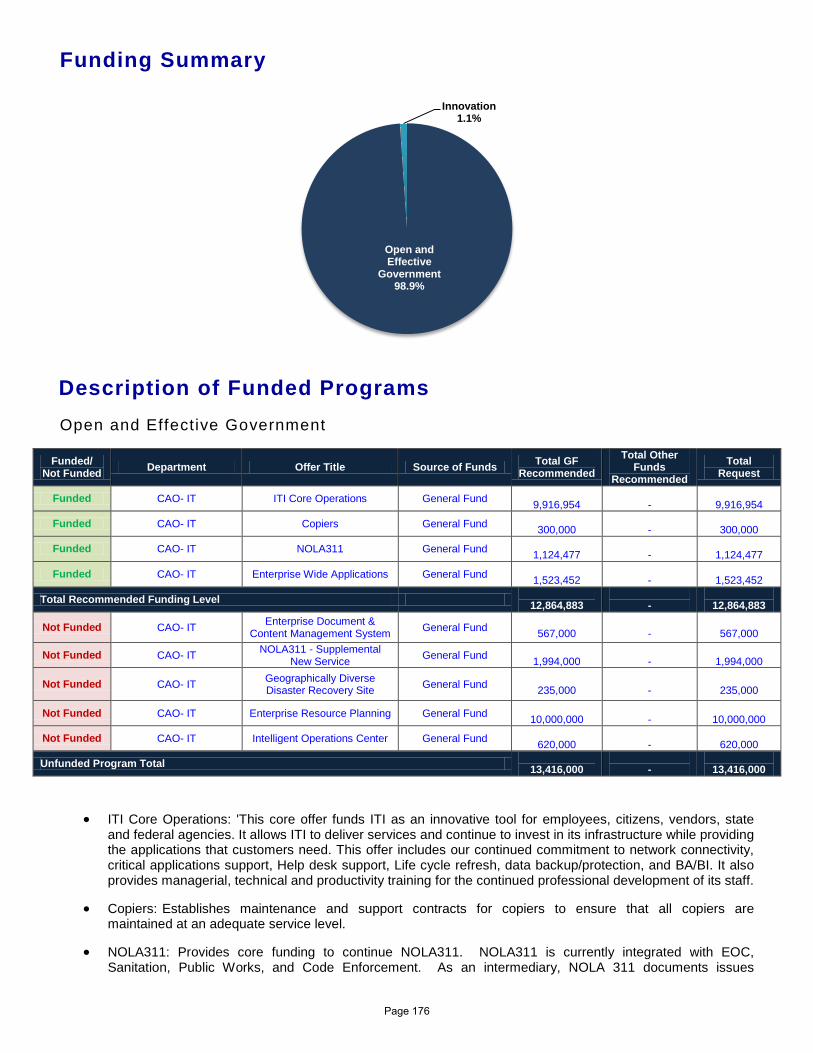
Funding Summary
Description of Funded Programs Open and Effective Government
Funded/ Not Funded Department Offer Title Source of Funds Total GF
Recommended Total Other
Funds Recommended
Total Request
Funded CAO- IT ITI Core Operations General Fund 9,916,954
-
9,916,954
Funded CAO- IT Copiers General Fund 300,000
-
300,000
Funded CAO- IT NOLA311 General Fund 1,124,477
-
1,124,477
Funded CAO- IT Enterprise Wide Applications General Fund 1,523,452
-
1,523,452
Total Recommended Funding Level 12,864,883
-
12,864,883
Not Funded CAO- IT Enterprise Document & Content Management System General Fund
567,000 -
567,000
Not Funded CAO- IT NOLA311 - Supplemental New Service General Fund
1,994,000 -
1,994,000
Not Funded CAO- IT Geographically Diverse Disaster Recovery Site General Fund
235,000 -
235,000
Not Funded CAO- IT Enterprise Resource Planning General Fund 10,000,000
-
10,000,000
Not Funded CAO- IT Intelligent Operations Center General Fund 620,000
-
620,000
Unfunded Program Total 13,416,000
-
13,416,000
• ITI Core Operations: 'This core offer funds ITI as an innovative tool for employees, citizens, vendors, state and federal agencies. It allows ITI to deliver services and continue to invest in its infrastructure while providing the applications that customers need. This offer includes our continued commitment to network connectivity, critical applications support, Help desk support, Life cycle refresh, data backup/protection, and BA/BI. It also provides managerial, technical and productivity training for the continued professional development of its staff.
• Copiers: Establishes maintenance and support contracts for copiers to ensure that all copiers are maintained at an adequate service level.
• NOLA311: Provides core funding to continue NOLA311. NOLA311 is currently integrated with EOC, Sanitation, Public Works, and Code Enforcement. As an intermediary, NOLA 311 documents issues
Open and Effective
Government 98.9%
Innovation 1.1%
[Type
Page 176
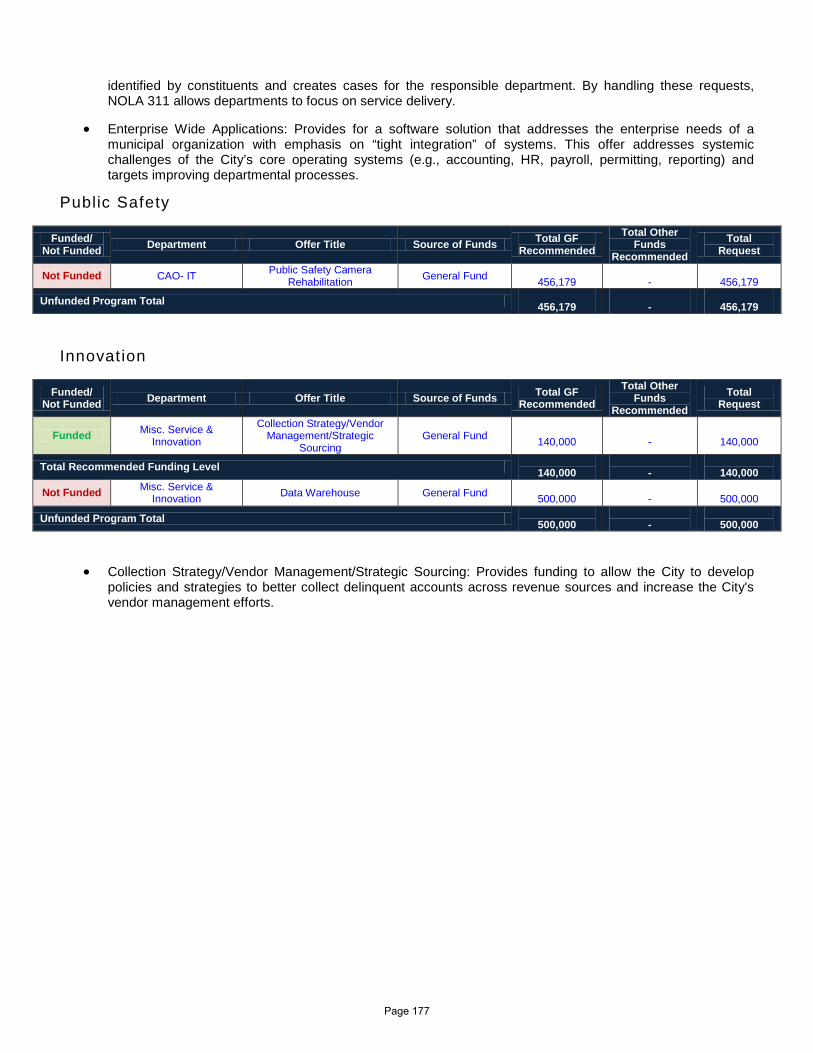
identified by constituents and creates cases for the responsible department. By handling these requests, NOLA 311 allows departments to focus on service delivery.
• Enterprise Wide Applications: Provides for a software solution that addresses the enterprise needs of a municipal organization with emphasis on “tight integration” of systems. This offer addresses systemic challenges of the City’s core operating systems (e.g., accounting, HR, payroll, permitting, reporting) and targets improving departmental processes.
Public Safety
Funded/ Not Funded Department Offer Title Source of Funds Total GF
Recommended Total Other
Funds Recommended
Total Request
Not Funded CAO- IT Public Safety Camera Rehabilitation General Fund
456,179 -
456,179
Unfunded Program Total 456,179
-
456,179
Innovation
Funded/ Not Funded Department Offer Title Source of Funds Total GF
Recommended Total Other
Funds Recommended
Total Request
Funded Misc. Service & Innovation
Collection Strategy/Vendor Management/Strategic
Sourcing General Fund
140,000 -
140,000
Total Recommended Funding Level 140,000
-
140,000
Not Funded Misc. Service & Innovation Data Warehouse General Fund
500,000 -
500,000
Unfunded Program Total 500,000
-
500,000
• Collection Strategy/Vendor Management/Strategic Sourcing: Provides funding to allow the City to develop policies and strategies to better collect delinquent accounts across revenue sources and increase the City's vendor management efforts.
Page 177

Homeland Security (OEP)
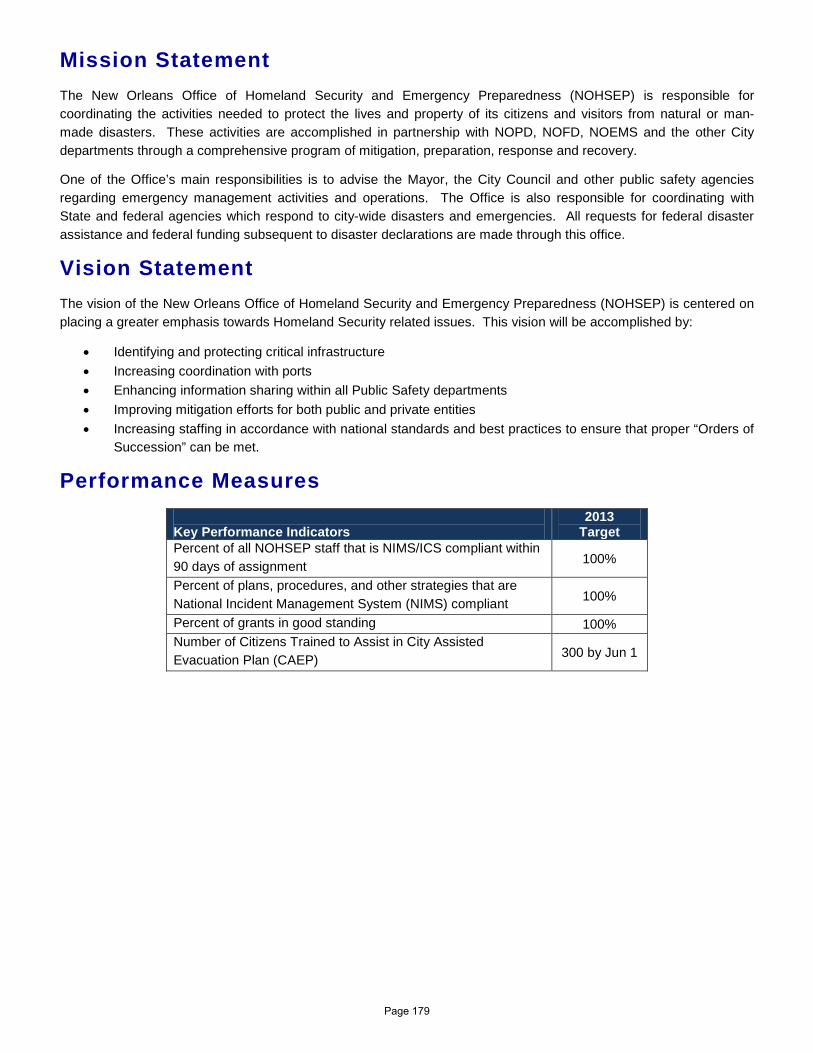
Mission Statement The New Orleans Office of Homeland Security and Emergency Preparedness (NOHSEP) is responsible for coordinating the activities needed to protect the lives and property of its citizens and visitors from natural or man-made disasters. These activities are accomplished in partnership with NOPD, NOFD, NOEMS and the other City departments through a comprehensive program of mitigation, preparation, response and recovery.
One of the Office’s main responsibilities is to advise the Mayor, the City Council and other public safety agencies regarding emergency management activities and operations. The Office is also responsible for coordinating with State and federal agencies which respond to city-wide disasters and emergencies. All requests for federal disaster assistance and federal funding subsequent to disaster declarations are made through this office.
Vision Statement The vision of the New Orleans Office of Homeland Security and Emergency Preparedness (NOHSEP) is centered on placing a greater emphasis towards Homeland Security related issues. This vision will be accomplished by:
• Identifying and protecting critical infrastructure • Increasing coordination with ports • Enhancing information sharing within all Public Safety departments • Improving mitigation efforts for both public and private entities • Increasing staffing in accordance with national standards and best practices to ensure that proper “Orders of
Succession” can be met.
Performance Measures Key Performance Indicators
2013 Target
Percent of all NOHSEP staff that is NIMS/ICS compliant within 90 days of assignment 100%
Percent of plans, procedures, and other strategies that are National Incident Management System (NIMS) compliant 100%
Percent of grants in good standing 100% Number of Citizens Trained to Assist in City Assisted Evacuation Plan (CAEP) 300 by Jun 1
Page 179
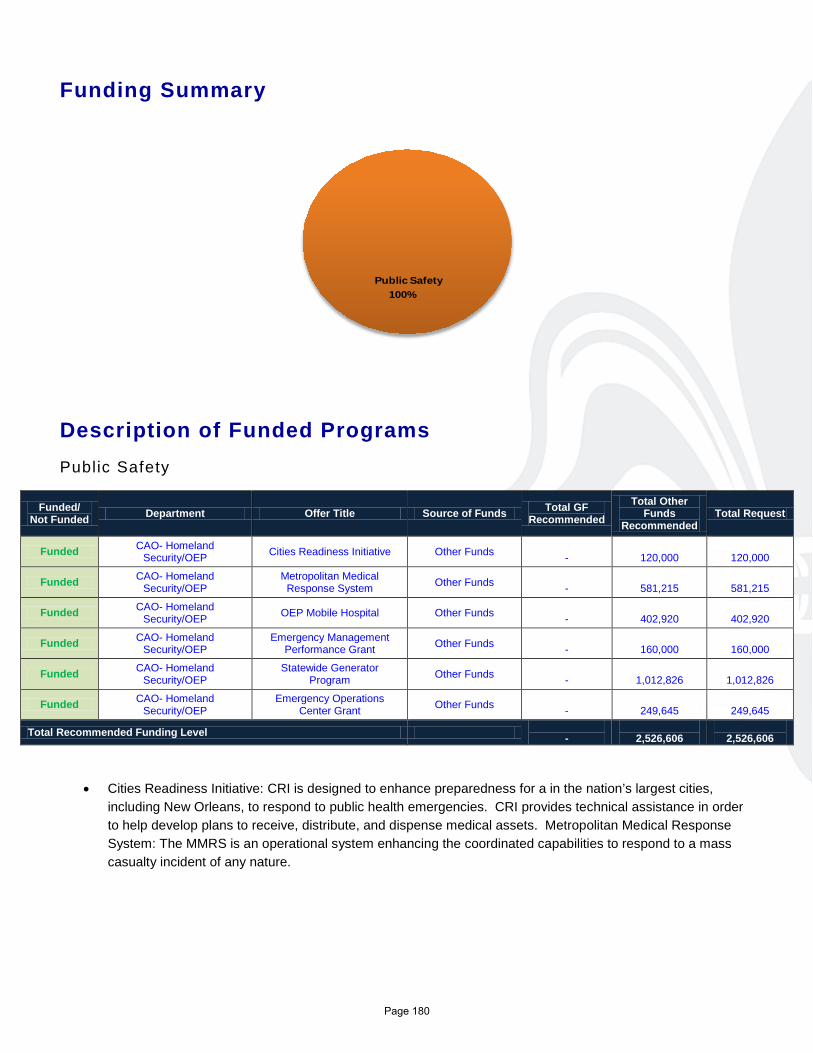
Funding Summary
Description of Funded Programs Public Safety
Funded/ Not Funded Department Offer Title Source of Funds Total GF
Recommended Total Other
Funds Recommended
Total Request
Funded CAO- Homeland Security/OEP Cities Readiness Initiative Other Funds
-
120,000
120,000
Funded CAO- Homeland Security/OEP
Metropolitan Medical Response System Other Funds
-
581,215
581,215
Funded CAO- Homeland Security/OEP OEP Mobile Hospital Other Funds
-
402,920
402,920
Funded CAO- Homeland Security/OEP
Emergency Management Performance Grant Other Funds
-
160,000
160,000
Funded CAO- Homeland Security/OEP
Statewide Generator Program Other Funds
-
1,012,826
1,012,826
Funded CAO- Homeland Security/OEP
Emergency Operations Center Grant Other Funds
-
249,645
249,645
Total Recommended Funding Level -
2,526,606
2,526,606
• Cities Readiness Initiative: CRI is designed to enhance preparedness for a in the nation’s largest cities,
including New Orleans, to respond to public health emergencies. CRI provides technical assistance in order to help develop plans to receive, distribute, and dispense medical assets. Metropolitan Medical Response System: The MMRS is an operational system enhancing the coordinated capabilities to respond to a mass casualty incident of any nature.
Public Safety100%
Page 180
• OEP Mobile Hospital: This earmark grant provides funding to equip a mobile medical hospital that can be deployed during large scale events or mass casualty disasters.
• Emergency Management Performance Grant: The Emergency Management Performance Grant (EMPG) enhances the operations of Emergency Operations by providing funding for personnel, training, exercise and equipment.
• Statewide Generator Program: The Statewide Generator Program provides funding for generators in shelter locations and in public safety sites. So far, generators and/or automatic transfer switches have been installed in City Hall, NOFD Headquarters, 6 shelter locations, and over 20 firehouses.
• Emergency Operations Center Grant: EOC Grant Program provides funding to improve emergency management and preparedness capabilities by supporting flexible, sustainable, secure, strategically located, and fully interoperable EOCs with a focus on addressing identified deficiencies and needs. This program provides funding for construction or renovation of a state, local, or tribal government’s primary EOC.
Page 181
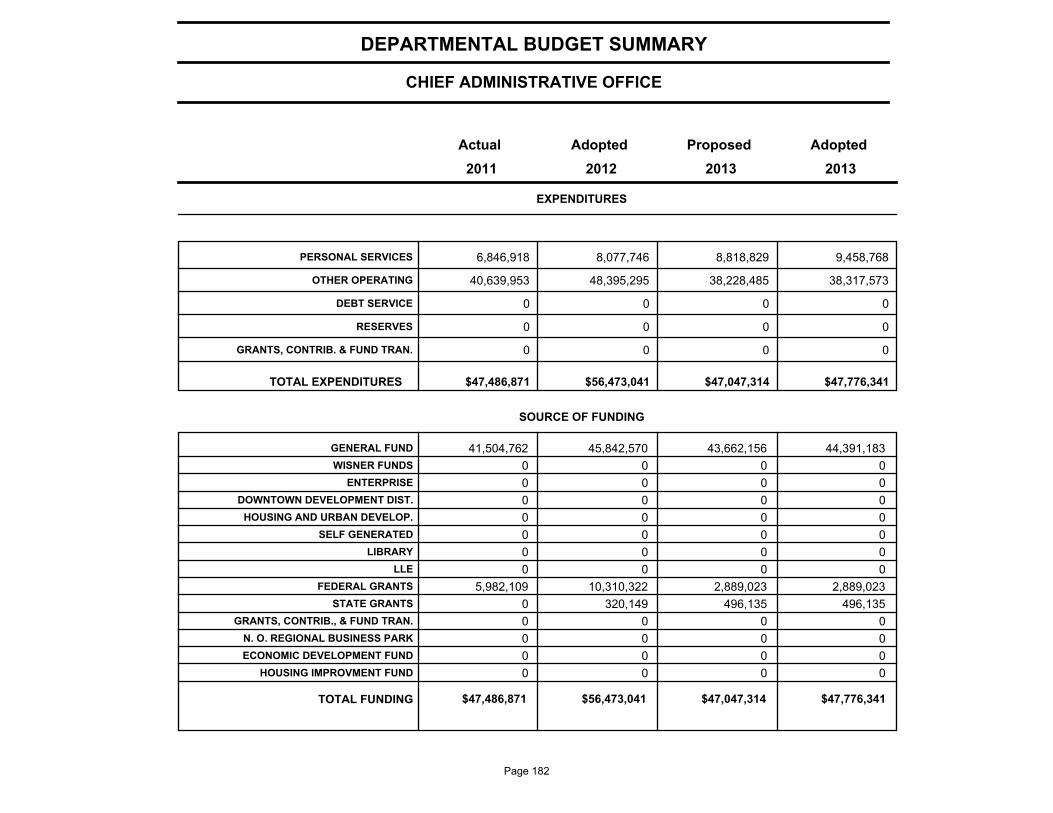
CHIEF ADMINISTRATIVE OFFICE
DEPARTMENTAL BUDGET SUMMARY
AdoptedProposedAdoptedActual
EXPENDITURES
2013 2012 2011 2013
PERSONAL SERVICES 6,846,918 8,077,746 8,818,829 9,458,768
OTHER OPERATING 40,639,953 48,395,295 38,228,485 38,317,573
DEBT SERVICE 0 0 0 0
RESERVES 0 0 0 0
GRANTS, CONTRIB. & FUND TRAN. 0 0 0 0
$47,486,871 $56,473,041 $47,047,314 TOTAL EXPENDITURES $47,776,341
SOURCE OF FUNDING
GENERAL FUND 41,504,762 45,842,570 43,662,156 44,391,183
WISNER FUNDS 0 0 0 0
ENTERPRISE 0 0 0 0
DOWNTOWN DEVELOPMENT DIST. 0 0 0 0
HOUSING AND URBAN DEVELOP. 0 0 0 0
SELF GENERATED 0 0 0 0
LIBRARY 0 0 0 0
LLE 0 0 0 0
FEDERAL GRANTS 5,982,109 10,310,322 2,889,023 2,889,023
STATE GRANTS 0 320,149 496,135 496,135
GRANTS, CONTRIB., & FUND TRAN. 0 0 0 0
N. O. REGIONAL BUSINESS PARK 0 0 0 0
ECONOMIC DEVELOPMENT FUND 0 0 0 0
HOUSING IMPROVMENT FUND 0 0 0 0
$47,486,871 $56,473,041 $47,047,314 TOTAL FUNDING $47,776,341
Page 182
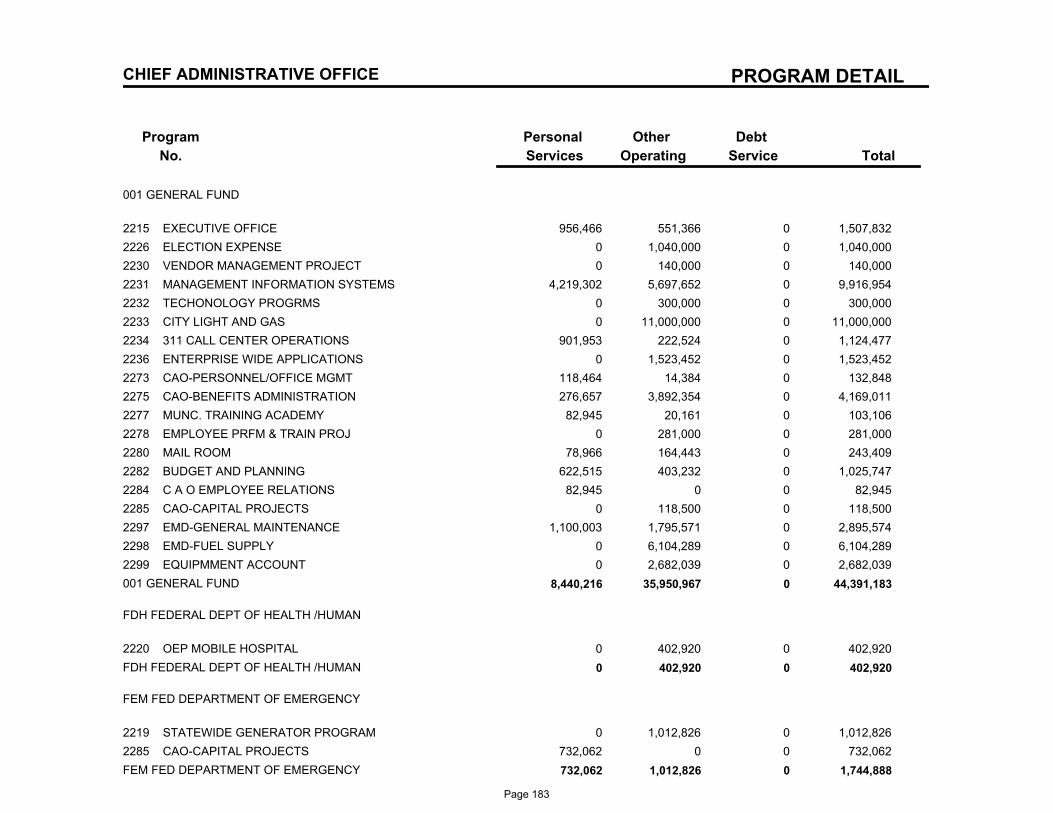
PROGRAM DETAIL
Program
No.
Debt
Service
Other
Operating
Personal
Services Total
CHIEF ADMINISTRATIVE OFFICE
001 GENERAL FUND
2215 EXECUTIVE OFFICE 956,466 551,366 0 1,507,832
2226 ELECTION EXPENSE 0 1,040,000 0 1,040,000
2230 VENDOR MANAGEMENT PROJECT 0 140,000 0 140,000
2231 MANAGEMENT INFORMATION SYSTEMS 4,219,302 5,697,652 0 9,916,954
2232 TECHONOLOGY PROGRMS 0 300,000 0 300,000
2233 CITY LIGHT AND GAS 0 11,000,000 0 11,000,000
2234 311 CALL CENTER OPERATIONS 901,953 222,524 0 1,124,477
2236 ENTERPRISE WIDE APPLICATIONS 0 1,523,452 0 1,523,452
2273 CAO-PERSONNEL/OFFICE MGMT 118,464 14,384 0 132,848
2275 CAO-BENEFITS ADMINISTRATION 276,657 3,892,354 0 4,169,011
2277 MUNC. TRAINING ACADEMY 82,945 20,161 0 103,106
2278 EMPLOYEE PRFM & TRAIN PROJ 0 281,000 0 281,000
2280 MAIL ROOM 78,966 164,443 0 243,409
2282 BUDGET AND PLANNING 622,515 403,232 0 1,025,747
2284 C A O EMPLOYEE RELATIONS 82,945 0 0 82,945
2285 CAO-CAPITAL PROJECTS 0 118,500 0 118,500
2297 EMD-GENERAL MAINTENANCE 1,100,003 1,795,571 0 2,895,574
2298 EMD-FUEL SUPPLY 0 6,104,289 0 6,104,289
2299 EQUIPMMENT ACCOUNT 0 2,682,039 0 2,682,039
001 GENERAL FUND 8,440,216 35,950,967 0 44,391,183
FDH FEDERAL DEPT OF HEALTH /HUMAN
2220 OEP MOBILE HOSPITAL 0 402,920 0 402,920
FDH FEDERAL DEPT OF HEALTH /HUMAN 0 402,920 0 402,920
FEM FED DEPARTMENT OF EMERGENCY
2219 STATEWIDE GENERATOR PROGRAM 0 1,012,826 0 1,012,826
2285 CAO-CAPITAL PROJECTS 732,062 0 0 732,062
FEM FED DEPARTMENT OF EMERGENCY 732,062 1,012,826 0 1,744,888
Page 183
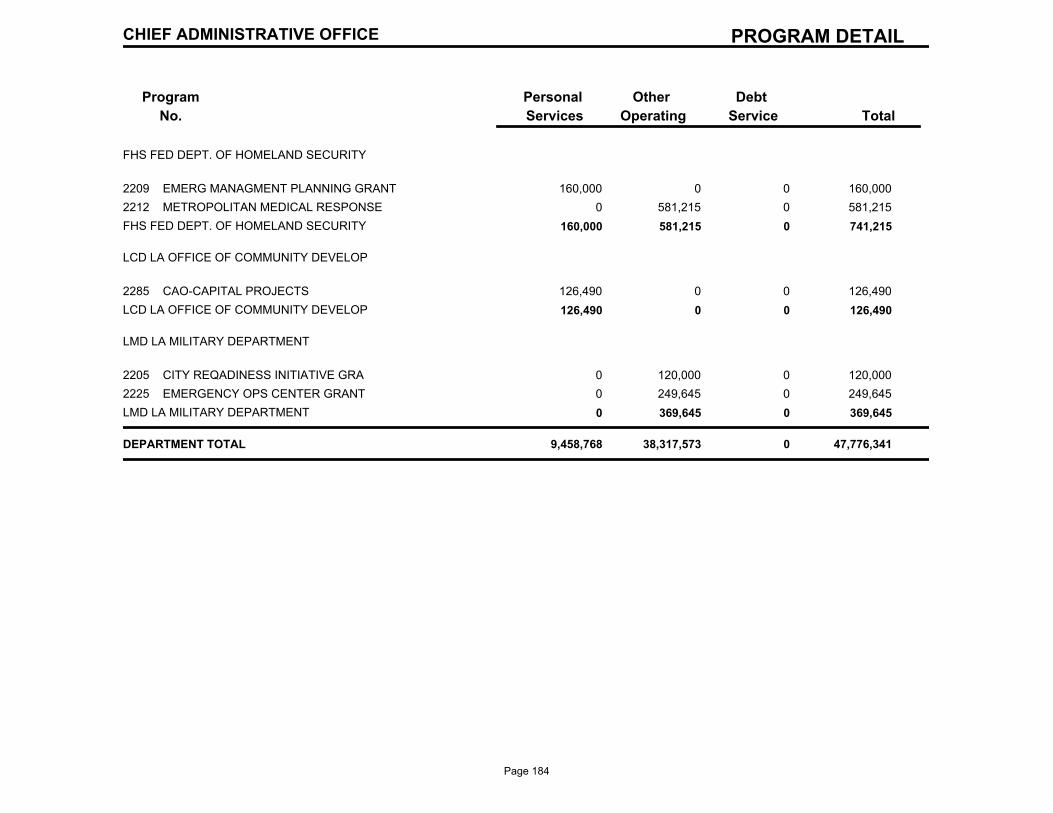
PROGRAM DETAIL
Program
No.
Debt
Service
Other
Operating
Personal
Services Total
CHIEF ADMINISTRATIVE OFFICE
FHS FED DEPT. OF HOMELAND SECURITY
2209 EMERG MANAGMENT PLANNING GRANT 160,000 0 0 160,000
2212 METROPOLITAN MEDICAL RESPONSE 0 581,215 0 581,215
FHS FED DEPT. OF HOMELAND SECURITY 160,000 581,215 0 741,215
LCD LA OFFICE OF COMMUNITY DEVELOP
2285 CAO-CAPITAL PROJECTS 126,490 0 0 126,490
LCD LA OFFICE OF COMMUNITY DEVELOP 126,490 0 0 126,490
LMD LA MILITARY DEPARTMENT
2205 CITY REQADINESS INITIATIVE GRA 0 120,000 0 120,000
2225 EMERGENCY OPS CENTER GRANT 0 249,645 0 249,645
LMD LA MILITARY DEPARTMENT 0 369,645 0 369,645
DEPARTMENT TOTAL 9,458,768 38,317,573 0 47,776,341
Page 184
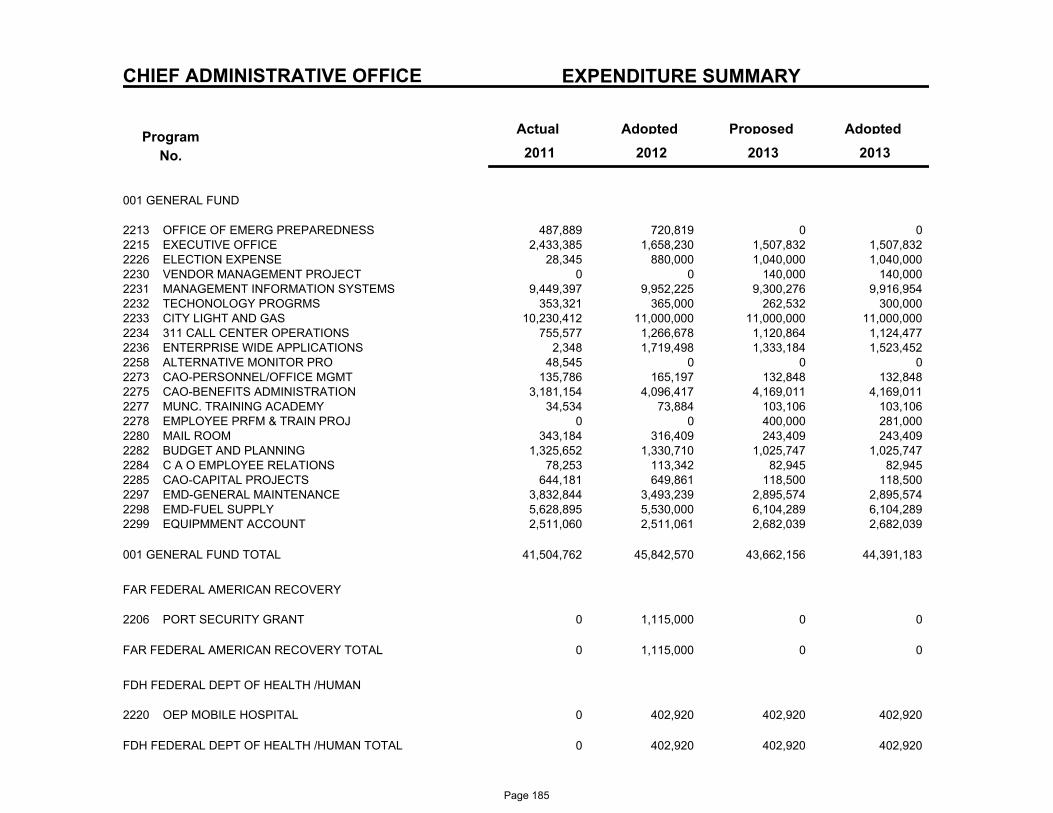
CHIEF ADMINISTRATIVE OFFICE EXPENDITURE SUMMARY
Program
No.
Actual AdoptedProposedAdopted
2013 2011 2012 2013
001 GENERAL FUND
487,889 720,819 0 OFFICE OF EMERG PREPAREDNESS2213 0 2,433,385 1,658,230 1,507,832 EXECUTIVE OFFICE2215 1,507,832
28,345 880,000 1,040,000 ELECTION EXPENSE2226 1,040,000 0 0 140,000 VENDOR MANAGEMENT PROJECT2230 140,000
9,449,397 9,952,225 9,300,276 MANAGEMENT INFORMATION SYSTEMS2231 9,916,954 353,321 365,000 262,532 TECHONOLOGY PROGRMS2232 300,000
10,230,412 11,000,000 11,000,000 CITY LIGHT AND GAS2233 11,000,000 755,577 1,266,678 1,120,864 311 CALL CENTER OPERATIONS2234 1,124,477
2,348 1,719,498 1,333,184 ENTERPRISE WIDE APPLICATIONS2236 1,523,452 48,545 0 0 ALTERNATIVE MONITOR PRO2258 0
135,786 165,197 132,848 CAO-PERSONNEL/OFFICE MGMT2273 132,848 3,181,154 4,096,417 4,169,011 CAO-BENEFITS ADMINISTRATION2275 4,169,011
34,534 73,884 103,106 MUNC. TRAINING ACADEMY2277 103,106 0 0 400,000 EMPLOYEE PRFM & TRAIN PROJ2278 281,000
343,184 316,409 243,409 MAIL ROOM2280 243,409 1,325,652 1,330,710 1,025,747 BUDGET AND PLANNING2282 1,025,747
78,253 113,342 82,945 C A O EMPLOYEE RELATIONS2284 82,945 644,181 649,861 118,500 CAO-CAPITAL PROJECTS2285 118,500
3,832,844 3,493,239 2,895,574 EMD-GENERAL MAINTENANCE2297 2,895,574 5,628,895 5,530,000 6,104,289 EMD-FUEL SUPPLY2298 6,104,289 2,511,060 2,511,061 2,682,039 EQUIPMMENT ACCOUNT2299 2,682,039
41,504,762 45,842,570 43,662,156 44,391,183 001 GENERAL FUND TOTAL
FAR FEDERAL AMERICAN RECOVERY
0 1,115,000 0 PORT SECURITY GRANT2206 0
0 1,115,000 0 0 FAR FEDERAL AMERICAN RECOVERY TOTAL
FDH FEDERAL DEPT OF HEALTH /HUMAN
0 402,920 402,920 OEP MOBILE HOSPITAL2220 402,920
0 402,920 402,920 402,920 FDH FEDERAL DEPT OF HEALTH /HUMAN TOTAL
Page 185
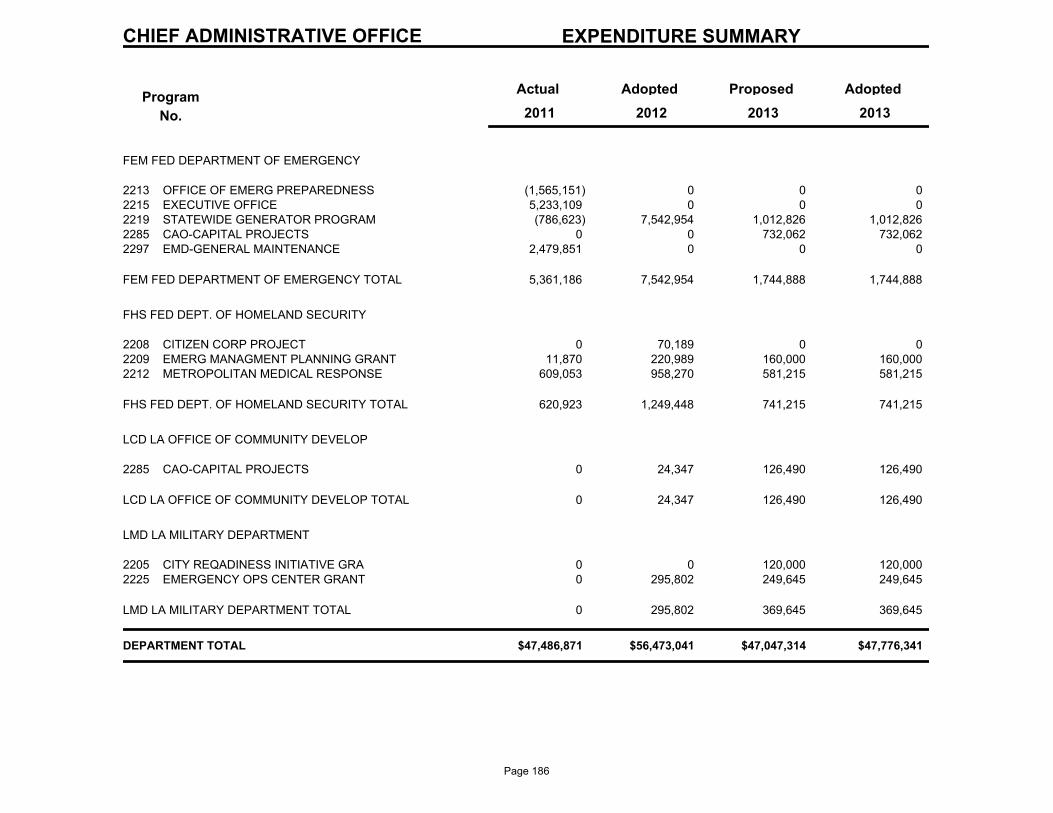
CHIEF ADMINISTRATIVE OFFICE EXPENDITURE SUMMARY
Program
No.
Actual AdoptedProposedAdopted
2013 2011 2012 2013
FEM FED DEPARTMENT OF EMERGENCY
(1,565,151) 0 0 OFFICE OF EMERG PREPAREDNESS2213 0 5,233,109 0 0 EXECUTIVE OFFICE2215 0
(786,623) 7,542,954 1,012,826 STATEWIDE GENERATOR PROGRAM2219 1,012,826 0 0 732,062 CAO-CAPITAL PROJECTS2285 732,062
2,479,851 0 0 EMD-GENERAL MAINTENANCE2297 0
5,361,186 7,542,954 1,744,888 1,744,888 FEM FED DEPARTMENT OF EMERGENCY TOTAL
FHS FED DEPT. OF HOMELAND SECURITY
0 70,189 0 CITIZEN CORP PROJECT2208 0 11,870 220,989 160,000 EMERG MANAGMENT PLANNING GRANT2209 160,000
609,053 958,270 581,215 METROPOLITAN MEDICAL RESPONSE2212 581,215
620,923 1,249,448 741,215 741,215 FHS FED DEPT. OF HOMELAND SECURITY TOTAL
LCD LA OFFICE OF COMMUNITY DEVELOP
0 24,347 126,490 CAO-CAPITAL PROJECTS2285 126,490
0 24,347 126,490 126,490 LCD LA OFFICE OF COMMUNITY DEVELOP TOTAL
LMD LA MILITARY DEPARTMENT
0 0 120,000 CITY REQADINESS INITIATIVE GRA2205 120,000 0 295,802 249,645 EMERGENCY OPS CENTER GRANT2225 249,645
0 295,802 369,645 369,645 LMD LA MILITARY DEPARTMENT TOTAL
$47,486,871 $56,473,041 $47,047,314 $47,776,341 DEPARTMENT TOTAL
Page 186
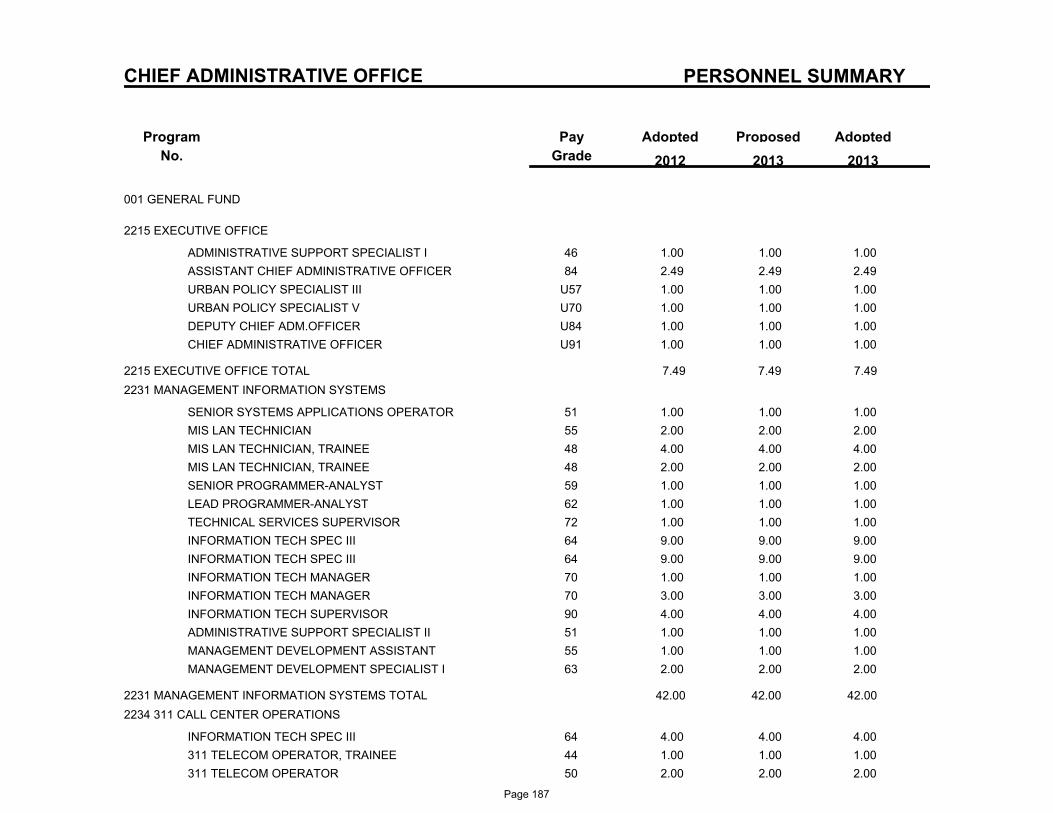
PERSONNEL SUMMARY
Program
No.
ProposedAdoptedPay
Grade
Adopted
2013 2012 2013
CHIEF ADMINISTRATIVE OFFICE
001 GENERAL FUND
2215 EXECUTIVE OFFICE
46ADMINISTRATIVE SUPPORT SPECIALIST I 1.00 1.00 1.00
84ASSISTANT CHIEF ADMINISTRATIVE OFFICER 2.49 2.49 2.49
U57URBAN POLICY SPECIALIST III 1.00 1.00 1.00
U70URBAN POLICY SPECIALIST V 1.00 1.00 1.00
U84DEPUTY CHIEF ADM.OFFICER 1.00 1.00 1.00
U91CHIEF ADMINISTRATIVE OFFICER 1.00 1.00 1.00
2215 EXECUTIVE OFFICE TOTAL 7.49 7.49 7.49
2231 MANAGEMENT INFORMATION SYSTEMS
51SENIOR SYSTEMS APPLICATIONS OPERATOR 1.00 1.00 1.00
55MIS LAN TECHNICIAN 2.00 2.00 2.00
48MIS LAN TECHNICIAN, TRAINEE 4.00 4.00 4.00
48MIS LAN TECHNICIAN, TRAINEE 2.00 2.00 2.00
59SENIOR PROGRAMMER-ANALYST 1.00 1.00 1.00
62LEAD PROGRAMMER-ANALYST 1.00 1.00 1.00
72TECHNICAL SERVICES SUPERVISOR 1.00 1.00 1.00
64INFORMATION TECH SPEC III 9.00 9.00 9.00
64INFORMATION TECH SPEC III 9.00 9.00 9.00
70INFORMATION TECH MANAGER 1.00 1.00 1.00
70INFORMATION TECH MANAGER 3.00 3.00 3.00
90INFORMATION TECH SUPERVISOR 4.00 4.00 4.00
51ADMINISTRATIVE SUPPORT SPECIALIST II 1.00 1.00 1.00
55MANAGEMENT DEVELOPMENT ASSISTANT 1.00 1.00 1.00
63MANAGEMENT DEVELOPMENT SPECIALIST I 2.00 2.00 2.00
2231 MANAGEMENT INFORMATION SYSTEMS TOTAL 42.00 42.00 42.00
2234 311 CALL CENTER OPERATIONS
64INFORMATION TECH SPEC III 4.00 4.00 4.00
44311 TELECOM OPERATOR, TRAINEE 1.00 1.00 1.00
50311 TELECOM OPERATOR 2.00 2.00 2.00
Page 187
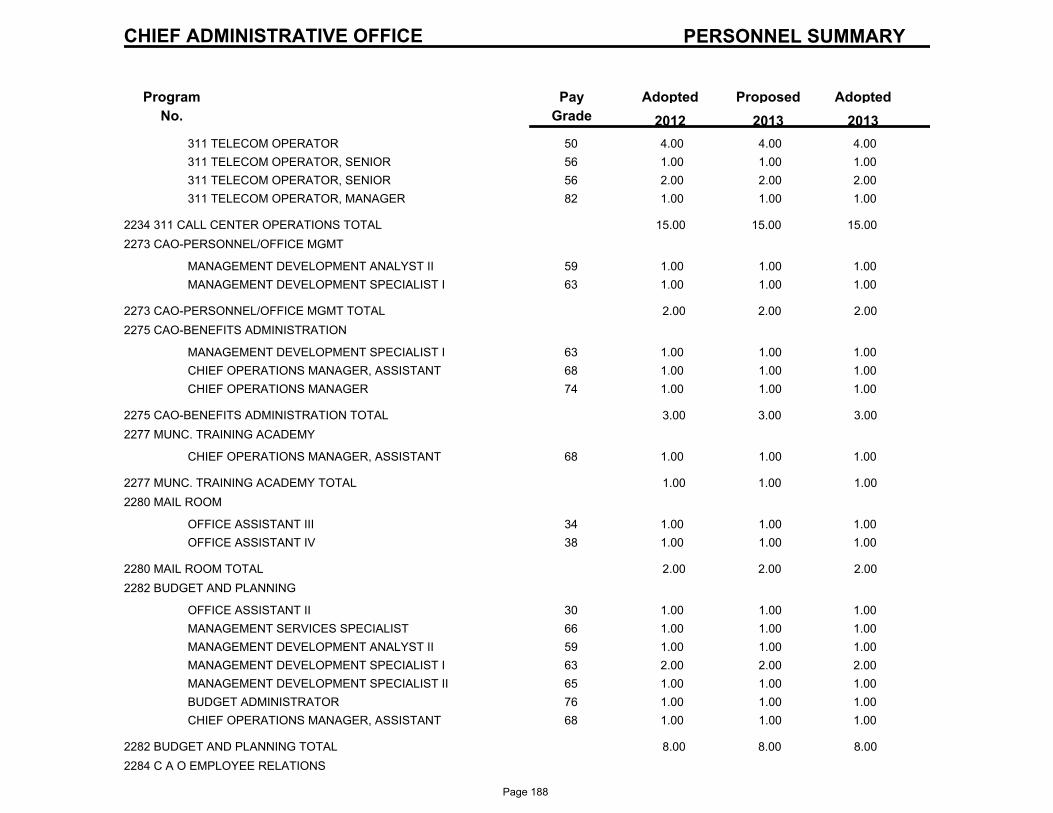
PERSONNEL SUMMARY
Program
No.
ProposedAdoptedPay
Grade
Adopted
2013 2012 2013
CHIEF ADMINISTRATIVE OFFICE
50311 TELECOM OPERATOR 4.00 4.00 4.00
56311 TELECOM OPERATOR, SENIOR 1.00 1.00 1.00
56311 TELECOM OPERATOR, SENIOR 2.00 2.00 2.00
82311 TELECOM OPERATOR, MANAGER 1.00 1.00 1.00
2234 311 CALL CENTER OPERATIONS TOTAL 15.00 15.00 15.00
2273 CAO-PERSONNEL/OFFICE MGMT
59MANAGEMENT DEVELOPMENT ANALYST II 1.00 1.00 1.00
63MANAGEMENT DEVELOPMENT SPECIALIST I 1.00 1.00 1.00
2273 CAO-PERSONNEL/OFFICE MGMT TOTAL 2.00 2.00 2.00
2275 CAO-BENEFITS ADMINISTRATION
63MANAGEMENT DEVELOPMENT SPECIALIST I 1.00 1.00 1.00
68CHIEF OPERATIONS MANAGER, ASSISTANT 1.00 1.00 1.00
74CHIEF OPERATIONS MANAGER 1.00 1.00 1.00
2275 CAO-BENEFITS ADMINISTRATION TOTAL 3.00 3.00 3.00
2277 MUNC. TRAINING ACADEMY
68CHIEF OPERATIONS MANAGER, ASSISTANT 1.00 1.00 1.00
2277 MUNC. TRAINING ACADEMY TOTAL 1.00 1.00 1.00
2280 MAIL ROOM
34OFFICE ASSISTANT III 1.00 1.00 1.00
38OFFICE ASSISTANT IV 1.00 1.00 1.00
2280 MAIL ROOM TOTAL 2.00 2.00 2.00
2282 BUDGET AND PLANNING
30OFFICE ASSISTANT II 1.00 1.00 1.00
66MANAGEMENT SERVICES SPECIALIST 1.00 1.00 1.00
59MANAGEMENT DEVELOPMENT ANALYST II 1.00 1.00 1.00
63MANAGEMENT DEVELOPMENT SPECIALIST I 2.00 2.00 2.00
65MANAGEMENT DEVELOPMENT SPECIALIST II 1.00 1.00 1.00
76BUDGET ADMINISTRATOR 1.00 1.00 1.00
68CHIEF OPERATIONS MANAGER, ASSISTANT 1.00 1.00 1.00
2282 BUDGET AND PLANNING TOTAL 8.00 8.00 8.00
2284 C A O EMPLOYEE RELATIONS
Page 188
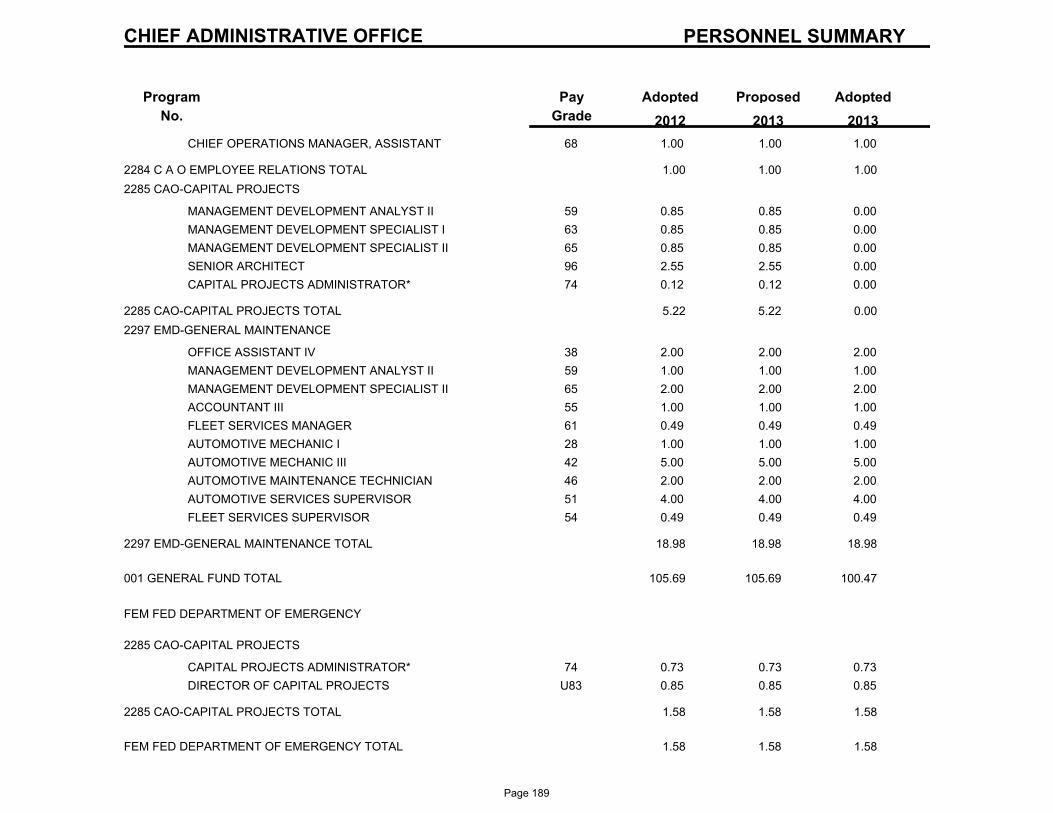
PERSONNEL SUMMARY
Program
No.
ProposedAdoptedPay
Grade
Adopted
2013 2012 2013
CHIEF ADMINISTRATIVE OFFICE
68CHIEF OPERATIONS MANAGER, ASSISTANT 1.00 1.00 1.00
2284 C A O EMPLOYEE RELATIONS TOTAL 1.00 1.00 1.00
2285 CAO-CAPITAL PROJECTS
59MANAGEMENT DEVELOPMENT ANALYST II 0.85 0.85 0.00
63MANAGEMENT DEVELOPMENT SPECIALIST I 0.85 0.85 0.00
65MANAGEMENT DEVELOPMENT SPECIALIST II 0.85 0.85 0.00
96SENIOR ARCHITECT 2.55 2.55 0.00
74CAPITAL PROJECTS ADMINISTRATOR* 0.12 0.12 0.00
2285 CAO-CAPITAL PROJECTS TOTAL 5.22 5.22 0.00
2297 EMD-GENERAL MAINTENANCE
38OFFICE ASSISTANT IV 2.00 2.00 2.00
59MANAGEMENT DEVELOPMENT ANALYST II 1.00 1.00 1.00
65MANAGEMENT DEVELOPMENT SPECIALIST II 2.00 2.00 2.00
55ACCOUNTANT III 1.00 1.00 1.00
61FLEET SERVICES MANAGER 0.49 0.49 0.49
28AUTOMOTIVE MECHANIC I 1.00 1.00 1.00
42AUTOMOTIVE MECHANIC III 5.00 5.00 5.00
46AUTOMOTIVE MAINTENANCE TECHNICIAN 2.00 2.00 2.00
51AUTOMOTIVE SERVICES SUPERVISOR 4.00 4.00 4.00
54FLEET SERVICES SUPERVISOR 0.49 0.49 0.49
2297 EMD-GENERAL MAINTENANCE TOTAL 18.98 18.98 18.98
001 GENERAL FUND TOTAL 105.69 105.69 100.47
FEM FED DEPARTMENT OF EMERGENCY
2285 CAO-CAPITAL PROJECTS
74CAPITAL PROJECTS ADMINISTRATOR* 0.73 0.73 0.73
U83DIRECTOR OF CAPITAL PROJECTS 0.85 0.85 0.85
2285 CAO-CAPITAL PROJECTS TOTAL 1.58 1.58 1.58
FEM FED DEPARTMENT OF EMERGENCY TOTAL 1.58 1.58 1.58
Page 189
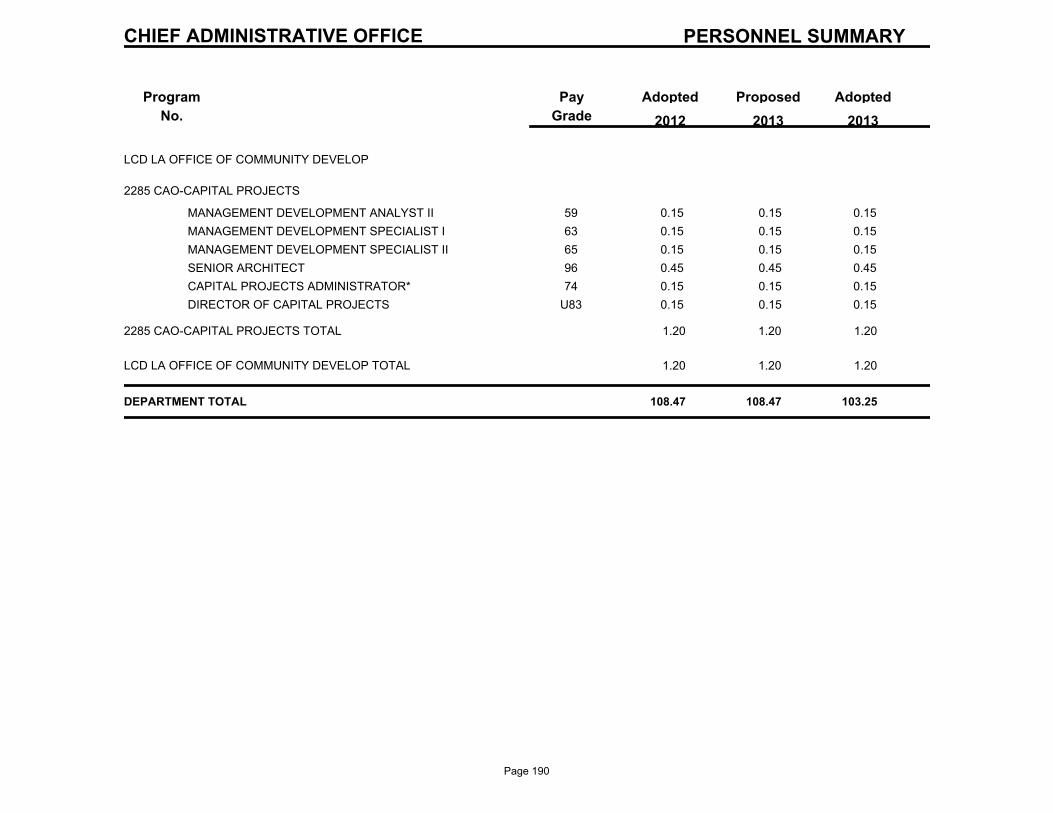
PERSONNEL SUMMARY
Program
No.
ProposedAdoptedPay
Grade
Adopted
2013 2012 2013
CHIEF ADMINISTRATIVE OFFICE
LCD LA OFFICE OF COMMUNITY DEVELOP
2285 CAO-CAPITAL PROJECTS
59MANAGEMENT DEVELOPMENT ANALYST II 0.15 0.15 0.15
63MANAGEMENT DEVELOPMENT SPECIALIST I 0.15 0.15 0.15
65MANAGEMENT DEVELOPMENT SPECIALIST II 0.15 0.15 0.15
96SENIOR ARCHITECT 0.45 0.45 0.45
74CAPITAL PROJECTS ADMINISTRATOR* 0.15 0.15 0.15
U83DIRECTOR OF CAPITAL PROJECTS 0.15 0.15 0.15
2285 CAO-CAPITAL PROJECTS TOTAL 1.20 1.20 1.20
LCD LA OFFICE OF COMMUNITY DEVELOP TOTAL 1.20 1.20 1.20
DEPARTMENT TOTAL 108.47 108.47 103.25
Page 190

Page 191

Law Department
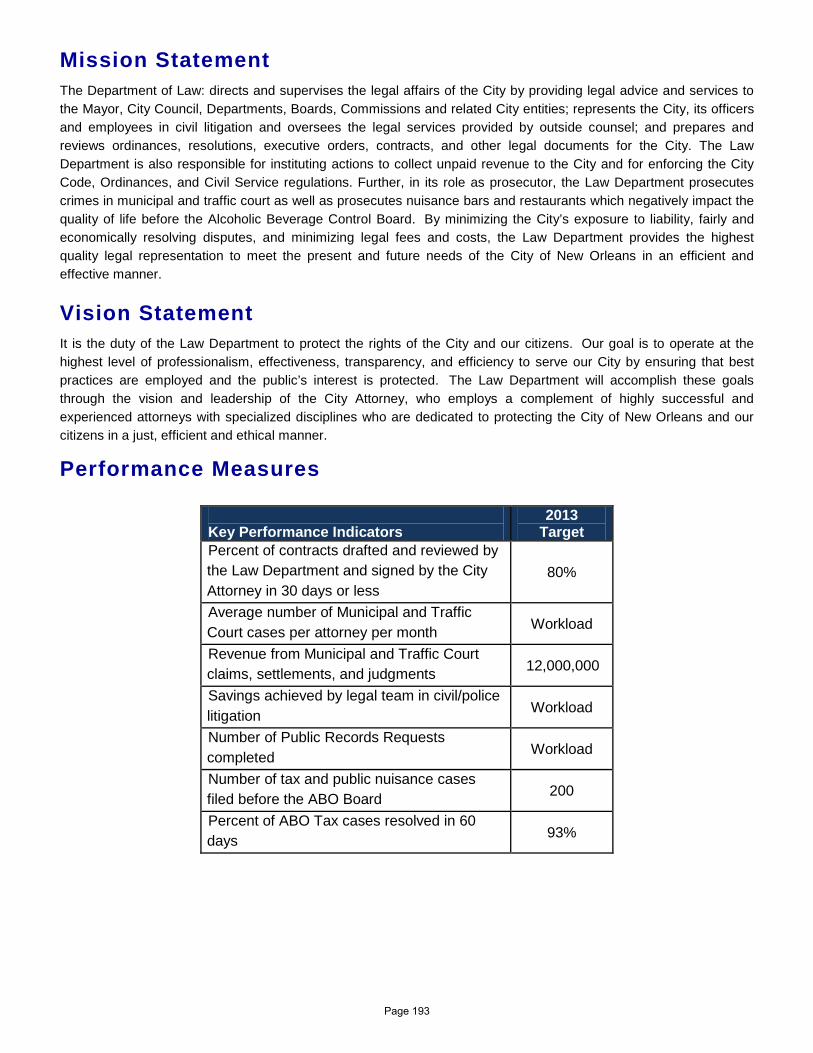
Mission Statement The Department of Law: directs and supervises the legal affairs of the City by providing legal advice and services to the Mayor, City Council, Departments, Boards, Commissions and related City entities; represents the City, its officers and employees in civil litigation and oversees the legal services provided by outside counsel; and prepares and reviews ordinances, resolutions, executive orders, contracts, and other legal documents for the City. The Law Department is also responsible for instituting actions to collect unpaid revenue to the City and for enforcing the City Code, Ordinances, and Civil Service regulations. Further, in its role as prosecutor, the Law Department prosecutes crimes in municipal and traffic court as well as prosecutes nuisance bars and restaurants which negatively impact the quality of life before the Alcoholic Beverage Control Board. By minimizing the City’s exposure to liability, fairly and economically resolving disputes, and minimizing legal fees and costs, the Law Department provides the highest quality legal representation to meet the present and future needs of the City of New Orleans in an efficient and effective manner.
Vision Statement It is the duty of the Law Department to protect the rights of the City and our citizens. Our goal is to operate at the highest level of professionalism, effectiveness, transparency, and efficiency to serve our City by ensuring that best practices are employed and the public’s interest is protected. The Law Department will accomplish these goals through the vision and leadership of the City Attorney, who employs a complement of highly successful and experienced attorneys with specialized disciplines who are dedicated to protecting the City of New Orleans and our citizens in a just, efficient and ethical manner.
Performance Measures
Key Performance Indicators
2013 Target
Percent of contracts drafted and reviewed by the Law Department and signed by the City Attorney in 30 days or less
80%
Average number of Municipal and Traffic Court cases per attorney per month Workload
Revenue from Municipal and Traffic Court claims, settlements, and judgments 12,000,000
Savings achieved by legal team in civil/police litigation Workload
Number of Public Records Requests completed Workload
Number of tax and public nuisance cases filed before the ABO Board 200
Percent of ABO Tax cases resolved in 60 days 93%
Page 193
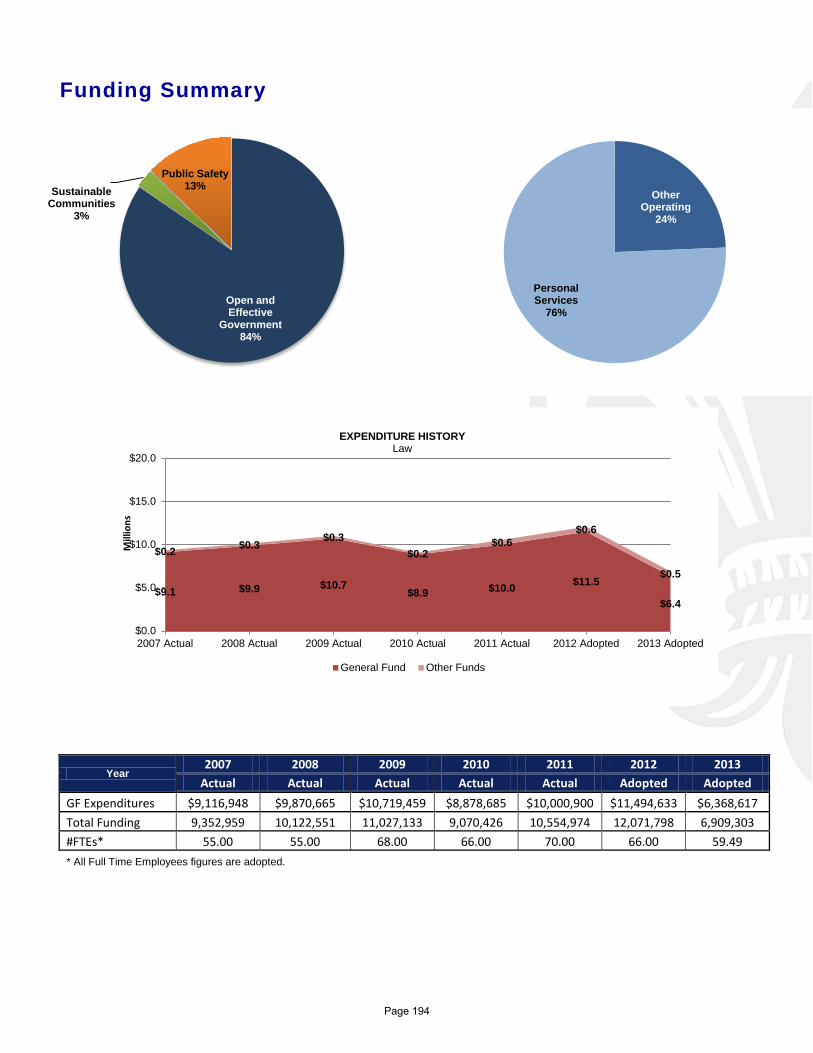
Funding Summary
Year 2007 2008 2009 2010 2011 2012 2013
Actual Actual Actual Actual Actual Adopted Adopted GF Expenditures $9,116,948 $9,870,665 $10,719,459 $8,878,685 $10,000,900 $11,494,633 $6,368,617 Total Funding 9,352,959 10,122,551 11,027,133 9,070,426 10,554,974 12,071,798 6,909,303 #FTEs* 55.00 55.00 68.00 66.00 70.00 66.00 59.49 * All Full Time Employees figures are adopted.
$9.1 $9.9 $10.7 $8.9 $10.0 $11.5
$6.4
$0.2 $0.3 $0.3
$0.2 $0.6
$0.6
$0.5
$0.0
$5.0
$10.0
$15.0
$20.0
2007 Actual 2008 Actual 2009 Actual 2010 Actual 2011 Actual 2012 Adopted 2013 Adopted
Mill
ions
EXPENDITURE HISTORY Law
General Fund Other Funds
Open and Effective
Government 84%
Sustainable Communities
3%
Public Safety 13%
Other Operating
24%
Personal Services
76%
Page 194
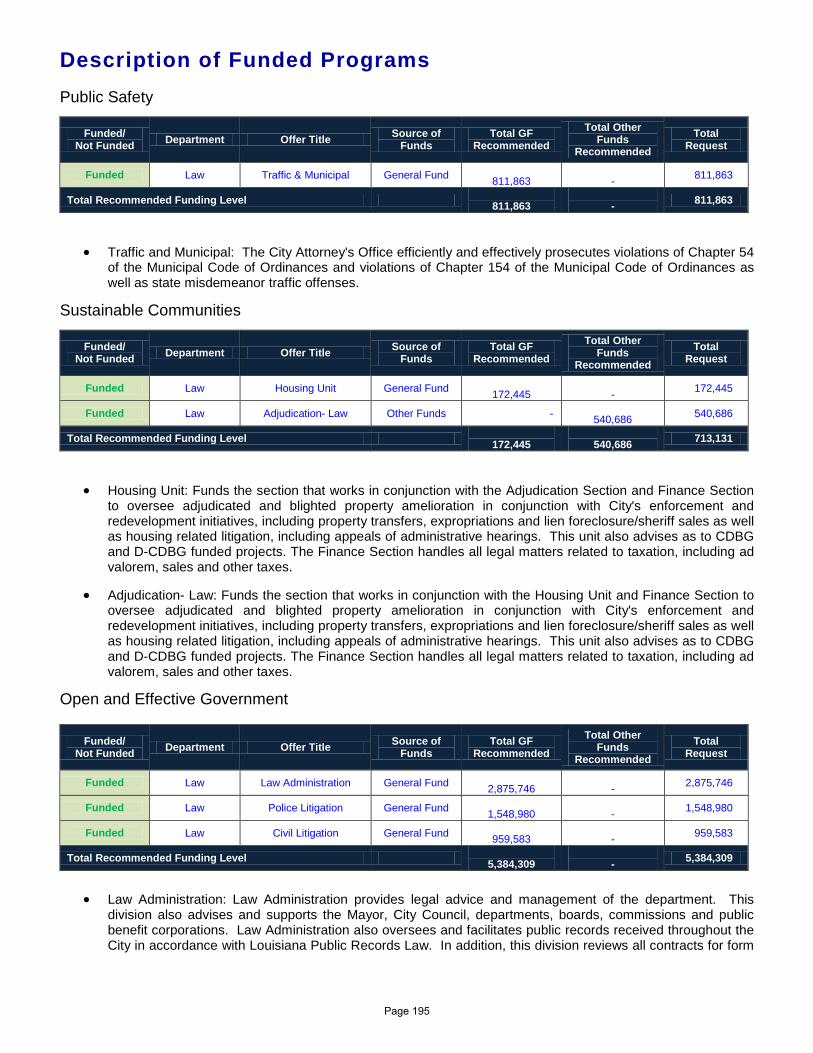
Description of Funded Programs Public Safety
Funded/ Not Funded Department Offer Title Source of
Funds Total GF
Recommended Total Other
Funds Recommended
Total Request
Funded Law Traffic & Municipal General Fund 811,863
- 811,863
Total Recommended Funding Level 811,863
- 811,863
• Traffic and Municipal: The City Attorney's Office efficiently and effectively prosecutes violations of Chapter 54 of the Municipal Code of Ordinances and violations of Chapter 154 of the Municipal Code of Ordinances as well as state misdemeanor traffic offenses.
Sustainable Communities
Funded/ Not Funded Department Offer Title Source of
Funds Total GF
Recommended Total Other
Funds Recommended
Total Request
Funded Law Housing Unit General Fund 172,445
- 172,445
Funded Law Adjudication- Law Other Funds - 540,686 540,686
Total Recommended Funding Level 172,445
540,686 713,131
• Housing Unit: Funds the section that works in conjunction with the Adjudication Section and Finance Section to oversee adjudicated and blighted property amelioration in conjunction with City's enforcement and redevelopment initiatives, including property transfers, expropriations and lien foreclosure/sheriff sales as well as housing related litigation, including appeals of administrative hearings. This unit also advises as to CDBG and D-CDBG funded projects. The Finance Section handles all legal matters related to taxation, including ad valorem, sales and other taxes.
• Adjudication- Law: Funds the section that works in conjunction with the Housing Unit and Finance Section to oversee adjudicated and blighted property amelioration in conjunction with City's enforcement and redevelopment initiatives, including property transfers, expropriations and lien foreclosure/sheriff sales as well as housing related litigation, including appeals of administrative hearings. This unit also advises as to CDBG and D-CDBG funded projects. The Finance Section handles all legal matters related to taxation, including ad valorem, sales and other taxes.
Open and Effective Government
Funded/ Not Funded Department Offer Title Source of
Funds Total GF
Recommended Total Other
Funds Recommended
Total Request
Funded Law Law Administration General Fund 2,875,746
- 2,875,746
Funded Law Police Litigation General Fund 1,548,980
- 1,548,980
Funded Law Civil Litigation General Fund 959,583
- 959,583
Total Recommended Funding Level 5,384,309
- 5,384,309
• Law Administration: Law Administration provides legal advice and management of the department. This
division also advises and supports the Mayor, City Council, departments, boards, commissions and public benefit corporations. Law Administration also oversees and facilitates public records received throughout the City in accordance with Louisiana Public Records Law. In addition, this division reviews all contracts for form
Page 195

and legality and advises on contracting and procurement issues. Finally, Law Administration prosecutes Alcoholic Beverage Outlets before the ABO board.
• Police Litigation: Police litigation defends the Police and the City in police related matters and represents the city in other federal litigation and civil service prosecution and appeals.
• Civil Litigation: The Civil Litigation unit defends the City against all lawsuits, including class actions, personal injury claims, casualty claims, contract and bid disputes, property damage, and zoning and other administrative appeals. The civil litigation unit also prosecutes damages claims and proactively pursues collection of unpaid taxes and loans owed to the City.
Page 196

LAW
DEPARTMENTAL BUDGET SUMMARY
AdoptedProposedAdoptedActual
EXPENDITURES
2013 2012 2011 2013
PERSONAL SERVICES 5,589,507 5,750,630 5,358,833 5,358,833
OTHER OPERATING 4,965,467 6,321,168 1,550,470 1,550,470
DEBT SERVICE 0 0 0 0
RESERVES 0 0 0 0
GRANTS, CONTRIB. & FUND TRAN. 0 0 0 0
$10,554,974 $12,071,798 $6,909,303 TOTAL EXPENDITURES $6,909,303
SOURCE OF FUNDING
GENERAL FUND 10,000,900 11,494,633 6,368,617 6,368,617
WISNER FUNDS 0 0 0 0
ENTERPRISE 0 0 0 0
DOWNTOWN DEVELOPMENT DIST. 0 0 0 0
HOUSING AND URBAN DEVELOP. 0 0 0 0
SELF GENERATED 0 0 0 0
LIBRARY 0 0 0 0
LLE 0 0 0 0
FEDERAL GRANTS 38,154 40,337 0 0
STATE GRANTS 0 0 0 0
GRANTS, CONTRIB., & FUND TRAN. 0 0 0 0
N. O. REGIONAL BUSINESS PARK 0 0 0 0
ECONOMIC DEVELOPMENT FUND 0 0 0 0
HOUSING IMPROVMENT FUND 515,920 536,828 540,686 540,686
$10,554,974 $12,071,798 $6,909,303 TOTAL FUNDING $6,909,303
Page 197
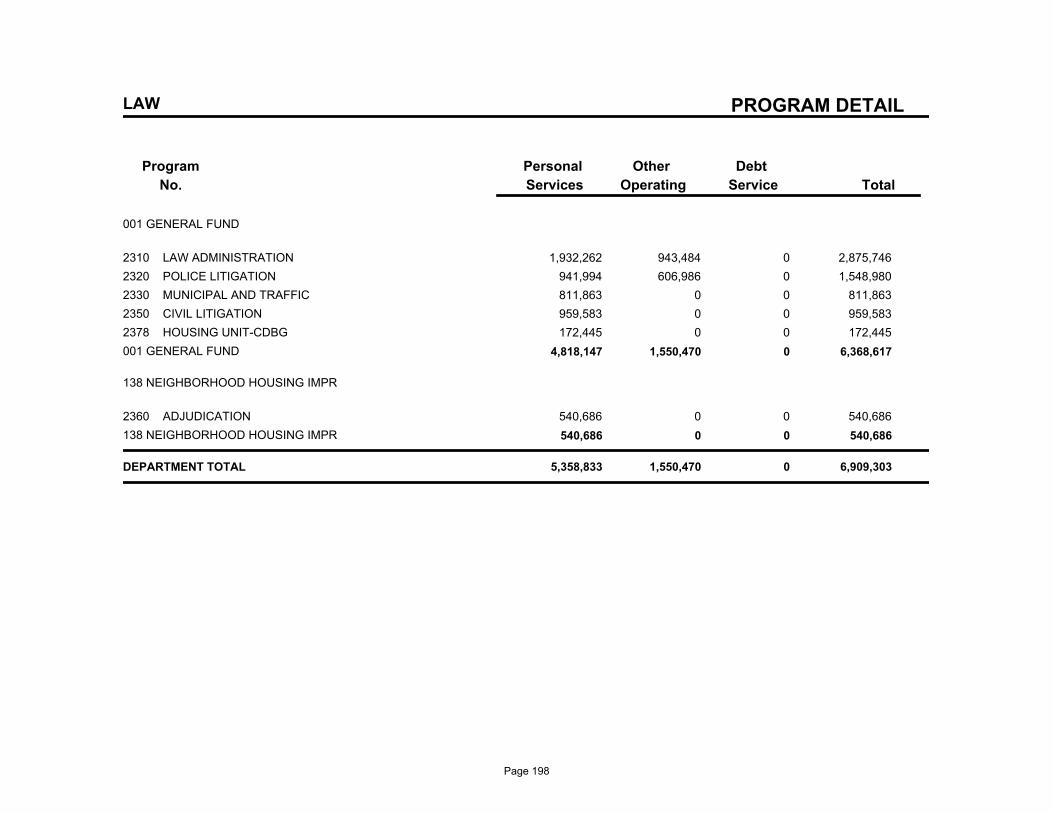
PROGRAM DETAIL
Program
No.
Debt
Service
Other
Operating
Personal
Services Total
LAW
001 GENERAL FUND
2310 LAW ADMINISTRATION 1,932,262 943,484 0 2,875,746
2320 POLICE LITIGATION 941,994 606,986 0 1,548,980
2330 MUNICIPAL AND TRAFFIC 811,863 0 0 811,863
2350 CIVIL LITIGATION 959,583 0 0 959,583
2378 HOUSING UNIT-CDBG 172,445 0 0 172,445
001 GENERAL FUND 4,818,147 1,550,470 0 6,368,617
138 NEIGHBORHOOD HOUSING IMPR
2360 ADJUDICATION 540,686 0 0 540,686
138 NEIGHBORHOOD HOUSING IMPR 540,686 0 0 540,686
DEPARTMENT TOTAL 5,358,833 1,550,470 0 6,909,303
Page 198
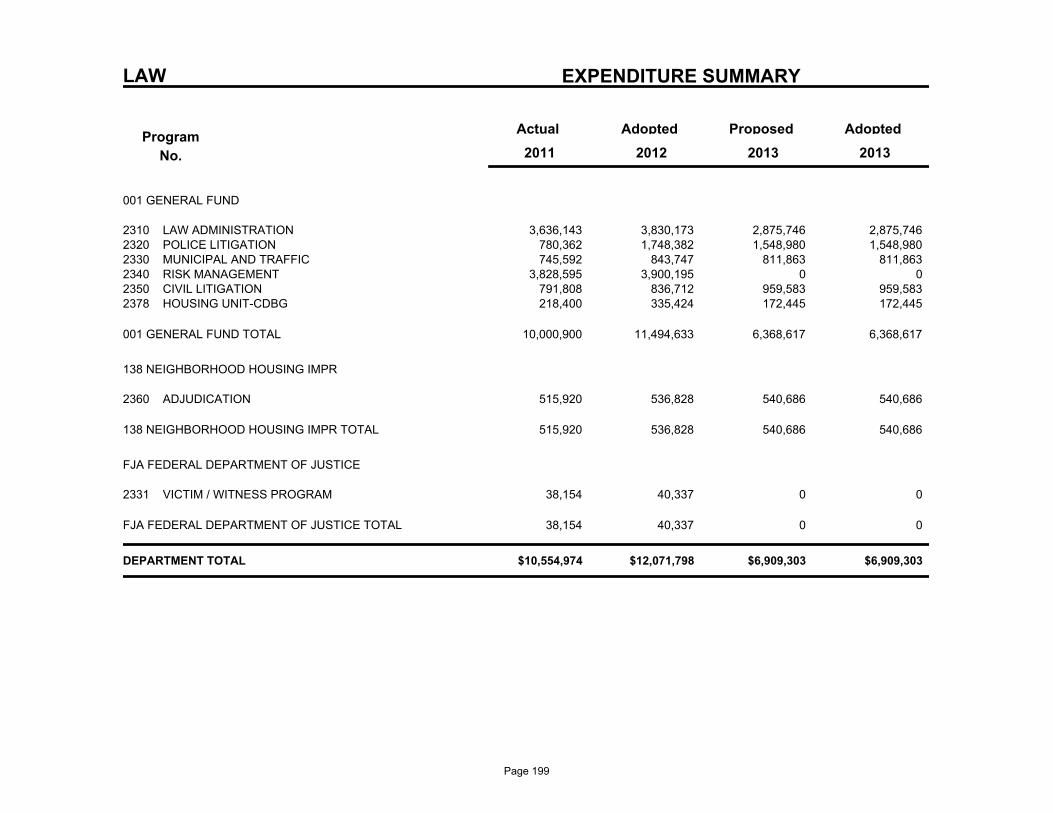
LAW EXPENDITURE SUMMARY
Program
No.
Actual AdoptedProposedAdopted
2013 2011 2012 2013
001 GENERAL FUND
3,636,143 3,830,173 2,875,746 LAW ADMINISTRATION2310 2,875,746 780,362 1,748,382 1,548,980 POLICE LITIGATION2320 1,548,980 745,592 843,747 811,863 MUNICIPAL AND TRAFFIC2330 811,863
3,828,595 3,900,195 0 RISK MANAGEMENT2340 0 791,808 836,712 959,583 CIVIL LITIGATION2350 959,583 218,400 335,424 172,445 HOUSING UNIT-CDBG2378 172,445
10,000,900 11,494,633 6,368,617 6,368,617 001 GENERAL FUND TOTAL
138 NEIGHBORHOOD HOUSING IMPR
515,920 536,828 540,686 ADJUDICATION2360 540,686
515,920 536,828 540,686 540,686 138 NEIGHBORHOOD HOUSING IMPR TOTAL
FJA FEDERAL DEPARTMENT OF JUSTICE
38,154 40,337 0 VICTIM / WITNESS PROGRAM2331 0
38,154 40,337 0 0 FJA FEDERAL DEPARTMENT OF JUSTICE TOTAL
$10,554,974 $12,071,798 $6,909,303 $6,909,303 DEPARTMENT TOTAL
Page 199
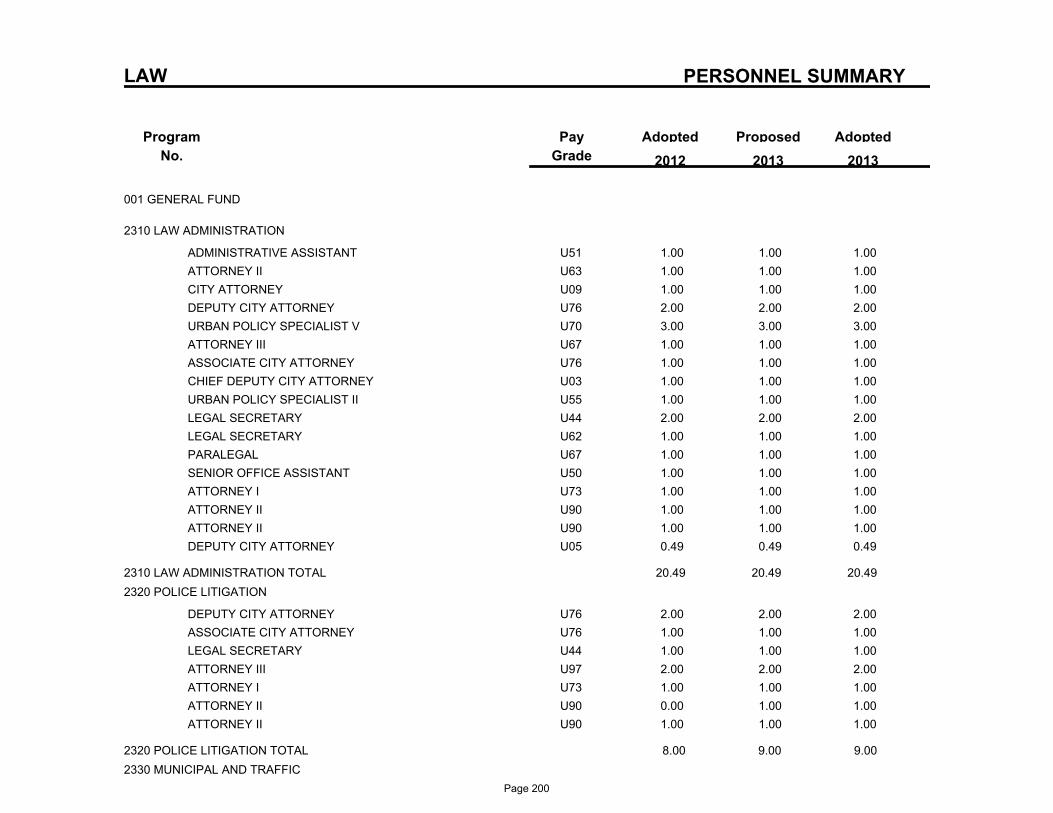
PERSONNEL SUMMARY
Program
No.
ProposedAdoptedPay
Grade
Adopted
2013 2012 2013
LAW
001 GENERAL FUND
2310 LAW ADMINISTRATION
U51ADMINISTRATIVE ASSISTANT 1.00 1.00 1.00
U63ATTORNEY II 1.00 1.00 1.00
U09CITY ATTORNEY 1.00 1.00 1.00
U76DEPUTY CITY ATTORNEY 2.00 2.00 2.00
U70URBAN POLICY SPECIALIST V 3.00 3.00 3.00
U67ATTORNEY III 1.00 1.00 1.00
U76ASSOCIATE CITY ATTORNEY 1.00 1.00 1.00
U03CHIEF DEPUTY CITY ATTORNEY 1.00 1.00 1.00
U55URBAN POLICY SPECIALIST II 1.00 1.00 1.00
U44LEGAL SECRETARY 2.00 2.00 2.00
U62LEGAL SECRETARY 1.00 1.00 1.00
U67PARALEGAL 1.00 1.00 1.00
U50SENIOR OFFICE ASSISTANT 1.00 1.00 1.00
U73ATTORNEY I 1.00 1.00 1.00
U90ATTORNEY II 1.00 1.00 1.00
U90ATTORNEY II 1.00 1.00 1.00
U05DEPUTY CITY ATTORNEY 0.49 0.49 0.49
2310 LAW ADMINISTRATION TOTAL 20.49 20.49 20.49
2320 POLICE LITIGATION
U76DEPUTY CITY ATTORNEY 2.00 2.00 2.00
U76ASSOCIATE CITY ATTORNEY 1.00 1.00 1.00
U44LEGAL SECRETARY 1.00 1.00 1.00
U97ATTORNEY III 2.00 2.00 2.00
U73ATTORNEY I 1.00 1.00 1.00
U90ATTORNEY II 0.00 1.00 1.00
U90ATTORNEY II 1.00 1.00 1.00
2320 POLICE LITIGATION TOTAL 8.00 9.00 9.00
2330 MUNICIPAL AND TRAFFIC
Page 200
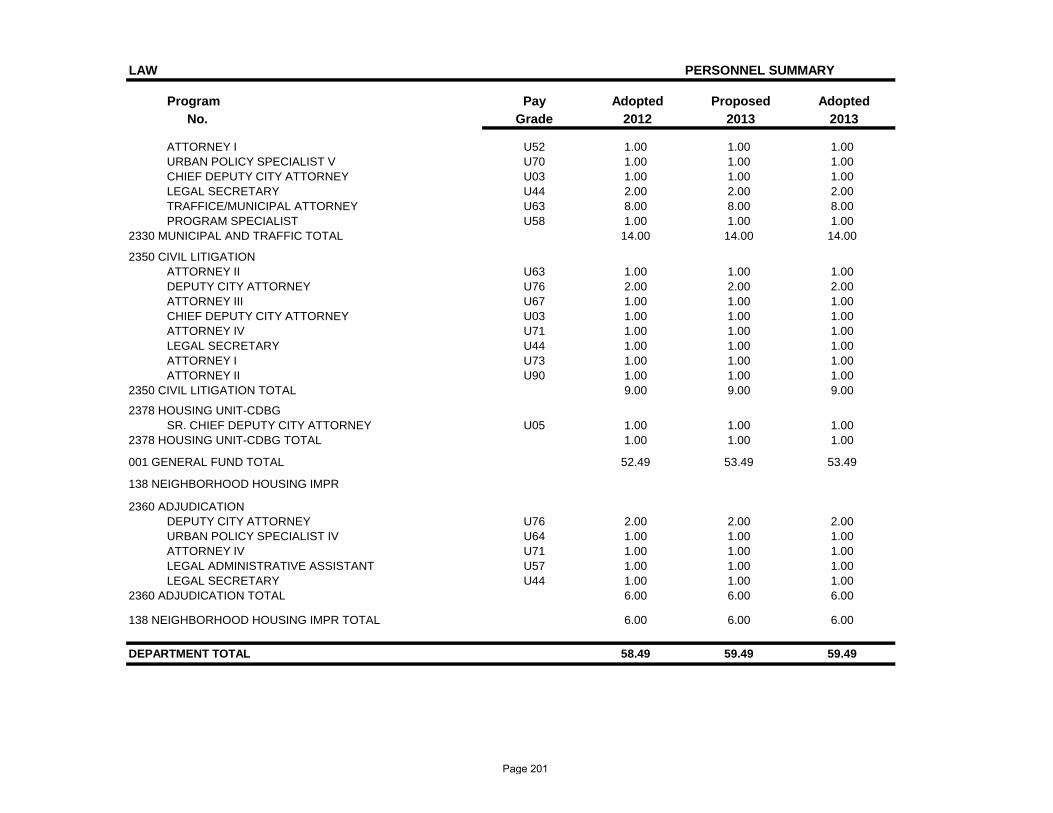
LAW PERSONNEL SUMMARY
Program Pay Adopted Proposed AdoptedNo. Grade 2012 2013 2013
ATTORNEY I U52 1.00 1.00 1.00URBAN POLICY SPECIALIST V U70 1.00 1.00 1.00CHIEF DEPUTY CITY ATTORNEY U03 1.00 1.00 1.00LEGAL SECRETARY U44 2.00 2.00 2.00TRAFFICE/MUNICIPAL ATTORNEY U63 8.00 8.00 8.00PROGRAM SPECIALIST U58 1.00 1.00 1.00
2330 MUNICIPAL AND TRAFFIC TOTAL 14.00 14.00 14.00
2350 CIVIL LITIGATIONATTORNEY II U63 1.00 1.00 1.00DEPUTY CITY ATTORNEY U76 2.00 2.00 2.00ATTORNEY III U67 1.00 1.00 1.00CHIEF DEPUTY CITY ATTORNEY U03 1.00 1.00 1.00ATTORNEY IV U71 1.00 1.00 1.00LEGAL SECRETARY U44 1.00 1.00 1.00ATTORNEY I U73 1.00 1.00 1.00ATTORNEY II U90 1.00 1.00 1.00
2350 CIVIL LITIGATION TOTAL 9.00 9.00 9.00
2378 HOUSING UNIT-CDBGSR. CHIEF DEPUTY CITY ATTORNEY U05 1.00 1.00 1.00
2378 HOUSING UNIT-CDBG TOTAL 1.00 1.00 1.00
001 GENERAL FUND TOTAL 52.49 53.49 53.49
138 NEIGHBORHOOD HOUSING IMPR
2360 ADJUDICATIONDEPUTY CITY ATTORNEY U76 2.00 2.00 2.00URBAN POLICY SPECIALIST IV U64 1.00 1.00 1.00ATTORNEY IV U71 1.00 1.00 1.00LEGAL ADMINISTRATIVE ASSISTANT U57 1.00 1.00 1.00LEGAL SECRETARY U44 1.00 1.00 1.00
2360 ADJUDICATION TOTAL 6.00 6.00 6.00
138 NEIGHBORHOOD HOUSING IMPR TOTAL 6.00 6.00 6.00
DEPARTMENT TOTAL 58.49 59.49 59.49
Page 201

Fire Department
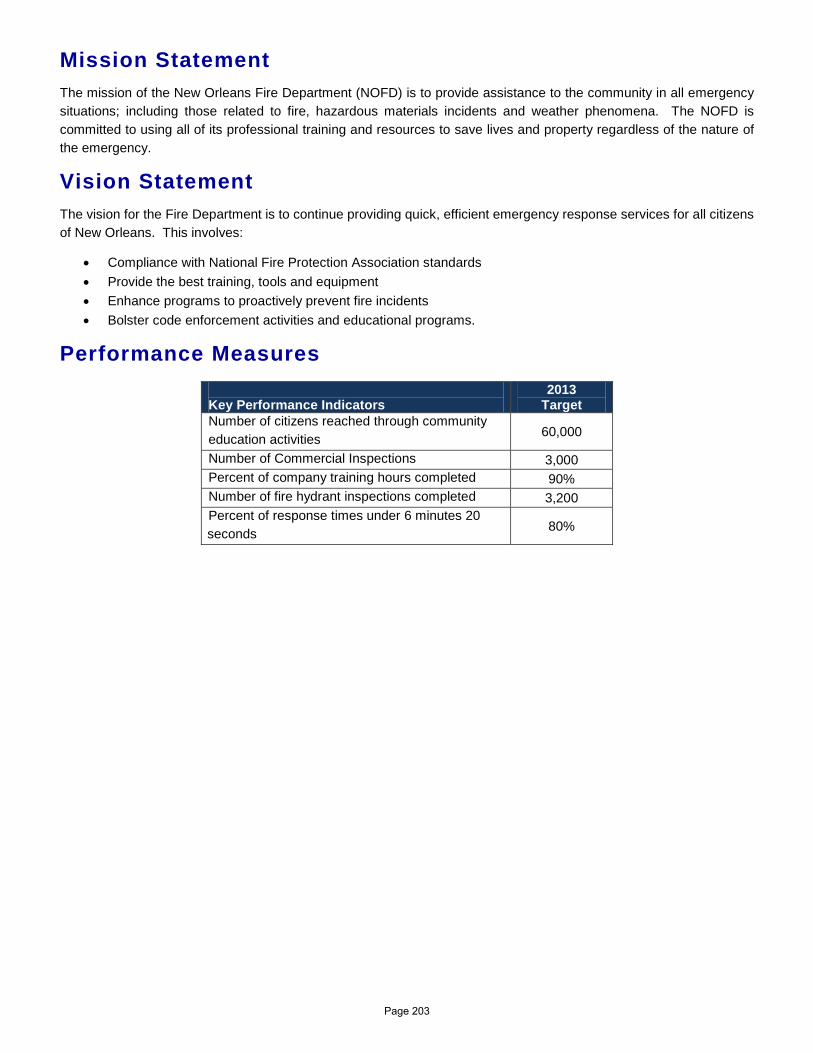
Mission Statement The mission of the New Orleans Fire Department (NOFD) is to provide assistance to the community in all emergency situations; including those related to fire, hazardous materials incidents and weather phenomena. The NOFD is committed to using all of its professional training and resources to save lives and property regardless of the nature of the emergency.
Vision Statement The vision for the Fire Department is to continue providing quick, efficient emergency response services for all citizens of New Orleans. This involves:
• Compliance with National Fire Protection Association standards • Provide the best training, tools and equipment • Enhance programs to proactively prevent fire incidents • Bolster code enforcement activities and educational programs.
Performance Measures Key Performance Indicators
2013 Target
Number of citizens reached through community education activities 60,000
Number of Commercial Inspections 3,000 Percent of company training hours completed 90% Number of fire hydrant inspections completed 3,200 Percent of response times under 6 minutes 20 seconds 80%
Page 203
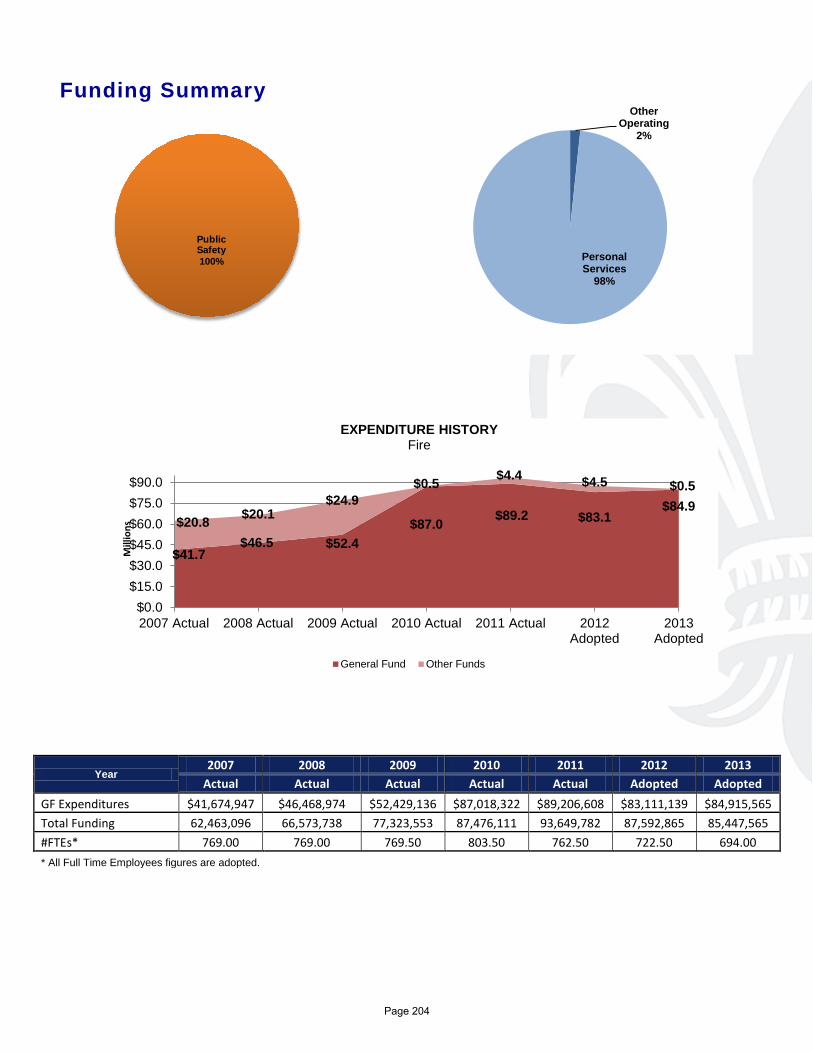
Funding Summary
Year 2007 2008 2009 2010 2011 2012 2013
Actual Actual Actual Actual Actual Adopted Adopted GF Expenditures $41,674,947 $46,468,974 $52,429,136 $87,018,322 $89,206,608 $83,111,139 $84,915,565 Total Funding 62,463,096 66,573,738 77,323,553 87,476,111 93,649,782 87,592,865 85,447,565 #FTEs* 769.00 769.00 769.50 803.50 762.50 722.50 694.00 * All Full Time Employees figures are adopted.
Public Safety100%
$41.7 $46.5 $52.4
$87.0 $89.2 $83.1 $84.9
$20.8 $20.1 $24.9
$0.5 $4.4 $4.5 $0.5
$0.0$15.0$30.0$45.0$60.0$75.0$90.0
2007 Actual 2008 Actual 2009 Actual 2010 Actual 2011 Actual 2012Adopted
2013Adopted
Mill
ions
EXPENDITURE HISTORY Fire
General Fund Other Funds
Other Operating
2%
Personal Services
98%
Page 204
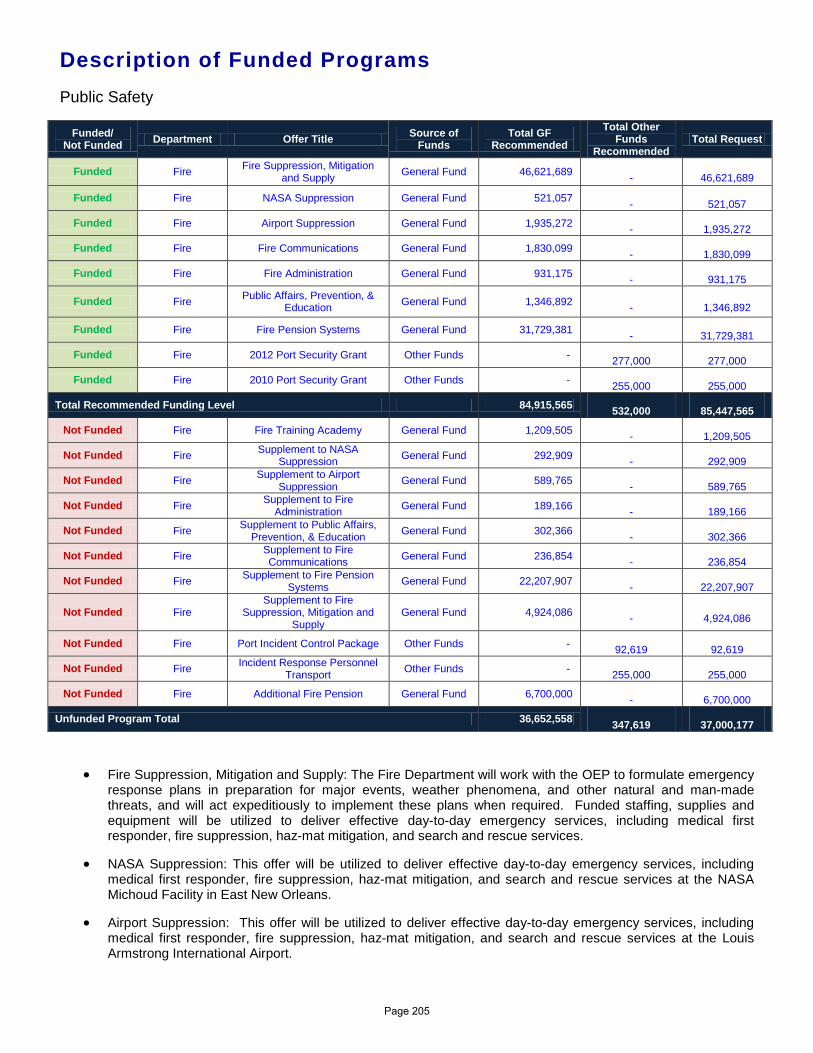
Description of Funded Programs Public Safety
Funded/ Not Funded Department Offer Title Source of
Funds Total GF
Recommended Total Other
Funds Recommended
Total Request
Funded Fire Fire Suppression, Mitigation and Supply General Fund 46,621,689
-
46,621,689
Funded Fire NASA Suppression General Fund 521,057 -
521,057
Funded Fire Airport Suppression General Fund 1,935,272 -
1,935,272
Funded Fire Fire Communications General Fund 1,830,099 -
1,830,099
Funded Fire Fire Administration General Fund 931,175 -
931,175
Funded Fire Public Affairs, Prevention, & Education General Fund 1,346,892
-
1,346,892
Funded Fire Fire Pension Systems General Fund 31,729,381 -
31,729,381
Funded Fire 2012 Port Security Grant Other Funds - 277,000
277,000
Funded Fire 2010 Port Security Grant Other Funds - 255,000
255,000
Total Recommended Funding Level 84,915,565 532,000
85,447,565
Not Funded Fire Fire Training Academy General Fund 1,209,505 -
1,209,505
Not Funded Fire Supplement to NASA Suppression General Fund 292,909
-
292,909
Not Funded Fire Supplement to Airport Suppression General Fund 589,765
-
589,765
Not Funded Fire Supplement to Fire Administration General Fund 189,166
-
189,166
Not Funded Fire Supplement to Public Affairs, Prevention, & Education General Fund 302,366
-
302,366
Not Funded Fire Supplement to Fire Communications General Fund 236,854
-
236,854
Not Funded Fire Supplement to Fire Pension Systems General Fund 22,207,907
-
22,207,907
Not Funded Fire Supplement to Fire
Suppression, Mitigation and Supply
General Fund 4,924,086 -
4,924,086
Not Funded Fire Port Incident Control Package Other Funds - 92,619
92,619
Not Funded Fire Incident Response Personnel Transport Other Funds -
255,000
255,000
Not Funded Fire Additional Fire Pension General Fund 6,700,000 -
6,700,000
Unfunded Program Total 36,652,558 347,619
37,000,177
• Fire Suppression, Mitigation and Supply: The Fire Department will work with the OEP to formulate emergency response plans in preparation for major events, weather phenomena, and other natural and man-made threats, and will act expeditiously to implement these plans when required. Funded staffing, supplies and equipment will be utilized to deliver effective day-to-day emergency services, including medical first responder, fire suppression, haz-mat mitigation, and search and rescue services.
• NASA Suppression: This offer will be utilized to deliver effective day-to-day emergency services, including medical first responder, fire suppression, haz-mat mitigation, and search and rescue services at the NASA Michoud Facility in East New Orleans.
• Airport Suppression: This offer will be utilized to deliver effective day-to-day emergency services, including medical first responder, fire suppression, haz-mat mitigation, and search and rescue services at the Louis Armstrong International Airport.
Page 205
• Fire Communications: This offer will provide a team of personnel to receive and dispatch emergency calls requiring Fire Department response, and to aid in coordination during emergency incidents. The Fire Communications Division is a critical component during emergency response because these personnel aid in field communications during emergencies and can relay information about victim locations, potential hazards, and other information needed to successfully protect life and property.
• Fire Administration: Fire Administration will provide a leadership team comprised of the Superintendent, Assistant Superintendent, and two Deputy Superintendents to direct and provide oversight over all departmental activities and operations. The team works to prioritize departmental goals, implements plans to meet these goals, and deploys staffing to accomplish the stated objectives.
• Public Affairs, Prevention, & Education: This offer funds the NOFD divisions of Public Affairs and Fire Prevention. Its purpose is to work proactively through public education, building code enforcement, and investigative activities to remove known fire hazards, to prevent fire incidents, and to thereby prevent loss of life and property.
• Fire Pension Systems: This offer funds pension benefits mandated by La. R.S. 11:3361 for fire suppression personnel. As part of a comprehensive benefits package that serves to recruit and retain highly qualified personnel, the pension plan helps the NOFD to keep experienced, knowledgeable staff members on the job to meet public safety needs.
Page 206
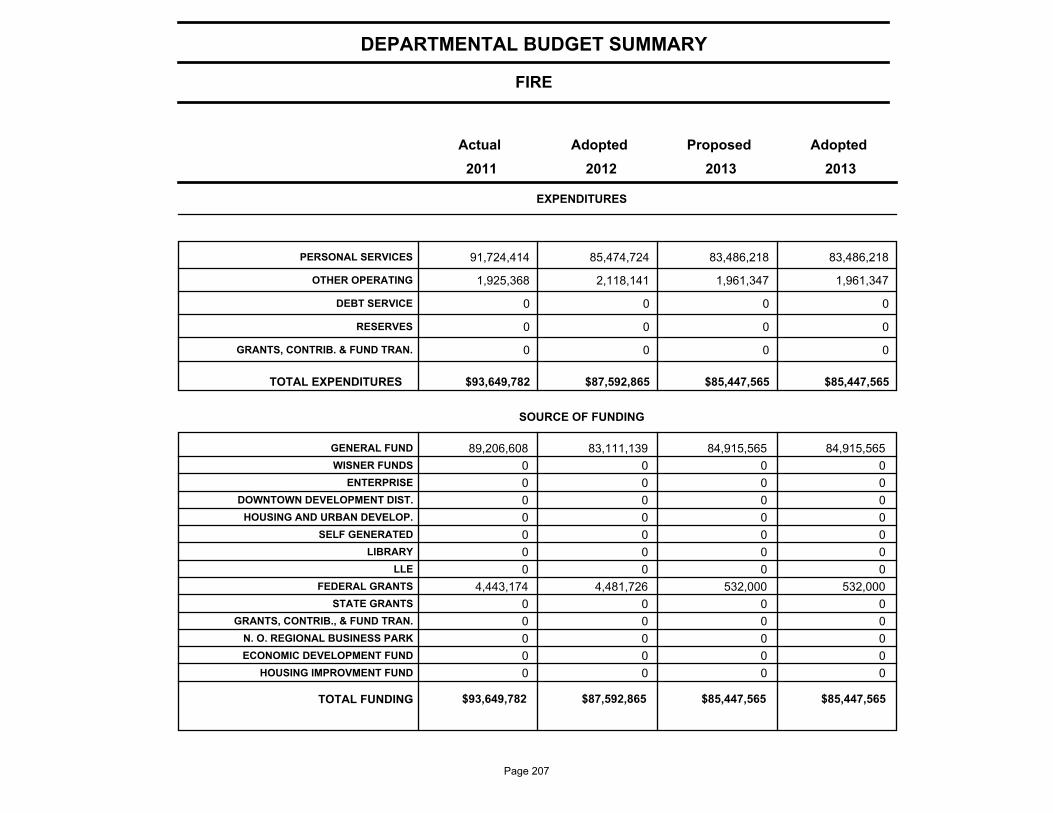
FIRE
DEPARTMENTAL BUDGET SUMMARY
AdoptedProposedAdoptedActual
EXPENDITURES
2013 2012 2011 2013
PERSONAL SERVICES 91,724,414 85,474,724 83,486,218 83,486,218
OTHER OPERATING 1,925,368 2,118,141 1,961,347 1,961,347
DEBT SERVICE 0 0 0 0
RESERVES 0 0 0 0
GRANTS, CONTRIB. & FUND TRAN. 0 0 0 0
$93,649,782 $87,592,865 $85,447,565 TOTAL EXPENDITURES $85,447,565
SOURCE OF FUNDING
GENERAL FUND 89,206,608 83,111,139 84,915,565 84,915,565
WISNER FUNDS 0 0 0 0
ENTERPRISE 0 0 0 0
DOWNTOWN DEVELOPMENT DIST. 0 0 0 0
HOUSING AND URBAN DEVELOP. 0 0 0 0
SELF GENERATED 0 0 0 0
LIBRARY 0 0 0 0
LLE 0 0 0 0
FEDERAL GRANTS 4,443,174 4,481,726 532,000 532,000
STATE GRANTS 0 0 0 0
GRANTS, CONTRIB., & FUND TRAN. 0 0 0 0
N. O. REGIONAL BUSINESS PARK 0 0 0 0
ECONOMIC DEVELOPMENT FUND 0 0 0 0
HOUSING IMPROVMENT FUND 0 0 0 0
$93,649,782 $87,592,865 $85,447,565 TOTAL FUNDING $85,447,565
Page 207
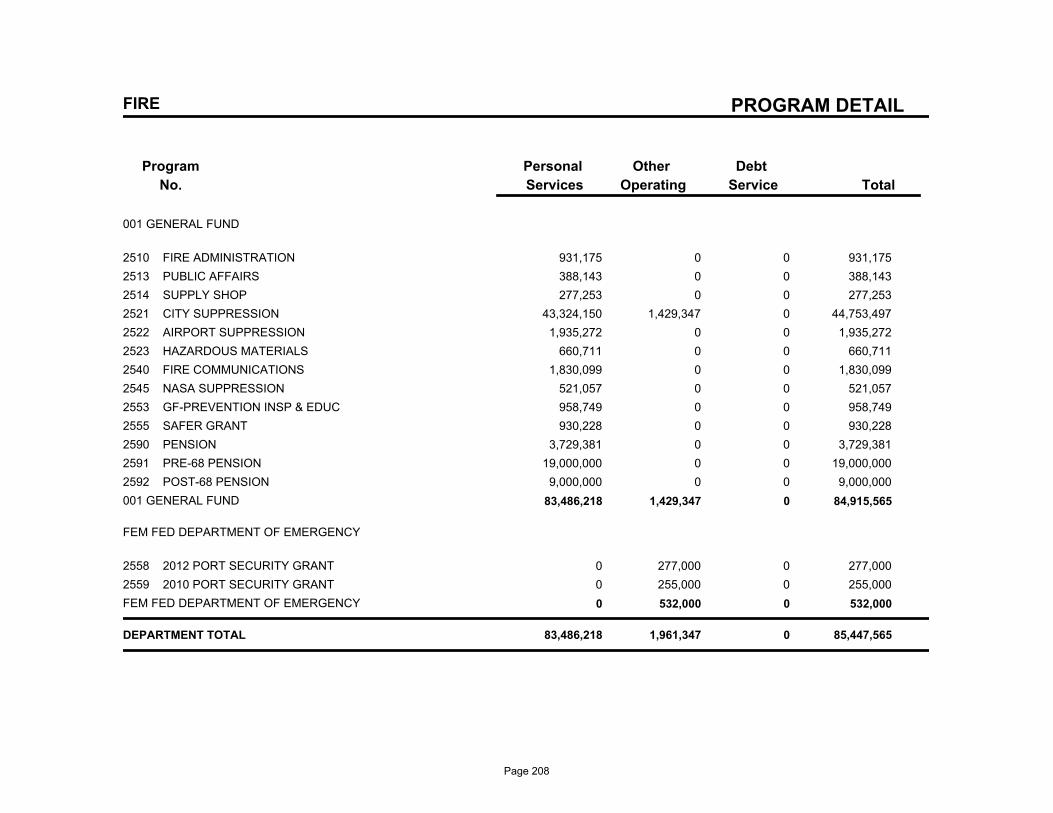
PROGRAM DETAIL
Program
No.
Debt
Service
Other
Operating
Personal
Services Total
FIRE
001 GENERAL FUND
2510 FIRE ADMINISTRATION 931,175 0 0 931,175
2513 PUBLIC AFFAIRS 388,143 0 0 388,143
2514 SUPPLY SHOP 277,253 0 0 277,253
2521 CITY SUPPRESSION 43,324,150 1,429,347 0 44,753,497
2522 AIRPORT SUPPRESSION 1,935,272 0 0 1,935,272
2523 HAZARDOUS MATERIALS 660,711 0 0 660,711
2540 FIRE COMMUNICATIONS 1,830,099 0 0 1,830,099
2545 NASA SUPPRESSION 521,057 0 0 521,057
2553 GF-PREVENTION INSP & EDUC 958,749 0 0 958,749
2555 SAFER GRANT 930,228 0 0 930,228
2590 PENSION 3,729,381 0 0 3,729,381
2591 PRE-68 PENSION 19,000,000 0 0 19,000,000
2592 POST-68 PENSION 9,000,000 0 0 9,000,000
001 GENERAL FUND 83,486,218 1,429,347 0 84,915,565
FEM FED DEPARTMENT OF EMERGENCY
2558 2012 PORT SECURITY GRANT 0 277,000 0 277,000
2559 2010 PORT SECURITY GRANT 0 255,000 0 255,000
FEM FED DEPARTMENT OF EMERGENCY 0 532,000 0 532,000
DEPARTMENT TOTAL 83,486,218 1,961,347 0 85,447,565
Page 208
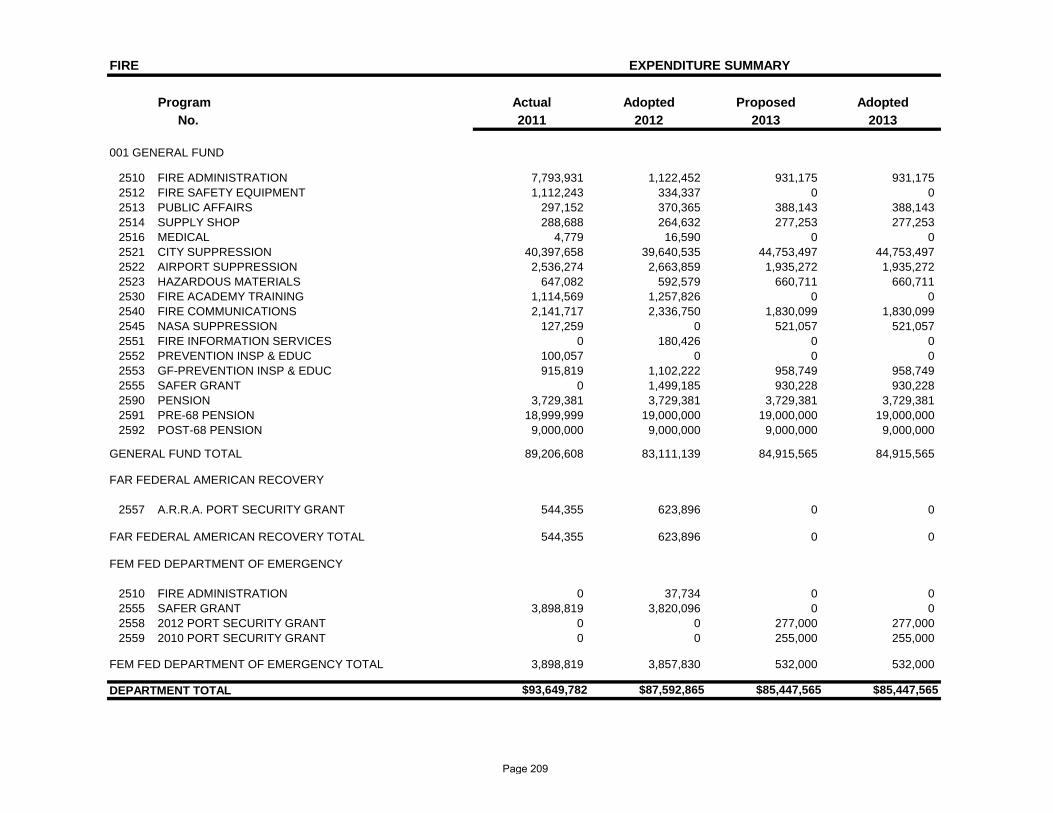
FIRE EXPENDITURE SUMMARY
Program Actual Adopted Proposed AdoptedNo. 2011 2012 2013 2013
001 GENERAL FUND
2510 FIRE ADMINISTRATION 7,793,931 1,122,452 931,175 931,1752512 FIRE SAFETY EQUIPMENT 1,112,243 334,337 0 02513 PUBLIC AFFAIRS 297,152 370,365 388,143 388,1432514 SUPPLY SHOP 288,688 264,632 277,253 277,2532516 MEDICAL 4,779 16,590 0 02521 CITY SUPPRESSION 40,397,658 39,640,535 44,753,497 44,753,4972522 AIRPORT SUPPRESSION 2,536,274 2,663,859 1,935,272 1,935,2722523 HAZARDOUS MATERIALS 647,082 592,579 660,711 660,7112530 FIRE ACADEMY TRAINING 1,114,569 1,257,826 0 02540 FIRE COMMUNICATIONS 2,141,717 2,336,750 1,830,099 1,830,0992545 NASA SUPPRESSION 127,259 0 521,057 521,0572551 FIRE INFORMATION SERVICES 0 180,426 0 02552 PREVENTION INSP & EDUC 100,057 0 0 02553 GF-PREVENTION INSP & EDUC 915,819 1,102,222 958,749 958,7492555 SAFER GRANT 0 1,499,185 930,228 930,2282590 PENSION 3,729,381 3,729,381 3,729,381 3,729,3812591 PRE-68 PENSION 18,999,999 19,000,000 19,000,000 19,000,0002592 POST-68 PENSION 9,000,000 9,000,000 9,000,000 9,000,000
GENERAL FUND TOTAL 89,206,608 83,111,139 84,915,565 84,915,565
FAR FEDERAL AMERICAN RECOVERY
2557 A.R.R.A. PORT SECURITY GRANT 544,355 623,896 0 0
FAR FEDERAL AMERICAN RECOVERY TOTAL 544,355 623,896 0 0
FEM FED DEPARTMENT OF EMERGENCY
2510 FIRE ADMINISTRATION 0 37,734 0 02555 SAFER GRANT 3,898,819 3,820,096 0 02558 2012 PORT SECURITY GRANT 0 0 277,000 277,0002559 2010 PORT SECURITY GRANT 0 0 255,000 255,000
FEM FED DEPARTMENT OF EMERGENCY TOTAL 3,898,819 3,857,830 532,000 532,000
DEPARTMENT TOTAL $93,649,782 $87,592,865 $85,447,565 $85,447,565
Page 209
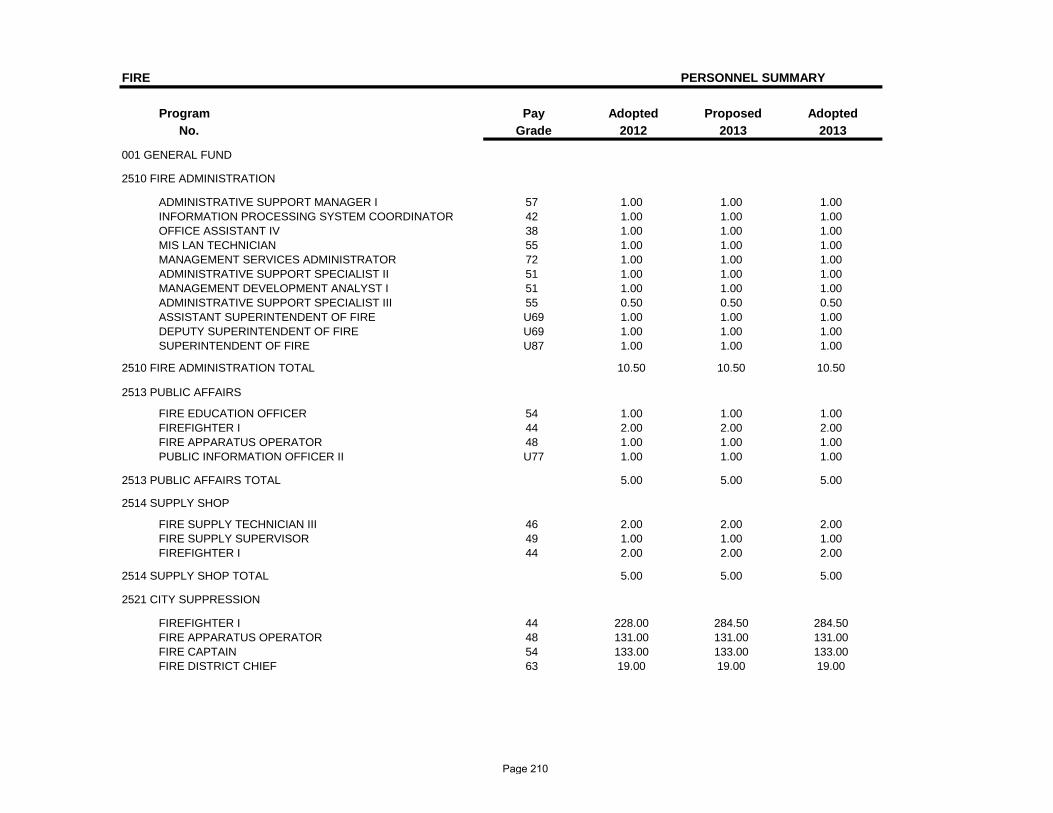
FIRE PERSONNEL SUMMARY
Program Pay Adopted Proposed AdoptedNo. Grade 2012 2013 2013
001 GENERAL FUND
2510 FIRE ADMINISTRATION
ADMINISTRATIVE SUPPORT MANAGER I 57 1.00 1.00 1.00INFORMATION PROCESSING SYSTEM COORDINATOR 42 1.00 1.00 1.00OFFICE ASSISTANT IV 38 1.00 1.00 1.00MIS LAN TECHNICIAN 55 1.00 1.00 1.00MANAGEMENT SERVICES ADMINISTRATOR 72 1.00 1.00 1.00ADMINISTRATIVE SUPPORT SPECIALIST II 51 1.00 1.00 1.00MANAGEMENT DEVELOPMENT ANALYST I 51 1.00 1.00 1.00ADMINISTRATIVE SUPPORT SPECIALIST III 55 0.50 0.50 0.50ASSISTANT SUPERINTENDENT OF FIRE U69 1.00 1.00 1.00DEPUTY SUPERINTENDENT OF FIRE U69 1.00 1.00 1.00SUPERINTENDENT OF FIRE U87 1.00 1.00 1.00
2510 FIRE ADMINISTRATION TOTAL 10.50 10.50 10.50
2513 PUBLIC AFFAIRS
FIRE EDUCATION OFFICER 54 1.00 1.00 1.00FIREFIGHTER I 44 2.00 2.00 2.00FIRE APPARATUS OPERATOR 48 1.00 1.00 1.00PUBLIC INFORMATION OFFICER II U77 1.00 1.00 1.00
2513 PUBLIC AFFAIRS TOTAL 5.00 5.00 5.00
2514 SUPPLY SHOP
FIRE SUPPLY TECHNICIAN III 46 2.00 2.00 2.00FIRE SUPPLY SUPERVISOR 49 1.00 1.00 1.00FIREFIGHTER I 44 2.00 2.00 2.00
2514 SUPPLY SHOP TOTAL 5.00 5.00 5.00
2521 CITY SUPPRESSION
FIREFIGHTER I 44 228.00 284.50 284.50FIRE APPARATUS OPERATOR 48 131.00 131.00 131.00FIRE CAPTAIN 54 133.00 133.00 133.00FIRE DISTRICT CHIEF 63 19.00 19.00 19.00
Page 210
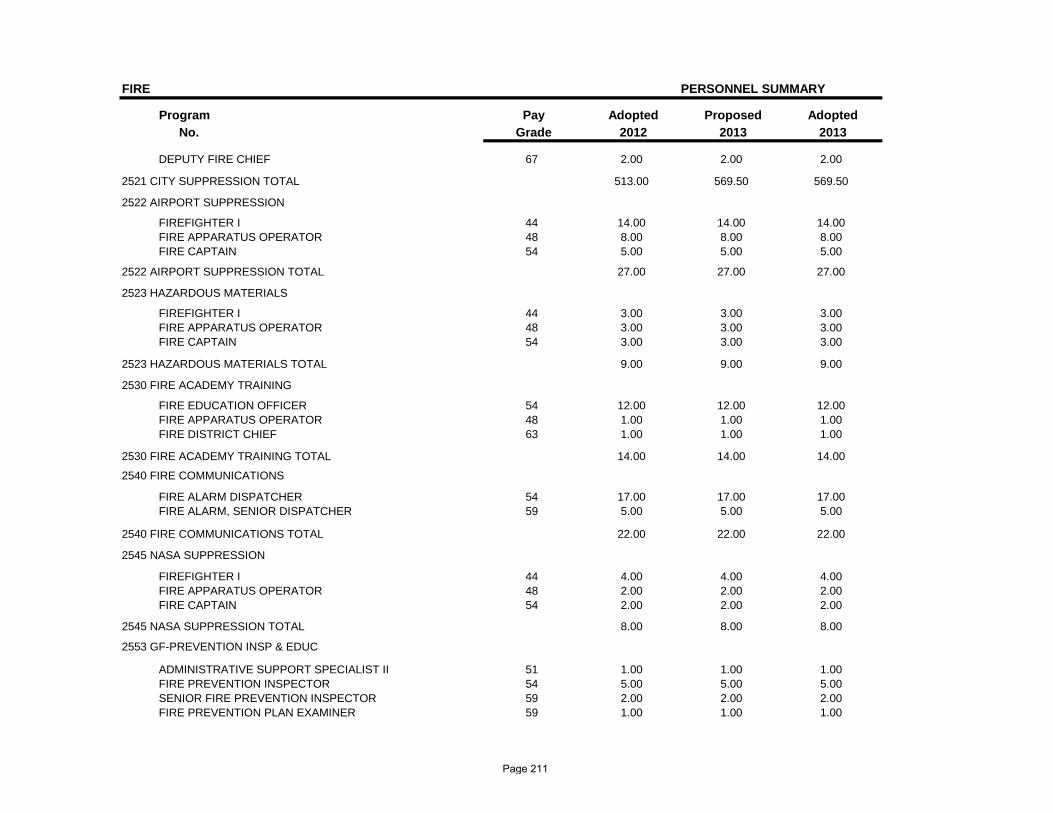
FIRE PERSONNEL SUMMARY
Program Pay Adopted Proposed AdoptedNo. Grade 2012 2013 2013
DEPUTY FIRE CHIEF 67 2.00 2.00 2.00
2521 CITY SUPPRESSION TOTAL 513.00 569.50 569.50
2522 AIRPORT SUPPRESSION
FIREFIGHTER I 44 14.00 14.00 14.00FIRE APPARATUS OPERATOR 48 8.00 8.00 8.00FIRE CAPTAIN 54 5.00 5.00 5.00
2522 AIRPORT SUPPRESSION TOTAL 27.00 27.00 27.00
2523 HAZARDOUS MATERIALS
FIREFIGHTER I 44 3.00 3.00 3.00FIRE APPARATUS OPERATOR 48 3.00 3.00 3.00FIRE CAPTAIN 54 3.00 3.00 3.00
2523 HAZARDOUS MATERIALS TOTAL 9.00 9.00 9.00
2530 FIRE ACADEMY TRAINING
FIRE EDUCATION OFFICER 54 12.00 12.00 12.00FIRE APPARATUS OPERATOR 48 1.00 1.00 1.00FIRE DISTRICT CHIEF 63 1.00 1.00 1.00
2530 FIRE ACADEMY TRAINING TOTAL 14.00 14.00 14.00
2540 FIRE COMMUNICATIONS
FIRE ALARM DISPATCHER 54 17.00 17.00 17.00FIRE ALARM, SENIOR DISPATCHER 59 5.00 5.00 5.00
2540 FIRE COMMUNICATIONS TOTAL 22.00 22.00 22.00
2545 NASA SUPPRESSION
FIREFIGHTER I 44 4.00 4.00 4.00FIRE APPARATUS OPERATOR 48 2.00 2.00 2.00FIRE CAPTAIN 54 2.00 2.00 2.00
2545 NASA SUPPRESSION TOTAL 8.00 8.00 8.00
2553 GF-PREVENTION INSP & EDUC
ADMINISTRATIVE SUPPORT SPECIALIST II 51 1.00 1.00 1.00FIRE PREVENTION INSPECTOR 54 5.00 5.00 5.00SENIOR FIRE PREVENTION INSPECTOR 59 2.00 2.00 2.00FIRE PREVENTION PLAN EXAMINER 59 1.00 1.00 1.00
Page 211
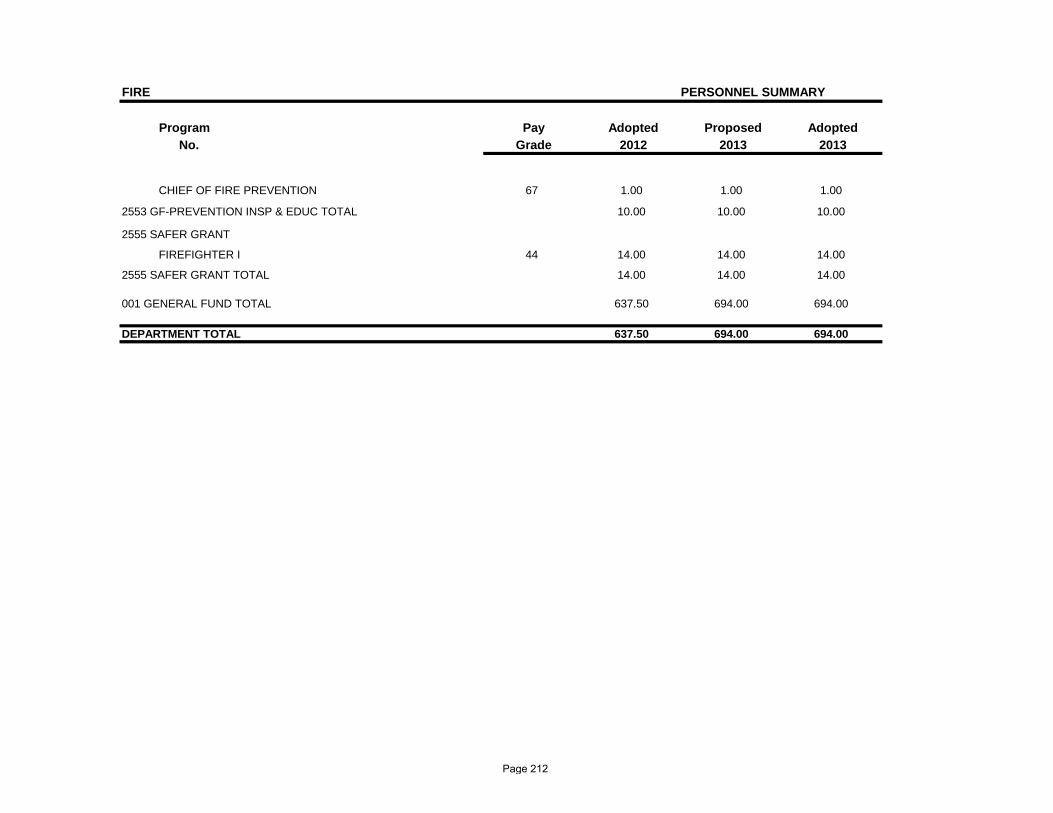
FIRE PERSONNEL SUMMARY
Program Pay Adopted Proposed AdoptedNo. Grade 2012 2013 2013
CHIEF OF FIRE PREVENTION 67 1.00 1.00 1.00
2553 GF-PREVENTION INSP & EDUC TOTAL 10.00 10.00 10.00
2555 SAFER GRANT
FIREFIGHTER I 44 14.00 14.00 14.00
2555 SAFER GRANT TOTAL 14.00 14.00 14.00
001 GENERAL FUND TOTAL 637.50 694.00 694.00
DEPARTMENT TOTAL 637.50 694.00 694.00
Page 212

Page 213

Safety & Permits

Mission Statement The Mission of the Safety & Permits Department is to:
• Administer and enforce the Comprehensive Zoning Ordinance, the Building Code, the Electrical Code and the Mechanical Code to ensure compliance with international standards for the construction, alteration, repair, use, occupancy, and demolition of buildings, structures and properties
• Enforce related land use regulations and ordinances such as the flood plain requirements moratorium.
Vision Statement The Department of Safety and Permits will strengthen its focus on customer service through more efficient internal operations and improved technology. The Department will become more efficient by working to ensure an effective and timely process for administering the permitting process for residents and businesses. The Department will also leverage new computer software to simplify its processes and create greater access to government. The combination of these two priorities will allow the Department to more quickly and efficiently serve the residents and businesses that depend on its services.
Performance Measures Key Performance Indicators
2013 Target
Revenue earned from permits N/A Average number of days for initial commercial building permit plan review 15
Average number of days for initial residential building permit plan review 5
Average number of days, application to permit issuance – residential 17
Average number of days, application to permit issuance – commercial 42
Average number of days to respond to a complaint 3 Average number of days to respond to an inspection request 3
Percent of building permits issued within 1 business day of receipt Workload
Number of enforcement cases resulting in citation issuance 600
Number of Certificates of Public Necessity and Convenience (CPNCs) issued Workload
Percent of eligible vehicles inspected semi-annually 100%
Number of Certificates of Public Necessity and Convenience (CPNCs) revoked Workload
Number of driver permits revoked Workload
Page 215
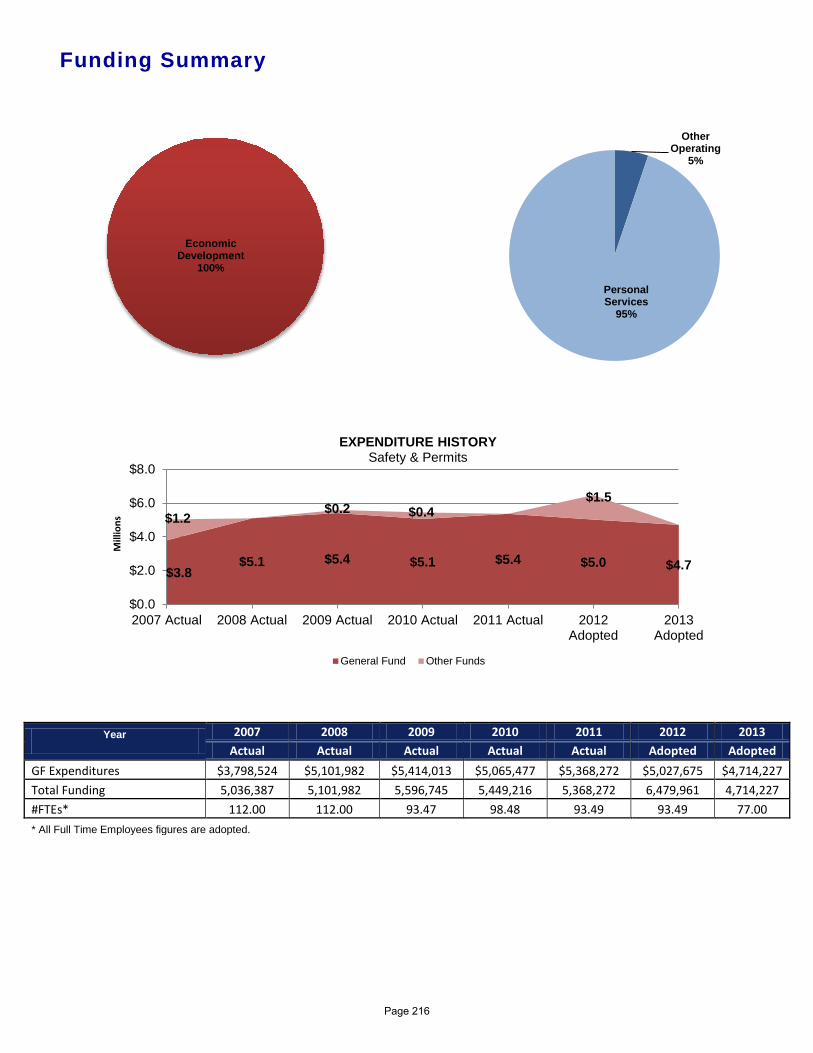
Other Operating
5%
Personal Services
95%
Funding Summary
Year 2007 2008 2009 2010 2011 2012 2013 Actual Actual Actual Actual Actual Adopted Adopted
GF Expenditures $3,798,524 $5,101,982 $5,414,013 $5,065,477 $5,368,272 $5,027,675 $4,714,227 Total Funding 5,036,387 5,101,982 5,596,745 5,449,216 5,368,272 6,479,961 4,714,227 #FTEs* 112.00 112.00 93.47 98.48 93.49 93.49 77.00 * All Full Time Employees figures are adopted.
$3.8 $5.1 $5.4 $5.1 $5.4 $5.0 $4.7
$1.2 $0.2 $0.4
$1.5
$0.0
$2.0
$4.0
$6.0
$8.0
2007 Actual 2008 Actual 2009 Actual 2010 Actual 2011 Actual 2012Adopted
2013Adopted
Mill
ions
EXPENDITURE HISTORY Safety & Permits
General Fund Other Funds
Economic Development
100%
Page 216
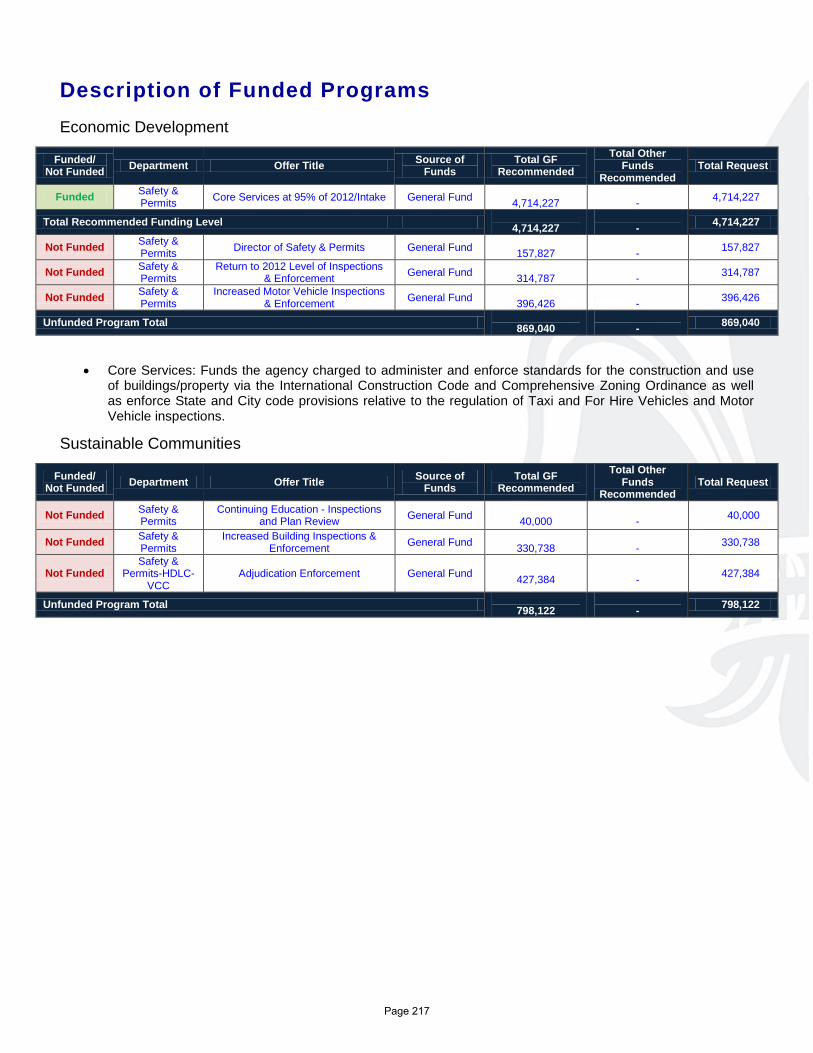
Description of Funded Programs Economic Development
Funded/ Not Funded Department Offer Title Source of
Funds Total GF
Recommended Total Other
Funds Recommended
Total Request
Funded Safety & Permits Core Services at 95% of 2012/Intake General Fund
4,714,227 - 4,714,227
Total Recommended Funding Level 4,714,227
- 4,714,227
Not Funded Safety & Permits Director of Safety & Permits General Fund
157,827 - 157,827
Not Funded Safety & Permits
Return to 2012 Level of Inspections & Enforcement General Fund
314,787 - 314,787
Not Funded Safety & Permits
Increased Motor Vehicle Inspections & Enforcement General Fund
396,426 - 396,426
Unfunded Program Total 869,040
- 869,040
• Core Services: Funds the agency charged to administer and enforce standards for the construction and use of buildings/property via the International Construction Code and Comprehensive Zoning Ordinance as well as enforce State and City code provisions relative to the regulation of Taxi and For Hire Vehicles and Motor Vehicle inspections.
Sustainable Communities
Funded/ Not Funded Department Offer Title Source of
Funds Total GF
Recommended Total Other
Funds Recommended
Total Request
Not Funded Safety & Permits
Continuing Education - Inspections and Plan Review General Fund
40,000 - 40,000
Not Funded Safety & Permits
Increased Building Inspections & Enforcement General Fund
330,738 - 330,738
Not Funded Safety &
Permits-HDLC-VCC
Adjudication Enforcement General Fund 427,384
- 427,384
Unfunded Program Total 798,122
- 798,122
Page 217

SAFETY & PERMITS
DEPARTMENTAL BUDGET SUMMARY
AdoptedProposedAdoptedActual
EXPENDITURES
2013 2012 2011 2013
PERSONAL SERVICES 5,154,399 4,767,986 4,490,853 4,490,853
OTHER OPERATING 213,873 1,711,975 223,374 223,374
DEBT SERVICE 0 0 0 0
RESERVES 0 0 0 0
GRANTS, CONTRIB. & FUND TRAN. 0 0 0 0
$5,368,272 $6,479,961 $4,714,227 TOTAL EXPENDITURES $4,714,227
SOURCE OF FUNDING
GENERAL FUND 5,368,272 5,027,675 4,714,227 4,714,227
WISNER FUNDS 0 0 0 0
ENTERPRISE 0 0 0 0
DOWNTOWN DEVELOPMENT DIST. 0 0 0 0
HOUSING AND URBAN DEVELOP. 0 0 0 0
SELF GENERATED 0 0 0 0
LIBRARY 0 0 0 0
LLE 0 0 0 0
FEDERAL GRANTS 0 1,452,286 0 0
STATE GRANTS 0 0 0 0
GRANTS, CONTRIB., & FUND TRAN. 0 0 0 0
N. O. REGIONAL BUSINESS PARK 0 0 0 0
ECONOMIC DEVELOPMENT FUND 0 0 0 0
HOUSING IMPROVMENT FUND 0 0 0 0
$5,368,272 $6,479,961 $4,714,227 TOTAL FUNDING $4,714,227
Page 218
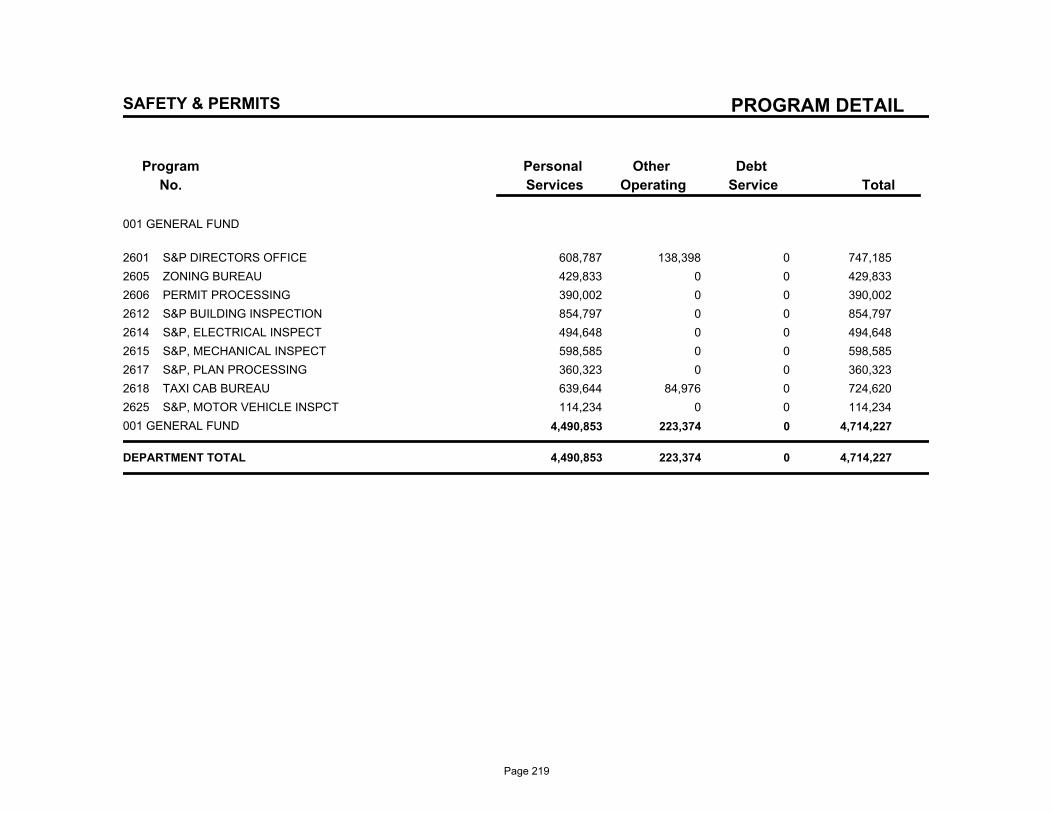
PROGRAM DETAIL
Program
No.
Debt
Service
Other
Operating
Personal
Services Total
SAFETY & PERMITS
001 GENERAL FUND
2601 S&P DIRECTORS OFFICE 608,787 138,398 0 747,185
2605 ZONING BUREAU 429,833 0 0 429,833
2606 PERMIT PROCESSING 390,002 0 0 390,002
2612 S&P BUILDING INSPECTION 854,797 0 0 854,797
2614 S&P, ELECTRICAL INSPECT 494,648 0 0 494,648
2615 S&P, MECHANICAL INSPECT 598,585 0 0 598,585
2617 S&P, PLAN PROCESSING 360,323 0 0 360,323
2618 TAXI CAB BUREAU 639,644 84,976 0 724,620
2625 S&P, MOTOR VEHICLE INSPCT 114,234 0 0 114,234
001 GENERAL FUND 4,490,853 223,374 0 4,714,227
DEPARTMENT TOTAL 4,490,853 223,374 0 4,714,227
Page 219
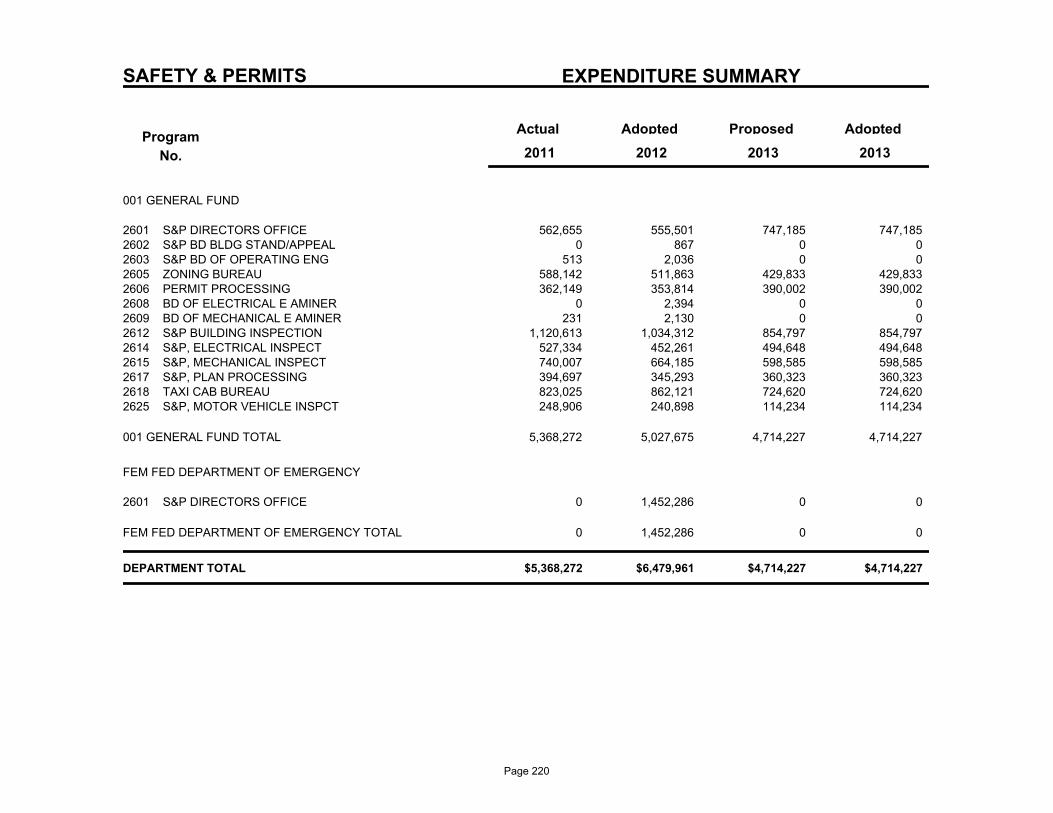
SAFETY & PERMITS EXPENDITURE SUMMARY
Program
No.
Actual AdoptedProposedAdopted
2013 2011 2012 2013
001 GENERAL FUND
562,655 555,501 747,185 S&P DIRECTORS OFFICE2601 747,185 0 867 0 S&P BD BLDG STAND/APPEAL2602 0
513 2,036 0 S&P BD OF OPERATING ENG2603 0 588,142 511,863 429,833 ZONING BUREAU2605 429,833 362,149 353,814 390,002 PERMIT PROCESSING2606 390,002
0 2,394 0 BD OF ELECTRICAL E AMINER2608 0 231 2,130 0 BD OF MECHANICAL E AMINER2609 0
1,120,613 1,034,312 854,797 S&P BUILDING INSPECTION2612 854,797 527,334 452,261 494,648 S&P, ELECTRICAL INSPECT2614 494,648 740,007 664,185 598,585 S&P, MECHANICAL INSPECT2615 598,585 394,697 345,293 360,323 S&P, PLAN PROCESSING2617 360,323 823,025 862,121 724,620 TAXI CAB BUREAU2618 724,620 248,906 240,898 114,234 S&P, MOTOR VEHICLE INSPCT2625 114,234
5,368,272 5,027,675 4,714,227 4,714,227 001 GENERAL FUND TOTAL
FEM FED DEPARTMENT OF EMERGENCY
0 1,452,286 0 S&P DIRECTORS OFFICE2601 0
0 1,452,286 0 0 FEM FED DEPARTMENT OF EMERGENCY TOTAL
$5,368,272 $6,479,961 $4,714,227 $4,714,227 DEPARTMENT TOTAL
Page 220
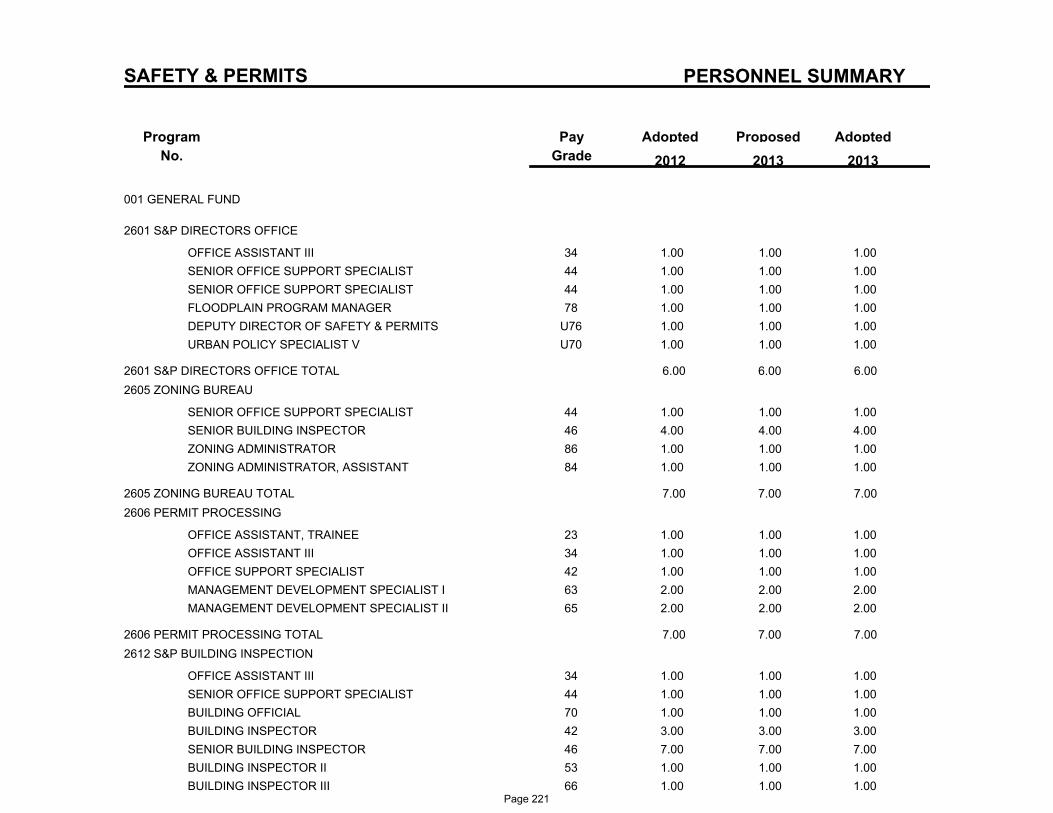
PERSONNEL SUMMARY
Program
No.
ProposedAdoptedPay
Grade
Adopted
2013 2012 2013
SAFETY & PERMITS
001 GENERAL FUND
2601 S&P DIRECTORS OFFICE
34OFFICE ASSISTANT III 1.00 1.00 1.00
44SENIOR OFFICE SUPPORT SPECIALIST 1.00 1.00 1.00
44SENIOR OFFICE SUPPORT SPECIALIST 1.00 1.00 1.00
78FLOODPLAIN PROGRAM MANAGER 1.00 1.00 1.00
U76DEPUTY DIRECTOR OF SAFETY & PERMITS 1.00 1.00 1.00
U70URBAN POLICY SPECIALIST V 1.00 1.00 1.00
2601 S&P DIRECTORS OFFICE TOTAL 6.00 6.00 6.00
2605 ZONING BUREAU
44SENIOR OFFICE SUPPORT SPECIALIST 1.00 1.00 1.00
46SENIOR BUILDING INSPECTOR 4.00 4.00 4.00
86ZONING ADMINISTRATOR 1.00 1.00 1.00
84ZONING ADMINISTRATOR, ASSISTANT 1.00 1.00 1.00
2605 ZONING BUREAU TOTAL 7.00 7.00 7.00
2606 PERMIT PROCESSING
23OFFICE ASSISTANT, TRAINEE 1.00 1.00 1.00
34OFFICE ASSISTANT III 1.00 1.00 1.00
42OFFICE SUPPORT SPECIALIST 1.00 1.00 1.00
63MANAGEMENT DEVELOPMENT SPECIALIST I 2.00 2.00 2.00
65MANAGEMENT DEVELOPMENT SPECIALIST II 2.00 2.00 2.00
2606 PERMIT PROCESSING TOTAL 7.00 7.00 7.00
2612 S&P BUILDING INSPECTION
34OFFICE ASSISTANT III 1.00 1.00 1.00
44SENIOR OFFICE SUPPORT SPECIALIST 1.00 1.00 1.00
70BUILDING OFFICIAL 1.00 1.00 1.00
42BUILDING INSPECTOR 3.00 3.00 3.00
46SENIOR BUILDING INSPECTOR 7.00 7.00 7.00
53BUILDING INSPECTOR II 1.00 1.00 1.00
66BUILDING INSPECTOR III 1.00 1.00 1.00Page 221
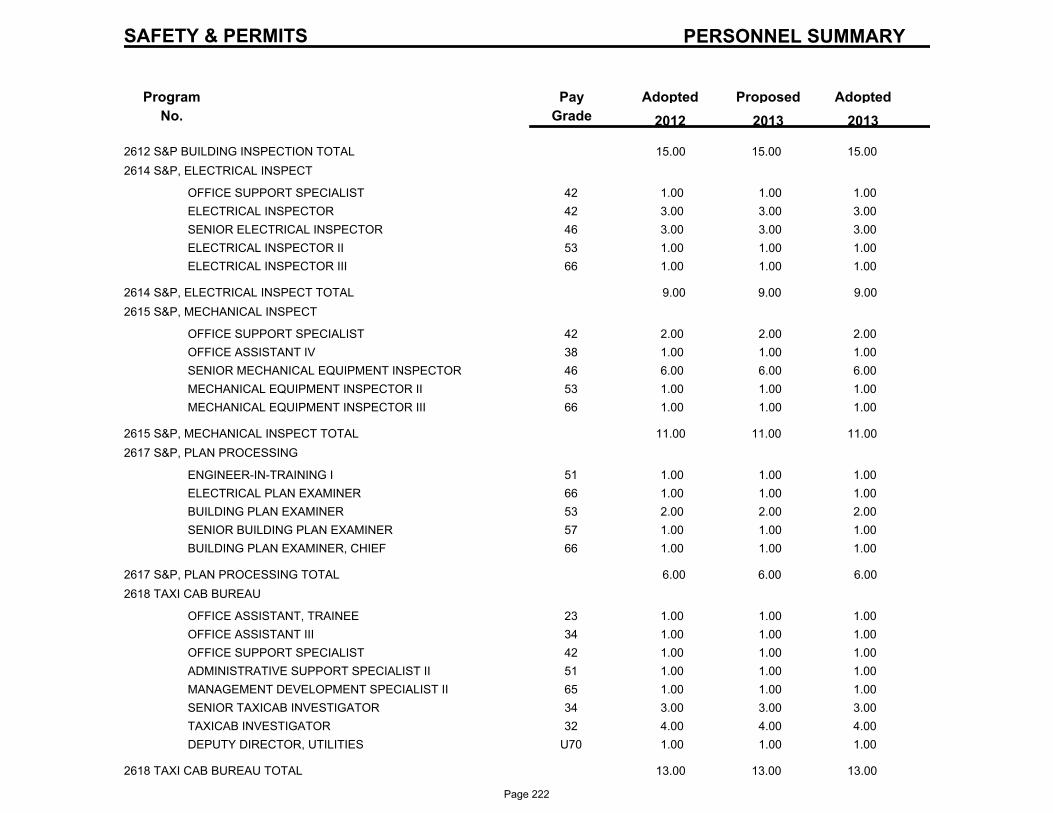
PERSONNEL SUMMARY
Program
No.
ProposedAdoptedPay
Grade
Adopted
2013 2012 2013
SAFETY & PERMITS
2612 S&P BUILDING INSPECTION TOTAL 15.00 15.00 15.00
2614 S&P, ELECTRICAL INSPECT
42OFFICE SUPPORT SPECIALIST 1.00 1.00 1.00
42ELECTRICAL INSPECTOR 3.00 3.00 3.00
46SENIOR ELECTRICAL INSPECTOR 3.00 3.00 3.00
53ELECTRICAL INSPECTOR II 1.00 1.00 1.00
66ELECTRICAL INSPECTOR III 1.00 1.00 1.00
2614 S&P, ELECTRICAL INSPECT TOTAL 9.00 9.00 9.00
2615 S&P, MECHANICAL INSPECT
42OFFICE SUPPORT SPECIALIST 2.00 2.00 2.00
38OFFICE ASSISTANT IV 1.00 1.00 1.00
46SENIOR MECHANICAL EQUIPMENT INSPECTOR 6.00 6.00 6.00
53MECHANICAL EQUIPMENT INSPECTOR II 1.00 1.00 1.00
66MECHANICAL EQUIPMENT INSPECTOR III 1.00 1.00 1.00
2615 S&P, MECHANICAL INSPECT TOTAL 11.00 11.00 11.00
2617 S&P, PLAN PROCESSING
51ENGINEER-IN-TRAINING I 1.00 1.00 1.00
66ELECTRICAL PLAN EXAMINER 1.00 1.00 1.00
53BUILDING PLAN EXAMINER 2.00 2.00 2.00
57SENIOR BUILDING PLAN EXAMINER 1.00 1.00 1.00
66BUILDING PLAN EXAMINER, CHIEF 1.00 1.00 1.00
2617 S&P, PLAN PROCESSING TOTAL 6.00 6.00 6.00
2618 TAXI CAB BUREAU
23OFFICE ASSISTANT, TRAINEE 1.00 1.00 1.00
34OFFICE ASSISTANT III 1.00 1.00 1.00
42OFFICE SUPPORT SPECIALIST 1.00 1.00 1.00
51ADMINISTRATIVE SUPPORT SPECIALIST II 1.00 1.00 1.00
65MANAGEMENT DEVELOPMENT SPECIALIST II 1.00 1.00 1.00
34SENIOR TAXICAB INVESTIGATOR 3.00 3.00 3.00
32TAXICAB INVESTIGATOR 4.00 4.00 4.00
U70DEPUTY DIRECTOR, UTILITIES 1.00 1.00 1.00
2618 TAXI CAB BUREAU TOTAL 13.00 13.00 13.00
Page 222
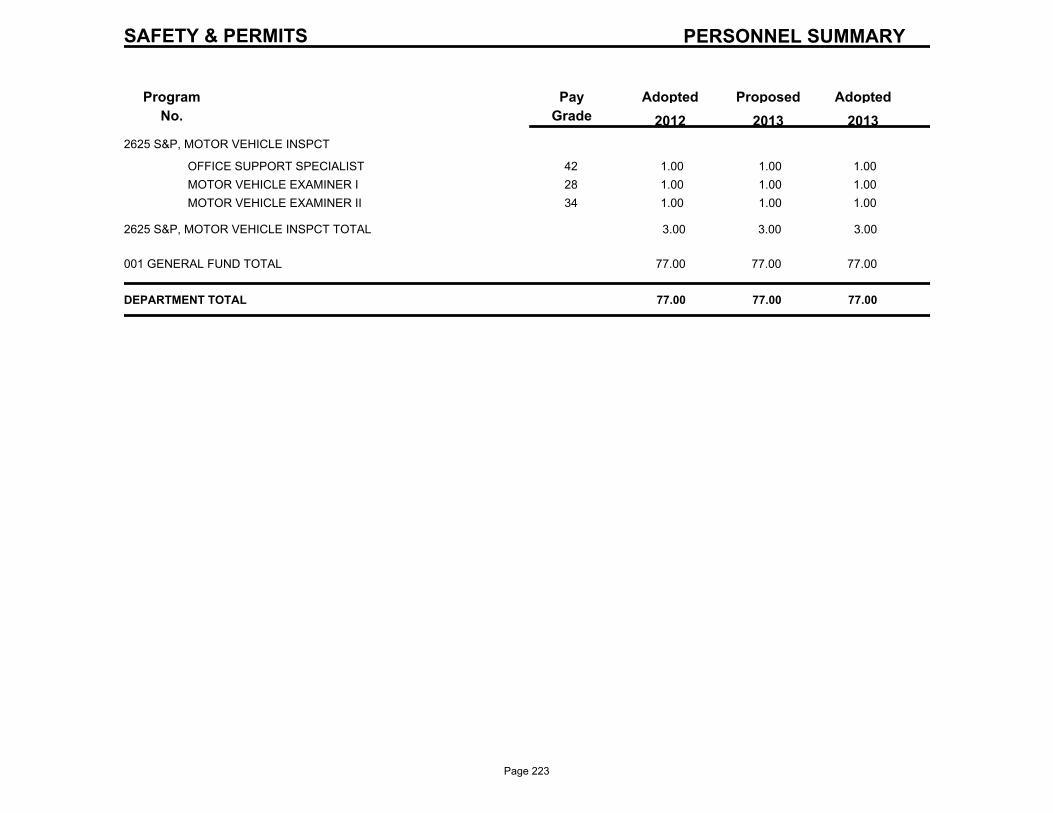
PERSONNEL SUMMARY
Program
No.
ProposedAdoptedPay
Grade
Adopted
2013 2012 2013
SAFETY & PERMITS
2625 S&P, MOTOR VEHICLE INSPCT
42OFFICE SUPPORT SPECIALIST 1.00 1.00 1.00
28MOTOR VEHICLE EXAMINER I 1.00 1.00 1.00
34MOTOR VEHICLE EXAMINER II 1.00 1.00 1.00
2625 S&P, MOTOR VEHICLE INSPCT TOTAL 3.00 3.00 3.00
001 GENERAL FUND TOTAL 77.00 77.00 77.00
DEPARTMENT TOTAL 77.00 77.00 77.00
Page 223

Police Department
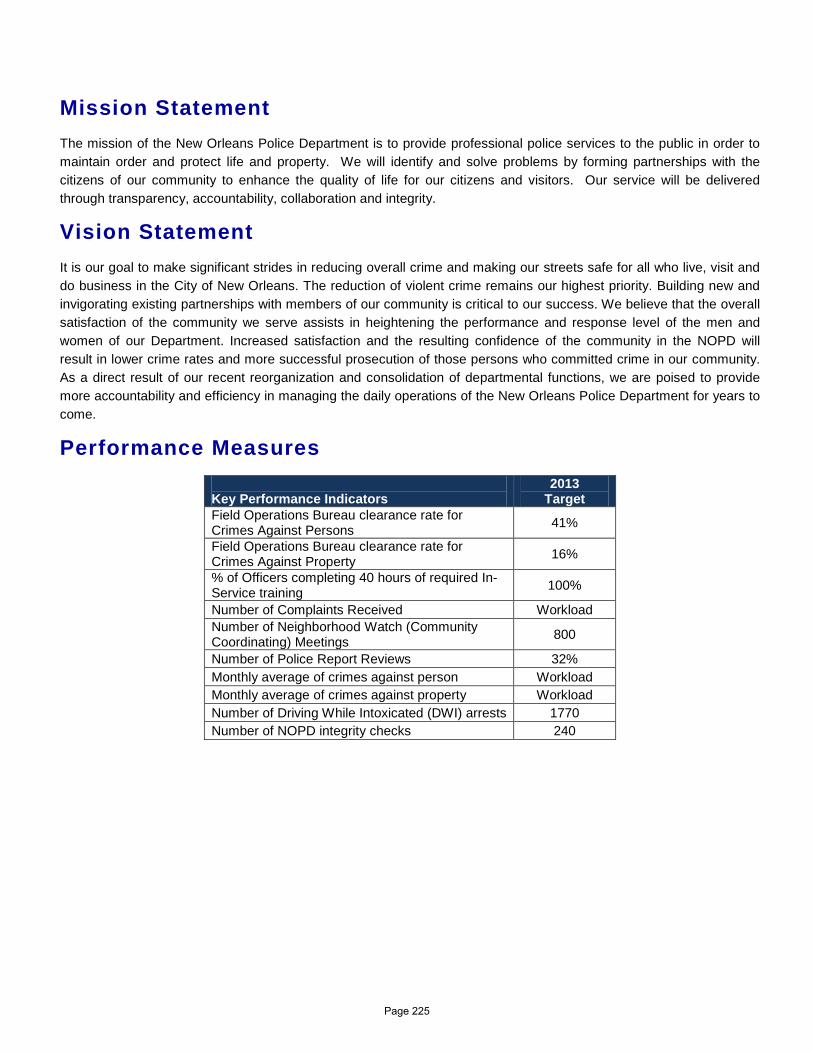
Mission Statement The mission of the New Orleans Police Department is to provide professional police services to the public in order to maintain order and protect life and property. We will identify and solve problems by forming partnerships with the citizens of our community to enhance the quality of life for our citizens and visitors. Our service will be delivered through transparency, accountability, collaboration and integrity.
Vision Statement It is our goal to make significant strides in reducing overall crime and making our streets safe for all who live, visit and do business in the City of New Orleans. The reduction of violent crime remains our highest priority. Building new and invigorating existing partnerships with members of our community is critical to our success. We believe that the overall satisfaction of the community we serve assists in heightening the performance and response level of the men and women of our Department. Increased satisfaction and the resulting confidence of the community in the NOPD will result in lower crime rates and more successful prosecution of those persons who committed crime in our community. As a direct result of our recent reorganization and consolidation of departmental functions, we are poised to provide more accountability and efficiency in managing the daily operations of the New Orleans Police Department for years to come.
Performance Measures
Key Performance Indicators
2013 Target
Field Operations Bureau clearance rate for Crimes Against Persons 41%
Field Operations Bureau clearance rate for Crimes Against Property 16%
% of Officers completing 40 hours of required In-Service training 100%
Number of Complaints Received Workload Number of Neighborhood Watch (Community Coordinating) Meetings 800
Number of Police Report Reviews 32% Monthly average of crimes against person Workload Monthly average of crimes against property Workload Number of Driving While Intoxicated (DWI) arrests 1770 Number of NOPD integrity checks 240
Page 225
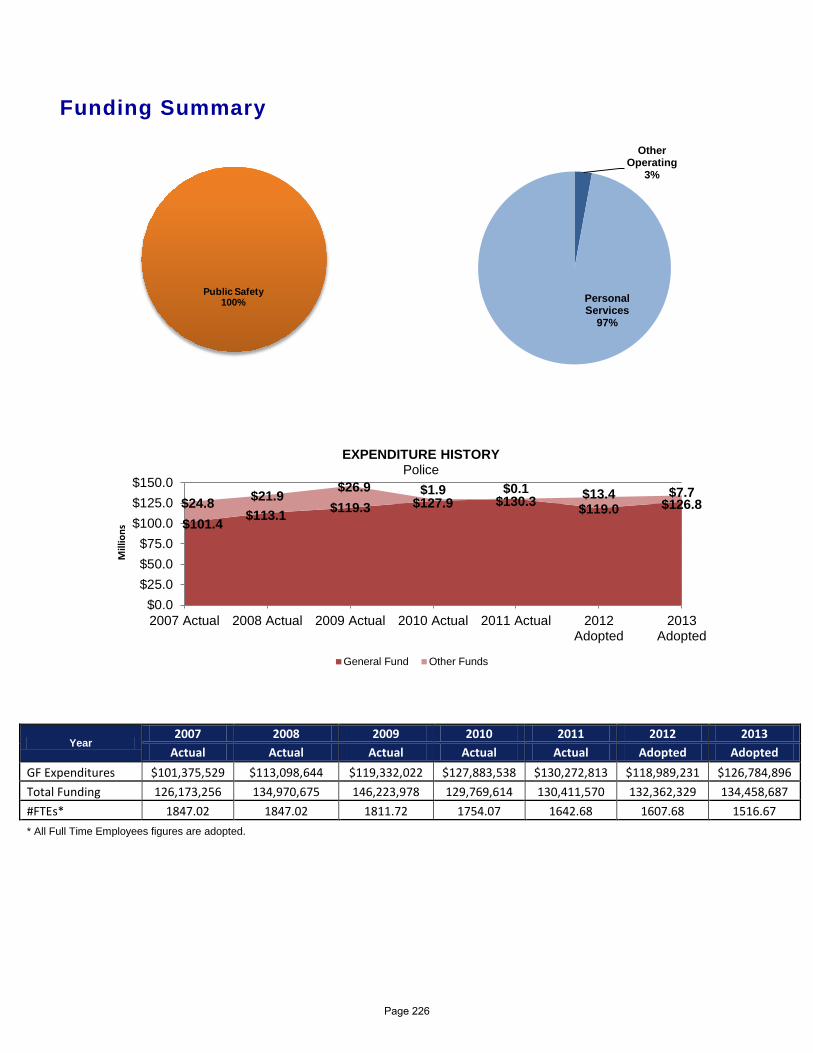
Funding Summary
Year 2007 2008 2009 2010 2011 2012 2013
Actual Actual Actual Actual Actual Adopted Adopted GF Expenditures $101,375,529 $113,098,644 $119,332,022 $127,883,538 $130,272,813 $118,989,231 $126,784,896 Total Funding 126,173,256 134,970,675 146,223,978 129,769,614 130,411,570 132,362,329 134,458,687 #FTEs* 1847.02 1847.02 1811.72 1754.07 1642.68 1607.68 1516.67 * All Full Time Employees figures are adopted.
Public Safety100%
$101.4 $113.1 $119.3 $127.9 $130.3 $119.0 $126.8 $24.8 $21.9 $26.9 $1.9 $0.1 $13.4 $7.7
$0.0$25.0$50.0$75.0
$100.0$125.0$150.0
2007 Actual 2008 Actual 2009 Actual 2010 Actual 2011 Actual 2012Adopted
2013Adopted
Mill
ions
EXPENDITURE HISTORY Police
General Fund Other Funds
Other Operating
3%
Personal Services
97%
Page 226
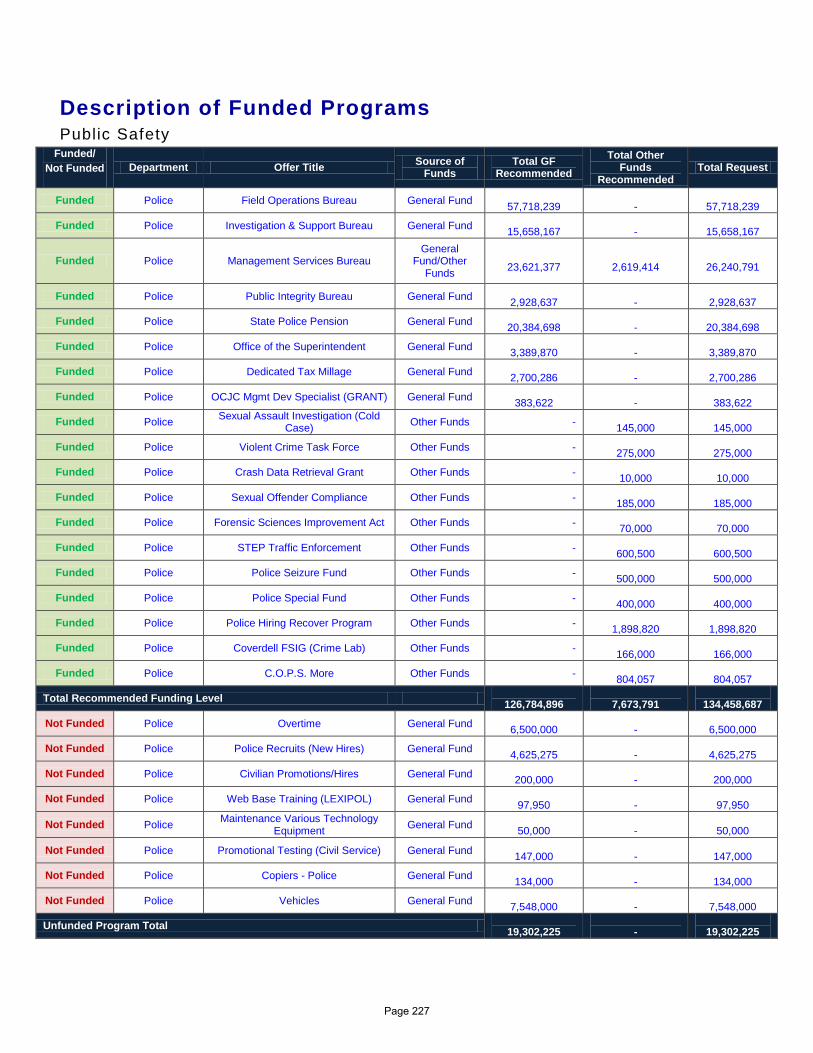
Description of Funded Programs Public Safety
Funded/ Not Funded Department Offer Title Source of
Funds Total GF
Recommended Total Other
Funds Recommended
Total Request
Funded Police Field Operations Bureau General Fund 57,718,239
-
57,718,239
Funded Police Investigation & Support Bureau General Fund 15,658,167
-
15,658,167
Funded Police Management Services Bureau General
Fund/Other Funds
23,621,377
2,619,414
26,240,791
Funded Police Public Integrity Bureau General Fund 2,928,637
-
2,928,637
Funded Police State Police Pension General Fund 20,384,698
-
20,384,698
Funded Police Office of the Superintendent General Fund 3,389,870
-
3,389,870
Funded Police Dedicated Tax Millage General Fund 2,700,286
-
2,700,286
Funded Police OCJC Mgmt Dev Specialist (GRANT) General Fund 383,622
-
383,622
Funded Police Sexual Assault Investigation (Cold Case) Other Funds -
145,000
145,000
Funded Police Violent Crime Task Force Other Funds - 275,000
275,000
Funded Police Crash Data Retrieval Grant Other Funds - 10,000
10,000
Funded Police Sexual Offender Compliance Other Funds - 185,000
185,000
Funded Police Forensic Sciences Improvement Act Other Funds - 70,000
70,000
Funded Police STEP Traffic Enforcement Other Funds - 600,500
600,500
Funded Police Police Seizure Fund Other Funds - 500,000
500,000
Funded Police Police Special Fund Other Funds - 400,000
400,000
Funded Police Police Hiring Recover Program Other Funds - 1,898,820
1,898,820
Funded Police Coverdell FSIG (Crime Lab) Other Funds - 166,000
166,000
Funded Police C.O.P.S. More Other Funds - 804,057
804,057
Total Recommended Funding Level 126,784,896
7,673,791
134,458,687
Not Funded Police Overtime General Fund 6,500,000
-
6,500,000
Not Funded Police Police Recruits (New Hires) General Fund 4,625,275
-
4,625,275
Not Funded Police Civilian Promotions/Hires General Fund 200,000
-
200,000
Not Funded Police Web Base Training (LEXIPOL) General Fund 97,950
-
97,950
Not Funded Police Maintenance Various Technology Equipment General Fund
50,000 -
50,000
Not Funded Police Promotional Testing (Civil Service) General Fund 147,000
-
147,000
Not Funded Police Copiers - Police General Fund 134,000
-
134,000
Not Funded Police Vehicles General Fund 7,548,000
-
7,548,000
Unfunded Program Total 19,302,225
-
19,302,225
Page 227
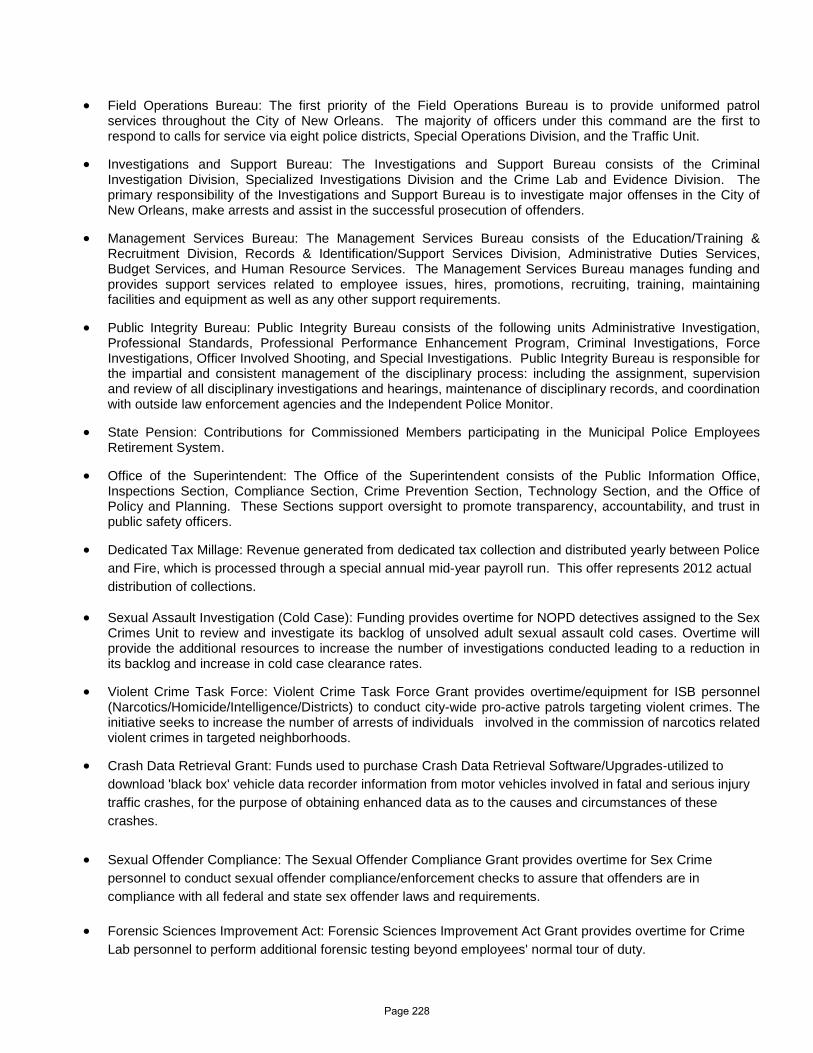
• Field Operations Bureau: The first priority of the Field Operations Bureau is to provide uniformed patrol services throughout the City of New Orleans. The majority of officers under this command are the first to respond to calls for service via eight police districts, Special Operations Division, and the Traffic Unit.
• Investigations and Support Bureau: The Investigations and Support Bureau consists of the Criminal Investigation Division, Specialized Investigations Division and the Crime Lab and Evidence Division. The primary responsibility of the Investigations and Support Bureau is to investigate major offenses in the City of New Orleans, make arrests and assist in the successful prosecution of offenders.
• Management Services Bureau: The Management Services Bureau consists of the Education/Training & Recruitment Division, Records & Identification/Support Services Division, Administrative Duties Services, Budget Services, and Human Resource Services. The Management Services Bureau manages funding and provides support services related to employee issues, hires, promotions, recruiting, training, maintaining facilities and equipment as well as any other support requirements.
• Public Integrity Bureau: Public Integrity Bureau consists of the following units Administrative Investigation, Professional Standards, Professional Performance Enhancement Program, Criminal Investigations, Force Investigations, Officer Involved Shooting, and Special Investigations. Public Integrity Bureau is responsible for the impartial and consistent management of the disciplinary process: including the assignment, supervision and review of all disciplinary investigations and hearings, maintenance of disciplinary records, and coordination with outside law enforcement agencies and the Independent Police Monitor.
• State Pension: Contributions for Commissioned Members participating in the Municipal Police Employees Retirement System.
• Office of the Superintendent: The Office of the Superintendent consists of the Public Information Office, Inspections Section, Compliance Section, Crime Prevention Section, Technology Section, and the Office of Policy and Planning. These Sections support oversight to promote transparency, accountability, and trust in public safety officers.
• Dedicated Tax Millage: Revenue generated from dedicated tax collection and distributed yearly between Police and Fire, which is processed through a special annual mid-year payroll run. This offer represents 2012 actual distribution of collections.
• Sexual Assault Investigation (Cold Case): Funding provides overtime for NOPD detectives assigned to the Sex Crimes Unit to review and investigate its backlog of unsolved adult sexual assault cold cases. Overtime will provide the additional resources to increase the number of investigations conducted leading to a reduction in its backlog and increase in cold case clearance rates.
• Violent Crime Task Force: Violent Crime Task Force Grant provides overtime/equipment for ISB personnel (Narcotics/Homicide/Intelligence/Districts) to conduct city-wide pro-active patrols targeting violent crimes. The initiative seeks to increase the number of arrests of individuals involved in the commission of narcotics related violent crimes in targeted neighborhoods.
• Crash Data Retrieval Grant: Funds used to purchase Crash Data Retrieval Software/Upgrades-utilized to download 'black box' vehicle data recorder information from motor vehicles involved in fatal and serious injury traffic crashes, for the purpose of obtaining enhanced data as to the causes and circumstances of these crashes.
• Sexual Offender Compliance: The Sexual Offender Compliance Grant provides overtime for Sex Crime personnel to conduct sexual offender compliance/enforcement checks to assure that offenders are in compliance with all federal and state sex offender laws and requirements.
• Forensic Sciences Improvement Act: Forensic Sciences Improvement Act Grant provides overtime for Crime Lab personnel to perform additional forensic testing beyond employees' normal tour of duty.
Page 228

• STEP Traffic Enforcement: STEP (Traffic Enforcement) provides for additional overtime hours to enforce traffic laws, DWI, Occupant Protection, Speeding, Motorcycle, Juvenile Underage Drinking Enforcement (JUDE), as well as to conduct Check Points.
Page 229
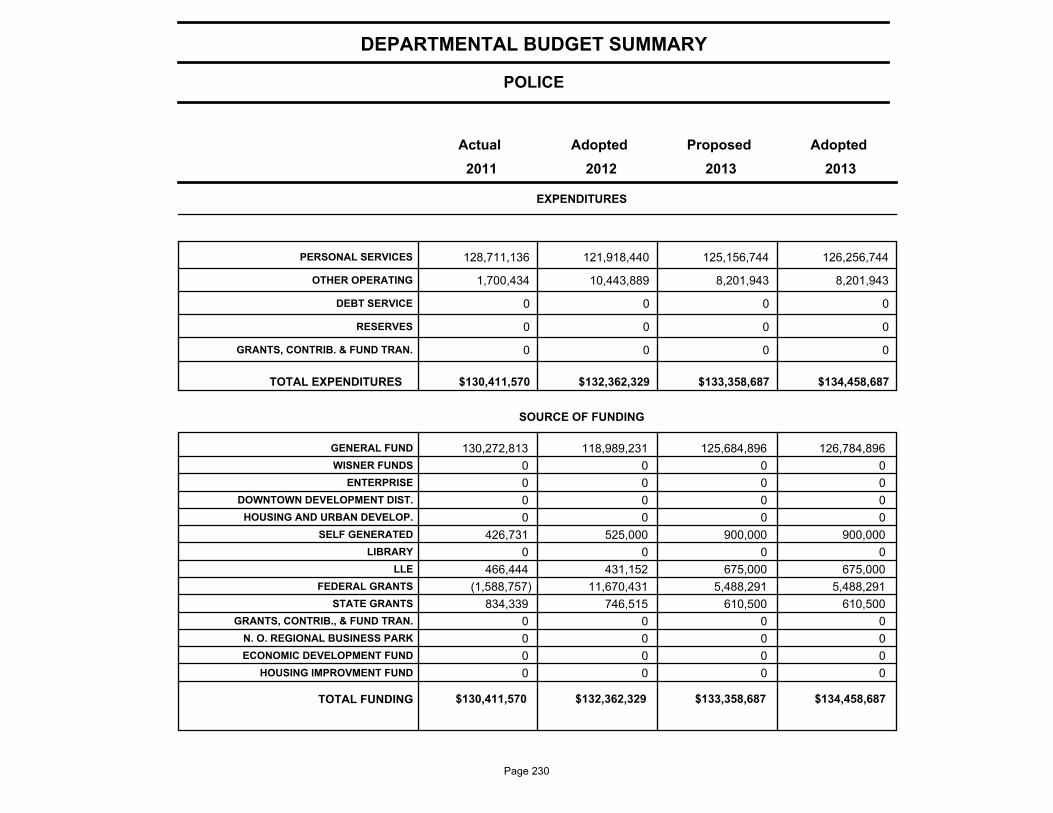
POLICE
DEPARTMENTAL BUDGET SUMMARY
AdoptedProposedAdoptedActual
EXPENDITURES
2013 2012 2011 2013
PERSONAL SERVICES 128,711,136 121,918,440 125,156,744 126,256,744
OTHER OPERATING 1,700,434 10,443,889 8,201,943 8,201,943
DEBT SERVICE 0 0 0 0
RESERVES 0 0 0 0
GRANTS, CONTRIB. & FUND TRAN. 0 0 0 0
$130,411,570 $132,362,329 $133,358,687 TOTAL EXPENDITURES $134,458,687
SOURCE OF FUNDING
GENERAL FUND 130,272,813 118,989,231 125,684,896 126,784,896
WISNER FUNDS 0 0 0 0
ENTERPRISE 0 0 0 0
DOWNTOWN DEVELOPMENT DIST. 0 0 0 0
HOUSING AND URBAN DEVELOP. 0 0 0 0
SELF GENERATED 426,731 525,000 900,000 900,000
LIBRARY 0 0 0 0
LLE 466,444 431,152 675,000 675,000
FEDERAL GRANTS (1,588,757) 11,670,431 5,488,291 5,488,291
STATE GRANTS 834,339 746,515 610,500 610,500
GRANTS, CONTRIB., & FUND TRAN. 0 0 0 0
N. O. REGIONAL BUSINESS PARK 0 0 0 0
ECONOMIC DEVELOPMENT FUND 0 0 0 0
HOUSING IMPROVMENT FUND 0 0 0 0
$130,411,570 $132,362,329 $133,358,687 TOTAL FUNDING $134,458,687
Page 230
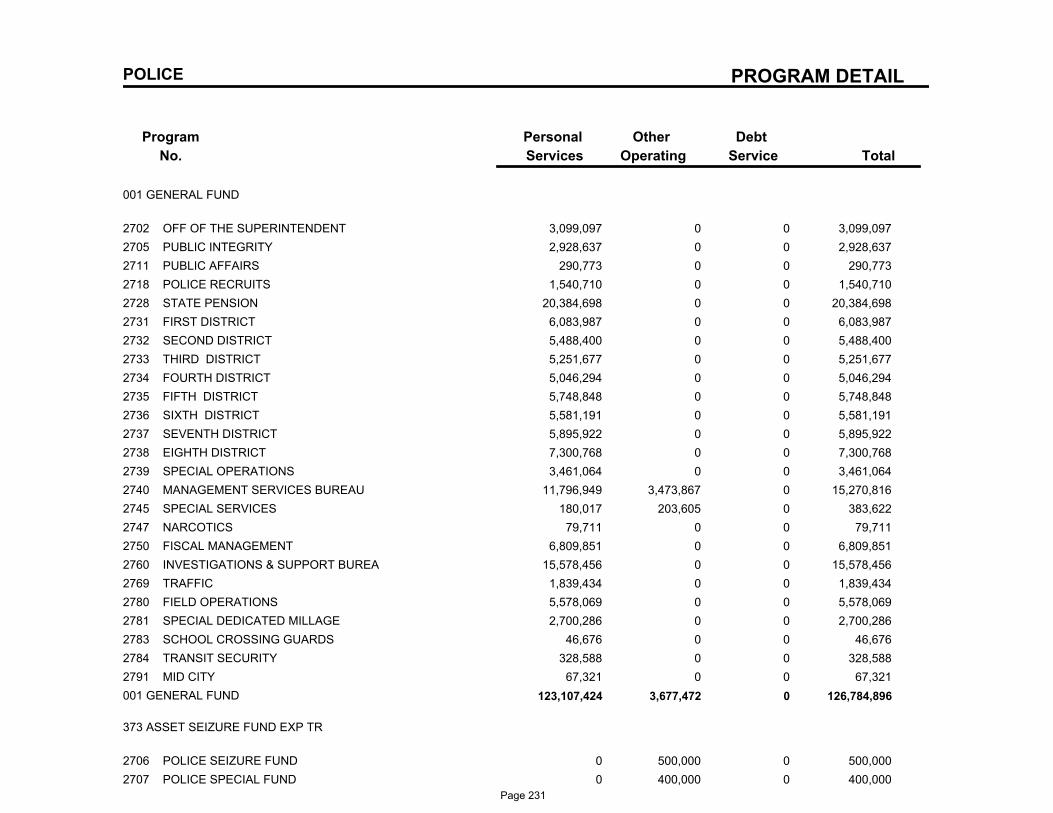
PROGRAM DETAIL
Program
No.
Debt
Service
Other
Operating
Personal
Services Total
POLICE
001 GENERAL FUND
2702 OFF OF THE SUPERINTENDENT 3,099,097 0 0 3,099,097
2705 PUBLIC INTEGRITY 2,928,637 0 0 2,928,637
2711 PUBLIC AFFAIRS 290,773 0 0 290,773
2718 POLICE RECRUITS 1,540,710 0 0 1,540,710
2728 STATE PENSION 20,384,698 0 0 20,384,698
2731 FIRST DISTRICT 6,083,987 0 0 6,083,987
2732 SECOND DISTRICT 5,488,400 0 0 5,488,400
2733 THIRD DISTRICT 5,251,677 0 0 5,251,677
2734 FOURTH DISTRICT 5,046,294 0 0 5,046,294
2735 FIFTH DISTRICT 5,748,848 0 0 5,748,848
2736 SIXTH DISTRICT 5,581,191 0 0 5,581,191
2737 SEVENTH DISTRICT 5,895,922 0 0 5,895,922
2738 EIGHTH DISTRICT 7,300,768 0 0 7,300,768
2739 SPECIAL OPERATIONS 3,461,064 0 0 3,461,064
2740 MANAGEMENT SERVICES BUREAU 11,796,949 3,473,867 0 15,270,816
2745 SPECIAL SERVICES 180,017 203,605 0 383,622
2747 NARCOTICS 79,711 0 0 79,711
2750 FISCAL MANAGEMENT 6,809,851 0 0 6,809,851
2760 INVESTIGATIONS & SUPPORT BUREA 15,578,456 0 0 15,578,456
2769 TRAFFIC 1,839,434 0 0 1,839,434
2780 FIELD OPERATIONS 5,578,069 0 0 5,578,069
2781 SPECIAL DEDICATED MILLAGE 2,700,286 0 0 2,700,286
2783 SCHOOL CROSSING GUARDS 46,676 0 0 46,676
2784 TRANSIT SECURITY 328,588 0 0 328,588
2791 MID CITY 67,321 0 0 67,321
001 GENERAL FUND 123,107,424 3,677,472 0 126,784,896
373 ASSET SEIZURE FUND EXP TR
2706 POLICE SEIZURE FUND 0 500,000 0 500,000
2707 POLICE SPECIAL FUND 0 400,000 0 400,000
Page 231
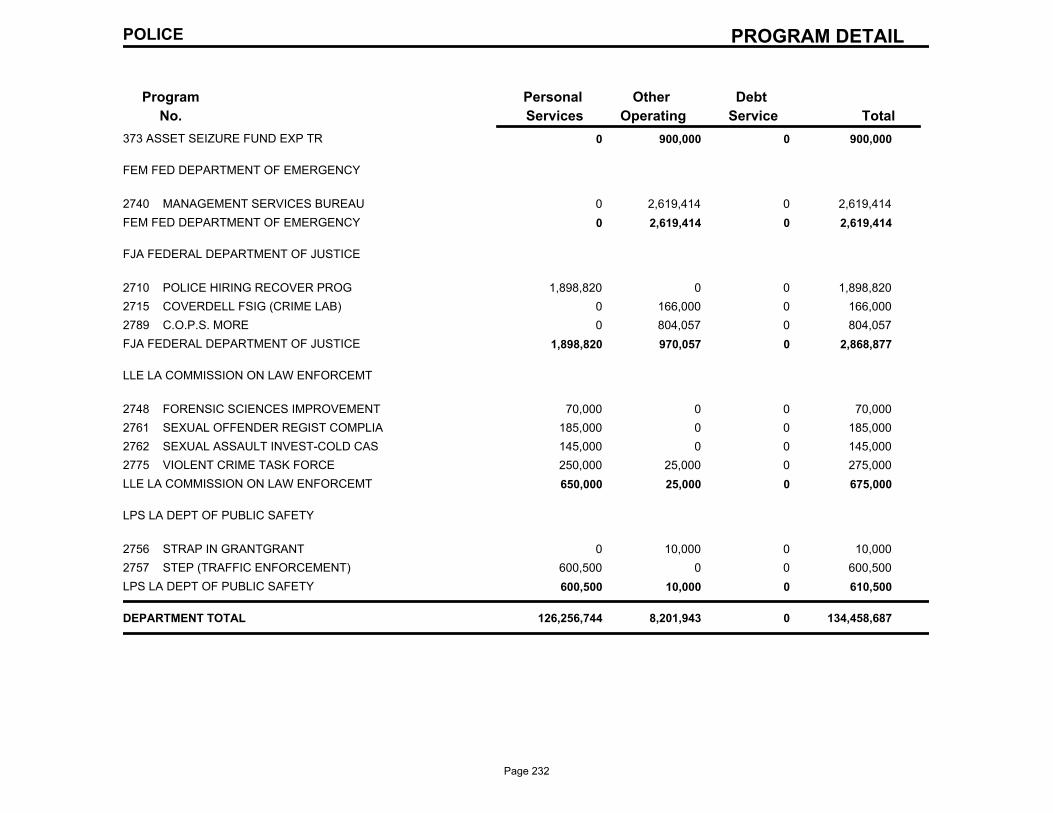
PROGRAM DETAIL
Program
No.
Debt
Service
Other
Operating
Personal
Services Total
POLICE
373 ASSET SEIZURE FUND EXP TR 0 900,000 0 900,000
FEM FED DEPARTMENT OF EMERGENCY
2740 MANAGEMENT SERVICES BUREAU 0 2,619,414 0 2,619,414
FEM FED DEPARTMENT OF EMERGENCY 0 2,619,414 0 2,619,414
FJA FEDERAL DEPARTMENT OF JUSTICE
2710 POLICE HIRING RECOVER PROG 1,898,820 0 0 1,898,820
2715 COVERDELL FSIG (CRIME LAB) 0 166,000 0 166,000
2789 C.O.P.S. MORE 0 804,057 0 804,057
FJA FEDERAL DEPARTMENT OF JUSTICE 1,898,820 970,057 0 2,868,877
LLE LA COMMISSION ON LAW ENFORCEMT
2748 FORENSIC SCIENCES IMPROVEMENT 70,000 0 0 70,000
2761 SEXUAL OFFENDER REGIST COMPLIA 185,000 0 0 185,000
2762 SEXUAL ASSAULT INVEST-COLD CAS 145,000 0 0 145,000
2775 VIOLENT CRIME TASK FORCE 250,000 25,000 0 275,000
LLE LA COMMISSION ON LAW ENFORCEMT 650,000 25,000 0 675,000
LPS LA DEPT OF PUBLIC SAFETY
2756 STRAP IN GRANTGRANT 0 10,000 0 10,000
2757 STEP (TRAFFIC ENFORCEMENT) 600,500 0 0 600,500
LPS LA DEPT OF PUBLIC SAFETY 600,500 10,000 0 610,500
DEPARTMENT TOTAL 126,256,744 8,201,943 0 134,458,687
Page 232
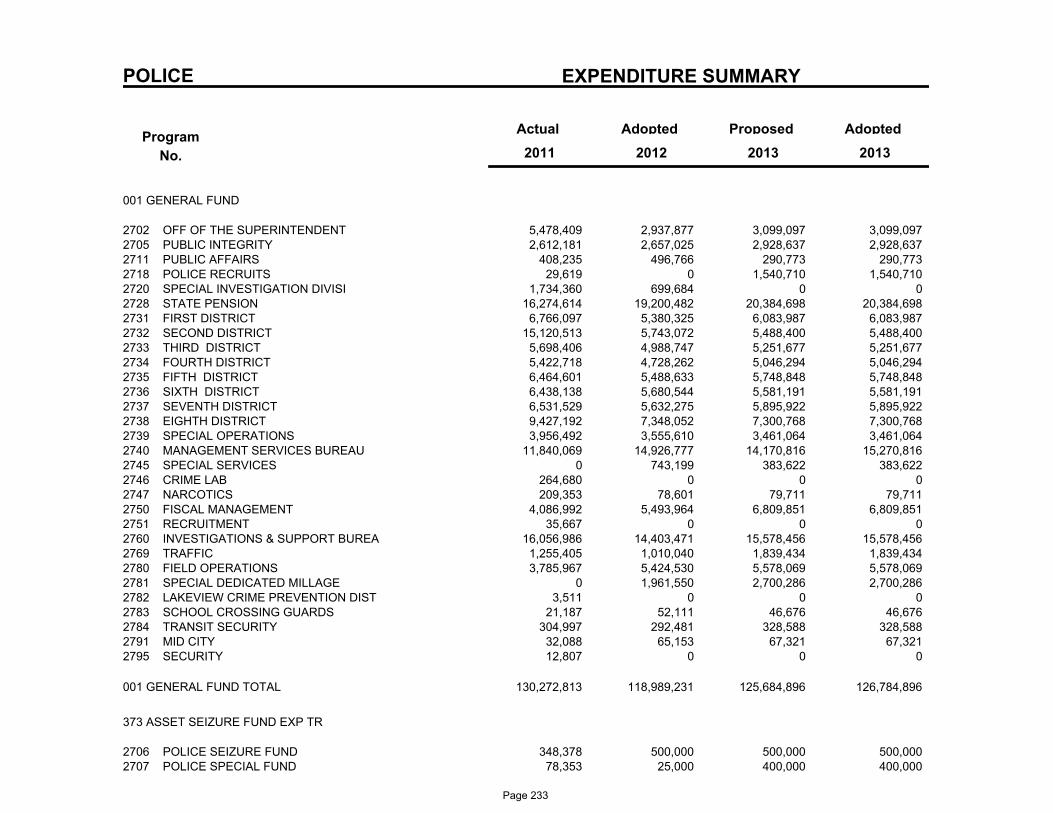
POLICE EXPENDITURE SUMMARY
Program
No.
Actual AdoptedProposedAdopted
2013 2011 2012 2013
001 GENERAL FUND
5,478,409 2,937,877 3,099,097 OFF OF THE SUPERINTENDENT2702 3,099,097 2,612,181 2,657,025 2,928,637 PUBLIC INTEGRITY2705 2,928,637
408,235 496,766 290,773 PUBLIC AFFAIRS2711 290,773 29,619 0 1,540,710 POLICE RECRUITS2718 1,540,710
1,734,360 699,684 0 SPECIAL INVESTIGATION DIVISI2720 0 16,274,614 19,200,482 20,384,698 STATE PENSION2728 20,384,698
6,766,097 5,380,325 6,083,987 FIRST DISTRICT2731 6,083,987 15,120,513 5,743,072 5,488,400 SECOND DISTRICT2732 5,488,400
5,698,406 4,988,747 5,251,677 THIRD DISTRICT2733 5,251,677 5,422,718 4,728,262 5,046,294 FOURTH DISTRICT2734 5,046,294 6,464,601 5,488,633 5,748,848 FIFTH DISTRICT2735 5,748,848 6,438,138 5,680,544 5,581,191 SIXTH DISTRICT2736 5,581,191 6,531,529 5,632,275 5,895,922 SEVENTH DISTRICT2737 5,895,922 9,427,192 7,348,052 7,300,768 EIGHTH DISTRICT2738 7,300,768 3,956,492 3,555,610 3,461,064 SPECIAL OPERATIONS2739 3,461,064
11,840,069 14,926,777 14,170,816 MANAGEMENT SERVICES BUREAU2740 15,270,816 0 743,199 383,622 SPECIAL SERVICES2745 383,622
264,680 0 0 CRIME LAB2746 0 209,353 78,601 79,711 NARCOTICS2747 79,711
4,086,992 5,493,964 6,809,851 FISCAL MANAGEMENT2750 6,809,851 35,667 0 0 RECRUITMENT2751 0
16,056,986 14,403,471 15,578,456 INVESTIGATIONS & SUPPORT BUREA2760 15,578,456 1,255,405 1,010,040 1,839,434 TRAFFIC2769 1,839,434 3,785,967 5,424,530 5,578,069 FIELD OPERATIONS2780 5,578,069
0 1,961,550 2,700,286 SPECIAL DEDICATED MILLAGE2781 2,700,286 3,511 0 0 LAKEVIEW CRIME PREVENTION DIST2782 0
21,187 52,111 46,676 SCHOOL CROSSING GUARDS2783 46,676 304,997 292,481 328,588 TRANSIT SECURITY2784 328,588
32,088 65,153 67,321 MID CITY2791 67,321 12,807 0 0 SECURITY2795 0
130,272,813 118,989,231 125,684,896 126,784,896 001 GENERAL FUND TOTAL
373 ASSET SEIZURE FUND EXP TR
348,378 500,000 500,000 POLICE SEIZURE FUND2706 500,000 78,353 25,000 400,000 POLICE SPECIAL FUND2707 400,000
Page 233
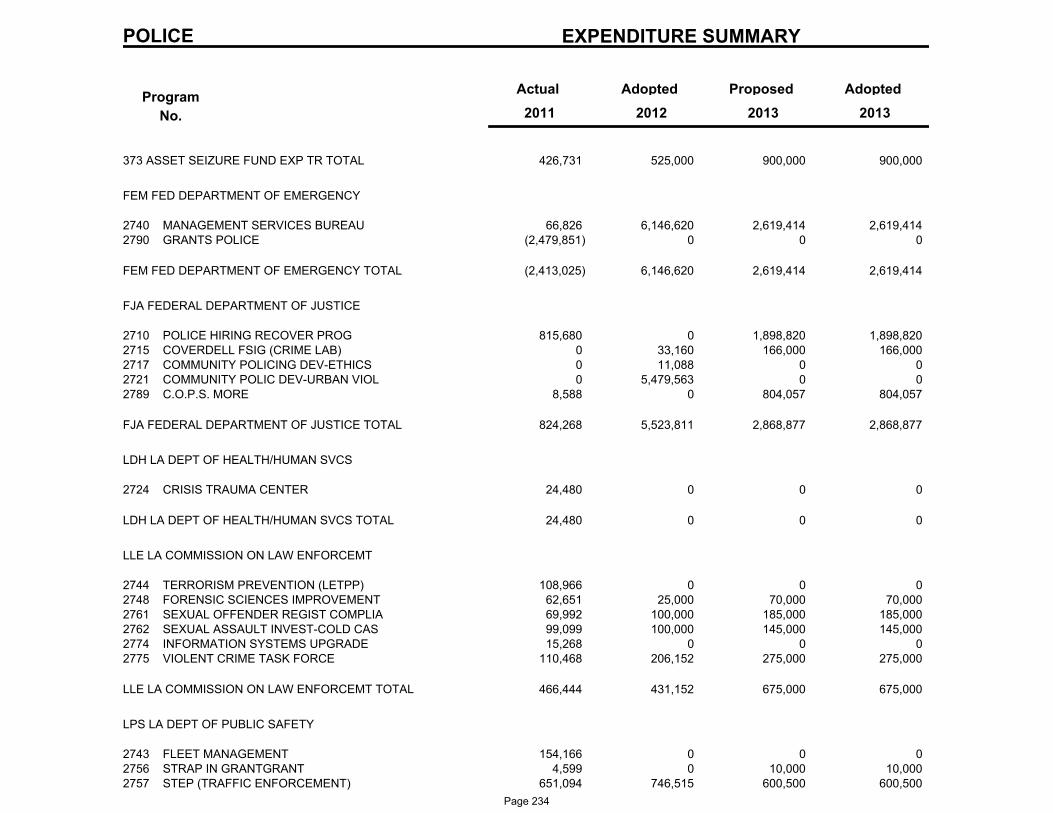
POLICE EXPENDITURE SUMMARY
Program
No.
Actual AdoptedProposedAdopted
2013 2011 2012 2013
426,731 525,000 900,000 900,000 373 ASSET SEIZURE FUND EXP TR TOTAL
FEM FED DEPARTMENT OF EMERGENCY
66,826 6,146,620 2,619,414 MANAGEMENT SERVICES BUREAU2740 2,619,414 (2,479,851) 0 0 GRANTS POLICE2790 0
(2,413,025) 6,146,620 2,619,414 2,619,414 FEM FED DEPARTMENT OF EMERGENCY TOTAL
FJA FEDERAL DEPARTMENT OF JUSTICE
815,680 0 1,898,820 POLICE HIRING RECOVER PROG2710 1,898,820 0 33,160 166,000 COVERDELL FSIG (CRIME LAB)2715 166,000 0 11,088 0 COMMUNITY POLICING DEV-ETHICS2717 0 0 5,479,563 0 COMMUNITY POLIC DEV-URBAN VIOL2721 0
8,588 0 804,057 C.O.P.S. MORE2789 804,057
824,268 5,523,811 2,868,877 2,868,877 FJA FEDERAL DEPARTMENT OF JUSTICE TOTAL
LDH LA DEPT OF HEALTH/HUMAN SVCS
24,480 0 0 CRISIS TRAUMA CENTER2724 0
24,480 0 0 0 LDH LA DEPT OF HEALTH/HUMAN SVCS TOTAL
LLE LA COMMISSION ON LAW ENFORCEMT
108,966 0 0 TERRORISM PREVENTION (LETPP)2744 0 62,651 25,000 70,000 FORENSIC SCIENCES IMPROVEMENT2748 70,000 69,992 100,000 185,000 SEXUAL OFFENDER REGIST COMPLIA2761 185,000 99,099 100,000 145,000 SEXUAL ASSAULT INVEST-COLD CAS2762 145,000 15,268 0 0 INFORMATION SYSTEMS UPGRADE2774 0
110,468 206,152 275,000 VIOLENT CRIME TASK FORCE2775 275,000
466,444 431,152 675,000 675,000 LLE LA COMMISSION ON LAW ENFORCEMT TOTAL
LPS LA DEPT OF PUBLIC SAFETY
154,166 0 0 FLEET MANAGEMENT2743 0 4,599 0 10,000 STRAP IN GRANTGRANT2756 10,000
651,094 746,515 600,500 STEP (TRAFFIC ENFORCEMENT)2757 600,500
Page 234
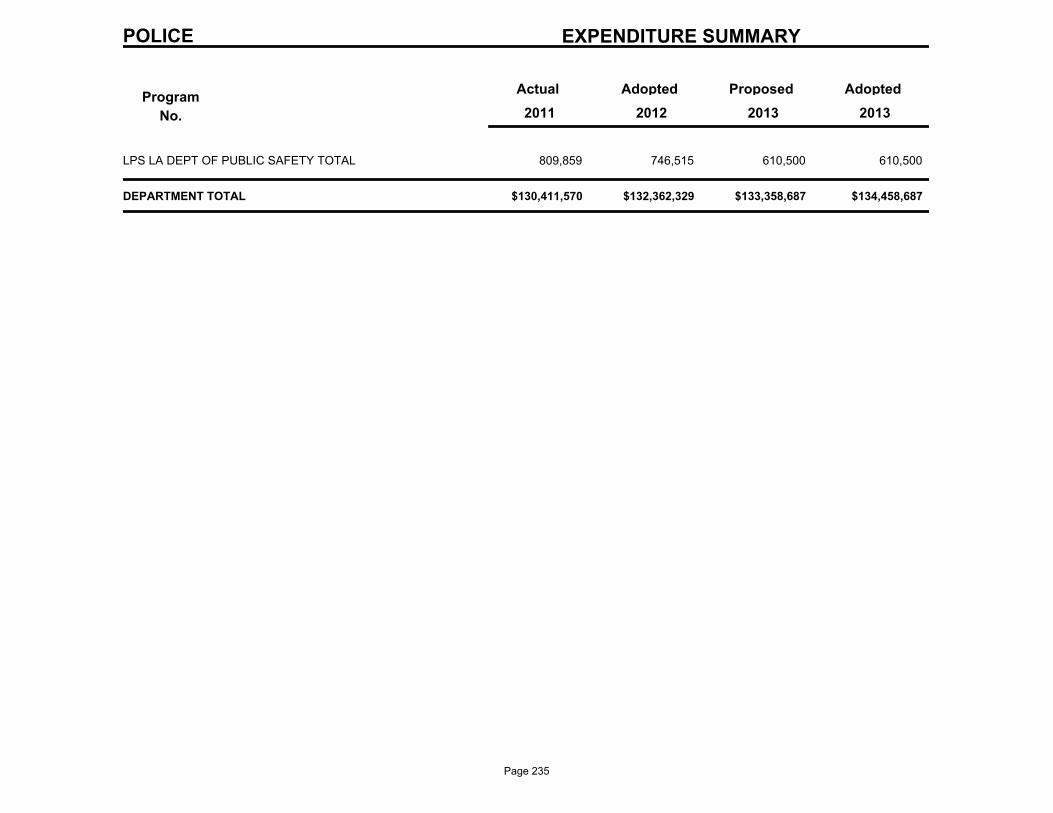
POLICE EXPENDITURE SUMMARY
Program
No.
Actual AdoptedProposedAdopted
2013 2011 2012 2013
809,859 746,515 610,500 610,500 LPS LA DEPT OF PUBLIC SAFETY TOTAL
$130,411,570 $132,362,329 $133,358,687 $134,458,687 DEPARTMENT TOTAL
Page 235
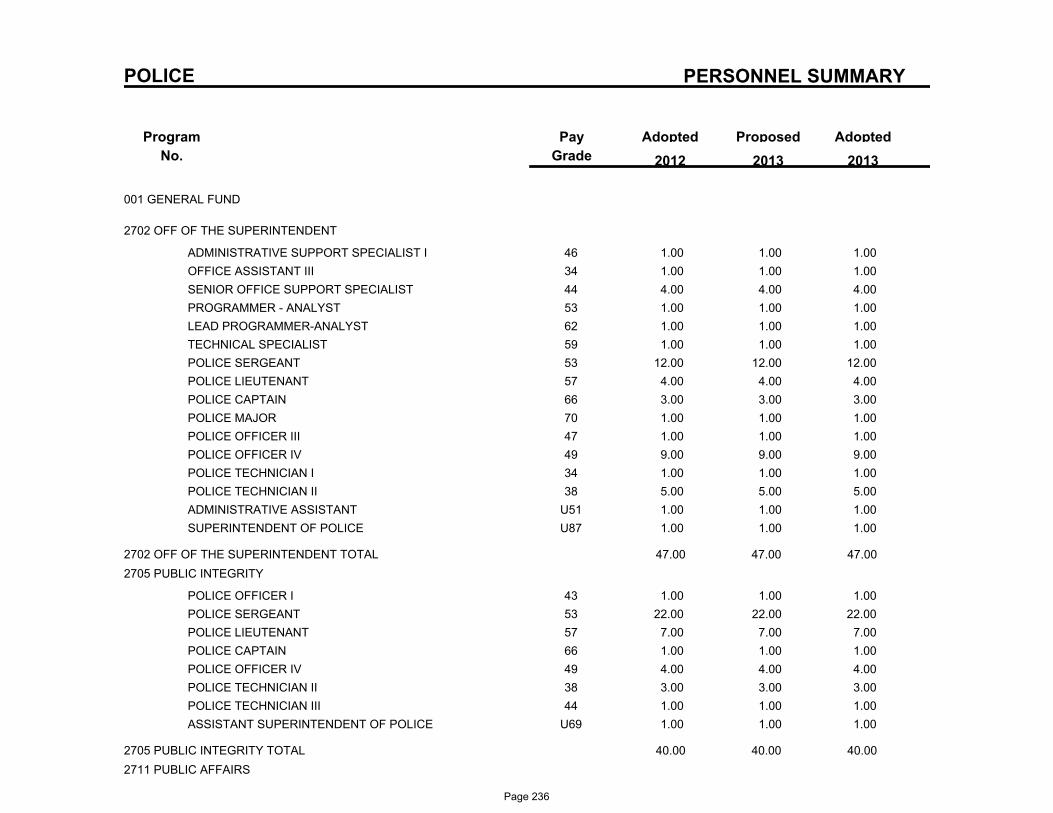
PERSONNEL SUMMARY
Program
No.
ProposedAdoptedPay
Grade
Adopted
2013 2012 2013
POLICE
001 GENERAL FUND
2702 OFF OF THE SUPERINTENDENT
46ADMINISTRATIVE SUPPORT SPECIALIST I 1.00 1.00 1.00
34OFFICE ASSISTANT III 1.00 1.00 1.00
44SENIOR OFFICE SUPPORT SPECIALIST 4.00 4.00 4.00
53PROGRAMMER - ANALYST 1.00 1.00 1.00
62LEAD PROGRAMMER-ANALYST 1.00 1.00 1.00
59TECHNICAL SPECIALIST 1.00 1.00 1.00
53POLICE SERGEANT 12.00 12.00 12.00
57POLICE LIEUTENANT 4.00 4.00 4.00
66POLICE CAPTAIN 3.00 3.00 3.00
70POLICE MAJOR 1.00 1.00 1.00
47POLICE OFFICER III 1.00 1.00 1.00
49POLICE OFFICER IV 9.00 9.00 9.00
34POLICE TECHNICIAN I 1.00 1.00 1.00
38POLICE TECHNICIAN II 5.00 5.00 5.00
U51ADMINISTRATIVE ASSISTANT 1.00 1.00 1.00
U87SUPERINTENDENT OF POLICE 1.00 1.00 1.00
2702 OFF OF THE SUPERINTENDENT TOTAL 47.00 47.00 47.00
2705 PUBLIC INTEGRITY
43POLICE OFFICER I 1.00 1.00 1.00
53POLICE SERGEANT 22.00 22.00 22.00
57POLICE LIEUTENANT 7.00 7.00 7.00
66POLICE CAPTAIN 1.00 1.00 1.00
49POLICE OFFICER IV 4.00 4.00 4.00
38POLICE TECHNICIAN II 3.00 3.00 3.00
44POLICE TECHNICIAN III 1.00 1.00 1.00
U69ASSISTANT SUPERINTENDENT OF POLICE 1.00 1.00 1.00
2705 PUBLIC INTEGRITY TOTAL 40.00 40.00 40.00
2711 PUBLIC AFFAIRS
Page 236
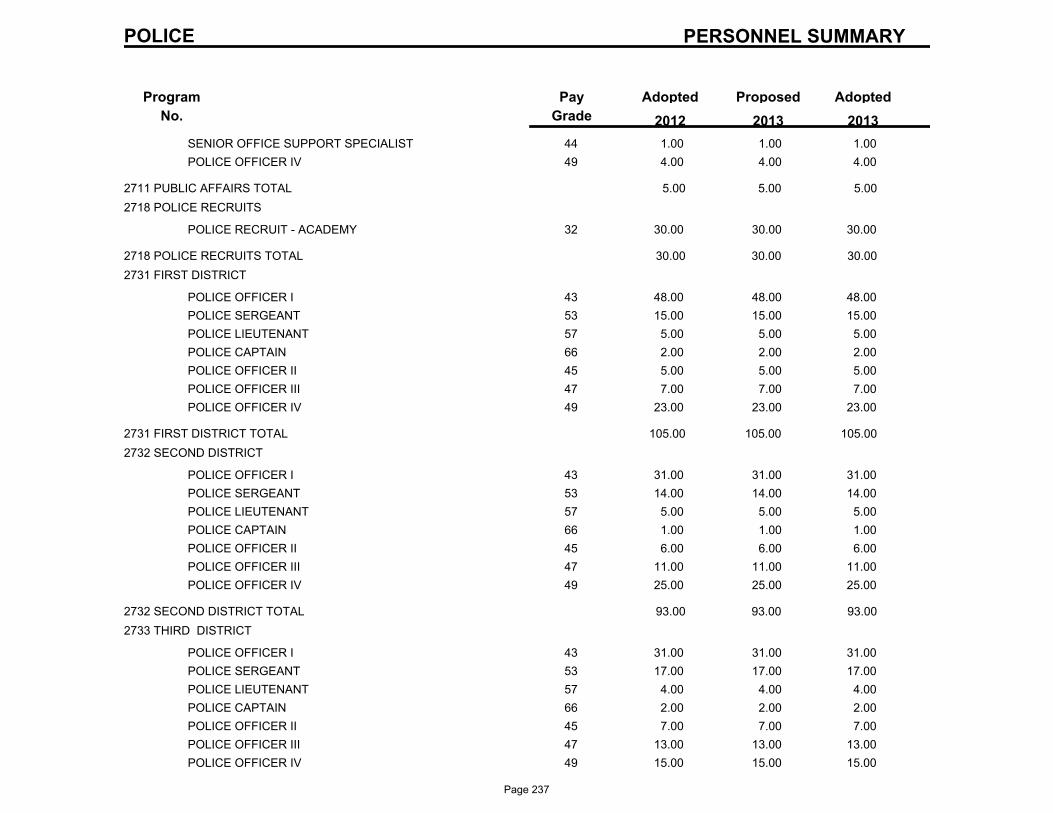
PERSONNEL SUMMARY
Program
No.
ProposedAdoptedPay
Grade
Adopted
2013 2012 2013
POLICE
44SENIOR OFFICE SUPPORT SPECIALIST 1.00 1.00 1.00
49POLICE OFFICER IV 4.00 4.00 4.00
2711 PUBLIC AFFAIRS TOTAL 5.00 5.00 5.00
2718 POLICE RECRUITS
32POLICE RECRUIT - ACADEMY 30.00 30.00 30.00
2718 POLICE RECRUITS TOTAL 30.00 30.00 30.00
2731 FIRST DISTRICT
43POLICE OFFICER I 48.00 48.00 48.00
53POLICE SERGEANT 15.00 15.00 15.00
57POLICE LIEUTENANT 5.00 5.00 5.00
66POLICE CAPTAIN 2.00 2.00 2.00
45POLICE OFFICER II 5.00 5.00 5.00
47POLICE OFFICER III 7.00 7.00 7.00
49POLICE OFFICER IV 23.00 23.00 23.00
2731 FIRST DISTRICT TOTAL 105.00 105.00 105.00
2732 SECOND DISTRICT
43POLICE OFFICER I 31.00 31.00 31.00
53POLICE SERGEANT 14.00 14.00 14.00
57POLICE LIEUTENANT 5.00 5.00 5.00
66POLICE CAPTAIN 1.00 1.00 1.00
45POLICE OFFICER II 6.00 6.00 6.00
47POLICE OFFICER III 11.00 11.00 11.00
49POLICE OFFICER IV 25.00 25.00 25.00
2732 SECOND DISTRICT TOTAL 93.00 93.00 93.00
2733 THIRD DISTRICT
43POLICE OFFICER I 31.00 31.00 31.00
53POLICE SERGEANT 17.00 17.00 17.00
57POLICE LIEUTENANT 4.00 4.00 4.00
66POLICE CAPTAIN 2.00 2.00 2.00
45POLICE OFFICER II 7.00 7.00 7.00
47POLICE OFFICER III 13.00 13.00 13.00
49POLICE OFFICER IV 15.00 15.00 15.00
Page 237
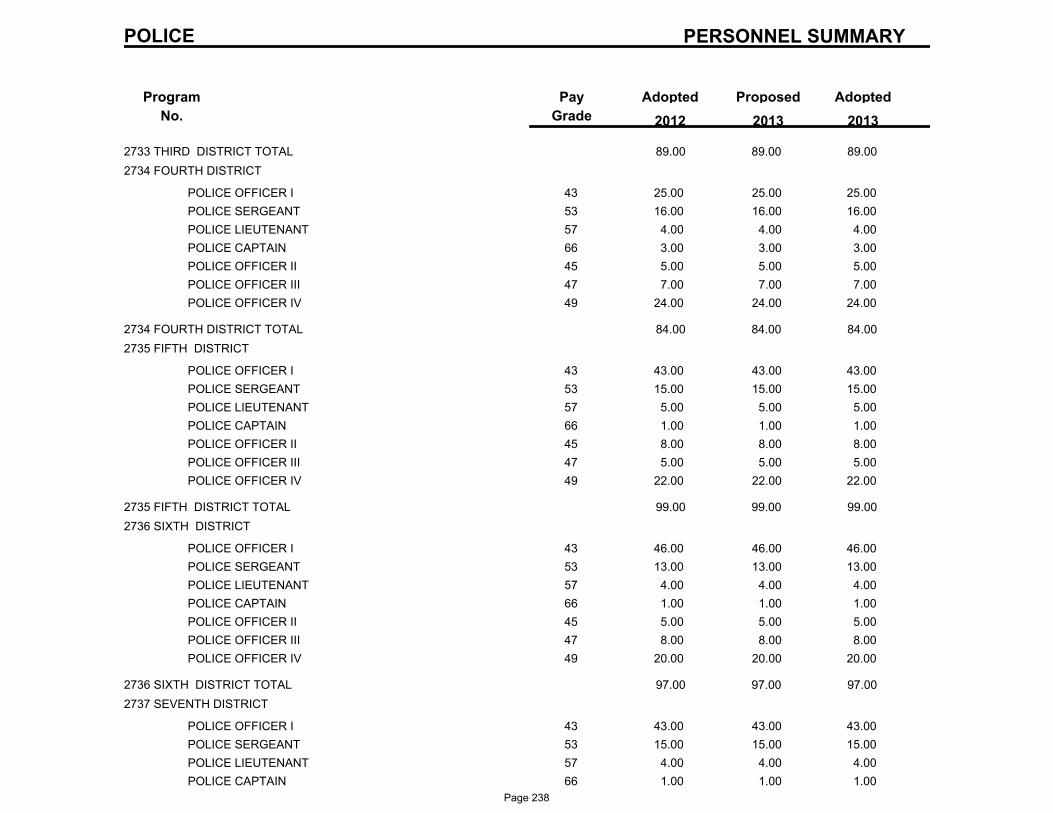
PERSONNEL SUMMARY
Program
No.
ProposedAdoptedPay
Grade
Adopted
2013 2012 2013
POLICE
2733 THIRD DISTRICT TOTAL 89.00 89.00 89.00
2734 FOURTH DISTRICT
43POLICE OFFICER I 25.00 25.00 25.00
53POLICE SERGEANT 16.00 16.00 16.00
57POLICE LIEUTENANT 4.00 4.00 4.00
66POLICE CAPTAIN 3.00 3.00 3.00
45POLICE OFFICER II 5.00 5.00 5.00
47POLICE OFFICER III 7.00 7.00 7.00
49POLICE OFFICER IV 24.00 24.00 24.00
2734 FOURTH DISTRICT TOTAL 84.00 84.00 84.00
2735 FIFTH DISTRICT
43POLICE OFFICER I 43.00 43.00 43.00
53POLICE SERGEANT 15.00 15.00 15.00
57POLICE LIEUTENANT 5.00 5.00 5.00
66POLICE CAPTAIN 1.00 1.00 1.00
45POLICE OFFICER II 8.00 8.00 8.00
47POLICE OFFICER III 5.00 5.00 5.00
49POLICE OFFICER IV 22.00 22.00 22.00
2735 FIFTH DISTRICT TOTAL 99.00 99.00 99.00
2736 SIXTH DISTRICT
43POLICE OFFICER I 46.00 46.00 46.00
53POLICE SERGEANT 13.00 13.00 13.00
57POLICE LIEUTENANT 4.00 4.00 4.00
66POLICE CAPTAIN 1.00 1.00 1.00
45POLICE OFFICER II 5.00 5.00 5.00
47POLICE OFFICER III 8.00 8.00 8.00
49POLICE OFFICER IV 20.00 20.00 20.00
2736 SIXTH DISTRICT TOTAL 97.00 97.00 97.00
2737 SEVENTH DISTRICT
43POLICE OFFICER I 43.00 43.00 43.00
53POLICE SERGEANT 15.00 15.00 15.00
57POLICE LIEUTENANT 4.00 4.00 4.00
66POLICE CAPTAIN 1.00 1.00 1.00
Page 238
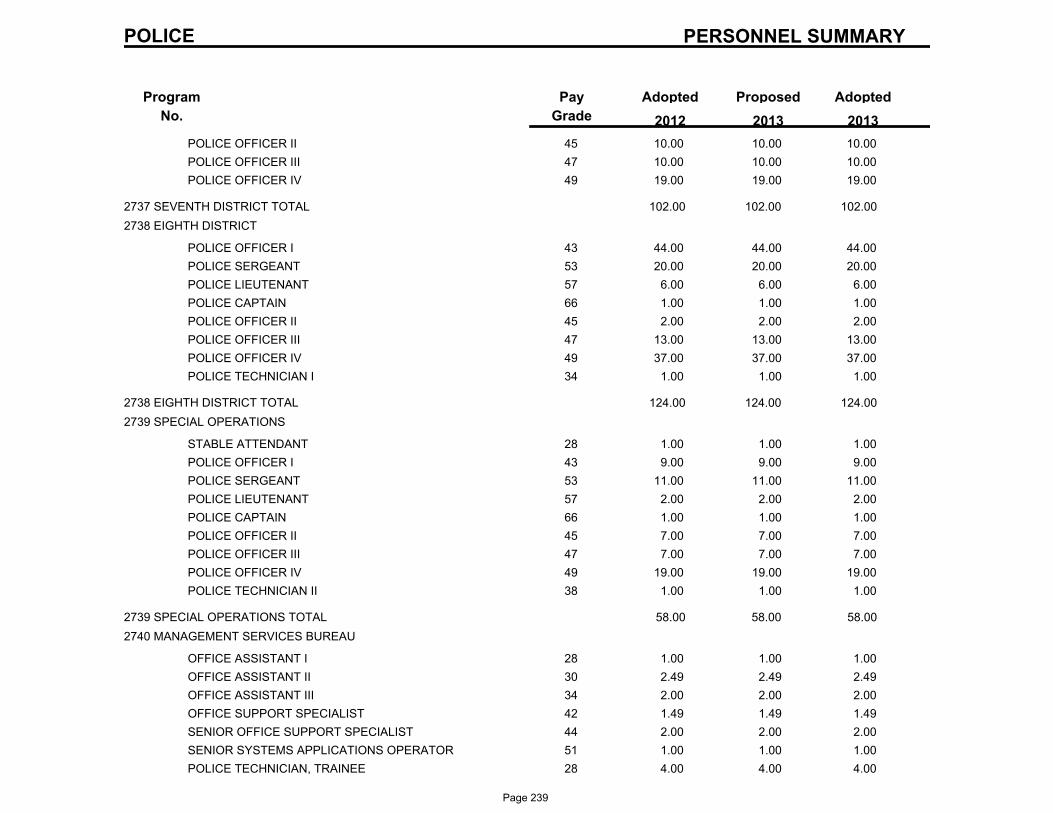
PERSONNEL SUMMARY
Program
No.
ProposedAdoptedPay
Grade
Adopted
2013 2012 2013
POLICE
45POLICE OFFICER II 10.00 10.00 10.00
47POLICE OFFICER III 10.00 10.00 10.00
49POLICE OFFICER IV 19.00 19.00 19.00
2737 SEVENTH DISTRICT TOTAL 102.00 102.00 102.00
2738 EIGHTH DISTRICT
43POLICE OFFICER I 44.00 44.00 44.00
53POLICE SERGEANT 20.00 20.00 20.00
57POLICE LIEUTENANT 6.00 6.00 6.00
66POLICE CAPTAIN 1.00 1.00 1.00
45POLICE OFFICER II 2.00 2.00 2.00
47POLICE OFFICER III 13.00 13.00 13.00
49POLICE OFFICER IV 37.00 37.00 37.00
34POLICE TECHNICIAN I 1.00 1.00 1.00
2738 EIGHTH DISTRICT TOTAL 124.00 124.00 124.00
2739 SPECIAL OPERATIONS
28STABLE ATTENDANT 1.00 1.00 1.00
43POLICE OFFICER I 9.00 9.00 9.00
53POLICE SERGEANT 11.00 11.00 11.00
57POLICE LIEUTENANT 2.00 2.00 2.00
66POLICE CAPTAIN 1.00 1.00 1.00
45POLICE OFFICER II 7.00 7.00 7.00
47POLICE OFFICER III 7.00 7.00 7.00
49POLICE OFFICER IV 19.00 19.00 19.00
38POLICE TECHNICIAN II 1.00 1.00 1.00
2739 SPECIAL OPERATIONS TOTAL 58.00 58.00 58.00
2740 MANAGEMENT SERVICES BUREAU
28OFFICE ASSISTANT I 1.00 1.00 1.00
30OFFICE ASSISTANT II 2.49 2.49 2.49
34OFFICE ASSISTANT III 2.00 2.00 2.00
42OFFICE SUPPORT SPECIALIST 1.49 1.49 1.49
44SENIOR OFFICE SUPPORT SPECIALIST 2.00 2.00 2.00
51SENIOR SYSTEMS APPLICATIONS OPERATOR 1.00 1.00 1.00
28POLICE TECHNICIAN, TRAINEE 4.00 4.00 4.00
Page 239
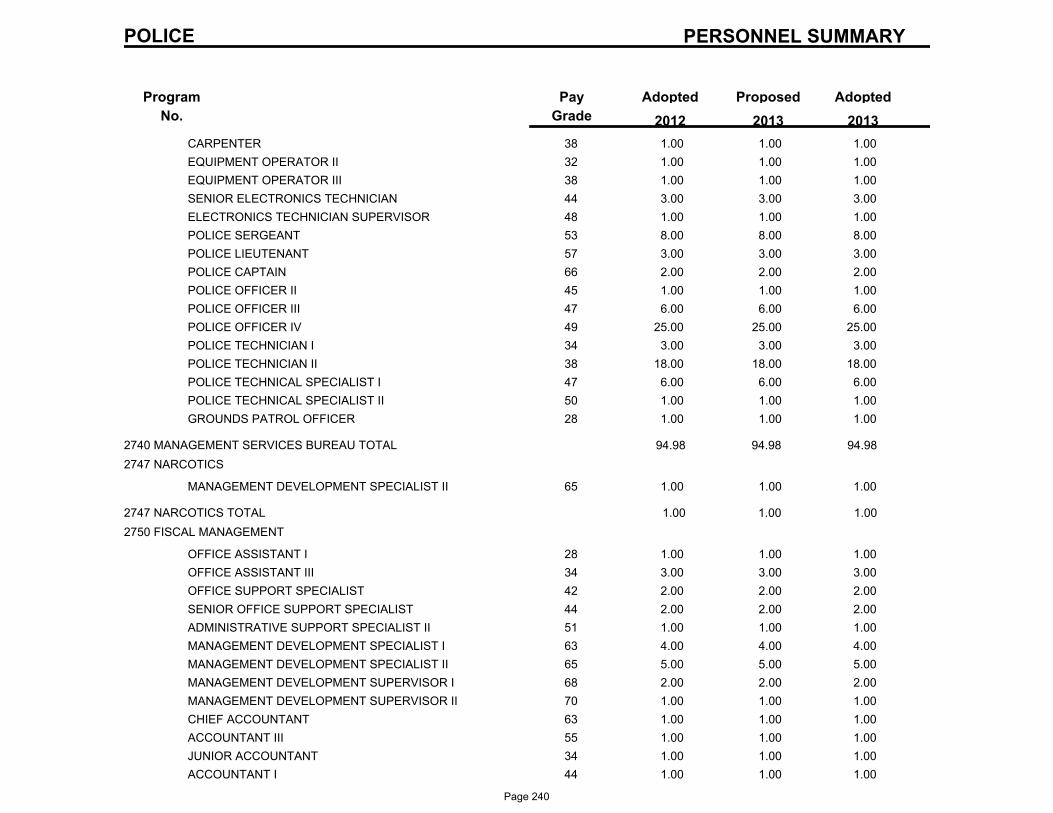
PERSONNEL SUMMARY
Program
No.
ProposedAdoptedPay
Grade
Adopted
2013 2012 2013
POLICE
38CARPENTER 1.00 1.00 1.00
32EQUIPMENT OPERATOR II 1.00 1.00 1.00
38EQUIPMENT OPERATOR III 1.00 1.00 1.00
44SENIOR ELECTRONICS TECHNICIAN 3.00 3.00 3.00
48ELECTRONICS TECHNICIAN SUPERVISOR 1.00 1.00 1.00
53POLICE SERGEANT 8.00 8.00 8.00
57POLICE LIEUTENANT 3.00 3.00 3.00
66POLICE CAPTAIN 2.00 2.00 2.00
45POLICE OFFICER II 1.00 1.00 1.00
47POLICE OFFICER III 6.00 6.00 6.00
49POLICE OFFICER IV 25.00 25.00 25.00
34POLICE TECHNICIAN I 3.00 3.00 3.00
38POLICE TECHNICIAN II 18.00 18.00 18.00
47POLICE TECHNICAL SPECIALIST I 6.00 6.00 6.00
50POLICE TECHNICAL SPECIALIST II 1.00 1.00 1.00
28GROUNDS PATROL OFFICER 1.00 1.00 1.00
2740 MANAGEMENT SERVICES BUREAU TOTAL 94.98 94.98 94.98
2747 NARCOTICS
65MANAGEMENT DEVELOPMENT SPECIALIST II 1.00 1.00 1.00
2747 NARCOTICS TOTAL 1.00 1.00 1.00
2750 FISCAL MANAGEMENT
28OFFICE ASSISTANT I 1.00 1.00 1.00
34OFFICE ASSISTANT III 3.00 3.00 3.00
42OFFICE SUPPORT SPECIALIST 2.00 2.00 2.00
44SENIOR OFFICE SUPPORT SPECIALIST 2.00 2.00 2.00
51ADMINISTRATIVE SUPPORT SPECIALIST II 1.00 1.00 1.00
63MANAGEMENT DEVELOPMENT SPECIALIST I 4.00 4.00 4.00
65MANAGEMENT DEVELOPMENT SPECIALIST II 5.00 5.00 5.00
68MANAGEMENT DEVELOPMENT SUPERVISOR I 2.00 2.00 2.00
70MANAGEMENT DEVELOPMENT SUPERVISOR II 1.00 1.00 1.00
63CHIEF ACCOUNTANT 1.00 1.00 1.00
55ACCOUNTANT III 1.00 1.00 1.00
34JUNIOR ACCOUNTANT 1.00 1.00 1.00
44ACCOUNTANT I 1.00 1.00 1.00
Page 240
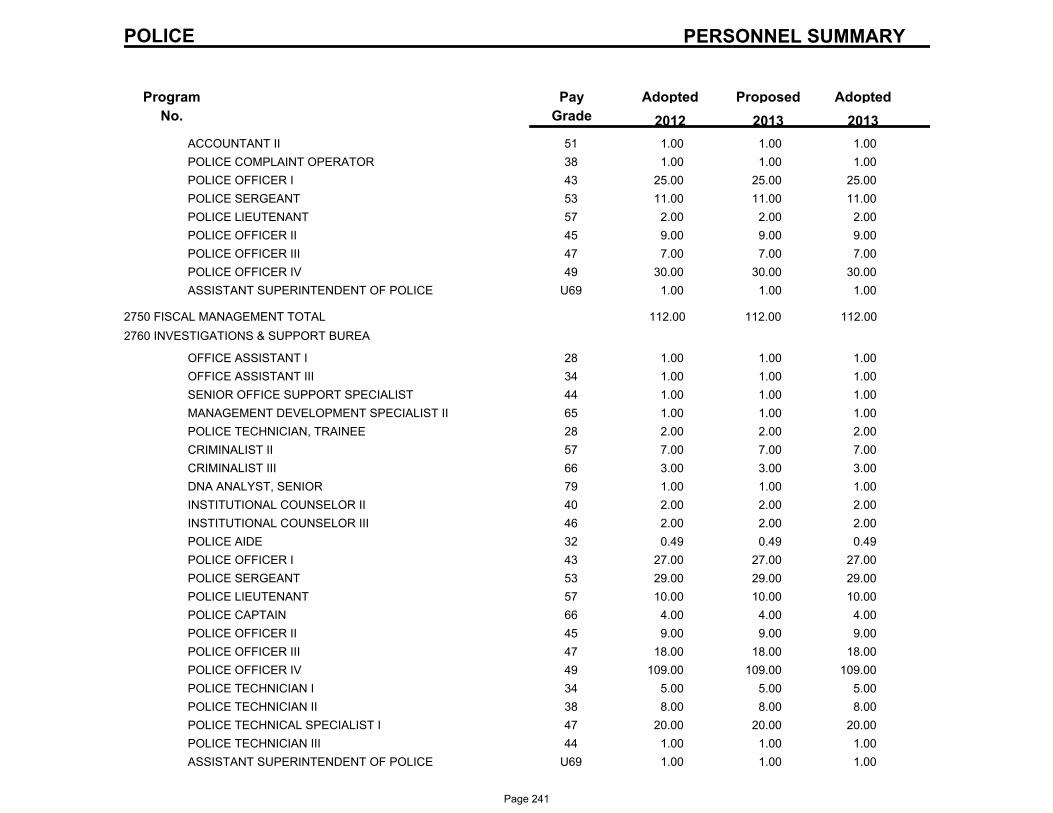
PERSONNEL SUMMARY
Program
No.
ProposedAdoptedPay
Grade
Adopted
2013 2012 2013
POLICE
51ACCOUNTANT II 1.00 1.00 1.00
38POLICE COMPLAINT OPERATOR 1.00 1.00 1.00
43POLICE OFFICER I 25.00 25.00 25.00
53POLICE SERGEANT 11.00 11.00 11.00
57POLICE LIEUTENANT 2.00 2.00 2.00
45POLICE OFFICER II 9.00 9.00 9.00
47POLICE OFFICER III 7.00 7.00 7.00
49POLICE OFFICER IV 30.00 30.00 30.00
U69ASSISTANT SUPERINTENDENT OF POLICE 1.00 1.00 1.00
2750 FISCAL MANAGEMENT TOTAL 112.00 112.00 112.00
2760 INVESTIGATIONS & SUPPORT BUREA
28OFFICE ASSISTANT I 1.00 1.00 1.00
34OFFICE ASSISTANT III 1.00 1.00 1.00
44SENIOR OFFICE SUPPORT SPECIALIST 1.00 1.00 1.00
65MANAGEMENT DEVELOPMENT SPECIALIST II 1.00 1.00 1.00
28POLICE TECHNICIAN, TRAINEE 2.00 2.00 2.00
57CRIMINALIST II 7.00 7.00 7.00
66CRIMINALIST III 3.00 3.00 3.00
79DNA ANALYST, SENIOR 1.00 1.00 1.00
40INSTITUTIONAL COUNSELOR II 2.00 2.00 2.00
46INSTITUTIONAL COUNSELOR III 2.00 2.00 2.00
32POLICE AIDE 0.49 0.49 0.49
43POLICE OFFICER I 27.00 27.00 27.00
53POLICE SERGEANT 29.00 29.00 29.00
57POLICE LIEUTENANT 10.00 10.00 10.00
66POLICE CAPTAIN 4.00 4.00 4.00
45POLICE OFFICER II 9.00 9.00 9.00
47POLICE OFFICER III 18.00 18.00 18.00
49POLICE OFFICER IV 109.00 109.00 109.00
34POLICE TECHNICIAN I 5.00 5.00 5.00
38POLICE TECHNICIAN II 8.00 8.00 8.00
47POLICE TECHNICAL SPECIALIST I 20.00 20.00 20.00
44POLICE TECHNICIAN III 1.00 1.00 1.00
U69ASSISTANT SUPERINTENDENT OF POLICE 1.00 1.00 1.00
Page 241
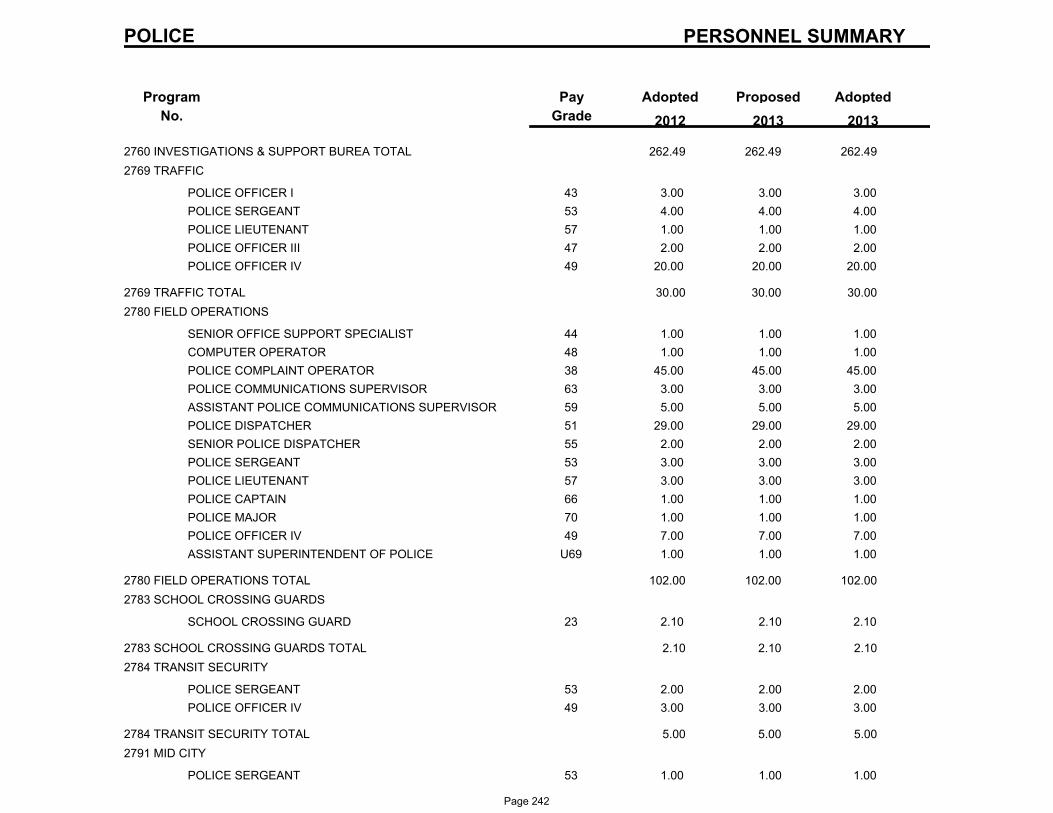
PERSONNEL SUMMARY
Program
No.
ProposedAdoptedPay
Grade
Adopted
2013 2012 2013
POLICE
2760 INVESTIGATIONS & SUPPORT BUREA TOTAL 262.49 262.49 262.49
2769 TRAFFIC
43POLICE OFFICER I 3.00 3.00 3.00
53POLICE SERGEANT 4.00 4.00 4.00
57POLICE LIEUTENANT 1.00 1.00 1.00
47POLICE OFFICER III 2.00 2.00 2.00
49POLICE OFFICER IV 20.00 20.00 20.00
2769 TRAFFIC TOTAL 30.00 30.00 30.00
2780 FIELD OPERATIONS
44SENIOR OFFICE SUPPORT SPECIALIST 1.00 1.00 1.00
48COMPUTER OPERATOR 1.00 1.00 1.00
38POLICE COMPLAINT OPERATOR 45.00 45.00 45.00
63POLICE COMMUNICATIONS SUPERVISOR 3.00 3.00 3.00
59ASSISTANT POLICE COMMUNICATIONS SUPERVISOR 5.00 5.00 5.00
51POLICE DISPATCHER 29.00 29.00 29.00
55SENIOR POLICE DISPATCHER 2.00 2.00 2.00
53POLICE SERGEANT 3.00 3.00 3.00
57POLICE LIEUTENANT 3.00 3.00 3.00
66POLICE CAPTAIN 1.00 1.00 1.00
70POLICE MAJOR 1.00 1.00 1.00
49POLICE OFFICER IV 7.00 7.00 7.00
U69ASSISTANT SUPERINTENDENT OF POLICE 1.00 1.00 1.00
2780 FIELD OPERATIONS TOTAL 102.00 102.00 102.00
2783 SCHOOL CROSSING GUARDS
23SCHOOL CROSSING GUARD 2.10 2.10 2.10
2783 SCHOOL CROSSING GUARDS TOTAL 2.10 2.10 2.10
2784 TRANSIT SECURITY
53POLICE SERGEANT 2.00 2.00 2.00
49POLICE OFFICER IV 3.00 3.00 3.00
2784 TRANSIT SECURITY TOTAL 5.00 5.00 5.00
2791 MID CITY
53POLICE SERGEANT 1.00 1.00 1.00
Page 242
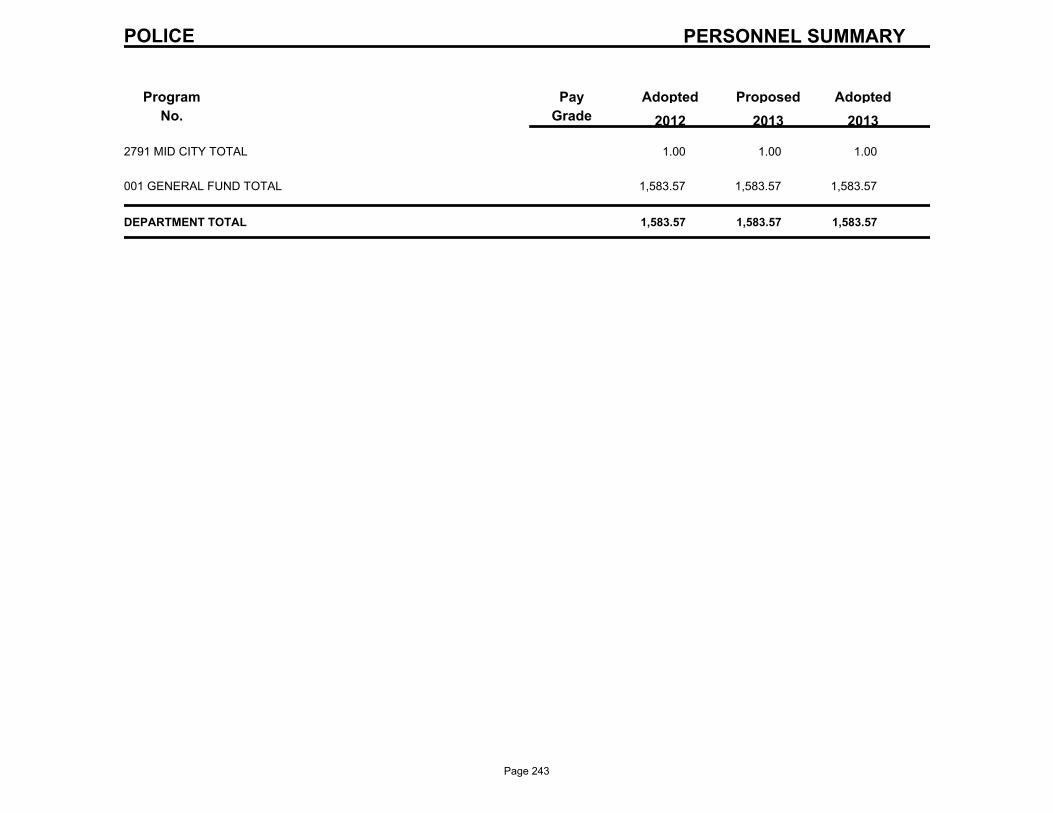
PERSONNEL SUMMARY
Program
No.
ProposedAdoptedPay
Grade
Adopted
2013 2012 2013
POLICE
2791 MID CITY TOTAL 1.00 1.00 1.00
001 GENERAL FUND TOTAL 1,583.57 1,583.57 1,583.57
DEPARTMENT TOTAL 1,583.57 1,583.57 1,583.57
Page 243

Sanitation Department
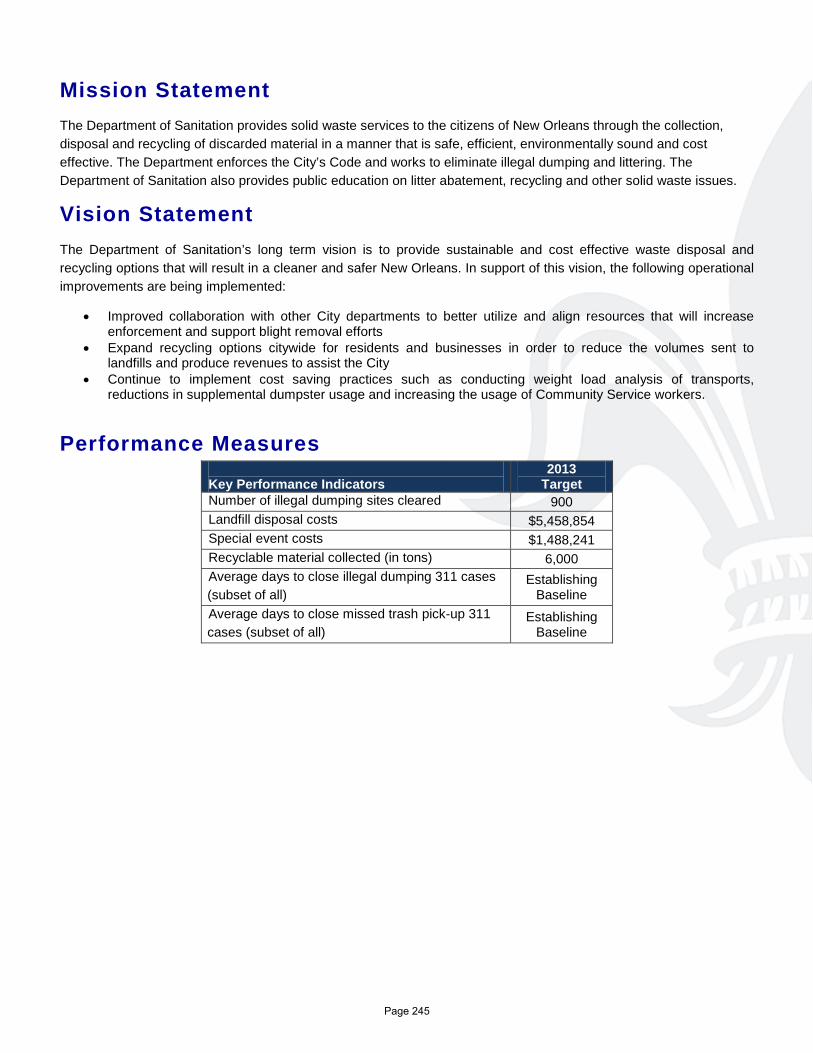
Mission Statement The Department of Sanitation provides solid waste services to the citizens of New Orleans through the collection, disposal and recycling of discarded material in a manner that is safe, efficient, environmentally sound and cost effective. The Department enforces the City’s Code and works to eliminate illegal dumping and littering. The Department of Sanitation also provides public education on litter abatement, recycling and other solid waste issues.
Vision Statement The Department of Sanitation’s long term vision is to provide sustainable and cost effective waste disposal and recycling options that will result in a cleaner and safer New Orleans. In support of this vision, the following operational improvements are being implemented:
• Improved collaboration with other City departments to better utilize and align resources that will increase enforcement and support blight removal efforts
• Expand recycling options citywide for residents and businesses in order to reduce the volumes sent to landfills and produce revenues to assist the City
• Continue to implement cost saving practices such as conducting weight load analysis of transports, reductions in supplemental dumpster usage and increasing the usage of Community Service workers.
Performance Measures
Key Performance Indicators
2013 Target
Number of illegal dumping sites cleared 900 Landfill disposal costs $5,458,854 Special event costs $1,488,241 Recyclable material collected (in tons) 6,000 Average days to close illegal dumping 311 cases (subset of all)
Establishing Baseline
Average days to close missed trash pick-up 311 cases (subset of all)
Establishing Baseline
Page 245
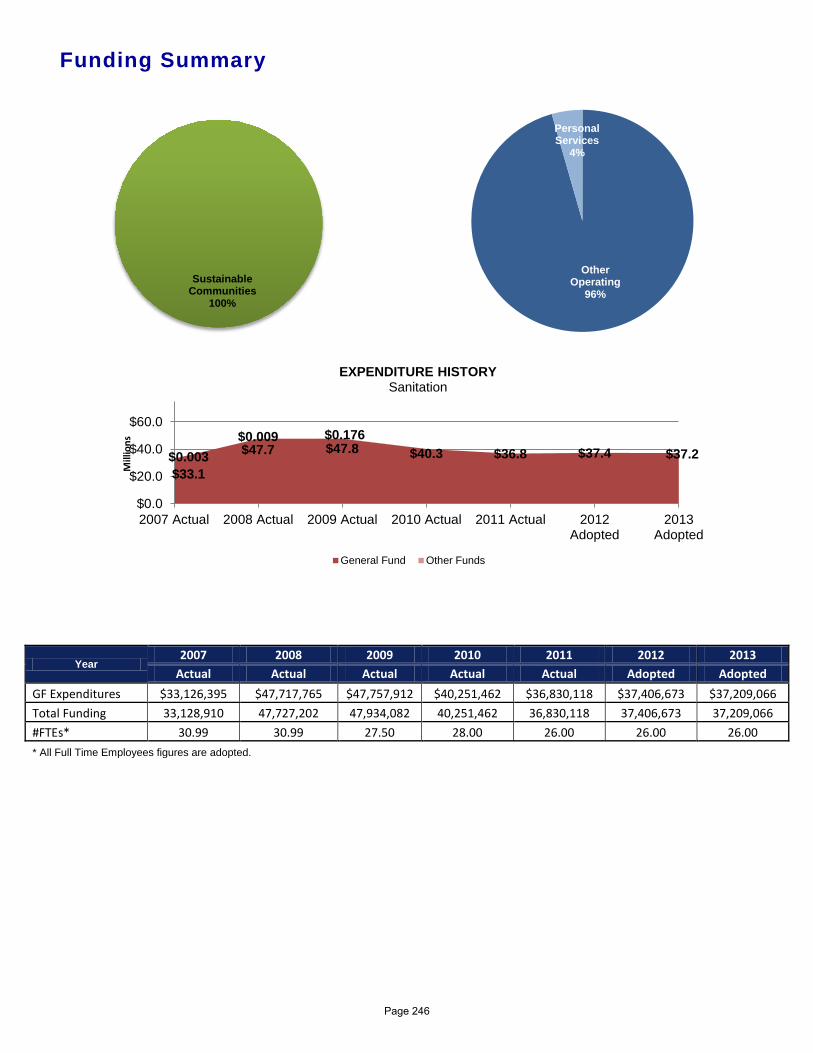
Funding Summary
Year 2007 2008 2009 2010 2011 2012 2013
Actual Actual Actual Actual Actual Adopted Adopted GF Expenditures $33,126,395 $47,717,765 $47,757,912 $40,251,462 $36,830,118 $37,406,673 $37,209,066 Total Funding 33,128,910 47,727,202 47,934,082 40,251,462 36,830,118 37,406,673 37,209,066 #FTEs* 30.99 30.99 27.50 28.00 26.00 26.00 26.00 * All Full Time Employees figures are adopted.
$33.1
$47.7 $47.8 $40.3 $36.8 $37.4 $37.2 $0.003 $0.009 $0.176
$0.0
$20.0
$40.0
$60.0
2007 Actual 2008 Actual 2009 Actual 2010 Actual 2011 Actual 2012Adopted
2013Adopted
Mill
ions
EXPENDITURE HISTORY Sanitation
General Fund Other Funds
Sustainable Communities
100%
Other Operating
96%
Personal Services
4%
Page 246
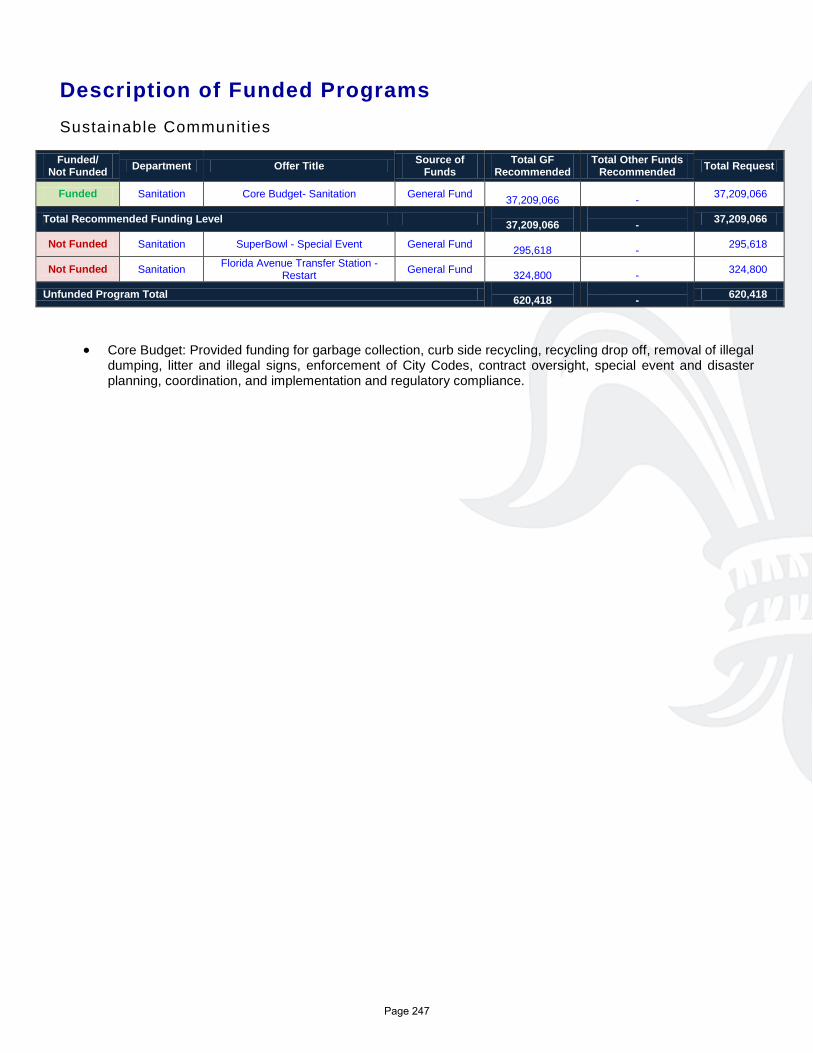
Description of Funded Programs Sustainable Communities
Funded/ Not Funded Department Offer Title Source of
Funds Total GF
Recommended Total Other Funds
Recommended Total Request
Funded Sanitation Core Budget- Sanitation General Fund 37,209,066
- 37,209,066
Total Recommended Funding Level 37,209,066
- 37,209,066
Not Funded Sanitation SuperBowl - Special Event General Fund 295,618
- 295,618
Not Funded Sanitation Florida Avenue Transfer Station -Restart General Fund
324,800 - 324,800
Unfunded Program Total 620,418
- 620,418
• Core Budget: Provided funding for garbage collection, curb side recycling, recycling drop off, removal of illegal dumping, litter and illegal signs, enforcement of City Codes, contract oversight, special event and disaster planning, coordination, and implementation and regulatory compliance.
Page 247

SANITATION
DEPARTMENTAL BUDGET SUMMARY
AdoptedProposedAdoptedActual
EXPENDITURES
2013 2012 2011 2013
PERSONAL SERVICES 1,763,474 1,781,588 1,655,112 1,655,112
OTHER OPERATING 35,066,644 35,625,085 35,553,954 35,553,954
DEBT SERVICE 0 0 0 0
RESERVES 0 0 0 0
GRANTS, CONTRIB. & FUND TRAN. 0 0 0 0
$36,830,118 $37,406,673 $37,209,066 TOTAL EXPENDITURES $37,209,066
SOURCE OF FUNDING
GENERAL FUND 36,830,118 37,406,673 37,209,066 37,209,066
WISNER FUNDS 0 0 0 0
ENTERPRISE 0 0 0 0
DOWNTOWN DEVELOPMENT DIST. 0 0 0 0
HOUSING AND URBAN DEVELOP. 0 0 0 0
SELF GENERATED 0 0 0 0
LIBRARY 0 0 0 0
LLE 0 0 0 0
FEDERAL GRANTS 0 0 0 0
STATE GRANTS 0 0 0 0
GRANTS, CONTRIB., & FUND TRAN. 0 0 0 0
N. O. REGIONAL BUSINESS PARK 0 0 0 0
ECONOMIC DEVELOPMENT FUND 0 0 0 0
HOUSING IMPROVMENT FUND 0 0 0 0
$36,830,118 $37,406,673 $37,209,066 TOTAL FUNDING $37,209,066
Page 248
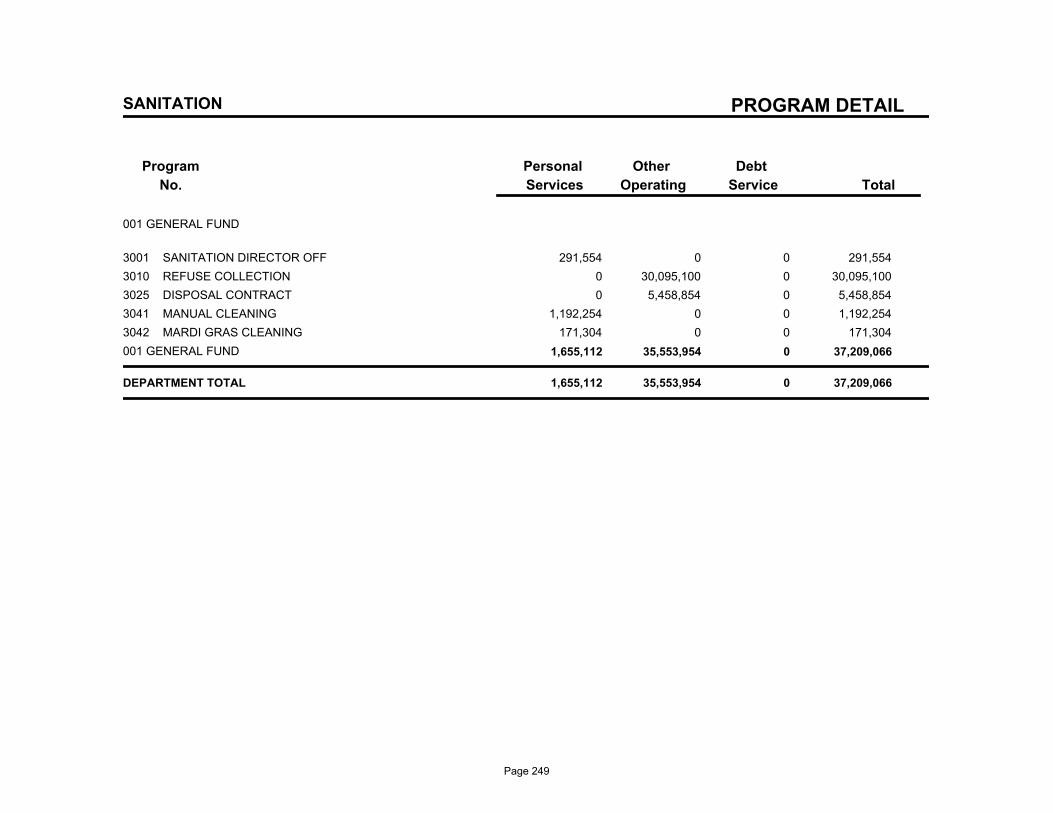
PROGRAM DETAIL
Program
No.
Debt
Service
Other
Operating
Personal
Services Total
SANITATION
001 GENERAL FUND
3001 SANITATION DIRECTOR OFF 291,554 0 0 291,554
3010 REFUSE COLLECTION 0 30,095,100 0 30,095,100
3025 DISPOSAL CONTRACT 0 5,458,854 0 5,458,854
3041 MANUAL CLEANING 1,192,254 0 0 1,192,254
3042 MARDI GRAS CLEANING 171,304 0 0 171,304
001 GENERAL FUND 1,655,112 35,553,954 0 37,209,066
DEPARTMENT TOTAL 1,655,112 35,553,954 0 37,209,066
Page 249
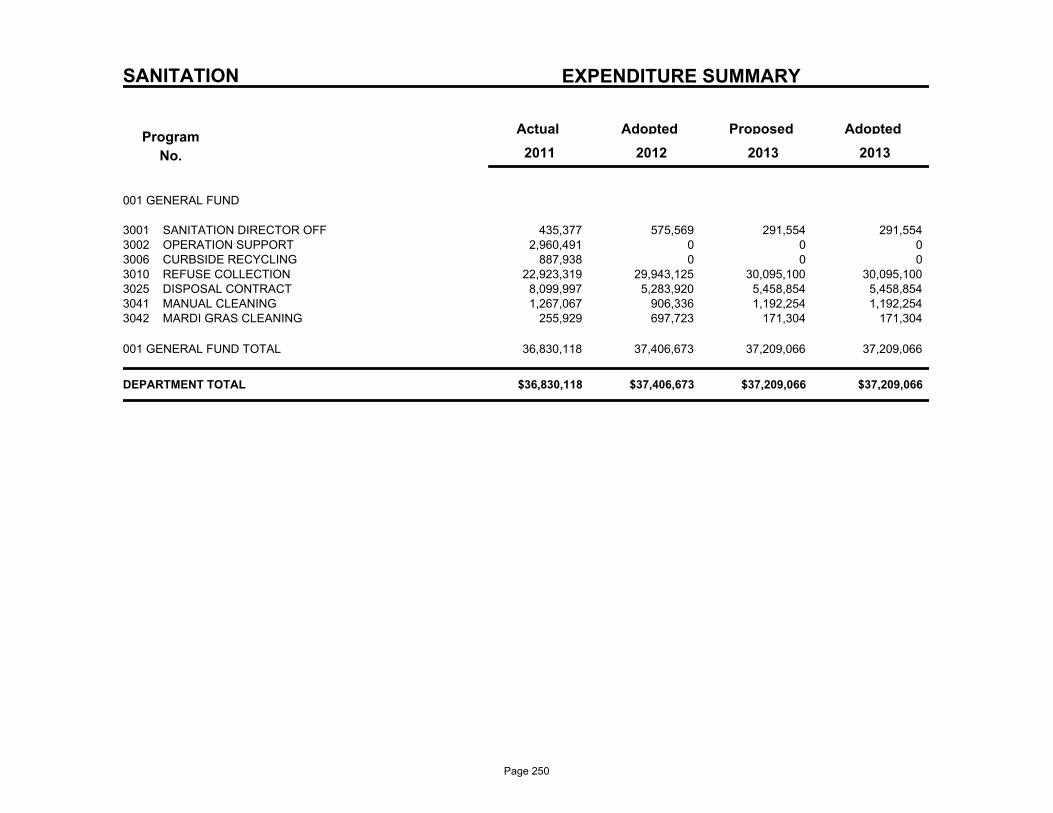
SANITATION EXPENDITURE SUMMARY
Program
No.
Actual AdoptedProposedAdopted
2013 2011 2012 2013
001 GENERAL FUND
435,377 575,569 291,554 SANITATION DIRECTOR OFF3001 291,554 2,960,491 0 0 OPERATION SUPPORT3002 0
887,938 0 0 CURBSIDE RECYCLING3006 0 22,923,319 29,943,125 30,095,100 REFUSE COLLECTION3010 30,095,100
8,099,997 5,283,920 5,458,854 DISPOSAL CONTRACT3025 5,458,854 1,267,067 906,336 1,192,254 MANUAL CLEANING3041 1,192,254
255,929 697,723 171,304 MARDI GRAS CLEANING3042 171,304
36,830,118 37,406,673 37,209,066 37,209,066 001 GENERAL FUND TOTAL
$36,830,118 $37,406,673 $37,209,066 $37,209,066 DEPARTMENT TOTAL
Page 250
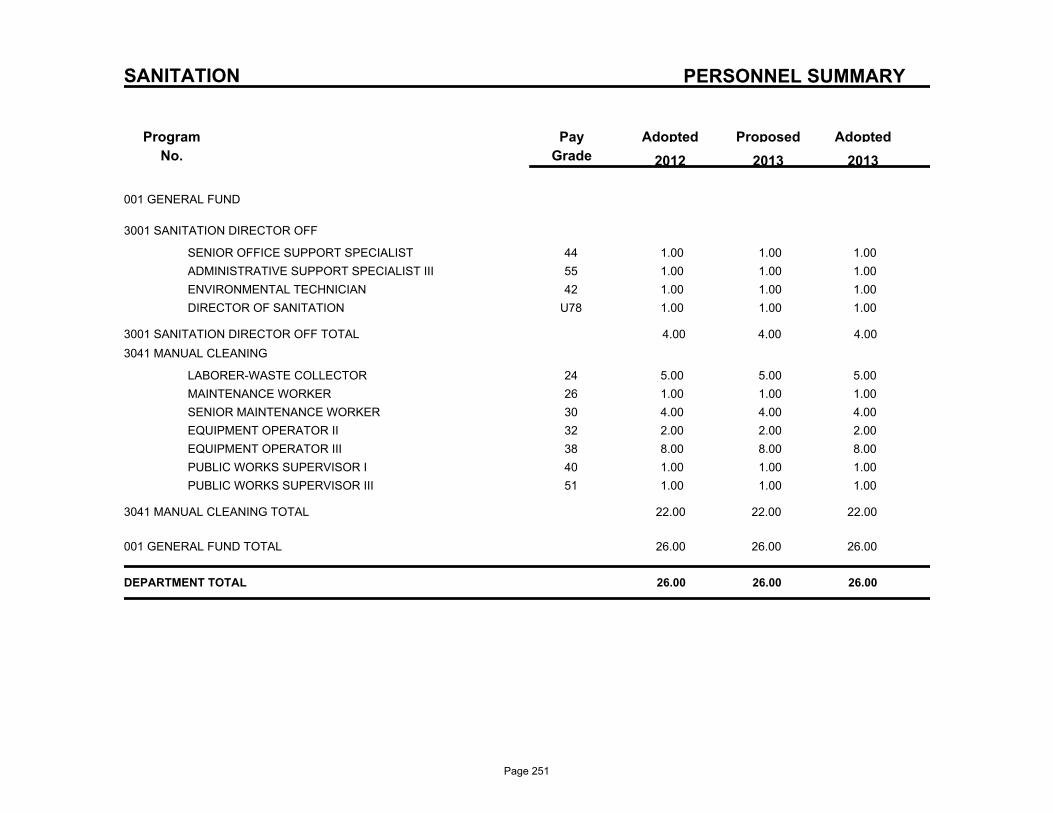
PERSONNEL SUMMARY
Program
No.
ProposedAdoptedPay
Grade
Adopted
2013 2012 2013
SANITATION
001 GENERAL FUND
3001 SANITATION DIRECTOR OFF
44SENIOR OFFICE SUPPORT SPECIALIST 1.00 1.00 1.00
55ADMINISTRATIVE SUPPORT SPECIALIST III 1.00 1.00 1.00
42ENVIRONMENTAL TECHNICIAN 1.00 1.00 1.00
U78DIRECTOR OF SANITATION 1.00 1.00 1.00
3001 SANITATION DIRECTOR OFF TOTAL 4.00 4.00 4.00
3041 MANUAL CLEANING
24LABORER-WASTE COLLECTOR 5.00 5.00 5.00
26MAINTENANCE WORKER 1.00 1.00 1.00
30SENIOR MAINTENANCE WORKER 4.00 4.00 4.00
32EQUIPMENT OPERATOR II 2.00 2.00 2.00
38EQUIPMENT OPERATOR III 8.00 8.00 8.00
40PUBLIC WORKS SUPERVISOR I 1.00 1.00 1.00
51PUBLIC WORKS SUPERVISOR III 1.00 1.00 1.00
3041 MANUAL CLEANING TOTAL 22.00 22.00 22.00
001 GENERAL FUND TOTAL 26.00 26.00 26.00
DEPARTMENT TOTAL 26.00 26.00 26.00
Page 251

Department of Health
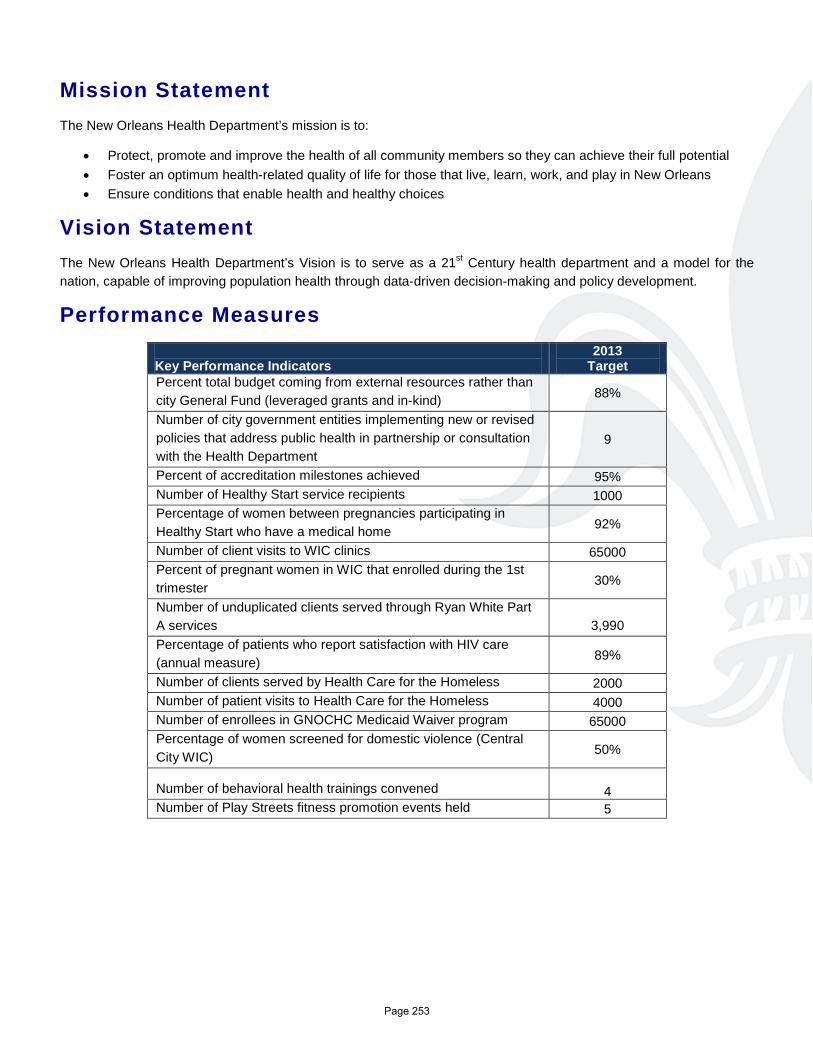
Mission Statement The New Orleans Health Department’s mission is to:
• Protect, promote and improve the health of all community members so they can achieve their full potential • Foster an optimum health-related quality of life for those that live, learn, work, and play in New Orleans • Ensure conditions that enable health and healthy choices
Vision Statement The New Orleans Health Department’s Vision is to serve as a 21st Century health department and a model for the nation, capable of improving population health through data-driven decision-making and policy development.
Performance Measures Key Performance Indicators
2013 Target
Percent total budget coming from external resources rather than city General Fund (leveraged grants and in-kind) 88%
Number of city government entities implementing new or revised policies that address public health in partnership or consultation with the Health Department
9
Percent of accreditation milestones achieved 95% Number of Healthy Start service recipients 1000 Percentage of women between pregnancies participating in Healthy Start who have a medical home 92%
Number of client visits to WIC clinics 65000 Percent of pregnant women in WIC that enrolled during the 1st trimester 30%
Number of unduplicated clients served through Ryan White Part A services
3,990
Percentage of patients who report satisfaction with HIV care (annual measure) 89%
Number of clients served by Health Care for the Homeless 2000 Number of patient visits to Health Care for the Homeless 4000 Number of enrollees in GNOCHC Medicaid Waiver program 65000 Percentage of women screened for domestic violence (Central City WIC) 50%
Number of behavioral health trainings convened 4
Number of Play Streets fitness promotion events held 5
Page 253
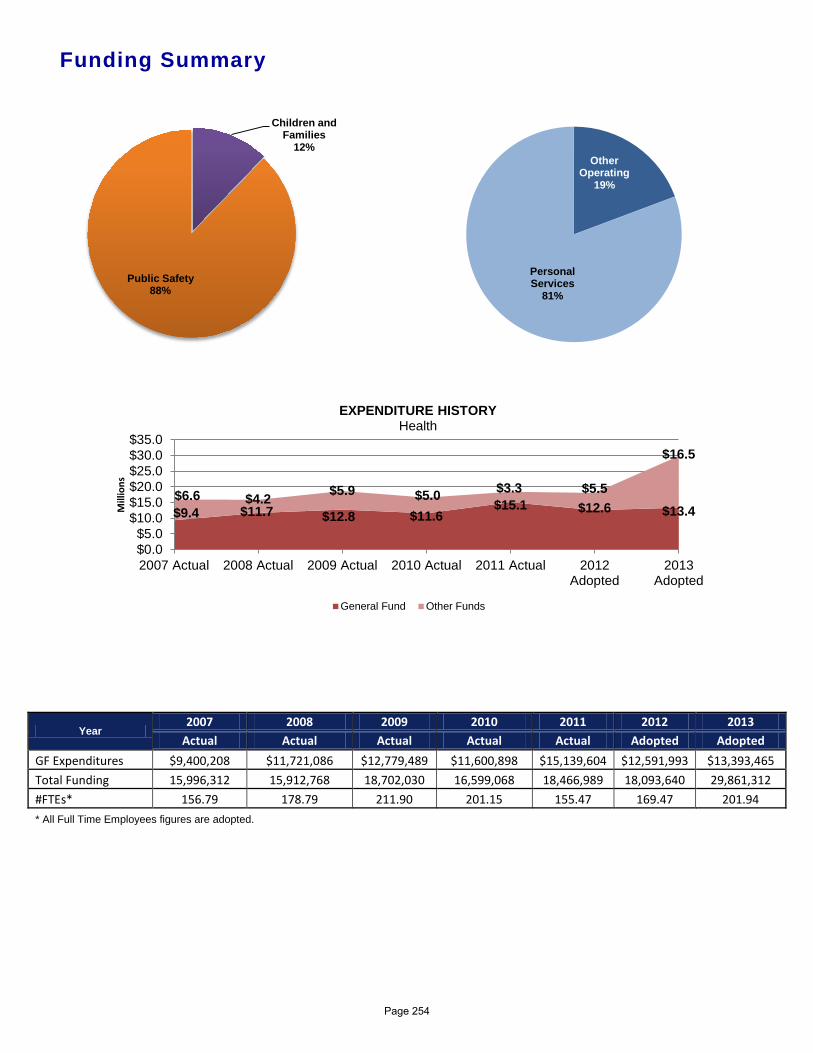
Funding Summary
Year 2007 2008 2009 2010 2011 2012 2013
Actual Actual Actual Actual Actual Adopted Adopted GF Expenditures $9,400,208 $11,721,086 $12,779,489 $11,600,898 $15,139,604 $12,591,993 $13,393,465 Total Funding 15,996,312 15,912,768 18,702,030 16,599,068 18,466,989 18,093,640 29,861,312 #FTEs* 156.79 178.79 211.90 201.15 155.47 169.47 201.94 * All Full Time Employees figures are adopted.
Children and Families
12%
Public Safety 88%
Other Operating
19%
Personal Services
81%
$9.4 $11.7 $12.8 $11.6 $15.1 $12.6 $13.4
$6.6 $4.2 $5.9 $5.0 $3.3 $5.5
$16.5
$0.0$5.0
$10.0$15.0$20.0$25.0$30.0$35.0
2007 Actual 2008 Actual 2009 Actual 2010 Actual 2011 Actual 2012Adopted
2013Adopted
Mill
ions
EXPENDITURE HISTORY Health
General Fund Other Funds
Page 254
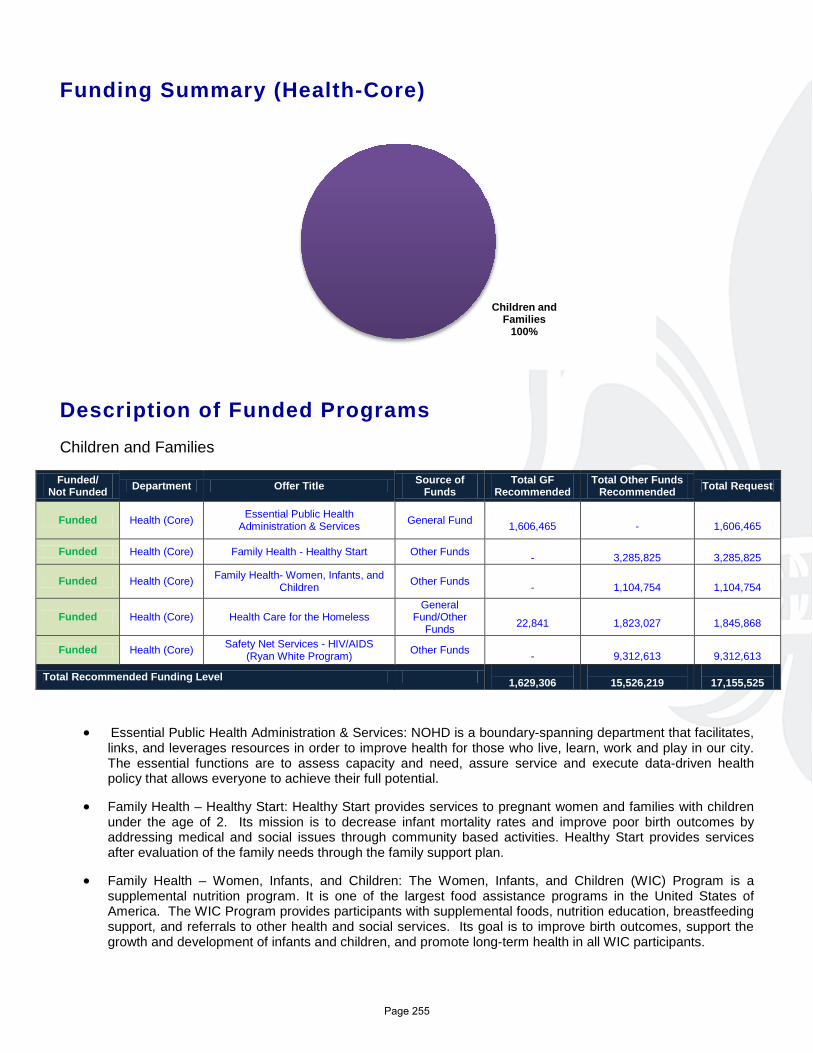
Funding Summary (Health-Core)
Description of Funded Programs Children and Families
Funded/ Not Funded Department Offer Title Source of
Funds Total GF
Recommended Total Other Funds
Recommended Total Request
Funded Health (Core) Essential Public Health Administration & Services General Fund
1,606,465 -
1,606,465
Funded Health (Core) Family Health - Healthy Start Other Funds -
3,285,825
3,285,825
Funded Health (Core) Family Health- Women, Infants, and Children Other Funds
-
1,104,754
1,104,754
Funded Health (Core) Health Care for the Homeless General
Fund/Other Funds
22,841
1,823,027
1,845,868
Funded Health (Core) Safety Net Services - HIV/AIDS (Ryan White Program) Other Funds
-
9,312,613
9,312,613
Total Recommended Funding Level 1,629,306
15,526,219
17,155,525
• Essential Public Health Administration & Services: NOHD is a boundary-spanning department that facilitates, links, and leverages resources in order to improve health for those who live, learn, work and play in our city. The essential functions are to assess capacity and need, assure service and execute data-driven health policy that allows everyone to achieve their full potential.
• Family Health – Healthy Start: Healthy Start provides services to pregnant women and families with children under the age of 2. Its mission is to decrease infant mortality rates and improve poor birth outcomes by addressing medical and social issues through community based activities. Healthy Start provides services after evaluation of the family needs through the family support plan.
• Family Health – Women, Infants, and Children: The Women, Infants, and Children (WIC) Program is a supplemental nutrition program. It is one of the largest food assistance programs in the United States of America. The WIC Program provides participants with supplemental foods, nutrition education, breastfeeding support, and referrals to other health and social services. Its goal is to improve birth outcomes, support the growth and development of infants and children, and promote long-term health in all WIC participants.
Children and Families
100%
Page 255

• Health Care for the Homeless: Health Care for the Homeless (HCH) is a federally qualified health center (FQHC) dedicated to providing comprehensive primary care services to homeless persons in the City of New Orleans and surrounding parishes for over 20 years under the direction of the City of New Orleans Health Department. HCH is the only health provider in this region that provides services specifically for this population and is 1 of 5 organizations in Region 1 designated as a FQHC.
• Safety Net Services - HIV/AIDS (Ryan White Program): This offer provides necessary access to HIV/AIDS treatment for eligible Persons Living with HIV/AIDS in the New Orleans Metropolitan Area. Services are provided by qualified AIDS Service Organizations, hospitals, and clinics.
Page 256

Page 257

Health – Emergency Medical Services
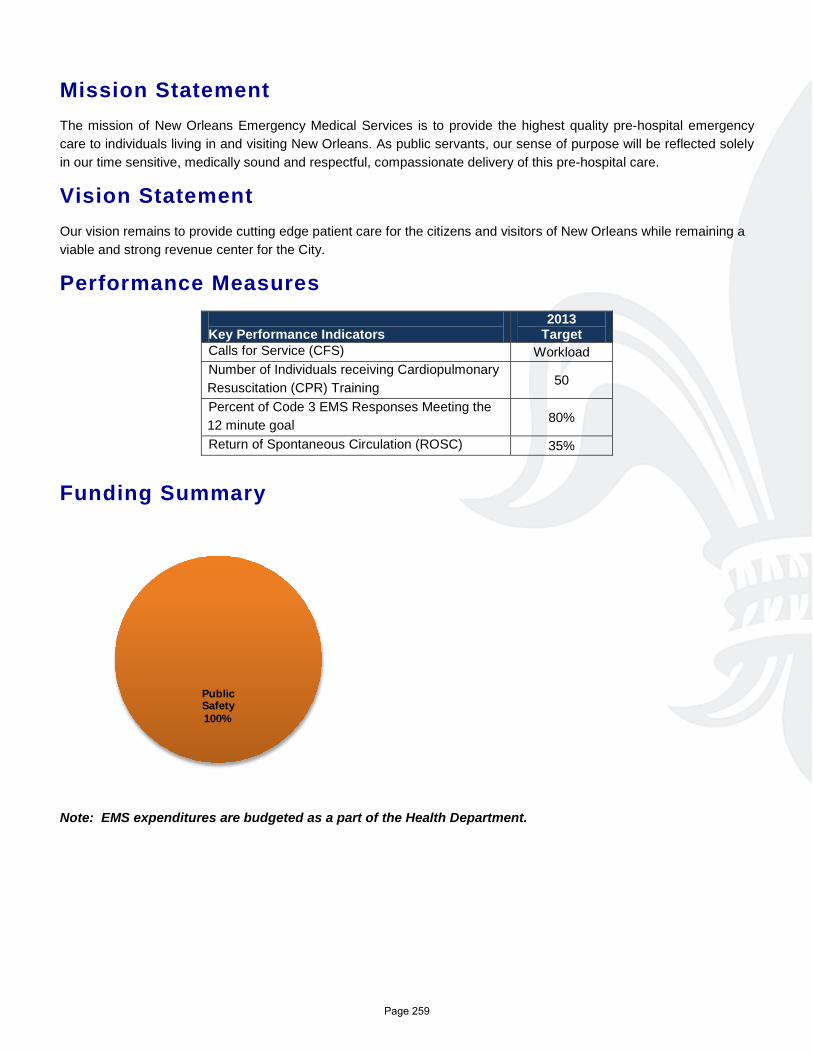
Mission Statement The mission of New Orleans Emergency Medical Services is to provide the highest quality pre-hospital emergency care to individuals living in and visiting New Orleans. As public servants, our sense of purpose will be reflected solely in our time sensitive, medically sound and respectful, compassionate delivery of this pre-hospital care.
Vision Statement Our vision remains to provide cutting edge patient care for the citizens and visitors of New Orleans while remaining a viable and strong revenue center for the City.
Performance Measures
Key Performance Indicators
2013 Target
Calls for Service (CFS) Workload Number of Individuals receiving Cardiopulmonary Resuscitation (CPR) Training 50
Percent of Code 3 EMS Responses Meeting the 12 minute goal 80%
Return of Spontaneous Circulation (ROSC) 35%
Funding Summary
Note: EMS expenditures are budgeted as a part of the Health Department.
Public Safety100%
Page 259
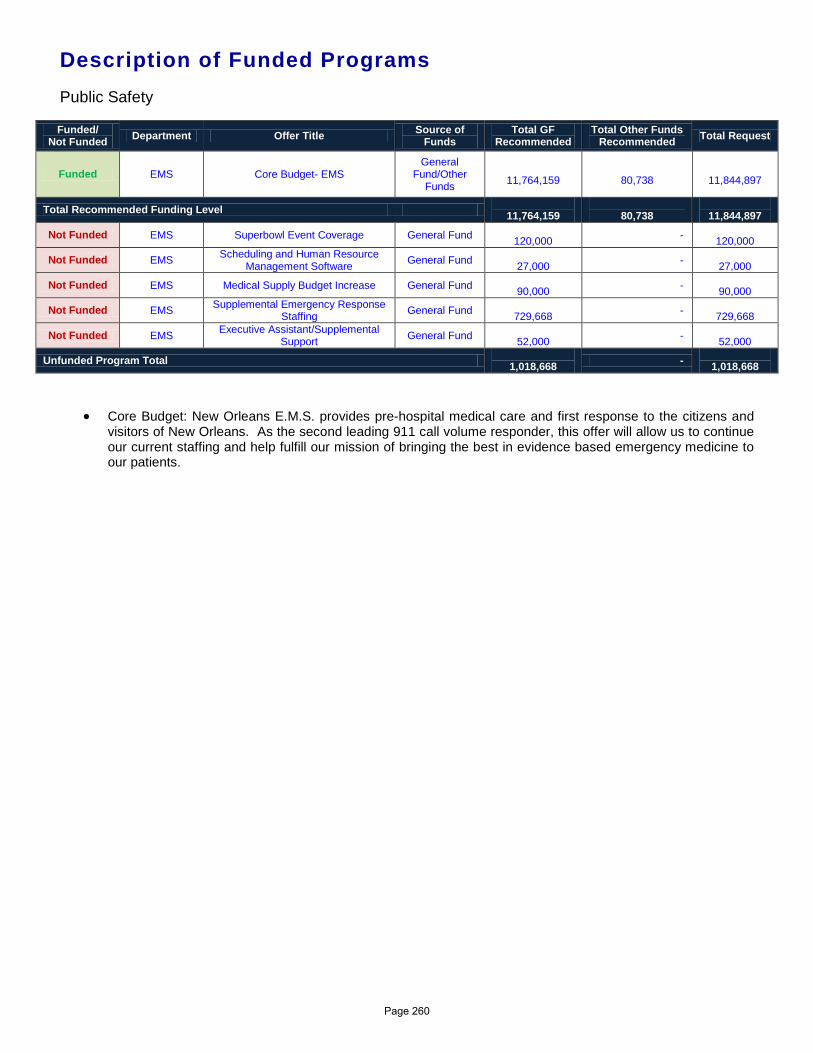
Description of Funded Programs Public Safety
Funded/ Not Funded Department Offer Title Source of
Funds Total GF
Recommended Total Other Funds
Recommended Total Request
Funded EMS Core Budget- EMS General
Fund/Other Funds
11,764,159
80,738
11,844,897
Total Recommended Funding Level 11,764,159
80,738
11,844,897
Not Funded EMS Superbowl Event Coverage General Fund 120,000 -
120,000
Not Funded EMS Scheduling and Human Resource Management Software General Fund
27,000 - 27,000
Not Funded EMS Medical Supply Budget Increase General Fund 90,000 -
90,000
Not Funded EMS Supplemental Emergency Response Staffing General Fund
729,668 - 729,668
Not Funded EMS Executive Assistant/Supplemental Support General Fund
52,000 - 52,000
Unfunded Program Total 1,018,668 -
1,018,668
• Core Budget: New Orleans E.M.S. provides pre-hospital medical care and first response to the citizens and visitors of New Orleans. As the second leading 911 call volume responder, this offer will allow us to continue our current staffing and help fulfill our mission of bringing the best in evidence based emergency medicine to our patients.
Page 260
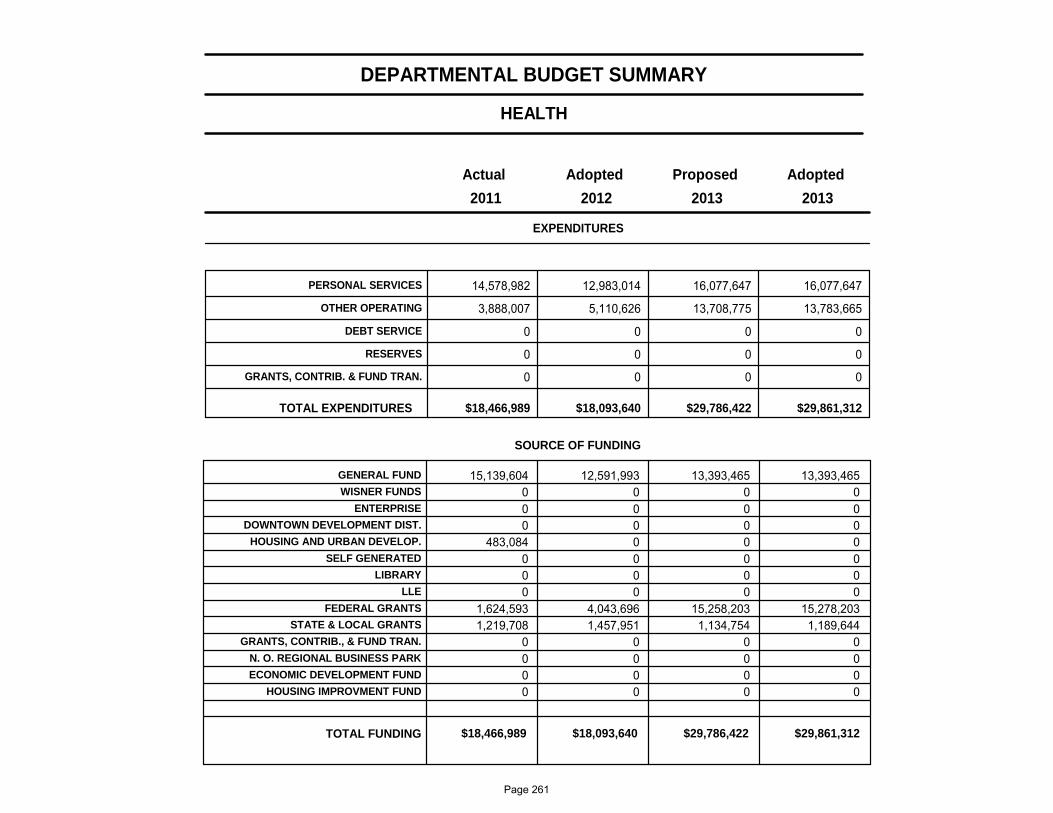
HEALTH
DEPARTMENTAL BUDGET SUMMARY
Adopted Proposed Adopted Actual
EXPENDITURES
2013 2012 2011 2013
PERSONAL SERVICES 14,578,982 12,983,014 16,077,647 16,077,647 OTHER OPERATING 3,888,007 5,110,626 13,708,775 13,783,665
DEBT SERVICE 0 0 0 0 RESERVES 0 0 0 0
GRANTS, CONTRIB. & FUND TRAN. 0 0 0 0
$18,466,989 $18,093,640 $29,786,422 TOTAL EXPENDITURES $29,861,312
SOURCE OF FUNDING
GENERAL FUND 15,139,604 12,591,993 13,393,465 13,393,465 WISNER FUNDS 0 0 0 0
ENTERPRISE 0 0 0 0 DOWNTOWN DEVELOPMENT DIST. 0 0 0 0
HOUSING AND URBAN DEVELOP. 483,084 0 0 0 SELF GENERATED 0 0 0 0
LIBRARY 0 0 0 0 LLE 0 0 0 0
FEDERAL GRANTS 1,624,593 4,043,696 15,258,203 15,278,203 STATE & LOCAL GRANTS 1,219,708 1,457,951 1,134,754 1,189,644
GRANTS, CONTRIB., & FUND TRAN. 0 0 0 0 N. O. REGIONAL BUSINESS PARK 0 0 0 0 ECONOMIC DEVELOPMENT FUND 0 0 0 0
HOUSING IMPROVMENT FUND 0 0 0 0
$18,466,989 $18,093,640 $29,786,422 TOTAL FUNDING $29,861,312
Page 261
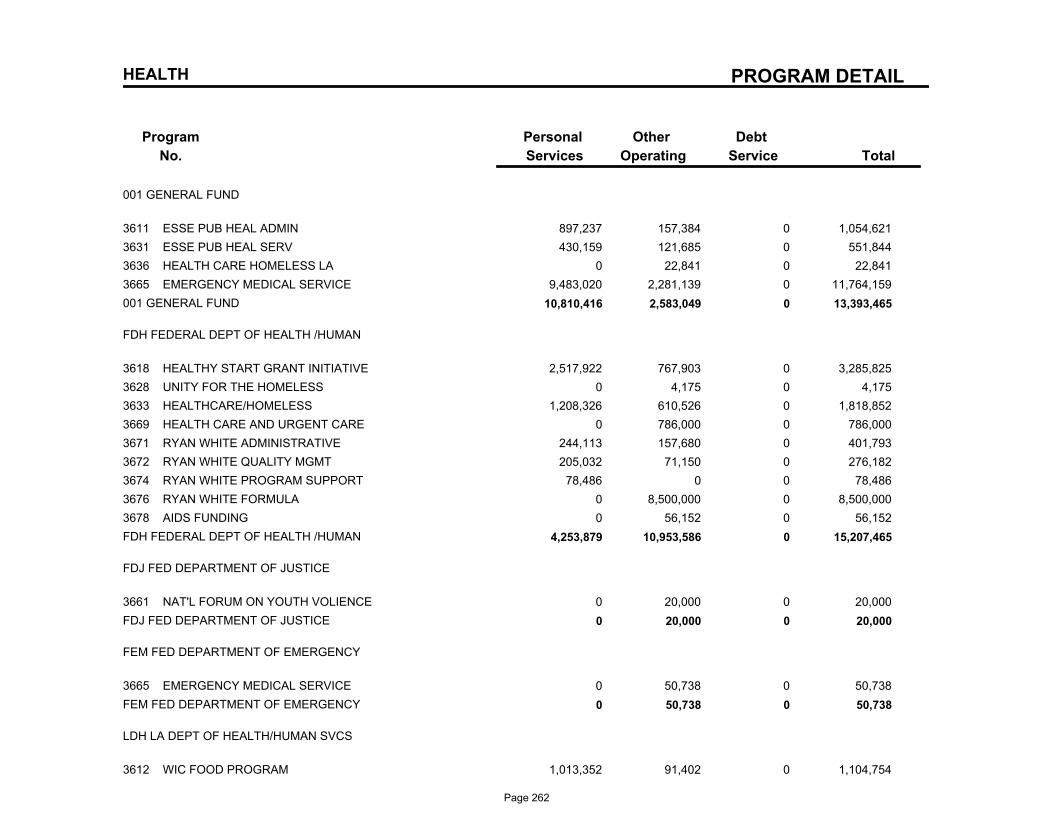
PROGRAM DETAIL
Program
No.
Debt
Service
Other
Operating
Personal
Services Total
HEALTH
001 GENERAL FUND
3611 ESSE PUB HEAL ADMIN 897,237 157,384 0 1,054,621
3631 ESSE PUB HEAL SERV 430,159 121,685 0 551,844
3636 HEALTH CARE HOMELESS LA 0 22,841 0 22,841
3665 EMERGENCY MEDICAL SERVICE 9,483,020 2,281,139 0 11,764,159
001 GENERAL FUND 10,810,416 2,583,049 0 13,393,465
FDH FEDERAL DEPT OF HEALTH /HUMAN
3618 HEALTHY START GRANT INITIATIVE 2,517,922 767,903 0 3,285,825
3628 UNITY FOR THE HOMELESS 0 4,175 0 4,175
3633 HEALTHCARE/HOMELESS 1,208,326 610,526 0 1,818,852
3669 HEALTH CARE AND URGENT CARE 0 786,000 0 786,000
3671 RYAN WHITE ADMINISTRATIVE 244,113 157,680 0 401,793
3672 RYAN WHITE QUALITY MGMT 205,032 71,150 0 276,182
3674 RYAN WHITE PROGRAM SUPPORT 78,486 0 0 78,486
3676 RYAN WHITE FORMULA 0 8,500,000 0 8,500,000
3678 AIDS FUNDING 0 56,152 0 56,152
FDH FEDERAL DEPT OF HEALTH /HUMAN 4,253,879 10,953,586 0 15,207,465
FDJ FED DEPARTMENT OF JUSTICE
3661 NAT'L FORUM ON YOUTH VOLIENCE 0 20,000 0 20,000
FDJ FED DEPARTMENT OF JUSTICE 0 20,000 0 20,000
FEM FED DEPARTMENT OF EMERGENCY
3665 EMERGENCY MEDICAL SERVICE 0 50,738 0 50,738
FEM FED DEPARTMENT OF EMERGENCY 0 50,738 0 50,738
LDH LA DEPT OF HEALTH/HUMAN SVCS
3612 WIC FOOD PROGRAM 1,013,352 91,402 0 1,104,754
Page 262
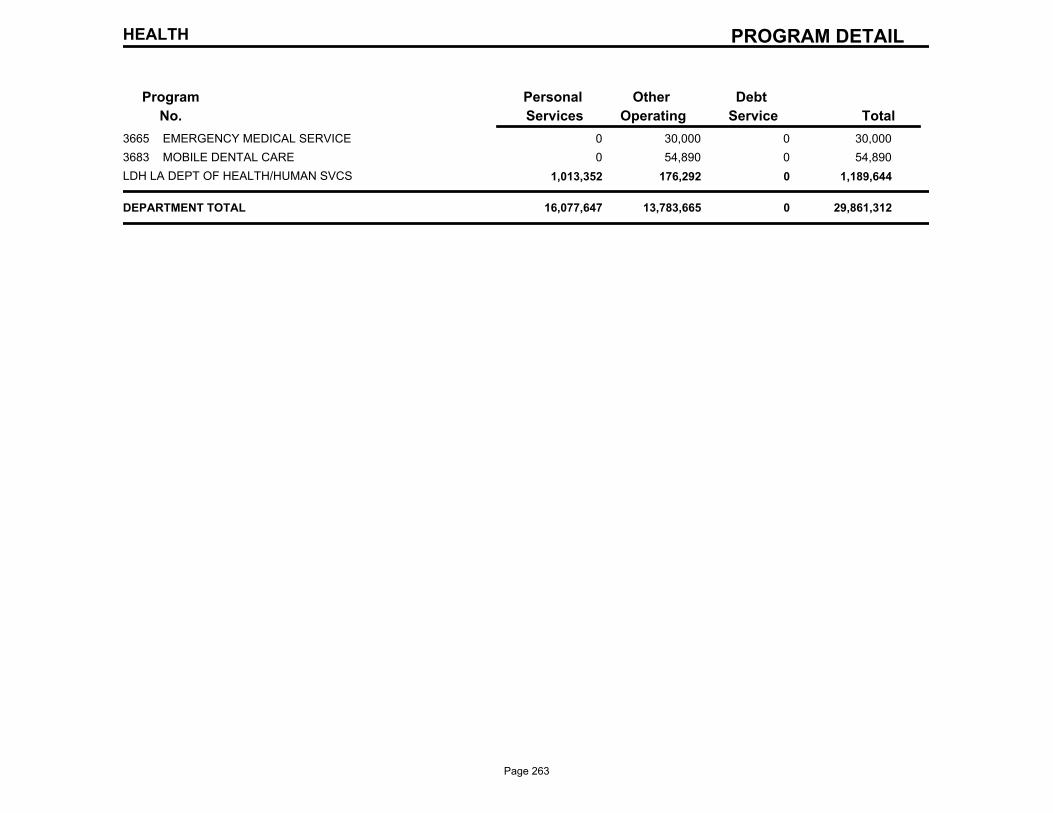
PROGRAM DETAIL
Program
No.
Debt
Service
Other
Operating
Personal
Services Total
HEALTH
3665 EMERGENCY MEDICAL SERVICE 0 30,000 0 30,000
3683 MOBILE DENTAL CARE 0 54,890 0 54,890
LDH LA DEPT OF HEALTH/HUMAN SVCS 1,013,352 176,292 0 1,189,644
DEPARTMENT TOTAL 16,077,647 13,783,665 0 29,861,312
Page 263
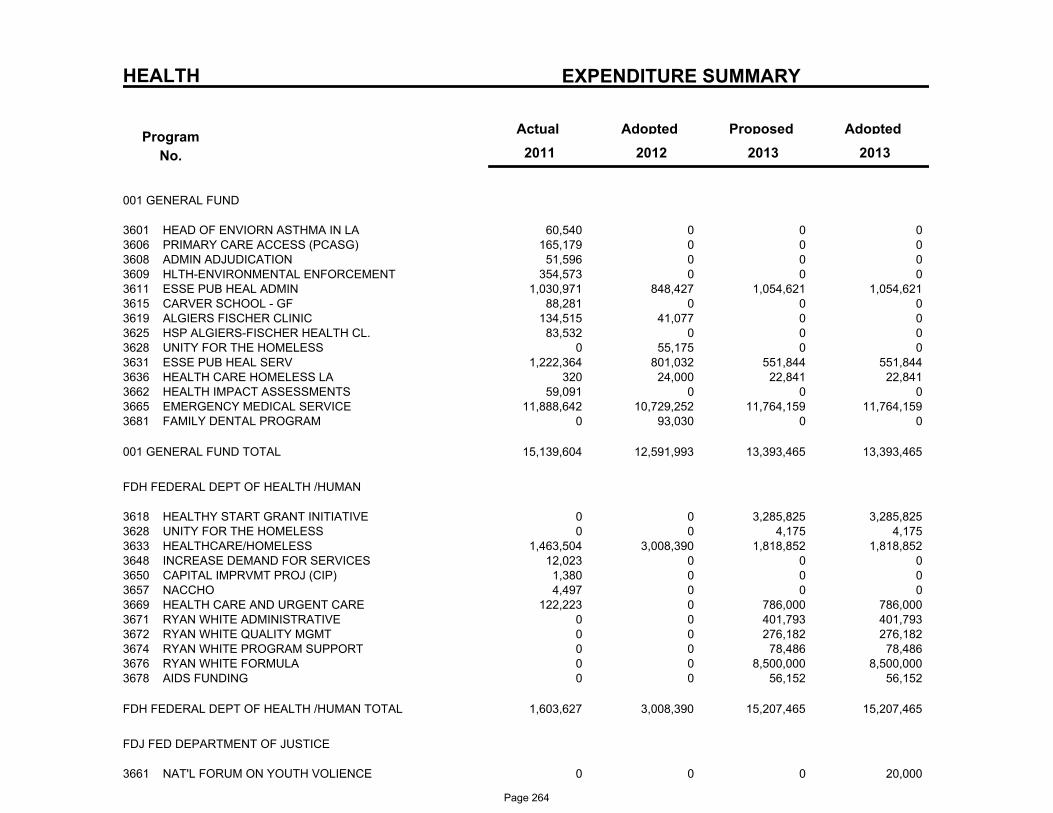
HEALTH EXPENDITURE SUMMARY
Program
No.
Actual AdoptedProposedAdopted
2013 2011 2012 2013
001 GENERAL FUND
60,540 0 0 HEAD OF ENVIORN ASTHMA IN LA3601 0 165,179 0 0 PRIMARY CARE ACCESS (PCASG)3606 0
51,596 0 0 ADMIN ADJUDICATION3608 0 354,573 0 0 HLTH-ENVIRONMENTAL ENFORCEMENT3609 0
1,030,971 848,427 1,054,621 ESSE PUB HEAL ADMIN3611 1,054,621 88,281 0 0 CARVER SCHOOL - GF3615 0
134,515 41,077 0 ALGIERS FISCHER CLINIC3619 0 83,532 0 0 HSP ALGIERS-FISCHER HEALTH CL.3625 0
0 55,175 0 UNITY FOR THE HOMELESS3628 0 1,222,364 801,032 551,844 ESSE PUB HEAL SERV3631 551,844
320 24,000 22,841 HEALTH CARE HOMELESS LA3636 22,841 59,091 0 0 HEALTH IMPACT ASSESSMENTS3662 0
11,888,642 10,729,252 11,764,159 EMERGENCY MEDICAL SERVICE3665 11,764,159 0 93,030 0 FAMILY DENTAL PROGRAM3681 0
15,139,604 12,591,993 13,393,465 13,393,465 001 GENERAL FUND TOTAL
FDH FEDERAL DEPT OF HEALTH /HUMAN
0 0 3,285,825 HEALTHY START GRANT INITIATIVE3618 3,285,825 0 0 4,175 UNITY FOR THE HOMELESS3628 4,175
1,463,504 3,008,390 1,818,852 HEALTHCARE/HOMELESS3633 1,818,852 12,023 0 0 INCREASE DEMAND FOR SERVICES3648 0
1,380 0 0 CAPITAL IMPRVMT PROJ (CIP)3650 0 4,497 0 0 NACCHO3657 0
122,223 0 786,000 HEALTH CARE AND URGENT CARE3669 786,000 0 0 401,793 RYAN WHITE ADMINISTRATIVE3671 401,793 0 0 276,182 RYAN WHITE QUALITY MGMT3672 276,182 0 0 78,486 RYAN WHITE PROGRAM SUPPORT3674 78,486 0 0 8,500,000 RYAN WHITE FORMULA3676 8,500,000 0 0 56,152 AIDS FUNDING3678 56,152
1,603,627 3,008,390 15,207,465 15,207,465 FDH FEDERAL DEPT OF HEALTH /HUMAN TOTAL
FDJ FED DEPARTMENT OF JUSTICE
0 0 0 NAT'L FORUM ON YOUTH VOLIENCE3661 20,000
Page 264
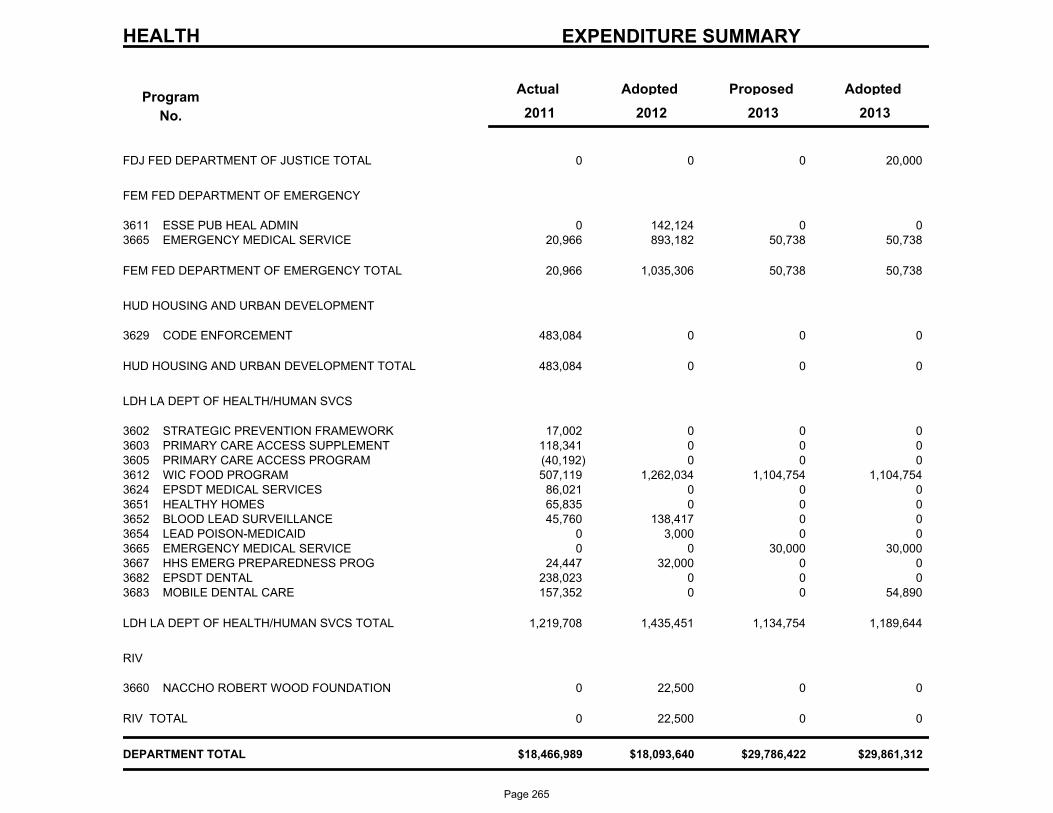
HEALTH EXPENDITURE SUMMARY
Program
No.
Actual AdoptedProposedAdopted
2013 2011 2012 2013
0 0 0 20,000 FDJ FED DEPARTMENT OF JUSTICE TOTAL
FEM FED DEPARTMENT OF EMERGENCY
0 142,124 0 ESSE PUB HEAL ADMIN3611 0 20,966 893,182 50,738 EMERGENCY MEDICAL SERVICE3665 50,738
20,966 1,035,306 50,738 50,738 FEM FED DEPARTMENT OF EMERGENCY TOTAL
HUD HOUSING AND URBAN DEVELOPMENT
483,084 0 0 CODE ENFORCEMENT3629 0
483,084 0 0 0 HUD HOUSING AND URBAN DEVELOPMENT TOTAL
LDH LA DEPT OF HEALTH/HUMAN SVCS
17,002 0 0 STRATEGIC PREVENTION FRAMEWORK3602 0 118,341 0 0 PRIMARY CARE ACCESS SUPPLEMENT3603 0 (40,192) 0 0 PRIMARY CARE ACCESS PROGRAM3605 0
507,119 1,262,034 1,104,754 WIC FOOD PROGRAM3612 1,104,754 86,021 0 0 EPSDT MEDICAL SERVICES3624 0 65,835 0 0 HEALTHY HOMES3651 0 45,760 138,417 0 BLOOD LEAD SURVEILLANCE3652 0
0 3,000 0 LEAD POISON-MEDICAID3654 0 0 0 30,000 EMERGENCY MEDICAL SERVICE3665 30,000
24,447 32,000 0 HHS EMERG PREPAREDNESS PROG3667 0 238,023 0 0 EPSDT DENTAL3682 0 157,352 0 0 MOBILE DENTAL CARE3683 54,890
1,219,708 1,435,451 1,134,754 1,189,644 LDH LA DEPT OF HEALTH/HUMAN SVCS TOTAL
RIV
0 22,500 0 NACCHO ROBERT WOOD FOUNDATION3660 0
0 22,500 0 0 RIV TOTAL
$18,466,989 $18,093,640 $29,786,422 $29,861,312 DEPARTMENT TOTAL
Page 265
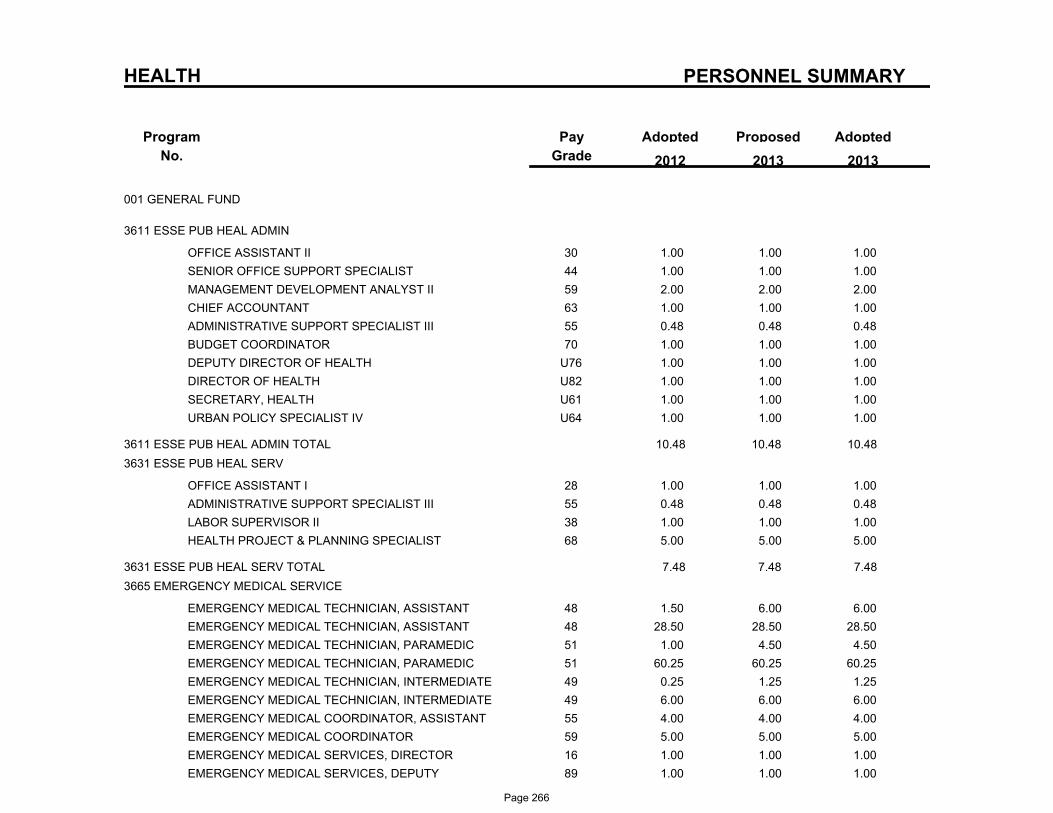
PERSONNEL SUMMARY
Program
No.
ProposedAdoptedPay
Grade
Adopted
2013 2012 2013
HEALTH
001 GENERAL FUND
3611 ESSE PUB HEAL ADMIN
30OFFICE ASSISTANT II 1.00 1.00 1.00
44SENIOR OFFICE SUPPORT SPECIALIST 1.00 1.00 1.00
59MANAGEMENT DEVELOPMENT ANALYST II 2.00 2.00 2.00
63CHIEF ACCOUNTANT 1.00 1.00 1.00
55ADMINISTRATIVE SUPPORT SPECIALIST III 0.48 0.48 0.48
70BUDGET COORDINATOR 1.00 1.00 1.00
U76DEPUTY DIRECTOR OF HEALTH 1.00 1.00 1.00
U82DIRECTOR OF HEALTH 1.00 1.00 1.00
U61SECRETARY, HEALTH 1.00 1.00 1.00
U64URBAN POLICY SPECIALIST IV 1.00 1.00 1.00
3611 ESSE PUB HEAL ADMIN TOTAL 10.48 10.48 10.48
3631 ESSE PUB HEAL SERV
28OFFICE ASSISTANT I 1.00 1.00 1.00
55ADMINISTRATIVE SUPPORT SPECIALIST III 0.48 0.48 0.48
38LABOR SUPERVISOR II 1.00 1.00 1.00
68HEALTH PROJECT & PLANNING SPECIALIST 5.00 5.00 5.00
3631 ESSE PUB HEAL SERV TOTAL 7.48 7.48 7.48
3665 EMERGENCY MEDICAL SERVICE
48EMERGENCY MEDICAL TECHNICIAN, ASSISTANT 1.50 6.00 6.00
48EMERGENCY MEDICAL TECHNICIAN, ASSISTANT 28.50 28.50 28.50
51EMERGENCY MEDICAL TECHNICIAN, PARAMEDIC 1.00 4.50 4.50
51EMERGENCY MEDICAL TECHNICIAN, PARAMEDIC 60.25 60.25 60.25
49EMERGENCY MEDICAL TECHNICIAN, INTERMEDIATE 0.25 1.25 1.25
49EMERGENCY MEDICAL TECHNICIAN, INTERMEDIATE 6.00 6.00 6.00
55EMERGENCY MEDICAL COORDINATOR, ASSISTANT 4.00 4.00 4.00
59EMERGENCY MEDICAL COORDINATOR 5.00 5.00 5.00
16EMERGENCY MEDICAL SERVICES, DIRECTOR 1.00 1.00 1.00
89EMERGENCY MEDICAL SERVICES, DEPUTY 1.00 1.00 1.00
Page 266
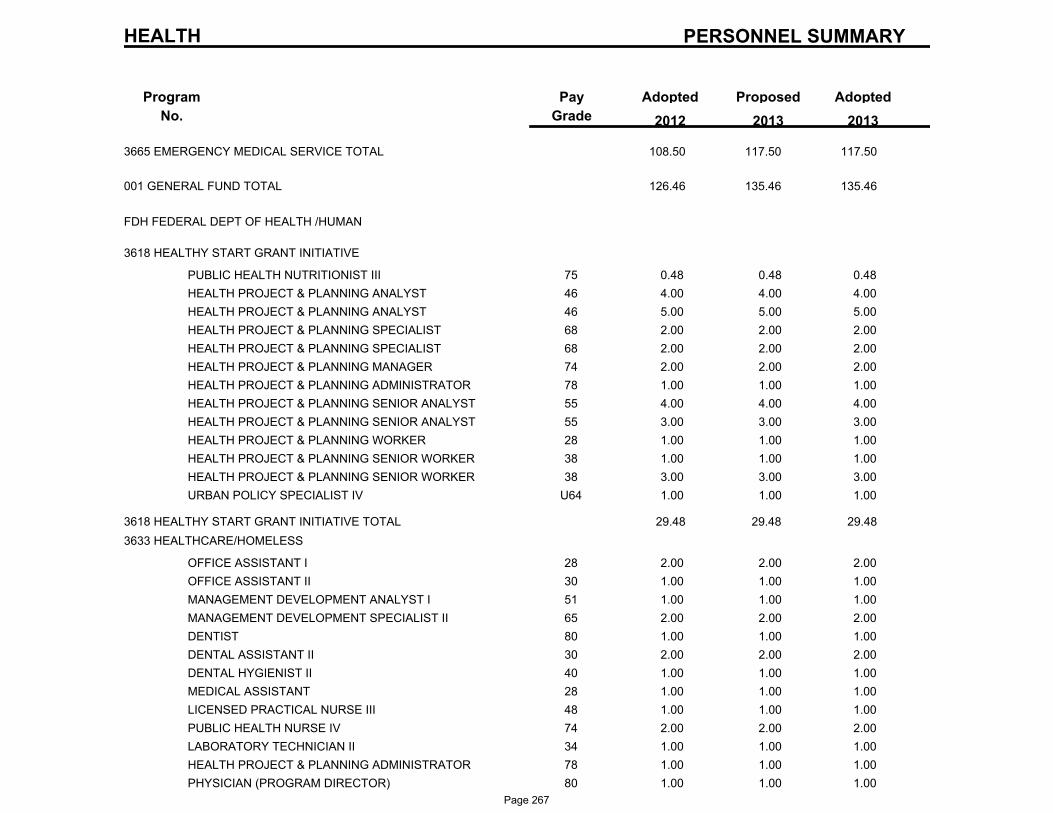
PERSONNEL SUMMARY
Program
No.
ProposedAdoptedPay
Grade
Adopted
2013 2012 2013
HEALTH
3665 EMERGENCY MEDICAL SERVICE TOTAL 108.50 117.50 117.50
001 GENERAL FUND TOTAL 126.46 135.46 135.46
FDH FEDERAL DEPT OF HEALTH /HUMAN
3618 HEALTHY START GRANT INITIATIVE
75PUBLIC HEALTH NUTRITIONIST III 0.48 0.48 0.48
46HEALTH PROJECT & PLANNING ANALYST 4.00 4.00 4.00
46HEALTH PROJECT & PLANNING ANALYST 5.00 5.00 5.00
68HEALTH PROJECT & PLANNING SPECIALIST 2.00 2.00 2.00
68HEALTH PROJECT & PLANNING SPECIALIST 2.00 2.00 2.00
74HEALTH PROJECT & PLANNING MANAGER 2.00 2.00 2.00
78HEALTH PROJECT & PLANNING ADMINISTRATOR 1.00 1.00 1.00
55HEALTH PROJECT & PLANNING SENIOR ANALYST 4.00 4.00 4.00
55HEALTH PROJECT & PLANNING SENIOR ANALYST 3.00 3.00 3.00
28HEALTH PROJECT & PLANNING WORKER 1.00 1.00 1.00
38HEALTH PROJECT & PLANNING SENIOR WORKER 1.00 1.00 1.00
38HEALTH PROJECT & PLANNING SENIOR WORKER 3.00 3.00 3.00
U64URBAN POLICY SPECIALIST IV 1.00 1.00 1.00
3618 HEALTHY START GRANT INITIATIVE TOTAL 29.48 29.48 29.48
3633 HEALTHCARE/HOMELESS
28OFFICE ASSISTANT I 2.00 2.00 2.00
30OFFICE ASSISTANT II 1.00 1.00 1.00
51MANAGEMENT DEVELOPMENT ANALYST I 1.00 1.00 1.00
65MANAGEMENT DEVELOPMENT SPECIALIST II 2.00 2.00 2.00
80DENTIST 1.00 1.00 1.00
30DENTAL ASSISTANT II 2.00 2.00 2.00
40DENTAL HYGIENIST II 1.00 1.00 1.00
28MEDICAL ASSISTANT 1.00 1.00 1.00
48LICENSED PRACTICAL NURSE III 1.00 1.00 1.00
74PUBLIC HEALTH NURSE IV 2.00 2.00 2.00
34LABORATORY TECHNICIAN II 1.00 1.00 1.00
78HEALTH PROJECT & PLANNING ADMINISTRATOR 1.00 1.00 1.00
80PHYSICIAN (PROGRAM DIRECTOR) 1.00 1.00 1.00
Page 267
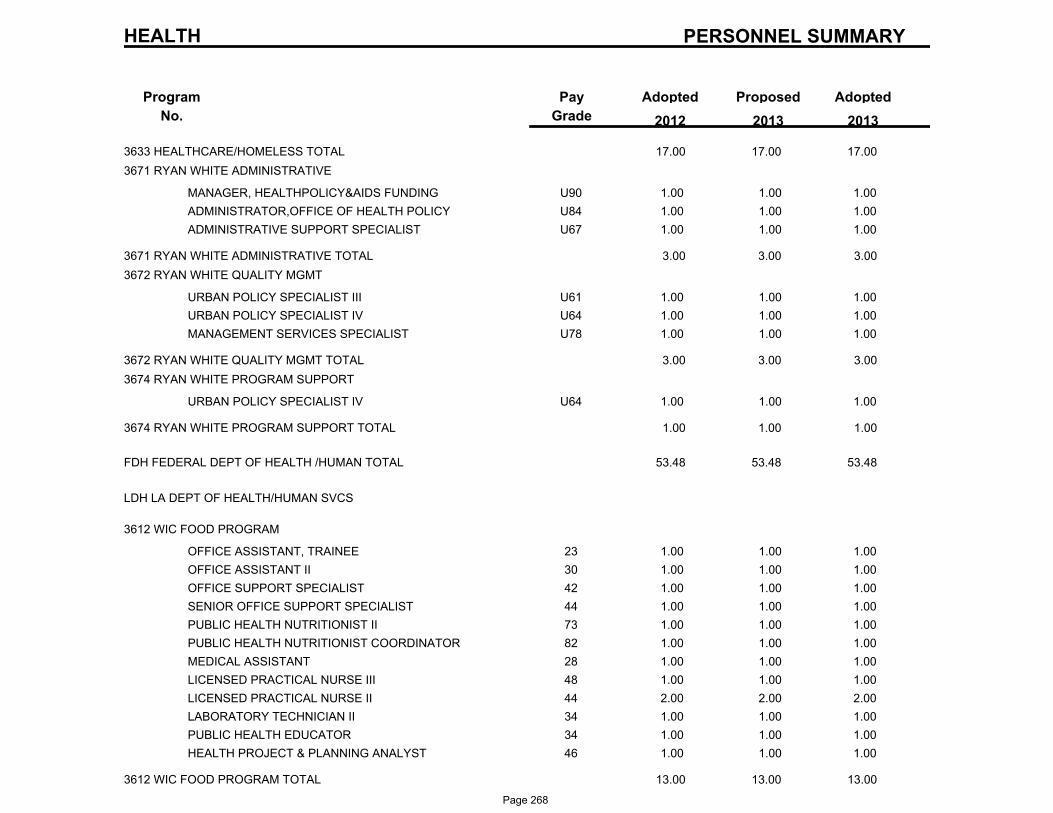
PERSONNEL SUMMARY
Program
No.
ProposedAdoptedPay
Grade
Adopted
2013 2012 2013
HEALTH
3633 HEALTHCARE/HOMELESS TOTAL 17.00 17.00 17.00
3671 RYAN WHITE ADMINISTRATIVE
U90MANAGER, HEALTHPOLICY&AIDS FUNDING 1.00 1.00 1.00
U84ADMINISTRATOR,OFFICE OF HEALTH POLICY 1.00 1.00 1.00
U67ADMINISTRATIVE SUPPORT SPECIALIST 1.00 1.00 1.00
3671 RYAN WHITE ADMINISTRATIVE TOTAL 3.00 3.00 3.00
3672 RYAN WHITE QUALITY MGMT
U61URBAN POLICY SPECIALIST III 1.00 1.00 1.00
U64URBAN POLICY SPECIALIST IV 1.00 1.00 1.00
U78MANAGEMENT SERVICES SPECIALIST 1.00 1.00 1.00
3672 RYAN WHITE QUALITY MGMT TOTAL 3.00 3.00 3.00
3674 RYAN WHITE PROGRAM SUPPORT
U64URBAN POLICY SPECIALIST IV 1.00 1.00 1.00
3674 RYAN WHITE PROGRAM SUPPORT TOTAL 1.00 1.00 1.00
FDH FEDERAL DEPT OF HEALTH /HUMAN TOTAL 53.48 53.48 53.48
LDH LA DEPT OF HEALTH/HUMAN SVCS
3612 WIC FOOD PROGRAM
23OFFICE ASSISTANT, TRAINEE 1.00 1.00 1.00
30OFFICE ASSISTANT II 1.00 1.00 1.00
42OFFICE SUPPORT SPECIALIST 1.00 1.00 1.00
44SENIOR OFFICE SUPPORT SPECIALIST 1.00 1.00 1.00
73PUBLIC HEALTH NUTRITIONIST II 1.00 1.00 1.00
82PUBLIC HEALTH NUTRITIONIST COORDINATOR 1.00 1.00 1.00
28MEDICAL ASSISTANT 1.00 1.00 1.00
48LICENSED PRACTICAL NURSE III 1.00 1.00 1.00
44LICENSED PRACTICAL NURSE II 2.00 2.00 2.00
34LABORATORY TECHNICIAN II 1.00 1.00 1.00
34PUBLIC HEALTH EDUCATOR 1.00 1.00 1.00
46HEALTH PROJECT & PLANNING ANALYST 1.00 1.00 1.00
3612 WIC FOOD PROGRAM TOTAL 13.00 13.00 13.00
Page 268
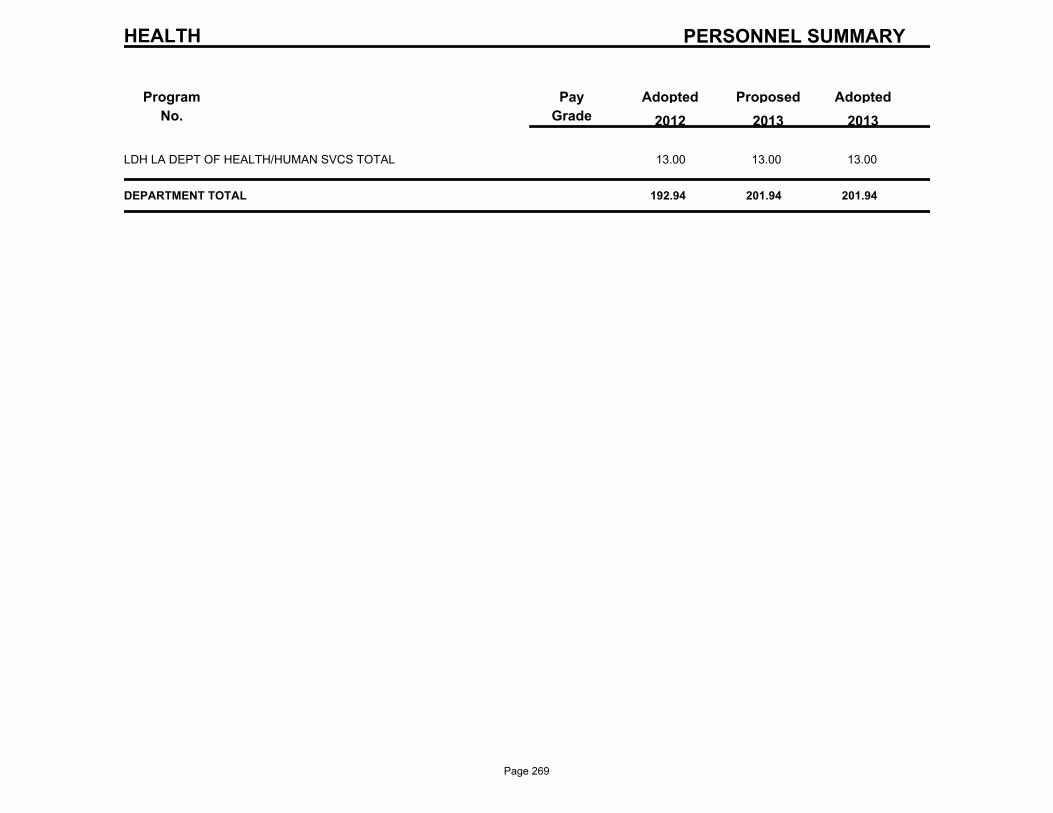
PERSONNEL SUMMARY
Program
No.
ProposedAdoptedPay
Grade
Adopted
2013 2012 2013
HEALTH
LDH LA DEPT OF HEALTH/HUMAN SVCS TOTAL 13.00 13.00 13.00
DEPARTMENT TOTAL 192.94 201.94 201.94
Page 269

Human Services/Youth Study Center
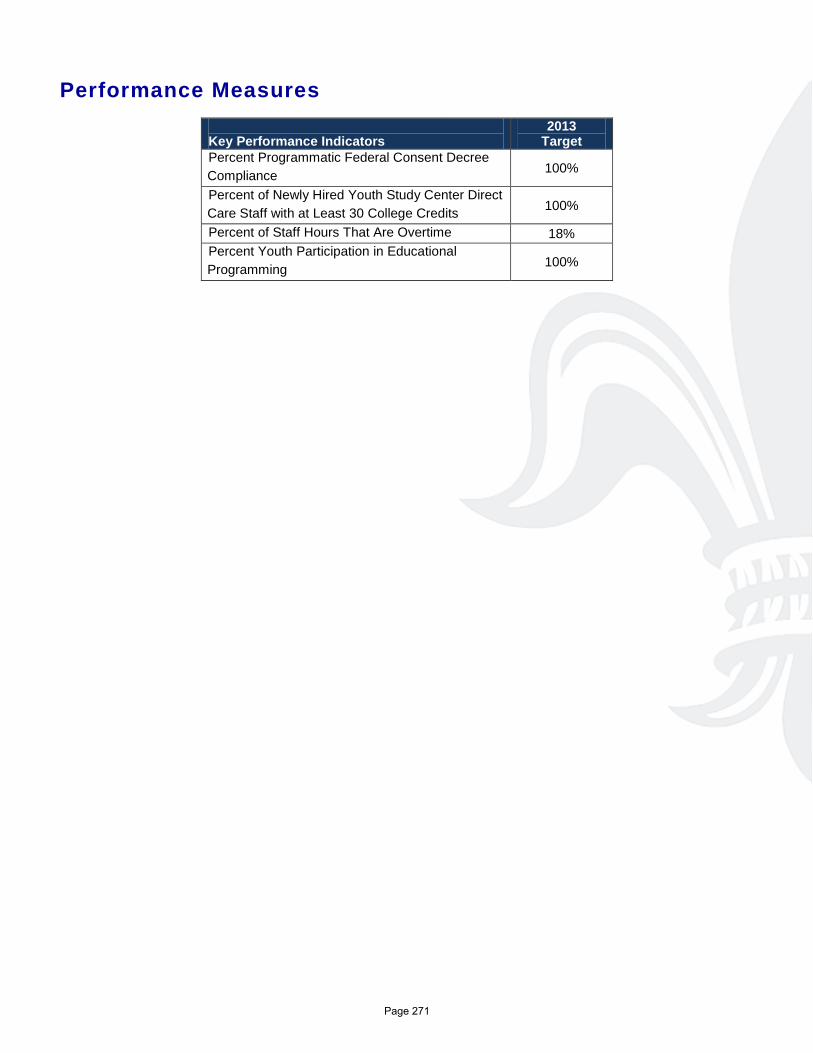
Performance Measures Key Performance Indicators
2013 Target
Percent Programmatic Federal Consent Decree Compliance 100%
Percent of Newly Hired Youth Study Center Direct Care Staff with at Least 30 College Credits 100%
Percent of Staff Hours That Are Overtime 18% Percent Youth Participation in Educational Programming 100%
Page 271
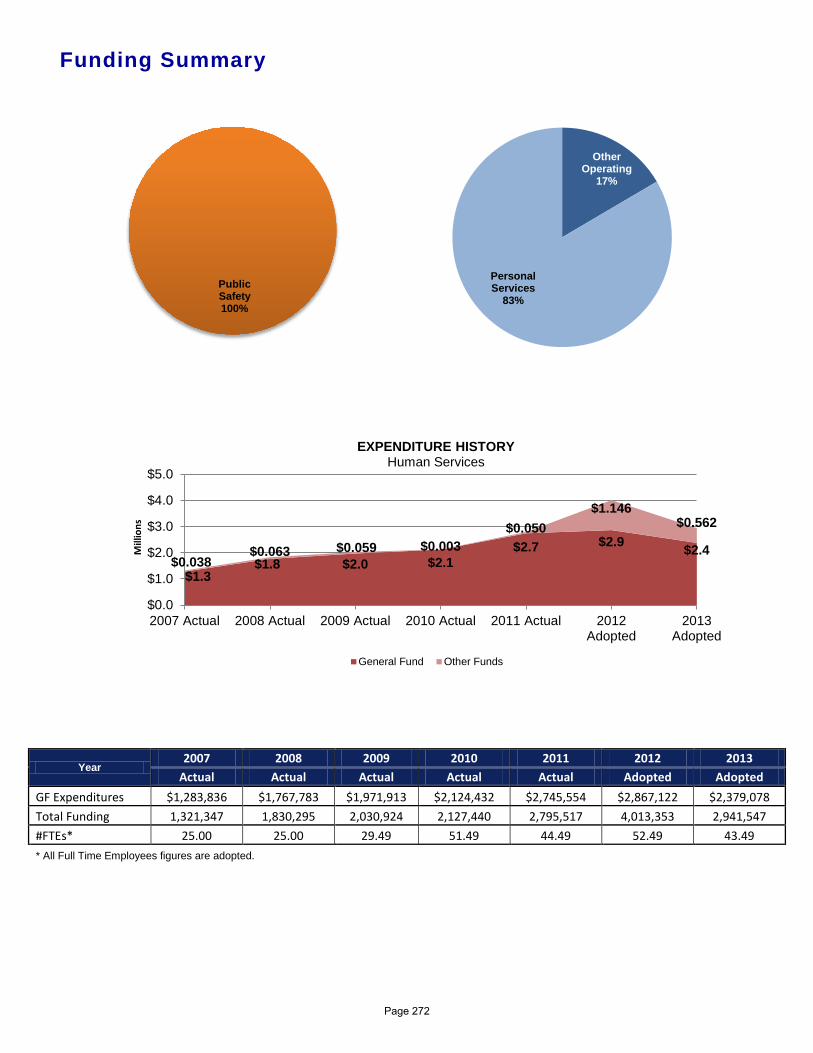
Funding Summary
Year 2007 2008 2009 2010 2011 2012 2013
Actual Actual Actual Actual Actual Adopted Adopted GF Expenditures $1,283,836 $1,767,783 $1,971,913 $2,124,432 $2,745,554 $2,867,122 $2,379,078 Total Funding 1,321,347 1,830,295 2,030,924 2,127,440 2,795,517 4,013,353 2,941,547 #FTEs* 25.00 25.00 29.49 51.49 44.49 52.49 43.49 * All Full Time Employees figures are adopted.
$1.3 $1.8 $2.0 $2.1
$2.7 $2.9 $2.4 $0.038
$0.063 $0.059 $0.003 $0.050
$1.146 $0.562
$0.0
$1.0
$2.0
$3.0
$4.0
$5.0
2007 Actual 2008 Actual 2009 Actual 2010 Actual 2011 Actual 2012Adopted
2013Adopted
Mill
ions
EXPENDITURE HISTORY Human Services
General Fund Other Funds
Public Safety 100%
Other Operating
17%
Personal Services
83%
Page 272
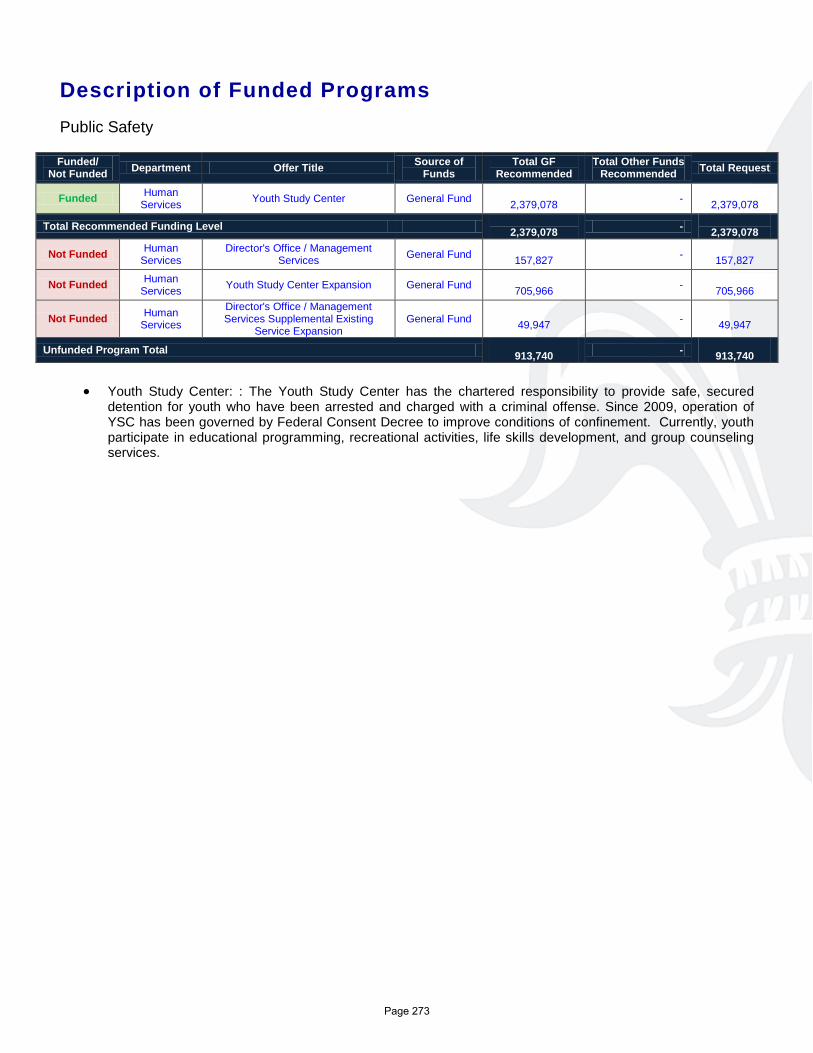
Description of Funded Programs Public Safety Funded/
Not Funded Department Offer Title Source of Funds
Total GF Recommended
Total Other Funds Recommended Total Request
Funded Human Services Youth Study Center General Fund
2,379,078 - 2,379,078
Total Recommended Funding Level 2,379,078 -
2,379,078
Not Funded Human Services
Director's Office / Management Services General Fund
157,827 - 157,827
Not Funded Human Services Youth Study Center Expansion General Fund
705,966 - 705,966
Not Funded Human Services
Director's Office / Management Services Supplemental Existing
Service Expansion General Fund
49,947 - 49,947
Unfunded Program Total 913,740 -
913,740
• Youth Study Center: : The Youth Study Center has the chartered responsibility to provide safe, secured detention for youth who have been arrested and charged with a criminal offense. Since 2009, operation of YSC has been governed by Federal Consent Decree to improve conditions of confinement. Currently, youth participate in educational programming, recreational activities, life skills development, and group counseling services.
Page 273

HUMAN SERVICES
DEPARTMENTAL BUDGET SUMMARY
AdoptedProposedAdoptedActual
EXPENDITURES
2013 2012 2011 2013
PERSONAL SERVICES 2,487,924 2,555,183 1,985,331 1,985,331
OTHER OPERATING 307,593 1,458,170 956,216 956,216
DEBT SERVICE 0 0 0 0
RESERVES 0 0 0 0
GRANTS, CONTRIB. & FUND TRAN. 0 0 0 0
$2,795,517 $4,013,353 $2,941,547 TOTAL EXPENDITURES $2,941,547
SOURCE OF FUNDING
GENERAL FUND 2,745,554 2,867,122 2,379,078 2,379,078
WISNER FUNDS 0 0 0 0
ENTERPRISE 0 0 0 0
DOWNTOWN DEVELOPMENT DIST. 0 0 0 0
HOUSING AND URBAN DEVELOP. 0 0 0 0
SELF GENERATED 0 0 0 0
LIBRARY 0 0 0 0
LLE 0 3,203 0 0
FEDERAL GRANTS 49,963 1,143,028 562,469 562,469
STATE GRANTS 0 0 0 0
GRANTS, CONTRIB., & FUND TRAN. 0 0 0 0
N. O. REGIONAL BUSINESS PARK 0 0 0 0
ECONOMIC DEVELOPMENT FUND 0 0 0 0
HOUSING IMPROVMENT FUND 0 0 0 0
$2,795,517 $4,013,353 $2,941,547 TOTAL FUNDING $2,941,547
Page 274
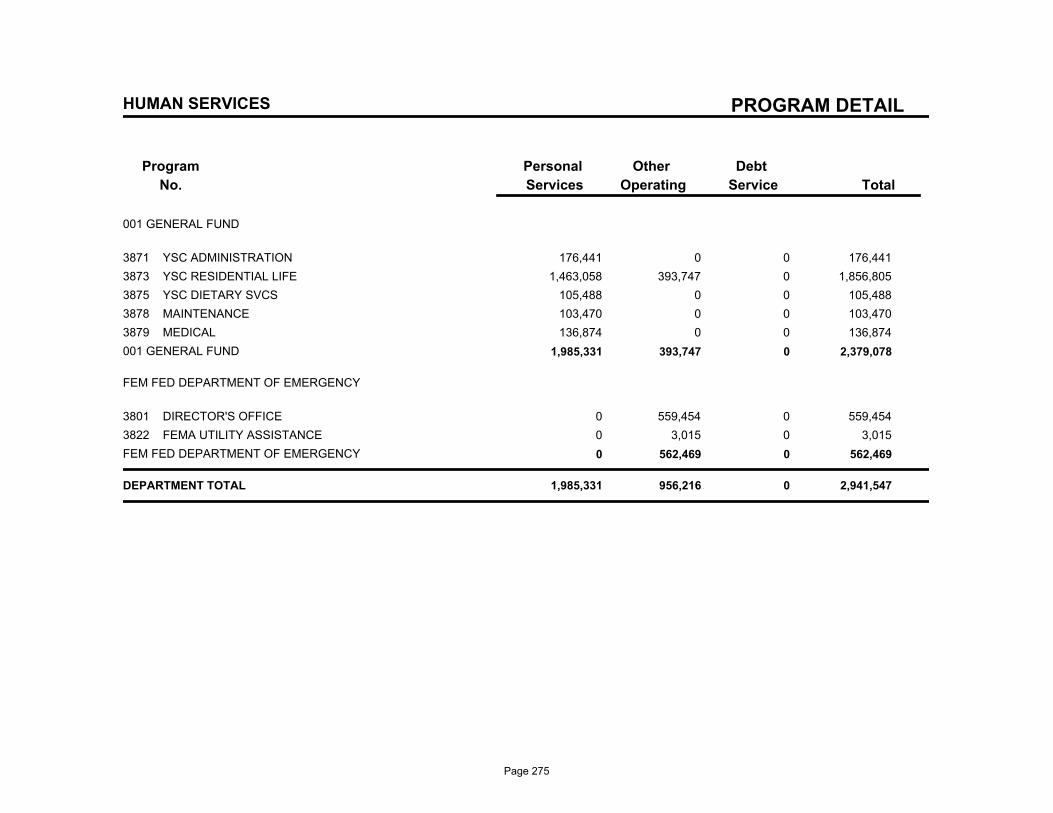
PROGRAM DETAIL
Program
No.
Debt
Service
Other
Operating
Personal
Services Total
HUMAN SERVICES
001 GENERAL FUND
3871 YSC ADMINISTRATION 176,441 0 0 176,441
3873 YSC RESIDENTIAL LIFE 1,463,058 393,747 0 1,856,805
3875 YSC DIETARY SVCS 105,488 0 0 105,488
3878 MAINTENANCE 103,470 0 0 103,470
3879 MEDICAL 136,874 0 0 136,874
001 GENERAL FUND 1,985,331 393,747 0 2,379,078
FEM FED DEPARTMENT OF EMERGENCY
3801 DIRECTOR'S OFFICE 0 559,454 0 559,454
3822 FEMA UTILITY ASSISTANCE 0 3,015 0 3,015
FEM FED DEPARTMENT OF EMERGENCY 0 562,469 0 562,469
DEPARTMENT TOTAL 1,985,331 956,216 0 2,941,547
Page 275
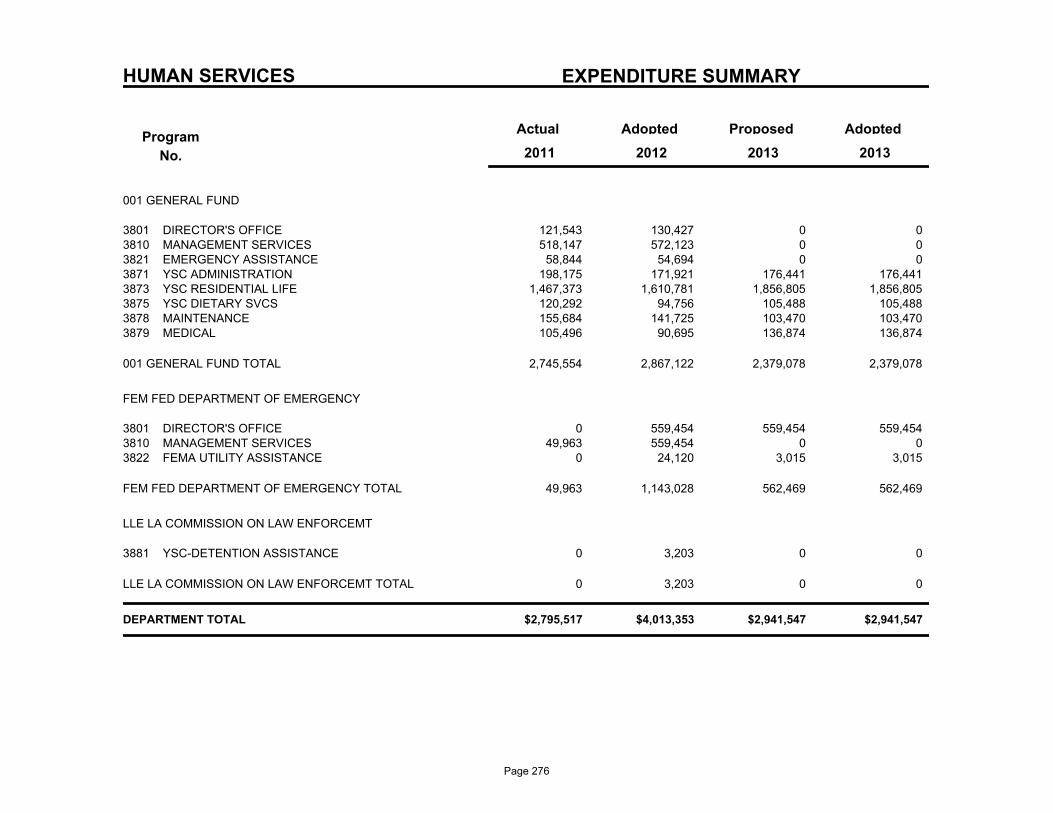
HUMAN SERVICES EXPENDITURE SUMMARY
Program
No.
Actual AdoptedProposedAdopted
2013 2011 2012 2013
001 GENERAL FUND
121,543 130,427 0 DIRECTOR'S OFFICE3801 0 518,147 572,123 0 MANAGEMENT SERVICES3810 0
58,844 54,694 0 EMERGENCY ASSISTANCE3821 0 198,175 171,921 176,441 YSC ADMINISTRATION3871 176,441
1,467,373 1,610,781 1,856,805 YSC RESIDENTIAL LIFE3873 1,856,805 120,292 94,756 105,488 YSC DIETARY SVCS3875 105,488 155,684 141,725 103,470 MAINTENANCE3878 103,470 105,496 90,695 136,874 MEDICAL3879 136,874
2,745,554 2,867,122 2,379,078 2,379,078 001 GENERAL FUND TOTAL
FEM FED DEPARTMENT OF EMERGENCY
0 559,454 559,454 DIRECTOR'S OFFICE3801 559,454 49,963 559,454 0 MANAGEMENT SERVICES3810 0
0 24,120 3,015 FEMA UTILITY ASSISTANCE3822 3,015
49,963 1,143,028 562,469 562,469 FEM FED DEPARTMENT OF EMERGENCY TOTAL
LLE LA COMMISSION ON LAW ENFORCEMT
0 3,203 0 YSC-DETENTION ASSISTANCE3881 0
0 3,203 0 0 LLE LA COMMISSION ON LAW ENFORCEMT TOTAL
$2,795,517 $4,013,353 $2,941,547 $2,941,547 DEPARTMENT TOTAL
Page 276
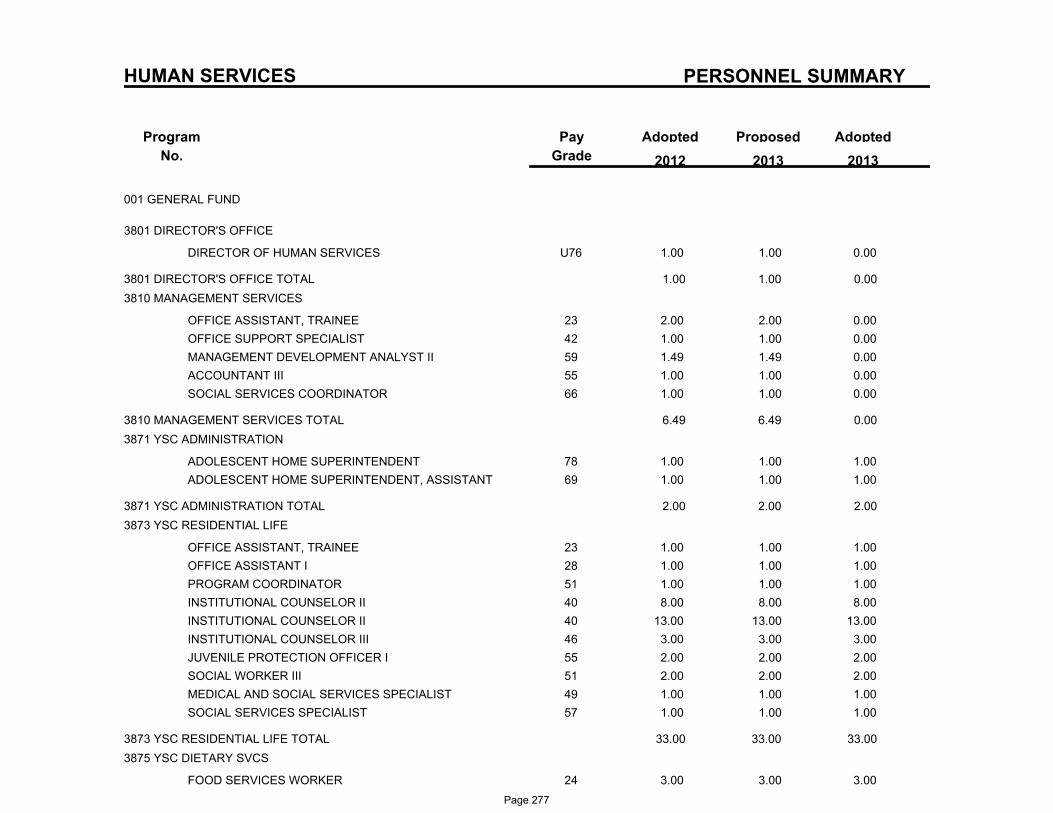
PERSONNEL SUMMARY
Program
No.
ProposedAdoptedPay
Grade
Adopted
2013 2012 2013
HUMAN SERVICES
001 GENERAL FUND
3801 DIRECTOR'S OFFICE
U76DIRECTOR OF HUMAN SERVICES 1.00 1.00 0.00
3801 DIRECTOR'S OFFICE TOTAL 1.00 1.00 0.00
3810 MANAGEMENT SERVICES
23OFFICE ASSISTANT, TRAINEE 2.00 2.00 0.00
42OFFICE SUPPORT SPECIALIST 1.00 1.00 0.00
59MANAGEMENT DEVELOPMENT ANALYST II 1.49 1.49 0.00
55ACCOUNTANT III 1.00 1.00 0.00
66SOCIAL SERVICES COORDINATOR 1.00 1.00 0.00
3810 MANAGEMENT SERVICES TOTAL 6.49 6.49 0.00
3871 YSC ADMINISTRATION
78ADOLESCENT HOME SUPERINTENDENT 1.00 1.00 1.00
69ADOLESCENT HOME SUPERINTENDENT, ASSISTANT 1.00 1.00 1.00
3871 YSC ADMINISTRATION TOTAL 2.00 2.00 2.00
3873 YSC RESIDENTIAL LIFE
23OFFICE ASSISTANT, TRAINEE 1.00 1.00 1.00
28OFFICE ASSISTANT I 1.00 1.00 1.00
51PROGRAM COORDINATOR 1.00 1.00 1.00
40INSTITUTIONAL COUNSELOR II 8.00 8.00 8.00
40INSTITUTIONAL COUNSELOR II 13.00 13.00 13.00
46INSTITUTIONAL COUNSELOR III 3.00 3.00 3.00
55JUVENILE PROTECTION OFFICER I 2.00 2.00 2.00
51SOCIAL WORKER III 2.00 2.00 2.00
49MEDICAL AND SOCIAL SERVICES SPECIALIST 1.00 1.00 1.00
57SOCIAL SERVICES SPECIALIST 1.00 1.00 1.00
3873 YSC RESIDENTIAL LIFE TOTAL 33.00 33.00 33.00
3875 YSC DIETARY SVCS
24FOOD SERVICES WORKER 3.00 3.00 3.00
Page 277
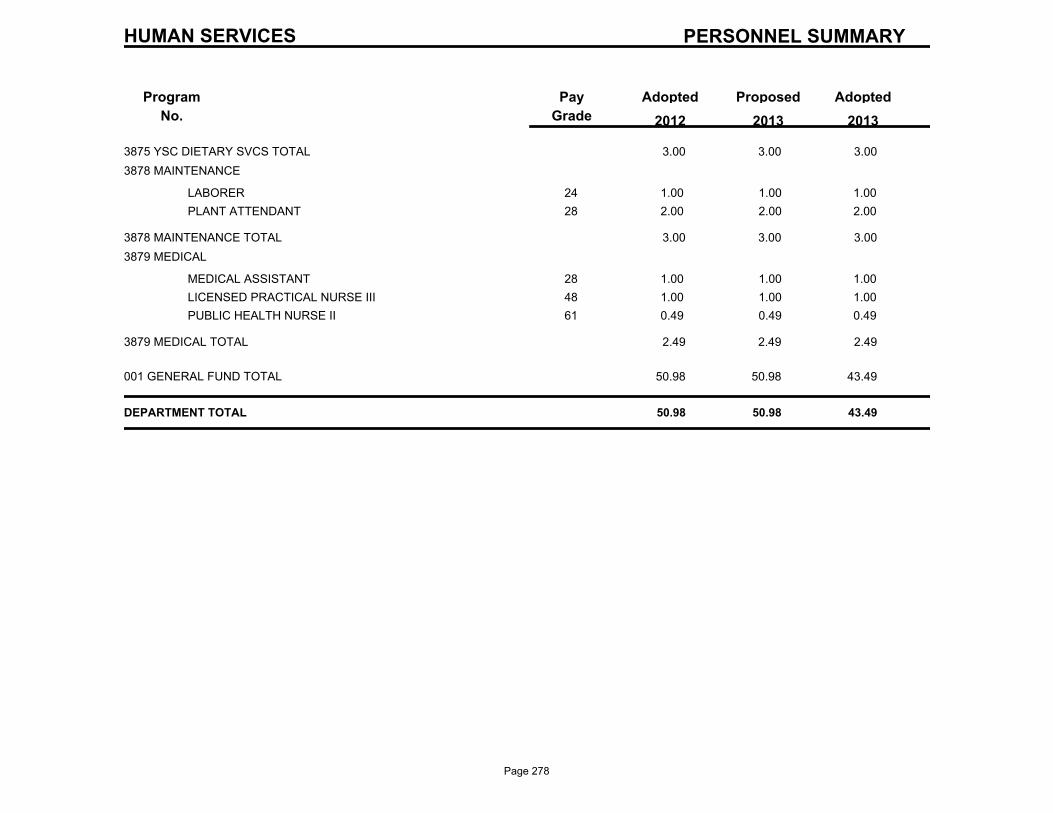
PERSONNEL SUMMARY
Program
No.
ProposedAdoptedPay
Grade
Adopted
2013 2012 2013
HUMAN SERVICES
3875 YSC DIETARY SVCS TOTAL 3.00 3.00 3.00
3878 MAINTENANCE
24LABORER 1.00 1.00 1.00
28PLANT ATTENDANT 2.00 2.00 2.00
3878 MAINTENANCE TOTAL 3.00 3.00 3.00
3879 MEDICAL
28MEDICAL ASSISTANT 1.00 1.00 1.00
48LICENSED PRACTICAL NURSE III 1.00 1.00 1.00
61PUBLIC HEALTH NURSE II 0.49 0.49 0.49
3879 MEDICAL TOTAL 2.49 2.49 2.49
001 GENERAL FUND TOTAL 50.98 50.98 43.49
DEPARTMENT TOTAL 50.98 50.98 43.49
Page 278

Page 279

Department of Finance
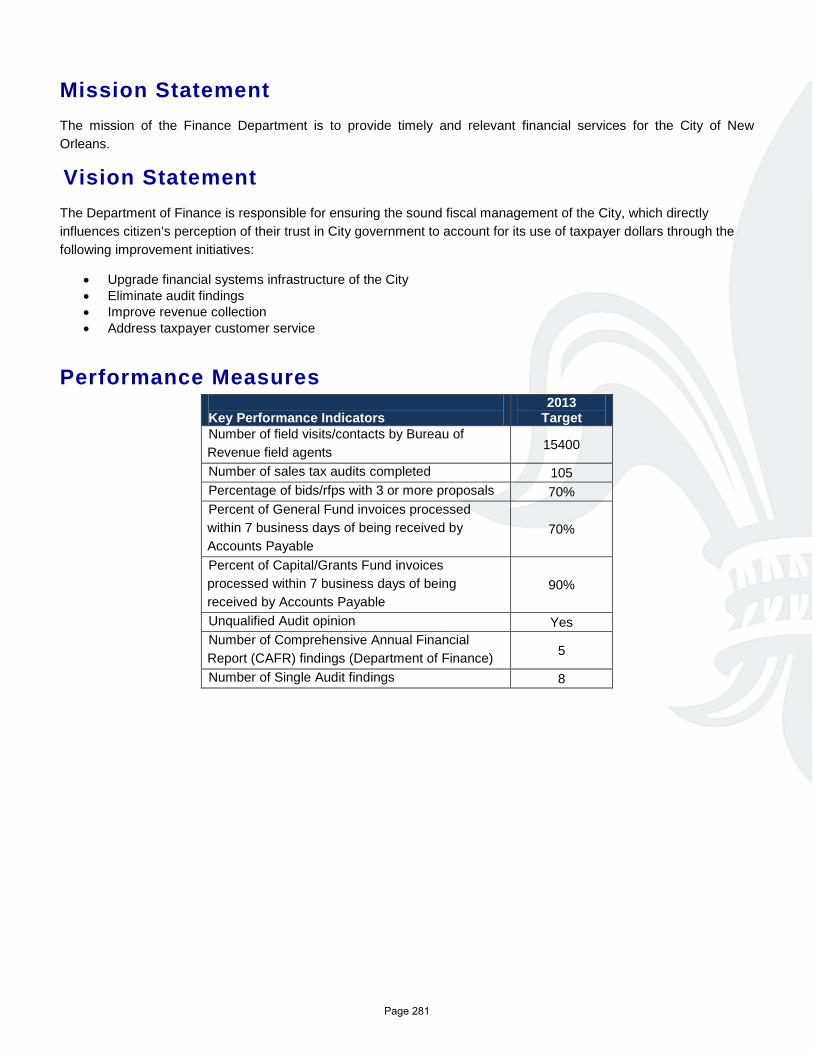
Mission Statement The mission of the Finance Department is to provide timely and relevant financial services for the City of New Orleans.
Vision Statement The Department of Finance is responsible for ensuring the sound fiscal management of the City, which directly influences citizen’s perception of their trust in City government to account for its use of taxpayer dollars through the following improvement initiatives:
• Upgrade financial systems infrastructure of the City • Eliminate audit findings • Improve revenue collection • Address taxpayer customer service
Performance Measures
Key Performance Indicators
2013 Target
Number of field visits/contacts by Bureau of Revenue field agents 15400
Number of sales tax audits completed 105 Percentage of bids/rfps with 3 or more proposals 70% Percent of General Fund invoices processed within 7 business days of being received by Accounts Payable
70%
Percent of Capital/Grants Fund invoices processed within 7 business days of being received by Accounts Payable
90%
Unqualified Audit opinion Yes Number of Comprehensive Annual Financial Report (CAFR) findings (Department of Finance) 5
Number of Single Audit findings 8
Page 281
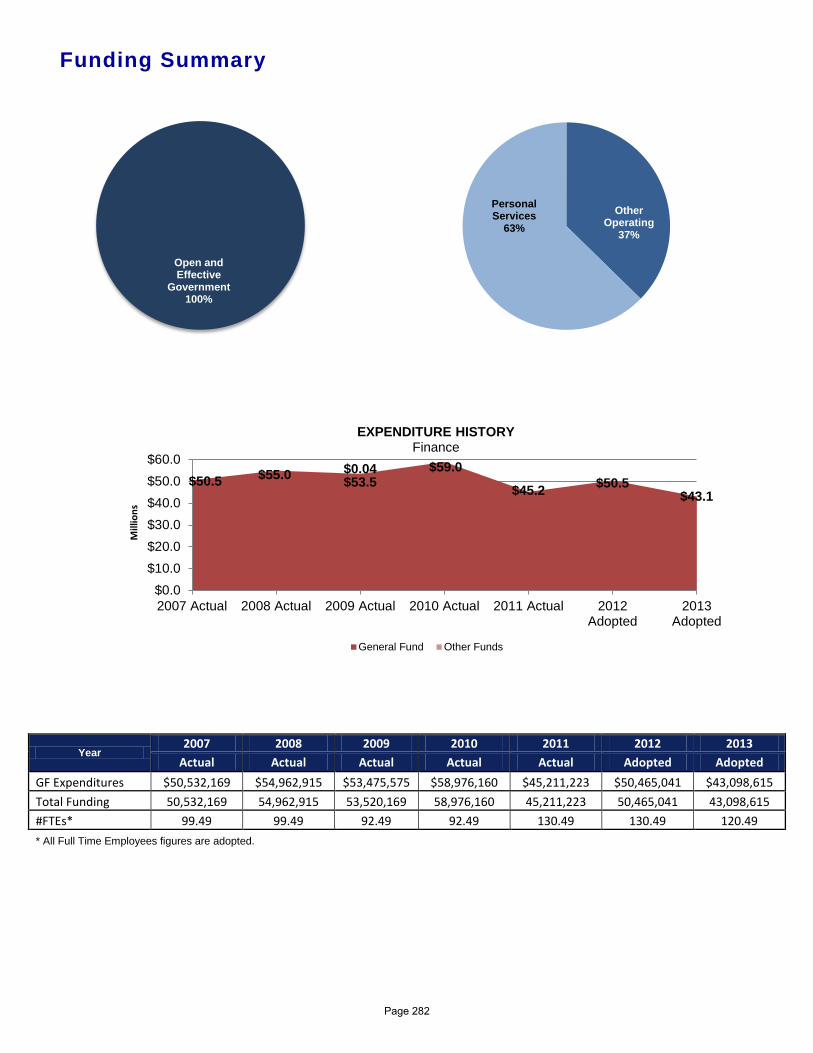
Open and Effective
Government 100%
Funding Summary
Year 2007 2008 2009 2010 2011 2012 2013
Actual Actual Actual Actual Actual Adopted Adopted GF Expenditures $50,532,169 $54,962,915 $53,475,575 $58,976,160 $45,211,223 $50,465,041 $43,098,615 Total Funding 50,532,169 54,962,915 53,520,169 58,976,160 45,211,223 50,465,041 43,098,615 #FTEs* 99.49 99.49 92.49 92.49 130.49 130.49 120.49 * All Full Time Employees figures are adopted.
$50.5 $55.0 $53.5 $59.0
$45.2 $50.5 $43.1
$0.04
$0.0$10.0$20.0$30.0$40.0$50.0$60.0
2007 Actual 2008 Actual 2009 Actual 2010 Actual 2011 Actual 2012Adopted
2013Adopted
Mill
ions
EXPENDITURE HISTORY Finance
General Fund Other Funds
Other Operating
37%
Personal Services
63%
Page 282
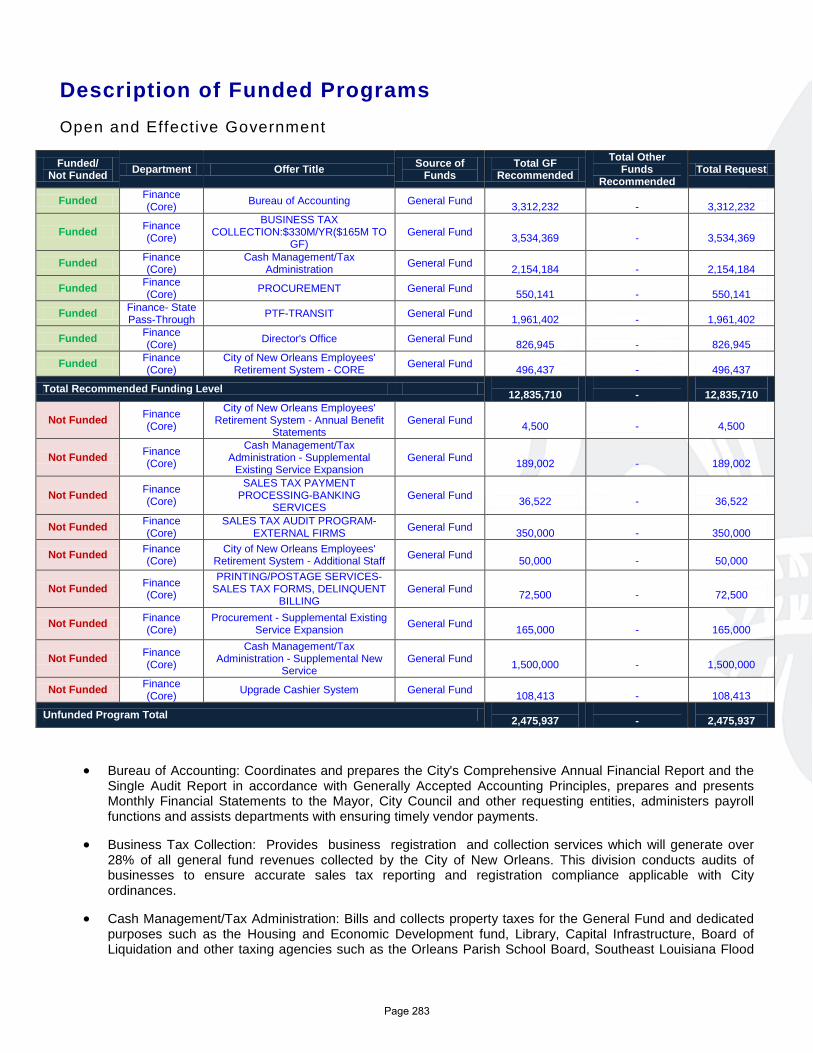
Description of Funded Programs Open and Effective Government
Funded/ Not Funded Department Offer Title Source of
Funds Total GF
Recommended Total Other
Funds Recommended
Total Request
Funded Finance (Core) Bureau of Accounting General Fund
3,312,232 -
3,312,232
Funded Finance (Core)
BUSINESS TAX COLLECTION:$330M/YR($165M TO
GF) General Fund
3,534,369 -
3,534,369
Funded Finance (Core)
Cash Management/Tax Administration General Fund
2,154,184 -
2,154,184
Funded Finance (Core) PROCUREMENT General Fund
550,141 -
550,141
Funded Finance- State Pass-Through PTF-TRANSIT General Fund
1,961,402 -
1,961,402
Funded Finance (Core) Director's Office General Fund
826,945 -
826,945
Funded Finance (Core)
City of New Orleans Employees' Retirement System - CORE General Fund
496,437 -
496,437
Total Recommended Funding Level 12,835,710
-
12,835,710
Not Funded Finance (Core)
City of New Orleans Employees' Retirement System - Annual Benefit
Statements General Fund
4,500 -
4,500
Not Funded Finance (Core)
Cash Management/Tax Administration - Supplemental
Existing Service Expansion General Fund
189,002 -
189,002
Not Funded Finance (Core)
SALES TAX PAYMENT PROCESSING-BANKING
SERVICES General Fund
36,522 -
36,522
Not Funded Finance (Core)
SALES TAX AUDIT PROGRAM-EXTERNAL FIRMS General Fund
350,000 -
350,000
Not Funded Finance (Core)
City of New Orleans Employees' Retirement System - Additional Staff General Fund
50,000 -
50,000
Not Funded Finance (Core)
PRINTING/POSTAGE SERVICES-SALES TAX FORMS, DELINQUENT
BILLING General Fund
72,500 -
72,500
Not Funded Finance (Core)
Procurement - Supplemental Existing Service Expansion General Fund
165,000 -
165,000
Not Funded Finance (Core)
Cash Management/Tax Administration - Supplemental New
Service General Fund
1,500,000 -
1,500,000
Not Funded Finance (Core) Upgrade Cashier System General Fund
108,413 -
108,413
Unfunded Program Total 2,475,937
-
2,475,937
• Bureau of Accounting: Coordinates and prepares the City's Comprehensive Annual Financial Report and the Single Audit Report in accordance with Generally Accepted Accounting Principles, prepares and presents Monthly Financial Statements to the Mayor, City Council and other requesting entities, administers payroll functions and assists departments with ensuring timely vendor payments.
• Business Tax Collection: Provides business registration and collection services which will generate over 28% of all general fund revenues collected by the City of New Orleans. This division conducts audits of businesses to ensure accurate sales tax reporting and registration compliance applicable with City ordinances.
• Cash Management/Tax Administration: Bills and collects property taxes for the General Fund and dedicated purposes such as the Housing and Economic Development fund, Library, Capital Infrastructure, Board of Liquidation and other taxing agencies such as the Orleans Parish School Board, Southeast Louisiana Flood
Page 283
Protection Authority, Sewerage and Water Board, Sheriff, Downtown Development District, New Orleans Regional Business Park as well as 24 Neighborhood Security Districts.
• Procurement: Allows the City to maximize purchasing value to the fullest extent possible in the procurement, management, control and disposal of any and all supplies, services and construction procured by the City. By modernizing the procedures pertaining to contracting by streamlining procurement through the development of fiscally sound policies and procedures as well as holding open meetings for professional services procurements, this division provides citizens with a voice, visibility and access to the procurement process.
• PTF-Transit: Supports the City's legal obligation of the PTF-Transit, which is the pass through account for state/parish transit.
• Director's Office: Ensures the fiscal management of the City, directly influencing citizen perception and trust in City government.
• City of New Orleans Employees' Retirement System - CORE: The Retirement System Office administers the retirement plan for all civilian City employees and associated agencies via the New Orleans Municipal Employees Retirement System.
Page 284

FINANCE
DEPARTMENTAL BUDGET SUMMARY
AdoptedProposedAdoptedActual
EXPENDITURES
2013 2012 2011 2013
PERSONAL SERVICES 8,121,889 8,571,554 8,044,911 8,044,911
OTHER OPERATING 3,050,008 3,268,838 4,340,799 4,790,799
DEBT SERVICE 17,252,080 38,624,649 30,769,059 30,262,905
RESERVES 16,787,246 0 0 0
GRANTS, CONTRIB. & FUND TRAN. 0 0 0 0
$45,211,223 $50,465,041 $43,154,769 TOTAL EXPENDITURES $43,098,615
SOURCE OF FUNDING
GENERAL FUND 45,211,223 50,465,041 43,154,769 43,098,615
WISNER FUNDS 0 0 0 0
ENTERPRISE 0 0 0 0
DOWNTOWN DEVELOPMENT DIST. 0 0 0 0
HOUSING AND URBAN DEVELOP. 0 0 0 0
SELF GENERATED 0 0 0 0
LIBRARY 0 0 0 0
LLE 0 0 0 0
FEDERAL GRANTS 0 0 0 0
STATE GRANTS 0 0 0 0
GRANTS, CONTRIB., & FUND TRAN. 0 0 0 0
N. O. REGIONAL BUSINESS PARK 0 0 0 0
ECONOMIC DEVELOPMENT FUND 0 0 0 0
HOUSING IMPROVMENT FUND 0 0 0 0
$45,211,223 $50,465,041 $43,154,769 TOTAL FUNDING $43,098,615
Page 285
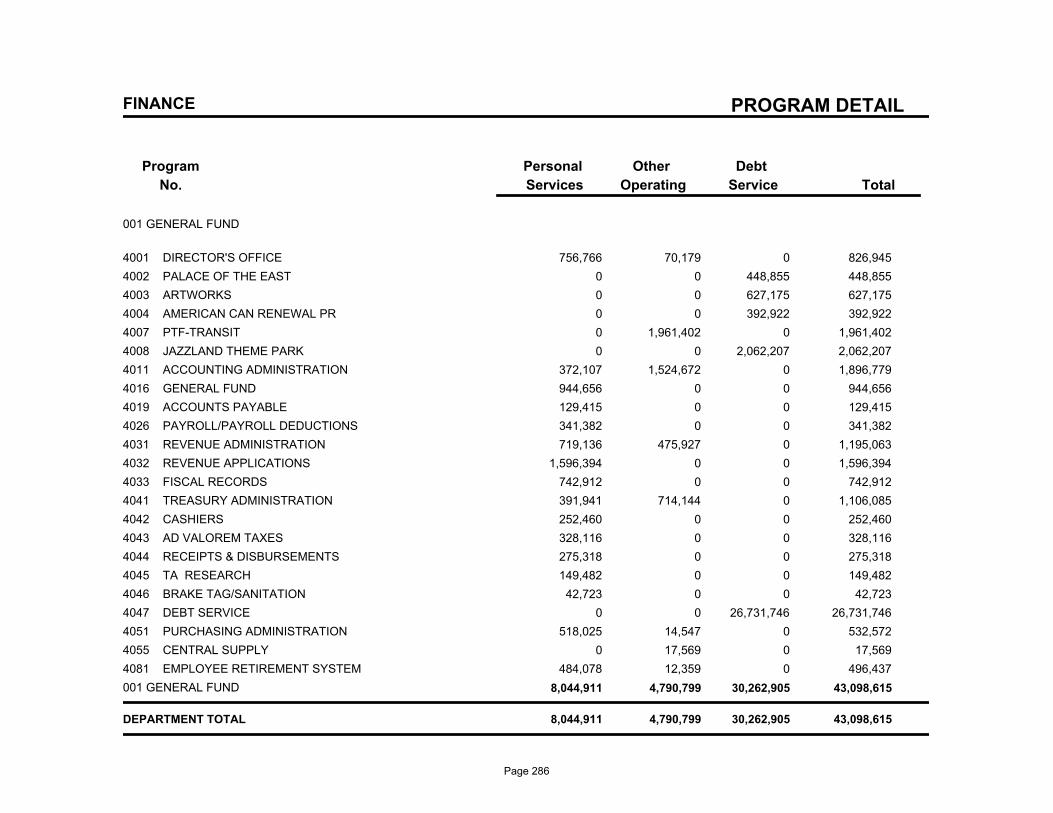
PROGRAM DETAIL
Program
No.
Debt
Service
Other
Operating
Personal
Services Total
FINANCE
001 GENERAL FUND
4001 DIRECTOR'S OFFICE 756,766 70,179 0 826,945
4002 PALACE OF THE EAST 0 0 448,855 448,855
4003 ARTWORKS 0 0 627,175 627,175
4004 AMERICAN CAN RENEWAL PR 0 0 392,922 392,922
4007 PTF-TRANSIT 0 1,961,402 0 1,961,402
4008 JAZZLAND THEME PARK 0 0 2,062,207 2,062,207
4011 ACCOUNTING ADMINISTRATION 372,107 1,524,672 0 1,896,779
4016 GENERAL FUND 944,656 0 0 944,656
4019 ACCOUNTS PAYABLE 129,415 0 0 129,415
4026 PAYROLL/PAYROLL DEDUCTIONS 341,382 0 0 341,382
4031 REVENUE ADMINISTRATION 719,136 475,927 0 1,195,063
4032 REVENUE APPLICATIONS 1,596,394 0 0 1,596,394
4033 FISCAL RECORDS 742,912 0 0 742,912
4041 TREASURY ADMINISTRATION 391,941 714,144 0 1,106,085
4042 CASHIERS 252,460 0 0 252,460
4043 AD VALOREM TAXES 328,116 0 0 328,116
4044 RECEIPTS & DISBURSEMENTS 275,318 0 0 275,318
4045 TA RESEARCH 149,482 0 0 149,482
4046 BRAKE TAG/SANITATION 42,723 0 0 42,723
4047 DEBT SERVICE 0 0 26,731,746 26,731,746
4051 PURCHASING ADMINISTRATION 518,025 14,547 0 532,572
4055 CENTRAL SUPPLY 0 17,569 0 17,569
4081 EMPLOYEE RETIREMENT SYSTEM 484,078 12,359 0 496,437
001 GENERAL FUND 8,044,911 4,790,799 30,262,905 43,098,615
DEPARTMENT TOTAL 8,044,911 4,790,799 30,262,905 43,098,615
Page 286
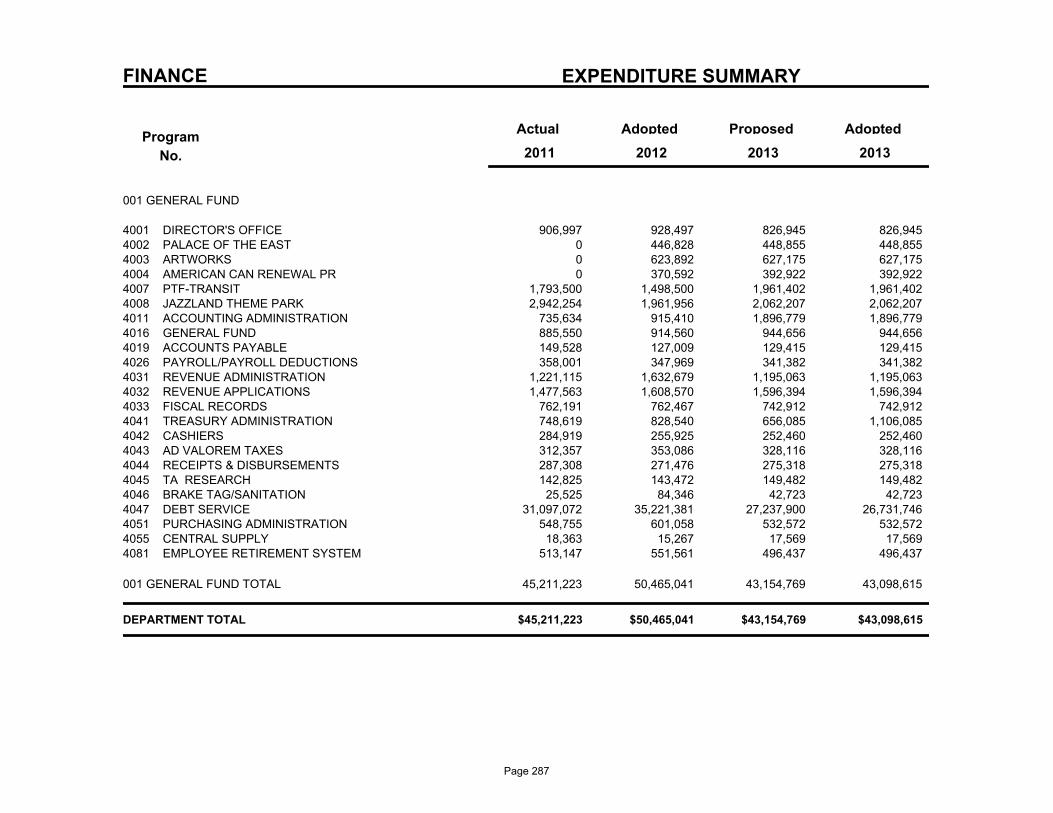
FINANCE EXPENDITURE SUMMARY
Program
No.
Actual AdoptedProposedAdopted
2013 2011 2012 2013
001 GENERAL FUND
906,997 928,497 826,945 DIRECTOR'S OFFICE4001 826,945 0 446,828 448,855 PALACE OF THE EAST4002 448,855 0 623,892 627,175 ARTWORKS4003 627,175 0 370,592 392,922 AMERICAN CAN RENEWAL PR4004 392,922
1,793,500 1,498,500 1,961,402 PTF-TRANSIT4007 1,961,402 2,942,254 1,961,956 2,062,207 JAZZLAND THEME PARK4008 2,062,207
735,634 915,410 1,896,779 ACCOUNTING ADMINISTRATION4011 1,896,779 885,550 914,560 944,656 GENERAL FUND4016 944,656 149,528 127,009 129,415 ACCOUNTS PAYABLE4019 129,415 358,001 347,969 341,382 PAYROLL/PAYROLL DEDUCTIONS4026 341,382
1,221,115 1,632,679 1,195,063 REVENUE ADMINISTRATION4031 1,195,063 1,477,563 1,608,570 1,596,394 REVENUE APPLICATIONS4032 1,596,394
762,191 762,467 742,912 FISCAL RECORDS4033 742,912 748,619 828,540 656,085 TREASURY ADMINISTRATION4041 1,106,085 284,919 255,925 252,460 CASHIERS4042 252,460 312,357 353,086 328,116 AD VALOREM TAXES4043 328,116 287,308 271,476 275,318 RECEIPTS & DISBURSEMENTS4044 275,318 142,825 143,472 149,482 TA RESEARCH4045 149,482
25,525 84,346 42,723 BRAKE TAG/SANITATION4046 42,723 31,097,072 35,221,381 27,237,900 DEBT SERVICE4047 26,731,746
548,755 601,058 532,572 PURCHASING ADMINISTRATION4051 532,572 18,363 15,267 17,569 CENTRAL SUPPLY4055 17,569
513,147 551,561 496,437 EMPLOYEE RETIREMENT SYSTEM4081 496,437
45,211,223 50,465,041 43,154,769 43,098,615 001 GENERAL FUND TOTAL
$45,211,223 $50,465,041 $43,154,769 $43,098,615 DEPARTMENT TOTAL
Page 287
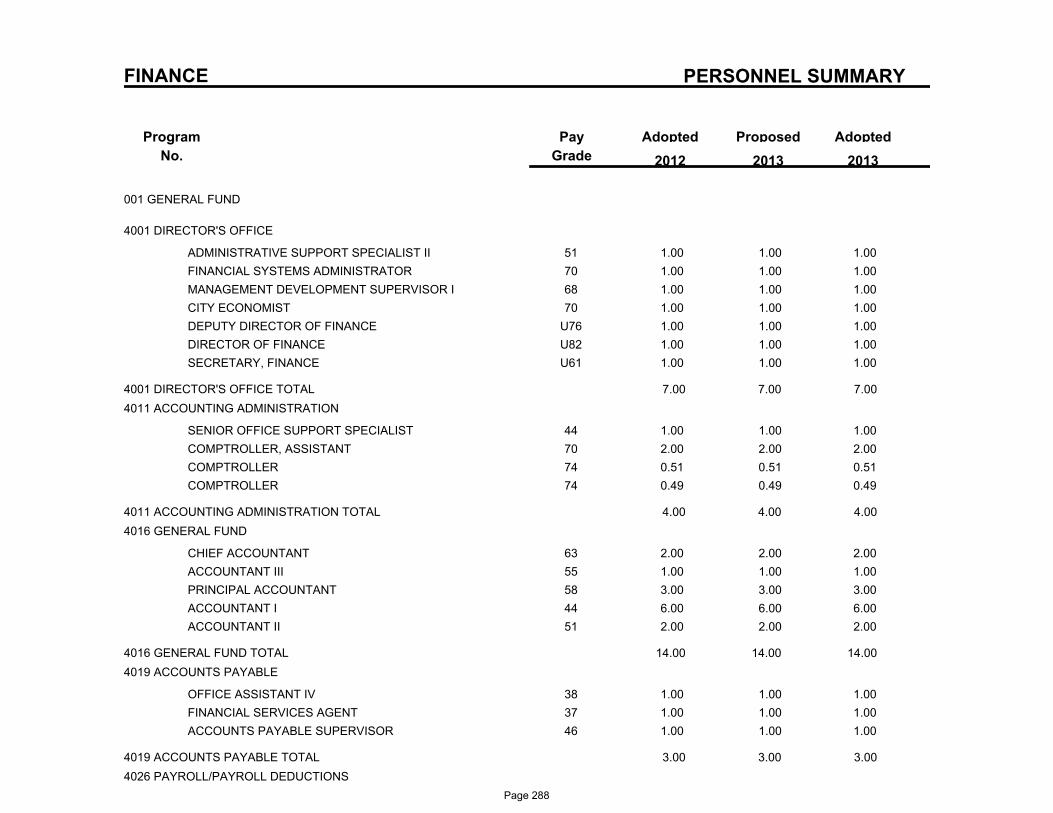
PERSONNEL SUMMARY
Program
No.
ProposedAdoptedPay
Grade
Adopted
2013 2012 2013
FINANCE
001 GENERAL FUND
4001 DIRECTOR'S OFFICE
51ADMINISTRATIVE SUPPORT SPECIALIST II 1.00 1.00 1.00
70FINANCIAL SYSTEMS ADMINISTRATOR 1.00 1.00 1.00
68MANAGEMENT DEVELOPMENT SUPERVISOR I 1.00 1.00 1.00
70CITY ECONOMIST 1.00 1.00 1.00
U76DEPUTY DIRECTOR OF FINANCE 1.00 1.00 1.00
U82DIRECTOR OF FINANCE 1.00 1.00 1.00
U61SECRETARY, FINANCE 1.00 1.00 1.00
4001 DIRECTOR'S OFFICE TOTAL 7.00 7.00 7.00
4011 ACCOUNTING ADMINISTRATION
44SENIOR OFFICE SUPPORT SPECIALIST 1.00 1.00 1.00
70COMPTROLLER, ASSISTANT 2.00 2.00 2.00
74COMPTROLLER 0.51 0.51 0.51
74COMPTROLLER 0.49 0.49 0.49
4011 ACCOUNTING ADMINISTRATION TOTAL 4.00 4.00 4.00
4016 GENERAL FUND
63CHIEF ACCOUNTANT 2.00 2.00 2.00
55ACCOUNTANT III 1.00 1.00 1.00
58PRINCIPAL ACCOUNTANT 3.00 3.00 3.00
44ACCOUNTANT I 6.00 6.00 6.00
51ACCOUNTANT II 2.00 2.00 2.00
4016 GENERAL FUND TOTAL 14.00 14.00 14.00
4019 ACCOUNTS PAYABLE
38OFFICE ASSISTANT IV 1.00 1.00 1.00
37FINANCIAL SERVICES AGENT 1.00 1.00 1.00
46ACCOUNTS PAYABLE SUPERVISOR 1.00 1.00 1.00
4019 ACCOUNTS PAYABLE TOTAL 3.00 3.00 3.00
4026 PAYROLL/PAYROLL DEDUCTIONS
Page 288
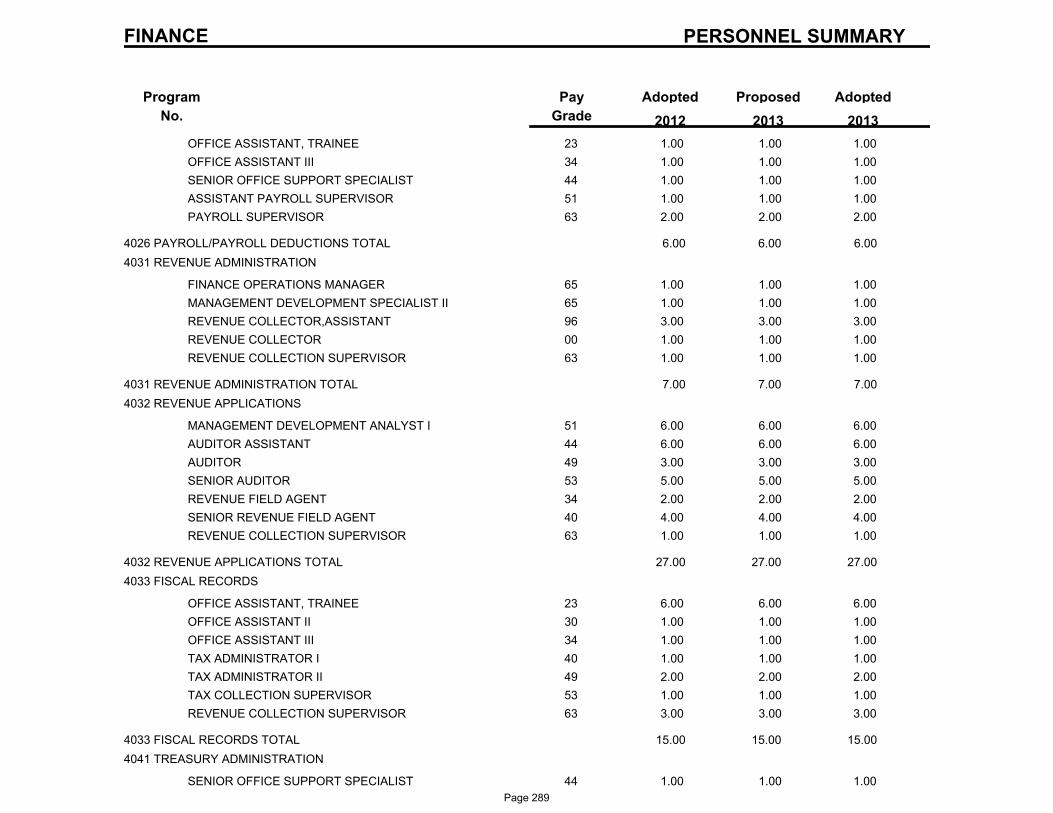
PERSONNEL SUMMARY
Program
No.
ProposedAdoptedPay
Grade
Adopted
2013 2012 2013
FINANCE
23OFFICE ASSISTANT, TRAINEE 1.00 1.00 1.00
34OFFICE ASSISTANT III 1.00 1.00 1.00
44SENIOR OFFICE SUPPORT SPECIALIST 1.00 1.00 1.00
51ASSISTANT PAYROLL SUPERVISOR 1.00 1.00 1.00
63PAYROLL SUPERVISOR 2.00 2.00 2.00
4026 PAYROLL/PAYROLL DEDUCTIONS TOTAL 6.00 6.00 6.00
4031 REVENUE ADMINISTRATION
65FINANCE OPERATIONS MANAGER 1.00 1.00 1.00
65MANAGEMENT DEVELOPMENT SPECIALIST II 1.00 1.00 1.00
96REVENUE COLLECTOR,ASSISTANT 3.00 3.00 3.00
00REVENUE COLLECTOR 1.00 1.00 1.00
63REVENUE COLLECTION SUPERVISOR 1.00 1.00 1.00
4031 REVENUE ADMINISTRATION TOTAL 7.00 7.00 7.00
4032 REVENUE APPLICATIONS
51MANAGEMENT DEVELOPMENT ANALYST I 6.00 6.00 6.00
44AUDITOR ASSISTANT 6.00 6.00 6.00
49AUDITOR 3.00 3.00 3.00
53SENIOR AUDITOR 5.00 5.00 5.00
34REVENUE FIELD AGENT 2.00 2.00 2.00
40SENIOR REVENUE FIELD AGENT 4.00 4.00 4.00
63REVENUE COLLECTION SUPERVISOR 1.00 1.00 1.00
4032 REVENUE APPLICATIONS TOTAL 27.00 27.00 27.00
4033 FISCAL RECORDS
23OFFICE ASSISTANT, TRAINEE 6.00 6.00 6.00
30OFFICE ASSISTANT II 1.00 1.00 1.00
34OFFICE ASSISTANT III 1.00 1.00 1.00
40TAX ADMINISTRATOR I 1.00 1.00 1.00
49TAX ADMINISTRATOR II 2.00 2.00 2.00
53TAX COLLECTION SUPERVISOR 1.00 1.00 1.00
63REVENUE COLLECTION SUPERVISOR 3.00 3.00 3.00
4033 FISCAL RECORDS TOTAL 15.00 15.00 15.00
4041 TREASURY ADMINISTRATION
44SENIOR OFFICE SUPPORT SPECIALIST 1.00 1.00 1.00
Page 289
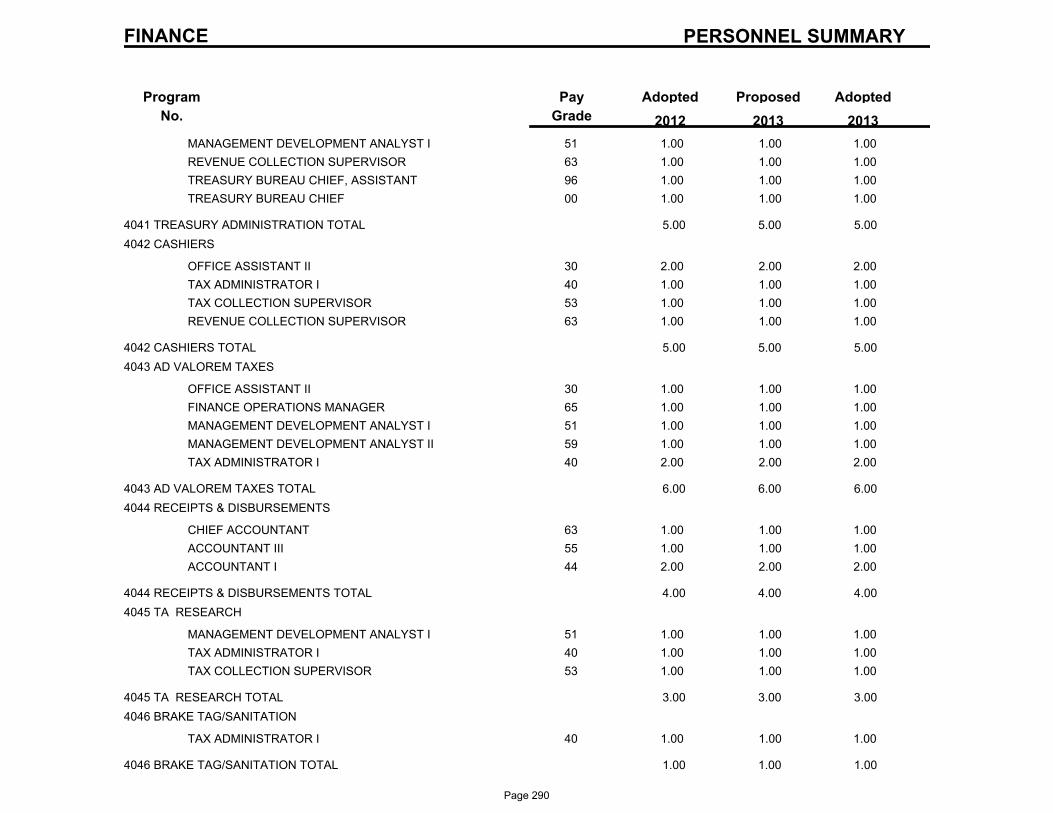
PERSONNEL SUMMARY
Program
No.
ProposedAdoptedPay
Grade
Adopted
2013 2012 2013
FINANCE
51MANAGEMENT DEVELOPMENT ANALYST I 1.00 1.00 1.00
63REVENUE COLLECTION SUPERVISOR 1.00 1.00 1.00
96TREASURY BUREAU CHIEF, ASSISTANT 1.00 1.00 1.00
00TREASURY BUREAU CHIEF 1.00 1.00 1.00
4041 TREASURY ADMINISTRATION TOTAL 5.00 5.00 5.00
4042 CASHIERS
30OFFICE ASSISTANT II 2.00 2.00 2.00
40TAX ADMINISTRATOR I 1.00 1.00 1.00
53TAX COLLECTION SUPERVISOR 1.00 1.00 1.00
63REVENUE COLLECTION SUPERVISOR 1.00 1.00 1.00
4042 CASHIERS TOTAL 5.00 5.00 5.00
4043 AD VALOREM TAXES
30OFFICE ASSISTANT II 1.00 1.00 1.00
65FINANCE OPERATIONS MANAGER 1.00 1.00 1.00
51MANAGEMENT DEVELOPMENT ANALYST I 1.00 1.00 1.00
59MANAGEMENT DEVELOPMENT ANALYST II 1.00 1.00 1.00
40TAX ADMINISTRATOR I 2.00 2.00 2.00
4043 AD VALOREM TAXES TOTAL 6.00 6.00 6.00
4044 RECEIPTS & DISBURSEMENTS
63CHIEF ACCOUNTANT 1.00 1.00 1.00
55ACCOUNTANT III 1.00 1.00 1.00
44ACCOUNTANT I 2.00 2.00 2.00
4044 RECEIPTS & DISBURSEMENTS TOTAL 4.00 4.00 4.00
4045 TA RESEARCH
51MANAGEMENT DEVELOPMENT ANALYST I 1.00 1.00 1.00
40TAX ADMINISTRATOR I 1.00 1.00 1.00
53TAX COLLECTION SUPERVISOR 1.00 1.00 1.00
4045 TA RESEARCH TOTAL 3.00 3.00 3.00
4046 BRAKE TAG/SANITATION
40TAX ADMINISTRATOR I 1.00 1.00 1.00
4046 BRAKE TAG/SANITATION TOTAL 1.00 1.00 1.00
Page 290
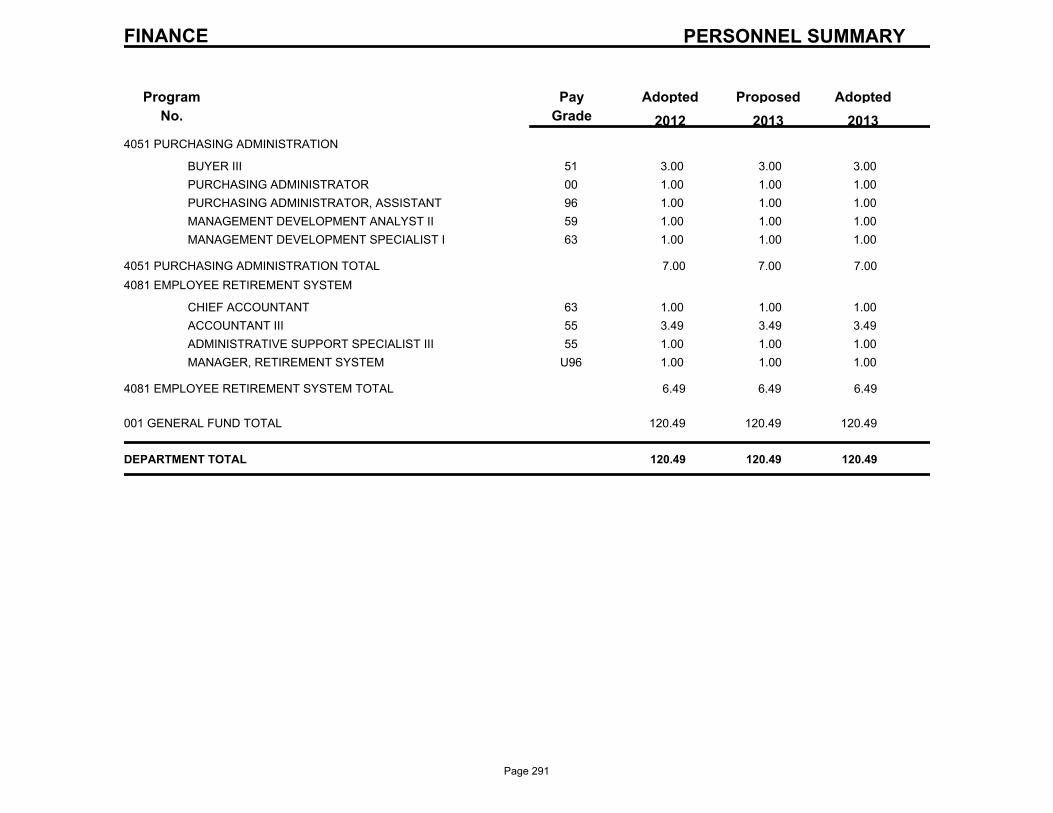
PERSONNEL SUMMARY
Program
No.
ProposedAdoptedPay
Grade
Adopted
2013 2012 2013
FINANCE
4051 PURCHASING ADMINISTRATION
51BUYER III 3.00 3.00 3.00
00PURCHASING ADMINISTRATOR 1.00 1.00 1.00
96PURCHASING ADMINISTRATOR, ASSISTANT 1.00 1.00 1.00
59MANAGEMENT DEVELOPMENT ANALYST II 1.00 1.00 1.00
63MANAGEMENT DEVELOPMENT SPECIALIST I 1.00 1.00 1.00
4051 PURCHASING ADMINISTRATION TOTAL 7.00 7.00 7.00
4081 EMPLOYEE RETIREMENT SYSTEM
63CHIEF ACCOUNTANT 1.00 1.00 1.00
55ACCOUNTANT III 3.49 3.49 3.49
55ADMINISTRATIVE SUPPORT SPECIALIST III 1.00 1.00 1.00
U96MANAGER, RETIREMENT SYSTEM 1.00 1.00 1.00
4081 EMPLOYEE RETIREMENT SYSTEM TOTAL 6.49 6.49 6.49
001 GENERAL FUND TOTAL 120.49 120.49 120.49
DEPARTMENT TOTAL 120.49 120.49 120.49
Page 291

Property Management
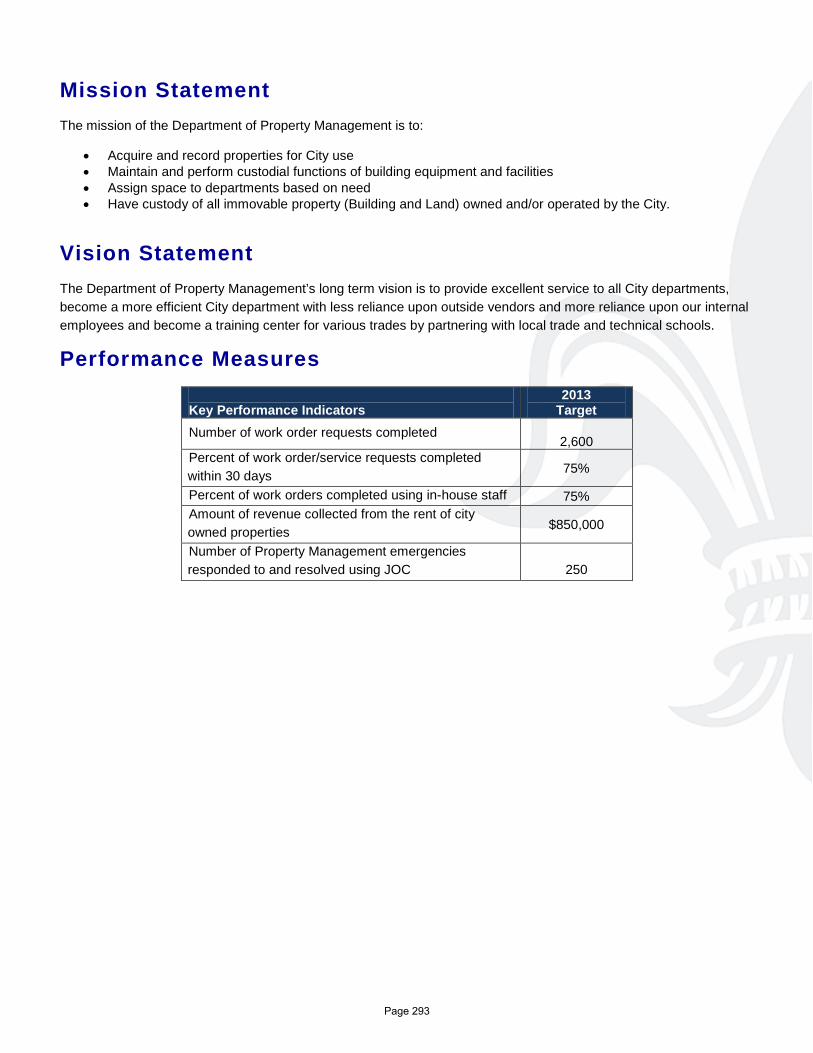
Mission Statement The mission of the Department of Property Management is to:
• Acquire and record properties for City use • Maintain and perform custodial functions of building equipment and facilities • Assign space to departments based on need • Have custody of all immovable property (Building and Land) owned and/or operated by the City.
Vision Statement The Department of Property Management’s long term vision is to provide excellent service to all City departments, become a more efficient City department with less reliance upon outside vendors and more reliance upon our internal employees and become a training center for various trades by partnering with local trade and technical schools.
Performance Measures Key Performance Indicators
2013 Target
Number of work order requests completed 2,600
Percent of work order/service requests completed within 30 days 75%
Percent of work orders completed using in-house staff 75% Amount of revenue collected from the rent of city owned properties $850,000
Number of Property Management emergencies responded to and resolved using JOC
250
Page 293
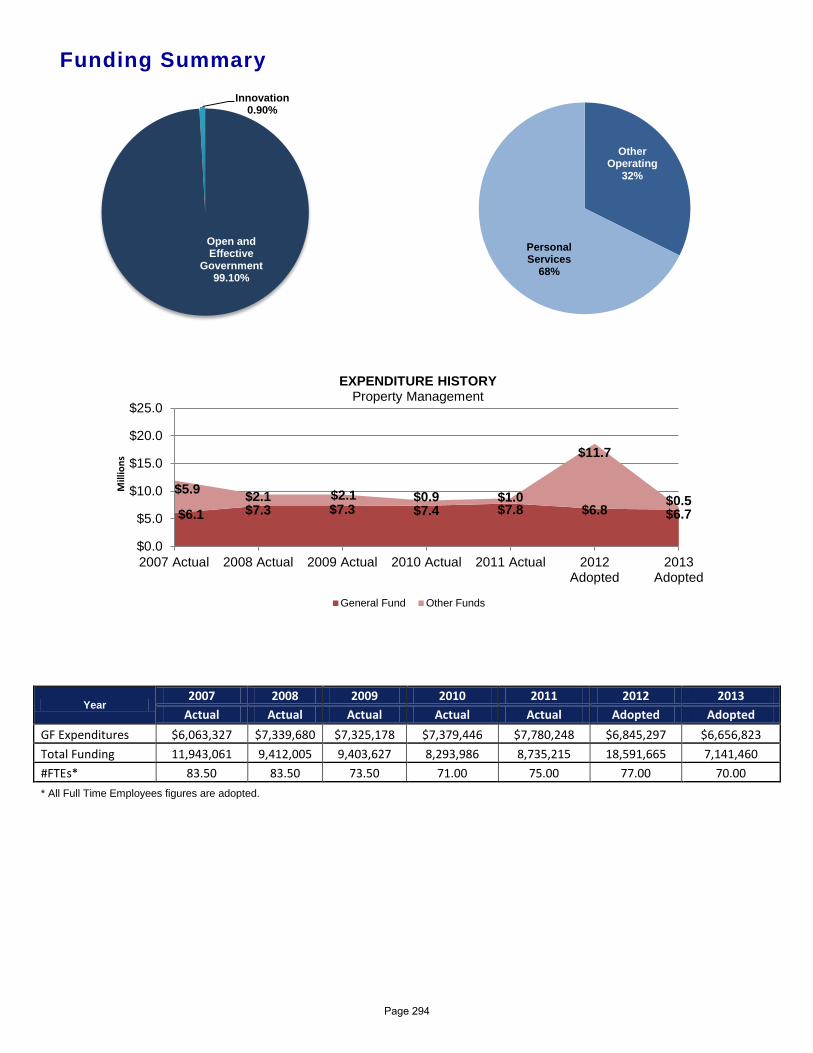
Funding Summary
Year 2007 2008 2009 2010 2011 2012 2013
Actual Actual Actual Actual Actual Adopted Adopted GF Expenditures $6,063,327 $7,339,680 $7,325,178 $7,379,446 $7,780,248 $6,845,297 $6,656,823 Total Funding 11,943,061 9,412,005 9,403,627 8,293,986 8,735,215 18,591,665 7,141,460 #FTEs* 83.50 83.50 73.50 71.00 75.00 77.00 70.00 * All Full Time Employees figures are adopted.
Open and Effective
Government 99.10%
Innovation 0.90%
Other Operating
32%
Personal Services
68%
$6.1 $7.3 $7.3 $7.4 $7.8 $6.8 $6.7
$5.9 $2.1 $2.1 $0.9 $1.0
$11.7
$0.5
$0.0
$5.0
$10.0
$15.0
$20.0
$25.0
2007 Actual 2008 Actual 2009 Actual 2010 Actual 2011 Actual 2012Adopted
2013Adopted
Mill
ions
EXPENDITURE HISTORY Property Management
General Fund Other Funds
Page 294
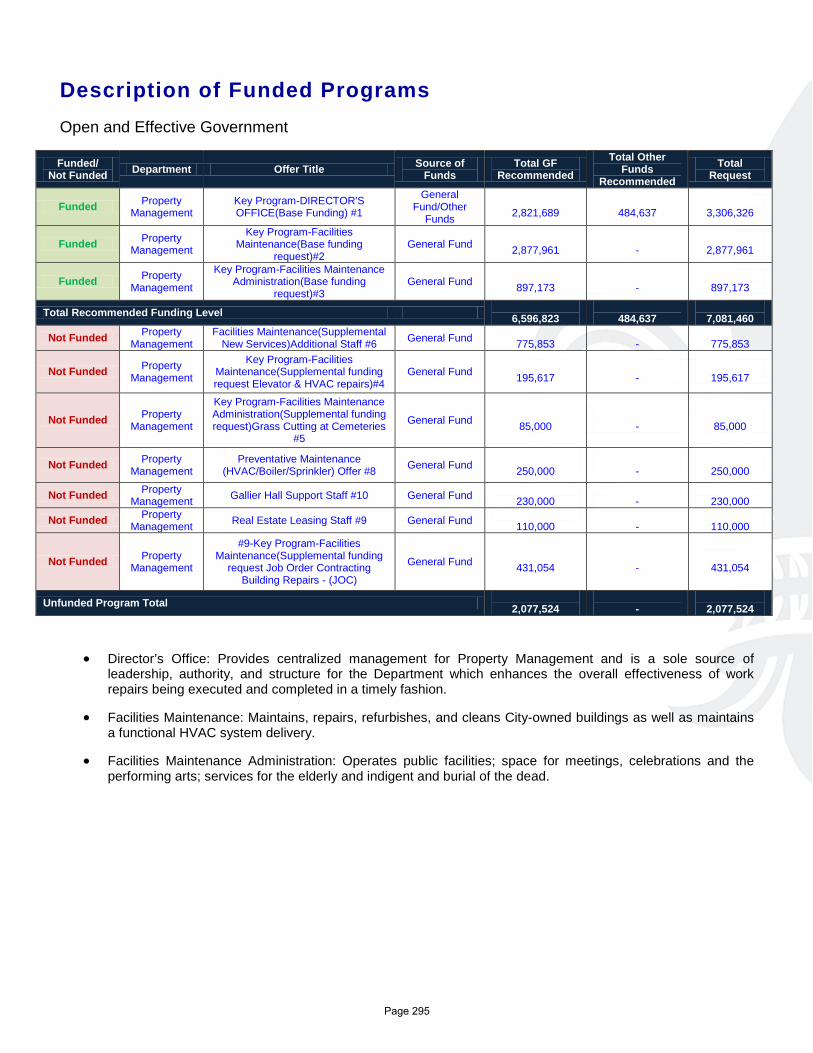
Description of Funded Programs Open and Effective Government
Funded/ Not Funded Department Offer Title Source of
Funds Total GF
Recommended Total Other
Funds Recommended
Total Request
Funded Property Management
Key Program-DIRECTOR'S OFFICE(Base Funding) #1
General Fund/Other
Funds
2,821,689
484,637
3,306,326
Funded Property Management
Key Program-Facilities Maintenance(Base funding
request)#2 General Fund
2,877,961 -
2,877,961
Funded Property Management
Key Program-Facilities Maintenance Administration(Base funding
request)#3 General Fund
897,173 -
897,173
Total Recommended Funding Level 6,596,823
484,637
7,081,460
Not Funded Property Management
Facilities Maintenance(Supplemental New Services)Additional Staff #6 General Fund
775,853 -
775,853
Not Funded Property Management
Key Program-Facilities Maintenance(Supplemental funding request Elevator & HVAC repairs)#4
General Fund 195,617
-
195,617
Not Funded Property Management
Key Program-Facilities Maintenance Administration(Supplemental funding request)Grass Cutting at Cemeteries
#5
General Fund 85,000
-
85,000
Not Funded Property Management
Preventative Maintenance (HVAC/Boiler/Sprinkler) Offer #8 General Fund
250,000 -
250,000
Not Funded Property Management Gallier Hall Support Staff #10 General Fund
230,000 -
230,000
Not Funded Property Management Real Estate Leasing Staff #9 General Fund
110,000 -
110,000
Not Funded Property Management
#9-Key Program-Facilities Maintenance(Supplemental funding
request Job Order Contracting Building Repairs - (JOC)
General Fund 431,054
-
431,054
Unfunded Program Total 2,077,524
-
2,077,524
• Director’s Office: Provides centralized management for Property Management and is a sole source of leadership, authority, and structure for the Department which enhances the overall effectiveness of work repairs being executed and completed in a timely fashion.
• Facilities Maintenance: Maintains, repairs, refurbishes, and cleans City-owned buildings as well as maintains a functional HVAC system delivery.
• Facilities Maintenance Administration: Operates public facilities; space for meetings, celebrations and the performing arts; services for the elderly and indigent and burial of the dead.
Page 295
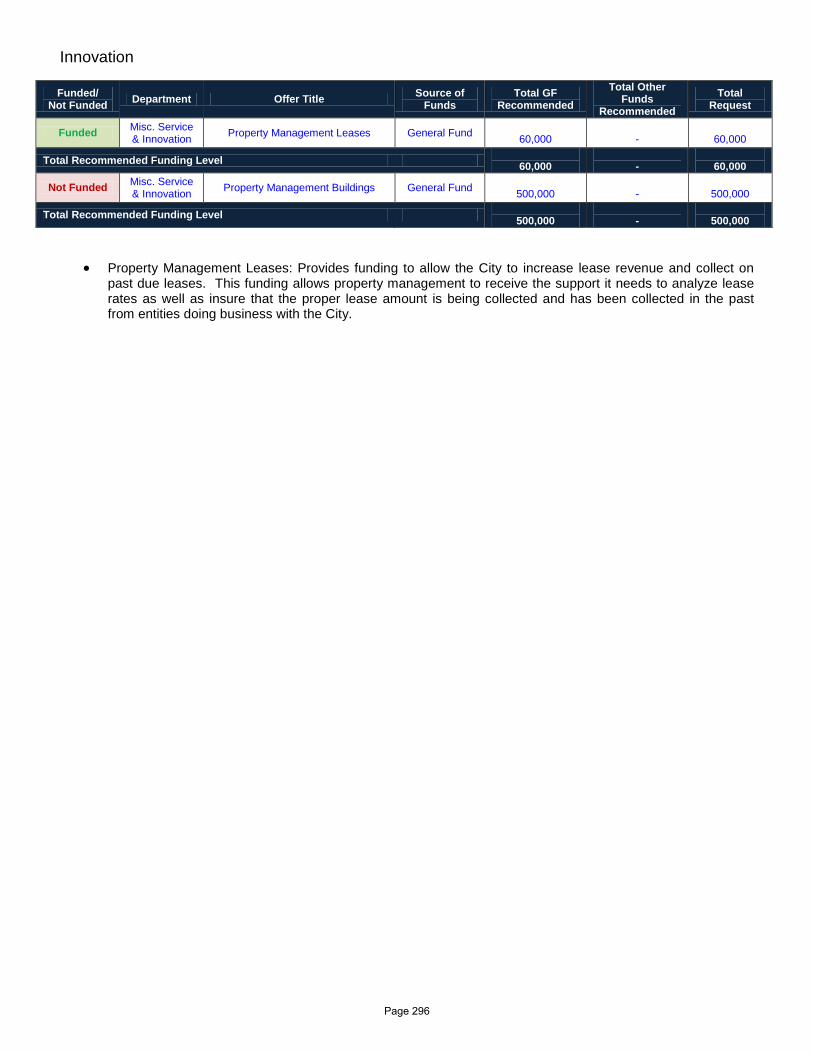
Innovation
Funded/ Not Funded Department Offer Title Source of
Funds Total GF
Recommended Total Other
Funds Recommended
Total Request
Funded Misc. Service & Innovation Property Management Leases General Fund
60,000 -
60,000
Total Recommended Funding Level 60,000
-
60,000
Not Funded Misc. Service & Innovation Property Management Buildings General Fund
500,000 -
500,000
Total Recommended Funding Level 500,000
-
500,000
• Property Management Leases: Provides funding to allow the City to increase lease revenue and collect on past due leases. This funding allows property management to receive the support it needs to analyze lease rates as well as insure that the proper lease amount is being collected and has been collected in the past from entities doing business with the City.
Page 296

PROPERTY MANAGEMENT
DEPARTMENTAL BUDGET SUMMARY
AdoptedProposedAdoptedActual
EXPENDITURES
2013 2012 2011 2013
PERSONAL SERVICES 4,553,125 4,142,344 4,505,305 4,505,305
OTHER OPERATING 4,182,090 14,449,321 2,636,155 2,636,155
DEBT SERVICE 0 0 0 0
RESERVES 0 0 0 0
GRANTS, CONTRIB. & FUND TRAN. 0 0 0 0
$8,735,215 $18,591,665 $7,141,460 TOTAL EXPENDITURES $7,141,460
SOURCE OF FUNDING
GENERAL FUND 7,780,248 6,845,297 6,656,823 6,656,823
WISNER FUNDS 0 0 0 0
ENTERPRISE 0 0 0 0
DOWNTOWN DEVELOPMENT DIST. 0 0 0 0
HOUSING AND URBAN DEVELOP. 0 0 0 0
SELF GENERATED 0 0 0 0
LIBRARY 0 0 0 0
LLE 0 0 0 0
FEDERAL GRANTS 954,967 11,746,368 484,637 484,637
STATE GRANTS 0 0 0 0
GRANTS, CONTRIB., & FUND TRAN. 0 0 0 0
N. O. REGIONAL BUSINESS PARK 0 0 0 0
ECONOMIC DEVELOPMENT FUND 0 0 0 0
HOUSING IMPROVMENT FUND 0 0 0 0
$8,735,215 $18,591,665 $7,141,460 TOTAL FUNDING $7,141,460
Page 297
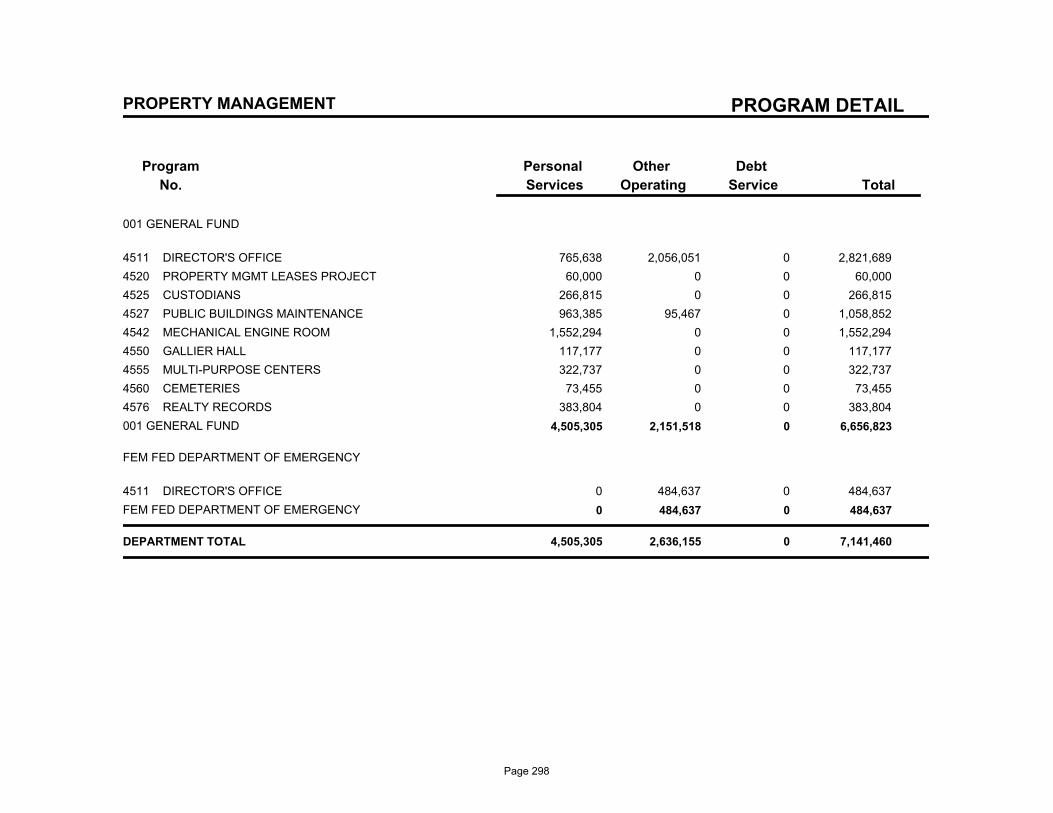
PROGRAM DETAIL
Program
No.
Debt
Service
Other
Operating
Personal
Services Total
PROPERTY MANAGEMENT
001 GENERAL FUND
4511 DIRECTOR'S OFFICE 765,638 2,056,051 0 2,821,689
4520 PROPERTY MGMT LEASES PROJECT 60,000 0 0 60,000
4525 CUSTODIANS 266,815 0 0 266,815
4527 PUBLIC BUILDINGS MAINTENANCE 963,385 95,467 0 1,058,852
4542 MECHANICAL ENGINE ROOM 1,552,294 0 0 1,552,294
4550 GALLIER HALL 117,177 0 0 117,177
4555 MULTI-PURPOSE CENTERS 322,737 0 0 322,737
4560 CEMETERIES 73,455 0 0 73,455
4576 REALTY RECORDS 383,804 0 0 383,804
001 GENERAL FUND 4,505,305 2,151,518 0 6,656,823
FEM FED DEPARTMENT OF EMERGENCY
4511 DIRECTOR'S OFFICE 0 484,637 0 484,637
FEM FED DEPARTMENT OF EMERGENCY 0 484,637 0 484,637
DEPARTMENT TOTAL 4,505,305 2,636,155 0 7,141,460
Page 298
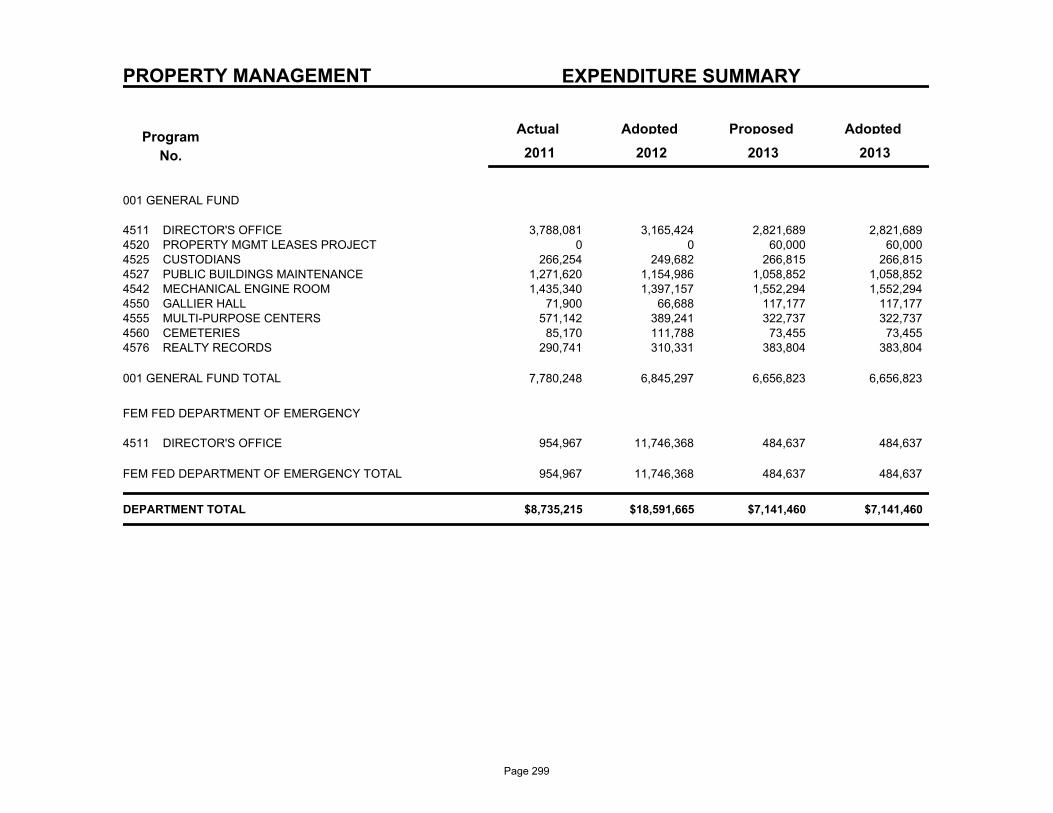
PROPERTY MANAGEMENT EXPENDITURE SUMMARY
Program
No.
Actual AdoptedProposedAdopted
2013 2011 2012 2013
001 GENERAL FUND
3,788,081 3,165,424 2,821,689 DIRECTOR'S OFFICE4511 2,821,689 0 0 60,000 PROPERTY MGMT LEASES PROJECT4520 60,000
266,254 249,682 266,815 CUSTODIANS4525 266,815 1,271,620 1,154,986 1,058,852 PUBLIC BUILDINGS MAINTENANCE4527 1,058,852 1,435,340 1,397,157 1,552,294 MECHANICAL ENGINE ROOM4542 1,552,294
71,900 66,688 117,177 GALLIER HALL4550 117,177 571,142 389,241 322,737 MULTI-PURPOSE CENTERS4555 322,737
85,170 111,788 73,455 CEMETERIES4560 73,455 290,741 310,331 383,804 REALTY RECORDS4576 383,804
7,780,248 6,845,297 6,656,823 6,656,823 001 GENERAL FUND TOTAL
FEM FED DEPARTMENT OF EMERGENCY
954,967 11,746,368 484,637 DIRECTOR'S OFFICE4511 484,637
954,967 11,746,368 484,637 484,637 FEM FED DEPARTMENT OF EMERGENCY TOTAL
$8,735,215 $18,591,665 $7,141,460 $7,141,460 DEPARTMENT TOTAL
Page 299
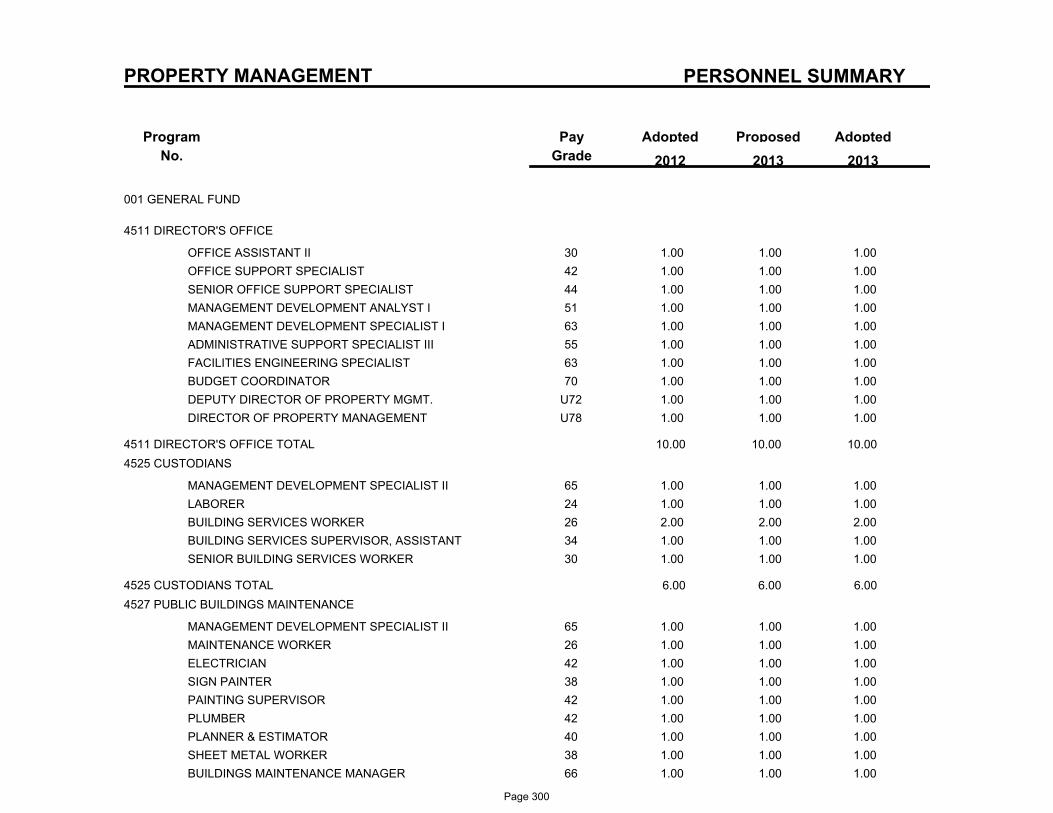
PERSONNEL SUMMARY
Program
No.
ProposedAdoptedPay
Grade
Adopted
2013 2012 2013
PROPERTY MANAGEMENT
001 GENERAL FUND
4511 DIRECTOR'S OFFICE
30OFFICE ASSISTANT II 1.00 1.00 1.00
42OFFICE SUPPORT SPECIALIST 1.00 1.00 1.00
44SENIOR OFFICE SUPPORT SPECIALIST 1.00 1.00 1.00
51MANAGEMENT DEVELOPMENT ANALYST I 1.00 1.00 1.00
63MANAGEMENT DEVELOPMENT SPECIALIST I 1.00 1.00 1.00
55ADMINISTRATIVE SUPPORT SPECIALIST III 1.00 1.00 1.00
63FACILITIES ENGINEERING SPECIALIST 1.00 1.00 1.00
70BUDGET COORDINATOR 1.00 1.00 1.00
U72DEPUTY DIRECTOR OF PROPERTY MGMT. 1.00 1.00 1.00
U78DIRECTOR OF PROPERTY MANAGEMENT 1.00 1.00 1.00
4511 DIRECTOR'S OFFICE TOTAL 10.00 10.00 10.00
4525 CUSTODIANS
65MANAGEMENT DEVELOPMENT SPECIALIST II 1.00 1.00 1.00
24LABORER 1.00 1.00 1.00
26BUILDING SERVICES WORKER 2.00 2.00 2.00
34BUILDING SERVICES SUPERVISOR, ASSISTANT 1.00 1.00 1.00
30SENIOR BUILDING SERVICES WORKER 1.00 1.00 1.00
4525 CUSTODIANS TOTAL 6.00 6.00 6.00
4527 PUBLIC BUILDINGS MAINTENANCE
65MANAGEMENT DEVELOPMENT SPECIALIST II 1.00 1.00 1.00
26MAINTENANCE WORKER 1.00 1.00 1.00
42ELECTRICIAN 1.00 1.00 1.00
38SIGN PAINTER 1.00 1.00 1.00
42PAINTING SUPERVISOR 1.00 1.00 1.00
42PLUMBER 1.00 1.00 1.00
40PLANNER & ESTIMATOR 1.00 1.00 1.00
38SHEET METAL WORKER 1.00 1.00 1.00
66BUILDINGS MAINTENANCE MANAGER 1.00 1.00 1.00
Page 300
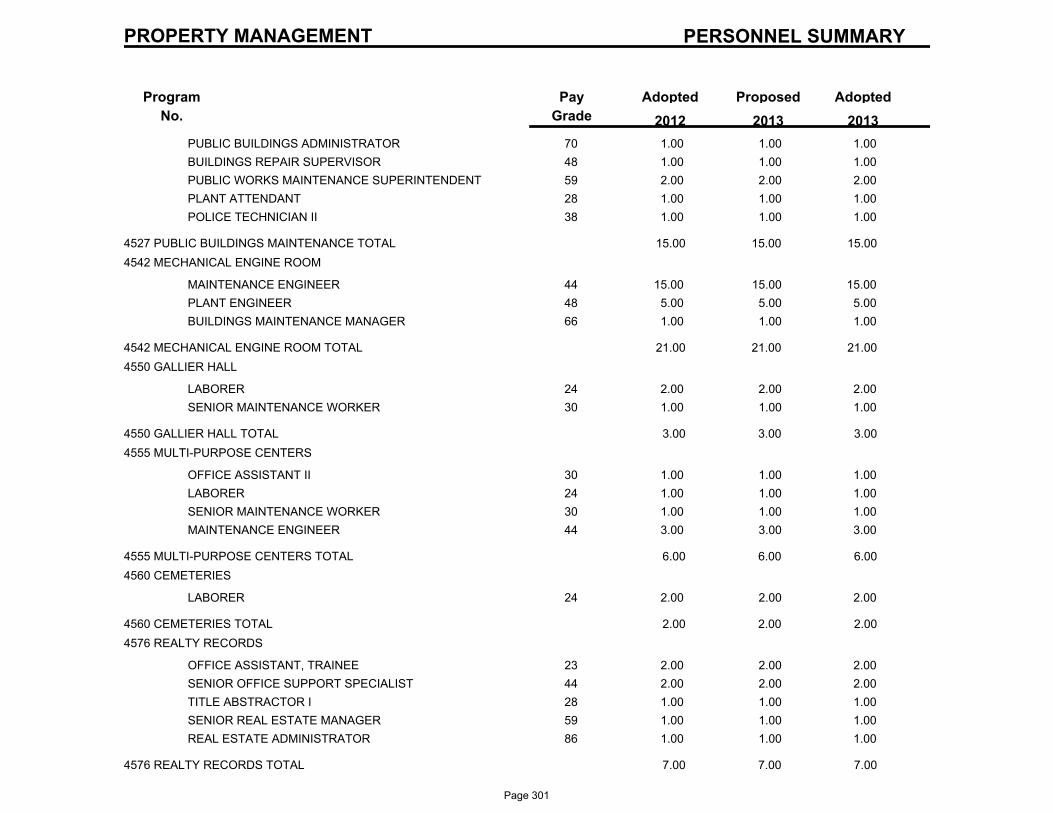
PERSONNEL SUMMARY
Program
No.
ProposedAdoptedPay
Grade
Adopted
2013 2012 2013
PROPERTY MANAGEMENT
70PUBLIC BUILDINGS ADMINISTRATOR 1.00 1.00 1.00
48BUILDINGS REPAIR SUPERVISOR 1.00 1.00 1.00
59PUBLIC WORKS MAINTENANCE SUPERINTENDENT 2.00 2.00 2.00
28PLANT ATTENDANT 1.00 1.00 1.00
38POLICE TECHNICIAN II 1.00 1.00 1.00
4527 PUBLIC BUILDINGS MAINTENANCE TOTAL 15.00 15.00 15.00
4542 MECHANICAL ENGINE ROOM
44MAINTENANCE ENGINEER 15.00 15.00 15.00
48PLANT ENGINEER 5.00 5.00 5.00
66BUILDINGS MAINTENANCE MANAGER 1.00 1.00 1.00
4542 MECHANICAL ENGINE ROOM TOTAL 21.00 21.00 21.00
4550 GALLIER HALL
24LABORER 2.00 2.00 2.00
30SENIOR MAINTENANCE WORKER 1.00 1.00 1.00
4550 GALLIER HALL TOTAL 3.00 3.00 3.00
4555 MULTI-PURPOSE CENTERS
30OFFICE ASSISTANT II 1.00 1.00 1.00
24LABORER 1.00 1.00 1.00
30SENIOR MAINTENANCE WORKER 1.00 1.00 1.00
44MAINTENANCE ENGINEER 3.00 3.00 3.00
4555 MULTI-PURPOSE CENTERS TOTAL 6.00 6.00 6.00
4560 CEMETERIES
24LABORER 2.00 2.00 2.00
4560 CEMETERIES TOTAL 2.00 2.00 2.00
4576 REALTY RECORDS
23OFFICE ASSISTANT, TRAINEE 2.00 2.00 2.00
44SENIOR OFFICE SUPPORT SPECIALIST 2.00 2.00 2.00
28TITLE ABSTRACTOR I 1.00 1.00 1.00
59SENIOR REAL ESTATE MANAGER 1.00 1.00 1.00
86REAL ESTATE ADMINISTRATOR 1.00 1.00 1.00
4576 REALTY RECORDS TOTAL 7.00 7.00 7.00
Page 301
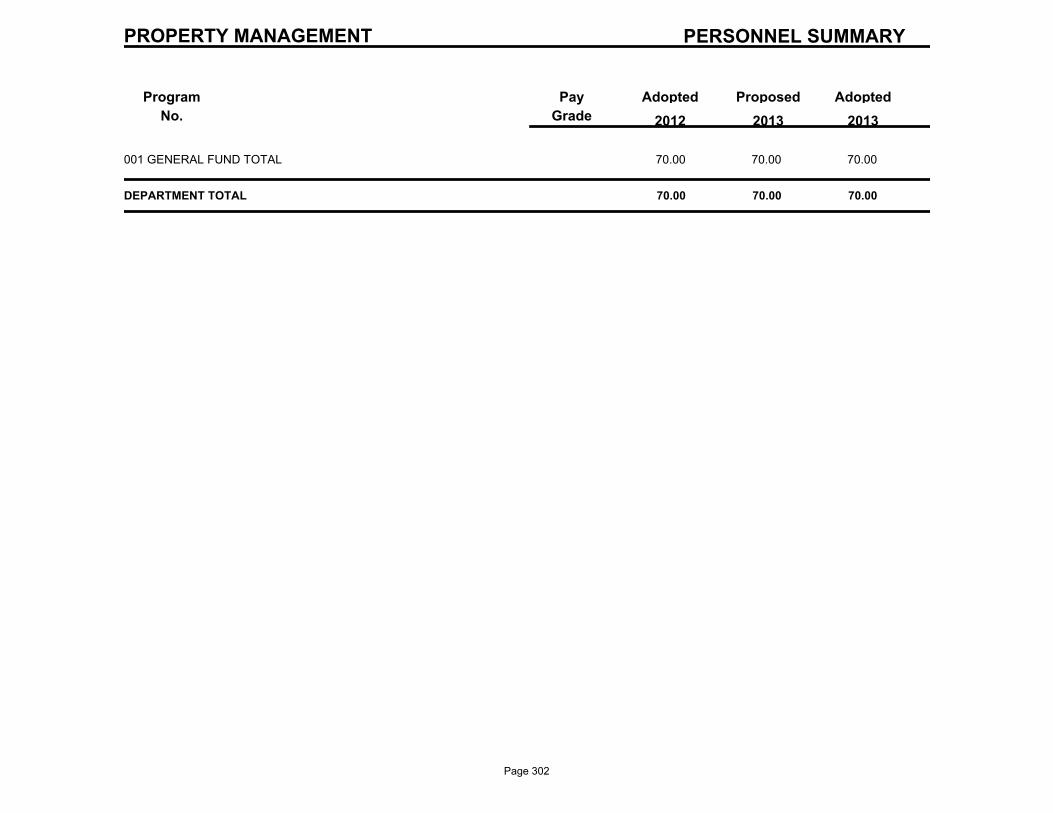
PERSONNEL SUMMARY
Program
No.
ProposedAdoptedPay
Grade
Adopted
2013 2012 2013
PROPERTY MANAGEMENT
001 GENERAL FUND TOTAL 70.00 70.00 70.00
DEPARTMENT TOTAL 70.00 70.00 70.00
Page 302

Page 303

Civil Service
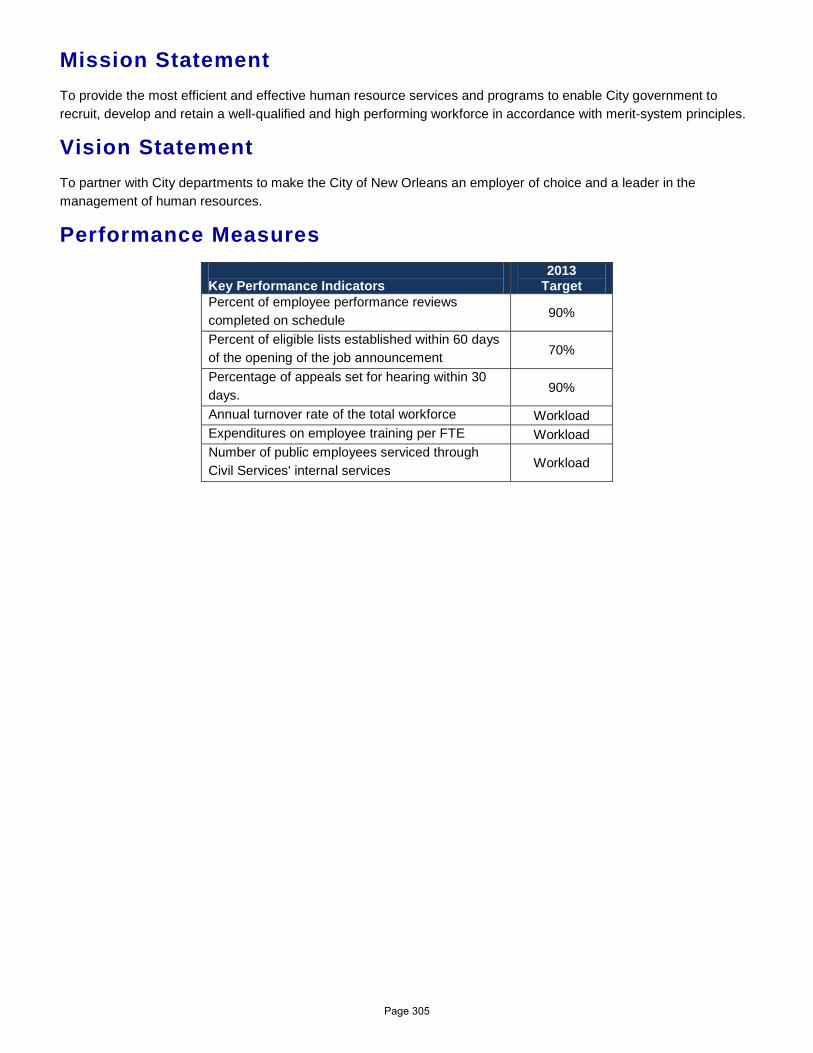
Mission Statement To provide the most efficient and effective human resource services and programs to enable City government to recruit, develop and retain a well-qualified and high performing workforce in accordance with merit-system principles.
Vision Statement To partner with City departments to make the City of New Orleans an employer of choice and a leader in the management of human resources.
Performance Measures Key Performance Indicators
2013 Target
Percent of employee performance reviews completed on schedule 90%
Percent of eligible lists established within 60 days of the opening of the job announcement 70%
Percentage of appeals set for hearing within 30 days. 90%
Annual turnover rate of the total workforce Workload Expenditures on employee training per FTE Workload Number of public employees serviced through Civil Services' internal services Workload
Page 305
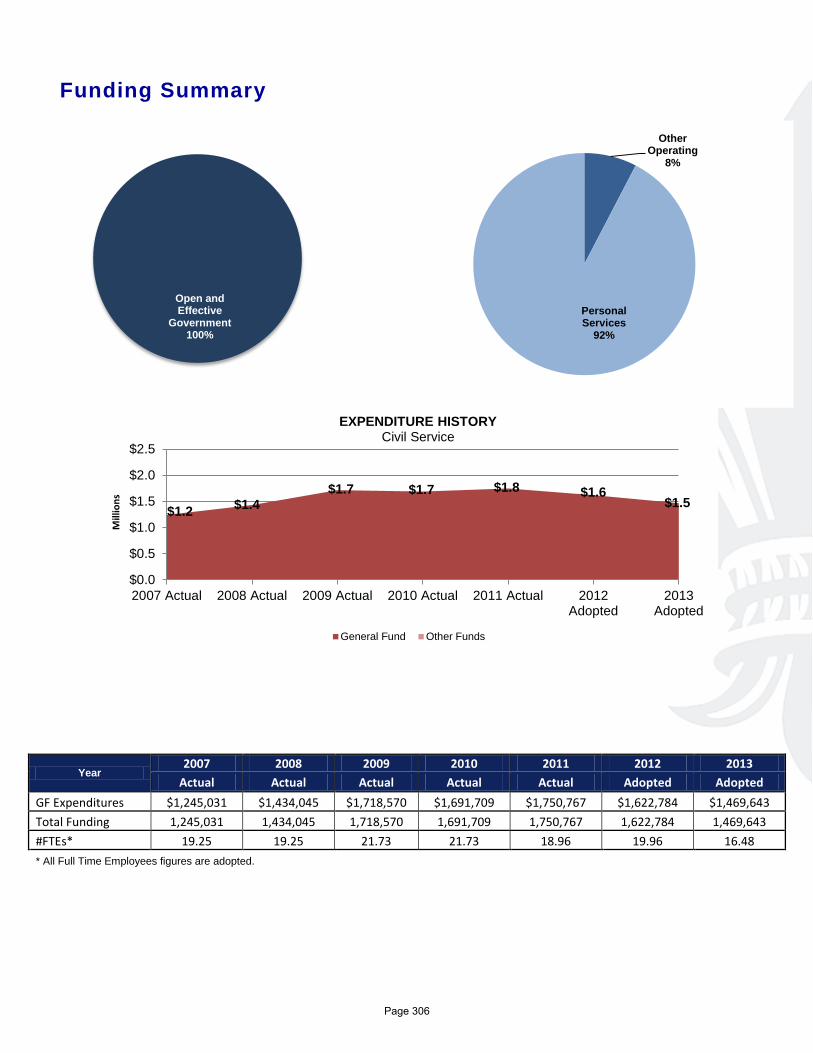
Open and Effective
Government 100%
Funding Summary
Year 2007 2008 2009 2010 2011 2012 2013
Actual Actual Actual Actual Actual Adopted Adopted GF Expenditures $1,245,031 $1,434,045 $1,718,570 $1,691,709 $1,750,767 $1,622,784 $1,469,643 Total Funding 1,245,031 1,434,045 1,718,570 1,691,709 1,750,767 1,622,784 1,469,643 #FTEs* 19.25 19.25 21.73 21.73 18.96 19.96 16.48 * All Full Time Employees figures are adopted.
$1.2 $1.4 $1.7 $1.7 $1.8 $1.6
$1.5
$0.0
$0.5
$1.0
$1.5
$2.0
$2.5
2007 Actual 2008 Actual 2009 Actual 2010 Actual 2011 Actual 2012Adopted
2013Adopted
Mill
ions
EXPENDITURE HISTORY Civil Service
General Fund Other Funds
Other Operating
8%
Personal Services
92%
Page 306
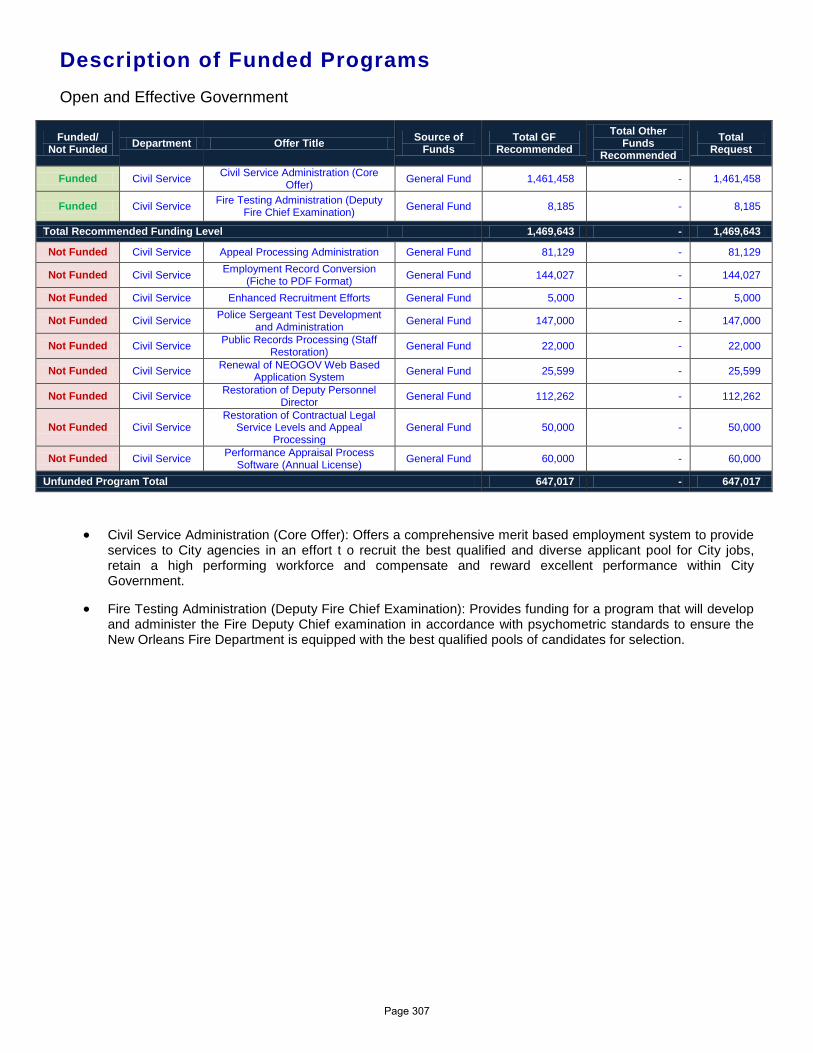
Description of Funded Programs Open and Effective Government
Funded/ Not Funded Department Offer Title Source of
Funds Total GF
Recommended Total Other
Funds Recommended
Total Request
Funded Civil Service Civil Service Administration (Core Offer) General Fund 1,461,458 - 1,461,458
Funded Civil Service Fire Testing Administration (Deputy Fire Chief Examination) General Fund 8,185 - 8,185
Total Recommended Funding Level 1,469,643 - 1,469,643
Not Funded Civil Service Appeal Processing Administration General Fund 81,129 - 81,129
Not Funded Civil Service Employment Record Conversion (Fiche to PDF Format) General Fund 144,027 - 144,027
Not Funded Civil Service Enhanced Recruitment Efforts General Fund 5,000 - 5,000
Not Funded Civil Service Police Sergeant Test Development and Administration General Fund 147,000 - 147,000
Not Funded Civil Service Public Records Processing (Staff Restoration) General Fund 22,000 - 22,000
Not Funded Civil Service Renewal of NEOGOV Web Based Application System General Fund 25,599 - 25,599
Not Funded Civil Service Restoration of Deputy Personnel Director General Fund 112,262 - 112,262
Not Funded Civil Service Restoration of Contractual Legal
Service Levels and Appeal Processing
General Fund 50,000 - 50,000
Not Funded Civil Service Performance Appraisal Process Software (Annual License) General Fund 60,000 - 60,000
Unfunded Program Total 647,017 - 647,017
• Civil Service Administration (Core Offer): Offers a comprehensive merit based employment system to provide services to City agencies in an effort t o recruit the best qualified and diverse applicant pool for City jobs, retain a high performing workforce and compensate and reward excellent performance within City Government.
• Fire Testing Administration (Deputy Fire Chief Examination): Provides funding for a program that will develop and administer the Fire Deputy Chief examination in accordance with psychometric standards to ensure the New Orleans Fire Department is equipped with the best qualified pools of candidates for selection.
Page 307

CIVIL SERVICE
DEPARTMENTAL BUDGET SUMMARY
AdoptedProposedAdoptedActual
EXPENDITURES
2013 2012 2011 2013
PERSONAL SERVICES 1,611,721 1,483,487 1,357,233 1,357,233
OTHER OPERATING 139,046 139,297 112,410 112,410
DEBT SERVICE 0 0 0 0
RESERVES 0 0 0 0
GRANTS, CONTRIB. & FUND TRAN. 0 0 0 0
$1,750,767 $1,622,784 $1,469,643 TOTAL EXPENDITURES $1,469,643
SOURCE OF FUNDING
GENERAL FUND 1,750,767 1,622,784 1,469,643 1,469,643
WISNER FUNDS 0 0 0 0
ENTERPRISE 0 0 0 0
DOWNTOWN DEVELOPMENT DIST. 0 0 0 0
HOUSING AND URBAN DEVELOP. 0 0 0 0
SELF GENERATED 0 0 0 0
LIBRARY 0 0 0 0
LLE 0 0 0 0
FEDERAL GRANTS 0 0 0 0
STATE GRANTS 0 0 0 0
GRANTS, CONTRIB., & FUND TRAN. 0 0 0 0
N. O. REGIONAL BUSINESS PARK 0 0 0 0
ECONOMIC DEVELOPMENT FUND 0 0 0 0
HOUSING IMPROVMENT FUND 0 0 0 0
$1,750,767 $1,622,784 $1,469,643 TOTAL FUNDING $1,469,643
Page 308
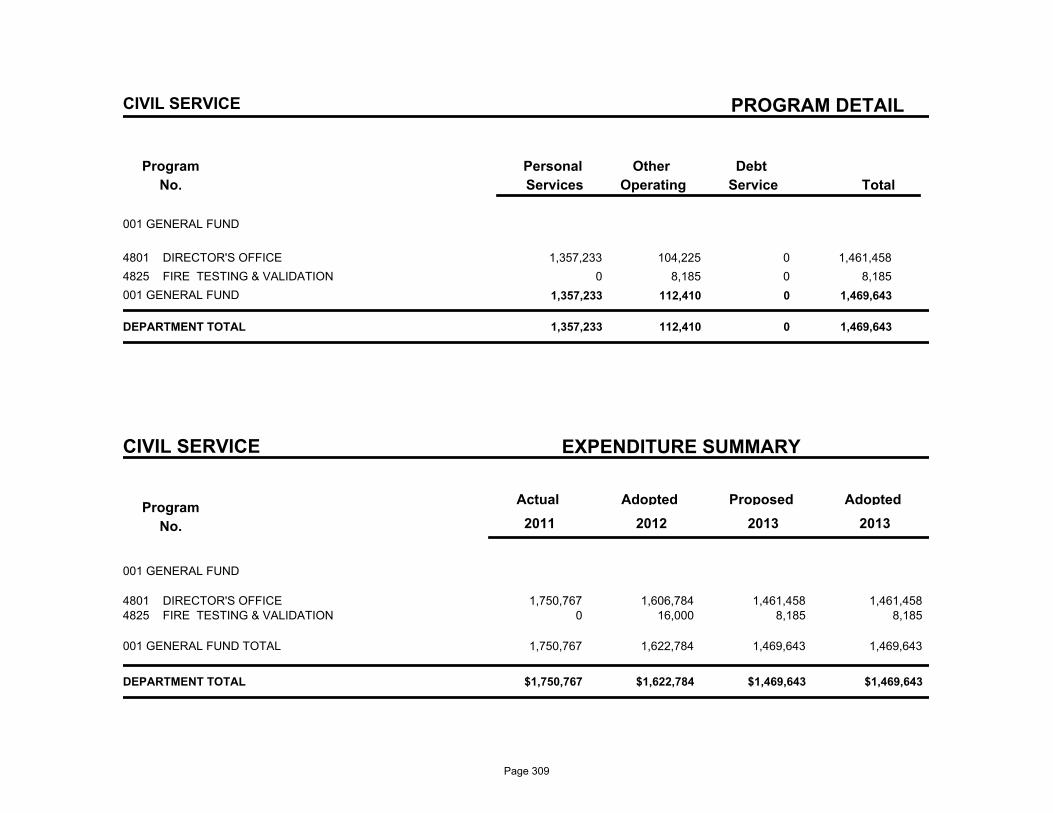
PROGRAM DETAIL
Program
No.
Debt
Service
Other
Operating
Personal
Services Total
CIVIL SERVICE
001 GENERAL FUND
4801 DIRECTOR'S OFFICE 1,357,233 104,225 0 1,461,458
4825 FIRE TESTING & VALIDATION 0 8,185 0 8,185
001 GENERAL FUND 1,357,233 112,410 0 1,469,643
DEPARTMENT TOTAL 1,357,233 112,410 0 1,469,643
CIVIL SERVICE EXPENDITURE SUMMARY
Program
No.
Actual AdoptedProposedAdopted
2013 2011 2012 2013
001 GENERAL FUND
1,750,767 1,606,784 1,461,458 DIRECTOR'S OFFICE4801 1,461,458 0 16,000 8,185 FIRE TESTING & VALIDATION4825 8,185
1,750,767 1,622,784 1,469,643 1,469,643 001 GENERAL FUND TOTAL
$1,750,767 $1,622,784 $1,469,643 $1,469,643 DEPARTMENT TOTAL
Page 309
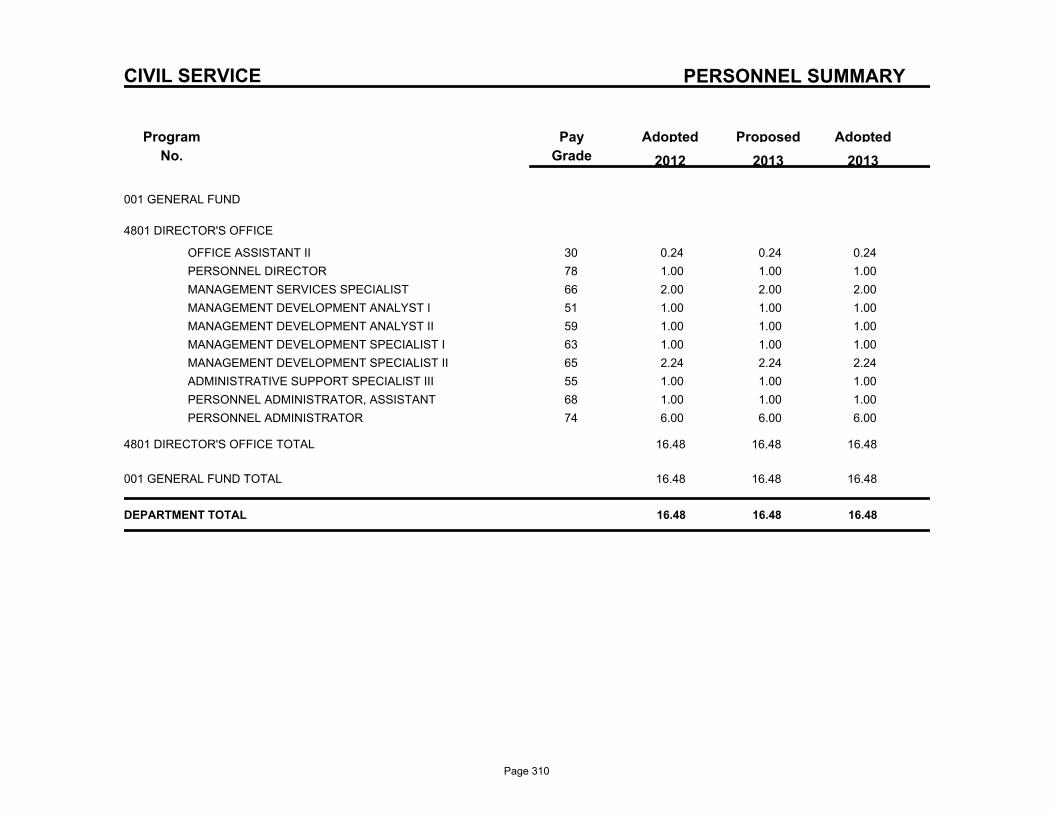
PERSONNEL SUMMARY
Program
No.
ProposedAdoptedPay
Grade
Adopted
2013 2012 2013
CIVIL SERVICE
001 GENERAL FUND
4801 DIRECTOR'S OFFICE
30OFFICE ASSISTANT II 0.24 0.24 0.24
78PERSONNEL DIRECTOR 1.00 1.00 1.00
66MANAGEMENT SERVICES SPECIALIST 2.00 2.00 2.00
51MANAGEMENT DEVELOPMENT ANALYST I 1.00 1.00 1.00
59MANAGEMENT DEVELOPMENT ANALYST II 1.00 1.00 1.00
63MANAGEMENT DEVELOPMENT SPECIALIST I 1.00 1.00 1.00
65MANAGEMENT DEVELOPMENT SPECIALIST II 2.24 2.24 2.24
55ADMINISTRATIVE SUPPORT SPECIALIST III 1.00 1.00 1.00
68PERSONNEL ADMINISTRATOR, ASSISTANT 1.00 1.00 1.00
74PERSONNEL ADMINISTRATOR 6.00 6.00 6.00
4801 DIRECTOR'S OFFICE TOTAL 16.48 16.48 16.48
001 GENERAL FUND TOTAL 16.48 16.48 16.48
DEPARTMENT TOTAL 16.48 16.48 16.48
Page 310

Page 311

Public Works
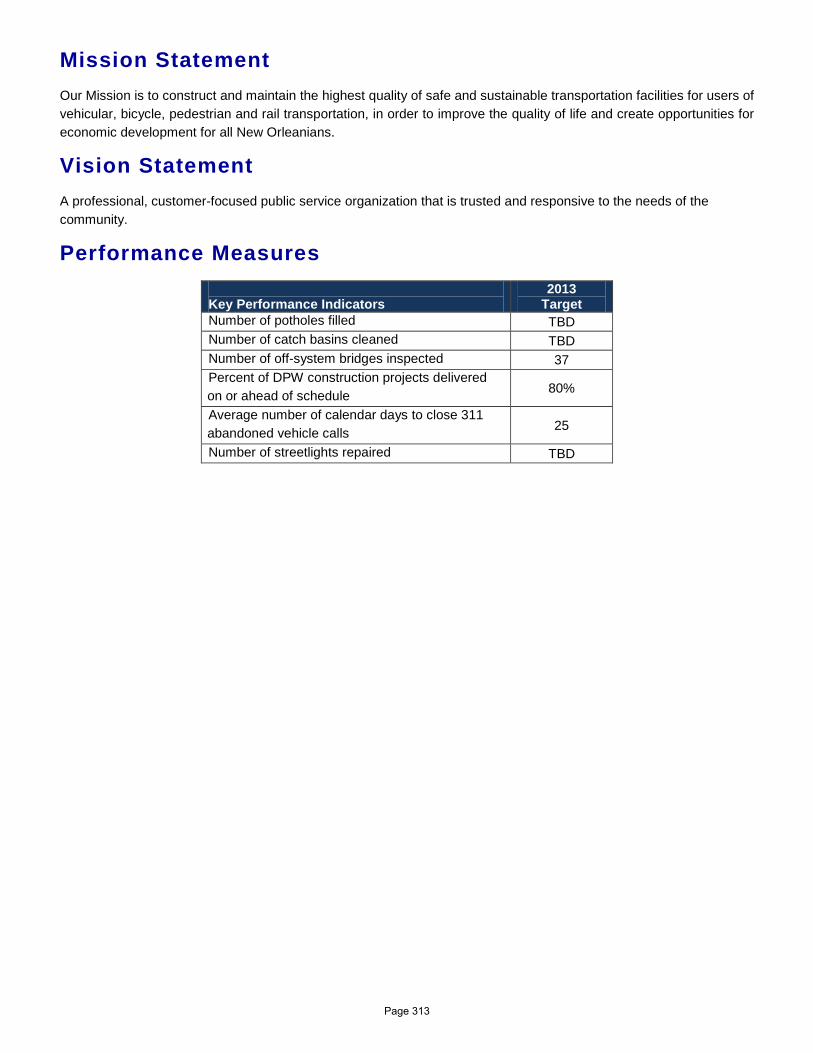
Mission Statement Our Mission is to construct and maintain the highest quality of safe and sustainable transportation facilities for users of vehicular, bicycle, pedestrian and rail transportation, in order to improve the quality of life and create opportunities for economic development for all New Orleanians.
Vision Statement A professional, customer-focused public service organization that is trusted and responsive to the needs of the community.
Performance Measures Key Performance Indicators
2013 Target
Number of potholes filled TBD Number of catch basins cleaned TBD Number of off-system bridges inspected 37 Percent of DPW construction projects delivered on or ahead of schedule 80%
Average number of calendar days to close 311 abandoned vehicle calls 25
Number of streetlights repaired TBD
Page 313
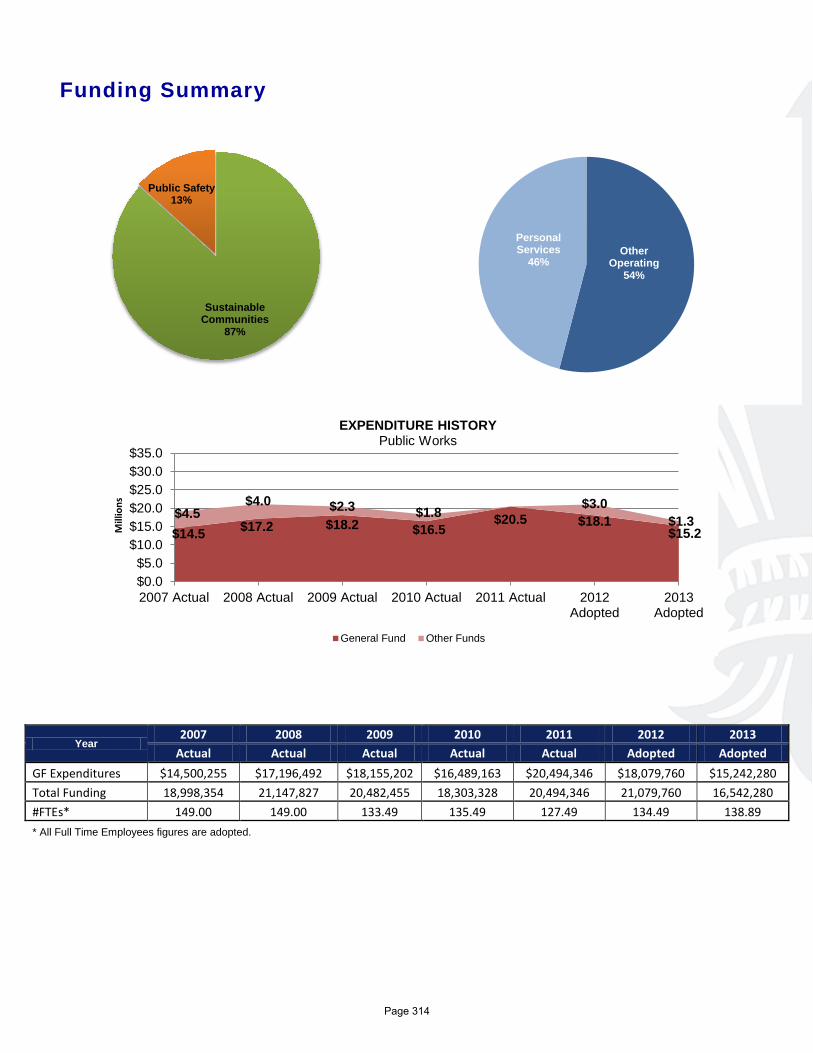
Funding Summary
Year 2007 2008 2009 2010 2011 2012 2013
Actual Actual Actual Actual Actual Adopted Adopted GF Expenditures $14,500,255 $17,196,492 $18,155,202 $16,489,163 $20,494,346 $18,079,760 $15,242,280 Total Funding 18,998,354 21,147,827 20,482,455 18,303,328 20,494,346 21,079,760 16,542,280 #FTEs* 149.00 149.00 133.49 135.49 127.49 134.49 138.89 * All Full Time Employees figures are adopted.
$14.5 $17.2 $18.2 $16.5 $20.5 $18.1
$15.2 $4.5
$4.0 $2.3 $1.8 $3.0 $1.3
$0.0$5.0
$10.0$15.0$20.0$25.0$30.0$35.0
2007 Actual 2008 Actual 2009 Actual 2010 Actual 2011 Actual 2012Adopted
2013Adopted
Mill
ions
EXPENDITURE HISTORY Public Works
General Fund Other Funds
Other Operating
54%
Personal Services
46%
Sustainable Communities
87%
Public Safety 13%
Page 314
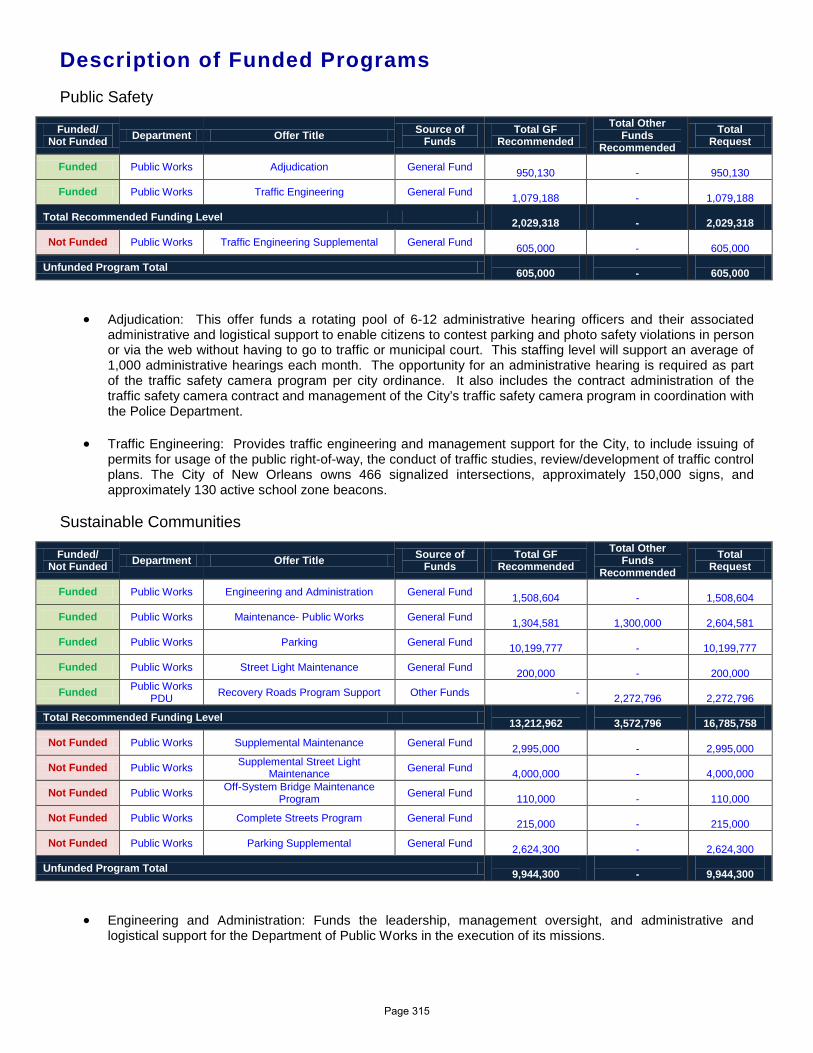
Description of Funded Programs Public Safety
Funded/ Not Funded Department Offer Title Source of
Funds Total GF
Recommended Total Other
Funds Recommended
Total Request
Funded Public Works Adjudication General Fund 950,130
-
950,130
Funded Public Works Traffic Engineering General Fund 1,079,188
-
1,079,188
Total Recommended Funding Level 2,029,318
-
2,029,318
Not Funded Public Works Traffic Engineering Supplemental General Fund 605,000
-
605,000
Unfunded Program Total 605,000
-
605,000
• Adjudication: This offer funds a rotating pool of 6-12 administrative hearing officers and their associated administrative and logistical support to enable citizens to contest parking and photo safety violations in person or via the web without having to go to traffic or municipal court. This staffing level will support an average of 1,000 administrative hearings each month. The opportunity for an administrative hearing is required as part of the traffic safety camera program per city ordinance. It also includes the contract administration of the traffic safety camera contract and management of the City’s traffic safety camera program in coordination with the Police Department.
• Traffic Engineering: Provides traffic engineering and management support for the City, to include issuing of permits for usage of the public right-of-way, the conduct of traffic studies, review/development of traffic control plans. The City of New Orleans owns 466 signalized intersections, approximately 150,000 signs, and approximately 130 active school zone beacons.
Sustainable Communities
Funded/ Not Funded Department Offer Title Source of
Funds Total GF
Recommended Total Other
Funds Recommended
Total Request
Funded Public Works Engineering and Administration General Fund 1,508,604
-
1,508,604
Funded Public Works Maintenance- Public Works General Fund 1,304,581
1,300,000
2,604,581
Funded Public Works Parking General Fund 10,199,777
-
10,199,777
Funded Public Works Street Light Maintenance General Fund 200,000
-
200,000
Funded Public Works PDU Recovery Roads Program Support Other Funds -
2,272,796
2,272,796
Total Recommended Funding Level 13,212,962
3,572,796
16,785,758
Not Funded Public Works Supplemental Maintenance General Fund 2,995,000
-
2,995,000
Not Funded Public Works Supplemental Street Light Maintenance General Fund
4,000,000 -
4,000,000
Not Funded Public Works Off-System Bridge Maintenance Program General Fund
110,000 -
110,000
Not Funded Public Works Complete Streets Program General Fund 215,000
-
215,000
Not Funded Public Works Parking Supplemental General Fund 2,624,300
-
2,624,300
Unfunded Program Total 9,944,300
-
9,944,300
• Engineering and Administration: Funds the leadership, management oversight, and administrative and logistical support for the Department of Public Works in the execution of its missions.
Page 315
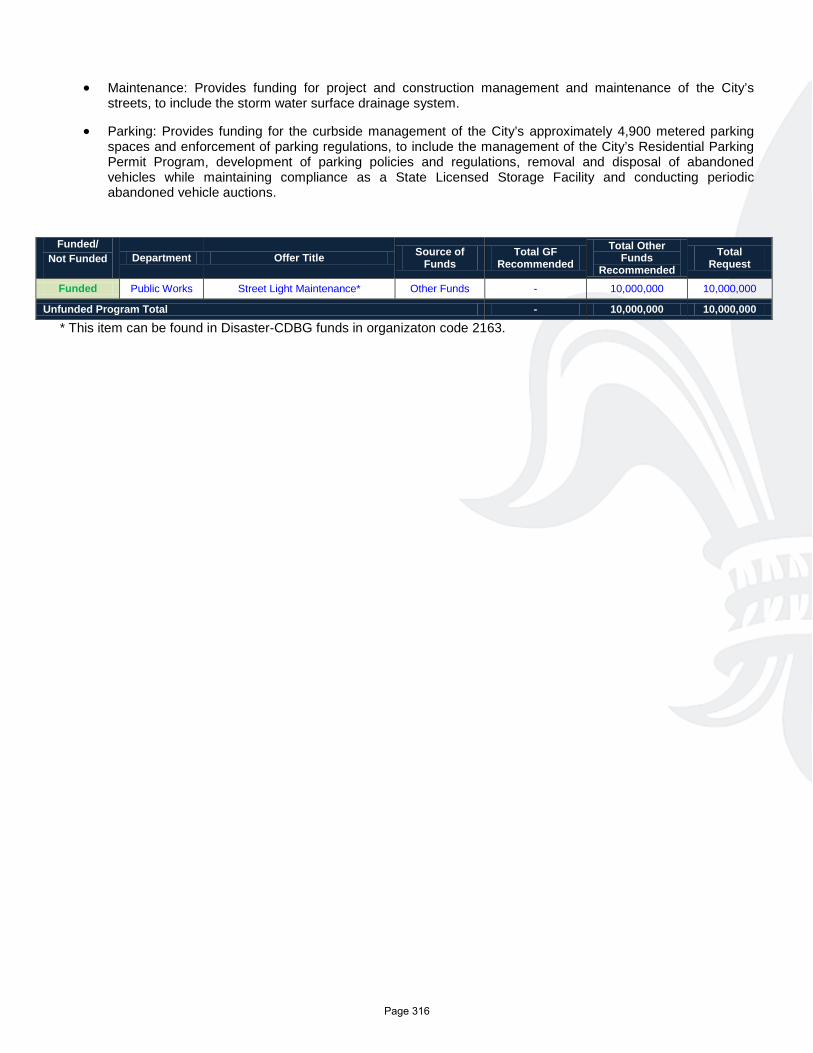
• Maintenance: Provides funding for project and construction management and maintenance of the City’s streets, to include the storm water surface drainage system.
• Parking: Provides funding for the curbside management of the City’s approximately 4,900 metered parking spaces and enforcement of parking regulations, to include the management of the City’s Residential Parking Permit Program, development of parking policies and regulations, removal and disposal of abandoned vehicles while maintaining compliance as a State Licensed Storage Facility and conducting periodic abandoned vehicle auctions.
Funded/ Not Funded Department Offer Title Source of
Funds Total GF
Recommended Total Other
Funds Recommended
Total Request
Funded Public Works Street Light Maintenance* Other Funds - 10,000,000 10,000,000
Unfunded Program Total - 10,000,000 10,000,000
* This item can be found in Disaster-CDBG funds in organizaton code 2163.
Page 316

PUBLIC WORKS
DEPARTMENTAL BUDGET SUMMARY
AdoptedProposedAdoptedActual
EXPENDITURES
2013 2012 2011 2013
PERSONAL SERVICES 6,916,178 6,557,019 7,763,972 7,004,666
OTHER OPERATING 13,578,168 14,522,741 7,478,308 9,537,614
DEBT SERVICE 0 0 0 0
RESERVES 0 0 0 0
GRANTS, CONTRIB. & FUND TRAN. 0 0 0 0
$20,494,346 $21,079,760 $15,242,280 TOTAL EXPENDITURES $16,542,280
SOURCE OF FUNDING
GENERAL FUND 20,494,346 18,079,760 15,242,280 15,242,280
WISNER FUNDS 0 0 0 0
ENTERPRISE 0 0 0 0
DOWNTOWN DEVELOPMENT DIST. 0 0 0 0
HOUSING AND URBAN DEVELOP. 0 3,000,000 0 1,300,000
SELF GENERATED 0 0 0 0
LIBRARY 0 0 0 0
LLE 0 0 0 0
FEDERAL GRANTS 0 0 0 0
STATE GRANTS 0 0 0 0
GRANTS, CONTRIB., & FUND TRAN. 0 0 0 0
N. O. REGIONAL BUSINESS PARK 0 0 0 0
ECONOMIC DEVELOPMENT FUND 0 0 0 0
HOUSING IMPROVMENT FUND 0 0 0 0
$20,494,346 $21,079,760 $15,242,280 TOTAL FUNDING $16,542,280
Page 317
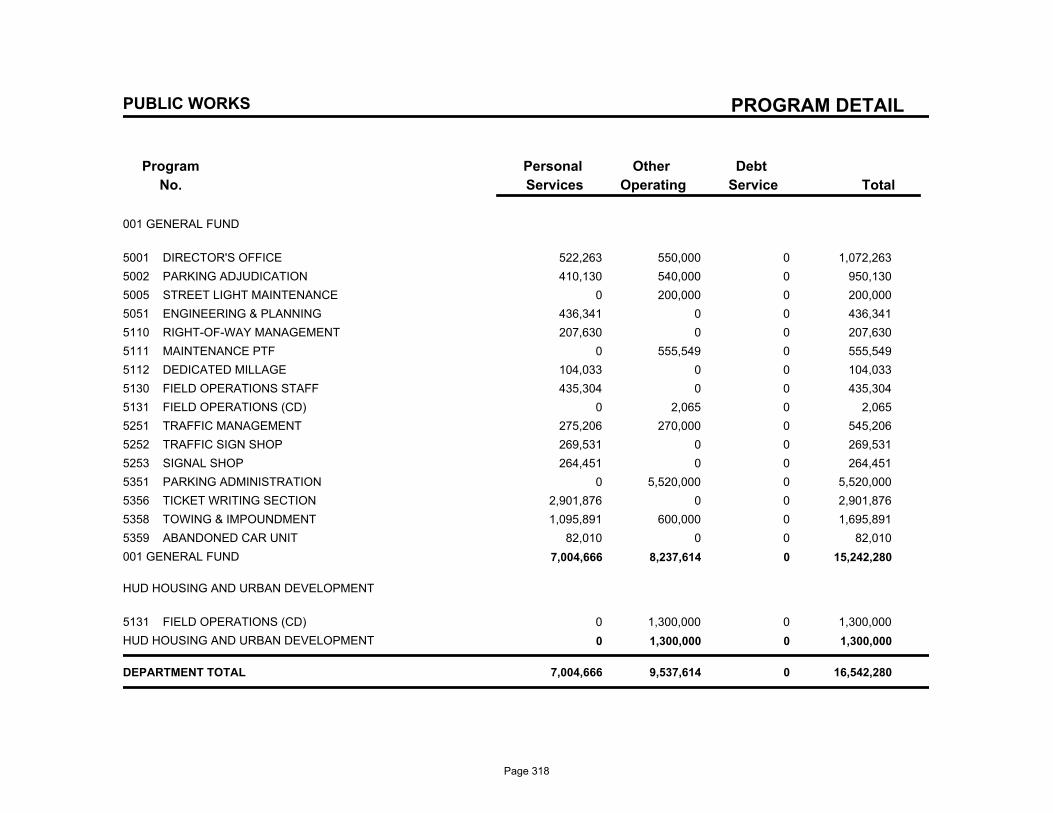
PROGRAM DETAIL
Program
No.
Debt
Service
Other
Operating
Personal
Services Total
PUBLIC WORKS
001 GENERAL FUND
5001 DIRECTOR'S OFFICE 522,263 550,000 0 1,072,263
5002 PARKING ADJUDICATION 410,130 540,000 0 950,130
5005 STREET LIGHT MAINTENANCE 0 200,000 0 200,000
5051 ENGINEERING & PLANNING 436,341 0 0 436,341
5110 RIGHT-OF-WAY MANAGEMENT 207,630 0 0 207,630
5111 MAINTENANCE PTF 0 555,549 0 555,549
5112 DEDICATED MILLAGE 104,033 0 0 104,033
5130 FIELD OPERATIONS STAFF 435,304 0 0 435,304
5131 FIELD OPERATIONS (CD) 0 2,065 0 2,065
5251 TRAFFIC MANAGEMENT 275,206 270,000 0 545,206
5252 TRAFFIC SIGN SHOP 269,531 0 0 269,531
5253 SIGNAL SHOP 264,451 0 0 264,451
5351 PARKING ADMINISTRATION 0 5,520,000 0 5,520,000
5356 TICKET WRITING SECTION 2,901,876 0 0 2,901,876
5358 TOWING & IMPOUNDMENT 1,095,891 600,000 0 1,695,891
5359 ABANDONED CAR UNIT 82,010 0 0 82,010
001 GENERAL FUND 7,004,666 8,237,614 0 15,242,280
HUD HOUSING AND URBAN DEVELOPMENT
5131 FIELD OPERATIONS (CD) 0 1,300,000 0 1,300,000
HUD HOUSING AND URBAN DEVELOPMENT 0 1,300,000 0 1,300,000
DEPARTMENT TOTAL 7,004,666 9,537,614 0 16,542,280
Page 318
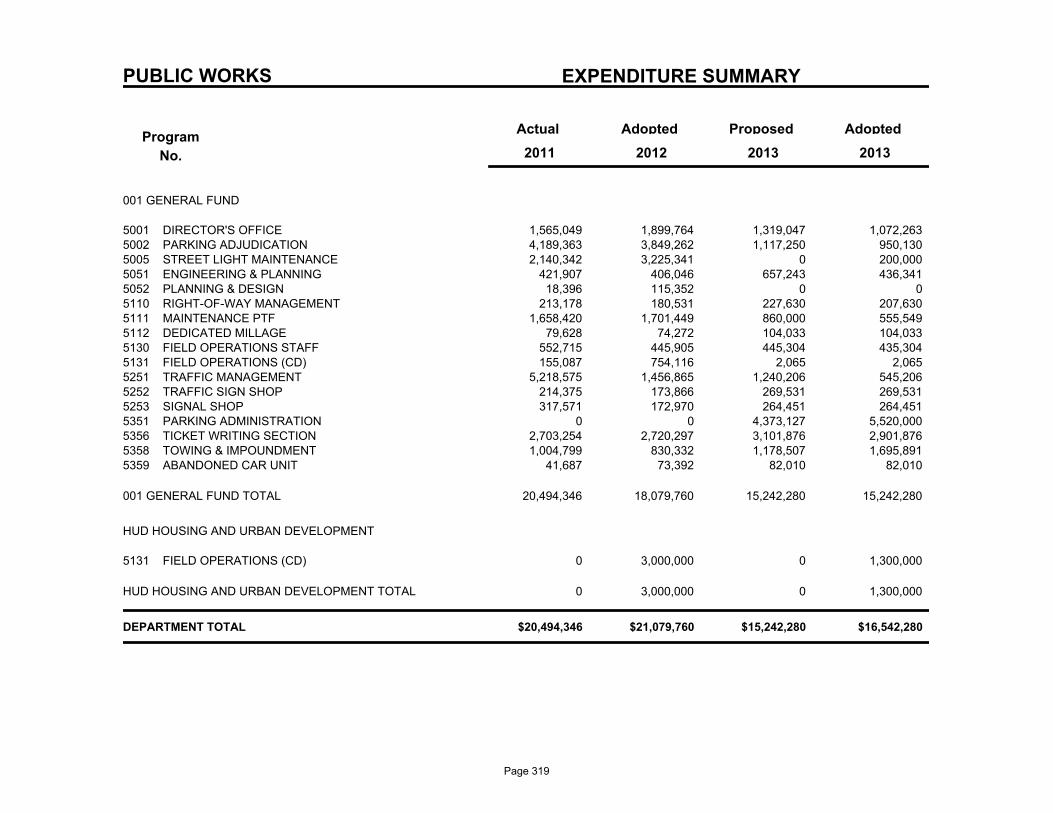
PUBLIC WORKS EXPENDITURE SUMMARY
Program
No.
Actual AdoptedProposedAdopted
2013 2011 2012 2013
001 GENERAL FUND
1,565,049 1,899,764 1,319,047 DIRECTOR'S OFFICE5001 1,072,263 4,189,363 3,849,262 1,117,250 PARKING ADJUDICATION5002 950,130 2,140,342 3,225,341 0 STREET LIGHT MAINTENANCE5005 200,000
421,907 406,046 657,243 ENGINEERING & PLANNING5051 436,341 18,396 115,352 0 PLANNING & DESIGN5052 0
213,178 180,531 227,630 RIGHT-OF-WAY MANAGEMENT5110 207,630 1,658,420 1,701,449 860,000 MAINTENANCE PTF5111 555,549
79,628 74,272 104,033 DEDICATED MILLAGE5112 104,033 552,715 445,905 445,304 FIELD OPERATIONS STAFF5130 435,304 155,087 754,116 2,065 FIELD OPERATIONS (CD)5131 2,065
5,218,575 1,456,865 1,240,206 TRAFFIC MANAGEMENT5251 545,206 214,375 173,866 269,531 TRAFFIC SIGN SHOP5252 269,531 317,571 172,970 264,451 SIGNAL SHOP5253 264,451
0 0 4,373,127 PARKING ADMINISTRATION5351 5,520,000 2,703,254 2,720,297 3,101,876 TICKET WRITING SECTION5356 2,901,876 1,004,799 830,332 1,178,507 TOWING & IMPOUNDMENT5358 1,695,891
41,687 73,392 82,010 ABANDONED CAR UNIT5359 82,010
20,494,346 18,079,760 15,242,280 15,242,280 001 GENERAL FUND TOTAL
HUD HOUSING AND URBAN DEVELOPMENT
0 3,000,000 0 FIELD OPERATIONS (CD)5131 1,300,000
0 3,000,000 0 1,300,000 HUD HOUSING AND URBAN DEVELOPMENT TOTAL
$20,494,346 $21,079,760 $15,242,280 $16,542,280 DEPARTMENT TOTAL
Page 319
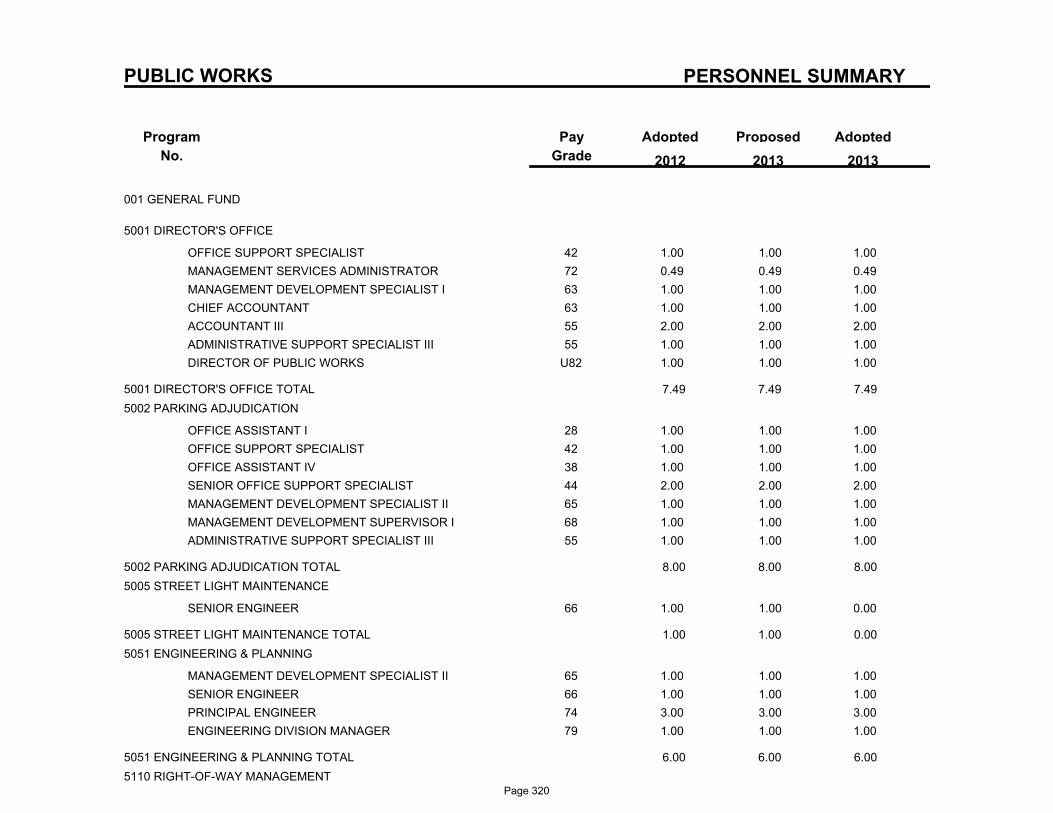
PERSONNEL SUMMARY
Program
No.
ProposedAdoptedPay
Grade
Adopted
2013 2012 2013
PUBLIC WORKS
001 GENERAL FUND
5001 DIRECTOR'S OFFICE
42OFFICE SUPPORT SPECIALIST 1.00 1.00 1.00
72MANAGEMENT SERVICES ADMINISTRATOR 0.49 0.49 0.49
63MANAGEMENT DEVELOPMENT SPECIALIST I 1.00 1.00 1.00
63CHIEF ACCOUNTANT 1.00 1.00 1.00
55ACCOUNTANT III 2.00 2.00 2.00
55ADMINISTRATIVE SUPPORT SPECIALIST III 1.00 1.00 1.00
U82DIRECTOR OF PUBLIC WORKS 1.00 1.00 1.00
5001 DIRECTOR'S OFFICE TOTAL 7.49 7.49 7.49
5002 PARKING ADJUDICATION
28OFFICE ASSISTANT I 1.00 1.00 1.00
42OFFICE SUPPORT SPECIALIST 1.00 1.00 1.00
38OFFICE ASSISTANT IV 1.00 1.00 1.00
44SENIOR OFFICE SUPPORT SPECIALIST 2.00 2.00 2.00
65MANAGEMENT DEVELOPMENT SPECIALIST II 1.00 1.00 1.00
68MANAGEMENT DEVELOPMENT SUPERVISOR I 1.00 1.00 1.00
55ADMINISTRATIVE SUPPORT SPECIALIST III 1.00 1.00 1.00
5002 PARKING ADJUDICATION TOTAL 8.00 8.00 8.00
5005 STREET LIGHT MAINTENANCE
66SENIOR ENGINEER 1.00 1.00 0.00
5005 STREET LIGHT MAINTENANCE TOTAL 1.00 1.00 0.00
5051 ENGINEERING & PLANNING
65MANAGEMENT DEVELOPMENT SPECIALIST II 1.00 1.00 1.00
66SENIOR ENGINEER 1.00 1.00 1.00
74PRINCIPAL ENGINEER 3.00 3.00 3.00
79ENGINEERING DIVISION MANAGER 1.00 1.00 1.00
5051 ENGINEERING & PLANNING TOTAL 6.00 6.00 6.00
5110 RIGHT-OF-WAY MANAGEMENTPage 320
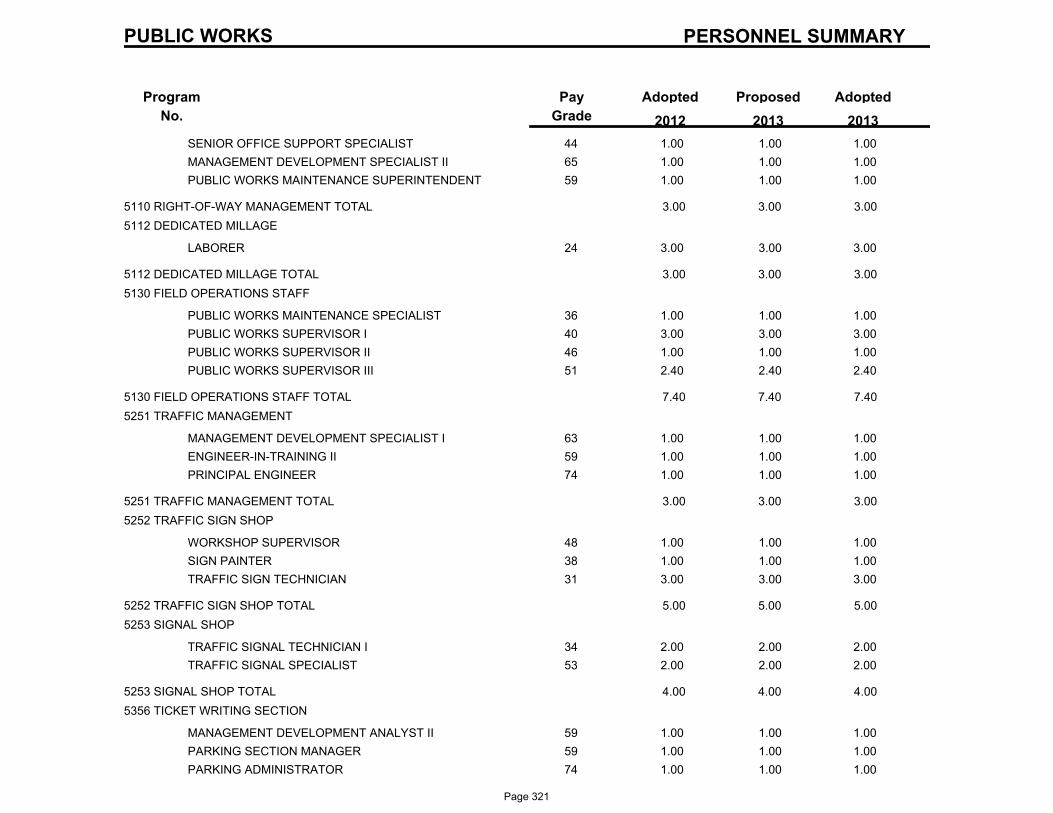
PERSONNEL SUMMARY
Program
No.
ProposedAdoptedPay
Grade
Adopted
2013 2012 2013
PUBLIC WORKS
44SENIOR OFFICE SUPPORT SPECIALIST 1.00 1.00 1.00
65MANAGEMENT DEVELOPMENT SPECIALIST II 1.00 1.00 1.00
59PUBLIC WORKS MAINTENANCE SUPERINTENDENT 1.00 1.00 1.00
5110 RIGHT-OF-WAY MANAGEMENT TOTAL 3.00 3.00 3.00
5112 DEDICATED MILLAGE
24LABORER 3.00 3.00 3.00
5112 DEDICATED MILLAGE TOTAL 3.00 3.00 3.00
5130 FIELD OPERATIONS STAFF
36PUBLIC WORKS MAINTENANCE SPECIALIST 1.00 1.00 1.00
40PUBLIC WORKS SUPERVISOR I 3.00 3.00 3.00
46PUBLIC WORKS SUPERVISOR II 1.00 1.00 1.00
51PUBLIC WORKS SUPERVISOR III 2.40 2.40 2.40
5130 FIELD OPERATIONS STAFF TOTAL 7.40 7.40 7.40
5251 TRAFFIC MANAGEMENT
63MANAGEMENT DEVELOPMENT SPECIALIST I 1.00 1.00 1.00
59ENGINEER-IN-TRAINING II 1.00 1.00 1.00
74PRINCIPAL ENGINEER 1.00 1.00 1.00
5251 TRAFFIC MANAGEMENT TOTAL 3.00 3.00 3.00
5252 TRAFFIC SIGN SHOP
48WORKSHOP SUPERVISOR 1.00 1.00 1.00
38SIGN PAINTER 1.00 1.00 1.00
31TRAFFIC SIGN TECHNICIAN 3.00 3.00 3.00
5252 TRAFFIC SIGN SHOP TOTAL 5.00 5.00 5.00
5253 SIGNAL SHOP
34TRAFFIC SIGNAL TECHNICIAN I 2.00 2.00 2.00
53TRAFFIC SIGNAL SPECIALIST 2.00 2.00 2.00
5253 SIGNAL SHOP TOTAL 4.00 4.00 4.00
5356 TICKET WRITING SECTION
59MANAGEMENT DEVELOPMENT ANALYST II 1.00 1.00 1.00
59PARKING SECTION MANAGER 1.00 1.00 1.00
74PARKING ADMINISTRATOR 1.00 1.00 1.00
Page 321
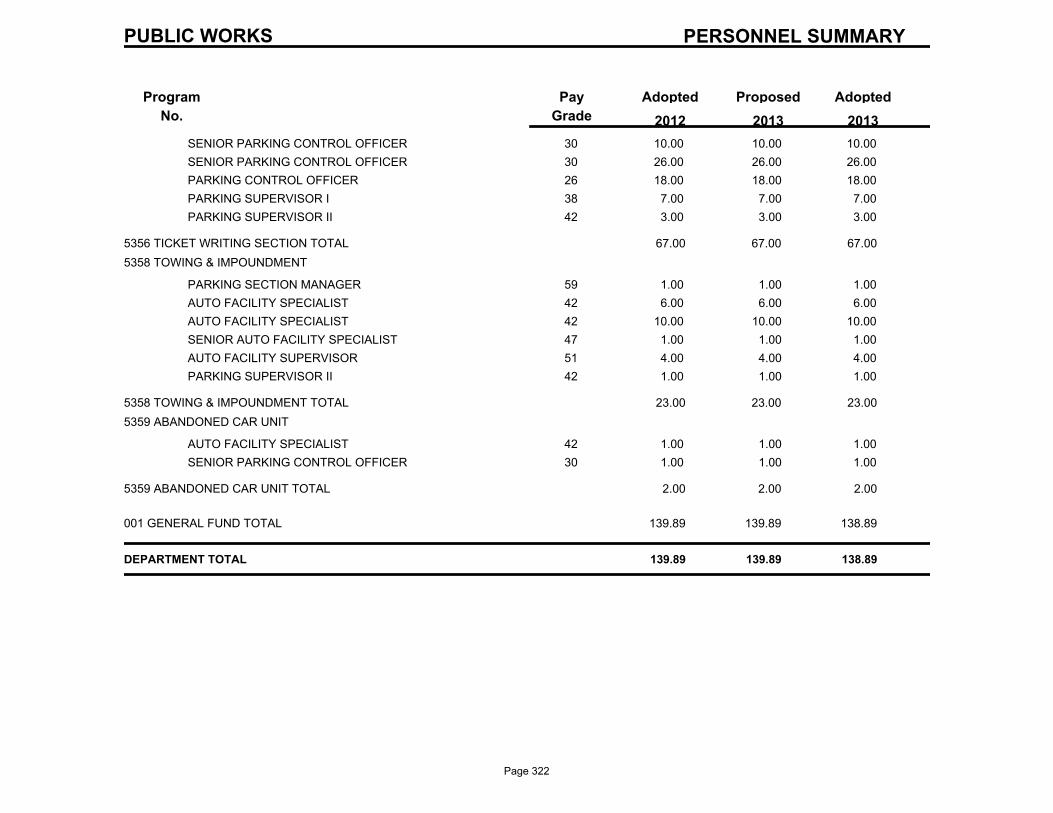
PERSONNEL SUMMARY
Program
No.
ProposedAdoptedPay
Grade
Adopted
2013 2012 2013
PUBLIC WORKS
30SENIOR PARKING CONTROL OFFICER 10.00 10.00 10.00
30SENIOR PARKING CONTROL OFFICER 26.00 26.00 26.00
26PARKING CONTROL OFFICER 18.00 18.00 18.00
38PARKING SUPERVISOR I 7.00 7.00 7.00
42PARKING SUPERVISOR II 3.00 3.00 3.00
5356 TICKET WRITING SECTION TOTAL 67.00 67.00 67.00
5358 TOWING & IMPOUNDMENT
59PARKING SECTION MANAGER 1.00 1.00 1.00
42AUTO FACILITY SPECIALIST 6.00 6.00 6.00
42AUTO FACILITY SPECIALIST 10.00 10.00 10.00
47SENIOR AUTO FACILITY SPECIALIST 1.00 1.00 1.00
51AUTO FACILITY SUPERVISOR 4.00 4.00 4.00
42PARKING SUPERVISOR II 1.00 1.00 1.00
5358 TOWING & IMPOUNDMENT TOTAL 23.00 23.00 23.00
5359 ABANDONED CAR UNIT
42AUTO FACILITY SPECIALIST 1.00 1.00 1.00
30SENIOR PARKING CONTROL OFFICER 1.00 1.00 1.00
5359 ABANDONED CAR UNIT TOTAL 2.00 2.00 2.00
001 GENERAL FUND TOTAL 139.89 139.89 138.89
DEPARTMENT TOTAL 139.89 139.89 138.89
Page 322

Page 323

Parks and Parkways
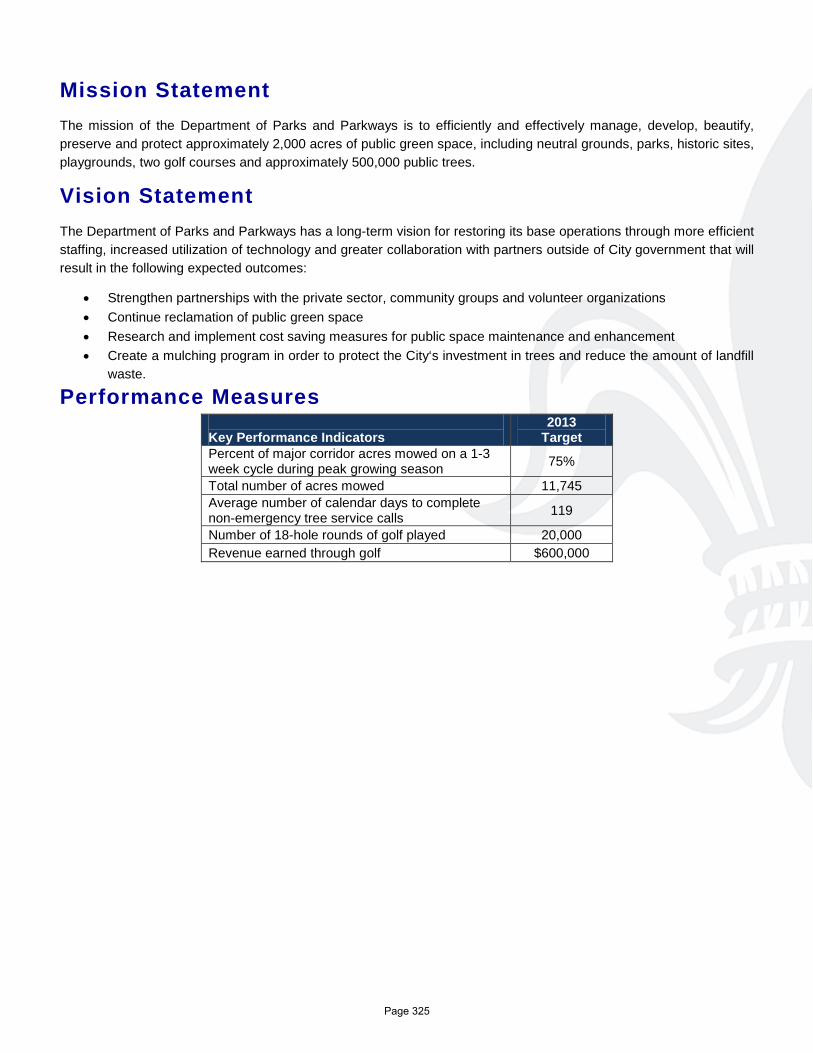
Mission Statement The mission of the Department of Parks and Parkways is to efficiently and effectively manage, develop, beautify, preserve and protect approximately 2,000 acres of public green space, including neutral grounds, parks, historic sites, playgrounds, two golf courses and approximately 500,000 public trees.
Vision Statement The Department of Parks and Parkways has a long-term vision for restoring its base operations through more efficient staffing, increased utilization of technology and greater collaboration with partners outside of City government that will result in the following expected outcomes:
• Strengthen partnerships with the private sector, community groups and volunteer organizations • Continue reclamation of public green space • Research and implement cost saving measures for public space maintenance and enhancement • Create a mulching program in order to protect the City‘s investment in trees and reduce the amount of landfill
waste.
Performance Measures Key Performance Indicators
2013 Target
Percent of major corridor acres mowed on a 1-3 week cycle during peak growing season 75%
Total number of acres mowed 11,745 Average number of calendar days to complete non-emergency tree service calls 119
Number of 18-hole rounds of golf played 20,000 Revenue earned through golf $600,000
Page 325
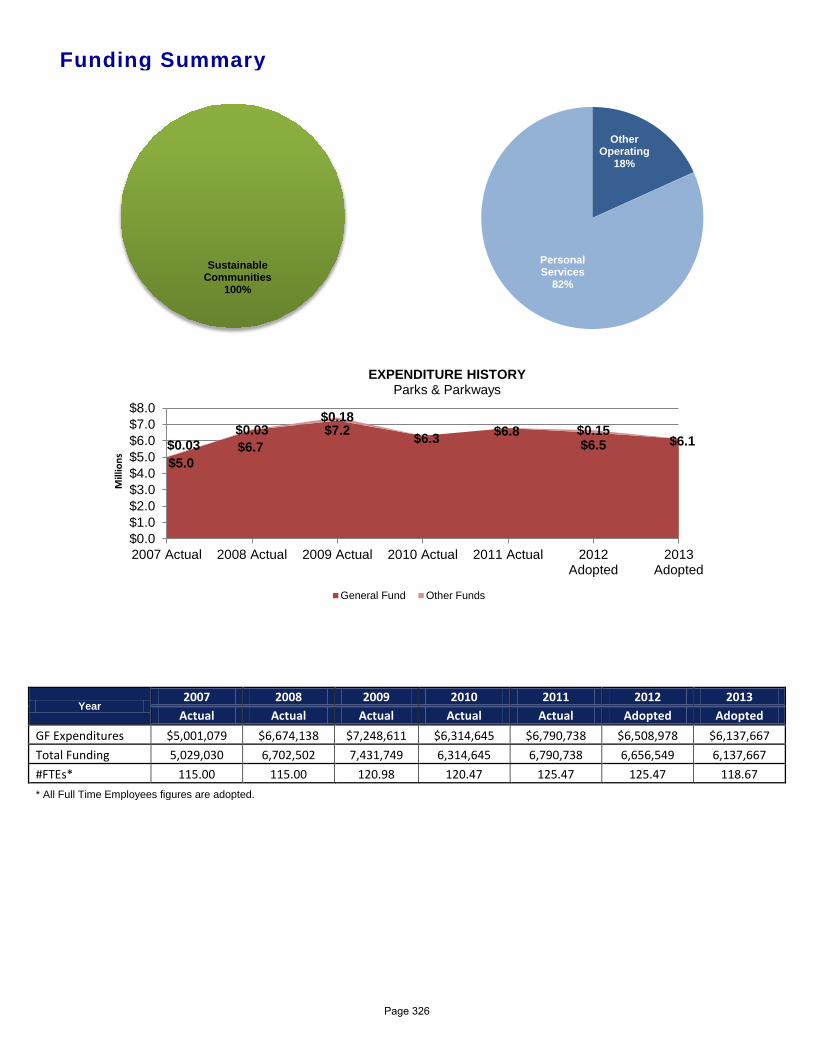
Funding Summary
Year 2007 2008 2009 2010 2011 2012 2013
Actual Actual Actual Actual Actual Adopted Adopted GF Expenditures $5,001,079 $6,674,138 $7,248,611 $6,314,645 $6,790,738 $6,508,978 $6,137,667 Total Funding 5,029,030 6,702,502 7,431,749 6,314,645 6,790,738 6,656,549 6,137,667 #FTEs* 115.00 115.00 120.98 120.47 125.47 125.47 118.67 * All Full Time Employees figures are adopted.
$5.0 $6.7
$7.2 $6.3 $6.8 $6.5 $6.1 $0.03
$0.03 $0.18
$0.15
$0.0$1.0$2.0$3.0$4.0$5.0$6.0$7.0$8.0
2007 Actual 2008 Actual 2009 Actual 2010 Actual 2011 Actual 2012Adopted
2013Adopted
Mill
ions
EXPENDITURE HISTORY Parks & Parkways
General Fund Other Funds
Sustainable Communities
100%
Other Operating
18%
Personal Services
82%
Page 326
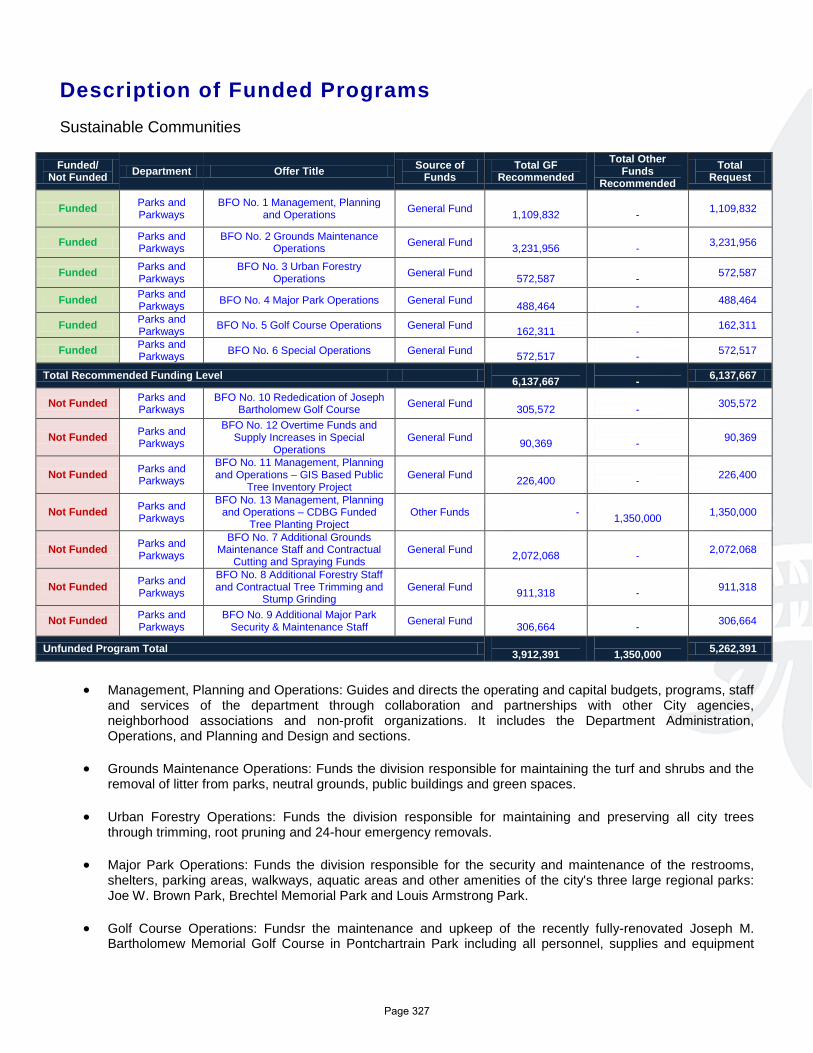
Description of Funded Programs Sustainable Communities Funded/
Not Funded Department Offer Title Source of Funds
Total GF Recommended
Total Other Funds
Recommended Total
Request
Funded Parks and Parkways
BFO No. 1 Management, Planning and Operations General Fund
1,109,832 - 1,109,832
Funded Parks and Parkways
BFO No. 2 Grounds Maintenance Operations General Fund
3,231,956 - 3,231,956
Funded Parks and Parkways
BFO No. 3 Urban Forestry Operations General Fund
572,587 - 572,587
Funded Parks and Parkways BFO No. 4 Major Park Operations General Fund
488,464 - 488,464
Funded Parks and Parkways BFO No. 5 Golf Course Operations General Fund
162,311 - 162,311
Funded Parks and Parkways BFO No. 6 Special Operations General Fund
572,517 - 572,517
Total Recommended Funding Level 6,137,667
- 6,137,667
Not Funded Parks and Parkways
BFO No. 10 Rededication of Joseph Bartholomew Golf Course General Fund
305,572 - 305,572
Not Funded Parks and Parkways
BFO No. 12 Overtime Funds and Supply Increases in Special
Operations General Fund
90,369 - 90,369
Not Funded Parks and Parkways
BFO No. 11 Management, Planning and Operations – GIS Based Public
Tree Inventory Project General Fund
226,400 - 226,400
Not Funded Parks and Parkways
BFO No. 13 Management, Planning and Operations – CDBG Funded
Tree Planting Project Other Funds -
1,350,000 1,350,000
Not Funded Parks and Parkways
BFO No. 7 Additional Grounds Maintenance Staff and Contractual
Cutting and Spraying Funds General Fund
2,072,068 - 2,072,068
Not Funded Parks and Parkways
BFO No. 8 Additional Forestry Staff and Contractual Tree Trimming and
Stump Grinding General Fund
911,318 - 911,318
Not Funded Parks and Parkways
BFO No. 9 Additional Major Park Security & Maintenance Staff General Fund
306,664 - 306,664
Unfunded Program Total 3,912,391
1,350,000 5,262,391
• Management, Planning and Operations: Guides and directs the operating and capital budgets, programs, staff
and services of the department through collaboration and partnerships with other City agencies, neighborhood associations and non-profit organizations. It includes the Department Administration, Operations, and Planning and Design and sections.
• Grounds Maintenance Operations: Funds the division responsible for maintaining the turf and shrubs and the removal of litter from parks, neutral grounds, public buildings and green spaces.
• Urban Forestry Operations: Funds the division responsible for maintaining and preserving all city trees through trimming, root pruning and 24-hour emergency removals.
• Major Park Operations: Funds the division responsible for the security and maintenance of the restrooms, shelters, parking areas, walkways, aquatic areas and other amenities of the city's three large regional parks: Joe W. Brown Park, Brechtel Memorial Park and Louis Armstrong Park.
• Golf Course Operations: Fundsr the maintenance and upkeep of the recently fully-renovated Joseph M. Bartholomew Memorial Golf Course in Pontchartrain Park including all personnel, supplies and equipment
Page 327

associated with green-side operations (including golf cart and course mowing equipment leasing) as well as the club house staff.
• Special Operations: Supports a diverse group of service provideers including the Heavy Equipment staff that assist with hauling and dumping debris collected and generated, Mowing and Forestry crews, building and grounds repairs and the installation of protective fencing around planted areas for Mardi Gras. It also supports the propagation of ornamental neutral ground plants and flowers from the department's green houses.
Page 328
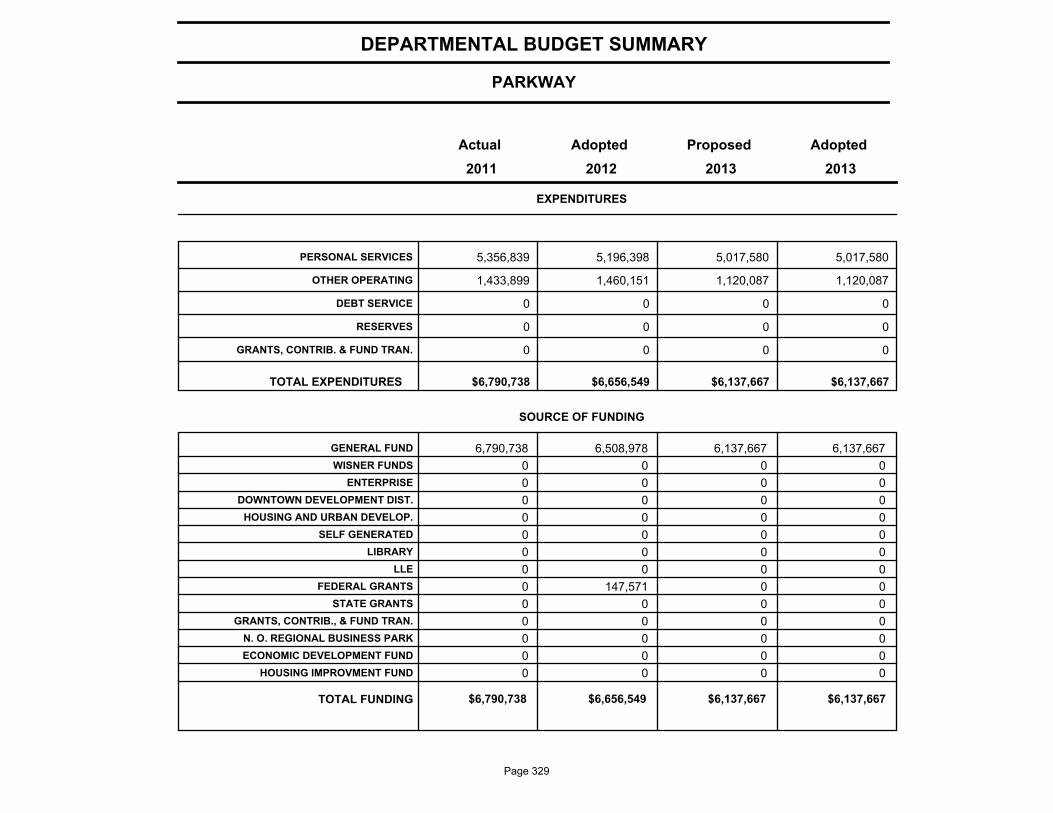
PARKWAY
DEPARTMENTAL BUDGET SUMMARY
AdoptedProposedAdoptedActual
EXPENDITURES
2013 2012 2011 2013
PERSONAL SERVICES 5,356,839 5,196,398 5,017,580 5,017,580
OTHER OPERATING 1,433,899 1,460,151 1,120,087 1,120,087
DEBT SERVICE 0 0 0 0
RESERVES 0 0 0 0
GRANTS, CONTRIB. & FUND TRAN. 0 0 0 0
$6,790,738 $6,656,549 $6,137,667 TOTAL EXPENDITURES $6,137,667
SOURCE OF FUNDING
GENERAL FUND 6,790,738 6,508,978 6,137,667 6,137,667
WISNER FUNDS 0 0 0 0
ENTERPRISE 0 0 0 0
DOWNTOWN DEVELOPMENT DIST. 0 0 0 0
HOUSING AND URBAN DEVELOP. 0 0 0 0
SELF GENERATED 0 0 0 0
LIBRARY 0 0 0 0
LLE 0 0 0 0
FEDERAL GRANTS 0 147,571 0 0
STATE GRANTS 0 0 0 0
GRANTS, CONTRIB., & FUND TRAN. 0 0 0 0
N. O. REGIONAL BUSINESS PARK 0 0 0 0
ECONOMIC DEVELOPMENT FUND 0 0 0 0
HOUSING IMPROVMENT FUND 0 0 0 0
$6,790,738 $6,656,549 $6,137,667 TOTAL FUNDING $6,137,667
Page 329
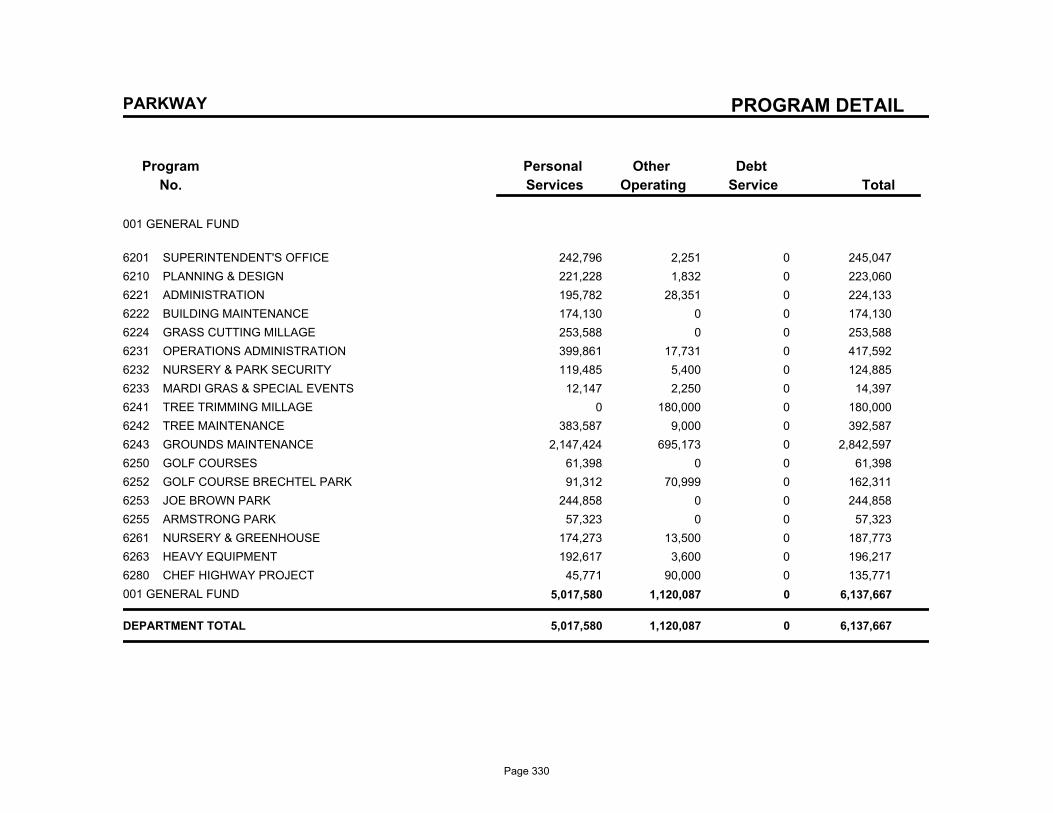
PROGRAM DETAIL
Program
No.
Debt
Service
Other
Operating
Personal
Services Total
PARKWAY
001 GENERAL FUND
6201 SUPERINTENDENT'S OFFICE 242,796 2,251 0 245,047
6210 PLANNING & DESIGN 221,228 1,832 0 223,060
6221 ADMINISTRATION 195,782 28,351 0 224,133
6222 BUILDING MAINTENANCE 174,130 0 0 174,130
6224 GRASS CUTTING MILLAGE 253,588 0 0 253,588
6231 OPERATIONS ADMINISTRATION 399,861 17,731 0 417,592
6232 NURSERY & PARK SECURITY 119,485 5,400 0 124,885
6233 MARDI GRAS & SPECIAL EVENTS 12,147 2,250 0 14,397
6241 TREE TRIMMING MILLAGE 0 180,000 0 180,000
6242 TREE MAINTENANCE 383,587 9,000 0 392,587
6243 GROUNDS MAINTENANCE 2,147,424 695,173 0 2,842,597
6250 GOLF COURSES 61,398 0 0 61,398
6252 GOLF COURSE BRECHTEL PARK 91,312 70,999 0 162,311
6253 JOE BROWN PARK 244,858 0 0 244,858
6255 ARMSTRONG PARK 57,323 0 0 57,323
6261 NURSERY & GREENHOUSE 174,273 13,500 0 187,773
6263 HEAVY EQUIPMENT 192,617 3,600 0 196,217
6280 CHEF HIGHWAY PROJECT 45,771 90,000 0 135,771
001 GENERAL FUND 5,017,580 1,120,087 0 6,137,667
DEPARTMENT TOTAL 5,017,580 1,120,087 0 6,137,667
Page 330
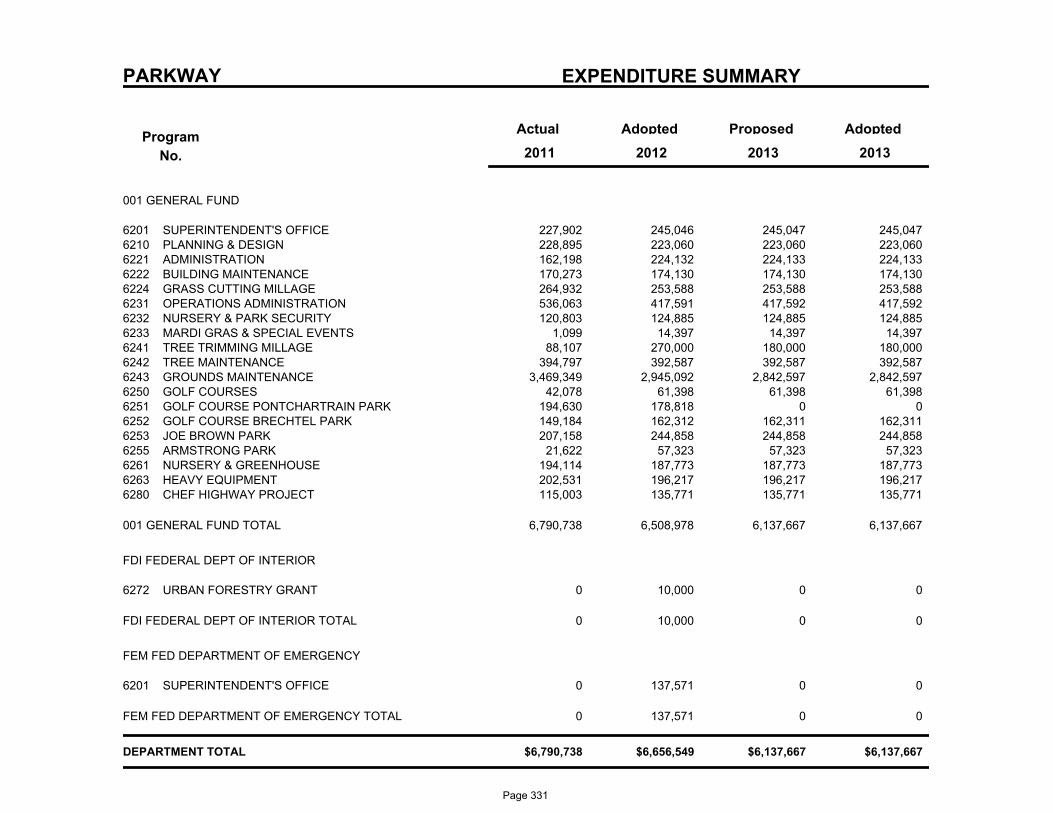
PARKWAY EXPENDITURE SUMMARY
Program
No.
Actual AdoptedProposedAdopted
2013 2011 2012 2013
001 GENERAL FUND
227,902 245,046 245,047 SUPERINTENDENT'S OFFICE6201 245,047 228,895 223,060 223,060 PLANNING & DESIGN6210 223,060 162,198 224,132 224,133 ADMINISTRATION6221 224,133 170,273 174,130 174,130 BUILDING MAINTENANCE6222 174,130 264,932 253,588 253,588 GRASS CUTTING MILLAGE6224 253,588 536,063 417,591 417,592 OPERATIONS ADMINISTRATION6231 417,592 120,803 124,885 124,885 NURSERY & PARK SECURITY6232 124,885
1,099 14,397 14,397 MARDI GRAS & SPECIAL EVENTS6233 14,397 88,107 270,000 180,000 TREE TRIMMING MILLAGE6241 180,000
394,797 392,587 392,587 TREE MAINTENANCE6242 392,587 3,469,349 2,945,092 2,842,597 GROUNDS MAINTENANCE6243 2,842,597
42,078 61,398 61,398 GOLF COURSES6250 61,398 194,630 178,818 0 GOLF COURSE PONTCHARTRAIN PARK6251 0 149,184 162,312 162,311 GOLF COURSE BRECHTEL PARK6252 162,311 207,158 244,858 244,858 JOE BROWN PARK6253 244,858
21,622 57,323 57,323 ARMSTRONG PARK6255 57,323 194,114 187,773 187,773 NURSERY & GREENHOUSE6261 187,773 202,531 196,217 196,217 HEAVY EQUIPMENT6263 196,217 115,003 135,771 135,771 CHEF HIGHWAY PROJECT6280 135,771
6,790,738 6,508,978 6,137,667 6,137,667 001 GENERAL FUND TOTAL
FDI FEDERAL DEPT OF INTERIOR
0 10,000 0 URBAN FORESTRY GRANT6272 0
0 10,000 0 0 FDI FEDERAL DEPT OF INTERIOR TOTAL
FEM FED DEPARTMENT OF EMERGENCY
0 137,571 0 SUPERINTENDENT'S OFFICE6201 0
0 137,571 0 0 FEM FED DEPARTMENT OF EMERGENCY TOTAL
$6,790,738 $6,656,549 $6,137,667 $6,137,667 DEPARTMENT TOTAL
Page 331
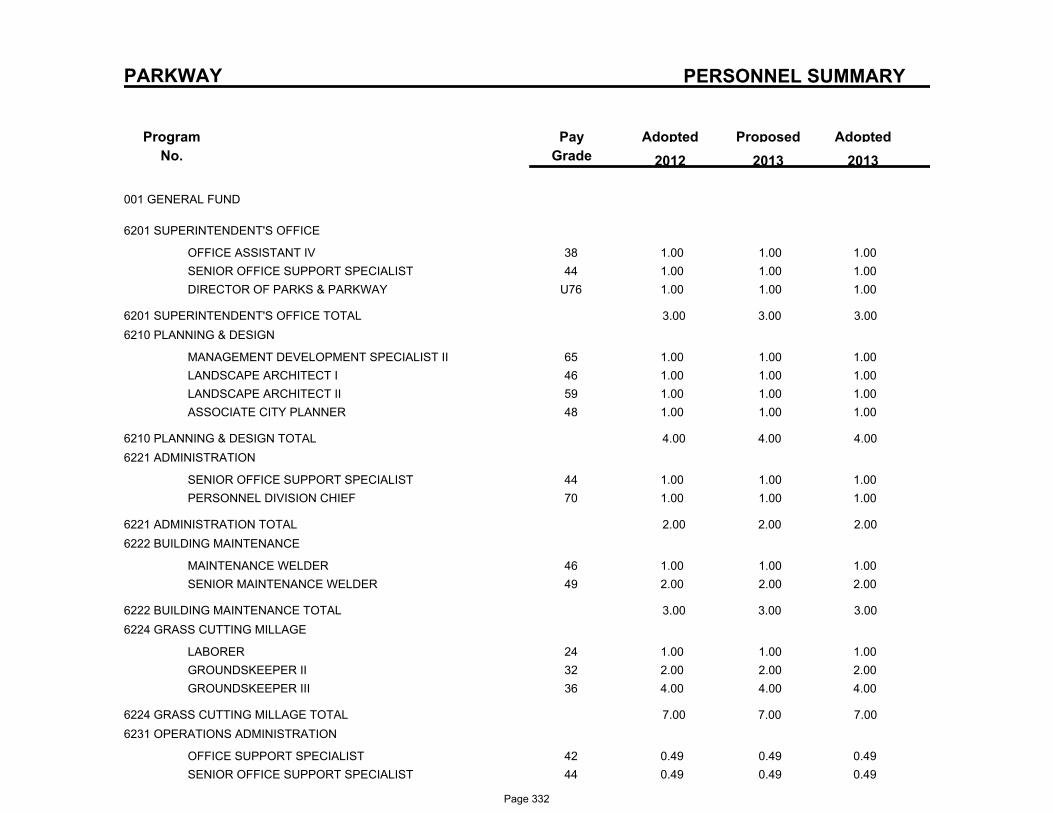
PERSONNEL SUMMARY
Program
No.
ProposedAdoptedPay
Grade
Adopted
2013 2012 2013
PARKWAY
001 GENERAL FUND
6201 SUPERINTENDENT'S OFFICE
38OFFICE ASSISTANT IV 1.00 1.00 1.00
44SENIOR OFFICE SUPPORT SPECIALIST 1.00 1.00 1.00
U76DIRECTOR OF PARKS & PARKWAY 1.00 1.00 1.00
6201 SUPERINTENDENT'S OFFICE TOTAL 3.00 3.00 3.00
6210 PLANNING & DESIGN
65MANAGEMENT DEVELOPMENT SPECIALIST II 1.00 1.00 1.00
46LANDSCAPE ARCHITECT I 1.00 1.00 1.00
59LANDSCAPE ARCHITECT II 1.00 1.00 1.00
48ASSOCIATE CITY PLANNER 1.00 1.00 1.00
6210 PLANNING & DESIGN TOTAL 4.00 4.00 4.00
6221 ADMINISTRATION
44SENIOR OFFICE SUPPORT SPECIALIST 1.00 1.00 1.00
70PERSONNEL DIVISION CHIEF 1.00 1.00 1.00
6221 ADMINISTRATION TOTAL 2.00 2.00 2.00
6222 BUILDING MAINTENANCE
46MAINTENANCE WELDER 1.00 1.00 1.00
49SENIOR MAINTENANCE WELDER 2.00 2.00 2.00
6222 BUILDING MAINTENANCE TOTAL 3.00 3.00 3.00
6224 GRASS CUTTING MILLAGE
24LABORER 1.00 1.00 1.00
32GROUNDSKEEPER II 2.00 2.00 2.00
36GROUNDSKEEPER III 4.00 4.00 4.00
6224 GRASS CUTTING MILLAGE TOTAL 7.00 7.00 7.00
6231 OPERATIONS ADMINISTRATION
42OFFICE SUPPORT SPECIALIST 0.49 0.49 0.49
44SENIOR OFFICE SUPPORT SPECIALIST 0.49 0.49 0.49
Page 332
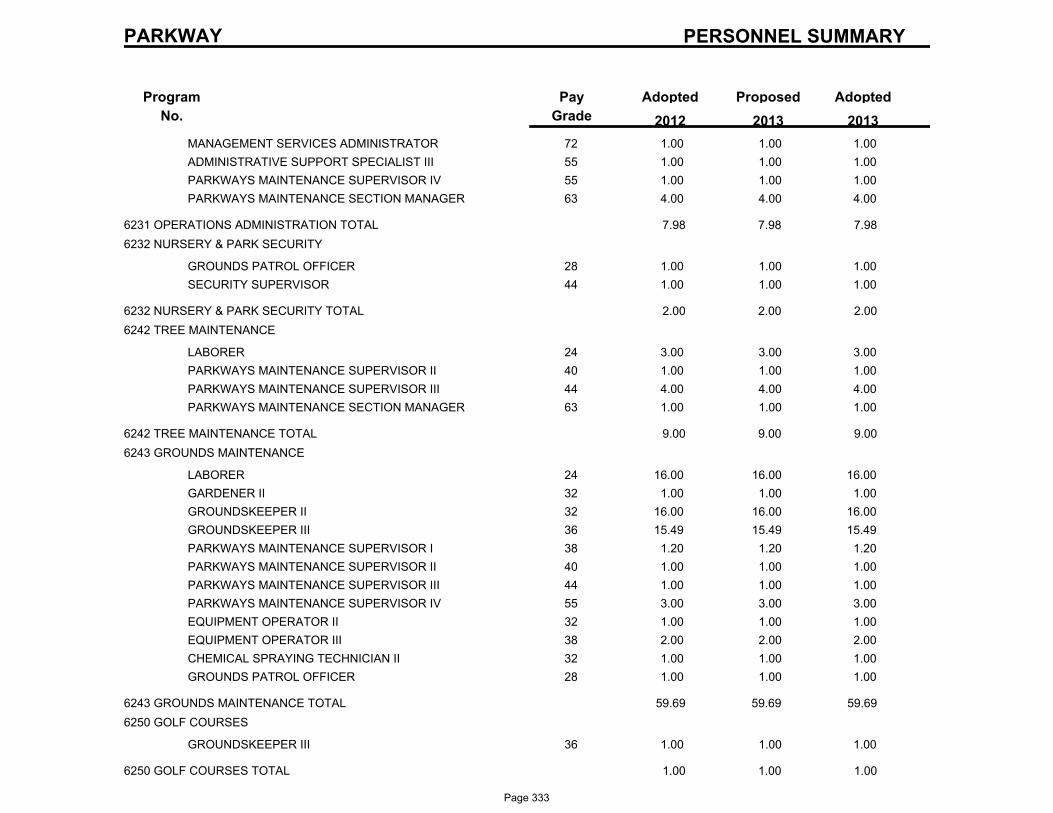
PERSONNEL SUMMARY
Program
No.
ProposedAdoptedPay
Grade
Adopted
2013 2012 2013
PARKWAY
72MANAGEMENT SERVICES ADMINISTRATOR 1.00 1.00 1.00
55ADMINISTRATIVE SUPPORT SPECIALIST III 1.00 1.00 1.00
55PARKWAYS MAINTENANCE SUPERVISOR IV 1.00 1.00 1.00
63PARKWAYS MAINTENANCE SECTION MANAGER 4.00 4.00 4.00
6231 OPERATIONS ADMINISTRATION TOTAL 7.98 7.98 7.98
6232 NURSERY & PARK SECURITY
28GROUNDS PATROL OFFICER 1.00 1.00 1.00
44SECURITY SUPERVISOR 1.00 1.00 1.00
6232 NURSERY & PARK SECURITY TOTAL 2.00 2.00 2.00
6242 TREE MAINTENANCE
24LABORER 3.00 3.00 3.00
40PARKWAYS MAINTENANCE SUPERVISOR II 1.00 1.00 1.00
44PARKWAYS MAINTENANCE SUPERVISOR III 4.00 4.00 4.00
63PARKWAYS MAINTENANCE SECTION MANAGER 1.00 1.00 1.00
6242 TREE MAINTENANCE TOTAL 9.00 9.00 9.00
6243 GROUNDS MAINTENANCE
24LABORER 16.00 16.00 16.00
32GARDENER II 1.00 1.00 1.00
32GROUNDSKEEPER II 16.00 16.00 16.00
36GROUNDSKEEPER III 15.49 15.49 15.49
38PARKWAYS MAINTENANCE SUPERVISOR I 1.20 1.20 1.20
40PARKWAYS MAINTENANCE SUPERVISOR II 1.00 1.00 1.00
44PARKWAYS MAINTENANCE SUPERVISOR III 1.00 1.00 1.00
55PARKWAYS MAINTENANCE SUPERVISOR IV 3.00 3.00 3.00
32EQUIPMENT OPERATOR II 1.00 1.00 1.00
38EQUIPMENT OPERATOR III 2.00 2.00 2.00
32CHEMICAL SPRAYING TECHNICIAN II 1.00 1.00 1.00
28GROUNDS PATROL OFFICER 1.00 1.00 1.00
6243 GROUNDS MAINTENANCE TOTAL 59.69 59.69 59.69
6250 GOLF COURSES
36GROUNDSKEEPER III 1.00 1.00 1.00
6250 GOLF COURSES TOTAL 1.00 1.00 1.00
Page 333
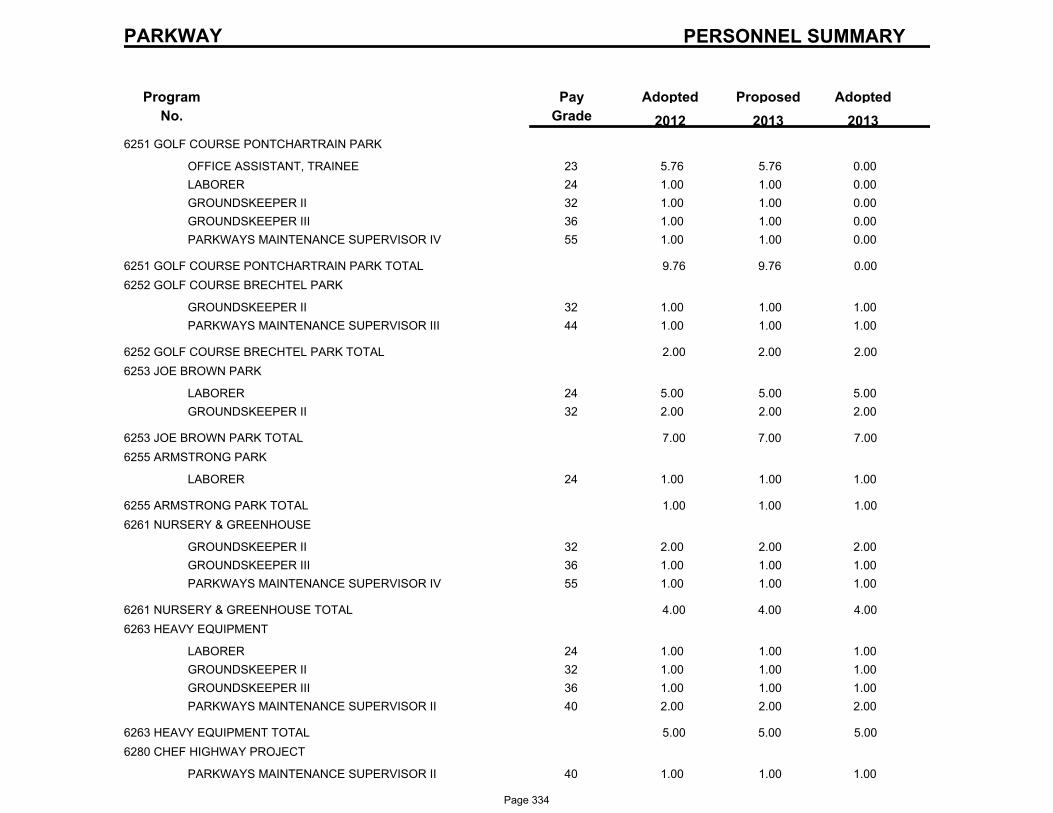
PERSONNEL SUMMARY
Program
No.
ProposedAdoptedPay
Grade
Adopted
2013 2012 2013
PARKWAY
6251 GOLF COURSE PONTCHARTRAIN PARK
23OFFICE ASSISTANT, TRAINEE 5.76 5.76 0.00
24LABORER 1.00 1.00 0.00
32GROUNDSKEEPER II 1.00 1.00 0.00
36GROUNDSKEEPER III 1.00 1.00 0.00
55PARKWAYS MAINTENANCE SUPERVISOR IV 1.00 1.00 0.00
6251 GOLF COURSE PONTCHARTRAIN PARK TOTAL 9.76 9.76 0.00
6252 GOLF COURSE BRECHTEL PARK
32GROUNDSKEEPER II 1.00 1.00 1.00
44PARKWAYS MAINTENANCE SUPERVISOR III 1.00 1.00 1.00
6252 GOLF COURSE BRECHTEL PARK TOTAL 2.00 2.00 2.00
6253 JOE BROWN PARK
24LABORER 5.00 5.00 5.00
32GROUNDSKEEPER II 2.00 2.00 2.00
6253 JOE BROWN PARK TOTAL 7.00 7.00 7.00
6255 ARMSTRONG PARK
24LABORER 1.00 1.00 1.00
6255 ARMSTRONG PARK TOTAL 1.00 1.00 1.00
6261 NURSERY & GREENHOUSE
32GROUNDSKEEPER II 2.00 2.00 2.00
36GROUNDSKEEPER III 1.00 1.00 1.00
55PARKWAYS MAINTENANCE SUPERVISOR IV 1.00 1.00 1.00
6261 NURSERY & GREENHOUSE TOTAL 4.00 4.00 4.00
6263 HEAVY EQUIPMENT
24LABORER 1.00 1.00 1.00
32GROUNDSKEEPER II 1.00 1.00 1.00
36GROUNDSKEEPER III 1.00 1.00 1.00
40PARKWAYS MAINTENANCE SUPERVISOR II 2.00 2.00 2.00
6263 HEAVY EQUIPMENT TOTAL 5.00 5.00 5.00
6280 CHEF HIGHWAY PROJECT
40PARKWAYS MAINTENANCE SUPERVISOR II 1.00 1.00 1.00
Page 334
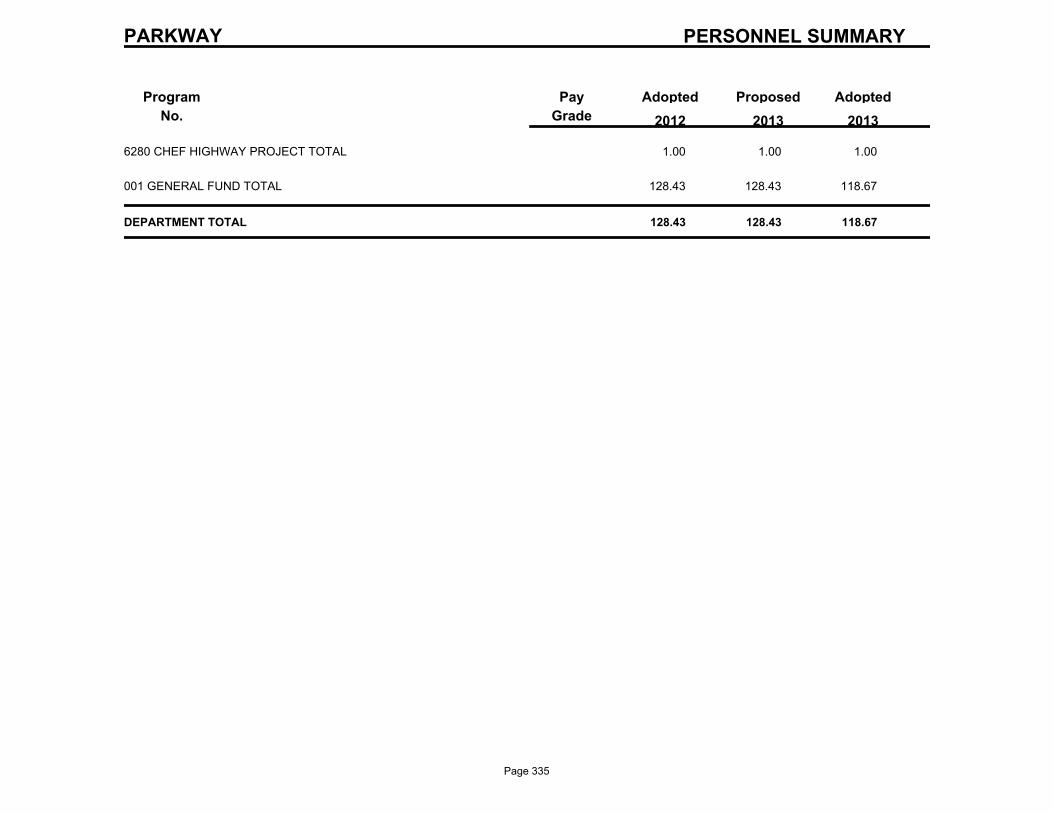
PERSONNEL SUMMARY
Program
No.
ProposedAdoptedPay
Grade
Adopted
2013 2012 2013
PARKWAY
6280 CHEF HIGHWAY PROJECT TOTAL 1.00 1.00 1.00
001 GENERAL FUND TOTAL 128.43 128.43 118.67
DEPARTMENT TOTAL 128.43 128.43 118.67
Page 335

New Orleans Public Library
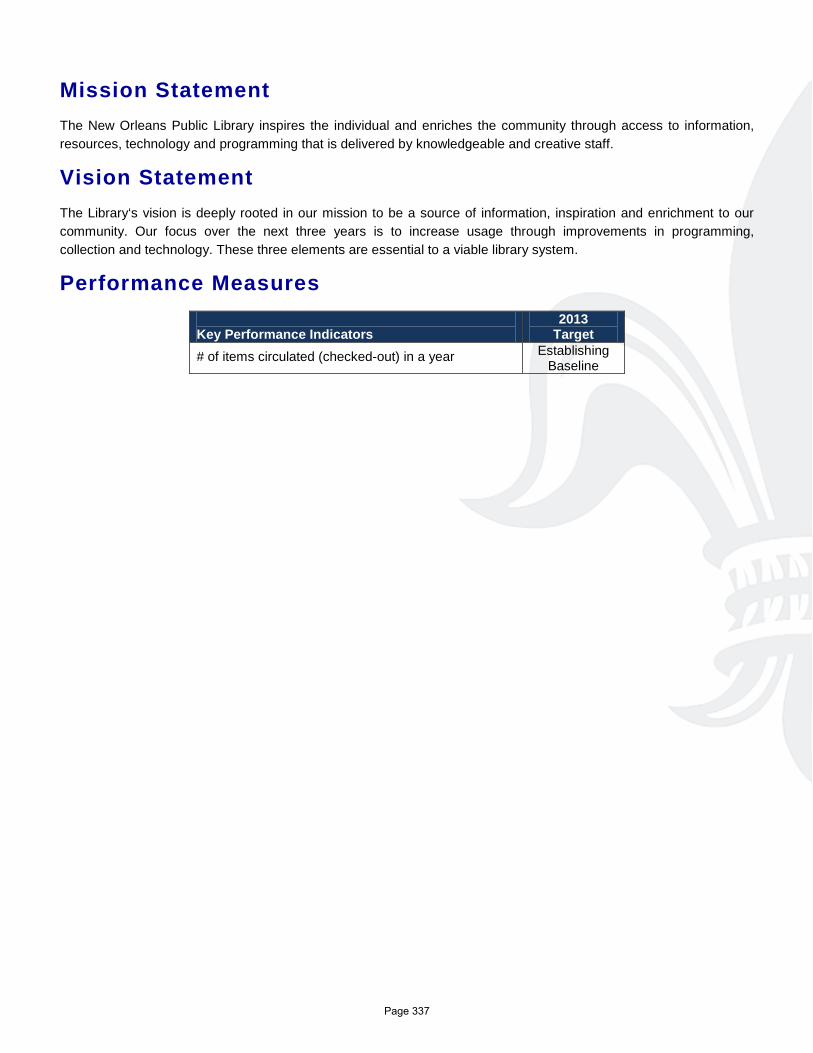
Mission Statement The New Orleans Public Library inspires the individual and enriches the community through access to information, resources, technology and programming that is delivered by knowledgeable and creative staff.
Vision Statement The Library‘s vision is deeply rooted in our mission to be a source of information, inspiration and enrichment to our community. Our focus over the next three years is to increase usage through improvements in programming, collection and technology. These three elements are essential to a viable library system.
Performance Measures Key Performance Indicators
2013 Target
# of items circulated (checked-out) in a year Establishing Baseline
Page 337
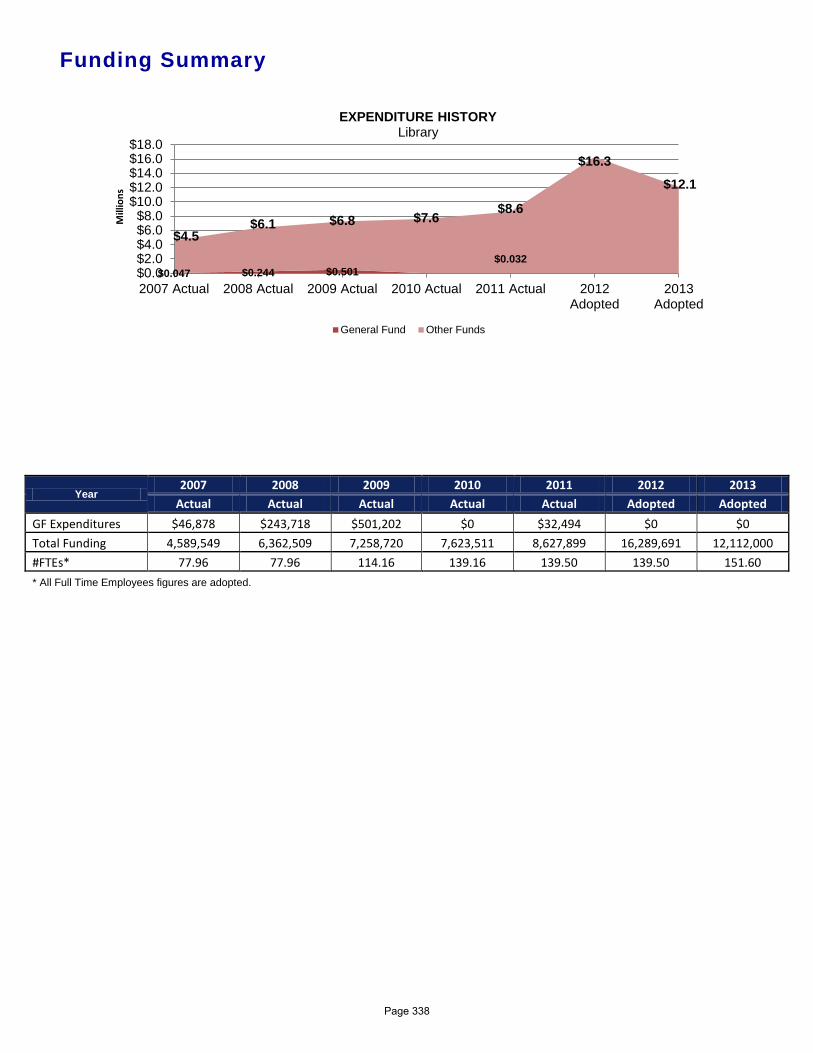
Funding Summary
Year 2007 2008 2009 2010 2011 2012 2013
Actual Actual Actual Actual Actual Adopted Adopted GF Expenditures $46,878 $243,718 $501,202 $0 $32,494 $0 $0 Total Funding 4,589,549 6,362,509 7,258,720 7,623,511 8,627,899 16,289,691 12,112,000 #FTEs* 77.96 77.96 114.16 139.16 139.50 139.50 151.60 * All Full Time Employees figures are adopted.
$0.047 $0.244 $0.501 $0.032
$4.5 $6.1 $6.8 $7.6
$8.6
$16.3 $12.1
$0.0$2.0$4.0$6.0$8.0
$10.0$12.0$14.0$16.0$18.0
2007 Actual 2008 Actual 2009 Actual 2010 Actual 2011 Actual 2012Adopted
2013Adopted
Mill
ions
EXPENDITURE HISTORY
Library
General Fund Other Funds
Page 338
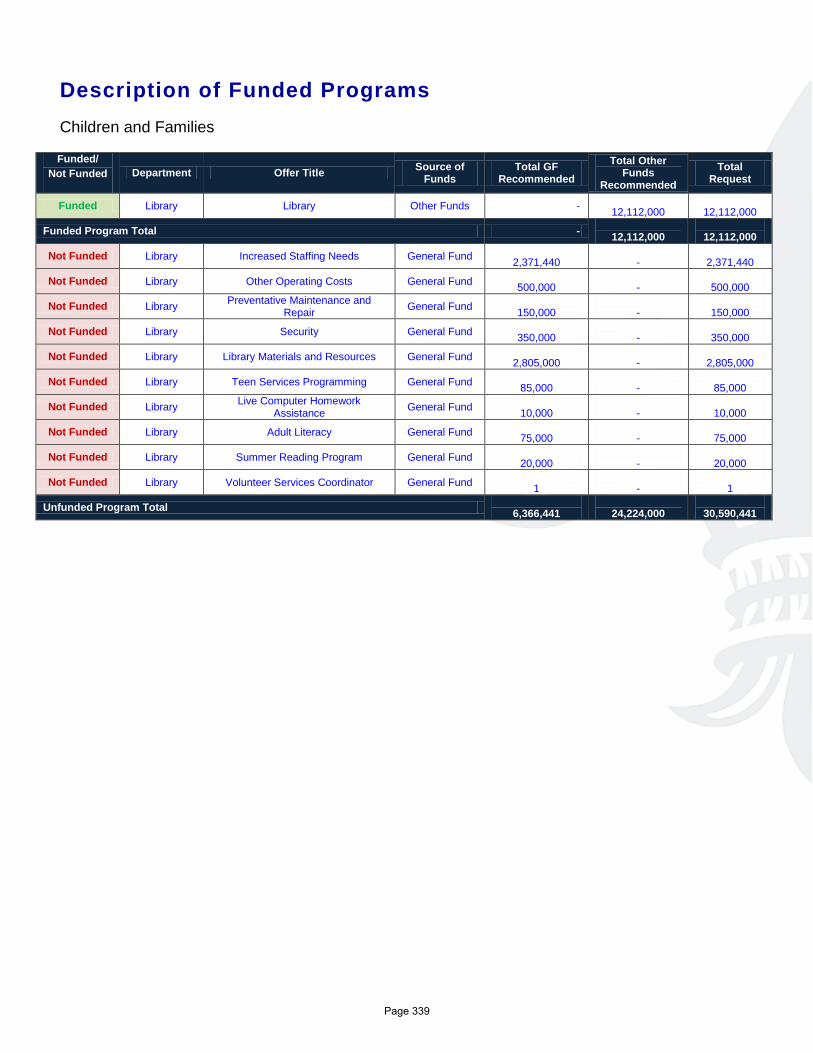
Description of Funded Programs Children and Families Funded/
Not Funded Department Offer Title Source of Funds
Total GF Recommended
Total Other Funds
Recommended Total
Request
Funded Library Library Other Funds - 12,112,000
12,112,000
Funded Program Total - 12,112,000
12,112,000
Not Funded Library Increased Staffing Needs General Fund 2,371,440
-
2,371,440
Not Funded Library Other Operating Costs General Fund 500,000
-
500,000
Not Funded Library Preventative Maintenance and Repair General Fund
150,000 -
150,000
Not Funded Library Security General Fund 350,000
-
350,000
Not Funded Library Library Materials and Resources General Fund 2,805,000
-
2,805,000
Not Funded Library Teen Services Programming General Fund 85,000
-
85,000
Not Funded Library Live Computer Homework Assistance General Fund
10,000 -
10,000
Not Funded Library Adult Literacy General Fund 75,000
-
75,000
Not Funded Library Summer Reading Program General Fund 20,000
-
20,000
Not Funded Library Volunteer Services Coordinator General Fund 1
-
1
Unfunded Program Total 6,366,441
24,224,000
30,590,441
Page 339

LIBRARY
DEPARTMENTAL BUDGET SUMMARY
AdoptedProposedAdoptedActual
EXPENDITURES
2013 2012 2011 2013
PERSONAL SERVICES 6,798,390 8,512,521 7,552,271 7,552,271
OTHER OPERATING 1,829,509 7,777,170 659,729 4,559,729
DEBT SERVICE 0 0 0 0
RESERVES 0 0 0 0
GRANTS, CONTRIB. & FUND TRAN. 0 0 0 0
$8,627,899 $16,289,691 $8,212,000 TOTAL EXPENDITURES $12,112,000
SOURCE OF FUNDING
GENERAL FUND 32,494 0 0 0
WISNER FUNDS 0 0 0 0
ENTERPRISE 0 0 0 0
DOWNTOWN DEVELOPMENT DIST. 0 0 0 0
HOUSING AND URBAN DEVELOP. 0 0 0 0
SELF GENERATED 0 0 0 0
LIBRARY 8,581,749 12,449,955 8,200,000 12,100,000
LLE 0 0 0 0
FEDERAL GRANTS 0 3,828,230 0 0
STATE GRANTS 13,656 11,506 12,000 12,000
GRANTS, CONTRIB., & FUND TRAN. 0 0 0 0
N. O. REGIONAL BUSINESS PARK 0 0 0 0
ECONOMIC DEVELOPMENT FUND 0 0 0 0
HOUSING IMPROVMENT FUND 0 0 0 0
$8,627,899 $16,289,691 $8,212,000 TOTAL FUNDING $12,112,000
Page 340
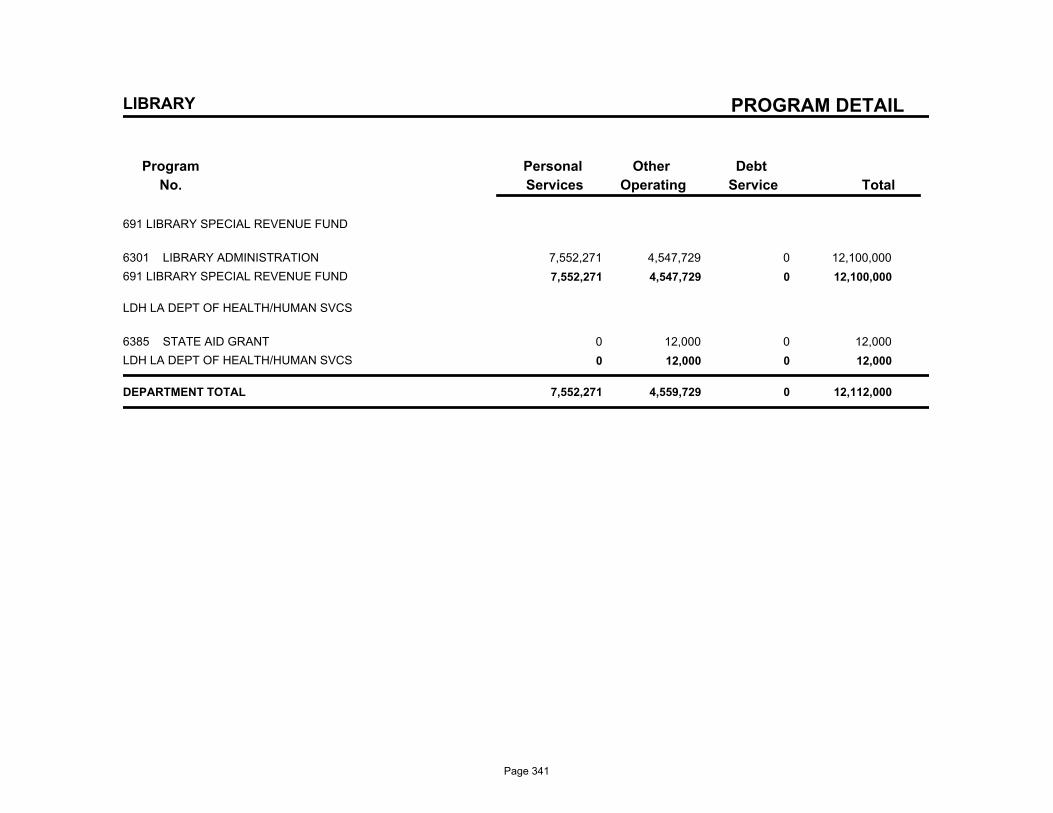
PROGRAM DETAIL
Program
No.
Debt
Service
Other
Operating
Personal
Services Total
LIBRARY
691 LIBRARY SPECIAL REVENUE FUND
6301 LIBRARY ADMINISTRATION 7,552,271 4,547,729 0 12,100,000
691 LIBRARY SPECIAL REVENUE FUND 7,552,271 4,547,729 0 12,100,000
LDH LA DEPT OF HEALTH/HUMAN SVCS
6385 STATE AID GRANT 0 12,000 0 12,000
LDH LA DEPT OF HEALTH/HUMAN SVCS 0 12,000 0 12,000
DEPARTMENT TOTAL 7,552,271 4,559,729 0 12,112,000
Page 341
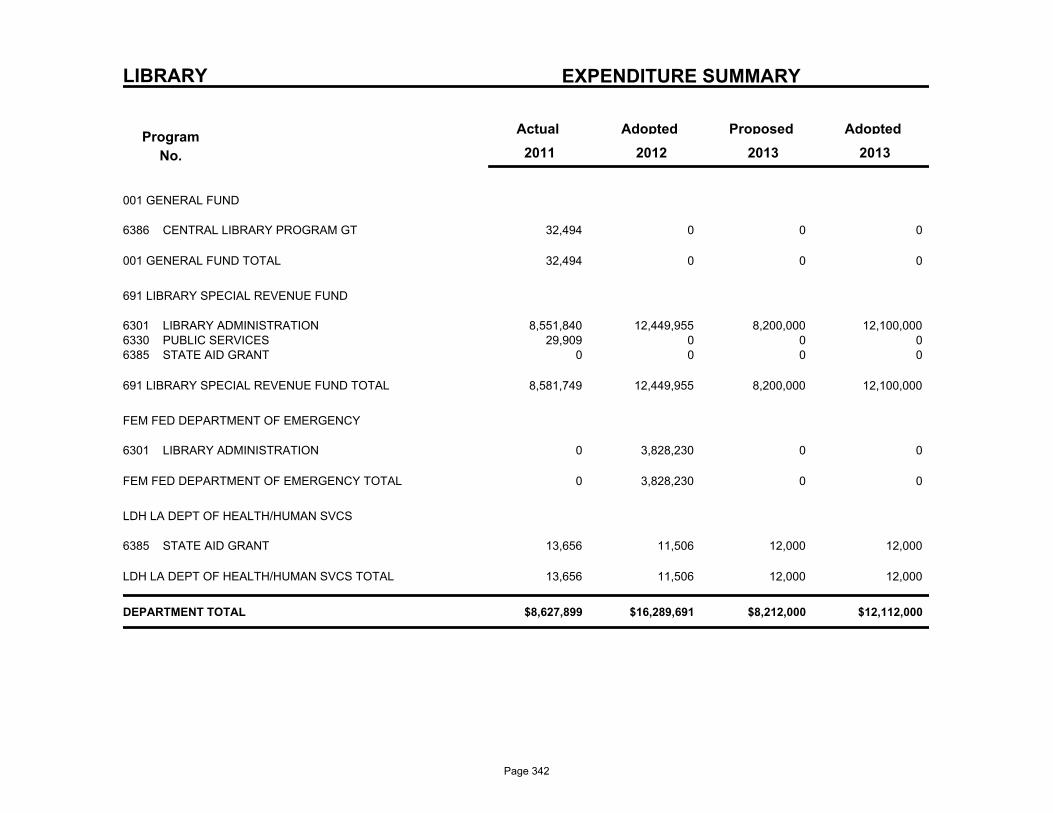
LIBRARY EXPENDITURE SUMMARY
Program
No.
Actual AdoptedProposedAdopted
2013 2011 2012 2013
001 GENERAL FUND
32,494 0 0 CENTRAL LIBRARY PROGRAM GT6386 0
32,494 0 0 0 001 GENERAL FUND TOTAL
691 LIBRARY SPECIAL REVENUE FUND
8,551,840 12,449,955 8,200,000 LIBRARY ADMINISTRATION6301 12,100,000 29,909 0 0 PUBLIC SERVICES6330 0
0 0 0 STATE AID GRANT6385 0
8,581,749 12,449,955 8,200,000 12,100,000 691 LIBRARY SPECIAL REVENUE FUND TOTAL
FEM FED DEPARTMENT OF EMERGENCY
0 3,828,230 0 LIBRARY ADMINISTRATION6301 0
0 3,828,230 0 0 FEM FED DEPARTMENT OF EMERGENCY TOTAL
LDH LA DEPT OF HEALTH/HUMAN SVCS
13,656 11,506 12,000 STATE AID GRANT6385 12,000
13,656 11,506 12,000 12,000 LDH LA DEPT OF HEALTH/HUMAN SVCS TOTAL
$8,627,899 $16,289,691 $8,212,000 $12,112,000 DEPARTMENT TOTAL
Page 342
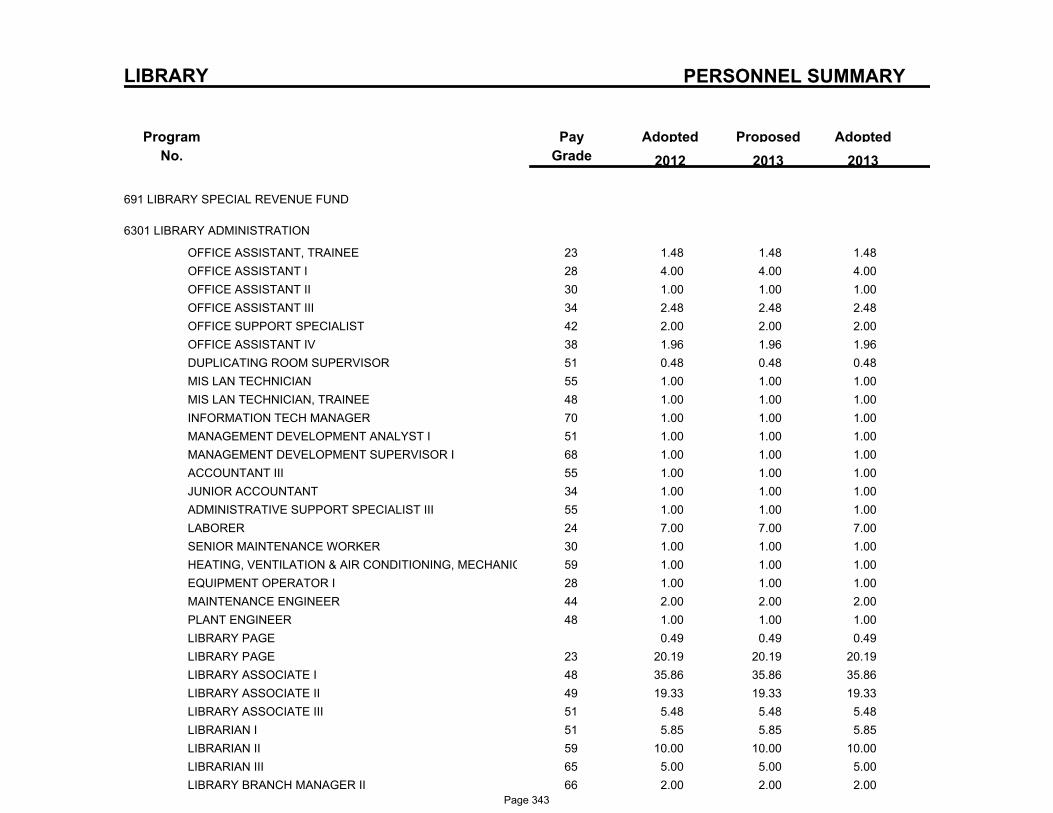
PERSONNEL SUMMARY
Program
No.
ProposedAdoptedPay
Grade
Adopted
2013 2012 2013
LIBRARY
691 LIBRARY SPECIAL REVENUE FUND
6301 LIBRARY ADMINISTRATION
23OFFICE ASSISTANT, TRAINEE 1.48 1.48 1.48
28OFFICE ASSISTANT I 4.00 4.00 4.00
30OFFICE ASSISTANT II 1.00 1.00 1.00
34OFFICE ASSISTANT III 2.48 2.48 2.48
42OFFICE SUPPORT SPECIALIST 2.00 2.00 2.00
38OFFICE ASSISTANT IV 1.96 1.96 1.96
51DUPLICATING ROOM SUPERVISOR 0.48 0.48 0.48
55MIS LAN TECHNICIAN 1.00 1.00 1.00
48MIS LAN TECHNICIAN, TRAINEE 1.00 1.00 1.00
70INFORMATION TECH MANAGER 1.00 1.00 1.00
51MANAGEMENT DEVELOPMENT ANALYST I 1.00 1.00 1.00
68MANAGEMENT DEVELOPMENT SUPERVISOR I 1.00 1.00 1.00
55ACCOUNTANT III 1.00 1.00 1.00
34JUNIOR ACCOUNTANT 1.00 1.00 1.00
55ADMINISTRATIVE SUPPORT SPECIALIST III 1.00 1.00 1.00
24LABORER 7.00 7.00 7.00
30SENIOR MAINTENANCE WORKER 1.00 1.00 1.00
59HEATING, VENTILATION & AIR CONDITIONING, MECHANIC 1.00 1.00 1.00
28EQUIPMENT OPERATOR I 1.00 1.00 1.00
44MAINTENANCE ENGINEER 2.00 2.00 2.00
48PLANT ENGINEER 1.00 1.00 1.00
LIBRARY PAGE 0.49 0.49 0.49
23LIBRARY PAGE 20.19 20.19 20.19
48LIBRARY ASSOCIATE I 35.86 35.86 35.86
49LIBRARY ASSOCIATE II 19.33 19.33 19.33
51LIBRARY ASSOCIATE III 5.48 5.48 5.48
51LIBRARIAN I 5.85 5.85 5.85
59LIBRARIAN II 10.00 10.00 10.00
65LIBRARIAN III 5.00 5.00 5.00
66LIBRARY BRANCH MANAGER II 2.00 2.00 2.00Page 343
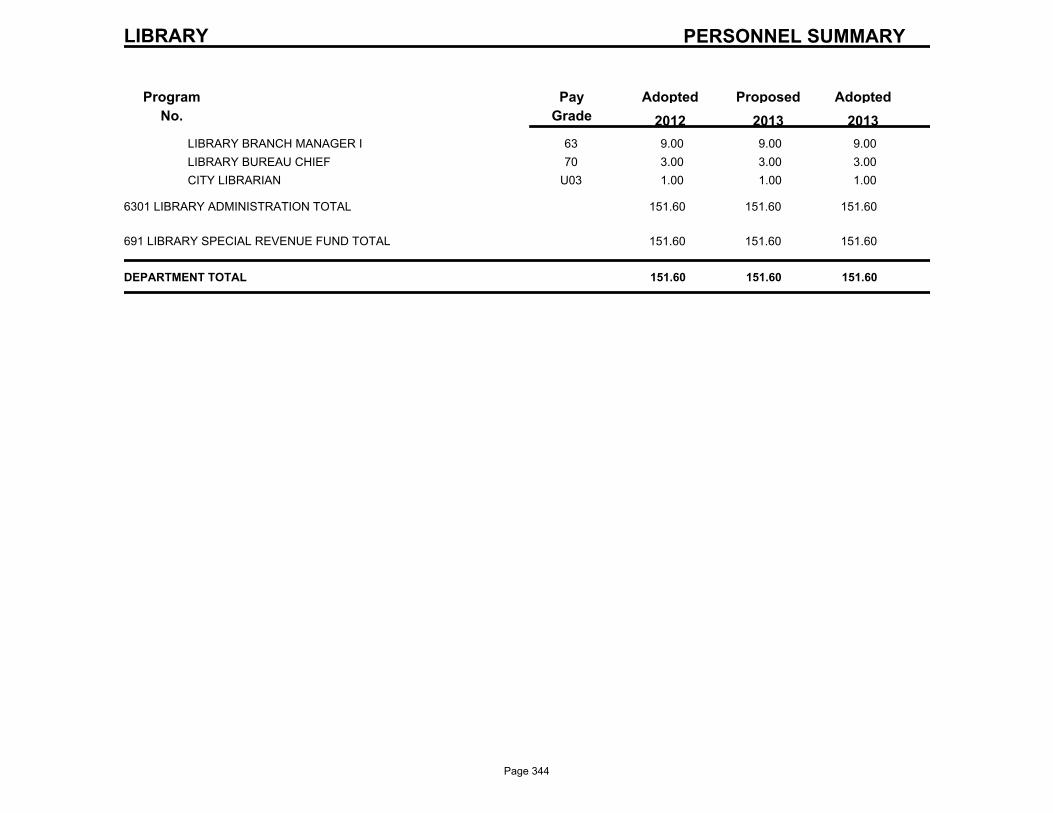
PERSONNEL SUMMARY
Program
No.
ProposedAdoptedPay
Grade
Adopted
2013 2012 2013
LIBRARY
63LIBRARY BRANCH MANAGER I 9.00 9.00 9.00
70LIBRARY BUREAU CHIEF 3.00 3.00 3.00
U03CITY LIBRARIAN 1.00 1.00 1.00
6301 LIBRARY ADMINISTRATION TOTAL 151.60 151.60 151.60
691 LIBRARY SPECIAL REVENUE FUND TOTAL 151.60 151.60 151.60
DEPARTMENT TOTAL 151.60 151.60 151.60
Page 344

Page 345

Historic Districts & Landmarks Commission/ Vieux Carré Commission
Introduction As part of the permitting reform effort, the Vieux Carré Commission and the Historic Districts & Landmarks Commission will work to share resources and consolidate operations.
Mission Statement Historic Districts & Landmarks Commission: The mission of the HDLC is to promote historic districts and landmarks for the educational, cultural, economic and general welfare of the public through the preservation, protection and regulation of buildings, sites, monuments, structures and areas of historic interest or importance within the City of New Orleans. The HDLC safeguards the heritage of the City by preserving and regulating historic landmarks and districts which reflect elements of its cultural, social, economic, political and architectural history in order to:
• Preserve and enhance the environmental quality of neighborhoods • Strengthen the City‘s economic base by the stimulation of the tourist industry • Establish and improve property values • Foster economic development while managing growth.
Vieux Carré Commission: The mission of the Vieux Carré Commission is to protect, preserve and maintain the distinct architectural, historic character and zoning integrity of the Vieux Carré as mandated by the Louisiana State Constitution, the City Charter, the City Code and the Comprehensive Zoning Ordinance.
Vision Statement Historic Districts & Landmarks Commission: In the coming years, we see both the mission and the duties of the HDLC being recognized as integral to the missions and duties of other departments such as the City Planning Commission, Safety & Permits, Economic Development, Environmental Affairs, Capital Projects and Code Enforcement. Recognizing that New Orleans’ past is a key piece of our future will allow the integration of historic preservation into other municipal processes. This integration will allow the City to provide property owners, businesses and developers with a clear and unified vision of what can and will be approved.
Vieux Carré Commission: The Vieux Carrè Commission regulates exterior modifications to the French Quarter‘s built environment to ensure that the district‘s architectural and historic resources are protected. Going forward, we envision an agency that is more proactive in carrying out its mission, offers better outreach and education to its constituents and effects positive change in blight reduction and violation enforcement in this important cultural district and prominent tourist attraction.
Page 347
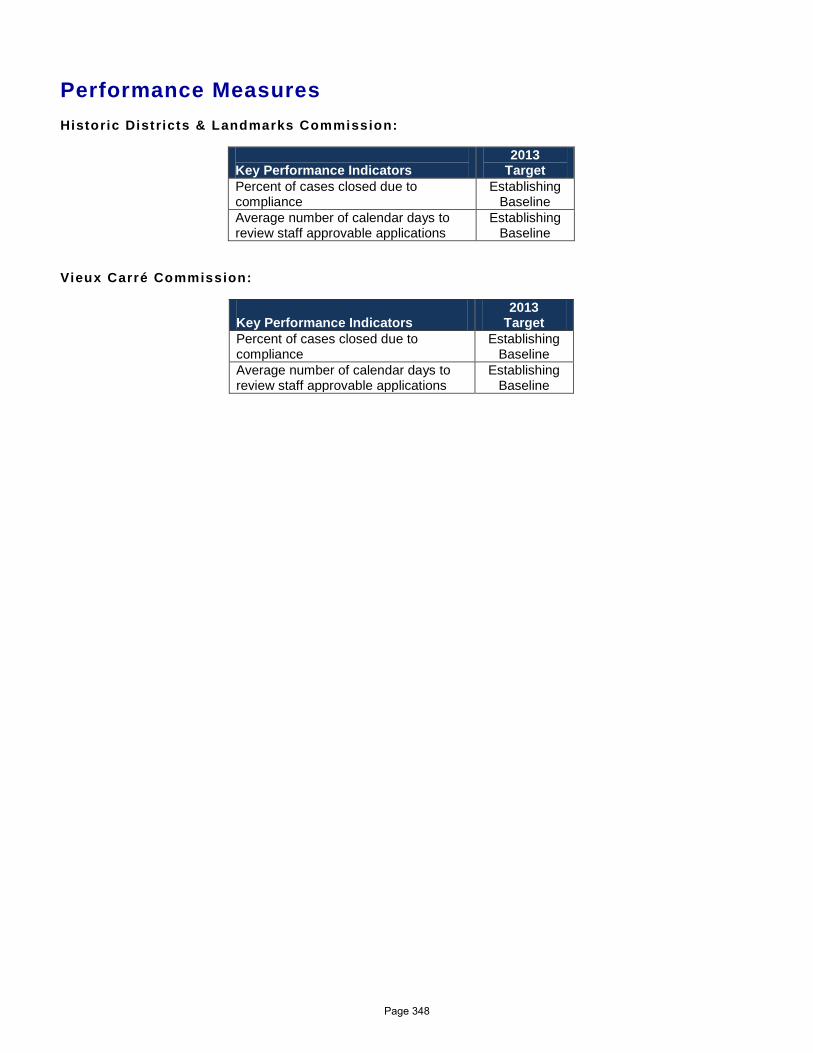
Performance Measures Historic Districts & Landmarks Commission:
Key Performance Indicators
2013 Target
Percent of cases closed due to compliance
Establishing Baseline
Average number of calendar days to review staff approvable applications
Establishing Baseline
Vieux Carré Commission: Key Performance Indicators
2013 Target
Percent of cases closed due to compliance
Establishing Baseline
Average number of calendar days to review staff approvable applications
Establishing Baseline
Page 348
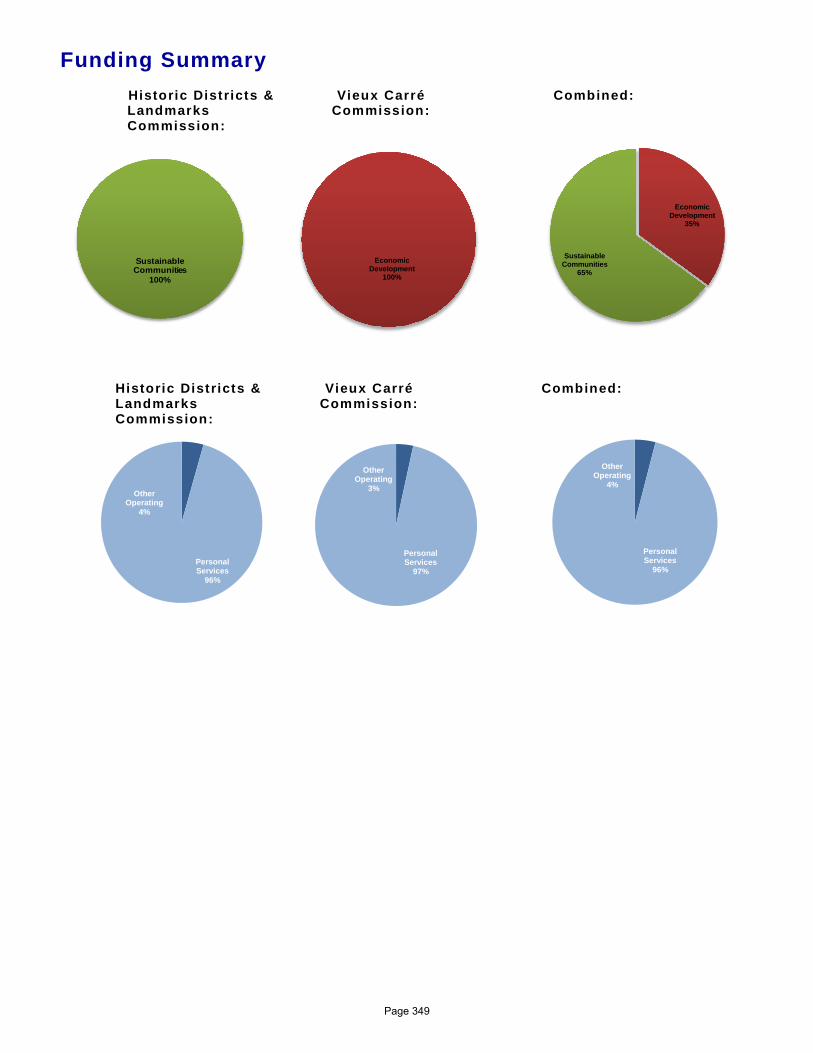
Funding Summary Historic Districts & Landmarks Commission:
Vieux Carré Commission:
Combined:
Historic Districts & Landmarks Commission:
Vieux Carré
Commission:
Combined:
Sustainable Communities
100%
Other Operating
3%
Personal Services
97%
Other Operating
4%
Personal Services
96%
Other Operating
4%
Personal Services
96%
Economic Development
100%
Economic Development
35%
Sustainable Communities
65%
Page 349
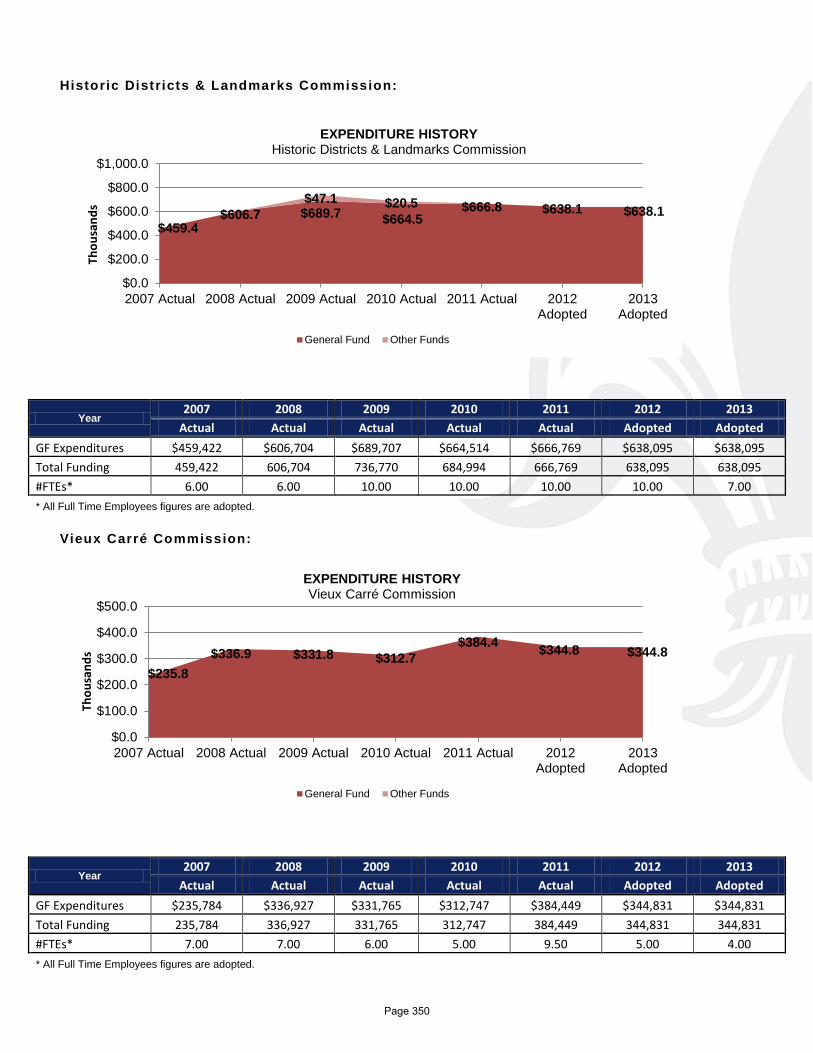
Historic Districts & Landmarks Commission:
Year 2007 2008 2009 2010 2011 2012 2013
Actual Actual Actual Actual Actual Adopted Adopted GF Expenditures $459,422 $606,704 $689,707 $664,514 $666,769 $638,095 $638,095 Total Funding 459,422 606,704 736,770 684,994 666,769 638,095 638,095 #FTEs* 6.00 6.00 10.00 10.00 10.00 10.00 7.00 * All Full Time Employees figures are adopted.
Vieux Carré Commission:
Year 2007 2008 2009 2010 2011 2012 2013
Actual Actual Actual Actual Actual Adopted Adopted GF Expenditures $235,784 $336,927 $331,765 $312,747 $384,449 $344,831 $344,831 Total Funding 235,784 336,927 331,765 312,747 384,449 344,831 344,831 #FTEs* 7.00 7.00 6.00 5.00 9.50 5.00 4.00 * All Full Time Employees figures are adopted.
$459.4 $606.7 $689.7 $664.5
$666.8 $638.1 $638.1 $47.1 $20.5
$0.0
$200.0
$400.0
$600.0
$800.0
$1,000.0
2007 Actual 2008 Actual 2009 Actual 2010 Actual 2011 Actual 2012Adopted
2013Adopted
Thou
sand
s
EXPENDITURE HISTORY Historic Districts & Landmarks Commission
General Fund Other Funds
$235.8 $336.9 $331.8 $312.7
$384.4 $344.8 $344.8
$0.0
$100.0
$200.0
$300.0
$400.0
$500.0
2007 Actual 2008 Actual 2009 Actual 2010 Actual 2011 Actual 2012Adopted
2013Adopted
Thou
sand
s
EXPENDITURE HISTORY Vieux Carré Commission
General Fund Other Funds
Page 350
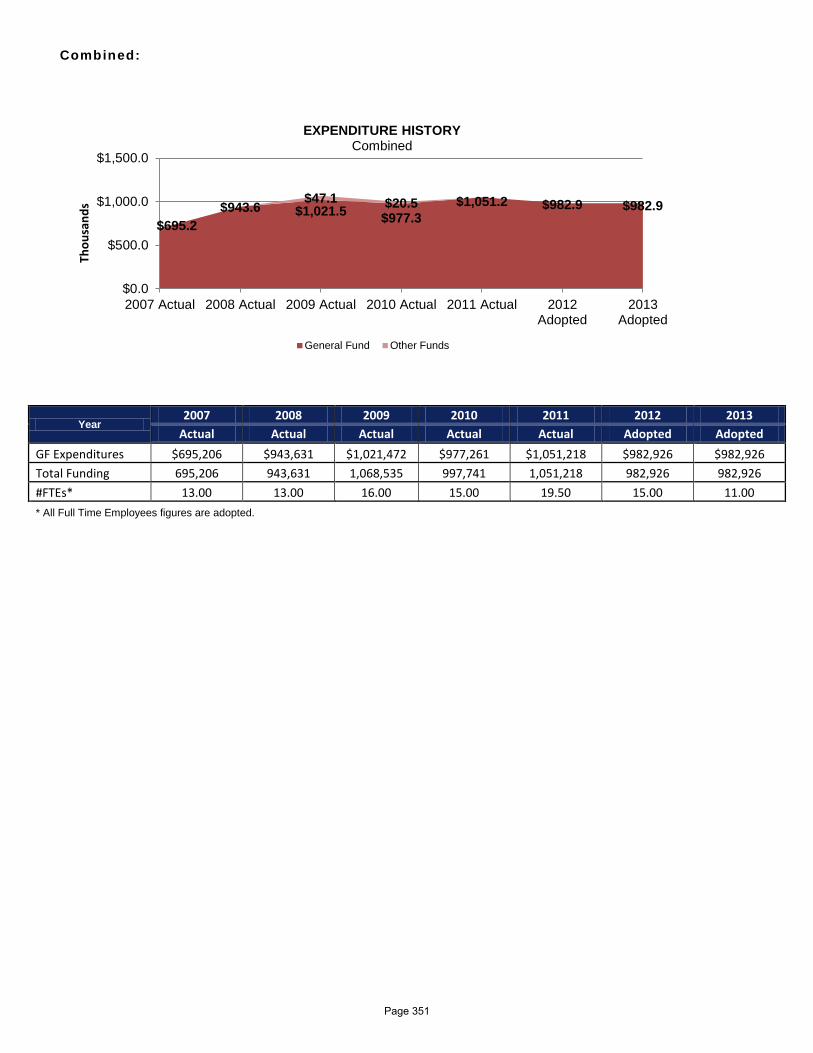
Combined:
Year 2007 2008 2009 2010 2011 2012 2013
Actual Actual Actual Actual Actual Adopted Adopted GF Expenditures $695,206 $943,631 $1,021,472 $977,261 $1,051,218 $982,926 $982,926 Total Funding 695,206 943,631 1,068,535 997,741 1,051,218 982,926 982,926 #FTEs* 13.00 13.00 16.00 15.00 19.50 15.00 11.00 * All Full Time Employees figures are adopted.
$695.2 $943.6 $1,021.5 $977.3
$1,051.2 $982.9 $982.9 $47.1 $20.5
$0.0
$500.0
$1,000.0
$1,500.0
2007 Actual 2008 Actual 2009 Actual 2010 Actual 2011 Actual 2012Adopted
2013Adopted
Thou
sand
s
EXPENDITURE HISTORY Combined
General Fund Other Funds
Page 351
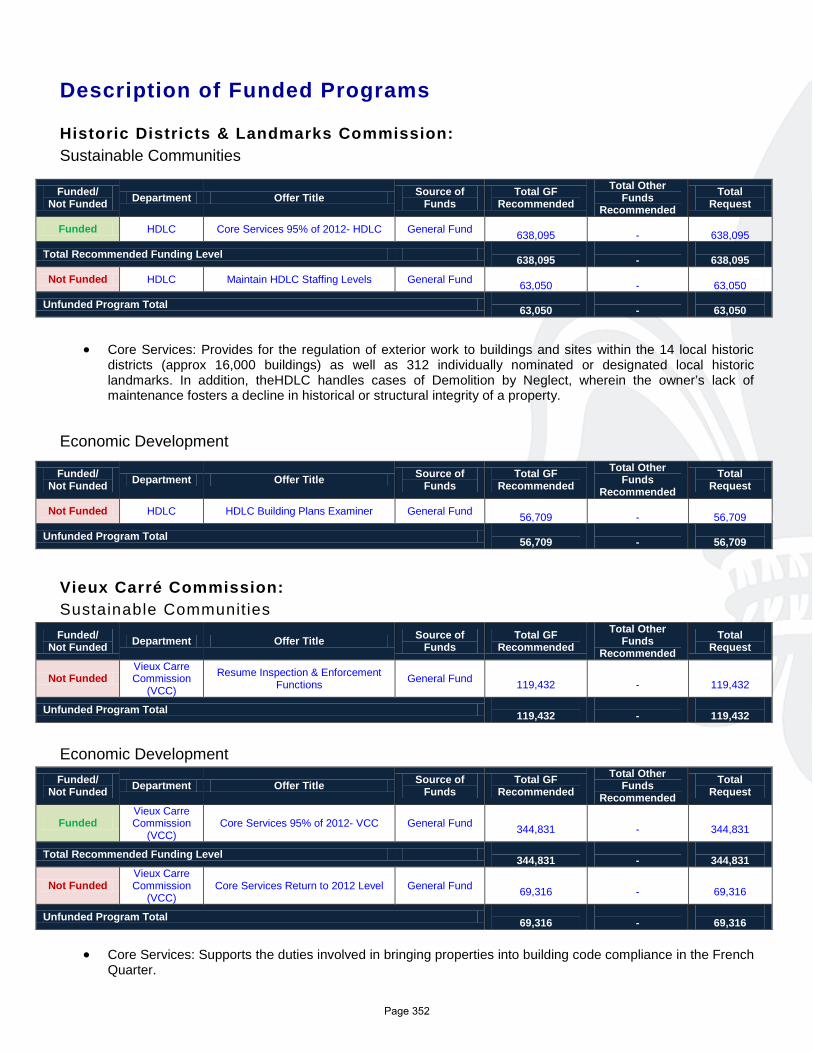
Description of Funded Programs Historic Districts & Landmarks Commission: Sustainable Communities
Funded/ Not Funded Department Offer Title Source of
Funds Total GF
Recommended Total Other
Funds Recommended
Total Request
Funded HDLC Core Services 95% of 2012- HDLC General Fund 638,095
-
638,095
Total Recommended Funding Level 638,095
-
638,095
Not Funded HDLC Maintain HDLC Staffing Levels General Fund 63,050
-
63,050
Unfunded Program Total 63,050
-
63,050
• Core Services: Provides for the regulation of exterior work to buildings and sites within the 14 local historic
districts (approx 16,000 buildings) as well as 312 individually nominated or designated local historic landmarks. In addition, theHDLC handles cases of Demolition by Neglect, wherein the owner’s lack of maintenance fosters a decline in historical or structural integrity of a property.
Economic Development
Funded/ Not Funded Department Offer Title Source of
Funds Total GF
Recommended Total Other
Funds Recommended
Total Request
Not Funded HDLC HDLC Building Plans Examiner General Fund 56,709
-
56,709
Unfunded Program Total 56,709
-
56,709
Vieux Carré Commission: Sustainable Communities
Funded/ Not Funded Department Offer Title Source of
Funds Total GF
Recommended Total Other
Funds Recommended
Total Request
Not Funded Vieux Carre Commission
(VCC)
Resume Inspection & Enforcement Functions General Fund
119,432 -
119,432
Unfunded Program Total 119,432
-
119,432
Economic Development Funded/
Not Funded Department Offer Title Source of Funds
Total GF Recommended
Total Other Funds
Recommended Total
Request
Funded Vieux Carre Commission
(VCC) Core Services 95% of 2012- VCC General Fund
344,831 -
344,831
Total Recommended Funding Level 344,831
-
344,831
Not Funded Vieux Carre Commission
(VCC) Core Services Return to 2012 Level General Fund
69,316 -
69,316
Unfunded Program Total 69,316
-
69,316
• Core Services: Supports the duties involved in bringing properties into building code compliance in the French
Quarter.
Page 352
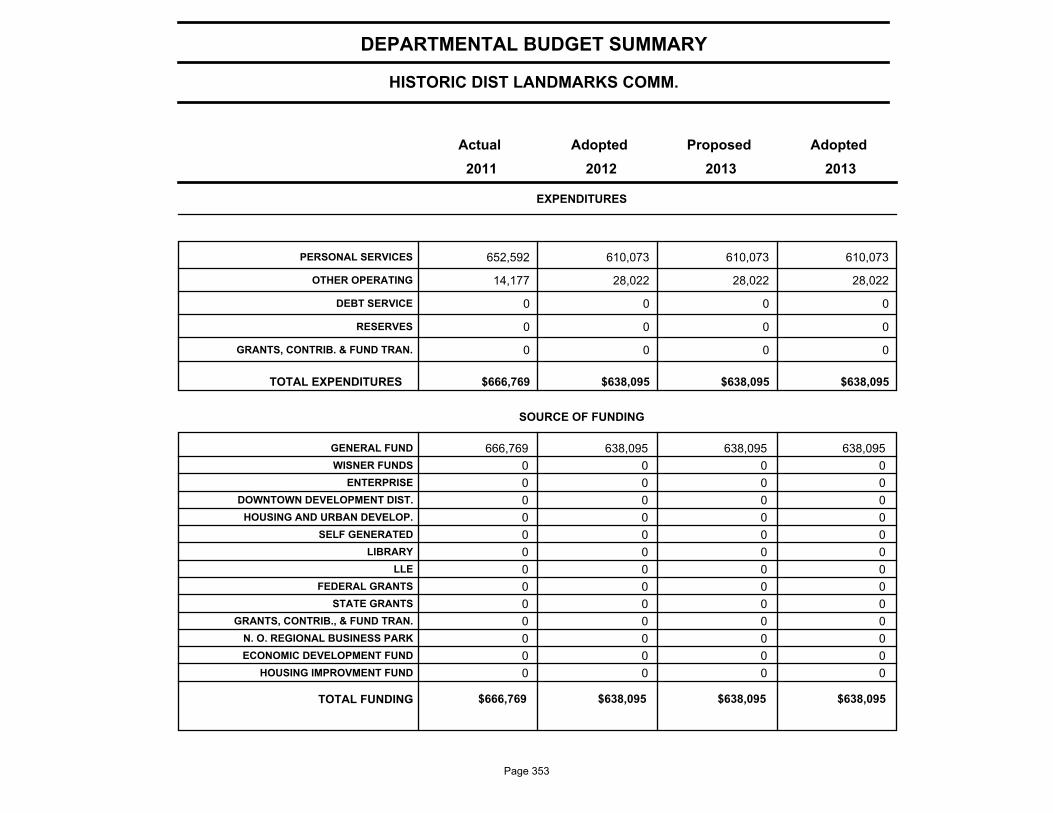
HISTORIC DIST LANDMARKS COMM.
DEPARTMENTAL BUDGET SUMMARY
AdoptedProposedAdoptedActual
EXPENDITURES
2013 2012 2011 2013
PERSONAL SERVICES 652,592 610,073 610,073 610,073
OTHER OPERATING 14,177 28,022 28,022 28,022
DEBT SERVICE 0 0 0 0
RESERVES 0 0 0 0
GRANTS, CONTRIB. & FUND TRAN. 0 0 0 0
$666,769 $638,095 $638,095 TOTAL EXPENDITURES $638,095
SOURCE OF FUNDING
GENERAL FUND 666,769 638,095 638,095 638,095
WISNER FUNDS 0 0 0 0
ENTERPRISE 0 0 0 0
DOWNTOWN DEVELOPMENT DIST. 0 0 0 0
HOUSING AND URBAN DEVELOP. 0 0 0 0
SELF GENERATED 0 0 0 0
LIBRARY 0 0 0 0
LLE 0 0 0 0
FEDERAL GRANTS 0 0 0 0
STATE GRANTS 0 0 0 0
GRANTS, CONTRIB., & FUND TRAN. 0 0 0 0
N. O. REGIONAL BUSINESS PARK 0 0 0 0
ECONOMIC DEVELOPMENT FUND 0 0 0 0
HOUSING IMPROVMENT FUND 0 0 0 0
$666,769 $638,095 $638,095 TOTAL FUNDING $638,095
Page 353
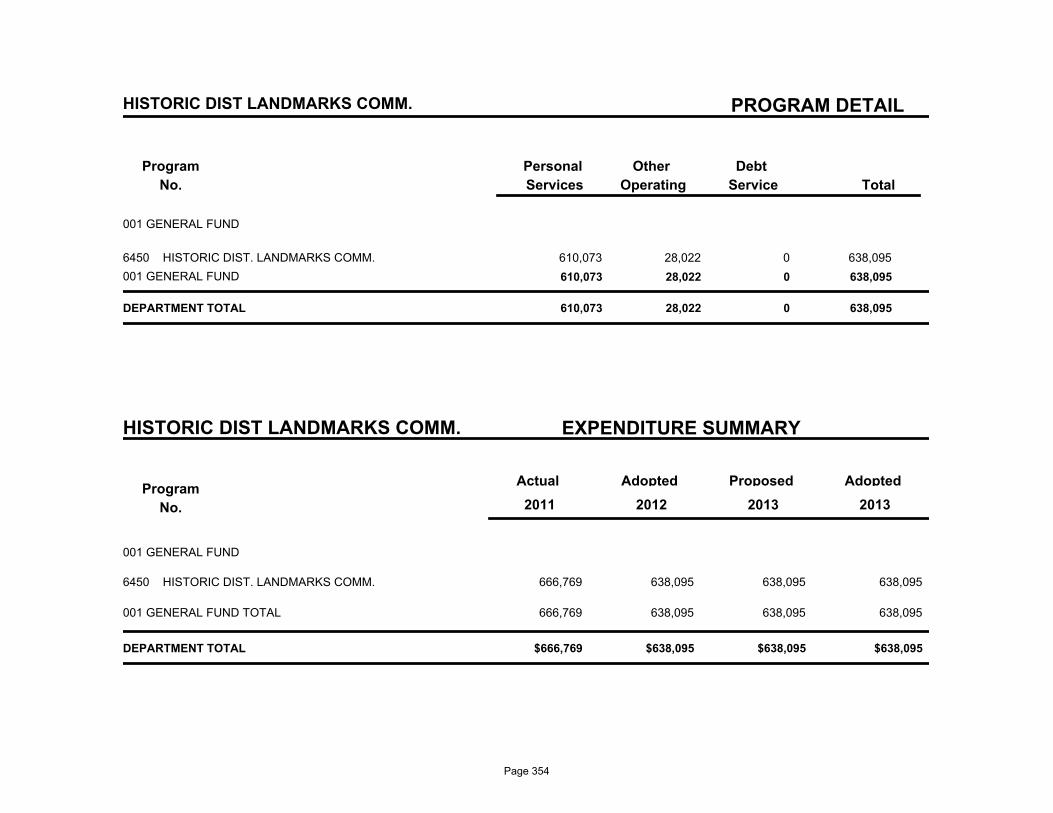
PROGRAM DETAIL
Program
No.
Debt
Service
Other
Operating
Personal
Services Total
HISTORIC DIST LANDMARKS COMM.
001 GENERAL FUND
6450 HISTORIC DIST. LANDMARKS COMM. 610,073 28,022 0 638,095
001 GENERAL FUND 610,073 28,022 0 638,095
DEPARTMENT TOTAL 610,073 28,022 0 638,095
HISTORIC DIST LANDMARKS COMM. EXPENDITURE SUMMARY
Program
No.
Actual AdoptedProposedAdopted
2013 2011 2012 2013
001 GENERAL FUND
666,769 638,095 638,095 HISTORIC DIST. LANDMARKS COMM.6450 638,095
666,769 638,095 638,095 638,095 001 GENERAL FUND TOTAL
$666,769 $638,095 $638,095 $638,095 DEPARTMENT TOTAL
Page 354
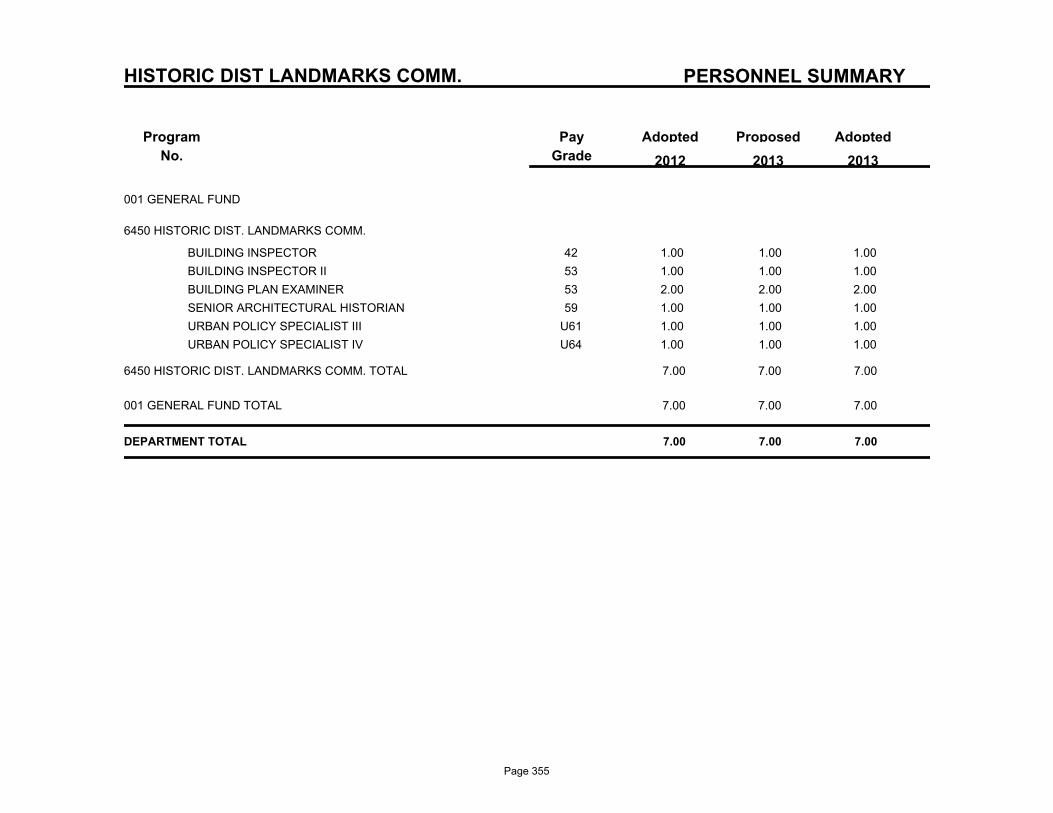
PERSONNEL SUMMARY
Program
No.
ProposedAdoptedPay
Grade
Adopted
2013 2012 2013
HISTORIC DIST LANDMARKS COMM.
001 GENERAL FUND
6450 HISTORIC DIST. LANDMARKS COMM.
42BUILDING INSPECTOR 1.00 1.00 1.00
53BUILDING INSPECTOR II 1.00 1.00 1.00
53BUILDING PLAN EXAMINER 2.00 2.00 2.00
59SENIOR ARCHITECTURAL HISTORIAN 1.00 1.00 1.00
U61URBAN POLICY SPECIALIST III 1.00 1.00 1.00
U64URBAN POLICY SPECIALIST IV 1.00 1.00 1.00
6450 HISTORIC DIST. LANDMARKS COMM. TOTAL 7.00 7.00 7.00
001 GENERAL FUND TOTAL 7.00 7.00 7.00
DEPARTMENT TOTAL 7.00 7.00 7.00
Page 355

VIEUX CARRE COMMISION
DEPARTMENTAL BUDGET SUMMARY
AdoptedProposedAdoptedActual
EXPENDITURES
2013 2012 2011 2013
PERSONAL SERVICES 374,182 332,985 332,985 332,985
OTHER OPERATING 10,267 11,846 11,846 11,846
DEBT SERVICE 0 0 0 0
RESERVES 0 0 0 0
GRANTS, CONTRIB. & FUND TRAN. 0 0 0 0
$384,449 $344,831 $344,831 TOTAL EXPENDITURES $344,831
SOURCE OF FUNDING
GENERAL FUND 384,449 344,831 344,831 344,831
WISNER FUNDS 0 0 0 0
ENTERPRISE 0 0 0 0
DOWNTOWN DEVELOPMENT DIST. 0 0 0 0
HOUSING AND URBAN DEVELOP. 0 0 0 0
SELF GENERATED 0 0 0 0
LIBRARY 0 0 0 0
LLE 0 0 0 0
FEDERAL GRANTS 0 0 0 0
STATE GRANTS 0 0 0 0
GRANTS, CONTRIB., & FUND TRAN. 0 0 0 0
N. O. REGIONAL BUSINESS PARK 0 0 0 0
ECONOMIC DEVELOPMENT FUND 0 0 0 0
HOUSING IMPROVMENT FUND 0 0 0 0
$384,449 $344,831 $344,831 TOTAL FUNDING $344,831
Page 356
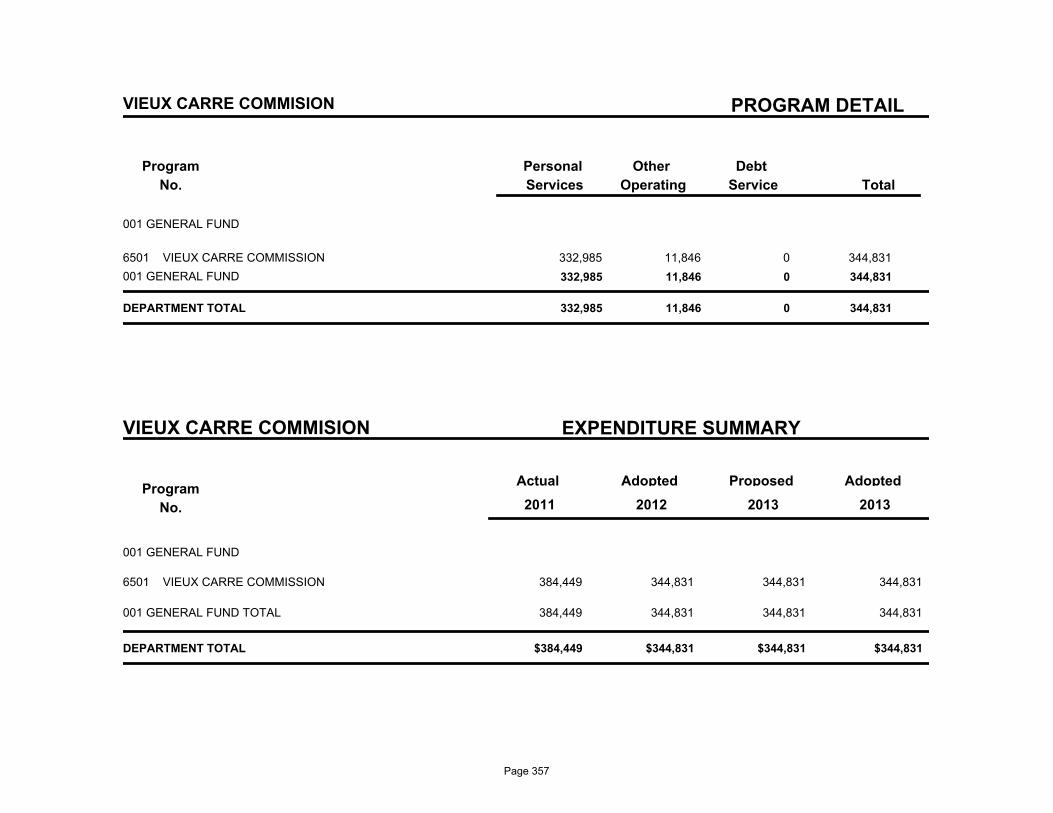
PROGRAM DETAIL
Program
No.
Debt
Service
Other
Operating
Personal
Services Total
VIEUX CARRE COMMISION
001 GENERAL FUND
6501 VIEUX CARRE COMMISSION 332,985 11,846 0 344,831
001 GENERAL FUND 332,985 11,846 0 344,831
DEPARTMENT TOTAL 332,985 11,846 0 344,831
VIEUX CARRE COMMISION EXPENDITURE SUMMARY
Program
No.
Actual AdoptedProposedAdopted
2013 2011 2012 2013
001 GENERAL FUND
384,449 344,831 344,831 VIEUX CARRE COMMISSION6501 344,831
384,449 344,831 344,831 344,831 001 GENERAL FUND TOTAL
$384,449 $344,831 $344,831 $344,831 DEPARTMENT TOTAL
Page 357
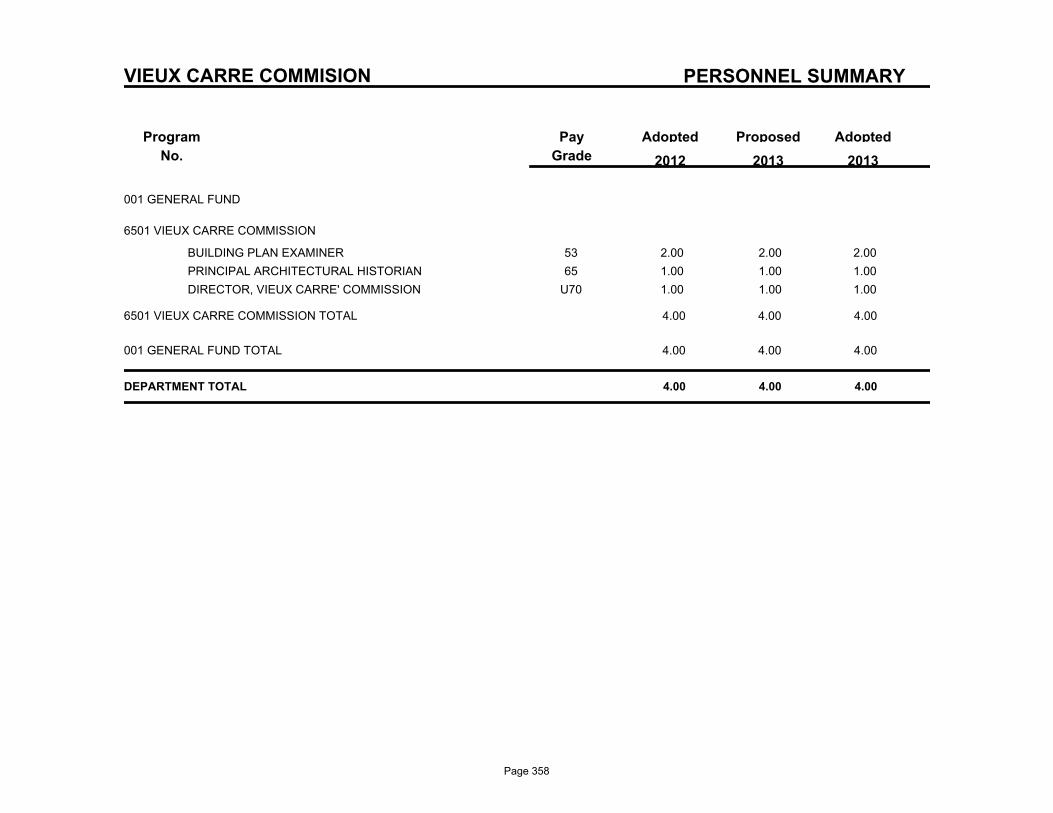
PERSONNEL SUMMARY
Program
No.
ProposedAdoptedPay
Grade
Adopted
2013 2012 2013
VIEUX CARRE COMMISION
001 GENERAL FUND
6501 VIEUX CARRE COMMISSION
53BUILDING PLAN EXAMINER 2.00 2.00 2.00
65PRINCIPAL ARCHITECTURAL HISTORIAN 1.00 1.00 1.00
U70DIRECTOR, VIEUX CARRE' COMMISSION 1.00 1.00 1.00
6501 VIEUX CARRE COMMISSION TOTAL 4.00 4.00 4.00
001 GENERAL FUND TOTAL 4.00 4.00 4.00
DEPARTMENT TOTAL 4.00 4.00 4.00
Page 358

Page 359

Alcoholic Beverage Control Board

Mission Statement The New Orleans Alcoholic Beverage Control Board (Ordinance #7658 (MCS)) functions to:
• Hear and decide cases for suspension or revocation of alcoholic beverage permits • Hear and decide appeals from persons who have been denied alcoholic beverage permits by an
administrative official in the enforcement of the Beer and Alcoholic Beverage ordinance.
Page 361
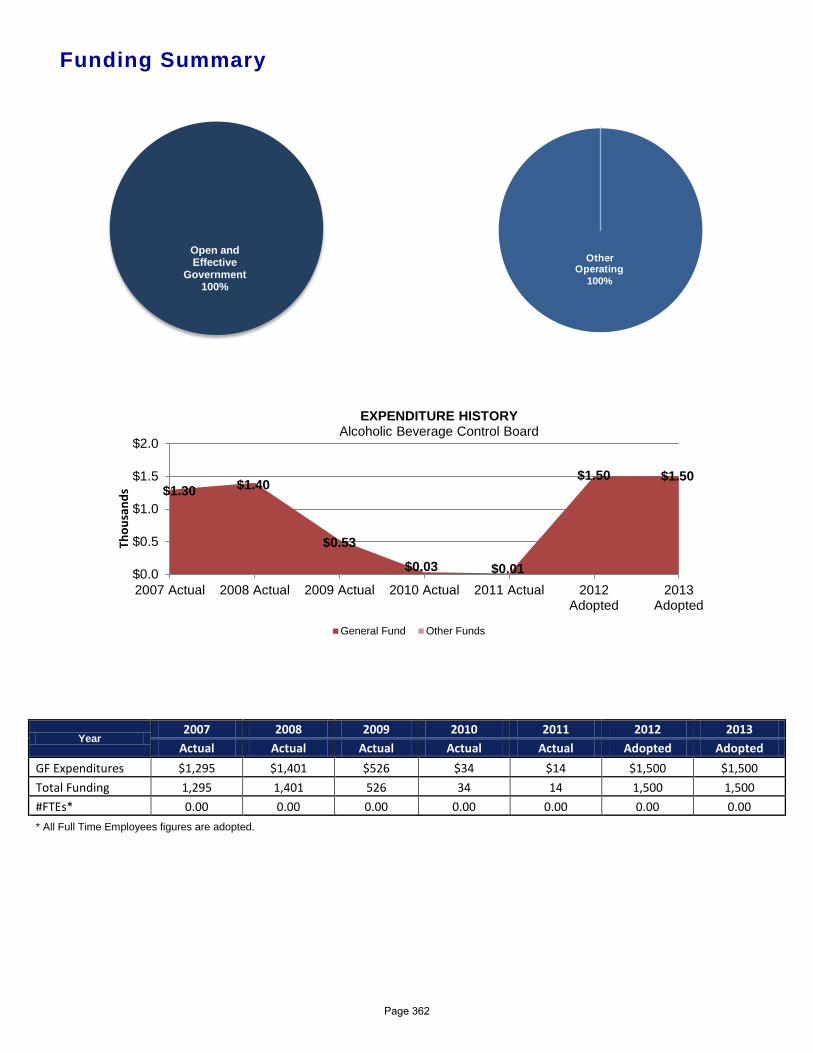
Open and Effective
Government 100%
Funding Summary
Year 2007 2008 2009 2010 2011 2012 2013
Actual Actual Actual Actual Actual Adopted Adopted GF Expenditures $1,295 $1,401 $526 $34 $14 $1,500 $1,500 Total Funding 1,295 1,401 526 34 14 1,500 1,500 #FTEs* 0.00 0.00 0.00 0.00 0.00 0.00 0.00 * All Full Time Employees figures are adopted.
$1.30 $1.40
$0.53
$0.03 $0.01
$1.50 $1.50
$0.0
$0.5
$1.0
$1.5
$2.0
2007 Actual 2008 Actual 2009 Actual 2010 Actual 2011 Actual 2012Adopted
2013Adopted
Thou
sand
s
EXPENDITURE HISTORY Alcoholic Beverage Control Board
General Fund Other Funds
Other Operating
100%
Personal Services
0%
Page 362
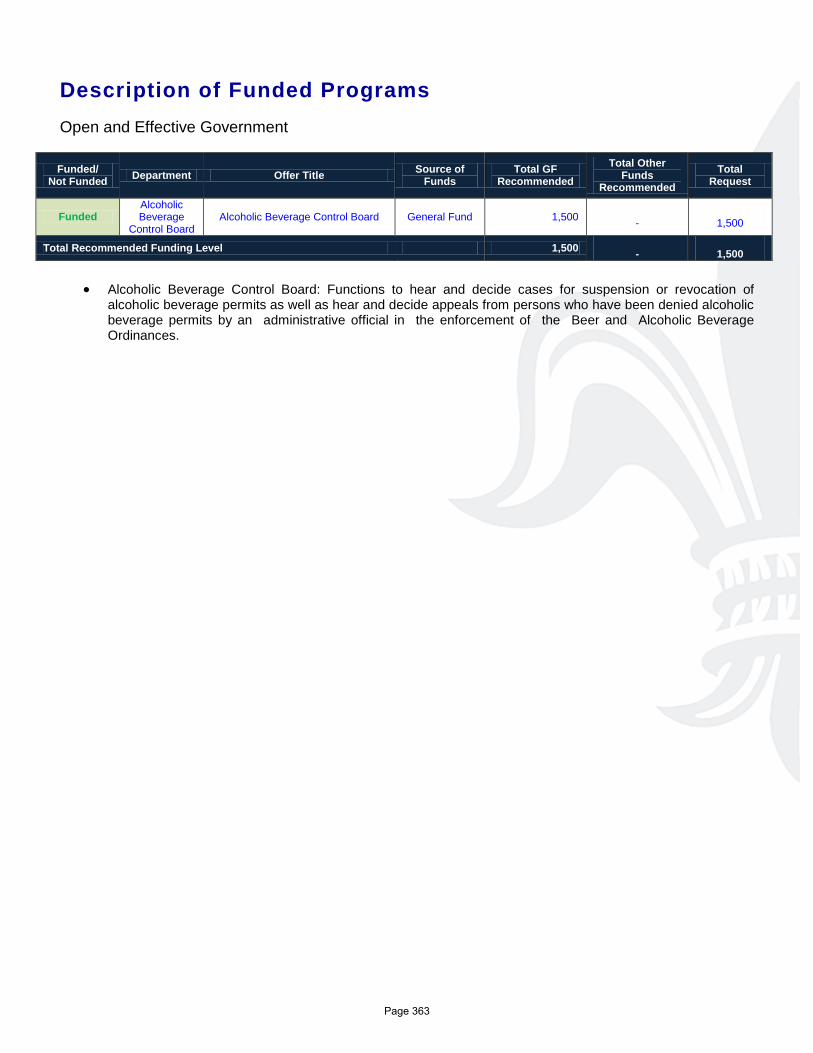
Description of Funded Programs
Open and Effective Government
Funded/ Not Funded Department Offer Title Source of
Funds Total GF
Recommended Total Other
Funds Recommended
Total Request
Funded Alcoholic Beverage
Control Board Alcoholic Beverage Control Board General Fund 1,500
-
1,500
Total Recommended Funding Level 1,500 -
1,500
• Alcoholic Beverage Control Board: Functions to hear and decide cases for suspension or revocation of
alcoholic beverage permits as well as hear and decide appeals from persons who have been denied alcoholic beverage permits by an administrative official in the enforcement of the Beer and Alcoholic Beverage Ordinances.
Page 363
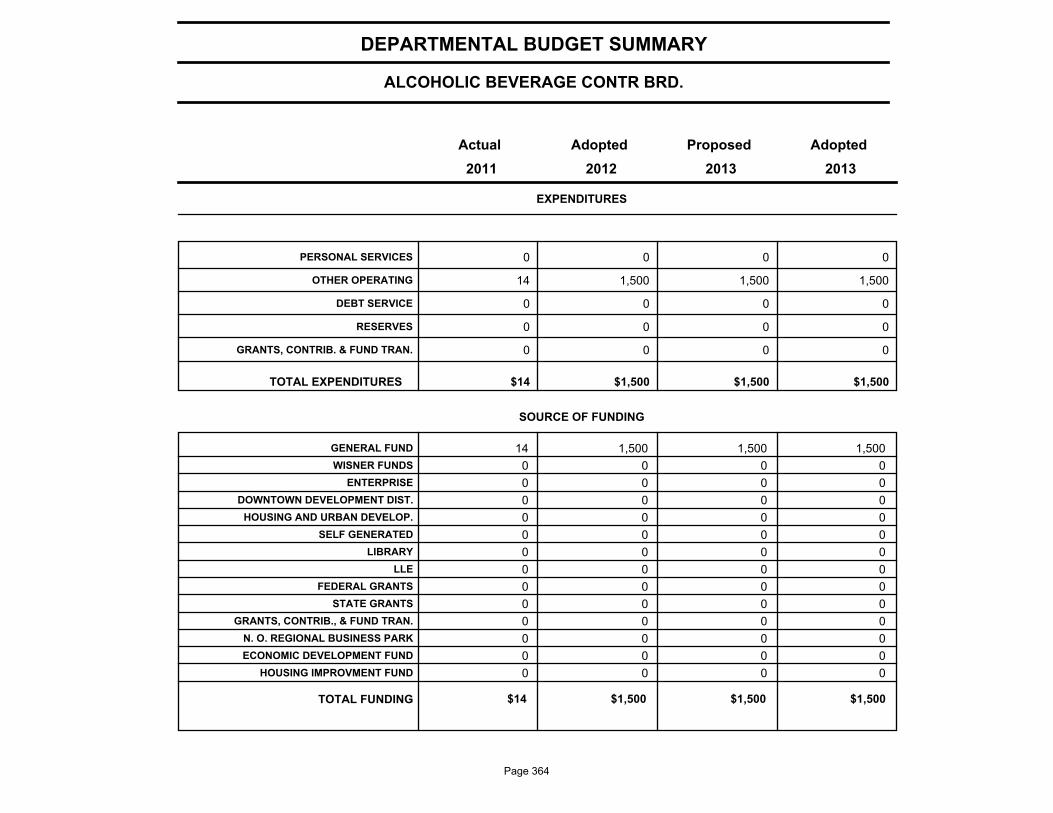
ALCOHOLIC BEVERAGE CONTR BRD.
DEPARTMENTAL BUDGET SUMMARY
AdoptedProposedAdoptedActual
EXPENDITURES
2013 2012 2011 2013
PERSONAL SERVICES 0 0 0 0
OTHER OPERATING 14 1,500 1,500 1,500
DEBT SERVICE 0 0 0 0
RESERVES 0 0 0 0
GRANTS, CONTRIB. & FUND TRAN. 0 0 0 0
$14 $1,500 $1,500 TOTAL EXPENDITURES $1,500
SOURCE OF FUNDING
GENERAL FUND 14 1,500 1,500 1,500
WISNER FUNDS 0 0 0 0
ENTERPRISE 0 0 0 0
DOWNTOWN DEVELOPMENT DIST. 0 0 0 0
HOUSING AND URBAN DEVELOP. 0 0 0 0
SELF GENERATED 0 0 0 0
LIBRARY 0 0 0 0
LLE 0 0 0 0
FEDERAL GRANTS 0 0 0 0
STATE GRANTS 0 0 0 0
GRANTS, CONTRIB., & FUND TRAN. 0 0 0 0
N. O. REGIONAL BUSINESS PARK 0 0 0 0
ECONOMIC DEVELOPMENT FUND 0 0 0 0
HOUSING IMPROVMENT FUND 0 0 0 0
$14 $1,500 $1,500 TOTAL FUNDING $1,500
Page 364
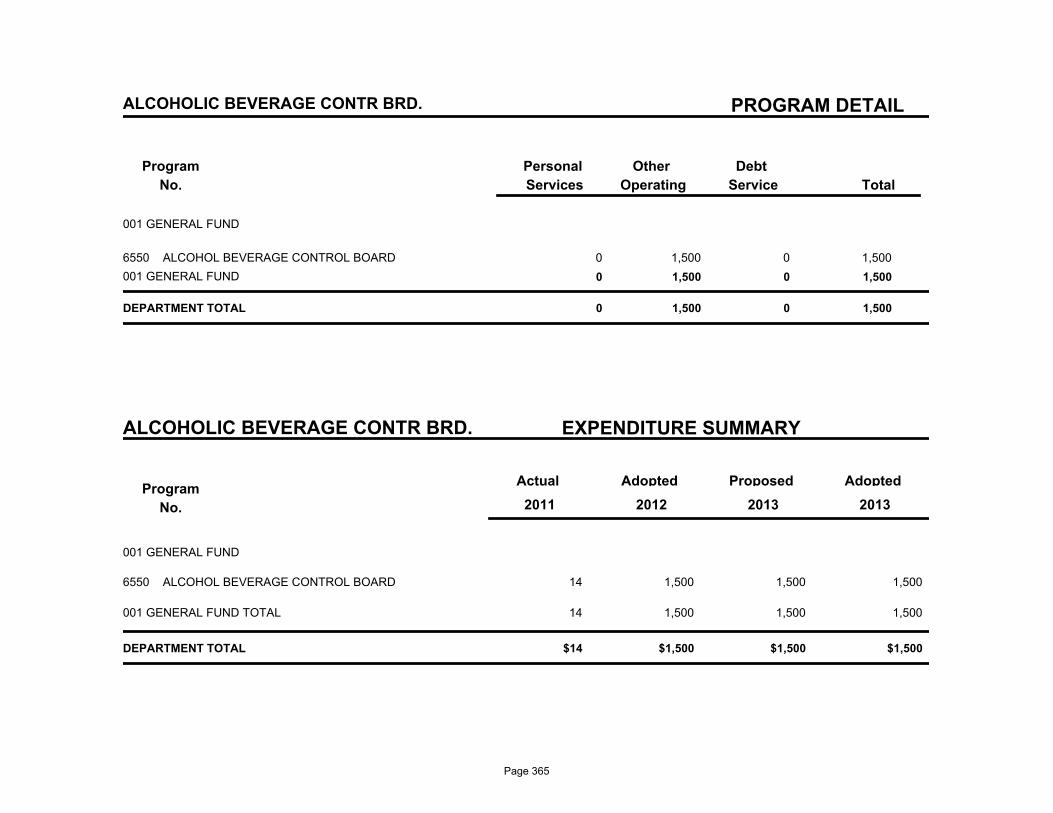
PROGRAM DETAIL
Program
No.
Debt
Service
Other
Operating
Personal
Services Total
ALCOHOLIC BEVERAGE CONTR BRD.
001 GENERAL FUND
6550 ALCOHOL BEVERAGE CONTROL BOARD 0 1,500 0 1,500
001 GENERAL FUND 0 1,500 0 1,500
DEPARTMENT TOTAL 0 1,500 0 1,500
ALCOHOLIC BEVERAGE CONTR BRD. EXPENDITURE SUMMARY
Program
No.
Actual AdoptedProposedAdopted
2013 2011 2012 2013
001 GENERAL FUND
14 1,500 1,500 ALCOHOL BEVERAGE CONTROL BOARD6550 1,500
14 1,500 1,500 1,500 001 GENERAL FUND TOTAL
$14 $1,500 $1,500 $1,500 DEPARTMENT TOTAL
Page 365

City Planning Commission
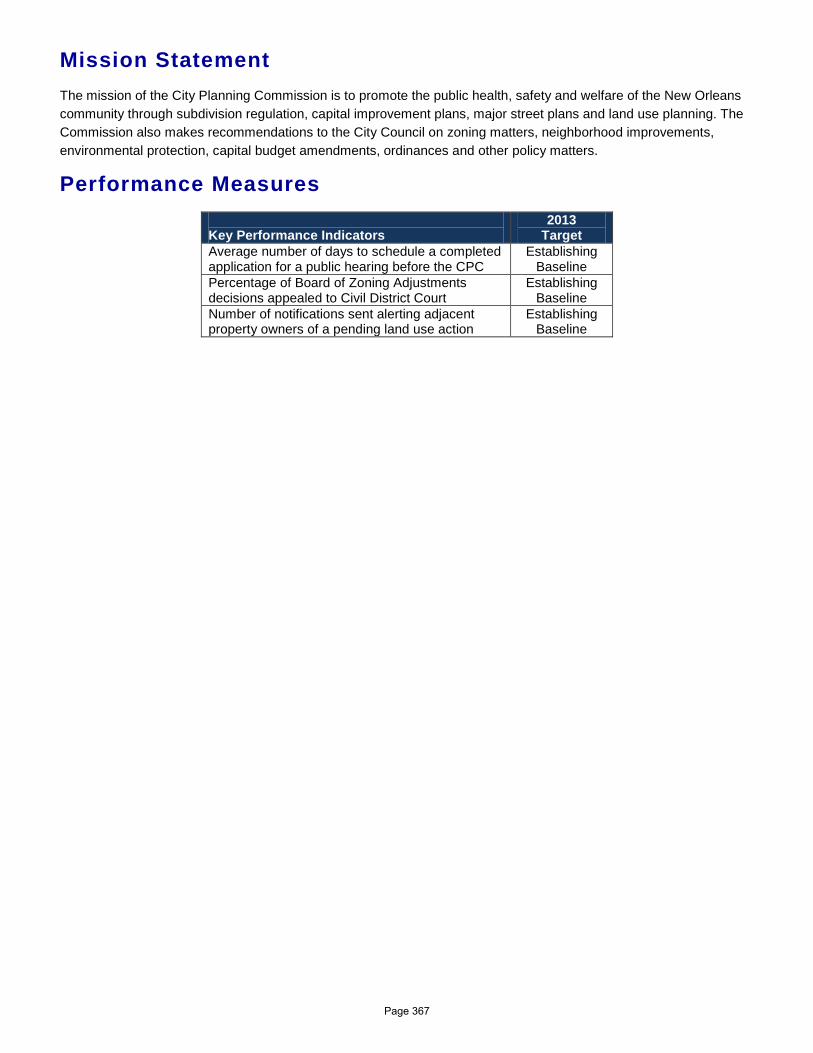
Mission Statement The mission of the City Planning Commission is to promote the public health, safety and welfare of the New Orleans community through subdivision regulation, capital improvement plans, major street plans and land use planning. The Commission also makes recommendations to the City Council on zoning matters, neighborhood improvements, environmental protection, capital budget amendments, ordinances and other policy matters.
Performance Measures Key Performance Indicators
2013 Target
Average number of days to schedule a completed application for a public hearing before the CPC
Establishing Baseline
Percentage of Board of Zoning Adjustments decisions appealed to Civil District Court
Establishing Baseline
Number of notifications sent alerting adjacent property owners of a pending land use action
Establishing Baseline
Page 367
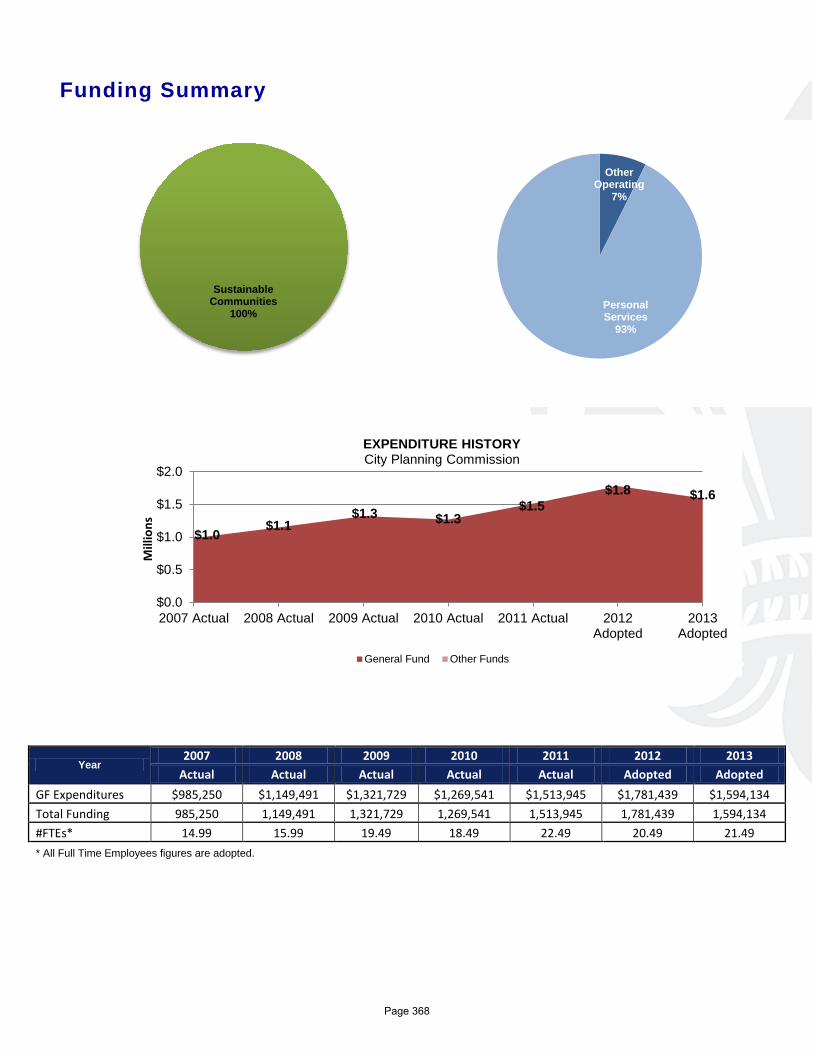
Funding Summary
Year 2007 2008 2009 2010 2011 2012 2013
Actual Actual Actual Actual Actual Adopted Adopted GF Expenditures $985,250 $1,149,491 $1,321,729 $1,269,541 $1,513,945 $1,781,439 $1,594,134 Total Funding 985,250 1,149,491 1,321,729 1,269,541 1,513,945 1,781,439 1,594,134 #FTEs* 14.99 15.99 19.49 18.49 22.49 20.49 21.49 * All Full Time Employees figures are adopted.
$1.0 $1.1
$1.3 $1.3 $1.5
$1.8 $1.6
$0.0
$0.5
$1.0
$1.5
$2.0
2007 Actual 2008 Actual 2009 Actual 2010 Actual 2011 Actual 2012Adopted
2013Adopted
Mill
ions
EXPENDITURE HISTORY City Planning Commission
General Fund Other Funds
Sustainable Communities
100%
Other Operating
7%
Personal Services
93%
Page 368
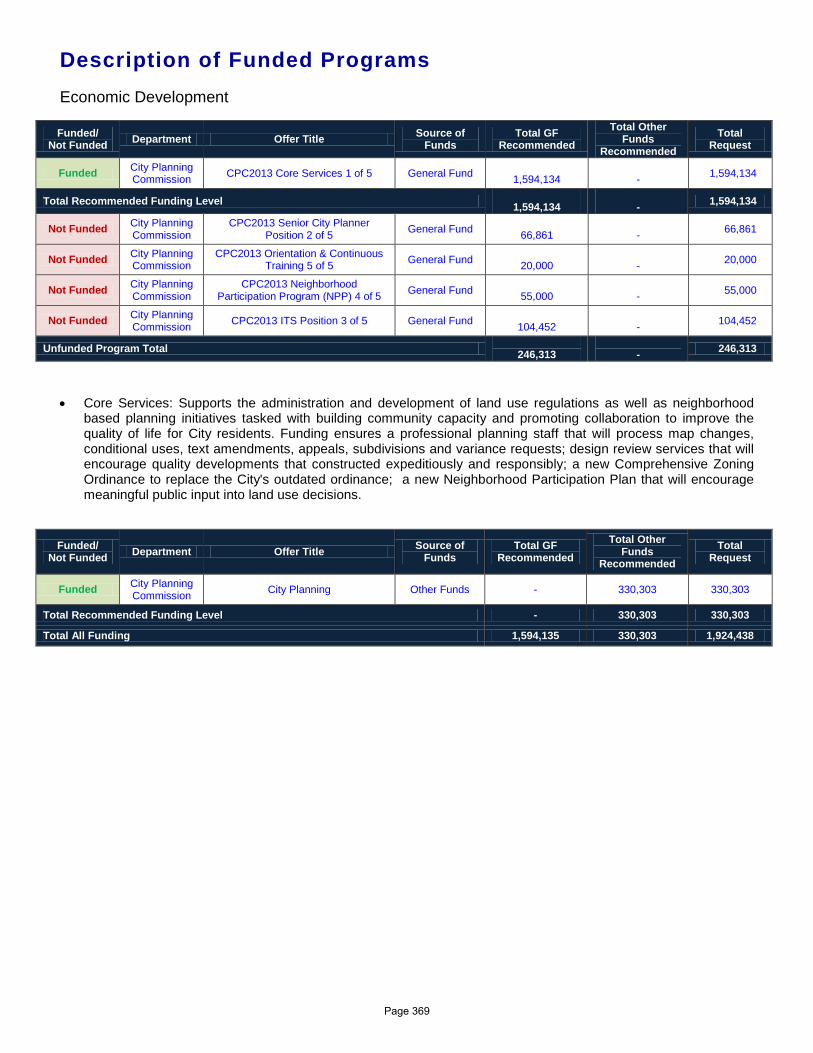
Description of Funded Programs Economic Development
Funded/ Not Funded Department Offer Title Source of
Funds Total GF
Recommended Total Other
Funds Recommended
Total Request
Funded City Planning Commission CPC2013 Core Services 1 of 5 General Fund
1,594,134 - 1,594,134
Total Recommended Funding Level 1,594,134
- 1,594,134
Not Funded City Planning Commission
CPC2013 Senior City Planner Position 2 of 5 General Fund
66,861 - 66,861
Not Funded City Planning Commission
CPC2013 Orientation & Continuous Training 5 of 5 General Fund
20,000 - 20,000
Not Funded City Planning Commission
CPC2013 Neighborhood Participation Program (NPP) 4 of 5 General Fund
55,000 - 55,000
Not Funded City Planning Commission CPC2013 ITS Position 3 of 5 General Fund
104,452 - 104,452
Unfunded Program Total 246,313
- 246,313
• Core Services: Supports the administration and development of land use regulations as well as neighborhood based planning initiatives tasked with building community capacity and promoting collaboration to improve the quality of life for City residents. Funding ensures a professional planning staff that will process map changes, conditional uses, text amendments, appeals, subdivisions and variance requests; design review services that will encourage quality developments that constructed expeditiously and responsibly; a new Comprehensive Zoning Ordinance to replace the City's outdated ordinance; a new Neighborhood Participation Plan that will encourage meaningful public input into land use decisions.
Funded/ Not Funded Department Offer Title Source of
Funds Total GF
Recommended Total Other
Funds Recommended
Total Request
Funded City Planning Commission City Planning Other Funds - 330,303 330,303
Total Recommended Funding Level - 330,303 330,303
Total All Funding 1,594,135 330,303 1,924,438
Page 369

CITY PLANNING COMMISSION
DEPARTMENTAL BUDGET SUMMARY
AdoptedProposedAdoptedActual
EXPENDITURES
2013 2012 2011 2013
PERSONAL SERVICES 1,479,721 1,705,897 1,531,221 1,476,221
OTHER OPERATING 34,224 75,542 62,913 117,913
DEBT SERVICE 0 0 0 0
RESERVES 0 0 0 0
GRANTS, CONTRIB. & FUND TRAN. 0 0 0 0
$1,513,945 $1,781,439 $1,594,134 TOTAL EXPENDITURES $1,594,134
SOURCE OF FUNDING
GENERAL FUND 1,513,945 1,781,439 1,594,134 1,594,134
WISNER FUNDS 0 0 0 0
ENTERPRISE 0 0 0 0
DOWNTOWN DEVELOPMENT DIST. 0 0 0 0
HOUSING AND URBAN DEVELOP. 0 0 0 0
SELF GENERATED 0 0 0 0
LIBRARY 0 0 0 0
LLE 0 0 0 0
FEDERAL GRANTS 0 0 0 0
STATE GRANTS 0 0 0 0
GRANTS, CONTRIB., & FUND TRAN. 0 0 0 0
N. O. REGIONAL BUSINESS PARK 0 0 0 0
ECONOMIC DEVELOPMENT FUND 0 0 0 0
HOUSING IMPROVMENT FUND 0 0 0 0
$1,513,945 $1,781,439 $1,594,134 TOTAL FUNDING $1,594,134
Page 370
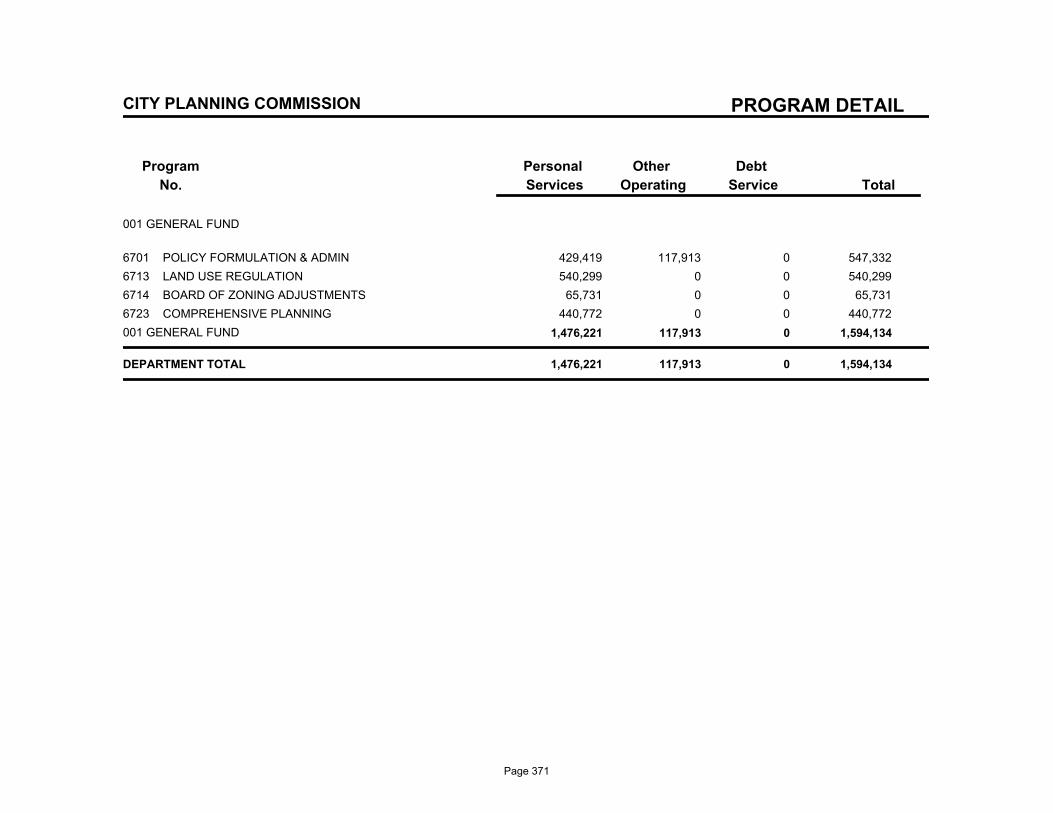
PROGRAM DETAIL
Program
No.
Debt
Service
Other
Operating
Personal
Services Total
CITY PLANNING COMMISSION
001 GENERAL FUND
6701 POLICY FORMULATION & ADMIN 429,419 117,913 0 547,332
6713 LAND USE REGULATION 540,299 0 0 540,299
6714 BOARD OF ZONING ADJUSTMENTS 65,731 0 0 65,731
6723 COMPREHENSIVE PLANNING 440,772 0 0 440,772
001 GENERAL FUND 1,476,221 117,913 0 1,594,134
DEPARTMENT TOTAL 1,476,221 117,913 0 1,594,134
Page 371
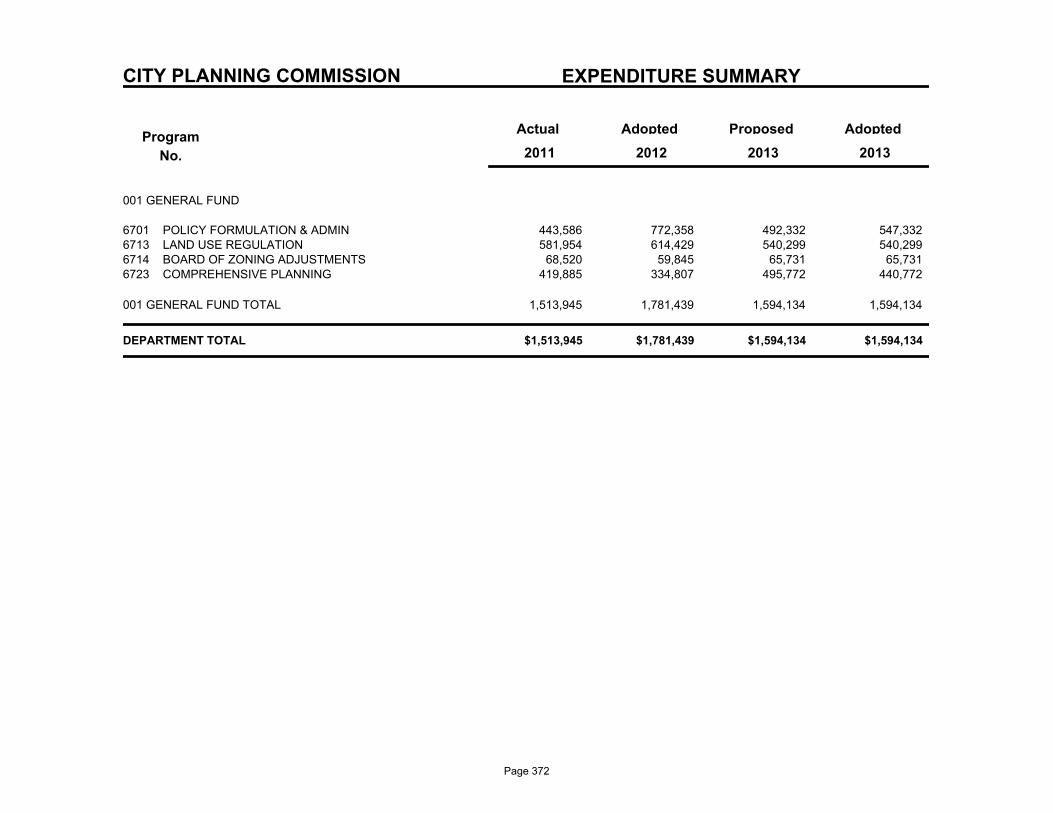
CITY PLANNING COMMISSION EXPENDITURE SUMMARY
Program
No.
Actual AdoptedProposedAdopted
2013 2011 2012 2013
001 GENERAL FUND
443,586 772,358 492,332 POLICY FORMULATION & ADMIN6701 547,332 581,954 614,429 540,299 LAND USE REGULATION6713 540,299
68,520 59,845 65,731 BOARD OF ZONING ADJUSTMENTS6714 65,731 419,885 334,807 495,772 COMPREHENSIVE PLANNING6723 440,772
1,513,945 1,781,439 1,594,134 1,594,134 001 GENERAL FUND TOTAL
$1,513,945 $1,781,439 $1,594,134 $1,594,134 DEPARTMENT TOTAL
Page 372
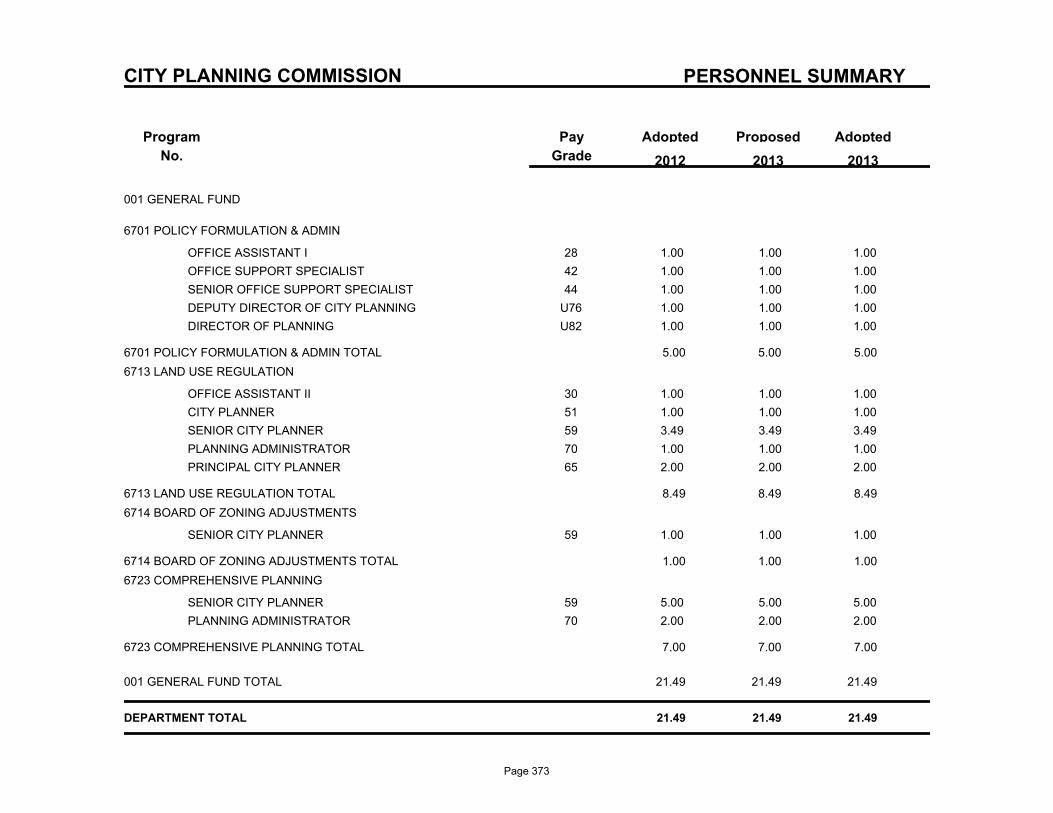
PERSONNEL SUMMARY
Program
No.
ProposedAdoptedPay
Grade
Adopted
2013 2012 2013
CITY PLANNING COMMISSION
001 GENERAL FUND
6701 POLICY FORMULATION & ADMIN
28OFFICE ASSISTANT I 1.00 1.00 1.00
42OFFICE SUPPORT SPECIALIST 1.00 1.00 1.00
44SENIOR OFFICE SUPPORT SPECIALIST 1.00 1.00 1.00
U76DEPUTY DIRECTOR OF CITY PLANNING 1.00 1.00 1.00
U82DIRECTOR OF PLANNING 1.00 1.00 1.00
6701 POLICY FORMULATION & ADMIN TOTAL 5.00 5.00 5.00
6713 LAND USE REGULATION
30OFFICE ASSISTANT II 1.00 1.00 1.00
51CITY PLANNER 1.00 1.00 1.00
59SENIOR CITY PLANNER 3.49 3.49 3.49
70PLANNING ADMINISTRATOR 1.00 1.00 1.00
65PRINCIPAL CITY PLANNER 2.00 2.00 2.00
6713 LAND USE REGULATION TOTAL 8.49 8.49 8.49
6714 BOARD OF ZONING ADJUSTMENTS
59SENIOR CITY PLANNER 1.00 1.00 1.00
6714 BOARD OF ZONING ADJUSTMENTS TOTAL 1.00 1.00 1.00
6723 COMPREHENSIVE PLANNING
59SENIOR CITY PLANNER 5.00 5.00 5.00
70PLANNING ADMINISTRATOR 2.00 2.00 2.00
6723 COMPREHENSIVE PLANNING TOTAL 7.00 7.00 7.00
001 GENERAL FUND TOTAL 21.49 21.49 21.49
DEPARTMENT TOTAL 21.49 21.49 21.49
Page 373

Mosquito, Termite & Rodent Control Board
Mission Statement The mission of the Mosquito Termite and Rodent Control Board is to:
• Administer and evaluate mosquito control activities • Monitor the populations of disease and virus transmitting mosquitoes and consult with appropriate authorities.
The Administrative Office has additionally assigned the Board the duties of rodent, termite and structural insect control under additional programs.
Vision Statement The City of New Orleans Mosquito and Termite Control Board has constructed a new administration building to our new state of the art facility that houses our administrative, supervisory, technical and field staff in the same building and improves the department's efficiency and productivity. We will continue to offer the citizens of New Orleans quality mosquito and rodent control services. Our department practices integrated pest management and places an emphasis on reducing the conducive conditions that lead to mosquito and rodent infestations. Our department will continue to expand termite services we offer to the City of New Orleans and to the general public. Each year we continue to expand pest control services in City facilities. Our highly trained and licensed staff inspects, treats and maintains the pest control services at City facilities.
In addition, we will continue geo-databasing data as it relates to mosquito surveillance, mosquito control efforts, termite and rodent control management strategies. We utilize GIS methodology to increase operational efficiency by providing enhanced services to the public with the available budget and increasing the technical capability of the employees.
Performance Measures Key Performance Indicators
2013 Target
Number of Cases of Human WNV and other arbovirus illness (febril, neuroinvasive, or death) Workload
Number of service requests Workload Number of service requests meeting response time goal
Establishing Baseline
Number of Proactive inspections for maintenance Establishing Baseline
Number of Rodent bites or disease transmission Workload
Page 375
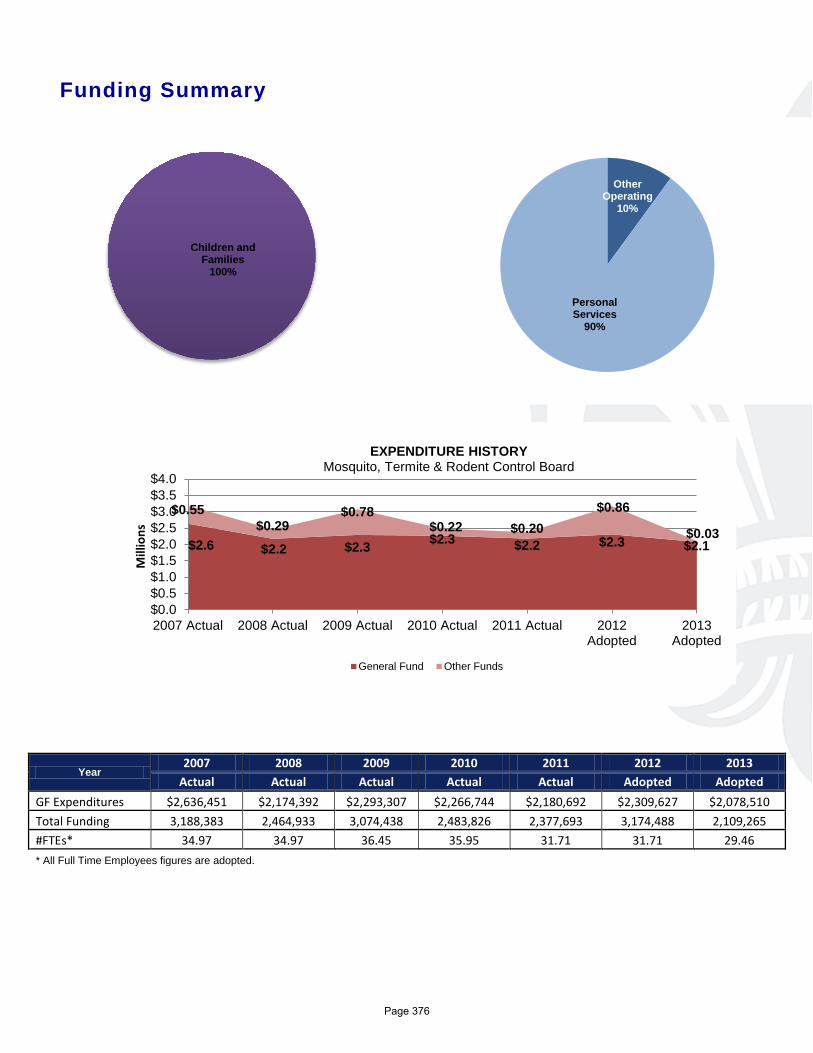
Funding Summary
Year 2007 2008 2009 2010 2011 2012 2013
Actual Actual Actual Actual Actual Adopted Adopted GF Expenditures $2,636,451 $2,174,392 $2,293,307 $2,266,744 $2,180,692 $2,309,627 $2,078,510 Total Funding 3,188,383 2,464,933 3,074,438 2,483,826 2,377,693 3,174,488 2,109,265 #FTEs* 34.97 34.97 36.45 35.95 31.71 31.71 29.46 * All Full Time Employees figures are adopted.
$2.6 $2.2 $2.3 $2.3 $2.2 $2.3 $2.1
$0.55 $0.29
$0.78 $0.22 $0.20
$0.86
$0.03
$0.0$0.5$1.0$1.5$2.0$2.5$3.0$3.5$4.0
2007 Actual 2008 Actual 2009 Actual 2010 Actual 2011 Actual 2012Adopted
2013Adopted
Mill
ions
EXPENDITURE HISTORY Mosquito, Termite & Rodent Control Board
General Fund Other Funds
Children and Families
100%
Other Operating
10%
Personal Services
90%
Page 376
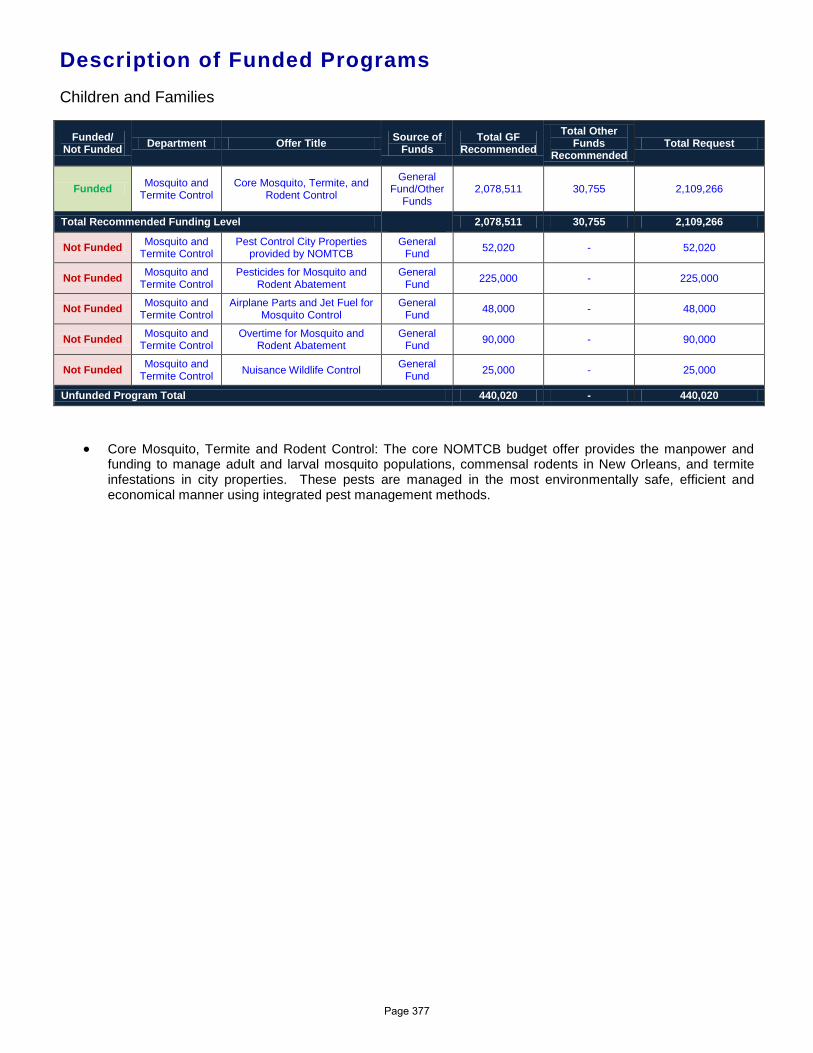
Description of Funded Programs Children and Families
Funded/ Not Funded Department Offer Title Source of
Funds Total GF
Recommended Total Other
Funds Recommended
Total Request
Funded Mosquito and Termite Control
Core Mosquito, Termite, and Rodent Control
General Fund/Other
Funds 2,078,511 30,755 2,109,266
Total Recommended Funding Level 2,078,511 30,755 2,109,266
Not Funded Mosquito and Termite Control
Pest Control City Properties provided by NOMTCB
General Fund 52,020 - 52,020
Not Funded Mosquito and Termite Control
Pesticides for Mosquito and Rodent Abatement
General Fund 225,000 - 225,000
Not Funded Mosquito and Termite Control
Airplane Parts and Jet Fuel for Mosquito Control
General Fund 48,000 - 48,000
Not Funded Mosquito and Termite Control
Overtime for Mosquito and Rodent Abatement
General Fund 90,000 - 90,000
Not Funded Mosquito and Termite Control Nuisance Wildlife Control General
Fund 25,000 - 25,000
Unfunded Program Total 440,020 - 440,020
• Core Mosquito, Termite and Rodent Control: The core NOMTCB budget offer provides the manpower and funding to manage adult and larval mosquito populations, commensal rodents in New Orleans, and termite infestations in city properties. These pests are managed in the most environmentally safe, efficient and economical manner using integrated pest management methods.
Page 377

N O MOSQUITO CONTROL BRD.
DEPARTMENTAL BUDGET SUMMARY
AdoptedProposedAdoptedActual
EXPENDITURES
2013 2012 2011 2013
PERSONAL SERVICES 1,988,025 2,017,577 1,870,054 1,870,054
OTHER OPERATING 389,668 1,156,911 239,211 239,211
DEBT SERVICE 0 0 0 0
RESERVES 0 0 0 0
GRANTS, CONTRIB. & FUND TRAN. 0 0 0 0
$2,377,693 $3,174,488 $2,109,265 TOTAL EXPENDITURES $2,109,265
SOURCE OF FUNDING
GENERAL FUND 2,180,692 2,309,627 2,078,510 2,078,510
WISNER FUNDS 0 0 0 0
ENTERPRISE 0 0 0 0
DOWNTOWN DEVELOPMENT DIST. 0 0 0 0
HOUSING AND URBAN DEVELOP. 0 0 0 0
SELF GENERATED 0 0 0 0
LIBRARY 0 0 0 0
LLE 0 0 0 0
FEDERAL GRANTS 197,001 864,861 30,755 30,755
STATE GRANTS 0 0 0 0
GRANTS, CONTRIB., & FUND TRAN. 0 0 0 0
N. O. REGIONAL BUSINESS PARK 0 0 0 0
ECONOMIC DEVELOPMENT FUND 0 0 0 0
HOUSING IMPROVMENT FUND 0 0 0 0
$2,377,693 $3,174,488 $2,109,265 TOTAL FUNDING $2,109,265
Page 378
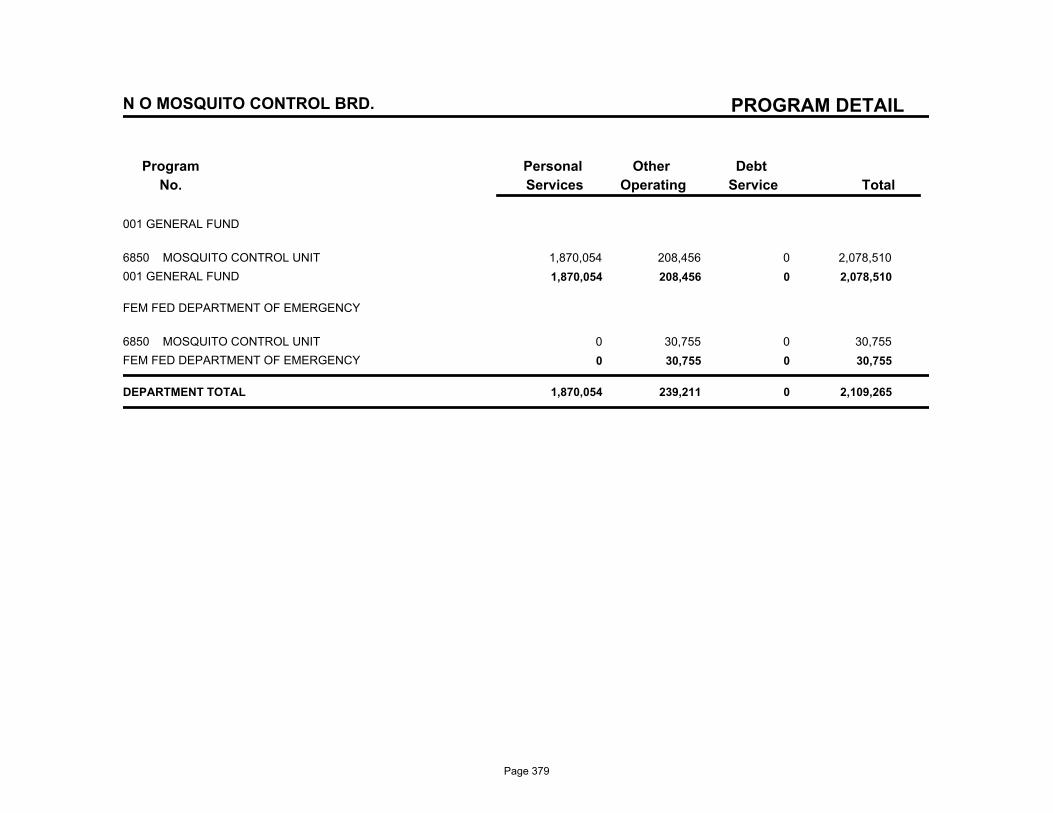
PROGRAM DETAIL
Program
No.
Debt
Service
Other
Operating
Personal
Services Total
N O MOSQUITO CONTROL BRD.
001 GENERAL FUND
6850 MOSQUITO CONTROL UNIT 1,870,054 208,456 0 2,078,510
001 GENERAL FUND 1,870,054 208,456 0 2,078,510
FEM FED DEPARTMENT OF EMERGENCY
6850 MOSQUITO CONTROL UNIT 0 30,755 0 30,755
FEM FED DEPARTMENT OF EMERGENCY 0 30,755 0 30,755
DEPARTMENT TOTAL 1,870,054 239,211 0 2,109,265
Page 379
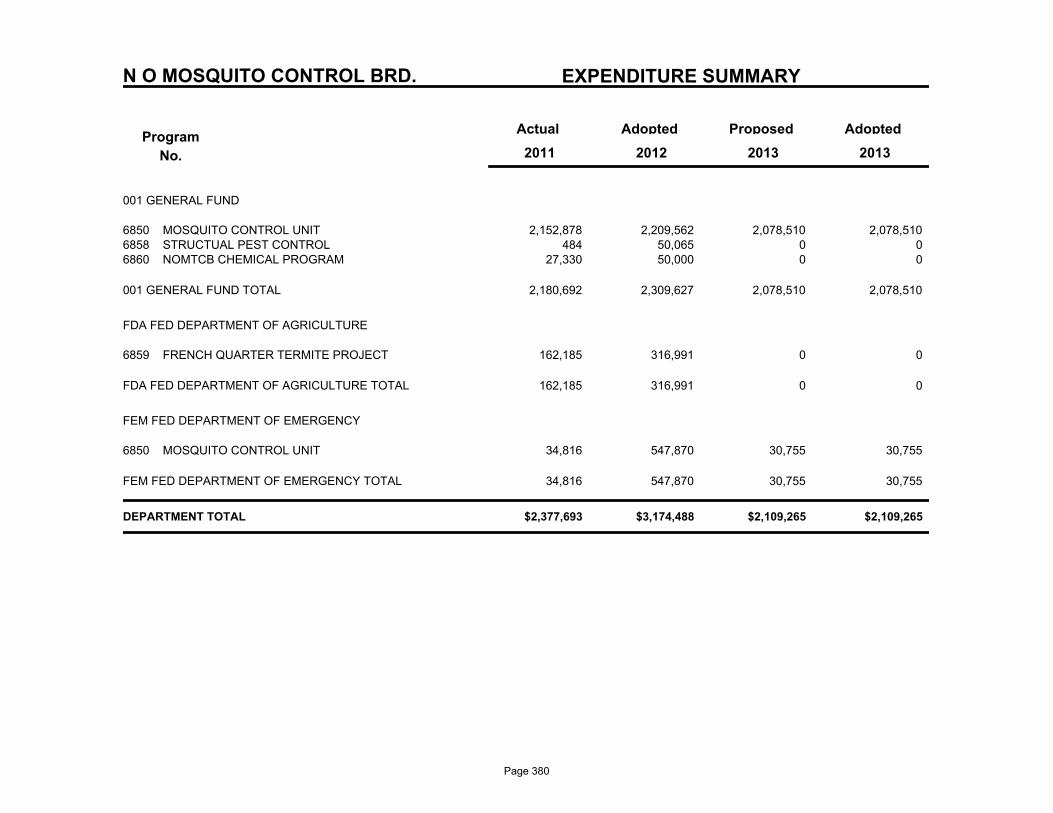
N O MOSQUITO CONTROL BRD. EXPENDITURE SUMMARY
Program
No.
Actual AdoptedProposedAdopted
2013 2011 2012 2013
001 GENERAL FUND
2,152,878 2,209,562 2,078,510 MOSQUITO CONTROL UNIT6850 2,078,510 484 50,065 0 STRUCTUAL PEST CONTROL6858 0
27,330 50,000 0 NOMTCB CHEMICAL PROGRAM6860 0
2,180,692 2,309,627 2,078,510 2,078,510 001 GENERAL FUND TOTAL
FDA FED DEPARTMENT OF AGRICULTURE
162,185 316,991 0 FRENCH QUARTER TERMITE PROJECT6859 0
162,185 316,991 0 0 FDA FED DEPARTMENT OF AGRICULTURE TOTAL
FEM FED DEPARTMENT OF EMERGENCY
34,816 547,870 30,755 MOSQUITO CONTROL UNIT6850 30,755
34,816 547,870 30,755 30,755 FEM FED DEPARTMENT OF EMERGENCY TOTAL
$2,377,693 $3,174,488 $2,109,265 $2,109,265 DEPARTMENT TOTAL
Page 380
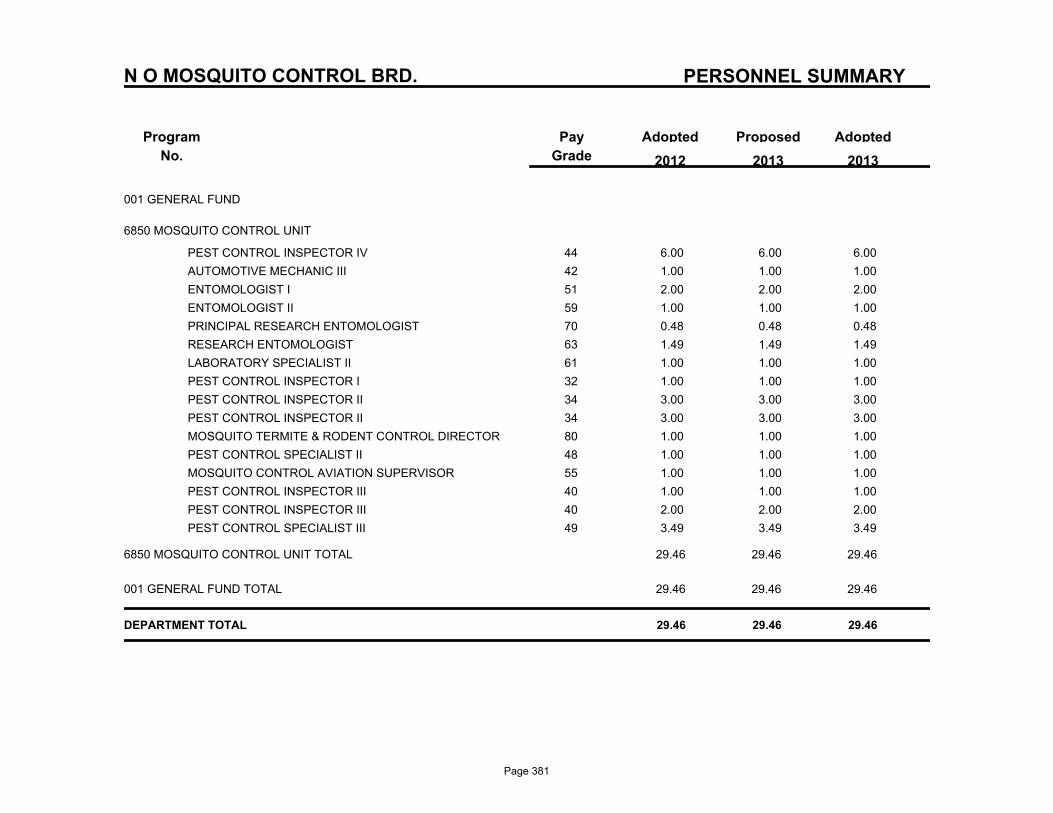
PERSONNEL SUMMARY
Program
No.
ProposedAdoptedPay
Grade
Adopted
2013 2012 2013
N O MOSQUITO CONTROL BRD.
001 GENERAL FUND
6850 MOSQUITO CONTROL UNIT
44PEST CONTROL INSPECTOR IV 6.00 6.00 6.00
42AUTOMOTIVE MECHANIC III 1.00 1.00 1.00
51ENTOMOLOGIST I 2.00 2.00 2.00
59ENTOMOLOGIST II 1.00 1.00 1.00
70PRINCIPAL RESEARCH ENTOMOLOGIST 0.48 0.48 0.48
63RESEARCH ENTOMOLOGIST 1.49 1.49 1.49
61LABORATORY SPECIALIST II 1.00 1.00 1.00
32PEST CONTROL INSPECTOR I 1.00 1.00 1.00
34PEST CONTROL INSPECTOR II 3.00 3.00 3.00
34PEST CONTROL INSPECTOR II 3.00 3.00 3.00
80MOSQUITO TERMITE & RODENT CONTROL DIRECTOR 1.00 1.00 1.00
48PEST CONTROL SPECIALIST II 1.00 1.00 1.00
55MOSQUITO CONTROL AVIATION SUPERVISOR 1.00 1.00 1.00
40PEST CONTROL INSPECTOR III 1.00 1.00 1.00
40PEST CONTROL INSPECTOR III 2.00 2.00 2.00
49PEST CONTROL SPECIALIST III 3.49 3.49 3.49
6850 MOSQUITO CONTROL UNIT TOTAL 29.46 29.46 29.46
001 GENERAL FUND TOTAL 29.46 29.46 29.46
DEPARTMENT TOTAL 29.46 29.46 29.46
Page 381

New Orleans Museum of Art
Mission Statement The New Orleans Museum of Art’s mission is to collect, preserve, display, and interpret original works of art which best reflect the artistic achievements of all cultures throughout history; to provide programs of fine arts information, education and appreciation to a wide audience; and represent in its overall activities the multi-cultural diversity of its city, state and region.
Vision Statement The guiding vision of the New Orleans Museum of Art is to advance its position as a premier national visual arts museum vital to the cultural and educational life of the City, state and region.
Performance Measures Key Performance Indicators
2013 Target
General Attendance Workload Number of Special Exhibitions Workload School Children Attendance Workload
Page 383
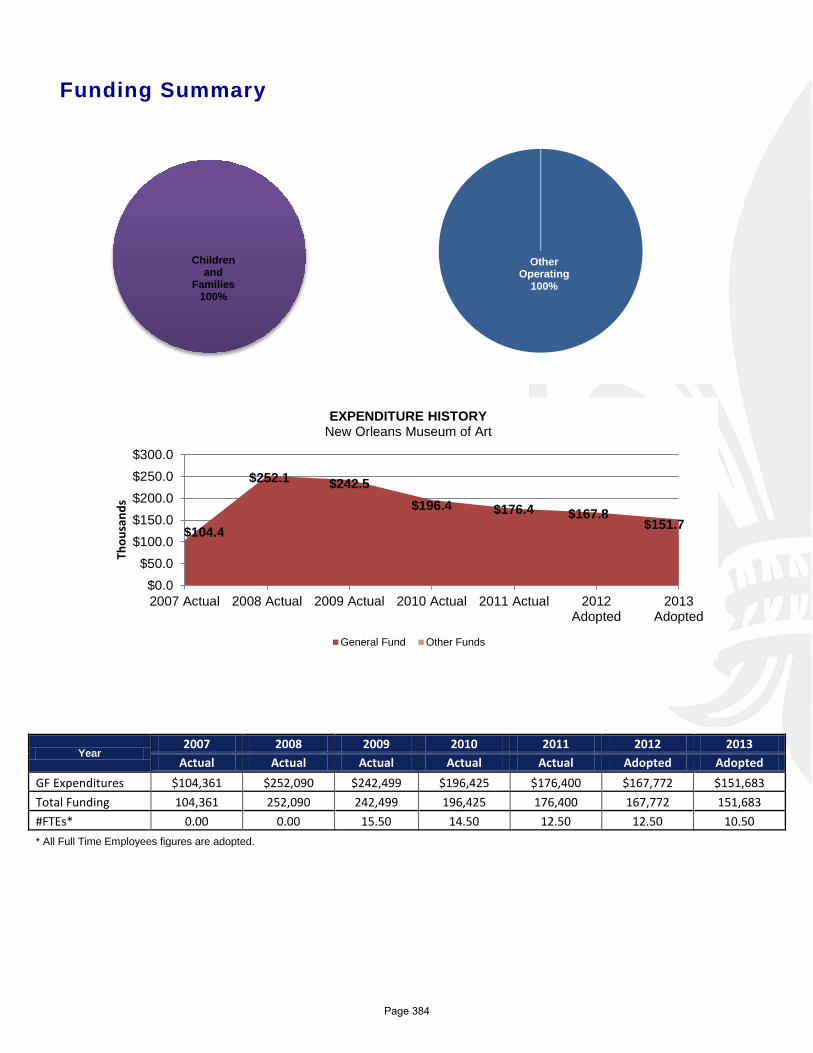
Funding Summary
Year 2007 2008 2009 2010 2011 2012 2013
Actual Actual Actual Actual Actual Adopted Adopted GF Expenditures $104,361 $252,090 $242,499 $196,425 $176,400 $167,772 $151,683 Total Funding 104,361 252,090 242,499 196,425 176,400 167,772 151,683 #FTEs* 0.00 0.00 15.50 14.50 12.50 12.50 10.50 * All Full Time Employees figures are adopted.
Other Operating
100%
Personal Services
0%
$104.4
$252.1 $242.5 $196.4 $176.4 $167.8
$151.7
$0.0$50.0
$100.0$150.0$200.0$250.0$300.0
2007 Actual 2008 Actual 2009 Actual 2010 Actual 2011 Actual 2012Adopted
2013Adopted
Thou
sand
s
EXPENDITURE HISTORY New Orleans Museum of Art
General Fund Other Funds
Children and
Families 100%
Page 384
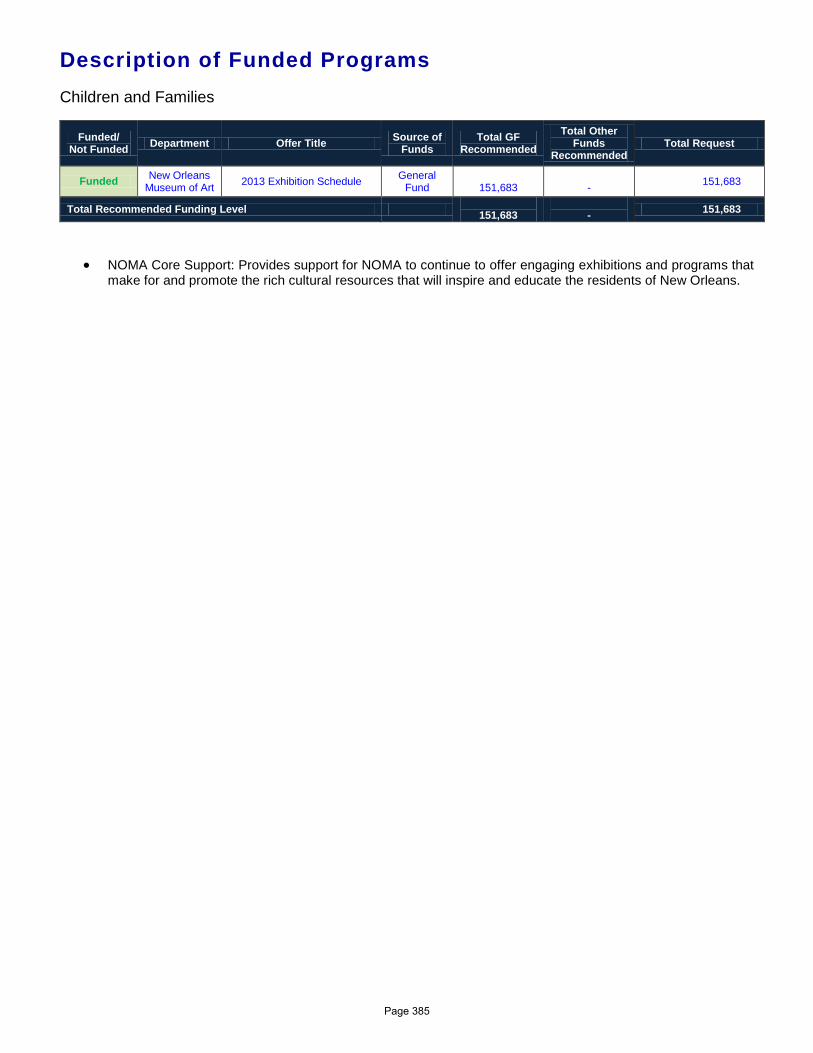
Description of Funded Programs
Children and Families
Funded/ Not Funded Department Offer Title Source of
Funds Total GF
Recommended Total Other
Funds Recommended
Total Request
Funded New Orleans Museum of Art 2013 Exhibition Schedule General
Fund
151,683 - 151,683
Total Recommended Funding Level 151,683
- 151,683
• NOMA Core Support: Provides support for NOMA to continue to offer engaging exhibitions and programs that make for and promote the rich cultural resources that will inspire and educate the residents of New Orleans.
Page 385

N O MUSEUM OF ART
DEPARTMENTAL BUDGET SUMMARY
AdoptedProposedAdoptedActual
EXPENDITURES
2013 2012 2011 2013
PERSONAL SERVICES 0 0 0 0
OTHER OPERATING 176,400 167,772 151,683 151,683
DEBT SERVICE 0 0 0 0
RESERVES 0 0 0 0
GRANTS, CONTRIB. & FUND TRAN. 0 0 0 0
$176,400 $167,772 $151,683 TOTAL EXPENDITURES $151,683
SOURCE OF FUNDING
GENERAL FUND 176,400 167,772 151,683 151,683
WISNER FUNDS 0 0 0 0
ENTERPRISE 0 0 0 0
DOWNTOWN DEVELOPMENT DIST. 0 0 0 0
HOUSING AND URBAN DEVELOP. 0 0 0 0
SELF GENERATED 0 0 0 0
LIBRARY 0 0 0 0
LLE 0 0 0 0
FEDERAL GRANTS 0 0 0 0
STATE GRANTS 0 0 0 0
GRANTS, CONTRIB., & FUND TRAN. 0 0 0 0
N. O. REGIONAL BUSINESS PARK 0 0 0 0
ECONOMIC DEVELOPMENT FUND 0 0 0 0
HOUSING IMPROVMENT FUND 0 0 0 0
$176,400 $167,772 $151,683 TOTAL FUNDING $151,683
Page 386
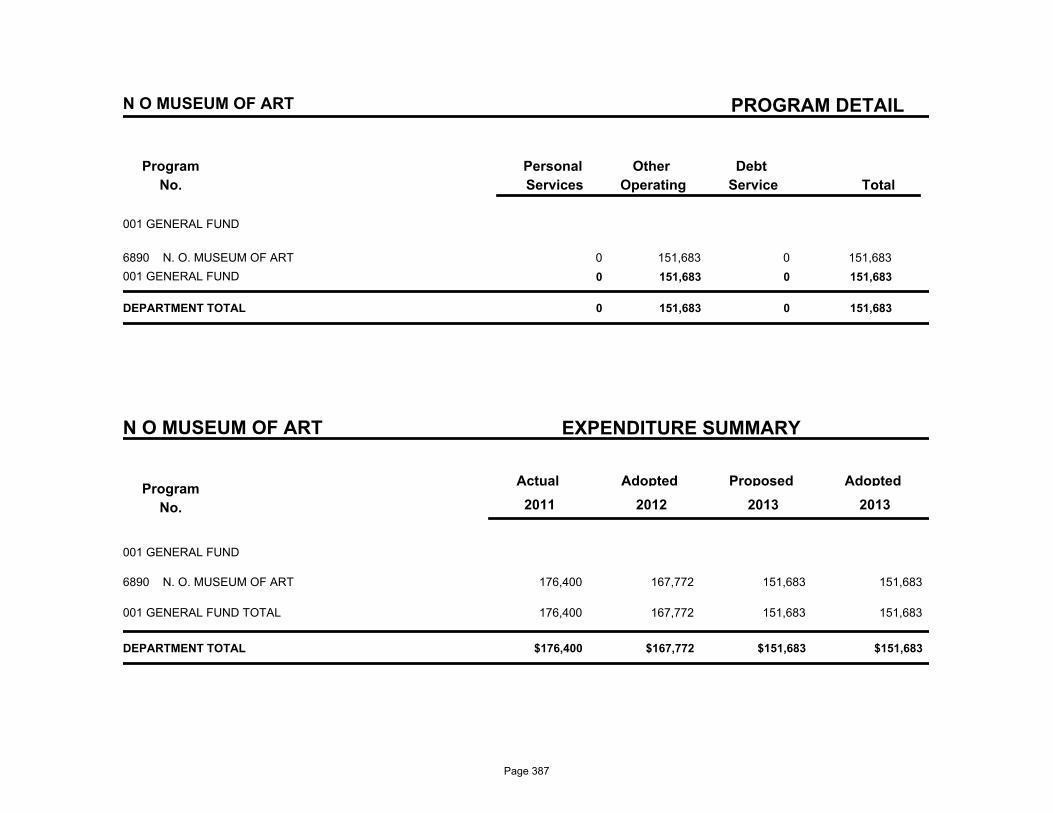
PROGRAM DETAIL
Program
No.
Debt
Service
Other
Operating
Personal
Services Total
N O MUSEUM OF ART
001 GENERAL FUND
6890 N. O. MUSEUM OF ART 0 151,683 0 151,683
001 GENERAL FUND 0 151,683 0 151,683
DEPARTMENT TOTAL 0 151,683 0 151,683
N O MUSEUM OF ART EXPENDITURE SUMMARY
Program
No.
Actual AdoptedProposedAdopted
2013 2011 2012 2013
001 GENERAL FUND
176,400 167,772 151,683 N. O. MUSEUM OF ART6890 151,683
176,400 167,772 151,683 151,683 001 GENERAL FUND TOTAL
$176,400 $167,772 $151,683 $151,683 DEPARTMENT TOTAL
Page 387
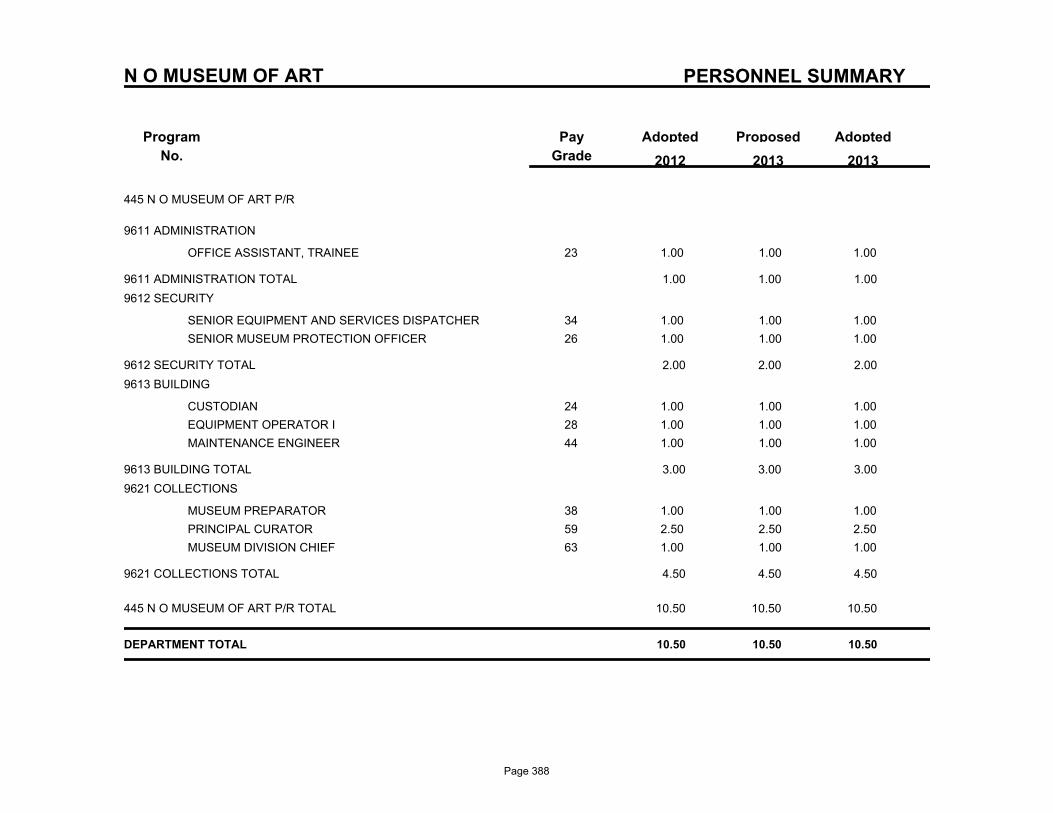
PERSONNEL SUMMARY
Program
No.
ProposedAdoptedPay
Grade
Adopted
2013 2012 2013
N O MUSEUM OF ART
445 N O MUSEUM OF ART P/R
9611 ADMINISTRATION
23OFFICE ASSISTANT, TRAINEE 1.00 1.00 1.00
9611 ADMINISTRATION TOTAL 1.00 1.00 1.00
9612 SECURITY
34SENIOR EQUIPMENT AND SERVICES DISPATCHER 1.00 1.00 1.00
26SENIOR MUSEUM PROTECTION OFFICER 1.00 1.00 1.00
9612 SECURITY TOTAL 2.00 2.00 2.00
9613 BUILDING
24CUSTODIAN 1.00 1.00 1.00
28EQUIPMENT OPERATOR I 1.00 1.00 1.00
44MAINTENANCE ENGINEER 1.00 1.00 1.00
9613 BUILDING TOTAL 3.00 3.00 3.00
9621 COLLECTIONS
38MUSEUM PREPARATOR 1.00 1.00 1.00
59PRINCIPAL CURATOR 2.50 2.50 2.50
63MUSEUM DIVISION CHIEF 1.00 1.00 1.00
9621 COLLECTIONS TOTAL 4.50 4.50 4.50
445 N O MUSEUM OF ART P/R TOTAL 10.50 10.50 10.50
DEPARTMENT TOTAL 10.50 10.50 10.50
Page 388

Page 389

Miscellaneous
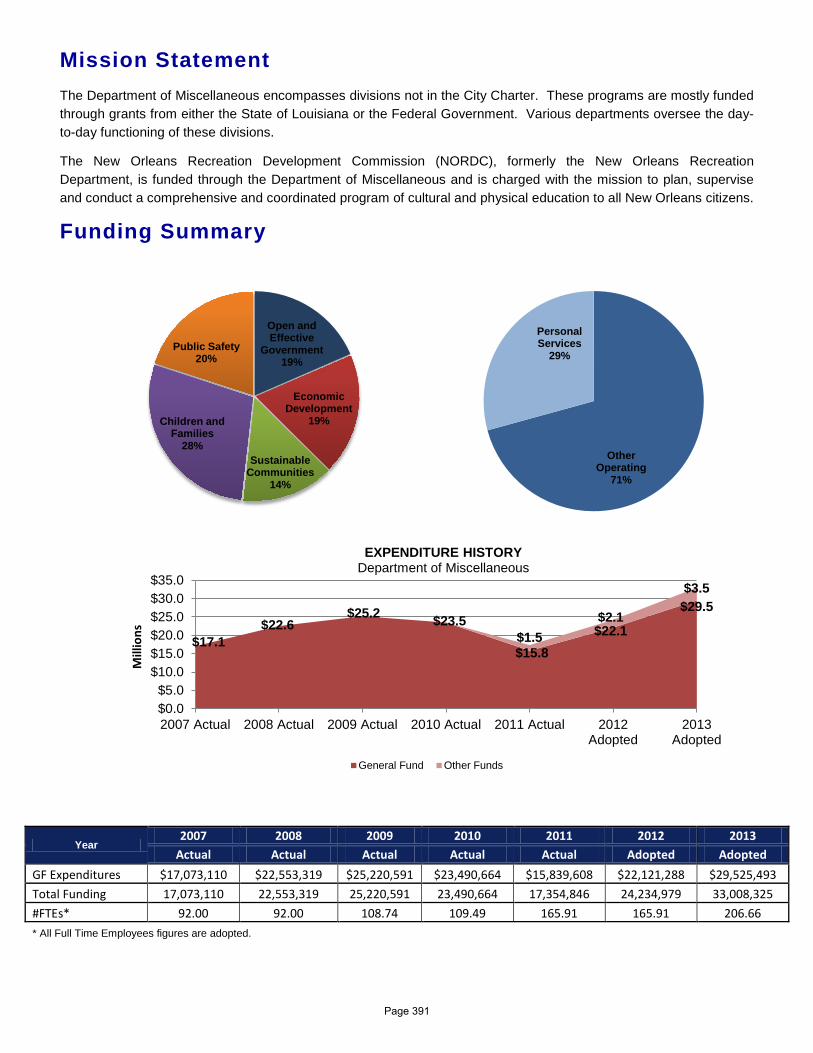
Mission Statement The Department of Miscellaneous encompasses divisions not in the City Charter. These programs are mostly funded through grants from either the State of Louisiana or the Federal Government. Various departments oversee the day-to-day functioning of these divisions.
The New Orleans Recreation Development Commission (NORDC), formerly the New Orleans Recreation Department, is funded through the Department of Miscellaneous and is charged with the mission to plan, supervise and conduct a comprehensive and coordinated program of cultural and physical education to all New Orleans citizens.
Funding Summary
Year 2007 2008 2009 2010 2011 2012 2013
Actual Actual Actual Actual Actual Adopted Adopted GF Expenditures $17,073,110 $22,553,319 $25,220,591 $23,490,664 $15,839,608 $22,121,288 $29,525,493 Total Funding 17,073,110 22,553,319 25,220,591 23,490,664 17,354,846 24,234,979 33,008,325 #FTEs* 92.00 92.00 108.74 109.49 165.91 165.91 206.66 * All Full Time Employees figures are adopted.
$17.1 $22.6
$25.2 $23.5
$15.8 $22.1
$29.5
$1.5 $2.1
$3.5
$0.0$5.0
$10.0$15.0$20.0$25.0$30.0$35.0
2007 Actual 2008 Actual 2009 Actual 2010 Actual 2011 Actual 2012Adopted
2013Adopted
Mill
ions
EXPENDITURE HISTORY Department of Miscellaneous
General Fund Other Funds
Open and Effective
Government 19%
Economic Development
19%
Sustainable Communities
14%
Children and Families
28%
Public Safety 20%
Other Operating
71%
Personal Services
29%
Page 391
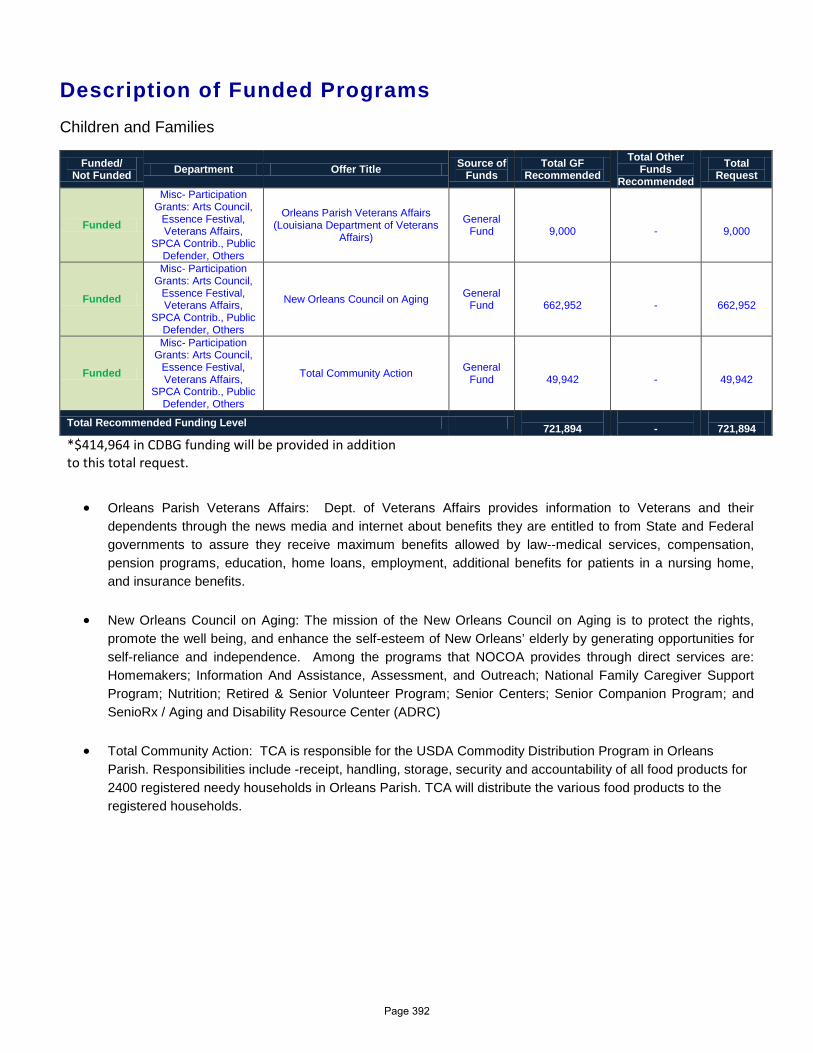
Description of Funded Programs Children and Families
Funded/ Not Funded Department Offer Title Source of
Funds Total GF
Recommended Total Other
Funds Recommended
Total Request
Funded
Misc- Participation Grants: Arts Council,
Essence Festival, Veterans Affairs,
SPCA Contrib., Public Defender, Others
Orleans Parish Veterans Affairs (Louisiana Department of Veterans
Affairs)
General Fund
9,000
-
9,000
Funded
Misc- Participation Grants: Arts Council,
Essence Festival, Veterans Affairs,
SPCA Contrib., Public Defender, Others
New Orleans Council on Aging General Fund
662,952
-
662,952
Funded
Misc- Participation Grants: Arts Council,
Essence Festival, Veterans Affairs,
SPCA Contrib., Public Defender, Others
Total Community Action General Fund
49,942
-
49,942
Total Recommended Funding Level 721,894
-
721,894
*$414,964 in CDBG funding will be provided in addition to this total request.
• Orleans Parish Veterans Affairs: Dept. of Veterans Affairs provides information to Veterans and their
dependents through the news media and internet about benefits they are entitled to from State and Federal governments to assure they receive maximum benefits allowed by law--medical services, compensation, pension programs, education, home loans, employment, additional benefits for patients in a nursing home, and insurance benefits.
• New Orleans Council on Aging: The mission of the New Orleans Council on Aging is to protect the rights, promote the well being, and enhance the self-esteem of New Orleans’ elderly by generating opportunities for self-reliance and independence. Among the programs that NOCOA provides through direct services are: Homemakers; Information And Assistance, Assessment, and Outreach; National Family Caregiver Support Program; Nutrition; Retired & Senior Volunteer Program; Senior Centers; Senior Companion Program; and SenioRx / Aging and Disability Resource Center (ADRC)
• Total Community Action: TCA is responsible for the USDA Commodity Distribution Program in Orleans Parish. Responsibilities include -receipt, handling, storage, security and accountability of all food products for 2400 registered needy households in Orleans Parish. TCA will distribute the various food products to the registered households.
Page 392
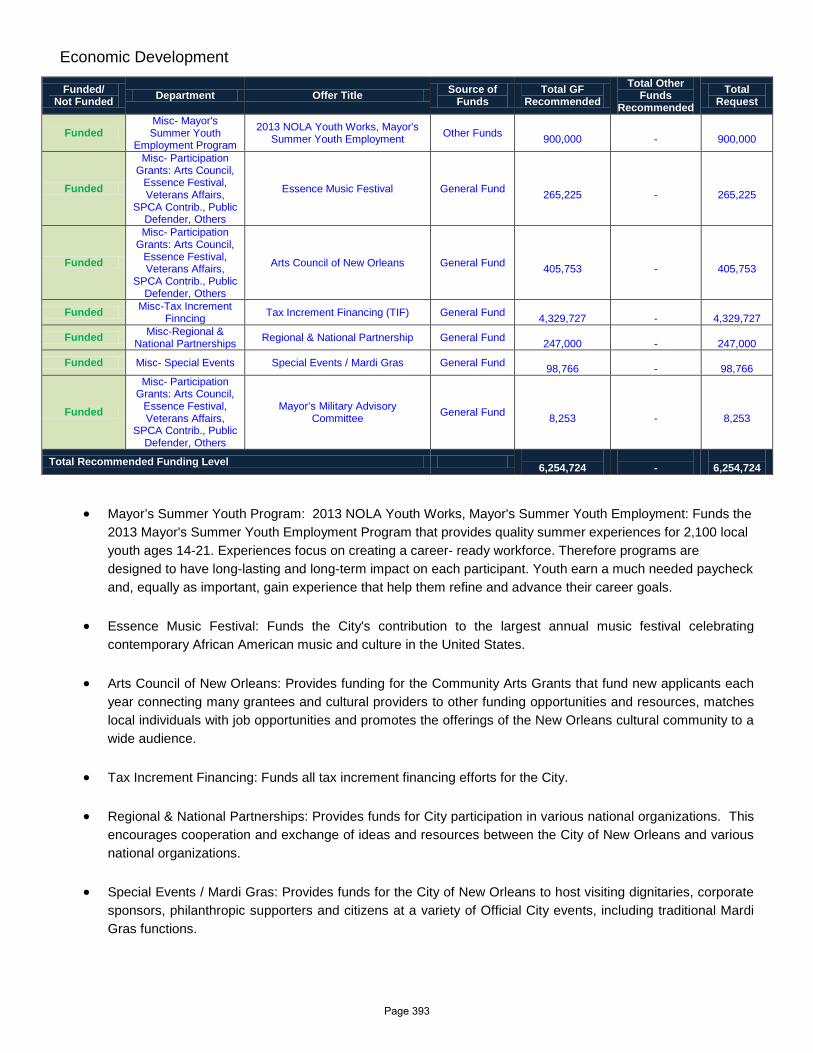
Economic Development
Funded/ Not Funded Department Offer Title Source of
Funds Total GF
Recommended Total Other
Funds Recommended
Total Request
Funded Misc- Mayor's Summer Youth
Employment Program
2013 NOLA Youth Works, Mayor's Summer Youth Employment Other Funds
900,000 -
900,000
Funded
Misc- Participation Grants: Arts Council,
Essence Festival, Veterans Affairs,
SPCA Contrib., Public Defender, Others
Essence Music Festival General Fund 265,225
-
265,225
Funded
Misc- Participation Grants: Arts Council,
Essence Festival, Veterans Affairs,
SPCA Contrib., Public Defender, Others
Arts Council of New Orleans General Fund 405,753
-
405,753
Funded Misc-Tax Increment Finncing Tax Increment Financing (TIF) General Fund
4,329,727 -
4,329,727
Funded Misc-Regional & National Partnerships Regional & National Partnership General Fund
247,000 -
247,000
Funded Misc- Special Events Special Events / Mardi Gras General Fund 98,766
-
98,766
Funded
Misc- Participation Grants: Arts Council,
Essence Festival, Veterans Affairs,
SPCA Contrib., Public Defender, Others
Mayor’s Military Advisory Committee General Fund
8,253 -
8,253
Total Recommended Funding Level 6,254,724
-
6,254,724
• Mayor’s Summer Youth Program: 2013 NOLA Youth Works, Mayor's Summer Youth Employment: Funds the 2013 Mayor's Summer Youth Employment Program that provides quality summer experiences for 2,100 local youth ages 14-21. Experiences focus on creating a career- ready workforce. Therefore programs are designed to have long-lasting and long-term impact on each participant. Youth earn a much needed paycheck and, equally as important, gain experience that help them refine and advance their career goals.
• Essence Music Festival: Funds the City's contribution to the largest annual music festival celebrating contemporary African American music and culture in the United States.
• Arts Council of New Orleans: Provides funding for the Community Arts Grants that fund new applicants each year connecting many grantees and cultural providers to other funding opportunities and resources, matches local individuals with job opportunities and promotes the offerings of the New Orleans cultural community to a wide audience.
• Tax Increment Financing: Funds all tax increment financing efforts for the City.
• Regional & National Partnerships: Provides funds for City participation in various national organizations. This encourages cooperation and exchange of ideas and resources between the City of New Orleans and various national organizations.
• Special Events / Mardi Gras: Provides funds for the City of New Orleans to host visiting dignitaries, corporate sponsors, philanthropic supporters and citizens at a variety of Official City events, including traditional Mardi Gras functions.
Page 393
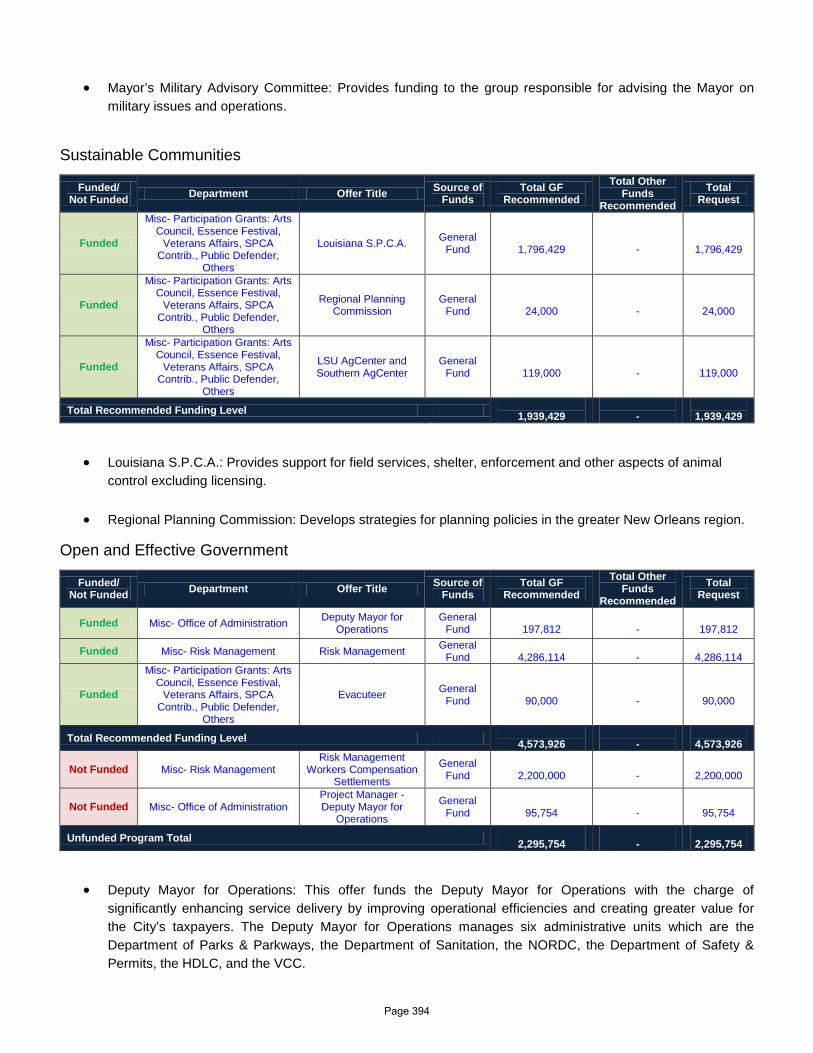
• Mayor’s Military Advisory Committee: Provides funding to the group responsible for advising the Mayor on military issues and operations.
Sustainable Communities
Funded/ Not Funded Department Offer Title Source of
Funds Total GF
Recommended Total Other
Funds Recommended
Total Request
Funded
Misc- Participation Grants: Arts Council, Essence Festival,
Veterans Affairs, SPCA Contrib., Public Defender,
Others
Louisiana S.P.C.A. General Fund
1,796,429
-
1,796,429
Funded
Misc- Participation Grants: Arts Council, Essence Festival,
Veterans Affairs, SPCA Contrib., Public Defender,
Others
Regional Planning Commission
General Fund
24,000
-
24,000
Funded
Misc- Participation Grants: Arts Council, Essence Festival,
Veterans Affairs, SPCA Contrib., Public Defender,
Others
LSU AgCenter and Southern AgCenter
General Fund
119,000
-
119,000
Total Recommended Funding Level 1,939,429
-
1,939,429
• Louisiana S.P.C.A.: Provides support for field services, shelter, enforcement and other aspects of animal control excluding licensing.
• Regional Planning Commission: Develops strategies for planning policies in the greater New Orleans region.
Open and Effective Government
Funded/ Not Funded Department Offer Title Source of
Funds Total GF
Recommended Total Other
Funds Recommended
Total Request
Funded Misc- Office of Administration Deputy Mayor for Operations
General Fund
197,812
-
197,812
Funded Misc- Risk Management Risk Management General Fund
4,286,114
-
4,286,114
Funded
Misc- Participation Grants: Arts Council, Essence Festival,
Veterans Affairs, SPCA Contrib., Public Defender,
Others
Evacuteer General Fund
90,000
-
90,000
Total Recommended Funding Level 4,573,926
-
4,573,926
Not Funded Misc- Risk Management Risk Management
Workers Compensation Settlements
General Fund
2,200,000
-
2,200,000
Not Funded Misc- Office of Administration Project Manager - Deputy Mayor for
Operations
General Fund
95,754
-
95,754
Unfunded Program Total 2,295,754
-
2,295,754
• Deputy Mayor for Operations: This offer funds the Deputy Mayor for Operations with the charge of significantly enhancing service delivery by improving operational efficiencies and creating greater value for the City’s taxpayers. The Deputy Mayor for Operations manages six administrative units which are the Department of Parks & Parkways, the Department of Sanitation, the NORDC, the Department of Safety & Permits, the HDLC, and the VCC.
Page 394
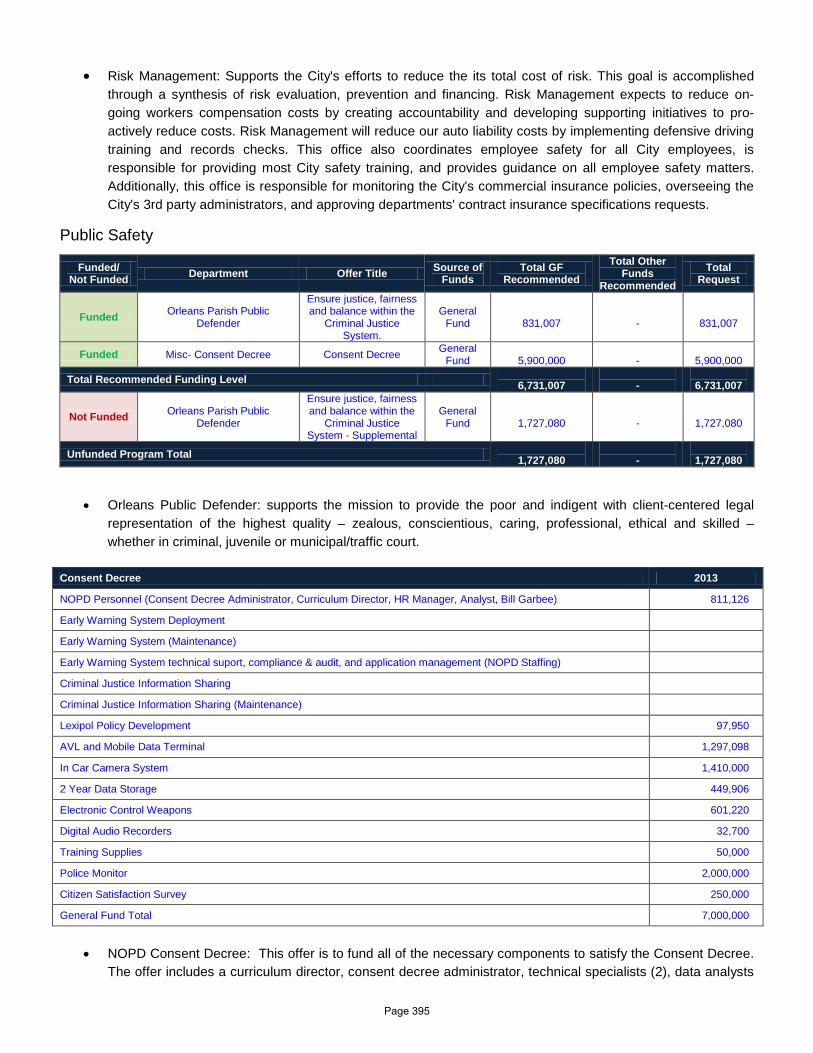
• Risk Management: Supports the City's efforts to reduce the its total cost of risk. This goal is accomplished
through a synthesis of risk evaluation, prevention and financing. Risk Management expects to reduce on-going workers compensation costs by creating accountability and developing supporting initiatives to pro-actively reduce costs. Risk Management will reduce our auto liability costs by implementing defensive driving training and records checks. This office also coordinates employee safety for all City employees, is responsible for providing most City safety training, and provides guidance on all employee safety matters. Additionally, this office is responsible for monitoring the City's commercial insurance policies, overseeing the City's 3rd party administrators, and approving departments' contract insurance specifications requests.
Public Safety
Funded/ Not Funded Department Offer Title Source of
Funds Total GF
Recommended Total Other
Funds Recommended
Total Request
Funded Orleans Parish Public Defender
Ensure justice, fairness and balance within the
Criminal Justice System.
General Fund
831,007
-
831,007
Funded Misc- Consent Decree Consent Decree General Fund
5,900,000
-
5,900,000
Total Recommended Funding Level 6,731,007
-
6,731,007
Not Funded Orleans Parish Public Defender
Ensure justice, fairness and balance within the
Criminal Justice System - Supplemental
General Fund
1,727,080
-
1,727,080
Unfunded Program Total 1,727,080
-
1,727,080
• Orleans Public Defender: supports the mission to provide the poor and indigent with client-centered legal representation of the highest quality – zealous, conscientious, caring, professional, ethical and skilled – whether in criminal, juvenile or municipal/traffic court.
• NOPD Consent Decree: This offer is to fund all of the necessary components to satisfy the Consent Decree.
The offer includes a curriculum director, consent decree administrator, technical specialists (2), data analysts
Consent Decree 2013
NOPD Personnel (Consent Decree Administrator, Curriculum Director, HR Manager, Analyst, Bill Garbee) 811,126
Early Warning System Deployment
Early Warning System (Maintenance)
Early Warning System technical suport, compliance & audit, and application management (NOPD Staffing)
Criminal Justice Information Sharing
Criminal Justice Information Sharing (Maintenance)
Lexipol Policy Development 97,950
AVL and Mobile Data Terminal 1,297,098
In Car Camera System 1,410,000
2 Year Data Storage 449,906
Electronic Control Weapons 601,220
Digital Audio Recorders 32,700
Training Supplies 50,000
Police Monitor 2,000,000
Citizen Satisfaction Survey 250,000
General Fund Total 7,000,000
Page 395

(3), and data entry personnel (4). All positions are civilian positions. Additionally, the offer includes funding for the first year of development for the Early Warning System and technical support accompanying it, AVL and camera system, in-car camera system, necessary data storage, electronic control weapons, digital audio recorders, additional copy supplies, federal monitor, office of police secondary employment, and citizen satisfaction survey. *The above listed areas of concentration will be funded baring any unanticipated contingencies incurred by the City of New Orleans during fiscal year 2013.
Page 396

Page 397

New Orleans Recreation Development Commission
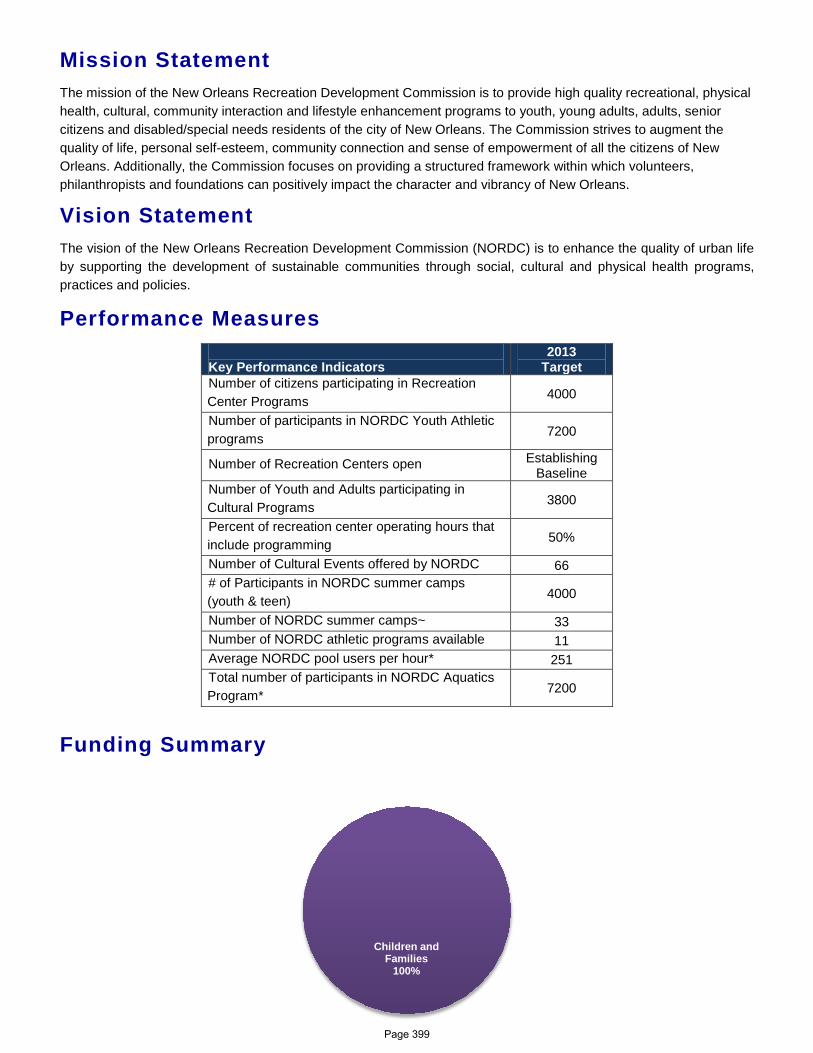
Children and Families
100%
Mission Statement The mission of the New Orleans Recreation Development Commission is to provide high quality recreational, physical health, cultural, community interaction and lifestyle enhancement programs to youth, young adults, adults, senior citizens and disabled/special needs residents of the city of New Orleans. The Commission strives to augment the quality of life, personal self-esteem, community connection and sense of empowerment of all the citizens of New Orleans. Additionally, the Commission focuses on providing a structured framework within which volunteers, philanthropists and foundations can positively impact the character and vibrancy of New Orleans.
Vision Statement The vision of the New Orleans Recreation Development Commission (NORDC) is to enhance the quality of urban life by supporting the development of sustainable communities through social, cultural and physical health programs, practices and policies.
Performance Measures Key Performance Indicators
2013 Target
Number of citizens participating in Recreation Center Programs 4000
Number of participants in NORDC Youth Athletic programs 7200
Number of Recreation Centers open Establishing Baseline
Number of Youth and Adults participating in Cultural Programs 3800
Percent of recreation center operating hours that include programming 50%
Number of Cultural Events offered by NORDC 66 # of Participants in NORDC summer camps (youth & teen) 4000
Number of NORDC summer camps~ 33 Number of NORDC athletic programs available 11 Average NORDC pool users per hour* 251 Total number of participants in NORDC Aquatics Program* 7200
Funding Summary
Page 399
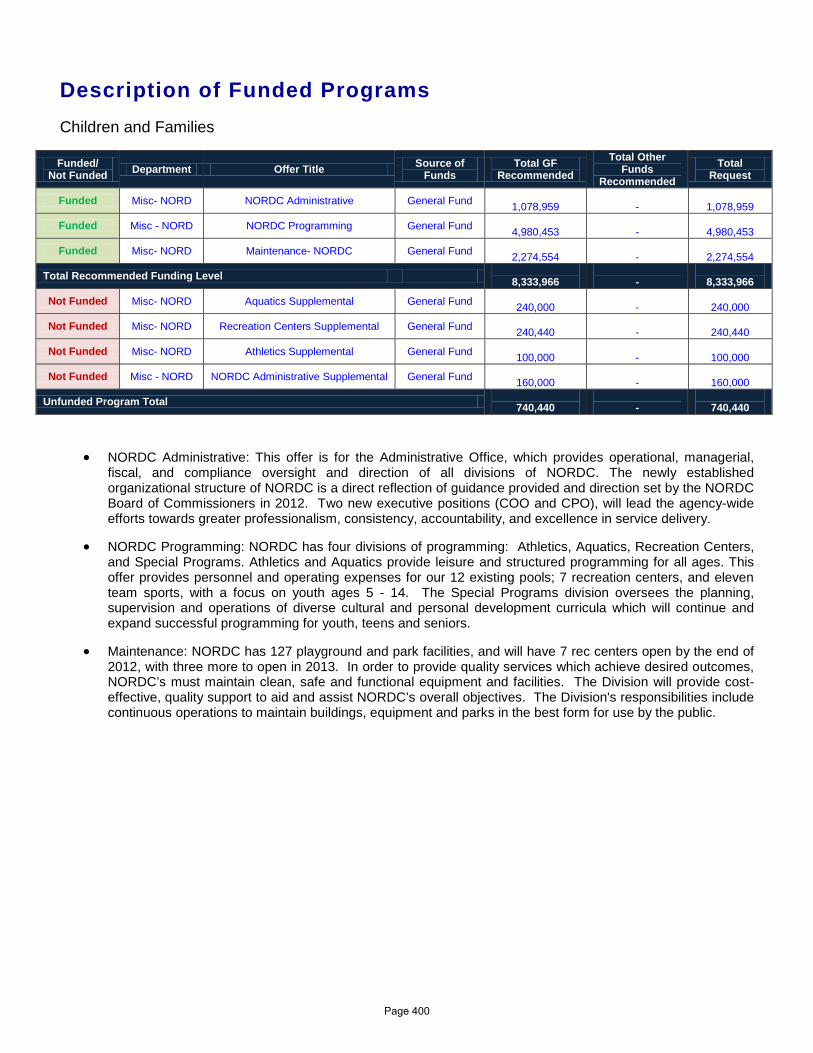
Description of Funded Programs Children and Families
Funded/ Not Funded Department Offer Title Source of
Funds Total GF
Recommended Total Other
Funds Recommended
Total Request
Funded Misc- NORD NORDC Administrative General Fund 1,078,959
-
1,078,959
Funded Misc - NORD NORDC Programming General Fund 4,980,453
-
4,980,453
Funded Misc- NORD Maintenance- NORDC General Fund 2,274,554
-
2,274,554
Total Recommended Funding Level 8,333,966
-
8,333,966
Not Funded Misc- NORD Aquatics Supplemental General Fund 240,000
-
240,000
Not Funded Misc- NORD Recreation Centers Supplemental General Fund 240,440
-
240,440
Not Funded Misc- NORD Athletics Supplemental General Fund 100,000
-
100,000
Not Funded Misc - NORD NORDC Administrative Supplemental General Fund 160,000
-
160,000
Unfunded Program Total 740,440
-
740,440
• NORDC Administrative: This offer is for the Administrative Office, which provides operational, managerial, fiscal, and compliance oversight and direction of all divisions of NORDC. The newly established organizational structure of NORDC is a direct reflection of guidance provided and direction set by the NORDC Board of Commissioners in 2012. Two new executive positions (COO and CPO), will lead the agency-wide efforts towards greater professionalism, consistency, accountability, and excellence in service delivery.
• NORDC Programming: NORDC has four divisions of programming: Athletics, Aquatics, Recreation Centers, and Special Programs. Athletics and Aquatics provide leisure and structured programming for all ages. This offer provides personnel and operating expenses for our 12 existing pools; 7 recreation centers, and eleven team sports, with a focus on youth ages 5 - 14. The Special Programs division oversees the planning, supervision and operations of diverse cultural and personal development curricula which will continue and expand successful programming for youth, teens and seniors.
• Maintenance: NORDC has 127 playground and park facilities, and will have 7 rec centers open by the end of 2012, with three more to open in 2013. In order to provide quality services which achieve desired outcomes, NORDC’s must maintain clean, safe and functional equipment and facilities. The Division will provide cost-effective, quality support to aid and assist NORDC’s overall objectives. The Division's responsibilities include continuous operations to maintain buildings, equipment and parks in the best form for use by the public.
Page 400

Page 401

Service & Innovation
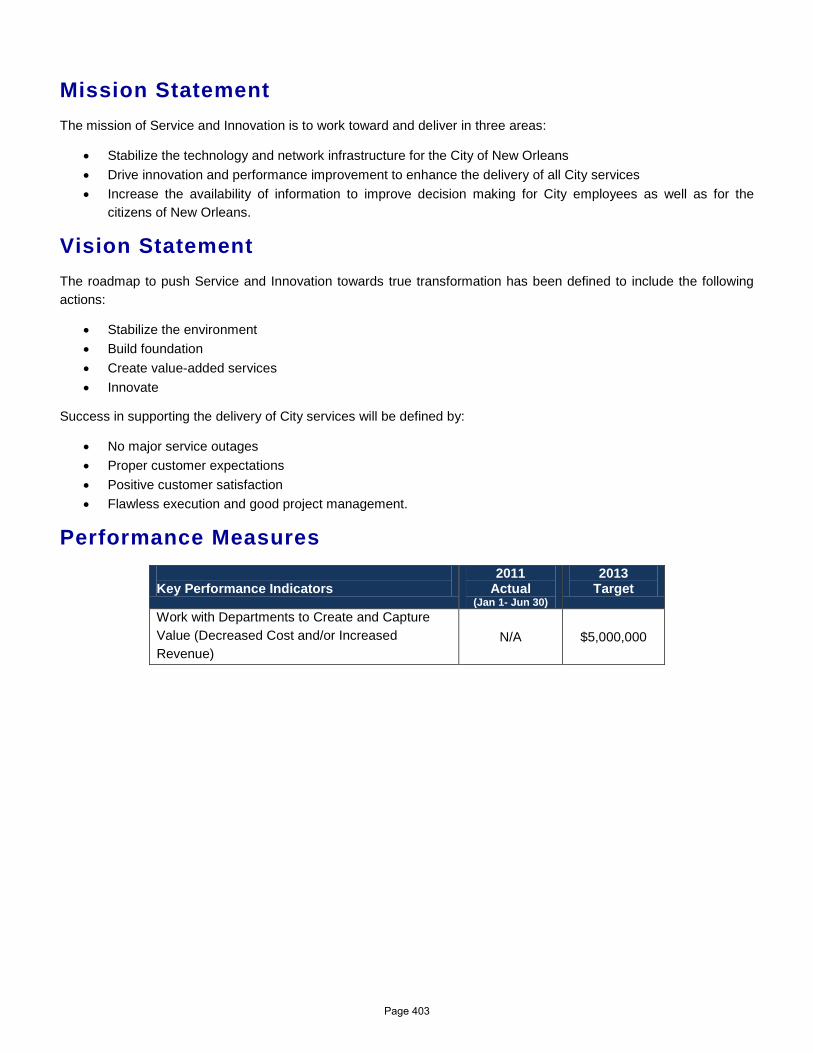
Mission Statement The mission of Service and Innovation is to work toward and deliver in three areas:
• Stabilize the technology and network infrastructure for the City of New Orleans • Drive innovation and performance improvement to enhance the delivery of all City services • Increase the availability of information to improve decision making for City employees as well as for the
citizens of New Orleans.
Vision Statement The roadmap to push Service and Innovation towards true transformation has been defined to include the following actions:
• Stabilize the environment • Build foundation • Create value-added services • Innovate
Success in supporting the delivery of City services will be defined by:
• No major service outages • Proper customer expectations • Positive customer satisfaction • Flawless execution and good project management.
Performance Measures Key Performance Indicators
2011 Actual
(Jan 1- Jun 30)
2013 Target
Work with Departments to Create and Capture Value (Decreased Cost and/or Increased Revenue)
N/A $5,000,000
Page 403
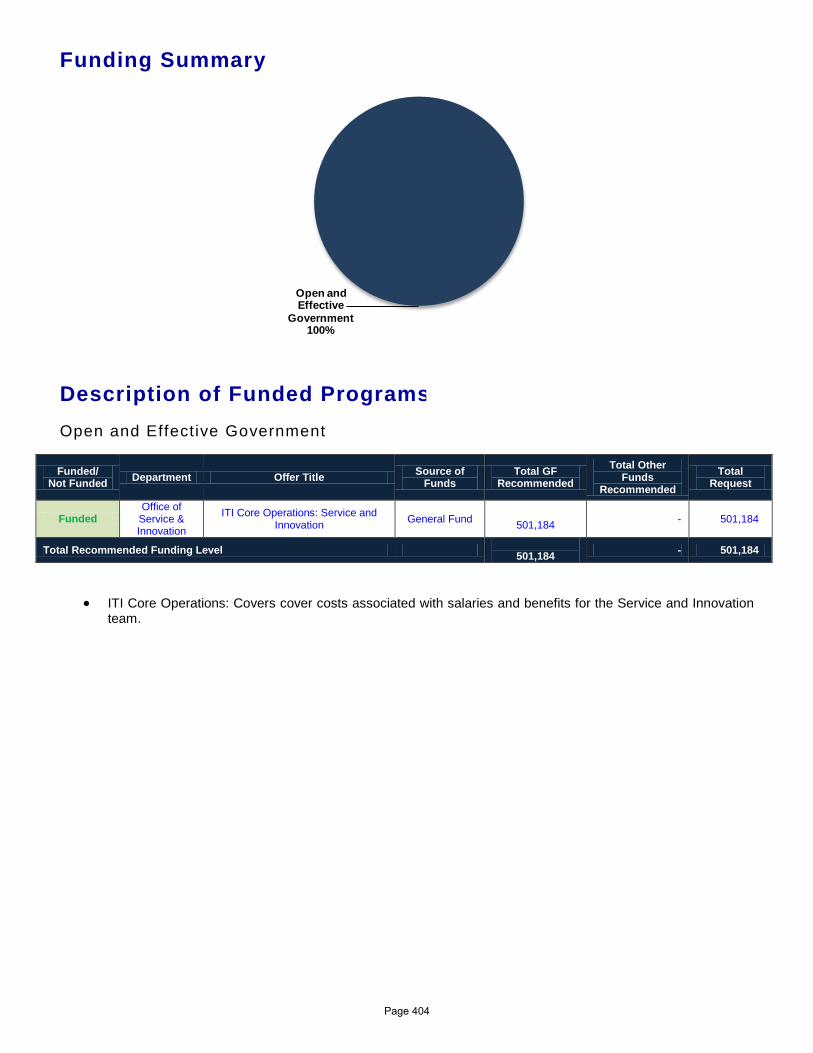
Funding Summary
Description of Funded Programs Open and Effective Government
Funded/ Not Funded Department Offer Title Source of
Funds Total GF
Recommended Total Other
Funds Recommended
Total Request
Funded Office of
Service & Innovation
ITI Core Operations: Service and Innovation General Fund
501,184 - 501,184
Total Recommended Funding Level 501,184 - 501,184
• ITI Core Operations: Covers cover costs associated with salaries and benefits for the Service and Innovation team.
Open and Effective
Government100%
[Type
Page 404

Page 405

Office of Performance & Accountability
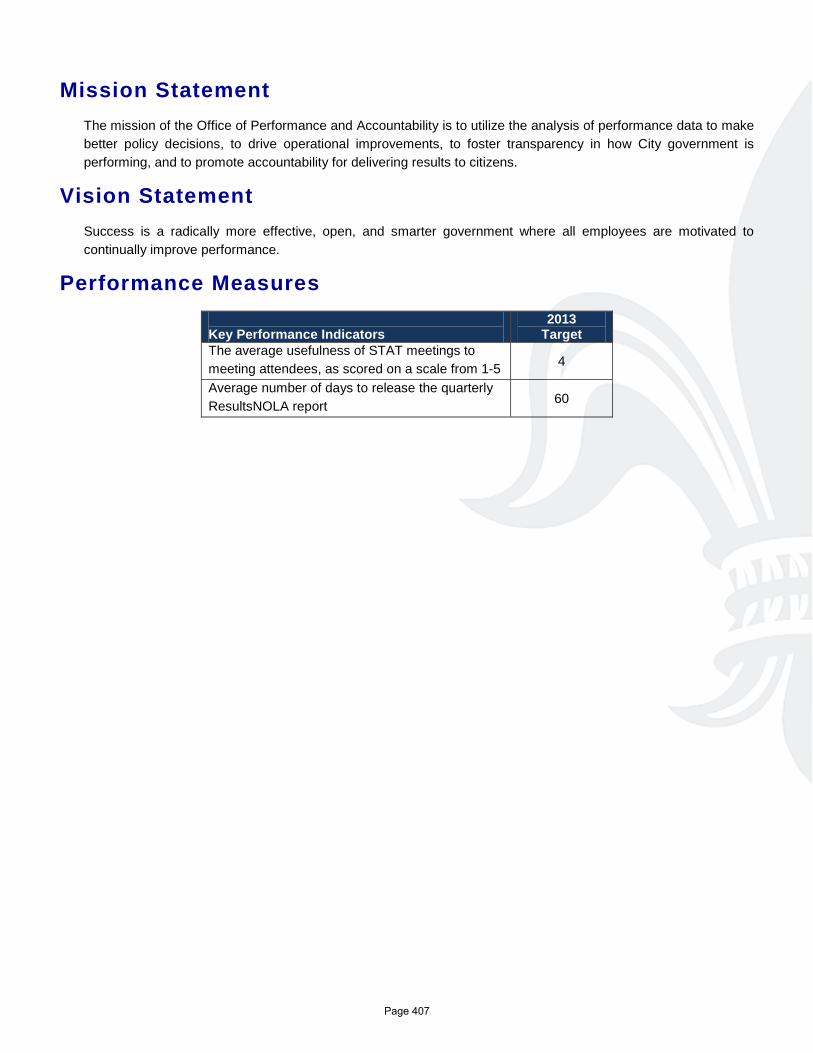
Mission Statement The mission of the Office of Performance and Accountability is to utilize the analysis of performance data to make better policy decisions, to drive operational improvements, to foster transparency in how City government is performing, and to promote accountability for delivering results to citizens.
Vision Statement Success is a radically more effective, open, and smarter government where all employees are motivated to continually improve performance.
Performance Measures Key Performance Indicators
2013 Target
The average usefulness of STAT meetings to meeting attendees, as scored on a scale from 1-5 4
Average number of days to release the quarterly ResultsNOLA report 60
Page 407
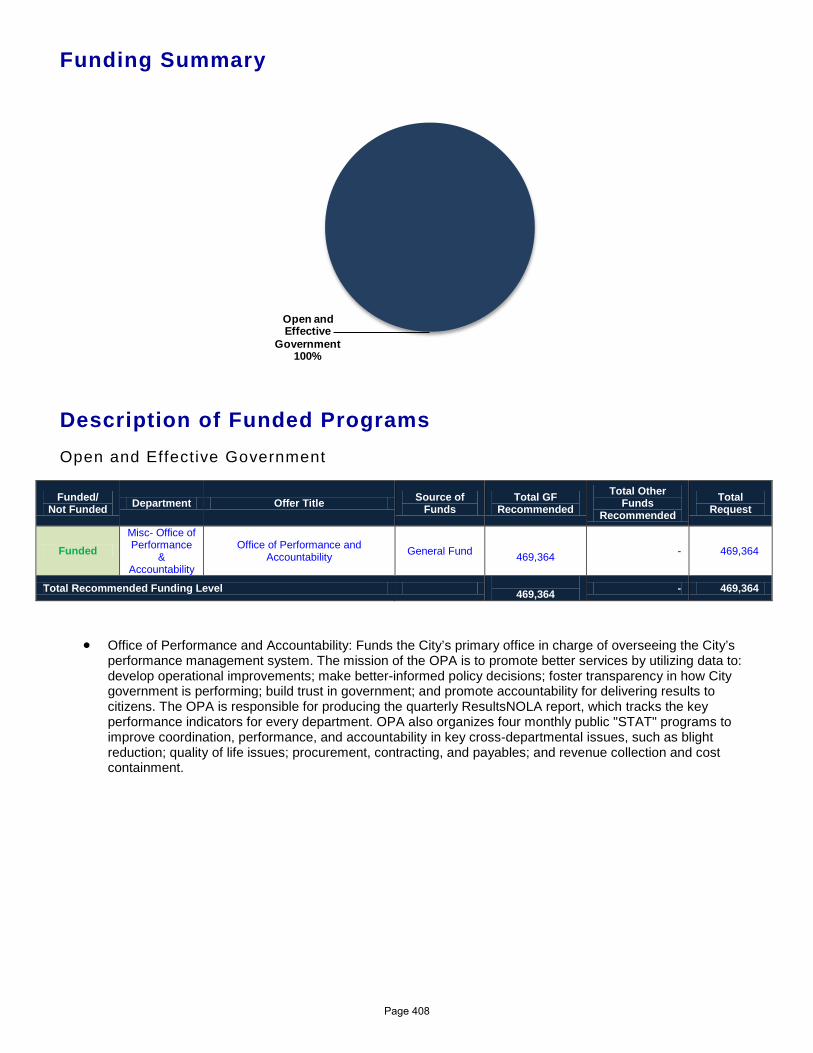
Funding Summary
Description of Funded Programs Open and Effective Government
Funded/ Not Funded Department Offer Title Source of
Funds Total GF
Recommended Total Other
Funds Recommended
Total Request
Funded Misc- Office of Performance
& Accountability
Office of Performance and Accountability General Fund
469,364 - 469,364
Total Recommended Funding Level 469,364 - 469,364
• Office of Performance and Accountability: Funds the City’s primary office in charge of overseeing the City’s performance management system. The mission of the OPA is to promote better services by utilizing data to: develop operational improvements; make better-informed policy decisions; foster transparency in how City government is performing; build trust in government; and promote accountability for delivering results to citizens. The OPA is responsible for producing the quarterly ResultsNOLA report, which tracks the key performance indicators for every department. OPA also organizes four monthly public "STAT" programs to improve coordination, performance, and accountability in key cross-departmental issues, such as blight reduction; quality of life issues; procurement, contracting, and payables; and revenue collection and cost containment.
Open and Effective
Government100%
Page 408

MISCELLANEOUS
DEPARTMENTAL BUDGET SUMMARY
AdoptedProposedAdoptedActual
EXPENDITURES
2013 2012 2011 2013
PERSONAL SERVICES 6,531,778 10,567,690 11,766,008 10,917,981
OTHER OPERATING 10,823,068 13,667,289 22,971,344 22,090,344
DEBT SERVICE 0 0 0 0
RESERVES 0 0 0 0
GRANTS, CONTRIB. & FUND TRAN. 0 0 0 0
$17,354,846 $24,234,979 $34,737,352 TOTAL EXPENDITURES $33,008,325
SOURCE OF FUNDING
GENERAL FUND 15,839,608 22,121,288 31,254,520 29,525,493
WISNER FUNDS 0 0 0 0
ENTERPRISE 0 0 0 0
DOWNTOWN DEVELOPMENT DIST. 0 0 0 0
HOUSING AND URBAN DEVELOP. 1,513,712 1,918,112 1,210,036 1,210,036
SELF GENERATED 0 0 0 0
LIBRARY 0 0 0 0
LLE 0 0 0 0
FEDERAL GRANTS 1,526 195,579 2,272,796 2,272,796
STATE GRANTS 0 0 0 0
GRANTS, CONTRIB., & FUND TRAN. 0 0 0 0
N. O. REGIONAL BUSINESS PARK 0 0 0 0
ECONOMIC DEVELOPMENT FUND 0 0 0 0
HOUSING IMPROVMENT FUND 0 0 0 0
$17,354,846 $24,234,979 $34,737,352 TOTAL FUNDING $33,008,325
Page 409
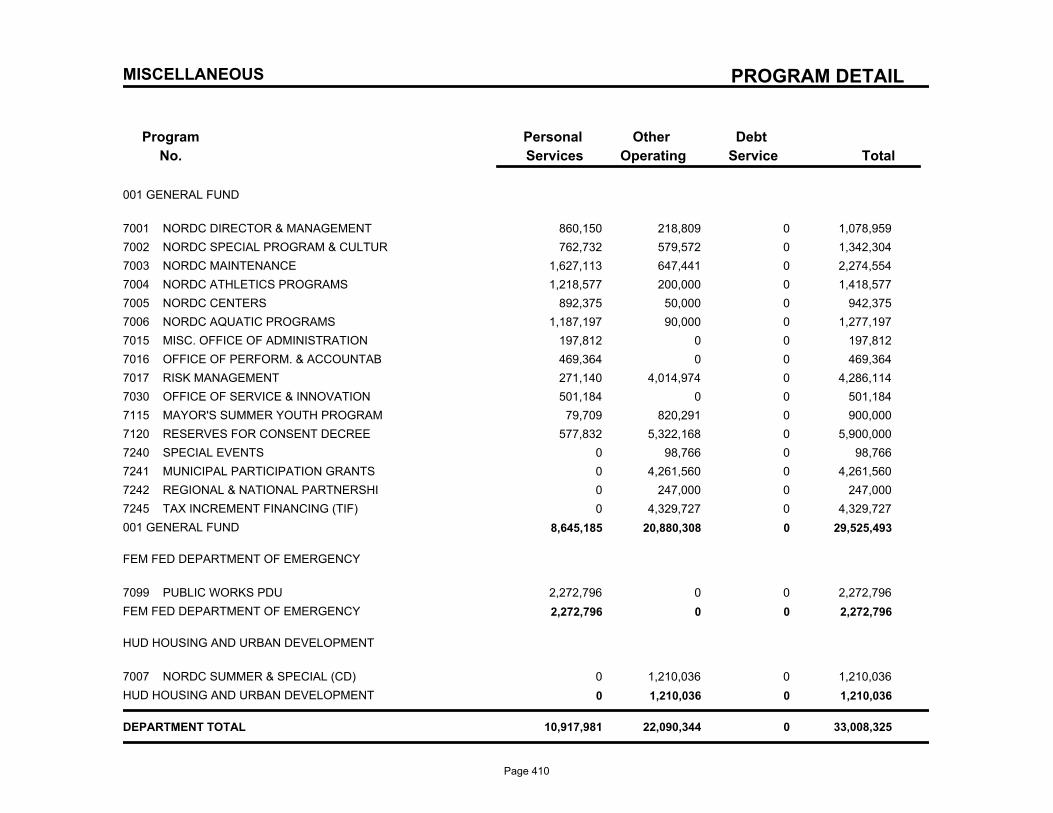
PROGRAM DETAIL
Program
No.
Debt
Service
Other
Operating
Personal
Services Total
MISCELLANEOUS
001 GENERAL FUND
7001 NORDC DIRECTOR & MANAGEMENT 860,150 218,809 0 1,078,959
7002 NORDC SPECIAL PROGRAM & CULTUR 762,732 579,572 0 1,342,304
7003 NORDC MAINTENANCE 1,627,113 647,441 0 2,274,554
7004 NORDC ATHLETICS PROGRAMS 1,218,577 200,000 0 1,418,577
7005 NORDC CENTERS 892,375 50,000 0 942,375
7006 NORDC AQUATIC PROGRAMS 1,187,197 90,000 0 1,277,197
7015 MISC. OFFICE OF ADMINISTRATION 197,812 0 0 197,812
7016 OFFICE OF PERFORM. & ACCOUNTAB 469,364 0 0 469,364
7017 RISK MANAGEMENT 271,140 4,014,974 0 4,286,114
7030 OFFICE OF SERVICE & INNOVATION 501,184 0 0 501,184
7115 MAYOR'S SUMMER YOUTH PROGRAM 79,709 820,291 0 900,000
7120 RESERVES FOR CONSENT DECREE 577,832 5,322,168 0 5,900,000
7240 SPECIAL EVENTS 0 98,766 0 98,766
7241 MUNICIPAL PARTICIPATION GRANTS 0 4,261,560 0 4,261,560
7242 REGIONAL & NATIONAL PARTNERSHI 0 247,000 0 247,000
7245 TAX INCREMENT FINANCING (TIF) 0 4,329,727 0 4,329,727
001 GENERAL FUND 8,645,185 20,880,308 0 29,525,493
FEM FED DEPARTMENT OF EMERGENCY
7099 PUBLIC WORKS PDU 2,272,796 0 0 2,272,796
FEM FED DEPARTMENT OF EMERGENCY 2,272,796 0 0 2,272,796
HUD HOUSING AND URBAN DEVELOPMENT
7007 NORDC SUMMER & SPECIAL (CD) 0 1,210,036 0 1,210,036
HUD HOUSING AND URBAN DEVELOPMENT 0 1,210,036 0 1,210,036
DEPARTMENT TOTAL 10,917,981 22,090,344 0 33,008,325
Page 410
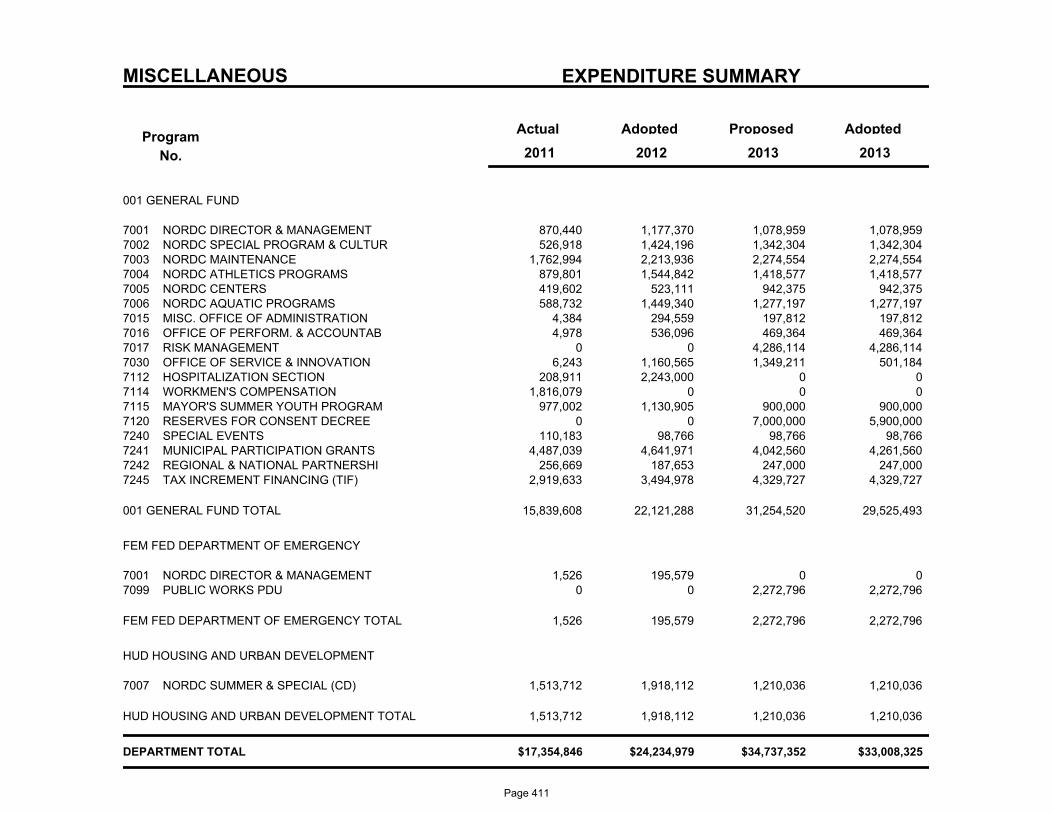
MISCELLANEOUS EXPENDITURE SUMMARY
Program
No.
Actual AdoptedProposedAdopted
2013 2011 2012 2013
001 GENERAL FUND
870,440 1,177,370 1,078,959 NORDC DIRECTOR & MANAGEMENT7001 1,078,959 526,918 1,424,196 1,342,304 NORDC SPECIAL PROGRAM & CULTUR7002 1,342,304
1,762,994 2,213,936 2,274,554 NORDC MAINTENANCE7003 2,274,554 879,801 1,544,842 1,418,577 NORDC ATHLETICS PROGRAMS7004 1,418,577 419,602 523,111 942,375 NORDC CENTERS7005 942,375 588,732 1,449,340 1,277,197 NORDC AQUATIC PROGRAMS7006 1,277,197
4,384 294,559 197,812 MISC. OFFICE OF ADMINISTRATION7015 197,812 4,978 536,096 469,364 OFFICE OF PERFORM. & ACCOUNTAB7016 469,364
0 0 4,286,114 RISK MANAGEMENT7017 4,286,114 6,243 1,160,565 1,349,211 OFFICE OF SERVICE & INNOVATION7030 501,184
208,911 2,243,000 0 HOSPITALIZATION SECTION7112 0 1,816,079 0 0 WORKMEN'S COMPENSATION7114 0
977,002 1,130,905 900,000 MAYOR'S SUMMER YOUTH PROGRAM7115 900,000 0 0 7,000,000 RESERVES FOR CONSENT DECREE7120 5,900,000
110,183 98,766 98,766 SPECIAL EVENTS7240 98,766 4,487,039 4,641,971 4,042,560 MUNICIPAL PARTICIPATION GRANTS7241 4,261,560
256,669 187,653 247,000 REGIONAL & NATIONAL PARTNERSHI7242 247,000 2,919,633 3,494,978 4,329,727 TAX INCREMENT FINANCING (TIF)7245 4,329,727
15,839,608 22,121,288 31,254,520 29,525,493 001 GENERAL FUND TOTAL
FEM FED DEPARTMENT OF EMERGENCY
1,526 195,579 0 NORDC DIRECTOR & MANAGEMENT7001 0 0 0 2,272,796 PUBLIC WORKS PDU7099 2,272,796
1,526 195,579 2,272,796 2,272,796 FEM FED DEPARTMENT OF EMERGENCY TOTAL
HUD HOUSING AND URBAN DEVELOPMENT
1,513,712 1,918,112 1,210,036 NORDC SUMMER & SPECIAL (CD)7007 1,210,036
1,513,712 1,918,112 1,210,036 1,210,036 HUD HOUSING AND URBAN DEVELOPMENT TOTAL
$17,354,846 $24,234,979 $34,737,352 $33,008,325 DEPARTMENT TOTAL
Page 411
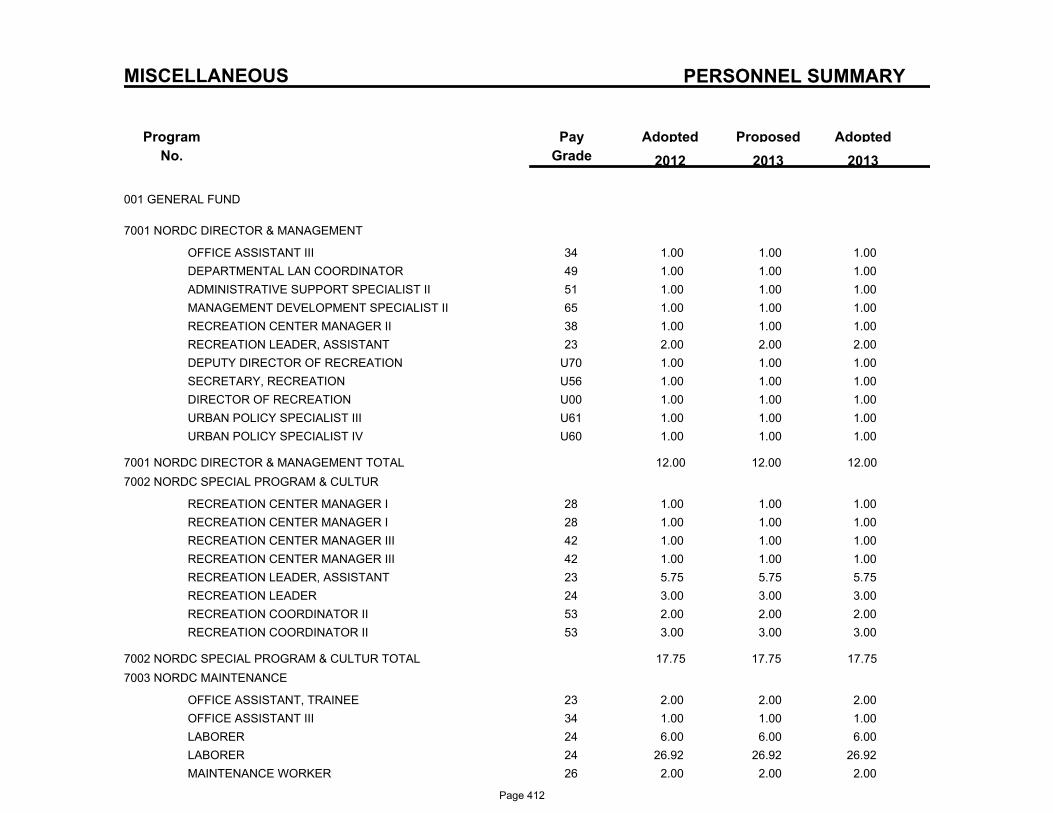
PERSONNEL SUMMARY
Program
No.
ProposedAdoptedPay
Grade
Adopted
2013 2012 2013
MISCELLANEOUS
001 GENERAL FUND
7001 NORDC DIRECTOR & MANAGEMENT
34OFFICE ASSISTANT III 1.00 1.00 1.00
49DEPARTMENTAL LAN COORDINATOR 1.00 1.00 1.00
51ADMINISTRATIVE SUPPORT SPECIALIST II 1.00 1.00 1.00
65MANAGEMENT DEVELOPMENT SPECIALIST II 1.00 1.00 1.00
38RECREATION CENTER MANAGER II 1.00 1.00 1.00
23RECREATION LEADER, ASSISTANT 2.00 2.00 2.00
U70DEPUTY DIRECTOR OF RECREATION 1.00 1.00 1.00
U56SECRETARY, RECREATION 1.00 1.00 1.00
U00DIRECTOR OF RECREATION 1.00 1.00 1.00
U61URBAN POLICY SPECIALIST III 1.00 1.00 1.00
U60URBAN POLICY SPECIALIST IV 1.00 1.00 1.00
7001 NORDC DIRECTOR & MANAGEMENT TOTAL 12.00 12.00 12.00
7002 NORDC SPECIAL PROGRAM & CULTUR
28RECREATION CENTER MANAGER I 1.00 1.00 1.00
28RECREATION CENTER MANAGER I 1.00 1.00 1.00
42RECREATION CENTER MANAGER III 1.00 1.00 1.00
42RECREATION CENTER MANAGER III 1.00 1.00 1.00
23RECREATION LEADER, ASSISTANT 5.75 5.75 5.75
24RECREATION LEADER 3.00 3.00 3.00
53RECREATION COORDINATOR II 2.00 2.00 2.00
53RECREATION COORDINATOR II 3.00 3.00 3.00
7002 NORDC SPECIAL PROGRAM & CULTUR TOTAL 17.75 17.75 17.75
7003 NORDC MAINTENANCE
23OFFICE ASSISTANT, TRAINEE 2.00 2.00 2.00
34OFFICE ASSISTANT III 1.00 1.00 1.00
24LABORER 6.00 6.00 6.00
24LABORER 26.92 26.92 26.92
26MAINTENANCE WORKER 2.00 2.00 2.00
Page 412
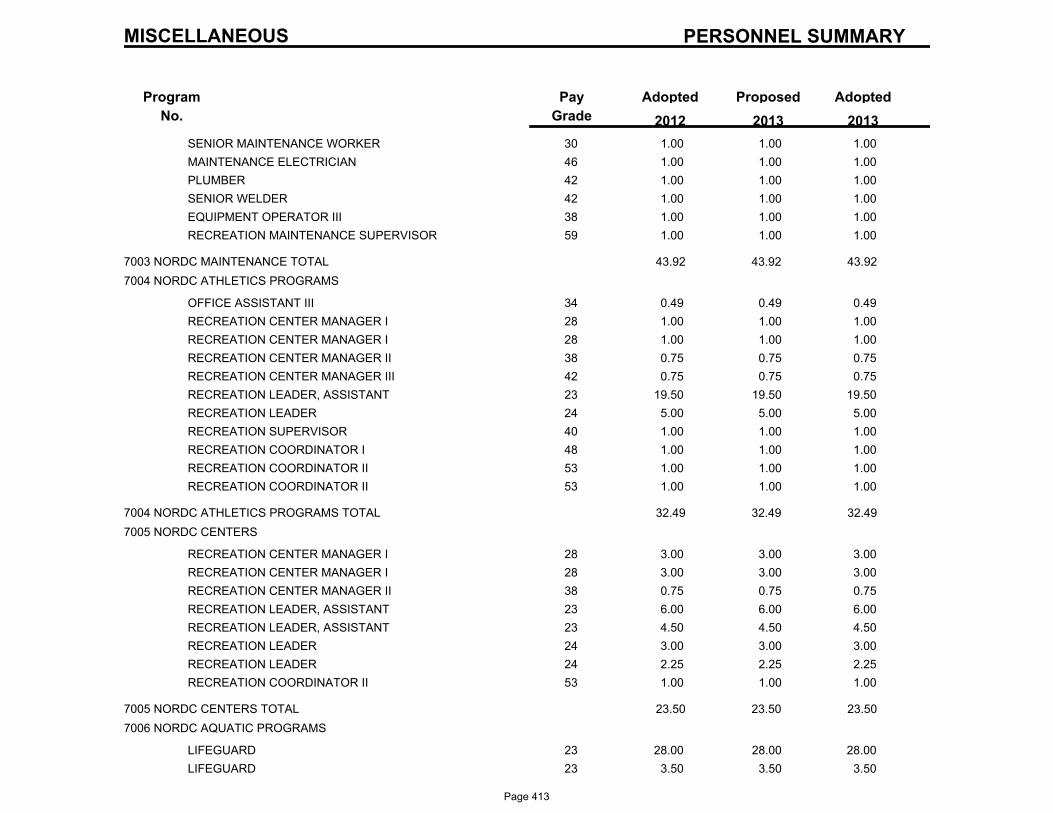
PERSONNEL SUMMARY
Program
No.
ProposedAdoptedPay
Grade
Adopted
2013 2012 2013
MISCELLANEOUS
30SENIOR MAINTENANCE WORKER 1.00 1.00 1.00
46MAINTENANCE ELECTRICIAN 1.00 1.00 1.00
42PLUMBER 1.00 1.00 1.00
42SENIOR WELDER 1.00 1.00 1.00
38EQUIPMENT OPERATOR III 1.00 1.00 1.00
59RECREATION MAINTENANCE SUPERVISOR 1.00 1.00 1.00
7003 NORDC MAINTENANCE TOTAL 43.92 43.92 43.92
7004 NORDC ATHLETICS PROGRAMS
34OFFICE ASSISTANT III 0.49 0.49 0.49
28RECREATION CENTER MANAGER I 1.00 1.00 1.00
28RECREATION CENTER MANAGER I 1.00 1.00 1.00
38RECREATION CENTER MANAGER II 0.75 0.75 0.75
42RECREATION CENTER MANAGER III 0.75 0.75 0.75
23RECREATION LEADER, ASSISTANT 19.50 19.50 19.50
24RECREATION LEADER 5.00 5.00 5.00
40RECREATION SUPERVISOR 1.00 1.00 1.00
48RECREATION COORDINATOR I 1.00 1.00 1.00
53RECREATION COORDINATOR II 1.00 1.00 1.00
53RECREATION COORDINATOR II 1.00 1.00 1.00
7004 NORDC ATHLETICS PROGRAMS TOTAL 32.49 32.49 32.49
7005 NORDC CENTERS
28RECREATION CENTER MANAGER I 3.00 3.00 3.00
28RECREATION CENTER MANAGER I 3.00 3.00 3.00
38RECREATION CENTER MANAGER II 0.75 0.75 0.75
23RECREATION LEADER, ASSISTANT 6.00 6.00 6.00
23RECREATION LEADER, ASSISTANT 4.50 4.50 4.50
24RECREATION LEADER 3.00 3.00 3.00
24RECREATION LEADER 2.25 2.25 2.25
53RECREATION COORDINATOR II 1.00 1.00 1.00
7005 NORDC CENTERS TOTAL 23.50 23.50 23.50
7006 NORDC AQUATIC PROGRAMS
23LIFEGUARD 28.00 28.00 28.00
23LIFEGUARD 3.50 3.50 3.50
Page 413
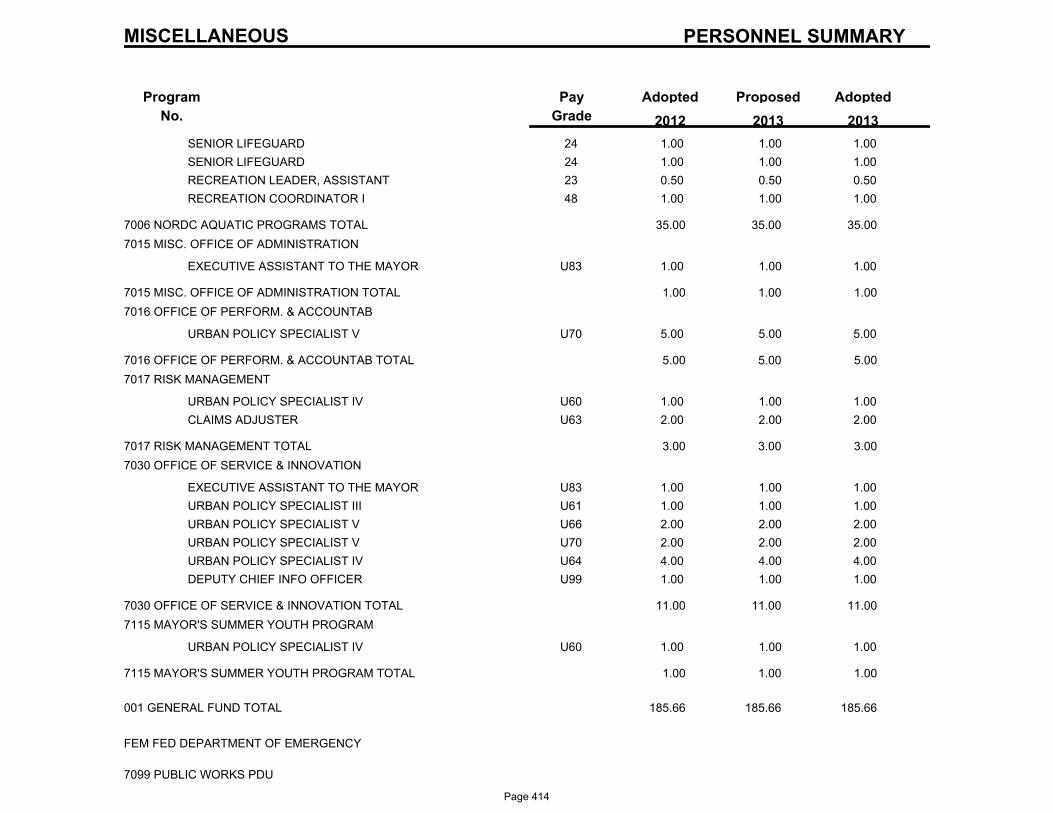
PERSONNEL SUMMARY
Program
No.
ProposedAdoptedPay
Grade
Adopted
2013 2012 2013
MISCELLANEOUS
24SENIOR LIFEGUARD 1.00 1.00 1.00
24SENIOR LIFEGUARD 1.00 1.00 1.00
23RECREATION LEADER, ASSISTANT 0.50 0.50 0.50
48RECREATION COORDINATOR I 1.00 1.00 1.00
7006 NORDC AQUATIC PROGRAMS TOTAL 35.00 35.00 35.00
7015 MISC. OFFICE OF ADMINISTRATION
U83EXECUTIVE ASSISTANT TO THE MAYOR 1.00 1.00 1.00
7015 MISC. OFFICE OF ADMINISTRATION TOTAL 1.00 1.00 1.00
7016 OFFICE OF PERFORM. & ACCOUNTAB
U70URBAN POLICY SPECIALIST V 5.00 5.00 5.00
7016 OFFICE OF PERFORM. & ACCOUNTAB TOTAL 5.00 5.00 5.00
7017 RISK MANAGEMENT
U60URBAN POLICY SPECIALIST IV 1.00 1.00 1.00
U63CLAIMS ADJUSTER 2.00 2.00 2.00
7017 RISK MANAGEMENT TOTAL 3.00 3.00 3.00
7030 OFFICE OF SERVICE & INNOVATION
U83EXECUTIVE ASSISTANT TO THE MAYOR 1.00 1.00 1.00
U61URBAN POLICY SPECIALIST III 1.00 1.00 1.00
U66URBAN POLICY SPECIALIST V 2.00 2.00 2.00
U70URBAN POLICY SPECIALIST V 2.00 2.00 2.00
U64URBAN POLICY SPECIALIST IV 4.00 4.00 4.00
U99DEPUTY CHIEF INFO OFFICER 1.00 1.00 1.00
7030 OFFICE OF SERVICE & INNOVATION TOTAL 11.00 11.00 11.00
7115 MAYOR'S SUMMER YOUTH PROGRAM
U60URBAN POLICY SPECIALIST IV 1.00 1.00 1.00
7115 MAYOR'S SUMMER YOUTH PROGRAM TOTAL 1.00 1.00 1.00
001 GENERAL FUND TOTAL 185.66 185.66 185.66
FEM FED DEPARTMENT OF EMERGENCY
7099 PUBLIC WORKS PDU
Page 414
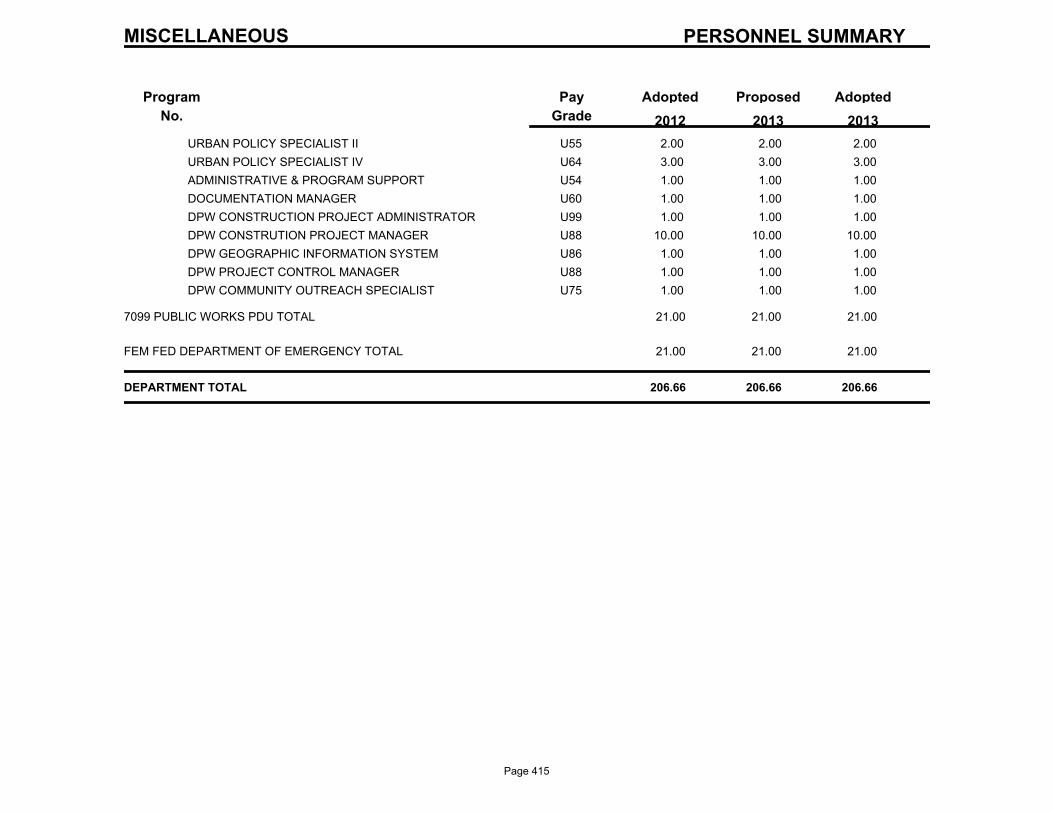
PERSONNEL SUMMARY
Program
No.
ProposedAdoptedPay
Grade
Adopted
2013 2012 2013
MISCELLANEOUS
U55URBAN POLICY SPECIALIST II 2.00 2.00 2.00
U64URBAN POLICY SPECIALIST IV 3.00 3.00 3.00
U54ADMINISTRATIVE & PROGRAM SUPPORT 1.00 1.00 1.00
U60DOCUMENTATION MANAGER 1.00 1.00 1.00
U99DPW CONSTRUCTION PROJECT ADMINISTRATOR 1.00 1.00 1.00
U88DPW CONSTRUTION PROJECT MANAGER 10.00 10.00 10.00
U86DPW GEOGRAPHIC INFORMATION SYSTEM 1.00 1.00 1.00
U88DPW PROJECT CONTROL MANAGER 1.00 1.00 1.00
U75DPW COMMUNITY OUTREACH SPECIALIST 1.00 1.00 1.00
7099 PUBLIC WORKS PDU TOTAL 21.00 21.00 21.00
FEM FED DEPARTMENT OF EMERGENCY TOTAL 21.00 21.00 21.00
DEPARTMENT TOTAL 206.66 206.66 206.66
Page 415

General Services
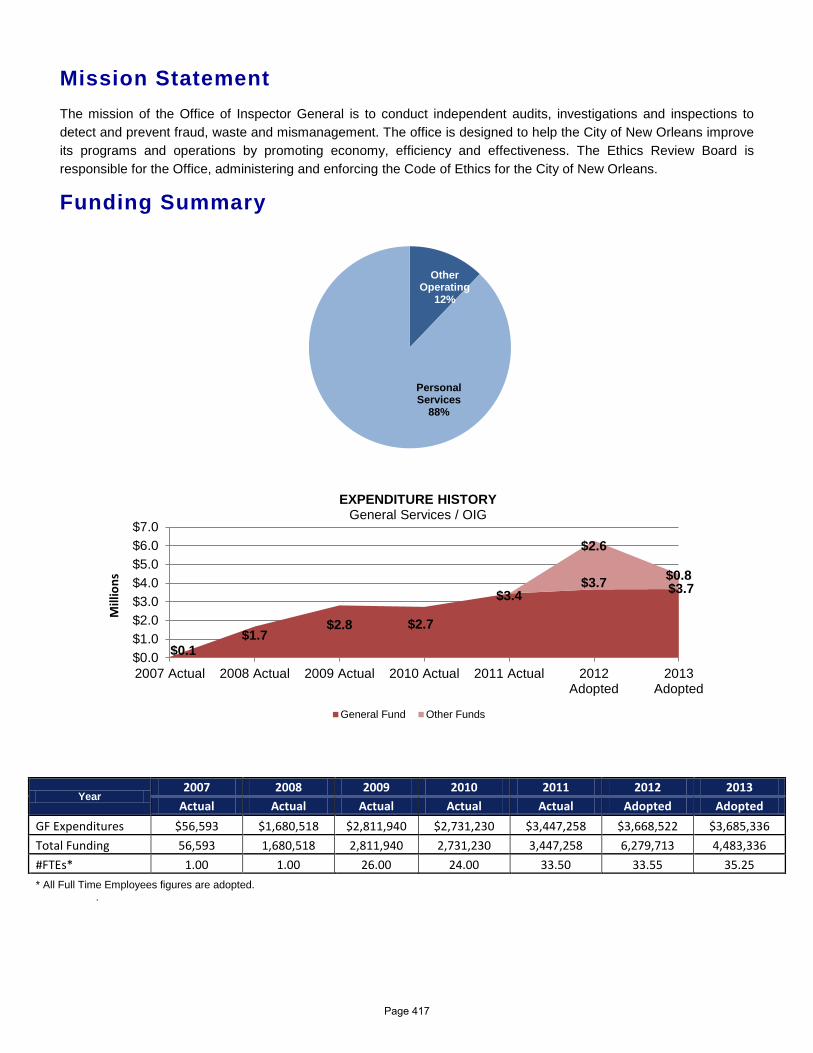
Mission Statement The mission of the Office of Inspector General is to conduct independent audits, investigations and inspections to detect and prevent fraud, waste and mismanagement. The office is designed to help the City of New Orleans improve its programs and operations by promoting economy, efficiency and effectiveness. The Ethics Review Board is responsible for the Office, administering and enforcing the Code of Ethics for the City of New Orleans.
Funding Summary
Year 2007 2008 2009 2010 2011 2012 2013
Actual Actual Actual Actual Actual Adopted Adopted GF Expenditures $56,593 $1,680,518 $2,811,940 $2,731,230 $3,447,258 $3,668,522 $3,685,336 Total Funding 56,593 1,680,518 2,811,940 2,731,230 3,447,258 6,279,713 4,483,336 #FTEs* 1.00 1.00 26.00 24.00 33.50 33.55 35.25 * All Full Time Employees figures are adopted.
.
$0.1 $1.7
$2.8 $2.7
$3.4 $3.7 $3.7
$2.6
$0.8
$0.0$1.0$2.0$3.0$4.0$5.0$6.0$7.0
2007 Actual 2008 Actual 2009 Actual 2010 Actual 2011 Actual 2012Adopted
2013Adopted
Mill
ions
EXPENDITURE HISTORY General Services / OIG
General Fund Other Funds
Other Operating
12%
Personal Services
88%
Page 417

GENERAL SERVICES
DEPARTMENTAL BUDGET SUMMARY
AdoptedProposedAdoptedActual
EXPENDITURES
2013 2012 2011 2013
PERSONAL SERVICES 2,836,792 5,570,225 3,796,630 3,796,630
OTHER OPERATING 610,466 709,488 687,130 686,706
DEBT SERVICE 0 0 0 0
RESERVES 0 0 0 0
GRANTS, CONTRIB. & FUND TRAN. 0 0 0 0
$3,447,258 $6,279,713 $4,483,760 TOTAL EXPENDITURES $4,483,336
SOURCE OF FUNDING
GENERAL FUND 3,447,258 3,668,522 3,685,760 3,685,336
WISNER FUNDS 0 0 0 0
ENTERPRISE 0 0 0 0
DOWNTOWN DEVELOPMENT DIST. 0 0 0 0
HOUSING AND URBAN DEVELOP. 0 0 0 0
SELF GENERATED 0 1,900,000 0 0
LIBRARY 0 0 0 0
LLE 0 0 0 0
FEDERAL GRANTS 0 0 0 0
STATE GRANTS 0 711,191 798,000 798,000
GRANTS, CONTRIB., & FUND TRAN. 0 0 0 0
N. O. REGIONAL BUSINESS PARK 0 0 0 0
ECONOMIC DEVELOPMENT FUND 0 0 0 0
HOUSING IMPROVMENT FUND 0 0 0 0
$3,447,258 $6,279,713 $4,483,760 TOTAL FUNDING $4,483,336
Page 418
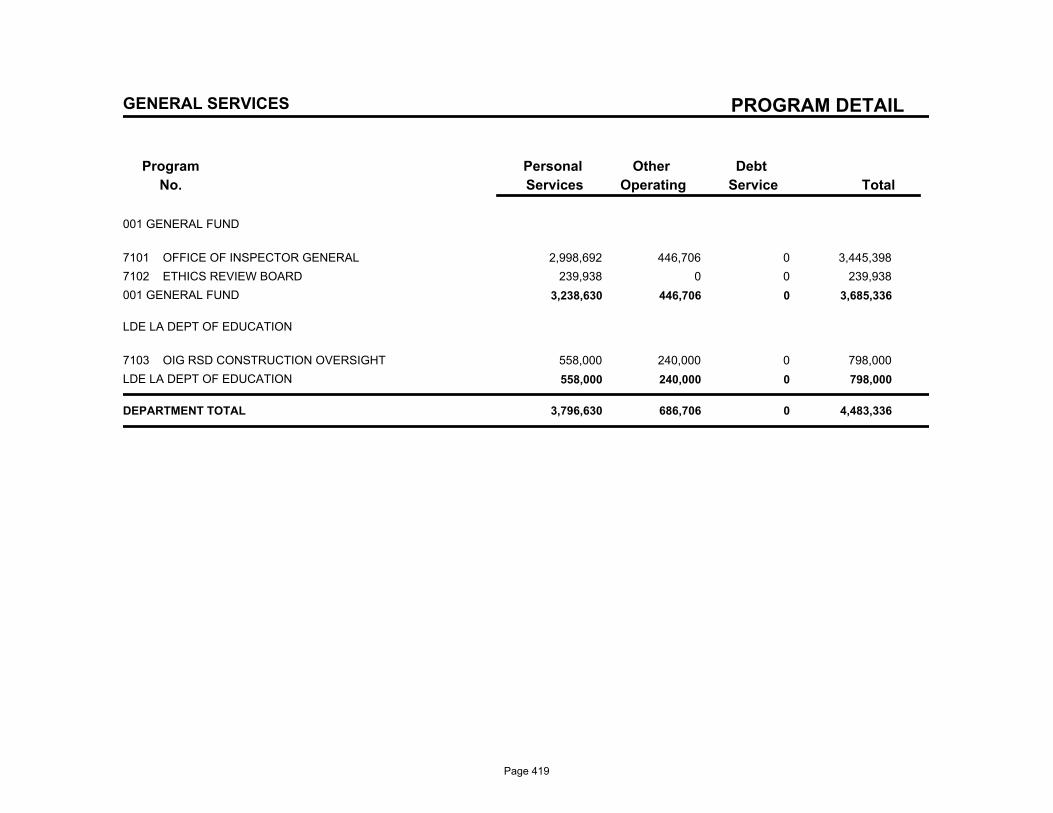
PROGRAM DETAIL
Program
No.
Debt
Service
Other
Operating
Personal
Services Total
GENERAL SERVICES
001 GENERAL FUND
7101 OFFICE OF INSPECTOR GENERAL 2,998,692 446,706 0 3,445,398
7102 ETHICS REVIEW BOARD 239,938 0 0 239,938
001 GENERAL FUND 3,238,630 446,706 0 3,685,336
LDE LA DEPT OF EDUCATION
7103 OIG RSD CONSTRUCTION OVERSIGHT 558,000 240,000 0 798,000
LDE LA DEPT OF EDUCATION 558,000 240,000 0 798,000
DEPARTMENT TOTAL 3,796,630 686,706 0 4,483,336
Page 419
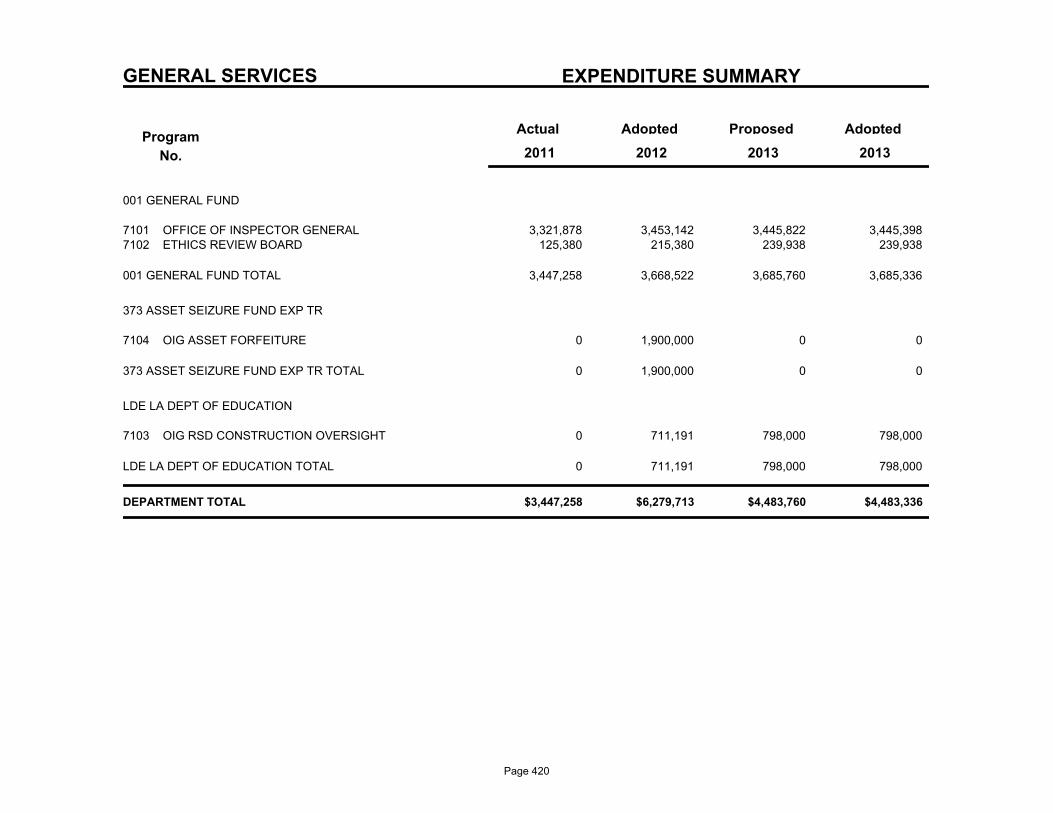
GENERAL SERVICES EXPENDITURE SUMMARY
Program
No.
Actual AdoptedProposedAdopted
2013 2011 2012 2013
001 GENERAL FUND
3,321,878 3,453,142 3,445,822 OFFICE OF INSPECTOR GENERAL7101 3,445,398 125,380 215,380 239,938 ETHICS REVIEW BOARD7102 239,938
3,447,258 3,668,522 3,685,760 3,685,336 001 GENERAL FUND TOTAL
373 ASSET SEIZURE FUND EXP TR
0 1,900,000 0 OIG ASSET FORFEITURE7104 0
0 1,900,000 0 0 373 ASSET SEIZURE FUND EXP TR TOTAL
LDE LA DEPT OF EDUCATION
0 711,191 798,000 OIG RSD CONSTRUCTION OVERSIGHT7103 798,000
0 711,191 798,000 798,000 LDE LA DEPT OF EDUCATION TOTAL
$3,447,258 $6,279,713 $4,483,760 $4,483,336 DEPARTMENT TOTAL
Page 420
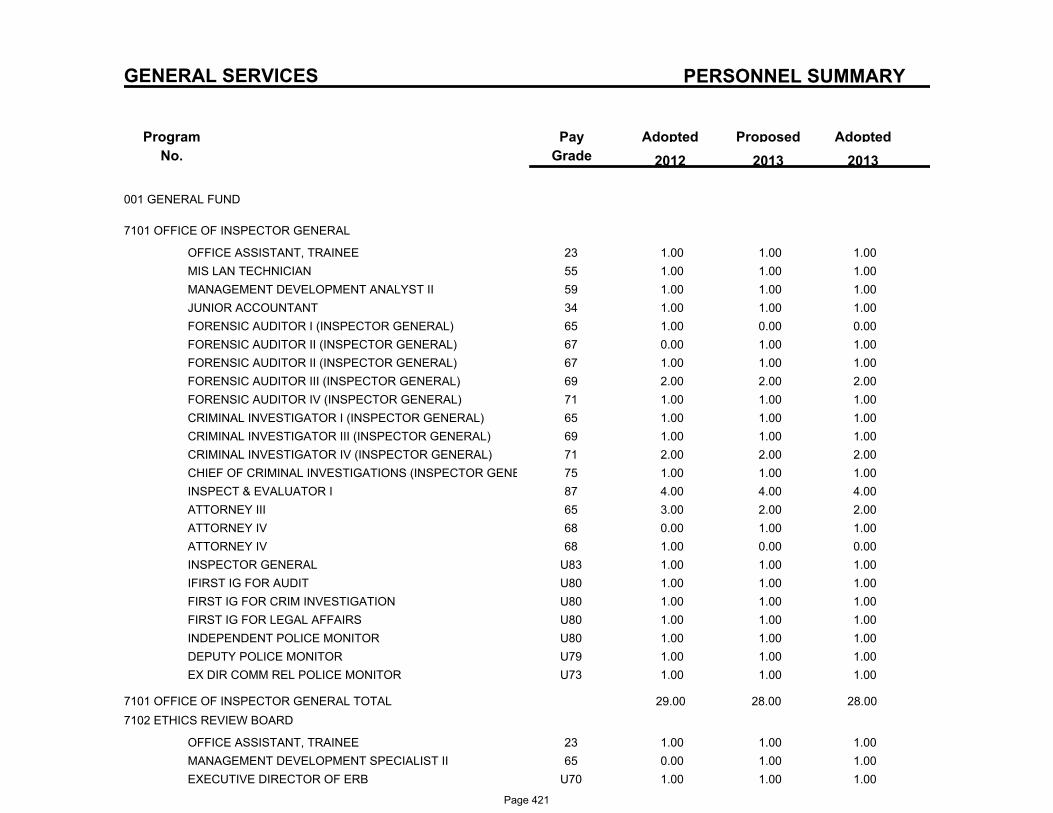
PERSONNEL SUMMARY
Program
No.
ProposedAdoptedPay
Grade
Adopted
2013 2012 2013
GENERAL SERVICES
001 GENERAL FUND
7101 OFFICE OF INSPECTOR GENERAL
23OFFICE ASSISTANT, TRAINEE 1.00 1.00 1.00
55MIS LAN TECHNICIAN 1.00 1.00 1.00
59MANAGEMENT DEVELOPMENT ANALYST II 1.00 1.00 1.00
34JUNIOR ACCOUNTANT 1.00 1.00 1.00
65FORENSIC AUDITOR I (INSPECTOR GENERAL) 1.00 0.00 0.00
67FORENSIC AUDITOR II (INSPECTOR GENERAL) 0.00 1.00 1.00
67FORENSIC AUDITOR II (INSPECTOR GENERAL) 1.00 1.00 1.00
69FORENSIC AUDITOR III (INSPECTOR GENERAL) 2.00 2.00 2.00
71FORENSIC AUDITOR IV (INSPECTOR GENERAL) 1.00 1.00 1.00
65CRIMINAL INVESTIGATOR I (INSPECTOR GENERAL) 1.00 1.00 1.00
69CRIMINAL INVESTIGATOR III (INSPECTOR GENERAL) 1.00 1.00 1.00
71CRIMINAL INVESTIGATOR IV (INSPECTOR GENERAL) 2.00 2.00 2.00
75CHIEF OF CRIMINAL INVESTIGATIONS (INSPECTOR GENERAL) 1.00 1.00 1.00
87INSPECT & EVALUATOR I 4.00 4.00 4.00
65ATTORNEY III 3.00 2.00 2.00
68ATTORNEY IV 0.00 1.00 1.00
68ATTORNEY IV 1.00 0.00 0.00
U83INSPECTOR GENERAL 1.00 1.00 1.00
U80IFIRST IG FOR AUDIT 1.00 1.00 1.00
U80FIRST IG FOR CRIM INVESTIGATION 1.00 1.00 1.00
U80FIRST IG FOR LEGAL AFFAIRS 1.00 1.00 1.00
U80INDEPENDENT POLICE MONITOR 1.00 1.00 1.00
U79DEPUTY POLICE MONITOR 1.00 1.00 1.00
U73EX DIR COMM REL POLICE MONITOR 1.00 1.00 1.00
7101 OFFICE OF INSPECTOR GENERAL TOTAL 29.00 28.00 28.00
7102 ETHICS REVIEW BOARD
23OFFICE ASSISTANT, TRAINEE 1.00 1.00 1.00
65MANAGEMENT DEVELOPMENT SPECIALIST II 0.00 1.00 1.00
U70EXECUTIVE DIRECTOR OF ERB 1.00 1.00 1.00
Page 421
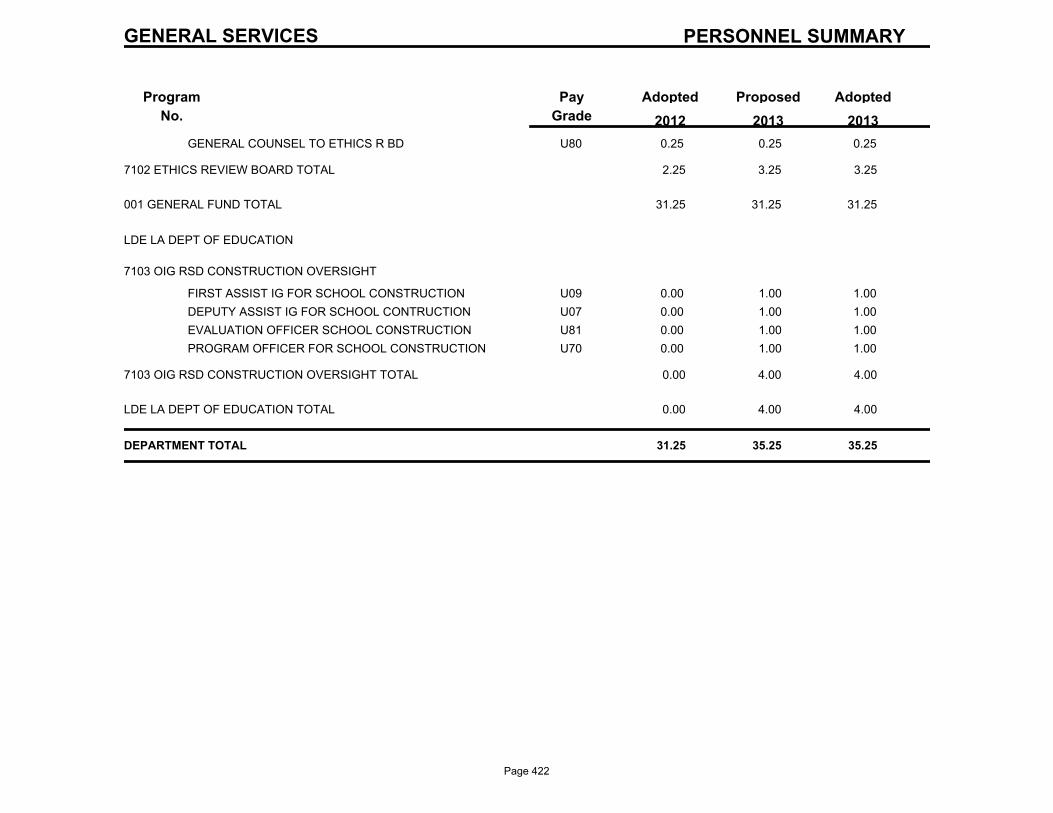
PERSONNEL SUMMARY
Program
No.
ProposedAdoptedPay
Grade
Adopted
2013 2012 2013
GENERAL SERVICES
U80GENERAL COUNSEL TO ETHICS R BD 0.25 0.25 0.25
7102 ETHICS REVIEW BOARD TOTAL 2.25 3.25 3.25
001 GENERAL FUND TOTAL 31.25 31.25 31.25
LDE LA DEPT OF EDUCATION
7103 OIG RSD CONSTRUCTION OVERSIGHT
U09FIRST ASSIST IG FOR SCHOOL CONSTRUCTION 0.00 1.00 1.00
U07DEPUTY ASSIST IG FOR SCHOOL CONTRUCTION 0.00 1.00 1.00
U81EVALUATION OFFICER SCHOOL CONSTRUCTION 0.00 1.00 1.00
U70PROGRAM OFFICER FOR SCHOOL CONSTRUCTION 0.00 1.00 1.00
7103 OIG RSD CONSTRUCTION OVERSIGHT TOTAL 0.00 4.00 4.00
LDE LA DEPT OF EDUCATION TOTAL 0.00 4.00 4.00
DEPARTMENT TOTAL 31.25 35.25 35.25
Page 422

Page 423

Office of Community Development
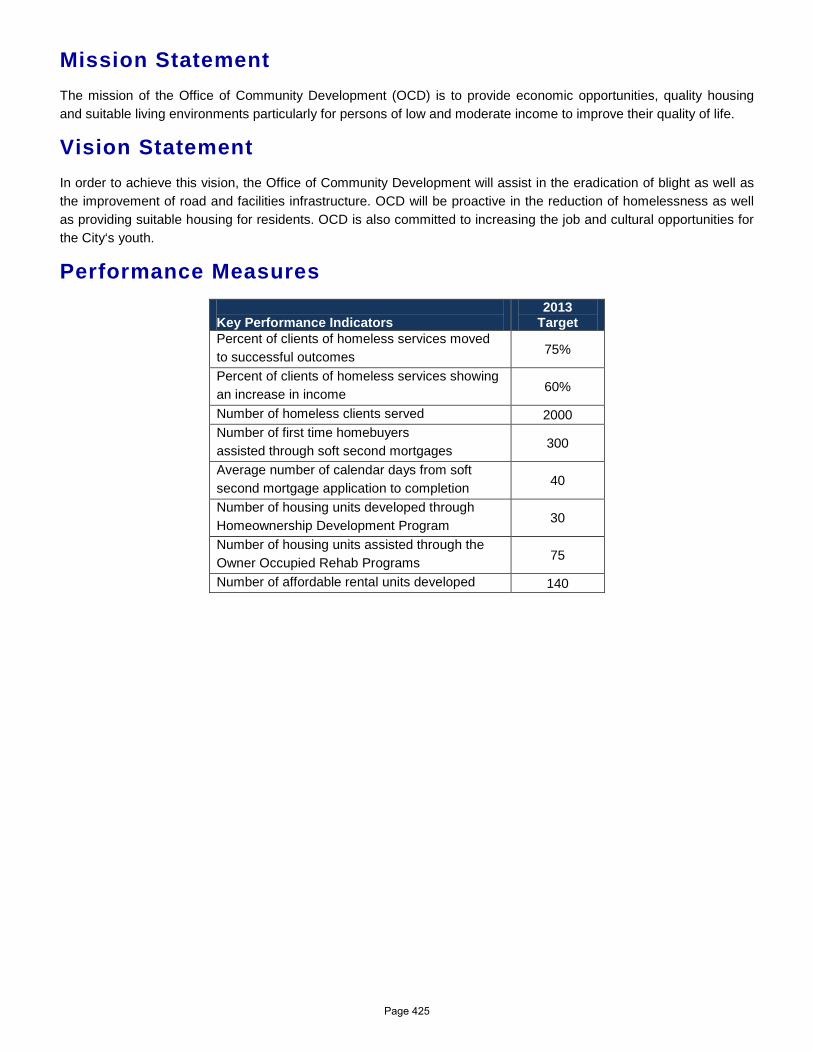
Mission Statement The mission of the Office of Community Development (OCD) is to provide economic opportunities, quality housing and suitable living environments particularly for persons of low and moderate income to improve their quality of life.
Vision Statement In order to achieve this vision, the Office of Community Development will assist in the eradication of blight as well as the improvement of road and facilities infrastructure. OCD will be proactive in the reduction of homelessness as well as providing suitable housing for residents. OCD is also committed to increasing the job and cultural opportunities for the City‘s youth.
Performance Measures Key Performance Indicators
2013 Target
Percent of clients of homeless services moved to successful outcomes 75%
Percent of clients of homeless services showing an increase in income 60%
Number of homeless clients served 2000 Number of first time homebuyers assisted through soft second mortgages 300
Average number of calendar days from soft second mortgage application to completion 40
Number of housing units developed through Homeownership Development Program 30
Number of housing units assisted through the Owner Occupied Rehab Programs 75
Number of affordable rental units developed 140
Page 425
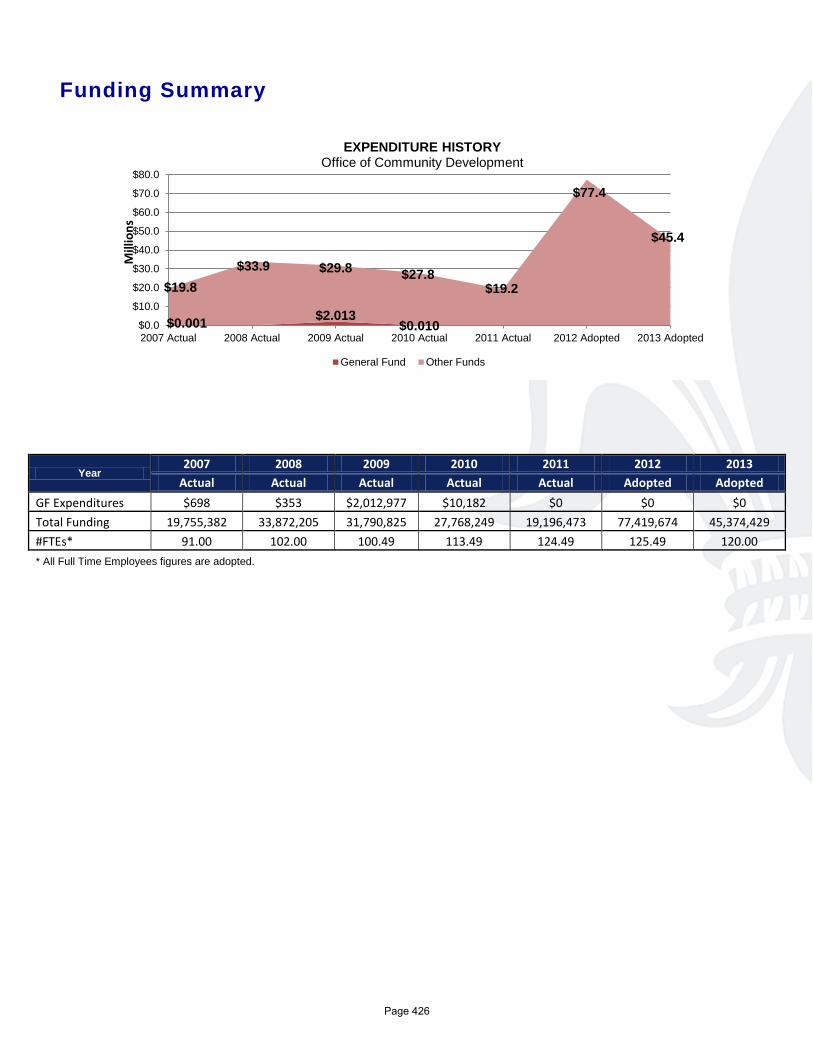
Funding Summary
Year 2007 2008 2009 2010 2011 2012 2013
Actual Actual Actual Actual Actual Adopted Adopted GF Expenditures $698 $353 $2,012,977 $10,182 $0 $0 $0 Total Funding 19,755,382 33,872,205 31,790,825 27,768,249 19,196,473 77,419,674 45,374,429 #FTEs* 91.00 102.00 100.49 113.49 124.49 125.49 120.00 * All Full Time Employees figures are adopted.
$0.001 $2.013 $0.010
$19.8 $33.9 $29.8 $27.8
$19.2
$77.4
$45.4
$0.0
$10.0
$20.0
$30.0
$40.0
$50.0
$60.0
$70.0
$80.0
2007 Actual 2008 Actual 2009 Actual 2010 Actual 2011 Actual 2012 Adopted 2013 Adopted
Mill
ions
EXPENDITURE HISTORY
Office of Community Development
General Fund Other Funds
Page 426
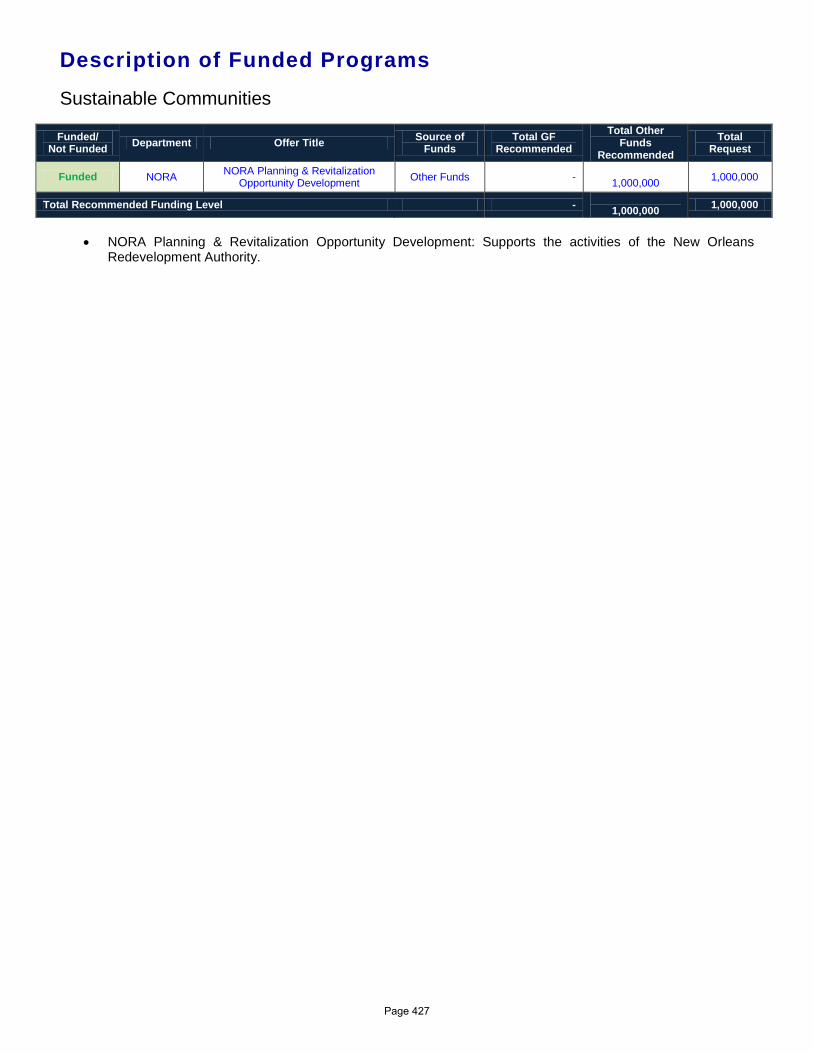
Description of Funded Programs
Sustainable Communities
Funded/ Not Funded Department Offer Title Source of
Funds Total GF
Recommended Total Other
Funds Recommended
Total Request
Funded NORA NORA Planning & Revitalization Opportunity Development Other Funds -
1,000,000 1,000,000
Total Recommended Funding Level - 1,000,000 1,000,000
• NORA Planning & Revitalization Opportunity Development: Supports the activities of the New Orleans
Redevelopment Authority.
[Type
Page 427
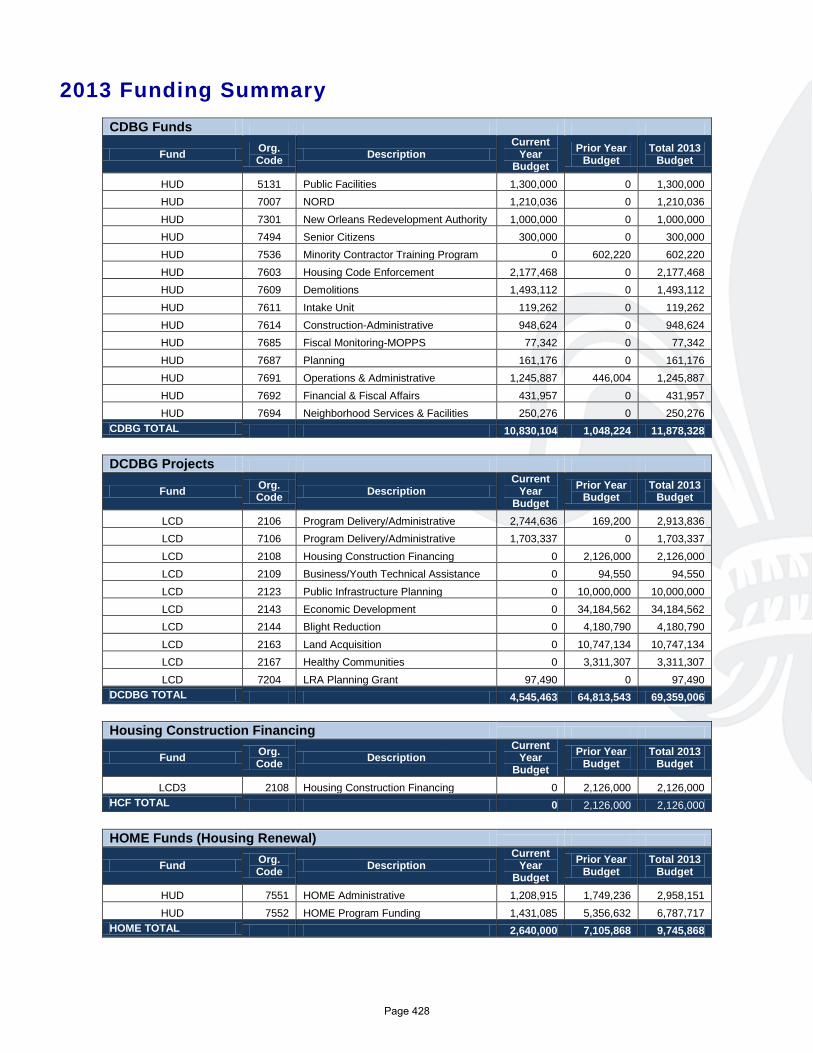
2013 Funding Summary
CDBG Funds
Fund Org. Code Description
Current Year
Budget Prior Year
Budget Total 2013
Budget
HUD 5131 Public Facilities 1,300,000 0 1,300,000 HUD 7007 NORD 1,210,036 0 1,210,036 HUD 7301 New Orleans Redevelopment Authority 1,000,000 0 1,000,000 HUD 7494 Senior Citizens 300,000 0 300,000 HUD 7536 Minority Contractor Training Program 0 602,220 602,220 HUD 7603 Housing Code Enforcement 2,177,468 0 2,177,468 HUD 7609 Demolitions 1,493,112 0 1,493,112 HUD 7611 Intake Unit 119,262 0 119,262 HUD 7614 Construction-Administrative 948,624 0 948,624 HUD 7685 Fiscal Monitoring-MOPPS 77,342 0 77,342 HUD 7687 Planning 161,176 0 161,176 HUD 7691 Operations & Administrative 1,245,887 446,004 1,245,887 HUD 7692 Financial & Fiscal Affairs 431,957 0 431,957 HUD 7694 Neighborhood Services & Facilities 250,276 0 250,276
CDBG TOTAL 10,830,104 1,048,224 11,878,328
DCDBG Projects
Fund Org. Code Description
Current Year
Budget Prior Year
Budget Total 2013
Budget
LCD 2106 Program Delivery/Administrative 2,744,636 169,200 2,913,836 LCD 7106 Program Delivery/Administrative 1,703,337 0 1,703,337 LCD 2108 Housing Construction Financing 0 2,126,000 2,126,000 LCD 2109 Business/Youth Technical Assistance 0 94,550 94,550 LCD 2123 Public Infrastructure Planning 0 10,000,000 10,000,000 LCD 2143 Economic Development 0 34,184,562 34,184,562 LCD 2144 Blight Reduction 0 4,180,790 4,180,790 LCD 2163 Land Acquisition 0 10,747,134 10,747,134 LCD 2167 Healthy Communities 0 3,311,307 3,311,307 LCD 7204 LRA Planning Grant 97,490 0 97,490
DCDBG TOTAL 4,545,463 64,813,543 69,359,006
Housing Construction Financing
Fund Org. Code Description
Current Year
Budget Prior Year
Budget Total 2013
Budget
LCD3 2108 Housing Construction Financing 0 2,126,000 2,126,000 HCF TOTAL 0 2,126,000 2,126,000
HOME Funds (Housing Renewal)
Fund Org. Code Description
Current Year
Budget Prior Year
Budget Total 2013
Budget
HUD 7551 HOME Administrative 1,208,915 1,749,236 2,958,151 HUD 7552 HOME Program Funding 1,431,085 5,356,632 6,787,717
HOME TOTAL 2,640,000 7,105,868 9,745,868
Page 428
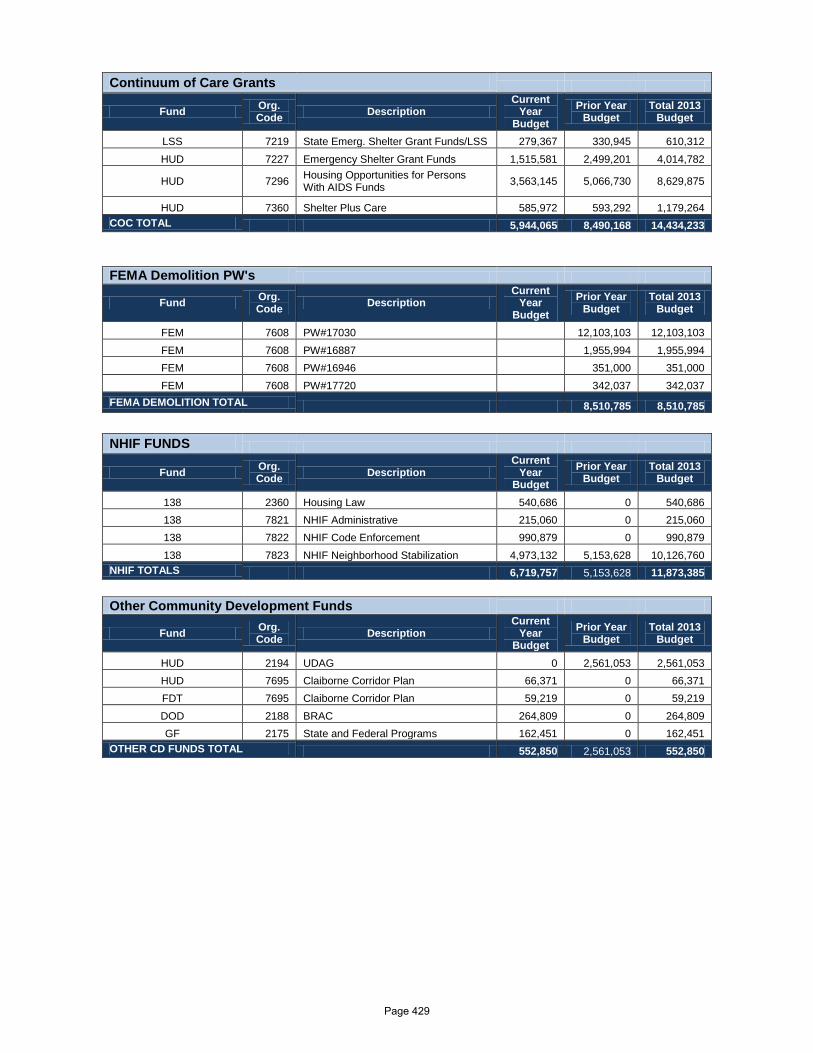
Continuum of Care Grants
Fund Org. Code Description
Current Year
Budget Prior Year
Budget Total 2013
Budget
LSS 7219 State Emerg. Shelter Grant Funds/LSS 279,367 330,945 610,312 HUD 7227 Emergency Shelter Grant Funds 1,515,581 2,499,201 4,014,782
HUD 7296 Housing Opportunities for Persons With AIDS Funds 3,563,145 5,066,730 8,629,875
HUD 7360 Shelter Plus Care 585,972 593,292 1,179,264 COC TOTAL 5,944,065 8,490,168 14,434,233
FEMA Demolition PW's
Fund Org. Code Description
Current Year
Budget Prior Year
Budget Total 2013
Budget
FEM 7608 PW#17030 12,103,103 12,103,103 FEM 7608 PW#16887 1,955,994 1,955,994 FEM 7608 PW#16946 351,000 351,000 FEM 7608 PW#17720 342,037 342,037
FEMA DEMOLITION TOTAL 8,510,785 8,510,785
NHIF FUNDS
Fund Org. Code Description
Current Year
Budget Prior Year
Budget Total 2013
Budget
138 2360 Housing Law 540,686 0 540,686 138 7821 NHIF Administrative 215,060 0 215,060 138 7822 NHIF Code Enforcement 990,879 0 990,879 138 7823 NHIF Neighborhood Stabilization 4,973,132 5,153,628 10,126,760
NHIF TOTALS 6,719,757 5,153,628 11,873,385
Other Community Development Funds
Fund Org. Code Description
Current Year
Budget Prior Year
Budget Total 2013
Budget
HUD 2194 UDAG 0 2,561,053 2,561,053 HUD 7695 Claiborne Corridor Plan 66,371 0 66,371 FDT 7695 Claiborne Corridor Plan 59,219 0 59,219 DOD 2188 BRAC 264,809 0 264,809 GF 2175 State and Federal Programs 162,451 0 162,451
OTHER CD FUNDS TOTAL 552,850 2,561,053 552,850
Page 429

Code Enforcement & Hearings Bureau
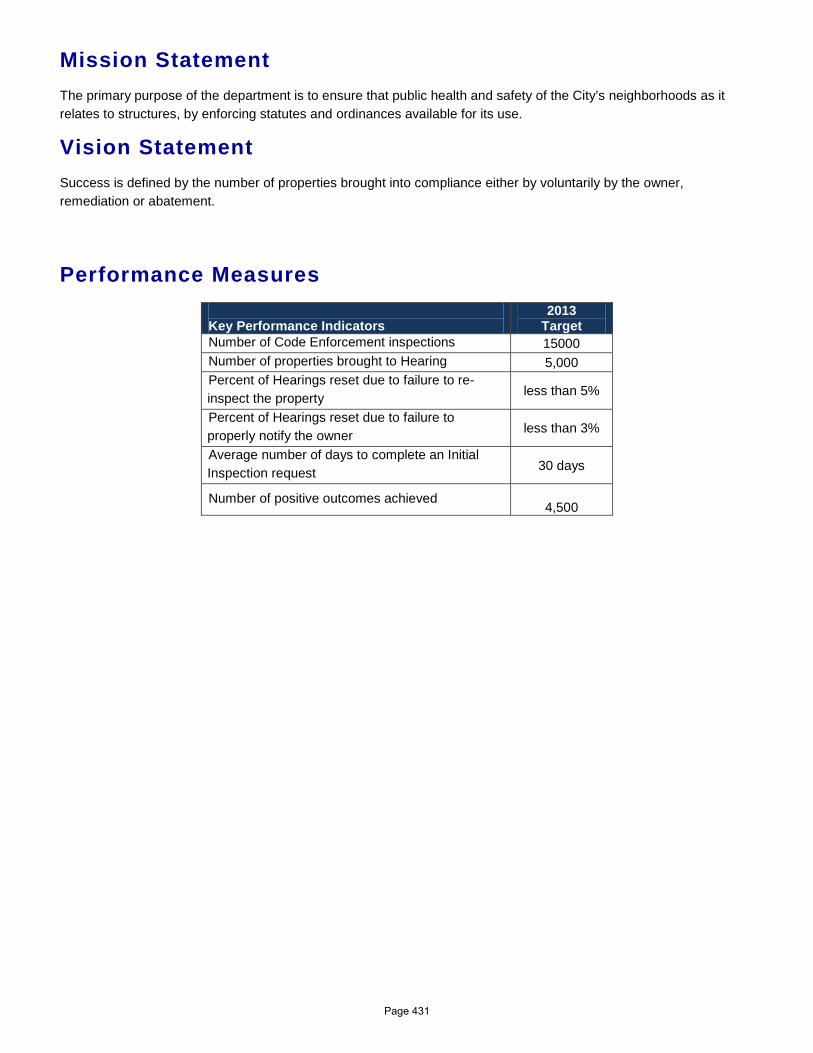
Mission Statement The primary purpose of the department is to ensure that public health and safety of the City’s neighborhoods as it relates to structures, by enforcing statutes and ordinances available for its use.
Vision Statement Success is defined by the number of properties brought into compliance either by voluntarily by the owner, remediation or abatement.
Performance Measures Key Performance Indicators
2013 Target
Number of Code Enforcement inspections 15000 Number of properties brought to Hearing 5,000 Percent of Hearings reset due to failure to re-inspect the property less than 5%
Percent of Hearings reset due to failure to properly notify the owner less than 3%
Average number of days to complete an Initial Inspection request 30 days
Number of positive outcomes achieved 4,500
Page 431
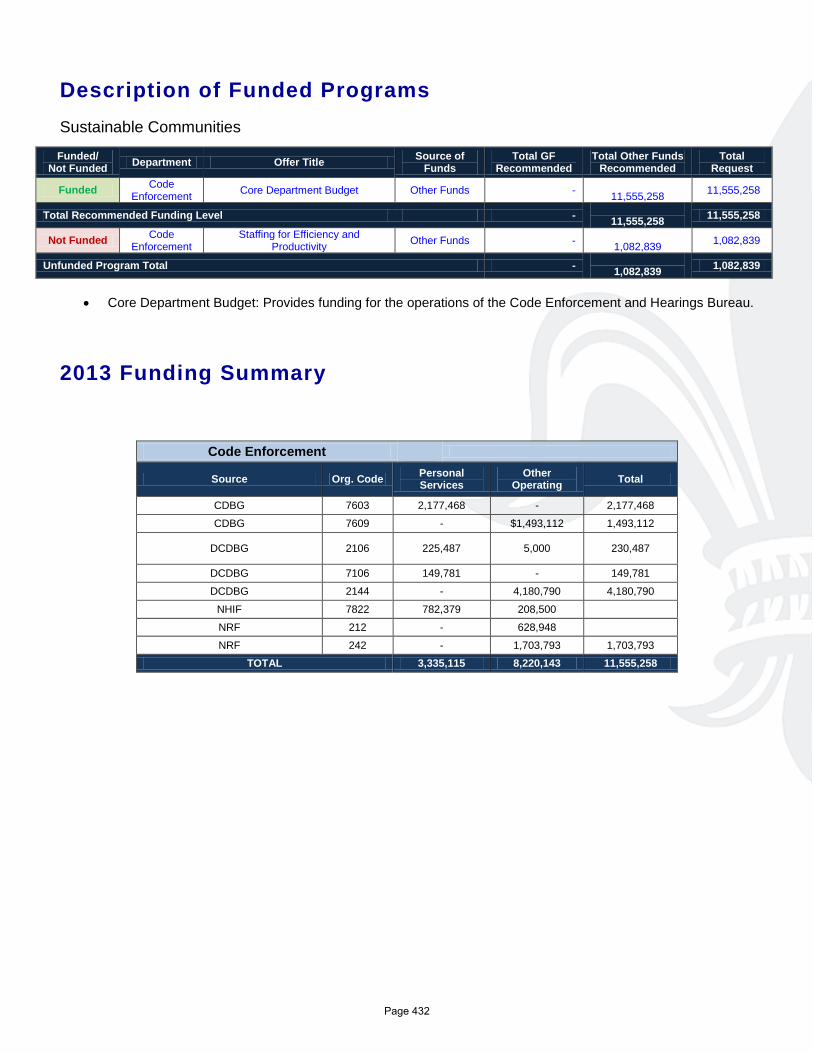
Description of Funded Programs Sustainable Communities
Funded/ Not Funded Department Offer Title Source of
Funds Total GF
Recommended Total Other Funds
Recommended Total
Request
Funded Code Enforcement Core Department Budget Other Funds -
11,555,258 11,555,258
Total Recommended Funding Level - 11,555,258 11,555,258
Not Funded Code Enforcement
Staffing for Efficiency and Productivity Other Funds -
1,082,839 1,082,839
Unfunded Program Total - 1,082,839 1,082,839
• Core Department Budget: Provides funding for the operations of the Code Enforcement and Hearings Bureau.
2013 Funding Summary
Code Enforcement
Source Org. Code Personal Services
Other Operating Total
CDBG 7603 2,177,468 - 2,177,468
CDBG 7609 - $1,493,112 1,493,112
DCDBG 2106 225,487 5,000 230,487
DCDBG 7106 149,781 - 149,781
DCDBG 2144 - 4,180,790 4,180,790
NHIF 7822 782,379 208,500
NRF 212 - 628,948
NRF 242 - 1,703,793 1,703,793
TOTAL 3,335,115 8,220,143 11,555,258
[Type
Page 432

OFFICE OF COMM DEVELOPMENT
DEPARTMENTAL BUDGET SUMMARY
AdoptedProposedAdoptedActual
EXPENDITURES
2013 2012 2011 2013
PERSONAL SERVICES 6,098,312 7,925,711 7,854,797 7,854,797
OTHER OPERATING 13,098,161 69,493,963 42,727,100 37,519,632
DEBT SERVICE 0 0 0 0
RESERVES 0 0 0 0
GRANTS, CONTRIB. & FUND TRAN. 0 0 0 0
$19,196,473 $77,419,674 $50,581,897 TOTAL EXPENDITURES $45,374,429
SOURCE OF FUNDING
GENERAL FUND 0 0 0 0
WISNER FUNDS 0 0 0 0
ENTERPRISE 0 0 0 0
DOWNTOWN DEVELOPMENT DIST. 0 0 0 0
HOUSING AND URBAN DEVELOP. 17,134,268 51,483,055 33,266,183 42,459,846
SELF GENERATED 0 0 0 0
LIBRARY 0 0 0 0
LLE 0 0 0 0
FEDERAL GRANTS 840,606 19,234,883 14,904,575 503,444
STATE GRANTS 1,221,599 6,701,736 2,411,139 2,411,139
GRANTS, CONTRIB., & FUND TRAN. 0 0 0 0
N. O. REGIONAL BUSINESS PARK 0 0 0 0
ECONOMIC DEVELOPMENT FUND 0 0 0 0
HOUSING IMPROVMENT FUND 0 0 0 0
$19,196,473 $77,419,674 $50,581,897 TOTAL FUNDING $45,374,429
Page 433
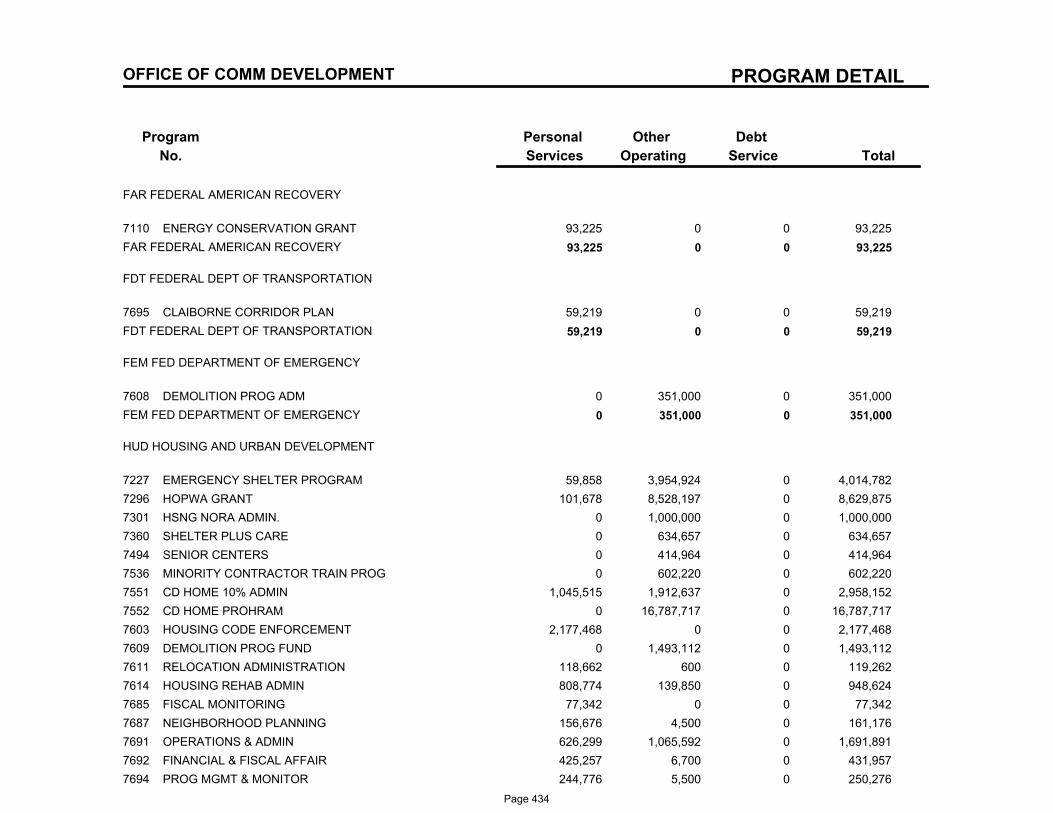
PROGRAM DETAIL
Program
No.
Debt
Service
Other
Operating
Personal
Services Total
OFFICE OF COMM DEVELOPMENT
FAR FEDERAL AMERICAN RECOVERY
7110 ENERGY CONSERVATION GRANT 93,225 0 0 93,225
FAR FEDERAL AMERICAN RECOVERY 93,225 0 0 93,225
FDT FEDERAL DEPT OF TRANSPORTATION
7695 CLAIBORNE CORRIDOR PLAN 59,219 0 0 59,219
FDT FEDERAL DEPT OF TRANSPORTATION 59,219 0 0 59,219
FEM FED DEPARTMENT OF EMERGENCY
7608 DEMOLITION PROG ADM 0 351,000 0 351,000
FEM FED DEPARTMENT OF EMERGENCY 0 351,000 0 351,000
HUD HOUSING AND URBAN DEVELOPMENT
7227 EMERGENCY SHELTER PROGRAM 59,858 3,954,924 0 4,014,782
7296 HOPWA GRANT 101,678 8,528,197 0 8,629,875
7301 HSNG NORA ADMIN. 0 1,000,000 0 1,000,000
7360 SHELTER PLUS CARE 0 634,657 0 634,657
7494 SENIOR CENTERS 0 414,964 0 414,964
7536 MINORITY CONTRACTOR TRAIN PROG 0 602,220 0 602,220
7551 CD HOME 10% ADMIN 1,045,515 1,912,637 0 2,958,152
7552 CD HOME PROHRAM 0 16,787,717 0 16,787,717
7603 HOUSING CODE ENFORCEMENT 2,177,468 0 0 2,177,468
7609 DEMOLITION PROG FUND 0 1,493,112 0 1,493,112
7611 RELOCATION ADMINISTRATION 118,662 600 0 119,262
7614 HOUSING REHAB ADMIN 808,774 139,850 0 948,624
7685 FISCAL MONITORING 77,342 0 0 77,342
7687 NEIGHBORHOOD PLANNING 156,676 4,500 0 161,176
7691 OPERATIONS & ADMIN 626,299 1,065,592 0 1,691,891
7692 FINANCIAL & FISCAL AFFAIR 425,257 6,700 0 431,957
7694 PROG MGMT & MONITOR 244,776 5,500 0 250,276
Page 434
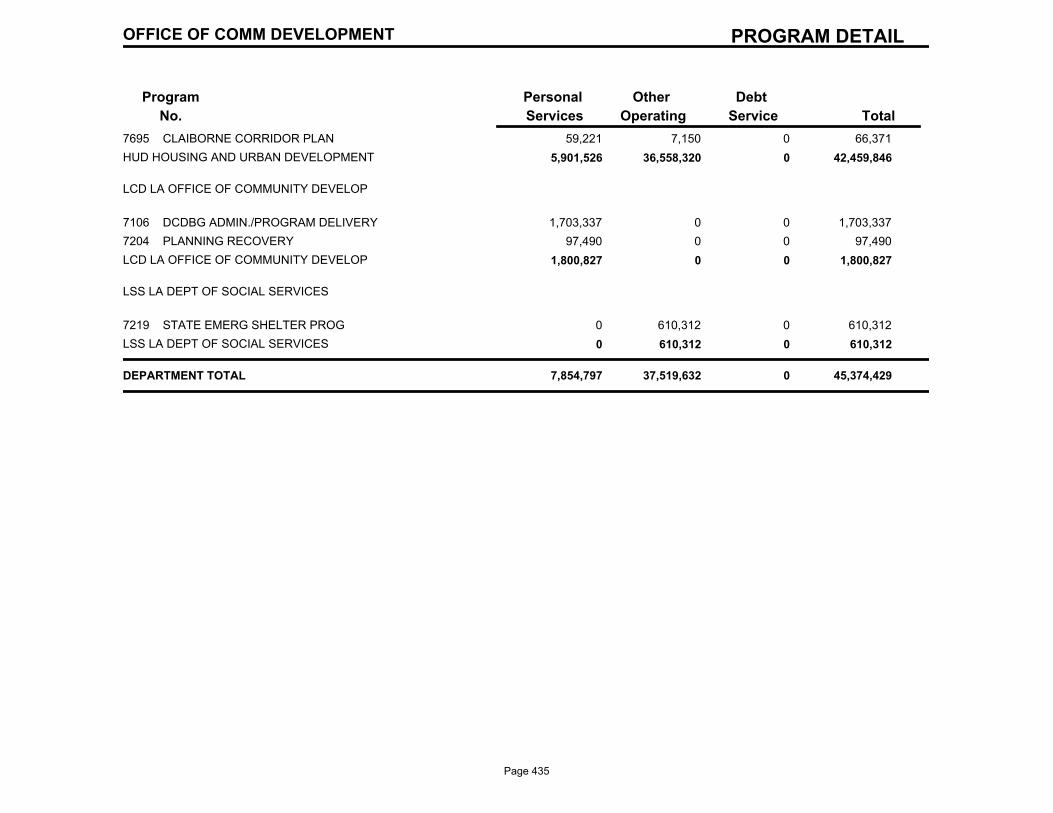
PROGRAM DETAIL
Program
No.
Debt
Service
Other
Operating
Personal
Services Total
OFFICE OF COMM DEVELOPMENT
7695 CLAIBORNE CORRIDOR PLAN 59,221 7,150 0 66,371
HUD HOUSING AND URBAN DEVELOPMENT 5,901,526 36,558,320 0 42,459,846
LCD LA OFFICE OF COMMUNITY DEVELOP
7106 DCDBG ADMIN./PROGRAM DELIVERY 1,703,337 0 0 1,703,337
7204 PLANNING RECOVERY 97,490 0 0 97,490
LCD LA OFFICE OF COMMUNITY DEVELOP 1,800,827 0 0 1,800,827
LSS LA DEPT OF SOCIAL SERVICES
7219 STATE EMERG SHELTER PROG 0 610,312 0 610,312
LSS LA DEPT OF SOCIAL SERVICES 0 610,312 0 610,312
DEPARTMENT TOTAL 7,854,797 37,519,632 0 45,374,429
Page 435
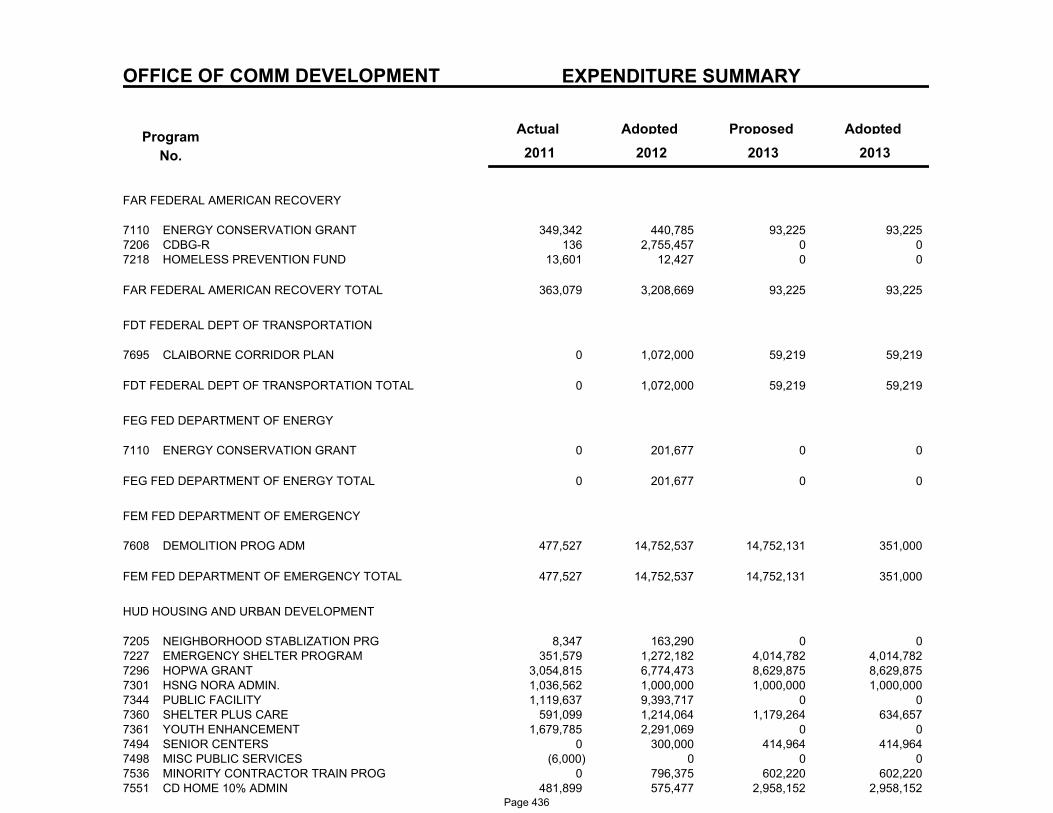
OFFICE OF COMM DEVELOPMENT EXPENDITURE SUMMARY
Program
No.
Actual AdoptedProposedAdopted
2013 2011 2012 2013
FAR FEDERAL AMERICAN RECOVERY
349,342 440,785 93,225 ENERGY CONSERVATION GRANT7110 93,225 136 2,755,457 0 CDBG-R7206 0
13,601 12,427 0 HOMELESS PREVENTION FUND7218 0
363,079 3,208,669 93,225 93,225 FAR FEDERAL AMERICAN RECOVERY TOTAL
FDT FEDERAL DEPT OF TRANSPORTATION
0 1,072,000 59,219 CLAIBORNE CORRIDOR PLAN7695 59,219
0 1,072,000 59,219 59,219 FDT FEDERAL DEPT OF TRANSPORTATION TOTAL
FEG FED DEPARTMENT OF ENERGY
0 201,677 0 ENERGY CONSERVATION GRANT7110 0
0 201,677 0 0 FEG FED DEPARTMENT OF ENERGY TOTAL
FEM FED DEPARTMENT OF EMERGENCY
477,527 14,752,537 14,752,131 DEMOLITION PROG ADM7608 351,000
477,527 14,752,537 14,752,131 351,000 FEM FED DEPARTMENT OF EMERGENCY TOTAL
HUD HOUSING AND URBAN DEVELOPMENT
8,347 163,290 0 NEIGHBORHOOD STABLIZATION PRG7205 0 351,579 1,272,182 4,014,782 EMERGENCY SHELTER PROGRAM7227 4,014,782
3,054,815 6,774,473 8,629,875 HOPWA GRANT7296 8,629,875 1,036,562 1,000,000 1,000,000 HSNG NORA ADMIN.7301 1,000,000 1,119,637 9,393,717 0 PUBLIC FACILITY7344 0
591,099 1,214,064 1,179,264 SHELTER PLUS CARE7360 634,657 1,679,785 2,291,069 0 YOUTH ENHANCEMENT7361 0
0 300,000 414,964 SENIOR CENTERS7494 414,964 (6,000) 0 0 MISC PUBLIC SERVICES7498 0
0 796,375 602,220 MINORITY CONTRACTOR TRAIN PROG7536 602,220 481,899 575,477 2,958,152 CD HOME 10% ADMIN7551 2,958,152
Page 436
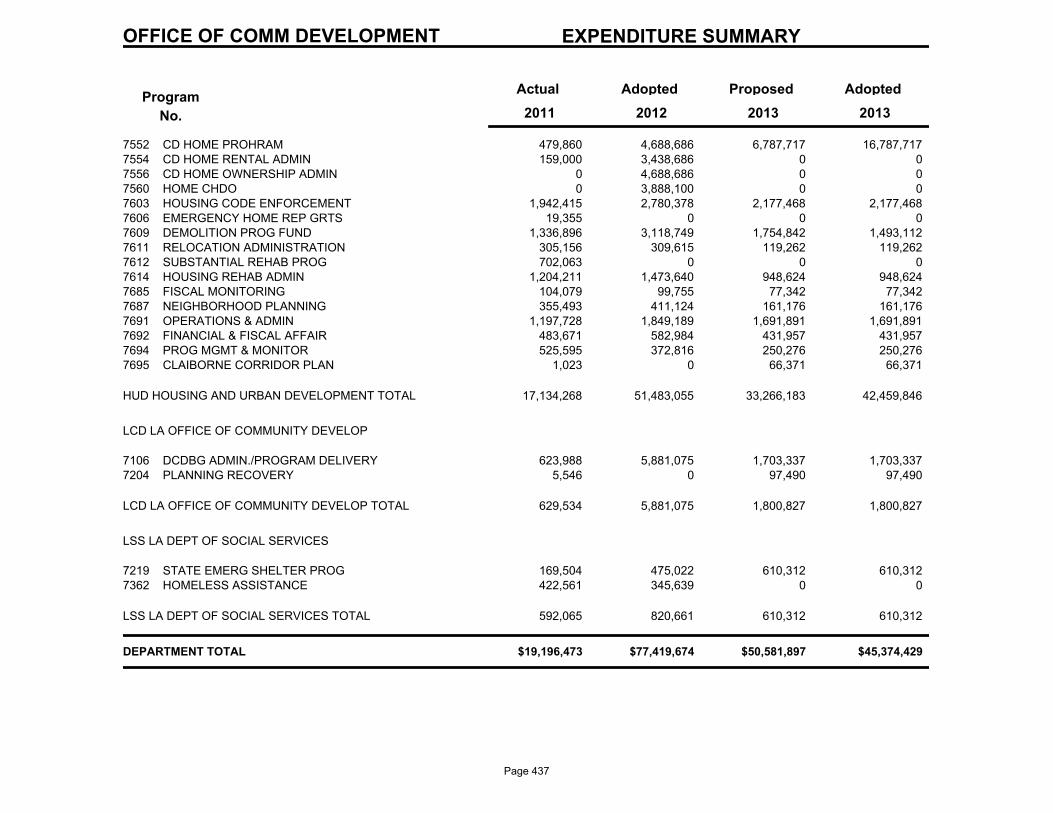
OFFICE OF COMM DEVELOPMENT EXPENDITURE SUMMARY
Program
No.
Actual AdoptedProposedAdopted
2013 2011 2012 2013
479,860 4,688,686 6,787,717 CD HOME PROHRAM7552 16,787,717 159,000 3,438,686 0 CD HOME RENTAL ADMIN7554 0
0 4,688,686 0 CD HOME OWNERSHIP ADMIN7556 0 0 3,888,100 0 HOME CHDO7560 0
1,942,415 2,780,378 2,177,468 HOUSING CODE ENFORCEMENT7603 2,177,468 19,355 0 0 EMERGENCY HOME REP GRTS7606 0
1,336,896 3,118,749 1,754,842 DEMOLITION PROG FUND7609 1,493,112 305,156 309,615 119,262 RELOCATION ADMINISTRATION7611 119,262 702,063 0 0 SUBSTANTIAL REHAB PROG7612 0
1,204,211 1,473,640 948,624 HOUSING REHAB ADMIN7614 948,624 104,079 99,755 77,342 FISCAL MONITORING7685 77,342 355,493 411,124 161,176 NEIGHBORHOOD PLANNING7687 161,176
1,197,728 1,849,189 1,691,891 OPERATIONS & ADMIN7691 1,691,891 483,671 582,984 431,957 FINANCIAL & FISCAL AFFAIR7692 431,957 525,595 372,816 250,276 PROG MGMT & MONITOR7694 250,276
1,023 0 66,371 CLAIBORNE CORRIDOR PLAN7695 66,371
17,134,268 51,483,055 33,266,183 42,459,846 HUD HOUSING AND URBAN DEVELOPMENT TOTAL
LCD LA OFFICE OF COMMUNITY DEVELOP
623,988 5,881,075 1,703,337 DCDBG ADMIN./PROGRAM DELIVERY7106 1,703,337 5,546 0 97,490 PLANNING RECOVERY7204 97,490
629,534 5,881,075 1,800,827 1,800,827 LCD LA OFFICE OF COMMUNITY DEVELOP TOTAL
LSS LA DEPT OF SOCIAL SERVICES
169,504 475,022 610,312 STATE EMERG SHELTER PROG7219 610,312 422,561 345,639 0 HOMELESS ASSISTANCE7362 0
592,065 820,661 610,312 610,312 LSS LA DEPT OF SOCIAL SERVICES TOTAL
$19,196,473 $77,419,674 $50,581,897 $45,374,429 DEPARTMENT TOTAL
Page 437
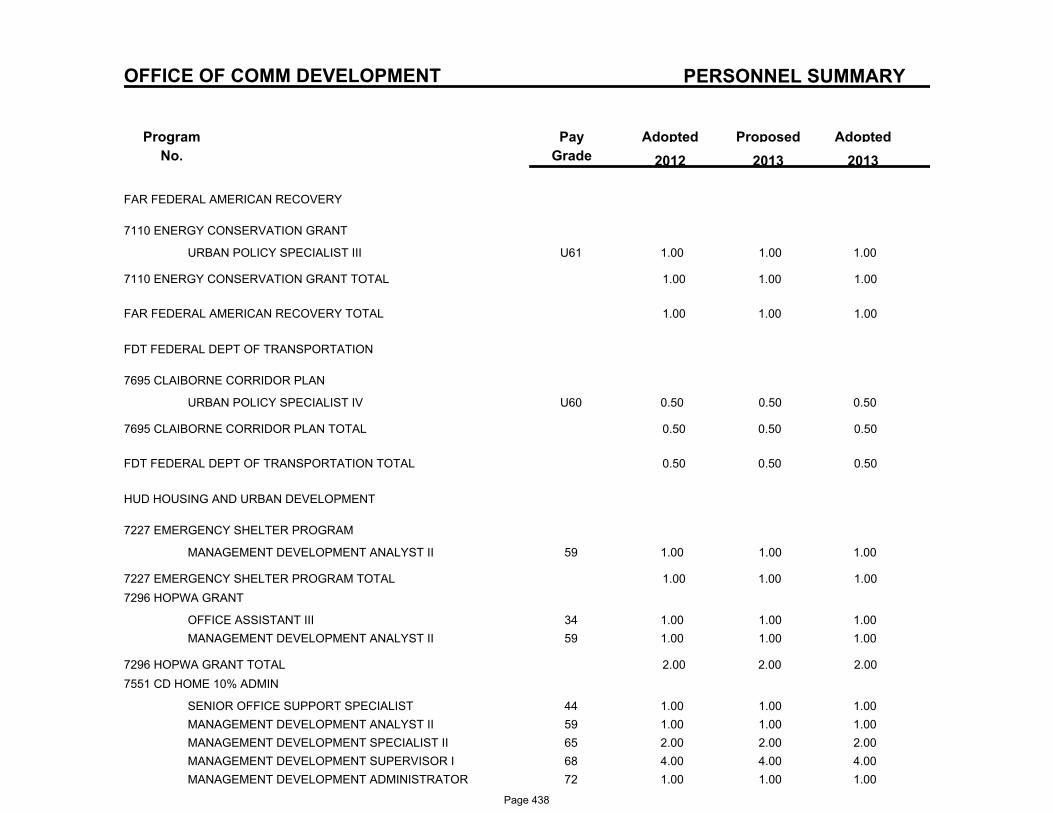
PERSONNEL SUMMARY
Program
No.
ProposedAdoptedPay
Grade
Adopted
2013 2012 2013
OFFICE OF COMM DEVELOPMENT
FAR FEDERAL AMERICAN RECOVERY
7110 ENERGY CONSERVATION GRANT
U61URBAN POLICY SPECIALIST III 1.00 1.00 1.00
7110 ENERGY CONSERVATION GRANT TOTAL 1.00 1.00 1.00
FAR FEDERAL AMERICAN RECOVERY TOTAL 1.00 1.00 1.00
FDT FEDERAL DEPT OF TRANSPORTATION
7695 CLAIBORNE CORRIDOR PLAN
U60URBAN POLICY SPECIALIST IV 0.50 0.50 0.50
7695 CLAIBORNE CORRIDOR PLAN TOTAL 0.50 0.50 0.50
FDT FEDERAL DEPT OF TRANSPORTATION TOTAL 0.50 0.50 0.50
HUD HOUSING AND URBAN DEVELOPMENT
7227 EMERGENCY SHELTER PROGRAM
59MANAGEMENT DEVELOPMENT ANALYST II 1.00 1.00 1.00
7227 EMERGENCY SHELTER PROGRAM TOTAL 1.00 1.00 1.00
7296 HOPWA GRANT
34OFFICE ASSISTANT III 1.00 1.00 1.00
59MANAGEMENT DEVELOPMENT ANALYST II 1.00 1.00 1.00
7296 HOPWA GRANT TOTAL 2.00 2.00 2.00
7551 CD HOME 10% ADMIN
44SENIOR OFFICE SUPPORT SPECIALIST 1.00 1.00 1.00
59MANAGEMENT DEVELOPMENT ANALYST II 1.00 1.00 1.00
65MANAGEMENT DEVELOPMENT SPECIALIST II 2.00 2.00 2.00
68MANAGEMENT DEVELOPMENT SUPERVISOR I 4.00 4.00 4.00
72MANAGEMENT DEVELOPMENT ADMINISTRATOR 1.00 1.00 1.00
Page 438
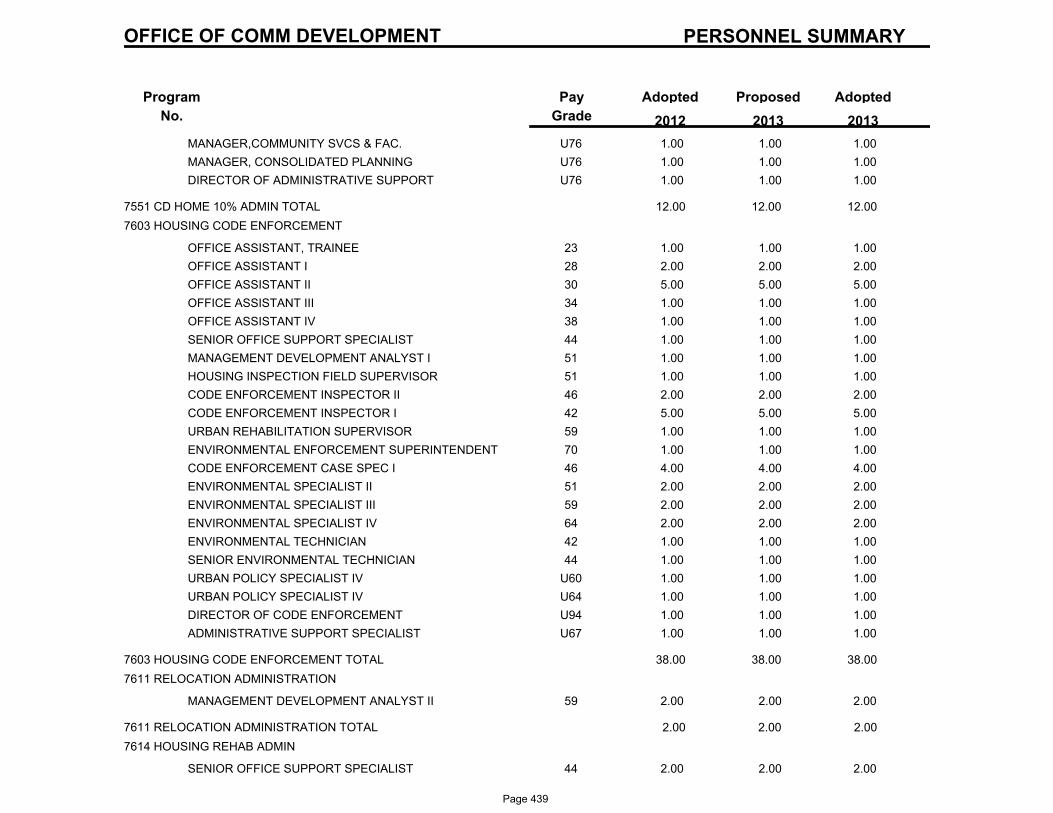
PERSONNEL SUMMARY
Program
No.
ProposedAdoptedPay
Grade
Adopted
2013 2012 2013
OFFICE OF COMM DEVELOPMENT
U76MANAGER,COMMUNITY SVCS & FAC. 1.00 1.00 1.00
U76MANAGER, CONSOLIDATED PLANNING 1.00 1.00 1.00
U76DIRECTOR OF ADMINISTRATIVE SUPPORT 1.00 1.00 1.00
7551 CD HOME 10% ADMIN TOTAL 12.00 12.00 12.00
7603 HOUSING CODE ENFORCEMENT
23OFFICE ASSISTANT, TRAINEE 1.00 1.00 1.00
28OFFICE ASSISTANT I 2.00 2.00 2.00
30OFFICE ASSISTANT II 5.00 5.00 5.00
34OFFICE ASSISTANT III 1.00 1.00 1.00
38OFFICE ASSISTANT IV 1.00 1.00 1.00
44SENIOR OFFICE SUPPORT SPECIALIST 1.00 1.00 1.00
51MANAGEMENT DEVELOPMENT ANALYST I 1.00 1.00 1.00
51HOUSING INSPECTION FIELD SUPERVISOR 1.00 1.00 1.00
46CODE ENFORCEMENT INSPECTOR II 2.00 2.00 2.00
42CODE ENFORCEMENT INSPECTOR I 5.00 5.00 5.00
59URBAN REHABILITATION SUPERVISOR 1.00 1.00 1.00
70ENVIRONMENTAL ENFORCEMENT SUPERINTENDENT 1.00 1.00 1.00
46CODE ENFORCEMENT CASE SPEC I 4.00 4.00 4.00
51ENVIRONMENTAL SPECIALIST II 2.00 2.00 2.00
59ENVIRONMENTAL SPECIALIST III 2.00 2.00 2.00
64ENVIRONMENTAL SPECIALIST IV 2.00 2.00 2.00
42ENVIRONMENTAL TECHNICIAN 1.00 1.00 1.00
44SENIOR ENVIRONMENTAL TECHNICIAN 1.00 1.00 1.00
U60URBAN POLICY SPECIALIST IV 1.00 1.00 1.00
U64URBAN POLICY SPECIALIST IV 1.00 1.00 1.00
U94DIRECTOR OF CODE ENFORCEMENT 1.00 1.00 1.00
U67ADMINISTRATIVE SUPPORT SPECIALIST 1.00 1.00 1.00
7603 HOUSING CODE ENFORCEMENT TOTAL 38.00 38.00 38.00
7611 RELOCATION ADMINISTRATION
59MANAGEMENT DEVELOPMENT ANALYST II 2.00 2.00 2.00
7611 RELOCATION ADMINISTRATION TOTAL 2.00 2.00 2.00
7614 HOUSING REHAB ADMIN
44SENIOR OFFICE SUPPORT SPECIALIST 2.00 2.00 2.00
Page 439
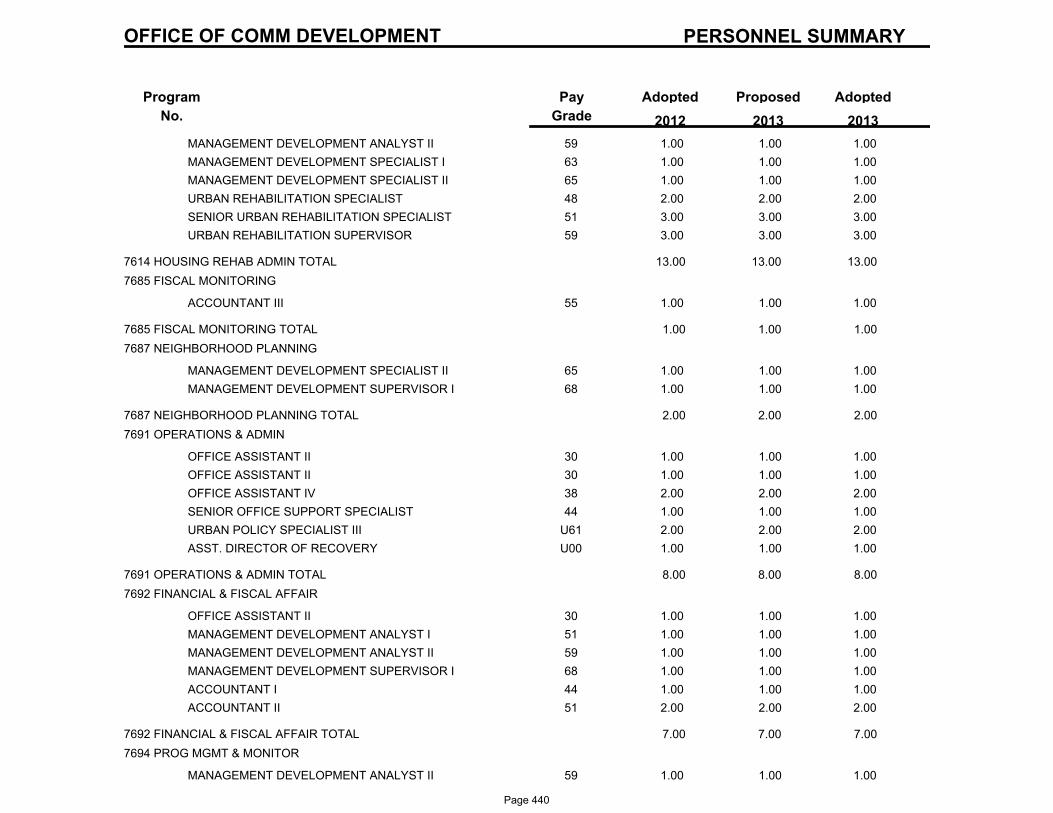
PERSONNEL SUMMARY
Program
No.
ProposedAdoptedPay
Grade
Adopted
2013 2012 2013
OFFICE OF COMM DEVELOPMENT
59MANAGEMENT DEVELOPMENT ANALYST II 1.00 1.00 1.00
63MANAGEMENT DEVELOPMENT SPECIALIST I 1.00 1.00 1.00
65MANAGEMENT DEVELOPMENT SPECIALIST II 1.00 1.00 1.00
48URBAN REHABILITATION SPECIALIST 2.00 2.00 2.00
51SENIOR URBAN REHABILITATION SPECIALIST 3.00 3.00 3.00
59URBAN REHABILITATION SUPERVISOR 3.00 3.00 3.00
7614 HOUSING REHAB ADMIN TOTAL 13.00 13.00 13.00
7685 FISCAL MONITORING
55ACCOUNTANT III 1.00 1.00 1.00
7685 FISCAL MONITORING TOTAL 1.00 1.00 1.00
7687 NEIGHBORHOOD PLANNING
65MANAGEMENT DEVELOPMENT SPECIALIST II 1.00 1.00 1.00
68MANAGEMENT DEVELOPMENT SUPERVISOR I 1.00 1.00 1.00
7687 NEIGHBORHOOD PLANNING TOTAL 2.00 2.00 2.00
7691 OPERATIONS & ADMIN
30OFFICE ASSISTANT II 1.00 1.00 1.00
30OFFICE ASSISTANT II 1.00 1.00 1.00
38OFFICE ASSISTANT IV 2.00 2.00 2.00
44SENIOR OFFICE SUPPORT SPECIALIST 1.00 1.00 1.00
U61URBAN POLICY SPECIALIST III 2.00 2.00 2.00
U00ASST. DIRECTOR OF RECOVERY 1.00 1.00 1.00
7691 OPERATIONS & ADMIN TOTAL 8.00 8.00 8.00
7692 FINANCIAL & FISCAL AFFAIR
30OFFICE ASSISTANT II 1.00 1.00 1.00
51MANAGEMENT DEVELOPMENT ANALYST I 1.00 1.00 1.00
59MANAGEMENT DEVELOPMENT ANALYST II 1.00 1.00 1.00
68MANAGEMENT DEVELOPMENT SUPERVISOR I 1.00 1.00 1.00
44ACCOUNTANT I 1.00 1.00 1.00
51ACCOUNTANT II 2.00 2.00 2.00
7692 FINANCIAL & FISCAL AFFAIR TOTAL 7.00 7.00 7.00
7694 PROG MGMT & MONITOR
59MANAGEMENT DEVELOPMENT ANALYST II 1.00 1.00 1.00
Page 440
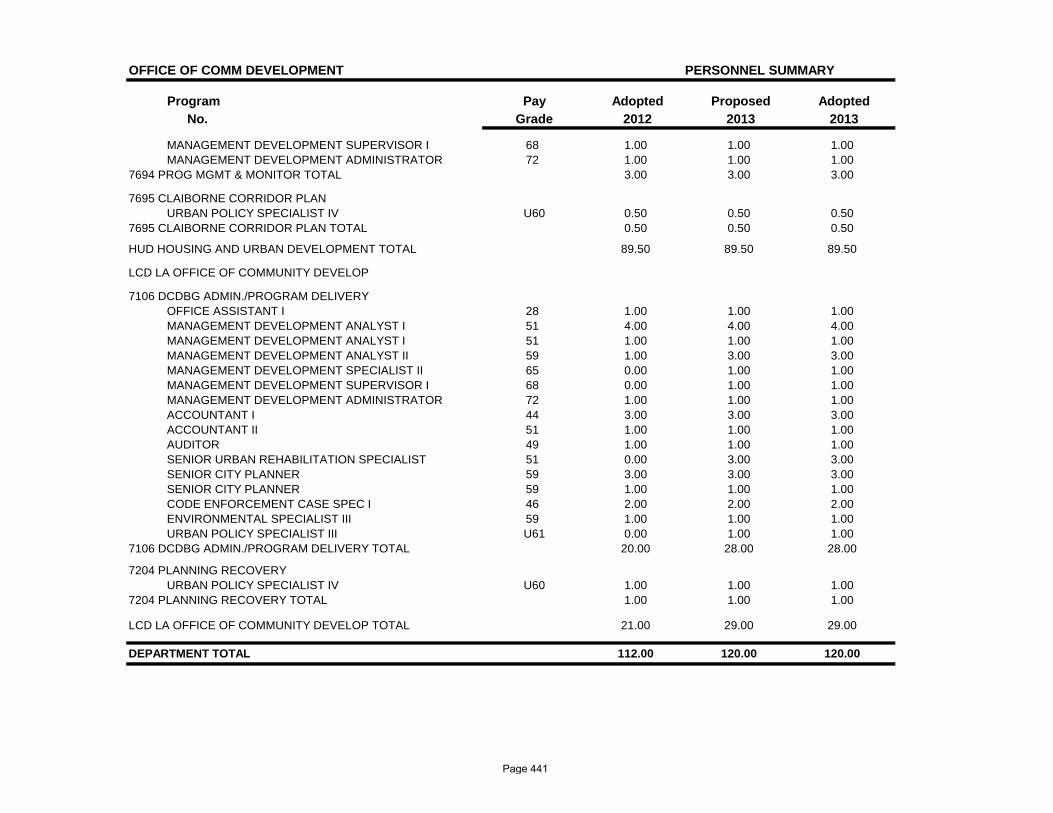
OFFICE OF COMM DEVELOPMENT PERSONNEL SUMMARY
Program Pay Adopted Proposed AdoptedNo. Grade 2012 2013 2013
MANAGEMENT DEVELOPMENT SUPERVISOR I 68 1.00 1.00 1.00MANAGEMENT DEVELOPMENT ADMINISTRATOR 72 1.00 1.00 1.00
7694 PROG MGMT & MONITOR TOTAL 3.00 3.00 3.00
7695 CLAIBORNE CORRIDOR PLANURBAN POLICY SPECIALIST IV U60 0.50 0.50 0.50
7695 CLAIBORNE CORRIDOR PLAN TOTAL 0.50 0.50 0.50
HUD HOUSING AND URBAN DEVELOPMENT TOTAL 89.50 89.50 89.50
LCD LA OFFICE OF COMMUNITY DEVELOP
7106 DCDBG ADMIN./PROGRAM DELIVERYOFFICE ASSISTANT I 28 1.00 1.00 1.00MANAGEMENT DEVELOPMENT ANALYST I 51 4.00 4.00 4.00MANAGEMENT DEVELOPMENT ANALYST I 51 1.00 1.00 1.00MANAGEMENT DEVELOPMENT ANALYST II 59 1.00 3.00 3.00MANAGEMENT DEVELOPMENT SPECIALIST II 65 0.00 1.00 1.00MANAGEMENT DEVELOPMENT SUPERVISOR I 68 0.00 1.00 1.00MANAGEMENT DEVELOPMENT ADMINISTRATOR 72 1.00 1.00 1.00ACCOUNTANT I 44 3.00 3.00 3.00ACCOUNTANT II 51 1.00 1.00 1.00AUDITOR 49 1.00 1.00 1.00SENIOR URBAN REHABILITATION SPECIALIST 51 0.00 3.00 3.00SENIOR CITY PLANNER 59 3.00 3.00 3.00SENIOR CITY PLANNER 59 1.00 1.00 1.00CODE ENFORCEMENT CASE SPEC I 46 2.00 2.00 2.00ENVIRONMENTAL SPECIALIST III 59 1.00 1.00 1.00URBAN POLICY SPECIALIST III U61 0.00 1.00 1.00
7106 DCDBG ADMIN./PROGRAM DELIVERY TOTAL 20.00 28.00 28.00
7204 PLANNING RECOVERYURBAN POLICY SPECIALIST IV U60 1.00 1.00 1.00
7204 PLANNING RECOVERY TOTAL 1.00 1.00 1.00
LCD LA OFFICE OF COMMUNITY DEVELOP TOTAL 21.00 29.00 29.00
DEPARTMENT TOTAL 112.00 120.00 120.00
Page 441

WORKFORCE INVESTMENT
DEPARTMENTAL BUDGET SUMMARY
AdoptedProposedAdoptedActual
EXPENDITURES
2013 2012 2011 2013
PERSONAL SERVICES 586,679 534,308 978,738 978,738
OTHER OPERATING 1,364,805 4,503,632 5,036,326 5,036,326
DEBT SERVICE 0 0 0 0
RESERVES 0 0 0 0
GRANTS, CONTRIB. & FUND TRAN. 0 0 0 0
$1,951,484 $5,037,940 $6,015,064 TOTAL EXPENDITURES $6,015,064
SOURCE OF FUNDING
GENERAL FUND 0 0 0 0
WISNER FUNDS 0 0 0 0
ENTERPRISE 0 0 0 0
DOWNTOWN DEVELOPMENT DIST. 0 0 0 0
HOUSING AND URBAN DEVELOP. 0 0 0 0
SELF GENERATED 0 0 0 0
LIBRARY 0 0 0 0
LLE 0 0 0 0
FEDERAL GRANTS 0 0 0 0
STATE GRANTS 1,951,484 5,037,940 6,015,064 6,015,064
GRANTS, CONTRIB., & FUND TRAN. 0 0 0 0
N. O. REGIONAL BUSINESS PARK 0 0 0 0
ECONOMIC DEVELOPMENT FUND 0 0 0 0
HOUSING IMPROVMENT FUND 0 0 0 0
$1,951,484 $5,037,940 $6,015,064 TOTAL FUNDING $6,015,064
Page 442
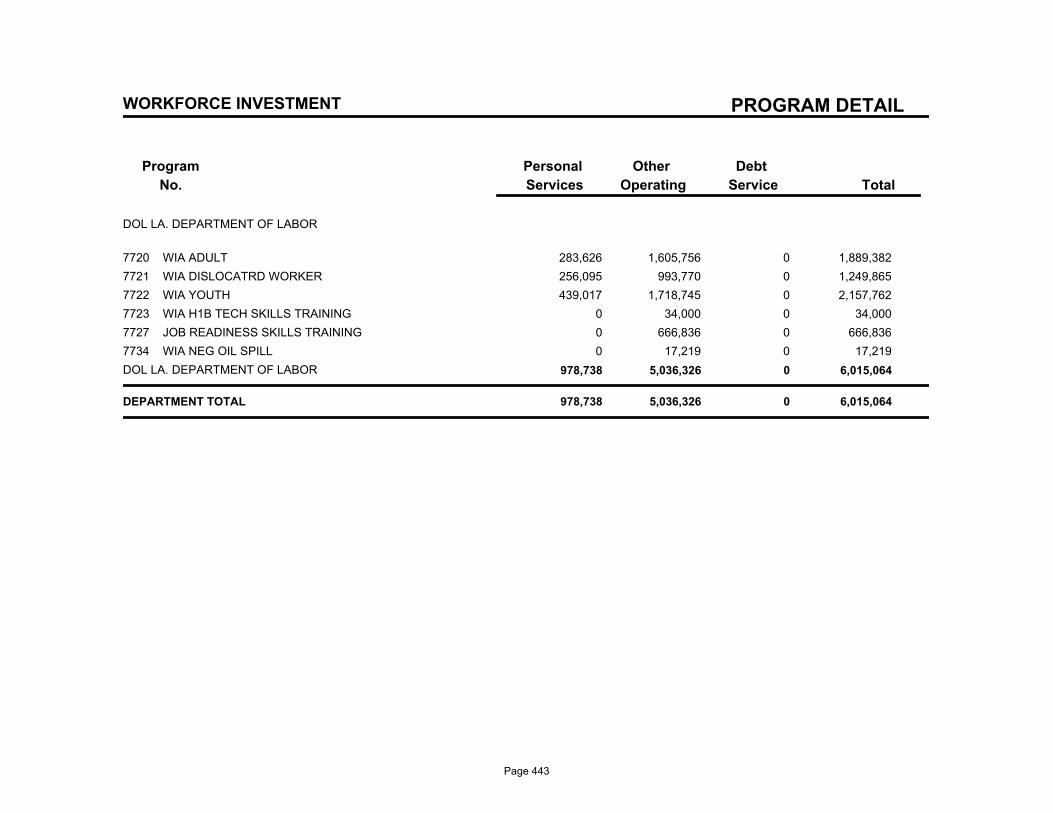
PROGRAM DETAIL
Program
No.
Debt
Service
Other
Operating
Personal
Services Total
WORKFORCE INVESTMENT
DOL LA. DEPARTMENT OF LABOR
7720 WIA ADULT 283,626 1,605,756 0 1,889,382
7721 WIA DISLOCATRD WORKER 256,095 993,770 0 1,249,865
7722 WIA YOUTH 439,017 1,718,745 0 2,157,762
7723 WIA H1B TECH SKILLS TRAINING 0 34,000 0 34,000
7727 JOB READINESS SKILLS TRAINING 0 666,836 0 666,836
7734 WIA NEG OIL SPILL 0 17,219 0 17,219
DOL LA. DEPARTMENT OF LABOR 978,738 5,036,326 0 6,015,064
DEPARTMENT TOTAL 978,738 5,036,326 0 6,015,064
Page 443
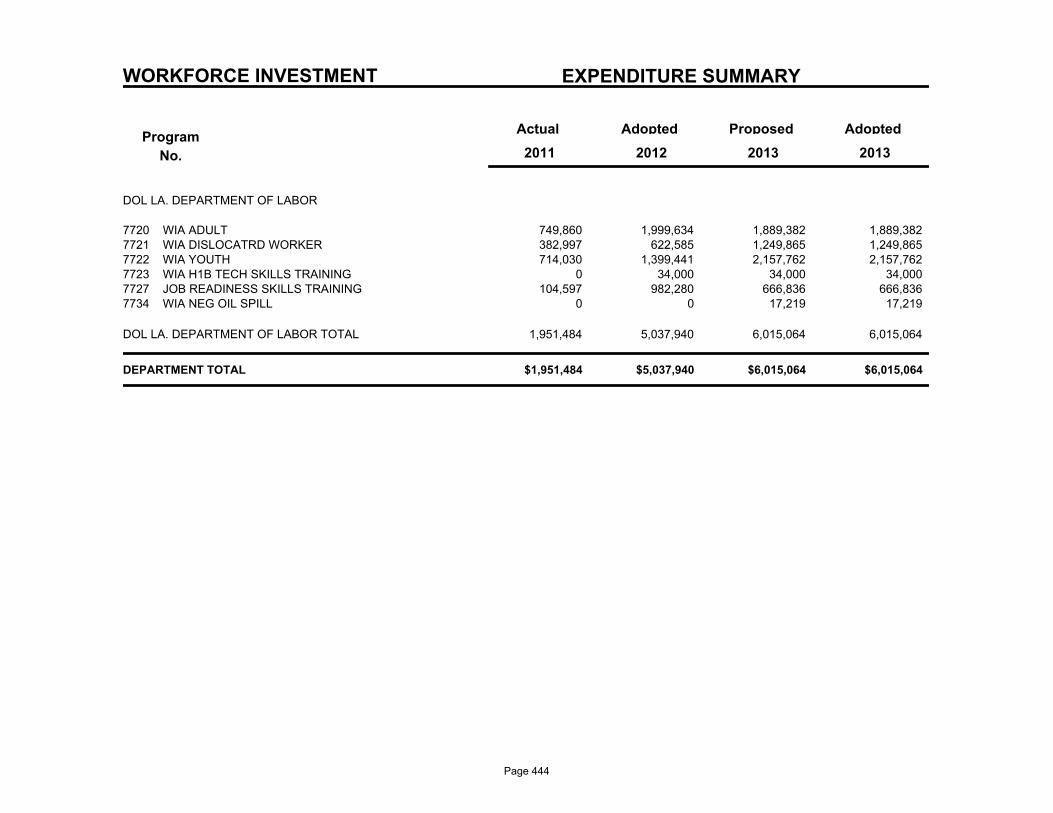
WORKFORCE INVESTMENT EXPENDITURE SUMMARY
Program
No.
Actual AdoptedProposedAdopted
2013 2011 2012 2013
DOL LA. DEPARTMENT OF LABOR
749,860 1,999,634 1,889,382 WIA ADULT7720 1,889,382 382,997 622,585 1,249,865 WIA DISLOCATRD WORKER7721 1,249,865 714,030 1,399,441 2,157,762 WIA YOUTH7722 2,157,762
0 34,000 34,000 WIA H1B TECH SKILLS TRAINING7723 34,000 104,597 982,280 666,836 JOB READINESS SKILLS TRAINING7727 666,836
0 0 17,219 WIA NEG OIL SPILL7734 17,219
1,951,484 5,037,940 6,015,064 6,015,064 DOL LA. DEPARTMENT OF LABOR TOTAL
$1,951,484 $5,037,940 $6,015,064 $6,015,064 DEPARTMENT TOTAL
Page 444
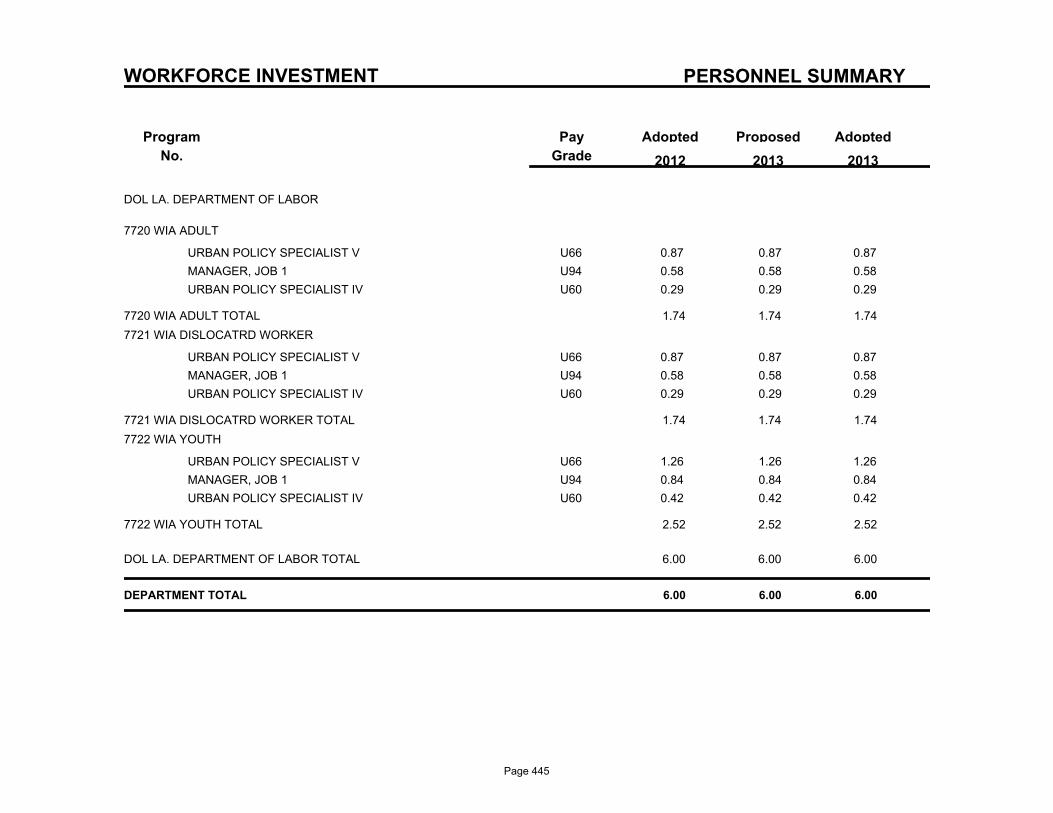
PERSONNEL SUMMARY
Program
No.
ProposedAdoptedPay
Grade
Adopted
2013 2012 2013
WORKFORCE INVESTMENT
DOL LA. DEPARTMENT OF LABOR
7720 WIA ADULT
U66URBAN POLICY SPECIALIST V 0.87 0.87 0.87
U94MANAGER, JOB 1 0.58 0.58 0.58
U60URBAN POLICY SPECIALIST IV 0.29 0.29 0.29
7720 WIA ADULT TOTAL 1.74 1.74 1.74
7721 WIA DISLOCATRD WORKER
U66URBAN POLICY SPECIALIST V 0.87 0.87 0.87
U94MANAGER, JOB 1 0.58 0.58 0.58
U60URBAN POLICY SPECIALIST IV 0.29 0.29 0.29
7721 WIA DISLOCATRD WORKER TOTAL 1.74 1.74 1.74
7722 WIA YOUTH
U66URBAN POLICY SPECIALIST V 1.26 1.26 1.26
U94MANAGER, JOB 1 0.84 0.84 0.84
U60URBAN POLICY SPECIALIST IV 0.42 0.42 0.42
7722 WIA YOUTH TOTAL 2.52 2.52 2.52
DOL LA. DEPARTMENT OF LABOR TOTAL 6.00 6.00 6.00
DEPARTMENT TOTAL 6.00 6.00 6.00
Page 445

ECONOMIC DEVELOPMENT FUND
DEPARTMENTAL BUDGET SUMMARY
AdoptedProposedAdoptedActual
EXPENDITURES
2013 2012 2011 2013
PERSONAL SERVICES 747,675 186,442 173,245 173,245
OTHER OPERATING 1,600,299 2,371,088 1,580,000 1,580,000
DEBT SERVICE 0 0 0 0
RESERVES 0 0 0 0
GRANTS, CONTRIB. & FUND TRAN. 0 0 0 0
$2,347,974 $2,557,530 $1,753,245 TOTAL EXPENDITURES $1,753,245
SOURCE OF FUNDING
GENERAL FUND 0 0 0 0
WISNER FUNDS 0 0 0 0
ENTERPRISE 0 0 0 0
DOWNTOWN DEVELOPMENT DIST. 0 0 0 0
HOUSING AND URBAN DEVELOP. 0 0 0 0
SELF GENERATED 0 0 0 0
LIBRARY 0 0 0 0
LLE 0 0 0 0
FEDERAL GRANTS 0 0 0 0
STATE GRANTS 0 0 0 0
GRANTS, CONTRIB., & FUND TRAN. 0 0 0 0
N. O. REGIONAL BUSINESS PARK 0 0 0 0
ECONOMIC DEVELOPMENT FUND 2,347,974 2,557,530 1,753,245 1,753,245
HOUSING IMPROVMENT FUND 0 0 0 0
$2,347,974 $2,557,530 $1,753,245 TOTAL FUNDING $1,753,245
Page 446
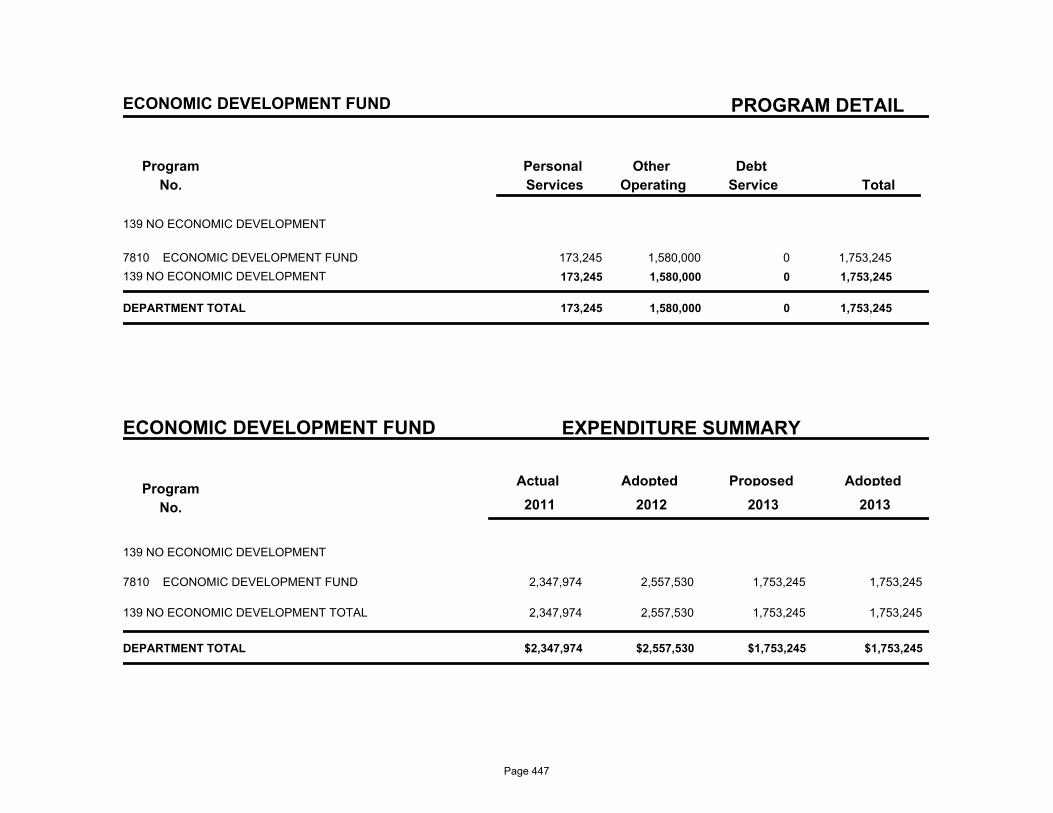
PROGRAM DETAIL
Program
No.
Debt
Service
Other
Operating
Personal
Services Total
ECONOMIC DEVELOPMENT FUND
139 NO ECONOMIC DEVELOPMENT
7810 ECONOMIC DEVELOPMENT FUND 173,245 1,580,000 0 1,753,245
139 NO ECONOMIC DEVELOPMENT 173,245 1,580,000 0 1,753,245
DEPARTMENT TOTAL 173,245 1,580,000 0 1,753,245
ECONOMIC DEVELOPMENT FUND EXPENDITURE SUMMARY
Program
No.
Actual AdoptedProposedAdopted
2013 2011 2012 2013
139 NO ECONOMIC DEVELOPMENT
2,347,974 2,557,530 1,753,245 ECONOMIC DEVELOPMENT FUND7810 1,753,245
2,347,974 2,557,530 1,753,245 1,753,245 139 NO ECONOMIC DEVELOPMENT TOTAL
$2,347,974 $2,557,530 $1,753,245 $1,753,245 DEPARTMENT TOTAL
Page 447
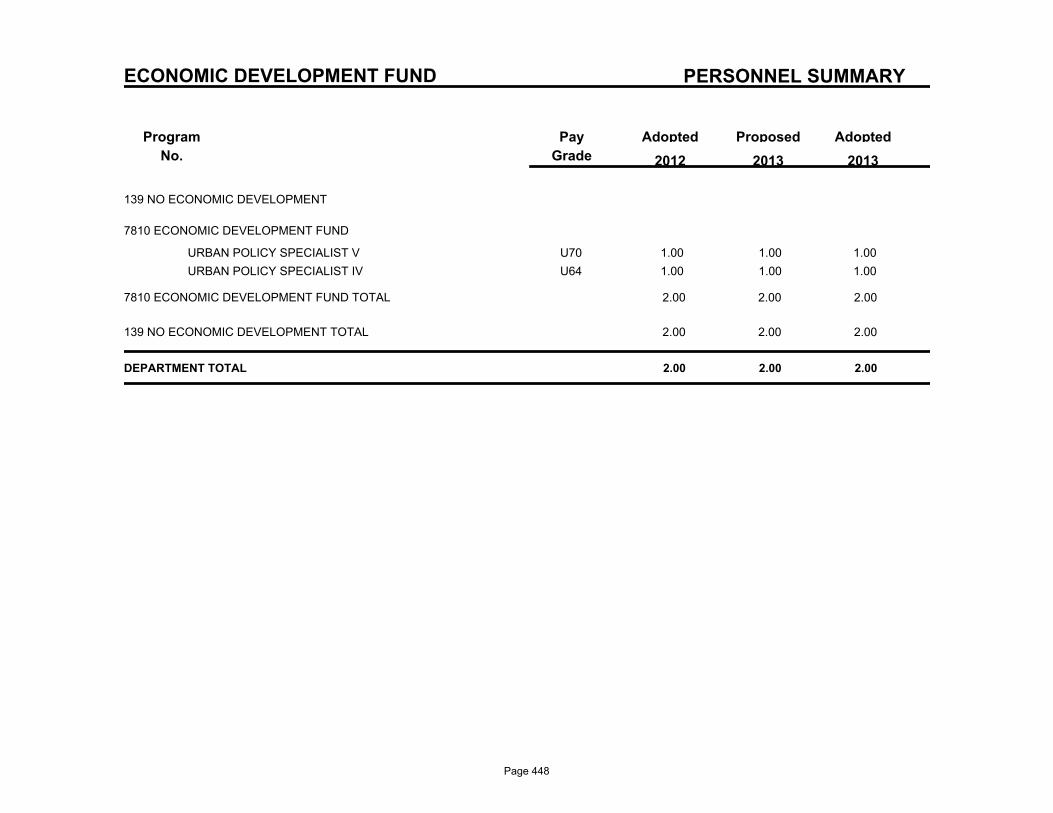
PERSONNEL SUMMARY
Program
No.
ProposedAdoptedPay
Grade
Adopted
2013 2012 2013
ECONOMIC DEVELOPMENT FUND
139 NO ECONOMIC DEVELOPMENT
7810 ECONOMIC DEVELOPMENT FUND
U70URBAN POLICY SPECIALIST V 1.00 1.00 1.00
U64URBAN POLICY SPECIALIST IV 1.00 1.00 1.00
7810 ECONOMIC DEVELOPMENT FUND TOTAL 2.00 2.00 2.00
139 NO ECONOMIC DEVELOPMENT TOTAL 2.00 2.00 2.00
DEPARTMENT TOTAL 2.00 2.00 2.00
Page 448
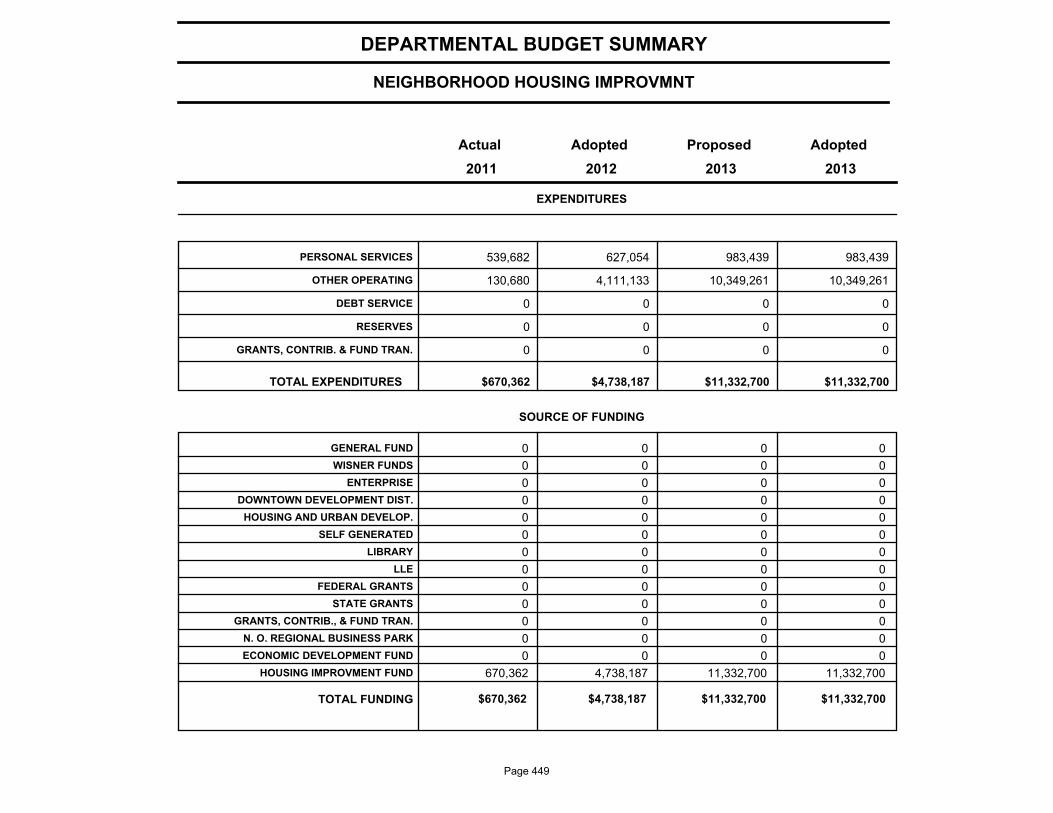
NEIGHBORHOOD HOUSING IMPROVMNT
DEPARTMENTAL BUDGET SUMMARY
AdoptedProposedAdoptedActual
EXPENDITURES
2013 2012 2011 2013
PERSONAL SERVICES 539,682 627,054 983,439 983,439
OTHER OPERATING 130,680 4,111,133 10,349,261 10,349,261
DEBT SERVICE 0 0 0 0
RESERVES 0 0 0 0
GRANTS, CONTRIB. & FUND TRAN. 0 0 0 0
$670,362 $4,738,187 $11,332,700 TOTAL EXPENDITURES $11,332,700
SOURCE OF FUNDING
GENERAL FUND 0 0 0 0
WISNER FUNDS 0 0 0 0
ENTERPRISE 0 0 0 0
DOWNTOWN DEVELOPMENT DIST. 0 0 0 0
HOUSING AND URBAN DEVELOP. 0 0 0 0
SELF GENERATED 0 0 0 0
LIBRARY 0 0 0 0
LLE 0 0 0 0
FEDERAL GRANTS 0 0 0 0
STATE GRANTS 0 0 0 0
GRANTS, CONTRIB., & FUND TRAN. 0 0 0 0
N. O. REGIONAL BUSINESS PARK 0 0 0 0
ECONOMIC DEVELOPMENT FUND 0 0 0 0
HOUSING IMPROVMENT FUND 670,362 4,738,187 11,332,700 11,332,700
$670,362 $4,738,187 $11,332,700 TOTAL FUNDING $11,332,700
Page 449
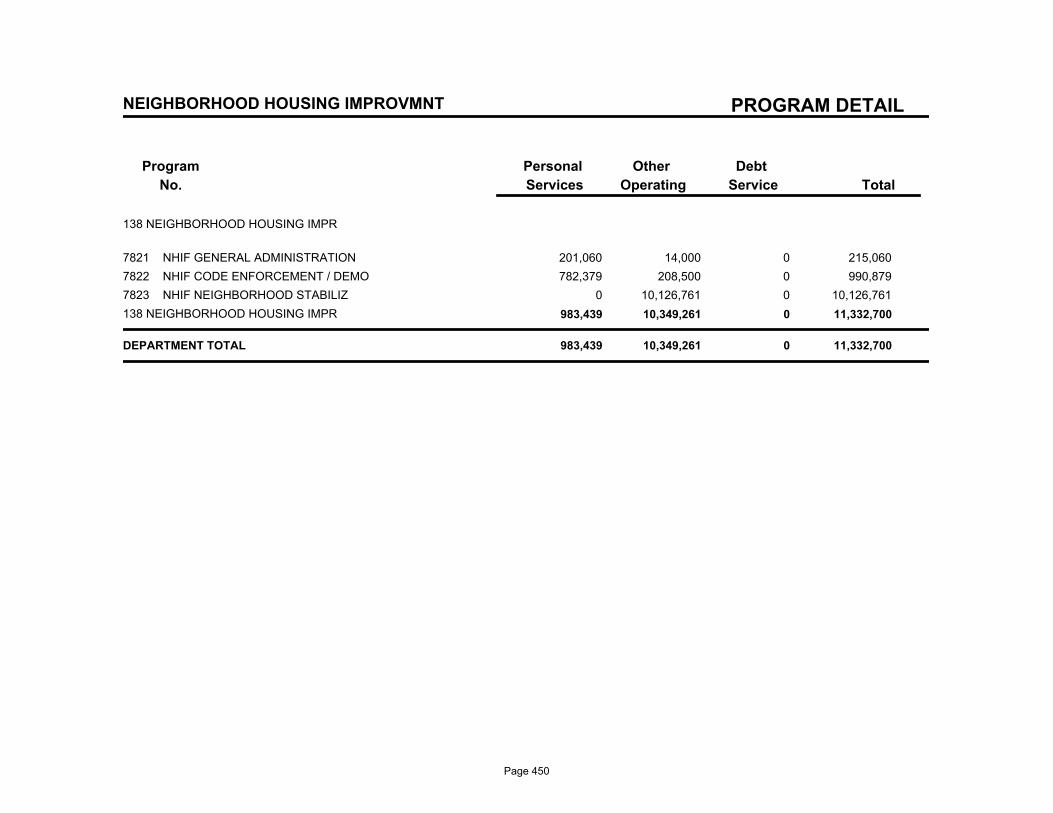
PROGRAM DETAIL
Program
No.
Debt
Service
Other
Operating
Personal
Services Total
NEIGHBORHOOD HOUSING IMPROVMNT
138 NEIGHBORHOOD HOUSING IMPR
7821 NHIF GENERAL ADMINISTRATION 201,060 14,000 0 215,060
7822 NHIF CODE ENFORCEMENT / DEMO 782,379 208,500 0 990,879
7823 NHIF NEIGHBORHOOD STABILIZ 0 10,126,761 0 10,126,761
138 NEIGHBORHOOD HOUSING IMPR 983,439 10,349,261 0 11,332,700
DEPARTMENT TOTAL 983,439 10,349,261 0 11,332,700
Page 450
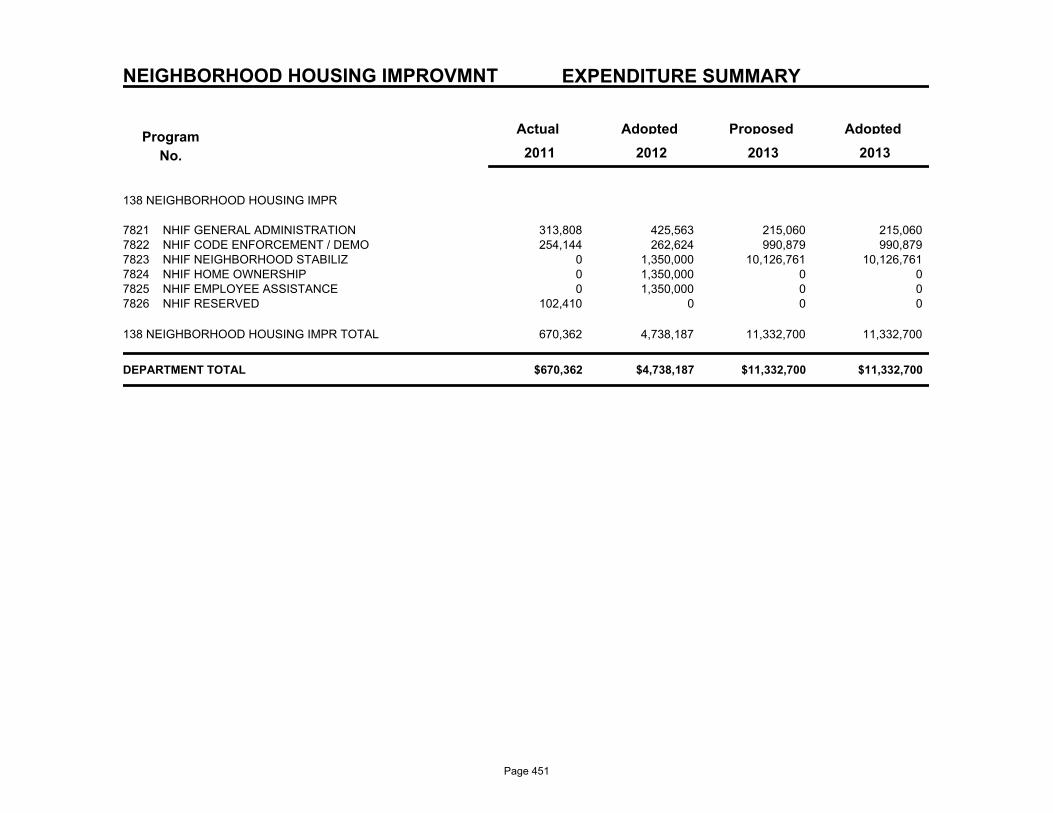
NEIGHBORHOOD HOUSING IMPROVMNT EXPENDITURE SUMMARY
Program
No.
Actual AdoptedProposedAdopted
2013 2011 2012 2013
138 NEIGHBORHOOD HOUSING IMPR
313,808 425,563 215,060 NHIF GENERAL ADMINISTRATION7821 215,060 254,144 262,624 990,879 NHIF CODE ENFORCEMENT / DEMO7822 990,879
0 1,350,000 10,126,761 NHIF NEIGHBORHOOD STABILIZ7823 10,126,761 0 1,350,000 0 NHIF HOME OWNERSHIP7824 0 0 1,350,000 0 NHIF EMPLOYEE ASSISTANCE7825 0
102,410 0 0 NHIF RESERVED7826 0
670,362 4,738,187 11,332,700 11,332,700 138 NEIGHBORHOOD HOUSING IMPR TOTAL
$670,362 $4,738,187 $11,332,700 $11,332,700 DEPARTMENT TOTAL
Page 451
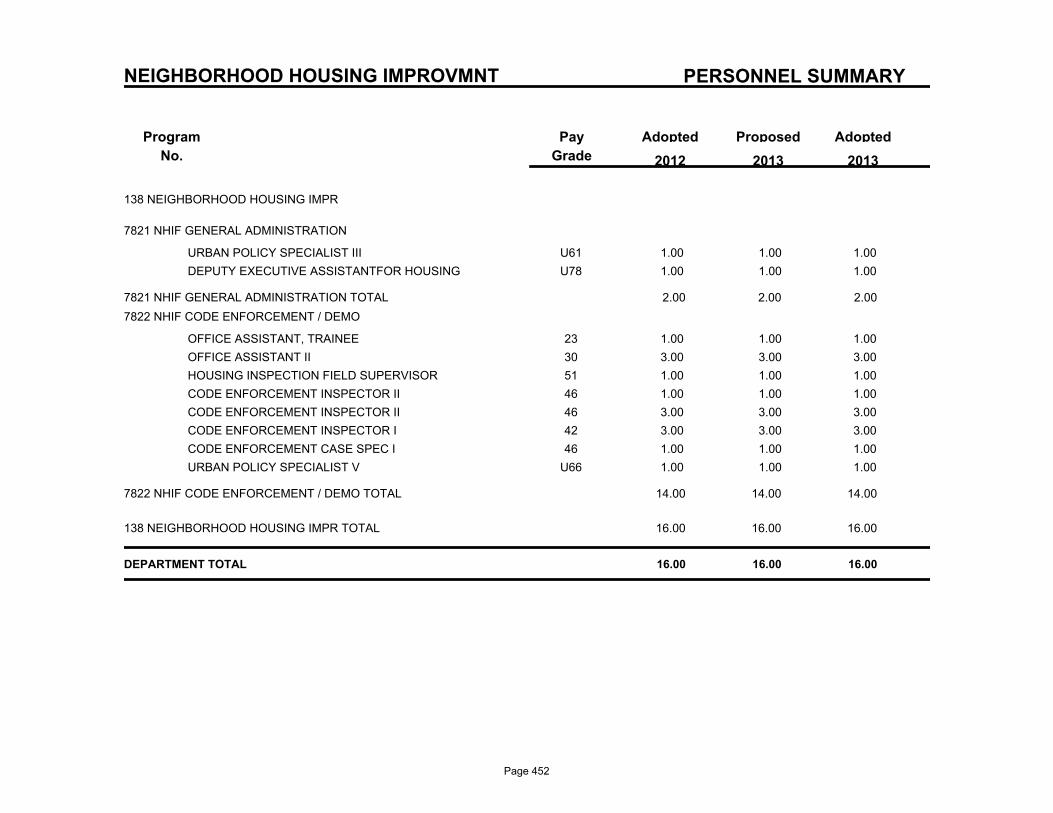
PERSONNEL SUMMARY
Program
No.
ProposedAdoptedPay
Grade
Adopted
2013 2012 2013
NEIGHBORHOOD HOUSING IMPROVMNT
138 NEIGHBORHOOD HOUSING IMPR
7821 NHIF GENERAL ADMINISTRATION
U61URBAN POLICY SPECIALIST III 1.00 1.00 1.00
U78DEPUTY EXECUTIVE ASSISTANTFOR HOUSING 1.00 1.00 1.00
7821 NHIF GENERAL ADMINISTRATION TOTAL 2.00 2.00 2.00
7822 NHIF CODE ENFORCEMENT / DEMO
23OFFICE ASSISTANT, TRAINEE 1.00 1.00 1.00
30OFFICE ASSISTANT II 3.00 3.00 3.00
51HOUSING INSPECTION FIELD SUPERVISOR 1.00 1.00 1.00
46CODE ENFORCEMENT INSPECTOR II 1.00 1.00 1.00
46CODE ENFORCEMENT INSPECTOR II 3.00 3.00 3.00
42CODE ENFORCEMENT INSPECTOR I 3.00 3.00 3.00
46CODE ENFORCEMENT CASE SPEC I 1.00 1.00 1.00
U66URBAN POLICY SPECIALIST V 1.00 1.00 1.00
7822 NHIF CODE ENFORCEMENT / DEMO TOTAL 14.00 14.00 14.00
138 NEIGHBORHOOD HOUSING IMPR TOTAL 16.00 16.00 16.00
DEPARTMENT TOTAL 16.00 16.00 16.00
Page 452
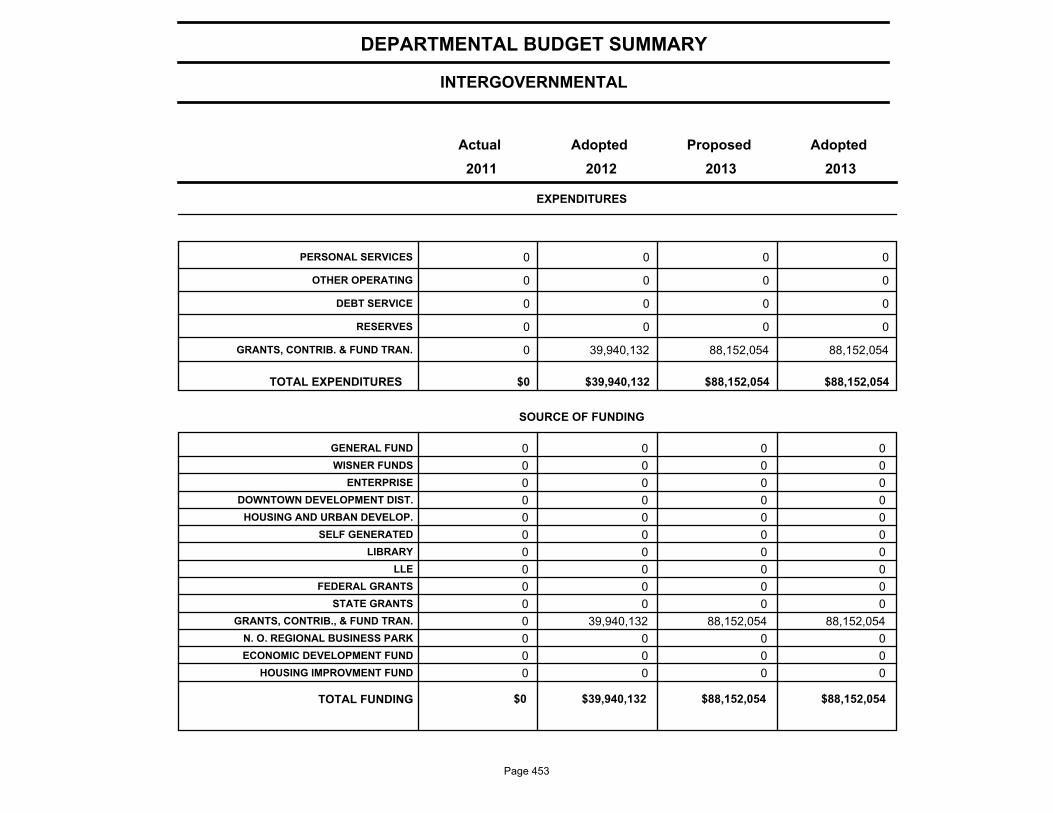
INTERGOVERNMENTAL
DEPARTMENTAL BUDGET SUMMARY
AdoptedProposedAdoptedActual
EXPENDITURES
2013 2012 2011 2013
PERSONAL SERVICES 0 0 0 0
OTHER OPERATING 0 0 0 0
DEBT SERVICE 0 0 0 0
RESERVES 0 0 0 0
GRANTS, CONTRIB. & FUND TRAN. 0 39,940,132 88,152,054 88,152,054
$0 $39,940,132 $88,152,054 TOTAL EXPENDITURES $88,152,054
SOURCE OF FUNDING
GENERAL FUND 0 0 0 0
WISNER FUNDS 0 0 0 0
ENTERPRISE 0 0 0 0
DOWNTOWN DEVELOPMENT DIST. 0 0 0 0
HOUSING AND URBAN DEVELOP. 0 0 0 0
SELF GENERATED 0 0 0 0
LIBRARY 0 0 0 0
LLE 0 0 0 0
FEDERAL GRANTS 0 0 0 0
STATE GRANTS 0 0 0 0
GRANTS, CONTRIB., & FUND TRAN. 0 39,940,132 88,152,054 88,152,054
N. O. REGIONAL BUSINESS PARK 0 0 0 0
ECONOMIC DEVELOPMENT FUND 0 0 0 0
HOUSING IMPROVMENT FUND 0 0 0 0
$0 $39,940,132 $88,152,054 TOTAL FUNDING $88,152,054
Page 453
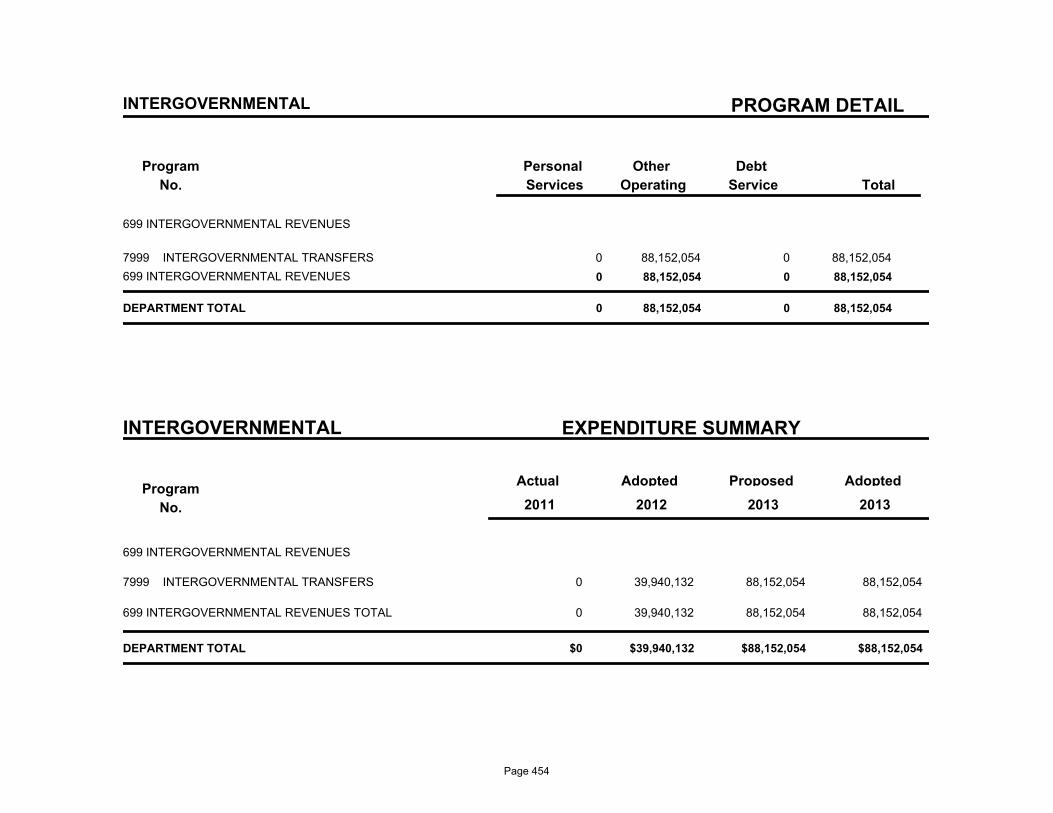
PROGRAM DETAIL
Program
No.
Debt
Service
Other
Operating
Personal
Services Total
INTERGOVERNMENTAL
699 INTERGOVERNMENTAL REVENUES
7999 INTERGOVERNMENTAL TRANSFERS 0 88,152,054 0 88,152,054
699 INTERGOVERNMENTAL REVENUES 0 88,152,054 0 88,152,054
DEPARTMENT TOTAL 0 88,152,054 0 88,152,054
INTERGOVERNMENTAL EXPENDITURE SUMMARY
Program
No.
Actual AdoptedProposedAdopted
2013 2011 2012 2013
699 INTERGOVERNMENTAL REVENUES
0 39,940,132 88,152,054 INTERGOVERNMENTAL TRANSFERS7999 88,152,054
0 39,940,132 88,152,054 88,152,054 699 INTERGOVERNMENTAL REVENUES TOTAL
$0 $39,940,132 $88,152,054 $88,152,054 DEPARTMENT TOTAL
Page 454

Page 455

District Attorney
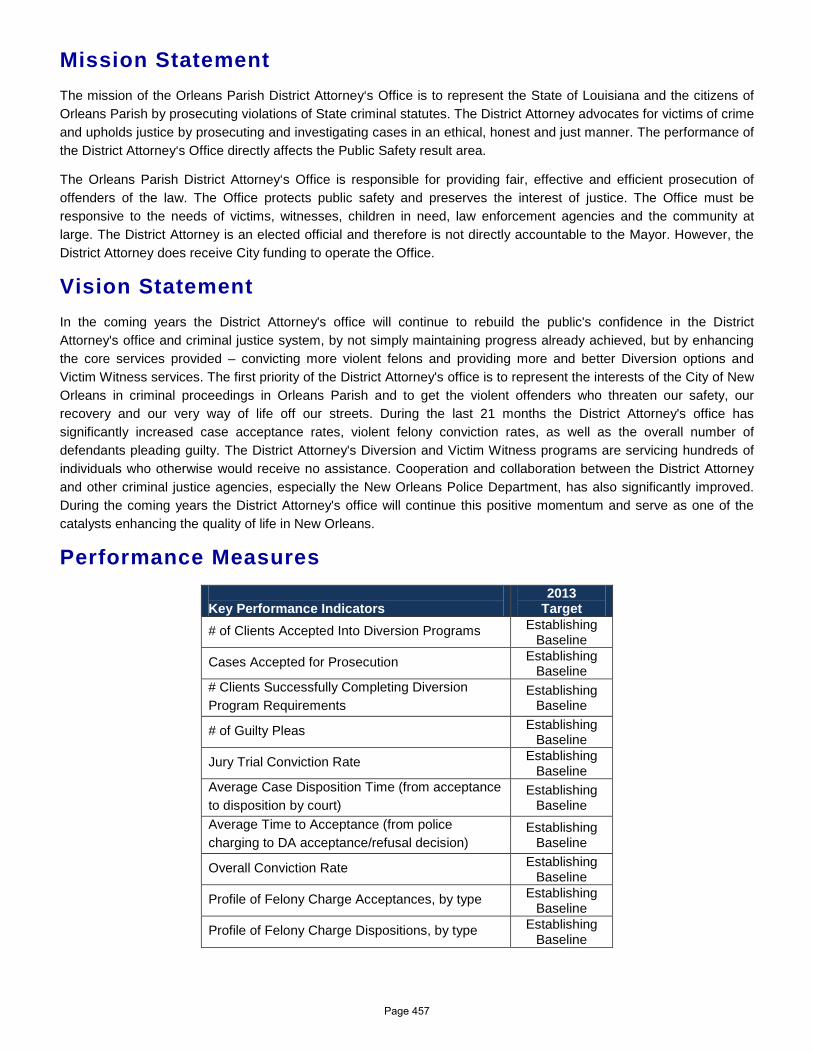
Mission Statement The mission of the Orleans Parish District Attorney‘s Office is to represent the State of Louisiana and the citizens of Orleans Parish by prosecuting violations of State criminal statutes. The District Attorney advocates for victims of crime and upholds justice by prosecuting and investigating cases in an ethical, honest and just manner. The performance of the District Attorney‘s Office directly affects the Public Safety result area.
The Orleans Parish District Attorney‘s Office is responsible for providing fair, effective and efficient prosecution of offenders of the law. The Office protects public safety and preserves the interest of justice. The Office must be responsive to the needs of victims, witnesses, children in need, law enforcement agencies and the community at large. The District Attorney is an elected official and therefore is not directly accountable to the Mayor. However, the District Attorney does receive City funding to operate the Office.
Vision Statement In the coming years the District Attorney's office will continue to rebuild the public's confidence in the District Attorney's office and criminal justice system, by not simply maintaining progress already achieved, but by enhancing the core services provided – convicting more violent felons and providing more and better Diversion options and Victim Witness services. The first priority of the District Attorney's office is to represent the interests of the City of New Orleans in criminal proceedings in Orleans Parish and to get the violent offenders who threaten our safety, our recovery and our very way of life off our streets. During the last 21 months the District Attorney's office has significantly increased case acceptance rates, violent felony conviction rates, as well as the overall number of defendants pleading guilty. The District Attorney's Diversion and Victim Witness programs are servicing hundreds of individuals who otherwise would receive no assistance. Cooperation and collaboration between the District Attorney and other criminal justice agencies, especially the New Orleans Police Department, has also significantly improved. During the coming years the District Attorney's office will continue this positive momentum and serve as one of the catalysts enhancing the quality of life in New Orleans.
Performance Measures Key Performance Indicators
2013 Target
# of Clients Accepted Into Diversion Programs Establishing Baseline
Cases Accepted for Prosecution Establishing Baseline
# Clients Successfully Completing Diversion Program Requirements
Establishing Baseline
# of Guilty Pleas Establishing Baseline
Jury Trial Conviction Rate Establishing Baseline
Average Case Disposition Time (from acceptance to disposition by court)
Establishing Baseline
Average Time to Acceptance (from police charging to DA acceptance/refusal decision)
Establishing Baseline
Overall Conviction Rate Establishing Baseline
Profile of Felony Charge Acceptances, by type Establishing Baseline
Profile of Felony Charge Dispositions, by type Establishing Baseline
Page 457
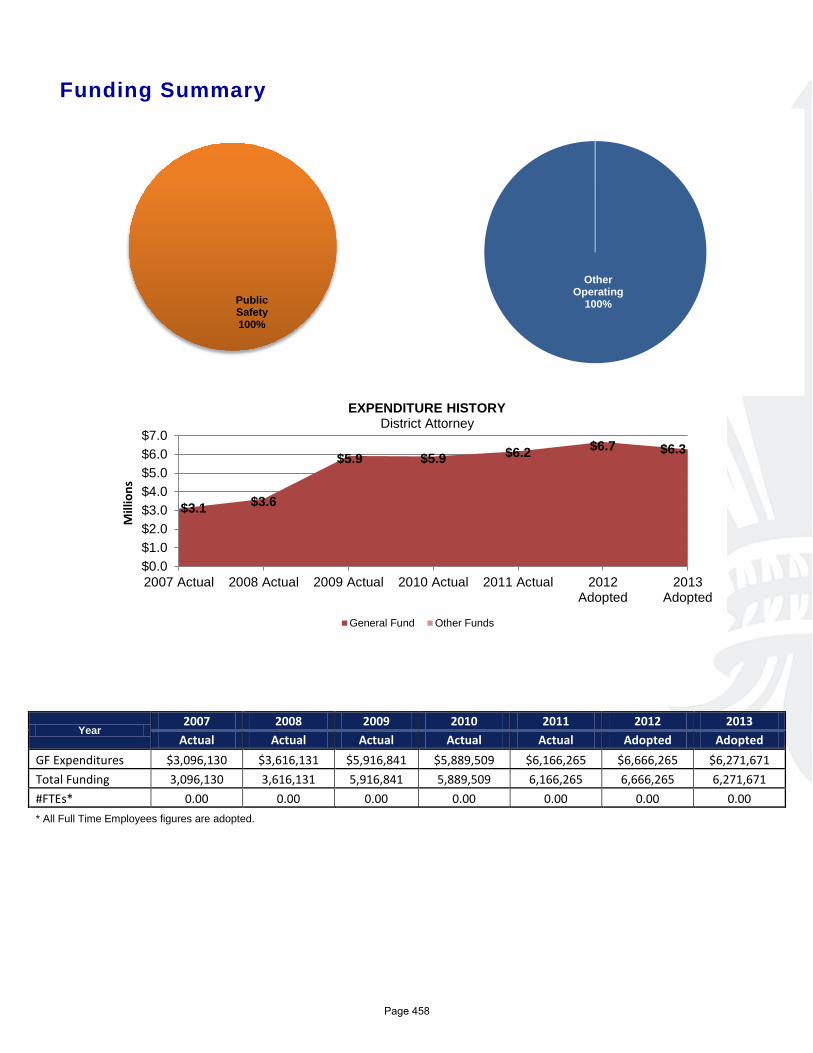
Funding Summary
Year 2007 2008 2009 2010 2011 2012 2013
Actual Actual Actual Actual Actual Adopted Adopted GF Expenditures $3,096,130 $3,616,131 $5,916,841 $5,889,509 $6,166,265 $6,666,265 $6,271,671 Total Funding 3,096,130 3,616,131 5,916,841 5,889,509 6,166,265 6,666,265 6,271,671 #FTEs* 0.00 0.00 0.00 0.00 0.00 0.00 0.00 * All Full Time Employees figures are adopted.
$3.1 $3.6
$5.9 $5.9 $6.2 $6.7 $6.3
$0.0$1.0$2.0$3.0$4.0$5.0$6.0$7.0
2007 Actual 2008 Actual 2009 Actual 2010 Actual 2011 Actual 2012Adopted
2013Adopted
Mill
ions
EXPENDITURE HISTORY District Attorney
General Fund Other Funds
Public Safety 100%
Other Operating
100%
Personal Services
0%
Page 458
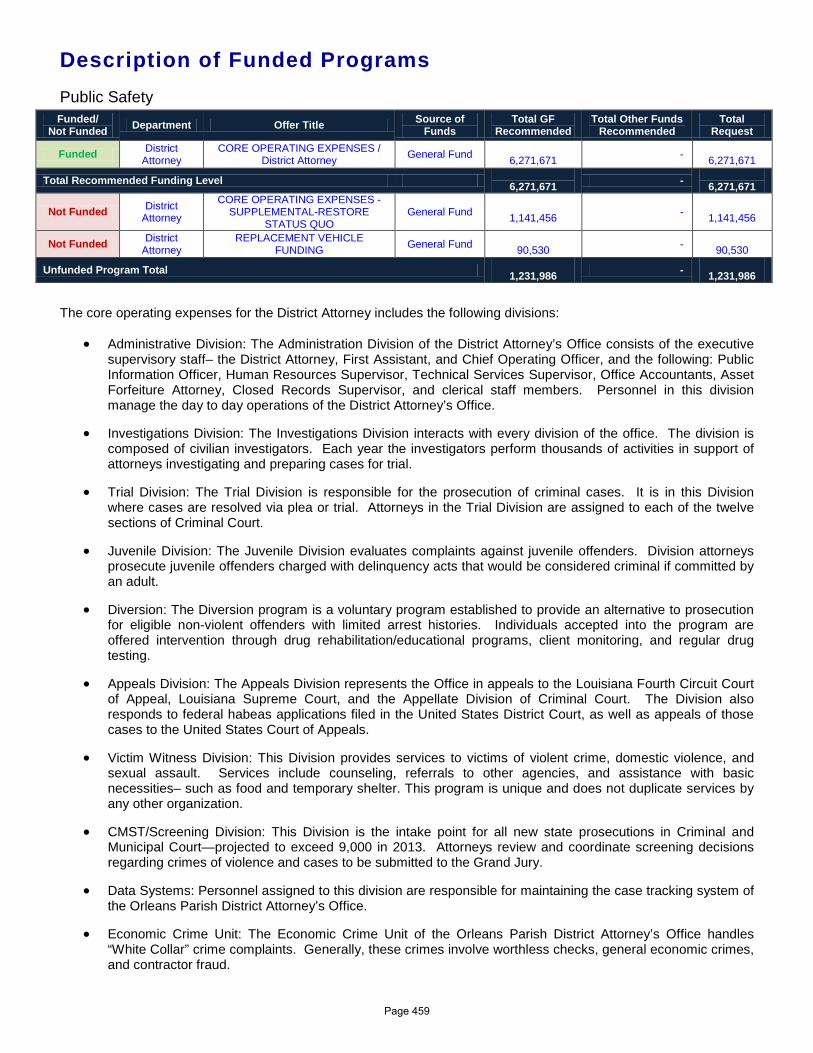
Description of Funded Programs Public Safety Funded/
Not Funded Department Offer Title Source of Funds
Total GF Recommended
Total Other Funds Recommended
Total Request
Funded District Attorney
CORE OPERATING EXPENSES / District Attorney General Fund
6,271,671 - 6,271,671
Total Recommended Funding Level 6,271,671 -
6,271,671
Not Funded District Attorney
CORE OPERATING EXPENSES - SUPPLEMENTAL-RESTORE
STATUS QUO General Fund
1,141,456 - 1,141,456
Not Funded District Attorney
REPLACEMENT VEHICLE FUNDING General Fund
90,530 - 90,530
Unfunded Program Total 1,231,986 -
1,231,986 The core operating expenses for the District Attorney includes the following divisions:
• Administrative Division: The Administration Division of the District Attorney’s Office consists of the executive supervisory staff– the District Attorney, First Assistant, and Chief Operating Officer, and the following: Public Information Officer, Human Resources Supervisor, Technical Services Supervisor, Office Accountants, Asset Forfeiture Attorney, Closed Records Supervisor, and clerical staff members. Personnel in this division manage the day to day operations of the District Attorney’s Office.
• Investigations Division: The Investigations Division interacts with every division of the office. The division is composed of civilian investigators. Each year the investigators perform thousands of activities in support of attorneys investigating and preparing cases for trial.
• Trial Division: The Trial Division is responsible for the prosecution of criminal cases. It is in this Division where cases are resolved via plea or trial. Attorneys in the Trial Division are assigned to each of the twelve sections of Criminal Court.
• Juvenile Division: The Juvenile Division evaluates complaints against juvenile offenders. Division attorneys prosecute juvenile offenders charged with delinquency acts that would be considered criminal if committed by an adult.
• Diversion: The Diversion program is a voluntary program established to provide an alternative to prosecution for eligible non-violent offenders with limited arrest histories. Individuals accepted into the program are offered intervention through drug rehabilitation/educational programs, client monitoring, and regular drug testing.
• Appeals Division: The Appeals Division represents the Office in appeals to the Louisiana Fourth Circuit Court of Appeal, Louisiana Supreme Court, and the Appellate Division of Criminal Court. The Division also responds to federal habeas applications filed in the United States District Court, as well as appeals of those cases to the United States Court of Appeals.
• Victim Witness Division: This Division provides services to victims of violent crime, domestic violence, and sexual assault. Services include counseling, referrals to other agencies, and assistance with basic necessities– such as food and temporary shelter. This program is unique and does not duplicate services by any other organization.
• CMST/Screening Division: This Division is the intake point for all new state prosecutions in Criminal and Municipal Court—projected to exceed 9,000 in 2013. Attorneys review and coordinate screening decisions regarding crimes of violence and cases to be submitted to the Grand Jury.
• Data Systems: Personnel assigned to this division are responsible for maintaining the case tracking system of the Orleans Parish District Attorney’s Office.
• Economic Crime Unit: The Economic Crime Unit of the Orleans Parish District Attorney’s Office handles “White Collar” crime complaints. Generally, these crimes involve worthless checks, general economic crimes, and contractor fraud.
Page 459

DISTRICT ATTORNEY
DEPARTMENTAL BUDGET SUMMARY
AdoptedProposedAdoptedActual
EXPENDITURES
2013 2012 2011 2013
PERSONAL SERVICES 0 0 0 0
OTHER OPERATING 6,166,265 6,666,265 6,271,671 6,271,671
DEBT SERVICE 0 0 0 0
RESERVES 0 0 0 0
GRANTS, CONTRIB. & FUND TRAN. 0 0 0 0
$6,166,265 $6,666,265 $6,271,671 TOTAL EXPENDITURES $6,271,671
SOURCE OF FUNDING
GENERAL FUND 6,166,265 6,666,265 6,271,671 6,271,671
WISNER FUNDS 0 0 0 0
ENTERPRISE 0 0 0 0
DOWNTOWN DEVELOPMENT DIST. 0 0 0 0
HOUSING AND URBAN DEVELOP. 0 0 0 0
SELF GENERATED 0 0 0 0
LIBRARY 0 0 0 0
LLE 0 0 0 0
FEDERAL GRANTS 0 0 0 0
STATE GRANTS 0 0 0 0
GRANTS, CONTRIB., & FUND TRAN. 0 0 0 0
N. O. REGIONAL BUSINESS PARK 0 0 0 0
ECONOMIC DEVELOPMENT FUND 0 0 0 0
HOUSING IMPROVMENT FUND 0 0 0 0
$6,166,265 $6,666,265 $6,271,671 TOTAL FUNDING $6,271,671
Page 460
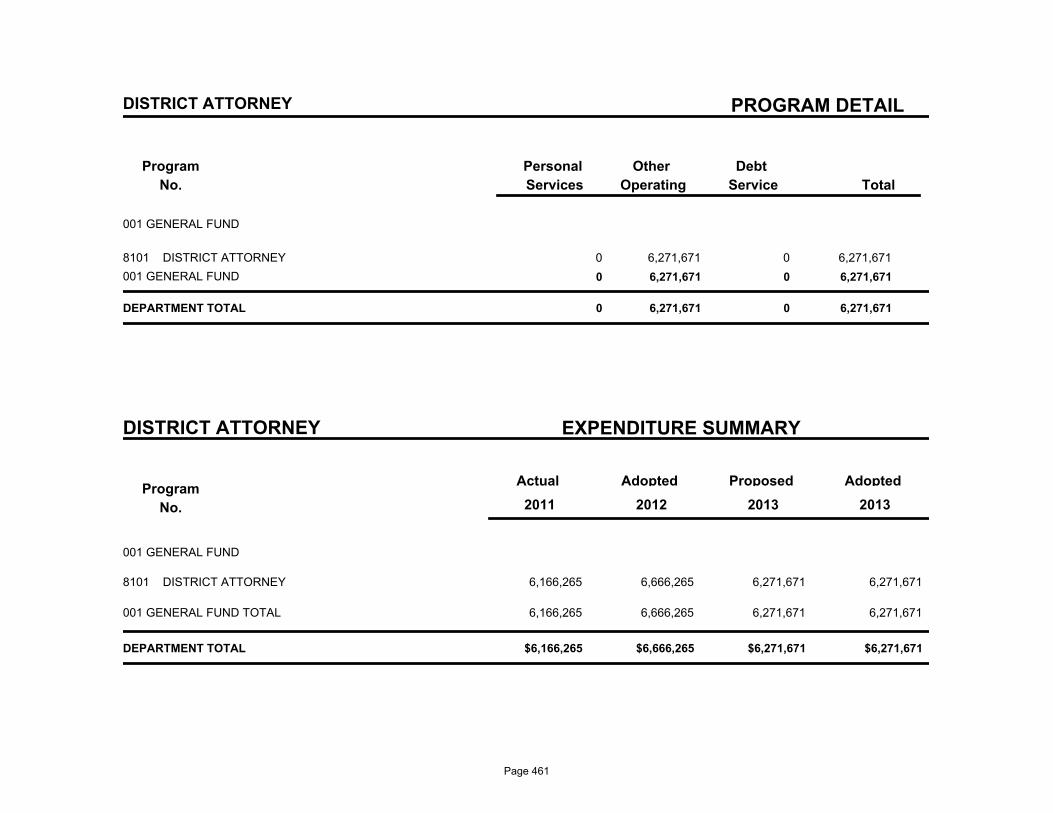
PROGRAM DETAIL
Program
No.
Debt
Service
Other
Operating
Personal
Services Total
DISTRICT ATTORNEY
001 GENERAL FUND
8101 DISTRICT ATTORNEY 0 6,271,671 0 6,271,671
001 GENERAL FUND 0 6,271,671 0 6,271,671
DEPARTMENT TOTAL 0 6,271,671 0 6,271,671
DISTRICT ATTORNEY EXPENDITURE SUMMARY
Program
No.
Actual AdoptedProposedAdopted
2013 2011 2012 2013
001 GENERAL FUND
6,166,265 6,666,265 6,271,671 DISTRICT ATTORNEY8101 6,271,671
6,166,265 6,666,265 6,271,671 6,271,671 001 GENERAL FUND TOTAL
$6,166,265 $6,666,265 $6,271,671 $6,271,671 DEPARTMENT TOTAL
Page 461

Coroner’s Office
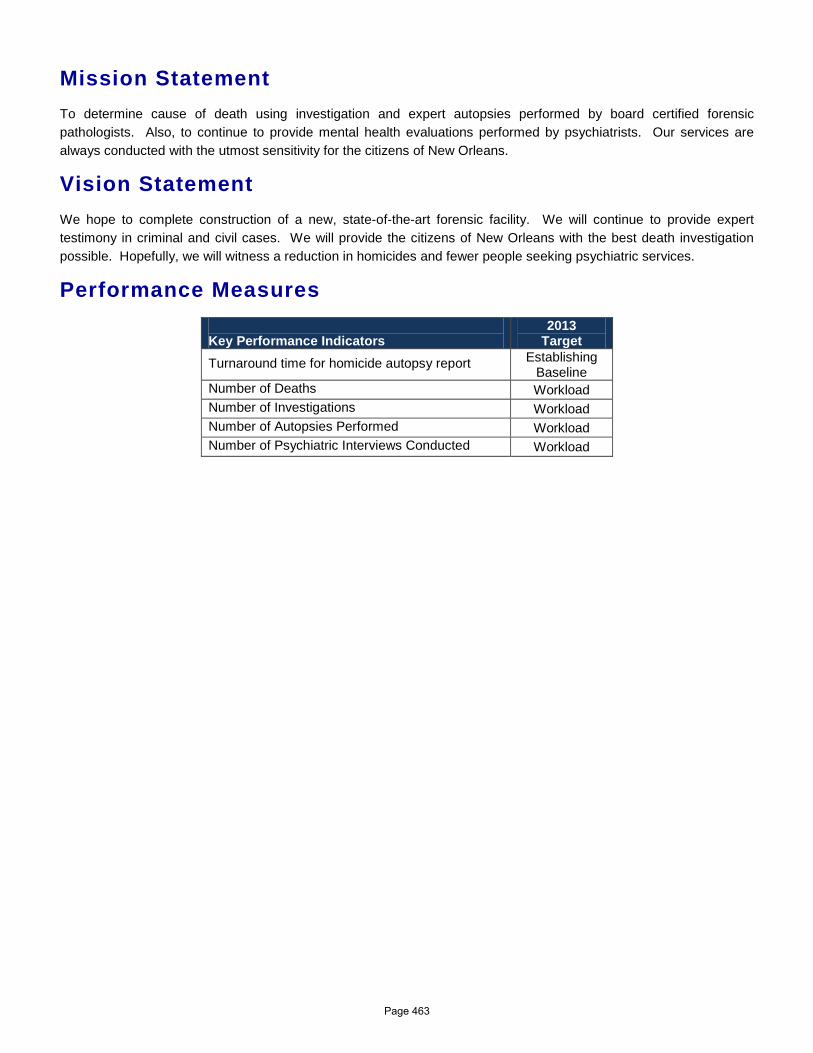
Mission Statement To determine cause of death using investigation and expert autopsies performed by board certified forensic pathologists. Also, to continue to provide mental health evaluations performed by psychiatrists. Our services are always conducted with the utmost sensitivity for the citizens of New Orleans.
Vision Statement We hope to complete construction of a new, state-of-the-art forensic facility. We will continue to provide expert testimony in criminal and civil cases. We will provide the citizens of New Orleans with the best death investigation possible. Hopefully, we will witness a reduction in homicides and fewer people seeking psychiatric services.
Performance Measures Key Performance Indicators
2013 Target
Turnaround time for homicide autopsy report Establishing Baseline
Number of Deaths Workload Number of Investigations Workload Number of Autopsies Performed Workload Number of Psychiatric Interviews Conducted Workload
Page 463
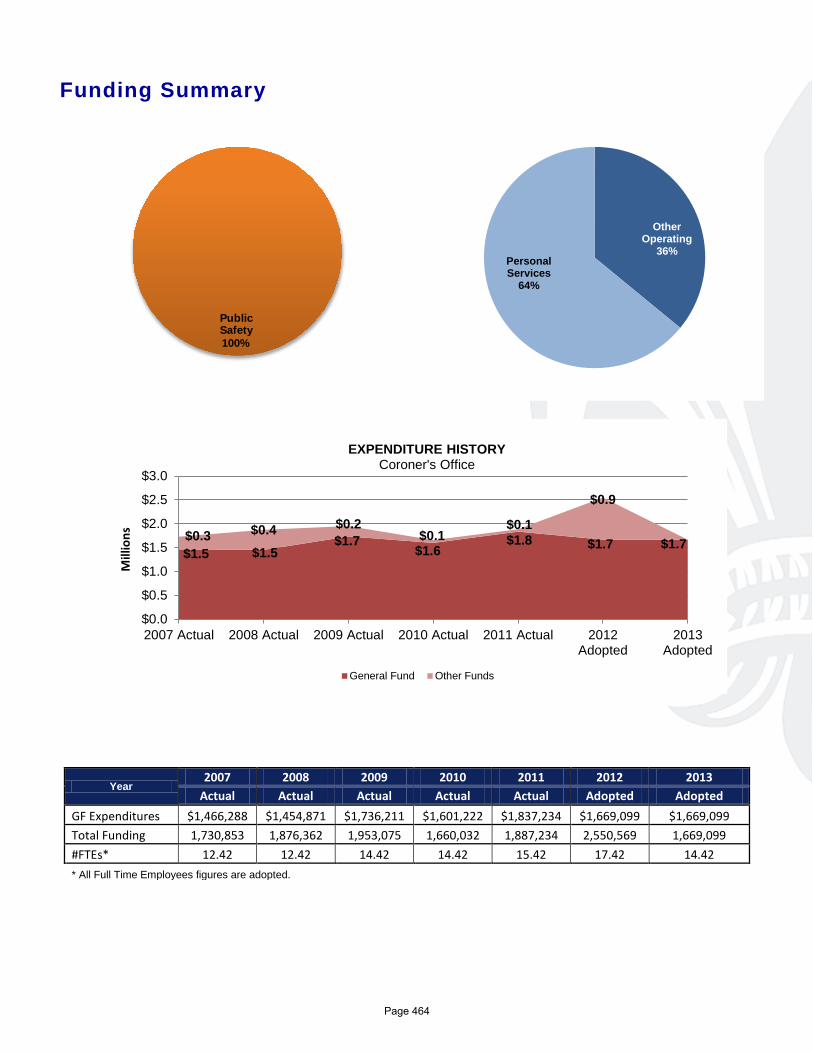
Other Operating
36% Personal Services
64%
Funding Summary
Year 2007 2008 2009 2010 2011 2012 2013
Actual Actual Actual Actual Actual Adopted Adopted GF Expenditures $1,466,288 $1,454,871 $1,736,211 $1,601,222 $1,837,234 $1,669,099 $1,669,099 Total Funding 1,730,853 1,876,362 1,953,075 1,660,032 1,887,234 2,550,569 1,669,099 #FTEs* 12.42 12.42 14.42 14.42 15.42 17.42 14.42 * All Full Time Employees figures are adopted.
$1.5 $1.5 $1.7
$1.6 $1.8 $1.7 $1.7 $0.3 $0.4 $0.2
$0.1 $0.1
$0.9
$0.0
$0.5
$1.0
$1.5
$2.0
$2.5
$3.0
2007 Actual 2008 Actual 2009 Actual 2010 Actual 2011 Actual 2012Adopted
2013Adopted
Mill
ions
EXPENDITURE HISTORY Coroner's Office
General Fund Other Funds
Public Safety100%
Page 464
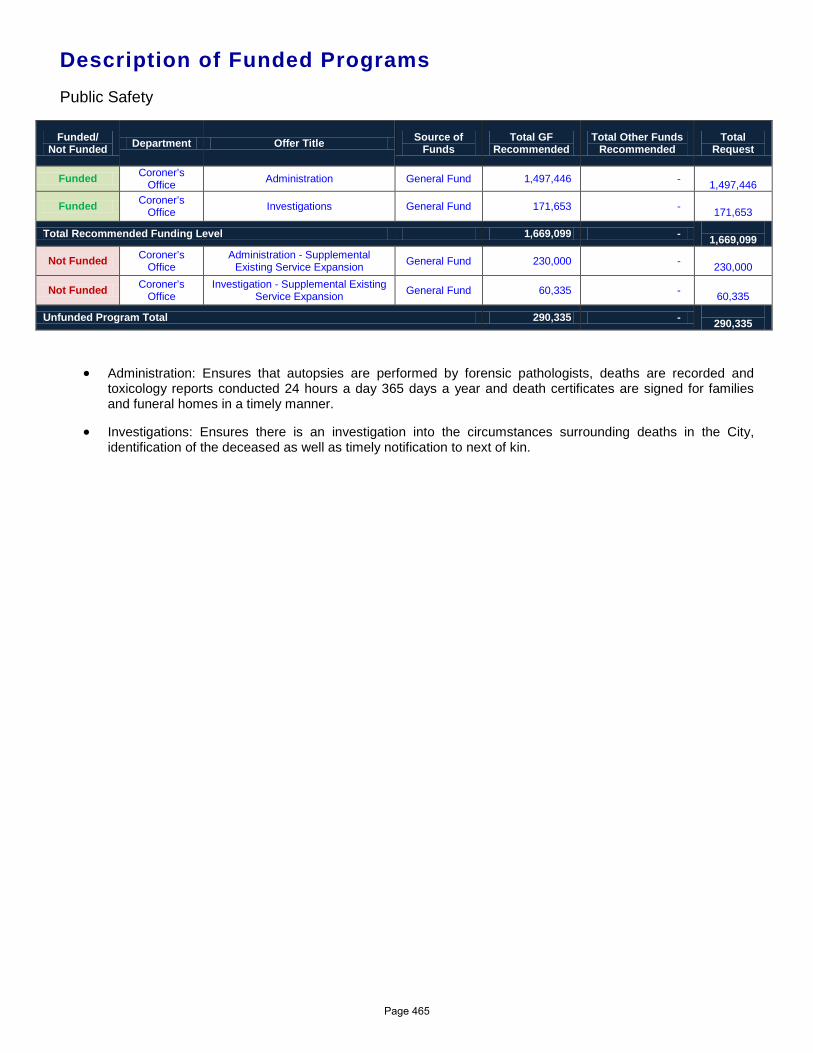
Description of Funded Programs Public Safety
Funded/ Not Funded Department Offer Title Source of
Funds Total GF
Recommended Total Other Funds
Recommended Total
Request
Funded Coroner’s Office Administration General Fund 1,497,446 -
1,497,446
Funded Coroner’s Office Investigations General Fund 171,653 -
171,653
Total Recommended Funding Level 1,669,099 - 1,669,099
Not Funded Coroner’s Office
Administration - Supplemental Existing Service Expansion General Fund 230,000 -
230,000
Not Funded Coroner’s Office
Investigation - Supplemental Existing Service Expansion General Fund 60,335 -
60,335
Unfunded Program Total 290,335 - 290,335
• Administration: Ensures that autopsies are performed by forensic pathologists, deaths are recorded and toxicology reports conducted 24 hours a day 365 days a year and death certificates are signed for families and funeral homes in a timely manner.
• Investigations: Ensures there is an investigation into the circumstances surrounding deaths in the City, identification of the deceased as well as timely notification to next of kin.
Page 465

CORONER'S OFFICE
DEPARTMENTAL BUDGET SUMMARY
AdoptedProposedAdoptedActual
EXPENDITURES
2013 2012 2011 2013
PERSONAL SERVICES 1,163,723 1,069,099 1,069,099 1,069,099
OTHER OPERATING 723,511 1,481,470 600,000 600,000
DEBT SERVICE 0 0 0 0
RESERVES 0 0 0 0
GRANTS, CONTRIB. & FUND TRAN. 0 0 0 0
$1,887,234 $2,550,569 $1,669,099 TOTAL EXPENDITURES $1,669,099
SOURCE OF FUNDING
GENERAL FUND 1,837,234 1,669,099 1,669,099 1,669,099
WISNER FUNDS 0 0 0 0
ENTERPRISE 0 0 0 0
DOWNTOWN DEVELOPMENT DIST. 0 0 0 0
HOUSING AND URBAN DEVELOP. 0 0 0 0
SELF GENERATED 0 0 0 0
LIBRARY 0 0 0 0
LLE 0 0 0 0
FEDERAL GRANTS 50,000 881,470 0 0
STATE GRANTS 0 0 0 0
GRANTS, CONTRIB., & FUND TRAN. 0 0 0 0
N. O. REGIONAL BUSINESS PARK 0 0 0 0
ECONOMIC DEVELOPMENT FUND 0 0 0 0
HOUSING IMPROVMENT FUND 0 0 0 0
$1,887,234 $2,550,569 $1,669,099 TOTAL FUNDING $1,669,099
Page 466
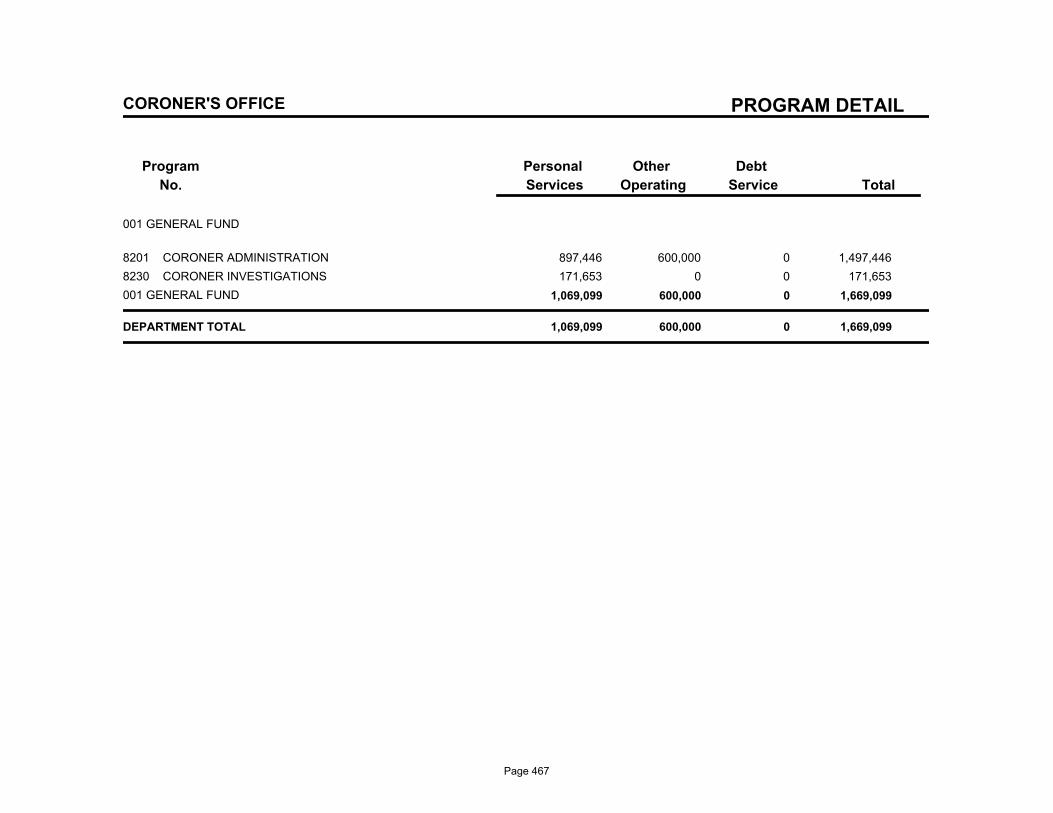
PROGRAM DETAIL
Program
No.
Debt
Service
Other
Operating
Personal
Services Total
CORONER'S OFFICE
001 GENERAL FUND
8201 CORONER ADMINISTRATION 897,446 600,000 0 1,497,446
8230 CORONER INVESTIGATIONS 171,653 0 0 171,653
001 GENERAL FUND 1,069,099 600,000 0 1,669,099
DEPARTMENT TOTAL 1,069,099 600,000 0 1,669,099
Page 467
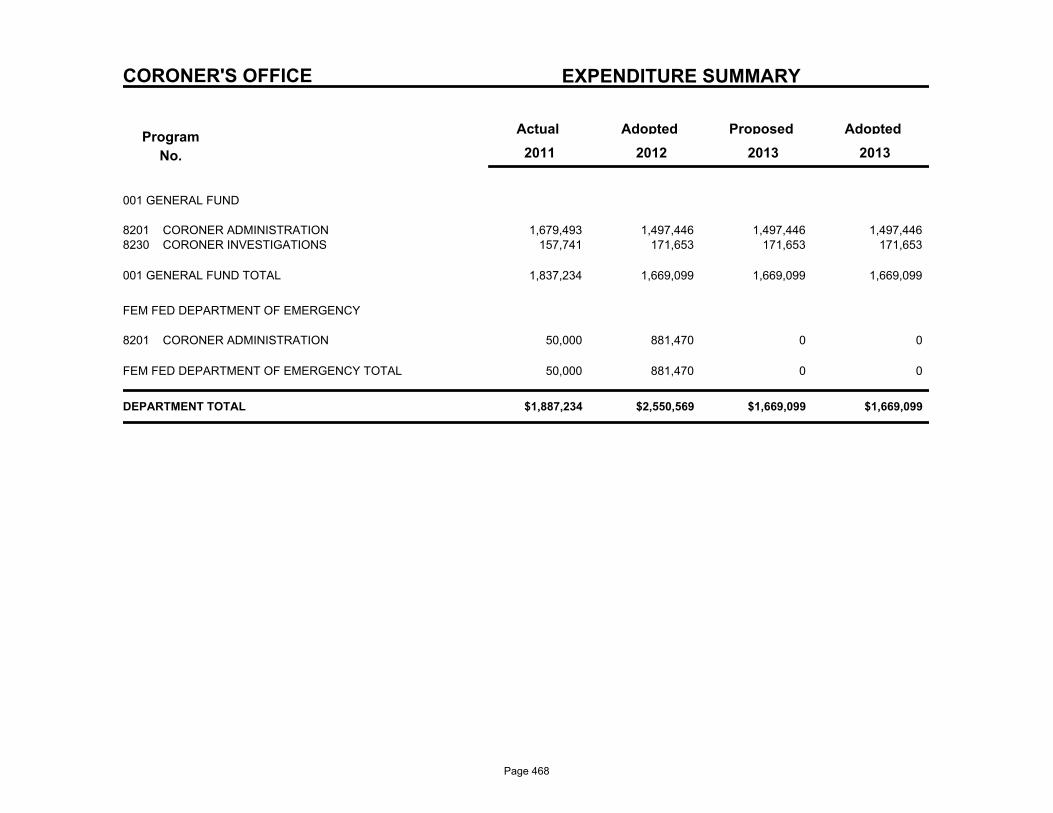
CORONER'S OFFICE EXPENDITURE SUMMARY
Program
No.
Actual AdoptedProposedAdopted
2013 2011 2012 2013
001 GENERAL FUND
1,679,493 1,497,446 1,497,446 CORONER ADMINISTRATION8201 1,497,446 157,741 171,653 171,653 CORONER INVESTIGATIONS8230 171,653
1,837,234 1,669,099 1,669,099 1,669,099 001 GENERAL FUND TOTAL
FEM FED DEPARTMENT OF EMERGENCY
50,000 881,470 0 CORONER ADMINISTRATION8201 0
50,000 881,470 0 0 FEM FED DEPARTMENT OF EMERGENCY TOTAL
$1,887,234 $2,550,569 $1,669,099 $1,669,099 DEPARTMENT TOTAL
Page 468
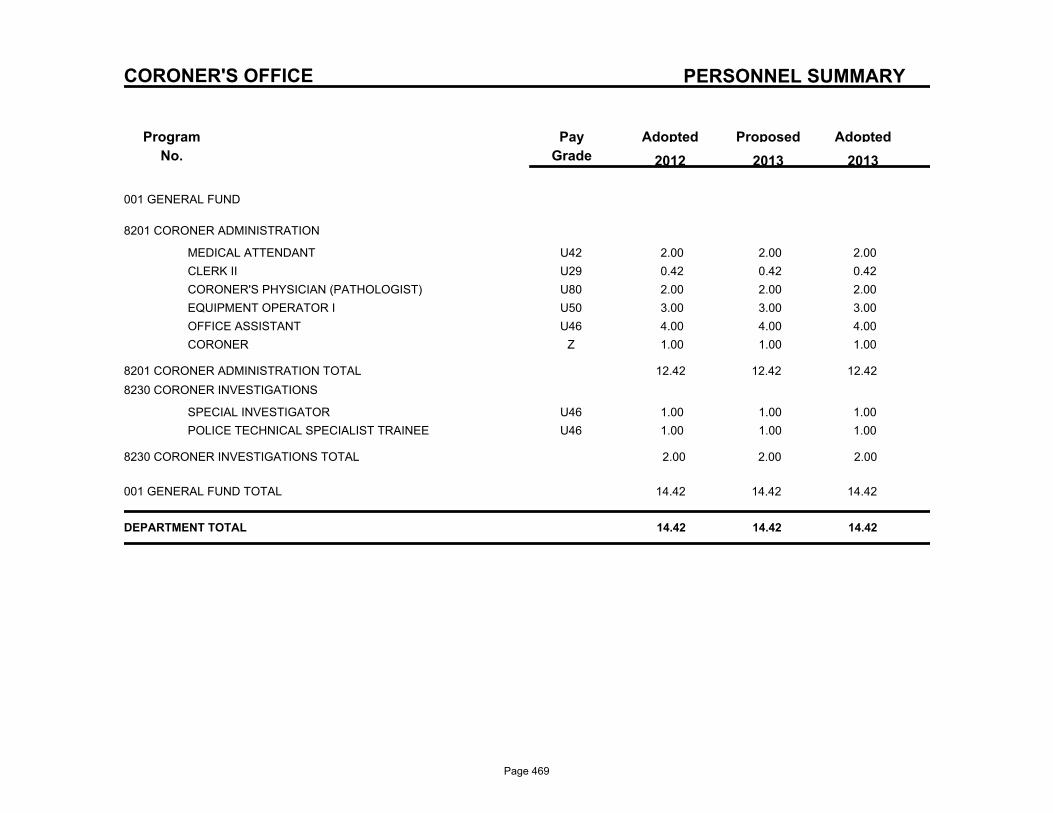
PERSONNEL SUMMARY
Program
No.
ProposedAdoptedPay
Grade
Adopted
2013 2012 2013
CORONER'S OFFICE
001 GENERAL FUND
8201 CORONER ADMINISTRATION
U42MEDICAL ATTENDANT 2.00 2.00 2.00
U29CLERK II 0.42 0.42 0.42
U80CORONER'S PHYSICIAN (PATHOLOGIST) 2.00 2.00 2.00
U50EQUIPMENT OPERATOR I 3.00 3.00 3.00
U46OFFICE ASSISTANT 4.00 4.00 4.00
ZCORONER 1.00 1.00 1.00
8201 CORONER ADMINISTRATION TOTAL 12.42 12.42 12.42
8230 CORONER INVESTIGATIONS
U46SPECIAL INVESTIGATOR 1.00 1.00 1.00
U46POLICE TECHNICAL SPECIALIST TRAINEE 1.00 1.00 1.00
8230 CORONER INVESTIGATIONS TOTAL 2.00 2.00 2.00
001 GENERAL FUND TOTAL 14.42 14.42 14.42
DEPARTMENT TOTAL 14.42 14.42 14.42
Page 469

Juvenile Court
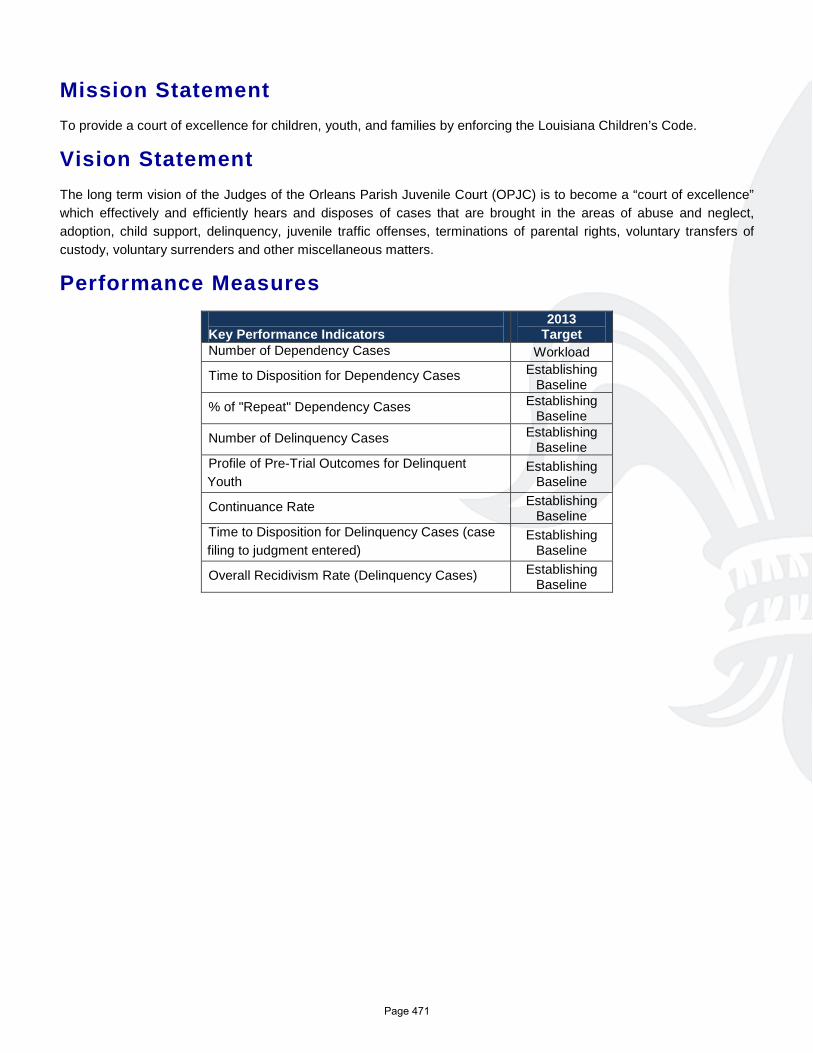
Mission Statement To provide a court of excellence for children, youth, and families by enforcing the Louisiana Children’s Code.
Vision Statement The long term vision of the Judges of the Orleans Parish Juvenile Court (OPJC) is to become a “court of excellence” which effectively and efficiently hears and disposes of cases that are brought in the areas of abuse and neglect, adoption, child support, delinquency, juvenile traffic offenses, terminations of parental rights, voluntary transfers of custody, voluntary surrenders and other miscellaneous matters.
Performance Measures Key Performance Indicators
2013 Target
Number of Dependency Cases Workload
Time to Disposition for Dependency Cases Establishing Baseline
% of "Repeat" Dependency Cases Establishing Baseline
Number of Delinquency Cases Establishing Baseline
Profile of Pre-Trial Outcomes for Delinquent Youth
Establishing Baseline
Continuance Rate Establishing Baseline
Time to Disposition for Delinquency Cases (case filing to judgment entered)
Establishing Baseline
Overall Recidivism Rate (Delinquency Cases) Establishing Baseline
Page 471
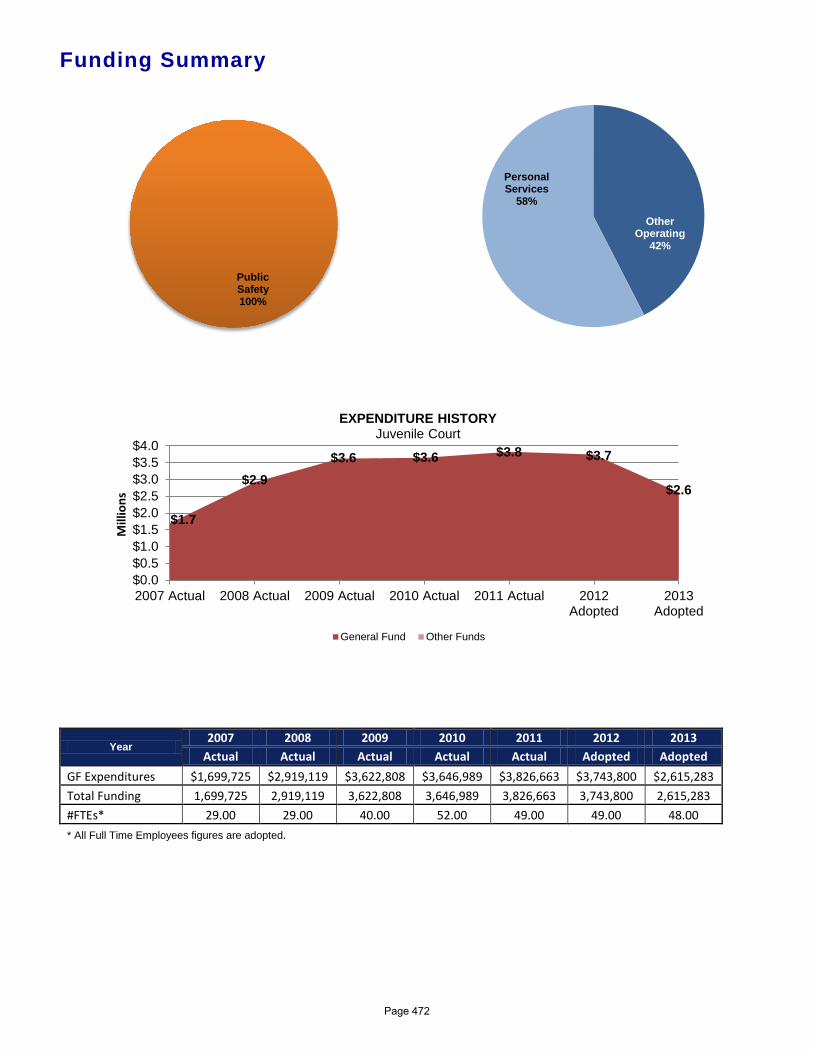
Funding Summary
Year 2007 2008 2009 2010 2011 2012 2013
Actual Actual Actual Actual Actual Adopted Adopted GF Expenditures $1,699,725 $2,919,119 $3,622,808 $3,646,989 $3,826,663 $3,743,800 $2,615,283 Total Funding 1,699,725 2,919,119 3,622,808 3,646,989 3,826,663 3,743,800 2,615,283 #FTEs* 29.00 29.00 40.00 52.00 49.00 49.00 48.00 * All Full Time Employees figures are adopted.
$1.7
$2.9 $3.6 $3.6 $3.8 $3.7
$2.6
$0.0$0.5$1.0$1.5$2.0$2.5$3.0$3.5$4.0
2007 Actual 2008 Actual 2009 Actual 2010 Actual 2011 Actual 2012Adopted
2013Adopted
Mill
ions
EXPENDITURE HISTORY Juvenile Court
General Fund Other Funds
Public Safety 100%
Other Operating
42%
Personal Services
58%
Page 472
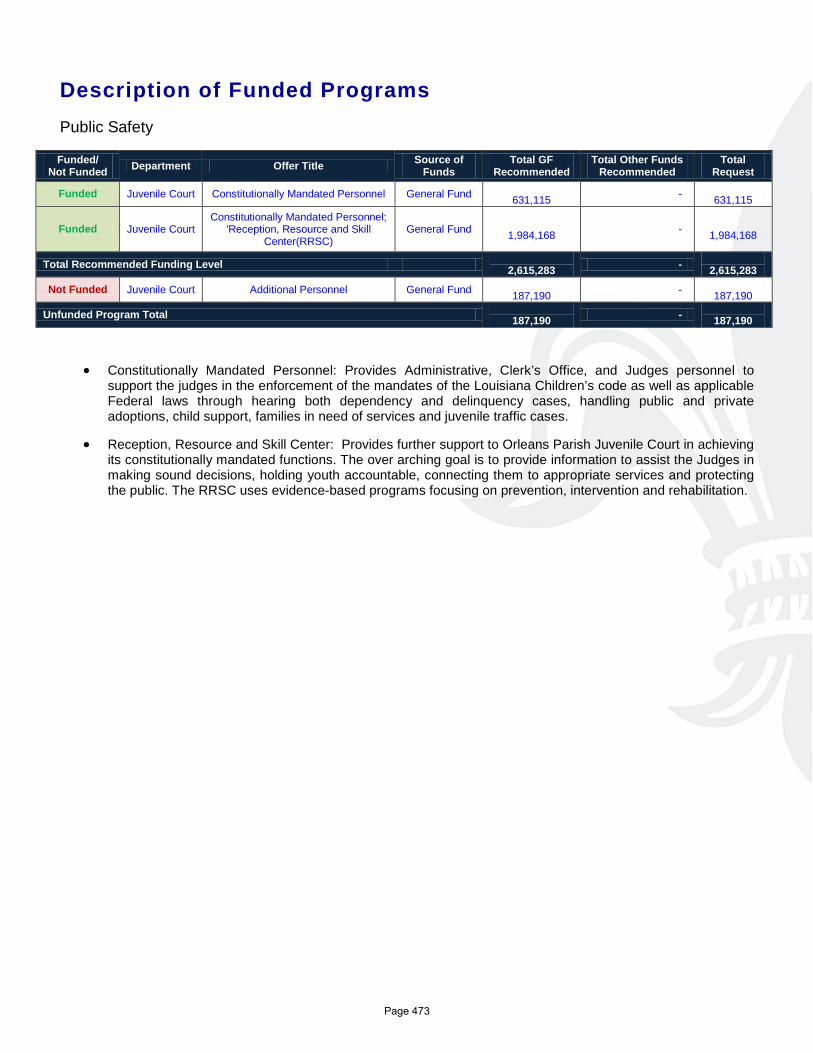
Description of Funded Programs Public Safety
Funded/ Not Funded Department Offer Title Source of
Funds Total GF
Recommended Total Other Funds
Recommended Total
Request
Funded Juvenile Court Constitutionally Mandated Personnel General Fund 631,115 -
631,115
Funded Juvenile Court Constitutionally Mandated Personnel;
'Reception, Resource and Skill Center(RRSC)
General Fund 1,984,168 -
1,984,168
Total Recommended Funding Level 2,615,283 -
2,615,283
Not Funded Juvenile Court Additional Personnel General Fund 187,190 -
187,190
Unfunded Program Total 187,190 -
187,190
• Constitutionally Mandated Personnel: Provides Administrative, Clerk’s Office, and Judges personnel to support the judges in the enforcement of the mandates of the Louisiana Children’s code as well as applicable Federal laws through hearing both dependency and delinquency cases, handling public and private adoptions, child support, families in need of services and juvenile traffic cases.
• Reception, Resource and Skill Center: Provides further support to Orleans Parish Juvenile Court in achieving its constitutionally mandated functions. The over arching goal is to provide information to assist the Judges in making sound decisions, holding youth accountable, connecting them to appropriate services and protecting the public. The RRSC uses evidence-based programs focusing on prevention, intervention and rehabilitation.
Page 473
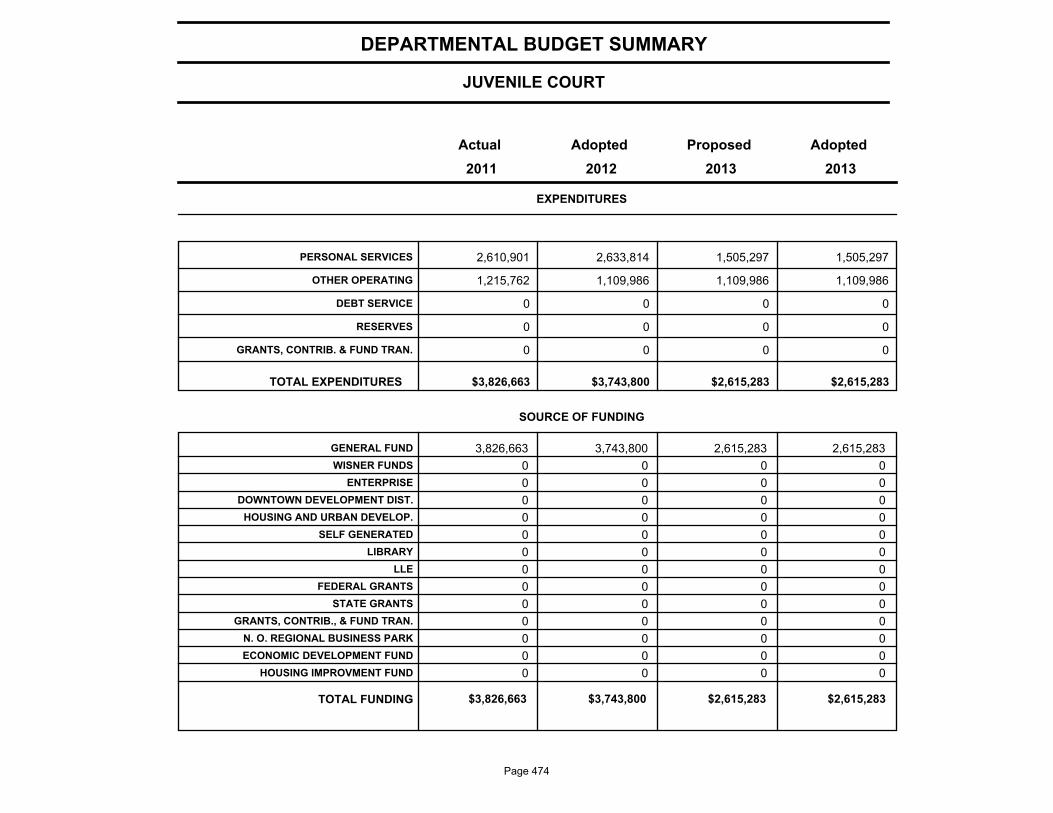
JUVENILE COURT
DEPARTMENTAL BUDGET SUMMARY
AdoptedProposedAdoptedActual
EXPENDITURES
2013 2012 2011 2013
PERSONAL SERVICES 2,610,901 2,633,814 1,505,297 1,505,297
OTHER OPERATING 1,215,762 1,109,986 1,109,986 1,109,986
DEBT SERVICE 0 0 0 0
RESERVES 0 0 0 0
GRANTS, CONTRIB. & FUND TRAN. 0 0 0 0
$3,826,663 $3,743,800 $2,615,283 TOTAL EXPENDITURES $2,615,283
SOURCE OF FUNDING
GENERAL FUND 3,826,663 3,743,800 2,615,283 2,615,283
WISNER FUNDS 0 0 0 0
ENTERPRISE 0 0 0 0
DOWNTOWN DEVELOPMENT DIST. 0 0 0 0
HOUSING AND URBAN DEVELOP. 0 0 0 0
SELF GENERATED 0 0 0 0
LIBRARY 0 0 0 0
LLE 0 0 0 0
FEDERAL GRANTS 0 0 0 0
STATE GRANTS 0 0 0 0
GRANTS, CONTRIB., & FUND TRAN. 0 0 0 0
N. O. REGIONAL BUSINESS PARK 0 0 0 0
ECONOMIC DEVELOPMENT FUND 0 0 0 0
HOUSING IMPROVMENT FUND 0 0 0 0
$3,826,663 $3,743,800 $2,615,283 TOTAL FUNDING $2,615,283
Page 474
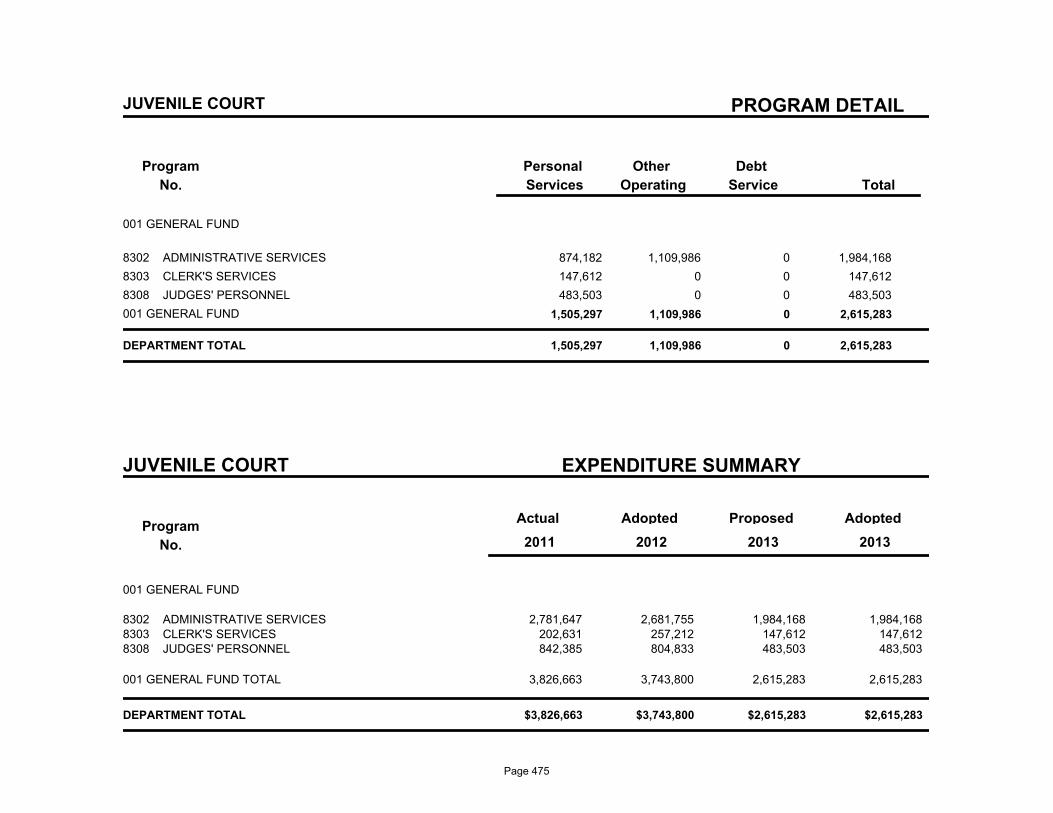
PROGRAM DETAIL
Program
No.
Debt
Service
Other
Operating
Personal
Services Total
JUVENILE COURT
001 GENERAL FUND
8302 ADMINISTRATIVE SERVICES 874,182 1,109,986 0 1,984,168
8303 CLERK'S SERVICES 147,612 0 0 147,612
8308 JUDGES' PERSONNEL 483,503 0 0 483,503
001 GENERAL FUND 1,505,297 1,109,986 0 2,615,283
DEPARTMENT TOTAL 1,505,297 1,109,986 0 2,615,283
JUVENILE COURT EXPENDITURE SUMMARY
Program
No.
Actual AdoptedProposedAdopted
2013 2011 2012 2013
001 GENERAL FUND
2,781,647 2,681,755 1,984,168 ADMINISTRATIVE SERVICES8302 1,984,168 202,631 257,212 147,612 CLERK'S SERVICES8303 147,612 842,385 804,833 483,503 JUDGES' PERSONNEL8308 483,503
3,826,663 3,743,800 2,615,283 2,615,283 001 GENERAL FUND TOTAL
$3,826,663 $3,743,800 $2,615,283 $2,615,283 DEPARTMENT TOTAL
Page 475
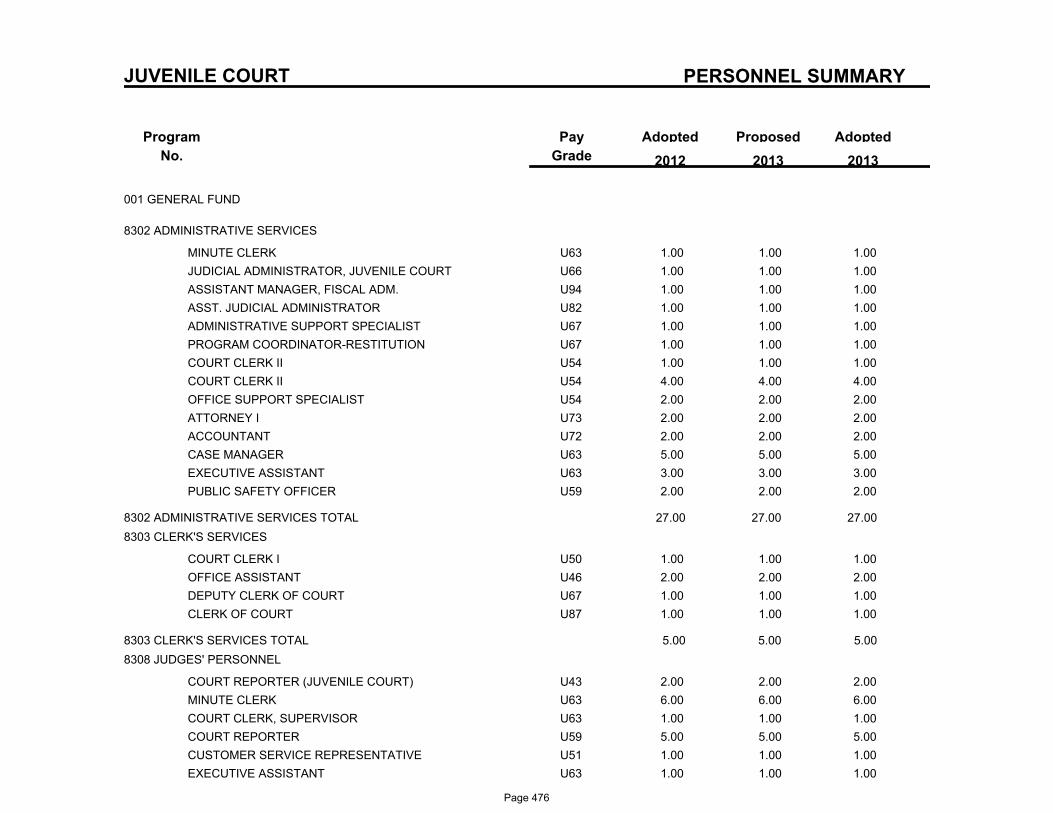
PERSONNEL SUMMARY
Program
No.
ProposedAdoptedPay
Grade
Adopted
2013 2012 2013
JUVENILE COURT
001 GENERAL FUND
8302 ADMINISTRATIVE SERVICES
U63MINUTE CLERK 1.00 1.00 1.00
U66JUDICIAL ADMINISTRATOR, JUVENILE COURT 1.00 1.00 1.00
U94ASSISTANT MANAGER, FISCAL ADM. 1.00 1.00 1.00
U82ASST. JUDICIAL ADMINISTRATOR 1.00 1.00 1.00
U67ADMINISTRATIVE SUPPORT SPECIALIST 1.00 1.00 1.00
U67PROGRAM COORDINATOR-RESTITUTION 1.00 1.00 1.00
U54COURT CLERK II 1.00 1.00 1.00
U54COURT CLERK II 4.00 4.00 4.00
U54OFFICE SUPPORT SPECIALIST 2.00 2.00 2.00
U73ATTORNEY I 2.00 2.00 2.00
U72ACCOUNTANT 2.00 2.00 2.00
U63CASE MANAGER 5.00 5.00 5.00
U63EXECUTIVE ASSISTANT 3.00 3.00 3.00
U59PUBLIC SAFETY OFFICER 2.00 2.00 2.00
8302 ADMINISTRATIVE SERVICES TOTAL 27.00 27.00 27.00
8303 CLERK'S SERVICES
U50COURT CLERK I 1.00 1.00 1.00
U46OFFICE ASSISTANT 2.00 2.00 2.00
U67DEPUTY CLERK OF COURT 1.00 1.00 1.00
U87CLERK OF COURT 1.00 1.00 1.00
8303 CLERK'S SERVICES TOTAL 5.00 5.00 5.00
8308 JUDGES' PERSONNEL
U43COURT REPORTER (JUVENILE COURT) 2.00 2.00 2.00
U63MINUTE CLERK 6.00 6.00 6.00
U63COURT CLERK, SUPERVISOR 1.00 1.00 1.00
U59COURT REPORTER 5.00 5.00 5.00
U51CUSTOMER SERVICE REPRESENTATIVE 1.00 1.00 1.00
U63EXECUTIVE ASSISTANT 1.00 1.00 1.00
Page 476
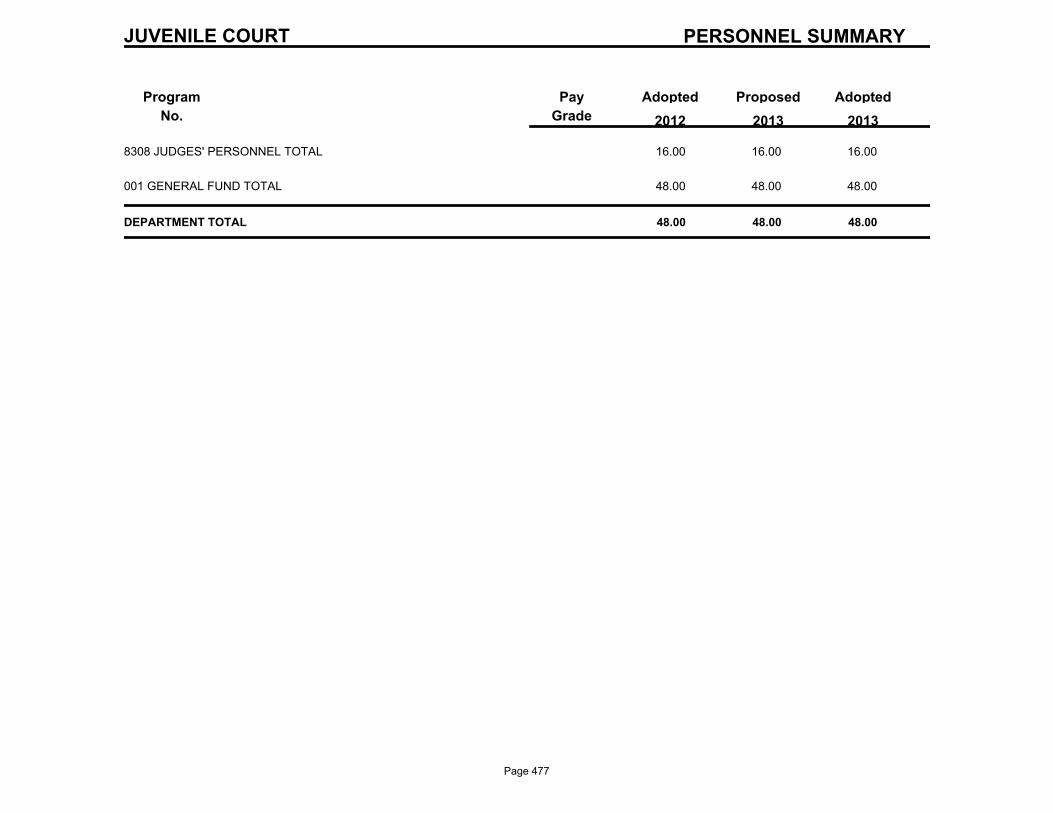
PERSONNEL SUMMARY
Program
No.
ProposedAdoptedPay
Grade
Adopted
2013 2012 2013
JUVENILE COURT
8308 JUDGES' PERSONNEL TOTAL 16.00 16.00 16.00
001 GENERAL FUND TOTAL 48.00 48.00 48.00
DEPARTMENT TOTAL 48.00 48.00 48.00
Page 477

First City Court
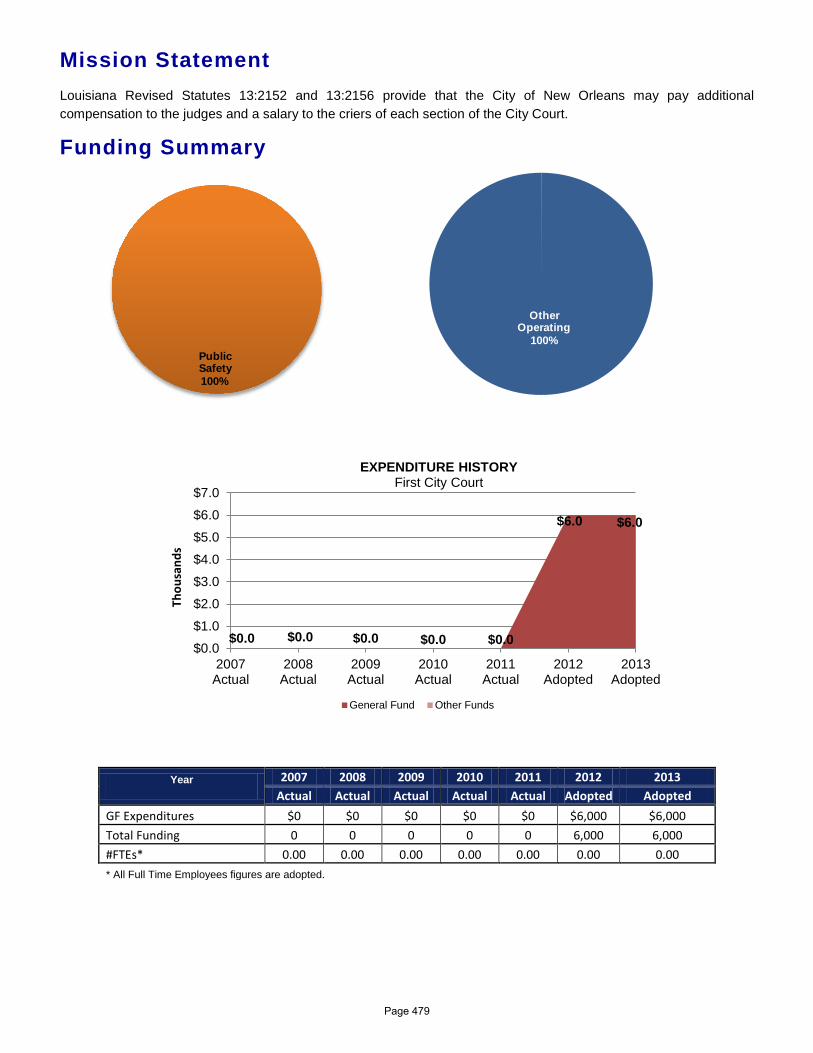
Mission Statement Louisiana Revised Statutes 13:2152 and 13:2156 provide that the City of New Orleans may pay additional compensation to the judges and a salary to the criers of each section of the City Court.
Funding Summary
Year 2007 2008 2009 2010 2011 2012 2013 Actual Actual Actual Actual Actual Adopted Adopted
GF Expenditures $0 $0 $0 $0 $0 $6,000 $6,000 Total Funding 0 0 0 0 0 6,000 6,000 #FTEs* 0.00 0.00 0.00 0.00 0.00 0.00 0.00 * All Full Time Employees figures are adopted.
$0.0 $0.0 $0.0 $0.0 $0.0
$6.0 $6.0
$0.0
$1.0
$2.0
$3.0
$4.0
$5.0
$6.0
$7.0
2007Actual
2008Actual
2009Actual
2010Actual
2011Actual
2012Adopted
2013Adopted
Thou
sand
s
EXPENDITURE HISTORY First City Court
General Fund Other Funds
Public Safety100%
Other Operating
100%
Page 479
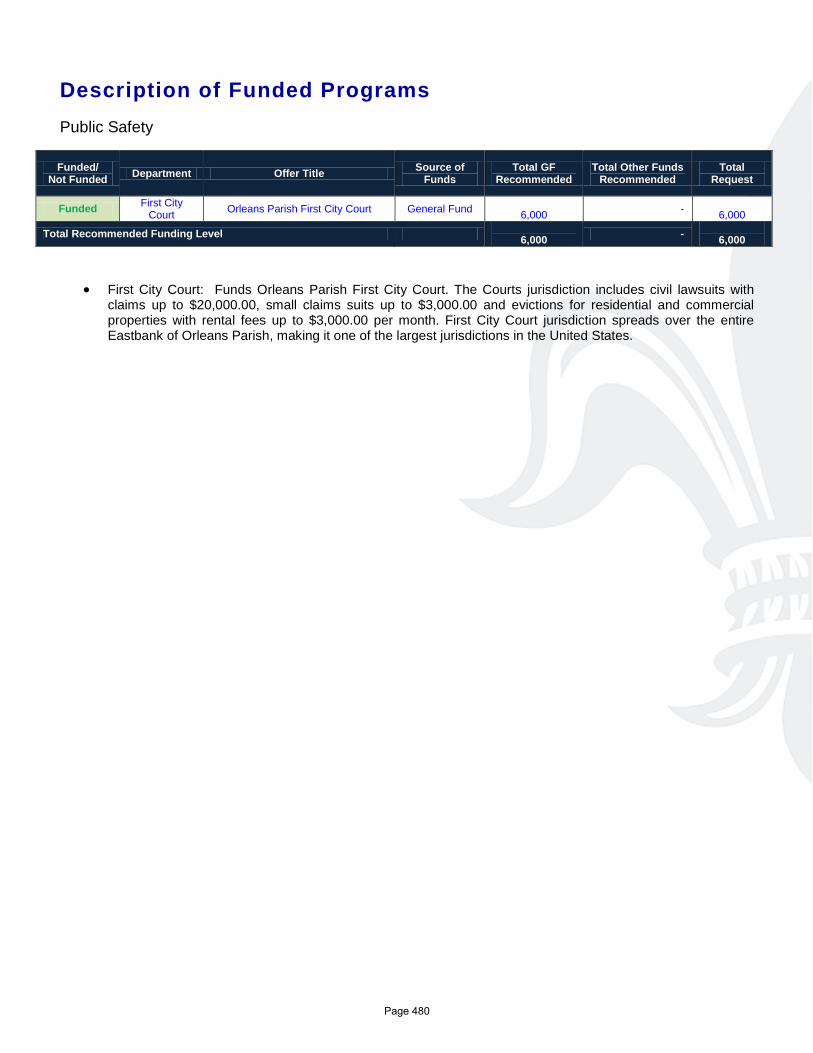
Description of Funded Programs Public Safety
Funded/ Not Funded Department Offer Title Source of
Funds Total GF
Recommended Total Other Funds
Recommended Total
Request
Funded First City Court Orleans Parish First City Court General Fund
6,000 - 6,000
Total Recommended Funding Level 6,000 -
6,000
• First City Court: Funds Orleans Parish First City Court. The Courts jurisdiction includes civil lawsuits with claims up to $20,000.00, small claims suits up to $3,000.00 and evictions for residential and commercial properties with rental fees up to $3,000.00 per month. First City Court jurisdiction spreads over the entire Eastbank of Orleans Parish, making it one of the largest jurisdictions in the United States.
Page 480

FIRST CITY COURT
DEPARTMENTAL BUDGET SUMMARY
AdoptedProposedAdoptedActual
EXPENDITURES
2013 2012 2011 2013
PERSONAL SERVICES 0 0 0 0
OTHER OPERATING 0 6,000 6,000 6,000
DEBT SERVICE 0 0 0 0
RESERVES 0 0 0 0
GRANTS, CONTRIB. & FUND TRAN. 0 0 0 0
$0 $6,000 $6,000 TOTAL EXPENDITURES $6,000
SOURCE OF FUNDING
GENERAL FUND 0 6,000 6,000 6,000
WISNER FUNDS 0 0 0 0
ENTERPRISE 0 0 0 0
DOWNTOWN DEVELOPMENT DIST. 0 0 0 0
HOUSING AND URBAN DEVELOP. 0 0 0 0
SELF GENERATED 0 0 0 0
LIBRARY 0 0 0 0
LLE 0 0 0 0
FEDERAL GRANTS 0 0 0 0
STATE GRANTS 0 0 0 0
GRANTS, CONTRIB., & FUND TRAN. 0 0 0 0
N. O. REGIONAL BUSINESS PARK 0 0 0 0
ECONOMIC DEVELOPMENT FUND 0 0 0 0
HOUSING IMPROVMENT FUND 0 0 0 0
$0 $6,000 $6,000 TOTAL FUNDING $6,000
Page 481
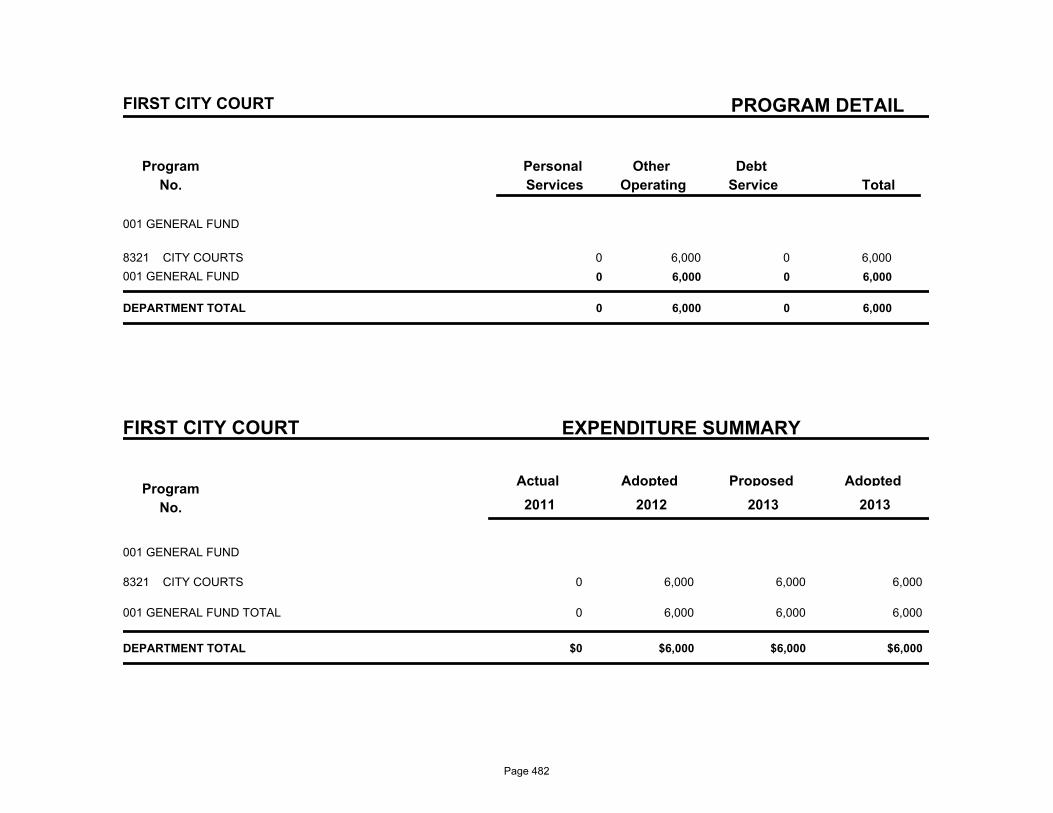
PROGRAM DETAIL
Program
No.
Debt
Service
Other
Operating
Personal
Services Total
FIRST CITY COURT
001 GENERAL FUND
8321 CITY COURTS 0 6,000 0 6,000
001 GENERAL FUND 0 6,000 0 6,000
DEPARTMENT TOTAL 0 6,000 0 6,000
FIRST CITY COURT EXPENDITURE SUMMARY
Program
No.
Actual AdoptedProposedAdopted
2013 2011 2012 2013
001 GENERAL FUND
0 6,000 6,000 CITY COURTS8321 6,000
0 6,000 6,000 6,000 001 GENERAL FUND TOTAL
$0 $6,000 $6,000 $6,000 DEPARTMENT TOTAL
Page 482

Page 483

Civil Court
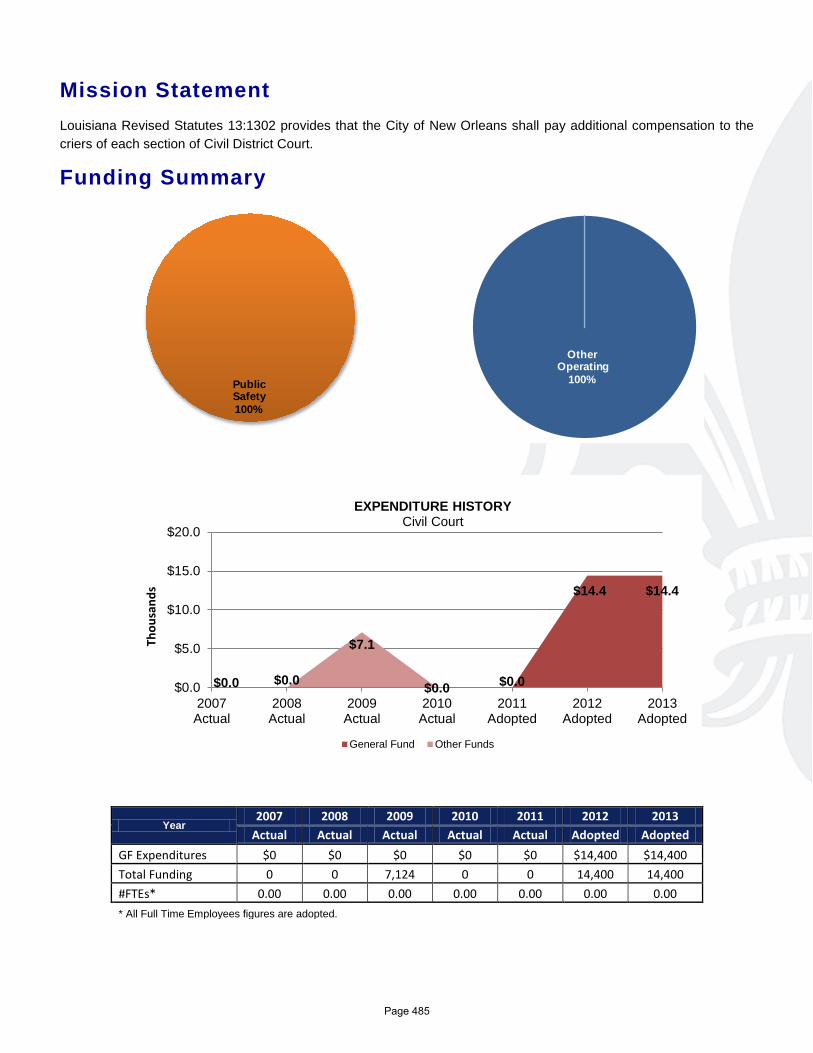
Mission Statement Louisiana Revised Statutes 13:1302 provides that the City of New Orleans shall pay additional compensation to the criers of each section of Civil District Court.
Funding Summary
Year 2007 2008 2009 2010 2011 2012 2013
Actual Actual Actual Actual Actual Adopted Adopted GF Expenditures $0 $0 $0 $0 $0 $14,400 $14,400 Total Funding 0 0 7,124 0 0 14,400 14,400 #FTEs* 0.00 0.00 0.00 0.00 0.00 0.00 0.00 * All Full Time Employees figures are adopted.
$0.0 $0.0
$14.4 $14.4
$0.0
$7.1
$0.0 $0.0
$5.0
$10.0
$15.0
$20.0
2007Actual
2008Actual
2009Actual
2010Actual
2011Adopted
2012Adopted
2013Adopted
Thou
sand
s
EXPENDITURE HISTORY Civil Court
General Fund Other Funds
Public Safety100%
Other Operating
100%
Person Service
0%
Page 485
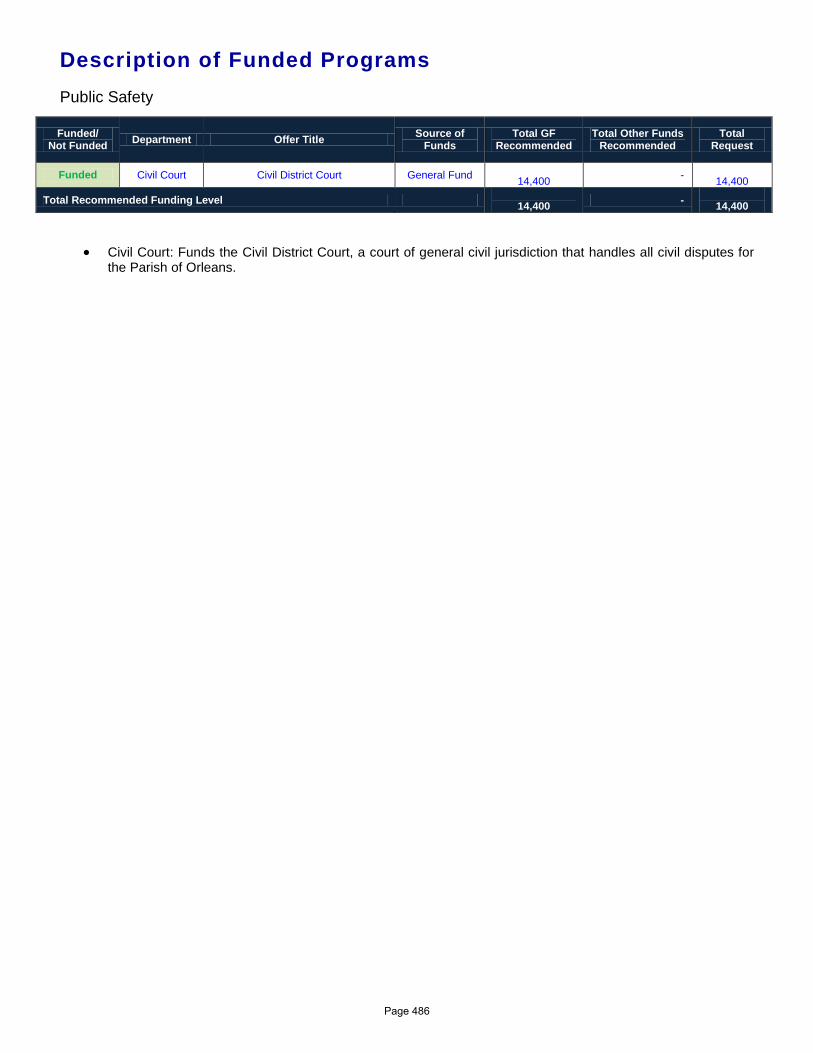
Description of Funded Programs Public Safety
Funded/ Not Funded Department Offer Title Source of
Funds Total GF
Recommended Total Other Funds
Recommended Total
Request
Funded Civil Court Civil District Court General Fund 14,400 -
14,400
Total Recommended Funding Level 14,400 -
14,400
• Civil Court: Funds the Civil District Court, a court of general civil jurisdiction that handles all civil disputes for the Parish of Orleans.
Page 486

CIVIL COURT
DEPARTMENTAL BUDGET SUMMARY
AdoptedProposedAdoptedActual
EXPENDITURES
2013 2012 2011 2013
PERSONAL SERVICES 0 0 0 0
OTHER OPERATING 0 14,400 14,400 14,400
DEBT SERVICE 0 0 0 0
RESERVES 0 0 0 0
GRANTS, CONTRIB. & FUND TRAN. 0 0 0 0
$0 $14,400 $14,400 TOTAL EXPENDITURES $14,400
SOURCE OF FUNDING
GENERAL FUND 0 14,400 14,400 14,400
WISNER FUNDS 0 0 0 0
ENTERPRISE 0 0 0 0
DOWNTOWN DEVELOPMENT DIST. 0 0 0 0
HOUSING AND URBAN DEVELOP. 0 0 0 0
SELF GENERATED 0 0 0 0
LIBRARY 0 0 0 0
LLE 0 0 0 0
FEDERAL GRANTS 0 0 0 0
STATE GRANTS 0 0 0 0
GRANTS, CONTRIB., & FUND TRAN. 0 0 0 0
N. O. REGIONAL BUSINESS PARK 0 0 0 0
ECONOMIC DEVELOPMENT FUND 0 0 0 0
HOUSING IMPROVMENT FUND 0 0 0 0
$0 $14,400 $14,400 TOTAL FUNDING $14,400
Page 487
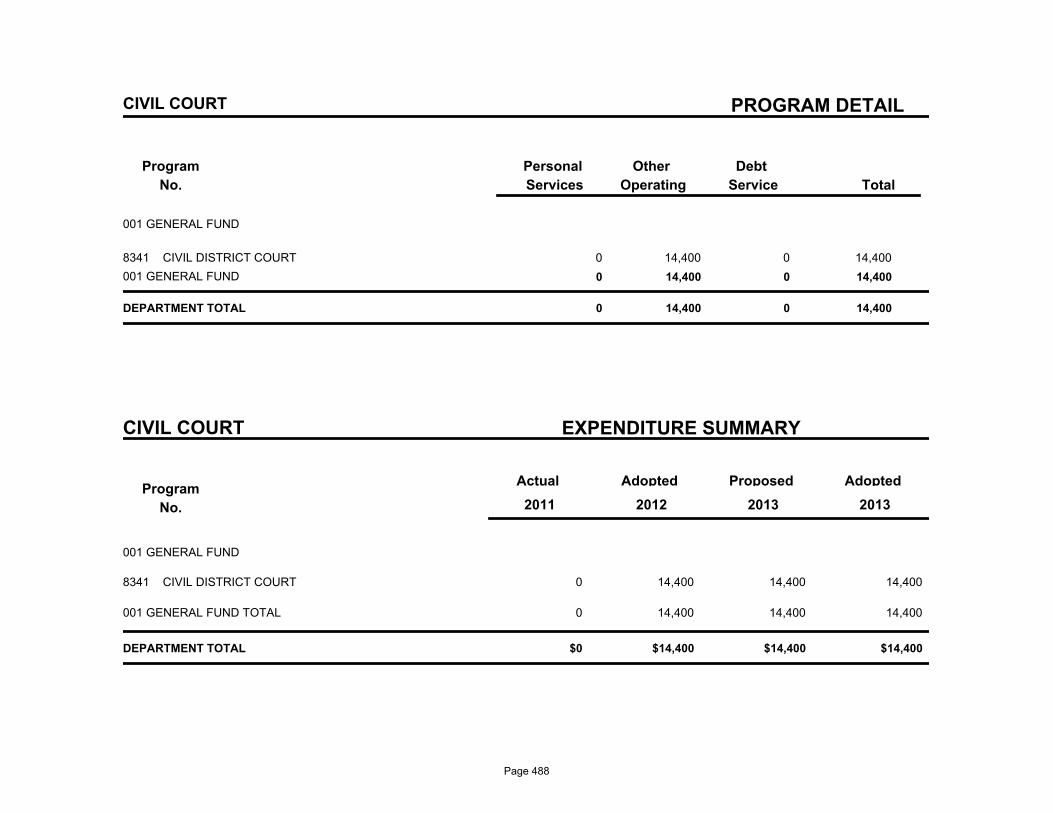
PROGRAM DETAIL
Program
No.
Debt
Service
Other
Operating
Personal
Services Total
CIVIL COURT
001 GENERAL FUND
8341 CIVIL DISTRICT COURT 0 14,400 0 14,400
001 GENERAL FUND 0 14,400 0 14,400
DEPARTMENT TOTAL 0 14,400 0 14,400
CIVIL COURT EXPENDITURE SUMMARY
Program
No.
Actual AdoptedProposedAdopted
2013 2011 2012 2013
001 GENERAL FUND
0 14,400 14,400 CIVIL DISTRICT COURT8341 14,400
0 14,400 14,400 14,400 001 GENERAL FUND TOTAL
$0 $14,400 $14,400 $14,400 DEPARTMENT TOTAL
Page 488

Page 489

Municipal Court
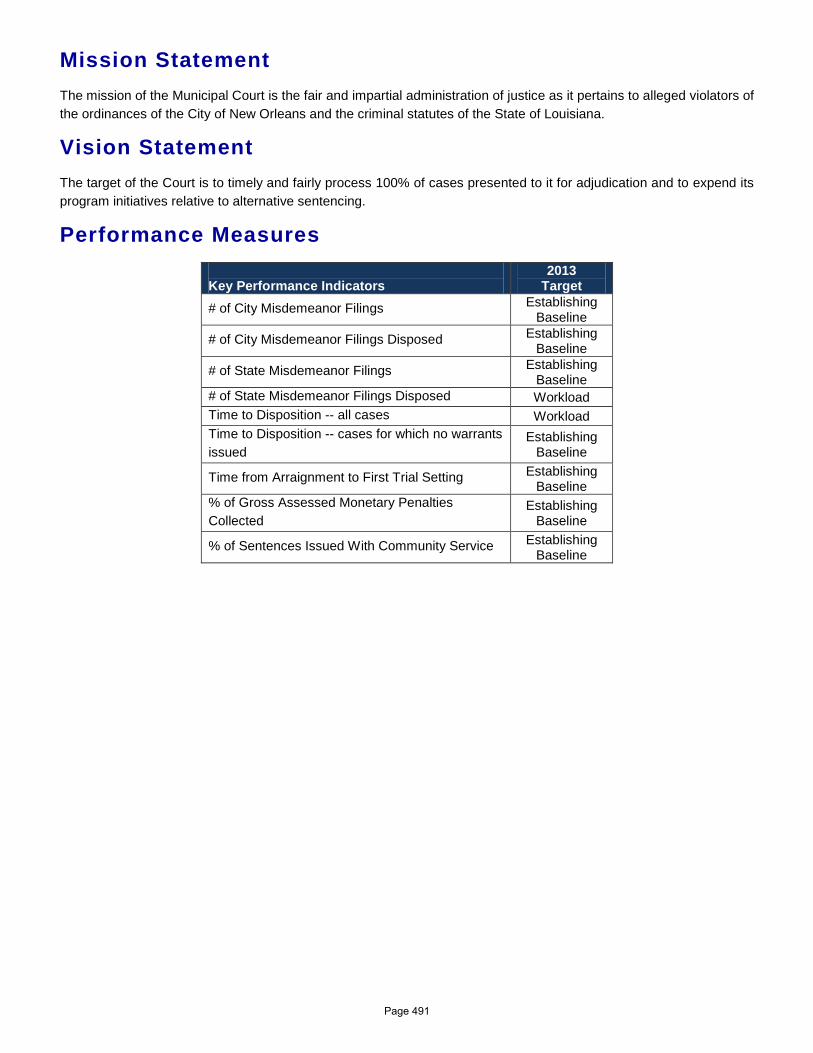
Mission Statement The mission of the Municipal Court is the fair and impartial administration of justice as it pertains to alleged violators of the ordinances of the City of New Orleans and the criminal statutes of the State of Louisiana.
Vision Statement The target of the Court is to timely and fairly process 100% of cases presented to it for adjudication and to expend its program initiatives relative to alternative sentencing.
Performance Measures Key Performance Indicators
2013 Target
# of City Misdemeanor Filings Establishing Baseline
# of City Misdemeanor Filings Disposed Establishing Baseline
# of State Misdemeanor Filings Establishing Baseline
# of State Misdemeanor Filings Disposed Workload Time to Disposition -- all cases Workload Time to Disposition -- cases for which no warrants issued
Establishing Baseline
Time from Arraignment to First Trial Setting Establishing Baseline
% of Gross Assessed Monetary Penalties Collected
Establishing Baseline
% of Sentences Issued With Community Service Establishing Baseline
Page 491
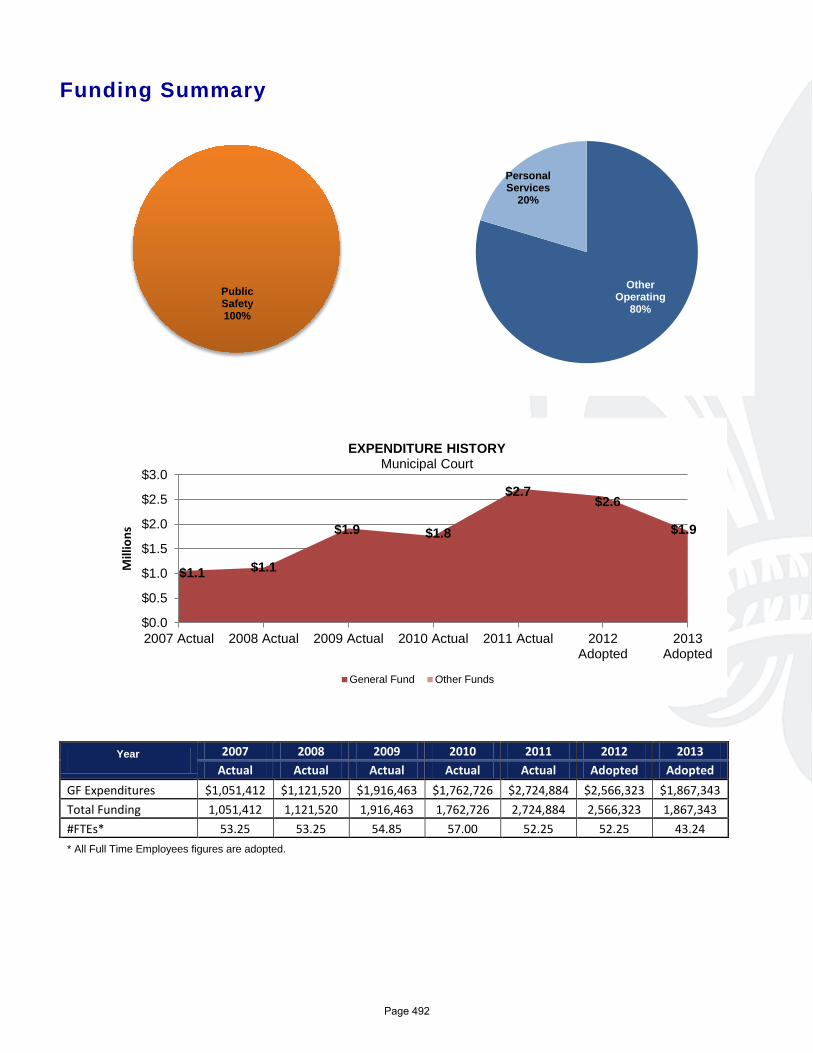
Funding Summary
Year 2007 2008 2009 2010 2011 2012 2013 Actual Actual Actual Actual Actual Adopted Adopted
GF Expenditures $1,051,412 $1,121,520 $1,916,463 $1,762,726 $2,724,884 $2,566,323 $1,867,343 Total Funding 1,051,412 1,121,520 1,916,463 1,762,726 2,724,884 2,566,323 1,867,343 #FTEs* 53.25 53.25 54.85 57.00 52.25 52.25 43.24 * All Full Time Employees figures are adopted.
$1.1 $1.1
$1.9 $1.8
$2.7 $2.6
$1.9
$0.0
$0.5
$1.0
$1.5
$2.0
$2.5
$3.0
2007 Actual 2008 Actual 2009 Actual 2010 Actual 2011 Actual 2012Adopted
2013Adopted
Mill
ions
EXPENDITURE HISTORY Municipal Court
General Fund Other Funds
Public Safety 100%
Other Operating
80%
Personal Services
20%
Page 492
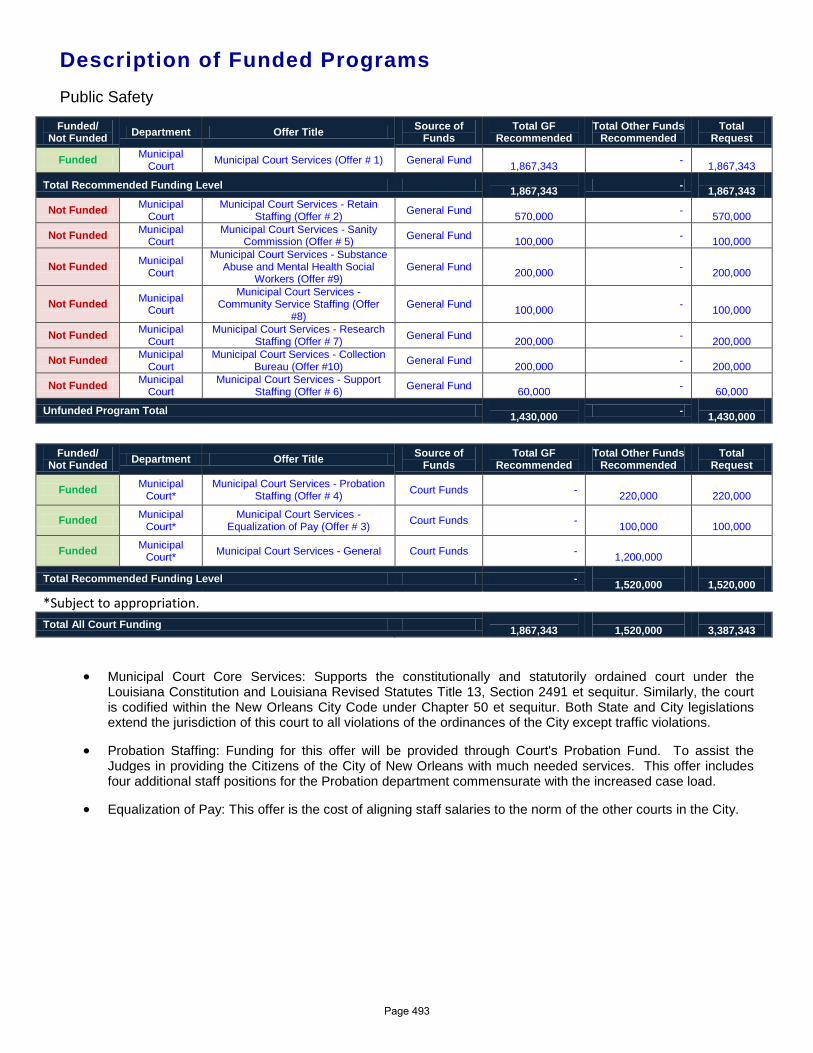
Description of Funded Programs Public Safety
Funded/ Not Funded Department Offer Title Source of
Funds Total GF
Recommended Total Other Funds
Recommended Total
Request
Funded Municipal Court Municipal Court Services (Offer # 1) General Fund
1,867,343 - 1,867,343
Total Recommended Funding Level 1,867,343 -
1,867,343
Not Funded Municipal Court
Municipal Court Services - Retain Staffing (Offer # 2) General Fund
570,000 - 570,000
Not Funded Municipal Court
Municipal Court Services - Sanity Commission (Offer # 5) General Fund
100,000 - 100,000
Not Funded Municipal Court
Municipal Court Services - Substance Abuse and Mental Health Social
Workers (Offer #9) General Fund
200,000 - 200,000
Not Funded Municipal Court
Municipal Court Services - Community Service Staffing (Offer
#8) General Fund
100,000 - 100,000
Not Funded Municipal Court
Municipal Court Services - Research Staffing (Offer # 7) General Fund
200,000 - 200,000
Not Funded Municipal Court
Municipal Court Services - Collection Bureau (Offer #10) General Fund
200,000 - 200,000
Not Funded Municipal Court
Municipal Court Services - Support Staffing (Offer # 6) General Fund
60,000 - 60,000
Unfunded Program Total 1,430,000 -
1,430,000
Funded/ Not Funded Department Offer Title Source of
Funds Total GF
Recommended Total Other Funds
Recommended Total
Request
Funded Municipal Court*
Municipal Court Services - Probation Staffing (Offer # 4) Court Funds -
220,000
220,000
Funded Municipal Court*
Municipal Court Services - Equalization of Pay (Offer # 3) Court Funds -
100,000
100,000
Funded Municipal Court* Municipal Court Services - General Court Funds -
1,200,000
Total Recommended Funding Level - 1,520,000
1,520,000
*Subject to appropriation. Total All Court Funding
1,867,343
1,520,000
3,387,343
• Municipal Court Core Services: Supports the constitutionally and statutorily ordained court under the Louisiana Constitution and Louisiana Revised Statutes Title 13, Section 2491 et sequitur. Similarly, the court is codified within the New Orleans City Code under Chapter 50 et sequitur. Both State and City legislations extend the jurisdiction of this court to all violations of the ordinances of the City except traffic violations.
• Probation Staffing: Funding for this offer will be provided through Court's Probation Fund. To assist the Judges in providing the Citizens of the City of New Orleans with much needed services. This offer includes four additional staff positions for the Probation department commensurate with the increased case load.
• Equalization of Pay: This offer is the cost of aligning staff salaries to the norm of the other courts in the City.
Page 493

MUNICIPAL COURT
DEPARTMENTAL BUDGET SUMMARY
AdoptedProposedAdoptedActual
EXPENDITURES
2013 2012 2011 2013
PERSONAL SERVICES 369,375 394,939 380,028 380,028
OTHER OPERATING 2,355,509 2,171,384 1,487,315 1,487,315
DEBT SERVICE 0 0 0 0
RESERVES 0 0 0 0
GRANTS, CONTRIB. & FUND TRAN. 0 0 0 0
$2,724,884 $2,566,323 $1,867,343 TOTAL EXPENDITURES $1,867,343
SOURCE OF FUNDING
GENERAL FUND 2,724,884 2,566,323 1,867,343 1,867,343
WISNER FUNDS 0 0 0 0
ENTERPRISE 0 0 0 0
DOWNTOWN DEVELOPMENT DIST. 0 0 0 0
HOUSING AND URBAN DEVELOP. 0 0 0 0
SELF GENERATED 0 0 0 0
LIBRARY 0 0 0 0
LLE 0 0 0 0
FEDERAL GRANTS 0 0 0 0
STATE GRANTS 0 0 0 0
GRANTS, CONTRIB., & FUND TRAN. 0 0 0 0
N. O. REGIONAL BUSINESS PARK 0 0 0 0
ECONOMIC DEVELOPMENT FUND 0 0 0 0
HOUSING IMPROVMENT FUND 0 0 0 0
$2,724,884 $2,566,323 $1,867,343 TOTAL FUNDING $1,867,343
Page 494
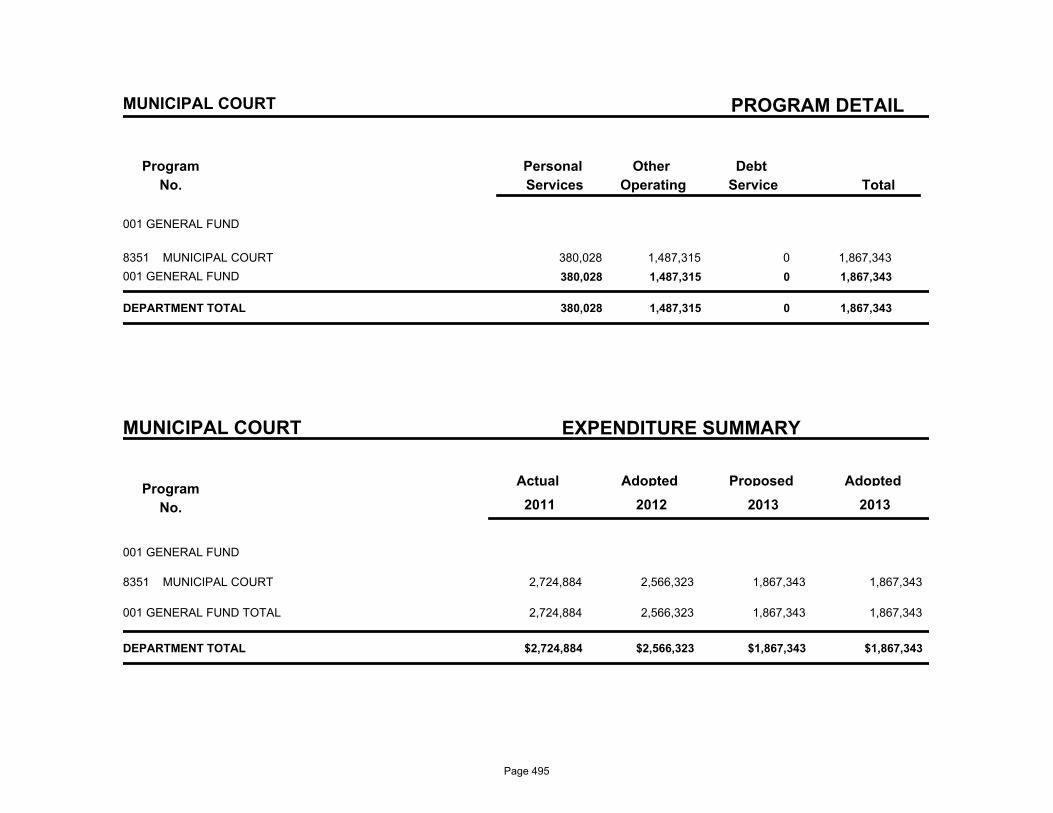
PROGRAM DETAIL
Program
No.
Debt
Service
Other
Operating
Personal
Services Total
MUNICIPAL COURT
001 GENERAL FUND
8351 MUNICIPAL COURT 380,028 1,487,315 0 1,867,343
001 GENERAL FUND 380,028 1,487,315 0 1,867,343
DEPARTMENT TOTAL 380,028 1,487,315 0 1,867,343
MUNICIPAL COURT EXPENDITURE SUMMARY
Program
No.
Actual AdoptedProposedAdopted
2013 2011 2012 2013
001 GENERAL FUND
2,724,884 2,566,323 1,867,343 MUNICIPAL COURT8351 1,867,343
2,724,884 2,566,323 1,867,343 1,867,343 001 GENERAL FUND TOTAL
$2,724,884 $2,566,323 $1,867,343 $1,867,343 DEPARTMENT TOTAL
Page 495
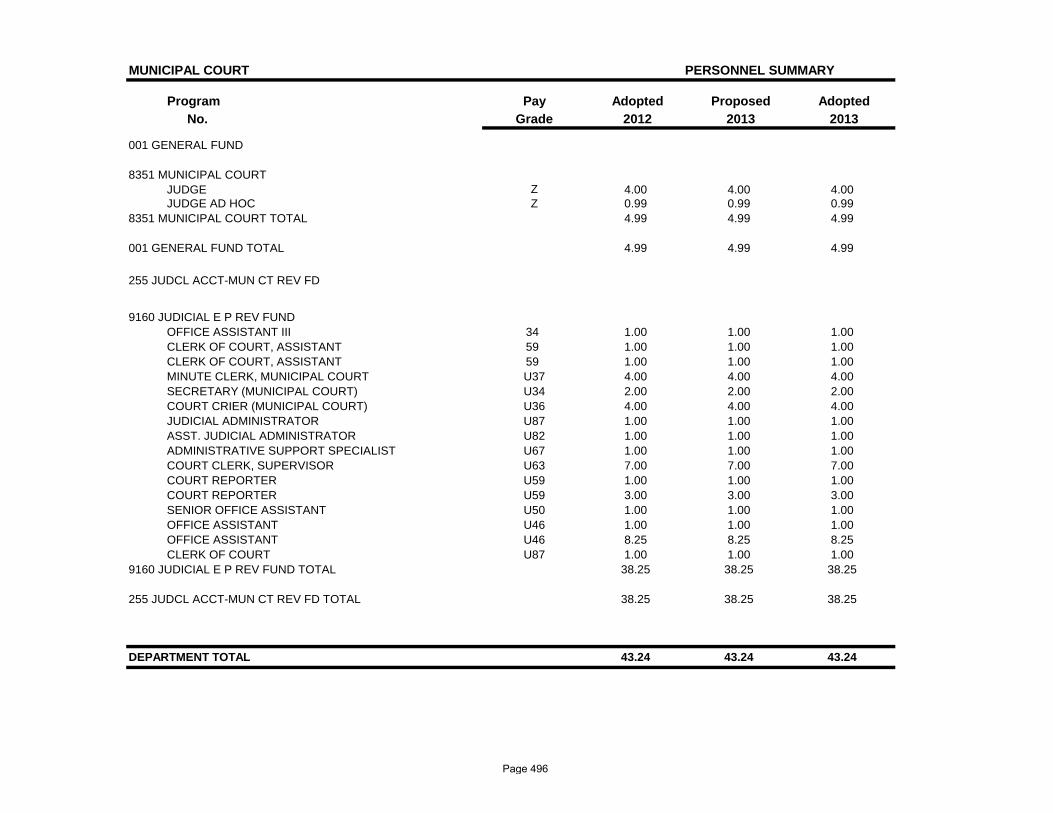
MUNICIPAL COURT PERSONNEL SUMMARY
Program Pay Adopted Proposed AdoptedNo. Grade 2012 2013 2013
001 GENERAL FUND
8351 MUNICIPAL COURTJUDGE Z 4.00 4.00 4.00JUDGE AD HOC Z 0.99 0.99 0.99
8351 MUNICIPAL COURT TOTAL 4.99 4.99 4.99
001 GENERAL FUND TOTAL 4.99 4.99 4.99
255 JUDCL ACCT-MUN CT REV FD
9160 JUDICIAL E P REV FUNDOFFICE ASSISTANT III 34 1.00 1.00 1.00CLERK OF COURT, ASSISTANT 59 1.00 1.00 1.00CLERK OF COURT, ASSISTANT 59 1.00 1.00 1.00MINUTE CLERK, MUNICIPAL COURT U37 4.00 4.00 4.00SECRETARY (MUNICIPAL COURT) U34 2.00 2.00 2.00COURT CRIER (MUNICIPAL COURT) U36 4.00 4.00 4.00JUDICIAL ADMINISTRATOR U87 1.00 1.00 1.00ASST. JUDICIAL ADMINISTRATOR U82 1.00 1.00 1.00ADMINISTRATIVE SUPPORT SPECIALIST U67 1.00 1.00 1.00COURT CLERK, SUPERVISOR U63 7.00 7.00 7.00COURT REPORTER U59 1.00 1.00 1.00COURT REPORTER U59 3.00 3.00 3.00SENIOR OFFICE ASSISTANT U50 1.00 1.00 1.00OFFICE ASSISTANT U46 1.00 1.00 1.00OFFICE ASSISTANT U46 8.25 8.25 8.25CLERK OF COURT U87 1.00 1.00 1.00
9160 JUDICIAL E P REV FUND TOTAL 38.25 38.25 38.25
255 JUDCL ACCT-MUN CT REV FD TOTAL 38.25 38.25 38.25
DEPARTMENT TOTAL 43.24 43.24 43.24
Page 496

Page 497

Traffic Court
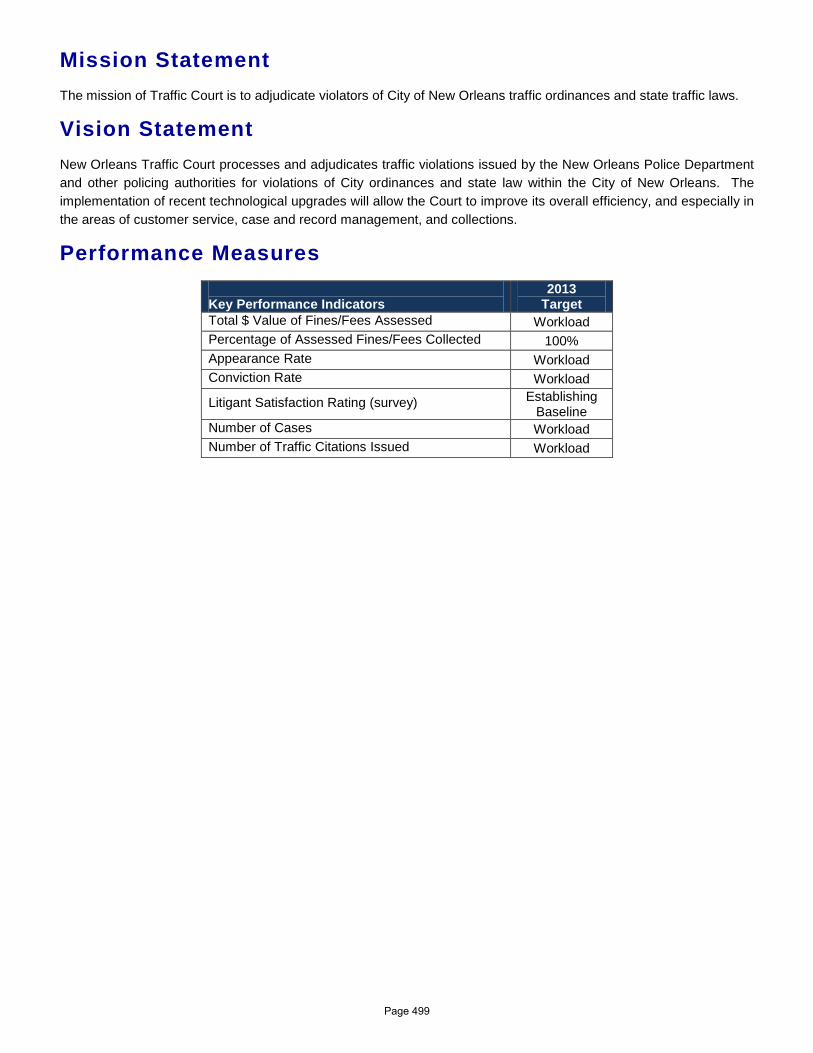
Mission Statement The mission of Traffic Court is to adjudicate violators of City of New Orleans traffic ordinances and state traffic laws.
Vision Statement New Orleans Traffic Court processes and adjudicates traffic violations issued by the New Orleans Police Department and other policing authorities for violations of City ordinances and state law within the City of New Orleans. The implementation of recent technological upgrades will allow the Court to improve its overall efficiency, and especially in the areas of customer service, case and record management, and collections.
Performance Measures Key Performance Indicators
2013 Target
Total $ Value of Fines/Fees Assessed Workload Percentage of Assessed Fines/Fees Collected 100% Appearance Rate Workload Conviction Rate Workload
Litigant Satisfaction Rating (survey) Establishing Baseline
Number of Cases Workload Number of Traffic Citations Issued Workload
Page 499
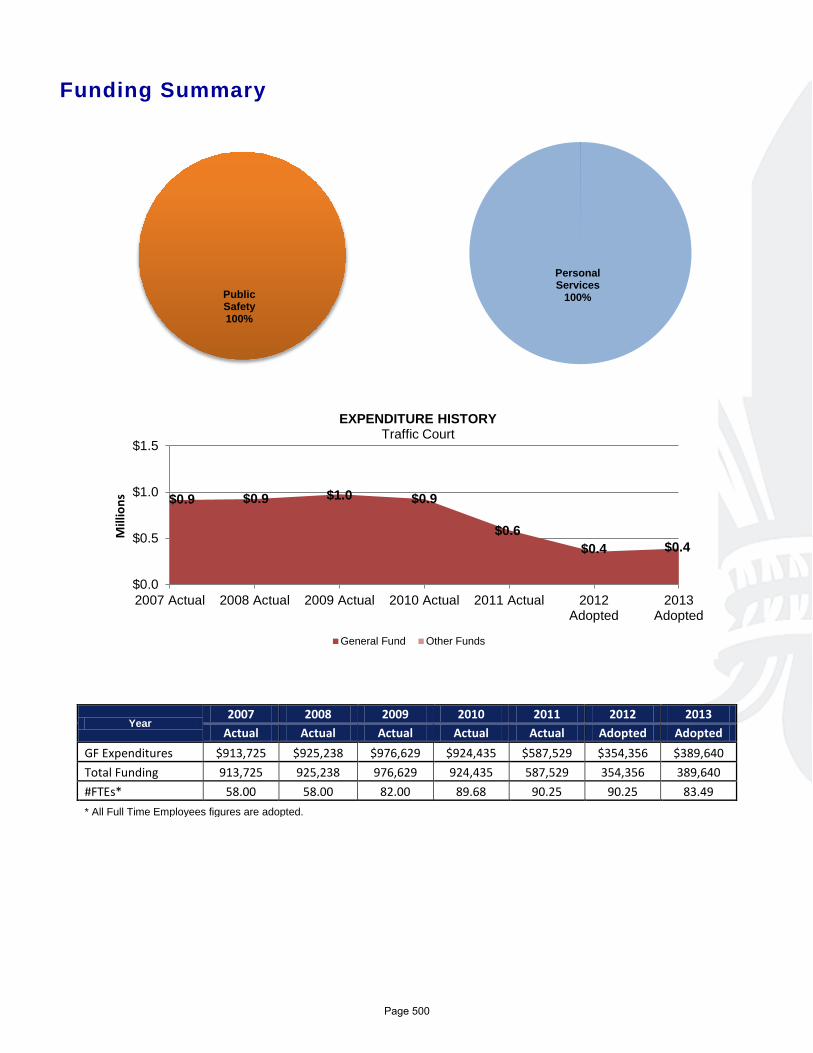
Funding Summary
Year 2007 2008 2009 2010 2011 2012 2013
Actual Actual Actual Actual Actual Adopted Adopted GF Expenditures $913,725 $925,238 $976,629 $924,435 $587,529 $354,356 $389,640 Total Funding 913,725 925,238 976,629 924,435 587,529 354,356 389,640 #FTEs* 58.00 58.00 82.00 89.68 90.25 90.25 83.49 * All Full Time Employees figures are adopted.
$0.9 $0.9 $1.0 $0.9
$0.6 $0.4 $0.4
$0.0
$0.5
$1.0
$1.5
2007 Actual 2008 Actual 2009 Actual 2010 Actual 2011 Actual 2012Adopted
2013Adopted
Mill
ions
EXPENDITURE HISTORY Traffic Court
General Fund Other Funds
Other Operating
0% Personal Services
100% Public Safety 100%
Page 500
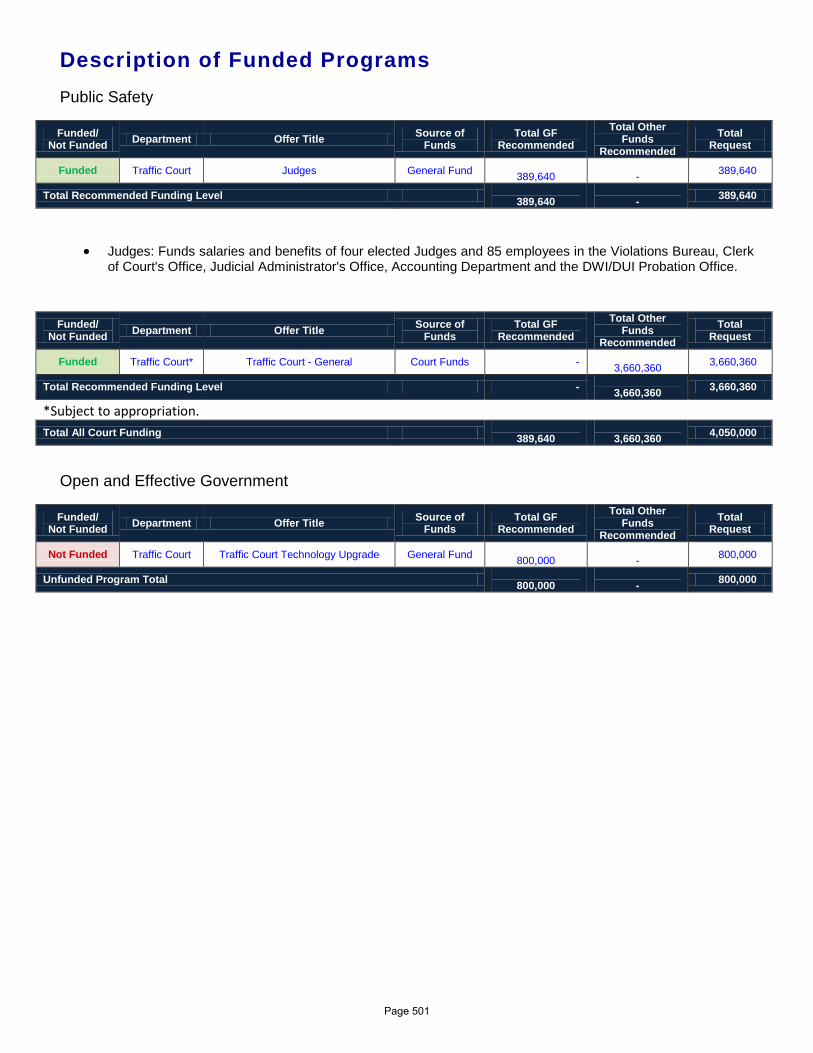
Description of Funded Programs Public Safety
Funded/ Not Funded Department Offer Title Source of
Funds Total GF
Recommended Total Other
Funds Recommended
Total Request
Funded Traffic Court Judges General Fund 389,640
- 389,640
Total Recommended Funding Level 389,640
- 389,640
• Judges: Funds salaries and benefits of four elected Judges and 85 employees in the Violations Bureau, Clerk of Court's Office, Judicial Administrator's Office, Accounting Department and the DWI/DUI Probation Office.
Funded/ Not Funded Department Offer Title Source of
Funds Total GF
Recommended Total Other
Funds Recommended
Total Request
Funded Traffic Court* Traffic Court - General Court Funds - 3,660,360 3,660,360
Total Recommended Funding Level - 3,660,360 3,660,360
*Subject to appropriation. Total All Court Funding
389,640
3,660,360 4,050,000
Open and Effective Government
Funded/ Not Funded Department Offer Title Source of
Funds Total GF
Recommended Total Other
Funds Recommended
Total Request
Not Funded Traffic Court Traffic Court Technology Upgrade General Fund 800,000
- 800,000
Unfunded Program Total 800,000
- 800,000
Page 501

TRAFFIC COURT
DEPARTMENTAL BUDGET SUMMARY
AdoptedProposedAdoptedActual
EXPENDITURES
2013 2012 2011 2013
PERSONAL SERVICES 274,240 354,356 389,640 389,640
OTHER OPERATING 313,289 0 0 0
DEBT SERVICE 0 0 0 0
RESERVES 0 0 0 0
GRANTS, CONTRIB. & FUND TRAN. 0 0 0 0
$587,529 $354,356 $389,640 TOTAL EXPENDITURES $389,640
SOURCE OF FUNDING
GENERAL FUND 587,529 354,356 389,640 389,640
WISNER FUNDS 0 0 0 0
ENTERPRISE 0 0 0 0
DOWNTOWN DEVELOPMENT DIST. 0 0 0 0
HOUSING AND URBAN DEVELOP. 0 0 0 0
SELF GENERATED 0 0 0 0
LIBRARY 0 0 0 0
LLE 0 0 0 0
FEDERAL GRANTS 0 0 0 0
STATE GRANTS 0 0 0 0
GRANTS, CONTRIB., & FUND TRAN. 0 0 0 0
N. O. REGIONAL BUSINESS PARK 0 0 0 0
ECONOMIC DEVELOPMENT FUND 0 0 0 0
HOUSING IMPROVMENT FUND 0 0 0 0
$587,529 $354,356 $389,640 TOTAL FUNDING $389,640
Page 502
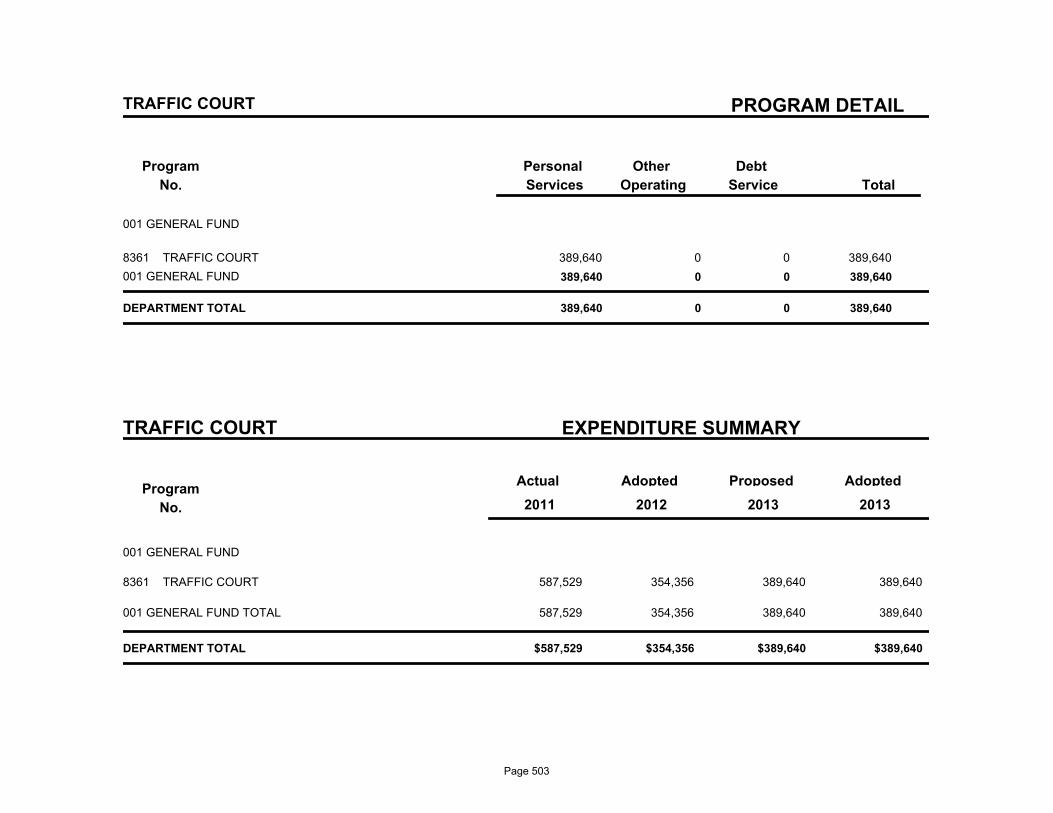
PROGRAM DETAIL
Program
No.
Debt
Service
Other
Operating
Personal
Services Total
TRAFFIC COURT
001 GENERAL FUND
8361 TRAFFIC COURT 389,640 0 0 389,640
001 GENERAL FUND 389,640 0 0 389,640
DEPARTMENT TOTAL 389,640 0 0 389,640
TRAFFIC COURT EXPENDITURE SUMMARY
Program
No.
Actual AdoptedProposedAdopted
2013 2011 2012 2013
001 GENERAL FUND
587,529 354,356 389,640 TRAFFIC COURT8361 389,640
587,529 354,356 389,640 389,640 001 GENERAL FUND TOTAL
$587,529 $354,356 $389,640 $389,640 DEPARTMENT TOTAL
Page 503
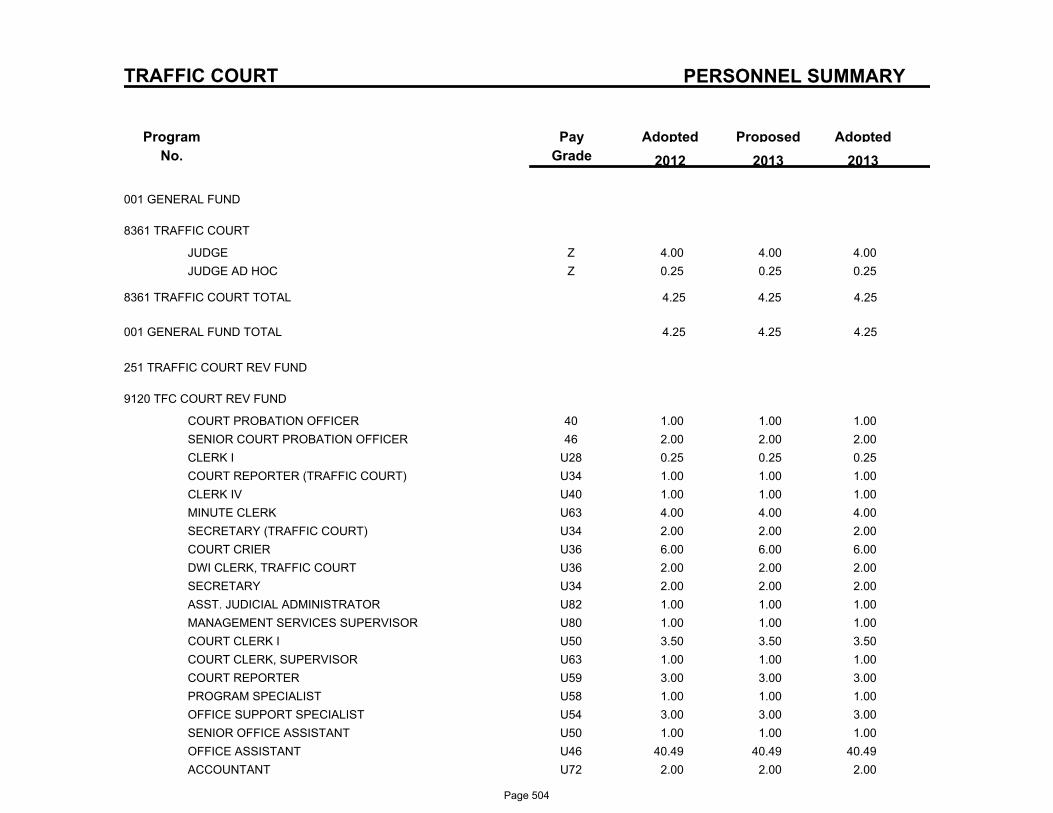
PERSONNEL SUMMARY
Program
No.
ProposedAdoptedPay
Grade
Adopted
2013 2012 2013
TRAFFIC COURT
001 GENERAL FUND
8361 TRAFFIC COURT
ZJUDGE 4.00 4.00 4.00
ZJUDGE AD HOC 0.25 0.25 0.25
8361 TRAFFIC COURT TOTAL 4.25 4.25 4.25
001 GENERAL FUND TOTAL 4.25 4.25 4.25
251 TRAFFIC COURT REV FUND
9120 TFC COURT REV FUND
40COURT PROBATION OFFICER 1.00 1.00 1.00
46SENIOR COURT PROBATION OFFICER 2.00 2.00 2.00
U28CLERK I 0.25 0.25 0.25
U34COURT REPORTER (TRAFFIC COURT) 1.00 1.00 1.00
U40CLERK IV 1.00 1.00 1.00
U63MINUTE CLERK 4.00 4.00 4.00
U34SECRETARY (TRAFFIC COURT) 2.00 2.00 2.00
U36COURT CRIER 6.00 6.00 6.00
U36DWI CLERK, TRAFFIC COURT 2.00 2.00 2.00
U34SECRETARY 2.00 2.00 2.00
U82ASST. JUDICIAL ADMINISTRATOR 1.00 1.00 1.00
U80MANAGEMENT SERVICES SUPERVISOR 1.00 1.00 1.00
U50COURT CLERK I 3.50 3.50 3.50
U63COURT CLERK, SUPERVISOR 1.00 1.00 1.00
U59COURT REPORTER 3.00 3.00 3.00
U58PROGRAM SPECIALIST 1.00 1.00 1.00
U54OFFICE SUPPORT SPECIALIST 3.00 3.00 3.00
U50SENIOR OFFICE ASSISTANT 1.00 1.00 1.00
U46OFFICE ASSISTANT 40.49 40.49 40.49
U72ACCOUNTANT 2.00 2.00 2.00
Page 504
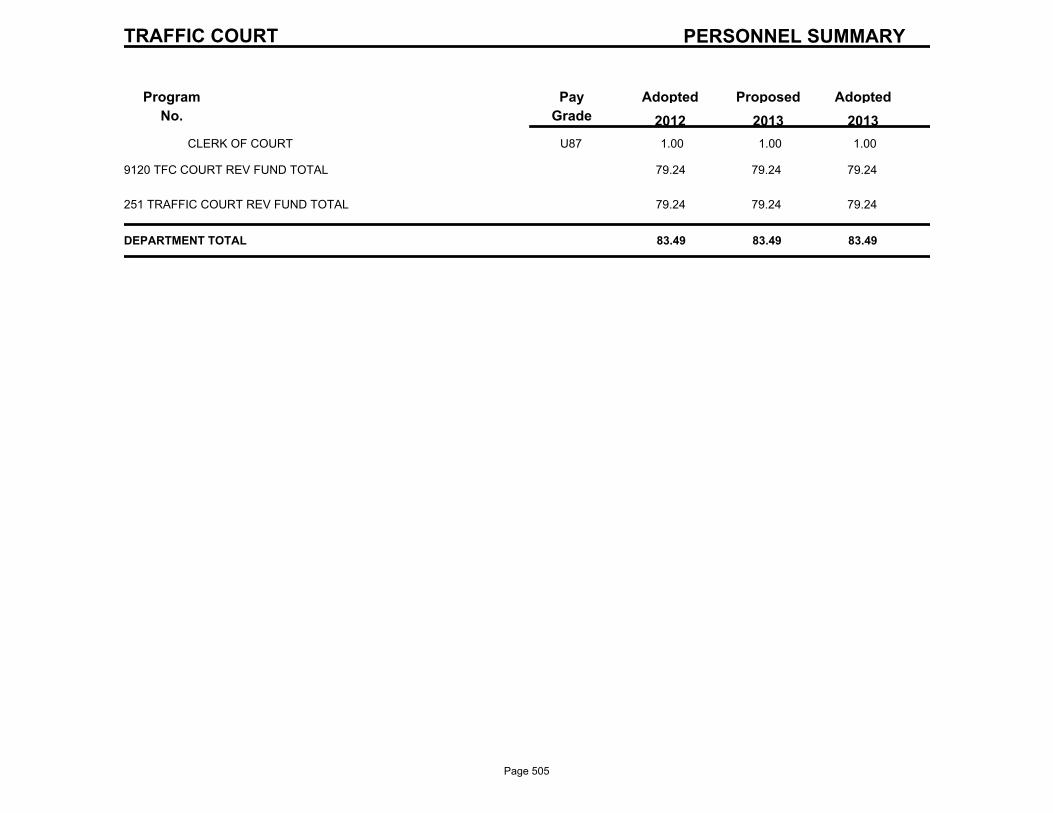
PERSONNEL SUMMARY
Program
No.
ProposedAdoptedPay
Grade
Adopted
2013 2012 2013
TRAFFIC COURT
U87CLERK OF COURT 1.00 1.00 1.00
9120 TFC COURT REV FUND TOTAL 79.24 79.24 79.24
251 TRAFFIC COURT REV FUND TOTAL 79.24 79.24 79.24
DEPARTMENT TOTAL 83.49 83.49 83.49
Page 505

Criminal District Court
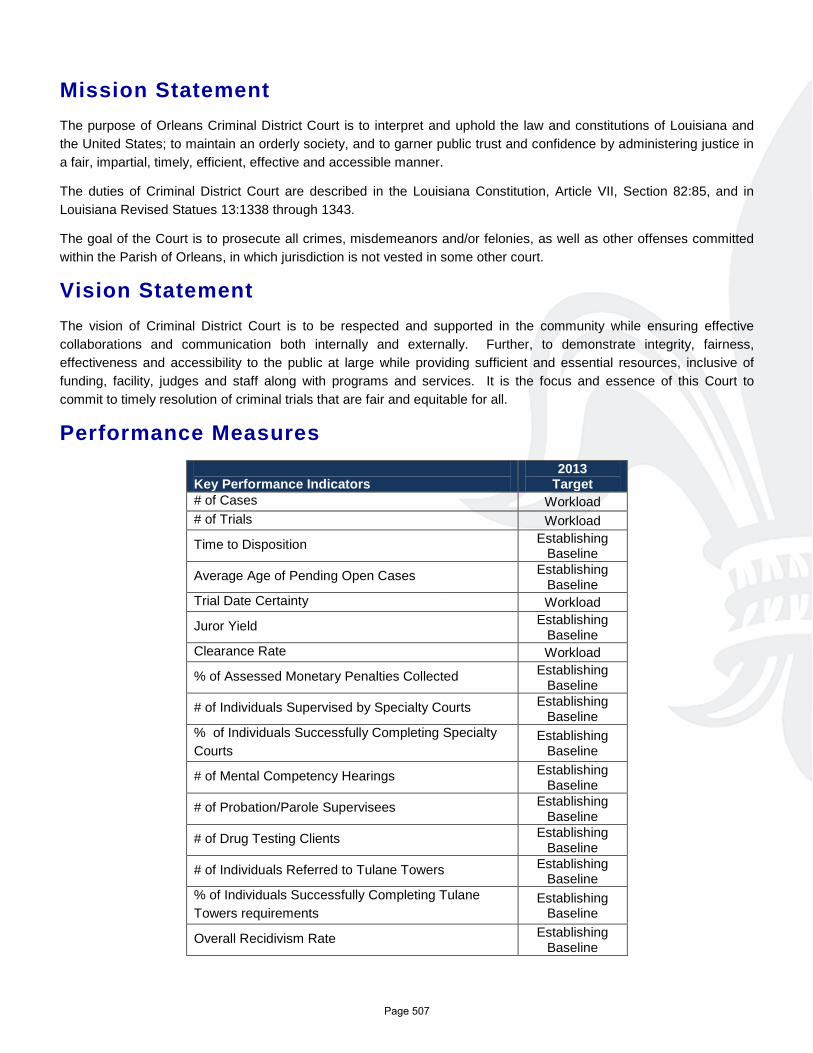
Mission Statement The purpose of Orleans Criminal District Court is to interpret and uphold the law and constitutions of Louisiana and the United States; to maintain an orderly society, and to garner public trust and confidence by administering justice in a fair, impartial, timely, efficient, effective and accessible manner.
The duties of Criminal District Court are described in the Louisiana Constitution, Article VII, Section 82:85, and in Louisiana Revised Statues 13:1338 through 1343.
The goal of the Court is to prosecute all crimes, misdemeanors and/or felonies, as well as other offenses committed within the Parish of Orleans, in which jurisdiction is not vested in some other court.
Vision Statement The vision of Criminal District Court is to be respected and supported in the community while ensuring effective collaborations and communication both internally and externally. Further, to demonstrate integrity, fairness, effectiveness and accessibility to the public at large while providing sufficient and essential resources, inclusive of funding, facility, judges and staff along with programs and services. It is the focus and essence of this Court to commit to timely resolution of criminal trials that are fair and equitable for all.
Performance Measures Key Performance Indicators
2013 Target
# of Cases Workload # of Trials Workload
Time to Disposition Establishing Baseline
Average Age of Pending Open Cases Establishing Baseline
Trial Date Certainty Workload
Juror Yield Establishing Baseline
Clearance Rate Workload
% of Assessed Monetary Penalties Collected Establishing Baseline
# of Individuals Supervised by Specialty Courts Establishing Baseline
% of Individuals Successfully Completing Specialty Courts
Establishing Baseline
# of Mental Competency Hearings Establishing Baseline
# of Probation/Parole Supervisees Establishing Baseline
# of Drug Testing Clients Establishing Baseline
# of Individuals Referred to Tulane Towers Establishing Baseline
% of Individuals Successfully Completing Tulane Towers requirements
Establishing Baseline
Overall Recidivism Rate Establishing Baseline
Page 507
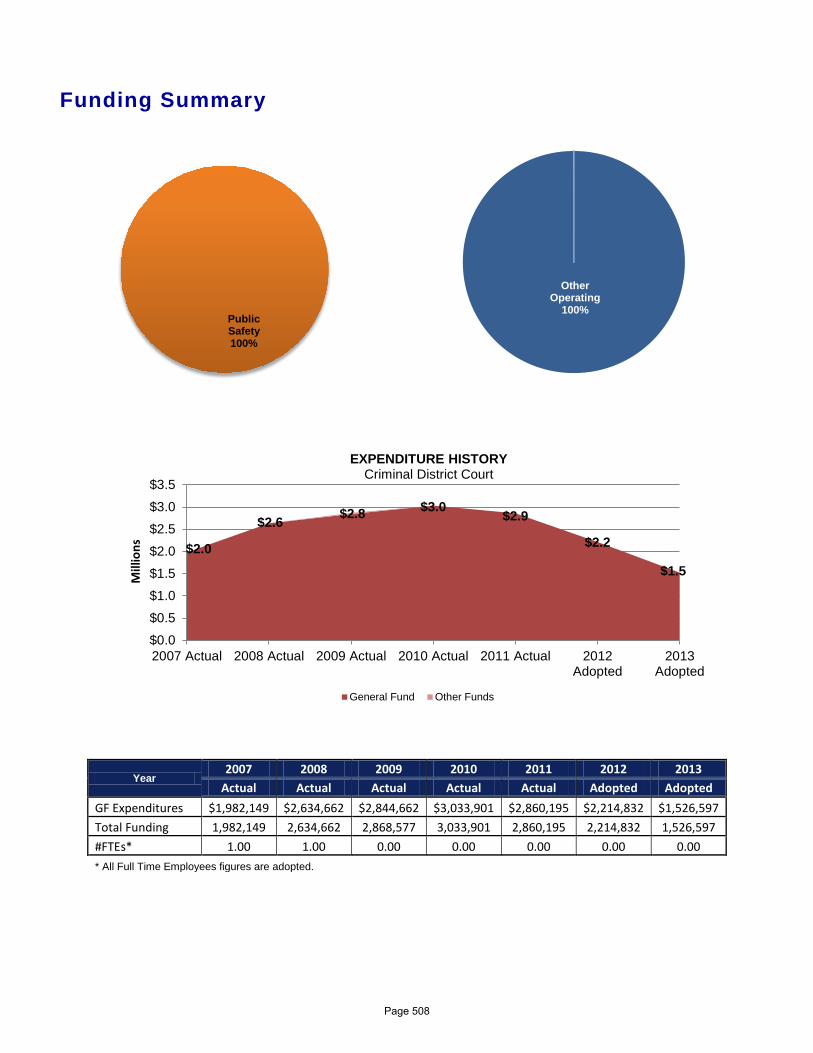
Funding Summary
Year 2007 2008 2009 2010 2011 2012 2013
Actual Actual Actual Actual Actual Adopted Adopted GF Expenditures $1,982,149 $2,634,662 $2,844,662 $3,033,901 $2,860,195 $2,214,832 $1,526,597 Total Funding 1,982,149 2,634,662 2,868,577 3,033,901 2,860,195 2,214,832 1,526,597 #FTEs* 1.00 1.00 0.00 0.00 0.00 0.00 0.00 * All Full Time Employees figures are adopted.
$2.0
$2.6 $2.8 $3.0 $2.9
$2.2
$1.5
$0.0
$0.5
$1.0
$1.5
$2.0
$2.5
$3.0
$3.5
2007 Actual 2008 Actual 2009 Actual 2010 Actual 2011 Actual 2012Adopted
2013Adopted
Mill
ions
EXPENDITURE HISTORY Criminal District Court
General Fund Other Funds
Public Safety 100%
Other Operating
100%
Personal Services
0%
Page 508
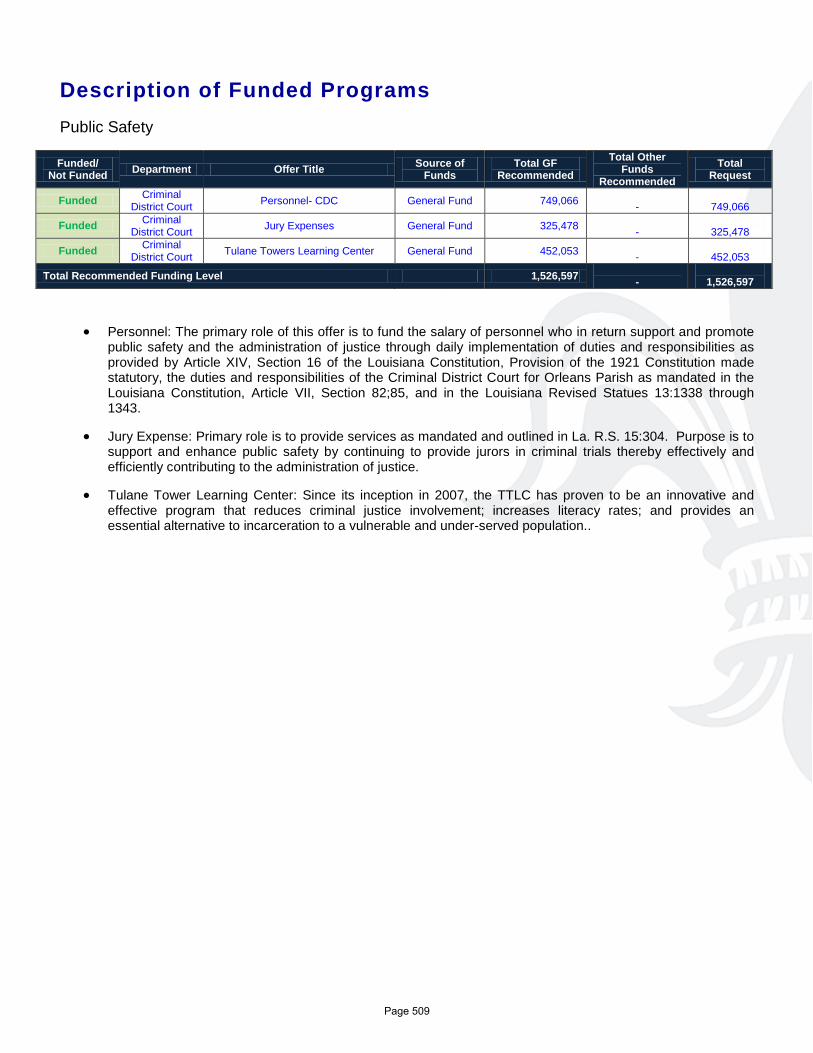
Description of Funded Programs Public Safety
Funded/ Not Funded Department Offer Title Source of
Funds Total GF
Recommended Total Other
Funds Recommended
Total Request
Funded Criminal District Court Personnel- CDC General Fund 749,066
-
749,066
Funded Criminal District Court Jury Expenses General Fund 325,478
-
325,478
Funded Criminal District Court Tulane Towers Learning Center General Fund 452,053
-
452,053
Total Recommended Funding Level 1,526,597 -
1,526,597
• Personnel: The primary role of this offer is to fund the salary of personnel who in return support and promote public safety and the administration of justice through daily implementation of duties and responsibilities as provided by Article XIV, Section 16 of the Louisiana Constitution, Provision of the 1921 Constitution made statutory, the duties and responsibilities of the Criminal District Court for Orleans Parish as mandated in the Louisiana Constitution, Article VII, Section 82;85, and in the Louisiana Revised Statues 13:1338 through 1343.
• Jury Expense: Primary role is to provide services as mandated and outlined in La. R.S. 15:304. Purpose is to support and enhance public safety by continuing to provide jurors in criminal trials thereby effectively and efficiently contributing to the administration of justice.
• Tulane Tower Learning Center: Since its inception in 2007, the TTLC has proven to be an innovative and effective program that reduces criminal justice involvement; increases literacy rates; and provides an essential alternative to incarceration to a vulnerable and under-served population..
Page 509
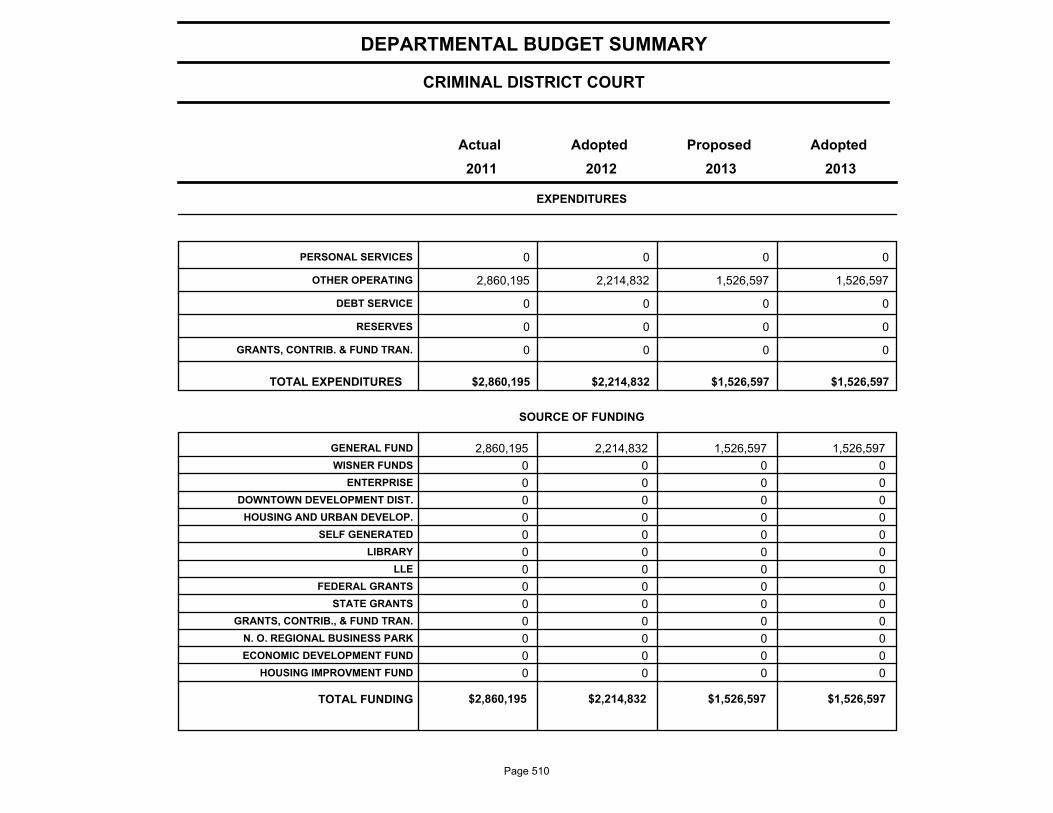
CRIMINAL DISTRICT COURT
DEPARTMENTAL BUDGET SUMMARY
AdoptedProposedAdoptedActual
EXPENDITURES
2013 2012 2011 2013
PERSONAL SERVICES 0 0 0 0
OTHER OPERATING 2,860,195 2,214,832 1,526,597 1,526,597
DEBT SERVICE 0 0 0 0
RESERVES 0 0 0 0
GRANTS, CONTRIB. & FUND TRAN. 0 0 0 0
$2,860,195 $2,214,832 $1,526,597 TOTAL EXPENDITURES $1,526,597
SOURCE OF FUNDING
GENERAL FUND 2,860,195 2,214,832 1,526,597 1,526,597
WISNER FUNDS 0 0 0 0
ENTERPRISE 0 0 0 0
DOWNTOWN DEVELOPMENT DIST. 0 0 0 0
HOUSING AND URBAN DEVELOP. 0 0 0 0
SELF GENERATED 0 0 0 0
LIBRARY 0 0 0 0
LLE 0 0 0 0
FEDERAL GRANTS 0 0 0 0
STATE GRANTS 0 0 0 0
GRANTS, CONTRIB., & FUND TRAN. 0 0 0 0
N. O. REGIONAL BUSINESS PARK 0 0 0 0
ECONOMIC DEVELOPMENT FUND 0 0 0 0
HOUSING IMPROVMENT FUND 0 0 0 0
$2,860,195 $2,214,832 $1,526,597 TOTAL FUNDING $1,526,597
Page 510
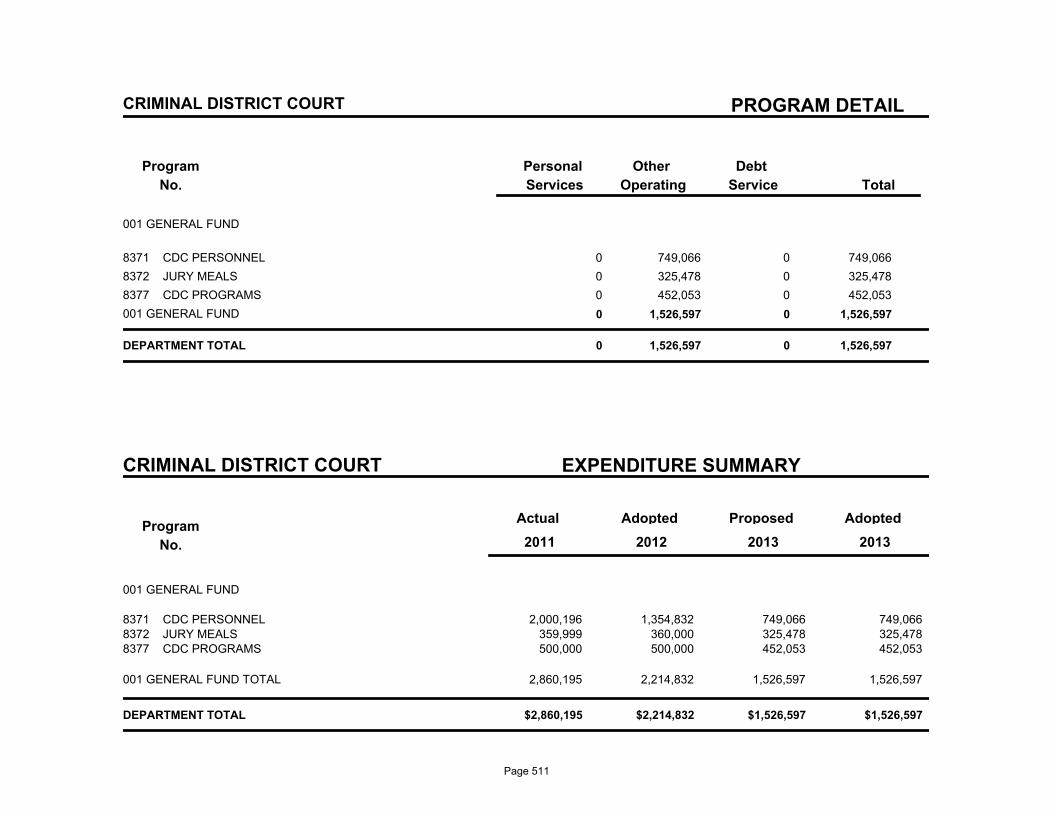
PROGRAM DETAIL
Program
No.
Debt
Service
Other
Operating
Personal
Services Total
CRIMINAL DISTRICT COURT
001 GENERAL FUND
8371 CDC PERSONNEL 0 749,066 0 749,066
8372 JURY MEALS 0 325,478 0 325,478
8377 CDC PROGRAMS 0 452,053 0 452,053
001 GENERAL FUND 0 1,526,597 0 1,526,597
DEPARTMENT TOTAL 0 1,526,597 0 1,526,597
CRIMINAL DISTRICT COURT EXPENDITURE SUMMARY
Program
No.
Actual AdoptedProposedAdopted
2013 2011 2012 2013
001 GENERAL FUND
2,000,196 1,354,832 749,066 CDC PERSONNEL8371 749,066 359,999 360,000 325,478 JURY MEALS8372 325,478 500,000 500,000 452,053 CDC PROGRAMS8377 452,053
2,860,195 2,214,832 1,526,597 1,526,597 001 GENERAL FUND TOTAL
$2,860,195 $2,214,832 $1,526,597 $1,526,597 DEPARTMENT TOTAL
Page 511

Sheriff
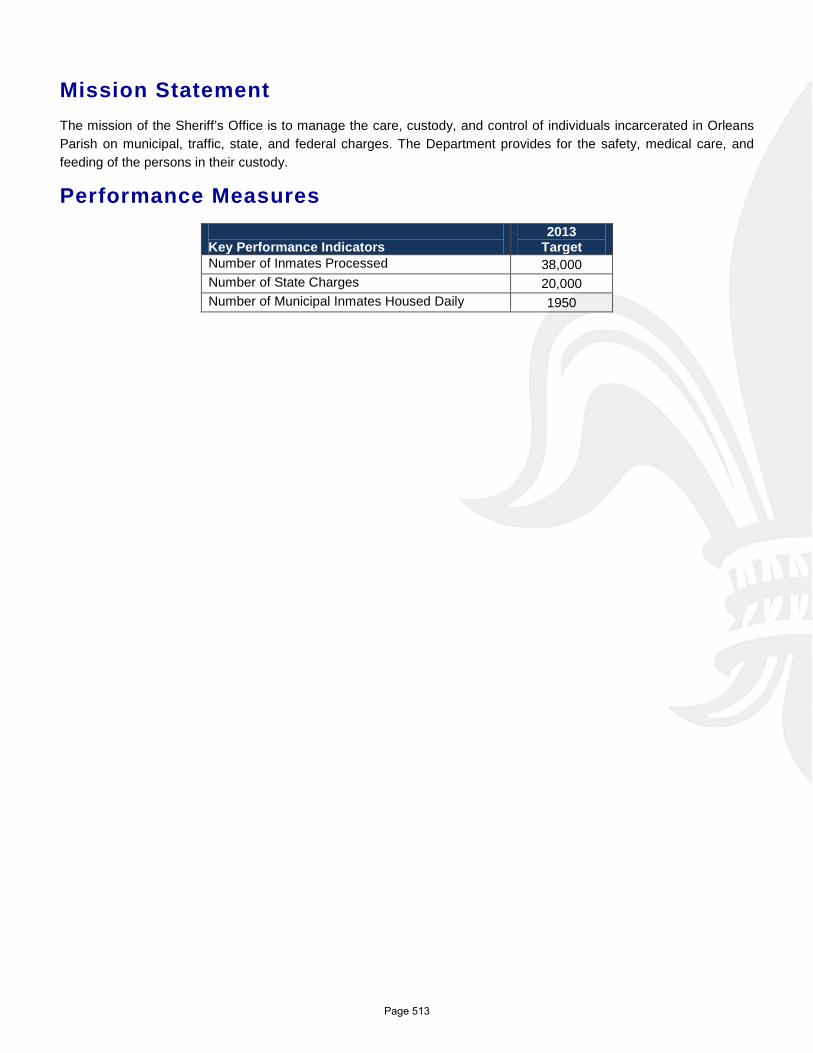
Mission Statement The mission of the Sheriff’s Office is to manage the care, custody, and control of individuals incarcerated in Orleans Parish on municipal, traffic, state, and federal charges. The Department provides for the safety, medical care, and feeding of the persons in their custody.
Performance Measures Key Performance Indicators
2013 Target
Number of Inmates Processed 38,000 Number of State Charges 20,000 Number of Municipal Inmates Housed Daily 1950
Page 513
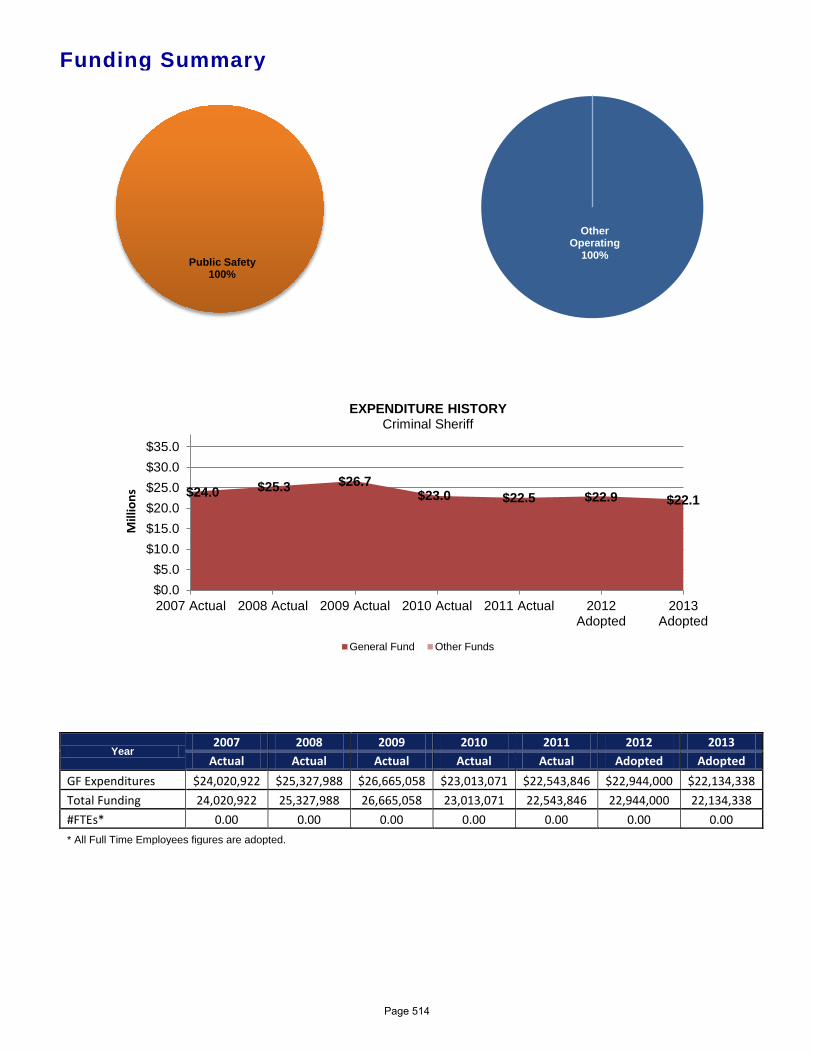
Funding Summary
Year 2007 2008 2009 2010 2011 2012 2013
Actual Actual Actual Actual Actual Adopted Adopted GF Expenditures $24,020,922 $25,327,988 $26,665,058 $23,013,071 $22,543,846 $22,944,000 $22,134,338 Total Funding 24,020,922 25,327,988 26,665,058 23,013,071 22,543,846 22,944,000 22,134,338 #FTEs* 0.00 0.00 0.00 0.00 0.00 0.00 0.00 * All Full Time Employees figures are adopted.
$24.0 $25.3 $26.7 $23.0 $22.5 $22.9 $22.1
$0.0$5.0
$10.0$15.0$20.0$25.0$30.0$35.0
2007 Actual 2008 Actual 2009 Actual 2010 Actual 2011 Actual 2012Adopted
2013Adopted
Mill
ions
EXPENDITURE HISTORY Criminal Sheriff
General Fund Other Funds
Public Safety 100%
Other Operating
100%
Personal Services
0%
Page 514
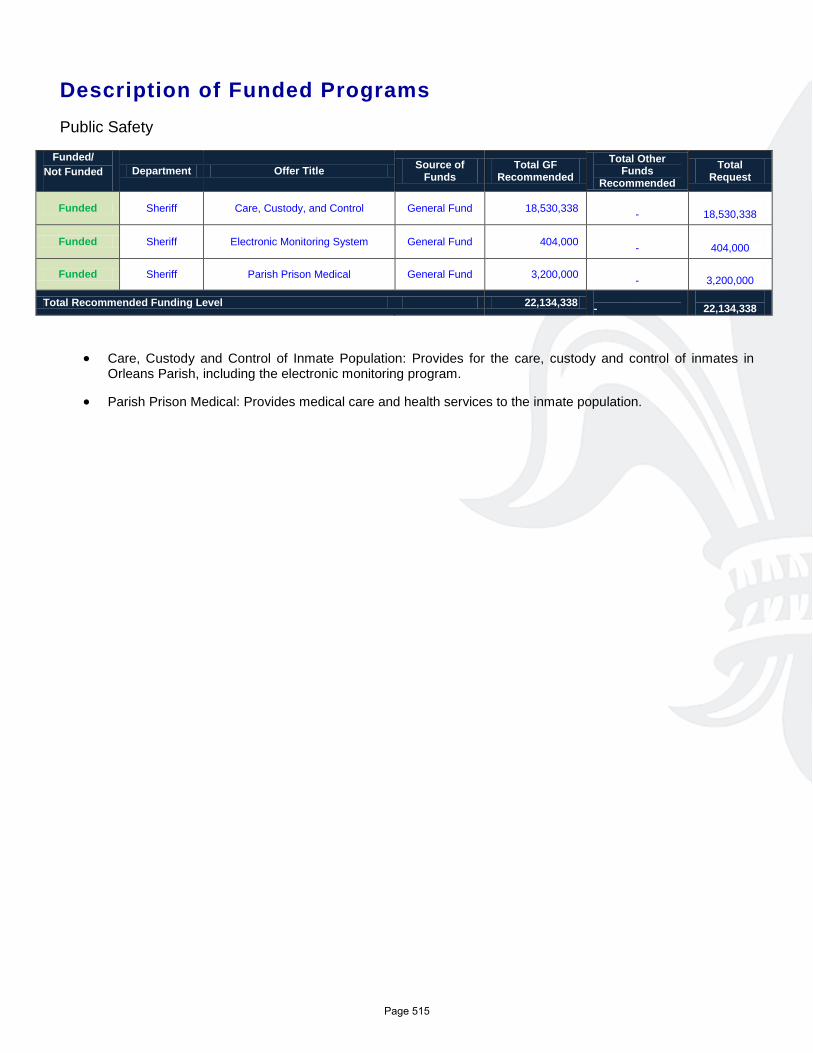
Description of Funded Programs Public Safety
Funded/ Not Funded Department Offer Title Source of
Funds Total GF
Recommended Total Other
Funds Recommended
Total Request
Funded Sheriff Care, Custody, and Control General Fund 18,530,338 -
18,530,338
Funded Sheriff Electronic Monitoring System General Fund 404,000 -
404,000
Funded Sheriff Parish Prison Medical General Fund 3,200,000 -
3,200,000
Total Recommended Funding Level 22,134,338 -
22,134,338
• Care, Custody and Control of Inmate Population: Provides for the care, custody and control of inmates in Orleans Parish, including the electronic monitoring program.
• Parish Prison Medical: Provides medical care and health services to the inmate population.
Page 515

SHERIFF
DEPARTMENTAL BUDGET SUMMARY
AdoptedProposedAdoptedActual
EXPENDITURES
2013 2012 2011 2013
PERSONAL SERVICES 0 0 0 0
OTHER OPERATING 22,543,846 22,944,000 22,434,338 22,134,338
DEBT SERVICE 0 0 0 0
RESERVES 0 0 0 0
GRANTS, CONTRIB. & FUND TRAN. 0 0 0 0
$22,543,846 $22,944,000 $22,434,338 TOTAL EXPENDITURES $22,134,338
SOURCE OF FUNDING
GENERAL FUND 22,543,846 22,944,000 22,434,338 22,134,338
WISNER FUNDS 0 0 0 0
ENTERPRISE 0 0 0 0
DOWNTOWN DEVELOPMENT DIST. 0 0 0 0
HOUSING AND URBAN DEVELOP. 0 0 0 0
SELF GENERATED 0 0 0 0
LIBRARY 0 0 0 0
LLE 0 0 0 0
FEDERAL GRANTS 0 0 0 0
STATE GRANTS 0 0 0 0
GRANTS, CONTRIB., & FUND TRAN. 0 0 0 0
N. O. REGIONAL BUSINESS PARK 0 0 0 0
ECONOMIC DEVELOPMENT FUND 0 0 0 0
HOUSING IMPROVMENT FUND 0 0 0 0
$22,543,846 $22,944,000 $22,434,338 TOTAL FUNDING $22,134,338
Page 516
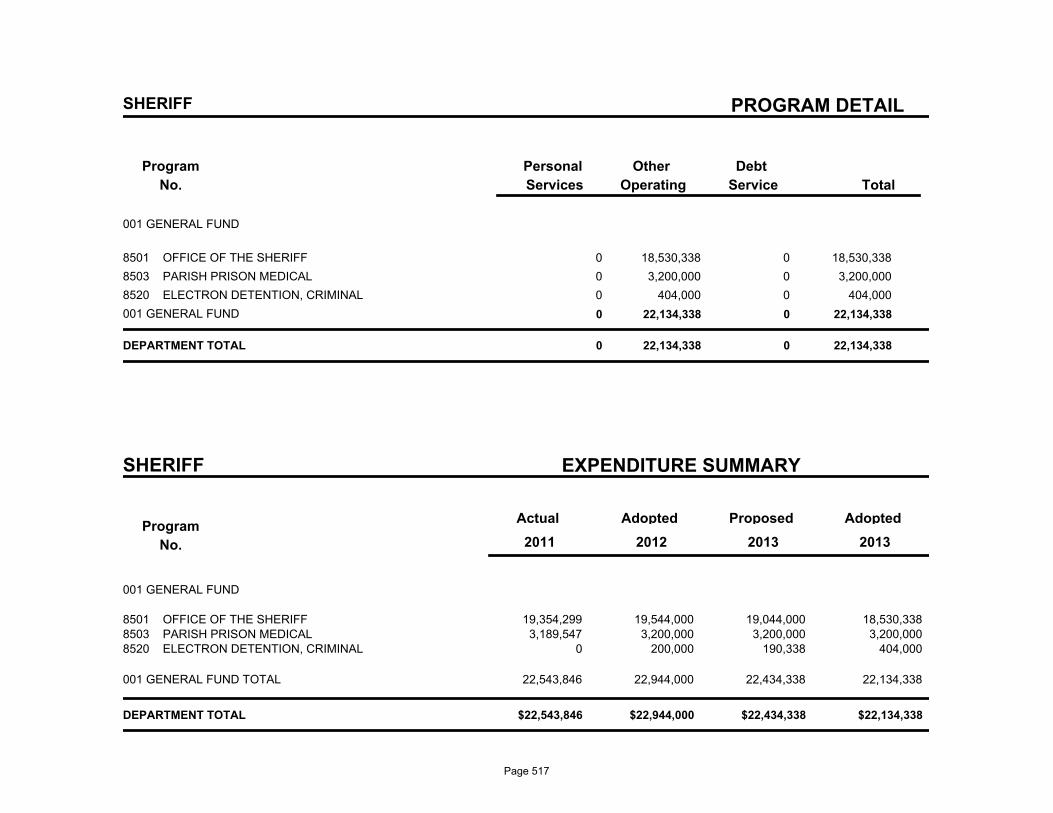
PROGRAM DETAIL
Program
No.
Debt
Service
Other
Operating
Personal
Services Total
SHERIFF
001 GENERAL FUND
8501 OFFICE OF THE SHERIFF 0 18,530,338 0 18,530,338
8503 PARISH PRISON MEDICAL 0 3,200,000 0 3,200,000
8520 ELECTRON DETENTION, CRIMINAL 0 404,000 0 404,000
001 GENERAL FUND 0 22,134,338 0 22,134,338
DEPARTMENT TOTAL 0 22,134,338 0 22,134,338
SHERIFF EXPENDITURE SUMMARY
Program
No.
Actual AdoptedProposedAdopted
2013 2011 2012 2013
001 GENERAL FUND
19,354,299 19,544,000 19,044,000 OFFICE OF THE SHERIFF8501 18,530,338 3,189,547 3,200,000 3,200,000 PARISH PRISON MEDICAL8503 3,200,000
0 200,000 190,338 ELECTRON DETENTION, CRIMINAL8520 404,000
22,543,846 22,944,000 22,434,338 22,134,338 001 GENERAL FUND TOTAL
$22,543,846 $22,944,000 $22,434,338 $22,134,338 DEPARTMENT TOTAL
Page 517

Clerk of Criminal District Court
Mission Statement Clerk of Criminal District Court's mission is to support the criminal justice system, as the keeper of records and evidence. The Clerk maintains integrity and justice within the system as the custodian of elections and polling sites.
Vision Statement To maintain the integrity of the Clerk of Criminal District Court Office, we will strive to improve our technology to meet the growing demands of the criminal justice system. Additionally, the Department is hoping to secure a program for a paperless system.
Performance Measures Key Performance Indicators
2013 Target
Reliability & Integrity of Case Files Establishing Baseline
Page 519
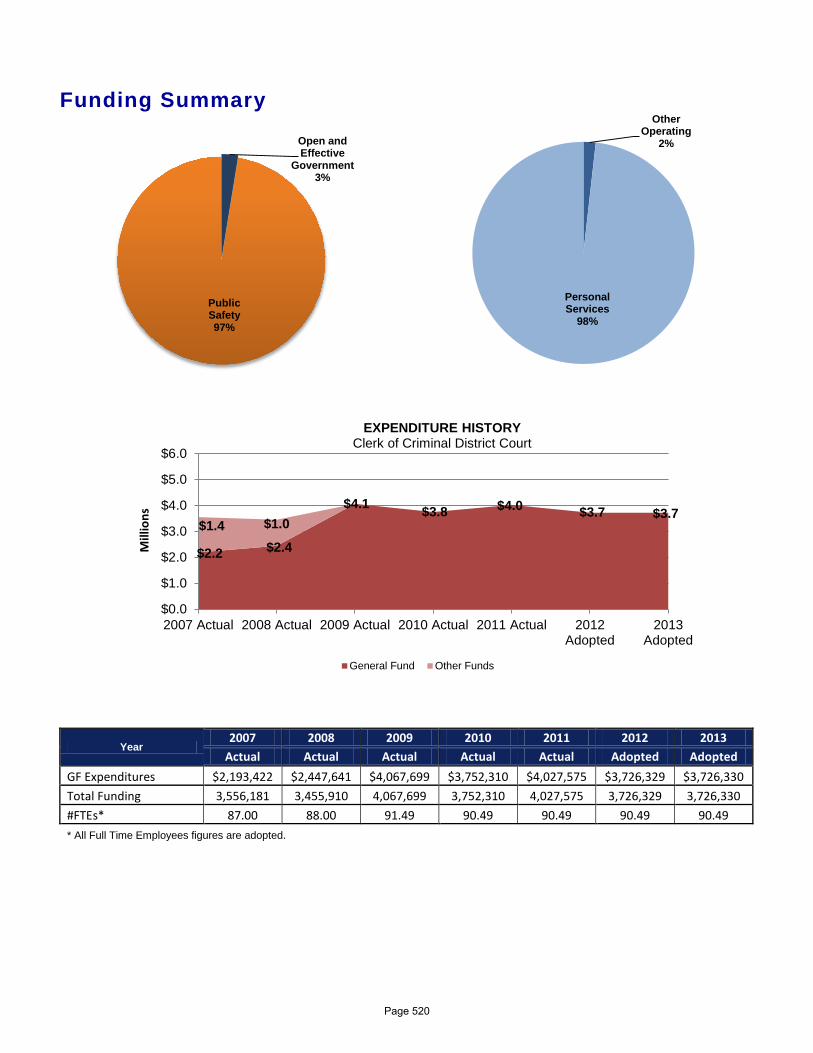
Funding Summary
Year 2007 2008 2009 2010 2011 2012 2013
Actual Actual Actual Actual Actual Adopted Adopted GF Expenditures $2,193,422 $2,447,641 $4,067,699 $3,752,310 $4,027,575 $3,726,329 $3,726,330 Total Funding 3,556,181 3,455,910 4,067,699 3,752,310 4,027,575 3,726,329 3,726,330 #FTEs* 87.00 88.00 91.49 90.49 90.49 90.49 90.49 * All Full Time Employees figures are adopted.
$2.2 $2.4
$4.1 $3.8 $4.0 $3.7 $3.7 $1.4 $1.0
$0.0
$1.0
$2.0
$3.0
$4.0
$5.0
$6.0
2007 Actual 2008 Actual 2009 Actual 2010 Actual 2011 Actual 2012Adopted
2013Adopted
Mill
ions
EXPENDITURE HISTORY Clerk of Criminal District Court
General Fund Other Funds
Open and Effective
Government 3%
Public Safety 97%
Other Operating
2%
Personal Services
98%
Page 520
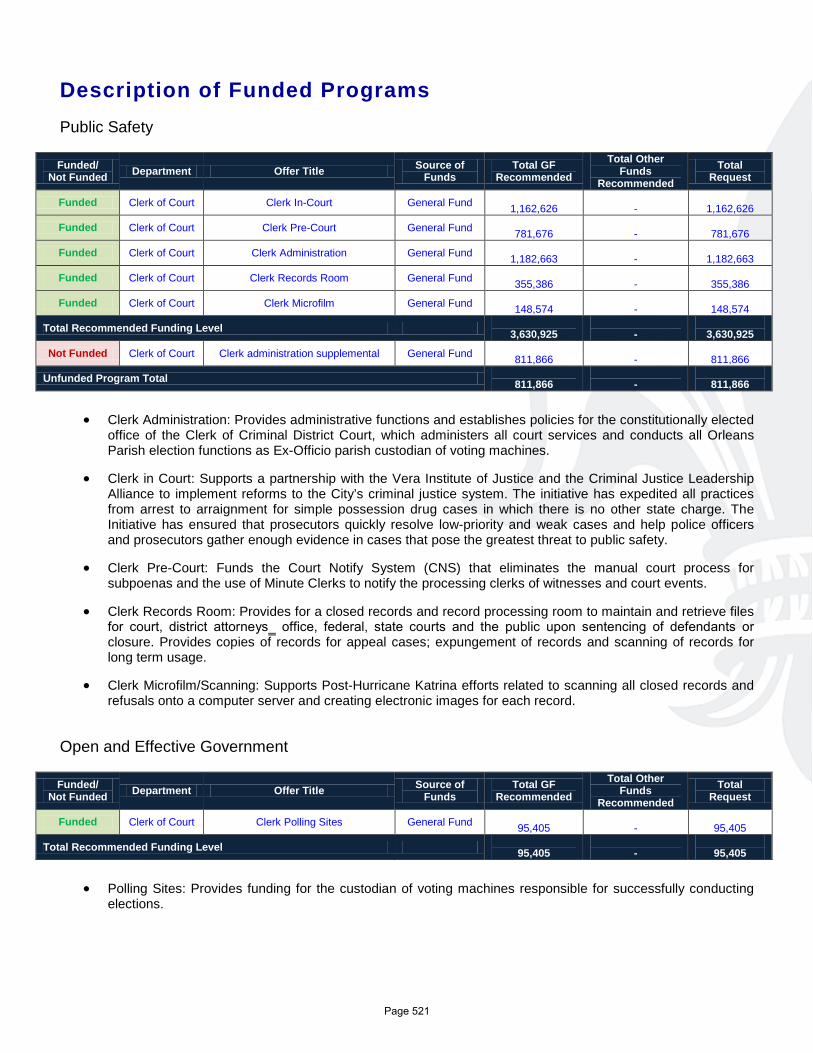
Description of Funded Programs Public Safety Funded/
Not Funded Department Offer Title Source of Funds
Total GF Recommended
Total Other Funds
Recommended Total
Request
Funded Clerk of Court Clerk In-Court General Fund 1,162,626
-
1,162,626
Funded Clerk of Court Clerk Pre-Court General Fund 781,676
-
781,676
Funded Clerk of Court Clerk Administration General Fund 1,182,663
-
1,182,663
Funded Clerk of Court Clerk Records Room General Fund 355,386
-
355,386
Funded Clerk of Court Clerk Microfilm General Fund 148,574
-
148,574
Total Recommended Funding Level 3,630,925
-
3,630,925
Not Funded Clerk of Court Clerk administration supplemental General Fund 811,866
-
811,866
Unfunded Program Total 811,866
-
811,866
• Clerk Administration: Provides administrative functions and establishes policies for the constitutionally elected
office of the Clerk of Criminal District Court, which administers all court services and conducts all Orleans Parish election functions as Ex-Officio parish custodian of voting machines.
• Clerk in Court: Supports a partnership with the Vera Institute of Justice and the Criminal Justice Leadership Alliance to implement reforms to the City’s criminal justice system. The initiative has expedited all practices from arrest to arraignment for simple possession drug cases in which there is no other state charge. The Initiative has ensured that prosecutors quickly resolve low-priority and weak cases and help police officers and prosecutors gather enough evidence in cases that pose the greatest threat to public safety.
• Clerk Pre-Court: Funds the Court Notify System (CNS) that eliminates the manual court process for subpoenas and the use of Minute Clerks to notify the processing clerks of witnesses and court events.
• Clerk Records Room: Provides for a closed records and record processing room to maintain and retrieve files for court, district attorneys‗ office, federal, state courts and the public upon sentencing of defendants or closure. Provides copies of records for appeal cases; expungement of records and scanning of records for long term usage.
• Clerk Microfilm/Scanning: Supports Post-Hurricane Katrina efforts related to scanning all closed records and refusals onto a computer server and creating electronic images for each record.
Open and Effective Government Funded/
Not Funded Department Offer Title Source of Funds
Total GF Recommended
Total Other Funds
Recommended Total
Request
Funded Clerk of Court Clerk Polling Sites General Fund 95,405
-
95,405
Total Recommended Funding Level 95,405
-
95,405
• Polling Sites: Provides funding for the custodian of voting machines responsible for successfully conducting
elections.
Page 521

CLERK OF CRIMINAL DIST COURT
DEPARTMENTAL BUDGET SUMMARY
AdoptedProposedAdoptedActual
EXPENDITURES
2013 2012 2011 2013
PERSONAL SERVICES 3,939,075 3,659,977 3,659,978 3,659,978
OTHER OPERATING 88,500 66,352 66,352 66,352
DEBT SERVICE 0 0 0 0
RESERVES 0 0 0 0
GRANTS, CONTRIB. & FUND TRAN. 0 0 0 0
$4,027,575 $3,726,329 $3,726,330 TOTAL EXPENDITURES $3,726,330
SOURCE OF FUNDING
GENERAL FUND 4,027,575 3,726,329 3,726,330 3,726,330
WISNER FUNDS 0 0 0 0
ENTERPRISE 0 0 0 0
DOWNTOWN DEVELOPMENT DIST. 0 0 0 0
HOUSING AND URBAN DEVELOP. 0 0 0 0
SELF GENERATED 0 0 0 0
LIBRARY 0 0 0 0
LLE 0 0 0 0
FEDERAL GRANTS 0 0 0 0
STATE GRANTS 0 0 0 0
GRANTS, CONTRIB., & FUND TRAN. 0 0 0 0
N. O. REGIONAL BUSINESS PARK 0 0 0 0
ECONOMIC DEVELOPMENT FUND 0 0 0 0
HOUSING IMPROVMENT FUND 0 0 0 0
$4,027,575 $3,726,329 $3,726,330 TOTAL FUNDING $3,726,330
Page 522
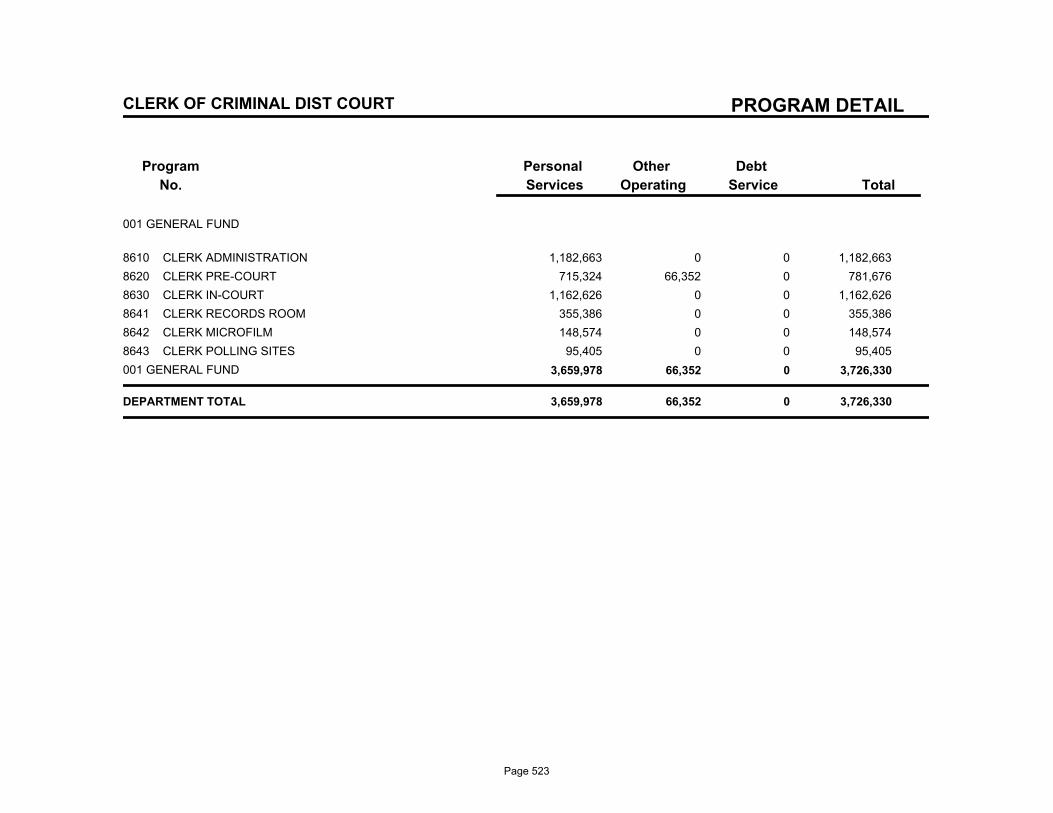
PROGRAM DETAIL
Program
No.
Debt
Service
Other
Operating
Personal
Services Total
CLERK OF CRIMINAL DIST COURT
001 GENERAL FUND
8610 CLERK ADMINISTRATION 1,182,663 0 0 1,182,663
8620 CLERK PRE-COURT 715,324 66,352 0 781,676
8630 CLERK IN-COURT 1,162,626 0 0 1,162,626
8641 CLERK RECORDS ROOM 355,386 0 0 355,386
8642 CLERK MICROFILM 148,574 0 0 148,574
8643 CLERK POLLING SITES 95,405 0 0 95,405
001 GENERAL FUND 3,659,978 66,352 0 3,726,330
DEPARTMENT TOTAL 3,659,978 66,352 0 3,726,330
Page 523
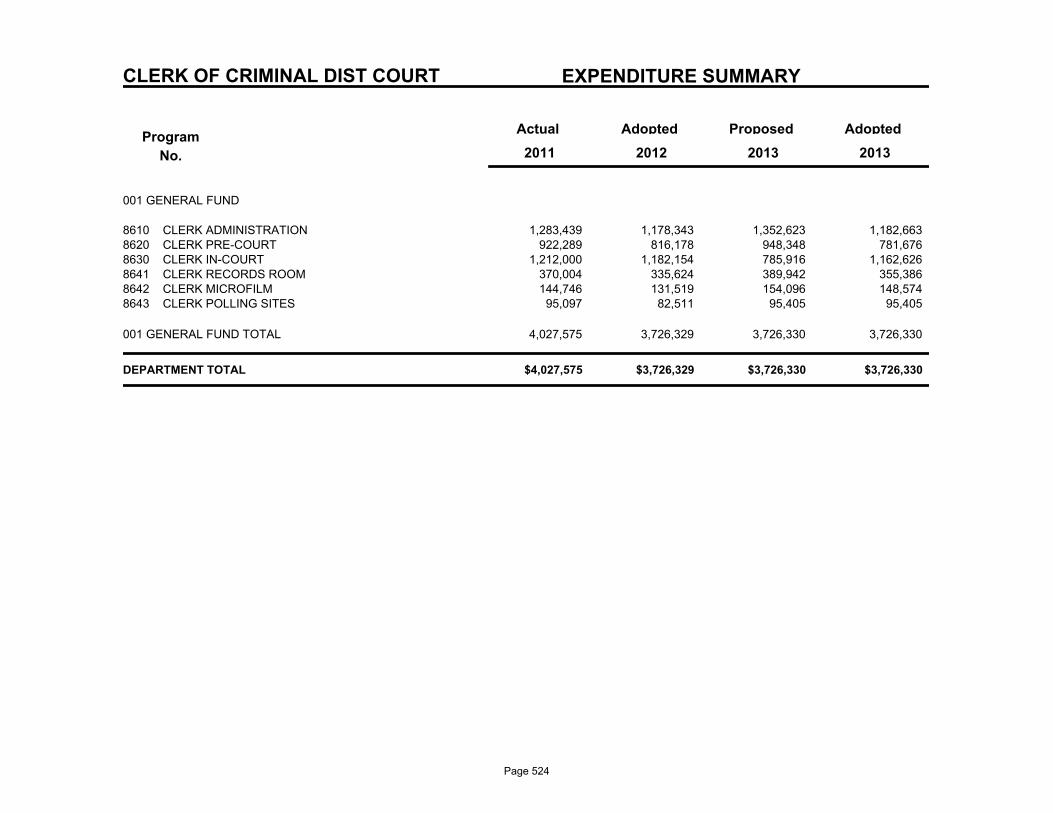
CLERK OF CRIMINAL DIST COURT EXPENDITURE SUMMARY
Program
No.
Actual AdoptedProposedAdopted
2013 2011 2012 2013
001 GENERAL FUND
1,283,439 1,178,343 1,352,623 CLERK ADMINISTRATION8610 1,182,663 922,289 816,178 948,348 CLERK PRE-COURT8620 781,676
1,212,000 1,182,154 785,916 CLERK IN-COURT8630 1,162,626 370,004 335,624 389,942 CLERK RECORDS ROOM8641 355,386 144,746 131,519 154,096 CLERK MICROFILM8642 148,574
95,097 82,511 95,405 CLERK POLLING SITES8643 95,405
4,027,575 3,726,329 3,726,330 3,726,330 001 GENERAL FUND TOTAL
$4,027,575 $3,726,329 $3,726,330 $3,726,330 DEPARTMENT TOTAL
Page 524
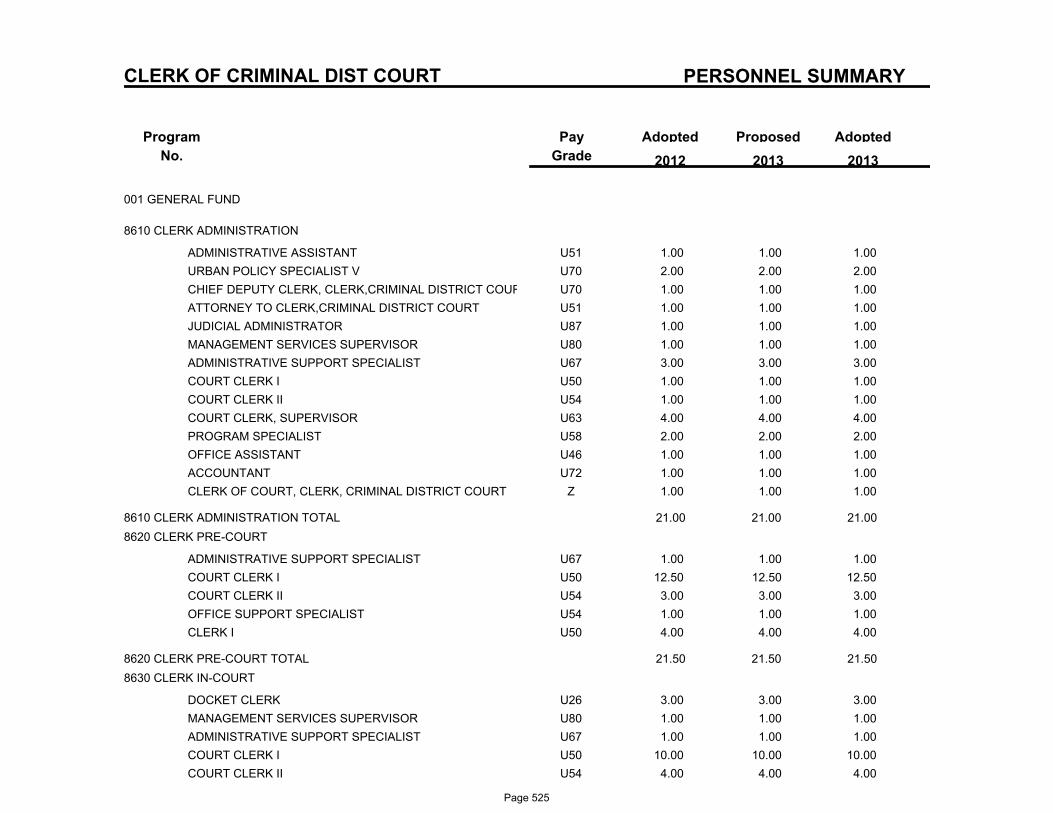
PERSONNEL SUMMARY
Program
No.
ProposedAdoptedPay
Grade
Adopted
2013 2012 2013
CLERK OF CRIMINAL DIST COURT
001 GENERAL FUND
8610 CLERK ADMINISTRATION
U51ADMINISTRATIVE ASSISTANT 1.00 1.00 1.00
U70URBAN POLICY SPECIALIST V 2.00 2.00 2.00
U70CHIEF DEPUTY CLERK, CLERK,CRIMINAL DISTRICT COURT 1.00 1.00 1.00
U51ATTORNEY TO CLERK,CRIMINAL DISTRICT COURT 1.00 1.00 1.00
U87JUDICIAL ADMINISTRATOR 1.00 1.00 1.00
U80MANAGEMENT SERVICES SUPERVISOR 1.00 1.00 1.00
U67ADMINISTRATIVE SUPPORT SPECIALIST 3.00 3.00 3.00
U50COURT CLERK I 1.00 1.00 1.00
U54COURT CLERK II 1.00 1.00 1.00
U63COURT CLERK, SUPERVISOR 4.00 4.00 4.00
U58PROGRAM SPECIALIST 2.00 2.00 2.00
U46OFFICE ASSISTANT 1.00 1.00 1.00
U72ACCOUNTANT 1.00 1.00 1.00
ZCLERK OF COURT, CLERK, CRIMINAL DISTRICT COURT 1.00 1.00 1.00
8610 CLERK ADMINISTRATION TOTAL 21.00 21.00 21.00
8620 CLERK PRE-COURT
U67ADMINISTRATIVE SUPPORT SPECIALIST 1.00 1.00 1.00
U50COURT CLERK I 12.50 12.50 12.50
U54COURT CLERK II 3.00 3.00 3.00
U54OFFICE SUPPORT SPECIALIST 1.00 1.00 1.00
U50CLERK I 4.00 4.00 4.00
8620 CLERK PRE-COURT TOTAL 21.50 21.50 21.50
8630 CLERK IN-COURT
U26DOCKET CLERK 3.00 3.00 3.00
U80MANAGEMENT SERVICES SUPERVISOR 1.00 1.00 1.00
U67ADMINISTRATIVE SUPPORT SPECIALIST 1.00 1.00 1.00
U50COURT CLERK I 10.00 10.00 10.00
U54COURT CLERK II 4.00 4.00 4.00
Page 525
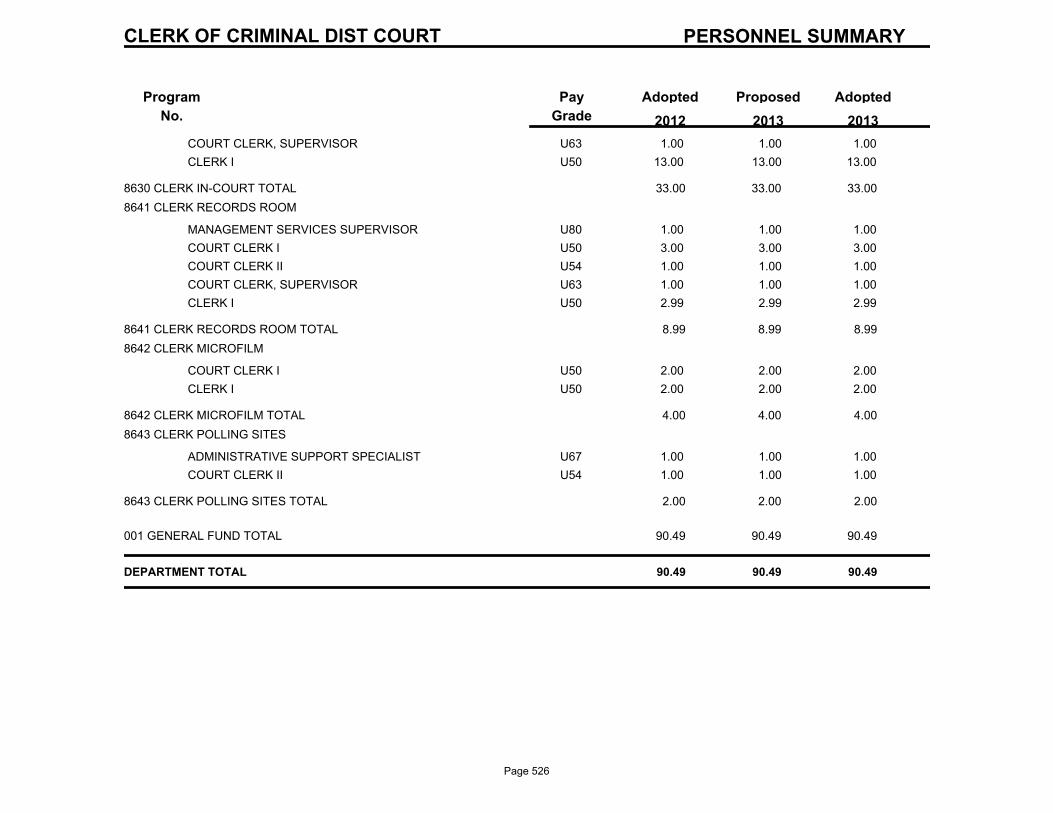
PERSONNEL SUMMARY
Program
No.
ProposedAdoptedPay
Grade
Adopted
2013 2012 2013
CLERK OF CRIMINAL DIST COURT
U63COURT CLERK, SUPERVISOR 1.00 1.00 1.00
U50CLERK I 13.00 13.00 13.00
8630 CLERK IN-COURT TOTAL 33.00 33.00 33.00
8641 CLERK RECORDS ROOM
U80MANAGEMENT SERVICES SUPERVISOR 1.00 1.00 1.00
U50COURT CLERK I 3.00 3.00 3.00
U54COURT CLERK II 1.00 1.00 1.00
U63COURT CLERK, SUPERVISOR 1.00 1.00 1.00
U50CLERK I 2.99 2.99 2.99
8641 CLERK RECORDS ROOM TOTAL 8.99 8.99 8.99
8642 CLERK MICROFILM
U50COURT CLERK I 2.00 2.00 2.00
U50CLERK I 2.00 2.00 2.00
8642 CLERK MICROFILM TOTAL 4.00 4.00 4.00
8643 CLERK POLLING SITES
U67ADMINISTRATIVE SUPPORT SPECIALIST 1.00 1.00 1.00
U54COURT CLERK II 1.00 1.00 1.00
8643 CLERK POLLING SITES TOTAL 2.00 2.00 2.00
001 GENERAL FUND TOTAL 90.49 90.49 90.49
DEPARTMENT TOTAL 90.49 90.49 90.49
Page 526

Page 527

Registrar of Voters
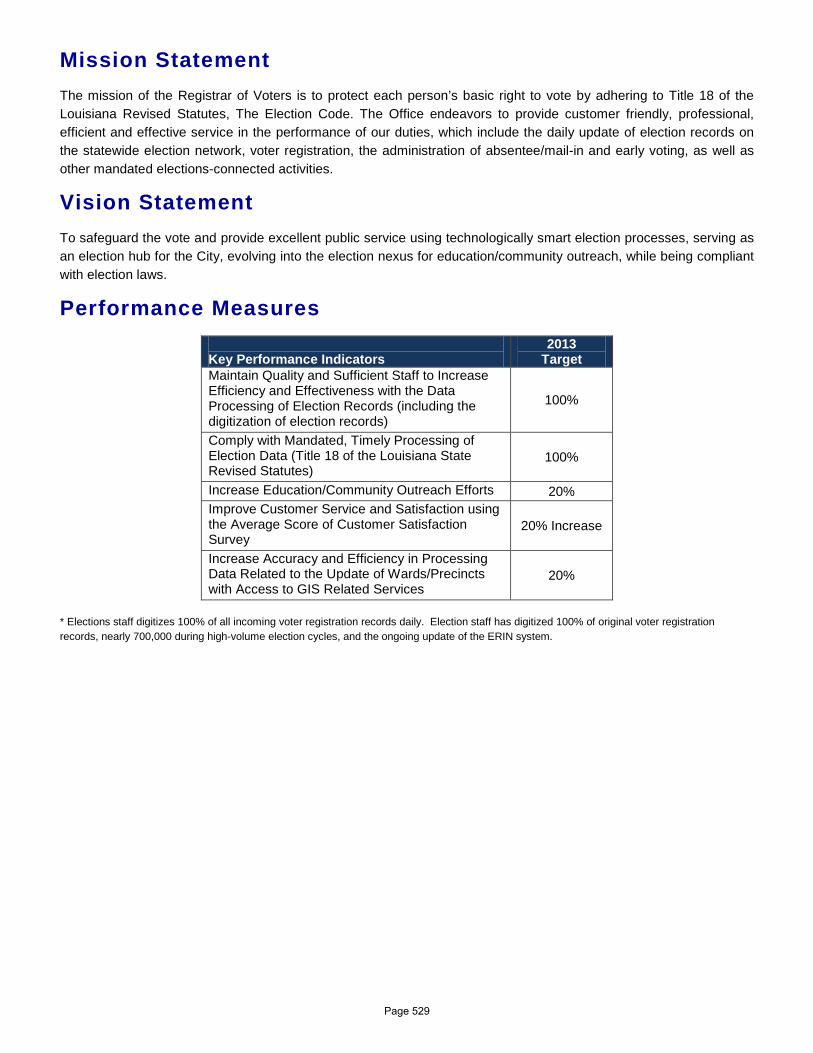
Mission Statement The mission of the Registrar of Voters is to protect each person’s basic right to vote by adhering to Title 18 of the Louisiana Revised Statutes, The Election Code. The Office endeavors to provide customer friendly, professional, efficient and effective service in the performance of our duties, which include the daily update of election records on the statewide election network, voter registration, the administration of absentee/mail-in and early voting, as well as other mandated elections-connected activities.
Vision Statement To safeguard the vote and provide excellent public service using technologically smart election processes, serving as an election hub for the City, evolving into the election nexus for education/community outreach, while being compliant with election laws.
Performance Measures Key Performance Indicators
2013 Target
Maintain Quality and Sufficient Staff to Increase Efficiency and Effectiveness with the Data Processing of Election Records (including the digitization of election records)
100%
Comply with Mandated, Timely Processing of Election Data (Title 18 of the Louisiana State Revised Statutes)
100%
Increase Education/Community Outreach Efforts 20% Improve Customer Service and Satisfaction using the Average Score of Customer Satisfaction Survey
20% Increase
Increase Accuracy and Efficiency in Processing Data Related to the Update of Wards/Precincts with Access to GIS Related Services
20%
* Elections staff digitizes 100% of all incoming voter registration records daily. Election staff has digitized 100% of original voter registration records, nearly 700,000 during high-volume election cycles, and the ongoing update of the ERIN system.
Page 529
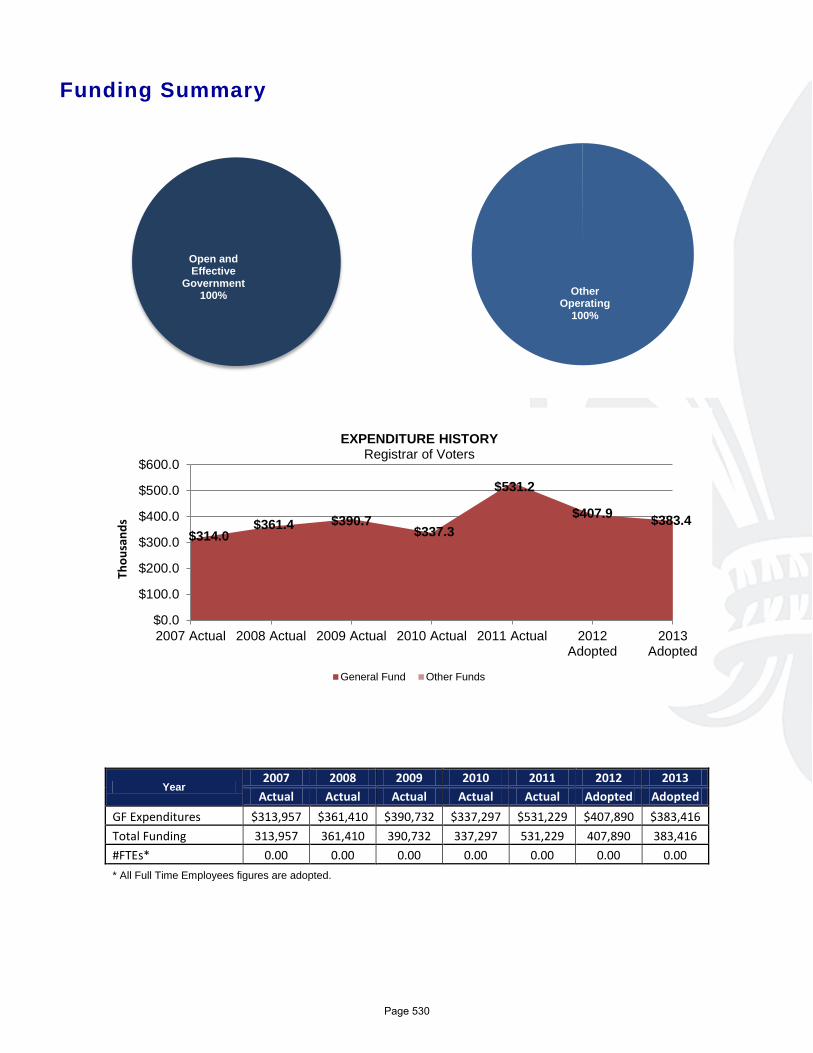
Funding Summary
Year 2007 2008 2009 2010 2011 2012 2013
Actual Actual Actual Actual Actual Adopted Adopted GF Expenditures $313,957 $361,410 $390,732 $337,297 $531,229 $407,890 $383,416 Total Funding 313,957 361,410 390,732 337,297 531,229 407,890 383,416 #FTEs* 0.00 0.00 0.00 0.00 0.00 0.00 0.00 * All Full Time Employees figures are adopted.
$314.0 $361.4 $390.7
$337.3
$531.2
$407.9 $383.4
$0.0
$100.0
$200.0
$300.0
$400.0
$500.0
$600.0
2007 Actual 2008 Actual 2009 Actual 2010 Actual 2011 Actual 2012Adopted
2013Adopted
Thou
sand
s
EXPENDITURE HISTORY Registrar of Voters
General Fund Other Funds
Open and Effective
Government 100% Other
Operating 100%
Personal Services
0%
Page 530
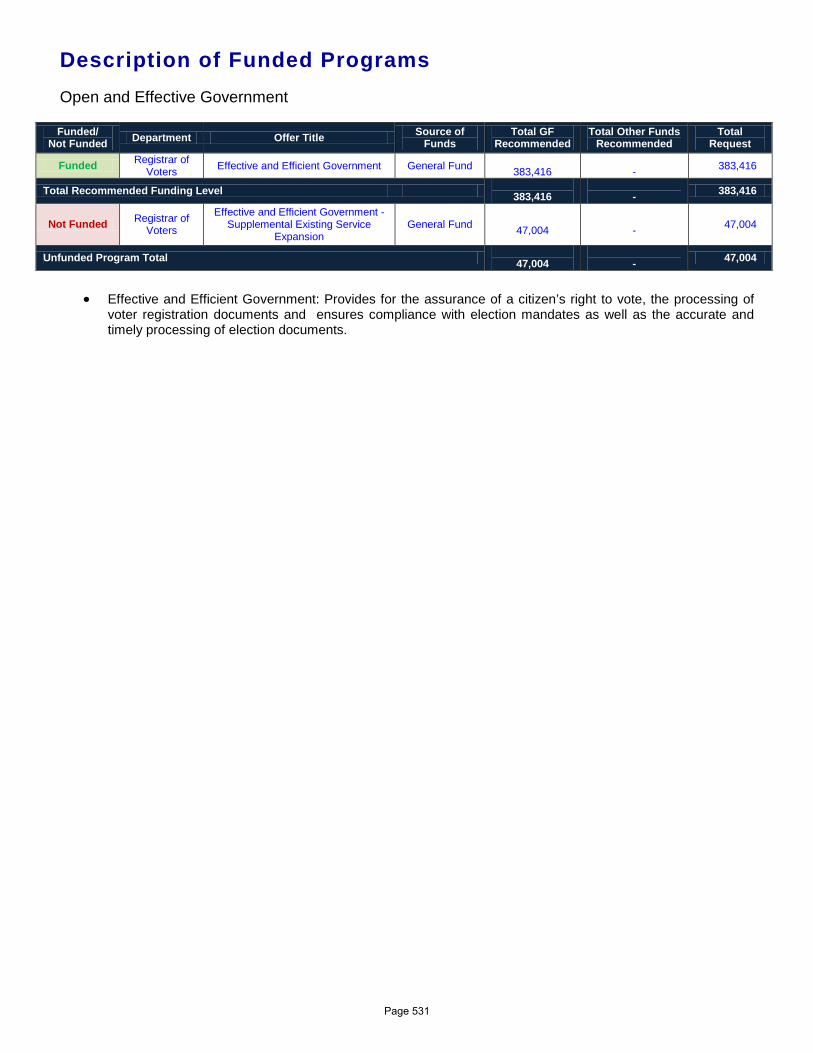
Description of Funded Programs Open and Effective Government Funded/
Not Funded Department Offer Title Source of Funds
Total GF Recommended
Total Other Funds Recommended
Total Request
Funded Registrar of Voters Effective and Efficient Government General Fund
383,416 - 383,416
Total Recommended Funding Level 383,416
- 383,416
Not Funded Registrar of Voters
Effective and Efficient Government - Supplemental Existing Service
Expansion General Fund
47,004 - 47,004
Unfunded Program Total 47,004
- 47,004
• Effective and Efficient Government: Provides for the assurance of a citizen’s right to vote, the processing of
voter registration documents and ensures compliance with election mandates as well as the accurate and timely processing of election documents.
Page 531
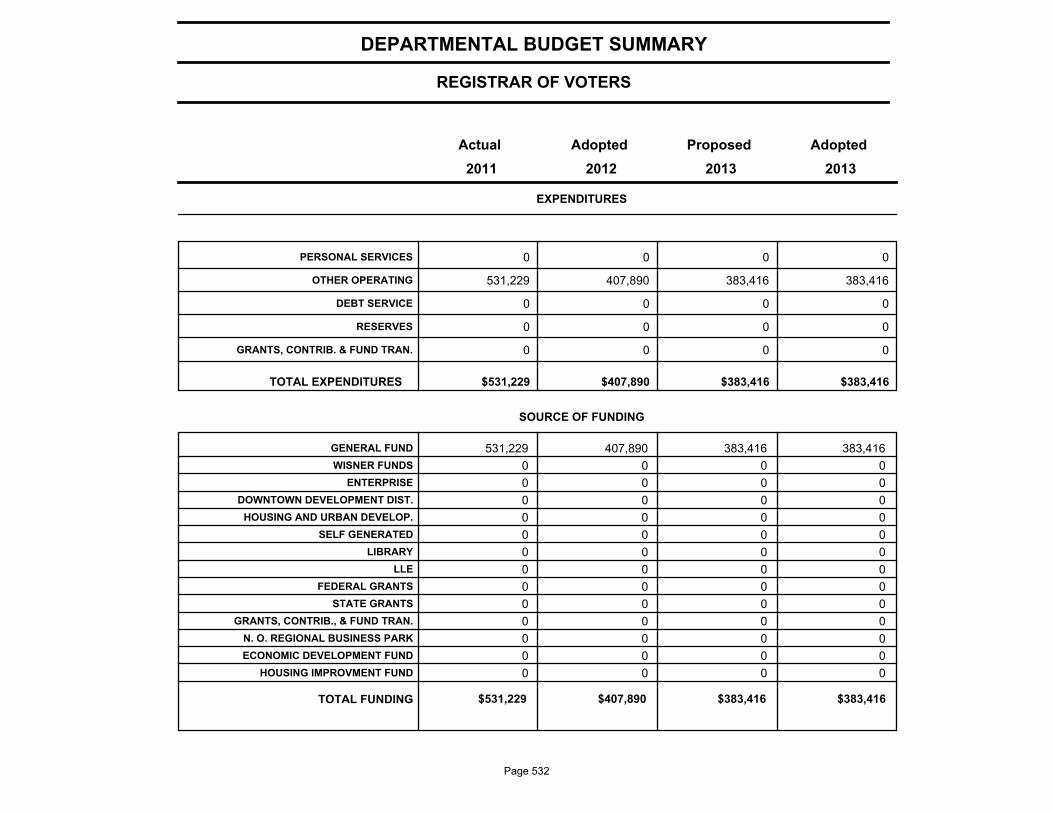
REGISTRAR OF VOTERS
DEPARTMENTAL BUDGET SUMMARY
AdoptedProposedAdoptedActual
EXPENDITURES
2013 2012 2011 2013
PERSONAL SERVICES 0 0 0 0
OTHER OPERATING 531,229 407,890 383,416 383,416
DEBT SERVICE 0 0 0 0
RESERVES 0 0 0 0
GRANTS, CONTRIB. & FUND TRAN. 0 0 0 0
$531,229 $407,890 $383,416 TOTAL EXPENDITURES $383,416
SOURCE OF FUNDING
GENERAL FUND 531,229 407,890 383,416 383,416
WISNER FUNDS 0 0 0 0
ENTERPRISE 0 0 0 0
DOWNTOWN DEVELOPMENT DIST. 0 0 0 0
HOUSING AND URBAN DEVELOP. 0 0 0 0
SELF GENERATED 0 0 0 0
LIBRARY 0 0 0 0
LLE 0 0 0 0
FEDERAL GRANTS 0 0 0 0
STATE GRANTS 0 0 0 0
GRANTS, CONTRIB., & FUND TRAN. 0 0 0 0
N. O. REGIONAL BUSINESS PARK 0 0 0 0
ECONOMIC DEVELOPMENT FUND 0 0 0 0
HOUSING IMPROVMENT FUND 0 0 0 0
$531,229 $407,890 $383,416 TOTAL FUNDING $383,416
Page 532
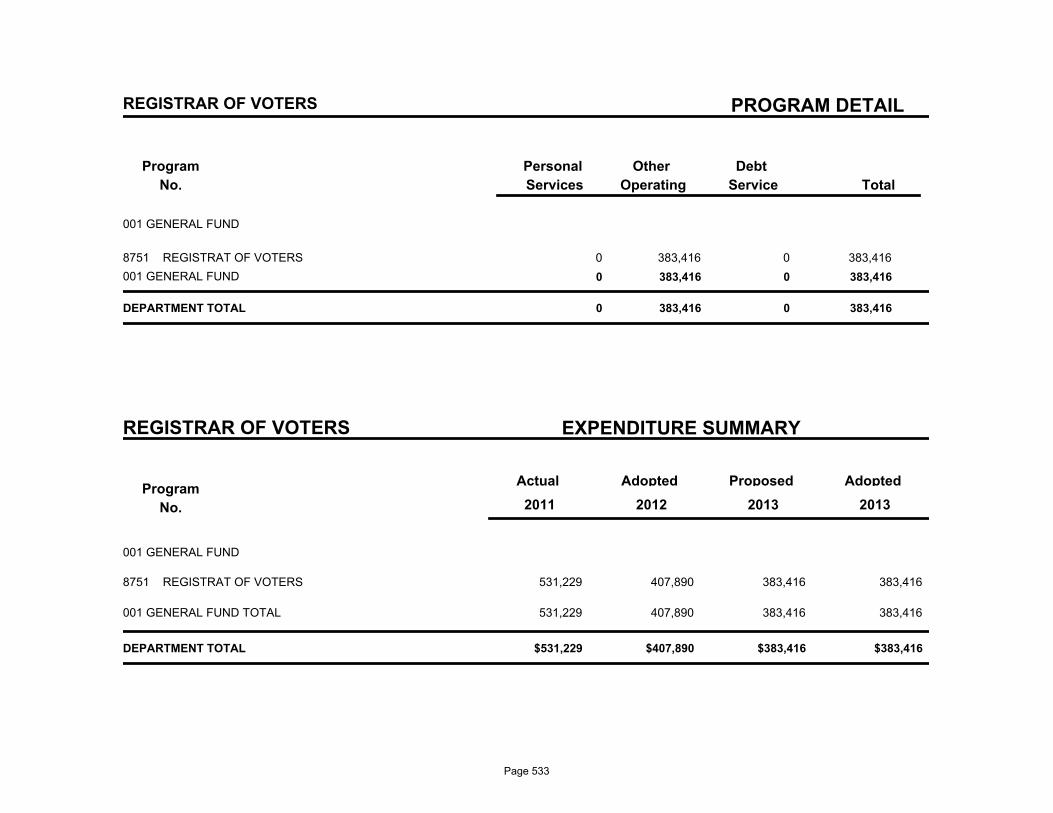
PROGRAM DETAIL
Program
No.
Debt
Service
Other
Operating
Personal
Services Total
REGISTRAR OF VOTERS
001 GENERAL FUND
8751 REGISTRAT OF VOTERS 0 383,416 0 383,416
001 GENERAL FUND 0 383,416 0 383,416
DEPARTMENT TOTAL 0 383,416 0 383,416
REGISTRAR OF VOTERS EXPENDITURE SUMMARY
Program
No.
Actual AdoptedProposedAdopted
2013 2011 2012 2013
001 GENERAL FUND
531,229 407,890 383,416 REGISTRAT OF VOTERS8751 383,416
531,229 407,890 383,416 383,416 001 GENERAL FUND TOTAL
$531,229 $407,890 $383,416 $383,416 DEPARTMENT TOTAL
Page 533

Judicial Retirement
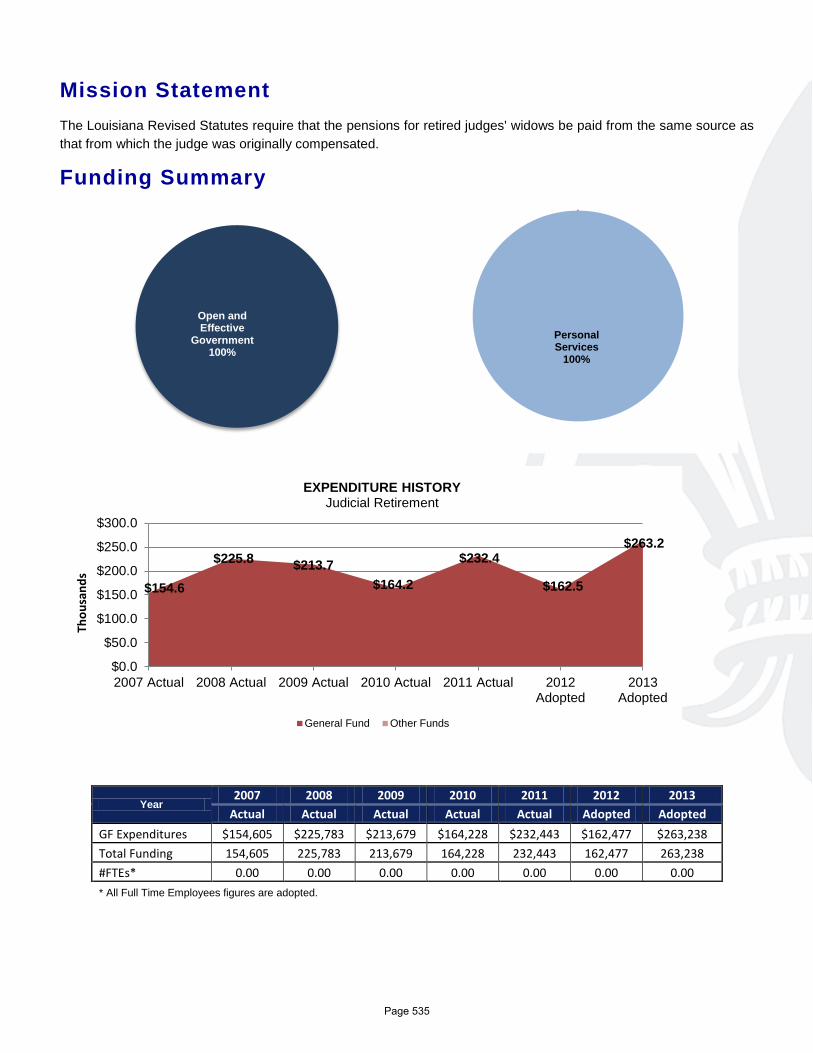
Mission Statement The Louisiana Revised Statutes require that the pensions for retired judges' widows be paid from the same source as that from which the judge was originally compensated.
Funding Summary
Year 2007 2008 2009 2010 2011 2012 2013
Actual Actual Actual Actual Actual Adopted Adopted GF Expenditures $154,605 $225,783 $213,679 $164,228 $232,443 $162,477 $263,238 Total Funding 154,605 225,783 213,679 164,228 232,443 162,477 263,238 #FTEs* 0.00 0.00 0.00 0.00 0.00 0.00 0.00 * All Full Time Employees figures are adopted.
$154.6
$225.8 $213.7 $164.2
$232.4
$162.5
$263.2
$0.0
$50.0
$100.0
$150.0
$200.0
$250.0
$300.0
2007 Actual 2008 Actual 2009 Actual 2010 Actual 2011 Actual 2012Adopted
2013Adopted
Thou
sand
s
EXPENDITURE HISTORY Judicial Retirement
General Fund Other Funds
Open and Effective
Government 100%
Personal Services
100%
Page 535
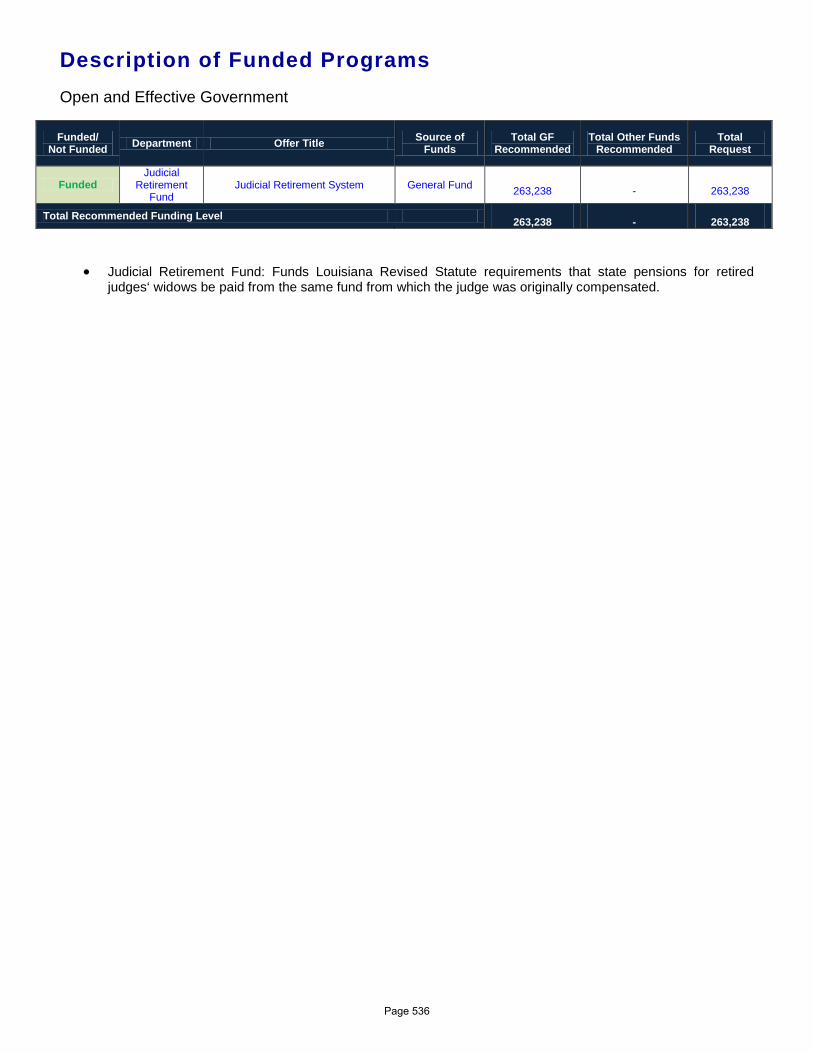
Description of Funded Programs Open and Effective Government
Funded/ Not Funded Department Offer Title Source of
Funds Total GF
Recommended Total Other Funds
Recommended Total
Request
Funded Judicial
Retirement Fund
Judicial Retirement System General Fund 263,238
-
263,238
Total Recommended Funding Level 263,238
-
263,238
• Judicial Retirement Fund: Funds Louisiana Revised Statute requirements that state pensions for retired judges‘ widows be paid from the same fund from which the judge was originally compensated.
Page 536

JUDICIAL RETIREMENT
DEPARTMENTAL BUDGET SUMMARY
AdoptedProposedAdoptedActual
EXPENDITURES
2013 2012 2011 2013
PERSONAL SERVICES 232,443 162,477 263,238 263,238
OTHER OPERATING 0 0 0 0
DEBT SERVICE 0 0 0 0
RESERVES 0 0 0 0
GRANTS, CONTRIB. & FUND TRAN. 0 0 0 0
$232,443 $162,477 $263,238 TOTAL EXPENDITURES $263,238
SOURCE OF FUNDING
GENERAL FUND 232,443 162,477 263,238 263,238
WISNER FUNDS 0 0 0 0
ENTERPRISE 0 0 0 0
DOWNTOWN DEVELOPMENT DIST. 0 0 0 0
HOUSING AND URBAN DEVELOP. 0 0 0 0
SELF GENERATED 0 0 0 0
LIBRARY 0 0 0 0
LLE 0 0 0 0
FEDERAL GRANTS 0 0 0 0
STATE GRANTS 0 0 0 0
GRANTS, CONTRIB., & FUND TRAN. 0 0 0 0
N. O. REGIONAL BUSINESS PARK 0 0 0 0
ECONOMIC DEVELOPMENT FUND 0 0 0 0
HOUSING IMPROVMENT FUND 0 0 0 0
$232,443 $162,477 $263,238 TOTAL FUNDING $263,238
Page 537
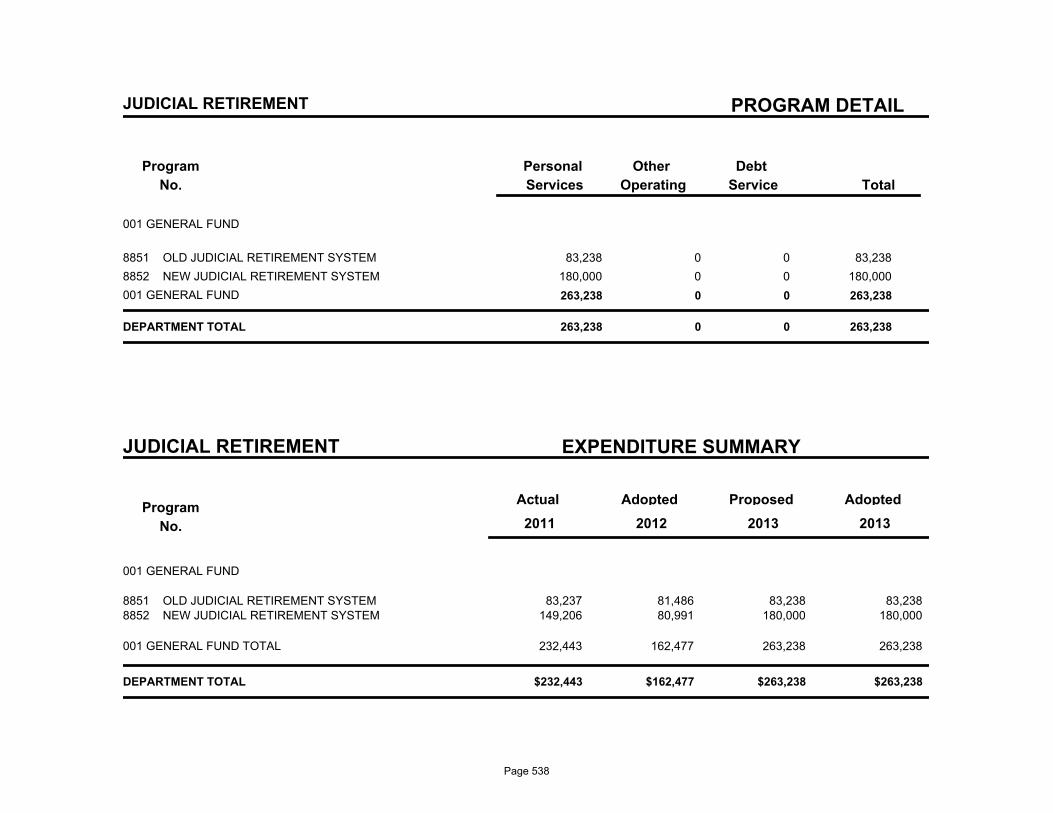
PROGRAM DETAIL
Program
No.
Debt
Service
Other
Operating
Personal
Services Total
JUDICIAL RETIREMENT
001 GENERAL FUND
8851 OLD JUDICIAL RETIREMENT SYSTEM 83,238 0 0 83,238
8852 NEW JUDICIAL RETIREMENT SYSTEM 180,000 0 0 180,000
001 GENERAL FUND 263,238 0 0 263,238
DEPARTMENT TOTAL 263,238 0 0 263,238
JUDICIAL RETIREMENT EXPENDITURE SUMMARY
Program
No.
Actual AdoptedProposedAdopted
2013 2011 2012 2013
001 GENERAL FUND
83,237 81,486 83,238 OLD JUDICIAL RETIREMENT SYSTEM8851 83,238 149,206 80,991 180,000 NEW JUDICIAL RETIREMENT SYSTEM8852 180,000
232,443 162,477 263,238 263,238 001 GENERAL FUND TOTAL
$232,443 $162,477 $263,238 $263,238 DEPARTMENT TOTAL
Page 538

Page 539

Enterprise Funds
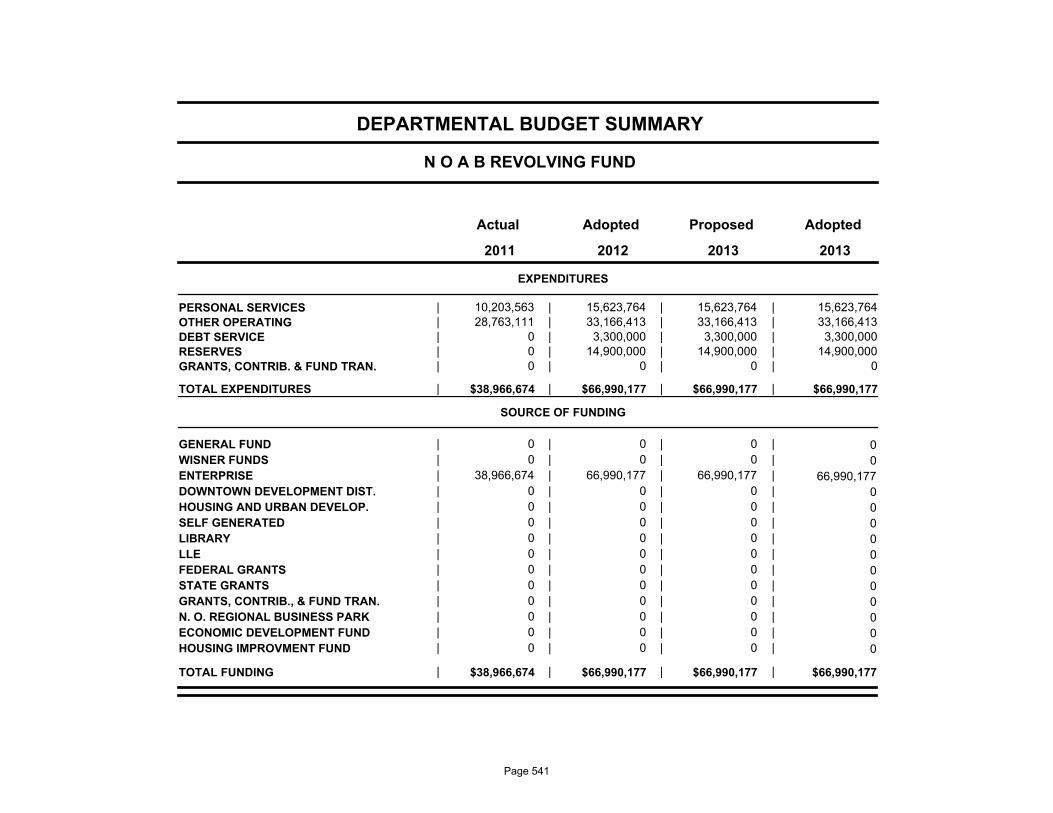
N O A B REVOLVING FUND
DEPARTMENTAL BUDGET SUMMARY
AdoptedProposedAdoptedActual
EXPENDITURES
2011 2012 2013 2013
PERSONAL SERVICES 10,203,563 15,623,764 15,623,764 | | | | 15,623,764
OTHER OPERATING 28,763,111 33,166,413 33,166,413 | | | | 33,166,413
DEBT SERVICE 0 3,300,000 3,300,000 | | | | 3,300,000
RESERVES 0 14,900,000 14,900,000 | | | | 14,900,000
GRANTS, CONTRIB. & FUND TRAN. 0 0 0 | | | | 0
$38,966,674 $66,990,177 $66,990,177 TOTAL EXPENDITURES | | | | $66,990,177
SOURCE OF FUNDING
GENERAL FUND 0 0 0 | | | | 0
WISNER FUNDS 0 0 0 | | | | 0
ENTERPRISE 38,966,674 66,990,177 66,990,177 | | | | 66,990,177
DOWNTOWN DEVELOPMENT DIST. 0 0 0 | | | | 0
HOUSING AND URBAN DEVELOP. 0 0 0 | | | | 0
SELF GENERATED 0 0 0 | | | | 0
LIBRARY 0 0 0 | | | | 0
LLE 0 0 0 | | | | 0
FEDERAL GRANTS 0 0 0 | | | | 0
STATE GRANTS 0 0 0 | | | | 0
GRANTS, CONTRIB., & FUND TRAN. 0 0 0 | | | | 0
N. O. REGIONAL BUSINESS PARK 0 0 0 | | | | 0
ECONOMIC DEVELOPMENT FUND 0 0 0 | | | | 0
HOUSING IMPROVMENT FUND 0 0 0 | | | | 0
$38,966,674 $66,990,177 $66,990,177 TOTAL FUNDING | | | | $66,990,177
Page 541
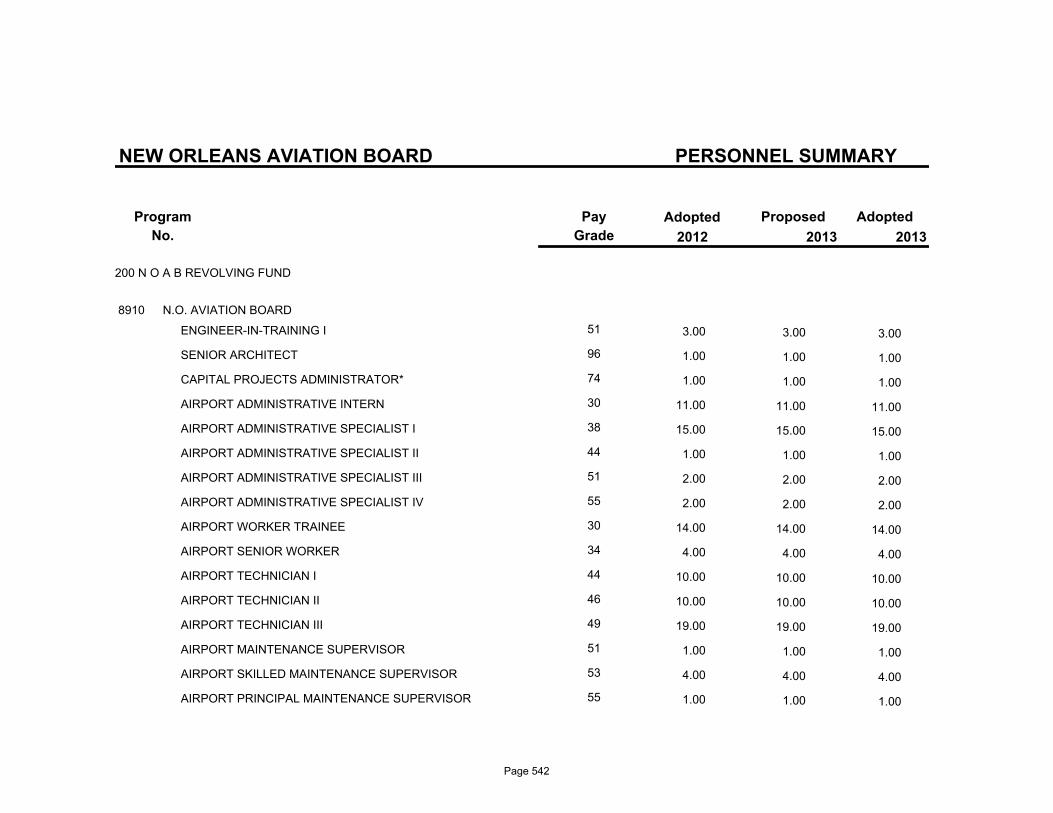
PERSONNEL SUMMARY
Program
No.
ProposedAdoptedPay
Grade
Adopted
NEW ORLEANS AVIATION BOARD
2013 2013 2012
200 N O A B REVOLVING FUND
8910 N.O. AVIATION BOARD
ENGINEER-IN-TRAINING I 51 3.00 3.00 3.00
SENIOR ARCHITECT 96 1.00 1.00 1.00
CAPITAL PROJECTS ADMINISTRATOR* 74 1.00 1.00 1.00
AIRPORT ADMINISTRATIVE INTERN 30 11.00 11.00 11.00
AIRPORT ADMINISTRATIVE SPECIALIST I 38 15.00 15.00 15.00
AIRPORT ADMINISTRATIVE SPECIALIST II 44 1.00 1.00 1.00
AIRPORT ADMINISTRATIVE SPECIALIST III 51 2.00 2.00 2.00
AIRPORT ADMINISTRATIVE SPECIALIST IV 55 2.00 2.00 2.00
AIRPORT WORKER TRAINEE 30 14.00 14.00 14.00
AIRPORT SENIOR WORKER 34 4.00 4.00 4.00
AIRPORT TECHNICIAN I 44 10.00 10.00 10.00
AIRPORT TECHNICIAN II 46 10.00 10.00 10.00
AIRPORT TECHNICIAN III 49 19.00 19.00 19.00
AIRPORT MAINTENANCE SUPERVISOR 51 1.00 1.00 1.00
AIRPORT SKILLED MAINTENANCE SUPERVISOR 53 4.00 4.00 4.00
AIRPORT PRINCIPAL MAINTENANCE SUPERVISOR 55 1.00 1.00 1.00
Page 542
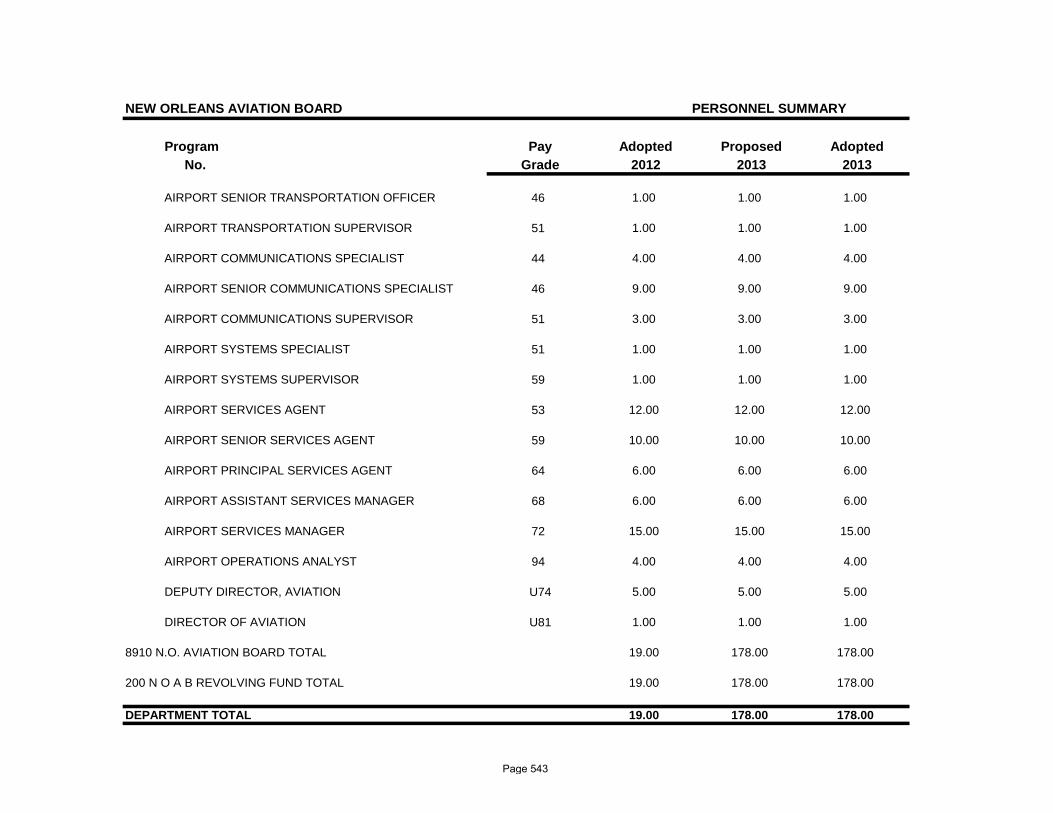
NEW ORLEANS AVIATION BOARD PERSONNEL SUMMARY
Program Pay Adopted Proposed AdoptedNo. Grade 2012 2013 2013
AIRPORT SENIOR TRANSPORTATION OFFICER 46 1.00 1.00 1.00
AIRPORT TRANSPORTATION SUPERVISOR 51 1.00 1.00 1.00
AIRPORT COMMUNICATIONS SPECIALIST 44 4.00 4.00 4.00
AIRPORT SENIOR COMMUNICATIONS SPECIALIST 46 9.00 9.00 9.00
AIRPORT COMMUNICATIONS SUPERVISOR 51 3.00 3.00 3.00
AIRPORT SYSTEMS SPECIALIST 51 1.00 1.00 1.00
AIRPORT SYSTEMS SUPERVISOR 59 1.00 1.00 1.00
AIRPORT SERVICES AGENT 53 12.00 12.00 12.00
AIRPORT SENIOR SERVICES AGENT 59 10.00 10.00 10.00
AIRPORT PRINCIPAL SERVICES AGENT 64 6.00 6.00 6.00
AIRPORT ASSISTANT SERVICES MANAGER 68 6.00 6.00 6.00
AIRPORT SERVICES MANAGER 72 15.00 15.00 15.00
AIRPORT OPERATIONS ANALYST 94 4.00 4.00 4.00
DEPUTY DIRECTOR, AVIATION U74 5.00 5.00 5.00
DIRECTOR OF AVIATION U81 1.00 1.00 1.00
8910 N.O. AVIATION BOARD TOTAL 19.00 178.00 178.00
200 N O A B REVOLVING FUND TOTAL 19.00 178.00 178.00
DEPARTMENT TOTAL 19.00 178.00 178.00
Page 543

DELGADO ALBANIA REVOLVING
DEPARTMENTAL BUDGET SUMMARY
AdoptedProposedAdoptedActual
EXPENDITURES
2011 2012 2013 2013
PERSONAL SERVICES 0 0 0 | | | | 0
OTHER OPERATING 10,000 37,000 37,000 | | | | 37,000
DEBT SERVICE 0 0 0 | | | | 0
RESERVES 0 0 0 | | | | 0
GRANTS, CONTRIB. & FUND TRAN. 0 0 0 | | | | 0
$10,000 $37,000 $37,000 TOTAL EXPENDITURES | | | | $37,000
SOURCE OF FUNDING
GENERAL FUND 0 0 0 | | | | 0
WISNER FUNDS 0 0 0 | | | | 0
ENTERPRISE 10,000 37,000 37,000 | | | | 37,000
DOWNTOWN DEVELOPMENT DIST. 0 0 0 | | | | 0
HOUSING AND URBAN DEVELOP. 0 0 0 | | | | 0
SELF GENERATED 0 0 0 | | | | 0
LIBRARY 0 0 0 | | | | 0
LLE 0 0 0 | | | | 0
FEDERAL GRANTS 0 0 0 | | | | 0
STATE GRANTS 0 0 0 | | | | 0
GRANTS, CONTRIB., & FUND TRAN. 0 0 0 | | | | 0
N. O. REGIONAL BUSINESS PARK 0 0 0 | | | | 0
ECONOMIC DEVELOPMENT FUND 0 0 0 | | | | 0
HOUSING IMPROVMENT FUND 0 0 0 | | | | 0
$10,000 $37,000 $37,000 TOTAL FUNDING | | | | $37,000
Page 544
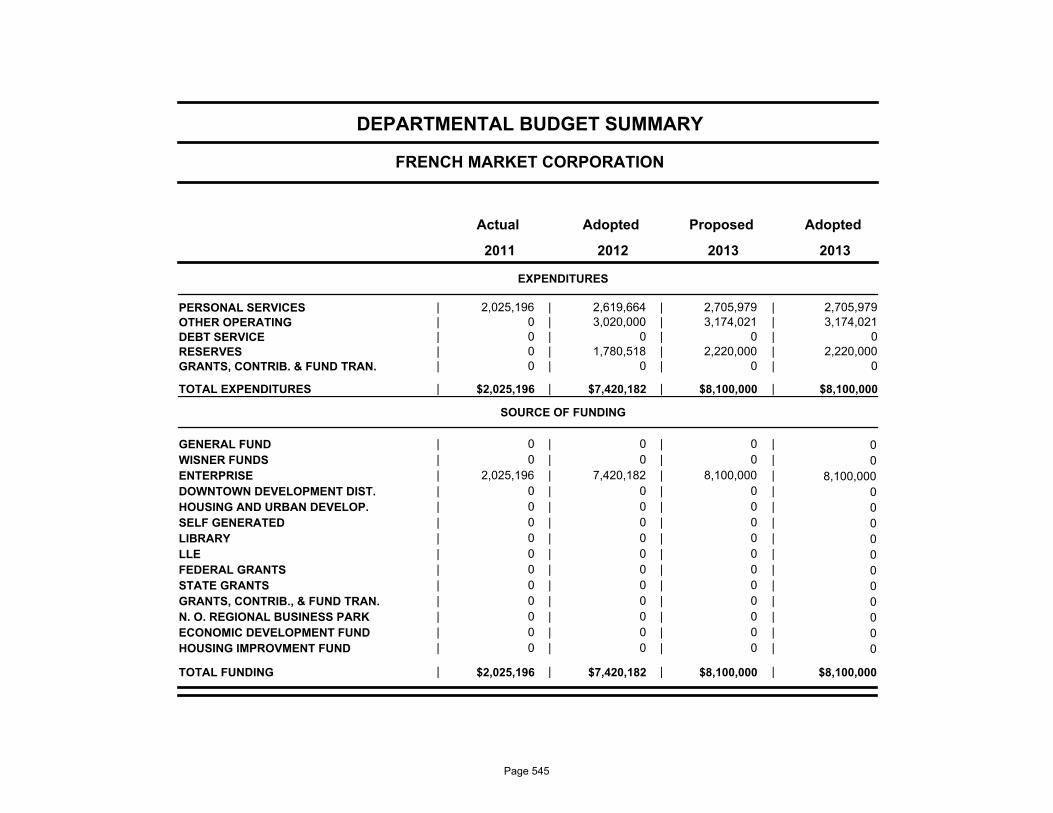
FRENCH MARKET CORPORATION
DEPARTMENTAL BUDGET SUMMARY
AdoptedProposedAdoptedActual
EXPENDITURES
2011 2012 2013 2013
PERSONAL SERVICES 2,025,196 2,619,664 2,705,979 | | | | 2,705,979
OTHER OPERATING 0 3,020,000 3,174,021 | | | | 3,174,021
DEBT SERVICE 0 0 0 | | | | 0
RESERVES 0 1,780,518 2,220,000 | | | | 2,220,000
GRANTS, CONTRIB. & FUND TRAN. 0 0 0 | | | | 0
$2,025,196 $7,420,182 $8,100,000 TOTAL EXPENDITURES | | | | $8,100,000
SOURCE OF FUNDING
GENERAL FUND 0 0 0 | | | | 0
WISNER FUNDS 0 0 0 | | | | 0
ENTERPRISE 2,025,196 7,420,182 8,100,000 | | | | 8,100,000
DOWNTOWN DEVELOPMENT DIST. 0 0 0 | | | | 0
HOUSING AND URBAN DEVELOP. 0 0 0 | | | | 0
SELF GENERATED 0 0 0 | | | | 0
LIBRARY 0 0 0 | | | | 0
LLE 0 0 0 | | | | 0
FEDERAL GRANTS 0 0 0 | | | | 0
STATE GRANTS 0 0 0 | | | | 0
GRANTS, CONTRIB., & FUND TRAN. 0 0 0 | | | | 0
N. O. REGIONAL BUSINESS PARK 0 0 0 | | | | 0
ECONOMIC DEVELOPMENT FUND 0 0 0 | | | | 0
HOUSING IMPROVMENT FUND 0 0 0 | | | | 0
$2,025,196 $7,420,182 $8,100,000 TOTAL FUNDING | | | | $8,100,000
Page 545
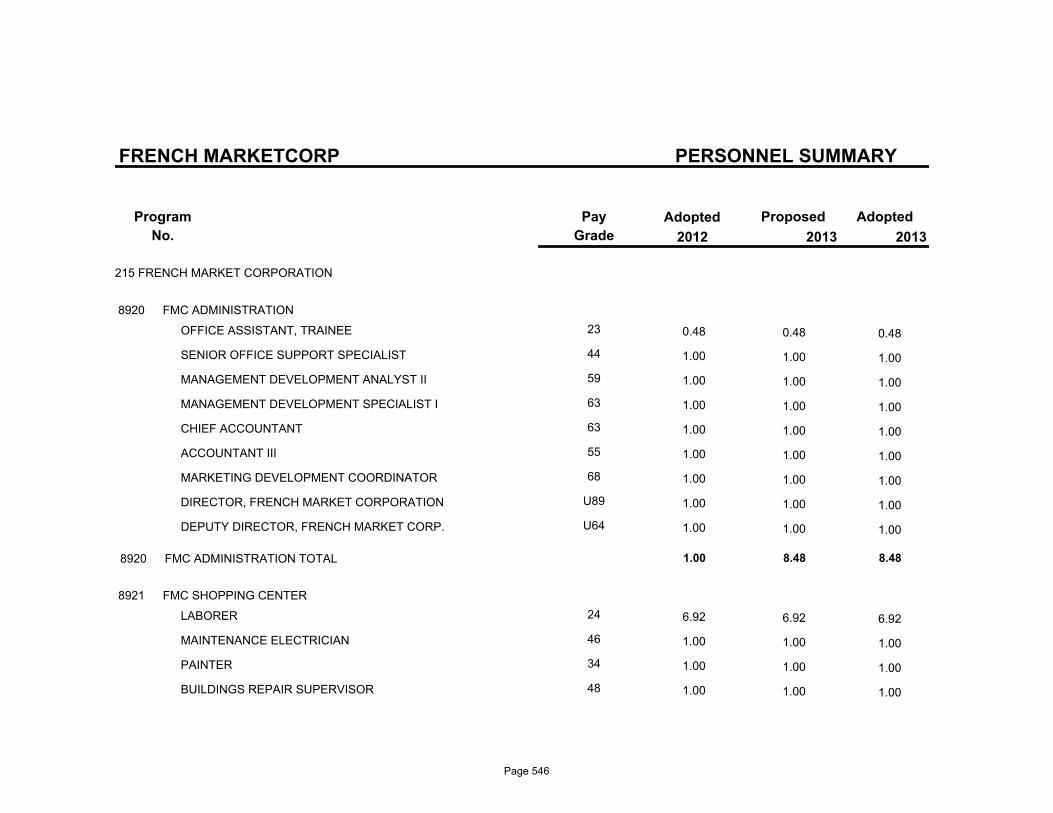
PERSONNEL SUMMARY
Program
No.
ProposedAdoptedPay
Grade
Adopted
FRENCH MARKETCORP
2013 2013 2012
215 FRENCH MARKET CORPORATION
8920 FMC ADMINISTRATION
OFFICE ASSISTANT, TRAINEE 23 0.48 0.48 0.48
SENIOR OFFICE SUPPORT SPECIALIST 44 1.00 1.00 1.00
MANAGEMENT DEVELOPMENT ANALYST II 59 1.00 1.00 1.00
MANAGEMENT DEVELOPMENT SPECIALIST I 63 1.00 1.00 1.00
CHIEF ACCOUNTANT 63 1.00 1.00 1.00
ACCOUNTANT III 55 1.00 1.00 1.00
MARKETING DEVELOPMENT COORDINATOR 68 1.00 1.00 1.00
DIRECTOR, FRENCH MARKET CORPORATION U89 1.00 1.00 1.00
DEPUTY DIRECTOR, FRENCH MARKET CORP. U64 1.00 1.00 1.00
8920 FMC ADMINISTRATION TOTAL 1.00 8.48 8.48
8921 FMC SHOPPING CENTER
LABORER 24 6.92 6.92 6.92
MAINTENANCE ELECTRICIAN 46 1.00 1.00 1.00
PAINTER 34 1.00 1.00 1.00
BUILDINGS REPAIR SUPERVISOR 48 1.00 1.00 1.00
Page 546
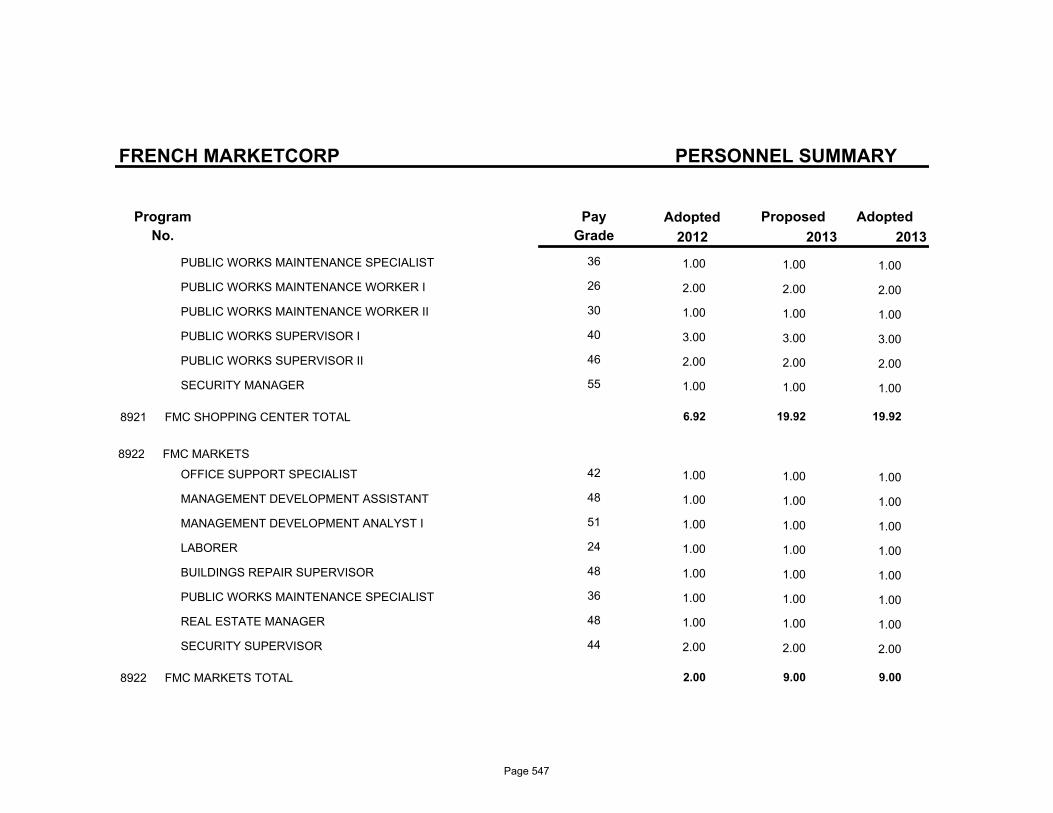
PERSONNEL SUMMARY
Program
No.
ProposedAdoptedPay
Grade
Adopted
FRENCH MARKETCORP
2013 2013 2012
PUBLIC WORKS MAINTENANCE SPECIALIST 36 1.00 1.00 1.00
PUBLIC WORKS MAINTENANCE WORKER I 26 2.00 2.00 2.00
PUBLIC WORKS MAINTENANCE WORKER II 30 1.00 1.00 1.00
PUBLIC WORKS SUPERVISOR I 40 3.00 3.00 3.00
PUBLIC WORKS SUPERVISOR II 46 2.00 2.00 2.00
SECURITY MANAGER 55 1.00 1.00 1.00
8921 FMC SHOPPING CENTER TOTAL 6.92 19.92 19.92
8922 FMC MARKETS
OFFICE SUPPORT SPECIALIST 42 1.00 1.00 1.00
MANAGEMENT DEVELOPMENT ASSISTANT 48 1.00 1.00 1.00
MANAGEMENT DEVELOPMENT ANALYST I 51 1.00 1.00 1.00
LABORER 24 1.00 1.00 1.00
BUILDINGS REPAIR SUPERVISOR 48 1.00 1.00 1.00
PUBLIC WORKS MAINTENANCE SPECIALIST 36 1.00 1.00 1.00
REAL ESTATE MANAGER 48 1.00 1.00 1.00
SECURITY SUPERVISOR 44 2.00 2.00 2.00
8922 FMC MARKETS TOTAL 2.00 9.00 9.00
Page 547
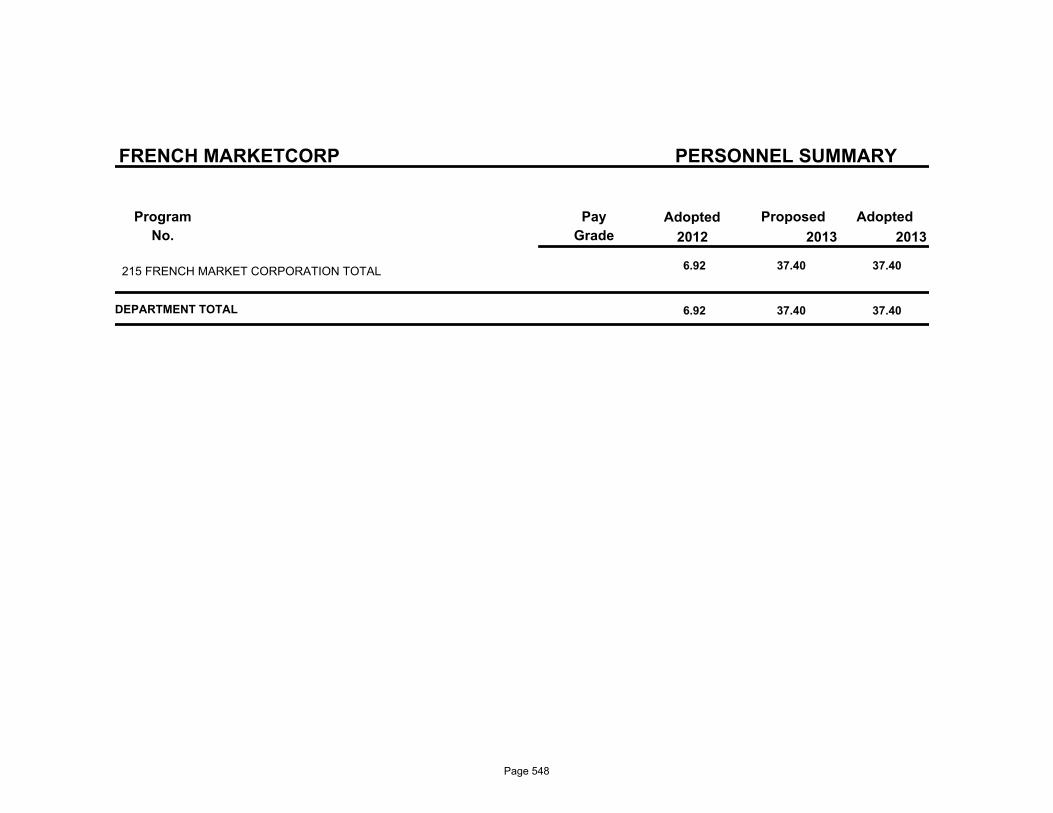
PERSONNEL SUMMARY
Program
No.
ProposedAdoptedPay
Grade
Adopted
FRENCH MARKETCORP
2013 2013 2012
37.40 37.40 6.92215 FRENCH MARKET CORPORATION TOTAL
DEPARTMENT TOTAL 6.92 37.40 37.40
Page 548
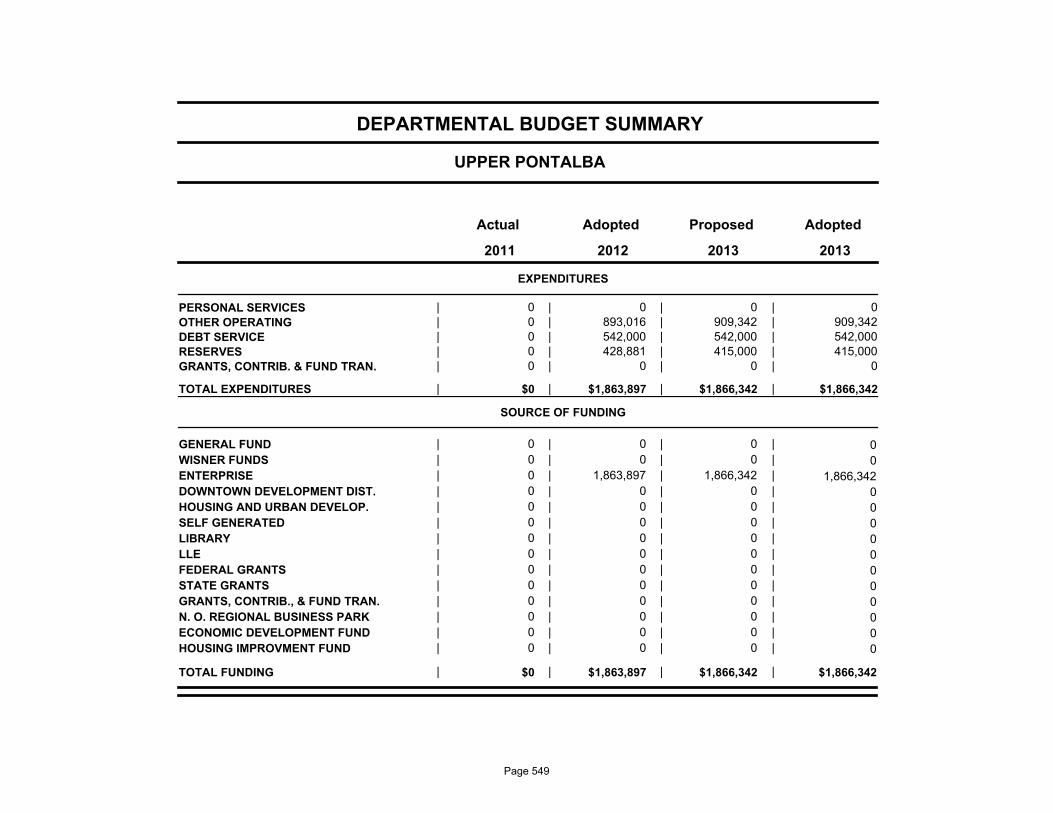
UPPER PONTALBA
DEPARTMENTAL BUDGET SUMMARY
AdoptedProposedAdoptedActual
EXPENDITURES
2011 2012 2013 2013
PERSONAL SERVICES 0 0 0 | | | | 0
OTHER OPERATING 0 893,016 909,342 | | | | 909,342
DEBT SERVICE 0 542,000 542,000 | | | | 542,000
RESERVES 0 428,881 415,000 | | | | 415,000
GRANTS, CONTRIB. & FUND TRAN. 0 0 0 | | | | 0
$0 $1,863,897 $1,866,342 TOTAL EXPENDITURES | | | | $1,866,342
SOURCE OF FUNDING
GENERAL FUND 0 0 0 | | | | 0
WISNER FUNDS 0 0 0 | | | | 0
ENTERPRISE 0 1,863,897 1,866,342 | | | | 1,866,342
DOWNTOWN DEVELOPMENT DIST. 0 0 0 | | | | 0
HOUSING AND URBAN DEVELOP. 0 0 0 | | | | 0
SELF GENERATED 0 0 0 | | | | 0
LIBRARY 0 0 0 | | | | 0
LLE 0 0 0 | | | | 0
FEDERAL GRANTS 0 0 0 | | | | 0
STATE GRANTS 0 0 0 | | | | 0
GRANTS, CONTRIB., & FUND TRAN. 0 0 0 | | | | 0
N. O. REGIONAL BUSINESS PARK 0 0 0 | | | | 0
ECONOMIC DEVELOPMENT FUND 0 0 0 | | | | 0
HOUSING IMPROVMENT FUND 0 0 0 | | | | 0
$0 $1,863,897 $1,866,342 TOTAL FUNDING | | | | $1,866,342
Page 549

MUN YCHT HBR ENTEPRISE
DEPARTMENTAL BUDGET SUMMARY
AdoptedProposedAdoptedActual
EXPENDITURES
2011 2012 2013 2013
PERSONAL SERVICES 165,420 156,737 312,300 | | | | 312,300
OTHER OPERATING 0 206,235 808,800 | | | | 808,800
DEBT SERVICE 0 0 0 | | | | 0
RESERVES 0 240,000 931,400 | | | | 931,400
GRANTS, CONTRIB. & FUND TRAN. 0 0 0 | | | | 0
$165,420 $602,972 $2,052,500 TOTAL EXPENDITURES | | | | $2,052,500
SOURCE OF FUNDING
GENERAL FUND 0 0 0 | | | | 0
WISNER FUNDS 0 0 0 | | | | 0
ENTERPRISE 165,420 602,972 2,052,500 | | | | 2,052,500
DOWNTOWN DEVELOPMENT DIST. 0 0 0 | | | | 0
HOUSING AND URBAN DEVELOP. 0 0 0 | | | | 0
SELF GENERATED 0 0 0 | | | | 0
LIBRARY 0 0 0 | | | | 0
LLE 0 0 0 | | | | 0
FEDERAL GRANTS 0 0 0 | | | | 0
STATE GRANTS 0 0 0 | | | | 0
GRANTS, CONTRIB., & FUND TRAN. 0 0 0 | | | | 0
N. O. REGIONAL BUSINESS PARK 0 0 0 | | | | 0
ECONOMIC DEVELOPMENT FUND 0 0 0 | | | | 0
HOUSING IMPROVMENT FUND 0 0 0 | | | | 0
$165,420 $602,972 $2,052,500 TOTAL FUNDING | | | | $2,052,500
Page 550
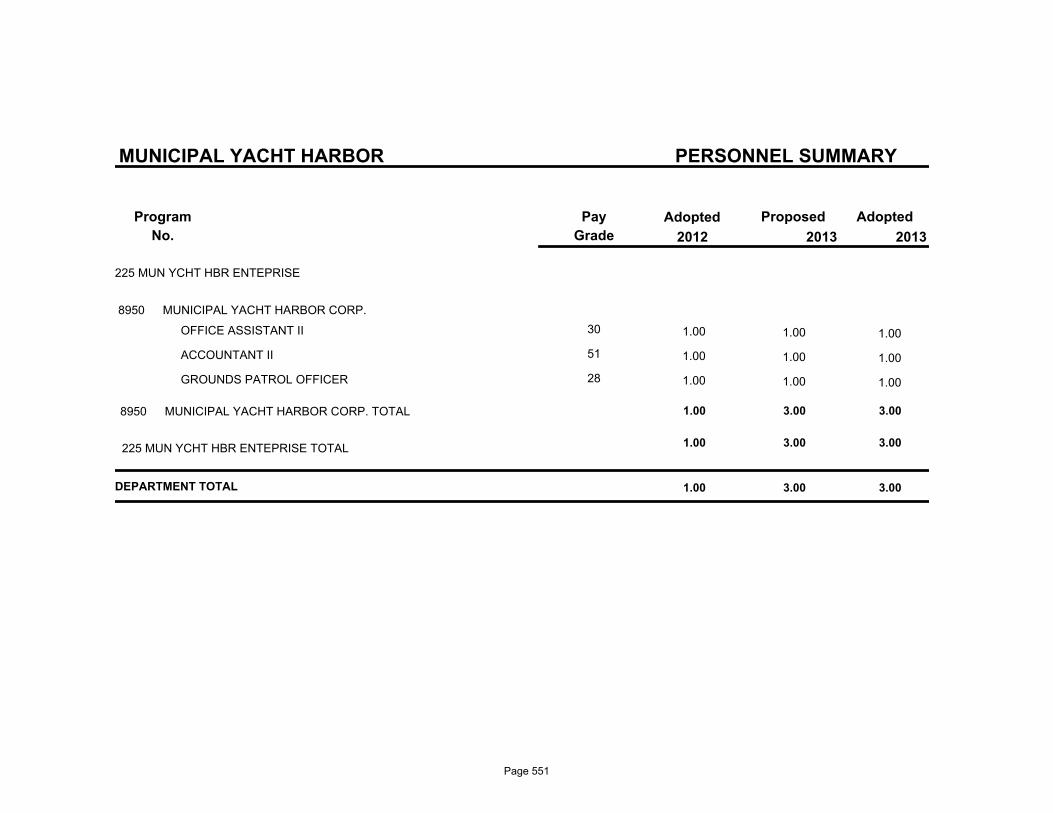
PERSONNEL SUMMARY
Program
No.
ProposedAdoptedPay
Grade
Adopted
MUNICIPAL YACHT HARBOR
2013 2013 2012
225 MUN YCHT HBR ENTEPRISE
8950 MUNICIPAL YACHT HARBOR CORP.
OFFICE ASSISTANT II 30 1.00 1.00 1.00
ACCOUNTANT II 51 1.00 1.00 1.00
GROUNDS PATROL OFFICER 28 1.00 1.00 1.00
8950 MUNICIPAL YACHT HARBOR CORP. TOTAL 1.00 3.00 3.00
3.00 3.00 1.00225 MUN YCHT HBR ENTEPRISE TOTAL
DEPARTMENT TOTAL 1.00 3.00 3.00
Page 551
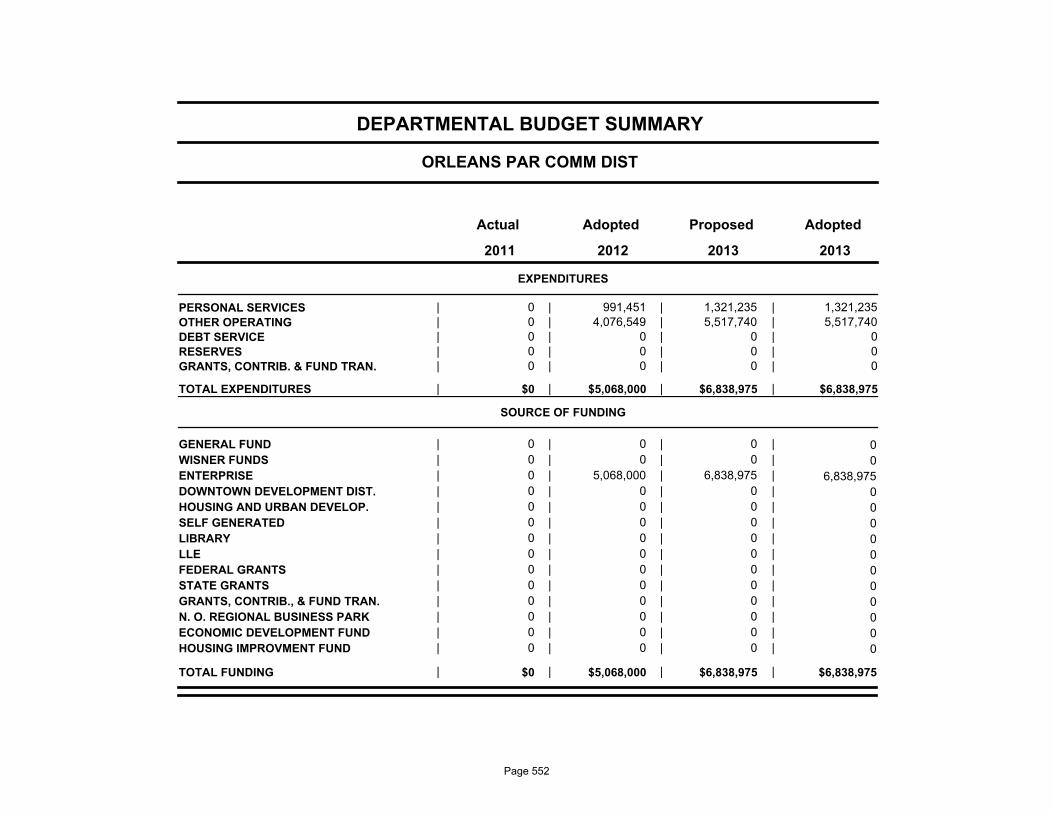
ORLEANS PAR COMM DIST
DEPARTMENTAL BUDGET SUMMARY
AdoptedProposedAdoptedActual
EXPENDITURES
2011 2012 2013 2013
PERSONAL SERVICES 0 991,451 1,321,235 | | | | 1,321,235
OTHER OPERATING 0 4,076,549 5,517,740 | | | | 5,517,740
DEBT SERVICE 0 0 0 | | | | 0
RESERVES 0 0 0 | | | | 0
GRANTS, CONTRIB. & FUND TRAN. 0 0 0 | | | | 0
$0 $5,068,000 $6,838,975 TOTAL EXPENDITURES | | | | $6,838,975
SOURCE OF FUNDING
GENERAL FUND 0 0 0 | | | | 0
WISNER FUNDS 0 0 0 | | | | 0
ENTERPRISE 0 5,068,000 6,838,975 | | | | 6,838,975
DOWNTOWN DEVELOPMENT DIST. 0 0 0 | | | | 0
HOUSING AND URBAN DEVELOP. 0 0 0 | | | | 0
SELF GENERATED 0 0 0 | | | | 0
LIBRARY 0 0 0 | | | | 0
LLE 0 0 0 | | | | 0
FEDERAL GRANTS 0 0 0 | | | | 0
STATE GRANTS 0 0 0 | | | | 0
GRANTS, CONTRIB., & FUND TRAN. 0 0 0 | | | | 0
N. O. REGIONAL BUSINESS PARK 0 0 0 | | | | 0
ECONOMIC DEVELOPMENT FUND 0 0 0 | | | | 0
HOUSING IMPROVMENT FUND 0 0 0 | | | | 0
$0 $5,068,000 $6,838,975 TOTAL FUNDING | | | | $6,838,975
Page 552
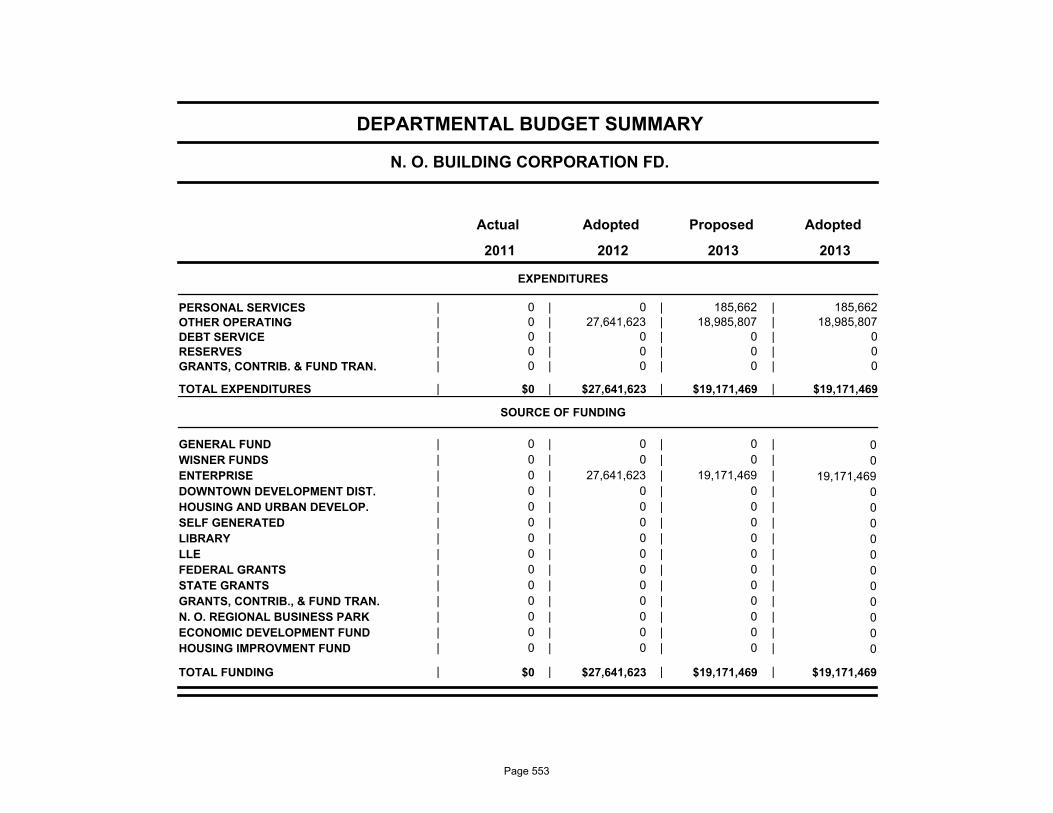
N. O. BUILDING CORPORATION FD.
DEPARTMENTAL BUDGET SUMMARY
AdoptedProposedAdoptedActual
EXPENDITURES
2011 2012 2013 2013
PERSONAL SERVICES 0 0 185,662 | | | | 185,662
OTHER OPERATING 0 27,641,623 18,985,807 | | | | 18,985,807
DEBT SERVICE 0 0 0 | | | | 0
RESERVES 0 0 0 | | | | 0
GRANTS, CONTRIB. & FUND TRAN. 0 0 0 | | | | 0
$0 $27,641,623 $19,171,469 TOTAL EXPENDITURES | | | | $19,171,469
SOURCE OF FUNDING
GENERAL FUND 0 0 0 | | | | 0
WISNER FUNDS 0 0 0 | | | | 0
ENTERPRISE 0 27,641,623 19,171,469 | | | | 19,171,469
DOWNTOWN DEVELOPMENT DIST. 0 0 0 | | | | 0
HOUSING AND URBAN DEVELOP. 0 0 0 | | | | 0
SELF GENERATED 0 0 0 | | | | 0
LIBRARY 0 0 0 | | | | 0
LLE 0 0 0 | | | | 0
FEDERAL GRANTS 0 0 0 | | | | 0
STATE GRANTS 0 0 0 | | | | 0
GRANTS, CONTRIB., & FUND TRAN. 0 0 0 | | | | 0
N. O. REGIONAL BUSINESS PARK 0 0 0 | | | | 0
ECONOMIC DEVELOPMENT FUND 0 0 0 | | | | 0
HOUSING IMPROVMENT FUND 0 0 0 | | | | 0
$0 $27,641,623 $19,171,469 TOTAL FUNDING | | | | $19,171,469
Page 553
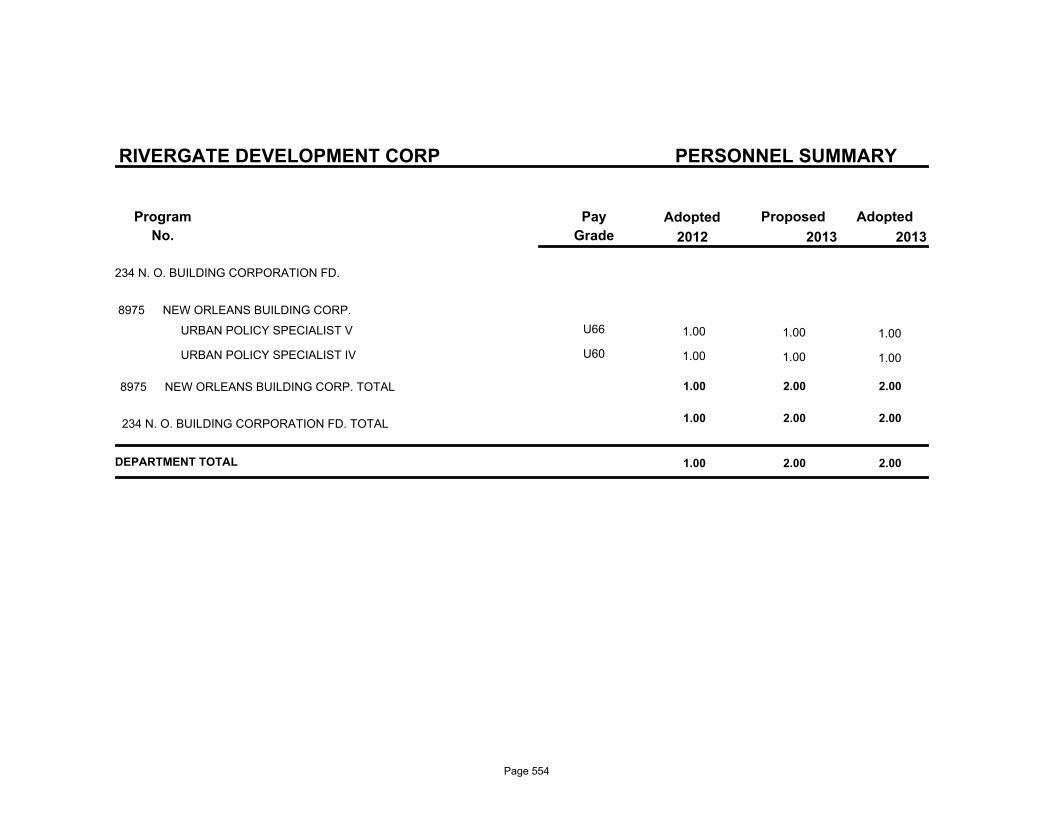
PERSONNEL SUMMARY
Program
No.
ProposedAdoptedPay
Grade
Adopted
RIVERGATE DEVELOPMENT CORP
2013 2013 2012
234 N. O. BUILDING CORPORATION FD.
8975 NEW ORLEANS BUILDING CORP.
URBAN POLICY SPECIALIST V U66 1.00 1.00 1.00
URBAN POLICY SPECIALIST IV U60 1.00 1.00 1.00
8975 NEW ORLEANS BUILDING CORP. TOTAL 1.00 2.00 2.00
2.00 2.00 1.00234 N. O. BUILDING CORPORATION FD. TOTAL
DEPARTMENT TOTAL 1.00 2.00 2.00
Page 554

RIVERGATE DEVELOPMENT COR
DEPARTMENTAL BUDGET SUMMARY
AdoptedProposedAdoptedActual
EXPENDITURES
2011 2012 2013 2013
PERSONAL SERVICES 248,690 247,168 249,123 | | | | 249,123
OTHER OPERATING 12,915,474 4,422,521 68,417 | | | | 68,417
DEBT SERVICE 0 0 0 | | | | 0
RESERVES 0 14,244,750 16,963,312 | | | | 16,963,312
GRANTS, CONTRIB. & FUND TRAN. 0 0 0 | | | | 0
$13,164,164 $18,914,439 $17,280,852 TOTAL EXPENDITURES | | | | $17,280,852
SOURCE OF FUNDING
GENERAL FUND 0 0 0 | | | | 0
WISNER FUNDS 0 0 0 | | | | 0
ENTERPRISE 13,164,164 18,914,439 17,280,852 | | | | 17,280,852
DOWNTOWN DEVELOPMENT DIST. 0 0 0 | | | | 0
HOUSING AND URBAN DEVELOP. 0 0 0 | | | | 0
SELF GENERATED 0 0 0 | | | | 0
LIBRARY 0 0 0 | | | | 0
LLE 0 0 0 | | | | 0
FEDERAL GRANTS 0 0 0 | | | | 0
STATE GRANTS 0 0 0 | | | | 0
GRANTS, CONTRIB., & FUND TRAN. 0 0 0 | | | | 0
N. O. REGIONAL BUSINESS PARK 0 0 0 | | | | 0
ECONOMIC DEVELOPMENT FUND 0 0 0 | | | | 0
HOUSING IMPROVMENT FUND 0 0 0 | | | | 0
$13,164,164 $18,914,439 $17,280,852 TOTAL FUNDING | | | | $17,280,852
Page 555
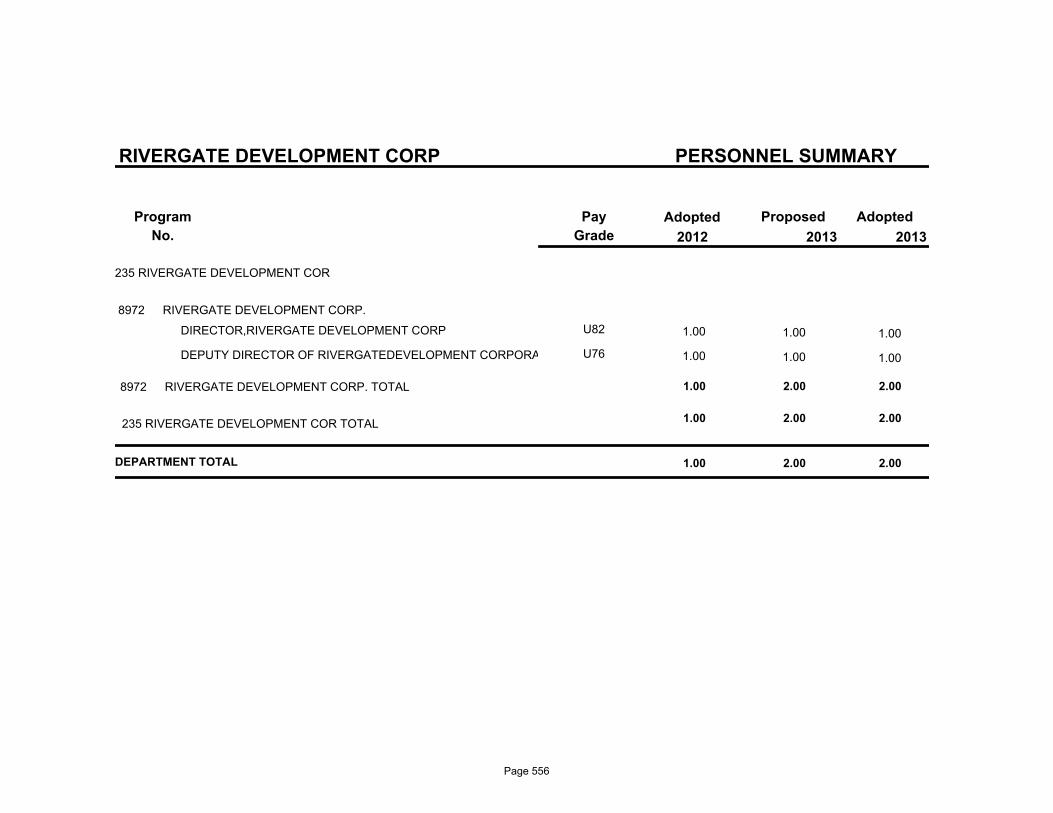
PERSONNEL SUMMARY
Program
No.
ProposedAdoptedPay
Grade
Adopted
RIVERGATE DEVELOPMENT CORP
2013 2013 2012
235 RIVERGATE DEVELOPMENT COR
8972 RIVERGATE DEVELOPMENT CORP.
DIRECTOR,RIVERGATE DEVELOPMENT CORP U82 1.00 1.00 1.00
DEPUTY DIRECTOR OF RIVERGATEDEVELOPMENT CORPORATION U76 1.00 1.00 1.00
8972 RIVERGATE DEVELOPMENT CORP. TOTAL 1.00 2.00 2.00
2.00 2.00 1.00235 RIVERGATE DEVELOPMENT COR TOTAL
DEPARTMENT TOTAL 1.00 2.00 2.00
Page 556

CANAL ST DEVELOPMENT CORP
DEPARTMENTAL BUDGET SUMMARY
AdoptedProposedAdoptedActual
EXPENDITURES
2011 2012 2013 2013
PERSONAL SERVICES 179,643 177,632 180,698 | | | | 180,698
OTHER OPERATING 0 197,570 0 | | | | 0
DEBT SERVICE 0 0 0 | | | | 0
RESERVES 0 624,942 0 | | | | 0
GRANTS, CONTRIB. & FUND TRAN. 0 0 0 | | | | 0
$179,643 $1,000,144 $180,698 TOTAL EXPENDITURES | | | | $180,698
SOURCE OF FUNDING
GENERAL FUND 0 0 0 | | | | 0
WISNER FUNDS 0 0 0 | | | | 0
ENTERPRISE 179,643 1,000,144 180,698 | | | | 180,698
DOWNTOWN DEVELOPMENT DIST. 0 0 0 | | | | 0
HOUSING AND URBAN DEVELOP. 0 0 0 | | | | 0
SELF GENERATED 0 0 0 | | | | 0
LIBRARY 0 0 0 | | | | 0
LLE 0 0 0 | | | | 0
FEDERAL GRANTS 0 0 0 | | | | 0
STATE GRANTS 0 0 0 | | | | 0
GRANTS, CONTRIB., & FUND TRAN. 0 0 0 | | | | 0
N. O. REGIONAL BUSINESS PARK 0 0 0 | | | | 0
ECONOMIC DEVELOPMENT FUND 0 0 0 | | | | 0
HOUSING IMPROVMENT FUND 0 0 0 | | | | 0
$179,643 $1,000,144 $180,698 TOTAL FUNDING | | | | $180,698
Page 557
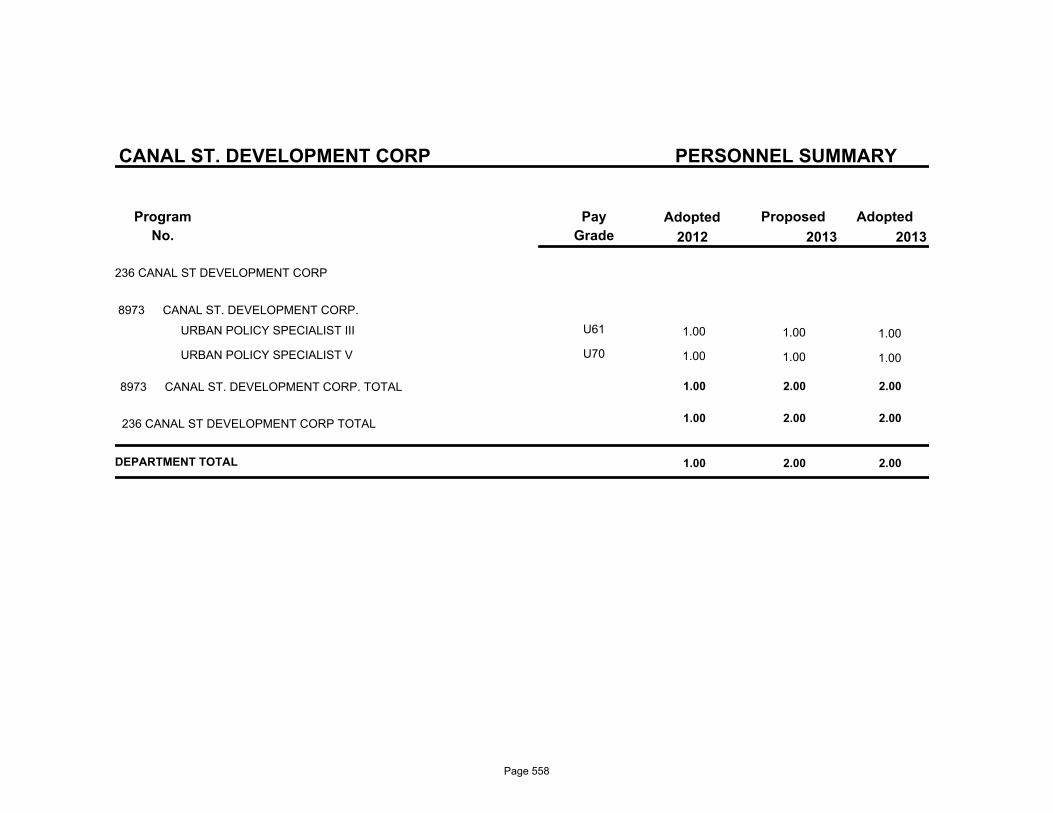
PERSONNEL SUMMARY
Program
No.
ProposedAdoptedPay
Grade
Adopted
CANAL ST. DEVELOPMENT CORP
2013 2013 2012
236 CANAL ST DEVELOPMENT CORP
8973 CANAL ST. DEVELOPMENT CORP.
URBAN POLICY SPECIALIST III U61 1.00 1.00 1.00
URBAN POLICY SPECIALIST V U70 1.00 1.00 1.00
8973 CANAL ST. DEVELOPMENT CORP. TOTAL 1.00 2.00 2.00
2.00 2.00 1.00236 CANAL ST DEVELOPMENT CORP TOTAL
DEPARTMENT TOTAL 1.00 2.00 2.00
Page 558
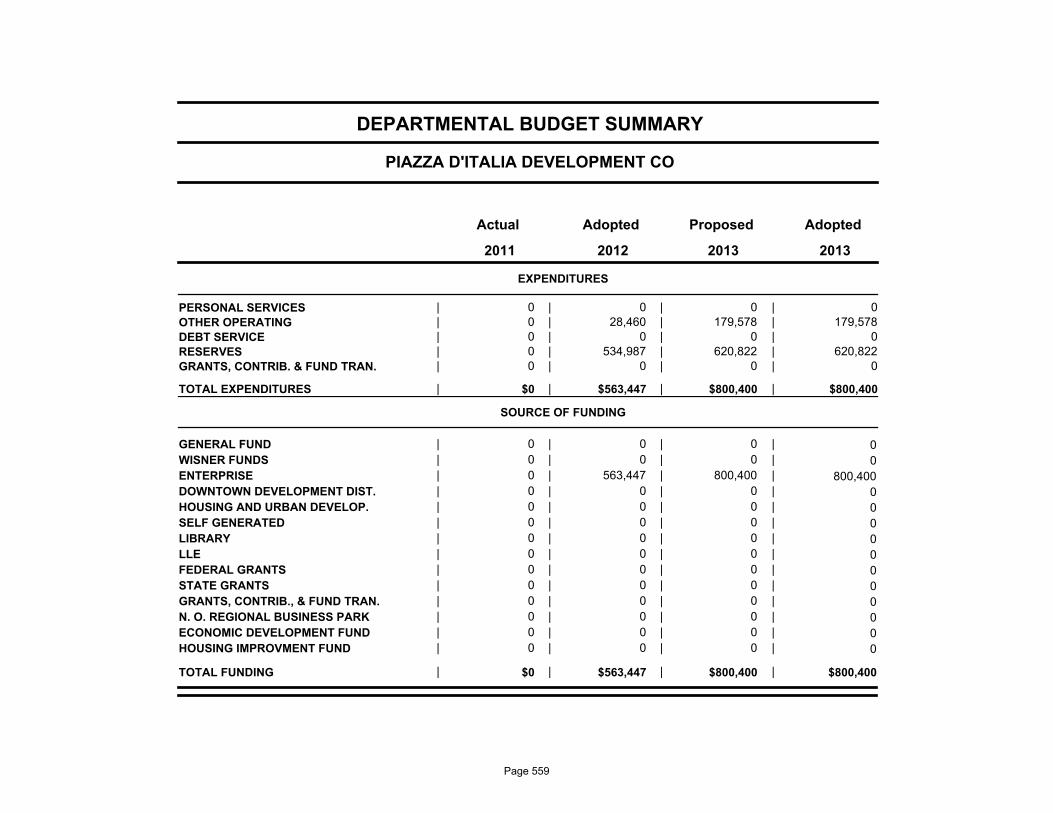
PIAZZA D'ITALIA DEVELOPMENT CO
DEPARTMENTAL BUDGET SUMMARY
AdoptedProposedAdoptedActual
EXPENDITURES
2011 2012 2013 2013
PERSONAL SERVICES 0 0 0 | | | | 0
OTHER OPERATING 0 28,460 179,578 | | | | 179,578
DEBT SERVICE 0 0 0 | | | | 0
RESERVES 0 534,987 620,822 | | | | 620,822
GRANTS, CONTRIB. & FUND TRAN. 0 0 0 | | | | 0
$0 $563,447 $800,400 TOTAL EXPENDITURES | | | | $800,400
SOURCE OF FUNDING
GENERAL FUND 0 0 0 | | | | 0
WISNER FUNDS 0 0 0 | | | | 0
ENTERPRISE 0 563,447 800,400 | | | | 800,400
DOWNTOWN DEVELOPMENT DIST. 0 0 0 | | | | 0
HOUSING AND URBAN DEVELOP. 0 0 0 | | | | 0
SELF GENERATED 0 0 0 | | | | 0
LIBRARY 0 0 0 | | | | 0
LLE 0 0 0 | | | | 0
FEDERAL GRANTS 0 0 0 | | | | 0
STATE GRANTS 0 0 0 | | | | 0
GRANTS, CONTRIB., & FUND TRAN. 0 0 0 | | | | 0
N. O. REGIONAL BUSINESS PARK 0 0 0 | | | | 0
ECONOMIC DEVELOPMENT FUND 0 0 0 | | | | 0
HOUSING IMPROVMENT FUND 0 0 0 | | | | 0
$0 $563,447 $800,400 TOTAL FUNDING | | | | $800,400
Page 559
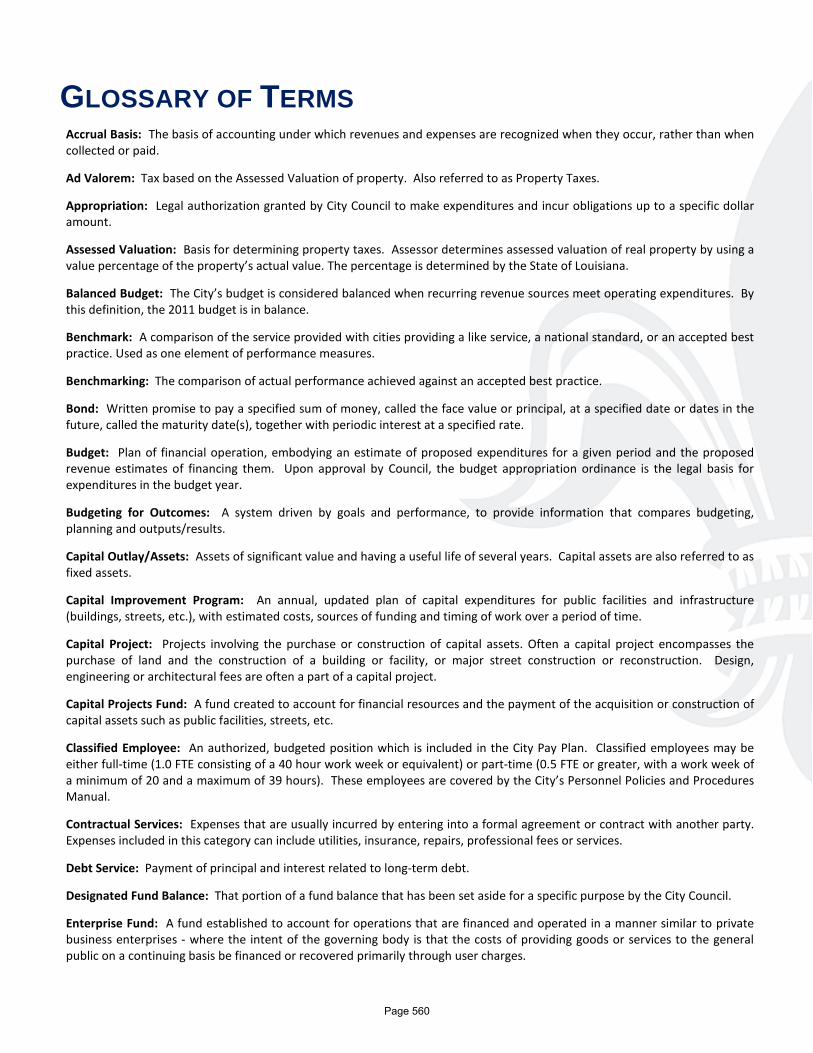
GLOSSARY OF TERMS
Accrual Basis: The basis of accounting under which revenues and expenses are recognized when they occur, rather than when collected or paid.
Ad Valorem: Tax based on the Assessed Valuation of property. Also referred to as Property Taxes.
Appropriation: Legal authorization granted by City Council to make expenditures and incur obligations up to a specific dollar amount.
Assessed Valuation: Basis for determining property taxes. Assessor determines assessed valuation of real property by using a value percentage of the property’s actual value. The percentage is determined by the State of Louisiana.
Balanced Budget: The City’s budget is considered balanced when recurring revenue sources meet operating expenditures. By this definition, the 2011 budget is in balance.
Benchmark: A comparison of the service provided with cities providing a like service, a national standard, or an accepted best practice. Used as one element of performance measures.
Benchmarking: The comparison of actual performance achieved against an accepted best practice.
Bond: Written promise to pay a specified sum of money, called the face value or principal, at a specified date or dates in the future, called the maturity date(s), together with periodic interest at a specified rate.
Budget: Plan of financial operation, embodying an estimate of proposed expenditures for a given period and the proposed revenue estimates of financing them. Upon approval by Council, the budget appropriation ordinance is the legal basis for expenditures in the budget year.
Budgeting for Outcomes: A system driven by goals and performance, to provide information that compares budgeting, planning and outputs/results.
Capital Outlay/Assets: Assets of significant value and having a useful life of several years. Capital assets are also referred to as fixed assets.
Capital Improvement Program: An annual, updated plan of capital expenditures for public facilities and infrastructure (buildings, streets, etc.), with estimated costs, sources of funding and timing of work over a period of time.
Capital Project: Projects involving the purchase or construction of capital assets. Often a capital project encompasses the purchase of land and the construction of a building or facility, or major street construction or reconstruction. Design, engineering or architectural fees are often a part of a capital project.
Capital Projects Fund: A fund created to account for financial resources and the payment of the acquisition or construction of capital assets such as public facilities, streets, etc.
Classified Employee: An authorized, budgeted position which is included in the City Pay Plan. Classified employees may be either full-time (1.0 FTE consisting of a 40 hour work week or equivalent) or part-time (0.5 FTE or greater, with a work week of a minimum of 20 and a maximum of 39 hours). These employees are covered by the City’s Personnel Policies and Procedures Manual.
Contractual Services: Expenses that are usually incurred by entering into a formal agreement or contract with another party. Expenses included in this category can include utilities, insurance, repairs, professional fees or services.
Debt Service: Payment of principal and interest related to long-term debt.
Designated Fund Balance: That portion of a fund balance that has been set aside for a specific purpose by the City Council.
Enterprise Fund: A fund established to account for operations that are financed and operated in a manner similar to private business enterprises - where the intent of the governing body is that the costs of providing goods or services to the general public on a continuing basis be financed or recovered primarily through user charges.
Page 560
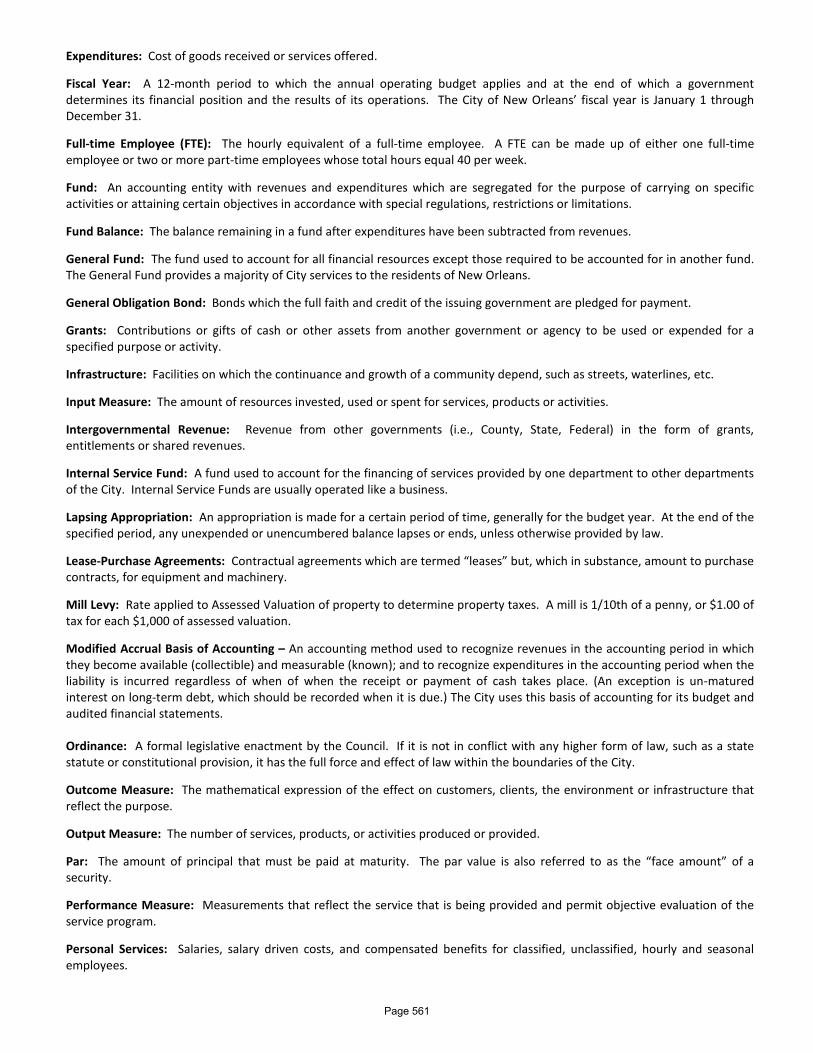
Expenditures: Cost of goods received or services offered.
Fiscal Year: A 12-month period to which the annual operating budget applies and at the end of which a government determines its financial position and the results of its operations. The City of New Orleans’ fiscal year is January 1 through December 31.
Full-time Employee (FTE): The hourly equivalent of a full-time employee. A FTE can be made up of either one full-time employee or two or more part-time employees whose total hours equal 40 per week.
Fund: An accounting entity with revenues and expenditures which are segregated for the purpose of carrying on specific activities or attaining certain objectives in accordance with special regulations, restrictions or limitations.
Fund Balance: The balance remaining in a fund after expenditures have been subtracted from revenues.
General Fund: The fund used to account for all financial resources except those required to be accounted for in another fund. The General Fund provides a majority of City services to the residents of New Orleans.
General Obligation Bond: Bonds which the full faith and credit of the issuing government are pledged for payment.
Grants: Contributions or gifts of cash or other assets from another government or agency to be used or expended for a specified purpose or activity.
Infrastructure: Facilities on which the continuance and growth of a community depend, such as streets, waterlines, etc.
Input Measure: The amount of resources invested, used or spent for services, products or activities.
Intergovernmental Revenue: Revenue from other governments (i.e., County, State, Federal) in the form of grants, entitlements or shared revenues.
Internal Service Fund: A fund used to account for the financing of services provided by one department to other departments of the City. Internal Service Funds are usually operated like a business.
Lapsing Appropriation: An appropriation is made for a certain period of time, generally for the budget year. At the end of the specified period, any unexpended or unencumbered balance lapses or ends, unless otherwise provided by law.
Lease-Purchase Agreements: Contractual agreements which are termed “leases” but, which in substance, amount to purchase contracts, for equipment and machinery.
Mill Levy: Rate applied to Assessed Valuation of property to determine property taxes. A mill is 1/10th of a penny, or $1.00 of tax for each $1,000 of assessed valuation.
Modified Accrual Basis of Accounting – An accounting method used to recognize revenues in the accounting period in which they become available (collectible) and measurable (known); and to recognize expenditures in the accounting period when the liability is incurred regardless of when of when the receipt or payment of cash takes place. (An exception is un-matured interest on long-term debt, which should be recorded when it is due.) The City uses this basis of accounting for its budget and audited financial statements. Ordinance: A formal legislative enactment by the Council. If it is not in conflict with any higher form of law, such as a state statute or constitutional provision, it has the full force and effect of law within the boundaries of the City.
Outcome Measure: The mathematical expression of the effect on customers, clients, the environment or infrastructure that reflect the purpose.
Output Measure: The number of services, products, or activities produced or provided.
Par: The amount of principal that must be paid at maturity. The par value is also referred to as the “face amount” of a security.
Performance Measure: Measurements that reflect the service that is being provided and permit objective evaluation of the service program.
Personal Services: Salaries, salary driven costs, and compensated benefits for classified, unclassified, hourly and seasonal employees.
Page 561

Result: The effect or outcome desired for the public, expressed as broad statements.
Unclassified Employee: An employee who is not a part of the Civil Service Commission’s pay and classification system. This includes either Unclassified Management Employees or Hourly/Seasonal employees.
Undesignated Fund Balance: A portion of a fund balance that has not been designated or reserved for any specific use.
User Fees: The payment of a fee for direct receipt of a public service by the party benefiting from the service.
Volunteer: An unpaid City worker who provides services to the City as a public service, or as a personal interest. Volunteers typically do short-term projects or donate a small number of hours a month.
Page 562
APPENDIX
I. Professional Services Contracts
A Professional Services Contract listing representing continuing or estimated obligations for fiscal year 2013 is available on the on the following pages. For contracts that are continuing, the vendor, amount, and description are provided. For contracts that are expected through a Request For Proposal (RFP), Bid, or other procurement method, the vendor is labeled as "To Be Procured" and a description as well as estimated amount is provided. Some departments have provided additional contractual information beyond their Professional Services obligations.
II. Outcome Measures
An important component of the Budgeting for Outcomes process is the tracking and reporting of outcome level measures for each result. Outcome measures represent key, high level indicators of the government’s performance in each of the result areas that matter most to citizens. In implementing the Budgeting for Outcomes process, the City of New Orleans has aligned resources to positively impact those outcomes. An important step in accountability is the reporting of outcome measures. The following pages present outcome measure data selected as part of the Budgeting for Outcomes process in 2012. The data reported in the following pages represents the outcomes measures from the City’s 2012 budget process and are subject to modification as the City refines its outcome measures and as results shift. For those outcome measures where more suitable data was determined relevant, alternative outcome measures are listed. As the City tracked and assessed its progress, each outcome measure selected in 2012 formed a foundational component.
Page 563
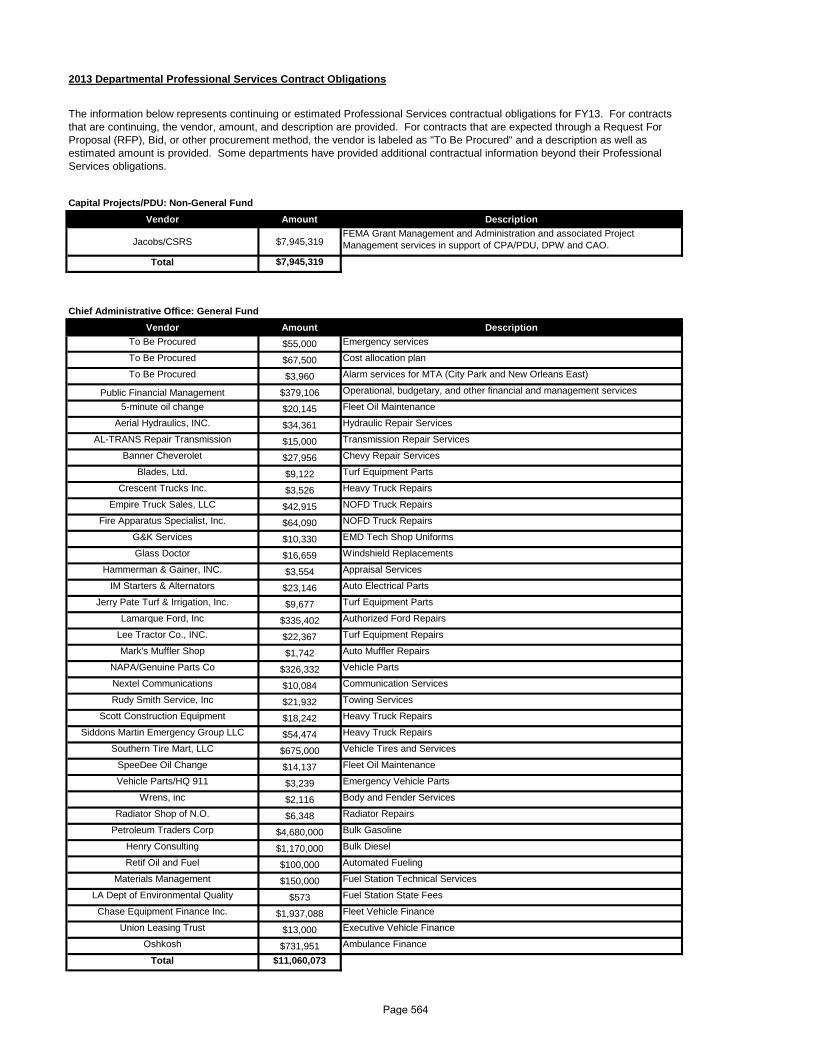
2013 Departmental Professional Services Contract Obligations
Capital Projects/PDU: Non-General FundVendor Amount Description
Jacobs/CSRS $7,945,319 FEMA Grant Management and Administration and associated Project Management services in support of CPA/PDU, DPW and CAO.
Total $7,945,319
Chief Administrative Office: General FundVendor Amount Description
To Be Procured $55,000 Emergency services
To Be Procured $67,500 Cost allocation plan
To Be Procured $3,960 Alarm services for MTA (City Park and New Orleans East)
Public Financial Management $379,106 Operational, budgetary, and other financial and management services
5-minute oil change $20,145 Fleet Oil Maintenance
Aerial Hydraulics, INC. $34,361 Hydraulic Repair Services
AL-TRANS Repair Transmission $15,000 Transmission Repair Services
Banner Cheverolet $27,956 Chevy Repair Services
Blades, Ltd. $9,122 Turf Equipment Parts
Crescent Trucks Inc. $3,526 Heavy Truck Repairs
Empire Truck Sales, LLC $42,915 NOFD Truck Repairs
Fire Apparatus Specialist, Inc. $64,090 NOFD Truck Repairs
G&K Services $10,330 EMD Tech Shop Uniforms
Glass Doctor $16,659 Windshield Replacements
Hammerman & Gainer, INC. $3,554 Appraisal Services
IM Starters & Alternators $23,146 Auto Electrical Parts
Jerry Pate Turf & Irrigation, Inc. $9,677 Turf Equipment Parts
Lamarque Ford, Inc $335,402 Authorized Ford Repairs
Lee Tractor Co., INC. $22,367 Turf Equipment Repairs
Mark's Muffler Shop $1,742 Auto Muffler Repairs
NAPA/Genuine Parts Co $326,332 Vehicle Parts
Nextel Communications $10,084 Communication Services
Rudy Smith Service, Inc $21,932 Towing Services
Scott Construction Equipment $18,242 Heavy Truck Repairs
Siddons Martin Emergency Group LLC $54,474 Heavy Truck Repairs
Southern Tire Mart, LLC $675,000 Vehicle Tires and Services
SpeeDee Oil Change $14,137 Fleet Oil Maintenance
Vehicle Parts/HQ 911 $3,239 Emergency Vehicle Parts
Wrens, inc $2,116 Body and Fender Services
Radiator Shop of N.O. $6,348 Radiator Repairs
Petroleum Traders Corp $4,680,000 Bulk Gasoline
Henry Consulting $1,170,000 Bulk Diesel
Retif Oil and Fuel $100,000 Automated Fueling
Materials Management $150,000 Fuel Station Technical Services
LA Dept of Environmental Quality $573 Fuel Station State Fees
Chase Equipment Finance Inc. $1,937,088 Fleet Vehicle Finance
Union Leasing Trust $13,000 Executive Vehicle Finance
Oshkosh $731,951 Ambulance Finance
Total $11,060,073
The information below represents continuing or estimated Professional Services contractual obligations for FY13. For contracts that are continuing, the vendor, amount, and description are provided. For contracts that are expected through a Request For Proposal (RFP), Bid, or other procurement method, the vendor is labeled as "To Be Procured" and a description as well as estimated amount is provided. Some departments have provided additional contractual information beyond their Professional Services obligations.
Page 564
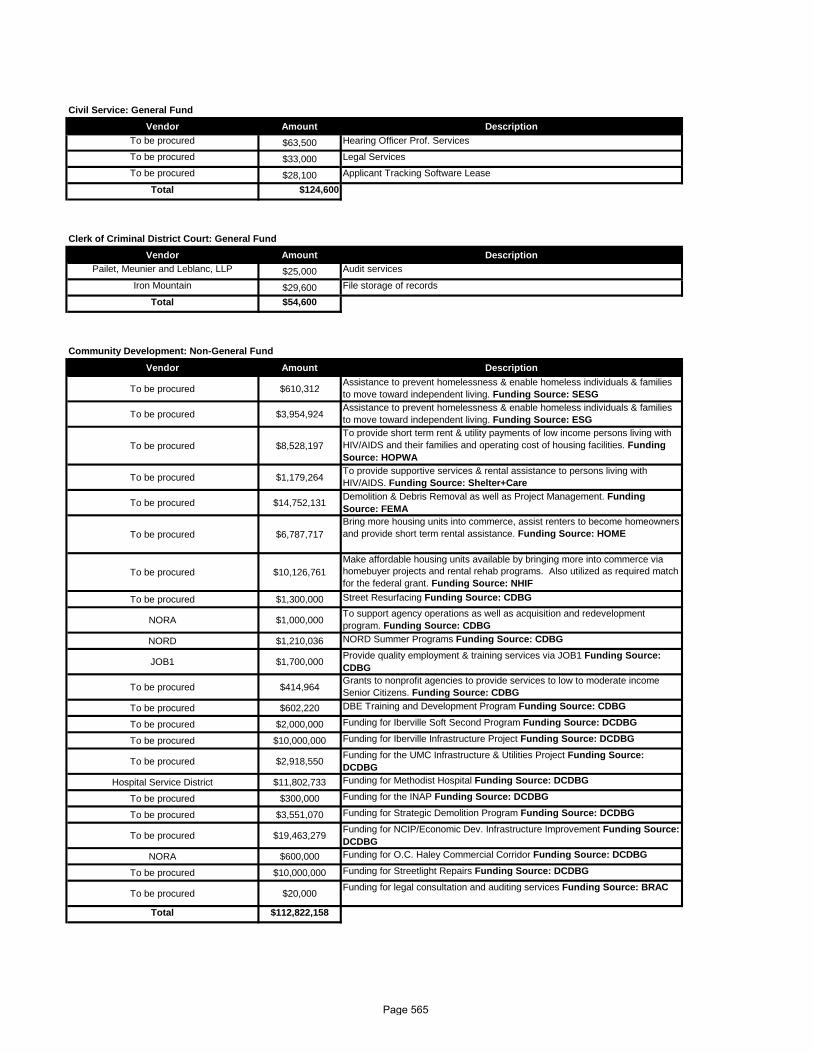
Civil Service: General FundVendor Amount Description
To be procured $63,500 Hearing Officer Prof. Services
To be procured $33,000 Legal Services
To be procured $28,100 Applicant Tracking Software Lease
Total $124,600
Clerk of Criminal District Court: General FundVendor Amount Description
Pailet, Meunier and Leblanc, LLP $25,000 Audit services
Iron Mountain $29,600 File storage of records
Total $54,600
Community Development: Non-General Fund
Vendor Amount Description
To be procured $610,312 Assistance to prevent homelessness & enable homeless individuals & families to move toward independent living. Funding Source: SESG
To be procured $3,954,924 Assistance to prevent homelessness & enable homeless individuals & families to move toward independent living. Funding Source: ESG
To be procured $8,528,197 To provide short term rent & utility payments of low income persons living with HIV/AIDS and their families and operating cost of housing facilities. Funding Source: HOPWA
To be procured $1,179,264 To provide supportive services & rental assistance to persons living with HIV/AIDS. Funding Source: Shelter+Care
To be procured $14,752,131 Demolition & Debris Removal as well as Project Management. Funding Source: FEMA
To be procured $6,787,717 Bring more housing units into commerce, assist renters to become homeowners and provide short term rental assistance. Funding Source: HOME
To be procured $10,126,761 Make affordable housing units available by bringing more into commerce via homebuyer projects and rental rehab programs. Also utilized as required match for the federal grant. Funding Source: NHIF
To be procured $1,300,000 Street Resurfacing Funding Source: CDBG
NORA $1,000,000 To support agency operations as well as acquisition and redevelopment program. Funding Source: CDBG
NORD $1,210,036 NORD Summer Programs Funding Source: CDBG
JOB1 $1,700,000 Provide quality employment & training services via JOB1 Funding Source: CDBG
To be procured $414,964 Grants to nonprofit agencies to provide services to low to moderate income Senior Citizens. Funding Source: CDBG
To be procured $602,220 DBE Training and Development Program Funding Source: CDBG
To be procured $2,000,000 Funding for Iberville Soft Second Program Funding Source: DCDBG
To be procured $10,000,000 Funding for Iberville Infrastructure Project Funding Source: DCDBG
To be procured $2,918,550 Funding for the UMC Infrastructure & Utilities Project Funding Source: DCDBG
Hospital Service District $11,802,733 Funding for Methodist Hospital Funding Source: DCDBG
To be procured $300,000 Funding for the INAP Funding Source: DCDBG
To be procured $3,551,070 Funding for Strategic Demolition Program Funding Source: DCDBG
To be procured $19,463,279 Funding for NCIP/Economic Dev. Infrastructure Improvement Funding Source: DCDBG
NORA $600,000 Funding for O.C. Haley Commercial Corridor Funding Source: DCDBG
To be procured $10,000,000 Funding for Streetlight Repairs Funding Source: DCDBG
To be procured $20,000 Funding for legal consultation and auditing services Funding Source: BRAC
Total $112,822,158
Page 565
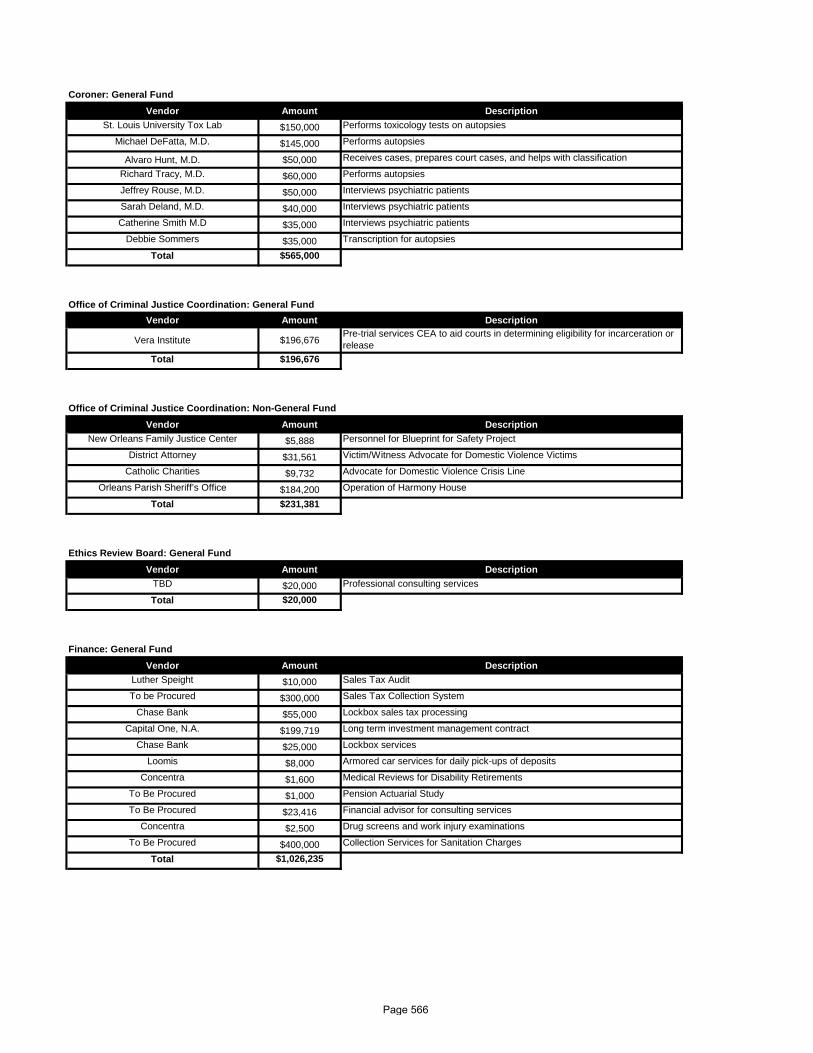
Coroner: General FundVendor Amount Description
St. Louis University Tox Lab $150,000 Performs toxicology tests on autopsies
Michael DeFatta, M.D. $145,000 Performs autopsies
Alvaro Hunt, M.D. $50,000 Receives cases, prepares court cases, and helps with classification
Richard Tracy, M.D. $60,000 Performs autopsies
Jeffrey Rouse, M.D. $50,000 Interviews psychiatric patients
Sarah Deland, M.D. $40,000 Interviews psychiatric patients
Catherine Smith M.D $35,000 Interviews psychiatric patients
Debbie Sommers $35,000 Transcription for autopsies
Total $565,000
Office of Criminal Justice Coordination: General FundVendor Amount Description
Vera Institute $196,676 Pre-trial services CEA to aid courts in determining eligibility for incarceration or release
Total $196,676
Office of Criminal Justice Coordination: Non-General FundVendor Amount Description
New Orleans Family Justice Center $5,888 Personnel for Blueprint for Safety Project
District Attorney $31,561 Victim/Witness Advocate for Domestic Violence Victims
Catholic Charities $9,732 Advocate for Domestic Violence Crisis Line
Orleans Parish Sheriff’s Office $184,200 Operation of Harmony House
Total $231,381
Ethics Review Board: General FundVendor Amount Description
TBD $20,000 Professional consulting services
Total $20,000
Finance: General FundVendor Amount Description
Luther Speight $10,000 Sales Tax Audit
To be Procured $300,000 Sales Tax Collection System
Chase Bank $55,000 Lockbox sales tax processing
Capital One, N.A. $199,719 Long term investment management contract
Chase Bank $25,000 Lockbox services
Loomis $8,000 Armored car services for daily pick-ups of deposits
Concentra $1,600 Medical Reviews for Disability Retirements
To Be Procured $1,000 Pension Actuarial Study
To Be Procured $23,416 Financial advisor for consulting services
Concentra $2,500 Drug screens and work injury examinations
To Be Procured $400,000 Collection Services for Sanitation Charges
Total $1,026,235
Page 566
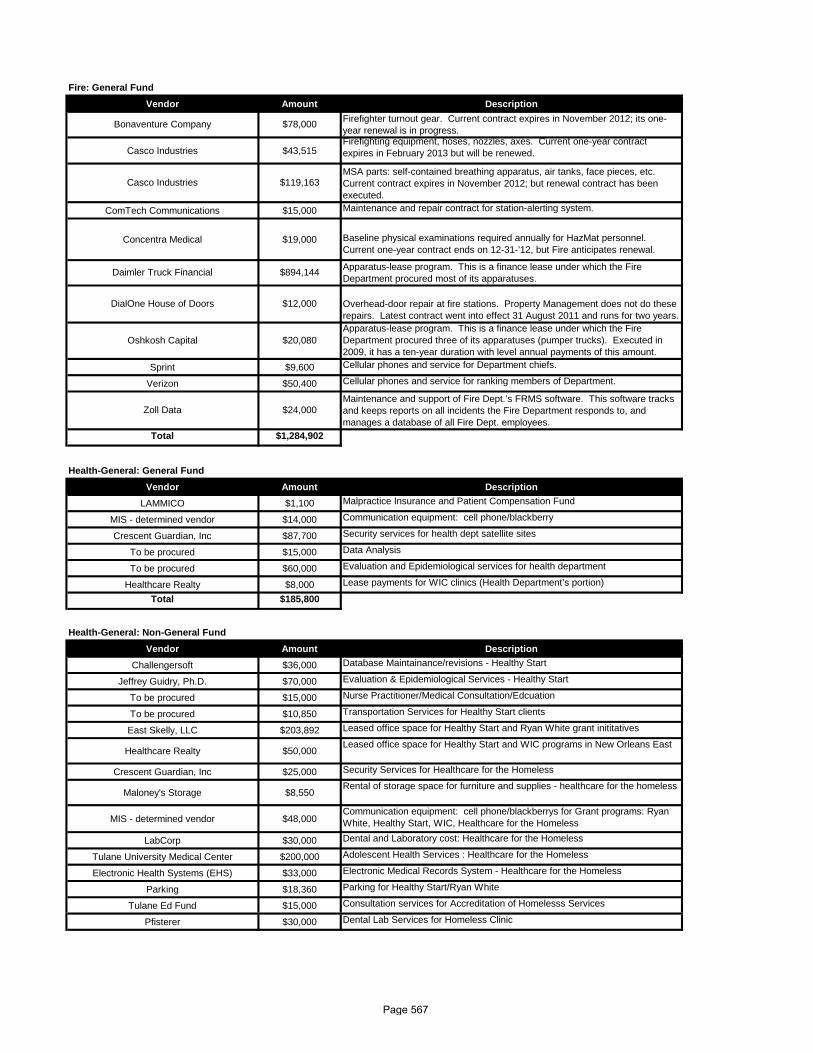
Fire: General FundVendor Amount Description
Casco Industries $43,515 Firefighting equipment, hoses, nozzles, axes. Current one-year contract expires in February 2013 but will be renewed.
ComTech Communications $15,000 Maintenance and repair contract for station-alerting system.
Concentra Medical $19,000 Baseline physical examinations required annually for HazMat personnel. Current one-year contract ends on 12-31-’12, but Fire anticipates renewal.
Sprint $9,600 Cellular phones and service for Department chiefs.
Verizon $50,400 Cellular phones and service for ranking members of Department.
Total $1,284,902
Health-General: General FundVendor Amount Description
LAMMICO $1,100 Malpractice Insurance and Patient Compensation Fund
MIS - determined vendor $14,000 Communication equipment: cell phone/blackberry
Crescent Guardian, Inc $87,700 Security services for health dept satellite sites
To be procured $15,000 Data Analysis
To be procured $60,000 Evaluation and Epidemiological services for health department
Healthcare Realty $8,000 Lease payments for WIC clinics (Health Department’s portion)
Total $185,800
Health-General: Non-General FundVendor Amount Description
Challengersoft $36,000 Database Maintainance/revisions - Healthy Start
Jeffrey Guidry, Ph.D. $70,000 Evaluation & Epidemiological Services - Healthy Start
To be procured $15,000 Nurse Practitioner/Medical Consultation/Edcuation
To be procured $10,850 Transportation Services for Healthy Start clients
East Skelly, LLC $203,892 Leased office space for Healthy Start and Ryan White grant inititatives
Healthcare Realty $50,000 Leased office space for Healthy Start and WIC programs in New Orleans East
Crescent Guardian, Inc $25,000 Security Services for Healthcare for the Homeless
Maloney's Storage $8,550 Rental of storage space for furniture and supplies - healthcare for the homeless
MIS - determined vendor $48,000 Communication equipment: cell phone/blackberrys for Grant programs: Ryan White, Healthy Start, WIC, Healthcare for the Homeless
LabCorp $30,000 Dental and Laboratory cost: Healthcare for the Homeless
Tulane University Medical Center $200,000 Adolescent Health Services : Healthcare for the Homeless
Electronic Health Systems (EHS) $33,000 Electronic Medical Records System - Healthcare for the Homeless
Parking $18,360 Parking for Healthy Start/Ryan White
Tulane Ed Fund $15,000 Consultation services for Accreditation of Homelesss Services
Pfisterer $30,000 Dental Lab Services for Homeless Clinic
Zoll Data $24,000 Maintenance and support of Fire Dept.’s FRMS software. This software tracks and keeps reports on all incidents the Fire Department responds to, and manages a database of all Fire Dept. employees.
Apparatus-lease program. This is a finance lease under which the Fire Department procured most of its apparatuses.
Overhead-door repair at fire stations. Property Management does not do these repairs. Latest contract went into effect 31 August 2011 and runs for two years.Apparatus-lease program. This is a finance lease under which the Fire Department procured three of its apparatuses (pumper trucks). Executed in 2009, it has a ten-year duration with level annual payments of this amount.
Bonaventure Company $78,000
Casco Industries $119,163
Firefighter turnout gear. Current contract expires in November 2012; its one-year renewal is in progress.
MSA parts: self-contained breathing apparatus, air tanks, face pieces, etc. Current contract expires in November 2012; but renewal contract has been executed.
Daimler Truck Financial $894,144
DialOne House of Doors $12,000
Oshkosh Capital $20,080
Page 567
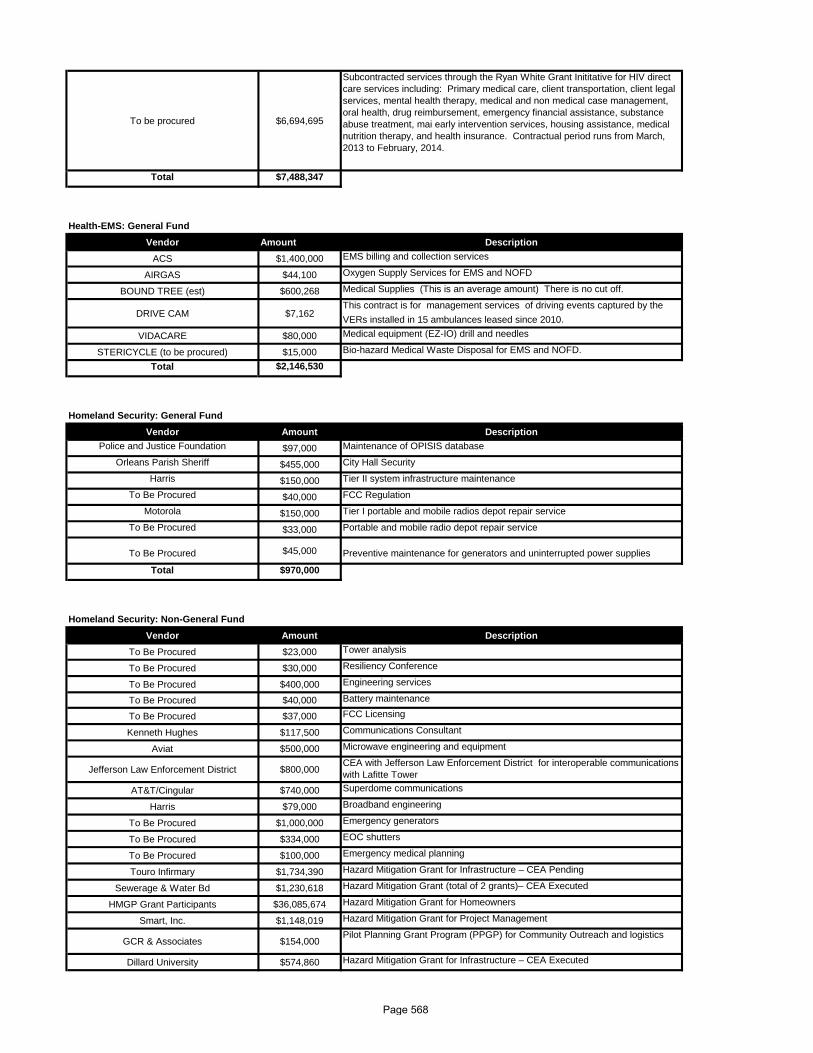
To be procured $6,694,695
Subcontracted services through the Ryan White Grant Inititative for HIV direct care services including: Primary medical care, client transportation, client legal services, mental health therapy, medical and non medical case management, oral health, drug reimbursement, emergency financial assistance, substance abuse treatment, mai early intervention services, housing assistance, medical nutrition therapy, and health insurance. Contractual period runs from March, 2013 to February, 2014.
Total $7,488,347
Health-EMS: General FundVendor Amount Description
ACS $1,400,000 EMS billing and collection services
AIRGAS $44,100 Oxygen Supply Services for EMS and NOFD
BOUND TREE (est) $600,268 Medical Supplies (This is an average amount) There is no cut off.
DRIVE CAM $7,162 This contract is for management services of driving events captured by the VERs installed in 15 ambulances leased since 2010.
VIDACARE $80,000 Medical equipment (EZ-IO) drill and needles
STERICYCLE (to be procured) $15,000 Bio-hazard Medical Waste Disposal for EMS and NOFD.
Total $2,146,530
Homeland Security: General FundVendor Amount Description
Police and Justice Foundation $97,000 Maintenance of OPISIS database
Orleans Parish Sheriff $455,000 City Hall Security
Harris $150,000 Tier II system infrastructure maintenance
To Be Procured $40,000 FCC Regulation
Motorola $150,000 Tier I portable and mobile radios depot repair service
To Be Procured $33,000 Portable and mobile radio depot repair service
To Be Procured $45,000 Preventive maintenance for generators and uninterrupted power supplies
Total $970,000
Homeland Security: Non-General FundVendor Amount Description
To Be Procured $23,000 Tower analysis
To Be Procured $30,000 Resiliency Conference
To Be Procured $400,000 Engineering services
To Be Procured $40,000 Battery maintenance
To Be Procured $37,000 FCC Licensing
Kenneth Hughes $117,500 Communications Consultant
Aviat $500,000 Microwave engineering and equipment
Jefferson Law Enforcement District $800,000 CEA with Jefferson Law Enforcement District for interoperable communications with Lafitte Tower
AT&T/Cingular $740,000 Superdome communications
Harris $79,000 Broadband engineering
To Be Procured $1,000,000 Emergency generators
To Be Procured $334,000 EOC shutters
To Be Procured $100,000 Emergency medical planning
Touro Infirmary $1,734,390 Hazard Mitigation Grant for Infrastructure – CEA Pending
Sewerage & Water Bd $1,230,618 Hazard Mitigation Grant (total of 2 grants)– CEA Executed
HMGP Grant Participants $36,085,674 Hazard Mitigation Grant for Homeowners
Smart, Inc. $1,148,019 Hazard Mitigation Grant for Project Management
GCR & Associates $154,000 Pilot Planning Grant Program (PPGP) for Community Outreach and logistics
Dillard University $574,860 Hazard Mitigation Grant for Infrastructure – CEA Executed
Page 568
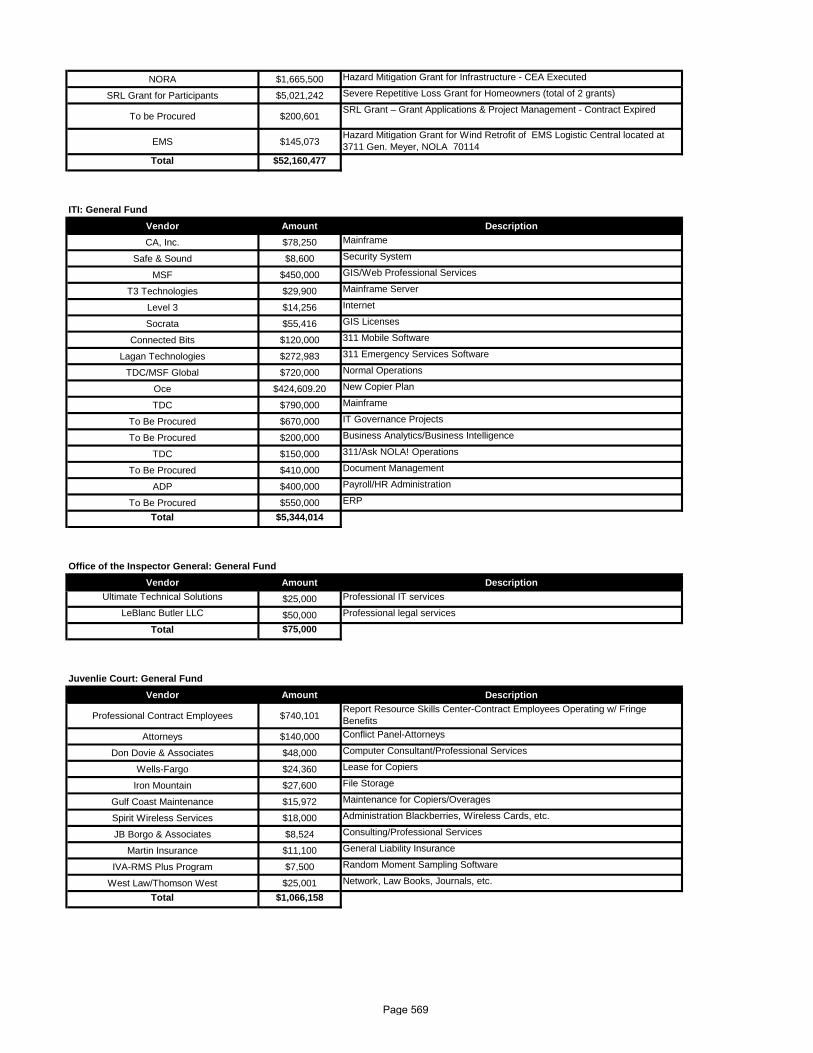
NORA $1,665,500 Hazard Mitigation Grant for Infrastructure - CEA Executed
SRL Grant for Participants $5,021,242 Severe Repetitive Loss Grant for Homeowners (total of 2 grants)
To be Procured $200,601 SRL Grant – Grant Applications & Project Management - Contract Expired
EMS $145,073 Hazard Mitigation Grant for Wind Retrofit of EMS Logistic Central located at 3711 Gen. Meyer, NOLA 70114
Total $52,160,477
ITI: General FundVendor Amount DescriptionCA, Inc. $78,250 Mainframe
Safe & Sound $8,600 Security System
MSF $450,000 GIS/Web Professional Services
T3 Technologies $29,900 Mainframe Server
Level 3 $14,256 Internet
Socrata $55,416 GIS Licenses
Connected Bits $120,000 311 Mobile Software
Lagan Technologies $272,983 311 Emergency Services Software
TDC/MSF Global $720,000 Normal Operations
Oce $424,609.20 New Copier Plan
TDC $790,000 Mainframe
To Be Procured $670,000 IT Governance Projects
To Be Procured $200,000 Business Analytics/Business Intelligence
TDC $150,000 311/Ask NOLA! Operations
To Be Procured $410,000 Document Management
ADP $400,000 Payroll/HR Administration
To Be Procured $550,000 ERP
Total $5,344,014
Office of the Inspector General: General FundVendor Amount Description
Ultimate Technical Solutions $25,000 Professional IT services
LeBlanc Butler LLC $50,000 Professional legal services
Total $75,000
Juvenlie Court: General FundVendor Amount Description
Professional Contract Employees $740,101 Report Resource Skills Center-Contract Employees Operating w/ Fringe Benefits
Attorneys $140,000 Conflict Panel-Attorneys
Don Dovie & Associates $48,000 Computer Consultant/Professional Services
Wells-Fargo $24,360 Lease for Copiers
Iron Mountain $27,600 File Storage
Gulf Coast Maintenance $15,972 Maintenance for Copiers/Overages
Spirit Wireless Services $18,000 Administration Blackberries, Wireless Cards, etc.
JB Borgo & Associates $8,524 Consulting/Professional Services
Martin Insurance $11,100 General Liability Insurance
IVA-RMS Plus Program $7,500 Random Moment Sampling Software
West Law/Thomson West $25,001 Network, Law Books, Journals, etc.
Total $1,066,158
Page 569
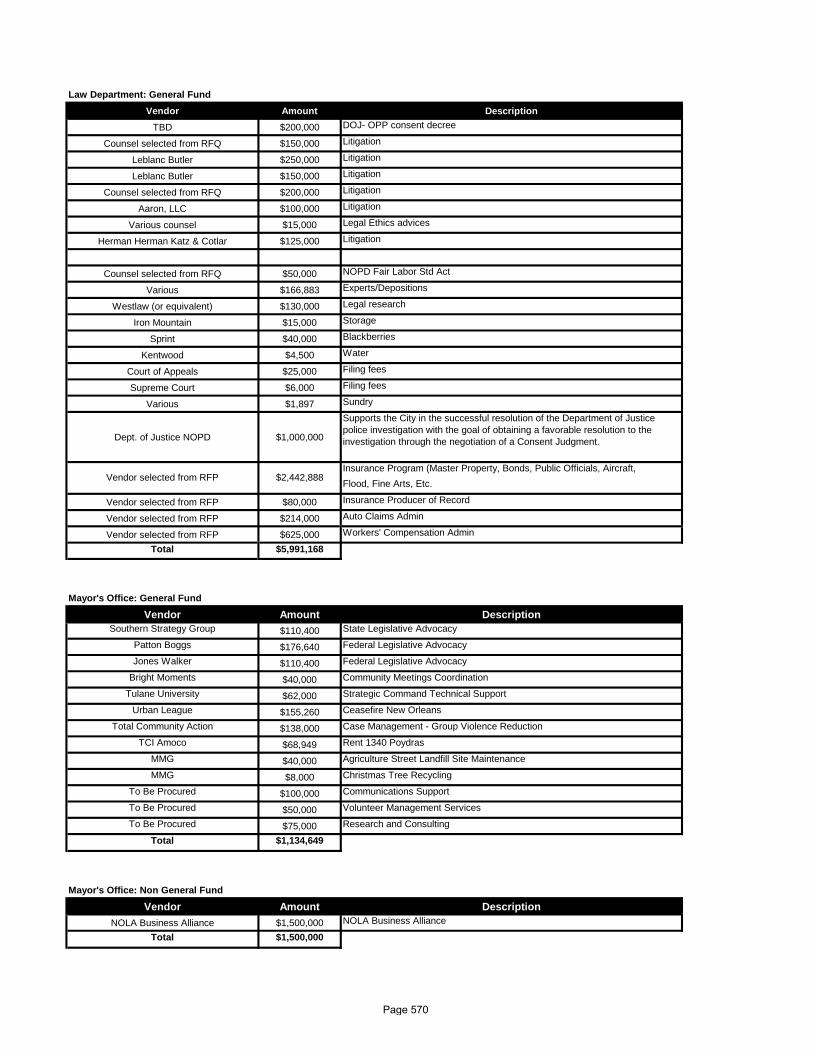
Law Department: General FundVendor Amount Description
TBD $200,000 DOJ- OPP consent decree
Counsel selected from RFQ $150,000 Litigation
Leblanc Butler $250,000 Litigation
Leblanc Butler $150,000 Litigation
Counsel selected from RFQ $200,000 Litigation
Aaron, LLC $100,000 Litigation
Various counsel $15,000 Legal Ethics advices
Herman Herman Katz & Cotlar $125,000 Litigation
Counsel selected from RFQ $50,000 NOPD Fair Labor Std Act
Various $166,883 Experts/Depositions
Westlaw (or equivalent) $130,000 Legal research
Iron Mountain $15,000 Storage
Sprint $40,000 Blackberries
Kentwood $4,500 Water
Court of Appeals $25,000 Filing fees
Supreme Court $6,000 Filing fees
Various $1,897 Sundry
Dept. of Justice NOPD $1,000,000
Supports the City in the successful resolution of the Department of Justice police investigation with the goal of obtaining a favorable resolution to the investigation through the negotiation of a Consent Judgment.
Insurance Program (Master Property, Bonds, Public Officials, Aircraft,Flood, Fine Arts, Etc.
Vendor selected from RFP $80,000 Insurance Producer of Record
Vendor selected from RFP $214,000 Auto Claims Admin
Vendor selected from RFP $625,000 Workers' Compensation Admin
Total $5,991,168
Mayor's Office: General Fund
Vendor Amount DescriptionSouthern Strategy Group $110,400 State Legislative Advocacy
Patton Boggs $176,640 Federal Legislative Advocacy
Jones Walker $110,400 Federal Legislative Advocacy
Bright Moments $40,000 Community Meetings Coordination
Tulane University $62,000 Strategic Command Technical Support
Urban League $155,260 Ceasefire New Orleans
Total Community Action $138,000 Case Management - Group Violence Reduction
TCI Amoco $68,949 Rent 1340 Poydras
MMG $40,000 Agriculture Street Landfill Site Maintenance
MMG $8,000 Christmas Tree Recycling
To Be Procured $100,000 Communications Support
To Be Procured $50,000 Volunteer Management Services
To Be Procured $75,000 Research and Consulting
Total $1,134,649
Mayor's Office: Non General Fund
Vendor Amount DescriptionNOLA Business Alliance $1,500,000 NOLA Business Alliance
Total $1,500,000
Vendor selected from RFP $2,442,888
Page 570
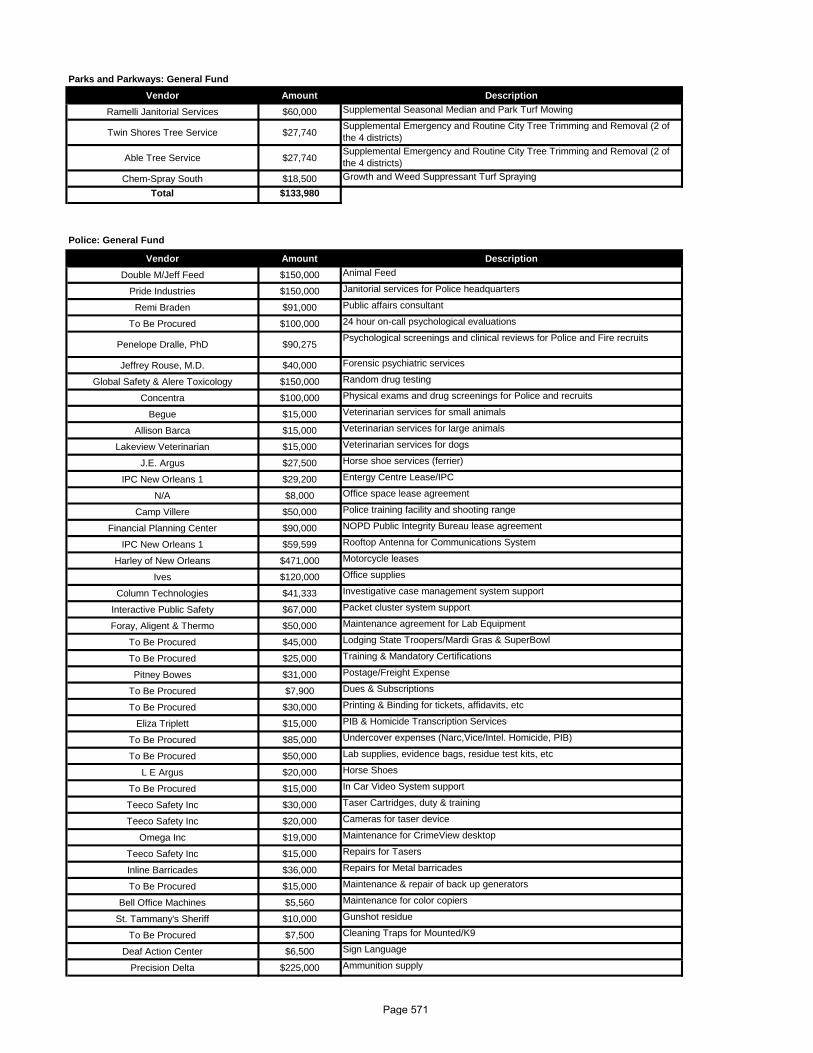
Parks and Parkways: General FundVendor Amount Description
Ramelli Janitorial Services $60,000 Supplemental Seasonal Median and Park Turf Mowing
Twin Shores Tree Service $27,740 Supplemental Emergency and Routine City Tree Trimming and Removal (2 of the 4 districts)
Able Tree Service $27,740 Supplemental Emergency and Routine City Tree Trimming and Removal (2 of the 4 districts)
Chem-Spray South $18,500 Growth and Weed Suppressant Turf Spraying
Total $133,980
Police: General Fund
Vendor Amount DescriptionDouble M/Jeff Feed $150,000 Animal Feed
Pride Industries $150,000 Janitorial services for Police headquarters
Remi Braden $91,000 Public affairs consultant
To Be Procured $100,000 24 hour on-call psychological evaluations
Penelope Dralle, PhD $90,275 Psychological screenings and clinical reviews for Police and Fire recruits
Jeffrey Rouse, M.D. $40,000 Forensic psychiatric services
Global Safety & Alere Toxicology $150,000 Random drug testing
Concentra $100,000 Physical exams and drug screenings for Police and recruits
Begue $15,000 Veterinarian services for small animals
Allison Barca $15,000 Veterinarian services for large animals
Lakeview Veterinarian $15,000 Veterinarian services for dogs
J.E. Argus $27,500 Horse shoe services (ferrier)
IPC New Orleans 1 $29,200 Entergy Centre Lease/IPC
N/A $8,000 Office space lease agreement
Camp Villere $50,000 Police training facility and shooting range
Financial Planning Center $90,000 NOPD Public Integrity Bureau lease agreement
IPC New Orleans 1 $59,599 Rooftop Antenna for Communications System
Harley of New Orleans $471,000 Motorcycle leases
Ives $120,000 Office supplies
Column Technologies $41,333 Investigative case management system support
Interactive Public Safety $67,000 Packet cluster system support
Foray, Aligent & Thermo $50,000 Maintenance agreement for Lab Equipment
To Be Procured $45,000 Lodging State Troopers/Mardi Gras & SuperBowl
To Be Procured $25,000 Training & Mandatory Certifications
Pitney Bowes $31,000 Postage/Freight Expense
To Be Procured $7,900 Dues & Subscriptions
To Be Procured $30,000 Printing & Binding for tickets, affidavits, etc
Eliza Triplett $15,000 PIB & Homicide Transcription Services
To Be Procured $85,000 Undercover expenses (Narc,Vice/Intel. Homicide, PIB)
To Be Procured $50,000 Lab supplies, evidence bags, residue test kits, etc
L E Argus $20,000 Horse Shoes
To Be Procured $15,000 In Car Video System support
Teeco Safety Inc $30,000 Taser Cartridges, duty & training
Teeco Safety Inc $20,000 Cameras for taser device
Omega Inc $19,000 Maintenance for CrimeView desktop
Teeco Safety Inc $15,000 Repairs for Tasers
Inline Barricades $36,000 Repairs for Metal barricades
To Be Procured $15,000 Maintenance & repair of back up generators
Bell Office Machines $5,560 Maintenance for color copiers
St. Tammany's Sheriff $10,000 Gunshot residue
To Be Procured $7,500 Cleaning Traps for Mounted/K9
Deaf Action Center $6,500 Sign Language
Precision Delta $225,000 Ammunition supply
Page 571
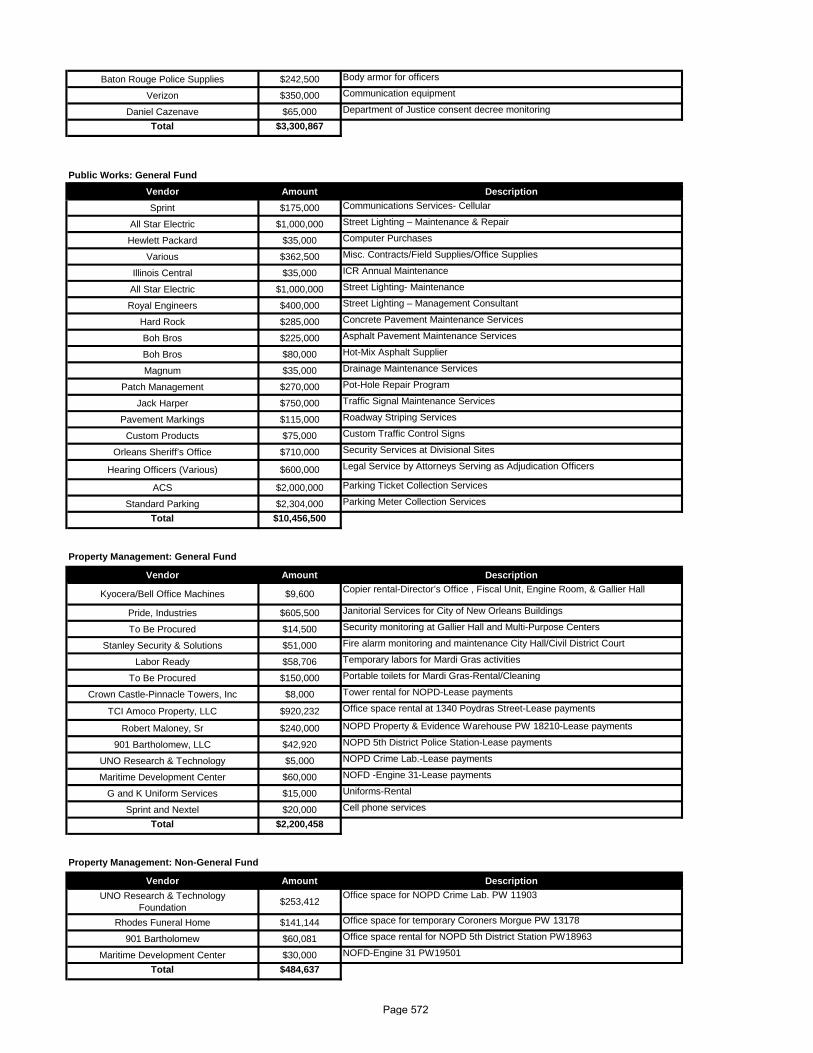
Baton Rouge Police Supplies $242,500 Body armor for officers
Verizon $350,000 Communication equipment
Daniel Cazenave $65,000 Department of Justice consent decree monitoring
Total $3,300,867
Public Works: General FundVendor Amount DescriptionSprint $175,000 Communications Services- Cellular
All Star Electric $1,000,000 Street Lighting – Maintenance & Repair
Hewlett Packard $35,000 Computer Purchases
Various $362,500 Misc. Contracts/Field Supplies/Office Supplies
Illinois Central $35,000 ICR Annual Maintenance
All Star Electric $1,000,000 Street Lighting- Maintenance
Royal Engineers $400,000 Street Lighting – Management Consultant
Hard Rock $285,000 Concrete Pavement Maintenance Services
Boh Bros $225,000 Asphalt Pavement Maintenance Services
Boh Bros $80,000 Hot-Mix Asphalt Supplier
Magnum $35,000 Drainage Maintenance Services
Patch Management $270,000 Pot-Hole Repair Program
Jack Harper $750,000 Traffic Signal Maintenance Services
Pavement Markings $115,000 Roadway Striping Services
Custom Products $75,000 Custom Traffic Control Signs
Orleans Sheriff’s Office $710,000 Security Services at Divisional Sites
Hearing Officers (Various) $600,000 Legal Service by Attorneys Serving as Adjudication Officers
ACS $2,000,000 Parking Ticket Collection Services
Standard Parking $2,304,000 Parking Meter Collection Services
Total $10,456,500
Property Management: General Fund
Vendor Amount Description
Kyocera/Bell Office Machines $9,600 Copier rental-Director’s Office , Fiscal Unit, Engine Room, & Gallier Hall
Pride, Industries $605,500 Janitorial Services for City of New Orleans Buildings
To Be Procured $14,500 Security monitoring at Gallier Hall and Multi-Purpose Centers
Stanley Security & Solutions $51,000 Fire alarm monitoring and maintenance City Hall/Civil District Court
Labor Ready $58,706 Temporary labors for Mardi Gras activities
To Be Procured $150,000 Portable toilets for Mardi Gras-Rental/Cleaning
Crown Castle-Pinnacle Towers, Inc $8,000 Tower rental for NOPD-Lease payments
TCI Amoco Property, LLC $920,232 Office space rental at 1340 Poydras Street-Lease payments
Robert Maloney, Sr $240,000 NOPD Property & Evidence Warehouse PW 18210-Lease payments
901 Bartholomew, LLC $42,920 NOPD 5th District Police Station-Lease payments
UNO Research & Technology $5,000 NOPD Crime Lab.-Lease payments
Maritime Development Center $60,000 NOFD -Engine 31-Lease payments
G and K Uniform Services $15,000 Uniforms-Rental
Sprint and Nextel $20,000 Cell phone services
Total $2,200,458
Property Management: Non-General Fund
Vendor Amount DescriptionUNO Research & Technology
Foundation $253,412 Office space for NOPD Crime Lab. PW 11903
Rhodes Funeral Home $141,144 Office space for temporary Coroners Morgue PW 13178
901 Bartholomew $60,081 Office space rental for NOPD 5th District Station PW18963
Maritime Development Center $30,000 NOFD-Engine 31 PW19501
Total $484,637
Page 572
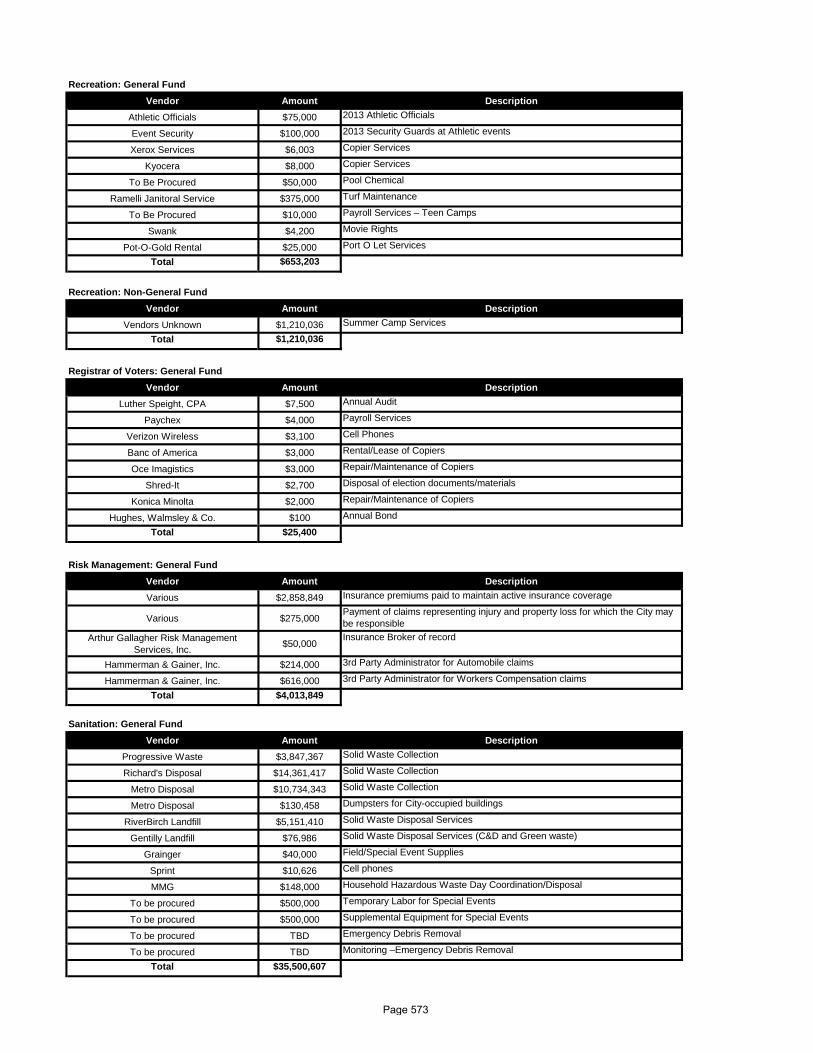
Recreation: General FundVendor Amount Description
Athletic Officials $75,000 2013 Athletic Officials
Event Security $100,000 2013 Security Guards at Athletic events
Xerox Services $6,003 Copier Services
Kyocera $8,000 Copier Services
To Be Procured $50,000 Pool Chemical
Ramelli Janitoral Service $375,000 Turf Maintenance
To Be Procured $10,000 Payroll Services – Teen Camps
Swank $4,200 Movie Rights
Pot-O-Gold Rental $25,000 Port O Let Services
Total $653,203
Recreation: Non-General FundVendor Amount Description
Vendors Unknown $1,210,036 Summer Camp Services
Total $1,210,036
Registrar of Voters: General FundVendor Amount Description
Luther Speight, CPA $7,500 Annual Audit
Paychex $4,000 Payroll Services
Verizon Wireless $3,100 Cell Phones
Banc of America $3,000 Rental/Lease of Copiers
Oce Imagistics $3,000 Repair/Maintenance of Copiers
Shred-It $2,700 Disposal of election documents/materials
Konica Minolta $2,000 Repair/Maintenance of Copiers
Hughes, Walmsley & Co. $100 Annual Bond
Total $25,400
Risk Management: General FundVendor Amount DescriptionVarious $2,858,849 Insurance premiums paid to maintain active insurance coverage
Various $275,000 Payment of claims representing injury and property loss for which the City may be responsible
Arthur Gallagher Risk Management Services, Inc. $50,000
Insurance Broker of record
Hammerman & Gainer, Inc. $214,000 3rd Party Administrator for Automobile claims
Hammerman & Gainer, Inc. $616,000 3rd Party Administrator for Workers Compensation claims
Total $4,013,849
Sanitation: General FundVendor Amount Description
Progressive Waste $3,847,367 Solid Waste Collection
Richard's Disposal $14,361,417 Solid Waste Collection
Metro Disposal $10,734,343 Solid Waste Collection
Metro Disposal $130,458 Dumpsters for City-occupied buildings
RiverBirch Landfill $5,151,410 Solid Waste Disposal Services
Gentilly Landfill $76,986 Solid Waste Disposal Services (C&D and Green waste)
Grainger $40,000 Field/Special Event Supplies
Sprint $10,626 Cell phones
MMG $148,000 Household Hazardous Waste Day Coordination/Disposal
To be procured $500,000 Temporary Labor for Special Events
To be procured $500,000 Supplemental Equipment for Special Events
To be procured TBD Emergency Debris Removal
To be procured TBD Monitoring –Emergency Debris Removal
Total $35,500,607
Page 573
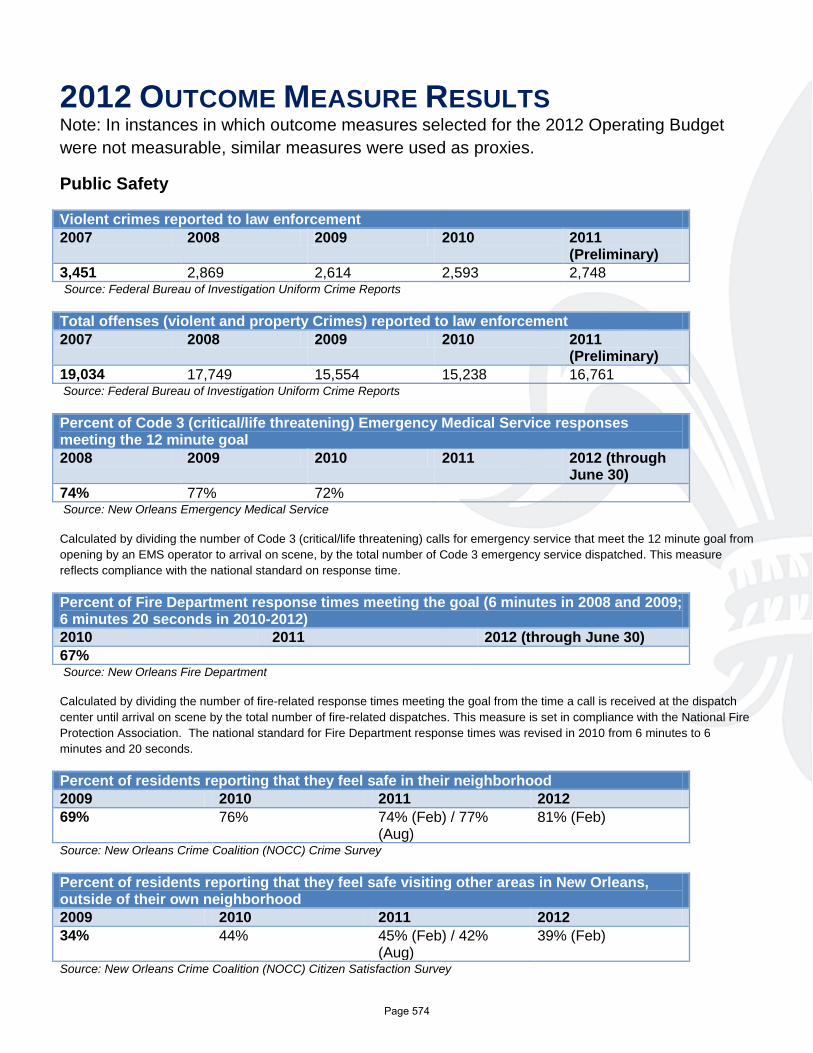
2012 OUTCOME MEASURE RESULTS Note: In instances in which outcome measures selected for the 2012 Operating Budget were not measurable, similar measures were used as proxies.
Public Safety
Violent crimes reported to law enforcement 2007 2008 2009 2010 2011
(Preliminary) 3,451 2,869 2,614 2,593 2,748 Source: Federal Bureau of Investigation Uniform Crime Reports
Total offenses (violent and property Crimes) reported to law enforcement 2007 2008 2009 2010 2011
(Preliminary) 19,034 17,749 15,554 15,238 16,761 Source: Federal Bureau of Investigation Uniform Crime Reports
Percent of Code 3 (critical/life threatening) Emergency Medical Service responses meeting the 12 minute goal 2008 2009 2010 2011 2012 (through
June 30) 74% 77% 72% Source: New Orleans Emergency Medical Service
Calculated by dividing the number of Code 3 (critical/life threatening) calls for emergency service that meet the 12 minute goal from opening by an EMS operator to arrival on scene, by the total number of Code 3 emergency service dispatched. This measure reflects compliance with the national standard on response time.
Percent of Fire Department response times meeting the goal (6 minutes in 2008 and 2009; 6 minutes 20 seconds in 2010-2012) 2010 2011 2012 (through June 30) 67% Source: New Orleans Fire Department
Calculated by dividing the number of fire-related response times meeting the goal from the time a call is received at the dispatch center until arrival on scene by the total number of fire-related dispatches. This measure is set in compliance with the National Fire Protection Association. The national standard for Fire Department response times was revised in 2010 from 6 minutes to 6 minutes and 20 seconds.
Percent of residents reporting that they feel safe in their neighborhood 2009 2010 2011 2012 69% 76% 74% (Feb) / 77%
(Aug) 81% (Feb)
Source: New Orleans Crime Coalition (NOCC) Crime Survey
Percent of residents reporting that they feel safe visiting other areas in New Orleans, outside of their own neighborhood 2009 2010 2011 2012 34% 44% 45% (Feb) / 42%
(Aug) 39% (Feb)
Source: New Orleans Crime Coalition (NOCC) Citizen Satisfaction Survey
Page 574
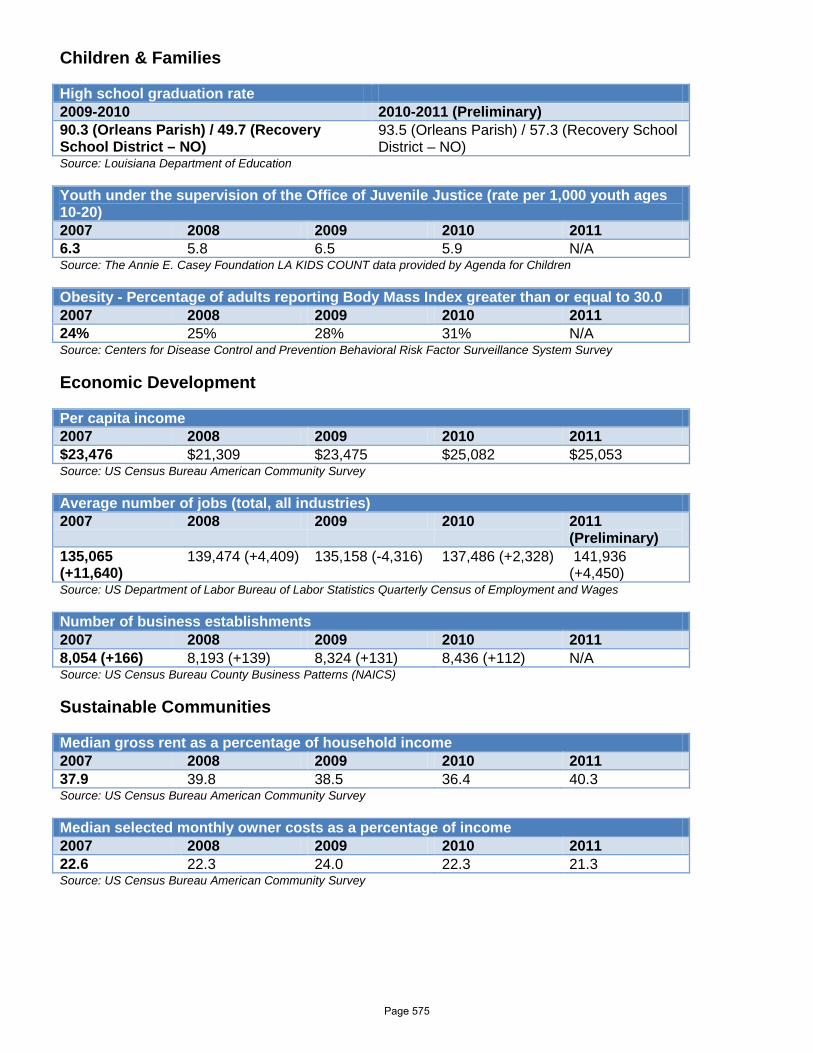
Children & Families
High school graduation rate 2009-2010 2010-2011 (Preliminary) 90.3 (Orleans Parish) / 49.7 (Recovery School District – NO)
93.5 (Orleans Parish) / 57.3 (Recovery School District – NO)
Source: Louisiana Department of Education
Youth under the supervision of the Office of Juvenile Justice (rate per 1,000 youth ages 10-20) 2007 2008 2009 2010 2011 6.3 5.8 6.5 5.9 N/A Source: The Annie E. Casey Foundation LA KIDS COUNT data provided by Agenda for Children
Obesity - Percentage of adults reporting Body Mass Index greater than or equal to 30.0 2007 2008 2009 2010 2011 24% 25% 28% 31% N/A Source: Centers for Disease Control and Prevention Behavioral Risk Factor Surveillance System Survey
Economic Development
Per capita income 2007 2008 2009 2010 2011 $23,476 $21,309 $23,475 $25,082 $25,053 Source: US Census Bureau American Community Survey
Average number of jobs (total, all industries) 2007 2008 2009 2010 2011
(Preliminary) 135,065 (+11,640)
139,474 (+4,409) 135,158 (-4,316) 137,486 (+2,328) 141,936 (+4,450)
Source: US Department of Labor Bureau of Labor Statistics Quarterly Census of Employment and Wages
Number of business establishments 2007 2008 2009 2010 2011 8,054 (+166) 8,193 (+139) 8,324 (+131) 8,436 (+112) N/A Source: US Census Bureau County Business Patterns (NAICS)
Sustainable Communities
Median gross rent as a percentage of household income 2007 2008 2009 2010 2011 37.9 39.8 38.5 36.4 40.3 Source: US Census Bureau American Community Survey
Median selected monthly owner costs as a percentage of income 2007 2008 2009 2010 2011 22.6 22.3 24.0 22.3 21.3 Source: US Census Bureau American Community Survey
Page 575
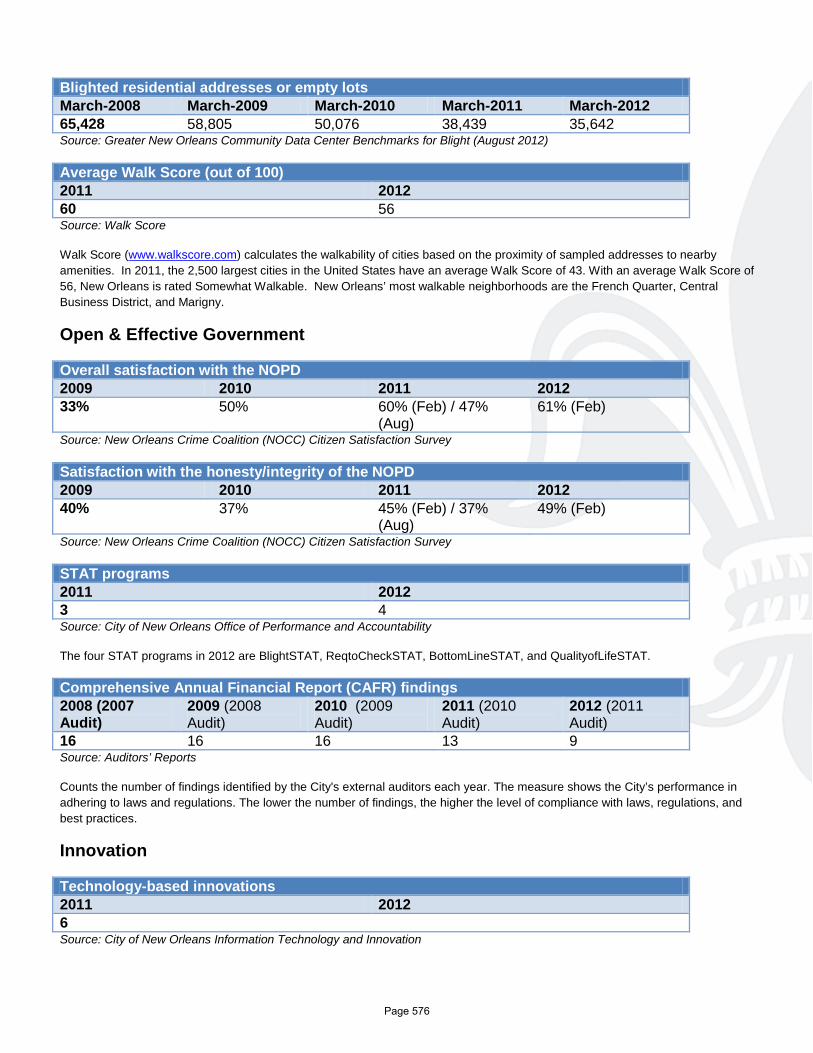
Blighted residential addresses or empty lots March-2008 March-2009 March-2010 March-2011 March-2012 65,428 58,805 50,076 38,439 35,642 Source: Greater New Orleans Community Data Center Benchmarks for Blight (August 2012)
Average Walk Score (out of 100) 2011 2012 60 56 Source: Walk Score
Walk Score (www.walkscore.com) calculates the walkability of cities based on the proximity of sampled addresses to nearby amenities. In 2011, the 2,500 largest cities in the United States have an average Walk Score of 43. With an average Walk Score of 56, New Orleans is rated Somewhat Walkable. New Orleans’ most walkable neighborhoods are the French Quarter, Central Business District, and Marigny.
Open & Effective Government
Overall satisfaction with the NOPD 2009 2010 2011 2012 33% 50% 60% (Feb) / 47%
(Aug) 61% (Feb)
Source: New Orleans Crime Coalition (NOCC) Citizen Satisfaction Survey
Satisfaction with the honesty/integrity of the NOPD 2009 2010 2011 2012 40% 37% 45% (Feb) / 37%
(Aug) 49% (Feb)
Source: New Orleans Crime Coalition (NOCC) Citizen Satisfaction Survey
STAT programs 2011 2012 3 4 Source: City of New Orleans Office of Performance and Accountability
The four STAT programs in 2012 are BlightSTAT, ReqtoCheckSTAT, BottomLineSTAT, and QualityofLifeSTAT.
Comprehensive Annual Financial Report (CAFR) findings 2008 (2007 Audit)
2009 (2008 Audit)
2010 (2009 Audit)
2011 (2010 Audit)
2012 (2011 Audit)
16 16 16 13 9 Source: Auditors’ Reports
Counts the number of findings identified by the City's external auditors each year. The measure shows the City’s performance in adhering to laws and regulations. The lower the number of findings, the higher the level of compliance with laws, regulations, and best practices.
Innovation
Technology-based innovations 2011 2012 6 Source: City of New Orleans Information Technology and Innovation
Page 576
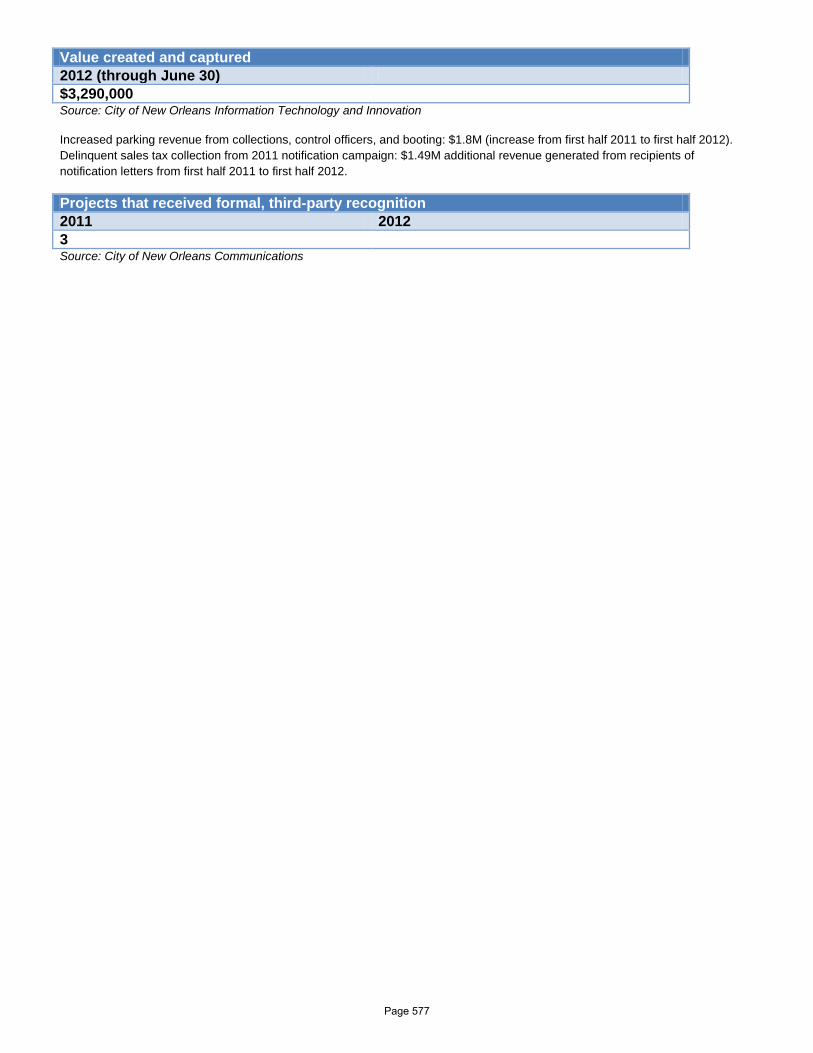
Value created and captured 2012 (through June 30) $3,290,000 Source: City of New Orleans Information Technology and Innovation
Increased parking revenue from collections, control officers, and booting: $1.8M (increase from first half 2011 to first half 2012). Delinquent sales tax collection from 2011 notification campaign: $1.49M additional revenue generated from recipients of notification letters from first half 2011 to first half 2012.
Projects that received formal, third-party recognition 2011 2012 3 Source: City of New Orleans Communications
Page 577