Embed Size (px)
Citation preview
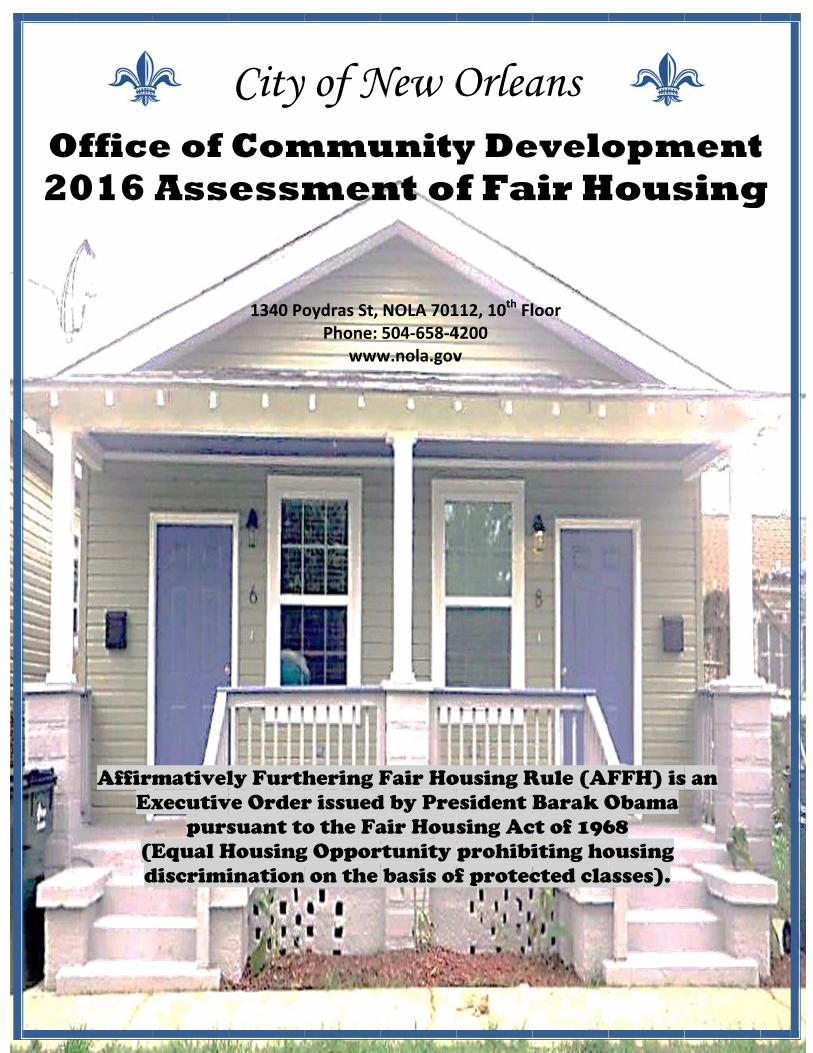
O20
AffirmEx
(Ed
Office016
mativelxecutiv
pursEqual H
discrimi
e of Ass
ly Furthve Ordersuant to
Housingination
City Comessm
1340 Po
hering Fr issuedo the Fa
g Opporn on the
y of Nmmumen
oydras St, Phone:
www
Fair Hod by Preair Housrtunity basis of
New O
unitynt o
NOLA 701504‐658‐4w.nola.gov
ousing Resident Bsing Ac prohibif protec
Orleay Def Fa
112, 10th Fl4200 v
Rule (AF Barak Oct of 196iting hocted cla
ans eveloair H
loor
FFH) isObama 68 ousing asses).
opmHous
s an
mentsing
t g

Assessment of Fair Housing Tool
Table of Contents
I. Cover Sheet
II. Executive Summary
III. Community Participation Process
IV. Assessment of Past Goals and Actions
V. Fair Housing Analysis
A. Demographic Summary
B. General Issues
i. Segregation/Integration
ii. Racially or Ethnically Concentrated Areas of Poverty (R/ECAPs)
iii. Disparities in Access to Opportunity
iv. Disproportionate Housing Needs
C. Publicly Supported Housing Analysis
D. Disability and Access Analysis
E. Fair Housing Enforcement, Outreach Capacity, and Resources Analysis
VI. Fair Housing Goals and Priorities
VII. Appendices
A. Appendix A – Stakeholder Engagement List
B. Appendix B – Public Meeting Comments
C. Appendix C – Public Comment Letters

2
I. Cover Sheet
1. Submission date: October 4,2016
2. Submitter name: City of New Orleans and Housing Authority of New Orleans
3. Type of submission (e.g., single program participant, joint submission): Joint Submission
4. Type of program participant(s) (e.g., consolidated plan participant, PHA): Consolidated Plan
participant and PHA participant
5. For PHAs, Jurisdiction in which the program participant is located: New Orleans, LA/Orleans
Parish
6. Submitter members (if applicable): N/A
7. Sole or lead submitter contact information:
a. Name: Ellen M. Lee
b. Title: Director of Housing Policy and Community Development
c. Department: City of New Orleans – Office of Community Development
d. Street address: 1340 Poydras Street – 10th Floor
e. City: New Orleans
f. State: LA
g. Zip code: 70112
8. Period covered by this assessment: 2017 - 2021
9. Initial, amended, or renewal AFH: Initial
10. To the best of its knowledge and belief, the statements and information contained herein are
true, accurate, and complete and the program participant has developed this AFH in
compliance with the requirements of 24 C.F.R. §§ 5.150-5.180 or comparable replacement
regulations of the Department of Housing and Urban Development;
11. The program participant will take meaningful actions to further the goals identified in its
AFH conducted in accordance with the requirements in §§ 5.150 through 5.180 and 24 C.F.R.
§§ 91.225(a)(1), 91.325(a)(1), 91.425(a)(1), 570.487(b)(1), 570.601, 903.7(o), and 903.15(d),
as applicable.
All Joint and Regional Participants are bound by the certification, except that some of the
analysis, goals or priorities included in the AFH may only apply to an individual program
participant as expressly stated in the AFH.
Note: Signature pages are included as separate attachments to the document.
(Signature) (date)
(Signature) (date)
12. Departmental acceptance or non-acceptance:
(Signature) (date)
3
II. Executive Summary
In 2015 the U.S. Department of Housing and Urban Development (HUD) released a final rule, revamping
and the process by which certain federal grantees demonstrate that they are affirmatively furthering the
purposes of the Fair Housing Act. In response to the regulation, the City of New Orleans (City) and the
Housing Authority of New Orleans (HANO) collaborated to produce a joint Assessment of Fair Housing
(AFH) Plan designed to provide meaningful goals and strategies that can be reasonably expected to
achieve a material positive change in disparities in housing needs and in access to opportunity; replacing
segregated living patterns with truly integrated and balanced living patterns; transforming racially or
ethnically concentrated areas of poverty into areas of opportunity; and fostering and maintaining
compliance with civil rights and fair housing laws.
In developing the AFH Plan, the City and HANO, along with partner organizations and residents, were
guided by the PolicyLink philosophy of equity that is defined as “just and fair inclusion into a society in
which all can participate, prosper, and reach their full potential.” More specifically, the City and HANO
stressed the equity principles below throughout the planning process.
Equity Guiding Principles
• Equity – AFH participants recognize the important role affordable housing plays in
promoting equity, and the overall importance of helping low- and moderate-income New
Orleanians, including people of color, persons with disabilities, and families with children,
build financial stability and live in thriving communities with linkages to jobs and
transportation.
• Collaboration – The City and HANO acknowledge that they alone cannot meet the growing
need for affordable housing and community assets in New Orleans. They will need support
from committed local, state, and federal partners, including for profit, nonprofit, and
governmental entities. In particular, collaboration between the City, the New Orleans
Redevelopment Authority (NORA), HANO, and the Finance Authority of New Orleans
(FANO) will be critical to meeting unmet needs.
• Openness – The AFH Plan seeks to create transparent accountability for all initiatives by
connecting proposed activities to metrics and milestones. The AFH Plan builds on the
extensive, community-based work already completed through HousingNOLA 10 Year
Strategy and Implementation Plan, Housing for a Resilient New Orleans, and NORA’s
Rental Housing Report, which all document the state of housing within the city, noting
challenges and providing recommendations for overcoming barriers.
With these equity guiding principles at the forefront of the planning process, the City and HANO were
able to analyze data that gave a clear picture of segregation; racially/ethnically concentrated areas of
poverty; disparities in access to jobs, proficient schools, transportation; and disproportionate housing
needs in New Orleans. The AFH Plan discusses these barriers to fair housing, as well as the fair housing
enforcement and outreach infrastructure in New Orleans, and identifies contributing factors that have a
causal relationship to those fair housing issues. The City and HANO found a number of contributing
factors through the process of developing the AFH Plan. Factors such as community opposition to the
placement of affordable housing, lack of public or private investment, zoning and land use laws, and

4
economic pressures, among many others, contribute to fair housing issues. Identifying contributing
factors was integral to crafting specific goals for affirmatively furthering fair housing.
Summary of Goals
To address these barriers, the AFH Plan proposes to:
1. Lower barriers to expanded affordable housing in high opportunity areas through inclusive
strategies.
2. Reduce housing segregation and discrimination by aggressively conducting fair housing
education and enforcement activities, in coordination and with fair housing organizations.
3. Ensure that internal policies and practices advance access & mobility for groups with significant
challenges in accessing safe and affordable housing including people with disabilities, people
with limited English proficiency, and people with criminal records.
4. Prioritize public investments in transit, quality schools, housing, parks, and other amenities in
underserved communities.
5. Expand efforts in creating equitable healthy housing that recognizes the direct connections
between healthy housing and quality of life.
6. Stabilize neighborhoods vulnerable to gentrification by preserving existing ownership and
affordable rental housing and developing affordable homeownership and rental housing.
7. Provide reliable, frequent, and affordable access to multiple transportation options to transit-
dependent populations.
The AFH Plan is consistent with the City’s Housing for a Resilient New Orleans plan, which sets the goal
of building or preserving 7,500 affordable housing units by 2021. The City and HANO also understand
that, in order to lay the foundation for efforts to affirmatively further fair housing, the AFH Plan must
address more than affordable housing and discrimination on the basis of race and national origin. The
AFH Plan must also identify other barriers to access to opportunity and address factors contributing to
those disparities. To accomplish a more in-depth look at these issues, the AFH Plan considered the
existing HousingNOLA Plan, which provided a data framework that addressed a number of issues that
create barriers to housing and opportunity in New Orleans. In addition, the City and HANO also referred
to the HANO PHA Plan and the City of New Orleans Consolidated Plan in conducting the analysis and
formulating the goals within the AFH Plan.
The AFH Plan is designed to facilitate efforts to affirmatively further fair housing by working towards a
mission of ensuring that everyone who calls New Orleans home is able to access similar opportunities
without being burdened by substantial barriers.

5
III. Community Participation Process
1. Describe outreach activities undertaken to encourage and broaden meaningful community
participation in the AFH process, including the types of outreach activities and dates of public
hearings or meetings. Identify media outlets used and include a description of efforts made to
reach the public, including those representing populations that are typically underrepresented in
the planning process such as persons who reside in areas identified as R/ECAPs, persons who
are limited English proficient (LEP), and persons with disabilities. Briefly explain how these
communications were designed to reach the broadest audience possible. For PHAs, identify
your meetings with the Resident Advisory Board.
HANO and the City undertook a number of activities to broaden and encourage meaningful
community participation. Steps that were taken to ensure meaningful community participation are
as follows:
Stakeholders List
HANO and the City developed a large list of over 100 stakeholders and grouped them by specialty
area (See Appendix A – Stakeholder Engagement List). HANO and the City invited stakeholders to
assist the HANO/OCD team in outreach efforts by providing data and information to their
constituents and gathering feedback on a number of AFH topics. Stakeholders were grouped into the
following categories:
Housing Neighborhood Groups
Social Services Zoning/Urban Planning
Advocacy/Criminal Justice Transportation
Economic/Jobs/Employment Persons with Limited English
Proficiency
Resident Advisory Board Public Officials
Stakeholder Meetings
The City and HANO scheduled a number of stakeholder meetings during the course of the
development of the AFH Plan. There were three types of stakeholder meetings: general stakeholder
public meetings, stakeholder capacity building sessions, and stakeholder planning group meetings.
General stakeholder meetings were open to the public and included information gathering and
sharing as well as breakout sessions. The City and HANO coordinated with the Greater New
Orleans Fair Housing Action Center (GNOFHAC), which took the lead in convening the
stakeholder capacity sessions. These sessions targeted smaller community-based and advocacy
groups whose fair housing outreach efforts to their constituents would benefit from capacity
building and training regarding the purpose and technical aspects of the AFH process. The
stakeholder planning group meetings were weekly meetings of the seven partner groups that were
charged with assisting in synthesizing community input, guiding research, and identifying and

6
addressing gaps in data. These seven groups were the City of New Orleans Office of Community
Development, HANO, GNOFHAC, PolicyLink, Lawyers’ Committee for Civil Rights Under Law,
Greater New Orleans Housing Alliance (GNOHA), and Enterprise Community Partners.
Approximately 40 participants attended the general stakeholder meeting with all of the specialty
areas listed above represented, and attendance at the capacity building sessions averaged 15
stakeholders.
Meeting dates were as follows:
General Stakeholder Meeting July 6, 2016
Stakeholder Capacity Session July 11, 2016
Stakeholder Capacity Session July 13, 2016
Stakeholder Capacity Session September 6, 2016
Stakeholder Capacity Session September 7, 2016
HANO Resident Advisory Board Meeting September 14, 2016
Community Meetings/Hearings Open to the General Public
Community outreach and feedback was also solicited at multiple meetings that were open to the
general public including the City of New Orleans Budget meetings held in every Council district,
HANO Board meetings, Resident Advisory Board (RAB) meetings, and public hearings. Meeting
dates were as follows:
District A Budget Meeting July 6, 2016
District C Budget Meeting July 7, 2016
District E Budget Meeting July 11, 2016
District D Budget Meeting July 13, 2016
District B Budget Meeting July 14, 2016
Public Hearing 1 July 19, 2016
HANO Board Meeting July 26, 2016
Public Hearing 2 September 10, 2016
Dillard University Housing Fair September 24, 2016
HANO Board Meeting September 27, 2016
Public Hearing 3 October 3, 2016

7
Short surveys distributed at budget meetings, stakeholder meetings, and public hearings garnered
109 responses, while a longer, online survey received 127 responses.
Analysis of short survey
Of the 109 respondents to the short survey, the majority of the respondents identified as
Black/African-American. The race/ethnicity composition was as follows:
White 12
Black 102
Black and Latino 1
American Indian 1
Latino or Hispanic 2
Other 3
Did not provide 17
The age group demonstrated that the age groups of the 41 – 50 year old respondents and
respondents 70 or older were underrepresented. The age group of respondents were as follows:
Age 18-30 19
Age 31-40 27
Age 41-50 8
Age 51-60 27
Age 61-70 16
Age 70+ 2
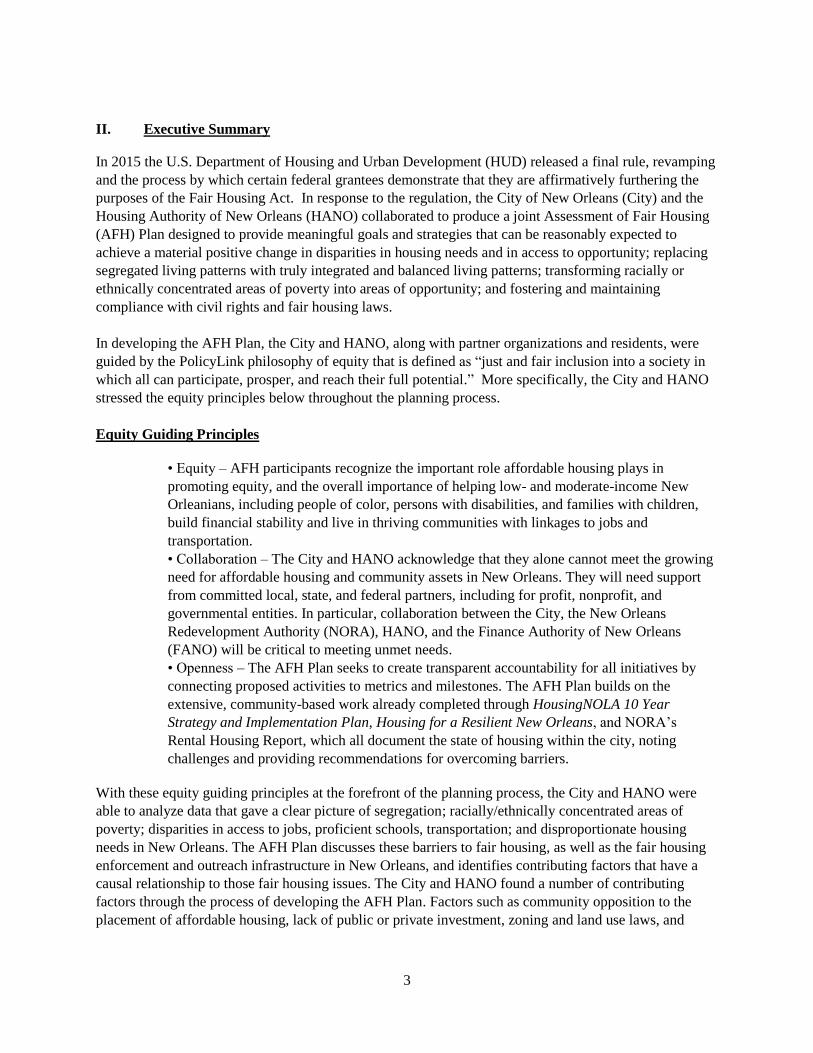
The issues that were identified are displayed in the below charts.
Analysis of Online Surveys
Responses to the on-line survey indicates an overwhelming response by white, college educated,
middle-class women without children. The three top concerns expressed by these respondents about
their neighborhood were violent crime, public transit, and rising prices while the three least
concerns were unsafe homes, environmental hazards, and good jobs. The majority of these
Good Schools
21%
Good Jobs10%
Quality Healthca
re13%
Healthy Food14%
Public Transit
24%
Parks18%
DISPARITIES IN ACCESS TO OPPORTUNITY Rising
prices23%
Blighted homes
17%Unsafe homes
13%
Violent Crime26%
Environmental Hazards
8%
Poverty13%
NEIGHBORHOOD ISSUES

8
respondents indicate no experience with discriminatory practices and, if they did experience
discrimination, they knew their rights and where to get assistance.
Print Media
Advertisements were placed in the Times Picayune, the New Orleans Advocate, the Louisiana
Weekly which is an African-American owned newspaper, Mary Queen of Vietnam
bulletins, and XXXX on multiple dates during the planning period.
Collaborated with the Mayor’s Office of Human Needs – Americans with Disabilities Act (ADA)
to provide outreach activity flyers to this target population.
News article on Public Hearing -
http://www.theadvocate.com/new_orleans/news/article_34bf02d2-4e10-11e6-bf2f-
5b6de5562baa.html
Social Media
Mayor Landrieu’s Facebook Page posted information on the AFH process
(www.facebook.com/mayorlandrieu/)
HANO, City of New Orleans, and GNOFHAC played a link to the online survey on their
websites, and City Council members and GNOHA sent numerous e-mail blasts about the
survey.
Notices of hearings and meeting dates as well as links to AFFH information were posted on
www.hano.org and www.nola.gov and GNOHA and GNOFHAC websites.
Drafts of the AFH Plan issued on August 19, 2016 and subsequent updates were placed on the
websites of HANO and the City, as well as on stakeholder websites. Hard copies were also
made available at HANO’s Central and Site Management Offices, at the City’s Office of
Community Development, and at New Orleans Public Library branches.
Live tweets of public hearings by Greater New Orleans Housing Alliance
Broadcasts
Local television news broadcasts reported on the initial July 19 AFFH Public Hearing and
provided information about the process and other points of engagement.
Interview regarding AFH on local African American focused radio station WBOK 1230 with
Ellen Lee, Director of Housing and Community Development for the City of New Orleans.
Broadcasts detailing comments and plan details heard at the September 10th public hearing
was on local news channel WWL-TV.
The AFH Plan was discussed on “Informed Sources” on September 9th on WYES, a local
public broadcasting channel.
All fliers and communications about the AFH process advertised an email address
([email protected]) for the submission of additional commentary. Emailed comments and attached
letters can be reviewed in Appendix B – Comment Letters
Outreach Activities Description for R/ECAPs, LEP Individuals, and Persons with Disabilities:
The City and HANO primarily attempted to engage and encourage community participation by
populations that are typically underrepresented in local planning processes through collaboration

9
with community organizations that work directly with the targeted populations. The AFH team
engaged in targeted outreach to residents of R/ECAPs by collaborating closely with community
organizations representing the neighborhoods. The team distributed flyers in R/ECAPs, as well as at
local community centers, churches, and schools.
For persons with limited English proficiency (LEP), the City and HANO worked with the Greater
New Orleans Housing Fair Housing Action Center (GNOFHAC) to perform outreach. GNOFHAC
has been working with Puentes, an advocacy organization for the Latino community, to reach
Spanish speakers. GNOFHAC had flyers announcing public meetings translated into
Spanish. Those flyers were distributed to Puentes. These flyers were also read on-air on the
Spanish-language radio and TV outlets that Lesley mentioned. The Director of GNOFHAC
appeared on Telemundo with a Spanish-speaking staff member and Puentes on September
8th. GNOFHAC also performed an interview on KGLA's Spanish radio station on that date. In
both appearances, GNOFHAC discussed the AFH process and encouraged viewers/listeners to
attend the September 10th hearing. GNOFHAC also performed another Telemundo interview on
Monday, September 26th.
In addition to Spanish speakers, GNOFHAC also reached out to Muslim community
members. There are large populations of Arabic speakers living in certain communities on the
Jefferson Parish west bank, in addition to an Urdu-speaking community in the Kenner
area. GNOFHAC has contacts in both of those communities, and they circulated Arabic and Urdu
flyers about public hearing meetings to those populations.
GNOFHAC also translated a flyer into Spanish, Arabic, and Urdu and circulated to promote
attendance at the September 24th community meeting at Dillard University regarding the AFH plan
and the final October 3rd public hearing.
From these efforts, 3% of survey respondents that attended public meetings identified as Latino. It is
important to note that the population of Latino residents in New Orleans is around 5%.
Lighthouse Louisiana, which provides services for individuals with auditory and visual disabilities,
made their services available at both AFH Public Hearings. All AFH meetings took place at
facilities that are accessible to persons with ambulatory disabilities.
2. Provide a list of organizations consulted during the community participation process.
See Appendix A.
3. How successful were the efforts at eliciting meaningful community participation? If there was
low participation, provide the reasons.
Successful Community Participation Process: The City and HANO initiated various
outreach activities to engage community members in the AFH process. Together, these
efforts comprised the City and HANO’s Community Participation Process. Because of
these outreach activities, HANO and the City witnessed unprecedented attendance at AFH
planning meetings compared to attendance at past City and HANO planning meetings.

10
At the first stakeholder meeting to introduce community-based organizations and other
interested parties to the task of developing a plan that affirmatively furthers fair housing,
there were 43 attendees. Participants included stakeholder organizations, residents, and
Resident Advisory Board members. Attendees from the Vietnamese and Spanish speaking
communities were present as well as attendees representing formerly incarcerated
individuals and persons with disabilities. The City and HANO provided stakeholders with
data on disparities in access to opportunity in New Orleans and barriers to fair housing and
asked attendees to be part of the process of developing solutions.
Collaborating as a planning team partner, GNOFHAC hosted a number of stakeholder
capacity building sessions to help members of community-based organizations understand
the issues central to the AFH process and provide feedback to assist in developing the
AFH Plan. From these sessions, the AFH planning team was able to garner valuable input
that was incorporated into the Plan.
4. Summarize all comments obtained in the community participation process. Include a summary
of any comments or views not accepted and the reasons why.
Scribed comments from public meetings is included as attachment A summary of public
hearing comments by topic area is as follows:
Housing Affordability
Where the hospitals are built, the prices are going way up. A lot of people have been put
out by the landlords near the hospitals because the landlords are raising rents.
The only option for people is Habitat for Humanity.
“If it wasn’t for Section 8, I would be out on the street.”
Rent is too much. Paying 1,200 a month with four kids to be comfortable.
Coming out of a housing development is like “Oh my god, what am I going to do?”
Choosing between being comfortable and pulling child out of college.
Not enough low-income and affordable housing.
High rent versus low wages.
Difficulty with upfront costs (deposits and first month rent) even with assistance.
Higher rent forces people out of their community.
Converting duplexes to single-family creates less rental housing.
Access to Housing
One-bedroom market rates in tax-credits are over a year on waiting list.
Where are people going? A lot of people living with families or in the shelters. Increase
in homeless – living under the overpass, hanging out on the neutral ground, Carrollton,
Napoleon.
People building and constantly coming in from other states and pushing people out from
better areas into the slum areas.
Demand for housing near schools, jobs, etc.
Gentrification causing residents to be pushed to areas with a lot of poverty to areas with
less amenities and transportation.
Short term rentals are causing evictions and will raise rent prices.

11
Public Housing taking too long to complete, like Guste.
Need more affordable housing.
Live close to schools.
Difficulty finding a house. Slum landlords. No jobs, no healthcare. PCP licenses? Access
to food pantries. Downtown and Carrollton areas. Grocery stores. Only Walmart, Family
Dollar, Dollar General. Community stores with no good food.
HCV is for very, very low income people.
Most people on the list don’t get off the list until they pass away. A lot of people might
qualify for the 60% units. Even on social security people are over income.
Renter Rights & Tenant Relations
In mixed-income communities, third-party managers are a problem (not community-
focused).
No knowledge of renter rights and the power to enforce violation, as well as, risk of
eviction.
Education for the public on renter’s rights.
The developers come and bring these management teams in. People were told, “if we fix
the gates, we are going to raise your rent.”
We need to take the community back as a community. It is not about community
anymore. Marrero Commons.
Do the individual public housing sites have a responsibility to inform tenants of what is
happening in housing programs?
Renters not having knowledge of what their rights are. Not having power to hold
landlords accountable. The schools don’t seem integrated. People seem forced into
accepting substandard housing. A lot of blighted housing.
Quality of Housing
People living in deplorable conditions. Mold, termites, lead paint, general disrepair.
Leaks and nonfunctioning air conditioners. Landlords are unresponsive.
Since Katrina, it hasn’t gotten back to the point where it was. Conditions of homes. Some
homes are deplorable and some people are living in luxury.
Bad streets and not enough lighting.
Low quality of housing (not up to code).
Privatized community police and neighborhood watch that goes around. The construction
is well-maintained Uptown. In lower-income areas construction is not as orderly.
Majority of the houses in neighborhoods uptown are Airbnb.
Blight map is concentrated in certain areas of the city. Blighted houses a big issue.
Unsafe occupied houses.
Housing needs and concerns should be on substandard properties. Lots of blighted
property.
Substandard Housing.
Not enough safe, low-income housing. “It is the housing society thinks we should have
because we are low-income.”
Abandoned houses with mold, termites, etc. Landlords expect tenants to make repairs.

12
Housing Discrimination
Discrimination because a person would like more cash instead of a voucher.
Some landlords prefer voucher holders over cash.
Jobs
Transportation
Jobs are concentrated in certain areas.
Access to jobs is a problem. People working temporary jobs, jobs are not sustainable.
Criminal background checks are keeping people from getting jobs.
Like the airport, there are a lot of jobs, but it is really far, the JP (Jefferson Parish) bus is
different from Orleans Parish.
The streetcar is being built in the Bywater where they already have transportation.
People who need transit in poor Black neighborhoods have to walk a far way to get
anywhere, transportation is going to the richer areas still.
The transportation is made for the tourists.
Driving, transportation close to work can be expensive.
Jobs that are close to home don’t pay that much.
Public/Private Investment Concerns
Tapping into community services is important. There are community services but people
are not aware of them.
“God, what am I going to do.” In Pigeontown, only five houses are lived-in and the
others are blighted.
Budget priority: build fewer jails and put more funds into affordable housing and schools
and youth improvement.
Grocery stores. No affordable grocery stores in vast places of the city.
Building a grocery store at Columbia Parc, which is good, but it is the only one.
Big infrastructure to reduce flooding uptown, but there are a lot of areas that have a lot of
flooding.
Not doing any work on roads in poorer Black neighborhoods.
Want to see more equity in construction, levees, streets, potholes, lighting.
Food deserts /a lot of blight in the industrial canal area.
Uneven investment/infrastructure/development/allocation of resources in certain
neighborhoods; seems like a way to push people out so developers can buy cheap and
redevelop.
Schools
Students have to take the bus at 7 in the morning.
Schools are fair, not good.
A bus is the only way to get to school, can create a very long day.
Not enough good schools.
Problems with resources at schools.
Lack of parent involvement.
Not enough libraries.
Libraries not open late enough.
Schools not offering enough vocational education.

13
Neighborhood schools – better integrated with community.
Need better neighborhood schools, loss of a sense of community, no school pride.
Access to Healthy Food:
There is Whole Foods, but it’s unaffordable.
Access to healthy food, but not affordable healthy food.
Not enough grocery stores.
Corner store food (not healthy).
Not enough grocery stores.
Food stamps not enough to afford healthy food.
Transit Access:
Buses running less frequently.
School buses are only on major roads, not into communities. Have to walk a long way for
kids to catch a bus.
City buses also don’t go into the community, only outskirts on major roads.
Transit not good in Jefferson, New Orleans East. No regional connectivity.
Transportation not accessible. Not taking care of people who use services.
Recreation Facilities:
Recreation facilities are available (but not programming).
Quality Health Care:
Not enough neighborhood-based clinics (were more before Hurricane Katrina).
Not enough residents have health insurance.
Insurance is very costly, some deductibles are way too high.
Health coverage from the state is limited.
Public Health & Environmental Concerns:
Violent crime.
Exposure to environmental health hazards.
Poverty.
Racial segregation.
Groups working with minority poverty populations should go through Undoing Racism
Training.
Community also has to take responsibility for some issues.
Agriculture Street landfill. Built on top of a landfill. Environmental injustice. Found out
in 1993. Has cancer at 34. No school in the area. No store in the area. No bus in the area.
Homeowners from HANO who are paying taxes but are not able to access their
properties. Want relocation for the 53 people who are left back there.
Budget priority: build fewer jails, and put more funds into affordable housing and
schools and youth improvement.
Agriculture street landfill. Built on top of a landfill. Environmental issues.

14
Following is a summary of public comments received during the AFH Plan but not accepted
for reasons stated below:
There was a public hearing comment raised that homeowners from HANO on the
Agriculture Street landfill site are paying taxes but are not able to access their properties.
All HANO-owned homes built on the Agriculture Street landfill (Press Park
development) have been demolished. All of the remaining homes on the Press Park site
are privately-owned. A fence has been placed around the perimeter of the property to
provide security and public safety until the remaining privately-owned structures are
demolished.
IV. Assessment of Past Goals, Actions and Strategies
1. Indicate what fair housing goals were selected by program participant(s) in recent Analyses of
Impediments, Assessments of Fair Housing, or other relevant planning documents:
Goals were selected in the most recent Analyses of Impediments in 2010 were:
Improve fair housing system capacity, access to system and ability to respond to needs.
Improve communication and coordination among agencies and those interested in affirmatively
furthering fair housing.
Enhance understanding of fair housing by both consumers and providers.
a. Discuss what progress has been made toward their achievement;
Improving Fair Housing System Capacity
HANO’s Housing Choice Voucher Program (HCVP) Department partnered with the
Advocacy Center to conduct six (6) training sessions to enhance departmental resources
by educating the HCVP staff on reasonable accommodations and recognizing
unarticulated needs for assistance and how to offer customer assistance to improve
customer satisfaction.
HANO revised its hearing procedures to ensure that hearing officers grant a continuance
of any hearing if a resident has a pending reasonable accommodation request. In making
this change, HANO acknowledged that the hearing outcome may change based on the
outcome of the reasonable accommodation request.
HANO revised its criminal background screening criteria to protect the rights of formerly incarcerated
individuals to obtain housing. The new policy strikes a balance between the critical importance of public
safety and the need for persons with criminal records, who are disproportionately people of color, to
secure housing. The new procedures ensure that no applicant with criminal convictions will be denied
housing without first receiving an individualized assessment.
Increase Communication and Coordination
GNOHA along with HANO, the City, GNOFHAC, NORA, and many other community
stakeholders were able to establish a Policy Working Group that met for over a year on a

15
regular basis to produce HousingNOLA, a ten-year housing plan that reflects upon
housing conditions in the past, analyzes the present state of housing in New Orleans, and
recommends strategies for making better housing policy decisions in the future in order
to affirmatively further fair housing.
HANO collaborated with HUD’s Office of Fair Housing and Equal Opportunity (FHEO)
to conduct a series of fair housing workshops for landlords and tenants on various fair
housing requirements and concepts, including non-discrimination, disparate impact,
reasonable accommodation, and the Violence Against Women Act.
The City requires the use of HUD’s Equal Housing Opportunity logo in all press releases
and on all informational brochures that are used to solicit applications from owners and
posts federal fair housing information in conspicuous areas of OCD’s office.
Enhance Understanding of Fair Housing for Both Consumers and Providers
The City distributes written pamphlets and brochures about fair housing topics to
participating developers, owners, and tenants who are involved in or affected by HOME-
funded projects.
HANO advises all HCVP participants about the program’s portability feature that allows
voucher holders to move to the jurisdiction of any housing authority in the United States
at the time of voucher issuance. HANO also absorbs voucher holders porting into New
Orleans from other jurisdictions in order to facilitate the return of households displaced
by Hurricane Katrina.
The City requires property owners and developers selected for the award of HOME funds
to affirmatively market vacant units to members of protected classes that are the least
likely to apply and to enter into a written agreement embodying that requirement.
HANO has conducted several staff-led workshops with landlords to discuss and resolve
program issues and improve landlord education on program rules, regulations, roles, and
responsibilities.
The City requires that sub-recipients’ of HUD funds adopt a fair housing impact
statement addressing not only how they will refrain from housing discrimination, but also
how they will ensure that their housing and community development programs are
accessible to persons with disabilities and do not contribute to or intensify segregated
housing patterns.
HANO worked with FHEO staff from HUD’s New Orleans field office to host a series of
fair housing workshops with landlords and property managers on the following dates:
March 27, 2015, May 21, 2015, July 24, 2015, and September 30, 2015.
HANO revised its criminal background screening criteria. The new policy considers
convictions rather than arrests, and does not bar anyone categorically, except where
mandated by law.
16
b. Discuss how you have been successful in achieving past goals, and/or how you have fallen short
of achieving those goals (including potentially harmful unintended consequences);
HousingNOLA furthered important conversations about fair housing policies with agency leaders
and multiple other stakeholders. Many of the plan’s recommended policies could promote the
ultimate goal of creating integrated communities of opportunity throughout the city.
Since the 2010 Analysis of Impediments, fair housing policies and programs have greatly
improved. The City, HANO, GNOFHAC, Southeast Louisiana Legal Services, and GNOHA
collaborate as an informal working group with other community stakeholders to address housing
issues and make recommendations on various issues. Through these working relationships,
HANO and the City have been able to identify issues and make positive changes in their policies
− thereby strengthening fair housing programs.
HANO
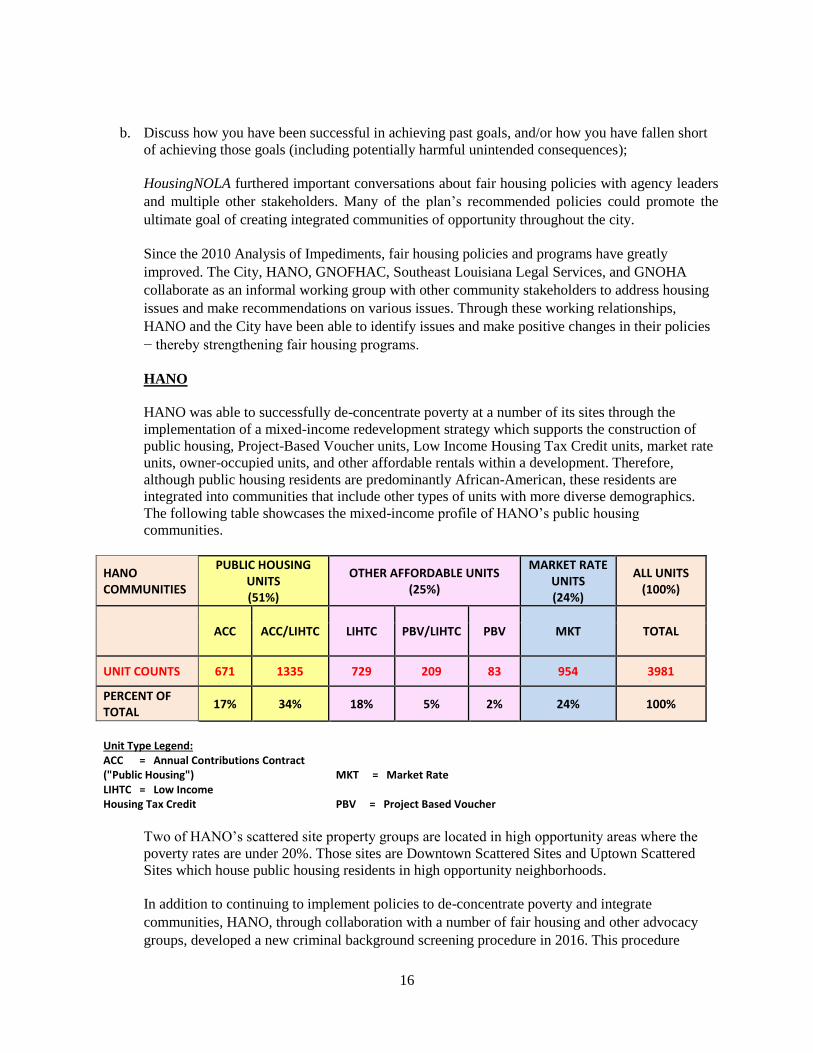
HANO was able to successfully de-concentrate poverty at a number of its sites through the
implementation of a mixed-income redevelopment strategy which supports the construction of
public housing, Project-Based Voucher units, Low Income Housing Tax Credit units, market rate
units, owner-occupied units, and other affordable rentals within a development. Therefore,
although public housing residents are predominantly African-American, these residents are
integrated into communities that include other types of units with more diverse demographics.
The following table showcases the mixed-income profile of HANO’s public housing
communities.
HANO COMMUNITIES
PUBLIC HOUSING UNITS (51%)
OTHER AFFORDABLE UNITS (25%)
MARKET RATE UNITS (24%)
ALL UNITS (100%)
ACC ACC/LIHTC LIHTC PBV/LIHTC PBV MKT TOTAL
UNIT COUNTS 671 1335 729 209 83 954 3981
PERCENT OF TOTAL
17% 34% 18% 5% 2% 24% 100%
Unit Type Legend:
ACC = Annual Contributions Contract ("Public Housing") MKT = Market Rate
LIHTC = Low Income Housing Tax Credit PBV = Project Based Voucher
Two of HANO’s scattered site property groups are located in high opportunity areas where the
poverty rates are under 20%. Those sites are Downtown Scattered Sites and Uptown Scattered
Sites which house public housing residents in high opportunity neighborhoods.
In addition to continuing to implement policies to de-concentrate poverty and integrate
communities, HANO, through collaboration with a number of fair housing and other advocacy
groups, developed a new criminal background screening procedure in 2016. This procedure

17
outlined the review process used to determine whether an applicant or potential additional
household member should be granted or denied housing assistance due to a past criminal
conviction and ensured that there is absolutely no presumption that an applicant with a criminal
conviction should be denied housing assistance. HANO is in the beginning stages of
implementing this policy.
City of New Orleans
The City was able to work with HANO and community stakeholders to develop the Housing for a
Resilient New Orleans plan. This plan proposes to build or preserve 7,500 affordable housing
units by 2021, including 4,000 units by 2018 and another 3,500 units by 2021.
The City has implemented programs that increase access to quality affordable housing and quality
of life amenities and services. New Orleans received a $141 million grant through HUD’s
National Disaster Resilience Competition and will use the grant to leverage additional private-
sector capital to support a range of neighborhood projects, including demonstration projects that
create and combine green space, public infrastructure, and storm water management. Also,
NORA and the City launched the Lower 9th Ward Initiative, which will accelerate the
redevelopment of 229 vacant or blighted properties in one of the areas hardest hit by Hurricane
Katrina.
To create greater access to opportunity, the City also adopted HireNOLA, which requires City
contractors to demonstrate that at least one-third of all work hours on projects are being
completed by local workers. In addition, the City increased the minimum wage for its employees
to $10.10 and enacted a living wage ordinance for local government contractors.
Although the City and HANO have made some progress on a number of goals, they have fallen
short on the overarching goals of furthering fair housing to produce more racially and
socioeconomically integrated communities in New Orleans. The goals in the 2010 Analysis of
Impediments were not specific enough to guide targeted action to further fair housing. As a
consequence, segregation and concentrated poverty areas appear to have become more
concentrated, and some neighborhoods have remained the same. Few communities have become
more integrated.
c. Discuss any additional policies, actions, or steps that you could take to achieve past goals, or
mitigate the problems you have experienced.
To achieve past goals or mitigate problems, HANO and/or the City can do the following:
HANO can develop policies that improve fair housing systems capacity to further the
rights of protect classes by:
o Implementing a Limited English Proficiency Policy to ensure that residents who have
limited English proficiency have access to HANO housing opportunities;
o HANO can improve its reasonable accommodations policy.
HANO and the City can continue to meet with housing groups and organizations that
represent members of protected classes to implement fair housing goals and strategies.
HANO and the City can increase communication to residents, developers, and other
stakeholders about fair housing laws and policies.

18
To mitigate fair housing issues and contributing factors in New Orleans, the City and HANO
will:
Develop specific, measurable, attainable/actionable, relevant/realistic, and timely
(SMART) goals;
Evaluate progress towards the achievement of those goals on a quarterly basis; and
Expand and enhance stakeholder and community involvement in planning and
implementation.
The City and HANO are currently working closely with GNOFHAC on the AFH Plan; however, they
have missed opportunities to support GNOFHAC's work to improve fair housing system capacity in the
past. Additional steps the City and HANO could take to support GNOFHAC's work include:
1. Provide monetary support for GNOFHAC's education and enforcement programs.
2. Provide letters of support for GNOFHAC’s grant applications.
3. Facilitate collaboration with NORD-C on Fair Housing Five workshops with youth.
4. Publicize GNOFHAC trainings and outreach materials through the Office of
Neighborhood Engagement's email list and other relevant lists.
5. Issue a Fair Housing Month (April) press release from the Mayor's office
highlighting the availability of fair housing resources.
6. Implement transparent tracking and reporting of complaints to the Human
Relations Commission.
7. Display GNOFHAC resources at the One Stop Shop.
8. Schedule training for 311 operators on fair housing issues and resources.
d. Discuss how the experience of program participant(s) with past goals has influenced the selection
of current goals.
Past experience has reinforced the need to have goals that are specific, measurable, attainable,
and timely instead of goals that lack specificity. To further fair housing, the City and HANO
understand that they must review and analyze data, set measurable goals, and take relevant
actions that can be attained in an estimated period of time.
V. Fair Housing Analysis
A. Demographic Summary
1. Describe demographic patterns in the jurisdiction and region, and describe trends over time (since
1990).
Please note that the terms African-American and Black are used interchangeably in this
document. Also, White and Non-Hispanic White are used interchangeably in this document.

19
Demographic Summary: According to US Census data, the demographics of New Orleans have
undergone tremendous change in the period between 1990 and 2010. In this time span, economic
doldrums in the 1990s and natural disasters in the early to mid-2000s have led to decreases in the City’s
population. Following the unprecedented evacuation of the entire city following Hurricane Katrina and
the subsequent levee failures in 2005, the population dramatically dropped down to just over 200,000. In
the following years, that number has risen back to 368,471 as of 2014 but has yet to reach the population
number of nearly half a million people counted in the 1990 Census (495,946).
In August 2005, Hurricane Katrina and the levee failures displaced much of the city’s population. Many
displaced residents returned to areas that experienced less damage, such as the West Bank of Orleans
Parish and the unflooded areas of Uptown. Despite its population shrinking 11 percent since the start of
the 2000 decade, parts of the metropolitan region experienced growth as population shifted away from
damaged areas. While the City remains largely African-American (59.6%), one of the most notable shifts
in population is the disproportionate decline in African-American residents. Following Hurricane Katrina,
due in large part to the influx of workers who arrived to take part in the recovery, the Latino population
has grown significantly. Many Latino workers have chosen to stay and have established households.
While Jefferson Parish is home to the largest number of Hispanics in the region, New Orleans has the
second largest number of Hispanics (18,051).
The breakdown of demographic and population data per HUD data tables 1, 2, and 3 and HUD Maps 1, 2,
and 3 is as follows:
Overall Population – Demographic Trends
In New Orleans, the overall population has declined since 1990.
The overall population in 1990 was 496,882.
In 2000, the overall population was 484,674, a decline of 12,208 people or 2.5% since 1990.

20
In 2010, after Hurricane Katrina, the Orleans parish population experienced a significant decline
with the overall population decreasing to 343,829, a decline of 137,845 residents or 28% of its
population. The City’s population’s nadir was at just over 200,000, shortly after Hurricane
Katrina.
By 2014, the total population of New Orleans increased to 368,471 residents.
In the region, the overall population increased from 1990 to 2000 but experienced a decrease
between 2000 and 2010, after Hurricane Katrina.
The overall population of the region was 1,285,197 in 1990.
In 2000, the regional population increased to 1,337,742, an increase of 52,545 (4%)
In 2010, the region experienced a decline after Hurricane Katrina with the population decreasing
to 1,189,866, a decrease of 147,876 people (11% decline from 2000).
In 2014, the regional overall population was estimated to be 1,251,849, an increase of 61,983
(5%) since 2010.
Race/Ethnicity – Demographic Trends
City of New Orleans (1990 to 2000)
From 1990 to 2000, the Non-Hispanic White (White) and Hispanic populations declined.
The White population decreased from 164,396 to 128,857, a decline of 35,539 (22%) White
residents.
The Hispanic population decreased from 17,149 to 14,812 which is a decline of 2,337 people
(13%).
All other racial and ethnic groups increased in population during the 1990 to 2000 period.
The Black population grew from 304,943 residents to 326,018 residents, which is an increase of
21,075 (7%).
The Asian-Pacific Islander community increased from 8,871 to 11,740, an increase of 2,869
residents (32%).
0 100,000 200,000 300,000 400,000 500,000 600,000
1990
2000
2010
2014
Population Count
Year
Race/Ethnicity Trend - New Orleans
TOTAL
Other
Native American, Non-Hispanic
Asian or Pacific Islander, Non-Hispanic
Hispanic
Black, Non-Hispanic
White, Non-Hispanic

21
The Native American population increased by 836 residents, growing from 587 residents to 1,423
residents, which is a significant increase of 70%.
City of New Orleans (2000-2010)
It is important to note that during this period New Orleans experienced a mass exodus due to
Hurricane Katrina in 2005.
Four of the five racial and ethnic groups experienced a decline from 2000 to 2010.
The Black population saw a drastic decline to 204,866, which is a loss of 121,152 people or 37%
of the City’s Black population.
The White population also experienced a decline but to a much smaller degree, decreasing almost
19% from 128,857 to 104,770, which is a loss of 24,087 residents.
The Native American population, which had huge increased between 1990 and 2000, declined
between 2000 and 2010. From 2000 to 2010, the Native American population went from 1,423 to
827, a decline of 596 residents which is a 42% loss of population.
The Asian-Pacific Islander community decreased from 11,740 people to 9,988, a decline of 1,752
(15%).
Despite Hurricane Katrina, the Hispanic population managed to increase during this period,
growing to 18,051, which is an increase of 3,239 people or 22%.
The Black population was 67% of the total population in 2000 and was reduced to 60% in 2010,
whereas, the White population, which was declining pre-Katrina, increased from 27% of the
population to 30%.
City of New Orleans (2010 – 2014)
The White population increased from 104,770 in 2010 to 113,105 in 2014 and went from
comprising 30% of the total population to 31% of the total population.
The African-American population increased from 204,866 in 2010 to 217,983 in 2014 but came
to comprise a smaller portion of the total population, going from 60% of the total population to
59% in 2014.
The Hispanic population continued to grow, going from 18,051 residents to 19,911 residents. The
percentage of city residents who are Latino increased from 5.25% of the total population in 2010
to 5.40% of the total population in 2014.
The Asian-Pacific Islander population also increased from 9,988 residents in 2010 to 10,842
residents in 2014.
The Native American population continued to decline, going from 827 residents to 536. The
Native American population was 0.24% of the total population in 2010 but is 0.15% of the total
population as of 2014.
New Orleans-Metairie-Kenner, LA MSA (1990 to 2000)
Similar to the City of New Orleans, the White population of the metropolitan region was in
decline going from 762,564 people to 731,452.
The populations of all other racial and ethnic groups increased during this period.
The Black population increased from 442,710 to 503,660 (60,950 or 14%).
The Hispanic population increased from 53,723 to 58,480 (4,757 or 9%).
The Asian/Pacific Islander population increased from 20,585 to 31,620 (11,035 or 54%).
The Native American population increased from 3,619 to 7,656 (4,037 or 112%).

22
New Orleans-Metairie-Kenner, LA MSA (2000 to 2010)
In the region, the populations of three racial and ethnic groups declined.
Similar to in the City of New Orleans, the White population decreased by 13%, going from
731,452 to 639,356, a loss of 92,096 people.
The Black population in the region went from 503,660 people to 403,731, losing 99,929 people or
20%. The decline in African-American population was less severe than in the City of New
Orleans.
The Native American population suffered a loss of 3,309 people, which was 43%. The population
went from 7,656 in 2000 to 4,347 in 2010. The decline was similar to that experience in the City
of New Orleans
Two populations grew in the region despite the effects of Hurricane Katrina.
Similar to the trend in the City of New Orleans, the Hispanic population showed a regional
increase. However, the increase was much larger in the region with a 58% gain as opposed to an
uptick of 22% in the City of New Orleans. The Hispanic population in the region went from
58,480 people to 92,178 for a total gain of 33,698 people.
The Asian-Pacific Islander population also showed a small increase in the region with a gain of
264 residents. By contrast, the Asian-Pacific Islander population declined by 15% in the City of
New Orleans during this same period.
National Origin – Demographic Trends
City of New Orleans
The number of foreign born residents decreased slightly from 1990 to 2000 by 200 people or less
than a tenth of a percent. In 1990, the population was 20,781, and, in 2000, the population was
20,581.
During the period from 2000 to 2010, the foreign born population increased despite the
devastation from Hurricane Katrina. The population went from 20,581 to 21,094, which is a gain
of 513 or 2.5%.
From 2010 to 2014, the foreign born population increased from 21,094 to 22,108.
The top three countries of origin for foreign born residents are:
o Vietnam 4,075
o Honduras 3,558
o Mexico 1,751
New Orleans-Metairie-Kenner, LA MSA
From 1990 to 2000, the population of foreign born residents increased from 52,998 to 64,166, an
increase of 11,168 (21%).
The number of foreign born residents also increased from 2000 to 2010, going from 64,166
residents to 86,328, an increase of 22,162 (35%).
The top three countries of origin for foreign born residents are:
o Honduras 18,475
o Vietnam 10,272
o Mexico 8,489

23
Limited English Proficiency – Demographic Trends
City of New Orleans
Since 1990, the population with limited English proficiency has declined from 14,997 people in
1990 to 14,168 people in 2000 and 12,527 people in 2010.
Although the number of residents with limited English proficiency has declined, their percentage
of the total population did increase between 2000 and 2010 from 2.92% to 3.64%.
The contrast between the increasing proportion of foreign born residents and the decreasing
proportion individuals with limited English proficiency is largely attributable to the aging of the
population of native-born monolingual French speakers.
The three main languages spoken by people with limited English proficiency in the City of New
Orleans are:
o Spanish 6,961
o Vietnamese 3,296
o French 739
New Orleans-Metairie-Kenner, LA MSA
While the limited English proficiency population was in decline in the City of New Orleans, the
population continued to increase in the region growing from 38,685 in 1990 to 42,253 in 2000
and 52,828 in 2010.
The three main languages spoken by people with limited English proficiency in the region are:
o Spanish 33,652
o Vietnamese 8,354
o French 1,933
Sex – Demographic Trends
City of New Orleans
The female population in Orleans Parish continued a downward trend during the period of 1990
to 2010 where females were once 54% (266,373) of the population in 1990 then declined to 53%
(256,993) of the population in 2000, and declined further to 51.65% (177,581) of the population
in 2010. However, the number of female residents increased slightly between 2010 and 2014
from 177,581 to 191,728, which was 52.03% of the total population.
The male population continued to increase its percentage of total population from 46% in 1990
and 47% in 2000 to 48% in 2010 but declined slightly to 47.97% in 2014.
Although the male population increased in percentage of the total population, the percentage
remains below that of the female population but the gap is decreasing every ten years. The
relative increase in the male population between 2000 and 2010 may be partially attributable to
the influx of workers who came to New Orleans to participate in the rebuilding of the city after
Hurricane Katrina.
Sex 1990 2000 2010 2014
Male 230,509 (46.39%) 227,681 (46.98%) 166,248 (48.35%) 176,743 (47.97%)
Female 266,373 (53.61%) 256,993 (53.02%) 177,581 (51.65%) 191,728 (52.03%)

24
New Orleans-Metairie-Kenner, LA MSA
The male and female population in the region followed the same pattern as in the City of New
Orleans with the male population steadily increasing its percentage of the total population while
the female population steadily decreased.
The female and male population trend were as follows:
Sex 1990 2000 2010
Male 611,391 (47.6%) 639,558 (47.8%) 579,187 (49%)
Female 673,805 (52.4%) 698,183 (52.2%) 610,679 (51%)
Age – Demographic Trends
City of New Orleans (1990 to 2000)
There was a nominal decline in the “under 18” age group during this period with 136,936 (27.6%)
in 1990 and 132,791 (27.4%) in 2010.
There was a nominal increase in the “18-64” age group during this period with 295,359 (59%) in
1990 and 295,082 (61%) in 2010.
The 65+ age group was in decline between 1990 and 2000 going from 64,587 residents to 56,801,
a loss of 7,786 (12%) residents.
City of New Orleans (2000-2010)
There was a distinct decline in those under 18 with a 45% decrease in the youth population
between 2000 and 2010. The under 18 population lost 59,576 residents, down from 132,791
residents in 2000 to 73,215 in 2010 which was 21% of the total population.
Between 2000 and 2010 the “18-64” population decreased by 62,107; however, the percentage of
this group’s total population increased by 7% going from 61% in 2000 to 68% in 2010.
The 65+ age group lost about 34% of its population with a loss of 19,162 residents going from a
population of 56,801 in 2000 to 37,639 in 2010 which represented 11% of the total population.
The average age for the metropolitan region has increased from 34.8 to 37.3 years old from 2000
to 2015. http://www.datacenterresearch.org/data-resources/who-lives-in-new-orleans-now/. The
influx of workers who came to New Orleans to take part in rebuilding efforts is likely partially
responsible for the increase in the share of the population comprised of working age adults.
City of New Orleans (2010-2014)
The under 18 population had a slight increase during this period going from 73,215 individuals to
75,168, and comprising 20% of the total population.
The 18-64 population also had an increased from 232,975 residents in 2010 to 251,085 in 2014,
remaining at 68% of the population.
The 65+ age group also had an increase in population. This group had 37,639 residents in 2010
and increased to 42,218 residents in 2014 but remained 11% of the population which was the case
in 2010.

25
2. Describe the location of homeowners and renters in the jurisdiction and region, and describe trends
over time.
The Data Center’s June 2016 report entitled “Who Lives in New Orleans Now” found that after
Hurricane Katrina, Jefferson Parish and New Orleans initially experienced a disproportionate return
of homeowners, but, as of 2014, both parishes have returned to their pre-Katrina homeownership
rates. With a 46 percent homeownership rate in New Orleans, a 62 percent homeownership rate in
Jefferson Parish, and a 78 percent homeownership rate in St. Tammany, New Orleans lags,
Jefferson is on par with, and St. Tammany exceeds the national homeownership rate.
(http://www.datacenterresearch.org/data-resources/who-lives-in-new-orleans-
now/#homeownership)
Below are maps showing percent of renter-occupied housing by block group and showing New
Orleans neighborhoods in order to facilitate a comparison of tenure patterns by neighborhood. A
third map shows that, over time, renters have experienced rising prices, and many cannot afford to
live in the same neighborhoods they resided in before Hurricane Katrina. In 2000, most renter
households could cover rent and utilities without spending more than 30% of their household
income. Data from the 2009-2013 ACS shows that in significant swaths of the city, long-term
residents' incomes would not be enough to pay current rents without a cost burden. African-
American households are even more likely to face this burden.
U.S. Census 2012 Renter Occupied Housing

26
B. General Issues
i. Segregation/Integration
1. Analysis
a. Describe and compare segregation levels in the jurisdiction and region. Identify the racial/ethnic
groups that experience the highest levels of segregation.
Table 3 from HUD’s AFFH Data & Mapping Tool provides dissimilarity index data for the City
of New Orleans and the New Orleans-Metairie-Kenner, LA MSA. The dissimilarity is a measure
that social scientists use to assess the level of residential racial or ethnic segregation within a
geographic area. The index reflects the percentage of people of a certain group, such as African-
Americans, who would have to move to a different Census Tract in order to be evenly distributed
throughout the city or region in relation to another group, such as Non-Hispanic Whites. Values
from 0 to 39 indicated low segregation, values from 40 to 54 indicate moderate segregation, and
values from 55 to 100 indicate high segregation.
City of New Orleans
In New Orleans, all racial/ethnic groups except Hispanics experienced high segregation with
scores above 55 in 1990, 2000, 2010, and 2014. The dissimilarity index for Hispanics has also
increased quickly over the past 14 years, rising from a low level of segregation to a moderate
level of segregation.
New Orleans-Metairie-Kenner, LA MSA
In the region, all but two racial groups have consistently experienced high segregation since
1990. The Hispanic population experienced low segregation in 1990 and 2000 but experienced
more moderate segregation by 2010. The Asian population experienced more moderate
segregation since 1990. The HUD Data Table excerpt below reflects these trends.
(New Orleans, LA CDBG, HOME, ESG) Jurisdiction
Racial/Ethnic Dissimilarity
Index 1990 2000 2010 2014
Non-White/White 60.07 63.44 68.31 66.62
Black/White 62.52 65.88 71.88 71.44
Hispanic/White 34.49 35.04 42.82 50.37
Asian or Pacific Islander/White 61.49 58.20 61.05 68.55

27
(New Orleans-Metairie, LA CBSA) Region
Racial/Ethnic Dissimilarity Index 1990 2000 2010
Non-White/White 59.99 60.47 57.89
Black/White 67.78 68.42 66.74
Hispanic/White 31.33 35.79 41.01
Asian or Pacific Islander/White 50.16 47.89 52.05
b. Explain how these segregation levels have changed over time (since 1990).
City of New Orleans
The level of segregation was increasing from 1990 to 2010 for all groups in New Orleans.
Black/White segregation appears to have plateaued since 2010, while Hispanic/White and
Asian/White segregation has increased quickly between 2010 and 2014. The Hispanic
population experienced low segregation in 1990 and 2000 with scores below 39 but began
experiencing moderate segregation by 2010 with a dissimilarity index of 43.
New Orleans-Metairie-Kenner, LA MSA
In the region between 1990 and 2000, all racial and ethnic groups experienced increased
segregation except the Asian/Pacific Islander group.
Between 1990 and 2010 the black population and the white population had a nominal decrease
in segregation. The black population dissimilarity score in 1990 was 68 and in 2010 it was 67.
The Non-White population had a dissimilarity score of 67 in 1990, 60 in the 2000, and 58 in
2010.
The Asian and Hispanic population saw an increase in segregation from 1990 to 2010 with the
Hispanic population going from low to moderate segregation.
c. Identify areas with relatively high segregation and integration by race/ethnicity, national origin,
or LEP group, and indicate the predominant groups living in each area.
Based on Maps 1 and 3 from the AFFH Data & Mapping Tool and the New Orleans
Neighborhood Map as captured above, the following neighborhoods demonstrate
disproportionately high and low levels of segregation.
Segregated Areas
French Quarter is highly segregated with majority white residents.
New Orleans East communities are highly segregated with mostly Vietnamese residents
living in the Michoud sections and Blacks and Hondurans living around Hayne, Crowder,
and Chef Menteur.

28
The Upper and Lower 9th Wards, the 7th Ward, large swaths of Gentilly, Gert Town,
Central City, and Hollygrove all have a far higher percentage of African-Americans than
the percentage of New Orleans.
Central Business District, Lower Garden District, Garden District, Uptown, Audubon,
City Park, Marigny, Bywater, Algiers Point, and all of Lakeview are majority White.
Integrated Areas
The River Gardens area, where a redeveloped public housing development is located,
appears more integrated than other New Orleans communities.
Fair Grounds, Treme, and some parts of Mid-City also appear more integrated than other
areas.
Although the Irish Channel has become increasingly White since 1990, it still maintains a
level of integration greater than other areas.
Old Aurora and pockets of Tall Timbers/Brechtel in Algiers are more integrated
communities when compared to other neighborhoods in New Orleans.
The map below depicts areas with a concentration of White, Black, Hispanic, and Asian
populations and highlights gentrification patterns since Hurricane Katrina. Gentrification often
creates temporary "windows of integration" while neighborhoods are shifting from majority
people of color to majority White. The Irish Channel, Tremé, Fair Grounds, and Mid-City
neighborhoods are perfect examples of this. The "White Teapot" Richard Campanella describes
in the map below has been both internally whitening and spreading. According to Campanella,
“the internal whitening has meant that once more diverse neighborhoods like the Lower Garden
District and Bywater are now majority white. The spreading present in the Tremé, Irish Channel,
Fair Grounds, and Mid-City is the result of the fact that historic neighborhoods of color are
porous to White residents, but historically White neighborhoods are not porous to residents of
color.”

29
d. Consider and describe the location of owner and renter occupied housing in determining whether
such housing is located in segregated or integrated areas.
Based on data cross-referenced with Map 6 from the AFFH Data & Mapping Tool and the
Greater New Orleans Data Center’s maps reflecting concentrated areas of poverty, the following
locations of homeowners and renters and levels of segregation or integration have been captured:
Central City – Central City has an African-American population of 72%, as compared to a White
population of 17%. 77% of households living in Central City are renters, and 23% are
homeowners in Central City.
New Orleans East ‘Little Woods’ - The Little Woods neighborhood has a population of 92.6%
African-Americans, as compared to a 3% White population, .9% Asian population. 49% of the
households in the ‘Little Woods’ neighborhood are renters, as compared to 51% who are
homeowners.
Lower 9th Ward - The Lower 9th Ward is a highly segregated community with a 96% African-
American population compared to a White population of 2%. Renters in the Lower 9th Ward
comprise 34% of households. By comparison, a relatively high 64% of households are
homeowners.
Gert Town - 88% of the population is African-American, while 5% of the population is White.
82% of households in Gert Town are renters, and 18% are homeowners.

30
Treme/Lafitte - 75% of the population is African-American, as compared 17% of the population
which is White. 66% of households in the Lafitte/Treme neighborhood are renters. Thirty-four
(34%) of households in the Treme/Lafitte area are homeowners.
7th Ward – The 7th Ward is also a segregated R/ECAP area although recent trends show
demographic changes and signs of possible gentrification. The data shows that 87% of the
population is African-American, as compared to 7% of the population which is White. 65% of
households in the 7th) Ward neighborhood are renters. 35% of 7th Ward households are
homeowners.
B.W. Cooper – B.W. Cooper, a redeveloped, mixed-income public housing development, is
another segregated R/ECAP area where the data shows that 91% of the population is African-
American, 7% of the population is Hispanic, and 1% of the population is White. 98% of
households in the B.W. Cooper neighborhood are renters, and 2% are homeowners.
Village de l’Est (New Orleans East) – This neighborhood is a segregated R/ECAP area. The
Village de l’Est neighborhood in New Orleans East has an African-American population of
43%, an Asian population of 45%, a White population of 2%, and a Hispanic population of 9%.
Renters comprise 37% of households in the Village de l’
Est neighborhood, and homeowners comprise 63%. Asian neighborhood residents are
predominantly Vietnamese-American.
Lakeview – Lakeview is a neighborhood that is segregated and is not a R/ECAP. Lakeview has
an African-American population of 1%, a Hispanic population of 4%, and a White population of
94%. The data shows that 32% of Lakeview households are renters, and 68% are homeowners.
Navarre – Navarre is another neighborhood that is segregated and is not a R/ECAP. The Navarre
neighborhood has an African-American population of 5%, a Hispanic population of 8%, and a
White population of 84%. 53% of households in Navarre are homeowners, and 47% renters.
Garden District - The Garden District neighborhood is also segregated with a population that is
3% African-American, 5% Hispanic, 1% Asian, and 88%. Renters in the Garden District
neighborhood comprise 47% of households, and 53% of households are homeowners.
e. Discuss how patterns of segregation have changed over time (since 1990).
According to the City of New Orleans’ 2010 Hazard Mitigation Plan, the loss of 99,650 African-
American residents and 11,494 White residents after Hurricane Katrina could be attributed to the
following factors directly linked to the storm:
http://www.nola.gov/getattachment/Hazard-Mitigation/Hazards-and-Planning/Orleans-Parish-
2010-Hazard-Mitigation-Plan-Final-032311.pdf
New Orleans had a wrecked infrastructure system citywide, and vital services were
completely shut down in the wake of Hurricane Katrina.
Loss of affordable housing in New Orleans post-Hurricane Katrina.
Challenges re-opening schools post-Hurricane Katrina.
Loss of public transportation post-Hurricane Katrina.

31
Loss of health services and facilities, including Charity Hospital and community health
clinics that served low-income populations,) post-Hurricane Katrina.
Loss of amenities, such as grocery stores, drug stores, service-oriented businesses, as
well as restaurants and entertainment venues.
Loss of economic development and employment opportunities post-Hurricane Katrina.
Loss of employment as a result of Hurricane Katrina.
Loss of community structure as a result of Hurricane Katrina.
Loss of public services (health, government agencies, recreation, education), primarily
for those with disabilities, the elderly, youth, low-income people, people of color.
Loss of over 5,000 public housing units and a subsequent increase in the size of the
HCVP program.
Much of the city's rental housing stock was damaged after the storm, and the investment in
rebuilding rental housing fell short of meeting the need, causing rents to spike. The few areas that
remained available to voucher holders were often in majority African-American, lower-income
neighborhoods, farther from job centers, transit, and other amenities.
The plan detailed the ways in which returning to New Orleans post-Katrina was challenging for
the most vulnerable populations, which included low-income African-American families, people
with disabilities, the elderly, and renters who found it difficult to return home because of the lack
of financial services, employment, and transportation, as well as suitable housing options. Higher-
income residents with homeowner’s insurance re-populated New Orleans more quickly than
uninsured and underinsured homeowners who were forced to wait for federal funding from the
Road Home Program to rebuild their houses.
The Road Home Program also utilized an inequitable formula for determining compensation
grants for homeowners to rebuild their storm-damaged homes. Grants were based on pre-storm
home value rather than the cost of repairs, resulting in a disproportionate negative impact on low-
income households and households of color as households in high income, largely White
neighborhoods received far greater rebuilding support than households in low income, largely
African-American neighborhoods.
https://www.washingtonpost.com/business/economy/hud-to-pay-62-million-to-la-homeowners-
to-settle-road-home-lawsuit/2011/07/06/gIQAtsFN1H_story.html
According to a 2015 LSU survey, Whites who returned to New Orleans were generally able to get
back into their homes sooner than African-Americans, typically within a year (70 percent). Only
42 percent of African-Americans were able to get back home in that time.
Residents who lived in neighborhoods severely damaged by Hurricane Katrina (80% of the city)
waited longer to return as landlords had difficulty their properties to meet the City of New
Orleans’ requirements for habitability. Sociologist Elizabeth Fussell wrote in a 2011 study
entitled “Race, Socioeconomic Status & Return Migration to New Orleans after Hurricane
Katrina” that New Orleans has become whiter and more affluent, as predominantly African-
American low-income residents have been returning at a much slower pace.
http://www.ncbi.nlm.nih.gov/pmc/articles/PMC2862006/
Table 2 from the AFFH Data & Mapping Tool shows that, in 1990, the African-American
population in New Orleans was 304,943 (61%), and the White population was 164,396 (33%). By
2010, there were 204,866 (60%) African-Americans and 104,770 (30%) Whites.

32
Broadly, areas that were majority African-American before the storm and on lower ground, such
as New Orleans East and parts of Gentilly, have become even more heavily African-American
over the past 11 years. Areas that were majority African-American but on higher ground have
changed quickly and are becoming significantly whiter. These areas include Bywater, Irish
Channel, E. and W. Riverside, Bayou St. John, and parts of Central City, Leonidas, Tremé, St.
Roch, St. Claude, and the 7th Ward.
f. Discuss whether there are any demographic trends, policies, or practices that could lead to higher
segregation in the jurisdiction in the future.
New Orleans is in the process of rebuilding the entire city after multiple recent natural and
human catastrophes. The City of New Orleans has benefited from significant infusions of federal
funding to facilitate recovery efforts. It has adopted a Place-Based Area Strategy, which is
designed to make investments in areas that are in need of public subsidy to reach their full
potential and that have or will have other investments that can be leveraged with city funds.
Since Hurricane Katrina, White and Latino residents have relocated to New Orleans and decided
to remain and make a home in many of the city’s R/ECAP neighborhoods. The influx of new,
disproportionately White and relatively more affluent residents in R/ECAPs may be contributing
to the displacement of long-time neighborhood residents. Additionally, zoning ordinances
limiting multi-family housing developments may contribute to segregation in certain
neighborhoods, such as Lakeview and the Garden District neighborhoods. In some cases,
rebuilding efforts have targeted public subsidy and infrastructure investment in historically
African-American, high-ground neighborhoods that are poised to gentrify. Without a
complimentary investment in affordable housing, some of these neighborhoods have already
shifted to majority White and long-time residents are not present to enjoy new amenities.
2. Additional Information
a. Beyond the HUD-provided data, provide additional relevant information, if any, about
segregation in the jurisdiction and region affecting groups with other protected
characteristics.
On September 29, 2006, St. Bernard Parish passed the “blood relative” ordinance, which
restricted rentals to the blood relatives of property owners who were over 90% White.
GNOFHAC filed a fair housing law suit to overturn this racially discriminatory policy
(‘How Racist Housing Laws are Keeping New Orleans White’,
http://fusion.net/story/137351/how-racist-housing-laws-are-keeping-new-orleans-white/,
2015). Following a consent decree in which St. Bernard Parish agreed to rescind the
ordinance, the parish continued to engage in a pattern of discriminatory conduct by
obstructing a Low Income Housing Tax Credit development in Chalmette. GNOFHAC
continued to challenge the parish’s discriminatory conduct, and the development
eventually proceeded following many court orders regarding the parish’s noncompliance
with the Fair Housing Act and with the consent decree from the “blood relative” case.
b. The program participant may also describe other information relevant to its assessment of
segregation, including activities such as place-based investments and mobility options for
protected class groups.

33
Homeowners and renters who are racial or ethnic minorities or who have disabilities tend
to live in R/ECAPs. The City of New Orleans has adopted a Place-Based Area Strategy,
which is designed to prioritize investments in areas that are in need of public subsidy to
rebuild their flood protection systems, roads, bridges, schools, parks, and public facilities.
New Orleans has focused on 11 Place-Based Areas (PBAs) throughout the city. The PBAs
in New Orleans are predominantly African-American R/ECAPs. The PBAs in New
Orleans are Hollygrove, Mid-City, Gert Town, B.W. Cooper, Central City, Pontchartrain
Park, the 7th Ward, St. Roch, the Lower 9th Ward, Riverview, and New Orleans East.
The Place-Based Area Strategy incorporates the principle that a vibrant, sustainable
neighborhood contains an array of resources for its residents including but not limited to
housing, jobs, transportation, education, and social services to assist those with special
needs. Various City of New Orleans departments, including Public Works, Capital
Projects, Health, and City Planning Commission, participate in the City’s Place-Based
Area Strategy for building strong, vibrant neighborhoods for all residents. With this
approach, New Orleans has engaged in efforts to build community assets such as
community centers, libraries, transit, goods, services, shopping areas, cultural activities,
and parks.
HANO clients are overwhelmingly African-American and the demolition and
redevelopment the “Big 4” public housing developments removed 5,000 units of public
housing from the city’s inventory and doubled the size of the HCVP. To mitigate the
impact of this significant shift on African-American voucher holders, HANO enabled
households to use vouchers to access housing throughout the New Orleans area and in
other jurisdictions by not having onerous portability restrictions.
To mitigate the impact on this protected class, HANO offers homeownership and the
ability to use vouchers to access housing throughout the New Orleans area and in other
jurisdiction as well.
HANO’s Homeownership Department assists public housing and HCVP residents with
becoming first time homeowners. HANO screens and refers clients to HUD-approved
homebuyer and financial fitness programs for the training and preparation required to
meet first time homebuyer eligibility. HANO also recruits and trains lenders and real
estate agents in the HCVP program. HANO staff also works closely with providers of soft
second mortgages and other assistance programs and assists families with accessing such
funding.
All HCVP participants are advised about the program’s portability feature that allows
voucher holders to move to any housing authority jurisdiction in the United States at the
time of voucher issuance. HANO also absorbs voucher holders porting into New Orleans
from other jurisdictions in order to facilitate the return of families displaced by Hurricane
Katrina.
The City's Placed-Based Area Strategy has contributed to important investments in
underserved areas but also requires some re-thinking as parts of some PBAs are now
seeing increasing market activity and rising home prices. Specifically, property values and
rents are climbing quickly in parts of Mid-City, Central City, the 7th Ward, and St. Roch.
Community Development Block Grant (CDBG) funds are often used to fund the public

34
investments in these neighborhoods, and their use must affirmatively further fair housing.
For example, $1.85 million in CDBG-Disaster Recovery funding is slated for streetscape
and drainage improvements along Oretha Castle Haley Blvd. in Central City. This corridor
has seen significant public investment since the storm and is now seeing increased home
and rental prices. While a significant amount of public sector resources were invested in
Central City to support affordable housing development after Hurricane Katrina,
continued capital investments are likely to attract more real estate interest and make it
more difficult for lower-income long-time residents, who are disproportionately African-
American, to stay and enjoy the improvements. Their displacement may contribute to
segregation and reinforce R/ECAPs elsewhere in the city.
3. Contributing Factors of Segregation
Consider the listed factors and any other factors affecting the jurisdiction and region. Identify
factors that significantly create, contribute to, perpetuate, or increase the severity of
segregation.
Community Opposition
Community opposition to low-income or mixed-income housing in higher opportunity
neighborhoods has been a constant presence throughout New Orleans' rebuilding efforts.
Intense neighborhood association opposition stymied a project in the Lower Garden
District and led to the downsizing of the Muses Apartments a few blocks off of St.
Charles Ave. and the Aloysius Apartments at the corner of N. Rampart and Esplanade.
Most notably, pressure from neighborhood groups stalled an affordable housing
development that included permanent supportive housing units at Esplanade and Broad,
resulting in a U.S. Department of Justice lawsuit against the City and subsequent
settlement that eventually allowed the project to be built. Other examples of community
opposition are listed below.
Example of Private Developers’ Opposition
Community opposition to affordable housing in neighborhoods and in the City is a
contributing factor to segregation in New Orleans. In a recent Times Picayune article
dated July 12, 2016, the homebuilding sector and related industries oppose Mayor
Mitch Landrieu's initiative to create more affordable housing in New Orleans. The
Homebuilders Association (HBA) of Greater New Orleans, states that requiring an
affordable housing impact statement would stretch an already-thin city planning staff
and create unnecessary delays for developers. HBA claims that inclusionary zoning has
done little to add significant numbers of affordable units in other cities where it has
been tried, citing Boston and San Francisco examples. Starting in 2000, Boston
required developers to set aside 10 percent of units as affordable housing for projects
seeking rezoning. It increased the rate to 13 percent in late 2015 -- after more than
3,600 affordable units were generated under the old standard. San Francisco voters
approved agreed to allow city leaders to increase inclusionary standards for
developments with more than 10 units. Instead of devoting 12 percent of units to
affordable housing, the new rules call for up to 25 percent of units to be set aside.
Development industry trade groups say the new standard will do more to discourage
housing production, rather than promote lower housing prices.
(www.nola.com/realestate-news/2016/07/mayor_landrieus_affordable_hou.html)

35
Examples of Neighborhood Group Opposition
The Muses Apartments generated some division between neighborhoods on either side
of St. Charles Avenue. Central City residents, merchants, and church leaders said it
would restore badly needed affordable housing to the neighborhood, while a number of
Coliseum Square residents criticized both its design and its density. The development
included 211 apartments in the first phase, roughly 65 percent of which would rent at
market rates, with the remainder set aside as affordable housing. The City Planning
Commission voted against the project in the face of such criticism, but the City Council
later gave its approval after the developers reduced the number of apartments and
otherwise tweaked the design.
http://blog.nola.com/tpmoney/2009/06/new_apartment_project_taking_s.html.
Displacement of residents due to economic pressures:
Gentrification of neighborhoods often leads to displacement of people of color as
neighborhoods attract new residents interested in purchasing and rehabilitating
properties. This may cause a rise in property values, increasing the rent for low-income
residents as well as creating situations in which homeowners may not be able to afford
to continue living in their neighborhoods due to increased property taxes. At the AFH
Public Hearing residents expressed that housing affordability was their biggest problem
and displacement due to economic pressures of not being able to remain in
neighborhoods such as Tremé (as property values soar) was a significant challenge.
At an AFH public meeting, residents expressed that developers and new residents are
constantly building and relocating from other states and pushing people out from better
areas into slum areas thus increasing segregation. Residents also expressed concern that
construction in lower-income, predominantly African-American areas is not as orderly
as in more affluent areas. There is also concern that AirBnB rentals are decreasing
opportunities for low-income renters throughout the City of New Orleans, particularly
in high-opportunity neighborhoods.
Lack of private investments in specific neighborhoods:
A few of New Orleans’ PBAs need more private investments. Specifically, PBAs such as Gert
Town, Hollygrove, and parts of the Upper 9th Ward have challenges due to the lack of private
investments.
Residents also expressed that neighborhoods have no grocery stores or unaffordable
grocery stores. They recommended a grocery store be built at Columbia Parc and in the
Lower 9th Ward.
Lack of public investments in specific neighborhoods, including services or amenities:
New Orleans’ Place-Based Area Strategy has facilitated ongoing efforts to provide public
investments in all neighborhoods throughout the city. However, two-thirds on online survey
respondents expressed that public investments are not made fairly in all neighborhoods. At the
first Public Hearing, residents also expressed that:

36
o There is an overall lack of big infrastructure to reduce flooding in poorer,
predominantly Black neighborhoods; however, there is a huge infrastructure project to
reduce flooding Uptown.
o Residents would like to see more equity in the construction, maintenance, and repair
of levees, streets, potholes, and lighting in low-income African-American
neighborhoods.
o A streetcar is under construction in the Bywater where public transportation already
exists. People who need transit in poor Black neighborhoods have to walk a long way
to get anywhere. Public transportation goes to affluent neighborhoods.
Lack of regional cooperation:
Following Hurricane Katrina, the lack of regional cooperation contributed to segregation
and adversely impacted affordable housing development in high opportunity areas.
On September 29, 2006, just thirteen months after Katrina, St. Bernard Parish passed the
infamous “blood relative” ordinance. This novel discriminatory policy restricted home
rentals to blood relatives of the owners defined as “within the first, second or third direct
ascending or descending generations.” To rent to anyone else, landlords would need to
obtain a Permissive Use Permit from the St. Bernard Parish Council. Violators of the
ordinance, including both lessors and lessees, were subject to criminal prosecution and
civil penalties, including a misdemeanor charge, a fine of between $50 and $250 per day
for each day they were in violation of the ordinance, and a civil penalty of $100 per day
for each day of unpermitted rental, plus administrative costs, court costs and attorney fees
for investigation and prosecution of the civil matter. http://fusion.net/story/137351/how-
racist-housing-laws-are-keeping-new-orleans-white/
In addition, in 2008, St. Bernard Parish, after public meetings where officials and the
citizenry vocalized racial fears about affordable rental housing, passed an ordinance
banning the construction of affordable rental housing in the parish. The Greater New
Orleans Fair Housing Action Center successfully challenged the parish’s actions in
federal court. The Parish was forced to overturn the ordinance and grant a permit to
Provident Housing to begin construction of an affordable housing development in the
parish’s borders. https://judiciary.house.gov/_files/hearings/pdf/Perry100729.pdf
In 2006, Volunteers of America sought federal tax credits to build a 200-unit complex for
adults 62 years or older in Terrytown, which is located in Jefferson Parish. The Jefferson
Parish Council unanimously objected to tax credits being used for the proposed
development. In 2008, the Jefferson Parish Council voted to exclude the Council's 1st
District from a non-profit developer's contract to build affordable housing in Jefferson
Parish. In another instance, a developer decided to build affordable apartments in Algiers
rather than Marrero after parish officials put a moratorium on developing the site.
http://www.nola.com/politics/index.ssf/2011/02/like_st_bernard_jefferson_pari.html
A resident from the first Public Hearing expressed that there is a great need for public
transit to go from the City of New Orleans to Jefferson Parish where the jobs are located.

37
Other jurisdictions throughout the region, including St. Tammany Parish, have zoning
and land use policies that afford extremely limited opportunities for the development of
affordable, multi-family housing.
Lending Discrimination:
From a review of the Home Mortgage Disclosure Act (HMDA) data for the 2015
year provided by the Consumer Financial Protection Bureau, it is clear that disparities
exist in access to financial services. From the HMDA data, it was found that African-
Americans originated 3,096 mortgages, but 2,669 were denied which is an 86%
denial rate. Individuals that were identified as white originated 15,678 mortgages and
4,304 were denied which is only a 27% denial rate. The Asian population originated
421 mortgages and 162 were denied which is a denial rate of 38%. The Latino
population originated 956 mortgages in the metro region but 476 were denied which
is 50%.In addition, the Kirwan Institute’s 2010 report, “Credit and Lending in
Communities of Color,” reported that consumers of color disproportionally pay more
for auto financing, credit cards, private student loans, payday lending, car title loans,
and other types of credit.
http://kirwaninstitute.osu.edu/my-product/credit-and-lending-in-communities-of-color/
Regarding discrimination against national origin groups in lending, a study on
immigrant banking completed in 2015 by the Appleseed Foundation found that:
Thirty-three percent of the banks and credit unions surveyed indicated that lack of
bilingual personnel or having a language barrier was a problem. Uncertainty
about government regulations, specifically Patriot Act requirements and proof
of identity, created obstacles for 50 percent of participants.
One institution listed determining credit history of immigrants as a particular issue
while two others recognized that many people in the Latino community
distrust mainstream institutions.
Lack of locations in Latino-populated areas created barriers for three institutions.
http://appleseednetwork.org/wp-content/uploads/2015/10/LA-Appleseed-
Immigrant-Banking-Report1.pdf
Location and type of affordable housing:
Segregation patterns may continue in neighborhoods that have houses that are
unaffordable for low-income minorities to purchase or rent. HUD maps reveal areas
of White population concentration with virtually no affordable housing. The
overwhelming majority of subsidized housing opportunities—whether HCVP,
project-based voucher, public housing, LIHTC, or soft-second mortgages —are
available in lower-income, majority African-American neighborhoods. Resident
comments about affordable housing include:
o Concern that converting duplexes into single-family residences creates less affordable
rental housing.

38
o The rent is too high and can require a family with four children to pay as much as
$1,200 a month to be comfortable.
o Coming out of a housing development is like, “[o]h my God, what am I going to do. I
have to choose between being comfortable and pulling my child out of college."
o HCVs are only for very, very, low-income people, and they cannot afford the rents in
New Orleans.
Land-use and Zoning laws:
In New Orleans current Comprehensive Zoning Ordinance (CZO), some neighborhoods
are designated as “suburban neighborhoods residential districts” with codes S-RM1, S-
RM2, S-LRM1, AND S-LRM2. These areas are characterized by lower density
development, including neighborhoods of single-family development on lots of various
sizes and more spacious setbacks between homes than found in older areas of the City with
a generally uniform front setback within each square. The list of neighborhoods that are
designated in the CZO are the same areas that are segregated with a majority white
population according to HUD Maps displaying race.
Private discrimination:
GNOFHAC's 2015 report "Where Opportunity Knocks, The Doors are Locked," showed
that African-American prospective renters encounter housing discrimination nearly half
the time when they seek housing in high opportunity neighborhoods. Equally qualified
Black and White testers with matching incomes, career paths, family types, and rental
histories attempted to view and apply for 50 apartment units in low-poverty
neighborhoods like Lakeview, East Carrollton, Audubon, and Algiers Point. African-
Americans were either denied the opportunity to rent or received less favorable treatment
than White mystery shoppers 44% of the time.
GNOFHAC also released a report in 2015 on the prevalence of housing providers using
criminal background checks as a pretext for discrimination. The report analyzes a testing
investigation of 50 area housing providers, in which mystery shoppers posing as
prospective renters inquired about rental availability and the apartment’s criminal
background policy. Of the 50 site-visit tests conducted, African-American testers
experienced discrimination 50% of the time. Testing revealed that agents often provided
inconsistent information about background policies, and that white prospective tenants
were much more likely to be quoted more lenient policies. Further, policies that were
either discretionary—that evaluated prospective tenants on a “case by case” basis—or
ambiguous favored White prospective tenants over African-Americans 55% of the time.
ii. R/ECAPs
1. Analysis
a. Identify any R/ECAPs or groupings of R/ECAP tracts within the jurisdiction.
Based on Map 1 from the AFFH Data & Mapping Tool, the following areas were identified
as R/ECAP areas:

39
Upper 9th Ward area
– North Claiborne to St. Claude and Forstall to Tupelo
– Lesseps to Congress and Derbigny to Urquhart
New Orleans East
- Florida Avenue/Peoples Avenue and Chef Menteur to Intracoastal Waterway
St. Bernard area
- Robert E. Lee to City Park Avenue and Marconi Drive to Wisner Blvd
7th Ward area
- North Broad to St. Claude Avenue and Elysian Fields to St. Bernard Avenue
- Small portion of St. Bernard to Esplanade and N. Prieur to St. Claude Avenue
8th Ward area
- Elysian Fields to Almonaster and Law to St. Claude Avenue
Iberville area
- North Claiborne to Basin Street and St. Louis to Iberville Street
Lafitte area
- North Claiborne to North Broad and St. Philip to St. Louis Street
Mid-City area
- St. Louis to Canal Street and N. Carrollton to N. Claiborne
- Canal Street to Tulane Avenue and Jeff Davis Pkwy. to Claiborne
Central City area
- O.C. Haley to Joliet Street and Pontchartrain Expy to Toledano/Washington
-St. Charles Avenue to O.C. Haley and 1st Street to Peniston
- (Magnolia area) S. Claiborne to LaSalle St. and Napoleon to Louisiana Avenue
Gert Town area
- Palmetto to Pontchartrain Expy and S. Carrollton to Hamilton
BW Cooper/Marrero Commons area
– US 90/Pontchartrain expressway to Washington Avenue and South Broad Street to South
Claiborne Avenue
Tulane/Gravier – Canal St. to US 90/Pontchartrain expressway and South Claiborne
Avenue to Jefferson Davis Parkway
Leonidas area
- Leonidas to Monticello Avenue and Spruce St. to Plum St.
Fischer area/Tall Timbers
- US 90 to LB Landry and General DeGaulle
b. Which protected classes disproportionately reside in R/ECAPs compared to the
jurisdiction and region?

40
According to Table 4 from the AFFH Data & Mapping Tool, the largest demographic group
living in New Orleans R/ECAPs is Blacks at 49,354 (84%). All other races and ethnicities
combined add up to 9,343 (15%) of the population living in R/ECAPs. The total number of
families living in New Orleans R/ECAP areas comprise of 12,642, and families with
children living in New Orleans R/ECAPs comprise 5,906 (46.72%) households. The most
prevalent country of origin of the population living in R/ECAPs is Honduras with 1,120
(1.91%) R/ECAP residents, and the next most prevalent country of origin is Mexico with
588 (1%) R/ECAP residents.
R/ECAP Race/Ethnicity # %
Total Population in R/ECAPs 58,697 -
White, Non-Hispanic 4,507 7.68
Black, Non-Hispanic 49,354 84.08
Hispanic 3,596 6.13
Asian or Pacific Islander, Non-Hispanic 453 0.77
Native American, Non-Hispanic 151 0.26
Other, Non-Hispanic 106 0.18
c. Describe how R/ECAPs have changed over time (since 1990).
One of the more significant trends is that, in 1990 and 2000, R/ECAP areas
encompassed areas of high ground in the East and West Riverside, Irish Channel,
Lower Garden District, Bayou St. John, and Bywater neighborhoods, as well as portions
of the Esplanade Ridge. HUD’s 2010 R/ECAP map shows that low-income people of
color have been priced out of these areas and are now in areas at higher risk of flooding
and farther from job centers and transit, such as New Orleans East.
1990 2000 2010
Race/Ethnicity # % # % # %
White, Non-Hispanic 164,396 33.08 128,857 26.59 104,770 30.47
Black, Non-Hispanic 304,943 61.36 326,018 67.26 204,866 59.58
Hispanic 17,149 3.45 14,812 3.06 18,051 5.25
Asian or Pacific Islander, Non-Hispanic 8,871 1.79 11,740 2.42 9,988 2.90
Native American, Non-Hispanic 587 0.12 1,423 0.29 827 0.24

41
2. Additional Information
a. Beyond the HUD-provided data, provide additional relevant information, if any, about
R/ECAPs in the jurisdiction and region affecting groups with other protected
characteristics.
As the Data Center observes in its recent post-Katrina look at the region, the poverty
rate of 27 percent in the city of New Orleans in 2013 was statistically unchanged from
2000. The city had about 33,000 fewer poor individuals in 2013 than in 2000, but the
drop in the city’s overall population left the poverty rate roughly the same.
http://www.datacenterresearch.org/reports_analysis/new-orleans-index-at-ten/
Analysis from Alan Berube and Natalie Holmes in an article on August 27, 2015
entitled “Concentrated poverty in New Orleans 10 years after Katrina” indicates that
the share of the City’s poor residents living in neighborhoods of extreme poverty
dropped from 39 percent in 2000 to 30 percent in 2009-2013 (the latest small-area
data available). This drop occurred at the same time that concentrated poverty rose
dramatically in many major American cities, spurred by the Great Recession and slow
recovery. Whereas New Orleans ranked second among big U.S. cities in concentrated
poverty prior to the storm, it ranked 40th by 2009-2013.
http://www.brookings.edu/blogs/the-avenue/posts/2015/08/27-concentrated-poverty-
new-orleans-katrina-berube-holmes
The maps below depict neighborhood poverty in 2000 in comparison to neighborhood
poverty in 2009-2013.

42
b. The program participant may also describe other information relevant to its assessment
of R/ECAPs, including activities such as place-based investments and mobility options
for protected class groups.
The City of New Orleans through a Place-Based Area Strategy for addressing the need
for infrastructure, quality housing, transportation, economic development, and
community investment in historically disinvested neighborhoods. This approach
provides the opportunity to address challenges often identified in R/ECAP
neighborhoods. The strategy directs new investments in a way that takes full
advantage of prior investments.
The successful implementation of the PBA Neighborhood Strategy is dependent upon
resident and neighborhood engagement. In all cases, the array of City facilities and
investments align to address unmet demand for housing or support services for these
communities. By encouraging applications to invest in these areas through the Notice
of Funding Availability (NOFA) process, the City is confident of successful projects
that will lead the way for greater neighborhood stability. As mentioned earlier in the
Segregation/Integration section, the City realizes it must be careful to ensure that
public investments in PBAs or R/ECAPs do not contribute to gentrification and
displacement in pockets of growing market interest.
3. Contributing Factors of R/ECAPs
Consider the listed factors and any other factors affecting the jurisdiction and region. Identify
factors that significantly create, contribute to, perpetuate, or increase the severity of R/ECAPs.
Community Opposition: Because opposition to affordable housing development
often comes from those who have a disproportionate amount of political influence,

43
the opposition leads to developers withdrawing projects in high opportunity
neighborhoods and placing them in areas of concentrated poverty where
neighborhood residents are less likely to be able to influence land use planning
processes. Opposition to broad legislative changes to zoning that would allow
diverse housing types in all neighborhoods contributes to R/ECAPs. In addition,
some types of zoning, particularly for planned developments and conditional zoning
have discretion as a part of the approval process which creates disparities in types of
developments allowed in certain neighborhoods.
Deteriorated and abandoned properties: New residents are not moving to
neighborhoods with high volumes of deteriorated and abandoned properties. At a
public hearing, residents stated that efforts should be focused on substandard
properties. There are far too many blighted properties in New Orleans. According to a
New Orleans Advocate article on August 29, 2015, “Blight in New Orleans is back to
pre-Katrina levels, but challenges remain”, the City of New Orleans estimated that
there were about 28,000 blighted properties in the City which was around pre-Katrina
blight numbers. The article points out that some neighborhoods fared better than others.
Majority white neighborhoods like Lakeview only had about 2 blighted properties on
the City’s list while majority African-American neighborhoods like the Upper 9th ward
still has many vacant overgrown lots.
http://www.theadvocate.com/baton_rouge/news/article_91d27e96-ec2f-50bb-a205-
48a394d128ab.html
Displacement of residents due to economic pressures: Displacement due to
economic pressures is a huge factor in neighborhoods like Treme as property values
have increased by almost 50%, making it difficult for many long-time residents to
remain in the neighborhood. This notion is underscored by a March 9, 2015 Times
Picayune article entitled “Properties in Central City, Treme, 7th Ward and St. Roch
draw most interest in New Orleans' online auction”, where the article discusses the
high interest from investors in purchasing tax sale property which increases the value
of properties.
http://www.nola.com/politics/index.ssf/2015/03/new_orleans_online_auction_tax.ht
ml
At a public hearing, residents commented that gentrification is causing low-income
people of color to be pushed to areas with highly concentrated areas of poverty and
fewer amenities and transportation options. This can exacerbate R/ECAP conditions.
Lack of community revitalization strategies: Some of the R/ECAPs have little
community revitalization activity. Residents expressed that it is difficult to find an
affordable house as well as locate amenities such as healthcare, services, and overall
healthy food in poor neighborhoods.
Lack of private investments in specific neighborhoods: A few of the R/ECAPs
have limited private investments, as the resident populations have not yet fully
returned to the areas since Hurricane Katrina. A number of residents have complained
that there is a significant lack of private investment in poorer Black neighborhoods.
Poorer Black neighborhoods only have places like Walmart, Family Dollar, Dollar
General, and community stores with limited healthy food choices for the purchase of
groceries. Some of the R/ECAPs such as the Lower-Ninth Ward and New Orleans
East have been facing challenges due to limited private investments as well as general
services such as health care, grocery stores, retail outlets, and restaurants.

44
Lack of public investments in specific neighborhoods, including services or
amenities: At public hearings, residents expressed the following related to public
investments:
The City should set better budget priorities by building less jails and putting
more funds into affordable housing, schools, and youth improvement.
Residents also expressed concern about the amount of time it is taking to
complete public housing projects like Guste and Florida.
Lack of regional cooperation: Challenges still exist regarding the RTA working
with the City of New Orleans to provide bus service to surrounding parishes in the
region. At the first public hearing, residents expressed concerns that the regional
transportation connections to Jefferson Parish are not good, especially from the New
Orleans East area.
Land use and zoning laws: Land-use and zoning laws need to be re-visited as they
often present barriers to protected classes when trying to obtain quality housing in
their neighborhoods of choice and, in particular, outside of R/ECAPs. The City is in
the process of updating the City’s Master Plan which establishes allowable land uses
throughout the City. At the first public hearing, residents expressed that short term
rentals are causing evictions and will raise prices on rent for poorer people and low-
income people of color in particular. Residents also expressed concern that zoning
laws enforced through the CPC can keep poorer people out of neighborhoods by
limiting the amount of affordable housing in certain areas.
Location and type of affordable housing: Challenges exist regarding the location
and type of affordable housing available in areas not designated as R/ECAPs. At the
first public hearing, residents expressed the need for more affordable housing in areas
that are not distressed.
Occupancy codes and restrictions: Continued collaboration between OCD, Safety
& Permits, and HANO is needed to address occupancy codes and restrictions that
present challenges to our protected class. Resident at the first public hearing
expressed concern over the conversion of duplex housing into single-family housing,
saying that it reduces the supply of rental housing and keeps low-income people out
of certain neighborhoods.
Private Discrimination: At the first public hearing, some residents expressed that
renters do not always know what their rights are. In addition, many residents do not
feel they have power to hold landlords accountable.
Other: Input provided at the public hearings as well as survey findings from residents in
the community describe significant concern about slum landlords and how landlords expect
tenants to make repairs to their homes. Commenters also expressed concern about public
housing redevelopment and the re-concentration of poverty in farther flung neighborhoods.
iii. Disparities in Access to Opportunity
1. Analysis
a. Educational Opportunities
i. Describe any disparities in access to proficient schools based on race/ethnicity, national
origin, and family status.

45
According to information from the Data Center in 2015 its report “The Transformation of
New Orleans Public Schools,” pre-Katrina New Orleans had the next-to-lowest ranked
public school district in the State of Louisiana. After a series of reforms in New Orleans,
public education can be described as having one of the most dramatic before and after
Hurricane Katrina images. Once managed by the Orleans Parish School Board, the
traditional public school district received a $1.8 billion dollar FEMA grant to build new
and renovate existing school structures.
http://www.datacenterresearch.org/reports_analysis/school-transformation/
A study released by Tulane University’s Cowen Institute in 2010 articulated the changes
to the traditional public school district after Hurricane Katrina. According to the study,
the state shifted 107 low-performing OPSB schools into the Recovery School District
(RSD). The RSD was charged with opening and operating those schools under its control
for an initial period of five years. The OPSB retained control over 16 schools that had
performed above the state average before Katrina. Both the OPSB and the RSD opened
traditional schools and charter schools to serve the returning student population. As they
reopened after Katrina, schools operated by both the RSD and the OPSB became city-
wide access schools. This means that every public school, charter or directly-run, can be
attended by any Orleans Parish student regardless of where they live in the Parish,
provided there is capacity at the school of their choice. www.coweninstitute.com/wp-
content/uploads/2010/07/katrina-book.final_.CIpageSmaller.pdf
Although on the surface it appears that students have the ability to access more proficient
schools, the below data captures issues that persist under the new structure.
According to a study done by the Southern Law Poverty Center (SLPC) analyzing the
2007-2008 school year:
98% of the students were African-American in the Recovery School District (RSD)
which is the system that ran the majority of public schools in Orleans Parish. RSD took
over low-performing OPSB schools at this time.
79% of students were low income in RSD schools.
In the 2007-08 school year, approximately 28.8% of Recovery School District (RSD)
students (3,537) were suspended from school. At the time of the study, the suspension
rate in schools operated by the RSD is more than twice the state average and more than
four times the national rate.
Unlike the Recovery School District in Orleans Parish, in St. Tammany Parish, only
18.5% of students are African-American, 42.5% are low-income, and only 8% of
students were suspended.
In St. Charles Parish, where only 36.4% of students are African-American and 45.1% are
low-income, only 4.1% of students were suspended from school.
According to a study done by the Cowen Institute analyzing the 2009-2010 school year,
the vast majority of Orleans Parish public school students, over 90 percent, were African-
American compared to 61 percent of the city’s population.
46
ii. Describe the relationship between the residency patterns of racial/ethnic, national origin,
and family status groups and their proximity to proficient schools.
Although New Orleans youth can access schools in any area on the City, there is still a
pattern that shows more proficient schools are located in predominantly White, affluent
areas or close to those areas. For the 2015-2016 school year, the Cowen Institute
prepared an analysis of the location of schools based on a letter grade to aid families in
school selection. The Cowen Institute’s analysis groups schools by five locations within
the City. The letter grade is based on school performance scores (SPS).
http://www.speno2014.com/governance-school-guide/
This is illustrated below:
Downtown/9th Ward
Of the six schools in this area, 33% of schools rated D, 33% rated C, and 33% rated B.
One B school, McDonogh 15, is located in the majority White and affluent neighborhood
of the French Quarter.
The other B school is located in a majority African-American neighborhood where
residents have a high rate of homeownership compared to other areas of New Orleans.
Central City/Garden District
Of the nine schools in this area, 13% rated D, 50% rated C, 13% rated B, and one rated
T. T indicates a school was recently taken over by a charter school due to it receiving a
failing score from the prior school year.
Uptown/Carrollton
Of the eight schools in this area, 63% were rated C, 25% rated B, and 12% rated F.
The B schools are located in White affluent areas.
The C schools are in mixed racial/ethnic and national origin zones.
The F school is located in a R/ECAP area.
Mid-City/Lakeview
Of the fifteen schools in this area, 13% rated F, 7% rated D, 33% rated C, 13% rated B,
20% do not have students in tested grades, and 13% were takeover schools with no
scoring.
Both F schools are located in areas near public housing. One is near BW Cooper/Marrero
Commons public housing and the other F school is near St. Bernard/Columbia Parc
public housing.
The D school, Medard Nelson Elementary, is also near St. Bernard/Columbia Parc public
housing.
The B schools are located in areas with more White and affluent residents along Canal
Street and S. Carrollton Avenue. .

47
Algiers/Westbank
Of the eight schools in the area, 63% rated D and F. 25% were rated D and 38% were
rated F. 25% rated B, and 13% rated A.
Algiers has the only A rated school in Orleans Parish, Alice Harte. It is located in an
upper middle class neighborhood, inhabited by a typical age distribution and moderately
educated population. This area is also home to Edna Karr, a B rated school.
The other B rated school, Martin Behrman, is located in the Algiers Point section which
has increasingly become a more White and affluent area than other areas of the city since
Hurricane Katrina.
Two of the D schools are located near the Fischer public housing development.
N.O. East/Gentilly
Out of 6 schools, 17% rated F, 17% rated D, 33% rated C, and 33% rated B.
The F school is located in a R/ECAP area along Dwyer Road.
The B schools are located in African-American neighborhoods that have a high incidence
of homeownership with one school being in Pontchartrain Park and the other in Gentilly
near Franklin Avenue.
The map below presents this data citywide for all schools in the OneApp system:

48
OneApp, the application and placement process for most New Orleans public schools, often gives
preference to students applying to a school in their “Geographic Zone.” This may perpetuate
existing segregation because many African-American students live in zones with few high quality
schools, while many White students live in zones with A or B rated schools.
According to a report from the GNO Data Center entitled ”The Transformation of New Orleans
Public Schools: Addressing System-Level Problems,” as integration began in the late 1950s,
Whites fled New Orleans public schools, and, by the 1970s, middle- class Blacks also began
abandoning the city’s public schools, leaving behind a high population of low-income African-
American students. Just before Hurricane Katrina in 2005, the New Orleans public school
population was 94% African-American, with 73% qualifying for the free or reduced lunch
program (the citywide child poverty rate in 2005 was 41%). Prior to Hurricane Katrina, like the
vast majority of the nation’s school districts, OPSB schools were arranged by neighborhood
zones. After 80% of New Orleans flooded as a result of Hurricane Katrina, the number of
available schools dropped, resulting in the removal of attendance zones. In an effort to promote
fairness, equity, and transparency for the school application process, the Recovery School
District created a centralized enrollment system called OneApp.
http://www.datacenterresearch.org/reports_analysis/school-transformation/

49
iii. Describe how school-related policies, such as school enrollment policies, affect a student’s
ability to attend a proficient school. Which protected class groups are least successful in
accessing proficient schools?
Policies affecting ability to attend a proficient school
The below information is based on a 2007 report by the Boston Consulting Group entitled
“State of Public Education in New Orleans” and depicts how school-related policies developed
after Hurricane Katrina affected attendance at proficient schools by protected class groups.
https://www.bcg.com/documents/file15048.pdf
From 1995 to 2005, public school enrollment in Orleans Parish decreased 25 percent,
while non-public school enrollment increased by 5 percent as a result of the public
school system’s inadequacies. Many families with the financial means took their
children out of public schools.
In December 2005, in light of its precarious financial situation and the loss of most of
its schools, the Orleans Parish School Board fired 7,500 school district employees that
had not already been rehired by one of its remaining schools. This resulted in a
decrease in the number of veteran teachers. Whereas approximately 40 percent of
teachers had more than 20 years of experience before Katrina, after the mass firing, in
the second full school year after the storm, 2007-2008, more than half of all teachers
had three or fewer years of teaching experience.
In 2008, the OPSB and the RSD adopted a comprehensive plan to renovate, rebuild, or
land bank existing buildings over the next ten years which should give more students
access to improved facilities.
RSD students are suspended at a rate that is more than three times the rate of
suspension in neighboring, mostly White, affluent school districts in the region.
The expulsion rate in the RSD was almost twice the statewide rate, and 10 times the
national rate which demonstrated the lack of proficiency during this time to maintain
students in a learning environment.
Seven of the highest ranked public schools in New Orleans (see chart below) do not participate in OneApp.
Their application and enrollment processes are demanding on parents’ schedules and require access to
transportation. These schools often expect parents to deliver parts of the application during school hours
and also require parent meetings and student exams.

50
Economically disadvantaged
Students w/ disabilities
% African America
Lusher Charter School 21% <5% 29%
Benjamin Franklin High School
30% <5% 32%
NOCCA 35% N/R 25%
Edward Hynes Charter School
41% 10% 42%
Audubon Charter School
44% 7% 45%
Lake Forest Charter School
60% 8% 90%
Robert Russa Moton Charter School
94% <5% 95%
Average of all New
Orleans public schools
84% 11% 87%
Students with Disabilities
The Southern Poverty Law Center’s report entitled “Access Denied: New Orleans Parents and
Students Identify Barriers to Public Education” discusses the policies that create barriers to
students with disabilities attending proficient schools.
www.splcenter.org/sites/default/files/d6_legacy_files/downloads/publication/SPLC_report_Acc
ess_Denied.pdf_
The findings were as follows:
Since 2007, the percentage of students with special education designations had steadily
risen, from 6 percent in 2007 to 8 percent in 2009; however, some students with
disabilities in New Orleans public schools were completely denied enrollment as a
result of their disability or forced to attend schools lacking the resources necessary to
serve them and suspended in record numbers.
The graduation rate for RSD students with disabilities was less than half of the overall
graduation rate and only 6.8% of RSD students with disabilities exited with a high
school diploma while the statewide average was 19.4%.
In the 2008-09 school year, RSD schools suspended nearly 30% of all students with
disabilities — a rate that was 63% higher than the state average.
During the 2007-08 school year, 94.6% of eighth grade RSD students with disabilities
failed the Louisiana Educational Assessment Program (LEAP) exam. For the same
year, 78.3% of all eighth grade charter school students with disabilities failed the
LEAP.
Louisiana Department of Education, NOLA.com

51
On average, school districts throughout Louisiana have identified 12.2% of their
students as eligible for special education services. New Orleans Public Schools have
identified only 8% of their students as eligible for special education services.
Comparable school districts throughout the country identify almost twice as many
students with disabilities.
Students with LEP
Students with limited English proficiency (LEP) are primarily protected class members as
discrimination on the basis national origin is prohibited under the Fair Housing Act. LEP students
also have been reported to face barriers to attending proficient schools in New Orleans.
In 2013, the Vietnamese American Young Leaders Association and the Asian
American Legal Defense and Education Fund filed a Complaint with the U.S.
Department of Education alleging that the school district violated Title VI of the Civil
Rights Act of 1964 by failing to meet the language needs of Asian American and
Latino LEP students. District-wide, these students and their families have been
underserved, severely damaging their quality of education and putting them at a huge
disadvantage in their efforts to attain success in their schools. http://aaldef.org/press-
releases/press-release/groups-file-doj-complaint-on-failing-language-services-in-new-
orleans-schools.html
Approximately 54.9 percent of Asian and Latino students said that there are no teachers
or staff at their school who speak their parents’ native language.
(http://ryhcnola.org/wp-content/uploads/2013/02/ESL-Lost-In-The-Sytem-2013.pdf)
Only 16 percent of students from LEP families classified said that their parents are
offered interpreters or translators for important school meetings.
http://theadvocate.com/news/neworleans/5770545-148/new-orleans-students-find-
shortcomings
In New Orleans, “school choice” refers to the range of policies that allow parents to select the
school they want their children to attend. Prior to Hurricane Katrina, schools were arranged in
neighborhood zones, much like the majority of the school districts throughout the country. Schools
would primarily enroll students from their respective zones and would accept students from
outside their zone if there was a seat available. Delivery of public education changed dramatically
in New Orleans after Hurricane Katrina; however, student demographics have remained similar.
According to the Data Center study, New Orleans public schools are only slightly more diverse
than before the storm. White enrollment has moved slightly upward from 3% in 2004-2005 to 6%
at the start of the 2014-2015 school year. The Data Center study notes that Whites are concentrated
in schools with selective admission tests authorized by the Orleans Parish School Board. In
addition, an influx of Hispanics to New Orleans and the surrounding region has resulted in an
increase in the proportion of Hispanic students in the public school system from 1% in 2004-2005
to 5% in 2013-2014. As stated above, in 2004-2005, African-American student enrollment in New
Orleans public schools was 94%, and in 2013-2014 enrollment went down slightly to 87%.
According to the Data Center, the overrepresentation of poor, Black students in public schools is
largely due to the fact that White and middle-class families opt out of the public school system and
choose private and parochial schools at significantly higher rates in New Orleans. Only 10 percent
of students nationwide attend private schools. In New Orleans, 25 percent of students attend
private/parochial schools.
http://www.datacenterresearch.org/reports_analysis/school-transformation/

52
b. Employment Opportunities
i. Describe any disparities in access to jobs and labor markets by protected class groups.
There are clear disparities indicated in access to jobs and labor markets in light of the Jobs Proximity and
Labor Market indices included in Tables 12 and Maps 10 and 11 of the AFFH Data & Mapping Tool. In
these indices, higher scores indicate higher levels of labor engagement and closer proximity to jobs.
Disparities noted are:
The White population has a very high score of 73.88 which indicates extremely high
levels of labor engagement, but all other racial and ethnic groups have far lower
indices, approximately 30 points lower for one group and almost 45 points lower for
another.
The Black population has an extremely low opportunity to access labor with a score
of 29.28. Hispanics have a score of 48.22, Asians and Pacific Islanders a score of
42.68, and Native Americans a score of 47.56.
The White population also lives closer to jobs with a score of 55.71 under the Jobs
Proximity Index, but the Hispanic population is not far behind with a score of 52.64.
The Hispanic population in New Orleans tends to be concentrated in Lower Mid-
City, which is close to many job centers, but is also facing serious development
pressures and is at risk of gentrification. With few protections for tenants, this group
may soon be facing displacement to areas farther from jobs.
The Asian and Pacific Islander and Native American populations also appear
moderately close to jobs with scores of 48.78 for Asians and Pacific Islanders and
46.41 for Native Americans.
Again, the Black population has the lowest access to opportunity, being farther away
from jobs with a score of 40.10 which is over 15 points below the White population.
Jobs in New Orleans are spread out across the city and metro area, with most jobs concentrated
in the following major clusters: the Central Business District (CBD)/French Quarter,
Veterans/Causeway/I-10 area, and the greater Elmwood Corridor, according to a 2015 study
“Persistent Low Wages in New Orleans' Economic Resurgence” conducted by the GNO Data
Center. Statistics from the Data Center show that Jefferson Parish has more low-wage jobs than
Orleans Parish. Jefferson has more than 108,000 low-wage jobs paying less than $3,333 a
month, with nearly 22,000 (51%) of these workers commuting into the parish for work while
Orleans Parish has 84,000. Nearly half (48 percent) of metro New Orleans’ low-earning
workers commuted outside of their home parish for work in 2011, up from 44 percent in 2002.
The Data Center characterizes areas where at least 80% of all earners are earning less than
$3,333/month as "wage deserts" and notes that 40 of the 44 wage deserts in the metro area are
in New Orleans. Workers living in "wage deserts" were more likely than their counterparts in
higher earning areas to commute out of parish. The following Data Center map identifies
Orleans Parish wage deserts and shows where these low-wage workers tend to work.

53
ii. How does a person’s place of residence affect their ability to obtain a job?
According to an article published in the City Observatory on March 27, 2015 entitled “How
Important is Proximity to Jobs for the Poor,” place of residence affects one’s ability to obtain a
job because the closer in proximity to the majority of jobs, the less one has to rely on personal
vehicles or public transportation to seek and/or maintain a job. Some jobs are inaccessible
unless one has the means to afford a personal vehicle. People living in the R/ECAPs of New
Orleans have more challenges finding a job because there are fewer opportunities for
employment in their neighborhoods and a lack of reliable high-frequency public transit.
http://cityobservatory.org/how-important-is-proximity-to-jobs-for-the-poor/
iii. Which racial/ethnic, national origin, or family status groups are least successful in
accessing employment?
Based on the Jobs Proximity and Labor Market indices, the Black population is the least
successful in accessing employment with a dismal score of 29.28 which is 44 points below the
White population (73.88) and almost 20 points below the Hispanic population (48.22).
Although the Hispanic population’s access to jobs is greater than other minority groups, Map 11
reflects that those of Honduran national origin appear to be less likely to have opportunity to
access the labor market.
54
The Vietnamese population also seems to be less likely than other national origin groups to have
access to the labor market. Contributing factors to this observation are likely language barriers
and the fact that the largest Vietnamese community in the city is located far from job centers in
New Orleans East.
With regard to family status, areas with greater access to the labor market generally have between
0 to 20% households with children. Areas with less access to the labor market tend to have
between 80 to 100% households with children.
According to a report issued by the City of New Orleans NOLA for Life Program in August
2014, the young African-American males living in concentrated areas of poverty are the least
successful in accessing employment due to lack of education, criminal records, lack of
transportation, and a lack of access to networking.
http://www.nolaforlife.org/images/economic-opportunity/bmu-report_final_pages2/
c. Transportation Opportunities
i. Describe any disparities in access to transportation based on place of residence, cost, or
other transportation related factors.
Based on the Transit Trips, access to transportation is as follows:
Hispanic population has greatest access to transportation. 63.36
White population is second. 63.12
Native American population is third. 63.08
Black population is fourth. 60.72
The Asian population has the least access. 56.58
HUD Table 12 also indicates that the cost for transportation is not highly disparate in relation to
race and ethnicity. The cost of transportation for racial and ethnic groups is as follows:
Hispanic population has the lowest costs for transportation. 65.40
White population is second. 64.53
Native American population is third. 64.53
Black population is fourth but nominal difference. 60.53
The Asian population has the least access. 51.21
Though the HUD indices suggest there are minimal racial disparities in access to
transportation, local data presented below presents the opposite view.
ii. Which racial/ethnic, national origin or family status groups are most affected by the lack
of a reliable, affordable transportation connection between their place of residence and
opportunities?
The Asian population is most affected by lack of access to transportation and lack of affordable
transportation based on Table 12. Within the Asian population, the national origin group that is
most affected by lack of access to transportation and lack of affordable transportation is the
Vietnamese population according to Map 12. This is consistent with the concentration of
Vietnamese residents in New Orleans East, one of the least transit-accessible parts of the city

55
Family Status - According to Map 12, in areas with lower transportation costs and lower transit
times, approximately 0 to 20 % of families have children, and, in areas with greater transportation
costs and greater transit times, between 80 to 100% of families have children.
iii. Describe how the jurisdiction’s and region’s policies, such as public transportation routes
or transportation systems designed for use personal vehicles, affect the ability of
protected class groups to access transportation.
According to the U.S. Department of Transportation’s April 2007 report entitled “Realizing the
Potential: Expanding Housing Opportunities Near Transit,” the average American family spends
more than half of their income on housing and transportation. The average family spends 19
percent of the household budget on transportation, and households in auto dependent
neighborhoods spend 25 percent while households with good access to transit spend just 9
percent. So while a growing number of families are moving further out to suburban or even
exurban locations to find affordable housing, the rising cost of transportation reduces much of
their cost savings. As a result, demand for housing near transit, which helps contain transportation
costs, is expected to grow over the next 20 years.
http://www.reconnectingamerica.org/assets/Uploads/2007RealizingthePotentialweb.pdf
Based on this projection, public transportation routes and transportation systems designed for use
of personal vehicles can impact protected class groups’ access to opportunity, as the more one
spends on transportation the less one has to spend towards quality housing, education, and other
needs. Below is a look at the various modes of city and regional transportation and how they
affect protected class groups.
New Orleans Transportation
Public Transportation: According to the “State of Transit” report published by Ride New
Orleans in 2015, RTA continues to operate less transit service than it did before Katrina. Ride
New Orleans has indicated that before Katrina, RTA buses and streetcars made more than 17,000
trips each week, and, by 2015, that number had fallen to just 7,813 which represents a 55%
decline in available transit service. This lowers the accessibility of affordable transportation for
families that may not have the means to own a personal vehicle. It may also increase transit times
which can reduce access to resources because of the many transfers that may be necessary to
access jobs and other resources. http://rideneworleans.org/wp-
content/uploads/2015/08/sots2015new.pdf
The Ride New Orleans report indicates the neighborhoods that are most affected by the reduced
transit service are in R/ECAP areas. According to the report, those hardest hit have seen only
20% to 40% of their transit service recovered. These neighborhoods include: Little Woods, West
Lake Forest, Desire, Read Blvd West, Filmore, Viavant / Venetian Isles, Lake Terrace & Oaks,
Lower Ninth Ward, Read Blvd East, Pontchartrain Park, Village de l’est, Bywater, Hollygrove,
St. Claude, Lakeshore / Lake Vista, Dillard, the 7th Ward, Tremé/Lafitte, St. Bernard Area,
Tulane / Gravier, St. Roch, St. Anthony, Pines Village, and Marigny. This lack of reinvestment
disproportionately affects neighborhoods of color.
In addition, streetcars have taken prominence over buses according to Ride New Orleans.
Although streetcars offer more frequent rides, they are mostly placed in areas with
disproportionately White and affluent populations. Ride New Orleans identifies the lines with the
most frequent streetcar service as #12 St. Charles Streetcar, Loyola-UPT Streetcar, Canal-
Museum/City Park Streetcar, Canal-Cemeteries Streetcar, and the Riverfront Streetcar. On

56
average, New Orleans’ five streetcar lines provide service every 17 minutes during peak hours.
Bus riders, however, often have to wait twice as long with the average peak hour frequency of all
of RTA’s bus routes combined at 38 minutes.
RIDE's 2016 State of Transit also includes an analysis of the percentage of jobs in the region that
are accessible by a transit or walking commute of 30 minutes or less. In many majority African-
American areas farther from the city center—like Gentilly, New Orleans East, the Lower 9th
Ward, and Algiers—less than 10% of the region's jobs are accessible by a 30 minute transit
commute. The only area where more than 30% of regional jobs are available in a 30 minute
transit commute is the Central Business District, which is majority White.
Lack of Light Rail Express Transportation:
RTA boasts that the authority has been at the forefront of the light rail system renaissance for
decades by operating three rail lines: the historic St. Charles Avenue Streetcar line, the Canal St.
Streetcar line, and the Riverfront Streetcar line. These rail lines transport more than 15,000 riders
to work, school, and entertainment venues every day. http://www.norta.com/Media/News-
Events/New-Orleans-Rail-A-Historic-Asset-Paving-the-Way-t.aspx. However, the number of
riders served is less than 4% of the New Orleans population, and the lines are concentrated in the
affluent, predominantly White neighborhoods of the Garden District, Mid-City, and the French
Quarter.
The lack of accessibility to the St. Charles Streetcar for people with disabilities and the general
disrepair of New Orleans streets and sidewalks make it difficult for people with disabilities to use
public transit and to traverse the city.
Transportation with Personal Vehicles: Post-Katrina, the share of New Orleans households without access to a vehicle has dropped from
27 percent in 2000 to 19 percent in 2014, according to the June 2016 Data Center report, “Who
Lives in New Orleans and Metro Parishes now.” The Data Center concludes that at 19 percent,
New Orleans’ percentage of individuals without access to vehicles is more than twice as high as
in neighboring parishes and the nation, indicating the importance of a robust public transportation
system. http://www.datacenterresearch.org/data-resources/who-lives-in-new-orleans-now/
Regional Data on Connectivity:
As documented in a Harvard study released in April 2015, commuting time has emerged as the
single strongest factor in the odds of escaping poverty. “The longer an average commute in a
given county, the worse the chances of low-income families there moving up the ladder. The
relationship between transportation and social mobility is stronger than that between mobility and
several other factors, like crime, elementary-school test scores or the percentage of two-parent
families in a community.” http://www.equality-of-
opportunity.org/images/nbhds_exec_summary.pdf
The Coordinated Public Transit-Human Services Transportation Plan completed by the Regional
Planning Commission (RPC) of Jefferson, Orleans, Plaquemines, St. Bernard, and St. Tammany
Parishes admits that during planning there was a consistent theme concerning lack of regional
connectivity, particularly when transferring from one system or mode to another.
This is a particular problem given the high share of low-wage workers commuting to jobs outside
of New Orleans noted in the employment section above.
57
Public Transportation:
In an earlier RPC study conducted in 2012 entitled “Origin Destination study,” the RPC
demonstrated that trips are often regional in nature. According to the same study more than half
of all trips on the fixed route public transportation system require at least one transfer. These
issues are exacerbated for transportation disadvantaged populations, especially for persons who
rely on the public transportation system for most or all of their travel needs. Such riders may have
non-traditional trip purposes (such as medical or non-peak hour/weekend employment trips) and
unique limitations on time and resources. They may also have a far more difficult challenge
navigating a complicated system. From an operator perspective, poor connectivity may lead to an
inefficient and undesirable system as well as increased rider reliance on an expensive paratransit
system. http://www.norpc.org/assets/pdf-documents/studies-and-
plans/Coordinated%20Plan_2013.pdf
Lack of Light Rail Express Transportation: In June 2005, prior to Hurricane Katina, the RPC released a policy plan for transit oriented
development entitled “New Orleans Light Rail Transit Project.” This policy plan supported the
development of a Light Rail Transit project between the Louis Armstrong International Airport
in Jefferson Parish and downtown New Orleans.
According to an article in the Times Picayune on July 17, 2014, Veolia Transportation, which
manages the RTA, envisions light rail or express bus service to the airport.
http://www.nola.com/politics/index.ssf/2014/07/new_orleans_rta_unveils_35_bil.html
Transportation with Personal Vehicles:
A route that connects New Orleans to Jefferson Parish was voted as the nation’s 30th worst
corridor by the Daily Beast in its article entitled “America’s 50 Worst Commutes.” The specific
route encompasses I-10 Westbound from Causeway Blvd./Exit 228 through West End
Blvd./Florida Blvd. Regarding the creation of exit-only lanes on this route in an attempt to
alleviate congestion, Chris Morvant, a state transportation engineer, stated that “the idea is to
separate traffic according to where people want to go and eliminate the need to try to merge over,
which slows things down, especially in heavy traffic."
http://www.thedailybeast.com/articles/2011/03/08/50-worst-commutes-americas-highways-to-
hell.html
In addition to the congestion on I-10 going towards Metairie, RPC has been also trying to
alleviate congestion on I-10 in the direction of the Westbank by installing ramp meters along
Pontchartrain expressway, according to a July 2016 Times Picayune article. “The meters are
designed to reduce traffic congestion, improve travel time and ensure safer merging,” Department
of Transportation and Development Secretary Shawn D. Wilson said. He said in a released
statement that the technology would allow for goods and services to be "delivered in a more
efficient and timely manner" more safely during rush hour. However, Iherif Ishak, a civil
engineering professor at Louisiana State University, recommended more research to figure out
"the nature of the congestion problems" in New Orleans and to ensure that ramp meter strategies
work. http://www.nola.com/traffic/index.ssf/2016/07/new_orleans_ramp_meters_set_to.html
d. Low Poverty Exposure Opportunities
i. Describe any disparities in exposure to poverty by protected class groups.
In New Orleans, African-Americans are the protected class with the highest exposure to
poverty. Their exposure is extremely high with an index of 18.23 where, the higher the

58
score, the less exposure to poverty. Unlike the Black population, the White population
has a score of 53.52 showing much less exposure to poverty and even the Hispanic,
Asian, and Native American populations have much less exposure to poverty than
Blacks. Table 12 indicates the disparities in exposure to poverty by protected class are as
follows:
Black population has the highest exposure to poverty at 18.23.
Native Americans have the next highest exposure to poverty at 30.75.
Hispanic residents have slightly lower exposure to poverty at 31.10.
Asians and Pacific Islanders have slightly lower exposure to poverty at 33.81.
White residents have the least exposure to poverty at 53.52.
The region is consistent with the New Orleans metropolitan area in that the protected class with the
most exposure to poverty is African-Americans.
ii. What role does a person’s place of residence play in their exposure to poverty?
According to an article published by the Metropolitan Policy Program at Brookings
entitled “Concentrated poverty in New Orleans 10 years after Katrina,” the share of the
city’s poor residents living in neighborhoods of extreme poverty dropped from 39% in
2000 to 30% in 2009-13. This drop in poverty partly stems from the disproportionate
inability of African-Americans return home after the storm. The Brookings study uses
data from the American Community Survey and the Geolytics Neighborhood Change
data base and finds that there are many very poor neighborhoods in New Orleans and
that, in 2009-2013, 38 of the city’s 173 census tracts had poverty rates exceeding 40%,
down only slightly from 41 census tracts in 2000. These high-poverty neighborhoods
have been slower to rebuild in the aftermath of Hurricane Katrina than other
neighborhoods.
To examine the disparities in exposure to poverty further, information from the GNO
Data Center shows that the geographies of poverty in New Orleans follow a consistent
pattern that is neighborhood specific and consistent with the R/ECAPs identified in Map
14. Poverty indicators for majority African-American neighborhoods in R/ECAP areas
are consistent with geographic patterns that are also correlated with low-income, low-
educational attainment, less access to transportation, and high rent cost-burden. In
addition, Hurricane Katrina revealed disparities in exposure to poverty among those in
the protected classes. African-American low-income people living in parts of New
Orleans that were flood prone, such as the Upper and Lower 9th Wards, 7th Ward, Gert
Town, Mid-City, and New Orleans East that experienced total loss of property, as well as
challenges returning home after the storm. Prior to the storm, these areas were considered
areas of concentrated areas.
iii. Which racial/ethnic, national origin or family status groups are most affected by these
poverty indicators?
Table 12 indicates the following:
The racial/ethnic groups most affected by these poverty indicators are Black residents with a
very low score of 14.40, as compared to White residents with a comparatively high score of

59
47.33. Also, on a regional level the group most affected by poverty indicators is Black
residents with a low score of 26.51, as compared to Whites with a high score of 56.49.
The national origin group most affected by these poverty indicators are Honduran
residents who live mostly in areas with a poverty index of 0 to 10.
Table 12 also shows that census tracts where families with children comprise 60% or
more of the households are more likely to be areas with high exposure to poverty. In
addition, the Data Center reports that the child poverty rate in New Orleans is fully 17
percentage points higher than the national average. 39 percent of New Orleans children
live in poverty. Moreover, it is higher than in many comparable U.S. cities. Among the
39 cities with populations between 275,000 and 600,000, New Orleans has the ninth
highest child poverty rate. http://www.datacenterresearch.org/reports_analysis/new-
orleans-kids-working-parents-and-poverty/
iv. Describe how the jurisdiction’s and region’s policies affect the ability of protected class
groups to access low poverty areas.
From a review of HUD data and local data the following assessments were made:
Jurisdictional and regional policies inhibit the ability of protected class groups to access
low poverty areas through zoning laws restricting certain housing developments in
specific neighborhoods. By restricting pre-fabricated housing and multi-family dwellings,
particularly public housing projects, in middle and upper-middle income neighborhoods,
local governments limit the protected class groups’ opportunity to gain access to low
poverty areas. In addition, there are many neighborhoods in New Orleans that are
classified as historic districts. Adhering to housing preservation regulations in those
neighborhoods can often be too costly for low-income residents and affordable housing
developers to afford.
Due to significant of investment in downtown urban areas, many groups with means are
returning to downtown living which creates a housing demand that results in increased
rents and inflated home values. These investment policies affect the ability of protected
class groups to access low poverty areas because these areas become less affordable as
the demand for housing increases.
Transportation policies also affect the ability of protected class groups to access low
poverty areas. A number of households in need of subsidized housing have had to access
housing outside of low poverty areas as the increase in rent in low poverty areas drove
those households toward lower rent areas like New Orleans East, which have fewer
public transportation services. New Orleans East has less transportation services because
transportation policies have resulted in an increase in streetcars in downtown areas but
have not increased bus service for remote areas like New Orleans East. In addition, the
development of a light rail system not been a part of any transportation plan. Therefore,
without a car, disproportionately African-American and Vietnamese families are hindered
from accessing areas of low poverty.

60
The lack of mobility counseling and Small Area Fair Market Rents can impede voucher
holders ability to access lower-poverty neighborhoods.
Conversely, development of HANO scattered sites in high-opportunity neighborhoods
would allow protected classes to access lower-poverty neighborhoods.
Public investments in gentrifying neighborhoods without complementary investments in
affordable housing make it harder for protected classes to stay in neighborhoods as they
become more affluent.
e. Environmentally Healthy Neighborhood Opportunities
i. Describe any disparities in access to environmentally healthy neighborhoods by protected
class groups.
The Environmental Health Index provided by the Table 12 and Map 15 measures
exposure based on EPA estimates of air quality carcinogenic, respiratory, and
neurological toxins by specific neighborhoods in New Orleans.
According to the HUD index, access to environmentally healthy neighborhoods is about
the same for White, Black, Hispanic, and Native American populations. All of these
populations have high exposure to carcinogenic, respiratory and neurological toxins as
indicated by the low scores on the HUD Environmental Health Index as follows:
White - 27.22 Black - 26.92
Hispanic - 26.89 Native American – 25.37
The Asian Pacific Islander population based on the index has less exposure than other
populations in New Orleans with a score of 37.27.
In addition to the Environmental Health Index that indicates exposure to air quality
toxins, New Orleans residents also encounter additional environmental health hazards
such as elevated highways, lead in the soil, industrial plants, and waste sites.
Lead: New Orleans has a high prevalence (61%) of lead above recommended levels in
soil and dust samples in and around residences. This information was obtained from a
cross sectional study done by Louisiana researchers to assess the distribution of
residential soil and lead dust two years after Katrina, comparing soil levels before and
after Katrina. 109 households were enrolled, and 61% had at least one lead measurement
above federal standards. Of homes with bare soil, 47% had elevated lead, and 27% had
levels exceeding 1,200 parts per million. Housing age was associated with soil lead, and
housing age and soil lead were associated with interior lead. Race, income, and
ownership status were not significantly associated with either interior or exterior lead
levels. The median soil lead level of 560 parts per million was significantly higher than
the median level of samples collected before Hurricane Katrina. See "Environmental
Lead after Hurricane Katrina." http://www.ncbi.nlm.nih.gov/pmc/articles/PMC3346792/
Elevated Highways: An organized preservation effort led to the 1969 defeat of a six-lane
elevated riverfront expressway proposed for the Vieux Carré. The preservation
community feared that an above-grade roadway would harm the Vieux Carré’s historic
61
character and permanently sever its relationship to the river.
http://architecture.tulane.edu/preservation-project/timeline-entry/956.
The proposed elevated expressway, however, was erected in the historically Black
neighborhood of Tremé above Claiborne Avenue. This was the central business corridor
of the Treme neighborhood, a historic Black and Creole neighborhood with roots
beginning in the 18th century. The construction of the expressway removed the character
of the oak-lined corridor. In the following decade, registered businesses along Claiborne
Avenue decreased by 50%. The Treme neighborhood, once a center of jazz and African-
American culture, began a steady decline. Cement parking lots replaced the public green
space underneath the expressway. https://reclaimingoldwestbroad.org/case-studies/new-
orleans-claiborne-expressway/
Unsafe and Unhealthy Homes: According to the 2011 American Housing Survey, New
Orleans has a particularly high rate of rental housing with environmental hazards. As much
as 78% of the private rental housing stock needed major repairs in the past 12 months.
Hazards in the home include mold (1,700 units), fire hazards (5,000+ units), and rodent and
insect infestations (7,000+ units). Insect infestations have taken on a new level of concern as
the Zika virus threatens the Gulf Coast and female-headed households with children are
overrepresented in the rental market. African-Americans are also overrepresented in the
rental market, and even more so in areas with little market activity where conditions are
likely to be worse. Unsafe and unhealthy homes have been linked to higher asthma rates,
missed school and work days, and higher healthcare costs. The City of New Orleans
currently does not proactively accept code enforcement complaints about the interior of a
home, but Housing for Resilient New Orleans calls for a Rental Registry to address this
problem.
Toxic Waste: The below maps depict landfills in New Orleans that are in close proximity to
neighborhoods. Not listed on this map is the old Silver City Dump, which was the site of
Booker T. Washington High School and the B.W. Cooper public housing development. The
B.W. Cooper development is being rebuilt as a mixed-income development—Marrero
Commons—on the same site. A new school is also slated to open on the site. The
Agriculture Street Dump, which has been mentioned often in public comments, is also
missing from the map. The residents self-report a 92% cancer rate among the remaining
homeowners.
http://www.deq.louisiana.gov/portal/NEWS/HurricaneInformation/ChefMenteurandGentilly
Landfill.aspx

62
ii. Which racial/ethnic, national origin or family status groups have the least access to
environmentally healthy neighborhoods?
Table 12 shows few disparities in access to environmentally healthy neighborhoods by
protected class groups for the total population of New Orleans, but local data mentioned
above overwhelmingly shows communities of color bear the brunt of environmental toxins
in New Orleans. A higher score on the HUD index indicates greater neighborhood
environmental quality (i.e., lower exposure rates to harmful toxins).
Native Americans at 25.37 have the least access to environmentally healthy
neighborhoods.
The Hispanic population also has low access to environmentally healthy neighborhoods at
26.89.
Blacks have the third lowest access to environmentally healthy neighborhoods at 26.92
Whites are fourth at 27.22 indicating greater access to environmentally healthy
neighborhoods.
Asians and Pacific Islanders have the greatest access to environmentally healthy
neighborhoods with a score of 37.27.

63
f. Patterns in Disparities in Access to Opportunity
i. Identify and discuss any overarching patterns of access to opportunity and exposure to
adverse community factors based on race/ethnicity, national origin or familial status.
Identify areas that experience an aggregate of poor access to opportunity and high
exposure to adverse factors. Include how these patterns compare to patterns of
segregation and R/ECAPs.
In reviewing and analyzing data, it is clear that the Black population continues to have the
most exposure to poverty, continues to have failing schools in their neighborhoods, and is
among the top three groups that have the most exposure to environmental hazards placed in
their communities. In addition, the black community ranks second to last in access to
transportation behind the Asian population which has the least access to transportation.
2. Additional Information
a. Beyond the HUD-provided data, provide additional relevant information, if any, about
disparities in access to opportunity in the jurisdiction and region affecting groups with
other protected characteristics.
Access to Healthcare
Large disparities in health exist between different groups of people in New Orleans. A report
developed by the New Orleans Health Department in 2010 examined racial health disparities
between African-Americans and Whites during the period of 2008-2010. The report found the
following disparities:
African-Americans in New Orleans were 1.37 times more likely to die than Whites
in New Orleans over the period of 2008-2010. This ratio was higher in New Orleans
over this period than in Louisiana and in the United States as a whole, which means
that New Orleans has a more severe disparity in all-cause mortality between Whites
and African-Americans than both the state and the nation.
African-Americans were eight times more likely to die of homicide than Whites in
Orleans Parish during this period.
African-Americans were three times more likely to die of diabetes and twice as
likely to die of kidney disease and HIV.
African-American children under 18 in New Orleans are about three and a half
times more likely to be uninsured than White children.
African-Americans ages 18-64 were nearly twice as likely to be uninsured than
White adults.
http://www.nola.gov/nola/media/Health-Department/Publications/Health-Disparities-in-New-Orleans-
Community-Health-Data-Profile-final.pdf
There is a 25.5 year difference between the ZIP codes in New Orleans with the highest and
lowest life expectancies. A 2012 study published by the Joint Center for Political and
Economic Studies' Place Matters Project examined the impact of place on health in Orleans
Parish. The Center collected ZIP code level data and calculated life expectancies for each
area, finding a 25.5 year disparity between the ZIP codes with the highest and lowest life
expectancies. ZIP code 70112, containing parts of the Tulane, Gravier, Iberville and Tremé
neighborhoods, had a life expectancy of 54.5 years. This is lower than the Democratic

64
Republic of the Congo. ZIP code 70124, containing the Lakeshore, Lake Vista, Lakeview,
West End, Lakewood, and Navarre neighborhoods, had a life expectancy of 80, similar to the
UK and higher than the US average in 2012.
http://jointcenter.org/docs/New%20Orleans%20CHERReport.pdf
Access to Financial Services
Anecdotal information from community members indicates that the ability to secure loans for
homes and businesses is one of the reasons that they are unable to locate in low poverty areas
or have better transportation options. The City’s 2010 Analysis of Impediments (AI) report
found that from 2002-2007, there was an average loan denial rate of 22%. The most common
reasons for denial were credit history and debt-to-income ratio. Whites had a denial rate of
13%, Hispanics a denial rate of 28%, and African-Americans a denial rate of 30%.
The disparity among races prevailed even when income was taken into account. The AI report
states that “White applicants with incomes below $15,000 were denied 25% of the time, while
black applicants in the same income range were denied 55% of the time. For applicants with
incomes above $75,000, whites had a denial rate of 10% and blacks had a denial rate of 27%.”
In addition, the Kirwan Institute indicates in its 2010 report, “Credit and Lending in
Communities of Color,” that consumers of color disproportionally pay more for auto
financing, credit cards, private student loans, payday lending, car title loans, and others forms
of credit. http://kirwaninstitute.osu.edu/my-product/credit-and-lending-in-communities-of-
color/.
Regarding national origin protected groups, a study on immigrant banking completed in 2015
by the Appleseed Foundation the found:
Thirty-three percent of the banks and credit unions surveyed indicated that lack of
bilingual personnel or having a language barrier was a problem. Uncertainty about
government regulations, specifically the Patriot Act requirements and proof of
identity, created obstacles for 50 percent of participants.
One institution listed determining the credit history of immigrants as a particular
issue while two others recognized that many people in the Latino community
distrust mainstream institutions.
A lack of locations in Latino-populated areas created barriers for three institutions.
http://appleseednetwork.org/wp-content/uploads/2015/10/LA-Appleseed-Immigrant-
Banking-Report1.pdf
b. The program participant may also describe other information relevant to its assessment
of disparities in access to opportunity, including any activities aimed at improving
access to opportunities for areas that may lack such access, or in promoting access to
opportunity (e.g., proficient schools, employment opportunities, and transportation).
New Orleans has enacted policies aimed at providing more access to quality schools by
ensuring that any child can attend any public school in the city, even if that school is not
within the child’s neighborhood. Although this policy on its face provides broader access,
in practice, only the families that have the ability to transport children to schools outside
of their neighborhoods to attend these schools or families that feel comfortable with
children leaving home extremely early in the morning to travel to school on a bus and
getting home late can take advantage of this citywide access policy.
Regarding healthcare, federal policies that provide broader access to health insurance may
lessen health disparities; however, the Affordable Care Act has only been fully

65
implemented for a short period which means its effect on disparities is not yet readily
apparent.
The City of New Orleans has also considered public transportation options that would
provide more access to families with children and other protected classes in accessing low
cost and quality transportation while reducing environmental hazards. The City
considered removing the elevated I-10 expressway from the majority African-American
neighborhood of Treme to (1) provide more bus access and bike lanes so families without
cars could access low cost transportation; (2) reduce air and noise pollution from the
elevated expressway; and (3) increase economic development activities on a once thriving
African-American commercial corridor. This proposal has not been implemented due to
opposition from a major industry, the Port of New Orleans, and opposition from the
public due to fear that the removal would affect evacuation routes.
In addition, the City of New Orleans has created a NOLA for Life program to assist
African-American males. This program focuses on assisting those with a criminal
background have access to alternative activities, jobs, and community resources.
3. Contributing Factors of Disparities in Access to Opportunity
Consider the listed factors and any other factors affecting the jurisdiction and region.
Identify factors that significantly create, contribute to, perpetuate, or increase the severity of
disparities in access to opportunity.
Location of proficient schools and school assignment policies: As a result of historic
patterns of residential racial segregation, many African-American students live in zones with
few high quality schools, while many white students live in zones with A or B rated schools.
Seven of the highest ranked public schools in New Orleans do not participate in the citywide
application system used by most public schools. The application and enrollment processes for
these schools are demanding on parents’ schedules and require access to transportation. These
schools often expect parents to deliver parts of the application during school hours and also
require parent meetings and student exams for entry. The majority of public schools lack LEP
services and a number do not have sufficient special education services. When reviewing the
HUD race/ethnicity map in conjunction with the maps showing the location of proficient
schools, the maps show that the majority of Latino and Asian residents do not live near
proficient schools.
Access to proficient schools for persons with disabilities: The chart in preceding pages
demonstrate barriers to accessing proficient schools with most schools only partially
accessible due to poor or missing sidewalks and curb ramps. In addition, according to the
Southern Poverty Law Center, a disproportionate number of students who have cognitive
disabilities are being suspended at high rates from integrated school settings.
Lack of employment opportunities: The City of New Orleans developed and conducted a
survey to provide a detailed illustration of the assets and challenges of African-American
males in gaining access to employment opportunities. The report found that education levels,
criminal history, lack of transportation, housing, and family life were obstacles to
employment.

66
Access to financial services: Anecdotal information from community members indicates that
the ability to secure loans for homes and businesses is one of the reasons that they are unable
to locate in low poverty areas or have better transportation options.
The availability, type, frequency, and reliability of public transportation: New Orleans
residents have experienced a 55% decline in available transit service since Hurricane Katrina
which lowers the accessibility to affordable transportation for families that may not have the
means to own a personal vehicle. Access to transportation for persons with disabilities: In
addition, most taxis do not have wheelchair accessible vehicles and the St. Charles Street car
is not wheelchair accessible.
Lack of regional cooperation: This topic drew comments due to the lack of regional
transportation. Participants cited the difficulty in traveling across the region on public transit
to and from job centers: “Jobs that are close to home don’t pay that much,” was a comment
made at the public hearing held on July 19, 2016, as part of the HUD Affirmatively
Furthering Fair Housing (AFFH) process.
Location of environmental health hazards: A theme that has been identified in reviewing
R/ECAP and segregated areas is that a majority of these areas have been adversely impacted
by elevated expressways where residents are subjected to noise pollution, lack of greenspace,
and pollutants from vehicle traffic. In addition, R/ECAP and segregated areas have been
located near or on landfill and waste sites.
Location of employers: At the first public hearing, some residents highlighted challenges
accessing jobs in New Orleans. In addition, many jobs in New Orleans are temporary and not
sustainable. High quality jobs outside of New Orleans are difficult to access due to the lack of
regional transportation.
Lack of access to Healthcare: Large disparities in health exist between different groups of
people in New Orleans. A report developed by the New Orleans Health Department in 2010
examined racial health disparities between African Americans and whites during the period
of 2008-2010. The report found the following disparities:
• African Americans in New Orleans were 1.37 times more likely to die than whites in New
Orleans over the period of 2008-2010. This ratio was higher in New Orleans over this period
than in Louisiana and the United States as a whole, which means that New Orleans has a
more severe disparity in all-cause mortality between whites and African Americans than both
the state and the nation.
• African Americans were eight times more likely to die of homicide than whites in Orleans
Parish during this period.
• African Americans were three times more likely to die of diabetes and twice as likely to die
of kidney disease and HIV.
• African American children under 18 in New Orleans are about three and a half times more
likely to be uninsured than white children.
Inaccessible government facilities or services: The City of New Orleans and Jefferson
Parish have both have entered into settlement agreements regarding inaccessible government
facilities and services. Jefferson Parish entered into an agreement to ensure that polling places
were accessible and the City of New Orleans had to modify government buildings to ensure
that they were ADA accessible. When government facilities and services are not in

67
compliance with ADA rules, individuals with disabilities face barriers in accessing
government services and participating in the civic process.
Inaccessible sidewalks, pedestrian crossings, or other infrastructure: Not until March 2016
did New Orleans install the first Accessible Pedestrian Signal (APA) located at McAlister
crosswalks at the Tulane University campus. It is an audible beeping that helps visually impaired
people know when it is safe to cross the road. This is the only APS in the City. In addition, the
majority of schools have documented that sidewalks and curb ramps are poor or missing.
Sidewalks in New Orleans remain in a state of disrepair. Cracks are present on the majority of
sidewalks, making movement in a wheelchair uneven and bumpy. The roots of trees upend
sidewalks, making the traverse quite difficult at times. Some sidewalks are not equipped with
curb cuts, making them inaccessible to the independent wheeler.
iv. Disproportionate Housing Needs
1. Analysis
a. Which groups (by race/ethnicity and family status) experience higher rates of housing cost
burden, overcrowding, or substandard housing when compared to other groups? Which
groups also experience higher rates of severe housing burdens when compared to other
groups?
Race/Ethnicity
According to Table below, the Black population experiences higher rates of housing cost
burden, overcrowding, and substandard housing as compared to other groups. The Hispanic
population also experiences higher rates of housing problems than other groups.
Disproportionate Housing Needs
(New Orleans, LA CDBG, HOME, ESG)
Jurisdiction
Households experiencing any of 4
housing problems* # with problems # households
% with
problems
Race/Ethnicity
Black, Non-Hispanic 42,965 80,175 53.59
Hispanic 3,185 6,725 47.36
Other, Non-Hispanic 835 1,769 47.20
Native American, Non-Hispanic 129 349 36.96
White, Non-Hispanic 18,685 51,315 36.41
Asian or Pacific Islander, Non-Hispanic 1,093 3,498 31.25
Total 66,920 143,850 46.52
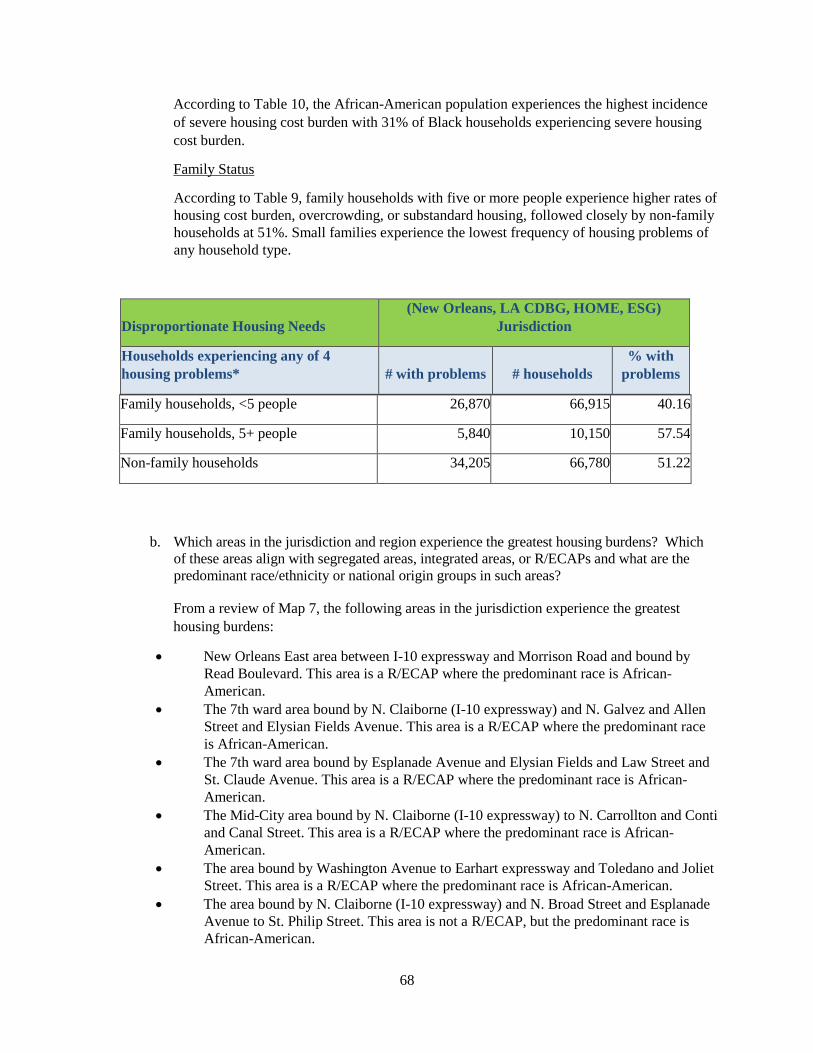
68
According to Table 10, the African-American population experiences the highest incidence
of severe housing cost burden with 31% of Black households experiencing severe housing
cost burden.
Family Status
According to Table 9, family households with five or more people experience higher rates of
housing cost burden, overcrowding, or substandard housing, followed closely by non-family
households at 51%. Small families experience the lowest frequency of housing problems of
any household type.
Family households, <5 people 26,870 66,915 40.16
Family households, 5+ people 5,840 10,150 57.54
Non-family households 34,205 66,780 51.22
b. Which areas in the jurisdiction and region experience the greatest housing burdens? Which
of these areas align with segregated areas, integrated areas, or R/ECAPs and what are the
predominant race/ethnicity or national origin groups in such areas?
From a review of Map 7, the following areas in the jurisdiction experience the greatest
housing burdens:
New Orleans East area between I-10 expressway and Morrison Road and bound by
Read Boulevard. This area is a R/ECAP where the predominant race is African-
American.
The 7th ward area bound by N. Claiborne (I-10 expressway) and N. Galvez and Allen
Street and Elysian Fields Avenue. This area is a R/ECAP where the predominant race
is African-American.
The 7th ward area bound by Esplanade Avenue and Elysian Fields and Law Street and
St. Claude Avenue. This area is a R/ECAP where the predominant race is African-
American.
The Mid-City area bound by N. Claiborne (I-10 expressway) to N. Carrollton and Conti
and Canal Street. This area is a R/ECAP where the predominant race is African-
American.
The area bound by Washington Avenue to Earhart expressway and Toledano and Joliet
Street. This area is a R/ECAP where the predominant race is African-American.
The area bound by N. Claiborne (I-10 expressway) and N. Broad Street and Esplanade
Avenue to St. Philip Street. This area is not a R/ECAP, but the predominant race is
African-American.
Disproportionate Housing Needs
(New Orleans, LA CDBG, HOME, ESG)
Jurisdiction
Households experiencing any of 4
housing problems* # with problems # households
% with
problems

69
The area bound by N. Claiborne Avenue and N. Peters and Charbonnet Street to St.
Bernard Parish line. This area is not a R/ECAP, but the predominant race is African-
American.
The area bound by N. Claiborne (I-10 expressway) to Jefferson Davis Parkway and St.
Louis Street to Banks Street. This area is a R/ECAP where the predominant race is
African-American.
The Central City area bound by O.C. Haley Blvd and Simon Bolivar Blvd and 1st
Street and Toledano Street. This area is a R/ECAP where the predominant race is
African-American.
The Central City area bound by Simon Bolivar Blvd and S. Claiborne Avenue and 1st
Street and Louisiana Avenue. This area is not a R/ECAP, but the predominant race is
African-American.
The area on the Westbank bound by US 90 expressway and Behrman Place and
General DeGaulle Drive and Jefferson/Orleans Parish line. This area is not a R/ECAP,
but the predominant race is African-American.
In the region, the primary areas with the greatest housing burden outside of the City of New
Orleans are as follows:
The area on the Westbank bound by Westbank expressway and 5th Street and
Orleans/Jefferson Parish line and Stumpf Boulevard. This area is not R/ECAP area, but
the predominant race is African-American.
The Bayou Segnette and Jean Lafitte areas also have high housing burdens.
c. Compare the needs of families with children for housing units with two, and three or more
bedrooms with the available existing housing stock in each category of publicly supported
housing.
According to Table 9, approximately 58% of Orleans Parish households with five or more
people experience severe housing problems. Approximately 24% of these households
experience severe housing cost burdens.
d. Describe the differences in rates of renter and owner occupied housing by race/ethnicity in
the jurisdiction and region.
According to a study commissioned by the New Orleans Redevelopment Authority and
published in March 2016 entitled “Where will People Live: New Orleans Growing Housing
Challenge” and prepared by the Center for Community Progress
(http://www.noraworks.org/images/NORA-Rental-Housing-Report.pdf), 55% or 86,000 of
all New Orleans households were renters in 2013. Renters comprised 58% of African-
American households, compared to 49% of white households. In addition, according to
HUD’s Comprehensive Assessment Survey (CHAS), in 2015, Orleans Parish had 143,850
households and, of these households, 48% or 68,505 were owner occupied. Renter
households in 2015 comprised around 52% or 75,345 households.
2. Additional Information
a. Beyond the HUD-provided data, provide additional relevant information, if any, about
disproportionate housing needs in the jurisdiction and region affecting groups with other
protected characteristics.

70
The following information is data provided by the March 2016 report “Where will People
Live: New Orleans Growing Housing Challenge” and prepared by the Center for
Community Progress (http://www.noraworks.org/images/NORA-Rental-Housing-
Report.pdf):
Family Status
According to the March 2016 report, 60% of all renter households in New Orleans are non-
family households, while 49% are single individuals, compared to 47% and 36% of renter
households respectively nationwide. One-third of renter households nationally have
children under 18 in the home, compared to roughly one-fifth of New Orleans renter
households. The table below shows a strong trend in New Orleans’ rental market away
from both married couples and female-headed families toward single individuals and other
non-family households.
Table – Renter Households by Type and Presence of Own Children 2000 and 2013
Age of Renters and Homeowners
Thirty-six percent of New Orleans’ renter heads of household are under age 35, compared
to 11% of homeowners under age 35. 28% of homeowners are 65 or older, compared to
11% of renters.
Socioeconomic Status of Renters and Homeowners
In New Orleans the median income of tenants is only 42% of the median for homeowners,
compared to 48% nationally. Householders earning under $20,000 are disproportionately
likely to be renters while households earning over $50,000 are disproportionately likely to
be homeowners. 43% of all renters have annual total household incomes of less than
$20,000. The table below depicts the disparities.

71
Table – Income Distribution of Households
b. The program participant may also describe other information relevant to its assessment of
disproportionate housing needs. For PHAs, such information may include a PHA’s
overriding housing needs analysis.
Please see the Housing Needs Analysis table from the Housing Authority of New Orleans PHA Plan for fiscal year beginning October 1, 2016 on the following pages. This table analyzes the needs of low-income renter households using HUD’s 2015 CHAS Survey.

72
HOUSING AUTHORITY OF NEW ORLEANS HOUSING NEEDS STATEMENT: PHA ANNUAL PLAN FYB OCTOBER 1, 2016
HUD 2015 COMPREHENSIVE HOUSING ASSESSMENT SURVEY (CHAS) USING U.S. CENSUS AMERICAN COMMUNITY SURVEY (ACS) 2008-2012 DATASETS
Total Orleans Parish Households 143,850
Owner Households 68,505 (48% of Total)
Renter Households 75,345 (52% of Total)
Orleans Parish Renter Households by Average Median Income (AMI) With Breakout of "Low Income Renter" Households
Statistical Notations
Extremely Low Income renter households (<=30% AMI) 23,510 Very Low Income renter households (>30% but <=50% AMI) 12,930 Low Income renter households (>50% but <=80% AMI) 13,055 Subtotal "Low Income Renter" Households (<=80% AMI) 49,500 Other renter households (>80% but <=100% AMI) 5,635 Other renter households (>100% AMI) 20,215 Subtotal Other Renter Households (>80% AMI) 25,850 Total Renter Households: 75,345
49,500
Of the total 75,345 Renter Households in Orleans Parish, 49,500 or 66% are classified as "Low Income" Renter Households
Low income renter households with moderate to severe housing cost burden (of total 49,500) 37,130
Of all 49,500 "Low income" Renter Households, 37,130 or 75% are Cost Burdended (24% Moderate and 51% Severe)
Low income renter households with housing problems (of total 49,500) 38,025 Of all 49,500 "Low income" Renter Households, 38,025 or 77% have Housing Problems
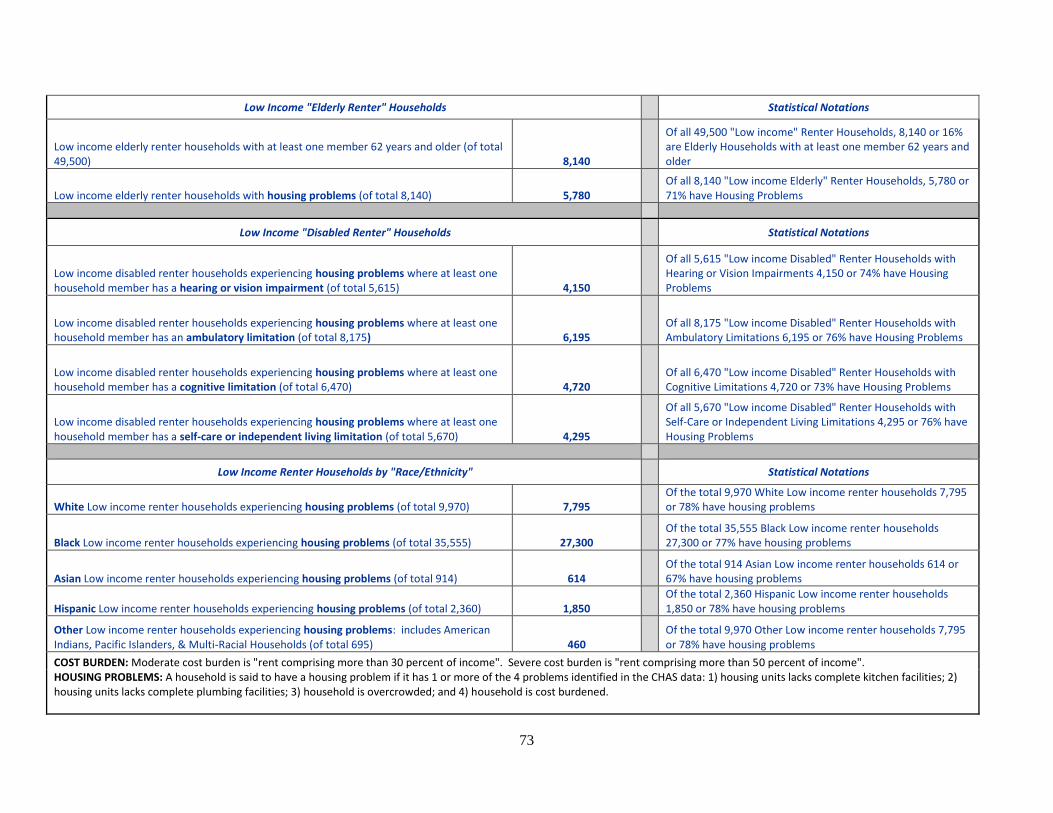
73
Low Income "Elderly Renter" Households Statistical Notations
Low income elderly renter households with at least one member 62 years and older (of total 49,500) 8,140
Of all 49,500 "Low income" Renter Households, 8,140 or 16% are Elderly Households with at least one member 62 years and older
Low income elderly renter households with housing problems (of total 8,140) 5,780 Of all 8,140 "Low income Elderly" Renter Households, 5,780 or 71% have Housing Problems
Low Income "Disabled Renter" Households Statistical Notations
Low income disabled renter households experiencing housing problems where at least one household member has a hearing or vision impairment (of total 5,615) 4,150
Of all 5,615 "Low income Disabled" Renter Households with Hearing or Vision Impairments 4,150 or 74% have Housing Problems
Low income disabled renter households experiencing housing problems where at least one household member has an ambulatory limitation (of total 8,175) 6,195
Of all 8,175 "Low income Disabled" Renter Households with Ambulatory Limitations 6,195 or 76% have Housing Problems
Low income disabled renter households experiencing housing problems where at least one household member has a cognitive limitation (of total 6,470) 4,720
Of all 6,470 "Low income Disabled" Renter Households with Cognitive Limitations 4,720 or 73% have Housing Problems
Low income disabled renter households experiencing housing problems where at least one household member has a self-care or independent living limitation (of total 5,670) 4,295
Of all 5,670 "Low income Disabled" Renter Households with Self-Care or Independent Living Limitations 4,295 or 76% have Housing Problems
Low Income Renter Households by "Race/Ethnicity" Statistical Notations
White Low income renter households experiencing housing problems (of total 9,970) 7,795 Of the total 9,970 White Low income renter households 7,795 or 78% have housing problems
Black Low income renter households experiencing housing problems (of total 35,555) 27,300 Of the total 35,555 Black Low income renter households 27,300 or 77% have housing problems
Asian Low income renter households experiencing housing problems (of total 914) 614 Of the total 914 Asian Low income renter households 614 or 67% have housing problems
Hispanic Low income renter households experiencing housing problems (of total 2,360) 1,850 Of the total 2,360 Hispanic Low income renter households 1,850 or 78% have housing problems
Other Low income renter households experiencing housing problems: includes American Indians, Pacific Islanders, & Multi-Racial Households (of total 695) 460
Of the total 9,970 Other Low income renter households 7,795 or 78% have housing problems
COST BURDEN: Moderate cost burden is "rent comprising more than 30 percent of income". Severe cost burden is "rent comprising more than 50 percent of income". HOUSING PROBLEMS: A household is said to have a housing problem if it has 1 or more of the 4 problems identified in the CHAS data: 1) housing units lacks complete kitchen facilities; 2) housing units lacks complete plumbing facilities; 3) household is overcrowded; and 4) household is cost burdened.

74
3. Contributing Factors of Disproportionate Housing Needs
Consider the listed factors and any other factors affecting the jurisdiction and region. Identify
factors that significantly create, contribute to, perpetuate, or increase the severity of
disproportionate housing needs.
The availability of affordable units in a range of sizes
The below maps taken from “Where will People Live: New Orleans Growing Housing Challenge”
provide a snapshot of the growing problem of the lack of affordable housing in New Orleans and how it
contributes to disproportionate housing needs. The maps show that residents are paying 50% or more of
median income for housing in many parts of the city.
Map – Affordable of Housing for 1 Person/1 Bedroom

75
Map – Affordable of Housing for 2 Person/1 Bedroom
Displacement of residents due to economic pressures
The map below from The Reinvestment Fund’s March 2016 report “Market Value Analysis – New
Orleans” details the percentage of owner-occupied homes that are in foreclosure in New Orleans. The
map shows a correlation between neighborhoods with high foreclosures and R/ECAP areas.
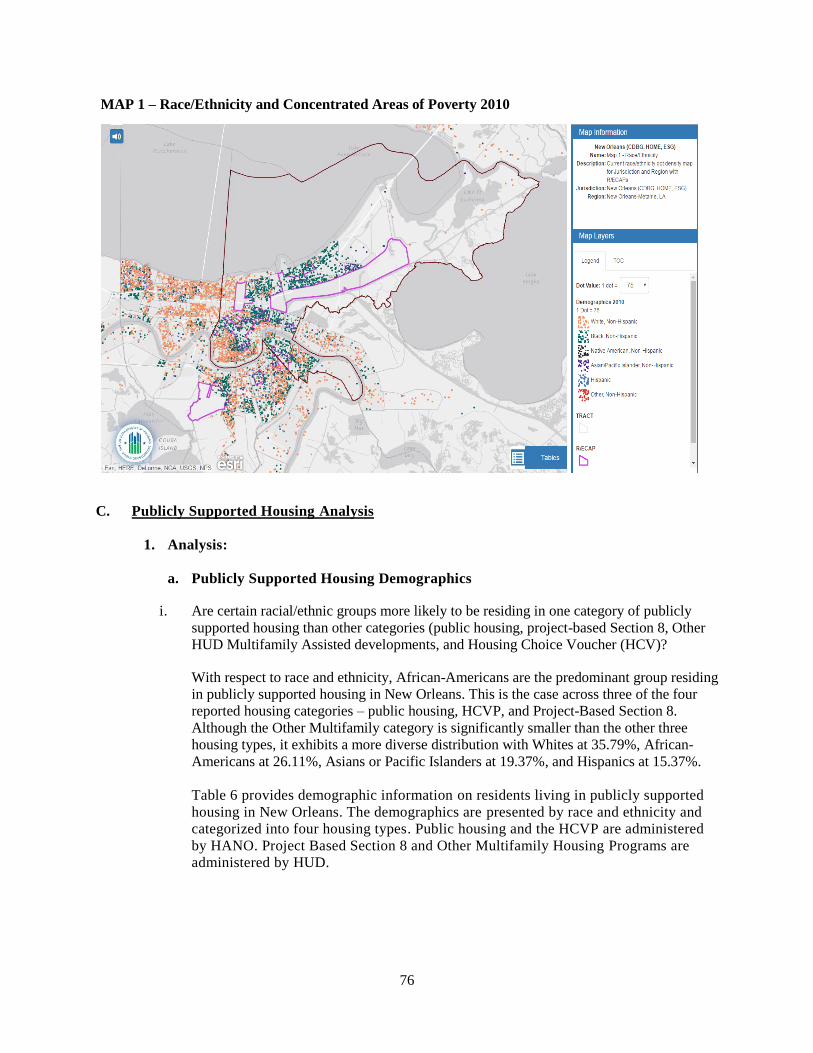
76
MAP 1 – Race/Ethnicity and Concentrated Areas of Poverty 2010
C. Publicly Supported Housing Analysis
1. Analysis:
a. Publicly Supported Housing Demographics
i. Are certain racial/ethnic groups more likely to be residing in one category of publicly
supported housing than other categories (public housing, project-based Section 8, Other
HUD Multifamily Assisted developments, and Housing Choice Voucher (HCV)?
With respect to race and ethnicity, African-Americans are the predominant group residing
in publicly supported housing in New Orleans. This is the case across three of the four
reported housing categories – public housing, HCVP, and Project-Based Section 8.
Although the Other Multifamily category is significantly smaller than the other three
housing types, it exhibits a more diverse distribution with Whites at 35.79%, African-
Americans at 26.11%, Asians or Pacific Islanders at 19.37%, and Hispanics at 15.37%.
Table 6 provides demographic information on residents living in publicly supported
housing in New Orleans. The demographics are presented by race and ethnicity and
categorized into four housing types. Public housing and the HCVP are administered
by HANO. Project Based Section 8 and Other Multifamily Housing Programs are
administered by HUD.

77
Data excerpted from Table 6 shows that 1,409 Black households (96.37%) residing in
New Orleans public housing − representing the highest racial/ethnic group. With respect
to other racial/ethnic groups, there are 35 Hispanic households (2.39%), 16 (1.09%)
White households, and only one (.07%) Asian or Pacific Islander household living in
New Orleans public housing.
Public housing demographics in New Orleans closely resemble the racial/ethnic
composition of residents assisted by HCVP. According to Table 6, there are 17,603
(95.24%) Black households participating in HCVP, which is clearly the largest
racial/ethnic group assisted under the program. Hispanics are ranked second, accounting
for 584 (3.16%) households. Whites are ranked third, accounting for 241 (1.30%)
households, and Asians or Pacific Islanders are the smallest group of only 30 (0.16%)
households. Black households are overwhelmingly the largest racial/ethnic group residing
in the New Orleans Public Housing and HCVP-supported housing at 96.37% and 95.24%
respectively.
It should be noted the HUD statistical data related to the "HCV Program" includes both
tenant-based and project-based vouchers administered by HANO, while units identified
in the "Project-Based Section 8" category are administered directly by HUD.
Additionally, many of the units captured in the "Other Multifamily" category include
developments that have received HUD loans or other subsidies, but have zero affordable
units. This is the case with a number of large luxury apartment buildings listed on the
HUD map, including the Saratoga, 903 Poydras, and the Rice Mill Lofts.
Table 6 also shows that Black households represent the majority of families living in
Project-Based Section 8 developments with 2,280 (56.17%) households reported in the
dataset. White households ranked as the second largest group with 1,160 (28.58%)
households, Hispanics ranked third with 420 households (10.35%), and Asians or Pacific
Islanders ranked last with 184 families (4.53%).
HUD’s Other Multifamily developments represent a small component of the New
Orleans publicly supported housing market. In terms of resident demographics, Table 6
shows that Whites ranked highest at 170 (35.79%) assisted households, followed by
HUD Table 6 Excerpt - Publicly Supported Housing Residents by Race/Ethnicity
Race/Ethnicity
(New Orleans, LA CDBG, HOME, ESG) Jurisdiction White Black Hispanic
Asian or Pacific Islander
Housing Type # % # % # % # %
Public Housing 16 1.09 1,409 96.37 35 2.39 1 0.07
Project-Based Section 8* 1,160 28.58 2,280 56.17 420 10.35 184 4.53
Other Multifamily 170 35.79 124 26.11 73 15.37 92 19.37
HCV Program 241 1.30 17,603 95.24 584 3.16 30 0.16 Note: Project Based Section 8 and Other Multifamily Housing administered by the U.S. Department of Housing and Urban Development (HUD).

78
Blacks at 124 (26.11%), Asians or Pacific Islanders at 92 (19.37%); and 73 (15.37%)
Hispanics living in HUD’s Other Multifamily housing developments.
ii. Compare the demographics, in terms of protected class, of residents of each category of
publicly supported housing (public housing, project-based Section 8, Other HUD
Multifamily Assisted developments, and HCV) to the population general, and persons who
meet the income eligibility requirements for the relevant category of publicly supported
housing. Include in the comparison, a description of whether there is a higher or lower
proportion of groups based on protected class.
Table 6 provides data on the number of households that meet income eligibility
requirements for publicly supported housing. The data is sorted by race and ethnicity
and categorized by Area Median Income (AMI) groupings of 0-30% AMI, 0-50%
AMI, and 0-80% AMI. As indicated earlier, the Public Housing and Housing Choice
Voucher (HCV) Programs are administered by HANO, and Project-Based Section 8
and Other Multifamily Housing are administered by HUD. Eligibility for all of these
programs is generally limited to families with household income up to 80% AMI.
Table 6 Excerpt – Publicly Supported Housing Residents by Race/Ethnicity
Race/Ethnicity
(New Orleans, LA CDBG, HOME, ESG) Jurisdiction
White Black Hispanic Asian or Pacific
Islander
# % # % # % # %
Income Eligible Households 14,335 19.83% 51,355 71.05% 3,175 4.39% 1,594 2.21% 70,459
0-80% of AMI
Housing Type / Assisted Households # % # % # % # %
Public Housing 16 0.11% 1,409 2.74% 35 1.10% 1 0.06%
Project-Based Section 8 1,160 8.09% 2,280 4.44% 420 13.23% 184 11.54%
Other Multifamily 170 1.19% 124 0.24% 73 2.30% 92 5.77%
HCV Program 241 1.68% 17,603 34.28% 584 18.39% 30 1.88%
Total Households Living in Publicly Supported Housing by Racial/Ethnic Protected Class Category
1,587 11.07% 21,416 41.70% 1,112 35.02% 307 19.26% 24,423
Data in the above chart highlights the fact that 70,459 New Orleans households are
income-eligible for publicly supported housing. The chart also illustrates that 24,423
(34%) of New Orleans income eligible-households reside in publicly supported housing −
with 2.07% residing in Public Housing; 5.74% residing in Project-Based Section 8
developments; .65% living in Other Multifamily Housing; and 26.20% using vouchers.
With regard to race and ethnicity, of the 70,459 total households that meet income-
eligibility for publicly supported housing, 51,355 (71.05%) are Black 14,335 (19.83%)
are White, 3,175 (4.39%) are Hispanic, and 1,594 (2.21%) are Asian or Pacific Islander.
21,416 (41.7%) of the 51,355 income-eligible Black households live in publicly
supported housing as compared to 1,587 (11.07%) of the 14,335 income-eligible Whites,
1,112 (35.02%) of income-eligible Hispanics, and 307 (19.26%) of income-eligible Asian
or Pacific Islanders. Thus, income-eligible Blacks have the highest degree of residency in

79
publicly supported housing, followed by income-eligible Hispanics, Asians or Pacific
Islanders, and Whites.
b. Publicly Supported Housing Location and Occupancy
i. Describe patterns in the geographic location of publicly supported housing by
program category (public housing, project-based Section 8, Other HUD Multifamily
Assisted developments, HCV, and LIHTC) in relation to previously discussed
segregated areas and R/ECAPs.
Map 5 depicts the location of publicly supported housing in New Orleans. The overlay
in Map 5 shows that publicly supported housing types are largely located in
segregated, predominantly African-American neighborhoods. The data also shows
that these publicly supported housing types are frequently located either within or in
close proximity to R/ECAPs. At the same time, Map 5 shows minimal overlay of
publicly supported housing in predominantly White segregated communities.
HUD Map 5 – Public Supported Housing with Race/Ethnic Legend
Map 6 depicts Housing Choice Vouchers with race and ethnicity dot density and
R/ECAP overlays. Consistent with Map 5, the overlay shows that areas with higher
percentages of HCVP-assisted housing are segregated African-American portions of
the city. Map 6 also shows that areas with lower percentages of voucher units are
generally occupied by higher concentrations of White households.

80
HUD Map 6 – HCV Housing with Race/Ethnic Legend
Table 7 allows for a comparison between R/ECAP and Non-R/ECAP units within four
publicly supported housing categories. The findings of this analysis are provided in
the table below for each of the four housing categories.
Table 7 Excerpt - R/ECAP and Non-R/ECAP Demographics by Publicly Supported Housing Program Category
(New Orleans, LA CDBG, HOME, ESG) Jurisdiction Total # units (occupied) % R/ECAP & NON-RECAP
Public Housing R/ECAP tracts 1,427 84.74% Non R/ECAP tracts 257 15.26% 1,684
Project-based Section 8 R/ECAP tracts 1,816 43.90% Non R/ECAP tracts 2,321 56.10% 4,137
Other HUD Multifamily R/ECAP tracts 181 36.49% Non R/ECAP tracts 315 63.51% 496
HCV Program R/ECAP tracts 6,192 33.31% Non R/ECAP tracts 12,399 66.69%
18,591
Although Maps 5 and 6 show that publicly supported housing is located throughout
the City’s R/ECAPs, Table 7 provides additional information about the extent to
which the various types of publicly supported housing are found in Non- R/ECAP
areas. Public housing comprises the greatest percentage of units located in R/ECAPs
(84.74%) while the HCVP has the lowest percentage of assisted units in R/ECAPs

81
(33.31%). Less than 50% of the Project-Based Section 8 and Other HUD Multifamily
units are located in R/ECAPs.
ii. Describe patterns in the geographic location for publicly supported housing that
primarily serves families with children, elderly persons, or persons with disabilities in
relation to previously discussed segregated areas or R/ECAPs?
Table 7 shows that 10,704 families with children reside in publicly supported housing and
these families are primarily assisted under the HCV Program (9,612 households) and the
Public Housing Program (701 households). There are 6,203 elderly households residing
in New Orleans publicly supported housing with the majority of these elderly households
living in Project-Based Section 8 (2,870) and in HCVP-assisted housing (2,336). With
respect to disability, Table 7 reflects 5,491 households where at least one member has a
disability, and the vast majority of those households (3,898) reside in HCVP-assisted
housing.
Table 7 Excerpt – Demographics on Elderly, Disabled, and Families with Children by Publicly Supported Housing Program Category
(New Orleans, LA CDBG, HOME, ESG) Jurisdiction
Total # units (occupied) % Elderly # Elderly
% with a disability*
# with a disability*
% Families
with children
# Families with
children
Public Housing 1,684 31.83% 536 36.69% 618 41.64% 701
Project-based Section 8* 4,137 69.38% 2,870 22.03% 911 9.46% 391
Other HUD Multifamily 496 92.91% 461 12.75% 63 0.00% 0
HCV Program 18,591 12.56% 2,336 20.97% 3,898 51.70% 9,612
Total Households Living in Publicly Supported Housing by Protected Class Category
24,908
24.90%
6,203
22.04%
5,491
42.98%
10,704
Note 1: Disability information is often reported for heads of household or spouse/co-head only. Here, the data reflect information on all members of the household. Note 2: Data Sources: APSH Note 3: Refer to the Data Documentation for details (www.hudexchange.info). Note 4: Project Based Section 8 and Other Multifamily Housing administered by the U.S. Department of Housing and Urban Development (HUD).
iii. How does the demographic composition of occupants of publicly supported housing in
R/ECAPS compare to the demographic composition of occupants of publicly supported
housing outside of R/ECAPs?
The demographic composition of occupants of publicly supported housing living in
R/ECAPs compared to the demographic composition of occupants of publicly
supported housing living outside of R/ECAPs is as follows:

82
In public housing, 97.01% of households in R/ECAPs are Black as opposed to 93.39%
of public housing households outside of R/ECAPs. 36.45% of public housing heads of
household in R/ECAPs are elderly as opposed to 6.18% outside of R/ECAPs. 40.87%
of households in R/ECAPs include a person with a disability as opposed to 13.51%
outside of R/ECAPs. Approximately 1.33% of households in R/ECAPs are White
households compared to 0% outside of R/ECAPs. Also, according to Table 7, 1.49% of
households in R/ECAPs are Hispanic compared to 6.61% outside of R/ECAPs. 0.08%
of households in R/ECAPs are Asian or Pacific Islander while no public housing
households outside of R/ECAPs are Asian or Pacific Islander.
In Project-Based Section 8, 75.48% of households in R/ECAPs are elderly as opposed
to 64.61% outside of R/ECAPs. 28.07% of households in R/ECAPs include a person
with a disability compared to 17.30% outside of R/ECAPs. Blacks are almost evenly
split, comprising 57.72% of Project-Based Section 8 households in R/ECAPS and
54.92% of such households outside of R/ECAPs. 30.75% of households in R/ECAPs
are White, which is similar to the 26.81% of households outside of R/ECAPs that are
White. 4.17% of households in R/ECAPs are Hispanic as compared to 15.37% of
households outside of R/ECAPs.
According to Table 7, there are minimal differences in the occupancy of Other HUD
Multi-Family Units within and outside of R/ECAPs. 92.22% of households in
R/ECAPs are elderly as opposed to 93.31% outside of R/ECAPs. 12.22% of
households in R/ECAPs include a person with a disability as opposed to 13.06%
outside of R/ECAPs. 20.59% of households in R/ECAPs are White as opposed to
44.26% of households outside of R/ECAPs, which is the largest disparity of any group.
22.94% of households in R/ECAPs are Black as opposed to 27.87% of households
outside of R/ECAPs. R/ECAP occupancy for Hispanics and Asian or Pacific Islanders
residing in Other Multi-Family is unreported; however, 9.84% of households outside
of R/ECAPs are Hispanic, and 12.29% of such households are Asian or Pacific
Islander.
According to Table 7, there were small disparities between occupancy within and
outside of R/ECAPs in the HCVP for all demographic groups.
Data used in this analysis is presented in two charts. Part A, which is derived from
Table 7, reflects the percentage of households in each category of publicly supported
housing within and outside of R/ECAPs. The data in Part A was recalculated to reflect
the actual number of households in each of the respective categories. That data,
presented in Part B, further quantifies and helps to illuminate several key comparisons
of households occupying publicly supported housing in New Orleans. For example:
The greatest number of White households live in Project-Based Section 8
housing, with 558 residing in R/ECAPs and 622 residing outside of R/ECAPs.
Project-Based Section 8 is also largely occupied by elderly households with
1,371 households living in R/ECAPs and 1,500 households living outside of
R/ECAPs.
The number of all HCV households living in R/ECAPs is 5,926 as compared to
11,778 HCV households outside of R/ECAPs.
Families with children with vouchers comprise 2,961 households in R/ECAPs
and 6,651 households outside of R/ECAPs.

83
Table 7 Excerpt: PART A - R/ECAP and Non-R/ECAP Demographics by Publicly Supported Housing Program Category (Reflects “Percentage” of Households)
(New Orleans, LA CDBG, HOME, ESG) Jurisdiction
Total # units
(occupied) %
Elderly % with a
disability* %
White %
Black %
Hispanic
% Asian or
Pacific Islander
% Families with children
Public Housing
R/ECAP tracts 1,427 36.45 40.87 1.33 97.01 1.49 0.08 36.69
Non R/ECAP tracts 257 6.18 13.51 0.00 93.39 6.61 0.00 69.11
Project-based Section 8
R/ECAP tracts 1,816 75.48 28.07 30.75 57.72 4.17 0.00
Non R/ECAP tracts 2,321 64.61 17.30 26.81 54.92 15.37 2.82 16.86
Other HUD Multifamily
R/ECAP tracts 181 92.22 12.22 20.59 22.94 0.00
Non R/ECAP tracts 315 93.31 13.06 44.26 27.87 9.84 12.79 0.00
HCV Program
R/ECAP tracts 6,192 14.53 23.01 1.25 95.70 2.87 0.05 47.82
Non R/ECAP tracts 12,399 11.58 19.95 1.37 94.99 3.28 0.22 53.64
(New Orleans, LA CDBG, HOME, ESG) Jurisdiction
Total # units
(occupied) #
Elderly # with a
disability* #
White #
Black #
Hispanic
# Asian or
Pacific Islander
# Families
with children
Public Housing
R/ECAP tracts 1,427 520 583 19 1384 21 1 524
Non R/ECAP tracts 257 16 35 0 240 17 0 178
Project-based Section 8
R/ECAP tracts 1,816 1371 510 558 1048 76 0 0
Non R/ECAP tracts 2,321 1500 402 622 1275 357 65 391
Other HUD Multifamily
R/ECAP tracts 181 167 22 37 42 0 0 0
Non R/ECAP tracts 315 294 41 139 88 31 40 0
HCV Program
R/ECAP tracts 6,192 900 1425 77 5926 178 3 2961
Non R/ECAP tracts 12,399 1436 2474 170 11778 407 27 6651
iv. (A) Do any developments of public housing, properties converted under the RAD, and
LIHTC developments have a significantly different demographic composition, in terms
of protected class, than other developments of the same category? Describe how these
developments differ.
Table 8 provides demographics of Publicly Supported Housing Developments by
program category. Data on public housing developments consistently reports that
Black households comprise between 94%-100% of all households with all other
racial/ethnic household occupancy rates ranging between 0% and 6%. One exception is
the River Garden Phase II Public Housing Development which is 86% Black and 14%
Hispanic. With the exception of HANO’s elderly designated developments, the
percentage of households with children in public housing developments generally
ranges between 45% and 80%. At 87%, the Westbank Scattered Sites have the greatest
percentage of families with children.

84
Project-based Section 8 developments are primarily resided in by African-American
households with occupancy percentages ranging from 77% to 96%, followed by White
households ranging from 2% to 21% of occupants. Exceptions include the Mater
Dolorosa development whose households are 43% Black, 49% White, and 8%
Hispanic and Christopher Inn, which is 47% Black, 50% White, 3% Hispanic, and 1%
Asian. In most Project-Based Section 8 developments in New Orleans, over 92% of
households are elderly; however, families with children reside in the Tivoli Place
Apartments (3%) and in Satchmo Plaza (4%).
HUD-provided demographic data is unavailable for Low Income Housing Tax Credit
(LIHTC) developments. However, due to the mixed-finance model used in
redeveloping the majority of New Orleans’ public housing developments, there are
significant numbers of LIHTC units embedded within the HANO public housing
portfolio. The table below provides details on the number of LIHTC units embedded
within the HANO public housing portfolio.
HANO COMMUNITIES
PUBLIC HOUSING UNITS (51%)
OTHER AFFORDABLE UNITS (25%)
MARKET RATE UNITS (24%)
ALL UNITS (100%)
ACC ACC/LIHTC LIHTC PBV/LIHTC PBV MKT TOTAL
UNIT COUNTS
671 1335 729 209 83 954 3981
PERCENT OF TOTAL
17% 34% 18% 5% 2% 24% 100%
Unit Type Legend:
ACC = Annual Contributions Contract ("Public Housing") MKT = Market Rate
LIHTC = Low Income Housing Tax Credit PBV = Project Based Voucher
Table 5 provides a “point-in-time” count of 1,684 public housing units and that “point-
in-time” snapshot has been used in this AFH Plan in order to maintain a consistent
“apples to apples” methodology in evaluating issues relating to the various categories
of publicly supported housing. HANO’s current public housing inventory is comprised
of 2,006 units. 1,333 (66%) of those units are LIHTC-assisted. Thus, to that extent, the
demographics of LIHTC households living in HANO’s public housing communities
are reflected in this demographic analysis.
(B) Provide additional relevant information, if any, about occupancy, by protected
class, in other types of publicly supported housing.
Affordable housing is subsidized by providing various forms of financial assistance to make
rent payments affordable for low-income families. The table below captures several other
categories of publicly-assisted units in the New Orleans area.

85
Other Publicly Supported Housing New Orleans Jurisdiction
HANO Single Room Occupancy 154
LHC Shelter Plus Care 995
LHC Permanent Supportive Housing 689
HUD Veterans Affairs Supportive Housing 265
City of N.O. Shelter Plus Care 49
HOPWA/HOME Tenant Based Rental Assistance 317
v. Compare the demographics of occupants of developments, for each category of
publicly supported housing (public housing, project-based Section 8, Other HUD
Multifamily Assisted developments, properties converted under RAD, and LIHTC) to
the demographic composition of the areas in which they are located. Describe whether
developments that are primarily occupied by one race/ethnicity are located in areas
occupied largely by the same race/ethnicity. Describe any differences for housing that
primarily serves families with children, elderly persons, or persons with disabilities.
HUD-provided data is insufficient to allow a full comparison between the
demographics within all categories of the city’s publicly supported housing and the
demographic composition of the census tracts in which developments are located.
Working with available data, this AFH includes a limited analysis of the public
housing and Project-based Section 8 housing categories.
Public Housing:
HANO’s public housing properties are comprised of one or more Asset Management
Projects (AMPs), and the AMPs are generally associated with each property’s
“redevelopment phases.” For example, the Faubourg Lafitte property is comprised of
two AMPs – Lafitte I and Lafitte II.
To address this AFH component, Public Housing AMPs were grouped by development
and evaluated in the context of each development’s corresponding census tract
locations. Findings are summarized as follows:
The racial and ethnic demographics of Columbia Parc, Fischer, Guste, The Estates
(formerly Desire), Marrero Commons, and Westbank Scattered Sites were closely
aligned with the demographic compositions of the census tracts in which they are
located − with Black households comprising greater than 90% of households and
households in other racial/ethnic categories aggregated at less than 10%. The River
Garden development, which has no White households, is located in a more racially and
ethnically diverse census tract which is 16% White. Finally, as highlighted below, the
Downtown and Uptown Scattered Sites properties demonstrate significantly different
demographics from their respective census tracts which are also characterized by
poverty rates of less than 20%.

86
% White % Black % Hispanic % Asian
Downtown Scattered Sites 0 100 0 0
Census Tract 22071000602 41 50 6 1
Uptown Scattered Sites 0 100 0 0
Census Tract 22071010600 60 33 4 1
Project-based Section 8 Housing:
Developments in the Project-based Section 8 category were also reviewed within the
context of their respective census tract locations. Specifically, there were 17 such
properties analyzed, the vast majority of which are elderly housing complexes. 11 of the
17 Project-based Section 8 developments have racial/ethnic characteristics similar to the
census tracts in which they are located. These include: St. John Berchman's Manor, St.
Martin House, Peace Lake Towers, Satchmo Plaza, The Terraces on Tulane, Mater
Dolorosa, Nazareth Inn, St. Michael Senior Housing, Annunciation Inn, Garden Oaks
Towers, and Renaissance Place. The six remaining properties in the Project-based
Section 8 category show greater differences between their racial and ethnic composition
and that of their respective census tracts.
Table of Project Based Section 8 Comparison to Census Tract
% White % Black % Hispanic % Asian
Tivoli Place Apartments 21 78 1 0
Census Tract 22071013400 62 23 6 7
Pine Street Apartments 13 87 0 0
Census Tract 22071012800 66 19 8 4
Delille Inn 2 96 2 0
Census Tract 22071001751 11 61 22 4
Christopher Inn 50 47 3 1
Census Tract 22071002600 73 16 6 2
Chateau D'orleans 0 100 0 0
Census Tract 22071001750 1 33 10 54
Nazareth II 9 89 2 0
Census Tract 22071012800 66 19 8 4
c. Disparities in Access to Opportunity
i. Describe any disparities in access to opportunity for residents of publicly supported
housing, including within different program categories (public housing, project-
based Section 8, Other HUD Multifamily Assisted Developments, HCV, and
LIHTC) and between types (housing primarily serving families with children,
elderly persons, and persons with disabilities) of publicly supported housing.

87
Maps 5 and 6 show that all categories of publicly supported housing are
predominantly located either within or in close proximity to R/ECAPs where Black
households comprise 84.08% of the population and families with children comprise
46.72% of the population. Additionally, Table 6 shows that 71.05% of Black
households are classified as low-income (0-80% AMI) under HUD’s criteria.
According to a 2014 Orleans Parish Place Matters report, persistent poverty can
have multiple negative effects on the growth and development of youth, creating
disparities in economic opportunity. These disparities in economic opportunity
(primarily in the R/ECAP areas) result in high unemployment, often leading to
crime and violence (www.PlaceMattersforEducationinOrleansParish.org, 2014). In
addition, according to HousingNOLA, a majority of jobs in New Orleans’ key
economic sectors pay below the City of New Orleans’ median income of $26,500.
Disparities in access to opportunity for residents of publicly supported housing can
be attributed to limited public transportation, limited public services, and limited
economic investment in some of the R/ECAP areas defined by HUD as having a
majority Non-White population greater than 50%, with more than 40% living at or
below poverty (www.HousingNOLA.org, 2015). Education, environment, health,
social, as well as political indicators were measured in a study released in January
2015 by the Greater New Orleans Foundation entitled “The Geography of
Opportunity,” which examined and analyzed access to opportunity across the New
Orleans region (www.HousingNOLA.org, 2015). The study highlights that where a
person lives geographically can have long-range effects on a person’s life,
physically, emotionally, as well as economically.
Disparities in access to opportunity are particularly sharp in the HCVP. A
GNOFHAC analysis of the HCV Program found that the 13 neighborhoods with
zero shootings per year are home to less than 2% of all children in the voucher
program. Conversely, the 12 neighborhoods with 10 or more shootings per year are
home to 55% of all children in the voucher program (Picture of Subsidized
Households, Resident Characteristics Report, and The Advocate's “New Orleans
Neighborhood Gun Violence Index"). The percentage of low birth weight babies is
another indicator of health outcomes that disproportionately affects neighborhoods
where voucher holders are concentrated. When neighborhoods are ranked by their
percentage of low birth weight babies, neighborhoods in the top third (rates of 14%
or higher) are home to more than half of all children in the voucher program.
Neighborhoods in the bottom third (rates of 9% or below) are home to only 5% of
children in the voucher program (Picture of Subsidized Households, Resident
Characteristics Report, and Child and Family Health in New Orleans (2013) New
Orleans Health Department). HousingNOLA also highlighted the lack of transit
access for HCVP households. Only 8% of voucher holders live within a quarter-
mile of a transit stop with 15 minute headways or less.

88
As reflected in Table 12, when comparing indices for disparities in access to
opportunity for persons both above and below the poverty line, African-Americans
have the least access to opportunity in all categories.
2. Additional Information
a. Beyond the HUD-provided data, provide additional relevant information, if any, about
publicly supported housing in the jurisdiction and region, particularly information about
groups with other protected characteristics and about housing not captured in the HUD-
provided data.
VASH (Veterans Affairs Supportive Housing)
In April of 2015, HANO received 56 vouchers under the Veterans Affairs Supportive
Housing (VASH) program, and, in April 2016, HUD invited HANO to apply for 22
additional VASH vouchers to be administered in partnership with the Department of Veterans
Affairs (VA) facility and Southeast Louisiana Health Care System/New Orleans VA Medical
Center. In response, the Agency has recently applied to HUD for an additional 22 VASH
vouchers in the 2016 funding cycle.
b. The program participant may also describe other information relevant to its assessment
of publicly supported housing. Information may include relevant programs, actions, or
activities, such as tenant self-sufficiency, place-based investments, or mobility
programs.

89
HANO’s Homeownership Department was created to assist public housing and HCVP
residents with becoming first time homebuyers. HANO screens and refers clients to HUD
approved homebuyer and financial fitness programs for the training and preparation required
to meet first time homebuyer eligibility. HANO recruits and trains lenders and real estate
agents in the HCVP program. HANO staff also works closely with providers of soft second
mortgages and other assistance programs and assists families with accessing such funding. In
addition, the Homeownership Department participates in the planning and monitoring of
homeownership programs that are a component of HANO’s development projects.
The homebuyer pays 30% of their adjusted monthly income toward the mortgage payment of
principal, interest, taxes and insurance payments. However, households can pay up to 40% if
their mortgage payment exceeds the voucher payment standard. The Section 8 HAP
contribution can be utilized to pay the difference between the actual mortgage and the portion
that can be paid by the homebuyer.
HANO may refer Section 8 homebuyers to community organizations for additional subsidies
to reduce the principal cost of their homes or to apply toward a second mortgage. In addition,
the City of New Orleans’ Soft Second Mortgage Pool provides Section 8 homebuyers with a
subsidy that is funded under the HOME Investment Partnership Program. Subsidies may be
provided to families earning 80% or less of the AMI. This second mortgage is forgiven if the
homebuyer maintains the property for a given period of affordability and if the buyer does not
default on the first or second mortgage.
Section 8 families are encouraged to participate in HANO’s Family Self-Sufficiency Program
in order to gain an additional subsidy for the purchase of a home. The program encourages
self-sufficiency by contributing to an escrow account for the family upon satisfactory
completion of self-sufficiency goals. Participants may apply the escrow funds toward
educational, employment and, homeownership expenses.
The major obstacle to affordable homeownership opportunities for HANO’s Section 8
participants is the cost of housing in New Orleans. The median home sales price in Orleans
Parish is over $180,000. However, since the start of the program in 2001, HANO has assisted
284 public housing and voucher participants in becoming homeowners. It provides direct
technical assistance and referrals to families through the entire home buying process, from
the completion of an application to loan closing.
According to HUD data, as of July 31, 2016, the demographics of 195 active homeownership
households are as follows:

90
Demographic Snapshot of HANO’s HCV Homeownership Program Participants
Report on 195 Households
As of July 31, 2016
Households with Children 112 (57%)
Female Headed Households with Children 109 (55%)
Households Including Persons with
Disabilities
50 (26%)
Elderly Households 23 (12%)
Race 99% Black / 1% White
Ethnicity 6% Hispanic / 94% Non-Hispanic
Average Annual Income $22,126
3. Contributing Factors of Publicly Supported Housing Location and Occupancy
Consider the listed factors and any other factors affecting the jurisdiction and region.
Identify factors that significantly create, contribute to, perpetuate, or increase the severity of
fair housing issues related to publicly supported housing, including Segregation, RECAPs,
Disparities in Access to Opportunity, and Disproportionate Housing Needs. For each
contributing factor that is significant, note which fair housing issue(s) the selected
contributing factor relates to.
Admissions and occupancy policies and procedures, including preferences in publicly
supported housing:
At the first Public Hearing, a resident said they could not get public housing and that the only option
left for people was Habitat for Humanity. In addition, some residents expressed real concern over
HANO’s termination of housing assistance for some residents. Included in this criticism of the
termination process at HANO were concerns over how minor infractions over little incidents could
result in residents being evicted.
Most housing admissions are at the discretion of private landlords and some of the comments
received indicated that costs as well as discrimination are factors in housing admission decisions.
HANO maintains a waiting list for available units that greatly exceeds available units. According to
the public comments, the income limits for public housing are an obstacle for some people. They feel
that “HCV is for very, very low income people.”
Land use and zoning laws:
At the first Public Hearing some residents expressed concerns that current City Planning
Commission policies and practices are pricing them out of their neighborhoods.

91
Community opposition: Community opposition can lead to developers withdrawing projects for affordable housing leaving a
number of low and very low income households disproportionately affected, as the overwhelming
need for affordable housing in New Orleans has not been met. Housing NOLA estimates that 33,000
affordable units are needed in New Orleans in the next 10 years.
Impediments to mobility:
A number of landlords are unaware of how to become a landlord with the HCV program
as indicated by public hearing comments. Using a metro-wide Fair Market Rent as a
base for HCVP payment standards does not allow HCV tenants the ability to reach
higher rent high opportunity neighborhoods.
HCVP households do not have access to a robust mobility counseling program that
includes pre-move counseling, housing search assistance—including tours of different
neighborhoods—an orientation to the new neighborhood, and post-move support.
Lack of private investment in specific neighborhoods:
Many neighborhoods have undergone rebuilding and restoration since Hurricane Katrina, but some
continue to lack private amenities. Often times, private investment decisions are based upon the
opportunity to gain profit for the organization making the investment. A business will look at four
elements in an opportunity: a need, means to fulfill the need, method to apply the means to fulfill the
need, and a method to benefit. https://en.wikipedia.org/wiki/Business_opportunity.org
As such, the private entities will make the decisions from existing information about an area, typically
from the U.S. Census to determine if they have an opportunity to provide goods or services and make
a profit doing so. With profit being the driving factor, businesses will locate where they can meet their
profit expectations. In low opportunity areas, while need may be present, often times the “method to
benefit” may be lacking.
Lack of public investment in specific neighborhoods, including services and amenities:
Public investments in neighborhoods have recently been on the increase in the City. For the past ten
years, the City has repaired or renovated community centers, healthcare facilities, and rebuilt
playgrounds. The City’s Department of Public Works maintains a list of repair and improvement
projects throughout the entire City which details the specific locations of that work.
http://www.nola.gov/dpw/projects/all/.org
In some cases, catalytic public investments in well-located, low-income, historically Black
neighborhoods have contributed to their transformation into higher-priced areas. One consequence
is that HCVP households who may have previously been able to rent in these neighborhoods on
higher ground and with better access to jobs and amenities can no longer afford to do so.
Lack of regional cooperation:
This topic drew comments due to the lack of regional transportation. Participants cited the difficulty
in traveling across the region on public transit and therefore, to where jobs are: “Jobs that are close
to home don’t pay that much,” was a comment made at the public hearing held on July 19, 2016,
as part of the AFH process.
Source of income discrimination:
Some residents have expressed that the housing needs of residents that do not participate in
subsidized housing programs are not met as some landlords with affordable housing have a
preference to lease to Section 8 voucher holders instead of renters who lack any subsidy. Others

92
have expressed that landlords discriminate against leasing to HCV voucher holders based on the
stigma associated with having a voucher.
D. Disability and Access Analysis
1. Population Profile
a. How are persons with disabilities geographically dispersed or concentrated in the
jurisdiction and region, including R/ECAPs and other segregated areas identified in
previous sections?
Maps 16a and 16b below depict the number of persons with disabilities living in various parts of the
City and the region, including those who live in R/ECAPs and segregated areas. The data leads to
several conclusions:
Persons with disabilities are fairly evenly dispersed throughout the city. Areas where
fewer persons with disabilities reside include the English Turn, New Orleans East, and
Metairie Cemetery/County Club, which are areas that have had a 60 to 100% decrease
in public transportation service into the Central Business District. (P. 14,
http://rideneworleans.org/wp-content/uploads/2015/08/sots2015new.pdf)
In the region, the areas that show smaller populations of persons with disabilities
appear to be the St. Bernard Parish area, Avondale/Bridge City, and Elmwood area.
However, this observation could simply reflect lower population densities in these
areas.

93
HUD MAP 16a – Hearing, Vision, Cognitive Disability
HUD Map 16b – Ambulatory, Self-Care, and Independent Living Disability

94
b. Describe whether these geographic patterns vary for persons with each type of
disability or for persons with disabilities in different age ranges.
Map 17a below shows that persons with disabilities in different age ranges and persons with
different types of disabilities all have similar residential patterns. In other words, they are also
evenly dispersed through the city and the region except for the English Turn, New Orleans
East, and Lakeview. The same holds true for the region except for the St. Bernard Parish area,
Avondale/Bridge City, and Elmwood. This map also shows that majority of persons with
disabilities in the city are non-elderly adults.
HUD Map 17a – Ambulatory, Self-Care, and Independent Living Disability
2. Housing Accessibility
a. Describe whether the jurisdiction and region have sufficient affordable,
accessible housing in a range of unit sizes.
The data in the tables below shows that neither the City of New Orleans nor the
metropolitan region has a sufficient supply of affordable, accessible housing.
The number of persons with disabilities in New Orleans is approximately 49,600. When
comparing the approximate number of individuals in New Orleans with disabilities to
the number of households in publicly supported housing that include persons with
disabilities (6,934), it appears that the City needs far more affordable, accessible units to
provide opportunities for community integration for this protected class.
If one only reviews one type of disability, such as ambulatory disabilities, it remains
clear that there is not enough accessible, affordable housing to support the 26,013
individuals with ambulatory disabilities. Although not all of those 26,013 individuals are
income-eligible for affordable housing and some reside in households including multiple
persons with ambulatory disabilities, there is a significant correlation between disability
status and household income.
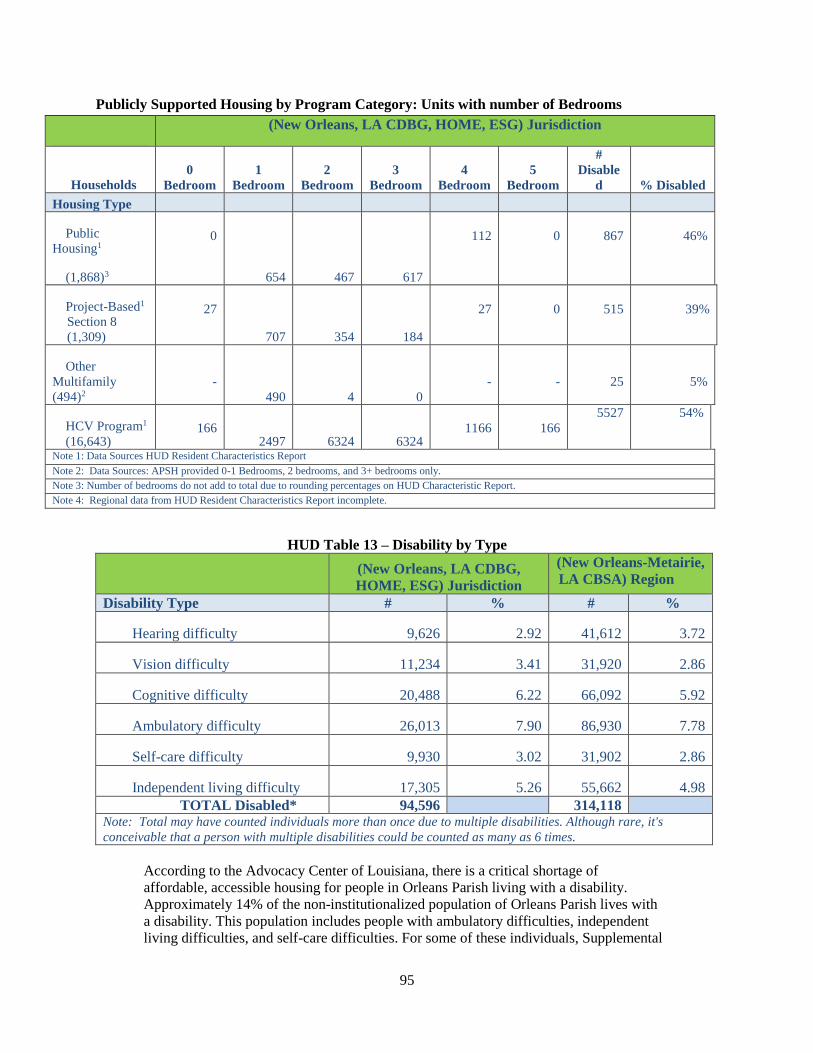
95
Publicly Supported Housing by Program Category: Units with number of Bedrooms
HUD Table 13 – Disability by Type
(New Orleans, LA CDBG,
HOME, ESG) Jurisdiction
(New Orleans-Metairie,
LA CBSA) Region
Disability Type # % # %
Hearing difficulty 9,626 2.92 41,612 3.72
Vision difficulty 11,234 3.41 31,920 2.86
Cognitive difficulty 20,488 6.22 66,092 5.92
Ambulatory difficulty 26,013 7.90 86,930 7.78
Self-care difficulty 9,930 3.02 31,902 2.86
Independent living difficulty 17,305 5.26 55,662 4.98
TOTAL Disabled* 94,596 314,118 Note: Total may have counted individuals more than once due to multiple disabilities. Although rare, it's
conceivable that a person with multiple disabilities could be counted as many as 6 times.
According to the Advocacy Center of Louisiana, there is a critical shortage of
affordable, accessible housing for people in Orleans Parish living with a disability.
Approximately 14% of the non-institutionalized population of Orleans Parish lives with
a disability. This population includes people with ambulatory difficulties, independent
living difficulties, and self-care difficulties. For some of these individuals, Supplemental
(New Orleans, LA CDBG, HOME, ESG) Jurisdiction
Households
0
Bedroom
1
Bedroom
2
Bedroom
3
Bedroom
4
Bedroom
5
Bedroom
#
Disable
d % Disabled
Housing Type
Public
Housing1
(1,868)3
0
654 467 617
112 0 867 46%
Project-Based1
Section 8
(1,309)
27
707 354 184
27 0 515 39%
Other
Multifamily
(494)2
-
490 4 0
-
-
25
5%
HCV Program1
(16,643)
166 2497 6324 6324
1166
166
5527 54%
Note 1: Data Sources HUD Resident Characteristics Report
Note 2: Data Sources: APSH provided 0-1 Bedrooms, 2 bedrooms, and 3+ bedrooms only.
Note 3: Number of bedrooms do not add to total due to rounding percentages on HUD Characteristic Report.
Note 4: Regional data from HUD Resident Characteristics Report incomplete.
96
Security Income (SSI) is their only source of income. Fair Market Rents have so far
outpaced SSI payments for persons with disabilities that a small one-bedroom unit
would cost a renter 116% of their monthly payment. http://www.nola.gov/community-
development/documents/general-reports/2012-2016-consolidated-plan-city-of-new-
orleans-w/)
The City of New Orleans 2012-2016 Consolidated Plan provides information from
survey respondents indicating whether they had a disability. It is estimated that 55% of
the local homeless population has a disability, a much higher percentage than the
national rate of 40%. There are currently 2,382 homeless persons experiencing at least
one disability on any given night in New Orleans. The prevalence of disabilities is most
severe highest among homeless individuals living on the street and in abandoned
building.
http://www.nola.gov/community-development/documents/general-reports/2012-
2016-consolidated-plan-city-of-new-orleans-w/)
b. Describe the areas where affordable accessible housing units are located. Do
they align with R/ECAPs or other areas that are segregated?
Table 7 below reflects the percentages of persons with disabilities living in publicly
supported housing within and outside of R/ECAPs. The table shows that 1,427 occupied
public housing units are located in R/ECAPs, and persons with disabilities reside in
40.87% of those units. Although the percentages of persons with disabilities in R/ECAPs
who live in Project-Based Section 8 units or who have vouchers 8 are lower than the
percentage in public housing, the percentage is still substantial with persons with
disabilities residing in 28.07% of the occupied units for Project-Based Section 8 and
23.01% of the occupied HCV units. Only Other Multifamily sites show a slightly greater
percentage of persons with disabilities living outside of rather than within R/ECAPs. See
table below.

97
Table 7 - R/ECAP and Non-R/ECAP Publicly Supported Housing Program Category
(New Orleans, LA CDBG, HOME, ESG)
Jurisdiction
Total # units
(occupied)
% with a
disability
Public Housing
R/ECAP tracts 1,427 40.87
Non R/ECAP tracts 257 13.51
Project-based Section 8
R/ECAP tracts 1,816 28.07
Non R/ECAP tracts 2,321 17.30
Other HUD Multifamily
R/ECAP tracts 181 12.22
Non R/ECAP tracts 315 13.06
HCV Program
R/ECAP tracts 6,192 23.01
Non R/ECAP tracts 12,399 19.95
c. To what extent are persons with different disabilities able to access and live in
the different categories of publicly supported housing?
The table below depicts the percentage of people with disabilities living in publicly
supported housing in the city and the region. The number of people living in publicly
supported housing is only a small fraction of the population of persons with disabilities.

98
(New Orleans, LA CDBG, HOME, ESG)
Jurisdiction People with a Disability*
# %
Public Housing 534 36.08
Project-Based Section 8 907 22.12
Other Multifamily 63 12.75
HCV Program 3,893 20.84
(New Orleans-Metairie, LA CBSA) Region
Public Housing 735 27.46
Project-Based Section 8 1,030 16.21
Other Multifamily 100 11.48
HCV Program 5,424 20.88
3. Integration of Persons with Disabilities Living in Institutions and Other Segregated
Settings
a. To what extent do persons with disabilities in or from the jurisdiction or
region reside in segregated or integrated settings?
In 1999, the U.S. Supreme Court issued its landmark Olmstead v. L.C. ruling that Title II of
the American with Disabilities Act requires states to serve individuals in the most integrated
setting appropriate to their needs and consistent with their informed choice. The decision
sparked lawsuits to secure community-based services for institutionalized persons as well as
other individuals who are at risk of institutionalization, absent community-based services. http://www.ndrn.org/images/Documents/Issues/Community_integration/Resources/NDRN_Litigation_Status_1227
04.pdf
Year 2000 Case
In April 2000, five individuals (two with developmental disabilities and three with physical
disabilities) along with Resources for Independent Living filed a complaint in the U.S. District
Court for Eastern Louisiana against the Louisiana Department of Health and Hospitals (DHH)
alleging that the state was violating the ADA and §504 of the Rehabilitation Act by restricting
the availability of services to “unnecessarily segregated settings” such as nursing homes. The
plaintiffs with non-developmental disabilities sued for access to the state’s elderly and
disabled and/or personal care attendant Medicaid waiver programs. The plaintiffs with
cognitive disabilities wanted access to Louisiana’s developmental disabilities and personal
care attendant Medicaid waiver programs. The plaintiffs charged that Louisiana spent “90% of
its Medicaid funds on institutional services.” They asked the Court to: grant class certification
to Louisianans with disabilities who are unnecessarily institutionalized and find the state in
violation of the ADA and §504 of the Rehabilitation Act.
In August 2001, DHH Secretary David Hood unveiled a settlement agreement that provided
for boosting state spending by $118 million over a four year period in order to provide

99
community-based services to 1,700 more individuals and reduce waiting time for services to
90 days or less. The settlement plan submitted by DHH, agreed to by the plaintiffs and
approved by the court addressed four broad areas: (a) reducing the waiting time for
community-based services; (b) supporting people to make informed choices about service
options; (c) adding a Medicaid state plan personal care services option; and (d) instituting
individualized long-term care assessments through a new single point of entry system. In the
agreement, the state committed to eliminate the waiting list for waiver services by 2005. The
Louisiana Nursing Home Association objected to the personal care coverage, but the court
turned the objection aside.
In 2003, DHH submitted a $38 million request to the Louisiana legislature to fund the addition
of personal care to the Medicaid state plan, but the legislature balked at this request. Instead, it
appropriated $28 million, instructed DHH to delay adding personal care to the Medicaid state
plan, and directed state officials to return to court to seek a modification of the settlement
agreement to further expand Home and Community Based Services waiver programs in lieu of
adding personal care to the state plan. In July 2003, as directed by the legislature, the state
filed a motion to amend the settlement agreement. The Louisiana Advocacy Center, which
represented the plaintiffs, opposed changing the agreement. The American Association of
Retired Persons filed an amicus brief in support of the Advocacy Center’s motion. In the
meantime, nursing home interests filed a motion to intervene in support of the state’s proposed
modification, expressing concern that the activating the personal care option might put their
businesses at risk.
In September 2003, the court denied the state’s motion to modify the settlement, directed it to
comply with the settlement order, and rejected the nursing home industry’s request to
intervene.
Year 2010 Case
In 2010, the Advocacy Center brought a case on behalf of four individuals with disabilities
who receive and depend on Medicaid Personal Care Services (PCS) in order to remain in the
community and to prevent hospitalization and institutionalization. Plaintiffs filed suit to
prevent Louisiana from reducing the maximum number of PCS hours available each week.
The U.S. Department of Justice filed a Statement of Interest supporting the Plaintiffs’
argument that the cuts would place individuals with disabilities at risk of institutionalization
and urging the Court to deny the state’s motion for summary judgment.
In May 2011, the District Court denied the state’s Motion for Summary Judgment. In June
2011, the court granted the Plaintiffs’ motion to certify a statewide class of individuals
affected by the reduction in PCS services.
In February 2012, the parties reached a settlement agreement requiring that slots on the
Community Choice Waiver program be set aside for people who were approved for more than
32 hours of long-term personal assistance services before the 32-hour cap took effect. The
Community Choice Waiver program, which has a four-year waiting list for most people who
are not currently in nursing facilities, provides personal care services as well as a variety of
other services that enable people to remain in their homes and communities. Additionally, the
state will offer waiver services on an expedited basis to class members who apply if they can
show that without the additional services, they will not be able to maintain their health and are
at serious risk of nursing facility placement. The settlement requires the Louisiana Department
of Health to ask the federal government for approval for Community Choice Waiver services
for an additional 200 people in order to meet the needs of class members. If any of these are

100
not needed for class members, they will be added to the pool that is available to meet the
needs of others who are waiting for the services. Further, the state must “use its best efforts” to
fund Community Choice Waiver services for an additional 500 people in the governor’s
executive budget.
b. Describe the range of options for persons with disabilities to access
affordable housing and supportive services.
According the Louisiana Developmental Disabilities Council the following supportive services
exist (http://www.laddc.org/Initiatives.cfm?aid=6&id=17):
Supported Living for adults with behavioral health needs is available in five regions of the
state (New Orleans, Baton Rouge, Houma/Thibodaux, Alexandria and Shreveport). Limited
funding is available to assist individuals who are making or have made the transition from
institutional settings to the community. Support coordination, rental assistance, furniture, and
transportation are the types of assistance that are available.
Supported Living services are available for a very small number of adults whose disability
occurred after the age of 22 but before the age of 55. Limited funding is available to assist
individuals moving out of nursing homes into the community or to those at risk of
institutionalization. Support coordination, rental assistance, furniture, and transportation are
the types of assistance that are available.
Medicaid Home and Community Based Waiver Services allow people the flexibility to
decide where they want to live and to access supports and services that best meet their
individualized needs. Louisiana has four Developmental Disability waivers, each with a
specific service package and eligibility requirements: the New Opportunities
Waiver, the Children's Choice Waiver, the Residential Options Waiver, and the Supports
Waiver.
The Flexible Family Fund provides a monthly stipend of $258 to families of children
with the most severe developmental disabilities to offset the costs of meeting their child’s
needs in their own home.
Individual and Family Support provides an array of flexible supports and services to
allow people with developmental disabilities to live in their own homes or with their
families in their own community. These supports are available based on priority of need,
rather than first-come, first-served. There is no menu of services, but rather the
supports are flexible to meet individual needs.
Permanent Supportive Housing - In addition, HANO, the City of New Orleans, and other
nonprofits offer affordable housing for persons with disabilities who have supportive service
needs. HANO houses low-income persons with disabilities in public housing, project-based,
and HCV units. Permanent supportive housing vouchers are also available through HANO and
the City of New Orleans. The City of New Orleans also provides financial assistance so that
homeowners who have disabilities can make repairs to their homes. Based on information
obtained from the City of New Orleans’ 2012-2016 Consolidated Plan, there were 1,857
persons living in permanent supportive housing in the city as of
2012.http://www.nola.gov/community-development/documents/general-reports/2012-2016-
consolidated-plan-city-of-new-orleans-w/, pages 47-48.

101
4. Disparities in Access to Opportunity
a. To what extent are persons with disabilities able to access the following? Identify major
barriers faced concerning:
i. Government services and facilities
On July 26, 2007, the U.S. Department of Justice entered into an amended settlement
agreement with the City of New Orleans, Louisiana, under the Americans with
Disabilities Act of 1990 (ADA) to make physical changes to specified facilities within
specific time frames in order to come into compliance with ADA requirements.
https://www.ada.gov/newola.htm
The Jefferson Parish Council recently approved moving more than two dozen polling
precincts as part of a settlement agreement in the federal case entitled Drake v. Jefferson
Parish. The polling precincts did not meet the requirements of the ADA and the
Rehabilitation Act. The suit that produced the settlement — originally filed in 2010 by
Kenner resident Denise Drake, who suffered from a debilitating neurological disease —
alleged that people in wheelchairs had too many barriers to overcome to cast their
ballots at their polling places.
http://www.theadvocate.com/new_orleans/news/communities/east_jefferson/article_f5d
6577d-8238-592f-868e-83f31e2d3667.html
ii. Public infrastructure (e.g., sidewalks, pedestrian crossings, pedestrian signals)
The City of New Orleans first installed the Accessible Pedestrian Signal (APS) located
at McAlister crosswalks on the Tulane University campus in March 2016. It produces an
audible beeping that helps persons with visual disabilities people know when it is safe to
cross the road. It is the only APS in the city.
https://www2.tulane.edu/news/newwave/031716_aps_crosswalks.cfm
In addition, the majority of schools have documented that sidewalks and curb ramps are
poor or missing. See table on subsequent pages.
http://prc.tulane.edu/uploads/kidswalk_coalition_web_final-1305305697.pdf
Sidewalks in New Orleans remain in a state of disrepair. Cracks are present on the
majority of sidewalks, making movement in a wheelchair uneven and bumpy. The roots
of trees upend sidewalks, making the traverse quite difficult at times. Some sidewalks
are not equipped with curb cuts, making them inaccessible to the independent wheeler.
https://wheelchairtravel.org/new-orleans-la/
iii. Transportation
Based on a study commissioned by the RTA, only 5.7 percent of bus stops are ADA
compliant.
http://www.nola.com/traffic/index.ssf/2016/03/new_orleans_faces_lawsuit_over.html

102
The St. Charles streetcar is not ADA accessible.
http://www.nola.com/politics/index.ssf/2016/04/new_orleans_st_charles_streetc.html
LIFTA paratransit services are available and feature modified vans that are equipped
with lifts to accommodate passengers who use wheelchairs with door-to-door pick-up.
Paratransit passengers must first be certified as eligible to use the services, which
usually consists of filing an application that describes the passenger's disability, explains
why they are unable to use regular transit, and includes the signature of a health care
professional. This can be a time consuming process for someone who lacks
transportation. After the submission, it may take up to three weeks for the RTA to
process the application for paratransit services prior to the passenger receiving a letter in
the mail about the decision. Once deemed eligible, the passenger must then make
advance reservations for transportation. http://www.norta.com/Accessibility/Eligibility-
for-Paratransit.aspx
As of 2014, the city of New Orleans had only a single wheelchair accessible private taxi.
https://wheelchairtravel.org/new-orleans-la/
iv. Proficient schools and educational programs
The below chart completed in 2011 shows barriers for children with ambulatory disabilities in
accessing proficient schools.

103
Ambulatory
(http://prc.tulane.edu/uploads/kidswalk_coalition_web_final-1305305697.pdf)
Cognitive Disability
As stated earlier in this plan, the Southern Poverty Law Center in its report entitled “Access Denied: New
Orleans Parents and Students identify Barriers to Public Education” discusses the policies that create
barriers for the disabled protected class in attending proficient schools as it reviews the 2007 to 2009
school periods.
www.splcenter.org/sites/default/files/d6_legacy_files/downloads/publication/SPLC_report_Access_Denie
d.pdf

104
The findings were as follows:
The graduation rate for RSD students with disabilities was less than half that of the overall
graduation rate, and only 6.8% of RSD students with disabilities exited with a high school
diploma. Across the state, the average was 19.4%.
In the 2008-09 school year, RSD schools suspended nearly 30% of all students with
disabilities — a rate that was 63% higher than the state average.
During the 2007-08 school year, 94.6% of eighth grade RSD students with disabilities failed
the Louisiana Educational Assessment Program (LEAP) exam. For the same year, 78.3% of all
eighth grade charter school students with disabilities in the state failed the LEAP.
On average, school districts throughout Louisiana have identified 12.2% of their students as
eligible for special education services. New Orleans Public Schools have identified only 8% of
their students as eligible for special education services. Comparable school districts
throughout the country identify almost twice as many students with disabilities.
v. Jobs
Earning Disparities
According to the HousingNOLA report, individuals with disabilities earn 29% less than those
without disabilities. http://housingnola.com/main/uploads/File/HousingNOLAReport.pdf
Hiring Discrimination
In a settlement reached on August 14, 2014, the U.S. Department of Justice and the Louisiana
Supreme Court put an end to the Department’s three-year investigation into Louisiana’s alleged
discriminatory treatment of lawyers and bar applicants with mental disabilities. DOJ charged that
the court’s procedures for evaluating bar applicants unlawfully discriminated against those with
psychiatric disabilities and, therefore, violated the ADA”. More specifically, the DOJ alleged that
the court unfairly imposed onerous admissions prerequisites on applicants who revealed a mental
health diagnosis. Some of these prerequisites included intrusive background investigations and
conditional admission for applicants who had no history of committing misconduct or criminal
activity. Under the settlement, the court’s character and fitness review of an applicant must now
focus principally on the applicant’s past conduct rather than on the
applicant’s condition. https://lalegalethics.org/wp-content/uploads/2014-08-14-DOJ-LASC-ADA-
Settlement-Agreement.pdf
b. Describe the processes that exist in the jurisdiction and region for persons with
disabilities to request and obtain reasonable accommodations and accessibility
modifications to address the barriers discussed above.

105
HANO HCVP Administrative Plan details reasonable accommodation process
HANO strives to ensure that persons with disabilities have full access to HANO’s programs and
services. HANO may need to verify that a person requesting an accommodation is a qualified
individual with a disability. HANO must also determine whether an accommodation is necessary
in order to provide the individual with an equal opportunity to participate in the HCV program. A
person who does not have a disability is not entitled to a reasonable accommodation.
HANO’s reasonable accommodation request process works most effectively when requests are
made in writing. However, if an applicant or participant indicates that an exception, change, or
adjustment to a rule, policy, practice, or service is needed because of a disability, HANO will
treat the information as a request for a reasonable accommodation, even if no formal, written
request is made. HANO requires individuals to certify that they are a person with a disability,
under the ADA or under the Fair Housing Act. Additional details and policies regarding
reasonable accommodations are found in the HCVP Administrative Plan on pages 25 to 28.
http://www.hano.org/home/agency_plans/2016%20REVISED%20ADMIN%20PLAN.pdf
HANO Admissions and Continued Occupancy – Public Housing Reasonable Accommodation
HANO policies and practices will be designed to provide assurances that all persons with
disabilities will be provided reasonable accommodation so they may fully access and utilize the
public housing program and related services.
Requests for reasonable accommodation from persons with disabilities will be granted upon
verification that accommodations address the need presented by the disability and they do not
create an "undue financial and administrative burden" for HANO. An undue burden requires
"significant difficulty or expense."
An applicant or resident may verbally request a reasonable accommodation. HANO and its
Agents must consider the request without a provider designated form, but HANO or its agent will
provide the applicant or the resident with the designated form to formalize the verification
process.
A reliable, knowledgeable professional will verify all requests for accommodation or
modification of a unit. Requests for reasonable accommodation from persons with disabilities
will be granted upon verification that they meet the need presented by the disability.
HANO or its agents will require verification from a knowledgeable professional when a request
for a home visit recertification is submitted. HANO and its agents must comply with HUD/DOJ
statement that provides instructions on verification of reasonable accommodations. Additional
details can be found throughout HANO’s Admissions and Continued Occupancy Policy.
http://www.hano.org/home/agency_plans/2016%20REVISED%20ACOP%20FINAL.pdf

106
The chart below provides statistics on reasonable accommodation requests to HANO for the last
two years.
Reasonable Accommodation Requests 2015
Feb. 4 – Dec. 31
2016
Jan. 1 – Aug. 15
No. of requests received 156 166
No. of requests approved 125 148
No. of requests denied 11 16
No. of requests returned (need additional info) 20 2
City of New Orleans Reasonable Accommodation Process
It is the policy of the City of New Orleans, pursuant to the federal Fair Housing Amendments Act
of 1988, the ADA, and applicable state laws, to provide individuals with disabilities reasonable
accommodation in the City’s zoning and land use regulations, rules, policies, and practices to
ensure equal access to housing and to facilitate the development of housing for individuals with
disabilities. Reasonable accommodations in the zoning and land use context means providing
individuals with disabilities or developers of housing for people with disabilities with flexibility
in the application of land use, zoning, and building regulations, policies, practices and
procedures. Reasonable accommodations include the waiver of certain requirements when it is
necessary to eliminate barriers to equal housing opportunities. Additional details are codified in
Article 27.5 of the Comprehensive Zoning Ordinance. http://www.nola.gov/nola/media/One-
Stop-Shop/CPC/OSS_BZA_APPLICATION-Reasonable-Accomodation.pdf
c. Describe any difficulties in achieving homeownership experienced by persons with
disabilities and by persons with different types of disabilities.
In October 2015, the New Orleans City Council voted to reprogram uses of the Neighborhood
Housing Improvement Fund. The fund is funded by a 30-year tax millage approved by New
Orleans voters in 1991. The fund has been used to pay for the rehabilitation of existing homes for
homeowners with disabilities so that they can remain in their homes in light of the difficulty that
many persons with disabilities with fixed incomes have in making necessary repairs to ensure
accessibility. http://housingnola.com/main/uploads/File/HousingNOLAReport.pdf
In addition, the table below demonstrates the difficulties that individuals with disabilities have in
maintaining their homes and the difficulties that renters with disabilities face in becoming
homeowners.
5. Disproportionate Housing Needs
a. Describe any disproportionate housing needs experienced by persons with disabilities and
by persons with certain types of disabilities.
The table below, which was included in HANO’s PHA Plan and above in the Disproportionate Housing
Needs section of this AFH Plan, demonstrates the starkly disproportionate housing needs experienced by
persons with disabilities who are low-income renters.
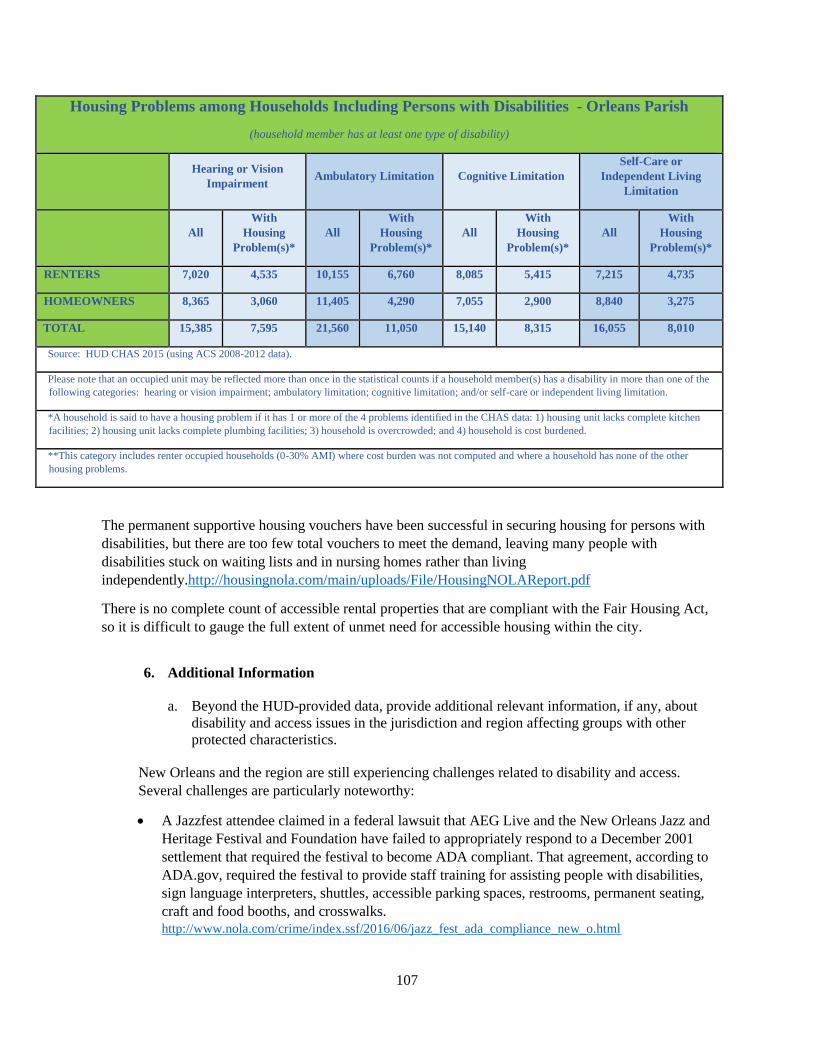
107
Housing Problems among Households Including Persons with Disabilities - Orleans Parish
(household member has at least one type of disability)
Hearing or Vision
Impairment Ambulatory Limitation Cognitive Limitation
Self-Care or
Independent Living
Limitation
All
With
Housing
Problem(s)*
All
With
Housing
Problem(s)*
All
With
Housing
Problem(s)*
All
With
Housing
Problem(s)*
RENTERS 7,020 4,535 10,155 6,760 8,085 5,415 7,215 4,735
HOMEOWNERS 8,365 3,060 11,405 4,290 7,055 2,900 8,840 3,275
TOTAL 15,385 7,595 21,560 11,050 15,140 8,315 16,055 8,010
Source: HUD CHAS 2015 (using ACS 2008-2012 data).
Please note that an occupied unit may be reflected more than once in the statistical counts if a household member(s) has a disability in more than one of the
following categories: hearing or vision impairment; ambulatory limitation; cognitive limitation; and/or self-care or independent living limitation.
*A household is said to have a housing problem if it has 1 or more of the 4 problems identified in the CHAS data: 1) housing unit lacks complete kitchen
facilities; 2) housing unit lacks complete plumbing facilities; 3) household is overcrowded; and 4) household is cost burdened.
**This category includes renter occupied households (0-30% AMI) where cost burden was not computed and where a household has none of the other
housing problems.
The permanent supportive housing vouchers have been successful in securing housing for persons with
disabilities, but there are too few total vouchers to meet the demand, leaving many people with
disabilities stuck on waiting lists and in nursing homes rather than living
independently.http://housingnola.com/main/uploads/File/HousingNOLAReport.pdf
There is no complete count of accessible rental properties that are compliant with the Fair Housing Act,
so it is difficult to gauge the full extent of unmet need for accessible housing within the city.
6. Additional Information
a. Beyond the HUD-provided data, provide additional relevant information, if any, about
disability and access issues in the jurisdiction and region affecting groups with other
protected characteristics.
New Orleans and the region are still experiencing challenges related to disability and access.
Several challenges are particularly noteworthy:
A Jazzfest attendee claimed in a federal lawsuit that AEG Live and the New Orleans Jazz and
Heritage Festival and Foundation have failed to appropriately respond to a December 2001
settlement that required the festival to become ADA compliant. That agreement, according to
ADA.gov, required the festival to provide staff training for assisting people with disabilities,
sign language interpreters, shuttles, accessible parking spaces, restrooms, permanent seating,
craft and food booths, and crosswalks.
http://www.nola.com/crime/index.ssf/2016/06/jazz_fest_ada_compliance_new_o.html

108
A chance to ride New Orleans' historic streetcar along oak-lined St. Charles Avenue is
something to look forward to, but that opportunity is not available to individuals who use
wheelchairs. Three men with disabilities sued the city, the RTA, and its private manager,
Transdev, over lack of access to the St. Charles Streetcar under both the ADA and the
Rehabilitation Act in April 2016.
http://www.nola.com/politics/index.ssf/2016/04/new_orleans_st_charles_streetc.html
Three New Orleans residents sued the City in March 2016, alleging that its "bus system is
inaccessible to persons with" mobility-related disabilities. The lawsuit comes after an internal
review of the City’s bus stops showed that roughly 94% of all bus stops in New Orleans are
not compliant with the ADA.
http://www.nola.com/traffic/index.ssf/2016/03/new_orleans_faces_lawsuit_over.html
b. The program participant may also describe other information relevant to its assessment of
disability and access issues.
According to the VERA Institute, people with disabilities experience violence at much higher
rates than people without disabilities. In 2013 alone, 1.3 million violent crimes were committed in
the United States against people with disabilities. Yet, people with disabilities face significant
barriers to reporting their victimization—their accounts are often dismissed or not taken
seriously—as well as unequal access to social and medical services. This creates difficulties in
accessing the judicial system. https://www.vera.org/projects/equal-access-for-people-with-
disabilities
7. Disability and Access Issues Contributing Factors
Consider the listed factors and any other factors affecting the jurisdiction and region.
Identify factors that significantly create, contribute to, perpetuate, or increase the severity of
disability and access issues and the fair housing issues, which are Segregation, R/ECAPs,
Disparities in Access to Opportunity, and Disproportionate Housing Needs. For each
contributing factor, note which fair housing issue(s) the selected contributing factor relates
to.
• Lack of affordable in-home or community based supportive services
As indicated by the Olmstead case against Louisiana Department of Health and Human
Services, lack of affordable in-home or community based services contributes to segregation
of persons with disabilities by leaving them few options other than segregated institutional
living.
http://www.ndrn.org/images/Documents/Issues/Community_integration/Resources/NDRN_Litigation_Status_122704.pdf
• Access to proficient schools for persons with disabilities
The chart on preceding pages demonstrates barriers to accessing proficient schools with
most schools only partially accessible due to poor or missing sidewalks and curb ramps. In
addition, according to the Southern Poverty Law Center, a number of students who have
cognitive disabilities are being suspended at high rates from integrated school settings. The inability to access proficient schools contributes to segregation of children with disabilities.

109
• Access to publicly supported housing for persons with disabilities & lack of affordable,
accessible housing in range of unit sizes
It appears that the City needs far more affordable, accessible units. Publicly supported
housing as of 2016 is serving 6,934 households; however, individuals with ambulatory
disabilities alone is 26,013. Without accessible, affordable housing, persons with disabilities
often have to opt to live in segregated settings for individuals with disabilities only.
A public hearing comment from an Advocacy Center representative indicated that contractor
fraud is still affecting residents living with disabilities. In addition, a resident said that
HANO does have a limited amount of vouchers to assist with rent for people living with disabilities.
• Access to transportation for persons with disabilities
Persons with disabilities are somewhat concentrated in downtown areas; however, persons
with disabilities who live outside of downtown areas experience barriers to transportation
due to a 60 to 100% decrease in public transportation services into the Central Business
District from certain neighborhoods. (P. 14, http://rideneworleans.org/wp-
content/uploads/2015/08/sots2015new.pdf). In addition, most taxis do not have wheelchair
accessible vehicles, and the St. Charles Street car is not wheelchair accessible.
Many residents at the first Public Hearing expressed dissatisfaction with the RTA in New
Orleans, saying there are not enough curb cuts for people living with disabilities to gain
access to public transit.
• Inaccessible government facilities or services
As discussed earlier, the City and other local governments in the region have entered into
settlement agreements regarding the accessibility of government facilities and services. For
example, Jefferson Parish entered into an agreement to ensure that polling places were
accessible, and the City of New Orleans had to modify government buildings to ensure that
they were ADA accessible. When government facilities and services are not in compliance
with ADA rules, individuals with disabilities undergo disparities in their ability to access government and participate in the civic process.
• Inaccessible sidewalks, pedestrian crossings, or other infrastructure
Above charts show the number of inaccessible sidewalks, pedestrian crossings, and other
infrastructure at schools. Also, New Orleans has only one APS signal to assist the persons
with visual disabilities in crossing the street. When City and regional infrastructure are not
in compliance with ADA rules, individuals with disabilities undergo disparities in their ability to access needed services.
At the first Public Hearing, residents made comments about sidewalks in disrepair and
infrastructure.
• Land use and zoning laws
Land use and zoning laws have been a barrier to individuals with disabilities finding
affordable housing. The City of New Orleans has at times voted to reject a project or change
zoning based on resident input that opposes affordable housing for persons with disabilities.

110
The following case regarding the property at 2535 Esplanade illustrates this contributing factor.
On August 6, 2012, the United States brought a case against the City and the Louisiana
State Bond Commission (Bond Commission) to enforce the Fair Housing Act and the
Americans with DiADA. The United States alleged that the City and the Bond
Commission engaged in a pattern or practice of discrimination against persons with
disabilities by taking a series of actions designed to block the Gulf Coast Housing
Partnership (GCHP) and its non-profit partners from converting an abandoned nursing
home into a 40-unit affordable housing development known as the “Esplanade.” Half the
units of the Esplanade were intended to be generally available to low-income households,
and half were intended as “permanent supportive housing” for homeless persons with
mental and physical disabilities, including homeless veterans and emancipated youth. The
United States also alleged that the City, through its Board of Zoning Adjustments and its
Historic District Landmarks Commission, discriminated by denying variance requests
and a demolition permit necessary for the development of the Esplanade. In addition, the
United States alleged that the City, through its Department of Safety and Permits,
reclassified the Esplanade property so that GCHP’s proposed use was no longer a
permitted use in a district that allowed for multifamily housing. The United States alleged
that the City undertook these and other actions in response to widespread community
opposition to the Esplanade that was based on fear and stereotypes of its prospective
residents with disabilities. The City entered into a settlement agreement with the United States, which allowed building of affordable housing at the location.
https://www.justice.gov/sites/default/files/crt/legacy/2014/05/22/new_orleanssettle.pdf
Because of restrictions regarding land use and zoning, individuals with disabilities can be
left with few options other than segregated institutional living, which contributes to segregation.
• Location of accessible housing
The following excerpt from a Times Picayune article discusses how the location of
accessible housing was challenged based on neighbor concerns.
“The Muses apartment generated some division between neighborhoods on either side of
St. Charles Avenue. Central City residents, merchants and church leaders said it would
restore badly needed affordable housing to the neighborhood, while a number of Coliseum
Square residents criticized both its design and its density. The development included 211
apartments in the first phase, roughly 65 percent of which will rent at market rates, with
the remainder set aside as affordable housing. The City Planning Commission voted
against the project in the face of such criticism, but the City Council later gave its
approval after the developers reduced the number of apartments and otherwise tweaked
the design.” http://blog.nola.com/tpmoney/2009/06/new_apartment_project_taking_s.html
Because affordable housing is often in concentrated areas of poverty due to land value,
availability, restrictive zoning and land use policies, and community opposition in low
poverty areas, individuals with disabilities can be left with few options other than segregated institutional living.

111
E. Fair Housing Enforcement, Outreach Capacity, and Resources Analysis
1. List and summarize any of the following that have not been resolved: a charge or letter of
finding from HUD concerning a violation of a civil rights-related law, a cause determination
from a substantially equivalent state or local fair housing agency concerning a violation of a
state or local fair housing law, a letter of findings issued by or lawsuit filed or joined by the
Department of Justice alleging a pattern or practice or systemic violation of a fair housing or
civil rights law, or a claim under the False Claims Act related to fair housing,
nondiscrimination, or civil rights generally, including an alleged failure to affirmatively
further fair housing.
Caused but Unresolved:
GNOFHAC vs. Jefferson Parish On June 11, 2013, Jefferson Parish entered into a conciliation agreement with HUD and
GNOFHAC to address a caused complaint by GNOFHAC that Jefferson Parish failed to fulfill its
obligation to affirmatively further fair housing. The relief set out in the settlement agreement
called for a new Analysis of Impediments, which was finally completed in 2016, and for the
introduction of a fair housing ordinance to the Parish Council. The Parish Council has not yet
considered any local housing anti-discrimination ordinances.
Cases Pending with HUD:
GNOFHAC currently has 16 cases pending with HUD against private entities in New Orleans.
An additional six cases are pending in suburban parishes. The most common basis of
discrimination for the New Orleans complaints was disability (7), followed by familial status (5),
race (3), and sex (1).
GNOFHAC is also party to complaints, along with multiple other fair housing centers and the
National Fair Housing Alliance, against Fannie Mae, U.S. Bank, Bank of America, and Deutsche
Bank for failing to maintain their real estate owned properties in neighborhoods of color in New
Orleans and Baton Rouge.
There are two pending cases against public entities in New Orleans. Cambridge Court LLC vs.
City of New Orleans was filed in 2013 and alleges that the down-zoning of the overwhelmingly
White Lakeview neighborhood had a disparate impact on protected classes. The restriction on
multi-family housing was passed after a slight increase in Lakeview’s minority population Post-
Katrina. Post-Katrina, the African-American population grew from .7% to 3.4%. Similarly, the
Latino population in Lakeview increased from 3.7% to 6%. Racial animus against the growing
New Orleans Latino communities was well documented during the City’s rebuilding efforts. In
addition, public opposition to recent attempts by landowners to rebuild their pre-Katrina duplexes
in Lakeview reflects racial bias.
GNOFHAC also has a pending case against HANO on behalf of an HCVP client who was denied
access to a unit after the landlord found out the tenant had a son with a disability. The son has
subsequently passed away, but the client’s case remains unresolved.

112
2. Describe any state or local fair housing laws. What characteristics are protected under each
law?
The Louisiana Equal Housing Opportunity Act is certified by HUD as substantially equivalent to the
federal Fair Housing Act. Like its federal equivalent, the statute protects individuals in seven protected
classes. The Louisiana Attorney General’s office is the only Fair Housing Assistance Program funded
agency in the state.
Though not a part of Louisiana Equal Housing Opportunity Act, the state did pass housing protections for
victims of domestic violence in 2015. The Louisiana Violence Against Women Act (LaVAWA) provide
four key protections:
Anyone in need of emergency assistance can contact the police without penalty.
Victims of domestic violence can no longer be evicted because of the violence of an abuser.
Survivors can no longer be denied housing solely on the basis of past abuse.
Survivors can now terminate a lease early and move when necessary to ensure their safety.
The City of New Orleans has its own non-discrimination laws that extend additional protections in
housing to individuals based on the following characteristics: age, creed, gender identification, marital
status, and sexual orientation. The New Orleans Human Relations Commission is the municipal agency
charged with enforcing the City's Human Relations Rights laws. The Commission accepts complaints
from all New Orleans residents and visitors.
3. Identify any local and regional agencies and organizations that provide fair housing
information, outreach, and enforcement, including their capacity and the resources available to
them.
GNOFHAC provides fair housing enforcement, education and outreach, policy advocacy, and
homeownership protection throughout the state of Louisiana and is based in New Orleans.
GNOFHAC enforcement staff conducts fair housing investigations and provide legal
representation to individuals who experience housing discrimination. GNOFHAC enforcement
staff also routinely conducts testing of the greater New Orleans housing market in order to
understand discriminatory trends and identify systemic discrimination. The organization regularly
files enforcement actions against individuals and entities engaging in discriminatory practices.
Since Hurricane Katrina, GNOFHAC has served more than 1,000 individuals and assisted in the
recovery of $5.43 million in monetary relief as a result of its enforcement actions. GNOFHAC
has also negotiated numerous settlements and consent decrees requiring housing providers or
local government entities to comply with fair housing laws.
GNOFHAC trains over a thousand people each year about their fair housing rights and
obligations through first time homebuyer classes, the annual Fit for a King conference, and talks
with students, neighborhood associations, local officials, housing providers, and volunteers. The
Center has conducted numerous statewide and local media campaigns to inform consumers and
housing professionals of their fair housing rights and responsibilities. GNOFHAC has also
produced an original children’s book, The Fair Housing Five & the Haunted House, which is
used across the country to teach about fair housing and civil rights.
In addition to GNOFHAC, Southeast Louisiana Legal Services (SLLS) also provides some fair
housing assistance to clients in the New Orleans regions. SLLS is the state's largest provider of

113
free civil legal aid to low-income people and operates a housing division which primarily focuses
on landlord-tenant law but occasionally does fair housing work as well.
The Advocacy Center, a statewide non-profit that advocates for the human and legal rights of
people with disabilities and seniors also assists with fair housing education and enforcement as it
relates to persons with disabilities in the New Orleans area.
4. Additional Information
a. Provide additional relevant information, if any, about fair housing enforcement, outreach
capacity, and resources in the jurisdiction and region.
The City's new updated Comprehensive Zoning Ordinance includes a new reasonable
accommodations provision that provide a clear written procedure for individuals with
disabilities and developers of housing for people with disabilities to follow when requesting
zoning and land use accommodations. The City must accept and process reasonable
accommodation requests that are made outside of this process, as well.
Earlier this year, HANO also revised its criminal background screening procedures. The new
policy considers convictions rather than arrests and does not bar anyone categorically, except
where mandated by federal law.
b. The program participant may also include information relevant to programs, actions, or
activities to promote fair housing outcomes and capacity.
5. Fair Housing Enforcement, Outreach Capacity, and Resources Contributing Factors
Consider the listed factors and any other factors affecting the jurisdiction and region.
Identify factors that significantly create, contribute to, perpetuate, or increase the severity of
fair housing enforcement, outreach capacity, and resources and the fair housing issues,
which are Segregation, R/ECAPs, Disparities in Access to Opportunity, and Disproportionate
Housing Needs. For each significant contributing factor, note which fair housing issue(s) the
selected contributing factor impacts.
Lack of local private fair housing outreach and enforcement:
The three agencies listed above provide local private fair housing outreach and
enforcement.
Lack of local public fair housing enforcement:
The City of New Orleans Human Relations Commission is empowered to investigate and
adjudicate discrimination complaints in employment, public accommodations, and
housing, but has not yet examined a fair housing case.
The Louisiana Department of Justice (LA DOJ) has adopted a standard of interpreting the
Fair Housing Act that is inconsistent with federal law. The LA DOJ's standard requires
that a respondent violate multiple, separate provisions of the Fair Housing Act in order
for a case to be "caused." Under federal law, each of those provisions would be a separate
114
violation of the law, and a respondent need only violate one for HUD to find reasonable
cause. The LA DOJ has not prosecuted a fair housing case and rarely completes
investigations within the 100 day timeline required by law.
Lack of resources for fair housing agencies and organizations:
GNOFHAC provides significant fair housing outreach and enforcement resources, but is
underfunded relative to the need. The organization responds to complaints and conducts
outreach statewide, and therefore has fewer resources dedicated exclusively to New
Orleans.
Lack of state or local fair housing laws:
Neither Louisiana nor New Orleans have source of income protections that would protect
HCVP participants and other residents who receive assistance from housing
discrimination. A 2009 GNOFHAC report examined 100 rental properties in the New
Orleans area and found widespread discrimination against voucher holders. The HCVP
program is currently 98% African-American.
Unresolved violations of fair housing or civil rights law
Other

115
VI. Fair Housing Goals and Priorities
1. For each fair housing issue, prioritize the identified contributing factors. Justify the
prioritization of the contributing factors that will be addressed by the goals set below in
Question 2. Give the highest priority to those factors that limit or deny fair housing choice or
access to opportunity, or negatively impact fair housing or civil rights compliance.
Identifying and Prioritizing Contributing Factors to R/ECAP Areas
Fair Housing
Issues Contributing Factors
Prioritization and
Justification
R/ECAPs
Displacement of residents due to economic pressures: Property
values have increased by almost 50% in some neighborhoods that
have had targeted community revitalization, had little to no
flooding, and that are close to the Central Business District. These
gentrifying neighborhoods are Treme, Marigny, Bywater, and the
St. Roch area of the 7th ward. This has made it difficult for many
long-time, predominantly African-American residents to remain in
their neighborhoods and for other low income people of color to
locate in those neighborhoods because of high rents, manipulative
evictions, uninhabitable housing conditions increased real estate
taxes, and high asking prices for homes. These residents often
relocate in areas of concentrated poverty with less access to
opportunity such as New Orleans East.
High - Low income,
predominantly African-
American renters and those
seeking to buy homes have had
to move out of neighborhoods
where access to opportunity is
increasing because the private
market in those areas has
combined with the high demand
for housing to reduce the amount
of affordable housing which is a
major factor in creating and
perpetuating R/ECAPs.
Land use and zoning laws: Land-use and zoning laws make it
more difficult for low-income people of color to obtain quality
housing in their neighborhoods of choice when density
restrictions and aesthetically oriented design standards make
affordable housing infeasible in certain neighborhoods.
Additionally, regulations allowing dwelling use for short term
rentals encourage evictions and rising rents for low-income
people of color.
High – There are limited areas
of public land on which to site
affordable housing, particularly
in high opportunity areas;
therefore, it is highly important
that zoning laws assist private
development of affordable
housing to address the
overwhelming need.
Location and type of affordable housing: Challenges exist
regarding the location and type of affordable housing available in
areas not designated as R/ECAPs. Rentals in high opportunity and
gentrifying neighborhoods are being converted to single family
homes to be sold, not rented as affordable. This causes a reduction
in affordable rentals in high opportunity and gentrifying
neighborhoods which forces African-Americans and Latinos to
seek rentals in concentrated areas of poverty where affordable
rentals is more prevalent.
High – This appears to be a
main factor in creating R/ECAPs
as landlords in gentrifying areas
near job centers and
transportation hubs are
converting rental properties into
owner-occupied homes for high
income residents and pushing
low income, predominantly
African-American residents
toward areas of concentrated
poverty where rent is affordable.
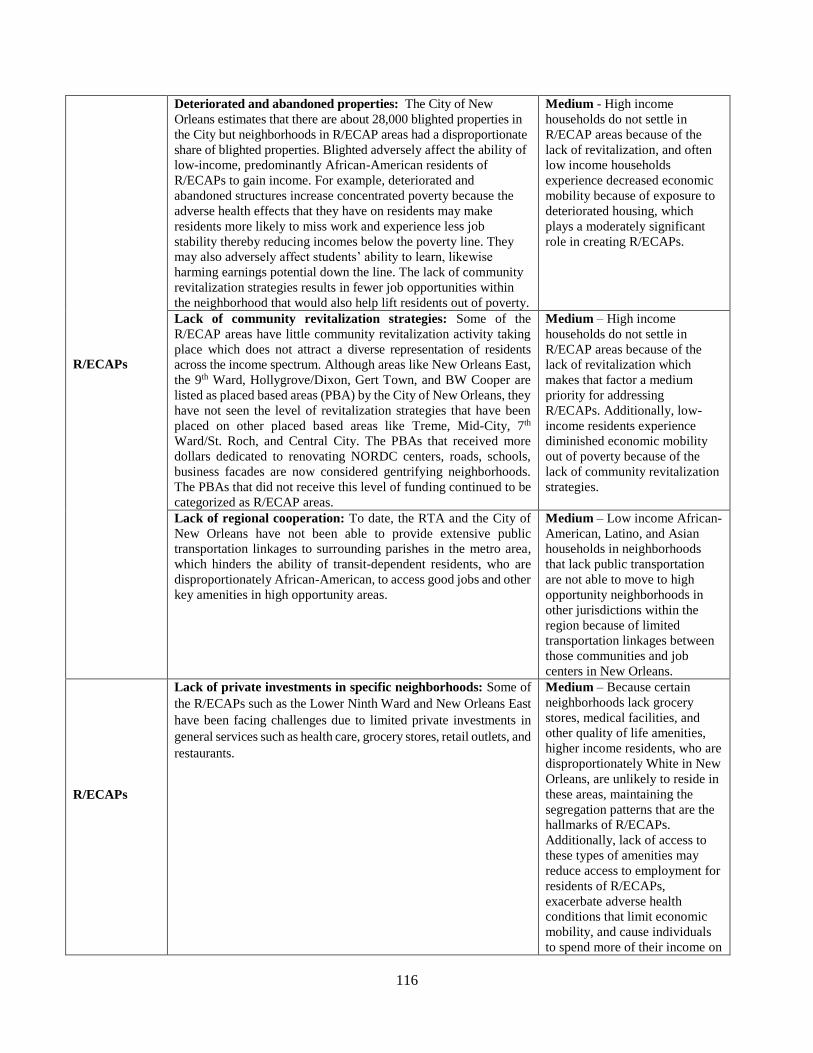
116
R/ECAPs
Deteriorated and abandoned properties: The City of New
Orleans estimates that there are about 28,000 blighted properties in
the City but neighborhoods in R/ECAP areas had a disproportionate
share of blighted properties. Blighted adversely affect the ability of
low-income, predominantly African-American residents of
R/ECAPs to gain income. For example, deteriorated and
abandoned structures increase concentrated poverty because the
adverse health effects that they have on residents may make
residents more likely to miss work and experience less job
stability thereby reducing incomes below the poverty line. They
may also adversely affect students’ ability to learn, likewise
harming earnings potential down the line. The lack of community
revitalization strategies results in fewer job opportunities within
the neighborhood that would also help lift residents out of poverty.
Medium - High income
households do not settle in
R/ECAP areas because of the
lack of revitalization, and often
low income households
experience decreased economic
mobility because of exposure to
deteriorated housing, which
plays a moderately significant
role in creating R/ECAPs.
Lack of community revitalization strategies: Some of the
R/ECAP areas have little community revitalization activity taking
place which does not attract a diverse representation of residents
across the income spectrum. Although areas like New Orleans East,
the 9th Ward, Hollygrove/Dixon, Gert Town, and BW Cooper are
listed as placed based areas (PBA) by the City of New Orleans, they
have not seen the level of revitalization strategies that have been
placed on other placed based areas like Treme, Mid-City, 7th
Ward/St. Roch, and Central City. The PBAs that received more
dollars dedicated to renovating NORDC centers, roads, schools,
business facades are now considered gentrifying neighborhoods.
The PBAs that did not receive this level of funding continued to be
categorized as R/ECAP areas.
Medium – High income
households do not settle in
R/ECAP areas because of the
lack of revitalization which
makes that factor a medium
priority for addressing
R/ECAPs. Additionally, low-
income residents experience
diminished economic mobility
out of poverty because of the
lack of community revitalization
strategies.
Lack of regional cooperation: To date, the RTA and the City of
New Orleans have not been able to provide extensive public
transportation linkages to surrounding parishes in the metro area,
which hinders the ability of transit-dependent residents, who are
disproportionately African-American, to access good jobs and other
key amenities in high opportunity areas.
Medium – Low income African-
American, Latino, and Asian
households in neighborhoods
that lack public transportation
are not able to move to high
opportunity neighborhoods in
other jurisdictions within the
region because of limited
transportation linkages between
those communities and job
centers in New Orleans.
R/ECAPs
Lack of private investments in specific neighborhoods: Some of
the R/ECAPs such as the Lower Ninth Ward and New Orleans East
have been facing challenges due to limited private investments in
general services such as health care, grocery stores, retail outlets, and
restaurants.
Medium – Because certain
neighborhoods lack grocery
stores, medical facilities, and
other quality of life amenities,
higher income residents, who are
disproportionately White in New
Orleans, are unlikely to reside in
these areas, maintaining the
segregation patterns that are the
hallmarks of R/ECAPs.
Additionally, lack of access to
these types of amenities may
reduce access to employment for
residents of R/ECAPs,
exacerbate adverse health
conditions that limit economic
mobility, and cause individuals
to spend more of their income on

117
R/ECAPs
certain expenses, such as food
and transportation, than they
would if, for example, grocery
stores were present in R/ECAPs.
Private Discrimination: At the public hearings, residents
expressed that renters do not always have knowledge of their rights.
As a result, when they experience private discrimination, they are
deterred from moving outside of R/ECAPs. Fair housing testing
results from GNOFHAC have consistently revealed high levels of
discrimination on the basis of race and national origin in New
Orleans and in the broader region. Landlords, sellers, real estate
agents and lenders are also unaware of their obligations under fair
housing laws, and of the legal consequences
High - Discrimination appears to
be a primary factor in low-
income renters not being able to
locate in high opportunity
neighborhoods, reinforcing the
existence of R/ECAPs.
Impediments to mobility:
Using a metro-wide Fair Market Rent as a base for
HCVP payment standards does not allow HCV tenants
the ability to reach higher-rent high opportunity
neighborhoods.
HCVP households do not have access to a robust
mobility counseling program that includes pre-move
counseling, housing search assistance—including tours
of different neighborhoods—an orientation to the new
neighborhood, and post-move support.
A number of landlords are unaware of how to become a
landlord with the HCV program.
Voucher holders experience discrimination from
landlords who do not want to rent to HCV participants.
High – Additional HCV
landlords in high opportunity
areas would increase voucher
holders’ access to high
opportunity areas and increase
the ability of HCV voucher
holders to relocate from
R/ECAP areas. Access to
mobility counseling could play a
role in increasing mobility from
R/ECAP areas.
Lack of public investments in specific neighborhoods, including
services or amenities: A number of R/ECAP areas lack public
investments. As a result, low-income people of color in R/ECAPs
experienced diminished economic mobility out of poverty, and
R/ECAP areas fail to attract high income residents. Residents living
in R/ECAP areas have expressed concern that the City’s budget
priorities are not consistent with deconcentrating poverty as more
funds go towards building jails than improving neighborhoods.
Residents also expressed concern that HANO’s slow turnaround of
public housing developments contributes to the concentration of low
income, predominantly African households in areas of poverty while
waiting to return to public housing. R/ECAP areas lacking
significant public investment are the Upper 9th Ward area, New
Orleans East, St. Bernard area, 7th Ward, Gert, BW Cooper/Marrero
Commons area, Tulane/Gravier, Leonidas area, and the Fischer/Tall
Timbers area.
Low – Disparities in public
investments are not a major
factor in creating R/ECAPs as
many majority white, high
opportunity neighborhoods also
have major needs for street
repair, flood reduction, and other
infrastructure needs, which have
not deterred households from
locating in these areas. However,
in light of historical disparities in
levels of public investment in
communities by race, there is a
need to strategically focus public
investments in communities of
color, which are often R/ECAPs,
in order to remedy the effects of
that past discrimination.
Community Opposition: Because opposition to affordable
housing development often comes from those who have a
disproportionate amount of political influence, the opposition leads
to developers withdrawing projects in high opportunity
neighborhoods and placing them in areas of concentrated poverty
where neighborhood residents are less likely to be able to influence
land use planning processes. Opposition to broad legislative
changes to zoning that would allow diverse housing types in all
neighborhoods contributes to R/ECAPs. In addition, some types of
zoning, particularly for planned developments and conditional
Medium – Community
opposition affects development
if certain zoning laws that
allowed diverse types of housing
in all neighborhoods had some
mandatory language that does
not take into account discretion
and community opposition.

118
R/ECAPs
zoning have discretion as a part of the approval process which
creates disparities in types of developments allowed in certain
neighborhoods.
Occupancy codes and restrictions: Residents expressed concern
that the conversion of duplex housing into single-family housing in
high opportunity neighborhoods reduces the availability of
affordable housing and that zoning laws do not address this trend.
This contributes to low income renters having to move from high
opportunity neighborhoods to neighborhoods with concentrated
poverty.
Low – The prevalence of
duplexes being converted to
single family homes is a factor
in decrease affordable rentals but
it is not so prevalent to be a main
factor contributing to R/ECAPs.
Public Housing redevelopment: Input provided at the public hearings
expressed concern about publicly supported housing spurring re-
concentration of poverty in farther flung neighborhoods.
Low –While HUD monitors
publicly supported housing to
ensure poverty deconcentration,
additional community
consultation and oversight will
help to address this challenge.
Identifying and Prioritizing Contributing Factors to Segregation
Fair Housing
Issues Contributing Factors
Prioritization and
Justification
Segregation
Location and type of affordable housing: Segregation patterns
may continue in neighborhoods that have houses that are
unaffordable for low-income minorities to purchase or rent
Ongoing discrimination in mortgage lending and property insurance
further restricts homeownership for low income people of color.
HUD maps reveal areas of white population concentration with
virtually no affordable housing. The overwhelming majority of
subsidized housing opportunities—whether HCVP, project-based
voucher, public housing, LIHTC, or soft-second mortgages —are
available in lower-income, majority African-American
neighborhoods.
High – When public housing
was decreased and HCV
programs increased due to
federal funding, low income
voucher holders were limited to
certain areas of the City where
their voucher could cover rent
which resulted in a number of
HCV renters being located in
certain sections of the City.
Displacement of residents due to economic pressures:
Gentrification of neighborhoods often leads to displacement of
people of color, as neighborhoods attract new residents
interested in purchasing and rehabilitating properties. This may
cause a rise in property values, increasing the rent for low-
income residents, who are disproportionately African-
American, as well as create situations where homeowners may
not be able to afford to continue living in their neighborhood
due to increased property taxes. Lack of renter protections that
would limit rent increases and eviction prevent low income
residents of color from remaining in neighborhoods that are
gentrifying.
High - Low income renters and
those seeking to buy homes
within the private market have
found affordable housing only
in certain areas of the City
which is a major factor in
creating segregation as the
majority of low income
households are people of color.

119
Segregation
Land-use and Zoning laws: In New Orleans current
Comprehensive Zoning Ordinance (CZO), some neighborhoods are
designated as “suburban neighborhoods residential districts” with
codes S-RM1, S-RM2, S-LRM1, AND S-LRM2. These areas are
characterized by lower density development, including
neighborhoods of single-family development on lots of various
sizes and more spacious setbacks between homes than found in
older areas of the City with a generally uniform front setback
within each square. The list of neighborhoods that are designated in
the CZO are the same areas that are segregated with a majority
white population according to HUD Maps displaying race.
Medium – There are limited
areas of public land on which to
site affordable housing,
particularly in high opportunity
areas; therefore, it is highly
important that zoning laws
assist private development of
affordable housing to address
the overwhelming need.
Lack of private investments in specific neighborhoods: A few of
New Orleans’ PBAs need more private investments. Specifically,
PBAs such as Gert Town, Hollygrove, New Orleans East and parts of
the Upper-Ninth Ward have challenges due to the lack of private
investments.
Medium – Because certain
neighborhoods lack grocery
stores, medical facilities, ample
greenspace, and other quality of
life amenities, high income
residents who are majority
white in New Orleans are
unlikely to reside in these areas
which is a secondary factor in
segregation.
Private discrimination: GNOFHAC's 2015 report "Where
Opportunity Knocks, The Doors are Locked," revealed that nearly
half of African-American prospective renters experience housing
discrimination when seeking housing in high opportunity
neighborhoods.
High – Discrimination appears
to be a primary factor in
African-American renters being
able to locate in high
opportunity neighborhoods
creating segregation.
Segregation
Impediments to mobility:
Using a metro-wide Fair Market Rent as a base for HCVP
payment standards does not allow HCV tenants the
ability to reach higher-rent high opportunity
neighborhoods.
HCVP households do not have access to a robust mobility
counseling program that includes pre-move counseling,
housing search assistance—including tours of different
neighborhoods—an orientation to the new
neighborhood, and post-move support.
A number of landlords are unaware of how to become a
landlord with the HCV program.
Voucher holders experience discrimination from
landlords who do not want to rent to HCV participants.
High – Additional HCV
landlords in high opportunity
areas would increase voucher
holders’ access to high
opportunity areas and increase
the ability of HCV voucher
holders to relocate from
R/ECAP areas. Access to
mobility counseling could play
a role in increasing mobility
from R/ECAP areas.
Community Opposition: Because opposition to affordable
housing development often comes from those who have a
disproportionate amount of political influence, the opposition leads
to developers withdrawing projects in high opportunity
neighborhoods and placing them in areas of concentrated poverty
where neighborhood residents are less likely to be able to influence
land use planning processes. Opposition to broad legislative
changes to zoning that would allow diverse housing types in all
neighborhoods contributes to R/ECAPs. In addition, some types of
zoning, particularly for planned developments and conditional
zoning have discretion as a part of the approval process which
creates disparities in types of developments allowed in certain
neighborhoods.
Medium – Community
opposition affects development
if certain zoning laws that
allowed diverse types of
housing in all neighborhoods
had some mandatory language
that does not take into account
discretion and community
opposition.

120
Segregation
Lack of regional cooperation: Following Hurricane Katrina, the
lack of regional cooperation contributed to segregation and adversely
impacted affordable housing development.
Medium – A number of
regions surrounding Orleans
Parish attempted to prevent
affordable multifamily housing.
While these attempts were
thwarted, exclusionary zoning
in area suburbs continues to
exert a significant impact on
segregation in Orleans Parish
because eventual zoning
changes in those areas were
site-specific rather than
systemic.
Lending Discrimination: From a review of the Home
Mortgage Disclosure Act (HMDA) data for the 2015 year
provided by the Consumer Financial Protection Bureau, it is
clear that disparities exist in access to financial services. From
the HMDA data, it was found that African-Americans
originated 3,096 mortgages, but 2,669 were denied which is an
86% denial rate. Individuals that were identified as white
originated 15,678 mortgages and 4,304 were denied which is
only a 27% denial rate. The Asian population originated 421
mortgages and 162 were denied which is a denial rate of 38%.
The Latino population originated 956 mortgages in the metro
region but 476 were denied which is 50%.
High – Denying 86% of
African-American loans and
50% of Latino loans in the New
Orleans metro region is a
significant factor in the
inability of these populations to
finance housing in desegregated
areas.
Segregation
of Persons
with
Disabilities
Lack of affordable in-home or community based supportive
services: As indicated by the Olmstead case against Louisiana
Department of Health and Human Services, the lack of affordable
in-home or community based services contributes to the
segregation of persons with disabilities by leaving them few options
other than segregated institutional living.
Low –Segregated institutional
living in Louisiana has been
litigated with the last major
case being in 2010. However,
with this case, according to the
Louisiana Developmental
Disabilities Council, a number
of solutions are being
implemented to prevent
segregated institutional living
for individuals with disabilities.
Identifying and Prioritizing Contributing Factors for
Disparities in Access to Opportunity
Fair Housing
Issues Contributing Factors
Prioritization and
Justification
DISPARITIES
IN ACCESS TO
OPPORTUNITY
Location of proficient schools and school assignment policies
As a result of historic patterns of residential racial segregation,
many African-American students live in zones with few high
quality schools, while many white students live in zones with A
or B rated schools. Seven of the highest ranked public schools in
New Orleans do not participate in the citywide application
system used by most public schools. The application and
enrollment processes for these schools are demanding on
parents’ schedules and require access to transportation. These
High –The City’s study and
other national studies have
shown a direct link between
educational attainment and
access to other opportunities.
Many in protected classes have
not had opportunities to further
their education and have been
subjected to failing schools. This

121
DISPARITIES
IN ACCESS TO
OPPORTUNITY
schools often expect parents to deliver parts of the application
during school hours and also require parent meetings and
student exams for entry. The majority of public schools lack
LEP services and a number do not have sufficient special
education services. When reviewing the HUD race/ethnicity
map in conjunction with the maps showing the location of
proficient schools, the maps show that the majority of Latino
and Asian residents do not live near proficient schools.
Access to proficient schools for persons with disabilities:
The chart in preceding pages demonstrate barriers to accessing
proficient schools with most schools only partially accessible
due to poor or missing sidewalks and curb ramps. In addition,
according to the Southern Poverty Law Center, a
disproportionate number of students who have cognitive
disabilities are being suspended at high rates from integrated
school settings.
is a major factor in their ability
to access other opportunities.
Lack of employment opportunities: The City of New Orleans
developed and conducted a survey to provide a detailed
illustration of the assets and challenges of African-American
males in gaining access to employment opportunities. The report
found that education levels, criminal history, lack of
transportation, housing, and family life were obstacles to
employment.
High – The earning potential of
residents has a direct correlation
to and major impact on the
ability to access opportunities.
Access to financial services: Anecdotal information from
community members indicates that the ability to secure loans for
homes and businesses is one of the reasons that they are unable
to locate in low poverty areas or have better transportation
options.
Medium – Evidence supports
that access to financial services
has been somewhat of an
obstacle to those within
protected classes which hinders
their ability to purchase homes
and cars, utilize credit, and start
businesses.
The availability, type, frequency, and reliability of public
transportation: New Orleans residents have experienced a
55% decline in available transit service since Hurricane Katrina
which lowers the accessibility to affordable transportation for
families that may not have the means to own a personal vehicle.
Access to transportation for persons with disabilities:
In addition, most taxis do not have wheelchair accessible
vehicles and the St. Charles Street car is not wheelchair
accessible.
Medium – Access to
transportation affects the ability
to obtain jobs, relocate to areas
of high opportunity, and access
other services like health care
and schools and plays a role in
disparities in access to
opportunity.
Lack of regional cooperation: This topic drew comments due
to the lack of regional transportation. Participants cited the
difficulty in traveling across the region on public transit to and
from job centers: “Jobs that are close to home don’t pay that
much,” was a comment made at the public hearing held on July
19, 2016, as part of the HUD Affirmatively Furthering Fair
Housing (AFFH) process.
Medium – Access to
transportation affects the ability
to obtain jobs, relocate to areas
of high opportunity, and access
other services like health care
and schools and plays a role in
disparities in access to
opportunity.

122
DISPARITIES
IN ACCESS TO
OPPORTUNITY
Location of environmental health hazards: A theme that has
been identified in reviewing R/ECAP and segregated areas is
that a majority of these areas have been adversely impacted by
elevated expressways where residents are subjected to noise
pollution, lack of greenspace, and pollutants from vehicle
traffic. In addition, R/ECAP and segregated areas have been
located near or on landfill and waste sites.
Medium – In Orleans Parish and
nationwide, studies articulate
how expressways have destroyed
neighborhoods and businesses,
creating R/ECAPs and
segregation. Accordingly, the
location of environmental health
hazards has a role in disparities.
Location of employers: At the first public hearing, some
residents highlighted challenges accessing jobs in New Orleans.
In addition, many jobs in New Orleans are temporary and not
sustainable. High quality jobs outside of New Orleans are
difficult to access due to the lack of regional transportation.
Medium – Jobs are primarily in
the Central Business District of
New Orleans and in the
Jefferson Parish regions. This
factor is rated medium.
Increasing access to public
transportation and developing
job centers outside of the CBD
and certain Jefferson Parish
areas can assist in overcoming
disparities in access to
opportunity.
Lack of access to Healthcare
Large disparities in health exist between different groups of
people in New Orleans. A report developed by the New Orleans
Health Department in 2010 examined racial health disparities
between African-Americans and whites during the period of
2008-2010. The report found the following disparities:
African-Americans in New Orleans were
1.37 times more likely to die than whites in
New Orleans over the period of 2008-2010.
This ratio was higher in New Orleans over
this period than in Louisiana and the United
States as a whole, which means that New
Orleans has a more severe disparity in all-
cause mortality between whites and
African-Americans than both the state and
the nation.
African-Americans were eight times more
likely to die of homicide than whites in
Orleans Parish during this period.
African-Americans were three times more
likely to die of diabetes and twice as likely
to die of kidney disease and HIV.
African-American children under 18 in New
Orleans are about three and a half times
more likely to be uninsured than white
children.
High - There is a 25.5 year
difference between the ZIP
codes in New Orleans with the
highest and lowest life
expectancies according to the
Joint Center for Political and
Economic Studies' Place Matters
Project ZIP code 70112,
containing parts of the Tulane,
Gravier, Iberville and Tremé
neighborhoods, had a life
expectancy of 54.5 years. This
is lower than the Democratic
Republic of the Congo. ZIP code
70124, containing the
Lakeshore, Lake Vista,
Lakeview, West End, Lakewood
and Navarre neighborhoods had
a life expectancy of 80, similar
to the UK and higher than the
US average in 2012. Disparities
in healthcare has a significant
impact on access to opportunity.
Inaccessible government facilities or services: The City of
New Orleans and Jefferson Parish have both have entered into
settlement agreements regarding inaccessible government
facilities and services. Jefferson Parish entered into an
agreement to ensure that polling places were accessible and the
City of New Orleans had to modify government buildings to
ensure that they were ADA accessible. When government
facilities and services are not in compliance with ADA rules,
Low: Individuals with
disabilities undergo disparities in
their ability to access
government and participate in
the civic process;

123
individuals with disabilities face barriers in accessing
government services and participating in the civic process.
Inaccessible sidewalks, pedestrian crossings, or other
infrastructure: Not until March 2016 did New Orleans install
the first Accessible Pedestrian Signal (APA) located at
McAlister crosswalks at the Tulane University campus. It is an
audible beeping that helps visually impaired people know when
it is safe to cross the road. This is the only APS in the City. In
addition, the majority of schools have documented that
sidewalks and curb ramps are poor or missing. Sidewalks in
New Orleans remain in a state of disrepair. Cracks are present
on the majority of sidewalks, making movement in a wheelchair
uneven and bumpy. The roots of trees upend sidewalks, making
the traverse quite difficult at times. Some sidewalks are not
equipped with curb cuts, making them inaccessible to the
independent wheeler.
Low: When City and regional
infrastructure are not in
compliance with ADA rules,
individuals with disabilities face
barriers in accessing needed
services like jobs, healthcare,
and housing. Although this is not
a high factor because the poor
conditions of roads and
sidewalks occur in all
neighborhoods in New Orleans,
with some of the worst
conditions in high opportunity
neighborhoods, it is a noted as a
factor in disparities in
opportunity.
Identifying and Prioritizing Contributing Factors for
Disproportionate Housing Needs/Publicly Supported Housing
Fair Housing
Issues Contributing Factors
Prioritization and
Justification
Disproportionate
Housing Needs
The availability of affordable units in a range of sizes
New Orleans has growing challenges related to the lack of
affordable housing and how it is a contributing factor to
disproportionate housing needs. Data shows a number of areas
where residents are paying 50% or more of median income for
housing. The breakdown of low income households is as
follows:
Extremely Low Income renter households (<=30%
AMI) = 23,510
Very Low Income renter households (>30% but
<=50% AMI) = 12,930
Low Income renter households (>50% but <=80%
AMI) = 13,055
The total low income households is 49,500. Of all 49,500 "Low
income" Renter Households, 37,130 or 75% are Cost Burdened
(24% Moderate and 51% Severe) and 38,025 or 77% have
Housing Problems
High – When the majority
African-American areas of the
City show that 1 bedroom
renters pay more than 50% of
median income and the majority
of 2 bedroom renters pay more
than 40% of their income to rent,
this shows that the availability of
affordable units in a range of
sizes is a major factor in
disproportionate housing needs
for African-Americans.
Displacement of residents due to economic pressures:
Gentrification of neighborhoods often leads to displacement
of people of color, as neighborhoods attract new residents
interested in purchasing and rehabilitating properties. This
may cause a rise in property values, increasing the rent for
low-income residents, who are disproportionately African-
American, as well as create situations where homeowners
High - Low income renters and
those seeking to buy homes
within the private market have
found affordable housing only in
certain areas of the City which is
a major factor in creating

124
Disproportionate
Housing Needs
may not be able to afford to continue living in their
neighborhood due to increased property taxes. Lack of renter
protections that would limit rent increases and eviction
prevent low income residents of color from remaining in
neighborhoods that are gentrifying. Lack of relocation
assistance requirements prevent renters that are displaced
from relocating in high opportunity areas as either renters or
homeowners.
disproportionate housing needs
for low-income households
Disproportionate
Housing Needs
&
Publicly
Supported
Housing
Admissions and occupancy policies and procedures,
including preferences in publicly supported housing:
Residents expressed concerns over HANO’s termination of
housing assistance due to policies that evict tenants over
minor infractions. Residents also feel that HCVP
inspection procedures often do not address problems with
homes in disrepair and that leasing is at the discretion of
the HCVP landlords where discrimination can be factors in
leasing decisions. In addition, HANO maintains a waiting
list for available units that greatly exceeds available units.
The 2016 HCV waitlist has 24,207 households and the
Public Housing waitlist has 10,322.
Medium – One strike policies
and minor infractions that evict
subsidized tenants from housing
can play a role in increasing the
need for housing for tenants with
a criminal background which in
New Orleans is a population that
is majority African-Americans.
Disproportionate
Housing Needs
&
Disability Access
&
Publicly
Supported
Housing
Access to publicly supported housing for persons with
disabilities & lack of affordable, accessible housing in range
of unit sizes: It appears that the City needs far more affordable,
accessible units. Publicly supported housing as of 2016 is
serving 6,934 households; however, individuals with
ambulatory disabilities alone is 26,013.
Medium – Without affordable
housing accessible units, persons
with disabilities may continue to
have disproportionate housing
needs
Disproportionate
Housing Needs
Disproportionate
Housing Needs
Lack of private investment in specific neighborhoods:
Private entities will make the decisions on whether to invest
based on existing information about an area and whether
there are government incentives or prior public investments
that they can leverage to create a profit if they invest in an
area.
Low - Although this may be
more of a factor in creating
R/ECAPs or segregation, this is
low in contributing to
disproportionate housing needs.
It does impact lack of jobs, lack
of income, and high housing cost
burden.
Community Opposition: Community opposition can lead
to developers withdrawing projects for affordable housing
leaving a number of low and very low income households
disproportionately affected, as the overwhelming need for
affordable housing in New Orleans has not been met.
HousingNOLA estimates that 33,000 affordable units are
needed in New Orleans in the next 10 years.
Low –Opposition to affordable
housing does negatively impact
the needs of low and very low
income residents but the impact
is not significant.
Impediments to mobility:
Using a metro-wide Fair Market Rent as a base for
HCVP payment standards does not allow HCV
tenants the ability to reach higher-rent high
opportunity neighborhoods.
HCVP households do not have access to a robust
mobility counseling program that includes pre-move
counseling, housing search assistance—including
tours of different neighborhoods—an orientation to
the new neighborhood, and post-move support.
Low – Additional landlords in
high opportunity areas as well as
voucher holders access to higher
rent-high opportunity areas is a
high factor in moving from
R/ECAP or segregated areas as
fair housing issues, it is not a
high on the fair housing issue of
disproportionate housing needs.

125
2. For each fair housing issue with significant contributing factors identified in Question 1, set
one or more goals. Explain how each goal is designed to overcome the identified contributing
factor and related fair housing issue(s). For goals designed to overcome more than one fair
housing issue, explain how the goal will overcome each issue and the related contributing
factors. For each goal, identify metrics and milestones for determining what fair housing
results will be achieved, and indicate the timeframe for achievement.
See Chart on next page.
Disproportionate
Housing Needs
A number of landlords are unaware of how to become
a landlord with the HCV program.
Voucher holders experience discrimination from
landlords who do not want to rent to HCV
participants.
Source of income discrimination: Some residents have
expressed that the housing needs of residents that do not
participate in subsidized housing programs are not met as some
landlords with affordable housing have a preference to lease to
Section 8 voucher holders instead of renters who lack any
subsidy. Others have expressed that landlords discriminate
against leasing to HCV voucher holders based on the stigma
associated with having a voucher.
Low – Although source of
income discrimination is a high
contributing factor to fair
housing issues of segregation
and R/ECAPs as it is included in
impediments to mobility, it is
not considered a high
contributing factor to
disproportionate housing needs.

126
Goal Strategy Fair Housing Issue Contributing Factor Timeframe for Action
Measure of Achievement
Responsible Program
Participant(s)
Lower barriers to expanded affordable housing in high opportunity areas through inclusive strategies.
Reserve publicly owned land in high-opportunity neighborhoods for affordable housing.
Segregation; Disparity in Access to Opportunity; Disproportionate Housing Need
Location and Type of Affordable Housing; Displacement of Residents Due to Economic Pressures; Community Opposition; Availability of affordable units in a range of sizes; Private Discrimination; Impediments to Mobility
1. 1-3 yrs 2. 3-5 yrs 3. 3-5 yrs
1. 20% of qualified tax adjudicated property is made available for development through OCD, NORA, HANO NOFAs. 2. Create 140 affordable rental units on HANO’s scattered site property in high opportunity areas in Bywater and Uptown by 2021. 3. Complete onsite construction of 302 affordable units (Phases III-VII) at Bienville Basin, (formerly Iberville) which is situated in a high opportunity area
OCD, HANO, NORA
Prioritize public subsidy for development in high-opportunity neighborhoods.
Segregation; Disparity in Access to Opportunity; Disproportionate Housing Need
Location and Type of Affordable Housing; Displacement of Residents Due to Economic Pressures; Community Opposition
<1 yr OCD, NORA, HANO NOFAs reflect priority in scoring for developments in high opportunity neighborhoods.
OCD, HANO, NORA, FANO
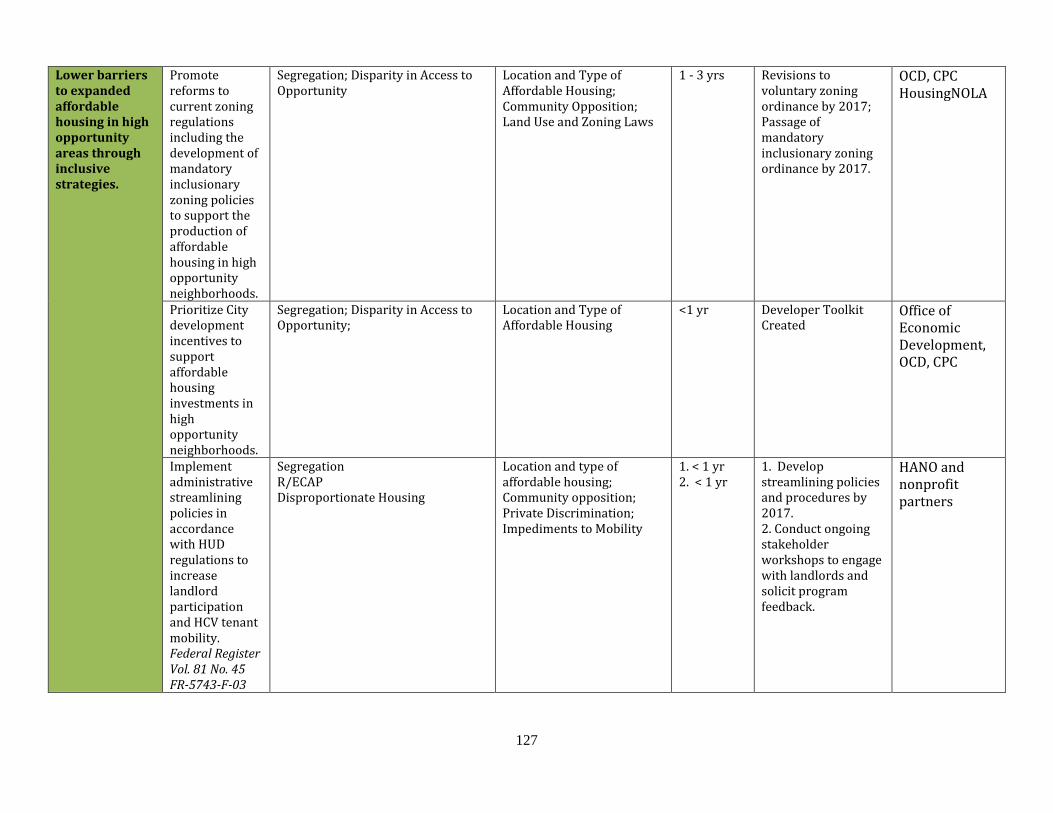
127
Lower barriers to expanded affordable housing in high opportunity areas through inclusive strategies.
Promote reforms to current zoning regulations including the development of mandatory inclusionary zoning policies to support the production of affordable housing in high opportunity neighborhoods.
Segregation; Disparity in Access to Opportunity
Location and Type of Affordable Housing; Community Opposition; Land Use and Zoning Laws
1 - 3 yrs Revisions to voluntary zoning ordinance by 2017; Passage of mandatory inclusionary zoning ordinance by 2017.
OCD, CPC HousingNOLA
Prioritize City development incentives to support affordable housing investments in high opportunity neighborhoods.
Segregation; Disparity in Access to Opportunity;
Location and Type of Affordable Housing
<1 yr Developer Toolkit Created
Office of Economic Development, OCD, CPC
Implement administrative streamlining policies in accordance with HUD regulations to increase landlord participation and HCV tenant mobility. Federal Register Vol. 81 No. 45 FR-5743-F-03
Segregation R/ECAP Disproportionate Housing
Location and type of affordable housing; Community opposition; Private Discrimination; Impediments to Mobility
1. < 1 yr 2. < 1 yr
1. Develop streamlining policies and procedures by 2017. 2. Conduct ongoing stakeholder workshops to engage with landlords and solicit program feedback.
HANO and nonprofit partners

128
Lower barriers to expanded affordable housing in high opportunity areas through inclusive strategies.
Provide rental registry landlords with information on how to become an HCV landlord to expand program participation in coordination with the City's rental registry timeline.
Segregation; R/ECAP; Disproportionate Housing
Location and type of affordable housing; Community opposition; Private Discrimination; Impediments to Mobility
3 - 5 yrs Decrease HCV properties in R/ECAP areas from 33% according to HUD tables to 30% by 2021 and increase HCV properties in non-R/ECAPs to 70%.
HANO
Prioritize the award of Project Based Vouchers (PBV) for developments in high-opportunity neighborhoods.
Segregation; Disparity in Access to Opportunity;
Location and Type of Affordable Housing; Availability of Affordable Units in a Range of Sizes; Community Opposition
1. < 1 yr 2. <1 yr
1. Vet with HUD the possibility of issuing neighborhood-specific PBV solicitations. 2. Establish a PBV implementation strategy with measures of achievement.
HANO

129
Lower barriers to expanded affordable housing in high opportunity areas through inclusive strategies.
Study the implications of Small Area Fair Market Rents and other potential Section 8 mobility strategies.
Segregation R/ECAP Disproportionate Housing Needs
Displacement of residents due to economic pressures Impediments to Mobility Location and type of affordable housing Location of proficient schools Access to proficient schools for persons with disabilities Private Discrimination
1. < 1 yr 2. 1 – 3 yrs 3. 1 – 3 yrs
1. Complete feasibility study. 2. Within six months of feasibility study, develop a Mobility Action Plan with implementation protocol and metrics. 3. Monitor Action Plan implementation and refine as feasible to further mobility.
HANO
Reduce housing segregation and discrimination by aggressively conducting fair housing education and enforcement activities, in coordination and with fair housing organizations.
Provide monetary support for local fair housing groups' education and/or enforcement programs and/or other forms of support (letters, endorsements, etc.) for local fair housing groups' fundraising efforts.
Segregation Private Discrimination; Lending Discrimination; Community Opposition;
< 1 yr Funding included in City budget
OCD, HANO, NORA
Reduce housing segregation and discrimination by aggressively conducting fair housing education and enforcement activities, in coordination
Expand fair housing outreach, education, and training for youth and other targeted populations through collaboration
Segregation Private Discrimination; Lending Discrimination; Community Opposition;
< 1 yr Regular training and outreach schedule developed through 2018
GNOFHAC, SLLS, Advocacy Center, Office of Neighborhood Engagement, NORD-C, CPC, HANO

130
and with fair housing organizations.
with NORD-C, Office of Neighborhood Engagement, One Stop Shop, and HANO.
Increase awareness about fair housing issues, resources, and equitable outcomes through enhanced media outreach especially during Fair Housing Month each year.
Segregation Private Discrimination; Lending Discrimination; Community Opposition;
< 1 yr Press release developed, PSAs developed, and related activities conducted
GNOFHAC, SLLS, Advocacy Center, OCD, HANO

131
Reduce housing segregation and discrimination by aggressively conducting fair housing education and enforcement activities, in coordination and with fair housing organizations.
Launch a public awareness campaign to create broad based support for fair housing efforts by 2019.
Segregation R/ECAP Disproportionate Housing
Private Discrimination; Lending Discrimination; Community Opposition;
1 - 3 yrs 1. Develop 2 PSA’s on fair housing. 2. Develop informational brochures on fair housing to distribute to landlords citywide. 3. Develop informational brochures to educate residents on their rights as renters. 4. Develop informational brochures to educate prospective owners on their rights in the lending environment.
HANO, GNOFHAC, OCD
Expand the capacity of public call centers, and HCV caseworkers, public agency front desk personnel including and 311 operators to provide information on resources to address.
Segregation Private Discrimination; Lending Discrimination; Community Opposition;
< 1 yr Trainings conducted with public call center staff; resource guide provided to public agencies
GNOFHAC, SLLS, Advocacy Center, City of New Orleans Departments, HANO

132
Reduce housing segregation and discrimination by aggressively conducting fair housing education and enforcement activities, in coordination and with fair housing organizations.
Implement transparent tracking and reporting of fair housing complaints to the Human Relations Commission.
Segregation Private Discrimination; Lending Discrimination; Community Opposition;
< 1 yr Reports available publicly
HRC, GNOFHAC, OCD
Develop a robust plan to assess banks’ performance related to the Community Reinvestment Act (CRA).
Segregation; Disparity in Access to Opportunity; Disproportionate Housing Need; R/ECAP;
Foreclosure rates that correlate with R/ECAPs; High denial rates for some protected classes; Lack of private investment in areas with protected classes; Low labor engagement; Lack of financial services are issues that inhibit fair housing choice.
<1 yr Annual assessment of of lenders’ performance in the City of New Orleans region completed. Host annual public forum with community based organizations, to discuss results of assessment.
OCD, HousingNOLA, GNOHA
Ensure that internal policies and practices advance access & mobility for groups with significant challenges in accessing safe and affordable housing including people with
Dedicate resources to support affordable homeownership and rental housing preservation and development for persons with disabilities.
Segregation; Disparity in Access to Opportunity; Disproportionate Housing Need
Location and Type of Affordable Housing; Displacement of Residents Due to Economic Pressures; Community Opposition; Land Use and Zoning
1 - 3 yrs Landlord Program Designed; 33% of home modification funds support accommodations for rental housing.
OCD
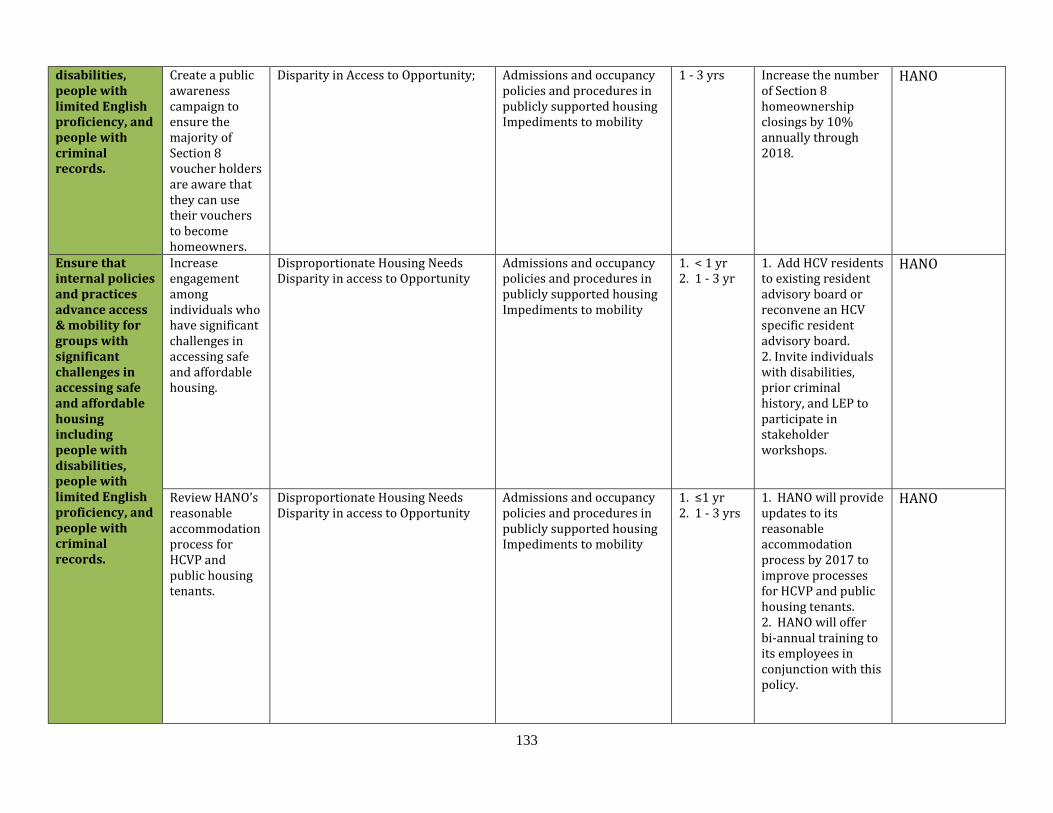
133
disabilities, people with limited English proficiency, and people with criminal records.
Create a public awareness campaign to ensure the majority of Section 8 voucher holders are aware that they can use their vouchers to become homeowners.
Disparity in Access to Opportunity; Admissions and occupancy policies and procedures in publicly supported housing Impediments to mobility
1 - 3 yrs Increase the number of Section 8 homeownership closings by 10% annually through 2018.
HANO
Ensure that internal policies and practices advance access & mobility for groups with significant challenges in accessing safe and affordable housing including people with disabilities, people with limited English proficiency, and people with criminal records.
Increase engagement among individuals who have significant challenges in accessing safe and affordable housing.
Disproportionate Housing Needs Disparity in access to Opportunity
Admissions and occupancy policies and procedures in publicly supported housing Impediments to mobility
1. < 1 yr 2. 1 - 3 yr
1. Add HCV residents to existing resident advisory board or reconvene an HCV specific resident advisory board. 2. Invite individuals with disabilities, prior criminal history, and LEP to participate in stakeholder workshops.
HANO
Review HANO’s reasonable accommodation process for HCVP and public housing tenants.
Disproportionate Housing Needs Disparity in access to Opportunity
Admissions and occupancy policies and procedures in publicly supported housing Impediments to mobility
1. ≤1 yr 2. 1 - 3 yrs
1. HANO will provide updates to its reasonable accommodation process by 2017 to improve processes for HCVP and public housing tenants. 2. HANO will offer bi-annual training to its employees in conjunction with this policy.
HANO
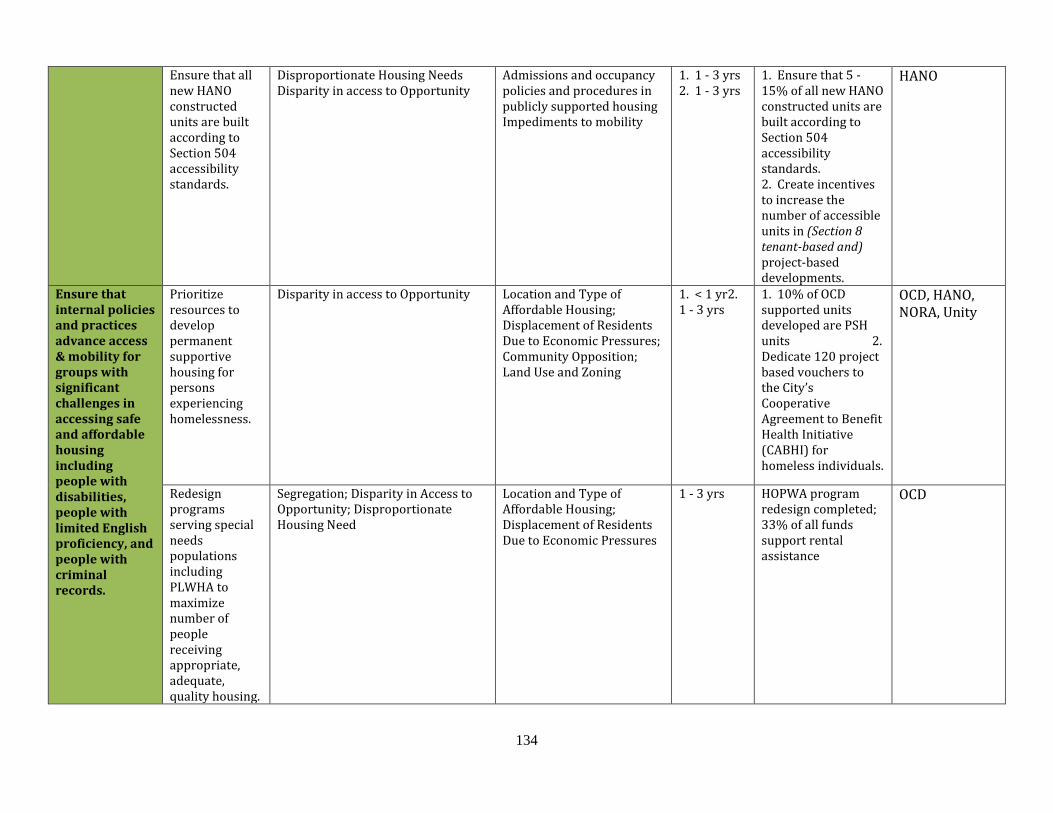
134
Ensure that all new HANO constructed units are built according to Section 504 accessibility standards.
Disproportionate Housing Needs Disparity in access to Opportunity
Admissions and occupancy policies and procedures in publicly supported housing Impediments to mobility
1. 1 - 3 yrs 2. 1 - 3 yrs
1. Ensure that 5 - 15% of all new HANO constructed units are built according to Section 504 accessibility standards. 2. Create incentives to increase the number of accessible units in (Section 8 tenant-based and) project-based developments.
HANO
Ensure that internal policies and practices advance access & mobility for groups with significant challenges in accessing safe and affordable housing including people with disabilities, people with limited English proficiency, and people with criminal records.
Prioritize resources to develop permanent supportive housing for persons experiencing homelessness.
Disparity in access to Opportunity Location and Type of Affordable Housing; Displacement of Residents Due to Economic Pressures; Community Opposition; Land Use and Zoning
1. < 1 yr2. 1 - 3 yrs
1. 10% of OCD supported units developed are PSH units 2. Dedicate 120 project based vouchers to the City’s Cooperative Agreement to Benefit Health Initiative (CABHI) for homeless individuals.
OCD, HANO, NORA, Unity
Redesign programs serving special needs populations including PLWHA to maximize number of people receiving appropriate, adequate, quality housing.
Segregation; Disparity in Access to Opportunity; Disproportionate Housing Need
Location and Type of Affordable Housing; Displacement of Residents Due to Economic Pressures
1 - 3 yrs HOPWA program redesign completed; 33% of all funds support rental assistance
OCD

135
Implement HANO criminal background policy to integrate formerly incarcerated individuals back into the community.
Segregation R/ECAP Disparity in access to Opportunity Disproportionate Housing Needs
Community Opposition Admissions and occupancy policies and procedures in publicly supported housing Impediments to mobility
1. < 1 yr 2. < 1 yr
1. Begin review of formerly incarcerated applicants using new Criminal Background Policy in Summer 2016. 2. Track implementation with reporting at 6-month intervals.
HANO
Ensure that internal policies and practices advance access & mobility for groups with significant challenges in accessing safe and affordable housing including people with disabilities, people with limited English proficiency, and people with criminal records.
Provide juvenile reentry services to youth to reduce barriers to future employment, education, or housing opportunities
Segregation R/ECAP Disparity in access to Opportunity Disproportionate Housing Needs
Community Opposition Admissions and occupancy policies and procedures in publicly supported housing Impediments to mobility Lack of employment opportunities
1. < 1 yr 2. 1 - 3yrs
1. Begin review of youth denied housing by 2017 2. Track implementation with reporting at 6-month intervals.
SLLS, HANO
Draft and pass an ordinance that requires transparency and accuracy in background checks used to secure public and private rental housing.
Segregation; Disparity in Access to Opportunity; Disproportionate Housing Need
Location and Type of Affordable Housing; Community Opposition; Admission and Occupancy Policies and Procedures; Impediments to Mobility
3-5 yrs Ordinance passed City Council, HousingNOLA
Ensure fair housing and other housing resource materials are available in languages other than English.
Segregation; Disparity in Access to Opportunity; Disproportionate Housing Need
Inaccessible government facilities or services
<1 yr Language accessibility provisions included in subrecipient grant agreements; OCD funded services available in languages other than English on City of New Orleans and HANO websites.
OCD, NORA, HANO

136
Ensure that internal policies and practices advance access & mobility for groups with significant challenges in accessing safe and affordable housing including people with disabilities, people with limited English proficiency, and people with criminal records.
Identify and utilize existing bilingual and/or hire and train bi-lingual staff at public agencies.
Segregation; Disparity in Access to Opportunity; Disproportionate Housing Need
Inaccessible government facilities or services
1 – 3 yrs Staff identified and/or hired and trained
OCD, HANO
Revise HANO's Limited English Proficiency Policy.
Disparity in Access to Opportunity; Inaccessible government facilities or services
< 1 yr 1. Ensure Spanish and Vietnamese languages are addressed in new policy by 2017. 2. Determine if any items should be standard issuance in top 3 languages in New Orleans by 2017. 3. Continue to provide documents in other languages upon request.
HANO
Identify alternate uses for vacant land to support food access, recreation and green space in underserved communities.
Disparity in access to opportunity Lack of public investments in specific neighborhoods; Lack of private investment in specific neighborhoods
1 - 3 yrs CNO Master Plan Adopted
NORA, CPC, CNO Development Committee, Economic Development

137
Prioritize public investments in transit, quality schools, housing, parks, and other amenities in underserved communities.
Prioritize blight reduction efforts to stimulate private sector investment.
R/ECAP; Disparity in access to opportunity;
Lack of public investments in specific neighborhoods; Lack of private investment in specific neighborhoods; Deteriorated and abandoned properties;
1 - 3 yrs Code Enforcement Plan Developed
Code Enforcement, OCD
Examine private lender management of REO properties.
R/ECAP; Disparity in access to opportunity;
Lack of private investment in specific neighborhoods; Deteriorated and abandoned properties;
1 - 3 yrs Assessment Complete
Code Enforcement, OCD
Support development of 200+ affordable rentals in underserved communities.
Disproportionate Housing Needs Availability of Affordable Units in a Range of Sizes Deteriorated and abandoned properties Lack of community revitalization strategies Access to publicly supported & affordable housing by persons with disabilities
1. ≤1 yr 2. ≤1 yr 3. 3 - 5 yrs
1. Complete redevelopment of 51 units of various sizes at Florida by 2017. 2. Complete redevelopment of 155 units at Guste III (155 units) by 2017. 3. Initiate redevelopment of 50 units at various sizes at BW Cooper (Marrero Commons) by 2021.
HANO

138
Prioritize public investments in transit, quality schools, housing, parks, and other amenities in underserved communities.
Support development of affordable single family homes in underserved areas to support de-concentration of racial and ethnic concentrated areas of poverty.
SegregationR/ECAPDisproportionate Housing Needs
Availability of Affordable Units in a Range of Sizes Deteriorated and abandoned properties Lack of community revitalization strategies Access to publicly supported & affordable housing by persons with disabilities
1. <1 yr 2. 3 - 5 yrs 3. 3 - 5 yrs 4. 3 - 5 yrs
Develop 5 or more on-site homeownership units at the following locations: -The Estates -vacant scattered sites inventory in Lower 9th Ward- vacant scattered sites inventory in New Orleans East-vacant scattered sites inventory in Westbank. (Actual number of homes developed dependent on financing and the housing market. Number of homes could be more or less than the target)
HANO
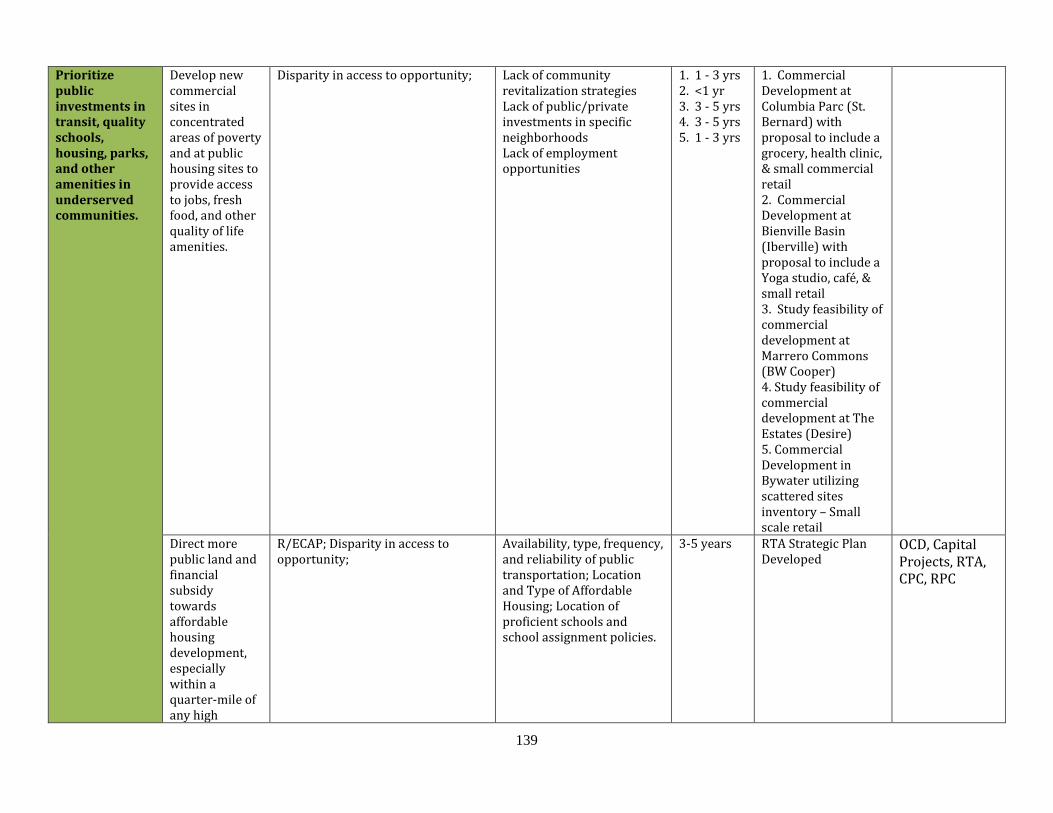
139
Prioritize public investments in transit, quality schools, housing, parks, and other amenities in underserved communities.
Develop new commercial sites in concentrated areas of poverty and at public housing sites to provide access to jobs, fresh food, and other quality of life amenities.
Disparity in access to opportunity; Lack of community revitalization strategies Lack of public/private investments in specific neighborhoods Lack of employment opportunities
1. 1 - 3 yrs 2. <1 yr 3. 3 - 5 yrs 4. 3 - 5 yrs 5. 1 - 3 yrs
1. Commercial Development at Columbia Parc (St. Bernard) with proposal to include a grocery, health clinic, & small commercial retail 2. Commercial Development at Bienville Basin (Iberville) with proposal to include a Yoga studio, café, & small retail 3. Study feasibility of commercial development at Marrero Commons (BW Cooper) 4. Study feasibility of commercial development at The Estates (Desire) 5. Commercial Development in Bywater utilizing scattered sites inventory – Small scale retail
Direct more public land and financial subsidy towards affordable housing development, especially within a quarter-mile of any high
R/ECAP; Disparity in access to opportunity;
Availability, type, frequency, and reliability of public transportation; Location and Type of Affordable Housing; Location of proficient schools and school assignment policies.
3-5 years RTA Strategic Plan Developed
OCD, Capital Projects, RTA, CPC, RPC

140
frequency transit stop and proficient schools.
Prioritize public investments in transit, quality schools, housing, parks, and other amenities in underserved communities.
Prioritize City development incentives to support infrastructure upgrades, blight reduction efforts, and commercial development in underserved neighborhoods.
R/ECAP; Disparity in access to opportunity;
Lack of public investments in specific neighborhoods; Lack of private investment in specific neighborhoods; Deteriorated and abandoned properties;
1 - 3 yrs Developer Toolkit Created
Office of Economic Development, OCD, CPC
Expand efforts in creating equitable healthy housing that recognizes the direct connections between healthy housing and quality of life.
Adopt Health and Safety Standards for occupied rental housing in the form of a Rental Registry and provide resources to assist low-income property owners in making needed repairs to their properties to meet health and safety standards.
R/ECAP; Disparity in access to opportunity; Disproportionate Housing Need
Lack of private investment in specific neighborhoods; Deteriorated and abandoned properties
< 1 yr Rental Registry Ordinance Adopted
CAO, Code Enforcement, City Council
Develop smoke free policies in accordance with HUD final rule when promulgated.
Disparity in access to Opportunity Location of environmental health hazards
1 - 3 yrs Implementation of HANO's Smoke-Free Policy in public housing within 18 months of HUD's publication of the final rule
HANO
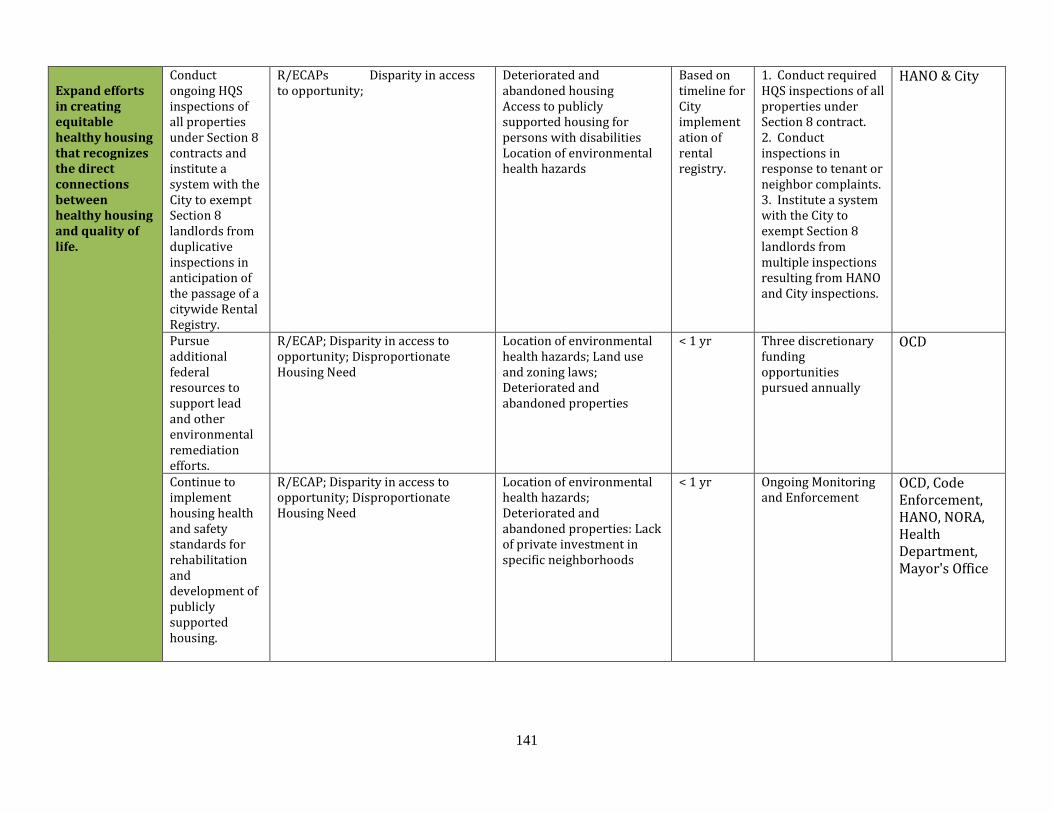
141
Expand efforts in creating equitable healthy housing that recognizes the direct connections between healthy housing and quality of life.
Conduct ongoing HQS inspections of all properties under Section 8 contracts and institute a system with the City to exempt Section 8 landlords from duplicative inspections in anticipation of the passage of a citywide Rental Registry.
R/ECAPs Disparity in access to opportunity;
Deteriorated and abandoned housing Access to publicly supported housing for persons with disabilities Location of environmental health hazards
Based on timeline for City implementation of rental registry.
1. Conduct required HQS inspections of all properties under Section 8 contract. 2. Conduct inspections in response to tenant or neighbor complaints. 3. Institute a system with the City to exempt Section 8 landlords from multiple inspections resulting from HANO and City inspections.
HANO & City
Pursue additional federal resources to support lead and other environmental remediation efforts.
R/ECAP; Disparity in access to opportunity; Disproportionate Housing Need
Location of environmental health hazards; Land use and zoning laws; Deteriorated and abandoned properties
< 1 yr Three discretionary funding opportunities pursued annually
OCD
Continue to implement housing health and safety standards for rehabilitation and development of publicly supported housing.
R/ECAP; Disparity in access to opportunity; Disproportionate Housing Need
Location of environmental health hazards; Deteriorated and abandoned properties: Lack of private investment in specific neighborhoods
< 1 yr Ongoing Monitoring and Enforcement
OCD, Code Enforcement, HANO, NORA, Health Department, Mayor's Office

142
Stabilize neighborhoods vulnerable to gentrification by preserving existing ownership and affordable rental housing and developing affordable homeowner-ship and rental housing.
Develop and implement a strategic plan to address environmental hazards including lead in water and housing.
R/ECAP; Disparity in access to opportunity; Disproportionate Housing Need
Location of environmental health hazards; Deteriorated and abandoned properties: Land use and zoning laws
< 1 yr Strategic Plan Developed 2. HANO continue annual HQS inspections for HCVP properties and annual HUD REAC inspections for Public Housing properties.
OCD, Code Enforcement, HANO, NORA, Health Department, Mayor's Office
Create incentives to preserve income-affordable rents at unsubsidized properties.
Disparity in Access to Opportunity; Disproportionate Housing Need
Location and Type of Affordable Housing; Displacement of Residents Due to Economic Pressures
1 - 3 yrs Program Designed; Resources Identified
OCD
Develop 400+ affordable rental units in gentrifying neighborhood of Treme
Disproportionate Housing Needs Disparity in access to Opportunity
Displacement of residents due to economic pressures; Availability of affordable units in a range of sizes Location & type of affordable housing
1. ≤1 yr 2. 3 - 5 yrs
1. Complete 100 housing units at Faubourg Lafitte by 2017 2. Develop 300+ Iberville CNI off-site replacement units in Treme
HANO

143
Stabilize neighborhoods vulnerable to gentrification by preserving existing ownership and affordable rental housing and developing affordable homeowner-ship and rental housing.
Utilize HANO scattered sites inventory in gentrifying areas to develop affordable single family homes
Disproportionate Housing Needs Disparity in access to Opportunity
Displacement of residents due to economic pressures; Availability of affordable units in a range of sizes; Location & type of affordable housing
1 - 3 yrs 1. Develop 45 on-site homeownership units (1/3 affordable) at Faubourg Lafitte in gentrifying neighborhood of Treme by 2018. 2. Target development of 5+ affordable single family homes utilizing HANO’s scattered sites in Treme 3. Target development of 5+ affordable single family homes utilizing HANO’s vacant scattered sites in Carrollton. 4. Develop 5+ affordable single family homes utilizing HANO’s vacant scattered sites inventory in Upper 9th Ward. (Actual number of homes developed dependent on financing and the housing market. Number of homes could be more or less than the target)
HANO
Protect the quantity and affordability of government-assisted rental properties.
Disproportionate Housing Need Location and Type of Affordable Housing; Displacement of Residents Due to Economic Pressures
1 - 3 yrs Expanded Affordability Periods Implemented; Support for community land trusts provided.
OCD, NORA, HANO

144
Stabilize neighborhoods vulnerable to gentrification by preserving existing ownership and affordable rental housing and developing affordable homeowner-ship and rental housing.
Assist low-income homeowners in financial distress.
Disproportionate Housing Need Displacement of Residents Due to Economic Pressures; Access to Financial Services; Lending Discrimination
< 1 yr Develop New Programs such as low-interest loans to leverage additional financial resources.
OCD, FANO, Lenders
Educate and encourage participation in existing housing cost savings programs.
Disproportionate Housing Need Displacement of Residents Due to Economic Pressures; Access to Financial Services
< 1 yr 10% increase in seniors in tax abatement program; 10% increase in participation in energy efficiency programs.
HousingNOLA, LHC, Assessor
Provide reliable, frequent, and affordable access to multiple transportation options to transit-dependent populations.
Better coordinate initiatives of housing agencies (OCD, HANO, NORA) and other departments (including Public Works, Parks and Parkways) and agencies (RTA, Sewerage and Water Board) to ensure that investments in gentrifying neighborhoods can be paired with affordable housing.
Disparity in Access to Opportunity Lack of public investments in specific neighborhoods; Lack of private investment in specific neighborhoods
1 - 3 yrs Refine and Revise Place Based Areas; Tracking and Reporting on all CDBG funding used for non-housing investments; Continue Geographically Limited NOFAs

145
Provide reliable, frequent, and affordable access to multiple transportation options to transit-dependent populations.
Ensure that the Regional Transit Authority (RTA) serves areas with higher concentration of affordable housing and transit dependent populations.
R/ECAP; Disparity in access to opportunity;
Availability, type, frequency, and reliability of public transportation; Location and Type of Affordable Housing
1 - 3 yrs RTA Strategic Plan Developed
RTA, OCD
Include the participation of housing policymakers in the development of the RTA Strategic Plan
Segregation; Disparity in Access to Opportunity;
Availability, type, frequency, and reliability of public transportation; Location and Type of Affordable Housing
1 - 3 yrs RTA Strategic Plan Developed with Housing Metrics Included
RTA, OCD
Direct more public land and financial subsidy towards affordable housing development, especially within a quarter-mile of any high frequency transit stop and proficient schools.
Segregation; Disparity in Access to Opportunity;
Availability, type, frequency, and reliability of public transportation; Location and Type of Affordable Housing; Location of proficient schools and school assignment policies.
1 - 3 yrs RTA Strategic Plan Developed; Identify adjudicated property in close proximity to transit lines
OCD, RTA, NORA, Finance Department

146
The City of New Orleans and the Housing Authority of New Orleans thank our partners who contributed to
the development of this assessment.
Greater New Orleans Fair Housing Action Center
PolicyLink
Lawyers’ Committee on Civil Rights Under Law
HousingNOLA
Enterprise Community Partners