Embed Size (px)
Citation preview
Registered Office and Principal Place of Business: 293 Springvale Road, Glen Waverley Vic 3150
MONASH CITY COUNCILFINANCIAL REPORT
FOR THE YEAR ENDED 30 JUNE 2015
Page 1
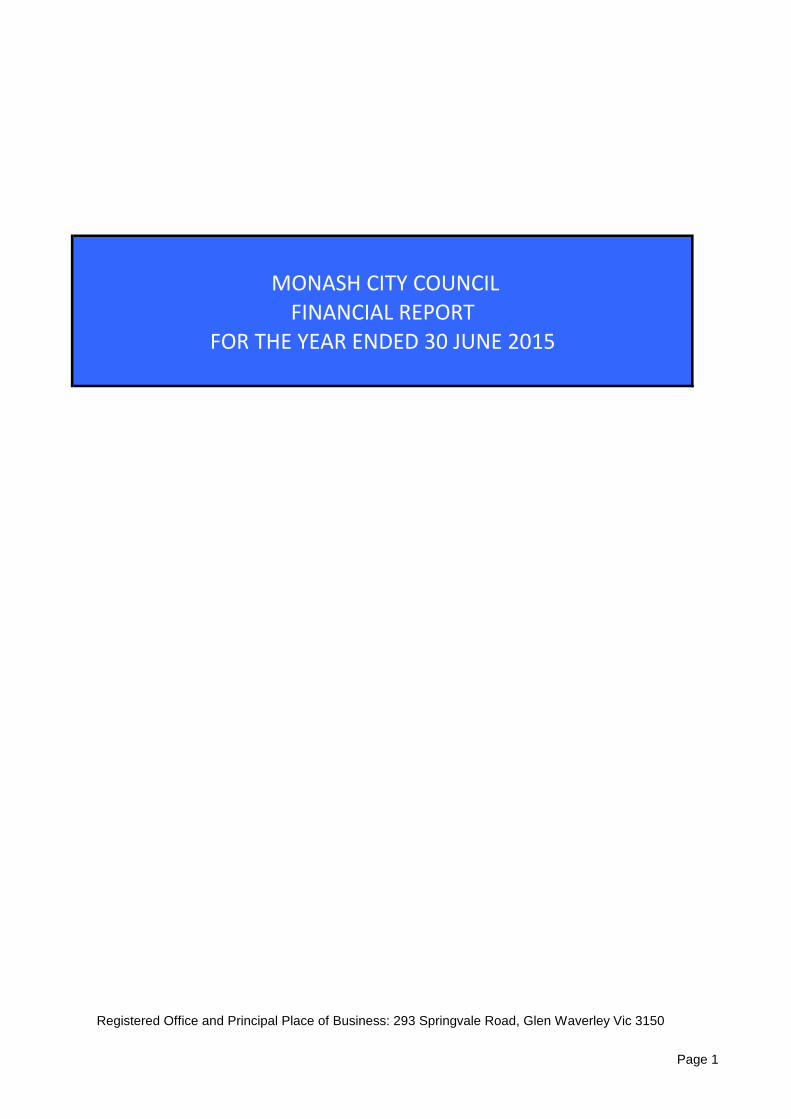
for the Year Ended 30 June 2015
Table of Contents
Page
Comprehensive Income Statement 2Balance Sheet 3Statement of Changes in Equity 4Statements of Cash Flows 5Statements of Capital Works 6
Notes to the Financial Statements
Note 1 Significant Accounting Policies 7-13Note 2 Budget Comparison 14-15Note 3 Rates & Charges 16Note 4 Statutory Fees & Fines 16Note 5 User Fees 16Note 6 Contributions 16Note 7 Grants & Subsidies 17Note 8 Interest Revenue 18Note 9 Other Revenue 18Note 10 Net Gain/(Loss) on Disposal of Property, Infrastructure, Plant & Equipment 18Note 11 Net Gain on Disposal of Residential Aged Care Facilities 19Note 12 Investment In Associates Accounted for using the Equity Method 19Note 13 Employee Benefits 20Note 14 Materials, Services & Contracts 20Note 15 Depreciation 21Note 16 Finance Costs 21Note 17 Other Expenses 21Note 18 Cash & Cash Equivalents 21Note 19 Other Financial Assets 21Note 20 Trade & Other Receivables 22Note 21 Other Assets 22Note 22 Property, Infrastructure, Plant & Equipment 23-29Note 23 Trade & Other Payables 30Note 24 Trust Funds & Deposits 30Note 25 Income in Advance 30Note 26 Provisions 31Note 27 Interest-Bearing Loans & Borrowings 32Note 28 Reserves 33-34Note 29 Contractual Commitments 35Note 30 Operating Lease Commitments 35Note 31 Contingent Liabilities and Assets 36Note 32 Related Party Transactions 37Note 33 Auditors' Remuneration 38Note 34 Reconciliation of cash flows from operating activities to surplus/(deficit) 38Note 35 Financial Instruments 39-40Note 36 Event Occuring After Balance Date 40
Certification of the Financial Report 41
Monash City Council
Annual Financial Report
Page 2
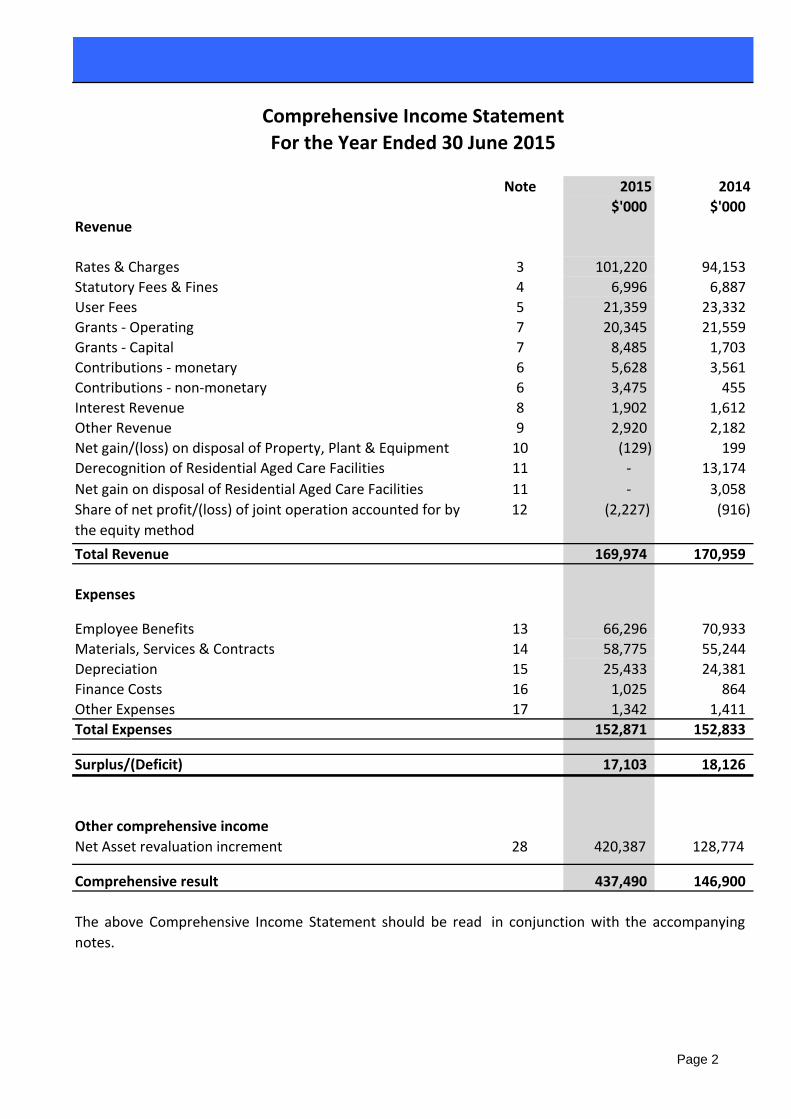
For the Year Ended 30 June 2015
Note 2015 2014
$'000 $'000
Revenue
Rates & Charges 3 101,220 94,153
Statutory Fees & Fines 4 6,996 6,887
User Fees 5 21,359 23,332
Grants - Operating 7 20,345 21,559
Grants - Capital 7 8,485 1,703
Contributions - monetary 6 5,628 3,561
Contributions - non-monetary 6 3,475 455
Interest Revenue 8 1,902 1,612
Other Revenue 9 2,920 2,182
Net gain/(loss) on disposal of Property, Plant & Equipment 10 (129) 199
Derecognition of Residential Aged Care Facilities 11 - 13,174
Net gain on disposal of Residential Aged Care Facilities 11 - 3,058
12 (2,227) (916)
Total Revenue 169,974 170,959
Expenses
Employee Benefits 13 66,296 70,933
Materials, Services & Contracts 14 58,775 55,244
Depreciation 15 25,433 24,381
Finance Costs 16 1,025 864
Other Expenses 17 1,342 1,411
Total Expenses 152,871 152,833
Surplus/(Deficit) 17,103 18,126
Other comprehensive income
Net Asset revaluation increment 28 420,387 128,774
Comprehensive result 437,490 146,900
Comprehensive Income Statement
Share of net profit/(loss) of joint operation accounted for by
the equity method
The above Comprehensive Income Statement should be read in conjunction with the accompanying
notes.
Page 2
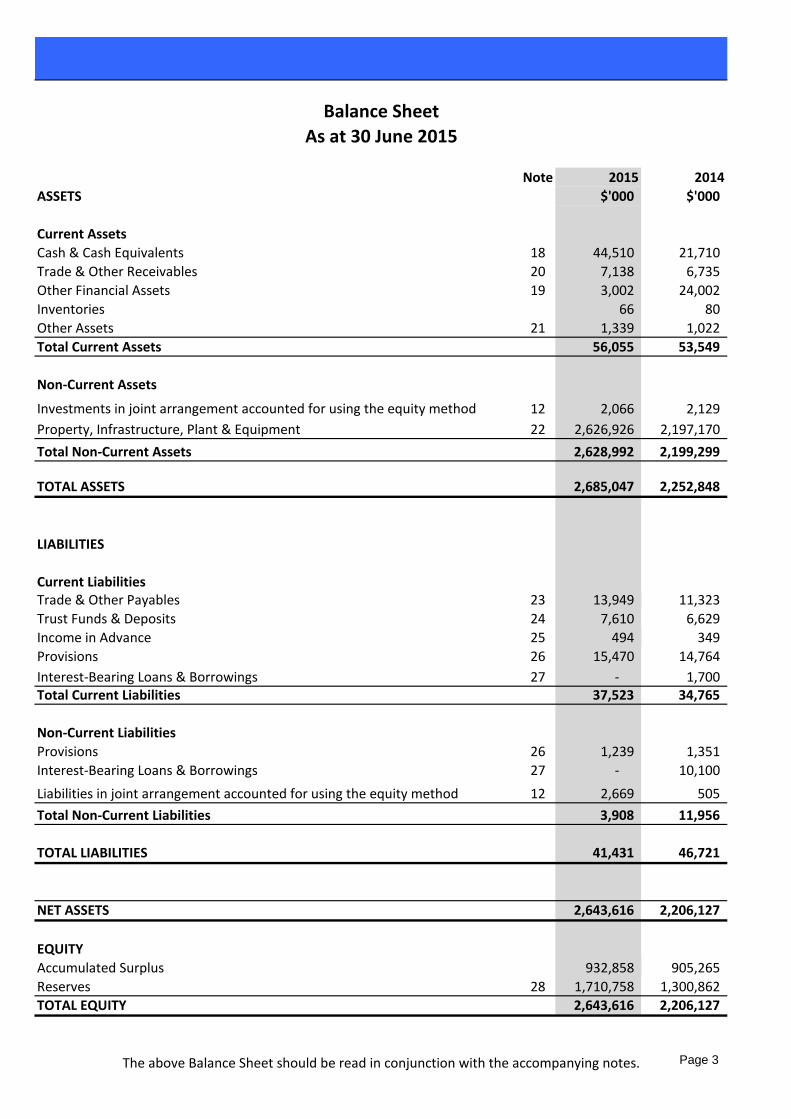
Note 2015 2014
ASSETS $'000 $'000
Current Assets
Cash & Cash Equivalents 18 44,510 21,710
Trade & Other Receivables 20 7,138 6,735
Other Financial Assets 19 3,002 24,002
Inventories 66 80
Other Assets 21 1,339 1,022
Total Current Assets 56,055 53,549
Non-Current Assets
12 2,066 2,129
Property, Infrastructure, Plant & Equipment 22 2,626,926 2,197,170
Total Non-Current Assets 2,628,992 2,199,299
TOTAL ASSETS 2,685,047 2,252,848
LIABILITIES
Current LiabilitiesTrade & Other Payables 23 13,949 11,323
Trust Funds & Deposits 24 7,610 6,629
Income in Advance 25 494 349
Provisions 26 15,470 14,764
Interest-Bearing Loans & Borrowings 27 - 1,700 Total Current Liabilities 37,523 34,765
Non-Current Liabilities
Provisions 26 1,239 1,351
Interest-Bearing Loans & Borrowings 27 - 10,100
Liabilities in joint arrangement accounted for using the equity method 12 2,669 505
Total Non-Current Liabilities 3,908 11,956
TOTAL LIABILITIES 41,431 46,721
NET ASSETS 2,643,616 2,206,127
EQUITY
Accumulated Surplus 932,858 905,265
Reserves 28 1,710,758 1,300,862
TOTAL EQUITY 2,643,616 2,206,127
The above Balance Sheet should be read in conjunction with the accompanying notes.
Balance Sheet
As at 30 June 2015
Investments in joint arrangement accounted for using the equity method
Page 3
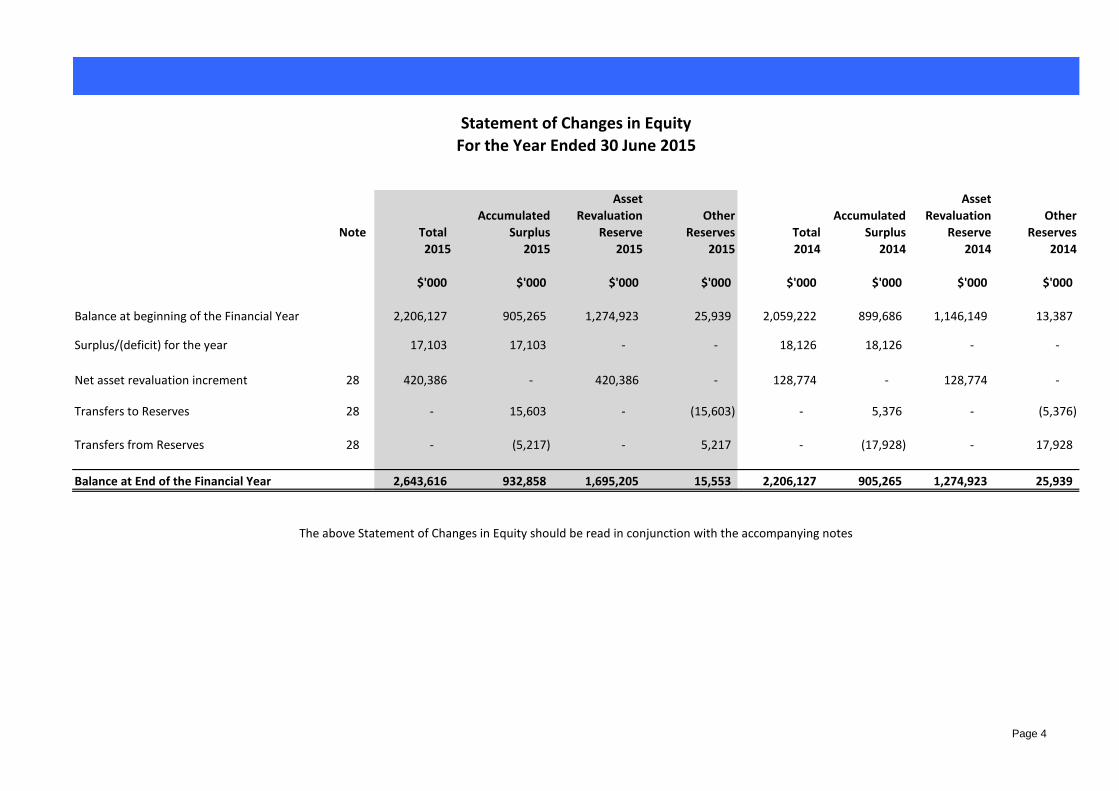
Asset Asset
Accumulated Revaluation Other Accumulated Revaluation Other
Note Total Surplus Reserve Reserves Total Surplus Reserve Reserves
2015 2015 2015 2015 2014 2014 2014 2014
$'000 $'000 $'000 $'000 $'000 $'000 $'000 $'000
Balance at beginning of the Financial Year 2,206,127 905,265 1,274,923 25,939 2,059,222 899,686 1,146,149 13,387
Surplus/(deficit) for the year 17,103 17,103 - - 18,126 18,126 - -
Net asset revaluation increment 28 420,386 - 420,386 - 128,774 - 128,774 -
5 5 Transfers to Reserves 28 - 15,603 - (15,603) - 5,376 - (5,376)
Transfers from Reserves 28 - (5,217) - 5,217 - (17,928) - 17,928
Balance at End of the Financial Year 2,643,616 932,858 1,695,205 15,553 2,206,127 905,265 1,274,923 25,939
Statement of Changes in Equity
For the Year Ended 30 June 2015
The above Statement of Changes in Equity should be read in conjunction with the accompanying notes
Page 4
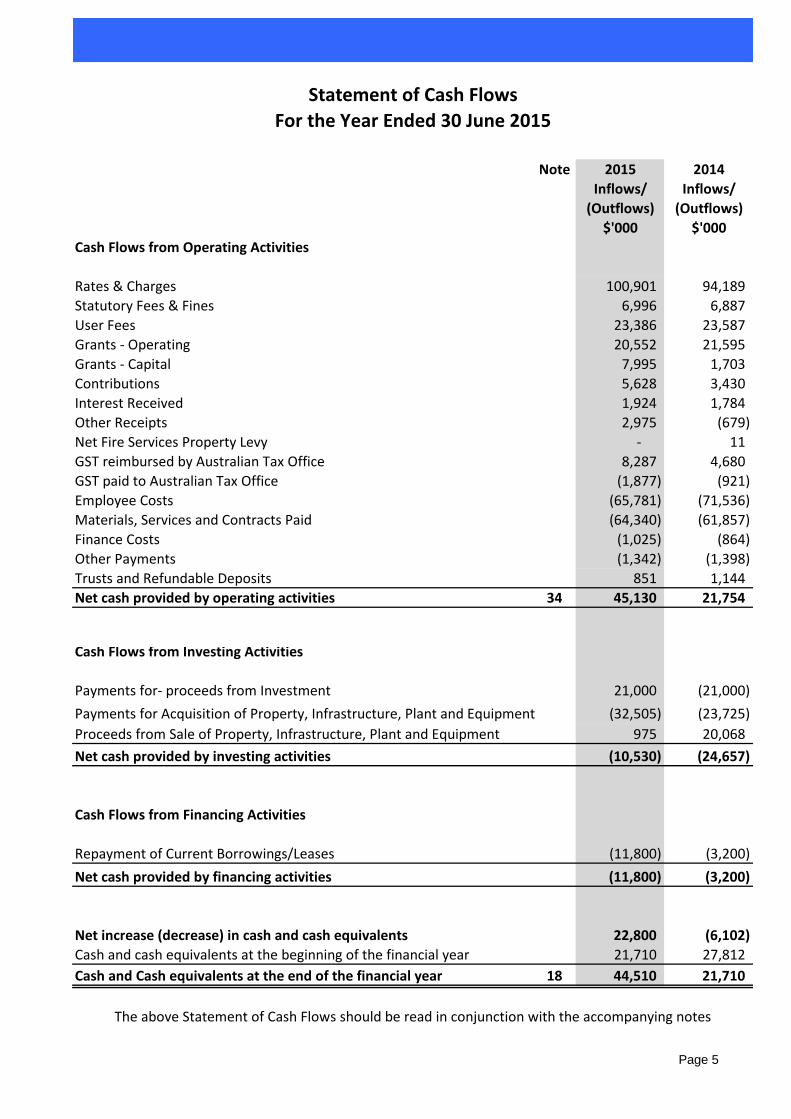
Note 2015 2014
Inflows/ Inflows/
(Outflows) (Outflows)
$'000 $'000
Cash Flows from Operating Activities
Rates & Charges 100,901 94,189
Statutory Fees & Fines 6,996 6,887
User Fees 23,386 23,587
Grants - Operating 20,552 21,595
Grants - Capital 7,995 1,703
Contributions 5,628 3,430
Interest Received 1,924 1,784
Other Receipts 2,975 (679)
Net Fire Services Property Levy - 11
GST reimbursed by Australian Tax Office 8,287 4,680
GST paid to Australian Tax Office (1,877) (921)
Employee Costs (65,781) (71,536)
Materials, Services and Contracts Paid (64,340) (61,857)
Finance Costs (1,025) (864)
Other Payments (1,342) (1,398)
Trusts and Refundable Deposits 851 1,144
Net cash provided by operating activities 34 45,130 21,754
Cash Flows from Investing Activities
Payments for- proceeds from Investment 21,000 (21,000)
Payments for Acquisition of Property, Infrastructure, Plant and Equipment (32,505) (23,725)
Proceeds from Sale of Property, Infrastructure, Plant and Equipment 975 20,068
Net cash provided by investing activities (10,530) (24,657)
Cash Flows from Financing Activities
Repayment of Current Borrowings/Leases (11,800) (3,200)
Net cash provided by financing activities (11,800) (3,200)
Net increase (decrease) in cash and cash equivalents 22,800 (6,102)
Cash and cash equivalents at the beginning of the financial year 21,710 27,812
Cash and Cash equivalents at the end of the financial year 18 44,510 21,710
The above Statement of Cash Flows should be read in conjunction with the accompanying notes
Statement of Cash Flows
For the Year Ended 30 June 2015
Page 5
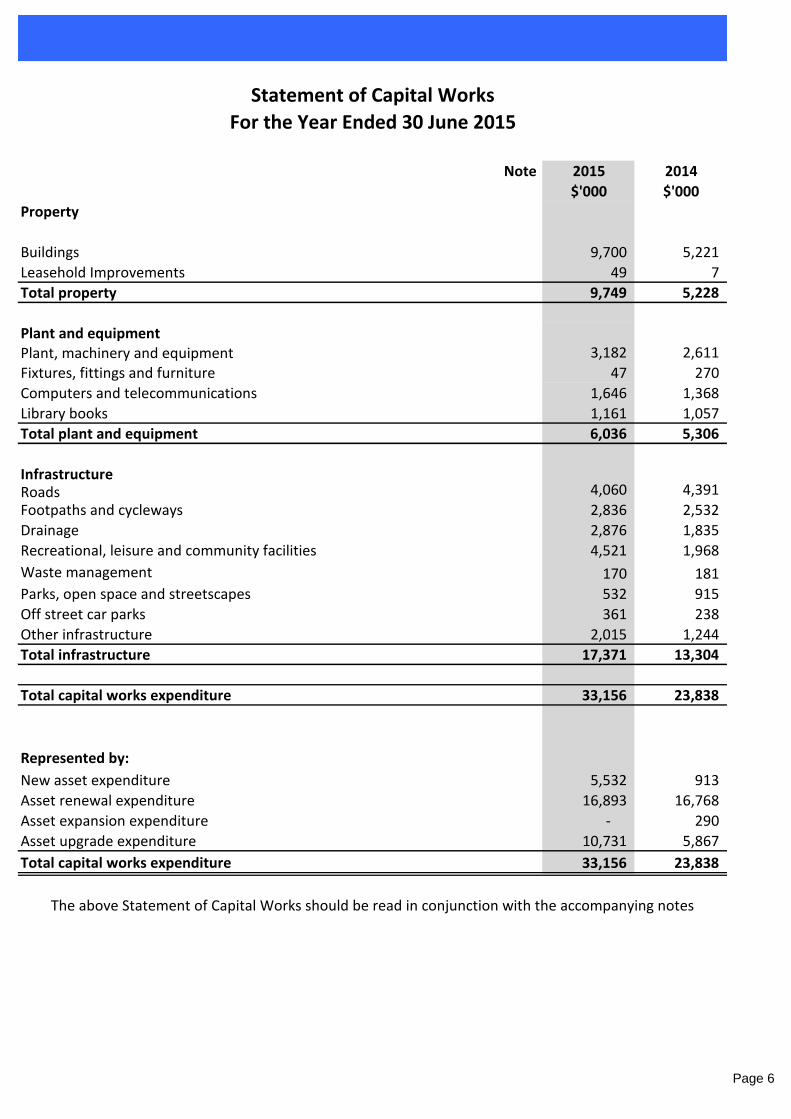
Note 2015 2014
$'000 $'000
Property
Buildings 9,700 5,221
Leasehold Improvements 49 7
Total property 9,749 5,228
Plant and equipmentPlant, machinery and equipment 3,182 2,611
Fixtures, fittings and furniture 47 270
Computers and telecommunications 1,646 1,368
Library books 1,161 1,057
Total plant and equipment 6,036 5,306
InfrastructureRoads 4,060 4,391
Footpaths and cycleways 2,836 2,532
Drainage 2,876 1,835
Recreational, leisure and community facilities 4,521 1,968
Waste management 170 181
Parks, open space and streetscapes 532 915
Off street car parks 361 238
Other infrastructure 2,015 1,244
Total infrastructure 17,371 13,304
Total capital works expenditure 33,156 23,838
Represented by:
New asset expenditure 5,532 913
Asset renewal expenditure 16,893 16,768
Asset expansion expenditure - 290
Asset upgrade expenditure 10,731 5,867
Total capital works expenditure 33,156 23,838
Statement of Capital Works
For the Year Ended 30 June 2015
The above Statement of Capital Works should be read in conjunction with the accompanying notes
Page 6
Notes to the Financial Report
For the Year Ended 30 June 2015
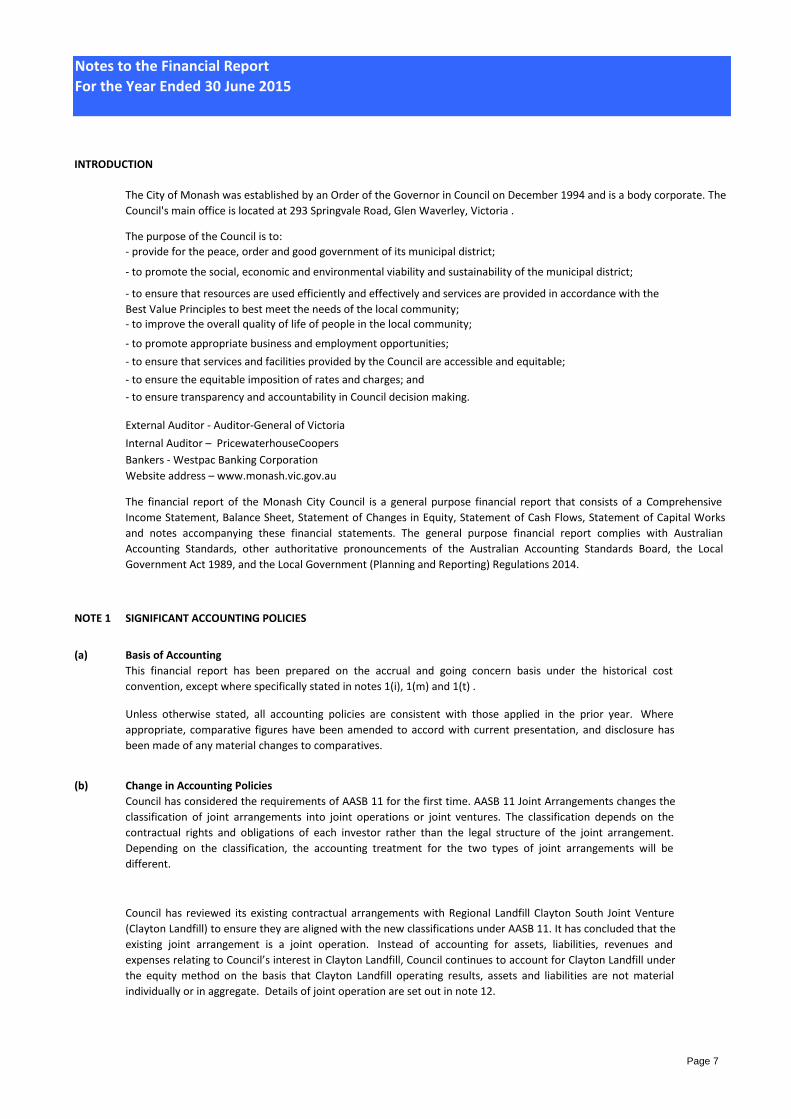
INTRODUCTION
The purpose of the Council is to:
- provide for the peace, order and good government of its municipal district;
- to promote the social, economic and environmental viability and sustainability of the municipal district;
- to ensure that resources are used efficiently and effectively and services are provided in accordance with the
Best Value Principles to best meet the needs of the local community; - to improve the overall quality of life of people in the local community;
- to promote appropriate business and employment opportunities;
- to ensure that services and facilities provided by the Council are accessible and equitable;
- to ensure the equitable imposition of rates and charges; and
- to ensure transparency and accountability in Council decision making.
External Auditor - Auditor-General of Victoria
Internal Auditor – PricewaterhouseCoopers
Bankers - Westpac Banking Corporation
Website address – www.monash.vic.gov.au
NOTE 1 SIGNIFICANT ACCOUNTING POLICIES
(a) Basis of Accounting
This financial report has been prepared on the accrual and going concern basis under the historical cost
convention, except where specifically stated in notes 1(i), 1(m) and 1(t) .
Unless otherwise stated, all accounting policies are consistent with those applied in the prior year. Where
appropriate, comparative figures have been amended to accord with current presentation, and disclosure has
been made of any material changes to comparatives.
(b) Change in Accounting Policies
Council has considered the requirements of AASB 11 for the first time. AASB 11 Joint Arrangements changes the
classification of joint arrangements into joint operations or joint ventures. The classification depends on the
contractual rights and obligations of each investor rather than the legal structure of the joint arrangement.
Depending on the classification, the accounting treatment for the two types of joint arrangements will be
different.
Council has reviewed its existing contractual arrangements with Regional Landfill Clayton South Joint Venture
(Clayton Landfill) to ensure they are aligned with the new classifications under AASB 11. It has concluded that the
existing joint arrangement is a joint operation. Instead of accounting for assets, liabilities, revenues and
expenses relating to Council’s interest in Clayton Landfill, Council continues to account for Clayton Landfill under
the equity method on the basis that Clayton Landfill operating results, assets and liabilities are not material
individually or in aggregate. Details of joint operation are set out in note 12.
The City of Monash was established by an Order of the Governor in Council on December 1994 and is a body corporate. The
Council's main office is located at 293 Springvale Road, Glen Waverley, Victoria .
The financial report of the Monash City Council is a general purpose financial report that consists of a Comprehensive
Income Statement, Balance Sheet, Statement of Changes in Equity, Statement of Cash Flows, Statement of Capital Works
and notes accompanying these financial statements. The general purpose financial report complies with Australian
Accounting Standards, other authoritative pronouncements of the Australian Accounting Standards Board, the Local
Government Act 1989, and the Local Government (Planning and Reporting) Regulations 2014.
Page 7
Notes to the Financial Report
For the Year Ended 30 June 2015
(c) Revenue recognition
Rates, Grants and Contributions
Statutory fees and fines
User Fees and Fines
Sale of property, plant and equipment, infrastructure
Interest
Interest is recognised progressively as it is earned.
Dividends
Dividend revenue is recognised when the Council's right to receive payment is established.
Other Income
(d) Inventories
(e) Fair value measurement
Level 3 — Valuation techniques for which the lowest level input that is significant to the fair value measurement is
unobservable.
Inventories held for distribution are measured at cost, adjusted when applicable for any loss of service potential. Other
inventories are measured at the lower of cost and the net realisable value.
User Fees and Fines (including parking fees and fines) are recognised as revenue when the service has been provided, the
payment is received, or when the penalty has been applied whichever first occurs. A provision for doubtful debts is
recognised when collection in full is no longer probable.
The profit or loss on sale of an asset is determined when control of the asset has irrevocably passed to the buyer.
For the purpose of fair value disclosures, Council has determined classes of assets and liabilities on the basis of the nature,
characteristics and risks of the asset or liability and the level of the fair value hierarchy as explained above.
In addition, Council determines whether transfers have occurred between levels in the hierarchy by re-assessing
categorisation (based on the lowest level input that is significant to the fair value measurement as a whole) at the end of
each reporting period.
Council measures certain assets and liabilities at fair value where required or permitted by Australian Accounting Standards.
AASB 13 Fair value measurement, aims to improve consistency and reduce complexity by providing a definition of fair value
and a single source of fair value measurement and disclosure requirements for use across Australian Accounting Standards.
AASB 13 defines fair value as the price that would be received to sell an asset or paid to transfer a liability in an orderly
transaction between market participants at the measurement date. Fair value under AASB 13 is an exit price regardless of
whether that price is directly observable or estimated using another valuation technique.
All assets and liabilities for which fair value is measured or disclosed in the financial statements are categorised within a fair
value hierarchy, described as follows, based on the lowest level input that is significant to the fair value measurement as a
whole:
Level 1 — Quoted (unadjusted) market prices in active markets for identical assets or liabilities;
Level 2 — Valuation techniques for which the lowest level input that is significant to the fair value measurement is directly
or indirectly observable; and
Statutory fees and fines (including parking fees and fines) are recognised as revenue when the service has been provided,
the payment is received, or when the penalty has been applied, whichever first occurs.
Rates, grants and contributions (including developer contributions) are recognised as revenues when the Council obtains
control over the assets comprising these receipts.
Control over assets acquired from rates is obtained at the commencement of the rating year as it is an enforceable debt
linked to the rateable property or, where earlier, upon receipt of the rates. A provision for doubtful debts on rates has not
been established as unpaid rates represents a charge against the rateable property that will be recovered when the
property is next sold.
Control over granted assets is normally obtained upon their receipt.
A liability is recognised in respect of revenue that is reciprocal in nature to the extent that the requisite service has not been
provided at the balance date.
Income is recognised when the Council obtains control of the contribution or the right to receive the contribution, it is
probable that the economic benefits comprising the contribution will flow to the Council and the amount of the
contribution can be measured reliably. Where grants or contributions recognised as revenues during the financial year
were obtained on condition that they be expended in a particular manner or used over a particular period and those
conditions were undischarged at balance date, the unused grant or subsidies is disclosed in Note 7. The Note also discloses
the amount of unused grant or contribution from prior years that was expended on Council's operations during the current
year.
Other income is measured at the fair value of the consideration received or receivable and is recognised when Council gains
control over the right to receive the income.
Page 8

Notes to the Financial Report
For the Year Ended 30 June 2015
(f)
2014/15Asset Description Useful Life
Land Indefinite
Land Under Roads Indefinite
Buildings 40 - 50 Years
Heritage Buildings 250 years
Plant & Machinery 2- 7 Years
Furniture & Equipment 3 -10 Years
Art IndefiniteLibrary Books 4 -7 Years
Roads
Base,Right of Ways,Kerb Channels 100-150 Years
Seal 25 Years
Footpaths 80 Years
Drains 100 Years
Bridges 40 - 120 Years
Other Infrastructure 10 - 100 Years
(g) Repairs and Maintenance
(h) Borrowing costs
Borrowing costs include interest on bank overdrafts and interest on borrowings.
(i) Recognition and measurement of Assets
Acquisition
Class of Asset Threshold$
Property, Infrastructure, Plant & Equipment
-Land 1
-Land under roads 1
-Buildings 1
-Plant & Equipment 1000
-Furniture & Fittings 1000
-Art 1
-Library Books 1
-Roads & Pavements 1
-Drains 1
-Bridges 1
The following classes of assets have been recognised in Note 22.
Routine maintenance, repair costs and minor renewal costs are expensed as incurred. Where the repair relates to the
replacement of a component of an asset and the cost exceeds the capitalisation threshold the cost is capitalised and depreciated.
The carrying value of the replaced assets is expensed.
Borrowing costs are recognised as an expense in the period in which they are incurred, except where they are capitalised as part
of a qualifying asset constructed by Council. Except where specific borrowings are obtained for the purpose of specific asset
acquisition, the weighted average interest rate applicable to borrowings at balance date, excluding borrowings associated with
superannuation, is used to determine the borrowing costs to be capitalised.
The purchase method of accounting is used for all acquisitions of assets, being the fair value of assets provided as consideration at
the date of acquisition plus any incidental costs attributable to the acquisition. Fair value is the price that would be received to
sell an asset or paid to transfer a liability in an orderly transaction between market participants at the measurement date.
Where assets are constructed by Council, costs include all materials used in construction, direct labour, and an appropriate share
of directly attributable variable and fixed overheads.
In accordance with Council policy, the threshold limits detailed below have been applied when recognising assets within applicable
asset class and unless otherwise stated are consistent with the prior year.
Depreciation of Property, Plant and Equipment, Infrastructure
Land and Artworks are not considered depreciable asset classes.
Major depreciation periods used are listed below and are consistent with the prior year unless otherwise stated:
Buildings, land improvements, plant and equipment, infrastructure and other assets have limited useful lives and are
systematically depreciated over their useful lives to the Council in a manner which reflects consumption of the service potential
embodied in those assets. Estimates of remaining useful lives and residual values are made on a regular basis with major asset
classes reassessed annually. Depreciation rates and methods are reviewed annually.
Depreciation is recognised on a straight line basis using rates which are reviewed each reporting period with respect to the
estimated remaining useful life of those assets.
During the financial year, Council reviewed the useful life, and applicable depreciation rates, of all asset classes, in accordance
with Australian Accounting Standard AASB 116 "Property, Plant & Equipment".
Page 9
Notes to the Financial Report
For the Year Ended 30 June 2015
(i) Recognition and measurement of Assets (Cont.)
Revaluation
Land Under Roads
(j) Cash & Cash Equivalents
(k) Trade and other receivables
(l) Other Financial Assets
For the purposes of the statement of cash flows, cash and cash equivalents include cash on hand, deposits at call, and other
highly liquid investments (term deposits with a maturity date of 90 days or less) with original maturities of three months or
less, net of outstanding bank overdrafts.
Receivables are carried at amortised cost using the effective interest rate method. A provision for doubtful debts is
recognised when there is objective evidence that an impairment has occurred.
Financial assets are valued at fair value, being market value, at balance date. Any unrealised gains and losses on holdings at
balance date are recognised as either a revenue or expenses. This includes term deposits with a maturity date greater than
90 days.
Subsequent to the initial recognition of assets, non-current physical assets, other than plant and equipment, are measured
at their fair value, being the amount for which the assets could be exchanged between Subsequent to the initial recognition
of assets, non-current physical assets, other than plant and equipment, are measured at their fair value, being the price that
would be received to sell an asset or paid to transfer a liability in an orderly transaction between market participants at the
measurement date. At balance date, the Council reviewed the carrying value of the individual classes of assets measured at
fair value to ensure that each asset materially approximated its fair value. Where the carrying value materially differed
from the fair value at balance date, the class of asset was revalued.
Fair value valuations are determined in accordance with a valuation hierarchy. Changes to the valuation hierarchy will only
occur if an external change in the restrictions or limitations of use on an asset result in changes to the permissible or
practical highest and best use of the asset. Further details regarding the fair value hierarchy are disclosed at Note 22,
Property, infrastructure, plant and equipment, and infrastructure.
In addition, Council undertakes a formal revaluation (either by experienced and appropriately qualified council officers or
independent experts) of land, buildings, art works and infrastructure assets on a regular basis, usually at intervals of 2 or 3
years. The basis of valuation is detailed in Note 22.
Where the assets are revalued, the revaluation increments are credited directly to the asset revaluation reserve except to
the extent that an increment reverses a prior year decrement for that class of asset that had been recognised as an expense,
in which case the increment is recognised as revenue up to the amount of the expense. Revaluation decrements are
recognised as an expense except where prior increments are included in the asset revaluation reserve for that class of asset
in which case the decrement is taken to the reserve to the extent of the remaining increments. Within the same class of
assets, revaluation increments and decrements within the year are offset.
Land under roads acquired after 30 June 2008 is brought to account using the deemed cost value basis. Council does not
recognise land under roads that it controlled prior to that period in its financial report.
In July 2011, the Department of Transport, Planning and Local Infrastructure (former Department of Planning and
Community Development (DPCD)) issued guidance circular LGV circular 15/11 regarding the recognition and measurement
of land under roads. It recommended that Council should recognise all land under roads it controls at fair value. In
December 2014 an extended transitional period was proposed and the Department expects Councils to be compliant by the
2017-18 financial year.
Page 10
Notes to the Financial Report
For the Year Ended 30 June 2015
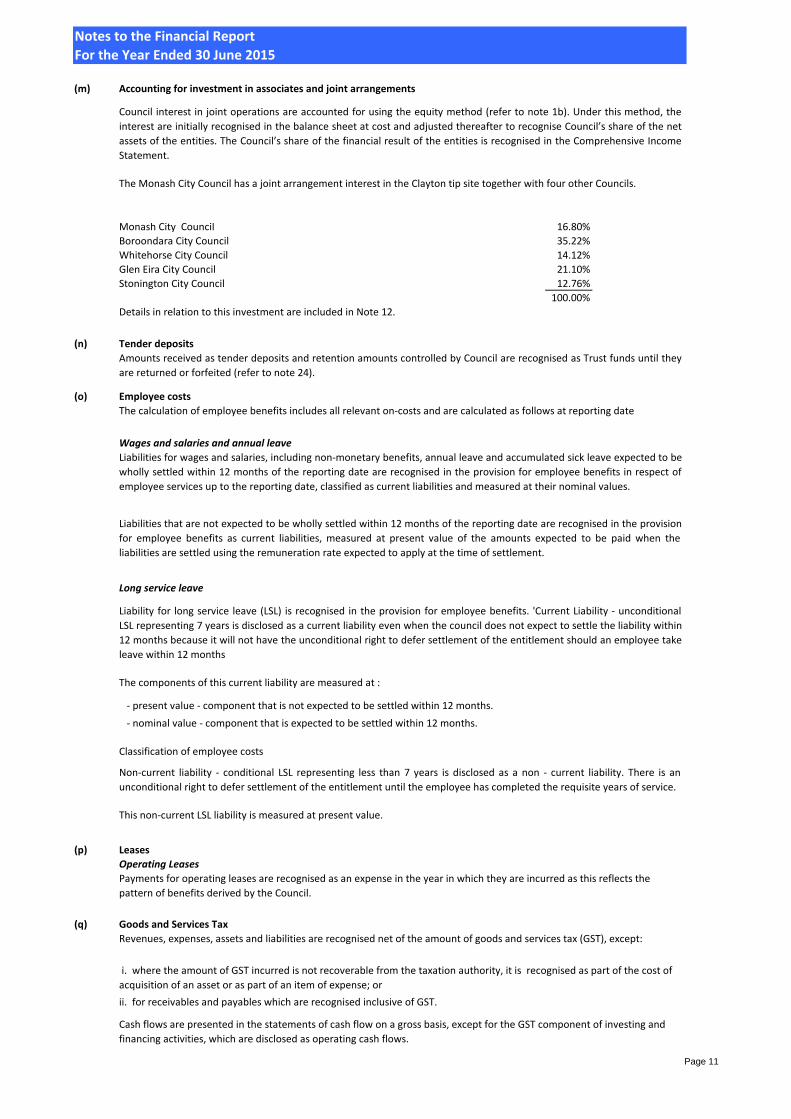
(m) Accounting for investment in associates and joint arrangements
Monash City Council 16.80%
Boroondara City Council 35.22%
Whitehorse City Council 14.12%
Glen Eira City Council 21.10%
Stonington City Council 12.76%
100.00%
Details in relation to this investment are included in Note 12.
(n) Tender deposits
(o) Employee costs
Wages and salaries and annual leave
Classification of employee costs
(p) Leases
Operating Leases
(q) Goods and Services Tax
ii. for receivables and payables which are recognised inclusive of GST.
Liability for long service leave (LSL) is recognised in the provision for employee benefits. 'Current Liability - unconditional
LSL representing 7 years is disclosed as a current liability even when the council does not expect to settle the liability within
12 months because it will not have the unconditional right to defer settlement of the entitlement should an employee take
leave within 12 months
- present value - component that is not expected to be settled within 12 months.
Long service leave
The components of this current liability are measured at :
Non-current liability - conditional LSL representing less than 7 years is disclosed as a non - current liability. There is an
unconditional right to defer settlement of the entitlement until the employee has completed the requisite years of service.
Payments for operating leases are recognised as an expense in the year in which they are incurred as this reflects the
pattern of benefits derived by the Council.
Revenues, expenses, assets and liabilities are recognised net of the amount of goods and services tax (GST), except:
i. where the amount of GST incurred is not recoverable from the taxation authority, it is recognised as part of the cost of
acquisition of an asset or as part of an item of expense; or
Cash flows are presented in the statements of cash flow on a gross basis, except for the GST component of investing and
financing activities, which are disclosed as operating cash flows.
- nominal value - component that is expected to be settled within 12 months.
This non-current LSL liability is measured at present value.
Council interest in joint operations are accounted for using the equity method (refer to note 1b). Under this method, the
interest are initially recognised in the balance sheet at cost and adjusted thereafter to recognise Council’s share of the net
assets of the entities. The Council’s share of the financial result of the entities is recognised in the Comprehensive Income
Statement.
The Monash City Council has a joint arrangement interest in the Clayton tip site together with four other Councils.
Amounts received as tender deposits and retention amounts controlled by Council are recognised as Trust funds until they
are returned or forfeited (refer to note 24).
The calculation of employee benefits includes all relevant on-costs and are calculated as follows at reporting date
Liabilities for wages and salaries, including non-monetary benefits, annual leave and accumulated sick leave expected to be
wholly settled within 12 months of the reporting date are recognised in the provision for employee benefits in respect of
employee services up to the reporting date, classified as current liabilities and measured at their nominal values.
Liabilities that are not expected to be wholly settled within 12 months of the reporting date are recognised in the provision
for employee benefits as current liabilities, measured at present value of the amounts expected to be paid when the
liabilities are settled using the remuneration rate expected to apply at the time of settlement.
Page 11
Notes to the Financial Report
For the Year Ended 30 June 2015
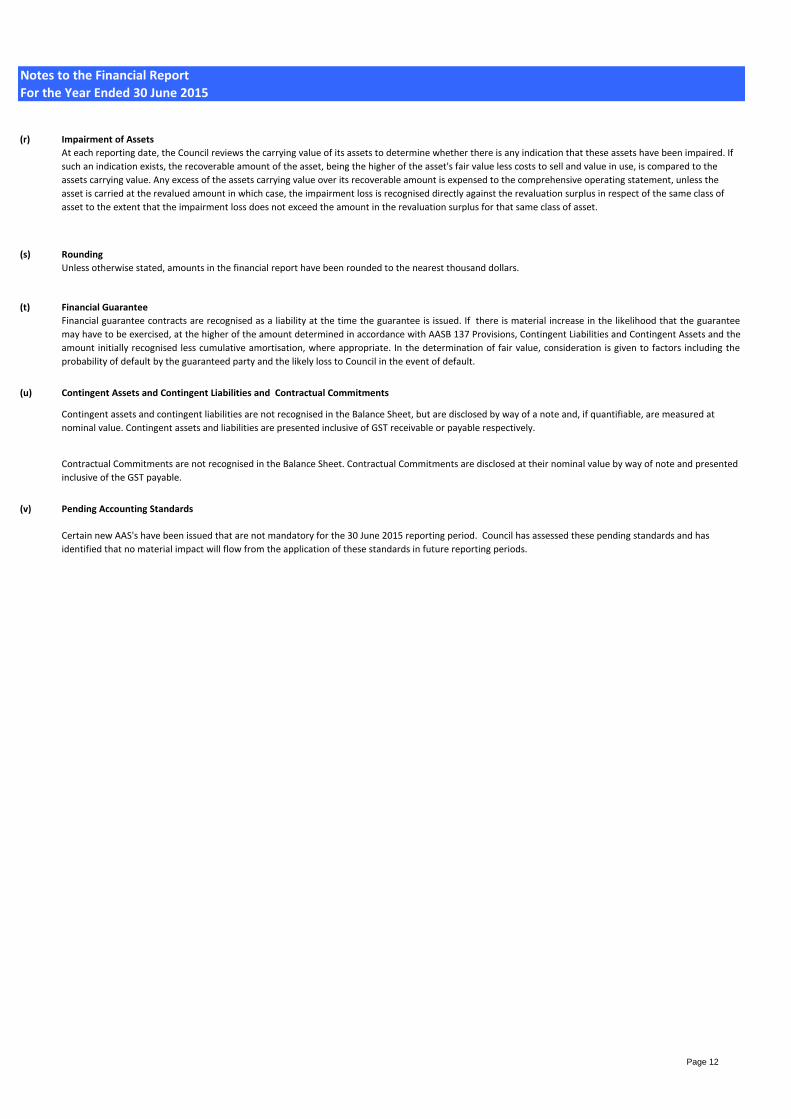
(r) Impairment of Assets
(s) Rounding
(t) Financial Guarantee
(u) Contingent Assets and Contingent Liabilities and Contractual Commitments
(v) Pending Accounting Standards
Certain new AAS's have been issued that are not mandatory for the 30 June 2015 reporting period. Council has assessed these pending standards and has
identified that no material impact will flow from the application of these standards in future reporting periods.
At each reporting date, the Council reviews the carrying value of its assets to determine whether there is any indication that these assets have been impaired. If
such an indication exists, the recoverable amount of the asset, being the higher of the asset's fair value less costs to sell and value in use, is compared to the
assets carrying value. Any excess of the assets carrying value over its recoverable amount is expensed to the comprehensive operating statement, unless the
asset is carried at the revalued amount in which case, the impairment loss is recognised directly against the revaluation surplus in respect of the same class of
asset to the extent that the impairment loss does not exceed the amount in the revaluation surplus for that same class of asset.
Unless otherwise stated, amounts in the financial report have been rounded to the nearest thousand dollars.
Financial guarantee contracts are recognised as a liability at the time the guarantee is issued. If there is material increase in the likelihood that the guarantee
may have to be exercised, at the higher of the amount determined in accordance with AASB 137 Provisions, Contingent Liabilities and Contingent Assets and the
amount initially recognised less cumulative amortisation, where appropriate. In the determination of fair value, consideration is given to factors including the
probability of default by the guaranteed party and the likely loss to Council in the event of default.
Contingent assets and contingent liabilities are not recognised in the Balance Sheet, but are disclosed by way of a note and, if quantifiable, are measured at
nominal value. Contingent assets and liabilities are presented inclusive of GST receivable or payable respectively.
Contractual Commitments are not recognised in the Balance Sheet. Contractual Commitments are disclosed at their nominal value by way of note and presented
inclusive of the GST payable.
Page 12
Notes to the Financial Report
For the Year Ended 30 June 2015
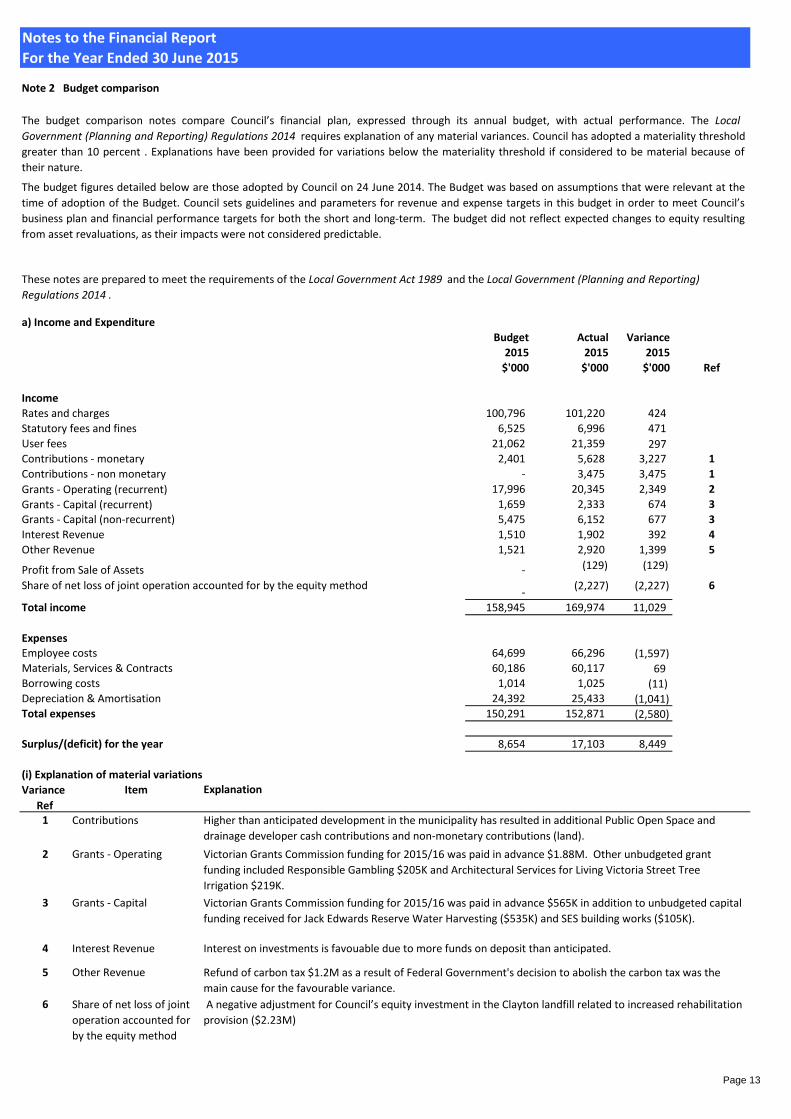
Note 2 Budget comparison
a) Income and Expenditure
Budget Actual Variance
2015 2015 2015
$'000 $'000 $'000 Ref
Income
Rates and charges 100,796 101,220 424
Statutory fees and fines 6,525 6,996 471
User fees 21,062 21,359 297 Contributions - monetary 2,401 5,628 3,227 1
Contributions - non monetary - 3,475 3,475 1
Grants - Operating (recurrent) 17,996 20,345 2,349 2
Grants - Capital (recurrent) 1,659 2,333 674 3
Grants - Capital (non-recurrent) 5,475 6,152 677 3
Interest Revenue 1,510 1,902 392 4
Other Revenue 1,521 2,920 1,399 5
Profit from Sale of Assets - (129) (129)
Share of net loss of joint operation accounted for by the equity method-
(2,227) (2,227) 6
Total income 158,945 169,974 11,029
ExpensesEmployee costs 64,699 66,296 (1,597)Materials, Services & Contracts 60,186 60,117 69 Borrowing costs 1,014 1,025 (11)Depreciation & Amortisation 24,392 25,433 (1,041)Total expenses 150,291 152,871 (2,580)
Surplus/(deficit) for the year 8,654 17,103 8,449
(i) Explanation of material variations
Item Explanation
1 Contributions
2 Grants - Operating
3 Grants - Capital
4 Interest Revenue Interest on investments is favouable due to more funds on deposit than anticipated.
5 Other Revenue
6 Share of net loss of joint
operation accounted for
by the equity method
The budget comparison notes compare Council’s financial plan, expressed through its annual budget, with actual performance. The Local
Government (Planning and Reporting) Regulations 2014 requires explanation of any material variances. Council has adopted a materiality threshold
greater than 10 percent . Explanations have been provided for variations below the materiality threshold if considered to be material because of
their nature.
The budget figures detailed below are those adopted by Council on 24 June 2014. The Budget was based on assumptions that were relevant at the
time of adoption of the Budget. Council sets guidelines and parameters for revenue and expense targets in this budget in order to meet Council’s
business plan and financial performance targets for both the short and long-term. The budget did not reflect expected changes to equity resulting
from asset revaluations, as their impacts were not considered predictable.
These notes are prepared to meet the requirements of the Local Government Act 1989 and the Local Government (Planning and Reporting)
Regulations 2014 .
A negative adjustment for Council’s equity investment in the Clayton landfill related to increased rehabilitation
provision ($2.23M)
Higher than anticipated development in the municipality has resulted in additional Public Open Space and
drainage developer cash contributions and non-monetary contributions (land).
Victorian Grants Commission funding for 2015/16 was paid in advance $1.88M. Other unbudgeted grant
funding included Responsible Gambling $205K and Architectural Services for Living Victoria Street Tree
Irrigation $219K.
Victorian Grants Commission funding for 2015/16 was paid in advance $565K in addition to unbudgeted capital
funding received for Jack Edwards Reserve Water Harvesting ($535K) and SES building works ($105K).
Refund of carbon tax $1.2M as a result of Federal Government's decision to abolish the carbon tax was the
main cause for the favourable variance.
Variance
Ref
Page 13
Notes to the Financial Report
For the Year Ended 30 June 2015
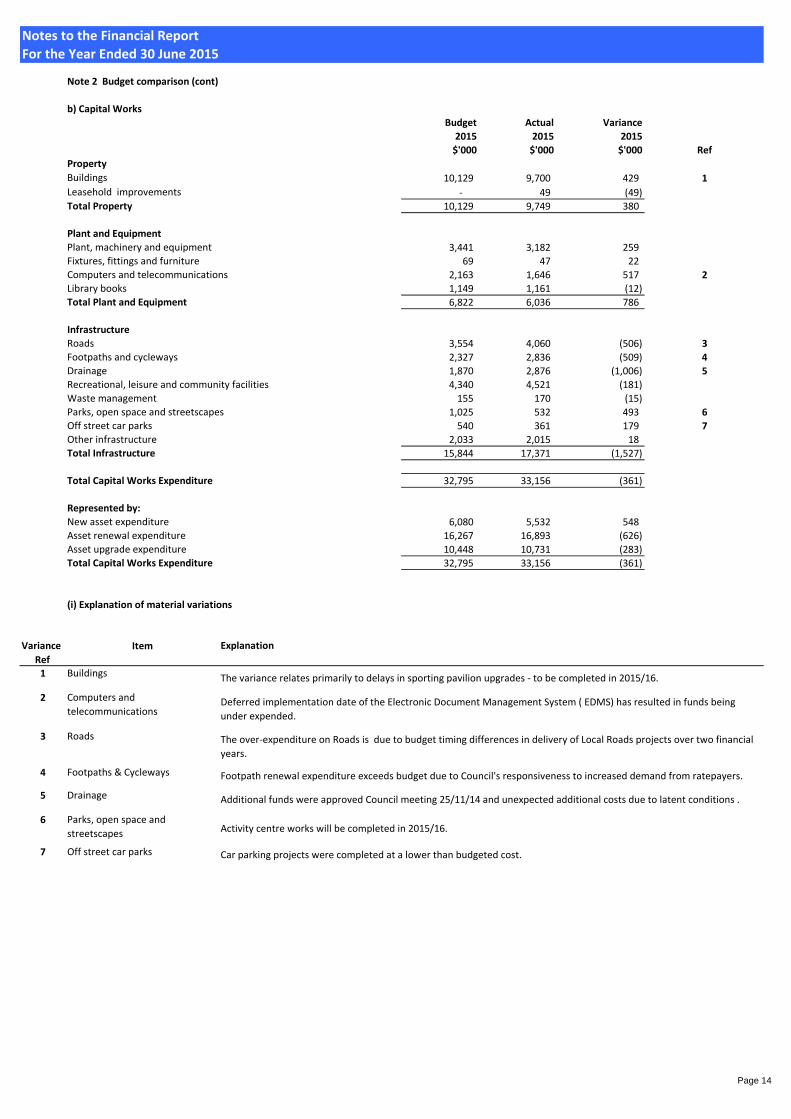
Note 2 Budget comparison (cont)
b) Capital Works
Budget Actual Variance
2015 2015 2015
$'000 $'000 $'000 Ref
Property
Buildings 10,129 9,700 429 1
Leasehold improvements - 49 (49)
Total Property 10,129 9,749 380
Plant and Equipment
Plant, machinery and equipment 3,441 3,182 259
Fixtures, fittings and furniture 69 47 22
Computers and telecommunications 2,163 1,646 517 2
Library books 1,149 1,161 (12) Total Plant and Equipment 6,822 6,036 786
Infrastructure
Roads 3,554 4,060 (506) 3
Footpaths and cycleways 2,327 2,836 (509) 4Drainage 1,870 2,876 (1,006) 5
Recreational, leisure and community facilities 4,340 4,521 (181)
Waste management 155 170 (15)
Parks, open space and streetscapes 1,025 532 493 6
Off street car parks 540 361 179 7Other infrastructure 2,033 2,015 18 Total Infrastructure 15,844 17,371 (1,527)
Total Capital Works Expenditure 32,795 33,156 (361)
Represented by:
New asset expenditure 6,080 5,532 548
Asset renewal expenditure 16,267 16,893 (626)
Asset upgrade expenditure 10,448 10,731 (283) Total Capital Works Expenditure 32,795 33,156 (361)
(i) Explanation of material variations
Item Explanation
1 Buildings The variance relates primarily to delays in sporting pavilion upgrades - to be completed in 2015/16.
2 Computers and
telecommunications
3 Roads
4 Footpaths & Cycleways
5 Drainage
6 Parks, open space and
streetscapes Activity centre works will be completed in 2015/16.
7 Off street car parks Car parking projects were completed at a lower than budgeted cost.
Variance
Ref
Deferred implementation date of the Electronic Document Management System ( EDMS) has resulted in funds being
under expended.
The over-expenditure on Roads is due to budget timing differences in delivery of Local Roads projects over two financial
years.
Footpath renewal expenditure exceeds budget due to Council's responsiveness to increased demand from ratepayers.
Additional funds were approved Council meeting 25/11/14 and unexpected additional costs due to latent conditions .
Page 14
Notes to the Financial Report
For the Year Ended 30 June 2015
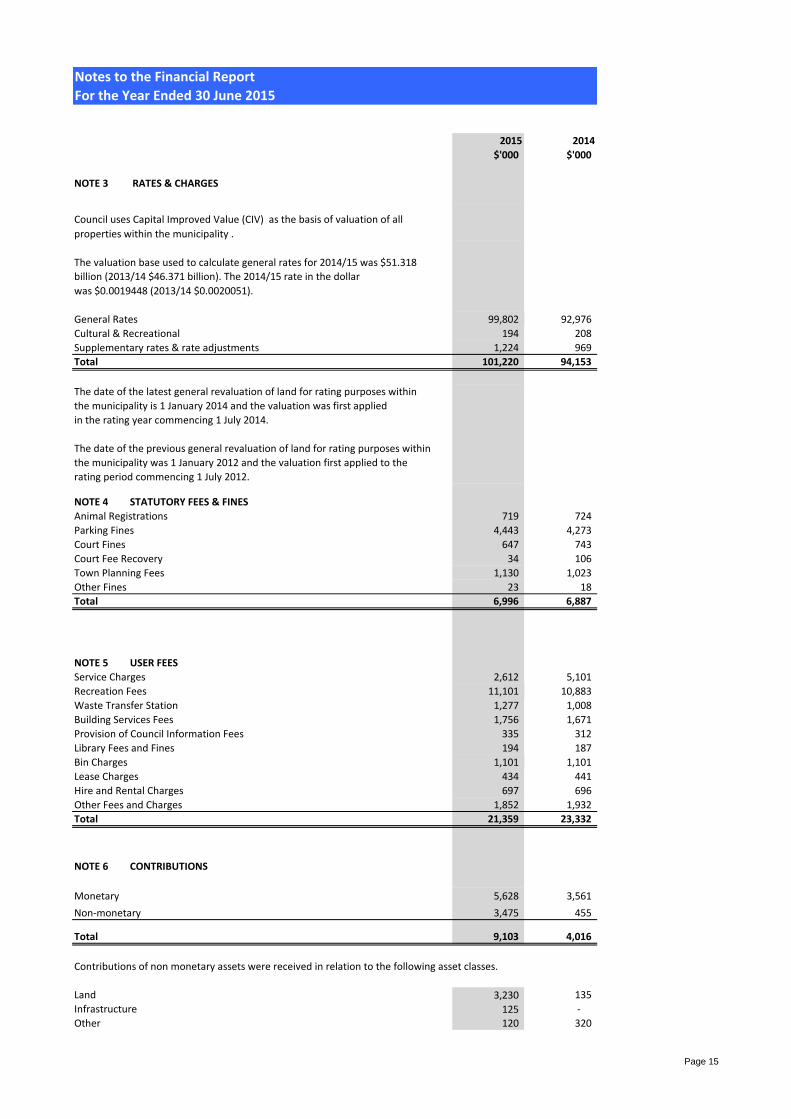
2015 2014
$'000 $'000
NOTE 3 RATES & CHARGES
The valuation base used to calculate general rates for 2014/15 was $51.318
was $0.0019448 (2013/14 $0.0020051).
General Rates 99,802 92,976
Cultural & Recreational 194 208
Supplementary rates & rate adjustments 1,224 969
Total 101,220 94,153
The date of the latest general revaluation of land for rating purposes within
the municipality is 1 January 2014 and the valuation was first applied
in the rating year commencing 1 July 2014.
The date of the previous general revaluation of land for rating purposes within
the municipality was 1 January 2012 and the valuation first applied to the
rating period commencing 1 July 2012.
NOTE 4 STATUTORY FEES & FINES
Animal Registrations 719 724
Parking Fines 4,443 4,273
Court Fines 647 743
Court Fee Recovery 34 106
Town Planning Fees 1,130 1,023
Other Fines 23 18
Total 6,996 6,887
NOTE 5 USER FEES
Service Charges 2,612 5,101
Recreation Fees 11,101 10,883
Waste Transfer Station 1,277 1,008
Building Services Fees 1,756 1,671
Provision of Council Information Fees 335 312
Library Fees and Fines 194 187
Bin Charges 1,101 1,101
Lease Charges 434 441
Hire and Rental Charges 697 696
Other Fees and Charges 1,852 1,932
Total 21,359 23,332
NOTE 6 CONTRIBUTIONS
Monetary 5,628 3,561
Non-monetary 3,475 455
Total 9,103 4,016
Contributions of non monetary assets were received in relation to the following asset classes.
Land 3,230 135
Infrastructure 125 -
Other 120 320
Council uses Capital Improved Value (CIV) as the basis of valuation of all
properties within the municipality .
billion (2013/14 $46.371 billion). The 2014/15 rate in the dollar
Page 15
Notes to the Financial Report
For the Year Ended 30 June 2015
2015 2014
$'000 $'000
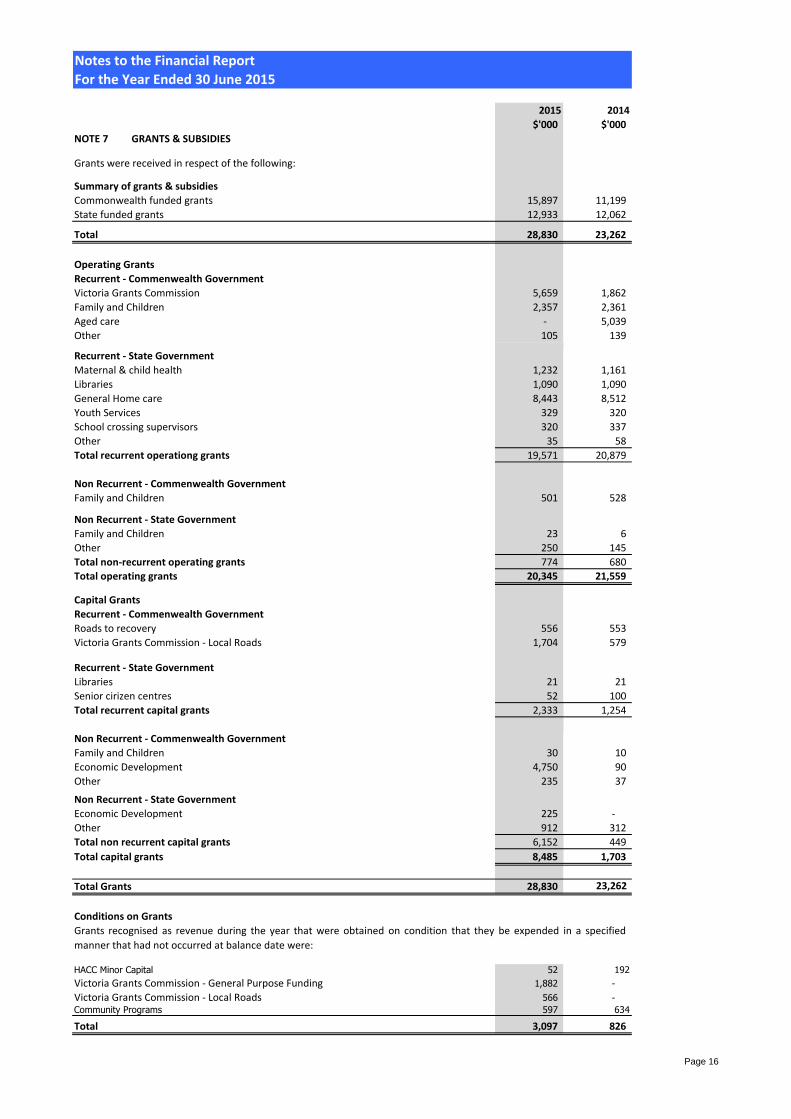
NOTE 7 GRANTS & SUBSIDIES
Grants were received in respect of the following:
Summary of grants & subsidies
Commonwealth funded grants 15,897 11,199
State funded grants 12,933 12,062
Total 28,830 23,262
Operating Grants
Recurrent - Commenwealth Government
Victoria Grants Commission 5,659 1,862
Family and Children 2,357 2,361
Aged care - 5,039
Other 105 139
Recurrent - State Government
Maternal & child health 1,232 1,161
Libraries 1,090 1,090
General Home care 8,443 8,512
Youth Services 329 320
School crossing supervisors 320 337
Other 35 58
Total recurrent operationg grants 19,571 20,879
Non Recurrent - Commenwealth Government
Family and Children 501 528
Non Recurrent - State Government
Family and Children 23 6
Other 250 145
Total non-recurrent operating grants 774 680
Total operating grants 20,345 21,559
Capital Grants
Recurrent - Commenwealth Government
Roads to recovery 556 553
Victoria Grants Commission - Local Roads 1,704 579
Recurrent - State Government
Libraries 21 21
Senior cirizen centres 52 100
Total recurrent capital grants 2,333 1,254
Non Recurrent - Commenwealth Government
Family and Children 30 10
Economic Development 4,750 90
Other 235 37
Non Recurrent - State Government
Economic Development 225 -
Other 912 312
Total non recurrent capital grants 6,152 449
Total capital grants 8,485 1,703
Total Grants 28,830 23,262
Conditions on Grants
HACC Minor Capital 52 192
Victoria Grants Commission - General Purpose Funding 1,882 -
Victoria Grants Commission - Local Roads 566 - Community Programs 597 634
Total 3,097 826
Grants recognised as revenue during the year that were obtained on condition that they be expended in a specified
manner that had not occurred at balance date were:
Page 16
Notes to the Financial Report
For the Year Ended 30 June 2015
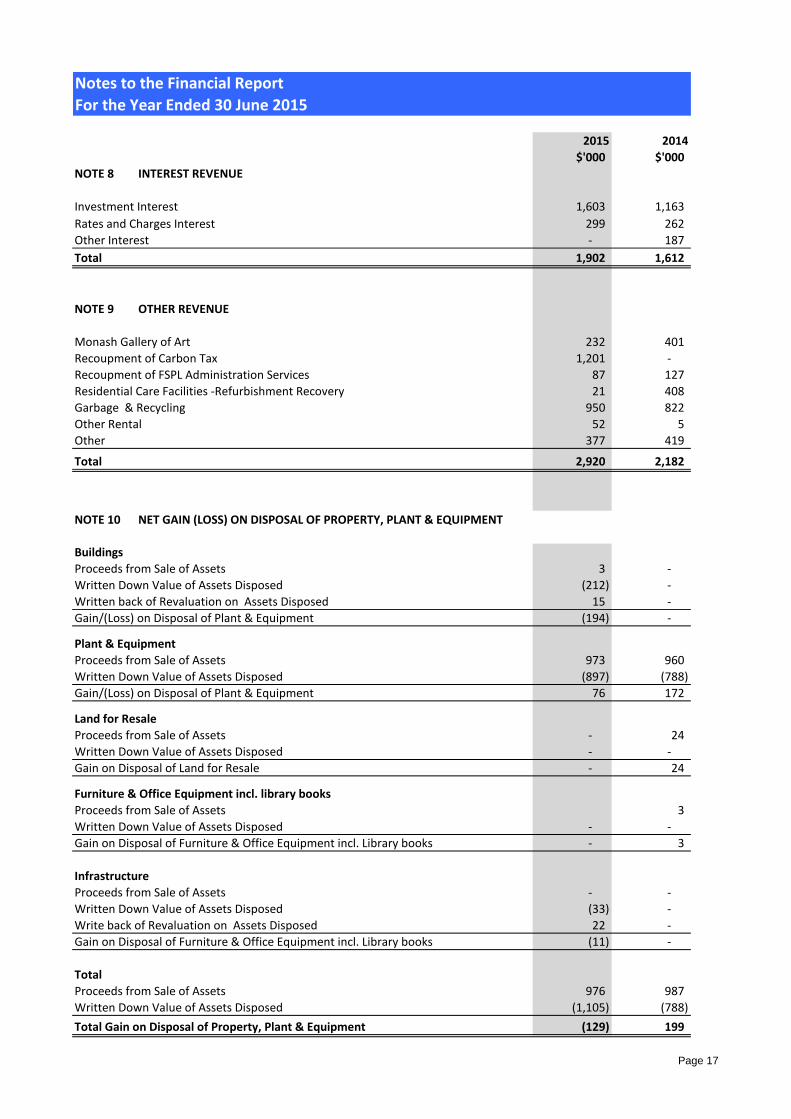
2015 2014
$'000 $'000
NOTE 8 INTEREST REVENUE
Investment Interest 1,603 1,163
Rates and Charges Interest 299 262
Other Interest - 187
Total 1,902 1,612
NOTE 9 OTHER REVENUE
Monash Gallery of Art 232 401
Recoupment of Carbon Tax 1,201 -
Recoupment of FSPL Administration Services 87 127
Residential Care Facilities -Refurbishment Recovery 21 408
Garbage & Recycling 950 822
Other Rental 52 5
Other 377 419
Total 2,920 2,182
NOTE 10
Buildings
Proceeds from Sale of Assets 3 -
Written Down Value of Assets Disposed (212) -
Written back of Revaluation on Assets Disposed 15 -
Gain/(Loss) on Disposal of Plant & Equipment (194) -
Plant & Equipment
Proceeds from Sale of Assets 973 960
Written Down Value of Assets Disposed (897) (788)
Gain/(Loss) on Disposal of Plant & Equipment 76 172
Land for Resale
Proceeds from Sale of Assets - 24
Written Down Value of Assets Disposed - -
Gain on Disposal of Land for Resale - 24
Furniture & Office Equipment incl. library books
Proceeds from Sale of Assets 3
Written Down Value of Assets Disposed - -
Gain on Disposal of Furniture & Office Equipment incl. Library books - 3
Infrastructure
Proceeds from Sale of Assets - -
Written Down Value of Assets Disposed (33) -
Write back of Revaluation on Assets Disposed 22 -
Gain on Disposal of Furniture & Office Equipment incl. Library books (11) -
Total
Proceeds from Sale of Assets 976 987
Written Down Value of Assets Disposed (1,105) (788)
Total Gain on Disposal of Property, Plant & Equipment (129) 199
NET GAIN (LOSS) ON DISPOSAL OF PROPERTY, PLANT & EQUIPMENT
Page 17
Notes to the Financial Report
For the Year Ended 30 June 2015
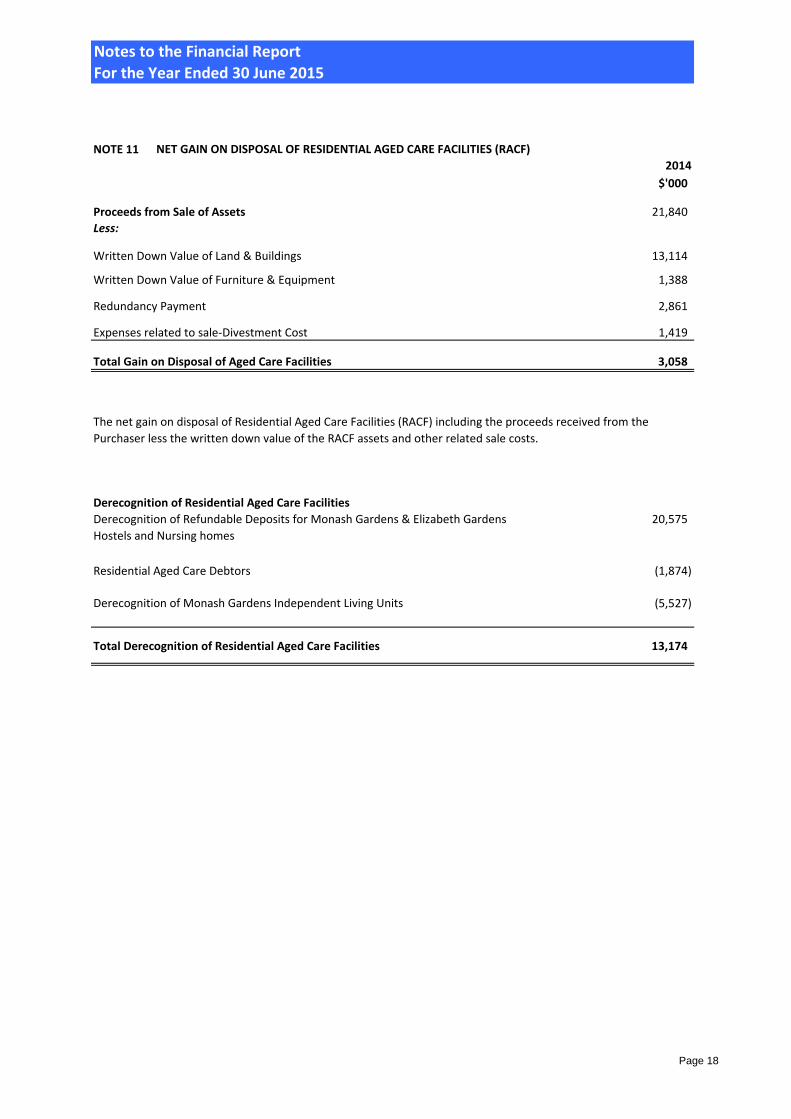
NOTE 11
2014
$'000
Proceeds from Sale of Assets 21,840
Less:
Written Down Value of Land & Buildings 13,114
Written Down Value of Furniture & Equipment 1,388
Redundancy Payment 2,861
Expenses related to sale-Divestment Cost 1,419
Total Gain on Disposal of Aged Care Facilities 3,058
Derecognition of Residential Aged Care Facilities
20,575
Residential Aged Care Debtors (1,874)
(5,527)
Total Derecognition of Residential Aged Care Facilities 13,174
NET GAIN ON DISPOSAL OF RESIDENTIAL AGED CARE FACILITIES (RACF)
The net gain on disposal of Residential Aged Care Facilities (RACF) including the proceeds received from the
Purchaser less the written down value of the RACF assets and other related sale costs.
Derecognition of Refundable Deposits for Monash Gardens & Elizabeth Gardens
Hostels and Nursing homes
Derecognition of Monash Gardens Independent Living Units
Page 18
Notes to the Financial Report
For the Year Ended 30 June 2015
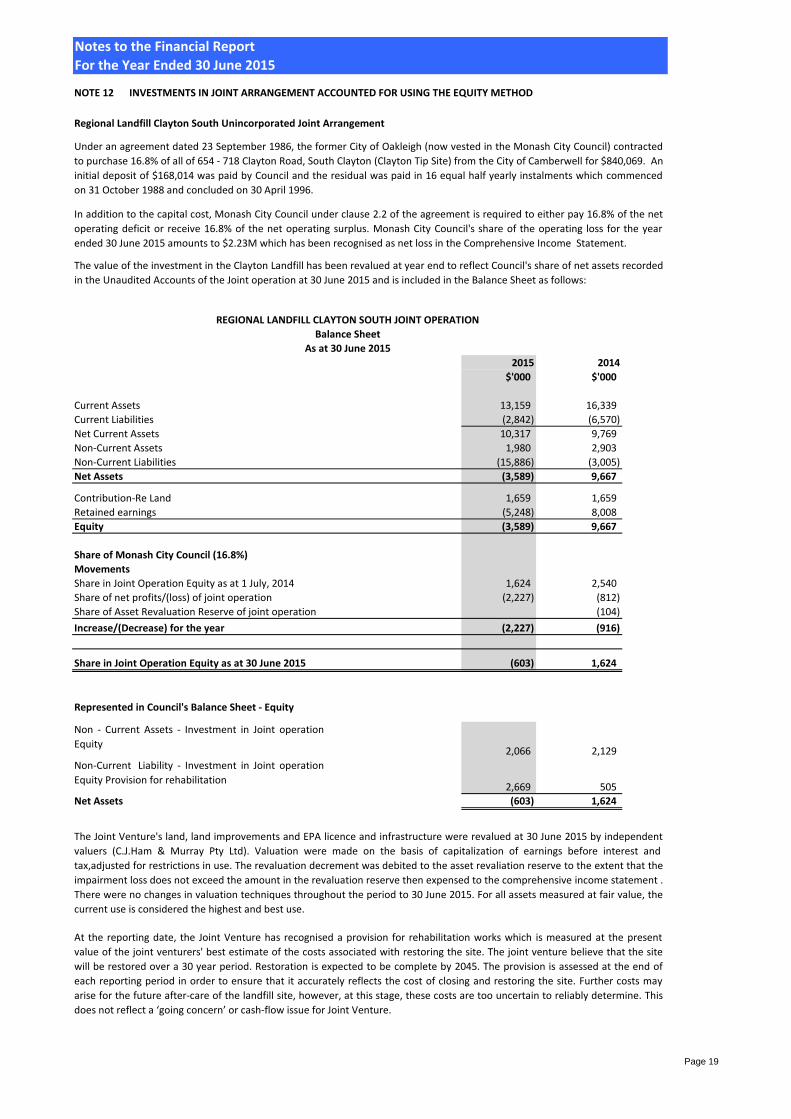
NOTE 12 INVESTMENTS IN JOINT ARRANGEMENT ACCOUNTED FOR USING THE EQUITY METHOD
Regional Landfill Clayton South Unincorporated Joint Arrangement
2015 2014
$'000 $'000
Current Assets 13,159 16,339
Current Liabilities (2,842) (6,570)
Net Current Assets 10,317 9,769
Non-Current Assets 1,980 2,903
Non-Current Liabilities (15,886) (3,005)
Net Assets (3,589) 9,667
Contribution-Re Land 1,659 1,659
Retained earnings (5,248) 8,008
Equity (3,589) 9,667
Share of Monash City Council (16.8%)
Movements
Share in Joint Operation Equity as at 1 July, 2014 1,624 2,540
Share of net profits/(loss) of joint operation (2,227) (812)
Share of Asset Revaluation Reserve of joint operation (104)
Increase/(Decrease) for the year (2,227) (916)
Share in Joint Operation Equity as at 30 June 2015 (603) 1,624
Represented in Council's Balance Sheet - Equity
2,066 2,129
2,669 505
Net Assets (603) 1,624
Non-Current Liability - Investment in Joint operation
Equity Provision for rehabilitation
The value of the investment in the Clayton Landfill has been revalued at year end to reflect Council's share of net assets recorded
in the Unaudited Accounts of the Joint operation at 30 June 2015 and is included in the Balance Sheet as follows:
Under an agreement dated 23 September 1986, the former City of Oakleigh (now vested in the Monash City Council) contracted
to purchase 16.8% of all of 654 - 718 Clayton Road, South Clayton (Clayton Tip Site) from the City of Camberwell for $840,069. An
initial deposit of $168,014 was paid by Council and the residual was paid in 16 equal half yearly instalments which commenced
on 31 October 1988 and concluded on 30 April 1996.
In addition to the capital cost, Monash City Council under clause 2.2 of the agreement is required to either pay 16.8% of the net
operating deficit or receive 16.8% of the net operating surplus. Monash City Council's share of the operating loss for the year
ended 30 June 2015 amounts to $2.23M which has been recognised as net loss in the Comprehensive Income Statement.
Balance Sheet
As at 30 June 2015
REGIONAL LANDFILL CLAYTON SOUTH JOINT OPERATION
The Joint Venture's land, land improvements and EPA licence and infrastructure were revalued at 30 June 2015 by independent
valuers (C.J.Ham & Murray Pty Ltd). Valuation were made on the basis of capitalization of earnings before interest and
tax,adjusted for restrictions in use. The revaluation decrement was debited to the asset revaliation reserve to the extent that the
impairment loss does not exceed the amount in the revaluation reserve then expensed to the comprehensive income statement .
There were no changes in valuation techniques throughout the period to 30 June 2015. For all assets measured at fair value, the
current use is considered the highest and best use.
At the reporting date, the Joint Venture has recognised a provision for rehabilitation works which is measured at the present
value of the joint venturers' best estimate of the costs associated with restoring the site. The joint venture believe that the site
will be restored over a 30 year period. Restoration is expected to be complete by 2045. The provision is assessed at the end of
each reporting period in order to ensure that it accurately reflects the cost of closing and restoring the site. Further costs may
arise for the future after-care of the landfill site, however, at this stage, these costs are too uncertain to reliably determine. This
does not reflect a ‘going concern’ or cash-flow issue for Joint Venture.
Non - Current Assets - Investment in Joint operation
Equity
Page 19
Notes to the Financial Report
For the Year Ended 30 June 2015
2015 2014
$'000 $'000
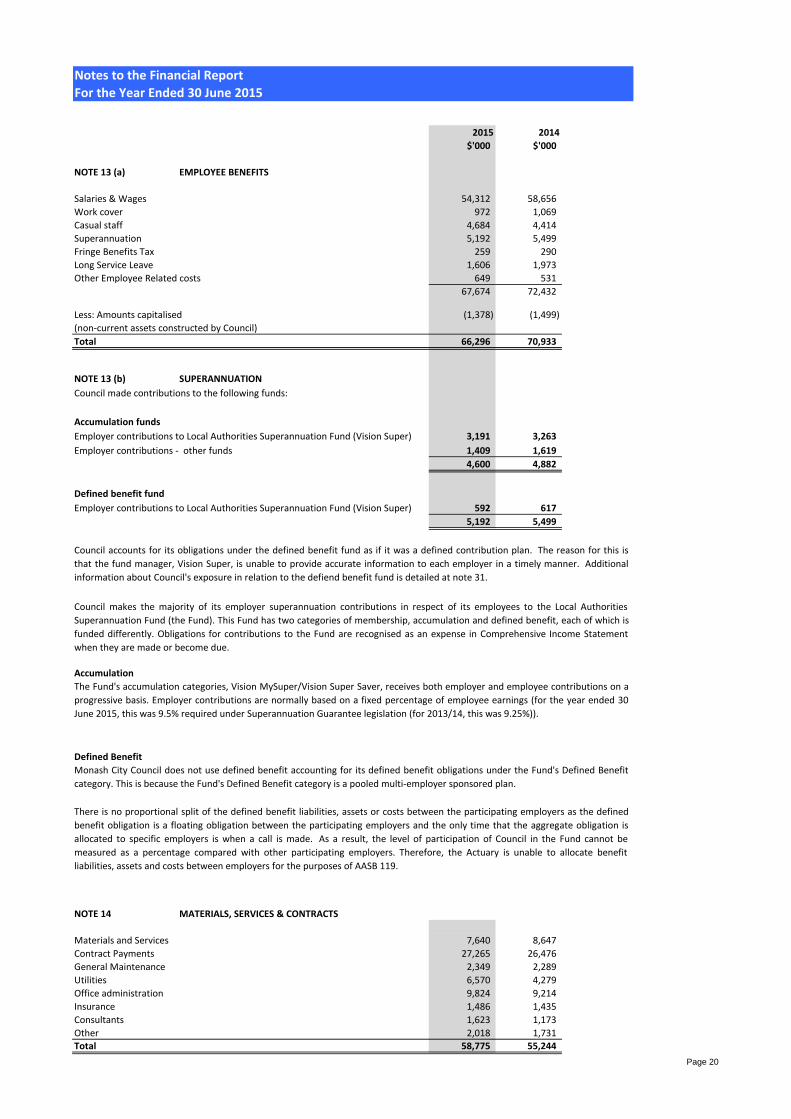
NOTE 13 (a) EMPLOYEE BENEFITS
Salaries & Wages 54,312 58,656
Work cover 972 1,069
Casual staff 4,684 4,414
Superannuation 5,192 5,499
Fringe Benefits Tax 259 290
Long Service Leave 1,606 1,973
Other Employee Related costs 649 531
67,674 72,432
Less: Amounts capitalised (1,378) (1,499)
(non-current assets constructed by Council)
Total 66,296 70,933
NOTE 13 (b) SUPERANNUATION
Council made contributions to the following funds:
Accumulation funds
Employer contributions to Local Authorities Superannuation Fund (Vision Super) 3,191 3,263
Employer contributions - other funds 1,409 1,619
4,600 4,882
Defined benefit fund
Employer contributions to Local Authorities Superannuation Fund (Vision Super) 592 617
5,192 5,499
Accumulation
Defined Benefit
NOTE 14 MATERIALS, SERVICES & CONTRACTS
Materials and Services 7,640 8,647
Contract Payments 27,265 26,476
General Maintenance 2,349 2,289
Utilities 6,570 4,279
Office administration 9,824 9,214
Insurance 1,486 1,435
Consultants 1,623 1,173
Other 2,018 1,731 Total 58,775 55,244
There is no proportional split of the defined benefit liabilities, assets or costs between the participating employers as the defined
benefit obligation is a floating obligation between the participating employers and the only time that the aggregate obligation is
allocated to specific employers is when a call is made. As a result, the level of participation of Council in the Fund cannot be
measured as a percentage compared with other participating employers. Therefore, the Actuary is unable to allocate benefit
liabilities, assets and costs between employers for the purposes of AASB 119.
Council accounts for its obligations under the defined benefit fund as if it was a defined contribution plan. The reason for this is
that the fund manager, Vision Super, is unable to provide accurate information to each employer in a timely manner. Additional
information about Council's exposure in relation to the defiend benefit fund is detailed at note 31.
Council makes the majority of its employer superannuation contributions in respect of its employees to the Local Authorities
Superannuation Fund (the Fund). This Fund has two categories of membership, accumulation and defined benefit, each of which is
funded differently. Obligations for contributions to the Fund are recognised as an expense in Comprehensive Income Statement
when they are made or become due.
The Fund's accumulation categories, Vision MySuper/Vision Super Saver, receives both employer and employee contributions on a
progressive basis. Employer contributions are normally based on a fixed percentage of employee earnings (for the year ended 30
June 2015, this was 9.5% required under Superannuation Guarantee legislation (for 2013/14, this was 9.25%)).
Monash City Council does not use defined benefit accounting for its defined benefit obligations under the Fund's Defined Benefit
category. This is because the Fund's Defined Benefit category is a pooled multi-employer sponsored plan.
Page 20
Notes to the Financial Report
For the Year Ended 30 June 20152015 2014
$'000 $'000
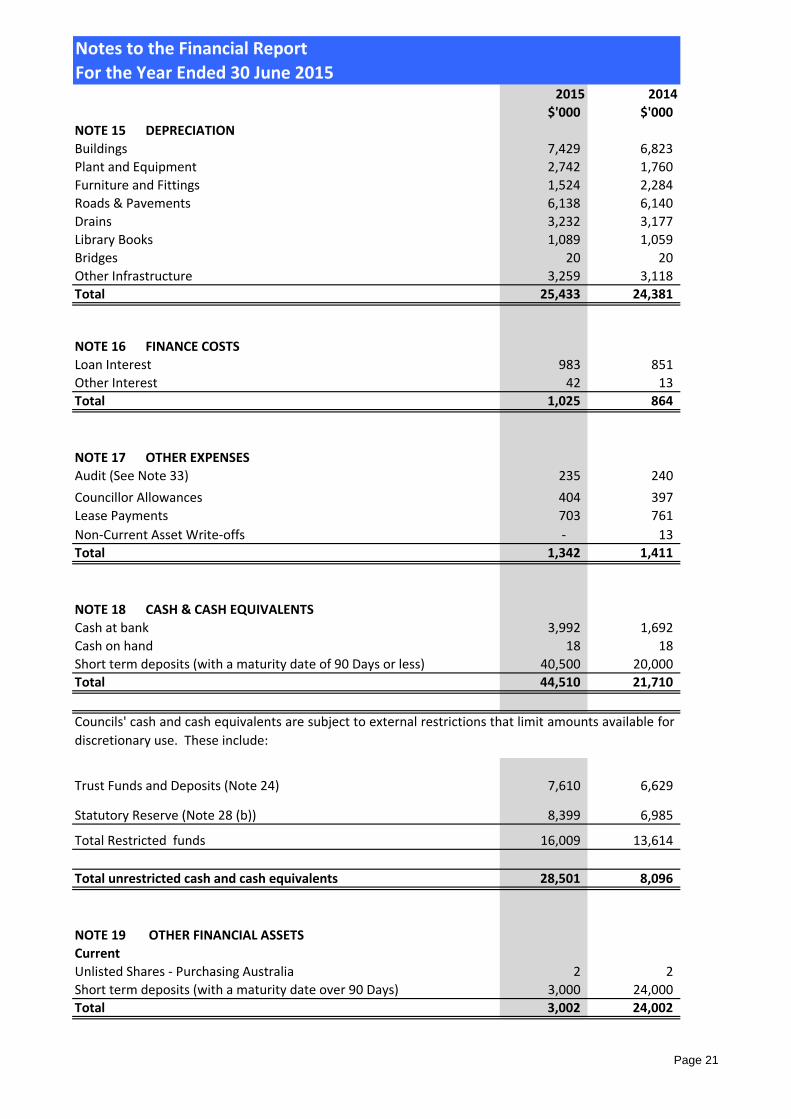
NOTE 15 DEPRECIATION
Buildings 7,429 6,823
Plant and Equipment 2,742 1,760
Furniture and Fittings 1,524 2,284
Roads & Pavements 6,138 6,140
Drains 3,232 3,177
Library Books 1,089 1,059
Bridges 20 20
Other Infrastructure 3,259 3,118
Total 25,433 24,381
NOTE 16 FINANCE COSTS
Loan Interest 983 851
Other Interest 42 13
Total 1,025 864
NOTE 17 OTHER EXPENSES
Audit (See Note 33) 235 240
Councillor Allowances 404 397
Lease Payments 703 761
Non-Current Asset Write-offs - 13
Total 1,342 1,411
NOTE 18 CASH & CASH EQUIVALENTS
Cash at bank 3,992 1,692
Cash on hand 18 18
Short term deposits (with a maturity date of 90 Days or less) 40,500 20,000
Total 44,510 21,710
Trust Funds and Deposits (Note 24) 7,610 6,629
Statutory Reserve (Note 28 (b)) 8,399 6,985
Total Restricted funds 16,009 13,614
Total unrestricted cash and cash equivalents 28,501 8,096
NOTE 19 OTHER FINANCIAL ASSETS
Current
Unlisted Shares - Purchasing Australia 2 2
Short term deposits (with a maturity date over 90 Days) 3,000 24,000
Total 3,002 24,002
Councils' cash and cash equivalents are subject to external restrictions that limit amounts available for
discretionary use. These include:
Page 21
Notes to the Financial Report
For the Year Ended 30 June 2015
2015 2014
$'000 $'000
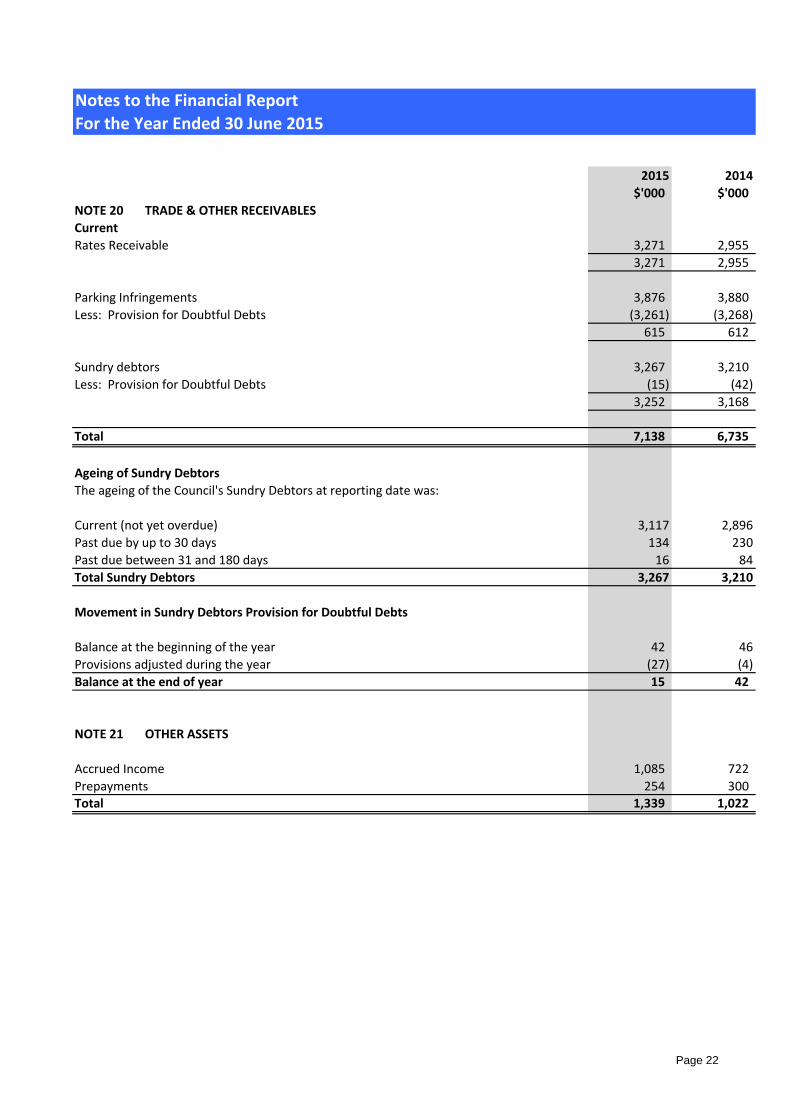
NOTE 20 TRADE & OTHER RECEIVABLES
Current
Rates Receivable 3,271 2,955
3,271 2,955
Parking Infringements 3,876 3,880
Less: Provision for Doubtful Debts (3,261) (3,268)
615 612
Sundry debtors 3,267 3,210
Less: Provision for Doubtful Debts (15) (42)
3,252 3,168
Total 7,138 6,735
Ageing of Sundry Debtors
The ageing of the Council's Sundry Debtors at reporting date was:
Current (not yet overdue) 3,117 2,896
Past due by up to 30 days 134 230
Past due between 31 and 180 days 16 84
Total Sundry Debtors 3,267 3,210
Movement in Sundry Debtors Provision for Doubtful Debts
Balance at the beginning of the year 42 46
Provisions adjusted during the year (27) (4)
Balance at the end of year 15 42
NOTE 21 OTHER ASSETS
Accrued Income 1,085 722
Prepayments 254 300 Total 1,339 1,022
Page 22
Notes to the Financial Report
For the Year Ended 30 June 2015
2015 2014
$'000 $'000
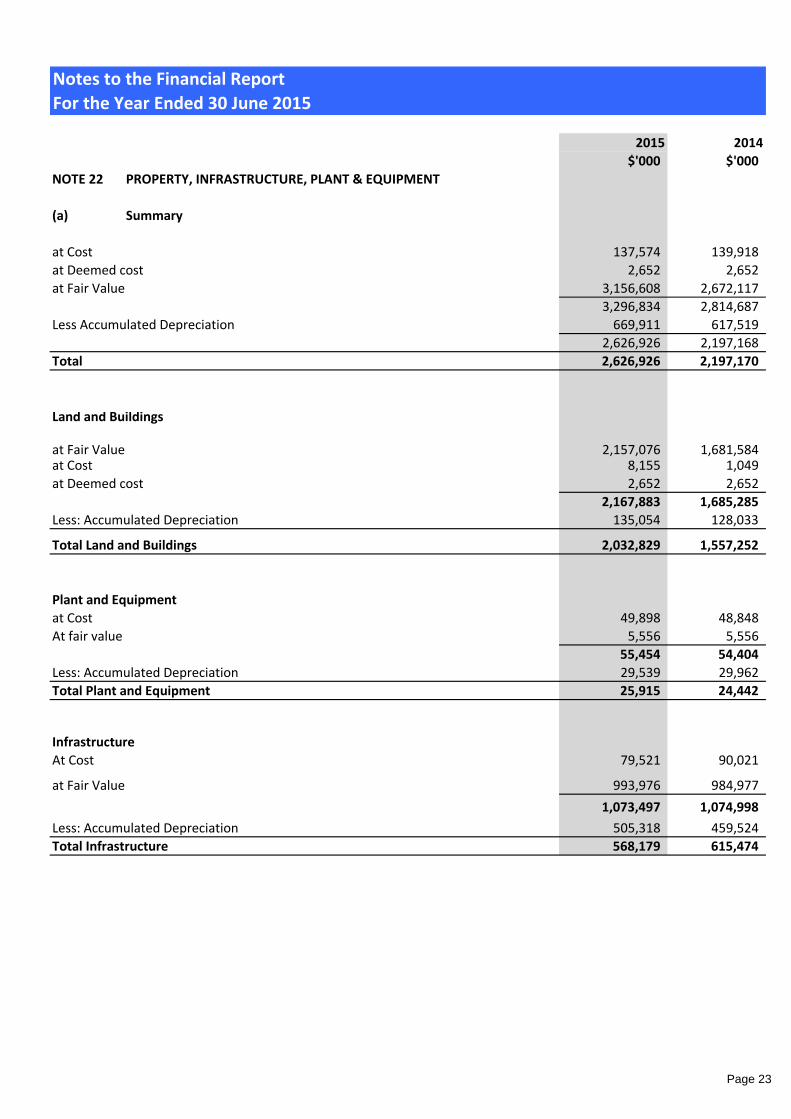
NOTE 22 PROPERTY, INFRASTRUCTURE, PLANT & EQUIPMENT
(a) Summary
at Cost 137,574 139,918
at Deemed cost 2,652 2,652
at Fair Value 3,156,608 2,672,117
3,296,834 2,814,687
Less Accumulated Depreciation 669,911 617,519
2,626,926 2,197,168
Total 2,626,926 2,197,170
Land and Buildings
at Fair Value 2,157,076 1,681,584 at Cost 8,155 1,049
at Deemed cost 2,652 2,652
2,167,883 1,685,285
Less: Accumulated Depreciation 135,054 128,033
Total Land and Buildings 2,032,829 1,557,252
Plant and Equipment
at Cost 49,898 48,848
At fair value 5,556 5,556
55,454 54,404
Less: Accumulated Depreciation 29,539 29,962
Total Plant and Equipment 25,915 24,442
Infrastructure
At Cost 79,521 90,021
at Fair Value 993,976 984,977
1,073,497 1,074,998
Less: Accumulated Depreciation 505,318 459,524
Total Infrastructure 568,179 615,474
Page 23
Notes to the Financial Report
For the Year Ended 30 June 2015
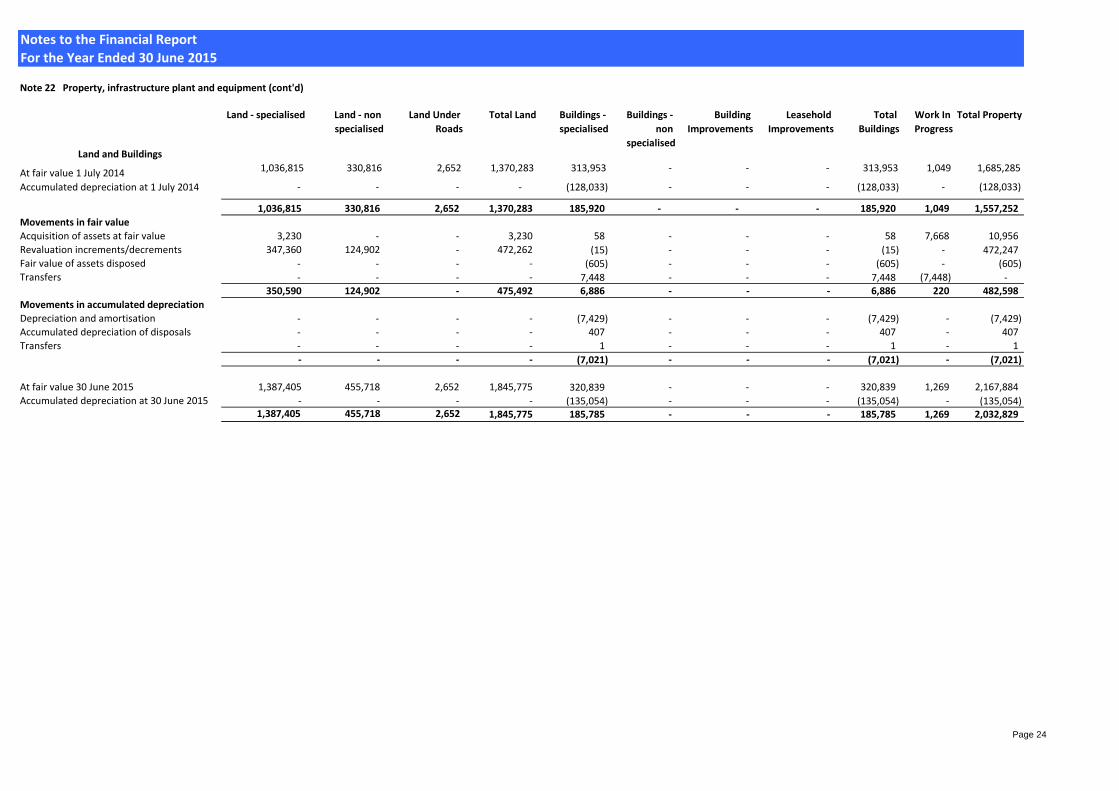
Note 22 Property, infrastructure plant and equipment (cont'd)
Land and Buildings
Land - specialised Land - non
specialised
Land Under
Roads
Total Land Buildings -
specialised
Buildings -
non
specialised
Building
Improvements
Leasehold
Improvements
Total
Buildings
Work In
Progress
Total Property
At fair value 1 July 2014 1,036,815 330,816 2,652 1,370,283 313,953 - - - 313,953 1,049 1,685,285
Accumulated depreciation at 1 July 2014 - - - - (128,033) - - - (128,033) - (128,033)
1,036,815 330,816 2,652 1,370,283 185,920 - - - 185,920 1,049 1,557,252
Movements in fair value
Acquisition of assets at fair value 3,230 - - 3,230 58 - - - 58 7,668 10,956
Revaluation increments/decrements 347,360 124,902 - 472,262 (15) - - - (15) - 472,247 Fair value of assets disposed - - - - (605) - - - (605) - (605) Transfers - - - - 7,448 - - - 7,448 (7,448) -
350,590 124,902 - 475,492 6,886 - - - 6,886 220 482,598
Movements in accumulated depreciation
Depreciation and amortisation - - - - (7,429) - - - (7,429) - (7,429) Accumulated depreciation of disposals - - - - 407 - - - 407 - 407
Transfers - - - - 1 - - - 1 - 1
- - - - (7,021) - - - (7,021) - (7,021)
At fair value 30 June 2015 1,387,405 455,718 2,652 1,845,775 320,839 - - - 320,839 1,269 2,167,884
Accumulated depreciation at 30 June 2015 - - - - (135,054) - - - (135,054) - (135,054) 1,387,405 455,718 2,652 1,845,775 185,785 - - - 185,785 1,269 2,032,829
Page 24
Notes to the Financial Report
For the Year Ended 30 June 2015
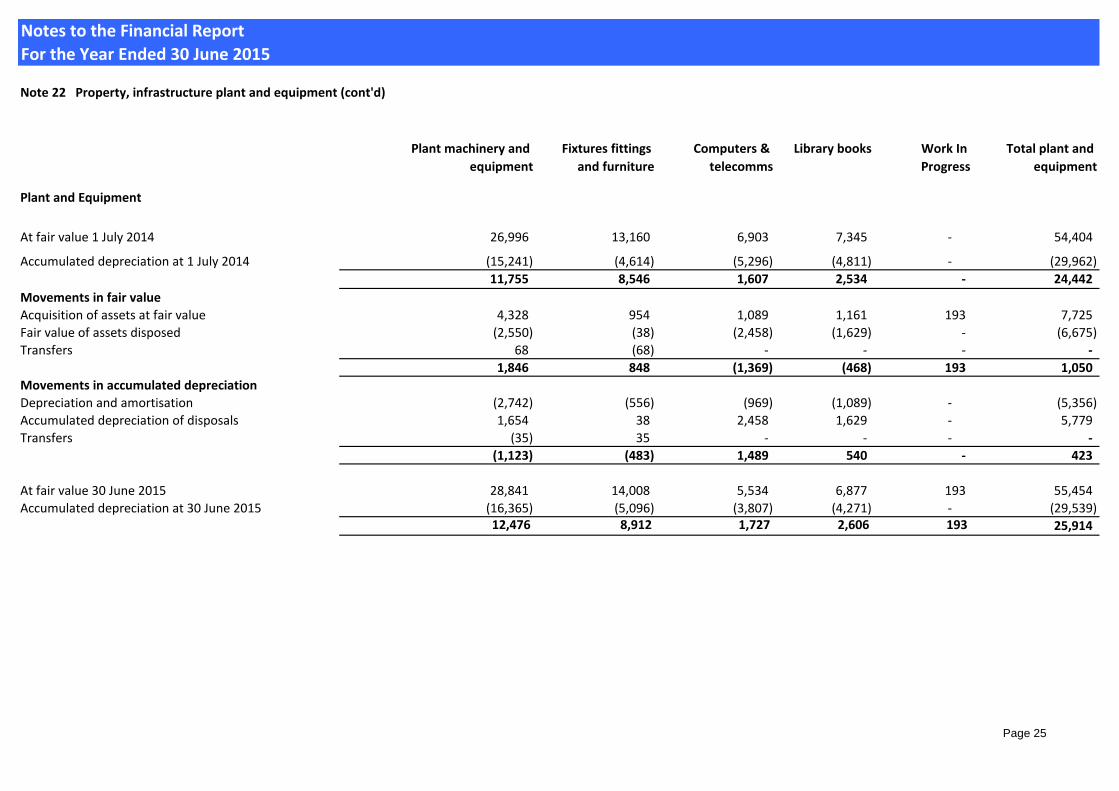
Note 22 Property, infrastructure plant and equipment (cont'd)
Plant and Equipment
Plant machinery and
equipment
Fixtures fittings
and furniture
Computers &
telecomms
Library books Work In
Progress
Total plant and
equipment
At fair value 1 July 2014 26,996 13,160 6,903 7,345 - 54,404
Accumulated depreciation at 1 July 2014 (15,241) (4,614) (5,296) (4,811) - (29,962)
11,755 8,546 1,607 2,534 - 24,442
Movements in fair value
Acquisition of assets at fair value 4,328 954 1,089 1,161 193 7,725
Fair value of assets disposed (2,550) (38) (2,458) (1,629) - (6,675)
Transfers 68 (68) - - - -
1,846 848 (1,369) (468) 193 1,050
Movements in accumulated depreciation
Depreciation and amortisation (2,742) (556) (969) (1,089) - (5,356)
Accumulated depreciation of disposals 1,654 38 2,458 1,629 - 5,779
Transfers (35) 35 - - - -
(1,123) (483) 1,489 540 - 423
At fair value 30 June 2015 28,841 14,008 5,534 6,877 193 55,454
Accumulated depreciation at 30 June 2015 (16,365) (5,096) (3,807) (4,271) - (29,539) 12,476 8,912 1,727 2,606 193 25,914
Page 25
Notes to the Financial Report
For the Year Ended 30 June 2015
Infrastructure Roads Bridges Footpaths Drainage
Recreational,
leisure and
Community
Traffic
Management
Parks open
spaces and
streetscapes Bycycle Paths
Off street car
parks
Other
Infrastructure
Work In
Progress
Total
Infrastructure
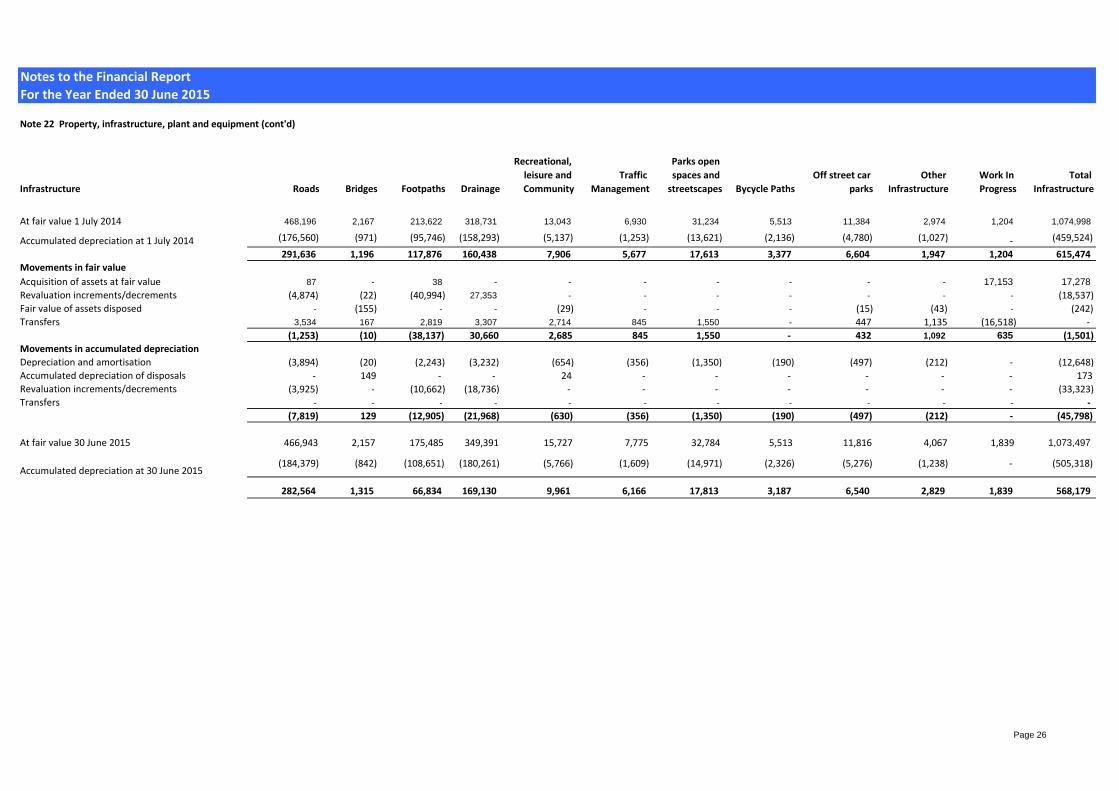
At fair value 1 July 2014 468,196 2,167 213,622 318,731 13,043 6,930 31,234 5,513 11,384 2,974 1,204 1,074,998
Accumulated depreciation at 1 July 2014 (176,560) (971) (95,746) (158,293) (5,137) (1,253) (13,621) (2,136) (4,780) (1,027) - (459,524)
291,636 1,196 117,876 160,438 7,906 5,677 17,613 3,377 6,604 1,947 1,204 615,474
Movements in fair value
Acquisition of assets at fair value 87 - 38 - - - - - - - 17,153 17,278
Revaluation increments/decrements (4,874) (22) (40,994) 27,353 - - - - - - - (18,537)
Fair value of assets disposed - (155) - - (29) - - - (15) (43) - (242)
Transfers 3,534 167 2,819 3,307 2,714 845 1,550 - 447 1,135 (16,518) -
(1,253) (10) (38,137) 30,660 2,685 845 1,550 - 432 1,092 635 (1,501)
Movements in accumulated depreciation
Depreciation and amortisation (3,894) (20) (2,243) (3,232) (654) (356) (1,350) (190) (497) (212) - (12,648)
Accumulated depreciation of disposals - 149 - - 24 - - - - - - 173
Revaluation increments/decrements (3,925) - (10,662) (18,736) - - - - - - - (33,323)
Transfers - - - - - - - - - - - -
(7,819) 129 (12,905) (21,968) (630) (356) (1,350) (190) (497) (212) - (45,798)
At fair value 30 June 2015 466,943 2,157 175,485 349,391 15,727 7,775 32,784 5,513 11,816 4,067 1,839 1,073,497
Accumulated depreciation at 30 June 2015 (184,379) (842) (108,651) (180,261) (5,766) (1,609) (14,971) (2,326) (5,276) (1,238) - (505,318)
282,564 1,315 66,834 169,130 9,961 6,166 17,813 3,187 6,540 2,829 1,839 568,179
Note 22 Property, infrastructure, plant and equipment (cont'd)
Page 26
Notes to the Financial Report
For the Year Ended 30 June 2015
NOTE 22 PROPERTY, INFRASTRUCTURE, PLANT & EQUIPMENT (cont.)
Level 1 Level 2 Level 3
$'000 $'000 $'000
Land - 455,718 -
Specialised Land - - 1,387,405
Buildings - - 185,785 Total - 455,718 1,573,190
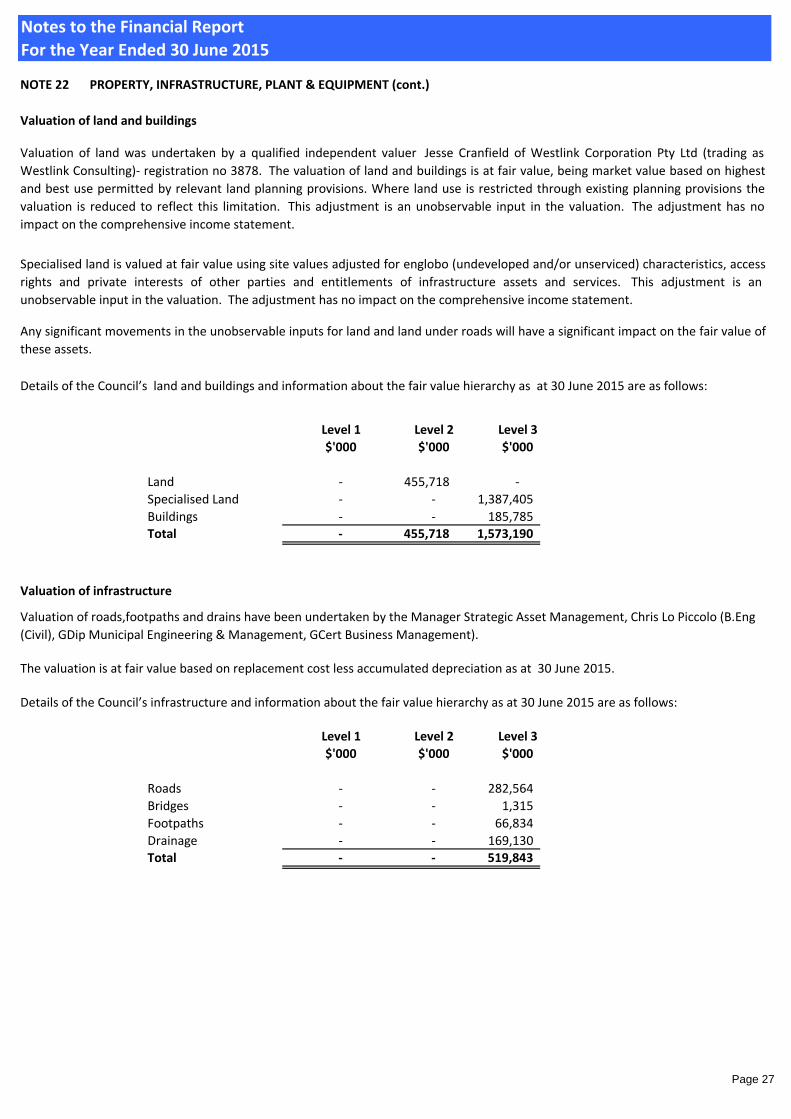
Level 1 Level 2 Level 3
$'000 $'000 $'000
Roads - - 282,564
Bridges - - 1,315
Footpaths - - 66,834
Drainage - - 169,130 Total - - 519,843
Details of the Council’s infrastructure and information about the fair value hierarchy as at 30 June 2015 are as follows:
Details of the Council’s land and buildings and information about the fair value hierarchy as at 30 June 2015 are as follows:
Valuation of roads,footpaths and drains have been undertaken by the Manager Strategic Asset Management, Chris Lo Piccolo (B.Eng
(Civil), GDip Municipal Engineering & Management, GCert Business Management).
Valuation of infrastructure
The valuation is at fair value based on replacement cost less accumulated depreciation as at 30 June 2015.
Valuation of land and buildings
Valuation of land was undertaken by a qualified independent valuer Jesse Cranfield of Westlink Corporation Pty Ltd (trading as
Westlink Consulting)- registration no 3878. The valuation of land and buildings is at fair value, being market value based on highest
and best use permitted by relevant land planning provisions. Where land use is restricted through existing planning provisions the
valuation is reduced to reflect this limitation. This adjustment is an unobservable input in the valuation. The adjustment has no
impact on the comprehensive income statement.
Specialised land is valued at fair value using site values adjusted for englobo (undeveloped and/or unserviced) characteristics, access
rights and private interests of other parties and entitlements of infrastructure assets and services. This adjustment is an
unobservable input in the valuation. The adjustment has no impact on the comprehensive income statement.
Any significant movements in the unobservable inputs for land and land under roads will have a significant impact on the fair value of
these assets.
Page 27
Notes to the Financial Report
For the Year Ended 30 June 2015
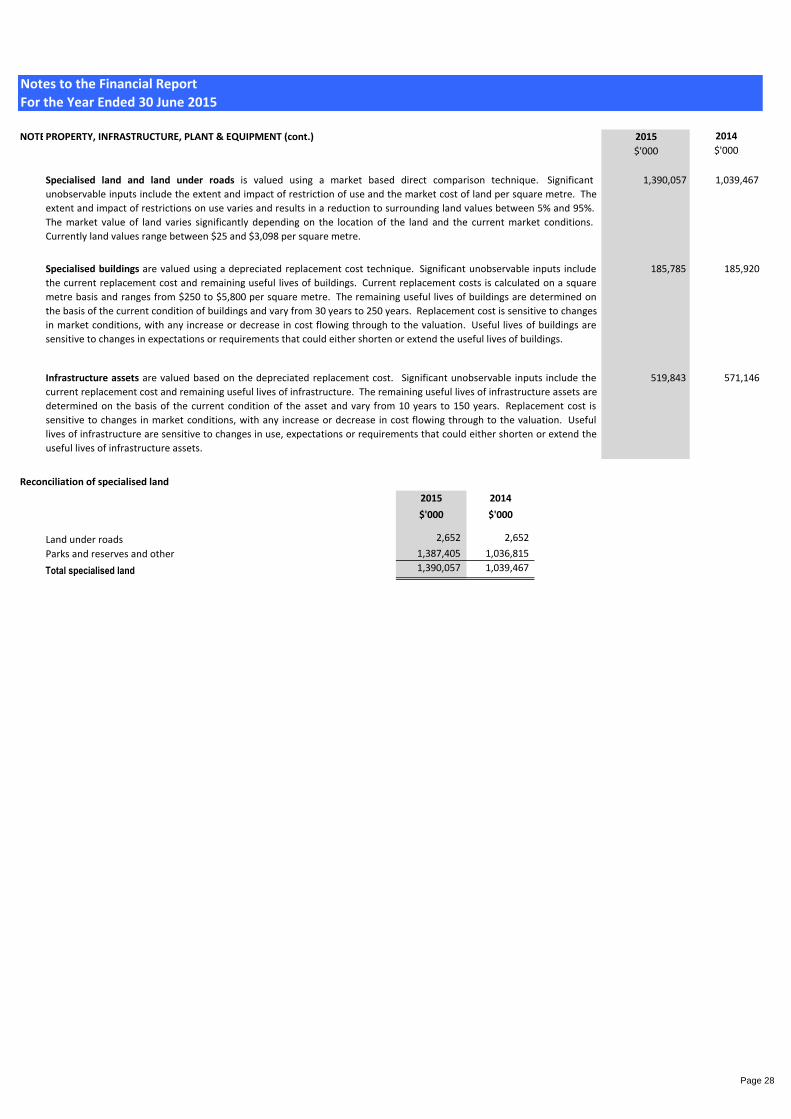
NOTE 22PROPERTY, INFRASTRUCTURE, PLANT & EQUIPMENT (cont.) 2015 2014
$'000 $'000
1,390,057 1,039,467
185,785 185,920
519,843 571,146
2015 2014
$'000 $'000
Land under roads 2,652 2,652
Parks and reserves and other 1,387,405 1,036,815
Total specialised land 1,390,057 1,039,467
Reconciliation of specialised land
Specialised land and land under roads is valued using a market based direct comparison technique. Significant
unobservable inputs include the extent and impact of restriction of use and the market cost of land per square metre. The
extent and impact of restrictions on use varies and results in a reduction to surrounding land values between 5% and 95%.
The market value of land varies significantly depending on the location of the land and the current market conditions.
Currently land values range between $25 and $3,098 per square metre.
Specialised buildings are valued using a depreciated replacement cost technique. Significant unobservable inputs include
the current replacement cost and remaining useful lives of buildings. Current replacement costs is calculated on a square
metre basis and ranges from $250 to $5,800 per square metre. The remaining useful lives of buildings are determined on
the basis of the current condition of buildings and vary from 30 years to 250 years. Replacement cost is sensitive to changes
in market conditions, with any increase or decrease in cost flowing through to the valuation. Useful lives of buildings are
sensitive to changes in expectations or requirements that could either shorten or extend the useful lives of buildings.
Infrastructure assets are valued based on the depreciated replacement cost. Significant unobservable inputs include the
current replacement cost and remaining useful lives of infrastructure. The remaining useful lives of infrastructure assets are
determined on the basis of the current condition of the asset and vary from 10 years to 150 years. Replacement cost is
sensitive to changes in market conditions, with any increase or decrease in cost flowing through to the valuation. Useful
lives of infrastructure are sensitive to changes in use, expectations or requirements that could either shorten or extend the
useful lives of infrastructure assets.
Page 28
Notes to the Financial Report
For the Year Ended 30 June 2015
2015 2014
$'000 $'000
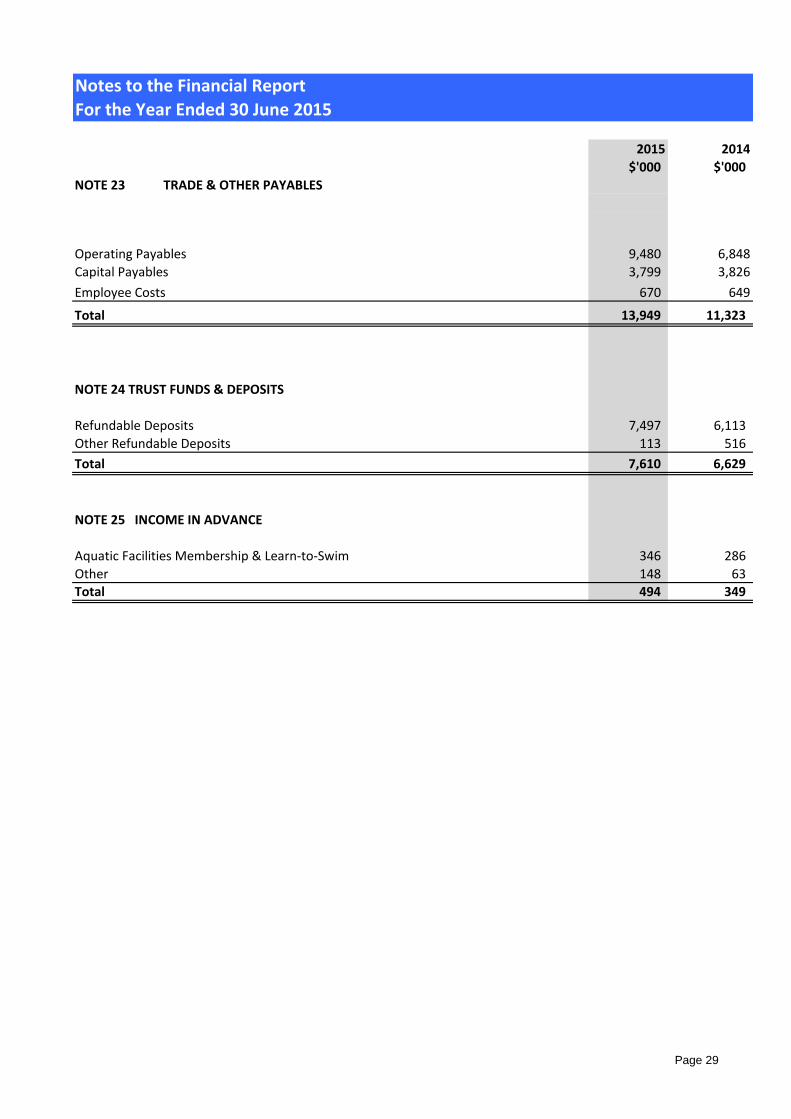
NOTE 23 TRADE & OTHER PAYABLES
Operating Payables 9,480 6,848
Capital Payables 3,799 3,826
Employee Costs 670 649
Total 13,949 11,323
NOTE 24 TRUST FUNDS & DEPOSITS
Refundable Deposits 7,497 6,113
Other Refundable Deposits 113 516
Total 7,610 6,629
NOTE 25 INCOME IN ADVANCE
Aquatic Facilities Membership & Learn-to-Swim 346 286
Other 148 63 Total 494 349
Page 29
Notes to the Financial Report
For the Year Ended 30 June 2015
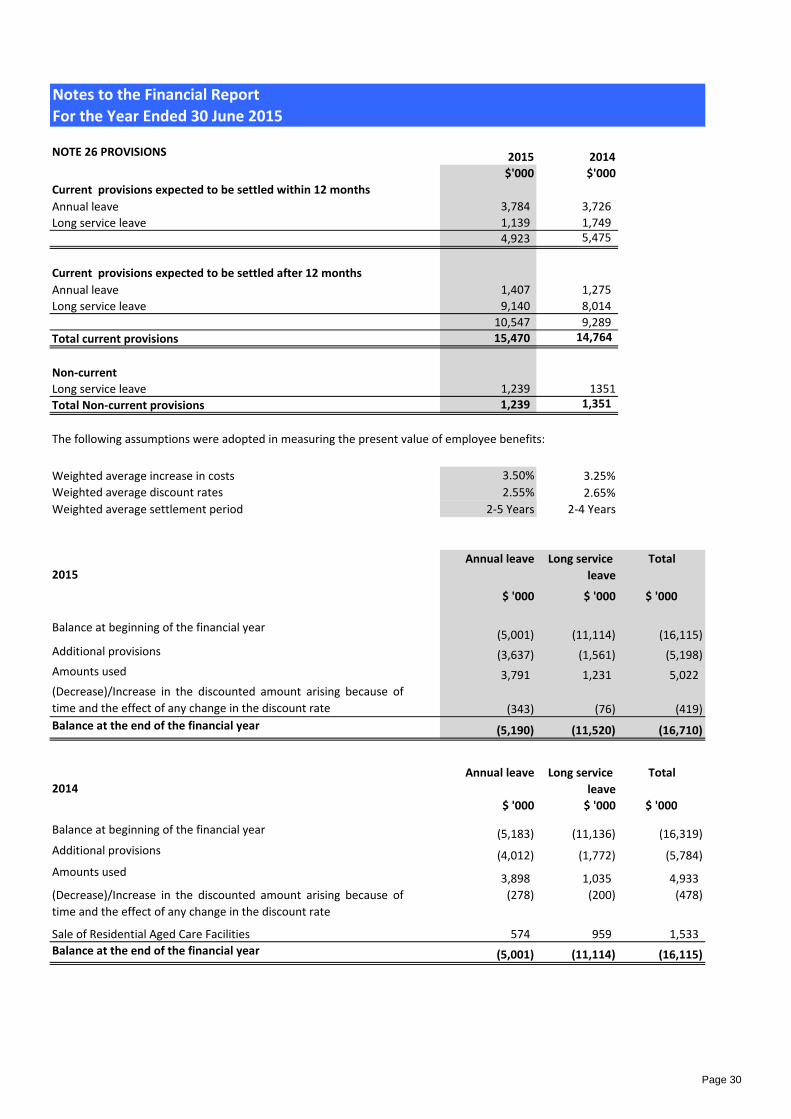
NOTE 26 PROVISIONS 2015 2014
$'000 $'000
Current provisions expected to be settled within 12 months
Annual leave 3,784 3,726
Long service leave 1,139 1,749 4,923 5,475
Current provisions expected to be settled after 12 months
Annual leave 1,407 1,275
Long service leave 9,140 8,014
10,547 9,289
Total current provisions 15,470 14,764
Non-current
Long service leave 1,239 1351
Total Non-current provisions 1,239 1,351
Weighted average increase in costs 3.50% 3.25%
Weighted average discount rates 2.55% 2.65%
Weighted average settlement period 2-5 Years 2-4 Years
2015Annual leave Long service
leave
Total
$ '000 $ '000 $ '000
Balance at beginning of the financial year(5,001) (11,114) (16,115)
Additional provisions (3,637) (1,561) (5,198)
Amounts used 3,791 1,231 5,022
(Decrease)/Increase in the discounted amount arising because of
time and the effect of any change in the discount rate (343) (76) (419)
Balance at the end of the financial year (5,190) (11,520) (16,710)
2014
Annual leave Long service
leave
Total
$ '000 $ '000 $ '000
Balance at beginning of the financial year (5,183) (11,136) (16,319)
Additional provisions (4,012) (1,772) (5,784)
Amounts used3,898 1,035 4,933
(Decrease)/Increase in the discounted amount arising because of
time and the effect of any change in the discount rate
(278) (200) (478)
Sale of Residential Aged Care Facilities 574 959 1,533
Balance at the end of the financial year (5,001) (11,114) (16,115)
The following assumptions were adopted in measuring the present value of employee benefits:
Page 30
Notes to the Financial Report
For the Year Ended 30 June 2015
2015 2014
$'000 $'000
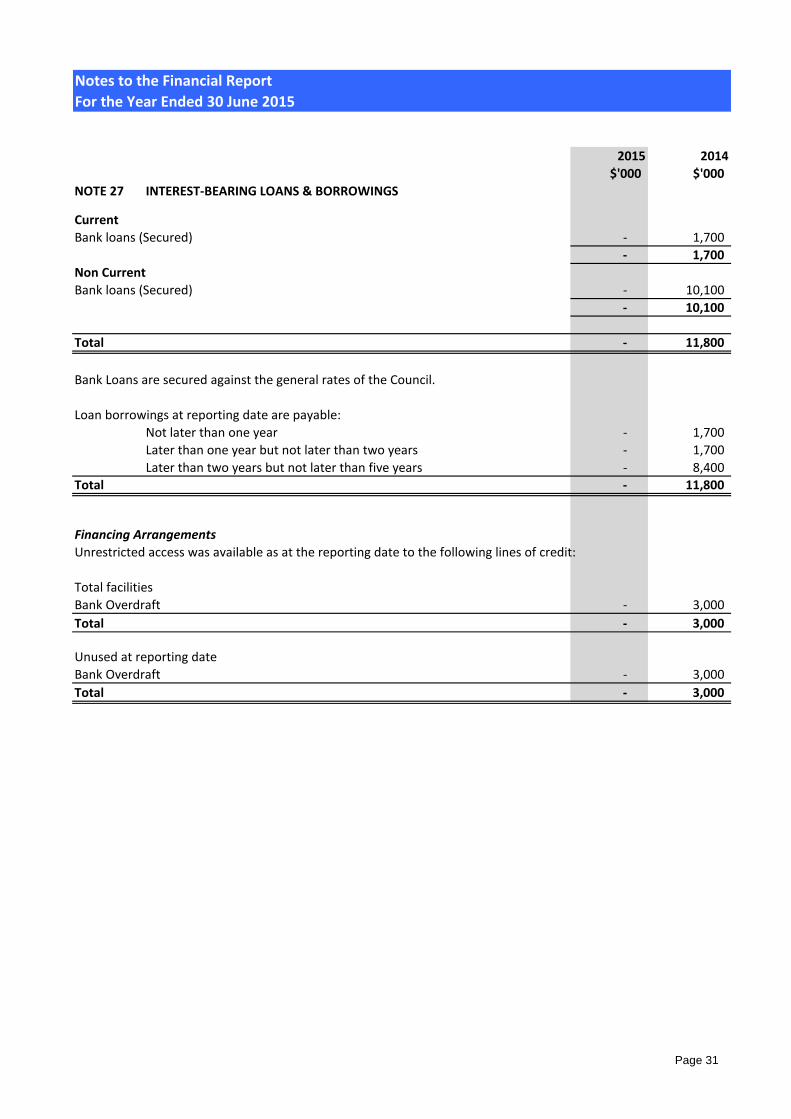
NOTE 27 INTEREST-BEARING LOANS & BORROWINGS
Current
Bank loans (Secured) - 1,700
- 1,700
Non Current
Bank loans (Secured) - 10,100
- 10,100
Total - 11,800
Bank Loans are secured against the general rates of the Council.
Loan borrowings at reporting date are payable:
Not later than one year - 1,700
Later than one year but not later than two years - 1,700
Later than two years but not later than five years - 8,400
Total - 11,800
Financing Arrangements
Unrestricted access was available as at the reporting date to the following lines of credit:
Total facilities
Bank Overdraft - 3,000
Total - 3,000
Unused at reporting date
Bank Overdraft - 3,000
Total - 3,000
Page 31
Notes to the Financial Report
For the Year Ended 30 June 2015
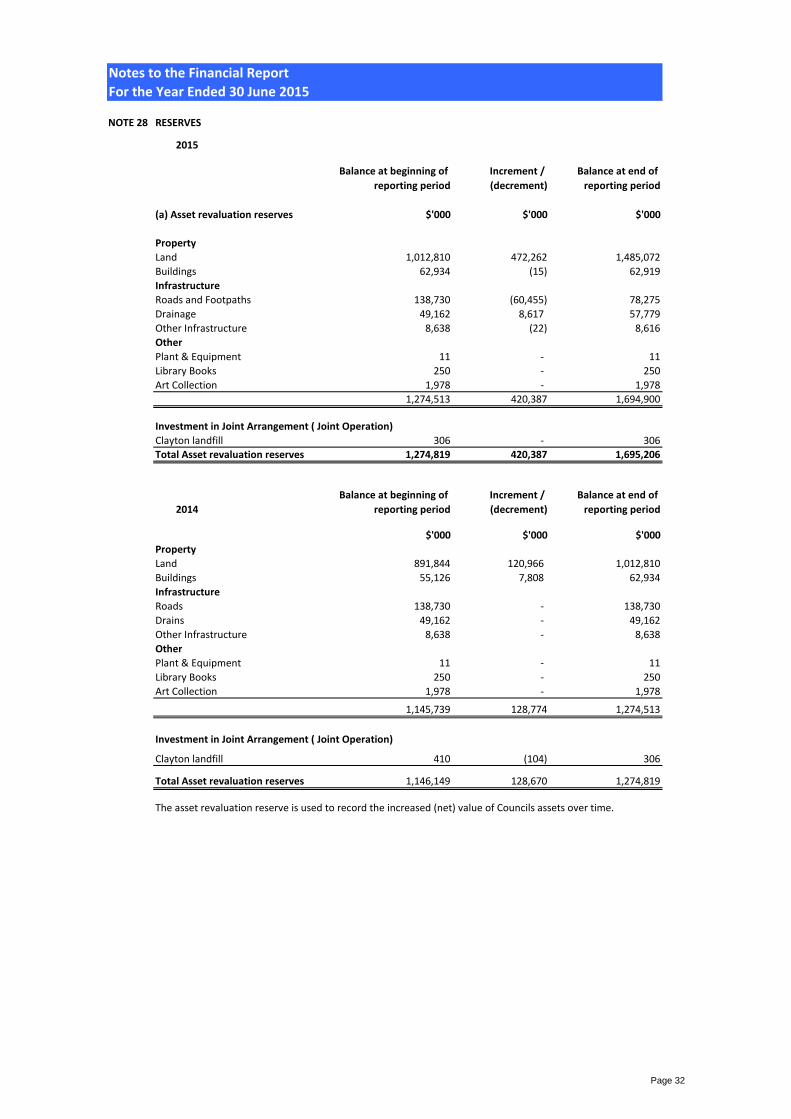
NOTE 28 RESERVES
2015
Balance at beginning of
reporting period
Increment /
(decrement)
Balance at end of
reporting period
(a) Asset revaluation reserves $'000 $'000 $'000
Property
Land 1,012,810 472,262 1,485,072
Buildings 62,934 (15) 62,919
Infrastructure
Roads and Footpaths 138,730 (60,455) 78,275
Drainage 49,162 8,617 57,779
Other Infrastructure 8,638 (22) 8,616
Other
Plant & Equipment 11 - 11
Library Books 250 - 250
Art Collection 1,978 - 1,978
1,274,513 420,387 1,694,900
Investment in Joint Arrangement ( Joint Operation)
Clayton landfill 306 - 306
Total Asset revaluation reserves 1,274,819 420,387 1,695,206
2014
Balance at beginning of
reporting period
Increment /
(decrement)
Balance at end of
reporting period
$'000 $'000 $'000
Property
Land 891,844 120,966 1,012,810
Buildings 55,126 7,808 62,934
Infrastructure
Roads 138,730 - 138,730
Drains 49,162 - 49,162
Other Infrastructure 8,638 - 8,638
Other
Plant & Equipment 11 - 11
Library Books 250 - 250
Art Collection 1,978 - 1,978
1,145,739 128,774 1,274,513
Investment in Joint Arrangement ( Joint Operation)
Clayton landfill 410 (104) 306
Total Asset revaluation reserves 1,146,149 128,670 1,274,819
The asset revaluation reserve is used to record the increased (net) value of Councils assets over time.
Page 32
Notes to the Financial Report
For the Year Ended 30 June 2015
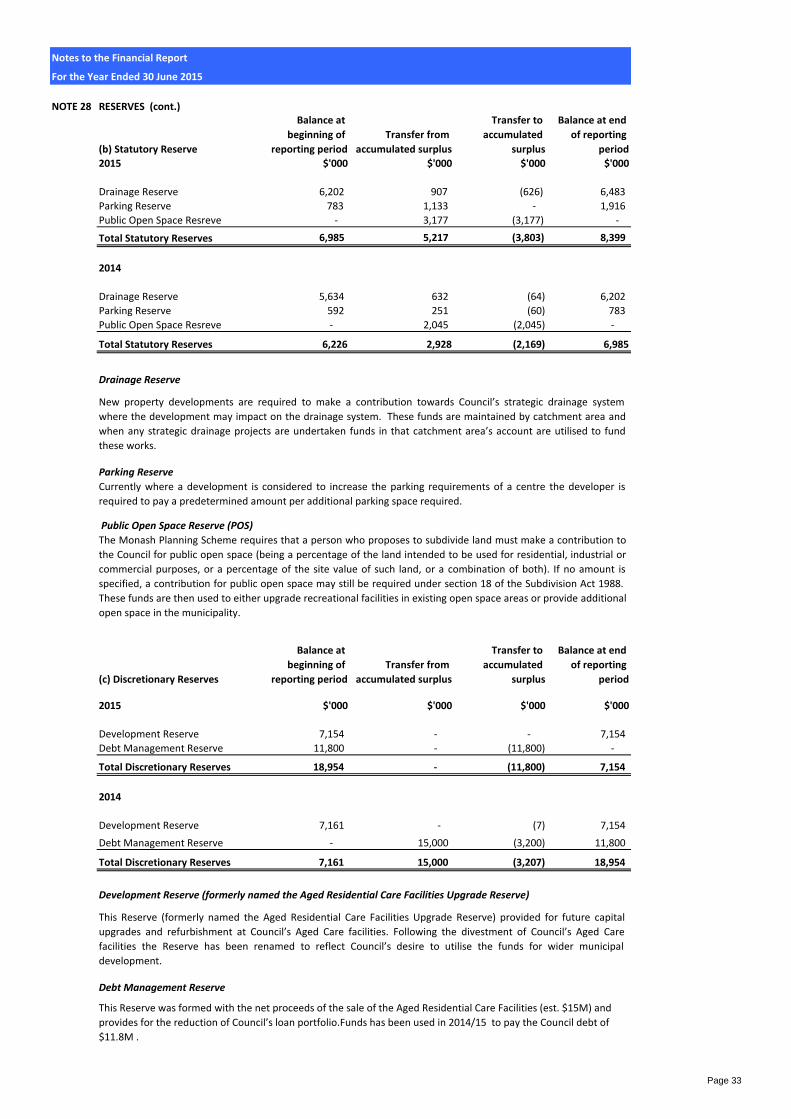
NOTE 28 RESERVES (cont.)
(b) Statutory Reserve
Balance at
beginning of
reporting period
Transfer from
accumulated surplus
Transfer to
accumulated
surplus
Balance at end
of reporting
period
2015 $'000 $'000 $'000 $'000
Drainage Reserve 6,202 907 (626) 6,483
Parking Reserve 783 1,133 - 1,916
Public Open Space Resreve - 3,177 (3,177) -
Total Statutory Reserves 6,985 5,217 (3,803) 8,399
2014
Drainage Reserve 5,634 632 (64) 6,202
Parking Reserve 592 251 (60) 783
Public Open Space Resreve - 2,045 (2,045) -
Total Statutory Reserves 6,226 2,928 (2,169) 6,985
Drainage Reserve
(c) Discretionary Reserves
Balance at
beginning of
reporting period
Transfer from
accumulated surplus
Transfer to
accumulated
surplus
Balance at end
of reporting
period
2015 $'000 $'000 $'000 $'000
Development Reserve 7,154 - - 7,154
Debt Management Reserve 11,800 - (11,800) -
Total Discretionary Reserves 18,954 - (11,800) 7,154
2014
Development Reserve 7,161 - (7) 7,154
Debt Management Reserve - 15,000 (3,200) 11,800
Total Discretionary Reserves 7,161 15,000 (3,207) 18,954
Development Reserve (formerly named the Aged Residential Care Facilities Upgrade Reserve)
Debt Management Reserve
Public Open Space Reserve (POS)
The Monash Planning Scheme requires that a person who proposes to subdivide land must make a contribution to
the Council for public open space (being a percentage of the land intended to be used for residential, industrial or
commercial purposes, or a percentage of the site value of such land, or a combination of both). If no amount is
specified, a contribution for public open space may still be required under section 18 of the Subdivision Act 1988.
These funds are then used to either upgrade recreational facilities in existing open space areas or provide additional
open space in the municipality.
This Reserve (formerly named the Aged Residential Care Facilities Upgrade Reserve) provided for future capital
upgrades and refurbishment at Council’s Aged Care facilities. Following the divestment of Council’s Aged Care
facilities the Reserve has been renamed to reflect Council’s desire to utilise the funds for wider municipal
development.
This Reserve was formed with the net proceeds of the sale of the Aged Residential Care Facilities (est. $15M) and
provides for the reduction of Council’s loan portfolio.Funds has been used in 2014/15 to pay the Council debt of
$11.8M .
New property developments are required to make a contribution towards Council’s strategic drainage system
where the development may impact on the drainage system. These funds are maintained by catchment area and
when any strategic drainage projects are undertaken funds in that catchment area’s account are utilised to fund
these works.
Parking Reserve
Currently where a development is considered to increase the parking requirements of a centre the developer is
required to pay a predetermined amount per additional parking space required.
Page 33
Notes to the Financial Report
For the Year Ended 30 June 2015
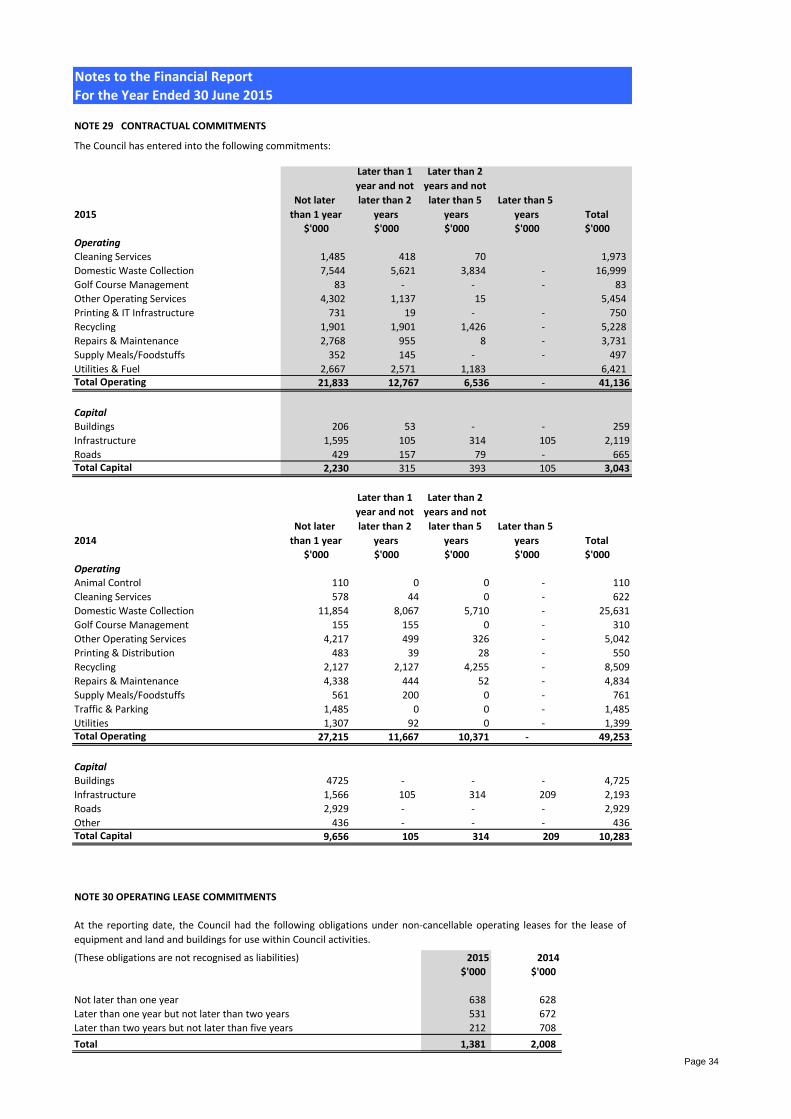
NOTE 29 CONTRACTUAL COMMITMENTS
The Council has entered into the following commitments:
2015
Not later
than 1 year
Later than 1
year and not
later than 2
years
Later than 2
years and not
later than 5
years
Later than 5
years Total
$'000 $'000 $'000 $'000 $'000
Operating
Cleaning Services 1,485 418 70 1,973
Domestic Waste Collection 7,544 5,621 3,834 - 16,999
Golf Course Management 83 - - - 83
Other Operating Services 4,302 1,137 15 5,454
Printing & IT Infrastructure 731 19 - - 750
Recycling 1,901 1,901 1,426 - 5,228
Repairs & Maintenance 2,768 955 8 - 3,731
Supply Meals/Foodstuffs 352 145 - - 497
Utilities & Fuel 2,667 2,571 1,183 6,421 Total Operating 21,833 12,767 6,536 - 41,136
Capital
Buildings 206 53 - - 259
Infrastructure 1,595 105 314 105 2,119
Roads 429 157 79 - 665Total Capital 2,230 315 393 105 3,043
2014
Not later
than 1 year
Later than 1
year and not
later than 2
years
Later than 2
years and not
later than 5
years
Later than 5
years Total
$'000 $'000 $'000 $'000 $'000
Operating
Animal Control 110 0 0 - 110
Cleaning Services 578 44 0 - 622
Domestic Waste Collection 11,854 8,067 5,710 - 25,631
Golf Course Management 155 155 0 - 310
Other Operating Services 4,217 499 326 - 5,042
Printing & Distribution 483 39 28 - 550
Recycling 2,127 2,127 4,255 - 8,509
Repairs & Maintenance 4,338 444 52 - 4,834
Supply Meals/Foodstuffs 561 200 0 - 761
Traffic & Parking 1,485 0 0 - 1,485
Utilities 1,307 92 0 - 1,399Total Operating 27,215 11,667 10,371 - 49,253
Capital
Buildings 4725 - - - 4,725
Infrastructure 1,566 105 314 209 2,193
Roads 2,929 - - - 2,929
Other 436 - - - 436Total Capital 9,656 105 314 209 10,283
NOTE 30 OPERATING LEASE COMMITMENTS
(These obligations are not recognised as liabilities) 2015 2014
$'000 $'000
Not later than one year 638 628
Later than one year but not later than two years 531 672
Later than two years but not later than five years 212 708
Total 1,381 2,008
At the reporting date, the Council had the following obligations under non-cancellable operating leases for the lease of
equipment and land and buildings for use within Council activities.
Page 34
Notes to the Financial Report
For the Year Ended 30 June 2015
Note 31 CONTINGENT LIABILITIES & ASSETS
Contingent Assets
As at 30 June 2015, there are no potential contingent assets.
Contingent liabilities
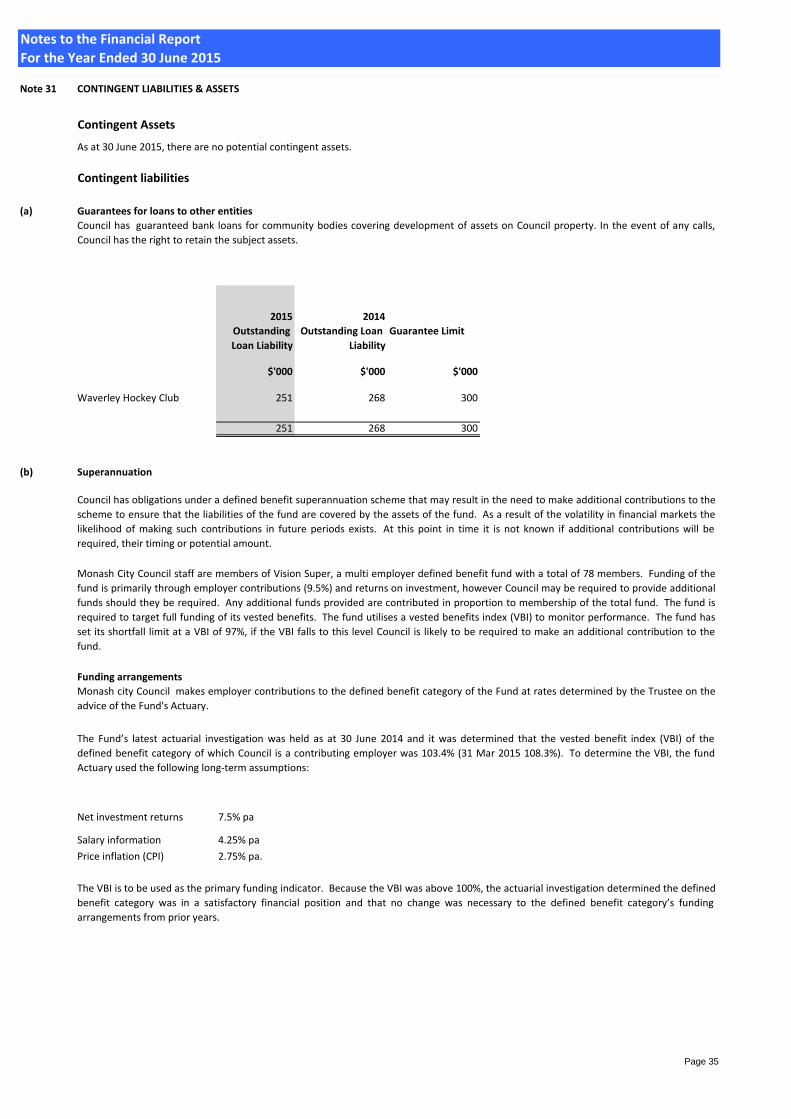
(a) Guarantees for loans to other entities
2015 2014
Outstanding
Loan Liability
Outstanding Loan
Liability
Guarantee Limit
$'000 $'000 $'000
Waverley Hockey Club 251 268 300
251 268 300
(b) Superannuation
Funding arrangements
Net investment returns 7.5% pa
Salary information 4.25% pa
Price inflation (CPI) 2.75% pa.
The VBI is to be used as the primary funding indicator. Because the VBI was above 100%, the actuarial investigation determined the defined
benefit category was in a satisfactory financial position and that no change was necessary to the defined benefit category’s funding
arrangements from prior years.
Council has guaranteed bank loans for community bodies covering development of assets on Council property. In the event of any calls,
Council has the right to retain the subject assets.
Council has obligations under a defined benefit superannuation scheme that may result in the need to make additional contributions to the
scheme to ensure that the liabilities of the fund are covered by the assets of the fund. As a result of the volatility in financial markets the
likelihood of making such contributions in future periods exists. At this point in time it is not known if additional contributions will be
required, their timing or potential amount.
Monash City Council staff are members of Vision Super, a multi employer defined benefit fund with a total of 78 members. Funding of the
fund is primarily through employer contributions (9.5%) and returns on investment, however Council may be required to provide additional
funds should they be required. Any additional funds provided are contributed in proportion to membership of the total fund. The fund is
required to target full funding of its vested benefits. The fund utilises a vested benefits index (VBI) to monitor performance. The fund has
set its shortfall limit at a VBI of 97%, if the VBI falls to this level Council is likely to be required to make an additional contribution to the
fund.
Monash city Council makes employer contributions to the defined benefit category of the Fund at rates determined by the Trustee on the
advice of the Fund's Actuary.
The Fund’s latest actuarial investigation was held as at 30 June 2014 and it was determined that the vested benefit index (VBI) of the
defined benefit category of which Council is a contributing employer was 103.4% (31 Mar 2015 108.3%). To determine the VBI, the fund
Actuary used the following long-term assumptions:
Page 35
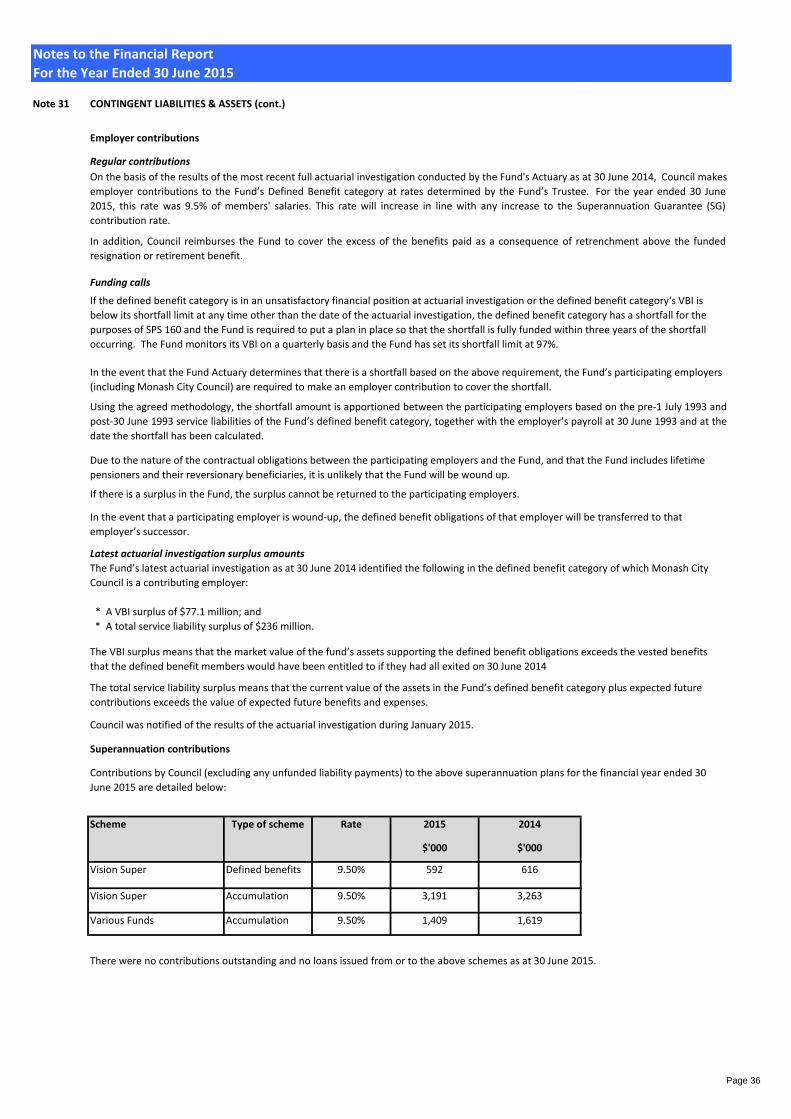
Notes to the Financial Report
For the Year Ended 30 June 2015
Note 31 CONTINGENT LIABILITIES & ASSETS (cont.)
Employer contributions
Regular contributions
Funding calls
Superannuation contributions
2015 2014
$'000 $'000
Vision Super Defined benefits 9.50% 592 616
Vision Super Accumulation 9.50% 3,191 3,263
Various Funds Accumulation 9.50% 1,409 1,619
Council was notified of the results of the actuarial investigation during January 2015.
On the basis of the results of the most recent full actuarial investigation conducted by the Fund's Actuary as at 30 June 2014, Council makes
employer contributions to the Fund’s Defined Benefit category at rates determined by the Fund’s Trustee. For the year ended 30 June
2015, this rate was 9.5% of members' salaries. This rate will increase in line with any increase to the Superannuation Guarantee (SG)
contribution rate.
In addition, Council reimburses the Fund to cover the excess of the benefits paid as a consequence of retrenchment above the funded
resignation or retirement benefit.
If the defined benefit category is in an unsatisfactory financial position at actuarial investigation or the defined benefit category‘s VBI is
below its shortfall limit at any time other than the date of the actuarial investigation, the defined benefit category has a shortfall for the
purposes of SPS 160 and the Fund is required to put a plan in place so that the shortfall is fully funded within three years of the shortfall
occurring. The Fund monitors its VBI on a quarterly basis and the Fund has set its shortfall limit at 97%.
In the event that the Fund Actuary determines that there is a shortfall based on the above requirement, the Fund’s participating employers
(including Monash City Council) are required to make an employer contribution to cover the shortfall.
Using the agreed methodology, the shortfall amount is apportioned between the participating employers based on the pre-1 July 1993 and
post-30 June 1993 service liabilities of the Fund’s defined benefit category, together with the employer’s payroll at 30 June 1993 and at the
date the shortfall has been calculated.
Due to the nature of the contractual obligations between the participating employers and the Fund, and that the Fund includes lifetime
pensioners and their reversionary beneficiaries, it is unlikely that the Fund will be wound up.
There were no contributions outstanding and no loans issued from or to the above schemes as at 30 June 2015.
Scheme Type of scheme Rate
If there is a surplus in the Fund, the surplus cannot be returned to the participating employers.
In the event that a participating employer is wound-up, the defined benefit obligations of that employer will be transferred to that
employer’s successor.
Latest actuarial investigation surplus amounts
The Fund’s latest actuarial investigation as at 30 June 2014 identified the following in the defined benefit category of which Monash City
Council is a contributing employer:
* A VBI surplus of $77.1 million; and
* A total service liability surplus of $236 million.
The VBI surplus means that the market value of the fund’s assets supporting the defined benefit obligations exceeds the vested benefits
that the defined benefit members would have been entitled to if they had all exited on 30 June 2014
Contributions by Council (excluding any unfunded liability payments) to the above superannuation plans for the financial year ended 30
June 2015 are detailed below:
The total service liability surplus means that the current value of the assets in the Fund’s defined benefit category plus expected future
contributions exceeds the value of expected future benefits and expenses.
Page 36
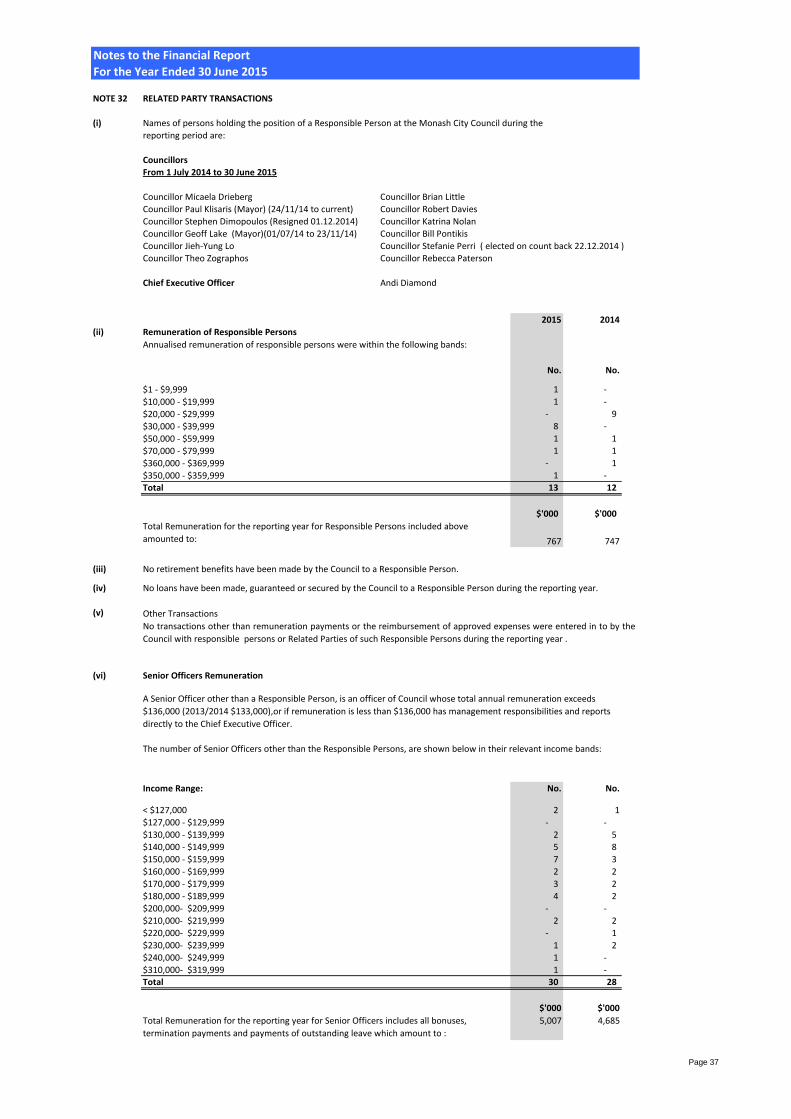
Notes to the Financial Report
For the Year Ended 30 June 2015
NOTE 32 RELATED PARTY TRANSACTIONS
(i) Names of persons holding the position of a Responsible Person at the Monash City Council during the
reporting period are:
Councillors
From 1 July 2014 to 30 June 2015
Councillor Micaela Drieberg Councillor Brian Little
Councillor Paul Klisaris (Mayor) (24/11/14 to current) Councillor Robert Davies
Councillor Stephen Dimopoulos (Resigned 01.12.2014) Councillor Katrina Nolan
Councillor Geoff Lake (Mayor)(01/07/14 to 23/11/14) Councillor Bill Pontikis
Councillor Jieh-Yung Lo Councillor Stefanie Perri ( elected on count back 22.12.2014 )
Councillor Theo Zographos Councillor Rebecca Paterson
Chief Executive Officer Andi Diamond
2015 2014
(ii) Remuneration of Responsible Persons
No. No.
$1 - $9,999 1 -
$10,000 - $19,999 1 -
$20,000 - $29,999 - 9
$30,000 - $39,999 8 -
$50,000 - $59,999 1 1
$70,000 - $79,999 1 1
$360,000 - $369,999 - 1
$350,000 - $359,999 1 -
Total 13 12
$'000 $'000
767 747
(iii) No retirement benefits have been made by the Council to a Responsible Person.
(iv)
(v) Other Transactions
(vi) Senior Officers Remuneration
Income Range: No. No.
< $127,000 2 1
$127,000 - $129,999 - -
$130,000 - $139,999 2 5
$140,000 - $149,999 5 8
$150,000 - $159,999 7 3
$160,000 - $169,999 2 2
$170,000 - $179,999 3 2
$180,000 - $189,999 4 2
$200,000- $209,999 - -
$210,000- $219,999 2 2
$220,000- $229,999 - 1
$230,000- $239,999 1 2
$240,000- $249,999 1 -
$310,000- $319,999 1 - Total 30 28
$'000 $'000
5,007 4,685
Annualised remuneration of responsible persons were within the following bands:
Total Remuneration for the reporting year for Senior Officers includes all bonuses,
termination payments and payments of outstanding leave which amount to :
Total Remuneration for the reporting year for Responsible Persons included above
amounted to:
A Senior Officer other than a Responsible Person, is an officer of Council whose total annual remuneration exceeds
$136,000 (2013/2014 $133,000),or if remuneration is less than $136,000 has management responsibilities and reports
directly to the Chief Executive Officer.
The number of Senior Officers other than the Responsible Persons, are shown below in their relevant income bands:
No loans have been made, guaranteed or secured by the Council to a Responsible Person during the reporting year.
No transactions other than remuneration payments or the reimbursement of approved expenses were entered in to by the
Council with responsible persons or Related Parties of such Responsible Persons during the reporting year .
Page 37
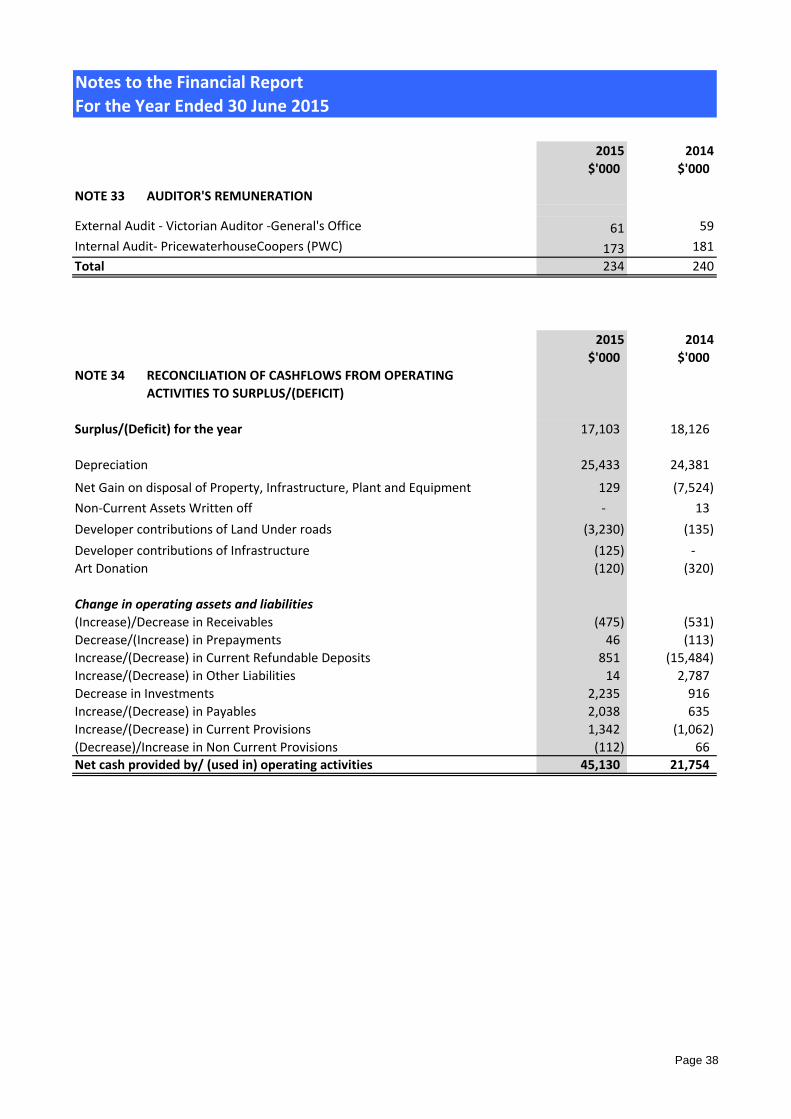
Notes to the Financial Report
For the Year Ended 30 June 2015
2015 2014
$'000 $'000
NOTE 33 AUDITOR'S REMUNERATION
61 59
173 181
Total 234 240
2015 2014
$'000 $'000
NOTE 34 RECONCILIATION OF CASHFLOWS FROM OPERATING
ACTIVITIES TO SURPLUS/(DEFICIT)
Surplus/(Deficit) for the year 17,103 18,126
Depreciation 25,433 24,381
Net Gain on disposal of Property, Infrastructure, Plant and Equipment 129 (7,524)
Non-Current Assets Written off - 13
Developer contributions of Land Under roads (3,230) (135)
Developer contributions of Infrastructure (125) -
Art Donation (120) (320)
Change in operating assets and liabilities
(Increase)/Decrease in Receivables (475) (531)
Decrease/(Increase) in Prepayments 46 (113)
Increase/(Decrease) in Current Refundable Deposits 851 (15,484)
Increase/(Decrease) in Other Liabilities 14 2,787
Decrease in Investments 2,235 916
Increase/(Decrease) in Payables 2,038 635
Increase/(Decrease) in Current Provisions 1,342 (1,062)
(Decrease)/Increase in Non Current Provisions (112) 66
Net cash provided by/ (used in) operating activities 45,130 21,754
External Audit - Victorian Auditor -General's Office
Internal Audit- PricewaterhouseCoopers (PWC)
Page 38
Notes to the Financial Report
For the Year Ended 30 June 2015
NOTE 35 FINANCIAL INSTRUMENTS
(a) Objectives and Policies
(b) Market risk
Interest rate risk
- diversification of investment product,
(c) Credit risk
- benchmarking of returns and comparison with budget.
Credit risk is the risk that a contracting entity will not complete its obligations under a financial instrument and cause us
to make a financial loss. We have exposure to credit risk on some financial assets included in our balance sheet. To help
manage this risk:
- we have a policy for establishing credit limits for the entities we deal with;
- we may require collateral where appropriate; and
Interest rate movements have not been sufficiently significant during the year to have an impact on the Council's year
end result.
Receivables consist of a large number of customers, spread across the ratepayer, business and government sectors.
Credit risk associated with the Council's financial assets is minimal because the main debtor is secured by a charge overf
the rateable property.
- we only invest surplus funds with financial institutions which have a recognised credit rating specified in our
investment policy.
The maximum exposure to credit risk at the reporting date to recognised financial assets is the carrying amount, net of
any provisions for impairment of those assets, as disclosed in the balance sheet and notes to the financial statements.
Council does not hold any collateral.
There are no material financial assets which are individually determined to be impaired.
- monitoring of return on investment,
We may also be subject to credit risk for transactions which are not included in the balance sheet, such as when we
provide a guarantee for another party. Details of our contingent liabilities are disclosed in note 31.
The Council's principal financial instruments comprise cash assets, term deposits, receivables (excluding statutory
receivables) and payables (excluding statutory payables) . 'Details of the significant accounting policies and methods
adopted, including the criteria for recognition, the basis of measurement and the basis on which income and expenses
are recognised, in respect of each class of financial asset, financial liability and equity instrument is disclosed in Note 1 of
the financial statements. Risk management is carried out by senior management under policies approved by the
Council. These policies include identification and analysis of the risk exposure to Council and appropriate procedures,
controls and risk minimisation.
Market risk is the risk that the fair value or future cash flows of our financial instruments will fluctuate because of
changes in market prices. The Council's exposure to market risk is primarily through interest rate risk with only
insignificant exposure to other price risks and no exposure to foreign currency risk.
Interest rate risk refers to the risk that the value of a financial instrument or cash flows associated with the instrument
will fluctuate due to changes in market interest rates. Our interest rate liability risk arises primarily from long term loans
and borrowings at fixed rates which exposes us to fair value interest rate risk / Council does not hold any interest
bearing financial instruments that are measured at fair value, and therefore has no exposure to fair value interest rate
risk. Cash flow interest rate risk is the risk that the future cash flows of a financial instrument will fluctuate because of
changes in market interest rates. Council has minimal exposure to cash flow interest rate risk through its cash and
deposits that are at floating rate.
Investment of surplus funds is made with approved financial institutions under the Local Government Act 1989. We
manage interest rate risk by adopting an investment policy that ensures:
There has been no significant change in the Council's exposure, or its objectives, policies and processes for managing
interest rate risk or the methods used to measure this risk from the previous reporting period.
Page 39
Notes to the Financial Report
For the Year Ended 30 June 2015
NOTE 35 FINANCIAL INSTRUMENTS (CONT.)
(d) Liquidity risk
(e) Fair value
(f) Sensitivity disclosure analysis
NOTE 36 EVENTS OCCURING AFTER BALANCE DATE
- monitors budget to actual performance on a regular basis; and
- has a liquidity portfolio structure that requires surplus funds to be invested within various bands of liquid
instruments;
Unless otherwise stated, the carrying amount of financial instruments reflect their fair value
Taking into account past performance, future expectations, economic forecasts, and management's knowledge
and experience of the financial markets, Council believes the following movements are 'reasonably possible'
over the next 12 months (base rates are sourced from Reserve Bank of Australia):
These movements will not have a material impact on the valuation of Council's fianncial assests and liabilities,
nor will they have a material impact on the results of Council's operations.
Liquidity risk includes the risk that, as a result of our operational liquidity requirements or we will not have
sufficient funds to settle a transaction when required, we will be forced to sell a financial asset at below value
or may be unable to settle or recover a financial asset.
To help reduce these risks Council:
- has a liquidity policy which targets a minimum and average level of cash and cash equivalents to be
maintained;
With the exception of borrowings, all financial liabilities are expected to be settled within normal terms of
trade. Details of the maturity profile for borrowings are disclosed at Note 27.
There has been no significant change in Council's exposure, or its objectives, policies and processes for
managing liquidity risk or the methods used to measure this risk from the previous reporting period.
- has readily accessible standby facilities and other funding arrangements in place;
- sets limits on borrowings relating to the percentage of loans to rate revenue and percentage of loan principal
repayments to rate revenue.
The Council's maximum exposure to liquidity risk is the carrying amounts of financial liabilities as disclosed in
the face of the balance sheet and the amounts related to financial guarantees disclosed in Note 31, and is
deemed insignificant based on prior periods' data and current assessment of risk.
Council's financial assets and liabilities are not valued in accordance with the fair value hierarchy , Council's
financial assets and liabilities are measured at amortised cost.
No matters have occurred after balance date that require disclosure in the financial report.
Fair value hierarchy
- A parallel shift of +1% and -1% in market interest rates (AUD) from year-end rates of 2%.
Page 40
CERTIFICATION OF THE FINANCIAL REPORT
....................................................…
Principal Accounting Officer
Dated: 25 August 2015
….........................................… ….........................................…
Mayor Councillor
.….....................…….............…
Acting Chief Executive Officer
Dated: 25 August 2015
In my opinion the accompanying financial statements have been prepared in accordance with the Local
Government Act 1989, the Local Government (Planning and Reporting) Regulations 2014, Australian Accounting
Standards and other mandatory professional reporting requirements.
In our opinion the accompanying financial report presents fairly the financial transactions of Monash City Council
for the year ended 30 June 2015 and the financial position of the Council as of that date.
As at the date of signing, we are not aware of any circumstance which would render any particulars in the financial
report to be misleading or inaccurate.
Julie Salomon
Daniel Wain CPA
Paul Klisaris Geoff Lake
We have been authorised by the Council and by the Local Government (Planning and Reporting) Regulations 2014
to certify the financial statements in their final form.
Page 41