Embed Size (px)
Citation preview
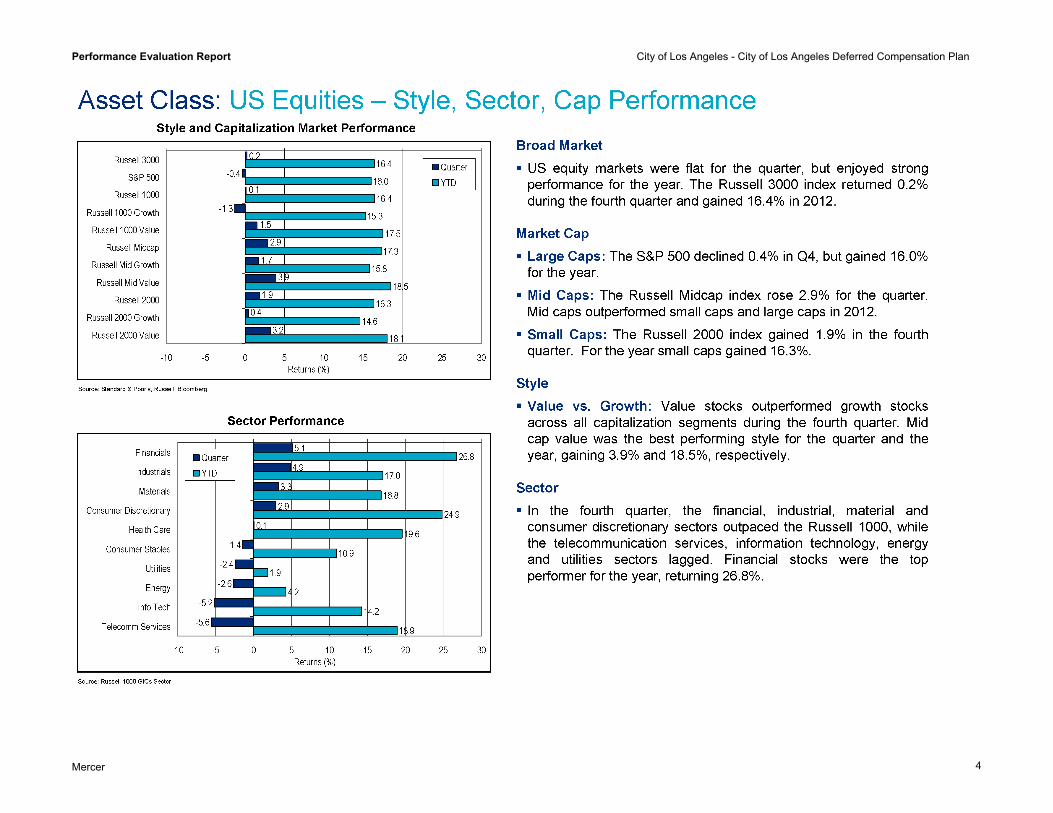
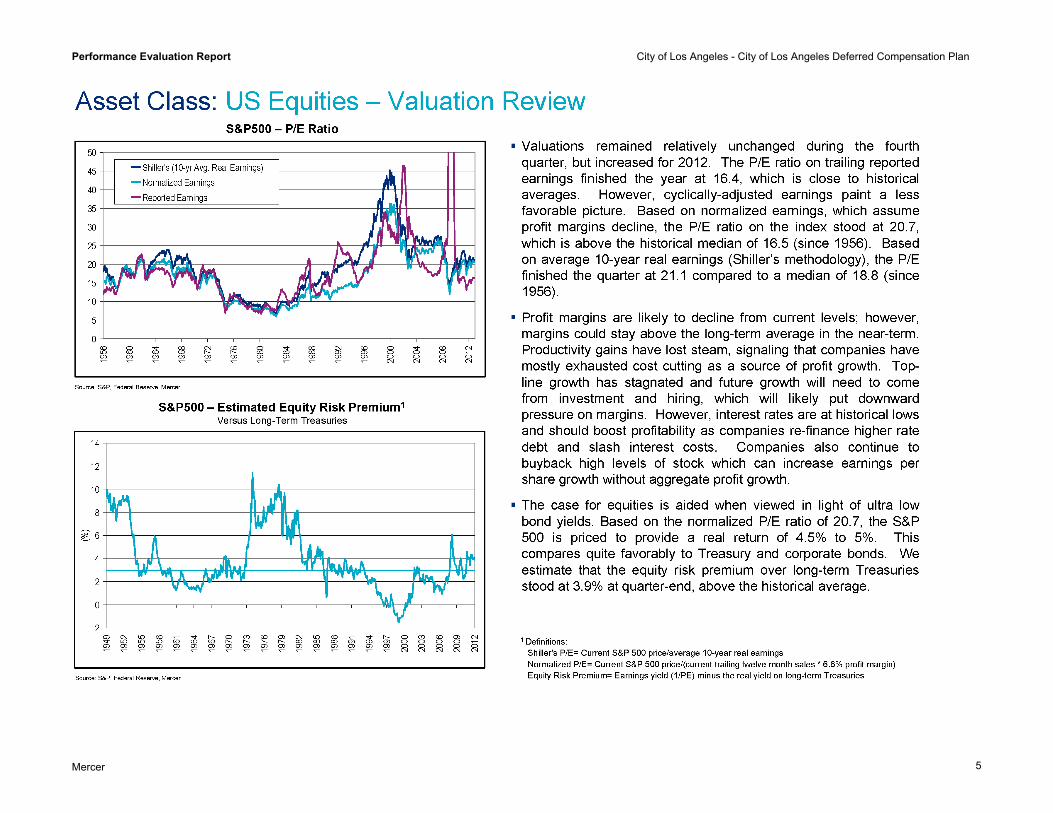
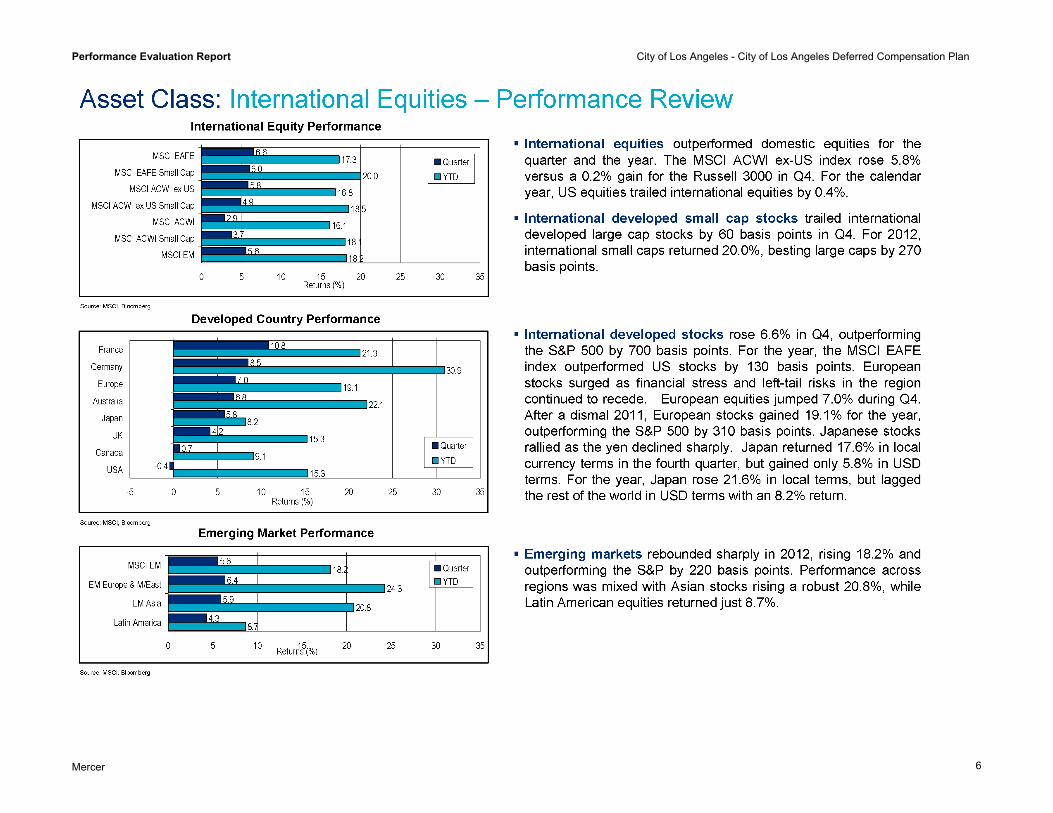
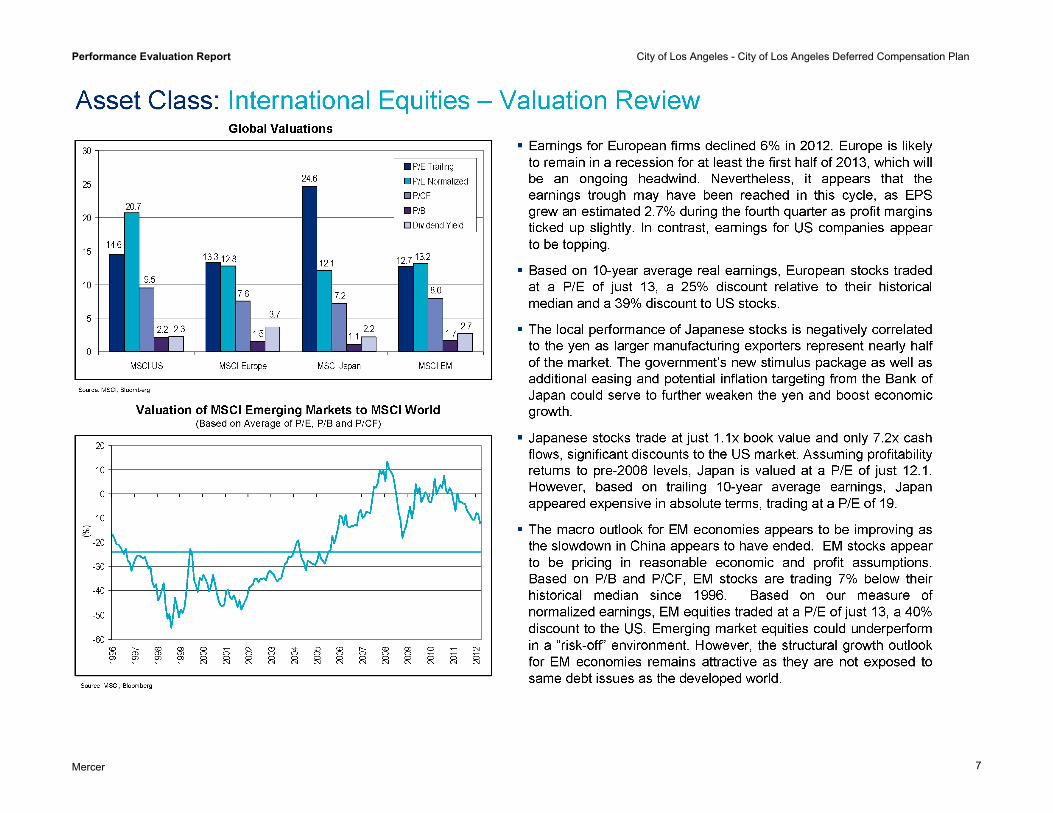
City of Los Angeles City of Los Angeles Deferred Compensation Plan
Defined Contribution Performance Evaluation Fourth Quarter 2012
Services provided by Mercer Investment Consulting, Inc.
Defined Contribution Performance Evaluation Report City of Los Angeles - City of Los Angeles Deferred Compensation Plan
Mercer i
Contents
Market Environment.....................................................................................................................................................................................................................1
Summary ...................................................................................................................................................................................................................................11
Fund Profiles..............................................................................................................................................................................................................................20
Appendix
A. Investment Manager Updates
B. Disclosures
Performance Evaluation Report City of Los Angeles - City of Los Angeles Deferred Compensation Plan
Mercer
1
Market Environment

Performance Evaluation Report City of Los Angeles - City of Los Angeles Deferred Compensation Plan
Mercer
2

Performance Evaluation Report City of Los Angeles - City of Los Angeles Deferred Compensation Plan
Mercer
3
Performance Evaluation Report City of Los Angeles - City of Los Angeles Deferred Compensation Plan
Mercer
4
Performance Evaluation Report City of Los Angeles - City of Los Angeles Deferred Compensation Plan
Mercer
5
Performance Evaluation Report City of Los Angeles - City of Los Angeles Deferred Compensation Plan
Mercer
6
Performance Evaluation Report City of Los Angeles - City of Los Angeles Deferred Compensation Plan
Mercer
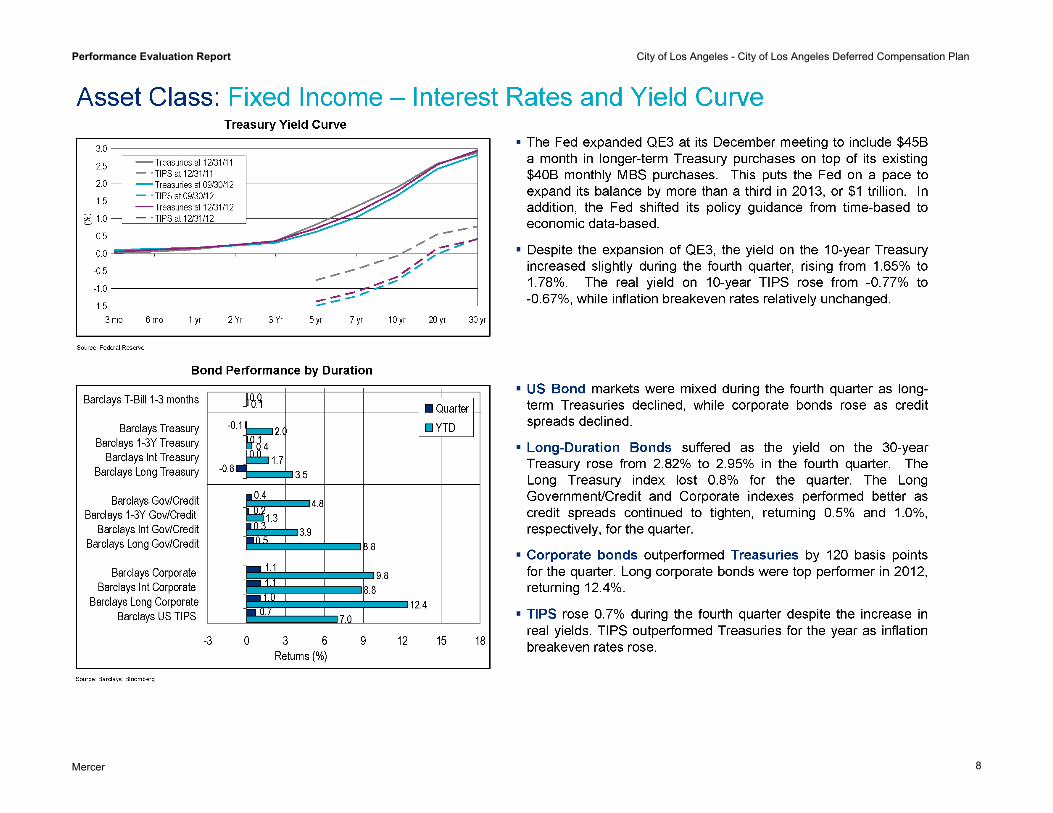
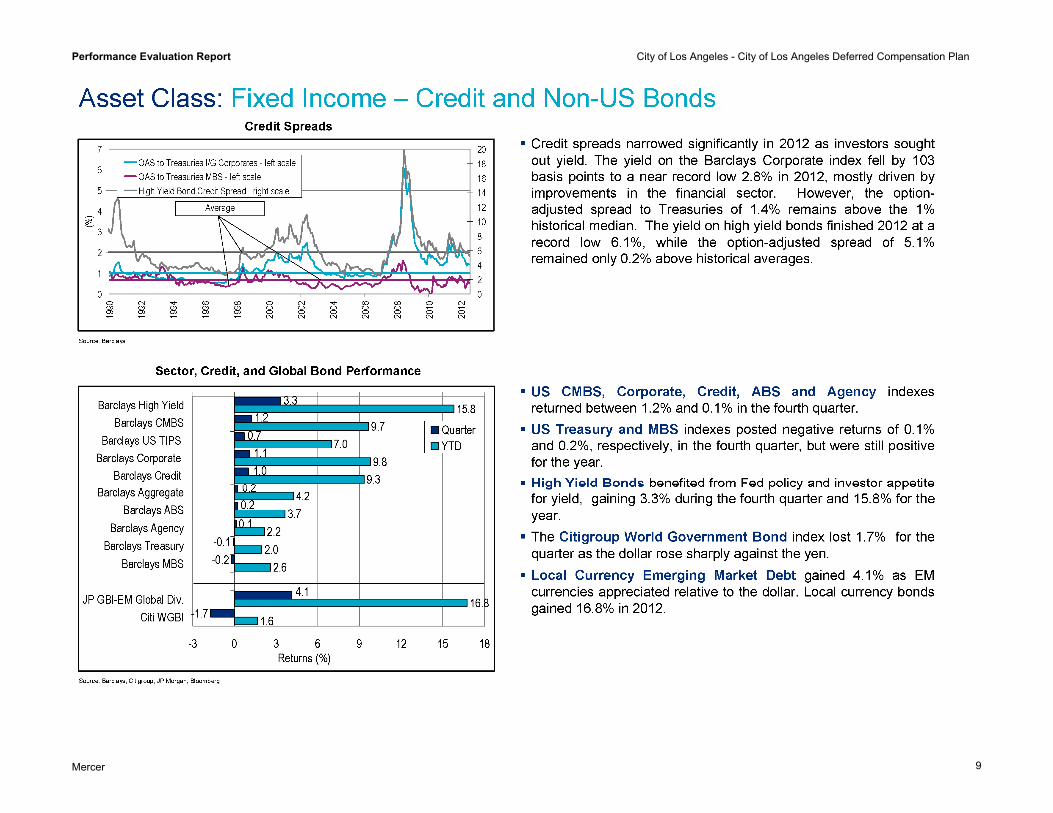
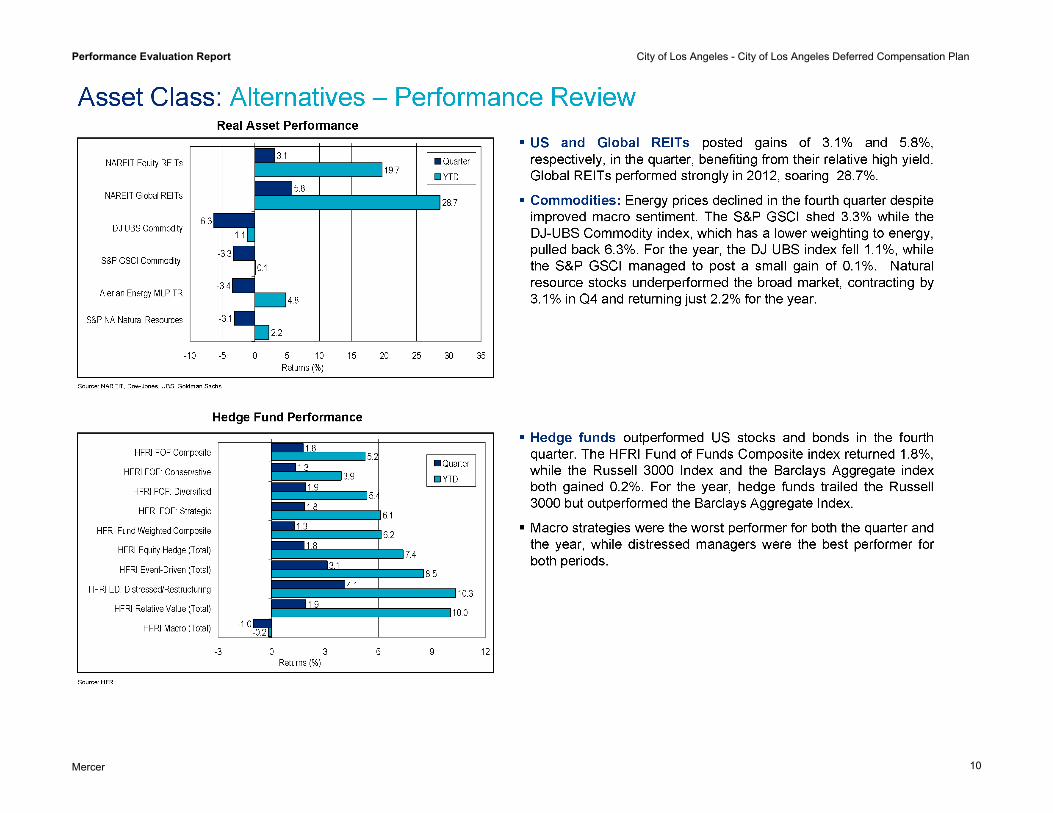
7
Performance Evaluation Report City of Los Angeles - City of Los Angeles Deferred Compensation Plan
Mercer
8
Performance Evaluation Report City of Los Angeles - City of Los Angeles Deferred Compensation Plan
Mercer
9
Performance Evaluation Report City of Los Angeles - City of Los Angeles Deferred Compensation Plan
Mercer
10
Performance Evaluation Report City of Los Angeles - City of Los Angeles Deferred Compensation Plan
Mercer
11
Summary
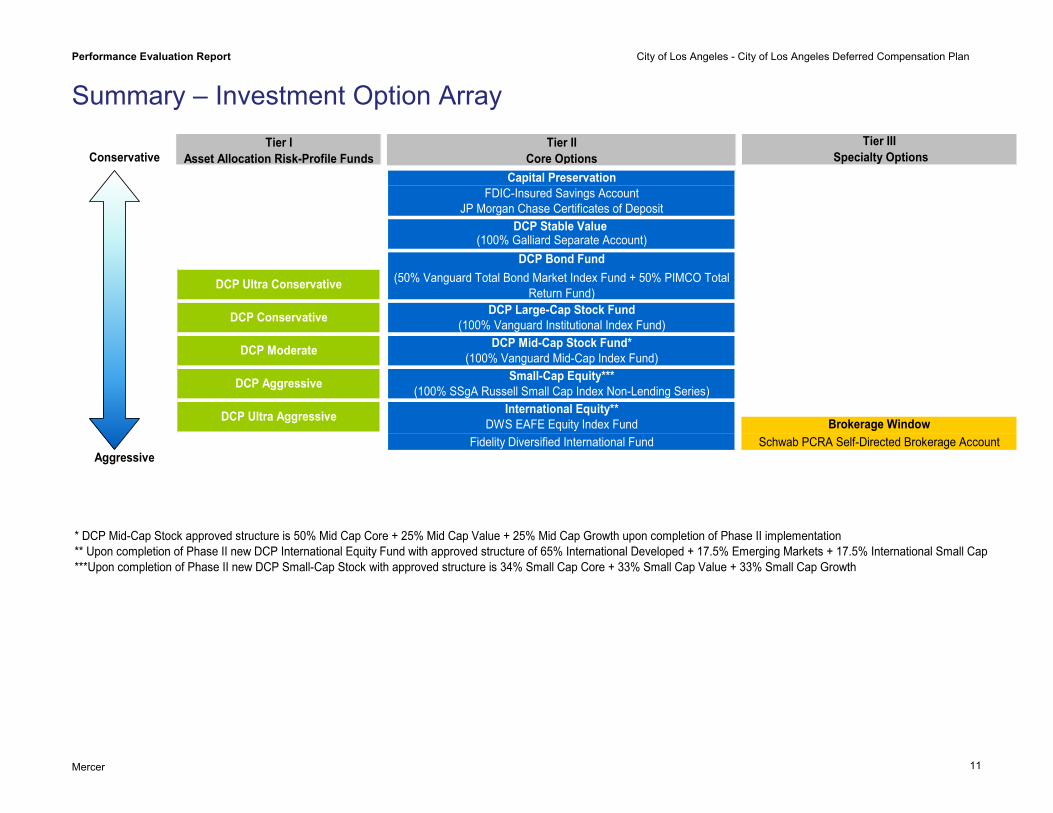
Summary – Investment Option Array
Tier I Asset Allocation Risk-Profile Funds
Tier IICore Options
Tier III Specialty Options
Capital PreservationFDIC-Insured Savings Account
JP Morgan Chase Certificates of DepositDCP Stable Value
(100% Galliard Separate Account)DCP Bond Fund
DCP Large-Cap Stock Fund(100% Vanguard Institutional Index Fund)
DCP Mid-Cap Stock Fund*(100% Vanguard Mid-Cap Index Fund)
Small-Cap Equity***(100% SSgA Russell Small Cap Index Non-Lending Series)
International Equity**DWS EAFE Equity Index Fund Brokerage Window
Fidelity Diversified International Fund Schwab PCRA Self-Directed Brokerage Account
* DCP Mid-Cap Stock approved structure is 50% Mid Cap Core + 25% Mid Cap Value + 25% Mid Cap Growth upon completion of Phase II implementation ** Upon completion of Phase II new DCP International Equity Fund with approved structure of 65% International Developed + 17.5% Emerging Markets + 17.5% International Small Cap ***Upon completion of Phase II new DCP Small-Cap Stock with approved structure is 34% Small Cap Core + 33% Small Cap Value + 33% Small Cap Growth
Conservative
Aggressive
DCP Ultra Conservative
DCP Conservative
DCP Moderate
DCP Aggressive
DCP Ultra Aggressive
(50% Vanguard Total Bond Market Index Fund + 50% PIMCO Total Return Fund)
Defined Contribution Performance Evaluation Report City of Los Angeles - City of Los Angeles Deferred Compensation Plan
Mercer 12
Summary – Plan Highlights, Key Observations and Recommendations Deferred Compensation Plan Assets
Distribution of Participant Account Balances
15,715
6,503
3,7202,627
6,225
3,194
1,238501 602
0
2,000
4,000
6,000
8,000
10,000
12,000
14,000
16,000
18,000
< $25,000 $25,001-$50,000
$50,001-$75,000
$75,001-$100,000
$100,001-$200,000
$200,001-$300,000
$300,001-$400,000
$400,001-$500,000
>$500,001
Num
ber o
f Par
ticip
ants
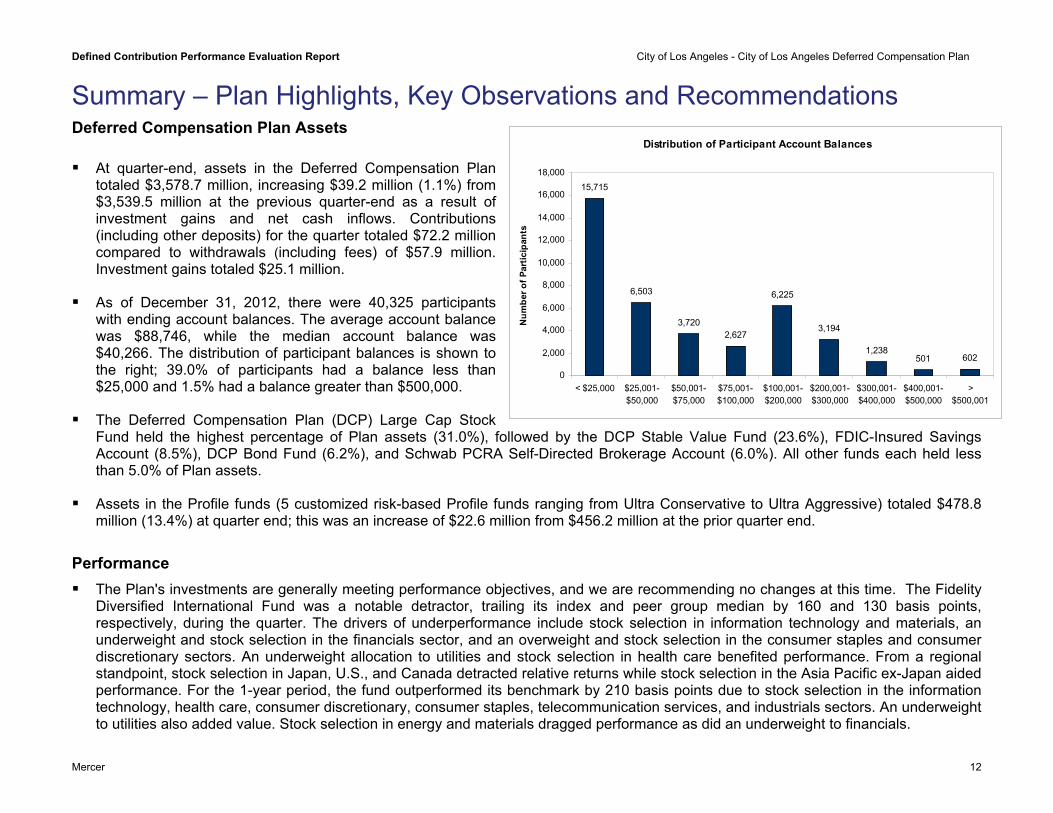
At quarter-end, assets in the Deferred Compensation Plan
totaled $3,578.7 million, increasing $39.2 million (1.1%) from $3,539.5 million at the previous quarter-end as a result of investment gains and net cash inflows. Contributions (including other deposits) for the quarter totaled $72.2 million compared to withdrawals (including fees) of $57.9 million. Investment gains totaled $25.1 million.
As of December 31, 2012, there were 40,325 participants with ending account balances. The average account balance was $88,746, while the median account balance was $40,266. The distribution of participant balances is shown to the right; 39.0% of participants had a balance less than $25,000 and 1.5% had a balance greater than $500,000.
The Deferred Compensation Plan (DCP) Large Cap Stock Fund held the highest percentage of Plan assets (31.0%), followed by the DCP Stable Value Fund (23.6%), FDIC-Insured Savings Account (8.5%), DCP Bond Fund (6.2%), and Schwab PCRA Self-Directed Brokerage Account (6.0%). All other funds each held less than 5.0% of Plan assets.
Assets in the Profile funds (5 customized risk-based Profile funds ranging from Ultra Conservative to Ultra Aggressive) totaled $478.8 million (13.4%) at quarter end; this was an increase of $22.6 million from $456.2 million at the prior quarter end.
Performance The Plan's investments are generally meeting performance objectives, and we are recommending no changes at this time. The Fidelity
Diversified International Fund was a notable detractor, trailing its index and peer group median by 160 and 130 basis points, respectively, during the quarter. The drivers of underperformance include stock selection in information technology and materials, an underweight and stock selection in the financials sector, and an overweight and stock selection in the consumer staples and consumer discretionary sectors. An underweight allocation to utilities and stock selection in health care benefited performance. From a regional standpoint, stock selection in Japan, U.S., and Canada detracted relative returns while stock selection in the Asia Pacific ex-Japan aided performance. For the 1-year period, the fund outperformed its benchmark by 210 basis points due to stock selection in the information technology, health care, consumer discretionary, consumer staples, telecommunication services, and industrials sectors. An underweight to utilities also added value. Stock selection in energy and materials dragged performance as did an underweight to financials.
Defined Contribution Performance Evaluation Report City of Los Angeles - City of Los Angeles Deferred Compensation Plan
Mercer 13
Summary – Plan Highlights, Key Observations and Recommendations Key Observations and Recommendations On April 20, 2012, Phase I of the Investment Menu Implementation was completed. The following changes took place: DCP Bond Fund was formed, which is 50% Vanguard Total Bond Market Index Fund and 50% PIMCO Total Return Fund The Vanguard Institutional Index Fund was transitioned to the newly formed DCP Large-Cap Stock Fund, which is 100% passively
managed The Hartford Capital Appreciation, American Funds Growth Fund of America, and American Funds Investment Company of America
were terminated and assets were mapped to the newly created DCP Large-Cap Stock Fund Investments in the Vanguard Mid-Cap Index Fund were mapped to the newly created DCP Mid-Cap Stock Fund as part of Phase I.
Future procurements for active mid value and mid growth managers will occur this year The Lazard US Mid Cap Equity Fund was terminated and assets were mapped to the DCP Mid-Cap Stock Fund
The next phase of the new line-up configuration will be the procurement process for new managers to build out the DCP Mid-Cap,
Small-Cap, and International Stock Funds. On November 1, 2012 Bank of the West reduced its declared rate to 0.75% from 1.00%. Bank of the West, Bank of America, and City
National Bank have weightings of 50%, 25%, and 25%, respectively. For the quarter ending December 31, 2012 their declared rates were as follows: Bank of America = 0.14%, Bank of the West = 0.75% and City National Bank = 0.15% yielding a 0.45% APR.
On January 31, 2013, the Vanguard Mid-cap Index Fund (currently 100% of the DCP Mid-Cap Stock Fund) changed its benchmark
from the MSCI US Mid Cap 450 Index to CRSP US Mid Cap Index.

Defined Contribution Performance Evaluation Report City of Los Angeles - City of Los Angeles Deferred Compensation Plan
Mercer 14
Prior Asset Allocation - September 30, 2012
Cash Equivalents
8.6%
Stable23.2%
Domestic6.2%
Domestic Equity38.4%
Brokerage Window
6.0%International Equity4.6%
Risk-based12.9%
Value
Fixed
Current Asset Allocation - December 31, 2012
Cash Equivalents
8.7%
Stable Value23.6%
Domestic Fixed6.2%
Brokerage Window
6.0%
Domestic Equity37.3%
International Equity4.8%
Risk-based13.4%
Investment Option Current Balance Prior Balance % of Plan % Chg vs.
Prior
Cash Equivalents $311,862,880 $304,920,066 8.7% 0.1%
FDIC-Insured Savings Account $305,937,996 $296,354,124 8.5% 0.2%
JPMorgan Chase Certificates of Deposit $5,924,884 $8,565,942 0.2% -0.1%
Stable Value $843,972,051 $821,127,274 23.6% 0.4%
Deferred Compensation Stable Value Fund (Net) $843,972,051 $821,127,274 23.6% 0.4%
Domestic Fixed $221,796,739 $220,856,218 6.2% 0.0%
DCP Bond Fund $221,796,739 $220,856,218 6.2% 0.0%
Risk-based $478,781,878 $456,215,737 13.4% 0.5%
Ultra Conservative $35,155,868 $32,641,812 1.0% 0.1%
Conservative Profile $68,440,050 $63,602,667 1.9% 0.1%
Moderate Profile $174,157,130 $169,507,145 4.9% 0.1%
Aggressive Profile $156,399,799 $151,715,332 4.4% 0.1%
Ultra Aggressive Profile $44,629,032 $38,748,781 1.2% 0.2%
Domestic Equity $1,334,780,236 $1,360,727,103 37.3% -1.1%
DCP Large Cap Stock Fund $1,107,862,635 $1,137,094,385 31.0% -1.2%
DCP Mid Cap Stock Fund $88,678,741 $87,417,024 2.5% 0.0%
SSgA Russell Small Cap Index Non-Lending Series Fund $138,238,861 $136,215,693 3.9% 0.0%
International Equity $172,756,851 $163,003,839 4.8% 0.2%
DWS EAFE Equity Index Fund Institutional $33,176,947 $30,898,281 0.9% 0.1%
Fidelity Diversified International Fund $139,579,904 $132,105,558 3.9% 0.2%
Brokerage Window $214,734,272 $212,608,893 6.0% 0.0%
Schwab PCRA Self-Directed Brokerage Account $214,734,272 $212,608,893 6.0% 0.0%
Total Plan $3,578,684,906 $3,539,459,130 100%
Summary – Asset Allocation
Defined Contribution Performance Evaluation Report City of Los Angeles - City of Los Angeles Deferred Compensation Plan
15
Mercer
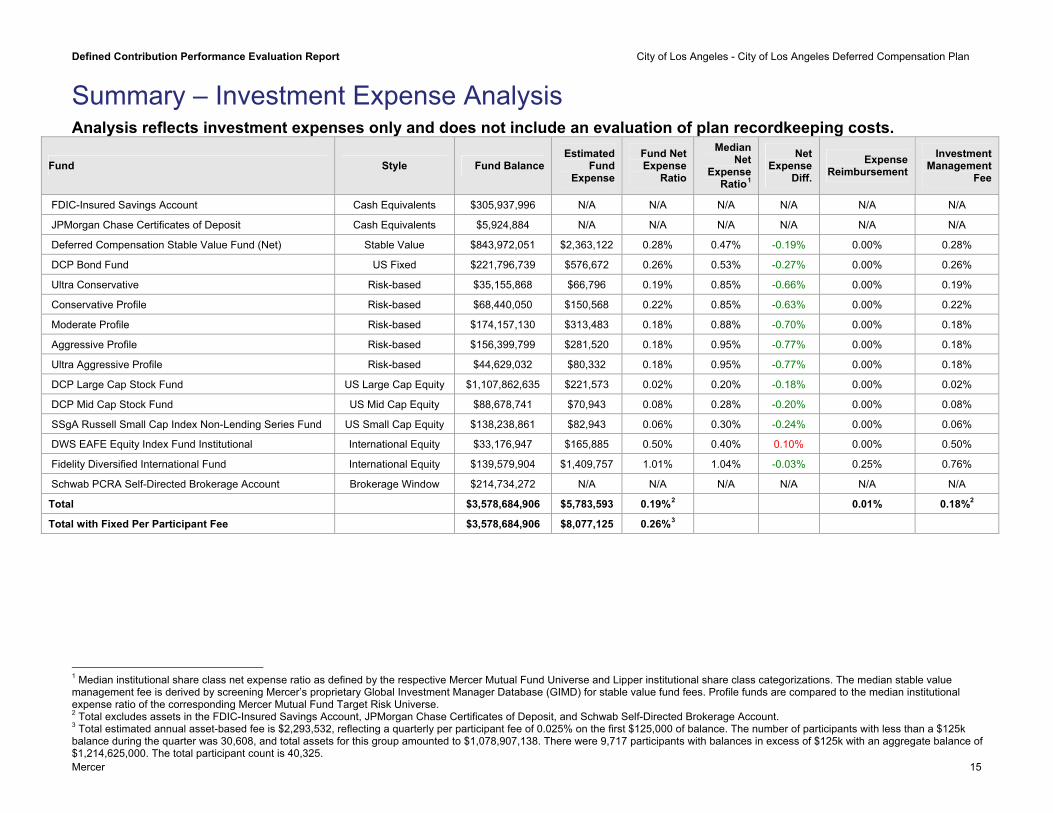
Summary – Investment Expense Analysis Analysis reflects investment expenses only and does not include an evaluation of plan recordkeeping costs.
Fund Style Fund Balance Estimated
Fund Expense
Fund Net Expense
Ratio
Median Net
Expense Ratio1
Net Expense
Diff.
Expense Reimbursement
Investment Management
Fee
FDIC-Insured Savings Account Cash Equivalents $305,937,996 N/A N/A N/A N/A N/A N/A
JPMorgan Chase Certificates of Deposit Cash Equivalents $5,924,884 N/A N/A N/A N/A N/A N/A
Deferred Compensation Stable Value Fund (Net) Stable Value $843,972,051 $2,363,122 0.28% 0.47% -0.19% 0.00% 0.28%
DCP Bond Fund US Fixed $221,796,739 $576,672 0.26% 0.53% -0.27% 0.00% 0.26%
Ultra Conservative Risk-based $35,155,868 $66,796 0.19% 0.85% -0.66% 0.00% 0.19%
Conservative Profile Risk-based $68,440,050 $150,568 0.22% 0.85% -0.63% 0.00% 0.22%
Moderate Profile Risk-based $174,157,130 $313,483 0.18% 0.88% -0.70% 0.00% 0.18%
Aggressive Profile Risk-based $156,399,799 $281,520 0.18% 0.95% -0.77% 0.00% 0.18%
Ultra Aggressive Profile Risk-based $44,629,032 $80,332 0.18% 0.95% -0.77% 0.00% 0.18%
DCP Large Cap Stock Fund US Large Cap Equity $1,107,862,635 $221,573 0.02% 0.20% -0.18% 0.00% 0.02%
DCP Mid Cap Stock Fund US Mid Cap Equity $88,678,741 $70,943 0.08% 0.28% -0.20% 0.00% 0.08%
SSgA Russell Small Cap Index Non-Lending Series Fund US Small Cap Equity $138,238,861 $82,943 0.06% 0.30% -0.24% 0.00% 0.06%
DWS EAFE Equity Index Fund Institutional International Equity $33,176,947 $165,885 0.50% 0.40% 0.10% 0.00% 0.50%
Fidelity Diversified International Fund International Equity $139,579,904 $1,409,757 1.01% 1.04% -0.03% 0.25% 0.76%
Schwab PCRA Self-Directed Brokerage Account Brokerage Window $214,734,272 N/A N/A N/A N/A N/A N/A
Total $3,578,684,906 $5,783,593 0.19%2 0.01% 0.18%2
Total with Fixed Per Participant Fee $3,578,684,906 $8,077,125 0.26%3
1 Median institutional share class net expense ratio as defined by the respective Mercer Mutual Fund Universe and Lipper institutional share class categorizations. The median stable value management fee is derived by screening Mercer’s proprietary Global Investment Manager Database (GIMD) for stable value fund fees. Profile funds are compared to the median institutional expense ratio of the corresponding Mercer Mutual Fund Target Risk Universe. 2 Total excludes assets in the FDIC-Insured Savings Account, JPMorgan Chase Certificates of Deposit, and Schwab Self-Directed Brokerage Account. 3 Total estimated annual asset-based fee is $2,293,532, reflecting a quarterly per participant fee of 0.025% on the first $125,000 of balance. The number of participants with less than a $125k balance during the quarter was 30,608, and total assets for this group amounted to $1,078,907,138. There were 9,717 participants with balances in excess of $125k with an aggregate balance of $1,214,625,000. The total participant count is 40,325.
Defined Contribution Performance Evaluation Report City of Los Angeles - City of Los Angeles Deferred Compensation Plan
Mercer 16
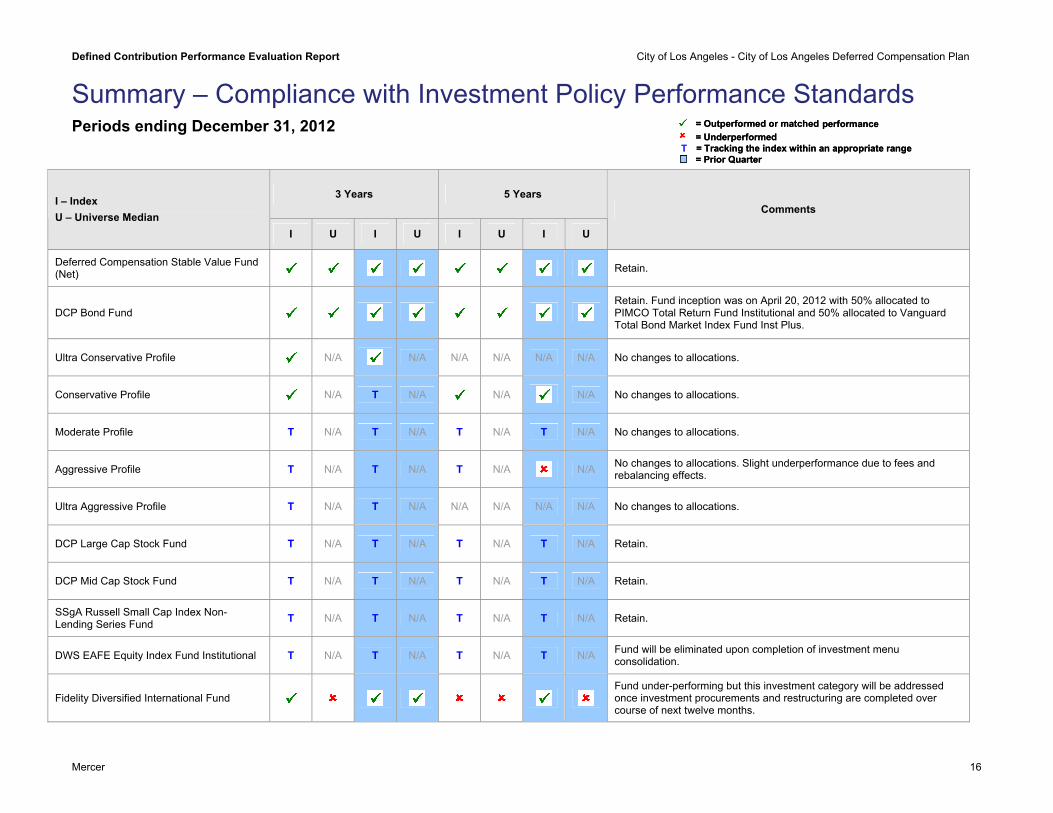
Summary – Compliance with Investment Policy Performance Standards Periods ending December 31, 2012 = Outperformed or matched
= UnderperformedT
= Prior Quarter= Tracking the index within an appropriate range
performance= Outperformed or matched = Underperformed
T= Prior Quarter= Tracking the index within an appropriate range
performance
3 Years 5 Years I – Index U – Universe Median
I U I U I U I U
Comments
Deferred Compensation Stable Value Fund (Net) Retain.
DCP Bond Fund Retain. Fund inception was on April 20, 2012 with 50% allocated to PIMCO Total Return Fund Institutional and 50% allocated to Vanguard Total Bond Market Index Fund Inst Plus.
Ultra Conservative Profile N/A N/A N/A N/A N/A N/A No changes to allocations.
Conservative Profile N/A T N/A N/A N/A No changes to allocations.
Moderate Profile T N/A T N/A T N/A T N/A No changes to allocations.
Aggressive Profile T N/A T N/A T N/A N/A No changes to allocations. Slight underperformance due to fees and rebalancing effects.
Ultra Aggressive Profile T N/A T N/A N/A N/A N/A N/A No changes to allocations.
DCP Large Cap Stock Fund T N/A T N/A T N/A T N/A Retain.
DCP Mid Cap Stock Fund T N/A T N/A T N/A T N/A Retain.
SSgA Russell Small Cap Index Non-Lending Series Fund T N/A T N/A T N/A T N/A Retain.
DWS EAFE Equity Index Fund Institutional T N/A T N/A T N/A T N/A Fund will be eliminated upon completion of investment menu consolidation.
Fidelity Diversified International Fund Fund under-performing but this investment category will be addressed once investment procurements and restructuring are completed over course of next twelve months.
Defined Contribution Performance Evaluation Report City of Los Angeles - City of Los Angeles Deferred Compensation Plan
Fund:
Outperformed Benchmark Underperformed Benchmark Tracked Benchmark Universe Ranking: 0% - 50% 50% - 75% 75% - 100%
Mercer 17
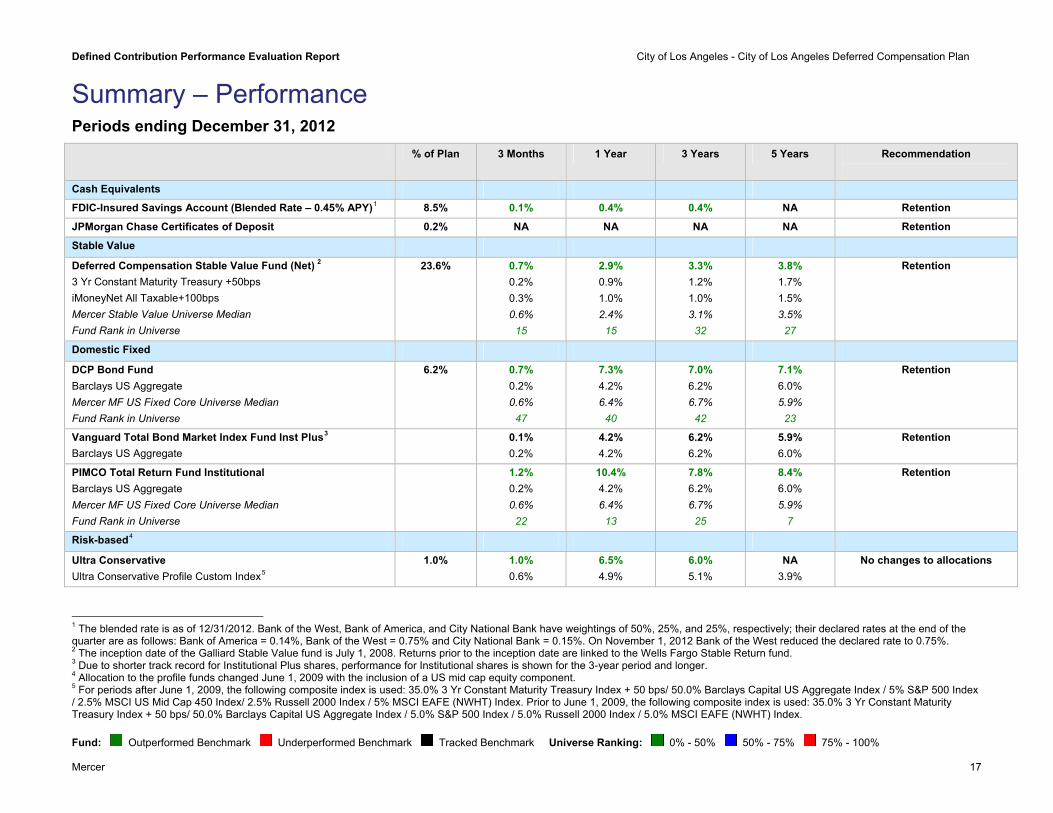
Summary – Performance Periods ending December 31, 2012 % of Plan 3 Months 1 Year 3 Years 5 Years Recommendation
Cash Equivalents
FDIC-Insured Savings Account (Blended Rate – 0.45% APY)1 8.5% 0.1% 0.4% 0.4% NA Retention JPMorgan Chase Certificates of Deposit 0.2% NA NA NA NA Retention Stable Value Deferred Compensation Stable Value Fund (Net) 2 3 Yr Constant Maturity Treasury +50bps iMoneyNet All Taxable+100bps Mercer Stable Value Universe Median Fund Rank in Universe
23.6% 0.7% 0.2% 0.3% 0.6%
15
2.9% 0.9% 1.0% 2.4%
15
3.3% 1.2% 1.0% 3.1%
32
3.8% 1.7% 1.5% 3.5%
27
Retention
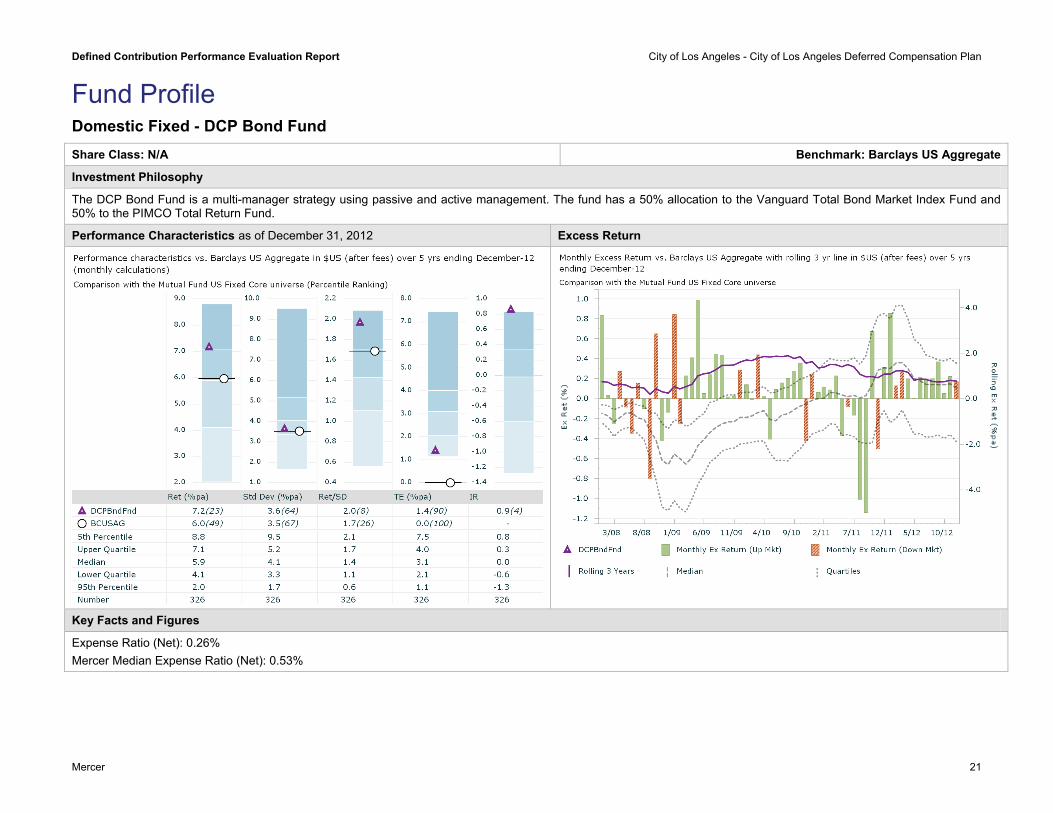
Domestic Fixed DCP Bond Fund Barclays US Aggregate Mercer MF US Fixed Core Universe Median Fund Rank in Universe
6.2% 0.7% 0.2% 0.6%
47
7.3% 4.2% 6.4%
40
7.0% 6.2% 6.7%
42
7.1% 6.0% 5.9%
23
Retention
Vanguard Total Bond Market Index Fund Inst Plus3 Barclays US Aggregate
0.1% 0.2%
4.2% 4.2%
6.2% 6.2%
5.9% 6.0%
Retention
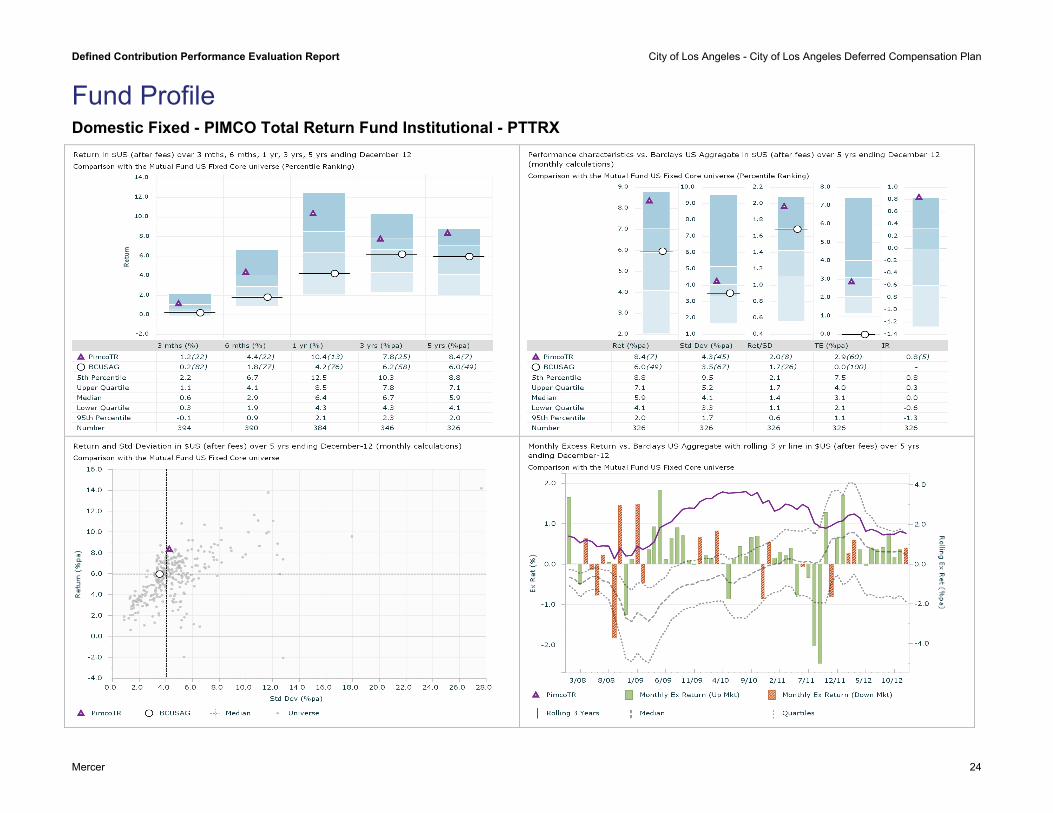
PIMCO Total Return Fund Institutional Barclays US Aggregate Mercer MF US Fixed Core Universe Median Fund Rank in Universe
1.2% 0.2% 0.6%
22
10.4% 4.2% 6.4%
13
7.8% 6.2% 6.7%
25
8.4% 6.0% 5.9%
7
Retention
Risk-based4 Ultra Conservative Ultra Conservative Profile Custom Index5
1.0% 1.0% 0.6%
6.5% 4.9%
6.0% 5.1%
NA 3.9%
No changes to allocations
1 The blended rate is as of 12/31/2012. Bank of the West, Bank of America, and City National Bank have weightings of 50%, 25%, and 25%, respectively; their declared rates at the end of the quarter are as follows: Bank of America = 0.14%, Bank of the West = 0.75% and City National Bank = 0.15%. On November 1, 2012 Bank of the West reduced the declared rate to 0.75%. 2 The inception date of the Galliard Stable Value fund is July 1, 2008. Returns prior to the inception date are linked to the Wells Fargo Stable Return fund. 3 Due to shorter track record for Institutional Plus shares, performance for Institutional shares is shown for the 3-year period and longer. 4 Allocation to the profile funds changed June 1, 2009 with the inclusion of a US mid cap equity component. 5 For periods after June 1, 2009, the following composite index is used: 35.0% 3 Yr Constant Maturity Treasury Index + 50 bps/ 50.0% Barclays Capital US Aggregate Index / 5% S&P 500 Index / 2.5% MSCI US Mid Cap 450 Index/ 2.5% Russell 2000 Index / 5% MSCI EAFE (NWHT) Index. Prior to June 1, 2009, the following composite index is used: 35.0% 3 Yr Constant Maturity Treasury Index + 50 bps/ 50.0% Barclays Capital US Aggregate Index / 5.0% S&P 500 Index / 5.0% Russell 2000 Index / 5.0% MSCI EAFE (NWHT) Index.
Defined Contribution Performance Evaluation Report City of Los Angeles - City of Los Angeles Deferred Compensation Plan
Fund:
Outperformed Benchmark Underperformed Benchmark Tracked Benchmark Universe Ranking: 0% - 50% 50% - 75% 75% - 100%
Mercer 18
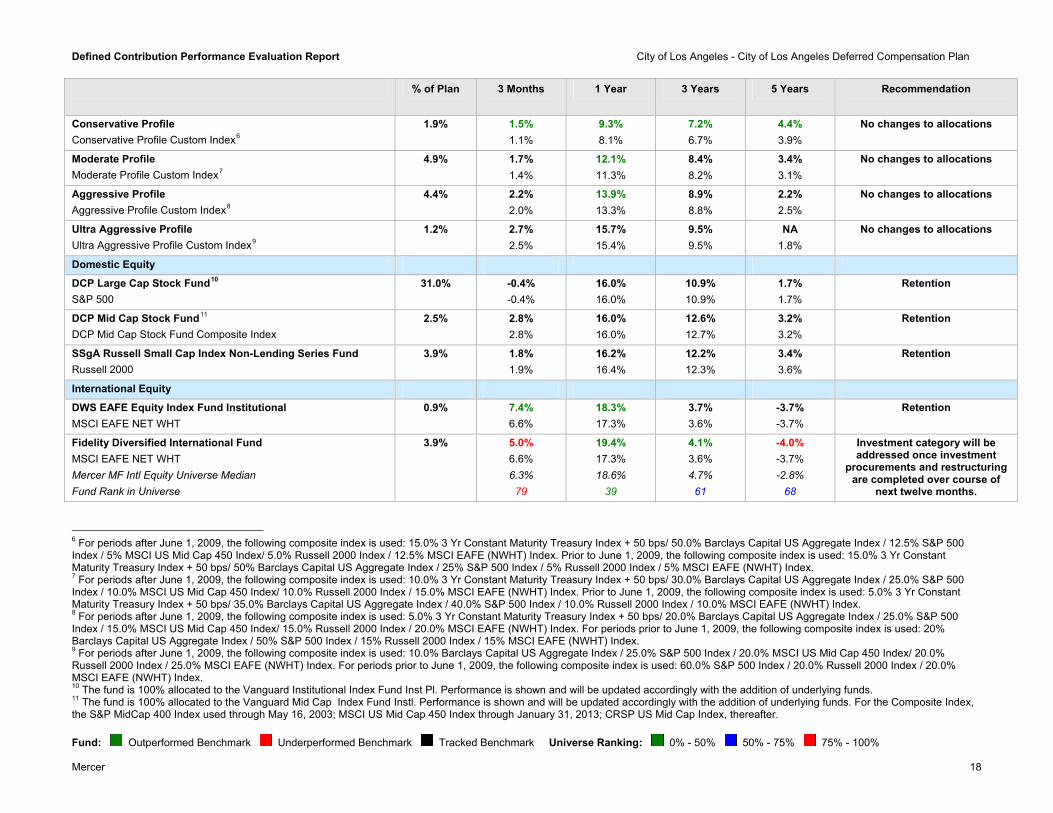
% of Plan 3 Months 1 Year 3 Years 5 Years Recommendation
Conservative Profile Conservative Profile Custom Index6
1.9% 1.5% 1.1%
9.3% 8.1%
7.2% 6.7%
4.4% 3.9%
No changes to allocations
Moderate Profile Moderate Profile Custom Index7
4.9% 1.7% 1.4%
12.1% 11.3%
8.4% 8.2%
3.4% 3.1%
No changes to allocations
Aggressive Profile Aggressive Profile Custom Index8
4.4% 2.2% 2.0%
13.9% 13.3%
8.9% 8.8%
2.2% 2.5%
No changes to allocations
Ultra Aggressive Profile Ultra Aggressive Profile Custom Index9
1.2% 2.7% 2.5%
15.7% 15.4%
9.5% 9.5%
NA 1.8%
No changes to allocations
Domestic Equity
DCP Large Cap Stock Fund10 S&P 500
31.0% -0.4% -0.4%
16.0% 16.0%
10.9% 10.9%
1.7% 1.7%
Retention
DCP Mid Cap Stock Fund11 DCP Mid Cap Stock Fund Composite Index
2.5% 2.8% 2.8%
16.0% 16.0%
12.6% 12.7%
3.2% 3.2%
Retention
SSgA Russell Small Cap Index Non-Lending Series Fund Russell 2000
3.9% 1.8% 1.9%
16.2% 16.4%
12.2% 12.3%
3.4% 3.6%
Retention
International Equity
DWS EAFE Equity Index Fund Institutional MSCI EAFE NET WHT
0.9% 7.4% 6.6%
18.3% 17.3%
3.7% 3.6%
-3.7% -3.7%
Retention
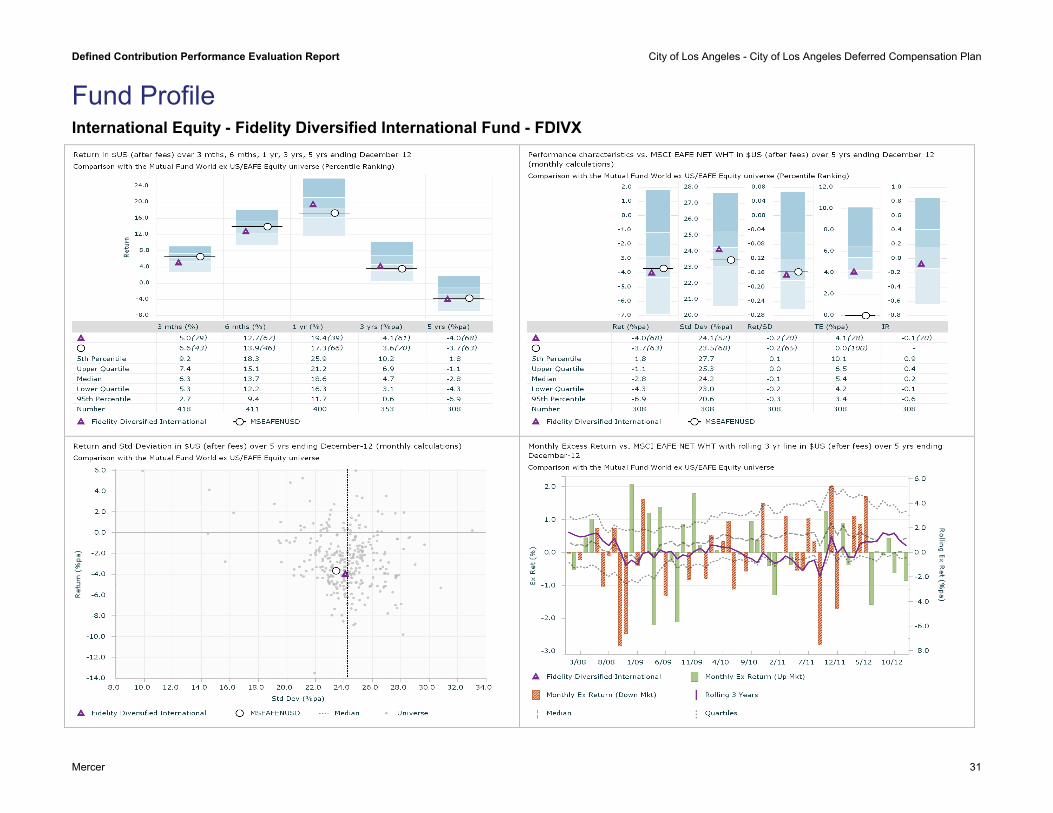
Fidelity Diversified International Fund MSCI EAFE NET WHT Mercer MF Intl Equity Universe Median Fund Rank in Universe
3.9% 5.0% 6.6% 6.3%
79
19.4% 17.3% 18.6%
39
4.1% 3.6% 4.7%
61
-4.0% -3.7% -2.8%
68
Investment category will be addressed once investment
procurements and restructuring are completed over course of
next twelve months.
6 For periods after June 1, 2009, the following composite index is used: 15.0% 3 Yr Constant Maturity Treasury Index + 50 bps/ 50.0% Barclays Capital US Aggregate Index / 12.5% S&P 500 Index / 5% MSCI US Mid Cap 450 Index/ 5.0% Russell 2000 Index / 12.5% MSCI EAFE (NWHT) Index. Prior to June 1, 2009, the following composite index is used: 15.0% 3 Yr Constant Maturity Treasury Index + 50 bps/ 50% Barclays Capital US Aggregate Index / 25% S&P 500 Index / 5% Russell 2000 Index / 5% MSCI EAFE (NWHT) Index. 7 For periods after June 1, 2009, the following composite index is used: 10.0% 3 Yr Constant Maturity Treasury Index + 50 bps/ 30.0% Barclays Capital US Aggregate Index / 25.0% S&P 500 Index / 10.0% MSCI US Mid Cap 450 Index/ 10.0% Russell 2000 Index / 15.0% MSCI EAFE (NWHT) Index. Prior to June 1, 2009, the following composite index is used: 5.0% 3 Yr Constant Maturity Treasury Index + 50 bps/ 35.0% Barclays Capital US Aggregate Index / 40.0% S&P 500 Index / 10.0% Russell 2000 Index / 10.0% MSCI EAFE (NWHT) Index. 8 For periods after June 1, 2009, the following composite index is used: 5.0% 3 Yr Constant Maturity Treasury Index + 50 bps/ 20.0% Barclays Capital US Aggregate Index / 25.0% S&P 500 Index / 15.0% MSCI US Mid Cap 450 Index/ 15.0% Russell 2000 Index / 20.0% MSCI EAFE (NWHT) Index. For periods prior to June 1, 2009, the following composite index is used: 20% Barclays Capital US Aggregate Index / 50% S&P 500 Index / 15% Russell 2000 Index / 15% MSCI EAFE (NWHT) Index. 9 For periods after June 1, 2009, the following composite index is used: 10.0% Barclays Capital US Aggregate Index / 25.0% S&P 500 Index / 20.0% MSCI US Mid Cap 450 Index/ 20.0% Russell 2000 Index / 25.0% MSCI EAFE (NWHT) Index. For periods prior to June 1, 2009, the following composite index is used: 60.0% S&P 500 Index / 20.0% Russell 2000 Index / 20.0% MSCI EAFE (NWHT) Index. 10 The fund is 100% allocated to the Vanguard Institutional Index Fund Inst Pl. Performance is shown and will be updated accordingly with the addition of underlying funds. 11 The fund is 100% allocated to the Vanguard Mid Cap Index Fund Instl. Performance is shown and will be updated accordingly with the addition of underlying funds. For the Composite Index, the S&P MidCap 400 Index used through May 16, 2003; MSCI US Mid Cap 450 Index through January 31, 2013; CRSP US Mid Cap Index, thereafter.
Defined Contribution Performance Evaluation Report City of Los Angeles - City of Los Angeles Deferred Compensation Plan
Mercer 19
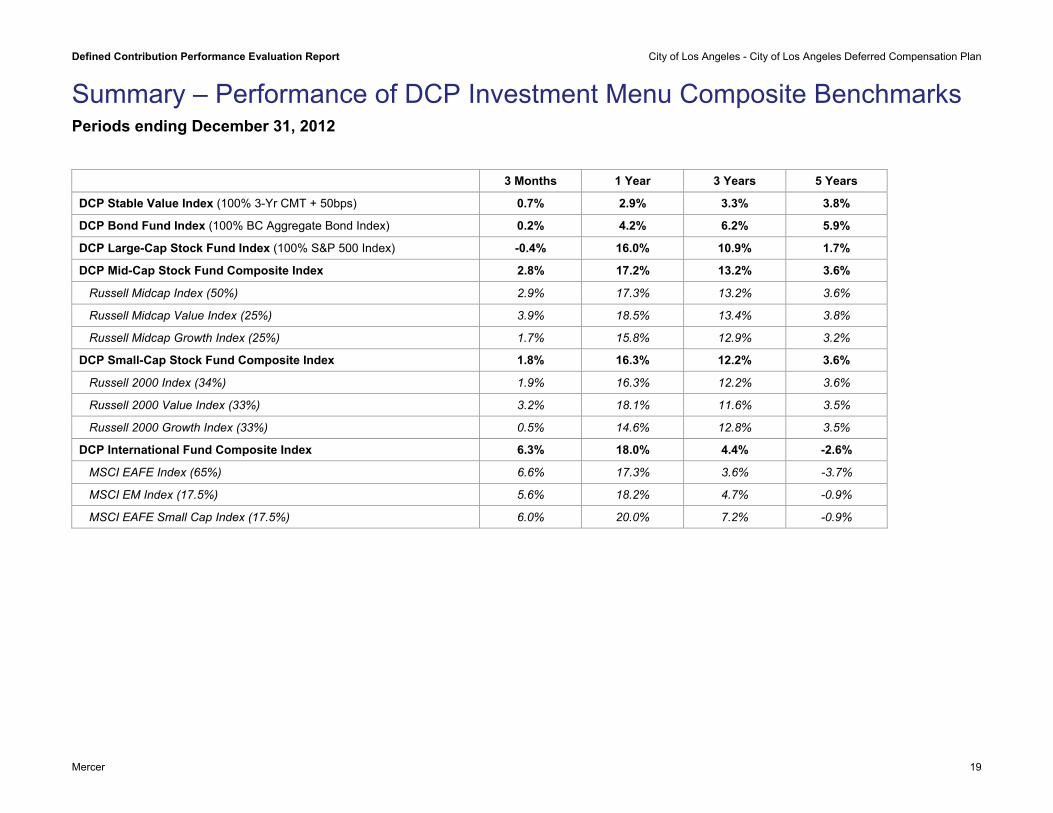
Summary – Performance of DCP Investment Menu Composite Benchmarks Periods ending December 31, 2012
3 Months 1 Year 3 Years 5 Years
DCP Stable Value Index (100% 3-Yr CMT + 50bps) 0.7% 2.9% 3.3% 3.8%
DCP Bond Fund Index (100% BC Aggregate Bond Index) 0.2% 4.2% 6.2% 5.9%
DCP Large-Cap Stock Fund Index (100% S&P 500 Index) -0.4% 16.0% 10.9% 1.7%
DCP Mid-Cap Stock Fund Composite Index 2.8% 17.2% 13.2% 3.6%
Russell Midcap Index (50%) 2.9% 17.3% 13.2% 3.6%
Russell Midcap Value Index (25%) 3.9% 18.5% 13.4% 3.8%
Russell Midcap Growth Index (25%) 1.7% 15.8% 12.9% 3.2%
DCP Small-Cap Stock Fund Composite Index 1.8% 16.3% 12.2% 3.6%
Russell 2000 Index (34%) 1.9% 16.3% 12.2% 3.6%
Russell 2000 Value Index (33%) 3.2% 18.1% 11.6% 3.5%
Russell 2000 Growth Index (33%) 0.5% 14.6% 12.8% 3.5%
DCP International Fund Composite Index 6.3% 18.0% 4.4% -2.6%
MSCI EAFE Index (65%) 6.6% 17.3% 3.6% -3.7%
MSCI EM Index (17.5%) 5.6% 18.2% 4.7% -0.9%
MSCI EAFE Small Cap Index (17.5%) 6.0% 20.0% 7.2% -0.9%
Defined Contribution Performance Evaluation Report City of Los Angeles - City of Los Angeles Deferred Compensation Plan
Mercer 20
Fund Profiles
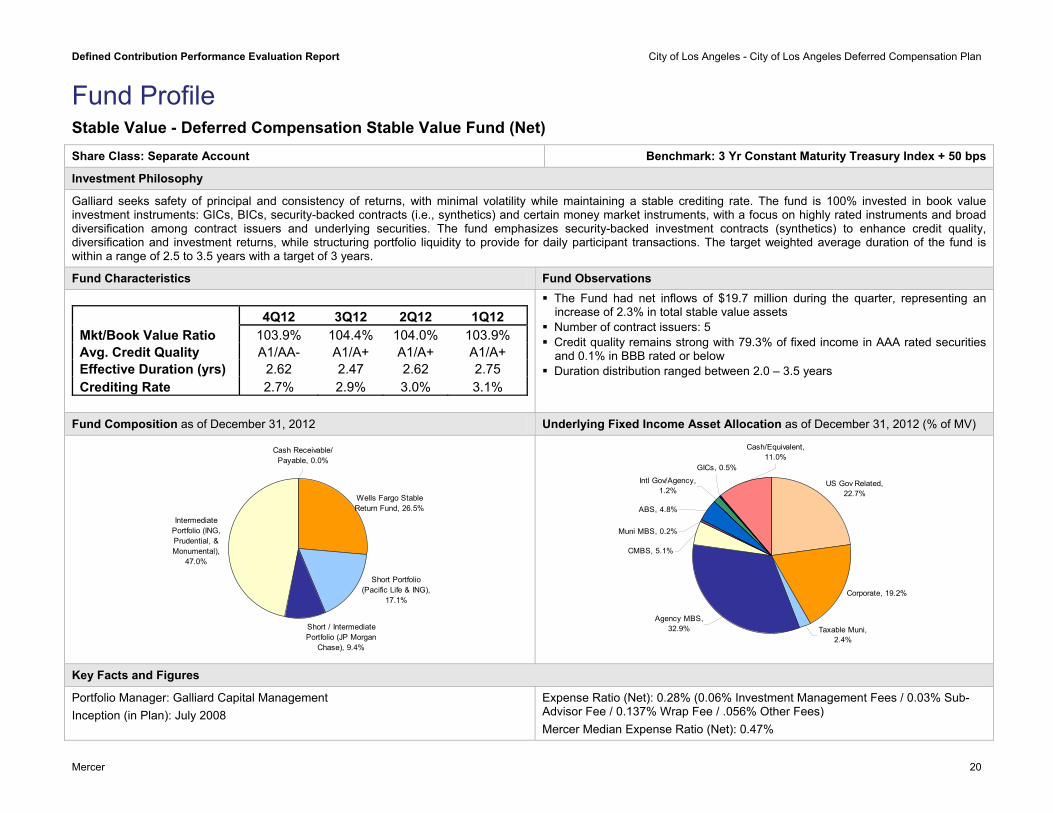
Fund Profile Stable Value - Deferred Compensation Stable Value Fund (Net) Share Class: Separate Account Benchmark: 3 Yr Constant Maturity Treasury Index + 50 bps
Investment Philosophy
Galliard seeks safety of principal and consistency of returns, with minimal volatility while maintaining a stable crediting rate. The fund is 100% invested in book value investment instruments: GICs, BICs, security-backed contracts (i.e., synthetics) and certain money market instruments, with a focus on highly rated instruments and broad diversification among contract issuers and underlying securities. The fund emphasizes security-backed investment contracts (synthetics) to enhance credit quality, diversification and investment returns, while structuring portfolio liquidity to provide for daily participant transactions. The target weighted average duration of the fund is within a range of 2.5 to 3.5 years with a target of 3 years.
Fund Characteristics Fund Observations
4Q12 3Q12 2Q12 1Q12 Mkt/Book Value Ratio 103.9% 104.4% 104.0% 103.9% Avg. Credit Quality A1/AA- A1/A+ A1/A+ A1/A+ Effective Duration (yrs) 2.62 2.47 2.62 2.75 Crediting Rate 2.7% 2.9% 3.0% 3.1%
The Fund had net inflows of $19.7 million during the quarter, representing an increase of 2.3% in total stable value assets
Number of contract issuers: 5 Credit quality remains strong with 79.3% of fixed income in AAA rated securities
and 0.1% in BBB rated or below Duration distribution ranged between 2.0 – 3.5 years
Fund Composition as of December 31, 2012 Underlying Fixed Income Asset Allocation as of December 31, 2012 (% of MV)
Wells Fargo Stable Return Fund, 26.5%
Intermediate Portfolio (ING, Prudential, & Monumental),
47.0%
Cash Receivable/ Payable, 0.0%
Short Portfolio (Pacific Life & ING),
17.1%
Short / Intermediate Portfolio (JP Morgan
Chase), 9.4%
Corporate, 19.2%
Agency MBS, 32.9% Taxable Muni,
2.4%
GICs, 0.5%
ABS, 4.8%
Muni MBS, 0.2%
CMBS, 5.1%
Intl Gov/Agency, 1.2%
US Gov Related, 22.7%
Cash/Equivalent, 11.0%
Key Facts and Figures
Portfolio Manager: Galliard Capital Management Inception (in Plan): July 2008
Expense Ratio (Net): 0.28% (0.06% Investment Management Fees / 0.03% Sub-Advisor Fee / 0.137% Wrap Fee / .056% Other Fees) Mercer Median Expense Ratio (Net): 0.47%
Defined Contribution Performance Evaluation Report City of Los Angeles - City of Los Angeles Deferred Compensation Plan
Mercer 21
Fund Profile Domestic Fixed - DCP Bond Fund Share Class: N/A Benchmark: Barclays US Aggregate
Investment Philosophy
The DCP Bond Fund is a multi-manager strategy using passive and active management. The fund has a 50% allocation to the Vanguard Total Bond Market Index Fund and 50% to the PIMCO Total Return Fund.
Performance Characteristics as of December 31, 2012 Excess Return
Key Facts and Figures
Expense Ratio (Net): 0.26% Mercer Median Expense Ratio (Net): 0.53%
Defined Contribution Performance Evaluation Report City of Los Angeles - City of Los Angeles Deferred Compensation Plan
Mercer 22
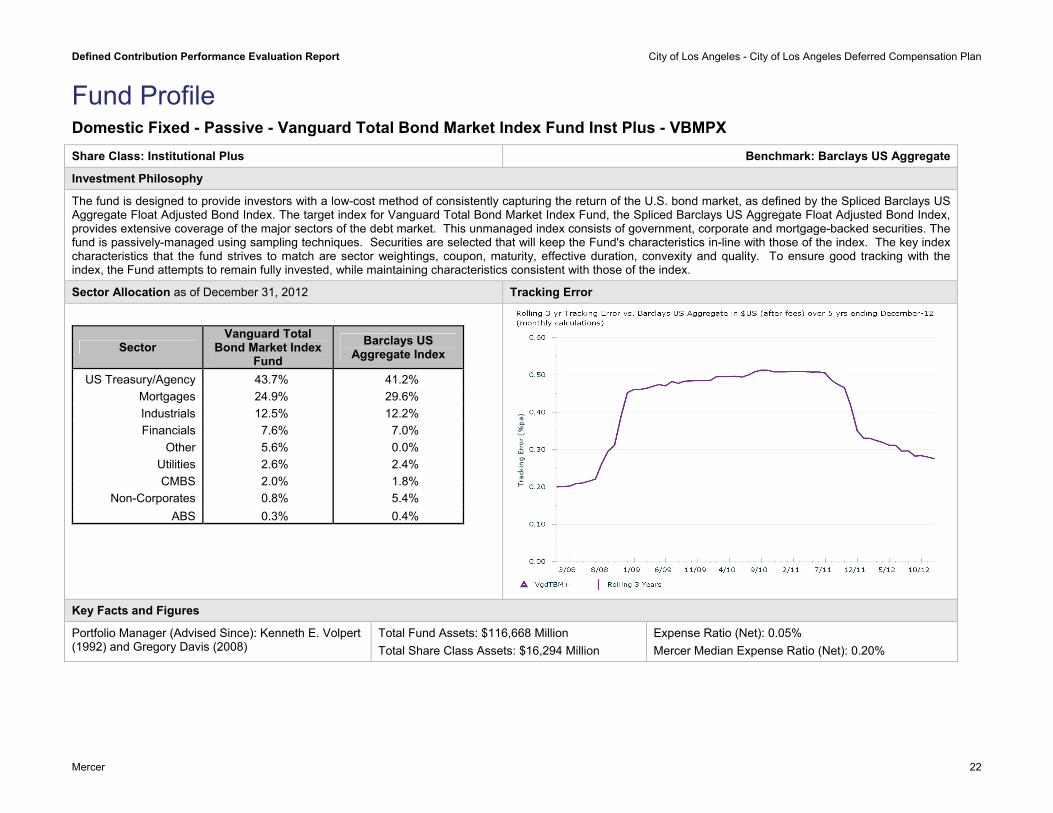
Share Class: Institutional Plus Benchmark: Barclays US Aggregate
Investment Philosophy
The fund is designed to provide investors with a low-cost method of consistently capturing the return of the U.S. bond market, as defined by the Spliced Barclays US Aggregate Float Adjusted Bond Index. The target index for Vanguard Total Bond Market Index Fund, the Spliced Barclays US Aggregate Float Adjusted Bond Index, provides extensive coverage of the major sectors of the debt market. This unmanaged index consists of government, corporate and mortgage-backed securities. The fund is passively-managed using sampling techniques. Securities are selected that will keep the Fund's characteristics in-line with those of the index. The key index characteristics that the fund strives to match are sector weightings, coupon, maturity, effective duration, convexity and quality. To ensure good tracking with the index, the Fund attempts to remain fully invested, while maintaining characteristics consistent with those of the index.
Sector Allocation as of December 31, 2012 Tracking Error
Sector Vanguard Total
Bond Market Index Fund
Barclays US Aggregate Index
US Treasury/Agency 43.7% 41.2% Mortgages 24.9% 29.6% Industrials 12.5% 12.2% Financials 7.6% 7.0%
Other 5.6% 0.0% Utilities 2.6% 2.4% CMBS 2.0% 1.8%
Non-Corporates 0.8% 5.4% ABS 0.3% 0.4%
Key Facts and Figures
Portfolio Manager (Advised Since): Kenneth E. Volpert (1992) and Gregory Davis (2008)
Total Fund Assets: $116,668 Million Total Share Class Assets: $16,294 Million
Expense Ratio (Net): 0.05% Mercer Median Expense Ratio (Net): 0.20%
Domestic Fixed - Passive - Vanguard Total Bond Market Index Fund Inst Plus - VBMPX
Fund Profile
Defined Contribution Performance Evaluation Report City of Los Angeles - City of Los Angeles Deferred Compensation Plan
Mercer 23
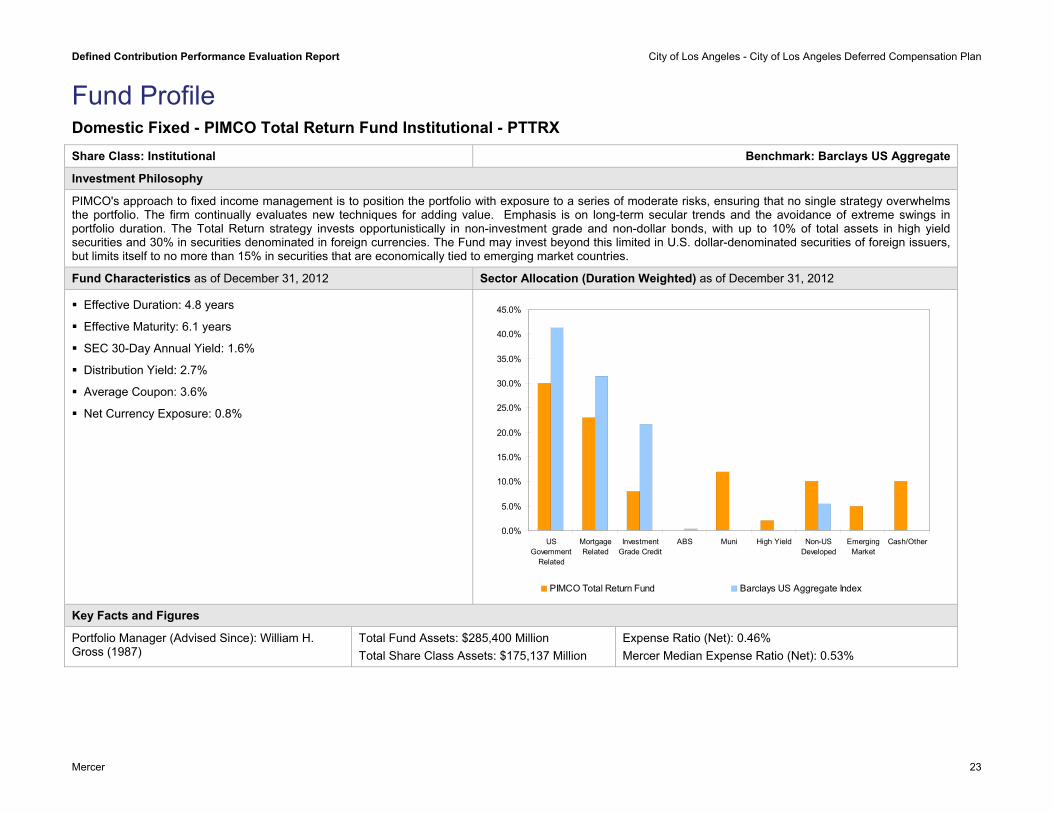
Fund Profile Domestic Fixed - PIMCO Total Return Fund Institutional - PTTRX Share Class: Institutional Benchmark: Barclays US Aggregate
Investment Philosophy
PIMCO's approach to fixed income management is to position the portfolio with exposure to a series of moderate risks, ensuring that no single strategy overwhelms the portfolio. The firm continually evaluates new techniques for adding value. Emphasis is on long-term secular trends and the avoidance of extreme swings in portfolio duration. The Total Return strategy invests opportunistically in non-investment grade and non-dollar bonds, with up to 10% of total assets in high yield securities and 30% in securities denominated in foreign currencies. The Fund may invest beyond this limited in U.S. dollar-denominated securities of foreign issuers, but limits itself to no more than 15% in securities that are economically tied to emerging market countries.
Fund Characteristics as of December 31, 2012 Sector Allocation (Duration Weighted) as of December 31, 2012
Effective Duration: 4.8 years
Effective Maturity: 6.1 years
SEC 30-Day Annual Yield: 1.6%
Distribution Yield: 2.7%
Average Coupon: 3.6%
Net Currency Exposure: 0.8%
0.0%
5.0%
10.0%
15.0%
20.0%
25.0%
30.0%
35.0%
40.0%
45.0%
USGovernment
Related
MortgageRelated
InvestmentGrade Credit
ABS Muni High Yield Non-USDeveloped
EmergingMarket
Cash/Other
PIMCO Total Return Fund Barclays US Aggregate Index
Key Facts and Figures
Portfolio Manager (Advised Since): William H. Gross (1987)
Total Fund Assets: $285,400 Million Total Share Class Assets: $175,137 Million
Expense Ratio (Net): 0.46% Mercer Median Expense Ratio (Net): 0.53%
Defined Contribution Performance Evaluation Report City of Los Angeles - City of Los Angeles Deferred Compensation Plan
Mercer 24
Fund Profile Domestic Fixed - PIMCO Total Return Fund Institutional - PTTRX
Defined Contribution Performance Evaluation Report City of Los Angeles - City of Los Angeles Deferred Compensation Plan
Mercer 25
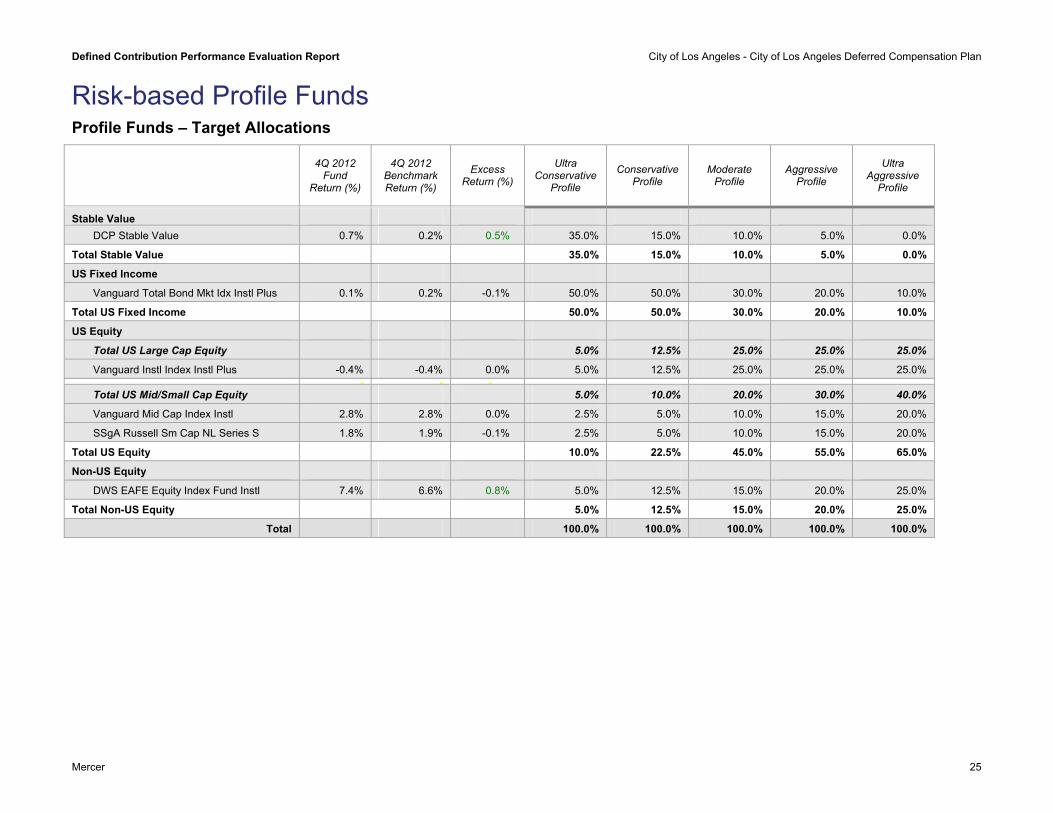
Risk-based Profile Funds Profile Funds – Target Allocations
4Q 2012 Fund
Return (%)
4Q 2012 Benchmark Return (%)
Excess Return (%)
Ultra Conservative
Profile
Conservative Profile
Moderate Profile
Aggressive Profile
Ultra Aggressive
Profile
Stable Value DCP Stable Value 0.7% 0.2% 0.5% 35.0% 15.0% 10.0% 5.0% 0.0%
Total Stable Value 35.0% 15.0% 10.0% 5.0% 0.0%
US Fixed Income
Vanguard Total Bond Mkt Idx Instl Plus 0.1% 0.2% -0.1% 50.0% 50.0% 30.0% 20.0% 10.0%
Total US Fixed Income 50.0% 50.0% 30.0% 20.0% 10.0%
US Equity
Total US Large Cap Equity 5.0% 12.5% 25.0% 25.0% 25.0%
Vanguard Instl Index Instl Plus -0.4% -0.4% 0.0% 5.0% 12.5% 25.0% 25.0% 25.0%
Total US Mid/Small Cap Equity 5.0% 10.0% 20.0% 30.0% 40.0%
Vanguard Mid Cap Index Instl 2.8% 2.8% 0.0% 2.5% 5.0% 10.0% 15.0% 20.0%
SSgA Russell Sm Cap NL Series S 1.8% 1.9% -0.1% 2.5% 5.0% 10.0% 15.0% 20.0%
Total US Equity 10.0% 22.5% 45.0% 55.0% 65.0%
Non-US Equity
DWS EAFE Equity Index Fund Instl 7.4% 6.6% 0.8% 5.0% 12.5% 15.0% 20.0% 25.0%
Total Non-US Equity 5.0% 12.5% 15.0% 20.0% 25.0%
Total 100.0% 100.0% 100.0% 100.0% 100.0%
Defined Contribution Performance Evaluation Report City of Los Angeles - City of Los Angeles Deferred Compensation Plan
Mercer 26
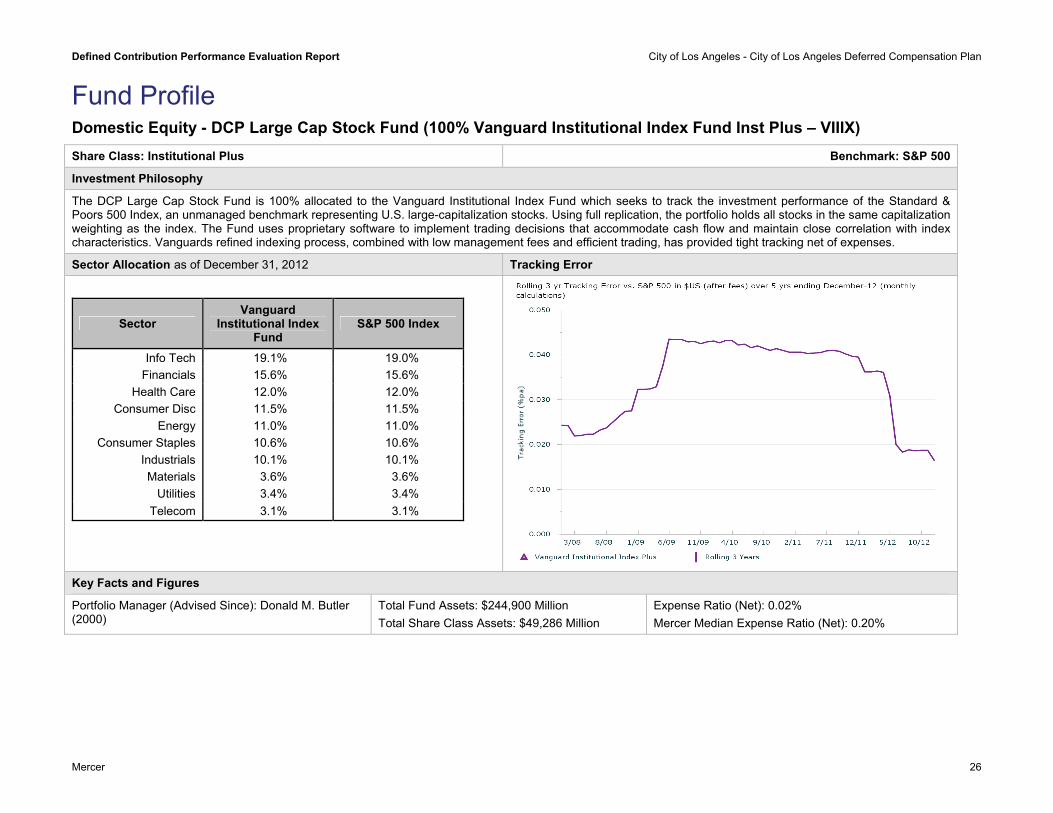
Fund Profile Domestic Equity - DCP Large Cap Stock Fund (100% Vanguard Institutional Index Fund Inst Plus – VIIIX) Share Class: Institutional Plus Benchmark: S&P 500
Investment Philosophy
The DCP Large Cap Stock Fund is 100% allocated to the Vanguard Institutional Index Fund which seeks to track the investment performance of the Standard & Poors 500 Index, an unmanaged benchmark representing U.S. large-capitalization stocks. Using full replication, the portfolio holds all stocks in the same capitalization weighting as the index. The Fund uses proprietary software to implement trading decisions that accommodate cash flow and maintain close correlation with index characteristics. Vanguards refined indexing process, combined with low management fees and efficient trading, has provided tight tracking net of expenses.
Sector Allocation as of December 31, 2012 Tracking Error
Sector Vanguard
Institutional Index Fund
S&P 500 Index
Info Tech 19.1% 19.0% Financials 15.6% 15.6%
Health Care 12.0% 12.0% Consumer Disc 11.5% 11.5%
Energy 11.0% 11.0% Consumer Staples 10.6% 10.6%
Industrials 10.1% 10.1% Materials 3.6% 3.6%
Utilities 3.4% 3.4% Telecom 3.1% 3.1%
Key Facts and Figures
Portfolio Manager (Advised Since): Donald M. Butler (2000)
Total Fund Assets: $244,900 Million Total Share Class Assets: $49,286 Million
Expense Ratio (Net): 0.02% Mercer Median Expense Ratio (Net): 0.20%
Defined Contribution Performance Evaluation Report City of Los Angeles - City of Los Angeles Deferred Compensation Plan
27
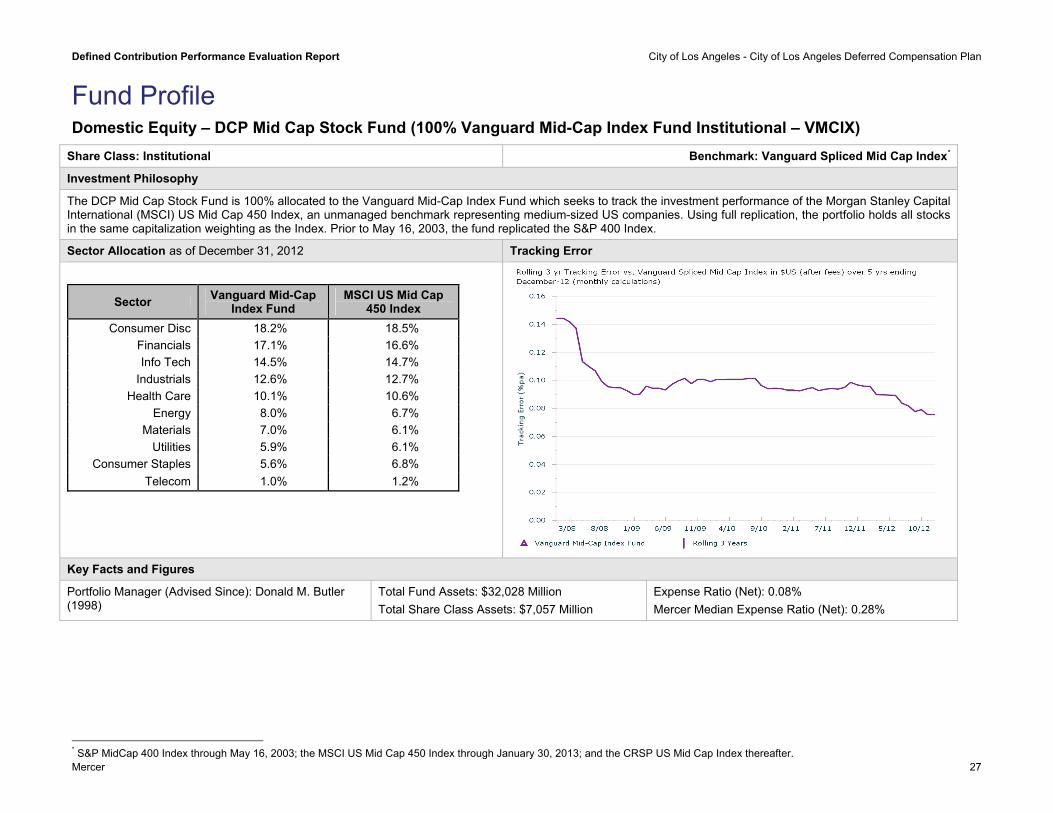
Fund Profile Domestic Equity – DCP Mid Cap Stock Fund (100% Vanguard Mid-Cap Index Fund Institutional – VMCIX)
Share Class: Institutional Benchmark: Vanguard Spliced Mid Cap Index*
Investment Philosophy
The DCP Mid Cap Stock Fund is 100% allocated to the Vanguard Mid-Cap Index Fund which seeks to track the investment performance of the Morgan Stanley Capital International (MSCI) US Mid Cap 450 Index, an unmanaged benchmark representing medium-sized US companies. Using full replication, the portfolio holds all stocks in the same capitalization weighting as the Index. Prior to May 16, 2003, the fund replicated the S&P 400 Index.
Sector Allocation as of December 31, 2012 Tracking Error
Sector Vanguard Mid-Cap Index Fund
MSCI US Mid Cap 450 Index
Consumer Disc 18.2% 18.5% Financials 17.1% 16.6% Info Tech 14.5% 14.7%
Industrials 12.6% 12.7% Health Care 10.1% 10.6%
Energy 8.0% 6.7% Materials 7.0% 6.1%
Utilities 5.9% 6.1% Consumer Staples 5.6% 6.8%
Telecom 1.0% 1.2%
Key Facts and Figures
Portfolio Manager (Advised Since): Donald M. Butler (1998)
Total Fund Assets: $32,028 Million Total Share Class Assets: $7,057 Million
Expense Ratio (Net): 0.08% Mercer Median Expense Ratio (Net): 0.28%
Mercer
* S&P MidCap 400 Index through May 16, 2003; the MSCI US Mid Cap 450 Index through January 30, 2013; and the CRSP US Mid Cap Index thereafter.

Defined Contribution Performance Evaluation Report City of Los Angeles - City of Los Angeles Deferred Compensation Plan
Mercer 28
Fund Profile Domestic Equity - Passive - SSgA Russell Small Cap Index Non-Lending Series Fund Share Class: S Benchmark: Russell 2000
Investment Philosophy
As a passive manager, SSgA's aim is to achieve returns as close to the index as possible, but in a cost effective manner. Market anomalies will be exploited where they can be, at very low risk levels. SSgA manages the Russell 2000 Index strategy using the full replication process. With regard to the replication approach, securities in the benchmark are purchased in the weights they represent in the benchmark. However, SSgA does allow for small mis-weights in the portfolio, recognizing that the cost of trading to avoid small mis-weights may be greater than any potential improvement in tracking error.
Sector Allocation as of December 31, 2012 Tracking Error
Sector SSgA Russell Small
Cap Index Non-Lending Series
Fund Russell 2000 Index
Info Tech 16.6% 16.6% Financials 22.6% 22.6%
Health Care 12.1% 12.1% Consumer Disc 14.1% 14.1%
Energy 6.1% 6.1% Consumer Staples 3.5% 3.5%
Industrials 15.8% 15.7% Materials 5.3% 5.3%
Utilities 3.4% 3.4% Telecom 0.7% 0.7%
Key Facts and Figures
Portfolio Manager: SSgA Portfolio Inception: August 1999
Total Strategy Assets: $10,000 Million Expense Ratio (Net): 0.06% Mercer Median Expense Ratio (Net): 0.30%
Defined Contribution Performance Evaluation Report City of Los Angeles - City of Los Angeles Deferred Compensation Plan
Mercer 29
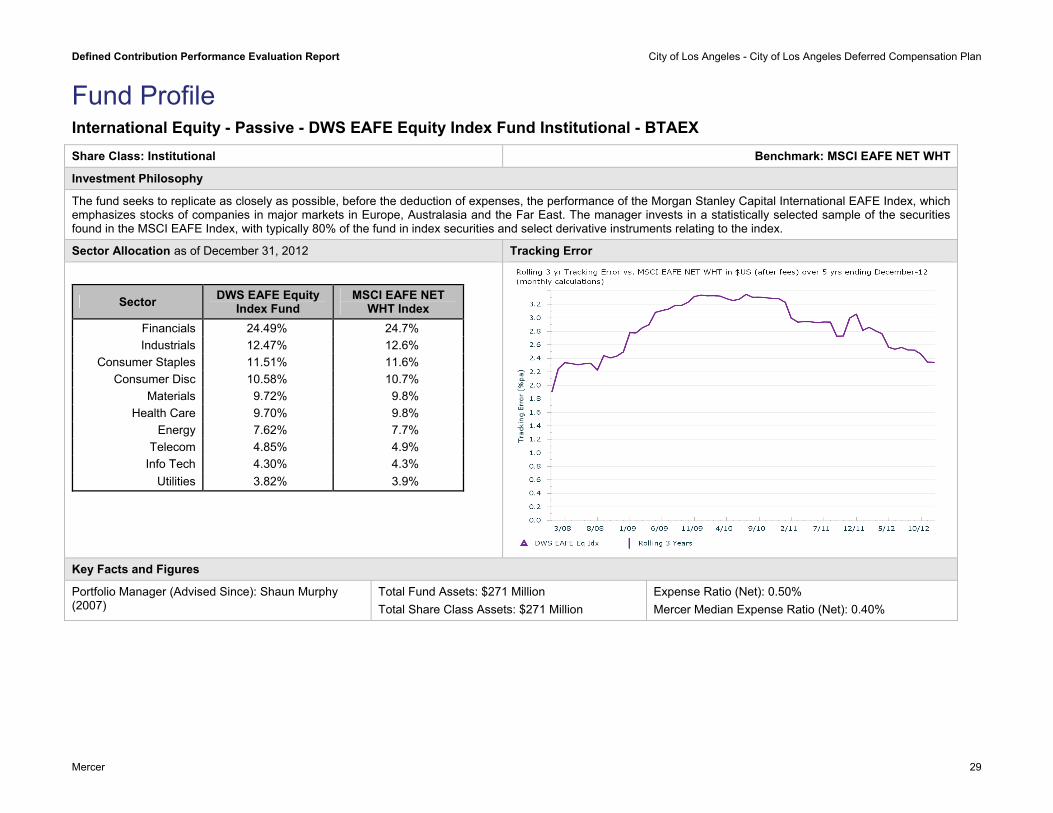
Fund Profile International Equity - Passive - DWS EAFE Equity Index Fund Institutional - BTAEX Share Class: Institutional Benchmark: MSCI EAFE NET WHT
Investment Philosophy
The fund seeks to replicate as closely as possible, before the deduction of expenses, the performance of the Morgan Stanley Capital International EAFE Index, which emphasizes stocks of companies in major markets in Europe, Australasia and the Far East. The manager invests in a statistically selected sample of the securities found in the MSCI EAFE Index, with typically 80% of the fund in index securities and select derivative instruments relating to the index.
Sector Allocation as of December 31, 2012 Tracking Error
Sector DWS EAFE Equity Index Fund
MSCI EAFE NET WHT Index
Financials 24.49% 24.7% Industrials 12.47% 12.6%
Consumer Staples 11.51% 11.6% Consumer Disc 10.58% 10.7%
Materials 9.72% 9.8% Health Care 9.70% 9.8%
Energy 7.62% 7.7% Telecom 4.85% 4.9%
Info Tech 4.30% 4.3% Utilities 3.82% 3.9%
Key Facts and Figures
Portfolio Manager (Advised Since): Shaun Murphy (2007)
Total Fund Assets: $271 Million Total Share Class Assets: $271 Million
Expense Ratio (Net): 0.50% Mercer Median Expense Ratio (Net): 0.40%
Defined Contribution Performance Evaluation Report City of Los Angeles - City of Los Angeles Deferred Compensation Plan
30
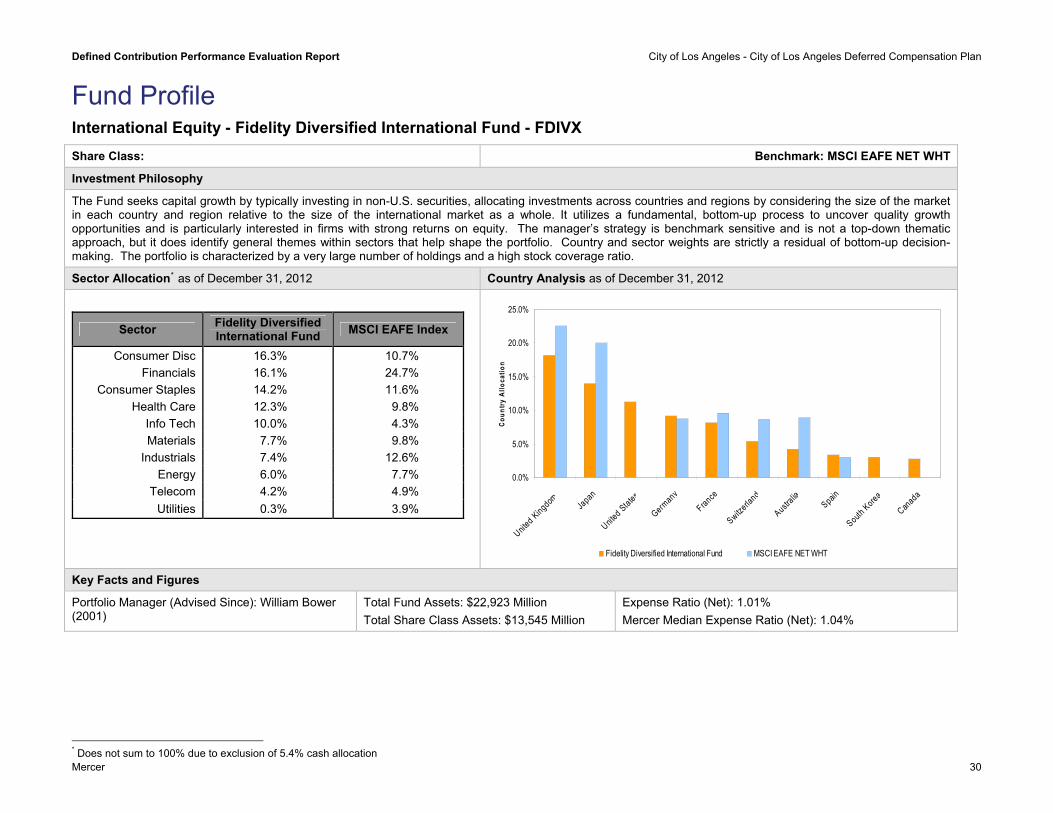
Fund Profile International Equity - Fidelity Diversified International Fund - FDIVX Share Class: Benchmark: MSCI EAFE NET WHT
Investment Philosophy
The Fund seeks capital growth by typically investing in non-U.S. securities, allocating investments across countries and regions by considering the size of the market in each country and region relative to the size of the international market as a whole. It utilizes a fundamental, bottom-up process to uncover quality growth opportunities and is particularly interested in firms with strong returns on equity. The manager’s strategy is benchmark sensitive and is not a top-down thematic approach, but it does identify general themes within sectors that help shape the portfolio. Country and sector weights are strictly a residual of bottom-up decision-making. The portfolio is characterized by a very large number of holdings and a high stock coverage ratio.
Sector Allocation* as of December 31, 2012 Country Analysis as of December 31, 2012
Sector Fidelity Diversified International Fund MSCI EAFE Index
Consumer Disc 16.3% 10.7% Financials 16.1% 24.7%
Consumer Staples 14.2% 11.6% Health Care 12.3% 9.8%
Info Tech 10.0% 4.3% Materials 7.7% 9.8%
Industrials 7.4% 12.6% Energy 6.0% 7.7%
Telecom 4.2% 4.9% Utilities 0.3% 3.9%
0.0%
5.0%
10.0%
15.0%
20.0%
25.0%
United Kingdo SpainSouth
KoreJapan
United State
Mercer
m s
Germany
France
Switzerla
nd
Australia a
Canada
Cou
ntry
Allo
catio
n
Fidelity Diversified International Fund MSCI EAFE NET WHT Key Facts and Figures
Portfolio Manager (Advised Since): William Bower (2001)
Total Fund Assets: $22,923 Million Total Share Class Assets: $13,545 Million
Expense Ratio (Net): 1.01% Mercer Median Expense Ratio (Net): 1.04%
* Does not sum to 100% due to exclusion of 5.4% cash allocation
Defined Contribution Performance Evaluation Report City of Los Angeles - City of Los Angeles Deferred Compensation Plan
Mercer 31
Fund Profile International Equity - Fidelity Diversified International Fund - FDIVX
Defined Contribution Performance Evaluation Report City of Los Angeles - City of Los Angeles Deferred Compensation Plan
Mercer 32
Appendix A – Investment Manager Updates Pacific Investment Management Company (PIMCO) Multi-Sector, Mortgage, and Long Duration Update; Ratings Affirmed (no changes) – January 30, 2013
Meeting Highlights:
Joshua Anderson, Brad Kinkelaar, and Qi Wang recently replaced Michael Gomez, Beth MacLean, and Mohit Mital as rotating members of the Investment Committee (IC). PIMCO’s IC represents its most senior decision-makers that set top-down positioning for multi-sector funds. There is no set term for permanent or rotating members of the IC; PIMCO typically reshuffles it according to its secular outlook, ensuring rotating members have expert input on the sectors that the firm currently views as relatively attractive. Complete membership of the IC is included in the Further Detail section of this note.
In multi-sector portfolios, PIMCO has been reducing risk by selling spread sector exposure, including most out-of-benchmark sectors. In our meeting, Tony Crescenzi described this as “selling into strength” as risk sectors continued to rally throughout the second half of 2012. The reduced MBS and corporate allocations has mostly been used to fund Treasuries (~50/50 mix of nominals and TIPS), which now account for 30% of Total Return on a duration-weighted basis.
PIMCO continues to underweight US duration, but has recently reduced the underweight to ~0.3 years short down from -.08 years. The thesis on rates has changed little in the past year: US inflation will be higher, but real rates will remain negative. In full discretion portfolios, the firm is overweight countries with more attractive real yields and improving economic conditions/situations (Canada, Mexico, Brazil, Spain, and Italy) as they are less concerned with a “left tail” event given Fed and ECB actions. Curve positioning reflects opportunities for rolldown in the 0-3 and 5-10 year portions of the curve, with an underweight to the long end.
Within the corporate bond allocation, PIMCO continues to find financials attractive; this has been a theme at PIMCO since the credit crisis as the firm believes large money center banks to be “too big to fail” and expects an increasingly bondholder-friendly regulatory environment. However, the firm has started to reduce this overweight as the sector rallies. Also, the team does not believe European banks are in as good of shape as they continue to de-risk, so PIMCO continues to avoid them.
In all multi-sector and long duration portfolios, PIMCO maintains significant exposure to Build-America Bonds (BABs). In market value terms the BABs position has been as high as 7% and in contribution to duration terms, it has been as high as four years.
Although PIMCO has reduced the allocation to agency pass-throughs since Q3 2012 as recent Fed actions have left the sector fully priced (~23% vs. 30% in Sept 2012), they continue to find value in non-agency RMBS and new issue AAA-rated CMBS. PIMCO has recently made significant investments in the non-agency mortgage team (led by Dan Ivascyn) and analytics.
Within the agency MBS strategy, PIMCO has recently reduced exposure to “policy coupons” (3.0s and 3.5s) in favor of the middle of the stack. They have maintained an allocation to select CMOs (PACs and sequentials) with structural call protection and superior collateral.
Issues to Watch:
Dispersion Across Vehicles/Accounts: Compared to most peer fixed income managers, PIMCO has historically had relatively high dispersion across accounts due to fund flows and client guidelines. In the past, we have generally assumed that most of these differences – especially those due to fund flows -- were effectively residuals that would sum to zero over the long run. Since its creation in March 2012, the performance of PIMCO’s new Total Return ETF (BOND) has significantly outpaced the Total Return mutual fund (~400 bps within the first six months of BOND’s existence). While we caution against using the first six months to draw conclusions about long-term excess return potential, we recognize that this level of dispersion is too large to ignore and/or dismiss as a function of random factors.
Define
Mercer 33
d Contribution Performance Evaluation Report City of Los Angeles - City of Los Angeles Deferred Compensation Plan
Product Proliferation: PIMCO continues to launch sector funds such as Credit Absolute Return, which is a global long-short credit strategy with an absolute return approach to portfolio construction. We are monitoring the impact of these ventures on PIMCO’s fixed income business, especially in market segments where we have concern with the firm’s total exposure. Additionally, we are wary of the growing level of portfolio management responsibility being levied on the credit team’s senior investment professionals.
Scott Simon Retirement: Recently, PIMCO announced the retirement of mortgage PM and trader Scott Simon, effective May 2013. As head of PIMCO’s agency MBS desk, Simon will be supplanted by Dan Hyman and Michael Cudzi, both Executive Vice Presidents on the mortgage team. While we view Simon as a talented investor and a seminal figure in PIMCO’s agency MBS, we do not think his departure warrants a ratings change. Simon’s approach, which emphasizes empirical relationships between nominal spreads across the coupon stack (rather than OAS) and technical factors, has been adopted by every senior member of the mortgage team we have met. That said, we will continue to monitor the team for turnover and/or a change in investment style.
State Street Global Advisors US lawsuit filed relating to securities lending revenues – February 20, 2013
Two separate lawsuits have been filed in the US against State Street Corporation, State Street Global Advisors and State Street Bank & Trust company (collectively “State Street”) relating to securities lending. The claims allege that State Street has retained an exorbitant share of the revenue generated from securities lending for investors. State Street has stated that they believe these cases are without merit and intend to vigorously defend themselves against the allegations.
Mercer View: The actual lending on the pooled products managed by State Street Global Advisors (SSgA) is itself outsourced to State Street Bank & Trust, in its capacity as lending agent. Pursuant to the securities lending agreement and in consideration for acting as lending agent, State Street Bank receives 40% of gross revenue generated by the lending activities – with all associated costs of the lending program paid by State Street Bank. The other 60% of gross revenue generated by the lending activities is returned to investors with no further reduction for oversight or expenses related to the program. We note that counterparty indemnity is also provided by State Street Bank for the program. State Street believe that given the level and quality of services provided, that the 60%/40% revenue split is reasonable, although they do reserve the right to review the split from time to time and as appropriate. We are not proposing to change the ratings of any of SSgA’s strategies as a result of this announcement.
Vanguard Update on Vanguard Index Changes; Recommend Removing Provisional Designation – October 19, 2012
We have conducted further due diligence on CRSP’s index methodology and characteristics and how these compare/contrast with those of the MSCI indices, which CRSP will be replacing in 2013. As a result of our conversations with Vanguard and research on the new index series, we are comfortable with the actions the firm has taken and have confidence in the firm’s ability to closely track the CRSP indices. As a result, we propose removing the Provisional (P) ratings across the 15 affected U.S. stock index funds. The Vanguard Balanced Index Fund is currently rated N, and we do not recommend any changes to the rating at this time.
Meeting Highlights:
Vanguard recently announced plans to transition a number of its U.S. stock and balanced index funds to new benchmarks developed by the University of Chicago’s Center for Research in Security Prices (CRSP). This move stems from an effort to reduce costs through negotiating lower-cost index licensing deals for benchmarks covering certain segments of the stock market that the funds track. Vanguard anticipates these long-term pricing contracts with the index providers will result in significant cost savings over the next few decades, which should translate into lower
Defined C
Mercer 34
ontribution Performance Evaluation Report City of Los Angeles - City of Los Angeles Deferred Compensation Plan
expense ratios for its index fund shareholders over time. The transition will not take place until 2013 and is expected to be completed within the first half of the year.
Founded in 1960, CRSP has historically been a provider of research and historical market data and returns. The CRSP indices were officially launched on October 1, 2012. Vanguard is the first investment management firm to use CRSP’s suite of benchmarks and has been engaged with CRSP since 2009 in the funding and development of the new index series. Approximately $367 billion in assets under management will be moved to track the new CRSP benchmarks.
Overall, there appears to be a high degree of correlation between the methods used by MSCI and CRSP in constructing their indexes. However, there are two notable differences between the two index providers and their methodologies. The first difference is CRSP’s market-cap segmentation approach, which uses breakpoints based on a cumulative market cap rather than a fixed number of securities.
The second major difference is the usage of “packeting,” an approach employed by CRSP to help cushion movements between adjacent indexes. CRSP defines a packet as 50% of the total holdings of a company. A packet is moved between indexes when a company passes completely through to the other side of a shared band between indexes into the core of the adjacent index. This approach allows holdings to be shared simultaneously between the two indexes, and Vanguard believes this should help in reducing index turnover and transaction costs during index rebalances, while still maintaining style purity.
Vanguard Resignation of Sandip Bhagat, Head of Equity Investment Group – January 7, 2013
Vanguard announced that Sandip Bhagat, Head of Equity Investment Group (EIG), has resigned from the firm to pursue other, undisclosed interests. Details of his resignation remain unclear, but no other employees of EIG have left or have indicated any intentions of leaving. Vanguard is in the process of seeking a replacement for Bhagat and expects to provide details within the next several weeks.
Mercer View:
Bhagat’s departure was unexpected and, interestingly, comes at a time when Tim Buckley has just formally assumed the role of Chief Investment Officer (CIO) at Vanguard, a title previously held by Gus Sauter. While it is unclear whether the CIO transition had any influence on Bhagat’s departure, it is suspected that this development had been in the works for some time but was not broadly communicated internally until recently. It is also unclear who will assume Bhagat’s position, though there is suspicion that the role will likely be filled by a senior employee of Vanguard.
As the Head of EIG, Bhagat had oversight of the firm’s passive funds (both US-based and Dublin-based) and active US quantitative equity strategies (both standalone and those included in Vanguard’s multi-manager funds), but according to Vanguard, he was not actively involved with the day-to-day operations or management of those portfolios. It is our understanding that Bhagat largely served in a strategic capacity and spent much of his time spearheading the build-out of a global investment team and trading platform. His departure is not expected to result in any changes to the underlying investment team or strategies within EIG. Mike Buek and Duane Kelly continue to lead the US-based passive equity team. Although the broader investment team remains intact, we would be concerned if we see additional senior level departures within EIG who do have direct portfolio management responsibilities.
This development does not alter our view of Vanguard as an organization or its strategies within the EIG umbrella, particularly the passive products. As a result, we are not recommending any changes to their Preferred Provider status. While Bhagat’s departure is disappointing, the firm continues to be well resourced, exhibit a unique corporate structure, and possess competitive advantages through its scale. We will keep the field apprised of any new developments and will provide an update once details of Bhagat’s replacement is known.
Defined Contribution Performance Evaluation Report City of Los Angeles - City of Los Angeles Deferred Compensation Plan
Mercer 35
Appendix B – Disclosures Important notices References to Mercer shall be construed to include Mercer LLC and/or its associated companies. © 2013 Mercer LLC. All rights reserved. This contains confidential and proprietary information of Mercer and is intended for the exclusive use of the parties to whom it was provided by Mercer. Its content may not be modified, sold or otherwise provided, in whole or in part, to any other person or entity, without Mercer’s prior written permission. The findings, ratings and/or opinions expressed herein are the intellectual property of Mercer and are subject to change without notice. They are not intended to convey any guarantees as to the future performance of the investment products, asset classes or capital markets discussed. Past performance does not guarantee future results. Mercer’s ratings do not constitute individualized investment advice. Information contained herein has been obtained from a range of third party sources. While the information is believed to be reliable, Mercer has not sought to verify it independently. As such, Mercer makes no representations or warranties as to the accuracy of the information presented and takes no responsibility or liability (including for indirect, consequential or incidental damages), for any error, omission or inaccuracy in the data supplied by any third party. This does not constitute an offer or a solicitation of an offer to buy or sell securities, commodities and/or any other financial instruments or products or constitute a solicitation on behalf of any of the investment managers, their affiliates, products or strategies that Mercer may evaluate or recommend. For the most recent approved ratings of an investment strategy, and a fuller explanation of their meanings, contact your Mercer representative. For Mercer’s conflict of interest disclosures, contact your Mercer representative or see www.mercer.com/conflictsofinterest. Mercer universes: Mercer’s universes are intended to provide collective samples of strategies that best allow for robust peer group comparisons over a chosen timeframe. Mercer does not assert that the peer groups are wholly representative of and applicable to all strategies available to investors. The value of your investments can go down as well as up, and you may not get back the amount you have invested. Investments denominated in a foreign currency will fluctuate with the value of the currency. Certain investments, such as securities issued by small capitalization, foreign and emerging market issuers, real property, and illiquid, leveraged or high-yield funds, carry additional risks that should be considered before choosing an investment manager or making an investment decision. Returns for periods greater than one year are annualized. Returns are calculated net of investment management fees, unless noted as gross of fees.
Style analysis graph time periods may differ reflecting the length of performance history available. THE FOLLOWING PROVISIONS APPLY TO DATA OR OTHER SERVICES PROVIDED BY THE FOLLOWING COMPANIES: Where “End User” appears before the Vendor name, a direct end-user license with the Vendor is required to receive some indices. You are responsible for ensuring you have in place all such licenses as are required by Vendors. BARCLAYS: © Barclays Bank PLC 2013. This data is provided by Barclays Bank PLC. Barclays Bank PLC and its affiliated companies accept no liability for the accuracy, timeliness or completeness of such data which is provided “as is.” All warranties in relation to such data are hereby extended to the fullest extent permitted under applicable law. BARCLAYS CAPITAL: The Barclays Indices are a proprietary product of Barclays. Barclays shall maintain exclusive ownership of and rights to the Barclays Indices and that inclusion of the Barclays Indices in this Service shall not be construed to vest in the subscriber any rights with respect to the Indices. The subscriber agrees that it will not remove any copyright notice or other notification or trade name or marks of Barclays that may appear in the Barclays Indices and that any reproduction and/or distribution of the Barclays Indices (if authorized) shall contain such notices and/or marks. BLOOMBERG L.P.: © 2013 Bloomberg L.P. All rights reserved. BLOOMBERG, BLOOMBERG PROFESSIONAL, BLOOMBERG FINANCIAL MARKETS, BLOOMBERG NEWS, BLOOMBERG TRADEMARK, BLOOMBERG BONDTRADER, AND BLOOMBERG TELEVISION are trademarks and service marks of Bloomberg L.P. a Delaware Limited Partnership.
BNY Mellon Asset Servicing: Source: © 2013 BNY Mellon Performance Risk and Analytics, LLC. All Rights Reserved.
CITIGROUP GLOBAL MARKETS (formerly SALOMON SMITH BARNEY): Smith Barneysm and Citigroup Global Equity Indexsm are service marks of Citigroup Inc. "BECAUSE ACCURACY COUNTS®" is a registered service mark of Citigroup Inc. FloatWatch© is a trade mark of Citigroup Inc. Citigroup Global Equity Index Systemsm , Citigroup Broad Market Indexsm, Citigroup Primary Market Indexsm, Citigroup Extended Market Indexsm, Citigroup Cap-Range Indexsm, Citigroup Internet Index (NIX)sm, Citigroup Style Indices (Growth/Value)sm, Citigroup Property Indexsm are service marks of Citigroup Inc. ©2013 Citigroup Inc All rights reserved. Any unauthorized use, duplication or disclosure is prohibited by law and may result in prosecution. Citigroup, including its parent, subsidiaries and/or affiliates ("the Firm"), usually makes a market in the securities discussed or recommended in its report and may sell to or buy from customers, as principal, securities discussed or recommended in its report. The Firm or employees preparing its report may have a position in securities or options of any company discussed or recommended in its report. An employee of the Firm may be a director of a company discussed or recommended in its report. The Firm may perform or solicit investment banking or other services from any company discussed or recommended in its report. Securities recommended, offered, or sold by SSB: (i) are not insured by the Federal Deposit Insurance Corporation; (ii) are not deposits or other obligations of any insured depository institution (including Citibank); and (iii) are subject to investment risks, including the possible loss of the principal amount invested. Although information has been obtained
Defined Contribution Performance Evaluation Report City of Los Angeles - City of Los Angeles Deferred Compensation Plan
Mercer 36
from and is based upon sources SSB believes to be reliable, we do not guarantee its accuracy and it may be incomplete or condensed. All opinions and estimates constitute SSB’s judgment as of the date of the report and are subject to change without notice. Its report is for informational purposes only and is not intended as an offer or solicitation for the purchase or sale of a security. Its report does not take into account the investment objectives or financial situation of any particular person. Investors should obtain advice based on their own individual circumstances before making an investment decision. CREDIT SUISSE FIRST BOSTON LLC. (CSFB): Copyright © 1996 – 2013 Credit Suisse First Boston LLC and/or its affiliate companies. All rights reserved. DataStream : Source: Thomson Reuters DataStream Dow Jones: The Dow Jones Indexes’ are proprietary to and distributed by Dow Jones & Company, Inc. and have been licensed for use. All content of Dow Jones Indexes’ © 2013 is proprietary to Dow Jones & Company, Inc. “End User” FTSE™ : is a trade mark of the London Stock Exchange PLC and The Financial Times Limited and is used by FTSE International Limited under license. Russell Investment Group Europe Ltd is licensed by FTSE International Limited to distribute FTSE Advanced Service and other FTSE indices. FTSE shall not be responsible for any error or omission in FTSE data. All copyright and database rights in FTSE products belong to FTSE or its licensors. Redistribution of the data comprising the FTSE products is not permitted. You agree to comply with any restrictions or conditions imposed upon the use, access, or storage of the data as may be notified to you by FTSE or Russell/Mellon Europe Ltd. You are not permitted to receive the FTSE Advanced Service unless you have a separate agreement with FTSE. “FTSE™”, “FT-SE™” and “Footie™” are trade marks of London Stock Exchange PLC and The Financial Times Limited and are used by FTSE International Limited under license. The FTSE Private Investor Indices are owned and calculated by FTSE International and are produced in association with APCIMS (Association of Private Client Investment Managers and Stockbrokers). FTSE International Limited 2013 The UK Value and Growth Indices are owned and calculated by FTSE International Limited in association with Russell Investment Group. FTSE International Limited 2013. RUSSELL INVESTMENT GROUP: Russell Investment Group is the source and owner of certain of the data contained or reflected in this material and all trademarks and copyrights related thereto. The material may contain confidential information and unauthorized use, disclosure, copying, dissemination or redistribution is strictly prohibited. This is a user presentation of the data. Russell Investment Group is not responsible for the formatting or configuration of this material or for any inaccuracy in presentation thereof. Returns and security data for the Russell indices are provided by Mellon Analytical Solutions. Russell indices are trademarks/service marks of the Russell Investment Group. Russell® is a trademark of the Russell Investment Group. HFRI: Source: Hedge Fund Research, Inc., © HFR, Inc. 2013, www.hedgefundresearch.com JPMORGAN: The JPMorgan EMBI Index (i) is protected by copyright and JPMorgan claims trade secret rights, (ii) is and shall remain the sole property of JPMorgan, and (iii) title and full ownership in the JPMorgan EMBI Index is reserved to and shall remain with JPMorgan. All proprietary and intellectual property rights of any nature, including patents,
copyrights, trademarks and trade secrets regarding the JPMorgan EMBI Index, and any and all parts, copies, modifications, enhancements and derivative works are owned by, and shall remain the property of JPMorgan and its affiliates. The JPMorgan EMBI Index and related materials and software were developed, compiled, prepared and arranged by JPMorgan through expenditure of substantial time, effort and money and constitute valuable intellectual property and trade secrets of JPMorgan. The JPMorgan EMBI Index shall not be used in a manner that would infringe the property rights of JPMorgan or others or violate the laws, tariffs, or regulations of any country.
LIPPER: Performance data was supplied by Lipper, A Thomson Reuters Company, subject to the following: Copyright 2013 © Thomson Reuters. All rights reserved. Any copying, republication or redistribution of Lipper Information, including by caching, framing or similar means, is expressly prohibited without the prior written consent of Lipper. Lipper shall not be liable for any errors or delays in the Information, or for any actions taken in reliance thereon. Lipper performance data is total return, and is preliminary and subject to revision. The data contained herein has been obtained from company reports, financial reporting services, periodicals, and other resources believed to be reasonable. Although carefully verified, data on compilations is not guaranteed by Lipper Inc. - A Reuters Company and may be incomplete. No offer or solicitations to buy or sell any of the securities herein is being made by Lipper. Portions of the information contained in this report was derived by Mercer using Content supplied by Lipper, A Thomson Reuters Company. MERRILL LYNCH: The Merrill Lynch Indices are used with permission. Copyright 2013, Merrill Lynch, Pierce, Fenner & Smith Incorporated. All rights reserved. The Merrill Lynch Indices may not be copied, used, or distributed without Merrill Lynch’s prior written approval. This Product is not sponsored, endorsed, sold or promoted by Merrill Lynch. Merrill Lynch makes no guarantees, representations or warranties of any kind, express or implied, to any person, including, without limitation, any member of the public regarding the use of the Indices in the Product, the advisability of investing in securities generally or of the ability of the Index to track any market performance. Merrill Lynch’s only relationship to Mellon Analytical Solutions or any other person or entity in respect to this Product is limited to the licensing of the Merrill Lynch Indices, which are determined, composed, and calculated by Merrill Lynch without regard to Mellon Analytical Solutions or this Product. Merrill Lynch retains exclusive ownership of the Indices and the programs and trademarks used in connection with the Indices. Merrill Lynch has no obligation to take the needs of Mellon Analytical Solutions or the purchasers, investors or participants in the Product into consideration in determining, composing or calculating the Indices, nor shall Merrill Lynch have any obligation to continue to calculate or provide the Indices in the future. Merrill Lynch may, in its absolute discretion and without prior notice, revise or terminate the Indices at any time. IN NO EVENT SHALL MERRILL LYNCH OR ANY OF ITS PARTNERS, AFFILIATES, EMPLOYEES, OFFICERS, DIRECTORS OR AGENTS HAVE ANY LIABILITY TO ANY PERSON OR ENTITY FOR ANY INDIRECT, PUNITIVE, SPECIAL, OR CONSEQUENTIAL DAMAGES, INCLUDING LOST PROFITS. MOODY’S INVESTORS SERVICE: Moody’s © Copyright 2013, Moody’s Investors Service, Inc. (“Moody’s). Moody’s ratings (“Ratings”) are proprietary to Moody’s or its affiliates and are protected by copyright and other intellectual property laws. Ratings are licensed to Distributor by Moody’s. RATINGS MAY NOT BE COPIED OR OTHERWISE REPRODUCED, REPACKAGED, FURTHER TRANSMITTED, TRANSFERRED, DISSEMINATED, REDISTRIBUTED OR RESOLD, OR STORED FOR SUBSEQUENT USE FOR ANY SUCH PURPOSE, IN WHOLE OR IN PART, IN ANY FORM OR MANNER

Defined Contribution Performance Evaluation Report City of Los Angeles - City of Los Angeles Deferred Compensation Plan
Mercer 37
OR BY ANY MEANS WHATSOEVER, BY ANY PERSON WITHOUT MOODY’S PRIOR WRITTEN CONSENT. Moody’s® is a registered trademark of Moody’s Investors Service, Inc.. MSCI®: Portions of this report are copyright MSCI 2013. Unpublished. All Rights Reserved. This information may only be used for your internal use, may not be reproduced or redisseminated in any form and may not be used to create any financial instruments or products or any indices. This information is provided on an “as is” basis and the user of this information assumes the entire risk of any use it may make or permit to be made of this information. Neither MSCI, any of its affiliates or any other person involved in or related to compiling, computing or creating this information makes any express or implied warranties or representations with respect to such information or the results to be obtained by the use thereof, and MSCI, its affiliates and each such other person hereby expressly disclaim all warranties (including, without limitation, all warranties of originality, accuracy, completeness, timeliness, non-infringement, merchantability and fitness for a particular purpose) with respect to this information. Without limiting any of the foregoing, in no event shall MSCI, any of its affiliates or any other person involved in or related to compiling, computing or creating this information have any liability for any direct, indirect, special, incidental, punitive, consequential or any other damages (including, without limitation, lost
profits) even if notified of, or if it might otherwise have anticipated, the possibility of such damages. MSCI is a registered trademark of MSCI, Inc. NAREIT: NAREIT® is the exclusive registered mark of the National Association of Real Estate Investment Trusts. NCREIF: All NCREIF Data - Copyright by the National Council of Real Estate Investment Fiduciaries. This information is proprietary and may not be reported in whole or in part without written permission. STANDARD & POOR’S: Standard & Poor’s information contained in this document is subject to change without notice. Standard & Poor’s cannot guarantee the accuracy, adequacy or completeness of the information and is not responsible for any errors or omissions or for results obtained from use of such information. Standard & Poor’s makes no warranties or merchantability or fitness for a particular purpose. In no event shall Standard & Poor’s be liable for direct, indirect or incidental, special or consequential damages from the information here regardless or whether such damages were foreseen or unforeseen. WILSHIRE ASSOCIATES: Copyright © 2013 Wilshire Associates Incorporated.

Mercer (US) Inc. 777 South Figueroa Street Suite 1900 Los Angeles, CA 90017 +1 213 346 2200