Embed Size (px)
Citation preview
City of Los Angeles
Reseda Boulevard Mixed-Use Project
Initial Study
November 2016
Reseda Boulevard Mixed-Use Project
Initial Study
Prepared for:
City of Los Angeles 200 North Spring Street, Suite 750
Los Angeles, CA 90012
Prepared with the assistance of:
Rincon Consultants, Inc. 180 North Ashwood Avenue
Ventura, California 93003
November 2016
Initial Study Reseda Boulevard Mixed-Use Project
City of Los Angeles 1
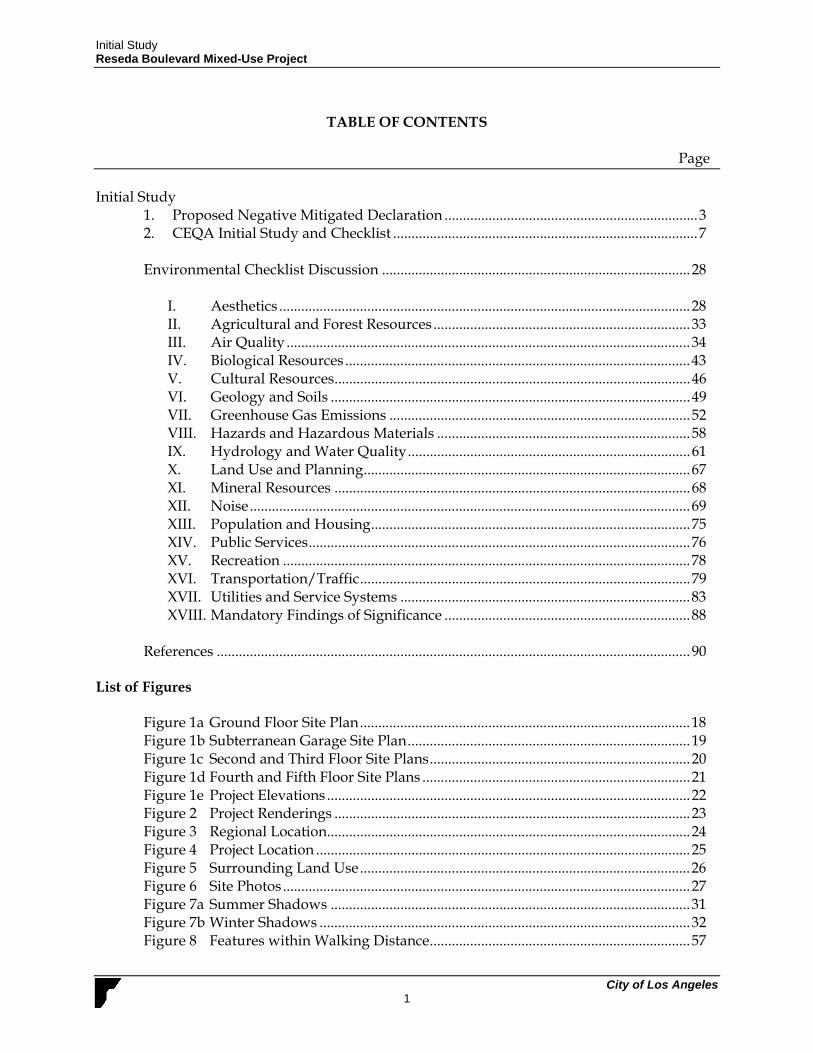
TABLE OF CONTENTS
Page
Initial Study 1. Proposed Negative Mitigated Declaration ..................................................................... 3 2. CEQA Initial Study and Checklist ................................................................................... 7
Environmental Checklist Discussion .................................................................................... 28
I. Aesthetics ................................................................................................................ 28 II. Agricultural and Forest Resources ...................................................................... 33 III. Air Quality .............................................................................................................. 34 IV. Biological Resources .............................................................................................. 43 V. Cultural Resources ................................................................................................. 46 VI. Geology and Soils .................................................................................................. 49 VII. Greenhouse Gas Emissions .................................................................................. 52 VIII. Hazards and Hazardous Materials ..................................................................... 58 IX. Hydrology and Water Quality ............................................................................. 61 X. Land Use and Planning ......................................................................................... 67 XI. Mineral Resources ................................................................................................. 68 XII. Noise ........................................................................................................................ 69 XIII. Population and Housing ....................................................................................... 75 XIV. Public Services ........................................................................................................ 76 XV. Recreation ............................................................................................................... 78 XVI. Transportation/Traffic .......................................................................................... 79 XVII. Utilities and Service Systems ............................................................................... 83 XVIII. Mandatory Findings of Significance ................................................................... 88
References ................................................................................................................................. 90
List of Figures
Figure 1a Ground Floor Site Plan .......................................................................................... 18 Figure 1b Subterranean Garage Site Plan ............................................................................. 19
Figure 1c Second and Third Floor Site Plans ....................................................................... 20 Figure 1d Fourth and Fifth Floor Site Plans ......................................................................... 21 Figure 1e Project Elevations ................................................................................................... 22 Figure 2 Project Renderings ................................................................................................. 23 Figure 3 Regional Location ................................................................................................... 24 Figure 4 Project Location ...................................................................................................... 25
Figure 5 Surrounding Land Use .......................................................................................... 26 Figure 6 Site Photos ............................................................................................................... 27 Figure 7a Summer Shadows .................................................................................................. 31 Figure 7b Winter Shadows ..................................................................................................... 32 Figure 8 Features within Walking Distance ....................................................................... 57
Initial Study Reseda Boulevard Mixed-Use Project
City of Los Angeles 2
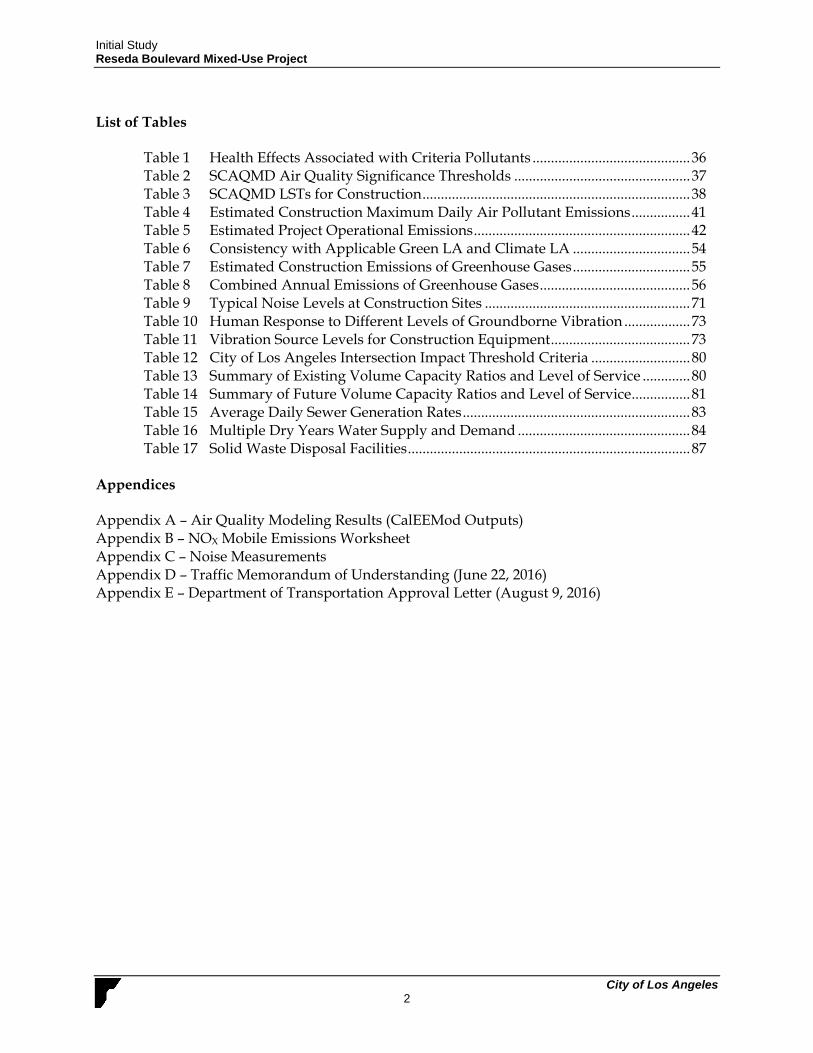
List of Tables
Table 1 Health Effects Associated with Criteria Pollutants ........................................... 36 Table 2 SCAQMD Air Quality Significance Thresholds ................................................ 37 Table 3 SCAQMD LSTs for Construction ......................................................................... 38 Table 4 Estimated Construction Maximum Daily Air Pollutant Emissions ................ 41
Table 5 Estimated Project Operational Emissions ........................................................... 42 Table 6 Consistency with Applicable Green LA and Climate LA ................................ 54 Table 7 Estimated Construction Emissions of Greenhouse Gases ................................ 55 Table 8 Combined Annual Emissions of Greenhouse Gases ......................................... 56 Table 9 Typical Noise Levels at Construction Sites ........................................................ 71 Table 10 Human Response to Different Levels of Groundborne Vibration .................. 73 Table 11 Vibration Source Levels for Construction Equipment ...................................... 73 Table 12 City of Los Angeles Intersection Impact Threshold Criteria ........................... 80 Table 13 Summary of Existing Volume Capacity Ratios and Level of Service ............. 80 Table 14 Summary of Future Volume Capacity Ratios and Level of Service ................ 81 Table 15 Average Daily Sewer Generation Rates .............................................................. 83 Table 16 Multiple Dry Years Water Supply and Demand ............................................... 84 Table 17 Solid Waste Disposal Facilities ............................................................................. 87
Appendices
Appendix A – Air Quality Modeling Results (CalEEMod Outputs) Appendix B – NOX Mobile Emissions Worksheet Appendix C – Noise Measurements Appendix D – Traffic Memorandum of Understanding (June 22, 2016) Appendix E – Department of Transportation Approval Letter (August 9, 2016)
3
CITY OF LOS ANGELES OFFICE OF THE CITY CLERK
ROOM 395, CITY HALL LOS ANGELES, CALIFORNIA 90012
CALIFORNIA ENVIRONMENTAL QUALITY ACT INITIAL STUDY
and CHECKLIST (CEQA Guidelines Section 15063)
LEAD CITY AGENCY: City of Los Angeles, Planning Department
COUNCIL DISTRICT: 3
DATE:
RESPONSIBLE AGENCIES: ENVIRONMENTAL CASE: No. EVN-2016-2882-MND
RELATED CASES: None
PREVIOUS ACTIONS CASE NO.: Does have significant changes from previous actions.
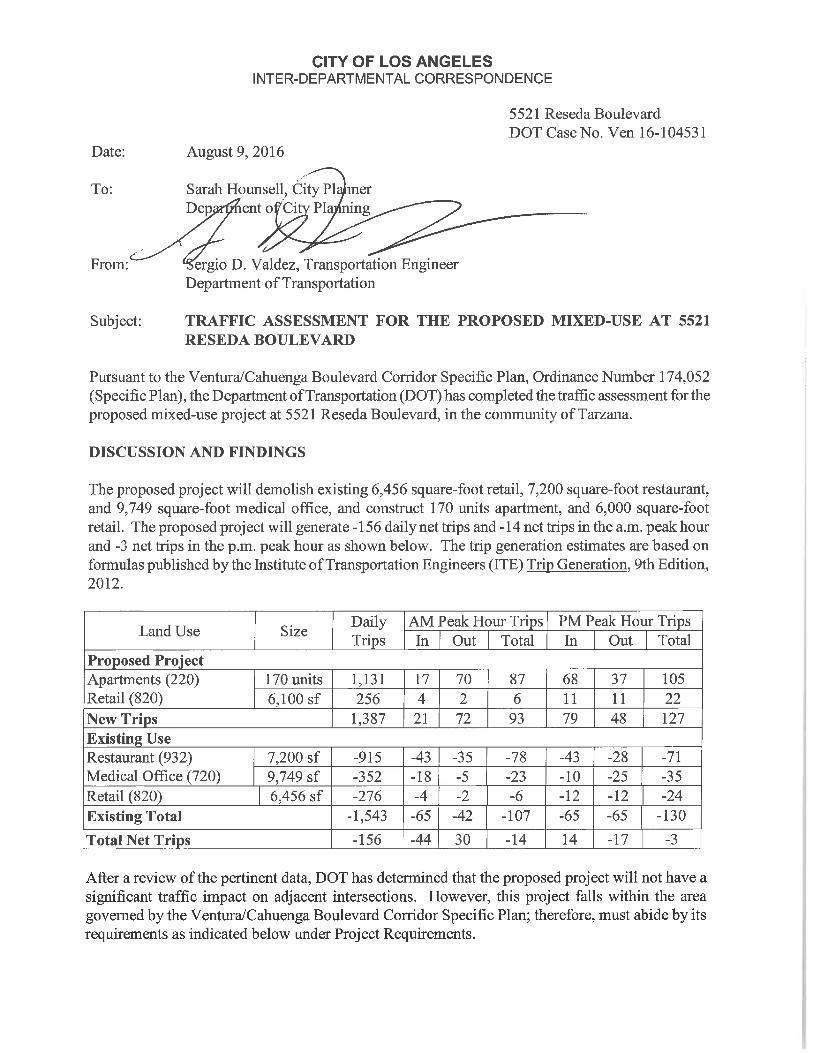
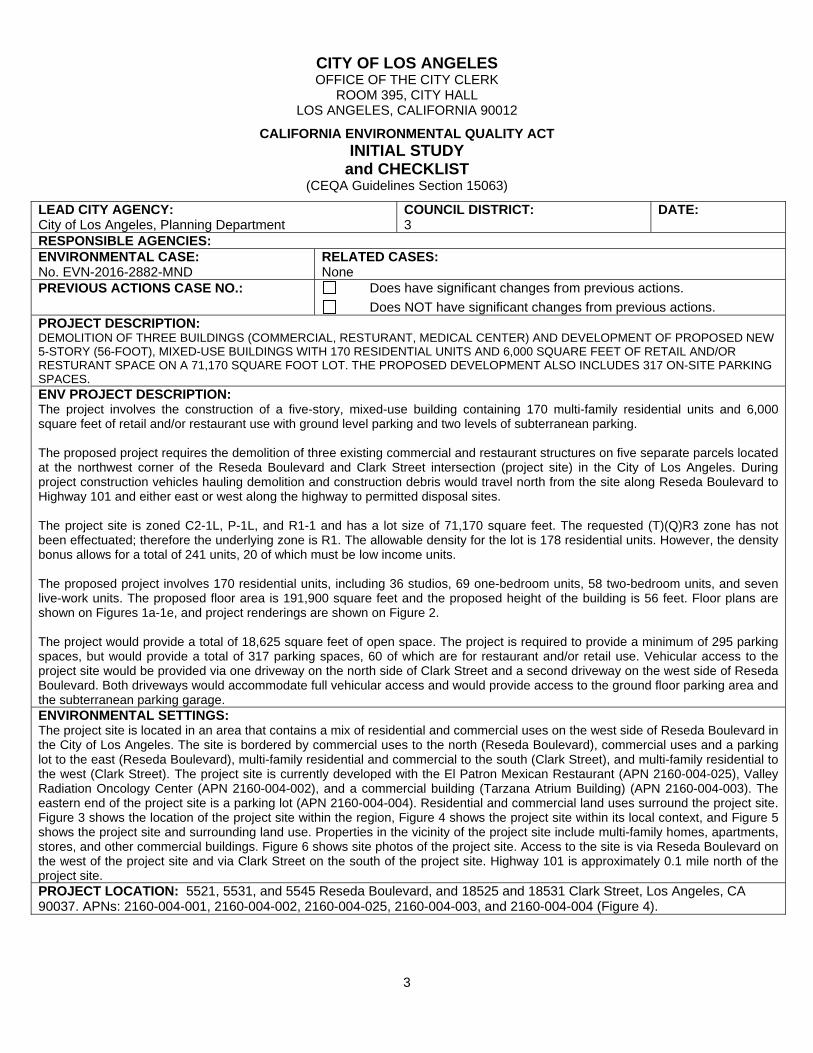
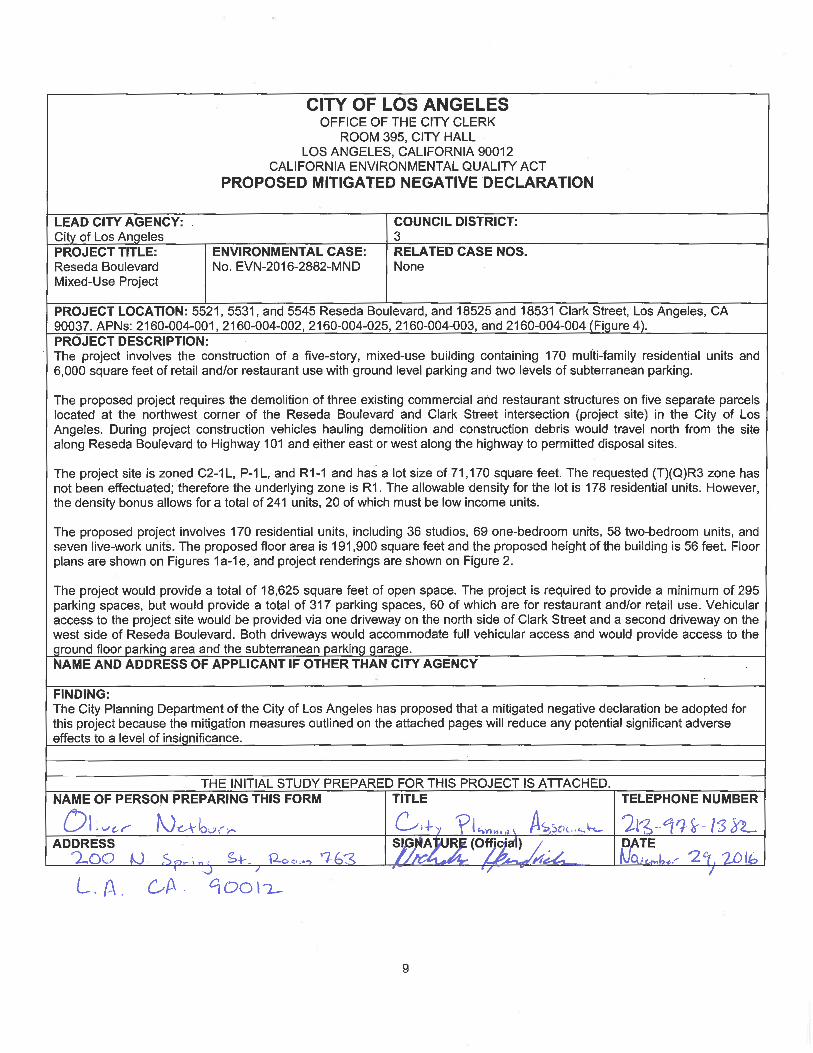
Does NOT have significant changes from previous actions. PROJECT DESCRIPTION: DEMOLITION OF THREE BUILDINGS (COMMERCIAL, RESTURANT, MEDICAL CENTER) AND DEVELOPMENT OF PROPOSED NEW 5-STORY (56-FOOT), MIXED-USE BUILDINGS WITH 170 RESIDENTIAL UNITS AND 6,000 SQUARE FEET OF RETAIL AND/ORRESTURANT SPACE ON A 71,170 SQUARE FOOT LOT. THE PROPOSED DEVELOPMENT ALSO INCLUDES 317 ON-SITE PARKINGSPACES.ENV PROJECT DESCRIPTION: The project involves the construction of a five-story, mixed-use building containing 170 multi-family residential units and 6,000 square feet of retail and/or restaurant use with ground level parking and two levels of subterranean parking.
The proposed project requires the demolition of three existing commercial and restaurant structures on five separate parcels located at the northwest corner of the Reseda Boulevard and Clark Street intersection (project site) in the City of Los Angeles. During project construction vehicles hauling demolition and construction debris would travel north from the site along Reseda Boulevard to Highway 101 and either east or west along the highway to permitted disposal sites.
The project site is zoned C2-1L, P-1L, and R1-1 and has a lot size of 71,170 square feet. The requested (T)(Q)R3 zone has not been effectuated; therefore the underlying zone is R1. The allowable density for the lot is 178 residential units. However, the density bonus allows for a total of 241 units, 20 of which must be low income units.
The proposed project involves 170 residential units, including 36 studios, 69 one-bedroom units, 58 two-bedroom units, and seven live-work units. The proposed floor area is 191,900 square feet and the proposed height of the building is 56 feet. Floor plans are shown on Figures 1a-1e, and project renderings are shown on Figure 2.
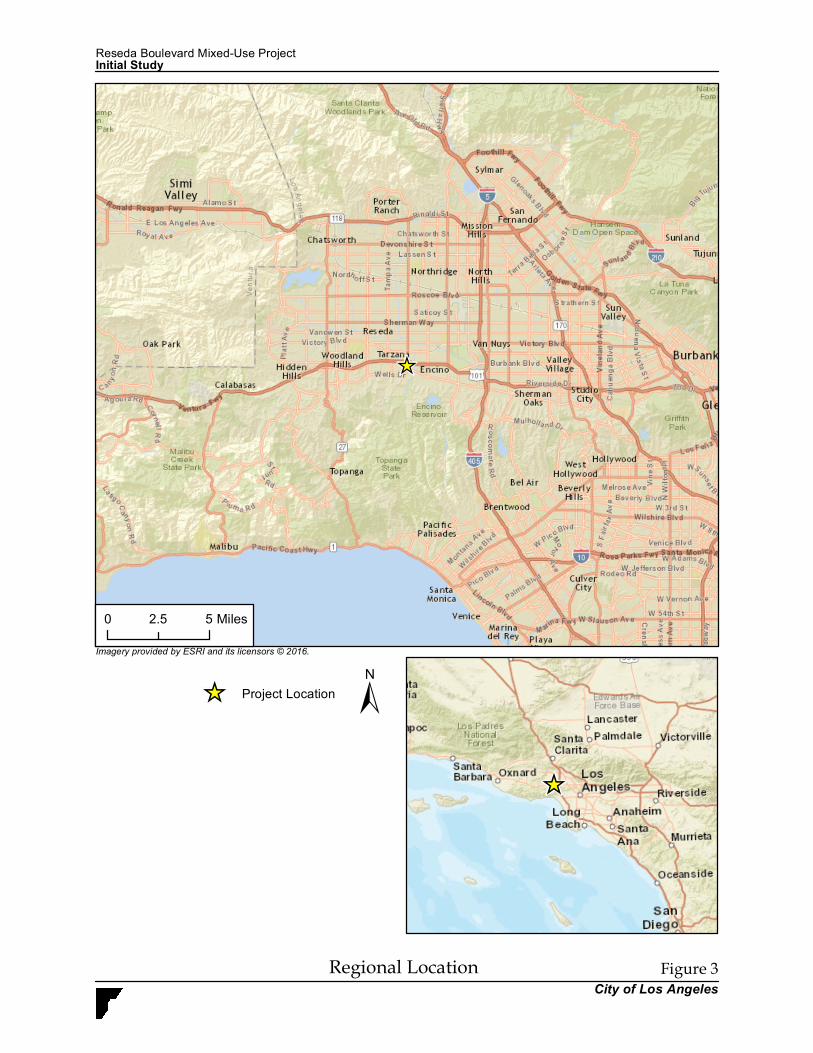
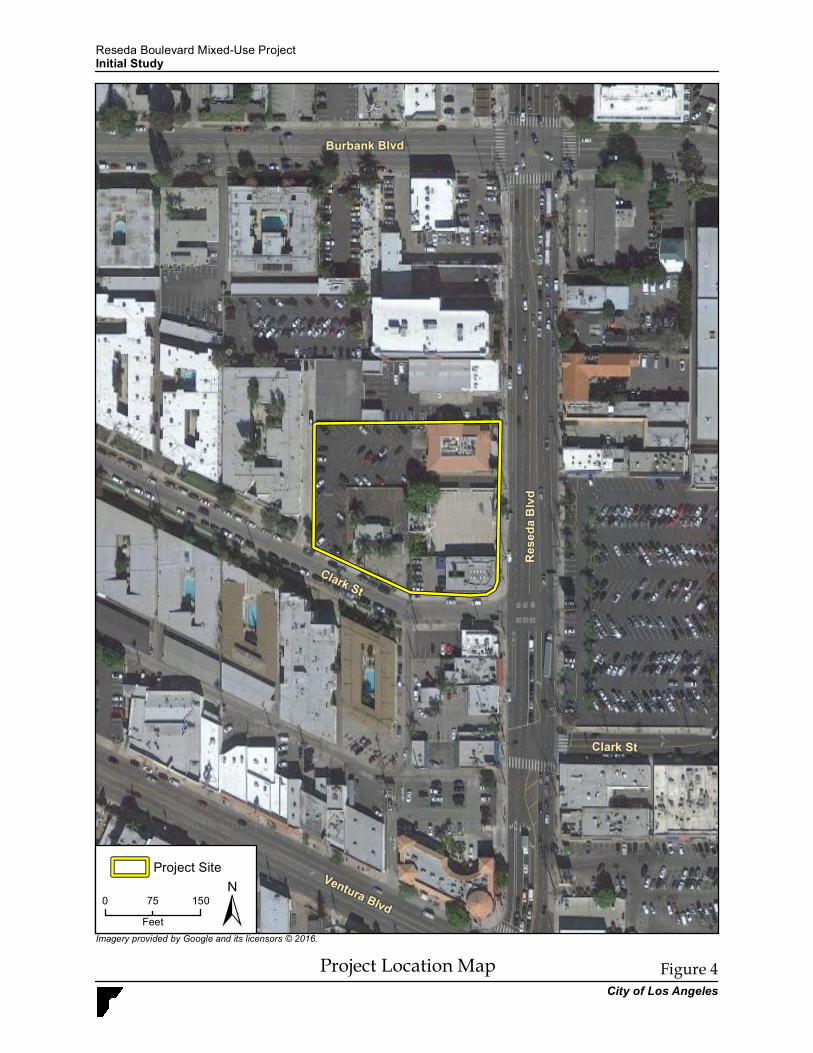
The project would provide a total of 18,625 square feet of open space. The project is required to provide a minimum of 295 parking spaces, but would provide a total of 317 parking spaces, 60 of which are for restaurant and/or retail use. Vehicular access to the project site would be provided via one driveway on the north side of Clark Street and a second driveway on the west side of Reseda Boulevard. Both driveways would accommodate full vehicular access and would provide access to the ground floor parking area and the subterranean parking garage. ENVIRONMENTAL SETTINGS: The project site is located in an area that contains a mix of residential and commercial uses on the west side of Reseda Boulevard in the City of Los Angeles. The site is bordered by commercial uses to the north (Reseda Boulevard), commercial uses and a parking lot to the east (Reseda Boulevard), multi-family residential and commercial to the south (Clark Street), and multi-family residential to the west (Clark Street). The project site is currently developed with the El Patron Mexican Restaurant (APN 2160-004-025), Valley Radiation Oncology Center (APN 2160-004-002), and a commercial building (Tarzana Atrium Building) (APN 2160-004-003). The eastern end of the project site is a parking lot (APN 2160-004-004). Residential and commercial land uses surround the project site. Figure 3 shows the location of the project site within the region, Figure 4 shows the project site within its local context, and Figure 5 shows the project site and surrounding land use. Properties in the vicinity of the project site include multi-family homes, apartments, stores, and other commercial buildings. Figure 6 shows site photos of the project site. Access to the site is via Reseda Boulevard on the west of the project site and via Clark Street on the south of the project site. Highway 101 is approximately 0.1 mile north of the project site. PROJECT LOCATION: 5521, 5531, and 5545 Reseda Boulevard, and 18525 and 18531 Clark Street, Los Angeles, CA 90037. APNs: 2160-004-001, 2160-004-002, 2160-004-025, 2160-004-003, and 2160-004-004 (Figure 4).

4
COMMUNITY PLAN AREA: Ventura and Cahuenga Boulevard Corridor STATUS:
Preliminary Does Conform to Plan Proposed Does NOT Conform to Plan ADOPTED
AREA PLANNING COMMISSION: North Valley
CERTIFIED NEIGHBORHOOD COUNCIL: Reseda Neighborhood Council
EXISTING ZONING: C2-1L, P-1L, R1-1
MAX DENSITY ZONING: 400 sf/du and 800 sf/du
GENERAL PLAN LAND USE: Community Commercial and Medium Residential
MAX DENSITY PLAN: 400 sf/du and 800 sf/du PROPOSED PROJECT DENSITY: 800 sf/du
6
c. Mitigation Measures. For effects that are “Less Than Significant With Mitigation Measures Incorporated,” describethe mitigation measures which were incorporated or refined from the earlier document and the extent to which theyaddress site-specific conditions for the project.
6. Lead agencies are encouraged to incorporate the checklist references to information sources for potential impacts (e.g.,general plans, zoning ordinances). Reference to a previously prepared or outside document should, where appropriate,include a reference to the page or pages where the statement is substantiated.
7. Supporting Information Sources: A sources list should be attached, and other sources used or individuals contactedshould be cited in the discussion.
8. This is only a suggested form, and lead agencies are free to use different formats; however, lead agencies shouldnormally address the questions from this checklist that are relevant to a project’s environmental effects in whicheverformat is selected.
9. The explanation of each issue should identify:
a. The significance criteria or threshold, if any, used to evaluate each question; and
b. The mitigation measure identified, if any, to reduce the impact to less than significant.
7
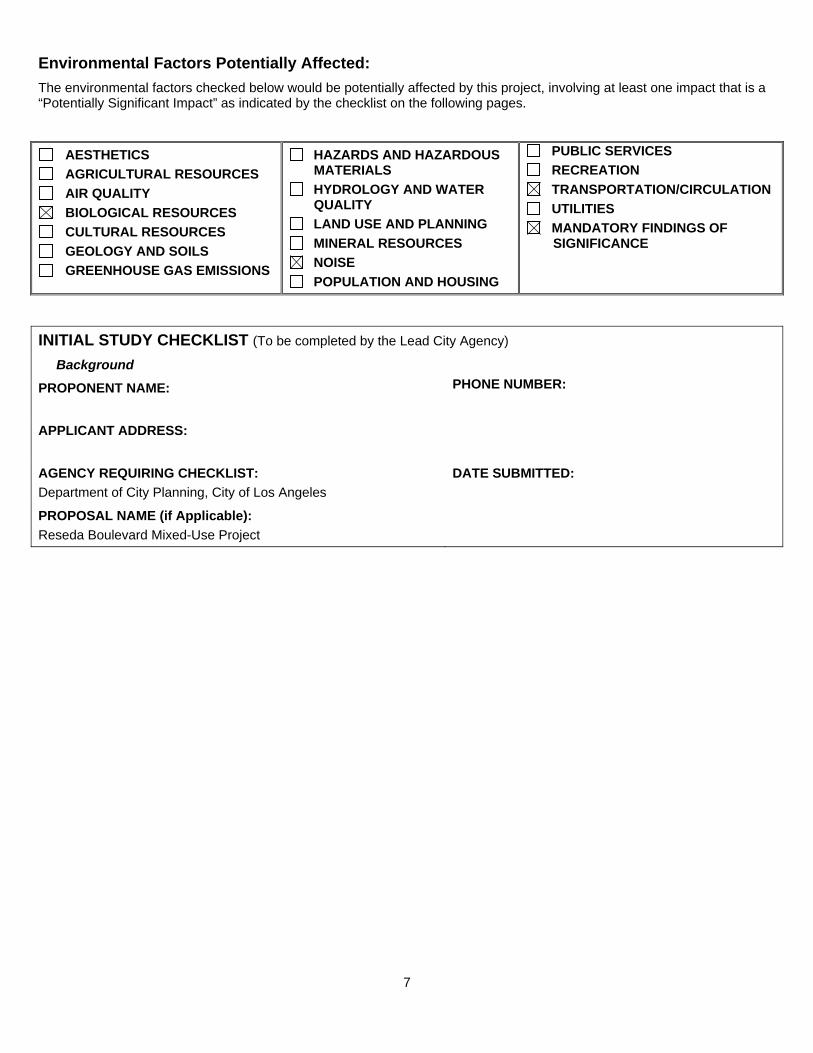
Environmental Factors Potentially Affected:
The environmental factors checked below would be potentially affected by this project, involving at least one impact that is a “Potentially Significant Impact” as indicated by the checklist on the following pages.
AESTHETICS
AGRICULTURAL RESOURCES
AIR QUALITY
BIOLOGICAL RESOURCES
CULTURAL RESOURCES
GEOLOGY AND SOILS
GREENHOUSE GAS EMISSIONS
HAZARDS AND HAZARDOUS MATERIALS
HYDROLOGY AND WATER QUALITY
LAND USE AND PLANNING
MINERAL RESOURCES
NOISE
POPULATION AND HOUSING
PUBLIC SERVICES
RECREATION
TRANSPORTATION/CIRCULATION
UTILITIES
MANDATORY FINDINGS OF SIGNIFICANCE
INITIAL STUDY CHECKLIST (To be completed by the Lead City Agency)
Background
PROPONENT NAME:
PHONE NUMBER:
APPLICANT ADDRESS:
AGENCY REQUIRING CHECKLIST:
Department of City Planning, City of Los Angeles
DATE SUBMITTED:
PROPOSAL NAME (if Applicable):
Reseda Boulevard Mixed-Use Project
8
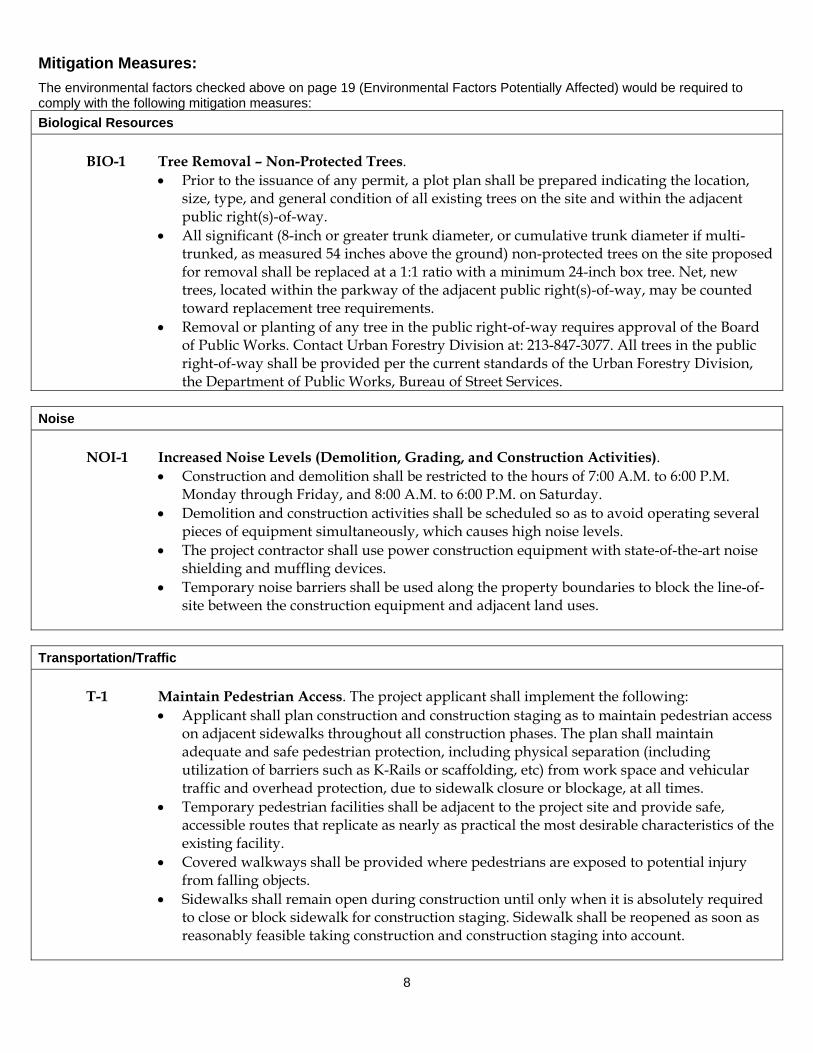
Mitigation Measures:
The environmental factors checked above on page 19 (Environmental Factors Potentially Affected) would be required to comply with the following mitigation measures:
Biological Resources
BIO-1 Tree Removal – Non-Protected Trees.
Prior to the issuance of any permit, a plot plan shall be prepared indicating the location, size, type, and general condition of all existing trees on the site and within the adjacent public right(s)-of-way.
All significant (8-inch or greater trunk diameter, or cumulative trunk diameter if multi-trunked, as measured 54 inches above the ground) non-protected trees on the site proposed for removal shall be replaced at a 1:1 ratio with a minimum 24-inch box tree. Net, new trees, located within the parkway of the adjacent public right(s)-of-way, may be counted toward replacement tree requirements.
Removal or planting of any tree in the public right-of-way requires approval of the Board of Public Works. Contact Urban Forestry Division at: 213-847-3077. All trees in the public right-of-way shall be provided per the current standards of the Urban Forestry Division, the Department of Public Works, Bureau of Street Services.
Noise
NOI-1 Increased Noise Levels (Demolition, Grading, and Construction Activities).
Construction and demolition shall be restricted to the hours of 7:00 A.M. to 6:00 P.M. Monday through Friday, and 8:00 A.M. to 6:00 P.M. on Saturday.
Demolition and construction activities shall be scheduled so as to avoid operating several pieces of equipment simultaneously, which causes high noise levels.
The project contractor shall use power construction equipment with state-of-the-art noise shielding and muffling devices.
Temporary noise barriers shall be used along the property boundaries to block the line-of-site between the construction equipment and adjacent land uses.
Transportation/Traffic
T-1 Maintain Pedestrian Access. The project applicant shall implement the following:
Applicant shall plan construction and construction staging as to maintain pedestrian access on adjacent sidewalks throughout all construction phases. The plan shall maintain adequate and safe pedestrian protection, including physical separation (including utilization of barriers such as K-Rails or scaffolding, etc) from work space and vehicular traffic and overhead protection, due to sidewalk closure or blockage, at all times.
Temporary pedestrian facilities shall be adjacent to the project site and provide safe, accessible routes that replicate as nearly as practical the most desirable characteristics of the existing facility.
Covered walkways shall be provided where pedestrians are exposed to potential injury from falling objects.
Sidewalks shall remain open during construction until only when it is absolutely required to close or block sidewalk for construction staging. Sidewalk shall be reopened as soon as reasonably feasible taking construction and construction staging into account.
Potentially significant
impact
Potentially Significant
Unless mitigation
incorporated
Less than significant
impact No
impact
10
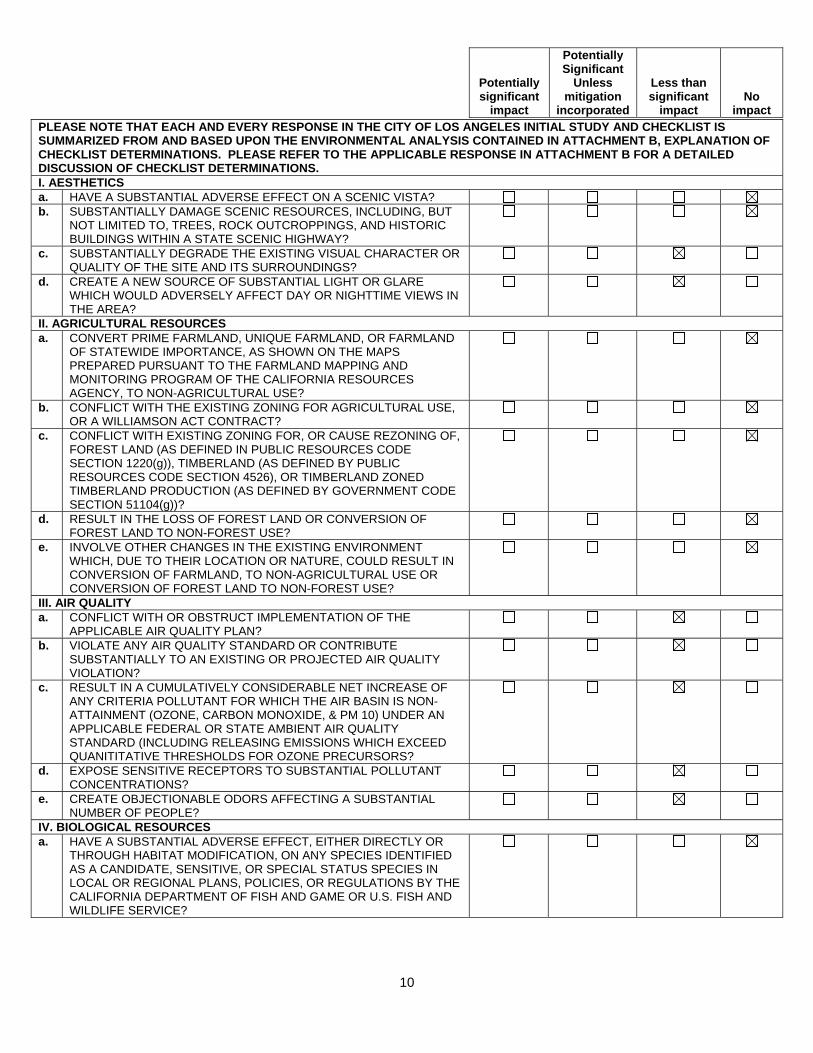
PLEASE NOTE THAT EACH AND EVERY RESPONSE IN THE CITY OF LOS ANGELES INITIAL STUDY AND CHECKLIST IS SUMMARIZED FROM AND BASED UPON THE ENVIRONMENTAL ANALYSIS CONTAINED IN ATTACHMENT B, EXPLANATION OF CHECKLIST DETERMINATIONS. PLEASE REFER TO THE APPLICABLE RESPONSE IN ATTACHMENT B FOR A DETAILED DISCUSSION OF CHECKLIST DETERMINATIONS. I. AESTHETICS a. HAVE A SUBSTANTIAL ADVERSE EFFECT ON A SCENIC VISTA? b. SUBSTANTIALLY DAMAGE SCENIC RESOURCES, INCLUDING, BUT
NOT LIMITED TO, TREES, ROCK OUTCROPPINGS, AND HISTORIC BUILDINGS WITHIN A STATE SCENIC HIGHWAY?
c. SUBSTANTIALLY DEGRADE THE EXISTING VISUAL CHARACTER OR QUALITY OF THE SITE AND ITS SURROUNDINGS?
d. CREATE A NEW SOURCE OF SUBSTANTIAL LIGHT OR GLARE WHICH WOULD ADVERSELY AFFECT DAY OR NIGHTTIME VIEWS IN THE AREA?
II. AGRICULTURAL RESOURCES a. CONVERT PRIME FARMLAND, UNIQUE FARMLAND, OR FARMLAND
OF STATEWIDE IMPORTANCE, AS SHOWN ON THE MAPS PREPARED PURSUANT TO THE FARMLAND MAPPING AND MONITORING PROGRAM OF THE CALIFORNIA RESOURCES AGENCY, TO NON-AGRICULTURAL USE?
b. CONFLICT WITH THE EXISTING ZONING FOR AGRICULTURAL USE, OR A WILLIAMSON ACT CONTRACT?
c. CONFLICT WITH EXISTING ZONING FOR, OR CAUSE REZONING OF, FOREST LAND (AS DEFINED IN PUBLIC RESOURCES CODE SECTION 1220(g)), TIMBERLAND (AS DEFINED BY PUBLIC RESOURCES CODE SECTION 4526), OR TIMBERLAND ZONED TIMBERLAND PRODUCTION (AS DEFINED BY GOVERNMENT CODE SECTION 51104(g))?
d. RESULT IN THE LOSS OF FOREST LAND OR CONVERSION OF FOREST LAND TO NON-FOREST USE?
e. INVOLVE OTHER CHANGES IN THE EXISTING ENVIRONMENT WHICH, DUE TO THEIR LOCATION OR NATURE, COULD RESULT IN CONVERSION OF FARMLAND, TO NON-AGRICULTURAL USE OR CONVERSION OF FOREST LAND TO NON-FOREST USE?
III. AIR QUALITY a. CONFLICT WITH OR OBSTRUCT IMPLEMENTATION OF THE
APPLICABLE AIR QUALITY PLAN?
b. VIOLATE ANY AIR QUALITY STANDARD OR CONTRIBUTE SUBSTANTIALLY TO AN EXISTING OR PROJECTED AIR QUALITY VIOLATION?
c. RESULT IN A CUMULATIVELY CONSIDERABLE NET INCREASE OF ANY CRITERIA POLLUTANT FOR WHICH THE AIR BASIN IS NON-ATTAINMENT (OZONE, CARBON MONOXIDE, & PM 10) UNDER AN APPLICABLE FEDERAL OR STATE AMBIENT AIR QUALITY STANDARD (INCLUDING RELEASING EMISSIONS WHICH EXCEED QUANITITATIVE THRESHOLDS FOR OZONE PRECURSORS?
d. EXPOSE SENSITIVE RECEPTORS TO SUBSTANTIAL POLLUTANT CONCENTRATIONS?
e. CREATE OBJECTIONABLE ODORS AFFECTING A SUBSTANTIAL NUMBER OF PEOPLE?
IV. BIOLOGICAL RESOURCES a. HAVE A SUBSTANTIAL ADVERSE EFFECT, EITHER DIRECTLY OR
THROUGH HABITAT MODIFICATION, ON ANY SPECIES IDENTIFIED AS A CANDIDATE, SENSITIVE, OR SPECIAL STATUS SPECIES IN LOCAL OR REGIONAL PLANS, POLICIES, OR REGULATIONS BY THE CALIFORNIA DEPARTMENT OF FISH AND GAME OR U.S. FISH AND WILDLIFE SERVICE?
Potentially significant
impact
Potentially Significant
Unless mitigation
incorporated
Less than significant
impact No
impact
11
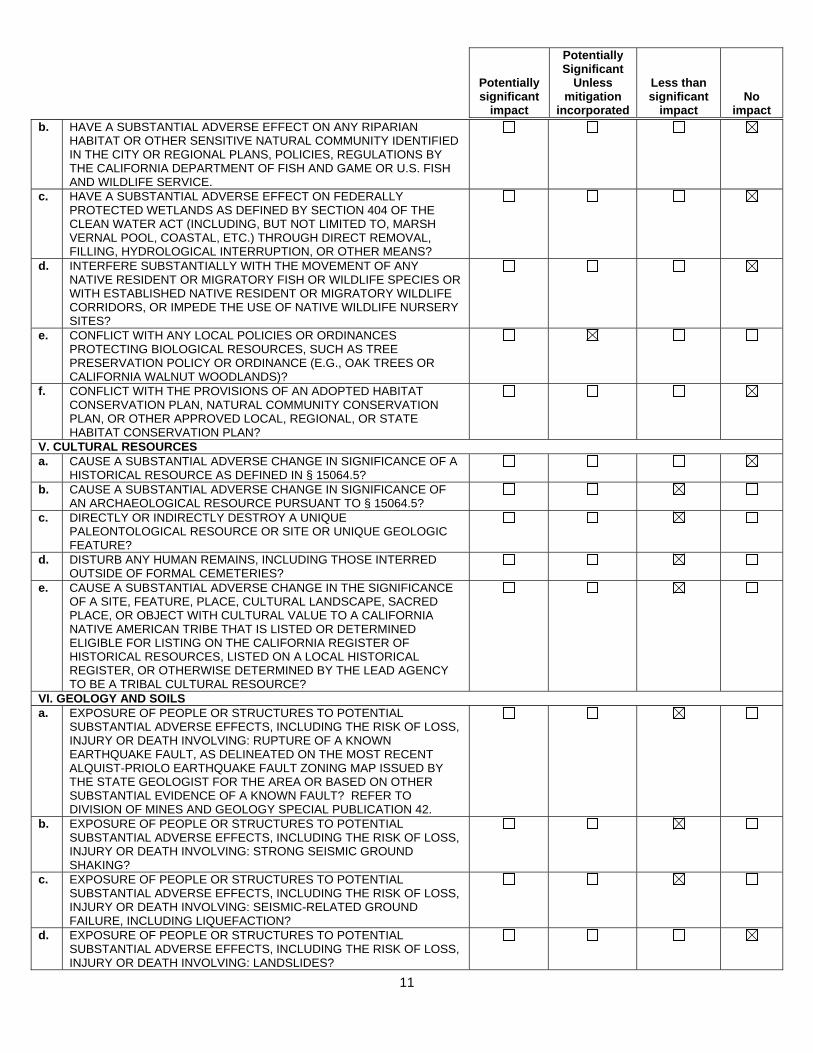
b. HAVE A SUBSTANTIAL ADVERSE EFFECT ON ANY RIPARIAN HABITAT OR OTHER SENSITIVE NATURAL COMMUNITY IDENTIFIED IN THE CITY OR REGIONAL PLANS, POLICIES, REGULATIONS BY THE CALIFORNIA DEPARTMENT OF FISH AND GAME OR U.S. FISH AND WILDLIFE SERVICE.
c. HAVE A SUBSTANTIAL ADVERSE EFFECT ON FEDERALLY PROTECTED WETLANDS AS DEFINED BY SECTION 404 OF THE CLEAN WATER ACT (INCLUDING, BUT NOT LIMITED TO, MARSH VERNAL POOL, COASTAL, ETC.) THROUGH DIRECT REMOVAL, FILLING, HYDROLOGICAL INTERRUPTION, OR OTHER MEANS?
d. INTERFERE SUBSTANTIALLY WITH THE MOVEMENT OF ANY NATIVE RESIDENT OR MIGRATORY FISH OR WILDLIFE SPECIES OR WITH ESTABLISHED NATIVE RESIDENT OR MIGRATORY WILDLIFE CORRIDORS, OR IMPEDE THE USE OF NATIVE WILDLIFE NURSERY SITES?
e. CONFLICT WITH ANY LOCAL POLICIES OR ORDINANCES PROTECTING BIOLOGICAL RESOURCES, SUCH AS TREE PRESERVATION POLICY OR ORDINANCE (E.G., OAK TREES OR CALIFORNIA WALNUT WOODLANDS)?
f. CONFLICT WITH THE PROVISIONS OF AN ADOPTED HABITAT CONSERVATION PLAN, NATURAL COMMUNITY CONSERVATION PLAN, OR OTHER APPROVED LOCAL, REGIONAL, OR STATE HABITAT CONSERVATION PLAN?
V. CULTURAL RESOURCES a. CAUSE A SUBSTANTIAL ADVERSE CHANGE IN SIGNIFICANCE OF A
HISTORICAL RESOURCE AS DEFINED IN § 15064.5?
b. CAUSE A SUBSTANTIAL ADVERSE CHANGE IN SIGNIFICANCE OF AN ARCHAEOLOGICAL RESOURCE PURSUANT TO § 15064.5?
c. DIRECTLY OR INDIRECTLY DESTROY A UNIQUE PALEONTOLOGICAL RESOURCE OR SITE OR UNIQUE GEOLOGIC FEATURE?
d. DISTURB ANY HUMAN REMAINS, INCLUDING THOSE INTERRED OUTSIDE OF FORMAL CEMETERIES?
e. CAUSE A SUBSTANTIAL ADVERSE CHANGE IN THE SIGNIFICANCE OF A SITE, FEATURE, PLACE, CULTURAL LANDSCAPE, SACRED PLACE, OR OBJECT WITH CULTURAL VALUE TO A CALIFORNIA NATIVE AMERICAN TRIBE THAT IS LISTED OR DETERMINED ELIGIBLE FOR LISTING ON THE CALIFORNIA REGISTER OF HISTORICAL RESOURCES, LISTED ON A LOCAL HISTORICAL REGISTER, OR OTHERWISE DETERMINED BY THE LEAD AGENCY TO BE A TRIBAL CULTURAL RESOURCE?
VI. GEOLOGY AND SOILS a. EXPOSURE OF PEOPLE OR STRUCTURES TO POTENTIAL
SUBSTANTIAL ADVERSE EFFECTS, INCLUDING THE RISK OF LOSS, INJURY OR DEATH INVOLVING: RUPTURE OF A KNOWN EARTHQUAKE FAULT, AS DELINEATED ON THE MOST RECENT ALQUIST-PRIOLO EARTHQUAKE FAULT ZONING MAP ISSUED BY THE STATE GEOLOGIST FOR THE AREA OR BASED ON OTHER SUBSTANTIAL EVIDENCE OF A KNOWN FAULT? REFER TO DIVISION OF MINES AND GEOLOGY SPECIAL PUBLICATION 42.
b. EXPOSURE OF PEOPLE OR STRUCTURES TO POTENTIAL SUBSTANTIAL ADVERSE EFFECTS, INCLUDING THE RISK OF LOSS, INJURY OR DEATH INVOLVING: STRONG SEISMIC GROUND SHAKING?
c. EXPOSURE OF PEOPLE OR STRUCTURES TO POTENTIAL SUBSTANTIAL ADVERSE EFFECTS, INCLUDING THE RISK OF LOSS, INJURY OR DEATH INVOLVING: SEISMIC-RELATED GROUND FAILURE, INCLUDING LIQUEFACTION?
d. EXPOSURE OF PEOPLE OR STRUCTURES TO POTENTIAL SUBSTANTIAL ADVERSE EFFECTS, INCLUDING THE RISK OF LOSS, INJURY OR DEATH INVOLVING: LANDSLIDES?
Potentially significant
impact
Potentially Significant
Unless mitigation
incorporated
Less than significant
impact No
impact
12
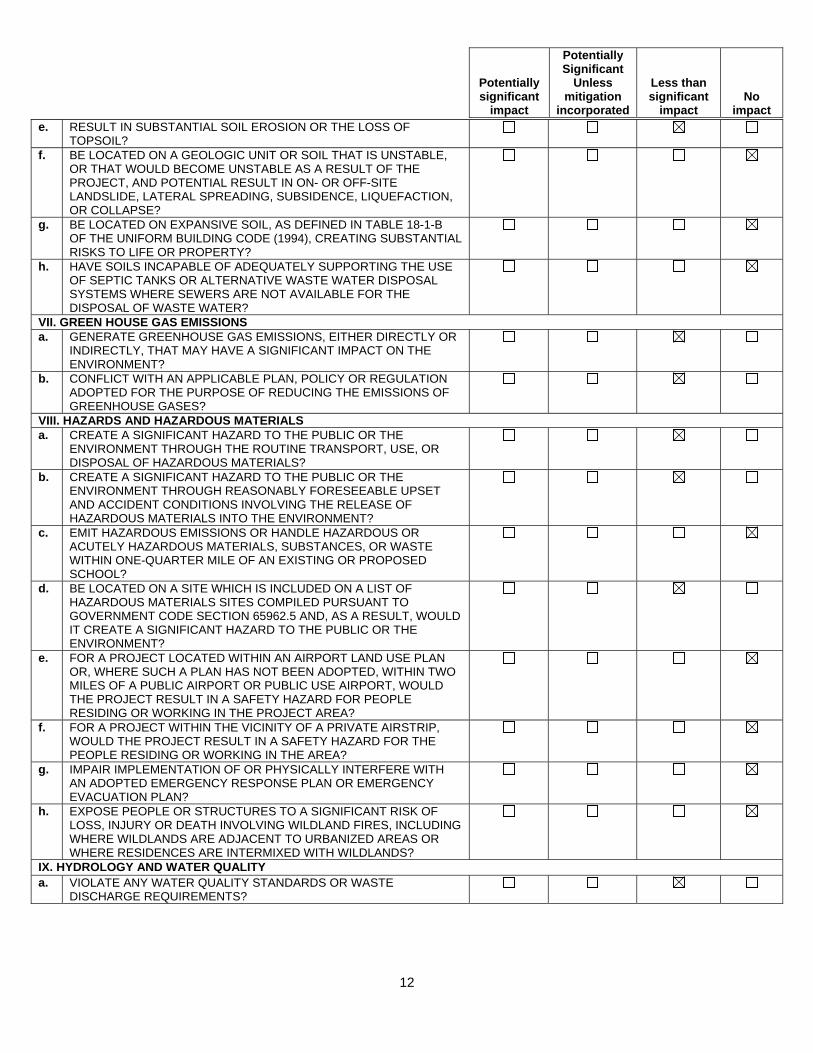
e. RESULT IN SUBSTANTIAL SOIL EROSION OR THE LOSS OF TOPSOIL?
f. BE LOCATED ON A GEOLOGIC UNIT OR SOIL THAT IS UNSTABLE, OR THAT WOULD BECOME UNSTABLE AS A RESULT OF THE PROJECT, AND POTENTIAL RESULT IN ON- OR OFF-SITE LANDSLIDE, LATERAL SPREADING, SUBSIDENCE, LIQUEFACTION, OR COLLAPSE?
g. BE LOCATED ON EXPANSIVE SOIL, AS DEFINED IN TABLE 18-1-B OF THE UNIFORM BUILDING CODE (1994), CREATING SUBSTANTIAL RISKS TO LIFE OR PROPERTY?
h. HAVE SOILS INCAPABLE OF ADEQUATELY SUPPORTING THE USE OF SEPTIC TANKS OR ALTERNATIVE WASTE WATER DISPOSAL SYSTEMS WHERE SEWERS ARE NOT AVAILABLE FOR THE DISPOSAL OF WASTE WATER?
VII. GREEN HOUSE GAS EMISSIONS a. GENERATE GREENHOUSE GAS EMISSIONS, EITHER DIRECTLY OR
INDIRECTLY, THAT MAY HAVE A SIGNIFICANT IMPACT ON THE ENVIRONMENT?
b. CONFLICT WITH AN APPLICABLE PLAN, POLICY OR REGULATION ADOPTED FOR THE PURPOSE OF REDUCING THE EMISSIONS OF GREENHOUSE GASES?
VIII. HAZARDS AND HAZARDOUS MATERIALS a. CREATE A SIGNIFICANT HAZARD TO THE PUBLIC OR THE
ENVIRONMENT THROUGH THE ROUTINE TRANSPORT, USE, OR DISPOSAL OF HAZARDOUS MATERIALS?
b. CREATE A SIGNIFICANT HAZARD TO THE PUBLIC OR THE ENVIRONMENT THROUGH REASONABLY FORESEEABLE UPSET AND ACCIDENT CONDITIONS INVOLVING THE RELEASE OF HAZARDOUS MATERIALS INTO THE ENVIRONMENT?
c. EMIT HAZARDOUS EMISSIONS OR HANDLE HAZARDOUS OR ACUTELY HAZARDOUS MATERIALS, SUBSTANCES, OR WASTE WITHIN ONE-QUARTER MILE OF AN EXISTING OR PROPOSED SCHOOL?
d. BE LOCATED ON A SITE WHICH IS INCLUDED ON A LIST OF HAZARDOUS MATERIALS SITES COMPILED PURSUANT TO GOVERNMENT CODE SECTION 65962.5 AND, AS A RESULT, WOULD IT CREATE A SIGNIFICANT HAZARD TO THE PUBLIC OR THE ENVIRONMENT?
e. FOR A PROJECT LOCATED WITHIN AN AIRPORT LAND USE PLAN OR, WHERE SUCH A PLAN HAS NOT BEEN ADOPTED, WITHIN TWO MILES OF A PUBLIC AIRPORT OR PUBLIC USE AIRPORT, WOULD THE PROJECT RESULT IN A SAFETY HAZARD FOR PEOPLE RESIDING OR WORKING IN THE PROJECT AREA?
f. FOR A PROJECT WITHIN THE VICINITY OF A PRIVATE AIRSTRIP, WOULD THE PROJECT RESULT IN A SAFETY HAZARD FOR THE PEOPLE RESIDING OR WORKING IN THE AREA?
g. IMPAIR IMPLEMENTATION OF OR PHYSICALLY INTERFERE WITH AN ADOPTED EMERGENCY RESPONSE PLAN OR EMERGENCY EVACUATION PLAN?
h. EXPOSE PEOPLE OR STRUCTURES TO A SIGNIFICANT RISK OF LOSS, INJURY OR DEATH INVOLVING WILDLAND FIRES, INCLUDING WHERE WILDLANDS ARE ADJACENT TO URBANIZED AREAS OR WHERE RESIDENCES ARE INTERMIXED WITH WILDLANDS?
IX. HYDROLOGY AND WATER QUALITY a. VIOLATE ANY WATER QUALITY STANDARDS OR WASTE
DISCHARGE REQUIREMENTS?
Potentially significant
impact
Potentially Significant
Unless mitigation
incorporated
Less than significant
impact No
impact
13
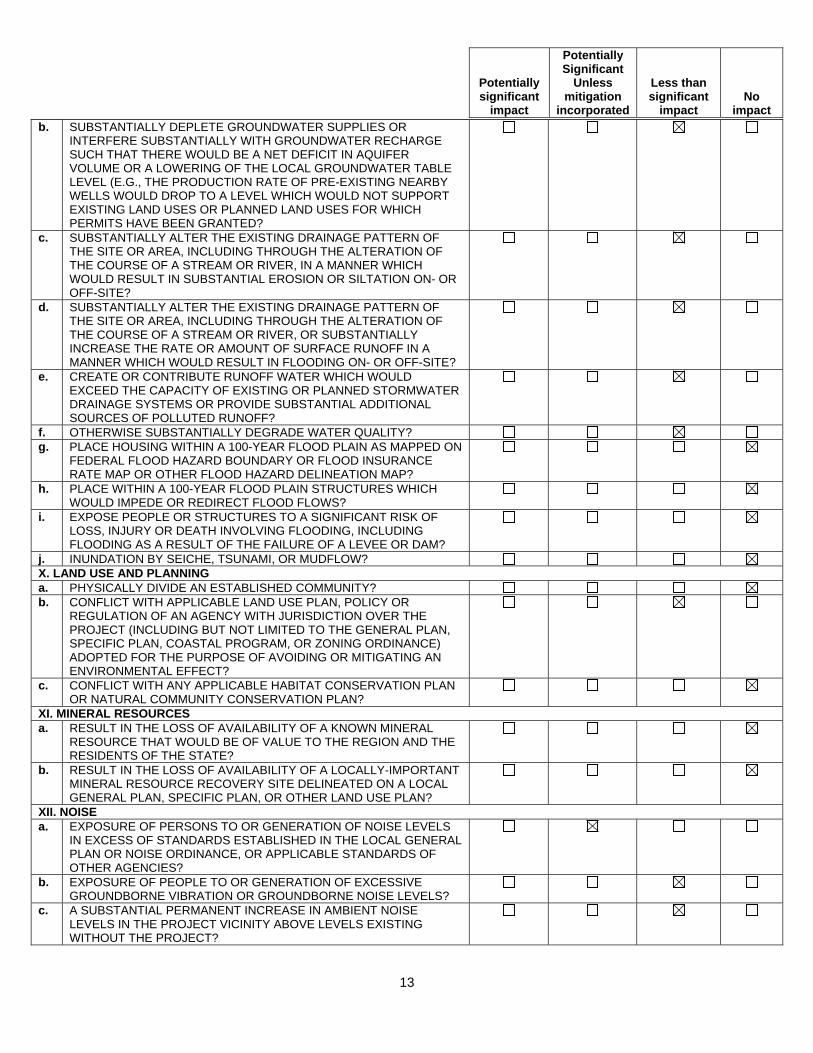
b. SUBSTANTIALLY DEPLETE GROUNDWATER SUPPLIES OR INTERFERE SUBSTANTIALLY WITH GROUNDWATER RECHARGE SUCH THAT THERE WOULD BE A NET DEFICIT IN AQUIFER VOLUME OR A LOWERING OF THE LOCAL GROUNDWATER TABLE LEVEL (E.G., THE PRODUCTION RATE OF PRE-EXISTING NEARBY WELLS WOULD DROP TO A LEVEL WHICH WOULD NOT SUPPORT EXISTING LAND USES OR PLANNED LAND USES FOR WHICH PERMITS HAVE BEEN GRANTED?
c. SUBSTANTIALLY ALTER THE EXISTING DRAINAGE PATTERN OF THE SITE OR AREA, INCLUDING THROUGH THE ALTERATION OF THE COURSE OF A STREAM OR RIVER, IN A MANNER WHICH WOULD RESULT IN SUBSTANTIAL EROSION OR SILTATION ON- OR OFF-SITE?
d. SUBSTANTIALLY ALTER THE EXISTING DRAINAGE PATTERN OF THE SITE OR AREA, INCLUDING THROUGH THE ALTERATION OF THE COURSE OF A STREAM OR RIVER, OR SUBSTANTIALLY INCREASE THE RATE OR AMOUNT OF SURFACE RUNOFF IN A MANNER WHICH WOULD RESULT IN FLOODING ON- OR OFF-SITE?
e. CREATE OR CONTRIBUTE RUNOFF WATER WHICH WOULD EXCEED THE CAPACITY OF EXISTING OR PLANNED STORMWATER DRAINAGE SYSTEMS OR PROVIDE SUBSTANTIAL ADDITIONAL SOURCES OF POLLUTED RUNOFF?
f. OTHERWISE SUBSTANTIALLY DEGRADE WATER QUALITY? g. PLACE HOUSING WITHIN A 100-YEAR FLOOD PLAIN AS MAPPED ON
FEDERAL FLOOD HAZARD BOUNDARY OR FLOOD INSURANCE RATE MAP OR OTHER FLOOD HAZARD DELINEATION MAP?
h. PLACE WITHIN A 100-YEAR FLOOD PLAIN STRUCTURES WHICH WOULD IMPEDE OR REDIRECT FLOOD FLOWS?
i. EXPOSE PEOPLE OR STRUCTURES TO A SIGNIFICANT RISK OF LOSS, INJURY OR DEATH INVOLVING FLOODING, INCLUDING FLOODING AS A RESULT OF THE FAILURE OF A LEVEE OR DAM?
j. INUNDATION BY SEICHE, TSUNAMI, OR MUDFLOW? X. LAND USE AND PLANNING a. PHYSICALLY DIVIDE AN ESTABLISHED COMMUNITY? b. CONFLICT WITH APPLICABLE LAND USE PLAN, POLICY OR
REGULATION OF AN AGENCY WITH JURISDICTION OVER THE PROJECT (INCLUDING BUT NOT LIMITED TO THE GENERAL PLAN, SPECIFIC PLAN, COASTAL PROGRAM, OR ZONING ORDINANCE) ADOPTED FOR THE PURPOSE OF AVOIDING OR MITIGATING AN ENVIRONMENTAL EFFECT?
c. CONFLICT WITH ANY APPLICABLE HABITAT CONSERVATION PLAN OR NATURAL COMMUNITY CONSERVATION PLAN?
XI. MINERAL RESOURCES a. RESULT IN THE LOSS OF AVAILABILITY OF A KNOWN MINERAL
RESOURCE THAT WOULD BE OF VALUE TO THE REGION AND THE RESIDENTS OF THE STATE?
b. RESULT IN THE LOSS OF AVAILABILITY OF A LOCALLY-IMPORTANT MINERAL RESOURCE RECOVERY SITE DELINEATED ON A LOCAL GENERAL PLAN, SPECIFIC PLAN, OR OTHER LAND USE PLAN?
XII. NOISE a. EXPOSURE OF PERSONS TO OR GENERATION OF NOISE LEVELS
IN EXCESS OF STANDARDS ESTABLISHED IN THE LOCAL GENERAL PLAN OR NOISE ORDINANCE, OR APPLICABLE STANDARDS OF OTHER AGENCIES?
b. EXPOSURE OF PEOPLE TO OR GENERATION OF EXCESSIVE GROUNDBORNE VIBRATION OR GROUNDBORNE NOISE LEVELS?
c. A SUBSTANTIAL PERMANENT INCREASE IN AMBIENT NOISE LEVELS IN THE PROJECT VICINITY ABOVE LEVELS EXISTING WITHOUT THE PROJECT?
Potentially significant
impact
Potentially Significant
Unless mitigation
incorporated
Less than significant
impact No
impact
14
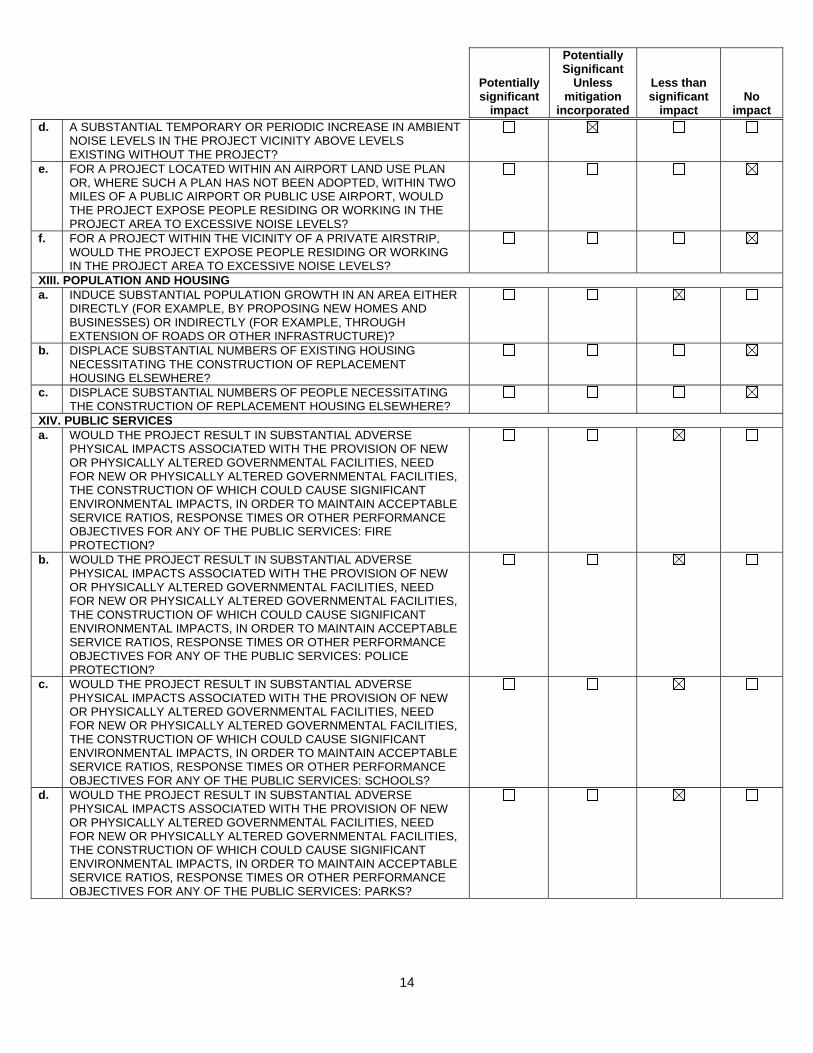
d. A SUBSTANTIAL TEMPORARY OR PERIODIC INCREASE IN AMBIENT NOISE LEVELS IN THE PROJECT VICINITY ABOVE LEVELS EXISTING WITHOUT THE PROJECT?
e. FOR A PROJECT LOCATED WITHIN AN AIRPORT LAND USE PLAN OR, WHERE SUCH A PLAN HAS NOT BEEN ADOPTED, WITHIN TWO MILES OF A PUBLIC AIRPORT OR PUBLIC USE AIRPORT, WOULD THE PROJECT EXPOSE PEOPLE RESIDING OR WORKING IN THE PROJECT AREA TO EXCESSIVE NOISE LEVELS?
f. FOR A PROJECT WITHIN THE VICINITY OF A PRIVATE AIRSTRIP, WOULD THE PROJECT EXPOSE PEOPLE RESIDING OR WORKING IN THE PROJECT AREA TO EXCESSIVE NOISE LEVELS?
XIII. POPULATION AND HOUSING a. INDUCE SUBSTANTIAL POPULATION GROWTH IN AN AREA EITHER
DIRECTLY (FOR EXAMPLE, BY PROPOSING NEW HOMES AND BUSINESSES) OR INDIRECTLY (FOR EXAMPLE, THROUGH EXTENSION OF ROADS OR OTHER INFRASTRUCTURE)?
b. DISPLACE SUBSTANTIAL NUMBERS OF EXISTING HOUSING NECESSITATING THE CONSTRUCTION OF REPLACEMENT HOUSING ELSEWHERE?
c. DISPLACE SUBSTANTIAL NUMBERS OF PEOPLE NECESSITATING THE CONSTRUCTION OF REPLACEMENT HOUSING ELSEWHERE?
XIV. PUBLIC SERVICES a. WOULD THE PROJECT RESULT IN SUBSTANTIAL ADVERSE
PHYSICAL IMPACTS ASSOCIATED WITH THE PROVISION OF NEW OR PHYSICALLY ALTERED GOVERNMENTAL FACILITIES, NEED FOR NEW OR PHYSICALLY ALTERED GOVERNMENTAL FACILITIES, THE CONSTRUCTION OF WHICH COULD CAUSE SIGNIFICANT ENVIRONMENTAL IMPACTS, IN ORDER TO MAINTAIN ACCEPTABLE SERVICE RATIOS, RESPONSE TIMES OR OTHER PERFORMANCE OBJECTIVES FOR ANY OF THE PUBLIC SERVICES: FIRE PROTECTION?
b. WOULD THE PROJECT RESULT IN SUBSTANTIAL ADVERSE PHYSICAL IMPACTS ASSOCIATED WITH THE PROVISION OF NEW OR PHYSICALLY ALTERED GOVERNMENTAL FACILITIES, NEED FOR NEW OR PHYSICALLY ALTERED GOVERNMENTAL FACILITIES, THE CONSTRUCTION OF WHICH COULD CAUSE SIGNIFICANT ENVIRONMENTAL IMPACTS, IN ORDER TO MAINTAIN ACCEPTABLE SERVICE RATIOS, RESPONSE TIMES OR OTHER PERFORMANCE OBJECTIVES FOR ANY OF THE PUBLIC SERVICES: POLICE PROTECTION?
c. WOULD THE PROJECT RESULT IN SUBSTANTIAL ADVERSE PHYSICAL IMPACTS ASSOCIATED WITH THE PROVISION OF NEW OR PHYSICALLY ALTERED GOVERNMENTAL FACILITIES, NEED FOR NEW OR PHYSICALLY ALTERED GOVERNMENTAL FACILITIES, THE CONSTRUCTION OF WHICH COULD CAUSE SIGNIFICANT ENVIRONMENTAL IMPACTS, IN ORDER TO MAINTAIN ACCEPTABLE SERVICE RATIOS, RESPONSE TIMES OR OTHER PERFORMANCE OBJECTIVES FOR ANY OF THE PUBLIC SERVICES: SCHOOLS?
d. WOULD THE PROJECT RESULT IN SUBSTANTIAL ADVERSE PHYSICAL IMPACTS ASSOCIATED WITH THE PROVISION OF NEW OR PHYSICALLY ALTERED GOVERNMENTAL FACILITIES, NEED FOR NEW OR PHYSICALLY ALTERED GOVERNMENTAL FACILITIES, THE CONSTRUCTION OF WHICH COULD CAUSE SIGNIFICANT ENVIRONMENTAL IMPACTS, IN ORDER TO MAINTAIN ACCEPTABLE SERVICE RATIOS, RESPONSE TIMES OR OTHER PERFORMANCE OBJECTIVES FOR ANY OF THE PUBLIC SERVICES: PARKS?
Potentially significant
impact
Potentially Significant
Unless mitigation
incorporated
Less than significant
impact No
impact
15
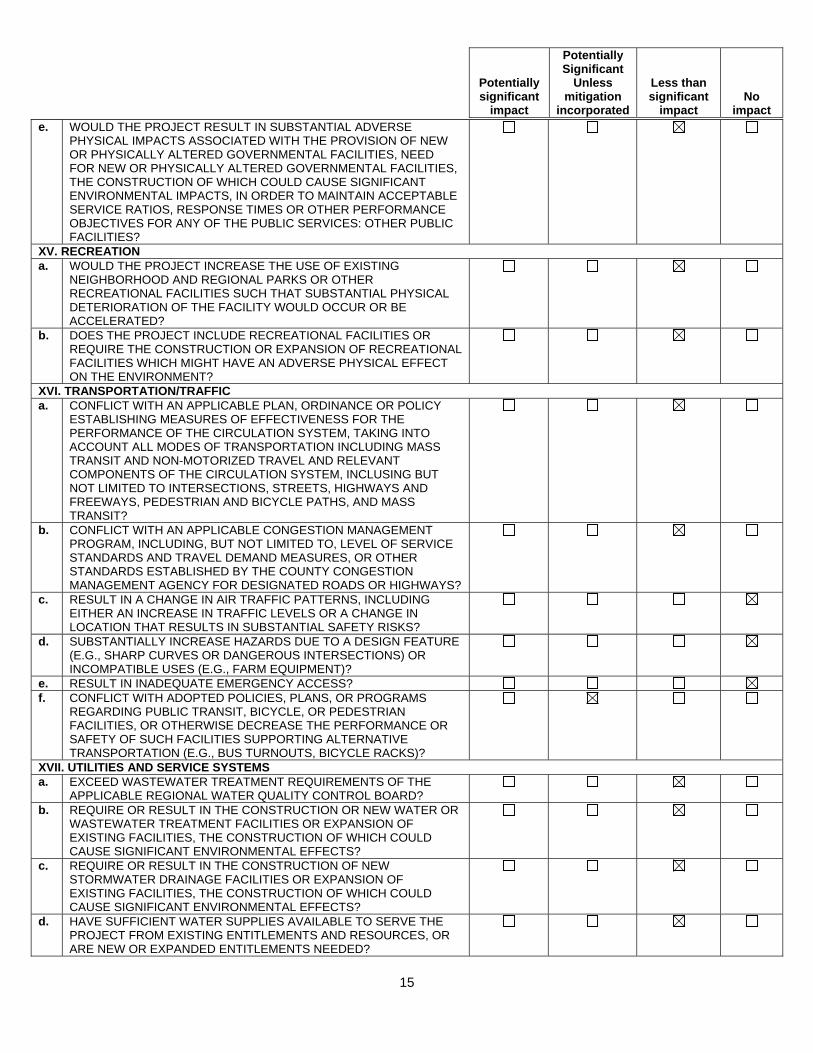
e. WOULD THE PROJECT RESULT IN SUBSTANTIAL ADVERSE PHYSICAL IMPACTS ASSOCIATED WITH THE PROVISION OF NEW OR PHYSICALLY ALTERED GOVERNMENTAL FACILITIES, NEED FOR NEW OR PHYSICALLY ALTERED GOVERNMENTAL FACILITIES, THE CONSTRUCTION OF WHICH COULD CAUSE SIGNIFICANT ENVIRONMENTAL IMPACTS, IN ORDER TO MAINTAIN ACCEPTABLE SERVICE RATIOS, RESPONSE TIMES OR OTHER PERFORMANCE OBJECTIVES FOR ANY OF THE PUBLIC SERVICES: OTHER PUBLIC FACILITIES?
XV. RECREATION a. WOULD THE PROJECT INCREASE THE USE OF EXISTING
NEIGHBORHOOD AND REGIONAL PARKS OR OTHER RECREATIONAL FACILITIES SUCH THAT SUBSTANTIAL PHYSICAL DETERIORATION OF THE FACILITY WOULD OCCUR OR BE ACCELERATED?
b. DOES THE PROJECT INCLUDE RECREATIONAL FACILITIES OR REQUIRE THE CONSTRUCTION OR EXPANSION OF RECREATIONAL FACILITIES WHICH MIGHT HAVE AN ADVERSE PHYSICAL EFFECT ON THE ENVIRONMENT?
XVI. TRANSPORTATION/TRAFFIC a. CONFLICT WITH AN APPLICABLE PLAN, ORDINANCE OR POLICY
ESTABLISHING MEASURES OF EFFECTIVENESS FOR THE PERFORMANCE OF THE CIRCULATION SYSTEM, TAKING INTO ACCOUNT ALL MODES OF TRANSPORTATION INCLUDING MASS TRANSIT AND NON-MOTORIZED TRAVEL AND RELEVANT COMPONENTS OF THE CIRCULATION SYSTEM, INCLUSING BUT NOT LIMITED TO INTERSECTIONS, STREETS, HIGHWAYS AND FREEWAYS, PEDESTRIAN AND BICYCLE PATHS, AND MASS TRANSIT?
b. CONFLICT WITH AN APPLICABLE CONGESTION MANAGEMENT PROGRAM, INCLUDING, BUT NOT LIMITED TO, LEVEL OF SERVICE STANDARDS AND TRAVEL DEMAND MEASURES, OR OTHER STANDARDS ESTABLISHED BY THE COUNTY CONGESTION MANAGEMENT AGENCY FOR DESIGNATED ROADS OR HIGHWAYS?
c. RESULT IN A CHANGE IN AIR TRAFFIC PATTERNS, INCLUDING EITHER AN INCREASE IN TRAFFIC LEVELS OR A CHANGE IN LOCATION THAT RESULTS IN SUBSTANTIAL SAFETY RISKS?
d. SUBSTANTIALLY INCREASE HAZARDS DUE TO A DESIGN FEATURE (E.G., SHARP CURVES OR DANGEROUS INTERSECTIONS) OR INCOMPATIBLE USES (E.G., FARM EQUIPMENT)?
e. RESULT IN INADEQUATE EMERGENCY ACCESS? f. CONFLICT WITH ADOPTED POLICIES, PLANS, OR PROGRAMS
REGARDING PUBLIC TRANSIT, BICYCLE, OR PEDESTRIAN FACILITIES, OR OTHERWISE DECREASE THE PERFORMANCE OR SAFETY OF SUCH FACILITIES SUPPORTING ALTERNATIVE TRANSPORTATION (E.G., BUS TURNOUTS, BICYCLE RACKS)?
XVII. UTILITIES AND SERVICE SYSTEMS a. EXCEED WASTEWATER TREATMENT REQUIREMENTS OF THE
APPLICABLE REGIONAL WATER QUALITY CONTROL BOARD?
b. REQUIRE OR RESULT IN THE CONSTRUCTION OR NEW WATER OR WASTEWATER TREATMENT FACILITIES OR EXPANSION OF EXISTING FACILITIES, THE CONSTRUCTION OF WHICH COULD CAUSE SIGNIFICANT ENVIRONMENTAL EFFECTS?
c. REQUIRE OR RESULT IN THE CONSTRUCTION OF NEW STORMWATER DRAINAGE FACILITIES OR EXPANSION OF EXISTING FACILITIES, THE CONSTRUCTION OF WHICH COULD CAUSE SIGNIFICANT ENVIRONMENTAL EFFECTS?
d. HAVE SUFFICIENT WATER SUPPLIES AVAILABLE TO SERVE THE PROJECT FROM EXISTING ENTITLEMENTS AND RESOURCES, OR ARE NEW OR EXPANDED ENTITLEMENTS NEEDED?
Potentially significant
impact
Potentially Significant
Unless mitigation
incorporated
Less than significant
impact No
impact
16
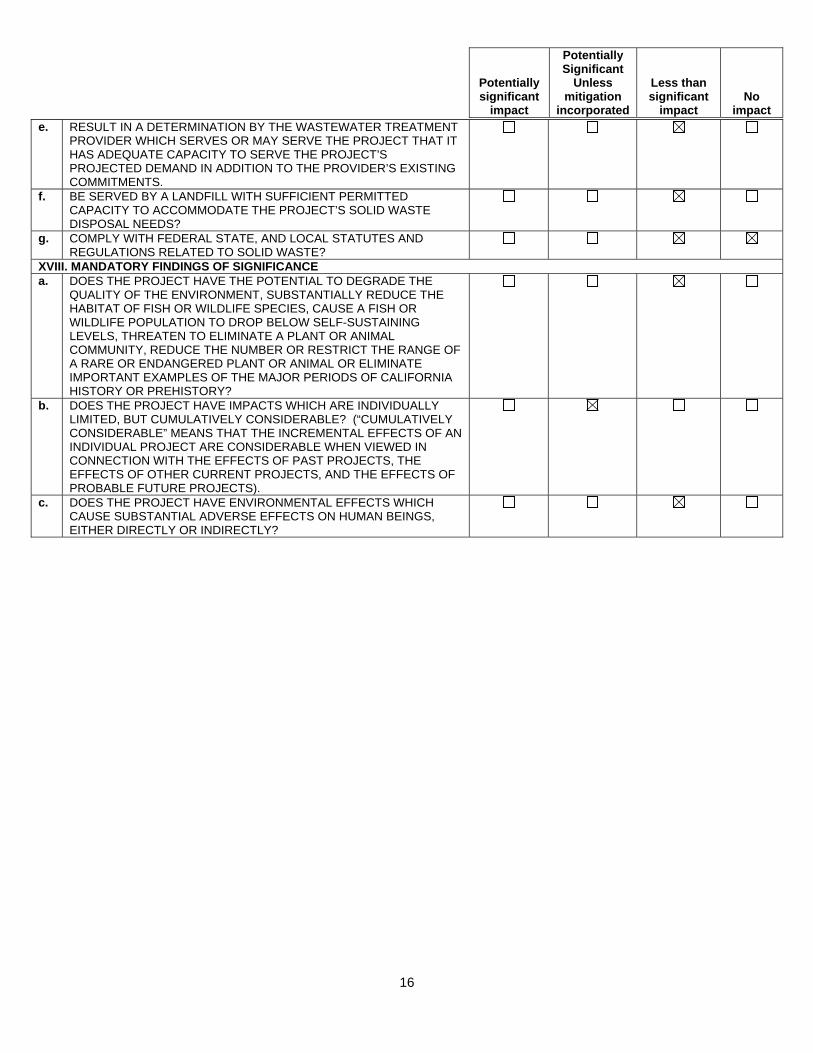
e. RESULT IN A DETERMINATION BY THE WASTEWATER TREATMENT PROVIDER WHICH SERVES OR MAY SERVE THE PROJECT THAT IT HAS ADEQUATE CAPACITY TO SERVE THE PROJECT’S PROJECTED DEMAND IN ADDITION TO THE PROVIDER’S EXISTING COMMITMENTS.
f. BE SERVED BY A LANDFILL WITH SUFFICIENT PERMITTED CAPACITY TO ACCOMMODATE THE PROJECT’S SOLID WASTE DISPOSAL NEEDS?
g. COMPLY WITH FEDERAL STATE, AND LOCAL STATUTES AND REGULATIONS RELATED TO SOLID WASTE?
XVIII. MANDATORY FINDINGS OF SIGNIFICANCE a. DOES THE PROJECT HAVE THE POTENTIAL TO DEGRADE THE
QUALITY OF THE ENVIRONMENT, SUBSTANTIALLY REDUCE THE HABITAT OF FISH OR WILDLIFE SPECIES, CAUSE A FISH OR WILDLIFE POPULATION TO DROP BELOW SELF-SUSTAINING LEVELS, THREATEN TO ELIMINATE A PLANT OR ANIMAL COMMUNITY, REDUCE THE NUMBER OR RESTRICT THE RANGE OF A RARE OR ENDANGERED PLANT OR ANIMAL OR ELIMINATE IMPORTANT EXAMPLES OF THE MAJOR PERIODS OF CALIFORNIA HISTORY OR PREHISTORY?
b. DOES THE PROJECT HAVE IMPACTS WHICH ARE INDIVIDUALLY LIMITED, BUT CUMULATIVELY CONSIDERABLE? (“CUMULATIVELY CONSIDERABLE” MEANS THAT THE INCREMENTAL EFFECTS OF AN INDIVIDUAL PROJECT ARE CONSIDERABLE WHEN VIEWED IN CONNECTION WITH THE EFFECTS OF PAST PROJECTS, THE EFFECTS OF OTHER CURRENT PROJECTS, AND THE EFFECTS OF PROBABLE FUTURE PROJECTS).
c. DOES THE PROJECT HAVE ENVIRONMENTAL EFFECTS WHICH CAUSE SUBSTANTIAL ADVERSE EFFECTS ON HUMAN BEINGS, EITHER DIRECTLY OR INDIRECTLY?
17
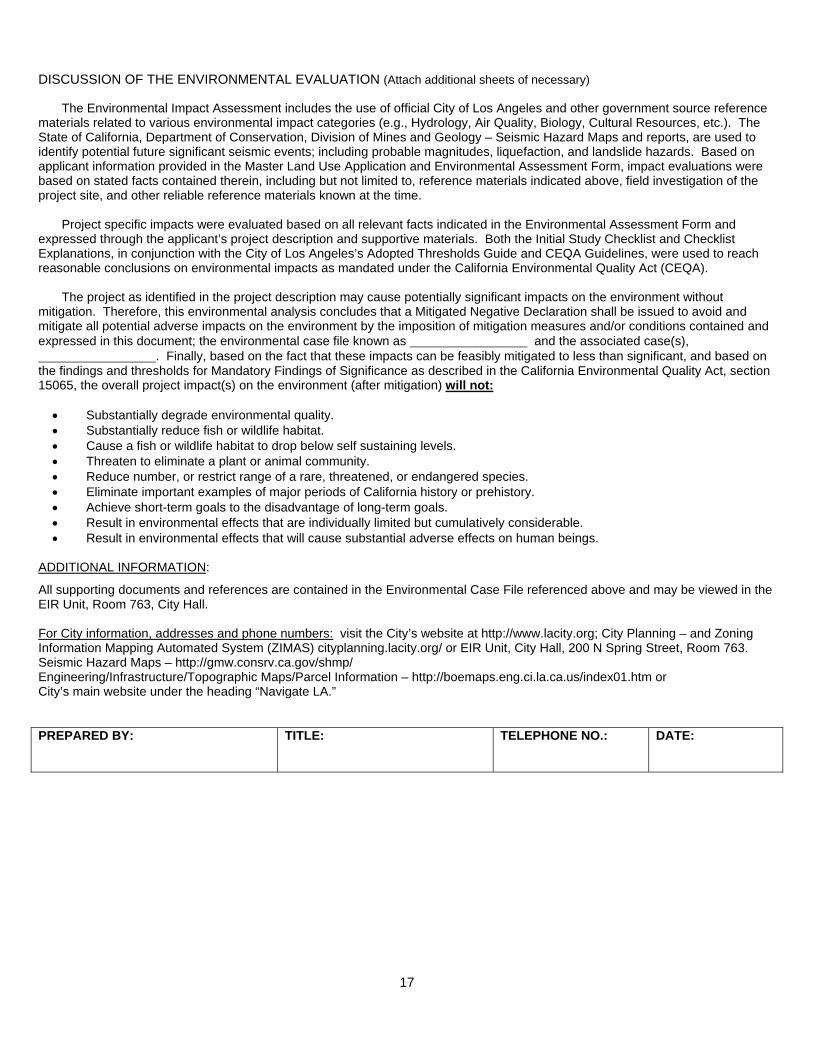
DISCUSSION OF THE ENVIRONMENTAL EVALUATION (Attach additional sheets of necessary)
The Environmental Impact Assessment includes the use of official City of Los Angeles and other government source reference materials related to various environmental impact categories (e.g., Hydrology, Air Quality, Biology, Cultural Resources, etc.). The State of California, Department of Conservation, Division of Mines and Geology – Seismic Hazard Maps and reports, are used to identify potential future significant seismic events; including probable magnitudes, liquefaction, and landslide hazards. Based on applicant information provided in the Master Land Use Application and Environmental Assessment Form, impact evaluations were based on stated facts contained therein, including but not limited to, reference materials indicated above, field investigation of the project site, and other reliable reference materials known at the time.
Project specific impacts were evaluated based on all relevant facts indicated in the Environmental Assessment Form and expressed through the applicant’s project description and supportive materials. Both the Initial Study Checklist and Checklist Explanations, in conjunction with the City of Los Angeles’s Adopted Thresholds Guide and CEQA Guidelines, were used to reach reasonable conclusions on environmental impacts as mandated under the California Environmental Quality Act (CEQA).
The project as identified in the project description may cause potentially significant impacts on the environment without mitigation. Therefore, this environmental analysis concludes that a Mitigated Negative Declaration shall be issued to avoid and mitigate all potential adverse impacts on the environment by the imposition of mitigation measures and/or conditions contained and expressed in this document; the environmental case file known as ________________ and the associated case(s), ________________. Finally, based on the fact that these impacts can be feasibly mitigated to less than significant, and based on the findings and thresholds for Mandatory Findings of Significance as described in the California Environmental Quality Act, section 15065, the overall project impact(s) on the environment (after mitigation) will not:
Substantially degrade environmental quality. Substantially reduce fish or wildlife habitat. Cause a fish or wildlife habitat to drop below self sustaining levels. Threaten to eliminate a plant or animal community. Reduce number, or restrict range of a rare, threatened, or endangered species. Eliminate important examples of major periods of California history or prehistory. Achieve short-term goals to the disadvantage of long-term goals. Result in environmental effects that are individually limited but cumulatively considerable. Result in environmental effects that will cause substantial adverse effects on human beings.
ADDITIONAL INFORMATION:
All supporting documents and references are contained in the Environmental Case File referenced above and may be viewed in the EIR Unit, Room 763, City Hall. For City information, addresses and phone numbers: visit the City’s website at http://www.lacity.org; City Planning – and Zoning Information Mapping Automated System (ZIMAS) cityplanning.lacity.org/ or EIR Unit, City Hall, 200 N Spring Street, Room 763. Seismic Hazard Maps – http://gmw.consrv.ca.gov/shmp/ Engineering/Infrastructure/Topographic Maps/Parcel Information – http://boemaps.eng.ci.la.ca.us/index01.htm or City’s main website under the heading “Navigate LA.” PREPARED BY:
TITLE:
TELEPHONE NO.:
DATE:
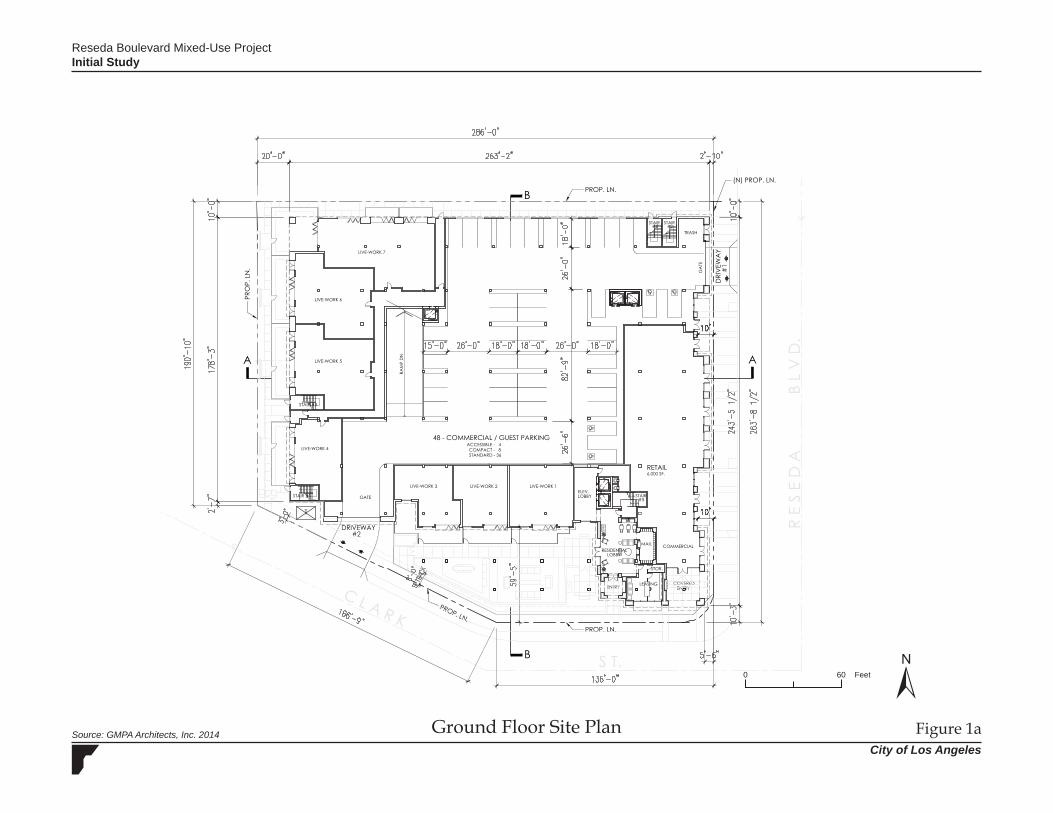
Source: GMPA Architects, Inc. 2014 Ground Floor Site Plan Figure 1aCity of Los Angeles
Reseda Boulevard Mixed-Use ProjectInitial Study
/0 60 Feet
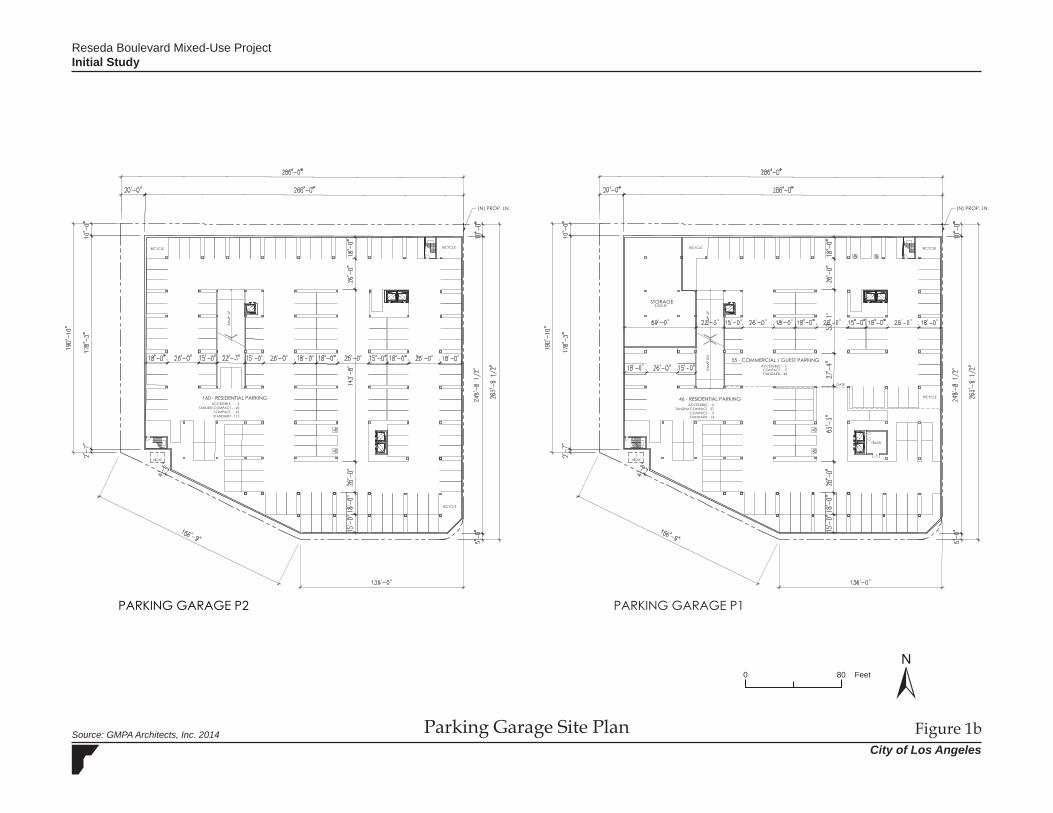
Source: GMPA Architects, Inc. 2014 Parking Garage Site Plan Figure 1bCity of Los Angeles
Reseda Boulevard Mixed-Use ProjectInitial Study
/0 80 Feet
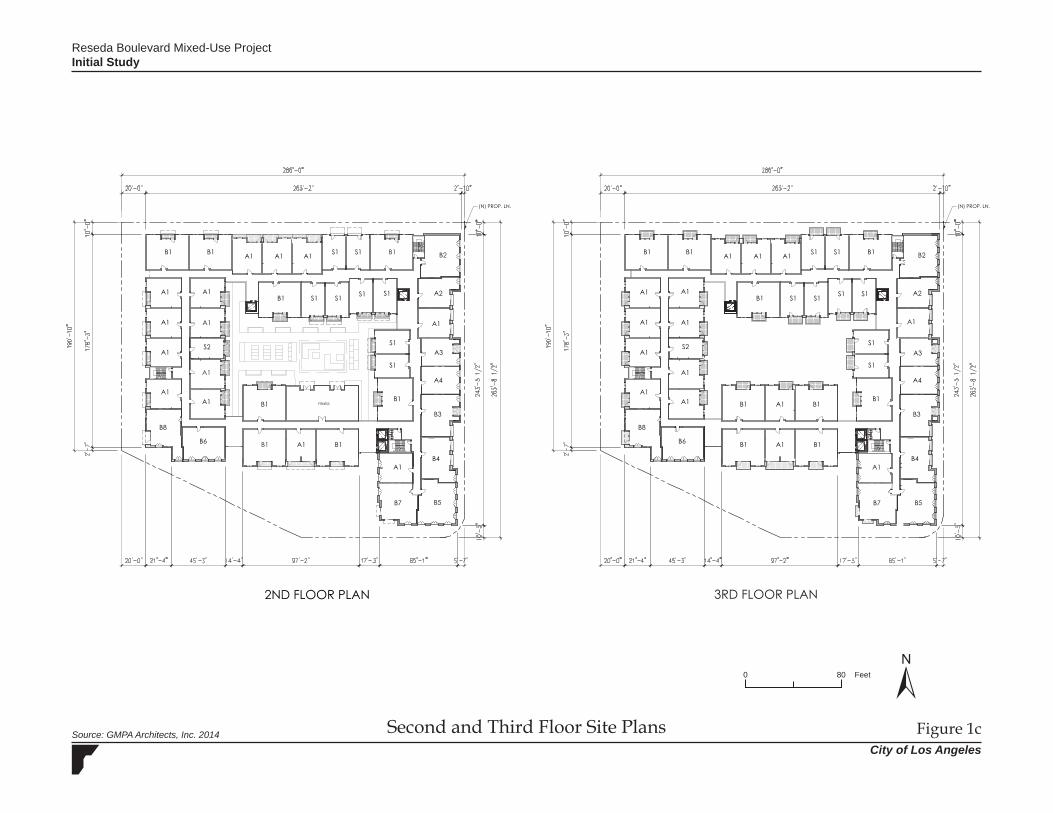
Source: GMPA Architects, Inc. 2014 Second and Third Floor Site Plans Figure 1cCity of Los Angeles
Reseda Boulevard Mixed-Use ProjectInitial Study
/0 80 Feet
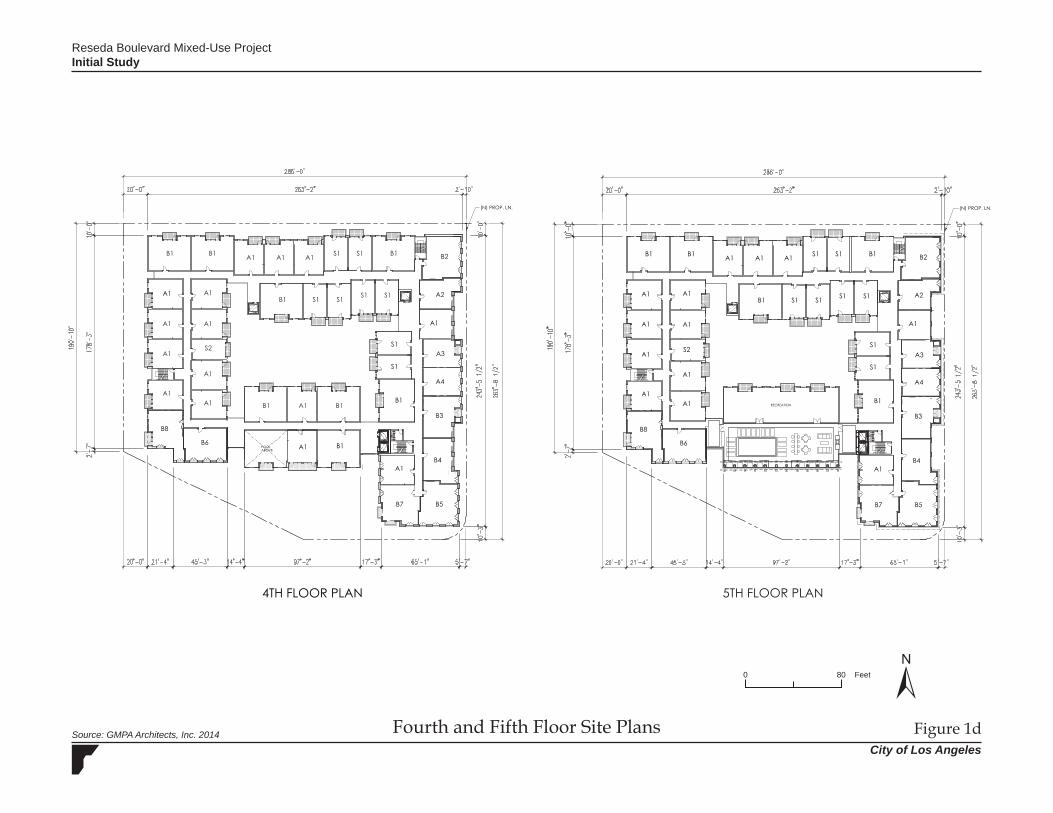
Source: GMPA Architects, Inc. 2014 Fourth and Fifth Floor Site Plans Figure 1dCity of Los Angeles
Reseda Boulevard Mixed-Use ProjectInitial Study
/0 80 Feet
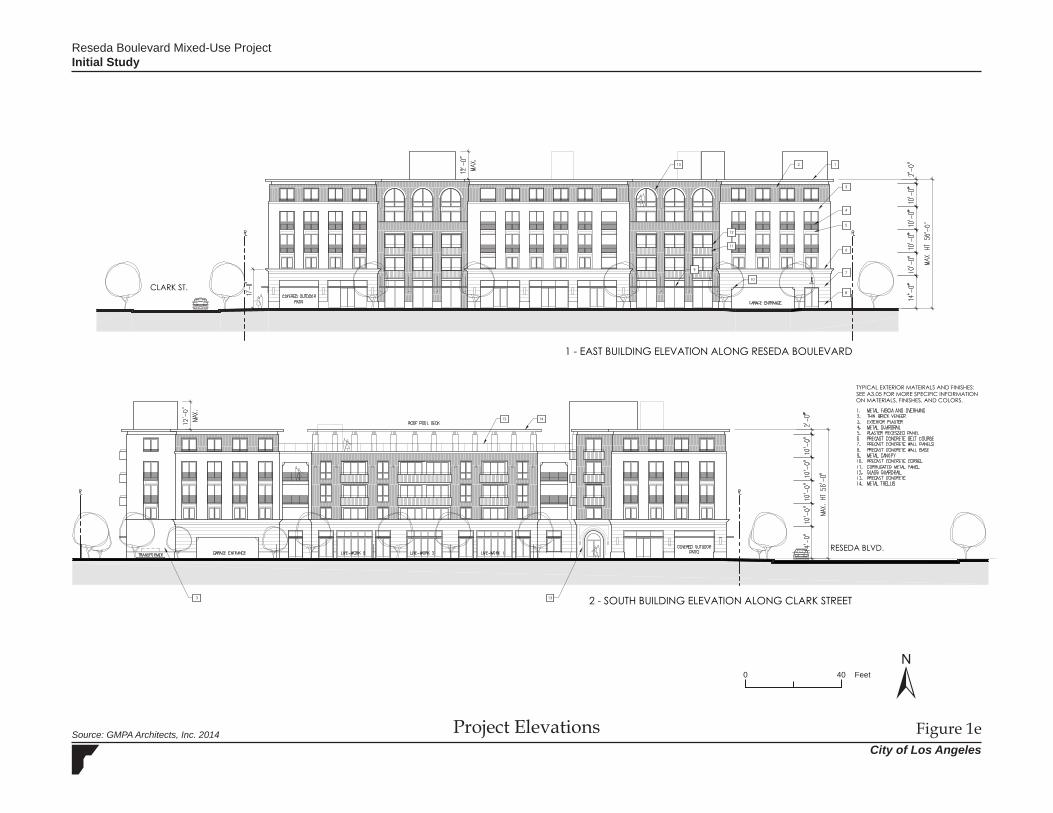
Source: GMPA Architects, Inc. 2014 Project Elevations Figure 1eCity of Los Angeles
Reseda Boulevard Mixed-Use ProjectInitial Study
/0 40 Feet
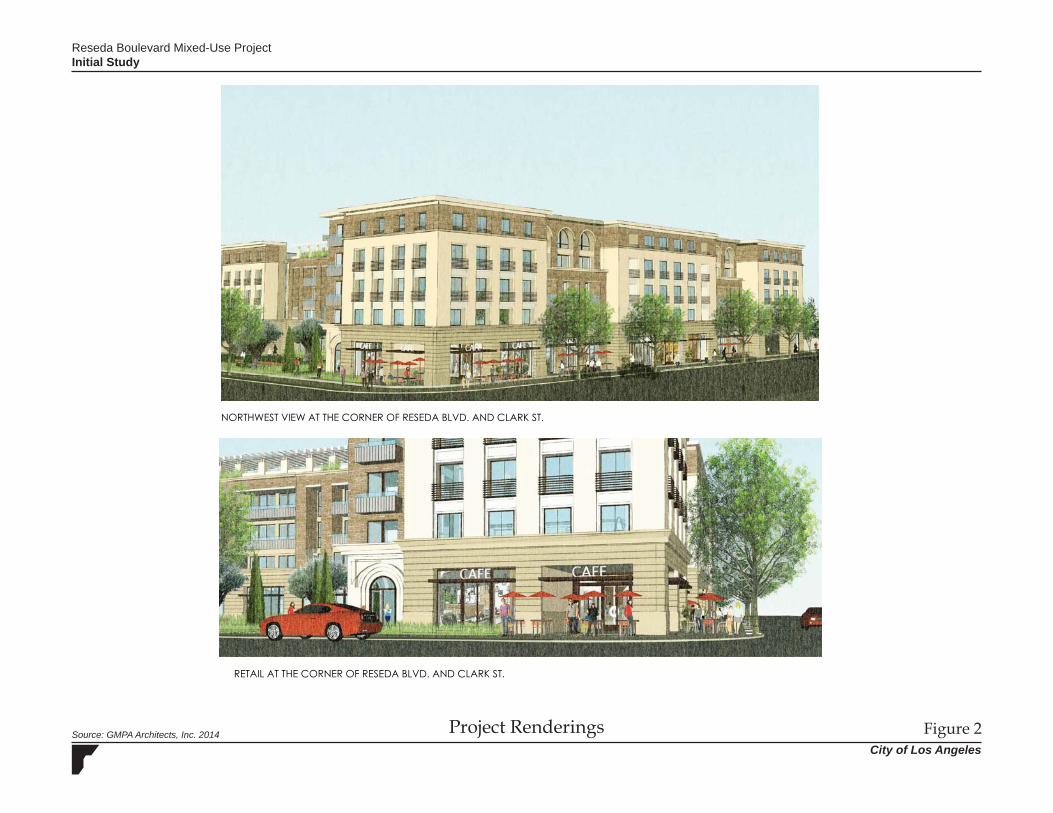
Source: GMPA Architects, Inc. 2014 Project Renderings Figure 2City of Los Angeles
Reseda Boulevard Mixed-Use ProjectInitial Study
Initial Study
City of Los AngelesRegional Location Figure 3
Basemap Source: ESRI Data, 2004, and USGS/CDFG, 2002.
Reseda Boulevard Mixed-Use Project
_̂
P A C I F I CO C E A N
_̂ Project Location
_̂
±
0 52.5 MilesImagery provided by ESRI and its licensors © 2016.
Ventura Blvd
Burbank Blvd
Re
seda
Blvd
Clark St
Me
cca A
ve
Clark St
Project Location Map Figure 4City of Los Angeles
Initial StudyReseda Boulevard Mixed-Use Project
Imagery provided by Google and its licensors © 2016.
Project Site
±0 15075Feet
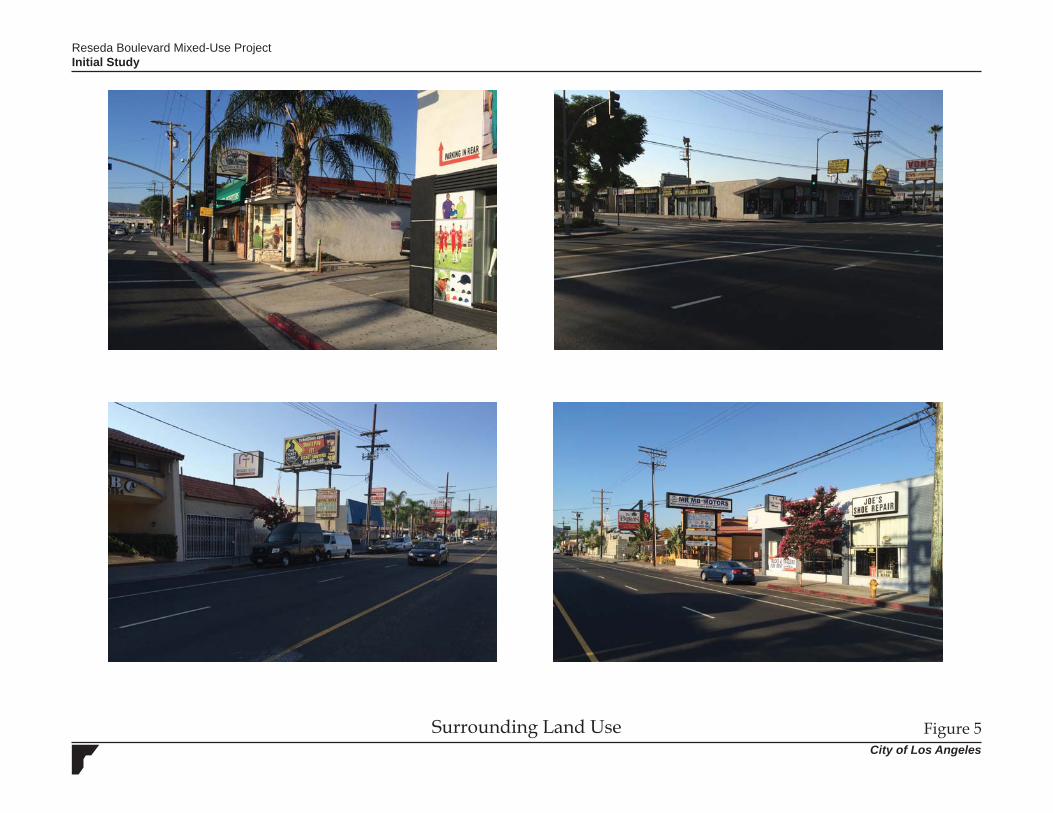
Surrounding Land Use Figure 5City of Los Angeles
Reseda Boulevard Mixed-Use ProjectInitial Study
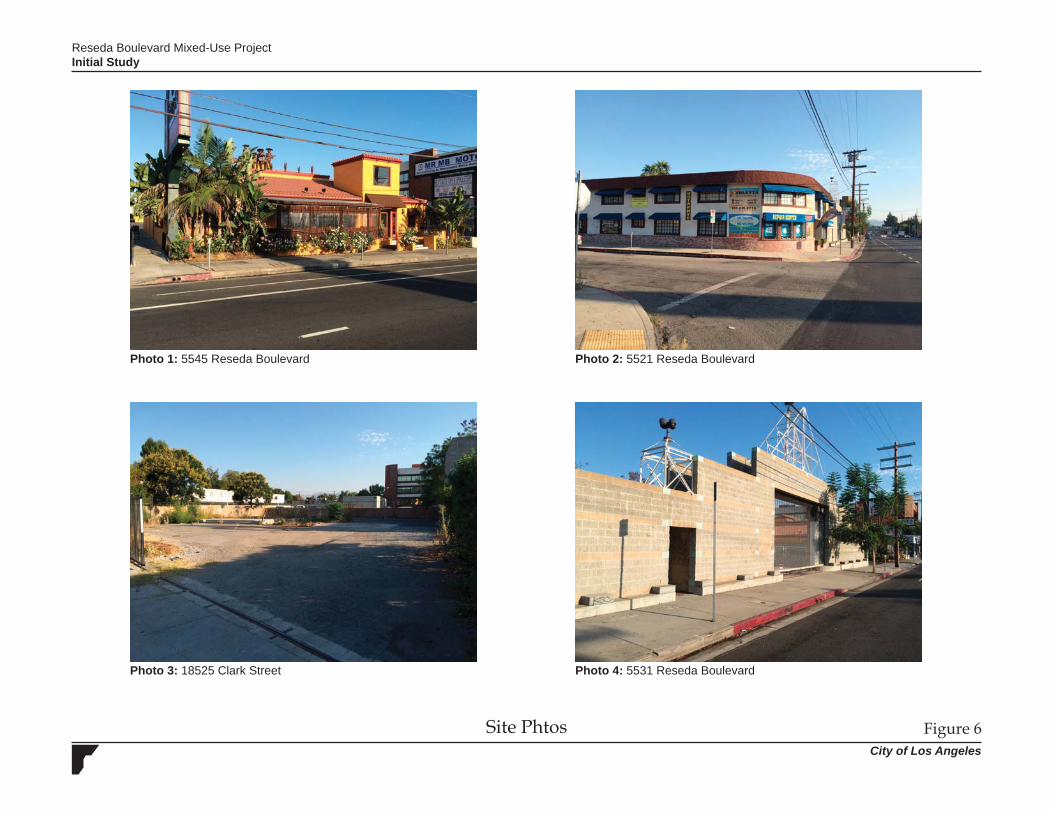
Site Phtos Figure 6City of Los Angeles
Photo 1: 5545 Reseda Boulevard Photo 2: 5521 Reseda Boulevard
Photo 3: 18525 Clark Street Photo 4: 5531 Reseda Boulevard
Reseda Boulevard Mixed-Use ProjectInitial Study
Initial Study Reseda Boulevard Mixed-Use Project
City of Los Angeles 28
Environmental Checklist Discussion I. AESTHETICS
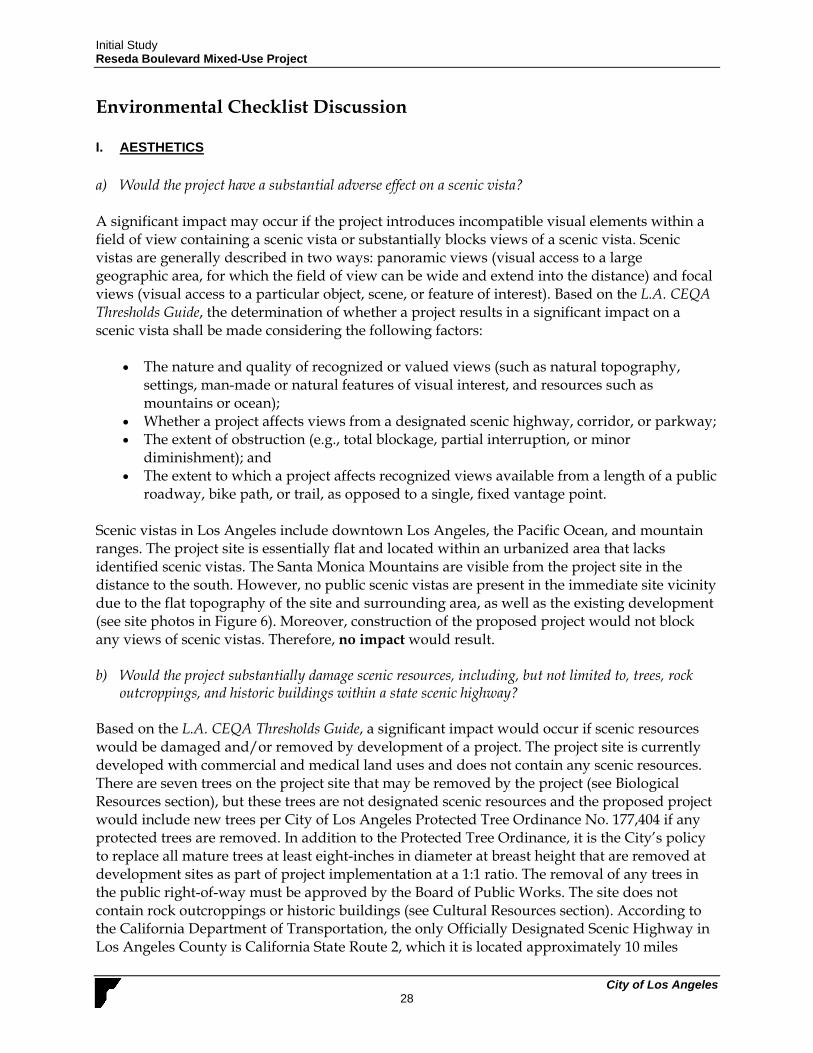
a) Would the project have a substantial adverse effect on a scenic vista? A significant impact may occur if the project introduces incompatible visual elements within a field of view containing a scenic vista or substantially blocks views of a scenic vista. Scenic vistas are generally described in two ways: panoramic views (visual access to a large geographic area, for which the field of view can be wide and extend into the distance) and focal views (visual access to a particular object, scene, or feature of interest). Based on the L.A. CEQA Thresholds Guide, the determination of whether a project results in a significant impact on a scenic vista shall be made considering the following factors:
The nature and quality of recognized or valued views (such as natural topography, settings, man-made or natural features of visual interest, and resources such as mountains or ocean);
Whether a project affects views from a designated scenic highway, corridor, or parkway; The extent of obstruction (e.g., total blockage, partial interruption, or minor
diminishment); and The extent to which a project affects recognized views available from a length of a public
roadway, bike path, or trail, as opposed to a single, fixed vantage point.
Scenic vistas in Los Angeles include downtown Los Angeles, the Pacific Ocean, and mountain ranges. The project site is essentially flat and located within an urbanized area that lacks identified scenic vistas. The Santa Monica Mountains are visible from the project site in the distance to the south. However, no public scenic vistas are present in the immediate site vicinity due to the flat topography of the site and surrounding area, as well as the existing development (see site photos in Figure 6). Moreover, construction of the proposed project would not block any views of scenic vistas. Therefore, no impact would result. b) Would the project substantially damage scenic resources, including, but not limited to, trees, rock
outcroppings, and historic buildings within a state scenic highway?
Based on the L.A. CEQA Thresholds Guide, a significant impact would occur if scenic resources would be damaged and/or removed by development of a project. The project site is currently developed with commercial and medical land uses and does not contain any scenic resources. There are seven trees on the project site that may be removed by the project (see Biological Resources section), but these trees are not designated scenic resources and the proposed project would include new trees per City of Los Angeles Protected Tree Ordinance No. 177,404 if any protected trees are removed. In addition to the Protected Tree Ordinance, it is the City’s policy to replace all mature trees at least eight-inches in diameter at breast height that are removed at development sites as part of project implementation at a 1:1 ratio. The removal of any trees in the public right-of-way must be approved by the Board of Public Works. The site does not contain rock outcroppings or historic buildings (see Cultural Resources section). According to the California Department of Transportation, the only Officially Designated Scenic Highway in Los Angeles County is California State Route 2, which it is located approximately 10 miles
Initial Study Reseda Boulevard Mixed-Use Project
City of Los Angeles 29
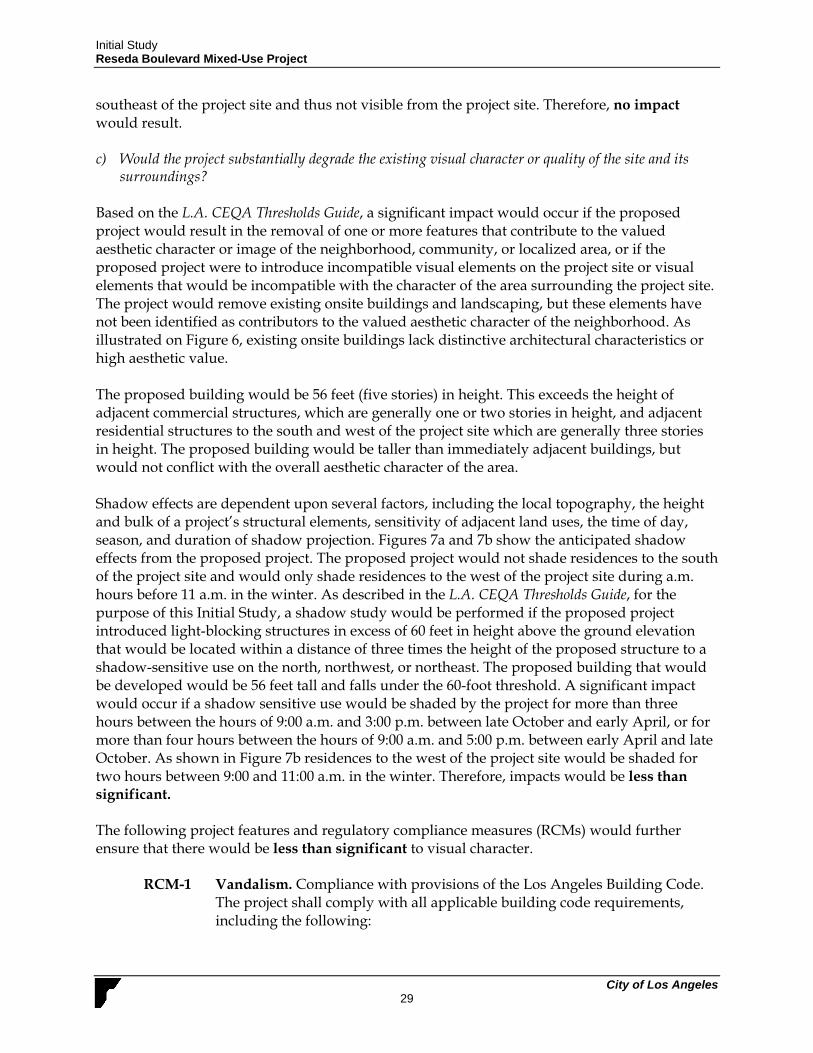
southeast of the project site and thus not visible from the project site. Therefore, no impact would result. c) Would the project substantially degrade the existing visual character or quality of the site and its
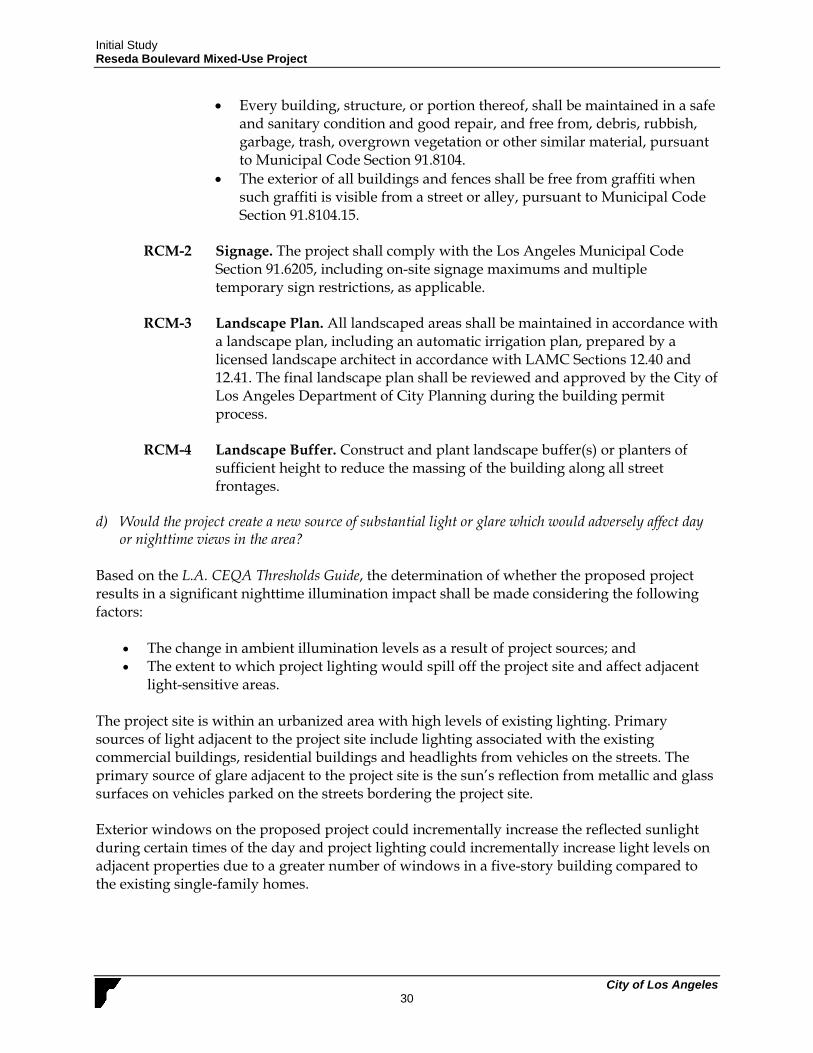
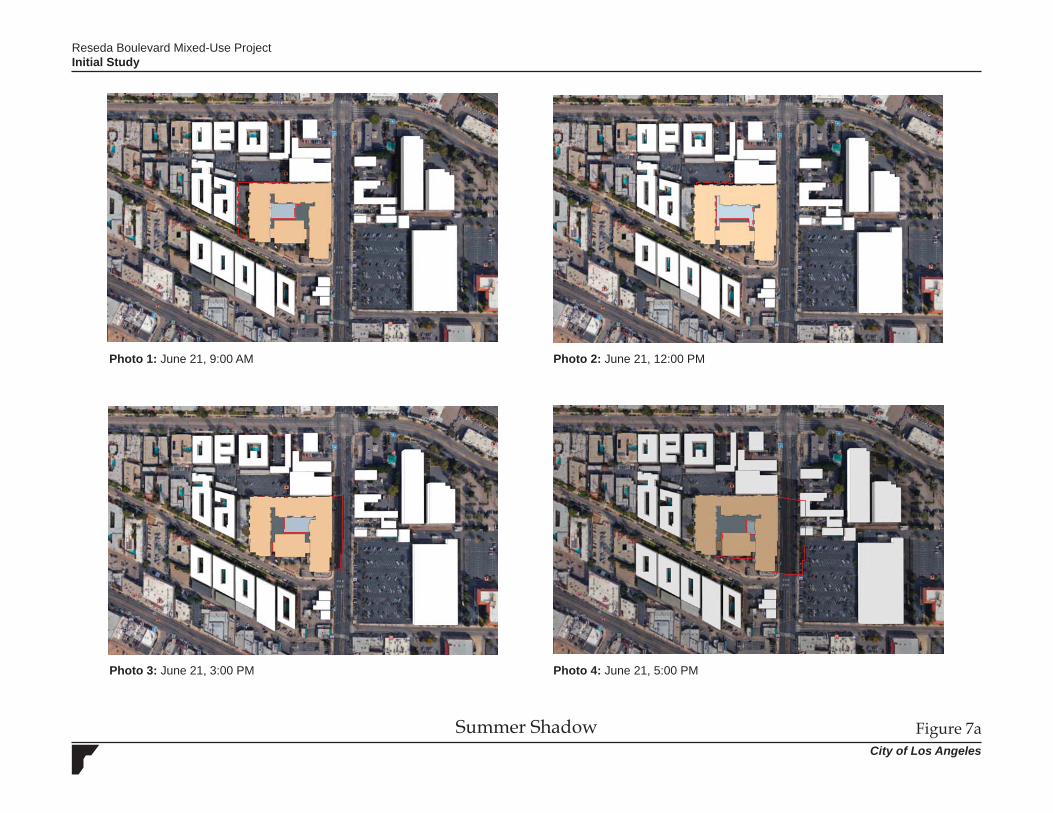
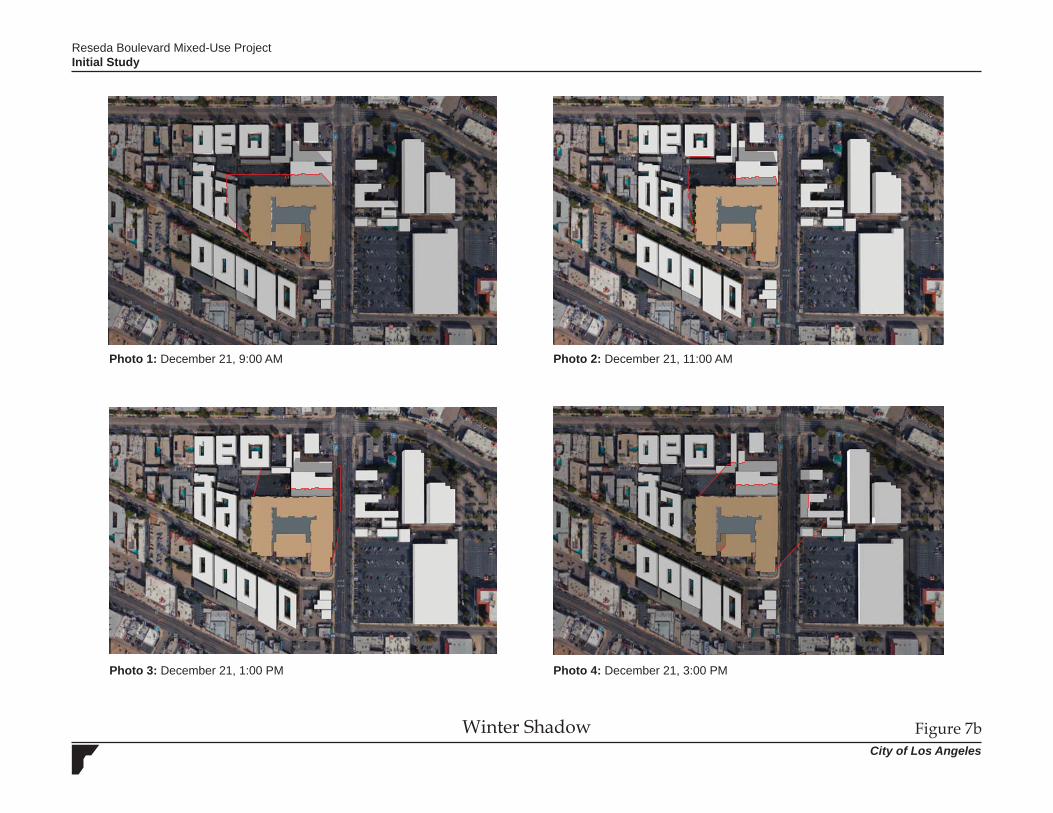
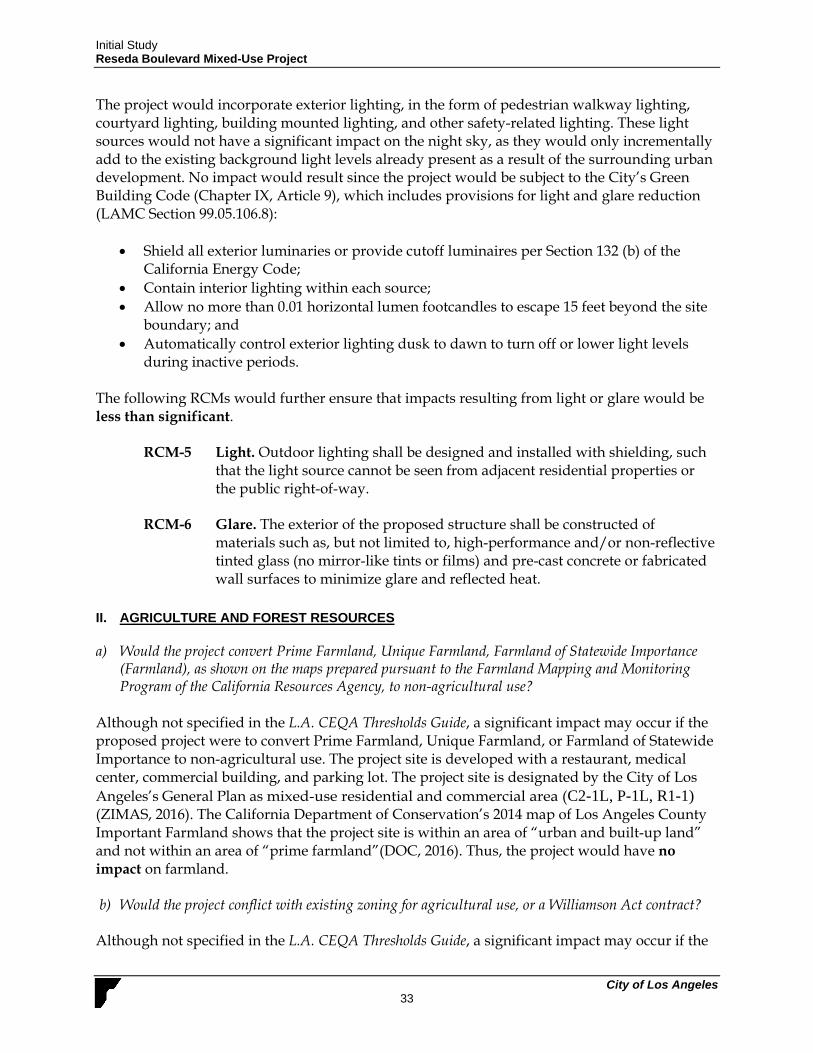
surroundings? Based on the L.A. CEQA Thresholds Guide, a significant impact would occur if the proposed project would result in the removal of one or more features that contribute to the valued aesthetic character or image of the neighborhood, community, or localized area, or if the proposed project were to introduce incompatible visual elements on the project site or visual elements that would be incompatible with the character of the area surrounding the project site. The project would remove existing onsite buildings and landscaping, but these elements have not been identified as contributors to the valued aesthetic character of the neighborhood. As illustrated on Figure 6, existing onsite buildings lack distinctive architectural characteristics or high aesthetic value. The proposed building would be 56 feet (five stories) in height. This exceeds the height of adjacent commercial structures, which are generally one or two stories in height, and adjacent residential structures to the south and west of the project site which are generally three stories in height. The proposed building would be taller than immediately adjacent buildings, but would not conflict with the overall aesthetic character of the area. Shadow effects are dependent upon several factors, including the local topography, the height and bulk of a project’s structural elements, sensitivity of adjacent land uses, the time of day, season, and duration of shadow projection. Figures 7a and 7b show the anticipated shadow effects from the proposed project. The proposed project would not shade residences to the south of the project site and would only shade residences to the west of the project site during a.m. hours before 11 a.m. in the winter. As described in the L.A. CEQA Thresholds Guide, for the purpose of this Initial Study, a shadow study would be performed if the proposed project introduced light-blocking structures in excess of 60 feet in height above the ground elevation that would be located within a distance of three times the height of the proposed structure to a shadow-sensitive use on the north, northwest, or northeast. The proposed building that would be developed would be 56 feet tall and falls under the 60-foot threshold. A significant impact would occur if a shadow sensitive use would be shaded by the project for more than three hours between the hours of 9:00 a.m. and 3:00 p.m. between late October and early April, or for more than four hours between the hours of 9:00 a.m. and 5:00 p.m. between early April and late October. As shown in Figure 7b residences to the west of the project site would be shaded for two hours between 9:00 and 11:00 a.m. in the winter. Therefore, impacts would be less than significant. The following project features and regulatory compliance measures (RCMs) would further ensure that there would be less than significant to visual character.
RCM-1 Vandalism. Compliance with provisions of the Los Angeles Building Code.
The project shall comply with all applicable building code requirements, including the following:
Initial Study Reseda Boulevard Mixed-Use Project
City of Los Angeles 30
Every building, structure, or portion thereof, shall be maintained in a safe and sanitary condition and good repair, and free from, debris, rubbish, garbage, trash, overgrown vegetation or other similar material, pursuant to Municipal Code Section 91.8104.
The exterior of all buildings and fences shall be free from graffiti when such graffiti is visible from a street or alley, pursuant to Municipal Code Section 91.8104.15.
RCM-2 Signage. The project shall comply with the Los Angeles Municipal Code
Section 91.6205, including on-site signage maximums and multiple temporary sign restrictions, as applicable.
RCM-3 Landscape Plan. All landscaped areas shall be maintained in accordance with
a landscape plan, including an automatic irrigation plan, prepared by a licensed landscape architect in accordance with LAMC Sections 12.40 and 12.41. The final landscape plan shall be reviewed and approved by the City of Los Angeles Department of City Planning during the building permit process.
RCM-4 Landscape Buffer. Construct and plant landscape buffer(s) or planters of
sufficient height to reduce the massing of the building along all street frontages.
d) Would the project create a new source of substantial light or glare which would adversely affect day
or nighttime views in the area? Based on the L.A. CEQA Thresholds Guide, the determination of whether the proposed project results in a significant nighttime illumination impact shall be made considering the following factors:
The change in ambient illumination levels as a result of project sources; and The extent to which project lighting would spill off the project site and affect adjacent
light-sensitive areas. The project site is within an urbanized area with high levels of existing lighting. Primary sources of light adjacent to the project site include lighting associated with the existing commercial buildings, residential buildings and headlights from vehicles on the streets. The primary source of glare adjacent to the project site is the sun’s reflection from metallic and glass surfaces on vehicles parked on the streets bordering the project site. Exterior windows on the proposed project could incrementally increase the reflected sunlight during certain times of the day and project lighting could incrementally increase light levels on adjacent properties due to a greater number of windows in a five-story building compared to the existing single-family homes.
Summer Shadow Figure 7aCity of Los Angeles
Photo 1: June 21, 9:00 AM Photo 2: June 21, 12:00 PM
Photo 3: June 21, 3:00 PM Photo 4: June 21, 5:00 PM
Reseda Boulevard Mixed-Use ProjectInitial Study
Winter Shadow Figure 7bCity of Los Angeles
Photo 1: December 21, 9:00 AM Photo 2: December 21, 11:00 AM
Photo 3: December 21, 1:00 PM Photo 4: December 21, 3:00 PM
Reseda Boulevard Mixed-Use ProjectInitial Study
Initial Study Reseda Boulevard Mixed-Use Project
City of Los Angeles 33
The project would incorporate exterior lighting, in the form of pedestrian walkway lighting, courtyard lighting, building mounted lighting, and other safety-related lighting. These light sources would not have a significant impact on the night sky, as they would only incrementally add to the existing background light levels already present as a result of the surrounding urban development. No impact would result since the project would be subject to the City’s Green Building Code (Chapter IX, Article 9), which includes provisions for light and glare reduction (LAMC Section 99.05.106.8):
Shield all exterior luminaries or provide cutoff luminaires per Section 132 (b) of the California Energy Code;
Contain interior lighting within each source; Allow no more than 0.01 horizontal lumen footcandles to escape 15 feet beyond the site
boundary; and Automatically control exterior lighting dusk to dawn to turn off or lower light levels
during inactive periods. The following RCMs would further ensure that impacts resulting from light or glare would be less than significant.
RCM-5 Light. Outdoor lighting shall be designed and installed with shielding, such
that the light source cannot be seen from adjacent residential properties or the public right-of-way.
RCM-6 Glare. The exterior of the proposed structure shall be constructed of materials such as, but not limited to, high-performance and/or non-reflective tinted glass (no mirror-like tints or films) and pre-cast concrete or fabricated wall surfaces to minimize glare and reflected heat.
II. AGRICULTURE AND FOREST RESOURCES
a) Would the project convert Prime Farmland, Unique Farmland, Farmland of Statewide Importance (Farmland), as shown on the maps prepared pursuant to the Farmland Mapping and Monitoring Program of the California Resources Agency, to non-agricultural use?
Although not specified in the L.A. CEQA Thresholds Guide, a significant impact may occur if the proposed project were to convert Prime Farmland, Unique Farmland, or Farmland of Statewide Importance to non-agricultural use. The project site is developed with a restaurant, medical center, commercial building, and parking lot. The project site is designated by the City of Los Angeles’s General Plan as mixed-use residential and commercial area (C2-1L, P-1L, R1-1) (ZIMAS, 2016). The California Department of Conservation’s 2014 map of Los Angeles County Important Farmland shows that the project site is within an area of “urban and built-up land” and not within an area of “prime farmland”(DOC, 2016). Thus, the project would have no impact on farmland. b) Would the project conflict with existing zoning for agricultural use, or a Williamson Act contract? Although not specified in the L.A. CEQA Thresholds Guide, a significant impact may occur if the
Initial Study Reseda Boulevard Mixed-Use Project
City of Los Angeles 34
proposed project were to conflict with existing zoning for agricultural use or a Williamson Act contract. The project site is not under any Williamson Act contract (California Department of Conservation, 2015-2016). The proposed project would not involve any development that could result in the conversion of farmland to non-agricultural uses, and therefore, the proposed project would have no impact with respect to agricultural zoning or other conversion of farmland to non-agricultural use. c) Would the project conflict with existing zoning for, or cause rezoning of, forest land (as defined in
Public Resources Code Section 12220(g)), timberland (as defined by Public Resources Code Section 4526), or timberland zoned Timberland Production (as defined by Government Code Section 51104(g))?
Although not specified in the L.A. CEQA Thresholds Guide, a significant impact may occur if the proposed project conflicts with existing zoning or rezoning. Neither the project site nor the surrounding parcels are zoned for forest land or timberland, and there is no timberland production at the project site; therefore, the proposed project would have no impact on such resources. d) Would the project result in the loss of forest land or conversion of forest land to non-forest use? Although not specified in the L.A. CEQA Thresholds Guide, a significant impact may occur if the proposed project resulted in the loss or conversion of forest land or timberland. Neither the project site nor the surrounding parcels are zoned for forest land. The project would have no impact on such resources. e) Would the project involve other changes in the existing environment which, due to their location or
nature, could result in conversion of Farmland, to non-agricultural use? Although not specified in the L.A. CEQA Thresholds Guide, a significant impact may occur if the proposed project were to involve other changes which could result in conversion of farmland to other non-agricultural uses. As discussed above, the proposed project would not involve any development that could result in the conversion of farmland to non-agricultural uses. The proposed project would have no impact with respect to conversion of farmland to non-agricultural use. III. AIR QUALITY
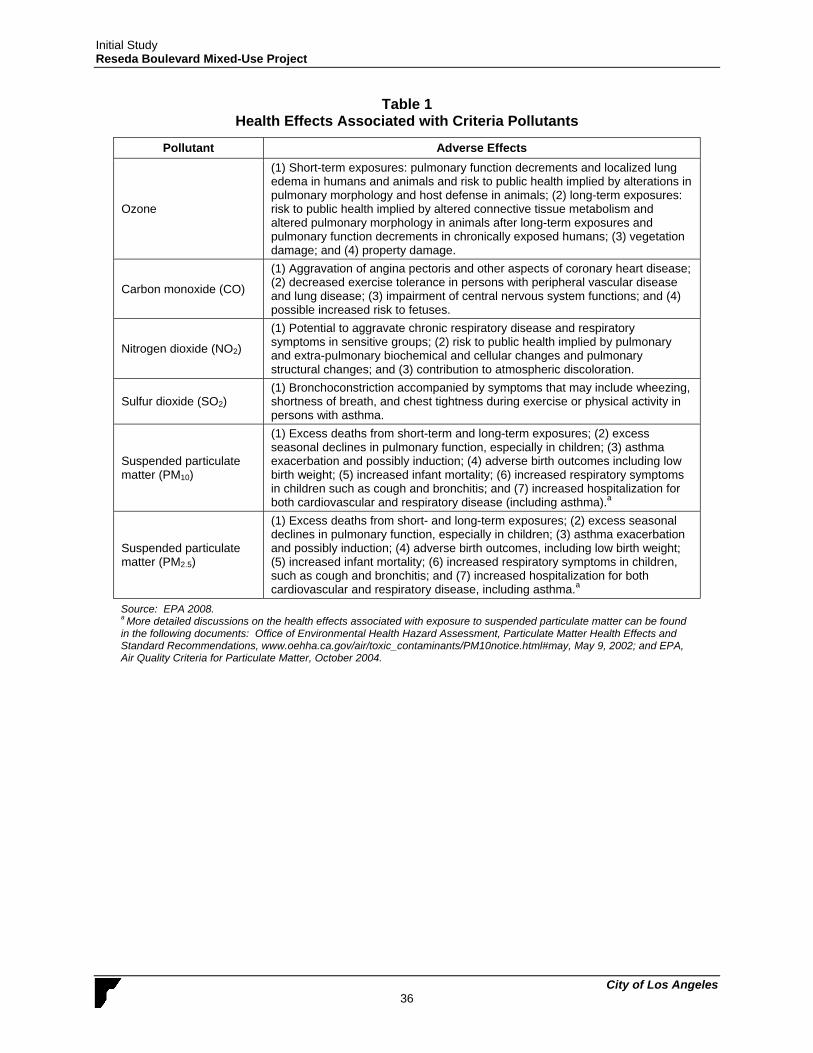
The project site is within the South Coast Air Basin (the Basin), which is under the jurisdiction of the South Coast Air Quality Management District (SCAQMD). As the local air quality management agency, the SCAQMD is required to monitor air pollutant levels to ensure that state and federal air quality standards are met and, if they are not met, to develop strategies to meet the standards. Depending on whether or not air quality standards are met or exceeded, the Basin is classified as being in “attainment” or “nonattainment.” The health effects associated with criteria pollutants are described in Table 1. According to the California Air Resources Board (ARB), the part of the Basin within which the project site is located is in nonattainment for both the federal and state standards for ozone, PM10, and PM2.5 (ARB). This nonattainment status is a result of several factors, the primary ones
Initial Study Reseda Boulevard Mixed-Use Project
City of Los Angeles 35
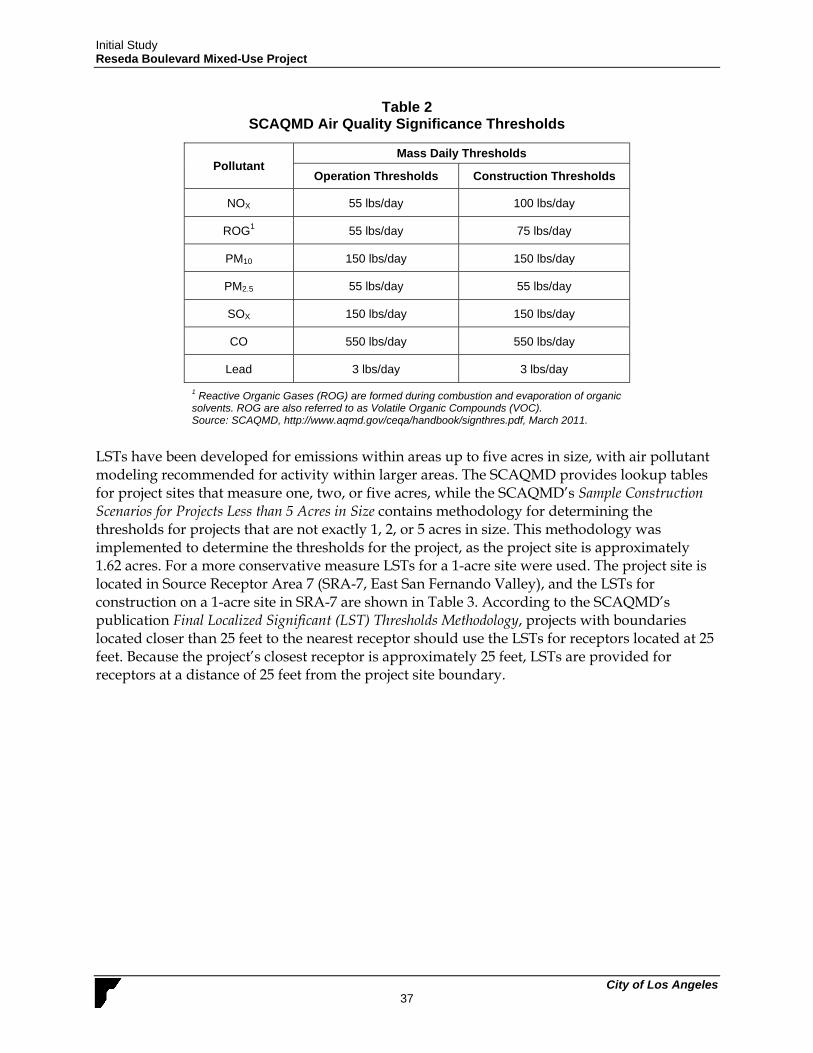
being the naturally adverse meteorological conditions that limit the dispersion and diffusion of pollutants, the limited capacity of the local airshed to eliminate pollutants from the air, and the number, type, and density of emission sources within the Basin. Due to this nonattainment status, the Basin is required to implement strategies to reduce pollutant levels to recognized acceptable standards. Accordingly, the SCAQMD has adopted an Air Quality Management Plan (AQMP) that provides a strategy for the attainment of state and federal air quality standards. The SCAQMD recommends the use of quantitative thresholds to determine the significance of temporary construction-related pollutant emissions and project operations. These thresholds are shown in Table 2. The SCAQMD has also developed Localized Significance Thresholds (LSTs), which were devised in response to concerns regarding the exposure of individuals to criteria pollutants in local communities. The use of LSTs is voluntary, to be implemented at the discretion of local agencies. LSTs represent the maximum emissions from a project that will not cause or contribute to an air quality exceedance of the most stringent applicable federal or state ambient air quality standard at the nearest sensitive receptor, taking into consideration ambient concentrations in each source receptor area (SRA), project size, and distance to the sensitive receptor. However, LSTs only apply to emissions within a fixed stationary location, including idling emissions during both project construction and operation. LSTs have been developed for NOX, CO, PM10, and PM2.5. LSTs do not apply to mobile sources such as cars on a roadway (Final Localized Significance Threshold Methodology, SCAQMD, June 2003).
Initial Study Reseda Boulevard Mixed-Use Project
City of Los Angeles 36
Table 1 Health Effects Associated with Criteria Pollutants
Pollutant Adverse Effects
Ozone
(1) Short-term exposures: pulmonary function decrements and localized lung edema in humans and animals and risk to public health implied by alterations in pulmonary morphology and host defense in animals; (2) long-term exposures: risk to public health implied by altered connective tissue metabolism and altered pulmonary morphology in animals after long-term exposures and pulmonary function decrements in chronically exposed humans; (3) vegetation damage; and (4) property damage.
Carbon monoxide (CO)
(1) Aggravation of angina pectoris and other aspects of coronary heart disease; (2) decreased exercise tolerance in persons with peripheral vascular disease and lung disease; (3) impairment of central nervous system functions; and (4) possible increased risk to fetuses.
Nitrogen dioxide (NO2)
(1) Potential to aggravate chronic respiratory disease and respiratory symptoms in sensitive groups; (2) risk to public health implied by pulmonary and extra-pulmonary biochemical and cellular changes and pulmonary structural changes; and (3) contribution to atmospheric discoloration.
Sulfur dioxide (SO2) (1) Bronchoconstriction accompanied by symptoms that may include wheezing, shortness of breath, and chest tightness during exercise or physical activity in persons with asthma.
Suspended particulate matter (PM10)
(1) Excess deaths from short-term and long-term exposures; (2) excess seasonal declines in pulmonary function, especially in children; (3) asthma exacerbation and possibly induction; (4) adverse birth outcomes including low birth weight; (5) increased infant mortality; (6) increased respiratory symptoms in children such as cough and bronchitis; and (7) increased hospitalization for both cardiovascular and respiratory disease (including asthma).a
Suspended particulate matter (PM2.5)
(1) Excess deaths from short- and long-term exposures; (2) excess seasonal declines in pulmonary function, especially in children; (3) asthma exacerbation and possibly induction; (4) adverse birth outcomes, including low birth weight; (5) increased infant mortality; (6) increased respiratory symptoms in children, such as cough and bronchitis; and (7) increased hospitalization for both cardiovascular and respiratory disease, including asthma.a
Source: EPA 2008. a More detailed discussions on the health effects associated with exposure to suspended particulate matter can be found in the following documents: Office of Environmental Health Hazard Assessment, Particulate Matter Health Effects and Standard Recommendations, www.oehha.ca.gov/air/toxic_contaminants/PM10notice.html#may, May 9, 2002; and EPA, Air Quality Criteria for Particulate Matter, October 2004.
Initial Study Reseda Boulevard Mixed-Use Project
City of Los Angeles 37
Table 2 SCAQMD Air Quality Significance Thresholds
Pollutant Mass Daily Thresholds
Operation Thresholds Construction Thresholds
NOX 55 lbs/day 100 lbs/day
ROG1 55 lbs/day 75 lbs/day
PM10 150 lbs/day 150 lbs/day
PM2.5 55 lbs/day 55 lbs/day
SOX 150 lbs/day 150 lbs/day
CO 550 lbs/day 550 lbs/day
Lead 3 lbs/day 3 lbs/day
1 Reactive Organic Gases (ROG) are formed during combustion and evaporation of organic solvents. ROG are also referred to as Volatile Organic Compounds (VOC). Source: SCAQMD, http://www.aqmd.gov/ceqa/handbook/signthres.pdf, March 2011.
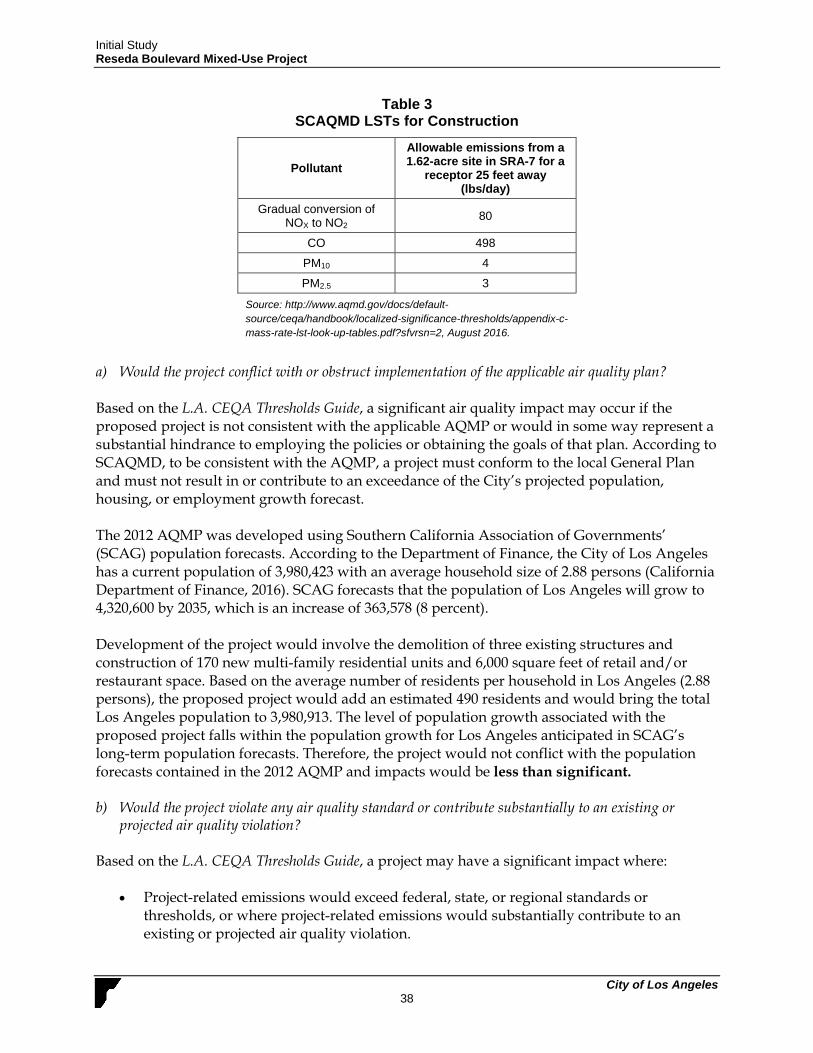
LSTs have been developed for emissions within areas up to five acres in size, with air pollutant modeling recommended for activity within larger areas. The SCAQMD provides lookup tables for project sites that measure one, two, or five acres, while the SCAQMD’s Sample Construction Scenarios for Projects Less than 5 Acres in Size contains methodology for determining the thresholds for projects that are not exactly 1, 2, or 5 acres in size. This methodology was implemented to determine the thresholds for the project, as the project site is approximately 1.62 acres. For a more conservative measure LSTs for a 1-acre site were used. The project site is located in Source Receptor Area 7 (SRA-7, East San Fernando Valley), and the LSTs for construction on a 1-acre site in SRA-7 are shown in Table 3. According to the SCAQMD’s publication Final Localized Significant (LST) Thresholds Methodology, projects with boundaries located closer than 25 feet to the nearest receptor should use the LSTs for receptors located at 25 feet. Because the project’s closest receptor is approximately 25 feet, LSTs are provided for receptors at a distance of 25 feet from the project site boundary.
Initial Study Reseda Boulevard Mixed-Use Project
City of Los Angeles 38
Table 3 SCAQMD LSTs for Construction
Pollutant
Allowable emissions from a 1.62-acre site in SRA-7 for a
receptor 25 feet away (lbs/day)
Gradual conversion of NOX to NO2
80
CO 498
PM10 4
PM2.5 3
Source: http://www.aqmd.gov/docs/default-source/ceqa/handbook/localized-significance-thresholds/appendix-c-mass-rate-lst-look-up-tables.pdf?sfvrsn=2, August 2016.
a) Would the project conflict with or obstruct implementation of the applicable air quality plan? Based on the L.A. CEQA Thresholds Guide, a significant air quality impact may occur if the proposed project is not consistent with the applicable AQMP or would in some way represent a substantial hindrance to employing the policies or obtaining the goals of that plan. According to SCAQMD, to be consistent with the AQMP, a project must conform to the local General Plan and must not result in or contribute to an exceedance of the City’s projected population, housing, or employment growth forecast. The 2012 AQMP was developed using Southern California Association of Governments’ (SCAG) population forecasts. According to the Department of Finance, the City of Los Angeles has a current population of 3,980,423 with an average household size of 2.88 persons (California Department of Finance, 2016). SCAG forecasts that the population of Los Angeles will grow to 4,320,600 by 2035, which is an increase of 363,578 (8 percent). Development of the project would involve the demolition of three existing structures and construction of 170 new multi-family residential units and 6,000 square feet of retail and/or restaurant space. Based on the average number of residents per household in Los Angeles (2.88 persons), the proposed project would add an estimated 490 residents and would bring the total Los Angeles population to 3,980,913. The level of population growth associated with the proposed project falls within the population growth for Los Angeles anticipated in SCAG’s long-term population forecasts. Therefore, the project would not conflict with the population forecasts contained in the 2012 AQMP and impacts would be less than significant. b) Would the project violate any air quality standard or contribute substantially to an existing or
projected air quality violation? Based on the L.A. CEQA Thresholds Guide, a project may have a significant impact where:
Project-related emissions would exceed federal, state, or regional standards or thresholds, or where project-related emissions would substantially contribute to an existing or projected air quality violation.
Initial Study Reseda Boulevard Mixed-Use Project
City of Los Angeles 39
A project would add a considerable cumulative contribution to federal or state non-attainment pollutant.
A project would generate pollutant concentrations to a degree that would significantly affect sensitive receptors.
Furthermore, the SCAQMD currently recommends that impacts to sensitive receptors be considered significant when emissions generated at a project site causes localized CO or NO2 levels to exceed state ambient air quality standards at sensitive receptors or where a project causes an increase in local PM10 levels of 10.4 μg/m3 during construction and 2.5 g/m3 during operation of the project. A significant impact may also occur where a project would increase concentrations at sensitive receptors located near congested intersections or result in concentrations exceeding national or state ambient air quality standards. Construction Emissions
The project would involve the demolition of three existing structures and the construction of a 170-unit mixed-use building and 6,000 square feet of commercial space. Trucks would haul construction debris north along Reseda Boulevard to Highway 101 and then east or west to permitted disposal facilities. Demolition and construction activities would generate temporary air pollutant emissions. These impacts are associated with fugitive dust (PM10 and PM2.5) and exhaust emissions from heavy construction vehicles. Project-related air pollutant emissions from demolition, grading, and construction activities were estimated using the California Emissions Estimator Model (CalEEMod) v2013.2.2. The phases of construction included demolition of the existing properties, site preparation, grading, building construction, architectural coating, and paving. Construction equipment included in the model were concrete/industrial saws, rubber tired dozers, tractors, loaders, backhoes, graders, cranes, forklifts, air compressors, cement and mortar mixers, pavers, and rollers. For the purposes of modeling, it was assumed that the proposed project would comply with SCAQMD Rule 403 to reduce fugitive dust and Rule 1113 to limit volatile organic compound (VOC) content in architectural coating. Specifically, Rule 403 and applicable RCMs include the following:
RCM-7 Demolition, Grading, and Construction Activities: Compliance with provisions of the SCAQMD District Rule 403. The project shall comply with all applicable standards of the Southern California Air Quality Management District, including the following provisions of District Rule 403:
All unpaved demolition and construction areas shall be wetted at least twice daily during excavation and construction, and temporary dust covers shall be used to reduce dust emissions and meet SCAQMD Rule 403. Wetting could reduce fugitive dust by as much as 50 percent.
The construction area shall be kept sufficiently dampened to control dust caused by grading and hauling, and at all times provide reasonable control of dust caused by wind.
Initial Study Reseda Boulevard Mixed-Use Project
City of Los Angeles 40
All clearing, earth moving, or excavation activities shall be discontinued during periods of high winds (i.e., greater than 15 mph), so as to prevent excessive amounts of dust.
All dirt/soil shall be secured by trimming, watering, or other appropriate means to prevent spillage and dust.
All dirt/soil materials transported off-site shall be either sufficiently watered or securely covered to prevent excessive amounts of dust.
General contractors shall maintain and operate construction equipment so as to minimize exhaust emissions.
Trucks having no current hauling activity shall not idle but be turned off.
RCM-8 Engine Idling. In accordance with Sections 2485 in Title 13 of the California Code of Regulations, the idling of all diesel-fueled commercial vehicles (weighing over 10,000 pounds) during construction shall be limited to five minutes at any location.
RCM-9 Emission Standards. In accordance with Sections 93115 in Title 17 of the
California Code of Regulations, operation of any stationary, diesel-fueled, compression-ignition engines shall meet specified fuel and fuel additive requirements and emission standards.
RCM-10 Architectural Coatings. The project shall comply with South Coast Air
Quality Management District Rule 1113 limiting the volatile organic compound content of architectural coatings.
RCM-11 Best Available Control Technology. New on-site facility nitrogen oxide
emissions shall be minimized through the use of emission control measures (e.g., use of best available control technology for new combustion sources such as boilers and water heaters) as required by South Coast Air Quality Management District Regulation XIII, New Source Review.
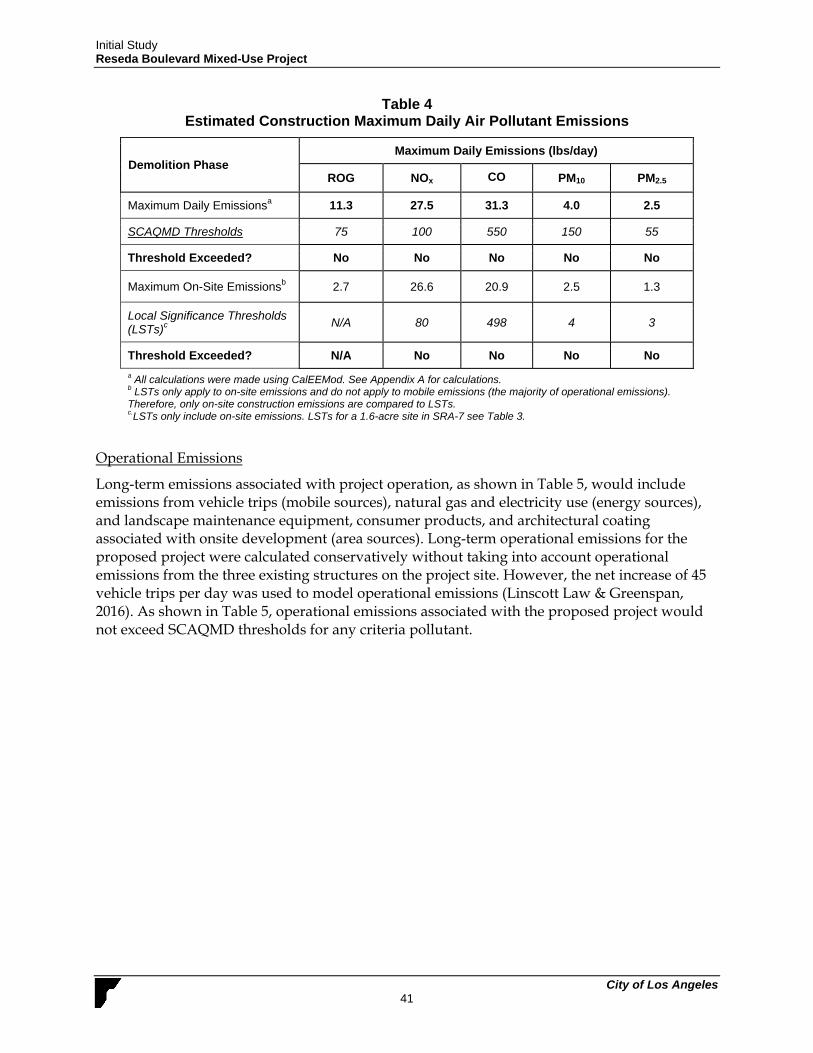
Table 4 shows the estimated maximum daily construction emissions. Construction emissions would not exceed SCAQMD thresholds or LSTs. Therefore, impacts associated with construction of the proposed project would be less than significant.
Initial Study Reseda Boulevard Mixed-Use Project
City of Los Angeles 41
Table 4 Estimated Construction Maximum Daily Air Pollutant Emissions
Demolition Phase Maximum Daily Emissions (lbs/day)
ROG NOx CO PM10 PM2.5
Maximum Daily Emissionsa 11.3 27.5 31.3 4.0 2.5
SCAQMD Thresholds 75 100 550 150 55
Threshold Exceeded? No No No No No
Maximum On-Site Emissionsb 2.7 26.6 20.9 2.5 1.3
Local Significance Thresholds (LSTs)c
N/A 80 498 4 3
Threshold Exceeded? N/A No No No No
a All calculations were made using CalEEMod. See Appendix A for calculations. b LSTs only apply to on-site emissions and do not apply to mobile emissions (the majority of operational emissions). Therefore, only on-site construction emissions are compared to LSTs. c.LSTs only include on-site emissions. LSTs for a 1.6-acre site in SRA-7 see Table 3.
Operational Emissions
Long-term emissions associated with project operation, as shown in Table 5, would include emissions from vehicle trips (mobile sources), natural gas and electricity use (energy sources), and landscape maintenance equipment, consumer products, and architectural coating associated with onsite development (area sources). Long-term operational emissions for the proposed project were calculated conservatively without taking into account operational emissions from the three existing structures on the project site. However, the net increase of 45 vehicle trips per day was used to model operational emissions (Linscott Law & Greenspan, 2016). As shown in Table 5, operational emissions associated with the proposed project would not exceed SCAQMD thresholds for any criteria pollutant.
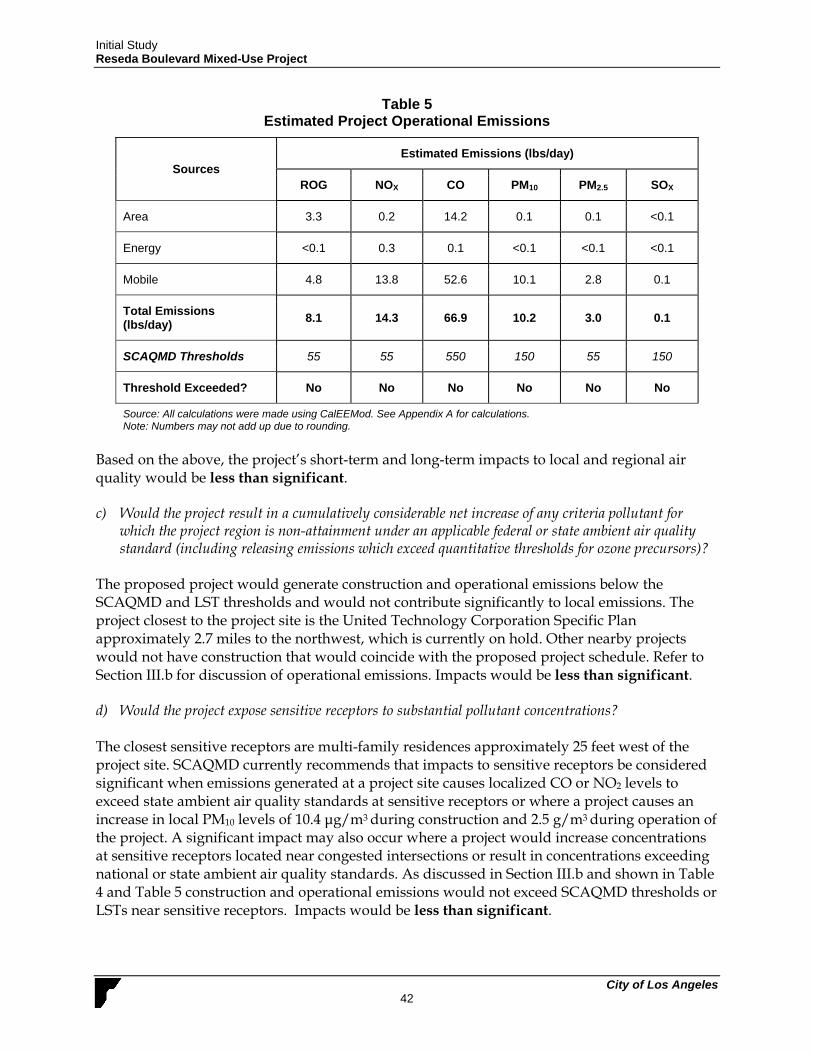
Initial Study Reseda Boulevard Mixed-Use Project
City of Los Angeles 42
Table 5 Estimated Project Operational Emissions
Sources Estimated Emissions (lbs/day)
ROG NOX CO PM10 PM2.5 SOX
Area 3.3 0.2 14.2 0.1 0.1 <0.1
Energy <0.1 0.3 0.1 <0.1 <0.1 <0.1
Mobile 4.8 13.8 52.6 10.1 2.8 0.1
Total Emissions (lbs/day)
8.1 14.3 66.9 10.2 3.0 0.1
SCAQMD Thresholds 55 55 550 150 55 150
Threshold Exceeded? No No No No No No
Source: All calculations were made using CalEEMod. See Appendix A for calculations. Note: Numbers may not add up due to rounding.
Based on the above, the project’s short-term and long-term impacts to local and regional air quality would be less than significant. c) Would the project result in a cumulatively considerable net increase of any criteria pollutant for
which the project region is non-attainment under an applicable federal or state ambient air quality standard (including releasing emissions which exceed quantitative thresholds for ozone precursors)?
The proposed project would generate construction and operational emissions below the SCAQMD and LST thresholds and would not contribute significantly to local emissions. The project closest to the project site is the United Technology Corporation Specific Plan approximately 2.7 miles to the northwest, which is currently on hold. Other nearby projects would not have construction that would coincide with the proposed project schedule. Refer to Section III.b for discussion of operational emissions. Impacts would be less than significant. d) Would the project expose sensitive receptors to substantial pollutant concentrations? The closest sensitive receptors are multi-family residences approximately 25 feet west of the project site. SCAQMD currently recommends that impacts to sensitive receptors be considered significant when emissions generated at a project site causes localized CO or NO2 levels to exceed state ambient air quality standards at sensitive receptors or where a project causes an increase in local PM10 levels of 10.4 μg/m3 during construction and 2.5 g/m3 during operation of the project. A significant impact may also occur where a project would increase concentrations at sensitive receptors located near congested intersections or result in concentrations exceeding national or state ambient air quality standards. As discussed in Section III.b and shown in Table 4 and Table 5 construction and operational emissions would not exceed SCAQMD thresholds or LSTs near sensitive receptors. Impacts would be less than significant.
Initial Study Reseda Boulevard Mixed-Use Project
City of Los Angeles 43
e) Would the project create objectionable odors affecting a substantial number of people? Although not specified in the L.A. CEQA Thresholds Guide, a project-related significant adverse effect could occur if construction or operation of the project would result in generation of odors that would be perceptible in adjacent sensitive areas. Substantial objectionable odors are normally associated with such uses as agriculture, wastewater treatment, industrial facilities, or landfills, while the proposed project would involve the demolition of three existing structures. Demolition activities could create temporary odors from the burning of fuel in construction equipment. These odors could be considered to be objectionable; however, due to the short-term and temporary nature of construction activity, they would not be significant. The proposed project involves construction of a mixed-use building that is not listed on Figure 4-3 of the 1993 SCAQMD CEQA Air Quality Handbook as a use that requires analysis of odor impacts. Further, residential uses are not identified on Figure 5-5, Land Uses Associated with Odor Complaints, of the SCAQMD CEQA Air Quality Handbook. Therefore, the proposed project would not generate objectionable odors affecting a substantial number of people, and impacts would be less than significant. IV. BIOLOGICAL RESOURCES
a) Would the project have a substantial adverse effect, either directly or through habitat modifications,
on any species identified as a candidate, sensitive, or special status species in local or regional plans, policies, or regulations, or by the California Department of Fish and Game or U.S. Fish and Wildlife Service?
Based upon the criteria established in the L.A. CEQA Thresholds Guide, a project would normally have a significant impact on biological resources if it could result in:
The loss of individuals, or the reduction of existing habitat, of a state or federal listed endangered, threatened, rare, protected, candidate, sensitive species, or a Species of Special Concern;
The loss of individuals or the reduction of existing habitat of a locally designated species or a reduction in a locally designated natural habitat or plant community;
The alternation of an existing wetland habitat; or Interference with habitat such that normal species behaviors are disturbed (e.g., from
the introduction of noise, light) to a degree that may diminish the chances for long-term survival of a sensitive species.
The project site is located in an urbanized area of Los Angeles. The project site and surrounding properties have been developed with residential and commercial urban land uses. Therefore, no riparian habitat or sensitive natural communities; federal-or-state-listed endangered, threatened, rare, or otherwise sensitive flora or fauna; or wetlands are located on or adjacent to the project site. However, the project site includes seven mature trees both on-site and in the public right-of-way that could potentially provide a suitable bird nesting habitat. Compliance with the following RCMs would ensure that no impact would result.
Initial Study Reseda Boulevard Mixed-Use Project
City of Los Angeles 44
RCM-12 Habitat Modification – Nesting Native Birds, Non-Hillside, or Urban Areas. The project would result in the removal of vegetation and disturbances to the ground and therefore may result in the removal of vegetation and disturbances to the ground and therefore may result in take of nesting native bird species. Migratory nongame native bird species are protected by international treaty under the Federal Migratory Bird Treaty Act (MBTA) of 1918 (50 C.F.R. Section 10.13). Sections 3503, 3503.5, and 3513 of the California Fish and Game Code prohibit take of all birds and their active nests including raptors and other migratory nongame birds (as listed under the Federal MBTA).
Proposed project activities (including disturbances to native and non-
native vegetation, structures, and substrates) should take place outside of the breeding bird season, which generally runs from March 1 – August 31 (as early as February 1 for raptors) to avoid take (including disturbances which would cause abandonment of active nests containing eggs and/or young). Take means to hunt, pursue, catch, capture, or kill, or attempt to hunt, pursue, catch, capture of kill (Fish and Game Code Section 86).
If project activities cannot feasibly avoid the breeding bird season, beginning thirty days prior to the disturbance of suitable nesting habitat, the applicant shall arrange for weekly bird surveys to detect any protected native birds in the habitat to be removed and any other such habitat within properties adjacent to the project site, as access to adjacent areas allows. The surveys shall be conducted by a qualified biologist with experience in conducting breeding bird surveys. The surveys shall continue on a weekly basis with the last survey being conducted no more than 3 days prior to the initiation of clearance/construction work.
If a protected native bird is found, the applicant shall delay all clearance/construction disturbance activities within 300 feet of suitable nesting habitat for the observed protected bird species until August 31.
Alternatively, the Qualified Biologist could continue the surveys in order to locate any nests. If an active nest is located, clearing and construction within 300 feet of the nest or as determined by a qualified biological monitor, shall be postponed until the nest is vacated and juveniles have fledged and when there is no evidence of a second attempt at nesting. The buffer zone from the nest shall be established in the field with flagging and stakes. Construction personnel shall be instructed on the sensitivity of the area.
The applicant shall record the results of the recommended protective measures described above to document compliance with applicable State and Federal laws received into the case file for the associated discretionary action permitting the project.
b) Would the project have a substantial adverse effect on any riparian habitat or other sensitive natural
community identified in local or regional plans, policies, or regulations, or by the California Department of Fish and Game or U.S. Fish and Wildlife Service?
Initial Study Reseda Boulevard Mixed-Use Project
City of Los Angeles 45
There are no riparian habitats or other sensitive natural communities on or adjacent to the project site. Consequently, there would be no impact. c) Would the project have a substantial adverse effect on federally protected wetlands as defined by
Section 404 of the Clean Water Act (including, but not limited to, marsh, vernal pool, coastal, etc.) through direct removal, filling, hydrological interruption, or other means?
There are no wetlands at the project site. Consequently, there would be no impact. d) Would the project interfere substantially with the movement of any native resident or migratory fish
or wildlife species or with established native resident or migratory wildlife corridors, or impede the use of native wildlife nursery sites?
Based upon the criteria established in the L.A. CEQA Thresholds Guide, a project would normally have a significant impact on biological resources if it could result in:
Interference with wildlife movement/migration corridors that may diminish the chances for long-term survival of a sensitive species.
The project site is within an urbanized area that lacks native biological habitats. Consequently, the project would not interfere substantially with the movement of any native resident or migratory fish or wildlife corridors, or impede the use of native wildlife nursery sites. Therefore, no impact would occur with respect to local wildlife movement. e) Would the project conflict with any local policies or ordinances protecting biological resources, such
as a tree preservation policy or ordinance? For the purpose of this Initial Study, a project-related significant adverse effect could occur if the project would cause an impact that is inconsistent with local regulations pertaining to biological resources (e.g., the City of Los Angeles Protected Tree Ordinance No. 177,404). In addition to the Protected Tree Ordinance, it is the City’s policy to replace all mature trees at least eight-inches in diameter at breast height that are removed at development sites as part of project implementation at a 1:1 ratio and that the removal of any trees in the public right-of-way be approved by the Board of Public Works. There are seven trees on and adjacent to the project site that may have a diameter at breast height (DBH) of 8 inches or greater. One or more of these trees may be protected by the City of Los Angeles Protected Tree Ordinance, such as oak, sycamore, black walnut, or bay laurel species. Any mature or protected trees on the project site would be replaced if removed during project construction and the appropriate permits would be acquired per the City of Los Angeles Protected Tree Ordinance No. 177,404. Additionally, compliance with Mitigation Measure BIO-1 would reduce impacts associated with removal of non-protected trees. Impacts would be less than significant with mitigation incorporated.
Initial Study Reseda Boulevard Mixed-Use Project
City of Los Angeles 46
BIO-11 Tree Removal – Non-Protected Trees
Prior to the issuance of any permit, a plot plan shall be prepared indicating the location, size, type, and general condition of all existing trees on the site and within the adjacent public right(s)-of-way.
All significant (8-inch or greater trunk diameter, or cumulative trunk diameter if multi-trunked, as measured 54 inches above the ground) non-protected trees on the site proposed for removal shall be replaced at a 1:1 ratio with a minimum 24-inch box tree. Net, new trees, located within the parkway of the adjacent public right(s)-of-way, may be counted toward replacement tree requirements.
Removal or planting of any tree in the public right-of-way requires approval of the Board of Public Works. Contact Urban Forestry Division at: 213-847-3077. All trees in the public right-of-way shall be provided per the current standards of the Urban Forestry Division, the Department of Public Works, Bureau of Street Services.
f) Would the project conflict with the provisions of an adopted Habitat Conservation Plan, Natural
Community Conservation Plan, or other approved local, regional, or state habitat conservation plan? Although not specified in the L.A. CEQA Thresholds Guide, a significant impact would occur if the project would be inconsistent with mapping or policies in any conservation plans of the types cited. The project site is not located within an area that is subject to an adopted conservation plan, natural community conservation plan, or other approved local, regional, or state habitat conservation plan (City of Los Angeles General Plan, 2001). Therefore, no impact would occur. V. CULTURAL RESOURCES
a) Would the project cause a substantial adverse change in the significance of a historical resource as defined in §15064.5?
Based upon the criteria established in L.A. CEQA Thresholds Guide, a significant impact may occur if a project would disturb historic resources that presently exist within the project site. Pursuant to Section 15064.5 of the CEQA Guidelines, a historical resource is presumed significant if it is listed on the California Register of Historic Resources (California Register) or has been determined to be eligible for listing by the State Historical Resources Commission (SHRC). A historical resource may also be considered significant if the lead agency determines, based on substantial evidence, that the resource meets the criteria for inclusion in the California Register. CEQA also contains the following additional guidelines for defining a historical resource:
California properties formally determined eligible for, or listed in the National Register of Historic Places (Section 5024.1.d.1);
Those resources included in a local register of historical resources, as defined in Section 5020.1(k) of the Public Resources Code, or identified as significant in a historical resources survey meeting the requirements of Section 5024.1(g) of the Public Resources Code;
Initial Study Reseda Boulevard Mixed-Use Project
City of Los Angeles 47
Those resources that a lead agency determines to be historically significant (generally, if it meets criteria for listing on the California Register), provided the determination is supported by substantial evidence; or
Those resources a local agency believes are historical for more broadly defined reasons than identified in the preceding criteria.
The L.A. CEQA Thresholds Guide further states that a project would normally have a significant impact on historical resources if it would result in a substantial adverse change in the significance of an historical resource. A substantial adverse change in significance occurs if the project involves:
Demolition of a significant resource; Relocation that does not maintain the integrity and significance of a significant resource;
Conversion, rehabilitation, or alteration of a significant resource that does not conform to the Secretary of the Interior's Standards for Rehabilitation and Guidelines for
Rehabilitating Historic Buildings; or Construction that reduces the integrity or significance of important resources on the site
or in the vicinity. No national, state, or locally designated historic resources are present on the project site according to the Los Angeles Historic Resources Inventory, SurveyLA (Los Angeles, City of, Office of Historic Resources, 2016). SurveyLA is the Los Angeles Historic Resources Survey, which is a comprehensive program to identify significant historic resources throughout the City. SurveyLA identifies and documents significant historic resources between 1850 and 1980 to reflect important themes in the city’s growth and development in architecture, city planning, social history, ethnic heritage, politics, industry, transportation, commerce, and entertainment. The proposed project would involve the demolition of three existing structures: a commercial building, medical center, and a restaurant. None of these buildings are identified as potential individual historic resources or as contributing buildings to a potential historic district or Historic Preservation Overlay Zone (ZIMAS, 2016). Therefore, no impact would occur. b) Would the project cause a substantial adverse change in the significance of an archaeological resource
as defined in §15064.5? The project site is within an urbanized area and has been previously disturbed in conjunction with the construction of the three existing onsite structures. There is no evidence that archaeological or paleontological resources or human remains are present onsite. Due to the previous development and use of the project site, the likelihood of disturbing as yet undiscovered cultural or paleontological resource remains is low. Nevertheless, should resources be discovered, compliance with the RCMs below would result in less than significant impacts. RCM-14 Cultural Resources (Archaeological)
The services of an archaeologist shall then be secured by contacting the South Central Coastal Information Center (657-278-5395) located at California State University Fullerton, or member of the Society of Professional Archaeologist (SOPA) or a SOPA-qualified archaeologist,

Initial Study Reseda Boulevard Mixed-Use Project
City of Los Angeles 48
who shall assess the discovered material(s) and prepare a survey, study, or report evaluating the impact.
The archaeologist’s survey, study, or report shall contain a recommendation(s), if necessary, for the preservation, conservation, or relocation of the resource.
The applicant shall comply with the recommendations of the evaluating archaeologist, as contained in the survey, study, or report.
Project development activities may resume once copies of the archaeological survey, study, or report are submitted to: SCCIC Department of Anthropology, McCarthy 477, CSU Fullerton, 800 North State College Boulevard, Fullerton, CA 92834.
Prior to the issuance of any building permit, the applicant shall submit a letter to the case file indicating what, if any, archaeological reports have been submitted, or a statement indicating that no material was discovered.
A covenant and agreement binding the applicant to this condition shall be recorded prior to issuance of a grading permit.
RCM-15 Cultural Resources (Paleontological)
If any paleontological materials are encountered during the course of project development, all further development activities shall halt. The services of a paleontologist shall then be secured by contacting the Center for Public Paleontology – USC, UCLA, California State University Los Angeles, California State University Long Beach, or the Los Angeles County Natural History Museum – who shall assess the discovered material(s) and prepare a survey, study, or report evaluating the impact. The paleontologist’s survey, study, or report shall contain a recommendation(s), if necessary, for the preservation, conservation, or relocation of the resource.
The applicant shall comply with the recommendations of the evaluating paleontologist, as contained in the survey, study, or report.
RCM-16 Cultural Resources (Human Remains)
In the event that human remains are discovered during excavation activities, the following procedure shall be observed:
Stop immediately and contact the County Coroner: 1104 N. Mission Road, Los Angeles, CA 90033. 323-343-0512 (8 a.m. to 5 p.m. Monday through Friday) or 323-343-0714 (After Hours, Saturday, Sunday, and Holidays).
The coroner has two working days to examine human remains after being notified by the responsible person. If the remains are Native American, the Coroner has 24 hours to notify the Native American Heritage Commission.
The Native American Heritage Commission will immediately notify the person it believes to be the most likely descendent of the deceased Native American.
Initial Study Reseda Boulevard Mixed-Use Project
City of Los Angeles 49
The most likely descendent has 48 hours to make recommendations to the owner, or representative, for the treatment or disposition, with proper dignity, of the human remains and grave goods.
If the descendent does not make recommendations within 48 hours, the owner shall reinter the remains in an area of the property secure from further disturbance, or;
If the owner does not accept the descendant’s recommendations, the owner or the descendent may request mediation by the Native American Heritage Commission.
Discuss and confer means the meaningful and timely discussion careful consideration of the views of each party.
c) Would the project directly or indirectly destroy a unique paleontological resource or site or unique
geologic feature? Refer to Section V.b. Impacts would be less than significant. d) Would the project disturb any human remains, including those interred outside of formal cemeteries? Refer to Section V.b. Impacts would be less than significant. e) Cause a substantial adverse change in the significance of a site, feature, place, cultural landscape,
sacred place, or object with cultural value to a California Native American Tribe that is listed or determined eligible for listing on the California register of historical resources, listed on a local historical register, or otherwise determined by the lead agency to be a tribal cultural resource?
The project site is within an urbanized area that has been previously disturbed with construction of existing onsite residences. Thus, the likelihood of discovering resources of cultural value to a California Native American Tribe remains low, and through the compliance with the RCMs identified in Section V.b., the impact would be less than significant. VI. GEOLOGY AND SOILS
a) Would the project expose people or structures to potential substantial adverse effects, including the
risk of loss, injury, or death involving:
i) Rupture of a known earthquake fault, as delineated on the most recent Alquist-Priolo Earthquake Fault Zoning Map issued by the State Geologist for the area or based on other substantial evidence of a known fault?
ii) Strong seismic ground shaking? Based upon criteria established in the L.A. CEQA Thresholds Guide, a project would normally have a significant geologic hazard impact if it would cause or accelerate geologic hazards that would result in substantial damage to structures or infrastructure, or expose people to substantial risk of injury. For the purpose of these specific issues, a significant impact may occur if:
Initial Study Reseda Boulevard Mixed-Use Project
City of Los Angeles 50
A project site is located within a state-designated Alquist-Priolo Zone or other designated fault zone, and appropriate building practices are not employed; or
A proposed project represents an increased risk to public safety or destruction of property by exposing people, property or infrastructure to seismically induced ground shaking hazards that are greater than the average risk associated with locations in the southern California region.
Similar to all of Southern California, the project site is subject to strong groundshaking associated with active and/or potentially active faults in the region. According to the City of Los Angeles General Plan Safety Element, there have been 60 damaging seismic events in the Los Angeles region since 1800 (City of Los Angeles, 1996). The U.S. Geological Survey has estimated a ten to thirty percent potential for a 7.5 or more magnitude quake along the southern portion of the San Andreas fault within the next five to thirty years. The Alquist-Priolo Act requires the State Geologist to map active earthquake fault zones. The project site lies outside the Alquist-Priolo Special Study Zone Areas and Fault Rupture Study Areas defined by Exhibit A of the City of Los Angeles General Plan Safety Element. Furthermore, the proposed project would replace existing development on the project site and additional risks of seismic activity would be minimal. Thus, impacts related to seismically-induced surface rupture or ground shaking would be less than significant. iii) Seismic-related ground failure, including liquefaction? Based upon the criteria established in the L.A. CEQA Thresholds Guide, a project would normally have a significant geologic hazard impact if it would cause or accelerate geologic hazards that would result in substantial damage to structures or infrastructure, or expose people to substantial risk of injury. For the purpose of this specific issue, a significant impact may occur if the project site is located in an area identified as having a high risk of liquefaction. The project site is relatively flat and located in an area that is designated as a Liquefaction Area on Exhibit B, Areas Susceptible to Liquefaction, of the City of Los Angeles General Plan Safety Element (1996). Implementation of RCM-17 would reduce impacts from liquefaction to a less than significant level by requiring a geotechnical report. In addition, the project would be required to comply with the City of Los Angeles Building Code (Chapter IX of the LAMC), and to adhere to the UBC and CBC. The CBC and UBC regulate the design and construction of excavations, foundations, building frames, retaining walls, and other building elements to mitigate the effects of adverse soil conditions. Thus, impacts would therefore be less than significant. RCM-17 Liquefaction.
Prior to the issuance of grading or building permits, the applicant shall submit a geotechnical report, prepared by a registered civil engineer or certified engineering geologist, to the Department of Building and Safety, for review and approval. The project shall comply with the Uniform Building Code Chapter 18, Division 1, Section 1804.5 Liquefaction Potential and Soil Strength Loss. The geotechnical report shall assess potential consequences of any liquefaction and soil strength loss,
Initial Study Reseda Boulevard Mixed-Use Project
City of Los Angeles 51
estimation of settlement, lateral movement or reduction in foundation soil-bearing capacity, and discuss mitigation measures that may include building design consideration. Building design considerations shall include, but are not limited to: ground stabilization, selection of appropriate foundation type and depths, selection of appropriate structural systems to accommodate anticipated displacements, or any combination of these measures.
The project shall comply with the conditions contained within the Department of Building and Safety’s Geology and Soils Report Approval Letter for the proposed project and as it may be subsequently amended or modified.
iv) Landslides? The project site and surrounding area is flat and not subject to landslide hazards as shown in Exhibit C (Landslide Inventory & Hillside Area) of the City of Los Angeles General Plan Safety Element (1996). No impact would occur. b) Would the project result in substantial soil erosion or the loss of topsoil? A significant impact may occur if a project exposes large areas to the erosional effects of wind or water for a protracted period of time. Erosional effects of water are discussed in Section IX, Hydrology and Water Quality. Demolition of the existing buildings could expose additional soil and allow for soil erosion resulting from wind. However, project site erosion would be limited due to the small size of the site, its flat topography, and the fact that it is surrounded by developed properties. Impacts related to soil disturbance, soil erosion, or loss of top soils would be less than significant. c) Would the project be located on a geologic unit or soil that is unstable, or that would become unstable,
as a result of the project, and potentially result in on- or off-site landslide, lateral spreading, subsidence, liquefaction, or collapse?
Based upon the criteria established in the L.A. CEQA Thresholds Guide, a project would normally have a significant geologic hazard impact if:
It would cause or accelerate geologic hazards that would result in substantial damage to structures or infrastructure, or expose people to substantial risk of injury. For the purpose of this specific issue, a project-related significant adverse effect may occur if the project is located in a hillside area with soil conditions that would suggest a high potential for sliding;
A project is built in an unstable area without proper site preparation or design features that provide adequate foundations for proposed buildings, thus posing a hazard to life and property; or
The project is built on expansive soils without proper site preparation or design features that provide adequate foundations for project buildings, thus, posing a hazard to life and property.
Initial Study Reseda Boulevard Mixed-Use Project
City of Los Angeles 52
The project site is flat and is not located in the vicinity of any hillside areas. According to Exhibit C (Landslide Inventory & Hillside Area) of the City of Los Angeles General Plan Safety Element (1996), the project site is not located in a landslide area. Thus, the probability of on- or off-site landslide, lateral spreading, subsidence, collapse, or expansive soils is very low and there impacts would be less than significant. d) Would the project be located on expansive soil, as defined in Table 1-B of the Uniform Building Code,
creating substantial risks to life or property? Refer to the answer in Section VI.c. Impacts would be less than significant. e) Would the project Have soils incapable of adequately supporting the use of septic tanks or alternative
wastewater disposal systems where sewers are not available for the disposal of wastewater? Although not specified in the L.A. CEQA Thresholds Guide, this question would apply to the proposed project only if it was located in an area not served by an existing sewer system. The project site would not involve the use of septic tanks because the project site is already developed and connected to the City’s sewer and wastewater disposal system. Therefore, no impact related to the use of septic tanks or alternative wastewater disposal systems would occur. VII. GREENHOUSE GAS EMISSIONS
The accumulation of greenhouse gases (GHGs) in the atmosphere naturally regulates Earth’s temperature. However, emissions from human activities, particularly the consumption of fossil fuels for electricity production and transportation, have elevated the concentration of these gases in the atmosphere beyond the level of naturally occurring concentrations. Carbon dioxide (CO2) and methane (CH4) are the GHGs that are emitted in the greatest quantities from human activities. Emissions of CO2 are largely by-products of fossil fuel combustion, whereas CH4 results from off-gassing associated with agricultural practices and landfills. Scientific modeling predicts that continued GHG emissions at or above current rates would induce more extreme climate changes during the 21st century than were observed during the 20th century. Some of the potential impacts in California of global warming may include loss of snow pack, sea level rise, more extreme heat days per year, more high ozone days, more large forest fires, and more drought years. (California Environmental Protection Agency, 2010) While these potential impacts identify the possible effects of climate change at a global and potentially statewide level, in general, scientific modeling tools are currently unable to predict what impacts would occur locally. In response to an increase in man-made GHG concentrations over the past 150 years, California has implemented AB 32, the “California Global Warming Solutions Act of 2006.” AB 32 requires achievement by 2020 of a statewide GHG emissions limit equivalent to 1990 emissions (essentially a 25% reduction below 2005 emission levels) and the adoption of rules and regulations to achieve the maximum technologically feasible and cost-effective GHG emissions reductions. Based upon the ARB’s California Greenhouse Gas Inventory for 2000-2012 (http://www.arb.ca.gov/cc/inventory/data/data.htm), California produced about 459 metric tons of CO2e in 2012.
Initial Study Reseda Boulevard Mixed-Use Project
City of Los Angeles 53
The City of Los Angeles adopted its climate action plan, Green LA: An Action Plan to Lead the Nation in Fighting Global Warming (Green LA), in May 2007. Green LA set the goal of reducing the City’s GHG emissions to 35% below 1990 levels by 2030. The emphasis of Green LA is on municipal facilities and operations followed by programs to reduce emissions in the community. Green LA is being implemented through Climate LA, which provides detailed information about each action item discussed in the Green LA framework. The adopted CEQA Guidelines provide regulatory guidance on the analysis and mitigation of GHG emissions in CEQA documents, while giving lead agencies the discretion to set quantitative or qualitative thresholds for the assessment and mitigation of GHGs and climate change impacts. The 2008 SCAQMD threshold considers emissions of over 10,000 metric tons of carbon dioxide equivalent (CO2e) per year from industrial development projects to be significant (SCAQMD, 2009). However, the SCAQMD’s threshold applies only to stationary sources and is expressly intended to apply only when the SCAQMD is the CEQA lead agency. Although not formally adopted, the SCAQMD has a recommended tiered GHG significance threshold (SCAQMD, 2008). Under Tier 2, project impacts would be less than significant if a project is consistent with an approved local or regional plan. Therefore, GHG emissions associated with the proposed project would be less than significant if the project is consistent with Climate LA and Green LA. For informational purposes, SCAQMD recommends Tier 3 thresholds, which are screening level quantitative thresholds. If a local or regional GHG reduction policy or plan is not applicable to a project, emissions would be less than significant if they are under the Tier 3 screening level threshold. SCAQMD has a recommended screening level quantitative threshold of 3,000 metric tons for all land use types CO2e /year (SCAQMD, 2010). This analysis is based on the methodologies recommended by the California Air Pollution Control Officers Association [CAPCOA] (January 2008) CEQA and Climate Change white paper. The analysis focuses on CO2, N2O, and CH4 as these are the GHG emissions that onsite development would generate in the largest quantities. For informational purposes, emissions associated with the proposed project were estimated using the California Emissions Estimator Model (CalEEMod) version 2013.2.2. Complete CalEEMod results and assumptions can be viewed in Appendix A. a) Would the project generate greenhouse gas emissions, either directly or indirectly, that may have a
significant impact on the environment? As discussed above, the City of Los Angeles released its climate action plan, Green LA: An Action Plan to Lead the Nation in Fighting Global Warming (Green LA), in May 2007. The goal of Green LA is to reduce the City’s GHG emissions to 35% below 1990 levels by 2030, encouraging municipal facilities and operations to reduce emissions in the community. Green LA is being implemented through Climate LA, which provides detailed information about each action item discussed in the Green LA framework. The proposed project would not conflict with Green LA or Climate LA, which is focused on municipal facilities. Table 6 shows the project’s consistency with applicable Green LA and Climate LA measures.
Initial Study Reseda Boulevard Mixed-Use Project
City of Los Angeles 54
Table 6 Consistency with Applicable Green LA and Climate LA
Climate Action Plan Reduction Measures
Measure Project Consistency
Transportation and Mobility
Promote walking and biking to work, within neighborhoods, and to large events and venues.
ConsistentThe project site is located within a five minute walking distance of retail facilities, restaurants, and public transportation. Nearby facilities include Gelson Market, Office Depot, CVS Pharmacy, Whole Foods, and others (Figure 8).
Promote high-density housing close to major transportation arteries.
ConsistentThe project is a multi-family residential development that is near public transportation (bus stops 300 feet to the north and 500 feet to the south on Reseda Boulevard).
Water
Meet all additional demand for water resulting from growth through water conservation and recycling.
ConsistentAccording to the 2009 Sustainability Plan by the Los Angeles Department of Water and Power (LADWP), LADWP is in partnership with the Bureau of Sanitation (BOS) to expand the use of recycled water and develop a Recycled Water Master Plan that would expand the recycled water pipeline system and use recycled water for groundwater replenishment. The project applicant would participate in City water conservation programs.
Reduce per capita water consumption by 20%.
ConsistentIn accordance with the 2010 California Green Building Standards Code, the proposed project would include a schedule of plumbing fixtures and fixture fittings that would reduce the overall use of potable water within the building by at least 20%. The reduction would be based on the maximum allowable water use per plumbing fixture and fitting as required by the California Building Standards Code.
Waste
Recycle 70% of trash by 2015.
ConsistentUsing the calculation methodology adopted by the State of California, the City of Los Angeles has achieved a landfill diversion rate of 76.4%. The project would be subject to the requirements of the statewide mandatory commercial recycling program, which establishes a statewide goal of diverting at least 75% of solid waste from landfills by 2020. Compliance with existing City and state programs would achieve consistency with this measure.
Senate Bill 375, signed in August 2008, requires the inclusion of sustainable community strategies (SCS) in regional transportation plans (RTPs) for the purpose of reducing GHG emissions. The South Coast Association of Government (SCAG) 2016-2040 Regional Transportation Plan/Sustainable Communities Strategy (RTP/SCS) includes a commitment to reduce emissions from transportation sources by promoting compact and infill development to comply with SB 375. A goal of the SCS is to “promote the development of better places to live and work through measures that encourage more compact development, varied housing options, bike and pedestrian improvements, and efficient transportation infrastructure.” The proposed project would be infill development that would also be located within walking
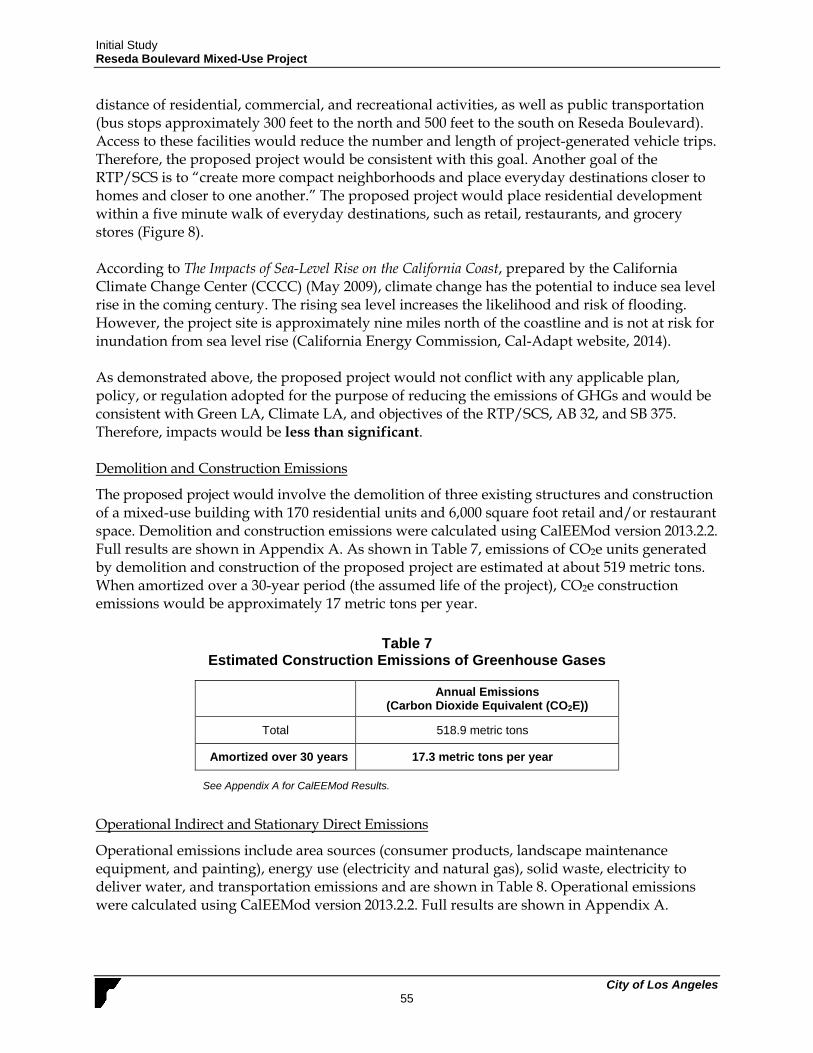
Initial Study Reseda Boulevard Mixed-Use Project
City of Los Angeles 55
distance of residential, commercial, and recreational activities, as well as public transportation (bus stops approximately 300 feet to the north and 500 feet to the south on Reseda Boulevard). Access to these facilities would reduce the number and length of project-generated vehicle trips. Therefore, the proposed project would be consistent with this goal. Another goal of the RTP/SCS is to “create more compact neighborhoods and place everyday destinations closer to homes and closer to one another.” The proposed project would place residential development within a five minute walk of everyday destinations, such as retail, restaurants, and grocery stores (Figure 8). According to The Impacts of Sea-Level Rise on the California Coast, prepared by the California Climate Change Center (CCCC) (May 2009), climate change has the potential to induce sea level rise in the coming century. The rising sea level increases the likelihood and risk of flooding. However, the project site is approximately nine miles north of the coastline and is not at risk for inundation from sea level rise (California Energy Commission, Cal-Adapt website, 2014). As demonstrated above, the proposed project would not conflict with any applicable plan, policy, or regulation adopted for the purpose of reducing the emissions of GHGs and would be consistent with Green LA, Climate LA, and objectives of the RTP/SCS, AB 32, and SB 375. Therefore, impacts would be less than significant. Demolition and Construction Emissions
The proposed project would involve the demolition of three existing structures and construction of a mixed-use building with 170 residential units and 6,000 square foot retail and/or restaurant space. Demolition and construction emissions were calculated using CalEEMod version 2013.2.2. Full results are shown in Appendix A. As shown in Table 7, emissions of CO2e units generated by demolition and construction of the proposed project are estimated at about 519 metric tons. When amortized over a 30-year period (the assumed life of the project), CO2e construction emissions would be approximately 17 metric tons per year.
Table 7 Estimated Construction Emissions of Greenhouse Gases
Annual Emissions
(Carbon Dioxide Equivalent (CO2E))
Total 518.9 metric tons
Amortized over 30 years 17.3 metric tons per year
See Appendix A for CalEEMod Results.
Operational Indirect and Stationary Direct Emissions
Operational emissions include area sources (consumer products, landscape maintenance equipment, and painting), energy use (electricity and natural gas), solid waste, electricity to deliver water, and transportation emissions and are shown in Table 8. Operational emissions were calculated using CalEEMod version 2013.2.2. Full results are shown in Appendix A.
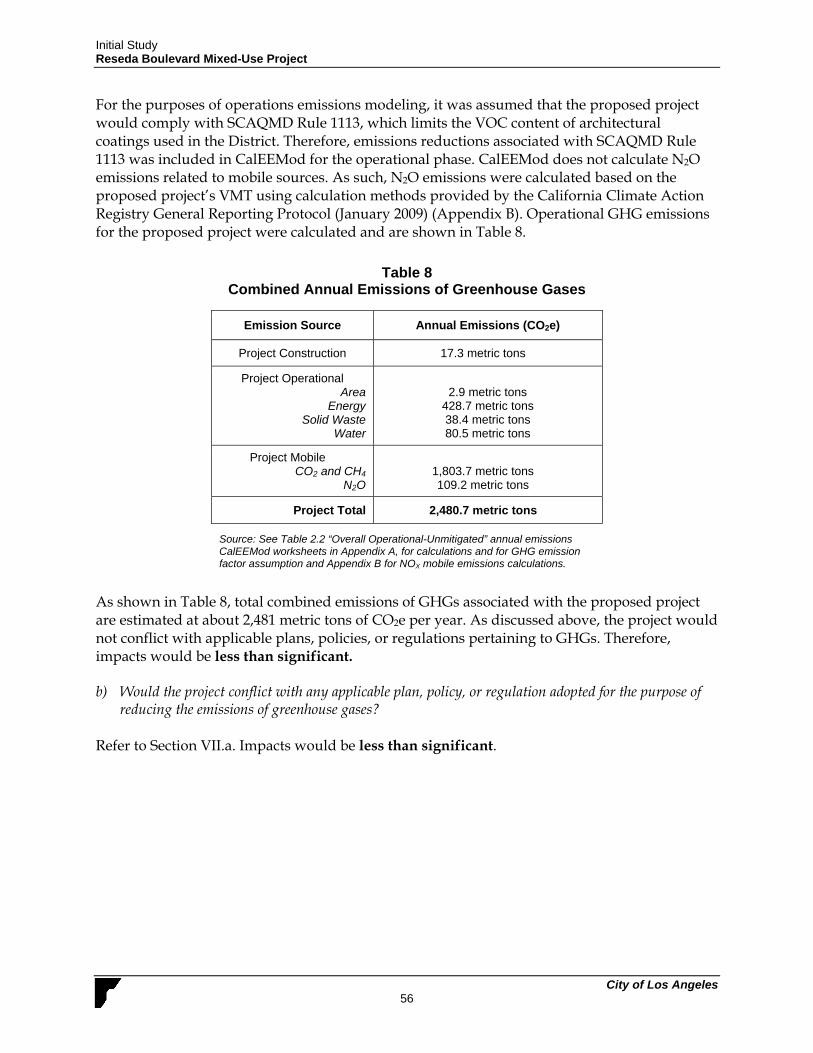
Initial Study Reseda Boulevard Mixed-Use Project
City of Los Angeles 56
For the purposes of operations emissions modeling, it was assumed that the proposed project would comply with SCAQMD Rule 1113, which limits the VOC content of architectural coatings used in the District. Therefore, emissions reductions associated with SCAQMD Rule 1113 was included in CalEEMod for the operational phase. CalEEMod does not calculate N2O emissions related to mobile sources. As such, N2O emissions were calculated based on the proposed project’s VMT using calculation methods provided by the California Climate Action Registry General Reporting Protocol (January 2009) (Appendix B). Operational GHG emissions for the proposed project were calculated and are shown in Table 8.
Table 8 Combined Annual Emissions of Greenhouse Gases
Emission Source Annual Emissions (CO2e)
Project Construction 17.3 metric tons
Project Operational Area
Energy Solid Waste
Water
2.9 metric tons
428.7 metric tons 38.4 metric tons 80.5 metric tons
Project Mobile CO2 and CH4
N2O
1,803.7 metric tons 109.2 metric tons
Project Total 2,480.7 metric tons
Source: See Table 2.2 “Overall Operational-Unmitigated” annual emissions CalEEMod worksheets in Appendix A, for calculations and for GHG emission factor assumption and Appendix B for NOX mobile emissions calculations.
As shown in Table 8, total combined emissions of GHGs associated with the proposed project are estimated at about 2,481 metric tons of CO2e per year. As discussed above, the project would not conflict with applicable plans, policies, or regulations pertaining to GHGs. Therefore, impacts would be less than significant. b) Would the project conflict with any applicable plan, policy, or regulation adopted for the purpose of
reducing the emissions of greenhouse gases? Refer to Section VII.a. Impacts would be less than significant.
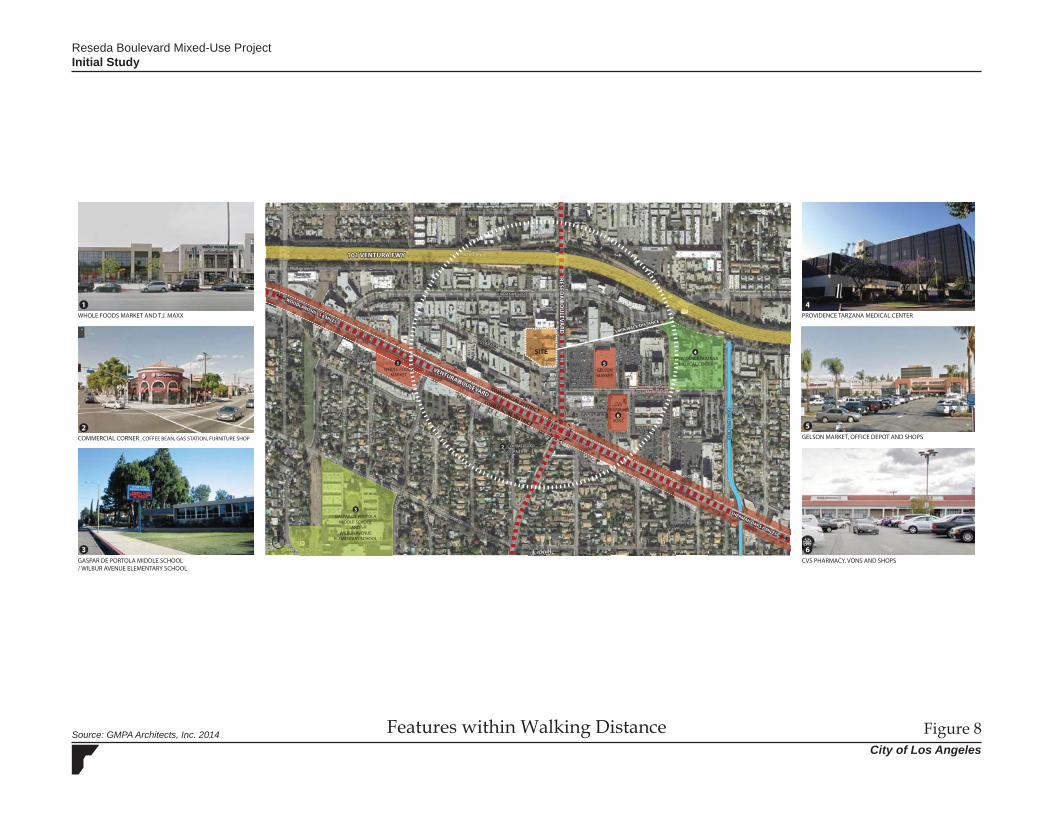
Features within Walking Distance Figure 8City of Los Angeles
Reseda Boulevard Mixed-Use ProjectInitial Study
Source: GMPA Architects, Inc. 2014
SITEPROVIDENCE TARZANA
MEDICAL CENTER
GASPAR DE PORTOLAMIDDLE SCHOOL
ANDWILBUR AVENUE
ELEMENTARY SCHOOL
GELSONMARKET
CABA
LLERO CREEK
CVSPHARMACY
VONS
COMMERCIALCOMMERCIALCORNERCORNER
CLART STCLART ST
BURBANK BLVDBURBANK BLVD
WHOLE FOODSMARKET
101 VENTURA FWY101 VENTURA FWY
VENTURA BOULEVARD
VENTURA BOULEVARD
RESEDA
BOU
LEVARD
RESEDA
BOU
LEVARD
5MIN WALK DISTANCE
5MIN WALK DISTANCE
1
1 4
2
3 6
5
2
4
5
6
3
WHOLE FOODS MARKET AND T.J. MAXX PROVIDENCE TARZANA MEDICAL CENTER
COMMERCIAL CORNER_COFFEE BEAN, GAS STATION, FURNITURE SHOP
GASPAR DE PORTOLA MIDDLE SCHOOL / WILBUR AVENUE ELEMENTARY SCHOOL
CVS PHARMACY, VONS AND SHOPS
GELSON MARKET, OFFICE DEPOT AND SHOPS
N
COMMERCIAL DISTRICT
COMMERCIAL DISTRICT
SHERMAN OAKS 6 MILES
SHERMAN OAKS 6 MILES
WOODLAND HILLS 6 MILES
WOODLAND HILLS 6 MILES
Initial Study Reseda Boulevard Mixed-Use Project
City of Los Angeles 58
VIII. HAZARDS AND HAZARDOUS MATERIALS
According to the L.A. CEQA Thresholds Guide, the determination of significance with respect to hazards and hazardous materials shall be made on a case-by-case basis considering the following factors:
The regulatory framework for the health hazard; The probable frequency and severity of consequences to people or property as a result of
a potential accidental release or explosion of a hazardous substance; The degree to which project design will reduce the frequency or severity of a potential
accidental release or explosion of a hazardous substance; The probable frequency and severity of consequences to people from exposure to the
health hazard; and The degree to which project design would reduce the frequency of exposure or severity
of consequences to exposure to the health hazard.
a) Would the project create a significant hazard to the public or the environment through the routine transport, use, or disposal of hazardous materials?
Based upon the criteria established in the L.A. CEQA Thresholds Guide, a project would normally have a significant impact to hazards and hazardous materials if:
The project involved a risk of accidental explosion or release of hazardous substances (including, but not limited to oil, pesticides, chemicals, or radiation); or
The project involved the creation of any health hazard or potential health hazard.
Small amounts of potentially hazardous materials such as fuels, lubricants, and solvents could be used during project construction. However, the transport, use, and storage of hazardous materials during the construction of the project would be conducted in accordance with applicable state and federal laws, such as the Hazardous Materials Transportation Act, Resource Conservation and Recovery Act, the California Hazardous Material Management Act, and the California Code of Regulations, Title 22. Onsite buildings to be demolished could potentially contain asbestos or lead-based paint. Emissions of asbestos or lead could potentially create hazards to nearby residents, employees, and patrons. Compliance with applicable laws and regulations identified below during construction of the proposed project would reduce the potential impact associated with the routine transport, use, storage, or disposal of hazardous materials to a less than significant level.
RCM-18 Explosion/Release (Existing Toxic/Hazardous Construction Materials)
Asbestos. Prior to the issuance of any permit for the demolition or alteration of the existing structure(s), the applicant shall provide a letter to the Department of Building and Safety from a qualified asbestos abatement consultant indicating that no Asbestos-Containing Materials (ACM) are present in the building. If ACMs are found to be present, it will need to be abated in compliance with the South Coast Air Quality
Initial Study Reseda Boulevard Mixed-Use Project
City of Los Angeles 59
Management District’s Rule 1403 as well as all other applicable State and Federal rules and regulations.
Lead Paint. Prior to issuance of any permit for the demolition or alteration of the existing structure(s), a lead-based paint survey shall be performed to the written satisfaction of the Department of Building and Safety. Should lead-based paint material be identified, standard handling and disposal practices shall be implemented pursuant to OSHA regulations.
b) Would the project create a significant hazard to the public or the environment through reasonably
foreseeable upset and accident conditions involving the release of hazardous materials into the environment?
Refer to Section VIII.a. Impacts would be less than significant. c) Would the project emit hazardous emissions or handle hazardous or acutely hazardous materials,
substances, or waste within ¼ mile of an existing or proposed school? Based upon criteria established in the L.A. CEQA Thresholds Guide, a project would normally have a significant impact to hazards and hazardous materials if:
A project involved a risk of accidental explosion or release of hazardous substances (including, but not limited to, oil, pesticides, chemicals, or radiation); or
A project involved the creation of any health hazard or potential health hazard.
The school closest to the project site is Gaspar de Portola Middle School, which is located approximately 0.37 mile to the southwest. Therefore, while the proposed project could involve the use of small quantities of potentially hazardous materials such as fuels, lubricants, and solvents during construction, there would be no impact related to the release of hazardous materials within ¼ mile of a school. d) Would the project be located on a site which is included on a list of hazardous material sites compiled
pursuant to Government Code Section 65962.5 and, as a result, would it create a significant hazard to the public or the environment?
California Government Code Section 65962.5 requires various State agencies to compile lists of hazardous waste disposal facilities, unauthorized releases from underground storage tanks, contaminated drinking water wells, and solid waste facilities where there is known migration of hazardous waste and to submit such information to the Secretary for Environmental Protection on at least an annual basis. A significant impact may occur if a project site is included on any of the above lists and poses an environmental hazard to surrounding sensitive uses. The following databases were checked in August 2016 for known hazardous materials contamination at the project site in compliance with California Government Code Section 65962.5:
Comprehensive Environmental Response, Compensation, and Liability Information System (CERCLIS) database;
Initial Study Reseda Boulevard Mixed-Use Project
City of Los Angeles 60
Environmental Protection Agency EnviroMapper database; California State Water Quality Control Board GeoTracker database; and California Department of Toxic Substances Control EnviroStor database
No known hazardous materials were found on the project site. The closest potentially hazardous materials are contaminated wells north and south of the project site. The nearest of the 42 contaminated wells is well MW10, located approximately 260 feet south of the project site. Therefore, the impact would be less than significant. e) For a project located within an airport land use plan or, where such a plan has not been adopted,
within two miles of a public airport or public use airport, would the project result in a safety hazard for people residing or working in the project area?
A significant impact may occur if a project:
Is located within a public airport land use plan area, or within two miles of a public airport, and subject to a safety hazard.
Were in the vicinity of a private airstrip and would subject area residents and workers to a safety hazard.
The closest public airport is Van Nuys Airport, which is located approximately 3.6 miles to the northeast, and there are no nearby private airstrips within the vicinity of the project site. The project site is not within the airport hazard area for Van Nuys Airport (City of Los Angeles, 2006b). Therefore, no impact related to airport safety would occur. f) For a project within the vicinity of a private airstrip, would the project result in a safety hazard for
people residing or working in the project area? Refer to Section VIII.e. Impacts would be less than significant. g) Would the project impair implementation of or physically interfere with an adopted emergency
response plan or emergency evacuation plan? Based upon the criteria established in the L.A. CEQA Thresholds Guide, a significant impact to hazards and hazardous materials would normally occur if:
A project involved possible interference with an emergency response plan or emergency evacuation plan.
The City of Los Angeles Department of Emergency Management is responsible for the development of citywide emergency plans. Because the proposed project involves infill development in an existing urbanized neighborhood and would not alter or interfere with any established emergency response or evacuation routes including those along Ventura Boulevard and Highway 101. Project implementation would not interfere with emergency response or evacuation. Therefore, no impact would occur. h) Would the project expose people or structures to a significant risk of loss, injury, or death involving
wildland fires, including where wildlands are adjacent to urbanized areas or where residences are
Initial Study Reseda Boulevard Mixed-Use Project
City of Los Angeles 61
intermixed with wildlands?
Although not specified in the L.A. CEQA Thresholds Guide, a significant impact would occur if the project site is located in proximity to wildland areas and poses a significant fire hazard, which could affect persons or structures in the areas in the event of a fire. The project site is within a developed part of Los Angeles and does not include wildlands or high fire hazard terrain or vegetation. Additionally, the project site is not located within a Very High Fire Hazard Severity Zone (ZIMAS, 2016). Therefore, no impact would occur. IX. HYDROLOGY AND WATER QUALITY
a) Would the project violate any water quality standards or waste discharge requirements? Based upon criteria in the L.A. CEQA Thresholds Guide, a project would normally have a significant impact on surface water quality if discharges associated with the project would create pollution, contamination, or nuisance as defined in Section 13050 of the California Water Code (CWC) or that cause regulatory standards to be violated, as defined in the applicable National Pollution Discharge Elimination System (NPDES) stormwater permit or Water Quality Control Plan for the receiving water body. A significant impact may occur if a project would discharge water that does not meet the quality standards of agencies responsible for regulating surface water quality and water discharge into stormwater drainage systems. A significant impact may also occur if a project would substantially alter drainage patterns, resulting in a significant increase in erosion or siltation during construction or operation. The approximately 1.62-acre project site is flat and currently developed with three buildings and the proposed project would replace the existing structures with a mixed-use commercial and residential development. The project site is not adjacent to any surface water bodies; therefore, project construction and operation would have no direct impact to surface drainages or surface water quality. The proposed project would comply with numerous regulatory requirements that would result in a reduction of stormwater flows off-site. As part of Section 402 of the Clean Water Act, the U.S. Environmental Protection Agency has established regulations under the NPDES program to control both construction and operation (occupancy) stormwater discharges. In California, the State Water Quality Control Board administers the NPDES permitting program and is responsible for developing permitting requirements. The project would be required to comply with the NPDES permitting system. The Los Angeles Regional Water Quality Control Board (LARWQCB) adopted the latest Municipal Separate Storm Sewer System (MS4) NPDES Permit in December 2012. The MS4 permit requires new development and redevelopment projects to incorporate stormwater mitigation measures. Under the conditions of the permit, the project applicant would be required to eliminate or reduce non-stormwater discharges to waters of the nation, develop and implement a Stormwater Pollution Prevention Plan (SWPPP) for project construction activities, and perform inspections of the stormwater pollution prevention measures and control practices to ensure conformance with the site SWPPP. The state permit prohibits the discharge of materials other than stormwater discharges, and prohibits all discharges that contain a hazardous substance in excess of reportable quantities established at
Initial Study Reseda Boulevard Mixed-Use Project
City of Los Angeles 62
40 Code of Federal Regulations (CFR) 117.3 or 40 CFR 302.4. The state permit also specifies that construction activities must meet applicable provisions of Sections 30 and 402 of the Clean Water Act (CWA). Conformance with Section 402 of the CWA would ensure that the proposed project does not violate any water quality standards or waste discharge requirements. Compliance with applicable state, regional, and City policies and regulations (General Construction Permit, MS4 permit, CWA, City stormwater ordinances) identified in the RCMs below would reduce the project’s impact related to surface runoff and water quality to a less than significant level.
RCM-19 Stormwater Pollution: Demolition, Grading, and Construction
Activities Leaks, drips, and spills shall be cleaned up immediately to prevent
contaminated soil on paved surfaces that can be washed away into the storm drains.
All vehicle/equipment maintenance, repair, and washing shall be conducted away from storm drains. All major repairs shall be conducted off-site. Drip pans or drop clothes shall be used to catch drips and spills.
Pavement shall not be hosed down at material spills. Dry cleanup methods shall be used whenever possible. Dumpsters shall be covered and maintained. Uncovered dumpsters shall be placed under a roof or be covered with tarps or plastic sheeting.
Standard Urban Stormwater Mitigation Plan – Hillside Residential and all 10-or-more unit Subdivisions and Multi-Family Dwellings.
Environmental impacts may result from erosion carrying sediments and/or the release of toxins into the storm water drainage channels. However, the potential impacts will be mitigated to a less than significant level by incorporating storm water pollution control measures. Ordinance No. 172,176 and Ordinance No. 173,494 specify Stormwater and Urban Runoff Pollution Control which requires the application of Best Management Practices (BMPs). Chapter IX, Division 70 of the Los Angeles Municipal Code addresses grading, excavations, and fills. Applicants must meet the requirements of the Standard Urban Stormwater Mitigation Plan (SUSMP) approved by Los Angeles Regional Water Quality Control Board.
Project applicants are required to implement stormwater BMPs to treat and infiltrate the runoff from a storm event producing ¾ inch of rainfall in a 24 hour period. The design of structural BMPs shall be in accordance with the Development Best Management Practices Handbook Part B Planning Activities. A signed certificate from a California licensed civil engineer or licensed architect that the proposed BMPs meet this numerical threshold standard is required.
Post development peak stormwater runoff discharge rates shall not exceed the estimated pre-development rate for developments where the increase peak stormwater discharge rate will result in increased potential for downstream erosion.
Initial Study Reseda Boulevard Mixed-Use Project
City of Los Angeles 63
Concrete or cluster development on portions of a site while leaving the remaining land in a natural undisturbed condition.
Maximize trees and other vegetation at each site by planting additional vegetation, clustering tree areas, and promoting the use of native and/or drought tolerant plants.
Promote natural vegetation by using parking lot islands and other landscaped areas.
Any connection to the sanitary sewer must have authorization from the Bureau of Sanitation.
Incorporate appropriate erosion control and drainage devices, such as interceptor terraces, berms, vee-channels, and inlet and outlet structures, as specified by Section 91.7013 of the Building Code. Protect outlets of culverts, conduits or channels from erosion by discharge velocities by installing a rock outlet protection. Rock outlet protection is a physical devise composed of rock, grouted riprap, or concrete rubble placed at the outlet of a pipe. Install sediment traps below the pipe-outlet. Inspect, repair, and maintain the outlet protection after each significant rain.
All storm drain inlets and catch basins within the project area must be stenciled with prohibitive language (such as NO DUMPING – DRAINS TO OCEAN) and/or graphical icons to discourage illegal dumping.
Signs and prohibitive language and/or graphical icons, which prohibit illegal dumping, must be posted at public access points along channels and creeks within the project area.
Legibility of stencils and signs must be maintained. Materials with the potential to contaminate stormwater must be: (1)
placed in an enclosure such as, but not limited to, a cabinet, shed, or similar structure that prevents contact with runoff spillage to the storm water conveyance system; or (2) protected by secondary containment structures such as berms, dikes, or curbs.
The storage area must be paved and sufficiently impervious to contain leaks and spills.
The storage area must have a roof or awning to minimize collection of storm water within the secondary containment area.
The owner(s) of the property will prepare and execute a covenant and agreement (Planning Department General form CP-6770) satisfactory to the Planning Department binding the owners to post construction maintenance on the structural BMPs in accordance with the Standard Urban Storm Water Mitigation Plan and or per manufacturer’s instructions.
RCM-20 National Pollutant Discharge Elimination System General Permit. Prior
to issuance of a grading permit, the Applicant shall obtain coverage under the State Water Resources Control Board National Pollutant Discharge Elimination System General Permit for Storm Water Discharges Associated with Construction and Land Disturbance
Initial Study Reseda Boulevard Mixed-Use Project
City of Los Angeles 64
Activities (Order No. 2009-0009-DWQ, National Pollutant Discharge Elimination System No. CAS000002) (Construction General Permit) for Phase 1 of the proposed Modified Project. The Applicant shall provide the Waste Discharge Identification Number to the City of Los Angeles to demonstrate proof of coverage under the Construction General Permit. A Storm Water Pollution Prevention Plan shall be prepared and implemented for the proposed Modified Project in compliance with the requirements of the Construction General Permit. The Storm Water Pollution Prevention Plan shall identify construction Best Management Practices to be implemented to ensure that the potential for soil erosion and sedimentation is minimized and to control the discharge of pollutants in stormwater runoff as a result of construction activities.
RCM-21 Dewatering. If required, any dewatering activities during construction
shall comply with the requirements of the Waste Discharge Requirements for Discharges of Groundwater from Construction and Project Dewatering to Surface Waters in Coastal Watersheds of Los Angeles and Ventura Counties (Order No. R4-2008-0032, National Pollutant Discharge Elimination System No. CAG994004) or subsequent permit. This will include submission of a Notice of Intent for coverage under the permit to the Los Angeles Regional Water Quality Control Board at least 45 days prior to the start of dewatering and compliance with all applicable provisions in the permit, including water sampling, analysis, and reporting of dewatering-related discharges.
RCM-22 Low Impact Development Plan. Prior to issuance of grading permits, the
Applicant shall submit a Low Impact Development Plan and/or Standard Urban Stormwater Mitigation Plan to the City of Los Angeles Bureau of Sanitation Watershed Protection Division for review and approval. The Low Impact Development Plan and/or Standard Urban Stormwater Mitigation Plan shall be prepared consistent with the requirements of the Development Best Management Practices Handbook.
RCM-23 Development Best Management Practices. Best Management Practices
shall be designed to retain or treat the runoff from a storm event producing 0.75 inch of rainfall in a 24-hour period, in accordance with the Development Best Management Practices Handbook Part B Planning Activities. A signed certificate from a licensed civil engineer or licensed architect confirming that the proposed Best Management Practices meet this numerical threshold standard shall be provided.
b) Would the project substantially deplete groundwater supplies or interfere substantially with
groundwater recharge such that there would be a net deficit in aquifer volume or a lowering or the local groundwater table level (e.g., the production rate of pre-existing nearby wells would drop to a level which would not support existing land uses or planned uses for which permits have been granted)?
Initial Study Reseda Boulevard Mixed-Use Project
City of Los Angeles 65
Based upon criteria established in the L.A. CEQA Thresholds Guide, a project would normally have a significant impact on groundwater level if it would:
Change potable water levels sufficiently to:
o Reduce the ability of a water utility to use the groundwater basin for public water supplies, conjunctive use purposes, storage of imported water, summer/winter peaking, or respond to emergencies and drought;
o Reduce yields of adjacent wells or well fields (public or private); or o Adversely change the rate or direction of flow of groundwater; or
Result in demonstrable and sustained reduction in groundwater recharge capacity The project site is connected to the City of Los Angeles’ water supply system and would not involve the direct extraction of groundwater. Development under the proposed project does not include the installation of new wells. Water for the project would be provided by the City of Los Angeles water supply, which would ensure supply reliability for the project prior to project approval. Water demand associated with the proposed project would not substantially deplete groundwater supply, as discussed in Section XVII, Utilities. Therefore, the proposed project would not result in an exceedance of safe yield or a significant depletion of groundwater supplies. If groundwater is encountered during excavation, dewatering would need to be performed in accordance with NPDES permit requirements. Therefore, the impact would be less than significant. c) Would the project substantially alter the existing drainage pattern of the site or area, including
through the alteration of the course of a stream or river, in a manner which would result in substantial erosion or siltation on- or off-site?
Refer to Section IX.a. Impacts would be less than significant. d) Would the project substantially alter the existing drainage pattern of the site or area, including the
alteration of the course of a stream or river, or substantially increase the rate or amount of surface runoff in a manner which would result in flooding on- or off-site?
Refer to Section IX.a. Impacts would be less than significant. e) Would the project create or contribute runoff water which would exceed the capacity of existing or
planned stormwater drainage systems or provide substantial additional sources of polluted runoff? Refer to Section IX.a. Impacts would be less than significant. f) Would the project otherwise substantially degrade water quality? Refer to Section IX.a. Impacts would be less than significant. g) Would the project place housing within a 100-year flood hazard area as mapped on a federal Flood
Hazard Boundary or Flood Insurance Rate Map or other flood hazard delineation map?
Initial Study Reseda Boulevard Mixed-Use Project
City of Los Angeles 66
Although not specified in the L.A. CEQA Thresholds Guide, a significant impact may occur if:
The project places housing in a 100-year flood zone; or The project is located within a 100-year flood zone, which would impede or redirect
flood flows. The project site is not located within a FEMA 100 or 500 Year Flood Zone (FEMA, 2016). As such, the proposed project would not have the potential to impede flood flows or expose people to significant flood-related safety impacts. There would be no impact related to flooding. h) Would the project place within a 100-year flood hazard area structures which would impede or
redirect flood flows? Refer to Section IX.g. Impacts would be less than significant. i) Would the project expose people or structures to a significant risk of loss, injury, or death involving
flooding, including flooding as a result of the failure of a levee or dam? Although not specified in the L.A. CEQA Thresholds Guide, a significant impact may occur if a project exposes people or structures to a significant risk of loss or death caused by the failure of a levee or dam, including but not limited to a seismically-induced seiche, which is a surface wave created when a body of water is shaken, which could result in a water storage facility failure. According to City of Los Angeles General Plan Safety Element Exhibit C, Landslide Inventory and Hillside Area, and Exhibit G, Inundation and Tsunami Hazard Areas, the project site is not located within a potential dam inundation area, seiche, or landslide/mudslide hazard zone (Los Angeles, City of, 1996). Moreover, the site and surrounding areas are flat, and the project site is approximately nine miles north of the Pacific Ocean. There would be no impact from flooding risks or hazards. j) Would the project inundation by seiche, tsunami, or mudflow? Although not specified in the L.A. CEQA Thresholds Guide, a significant impact may occur if a project site is sufficiently close to the ocean or other water body to be potentially at risk of the effects of seismically-induced tidal phenomena (i.e., seiche and tsunami), or if the project site is located adjacent to a hillside area with soil characteristics that would indicate potential susceptibility to mudslides or mudflows. According to the California Department of Conservation, the project site is not located within a tsunami hazard zone (DOC, 2009). The project site is not in proximity to a large body of water, the project does not involve any structures, and seiches are not a significant concern. Additionally, the project is not located near a hillside area and at risk from mudslides or mudflow. Therefore, no impact related to these hazards would occur.
Initial Study Reseda Boulevard Mixed-Use Project
City of Los Angeles 67
X. LAND USE AND PLANNING
a) Would the project physically divide an established community? A significant impact may occur if the project would be sufficiently large enough or otherwise configured in such a way as to create a physical barrier within an established community. According to the L.A. CEQA Thresholds Guide, the determination of significance shall be made on a case-by-case basis considering the following factors:
The extent of the area that would be impacted, the nature and degree of impacts, and the types of land uses within that area;
The extent to which existing neighborhoods, communities, or land uses would be disrupted, divided, or isolated, and the duration of the disruptions; and
The number, degree, and type of secondary impacts to surrounding land uses that could result from implementation of the proposed project.
The project site is located on a developed parcel within an urbanized area of Los Angeles. The proposed mixed-use project would be consistent with the existing built environment, and does not include new roads or other features that would create a physical barrier that would divide the established community. Therefore, no impact would occur. b) Would the project conflict with any applicable land use plan, policy, or regulation of an agency with
jurisdiction over the project (including, but not limited to the general plan, specific plan, local coastal program, or zoning ordinance) adopted for the purpose of avoiding or mitigating an environmental effect?
A significant impact may occur if the project is inconsistent with the General Plan or zoning designations currently applicable to the project site and would cause adverse environmental effects, which the General Plan and zoning ordinance are designed to avoid or mitigate. According to the L.A. CEQA Thresholds Guide, the determination of significance shall be made on a case-by-case basis considering the following factors:
Whether the proposal is inconsistent with the adopted land use/density designation in the Community Plan, redevelopment plan, or specific plan for the site; and
Whether the proposal is inconsistent with the General Plan or adopted environmental goals or policies contained in other applicable plans.
The proposed project involves the demolition of commercial buildings and construction of a five-story, mixed-use building containing 170 multi-family residential units and 6,000 square feet of retail and/or restaurant space with one ground level of parking and two levels of subterranean parking. An Affordable Housing Density Bonus was filed to receive approval of a density bonus per LA City guidelines. This provided an incentive of increasing the floor area ratio (FAR) by from 1.25:1 to 2.75:1 per LAMC 12.22 A25(f)(4)(i) and another incentive to allow a height of 56 feet in lieu of 45 feet per LAMC 12.22 A25(f)(5)(i).
Initial Study Reseda Boulevard Mixed-Use Project
City of Los Angeles 68
The project site is zoned C2-1L, P-1L, R1-1 and has a lot size of 71,170 square feet. The allowable density for the parcels is 178 residential units. However, the density bonus would allow up to 241 units, 20 of which must be very low income units. The proposed project involves 170 units, less than the maximum allowance of 241 units. The proposed floor area is 191,900 square feet and the proposed height of the building is 56 feet. Although the allowable height is 45 feet, the Affordable Housing Density Bonus incentive increases the allowable height by 11 feet to 56 feet. The project site would require a zone change from P-1L (Automobile Parking Zone) to C2 (Commercial Zone) to accommodate the proposed mixed-use building, and be consistent with the City zoning standards. Additionally, the proposed project would require a zone change from R1 (Residential) to C2 (Commercial Zone). The zone changes would accommodate the proposed project. The project site is within the Ventura and Cahuenga Boulevard Corridor Specific Plan (Specific Plan) area which extends from Dry Canyon-Calabasas Flood Control Channel west of Woodlake Avenue to Woodrow Wilson Drove. The project site is in an area defined as regional commercial by the Specific Plan (Los Angeles, City of, 2001). The proposed project is consistent with the Specific Plan, specifically Section 7(B) to not exceed 75 percent lot coverage and Section 7(D) landscape requirements by developing the necessary landscaping in its yards and setbacks. If these density bonus options are granted, the project would conform to the LAMC and, by extension, the General Plan land use designation for the site. As discussed in sections III, Air Quality, and VII, Greenhouse Gases, the project would not conflict with the regional Air Quality Management Plan or Sustainable Communities Strategy. Therefore, the impact would be less than significant. c) Would the project conflict with an applicable habitat conservation plan or natural community
conservation plan? Although not specified in the L.A. CEQA Thresholds Guide, a project-related significant adverse effect could occur if the project site were located within an area governed by a habitat conservation plan or natural community conservation plan. As discussed in Section IV. (f), the project site is not located within an area that is subject to an adopted habitat conservation plan or natural community plan. No impact would occur. XI. MINERAL RESOURCES
a, b) Would the project result in the loss of availability of a known mineral resource that would be of value
to the region and the residents of the state? Although not specified in the L.A. CEQA Thresholds Guide, a significant impact may occur if the Project Site is located in an area used or available for extraction of a regionally-important or locally-important mineral resource, or if the project development would convert an existing or future regionally-important or locally-important mineral extraction use to another use, or if the
Initial Study Reseda Boulevard Mixed-Use Project
City of Los Angeles 69
project development would affect access to a site used or potentially available for regionally-important or locally-important mineral resource extraction. According to the L.A. CEQA Thresholds Guide, the determination of significance shall be made on a case-by-case basis considering the following factors:
Whether, or the degree to which, the project might result in the permanent loss of, or loss of access to, a mineral resource that is located in a State Mining and Geology Board Mineral Resource Zone MRZ-2 zone or other known or potential mineral resource area, and
Whether the mineral resource is of regional or statewide significance or is noted in the Conservation Element as being of local importance.
The project site is not currently or historically used for extraction of mineral resources, as shown in the City of Los Angeles General Plan Conservation Element Exhibit A, Mineral Resources (Los Angeles, City of, 2001). Moreover, the proposed project does not propose the use or mining of mineral resources. Therefore, the proposed project would have no impact related to the loss of availability of a known mineral resource. b) Would the project result in the loss of availability of a locally important mineral resource recovery
site delineated on a local general plan, specific plan, or other land use plan? Refer to Section XI.a. There would be no impact. XII. NOISE
Noise level (or volume) is generally measured in decibels (dB) using the A-weighted sound pressure level (dBA). The A-weighting scale is an adjustment to the actual sound power levels to be consistent with that of human hearing response, which is most sensitive to frequencies around 4,000 Hertz (about the highest note on a piano) and less sensitive to low frequencies (below 100 Hertz). Because of the logarithmic scale of the decibel unit, sound levels cannot be added or subtracted arithmetically. If a sound’s noise energy is doubled, the sound level increases by 3 dBA, regardless of the initial sound level. For example, 60 dBA plus 60 dBA equals 63 dBA. Where ambient noise levels are high in comparison to a new noise source, only a small change in noise levels occurs. For example, if 70 dBA ambient noise levels are combined with a 60 dBA noise source, the resulting noise level equals 70.4 dBA. Noise level increases of less than 3 dBA typically are not noticeable. Noise that is experienced at any receptor can be attenuated by distance or the presence of noise barriers or intervening terrain. Sound from a single source (i.e., a point source) radiates uniformly outward as it travels away from the source in a spherical pattern. The sound level attenuates (or drops off) from point sources at a rate of about 6 dBA for each doubling of distance. Noise from roads (line sources) typically drops off at about 3-4.5 dBA per doubling of distance. For acoustically absorptive, or soft, sites (i.e., sites with an absorptive ground surface, such as soft dirt, grass, or scattered bushes and trees), an additional ground attenuation value of 1.5 dBA per doubling of distance is normally assumed. A large object or barrier in the path
Initial Study Reseda Boulevard Mixed-Use Project
City of Los Angeles 70
between a noise source and a receiver can substantially attenuate noise levels at the receiver. The amount of attenuation provided by this shielding depends on the size of the object, proximity to the noise source and receiver, surface weight, solidity, and the frequency content of the noise source. Natural terrain features (such as hills and dense woods) and human-made features (such as buildings and walls) can substantially reduce noise levels. Walls are often constructed between a source and a receiver specifically to reduce noise. A barrier that breaks the line of sight between a source and a receiver would typically result in at least 5 dBA of noise reduction. In order to determine existing ambient noise levels on the project site, an a.m. peak hour weekday 15-minute noise measurement (Leq[15] dBA) was taken on the project site on July 30, 2016. During the sample time from 7:29 a.m. to 7:44 a.m. noise level was 70 dBA. a) Would the project result in exposure of persons to or generation of noise levels in excess of standards
established in the local general plan or noise ordinance, or applicable standards of other agencies? Although not specified in L.A. CEQA Thresholds Guide, a significant impact may occur where a project would not comply with the City of Los Angeles General Plan Noise Element or the City of Los Angeles Noise Ordinance (Ordinance No. 144,331). A significant impact may also occur if the project were to result in a substantial temporary or periodic increase in ambient noise levels above existing ambient noise levels without the project. Based upon the criteria established in the L.A. CEQA Thresholds Guide, a project would normally have a significant impact from noise levels from construction if:
Construction activities lasting more than one day would exceed existing ambient exterior noise levels by 10 dBA [CNEL1] or more at a noise sensitive use;
Construction activities lasting more than 10 days in a three-month period would exceed existing ambient exterior noise levels by 5 dBA [CNEL] or more at a noise sensitive use; or
Construction activities would exceed the ambient noise level by 5 dBA [CNEL] at a noise sensitive use between the hours of 9:00 PM and 7:00 AM Monday through Friday, before 8:00 AM or after 6:00 PM on Saturday, or at any time on Sunday.
The proposed project would involve the demolition of three existing structures and construction of a new mixed-use building. Short-term noise impacts during demolition and construction would be higher than existing ambient noise levels, but would cease upon completion of project construction. Noise impacts associated with construction activity are a function of the noise generated by construction equipment, the location and sensitivity of nearby land uses, and the timing and duration of the noise-generating activities. Normally, demolition and construction activities are carried out in stages and each stage has its own characteristics based on the mix of equipment in use. Table 9 shows typical noise levels of equipment used for demolition and construction activities. The closest sensitive receptors to the project site are multi-family residences approximately 25 feet west of the project site.
1 CNEL is the Community Noise Equivalent Level, which is a 24-hour average noise level that adds 5 dBA to noise levels occurring from 7 p.m. to 10 p.m. and 10 dBA to noise levels occurring from 10 p.m. to 7 a.m.
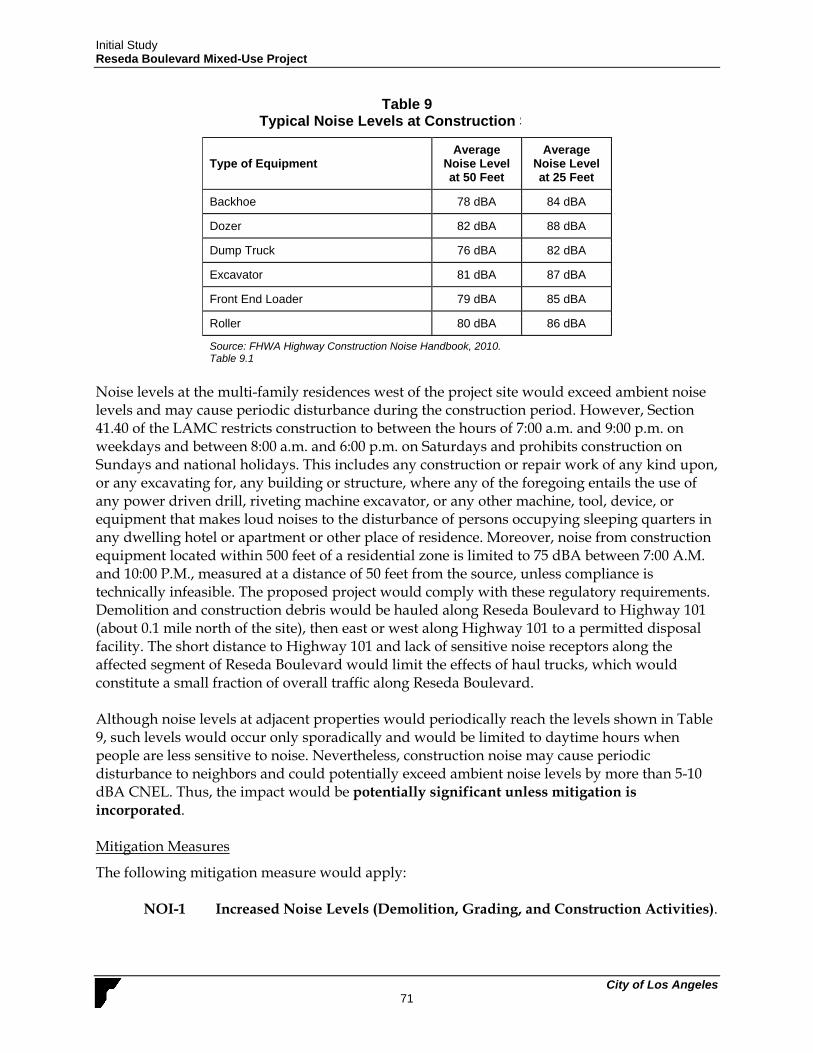
Initial Study Reseda Boulevard Mixed-Use Project
City of Los Angeles 71
Table 9 Typical Noise Levels at Construction S
Type of Equipment Average
Noise Level at 50 Feet
Average Noise Level at 25 Feet
Backhoe 78 dBA 84 dBA
Dozer 82 dBA 88 dBA
Dump Truck 76 dBA 82 dBA
Excavator 81 dBA 87 dBA
Front End Loader 79 dBA 85 dBA
Roller 80 dBA 86 dBA
Source: FHWA Highway Construction Noise Handbook, 2010. Table 9.1
Noise levels at the multi-family residences west of the project site would exceed ambient noise levels and may cause periodic disturbance during the construction period. However, Section 41.40 of the LAMC restricts construction to between the hours of 7:00 a.m. and 9:00 p.m. on weekdays and between 8:00 a.m. and 6:00 p.m. on Saturdays and prohibits construction on Sundays and national holidays. This includes any construction or repair work of any kind upon, or any excavating for, any building or structure, where any of the foregoing entails the use of any power driven drill, riveting machine excavator, or any other machine, tool, device, or equipment that makes loud noises to the disturbance of persons occupying sleeping quarters in any dwelling hotel or apartment or other place of residence. Moreover, noise from construction equipment located within 500 feet of a residential zone is limited to 75 dBA between 7:00 A.M. and 10:00 P.M., measured at a distance of 50 feet from the source, unless compliance is technically infeasible. The proposed project would comply with these regulatory requirements. Demolition and construction debris would be hauled along Reseda Boulevard to Highway 101 (about 0.1 mile north of the site), then east or west along Highway 101 to a permitted disposal facility. The short distance to Highway 101 and lack of sensitive noise receptors along the affected segment of Reseda Boulevard would limit the effects of haul trucks, which would constitute a small fraction of overall traffic along Reseda Boulevard. Although noise levels at adjacent properties would periodically reach the levels shown in Table 9, such levels would occur only sporadically and would be limited to daytime hours when people are less sensitive to noise. Nevertheless, construction noise may cause periodic disturbance to neighbors and could potentially exceed ambient noise levels by more than 5-10 dBA CNEL. Thus, the impact would be potentially significant unless mitigation is incorporated. Mitigation Measures
The following mitigation measure would apply:
NOI-1 Increased Noise Levels (Demolition, Grading, and Construction Activities).
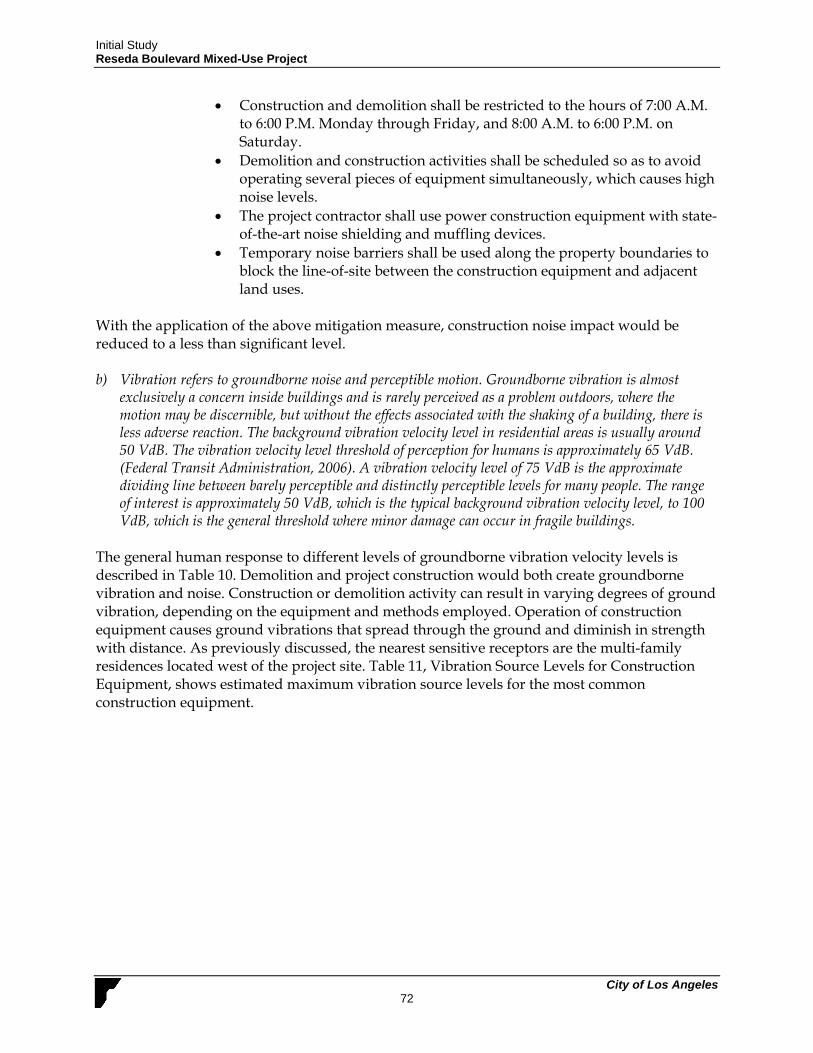
Initial Study Reseda Boulevard Mixed-Use Project
City of Los Angeles 72
Construction and demolition shall be restricted to the hours of 7:00 A.M. to 6:00 P.M. Monday through Friday, and 8:00 A.M. to 6:00 P.M. on Saturday.
Demolition and construction activities shall be scheduled so as to avoid operating several pieces of equipment simultaneously, which causes high noise levels.
The project contractor shall use power construction equipment with state-of-the-art noise shielding and muffling devices.
Temporary noise barriers shall be used along the property boundaries to block the line-of-site between the construction equipment and adjacent land uses.
With the application of the above mitigation measure, construction noise impact would be reduced to a less than significant level. b) Vibration refers to groundborne noise and perceptible motion. Groundborne vibration is almost
exclusively a concern inside buildings and is rarely perceived as a problem outdoors, where the motion may be discernible, but without the effects associated with the shaking of a building, there is less adverse reaction. The background vibration velocity level in residential areas is usually around 50 VdB. The vibration velocity level threshold of perception for humans is approximately 65 VdB. (Federal Transit Administration, 2006). A vibration velocity level of 75 VdB is the approximate dividing line between barely perceptible and distinctly perceptible levels for many people. The range of interest is approximately 50 VdB, which is the typical background vibration velocity level, to 100 VdB, which is the general threshold where minor damage can occur in fragile buildings.
The general human response to different levels of groundborne vibration velocity levels is described in Table 10. Demolition and project construction would both create groundborne vibration and noise. Construction or demolition activity can result in varying degrees of ground vibration, depending on the equipment and methods employed. Operation of construction equipment causes ground vibrations that spread through the ground and diminish in strength with distance. As previously discussed, the nearest sensitive receptors are the multi-family residences located west of the project site. Table 11, Vibration Source Levels for Construction Equipment, shows estimated maximum vibration source levels for the most common construction equipment.
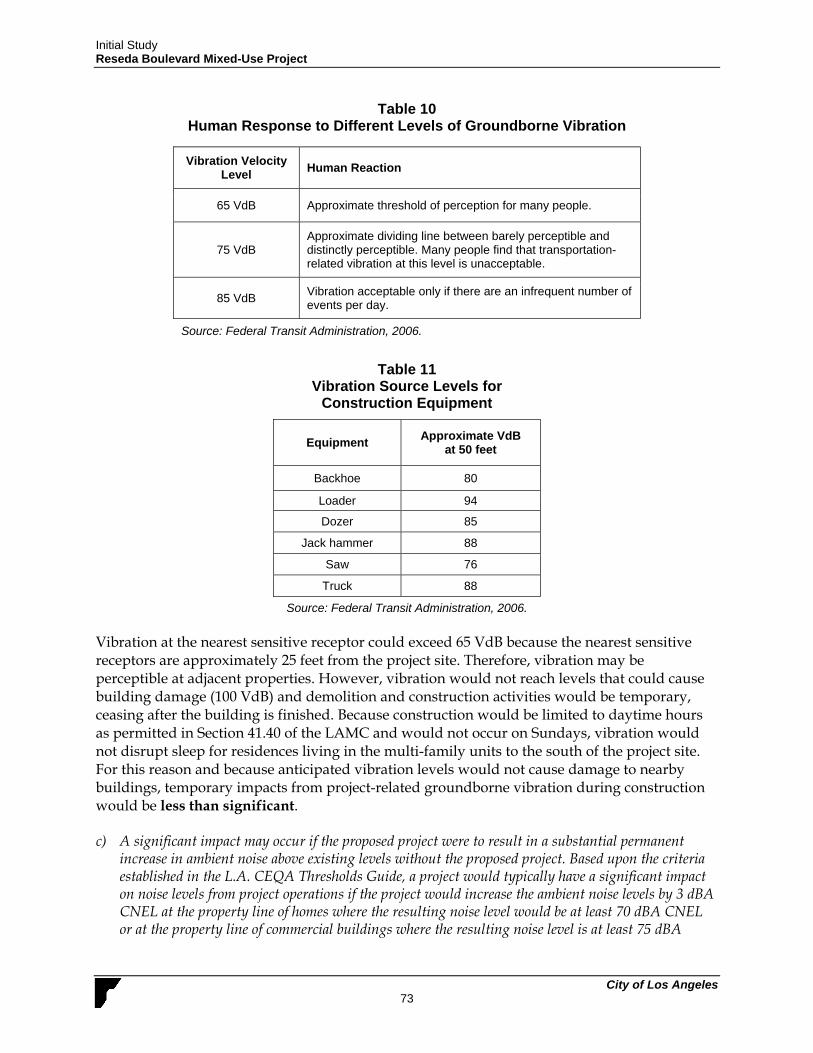
Initial Study Reseda Boulevard Mixed-Use Project
City of Los Angeles 73
Table 10 Human Response to Different Levels of Groundborne Vibration
Vibration Velocity Level
Human Reaction
65 VdB Approximate threshold of perception for many people.
75 VdB Approximate dividing line between barely perceptible and distinctly perceptible. Many people find that transportation-related vibration at this level is unacceptable.
85 VdB Vibration acceptable only if there are an infrequent number of events per day.
Source: Federal Transit Administration, 2006.
Table 11
Vibration Source Levels for Construction Equipment
Equipment Approximate VdB
at 50 feet
Backhoe 80
Loader 94
Dozer 85
Jack hammer 88
Saw 76
Truck 88
Source: Federal Transit Administration, 2006. Vibration at the nearest sensitive receptor could exceed 65 VdB because the nearest sensitive receptors are approximately 25 feet from the project site. Therefore, vibration may be perceptible at adjacent properties. However, vibration would not reach levels that could cause building damage (100 VdB) and demolition and construction activities would be temporary, ceasing after the building is finished. Because construction would be limited to daytime hours as permitted in Section 41.40 of the LAMC and would not occur on Sundays, vibration would not disrupt sleep for residences living in the multi-family units to the south of the project site. For this reason and because anticipated vibration levels would not cause damage to nearby buildings, temporary impacts from project-related groundborne vibration during construction would be less than significant. c) A significant impact may occur if the proposed project were to result in a substantial permanent
increase in ambient noise above existing levels without the proposed project. Based upon the criteria established in the L.A. CEQA Thresholds Guide, a project would typically have a significant impact on noise levels from project operations if the project would increase the ambient noise levels by 3 dBA CNEL at the property line of homes where the resulting noise level would be at least 70 dBA CNEL or at the property line of commercial buildings where the resulting noise level is at least 75 dBA
Initial Study Reseda Boulevard Mixed-Use Project
City of Los Angeles 74
CNEL. In addition, any long-term increase of 5 dBA CNEL or more would cause a significant impact based on City criteria.
Existing uses near the project site may periodically be subject to noise associated with operation of the proposed project, including noise that is typical of residential development such as delivery trucks and noise associated with rooftop ventilation and heating systems. The closest sensitive receptors are the multi-family residences located approximately 25 feet west of the project site. Rooftop ventilation and heating systems would be onsite noise generators. Noise levels from commercial heating, ventilation, and air conditioning (HVAC) equipment can reach 100 dBA at a distance of three feet (EPA, 1971). This equipment usually has noise shielding cabinets placed on the roof or is within mechanical equipment rooms. Typically, the shielding and location of these units reduce noise levels to no greater than 55 dBA at 50 feet from the source. Assuming that commercial rooftop HVAC systems for the proposed project were placed within 25 feet of adjacent residences and a 6 dBA drop-off per doubling of distance from the source, noise from the HVAC system at the nearest sensitive receptors would be 61 dBA, which is below the ambient noise measurement of 70 dBA taken on the project site (Appendix C). Operation of the proposed project would involve delivery trucks and trash hauling trucks going to and from the project site. An individual truck can generate noise of up to 85 dBA at 50 feet, which could be disruptive if it were to occur at night or in the early morning hours. Noise generated by daytime deliveries and trash pickups would not adversely affect nearby sensitive receptors due to their relatively low frequency and the lower noise level sensitivity of receptors during the day when deliveries would occur. Moreover, existing development at the site already involves trash hauling trucks, which would continue to serve the area with the new residences. The proposed project would generate an estimated two a.m. peak hour trips and 11 p.m. peak hour trips, which would access the site via either Reseda Boulevard from the east or Clark Street to the south. This number of new trips would incrementally increase noise on area roadways. However, as discussed above, a doubling of noise energy (and thus a doubling of traffic) would be needed to generate noise increases exceeding the City’s 3 dBA CNEL threshold. The two to 11 peak hour trips would represent only an incremental increase in traffic and would not generate traffic noise increases even approaching the 3 dBA threshold. Therefore, operational noise impacts would be less than significant. d) Would the project result in a substantial temporary or periodic increase in ambient noise levels in the
project vicinity above levels existing without the project? Refer to Section XII.a. This impact would be less than significant with mitigation incorporated. e) For a project located within an airport land use plan or, where such a plan has not been adopted,
within two miles of a public airport or public use airport, would the project expose people residing or working in the project area to excessive noise levels?
Based upon criteria established in the L.A. CEQA Thresholds Guide, a significant impact on ambient noise levels would normally occur if noise levels at a noise sensitive use attributable to
Initial Study Reseda Boulevard Mixed-Use Project
City of Los Angeles 75
airport operations exceed 65 dBA CNEL and the project increases ambient noise levels by 1.5 dBA CNEL or greater. The airport closest public airport to the project site is the Van Nuys Airport, which is located approximately 3.6 miles to the northeast of the project site. In addition, the project site is not in close proximity to a private airport. Therefore, no impact would occur. f) For a project within the vicinity of a private airstrip, would the project expose people residing or
working in the project area to excessive noise? Refer to Section XII.e. No impact would occur. XIII. POPULATION AND HOUSING
a) Would the project induce substantial population growth in an area, either directly (for example, by
proposing new homes and businesses) or indirectly (for example, through extension of roads or other infrastructure)?
A significant impact may occur if a project were to locate new development such as homes, businesses, or infrastructure, with the effect of substantially inducing population growth that would otherwise not have occurred as rapidly or in as great a magnitude. Additionally, a significant impact may occur if a project would result in the displacement of existing housing and/or residents, necessitating construction of replacement housing elsewhere. According to the Department of Finance, Los Angeles has a current population of 3,980,423 with an average household size of 2.88 persons (DOF, 2016). SCAG forecasts that the population of Los Angeles will grow to 4,320,600 by 2035, which is an increase of 363,578 (8%). The proposed project involves the demolition of three existing non-residential buildings and the construction of 170 new multi-family residential units. Based on the average number of residents per household in Los Angeles of 2.88 persons, the project would add an estimated 490 residents and would bring the total Los Angeles population to 3,980,913. The level of population growth associated with the proposed project falls within the population growth for Los Angeles anticipated in SCAG’s long-term population forecasts. Based on the above, the project would have a less than significant impact. b) Would the project displace substantial numbers of existing housing, necessitating the construction of
replacement housing elsewhere? The proposed project would involve the demolition of commercial buildings, but would not displace housing. Rather, it would increase the local housing stock by 170 units. No impact would occur. c) Would the project displace substantial numbers of people, necessitating the construction of
replacement housing elsewhere? Refer to Section XIII.b. No impact would occur.
Initial Study Reseda Boulevard Mixed-Use Project
City of Los Angeles 76
XIV. PUBLIC SERVICES
a.) Would the project result in substantial adverse physical impacts associated with the provision of new
or physically altered governmental facilities, or the need for new or physically altered governmental facilities, the construction of which could cause significant environmental impacts, in order to maintain acceptable service ratios, response times or other performance objectives for any of the public services:
i) Fire protection?
Based on the L.A. CEQA Thresholds Guide, a project would normally have a significant impact related to fire protection if it requires the addition of a new fire station or the expansion, consolidation, or relocation of an existing facility to maintain service. The Los Angeles County Fire Department (LACFD) provides fire protection and emergency medical services for the City of Los Angeles. The fire station closest to the project site is Fire Station #93, located about 1.0 mile from the project site (Los Angeles Fire Department, 2016). The proposed project would incrementally increase population by approximately 490 new residents. Impacts through compliance with RCM-24 would make the impact less than significant
RCM-24 Fire. The following recommendations of the Fire Department relative to fire safety shall be incorporated into the building plans, which includes the submittal of a plot plan for approval by the Fire Department either prior to the recordation of a final map or the approval of a building permit. The plot plan shall include the following minimum design features:
Fire lanes, where required, shall be a minimum of 20 feet in width. All structures must be within 300 feet of an approved fire hydrant. Entrances to any dwelling unit or guest room shall not be more than 150
feet in distance in horizontal travel from the edge of the roadway of an improved street or approved fire lane.
ii) Police protection? For the purpose of this Initial Study, a significant impact may occur if the City of Los Angeles Police Department (LAPD) could not adequately serve a project, necessitating a new or physically altered station. Based on the L.A. CEQA Thresholds Guide the determination of whether the project results in a significant impact on police protection must be made considering the following factors:
The population increase resulting from the proposed project, based on the net increase of residential units or square footage of non-residential floor area;
The demand for police services anticipated at the time of project buildout compared to the expected level of service available. Consider, as applicable, scheduled improvements to LAPD services (facilities, equipment, and officers) and the project’s proportional contribution to the demand; and
Initial Study Reseda Boulevard Mixed-Use Project
City of Los Angeles 77
Whether the project includes security and/or design features that would reduce the demand for police services.
The police station closest to the project site is West Valley Community Police Station, located approximately 2.2 miles from the project site. The proposed project would generate approximately 490 new residents. The police station would be able to continue to serve the area with the additional residents and new or expanded facilities would not be required (personal communication, Marco Jimenez, LAPD, August 4, 2016). Impacts through compliance with the below RCMs would make this impact less than significant.
RCM-25 Police – Demolition/Construction Sites. Temporary construction fencing
shall be placed along the periphery of the active construction areas to screen as much of the construction activity from view at the local street level and to keep unpermitted persons from entering the construction area.
RCM-26 Police. The plans shall incorporate the design guidelines relative to security,
semi-public and private spaces, which may include but not be limited to access control to building, secured parking facilities, walls/fences with key systems, well-illuminated public and semi-public space designed with a minimum of dead space to eliminate areas of concealment, location of toilet facilities or building entrances in high-foot traffic areas, and provision of security guard patrol throughout the project site if needed. Please refer to “Design Out Crime Guidelines: Crime Prevention Through Environmental Design,” published by the Los Angeles Police Department.
iii) Schools? A significant impact may occur if a project includes substantial employment or population growth, which could generate demand for school facilities that exceeds the capacity of the schools serving the project site. The project site is located within the Los Angeles Unified School District (LAUSD) and would be served by Tarzana Elementary, Gaspar de Portola Middle School, and Reseda Senior High (Resident School Identifier, LAUSD). The proposed 170 residential unit development would increase the City population by approximately 490 new residents and incrementally increase students within the LAUSD. Using a conservative per household estimate of 0.12 students from Kindergarten through 5th grade, 0.07 for students from 6th through 8th grade, and 0.07 for students from 9th through 12th grade, the proposed project would generate 45 additional students at LASUD schools (City of Los Angeles, 2012). Students generated by the proposed project would represent an incremental increase in the students served by LAUSD. To offset a project’s potential impact on schools, Government Code 65995 (b) establishes the base amount of allowable developer fees a school district can collect from development projects located within its boundaries. The fees obtained by LAUSD are used to maintain the desired school capacity and the maintenance and/or development of new school facilities. The project applicant would be required to pay the state-mandated school impact fees. Pursuant to Section 65995 (3)(h) of the California Government Code (Senate Bill 50, chaptered August 27, 1998), the
Initial Study Reseda Boulevard Mixed-Use Project
City of Los Angeles 78
payment of statutory fees “… is deemed to be full and complete mitigation of the impacts of any legislative or adjudicative act, or both, involving, but not limited to, the planning, use, or development of real property, or any change in governmental organization or reorganization.” Through compliance with RCM-27, impacts would be less than significant.
RCM-27 Schools. The applicant shall pay school fees to the Los Angeles Unified School District to offset the impact of additional student enrollment at schools serving the project area.
iv) Parks? Refer to Section XV, Recreation. Impacts would be less than significant. v) Other public facilities? A significant impact may occur if a project includes substantial employment or population growth that could generate a demand for other public facilities (such as libraries), which would exceed the capacity available to serve the project site, necessitating a new or physically altered library, the construction of which would have significant physical impacts on the environment. The proposed project would increase population by approximately 490 new residents. However, increased demand would be nominal and public facilities would continue to accommodate the needs of the City and others in Los Angeles County. Therefore, impacts would be less than significant. XV. RECREATION
a) Would the project increase the use of existing neighborhood and regional parks or other recreational
facilities such that substantial physical deterioration of the facility would occur or be accelerated? A significant impact may occur if a project:
Would include substantial employment or population growth, which could generate an increased demand for park or recreational facilities that would exceed the capacity of existing parks and cause premature deterioration of the park facilities; or
Includes the construction or expansion of park facilities, the construction of which would have a significant adverse effect on the environment.
As identified by the City of Los Angeles Department of Recreation and Parks, the City’s parks system consists of approximately 16,000 acres of parklands (Los Angeles Department of Recreation and Parks, 2016). The parks closest to the project site are Mecca Avenue Park (0.3 miles away), L.A.P.D. S.W.A.T. Officer Randal D. Simmons Park (2 miles away), Encino Park (2.2 miles away), and Lake Balboa/Anthony C. Beilenson Park, which is approximately 2.8 miles away (Los Angeles Department of Recreation and Parks, 2016). The City’s current population is estimated at 3,980,423 people (California DOF, 2016). Consequently, there are 4.0 acres of parkland for every 1,000 residents and the City currently meets the standard ratio for parkland in the Quimby Act (California Department of Parks and Recreation, 2002).
Initial Study Reseda Boulevard Mixed-Use Project
City of Los Angeles 79
The proposed project does not involve construction of new parks, but would accommodate a population increase estimated at 490 persons. This would incrementally reduce the parkland ratio of 4.0 acres of parkland for every 1,000 residents. The project applicant would be required to pay applicable Quimby Act fees required for the project’s proposed 170 units. Thus, while there would be an incremental increase in use of the existing parks, the existing parkland ratio would stay nearly the same and no significant impacts would occur to existing parks. Therefore, impacts would be less than significant. b) Does the project include recreational facilities or require the construction or expansion of recreational
facilities which might have an adverse physical effect on the environment? Refer to Section XV.a. Impacts would be less than significant. XVI. TRANSPORTATION / TRAFFIC
a) Would the project Conflict with an applicable plan, ordinance or policy establishing a measure of
effectiveness for the performance of the circulation system, taking into account all modes of transportation, including mass transit and non-motorized travel and relevant components of the circulation system, including but not limited to intersections, streets, highways, and freeways, pedestrian and bicycle paths, and mass transit?
A Technical Memorandum for the project was developed by Linscott Law & Greenspan in June 2016 (Appendix D) and the Department of Transportation issued an approval letter for the Traffic Memorandum in August 2016 (Appendix E). The proposed 170-unit project would generate a net increase, after demolishing the three existing structures, of about 45 daily vehicle trips, including two a.m. peak hour trips and 11 p.m. peak hour trips. The Technical Memorandum prepared by Linscott Law & Greenspan, Engineers examined four intersections that have potential traffic impacts from the proposed project. The four intersections include:
Reseda Boulevard/US-101 Northbound Ramps Reseda Boulevard/US-101 Southbound Ramps Reseda Boulevard/Burbank Boulevard Reseda Boulevard/Ventura Boulevard
The analysis found that the project would not result in any significant impacts to the four study intersections. The significance of the potential impacts of project generated traffic was identified using the traffic impact criteria set forth in the Los Angeles Department of Transportation’s (LADOT) Traffic Study Policies and Procedures, August 2014. According to these guidelines an impact is considered significant if the project-related increase in the volume-to-capacity (v/c) ratio equals or exceeds the thresholds presented below in Table 12.
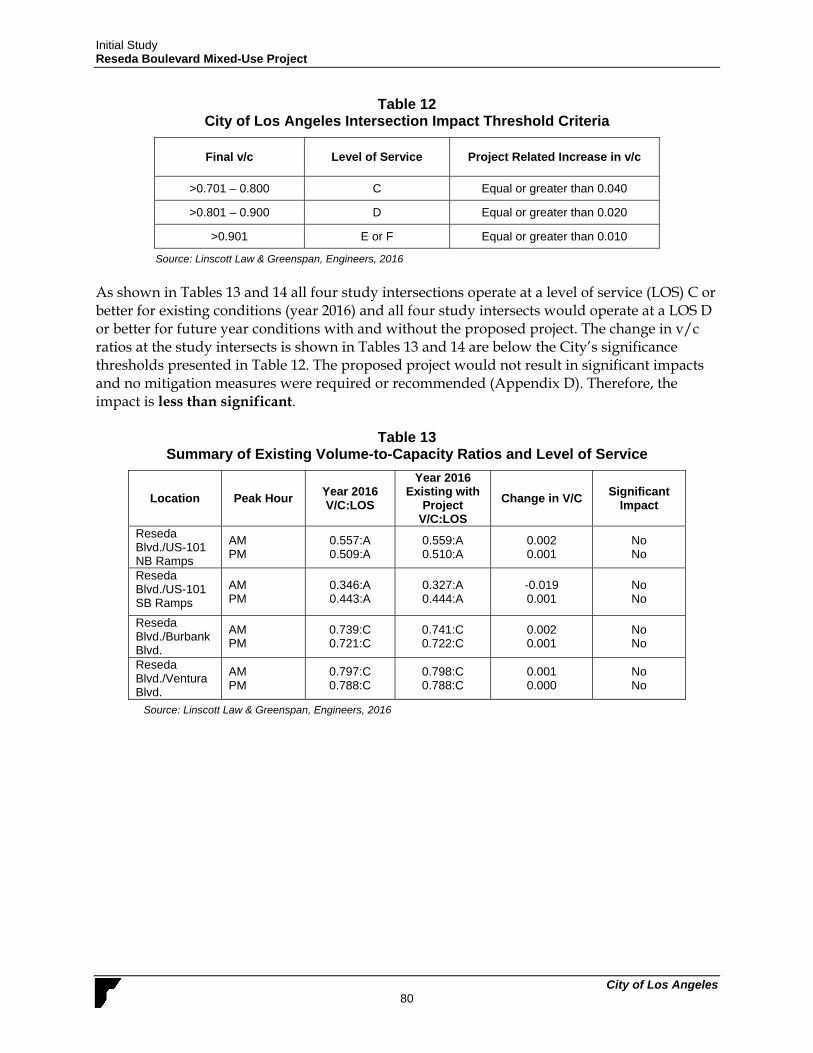
Initial Study Reseda Boulevard Mixed-Use Project
City of Los Angeles 80
Table 12 City of Los Angeles Intersection Impact Threshold Criteria
Final v/c Level of Service Project Related Increase in v/c
>0.701 – 0.800 C Equal or greater than 0.040
>0.801 – 0.900 D Equal or greater than 0.020
>0.901 E or F Equal or greater than 0.010
Source: Linscott Law & Greenspan, Engineers, 2016
As shown in Tables 13 and 14 all four study intersections operate at a level of service (LOS) C or better for existing conditions (year 2016) and all four study intersects would operate at a LOS D or better for future year conditions with and without the proposed project. The change in v/c ratios at the study intersects is shown in Tables 13 and 14 are below the City’s significance thresholds presented in Table 12. The proposed project would not result in significant impacts and no mitigation measures were required or recommended (Appendix D). Therefore, the impact is less than significant.
Table 13 Summary of Existing Volume-to-Capacity Ratios and Level of Service
Location Peak Hour Year 2016 V/C:LOS
Year 2016 Existing with
Project V/C:LOS
Change in V/C Significant
Impact
Reseda Blvd./US-101 NB Ramps
AM PM
0.557:A 0.509:A
0.559:A 0.510:A
0.002 0.001
No No
Reseda Blvd./US-101 SB Ramps
AM PM
0.346:A 0.443:A
0.327:A 0.444:A
-0.019 0.001
No No
Reseda Blvd./Burbank Blvd.
AM PM
0.739:C 0.721:C
0.741:C 0.722:C
0.002 0.001
No No
Reseda Blvd./Ventura Blvd.
AM PM
0.797:C 0.788:C
0.798:C 0.788:C
0.001 0.000
No No
Source: Linscott Law & Greenspan, Engineers, 2016
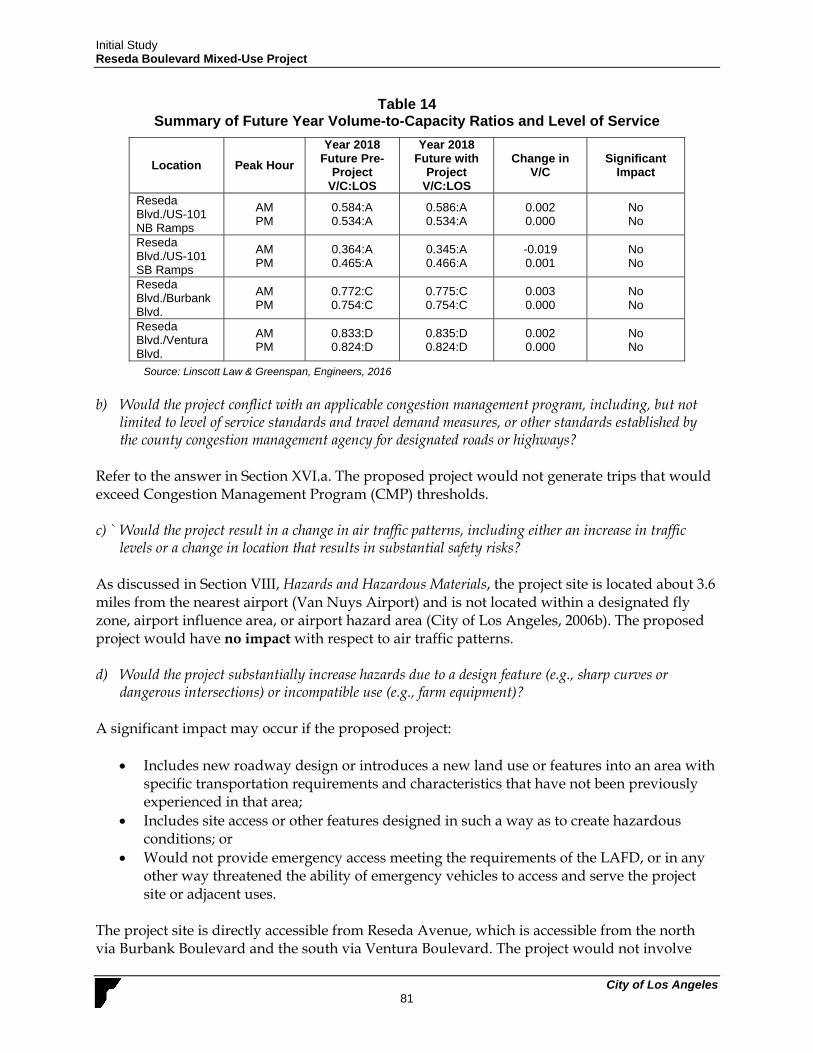
Initial Study Reseda Boulevard Mixed-Use Project
City of Los Angeles 81
Table 14 Summary of Future Year Volume-to-Capacity Ratios and Level of Service
Location Peak Hour
Year 2018 Future Pre-
Project V/C:LOS
Year 2018 Future with
Project V/C:LOS
Change in V/C
Significant Impact
Reseda Blvd./US-101 NB Ramps
AM PM
0.584:A 0.534:A
0.586:A 0.534:A
0.002 0.000
No No
Reseda Blvd./US-101 SB Ramps
AM PM
0.364:A 0.465:A
0.345:A 0.466:A
-0.019 0.001
No No
Reseda Blvd./Burbank Blvd.
AM PM
0.772:C 0.754:C
0.775:C 0.754:C
0.003 0.000
No No
Reseda Blvd./Ventura Blvd.
AM PM
0.833:D 0.824:D
0.835:D 0.824:D
0.002 0.000
No No
Source: Linscott Law & Greenspan, Engineers, 2016
b) Would the project conflict with an applicable congestion management program, including, but not
limited to level of service standards and travel demand measures, or other standards established by the county congestion management agency for designated roads or highways?
Refer to the answer in Section XVI.a. The proposed project would not generate trips that would exceed Congestion Management Program (CMP) thresholds. c) ` Would the project result in a change in air traffic patterns, including either an increase in traffic
levels or a change in location that results in substantial safety risks? As discussed in Section VIII, Hazards and Hazardous Materials, the project site is located about 3.6 miles from the nearest airport (Van Nuys Airport) and is not located within a designated fly zone, airport influence area, or airport hazard area (City of Los Angeles, 2006b). The proposed project would have no impact with respect to air traffic patterns. d) Would the project substantially increase hazards due to a design feature (e.g., sharp curves or
dangerous intersections) or incompatible use (e.g., farm equipment)? A significant impact may occur if the proposed project:
Includes new roadway design or introduces a new land use or features into an area with specific transportation requirements and characteristics that have not been previously experienced in that area;
Includes site access or other features designed in such a way as to create hazardous conditions; or
Would not provide emergency access meeting the requirements of the LAFD, or in any other way threatened the ability of emergency vehicles to access and serve the project site or adjacent uses.
The project site is directly accessible from Reseda Avenue, which is accessible from the north via Burbank Boulevard and the south via Ventura Boulevard. The project would not involve
Initial Study Reseda Boulevard Mixed-Use Project
City of Los Angeles 82
any new roadways, would not alter site access, or result in levels of traffic congestion that would impede emergency access. There would be no impact. e) Would the project result in inadequate emergency access? The City of Los Angeles Department of Emergency Management is responsible for response and preparation of citywide emergencies. Because the proposed project involves infill development in an existing urbanized neighborhood and would not alter or interfere with any established emergency access including emergency routes along Ventura Boulevard and Highway 101.Refer to Section XVI.d for discussion on hazards for design features. f) Would the project conflict with adopted policies, plans, or programs regarding public transit,
bikeways, or pedestrian facilities, or otherwise substantially decrease the performance or safety of such facilities?
A significant impact may occur if the project would conflict with adopted polices or involve modification of existing alternative transportation facilities located on- or off-site. No changes to public transportation systems are proposed and the project would have access to various transit lines that operate along Reseda Boulevard, about 300 feet to the north and 500 feet to the south. However, sidewalk closures may occur during project construction conflicting with pedestrian facility plans and policies. Implementation of Mitigation Measure T-1 would require maintenance of pedestrian access during construction. Impacts would be less than significant with mitigation incorporated.
T-1 Maintain Pedestrian Access. The project applicant shall implement the following:
The applicant shall plan construction and construction staging as to maintain
pedestrian access on adjacent sidewalks throughout all construction phases. The plan shall maintain adequate and safe pedestrian protection, including physical separation (including utilization of barriers such as K-Rails or scaffolding, etc) from work space and vehicular traffic and overhead protection, due to sidewalk closure or blockage, at all times.
Temporary pedestrian facilities shall be adjacent to the project site and provide safe, accessible routes that replicate as nearly as practical the most desirable characteristics of the existing facility.
Covered walkways shall be provided where pedestrians are exposed to potential injury from falling objects.
Sidewalks shall remain open during construction until only when it is absolutely required to close or block sidewalk for construction staging. Sidewalk shall be reopened as soon as reasonably feasible taking construction and construction staging into account.
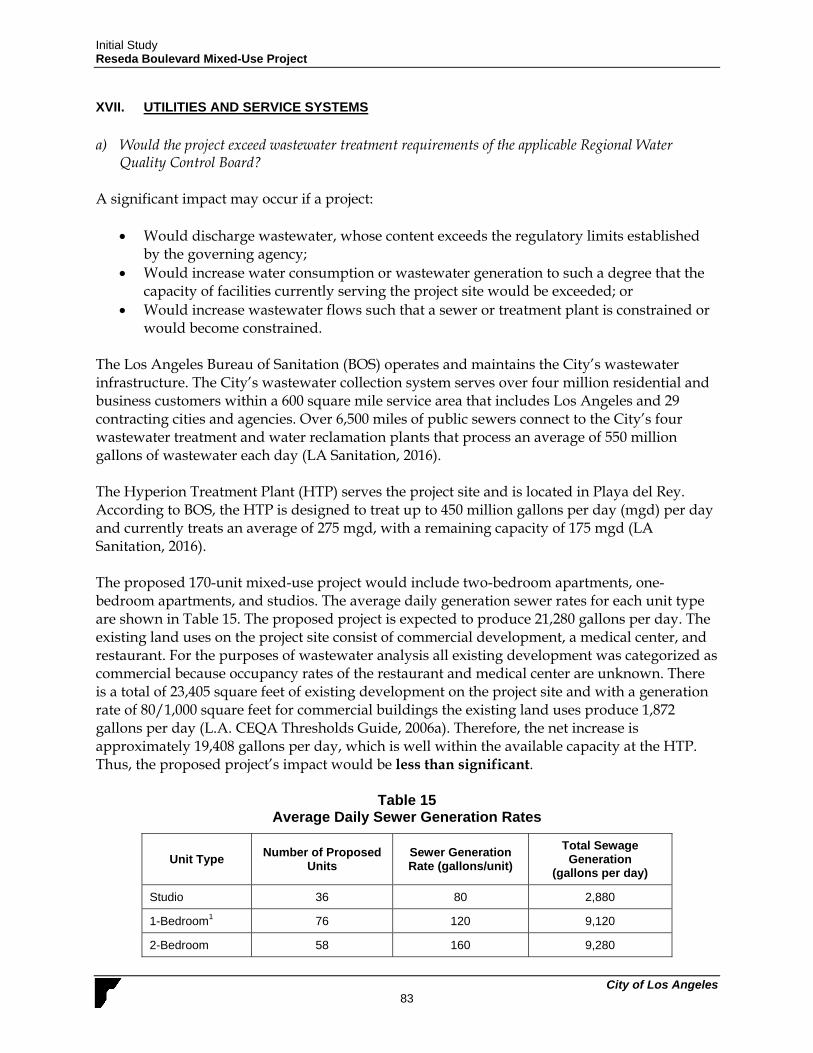
Initial Study Reseda Boulevard Mixed-Use Project
City of Los Angeles 83
XVII. UTILITIES AND SERVICE SYSTEMS
a) Would the project exceed wastewater treatment requirements of the applicable Regional Water
Quality Control Board? A significant impact may occur if a project:
Would discharge wastewater, whose content exceeds the regulatory limits established by the governing agency;
Would increase water consumption or wastewater generation to such a degree that the capacity of facilities currently serving the project site would be exceeded; or
Would increase wastewater flows such that a sewer or treatment plant is constrained or would become constrained.
The Los Angeles Bureau of Sanitation (BOS) operates and maintains the City’s wastewater infrastructure. The City’s wastewater collection system serves over four million residential and business customers within a 600 square mile service area that includes Los Angeles and 29 contracting cities and agencies. Over 6,500 miles of public sewers connect to the City’s four wastewater treatment and water reclamation plants that process an average of 550 million gallons of wastewater each day (LA Sanitation, 2016). The Hyperion Treatment Plant (HTP) serves the project site and is located in Playa del Rey. According to BOS, the HTP is designed to treat up to 450 million gallons per day (mgd) per day and currently treats an average of 275 mgd, with a remaining capacity of 175 mgd (LA Sanitation, 2016). The proposed 170-unit mixed-use project would include two-bedroom apartments, one-bedroom apartments, and studios. The average daily generation sewer rates for each unit type are shown in Table 15. The proposed project is expected to produce 21,280 gallons per day. The existing land uses on the project site consist of commercial development, a medical center, and restaurant. For the purposes of wastewater analysis all existing development was categorized as commercial because occupancy rates of the restaurant and medical center are unknown. There is a total of 23,405 square feet of existing development on the project site and with a generation rate of 80/1,000 square feet for commercial buildings the existing land uses produce 1,872 gallons per day (L.A. CEQA Thresholds Guide, 2006a). Therefore, the net increase is approximately 19,408 gallons per day, which is well within the available capacity at the HTP. Thus, the proposed project’s impact would be less than significant.
Table 15 Average Daily Sewer Generation Rates
Unit Type Number of Proposed
Units Sewer Generation Rate (gallons/unit)
Total Sewage Generation
(gallons per day)
Studio 36 80 2,880
1-Bedroom1 76 120 9,120
2-Bedroom 58 160 9,280
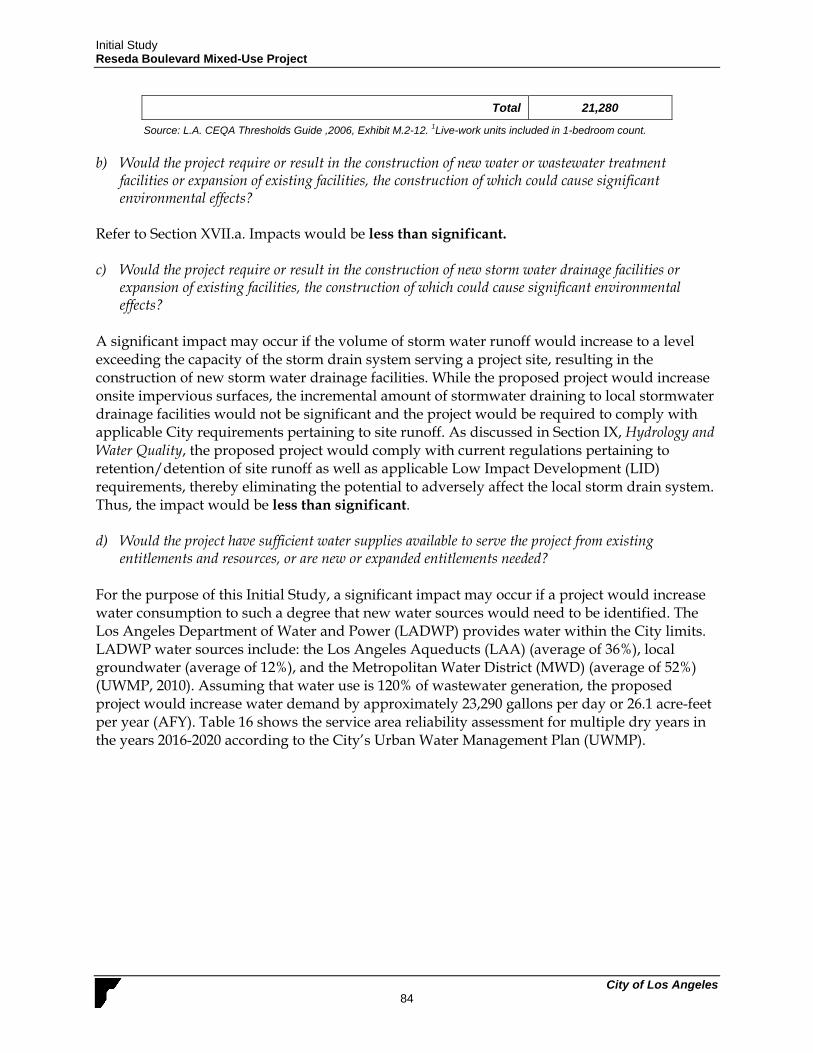
Initial Study Reseda Boulevard Mixed-Use Project
City of Los Angeles 84
Total 21,280
Source: L.A. CEQA Thresholds Guide ,2006, Exhibit M.2-12. 1Live-work units included in 1-bedroom count.
b) Would the project require or result in the construction of new water or wastewater treatment
facilities or expansion of existing facilities, the construction of which could cause significant environmental effects?
Refer to Section XVII.a. Impacts would be less than significant. c) Would the project require or result in the construction of new storm water drainage facilities or
expansion of existing facilities, the construction of which could cause significant environmental effects?
A significant impact may occur if the volume of storm water runoff would increase to a level exceeding the capacity of the storm drain system serving a project site, resulting in the construction of new storm water drainage facilities. While the proposed project would increase onsite impervious surfaces, the incremental amount of stormwater draining to local stormwater drainage facilities would not be significant and the project would be required to comply with applicable City requirements pertaining to site runoff. As discussed in Section IX, Hydrology and Water Quality, the proposed project would comply with current regulations pertaining to retention/detention of site runoff as well as applicable Low Impact Development (LID) requirements, thereby eliminating the potential to adversely affect the local storm drain system. Thus, the impact would be less than significant. d) Would the project have sufficient water supplies available to serve the project from existing
entitlements and resources, or are new or expanded entitlements needed? For the purpose of this Initial Study, a significant impact may occur if a project would increase water consumption to such a degree that new water sources would need to be identified. The Los Angeles Department of Water and Power (LADWP) provides water within the City limits. LADWP water sources include: the Los Angeles Aqueducts (LAA) (average of 36%), local groundwater (average of 12%), and the Metropolitan Water District (MWD) (average of 52%) (UWMP, 2010). Assuming that water use is 120% of wastewater generation, the proposed project would increase water demand by approximately 23,290 gallons per day or 26.1 acre-feet per year (AFY). Table 16 shows the service area reliability assessment for multiple dry years in the years 2016-2020 according to the City’s Urban Water Management Plan (UWMP).
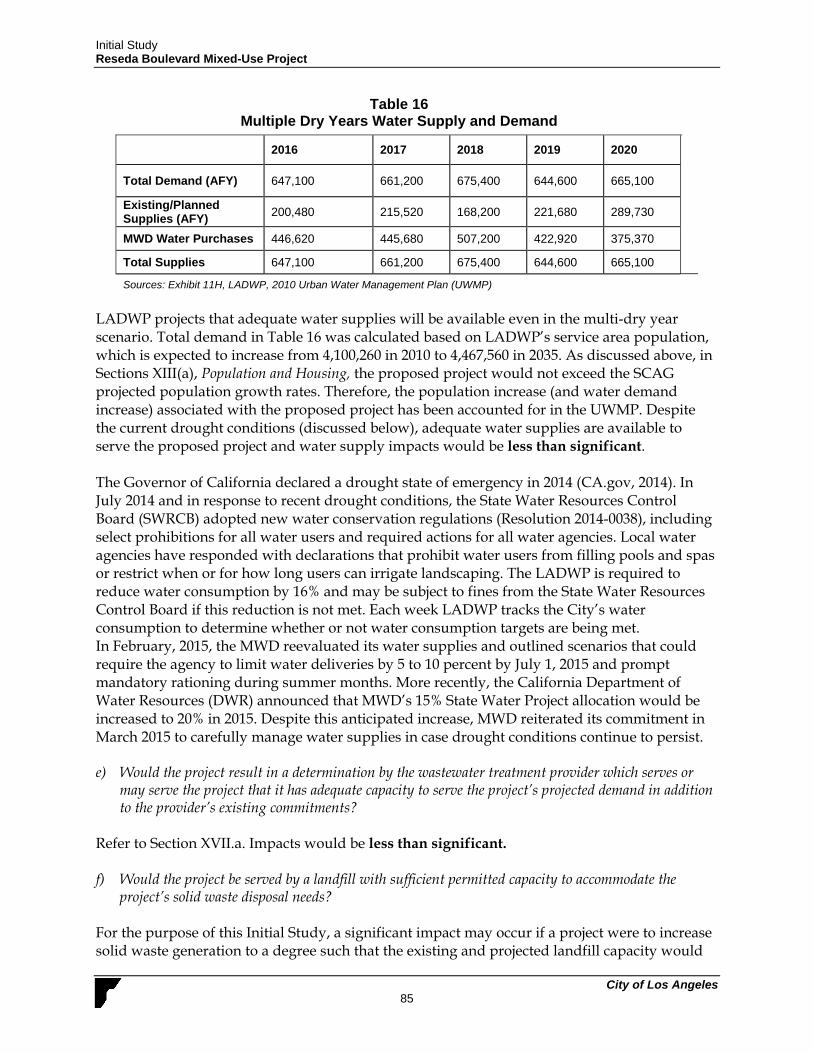
Initial Study Reseda Boulevard Mixed-Use Project
City of Los Angeles 85
Table 16 Multiple Dry Years Water Supply and Demand
2016 2017 2018 2019 2020
Total Demand (AFY) 647,100 661,200 675,400 644,600 665,100
Existing/Planned Supplies (AFY)
200,480 215,520 168,200 221,680 289,730
MWD Water Purchases 446,620 445,680 507,200 422,920 375,370
Total Supplies 647,100 661,200 675,400 644,600 665,100
Sources: Exhibit 11H, LADWP, 2010 Urban Water Management Plan (UWMP) LADWP projects that adequate water supplies will be available even in the multi-dry year scenario. Total demand in Table 16 was calculated based on LADWP’s service area population, which is expected to increase from 4,100,260 in 2010 to 4,467,560 in 2035. As discussed above, in Sections XIII(a), Population and Housing, the proposed project would not exceed the SCAG projected population growth rates. Therefore, the population increase (and water demand increase) associated with the proposed project has been accounted for in the UWMP. Despite the current drought conditions (discussed below), adequate water supplies are available to serve the proposed project and water supply impacts would be less than significant. The Governor of California declared a drought state of emergency in 2014 (CA.gov, 2014). In July 2014 and in response to recent drought conditions, the State Water Resources Control Board (SWRCB) adopted new water conservation regulations (Resolution 2014-0038), including select prohibitions for all water users and required actions for all water agencies. Local water agencies have responded with declarations that prohibit water users from filling pools and spas or restrict when or for how long users can irrigate landscaping. The LADWP is required to reduce water consumption by 16% and may be subject to fines from the State Water Resources Control Board if this reduction is not met. Each week LADWP tracks the City’s water consumption to determine whether or not water consumption targets are being met. In February, 2015, the MWD reevaluated its water supplies and outlined scenarios that could require the agency to limit water deliveries by 5 to 10 percent by July 1, 2015 and prompt mandatory rationing during summer months. More recently, the California Department of Water Resources (DWR) announced that MWD’s 15% State Water Project allocation would be increased to 20% in 2015. Despite this anticipated increase, MWD reiterated its commitment in March 2015 to carefully manage water supplies in case drought conditions continue to persist. e) Would the project result in a determination by the wastewater treatment provider which serves or
may serve the project that it has adequate capacity to serve the project’s projected demand in addition to the provider’s existing commitments?
Refer to Section XVII.a. Impacts would be less than significant. f) Would the project be served by a landfill with sufficient permitted capacity to accommodate the
project’s solid waste disposal needs? For the purpose of this Initial Study, a significant impact may occur if a project were to increase solid waste generation to a degree such that the existing and projected landfill capacity would
Initial Study Reseda Boulevard Mixed-Use Project
City of Los Angeles 86
be insufficient to accommodate the additional solid waste or if a project would generate solid waste that was not disposed of in accordance with applicable regulations. The City has enacted numerous waste reduction and recycling programs in order to comply with AB 939, which required every city in California to divert at least 50% of its annual waste by the year 2000, and be consistent with AB 341, which sets a 75% recycling goal for California by 2020. As of 2012, the City of Los Angeles achieved a landfill diversion rate of 76% (City of Los Angeles, May 2013). AB 939 also requires each county to prepare and administer a Countywide Integrated Waste Management Plan. For Los Angeles County, the County’s Department of Public Works is responsible for preparing and administering the Los Angeles County Countywide Integrated Waste Management Summary Plan (Summary Plan) and the Countywide Siting Element (CSE). These documents were approved by the County, a majority of the cities within the County containing a majority of the cities’ population, the County Board of Supervisors, and CalRecycle. The Summary Plan, approved by CalRecycle on June 23, 1999, describes the steps to be taken by local agencies, acting independently and in concert, to achieve the mandated state diversion goal by integrating strategies aimed toward reducing, reusing, recycling, diverting, and marketing solid waste generated within the County. The CSE, approved by CalRecycle on June 24, 1998, identifies how, for a 15-year planning period, the county and the cities within would address their long-term disposal capacity demand to safely handle solid waste generated in the county that cannot be reduced, recycled, or composted (County of Los Angeles, 2011). The CSE is in the process of being updated. Various provisions of the LAMC also address solid waste recycling. The City of Los Angeles Space Allocation Ordinance (Ordinance No. 171687, August 6, 1997) sets requirements for the inclusion of recycling areas within individual development projects. In accordance with the Space Allocation Ordinance, all new multi-family residential development projects with four or more units shall provide an adequate recycling area or room for collecting and loading recyclable materials. The proposed project would be subject to the multi-family residential requirement. The City has adopted a Construction and Demolition (C&D) Waste Recycling Ordinance to assist in meeting the diversion goals of AB 939 and City of Los Angeles. The proposed project would be required to comply with this ordinance. All construction and demolition waste generated by the proposed project would be required to be taken to a certified C&D waste processor. Many certified waste processors are located within with the City of Los Angeles. The processor closest to the project site is East Downtown Diversion/USA Waste of California located approximately 12.8 miles northeast of the project site, which has a recycling rate of 74.94 percent as of July 1, 2016 (Los Angeles, City of, 2016a). Solid waste collection in the City is managed by the City’s Bureau of Sanitation. Table 17 summarizes the permitted daily throughput, estimated average waste quantities disposed, remaining capacity, and closure date for landfills near the project site. As shown, landfills that may serve the project site have a remaining capacity of over 11,000 tons per day.
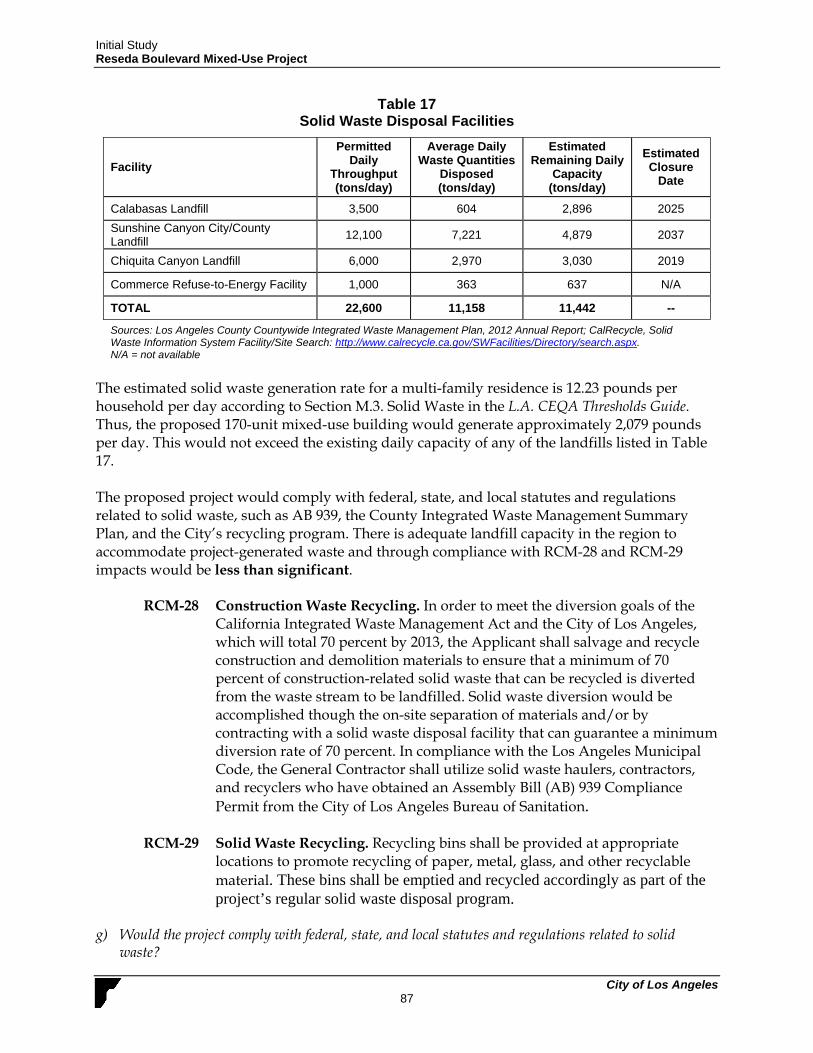
Initial Study Reseda Boulevard Mixed-Use Project
City of Los Angeles 87
Table 17 Solid Waste Disposal Facilities
Facility
Permitted Daily
Throughput (tons/day)
Average Daily Waste Quantities
Disposed (tons/day)
Estimated Remaining Daily
Capacity (tons/day)
Estimated Closure
Date
Calabasas Landfill 3,500 604 2,896 2025
Sunshine Canyon City/County Landfill
12,100 7,221 4,879 2037
Chiquita Canyon Landfill 6,000 2,970 3,030 2019
Commerce Refuse-to-Energy Facility 1,000 363 637 N/A
TOTAL 22,600 11,158 11,442 --
Sources: Los Angeles County Countywide Integrated Waste Management Plan, 2012 Annual Report; CalRecycle, Solid Waste Information System Facility/Site Search: http://www.calrecycle.ca.gov/SWFacilities/Directory/search.aspx. N/A = not available
The estimated solid waste generation rate for a multi-family residence is 12.23 pounds per household per day according to Section M.3. Solid Waste in the L.A. CEQA Thresholds Guide. Thus, the proposed 170-unit mixed-use building would generate approximately 2,079 pounds per day. This would not exceed the existing daily capacity of any of the landfills listed in Table 17. The proposed project would comply with federal, state, and local statutes and regulations related to solid waste, such as AB 939, the County Integrated Waste Management Summary Plan, and the City’s recycling program. There is adequate landfill capacity in the region to accommodate project-generated waste and through compliance with RCM-28 and RCM-29 impacts would be less than significant.
RCM-28 Construction Waste Recycling. In order to meet the diversion goals of the California Integrated Waste Management Act and the City of Los Angeles, which will total 70 percent by 2013, the Applicant shall salvage and recycle construction and demolition materials to ensure that a minimum of 70 percent of construction-related solid waste that can be recycled is diverted from the waste stream to be landfilled. Solid waste diversion would be accomplished though the on-site separation of materials and/or by contracting with a solid waste disposal facility that can guarantee a minimum diversion rate of 70 percent. In compliance with the Los Angeles Municipal Code, the General Contractor shall utilize solid waste haulers, contractors, and recyclers who have obtained an Assembly Bill (AB) 939 Compliance Permit from the City of Los Angeles Bureau of Sanitation.
RCM-29 Solid Waste Recycling. Recycling bins shall be provided at appropriate
locations to promote recycling of paper, metal, glass, and other recyclable material. These bins shall be emptied and recycled accordingly as part of the project’s regular solid waste disposal program.
g) Would the project comply with federal, state, and local statutes and regulations related to solid
waste?
Initial Study Reseda Boulevard Mixed-Use Project
City of Los Angeles 88
Refer to Section XVII.f. Impacts would be less than significant. XVIII. MANDATORY FINDINGS OF SIGNIFICANCE
a) Does the project have the potential to substantially reduce the habitat of a fish or wildlife species,
cause a fish or wildlife population to drop below self- sustaining levels, eliminate a plant or animal community, reduce the number or restrict the range of a rare or endangered plant or animal or eliminate important examples of the major periods of California history or prehistory?
A significant impact may occur only if a project would have an identified potentially significant impact for any of the above issues, as discussed in the preceding sections. As discussed in Section IV, Biological Resources, and Section V, Cultural Resources, the project would have less than significant impacts on sensitive species, habitats, endangered plants, or historical resources with mitigation incorporated. b) Does the project have impacts that are individually limited, but cumulatively considerable?
(“Cumulatively considerable” means that the incremental effects of a project are considerable when viewed in connection with the effects of past projects, the effects of other current projects, and the effects of probable future projects)?
A significant impact may occur if the proposed project, in conjunction with other related projects in the area of the project site, would result in impacts that would be less than significant when viewed separately, but would be significant when viewed together. There are no projects within the vicinity of the project site. The projects closest to the project site are United Technology Corporation Specific Plan approximately 2.7 miles to the northwest, MGA Mixed-Use Campus 4.9 miles northwest of the project site, and ICON Sherman Oaks mixed-use development approximately 5.7 miles southeast of the project site (City of Los Angeles, Major Projects, 2016). All potential environmental impacts of the proposed project have been considered in this Initial Study and have been determined to be less than significant. There are no additional projects in the immediate vicinity of the project site. The nearest related project is the United Technologies MGA Mixed-Use Campus 4.9 miles to the northwest of the project site and other related projects are considerably further away. As such, there are no other known planned or pending projects in the immediate site vicinity that would substantially contribute to any additive effects in conjunction with the project with respect to such issues as aesthetics, land use, and construction-related impacts (such as for traffic, air quality, noise) (City of Los Angeles, Major Projects, 2016). The project’s contribution to cumulative regional and global impacts with respect to such issues as air quality, climate change, and noise would not be substantial due to the project size, location, and design. As such, with implementation of mitigation measures included in this Initial Study, the project would not substantially contribute to any cumulative impacts. c) Does the project have environmental effects which will cause substantial adverse effects on human
beings, either directly or indirectly?
Initial Study Reseda Boulevard Mixed-Use Project
City of Los Angeles 89
A significant impact may occur if the proposed project has the potential to result in significant impacts, as discussed in the preceding sections. In general, impacts to human beings are associated with such issues as air quality, hazards and hazardous materials, and noise impacts. As detailed in Section III, Air Quality, Section VIII, Hazards and Hazardous Materials, the proposed project would not result, either directly or indirectly, in adverse hazards related to air quality or hazardous materials. As discussed in Section XII, Noise, construction activity would create potentially significant noise impacts on neighboring properties, including residences and a church. Such impacts would be reduced to less than significant levels through implementation of the mitigation measures identified in Section XII. Therefore, impact to human beings would be less than significant with mitigation and regulatory compliance measures incorporated in other sections of this document.
Initial Study Reseda Boulevard Mixed-Use Project
City of Los Angeles 90
References California Code of Regulations, Title 24, Part 11. 2010 California Green Building Code. Accessed
Retrieved from: http://ladbs.org/LADBSWeb/codes.jsf California Department of Conservation, Division of Land Resource Protection (DOC). Los
Angeles County Important Farmland 2014. April 2016. Retrieved from: ftp://ftp.consrv.ca.gov/pub/dlrp/FMMP/pdf/2014/los14.pdf
California Department of Conservation, Division of Land Resource Protection. Los Angeles
County Williamson Act FY 2012/2013. Accessed December 2015. Retrieved from: ftp://ftp.consrv.ca.gov/pub/dlrp/wa/LA_12_13_WA.pdf
California Department of Conservation, Division of Land Resources Protection. Los Angeles
County Tsunami Inundation with USGS 24K Quads. March 2009. Accessed August 2016. Retrieved from: http://www.conservation.ca.gov/cgs/geologic_hazards/Tsunami/Inundation_Maps/LosAngeles
California Department of Finance. E-5 Population and Housing Estimates for Cities, Counties,
and the State, 2011-2016 with 2010 Benchmark. May 2016. Retrieved from: http://www.dof.ca.gov/Forecasting/Demographics/Estimates/E-5/
California Department of Parks and Recreation. Quimby Act 101: An Abbreviated Overview.
May 28, 2002. http://www.parks.ca.gov/pages/795/files/quimby101.pdf California Department of Resource Recycling and Recovery (CalRecycle). Website:
calrecycle.org. Accessed December 2015. California Energy Commission. Cal-Adatp. 2014. Retrieved from: http://cal-adapt.org/tools/ California Environmental Protection Agency (CalEPA). Climate Action Team Biennial Report.
Final Report. April 2010. Federal Emergency Management Agency (FEMA). FEMA Map Service Center. Map no.
06037C1295F. Retrieved at: https://msc.fema.gov/portal Federal Transit Administration. Transit Noise and Vibration Impact Assessment. May 2006. Institute of Transportation Engineers, Trip Generation, 9th Edition, 2012. Linscott Law & Greenspan, Engineers. Technical Memorandum – Reseda & Clark Mixed-Use Project.
June 22, 2016. Los Angeles Beau of Sanitation (BOS). Accessed August 2016 at:
https://www.lacitysan.org/san/faces/home?_afrLoop=31985931059892693&_afrWindow
Initial Study Reseda Boulevard Mixed-Use Project
City of Los Angeles 91
Mode=0&_afrWindowId=null#!%40%40%3F_afrWindowId%3Dnull%26_afrLoop%3D31985931059892693%26_afrWindowMode%3D0%26_adf.ctrl-state%3Dhstl2sht0_133
Los Angeles, City of. General Plan Safety Element. Adopted November 1996. Retrieved from:
http://cityplanning.lacity.org/cwd/gnlpln/saftyelt.pdf Los Angeles, City of. General Plan Conservation Element. Adopted September 2001. Retrieved
from: http://planning.lacity.org/cwd/gnlpln/consvelt.pdf Los Angeles, City of. 2006a. CEQA Thresholds Guidelines. Los Angeles, City of. 2006b. Van Nuys Airport Plan. Department of City Planning. January 2006.
Retrieved from: https://www.lawa.org/uploadedFiles/VNY/VNY_Part_161/VNY%20Master%20Plan%20with%20Alt%20J%20map.pdf
Los Angeles, City of. Climate LA Executive Summary. 2008. Retrieved from:
http://environmentla.org/pdf/ClimateLA_v5.pdf Los Angeles, City of. Los Angeles Fire Department. Accessed August 2016. Retrieved from:
http://www.lafd.org/ Los Angeles, City of. Barlow Hospital Replacement and Master Plan Project, Draft EIR. April 2012. Los Angeles, City of. Floodplain Management Plan. October, 2015. Retrieved from:
http://eng.lacity.org/projects/fmp/pdf/2015-fmp.pdf Los Angeles, City of. Green LA: An Action Plan to Lead the Nation in Fighting Global
Warming. May 2007. Los Angeles, City of. Municipal Code. Accessed August 2016. Accessed at:
http://www.amlegal.com/library/ca/losangeles.shtml Los Angeles, City of. Environment LA Sanitation. Construction and Demolition Recycling. July
1, 2016. Accessed at: https://www.lacitysan.org/san/faces/home/portal/s-lsh-wwd/s-lsh-wwd-s/s-lsh-wwd-s-r/s-lsh-wwd-s-r-cdr;jsessionid=DQtRCLemV6W7NjkWvheM3mUA3NeLqUUO3QrgMpRtoNILcrlkZS6E!642002342!-1376190690?_afrLoop=32051576448761725&_afrWindowMode=0&_afrWindowId=null#!%40%40%3F_afrWindowId%3Dnull%26_afrLoop%3D32051576448761725%26_afrWindowMode%3D0%26_adf.ctrl-state%3D19t9xxcscj_4
Los Angeles, City of. Office of Historic Resources, Historic Places LA. Los Angeles Historic
Resources Inventory. 2016. Retrieved at: http://www.historicplacesla.org/map
Initial Study Reseda Boulevard Mixed-Use Project
City of Los Angeles 92
Los Angeles, City of. Planning and Zoning Code. Accessed August 2016. Accessed at: http://www.amlegal.com/nxt/gateway.dll?f=templates&fn=default.htm&vid=amlegal:lapz_ca
Los Angeles, City of. Public Recreation Plan. Accessed August 2016. Accessed at: http://planning.lacity.org/Code_Studies/GeneralElement/PublicRecreationPlan.pdf Los Angeles, City of. LA Sanitation: Hyperion Water Reclamation Plant. Accessed August 2016.
Accessed at: https://www.lacitysan.org/san/faces/home/portal/s-lsh-wwd/s-lsh-wwd-cw/s-lsh-
wwd-cw-p/s-lsh-wwd-cw-p-hwrp?_adf.ctrl-state=tyk6kwid1_70&_afrLoop=29823994389824166#!
Los Angeles, City of. Department of City Planning, Major Projects. Accessed August 2016.
Retrieved from: https://ladcp.maps.arcgis.com/apps/MapJournal/index.html?appid=b06f97ccf94741fdaad27443013eead1
Los Angeles, City of. Zone Information and Map Access System (ZIMAS). Accessed August
2016. Accessed at: http://zimas.lacity.org/ Los Angeles, City of Department of Recreation and Parks. Who We are and Park Locator.
Accessed August 2016. Retrieved from: http://www.laparks.org/department/who-we-are. Los Angeles Department of Transportation (LADOT). Traffic Study Policies and Procedures.
August 2014. Los Angeles County, Department of Regional Planning. Los Angeles County Airport Land Use
Plan. 2004. Retrieved from: http://planning.lacounty.gov/view/alup/ Los Angeles County Department of Public Works. Development Planning for Storm Water
Management: A Manual for the Standard Urban Storm Water Mitigation Plan (SUSMP). Approved March 2008. http://www.swrcb.ca.gov/losangeles/water_issues/programs/stormwater/susmp/susmp_rbfinal.pdf
Los Angeles County, Department of Regional Planning. Los Angeles County Airport Land Use
Plan. October, 2004. Retrieved from: http://planning.lacounty.gov/view/alup/ Los Angeles County Zoning Ordinance. Zoning Ordinance Summary – Residential Zones and
Commercial Zones. Accessed August 2016. Retrieved at: http://planning.lacounty.gov/luz/summary/category/residential_zones/
Los Angeles Department of Water and Power. Sustainability Plan. August 20, 2009. Accessed
December 24, 2015. Accessed at: https://www.ladwp.com/ladwp/faces/ladwp/aboutus/a-inourcommunity/a-ioc-goinggreen/a-ioc-gg-
Initial Study Reseda Boulevard Mixed-Use Project
City of Los Angeles 93
commitmenttosustainability?_afrLoop=59293143600349&_afrWindowMode=0&_afrWindowId=11jw72ejv8_14#%40%3F_afrWindowId%3D11jw72ejv8_14%26_afrLoop%3D59293143600349%26_afrWindowMode%3D0%26_adf.ctrl-state%3D11jw72ejv8_38
Los Angeles Department of Water and Power. Urban Water Management Plan. 2010. Accessed August 2016 at: http://www.water.ca.gov/urbanwatermanagement/2010uwmps/Los%20Angeles%20Department%20of%20Water%20and%20Power/LADWP%20UWMP_2010_LowRes.pdf
Los Angeles Fire Department. Find Your Station. Accessed August 2016. Retrieved from:
http://www.lafd.org/fire-stations/find-your-station Los Angeles Unified School District. Resident School Identifier. Accessed December 23,
2015.Retrieved from: http://rsi.lausd.net/ResidentSchoolIdentifier/ South Coast Air Quality Management District (SCAQMD). 2007. Air Quality Management
Plan. SCAQMD. December 5, 2008. Interim CEQA GHG Significance Threshold for Stationary
Sources, Rules and Plans. Southern California Association of Governments (SCAG). Growth Forecasting. Retrieved from:
http://www.scag.ca.gov/DataAndTools/Pages/GrowthForecasting.aspx U.S. Environmental Protection Agency. Noise From Construction Equipment, and Operations,
Building Equipment, and Home Appliances. December 31, 1971. Personal Communication Senior Lead Officer, Marco Jimenez, Los Angeles Police Department, Office of Operations,
August 4, 2016

Appendix A Air Quality Modeling Results (CalEEMod Outputs)

South Coast Air Basin, Winter
Reseda Boulevard Mixed-Use Project
1.1 Land Usage
Land Uses Size Metric Lot Acreage Floor Surface Area Population
Enclosed Parking Structure 219.00 Space 0.00 87,600.00 0
Parking Lot 48.00 Space 0.00 19,200.00 0
Apartments Mid Rise 170.00 Dwelling Unit 1.30 3,725.00 486
Regional Shopping Center 6.00 1000sqft 0.30 6,000.00 0
1.2 Other Project Characteristics
Urbanization
Climate Zone
Urban
11
Wind Speed (m/s) Precipitation Freq (Days)2.2 31
1.3 User Entered Comments & Non-Default Data
1.0 Project Characteristics
Utility Company Southern California Edison
2018Operational Year
CO2 Intensity (lb/MWhr)
630.89 0.029CH4 Intensity (lb/MWhr)
0.006N2O Intensity (lb/MWhr)
CalEEMod Version: CalEEMod.2013.2.2 Date: 8/3/2016 3:55 PMPage 1 of 25
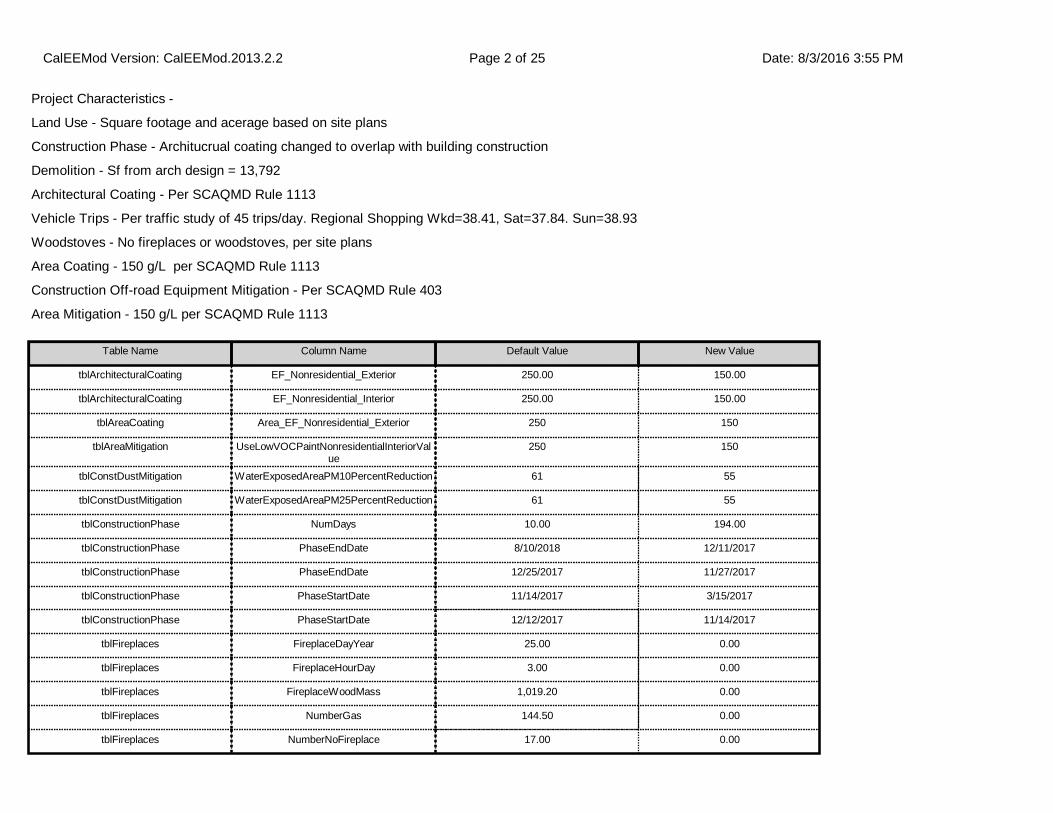
Project Characteristics -
Land Use - Square footage and acerage based on site plans
Construction Phase - Architucrual coating changed to overlap with building construction
Demolition - Sf from arch design = 13,792
Architectural Coating - Per SCAQMD Rule 1113
Vehicle Trips - Per traffic study of 45 trips/day. Regional Shopping Wkd=38.41, Sat=37.84. Sun=38.93
Woodstoves - No fireplaces or woodstoves, per site plans
Area Coating - 150 g/L per SCAQMD Rule 1113
Construction Off-road Equipment Mitigation - Per SCAQMD Rule 403
Area Mitigation - 150 g/L per SCAQMD Rule 1113
Table Name Column Name Default Value New Value
tblArchitecturalCoating EF_Nonresidential_Exterior 250.00 150.00
tblArchitecturalCoating EF_Nonresidential_Interior 250.00 150.00
tblAreaCoating Area_EF_Nonresidential_Exterior 250 150
tblAreaMitigation UseLowVOCPaintNonresidentialInteriorValue
250 150
tblConstDustMitigation WaterExposedAreaPM10PercentReduction 61 55
tblConstDustMitigation WaterExposedAreaPM25PercentReduction 61 55
tblConstructionPhase NumDays 10.00 194.00
tblConstructionPhase PhaseEndDate 8/10/2018 12/11/2017
tblConstructionPhase PhaseEndDate 12/25/2017 11/27/2017
tblConstructionPhase PhaseStartDate 11/14/2017 3/15/2017
tblConstructionPhase PhaseStartDate 12/12/2017 11/14/2017
tblFireplaces FireplaceDayYear 25.00 0.00
tblFireplaces FireplaceHourDay 3.00 0.00
tblFireplaces FireplaceWoodMass 1,019.20 0.00
tblFireplaces NumberGas 144.50 0.00
tblFireplaces NumberNoFireplace 17.00 0.00
CalEEMod Version: CalEEMod.2013.2.2 Date: 8/3/2016 3:55 PMPage 2 of 25

2.0 Emissions Summary
tblFireplaces NumberWood 8.50 0.00
tblLandUse LandUseSquareFeet 170,000.00 3,725.00
tblLandUse LotAcreage 1.97 0.00
tblLandUse LotAcreage 0.43 0.00
tblLandUse LotAcreage 4.47 1.30
tblLandUse LotAcreage 0.14 0.30
tblProjectCharacteristics OperationalYear 2014 2018
tblVehicleTrips ST_TR 49.97 37.84
tblVehicleTrips SU_TR 25.24 38.93
tblVehicleTrips WD_TR 42.94 38.41
tblWoodstoves NumberCatalytic 8.50 0.00
tblWoodstoves NumberNoncatalytic 8.50 0.00
tblWoodstoves WoodstoveDayYear 25.00 0.00
tblWoodstoves WoodstoveWoodMass 999.60 0.00
CalEEMod Version: CalEEMod.2013.2.2 Date: 8/3/2016 3:55 PMPage 3 of 25
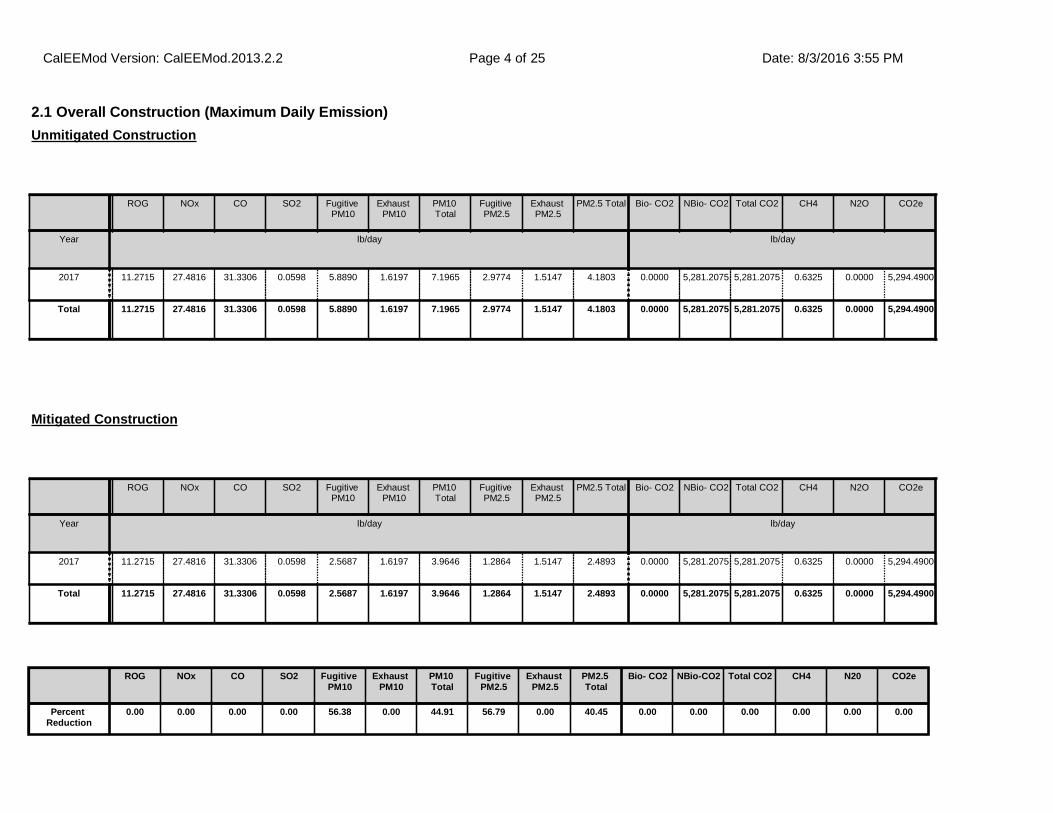
2.1 Overall Construction (Maximum Daily Emission)
ROG NOx CO SO2 Fugitive PM10
Exhaust PM10
PM10 Total
Fugitive PM2.5
Exhaust PM2.5
PM2.5 Total Bio- CO2 NBio- CO2 Total CO2 CH4 N2O CO2e
Year lb/day lb/day
2017 11.2715 27.4816 31.3306 0.0598 5.8890 1.6197 7.1965 2.9774 1.5147 4.1803 0.0000 5,281.2075 5,281.2075 0.6325 0.0000 5,294.4900
Total 11.2715 27.4816 31.3306 0.0598 5.8890 1.6197 7.1965 2.9774 1.5147 4.1803 0.0000 5,281.2075 5,281.2075 0.6325 0.0000 5,294.4900
Unmitigated Construction
ROG NOx CO SO2 Fugitive PM10
Exhaust PM10
PM10 Total
Fugitive PM2.5
Exhaust PM2.5
PM2.5 Total Bio- CO2 NBio- CO2 Total CO2 CH4 N2O CO2e
Year lb/day lb/day
2017 11.2715 27.4816 31.3306 0.0598 2.5687 1.6197 3.9646 1.2864 1.5147 2.4893 0.0000 5,281.2075 5,281.2075 0.6325 0.0000 5,294.4900
Total 11.2715 27.4816 31.3306 0.0598 2.5687 1.6197 3.9646 1.2864 1.5147 2.4893 0.0000 5,281.2075 5,281.2075 0.6325 0.0000 5,294.4900
Mitigated Construction
ROG NOx CO SO2 Fugitive PM10
Exhaust PM10
PM10 Total
Fugitive PM2.5
Exhaust PM2.5
PM2.5 Total
Bio- CO2 NBio-CO2 Total CO2 CH4 N20 CO2e
Percent Reduction
0.00 0.00 0.00 0.00 56.38 0.00 44.91 56.79 0.00 40.45 0.00 0.00 0.00 0.00 0.00 0.00
CalEEMod Version: CalEEMod.2013.2.2 Date: 8/3/2016 3:55 PMPage 4 of 25

2.2 Overall Operational
ROG NOx CO SO2 Fugitive PM10
Exhaust PM10
PM10 Total
Fugitive PM2.5
Exhaust PM2.5
PM2.5 Total Bio- CO2 NBio- CO2 Total CO2 CH4 N2O CO2e
Category lb/day lb/day
Area 3.2914 0.1642 14.1527 7.4000e-004
0.0772 0.0772 0.0772 0.0772 0.0000 25.3136 25.3136 0.0252 0.0000 25.8427
Energy 0.0346 0.2955 0.1269 1.8800e-003
0.0239 0.0239 0.0239 0.0239 376.9753 376.9753 7.2300e-003
6.9100e-003
379.2696
Mobile 4.8002 13.8090 52.6271 0.1405 9.8783 0.2012 10.0795 2.6394 0.1854 2.8248 11,611.3637
11,611.3637
0.4442 11,620.6913
Total 8.1262 14.2686 66.9066 0.1431 9.8783 0.3023 10.1805 2.6394 0.2865 2.9259 0.0000 12,013.6527
12,013.6527
0.4766 6.9100e-003
12,025.8035
Unmitigated Operational
ROG NOx CO SO2 Fugitive PM10
Exhaust PM10
PM10 Total
Fugitive PM2.5
Exhaust PM2.5
PM2.5 Total Bio- CO2 NBio- CO2 Total CO2 CH4 N2O CO2e
Category lb/day lb/day
Area 3.2914 0.1642 14.1527 7.4000e-004
0.0772 0.0772 0.0772 0.0772 0.0000 25.3136 25.3136 0.0252 0.0000 25.8427
Energy 0.0346 0.2955 0.1269 1.8800e-003
0.0239 0.0239 0.0239 0.0239 376.9753 376.9753 7.2300e-003
6.9100e-003
379.2696
Mobile 4.8002 13.8090 52.6271 0.1405 9.8783 0.2012 10.0795 2.6394 0.1854 2.8248 11,611.3637
11,611.3637
0.4442 11,620.6913
Total 8.1262 14.2686 66.9066 0.1431 9.8783 0.3023 10.1805 2.6394 0.2865 2.9259 0.0000 12,013.6527
12,013.6527
0.4766 6.9100e-003
12,025.8035
Mitigated Operational
CalEEMod Version: CalEEMod.2013.2.2 Date: 8/3/2016 3:55 PMPage 5 of 25

3.0 Construction Detail
Construction Phase
Phase Number
Phase Name Phase Type Start Date End Date Num Days Week
Num Days Phase Description
1 Demolition Demolition 1/1/2017 1/27/2017 5 20
2 Site Preparation Site Preparation 1/28/2017 1/31/2017 5 2
3 Grading Grading 2/1/2017 2/6/2017 5 4
4 Building Construction Building Construction 2/7/2017 11/13/2017 5 200
5 Architectural Coating Architectural Coating 3/15/2017 12/11/2017 5 194
6 Paving Paving 11/14/2017 11/27/2017 5 10
OffRoad Equipment
ROG NOx CO SO2 Fugitive PM10
Exhaust PM10
PM10 Total
Fugitive PM2.5
Exhaust PM2.5
PM2.5 Total
Bio- CO2 NBio-CO2 Total CO2 CH4 N20 CO2e
Percent Reduction
0.00 0.00 0.00 0.00 0.00 0.00 0.00 0.00 0.00 0.00 0.00 0.00 0.00 0.00 0.00 0.00
Residential Indoor: 7,543; Residential Outdoor: 2,514; Non-Residential Indoor: 141,264; Non-Residential Outdoor: 47,088 (Architectural Coating – sqft)
Acres of Grading (Site Preparation Phase): 1
Acres of Grading (Grading Phase): 1.5
Acres of Paving: 0
CalEEMod Version: CalEEMod.2013.2.2 Date: 8/3/2016 3:55 PMPage 6 of 25
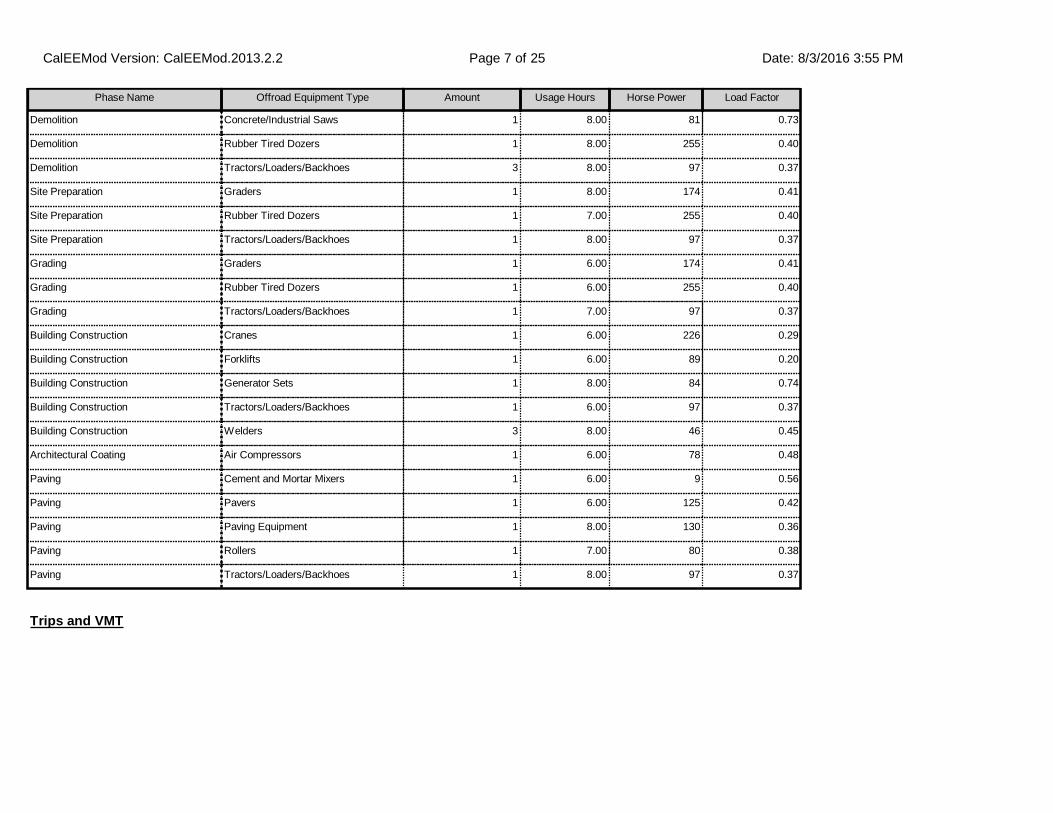
Phase Name Offroad Equipment Type Amount Usage Hours Horse Power Load Factor
Demolition Concrete/Industrial Saws 1 8.00 81 0.73
Demolition Rubber Tired Dozers 1 8.00 255 0.40
Demolition Tractors/Loaders/Backhoes 3 8.00 97 0.37
Site Preparation Graders 1 8.00 174 0.41
Site Preparation Rubber Tired Dozers 1 7.00 255 0.40
Site Preparation Tractors/Loaders/Backhoes 1 8.00 97 0.37
Grading Graders 1 6.00 174 0.41
Grading Rubber Tired Dozers 1 6.00 255 0.40
Grading Tractors/Loaders/Backhoes 1 7.00 97 0.37
Building Construction Cranes 1 6.00 226 0.29
Building Construction Forklifts 1 6.00 89 0.20
Building Construction Generator Sets 1 8.00 84 0.74
Building Construction Tractors/Loaders/Backhoes 1 6.00 97 0.37
Building Construction Welders 3 8.00 46 0.45
Architectural Coating Air Compressors 1 6.00 78 0.48
Paving Cement and Mortar Mixers 1 6.00 9 0.56
Paving Pavers 1 6.00 125 0.42
Paving Paving Equipment 1 8.00 130 0.36
Paving Rollers 1 7.00 80 0.38
Paving Tractors/Loaders/Backhoes 1 8.00 97 0.37
Trips and VMT
CalEEMod Version: CalEEMod.2013.2.2 Date: 8/3/2016 3:55 PMPage 7 of 25

3.2 Demolition - 2017
ROG NOx CO SO2 Fugitive PM10
Exhaust PM10
PM10 Total
Fugitive PM2.5
Exhaust PM2.5
PM2.5 Total Bio- CO2 NBio- CO2 Total CO2 CH4 N2O CO2e
Category lb/day lb/day
Fugitive Dust 0.6788 0.0000 0.6788 0.1028 0.0000 0.1028 0.0000 0.0000
Off-Road 2.7216 26.5855 20.8712 0.0245 1.6062 1.6062 1.5022 1.5022 2,457.4682 2,457.4682 0.6235 2,470.5620
Total 2.7216 26.5855 20.8712 0.0245 0.6788 1.6062 2.2850 0.1028 1.5022 1.6050 2,457.4682 2,457.4682 0.6235 2,470.5620
Unmitigated Construction On-Site
3.1 Mitigation Measures Construction
Use Soil Stabilizer
Replace Ground Cover
Water Exposed Area
Clean Paved Roads
Phase Name Offroad Equipment Count
Worker Trip Number
Vendor Trip Number
Hauling Trip Number
Worker Trip Length
Vendor Trip Length
Hauling Trip Length
Worker Vehicle Class
Vendor Vehicle Class
Hauling Vehicle Class
Demolition 5 13.00 0.00 63.00 14.70 6.90 20.00 LD_Mix HDT_Mix HHDT
Site Preparation 3 8.00 0.00 0.00 14.70 6.90 20.00 LD_Mix HDT_Mix HHDT
Grading 3 8.00 0.00 0.00 14.70 6.90 20.00 LD_Mix HDT_Mix HHDT
Building Construction 7 169.00 37.00 0.00 14.70 6.90 20.00 LD_Mix HDT_Mix HHDT
Architectural Coating 1 34.00 0.00 0.00 14.70 6.90 20.00 LD_Mix HDT_Mix HHDT
Paving 5 13.00 0.00 0.00 14.70 6.90 20.00 LD_Mix HDT_Mix HHDT
CalEEMod Version: CalEEMod.2013.2.2 Date: 8/3/2016 3:55 PMPage 8 of 25

3.2 Demolition - 2017
ROG NOx CO SO2 Fugitive PM10
Exhaust PM10
PM10 Total
Fugitive PM2.5
Exhaust PM2.5
PM2.5 Total Bio- CO2 NBio- CO2 Total CO2 CH4 N2O CO2e
Category lb/day lb/day
Hauling 0.0540 0.8290 0.6779 2.3200e-003
0.0549 0.0124 0.0673 0.0150 0.0114 0.0264 229.9870 229.9870 1.6700e-003
230.0221
Vendor 0.0000 0.0000 0.0000 0.0000 0.0000 0.0000 0.0000 0.0000 0.0000 0.0000 0.0000 0.0000 0.0000 0.0000
Worker 0.0496 0.0671 0.7010 1.7200e-003
0.1453 1.1700e-003
0.1465 0.0385 1.0800e-003
0.0396 139.4700 139.4700 7.3200e-003
139.6236
Total 0.1036 0.8961 1.3789 4.0400e-003
0.2002 0.0135 0.2137 0.0536 0.0125 0.0660 369.4570 369.4570 8.9900e-003
369.6457
Unmitigated Construction Off-Site
ROG NOx CO SO2 Fugitive PM10
Exhaust PM10
PM10 Total
Fugitive PM2.5
Exhaust PM2.5
PM2.5 Total Bio- CO2 NBio- CO2 Total CO2 CH4 N2O CO2e
Category lb/day lb/day
Fugitive Dust 0.2902 0.0000 0.2902 0.0439 0.0000 0.0439 0.0000 0.0000
Off-Road 2.7216 26.5855 20.8712 0.0245 1.6062 1.6062 1.5022 1.5022 0.0000 2,457.4682 2,457.4682 0.6235 2,470.5620
Total 2.7216 26.5855 20.8712 0.0245 0.2902 1.6062 1.8964 0.0439 1.5022 1.5462 0.0000 2,457.4682 2,457.4682 0.6235 2,470.5620
Mitigated Construction On-Site
CalEEMod Version: CalEEMod.2013.2.2 Date: 8/3/2016 3:55 PMPage 9 of 25
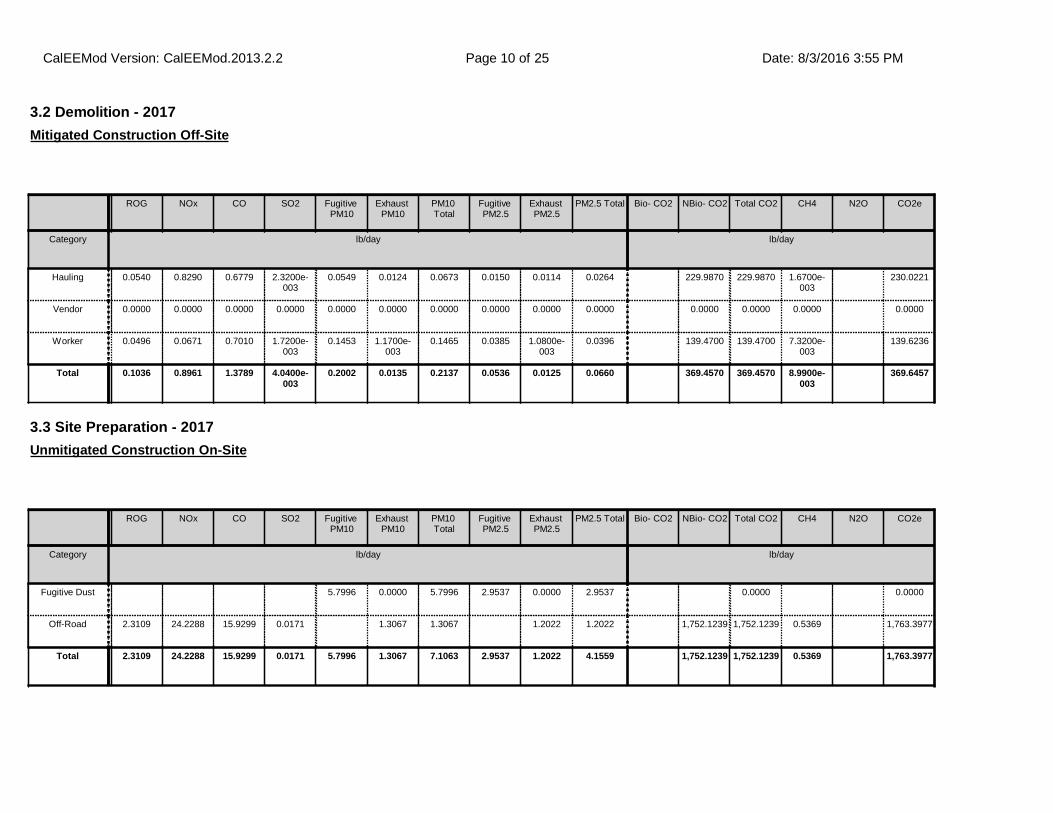
3.2 Demolition - 2017
ROG NOx CO SO2 Fugitive PM10
Exhaust PM10
PM10 Total
Fugitive PM2.5
Exhaust PM2.5
PM2.5 Total Bio- CO2 NBio- CO2 Total CO2 CH4 N2O CO2e
Category lb/day lb/day
Hauling 0.0540 0.8290 0.6779 2.3200e-003
0.0549 0.0124 0.0673 0.0150 0.0114 0.0264 229.9870 229.9870 1.6700e-003
230.0221
Vendor 0.0000 0.0000 0.0000 0.0000 0.0000 0.0000 0.0000 0.0000 0.0000 0.0000 0.0000 0.0000 0.0000 0.0000
Worker 0.0496 0.0671 0.7010 1.7200e-003
0.1453 1.1700e-003
0.1465 0.0385 1.0800e-003
0.0396 139.4700 139.4700 7.3200e-003
139.6236
Total 0.1036 0.8961 1.3789 4.0400e-003
0.2002 0.0135 0.2137 0.0536 0.0125 0.0660 369.4570 369.4570 8.9900e-003
369.6457
Mitigated Construction Off-Site
3.3 Site Preparation - 2017
ROG NOx CO SO2 Fugitive PM10
Exhaust PM10
PM10 Total
Fugitive PM2.5
Exhaust PM2.5
PM2.5 Total Bio- CO2 NBio- CO2 Total CO2 CH4 N2O CO2e
Category lb/day lb/day
Fugitive Dust 5.7996 0.0000 5.7996 2.9537 0.0000 2.9537 0.0000 0.0000
Off-Road 2.3109 24.2288 15.9299 0.0171 1.3067 1.3067 1.2022 1.2022 1,752.1239 1,752.1239 0.5369 1,763.3977
Total 2.3109 24.2288 15.9299 0.0171 5.7996 1.3067 7.1063 2.9537 1.2022 4.1559 1,752.1239 1,752.1239 0.5369 1,763.3977
Unmitigated Construction On-Site
CalEEMod Version: CalEEMod.2013.2.2 Date: 8/3/2016 3:55 PMPage 10 of 25
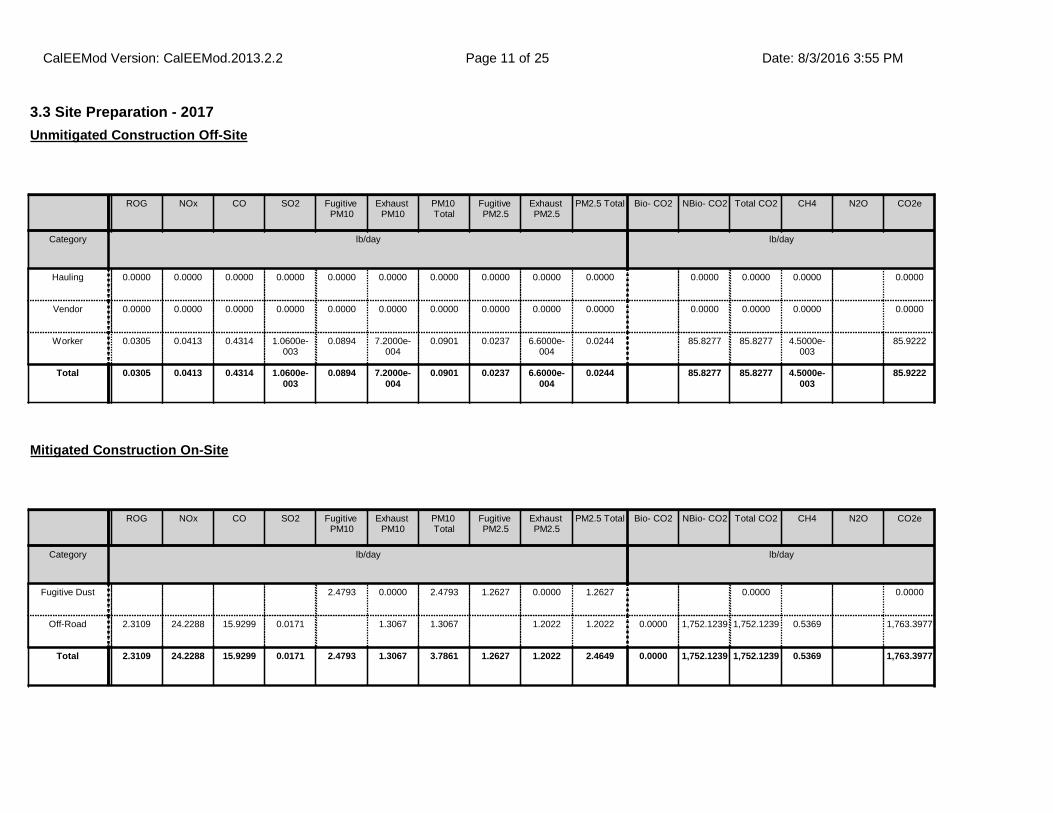
3.3 Site Preparation - 2017
ROG NOx CO SO2 Fugitive PM10
Exhaust PM10
PM10 Total
Fugitive PM2.5
Exhaust PM2.5
PM2.5 Total Bio- CO2 NBio- CO2 Total CO2 CH4 N2O CO2e
Category lb/day lb/day
Hauling 0.0000 0.0000 0.0000 0.0000 0.0000 0.0000 0.0000 0.0000 0.0000 0.0000 0.0000 0.0000 0.0000 0.0000
Vendor 0.0000 0.0000 0.0000 0.0000 0.0000 0.0000 0.0000 0.0000 0.0000 0.0000 0.0000 0.0000 0.0000 0.0000
Worker 0.0305 0.0413 0.4314 1.0600e-003
0.0894 7.2000e-004
0.0901 0.0237 6.6000e-004
0.0244 85.8277 85.8277 4.5000e-003
85.9222
Total 0.0305 0.0413 0.4314 1.0600e-003
0.0894 7.2000e-004
0.0901 0.0237 6.6000e-004
0.0244 85.8277 85.8277 4.5000e-003
85.9222
Unmitigated Construction Off-Site
ROG NOx CO SO2 Fugitive PM10
Exhaust PM10
PM10 Total
Fugitive PM2.5
Exhaust PM2.5
PM2.5 Total Bio- CO2 NBio- CO2 Total CO2 CH4 N2O CO2e
Category lb/day lb/day
Fugitive Dust 2.4793 0.0000 2.4793 1.2627 0.0000 1.2627 0.0000 0.0000
Off-Road 2.3109 24.2288 15.9299 0.0171 1.3067 1.3067 1.2022 1.2022 0.0000 1,752.1239 1,752.1239 0.5369 1,763.3977
Total 2.3109 24.2288 15.9299 0.0171 2.4793 1.3067 3.7861 1.2627 1.2022 2.4649 0.0000 1,752.1239 1,752.1239 0.5369 1,763.3977
Mitigated Construction On-Site
CalEEMod Version: CalEEMod.2013.2.2 Date: 8/3/2016 3:55 PMPage 11 of 25

3.3 Site Preparation - 2017
ROG NOx CO SO2 Fugitive PM10
Exhaust PM10
PM10 Total
Fugitive PM2.5
Exhaust PM2.5
PM2.5 Total Bio- CO2 NBio- CO2 Total CO2 CH4 N2O CO2e
Category lb/day lb/day
Hauling 0.0000 0.0000 0.0000 0.0000 0.0000 0.0000 0.0000 0.0000 0.0000 0.0000 0.0000 0.0000 0.0000 0.0000
Vendor 0.0000 0.0000 0.0000 0.0000 0.0000 0.0000 0.0000 0.0000 0.0000 0.0000 0.0000 0.0000 0.0000 0.0000
Worker 0.0305 0.0413 0.4314 1.0600e-003
0.0894 7.2000e-004
0.0901 0.0237 6.6000e-004
0.0244 85.8277 85.8277 4.5000e-003
85.9222
Total 0.0305 0.0413 0.4314 1.0600e-003
0.0894 7.2000e-004
0.0901 0.0237 6.6000e-004
0.0244 85.8277 85.8277 4.5000e-003
85.9222
Mitigated Construction Off-Site
3.4 Grading - 2017
ROG NOx CO SO2 Fugitive PM10
Exhaust PM10
PM10 Total
Fugitive PM2.5
Exhaust PM2.5
PM2.5 Total Bio- CO2 NBio- CO2 Total CO2 CH4 N2O CO2e
Category lb/day lb/day
Fugitive Dust 4.9143 0.0000 4.9143 2.5256 0.0000 2.5256 0.0000 0.0000
Off-Road 1.8844 19.7889 13.1786 0.0141 1.0661 1.0661 0.9808 0.9808 1,439.1894 1,439.1894 0.4410 1,448.4496
Total 1.8844 19.7889 13.1786 0.0141 4.9143 1.0661 5.9804 2.5256 0.9808 3.5064 1,439.1894 1,439.1894 0.4410 1,448.4496
Unmitigated Construction On-Site
CalEEMod Version: CalEEMod.2013.2.2 Date: 8/3/2016 3:55 PMPage 12 of 25
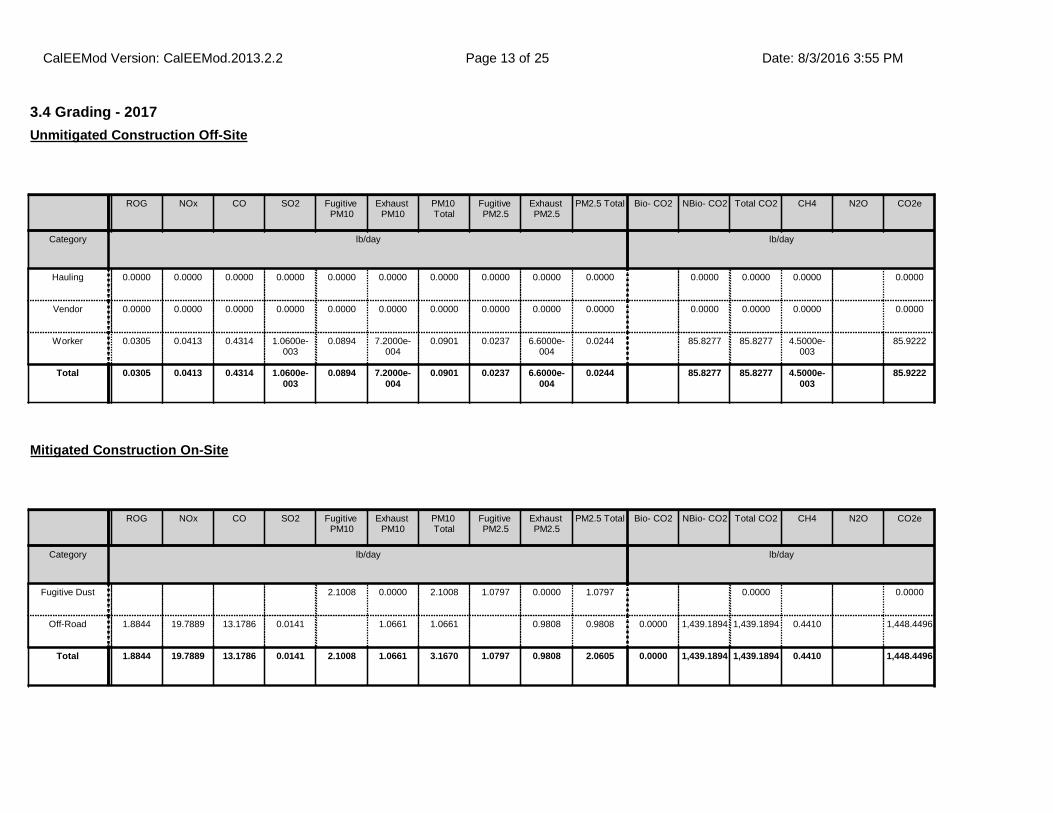
3.4 Grading - 2017
ROG NOx CO SO2 Fugitive PM10
Exhaust PM10
PM10 Total
Fugitive PM2.5
Exhaust PM2.5
PM2.5 Total Bio- CO2 NBio- CO2 Total CO2 CH4 N2O CO2e
Category lb/day lb/day
Hauling 0.0000 0.0000 0.0000 0.0000 0.0000 0.0000 0.0000 0.0000 0.0000 0.0000 0.0000 0.0000 0.0000 0.0000
Vendor 0.0000 0.0000 0.0000 0.0000 0.0000 0.0000 0.0000 0.0000 0.0000 0.0000 0.0000 0.0000 0.0000 0.0000
Worker 0.0305 0.0413 0.4314 1.0600e-003
0.0894 7.2000e-004
0.0901 0.0237 6.6000e-004
0.0244 85.8277 85.8277 4.5000e-003
85.9222
Total 0.0305 0.0413 0.4314 1.0600e-003
0.0894 7.2000e-004
0.0901 0.0237 6.6000e-004
0.0244 85.8277 85.8277 4.5000e-003
85.9222
Unmitigated Construction Off-Site
ROG NOx CO SO2 Fugitive PM10
Exhaust PM10
PM10 Total
Fugitive PM2.5
Exhaust PM2.5
PM2.5 Total Bio- CO2 NBio- CO2 Total CO2 CH4 N2O CO2e
Category lb/day lb/day
Fugitive Dust 2.1008 0.0000 2.1008 1.0797 0.0000 1.0797 0.0000 0.0000
Off-Road 1.8844 19.7889 13.1786 0.0141 1.0661 1.0661 0.9808 0.9808 0.0000 1,439.1894 1,439.1894 0.4410 1,448.4496
Total 1.8844 19.7889 13.1786 0.0141 2.1008 1.0661 3.1670 1.0797 0.9808 2.0605 0.0000 1,439.1894 1,439.1894 0.4410 1,448.4496
Mitigated Construction On-Site
CalEEMod Version: CalEEMod.2013.2.2 Date: 8/3/2016 3:55 PMPage 13 of 25

3.4 Grading - 2017
ROG NOx CO SO2 Fugitive PM10
Exhaust PM10
PM10 Total
Fugitive PM2.5
Exhaust PM2.5
PM2.5 Total Bio- CO2 NBio- CO2 Total CO2 CH4 N2O CO2e
Category lb/day lb/day
Hauling 0.0000 0.0000 0.0000 0.0000 0.0000 0.0000 0.0000 0.0000 0.0000 0.0000 0.0000 0.0000 0.0000 0.0000
Vendor 0.0000 0.0000 0.0000 0.0000 0.0000 0.0000 0.0000 0.0000 0.0000 0.0000 0.0000 0.0000 0.0000 0.0000
Worker 0.0305 0.0413 0.4314 1.0600e-003
0.0894 7.2000e-004
0.0901 0.0237 6.6000e-004
0.0244 85.8277 85.8277 4.5000e-003
85.9222
Total 0.0305 0.0413 0.4314 1.0600e-003
0.0894 7.2000e-004
0.0901 0.0237 6.6000e-004
0.0244 85.8277 85.8277 4.5000e-003
85.9222
Mitigated Construction Off-Site
3.5 Building Construction - 2017
ROG NOx CO SO2 Fugitive PM10
Exhaust PM10
PM10 Total
Fugitive PM2.5
Exhaust PM2.5
PM2.5 Total Bio- CO2 NBio- CO2 Total CO2 CH4 N2O CO2e
Category lb/day lb/day
Off-Road 2.9546 19.1088 14.3110 0.0220 1.2257 1.2257 1.1823 1.1823 2,034.2860 2,034.2860 0.4268 2,043.2497
Total 2.9546 19.1088 14.3110 0.0220 1.2257 1.2257 1.1823 1.1823 2,034.2860 2,034.2860 0.4268 2,043.2497
Unmitigated Construction On-Site
CalEEMod Version: CalEEMod.2013.2.2 Date: 8/3/2016 3:55 PMPage 14 of 25
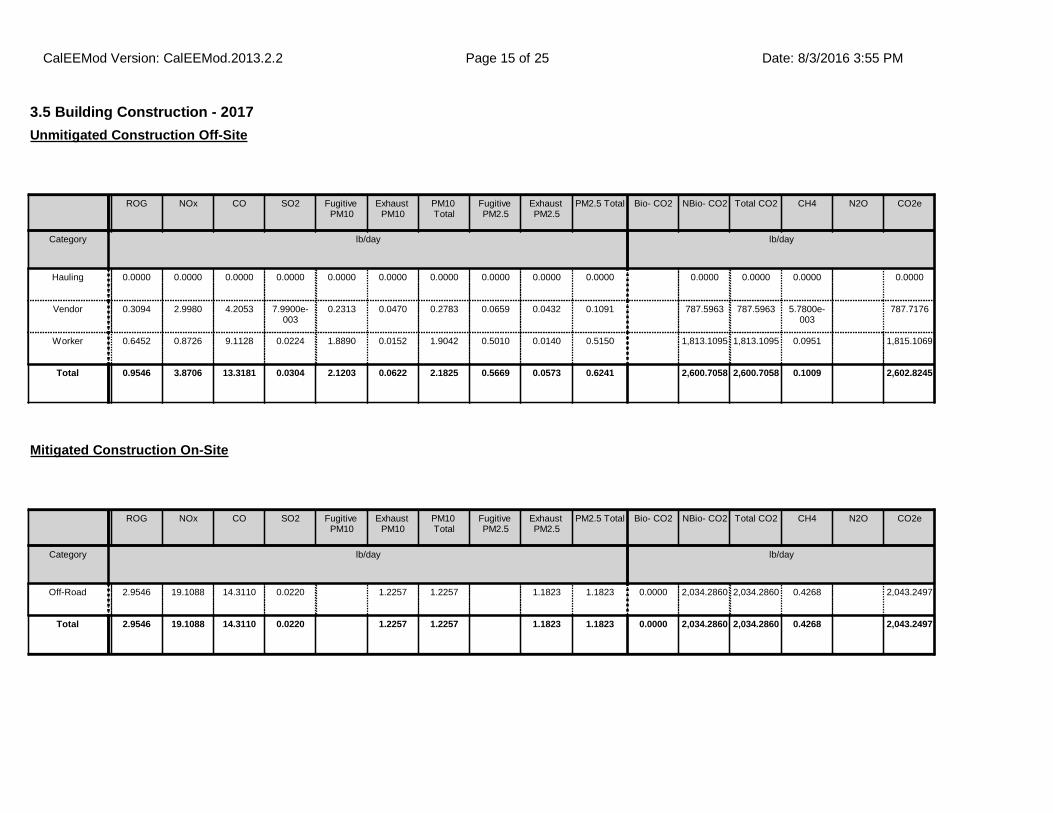
3.5 Building Construction - 2017
ROG NOx CO SO2 Fugitive PM10
Exhaust PM10
PM10 Total
Fugitive PM2.5
Exhaust PM2.5
PM2.5 Total Bio- CO2 NBio- CO2 Total CO2 CH4 N2O CO2e
Category lb/day lb/day
Hauling 0.0000 0.0000 0.0000 0.0000 0.0000 0.0000 0.0000 0.0000 0.0000 0.0000 0.0000 0.0000 0.0000 0.0000
Vendor 0.3094 2.9980 4.2053 7.9900e-003
0.2313 0.0470 0.2783 0.0659 0.0432 0.1091 787.5963 787.5963 5.7800e-003
787.7176
Worker 0.6452 0.8726 9.1128 0.0224 1.8890 0.0152 1.9042 0.5010 0.0140 0.5150 1,813.1095 1,813.1095 0.0951 1,815.1069
Total 0.9546 3.8706 13.3181 0.0304 2.1203 0.0622 2.1825 0.5669 0.0573 0.6241 2,600.7058 2,600.7058 0.1009 2,602.8245
Unmitigated Construction Off-Site
ROG NOx CO SO2 Fugitive PM10
Exhaust PM10
PM10 Total
Fugitive PM2.5
Exhaust PM2.5
PM2.5 Total Bio- CO2 NBio- CO2 Total CO2 CH4 N2O CO2e
Category lb/day lb/day
Off-Road 2.9546 19.1088 14.3110 0.0220 1.2257 1.2257 1.1823 1.1823 0.0000 2,034.2860 2,034.2860 0.4268 2,043.2497
Total 2.9546 19.1088 14.3110 0.0220 1.2257 1.2257 1.1823 1.1823 0.0000 2,034.2860 2,034.2860 0.4268 2,043.2497
Mitigated Construction On-Site
CalEEMod Version: CalEEMod.2013.2.2 Date: 8/3/2016 3:55 PMPage 15 of 25
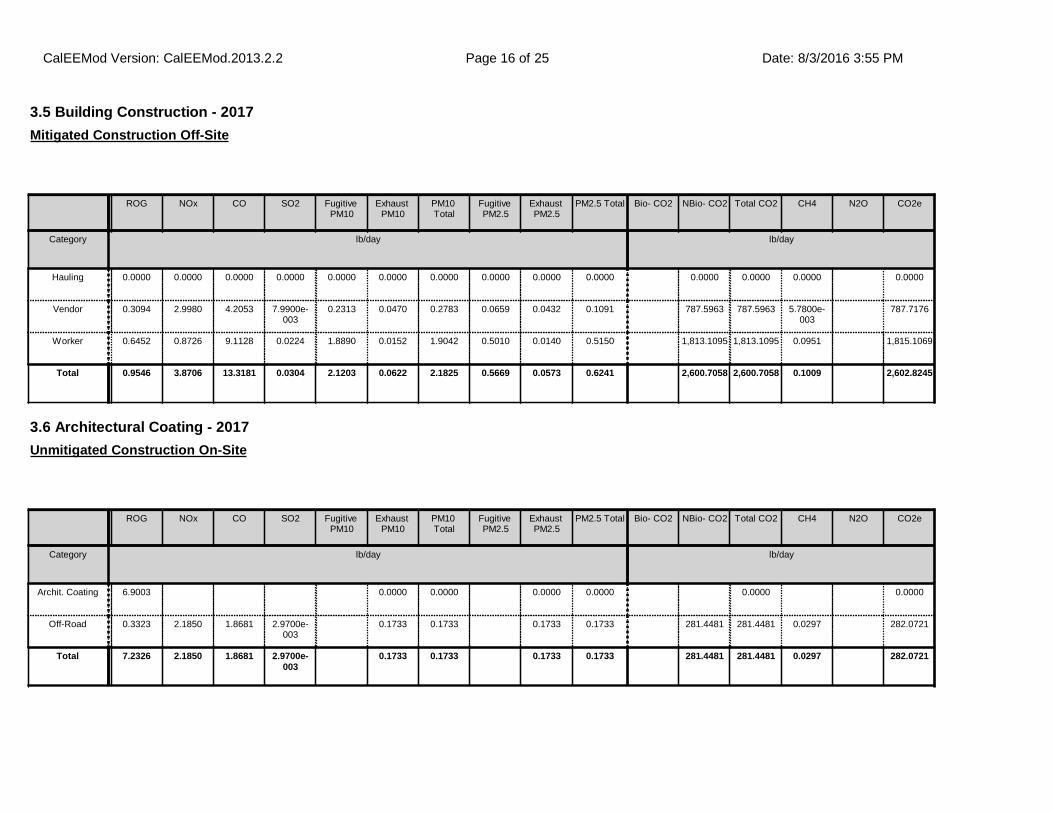
3.5 Building Construction - 2017
ROG NOx CO SO2 Fugitive PM10
Exhaust PM10
PM10 Total
Fugitive PM2.5
Exhaust PM2.5
PM2.5 Total Bio- CO2 NBio- CO2 Total CO2 CH4 N2O CO2e
Category lb/day lb/day
Hauling 0.0000 0.0000 0.0000 0.0000 0.0000 0.0000 0.0000 0.0000 0.0000 0.0000 0.0000 0.0000 0.0000 0.0000
Vendor 0.3094 2.9980 4.2053 7.9900e-003
0.2313 0.0470 0.2783 0.0659 0.0432 0.1091 787.5963 787.5963 5.7800e-003
787.7176
Worker 0.6452 0.8726 9.1128 0.0224 1.8890 0.0152 1.9042 0.5010 0.0140 0.5150 1,813.1095 1,813.1095 0.0951 1,815.1069
Total 0.9546 3.8706 13.3181 0.0304 2.1203 0.0622 2.1825 0.5669 0.0573 0.6241 2,600.7058 2,600.7058 0.1009 2,602.8245
Mitigated Construction Off-Site
3.6 Architectural Coating - 2017
ROG NOx CO SO2 Fugitive PM10
Exhaust PM10
PM10 Total
Fugitive PM2.5
Exhaust PM2.5
PM2.5 Total Bio- CO2 NBio- CO2 Total CO2 CH4 N2O CO2e
Category lb/day lb/day
Archit. Coating 6.9003 0.0000 0.0000 0.0000 0.0000 0.0000 0.0000
Off-Road 0.3323 2.1850 1.8681 2.9700e-003
0.1733 0.1733 0.1733 0.1733 281.4481 281.4481 0.0297 282.0721
Total 7.2326 2.1850 1.8681 2.9700e-003
0.1733 0.1733 0.1733 0.1733 281.4481 281.4481 0.0297 282.0721
Unmitigated Construction On-Site
CalEEMod Version: CalEEMod.2013.2.2 Date: 8/3/2016 3:55 PMPage 16 of 25

3.6 Architectural Coating - 2017
ROG NOx CO SO2 Fugitive PM10
Exhaust PM10
PM10 Total
Fugitive PM2.5
Exhaust PM2.5
PM2.5 Total Bio- CO2 NBio- CO2 Total CO2 CH4 N2O CO2e
Category lb/day lb/day
Hauling 0.0000 0.0000 0.0000 0.0000 0.0000 0.0000 0.0000 0.0000 0.0000 0.0000 0.0000 0.0000 0.0000 0.0000
Vendor 0.0000 0.0000 0.0000 0.0000 0.0000 0.0000 0.0000 0.0000 0.0000 0.0000 0.0000 0.0000 0.0000 0.0000
Worker 0.1298 0.1756 1.8334 4.5100e-003
0.3800 3.0600e-003
0.3831 0.1008 2.8200e-003
0.1036 364.7676 364.7676 0.0191 365.1694
Total 0.1298 0.1756 1.8334 4.5100e-003
0.3800 3.0600e-003
0.3831 0.1008 2.8200e-003
0.1036 364.7676 364.7676 0.0191 365.1694
Unmitigated Construction Off-Site
ROG NOx CO SO2 Fugitive PM10
Exhaust PM10
PM10 Total
Fugitive PM2.5
Exhaust PM2.5
PM2.5 Total Bio- CO2 NBio- CO2 Total CO2 CH4 N2O CO2e
Category lb/day lb/day
Archit. Coating 6.9003 0.0000 0.0000 0.0000 0.0000 0.0000 0.0000
Off-Road 0.3323 2.1850 1.8681 2.9700e-003
0.1733 0.1733 0.1733 0.1733 0.0000 281.4481 281.4481 0.0297 282.0721
Total 7.2326 2.1850 1.8681 2.9700e-003
0.1733 0.1733 0.1733 0.1733 0.0000 281.4481 281.4481 0.0297 282.0721
Mitigated Construction On-Site
CalEEMod Version: CalEEMod.2013.2.2 Date: 8/3/2016 3:55 PMPage 17 of 25

3.6 Architectural Coating - 2017
ROG NOx CO SO2 Fugitive PM10
Exhaust PM10
PM10 Total
Fugitive PM2.5
Exhaust PM2.5
PM2.5 Total Bio- CO2 NBio- CO2 Total CO2 CH4 N2O CO2e
Category lb/day lb/day
Hauling 0.0000 0.0000 0.0000 0.0000 0.0000 0.0000 0.0000 0.0000 0.0000 0.0000 0.0000 0.0000 0.0000 0.0000
Vendor 0.0000 0.0000 0.0000 0.0000 0.0000 0.0000 0.0000 0.0000 0.0000 0.0000 0.0000 0.0000 0.0000 0.0000
Worker 0.1298 0.1756 1.8334 4.5100e-003
0.3800 3.0600e-003
0.3831 0.1008 2.8200e-003
0.1036 364.7676 364.7676 0.0191 365.1694
Total 0.1298 0.1756 1.8334 4.5100e-003
0.3800 3.0600e-003
0.3831 0.1008 2.8200e-003
0.1036 364.7676 364.7676 0.0191 365.1694
Mitigated Construction Off-Site
3.7 Paving - 2017
ROG NOx CO SO2 Fugitive PM10
Exhaust PM10
PM10 Total
Fugitive PM2.5
Exhaust PM2.5
PM2.5 Total Bio- CO2 NBio- CO2 Total CO2 CH4 N2O CO2e
Category lb/day lb/day
Off-Road 1.1857 12.0981 9.0308 0.0133 0.7333 0.7333 0.6755 0.6755 1,347.6575 1,347.6575 0.4052 1,356.1677
Paving 0.0000 0.0000 0.0000 0.0000 0.0000 0.0000 0.0000
Total 1.1857 12.0981 9.0308 0.0133 0.7333 0.7333 0.6755 0.6755 1,347.6575 1,347.6575 0.4052 1,356.1677
Unmitigated Construction On-Site
CalEEMod Version: CalEEMod.2013.2.2 Date: 8/3/2016 3:55 PMPage 18 of 25
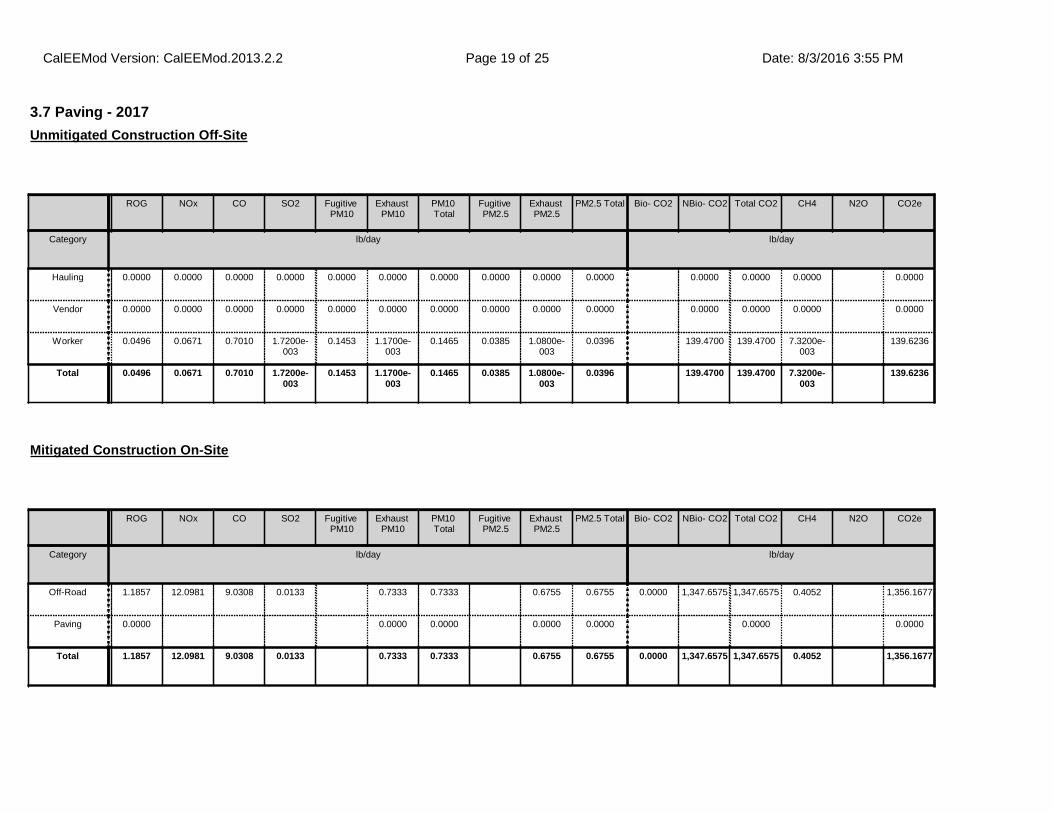
3.7 Paving - 2017
ROG NOx CO SO2 Fugitive PM10
Exhaust PM10
PM10 Total
Fugitive PM2.5
Exhaust PM2.5
PM2.5 Total Bio- CO2 NBio- CO2 Total CO2 CH4 N2O CO2e
Category lb/day lb/day
Hauling 0.0000 0.0000 0.0000 0.0000 0.0000 0.0000 0.0000 0.0000 0.0000 0.0000 0.0000 0.0000 0.0000 0.0000
Vendor 0.0000 0.0000 0.0000 0.0000 0.0000 0.0000 0.0000 0.0000 0.0000 0.0000 0.0000 0.0000 0.0000 0.0000
Worker 0.0496 0.0671 0.7010 1.7200e-003
0.1453 1.1700e-003
0.1465 0.0385 1.0800e-003
0.0396 139.4700 139.4700 7.3200e-003
139.6236
Total 0.0496 0.0671 0.7010 1.7200e-003
0.1453 1.1700e-003
0.1465 0.0385 1.0800e-003
0.0396 139.4700 139.4700 7.3200e-003
139.6236
Unmitigated Construction Off-Site
ROG NOx CO SO2 Fugitive PM10
Exhaust PM10
PM10 Total
Fugitive PM2.5
Exhaust PM2.5
PM2.5 Total Bio- CO2 NBio- CO2 Total CO2 CH4 N2O CO2e
Category lb/day lb/day
Off-Road 1.1857 12.0981 9.0308 0.0133 0.7333 0.7333 0.6755 0.6755 0.0000 1,347.6575 1,347.6575 0.4052 1,356.1677
Paving 0.0000 0.0000 0.0000 0.0000 0.0000 0.0000 0.0000
Total 1.1857 12.0981 9.0308 0.0133 0.7333 0.7333 0.6755 0.6755 0.0000 1,347.6575 1,347.6575 0.4052 1,356.1677
Mitigated Construction On-Site
CalEEMod Version: CalEEMod.2013.2.2 Date: 8/3/2016 3:55 PMPage 19 of 25
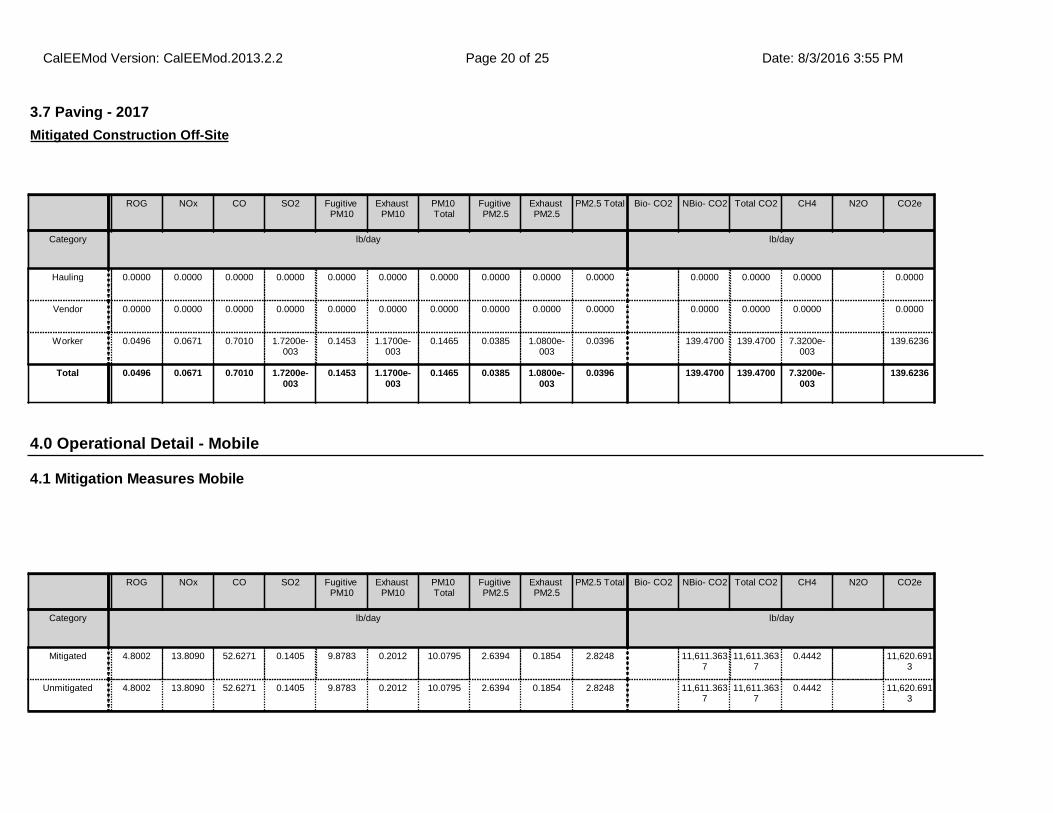
4.0 Operational Detail - Mobile
ROG NOx CO SO2 Fugitive PM10
Exhaust PM10
PM10 Total
Fugitive PM2.5
Exhaust PM2.5
PM2.5 Total Bio- CO2 NBio- CO2 Total CO2 CH4 N2O CO2e
Category lb/day lb/day
Mitigated 4.8002 13.8090 52.6271 0.1405 9.8783 0.2012 10.0795 2.6394 0.1854 2.8248 11,611.3637
11,611.3637
0.4442 11,620.6913
Unmitigated 4.8002 13.8090 52.6271 0.1405 9.8783 0.2012 10.0795 2.6394 0.1854 2.8248 11,611.3637
11,611.3637
0.4442 11,620.6913
4.1 Mitigation Measures Mobile
3.7 Paving - 2017
ROG NOx CO SO2 Fugitive PM10
Exhaust PM10
PM10 Total
Fugitive PM2.5
Exhaust PM2.5
PM2.5 Total Bio- CO2 NBio- CO2 Total CO2 CH4 N2O CO2e
Category lb/day lb/day
Hauling 0.0000 0.0000 0.0000 0.0000 0.0000 0.0000 0.0000 0.0000 0.0000 0.0000 0.0000 0.0000 0.0000 0.0000
Vendor 0.0000 0.0000 0.0000 0.0000 0.0000 0.0000 0.0000 0.0000 0.0000 0.0000 0.0000 0.0000 0.0000 0.0000
Worker 0.0496 0.0671 0.7010 1.7200e-003
0.1453 1.1700e-003
0.1465 0.0385 1.0800e-003
0.0396 139.4700 139.4700 7.3200e-003
139.6236
Total 0.0496 0.0671 0.7010 1.7200e-003
0.1453 1.1700e-003
0.1465 0.0385 1.0800e-003
0.0396 139.4700 139.4700 7.3200e-003
139.6236
Mitigated Construction Off-Site
CalEEMod Version: CalEEMod.2013.2.2 Date: 8/3/2016 3:55 PMPage 20 of 25

4.2 Trip Summary Information
4.3 Trip Type Information
Average Daily Trip Rate Unmitigated Mitigated
Land Use Weekday Saturday Sunday Annual VMT Annual VMT
Apartments Mid Rise 1,120.30 1,217.20 1031.90 3,832,385 3,832,385
Enclosed Parking Structure 0.00 0.00 0.00
Parking Lot 0.00 0.00 0.00
Regional Shopping Center 230.46 227.04 233.58 498,356 498,356
Total 1,350.76 1,444.24 1,265.48 4,330,741 4,330,741
Miles Trip % Trip Purpose %
Land Use H-W or C-W H-S or C-C H-O or C-NW H-W or C-W
H-S or C-C H-O or C-NW Primary Diverted Pass-by
Apartments Mid Rise 14.70 5.90 8.70 40.20 19.20 40.60 86 11 3
Enclosed Parking Structure 16.60 8.40 6.90 0.00 0.00 0.00 0 0 0
Parking Lot 16.60 8.40 6.90 0.00 0.00 0.00 0 0 0
Regional Shopping Center 16.60 8.40 6.90 16.30 64.70 19.00 54 35 11
5.0 Energy Detail
5.1 Mitigation Measures Energy
4.4 Fleet Mix
LDA LDT1 LDT2 MDV LHD1 LHD2 MHD HHD OBUS UBUS MCY SBUS MH
0.512137 0.059943 0.180601 0.139123 0.042256 0.006647 0.016115 0.031670 0.001940 0.002502 0.004362 0.000588 0.002117
Historical Energy Use: N
CalEEMod Version: CalEEMod.2013.2.2 Date: 8/3/2016 3:55 PMPage 21 of 25

ROG NOx CO SO2 Fugitive PM10
Exhaust PM10
PM10 Total
Fugitive PM2.5
Exhaust PM2.5
PM2.5 Total Bio- CO2 NBio- CO2 Total CO2 CH4 N2O CO2e
Category lb/day lb/day
NaturalGas Mitigated
0.0346 0.2955 0.1269 1.8800e-003
0.0239 0.0239 0.0239 0.0239 376.9753 376.9753 7.2300e-003
6.9100e-003
379.2696
NaturalGas Unmitigated
0.0346 0.2955 0.1269 1.8800e-003
0.0239 0.0239 0.0239 0.0239 376.9753 376.9753 7.2300e-003
6.9100e-003
379.2696
5.2 Energy by Land Use - NaturalGas
NaturalGas Use
ROG NOx CO SO2 Fugitive PM10
Exhaust PM10
PM10 Total
Fugitive PM2.5
Exhaust PM2.5
PM2.5 Total Bio- CO2 NBio- CO2 Total CO2 CH4 N2O CO2e
Land Use kBTU/yr lb/day lb/day
Parking Lot 0 0.0000 0.0000 0.0000 0.0000 0.0000 0.0000 0.0000 0.0000 0.0000 0.0000 0.0000 0.0000 0.0000
Regional Shopping Center
27.9452 3.0000e-004
2.7400e-003
2.3000e-003
2.0000e-005
2.1000e-004
2.1000e-004
2.1000e-004
2.1000e-004
3.2877 3.2877 6.0000e-005
6.0000e-005
3.3077
Apartments Mid Rise
3176.35 0.0343 0.2927 0.1246 1.8700e-003
0.0237 0.0237 0.0237 0.0237 373.6877 373.6877 7.1600e-003
6.8500e-003
375.9619
Enclosed Parking Structure
0 0.0000 0.0000 0.0000 0.0000 0.0000 0.0000 0.0000 0.0000 0.0000 0.0000 0.0000 0.0000 0.0000
Total 0.0346 0.2955 0.1269 1.8900e-003
0.0239 0.0239 0.0239 0.0239 376.9753 376.9753 7.2200e-003
6.9100e-003
379.2696
Unmitigated
CalEEMod Version: CalEEMod.2013.2.2 Date: 8/3/2016 3:55 PMPage 22 of 25
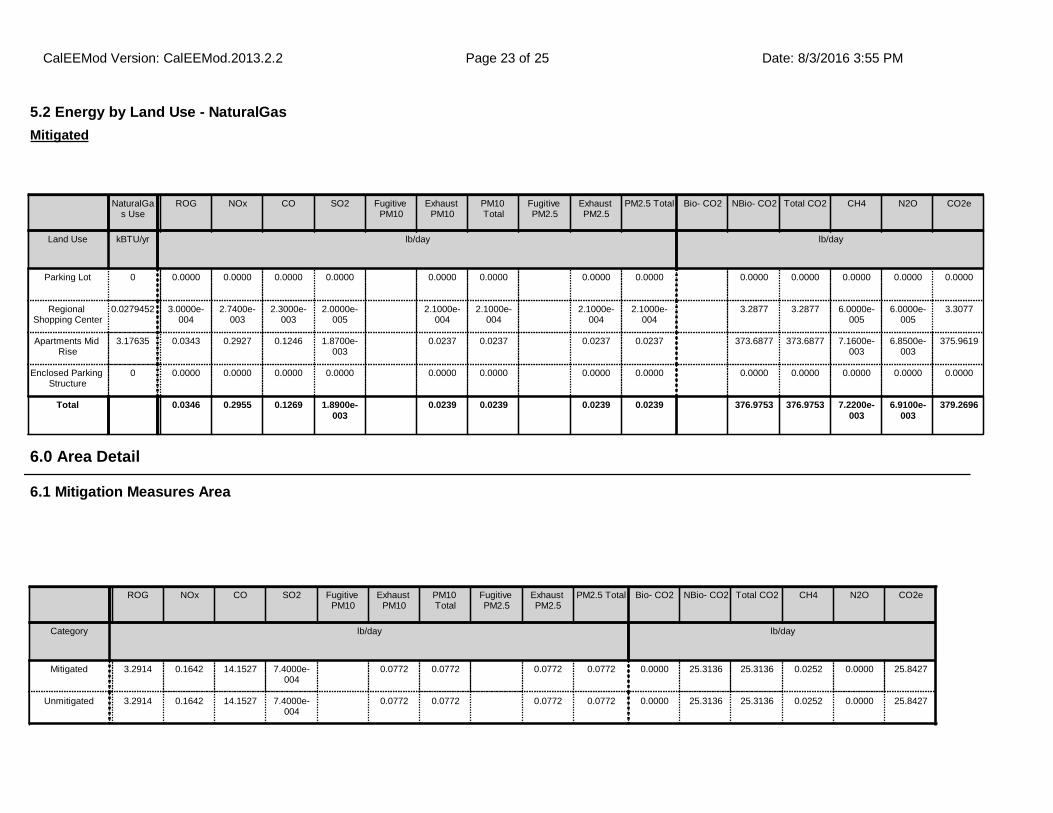
6.1 Mitigation Measures Area
6.0 Area Detail
ROG NOx CO SO2 Fugitive PM10
Exhaust PM10
PM10 Total
Fugitive PM2.5
Exhaust PM2.5
PM2.5 Total Bio- CO2 NBio- CO2 Total CO2 CH4 N2O CO2e
Category lb/day lb/day
Mitigated 3.2914 0.1642 14.1527 7.4000e-004
0.0772 0.0772 0.0772 0.0772 0.0000 25.3136 25.3136 0.0252 0.0000 25.8427
Unmitigated 3.2914 0.1642 14.1527 7.4000e-004
0.0772 0.0772 0.0772 0.0772 0.0000 25.3136 25.3136 0.0252 0.0000 25.8427
5.2 Energy by Land Use - NaturalGas
NaturalGas Use
ROG NOx CO SO2 Fugitive PM10
Exhaust PM10
PM10 Total
Fugitive PM2.5
Exhaust PM2.5
PM2.5 Total Bio- CO2 NBio- CO2 Total CO2 CH4 N2O CO2e
Land Use kBTU/yr lb/day lb/day
Parking Lot 0 0.0000 0.0000 0.0000 0.0000 0.0000 0.0000 0.0000 0.0000 0.0000 0.0000 0.0000 0.0000 0.0000
Regional Shopping Center
0.0279452 3.0000e-004
2.7400e-003
2.3000e-003
2.0000e-005
2.1000e-004
2.1000e-004
2.1000e-004
2.1000e-004
3.2877 3.2877 6.0000e-005
6.0000e-005
3.3077
Apartments Mid Rise
3.17635 0.0343 0.2927 0.1246 1.8700e-003
0.0237 0.0237 0.0237 0.0237 373.6877 373.6877 7.1600e-003
6.8500e-003
375.9619
Enclosed Parking Structure
0 0.0000 0.0000 0.0000 0.0000 0.0000 0.0000 0.0000 0.0000 0.0000 0.0000 0.0000 0.0000 0.0000
Total 0.0346 0.2955 0.1269 1.8900e-003
0.0239 0.0239 0.0239 0.0239 376.9753 376.9753 7.2200e-003
6.9100e-003
379.2696
Mitigated
CalEEMod Version: CalEEMod.2013.2.2 Date: 8/3/2016 3:55 PMPage 23 of 25
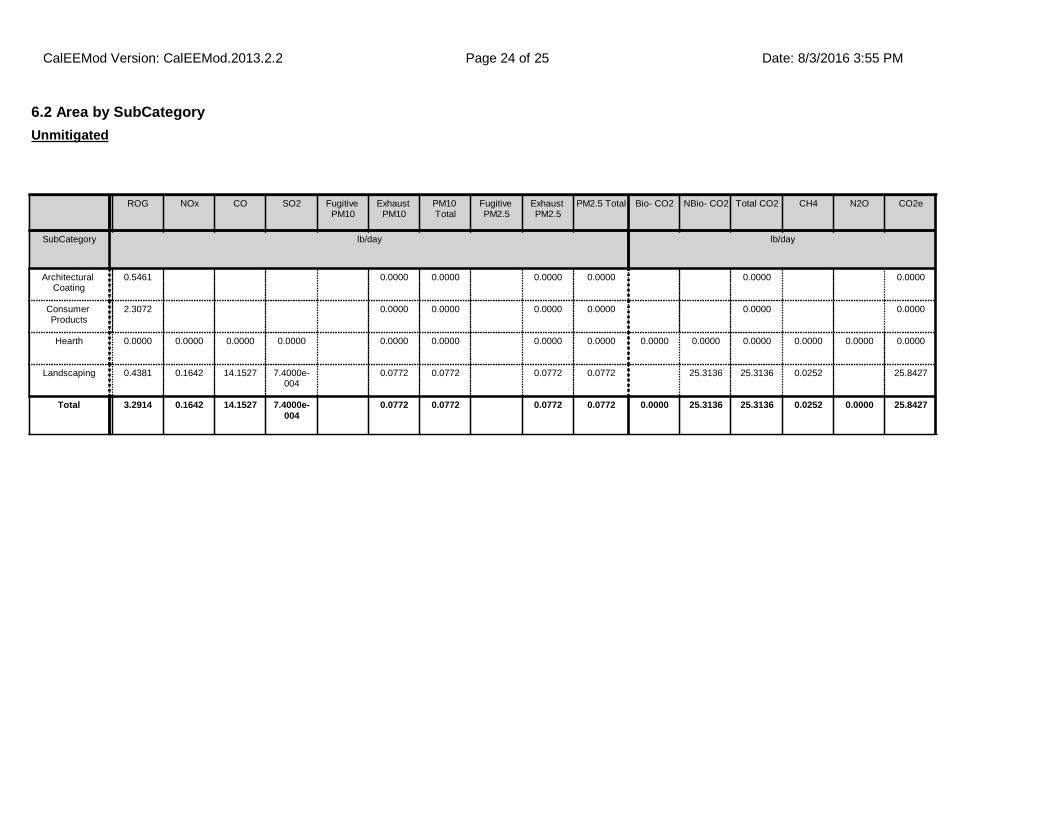
6.2 Area by SubCategory
ROG NOx CO SO2 Fugitive PM10
Exhaust PM10
PM10 Total
Fugitive PM2.5
Exhaust PM2.5
PM2.5 Total Bio- CO2 NBio- CO2 Total CO2 CH4 N2O CO2e
SubCategory lb/day lb/day
Architectural Coating
0.5461 0.0000 0.0000 0.0000 0.0000 0.0000 0.0000
Consumer Products
2.3072 0.0000 0.0000 0.0000 0.0000 0.0000 0.0000
Hearth 0.0000 0.0000 0.0000 0.0000 0.0000 0.0000 0.0000 0.0000 0.0000 0.0000 0.0000 0.0000 0.0000 0.0000
Landscaping 0.4381 0.1642 14.1527 7.4000e-004
0.0772 0.0772 0.0772 0.0772 25.3136 25.3136 0.0252 25.8427
Total 3.2914 0.1642 14.1527 7.4000e-004
0.0772 0.0772 0.0772 0.0772 0.0000 25.3136 25.3136 0.0252 0.0000 25.8427
Unmitigated
CalEEMod Version: CalEEMod.2013.2.2 Date: 8/3/2016 3:55 PMPage 24 of 25
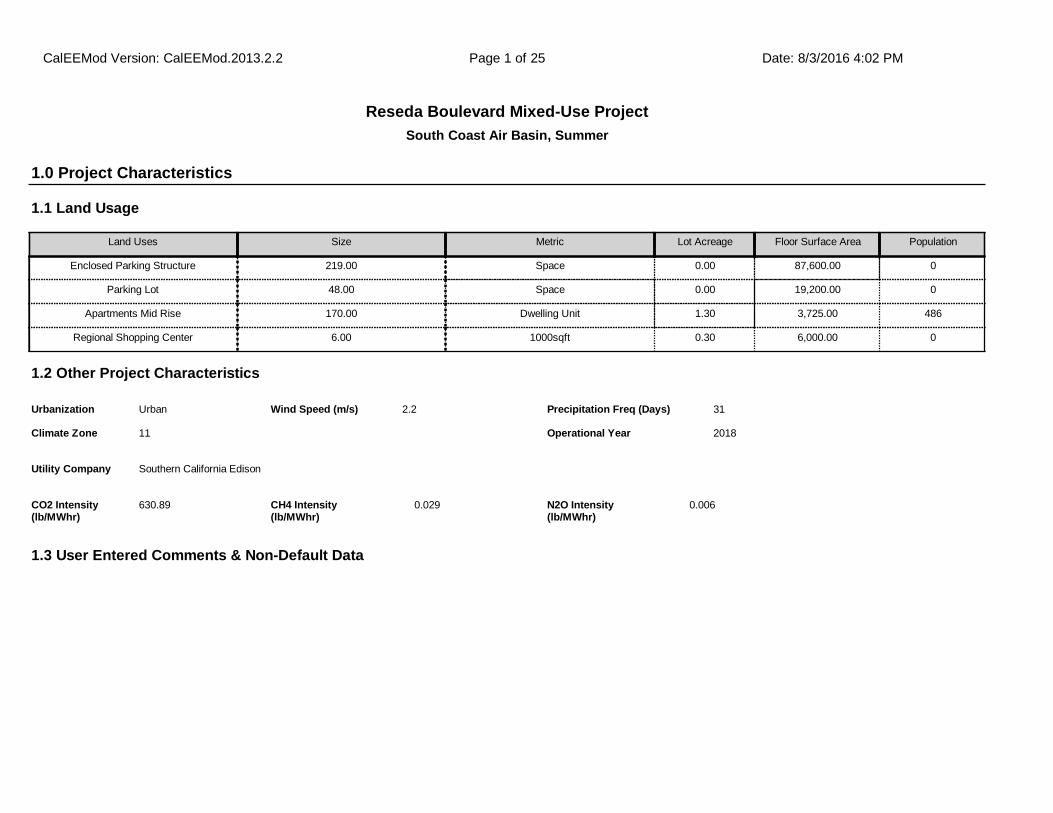
South Coast Air Basin, Summer
Reseda Boulevard Mixed-Use Project
1.1 Land Usage
Land Uses Size Metric Lot Acreage Floor Surface Area Population
Enclosed Parking Structure 219.00 Space 0.00 87,600.00 0
Parking Lot 48.00 Space 0.00 19,200.00 0
Apartments Mid Rise 170.00 Dwelling Unit 1.30 3,725.00 486
Regional Shopping Center 6.00 1000sqft 0.30 6,000.00 0
1.2 Other Project Characteristics
Urbanization
Climate Zone
Urban
11
Wind Speed (m/s) Precipitation Freq (Days)2.2 31
1.3 User Entered Comments & Non-Default Data
1.0 Project Characteristics
Utility Company Southern California Edison
2018Operational Year
CO2 Intensity (lb/MWhr)
630.89 0.029CH4 Intensity (lb/MWhr)
0.006N2O Intensity (lb/MWhr)
CalEEMod Version: CalEEMod.2013.2.2 Date: 8/3/2016 4:02 PMPage 1 of 25

Project Characteristics -
Land Use - Square footage and acerage based on site plans
Construction Phase - Architucrual coating changed to overlap with building construction
Demolition - Sf from arch design = 13,792
Architectural Coating - Per SCAQMD Rule 1113
Vehicle Trips - Per traffic study of 45 trips/day. Regional Shopping Wkd=38.41, Sat=37.84. Sun=38.93
Woodstoves - No fireplaces or woodstoves, per site plans
Area Coating - 150 g/L per SCAQMD Rule 1113
Construction Off-road Equipment Mitigation - Per SCAQMD Rule 403
Area Mitigation - 150 g/L per SCAQMD Rule 1113
Table Name Column Name Default Value New Value
tblArchitecturalCoating EF_Nonresidential_Exterior 250.00 150.00
tblArchitecturalCoating EF_Nonresidential_Interior 250.00 150.00
tblAreaCoating Area_EF_Nonresidential_Exterior 250 150
tblAreaMitigation UseLowVOCPaintNonresidentialInteriorValue
250 150
tblConstDustMitigation WaterExposedAreaPM10PercentReduction 61 55
tblConstDustMitigation WaterExposedAreaPM25PercentReduction 61 55
tblConstructionPhase NumDays 10.00 194.00
tblConstructionPhase PhaseEndDate 8/10/2018 12/11/2017
tblConstructionPhase PhaseEndDate 12/25/2017 11/27/2017
tblConstructionPhase PhaseStartDate 11/14/2017 3/15/2017
tblConstructionPhase PhaseStartDate 12/12/2017 11/14/2017
tblFireplaces FireplaceDayYear 25.00 0.00
tblFireplaces FireplaceHourDay 3.00 0.00
tblFireplaces FireplaceWoodMass 1,019.20 0.00
tblFireplaces NumberGas 144.50 0.00
tblFireplaces NumberNoFireplace 17.00 0.00
CalEEMod Version: CalEEMod.2013.2.2 Date: 8/3/2016 4:02 PMPage 2 of 25
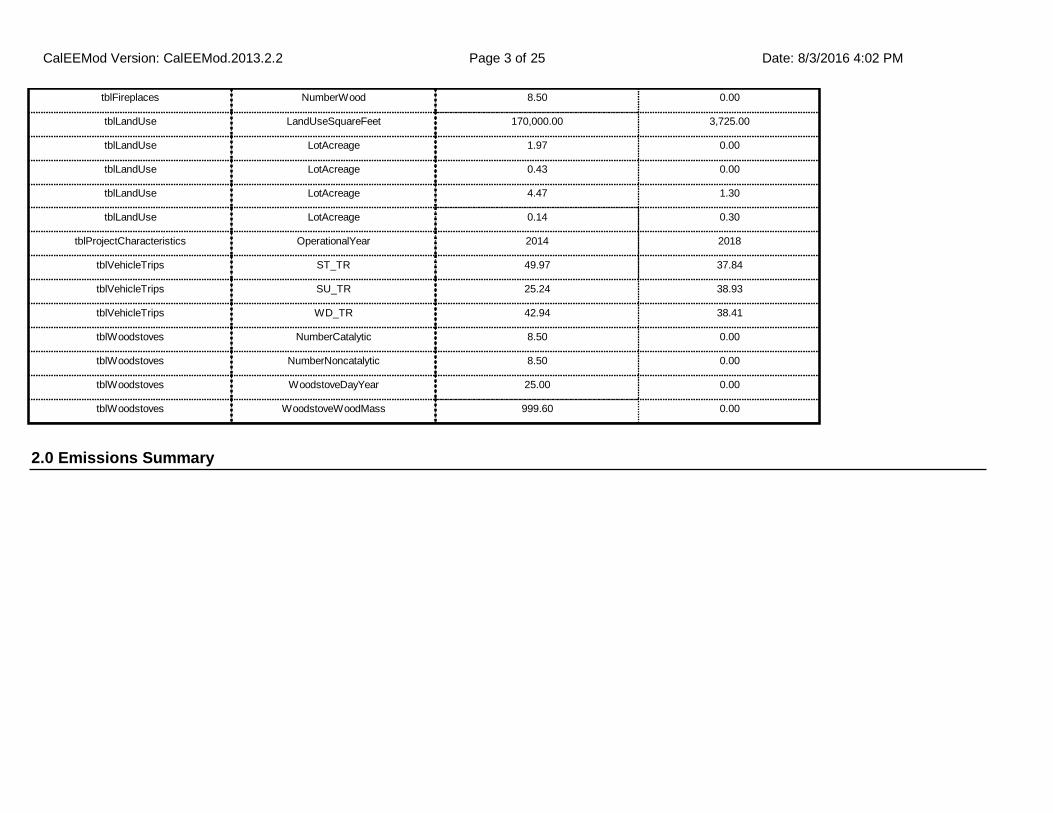
2.0 Emissions Summary
tblFireplaces NumberWood 8.50 0.00
tblLandUse LandUseSquareFeet 170,000.00 3,725.00
tblLandUse LotAcreage 1.97 0.00
tblLandUse LotAcreage 0.43 0.00
tblLandUse LotAcreage 4.47 1.30
tblLandUse LotAcreage 0.14 0.30
tblProjectCharacteristics OperationalYear 2014 2018
tblVehicleTrips ST_TR 49.97 37.84
tblVehicleTrips SU_TR 25.24 38.93
tblVehicleTrips WD_TR 42.94 38.41
tblWoodstoves NumberCatalytic 8.50 0.00
tblWoodstoves NumberNoncatalytic 8.50 0.00
tblWoodstoves WoodstoveDayYear 25.00 0.00
tblWoodstoves WoodstoveWoodMass 999.60 0.00
CalEEMod Version: CalEEMod.2013.2.2 Date: 8/3/2016 4:02 PMPage 3 of 25
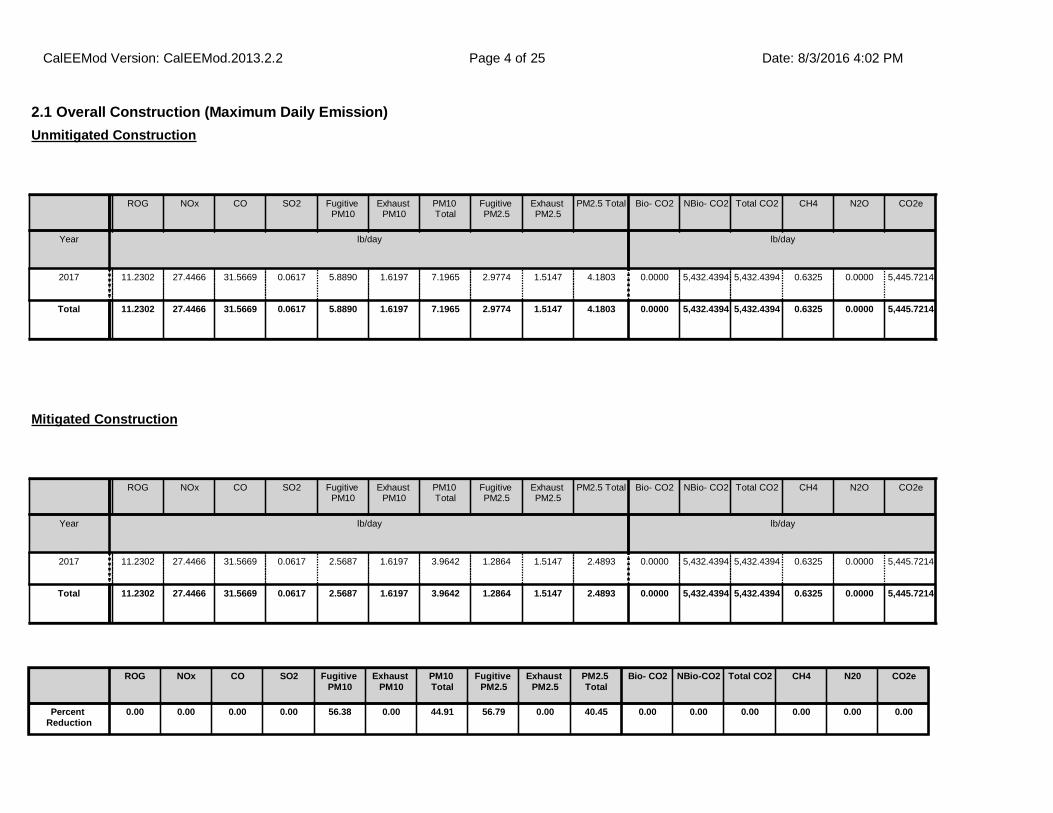
2.1 Overall Construction (Maximum Daily Emission)
ROG NOx CO SO2 Fugitive PM10
Exhaust PM10
PM10 Total
Fugitive PM2.5
Exhaust PM2.5
PM2.5 Total Bio- CO2 NBio- CO2 Total CO2 CH4 N2O CO2e
Year lb/day lb/day
2017 11.2302 27.4466 31.5669 0.0617 5.8890 1.6197 7.1965 2.9774 1.5147 4.1803 0.0000 5,432.4394 5,432.4394 0.6325 0.0000 5,445.7214
Total 11.2302 27.4466 31.5669 0.0617 5.8890 1.6197 7.1965 2.9774 1.5147 4.1803 0.0000 5,432.4394 5,432.4394 0.6325 0.0000 5,445.7214
Unmitigated Construction
ROG NOx CO SO2 Fugitive PM10
Exhaust PM10
PM10 Total
Fugitive PM2.5
Exhaust PM2.5
PM2.5 Total Bio- CO2 NBio- CO2 Total CO2 CH4 N2O CO2e
Year lb/day lb/day
2017 11.2302 27.4466 31.5669 0.0617 2.5687 1.6197 3.9642 1.2864 1.5147 2.4893 0.0000 5,432.4394 5,432.4394 0.6325 0.0000 5,445.7214
Total 11.2302 27.4466 31.5669 0.0617 2.5687 1.6197 3.9642 1.2864 1.5147 2.4893 0.0000 5,432.4394 5,432.4394 0.6325 0.0000 5,445.7214
Mitigated Construction
ROG NOx CO SO2 Fugitive PM10
Exhaust PM10
PM10 Total
Fugitive PM2.5
Exhaust PM2.5
PM2.5 Total
Bio- CO2 NBio-CO2 Total CO2 CH4 N20 CO2e
Percent Reduction
0.00 0.00 0.00 0.00 56.38 0.00 44.91 56.79 0.00 40.45 0.00 0.00 0.00 0.00 0.00 0.00
CalEEMod Version: CalEEMod.2013.2.2 Date: 8/3/2016 4:02 PMPage 4 of 25

2.2 Overall Operational
ROG NOx CO SO2 Fugitive PM10
Exhaust PM10
PM10 Total
Fugitive PM2.5
Exhaust PM2.5
PM2.5 Total Bio- CO2 NBio- CO2 Total CO2 CH4 N2O CO2e
Category lb/day lb/day
Area 3.2914 0.1642 14.1527 7.4000e-004
0.0772 0.0772 0.0772 0.0772 0.0000 25.3136 25.3136 0.0252 0.0000 25.8427
Energy 0.0346 0.2955 0.1269 1.8800e-003
0.0239 0.0239 0.0239 0.0239 376.9753 376.9753 7.2300e-003
6.9100e-003
379.2696
Mobile 4.6567 13.1402 53.4226 0.1479 9.8783 0.2005 10.0787 2.6394 0.1847 2.8241 12,197.0233
12,197.0233
0.4438 12,206.3423
Total 7.9827 13.5998 67.7021 0.1505 9.8783 0.3015 10.1798 2.6394 0.2858 2.9252 0.0000 12,599.3123
12,599.3123
0.4762 6.9100e-003
12,611.4545
Unmitigated Operational
ROG NOx CO SO2 Fugitive PM10
Exhaust PM10
PM10 Total
Fugitive PM2.5
Exhaust PM2.5
PM2.5 Total Bio- CO2 NBio- CO2 Total CO2 CH4 N2O CO2e
Category lb/day lb/day
Area 3.2914 0.1642 14.1527 7.4000e-004
0.0772 0.0772 0.0772 0.0772 0.0000 25.3136 25.3136 0.0252 0.0000 25.8427
Energy 0.0346 0.2955 0.1269 1.8800e-003
0.0239 0.0239 0.0239 0.0239 376.9753 376.9753 7.2300e-003
6.9100e-003
379.2696
Mobile 4.6567 13.1402 53.4226 0.1479 9.8783 0.2005 10.0787 2.6394 0.1847 2.8241 12,197.0233
12,197.0233
0.4438 12,206.3423
Total 7.9827 13.5998 67.7021 0.1505 9.8783 0.3015 10.1798 2.6394 0.2858 2.9252 0.0000 12,599.3123
12,599.3123
0.4762 6.9100e-003
12,611.4545
Mitigated Operational
CalEEMod Version: CalEEMod.2013.2.2 Date: 8/3/2016 4:02 PMPage 5 of 25
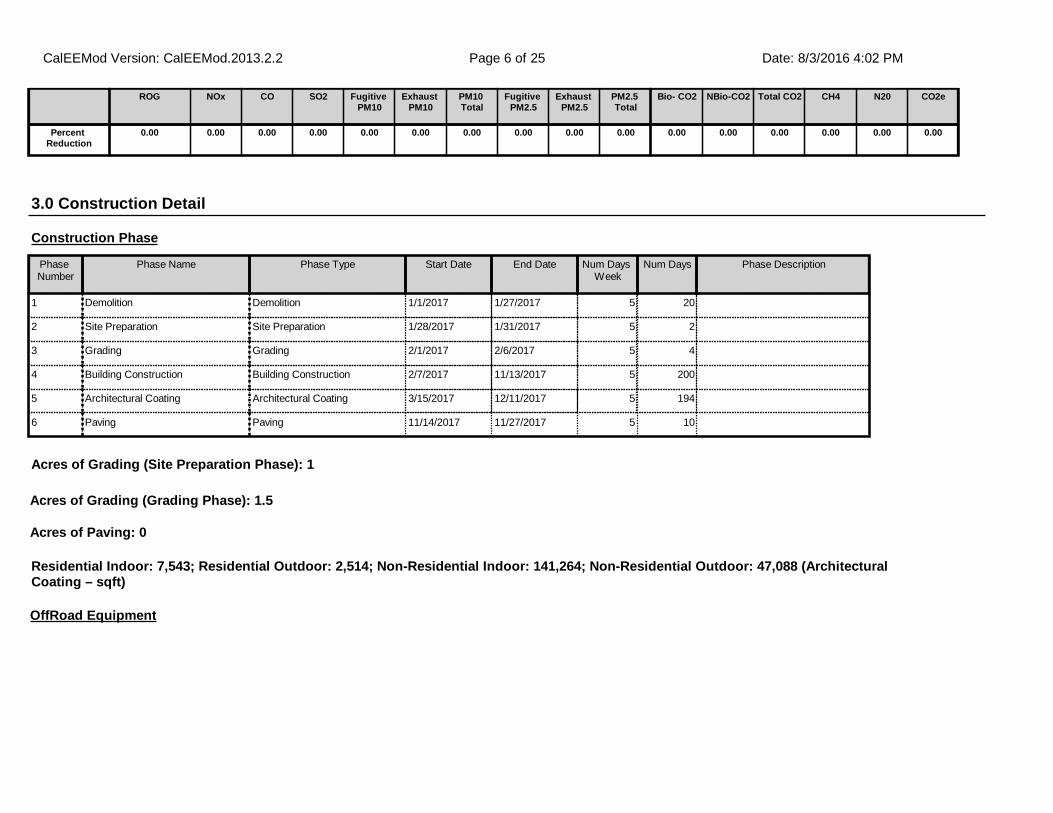
3.0 Construction Detail
Construction Phase
Phase Number
Phase Name Phase Type Start Date End Date Num Days Week
Num Days Phase Description
1 Demolition Demolition 1/1/2017 1/27/2017 5 20
2 Site Preparation Site Preparation 1/28/2017 1/31/2017 5 2
3 Grading Grading 2/1/2017 2/6/2017 5 4
4 Building Construction Building Construction 2/7/2017 11/13/2017 5 200
5 Architectural Coating Architectural Coating 3/15/2017 12/11/2017 5 194
6 Paving Paving 11/14/2017 11/27/2017 5 10
OffRoad Equipment
ROG NOx CO SO2 Fugitive PM10
Exhaust PM10
PM10 Total
Fugitive PM2.5
Exhaust PM2.5
PM2.5 Total
Bio- CO2 NBio-CO2 Total CO2 CH4 N20 CO2e
Percent Reduction
0.00 0.00 0.00 0.00 0.00 0.00 0.00 0.00 0.00 0.00 0.00 0.00 0.00 0.00 0.00 0.00
Residential Indoor: 7,543; Residential Outdoor: 2,514; Non-Residential Indoor: 141,264; Non-Residential Outdoor: 47,088 (Architectural Coating – sqft)
Acres of Grading (Site Preparation Phase): 1
Acres of Grading (Grading Phase): 1.5
Acres of Paving: 0
CalEEMod Version: CalEEMod.2013.2.2 Date: 8/3/2016 4:02 PMPage 6 of 25

Phase Name Offroad Equipment Type Amount Usage Hours Horse Power Load Factor
Demolition Concrete/Industrial Saws 1 8.00 81 0.73
Demolition Rubber Tired Dozers 1 8.00 255 0.40
Demolition Tractors/Loaders/Backhoes 3 8.00 97 0.37
Site Preparation Graders 1 8.00 174 0.41
Site Preparation Rubber Tired Dozers 1 7.00 255 0.40
Site Preparation Tractors/Loaders/Backhoes 1 8.00 97 0.37
Grading Graders 1 6.00 174 0.41
Grading Rubber Tired Dozers 1 6.00 255 0.40
Grading Tractors/Loaders/Backhoes 1 7.00 97 0.37
Building Construction Cranes 1 6.00 226 0.29
Building Construction Forklifts 1 6.00 89 0.20
Building Construction Generator Sets 1 8.00 84 0.74
Building Construction Tractors/Loaders/Backhoes 1 6.00 97 0.37
Building Construction Welders 3 8.00 46 0.45
Architectural Coating Air Compressors 1 6.00 78 0.48
Paving Cement and Mortar Mixers 1 6.00 9 0.56
Paving Pavers 1 6.00 125 0.42
Paving Paving Equipment 1 8.00 130 0.36
Paving Rollers 1 7.00 80 0.38
Paving Tractors/Loaders/Backhoes 1 8.00 97 0.37
Trips and VMT
CalEEMod Version: CalEEMod.2013.2.2 Date: 8/3/2016 4:02 PMPage 7 of 25
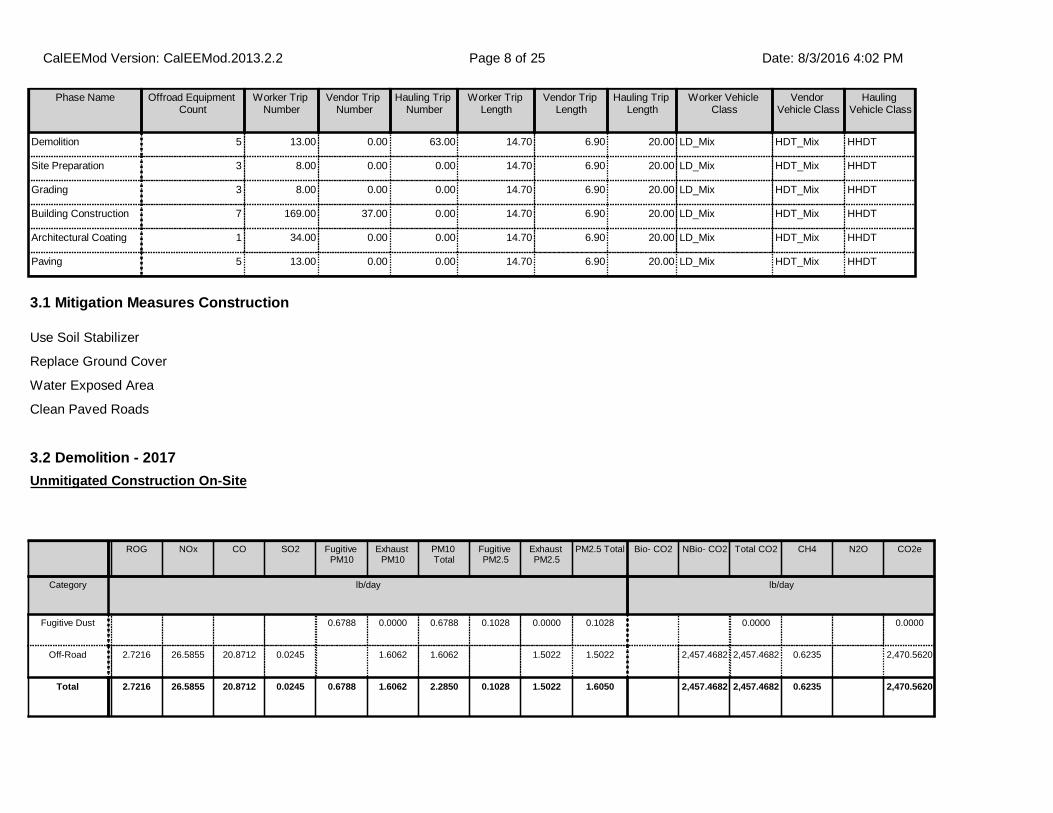
3.2 Demolition - 2017
ROG NOx CO SO2 Fugitive PM10
Exhaust PM10
PM10 Total
Fugitive PM2.5
Exhaust PM2.5
PM2.5 Total Bio- CO2 NBio- CO2 Total CO2 CH4 N2O CO2e
Category lb/day lb/day
Fugitive Dust 0.6788 0.0000 0.6788 0.1028 0.0000 0.1028 0.0000 0.0000
Off-Road 2.7216 26.5855 20.8712 0.0245 1.6062 1.6062 1.5022 1.5022 2,457.4682 2,457.4682 0.6235 2,470.5620
Total 2.7216 26.5855 20.8712 0.0245 0.6788 1.6062 2.2850 0.1028 1.5022 1.6050 2,457.4682 2,457.4682 0.6235 2,470.5620
Unmitigated Construction On-Site
3.1 Mitigation Measures Construction
Use Soil Stabilizer
Replace Ground Cover
Water Exposed Area
Clean Paved Roads
Phase Name Offroad Equipment Count
Worker Trip Number
Vendor Trip Number
Hauling Trip Number
Worker Trip Length
Vendor Trip Length
Hauling Trip Length
Worker Vehicle Class
Vendor Vehicle Class
Hauling Vehicle Class
Demolition 5 13.00 0.00 63.00 14.70 6.90 20.00 LD_Mix HDT_Mix HHDT
Site Preparation 3 8.00 0.00 0.00 14.70 6.90 20.00 LD_Mix HDT_Mix HHDT
Grading 3 8.00 0.00 0.00 14.70 6.90 20.00 LD_Mix HDT_Mix HHDT
Building Construction 7 169.00 37.00 0.00 14.70 6.90 20.00 LD_Mix HDT_Mix HHDT
Architectural Coating 1 34.00 0.00 0.00 14.70 6.90 20.00 LD_Mix HDT_Mix HHDT
Paving 5 13.00 0.00 0.00 14.70 6.90 20.00 LD_Mix HDT_Mix HHDT
CalEEMod Version: CalEEMod.2013.2.2 Date: 8/3/2016 4:02 PMPage 8 of 25
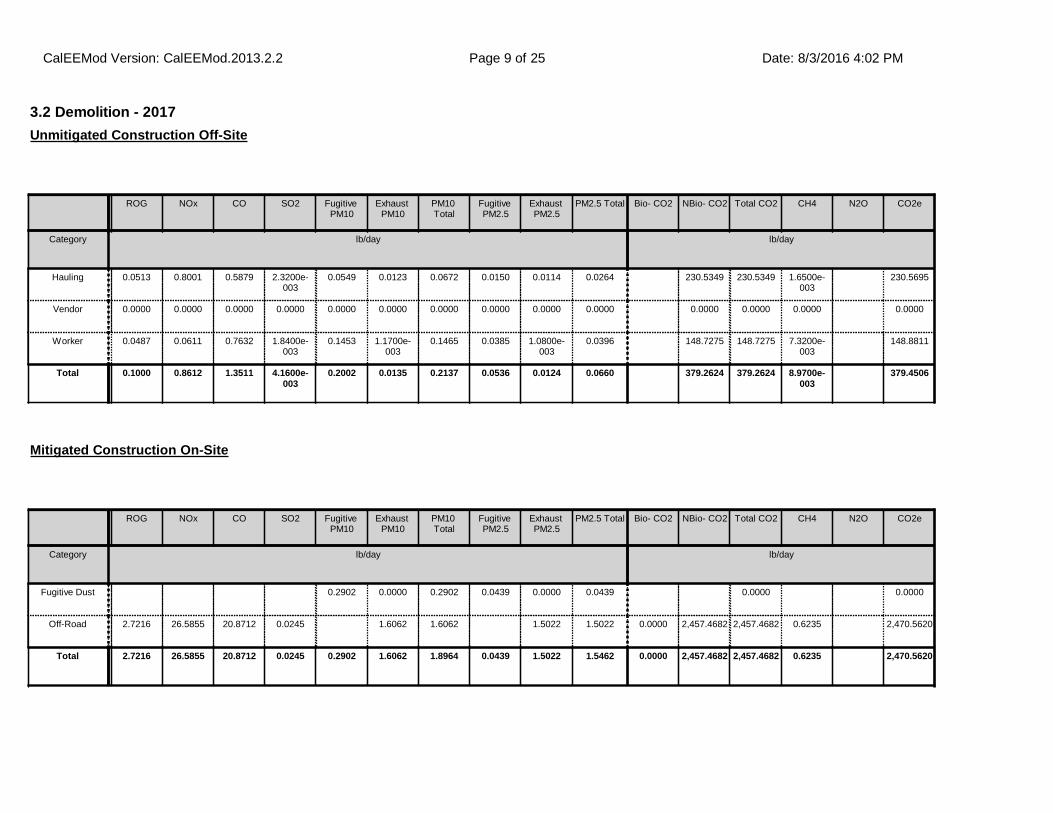
3.2 Demolition - 2017
ROG NOx CO SO2 Fugitive PM10
Exhaust PM10
PM10 Total
Fugitive PM2.5
Exhaust PM2.5
PM2.5 Total Bio- CO2 NBio- CO2 Total CO2 CH4 N2O CO2e
Category lb/day lb/day
Hauling 0.0513 0.8001 0.5879 2.3200e-003
0.0549 0.0123 0.0672 0.0150 0.0114 0.0264 230.5349 230.5349 1.6500e-003
230.5695
Vendor 0.0000 0.0000 0.0000 0.0000 0.0000 0.0000 0.0000 0.0000 0.0000 0.0000 0.0000 0.0000 0.0000 0.0000
Worker 0.0487 0.0611 0.7632 1.8400e-003
0.1453 1.1700e-003
0.1465 0.0385 1.0800e-003
0.0396 148.7275 148.7275 7.3200e-003
148.8811
Total 0.1000 0.8612 1.3511 4.1600e-003
0.2002 0.0135 0.2137 0.0536 0.0124 0.0660 379.2624 379.2624 8.9700e-003
379.4506
Unmitigated Construction Off-Site
ROG NOx CO SO2 Fugitive PM10
Exhaust PM10
PM10 Total
Fugitive PM2.5
Exhaust PM2.5
PM2.5 Total Bio- CO2 NBio- CO2 Total CO2 CH4 N2O CO2e
Category lb/day lb/day
Fugitive Dust 0.2902 0.0000 0.2902 0.0439 0.0000 0.0439 0.0000 0.0000
Off-Road 2.7216 26.5855 20.8712 0.0245 1.6062 1.6062 1.5022 1.5022 0.0000 2,457.4682 2,457.4682 0.6235 2,470.5620
Total 2.7216 26.5855 20.8712 0.0245 0.2902 1.6062 1.8964 0.0439 1.5022 1.5462 0.0000 2,457.4682 2,457.4682 0.6235 2,470.5620
Mitigated Construction On-Site
CalEEMod Version: CalEEMod.2013.2.2 Date: 8/3/2016 4:02 PMPage 9 of 25

3.2 Demolition - 2017
ROG NOx CO SO2 Fugitive PM10
Exhaust PM10
PM10 Total
Fugitive PM2.5
Exhaust PM2.5
PM2.5 Total Bio- CO2 NBio- CO2 Total CO2 CH4 N2O CO2e
Category lb/day lb/day
Hauling 0.0513 0.8001 0.5879 2.3200e-003
0.0549 0.0123 0.0672 0.0150 0.0114 0.0264 230.5349 230.5349 1.6500e-003
230.5695
Vendor 0.0000 0.0000 0.0000 0.0000 0.0000 0.0000 0.0000 0.0000 0.0000 0.0000 0.0000 0.0000 0.0000 0.0000
Worker 0.0487 0.0611 0.7632 1.8400e-003
0.1453 1.1700e-003
0.1465 0.0385 1.0800e-003
0.0396 148.7275 148.7275 7.3200e-003
148.8811
Total 0.1000 0.8612 1.3511 4.1600e-003
0.2002 0.0135 0.2137 0.0536 0.0124 0.0660 379.2624 379.2624 8.9700e-003
379.4506
Mitigated Construction Off-Site
3.3 Site Preparation - 2017
ROG NOx CO SO2 Fugitive PM10
Exhaust PM10
PM10 Total
Fugitive PM2.5
Exhaust PM2.5
PM2.5 Total Bio- CO2 NBio- CO2 Total CO2 CH4 N2O CO2e
Category lb/day lb/day
Fugitive Dust 5.7996 0.0000 5.7996 2.9537 0.0000 2.9537 0.0000 0.0000
Off-Road 2.3109 24.2288 15.9299 0.0171 1.3067 1.3067 1.2022 1.2022 1,752.1239 1,752.1239 0.5369 1,763.3977
Total 2.3109 24.2288 15.9299 0.0171 5.7996 1.3067 7.1063 2.9537 1.2022 4.1559 1,752.1239 1,752.1239 0.5369 1,763.3977
Unmitigated Construction On-Site
CalEEMod Version: CalEEMod.2013.2.2 Date: 8/3/2016 4:02 PMPage 10 of 25

3.3 Site Preparation - 2017
ROG NOx CO SO2 Fugitive PM10
Exhaust PM10
PM10 Total
Fugitive PM2.5
Exhaust PM2.5
PM2.5 Total Bio- CO2 NBio- CO2 Total CO2 CH4 N2O CO2e
Category lb/day lb/day
Hauling 0.0000 0.0000 0.0000 0.0000 0.0000 0.0000 0.0000 0.0000 0.0000 0.0000 0.0000 0.0000 0.0000 0.0000
Vendor 0.0000 0.0000 0.0000 0.0000 0.0000 0.0000 0.0000 0.0000 0.0000 0.0000 0.0000 0.0000 0.0000 0.0000
Worker 0.0299 0.0376 0.4696 1.1300e-003
0.0894 7.2000e-004
0.0901 0.0237 6.6000e-004
0.0244 91.5246 91.5246 4.5000e-003
91.6192
Total 0.0299 0.0376 0.4696 1.1300e-003
0.0894 7.2000e-004
0.0901 0.0237 6.6000e-004
0.0244 91.5246 91.5246 4.5000e-003
91.6192
Unmitigated Construction Off-Site
ROG NOx CO SO2 Fugitive PM10
Exhaust PM10
PM10 Total
Fugitive PM2.5
Exhaust PM2.5
PM2.5 Total Bio- CO2 NBio- CO2 Total CO2 CH4 N2O CO2e
Category lb/day lb/day
Fugitive Dust 2.4793 0.0000 2.4793 1.2627 0.0000 1.2627 0.0000 0.0000
Off-Road 2.3109 24.2288 15.9299 0.0171 1.3067 1.3067 1.2022 1.2022 0.0000 1,752.1239 1,752.1239 0.5369 1,763.3977
Total 2.3109 24.2288 15.9299 0.0171 2.4793 1.3067 3.7861 1.2627 1.2022 2.4649 0.0000 1,752.1239 1,752.1239 0.5369 1,763.3977
Mitigated Construction On-Site
CalEEMod Version: CalEEMod.2013.2.2 Date: 8/3/2016 4:02 PMPage 11 of 25
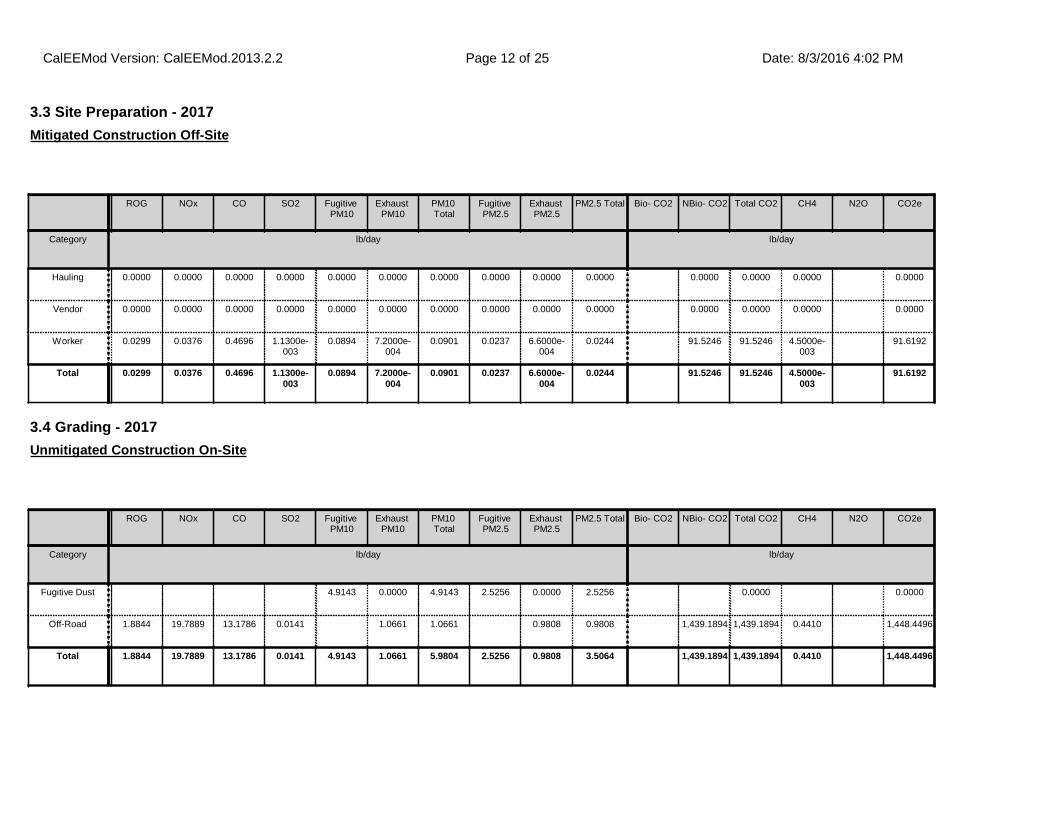
3.3 Site Preparation - 2017
ROG NOx CO SO2 Fugitive PM10
Exhaust PM10
PM10 Total
Fugitive PM2.5
Exhaust PM2.5
PM2.5 Total Bio- CO2 NBio- CO2 Total CO2 CH4 N2O CO2e
Category lb/day lb/day
Hauling 0.0000 0.0000 0.0000 0.0000 0.0000 0.0000 0.0000 0.0000 0.0000 0.0000 0.0000 0.0000 0.0000 0.0000
Vendor 0.0000 0.0000 0.0000 0.0000 0.0000 0.0000 0.0000 0.0000 0.0000 0.0000 0.0000 0.0000 0.0000 0.0000
Worker 0.0299 0.0376 0.4696 1.1300e-003
0.0894 7.2000e-004
0.0901 0.0237 6.6000e-004
0.0244 91.5246 91.5246 4.5000e-003
91.6192
Total 0.0299 0.0376 0.4696 1.1300e-003
0.0894 7.2000e-004
0.0901 0.0237 6.6000e-004
0.0244 91.5246 91.5246 4.5000e-003
91.6192
Mitigated Construction Off-Site
3.4 Grading - 2017
ROG NOx CO SO2 Fugitive PM10
Exhaust PM10
PM10 Total
Fugitive PM2.5
Exhaust PM2.5
PM2.5 Total Bio- CO2 NBio- CO2 Total CO2 CH4 N2O CO2e
Category lb/day lb/day
Fugitive Dust 4.9143 0.0000 4.9143 2.5256 0.0000 2.5256 0.0000 0.0000
Off-Road 1.8844 19.7889 13.1786 0.0141 1.0661 1.0661 0.9808 0.9808 1,439.1894 1,439.1894 0.4410 1,448.4496
Total 1.8844 19.7889 13.1786 0.0141 4.9143 1.0661 5.9804 2.5256 0.9808 3.5064 1,439.1894 1,439.1894 0.4410 1,448.4496
Unmitigated Construction On-Site
CalEEMod Version: CalEEMod.2013.2.2 Date: 8/3/2016 4:02 PMPage 12 of 25

3.4 Grading - 2017
ROG NOx CO SO2 Fugitive PM10
Exhaust PM10
PM10 Total
Fugitive PM2.5
Exhaust PM2.5
PM2.5 Total Bio- CO2 NBio- CO2 Total CO2 CH4 N2O CO2e
Category lb/day lb/day
Hauling 0.0000 0.0000 0.0000 0.0000 0.0000 0.0000 0.0000 0.0000 0.0000 0.0000 0.0000 0.0000 0.0000 0.0000
Vendor 0.0000 0.0000 0.0000 0.0000 0.0000 0.0000 0.0000 0.0000 0.0000 0.0000 0.0000 0.0000 0.0000 0.0000
Worker 0.0299 0.0376 0.4696 1.1300e-003
0.0894 7.2000e-004
0.0901 0.0237 6.6000e-004
0.0244 91.5246 91.5246 4.5000e-003
91.6192
Total 0.0299 0.0376 0.4696 1.1300e-003
0.0894 7.2000e-004
0.0901 0.0237 6.6000e-004
0.0244 91.5246 91.5246 4.5000e-003
91.6192
Unmitigated Construction Off-Site
ROG NOx CO SO2 Fugitive PM10
Exhaust PM10
PM10 Total
Fugitive PM2.5
Exhaust PM2.5
PM2.5 Total Bio- CO2 NBio- CO2 Total CO2 CH4 N2O CO2e
Category lb/day lb/day
Fugitive Dust 2.1008 0.0000 2.1008 1.0797 0.0000 1.0797 0.0000 0.0000
Off-Road 1.8844 19.7889 13.1786 0.0141 1.0661 1.0661 0.9808 0.9808 0.0000 1,439.1894 1,439.1894 0.4410 1,448.4496
Total 1.8844 19.7889 13.1786 0.0141 2.1008 1.0661 3.1670 1.0797 0.9808 2.0605 0.0000 1,439.1894 1,439.1894 0.4410 1,448.4496
Mitigated Construction On-Site
CalEEMod Version: CalEEMod.2013.2.2 Date: 8/3/2016 4:02 PMPage 13 of 25

3.4 Grading - 2017
ROG NOx CO SO2 Fugitive PM10
Exhaust PM10
PM10 Total
Fugitive PM2.5
Exhaust PM2.5
PM2.5 Total Bio- CO2 NBio- CO2 Total CO2 CH4 N2O CO2e
Category lb/day lb/day
Hauling 0.0000 0.0000 0.0000 0.0000 0.0000 0.0000 0.0000 0.0000 0.0000 0.0000 0.0000 0.0000 0.0000 0.0000
Vendor 0.0000 0.0000 0.0000 0.0000 0.0000 0.0000 0.0000 0.0000 0.0000 0.0000 0.0000 0.0000 0.0000 0.0000
Worker 0.0299 0.0376 0.4696 1.1300e-003
0.0894 7.2000e-004
0.0901 0.0237 6.6000e-004
0.0244 91.5246 91.5246 4.5000e-003
91.6192
Total 0.0299 0.0376 0.4696 1.1300e-003
0.0894 7.2000e-004
0.0901 0.0237 6.6000e-004
0.0244 91.5246 91.5246 4.5000e-003
91.6192
Mitigated Construction Off-Site
3.5 Building Construction - 2017
ROG NOx CO SO2 Fugitive PM10
Exhaust PM10
PM10 Total
Fugitive PM2.5
Exhaust PM2.5
PM2.5 Total Bio- CO2 NBio- CO2 Total CO2 CH4 N2O CO2e
Category lb/day lb/day
Off-Road 2.9546 19.1088 14.3110 0.0220 1.2257 1.2257 1.1823 1.1823 2,034.2860 2,034.2860 0.4268 2,043.2497
Total 2.9546 19.1088 14.3110 0.0220 1.2257 1.2257 1.1823 1.1823 2,034.2860 2,034.2860 0.4268 2,043.2497
Unmitigated Construction On-Site
CalEEMod Version: CalEEMod.2013.2.2 Date: 8/3/2016 4:02 PMPage 14 of 25

3.5 Building Construction - 2017
ROG NOx CO SO2 Fugitive PM10
Exhaust PM10
PM10 Total
Fugitive PM2.5
Exhaust PM2.5
PM2.5 Total Bio- CO2 NBio- CO2 Total CO2 CH4 N2O CO2e
Category lb/day lb/day
Hauling 0.0000 0.0000 0.0000 0.0000 0.0000 0.0000 0.0000 0.0000 0.0000 0.0000 0.0000 0.0000 0.0000 0.0000
Vendor 0.2833 2.9258 3.4710 8.0400e-003
0.2313 0.0466 0.2779 0.0659 0.0428 0.1087 794.2685 794.2685 5.6000e-003
794.3861
Worker 0.6325 0.7946 9.9209 0.0239 1.8890 0.0152 1.9042 0.5010 0.0140 0.5150 1,933.4572 1,933.4572 0.0951 1,935.4546
Total 0.9158 3.7204 13.3918 0.0320 2.1203 0.0618 2.1821 0.5669 0.0568 0.6237 2,727.7257 2,727.7257 0.1007 2,729.8408
Unmitigated Construction Off-Site
ROG NOx CO SO2 Fugitive PM10
Exhaust PM10
PM10 Total
Fugitive PM2.5
Exhaust PM2.5
PM2.5 Total Bio- CO2 NBio- CO2 Total CO2 CH4 N2O CO2e
Category lb/day lb/day
Off-Road 2.9546 19.1088 14.3110 0.0220 1.2257 1.2257 1.1823 1.1823 0.0000 2,034.2860 2,034.2860 0.4268 2,043.2497
Total 2.9546 19.1088 14.3110 0.0220 1.2257 1.2257 1.1823 1.1823 0.0000 2,034.2860 2,034.2860 0.4268 2,043.2497
Mitigated Construction On-Site
CalEEMod Version: CalEEMod.2013.2.2 Date: 8/3/2016 4:02 PMPage 15 of 25
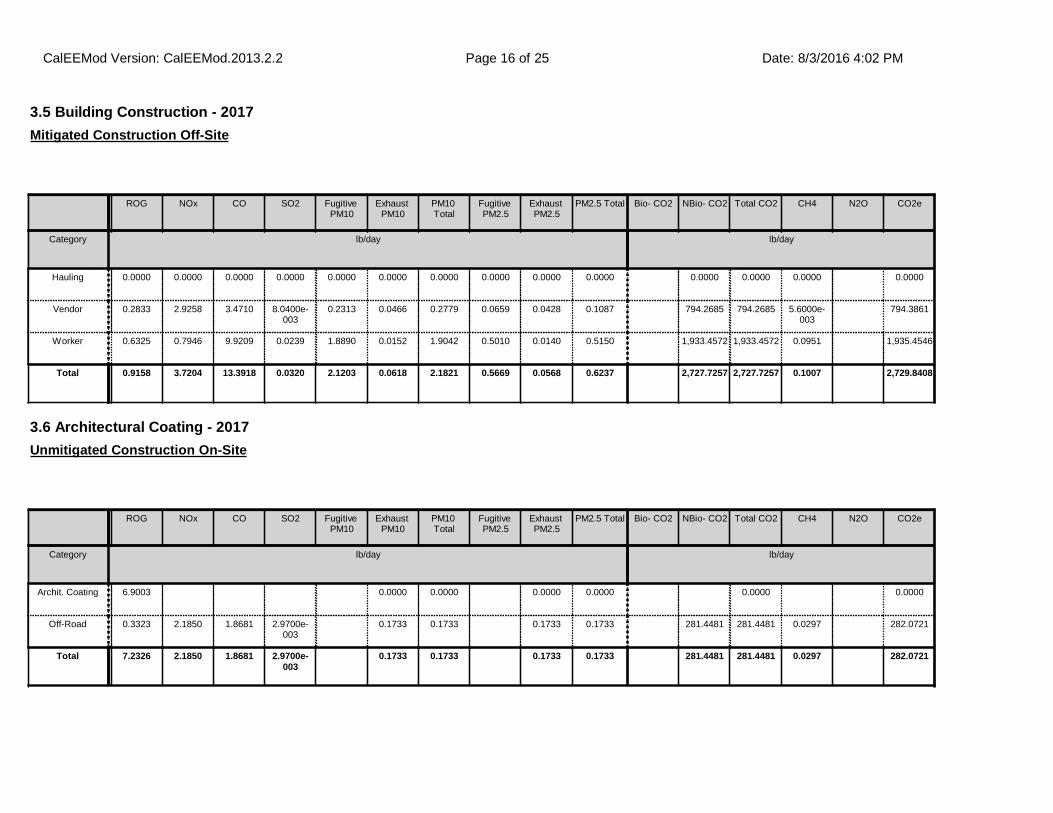
3.5 Building Construction - 2017
ROG NOx CO SO2 Fugitive PM10
Exhaust PM10
PM10 Total
Fugitive PM2.5
Exhaust PM2.5
PM2.5 Total Bio- CO2 NBio- CO2 Total CO2 CH4 N2O CO2e
Category lb/day lb/day
Hauling 0.0000 0.0000 0.0000 0.0000 0.0000 0.0000 0.0000 0.0000 0.0000 0.0000 0.0000 0.0000 0.0000 0.0000
Vendor 0.2833 2.9258 3.4710 8.0400e-003
0.2313 0.0466 0.2779 0.0659 0.0428 0.1087 794.2685 794.2685 5.6000e-003
794.3861
Worker 0.6325 0.7946 9.9209 0.0239 1.8890 0.0152 1.9042 0.5010 0.0140 0.5150 1,933.4572 1,933.4572 0.0951 1,935.4546
Total 0.9158 3.7204 13.3918 0.0320 2.1203 0.0618 2.1821 0.5669 0.0568 0.6237 2,727.7257 2,727.7257 0.1007 2,729.8408
Mitigated Construction Off-Site
3.6 Architectural Coating - 2017
ROG NOx CO SO2 Fugitive PM10
Exhaust PM10
PM10 Total
Fugitive PM2.5
Exhaust PM2.5
PM2.5 Total Bio- CO2 NBio- CO2 Total CO2 CH4 N2O CO2e
Category lb/day lb/day
Archit. Coating 6.9003 0.0000 0.0000 0.0000 0.0000 0.0000 0.0000
Off-Road 0.3323 2.1850 1.8681 2.9700e-003
0.1733 0.1733 0.1733 0.1733 281.4481 281.4481 0.0297 282.0721
Total 7.2326 2.1850 1.8681 2.9700e-003
0.1733 0.1733 0.1733 0.1733 281.4481 281.4481 0.0297 282.0721
Unmitigated Construction On-Site
CalEEMod Version: CalEEMod.2013.2.2 Date: 8/3/2016 4:02 PMPage 16 of 25

3.6 Architectural Coating - 2017
ROG NOx CO SO2 Fugitive PM10
Exhaust PM10
PM10 Total
Fugitive PM2.5
Exhaust PM2.5
PM2.5 Total Bio- CO2 NBio- CO2 Total CO2 CH4 N2O CO2e
Category lb/day lb/day
Hauling 0.0000 0.0000 0.0000 0.0000 0.0000 0.0000 0.0000 0.0000 0.0000 0.0000 0.0000 0.0000 0.0000 0.0000
Vendor 0.0000 0.0000 0.0000 0.0000 0.0000 0.0000 0.0000 0.0000 0.0000 0.0000 0.0000 0.0000 0.0000 0.0000
Worker 0.1273 0.1599 1.9959 4.8100e-003
0.3800 3.0600e-003
0.3831 0.1008 2.8200e-003
0.1036 388.9796 388.9796 0.0191 389.3814
Total 0.1273 0.1599 1.9959 4.8100e-003
0.3800 3.0600e-003
0.3831 0.1008 2.8200e-003
0.1036 388.9796 388.9796 0.0191 389.3814
Unmitigated Construction Off-Site
ROG NOx CO SO2 Fugitive PM10
Exhaust PM10
PM10 Total
Fugitive PM2.5
Exhaust PM2.5
PM2.5 Total Bio- CO2 NBio- CO2 Total CO2 CH4 N2O CO2e
Category lb/day lb/day
Archit. Coating 6.9003 0.0000 0.0000 0.0000 0.0000 0.0000 0.0000
Off-Road 0.3323 2.1850 1.8681 2.9700e-003
0.1733 0.1733 0.1733 0.1733 0.0000 281.4481 281.4481 0.0297 282.0721
Total 7.2326 2.1850 1.8681 2.9700e-003
0.1733 0.1733 0.1733 0.1733 0.0000 281.4481 281.4481 0.0297 282.0721
Mitigated Construction On-Site
CalEEMod Version: CalEEMod.2013.2.2 Date: 8/3/2016 4:02 PMPage 17 of 25
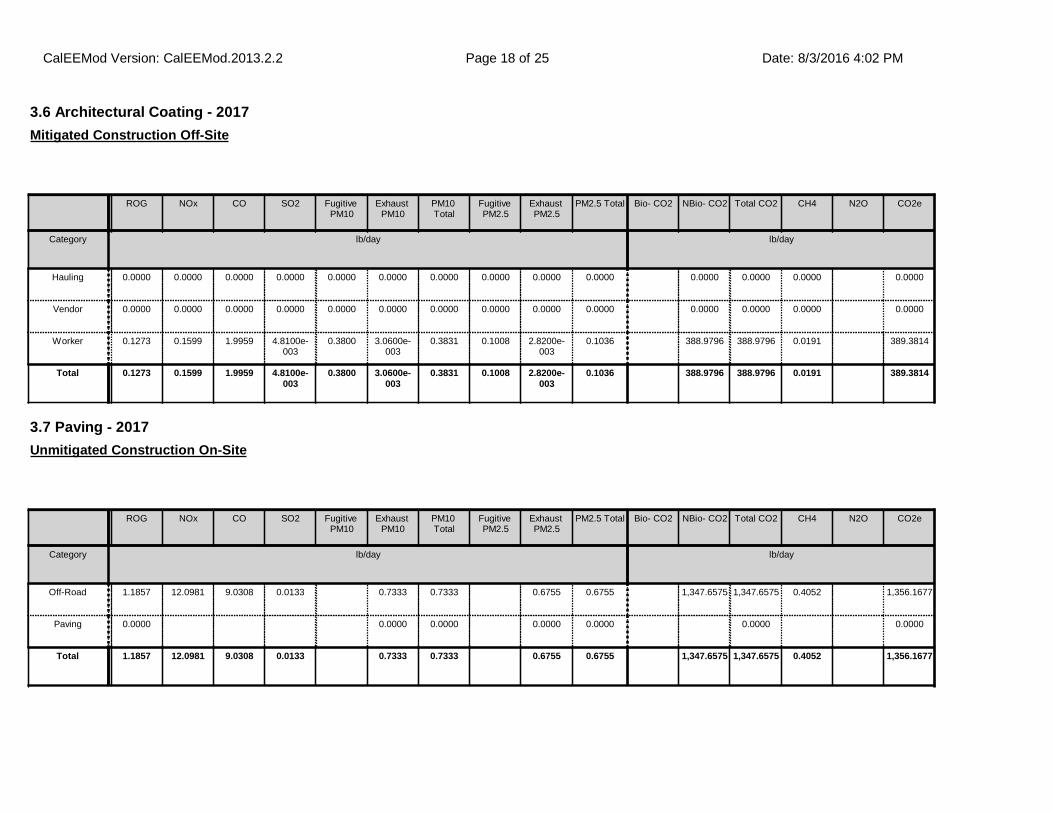
3.6 Architectural Coating - 2017
ROG NOx CO SO2 Fugitive PM10
Exhaust PM10
PM10 Total
Fugitive PM2.5
Exhaust PM2.5
PM2.5 Total Bio- CO2 NBio- CO2 Total CO2 CH4 N2O CO2e
Category lb/day lb/day
Hauling 0.0000 0.0000 0.0000 0.0000 0.0000 0.0000 0.0000 0.0000 0.0000 0.0000 0.0000 0.0000 0.0000 0.0000
Vendor 0.0000 0.0000 0.0000 0.0000 0.0000 0.0000 0.0000 0.0000 0.0000 0.0000 0.0000 0.0000 0.0000 0.0000
Worker 0.1273 0.1599 1.9959 4.8100e-003
0.3800 3.0600e-003
0.3831 0.1008 2.8200e-003
0.1036 388.9796 388.9796 0.0191 389.3814
Total 0.1273 0.1599 1.9959 4.8100e-003
0.3800 3.0600e-003
0.3831 0.1008 2.8200e-003
0.1036 388.9796 388.9796 0.0191 389.3814
Mitigated Construction Off-Site
3.7 Paving - 2017
ROG NOx CO SO2 Fugitive PM10
Exhaust PM10
PM10 Total
Fugitive PM2.5
Exhaust PM2.5
PM2.5 Total Bio- CO2 NBio- CO2 Total CO2 CH4 N2O CO2e
Category lb/day lb/day
Off-Road 1.1857 12.0981 9.0308 0.0133 0.7333 0.7333 0.6755 0.6755 1,347.6575 1,347.6575 0.4052 1,356.1677
Paving 0.0000 0.0000 0.0000 0.0000 0.0000 0.0000 0.0000
Total 1.1857 12.0981 9.0308 0.0133 0.7333 0.7333 0.6755 0.6755 1,347.6575 1,347.6575 0.4052 1,356.1677
Unmitigated Construction On-Site
CalEEMod Version: CalEEMod.2013.2.2 Date: 8/3/2016 4:02 PMPage 18 of 25

3.7 Paving - 2017
ROG NOx CO SO2 Fugitive PM10
Exhaust PM10
PM10 Total
Fugitive PM2.5
Exhaust PM2.5
PM2.5 Total Bio- CO2 NBio- CO2 Total CO2 CH4 N2O CO2e
Category lb/day lb/day
Hauling 0.0000 0.0000 0.0000 0.0000 0.0000 0.0000 0.0000 0.0000 0.0000 0.0000 0.0000 0.0000 0.0000 0.0000
Vendor 0.0000 0.0000 0.0000 0.0000 0.0000 0.0000 0.0000 0.0000 0.0000 0.0000 0.0000 0.0000 0.0000 0.0000
Worker 0.0487 0.0611 0.7632 1.8400e-003
0.1453 1.1700e-003
0.1465 0.0385 1.0800e-003
0.0396 148.7275 148.7275 7.3200e-003
148.8811
Total 0.0487 0.0611 0.7632 1.8400e-003
0.1453 1.1700e-003
0.1465 0.0385 1.0800e-003
0.0396 148.7275 148.7275 7.3200e-003
148.8811
Unmitigated Construction Off-Site
ROG NOx CO SO2 Fugitive PM10
Exhaust PM10
PM10 Total
Fugitive PM2.5
Exhaust PM2.5
PM2.5 Total Bio- CO2 NBio- CO2 Total CO2 CH4 N2O CO2e
Category lb/day lb/day
Off-Road 1.1857 12.0981 9.0308 0.0133 0.7333 0.7333 0.6755 0.6755 0.0000 1,347.6575 1,347.6575 0.4052 1,356.1677
Paving 0.0000 0.0000 0.0000 0.0000 0.0000 0.0000 0.0000
Total 1.1857 12.0981 9.0308 0.0133 0.7333 0.7333 0.6755 0.6755 0.0000 1,347.6575 1,347.6575 0.4052 1,356.1677
Mitigated Construction On-Site
CalEEMod Version: CalEEMod.2013.2.2 Date: 8/3/2016 4:02 PMPage 19 of 25

4.0 Operational Detail - Mobile
ROG NOx CO SO2 Fugitive PM10
Exhaust PM10
PM10 Total
Fugitive PM2.5
Exhaust PM2.5
PM2.5 Total Bio- CO2 NBio- CO2 Total CO2 CH4 N2O CO2e
Category lb/day lb/day
Mitigated 4.6567 13.1402 53.4226 0.1479 9.8783 0.2005 10.0787 2.6394 0.1847 2.8241 12,197.0233
12,197.0233
0.4438 12,206.3423
Unmitigated 4.6567 13.1402 53.4226 0.1479 9.8783 0.2005 10.0787 2.6394 0.1847 2.8241 12,197.0233
12,197.0233
0.4438 12,206.3423
4.1 Mitigation Measures Mobile
3.7 Paving - 2017
ROG NOx CO SO2 Fugitive PM10
Exhaust PM10
PM10 Total
Fugitive PM2.5
Exhaust PM2.5
PM2.5 Total Bio- CO2 NBio- CO2 Total CO2 CH4 N2O CO2e
Category lb/day lb/day
Hauling 0.0000 0.0000 0.0000 0.0000 0.0000 0.0000 0.0000 0.0000 0.0000 0.0000 0.0000 0.0000 0.0000 0.0000
Vendor 0.0000 0.0000 0.0000 0.0000 0.0000 0.0000 0.0000 0.0000 0.0000 0.0000 0.0000 0.0000 0.0000 0.0000
Worker 0.0487 0.0611 0.7632 1.8400e-003
0.1453 1.1700e-003
0.1465 0.0385 1.0800e-003
0.0396 148.7275 148.7275 7.3200e-003
148.8811
Total 0.0487 0.0611 0.7632 1.8400e-003
0.1453 1.1700e-003
0.1465 0.0385 1.0800e-003
0.0396 148.7275 148.7275 7.3200e-003
148.8811
Mitigated Construction Off-Site
CalEEMod Version: CalEEMod.2013.2.2 Date: 8/3/2016 4:02 PMPage 20 of 25

4.2 Trip Summary Information
4.3 Trip Type Information
Average Daily Trip Rate Unmitigated Mitigated
Land Use Weekday Saturday Sunday Annual VMT Annual VMT
Apartments Mid Rise 1,120.30 1,217.20 1031.90 3,832,385 3,832,385
Enclosed Parking Structure 0.00 0.00 0.00
Parking Lot 0.00 0.00 0.00
Regional Shopping Center 230.46 227.04 233.58 498,356 498,356
Total 1,350.76 1,444.24 1,265.48 4,330,741 4,330,741
Miles Trip % Trip Purpose %
Land Use H-W or C-W H-S or C-C H-O or C-NW H-W or C-W
H-S or C-C H-O or C-NW Primary Diverted Pass-by
Apartments Mid Rise 14.70 5.90 8.70 40.20 19.20 40.60 86 11 3
Enclosed Parking Structure 16.60 8.40 6.90 0.00 0.00 0.00 0 0 0
Parking Lot 16.60 8.40 6.90 0.00 0.00 0.00 0 0 0
Regional Shopping Center 16.60 8.40 6.90 16.30 64.70 19.00 54 35 11
5.0 Energy Detail
5.1 Mitigation Measures Energy
4.4 Fleet Mix
LDA LDT1 LDT2 MDV LHD1 LHD2 MHD HHD OBUS UBUS MCY SBUS MH
0.512137 0.059943 0.180601 0.139123 0.042256 0.006647 0.016115 0.031670 0.001940 0.002502 0.004362 0.000588 0.002117
Historical Energy Use: N
CalEEMod Version: CalEEMod.2013.2.2 Date: 8/3/2016 4:02 PMPage 21 of 25
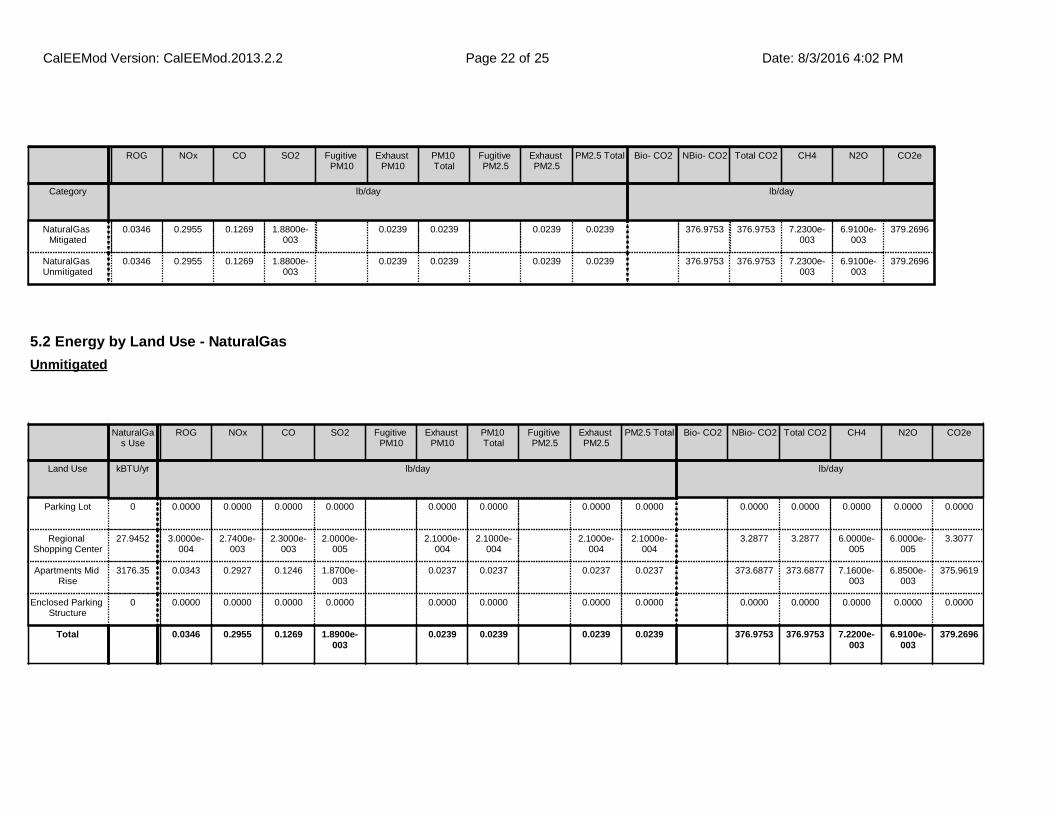
ROG NOx CO SO2 Fugitive PM10
Exhaust PM10
PM10 Total
Fugitive PM2.5
Exhaust PM2.5
PM2.5 Total Bio- CO2 NBio- CO2 Total CO2 CH4 N2O CO2e
Category lb/day lb/day
NaturalGas Mitigated
0.0346 0.2955 0.1269 1.8800e-003
0.0239 0.0239 0.0239 0.0239 376.9753 376.9753 7.2300e-003
6.9100e-003
379.2696
NaturalGas Unmitigated
0.0346 0.2955 0.1269 1.8800e-003
0.0239 0.0239 0.0239 0.0239 376.9753 376.9753 7.2300e-003
6.9100e-003
379.2696
5.2 Energy by Land Use - NaturalGas
NaturalGas Use
ROG NOx CO SO2 Fugitive PM10
Exhaust PM10
PM10 Total
Fugitive PM2.5
Exhaust PM2.5
PM2.5 Total Bio- CO2 NBio- CO2 Total CO2 CH4 N2O CO2e
Land Use kBTU/yr lb/day lb/day
Parking Lot 0 0.0000 0.0000 0.0000 0.0000 0.0000 0.0000 0.0000 0.0000 0.0000 0.0000 0.0000 0.0000 0.0000
Regional Shopping Center
27.9452 3.0000e-004
2.7400e-003
2.3000e-003
2.0000e-005
2.1000e-004
2.1000e-004
2.1000e-004
2.1000e-004
3.2877 3.2877 6.0000e-005
6.0000e-005
3.3077
Apartments Mid Rise
3176.35 0.0343 0.2927 0.1246 1.8700e-003
0.0237 0.0237 0.0237 0.0237 373.6877 373.6877 7.1600e-003
6.8500e-003
375.9619
Enclosed Parking Structure
0 0.0000 0.0000 0.0000 0.0000 0.0000 0.0000 0.0000 0.0000 0.0000 0.0000 0.0000 0.0000 0.0000
Total 0.0346 0.2955 0.1269 1.8900e-003
0.0239 0.0239 0.0239 0.0239 376.9753 376.9753 7.2200e-003
6.9100e-003
379.2696
Unmitigated
CalEEMod Version: CalEEMod.2013.2.2 Date: 8/3/2016 4:02 PMPage 22 of 25
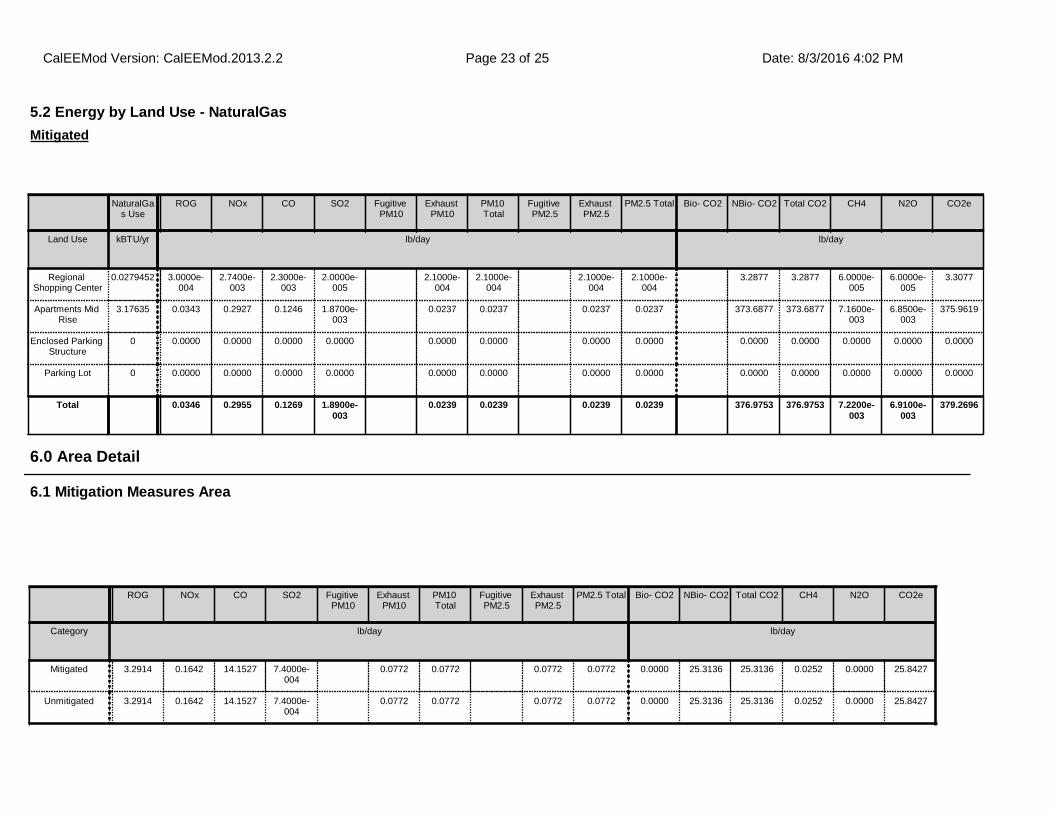
6.1 Mitigation Measures Area
6.0 Area Detail
ROG NOx CO SO2 Fugitive PM10
Exhaust PM10
PM10 Total
Fugitive PM2.5
Exhaust PM2.5
PM2.5 Total Bio- CO2 NBio- CO2 Total CO2 CH4 N2O CO2e
Category lb/day lb/day
Mitigated 3.2914 0.1642 14.1527 7.4000e-004
0.0772 0.0772 0.0772 0.0772 0.0000 25.3136 25.3136 0.0252 0.0000 25.8427
Unmitigated 3.2914 0.1642 14.1527 7.4000e-004
0.0772 0.0772 0.0772 0.0772 0.0000 25.3136 25.3136 0.0252 0.0000 25.8427
5.2 Energy by Land Use - NaturalGas
NaturalGas Use
ROG NOx CO SO2 Fugitive PM10
Exhaust PM10
PM10 Total
Fugitive PM2.5
Exhaust PM2.5
PM2.5 Total Bio- CO2 NBio- CO2 Total CO2 CH4 N2O CO2e
Land Use kBTU/yr lb/day lb/day
Regional Shopping Center
0.0279452 3.0000e-004
2.7400e-003
2.3000e-003
2.0000e-005
2.1000e-004
2.1000e-004
2.1000e-004
2.1000e-004
3.2877 3.2877 6.0000e-005
6.0000e-005
3.3077
Apartments Mid Rise
3.17635 0.0343 0.2927 0.1246 1.8700e-003
0.0237 0.0237 0.0237 0.0237 373.6877 373.6877 7.1600e-003
6.8500e-003
375.9619
Enclosed Parking Structure
0 0.0000 0.0000 0.0000 0.0000 0.0000 0.0000 0.0000 0.0000 0.0000 0.0000 0.0000 0.0000 0.0000
Parking Lot 0 0.0000 0.0000 0.0000 0.0000 0.0000 0.0000 0.0000 0.0000 0.0000 0.0000 0.0000 0.0000 0.0000
Total 0.0346 0.2955 0.1269 1.8900e-003
0.0239 0.0239 0.0239 0.0239 376.9753 376.9753 7.2200e-003
6.9100e-003
379.2696
Mitigated
CalEEMod Version: CalEEMod.2013.2.2 Date: 8/3/2016 4:02 PMPage 23 of 25

6.2 Area by SubCategory
ROG NOx CO SO2 Fugitive PM10
Exhaust PM10
PM10 Total
Fugitive PM2.5
Exhaust PM2.5
PM2.5 Total Bio- CO2 NBio- CO2 Total CO2 CH4 N2O CO2e
SubCategory lb/day lb/day
Architectural Coating
0.5461 0.0000 0.0000 0.0000 0.0000 0.0000 0.0000
Consumer Products
2.3072 0.0000 0.0000 0.0000 0.0000 0.0000 0.0000
Hearth 0.0000 0.0000 0.0000 0.0000 0.0000 0.0000 0.0000 0.0000 0.0000 0.0000 0.0000 0.0000 0.0000 0.0000
Landscaping 0.4381 0.1642 14.1527 7.4000e-004
0.0772 0.0772 0.0772 0.0772 25.3136 25.3136 0.0252 25.8427
Total 3.2914 0.1642 14.1527 7.4000e-004
0.0772 0.0772 0.0772 0.0772 0.0000 25.3136 25.3136 0.0252 0.0000 25.8427
Unmitigated
CalEEMod Version: CalEEMod.2013.2.2 Date: 8/3/2016 4:02 PMPage 24 of 25

8.1 Mitigation Measures Waste
7.1 Mitigation Measures Water
7.0 Water Detail
8.0 Waste Detail
10.0 Vegetation
6.2 Area by SubCategory
ROG NOx CO SO2 Fugitive PM10
Exhaust PM10
PM10 Total
Fugitive PM2.5
Exhaust PM2.5
PM2.5 Total Bio- CO2 NBio- CO2 Total CO2 CH4 N2O CO2e
SubCategory lb/day lb/day
Architectural Coating
0.5461 0.0000 0.0000 0.0000 0.0000 0.0000 0.0000
Consumer Products
2.3072 0.0000 0.0000 0.0000 0.0000 0.0000 0.0000
Hearth 0.0000 0.0000 0.0000 0.0000 0.0000 0.0000 0.0000 0.0000 0.0000 0.0000 0.0000 0.0000 0.0000 0.0000
Landscaping 0.4381 0.1642 14.1527 7.4000e-004
0.0772 0.0772 0.0772 0.0772 25.3136 25.3136 0.0252 25.8427
Total 3.2914 0.1642 14.1527 7.4000e-004
0.0772 0.0772 0.0772 0.0772 0.0000 25.3136 25.3136 0.0252 0.0000 25.8427
Mitigated
9.0 Operational Offroad
Equipment Type Number Hours/Day Days/Year Horse Power Load Factor Fuel Type
CalEEMod Version: CalEEMod.2013.2.2 Date: 8/3/2016 4:02 PMPage 25 of 25
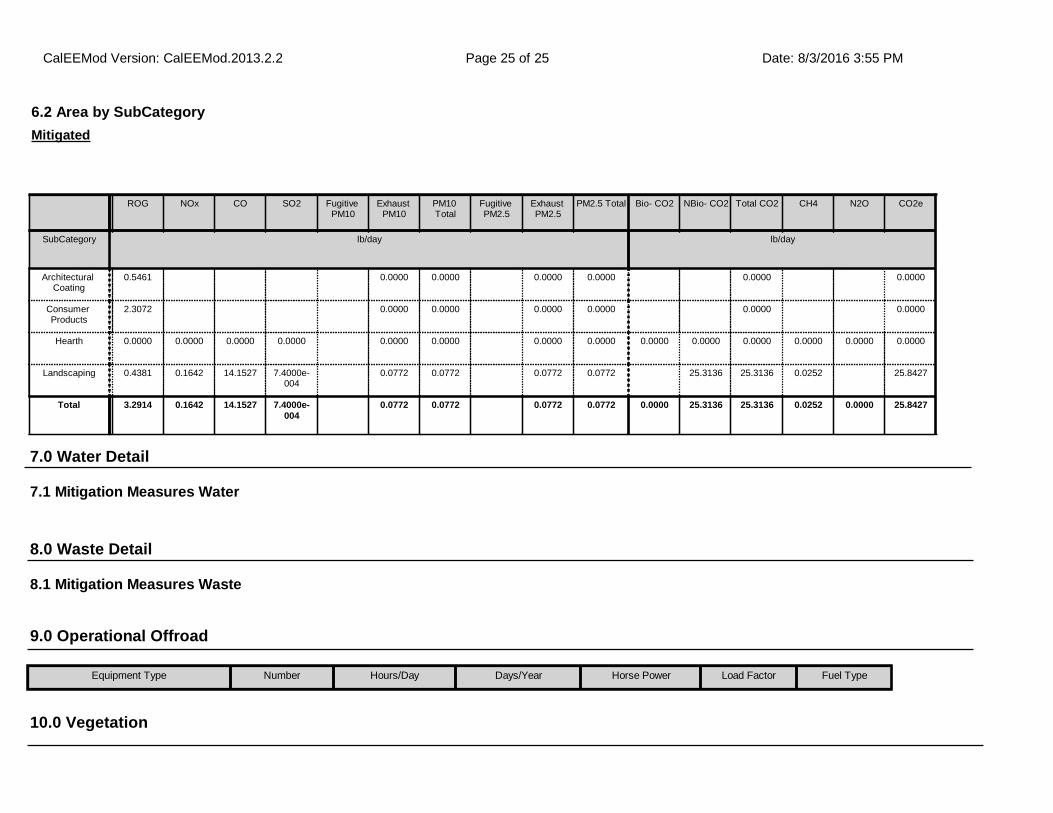
8.1 Mitigation Measures Waste
7.1 Mitigation Measures Water
7.0 Water Detail
8.0 Waste Detail
10.0 Vegetation
6.2 Area by SubCategory
ROG NOx CO SO2 Fugitive PM10
Exhaust PM10
PM10 Total
Fugitive PM2.5
Exhaust PM2.5
PM2.5 Total Bio- CO2 NBio- CO2 Total CO2 CH4 N2O CO2e
SubCategory lb/day lb/day
Architectural Coating
0.5461 0.0000 0.0000 0.0000 0.0000 0.0000 0.0000
Consumer Products
2.3072 0.0000 0.0000 0.0000 0.0000 0.0000 0.0000
Hearth 0.0000 0.0000 0.0000 0.0000 0.0000 0.0000 0.0000 0.0000 0.0000 0.0000 0.0000 0.0000 0.0000 0.0000
Landscaping 0.4381 0.1642 14.1527 7.4000e-004
0.0772 0.0772 0.0772 0.0772 25.3136 25.3136 0.0252 25.8427
Total 3.2914 0.1642 14.1527 7.4000e-004
0.0772 0.0772 0.0772 0.0772 0.0000 25.3136 25.3136 0.0252 0.0000 25.8427
Mitigated
9.0 Operational Offroad
Equipment Type Number Hours/Day Days/Year Horse Power Load Factor Fuel Type
CalEEMod Version: CalEEMod.2013.2.2 Date: 8/3/2016 3:55 PMPage 25 of 25
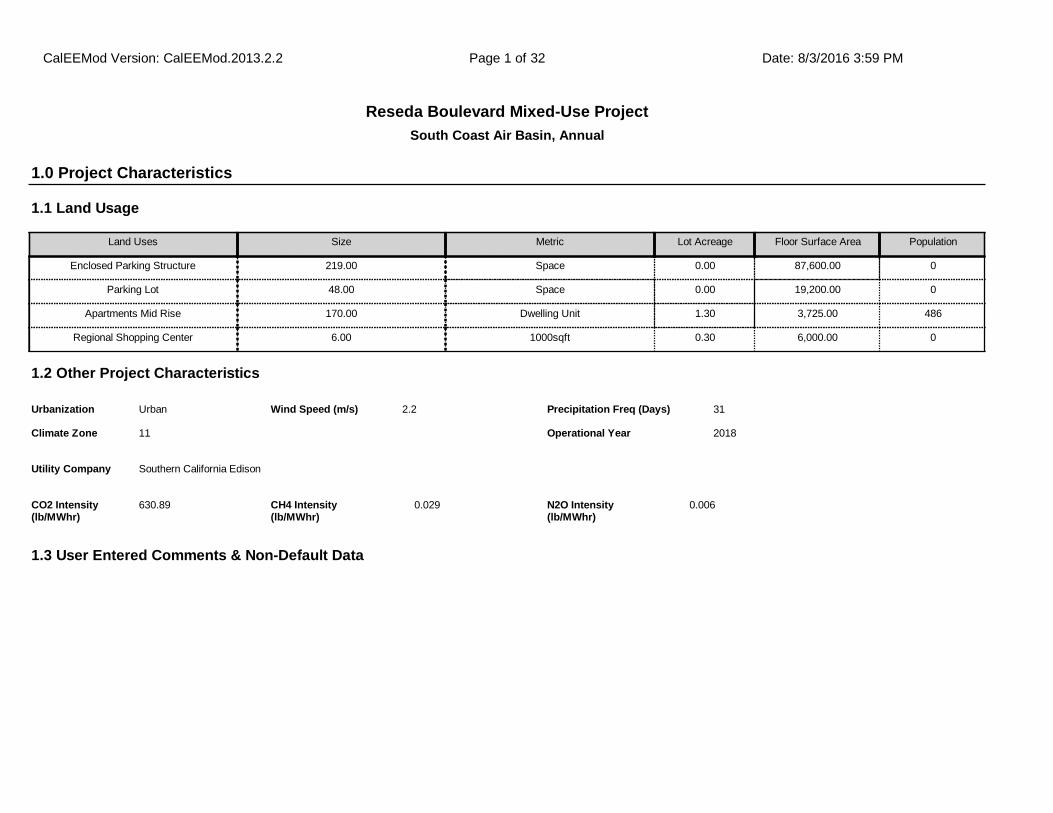
South Coast Air Basin, Annual
Reseda Boulevard Mixed-Use Project
1.1 Land Usage
Land Uses Size Metric Lot Acreage Floor Surface Area Population
Enclosed Parking Structure 219.00 Space 0.00 87,600.00 0
Parking Lot 48.00 Space 0.00 19,200.00 0
Apartments Mid Rise 170.00 Dwelling Unit 1.30 3,725.00 486
Regional Shopping Center 6.00 1000sqft 0.30 6,000.00 0
1.2 Other Project Characteristics
Urbanization
Climate Zone
Urban
11
Wind Speed (m/s) Precipitation Freq (Days)2.2 31
1.3 User Entered Comments & Non-Default Data
1.0 Project Characteristics
Utility Company Southern California Edison
2018Operational Year
CO2 Intensity (lb/MWhr)
630.89 0.029CH4 Intensity (lb/MWhr)
0.006N2O Intensity (lb/MWhr)
CalEEMod Version: CalEEMod.2013.2.2 Date: 8/3/2016 3:59 PMPage 1 of 32

Project Characteristics -
Land Use - Square footage and acerage based on site plans
Construction Phase - Architucrual coating changed to overlap with building construction
Demolition - Sf from arch design = 13,792
Architectural Coating - Per SCAQMD Rule 1113
Vehicle Trips - Per traffic study of 45 trips/day. Regional Shopping Wkd=38.41, Sat=37.84. Sun=38.93
Woodstoves - No fireplaces or woodstoves, per site plans
Area Coating - 150 g/L per SCAQMD Rule 1113
Construction Off-road Equipment Mitigation - Per SCAQMD Rule 403
Area Mitigation - 150 g/L per SCAQMD Rule 1113
Table Name Column Name Default Value New Value
tblArchitecturalCoating EF_Nonresidential_Exterior 250.00 150.00
tblArchitecturalCoating EF_Nonresidential_Interior 250.00 150.00
tblAreaCoating Area_EF_Nonresidential_Exterior 250 150
tblAreaMitigation UseLowVOCPaintNonresidentialInteriorValue
250 150
tblConstDustMitigation WaterExposedAreaPM10PercentReduction 61 55
tblConstDustMitigation WaterExposedAreaPM25PercentReduction 61 55
tblConstructionPhase NumDays 10.00 194.00
tblConstructionPhase PhaseEndDate 8/10/2018 12/11/2017
tblConstructionPhase PhaseEndDate 12/25/2017 11/27/2017
tblConstructionPhase PhaseStartDate 11/14/2017 3/15/2017
tblConstructionPhase PhaseStartDate 12/12/2017 11/14/2017
tblFireplaces FireplaceDayYear 25.00 0.00
tblFireplaces FireplaceHourDay 3.00 0.00
tblFireplaces FireplaceWoodMass 1,019.20 0.00
tblFireplaces NumberGas 144.50 0.00
tblFireplaces NumberNoFireplace 17.00 0.00
CalEEMod Version: CalEEMod.2013.2.2 Date: 8/3/2016 3:59 PMPage 2 of 32

2.0 Emissions Summary
tblFireplaces NumberWood 8.50 0.00
tblLandUse LandUseSquareFeet 170,000.00 3,725.00
tblLandUse LotAcreage 1.97 0.00
tblLandUse LotAcreage 0.43 0.00
tblLandUse LotAcreage 4.47 1.30
tblLandUse LotAcreage 0.14 0.30
tblProjectCharacteristics OperationalYear 2014 2018
tblVehicleTrips ST_TR 49.97 37.84
tblVehicleTrips SU_TR 25.24 38.93
tblVehicleTrips WD_TR 42.94 38.41
tblWoodstoves NumberCatalytic 8.50 0.00
tblWoodstoves NumberNoncatalytic 8.50 0.00
tblWoodstoves WoodstoveDayYear 25.00 0.00
tblWoodstoves WoodstoveWoodMass 999.60 0.00
CalEEMod Version: CalEEMod.2013.2.2 Date: 8/3/2016 3:59 PMPage 3 of 32
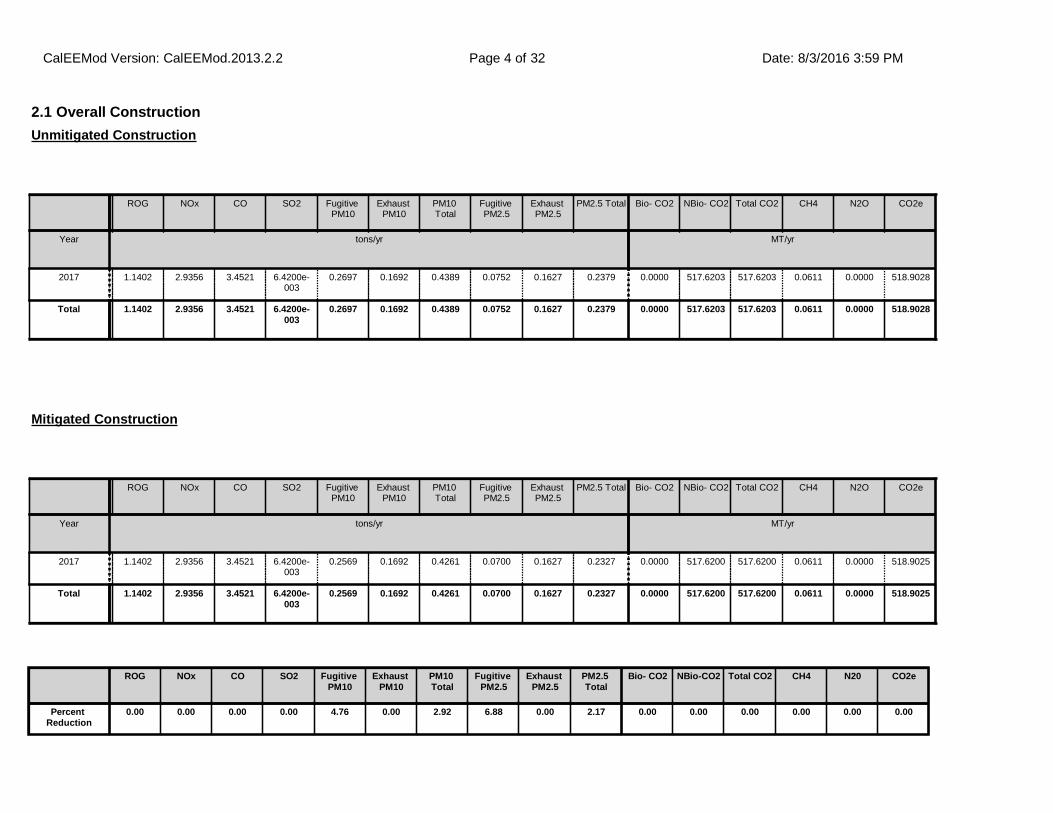
2.1 Overall Construction
ROG NOx CO SO2 Fugitive PM10
Exhaust PM10
PM10 Total
Fugitive PM2.5
Exhaust PM2.5
PM2.5 Total Bio- CO2 NBio- CO2 Total CO2 CH4 N2O CO2e
Year tons/yr MT/yr
2017 1.1402 2.9356 3.4521 6.4200e-003
0.2697 0.1692 0.4389 0.0752 0.1627 0.2379 0.0000 517.6203 517.6203 0.0611 0.0000 518.9028
Total 1.1402 2.9356 3.4521 6.4200e-003
0.2697 0.1692 0.4389 0.0752 0.1627 0.2379 0.0000 517.6203 517.6203 0.0611 0.0000 518.9028
Unmitigated Construction
ROG NOx CO SO2 Fugitive PM10
Exhaust PM10
PM10 Total
Fugitive PM2.5
Exhaust PM2.5
PM2.5 Total Bio- CO2 NBio- CO2 Total CO2 CH4 N2O CO2e
Year tons/yr MT/yr
2017 1.1402 2.9356 3.4521 6.4200e-003
0.2569 0.1692 0.4261 0.0700 0.1627 0.2327 0.0000 517.6200 517.6200 0.0611 0.0000 518.9025
Total 1.1402 2.9356 3.4521 6.4200e-003
0.2569 0.1692 0.4261 0.0700 0.1627 0.2327 0.0000 517.6200 517.6200 0.0611 0.0000 518.9025
Mitigated Construction
ROG NOx CO SO2 Fugitive PM10
Exhaust PM10
PM10 Total
Fugitive PM2.5
Exhaust PM2.5
PM2.5 Total
Bio- CO2 NBio-CO2 Total CO2 CH4 N20 CO2e
Percent Reduction
0.00 0.00 0.00 0.00 4.76 0.00 2.92 6.88 0.00 2.17 0.00 0.00 0.00 0.00 0.00 0.00
CalEEMod Version: CalEEMod.2013.2.2 Date: 8/3/2016 3:59 PMPage 4 of 32
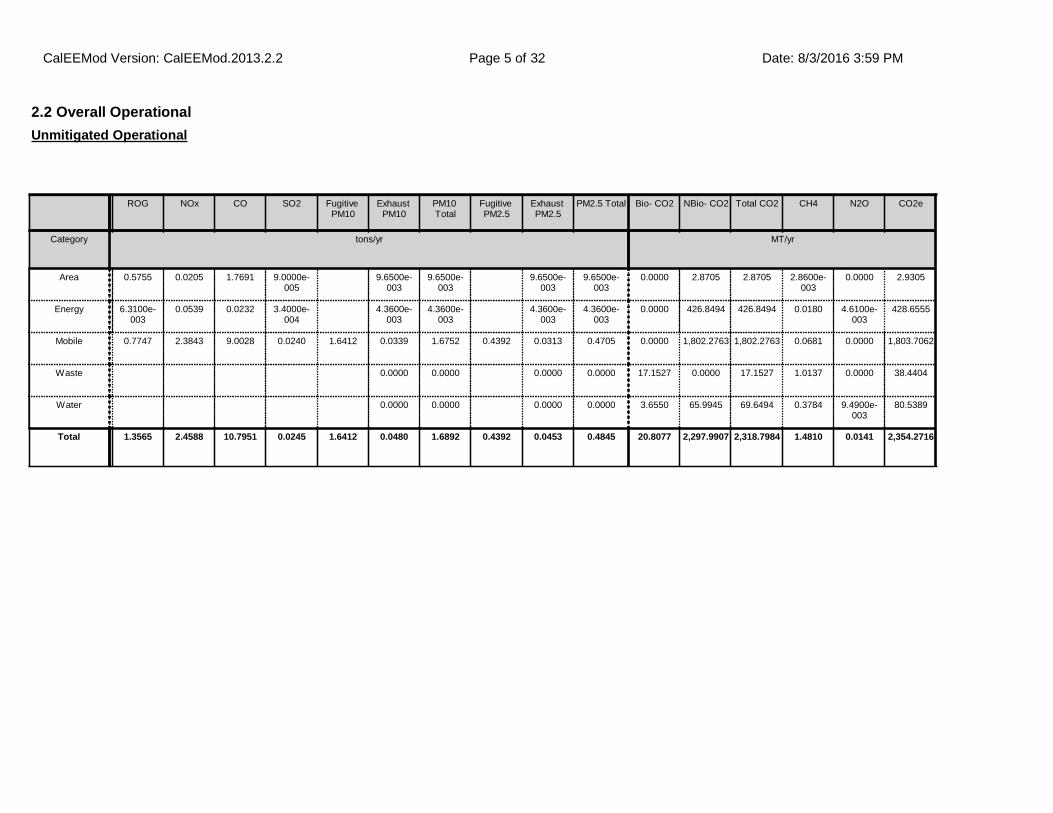
2.2 Overall Operational
ROG NOx CO SO2 Fugitive PM10
Exhaust PM10
PM10 Total
Fugitive PM2.5
Exhaust PM2.5
PM2.5 Total Bio- CO2 NBio- CO2 Total CO2 CH4 N2O CO2e
Category tons/yr MT/yr
Area 0.5755 0.0205 1.7691 9.0000e-005
9.6500e-003
9.6500e-003
9.6500e-003
9.6500e-003
0.0000 2.8705 2.8705 2.8600e-003
0.0000 2.9305
Energy 6.3100e-003
0.0539 0.0232 3.4000e-004
4.3600e-003
4.3600e-003
4.3600e-003
4.3600e-003
0.0000 426.8494 426.8494 0.0180 4.6100e-003
428.6555
Mobile 0.7747 2.3843 9.0028 0.0240 1.6412 0.0339 1.6752 0.4392 0.0313 0.4705 0.0000 1,802.2763 1,802.2763 0.0681 0.0000 1,803.7062
Waste 0.0000 0.0000 0.0000 0.0000 17.1527 0.0000 17.1527 1.0137 0.0000 38.4404
Water 0.0000 0.0000 0.0000 0.0000 3.6550 65.9945 69.6494 0.3784 9.4900e-003
80.5389
Total 1.3565 2.4588 10.7951 0.0245 1.6412 0.0480 1.6892 0.4392 0.0453 0.4845 20.8077 2,297.9907 2,318.7984 1.4810 0.0141 2,354.2716
Unmitigated Operational
CalEEMod Version: CalEEMod.2013.2.2 Date: 8/3/2016 3:59 PMPage 5 of 32
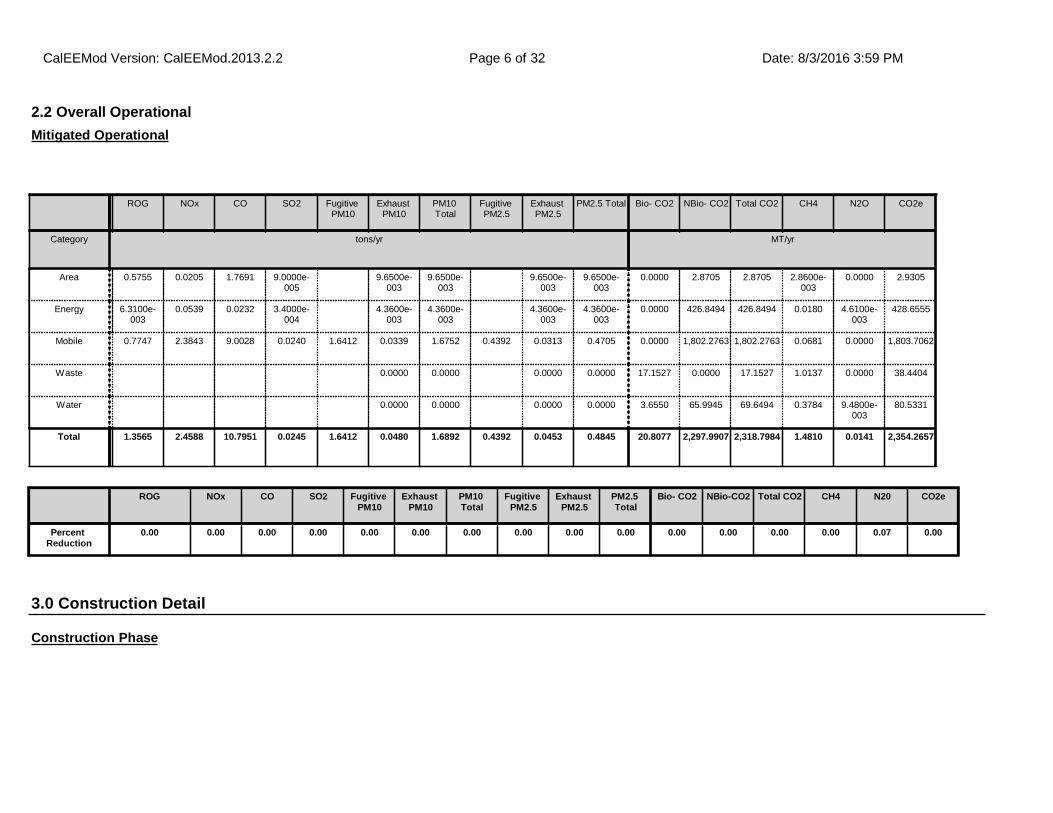
2.2 Overall Operational
ROG NOx CO SO2 Fugitive PM10
Exhaust PM10
PM10 Total
Fugitive PM2.5
Exhaust PM2.5
PM2.5 Total Bio- CO2 NBio- CO2 Total CO2 CH4 N2O CO2e
Category tons/yr MT/yr
Area 0.5755 0.0205 1.7691 9.0000e-005
9.6500e-003
9.6500e-003
9.6500e-003
9.6500e-003
0.0000 2.8705 2.8705 2.8600e-003
0.0000 2.9305
Energy 6.3100e-003
0.0539 0.0232 3.4000e-004
4.3600e-003
4.3600e-003
4.3600e-003
4.3600e-003
0.0000 426.8494 426.8494 0.0180 4.6100e-003
428.6555
Mobile 0.7747 2.3843 9.0028 0.0240 1.6412 0.0339 1.6752 0.4392 0.0313 0.4705 0.0000 1,802.2763 1,802.2763 0.0681 0.0000 1,803.7062
Waste 0.0000 0.0000 0.0000 0.0000 17.1527 0.0000 17.1527 1.0137 0.0000 38.4404
Water 0.0000 0.0000 0.0000 0.0000 3.6550 65.9945 69.6494 0.3784 9.4800e-003
80.5331
Total 1.3565 2.4588 10.7951 0.0245 1.6412 0.0480 1.6892 0.4392 0.0453 0.4845 20.8077 2,297.9907 2,318.7984 1.4810 0.0141 2,354.2657
Mitigated Operational
3.0 Construction Detail
Construction Phase
ROG NOx CO SO2 Fugitive PM10
Exhaust PM10
PM10 Total
Fugitive PM2.5
Exhaust PM2.5
PM2.5 Total
Bio- CO2 NBio-CO2 Total CO2 CH4 N20 CO2e
Percent Reduction
0.00 0.00 0.00 0.00 0.00 0.00 0.00 0.00 0.00 0.00 0.00 0.00 0.00 0.00 0.07 0.00
CalEEMod Version: CalEEMod.2013.2.2 Date: 8/3/2016 3:59 PMPage 6 of 32
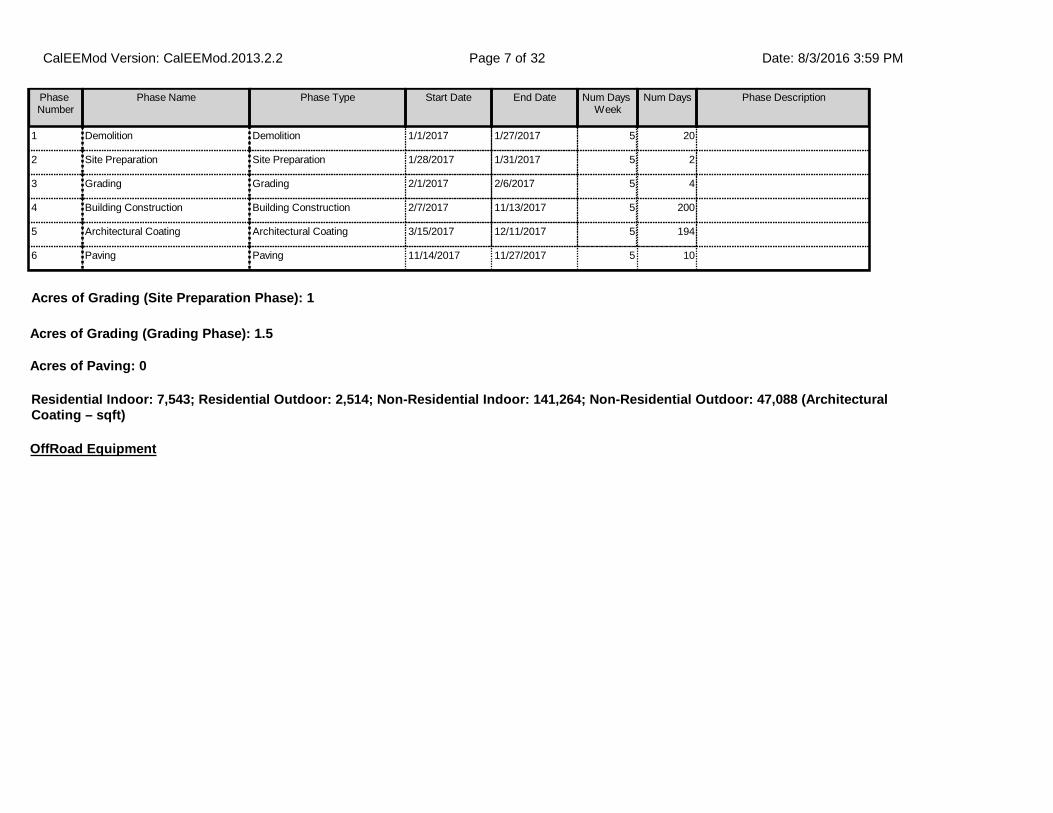
Phase Number
Phase Name Phase Type Start Date End Date Num Days Week
Num Days Phase Description
1 Demolition Demolition 1/1/2017 1/27/2017 5 20
2 Site Preparation Site Preparation 1/28/2017 1/31/2017 5 2
3 Grading Grading 2/1/2017 2/6/2017 5 4
4 Building Construction Building Construction 2/7/2017 11/13/2017 5 200
5 Architectural Coating Architectural Coating 3/15/2017 12/11/2017 5 194
6 Paving Paving 11/14/2017 11/27/2017 5 10
OffRoad Equipment
Residential Indoor: 7,543; Residential Outdoor: 2,514; Non-Residential Indoor: 141,264; Non-Residential Outdoor: 47,088 (Architectural Coating – sqft)
Acres of Grading (Site Preparation Phase): 1
Acres of Grading (Grading Phase): 1.5
Acres of Paving: 0
CalEEMod Version: CalEEMod.2013.2.2 Date: 8/3/2016 3:59 PMPage 7 of 32

Phase Name Offroad Equipment Type Amount Usage Hours Horse Power Load Factor
Demolition Concrete/Industrial Saws 1 8.00 81 0.73
Demolition Rubber Tired Dozers 1 8.00 255 0.40
Demolition Tractors/Loaders/Backhoes 3 8.00 97 0.37
Site Preparation Graders 1 8.00 174 0.41
Site Preparation Rubber Tired Dozers 1 7.00 255 0.40
Site Preparation Tractors/Loaders/Backhoes 1 8.00 97 0.37
Grading Graders 1 6.00 174 0.41
Grading Rubber Tired Dozers 1 6.00 255 0.40
Grading Tractors/Loaders/Backhoes 1 7.00 97 0.37
Building Construction Cranes 1 6.00 226 0.29
Building Construction Forklifts 1 6.00 89 0.20
Building Construction Generator Sets 1 8.00 84 0.74
Building Construction Tractors/Loaders/Backhoes 1 6.00 97 0.37
Building Construction Welders 3 8.00 46 0.45
Architectural Coating Air Compressors 1 6.00 78 0.48
Paving Cement and Mortar Mixers 1 6.00 9 0.56
Paving Pavers 1 6.00 125 0.42
Paving Paving Equipment 1 8.00 130 0.36
Paving Rollers 1 7.00 80 0.38
Paving Tractors/Loaders/Backhoes 1 8.00 97 0.37
Trips and VMT
CalEEMod Version: CalEEMod.2013.2.2 Date: 8/3/2016 3:59 PMPage 8 of 32
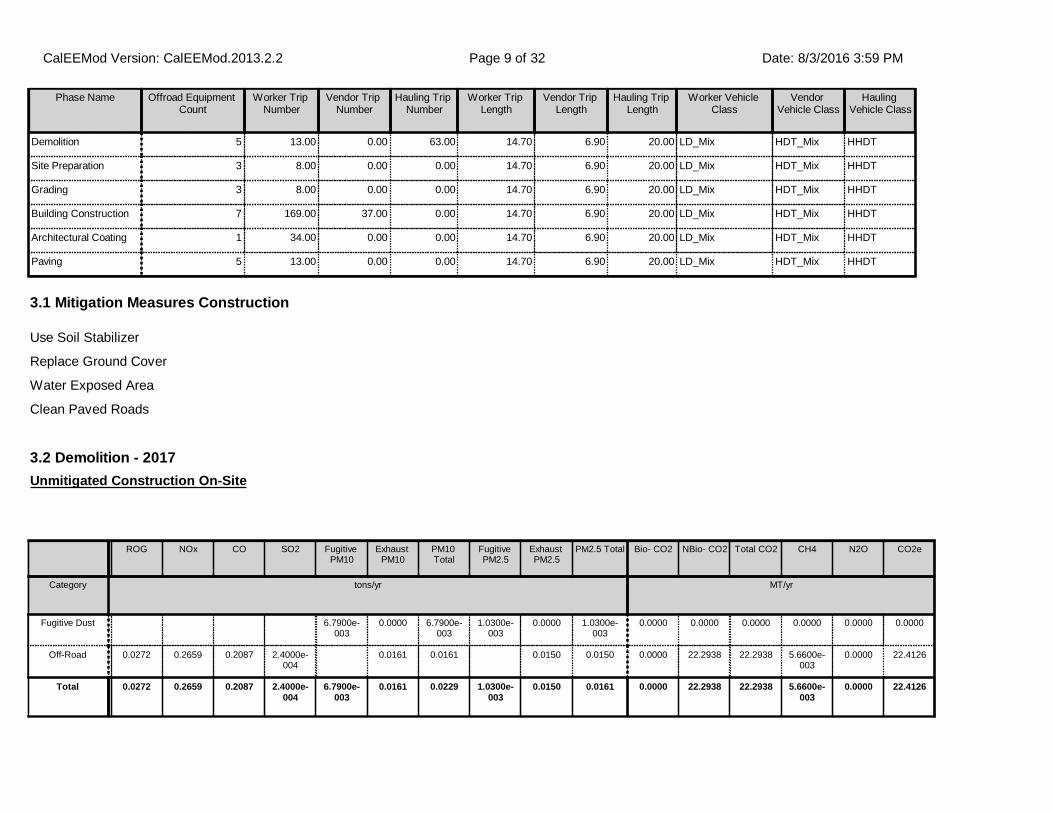
3.2 Demolition - 2017
ROG NOx CO SO2 Fugitive PM10
Exhaust PM10
PM10 Total
Fugitive PM2.5
Exhaust PM2.5
PM2.5 Total Bio- CO2 NBio- CO2 Total CO2 CH4 N2O CO2e
Category tons/yr MT/yr
Fugitive Dust 6.7900e-003
0.0000 6.7900e-003
1.0300e-003
0.0000 1.0300e-003
0.0000 0.0000 0.0000 0.0000 0.0000 0.0000
Off-Road 0.0272 0.2659 0.2087 2.4000e-004
0.0161 0.0161 0.0150 0.0150 0.0000 22.2938 22.2938 5.6600e-003
0.0000 22.4126
Total 0.0272 0.2659 0.2087 2.4000e-004
6.7900e-003
0.0161 0.0229 1.0300e-003
0.0150 0.0161 0.0000 22.2938 22.2938 5.6600e-003
0.0000 22.4126
Unmitigated Construction On-Site
3.1 Mitigation Measures Construction
Use Soil Stabilizer
Replace Ground Cover
Water Exposed Area
Clean Paved Roads
Phase Name Offroad Equipment Count
Worker Trip Number
Vendor Trip Number
Hauling Trip Number
Worker Trip Length
Vendor Trip Length
Hauling Trip Length
Worker Vehicle Class
Vendor Vehicle Class
Hauling Vehicle Class
Demolition 5 13.00 0.00 63.00 14.70 6.90 20.00 LD_Mix HDT_Mix HHDT
Site Preparation 3 8.00 0.00 0.00 14.70 6.90 20.00 LD_Mix HDT_Mix HHDT
Grading 3 8.00 0.00 0.00 14.70 6.90 20.00 LD_Mix HDT_Mix HHDT
Building Construction 7 169.00 37.00 0.00 14.70 6.90 20.00 LD_Mix HDT_Mix HHDT
Architectural Coating 1 34.00 0.00 0.00 14.70 6.90 20.00 LD_Mix HDT_Mix HHDT
Paving 5 13.00 0.00 0.00 14.70 6.90 20.00 LD_Mix HDT_Mix HHDT
CalEEMod Version: CalEEMod.2013.2.2 Date: 8/3/2016 3:59 PMPage 9 of 32
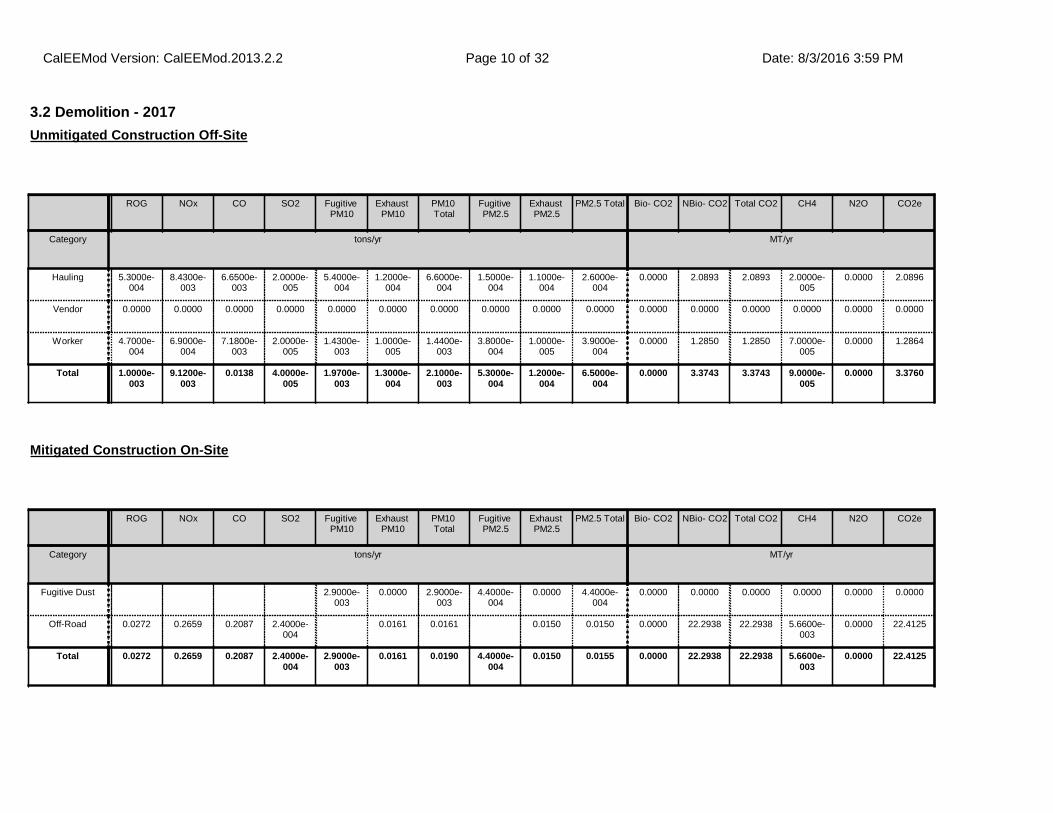
3.2 Demolition - 2017
ROG NOx CO SO2 Fugitive PM10
Exhaust PM10
PM10 Total
Fugitive PM2.5
Exhaust PM2.5
PM2.5 Total Bio- CO2 NBio- CO2 Total CO2 CH4 N2O CO2e
Category tons/yr MT/yr
Hauling 5.3000e-004
8.4300e-003
6.6500e-003
2.0000e-005
5.4000e-004
1.2000e-004
6.6000e-004
1.5000e-004
1.1000e-004
2.6000e-004
0.0000 2.0893 2.0893 2.0000e-005
0.0000 2.0896
Vendor 0.0000 0.0000 0.0000 0.0000 0.0000 0.0000 0.0000 0.0000 0.0000 0.0000 0.0000 0.0000 0.0000 0.0000 0.0000 0.0000
Worker 4.7000e-004
6.9000e-004
7.1800e-003
2.0000e-005
1.4300e-003
1.0000e-005
1.4400e-003
3.8000e-004
1.0000e-005
3.9000e-004
0.0000 1.2850 1.2850 7.0000e-005
0.0000 1.2864
Total 1.0000e-003
9.1200e-003
0.0138 4.0000e-005
1.9700e-003
1.3000e-004
2.1000e-003
5.3000e-004
1.2000e-004
6.5000e-004
0.0000 3.3743 3.3743 9.0000e-005
0.0000 3.3760
Unmitigated Construction Off-Site
ROG NOx CO SO2 Fugitive PM10
Exhaust PM10
PM10 Total
Fugitive PM2.5
Exhaust PM2.5
PM2.5 Total Bio- CO2 NBio- CO2 Total CO2 CH4 N2O CO2e
Category tons/yr MT/yr
Fugitive Dust 2.9000e-003
0.0000 2.9000e-003
4.4000e-004
0.0000 4.4000e-004
0.0000 0.0000 0.0000 0.0000 0.0000 0.0000
Off-Road 0.0272 0.2659 0.2087 2.4000e-004
0.0161 0.0161 0.0150 0.0150 0.0000 22.2938 22.2938 5.6600e-003
0.0000 22.4125
Total 0.0272 0.2659 0.2087 2.4000e-004
2.9000e-003
0.0161 0.0190 4.4000e-004
0.0150 0.0155 0.0000 22.2938 22.2938 5.6600e-003
0.0000 22.4125
Mitigated Construction On-Site
CalEEMod Version: CalEEMod.2013.2.2 Date: 8/3/2016 3:59 PMPage 10 of 32
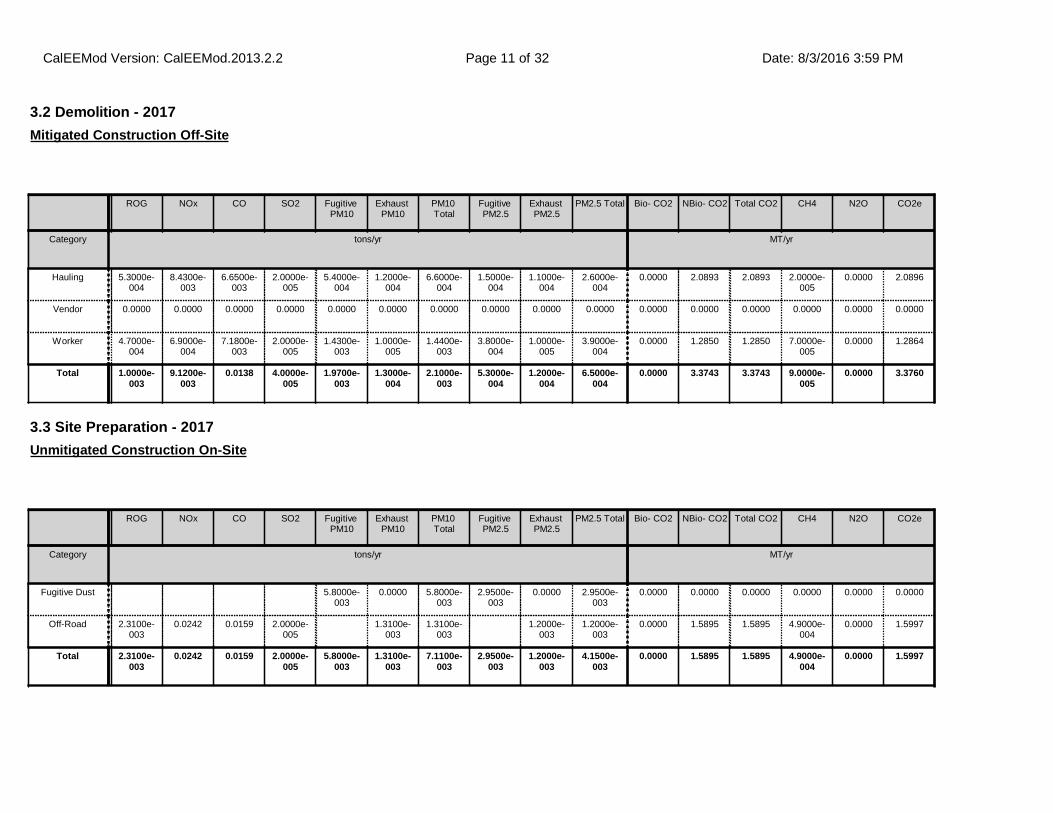
3.2 Demolition - 2017
ROG NOx CO SO2 Fugitive PM10
Exhaust PM10
PM10 Total
Fugitive PM2.5
Exhaust PM2.5
PM2.5 Total Bio- CO2 NBio- CO2 Total CO2 CH4 N2O CO2e
Category tons/yr MT/yr
Hauling 5.3000e-004
8.4300e-003
6.6500e-003
2.0000e-005
5.4000e-004
1.2000e-004
6.6000e-004
1.5000e-004
1.1000e-004
2.6000e-004
0.0000 2.0893 2.0893 2.0000e-005
0.0000 2.0896
Vendor 0.0000 0.0000 0.0000 0.0000 0.0000 0.0000 0.0000 0.0000 0.0000 0.0000 0.0000 0.0000 0.0000 0.0000 0.0000 0.0000
Worker 4.7000e-004
6.9000e-004
7.1800e-003
2.0000e-005
1.4300e-003
1.0000e-005
1.4400e-003
3.8000e-004
1.0000e-005
3.9000e-004
0.0000 1.2850 1.2850 7.0000e-005
0.0000 1.2864
Total 1.0000e-003
9.1200e-003
0.0138 4.0000e-005
1.9700e-003
1.3000e-004
2.1000e-003
5.3000e-004
1.2000e-004
6.5000e-004
0.0000 3.3743 3.3743 9.0000e-005
0.0000 3.3760
Mitigated Construction Off-Site
3.3 Site Preparation - 2017
ROG NOx CO SO2 Fugitive PM10
Exhaust PM10
PM10 Total
Fugitive PM2.5
Exhaust PM2.5
PM2.5 Total Bio- CO2 NBio- CO2 Total CO2 CH4 N2O CO2e
Category tons/yr MT/yr
Fugitive Dust 5.8000e-003
0.0000 5.8000e-003
2.9500e-003
0.0000 2.9500e-003
0.0000 0.0000 0.0000 0.0000 0.0000 0.0000
Off-Road 2.3100e-003
0.0242 0.0159 2.0000e-005
1.3100e-003
1.3100e-003
1.2000e-003
1.2000e-003
0.0000 1.5895 1.5895 4.9000e-004
0.0000 1.5997
Total 2.3100e-003
0.0242 0.0159 2.0000e-005
5.8000e-003
1.3100e-003
7.1100e-003
2.9500e-003
1.2000e-003
4.1500e-003
0.0000 1.5895 1.5895 4.9000e-004
0.0000 1.5997
Unmitigated Construction On-Site
CalEEMod Version: CalEEMod.2013.2.2 Date: 8/3/2016 3:59 PMPage 11 of 32
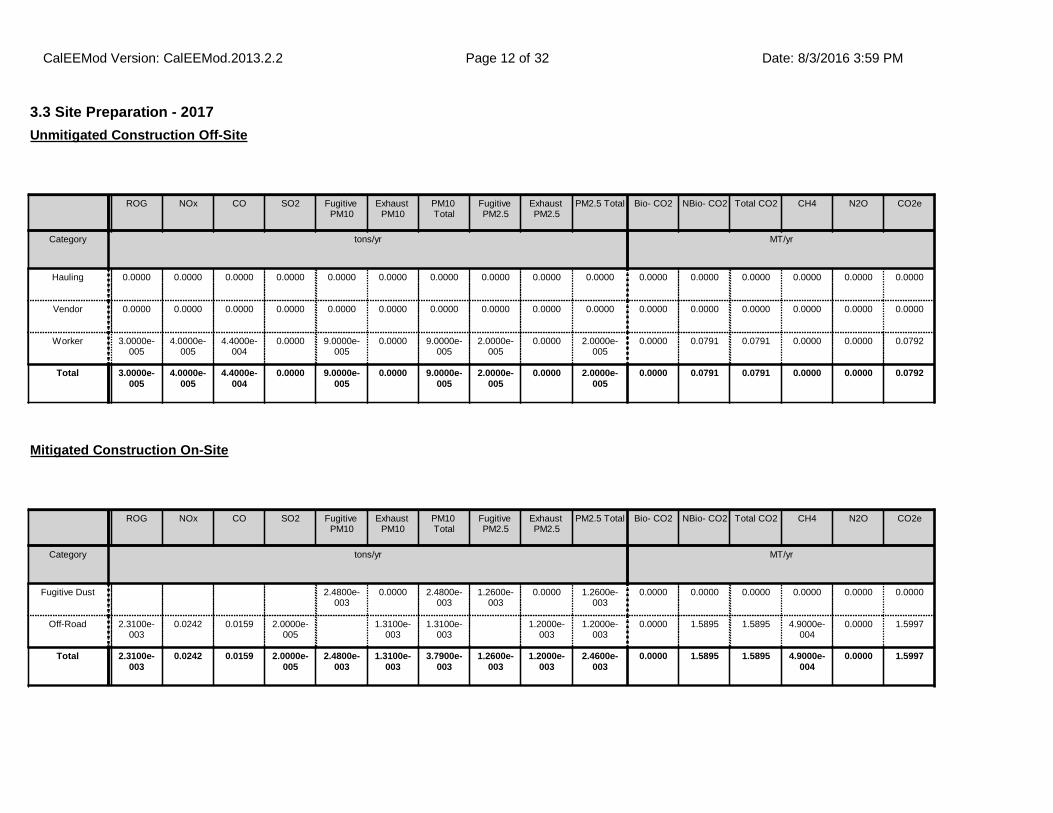
3.3 Site Preparation - 2017
ROG NOx CO SO2 Fugitive PM10
Exhaust PM10
PM10 Total
Fugitive PM2.5
Exhaust PM2.5
PM2.5 Total Bio- CO2 NBio- CO2 Total CO2 CH4 N2O CO2e
Category tons/yr MT/yr
Hauling 0.0000 0.0000 0.0000 0.0000 0.0000 0.0000 0.0000 0.0000 0.0000 0.0000 0.0000 0.0000 0.0000 0.0000 0.0000 0.0000
Vendor 0.0000 0.0000 0.0000 0.0000 0.0000 0.0000 0.0000 0.0000 0.0000 0.0000 0.0000 0.0000 0.0000 0.0000 0.0000 0.0000
Worker 3.0000e-005
4.0000e-005
4.4000e-004
0.0000 9.0000e-005
0.0000 9.0000e-005
2.0000e-005
0.0000 2.0000e-005
0.0000 0.0791 0.0791 0.0000 0.0000 0.0792
Total 3.0000e-005
4.0000e-005
4.4000e-004
0.0000 9.0000e-005
0.0000 9.0000e-005
2.0000e-005
0.0000 2.0000e-005
0.0000 0.0791 0.0791 0.0000 0.0000 0.0792
Unmitigated Construction Off-Site
ROG NOx CO SO2 Fugitive PM10
Exhaust PM10
PM10 Total
Fugitive PM2.5
Exhaust PM2.5
PM2.5 Total Bio- CO2 NBio- CO2 Total CO2 CH4 N2O CO2e
Category tons/yr MT/yr
Fugitive Dust 2.4800e-003
0.0000 2.4800e-003
1.2600e-003
0.0000 1.2600e-003
0.0000 0.0000 0.0000 0.0000 0.0000 0.0000
Off-Road 2.3100e-003
0.0242 0.0159 2.0000e-005
1.3100e-003
1.3100e-003
1.2000e-003
1.2000e-003
0.0000 1.5895 1.5895 4.9000e-004
0.0000 1.5997
Total 2.3100e-003
0.0242 0.0159 2.0000e-005
2.4800e-003
1.3100e-003
3.7900e-003
1.2600e-003
1.2000e-003
2.4600e-003
0.0000 1.5895 1.5895 4.9000e-004
0.0000 1.5997
Mitigated Construction On-Site
CalEEMod Version: CalEEMod.2013.2.2 Date: 8/3/2016 3:59 PMPage 12 of 32

3.3 Site Preparation - 2017
ROG NOx CO SO2 Fugitive PM10
Exhaust PM10
PM10 Total
Fugitive PM2.5
Exhaust PM2.5
PM2.5 Total Bio- CO2 NBio- CO2 Total CO2 CH4 N2O CO2e
Category tons/yr MT/yr
Hauling 0.0000 0.0000 0.0000 0.0000 0.0000 0.0000 0.0000 0.0000 0.0000 0.0000 0.0000 0.0000 0.0000 0.0000 0.0000 0.0000
Vendor 0.0000 0.0000 0.0000 0.0000 0.0000 0.0000 0.0000 0.0000 0.0000 0.0000 0.0000 0.0000 0.0000 0.0000 0.0000 0.0000
Worker 3.0000e-005
4.0000e-005
4.4000e-004
0.0000 9.0000e-005
0.0000 9.0000e-005
2.0000e-005
0.0000 2.0000e-005
0.0000 0.0791 0.0791 0.0000 0.0000 0.0792
Total 3.0000e-005
4.0000e-005
4.4000e-004
0.0000 9.0000e-005
0.0000 9.0000e-005
2.0000e-005
0.0000 2.0000e-005
0.0000 0.0791 0.0791 0.0000 0.0000 0.0792
Mitigated Construction Off-Site
3.4 Grading - 2017
ROG NOx CO SO2 Fugitive PM10
Exhaust PM10
PM10 Total
Fugitive PM2.5
Exhaust PM2.5
PM2.5 Total Bio- CO2 NBio- CO2 Total CO2 CH4 N2O CO2e
Category tons/yr MT/yr
Fugitive Dust 9.8300e-003
0.0000 9.8300e-003
5.0500e-003
0.0000 5.0500e-003
0.0000 0.0000 0.0000 0.0000 0.0000 0.0000
Off-Road 3.7700e-003
0.0396 0.0264 3.0000e-005
2.1300e-003
2.1300e-003
1.9600e-003
1.9600e-003
0.0000 2.6112 2.6112 8.0000e-004
0.0000 2.6280
Total 3.7700e-003
0.0396 0.0264 3.0000e-005
9.8300e-003
2.1300e-003
0.0120 5.0500e-003
1.9600e-003
7.0100e-003
0.0000 2.6112 2.6112 8.0000e-004
0.0000 2.6280
Unmitigated Construction On-Site
CalEEMod Version: CalEEMod.2013.2.2 Date: 8/3/2016 3:59 PMPage 13 of 32
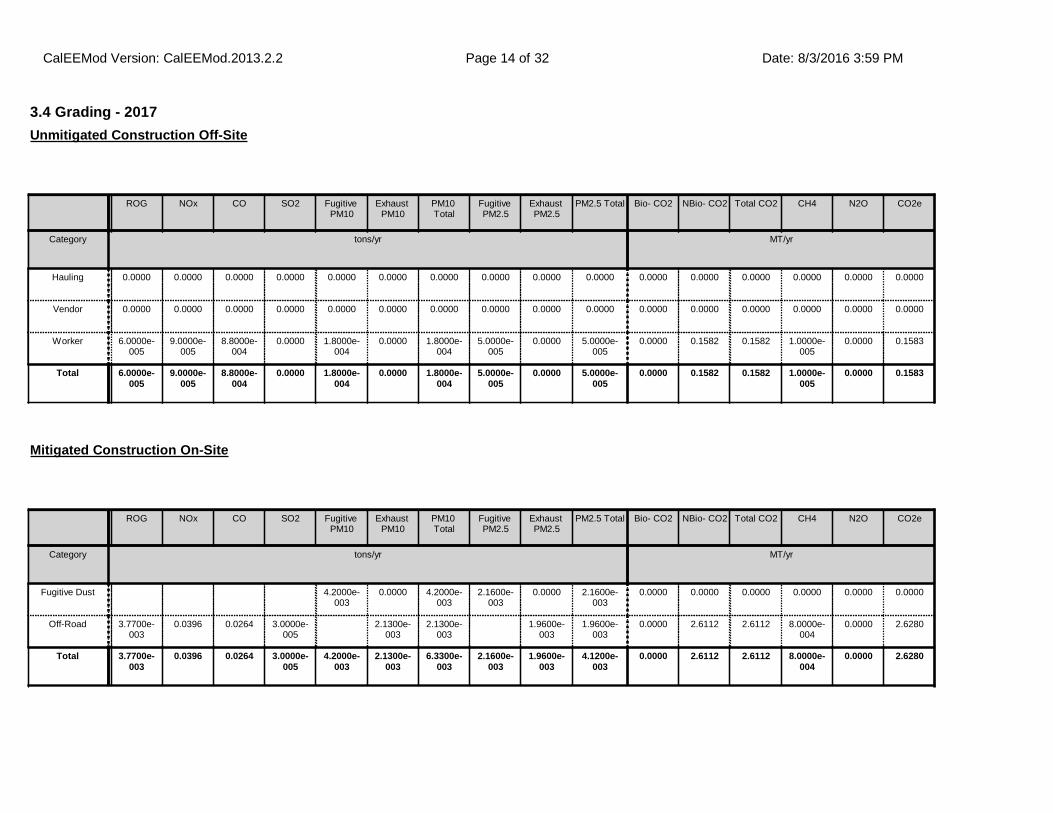
3.4 Grading - 2017
ROG NOx CO SO2 Fugitive PM10
Exhaust PM10
PM10 Total
Fugitive PM2.5
Exhaust PM2.5
PM2.5 Total Bio- CO2 NBio- CO2 Total CO2 CH4 N2O CO2e
Category tons/yr MT/yr
Hauling 0.0000 0.0000 0.0000 0.0000 0.0000 0.0000 0.0000 0.0000 0.0000 0.0000 0.0000 0.0000 0.0000 0.0000 0.0000 0.0000
Vendor 0.0000 0.0000 0.0000 0.0000 0.0000 0.0000 0.0000 0.0000 0.0000 0.0000 0.0000 0.0000 0.0000 0.0000 0.0000 0.0000
Worker 6.0000e-005
9.0000e-005
8.8000e-004
0.0000 1.8000e-004
0.0000 1.8000e-004
5.0000e-005
0.0000 5.0000e-005
0.0000 0.1582 0.1582 1.0000e-005
0.0000 0.1583
Total 6.0000e-005
9.0000e-005
8.8000e-004
0.0000 1.8000e-004
0.0000 1.8000e-004
5.0000e-005
0.0000 5.0000e-005
0.0000 0.1582 0.1582 1.0000e-005
0.0000 0.1583
Unmitigated Construction Off-Site
ROG NOx CO SO2 Fugitive PM10
Exhaust PM10
PM10 Total
Fugitive PM2.5
Exhaust PM2.5
PM2.5 Total Bio- CO2 NBio- CO2 Total CO2 CH4 N2O CO2e
Category tons/yr MT/yr
Fugitive Dust 4.2000e-003
0.0000 4.2000e-003
2.1600e-003
0.0000 2.1600e-003
0.0000 0.0000 0.0000 0.0000 0.0000 0.0000
Off-Road 3.7700e-003
0.0396 0.0264 3.0000e-005
2.1300e-003
2.1300e-003
1.9600e-003
1.9600e-003
0.0000 2.6112 2.6112 8.0000e-004
0.0000 2.6280
Total 3.7700e-003
0.0396 0.0264 3.0000e-005
4.2000e-003
2.1300e-003
6.3300e-003
2.1600e-003
1.9600e-003
4.1200e-003
0.0000 2.6112 2.6112 8.0000e-004
0.0000 2.6280
Mitigated Construction On-Site
CalEEMod Version: CalEEMod.2013.2.2 Date: 8/3/2016 3:59 PMPage 14 of 32
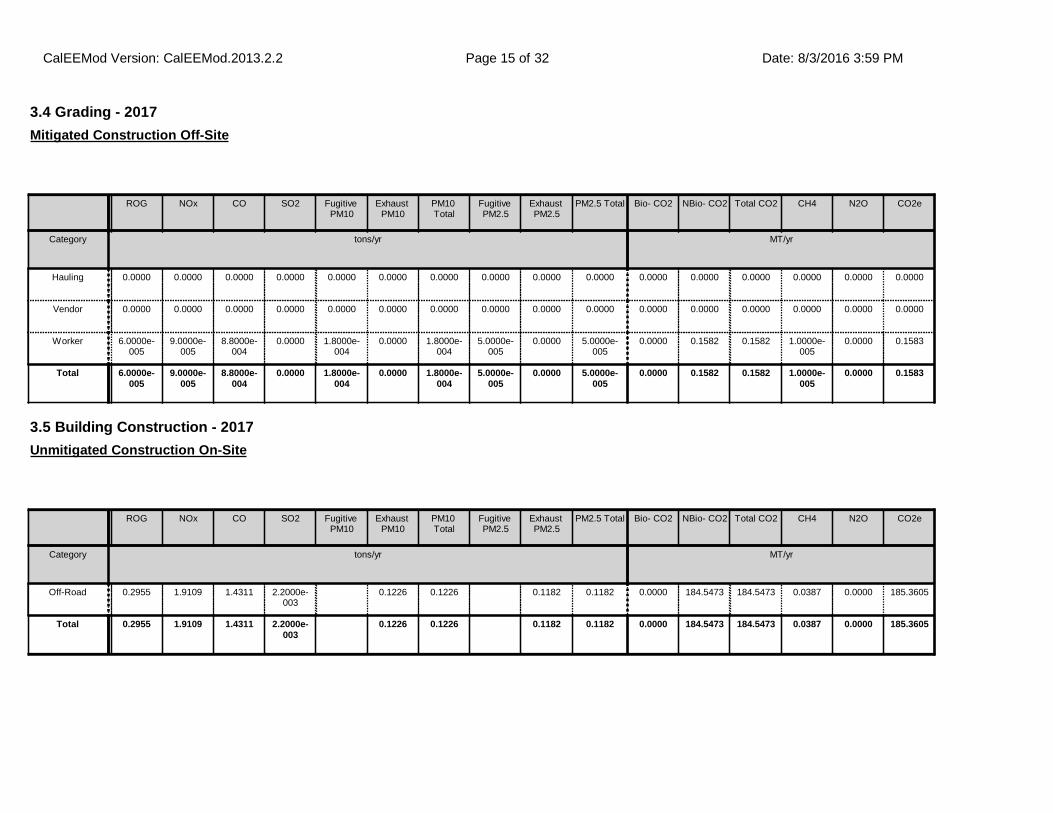
3.4 Grading - 2017
ROG NOx CO SO2 Fugitive PM10
Exhaust PM10
PM10 Total
Fugitive PM2.5
Exhaust PM2.5
PM2.5 Total Bio- CO2 NBio- CO2 Total CO2 CH4 N2O CO2e
Category tons/yr MT/yr
Hauling 0.0000 0.0000 0.0000 0.0000 0.0000 0.0000 0.0000 0.0000 0.0000 0.0000 0.0000 0.0000 0.0000 0.0000 0.0000 0.0000
Vendor 0.0000 0.0000 0.0000 0.0000 0.0000 0.0000 0.0000 0.0000 0.0000 0.0000 0.0000 0.0000 0.0000 0.0000 0.0000 0.0000
Worker 6.0000e-005
9.0000e-005
8.8000e-004
0.0000 1.8000e-004
0.0000 1.8000e-004
5.0000e-005
0.0000 5.0000e-005
0.0000 0.1582 0.1582 1.0000e-005
0.0000 0.1583
Total 6.0000e-005
9.0000e-005
8.8000e-004
0.0000 1.8000e-004
0.0000 1.8000e-004
5.0000e-005
0.0000 5.0000e-005
0.0000 0.1582 0.1582 1.0000e-005
0.0000 0.1583
Mitigated Construction Off-Site
3.5 Building Construction - 2017
ROG NOx CO SO2 Fugitive PM10
Exhaust PM10
PM10 Total
Fugitive PM2.5
Exhaust PM2.5
PM2.5 Total Bio- CO2 NBio- CO2 Total CO2 CH4 N2O CO2e
Category tons/yr MT/yr
Off-Road 0.2955 1.9109 1.4311 2.2000e-003
0.1226 0.1226 0.1182 0.1182 0.0000 184.5473 184.5473 0.0387 0.0000 185.3605
Total 0.2955 1.9109 1.4311 2.2000e-003
0.1226 0.1226 0.1182 0.1182 0.0000 184.5473 184.5473 0.0387 0.0000 185.3605
Unmitigated Construction On-Site
CalEEMod Version: CalEEMod.2013.2.2 Date: 8/3/2016 3:59 PMPage 15 of 32
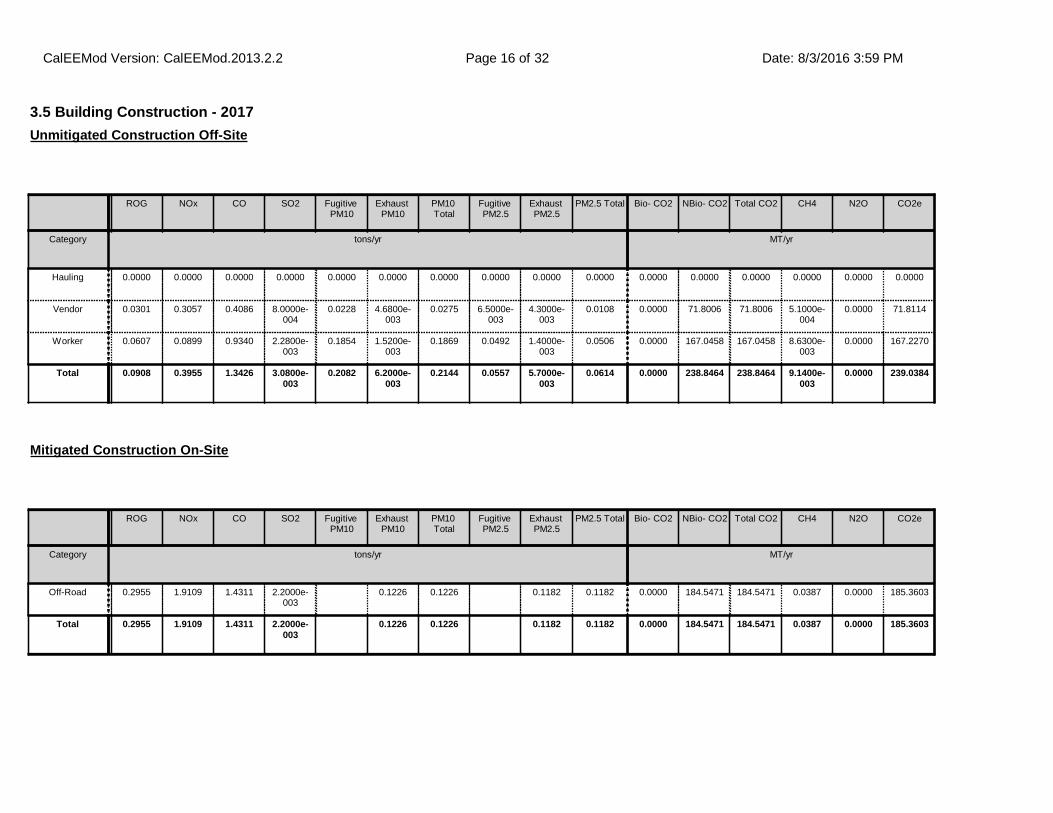
3.5 Building Construction - 2017
ROG NOx CO SO2 Fugitive PM10
Exhaust PM10
PM10 Total
Fugitive PM2.5
Exhaust PM2.5
PM2.5 Total Bio- CO2 NBio- CO2 Total CO2 CH4 N2O CO2e
Category tons/yr MT/yr
Hauling 0.0000 0.0000 0.0000 0.0000 0.0000 0.0000 0.0000 0.0000 0.0000 0.0000 0.0000 0.0000 0.0000 0.0000 0.0000 0.0000
Vendor 0.0301 0.3057 0.4086 8.0000e-004
0.0228 4.6800e-003
0.0275 6.5000e-003
4.3000e-003
0.0108 0.0000 71.8006 71.8006 5.1000e-004
0.0000 71.8114
Worker 0.0607 0.0899 0.9340 2.2800e-003
0.1854 1.5200e-003
0.1869 0.0492 1.4000e-003
0.0506 0.0000 167.0458 167.0458 8.6300e-003
0.0000 167.2270
Total 0.0908 0.3955 1.3426 3.0800e-003
0.2082 6.2000e-003
0.2144 0.0557 5.7000e-003
0.0614 0.0000 238.8464 238.8464 9.1400e-003
0.0000 239.0384
Unmitigated Construction Off-Site
ROG NOx CO SO2 Fugitive PM10
Exhaust PM10
PM10 Total
Fugitive PM2.5
Exhaust PM2.5
PM2.5 Total Bio- CO2 NBio- CO2 Total CO2 CH4 N2O CO2e
Category tons/yr MT/yr
Off-Road 0.2955 1.9109 1.4311 2.2000e-003
0.1226 0.1226 0.1182 0.1182 0.0000 184.5471 184.5471 0.0387 0.0000 185.3603
Total 0.2955 1.9109 1.4311 2.2000e-003
0.1226 0.1226 0.1182 0.1182 0.0000 184.5471 184.5471 0.0387 0.0000 185.3603
Mitigated Construction On-Site
CalEEMod Version: CalEEMod.2013.2.2 Date: 8/3/2016 3:59 PMPage 16 of 32
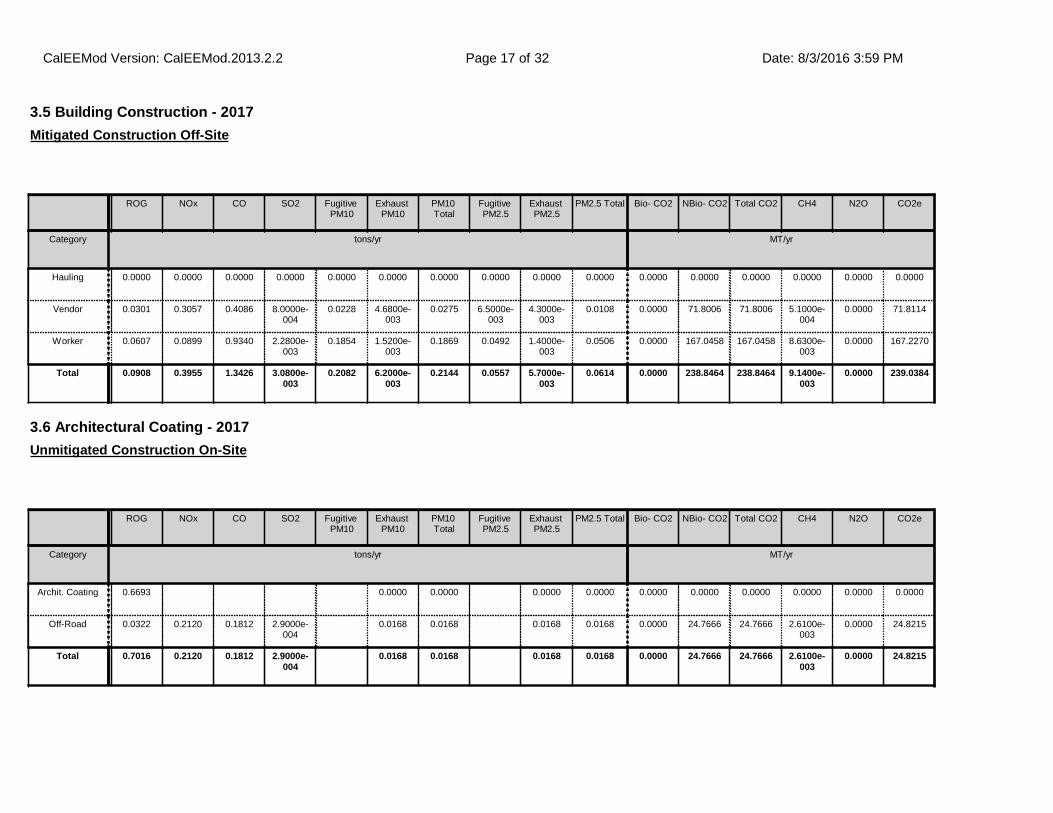
3.5 Building Construction - 2017
ROG NOx CO SO2 Fugitive PM10
Exhaust PM10
PM10 Total
Fugitive PM2.5
Exhaust PM2.5
PM2.5 Total Bio- CO2 NBio- CO2 Total CO2 CH4 N2O CO2e
Category tons/yr MT/yr
Hauling 0.0000 0.0000 0.0000 0.0000 0.0000 0.0000 0.0000 0.0000 0.0000 0.0000 0.0000 0.0000 0.0000 0.0000 0.0000 0.0000
Vendor 0.0301 0.3057 0.4086 8.0000e-004
0.0228 4.6800e-003
0.0275 6.5000e-003
4.3000e-003
0.0108 0.0000 71.8006 71.8006 5.1000e-004
0.0000 71.8114
Worker 0.0607 0.0899 0.9340 2.2800e-003
0.1854 1.5200e-003
0.1869 0.0492 1.4000e-003
0.0506 0.0000 167.0458 167.0458 8.6300e-003
0.0000 167.2270
Total 0.0908 0.3955 1.3426 3.0800e-003
0.2082 6.2000e-003
0.2144 0.0557 5.7000e-003
0.0614 0.0000 238.8464 238.8464 9.1400e-003
0.0000 239.0384
Mitigated Construction Off-Site
3.6 Architectural Coating - 2017
ROG NOx CO SO2 Fugitive PM10
Exhaust PM10
PM10 Total
Fugitive PM2.5
Exhaust PM2.5
PM2.5 Total Bio- CO2 NBio- CO2 Total CO2 CH4 N2O CO2e
Category tons/yr MT/yr
Archit. Coating 0.6693 0.0000 0.0000 0.0000 0.0000 0.0000 0.0000 0.0000 0.0000 0.0000 0.0000
Off-Road 0.0322 0.2120 0.1812 2.9000e-004
0.0168 0.0168 0.0168 0.0168 0.0000 24.7666 24.7666 2.6100e-003
0.0000 24.8215
Total 0.7016 0.2120 0.1812 2.9000e-004
0.0168 0.0168 0.0168 0.0168 0.0000 24.7666 24.7666 2.6100e-003
0.0000 24.8215
Unmitigated Construction On-Site
CalEEMod Version: CalEEMod.2013.2.2 Date: 8/3/2016 3:59 PMPage 17 of 32
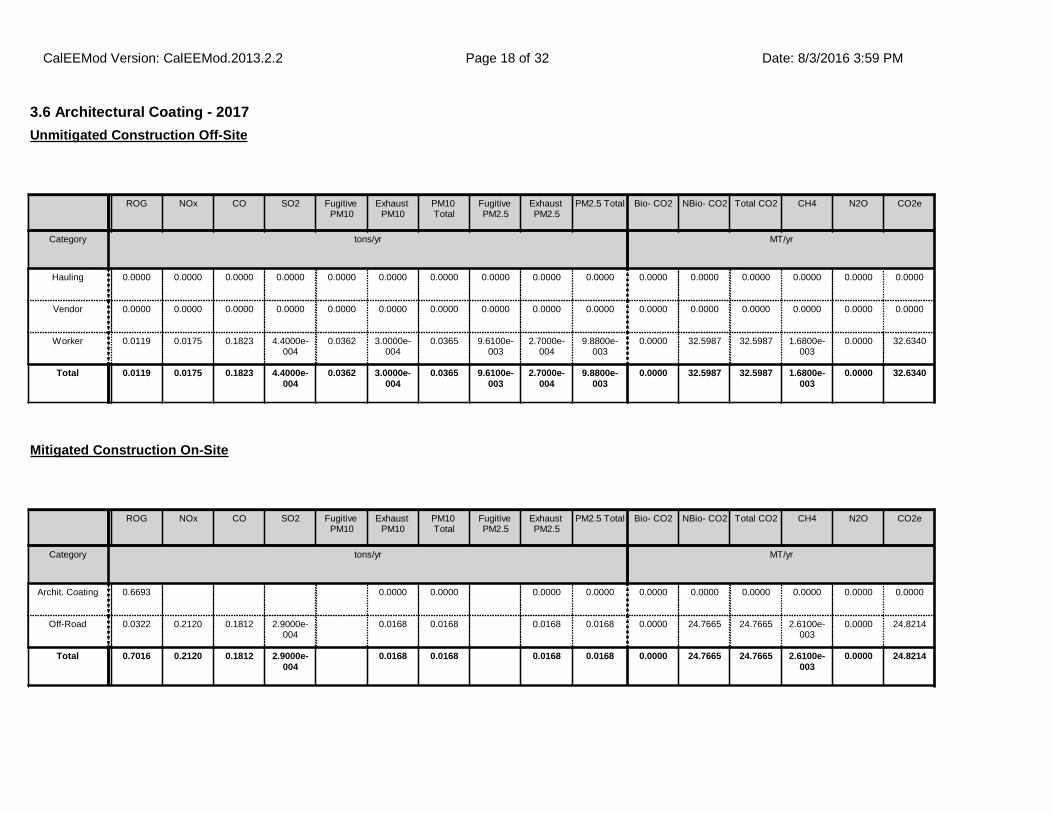
3.6 Architectural Coating - 2017
ROG NOx CO SO2 Fugitive PM10
Exhaust PM10
PM10 Total
Fugitive PM2.5
Exhaust PM2.5
PM2.5 Total Bio- CO2 NBio- CO2 Total CO2 CH4 N2O CO2e
Category tons/yr MT/yr
Hauling 0.0000 0.0000 0.0000 0.0000 0.0000 0.0000 0.0000 0.0000 0.0000 0.0000 0.0000 0.0000 0.0000 0.0000 0.0000 0.0000
Vendor 0.0000 0.0000 0.0000 0.0000 0.0000 0.0000 0.0000 0.0000 0.0000 0.0000 0.0000 0.0000 0.0000 0.0000 0.0000 0.0000
Worker 0.0119 0.0175 0.1823 4.4000e-004
0.0362 3.0000e-004
0.0365 9.6100e-003
2.7000e-004
9.8800e-003
0.0000 32.5987 32.5987 1.6800e-003
0.0000 32.6340
Total 0.0119 0.0175 0.1823 4.4000e-004
0.0362 3.0000e-004
0.0365 9.6100e-003
2.7000e-004
9.8800e-003
0.0000 32.5987 32.5987 1.6800e-003
0.0000 32.6340
Unmitigated Construction Off-Site
ROG NOx CO SO2 Fugitive PM10
Exhaust PM10
PM10 Total
Fugitive PM2.5
Exhaust PM2.5
PM2.5 Total Bio- CO2 NBio- CO2 Total CO2 CH4 N2O CO2e
Category tons/yr MT/yr
Archit. Coating 0.6693 0.0000 0.0000 0.0000 0.0000 0.0000 0.0000 0.0000 0.0000 0.0000 0.0000
Off-Road 0.0322 0.2120 0.1812 2.9000e-004
0.0168 0.0168 0.0168 0.0168 0.0000 24.7665 24.7665 2.6100e-003
0.0000 24.8214
Total 0.7016 0.2120 0.1812 2.9000e-004
0.0168 0.0168 0.0168 0.0168 0.0000 24.7665 24.7665 2.6100e-003
0.0000 24.8214
Mitigated Construction On-Site
CalEEMod Version: CalEEMod.2013.2.2 Date: 8/3/2016 3:59 PMPage 18 of 32
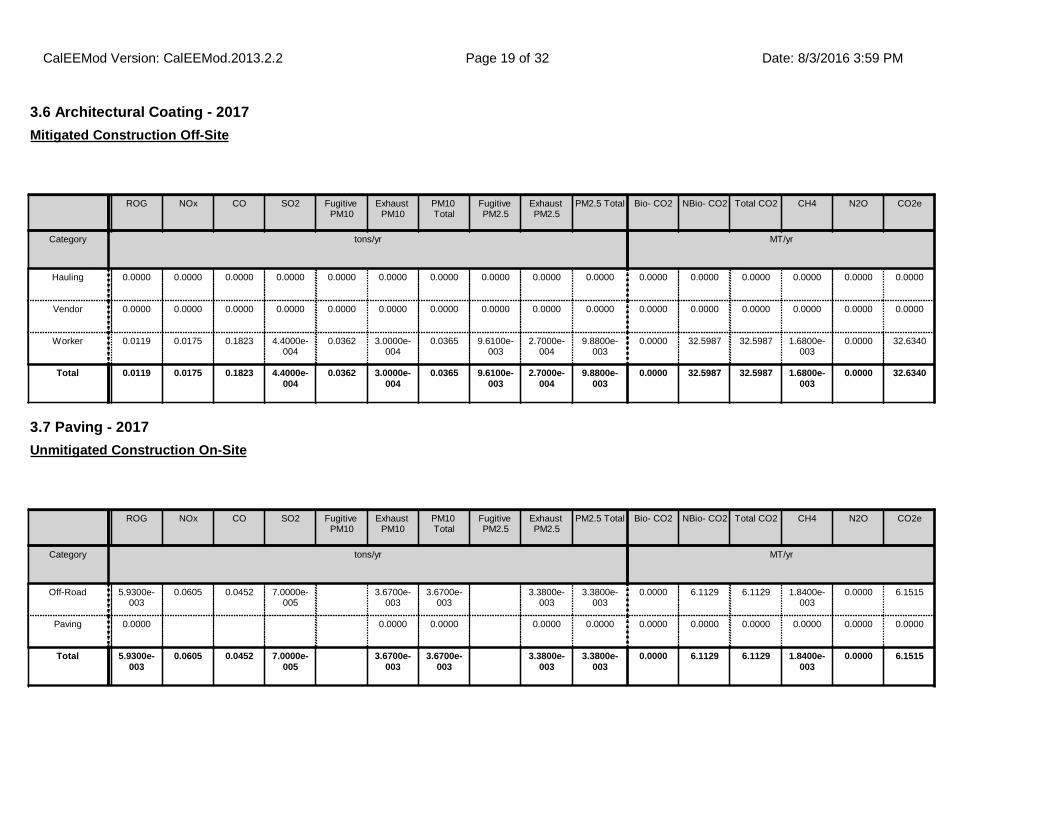
3.6 Architectural Coating - 2017
ROG NOx CO SO2 Fugitive PM10
Exhaust PM10
PM10 Total
Fugitive PM2.5
Exhaust PM2.5
PM2.5 Total Bio- CO2 NBio- CO2 Total CO2 CH4 N2O CO2e
Category tons/yr MT/yr
Hauling 0.0000 0.0000 0.0000 0.0000 0.0000 0.0000 0.0000 0.0000 0.0000 0.0000 0.0000 0.0000 0.0000 0.0000 0.0000 0.0000
Vendor 0.0000 0.0000 0.0000 0.0000 0.0000 0.0000 0.0000 0.0000 0.0000 0.0000 0.0000 0.0000 0.0000 0.0000 0.0000 0.0000
Worker 0.0119 0.0175 0.1823 4.4000e-004
0.0362 3.0000e-004
0.0365 9.6100e-003
2.7000e-004
9.8800e-003
0.0000 32.5987 32.5987 1.6800e-003
0.0000 32.6340
Total 0.0119 0.0175 0.1823 4.4000e-004
0.0362 3.0000e-004
0.0365 9.6100e-003
2.7000e-004
9.8800e-003
0.0000 32.5987 32.5987 1.6800e-003
0.0000 32.6340
Mitigated Construction Off-Site
3.7 Paving - 2017
ROG NOx CO SO2 Fugitive PM10
Exhaust PM10
PM10 Total
Fugitive PM2.5
Exhaust PM2.5
PM2.5 Total Bio- CO2 NBio- CO2 Total CO2 CH4 N2O CO2e
Category tons/yr MT/yr
Off-Road 5.9300e-003
0.0605 0.0452 7.0000e-005
3.6700e-003
3.6700e-003
3.3800e-003
3.3800e-003
0.0000 6.1129 6.1129 1.8400e-003
0.0000 6.1515
Paving 0.0000 0.0000 0.0000 0.0000 0.0000 0.0000 0.0000 0.0000 0.0000 0.0000 0.0000
Total 5.9300e-003
0.0605 0.0452 7.0000e-005
3.6700e-003
3.6700e-003
3.3800e-003
3.3800e-003
0.0000 6.1129 6.1129 1.8400e-003
0.0000 6.1515
Unmitigated Construction On-Site
CalEEMod Version: CalEEMod.2013.2.2 Date: 8/3/2016 3:59 PMPage 19 of 32
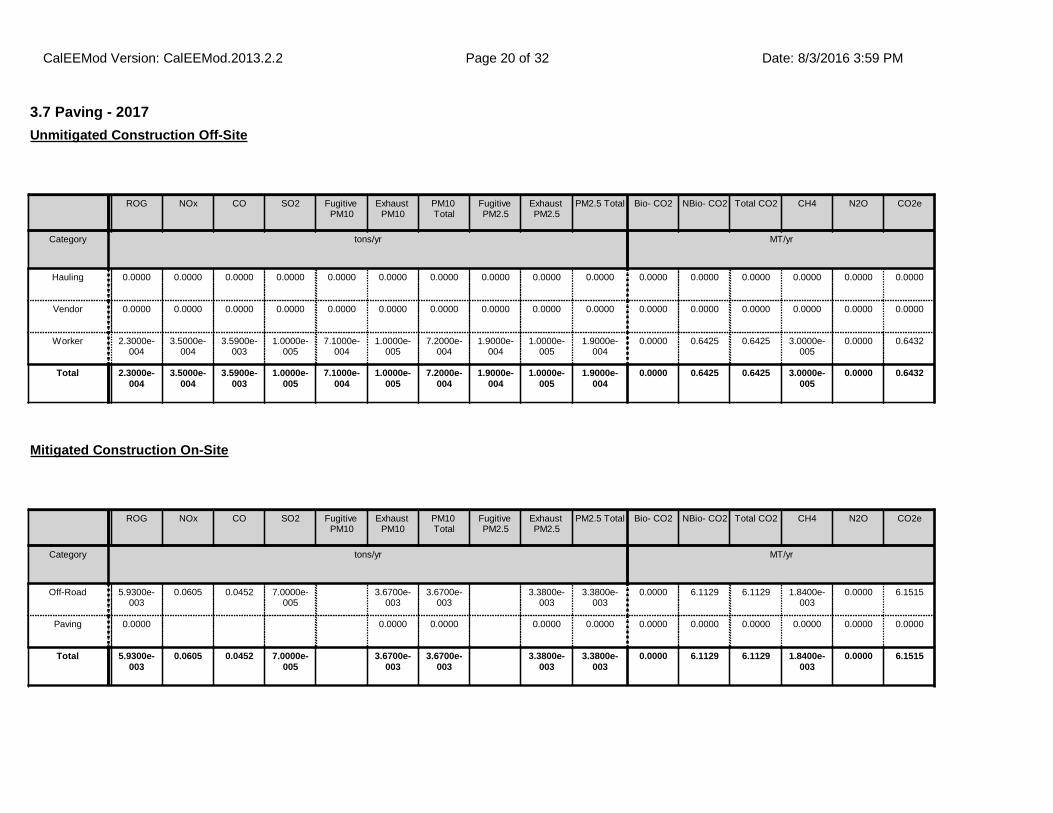
3.7 Paving - 2017
ROG NOx CO SO2 Fugitive PM10
Exhaust PM10
PM10 Total
Fugitive PM2.5
Exhaust PM2.5
PM2.5 Total Bio- CO2 NBio- CO2 Total CO2 CH4 N2O CO2e
Category tons/yr MT/yr
Hauling 0.0000 0.0000 0.0000 0.0000 0.0000 0.0000 0.0000 0.0000 0.0000 0.0000 0.0000 0.0000 0.0000 0.0000 0.0000 0.0000
Vendor 0.0000 0.0000 0.0000 0.0000 0.0000 0.0000 0.0000 0.0000 0.0000 0.0000 0.0000 0.0000 0.0000 0.0000 0.0000 0.0000
Worker 2.3000e-004
3.5000e-004
3.5900e-003
1.0000e-005
7.1000e-004
1.0000e-005
7.2000e-004
1.9000e-004
1.0000e-005
1.9000e-004
0.0000 0.6425 0.6425 3.0000e-005
0.0000 0.6432
Total 2.3000e-004
3.5000e-004
3.5900e-003
1.0000e-005
7.1000e-004
1.0000e-005
7.2000e-004
1.9000e-004
1.0000e-005
1.9000e-004
0.0000 0.6425 0.6425 3.0000e-005
0.0000 0.6432
Unmitigated Construction Off-Site
ROG NOx CO SO2 Fugitive PM10
Exhaust PM10
PM10 Total
Fugitive PM2.5
Exhaust PM2.5
PM2.5 Total Bio- CO2 NBio- CO2 Total CO2 CH4 N2O CO2e
Category tons/yr MT/yr
Off-Road 5.9300e-003
0.0605 0.0452 7.0000e-005
3.6700e-003
3.6700e-003
3.3800e-003
3.3800e-003
0.0000 6.1129 6.1129 1.8400e-003
0.0000 6.1515
Paving 0.0000 0.0000 0.0000 0.0000 0.0000 0.0000 0.0000 0.0000 0.0000 0.0000 0.0000
Total 5.9300e-003
0.0605 0.0452 7.0000e-005
3.6700e-003
3.6700e-003
3.3800e-003
3.3800e-003
0.0000 6.1129 6.1129 1.8400e-003
0.0000 6.1515
Mitigated Construction On-Site
CalEEMod Version: CalEEMod.2013.2.2 Date: 8/3/2016 3:59 PMPage 20 of 32

4.0 Operational Detail - Mobile
ROG NOx CO SO2 Fugitive PM10
Exhaust PM10
PM10 Total
Fugitive PM2.5
Exhaust PM2.5
PM2.5 Total Bio- CO2 NBio- CO2 Total CO2 CH4 N2O CO2e
Category tons/yr MT/yr
Mitigated 0.7747 2.3843 9.0028 0.0240 1.6412 0.0339 1.6752 0.4392 0.0313 0.4705 0.0000 1,802.2763 1,802.2763 0.0681 0.0000 1,803.7062
Unmitigated 0.7747 2.3843 9.0028 0.0240 1.6412 0.0339 1.6752 0.4392 0.0313 0.4705 0.0000 1,802.2763 1,802.2763 0.0681 0.0000 1,803.7062
4.1 Mitigation Measures Mobile
3.7 Paving - 2017
ROG NOx CO SO2 Fugitive PM10
Exhaust PM10
PM10 Total
Fugitive PM2.5
Exhaust PM2.5
PM2.5 Total Bio- CO2 NBio- CO2 Total CO2 CH4 N2O CO2e
Category tons/yr MT/yr
Hauling 0.0000 0.0000 0.0000 0.0000 0.0000 0.0000 0.0000 0.0000 0.0000 0.0000 0.0000 0.0000 0.0000 0.0000 0.0000 0.0000
Vendor 0.0000 0.0000 0.0000 0.0000 0.0000 0.0000 0.0000 0.0000 0.0000 0.0000 0.0000 0.0000 0.0000 0.0000 0.0000 0.0000
Worker 2.3000e-004
3.5000e-004
3.5900e-003
1.0000e-005
7.1000e-004
1.0000e-005
7.2000e-004
1.9000e-004
1.0000e-005
1.9000e-004
0.0000 0.6425 0.6425 3.0000e-005
0.0000 0.6432
Total 2.3000e-004
3.5000e-004
3.5900e-003
1.0000e-005
7.1000e-004
1.0000e-005
7.2000e-004
1.9000e-004
1.0000e-005
1.9000e-004
0.0000 0.6425 0.6425 3.0000e-005
0.0000 0.6432
Mitigated Construction Off-Site
CalEEMod Version: CalEEMod.2013.2.2 Date: 8/3/2016 3:59 PMPage 21 of 32
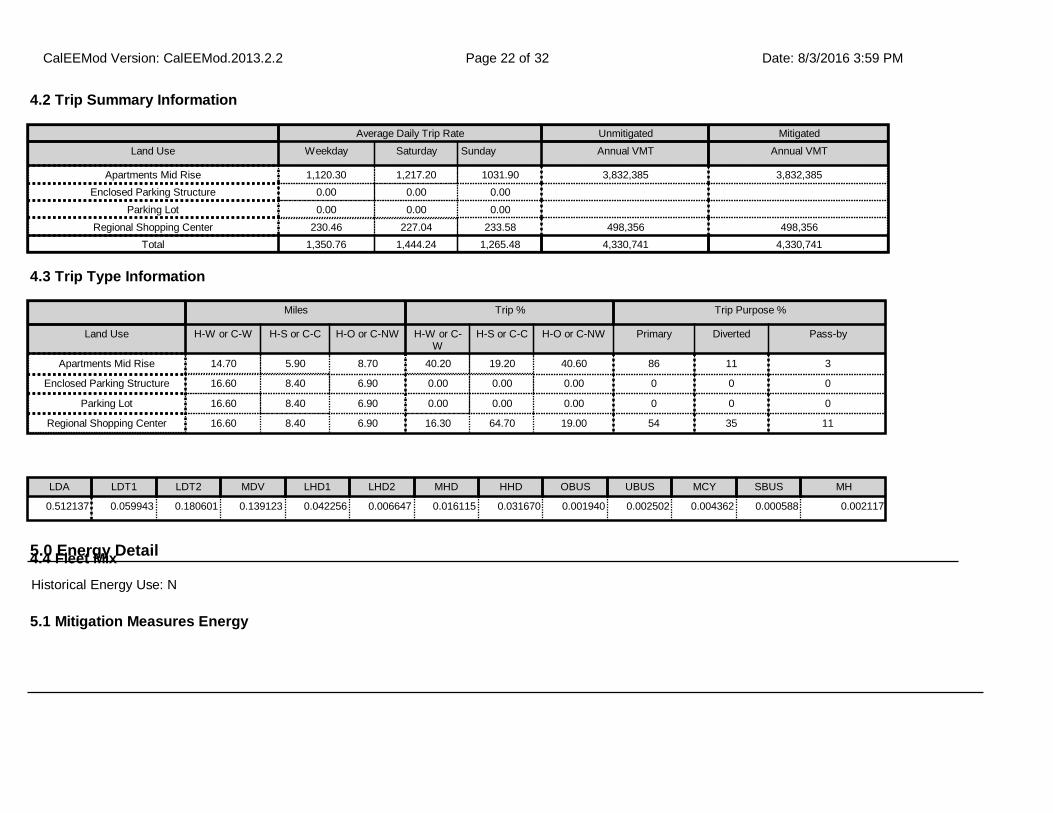
4.2 Trip Summary Information
4.3 Trip Type Information
Average Daily Trip Rate Unmitigated Mitigated
Land Use Weekday Saturday Sunday Annual VMT Annual VMT
Apartments Mid Rise 1,120.30 1,217.20 1031.90 3,832,385 3,832,385
Enclosed Parking Structure 0.00 0.00 0.00
Parking Lot 0.00 0.00 0.00
Regional Shopping Center 230.46 227.04 233.58 498,356 498,356
Total 1,350.76 1,444.24 1,265.48 4,330,741 4,330,741
Miles Trip % Trip Purpose %
Land Use H-W or C-W H-S or C-C H-O or C-NW H-W or C-W
H-S or C-C H-O or C-NW Primary Diverted Pass-by
Apartments Mid Rise 14.70 5.90 8.70 40.20 19.20 40.60 86 11 3
Enclosed Parking Structure 16.60 8.40 6.90 0.00 0.00 0.00 0 0 0
Parking Lot 16.60 8.40 6.90 0.00 0.00 0.00 0 0 0
Regional Shopping Center 16.60 8.40 6.90 16.30 64.70 19.00 54 35 11
5.0 Energy Detail
5.1 Mitigation Measures Energy
4.4 Fleet Mix
LDA LDT1 LDT2 MDV LHD1 LHD2 MHD HHD OBUS UBUS MCY SBUS MH
0.512137 0.059943 0.180601 0.139123 0.042256 0.006647 0.016115 0.031670 0.001940 0.002502 0.004362 0.000588 0.002117
Historical Energy Use: N
CalEEMod Version: CalEEMod.2013.2.2 Date: 8/3/2016 3:59 PMPage 22 of 32
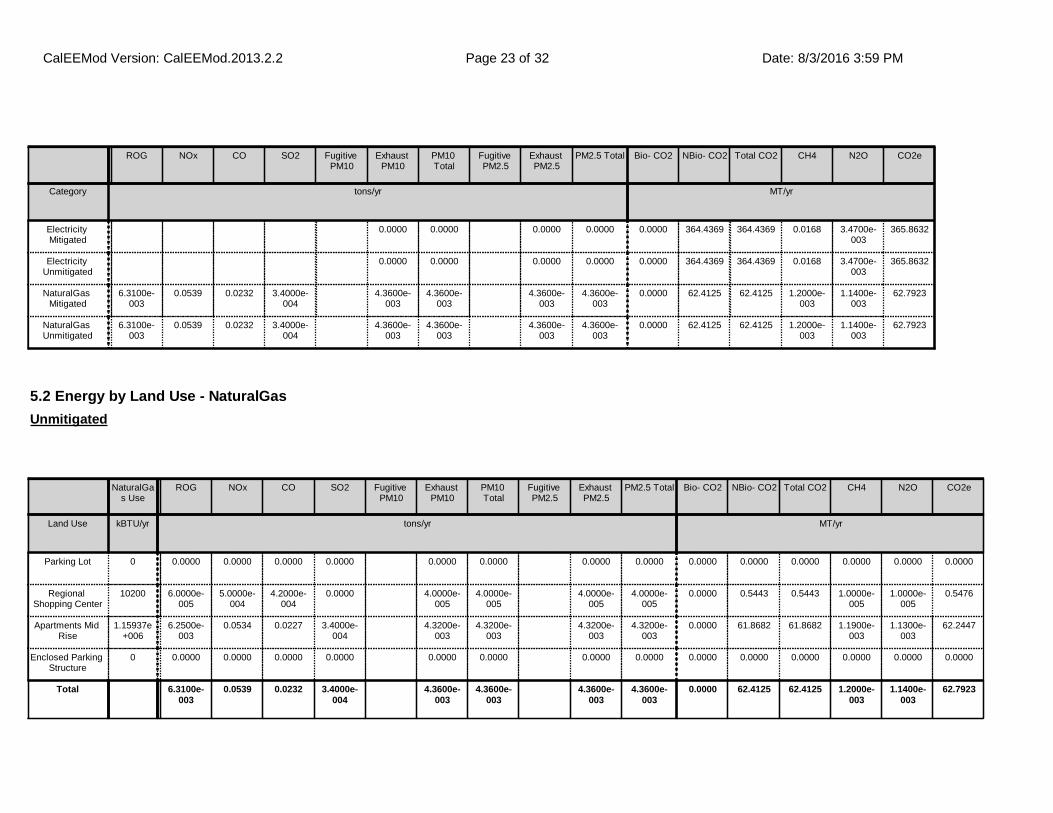
ROG NOx CO SO2 Fugitive PM10
Exhaust PM10
PM10 Total
Fugitive PM2.5
Exhaust PM2.5
PM2.5 Total Bio- CO2 NBio- CO2 Total CO2 CH4 N2O CO2e
Category tons/yr MT/yr
Electricity Mitigated
0.0000 0.0000 0.0000 0.0000 0.0000 364.4369 364.4369 0.0168 3.4700e-003
365.8632
Electricity Unmitigated
0.0000 0.0000 0.0000 0.0000 0.0000 364.4369 364.4369 0.0168 3.4700e-003
365.8632
NaturalGas Mitigated
6.3100e-003
0.0539 0.0232 3.4000e-004
4.3600e-003
4.3600e-003
4.3600e-003
4.3600e-003
0.0000 62.4125 62.4125 1.2000e-003
1.1400e-003
62.7923
NaturalGas Unmitigated
6.3100e-003
0.0539 0.0232 3.4000e-004
4.3600e-003
4.3600e-003
4.3600e-003
4.3600e-003
0.0000 62.4125 62.4125 1.2000e-003
1.1400e-003
62.7923
5.2 Energy by Land Use - NaturalGas
NaturalGas Use
ROG NOx CO SO2 Fugitive PM10
Exhaust PM10
PM10 Total
Fugitive PM2.5
Exhaust PM2.5
PM2.5 Total Bio- CO2 NBio- CO2 Total CO2 CH4 N2O CO2e
Land Use kBTU/yr tons/yr MT/yr
Parking Lot 0 0.0000 0.0000 0.0000 0.0000 0.0000 0.0000 0.0000 0.0000 0.0000 0.0000 0.0000 0.0000 0.0000 0.0000
Regional Shopping Center
10200 6.0000e-005
5.0000e-004
4.2000e-004
0.0000 4.0000e-005
4.0000e-005
4.0000e-005
4.0000e-005
0.0000 0.5443 0.5443 1.0000e-005
1.0000e-005
0.5476
Apartments Mid Rise
1.15937e+006
6.2500e-003
0.0534 0.0227 3.4000e-004
4.3200e-003
4.3200e-003
4.3200e-003
4.3200e-003
0.0000 61.8682 61.8682 1.1900e-003
1.1300e-003
62.2447
Enclosed Parking Structure
0 0.0000 0.0000 0.0000 0.0000 0.0000 0.0000 0.0000 0.0000 0.0000 0.0000 0.0000 0.0000 0.0000 0.0000
Total 6.3100e-003
0.0539 0.0232 3.4000e-004
4.3600e-003
4.3600e-003
4.3600e-003
4.3600e-003
0.0000 62.4125 62.4125 1.2000e-003
1.1400e-003
62.7923
Unmitigated
CalEEMod Version: CalEEMod.2013.2.2 Date: 8/3/2016 3:59 PMPage 23 of 32
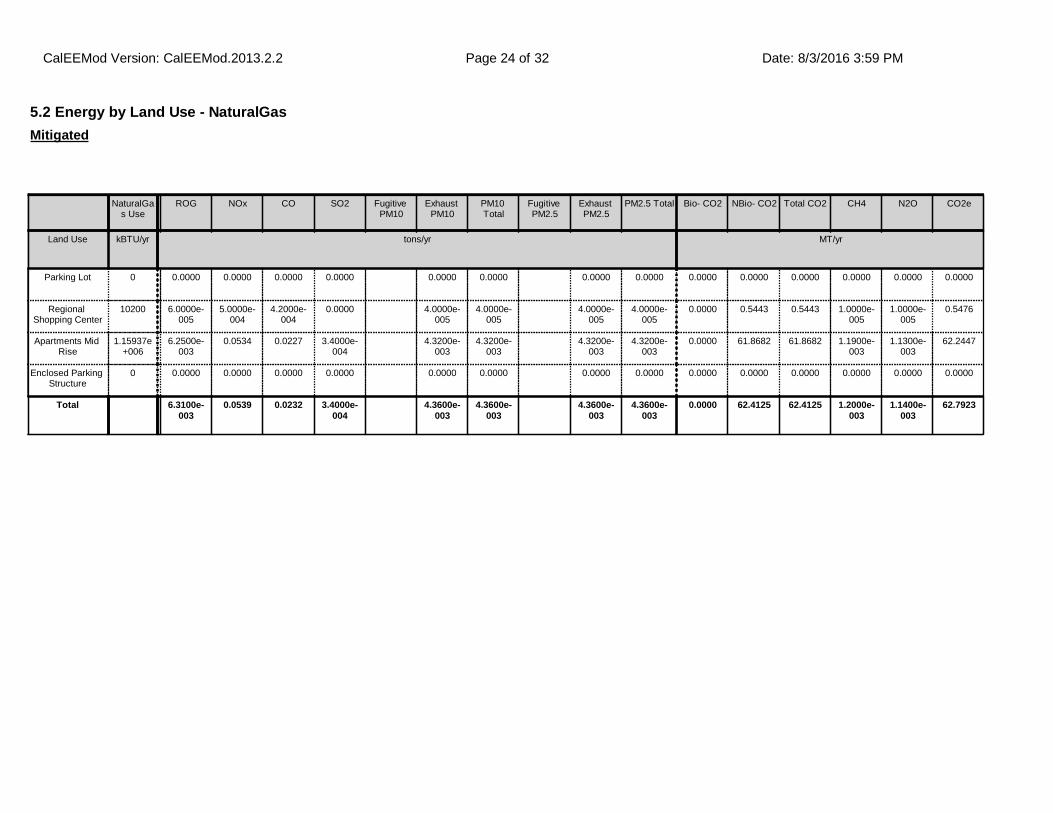
5.2 Energy by Land Use - NaturalGas
NaturalGas Use
ROG NOx CO SO2 Fugitive PM10
Exhaust PM10
PM10 Total
Fugitive PM2.5
Exhaust PM2.5
PM2.5 Total Bio- CO2 NBio- CO2 Total CO2 CH4 N2O CO2e
Land Use kBTU/yr tons/yr MT/yr
Parking Lot 0 0.0000 0.0000 0.0000 0.0000 0.0000 0.0000 0.0000 0.0000 0.0000 0.0000 0.0000 0.0000 0.0000 0.0000
Regional Shopping Center
10200 6.0000e-005
5.0000e-004
4.2000e-004
0.0000 4.0000e-005
4.0000e-005
4.0000e-005
4.0000e-005
0.0000 0.5443 0.5443 1.0000e-005
1.0000e-005
0.5476
Apartments Mid Rise
1.15937e+006
6.2500e-003
0.0534 0.0227 3.4000e-004
4.3200e-003
4.3200e-003
4.3200e-003
4.3200e-003
0.0000 61.8682 61.8682 1.1900e-003
1.1300e-003
62.2447
Enclosed Parking Structure
0 0.0000 0.0000 0.0000 0.0000 0.0000 0.0000 0.0000 0.0000 0.0000 0.0000 0.0000 0.0000 0.0000 0.0000
Total 6.3100e-003
0.0539 0.0232 3.4000e-004
4.3600e-003
4.3600e-003
4.3600e-003
4.3600e-003
0.0000 62.4125 62.4125 1.2000e-003
1.1400e-003
62.7923
Mitigated
CalEEMod Version: CalEEMod.2013.2.2 Date: 8/3/2016 3:59 PMPage 24 of 32
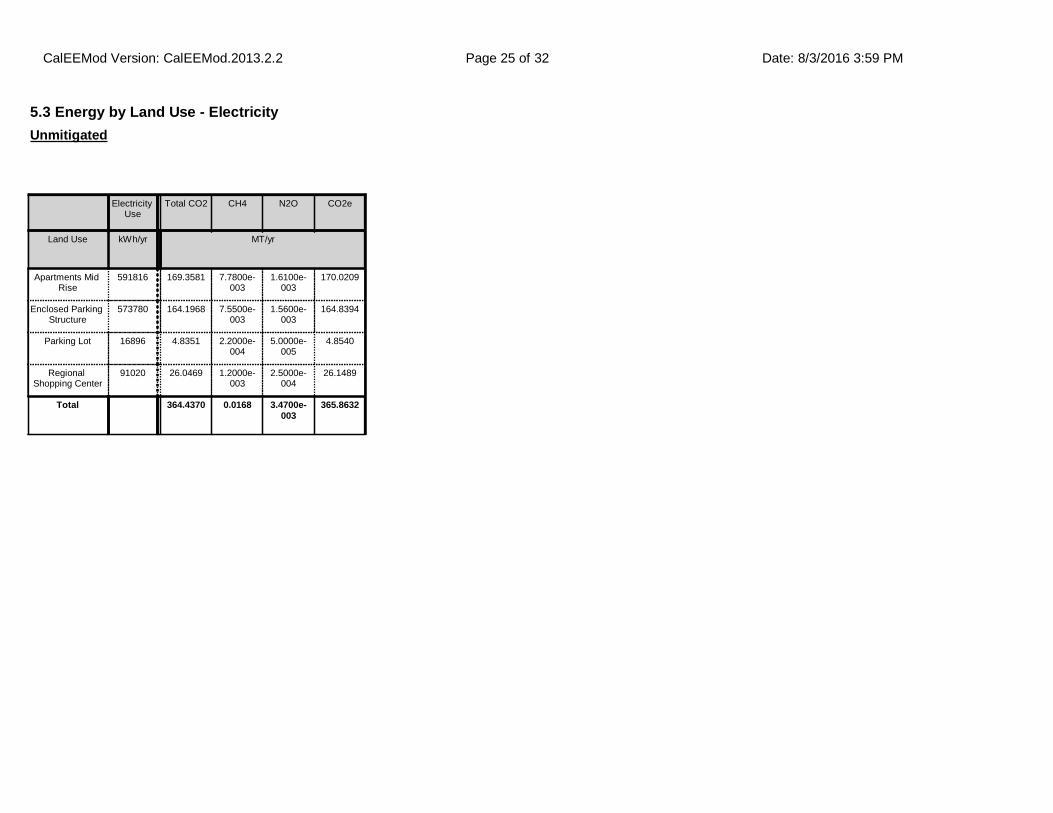
5.3 Energy by Land Use - Electricity
Electricity Use
Total CO2 CH4 N2O CO2e
Land Use kWh/yr MT/yr
Apartments Mid Rise
591816 169.3581 7.7800e-003
1.6100e-003
170.0209
Enclosed Parking Structure
573780 164.1968 7.5500e-003
1.5600e-003
164.8394
Parking Lot 16896 4.8351 2.2000e-004
5.0000e-005
4.8540
Regional Shopping Center
91020 26.0469 1.2000e-003
2.5000e-004
26.1489
Total 364.4370 0.0168 3.4700e-003
365.8632
Unmitigated
CalEEMod Version: CalEEMod.2013.2.2 Date: 8/3/2016 3:59 PMPage 25 of 32
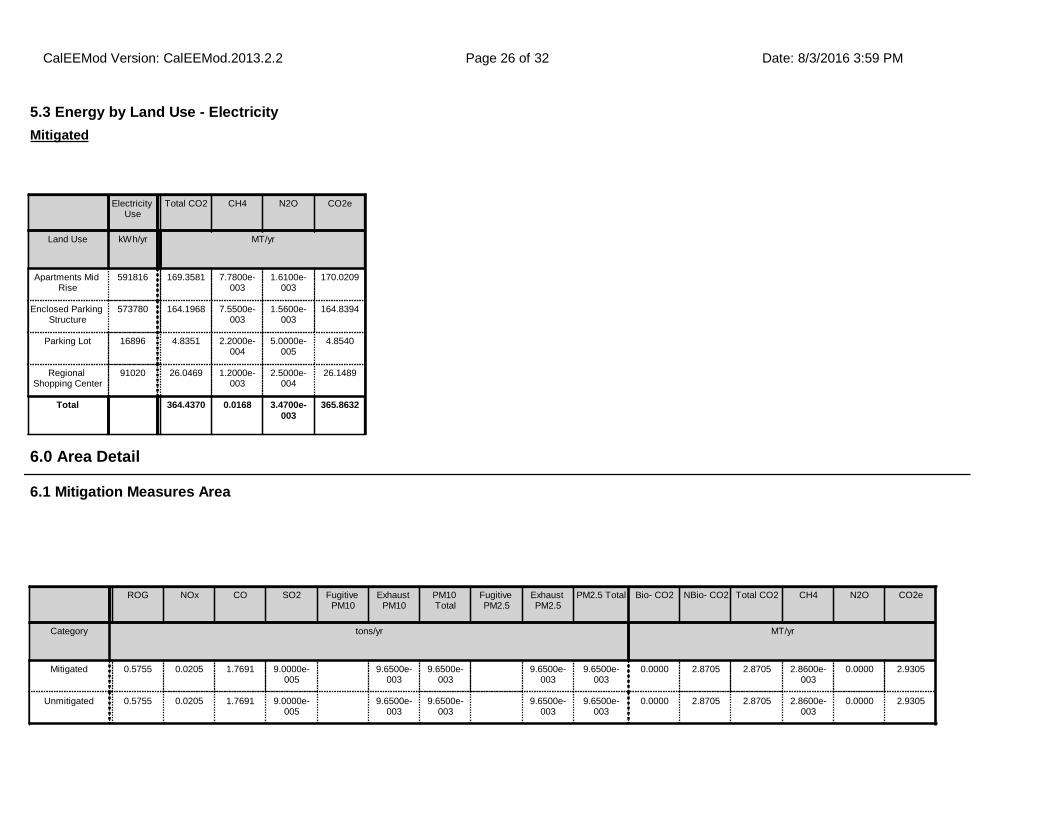
6.1 Mitigation Measures Area
6.0 Area Detail
ROG NOx CO SO2 Fugitive PM10
Exhaust PM10
PM10 Total
Fugitive PM2.5
Exhaust PM2.5
PM2.5 Total Bio- CO2 NBio- CO2 Total CO2 CH4 N2O CO2e
Category tons/yr MT/yr
Mitigated 0.5755 0.0205 1.7691 9.0000e-005
9.6500e-003
9.6500e-003
9.6500e-003
9.6500e-003
0.0000 2.8705 2.8705 2.8600e-003
0.0000 2.9305
Unmitigated 0.5755 0.0205 1.7691 9.0000e-005
9.6500e-003
9.6500e-003
9.6500e-003
9.6500e-003
0.0000 2.8705 2.8705 2.8600e-003
0.0000 2.9305
5.3 Energy by Land Use - Electricity
Electricity Use
Total CO2 CH4 N2O CO2e
Land Use kWh/yr MT/yr
Apartments Mid Rise
591816 169.3581 7.7800e-003
1.6100e-003
170.0209
Enclosed Parking Structure
573780 164.1968 7.5500e-003
1.5600e-003
164.8394
Parking Lot 16896 4.8351 2.2000e-004
5.0000e-005
4.8540
Regional Shopping Center
91020 26.0469 1.2000e-003
2.5000e-004
26.1489
Total 364.4370 0.0168 3.4700e-003
365.8632
Mitigated
CalEEMod Version: CalEEMod.2013.2.2 Date: 8/3/2016 3:59 PMPage 26 of 32

6.2 Area by SubCategory
ROG NOx CO SO2 Fugitive PM10
Exhaust PM10
PM10 Total
Fugitive PM2.5
Exhaust PM2.5
PM2.5 Total Bio- CO2 NBio- CO2 Total CO2 CH4 N2O CO2e
SubCategory tons/yr MT/yr
Architectural Coating
0.0997 0.0000 0.0000 0.0000 0.0000 0.0000 0.0000 0.0000 0.0000 0.0000 0.0000
Consumer Products
0.4211 0.0000 0.0000 0.0000 0.0000 0.0000 0.0000 0.0000 0.0000 0.0000 0.0000
Hearth 0.0000 0.0000 0.0000 0.0000 0.0000 0.0000 0.0000 0.0000 0.0000 0.0000 0.0000 0.0000 0.0000 0.0000
Landscaping 0.0548 0.0205 1.7691 9.0000e-005
9.6500e-003
9.6500e-003
9.6500e-003
9.6500e-003
0.0000 2.8705 2.8705 2.8600e-003
0.0000 2.9305
Total 0.5755 0.0205 1.7691 9.0000e-005
9.6500e-003
9.6500e-003
9.6500e-003
9.6500e-003
0.0000 2.8705 2.8705 2.8600e-003
0.0000 2.9305
Unmitigated
CalEEMod Version: CalEEMod.2013.2.2 Date: 8/3/2016 3:59 PMPage 27 of 32
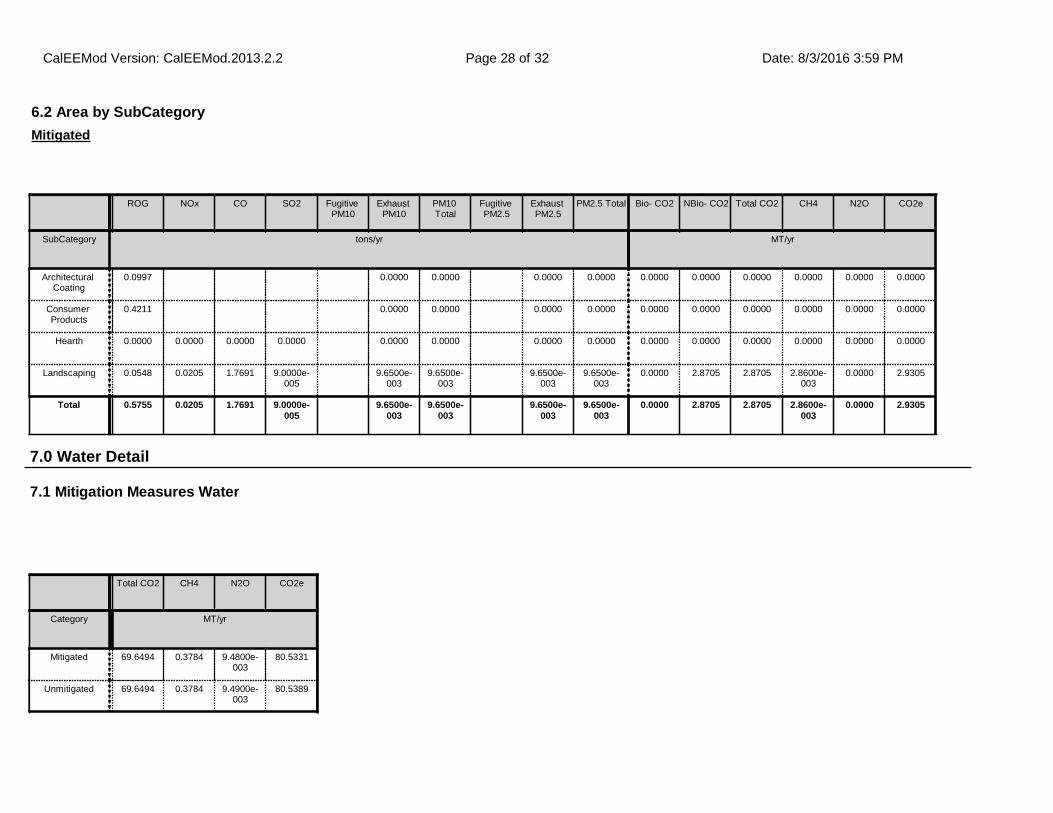
7.1 Mitigation Measures Water
Total CO2 CH4 N2O CO2e
Category MT/yr
Mitigated 69.6494 0.3784 9.4800e-003
80.5331
Unmitigated 69.6494 0.3784 9.4900e-003
80.5389
7.0 Water Detail
6.2 Area by SubCategory
ROG NOx CO SO2 Fugitive PM10
Exhaust PM10
PM10 Total
Fugitive PM2.5
Exhaust PM2.5
PM2.5 Total Bio- CO2 NBio- CO2 Total CO2 CH4 N2O CO2e
SubCategory tons/yr MT/yr
Architectural Coating
0.0997 0.0000 0.0000 0.0000 0.0000 0.0000 0.0000 0.0000 0.0000 0.0000 0.0000
Consumer Products
0.4211 0.0000 0.0000 0.0000 0.0000 0.0000 0.0000 0.0000 0.0000 0.0000 0.0000
Hearth 0.0000 0.0000 0.0000 0.0000 0.0000 0.0000 0.0000 0.0000 0.0000 0.0000 0.0000 0.0000 0.0000 0.0000
Landscaping 0.0548 0.0205 1.7691 9.0000e-005
9.6500e-003
9.6500e-003
9.6500e-003
9.6500e-003
0.0000 2.8705 2.8705 2.8600e-003
0.0000 2.9305
Total 0.5755 0.0205 1.7691 9.0000e-005
9.6500e-003
9.6500e-003
9.6500e-003
9.6500e-003
0.0000 2.8705 2.8705 2.8600e-003
0.0000 2.9305
Mitigated
CalEEMod Version: CalEEMod.2013.2.2 Date: 8/3/2016 3:59 PMPage 28 of 32
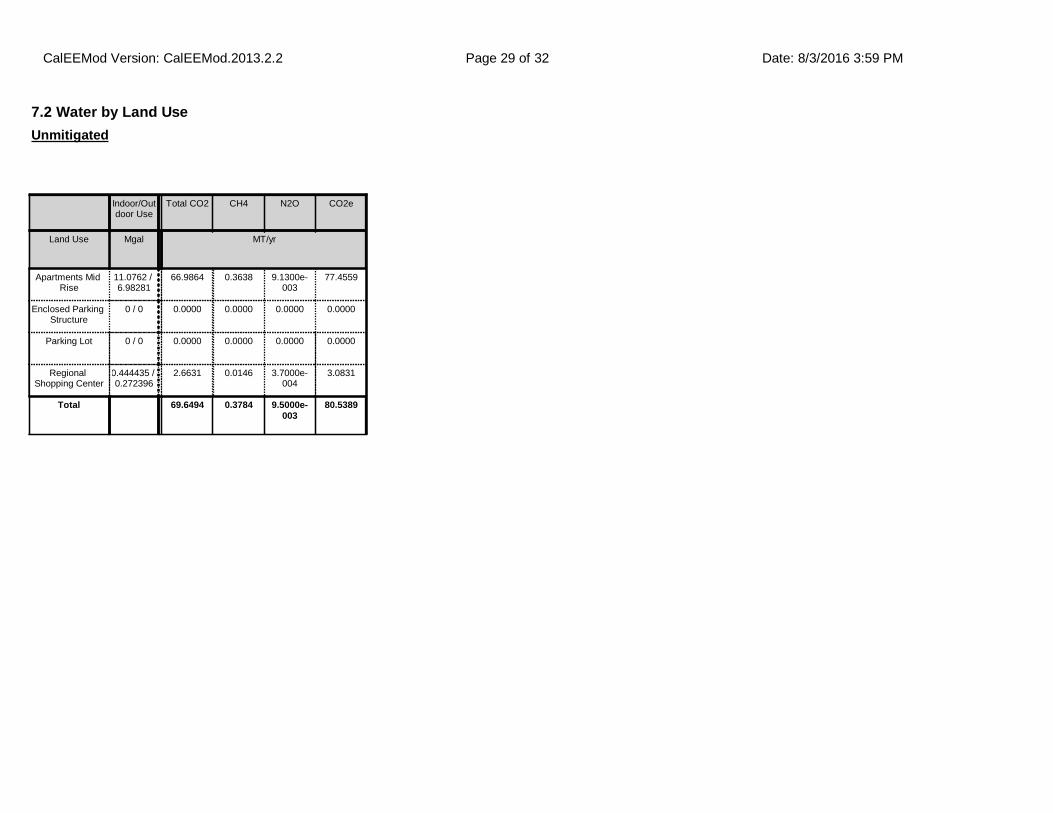
7.2 Water by Land Use
Indoor/Outdoor Use
Total CO2 CH4 N2O CO2e
Land Use Mgal MT/yr
Apartments Mid Rise
11.0762 / 6.98281
66.9864 0.3638 9.1300e-003
77.4559
Enclosed Parking Structure
0 / 0 0.0000 0.0000 0.0000 0.0000
Parking Lot 0 / 0 0.0000 0.0000 0.0000 0.0000
Regional Shopping Center
0.444435 / 0.272396
2.6631 0.0146 3.7000e-004
3.0831
Total 69.6494 0.3784 9.5000e-003
80.5389
Unmitigated
CalEEMod Version: CalEEMod.2013.2.2 Date: 8/3/2016 3:59 PMPage 29 of 32
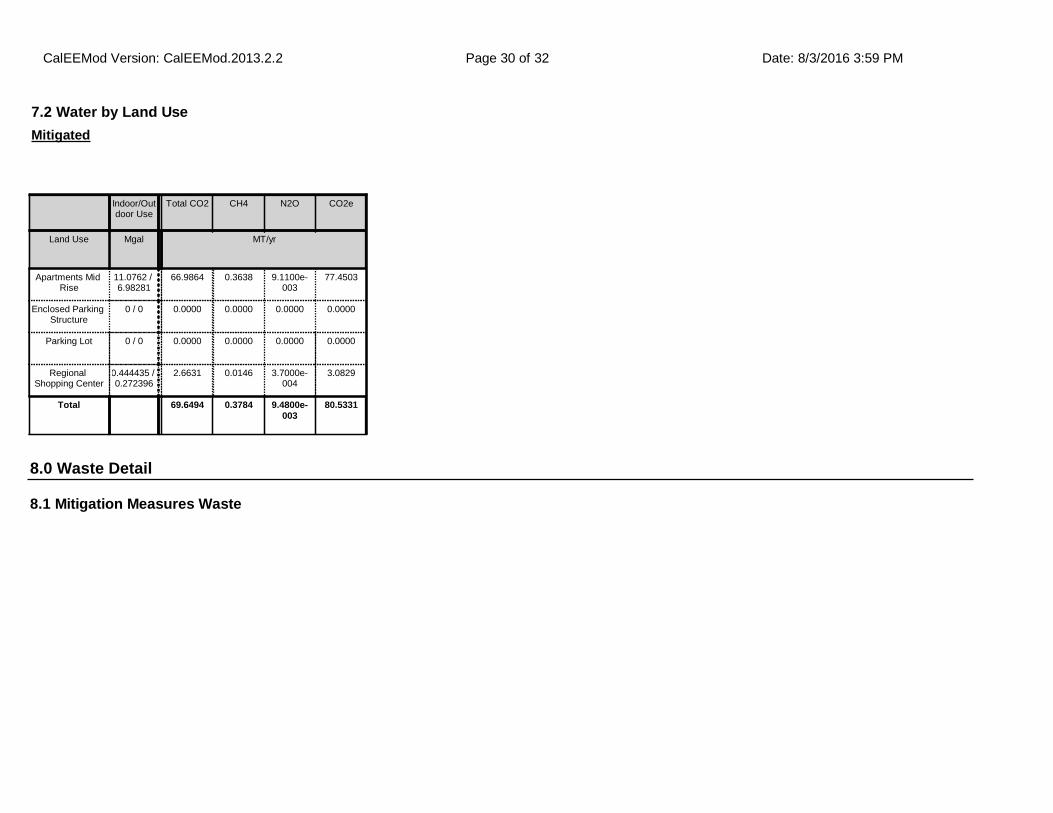
8.1 Mitigation Measures Waste
7.2 Water by Land Use
Indoor/Outdoor Use
Total CO2 CH4 N2O CO2e
Land Use Mgal MT/yr
Apartments Mid Rise
11.0762 / 6.98281
66.9864 0.3638 9.1100e-003
77.4503
Enclosed Parking Structure
0 / 0 0.0000 0.0000 0.0000 0.0000
Parking Lot 0 / 0 0.0000 0.0000 0.0000 0.0000
Regional Shopping Center
0.444435 / 0.272396
2.6631 0.0146 3.7000e-004
3.0829
Total 69.6494 0.3784 9.4800e-003
80.5331
Mitigated
8.0 Waste Detail
CalEEMod Version: CalEEMod.2013.2.2 Date: 8/3/2016 3:59 PMPage 30 of 32
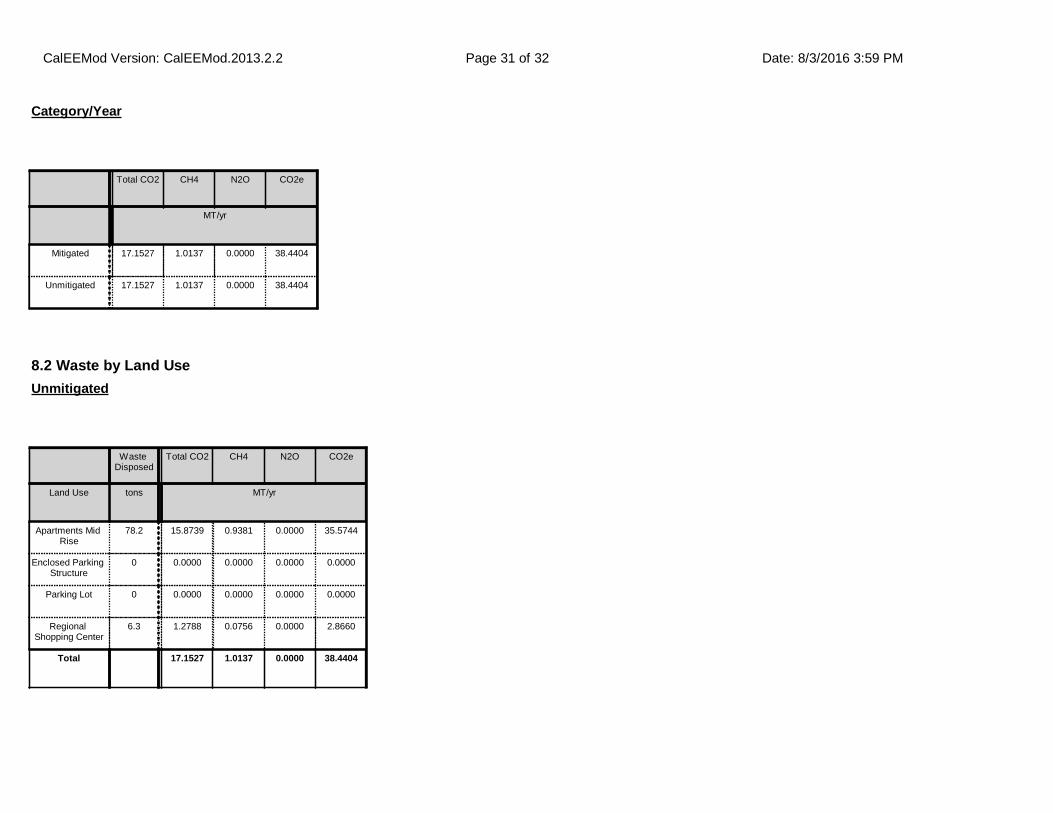
Total CO2 CH4 N2O CO2e
MT/yr
Mitigated 17.1527 1.0137 0.0000 38.4404
Unmitigated 17.1527 1.0137 0.0000 38.4404
Category/Year
8.2 Waste by Land Use
Waste Disposed
Total CO2 CH4 N2O CO2e
Land Use tons MT/yr
Apartments Mid Rise
78.2 15.8739 0.9381 0.0000 35.5744
Enclosed Parking Structure
0 0.0000 0.0000 0.0000 0.0000
Parking Lot 0 0.0000 0.0000 0.0000 0.0000
Regional Shopping Center
6.3 1.2788 0.0756 0.0000 2.8660
Total 17.1527 1.0137 0.0000 38.4404
Unmitigated
CalEEMod Version: CalEEMod.2013.2.2 Date: 8/3/2016 3:59 PMPage 31 of 32
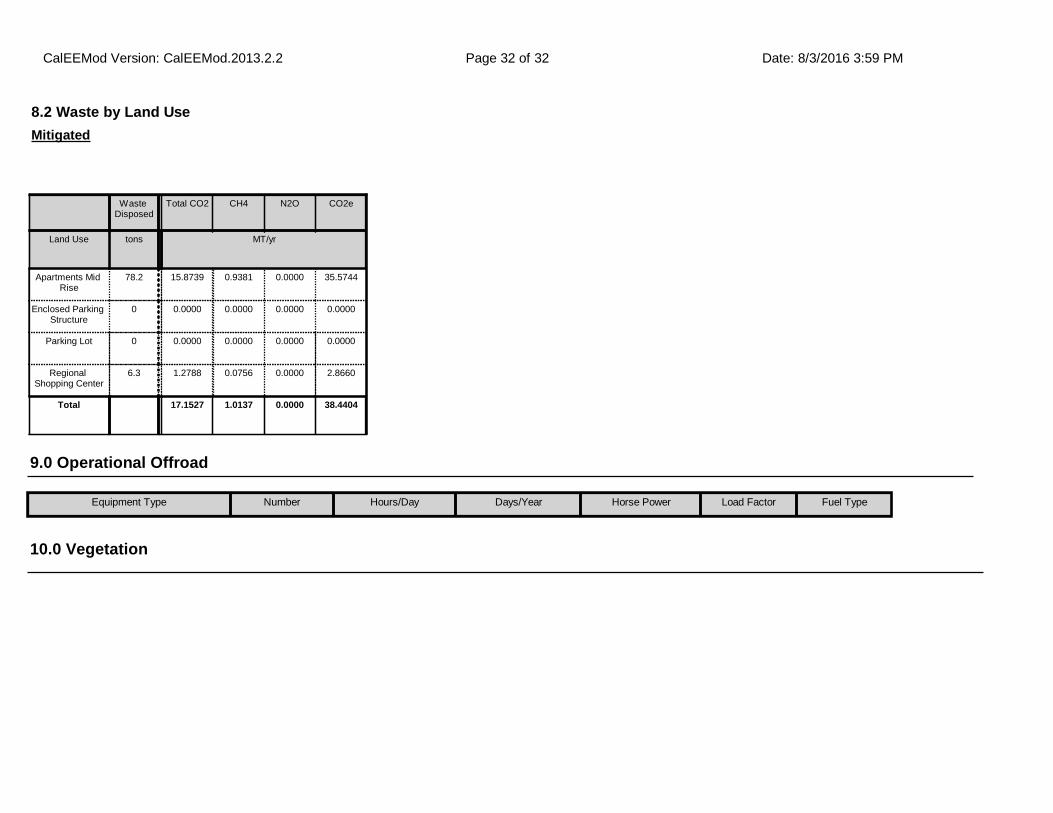
10.0 Vegetation
8.2 Waste by Land Use
Waste Disposed
Total CO2 CH4 N2O CO2e
Land Use tons MT/yr
Apartments Mid Rise
78.2 15.8739 0.9381 0.0000 35.5744
Enclosed Parking Structure
0 0.0000 0.0000 0.0000 0.0000
Parking Lot 0 0.0000 0.0000 0.0000 0.0000
Regional Shopping Center
6.3 1.2788 0.0756 0.0000 2.8660
Total 17.1527 1.0137 0.0000 38.4404
Mitigated
9.0 Operational Offroad
Equipment Type Number Hours/Day Days/Year Horse Power Load Factor Fuel Type
CalEEMod Version: CalEEMod.2013.2.2 Date: 8/3/2016 3:59 PMPage 32 of 32
Appendix B NOX Mobile Emissions Worksheet
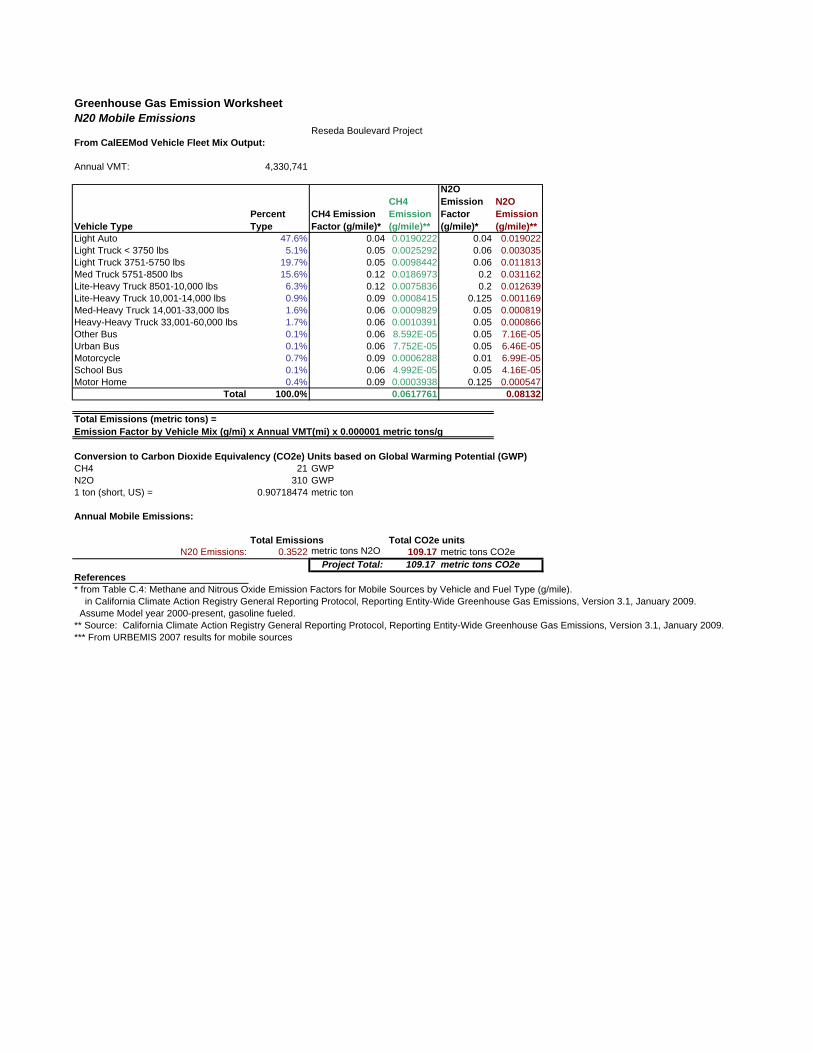
Greenhouse Gas Emission WorksheetN20 Mobile Emissions
Reseda Boulevard ProjectFrom CalEEMod Vehicle Fleet Mix Output:
Annual VMT: 4,330,741
Vehicle TypePercent Type
CH4 Emission Factor (g/mile)*
CH4 Emission (g/mile)**
N2O Emission Factor (g/mile)*
N2O Emission (g/mile)**
Light Auto 47.6% 0.04 0.0190222 0.04 0.019022Light Truck < 3750 lbs 5.1% 0.05 0.0025292 0.06 0.003035Light Truck 3751-5750 lbs 19.7% 0.05 0.0098442 0.06 0.011813Med Truck 5751-8500 lbs 15.6% 0.12 0.0186973 0.2 0.031162Lite-Heavy Truck 8501-10,000 lbs 6.3% 0.12 0.0075836 0.2 0.012639Lite-Heavy Truck 10,001-14,000 lbs 0.9% 0.09 0.0008415 0.125 0.001169Med-Heavy Truck 14,001-33,000 lbs 1.6% 0.06 0.0009829 0.05 0.000819Heavy-Heavy Truck 33,001-60,000 lbs 1.7% 0.06 0.0010391 0.05 0.000866Other Bus 0.1% 0.06 8.592E-05 0.05 7.16E-05Urban Bus 0.1% 0.06 7.752E-05 0.05 6.46E-05Motorcycle 0.7% 0.09 0.0006288 0.01 6.99E-05School Bus 0.1% 0.06 4.992E-05 0.05 4.16E-05Motor Home 0.4% 0.09 0.0003938 0.125 0.000547
Total 100.0% 0.0617761 0.08132
Total Emissions (metric tons) =Emission Factor by Vehicle Mix (g/mi) x Annual VMT(mi) x 0.000001 metric tons/g
Conversion to Carbon Dioxide Equivalency (CO2e) Units based on Global Warming Potential (GWP)CH4 21 GWPN2O 310 GWP1 ton (short, US) = 0.90718474 metric ton
Annual Mobile Emissions:
Total Emissions Total CO2e units N20 Emissions: 0.3522 metric tons N2O 109.17 metric tons CO2e
Project Total: 109.17 metric tons CO2eReferences* from Table C.4: Methane and Nitrous Oxide Emission Factors for Mobile Sources by Vehicle and Fuel Type (g/mile). in California Climate Action Registry General Reporting Protocol, Reporting Entity-Wide Greenhouse Gas Emissions, Version 3.1, January 2009. Assume Model year 2000-present, gasoline fueled.** Source: California Climate Action Registry General Reporting Protocol, Reporting Entity-Wide Greenhouse Gas Emissions, Version 3.1, January 2009.*** From URBEMIS 2007 results for mobile sources

Appendix C Noise Measurement
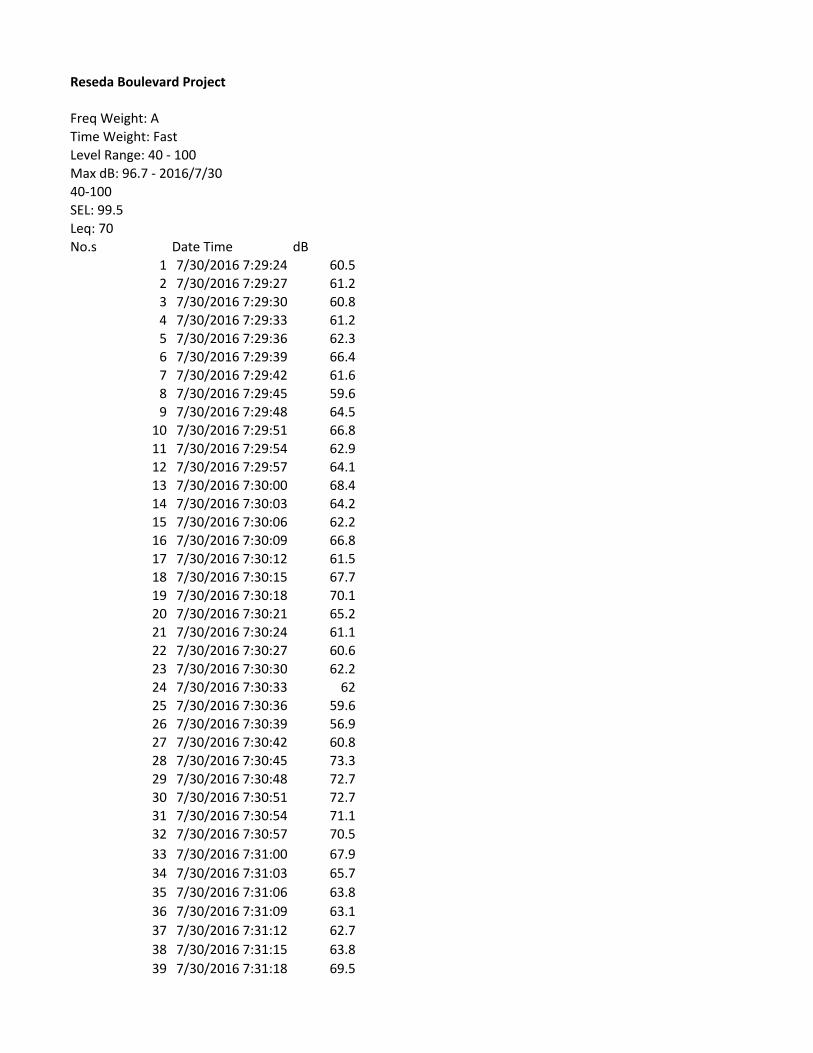
Reseda Boulevard Project
Freq Weight: A
Time Weight: Fast
Level Range: 40 ‐ 100
Max dB: 96.7 ‐ 2016/7/30
40‐100
SEL: 99.5
Leq: 70
No.s Date Time dB
1 7/30/2016 7:29:24 60.5
2 7/30/2016 7:29:27 61.2
3 7/30/2016 7:29:30 60.8
4 7/30/2016 7:29:33 61.2
5 7/30/2016 7:29:36 62.3
6 7/30/2016 7:29:39 66.4
7 7/30/2016 7:29:42 61.6
8 7/30/2016 7:29:45 59.6
9 7/30/2016 7:29:48 64.5
10 7/30/2016 7:29:51 66.8
11 7/30/2016 7:29:54 62.9
12 7/30/2016 7:29:57 64.1
13 7/30/2016 7:30:00 68.4
14 7/30/2016 7:30:03 64.2
15 7/30/2016 7:30:06 62.2
16 7/30/2016 7:30:09 66.8
17 7/30/2016 7:30:12 61.5
18 7/30/2016 7:30:15 67.7
19 7/30/2016 7:30:18 70.1
20 7/30/2016 7:30:21 65.2
21 7/30/2016 7:30:24 61.1
22 7/30/2016 7:30:27 60.6
23 7/30/2016 7:30:30 62.2
24 7/30/2016 7:30:33 62
25 7/30/2016 7:30:36 59.6
26 7/30/2016 7:30:39 56.9
27 7/30/2016 7:30:42 60.8
28 7/30/2016 7:30:45 73.3
29 7/30/2016 7:30:48 72.7
30 7/30/2016 7:30:51 72.7
31 7/30/2016 7:30:54 71.1
32 7/30/2016 7:30:57 70.5
33 7/30/2016 7:31:00 67.9
34 7/30/2016 7:31:03 65.7
35 7/30/2016 7:31:06 63.8
36 7/30/2016 7:31:09 63.1
37 7/30/2016 7:31:12 62.7
38 7/30/2016 7:31:15 63.8
39 7/30/2016 7:31:18 69.5
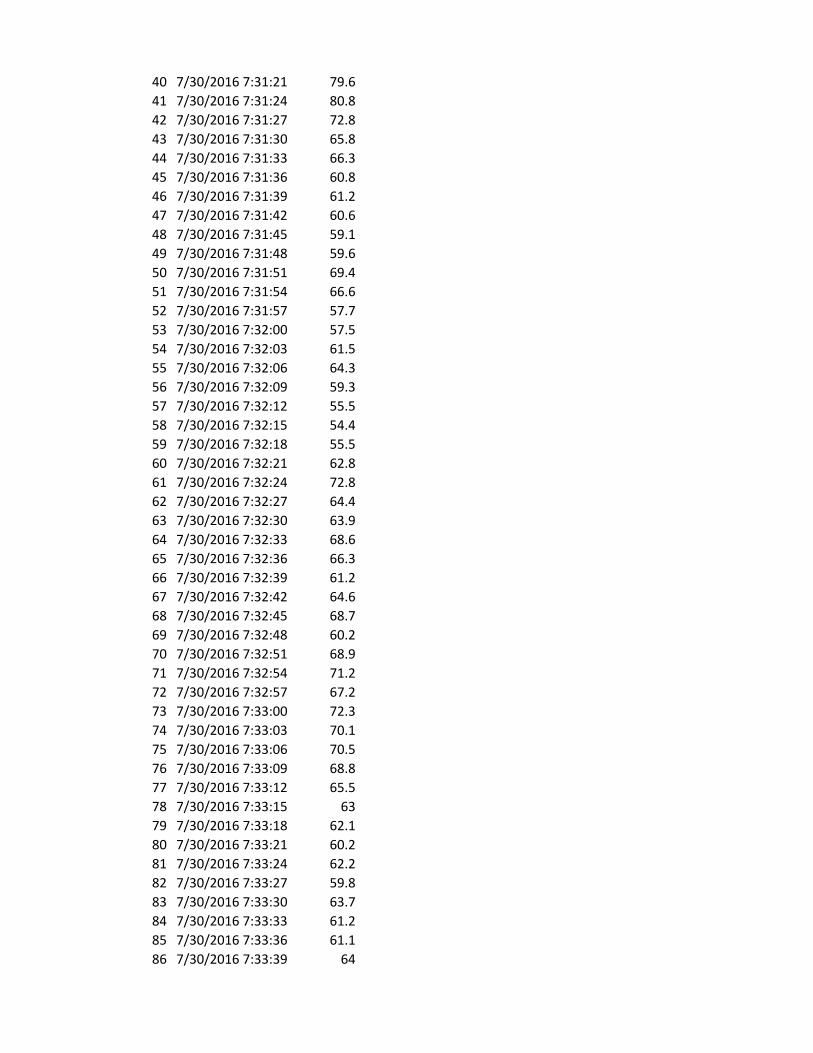
40 7/30/2016 7:31:21 79.6
41 7/30/2016 7:31:24 80.8
42 7/30/2016 7:31:27 72.8
43 7/30/2016 7:31:30 65.8
44 7/30/2016 7:31:33 66.3
45 7/30/2016 7:31:36 60.8
46 7/30/2016 7:31:39 61.2
47 7/30/2016 7:31:42 60.6
48 7/30/2016 7:31:45 59.1
49 7/30/2016 7:31:48 59.6
50 7/30/2016 7:31:51 69.4
51 7/30/2016 7:31:54 66.6
52 7/30/2016 7:31:57 57.7
53 7/30/2016 7:32:00 57.5
54 7/30/2016 7:32:03 61.5
55 7/30/2016 7:32:06 64.3
56 7/30/2016 7:32:09 59.3
57 7/30/2016 7:32:12 55.5
58 7/30/2016 7:32:15 54.4
59 7/30/2016 7:32:18 55.5
60 7/30/2016 7:32:21 62.8
61 7/30/2016 7:32:24 72.8
62 7/30/2016 7:32:27 64.4
63 7/30/2016 7:32:30 63.9
64 7/30/2016 7:32:33 68.6
65 7/30/2016 7:32:36 66.3
66 7/30/2016 7:32:39 61.2
67 7/30/2016 7:32:42 64.6
68 7/30/2016 7:32:45 68.7
69 7/30/2016 7:32:48 60.2
70 7/30/2016 7:32:51 68.9
71 7/30/2016 7:32:54 71.2
72 7/30/2016 7:32:57 67.2
73 7/30/2016 7:33:00 72.3
74 7/30/2016 7:33:03 70.1
75 7/30/2016 7:33:06 70.5
76 7/30/2016 7:33:09 68.8
77 7/30/2016 7:33:12 65.5
78 7/30/2016 7:33:15 63
79 7/30/2016 7:33:18 62.1
80 7/30/2016 7:33:21 60.2
81 7/30/2016 7:33:24 62.2
82 7/30/2016 7:33:27 59.8
83 7/30/2016 7:33:30 63.7
84 7/30/2016 7:33:33 61.2
85 7/30/2016 7:33:36 61.1
86 7/30/2016 7:33:39 64
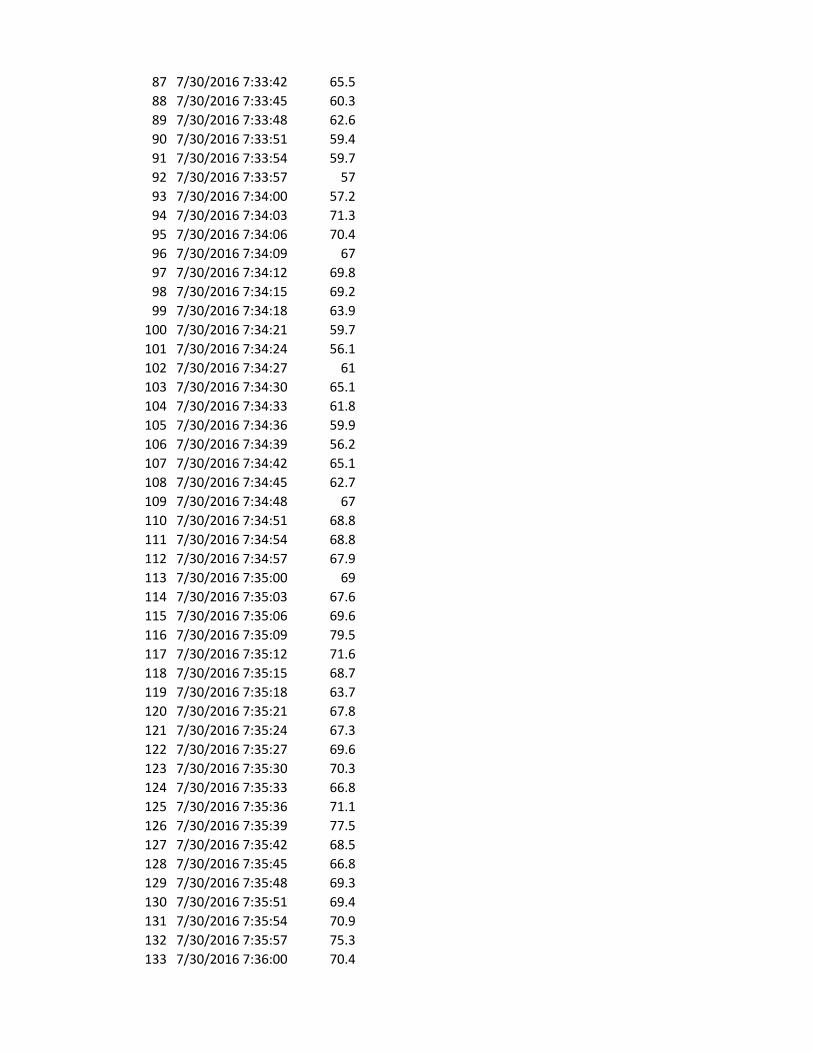
87 7/30/2016 7:33:42 65.5
88 7/30/2016 7:33:45 60.3
89 7/30/2016 7:33:48 62.6
90 7/30/2016 7:33:51 59.4
91 7/30/2016 7:33:54 59.7
92 7/30/2016 7:33:57 57
93 7/30/2016 7:34:00 57.2
94 7/30/2016 7:34:03 71.3
95 7/30/2016 7:34:06 70.4
96 7/30/2016 7:34:09 67
97 7/30/2016 7:34:12 69.8
98 7/30/2016 7:34:15 69.2
99 7/30/2016 7:34:18 63.9
100 7/30/2016 7:34:21 59.7
101 7/30/2016 7:34:24 56.1
102 7/30/2016 7:34:27 61
103 7/30/2016 7:34:30 65.1
104 7/30/2016 7:34:33 61.8
105 7/30/2016 7:34:36 59.9
106 7/30/2016 7:34:39 56.2
107 7/30/2016 7:34:42 65.1
108 7/30/2016 7:34:45 62.7
109 7/30/2016 7:34:48 67
110 7/30/2016 7:34:51 68.8
111 7/30/2016 7:34:54 68.8
112 7/30/2016 7:34:57 67.9
113 7/30/2016 7:35:00 69
114 7/30/2016 7:35:03 67.6
115 7/30/2016 7:35:06 69.6
116 7/30/2016 7:35:09 79.5
117 7/30/2016 7:35:12 71.6
118 7/30/2016 7:35:15 68.7
119 7/30/2016 7:35:18 63.7
120 7/30/2016 7:35:21 67.8
121 7/30/2016 7:35:24 67.3
122 7/30/2016 7:35:27 69.6
123 7/30/2016 7:35:30 70.3
124 7/30/2016 7:35:33 66.8
125 7/30/2016 7:35:36 71.1
126 7/30/2016 7:35:39 77.5
127 7/30/2016 7:35:42 68.5
128 7/30/2016 7:35:45 66.8
129 7/30/2016 7:35:48 69.3
130 7/30/2016 7:35:51 69.4
131 7/30/2016 7:35:54 70.9
132 7/30/2016 7:35:57 75.3
133 7/30/2016 7:36:00 70.4
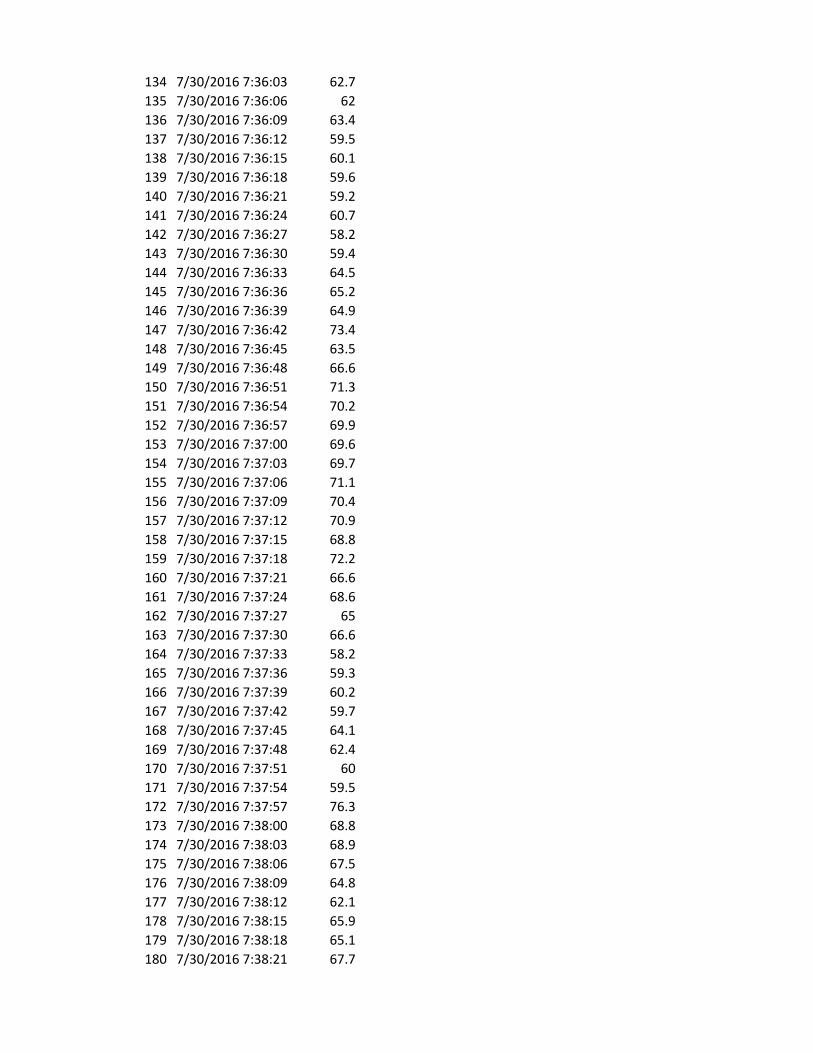
134 7/30/2016 7:36:03 62.7
135 7/30/2016 7:36:06 62
136 7/30/2016 7:36:09 63.4
137 7/30/2016 7:36:12 59.5
138 7/30/2016 7:36:15 60.1
139 7/30/2016 7:36:18 59.6
140 7/30/2016 7:36:21 59.2
141 7/30/2016 7:36:24 60.7
142 7/30/2016 7:36:27 58.2
143 7/30/2016 7:36:30 59.4
144 7/30/2016 7:36:33 64.5
145 7/30/2016 7:36:36 65.2
146 7/30/2016 7:36:39 64.9
147 7/30/2016 7:36:42 73.4
148 7/30/2016 7:36:45 63.5
149 7/30/2016 7:36:48 66.6
150 7/30/2016 7:36:51 71.3
151 7/30/2016 7:36:54 70.2
152 7/30/2016 7:36:57 69.9
153 7/30/2016 7:37:00 69.6
154 7/30/2016 7:37:03 69.7
155 7/30/2016 7:37:06 71.1
156 7/30/2016 7:37:09 70.4
157 7/30/2016 7:37:12 70.9
158 7/30/2016 7:37:15 68.8
159 7/30/2016 7:37:18 72.2
160 7/30/2016 7:37:21 66.6
161 7/30/2016 7:37:24 68.6
162 7/30/2016 7:37:27 65
163 7/30/2016 7:37:30 66.6
164 7/30/2016 7:37:33 58.2
165 7/30/2016 7:37:36 59.3
166 7/30/2016 7:37:39 60.2
167 7/30/2016 7:37:42 59.7
168 7/30/2016 7:37:45 64.1
169 7/30/2016 7:37:48 62.4
170 7/30/2016 7:37:51 60
171 7/30/2016 7:37:54 59.5
172 7/30/2016 7:37:57 76.3
173 7/30/2016 7:38:00 68.8
174 7/30/2016 7:38:03 68.9
175 7/30/2016 7:38:06 67.5
176 7/30/2016 7:38:09 64.8
177 7/30/2016 7:38:12 62.1
178 7/30/2016 7:38:15 65.9
179 7/30/2016 7:38:18 65.1
180 7/30/2016 7:38:21 67.7
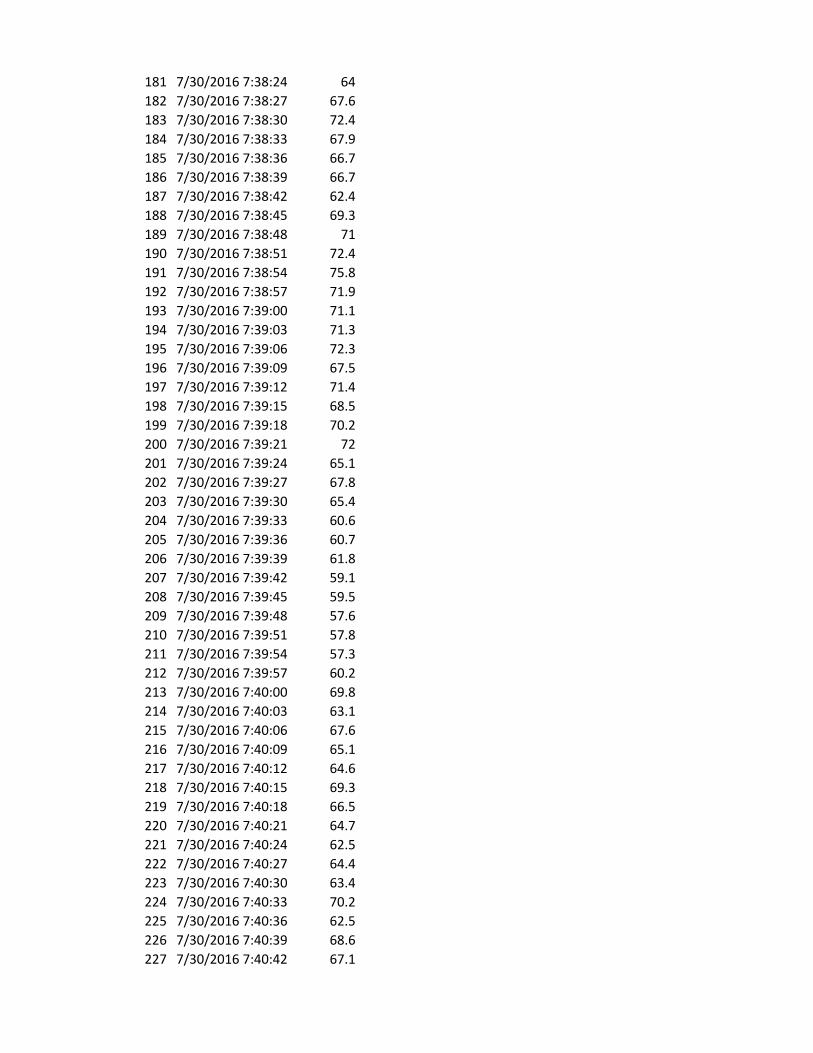
181 7/30/2016 7:38:24 64
182 7/30/2016 7:38:27 67.6
183 7/30/2016 7:38:30 72.4
184 7/30/2016 7:38:33 67.9
185 7/30/2016 7:38:36 66.7
186 7/30/2016 7:38:39 66.7
187 7/30/2016 7:38:42 62.4
188 7/30/2016 7:38:45 69.3
189 7/30/2016 7:38:48 71
190 7/30/2016 7:38:51 72.4
191 7/30/2016 7:38:54 75.8
192 7/30/2016 7:38:57 71.9
193 7/30/2016 7:39:00 71.1
194 7/30/2016 7:39:03 71.3
195 7/30/2016 7:39:06 72.3
196 7/30/2016 7:39:09 67.5
197 7/30/2016 7:39:12 71.4
198 7/30/2016 7:39:15 68.5
199 7/30/2016 7:39:18 70.2
200 7/30/2016 7:39:21 72
201 7/30/2016 7:39:24 65.1
202 7/30/2016 7:39:27 67.8
203 7/30/2016 7:39:30 65.4
204 7/30/2016 7:39:33 60.6
205 7/30/2016 7:39:36 60.7
206 7/30/2016 7:39:39 61.8
207 7/30/2016 7:39:42 59.1
208 7/30/2016 7:39:45 59.5
209 7/30/2016 7:39:48 57.6
210 7/30/2016 7:39:51 57.8
211 7/30/2016 7:39:54 57.3
212 7/30/2016 7:39:57 60.2
213 7/30/2016 7:40:00 69.8
214 7/30/2016 7:40:03 63.1
215 7/30/2016 7:40:06 67.6
216 7/30/2016 7:40:09 65.1
217 7/30/2016 7:40:12 64.6
218 7/30/2016 7:40:15 69.3
219 7/30/2016 7:40:18 66.5
220 7/30/2016 7:40:21 64.7
221 7/30/2016 7:40:24 62.5
222 7/30/2016 7:40:27 64.4
223 7/30/2016 7:40:30 63.4
224 7/30/2016 7:40:33 70.2
225 7/30/2016 7:40:36 62.5
226 7/30/2016 7:40:39 68.6
227 7/30/2016 7:40:42 67.1
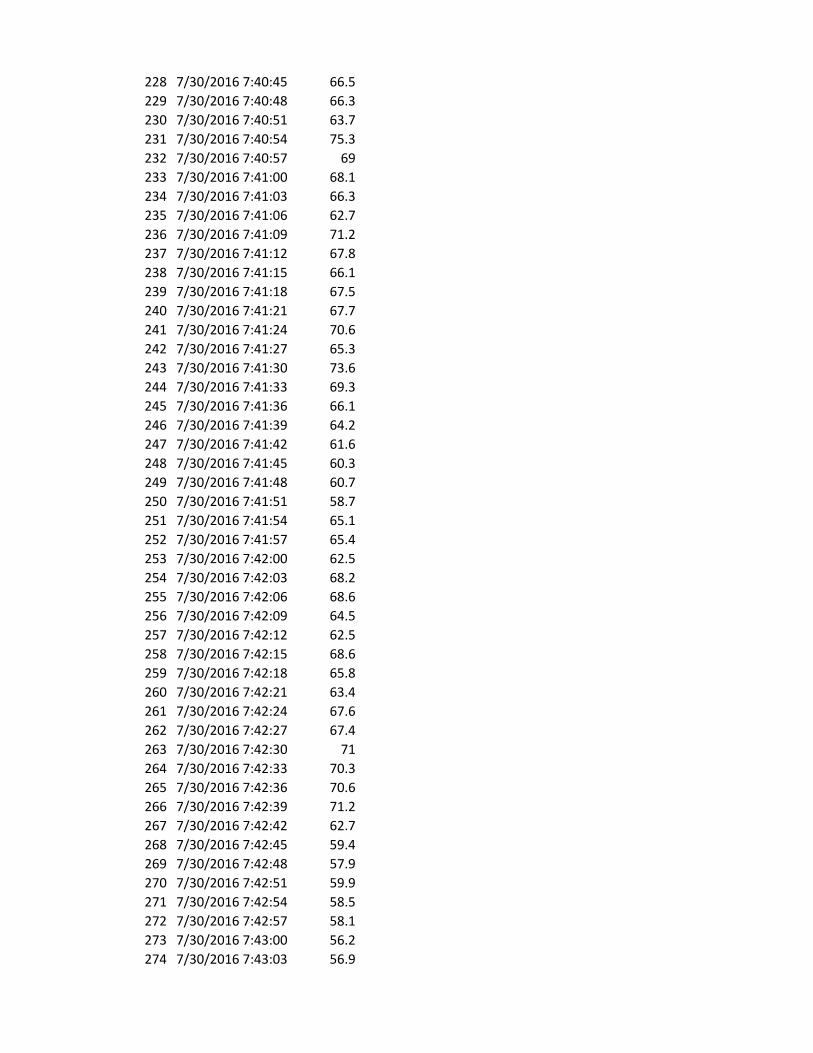
228 7/30/2016 7:40:45 66.5
229 7/30/2016 7:40:48 66.3
230 7/30/2016 7:40:51 63.7
231 7/30/2016 7:40:54 75.3
232 7/30/2016 7:40:57 69
233 7/30/2016 7:41:00 68.1
234 7/30/2016 7:41:03 66.3
235 7/30/2016 7:41:06 62.7
236 7/30/2016 7:41:09 71.2
237 7/30/2016 7:41:12 67.8
238 7/30/2016 7:41:15 66.1
239 7/30/2016 7:41:18 67.5
240 7/30/2016 7:41:21 67.7
241 7/30/2016 7:41:24 70.6
242 7/30/2016 7:41:27 65.3
243 7/30/2016 7:41:30 73.6
244 7/30/2016 7:41:33 69.3
245 7/30/2016 7:41:36 66.1
246 7/30/2016 7:41:39 64.2
247 7/30/2016 7:41:42 61.6
248 7/30/2016 7:41:45 60.3
249 7/30/2016 7:41:48 60.7
250 7/30/2016 7:41:51 58.7
251 7/30/2016 7:41:54 65.1
252 7/30/2016 7:41:57 65.4
253 7/30/2016 7:42:00 62.5
254 7/30/2016 7:42:03 68.2
255 7/30/2016 7:42:06 68.6
256 7/30/2016 7:42:09 64.5
257 7/30/2016 7:42:12 62.5
258 7/30/2016 7:42:15 68.6
259 7/30/2016 7:42:18 65.8
260 7/30/2016 7:42:21 63.4
261 7/30/2016 7:42:24 67.6
262 7/30/2016 7:42:27 67.4
263 7/30/2016 7:42:30 71
264 7/30/2016 7:42:33 70.3
265 7/30/2016 7:42:36 70.6
266 7/30/2016 7:42:39 71.2
267 7/30/2016 7:42:42 62.7
268 7/30/2016 7:42:45 59.4
269 7/30/2016 7:42:48 57.9
270 7/30/2016 7:42:51 59.9
271 7/30/2016 7:42:54 58.5
272 7/30/2016 7:42:57 58.1
273 7/30/2016 7:43:00 56.2
274 7/30/2016 7:43:03 56.9
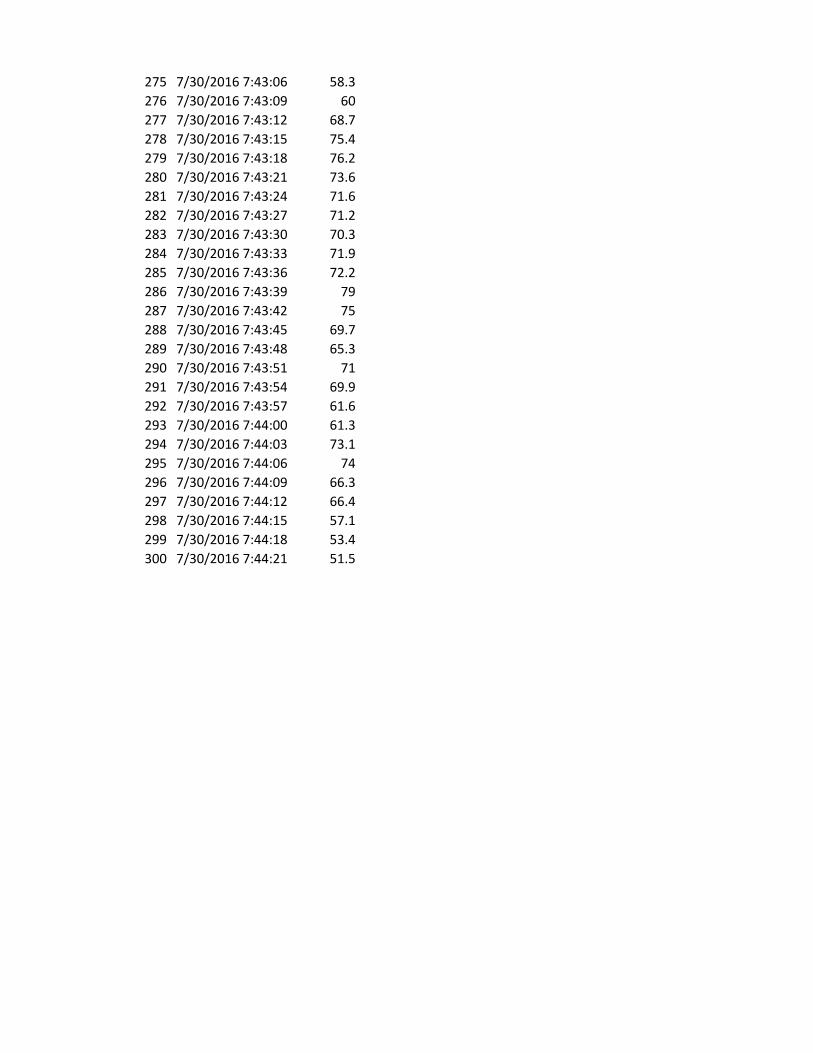
275 7/30/2016 7:43:06 58.3
276 7/30/2016 7:43:09 60
277 7/30/2016 7:43:12 68.7
278 7/30/2016 7:43:15 75.4
279 7/30/2016 7:43:18 76.2
280 7/30/2016 7:43:21 73.6
281 7/30/2016 7:43:24 71.6
282 7/30/2016 7:43:27 71.2
283 7/30/2016 7:43:30 70.3
284 7/30/2016 7:43:33 71.9
285 7/30/2016 7:43:36 72.2
286 7/30/2016 7:43:39 79
287 7/30/2016 7:43:42 75
288 7/30/2016 7:43:45 69.7
289 7/30/2016 7:43:48 65.3
290 7/30/2016 7:43:51 71
291 7/30/2016 7:43:54 69.9
292 7/30/2016 7:43:57 61.6
293 7/30/2016 7:44:00 61.3
294 7/30/2016 7:44:03 73.1
295 7/30/2016 7:44:06 74
296 7/30/2016 7:44:09 66.3
297 7/30/2016 7:44:12 66.4
298 7/30/2016 7:44:15 57.1
299 7/30/2016 7:44:18 53.4
300 7/30/2016 7:44:21 51.5

Appendix D Traffic Memo
MEMORANDUM
O:\0225\memo\0225-M1.docx
To: Pamela Scott-Belinfante Wasserman & Associates
Date: June 22, 2016
From: David S. Shender, P.E. Corinna Gutierrez, P.E. Linscott, Law & Greenspan, Engineers
LLG Ref: 5-15-0225-1
Subject: Technical Memorandum – Reseda & Clark Mixed-Use Project
This Technical Memorandum has been prepared by Linscott, Law & Greenspan, Engineers (LLG) to provide a traffic assessment associated with the proposed Reseda & Clark Mixed-Use project (“the Project”) located at the northwest corner of the Reseda Boulevard and Clark Street intersection in the Tarzana area of the City of Los Angeles, California. The Project is located within the City’s Ventura-Cahuenga Boulevard Specific Plan area. The Project consists of the construction of 170 apartment units and 6,000 square feet of ground floor retail/commercial area. The Project site location and general vicinity are shown in Figure 1. The site plan for the Project is illustrated in Figure 2.
This memorandum provides: 1) a description of the existing setting; 2) a description of the proposed Project and its forecast potential vehicular trip generation; 3) a summary of the calculated operation at the study intersections with the proposed Project; and 4) an assessment of the relative impact of the Project at the study intersections. The Technical Memorandum has been prepared in compliance with the requirements of the Los Angeles Department of Transportation (LADOT) as provided in LADOT’s traffic study policies manual.1
Existing Setting
As noted above, the Project site is located at the northwest corner of the Reseda Boulevard and Clark Street intersection in the Tarzana area of the City of Los Angeles, California. The existing Project site is currently occupied by 6,456 square feet of commercial/retail floor area, a 7,200 square foot restaurant, and 9,749 square feet of medical office floor area.
This traffic assessment evaluates the potential traffic impact of the Project on the local street system. The following intersections have been evaluated for potential traffic impacts due to the Project:
1. Reseda Boulevard / US-101 NB Ramps 2. Reseda Boulevard / US-101 SB Off-Ramp 3. Reseda Boulevard / Burbank Boulevard 4. Reseda Boulevard / Ventura Boulevard
1 Traffic Study Policies and Procedures, LADOT, August 2014.
Pamela Scott-Belinfante June 22, 2016 Page 2
O:\0225\memo\0225-M1.docx
The intersections selected for analysis were identified as they are located closest to the Project site, and therefore have the greatest potential to have adverse traffic impacts related to the project. Further away from the Project site, project-related traffic disperses, and thus, the potential for significant traffic impacts diminish. The existing lane configurations and traffic control devices at the study intersections are provided on Figure 3.
Existing Traffic Volumes
Manual traffic counts of vehicular turning movements were conducted during the week of May 22, 2016 at the study intersections during the weekday morning and afternoon commuter periods to determine the peak hour traffic volumes. The manual traffic counts at the study intersections were conducted from 7:00 AM to 10:00 AM to determine the AM peak commuter hour, and from 3:00 PM to 6:00 PM to determine the PM peak commuter hour. The summary data worksheets of the manual traffic counts at the study intersections are provided in Appendix A attached to this memorandum. The existing peak hour volumes at each study intersection are shown on Figure 4.
Proposed Project Description
The Project site is located at the northwest corner of the Reseda Boulevard and Clark Street intersection in the Tarzana area of the City of Los Angeles, California. The Project site is bounded by commercial buildings to the north, Clark Street to the south, Reseda Boulevard to the east, and residential buildings to the west. The Project consists of the construction of 170 apartment units and 6,000 square feet of ground floor retail/commercial area. The existing on-site uses will be removed to accommodate construction of the proposed Project.
Vehicular access to the Project is proposed via one driveway on the north side of Clark Street along the southerly property frontage and a second driveway on the west side of Reseda Boulevard along the easterly property frontage. The Clark Street Project driveway is proposed to accommodate full vehicular access (i.e., left-turn and right-tum ingress and egress turning movements). The Reseda Boulevard Project driveway is proposed to accommodate full vehicular access (i.e., left-turn and right-tum ingress and egress turning movements). The proposed site driveways will provide access to the street level parking area, as well as the subterranean levels of the on-site parking garage.
Pamela Scott-Belinfante June 22, 2016 Page 3
O:\0225\memo\0225-M1.docx
Project Trip Generation
Traffic volumes expected to be generated by the proposed Project during the weekday AM and PM peak hours, as well as on a daily basis, were estimated using trip rates published in the ITE Trip Generation manual2. Trip generation rates for the Apartment land use (ITE Land Use Code 220) were used to forecast the traffic volumes expected to be generated by the residential component of the Project. The ITE Apartment trip rates are based on the number of dwelling units proposed by the Project. Trip generation rates for the Shopping Center land use (ITE Land Use Code 820) were used to forecast the traffic volumes expected to be generated by the commercial component of the Project. The ITE Shopping Center trip rates are based on the floor area of the Project’s commercial component.
In addition to the trip generation forecasts for the project land use components (which are essentially an estimate of the number of vehicles that could be expected to enter and exit the site access points), an internal capture adjustment has been applied for the project to account for the synergistic effects of the planned land use mix. Internal capture trips are those trips made internal to the site between land uses in a mixed or multi-use development. When combined within a mixed or multi-use development, land uses tend to interact, and thus attract a portion of each other’s trip generation. An internal capture adjustment of 5% has been utilized to account for the interaction between the residential and commercial land uses.
A forecast was also made of transit trips. The transit reduction is based on the site’s proximity to the various bus lines (including Metro Rapid Line service on Reseda Boulevard and Ventura Boulevard), as well as the land use characteristics of the Project. A transit adjustment of 15% has been utilized consistent with procedures outlined in the LADOT’s traffic study policies manual.
An adjustment was made to the trip generation forecast based on the Project site’s existing land uses. The existing land uses to be removed include 6,456 square feet of commercial/retail floor area, a 7,200 square foot restaurant, and a 9,749 square foot medical office. ITE Land Use Code 820 (Shopping Center) trip generation average rates were used to estimate the trips generated by the existing commercial/retail uses at the Project site. ITE Land Use Code 932 (High-Turnover [Sit-Down] Restaurant) trip generation average rates were used to estimate the trips generated by the existing restaurant at the Project site. Lastly, ITE Land Use Code 720 (Medical-Dental Office Building) trip generation average rates were used to estimate the trips generated by the existing medical office at the Project site.
2 Institute of Transportation Engineers Trip Generation manual, 9th Edition, Washington, D.C., 2012.
Pamela Scott-Belinfante June 22, 2016 Page 4
O:\0225\memo\0225-M1.docx
Lastly, a forecast was made of likely pass-by trips for the existing uses. Pass-by trips are made as intermediate stops on the way from an origin to a primary destination without a route diversion. Pass-by trips are attracted from traffic passing the site on an adjacent street or roadway that offers direct access to the site. In this instance, the adjacent roadways to the Project site include Reseda Boulevard and Clark Street. Based on the LADOT Policy on Pass-By Trips, a 50% pass-by reduction adjustment was applied to the commercial component of the Project as well as the existing commercial/retail floor area. A 20% and 10% pass-by reduction adjustment was applied to the existing restaurant and medical office, respectively.
Table 1 attached to this memorandum provides the trip generation forecast for the Project. As shown in Table 1, the Project on a typical weekday is forecast to generate 45 net daily trips (e.g., 23 inbound trips, 22 outbound trips), 2 net new AM peak hour trips (decrease in 29 inbound trips and increase in 31 outbound trips) and 11 net new PM peak hour trips (increase in 19 inbound trips and decrease in 8 outbound trips).
Project Trip Assignment
The weekday AM and PM commuter peak hour vehicle trips forecast to be generated by the Project were assigned to the study intersections. Figure 5 provides the vehicular trip distribution for the Project and Figure 6 displays the forecast AM and PM peak hour Project-related trips at the study intersections. It is noted that while left-turn ingress and egress traffic movements are expected to be permitted at the Project’s Reseda Boulevard driveway, the assignment of Project trips at this driveway is assumed to be right-turns only during peak hours as some Project-related motorists may prefer to attempt left-turns to and from the site at the Clark Street intersection
Traffic Volume Forecast
As required by LADOT, the traffic impact study evaluates the potential impacts of the Project through analysis of the following traffic volume conditions:
Existing Existing with Project Future Future with Project
As previously noted, the existing traffic volumes at the study intersections are presented in Figure 4. The forecast traffic volumes associated with the Project at the study intersections are added to the existing volumes to derive the Existing plus Project traffic volumes, which are shown on Figure 7.
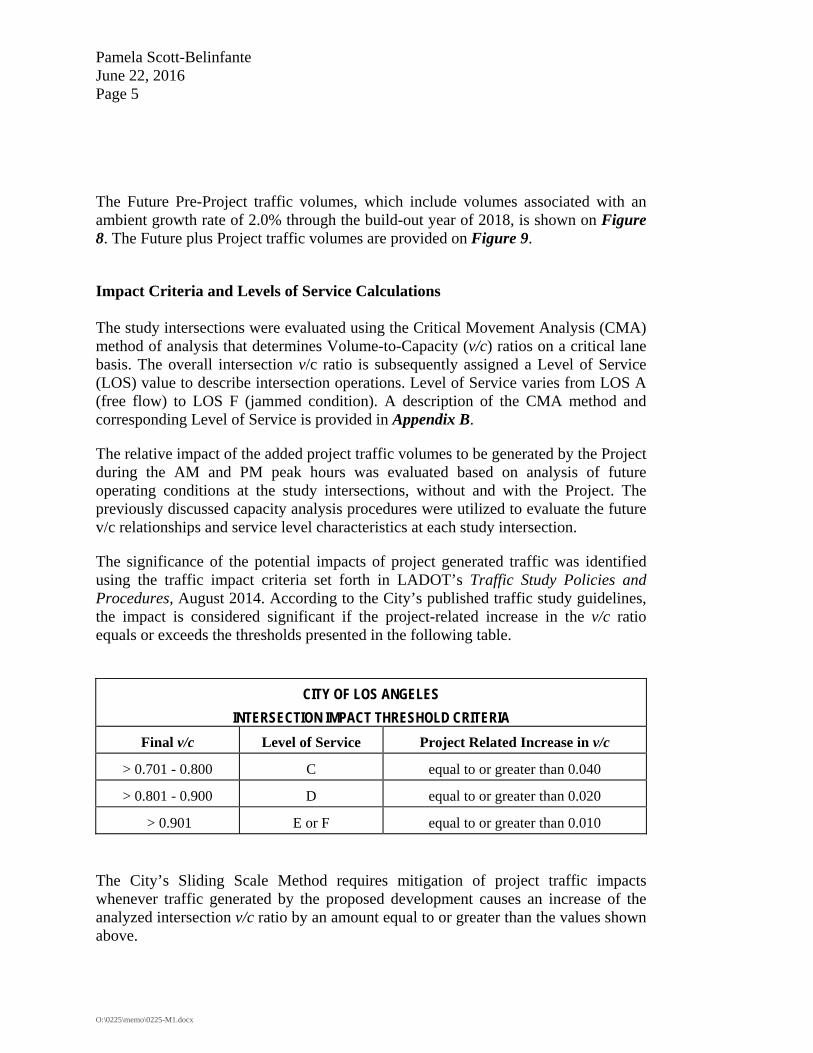
Pamela Scott-Belinfante June 22, 2016 Page 5
O:\0225\memo\0225-M1.docx
The Future Pre-Project traffic volumes, which include volumes associated with an ambient growth rate of 2.0% through the build-out year of 2018, is shown on Figure 8. The Future plus Project traffic volumes are provided on Figure 9.
Impact Criteria and Levels of Service Calculations The study intersections were evaluated using the Critical Movement Analysis (CMA) method of analysis that determines Volume-to-Capacity (v/c) ratios on a critical lane basis. The overall intersection v/c ratio is subsequently assigned a Level of Service (LOS) value to describe intersection operations. Level of Service varies from LOS A (free flow) to LOS F (jammed condition). A description of the CMA method and corresponding Level of Service is provided in Appendix B.
The relative impact of the added project traffic volumes to be generated by the Project during the AM and PM peak hours was evaluated based on analysis of future operating conditions at the study intersections, without and with the Project. The previously discussed capacity analysis procedures were utilized to evaluate the future v/c relationships and service level characteristics at each study intersection.
The significance of the potential impacts of project generated traffic was identified using the traffic impact criteria set forth in LADOT’s Traffic Study Policies and Procedures, August 2014. According to the City’s published traffic study guidelines, the impact is considered significant if the project-related increase in the v/c ratio equals or exceeds the thresholds presented in the following table.
CITY OF LOS ANGELES
INTERSECTION IMPACT THRESHOLD CRITERIA
Final v/c Level of Service Project Related Increase in v/c
> 0.701 - 0.800 C equal to or greater than 0.040
> 0.801 - 0.900 D equal to or greater than 0.020
> 0.901 E or F equal to or greater than 0.010
The City’s Sliding Scale Method requires mitigation of project traffic impacts whenever traffic generated by the proposed development causes an increase of the analyzed intersection v/c ratio by an amount equal to or greater than the values shown above.
Pamela Scott-Belinfante June 22, 2016 Page 6
O:\0225\memo\0225-M1.docx
The traffic impact analysis prepared for the study intersections using the CMA methodology and application of the City of Los Angeles significant traffic impact criteria are summarized for the Project in Table 2. The CMA data worksheets for the analyzed intersections are contained for each Project option in Appendix B.
As indicated in column [1] of Table 2 for Existing conditions, all four study intersections are operating at LOS C or better during the AM and PM peak hours. As previously noted, the existing traffic volumes at the study intersections during the weekday AM and PM peak hours are displayed in Figure 4.
For the Existing with Project condition following construction and occupancy of the Project, the forecast changes in v/c ratios at the study intersections due to Project-related traffic are calculated to be below the City’s significance thresholds as shown in column [2]. Therefore, the traffic impacts of the Project in the Existing with Project condition will be less than significant for all four study intersections. As previously noted, the Existing with Project traffic volumes are provided on Figure 7.
For the Future conditions as presented in column [3], all four study intersections are operating at LOS D or better during the peak hours. As previously noted, the future traffic volumes at the study intersections during the weekday AM and PM peak hours are displayed in Figure 8.
As shown in column [4], the traffic impacts in the Future with Project condition will be less than significant for all four study intersections with application of the City’s thresholds. As previously noted, the Future with Project traffic volumes are provided on Figure 9.
Pamela Scott-Belinfante June 22, 2016 Page 7
O:\0225\memo\0225-M1.docx
Summary
This memorandum provides the traffic assessment prepared for the proposed Reseda & Clark Mixed-Use project located at the northwest corner of the Reseda Boulevard and Clark Street intersection in the Tarzana area of the City of Los Angeles, California, within the City’s Ventura-Cahuenga Boulevard Specific Plan area. The conclusions of the traffic assessment are as follows:
The Project is forecast to generate 45 net new daily trips, 2 net new AM peak hour trips, and 11 net new PM peak hour trips during a typical weekday.
Based on application of the City’s thresholds of significance, the Project is forecast to result in incremental, but not significant traffic impacts at the four study intersections during the weekday AM and PM peak hours. Therefore, no traffic mitigation measures are required.
cc: File
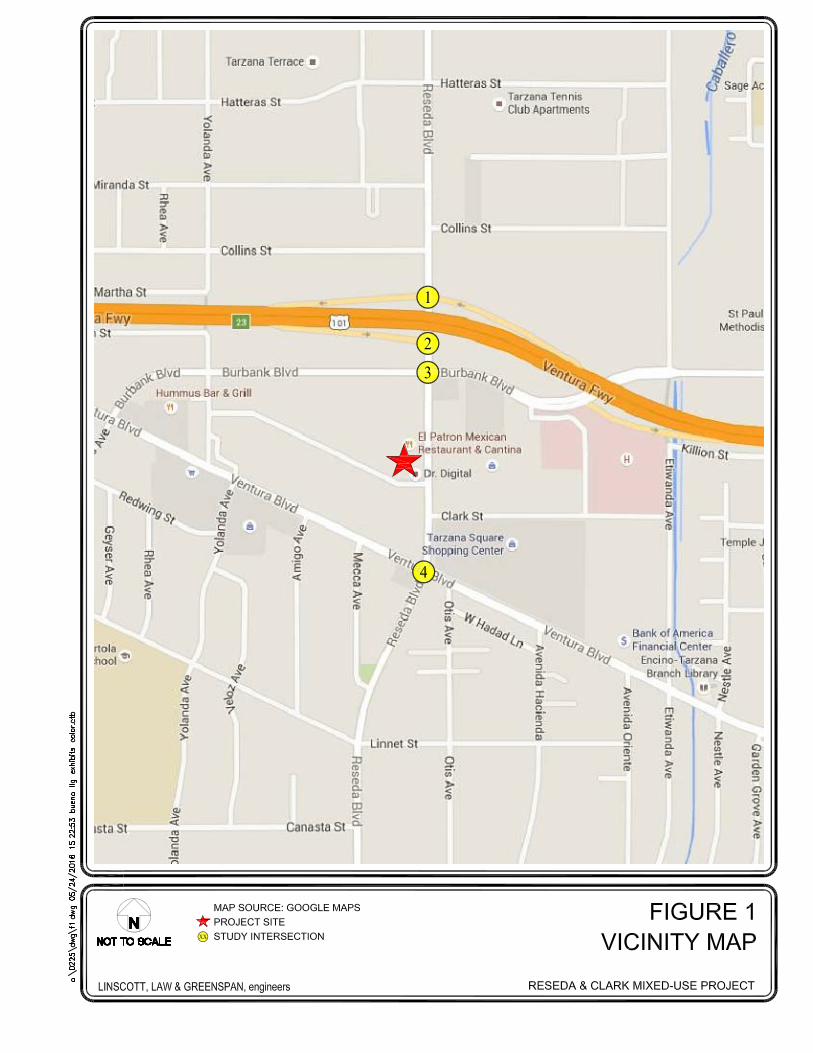
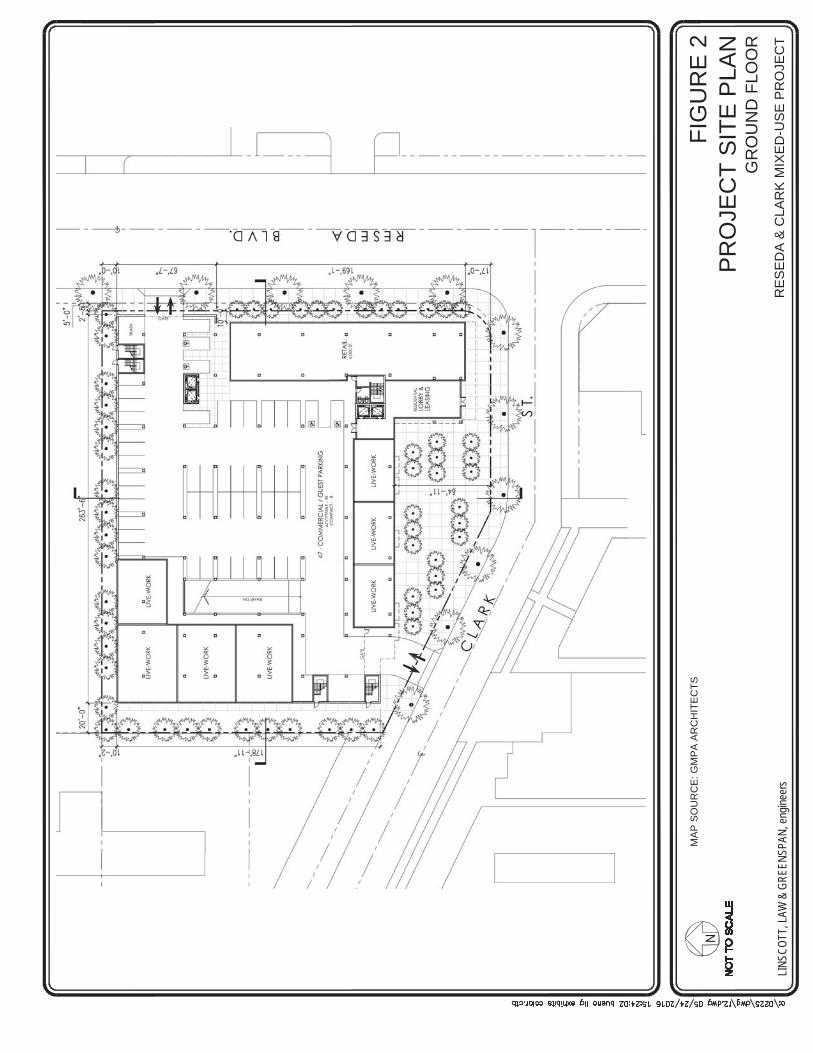
FIG
UR
E 2
PR
OJE
CT
SIT
E P
LAN
RE
SE
DA
& C
LAR
K M
IXE
D-U
SE
PR
OJE
CT
MA
P S
OU
RC
E: G
MP
A A
RC
HIT
EC
TS
LIN
SCO
TT, L
AW &
GR
EEN
SPAN
, eng
inee
rs
GR
OU
ND
FLO
OR
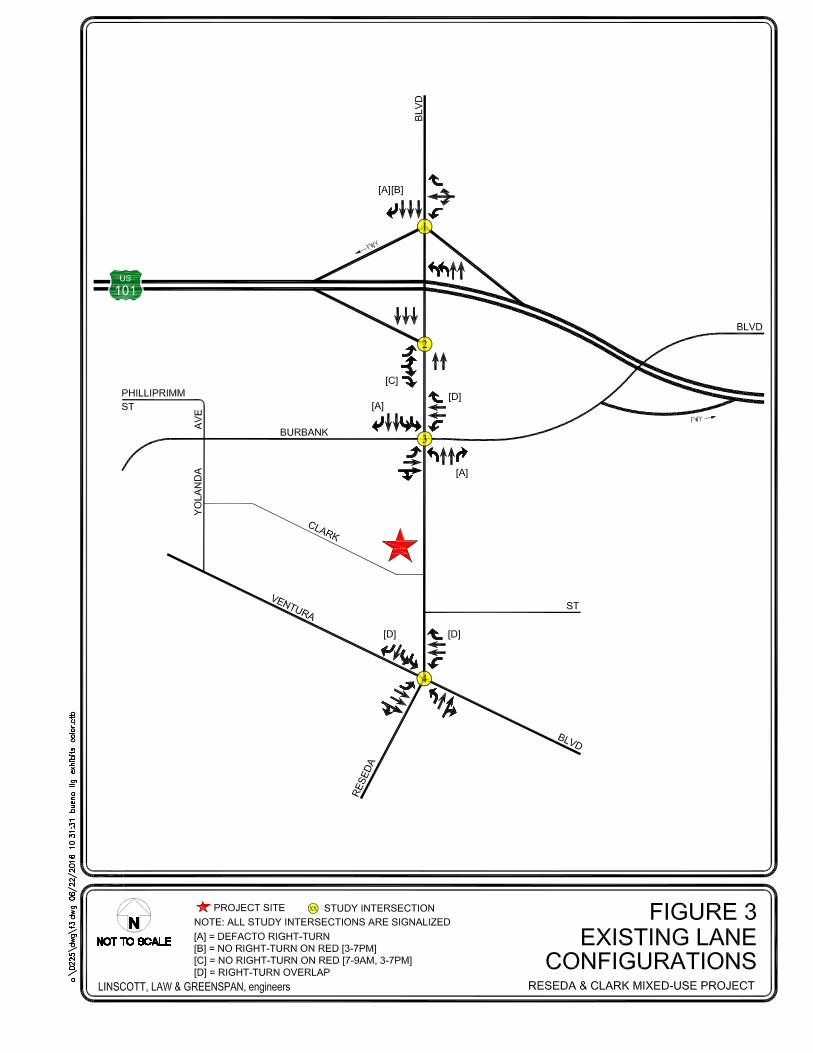
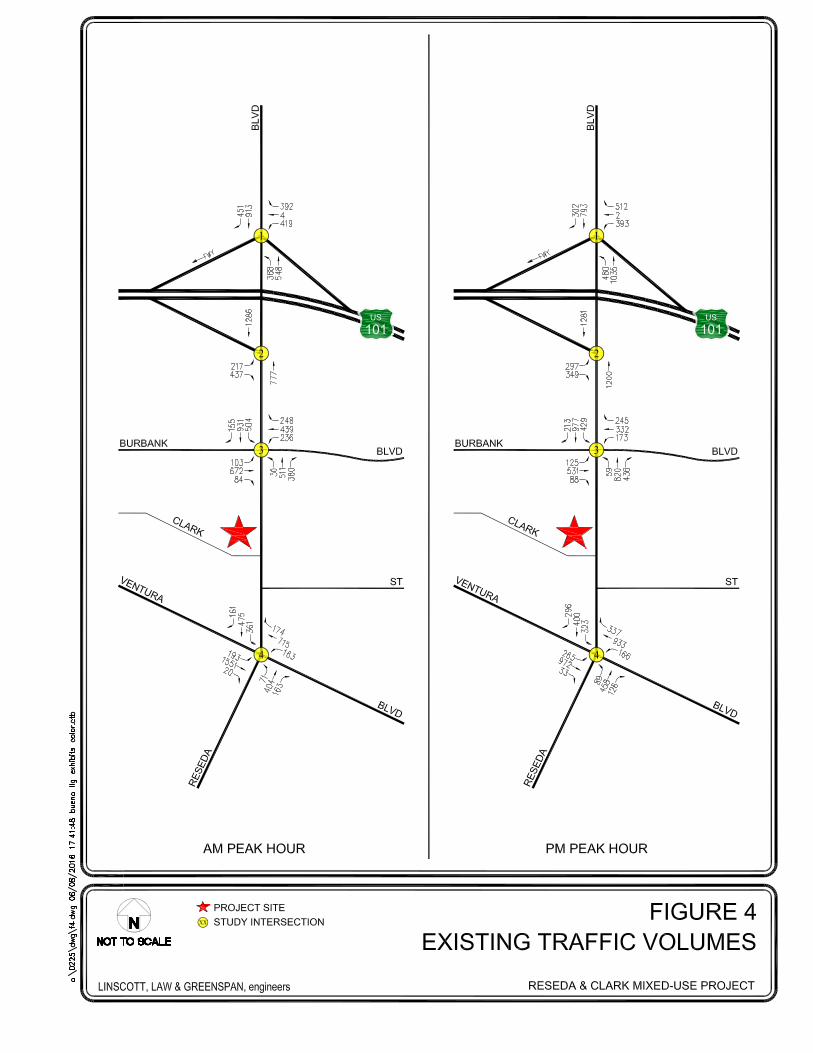
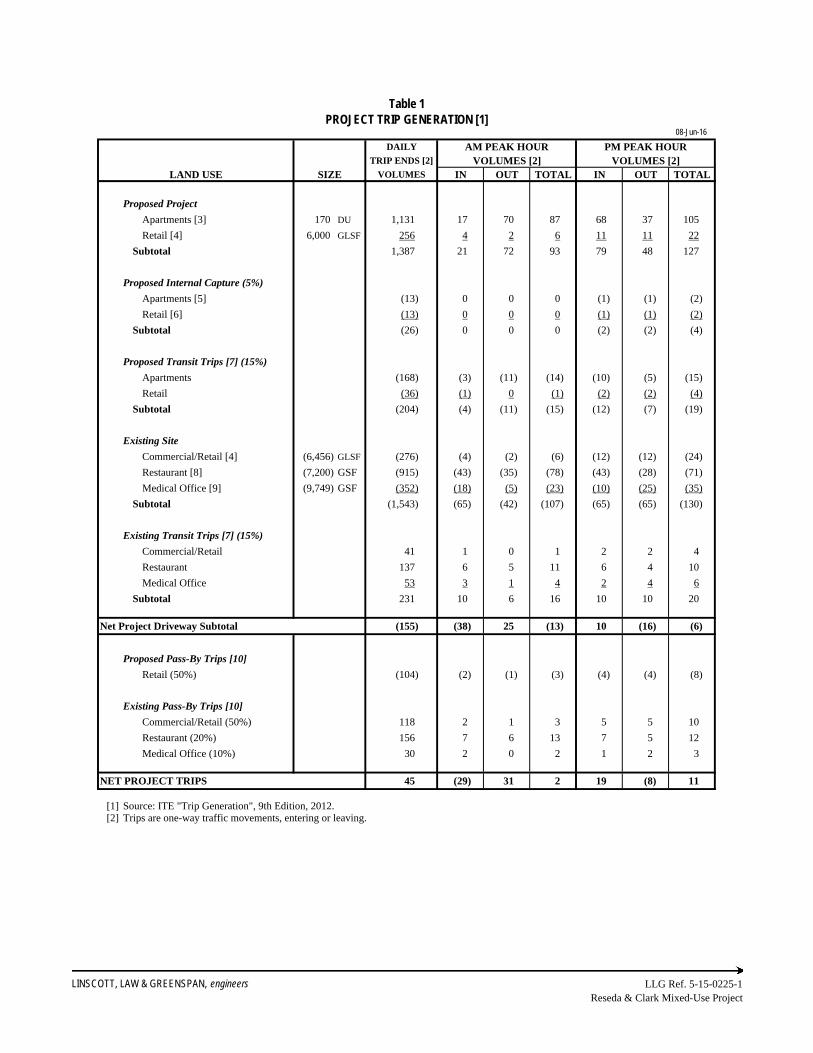
Table 1PROJECT TRIP GENERATION [1]
08-Jun-16
DAILY AM PEAK HOUR PM PEAK HOURTRIP ENDS [2] VOLUMES [2] VOLUMES [2]
LAND USE SIZE VOLUMES IN OUT TOTAL IN OUT TOTAL
Proposed Project
Apartments [3] 170 DU 1,131 17 70 87 68 37 105
Retail [4] 6,000 GLSF 256 4 2 6 11 11 22
Subtotal 1,387 21 72 93 79 48 127
Proposed Internal Capture (5%)
Apartments [5] (13) 0 0 0 (1) (1) (2)
Retail [6] (13) 0 0 0 (1) (1) (2)
Subtotal (26) 0 0 0 (2) (2) (4)
Proposed Transit Trips [7] (15%)
Apartments (168) (3) (11) (14) (10) (5) (15)
Retail (36) (1) 0 (1) (2) (2) (4)
Subtotal (204) (4) (11) (15) (12) (7) (19)
Existing Site
Commercial/Retail [4] (6,456) GLSF (276) (4) (2) (6) (12) (12) (24)
Restaurant [8] (7,200) GSF (915) (43) (35) (78) (43) (28) (71)
Medical Office [9] (9,749) GSF (352) (18) (5) (23) (10) (25) (35)
Subtotal (1,543) (65) (42) (107) (65) (65) (130)
Existing Transit Trips [7] (15%)
Commercial/Retail 41 1 0 1 2 2 4
Restaurant 137 6 5 11 6 4 10
Medical Office 53 3 1 4 2 4 6
Subtotal 231 10 6 16 10 10 20
Net Project Driveway Subtotal (155) (38) 25 (13) 10 (16) (6)
Proposed Pass-By Trips [10]
Retail (50%) (104) (2) (1) (3) (4) (4) (8)
Existing Pass-By Trips [10]
Commercial/Retail (50%) 118 2 1 3 5 5 10
Restaurant (20%) 156 7 6 13 7 5 12
Medical Office (10%) 30 2 0 2 1 2 3
NET PROJECT TRIPS 45 (29) 31 2 19 (8) 11
[1] Source: ITE "Trip Generation", 9th Edition, 2012. [2] Trips are one-way traffic movements, entering or leaving.
LINSCOTT, LAW & GREENSPAN, engineers LLG Ref. 5-15-0225-1Reseda & Clark Mixed-Use Project
[3] ITE Land Use Code 220 (Apartment) trip generation average rates. - Daily Trip Rate: 6.65 trips/dwelling unit; 50% inbound/50% outbound - AM Peak Hour Trip Rate: 0.51 trips/dwelling unit; 20% inbound/80% outbound - PM Peak Hour Trip Rate: 0.62 trips/dwelling unit; 65% inbound/35% outbound
[4] ITE Land Use Code 820 (Shopping Center) trip generation average rates. - Daily Trip Rate: 42.70 trips/1,000 SF of floor area; 50% inbound/50% outbound - AM Peak Hour Trip Rate: 0.96 trips/1,000 SF of floor area; 62% inbound/38% outbound - PM Peak Hour Trip Rate: 3.71 trips/1,000 SF of floor area; 48% inbound/52% outbound
[5] Internal capture reduction for the residential use is based on the internal capture reduction of retail uses. [6] Internal capture reduction for the retail use is based on the synergy between the residential and retail uses provided
within the project site. [7] The trip reduction for transit trips has been applied to the apartments and retail components of the project based on the
"LADOT Traffic Study Policies and Procedures," August 2014 for developments within 1/4 mile walking distance of a Rapid Bus stop. [8] ITE Land Use Code 932 (High-Turnover [Sit-Down] Restaurant) trip generation average rates.
- Daily Trip Rate: 127.15 trips/1,000 GSF of floor area; 50% inbound/50% outbound - AM Peak Hour Trip Rate: 10.81 trips/1000 GSF of floor area; 55% inbound/45% outbound - PM Peak Hour Trip Rate: 9.85 trips/1000 GSF of floor area; 60% inbound/40% outbound
[9] ITE Land Use Code 720 (Medical-Dental Office Building) trip generation average rates. - Daily Trip Rate: 36.13 trips/1,000 GSF of floor area; 50% inbound/50% outbound - AM Peak Hour Trip Rate: 2.39 trips/1000 GSF of floor area; 79% inbound/21% outbound - PM Peak Hour Trip Rate: 3.57 trips/1000 GSF of floor area; 28% inbound/72% outbound
[10] Pass-by trips are made as intermediate stops on the way from an origin to a primary trip destination without a route diversion. Pass-by trips are attracted from traffic passing the site on an adjacent street or roadway that offers direct access to the site. The trip reduction for pass-by trips has been applied to the commercial component of the project based on the "LADOT Traffic Study Policies and Procedures", August 2014 for Shopping Center less than 50,000 sf and high turnover restaurant.
LINSCOTT, LAW & GREENSPAN, engineers LLG Ref. 5-15-0225-1Reseda & Clark Mixed-Use Project
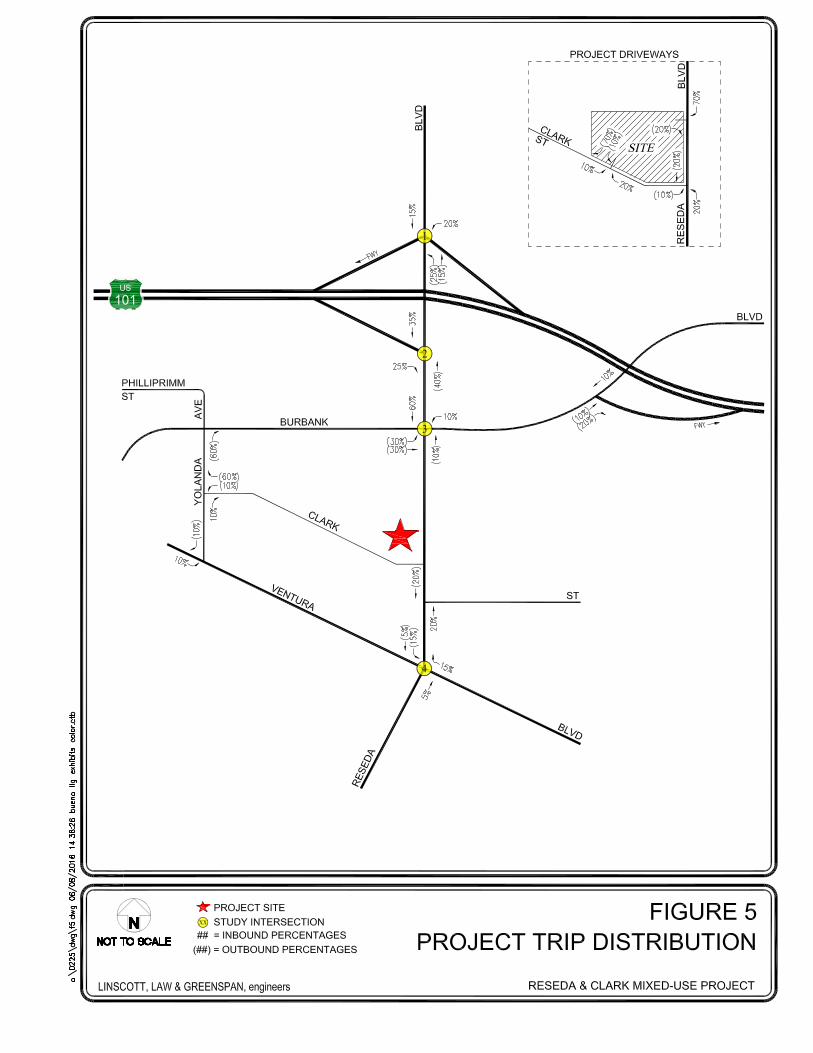

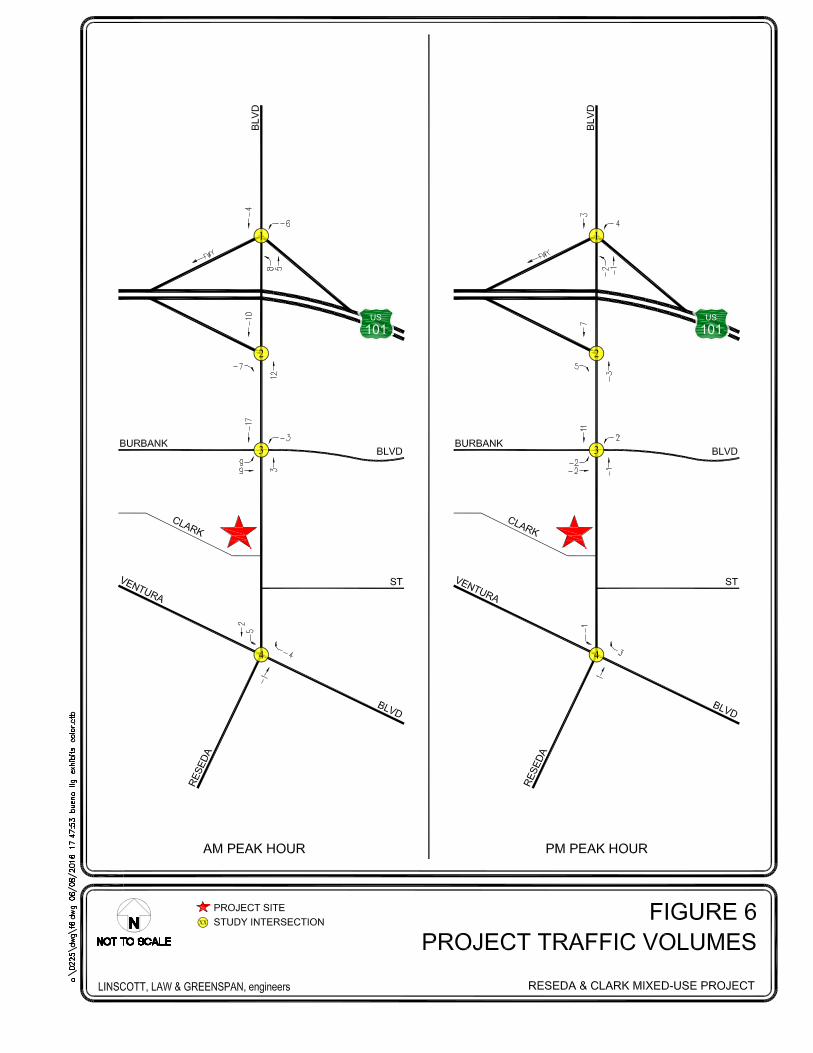
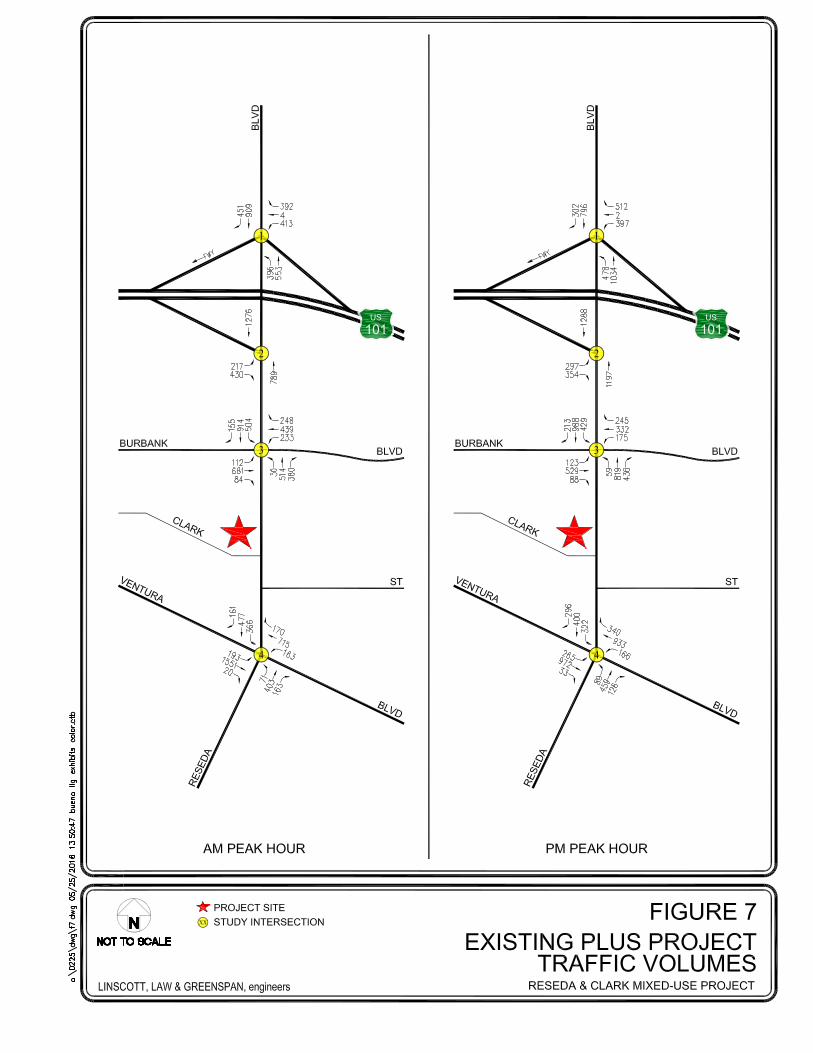
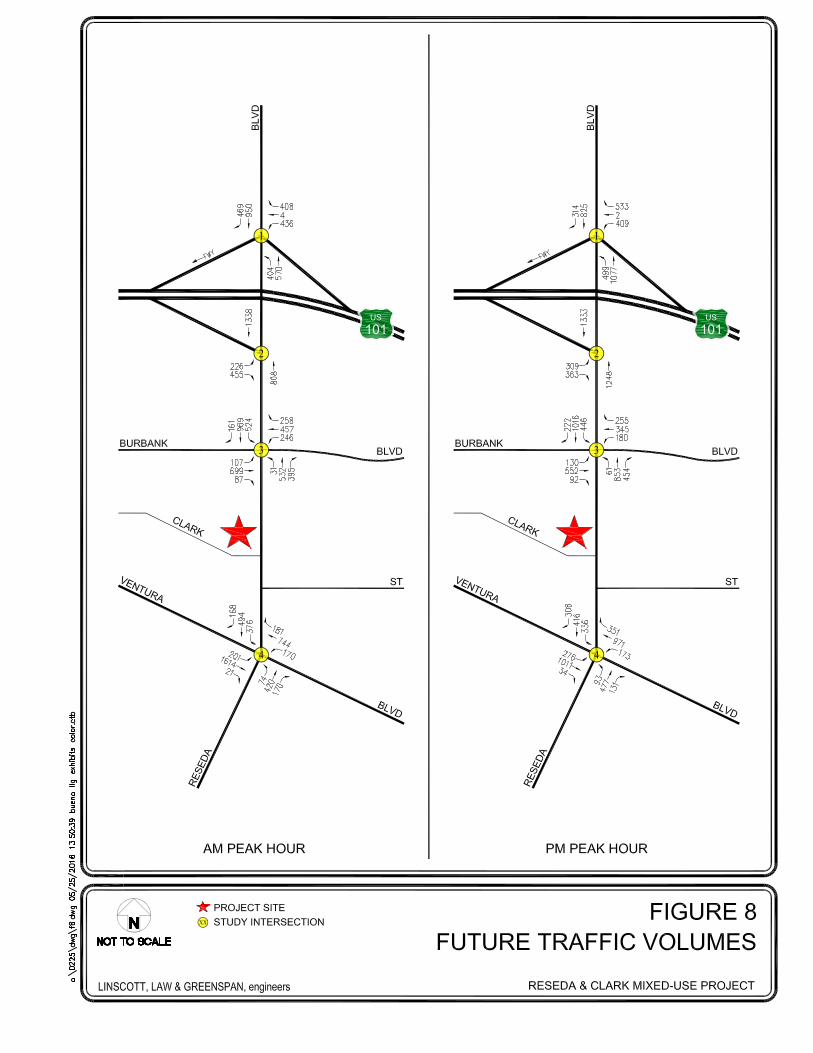

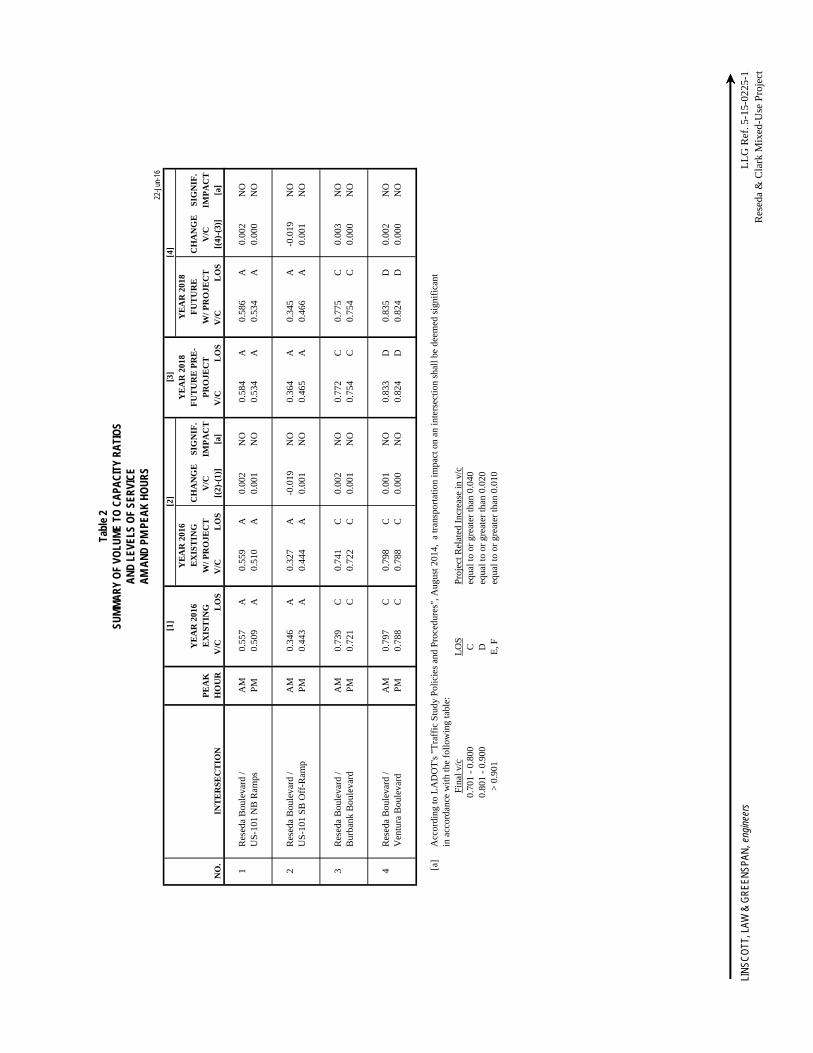
Tabl
e 2
SUM
MA
RY
OF
VOLU
ME
TO C
APA
CIT
Y R
ATI
OS
AN
D L
EVEL
S O
F SE
RVI
CE
AM
AN
D P
M P
EAK
HO
UR
S22
-Jun
-16
[1]
[2]
[3]
[4]
YE
AR
201
6Y
EA
R 2
018
YE
AR
201
8Y
EA
R 2
016
EX
IST
ING
CH
AN
GE
SIG
NIF
.F
UT
UR
E P
RE
-F
UT
UR
EC
HA
NG
ES
IGN
IF.
PE
AK
EX
IST
ING
W/ P
RO
JEC
TV
/CIM
PA
CT
PR
OJE
CT
W/ P
RO
JEC
TV
/CIM
PA
CT
NO
.IN
TE
RS
EC
TIO
NH
OU
RV
/CL
OS
V/C
LO
S[(
2)-(
1)]
[a]
V/C
LO
SV
/CL
OS
[(4)
-(3)
][a
]
1R
esed
a B
oule
vard
/A
M0.
557
A0.
559
A0.
002
NO
0.58
4A
0.58
6A
0.00
2N
OU
S-1
01 N
B R
amps
PM
0.50
9A
0.51
0A
0.00
1N
O0.
534
A0.
534
A0.
000
NO
2R
esed
a B
oule
vard
/A
M0.
346
A0.
327
A-0
.019
NO
0.36
4A
0.34
5A
-0.0
19N
OU
S-1
01 S
B O
ff-R
amp
PM
0.44
3A
0.44
4A
0.00
1N
O0.
465
A0.
466
A0.
001
NO
3R
esed
a B
oule
vard
/A
M0.
739
C0.
741
C0.
002
NO
0.77
2C
0.77
5C
0.00
3N
OB
urba
nk B
oule
vard
PM
0.72
1C
0.72
2C
0.00
1N
O0.
754
C0.
754
C0.
000
NO
4R
esed
a B
oule
vard
/A
M0.
797
C0.
798
C0.
001
NO
0.83
3D
0.83
5D
0.00
2N
OV
entu
ra B
oule
vard
PM
0.78
8C
0.78
8C
0.00
0N
O0.
824
D0.
824
D0.
000
NO
[a]
Acc
ordi
ng to
LA
DO
T's
"T
raff
ic S
tudy
Pol
icie
s an
d P
roce
dure
s", A
ugus
t 201
4, a
tran
spor
tati
on im
pact
on
an in
ters
ecti
on s
hall
be d
eem
ed s
igni
fica
nt
in a
ccor
danc
e w
ith
the
foll
owin
g ta
ble:
Fin
al v
/cL
OS
Pro
ject
Rel
ated
Inc
reas
e in
v/c
0.70
1 -
0.80
0C
equa
l to
or g
reat
er th
an 0
.040
0.80
1 -
0.90
0D
equa
l to
or g
reat
er th
an 0
.020
> 0
.901
E, F
equa
l to
or g
reat
er th
an 0
.010
LIN
SCO
TT, L
AW &
GR
EEN
SPAN
, eng
inee
rs L
LG
Ref
. 5-1
5-02
25-1
Res
eda
& C
lark
Mix
ed-U
se P
roje
ct
LINSCOTT, LAW & GREENSPAN, engineers LLG Ref. 5-15-0225-1 Reseda & Clark Mixed-Use Project
O:\0225\memo\0225-Appendix Covers.docx
APPENDIX A
MANUAL TRAFFIC COUNT DATA

ITM Peak Hour SummaryPrepared by:
National Data & Surveying Services
Lanes 0 4 0 City:
AM 451 913 0 AM
NOON 0 0 0 NOON
PM 302 793 0 PM
AM NOON PM AM NOON PM Lanes
392 0 512 1.3
4 0 2 0.3
0 0 0 0 419 0 393 1.3
0 0 0 0
0 0 0 0
Lanes AM NOON PM AM NOON PM
AM 388 548 0 AM
NOON 0 0 0 NOON
PM 480 1035 0 PM
2 2 0 Lanes
AM AM
NOON NOON
PM PM
AM NOON PM AM NOON PM
843 0 784 815 0 907
0 0 0 0 0 0
AM NOON PM AM NOON PM
AM AM
NOON NOON
PM PM
Date:
0 0
800 AM
Peak Hour Summary
Southbound Approach Project #:5/26/2016
US-101 NB Ramps
430 PM
843 0 784
Res
eda
Blv
dAM Peak Hour
Thursday
We
stb
ou
nd
Ap
pro
ac
h
TarzanaDay:
Ea
stb
ou
nd
Ap
pro
ac
h
Reseda Blvd and US-101 NB Ramps , Tarzana
PM Peak Hour
0
940
0
1547
Signalized
CONTROL
Count Periods
AM
Start
3:00 PM
16-5385-001
NOON Peak Hour
NOON
PM
7:00 AM
NONE
10:00 AM
NONE
2304
0
6:00 PM
940
0
Total Volume Per Leg
0
West Leg
907
End
Total Ins & Outs
North Leg
1332
0
1186
Northbound Approach
South Leg
East Leg
936
0 0
15471095
West Leg
South Leg
784843 0
East Leg
North Leg
2642
815
2268
0
27011515
1364
1186
1332
0

Intersection Turning MovementPrepared by:
National Data & Surveying Services
Day:
Date:
NL NT NR SL ST SR EL ET ER WL WT WR TOTAL NB SB EB WB
LANES: 2 2 0 0 4 0 0 0 0 1.3 0.3 1.3
7:00 AM 93 104 0 0 201 136 0 0 0 91 1 72 6987:15 AM 114 139 0 0 199 144 0 0 0 82 0 97 7757:30 AM 105 142 0 0 181 134 0 0 0 82 1 80 7257:45 AM 98 175 0 0 199 99 0 0 0 91 1 75 7388:00 AM 97 145 0 0 214 99 0 0 0 90 1 114 7608:15 AM 101 155 0 0 237 117 0 0 0 101 2 112 8258:30 AM 108 103 0 0 199 135 0 0 0 106 0 78 7298:45 AM 82 145 0 0 263 100 0 0 0 122 1 88 8019:00 AM 91 145 0 0 198 88 0 0 0 99 0 92 7139:15 AM 119 150 0 0 204 91 0 0 0 100 0 83 7479:30 AM 112 154 0 0 208 89 0 0 0 100 0 88 7519:45 AM 90 161 0 0 208 73 0 0 0 105 0 75 712
NL NT NR SL ST SR EL ET ER WL WT WR TOTAL NB SB EB WBTOTAL VOLUMES : 1210 1718 0 0 2511 1305 0 0 0 1169 7 1054 8974 0 0 0 0APPROACH %'s : 41.33% 58.67% 0.00% 0.00% 65.80% 34.20% #DIV/0! #DIV/0! #DIV/0! 52.42% 0.31% 47.26%
nb a nb d sb a sb d eb a eb d wb a nb dPEAK HR START TIME : 800 AM TOTAL
PEAK HR VOL : 388 548 0 0 913 451 0 0 0 419 4 392 3115
PEAK HR FACTOR : 0.944
CONTROL :
Reseda Blvd Reseda Blvd
AM
US-101 NB Ramps
Signalized
UTURNS
US-101 NB Ramps
0.948
WESTBOUND
0.939 0.0000.914
NS/EW Streets:
ThursdayProject ID:
City:
16-5385-001
Tarzana
EASTBOUND NORTHBOUND
5/26/2016
SOUTHBOUND
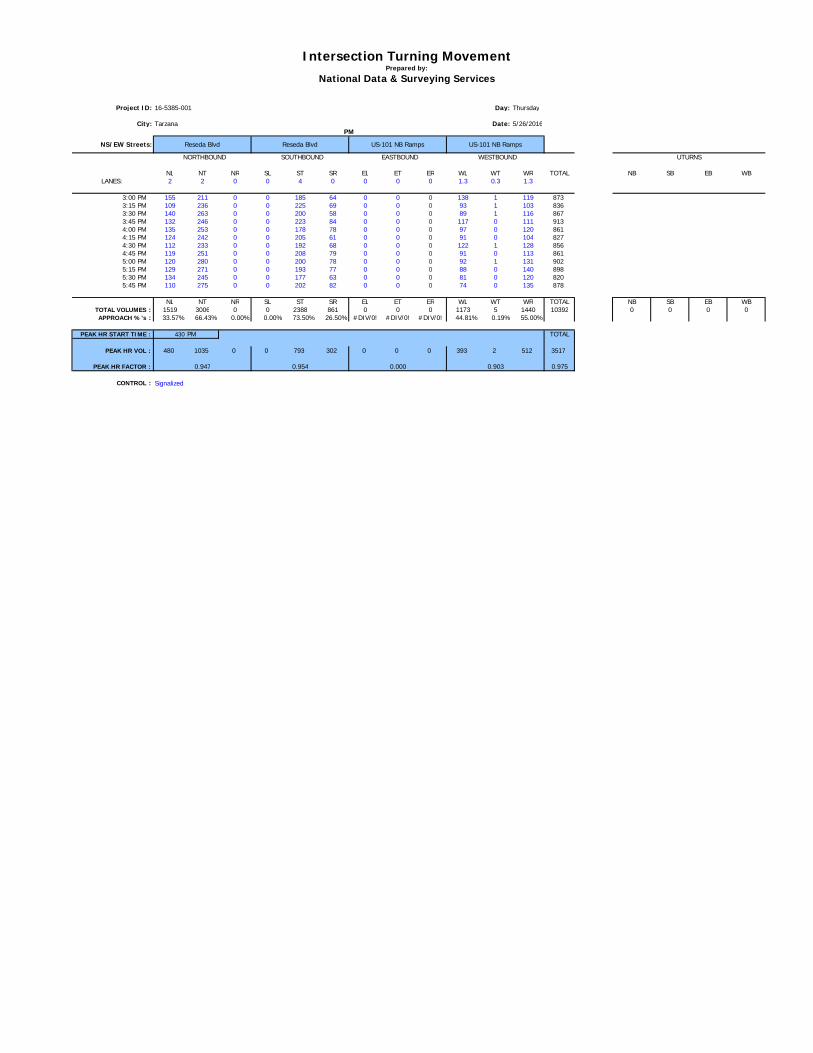
Intersection Turning MovementPrepared by:
National Data & Surveying Services
Day:
Date:
NL NT NR SL ST SR EL ET ER WL WT WR TOTAL NB SB EB WB
LANES: 2 2 0 0 4 0 0 0 0 1.3 0.3 1.3
3:00 PM 155 211 0 0 185 64 0 0 0 138 1 119 8733:15 PM 109 236 0 0 225 69 0 0 0 93 1 103 8363:30 PM 140 263 0 0 200 58 0 0 0 89 1 116 8673:45 PM 132 246 0 0 223 84 0 0 0 117 0 111 9134:00 PM 135 253 0 0 178 78 0 0 0 97 0 120 8614:15 PM 124 242 0 0 205 61 0 0 0 91 0 104 8274:30 PM 112 233 0 0 192 68 0 0 0 122 1 128 8564:45 PM 119 251 0 0 208 79 0 0 0 91 0 113 8615:00 PM 120 280 0 0 200 78 0 0 0 92 1 131 9025:15 PM 129 271 0 0 193 77 0 0 0 88 0 140 8985:30 PM 134 245 0 0 177 63 0 0 0 81 0 120 8205:45 PM 110 275 0 0 202 82 0 0 0 74 0 135 878
NL NT NR SL ST SR EL ET ER WL WT WR TOTAL NB SB EB WBTOTAL VOLUMES : 1519 3006 0 0 2388 861 0 0 0 1173 5 1440 10392 0 0 0 0APPROACH %'s : 33.57% 66.43% 0.00% 0.00% 73.50% 26.50% #DIV/0! #DIV/0! #DIV/0! 44.81% 0.19% 55.00%
nb a nb d sb a sb d eb a eb d wb a nb dPEAK HR START TIME : 430 PM TOTAL
PEAK HR VOL : 480 1035 0 0 793 302 0 0 0 393 2 512 3517
PEAK HR FACTOR : 0.975
CONTROL :
Project ID: 16-5385-001
City: Tarzana
UTURNS
5/26/2016
Thursday
Signalized
US-101 NB RampsNS/EW Streets: US-101 NB Ramps
PM
Reseda Blvd Reseda Blvd
0.0000.947 0.903
WESTBOUND NORTHBOUND SOUTHBOUND EASTBOUND
0.954

ITM Peak Hour SummaryPrepared by:
National Data & Surveying Services
Lanes 0 2 2 City:
AM 0 1286 0 AM
NOON 0 0 0 NOON
PM 0 1281 0 PM
AM NOON PM AM NOON PM Lanes
0 0 0 0
0 0 0 0
1.5 217 0 297 0 0 0 0
0 0 0 0
1.5 437 0 349
Lanes AM NOON PM AM NOON PM
AM 0 777 0 AM
NOON 0 0 0 NOON
PM 0 1200 0 PM
0 2 0 Lanes
AM AM
NOON NOON
PM PM
AM NOON PM AM NOON PM
0 0 0 0 0 0
654 0 646 0 0 0
AM NOON PM AM NOON PM
AM AM
NOON NOON
PM PM
Date:
0 0
845 AM
Peak Hour Summary
Southbound Approach Project #:5/26/2016
US-101 SB Off-Ramp
300 PM
0 0 0
Res
eda
Blv
dAM Peak Hour
Thursday
We
stb
ou
nd
Ap
pro
ac
h
TarzanaDay:
Ea
stb
ou
nd
Ap
pro
ac
h
Reseda Blvd and US-101 SB Off-Ramp , Tarzana
PM Peak Hour
0
994
0
1497
Signalized
CONTROL
Count Periods
AM
Start
3:00 PM
16-5385-002
NOON Peak Hour
NOON
PM
7:00 AM
NONE
10:00 AM
NONE
2280
0
6:00 PM
994
0
Total Volume Per Leg
0
West Leg
0
End
Total Ins & Outs
North Leg
1723
0
1630
Northbound Approach
South Leg
East Leg
777
0 0
14971281
West Leg
South Leg
646654 0
East Leg
North Leg
2778
0
2500
0
28301200
1286
1630
1723
0
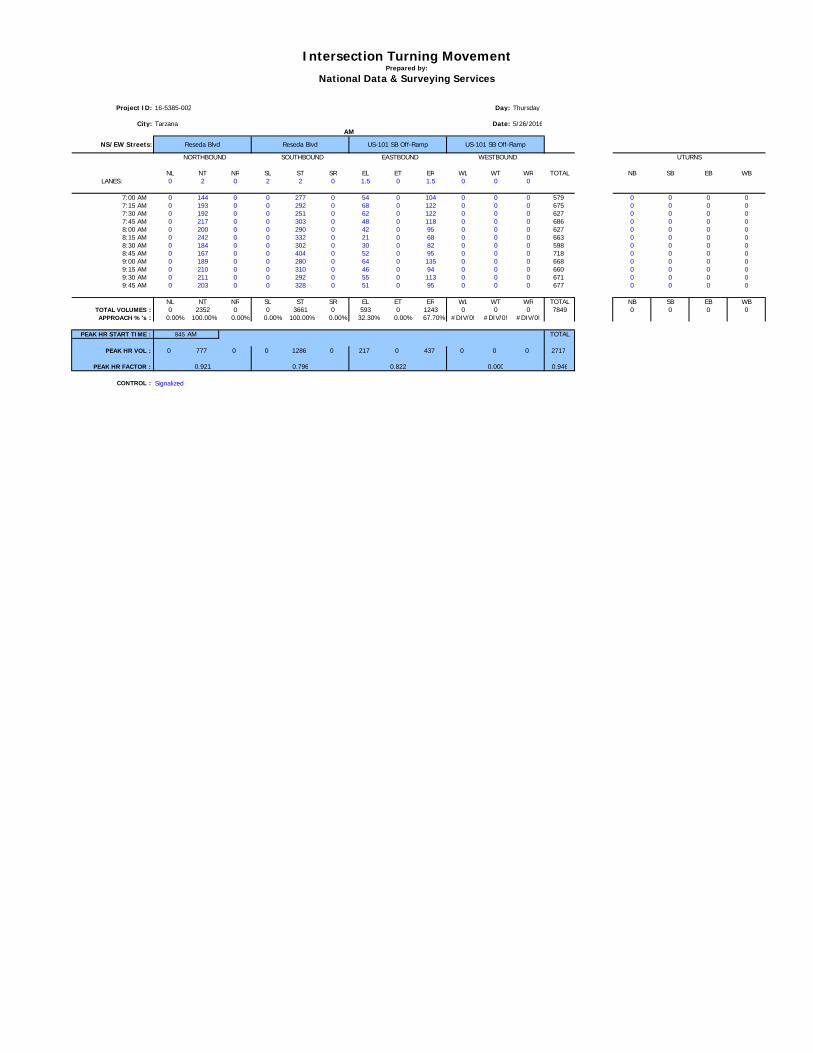
Intersection Turning MovementPrepared by:
National Data & Surveying Services
Day:
Date:
NL NT NR SL ST SR EL ET ER WL WT WR TOTAL NB SB EB WB
LANES: 0 2 0 2 2 0 1.5 0 1.5 0 0 0
7:00 AM 0 144 0 0 277 0 54 0 104 0 0 0 579 0 0 0 07:15 AM 0 193 0 0 292 0 68 0 122 0 0 0 675 0 0 0 07:30 AM 0 192 0 0 251 0 62 0 122 0 0 0 627 0 0 0 07:45 AM 0 217 0 0 303 0 48 0 118 0 0 0 686 0 0 0 08:00 AM 0 200 0 0 290 0 42 0 95 0 0 0 627 0 0 0 08:15 AM 0 242 0 0 332 0 21 0 68 0 0 0 663 0 0 0 08:30 AM 0 184 0 0 302 0 30 0 82 0 0 0 598 0 0 0 08:45 AM 0 167 0 0 404 0 52 0 95 0 0 0 718 0 0 0 09:00 AM 0 189 0 0 280 0 64 0 135 0 0 0 668 0 0 0 09:15 AM 0 210 0 0 310 0 46 0 94 0 0 0 660 0 0 0 09:30 AM 0 211 0 0 292 0 55 0 113 0 0 0 671 0 0 0 09:45 AM 0 203 0 0 328 0 51 0 95 0 0 0 677 0 0 0 0
NL NT NR SL ST SR EL ET ER WL WT WR TOTAL NB SB EB WBTOTAL VOLUMES : 0 2352 0 0 3661 0 593 0 1243 0 0 0 7849 0 0 0 0APPROACH %'s : 0.00% 100.00% 0.00% 0.00% 100.00% 0.00% 32.30% 0.00% 67.70% #DIV/0! #DIV/0! #DIV/0!
nb a nb d sb a sb d eb a eb d wb a nb dPEAK HR START TIME : 845 AM TOTAL
PEAK HR VOL : 0 777 0 0 1286 0 217 0 437 0 0 0 2717
PEAK HR FACTOR : 0.946
CONTROL :
Reseda Blvd Reseda Blvd
AM
US-101 SB Off-Ramp
Signalized
UTURNS
US-101 SB Off-Ramp
0.000
WESTBOUND
0.796 0.8220.921
NS/EW Streets:
ThursdayProject ID:
City:
16-5385-002
Tarzana
EASTBOUND NORTHBOUND
5/26/2016
SOUTHBOUND

Intersection Turning MovementPrepared by:
National Data & Surveying Services
Day:
Date:
NL NT NR SL ST SR EL ET ER WL WT WR TOTAL NB SB EB WB
LANES: 0 2 0 2 2 0 1.5 0 1.5 0 0 0
3:00 PM 0 294 0 0 323 0 83 0 82 0 0 0 782 0 0 0 03:15 PM 0 293 0 0 325 0 59 0 84 0 0 0 761 0 0 0 03:30 PM 0 310 0 0 283 0 89 0 105 0 0 0 787 0 0 0 03:45 PM 0 303 0 0 350 0 66 0 78 0 0 0 797 0 0 0 04:00 PM 0 314 0 0 258 0 86 0 86 0 0 0 744 0 0 0 04:15 PM 0 305 0 0 299 0 59 0 68 0 0 0 731 0 0 0 04:30 PM 0 263 0 0 301 0 79 0 98 0 0 0 741 0 0 0 04:45 PM 0 303 0 0 317 0 68 0 65 0 0 0 753 0 0 0 05:00 PM 0 311 0 0 283 0 88 0 86 0 0 0 768 0 0 0 05:15 PM 0 323 0 0 291 0 76 0 85 0 0 0 775 0 0 0 05:30 PM 0 290 0 0 244 0 90 0 80 0 0 0 704 0 0 0 05:45 PM 0 270 0 0 268 0 86 0 91 0 0 0 715 0 0 0 0
NL NT NR SL ST SR EL ET ER WL WT WR TOTAL NB SB EB WBTOTAL VOLUMES : 0 3579 0 0 3542 0 929 0 1008 0 0 0 9058 0 0 0 0APPROACH %'s : 0.00% 100.00% 0.00% 0.00% 100.00% 0.00% 47.96% 0.00% 52.04% #DIV/0! #DIV/0! #DIV/0!
nb a nb d sb a sb d eb a eb d wb a nb dPEAK HR START TIME : 300 PM TOTAL
PEAK HR VOL : 0 1200 0 0 1281 0 297 0 349 0 0 0 3127
PEAK HR FACTOR : 0.981
CONTROL :
Project ID: 16-5385-002
City: Tarzana
UTURNS
5/26/2016
Thursday
Signalized
US-101 SB Off-RampNS/EW Streets: US-101 SB Off-Ramp
PM
Reseda Blvd Reseda Blvd
0.8320.968 0.000
WESTBOUND NORTHBOUND SOUTHBOUND EASTBOUND
0.915
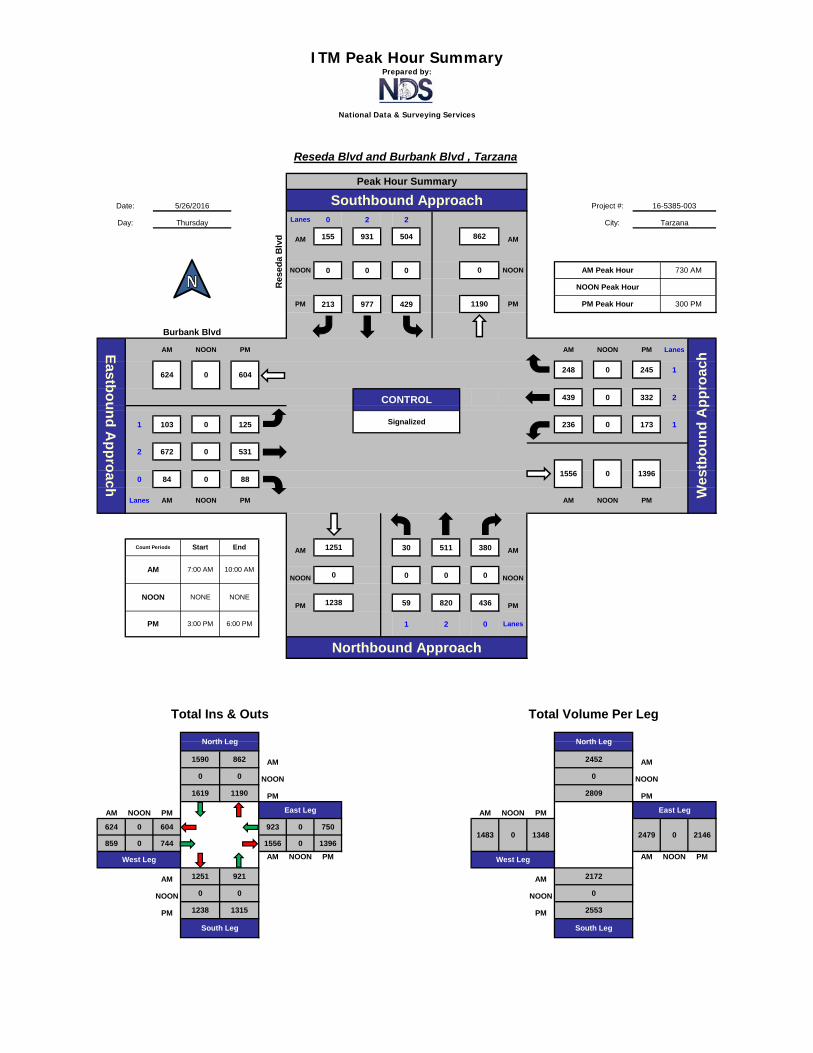
ITM Peak Hour SummaryPrepared by:
National Data & Surveying Services
Lanes 0 2 2 City:
AM 155 931 504 AM
NOON 0 0 0 NOON
PM 213 977 429 PM
AM NOON PM AM NOON PM Lanes
248 0 245 1
439 0 332 2
1 103 0 125 236 0 173 1
2 672 0 531
0 84 0 88
Lanes AM NOON PM AM NOON PM
AM 30 511 380 AM
NOON 0 0 0 NOON
PM 59 820 436 PM
1 2 0 Lanes
AM AM
NOON NOON
PM PM
AM NOON PM AM NOON PM
624 0 604 923 0 750
859 0 744 1556 0 1396
AM NOON PM AM NOON PM
AM AM
NOON NOON
PM PM
Date:
1556 0
730 AM
Peak Hour Summary
Southbound Approach Project #:5/26/2016
Burbank Blvd
300 PM
624 0 604
Res
eda
Blv
dAM Peak Hour
Thursday
We
stb
ou
nd
Ap
pro
ac
h
TarzanaDay:
Ea
stb
ou
nd
Ap
pro
ac
h
Reseda Blvd and Burbank Blvd , Tarzana
PM Peak Hour
1396
862
0
1190
Signalized
CONTROL
Count Periods
AM
Start
3:00 PM
16-5385-003
NOON Peak Hour
NOON
PM
7:00 AM
NONE
10:00 AM
NONE
2452
0
6:00 PM
862
0
Total Volume Per Leg
0
West Leg
2146
End
Total Ins & Outs
North Leg
1251
0
1238
Northbound Approach
South Leg
East Leg
921
0 0
11901619
West Leg
South Leg
13481483 0
East Leg
North Leg
2809
2479
2172
0
25531315
1590
1238
1251
0
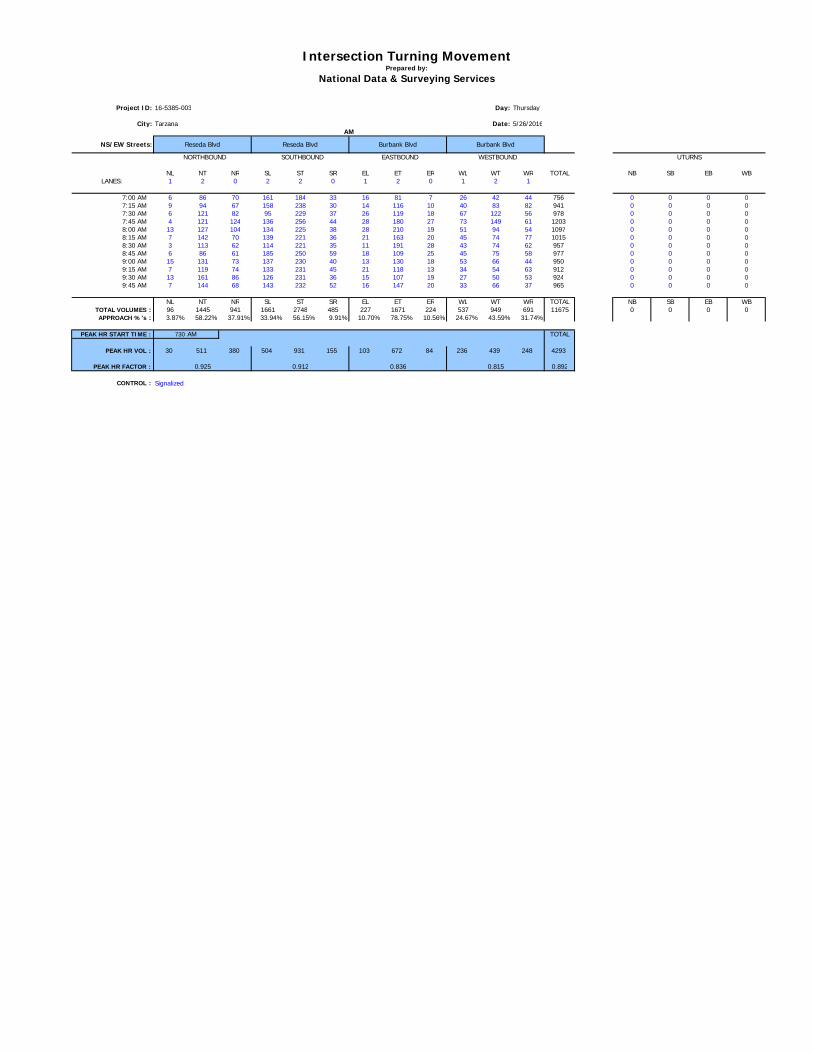
Intersection Turning MovementPrepared by:
National Data & Surveying Services
Day:
Date:
NL NT NR SL ST SR EL ET ER WL WT WR TOTAL NB SB EB WB
LANES: 1 2 0 2 2 0 1 2 0 1 2 1
7:00 AM 6 86 70 161 184 33 16 81 7 26 42 44 756 0 0 0 07:15 AM 9 94 67 158 238 30 14 116 10 40 83 82 941 0 0 0 07:30 AM 6 121 82 95 229 37 26 119 18 67 122 56 978 0 0 0 07:45 AM 4 121 124 136 256 44 28 180 27 73 149 61 1203 0 0 0 08:00 AM 13 127 104 134 225 38 28 210 19 51 94 54 1097 0 0 0 08:15 AM 7 142 70 139 221 36 21 163 20 45 74 77 1015 0 0 0 08:30 AM 3 113 62 114 221 35 11 191 28 43 74 62 957 0 0 0 08:45 AM 6 86 61 185 250 59 18 109 25 45 75 58 977 0 0 0 09:00 AM 15 131 73 137 230 40 13 130 18 53 66 44 950 0 0 0 09:15 AM 7 119 74 133 231 45 21 118 13 34 54 63 912 0 0 0 09:30 AM 13 161 86 126 231 36 15 107 19 27 50 53 924 0 0 0 09:45 AM 7 144 68 143 232 52 16 147 20 33 66 37 965 0 0 0 0
NL NT NR SL ST SR EL ET ER WL WT WR TOTAL NB SB EB WBTOTAL VOLUMES : 96 1445 941 1661 2748 485 227 1671 224 537 949 691 11675 0 0 0 0APPROACH %'s : 3.87% 58.22% 37.91% 33.94% 56.15% 9.91% 10.70% 78.75% 10.56% 24.67% 43.59% 31.74%
nb a nb d sb a sb d eb a eb d wb a nb dPEAK HR START TIME : 730 AM TOTAL
PEAK HR VOL : 30 511 380 504 931 155 103 672 84 236 439 248 4293
PEAK HR FACTOR : 0.892
CONTROL :
Reseda Blvd Reseda Blvd
AM
Burbank Blvd
Signalized
UTURNS
Burbank Blvd
0.815
WESTBOUND
0.912 0.8360.925
NS/EW Streets:
ThursdayProject ID:
City:
16-5385-003
Tarzana
EASTBOUND NORTHBOUND
5/26/2016
SOUTHBOUND
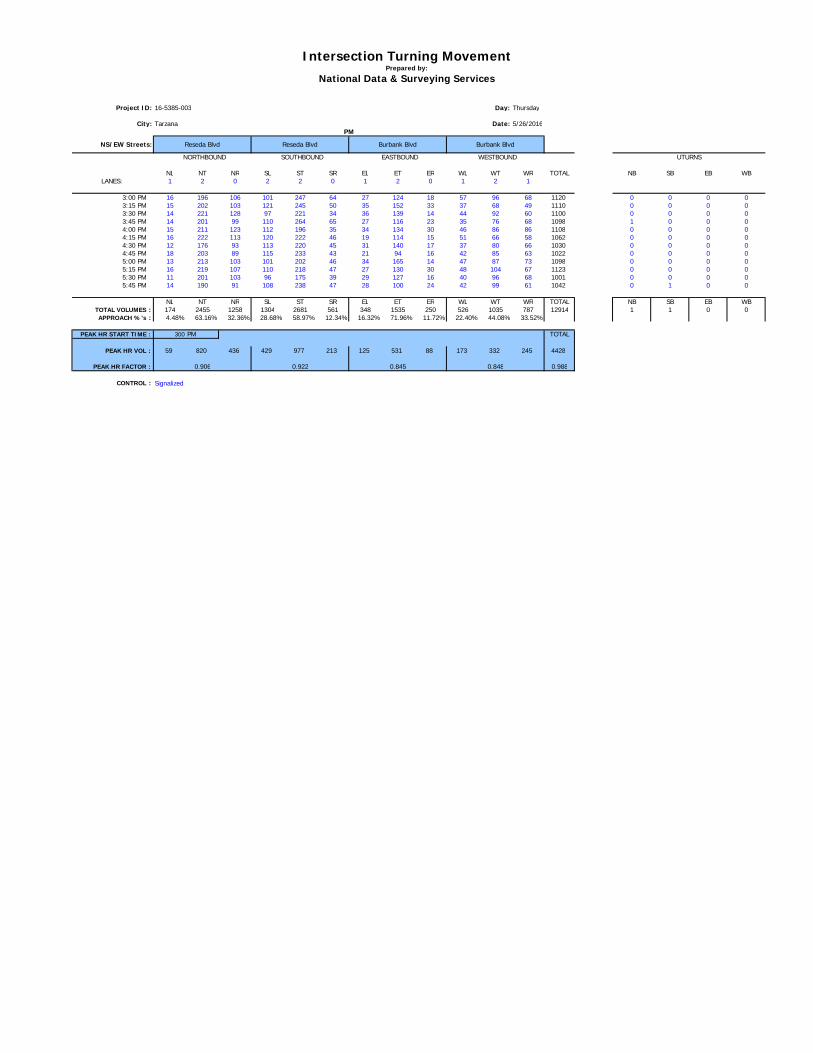
Intersection Turning MovementPrepared by:
National Data & Surveying Services
Day:
Date:
NL NT NR SL ST SR EL ET ER WL WT WR TOTAL NB SB EB WB
LANES: 1 2 0 2 2 0 1 2 0 1 2 1
3:00 PM 16 196 106 101 247 64 27 124 18 57 96 68 1120 0 0 0 03:15 PM 15 202 103 121 245 50 35 152 33 37 68 49 1110 0 0 0 03:30 PM 14 221 128 97 221 34 36 139 14 44 92 60 1100 0 0 0 03:45 PM 14 201 99 110 264 65 27 116 23 35 76 68 1098 1 0 0 04:00 PM 15 211 123 112 196 35 34 134 30 46 86 86 1108 0 0 0 04:15 PM 16 222 113 120 222 46 19 114 15 51 66 58 1062 0 0 0 04:30 PM 12 176 93 113 220 45 31 140 17 37 80 66 1030 0 0 0 04:45 PM 18 203 89 115 233 43 21 94 16 42 85 63 1022 0 0 0 05:00 PM 13 213 103 101 202 46 34 165 14 47 87 73 1098 0 0 0 05:15 PM 16 219 107 110 218 47 27 130 30 48 104 67 1123 0 0 0 05:30 PM 11 201 103 96 175 39 29 127 16 40 96 68 1001 0 0 0 05:45 PM 14 190 91 108 238 47 28 100 24 42 99 61 1042 0 1 0 0
NL NT NR SL ST SR EL ET ER WL WT WR TOTAL NB SB EB WBTOTAL VOLUMES : 174 2455 1258 1304 2681 561 348 1535 250 526 1035 787 12914 1 1 0 0APPROACH %'s : 4.48% 63.16% 32.36% 28.68% 58.97% 12.34% 16.32% 71.96% 11.72% 22.40% 44.08% 33.52%
nb a nb d sb a sb d eb a eb d wb a nb dPEAK HR START TIME : 300 PM TOTAL
PEAK HR VOL : 59 820 436 429 977 213 125 531 88 173 332 245 4428
PEAK HR FACTOR : 0.988
CONTROL :
Project ID: 16-5385-003
City: Tarzana
UTURNS
5/26/2016
Thursday
Signalized
Burbank BlvdNS/EW Streets: Burbank Blvd
PM
Reseda Blvd Reseda Blvd
0.8450.906 0.848
WESTBOUND NORTHBOUND SOUTHBOUND EASTBOUND
0.922
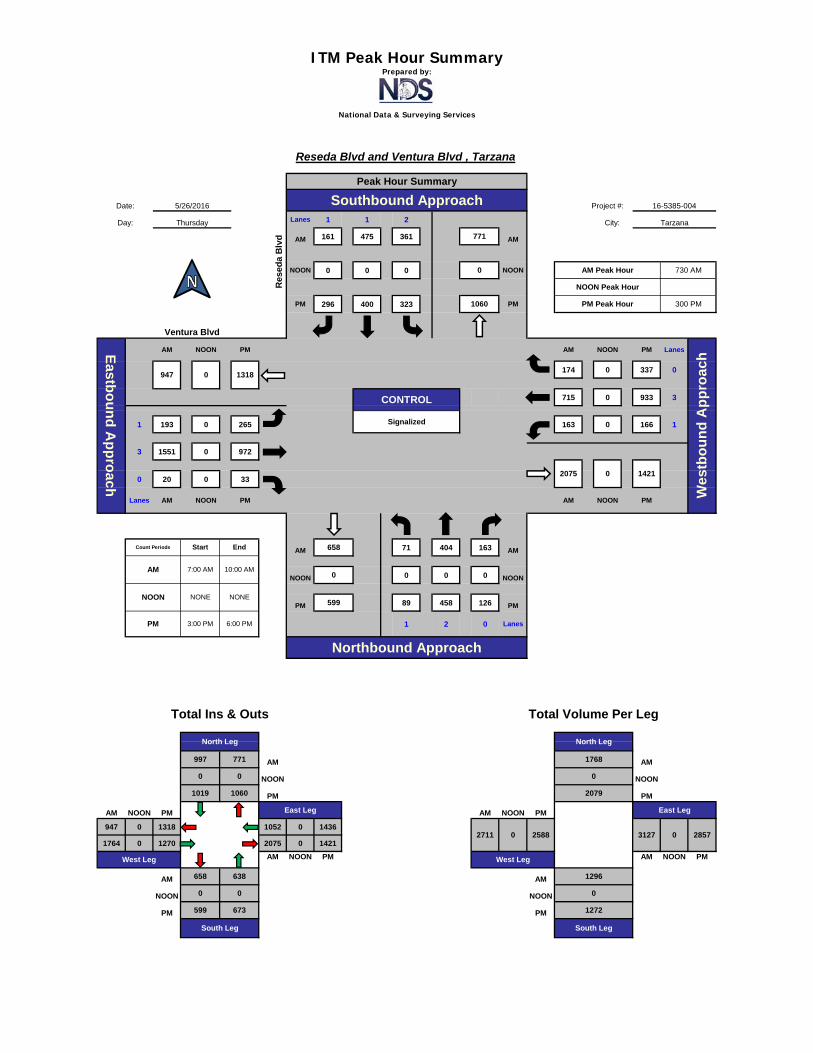
ITM Peak Hour SummaryPrepared by:
National Data & Surveying Services
Lanes 1 1 2 City:
AM 161 475 361 AM
NOON 0 0 0 NOON
PM 296 400 323 PM
AM NOON PM AM NOON PM Lanes
174 0 337 0
715 0 933 3
1 193 0 265 163 0 166 1
3 1551 0 972
0 20 0 33
Lanes AM NOON PM AM NOON PM
AM 71 404 163 AM
NOON 0 0 0 NOON
PM 89 458 126 PM
1 2 0 Lanes
AM AM
NOON NOON
PM PM
AM NOON PM AM NOON PM
947 0 1318 1052 0 1436
1764 0 1270 2075 0 1421
AM NOON PM AM NOON PM
AM AM
NOON NOON
PM PM
Date:
2075 0
730 AM
Peak Hour Summary
Southbound Approach Project #:5/26/2016
Ventura Blvd
300 PM
947 0 1318
Res
eda
Blv
dAM Peak Hour
Thursday
We
stb
ou
nd
Ap
pro
ac
h
TarzanaDay:
Ea
stb
ou
nd
Ap
pro
ac
h
Reseda Blvd and Ventura Blvd , Tarzana
PM Peak Hour
1421
771
0
1060
Signalized
CONTROL
Count Periods
AM
Start
3:00 PM
16-5385-004
NOON Peak Hour
NOON
PM
7:00 AM
NONE
10:00 AM
NONE
1768
0
6:00 PM
771
0
Total Volume Per Leg
0
West Leg
2857
End
Total Ins & Outs
North Leg
658
0
599
Northbound Approach
South Leg
East Leg
638
0 0
10601019
West Leg
South Leg
25882711 0
East Leg
North Leg
2079
3127
1296
0
1272673
997
599
658
0
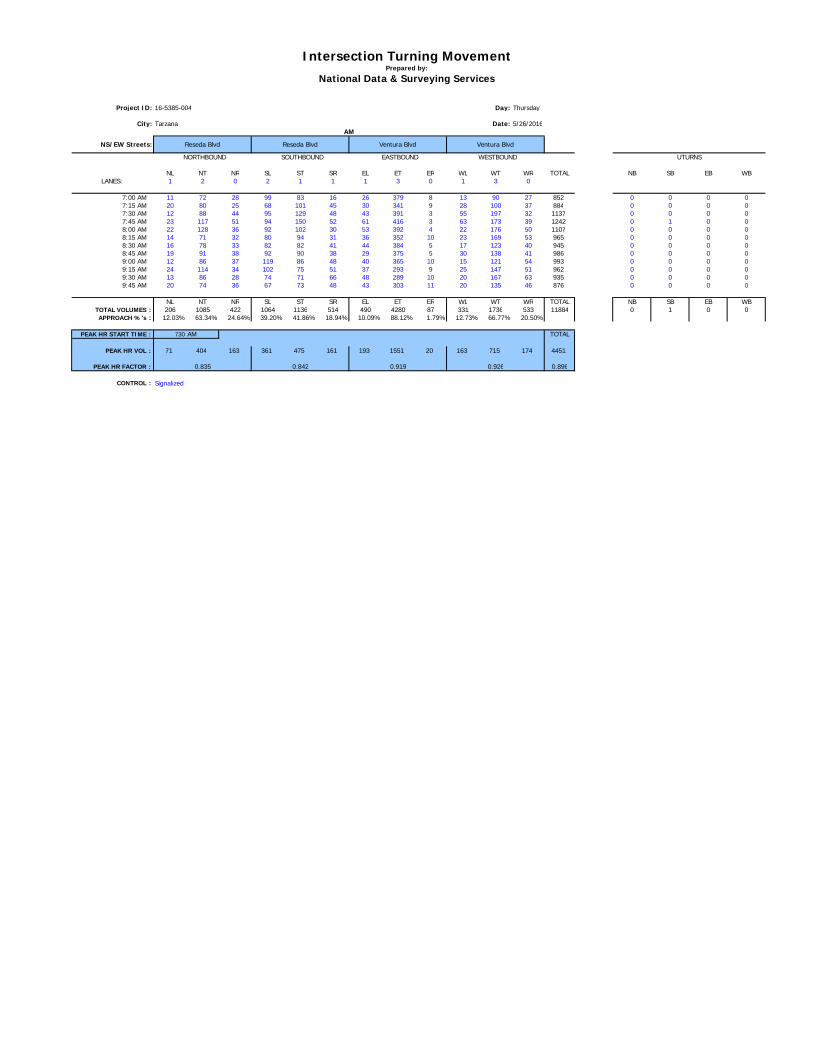
Intersection Turning MovementPrepared by:
National Data & Surveying Services
Day:
Date:
NL NT NR SL ST SR EL ET ER WL WT WR TOTAL NB SB EB WB
LANES: 1 2 0 2 1 1 1 3 0 1 3 0
7:00 AM 11 72 28 99 83 16 26 379 8 13 90 27 852 0 0 0 07:15 AM 20 80 25 68 101 45 30 341 9 28 100 37 884 0 0 0 07:30 AM 12 88 44 95 129 48 43 391 3 55 197 32 1137 0 0 0 07:45 AM 23 117 51 94 150 52 61 416 3 63 173 39 1242 0 1 0 08:00 AM 22 128 36 92 102 30 53 392 4 22 176 50 1107 0 0 0 08:15 AM 14 71 32 80 94 31 36 352 10 23 169 53 965 0 0 0 08:30 AM 16 78 33 82 82 41 44 384 5 17 123 40 945 0 0 0 08:45 AM 19 91 38 92 90 38 29 375 5 30 138 41 986 0 0 0 09:00 AM 12 86 37 119 86 48 40 365 10 15 121 54 993 0 0 0 09:15 AM 24 114 34 102 75 51 37 293 9 25 147 51 962 0 0 0 09:30 AM 13 86 28 74 71 66 48 289 10 20 167 63 935 0 0 0 09:45 AM 20 74 36 67 73 48 43 303 11 20 135 46 876 0 0 0 0
NL NT NR SL ST SR EL ET ER WL WT WR TOTAL NB SB EB WBTOTAL VOLUMES : 206 1085 422 1064 1136 514 490 4280 87 331 1736 533 11884 0 1 0 0APPROACH %'s : 12.03% 63.34% 24.64% 39.20% 41.86% 18.94% 10.09% 88.12% 1.79% 12.73% 66.77% 20.50%
nb a nb d sb a sb d eb a eb d wb a nb dPEAK HR START TIME : 730 AM TOTAL
PEAK HR VOL : 71 404 163 361 475 161 193 1551 20 163 715 174 4451
PEAK HR FACTOR : 0.896
CONTROL :
Reseda Blvd Reseda Blvd
AM
Ventura Blvd
Signalized
UTURNS
Ventura Blvd
0.926
WESTBOUND
0.842 0.9190.835
NS/EW Streets:
ThursdayProject ID:
City:
16-5385-004
Tarzana
EASTBOUND NORTHBOUND
5/26/2016
SOUTHBOUND
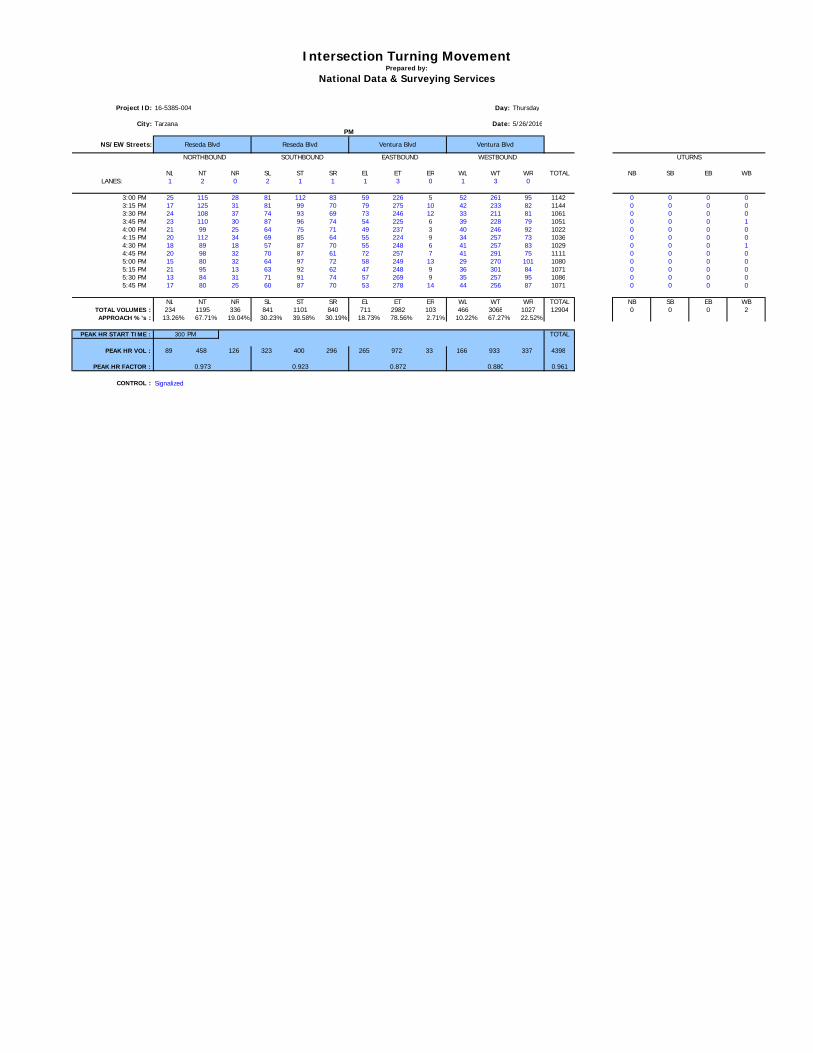
Intersection Turning MovementPrepared by:
National Data & Surveying Services
Day:
Date:
NL NT NR SL ST SR EL ET ER WL WT WR TOTAL NB SB EB WB
LANES: 1 2 0 2 1 1 1 3 0 1 3 0
3:00 PM 25 115 28 81 112 83 59 226 5 52 261 95 1142 0 0 0 03:15 PM 17 125 31 81 99 70 79 275 10 42 233 82 1144 0 0 0 03:30 PM 24 108 37 74 93 69 73 246 12 33 211 81 1061 0 0 0 03:45 PM 23 110 30 87 96 74 54 225 6 39 228 79 1051 0 0 0 14:00 PM 21 99 25 64 75 71 49 237 3 40 246 92 1022 0 0 0 04:15 PM 20 112 34 69 85 64 55 224 9 34 257 73 1036 0 0 0 04:30 PM 18 89 18 57 87 70 55 248 6 41 257 83 1029 0 0 0 14:45 PM 20 98 32 70 87 61 72 257 7 41 291 75 1111 0 0 0 05:00 PM 15 80 32 64 97 72 58 249 13 29 270 101 1080 0 0 0 05:15 PM 21 95 13 63 92 62 47 248 9 36 301 84 1071 0 0 0 05:30 PM 13 84 31 71 91 74 57 269 9 35 257 95 1086 0 0 0 05:45 PM 17 80 25 60 87 70 53 278 14 44 256 87 1071 0 0 0 0
NL NT NR SL ST SR EL ET ER WL WT WR TOTAL NB SB EB WBTOTAL VOLUMES : 234 1195 336 841 1101 840 711 2982 103 466 3068 1027 12904 0 0 0 2APPROACH %'s : 13.26% 67.71% 19.04% 30.23% 39.58% 30.19% 18.73% 78.56% 2.71% 10.22% 67.27% 22.52%
nb a nb d sb a sb d eb a eb d wb a nb dPEAK HR START TIME : 300 PM TOTAL
PEAK HR VOL : 89 458 126 323 400 296 265 972 33 166 933 337 4398
PEAK HR FACTOR : 0.961
CONTROL :
Project ID: 16-5385-004
City: Tarzana
UTURNS
5/26/2016
Thursday
Signalized
Ventura BlvdNS/EW Streets: Ventura Blvd
PM
Reseda Blvd Reseda Blvd
0.8720.973 0.880
WESTBOUND NORTHBOUND SOUTHBOUND EASTBOUND
0.923
LINSCOTT, LAW & GREENSPAN, engineers LLG Ref. 5-15-0225-1 Reseda & Clark Mixed-Use Project
O:\0225\memo\0225-Appendix Covers.docx
APPENDIX B
CMA AND LEVELS OF SERVICE EXPLANATION CMA DATA WORKSHEETS – WEEKDAY AM AND PM PEAK HOURS
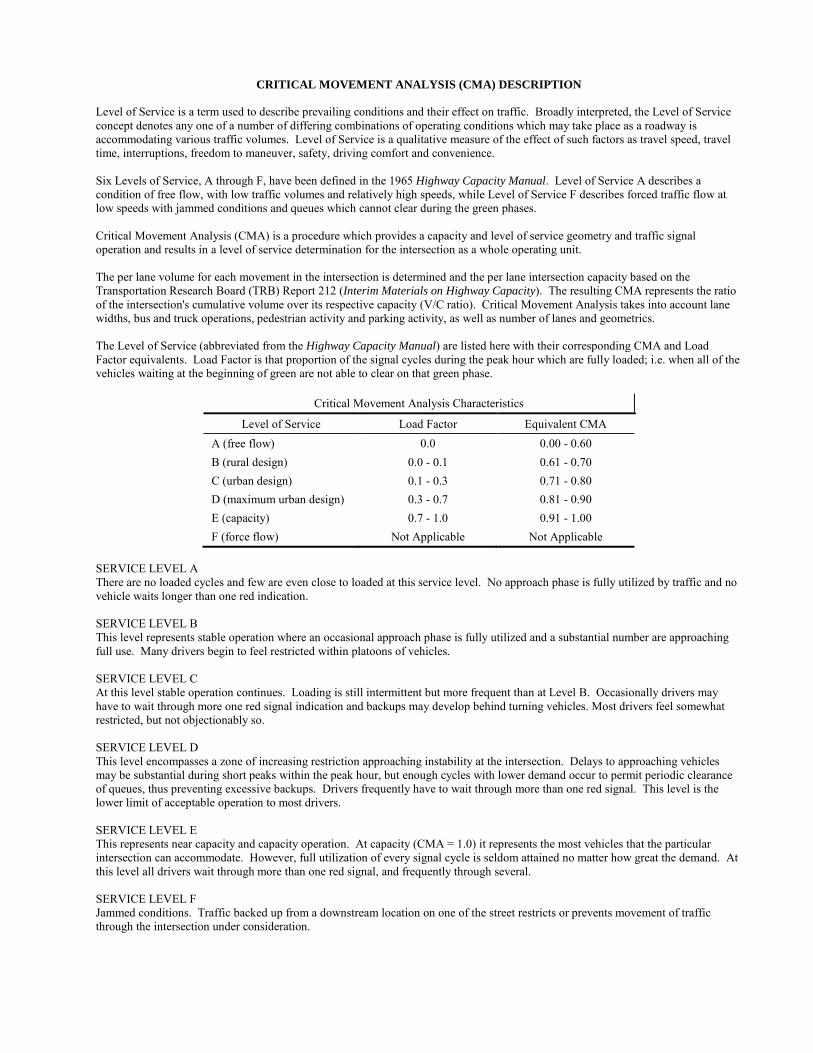
CRITICAL MOVEMENT ANALYSIS (CMA) DESCRIPTION Level of Service is a term used to describe prevailing conditions and their effect on traffic. Broadly interpreted, the Level of Service concept denotes any one of a number of differing combinations of operating conditions which may take place as a roadway is accommodating various traffic volumes. Level of Service is a qualitative measure of the effect of such factors as travel speed, travel time, interruptions, freedom to maneuver, safety, driving comfort and convenience. Six Levels of Service, A through F, have been defined in the 1965 Highway Capacity Manual. Level of Service A describes a condition of free flow, with low traffic volumes and relatively high speeds, while Level of Service F describes forced traffic flow at low speeds with jammed conditions and queues which cannot clear during the green phases. Critical Movement Analysis (CMA) is a procedure which provides a capacity and level of service geometry and traffic signal operation and results in a level of service determination for the intersection as a whole operating unit. The per lane volume for each movement in the intersection is determined and the per lane intersection capacity based on the Transportation Research Board (TRB) Report 212 (Interim Materials on Highway Capacity). The resulting CMA represents the ratio of the intersection's cumulative volume over its respective capacity (V/C ratio). Critical Movement Analysis takes into account lane widths, bus and truck operations, pedestrian activity and parking activity, as well as number of lanes and geometrics. The Level of Service (abbreviated from the Highway Capacity Manual) are listed here with their corresponding CMA and Load Factor equivalents. Load Factor is that proportion of the signal cycles during the peak hour which are fully loaded; i.e. when all of the vehicles waiting at the beginning of green are not able to clear on that green phase.
Critical Movement Analysis Characteristics
Level of Service Load Factor Equivalent CMA A (free flow) 0.0 0.00 - 0.60 B (rural design) 0.0 - 0.1 0.61 - 0.70 C (urban design) 0.1 - 0.3 0.71 - 0.80 D (maximum urban design) 0.3 - 0.7 0.81 - 0.90 E (capacity) 0.7 - 1.0 0.91 - 1.00 F (force flow) Not Applicable Not Applicable
SERVICE LEVEL A There are no loaded cycles and few are even close to loaded at this service level. No approach phase is fully utilized by traffic and no vehicle waits longer than one red indication. SERVICE LEVEL B This level represents stable operation where an occasional approach phase is fully utilized and a substantial number are approaching full use. Many drivers begin to feel restricted within platoons of vehicles. SERVICE LEVEL C At this level stable operation continues. Loading is still intermittent but more frequent than at Level B. Occasionally drivers may have to wait through more one red signal indication and backups may develop behind turning vehicles. Most drivers feel somewhat restricted, but not objectionably so. SERVICE LEVEL D This level encompasses a zone of increasing restriction approaching instability at the intersection. Delays to approaching vehicles may be substantial during short peaks within the peak hour, but enough cycles with lower demand occur to permit periodic clearance of queues, thus preventing excessive backups. Drivers frequently have to wait through more than one red signal. This level is the lower limit of acceptable operation to most drivers. SERVICE LEVEL E This represents near capacity and capacity operation. At capacity (CMA = 1.0) it represents the most vehicles that the particular intersection can accommodate. However, full utilization of every signal cycle is seldom attained no matter how great the demand. At this level all drivers wait through more than one red signal, and frequently through several. SERVICE LEVEL F Jammed conditions. Traffic backed up from a downstream location on one of the street restricts or prevents movement of traffic through the intersection under consideration.
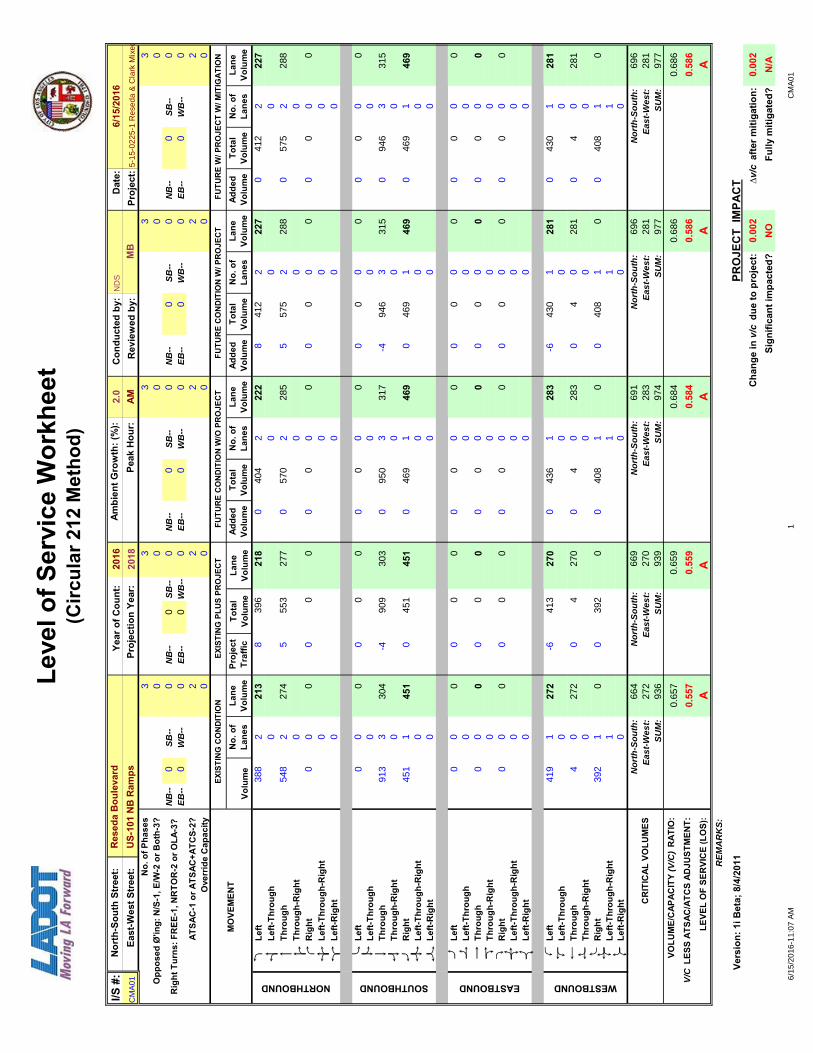
Leve
l of S
ervi
ce W
orkh
eet
(Circ
ular
212
Met
hod)
I/S #
:N
orth
-Sou
th S
tree
t: Ye
ar o
f Cou
nt:
2016
2.0
Dat
e:C
MA
01
East
-Wes
t Str
eet:
Proj
ectio
n Ye
ar:
2018
AMPr
ojec
t: N
o. o
f Pha
ses
33
33
3 O
ppos
ed Ø
'ing:
N/S
-1, E
/W-2
or B
oth-
3?0
00
00
NB
--0
SB
--0
NB
--0
0N
B--
0S
B--
0N
B--
0S
B--
0N
B--
0S
B--
0E
B--
0W
B--
0E
B--
00
EB
--0
WB
--0
EB
--0
WB
--0
EB
--0
WB
--0
ATSA
C-1
or A
TSAC
+ATC
S-2?
22
22
2 O
verr
ide
Cap
acity
00
00
0
No.
of
Lane
sLa
ne
Volu
me
Proj
ect
Traf
ficAd
ded
Volu
me
Tota
l Vo
lum
eN
o. o
f La
nes
Lane
Vo
lum
eAd
ded
Volu
me
Tota
l Vo
lum
eN
o. o
f La
nes
Lane
Vo
lum
eAd
ded
Volu
me
Tota
l Vo
lum
eN
o. o
f La
nes
Lane
Vo
lum
e L
eft
22
22
Lef
t-Thr
ough
00
00
Thr
ough
22
22
Thr
ough
-Rig
ht0
00
0 R
ight
00
00
Lef
t-Thr
ough
-Rig
ht0
00
0 L
eft-R
ight
00
00
L
eft
00
00
Lef
t-Thr
ough
00
00
Thr
ough
33
33
Thr
ough
-Rig
ht0
00
0 R
ight
11
11
Lef
t-Thr
ough
-Rig
ht0
00
0 L
eft-R
ight
00
00
L
eft
00
00
Lef
t-Thr
ough
00
00
Thr
ough
00
00
Thr
ough
-Rig
ht0
00
0 R
ight
00
00
Lef
t-Thr
ough
-Rig
ht0
00
0 L
eft-R
ight
00
00
L
eft
11
11
Lef
t-Thr
ough
00
00
Thr
ough
00
00
Thr
ough
-Rig
ht0
00
0 R
ight
11
11
Lef
t-Thr
ough
-Rig
ht1
11
1 L
eft-R
ight
00
00
664
No
rth
-So
uth
:69
169
669
627
2E
as
t-W
es
t:28
328
128
1S
UM
:93
6S
UM
:S
UM
:97
4S
UM
:97
7S
UM
:97
7
0.65
70.
684
0.68
60.
686
0.55
70.
584
0.58
60.
586
AA
AA
Vers
ion:
1i B
eta;
8/4
/201
10.
002
0.00
2N
ON
/A
PRO
JEC
T IM
PAC
TC
hang
e in
v/c
due
to p
roje
ct:
∆v/c
afte
r miti
gatio
n:Si
gnifi
cant
impa
cted
?Fu
lly m
itiga
ted?
RE
MA
RK
S:
V/C
LES
S AT
SAC
/ATC
S AD
JUST
MEN
T:0.
559
LEVE
L O
F SE
RVI
CE
(LO
S):
A
No
rth
-So
uth
:E
as
t-W
es
t:27
0E
as
t-W
es
t:E
as
t-W
es
t:E
as
t-W
es
t:C
RIT
ICAL
VO
LUM
ESN
ort
h-S
ou
th:
669
No
rth
-So
uth
:N
ort
h-S
ou
th:
WESTBOUND
939
VOLU
ME/
CAP
ACIT
Y (V
/C)
RAT
IO:
0.65
9
428
10
4
408
00
408
043
0
039
20
039
20
040
80
0
281
427
20
427
00
4
043
628
3-6
430
281
419
272
-641
327
0
281
283
0
000
00
00
00
00
0
00
00
000
0
00
00
00
0
00
00
00
EASTBOUND
00
00
0
469
469
0
SOUTHBOUND
0
00
00
469
469
315
451
451
045
145
10
469
469
0
317
-494
631
50
9460
0
913
304
-490
930
30
950
00
00
00
00
00
0
00
0
288
00
00
00
00
0
285
557
528
80
575
NORTHBOUND
388
213
839
621
80
412
227
548
274
555
327
70
570
040
422
28
412
227
00
MO
VEM
ENT
EXIS
TIN
G C
ON
DIT
ION
EXIS
TIN
G P
LUS
PRO
JEC
TFU
TUR
E C
ON
DIT
ION
W/O
PR
OJE
CT
FUTU
RE
CO
ND
ITIO
N W
/ PR
OJE
CT
FUTU
RE
W/ P
RO
JEC
T W
/ MIT
IGA
TIO
N
Volu
me
Tota
l Vo
lum
eLa
ne
Volu
me
Rig
ht T
urns
: FR
EE-1
, NR
TOR
-2 o
r OLA
-3?
SB
--W
B--
Res
eda
Bou
leva
rdAm
bien
t Gro
wth
: (%
): C
ondu
cted
by:
ND
S6/
15/2
016
US-
101
NB
Ram
psPe
ak H
our:
R
evie
wed
by:
M
B5
-15
-02
25
-1 R
ese
da
& C
lark
Mix
ed
6/1
5/2
01
6-1
1:0
7 A
M1
CM
A0
1
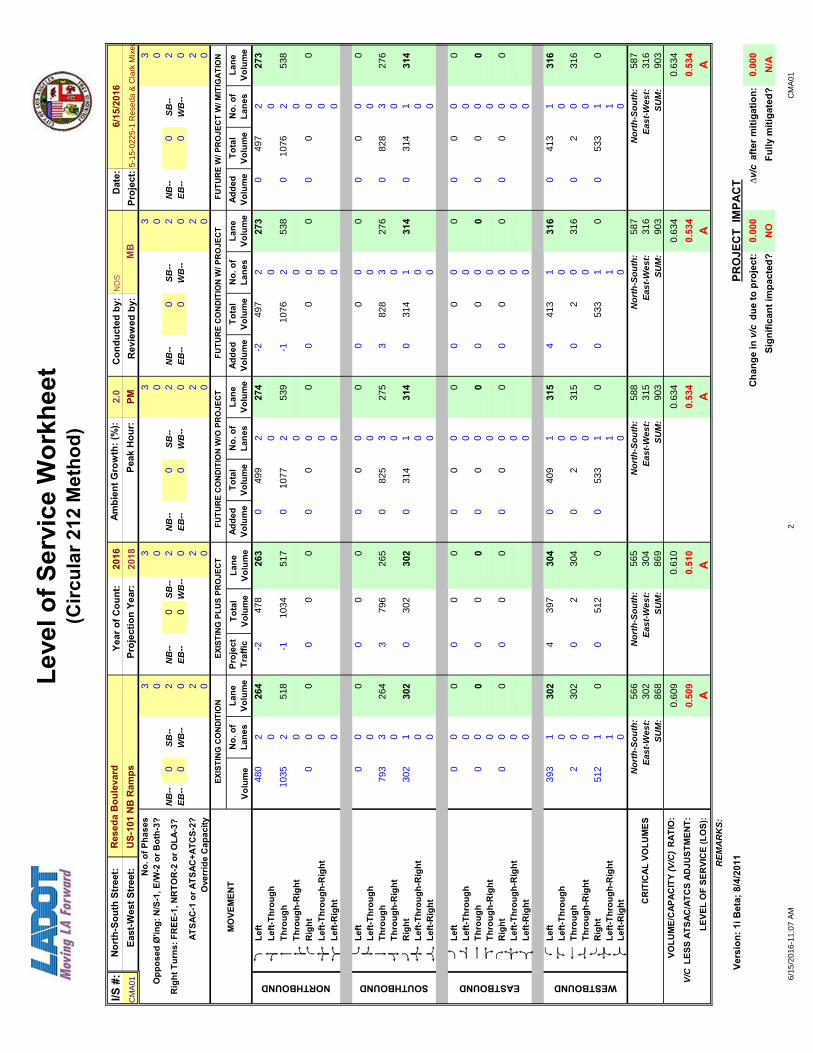
Leve
l of S
ervi
ce W
orkh
eet
(Circ
ular
212
Met
hod)
I/S #
:N
orth
-Sou
th S
tree
t: Ye
ar o
f Cou
nt:
2016
2.0
Dat
e:C
MA
01
East
-Wes
t Str
eet:
Proj
ectio
n Ye
ar:
2018
PMPr
ojec
t: N
o. o
f Pha
ses
33
33
3 O
ppos
ed Ø
'ing:
N/S
-1, E
/W-2
or B
oth-
3?0
00
00
NB
--0
SB
--2
NB
--0
2N
B--
0S
B--
2N
B--
0S
B--
2N
B--
0S
B--
2E
B--
0W
B--
0E
B--
00
EB
--0
WB
--0
EB
--0
WB
--0
EB
--0
WB
--0
ATSA
C-1
or A
TSAC
+ATC
S-2?
22
22
2 O
verr
ide
Cap
acity
00
00
0
No.
of
Lane
sLa
ne
Volu
me
Proj
ect
Traf
ficAd
ded
Volu
me
Tota
l Vo
lum
eN
o. o
f La
nes
Lane
Vo
lum
eAd
ded
Volu
me
Tota
l Vo
lum
eN
o. o
f La
nes
Lane
Vo
lum
eAd
ded
Volu
me
Tota
l Vo
lum
eN
o. o
f La
nes
Lane
Vo
lum
e L
eft
22
22
Lef
t-Thr
ough
00
00
Thr
ough
22
22
Thr
ough
-Rig
ht0
00
0 R
ight
00
00
Lef
t-Thr
ough
-Rig
ht0
00
0 L
eft-R
ight
00
00
L
eft
00
00
Lef
t-Thr
ough
00
00
Thr
ough
33
33
Thr
ough
-Rig
ht0
00
0 R
ight
11
11
Lef
t-Thr
ough
-Rig
ht0
00
0 L
eft-R
ight
00
00
L
eft
00
00
Lef
t-Thr
ough
00
00
Thr
ough
00
00
Thr
ough
-Rig
ht0
00
0 R
ight
00
00
Lef
t-Thr
ough
-Rig
ht0
00
0 L
eft-R
ight
00
00
L
eft
11
11
Lef
t-Thr
ough
00
00
Thr
ough
00
00
Thr
ough
-Rig
ht0
00
0 R
ight
11
11
Lef
t-Thr
ough
-Rig
ht1
11
1 L
eft-R
ight
00
00
566
No
rth
-So
uth
:58
858
758
730
2E
as
t-W
es
t:31
531
631
6S
UM
:86
8S
UM
:S
UM
:90
3S
UM
:90
3S
UM
:90
3
0.60
90.
634
0.63
40.
634
0.50
90.
534
0.53
40.
534
AA
AA
Vers
ion:
1i B
eta;
8/4
/201
10.
000
0.00
0N
ON
/A
PRO
JEC
T IM
PAC
TC
hang
e in
v/c
due
to p
roje
ct:
∆v/c
afte
r miti
gatio
n:Si
gnifi
cant
impa
cted
?Fu
lly m
itiga
ted?
RE
MA
RK
S:
V/C
LES
S AT
SAC
/ATC
S AD
JUST
MEN
T:0.
510
LEVE
L O
F SE
RVI
CE
(LO
S):
A
No
rth
-So
uth
:E
as
t-W
es
t:30
4E
as
t-W
es
t:E
as
t-W
es
t:E
as
t-W
es
t:C
RIT
ICAL
VO
LUM
ESN
ort
h-S
ou
th:
565
No
rth
-So
uth
:N
ort
h-S
ou
th:
WESTBOUND
869
VOLU
ME/
CAP
ACIT
Y (V
/C)
RAT
IO:
0.61
0
231
60
2
533
00
533
041
3
051
20
051
20
053
30
0
316
230
20
230
40
2
040
931
54
413
316
393
302
439
730
4
316
315
0
000
00
00
00
00
0
00
00
000
0
00
00
00
0
00
00
00
EASTBOUND
00
00
0
314
314
0
SOUTHBOUND
0
00
00
314
314
276
302
302
030
230
20
314
314
0
275
382
827
60
8280
0
793
264
379
626
50
825
00
00
00
00
00
0
00
0
538
00
00
00
00
0
539
-110
7653
80
1076
NORTHBOUND
480
264
-247
826
30
497
273
1035
518
-110
3451
70
1077
049
927
4-2
497
273
00
MO
VEM
ENT
EXIS
TIN
G C
ON
DIT
ION
EXIS
TIN
G P
LUS
PRO
JEC
TFU
TUR
E C
ON
DIT
ION
W/O
PR
OJE
CT
FUTU
RE
CO
ND
ITIO
N W
/ PR
OJE
CT
FUTU
RE
W/ P
RO
JEC
T W
/ MIT
IGA
TIO
N
Volu
me
Tota
l Vo
lum
eLa
ne
Volu
me
Rig
ht T
urns
: FR
EE-1
, NR
TOR
-2 o
r OLA
-3?
SB
--W
B--
Res
eda
Bou
leva
rdAm
bien
t Gro
wth
: (%
): C
ondu
cted
by:
ND
S6/
15/2
016
US-
101
NB
Ram
psPe
ak H
our:
R
evie
wed
by:
M
B5
-15
-02
25
-1 R
ese
da
& C
lark
Mix
ed
6/1
5/2
01
6-1
1:0
7 A
M2
CM
A0
1
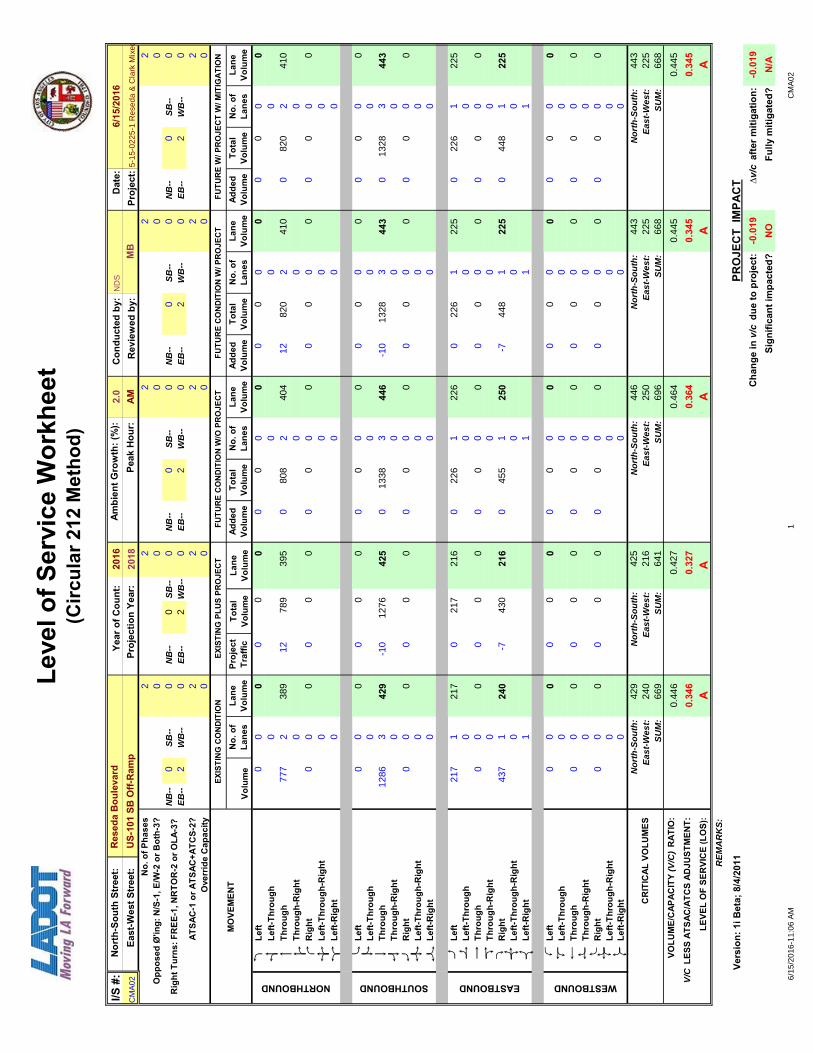
Leve
l of S
ervi
ce W
orkh
eet
(Circ
ular
212
Met
hod)
I/S #
:N
orth
-Sou
th S
tree
t: Ye
ar o
f Cou
nt:
2016
2.0
Dat
e:C
MA
02
East
-Wes
t Str
eet:
Proj
ectio
n Ye
ar:
2018
AMPr
ojec
t: N
o. o
f Pha
ses
22
22
2 O
ppos
ed Ø
'ing:
N/S
-1, E
/W-2
or B
oth-
3?0
00
00
NB
--0
SB
--0
NB
--0
0N
B--
0S
B--
0N
B--
0S
B--
0N
B--
0S
B--
0E
B--
2W
B--
0E
B--
20
EB
--2
WB
--0
EB
--2
WB
--0
EB
--2
WB
--0
ATSA
C-1
or A
TSAC
+ATC
S-2?
22
22
2 O
verr
ide
Cap
acity
00
00
0
No.
of
Lane
sLa
ne
Volu
me
Proj
ect
Traf
ficAd
ded
Volu
me
Tota
l Vo
lum
eN
o. o
f La
nes
Lane
Vo
lum
eAd
ded
Volu
me
Tota
l Vo
lum
eN
o. o
f La
nes
Lane
Vo
lum
eAd
ded
Volu
me
Tota
l Vo
lum
eN
o. o
f La
nes
Lane
Vo
lum
e L
eft
00
00
Lef
t-Thr
ough
00
00
Thr
ough
22
22
Thr
ough
-Rig
ht0
00
0 R
ight
00
00
Lef
t-Thr
ough
-Rig
ht0
00
0 L
eft-R
ight
00
00
L
eft
00
00
Lef
t-Thr
ough
00
00
Thr
ough
33
33
Thr
ough
-Rig
ht0
00
0 R
ight
00
00
Lef
t-Thr
ough
-Rig
ht0
00
0 L
eft-R
ight
00
00
L
eft
11
11
Lef
t-Thr
ough
00
00
Thr
ough
00
00
Thr
ough
-Rig
ht0
00
0 R
ight
11
11
Lef
t-Thr
ough
-Rig
ht0
00
0 L
eft-R
ight
11
11
L
eft
00
00
Lef
t-Thr
ough
00
00
Thr
ough
00
00
Thr
ough
-Rig
ht0
00
0 R
ight
00
00
Lef
t-Thr
ough
-Rig
ht0
00
0 L
eft-R
ight
00
00
429
No
rth
-So
uth
:44
644
344
324
0E
as
t-W
es
t:25
022
522
5S
UM
:66
9S
UM
:S
UM
:69
6S
UM
:66
8S
UM
:66
8
0.44
60.
464
0.44
50.
445
0.34
60.
364
0.34
50.
345
AA
AA
Vers
ion:
1i B
eta;
8/4
/201
1-0
.019
-0.0
19N
ON
/A
Rig
ht T
urns
: FR
EE-1
, NR
TOR
-2 o
r OLA
-3?
SB
--W
B--
Res
eda
Bou
leva
rdAm
bien
t Gro
wth
: (%
): C
ondu
cted
by:
ND
S6/
15/2
016
US-
101
SB O
ff-R
amp
Peak
Hou
r:
Rev
iew
ed b
y:
MB
5-1
5-0
22
5-1
Re
sed
a &
Cla
rk M
ixe
d
MO
VEM
ENT
EXIS
TIN
G C
ON
DIT
ION
EXIS
TIN
G P
LUS
PRO
JEC
TFU
TUR
E C
ON
DIT
ION
W/O
PR
OJE
CT
FUTU
RE
CO
ND
ITIO
N W
/ PR
OJE
CT
FUTU
RE
W/ P
RO
JEC
T W
/ MIT
IGA
TIO
N
Volu
me
Tota
l Vo
lum
eLa
ne
Volu
me
NORTHBOUND
00
00
00
00
777
389
1278
939
50
808
00
00
00
00
00
0
410
00
00
00
00
0
404
1282
041
00
820 0
0
1286
429
-10
1276
425
013
38
00
00
00
00
00
0
00
443
00
00
00
00
0
446
-10
1328
443
013
28
EASTBOUND
217
217
021
721
6
00
0
SOUTHBOUND
0
448
225
00
226
225
00
00
00
0
022
622
60
226
225
448
2250
437
240
-743
021
60
455
250
-7
00
00
00
0
00
00
00
0
00
00
00
00
00
0
00
0
00
00
00
00
00
WESTBOUND
641
VOLU
ME/
CAP
ACIT
Y (V
/C)
RAT
IO:
0.42
7
00
00
00
00
00
V/C
LES
S AT
SAC
/ATC
S AD
JUST
MEN
T:0.
327
LEVE
L O
F SE
RVI
CE
(LO
S):
A
No
rth
-So
uth
:E
as
t-W
es
t:21
6E
as
t-W
es
t:E
as
t-W
es
t:E
as
t-W
es
t:C
RIT
ICAL
VO
LUM
ESN
ort
h-S
ou
th:
425
No
rth
-So
uth
:N
ort
h-S
ou
th:
PRO
JEC
T IM
PAC
TC
hang
e in
v/c
due
to p
roje
ct:
∆v/c
afte
r miti
gatio
n:Si
gnifi
cant
impa
cted
?Fu
lly m
itiga
ted?
RE
MA
RK
S:
6/1
5/2
01
6-1
1:0
6 A
M1
CM
A0
2

Leve
l of S
ervi
ce W
orkh
eet
(Circ
ular
212
Met
hod)
I/S #
:N
orth
-Sou
th S
tree
t: Ye
ar o
f Cou
nt:
2016
2.0
Dat
e:C
MA
02
East
-Wes
t Str
eet:
Proj
ectio
n Ye
ar:
2018
PMPr
ojec
t: N
o. o
f Pha
ses
22
22
2 O
ppos
ed Ø
'ing:
N/S
-1, E
/W-2
or B
oth-
3?0
00
00
NB
--0
SB
--0
NB
--0
0N
B--
0S
B--
0N
B--
0S
B--
0N
B--
0S
B--
0E
B--
2W
B--
0E
B--
20
EB
--2
WB
--0
EB
--2
WB
--0
EB
--2
WB
--0
ATSA
C-1
or A
TSAC
+ATC
S-2?
22
22
2 O
verr
ide
Cap
acity
00
00
0
No.
of
Lane
sLa
ne
Volu
me
Proj
ect
Traf
ficAd
ded
Volu
me
Tota
l Vo
lum
eN
o. o
f La
nes
Lane
Vo
lum
eAd
ded
Volu
me
Tota
l Vo
lum
eN
o. o
f La
nes
Lane
Vo
lum
eAd
ded
Volu
me
Tota
l Vo
lum
eN
o. o
f La
nes
Lane
Vo
lum
e L
eft
00
00
Lef
t-Thr
ough
00
00
Thr
ough
22
22
Thr
ough
-Rig
ht0
00
0 R
ight
00
00
Lef
t-Thr
ough
-Rig
ht0
00
0 L
eft-R
ight
00
00
L
eft
00
00
Lef
t-Thr
ough
00
00
Thr
ough
33
33
Thr
ough
-Rig
ht0
00
0 R
ight
00
00
Lef
t-Thr
ough
-Rig
ht0
00
0 L
eft-R
ight
00
00
L
eft
11
11
Lef
t-Thr
ough
00
00
Thr
ough
00
00
Thr
ough
-Rig
ht0
00
0 R
ight
11
11
Lef
t-Thr
ough
-Rig
ht0
00
0 L
eft-R
ight
11
11
L
eft
00
00
Lef
t-Thr
ough
00
00
Thr
ough
00
00
Thr
ough
-Rig
ht0
00
0 R
ight
00
00
Lef
t-Thr
ough
-Rig
ht0
00
0 L
eft-R
ight
00
00
600
No
rth
-So
uth
:62
462
362
321
5E
as
t-W
es
t:22
422
622
6S
UM
:81
5S
UM
:S
UM
:84
8S
UM
:84
9S
UM
:84
9
0.54
30.
565
0.56
60.
566
0.44
30.
465
0.46
60.
466
AA
AA
Vers
ion:
1i B
eta;
8/4
/201
10.
001
0.00
1N
ON
/A
Rig
ht T
urns
: FR
EE-1
, NR
TOR
-2 o
r OLA
-3?
SB
--W
B--
Res
eda
Bou
leva
rdAm
bien
t Gro
wth
: (%
): C
ondu
cted
by:
ND
S6/
15/2
016
US-
101
SB O
ff-R
amp
Peak
Hou
r:
Rev
iew
ed b
y:
MB
5-1
5-0
22
5-1
Re
sed
a &
Cla
rk M
ixe
d
MO
VEM
ENT
EXIS
TIN
G C
ON
DIT
ION
EXIS
TIN
G P
LUS
PRO
JEC
TFU
TUR
E C
ON
DIT
ION
W/O
PR
OJE
CT
FUTU
RE
CO
ND
ITIO
N W
/ PR
OJE
CT
FUTU
RE
W/ P
RO
JEC
T W
/ MIT
IGA
TIO
N
Volu
me
Tota
l Vo
lum
eLa
ne
Volu
me
NORTHBOUND
00
00
00
00
1200
600
-311
9759
90
1248
00
00
00
00
00
0
623
00
00
00
00
0
624
-312
4562
30
1245 0
0
1281
427
712
8842
90
1333
00
00
00
00
00
0
00
447
00
00
00
00
0
444
713
4044
70
1340
EASTBOUND
297
215
029
721
7
00
0
SOUTHBOUND
0
368
226
00
309
226
00
00
00
0
030
922
40
309
226
368
2260
349
215
535
421
70
363
224
5
00
00
00
0
00
00
00
0
00
00
00
00
00
0
00
0
00
00
00
00
00
WESTBOUND
816
VOLU
ME/
CAP
ACIT
Y (V
/C)
RAT
IO:
0.54
4
00
00
00
00
00
V/C
LES
S AT
SAC
/ATC
S AD
JUST
MEN
T:0.
444
LEVE
L O
F SE
RVI
CE
(LO
S):
A
No
rth
-So
uth
:E
as
t-W
es
t:21
7E
as
t-W
es
t:E
as
t-W
es
t:E
as
t-W
es
t:C
RIT
ICAL
VO
LUM
ESN
ort
h-S
ou
th:
599
No
rth
-So
uth
:N
ort
h-S
ou
th:
PRO
JEC
T IM
PAC
TC
hang
e in
v/c
due
to p
roje
ct:
∆v/c
afte
r miti
gatio
n:Si
gnifi
cant
impa
cted
?Fu
lly m
itiga
ted?
RE
MA
RK
S:
6/1
5/2
01
6-1
1:0
6 A
M2
CM
A0
2

Leve
l of S
ervi
ce W
orkh
eet
(Circ
ular
212
Met
hod)
I/S #
:N
orth
-Sou
th S
tree
t: Ye
ar o
f Cou
nt:
2016
2.0
Dat
e:C
MA
03
East
-Wes
t Str
eet:
Proj
ectio
n Ye
ar:
2018
AMPr
ojec
t: N
o. o
f Pha
ses
44
44
4 O
ppos
ed Ø
'ing:
N/S
-1, E
/W-2
or B
oth-
3?0
00
00
NB
--0
SB
--0
NB
--0
0N
B--
0S
B--
0N
B--
0S
B--
0N
B--
0S
B--
0E
B--
0W
B--
3E
B--
03
EB
--0
WB
--3
EB
--0
WB
--3
EB
--0
WB
--3
ATSA
C-1
or A
TSAC
+ATC
S-2?
22
22
2 O
verr
ide
Cap
acity
00
00
0
No.
of
Lane
sLa
ne
Volu
me
Proj
ect
Traf
ficAd
ded
Volu
me
Tota
l Vo
lum
eN
o. o
f La
nes
Lane
Vo
lum
eAd
ded
Volu
me
Tota
l Vo
lum
eN
o. o
f La
nes
Lane
Vo
lum
eAd
ded
Volu
me
Tota
l Vo
lum
eN
o. o
f La
nes
Lane
Vo
lum
e L
eft
11
11
Lef
t-Thr
ough
00
00
Thr
ough
22
22
Thr
ough
-Rig
ht0
00
0 R
ight
11
11
Lef
t-Thr
ough
-Rig
ht0
00
0 L
eft-R
ight
00
00
L
eft
22
22
Lef
t-Thr
ough
00
00
Thr
ough
22
22
Thr
ough
-Rig
ht0
00
0 R
ight
11
11
Lef
t-Thr
ough
-Rig
ht0
00
0 L
eft-R
ight
00
00
L
eft
11
11
Lef
t-Thr
ough
00
00
Thr
ough
11
11
Thr
ough
-Rig
ht1
11
1 R
ight
00
00
Lef
t-Thr
ough
-Rig
ht0
00
0 L
eft-R
ight
00
00
L
eft
11
11
Lef
t-Thr
ough
00
00
Thr
ough
22
22
Thr
ough
-Rig
ht0
00
0 R
ight
11
11
Lef
t-Thr
ough
-Rig
ht0
00
0 L
eft-R
ight
00
00
539
No
rth
-So
uth
:56
056
256
261
4E
as
t-W
es
t:63
964
164
1S
UM
:11
53S
UM
:S
UM
:11
99S
UM
:12
03S
UM
:12
03
0.83
90.
872
0.87
50.
875
0.73
90.
772
0.77
50.
775
CC
CC
Vers
ion:
1i B
eta;
8/4
/201
10.
003
0.00
3N
ON
/A
Rig
ht T
urns
: FR
EE-1
, NR
TOR
-2 o
r OLA
-3?
SB
--W
B--
Res
eda
Bou
leva
rdAm
bien
t Gro
wth
: (%
): C
ondu
cted
by:
ND
S6/
15/2
016
Bur
bank
Bou
leva
rdPe
ak H
our:
R
evie
wed
by:
M
B5
-15
-02
25
-1 R
ese
da
& C
lark
Mix
ed
MO
VEM
ENT
EXIS
TIN
G C
ON
DIT
ION
EXIS
TIN
G P
LUS
PRO
JEC
TFU
TUR
E C
ON
DIT
ION
W/O
PR
OJE
CT
FUTU
RE
CO
ND
ITIO
N W
/ PR
OJE
CT
FUTU
RE
W/ P
RO
JEC
T W
/ MIT
IGA
TIO
N
Volu
me
Tota
l Vo
lum
eLa
ne
Volu
me
NORTHBOUND
3030
030
300
3131
511
256
351
425
70
532
031
310
3131
395
274
039
527
4
268
380
262
038
026
40
395
272
0
266
353
526
80
535
524
288
931
466
-17
914
457
096
9
052
428
80
524
288
504
277
050
427
7
161
103
476
155
104
015
599
016
110
80
485
-17
952
476
095
2
EASTBOUND
103
103
911
211
2
161
103
0
SOUTHBOUND
0
8787
00
116
116
672
378
968
138
30
699
010
710
79
116
116
8787398
8484
084
840
8787
0
393
970
839
80
708
243
439
220
043
922
00
457
024
624
6-3
243
243
236
236
-323
323
3
229
229
0
024
80
024
80
025
80
0
WESTBOUND
1157
VOLU
ME/
CAP
ACIT
Y (V
/C)
RAT
IO:
0.84
1
457
229
045
7
258
00
258
024
3
V/C
LES
S AT
SAC
/ATC
S AD
JUST
MEN
T:0.
741
LEVE
L O
F SE
RVI
CE
(LO
S):
C
No
rth
-So
uth
:E
as
t-W
es
t:61
6E
as
t-W
es
t:E
as
t-W
es
t:E
as
t-W
es
t:C
RIT
ICAL
VO
LUM
ESN
ort
h-S
ou
th:
541
No
rth
-So
uth
:N
ort
h-S
ou
th:
PRO
JEC
T IM
PAC
TC
hang
e in
v/c
due
to p
roje
ct:
∆v/c
afte
r miti
gatio
n:Si
gnifi
cant
impa
cted
?Fu
lly m
itiga
ted?
RE
MA
RK
S:
6/1
5/2
01
6-1
1:0
7 A
M1
CM
A0
3

Leve
l of S
ervi
ce W
orkh
eet
(Circ
ular
212
Met
hod)
I/S #
:N
orth
-Sou
th S
tree
t: Ye
ar o
f Cou
nt:
2016
2.0
Dat
e:C
MA
03
East
-Wes
t Str
eet:
Proj
ectio
n Ye
ar:
2018
PMPr
ojec
t: N
o. o
f Pha
ses
44
44
4 O
ppos
ed Ø
'ing:
N/S
-1, E
/W-2
or B
oth-
3?0
00
00
NB
--0
SB
--0
NB
--0
0N
B--
0S
B--
0N
B--
0S
B--
0N
B--
0S
B--
0E
B--
0W
B--
3E
B--
03
EB
--0
WB
--3
EB
--0
WB
--3
EB
--0
WB
--3
ATSA
C-1
or A
TSAC
+ATC
S-2?
22
22
2 O
verr
ide
Cap
acity
00
00
0
No.
of
Lane
sLa
ne
Volu
me
Proj
ect
Traf
ficAd
ded
Volu
me
Tota
l Vo
lum
eN
o. o
f La
nes
Lane
Vo
lum
eAd
ded
Volu
me
Tota
l Vo
lum
eN
o. o
f La
nes
Lane
Vo
lum
eAd
ded
Volu
me
Tota
l Vo
lum
eN
o. o
f La
nes
Lane
Vo
lum
e L
eft
11
11
Lef
t-Thr
ough
00
00
Thr
ough
22
22
Thr
ough
-Rig
ht0
00
0 R
ight
11
11
Lef
t-Thr
ough
-Rig
ht0
00
0 L
eft-R
ight
00
00
L
eft
22
22
Lef
t-Thr
ough
00
00
Thr
ough
22
22
Thr
ough
-Rig
ht0
00
0 R
ight
11
11
Lef
t-Thr
ough
-Rig
ht0
00
0 L
eft-R
ight
00
00
L
eft
11
11
Lef
t-Thr
ough
00
00
Thr
ough
11
11
Thr
ough
-Rig
ht1
11
1 R
ight
00
00
Lef
t-Thr
ough
-Rig
ht0
00
0 L
eft-R
ight
00
00
L
eft
11
11
Lef
t-Thr
ough
00
00
Thr
ough
22
22
Thr
ough
-Rig
ht0
00
0 R
ight
11
11
Lef
t-Thr
ough
-Rig
ht0
00
0 L
eft-R
ight
00
00
646
No
rth
-So
uth
:67
267
167
148
3E
as
t-W
es
t:50
250
350
3S
UM
:11
29S
UM
:S
UM
:11
74S
UM
:11
74S
UM
:11
74
0.82
10.
854
0.85
40.
854
0.72
10.
754
0.75
40.
754
CC
CC
Vers
ion:
1i B
eta;
8/4
/201
10.
000
0.00
0N
ON
/A
Rig
ht T
urns
: FR
EE-1
, NR
TOR
-2 o
r OLA
-3?
SB
--W
B--
Res
eda
Bou
leva
rdAm
bien
t Gro
wth
: (%
): C
ondu
cted
by:
ND
S6/
15/2
016
Bur
bank
Bou
leva
rdPe
ak H
our:
R
evie
wed
by:
M
B5
-15
-02
25
-1 R
ese
da
& C
lark
Mix
ed
MO
VEM
ENT
EXIS
TIN
G C
ON
DIT
ION
EXIS
TIN
G P
LUS
PRO
JEC
TFU
TUR
E C
ON
DIT
ION
W/O
PR
OJE
CT
FUTU
RE
CO
ND
ITIO
N W
/ PR
OJE
CT
FUTU
RE
W/ P
RO
JEC
T W
/ MIT
IGA
TIO
N
Volu
me
Tota
l Vo
lum
eLa
ne
Volu
me
NORTHBOUND
5959
059
590
6161
820
410
-181
941
00
853
061
610
6161
454
363
045
436
3
426
436
350
043
634
90
454
364
0
427
-185
242
60
852
446
245
977
489
1198
849
40
1016
044
624
50
446
245
429
236
042
923
6
222
158
514
213
151
021
315
20
222
157
0
508
1110
2751
40
1027
EASTBOUND
125
125
-212
312
3
222
158
0
SOUTHBOUND
0
9292
00
128
128
531
310
-252
930
90
552
013
013
0-2
128
128
9292321
8888
088
880
9292
0
322
-255
032
10
550
182
332
166
033
216
60
345
018
018
02
182
182
173
173
217
517
5
173
173
0
1024
59
024
59
025
510
0
WESTBOUND
1130
VOLU
ME/
CAP
ACIT
Y (V
/C)
RAT
IO:
0.82
2
345
173
034
5
255
100
255
018
2
V/C
LES
S AT
SAC
/ATC
S AD
JUST
MEN
T:0.
722
LEVE
L O
F SE
RVI
CE
(LO
S):
C
No
rth
-So
uth
:E
as
t-W
es
t:48
4E
as
t-W
es
t:E
as
t-W
es
t:E
as
t-W
es
t:C
RIT
ICAL
VO
LUM
ESN
ort
h-S
ou
th:
646
No
rth
-So
uth
:N
ort
h-S
ou
th:
PRO
JEC
T IM
PAC
TC
hang
e in
v/c
due
to p
roje
ct:
∆v/c
afte
r miti
gatio
n:Si
gnifi
cant
impa
cted
?Fu
lly m
itiga
ted?
RE
MA
RK
S:
6/1
5/2
01
6-1
1:0
7 A
M2
CM
A0
3

Leve
l of S
ervi
ce W
orkh
eet
(Circ
ular
212
Met
hod)
I/S #
:N
orth
-Sou
th S
tree
t: Ye
ar o
f Cou
nt:
2016
2.0
Dat
e:C
MA
04
East
-Wes
t Str
eet:
Proj
ectio
n Ye
ar:
2018
AMPr
ojec
t: N
o. o
f Pha
ses
44
44
4 O
ppos
ed Ø
'ing:
N/S
-1, E
/W-2
or B
oth-
3?0
00
00
NB
--0
SB
--3
NB
--0
3N
B--
0S
B--
3N
B--
0S
B--
3N
B--
0S
B--
3E
B--
0W
B--
3E
B--
03
EB
--0
WB
--3
EB
--0
WB
--3
EB
--0
WB
--3
ATSA
C-1
or A
TSAC
+ATC
S-2?
22
22
2 O
verr
ide
Cap
acity
00
00
0
No.
of
Lane
sLa
ne
Volu
me
Proj
ect
Traf
ficAd
ded
Volu
me
Tota
l Vo
lum
eN
o. o
f La
nes
Lane
Vo
lum
eAd
ded
Volu
me
Tota
l Vo
lum
eN
o. o
f La
nes
Lane
Vo
lum
eAd
ded
Volu
me
Tota
l Vo
lum
eN
o. o
f La
nes
Lane
Vo
lum
e L
eft
11
11
Lef
t-Thr
ough
00
00
Thr
ough
11
11
Thr
ough
-Rig
ht1
11
1 R
ight
00
00
Lef
t-Thr
ough
-Rig
ht0
00
0 L
eft-R
ight
00
00
L
eft
22
22
Lef
t-Thr
ough
00
00
Thr
ough
11
11
Thr
ough
-Rig
ht0
00
0 R
ight
11
11
Lef
t-Thr
ough
-Rig
ht0
00
0 L
eft-R
ight
00
00
L
eft
11
11
Lef
t-Thr
ough
00
00
Thr
ough
22
22
Thr
ough
-Rig
ht1
11
1 R
ight
00
00
Lef
t-Thr
ough
-Rig
ht0
00
0 L
eft-R
ight
00
00
L
eft
11
11
Lef
t-Thr
ough
00
00
Thr
ough
22
22
Thr
ough
-Rig
ht0
00
0 R
ight
11
11
Lef
t-Thr
ough
-Rig
ht0
00
0 L
eft-R
ight
00
00
546
No
rth
-So
uth
:56
857
057
068
7E
as
t-W
es
t:71
571
571
5S
UM
:12
33S
UM
:S
UM
:12
83S
UM
:12
85S
UM
:12
85
0.89
70.
933
0.93
50.
935
0.79
70.
833
0.83
50.
835
CD
DD
Vers
ion:
1i B
eta;
8/4
/201
10.
002
0.00
2N
ON
/A
PRO
JEC
T IM
PAC
TC
hang
e in
v/c
due
to p
roje
ct:
∆v/c
afte
r miti
gatio
n:Si
gnifi
cant
impa
cted
?Fu
lly m
itiga
ted?
RE
MA
RK
S:
V/C
LES
S AT
SAC
/ATC
S AD
JUST
MEN
T:0.
798
LEVE
L O
F SE
RVI
CE
(LO
S):
C
No
rth
-So
uth
:E
as
t-W
es
t:68
7E
as
t-W
es
t:E
as
t-W
es
t:E
as
t-W
es
t:C
RIT
ICAL
VO
LUM
ESN
ort
h-S
ou
th:
548
No
rth
-So
uth
:N
ort
h-S
ou
th:
WESTBOUND
1235
VOLU
ME/
CAP
ACIT
Y (V
/C)
RAT
IO:
0.89
8
744
372
074
4
177
00
177
017
0
017
40
-417
00
018
10
-4
170
715
358
071
535
80
744
017
017
00
170
170
163
163
016
316
3
372
372
0
2121545
2020
020
200
2121
0
545
016
1454
50
1614201
201
1551
524
015
5152
40
1614
020
120
10
201
201
EASTBOUND
193
193
019
319
3
168
00
SOUTHBOUND
0
2121
00
168
0
496
161
00
161
00
168
00
494
249
649
60
496
381
210
475
475
247
747
70
494
037
620
75
381
210
361
199
536
620
1
017
017
0
295
163
163
016
316
30
170
170
0
295
-141
929
50
419
NORTHBOUND
7171
071
710
7474
404
284
-140
328
30
420
074
740
7474
170
170
MO
VEM
ENT
EXIS
TIN
G C
ON
DIT
ION
EXIS
TIN
G P
LUS
PRO
JEC
TFU
TUR
E C
ON
DIT
ION
W/O
PR
OJE
CT
FUTU
RE
CO
ND
ITIO
N W
/ PR
OJE
CT
FUTU
RE
W/ P
RO
JEC
T W
/ MIT
IGA
TIO
N
Volu
me
Tota
l Vo
lum
eLa
ne
Volu
me
Rig
ht T
urns
: FR
EE-1
, NR
TOR
-2 o
r OLA
-3?
SB
--W
B--
Res
eda
Bou
leva
rdAm
bien
t Gro
wth
: (%
): C
ondu
cted
by:
ND
S6/
22/2
016
Vent
ura
Bou
leva
rdPe
ak H
our:
R
evie
wed
by:
M
B5
-15
-02
25
-1 R
ese
da
& C
lark
Mix
ed
6/2
2/2
01
6-1
0:3
5 A
M1
CM
A0
4
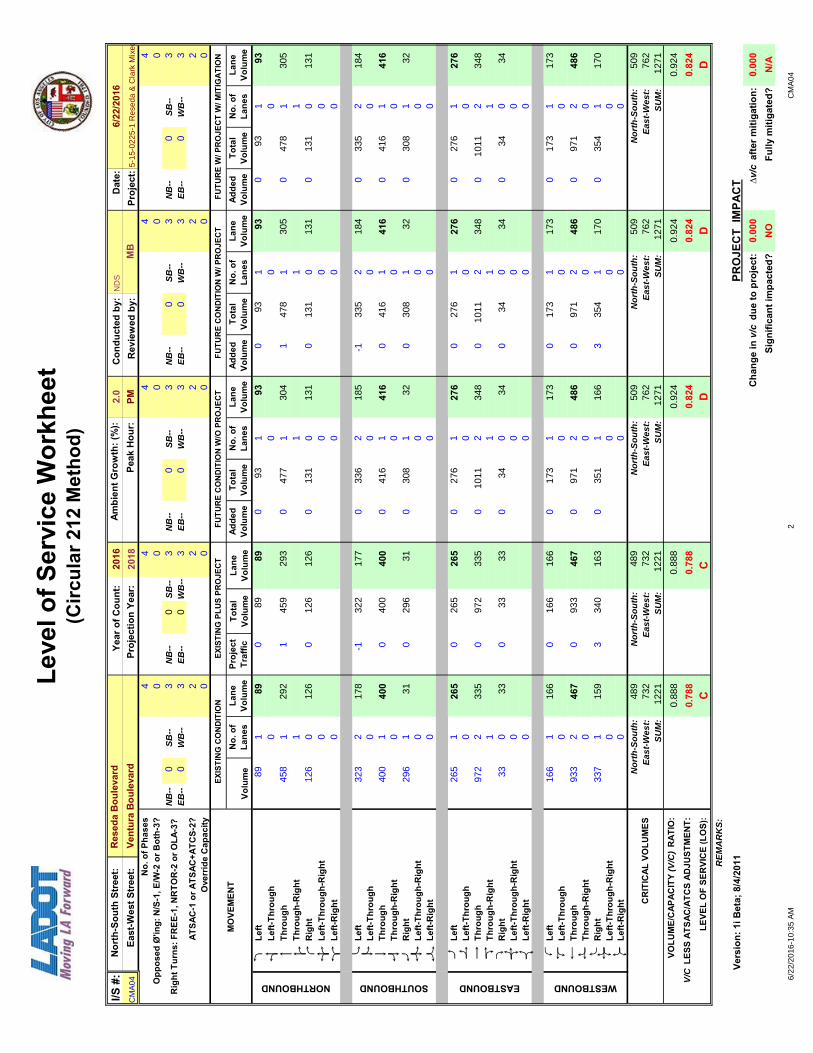
Leve
l of S
ervi
ce W
orkh
eet
(Circ
ular
212
Met
hod)
I/S #
:N
orth
-Sou
th S
tree
t: Ye
ar o
f Cou
nt:
2016
2.0
Dat
e:C
MA
04
East
-Wes
t Str
eet:
Proj
ectio
n Ye
ar:
2018
PMPr
ojec
t: N
o. o
f Pha
ses
44
44
4 O
ppos
ed Ø
'ing:
N/S
-1, E
/W-2
or B
oth-
3?0
00
00
NB
--0
SB
--3
NB
--0
3N
B--
0S
B--
3N
B--
0S
B--
3N
B--
0S
B--
3E
B--
0W
B--
3E
B--
03
EB
--0
WB
--3
EB
--0
WB
--3
EB
--0
WB
--3
ATSA
C-1
or A
TSAC
+ATC
S-2?
22
22
2 O
verr
ide
Cap
acity
00
00
0
No.
of
Lane
sLa
ne
Volu
me
Proj
ect
Traf
ficAd
ded
Volu
me
Tota
l Vo
lum
eN
o. o
f La
nes
Lane
Vo
lum
eAd
ded
Volu
me
Tota
l Vo
lum
eN
o. o
f La
nes
Lane
Vo
lum
eAd
ded
Volu
me
Tota
l Vo
lum
eN
o. o
f La
nes
Lane
Vo
lum
e L
eft
11
11
Lef
t-Thr
ough
00
00
Thr
ough
11
11
Thr
ough
-Rig
ht1
11
1 R
ight
00
00
Lef
t-Thr
ough
-Rig
ht0
00
0 L
eft-R
ight
00
00
L
eft
22
22
Lef
t-Thr
ough
00
00
Thr
ough
11
11
Thr
ough
-Rig
ht0
00
0 R
ight
11
11
Lef
t-Thr
ough
-Rig
ht0
00
0 L
eft-R
ight
00
00
L
eft
11
11
Lef
t-Thr
ough
00
00
Thr
ough
22
22
Thr
ough
-Rig
ht1
11
1 R
ight
00
00
Lef
t-Thr
ough
-Rig
ht0
00
0 L
eft-R
ight
00
00
L
eft
11
11
Lef
t-Thr
ough
00
00
Thr
ough
22
22
Thr
ough
-Rig
ht0
00
0 R
ight
11
11
Lef
t-Thr
ough
-Rig
ht0
00
0 L
eft-R
ight
00
00
489
No
rth
-So
uth
:50
950
950
973
2E
as
t-W
es
t:76
276
276
2S
UM
:12
21S
UM
:S
UM
:12
71S
UM
:12
71S
UM
:12
71
0.88
80.
924
0.92
40.
924
0.78
80.
824
0.82
40.
824
CD
DD
Vers
ion:
1i B
eta;
8/4
/201
10.
000
0.00
0N
ON
/A
PRO
JEC
T IM
PAC
TC
hang
e in
v/c
due
to p
roje
ct:
∆v/c
afte
r miti
gatio
n:Si
gnifi
cant
impa
cted
?Fu
lly m
itiga
ted?
RE
MA
RK
S:
V/C
LES
S AT
SAC
/ATC
S AD
JUST
MEN
T:0.
788
LEVE
L O
F SE
RVI
CE
(LO
S):
C
No
rth
-So
uth
:E
as
t-W
es
t:73
2E
as
t-W
es
t:E
as
t-W
es
t:E
as
t-W
es
t:C
RIT
ICAL
VO
LUM
ESN
ort
h-S
ou
th:
489
No
rth
-So
uth
:N
ort
h-S
ou
th:
WESTBOUND
1221
VOLU
ME/
CAP
ACIT
Y (V
/C)
RAT
IO:
0.88
8
971
486
097
1
354
170
035
4
017
3
170
337
159
334
016
30
351
166
3
173
933
467
093
346
70
971
017
317
30
173
173
166
166
016
616
6
486
486
0
3434348
3333
033
330
3434
0
348
010
1134
80
1011276
276
972
335
097
233
50
1011
027
627
60
276
276
EASTBOUND
265
265
026
526
5
308
320
SOUTHBOUND
0
3434
00
308
32416
296
310
296
310
308
320
416
041
641
60
416
335
184
400
400
040
040
00
416
033
618
5-1
335
184
323
178
-132
217
7
013
113
1
305
126
126
012
612
60
131
131
0
304
147
830
50
478
NORTHBOUND
8989
089
890
9393
458
292
145
929
30
477
093
930
9393
131
131
MO
VEM
ENT
EXIS
TIN
G C
ON
DIT
ION
EXIS
TIN
G P
LUS
PRO
JEC
TFU
TUR
E C
ON
DIT
ION
W/O
PR
OJE
CT
FUTU
RE
CO
ND
ITIO
N W
/ PR
OJE
CT
FUTU
RE
W/ P
RO
JEC
T W
/ MIT
IGA
TIO
N
Volu
me
Tota
l Vo
lum
eLa
ne
Volu
me
Rig
ht T
urns
: FR
EE-1
, NR
TOR
-2 o
r OLA
-3?
SB
--W
B--
Res
eda
Bou
leva
rdAm
bien
t Gro
wth
: (%
): C
ondu
cted
by:
ND
S6/
22/2
016
Vent
ura
Bou
leva
rdPe
ak H
our:
R
evie
wed
by:
M
B5
-15
-02
25
-1 R
ese
da
& C
lark
Mix
ed
6/2
2/2
01
6-1
0:3
5 A
M2
CM
A0
4
Appendix E Department of Transportation Approval Letter