Embed Size (px)
Citation preview
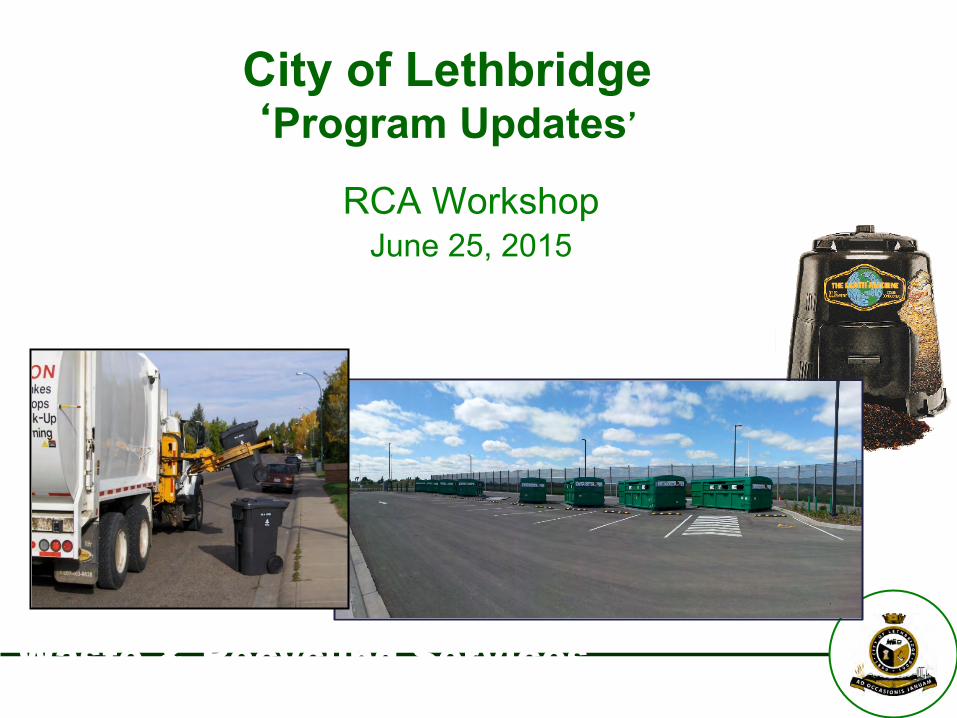
Waste & Recycling Services
City of Lethbridge ‘Program Updates’
RCA Workshop June 25, 2015

WATER UTILITY Waste & Recycling Services
Waste & Recycling Services Agenda 1. Clean Community Programming
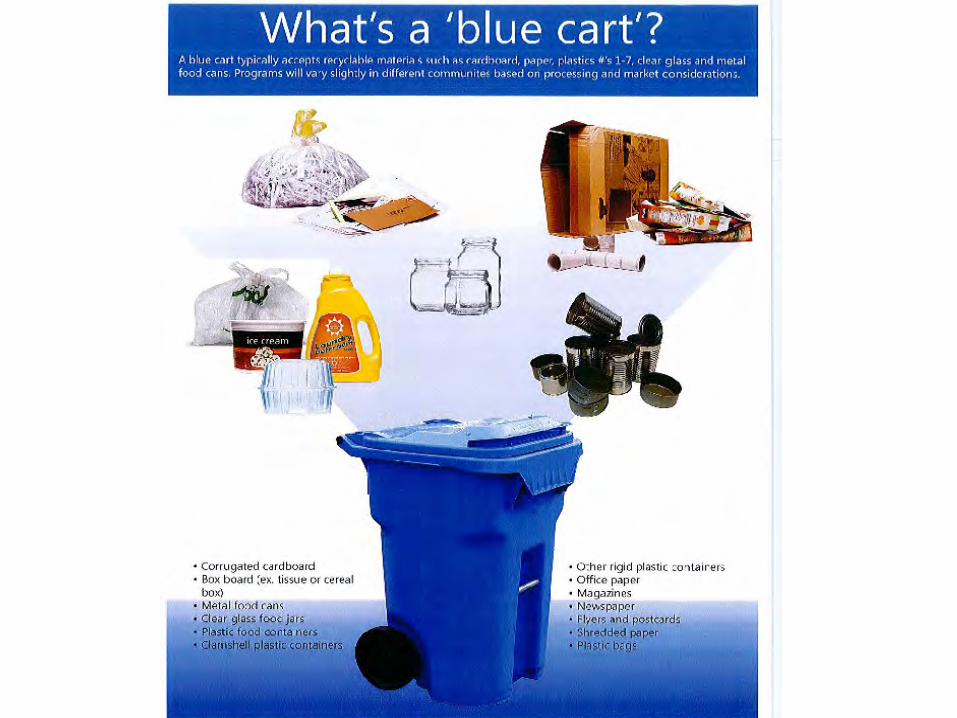
2. Residential Curbside Programs w Blue cart w Green cart
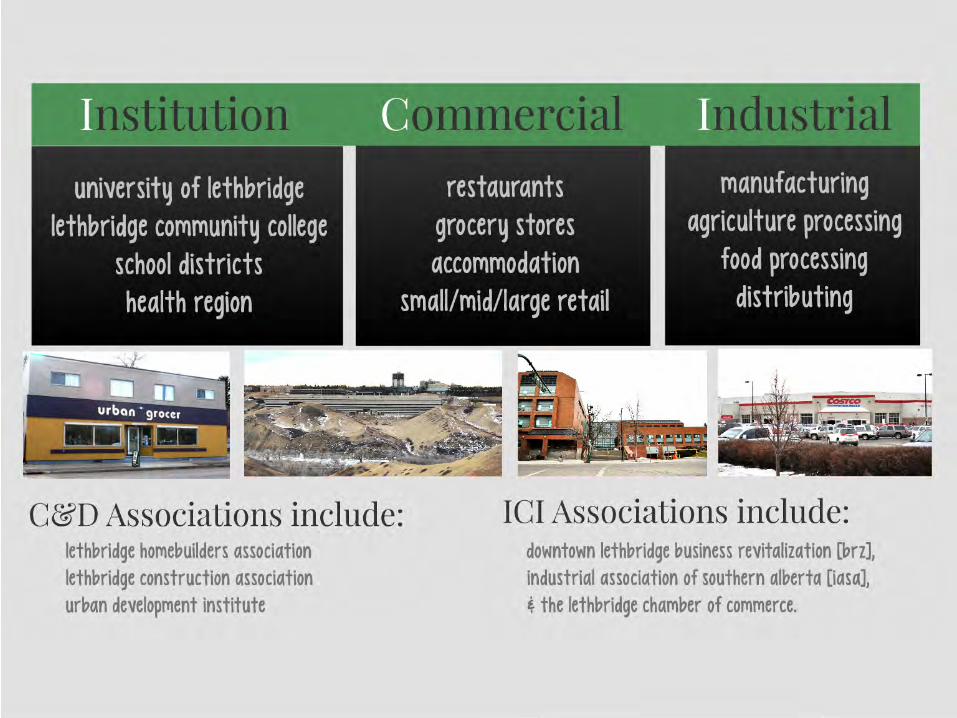
3. ICI/C&D Diversion strategy
WATER UTILITY Waste & Recycling Services
Clean Community Programming
WATER UTILITY Waste & Recycling Services
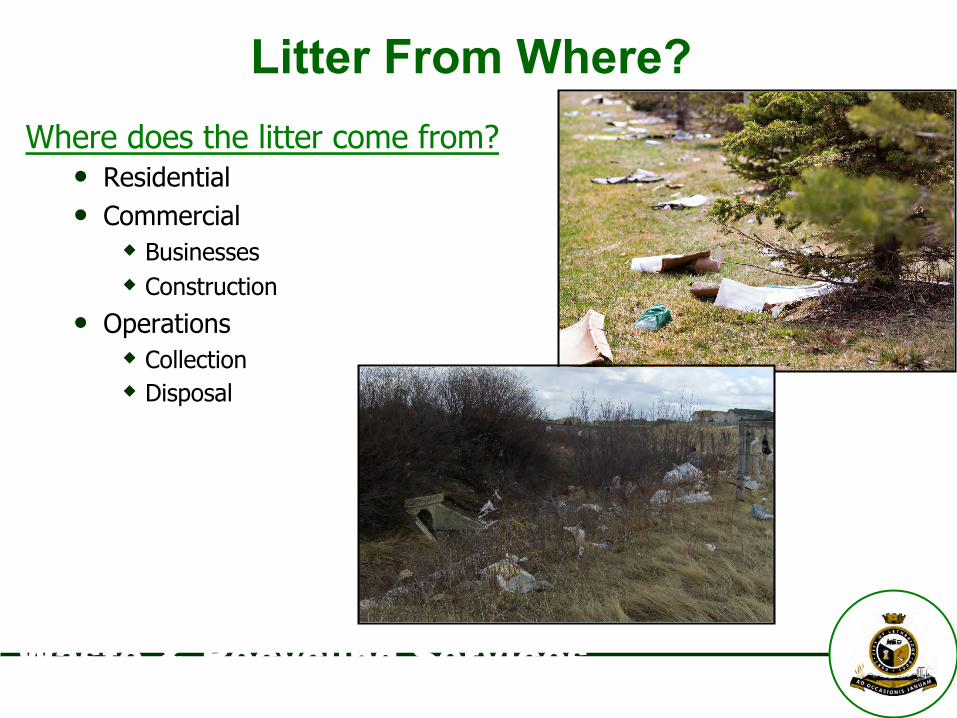
Litter From Where? Where does the litter come from?
• Residential • Commercial
w Businesses w Construction
• Operations w Collection w Disposal
WATER UTILITY Waste & Recycling Services
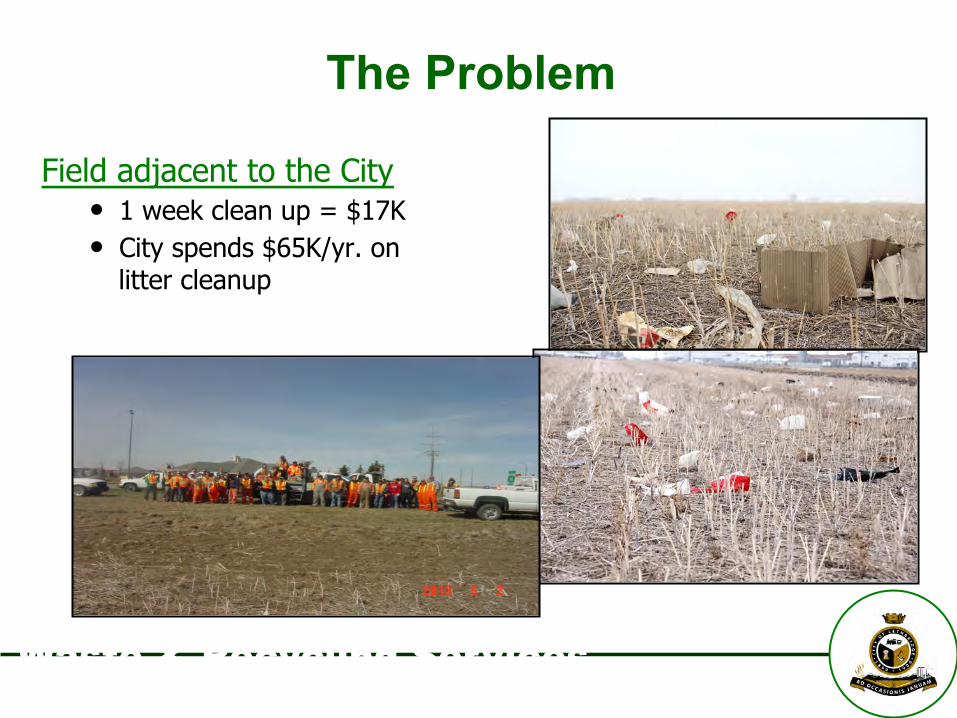
The Problem
Field adjacent to the City • 1 week clean up = $17K • City spends $65K/yr. on
litter cleanup

WATER UTILITY Waste & Recycling Services
Lets Try a Different Approach?
One on One • Visit all business’s in the
industrial park • Tell them our story • Assess their situation
w Loose material in the bin w Loose material on their property w Understand their responsibilities
• Create awareness, seek cooperation
• Staff growth
WATER UTILITY Waste & Recycling Services
What Did We Hear? The First Round
• From 5 to 45 minutes • So your from the city, well let me tell your • Too busy, no time • Can you do something about my neighbour • Were not aware of what was happening, concerned • Doing everything right & proud to show you
Follow up • Avoided, but acted • Part of staff meetings • Responsibility – check list • Clean sites
WATER UTILITY Waste & Recycling Services
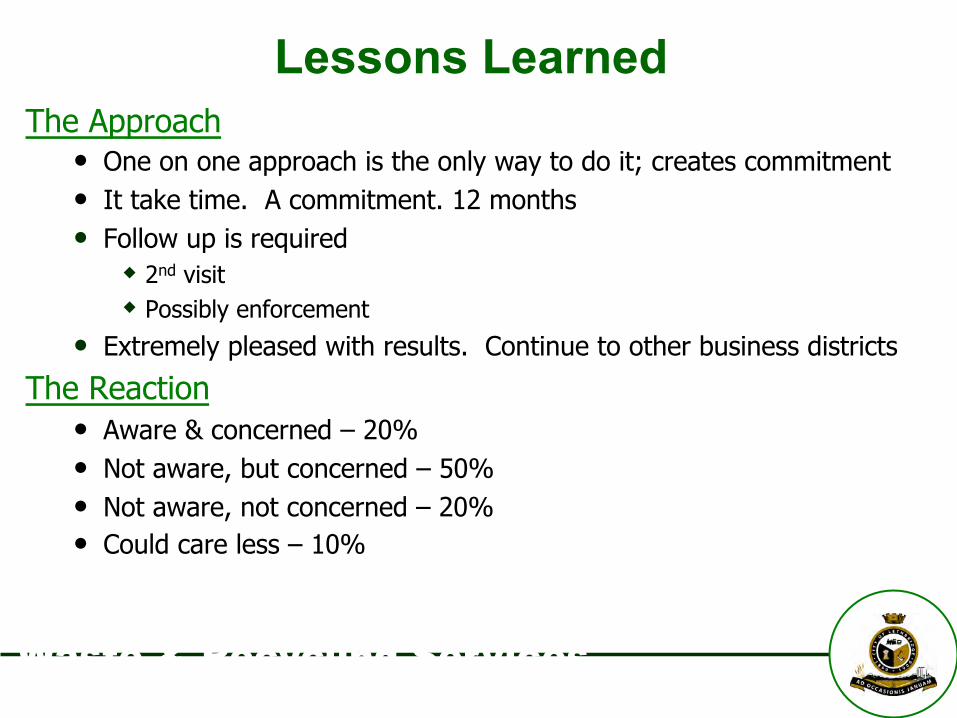
Lessons Learned The Approach
• One on one approach is the only way to do it; creates commitment • It take time. A commitment. 12 months • Follow up is required
w 2nd visit w Possibly enforcement
• Extremely pleased with results. Continue to other business districts
The Reaction • Aware & concerned – 20% • Not aware, but concerned – 50% • Not aware, not concerned – 20% • Could care less – 10%
WATER UTILITY Waste & Recycling Services
Residential Diversion Strategy
WATER UTILITY Waste & Recycling Services
WATER UTILITY Waste & Recycling Services
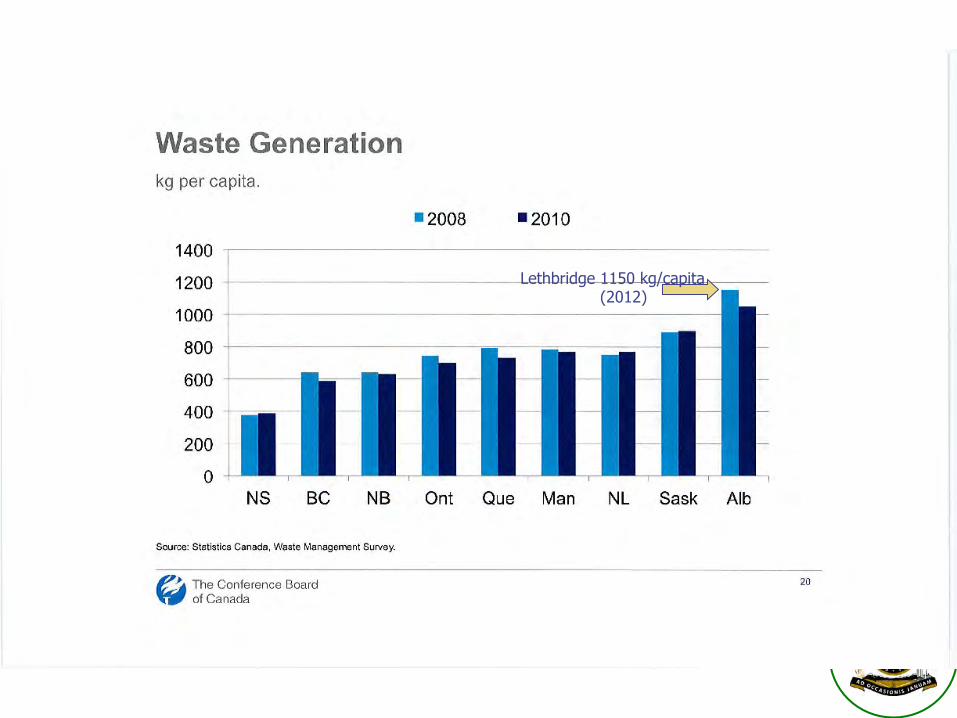
Lethbridge 1150 kg/capita (2012)
WATER UTILITY Waste & Recycling Services
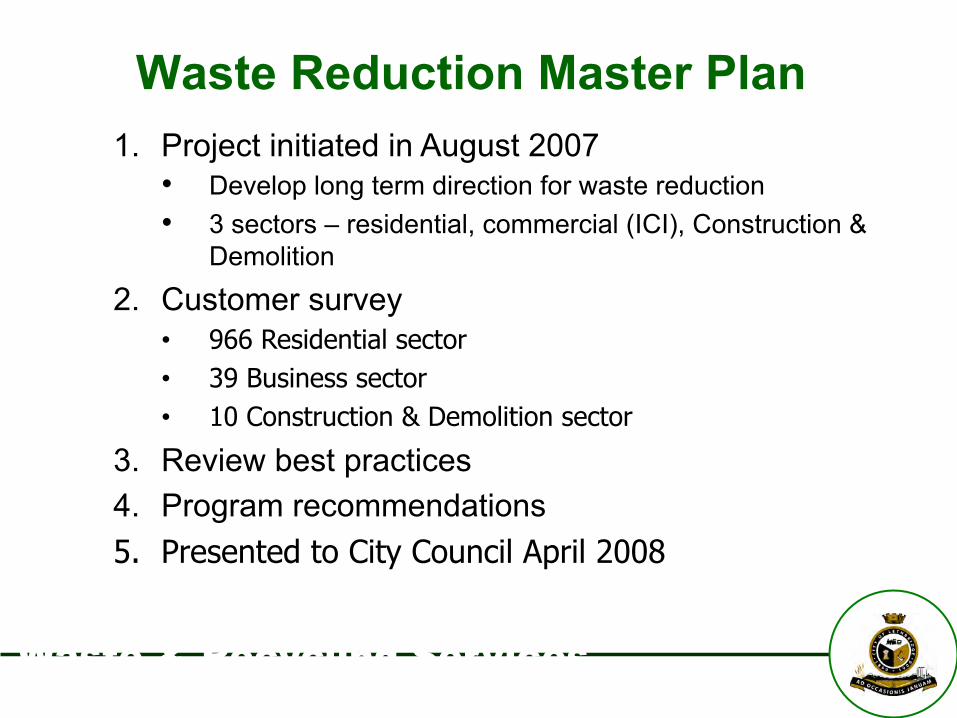
Waste Reduction Master Plan 1. Project initiated in August 2007
• Develop long term direction for waste reduction • 3 sectors – residential, commercial (ICI), Construction &
Demolition
2. Customer survey • 966 Residential sector • 39 Business sector • 10 Construction & Demolition sector
3. Review best practices 4. Program recommendations 5. Presented to City Council April 2008
WATER UTILITY Waste & Recycling Services
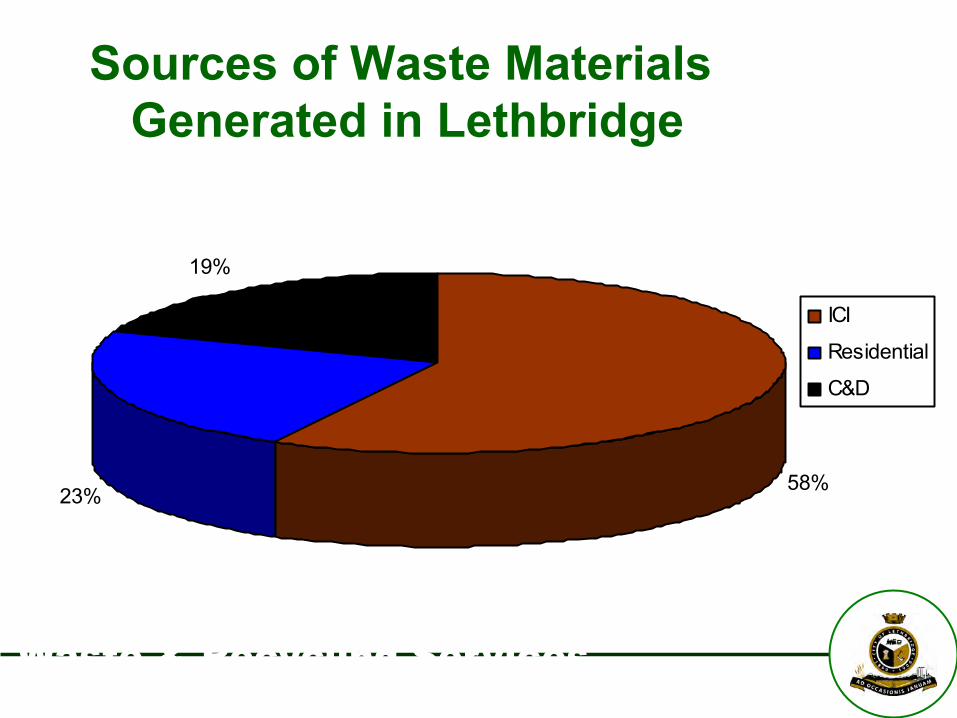
Sources of Waste Materials Generated in Lethbridge
City of Lethbridge Waste Sources 2006
58%23%
19%
ICI
Residential
C&D
WATER UTILITY Waste & Recycling Services
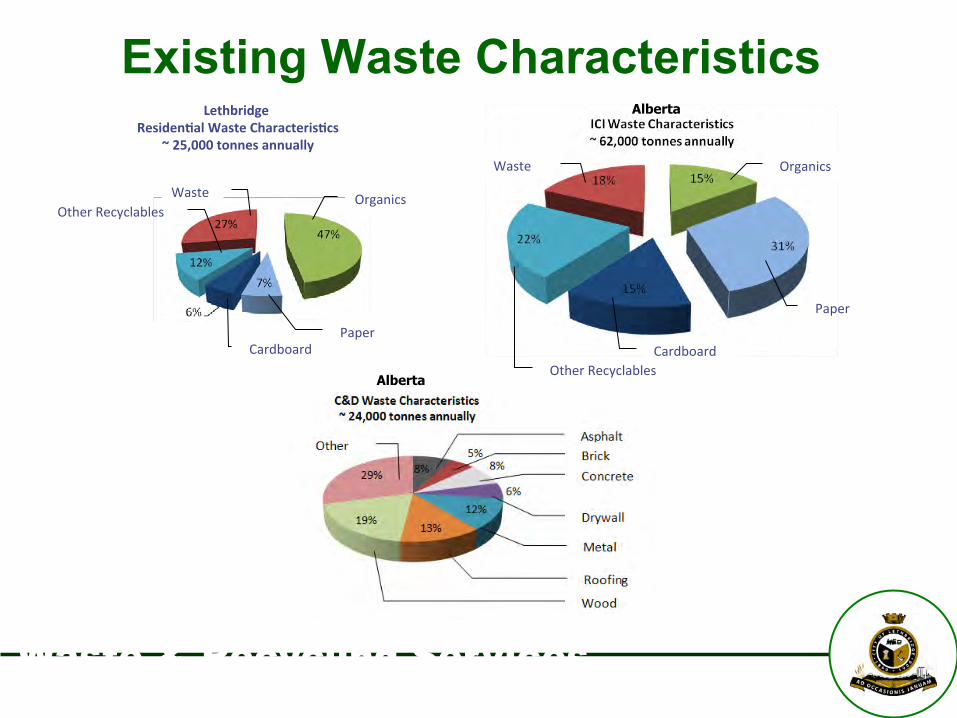
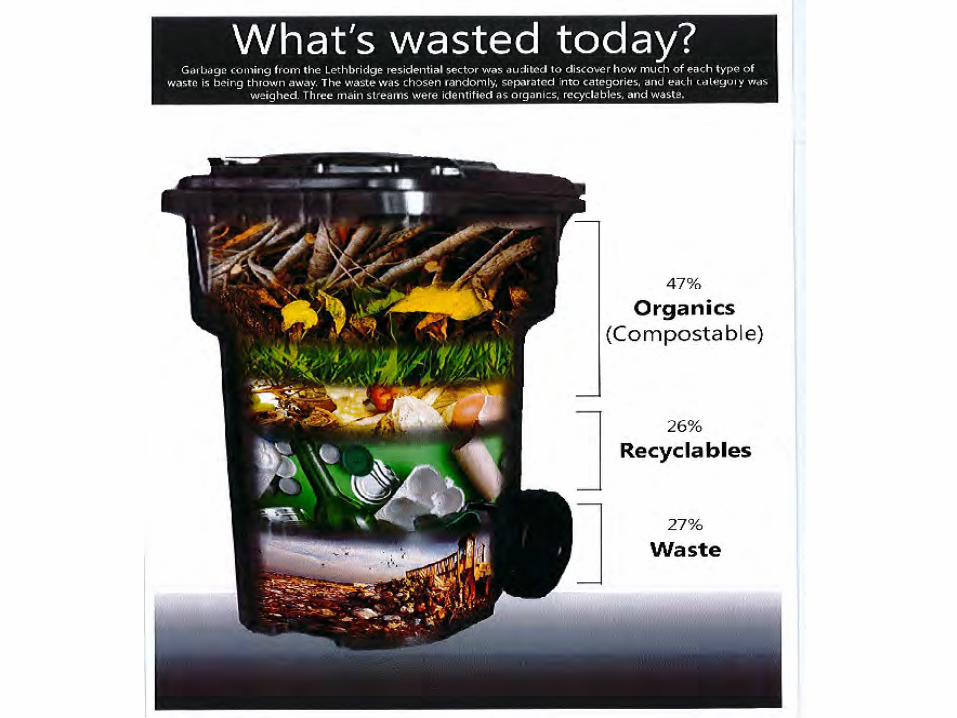
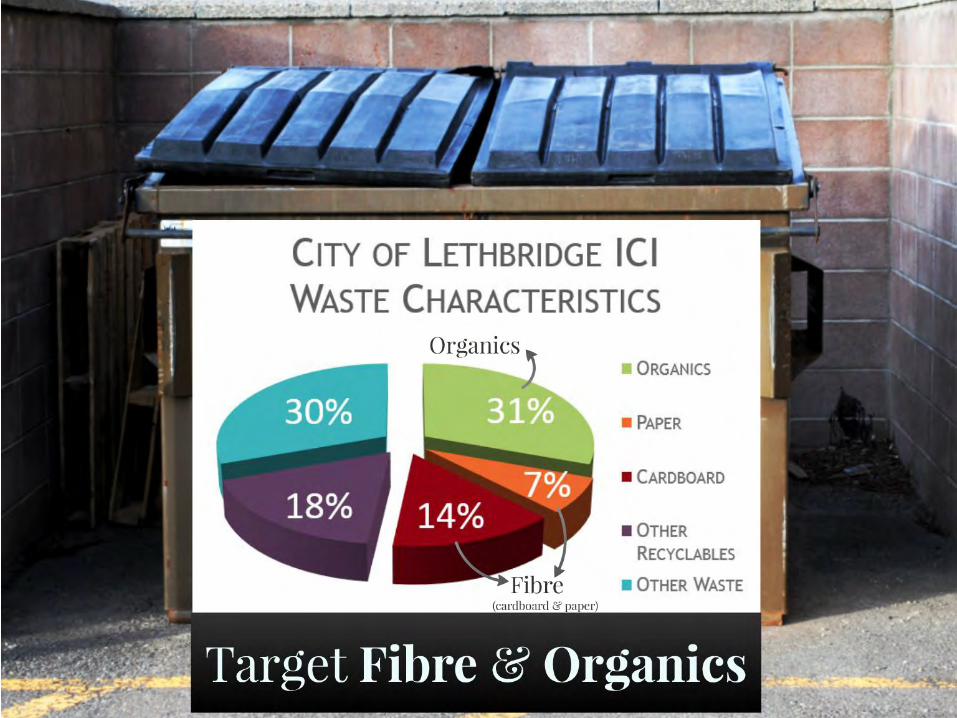
Existing Waste Characteristics Lethbridge
Residen.al Waste Characteris.cs ~ 25,000 tonnes annually
Organics
Paper Cardboard
Other Recyclables Waste
Organics
Paper Cardboard
Other Recyclables
Waste
Alberta
Alberta
WATER UTILITY Waste & Recycling Services
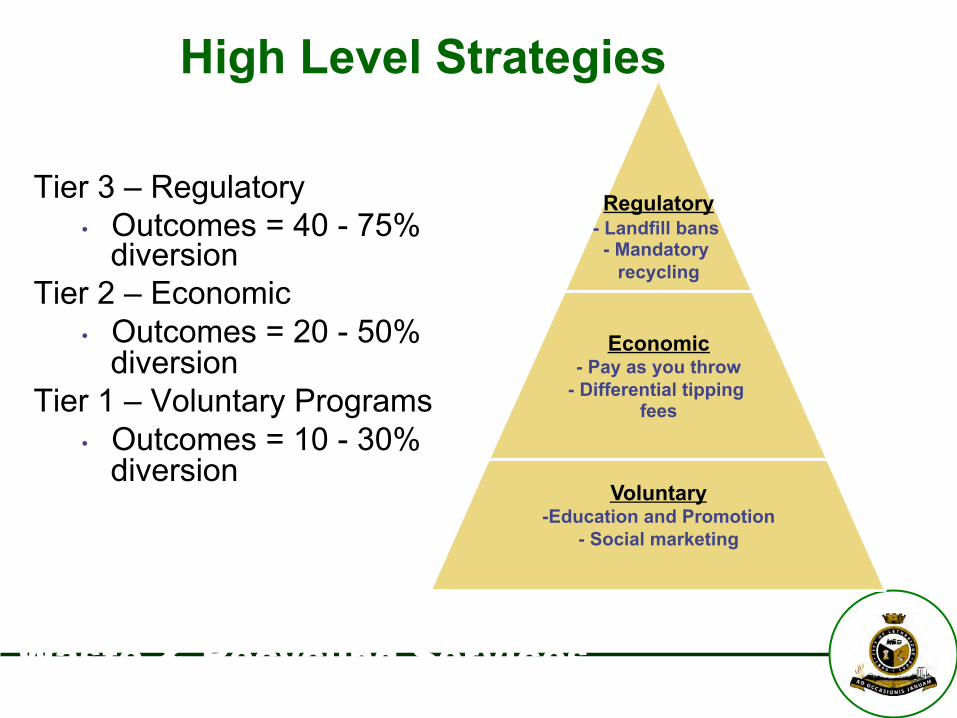
High Level Strategies
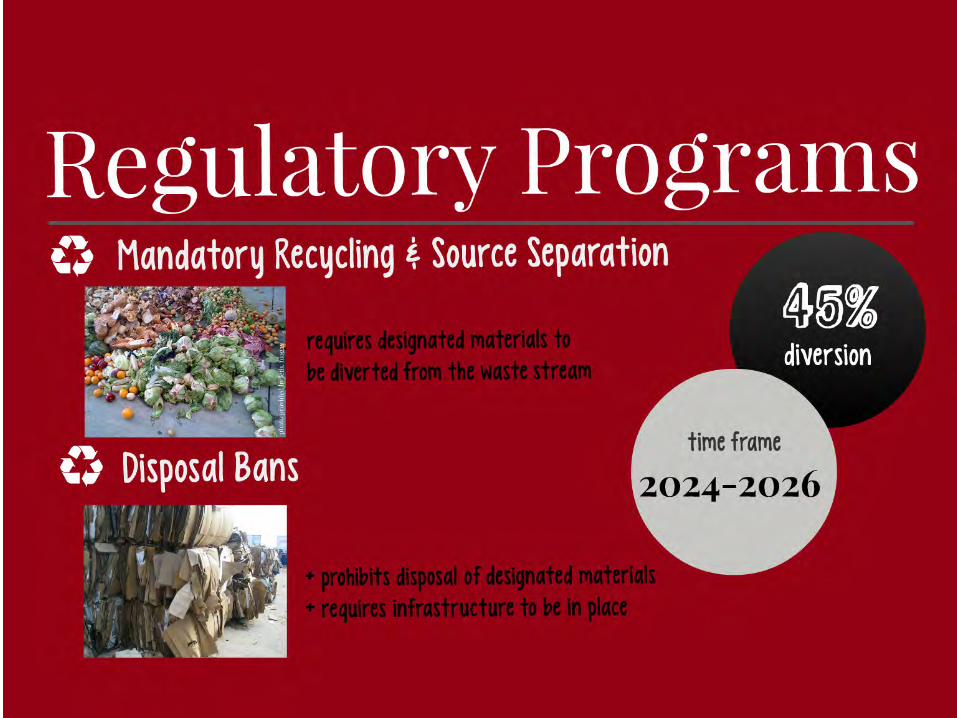
Tier 3 – Regulatory • Outcomes = 40 - 75%
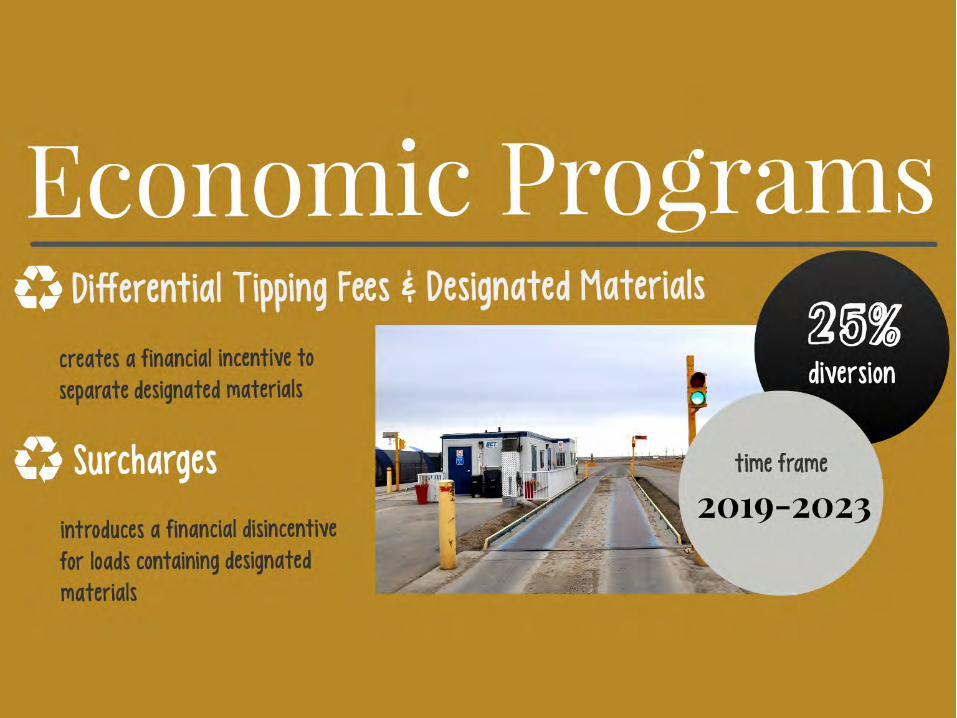
diversion Tier 2 – Economic
• Outcomes = 20 - 50% diversion
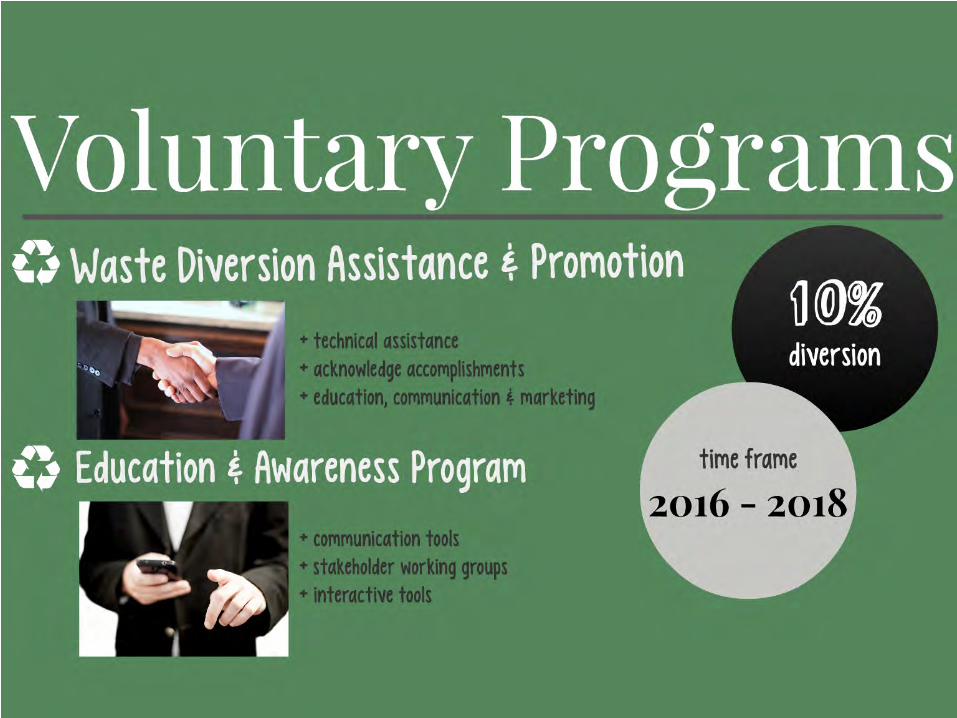
Tier 1 – Voluntary Programs • Outcomes = 10 - 30%
diversion
Regulatory - Landfill bans - Mandatory
recycling
Economic - Pay as you throw
- Differential tipping fees
Voluntary -Education and Promotion
- Social marketing
WATER UTILITY Waste & Recycling Services
Current Diversion Activities in Lethbridge
• Recycling drop-off depots - 1992 • Promotion of backyard composting -1992 • Christmas tree recycling – 1992 • HHW, e-waste, and paint collection at the Waste
and Recycling Centre – 2004, 2008 • Yard Waste drop-off site – 2006 • Fall leaf collection – 2009 • Centralized Recycling Stations - 2013
WATER UTILITY Waste & Recycling Services
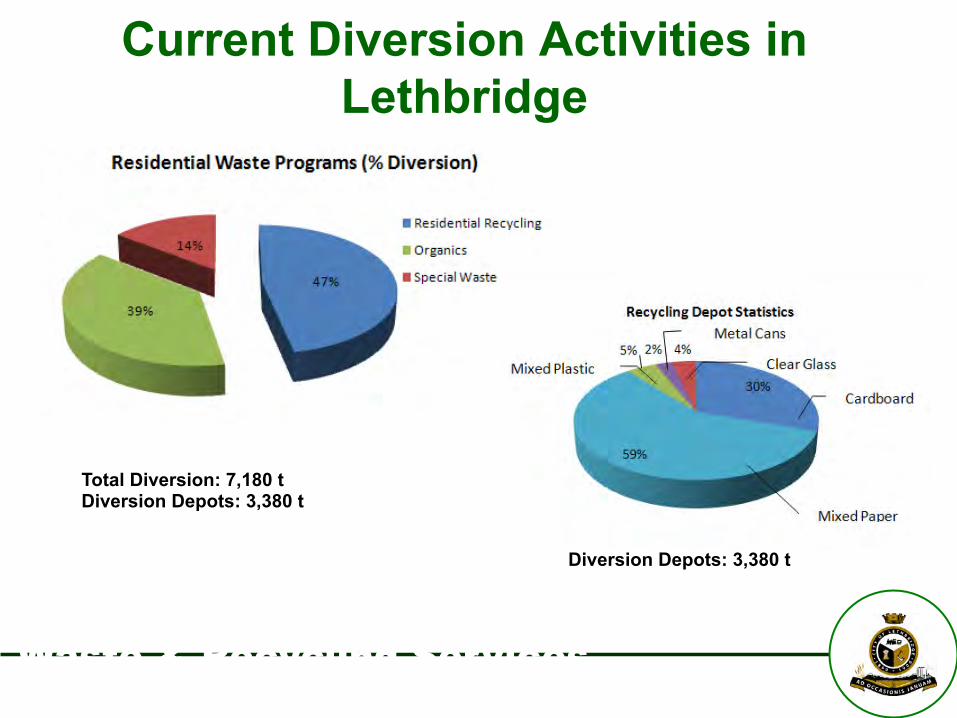
Current Diversion Activities in Lethbridge
Total Diversion: 7,180 t Diversion Depots: 3,380 t
Diversion Depots: 3,380 t
WATER UTILITY Waste & Recycling Services
The Journey Starts
Environment committee/Council meetings • 2009 • 2011 • Budget initiatives in fall 2014
Customer Survey – Feb 2013 • What about the customer? • What do they think?
WATER UTILITY Waste & Recycling Services
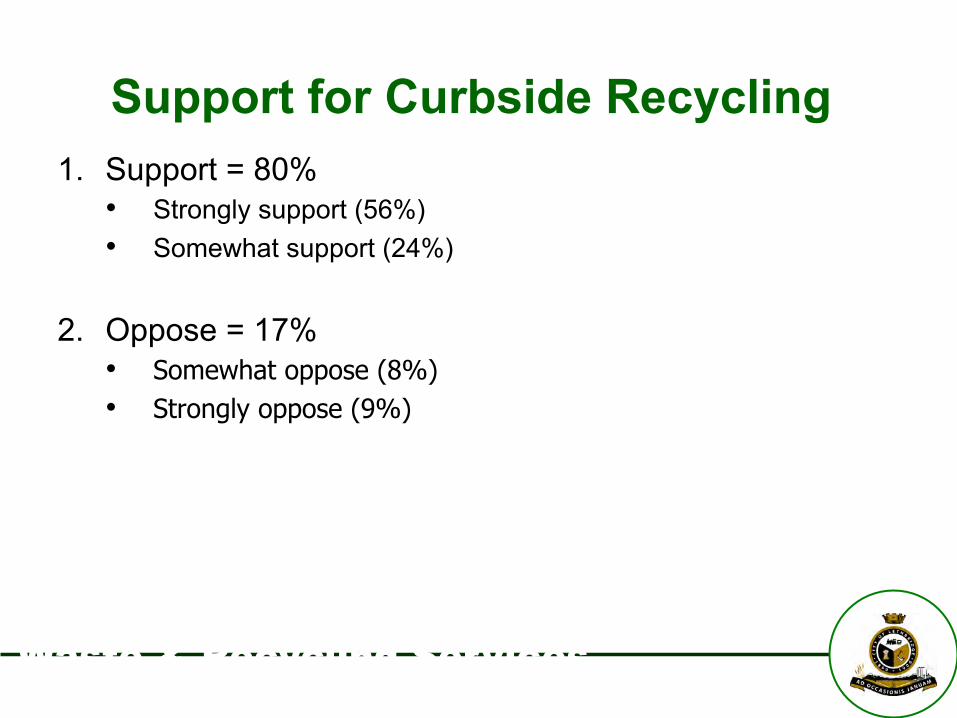
Support for Curbside Recycling 1. Support = 80%
• Strongly support (56%) • Somewhat support (24%)
2. Oppose = 17% • Somewhat oppose (8%) • Strongly oppose (9%)
WATER UTILITY Waste & Recycling Services
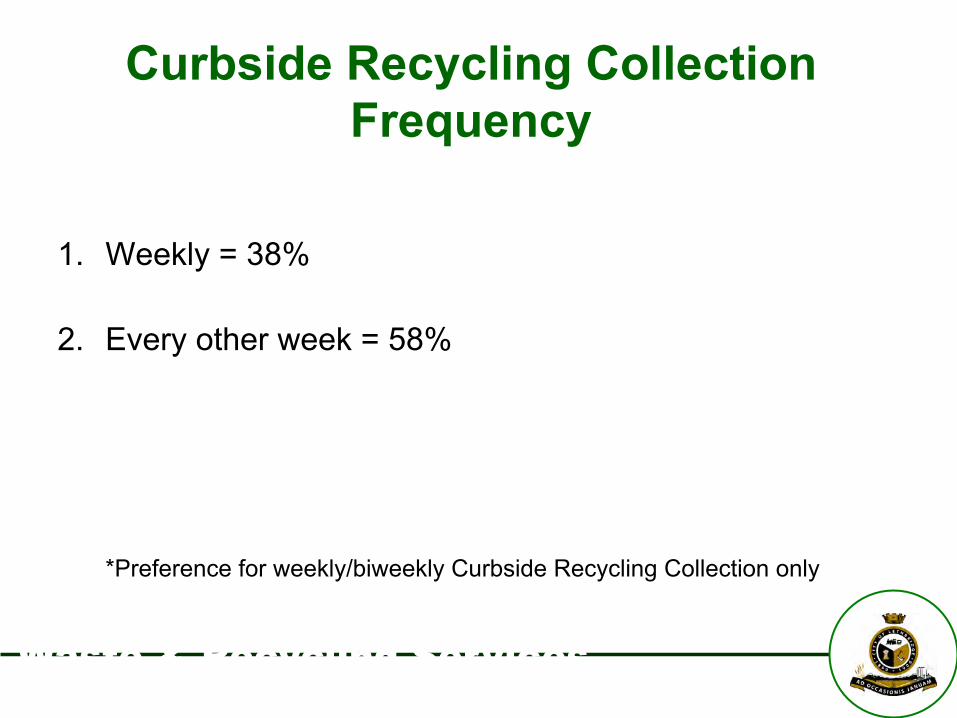
Curbside Recycling Collection Frequency
1. Weekly = 38%
2. Every other week = 58%
*Preference for weekly/biweekly Curbside Recycling Collection only
WATER UTILITY Waste & Recycling Services
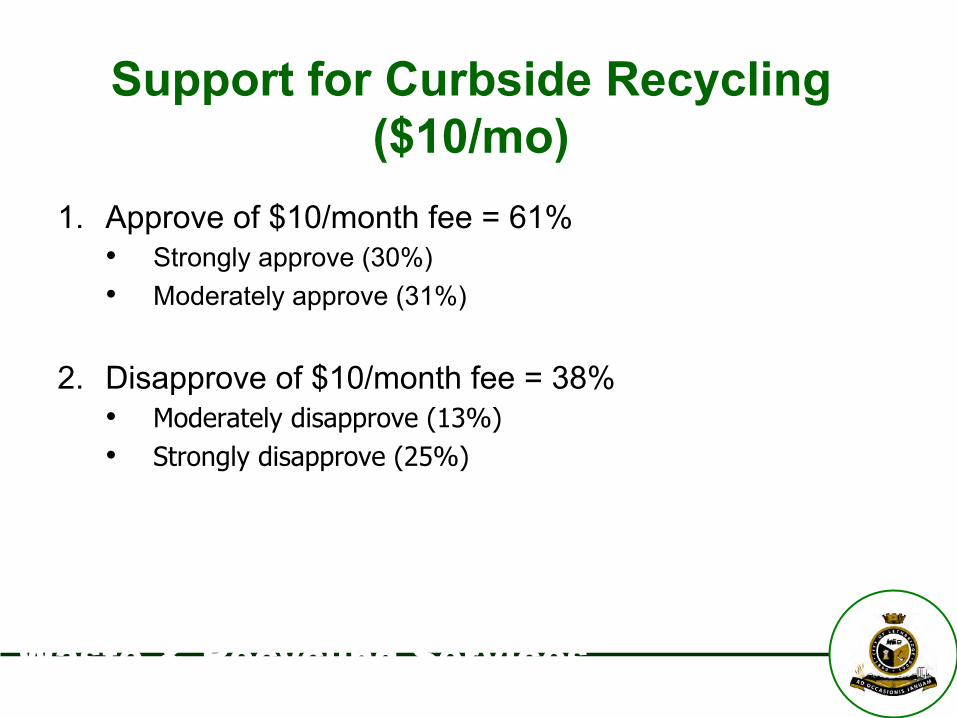
Support for Curbside Recycling ($10/mo)
1. Approve of $10/month fee = 61% • Strongly approve (30%) • Moderately approve (31%)
2. Disapprove of $10/month fee = 38% • Moderately disapprove (13%) • Strongly disapprove (25%)

WATER UTILITY Waste & Recycling Services
Support for Curbside Recycling ($8/mo)
1. Approve of $8/month fee = 66% • Strongly approve (31%) • Moderately approve (35%)
2. Disapprove of $8/month fee = 32% • Moderately disapprove (10%) • Strongly disapprove (23%)
WATER UTILITY Waste & Recycling Services
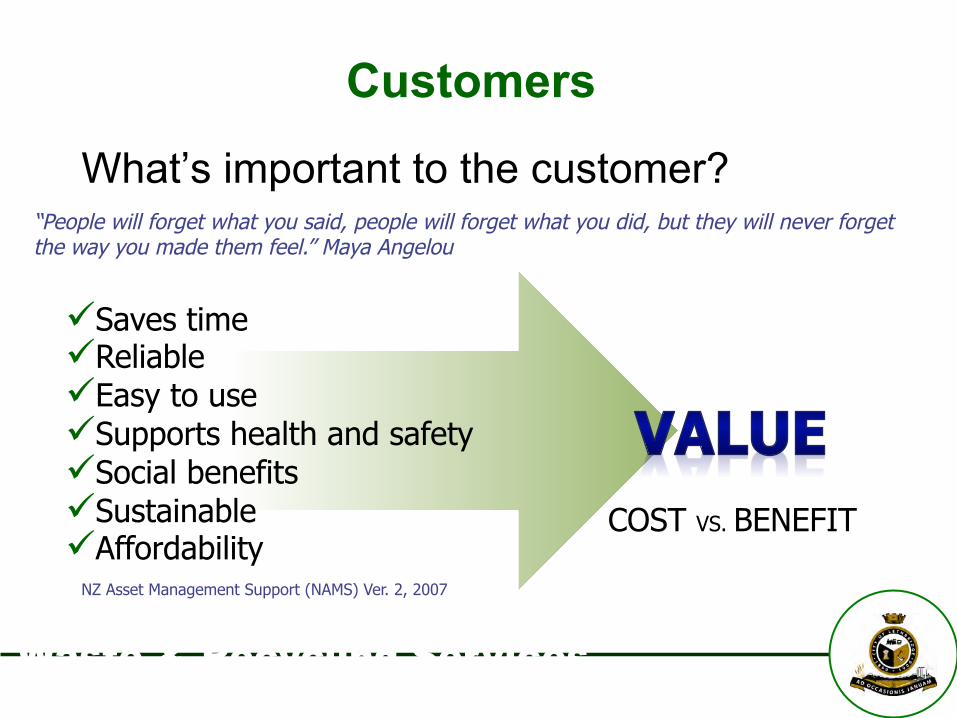
Customers
What’s important to the customer? “People will forget what you said, people will forget what you did, but they will never forget
the way you made them feel.” Maya Angelou
ü Saves time ü Reliable ü Easy to use ü Supports health and safety ü Social benefits ü Sustainable ü Affordability
COST VS. BENEFIT
NZ Asset Management Support (NAMS) Ver. 2, 2007
WATER UTILITY Waste & Recycling Services
• Technical decisions will affect the customer in a non-technical manner
• Value can be added to a service by addressing core values
• The more we know, the better
Customers
WATER UTILITY Waste & Recycling Services
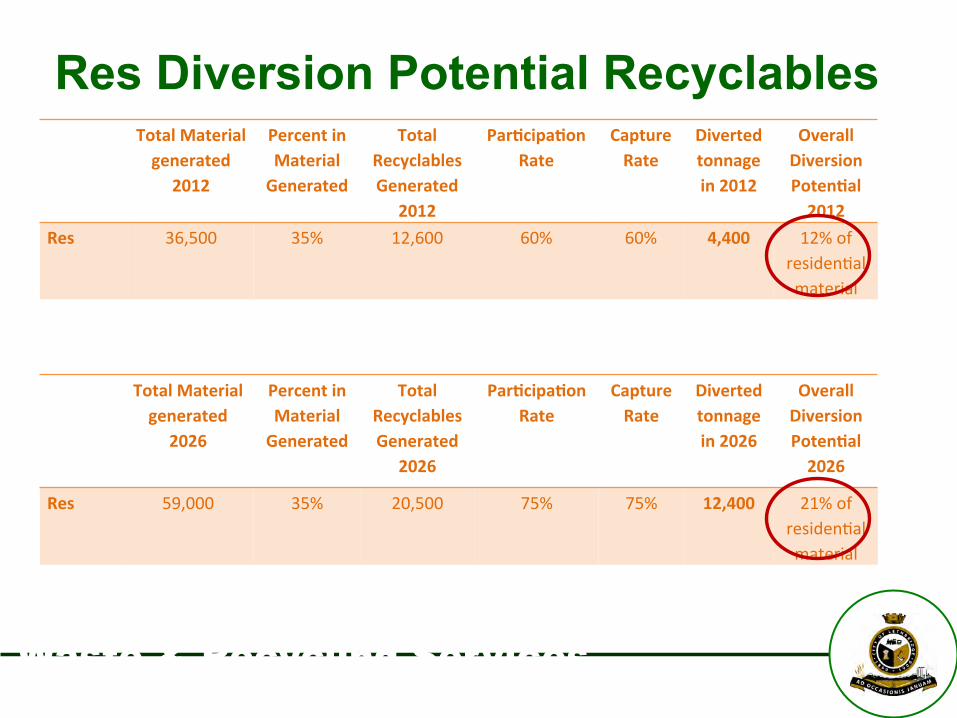
Res Diversion Potential Recyclables Total Material generated
2012
Percent in Material Generated
Total Recyclables Generated
2012
Par.cipa.on Rate
Capture Rate
Diverted tonnage in 2012
Overall Diversion Poten.al 2012
Res 36,500 35% 12,600 60% 60% 4,400 12% of residen@al material
Total Material generated
2026
Percent in Material Generated
Total Recyclables Generated
2026
Par.cipa.on Rate
Capture Rate
Diverted tonnage in 2026
Overall Diversion Poten.al 2026
Res 59,000 35% 20,500 75% 75% 12,400 21% of residen@al material
WATER UTILITY Waste & Recycling Services
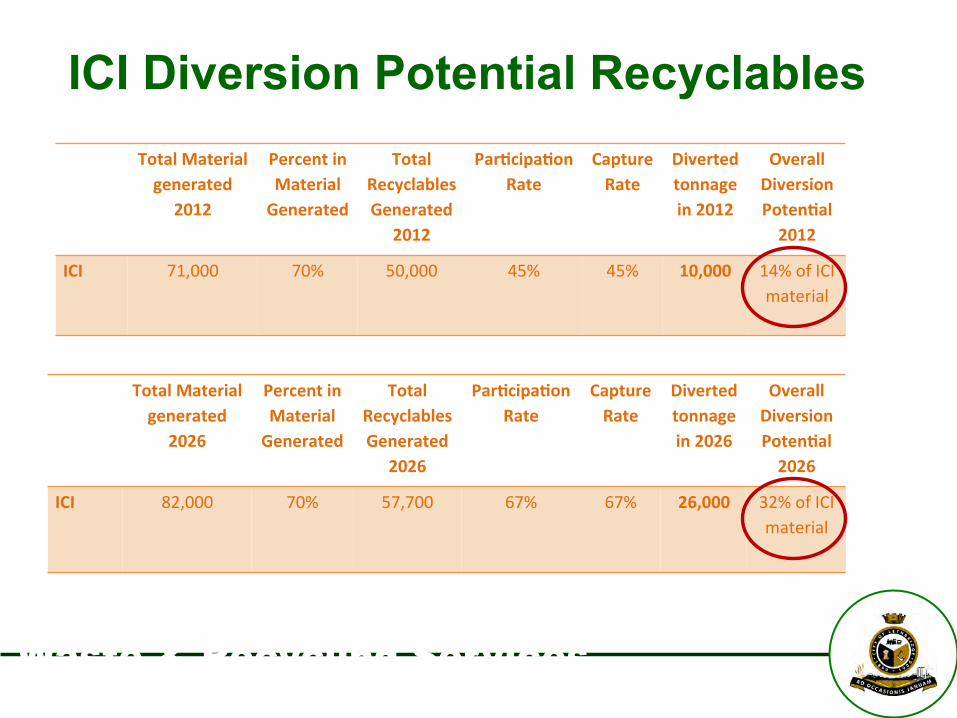
ICI Diversion Potential Recyclables Total Material generated
2012
Percent in Material Generated
Total Recyclables Generated
2012
Par.cipa.on Rate
Capture Rate
Diverted tonnage in 2012
Overall Diversion Poten.al 2012
ICI 71,000 70% 50,000 45% 45% 10,000 14% of ICI material
Total Material generated
2026
Percent in Material Generated
Total Recyclables Generated
2026
Par.cipa.on Rate
Capture Rate
Diverted tonnage in 2026
Overall Diversion Poten.al 2026
ICI 82,000 70% 57,700 67% 67% 26,000 32% of ICI material

WATER UTILITY Waste & Recycling Services
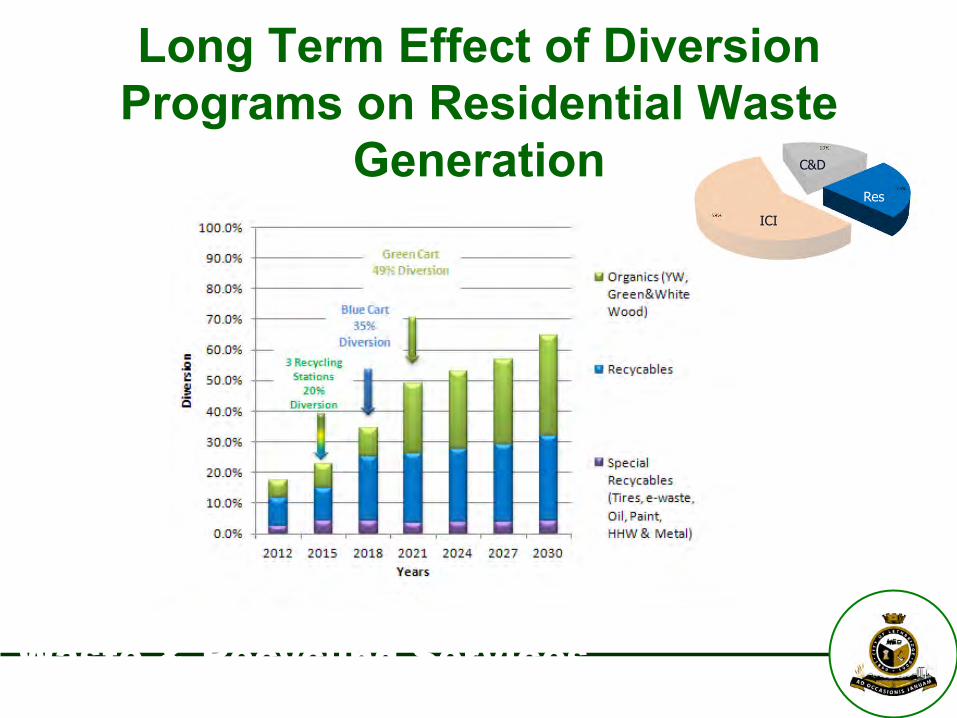
Long Term Effect of Diversion Programs on Residential Waste
Generation Res
ICI
C&D
WATER UTILITY Waste & Recycling Services
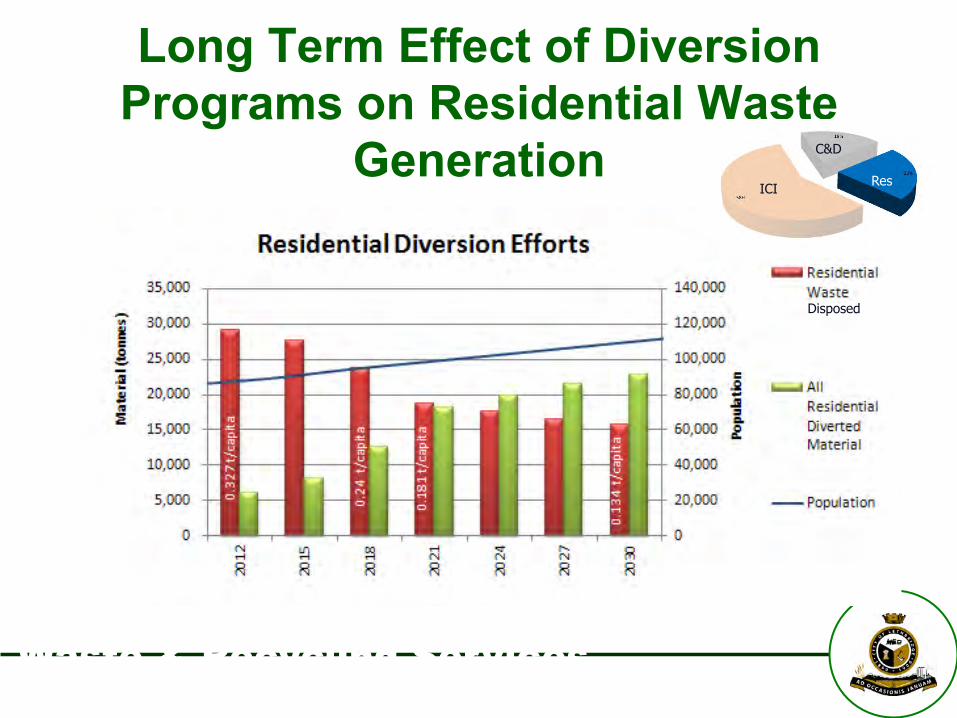
Long Term Effect of Diversion Programs on Residential Waste
Generation C&D
Res ICI
Disposed
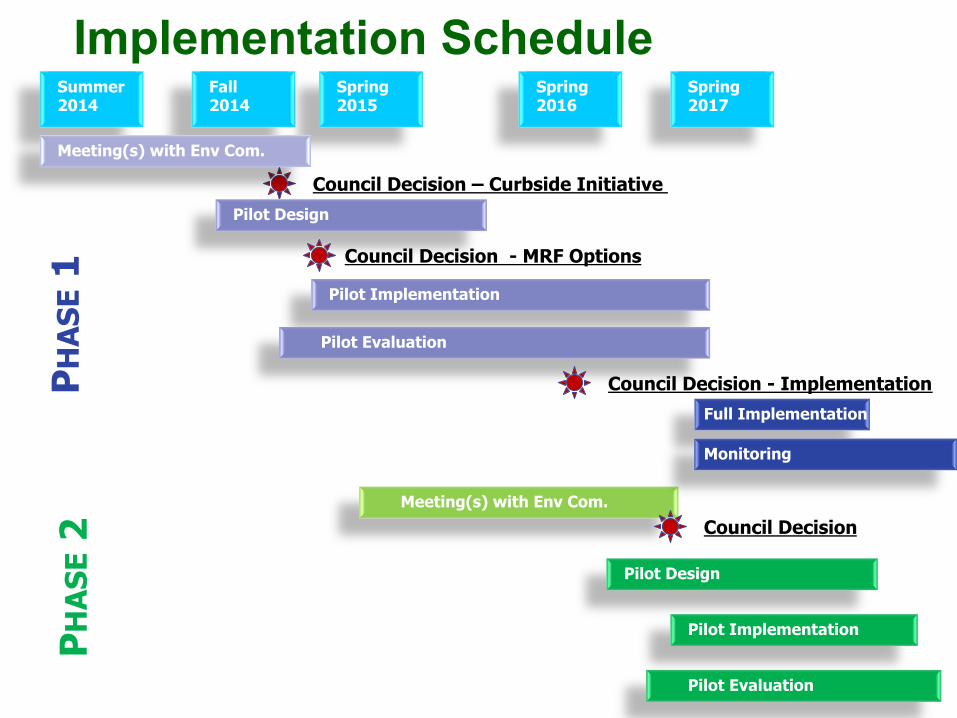
Implementation Schedule
Meeting(s) with Env Com.
Council Decision – Curbside Initiative
Meeting(s) with Env Com.
Pilot Design
Pilot Implementation
Pilot Evaluation
Summer 2014
Fall 2014
Spring 2015
Spring 2016
Spring 2017
PH
AS
E 1
Council Decision
Pilot Design
Pilot Implementation
Pilot Evaluation
PH
AS
E 2
Council Decision - MRF Options
Full Implementation
Council Decision - Implementation
Monitoring

WATER UTILITY Waste & Recycling Services
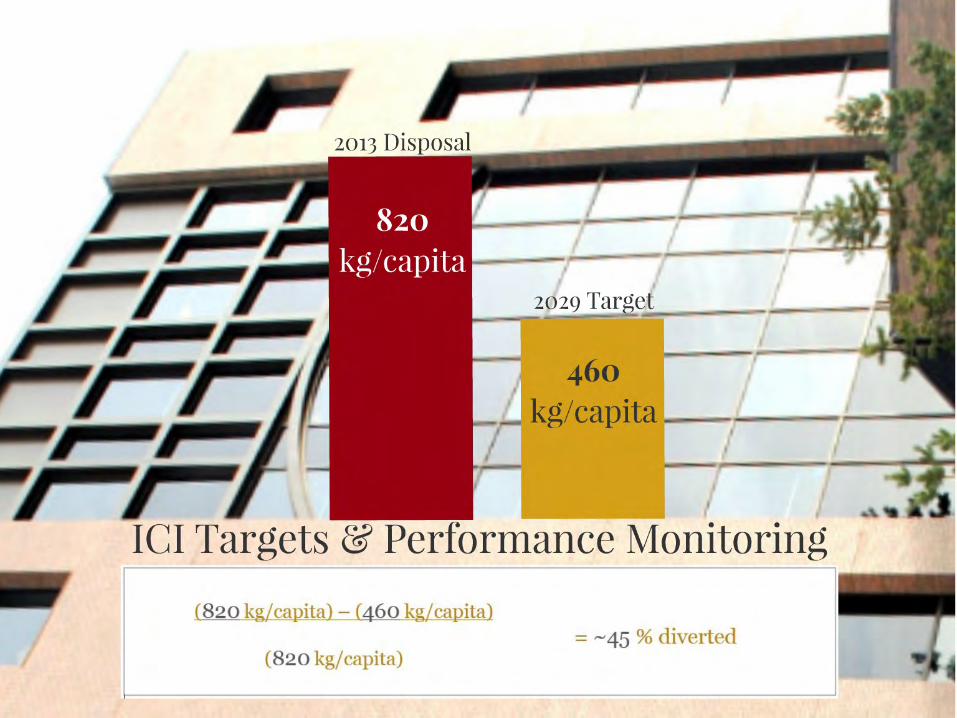
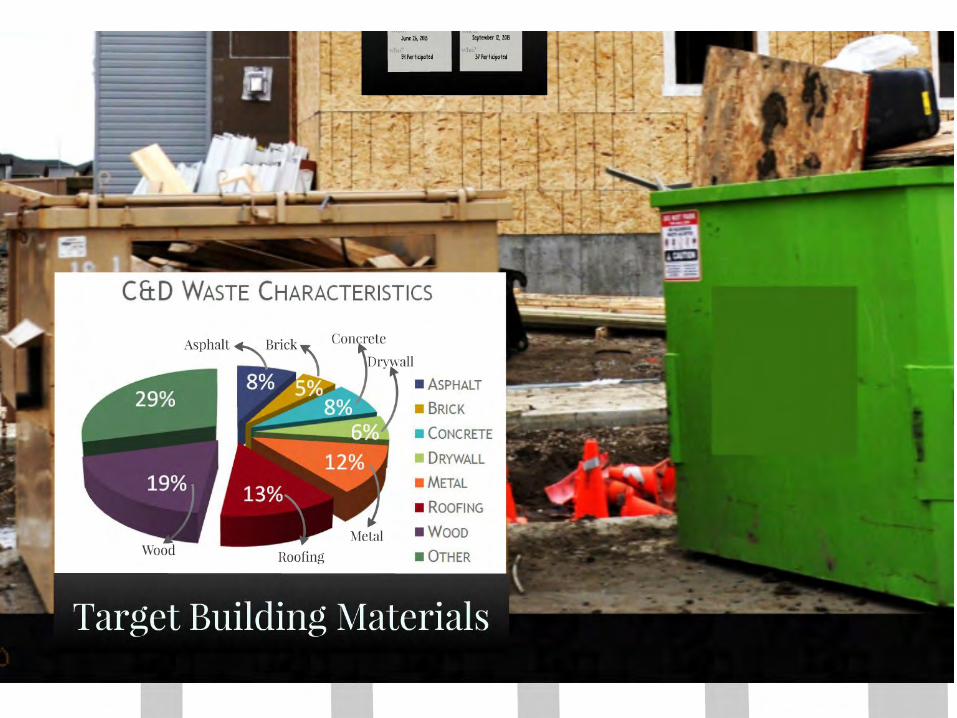
ICI/C&D Diversion Strategy


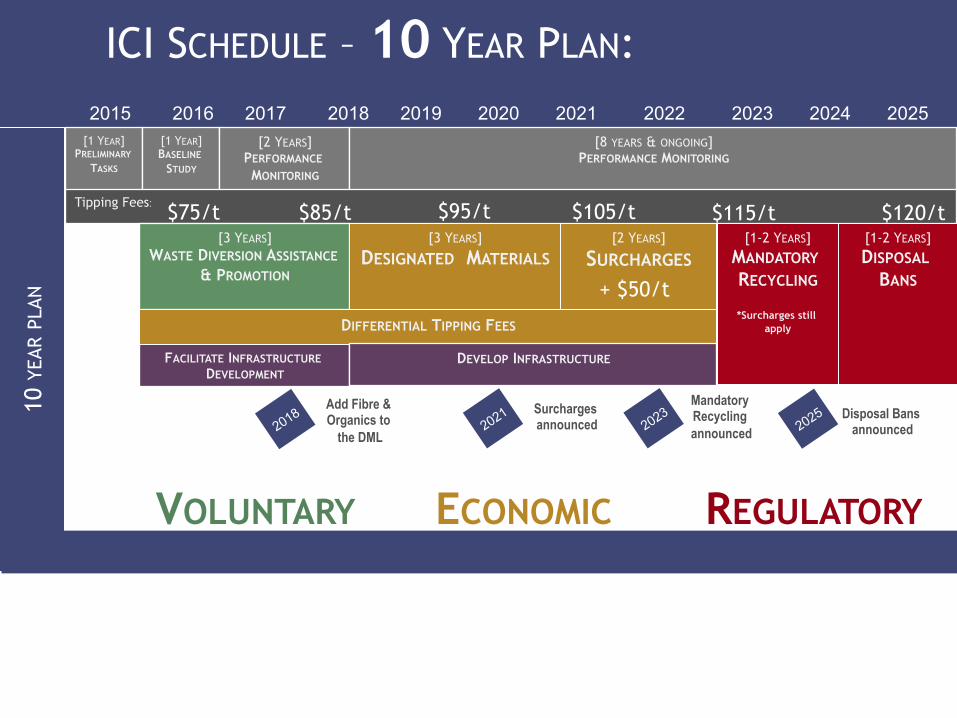
Tipping Fees:
ICI SCHEDULE – 10 YEAR PLAN:
2015 2016 2017 2018 2019 2020 2021 2022 2023 2024 2025 2026
10 Y
EAR
PLAN
[1 YEAR] PRELIMINARY
TASKS
[1 YEAR] BASELINE
STUDY
[2 YEARS] PERFORMANCE MONITORING
[3 YEARS] WASTE DIVERSION ASSISTANCE
& PROMOTION
FACILITATE INFRASTRUCTURE DEVELOPMENT
Add Fibre & Organics to
the DML
VOLUNTARY
$75/t $85/t
[8 YEARS & ONGOING] PERFORMANCE MONITORING
[3 YEARS]
DESIGNATED MATERIALS [2 YEARS]
SURCHARGES
DIFFERENTIAL TIPPING FEES
DEVELOP INFRASTRUCTURE
Surcharges announced
Mandatory Recycling announced
ECONOMIC
$95/t $105/t [1-2 YEARS]
MANDATORY RECYCLING
*Surcharges still
apply
[1-2 YEARS] DISPOSAL
BANS
Disposal Bans announced
REGULATORY
$115/t $120/t
+ $50/t
WATER UTILITY Waste & Recycling Services
City of Lethbridge Waste & Recycling Services
Questions?