Embed Size (px)
Citation preview
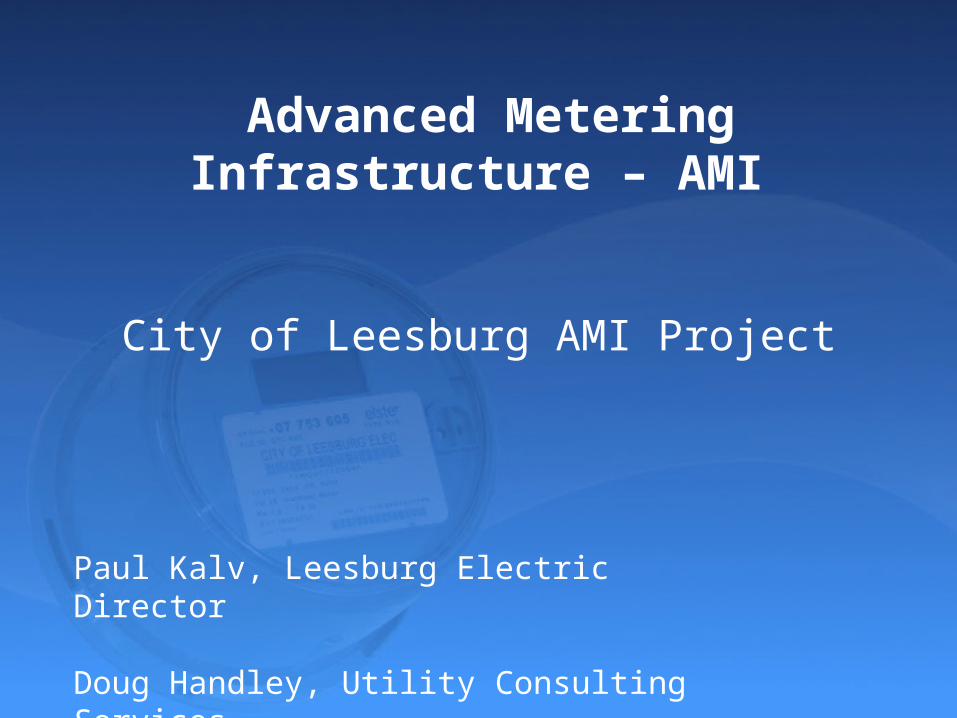
City of Leesburg AMI Project
Paul Kalv, Leesburg Electric Director
Doug Handley, Utility Consulting Services
Advanced Metering Infrastructure – AMI
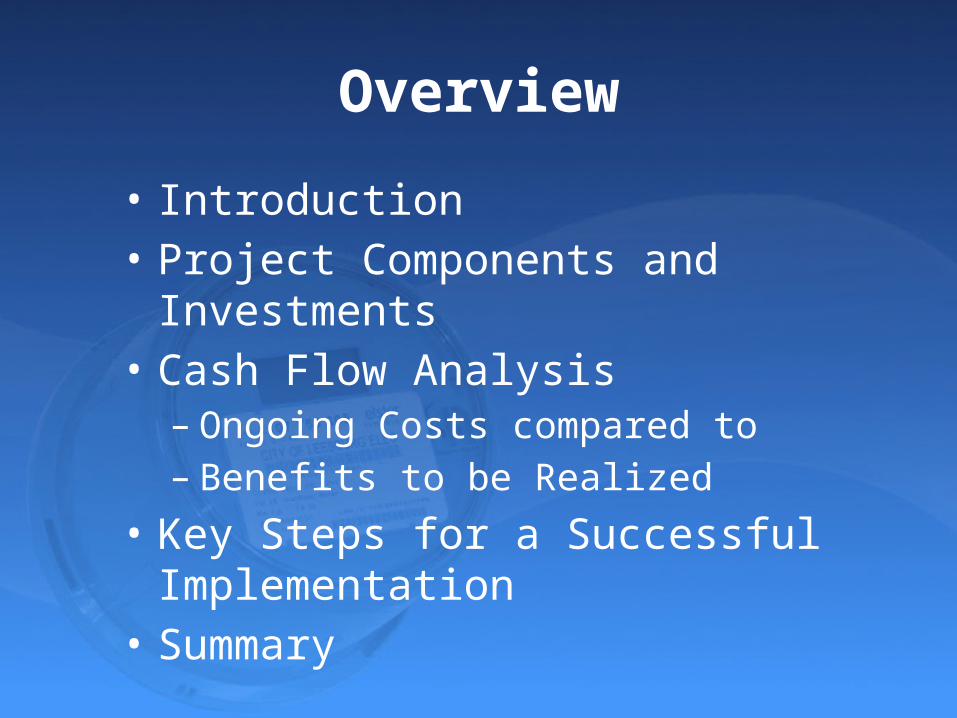
Overview
• Introduction• Project Components and Investments• Cash Flow Analysis– Ongoing Costs compared to– Benefits to be Realized
• Key Steps for a Successful Implementation• Summary
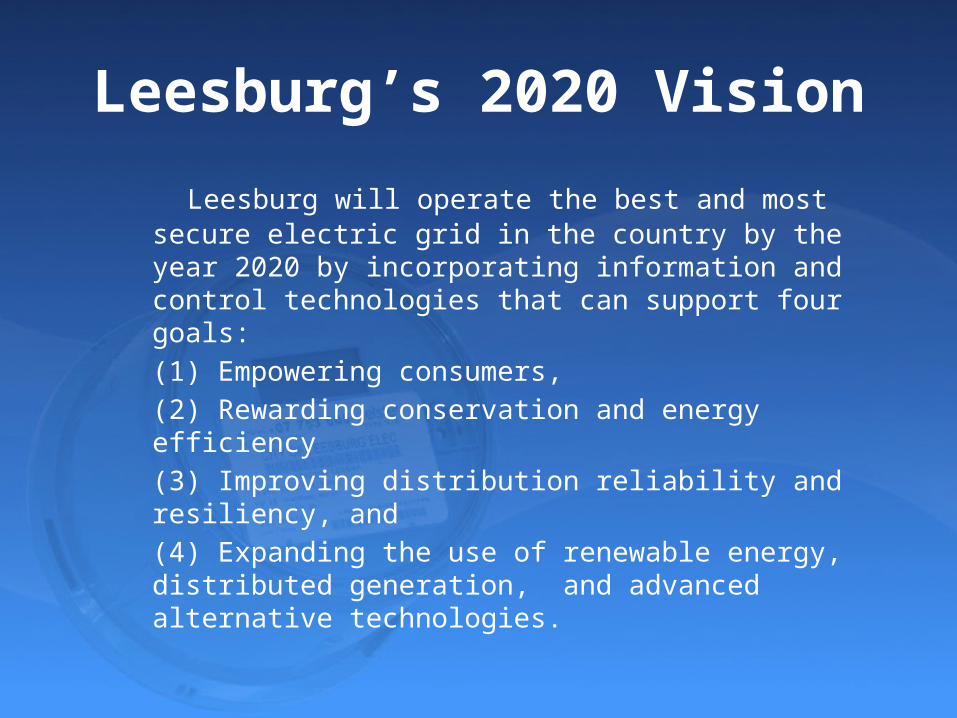
Leesburg’s 2020 Vision
Leesburg will operate the best and most secure electric grid in the country by the year 2020 by incorporating information and control technologies that can support four goals:(1) Empowering consumers,(2) Rewarding conservation and energy efficiency(3) Improving distribution reliability and resiliency, and(4) Expanding the use of renewable energy, distributed generation, and advanced alternative technologies.
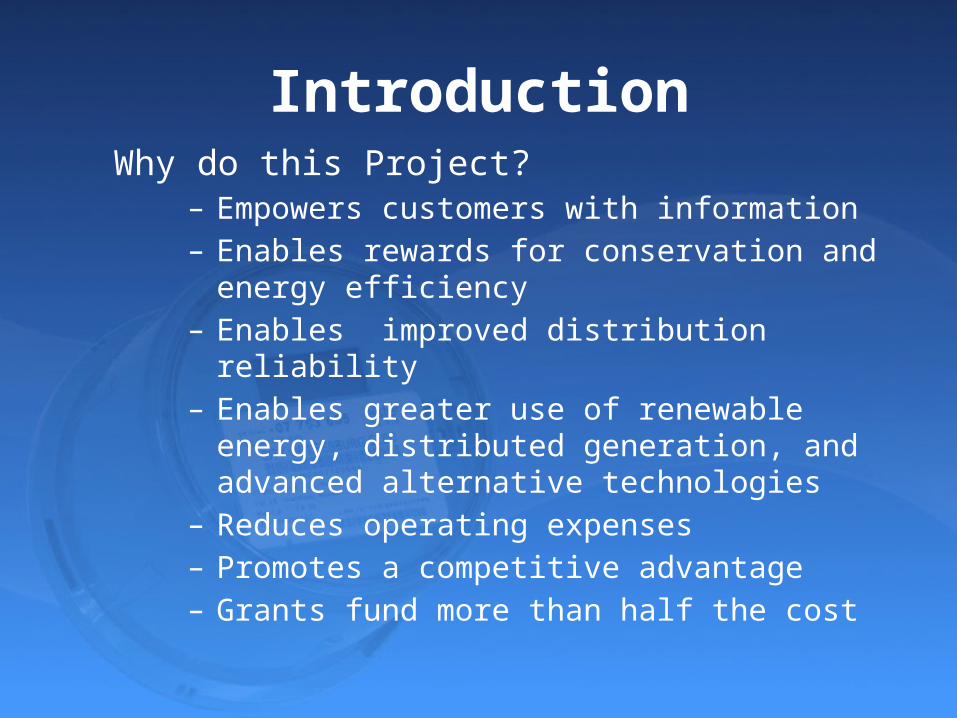
IntroductionWhy do this Project?
– Empowers customers with information– Enables rewards for conservation and energy
efficiency– Enables improved distribution reliability– Enables greater use of renewable energy,
distributed generation, and advanced alternative technologies
– Reduces operating expenses– Promotes a competitive advantage– Grants fund more than half the cost
0
5
10
15
20
25
30
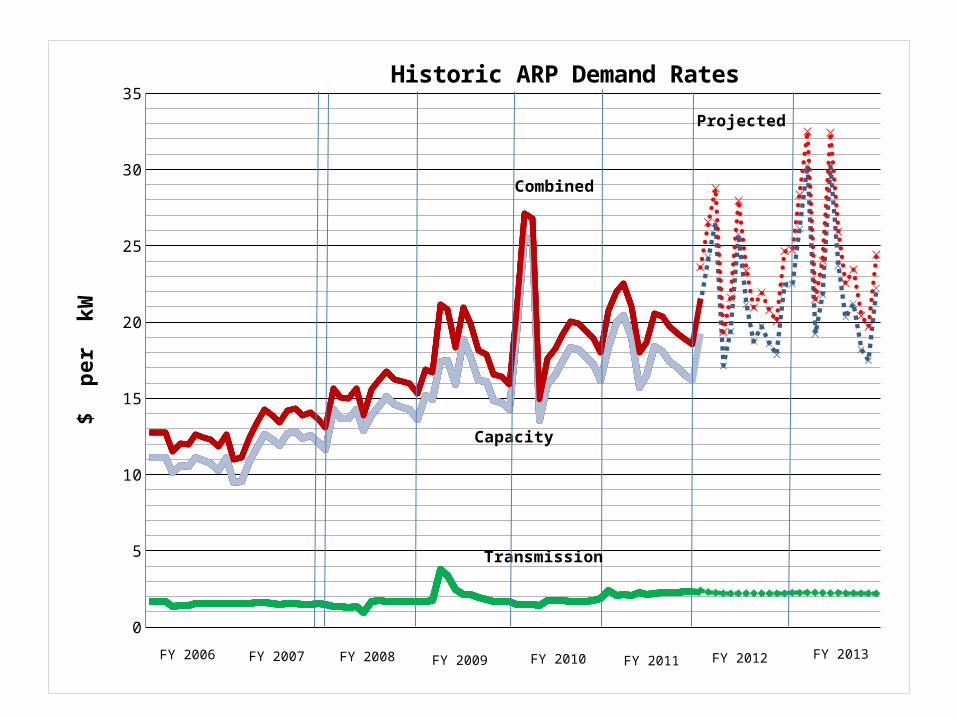
35Historic ARP Demand Rates
$ p
er k
W
FY 2006 FY 2012
Projected
Capacity
FY 2010FY 2007 FY 2008 FY 2009 FY 2013
Combined
Transmission
FY 2011
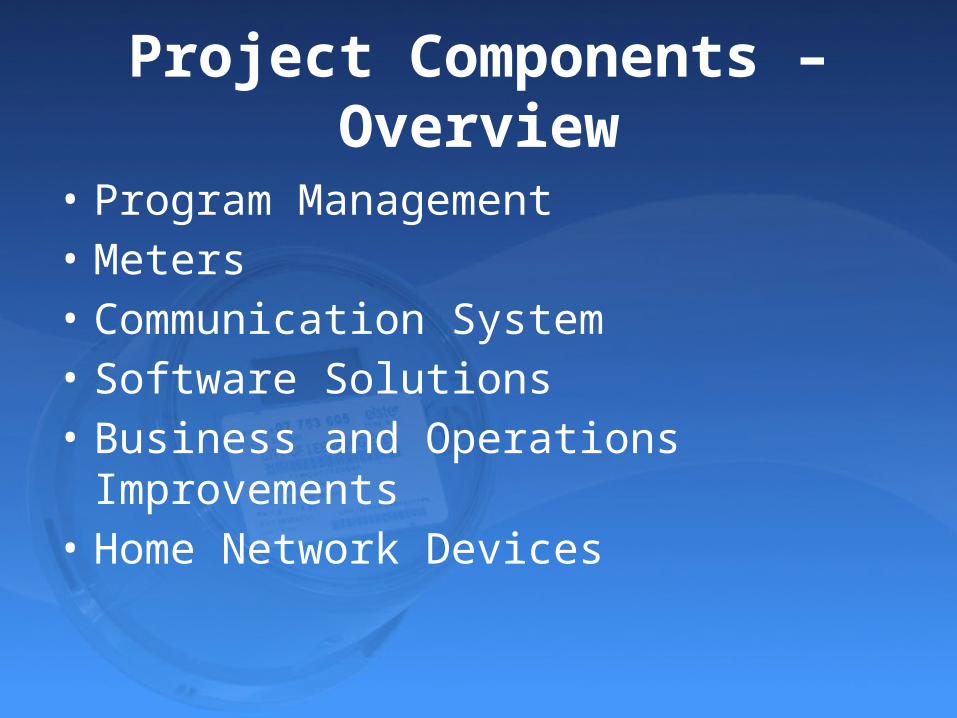
Project Components – Overview
• Program Management• Meters• Communication System• Software Solutions• Business and Operations Improvements• Home Network Devices
Project Components – Program Management
• Includes – Project Manager– Technology Coach
• Benefits– Expertise with similar large projects– Centralized control – “one back to pat” and “one
throat to choke”– Contract structure and management
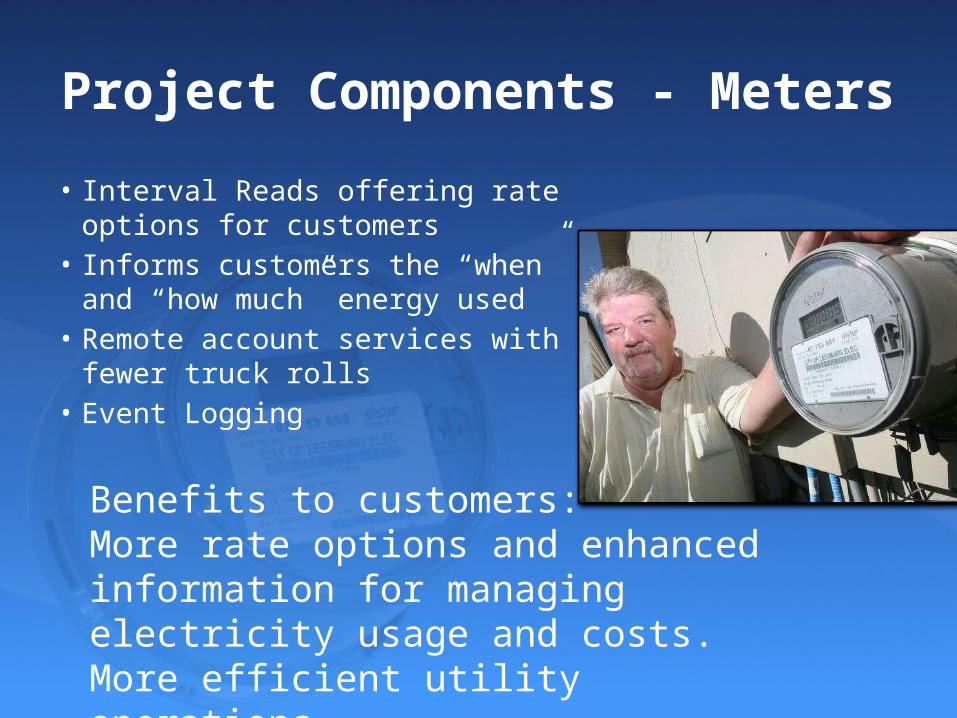
Project Components - Meters
• Interval Reads offering rate options for customers
• Informs customers the “when” and “how much” energy used
• Remote account services with fewer truck rolls
• Event Logging
Benefits to customers: More rate options and enhanced information for managing electricity usage and costs.More efficient utility operations.
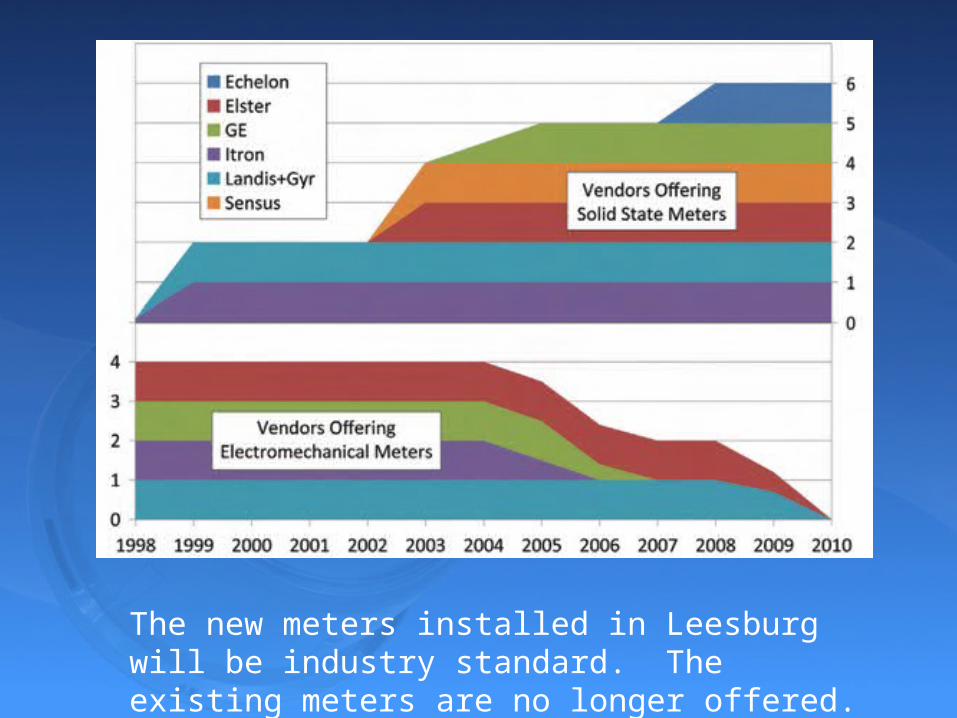
The new meters installed in Leesburg will be industry standard. The existing meters are no longer offered.
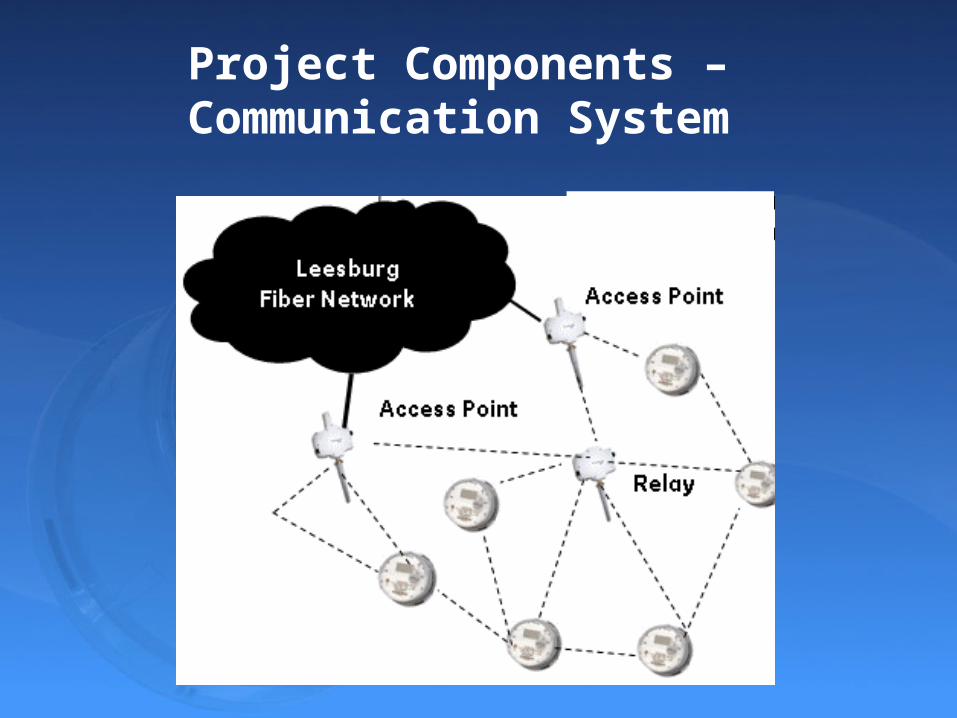
Project Components – Communication System
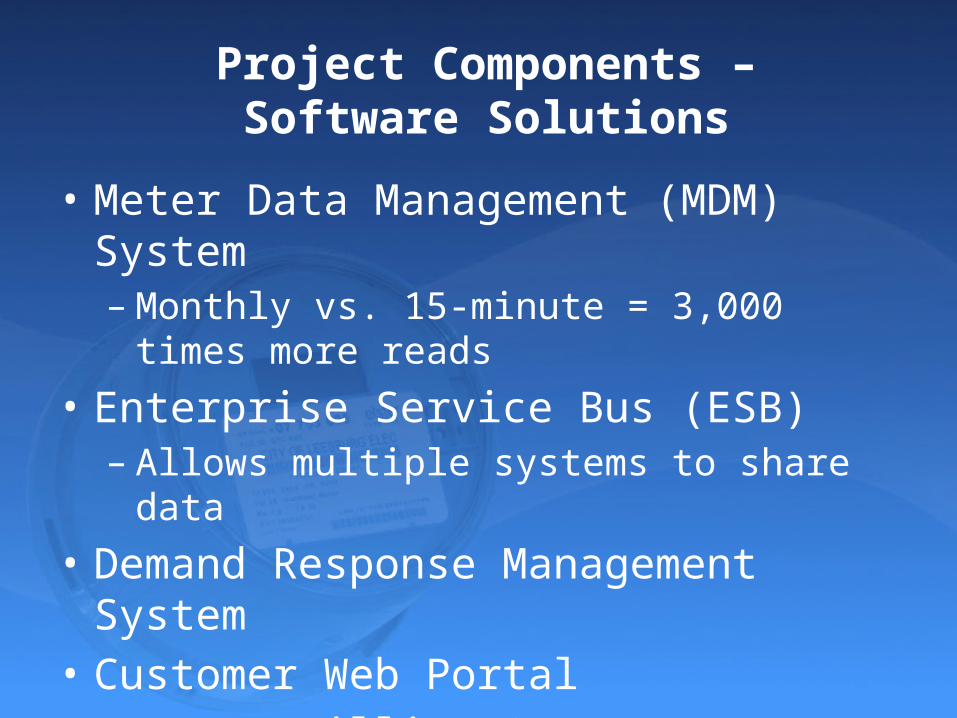
Project Components – Software Solutions
• Meter Data Management (MDM) System– Monthly vs. 15-minute = 3,000 times more reads
• Enterprise Service Bus (ESB)– Allows multiple systems to share data
• Demand Response Management System • Customer Web Portal• Pre-pay Billing System
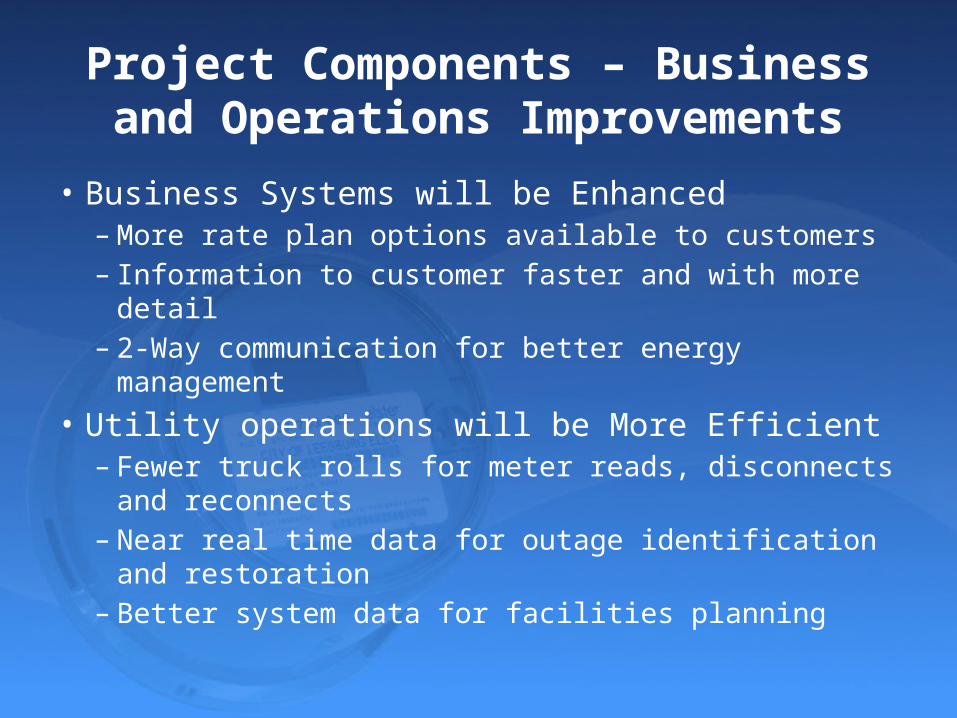
Project Components – Business and Operations Improvements
• Business Systems will be Enhanced– More rate plan options available to customers– Information to customer faster and with more detail– 2-Way communication for better energy management
• Utility operations will be More Efficient– Fewer truck rolls for meter reads, disconnects and
reconnects– Near real time data for outage identification and
restoration– Better system data for facilities planning
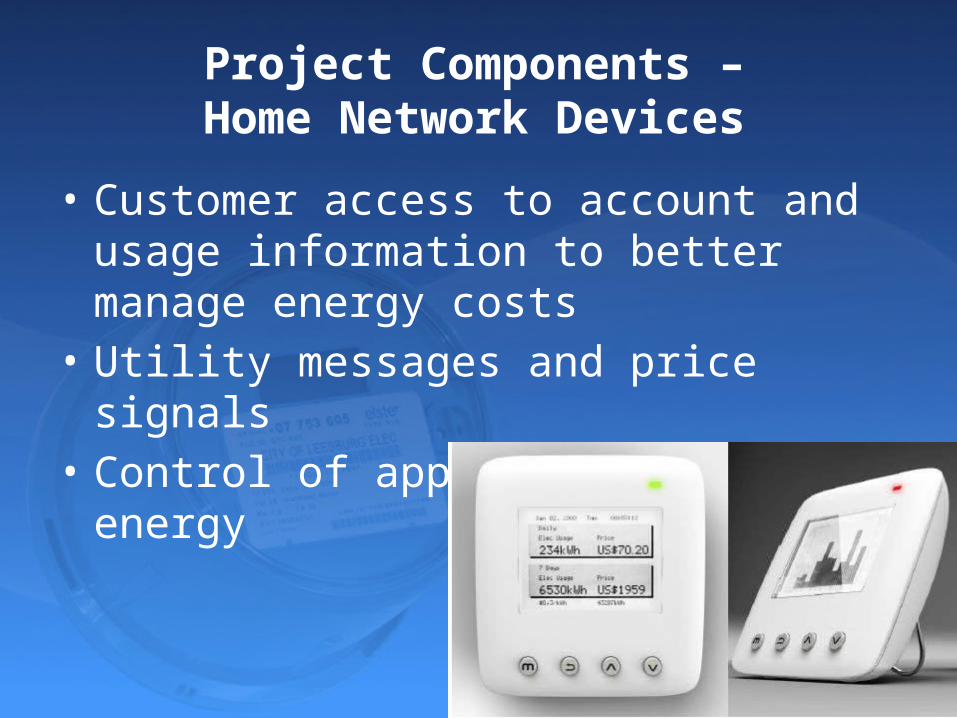
Project Components – Home Network Devices
• Customer access to account and usage information to better manage energy costs
• Utility messages and price signals• Control of appliances to save energy
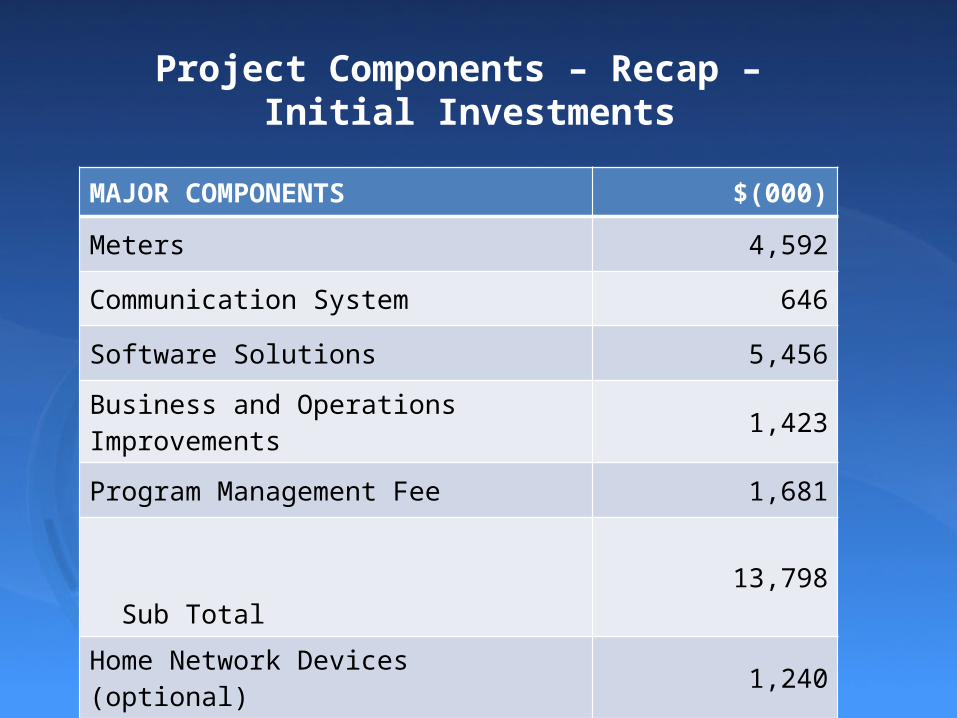
Project Components – Recap – Initial Investments
MAJOR COMPONENTS $(000)
Meters 4,592
Communication System 646
Software Solutions 5,456
Business and Operations Improvements 1,423
Program Management Fee 1,681
Sub Total 13,798
Home Network Devices (optional) 1,240
TOTAL 15,038
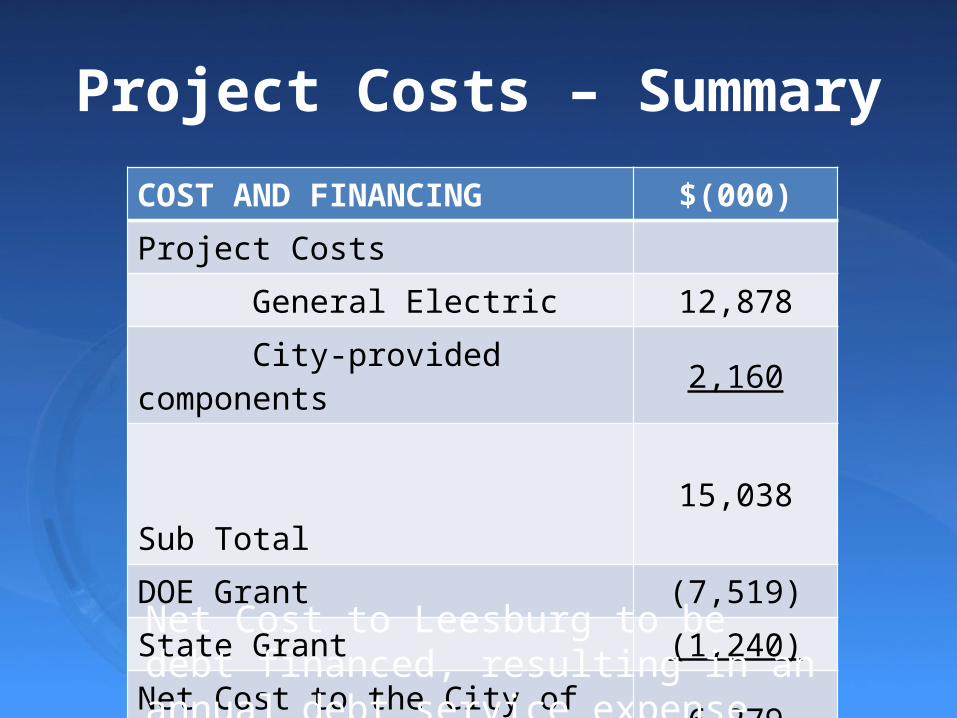
Project Costs – SummaryCOST AND FINANCING $(000)Project Costs General Electric 12,878 City-provided components 2,160 Sub Total 15,038DOE Grant (7,519)State Grant (1,240)Net Cost to the City of Leesburg 6,279
Net Cost to Leesburg to be debt financed, resulting in an annual debt service expense
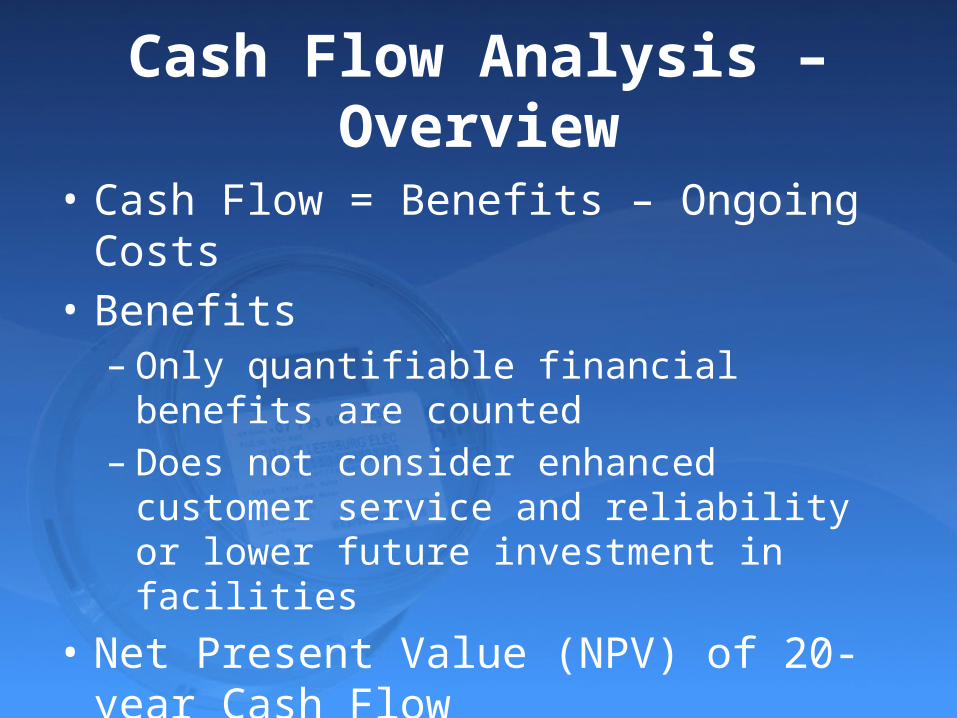
Cash Flow Analysis – Overview
• Cash Flow = Benefits – Ongoing Costs • Benefits– Only quantifiable financial benefits are counted– Does not consider enhanced customer service and
reliability or lower future investment in facilities• Net Present Value (NPV) of 20-year Cash Flow– Compared to Initial Investment to determine
“payback period”
Ongoing Costs
• Debt Service • Information systems hosting service• City Operating expenses
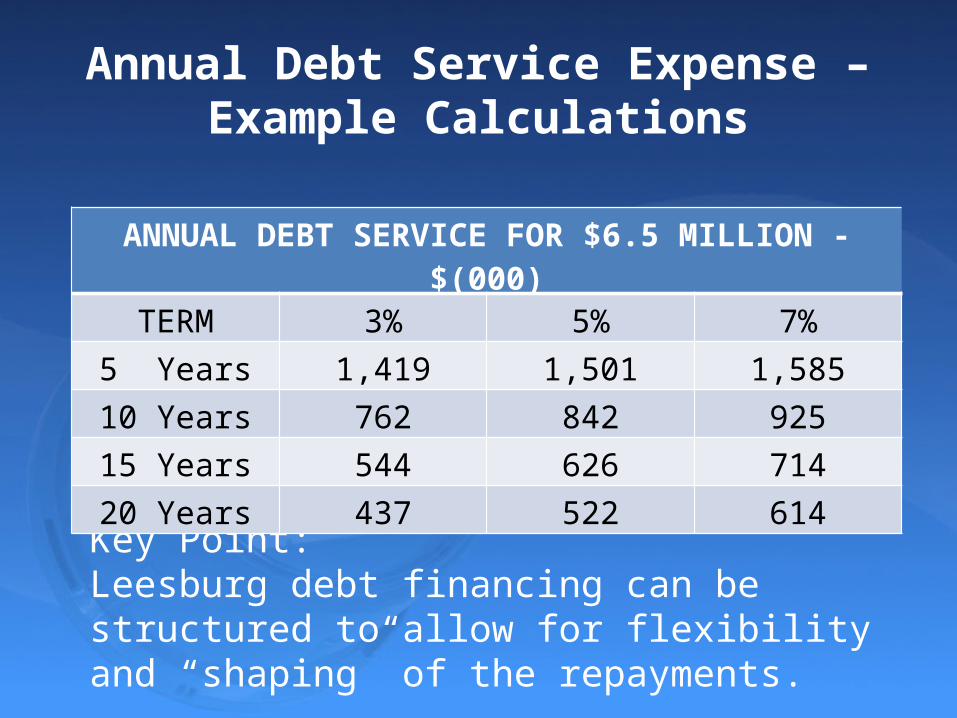
Annual Debt Service Expense – Example Calculations
Key Point:Leesburg debt financing can be structured to allow for flexibility and “shaping” of the repayments.
ANNUAL DEBT SERVICE FOR $6.5 MILLION - $(000)TERM 3% 5% 7%
5 Years 1,419 1,501 1,58510 Years 762 842 92515 Years 544 626 71420 Years 437 522 614
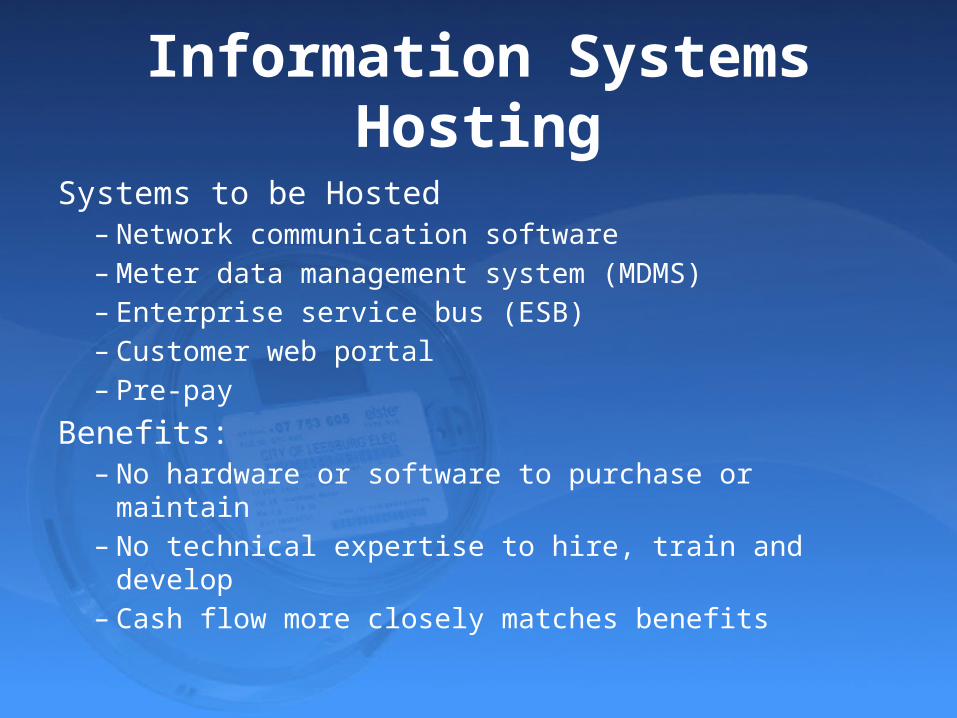
Information Systems Hosting
Systems to be Hosted– Network communication software– Meter data management system (MDMS)– Enterprise service bus (ESB)– Customer web portal– Pre-pay
Benefits:– No hardware or software to purchase or maintain– No technical expertise to hire, train and develop– Cash flow more closely matches benefits
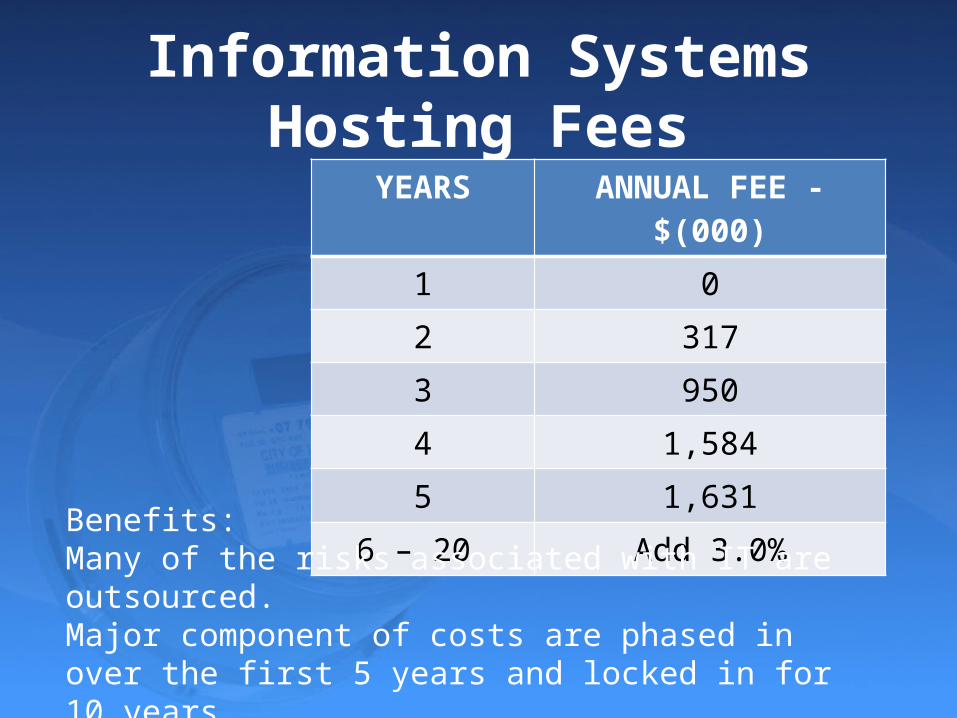
Information Systems Hosting FeesYEARS ANNUAL FEE - $(000)
1 02 3173 9504 1,5845 1,631
6 – 20 Add 3.0%
Benefits:Many of the risks associated with IT are outsourced.Major component of costs are phased in over the first 5 years and locked in for 10 years.
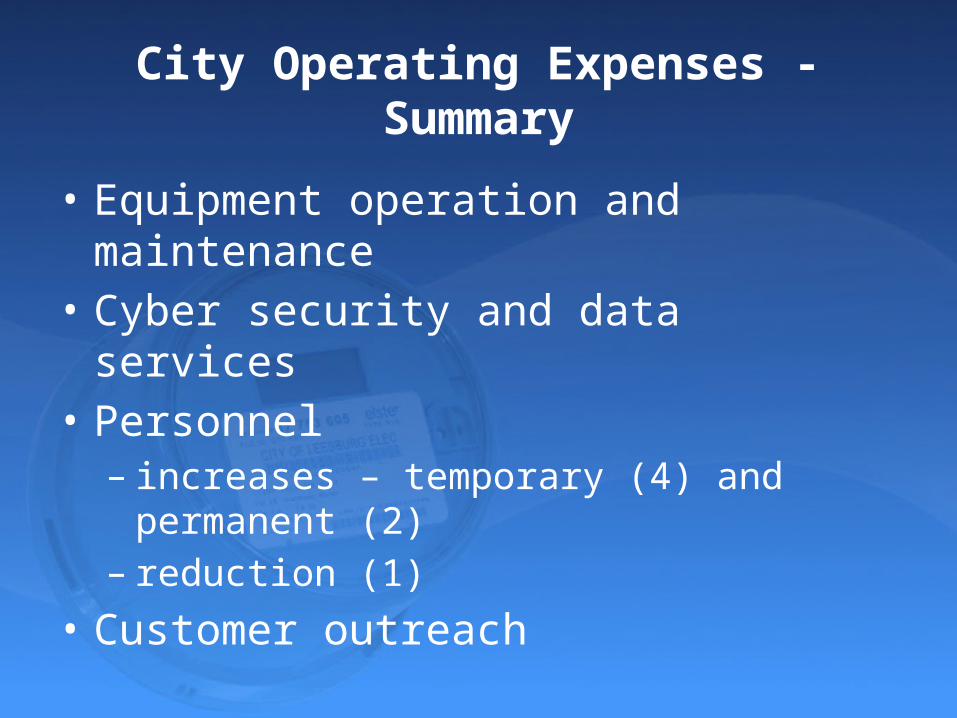
City Operating Expenses - Summary
• Equipment operation and maintenance• Cyber security and data services• Personnel – increases – temporary (4) and permanent (2)– reduction (1)
• Customer outreach
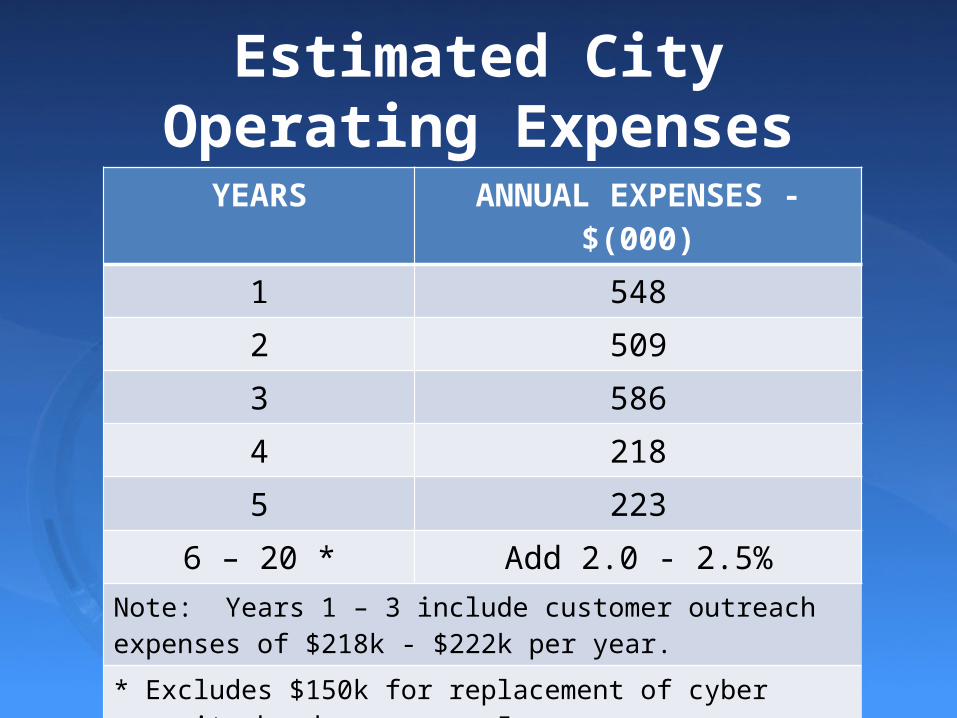
Estimated City Operating ExpensesYEARS ANNUAL EXPENSES - $(000)
1 5482 5093 5864 2185 223
6 – 20 * Add 2.0 - 2.5%Note: Years 1 – 3 include customer outreach expenses of $218k - $222k per year.* Excludes $150k for replacement of cyber security hardware every 5 years.
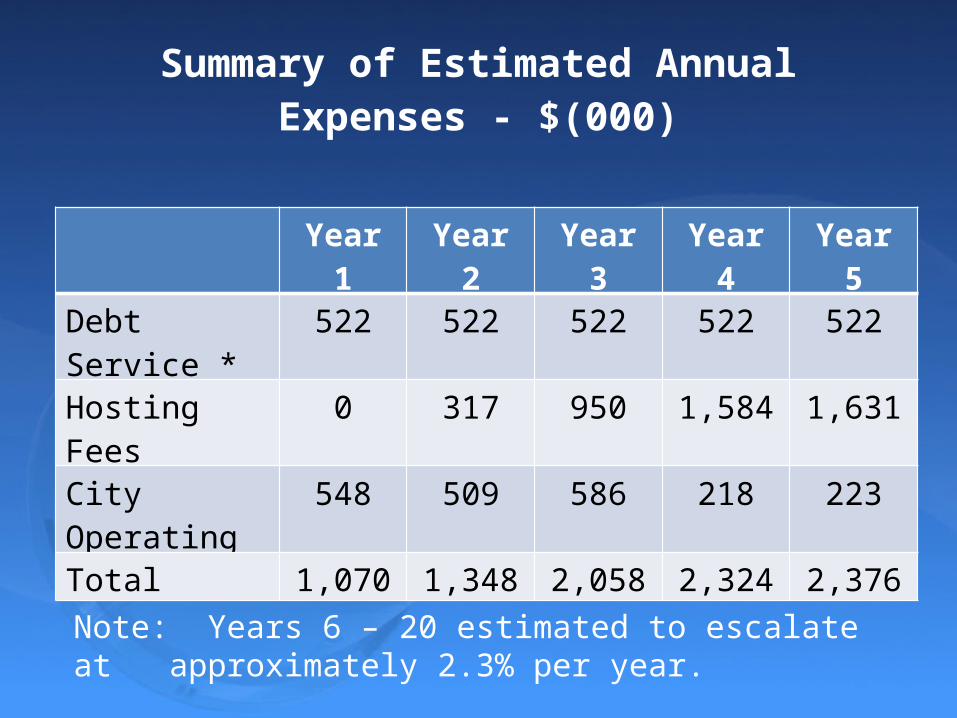
Summary of Estimated Annual Expenses - $(000)
* Based on assumed 20-year term and 5% interest rate.
Note: Years 6 – 20 estimated to escalate at approximately 2.3% per year.
Year 1 Year 2 Year 3 Year 4 Year 5Debt Service * 522 522 522 522 522Hosting Fees 0 317 950 1,584 1,631City Operating 548 509 586 218 223Total 1,070 1,348 2,058 2,324 2,376
Benefits to be Realized
• Soft Benefits– Customer benefits, choices, rate options– Improved outage restoration
• Financial Benefits– Power cost reductions– Fewer “truck rolls” for disconnect/reconnect and
re-reads– Better revenue collection– Reduced energy theft
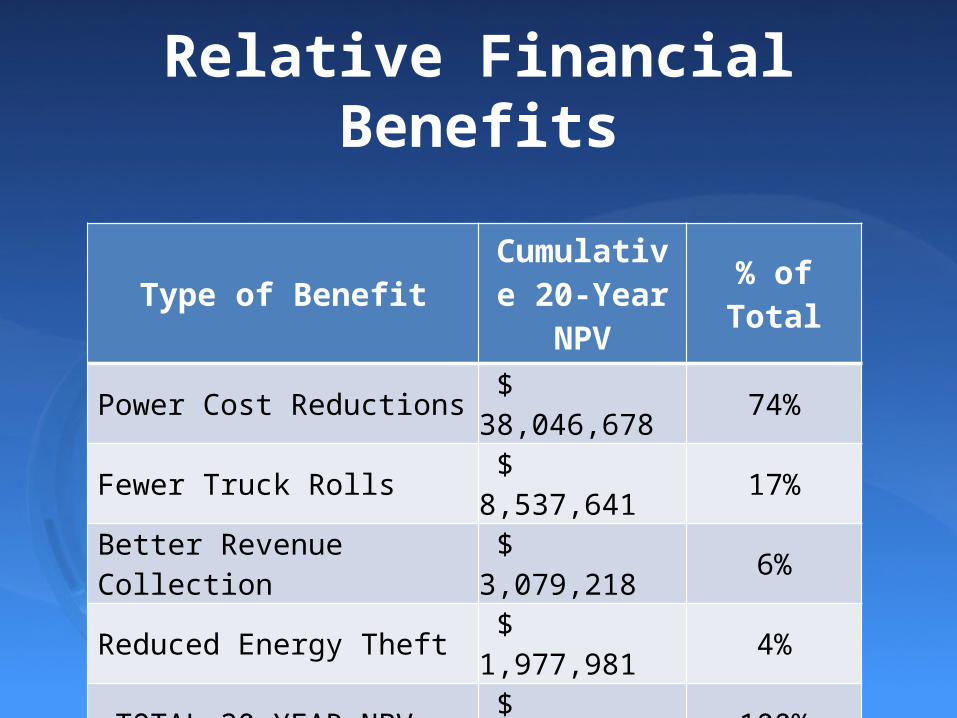
Relative Financial Benefits
Type of Benefit Cumulative 20-Year NPV % of Total
Power Cost Reductions $ 38,046,678 74%
Fewer Truck Rolls $ 8,537,641 17%
Better Revenue Collection $ 3,079,218 6%
Reduced Energy Theft $ 1,977,981 4%
TOTAL 20-YEAR NPV $ 51,641,519 100%
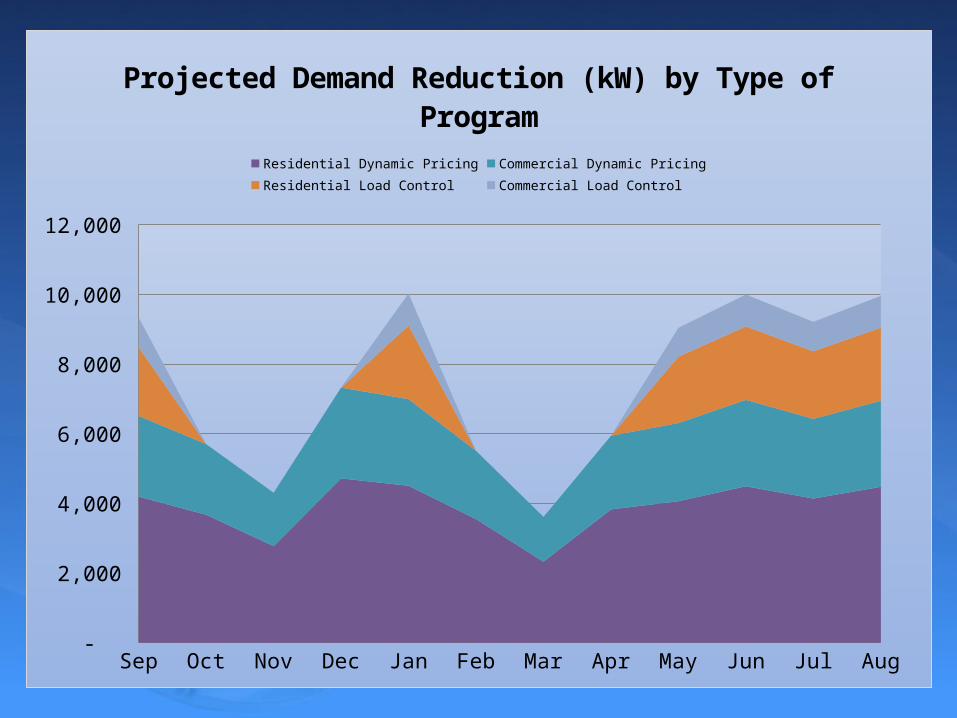
Sep Oct Nov Dec Jan Feb Mar Apr May Jun Jul Aug -
2,000
4,000
6,000
8,000
10,000
12,000
Projected Demand Reduction (kW) by Type of ProgramResidential Dynamic Pricing Commercial Dynamic Pricing Residential Load Control Commercial Load Control
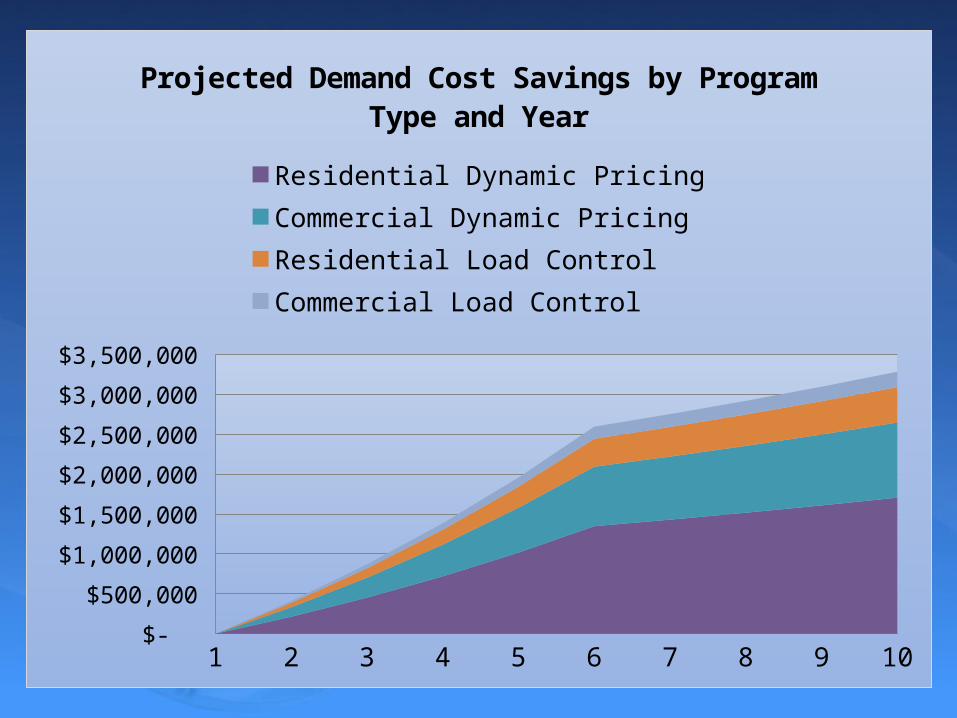
1 2 3 4 5 6 7 8 9 10 $-
$500,000
$1,000,000
$1,500,000
$2,000,000
$2,500,000
$3,000,000
$3,500,000
Projected Demand Cost Savings by Program Type and Year
Residential Dynamic Pricing Commercial Dynamic PricingResidential Load Control Commercial Load Control
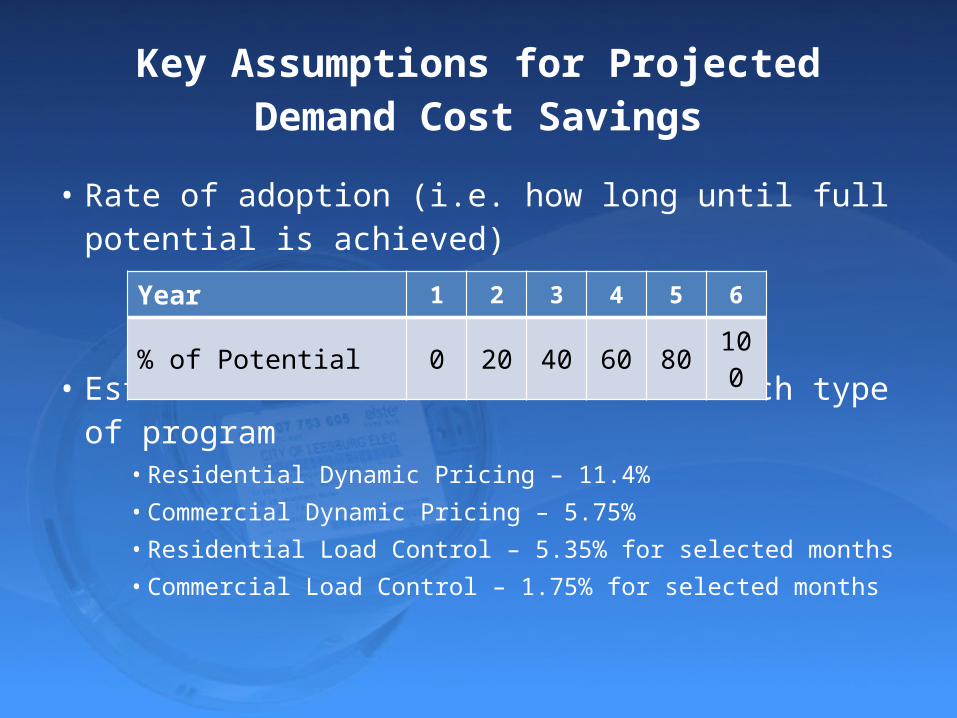
Key Assumptions for Projected Demand Cost Savings
• Rate of adoption (i.e. how long until full potential is achieved)
• Estimated % demand reduction for each type of program
• Residential Dynamic Pricing – 11.4%• Commercial Dynamic Pricing – 5.75%• Residential Load Control – 5.35% for selected months• Commercial Load Control – 1.75% for selected months
Year 1 2 3 4 5 6
% of Potential 0 20 40 60 80 100
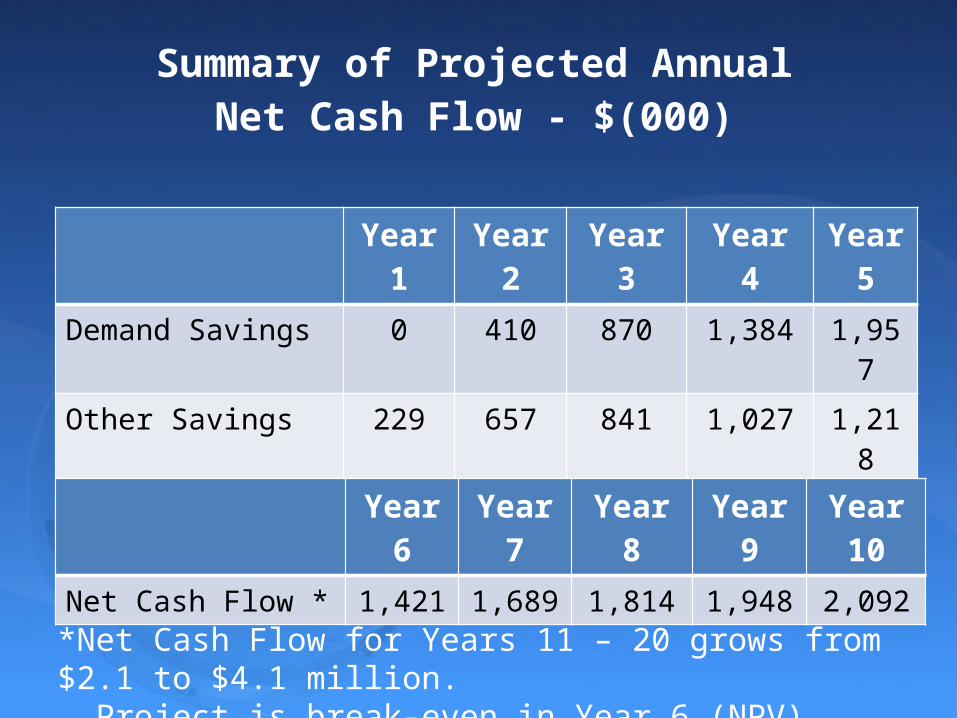
Summary of Projected Annual Net Cash Flow - $(000)
Year 1 Year 2 Year 3 Year 4 Year 5Demand Savings 0 410 870 1,384 1,957Other Savings 229 657 841 1,027 1,218Expenses 1,070 1,348 2,058 2,324 2,376Net Cash Flow 841 281 377 87 799
Year 6 Year 7 Year 8 Year 9 Year 10Net Cash Flow * 1,421 1,689 1,814 1,948 2,092
*Net Cash Flow for Years 11 – 20 grows from $2.1 to $4.1 million. Project is break-even in Year 6 (NPV)
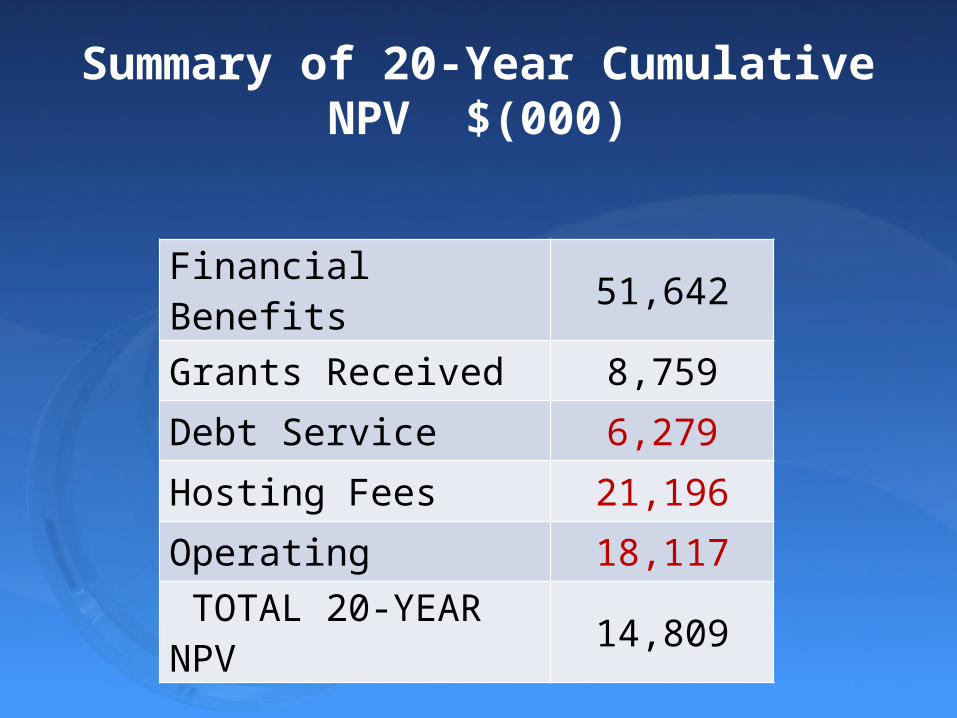
Summary of 20-Year Cumulative NPV $(000)
Financial Benefits 51,642
Grants Received 8,759
Debt Service 6,279
Hosting Fees 21,196
Operating 18,117
TOTAL 20-YEAR NPV 14,809
Key Steps for a Successful Implementation
• Execute contract – tonight’s agenda• Dynamic Pricing programs• Personnel development• Customer outreach
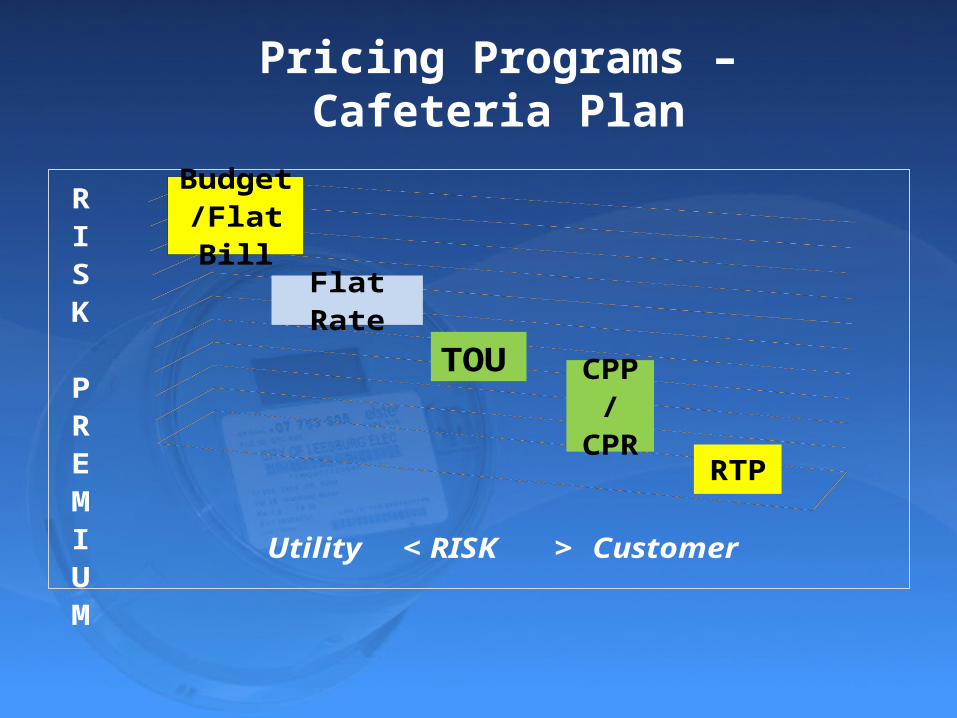
Pricing Programs – Cafeteria Plan
Utility < RISK > Customer
RISK PREMIUM
Budget/Flat Bill
Flat Rate
TOU CPP
/CPR
RTP
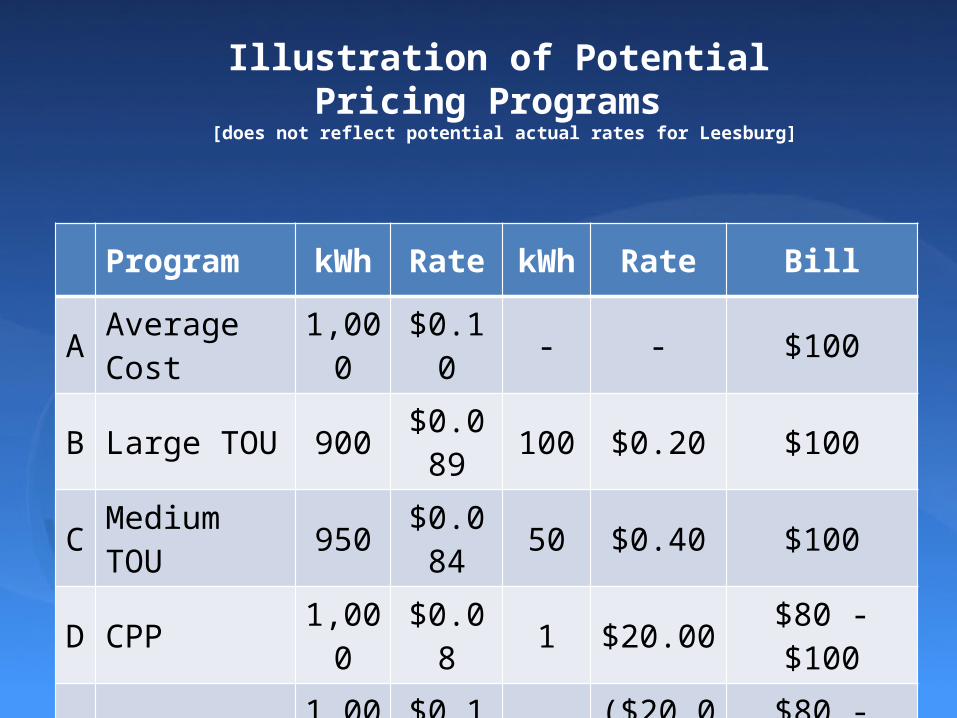
Illustration of Potential Pricing Programs
[does not reflect potential actual rates for Leesburg]
Program kWh Rate kWh Rate Bill
A Average Cost 1,000 $0.10 - - $100
B Large TOU 900 $0.089 100 $0.20 $100
C Medium TOU 950 $0.084 50 $0.40 $100
D CPP 1,000 $0.08 1 $20.00 $80 - $100
E CPR 1,000 $0.10 1 ($20.00) $80 - $100
Implementation Steps – Pricing Program Goals
• Offer customers choices– Pick the plan that’s right for you– Opt-in or Opt-out
• Provide incentives to customers to reduce peak demand
• Share power cost savings with customers that cause reductions in peak demand
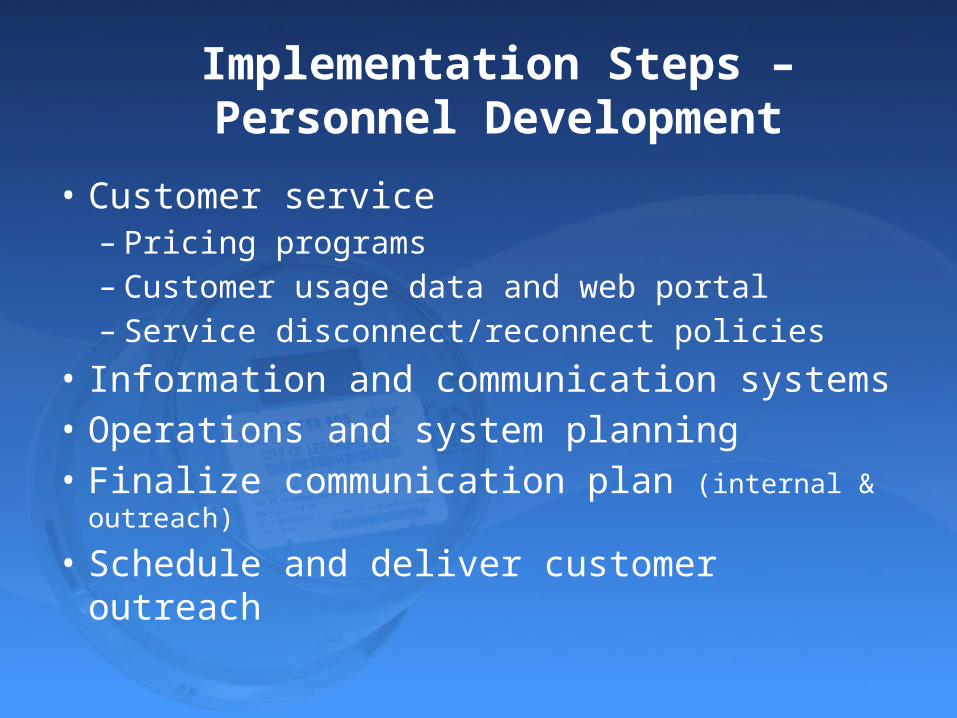
Implementation Steps – Personnel Development
• Customer service– Pricing programs– Customer usage data and web portal– Service disconnect/reconnect policies
• Information and communication systems• Operations and system planning• Finalize communication plan (internal & outreach)
• Schedule and deliver customer outreach
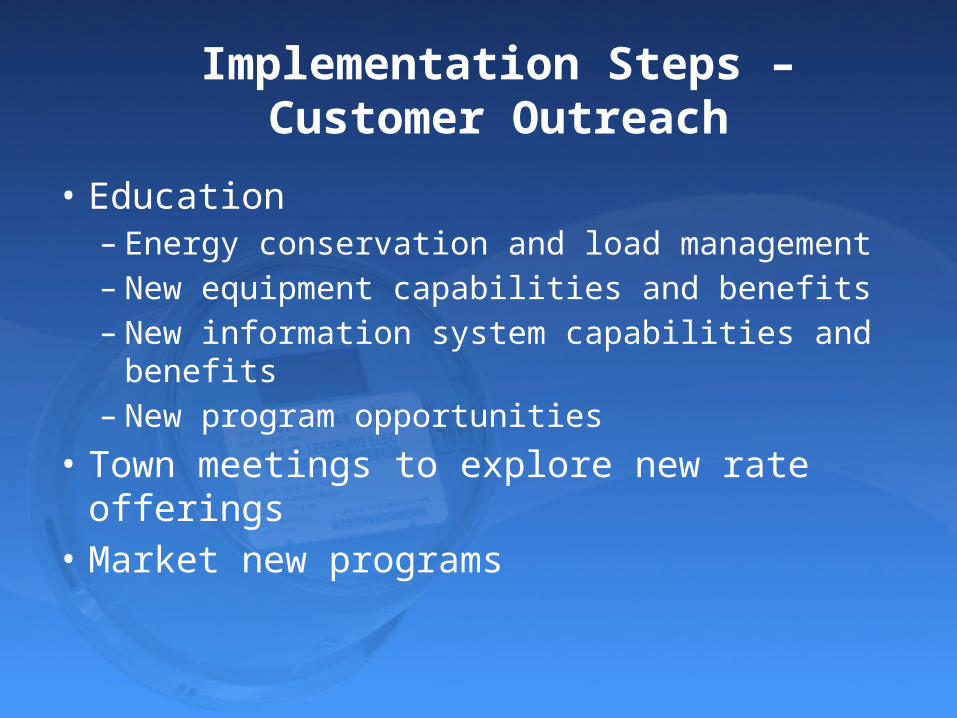
Implementation Steps – Customer Outreach
• Education– Energy conservation and load management– New equipment capabilities and benefits– New information system capabilities and benefits– New program opportunities
• Town meetings to explore new rate offerings• Market new programs
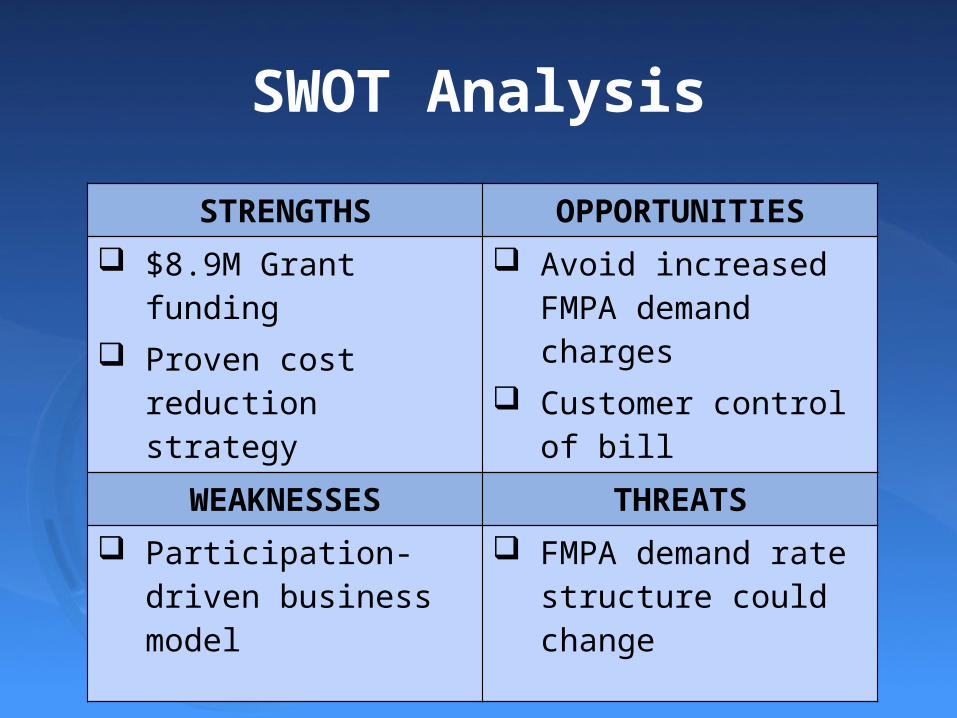
SWOT Analysis
STRENGTHS OPPORTUNITIES $8.9M Grant funding Proven cost reduction
strategy
Avoid increased FMPA demand charges
Customer control of bill
WEAKNESSES THREATS Participation-driven
business model FMPA demand rate
structure could change
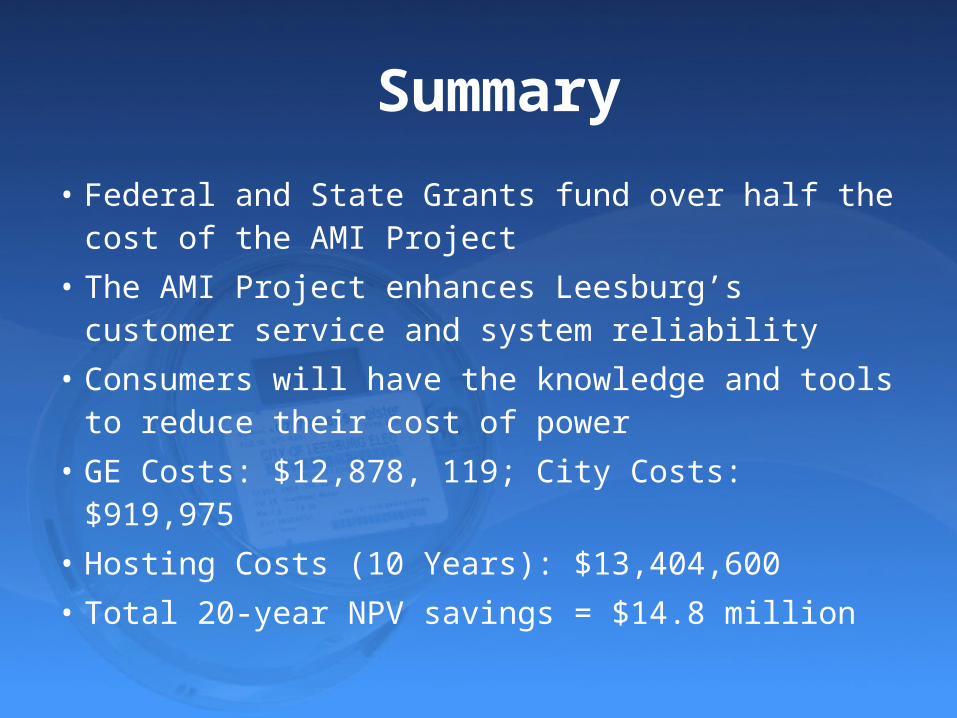
Summary
• Federal and State Grants fund over half the cost of the AMI Project
• The AMI Project enhances Leesburg’s customer service and system reliability
• Consumers will have the knowledge and tools to reduce their cost of power
• GE Costs: $12,878, 119; City Costs: $919,975• Hosting Costs (10 Years): $13,404,600• Total 20-year NPV savings = $14.8 million
Acknowledgement & DisclaimerThis material is based upon work supported by the Department of Energy under Award Number DE-OE0000365. Disclaimer: This report was prepared as an account of work sponsored by an agency of the United States Government. Neither the United States Government nor any agency thereof, nor any of their employees, makes any warranty, express or implied, or assumes any legal liability or responsibility for the accuracy, completeness, or usefulness of any information, apparatus, product, or process disclosed, or represents that its use would not infringe privately owned rights. Reference herein to any specific commercial product, process, or service by trade name, trademark, manufacturer, or otherwise does not necessarily constitute or imply its endorsement, recommendation, or favoring by the United States Government or any agency thereof. The views and opinions of authors expressed herein do not necessarily state or reflect those of the United States Government or any agency thereof.