Embed Size (px)
Citation preview
Analysis of the Impediments to Fair Housing
Knoxville, Tennessee 2010
City of Knoxville Community Development Department
400 Main Street Knoxville, TN 37902
(865) 215‐2120 [email protected]
Prepared by: Community Development Services
July 9th, 2010
Knoxville Analysis of the Impediments to Fair Housing 2010 Page 2
Table of Contents SECTION I: Introduction, Methodology and Background ............................................................... 5
METHODOLOGY .......................................................................................................................... 6
BACKGROUND............................................................................................................................. 7
CITY OF KNOXVILLE OFFICE OF FAIR HOUSING........................................................................... 7
Case Processing Procedures: Investigation, Conciliation and Enforcement .......................... 7
I. Investigation..................................................................................................................... 7
II. Intake Process............................................................................................................... 7
III. Conciliation of Housing Discrimination Complaints ................................................... 14
IV. Enforcement Activities ............................................................................................... 16
KNOXVILLE ANALYSIS OF THE IMPEDIMENTS TO FAIR HOUSING 2005.................................... 17
Knoxville Progress (2005‐2010) ............................................................................................ 19
SECTION II: Demographic and Economic Overview...................................................................... 21
OVERVIEW................................................................................................................................. 21
EMPLOYMENT PROFILE............................................................................................................. 22
DEMOGRAPHIC PROFILE ............................................................................................................... 24
POPULATION............................................................................................................................. 24
RACE/ETHNICITY ....................................................................................................................... 30
HOUSEHOLD CHARACTERISTICS ............................................................................................... 31
INCOME PROFILE........................................................................................................................... 32
INCOME..................................................................................................................................... 32
TENURE ..................................................................................................................................... 34
OVERVIEW OF HOUSING SUPPLY.................................................................................................. 35
TENURE AND TYPE .................................................................................................................... 35
AGE AND CONDITION................................................................................................................ 37
VACANT UNITS .......................................................................................................................... 38
HOUSING DEMAND VERSUS SUPPLY ........................................................................................ 39
HOUSING AFFORDABILITY......................................................................................................... 44
HOUSING PROBLEMS................................................................................................................ 48
SECTION III: Fair Housing Status, 2010 ......................................................................................... 49
COMPLAINTS OF UNLAWFUL DISCRIMINATION....................................................................... 50
TESTING..................................................................................................................................... 52
Table III–1: Cases Under Investigation Nationally ................................................................ 54
KNOXVILLE TITLE VIII COMPLAINTS .......................................................................................... 56
Table III‐2: Knoxville Complaints 2000‐2009 ........................................................................ 57
Knoxville Analysis of the Impediments to Fair Housing 2010 Page 3
Table III‐3: Knoxville Outcomes 2000‐2009 .......................................................................... 57
COMPARATIVE DATA ................................................................................................................ 58
Table III‐4: Knox County Complaints 1998‐2009 .................................................................. 58
Table III‐5: Knox County Outcomes 1998‐2009 .................................................................... 59
Table III‐6: Balance of State Complaints 2008‐2009............................................................. 59
Table III‐7: Balance of State Outcomes 2008‐2009 .............................................................. 60
SECTION IV: Public Sector Analysis ............................................................................................... 62
OVERVIEW................................................................................................................................. 62
TRANSPORTATION .................................................................................................................... 63
NEIGHBORHOOD REVITALIZATION ........................................................................................... 63
PROPERTY TAX POLICIES ........................................................................................................... 64
ZONING AND SITE SELECTION................................................................................................... 66
CONSOLIDATED PLAN HOUSING ACIVITIES .............................................................................. 70
AFFORDABLE HOUSING NEEDS AND ACTIVITIES ...................................................................... 70
AFFORDABLE HOUSING PRIORITIES.......................................................................................... 71
TABLE IV‐1: Consolidated Plan Priorities: 2010 ‐2015 .............................................................. 72
A. HOMEOWNERSHIP........................................................................................................... 72
B. RENTAL HOUSING ........................................................................................................... 72
C. HOMELESSNESS................................................................................................................ 73
D. NEIGHBORHOOD STABILIZATION .................................................................................... 73
E. ECONOMIC DEVELOPMENT .............................................................................................. 73
INSTITUTIONAL STRUCTURE ..................................................................................................... 74
INTERGOVERNMENTAL COOPERATION.................................................................................... 74
LEAD‐BASED PAINT HAZARD REDUCTION ................................................................................ 75
SECTION V: Fair Housing and Knoxville’s Private Sector .............................................................. 79
LENDERS IN THE CITY OF KNOXVILLE........................................................................................ 79
LENDING ACTIVITY IN THE CITY OF KNOXVILLE: 2004‐2008..................................................... 83
Analysis by Income.............................................................................................................. 100
ALTERNATIVE LENDING SOURCES........................................................................................... 105
Sub‐Prime Lenders .............................................................................................................. 105
“Payday Lenders”................................................................................................................ 105
Predatory Lenders............................................................................................................... 106
OTHER PRIVATE ENTITIES THAT IMPACT FAIR HOUSING CHOICE .......................................... 108
Homeowners Insurance Industry........................................................................................ 109
Internet Advertising ............................................................................................................ 111
Knoxville Analysis of the Impediments to Fair Housing 2010 Page 4
Print Media Advertising ...................................................................................................... 112
The General Public .............................................................................................................. 113
Section VI: Conclusions and Recommendations......................................................................... 113
IMPORTANT CONSIDERATIONS .............................................................................................. 114
IMPEDIMENT #1...................................................................................................................... 116
Market Availability .............................................................................................................. 116
IMPEDIMENT #2...................................................................................................................... 117
Potential Protected Class Discrimination in the Homebuyer Lending Market................... 117
IMPEDIMENT #3...................................................................................................................... 118
Public Policy Implementation ............................................................................................. 118
IMPEDIMENT #4...................................................................................................................... 119
Need for Permanent Supportive Housing........................................................................... 119
Knoxville Analysis of the Impediments to Fair Housing 2010 Page 5
SECTION I: Introduction, Methodology and Background
Fair Housing is the right of individuals to obtain the housing of their choice, free from
discrimination based on race, color, religion, sex, disability, familial status, or national origin.
This right is assured by the Federal Fair Housing Acts of 1968 and 1988, as amended, which
makes it unlawful to discriminate in the sale, rental, financing, and insuring of housing.
Under the Fair Housing Act an aggrieved person may, not later than one year after an alleged
discriminatory housing practice has occurred, file a complaint directly with the U.S. Department
of Housing and Urban Development (HUD), or a State or local agency enforcing laws that are
“substantially equivalent” to the Fair Housing Act. Upon the filing of such a complaint, HUD has
the responsibility to serve notice of the complaint and conduct an investigation into the alleged
discriminatory housing practice.
Since Knoxville’s Equal Housing Opportunities ordinance has been determined by HUD to be
“substantially equivalent”, the City is empowered to accept complaints, serve notice of
complaints, conduct investigations into alleged discriminatory housing practices, make
determinations, and adjudicate cause findings through the City’s Fair Housing Assistance
Program.
In order to ensure the prevention and elimination of housing discrimination, HUD requires all
governing authorities directly receiving Consolidated Plan Program funds to certify that the
community, consortium or state will “affirmatively further Fair Housing” within their
jurisdictions. This requirement is codified in the Consolidated Plan requirements under 24 CFR
91.225. Public agency obligations under the Act may be grouped into three categories:
Intent: The obligation to avoid policies, customs, practices, or processes whose intent or
purpose is to impede, infringe, or deny the exercise of fair housing rights by persons
protected under the Act.
Knoxville Analysis of the Impediments to Fair Housing 2010 Page 6
Effect: The obligation to avoid policies, customs, practices, or processes whose effect or
impact is to impede, infringe, or deny the exercise of Fair Housing rights by persons
protected under the Act.
Affirmative Duties: The Act imposes a fiduciary responsibility upon public agencies to
anticipate policies, customs, practices, or processes that previously, currently, or may
potentially impede, infringe, or deny the exercise of Fair Housing rights by persons
protected under the Act.
The first two obligations pertain to public agency operations and administration, including
those of employees and agents, while the third obligation extends to private as well as public
sector activity.
The Knoxville Fair Housing Analysis of Impediments discusses the results of earlier analyses of
impediments and the steps the City intends to take to implement policies that will prevent and
eliminate housing discrimination in the City.
METHODOLOGY
The Analysis of Impediments (AI) conducted by the Community Development Services team
involved a variety of data collection and analysis techniques, including:
1. Analyzing demographic data available through the U.S. Census Bureau, as well as
descriptive data pertaining to the Knox County housing market and trends in real estate
over the past ten years.
2. Examination of mortgage lending trends through the analysis of data available through
the Home Mortgage Disclosure Act (HMDA). Enacted by Congress in 1975 and
implemented by the Federal Reserve Board's Regulation C, HMDA requires lending
institutions to report public loan data. Using the loan data submitted by these financial
institutions, the Federal Financial Institutions Examination Council (FFIEC) creates
aggregate and disclosure reports for each metropolitan area (MA) that are available to
the public at central data depositories located in each MA.
3. Interviews with local government staff and community representatives.
Knoxville Analysis of the Impediments to Fair Housing 2010 Page 7
4. A review of source documents, including the most recent AI, conducted in 2005, the
2010‐2015 Consolidated Plan, the City’s Fair Housing Records, most recent HUD and
State of Tennessee Human Rights Reports, as well as, the City’s most recent CAPERs.
To begin an examination of current Fair Housing policies and strategies, this report will look at
past accomplishments and look at the City of Knoxville, Knox County and other Tennessee
communities to provide a basis of comparison between what the Knoxville Fair Housing Plan
proposes to do and further steps it can and should take to affirmatively further Fair Housing.
BACKGROUND
CITY OF KNOXVILLE OFFICE OF FAIR HOUSING
Case Processing Procedures: Investigation, Conciliation and Enforcement
I. Investigation
The Knoxville Office of Fair Housing is committed to conducting thorough and neutral
investigations of housing discrimination complaints. Investigations begin with the intake of a
complaint and conclude with a statement, withdrawal, conciliation or an administrative closure.
The goal of the Office of Fair Housing is to complete each investigation within 100 business
days.
II. Intake Process
The investigation process begins with the intake of a complaint. At intake, the complaining
party is asked to describe, verbally and in writing, the events and issues that prompted the
complaint. The complaining party or his or her representative is asked to sign and return an
Intake Questionnaire. The Intake Questionnaire provides space for the complaining party to list
others affected by the alleged discriminatory act, and to detail the damages or injuries suffered
due to the alleged discrimination.
During intake, the allegations are analyzed to determine whether the complaining party
provided sufficient information to establish each of the following elements required to exercise
jurisdiction: Timeliness, Standing, Subject Matter, and Jurisdiction over the Respondent.
“Timeliness” refers to the statute of limitations for filing a complaint. Under the City of
Knoxville Analysis of the Impediments to Fair Housing 2010 Page 8
Knoxville Fair Housing Opportunities Ordinance, a complaint must be filed within twelve (12)
months after the most recent act alleged to be unlawful.
“Standing” is analyzed to determine whether the person filing the complaint was injured by the
alleged discriminatory housing practice. “Subject Matter” is analyzed to determine whether
the alleged discriminatory act is a violation of the fair housing law. “Jurisdiction” is analyzed to
determine whether the alleged act occurred within the Knoxville city limits.
A complaint is accepted for processing when it is determined that all jurisdictional elements are
met. If the Office of Fair Housing determines that the complaining party has failed to establish
any jurisdictional elements, the complaining party is informed that the Office of Fair Housing
lacks authority to investigate the complaint. The Office of Fair Housing will then inform the
complaining party that there may be other options available and may refer the complaining
party to other agencies such as Legal Aid of East Tennessee, Tennessee Human Rights
Commission, or the U.S. Department of Housing and Urban Development (HUD).
Processing the Complaint
If the intake process provides sufficient information to process a complaint, a formal complaint
form (HUD form 903) is completed on behalf of the complaining party. The Complainant is
asked to sign and date this form verifying that it entails an accurate account of the alleged
housing discrimination. A complaint is considered “accepted” when the Office of Fair Housing
receives a properly signed and dated HUD‐903 from the complaining party. The Office of Fair
Housing will either stamp or write the date of acceptance on the HUD‐903.
Pursuant to the Memorandum of Understanding between the City and HUD, the Office of Fair
Housing will request the complaint to be dual‐filed with HUD. A request for dual filing is
submitted once all complaint data gathered at intake is inputted into TEAPOTS (Title Eight
Automated Paperless Office Tracking System). This allows HUD to assist the City with the
investigation, and allows the Office of Fair Housing to be reimbursed for the investigation.
In addition to notifying HUD of the acceptance of the complaint, the Office of Fair Housing also
sends notification letters to the Complainant and to the Respondent. Notifications to the
Knoxville Analysis of the Impediments to Fair Housing 2010 Page 9
Complainant and Respondent are sent via U.S. First‐Class mail and U.S. Certified mail, return
receipt requested, within ten (10) days after accepting a complaint. Notification letters may
also be hand‐delivered if the letter is returned to the office as undelivered.
Notification letters will include a Conciliation Fact Sheet. The notification letter to the
Respondent will also state that the Respondent may respond to the complaint within ten (10)
days of receiving notification of the complaint. If the Respondent has not contacted the Office
of Fair Housing within a reasonable time after the first notification letter, the Investigator will
send a second notification letter to the Respondent by regular first class and certified mail.
Commencing the Investigation
The Investigator will develop an Investigative Plan at the outset of the investigation that will be
used as a guide throughout the investigation. The Investigative Plan will ensure that the
investigation focuses on the Complainant's allegations and the Respondent's defenses
throughout the investigation. The Investigator's supervisor will review all Investigative Plans
and will assist the Investigator in developing an Investigative Plan in appropriate cases. The City
Law Department will also assist the Investigator in preparing an Investigative Plan when the
complaint involves pattern and practice allegations, and when novel and complex issues of law
and fact arise.
The Investigative Plan will include:
a description of the allegations, issues and bases;
a statement of the defense raised by each Respondent;
the facts to be investigated in order to prove or disprove the allegations;
a list of persons who must be interviewed;
a list of documents and records to be obtained;
a list of other sources of information and evidence; and
a projected timetable for completion of the various steps in the investigation.
Interviews and the collection and review of documents will follow the development of the
Investigative Plan. HUD has provided a manual entitled "Investigative Techniques and Case
Knoxville Analysis of the Impediments to Fair Housing 2010 Page 10
Management for Investigators" ("Investigative Techniques") to the Office of Fair Housing.
"Investigative Techniques" sets out the requirements for conducting interviews of the
Complainant, the Respondent, and all witnesses. The Office of Fair Housing follows the
requirements of "Investigative Techniques" in conducting all interviews.
The Investigator interviews the Complainant first. Before asking the Complainant any questions
about the facts and circumstances directly related to the alleged act of overt discrimination or
unequal treatment, the Investigator will again verify the facts and circumstances that establish
the elements of jurisdiction: timeliness, standing, subject matter, and jurisdiction over the
Respondent and geographic jurisdiction. Once the Investigator has established that the Office
of Fair Housing has jurisdiction to investigate the Complainant's allegations, the Investigator
then asks the Complainant questions necessary to obtain the "who, what, when, where, how,
and why," for the facts, circumstances, and events in the Complainant's allegation. When the
Complainant's interview is complete, the Investigator should know the "who, what, when,
where, how, and why" of the Complainant's story. The Investigator should also know how the
alleged discrimination affected the Complainant (financially, physically, and emotionally).
After the Investigator has the Complainant's side of the story, the Investigator will need the
facts and circumstances, the supporting statements of witnesses and the supporting documents
that objectively confirm the Complainants' statements and resolve any questions of credibility.
This process ultimately works to prove or disprove the Complainant's story: those facts that
prove or disprove the elements of the Complainant's prima facie case of discrimination.
The Investigator will then interview the Respondent. The Investigator must use the same
professionalism, impartiality, investigative procedures, and techniques when interviewing the
Respondent that were used to interview the Complainant. The Investigator will interview the
Respondent to discover information about:
1. The statements and documents provided to the Investigator by the Complainant.
2. The statements and documents provided to the Investigator by the Respondent with
the answer to the complaint.
Knoxville Analysis of the Impediments to Fair Housing 2010 Page 11
3. Any defense offered by the Respondent, whether a general denial or an affirmative
defense.
4. The verbal or written statements and documents provided by the Respondent in
response to the Initial Data Request Letter.
If the Complainant or the respondent provides the name of any person, or reveals the existence
or name of any person who has personal knowledge of the facts and circumstances, directly or
indirectly, related to the Complainant's case, the Investigator must find and interview each of
those persons. If the Complainant told someone about the alleged discriminatory act, or its
impact on the Complainant and the Complainant tells the Investigator about this person or the
conversation, the Investigator must find and interview each person. Witness interviews can
complete or add credibility to the Complainant's and Respondent’s story.
During each interview, the Investigator will request information from the parties and witnesses
in accordance with the Investigative Plan. The Investigator will also send an Initial Data
Request, via certified U.S. mail and by regular first class U.S. mail, to the Respondent requesting
information and documents that may be necessary to determine whether discrimination
occurred as alleged. The Investigator will review all documents received and will determine
what additional information will be needed to complete the investigation. In some
circumstances, it may be necessary for the Investigator to inspect documents at a place
convenient for the Respondent or at the location where the documents are usually maintained.
The Investigator will repeat the data collection and interview processes until sufficient data is
collected to make a reasonable determination of whether discrimination occurred as alleged.
The Investigator will maintain contact with the Complainant and the Respondent and will
provide updates of the investigation. The Complainant will be responsible for informing the
Office of Fair Housing Office of any address or phone number changes. When a Complainant
cannot be located, the Investigator will search various sources in an effort to find the
Complainant. Sources to find the Complainant include, but are not limited to the Internet,
Directory Assistance, the United States Postal Service, utility companies, Polk’s Directory,
contact information provided on the Intake Questionnaire, relatives, neighbors, and law
Knoxville Analysis of the Impediments to Fair Housing 2010 Page 12
enforcement authorities. Failure to locate a Complainant may be grounds to administratively
close the complaint. When either party is represented by an attorney, the Investigator will
communicate with the attorney or with the party in the presence of the attorney. The
Investigator will notify the Law Department when any party is represented by an attorney.
If the investigation of a complaint is not completed within 100 business days, the Investigator
will send a 100‐day letter to the Complainant and to the Respondent within ten (10) business
days of the 100th day. The 100‐day letter will indicate the reasons why it was impracticable to
complete the investigation within 100 days. The letter will also state a date for when the
Investigator anticipates the investigation to conclude.
The investigation of a housing discrimination complaint will conclude when sufficient evidence
and information is gathered to determine whether discrimination occurred. When the
investigation is complete, the Investigator will describe the evidence and information gathered
in a document called a Final Investigative Report (FIR). The FIR will include a list of all parties
and witnesses contacted during the investigation, a summary of interviews with the
Complainant, the Respondent, and all witnesses, a summary description of the documents and
records received during the investigation, and answers to any interrogatories. The FIR is a
record of factual information and does not include the conclusion or recommendation of the
Office of the Fair Housing.
The FIR must contain all of the substantive factual information that was obtained in the course
of the investigation, regardless of the relevance of the information to the allegations of the
complaint. Specifically, the FIR must contain:
1. A summary of contacts with the Complainant, other aggrieved persons, and the
Respondent, including the date of each contact;
2. The names of witnesses and dates of contact with those witnesses;
3. A summary of each witness's statement;
4. A summary description of other pertinent records; and
Knoxville Analysis of the Impediments to Fair Housing 2010 Page 13
5. Answers to any interrogatories.
[See "Investigative Techniques," infra; see also title 24, Code of Federal Regulations, §103.230
(a)(1) through (5).]
Based upon the FIR, the Investigator will prepare a draft Statement that will include the
Investigator's recommendation for the disposition of the complaint. The Investigator's
Statement will be either no reasonable cause, or reasonable cause. A no reasonable cause
statement means that the facts and circumstances obtained during the investigation did not
support the Complainant's claim of discrimination. A reasonable cause statement means the
facts and circumstances obtained during the investigation established that reasonable cause
exists to believe that a discriminatory act occurred. The Findings and Conclusions section of the
Determination must contain those facts and circumstances that:
(1) Prove all of the elements of the Complainant's prima facie case of discrimination, or
disprove one or more elements; or
(2) Prove or disprove each of the Respondent's defenses through the resolution of all
disputed substantive and procedural issues.
Each substantive finding (of fact) in the Findings and Conclusions section should be supported
by a document or statement that has been obtained during the investigation, physically placed
in the case file, and stated in the Summary, Interview or the Document section of TEAPOTS. All
analyses and conclusions must be derived from the application of the law to those factual
statements from credible witnesses and factual statements extracted from credible documents
obtained during the investigation, and presented in the FIR. These circumstances minimize the
opportunity to successfully challenge the findings and conclusions contained in the Statement,
and will be used as the basis for the Office of Fair Housing official signatures and concurrence
by the Law Department with the recommendation of the Investigator and Investigator's
supervisors.
The Investigator will send a draft Statement to the Law Department for review along with the
case file. The Law Department will review the materials and will inform the Investigator if
Knoxville Analysis of the Impediments to Fair Housing 2010 Page 14
additional information is needed to complete the investigation, and will make
recommendations if additional information should be included in the Statement. The case file
will be returned to the Office of Fair Housing for completion of the investigation if necessary.
When the Law Department concurs with the findings and the Statement, the City of Knoxville
attorney will notify the Investigator.
If the Statement is one of "No Cause," the Investigator will close the case in TEAPOTS and send
a request for closure to HUD. When HUD reviews the Statement, it may recommend additional
investigation or documentation. If HUD recommends additional information or further
investigation, the Investigator will inform the Law Department of HUD's request and will
comply with HUD's recommendation. The Investigator will submit a recommendation to HUD
for closure after completing the requested additional investigation or providing additional
documentation.
If there is a Statement of Reasonable Cause supported by the Law Department, the City
Attorney will file a complaint with the Fair Housing Hearings Board (the "Board"). Unless
conciliation is negotiated, the Board shall hold a hearing and render a decision in accordance
with the City of Knoxville’s Equal Housing Opportunities ordinance.
A Complainant may opt to withdraw his or her complaint prior to the conclusion of the
investigation. Withdrawals are effective when the Complainant signs and dates the Notice of
Withdrawal. This notice states the reasons for withdrawal and informs the Complainant of his
or her right to pursue a housing discrimination complaint through the legal process. A signed
and dated withdrawal will effectively close the complaint. A complaint will also be closed if the
parties decide to conciliate.
III. Conciliation of Housing Discrimination Complaints
Conciliation is an alternative dispute resolution available for housing discrimination complaints.
It is an option available during each stage of the investigation process. The Office of Fair
Housing will offer the parties every reasonable opportunity to settle the issues raised by the
complaint through conciliation. Conciliation is discussed at the period commencing from the
Knoxville Analysis of the Impediments to Fair Housing 2010 Page 15
filing of the housing discrimination complaint, throughout the investigation of the complaint,
and until a determination of reasonable cause or no reasonable cause is reached.
Whenever feasible, the Conciliator will be someone other than the person assigned to
investigate the complaint. The Conciliator is a neutral participant seeking to facilitate a
mutually agreeable settlement. The Conciliator will inform the parties of their rights during
conciliation, the conciliation process, and will help formulate negotiation procedures that will
further enhance productive dialogue between the parties. If necessary, the Conciliator will
provide interpretations of the Fair Housing Act and the Knoxville Fair Housing Opportunities
Ordinance in order to enable the parties to negotiate from an informed position.
The Conciliator may describe the evidence gathered during the investigation in order to enable
the parties to negotiate from informed positions. The Conciliator will also convey offers and
counter‐offers between the parties, and may describe the potential relief which could be
sought or awarded for violating the Fair Housing Act or the Knoxville Fair Housing Opportunities
Ordinance, but will not comment on the likelihood that those penalties would be imposed upon
a particular Respondent. When Conciliation is successful, the Conciliator will draft a
Conciliation Agreement incorporating the individual relief for the Complainant, and relief
intended to further the public interest in preventing future discrimination.
Because conciliation is an amicable process, nothing said or done during the course of
conciliation negotiations may be used against a party in a subsequent administrative hearing or
civil trial arising from the complaint. All parties have the right to be represented by legal
counsel, an advocate, or an organization of their choice during conciliation negotiations. Both
parties are informed that participation in conciliation is entirely voluntary. No person may be
coerced into conciliating a complaint. Investigators and conciliators may not bully, threaten,
intimidate, or otherwise influence any party in an effort to reach settlement. Furthermore,
there is no penalty for declining to settle a complaint through conciliation.
A Conciliation Log is kept for all successful conciliations. Compliance with the conciliation terms
is reviewed within one (1) year of the signed conciliation. The Conciliator or Investigator refers
Knoxville Analysis of the Impediments to Fair Housing 2010 Page 16
to this log to determine when a compliance review should be conducted. The Conciliator or
Investigator also uses this log to document when the parties completed their obligations under
the agreement.
IV. Enforcement Activities
The Office of Fair Housing is endowed with certain powers to help facilitate the investigation
process and to eliminate housing discrimination. In addition to investigating a housing
discrimination complaint, the Office of Fair Housing may conduct tests of housing providers to
determine whether they comply with the applicable fair housing laws.
When a party to a complaint refuses or delays providing information, the Office of Fair Housing
may subpoena the person or the documents. The drafted subpoenas are reviewed by the City’s
Law Department and approved prior to service.
The Office of Fair Housing also has the power to review the activities of the parties after
conciliation to confirm compliance with the Conciliation Agreement. The Office of Fair Housing
will perform a compliance review within one (1) year of the execution of the Conciliation
Agreement to confirm the parties adhered to the Agreement and performed accordingly.
Judicial Enforcement Procedures
The City of Knoxville has adopted the Fair Housing Opportunities Ordinance, City of Knoxville
Code of Ordinances Chapter 15, Article II, Division, 3, Section 15‐81, et seq. (the “Ordinance”).
Section 15‐85 establishes a fair housing board and specifies the general powers of the fair
housing board, including the powers to “compel attendance of witnesses at hearings, to compel
the production of evidence and to administer oaths.” Section 15‐85 (b)(2). A copy of Section
15‐85 is attached. In the event an individual or organization fails to comply with a subpoena
issued by the fair housing board, the board has the authority to “appeal to the circuit or
chancery court [of the State of Tennessee] for an order to compel compliance with the
subpoena or the furnishing of information or giving of testimony.” Section 15‐87(3) provides
that the fair housing board has the power to “apply to the court upon the failure of any person
to respond to or comply with a lawful interrogatory, subpoena, or request for the production of
Knoxville Analysis of the Impediments to Fair Housing 2010 Page 17
relevant evidence or possible sources of evidence, for an order requiring such person to
respond to or comply with the interrogatory, subpoena, or request for production of relevant
evidence or possible sources of evidence.” (A copy of Section 15‐87 is attached). No
subpoenas were used during the reporting period.
Section 15‐86 of the Ordinance sets out the provisions for judicial enforcement. Specifically,
Section 15‐86 provides that an action alleging a violation of the ordinance may be filed in the
chancery court of the Knox County, that such an action may be filed by an aggrieved person not
later than two (2) years after the occurrence or termination of the alleged discriminatory act,
and that an aggrieved person’s timely motion to intervene in an action filed by the fair housing
board shall be granted. Section 15‐86 also sets out the general types of relief that the chancery
court may grant and provides for appeals from the chancery court to the state court of appeals.
(A copy of Section 15‐86 is attached.) Section 15‐87 (4) authorizes the fair housing board to
“apply to the court for appropriate temporary or preliminary relief pending final disposition of a
complaint if the board concludes that such action is necessary to carry out the purposes of this
article.”
KNOXVILLE ANALYSIS OF THE IMPEDIMENTS TO FAIR HOUSING 2005
The following were the Impediments to Fair Housing identified in 2005
1. Lack of Information/Awareness regarding Fair Housing
There has traditionally been lack of knowledge among protected classes regarding
resources, services, and programs for lower income families and persons with special
needs. This lack of knowledge has occurred among renters, owners, property owners,
builders, and other organizations.
2. Failure to Report Discrimination
Most protected class families and individuals do not follow through when they feel they
have been subjected to discrimination. The Knoxville Office of Fair Housing receives
many inquiries regarding housing opportunities that have resulted in disappointment at
Knoxville Analysis of the Impediments to Fair Housing 2010 Page 18
not obtaining their choice of housing. However, those who inquire usually will not take
the next step to request help from the City by filing a complaint.
3. Affect and effect of patterns and practices of housing practitioners
It is important for lenders, housing providers and their agents to know their
responsibilities and when they may be violating fair housing laws. Subtle discrimination
and discriminatory attitudes continue to exist and awareness of fair housing issues
continues to be important. Everyone needs to know what may constitute a violation,
and protected classes need to know what they can do in the event they believe they
may have been discriminated against.
4. Lack of accessible and affordable housing
Approximately one‐third of fair housing complaints had to do with a lack of accessible as
well as affordable housing in the City. Although persons with disabilities are not directly
denied housing, the needed accommodations are not often present or that “no pet”
policies often negate an opportunity for a disabled person to obtain a housing unit.
5. Appearance of a lack of housing and the geographical distribution of affordable
housing units
Although affordability by itself is not a violation of fair housing laws, the fact that many
individuals and families are most often denied shelter due to economic conditions,
income, personal appearance, or disability, coupled with high cost and ineffective fair
housing marketing limits choice among protected classes and decreases the likelihood
of effectively integrating communities.
6. Lack of full integration, which could bring about parity in Knoxville’s communities
Mass media tends to stereotype communities and facilities through reporting
mechanisms. In addition, there is a lack of communication about expectations of
integration versus segregation, or inclusion versus exclusion. Negative characterization
of communities within the City leads to perceptions that this is a bad part of town and
hence not a good place to reside. To change these perceptions requires promotion of a
positive image of troubled neighborhoods.
Knoxville Analysis of the Impediments to Fair Housing 2010 Page 19
Knoxville Progress (2005‐2010)
The City continues to address the needs and impediments, summarized above and identified in
the September 2005 Analysis of Fair Housing Impediments. Activities conducted and reported
to the general public and HUD include:
City staff investigations and the conciliation of complaints related to housing
discrimination.
Fair Housing Counseling and referrals
Education and outreach to residents, housing providers, lenders, and other community
members.
Dissemination of information to the local news media on fair housing and equality issues
and activities.
Participation in training sessions, workshops, and conferences.
Visible placement of equal opportunity housing logo on relevant City publications and
housing programs that use City, CDBG, HOME, and ESG funding.
Staff support and/or technical assistance to the Equality Coalition for Housing
Opportunity, the Mayor’s Council On Disability Issues, Knoxville/Knox County Access to
Justice Collaborative, the disABILITY Resource Center, East Tennessee Coalition for the
Homeless, and Dr. Martin Luther King Jr. Commemoration Commission.
Knoxville Analysis of the Impediments to Fair Housing 2010 Page 20
Operating and/or funding programs that promote housing opportunities, such as
homeownership education and down payment assistance, housing improvements, and
new housing development.
By providing CDBG funds to the disABILITY Resource Center for the construction of
ramps and other home modifications to enable housing accessibility for persons with
disabilities.
Knoxville Analysis of the Impediments to Fair Housing 2010 Page 21
SECTION II: Demographic and Economic Overview
This section profiles the City of Knoxville’s demographic and housing trends by examining and
mapping data from the 1990 decennial Census, 2000 decennial Census, American Community
Survey 2008 and other relevant data. After describing demographic characteristics and trends,
this section provides an analysis of the area’s housing market and a household’s ability to
purchase a home. The section concludes with a synopsis of housing problems experienced by
residents, such as cost burden, physical defects and overcrowding.
OVERVIEW
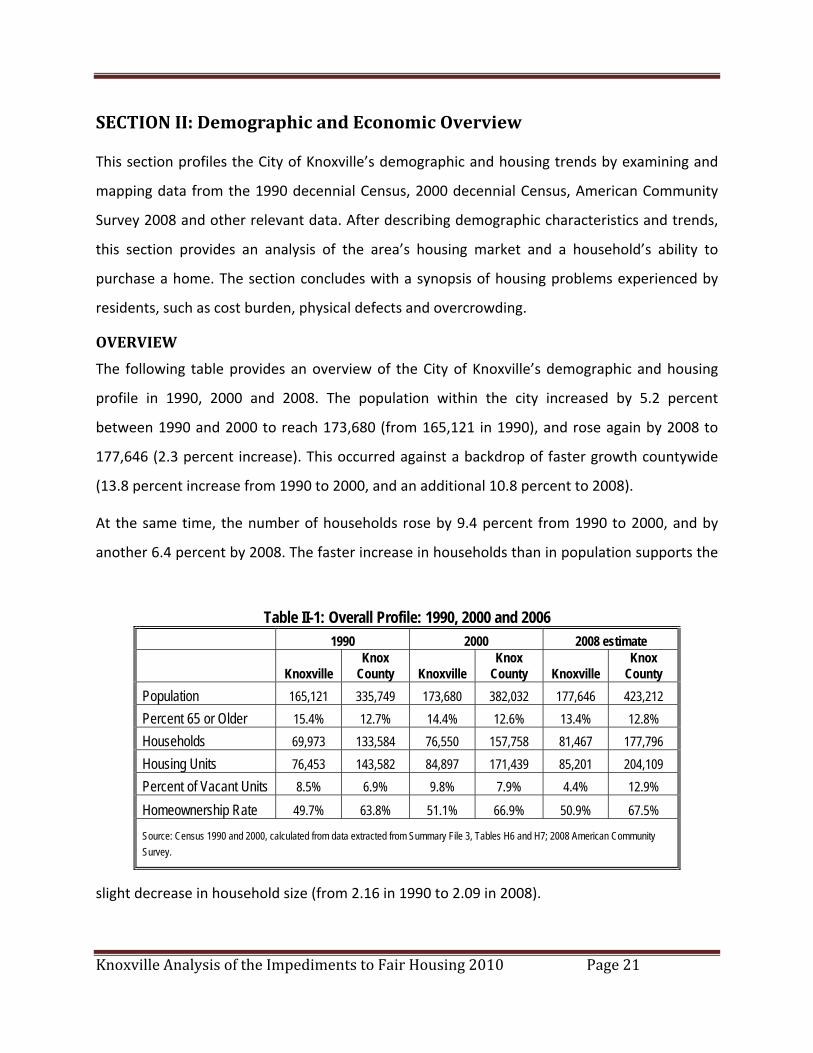
The following table provides an overview of the City of Knoxville’s demographic and housing
profile in 1990, 2000 and 2008. The population within the city increased by 5.2 percent
between 1990 and 2000 to reach 173,680 (from 165,121 in 1990), and rose again by 2008 to
177,646 (2.3 percent increase). This occurred against a backdrop of faster growth countywide
(13.8 percent increase from 1990 to 2000, and an additional 10.8 percent to 2008).
At the same time, the number of households rose by 9.4 percent from 1990 to 2000, and by
another 6.4 percent by 2008. The faster increase in households than in population supports the
slight decrease in household size (from 2.16 in 1990 to 2.09 in 2008).
Table II-1: Overall Profile: 1990, 2000 and 2006 1990 2000 2008 estimate
Knoxville Knox
County Knoxville Knox
County Knoxville Knox
County Population 165,121 335,749 173,680 382,032 177,646 423,212 Percent 65 or Older 15.4% 12.7% 14.4% 12.6% 13.4% 12.8% Households 69,973 133,584 76,550 157,758 81,467 177,796 Housing Units 76,453 143,582 84,897 171,439 85,201 204,109 Percent of Vacant Units 8.5% 6.9% 9.8% 7.9% 4.4% 12.9%
Homeownership Rate 49.7% 63.8% 51.1% 66.9% 50.9% 67.5%
Source: Census 1990 and 2000, calculated from data extracted from Summary File 3, Tables H6 and H7; 2008 American Community Survey.
Knoxville Analysis of the Impediments to Fair Housing 2010 Page 22
From 1990 to 2000, the percent of persons 65 and older in the City of Knoxville declined from
15.4 to 14.4 percent, and fell again to 13.4 percent in 2008. The slower increase among those
aged under 65 against the increase in the elderly population supports the steady rise of the
median age of the population from 32.7 years in 1990 to 33.6 years in 2000, and an estimated
34.1 in 2008.
EMPLOYMENT PROFILE
The 1990 Census reported a labor force of 81,230 persons in the City of Knoxville. In 2000,
Census data reported a labor force of 86,202 and a calculated unemployment rate of 6.5
percent (down from 7.1 in 1990). American Community Survey 2008 data estimate 89,880
persons in the labor force, and a calculated unemployment rate of 6.5 percent. However,
Bureau Labor Statistics data show a 2008 unemployment rate of 5.2 percent in the MSA, up
from 3.4 in 2000.
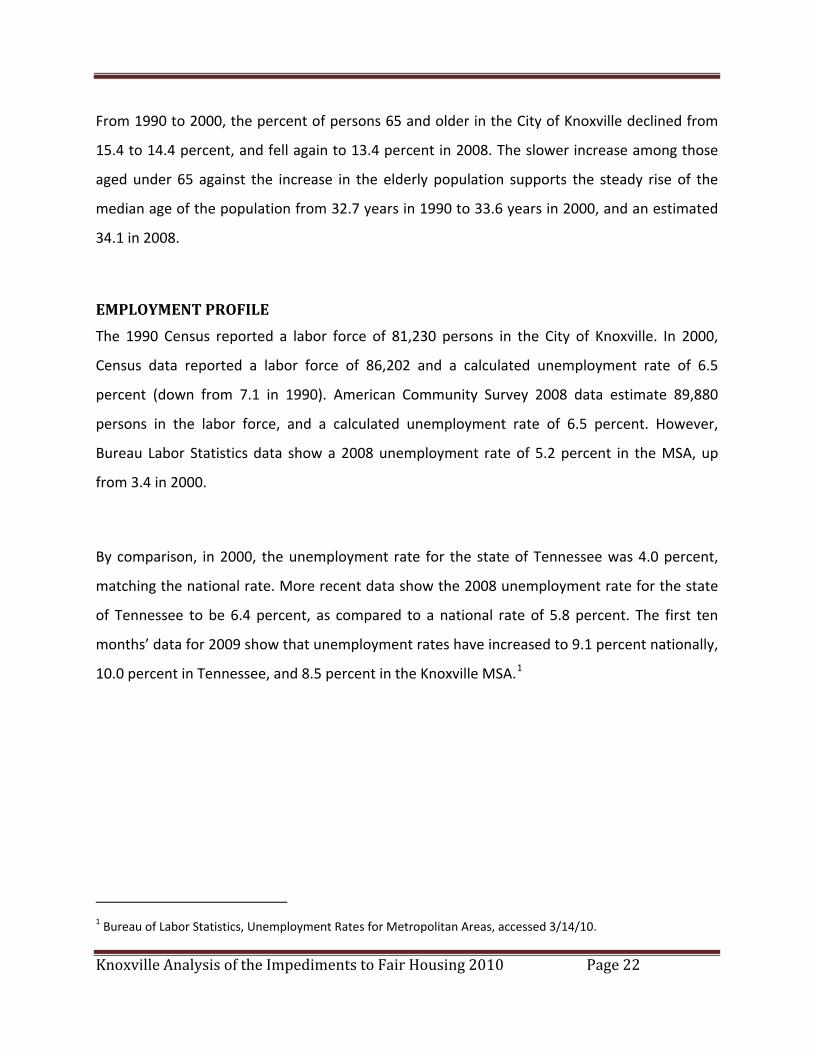
By comparison, in 2000, the unemployment rate for the state of Tennessee was 4.0 percent,
matching the national rate. More recent data show the 2008 unemployment rate for the state
of Tennessee to be 6.4 percent, as compared to a national rate of 5.8 percent. The first ten
months’ data for 2009 show that unemployment rates have increased to 9.1 percent nationally,
10.0 percent in Tennessee, and 8.5 percent in the Knoxville MSA.1
1 Bureau of Labor Statistics, Unemployment Rates for Metropolitan Areas, accessed 3/14/10.
Knoxville Analysis of the Impediments to Fair Housing 2010 Page 23
Figure II-1: Unemployment Rate History
Knoxville MSA
U.S.
U.S.
TN
U.S.
TNTN
TN
Knoxville MSA
1999 2000 2001 2002 2003 2004 2005 2006 2007 2008 2009 (10 m .)os
0.0
Knoxville M A S 3.0 3.4 3.8 4.0 4.3 4.2 4.5 4.1 3.8 5.2 8.5 Tennessee 4.1 4.0 4.7 5.3 5.7 5.4 5.6 5.2 4.9 6.4 10.0
9.1 5.8 4.64.65.15.56.05.84.74.0 4.2 U.S.
12.0
10.0
8.0
6.0
4.0
2.0
Source: Decennial Census (1990, 2000), 2008 ACS, Bureau of Labor Statistics
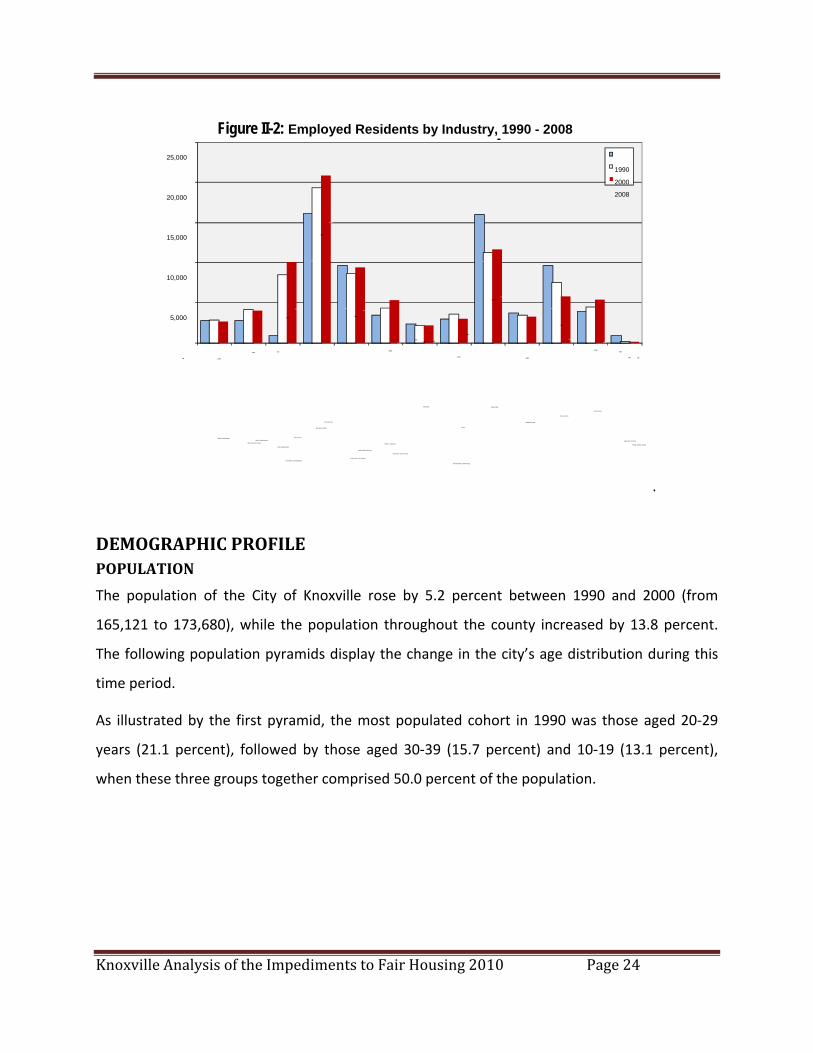
American Community Survey 2008 data showed that the largest numbers of residents within
the City of Knoxville were employed in the Education, health and social services industry (26.0
percent), followed distantly by Retail trade (14.5 percent) and Arts, entertainment, recreation,
accommodation and food services (12.6 percent). These first two industries ranked in the same
positions in 2000 (at 24.1 and 14.0 percent, respectively), while Professional, management and
administration services ranked third in that year, at 10.8 percent. In 1990, Education, health
and social services was still first (21.4 percent), but Retail trade was second in that year (at a
very close 21.3 percent), with Professional, management and administrative services and
Manufacturing each providing 12.8 percent of employment. The graph below shows the
distribution of the City of Knoxville employed residents by industry in all three years.
Knoxville Analysis of the Impediments to Fair Housing 2010 Page 24
1990 2000 2008
Figure II-2: Employed Residents by Industry, 1990 - 2008 -
166 5,401 5,808
3,269
11,644
3,032
2,1785,311
9,390
20,899
10,106
4,039 2,698 187 4,457
7,538
3,460
11,264
3,612
2,123
4,364
8,664
19,372
8,488
4,163 2,804 920
3,941
9,660
3,710
16,032
2,976
2,361
3,472
9,646
16,152
913 2,765 2,775
25,000
20,000
15,000
10,000
5,000
-
Construction Information Retail trade
Education, health, social services
Manufacturing
Wholesale trade
.
DEMOGRAPHIC PROFILE POPULATION
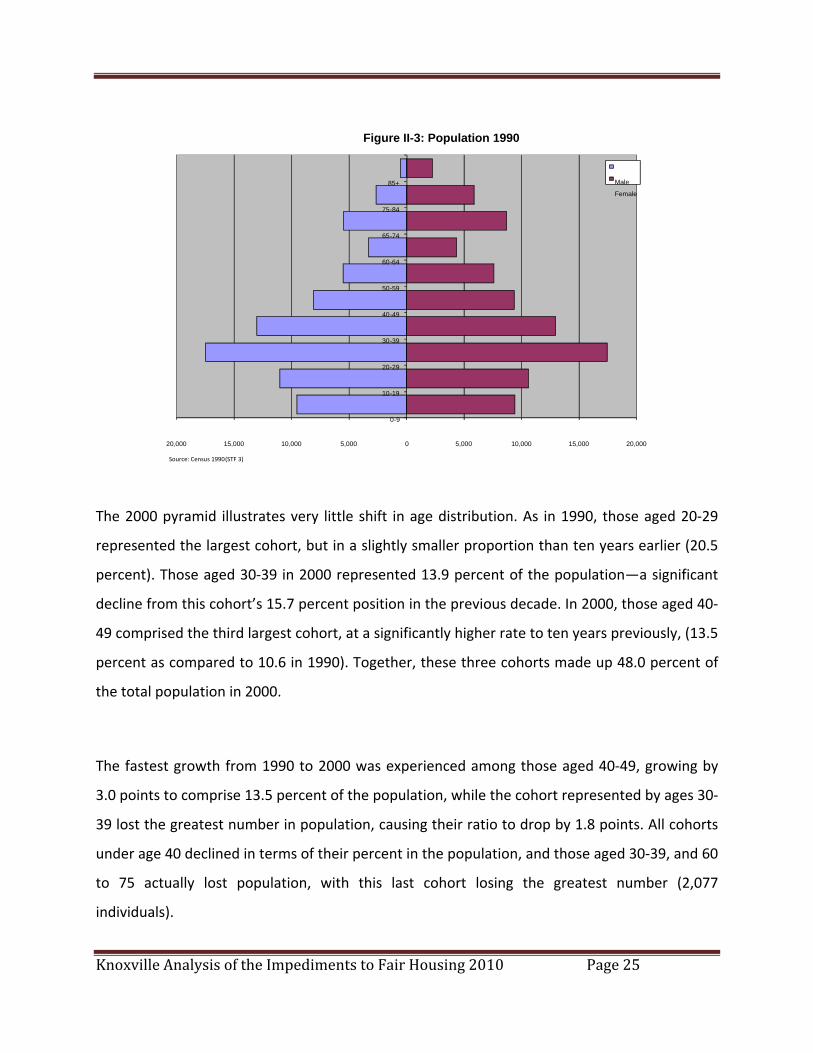
The population of the City of Knoxville rose by 5.2 percent between 1990 and 2000 (from
165,121 to 173,680), while the population throughout the county increased by 13.8 percent.
The following population pyramids display the change in the city’s age distribution during this
time period.
As illustrated by the first pyramid, the most populated cohort in 1990 was those aged 20‐29
years (21.1 percent), followed by those aged 30‐39 (15.7 percent) and 10‐19 (13.1 percent),
when these three groups together comprised 50.0 percent of the population.
Public Administration Other services (except public administration)
Arts, entertainment, recreation, accommodation,
food services utilities
Agriculture, forestry,
fishing, hunting, mining Finance, insurance,
administrative services
real estate, rental, leasing
Professional, management,
Transportation, warehousing,
Knoxville Analysis of the Impediments to Fair Housing 2010 Page 25
Figure II-3: Population 1990
Male Female
85+
-8475
-7465
-6460
-5950
-4940
-3930
-2920
-1910
-90
20,000 15,000
Source: Census 1990 (STF 3) 10,000 15,000 20,000 5,000 0 5,000 10,000
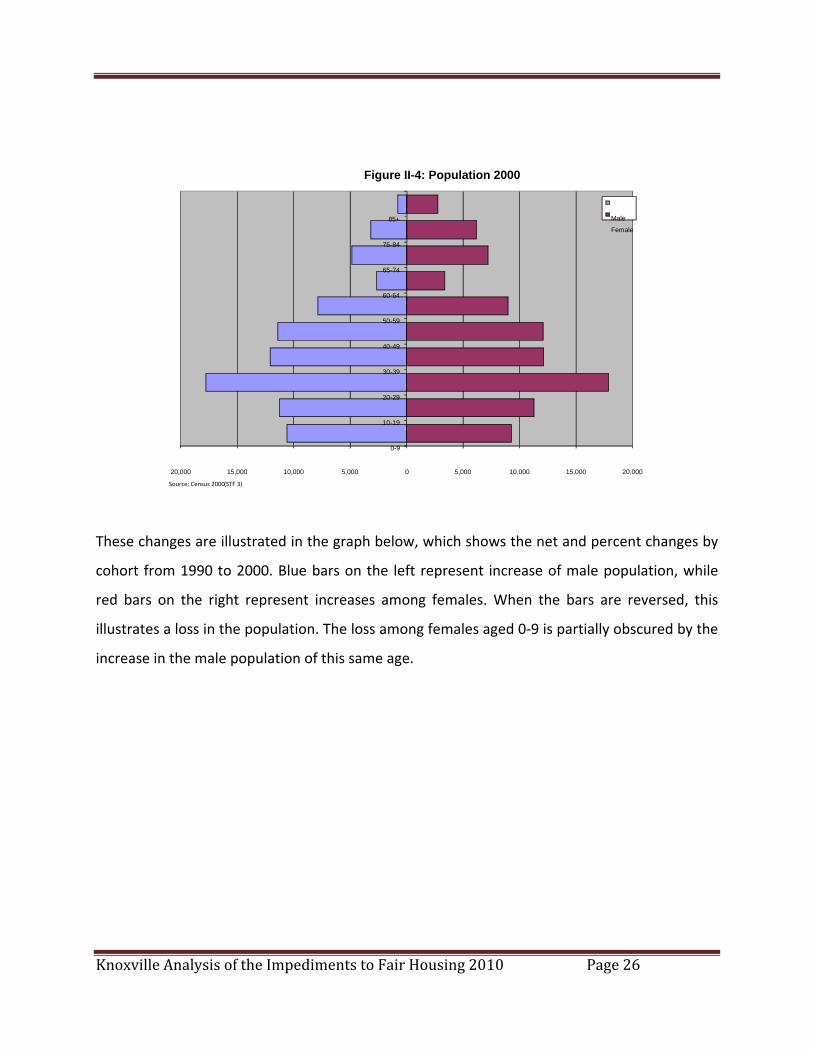
The 2000 pyramid illustrates very little shift in age distribution. As in 1990, those aged 20‐29
represented the largest cohort, but in a slightly smaller proportion than ten years earlier (20.5
percent). Those aged 30‐39 in 2000 represented 13.9 percent of the population—a significant
decline from this cohort’s 15.7 percent position in the previous decade. In 2000, those aged 40‐
49 comprised the third largest cohort, at a significantly higher rate to ten years previously, (13.5
percent as compared to 10.6 in 1990). Together, these three cohorts made up 48.0 percent of
the total population in 2000.
The fastest growth from 1990 to 2000 was experienced among those aged 40‐49, growing by
3.0 points to comprise 13.5 percent of the population, while the cohort represented by ages 30‐
39 lost the greatest number in population, causing their ratio to drop by 1.8 points. All cohorts
under age 40 declined in terms of their percent in the population, and those aged 30‐39, and 60
to 75 actually lost population, with this last cohort losing the greatest number (2,077
individuals).
Knoxville Analysis of the Impediments to Fair Housing 2010 Page 26
Figure II-4: Population 2000
Male Female
85+
84-75
74-65
64-60
59-50
49-40
39-30
29-20
19-10
9-0
20,000 15,00 0Source: Census 2000 (STF 3)
10,000 15,000 20,000 5,000 0 5,000 10,000
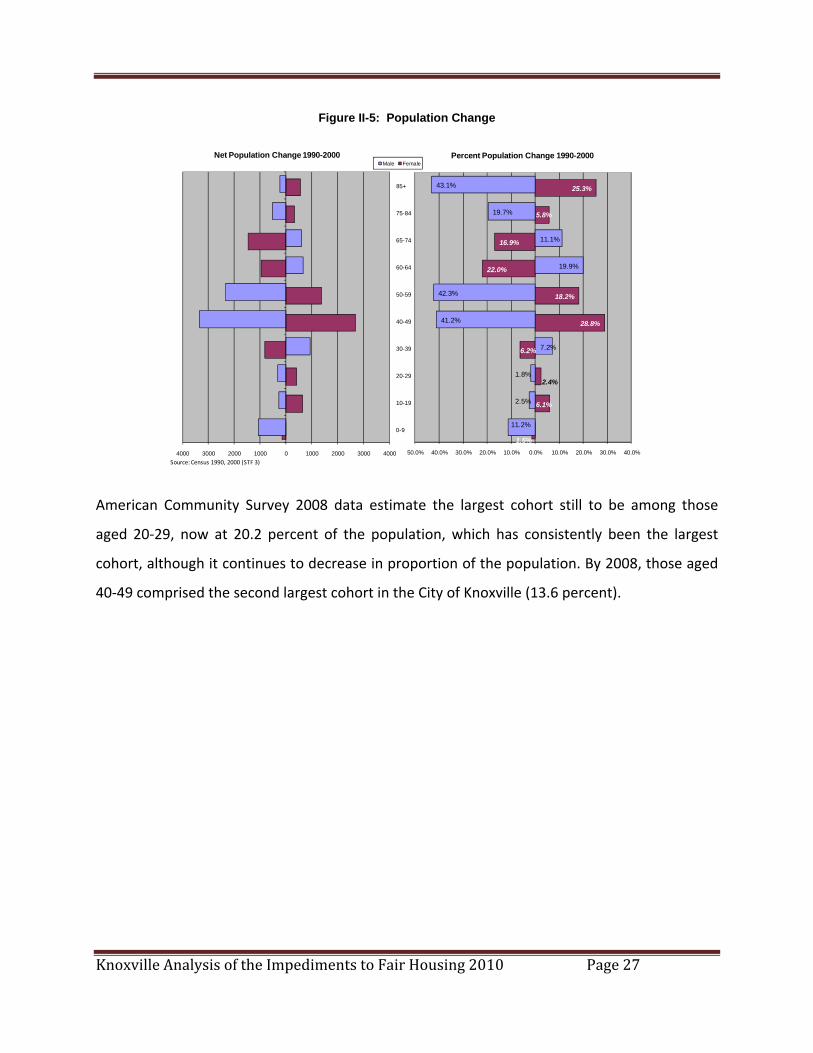
These changes are illustrated in the graph below, which shows the net and percent changes by
cohort from 1990 to 2000. Blue bars on the left represent increase of male population, while
red bars on the right represent increases among females. When the bars are reversed, this
illustrates a loss in the population. The loss among females aged 0‐9 is partially obscured by the
increase in the male population of this same age.
Knoxville Analysis of the Impediments to Fair Housing 2010 Page 27
Figure II-5: Population Change
1.5%
6.1%
2.4%
6.2%
28.8%
18.2%
22.0%
16.9%
5.8%
25.3%
11.2%
2.5%
1.8%
7.2%
41.2%
42.3%
19.9%
11.1%
19.7%
43.1%
50.0% 40.0% 30.0% 20.0% 10.0% 0.0% 10.0% 20.0% 30.0% 40.0%
Percent Population Change 1990-2000Male Female
4000 3000 2000 1000 0 1000 2000 3000 4000
0-9
10-19
20-29
30-39
40-49
50-59
60-64
65-74
75-84
85+
Net Population Change 1990-2000
Source: Census 1990, 2000 (STF 3)
American Community Survey 2008 data estimate the largest cohort still to be among those
aged 20‐29, now at 20.2 percent of the population, which has consistently been the largest
cohort, although it continues to decrease in proportion of the population. By 2008, those aged
40‐49 comprised the second largest cohort in the City of Knoxville (13.6 percent).
Knoxville Analysis of the Impediments to Fair Housing 2010 Page 28
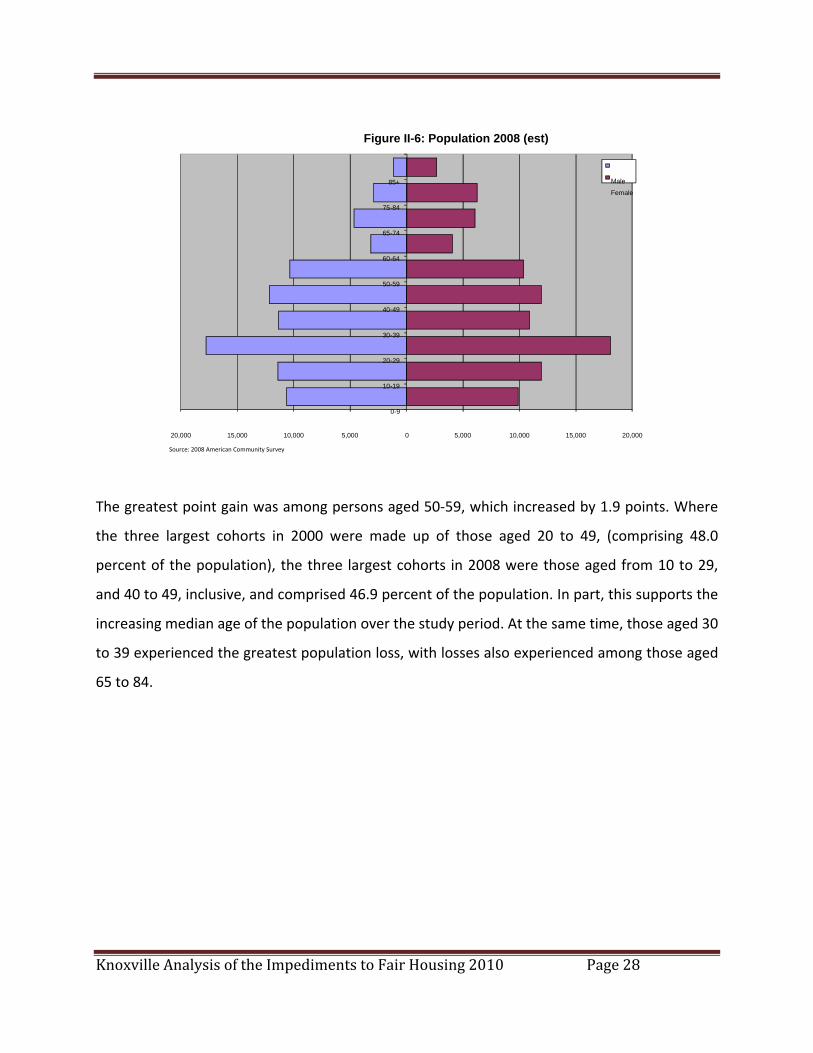
Figure II-6: Population 2008 (est)
Female
Male 85+
-8475
-7465
-6460
-5950
-4940
-3930
-2920
-1910
0-9
20,000 15,000 10,000 Source: 2008 American Community Survey
15,000 20,000 5,000 0 5,000 10,000
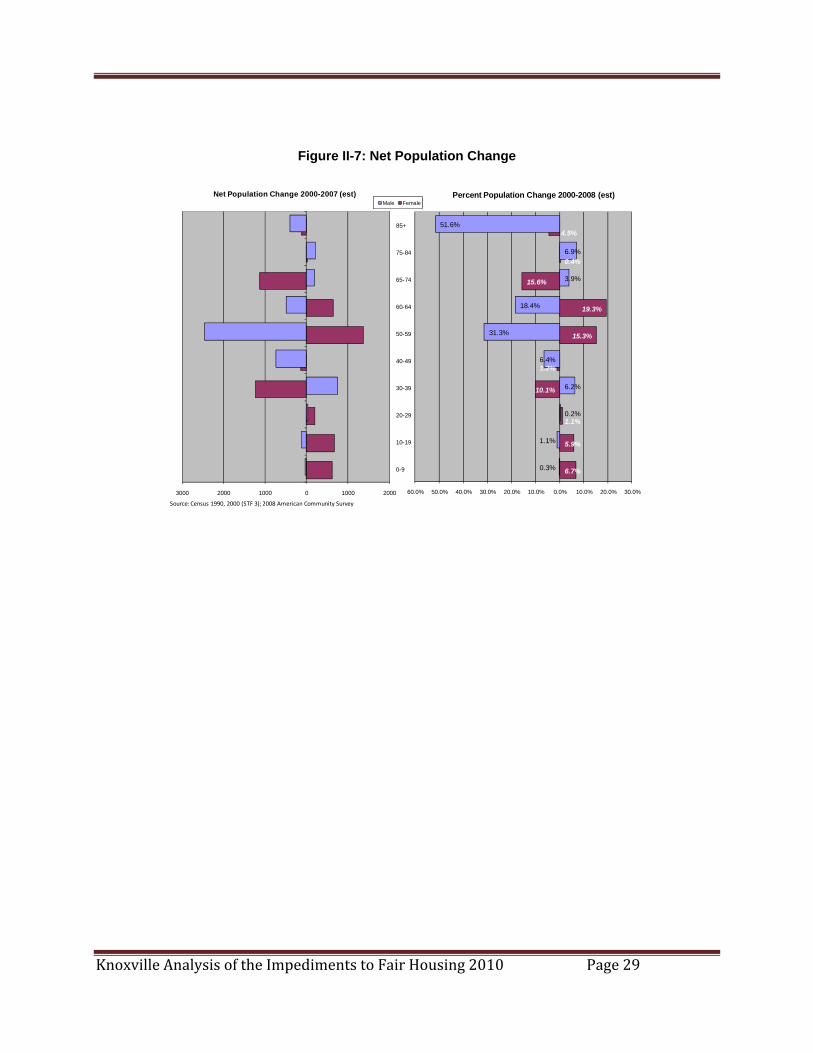
The greatest point gain was among persons aged 50‐59, which increased by 1.9 points. Where
the three largest cohorts in 2000 were made up of those aged 20 to 49, (comprising 48.0
percent of the population), the three largest cohorts in 2008 were those aged from 10 to 29,
and 40 to 49, inclusive, and comprised 46.9 percent of the population. In part, this supports the
increasing median age of the population over the study period. At the same time, those aged 30
to 39 experienced the greatest population loss, with losses also experienced among those aged
65 to 84.
Knoxville Analysis of the Impediments to Fair Housing 2010 Page 29
Figure II-7: Net Population Change
6.7%
5.9%
1.1%
10.1%
1.2%
15.3%
19.3%
15.6%
0.4%
4.5%
0.3%
1.1%
0.2%
6.2%
6.4%
31.3%
18.4%
3.9%
6.9%
51.6%
60.0% 50.0% 40.0% 30.0% 20.0% 10.0% 0.0% 10.0% 20.0% 30.0%
Percent Population Change 2000-2008 (est)Male Female
3000 2000 1000 0 1000 2000
0-9
10-19
20-29
30-39
40-49
50-59
60-64
65-74
75-84
85+
Net Population Change 2000-2007 (est)
Source: Census 1990, 2000 (STF 3); 2008 American Community Survey
Knoxville Analysis of the Impediments to Fair Housing 2010 Page 30
RACE/ETHNICITY
In 2000, the City of Knoxville’s population was 79.6 percent White, 16.3 percent Black, 0.3
percent American Indian/Alaska Native, 1.3 percent Asian, 0.8 percent Other, and 1.7 percent
two or more races. The Hispanic population comprised 1.5 percent of the city’s total
population.
2008 American Community Survey estimates report a slight shift in population composition,
indicating the population to be 79.5 percent White, 16.0 percent Black, 0.1 percent American
Indian/Alaska Native, 1.3 percent Asian, 0.9 percent Other and 2.1 percent two or more races.
The Hispanic population had nearly doubled to 2.9 percent.
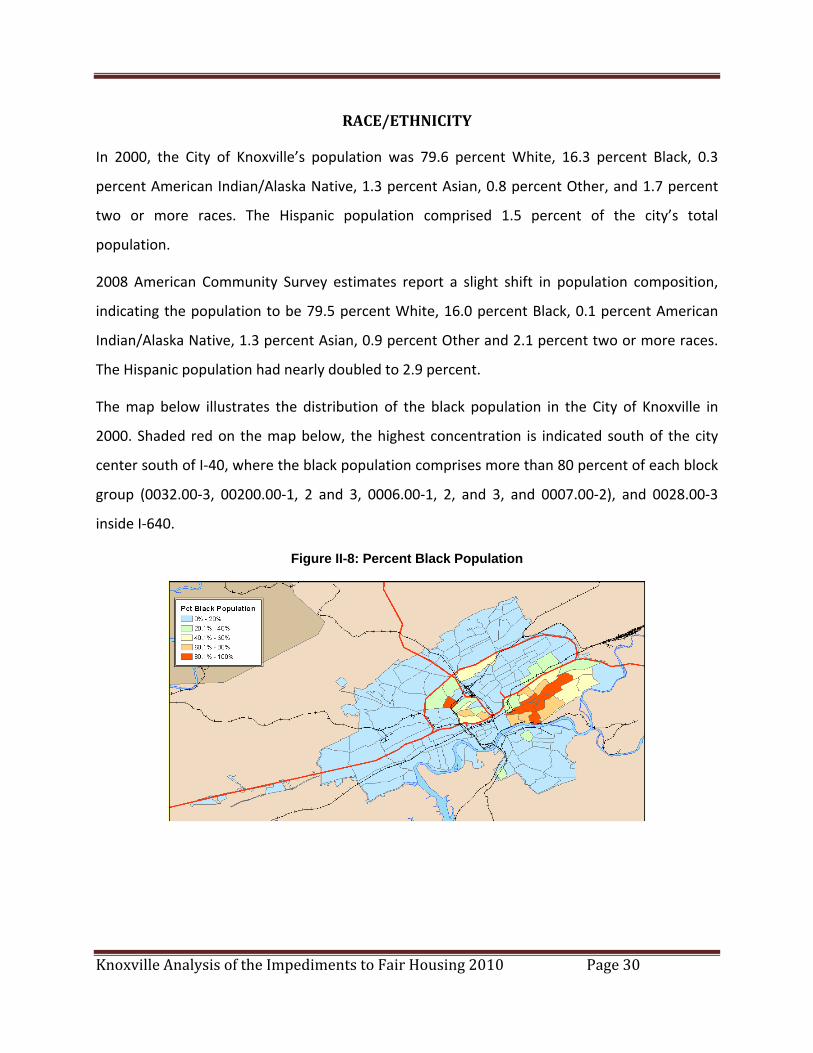
The map below illustrates the distribution of the black population in the City of Knoxville in
2000. Shaded red on the map below, the highest concentration is indicated south of the city
center south of I‐40, where the black population comprises more than 80 percent of each block
group (0032.00‐3, 00200.00‐1, 2 and 3, 0006.00‐1, 2, and 3, and 0007.00‐2), and 0028.00‐3
inside I‐640.
Figure II-8: Percent Black Population
Knoxville Analysis of the Impediments to Fair Housing 2010 Page 31
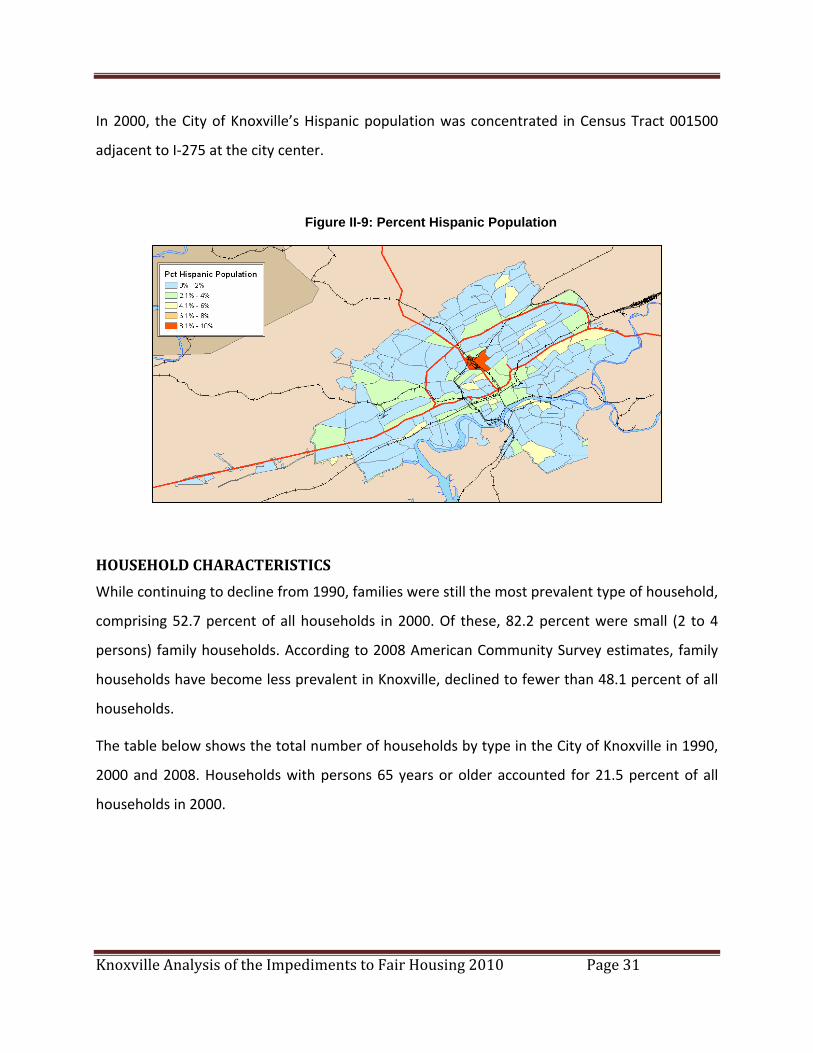
In 2000, the City of Knoxville’s Hispanic population was concentrated in Census Tract 001500
adjacent to I‐275 at the city center.
Figure II-9: Percent Hispanic Population
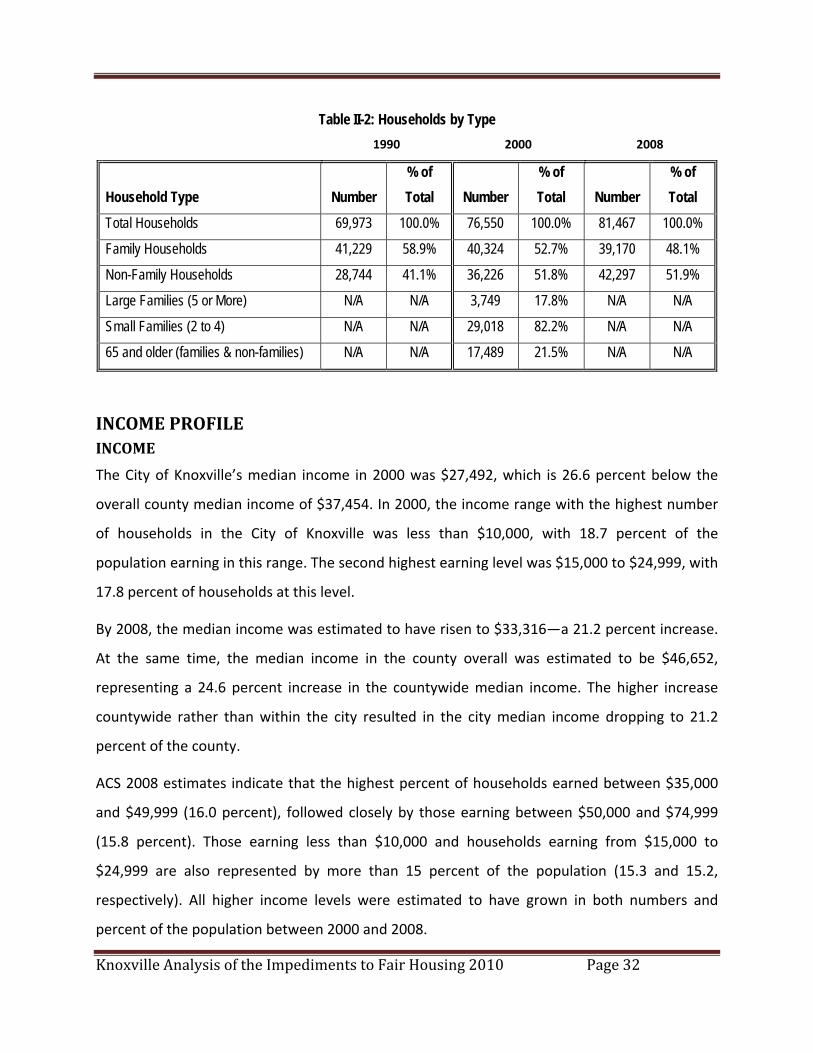
HOUSEHOLD CHARACTERISTICS
While continuing to decline from 1990, families were still the most prevalent type of household,
comprising 52.7 percent of all households in 2000. Of these, 82.2 percent were small (2 to 4
persons) family households. According to 2008 American Community Survey estimates, family
households have become less prevalent in Knoxville, declined to fewer than 48.1 percent of all
households.
The table below shows the total number of households by type in the City of Knoxville in 1990,
2000 and 2008. Households with persons 65 years or older accounted for 21.5 percent of all
households in 2000.
Knoxville Analysis of the Impediments to Fair Housing 2010 Page 32
Table II-2: Households by Type 1990 2000 2008
Household Type Number % of Total Number
% of Total Number
% of Total
Total Households 69,973 100.0% 76,550 100.0% 81,467 100.0%
Family Households 41,229 58.9% 40,324 52.7% 39,170 48.1%
Non-Family Households 28,744 41.1% 36,226 51.8% 42,297 51.9%
Large Families (5 or More) N/A N/A 3,749 17.8% N/A N/A
Small Families (2 to 4) N/A N/A 29,018 82.2% N/A N/A
65 and older (families & non-families) N/A N/A 17,489 21.5% N/A N/A
INCOME PROFILE INCOME
The City of Knoxville’s median income in 2000 was $27,492, which is 26.6 percent below the
overall county median income of $37,454. In 2000, the income range with the highest number
of households in the City of Knoxville was less than $10,000, with 18.7 percent of the
population earning in this range. The second highest earning level was $15,000 to $24,999, with
17.8 percent of households at this level.
By 2008, the median income was estimated to have risen to $33,316—a 21.2 percent increase.
At the same time, the median income in the county overall was estimated to be $46,652,
representing a 24.6 percent increase in the countywide median income. The higher increase
countywide rather than within the city resulted in the city median income dropping to 21.2
percent of the county.
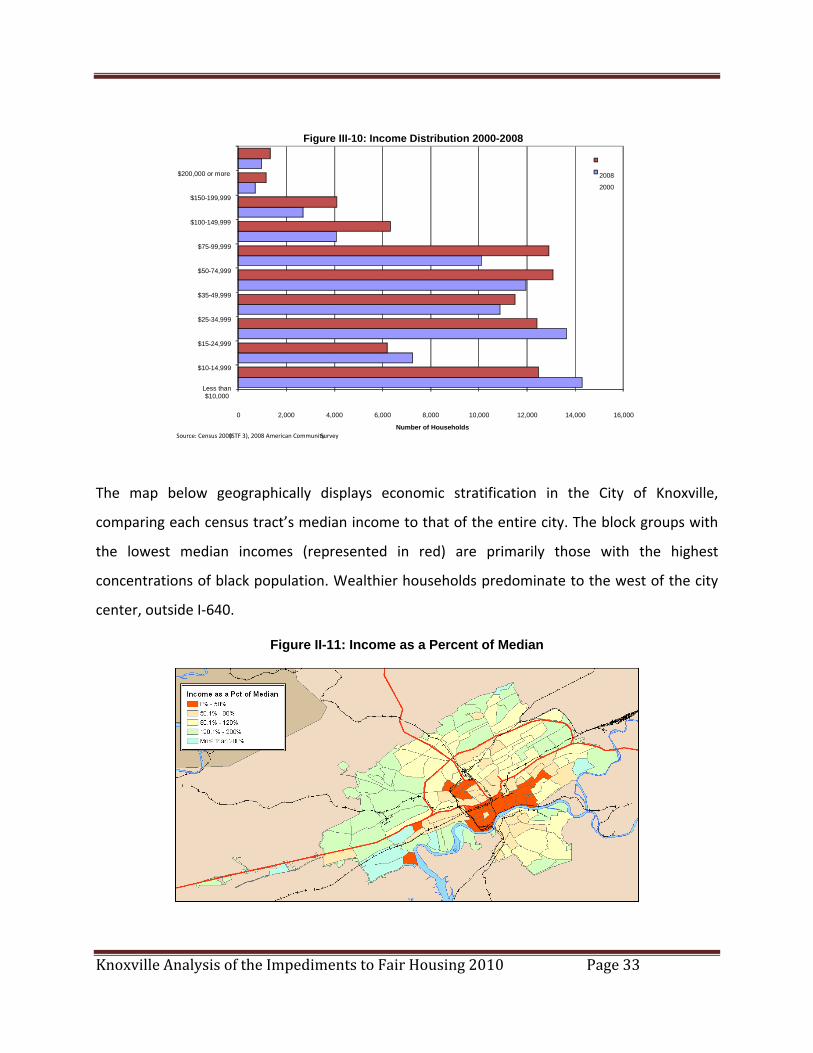
ACS 2008 estimates indicate that the highest percent of households earned between $35,000
and $49,999 (16.0 percent), followed closely by those earning between $50,000 and $74,999
(15.8 percent). Those earning less than $10,000 and households earning from $15,000 to
$24,999 are also represented by more than 15 percent of the population (15.3 and 15.2,
respectively). All higher income levels were estimated to have grown in both numbers and
percent of the population between 2000 and 2008.
Knoxville Analysis of the Impediments to Fair Housing 2010 Page 33
2008 2000
Figure III-10: Income Distribution 2000-2008
$200,000 or more
$150 199,999 -
$100 149,999 -
$75 99,999 -
$50 74,999 -
$35 49,999 -
$25 34,999 -
$15 24,999 -
$10 14,999 -
Less than $10,000
0 2,000 14,000 16,000 4,000 6,000 8,000 10,000 12,000
Source: Census 2000( STF 3), 2008 American CommunitySurveyNumber of Households
The map below geographically displays economic stratification in the City of Knoxville,
comparing each census tract’s median income to that of the entire city. The block groups with
the lowest median incomes (represented in red) are primarily those with the highest
concentrations of black population. Wealthier households predominate to the west of the city
center, outside I‐640.
Figure II-11: Income as a Percent of Median
Knoxville Analysis of the Impediments to Fair Housing 2010 Page 34
According to HUD, the current (2009) median income for a family of four in the City of Knoxville
is $58,800. The table below provides 2009 income limits by family size.2
Table II-3: Income Limits 2009
Family Size 1 2 3 4 5 6
Income Limit 32,950 37,650 42,350 47,050 50,800 54,600
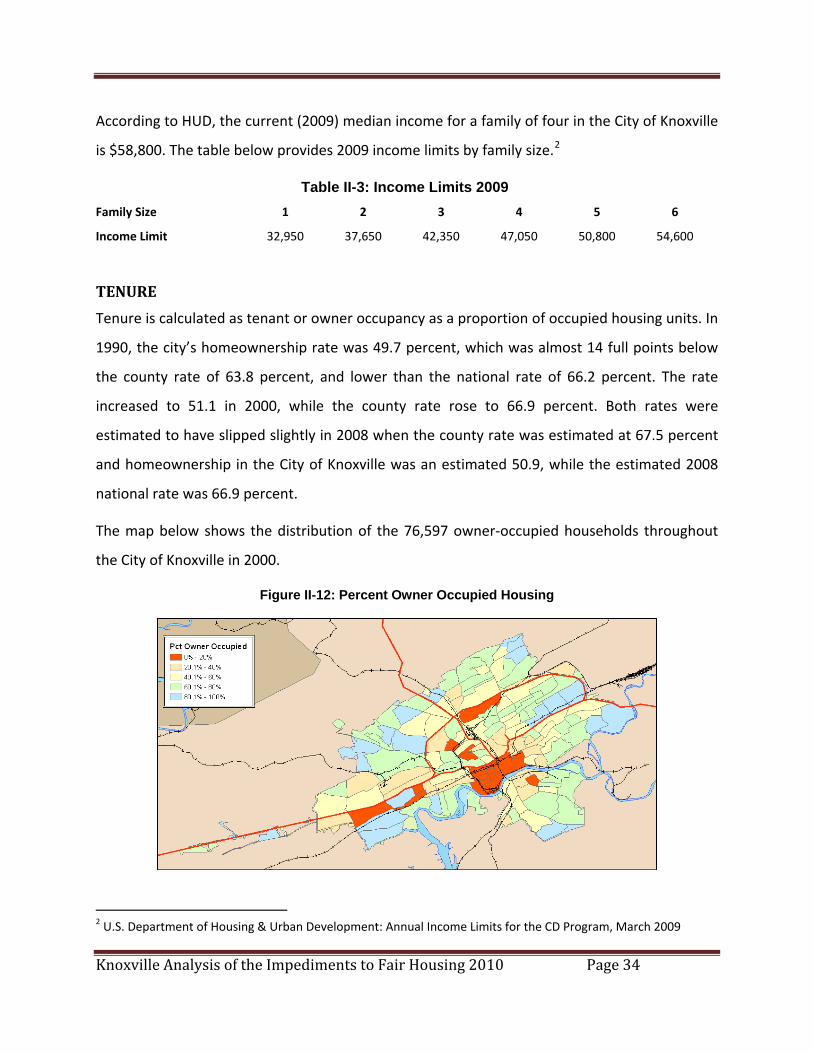
TENURE
Tenure is calculated as tenant or owner occupancy as a proportion of occupied housing units. In
1990, the city’s homeownership rate was 49.7 percent, which was almost 14 full points below
the county rate of 63.8 percent, and lower than the national rate of 66.2 percent. The rate
increased to 51.1 in 2000, while the county rate rose to 66.9 percent. Both rates were
estimated to have slipped slightly in 2008 when the county rate was estimated at 67.5 percent
and homeownership in the City of Knoxville was an estimated 50.9, while the estimated 2008
national rate was 66.9 percent.
The map below shows the distribution of the 76,597 owner‐occupied households throughout
the City of Knoxville in 2000.
Figure II-12: Percent Owner Occupied Housing
2 U.S. Department of Housing & Urban Development: Annual Income Limits for the CD Program, March 2009
Knoxville Analysis of the Impediments to Fair Housing 2010 Page 35
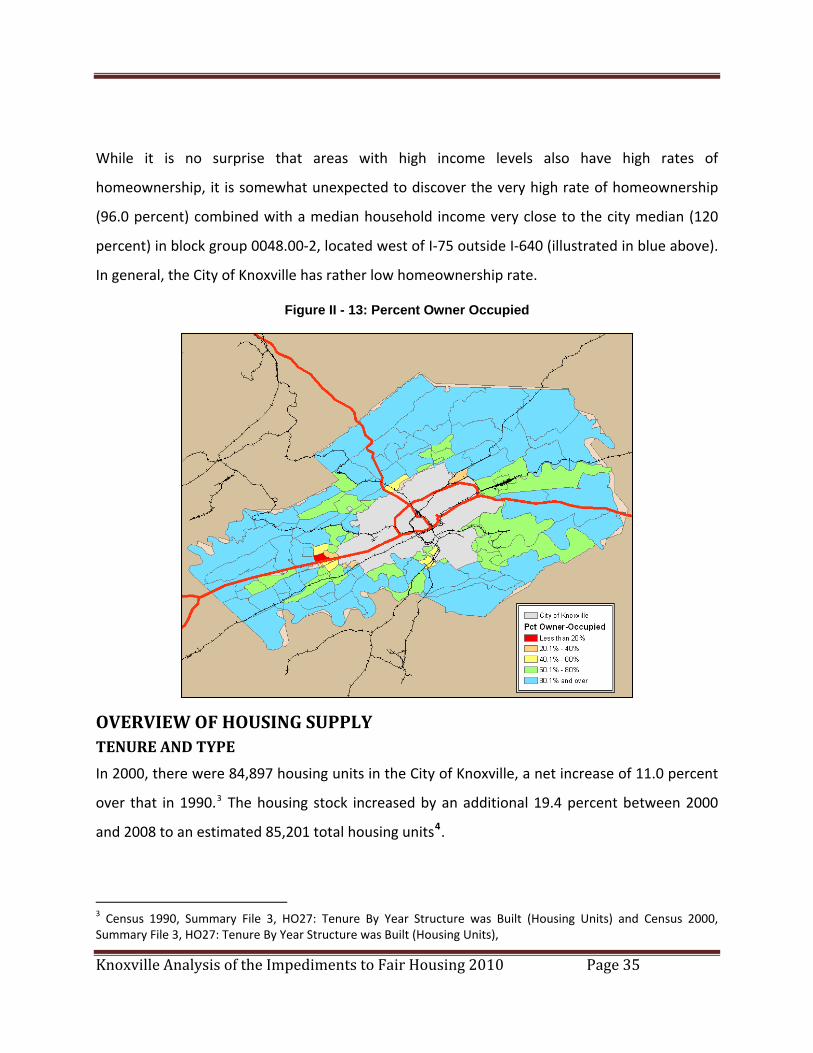
While it is no surprise that areas with high income levels also have high rates of
homeownership, it is somewhat unexpected to discover the very high rate of homeownership
(96.0 percent) combined with a median household income very close to the city median (120
percent) in block group 0048.00‐2, located west of I‐75 outside I‐640 (illustrated in blue above).
In general, the City of Knoxville has rather low homeownership rate.
Figure II - 13: Percent Owner Occupied
OVERVIEW OF HOUSING SUPPLY TENURE AND TYPE
In 2000, there were 84,897 housing units in the City of Knoxville, a net increase of 11.0 percent
over that in 1990.3 The housing stock increased by an additional 19.4 percent between 2000
and 2008 to an estimated 85,201 total housing units4.
3 Census 1990, Summary File 3, HO27: Tenure By Year Structure was Built (Housing Units) and Census 2000, Summary File 3, HO27: Tenure By Year Structure was Built (Housing Units),
Knoxville Analysis of the Impediments to Fair Housing 2010 Page 36
Table II-4: Knoxville: Housing Units by Tenure 2000-2008
2000 2008 Change
Units
Number Percent Number Percent Number Percent
Owner‐Occupied 39,124 46.1% 41,474 45.3% 2,350 35.2%
Renter‐Occupied 37,473 44.1% 39,993 43.7% 2,520 37.8%
Vacant 8,300 9.8% 10,100 11.0% 1,800 27.0%
Total 84,897 100.0% 91,567 100.0% 6,670 100.0%
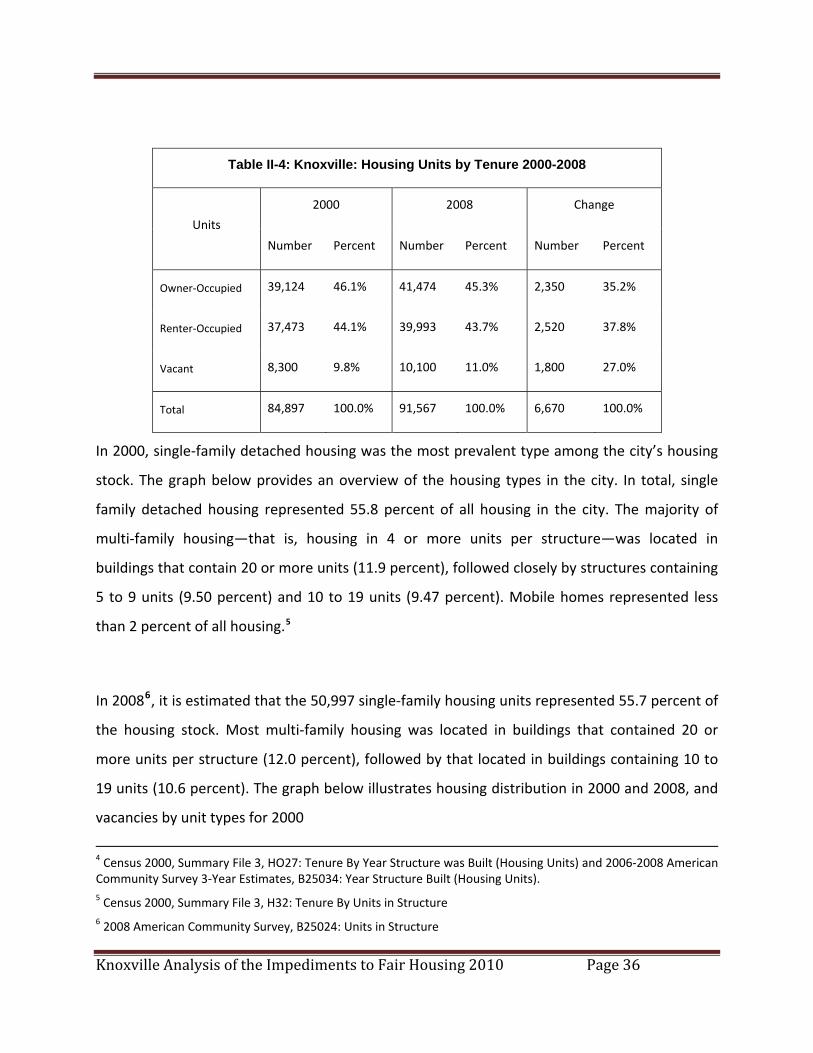
In 2000, single‐family detached housing was the most prevalent type among the city’s housing
stock. The graph below provides an overview of the housing types in the city. In total, single
family detached housing represented 55.8 percent of all housing in the city. The majority of
multi‐family housing—that is, housing in 4 or more units per structure—was located in
buildings that contain 20 or more units (11.9 percent), followed closely by structures containing
5 to 9 units (9.50 percent) and 10 to 19 units (9.47 percent). Mobile homes represented less
than 2 percent of all housing.5
In 20086, it is estimated that the 50,997 single‐family housing units represented 55.7 percent of
the housing stock. Most multi‐family housing was located in buildings that contained 20 or
more units per structure (12.0 percent), followed by that located in buildings containing 10 to
19 units (10.6 percent). The graph below illustrates housing distribution in 2000 and 2008, and
vacancies by unit types for 2000
4 Census 2000, Summary File 3, HO27: Tenure By Year Structure was Built (Housing Units) and 2006‐2008 American Community Survey 3‐Year Estimates, B25034: Year Structure Built (Housing Units). 5 Census 2000, Summary File 3, H32: Tenure By Units in Structure 6 2008 American Community Survey, B25024: Units in Structure
Knoxville Analysis of the Impediments to Fair Housing 2010 Page 37
Figure II-14: Housing by Type
Units 2008 Vacant 20 00
Units 2000
10,993
6 0
1,087
1,104
3,518
16,104
16,927
7,429
6,874
2,763
4,672
47,400 50,997
Boat, RV, van, etc.
Mobile home
20 or more units
5 to 19 units
2 to 4 units
1 unit, attached
1 unit, detached
0 10,000 50,000 20,000 30,000 40,000
Source: Census 2000 (STF 3), 2008 American Community Survey
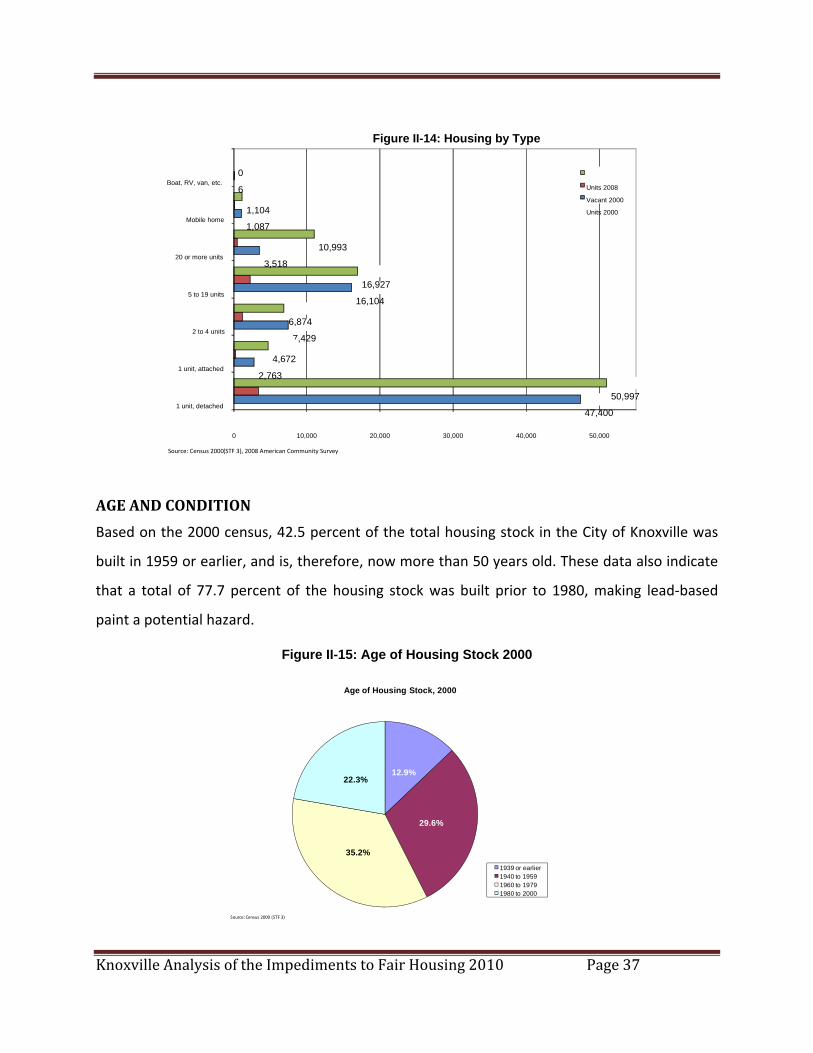
AGE AND CONDITION
Based on the 2000 census, 42.5 percent of the total housing stock in the City of Knoxville was
built in 1959 or earlier, and is, therefore, now more than 50 years old. These data also indicate
that a total of 77.7 percent of the housing stock was built prior to 1980, making lead‐based
paint a potential hazard.
Figure II-15: Age of Housing Stock 2000
12.9%
29.6%
35.2%
22.3%
Age of Housing Stock, 2000
1939 or earlier1940 to 19591960 to 19791980 to 2000
Source: Census 2000 (STF 3)
Knoxville Analysis of the Impediments to Fair Housing 2010 Page 38
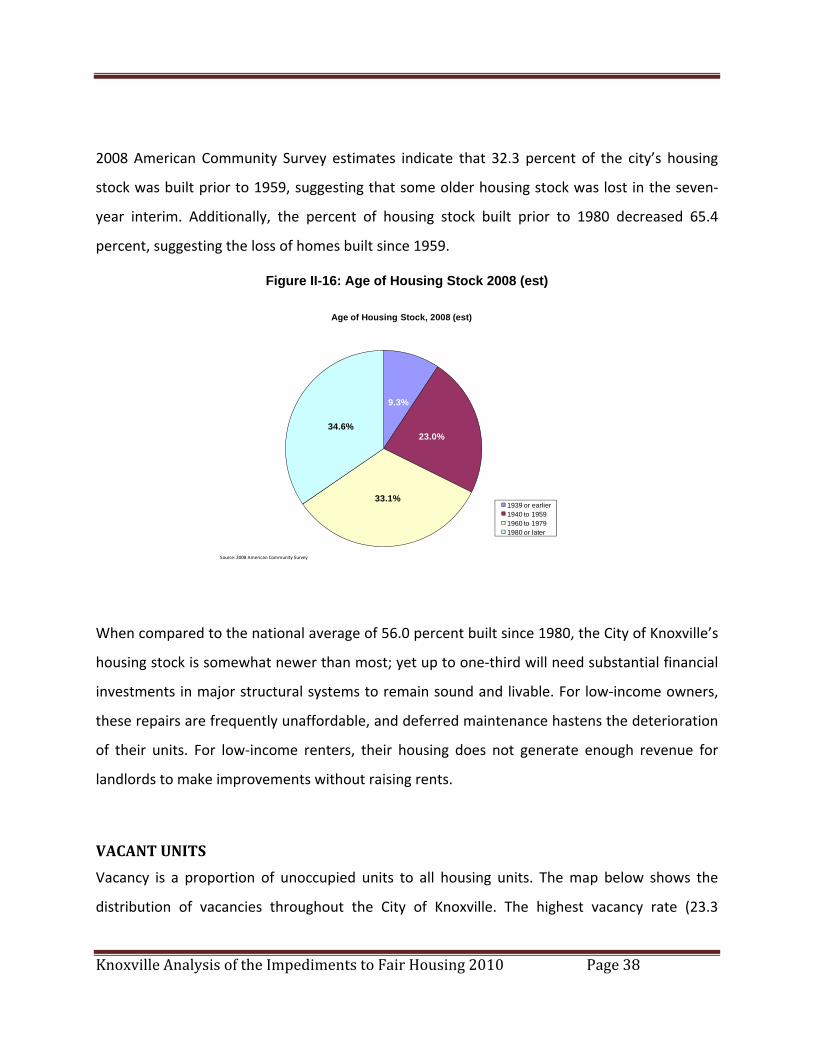
2008 American Community Survey estimates indicate that 32.3 percent of the city’s housing
stock was built prior to 1959, suggesting that some older housing stock was lost in the seven‐
year interim. Additionally, the percent of housing stock built prior to 1980 decreased 65.4
percent, suggesting the loss of homes built since 1959.
Figure II-16: Age of Housing Stock 2008 (est)
9.3%
23.0%
33.1%
34.6%
Age of Housing Stock, 2008 (est)
1939 or earlier1940 to 19591960 to 19791980 or later
Source: 2008 American Community Survey
When compared to the national average of 56.0 percent built since 1980, the City of Knoxville’s
housing stock is somewhat newer than most; yet up to one‐third will need substantial financial
investments in major structural systems to remain sound and livable. For low‐income owners,
these repairs are frequently unaffordable, and deferred maintenance hastens the deterioration
of their units. For low‐income renters, their housing does not generate enough revenue for
landlords to make improvements without raising rents.
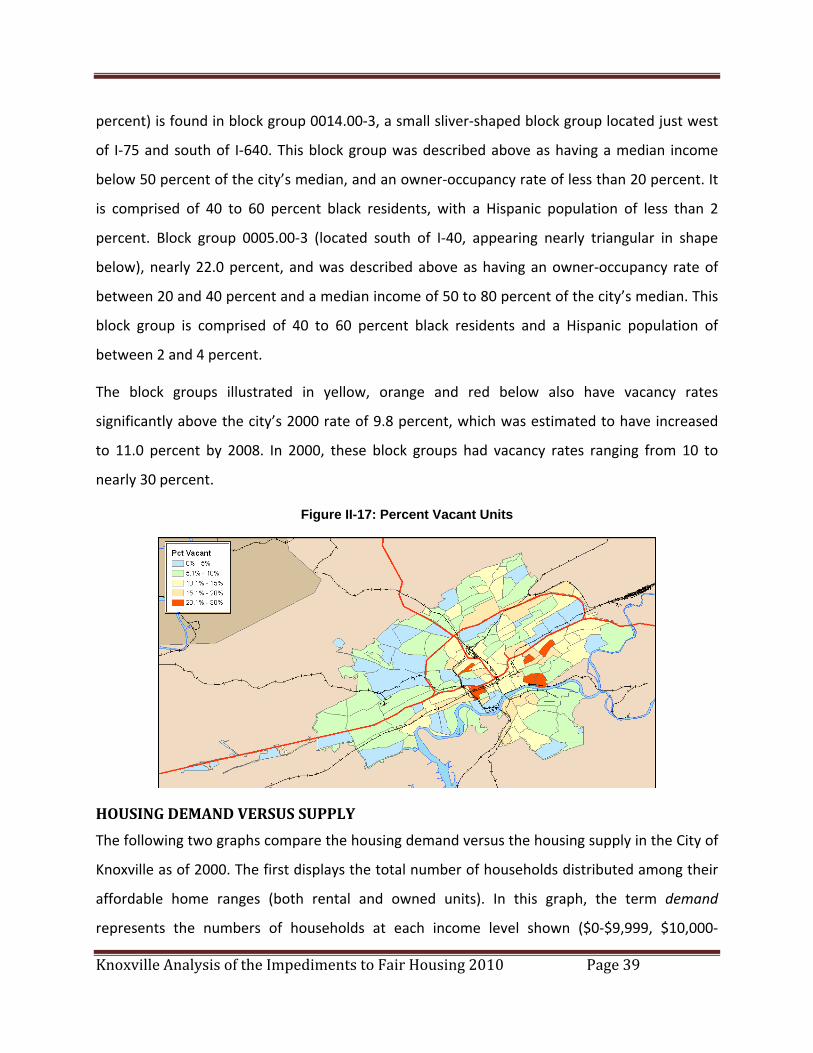
VACANT UNITS
Vacancy is a proportion of unoccupied units to all housing units. The map below shows the
distribution of vacancies throughout the City of Knoxville. The highest vacancy rate (23.3
Knoxville Analysis of the Impediments to Fair Housing 2010 Page 39
percent) is found in block group 0014.00‐3, a small sliver‐shaped block group located just west
of I‐75 and south of I‐640. This block group was described above as having a median income
below 50 percent of the city’s median, and an owner‐occupancy rate of less than 20 percent. It
is comprised of 40 to 60 percent black residents, with a Hispanic population of less than 2
percent. Block group 0005.00‐3 (located south of I‐40, appearing nearly triangular in shape
below), nearly 22.0 percent, and was described above as having an owner‐occupancy rate of
between 20 and 40 percent and a median income of 50 to 80 percent of the city’s median. This
block group is comprised of 40 to 60 percent black residents and a Hispanic population of
between 2 and 4 percent.
The block groups illustrated in yellow, orange and red below also have vacancy rates
significantly above the city’s 2000 rate of 9.8 percent, which was estimated to have increased
to 11.0 percent by 2008. In 2000, these block groups had vacancy rates ranging from 10 to
nearly 30 percent.
Figure II-17: Percent Vacant Units
HOUSING DEMAND VERSUS SUPPLY
The following two graphs compare the housing demand versus the housing supply in the City of
Knoxville as of 2000. The first displays the total number of households distributed among their
affordable home ranges (both rental and owned units). In this graph, the term demand
represents the numbers of households at each income level shown ($0‐$9,999, $10,000‐
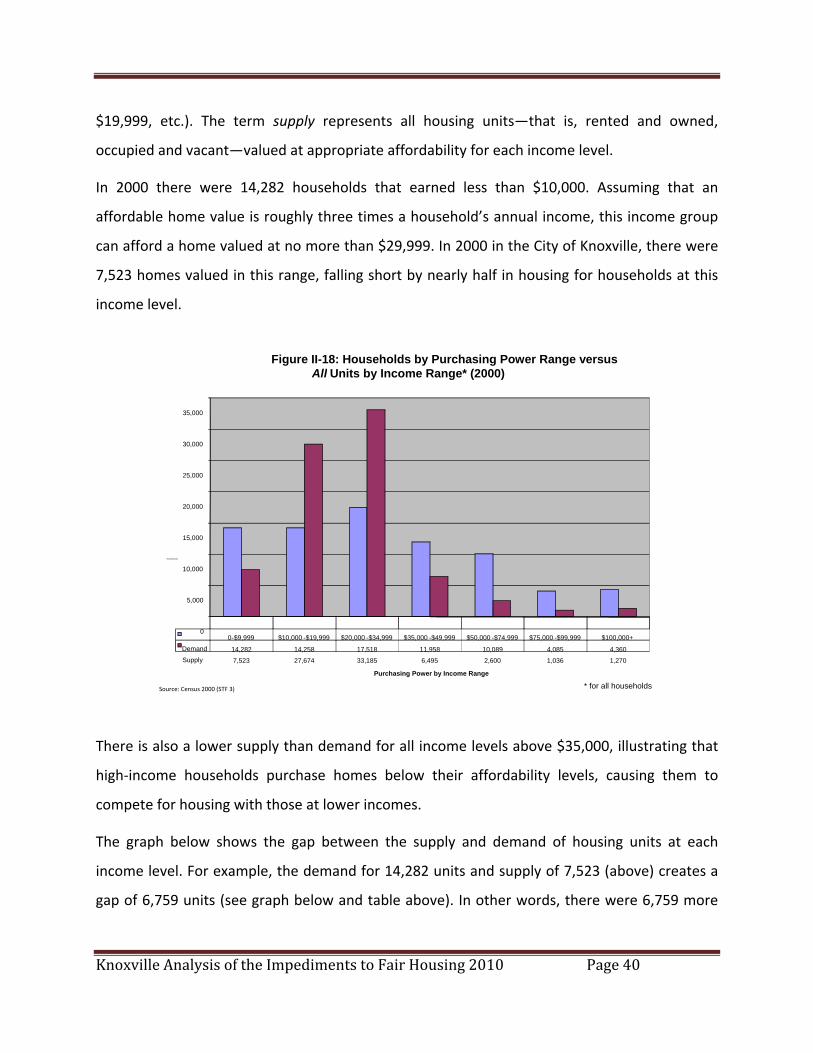
Knoxville Analysis of the Impediments to Fair Housing 2010 Page 40
$19,999, etc.). The term supply represents all housing units—that is, rented and owned,
occupied and vacant—valued at appropriate affordability for each income level.
In 2000 there were 14,282 households that earned less than $10,000. Assuming that an
affordable home value is roughly three times a household’s annual income, this income group
can afford a home valued at no more than $29,999. In 2000 in the City of Knoxville, there were
7,523 homes valued in this range, falling short by nearly half in housing for households at this
income level.
Figure II-18: Households by Purchasing Power Range versus Units by Income Range* (2000)All
0 $9,99 - 9 $10,000 - $1 9999, $20,000 -$34,999 $35,000 -$49,999 $50,000 -$74,999 $75,000 -$99,999 $100,00 + 00
Demand 14,28 2 14,258 17,518 11,958 10,089 4,085 4,360 1,270 1,0362,6006,49533,18527,674 7,523 Supply
35,000
30,000
25,000
20,000
15,000 Households/Units
10,000
5,000
Purchasing Power by Income Range
Source: Census 2000 (STF 3) * for all households
There is also a lower supply than demand for all income levels above $35,000, illustrating that
high‐income households purchase homes below their affordability levels, causing them to
compete for housing with those at lower incomes.
The graph below shows the gap between the supply and demand of housing units at each
income level. For example, the demand for 14,282 units and supply of 7,523 (above) creates a
gap of 6,759 units (see graph below and table above). In other words, there were 6,759 more
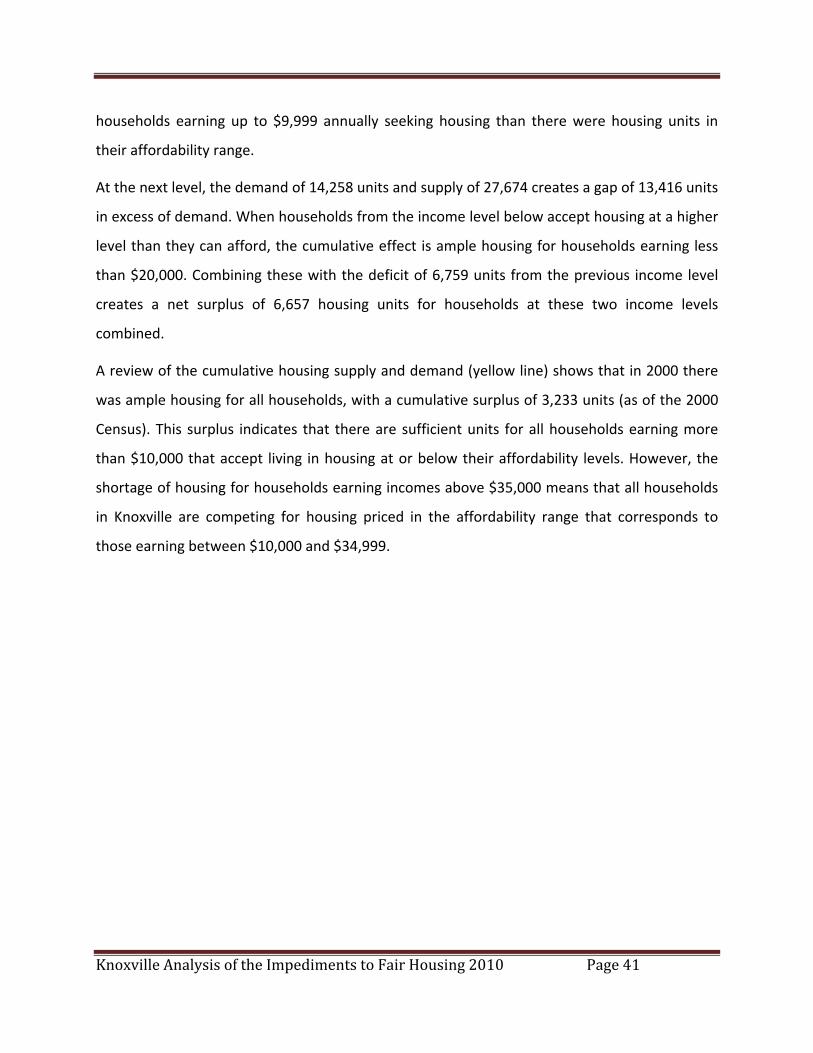
Knoxville Analysis of the Impediments to Fair Housing 2010 Page 41
households earning up to $9,999 annually seeking housing than there were housing units in
their affordability range.
At the next level, the demand of 14,258 units and supply of 27,674 creates a gap of 13,416 units
in excess of demand. When households from the income level below accept housing at a higher
level than they can afford, the cumulative effect is ample housing for households earning less
than $20,000. Combining these with the deficit of 6,759 units from the previous income level
creates a net surplus of 6,657 housing units for households at these two income levels
combined.
A review of the cumulative housing supply and demand (yellow line) shows that in 2000 there
was ample housing for all households, with a cumulative surplus of 3,233 units (as of the 2000
Census). This surplus indicates that there are sufficient units for all households earning more
than $10,000 that accept living in housing at or below their affordability levels. However, the
shortage of housing for households earning incomes above $35,000 means that all households
in Knoxville are competing for housing priced in the affordability range that corresponds to
those earning between $10,000 and $34,999.
Knoxville Analysis of the Impediments to Fair Housing 2010 Page 42
Figure II-19: Housing Gap 2000
Surplus/Deficit
Cumulative Gap
$100,000+ Over 364%
$99,999 -$75,000$74,999-$50,000$49,999-$35,000$34,999-$20,000$10,000 -$19,999 73%
0 -$9,999
36%
3,233
6,323
9,372
16,861
22,324
6,657
- 3,090 -3,049
-7,489-5,463
15,66713,416
- 6,759- 6,759
25,000
20,000
15,000
10,000
5,000
Number of Units 0
(5,000)
(10,000)
127% 182% 273% 364%
Income Range and as Percent of Area Median(STF 3) Source: Census 2000
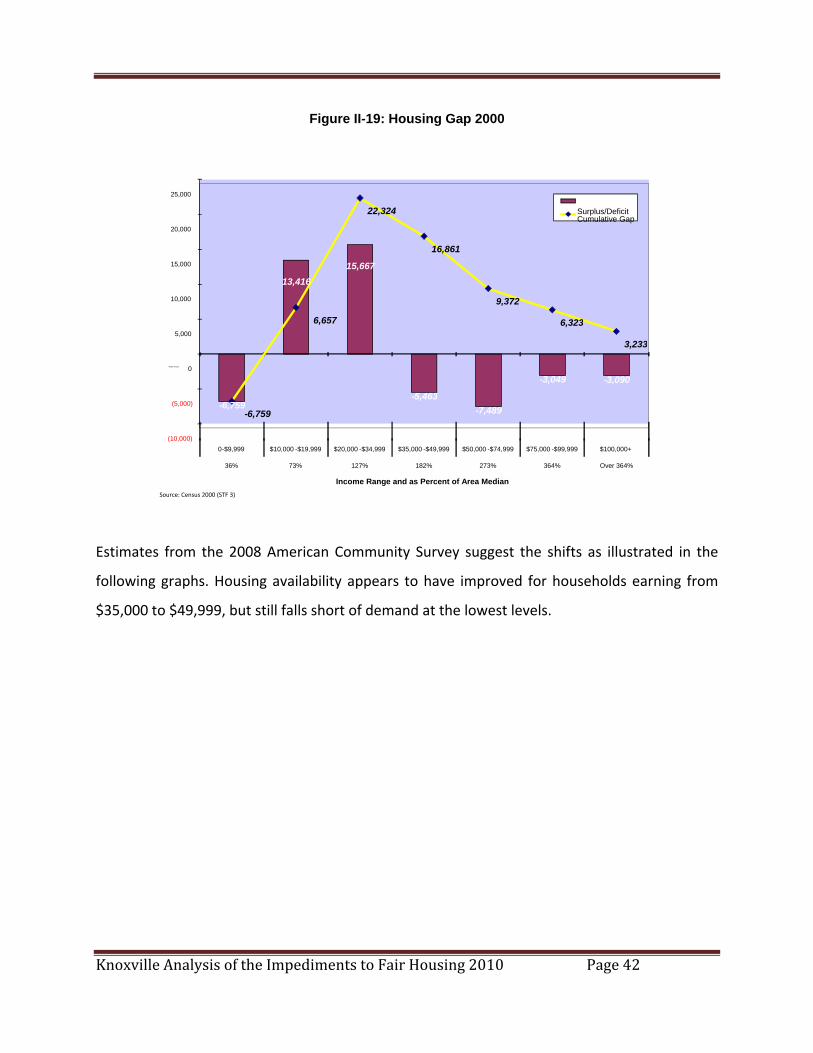
Estimates from the 2008 American Community Survey suggest the shifts as illustrated in the
following graphs. Housing availability appears to have improved for households earning from
$35,000 to $49,999, but still falls short of demand at the lowest levels.
Knoxville Analysis of the Impediments to Fair Housing 2010 Page 43
Figure II-20: Households by Purchasing Power Range versus
All Units by Income Range* (2008 est)
45,000
40,000
35,000
30,000
25,000
20,000
15,000Households/Units
10,000
5,000
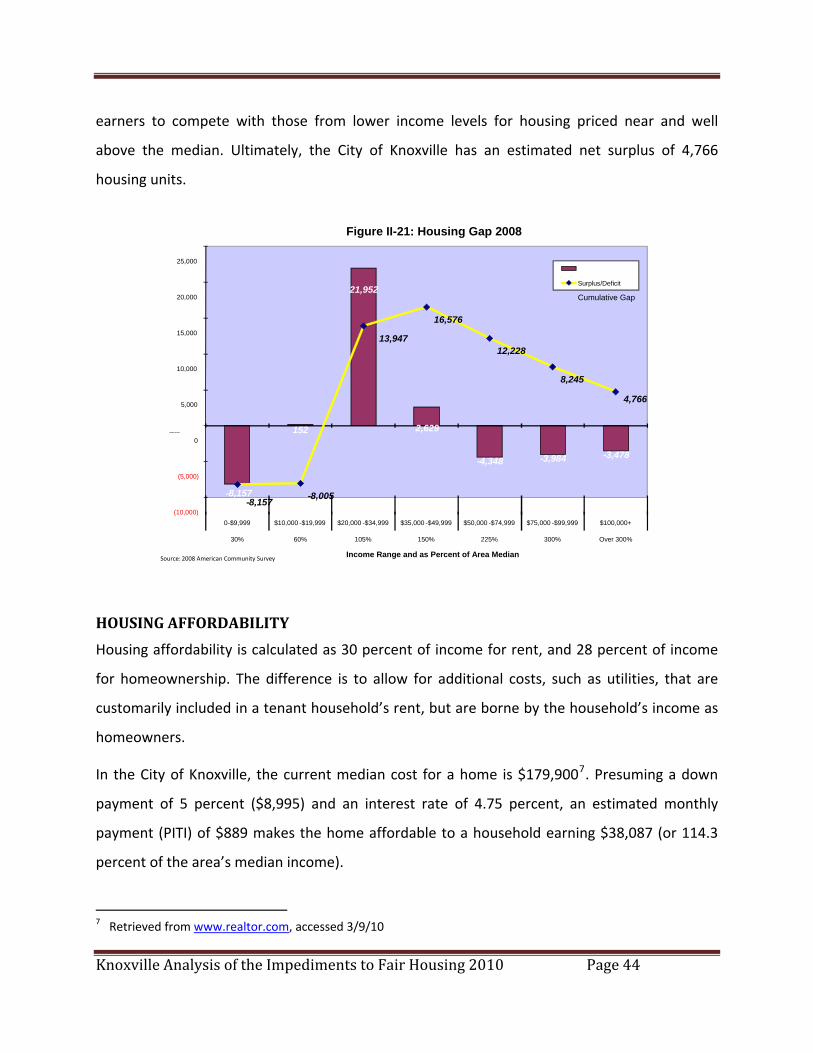
The demand for 12,473 units and supply of 4,316 at the lowest level reveals a gap of ‐8,157
units—considerably larger than the gap in 2000. Important to note is that a home priced at less
than $10,000 in 2000 was available to households earning up to 36 percent of the area’s
median income. By 2008, this home was available to those earning up to just 30 percent of the
area’s median income. Because the price of the home is held constant against a rising median
income, the affordability measure decreases.
At the next price point, the demand for 12,395 units and supply of 12,547 units meets the
needs of households earning from $10,000 to $19,999, but represents a continued deficit of
housing for those with incomes below 30 percent of the area’s median. Relief for the unmet
needs of the high demand and low supply does not occur until the excess of 13,947 housing
units for those who earn 105 percent of the area’s median income (up to $35,999).
Furthermore, the continued shortage of housing units at the highest levels causes the highest
0-$9,999 $10,000- $19,999 $20,000-$34,999 $35,000-$49,999 $50,000-$74,999 $75,000- $99,999 $100,000+0
Demand 12,473 12,395 17,696 13,071 12,904 6,331 6,598Supply 4,316 12,547 39,647 15,700 8,556 2,347 3,120
Purchasing Power by Income RangeSource: 2008 American Community SUrvey * for all households
Knoxville Analysis of the Impediments to Fair Housing 2010 Page 44
earners to compete with those from lower income levels for housing priced near and well
above the median. Ultimately, the City of Knoxville has an estimated net surplus of 4,766
housing units.
Figure II-21: Housing Gap 2008
25,000
Surplus/Deficit 21,952
Cumulative Gap20,000
16,57615,000
13,94712,228
10,000
8,245 4,766
5,000
Number of Units 152 2,6290
- 3,478 -3,984-4,348(5,000)
HOUSING AFFORDABILITY
Housing affordability is calculated as 30 percent of income for rent, and 28 percent of income
for homeownership. The difference is to allow for additional costs, such as utilities, that are
customarily included in a tenant household’s rent, but are borne by the household’s income as
homeowners.
In the City of Knoxville, the current median cost for a home is $179,9007. Presuming a down
payment of 5 percent ($8,995) and an interest rate of 4.75 percent, an estimated monthly
payment (PITI) of $889 makes the home affordable to a household earning $38,087 (or 114.3
percent of the area’s median income).
7 Retrieved from www.realtor.com, accessed 3/9/10
- 8,157 - - 8,005 8,157
(10,000) 0 $9,999 -$19,999 $99,999 $100,000+ - $10,000 $20,000 -$34,999 $35,000 -$49,999 $50,000 -$74,999 $75,000 -
60% Over 300% 30% 105% 150% 225% 300%
Income Range and as Percent of Area MedianSource: 2008 American Community Survey
Knoxville Analysis of the Impediments to Fair Housing 2010 Page 45
According to the National Low‐Income Housing Coalition’s “Out of Reach” database, in 2009,
the City of Knoxville’s median gross rent for a two‐bedroom unit was $667. As 30 percent of
annual income, this rent would be affordable to a household earning $26,680, or 80.1 percent
of the area’s median income. Three‐bedroom rental housing was reported to cost $894.
Affording this rent requires an annual income of $35,760, and is affordable to households
earning 107.3 percent or more of the area’s median income. In general, rental housing in the
City of Knoxville is affordable for those who earn an income above 80 percent of the city’s
median.
The first table on the following page illustrates the income needed to afford a home of the 2010
median home value in the City of Knoxville, based on interest rates of 4.75 and 5.25 percent
with a 5‐percent down payment.
The second table illustrates the price of a home that households paying the 2009 Fair Market
Rent (FMR) for two‐ and three‐bedroom units can afford, if they were to own rather than rent.
These charts assume an affordable rental housing cost to be 30 percent of a household’s
monthly income and an affordable ownership cost to be 28 percent.
Assuming a 28 percent affordability index, the results of the analysis show that a median‐priced
home in 2010 is affordable to a household earning between $38,087 and $40,431 (or from
114.3 to 121.4 percent of the AMI). This assumes that the household can provide a down
payment of 5 percent.
This analysis further examines the affordability of rental housing in the City of Knoxville in
comparison to the cost of homeownership. A household paying the 2009 fair market rent (FMR)
for a 2‐bedroom rental unit with no funds available for a down payment can afford a home
between 63 and 67 percent of the 2009 median home value in the City of Knoxville; that is, a
home priced between $112,778 and $119,718. A household paying the 2009 fair market rent
(FMR) for a 3‐bedroom rental unit with no funds available for a down payment can afford a
home between 84 and 89 percent of the 2009 median home value in the City of Knoxville; that
is, a home priced between $151,159 and $160,462. A current search of homes for sale revealed
Knoxville Analysis of the Impediments to Fair Housing 2010 Page 46
the lowest priced home in the City of Knoxville to be $9,900, with 2,164 homes priced below
$179,900.8
8 Search conducted 3/9/10 at www.realtor.com.
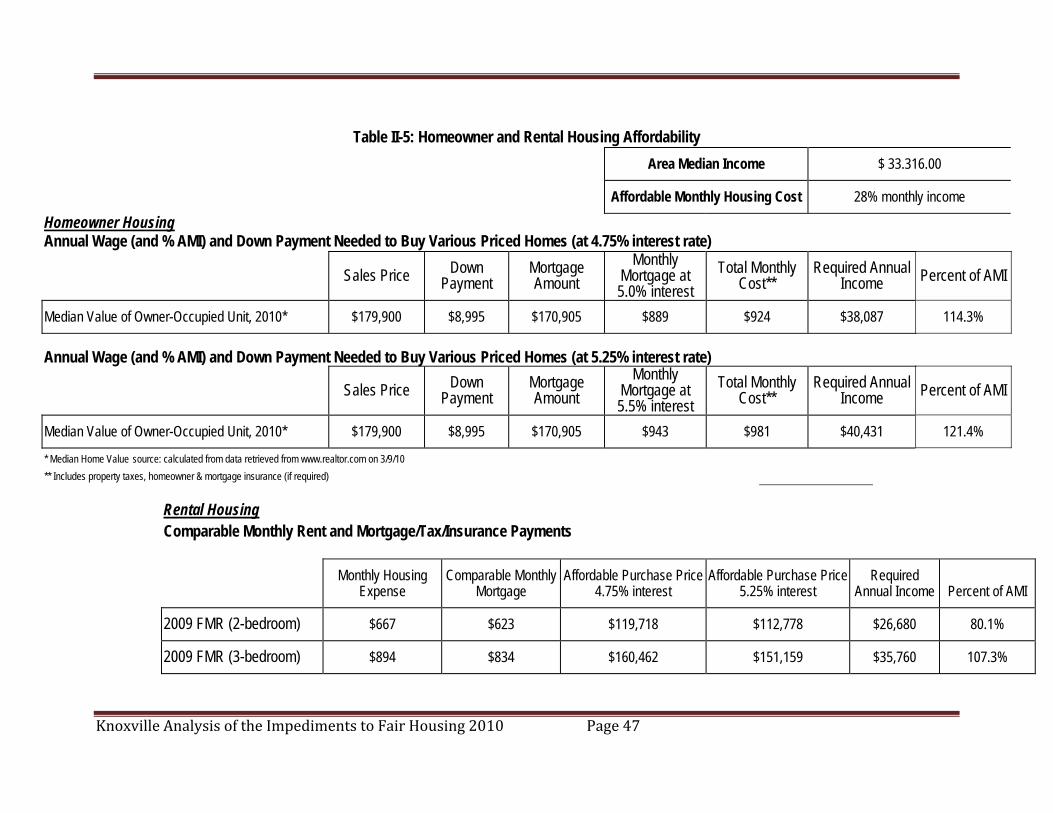
Knoxville Analysis of the Impediments to Fair Housing 2010 Page 47
Table II-5: Homeowner and Rental Housing Affordability
Area Median Income $ 33.316.00
Affordable Monthly Housing Cost 28% monthly income
Homeowner Housing Annual Wage (and % AMI) and Down Payment Needed to Buy Various Priced Homes (at 4.75% interest rate)
Sales Price Down
Payment Mortgage Amount
Monthly Mortgage at 5.0% interest
Total Monthly Cost**
Required Annual Income Percent of AMI
Median Value of Owner-Occupied Unit, 2010* $179,900 $8,995 $170,905 $889 $924 $38,087 114.3%
Annual Wage (and % AMI) and Down Payment Needed to Buy Various Priced Homes (at 5.25% interest rate)
Sales Price Down Payment
Mortgage Amount
Monthly Mortgage at 5.5% interest
Total Monthly Cost**
Required Annual Income Percent of AMI
Median Value of Owner-Occupied Unit, 2010* $179,900 $8,995 $170,905 $943 $981 $40,431 121.4%
* Median Home Value source: calculated from data retrieved from www.realtor.com on 3/9/10 ** Includes property taxes, homeowner & mortgage insurance (if required)
Rental Housing Comparable Monthly Rent and Mortgage/Tax/Insurance Payments
Monthly Housing Expense
Comparable Monthly Mortgage
Affordable Purchase Price 4.75% interest
Affordable Purchase Price 5.25% interest
Required Annual Income Percent of AMI
2009 FMR (2-bedroom) $667 $623 $119,718 $112,778 $26,680 80.1%
2009 FMR (3-bedroom) $894 $834 $160,462 $151,159 $35,760 107.3%
Knoxville Analysis of the Impediments to Fair Housing 2010 Page 48
HOUSING PROBLEMS
By Department of Housing and Urban Development (HUD) standards, there are three
criteria by which a household is determined to have a housing problem:
• If a household pays more than 30 percent of its gross monthly income for housing, it
is considered cost burdened. HUD considers households that pay more than 50
percent of their income on housing costs to be severely cost burdened.
• If a household occupies a unit that lacks a complete kitchen or bathroom, the unit
has a physical defect.
• If a household contains more members than the unit has rooms, the unit is
overcrowded.
Based on HUD’s definition, 37.6 percent of the City of Knoxville renters (14,066) were
cost‐burdened in 2000, including 20.7 percent (7,744) who were severely cost‐
burdened. A significantly smaller percent of homeowners with a mortgage experience
this housing problem: 22.1 percent (8,643) were cost‐burdened, including 9.0 percent
(3,520) who were severely cost burdened.
According to the 2000 Census, 235 households (0.3 percent) lacked adequate plumbing
facilities—70 owners (0.2 percent) and 165 renters (0.4 percent). At the same time, 479
households (0.6 percent) lacked complete kitchen facilities—109 owners (0.3 percent)
and 370 renters (1.0 percent). American Community Survey data are not available.
In 2000, 1,560 (2.0 percent) of the City of Knoxville households were overcrowded.
These were comprised of 320 owner‐occupied households, or 0.8 percent of all owner‐
occupied households. Considerably more tenant‐occupied households were
overcrowded: 1,240 or 3.3 percent of all renters.
American Community Survey estimates reported substantial improvement by 2008,
indicating that overall, 0.8 percent of households were overcrowded (625), comprised of
210 owners (.05 percent of all owners) and 415 renters (1.0 percent of all renters).
Knoxville Analysis of the Impediments to Fair Housing 2010 Page 49
SECTION III: Fair Housing Status, 2010 According to the Knoxville 2005‐2010 Consolidated Plan, in 2000, the City’s estimated
population was 165,121 residents and rising. The City’s 2008 population has been
estimate at 177,646.
As indicated in Section II (Demographic and Economic Overview), the 1990 Census
reported a labor force of 81,230 persons in Knoxville. In 2000, Census data reported a
labor force of 86,202 and an unemployment rate of 6.5 percent (down from 7.1 in
1990). American Community Survey 2008 data estimate 89,880 persons in the labor
force, and the Bureau of Labor Statistics data show a 2008 unemployment rate of 5.2
percent in the MSA. Calculations based on the 2008 ACS data, however, place the City
unemployment rate at 6.5.
By comparison, in 2000, the unemployment rate for the State of Tennessee was 4.0
percent, matching the National rate. More recent data show the 2008 unemployment
rate for the State of Tennessee to be 6.4 percent, as compared to a National rate of 5.8
percent. The first nine months’ data for 2009 show that unemployment rates have
increased to 9.0 percent nationally, 10.0 percent in Tennessee, and 8.5 percent in the
Knoxville MSA.
Unlawful discrimination is one of the most blatant impediments to fair housing, and it is
therefore important to make efforts to measure the extent to which unlawful
discrimination occurs in the housing market. Analyzing complaints brought by those
who believe they have been illegally discriminated against can shed light on the barriers
to housing choice and accessibility. Though the number of complaints cannot provide a
complete picture of the level of discrimination, it can provide a snapshot of some of the
barriers that may exist. The 2005 Analysis of Impediments for Knoxville can also shed
some light on the community’s perceptions of the fair housing environment.
This section will review both the evidence of unlawful discrimination (in the form of an
analysis of discrimination complaints) and the recent fair housing related activities of
Knoxville Analysis of the Impediments to Fair Housing 2010 Page 50
Knoxville. Another purpose of this section is to describe the current fair housing
environment. Subsequent sections of this report will analyze this information for the
purpose of identifying current impediments and action steps to minimize the effect of
those impediments.
COMPLAINTS OF UNLAWFUL DISCRIMINATION
During 2005, Knoxville conducted an analysis of the impediments to fair housing choice.
HUD defines this procedure as a “comprehensive review of policies, practices and
procedures that effect the location, availability and accessibility of housing and the
current residential patterns and conditions.” In order to accomplish this task, the City
examined existing studies and literature, conducted an historical analysis, reviewed the
public policies from a fair housing perspective, analyzed the effectiveness of existing fair
housing activities and examined barriers to fair housing choice for each protected class.
“The State of Fair Housing”9 the HUD Annual Report on Fair Housing indicates that in FY
2008, HUD and the Fair Housing Assistance Program (FHAP) agencies received a
combined 10,552 housing discrimination complaints—the highest number of complaints
ever filed in a single fiscal year. This was the third year in a row that HUD and FHAP
agencies received more than 10,000 complaints. Prior to this, the only other fiscal year
in which HUD and FHAP agencies received more than 10,000 housing discrimination
complaints was FY 1993.10 The annual increase in complaints from 2007 to 2008 was 3.9
percent (3.9%). Since 2005 when disability complaints first exceeded race complaints,
the rate of discrimination complaints for disabilities has increased from 41% to 44% of
all Fair Housing complaints. The top three Fair Housing discrimination complaints in
2008 were disabilities (44%); race (35%) and familial status (16%).
9 See http://www.hud.gov/content/releases/fy2008annual‐rpt.pdf 10 The State of Fair Housing 2008, HUD, page 2: http://www.hud.gov/content/releases/fy2008annual‐rpt.pdf
Knoxville Analysis of the Impediments to Fair Housing 2010 Page 51
Although disability was the most common basis for discrimination in complaints filed
with HUD and FHAP agencies such as the Knoxville Office of Fair Housing, a HUD study
suggests that those complaints represent only a small fraction of incidents of disability
discrimination in the housing market. In July 2005, HUD issued the fourth phase of its
Housing Discrimination Study—“Discrimination Against Persons with Disabilities:
Barriers At Every Step”11. The study examined the Chicago area rental market and found
that hearing‐ impaired persons, using a telephone‐operator relay to search for rental
housing, experienced consistent adverse treatment 49.5 percent of the time. The study
also found that mobility‐impaired persons using wheelchairs experienced consistent
adverse treatment 32.3 percent of the time when they visited rental properties.
The number of complaints alleging racial or ethnic discrimination in the housing market
also account for far less than the actual number of discriminatory acts suggested by
recent studies. A series of national studies on the experiences of African Americans,
Hispanics, and Asians and Pacific Islanders in the housing market has found evidence of
consistent adverse treatment in roughly one of every five interactions with a sales or
rental agent. A study on the experience of Native Americans in the rental market in
three states found that they experience consistent adverse treatment in 28.5 percent of
their interactions with a rental agent, on average.
In addition to presenting information on the level of racial, ethnic, or disability
discrimination, recent HUD studies show that discrimination is often subtle. Much of the
consistent adverse treatment reported in the aforementioned studies was uncovered
using paired‐testing—a method by which two persons, differing only on a single
characteristic that is being tested (e.g., race), independently inquire about an advertised
housing unit. Each of the testers independently records his or her experience, and any
difference in treatment is often only apparent when an analyst compares the resulting
information. Thus, the disparity between the number of complaints filed with HUD and
11 See www.huduser.org/Publications/pdf/DDS_Barriers.pdf
Knoxville Analysis of the Impediments to Fair Housing 2010 Page 52
FHAP agencies and the frequency of discrimination found in housing discrimination
studies indicates that victims are often unaware that they have been discriminated
against and suggests that discrimination is greatly underreported.
In January 2005, HUD established the Office of Systemic Investigations (OSI) to
investigate discriminatory practices that are not reported by individuals. OSI uses
methods such as paired‐testing to investigate housing providers or other entities that it
suspects of engaging in unlawful discrimination.
TESTING
In July 2005, HUD published “Discrimination Against Persons with Disabilities: Testing
Guidance for Practitioners”12 as an aid for fair housing and disability‐rights advocates,
civil rights enforcement agencies, and others interested in testing for disability‐based
discrimination. The guidebook resulted from testing in the HUD‐commissioned study
entitled Discrimination Against Persons with Disabilities: Barriers at Every Step.
The guidebook describes the advantages and challenges of conducting telephone and in‐
person testing for discrimination against persons with disabilities. TTY testing was found
to be an inexpensive and effective testing strategy because it can be completed quickly,
it does not require testers to travel, and it can span a wide geographic area. Moreover,
relay operators provide customers with a verbatim report on each telephone call,
providing an independent narrative of what occurred in the disabled portion of the test.
However, because telephone calls are generally brief, these tests do not offer the
opportunity to capture as much information about differential treatment as in‐person
tests.
The report also addresses two particular challenges faced by persons with disabilities
when conducting in‐person tests—transportation and access to the property and/or
unit. Deaf or hard‐of‐hearing testers were not able to access housing that contained an
12 See http://www.huduser.org/publications/hsgspec/dds.html
Knoxville Analysis of the Impediments to Fair Housing 2010 Page 53
intercom/buzzer entry system and blind testers sometimes had difficulty finding the
front door or gaining access to rental properties or management offices. Therefore, the
report concluded that it might make sense to send testers to their assignments with
someone who could help them gain entrance, but who would not accompany them
during tests.
With proper planning and support, persons with disabilities were able to effectively
serve as testers. The most common types of assistance provided for testers with
disabilities were transportation to and from the test site, training materials in other
formats, such as Braille, and assistance from project staff in completing the test report
forms. Testers with cognitive disabilities sometimes needed companions to accompany
them during the test to help them remember and record the test experiences.
HUD intends for the study and report to serve as a guide for conducting disability
discrimination testing. As such, they should be used in conjunction with other testing
approaches that may be appropriate for the discriminatory practice being investigated.
HUD investigates complaints of housing discrimination based on race, color, religion,
national origin, sex, disability, or familial status. At no cost, HUD will investigate the
complaint and attempt to conciliate the matter with both parties. If conciliation fails,
HUD will determine whether "reasonable cause" exists to believe that a discriminatory
housing practice has occurred. If HUD finds "no reasonable cause," the Department
dismisses the complaint. If HUD finds reasonable cause, the Department will issue a
charge of discrimination and schedule a hearing before a HUD administrative law judge
(ALJ). Either party may elect to proceed in federal court. In that case, the Department of
Justice will pursue the case on behalf of the Complainant. The decisions of the ALJ and
the federal district court are subject to review by the U.S. Court of Appeals. As of April,
2009 the following cases are being investigated by HUD Headquarters:
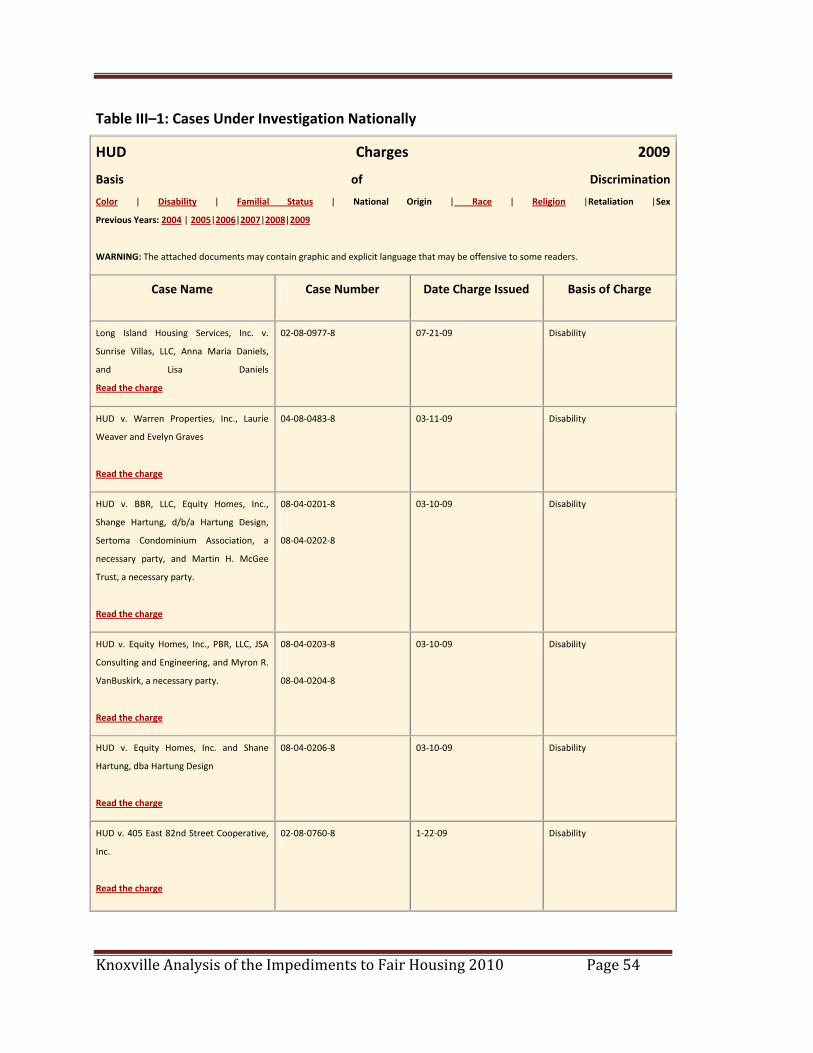
Knoxville Analysis of the Impediments to Fair Housing 2010 Page 54
Table III–1: Cases Under Investigation Nationally
HUD Charges 2009
Basis of Discrimination
Color | Disability | Familial Status | National Origin | Race | Religion |Retaliation |Sex
Previous Years: 2004 | 2005|2006|2007|2008|2009
WARNING: The attached documents may contain graphic and explicit language that may be offensive to some readers.
Case Name Case Number Date Charge Issued Basis of Charge
Long Island Housing Services, Inc. v.
Sunrise Villas, LLC, Anna Maria Daniels,
and Lisa Daniels
Read the charge
02‐08‐0977‐8 07‐21‐09 Disability
HUD v. Warren Properties, Inc., Laurie
Weaver and Evelyn Graves
Read the charge
04‐08‐0483‐8 03‐11‐09 Disability
HUD v. BBR, LLC, Equity Homes, Inc.,
Shange Hartung, d/b/a Hartung Design,
Sertoma Condominium Association, a
necessary party, and Martin H. McGee
Trust, a necessary party.
Read the charge
08‐04‐0201‐8
08‐04‐0202‐8
03‐10‐09 Disability
HUD v. Equity Homes, Inc., PBR, LLC, JSA
Consulting and Engineering, and Myron R.
VanBuskirk, a necessary party.
Read the charge
08‐04‐0203‐8
08‐04‐0204‐8
03‐10‐09 Disability
HUD v. Equity Homes, Inc. and Shane
Hartung, dba Hartung Design
Read the charge
08‐04‐0206‐8 03‐10‐09 Disability
HUD v. 405 East 82nd Street Cooperative,
Inc.
Read the charge
02‐08‐0760‐8 1‐22‐09 Disability
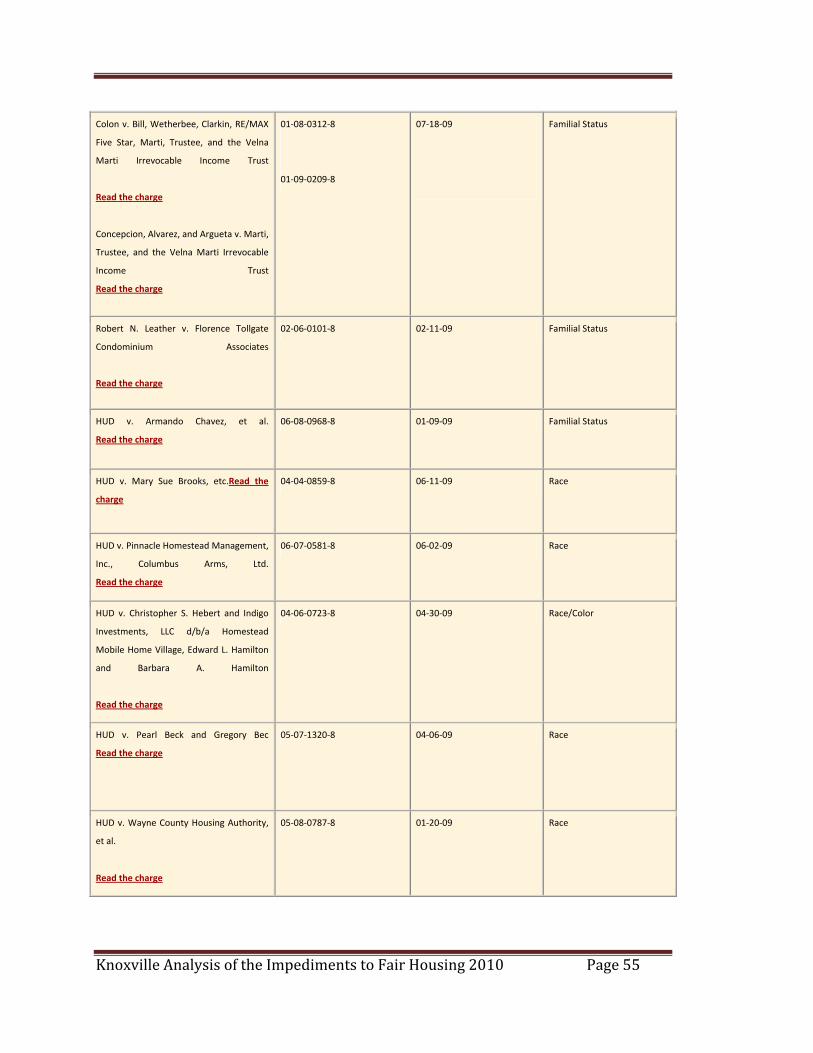
Knoxville Analysis of the Impediments to Fair Housing 2010 Page 55
Colon v. Bill, Wetherbee, Clarkin, RE/MAX
Five Star, Marti, Trustee, and the Velna
Marti Irrevocable Income Trust
Read the charge
Concepcion, Alvarez, and Argueta v. Marti,
Trustee, and the Velna Marti Irrevocable
Income Trust
Read the charge
01‐08‐0312‐8
01‐09‐0209‐8
07‐18‐09
Familial Status
Robert N. Leather v. Florence Tollgate
Condominium Associates
Read the charge
02‐06‐0101‐8 02‐11‐09 Familial Status
HUD v. Armando Chavez, et al.
Read the charge 06‐08‐0968‐8 01‐09‐09 Familial Status
HUD v. Mary Sue Brooks, etc.Read the
charge 04‐04‐0859‐8 06‐11‐09 Race
HUD v. Pinnacle Homestead Management,
Inc., Columbus Arms, Ltd.
Read the charge
06‐07‐0581‐8 06‐02‐09 Race
HUD v. Christopher S. Hebert and Indigo
Investments, LLC d/b/a Homestead
Mobile Home Village, Edward L. Hamilton
and Barbara A. Hamilton
Read the charge
04‐06‐0723‐8 04‐30‐09 Race/Color
HUD v. Pearl Beck and Gregory Bec
Read the charge 05‐07‐1320‐8 04‐06‐09 Race
HUD v. Wayne County Housing Authority,
et al.
Read the charge
05‐08‐0787‐8 01‐20‐09 Race
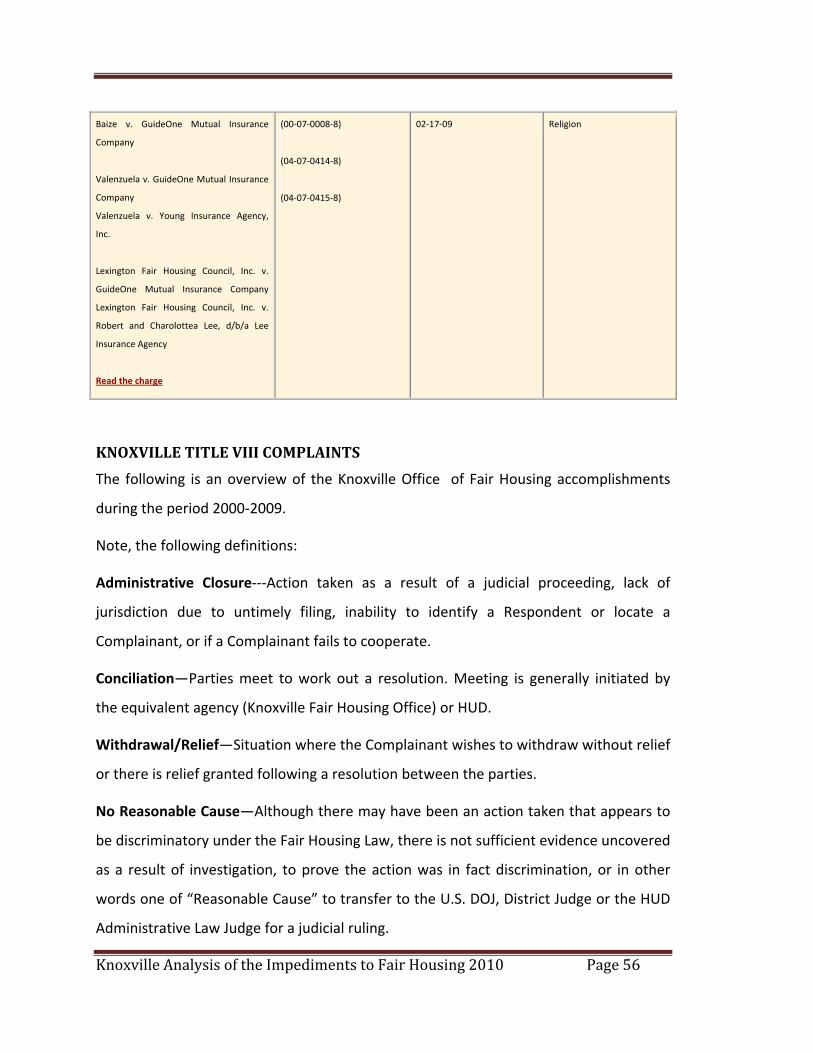
Knoxville Analysis of the Impediments to Fair Housing 2010 Page 56
Baize v. GuideOne Mutual Insurance
Company
Valenzuela v. GuideOne Mutual Insurance
Company
Valenzuela v. Young Insurance Agency,
Inc.
Lexington Fair Housing Council, Inc. v.
GuideOne Mutual Insurance Company
Lexington Fair Housing Council, Inc. v.
Robert and Charolottea Lee, d/b/a Lee
Insurance Agency
Read the charge
(00‐07‐0008‐8)
(04‐07‐0414‐8)
(04‐07‐0415‐8)
02‐17‐09 Religion
KNOXVILLE TITLE VIII COMPLAINTS
The following is an overview of the Knoxville Office of Fair Housing accomplishments
during the period 2000‐2009.
Note, the following definitions:
Administrative Closure‐‐‐Action taken as a result of a judicial proceeding, lack of
jurisdiction due to untimely filing, inability to identify a Respondent or locate a
Complainant, or if a Complainant fails to cooperate.
Conciliation—Parties meet to work out a resolution. Meeting is generally initiated by
the equivalent agency (Knoxville Fair Housing Office) or HUD.
Withdrawal/Relief—Situation where the Complainant wishes to withdraw without relief
or there is relief granted following a resolution between the parties.
No Reasonable Cause—Although there may have been an action taken that appears to
be discriminatory under the Fair Housing Law, there is not sufficient evidence uncovered
as a result of investigation, to prove the action was in fact discrimination, or in other
words one of “Reasonable Cause” to transfer to the U.S. DOJ, District Judge or the HUD
Administrative Law Judge for a judicial ruling.
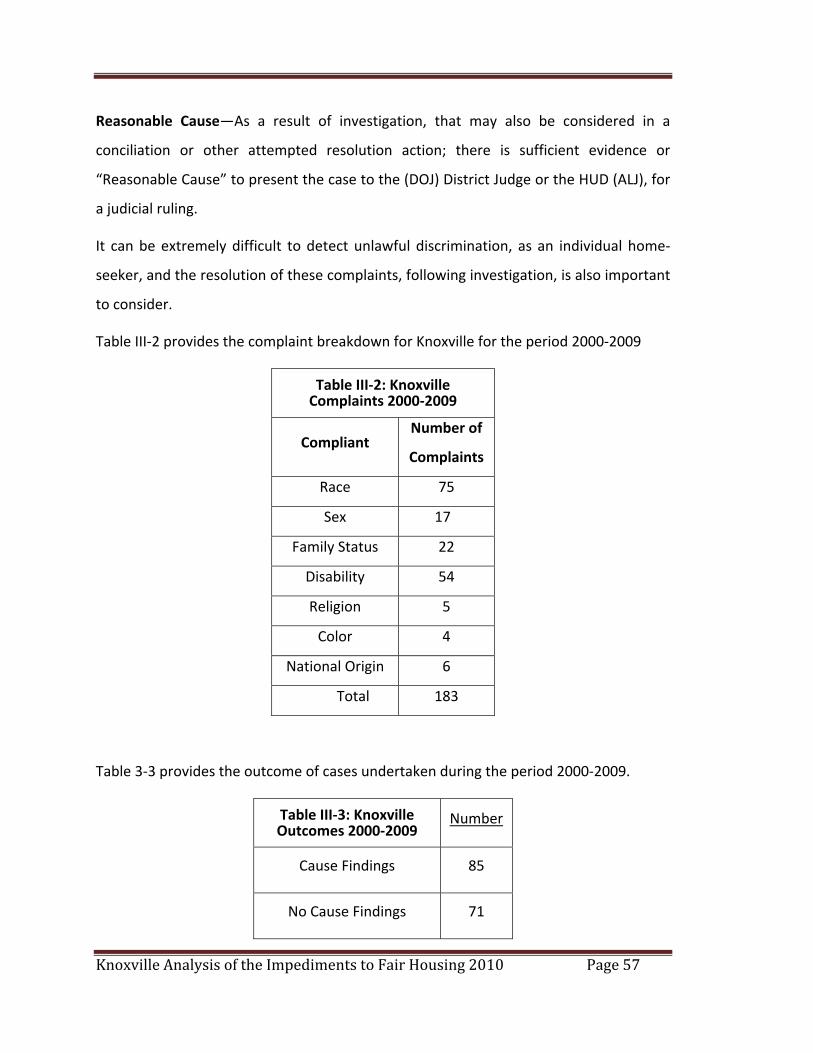
Knoxville Analysis of the Impediments to Fair Housing 2010 Page 57
Reasonable Cause—As a result of investigation, that may also be considered in a
conciliation or other attempted resolution action; there is sufficient evidence or
“Reasonable Cause” to present the case to the (DOJ) District Judge or the HUD (ALJ), for
a judicial ruling.
It can be extremely difficult to detect unlawful discrimination, as an individual home‐
seeker, and the resolution of these complaints, following investigation, is also important
to consider.
Table III‐2 provides the complaint breakdown for Knoxville for the period 2000‐2009
Table III‐2: Knoxville Complaints 2000‐2009
Compliant Number of
Complaints
Race 75
Sex 17
Family Status 22
Disability 54
Religion 5
Color 4
National Origin 6
Total 183
Table 3‐3 provides the outcome of cases undertaken during the period 2000‐2009.
Table III‐3: Knoxville Outcomes 2000‐2009
Number
Cause Findings 85
No Cause Findings 71
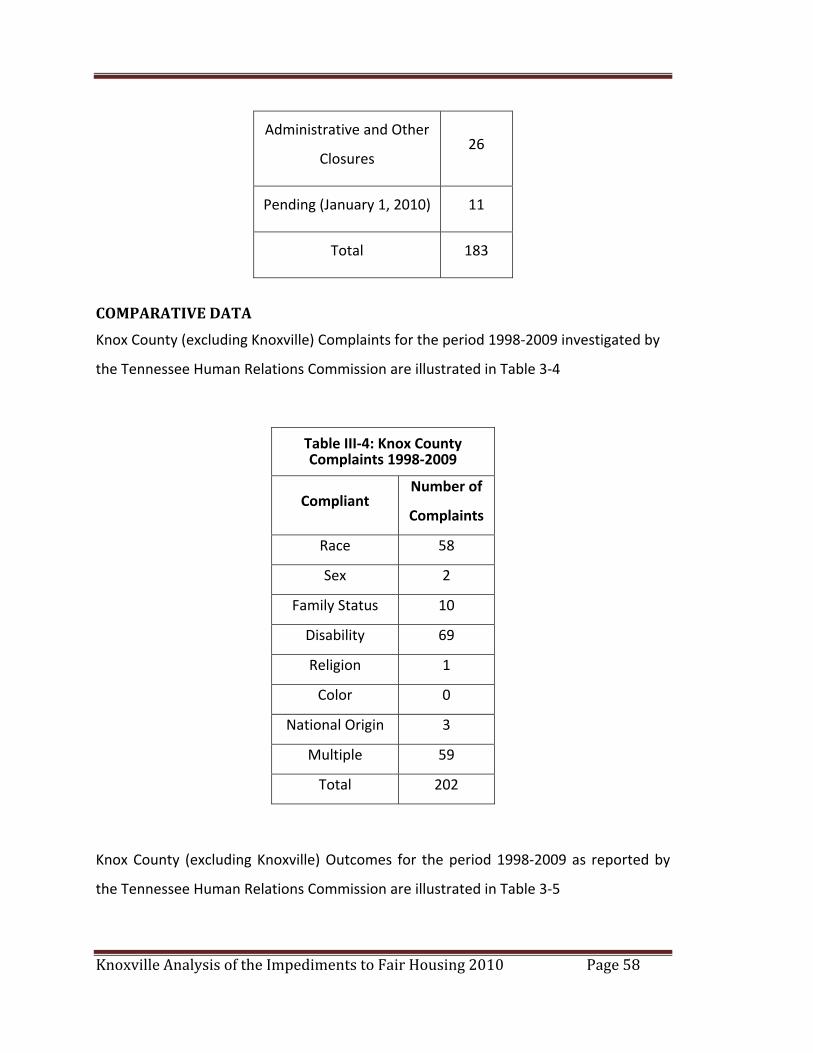
Knoxville Analysis of the Impediments to Fair Housing 2010 Page 58
Administrative and Other
Closures 26
Pending (January 1, 2010) 11
Total 183
COMPARATIVE DATA
Knox County (excluding Knoxville) Complaints for the period 1998‐2009 investigated by
the Tennessee Human Relations Commission are illustrated in Table 3‐4
Table III‐4: Knox County Complaints 1998‐2009
Compliant Number of
Complaints
Race 58
Sex 2
Family Status 10
Disability 69
Religion 1
Color 0
National Origin 3
Multiple 59
Total 202
Knox County (excluding Knoxville) Outcomes for the period 1998‐2009 as reported by
the Tennessee Human Relations Commission are illustrated in Table 3‐5
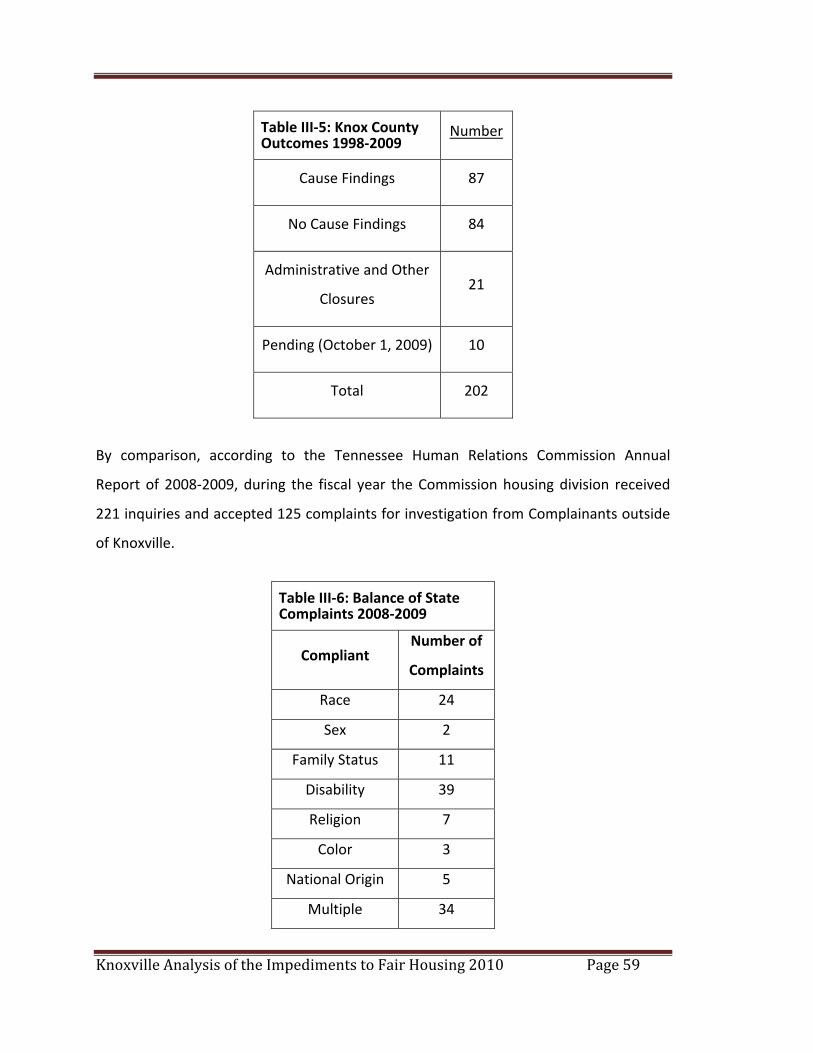
Knoxville Analysis of the Impediments to Fair Housing 2010 Page 59
Table III‐5: Knox County Outcomes 1998‐2009
Number
Cause Findings 87
No Cause Findings 84
Administrative and Other
Closures 21
Pending (October 1, 2009) 10
Total 202
By comparison, according to the Tennessee Human Relations Commission Annual
Report of 2008‐2009, during the fiscal year the Commission housing division received
221 inquiries and accepted 125 complaints for investigation from Complainants outside
of Knoxville.
Table III‐6: Balance of State Complaints 2008‐2009
Compliant Number of
Complaints
Race 24
Sex 2
Family Status 11
Disability 39
Religion 7
Color 3
National Origin 5
Multiple 34
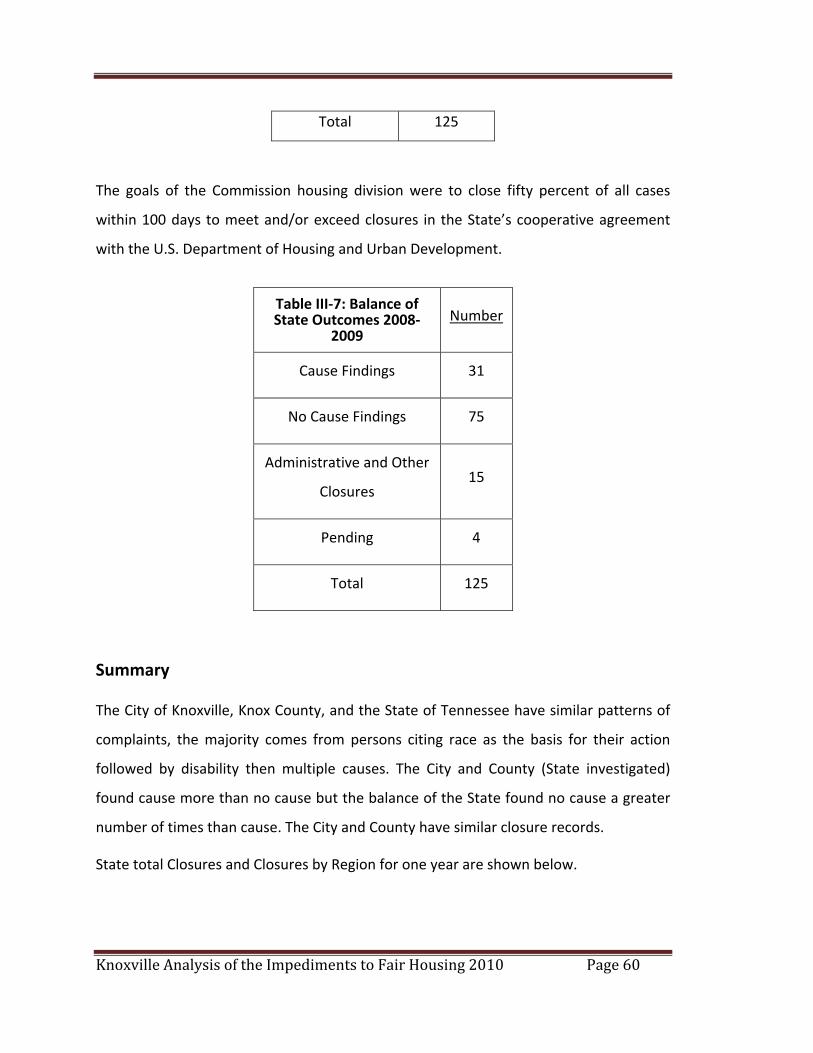
Knoxville Analysis of the Impediments to Fair Housing 2010 Page 60
Total 125
The goals of the Commission housing division were to close fifty percent of all cases
within 100 days to meet and/or exceed closures in the State’s cooperative agreement
with the U.S. Department of Housing and Urban Development.
Table III‐7: Balance of State Outcomes 2008‐
2009 Number
Cause Findings 31
No Cause Findings 75
Administrative and Other
Closures 15
Pending 4
Total 125
Summary
The City of Knoxville, Knox County, and the State of Tennessee have similar patterns of
complaints, the majority comes from persons citing race as the basis for their action
followed by disability then multiple causes. The City and County (State investigated)
found cause more than no cause but the balance of the State found no cause a greater
number of times than cause. The City and County have similar closure records.
State total Closures and Closures by Region for one year are shown below.
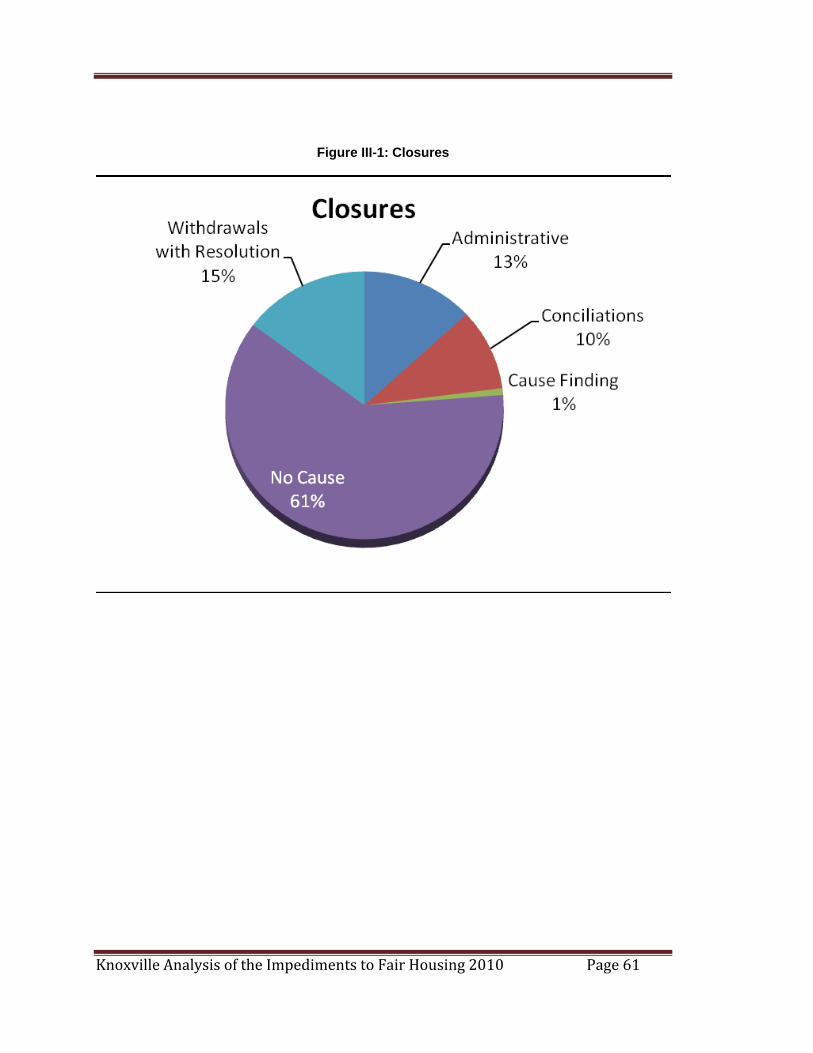
Knoxville Analysis of the Impediments to Fair Housing 2010 Page 61
Figure III-1: Closures
Knoxville Analysis of the Impediments to Fair Housing 2010 Page 62
SECTION IV: Public Sector Analysis OVERVIEW
The Fair Housing Act generally prohibits the application of special requirements through
land‐use regulations, restrictive covenants, and conditional or special use permits that,
in effect, limit the ability of minorities or persons with disabilities to live in the residence
of their choice in the community. If large‐lot minimums are prescribed, if a house must
contain a certain minimum amount of square feet, or if no multi‐family housing or
manufactured homes are permitted in an area, the results can exclude persons
protected by the Act. If local mandates make it unfeasible to build affordable housing or
impose significant obstacles, then a community must affirmatively work toward
eliminating this impediment to fair housing choice.
The Fair Housing Acts of 1968 and 1988, as amended, also make it unlawful for
municipalities to utilize their governmental authority, including zoning and land use
authority, to discriminate against racial minorities or persons with disabilities. Zoning
ordinances segregate uses and make differentiations within each use classifications.
While many zoning advocates assert that the primary purpose of zoning and land use
regulation is to promote and preserve the character of communities, inclusionary zoning
can also promote equality and diversity of living patterns. Unfortunately, zoning and
land‐use planning measures may also have the effect of excluding lower‐income and
racial groups.
Zoning ordinances aimed at controlling the placement of group homes is one of the
most litigated areas of fair housing regulations. Nationally, advocates for persons with
disabilities, the homeless and special needs groups have filed complaints against
restrictive zoning codes that narrowly define “family” for the purpose of limiting the
number of non‐related individuals occupying a single‐family dwelling unit. The ‘group
home’ arrangement/environment affords many persons who are disabled the only
affordable housing option for residential stability and more independent living. By
limiting the definition of “family” and creating burdensome occupancy standards,
Knoxville Analysis of the Impediments to Fair Housing 2010 Page 63
disabled persons may suffer discriminatory exclusion from prime residential
neighborhoods.
TRANSPORTATION
Transportation links are an essential component to successful fair housing. Residents
who do not have access to commercial areas are limited in where they can shop for
goods and services, as well as seek employment. The converse is true as well.
Inadequate transportation routes limit the selection of housing to neighborhoods within
transportation service areas. Convenient roads in good repair are as important for those
who rely on their own vehicles for transportation as they are for those who rely on
public transportation provided by the Knoxville Area Transit (KAT) system.
Knoxville Area Transit is developing a short‐range Transit Development Plan (TDP) to
provide guidance for operational and capital changes over the next five years. In
addition, with the pending opening of the new downtown transit center, Knoxville
Station, there will be a variety of almost immediate changes to the downtown
operations of the system. The TDP study focuses on providing short‐term guidance to
KAT as well as maintaining a perspective of a longer term vision.
Seventeen regular routes are operated, plus five that are contingent upon the University
of Tennessee class schedule and that are designed to transport students from off
campus housing. Two express routes also operate daily, which feature park & ride
opportunities for I‐40 commuters. Knoxville Trolley Lines is a free shuttle service which
provides service to the University and the downtown area. KAT also provides lift service
vehicles for the University of Tennessee campus shuttles. Decreased Federal funding has
put pressure on KAT to reduce the geographic service area.
NEIGHBORHOOD REVITALIZATION
The City of Knoxville carries out Federal programs administered by the U.S. Department
of Housing and Urban Development. In FY 2010, the City published its Consolidated Five
Knoxville Analysis of the Impediments to Fair Housing 2010 Page 64
Year Strategic Plan, which addresses housing and community development needs during
the period of FY 2010 to 2015. The one‐year Annual Plan describes the activities to be
undertaken during the fiscal year and how the City will use Federal and local resources
to accomplish the stated objectives. The annual plan also describes how other
community resources will be utilized to address the needs of persons that are homeless,
low to moderate income individuals and families, and other targeted populations. The
2010‐2015 Consolidated Plan, that features extensive program targeting in the
homeowner rehabilitation, senior disability housing, infrastructure, and public service
areas, was submitted to HUD in May, 2010.
PROPERTY TAX POLICIES
Across the Country, older communities – with the support of the Federal government –
have begun to invest in economic and community development programs designed to
revitalize their decaying urban cores. Knoxville is no exception. The foundation upon
which this kind of development is built is the ability to achieve fairness in the appraisal
process within these neighborhoods. Since the starting point for most bank appraisals is
the tax department, discriminatory assessment practices can undermine a homebuyer’s
ability to secure mortgage financing in an amount commensurate with the property’s
true market value.
Although the Fair Housing Act specifically prohibits the consideration of the racial or
ethnic composition of the surrounding neighborhood in arriving at appraised values of
homes, no practical means exist to investigate violations of this kind. One reliable
approach, however, is to review, periodically, the assessment policies and practices of
the taxing jurisdiction since their valuations generally comprise the bases for private
appraisals.
Property tax assessment discrimination against low‐income groups occurs when lower
value properties and/or properties in poorer neighborhoods are assessed for property
Knoxville Analysis of the Impediments to Fair Housing 2010 Page 65
tax purposes at a higher percentage of market value, on average, than other properties
in a jurisdiction. Regressive assessments (the tendency to assess lower value properties
at a higher percentage of market value than higher value properties) are not uncommon
in this country. They result from political pressures, practical problems in assessment
administration and the use of certain inappropriate appraisal techniques. Assessments
tend to remain relatively rigid at a time when property values are rising in middle
income neighborhoods and are declining or remaining at the same level in low‐income
neighborhoods.
Inequities in property tax assessments are a problem for both lower‐income
homeowners and low‐income tenants. Millions of low‐income families own homes.
Variations in assessment‐to‐market value ratios between neighborhoods or between
higher and lower value properties can make a difference of several hundred dollars or
more each year in an individual homeowner’s property tax bill. In addition to causing
higher property tax bills, discriminatorily high assessment levels can also have an
adverse impact upon property values. Buyers are less likely to purchase a property if the
property taxes are perceived as too high thereby making the property less attractive and
reducing its market value.
Another common inequity is the assessment of multifamily dwellings at a higher ratio to
market value than single family dwellings. This type of inequity may be considered a
form of discrimination against low‐income groups because a higher percentage of low‐
income than middle‐income persons live in multifamily rental dwellings. The
requirement to pay a higher assessment is passed on to the tenant in the form of higher
rent. Quite often, higher assessments also make it difficult for landlords to maintain
property within the limits of the property’s rent structure leading to substandard
housing conditions.
Most jurisdictions rely heavily on a market value approach to determining value when
conducting their property assessment appraisals. Under this approach, an appraiser
Knoxville Analysis of the Impediments to Fair Housing 2010 Page 66
compares recent sale prices of comparable properties within the area – in addition to
site visits and a good deal of expert speculation – in arriving at an appraised value. The
limitations inherent in market value approaches are many. Most prominent among the
limitations are the cumulative result of decades of discriminatory valuations,
particularly in neighborhoods with historically high percentages of minority residents.
Unless some radical re‐appraisal process has been conducted within the preceding 10‐
year period, the present market value approach merely compounds past discrimination.
While the market value approach may operate successfully in some jurisdictions, a
substantial percentage of jurisdictions rely primarily on a replacement cost approach in
valuing properties. Making determinations of value based on comparable sales is a
complex task, which requires considerable exercise of judgment. Assessor’s
departments, which must appraise every property within a jurisdiction, often do not
find it feasible to make the detailed individual analysis required to apply the market
value approach.
ZONING AND SITE SELECTION
Zoning may have a positive impact and can help to control the character of the
communities that make up a City. In zoning a careful balance must be achieved to avoid
promoting barriers to equal housing.
Professor Richard T. Lal, Arizona State University surveying the view of representative
studies concerning the nature of zoning discrimination states:
“If land‐use zoning for the purpose of promoting reason, order and beauty in urban
growth management is one side of the coin, so can it be said that exclusion of housing
affordable to low and moderate income groups is the other…as practiced, zoning and
other land‐use regulations can diminish the general availability of good quality, low‐cost
dwellings….”
Knoxville Analysis of the Impediments to Fair Housing 2010 Page 67
In considering how zoning might create barriers to fair housing, four key areas were
reviewed; these included the following which were selected because of the possible
adverse effects they could have on families and persons with disabilities.
• Definitions used for “families” and “group homes”
• Regulations (if any) regarding group homes
• Ability for group homes or other similar type housing to be developed
• Unreasonable restrictions on developing multifamily units, such as lot size
requirements.
While the definition of group care facility is broader in terms of the number of people
that can be served and is not limited to temporary disability, group housing is much
more restricted in where it is permitted under current zoning designations. Family care
homes are permitted under all single‐family zoning districts as well as all multifamily and
office use districts, neighborhood business districts (light commercial), agriculture
districts and mixed use districts (traditional neighborhoods). Group homes, on the other
hand, are not permitted in any single‐family zoning districts and are only permitted in
the highest density multifamily residential districts and commercial, office and public
and institutional districts. This serves to limit group homes located in single‐family and
low density multifamily districts to only small‐scale homes (six persons or less) that
serve those with temporary disabilities. Generally, the concept of group homes is to
integrate them into neighborhoods, providing the maximum amount of independent
living in a community‐based environment. For example, those group homes that serve
persons with permanent disabilities and/or more than six occupants, this neighborhood
integration may be unattainable in some communities based on zoning restrictions.
Knoxville’s land use plan requires that adequate public facilities be available for any
development activities. In this context, “adequate public facilities generally refers to
governmental strategies for assuring that all infrastructure required to meet the service
demands of a particular development is available as development occurs. Such
Knoxville Analysis of the Impediments to Fair Housing 2010 Page 68
strategies can, where permitted by statute, require that the costs for all or a portion of
such infrastructure be borne by the developer (ultimately the consumer), and not the
general public. Currently, the City’s policy is that all streets, water, sewer and storm
drainage facilities within a subdivision, including any required water quality retention
ponds, are paid for by the developer.”
The ability to provide affordable housing to low‐income persons is often enhanced by an
entitlement grantee’s willingness to assist in defraying the costs of development.
Effective approaches include contributing water, sewer or other infrastructure
improvements to projects as development subsidies or waiving impact and other fees.
These types of approaches help to reduce development costs and increase affordability
allowing developers to serve lower‐income households. Knoxville has historically sought
to defray development costs by contributing land, utilizing CDBG and CDBG‐R for
targeted infrastructure and utilizing NSP and HOME funds to encourage affordable
housing.
Knoxville/Knox County Metropolitan Planning Commission (MPC) and Knoxville Board of Zoning Appeals (BZA)
The MPC is an advisory body appointed by the City and County.
The MPC is intended to be representative of the community and members are
encouraged to be deeply interested in its physical, social and economic betterment.
Members are responsible for the development of a comprehensive plan, which the MPC
prepares and recommends to the City, along with other specialized plans and studies. A
majority of the Commission's work together with the BZA, however, involves hearing
and making recommendations to the zoning map amendments, conditional use permit
requests, special use permit requests and street closings.
Knoxville Empowerment Zone
A sixteen square mile section of Knoxville was designated as a federal Empowerment
Zone (EZ) in December 1998. This area was identified as having the City’s greatest need
for housing and infrastructure improvements, commercial development, social services,
Knoxville Analysis of the Impediments to Fair Housing 2010 Page 69
and expanded economic opportunities. With the designation has come approximately
$25 million in federal EZ funding, which has in turn leveraged approximately $490
million in additional public and private funding.
During the 2008 fiscal year, EZ funds were used to accomplish a number of activities
related to the goals and objectives identified in the Consolidated Plan. They include:
The Blighted Properties Redevelopment/Renovation program provides loans and
grants for the redevelopment of vacant housing or lots that are deemed blighted or
problem properties. Funding has been approved for the construction of ten new
homes, with seven being completed, and for rehabilitation of six homes, with one
being completed. The completed new homes are designed to be accessible to
persons with disabilities, and certified Energy Star efficient and sustainable per the
US Green Building Council’s LEED for Homes program. One of these homes has been
sold to date.
The commercial façade improvement program in the Broadway/Central corridor has
made loans to 20 businesses creating or retaining 240 jobs. Six Façade improvements
have been completed during the 2008 program year for eleven businesses creating or
retaining 130 jobs.
Enhancement of the commercial capacity in the Lonsdale redevelopment area included
issuing a Request for Proposal (RFP) for development of commercial facilities along
Heiskell Avenue at I‐275 to include Rudy Street. Two proposals were received and
contracts with each developer have been executed and approved by the City Council.
The Vestal Commercial Redevelopment Program serves as the non‐housing component
of the Vestal Bicentennial Neighborhood Initiative. During the 2008 program year, a
design team created a conceptual design plan for the commercial area. Two parcels for
future development have been acquired and environmental reviews have been
completed. Demolition has been completed.
Knoxville Analysis of the Impediments to Fair Housing 2010 Page 70
CONSOLIDATED PLAN HOUSING ACIVITIES
AFFORDABLE HOUSING NEEDS AND ACTIVITIES
The Knoxville Community Development and Housing Programs are designed to
implement various housing assistance strategies that include rehabilitation, down
payment assistance for first‐time homebuyers, and affordable new construction. The
City’s community and neighborhood development activities are designed to:
• Assist with neighborhood improvement projects
• Assist homeowners, including seniors and persons with disabilities
• Provide housing rehabilitation
• Help low to moderate‐income residents acquire needed information, knowledge
and skills
• Enhance the provision of public services
Community Development Block Grant Program
The Community Development Block Grant (CDBG) program is used to plan and
implement projects that foster revitalization of eligible communities. The primary goal
of the program is the development of viable urban communities. Program objectives
include the provision of decent housing, a suitable living environment and expanded
opportunities principally for low‐ to moderate‐income individuals and families. Knoxville
has been an entitlement community for over 35 years and receives its CDBG allocation
directly from HUD.
HOME Investment Partnership Program
The HOME Investment Partnership (HOME) program is used to assist in developing
affordable housing strategies that address local housing needs. HOME strives to meet
both the short‐term goal of increasing the supply and availability of affordable housing
Knoxville Analysis of the Impediments to Fair Housing 2010 Page 71
and the long‐term goal of building partnerships between state and local governments
and nonprofit housing providers. Knoxville receives its funding directly from HUD.
Affordable Housing Needs and Activities
The Community Development and Housing Department has designed and implemented
various housing assistance strategies that include homeowner rehabilitation, homeless
assistance and senior housing. The City’s community and neighborhood development
activities are designed to assist with neighborhood improvement projects, provide
public services, help low‐ to moderate‐income residents acquire needed information,
knowledge and skills to build their capacity, and enhance the provision of public
services.
Housing and neighborhood improvement needs and activities are described in the 2010‐
15 Consolidated Plan Strategic plan and include:
Provide HOME and CHDO funding to a non‐profit organization designated as a
Community Housing Development Organization (CHDO) to undertake an eligible HOME
activity.
Provide housing assistance for persons with AIDS through the State funded Housing
Opportunities for Persons With AIDS (HOPWA) program.
Provide assistance to persons that are homeless through the Emergency Shelter Grant
program and various federally‐funded Supportive Housing Programs in cooperation with
the Knoxville/Knox County Continuum of Care.
The Knoxville‐Knox County Homeless Commission, the local Continuum of Care, has
established permanent housing for persons who are homeless with supportive services
as the highest priority for the area.
AFFORDABLE HOUSING PRIORITIES
Faced with the reality of limited Federal and local government resources for housing,
Knoxville has been challenged to create a comprehensive, affordable housing program
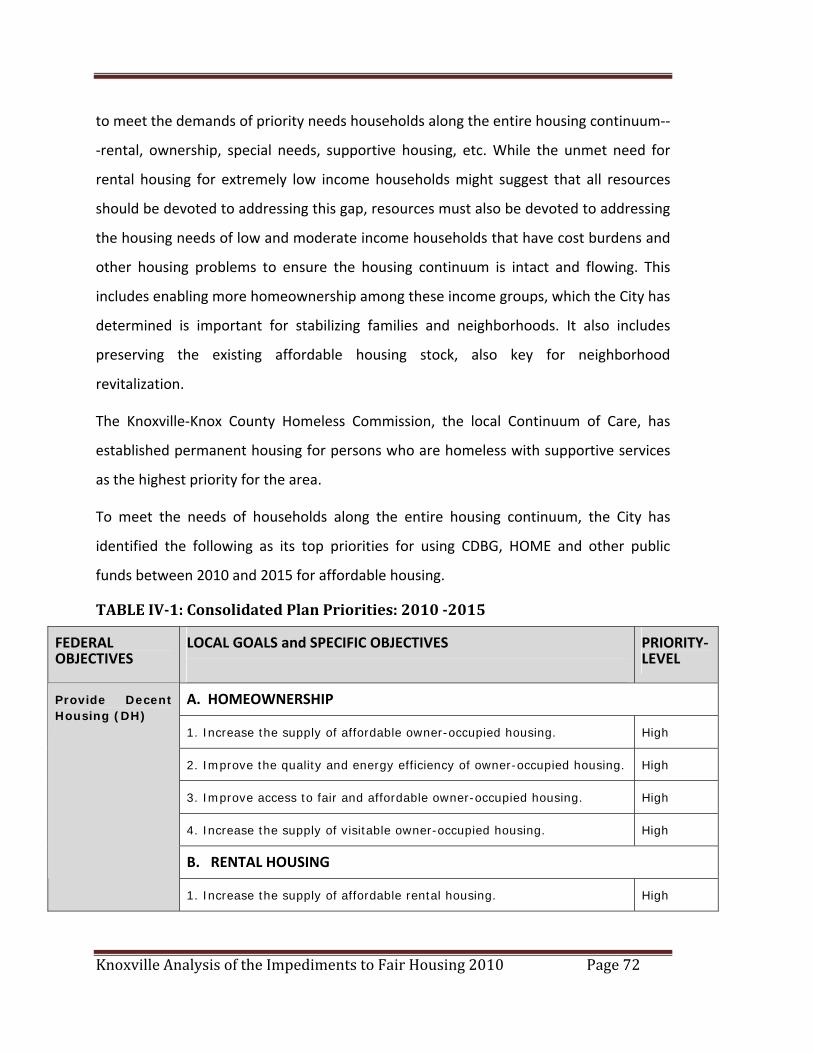
Knoxville Analysis of the Impediments to Fair Housing 2010 Page 72
to meet the demands of priority needs households along the entire housing continuum‐‐
‐rental, ownership, special needs, supportive housing, etc. While the unmet need for
rental housing for extremely low income households might suggest that all resources
should be devoted to addressing this gap, resources must also be devoted to addressing
the housing needs of low and moderate income households that have cost burdens and
other housing problems to ensure the housing continuum is intact and flowing. This
includes enabling more homeownership among these income groups, which the City has
determined is important for stabilizing families and neighborhoods. It also includes
preserving the existing affordable housing stock, also key for neighborhood
revitalization.
The Knoxville‐Knox County Homeless Commission, the local Continuum of Care, has
established permanent housing for persons who are homeless with supportive services
as the highest priority for the area.
To meet the needs of households along the entire housing continuum, the City has
identified the following as its top priorities for using CDBG, HOME and other public
funds between 2010 and 2015 for affordable housing.
TABLE IV1: Consolidated Plan Priorities: 2010 2015
FEDERAL OBJECTIVES
LOCAL GOALS and SPECIFIC OBJECTIVES
PRIORITY‐LEVEL
A. HOMEOWNERSHIP
1. Increase the supply of affordable owner-occupied housing. High
2. Improve the quality and energy efficiency of owner-occupied housing. High
3. Improve access to fair and affordable owner-occupied housing. High
4. Increase the supply of visitable owner-occupied housing. High
B. RENTAL HOUSING
Provide Decent Housing (DH)
1. Increase the supply of affordable rental housing. High
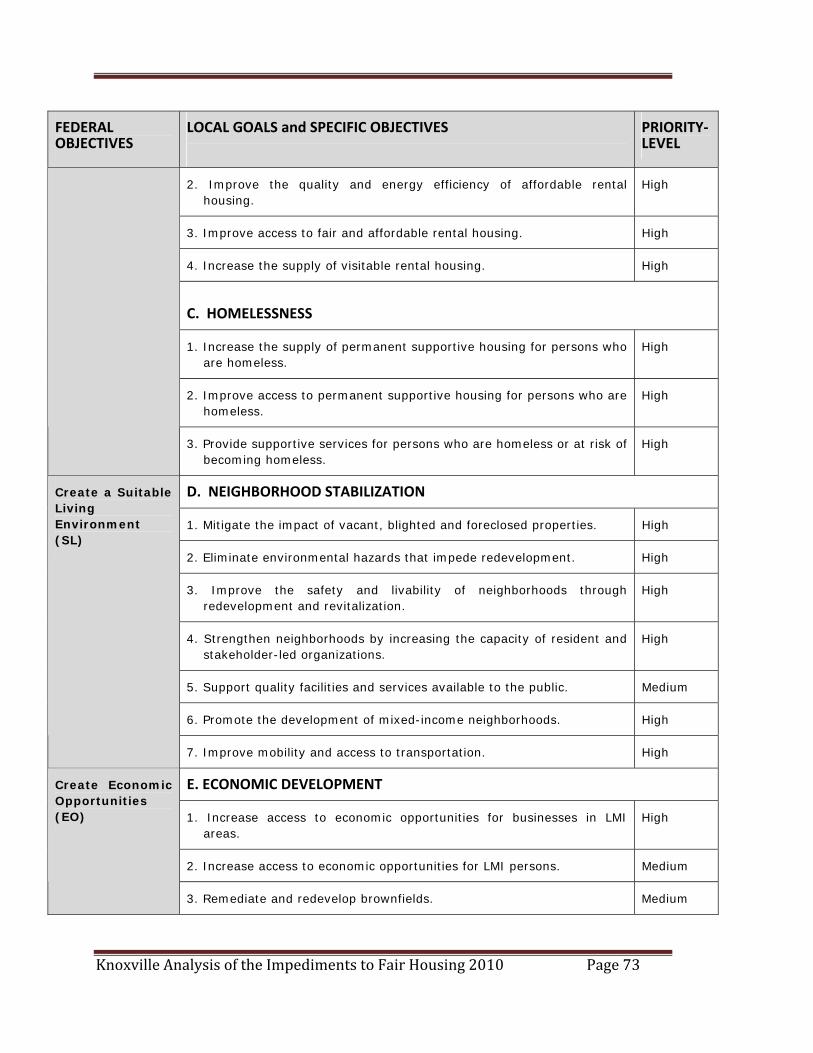
Knoxville Analysis of the Impediments to Fair Housing 2010 Page 73
FEDERAL OBJECTIVES
LOCAL GOALS and SPECIFIC OBJECTIVES
PRIORITY‐LEVEL
2. Improve the quality and energy efficiency of affordable rental housing.
High
3. Improve access to fair and affordable rental housing. High
4. Increase the supply of visitable rental housing. High
C. HOMELESSNESS
1. Increase the supply of permanent supportive housing for persons who are homeless.
High
2. Improve access to permanent supportive housing for persons who are homeless.
High
3. Provide supportive services for persons who are homeless or at risk of becoming homeless.
High
D. NEIGHBORHOOD STABILIZATION
1. Mitigate the impact of vacant, blighted and foreclosed properties. High
2. Eliminate environmental hazards that impede redevelopment. High
3. Improve the safety and livability of neighborhoods through redevelopment and revitalization.
High
4. Strengthen neighborhoods by increasing the capacity of resident and stakeholder-led organizations.
High
5. Support quality facilities and services available to the public. Medium
6. Promote the development of mixed-income neighborhoods. High
Create a Suitable Living Environment (SL)
7. Improve mobility and access to transportation. High
E. ECONOMIC DEVELOPMENT
1. Increase access to economic opportunities for businesses in LMI areas.
High
2. Increase access to economic opportunities for LMI persons. Medium
Create Economic Opportunities (EO)
3. Remediate and redevelop brownfields. Medium
Knoxville Analysis of the Impediments to Fair Housing 2010 Page 74
INSTITUTIONAL STRUCTURE
Knoxville’s Community Development Department is the lead agency implementing the
strategies for addressing housing and community development needs identified as part
of its consolidated planning process. The Department, with City Council approval,
oversees Knoxville’s allocation of CDBG, HOME, and ESG funds and is responsible for
maintaining records, overseeing work done using these federal funds and reporting
information to HUD concerning the performance of these programs. Knoxville’s
Community Development Corporation (KCDC) is responsible for the development and
maintenance of the City’s public housing. The member agencies of the Knoxville‐Knox
County Homeless Commission and the Mayor’s office work on the 10 Year Plan to End
Chronic Homelessness and to address the ongoing needs of persons who are homeless
and/or persons who may have special needs. The City also coordinates its efforts with
other local, State and Federal institutions to address specific needs or to implement new
programs. Affordable housing in the City is provided through a variety of public
agencies, nonprofit organizations, private sector developers and lenders. In many cases,
individual housing providers focus their efforts on specific income groups, tenure types
or on providing certain types of housing and supportive services.
INTERGOVERNMENTAL COOPERATION
The City has enjoyed a positive relationship with the Knoxville’s Community
Development Corporation, Knox County, and Continuum of Care Agencies for many
years. The City Staff and the other Agencies work cooperatively and share information
relative to the City’s strategies to address housing and other community development
needs.
Knoxville Analysis of the Impediments to Fair Housing 2010 Page 75
LEADBASED PAINT HAZARD REDUCTION
Lead poisoning is one of the worst environmental threats to children in the United
States. While anyone exposed to high concentrations of lead can become poisoned, the
effects are most pronounced among young children. All children are at higher risk to
suffer lead poisoning than adults; but children under age six are even more vulnerable
because their nervous systems are still developing. At high levels, lead poisoning can
cause convulsions, coma, and even death. Such severe cases of lead poisoning are now
extremely rare, but do still occur. At lower levels, observed adverse health effects from
lead poisoning in young children include reduced intelligence, reading and learning
disabilities, impaired hearing, and slowed growth.
Since the 1970s, restrictions on the use of lead have limited the amount of lead being
released into the environment. As a result, national blood lead levels for children under
the age of six declined by 75 percent over the 1980s and dropped another 29 percent
through the early 1990s. Despite the decline in blood‐lead levels over the past decade,
recent data show that 900,000 children in the United States still have blood lead levels
above 10µg/dL (micrograms of lead per deciliter of whole blood). These levels are
unacceptable according to the Centers for Disease Control and Prevention (CDC) which
lowered blood lead intervention levels for young children from 25µg/dL to 10µg/dL in
1991. Many of these lead‐poisoned children live in low‐income families and in old
homes with heavy concentrations of lead‐based paint. The CDC identified the two most
important remaining sources of lead hazards to be deteriorated lead‐based paint in
housing built before 1978 and urban soil and dust contaminated by past emissions of
leaded gasoline.
The national goal for blood lead levels among children ages six months to five years is to
limit elevations above 15µg/dL to no more than 300,000 per year and to entirely
eliminate elevations above 25µg/dL.
Many housing units in the City may have lead‐based paint. Since the City undertakes the
repair or rehabilitation of housing units (many of which were constructed prior to 1978),
Knoxville Analysis of the Impediments to Fair Housing 2010 Page 76
painted surfaces will be disturbed as part of this process. As such, the City is required to
incorporate lead‐based paint hazard evaluation, approved remediation/reduction
strategies and clearance requirements for all housing structures built before 1978.
To reduce the potential for adverse health effects attributable to the rehabilitation of
deteriorated lead‐based paint surfaces, the City provides educational material. All
customers receiving housing rehabilitation assistance from the city are informed about
the potential health hazards posed by the presence of deteriorated lead‐based paint,
which includes information about protecting their families from this hazardous
substance.
In addition, Project Managers who oversee rehabilitation projects are trained to
incorporate proper hazard reduction techniques into the treatment of lead‐based paint.
Instead of performing lead hazard evaluations on properties proposed for rehabilitation,
it is the City’s policy to automatically presume that lead‐based paint and/or lead‐based
paint hazards are present when the housing was built before 1978. Visual assessment,
stabilization and standard treatment methodologies are employed to achieve clearance
for each comprehensive rehabilitation project. The City will conduct one of the following
lead hazard reduction methods as routine to rehabilitation activity:
• If interim controls are required, conduct standard treatments in lieu of interim
controls on all applicable surfaces, including soil, to control lead based paint hazards
that may be present
• If abatement is required, abate all applicable surfaces, including soil, to control
lead based paint hazards that may be present
As the result of elevated lead poisoning cases that were reported by the local media, the
City has stepped up its activities to elevate public consciousness regarding the adverse
effects of lead poisoning in the City.
Knoxville Analysis of the Impediments to Fair Housing 2010 Page 77
A number of the tasks and activities performed by the City address these impediments.
Through the City of Knoxville’s Fair Housing Assistance Program (FHAP) city employees
serve on the boards of community grassroots efforts and other non‐profit organizations.
Although the specific missions of these boards vary, they each have the general goal of
solidifying the City of Knoxville by enriching the members of its community. This
provides the City with the opportunity to give input, from the fair housing perspective,
on how the community could be made stronger.
The following is a list and brief summary of these boards:
1. ECHO (Equality Coalition for Housing Opportunities) Formerly known as CHRB, this group is comprised of persons who represent
housing‐related organizations, social services agencies, educational institutions and
advocacy groups.
ECHO is committed to promoting housing equality through the implementation of
special projects geared at marketing equal opportunity legislations. ECHO meets on
a monthly basis. ECHO is a co‐sponsor of the Annual Fair Housing and Equal
Opportunity Conference held each spring in the greater Knoxville area. The Fair
Housing Specialist serves as the City’s representative.
2. CODI (Mayor's Council On Disability Issues). CODI serves as an advisory group to provide direction and guidance to the Mayor
and the City in matters concerning persons with disabilities. The Disability
Coordinator serves as the City’s advisor to the board. CODI meets on the second
Wednesday of each month at 4 p.m. Meetings include discussions about accessibility
issues in Knoxville, public accommodations, reasonable accommodations and
modifications of residential property, and other opportunities that need to be
afforded to citizens with disabilities.
3. Dr. Martin Luther King, Jr. Commemoration Commission
Knoxville Analysis of the Impediments to Fair Housing 2010 Page 78
This commission focuses on keeping Dr. King’s dream of equal opportunity alive in
Knoxville. The Fair Housing Specialist serves on the Youth Symposium committee.
For more information visit www.kornett.org/mlk
4. Access To Justice Collaboration of Knoxville/Knox County (A2J).
A2J is an initiative of the Tennessee Bar Association to help people access the justice
and social service system. The Collaborative works to help all people protect their
rights by getting entry to and using our legal system effectively. A2J provides
education, choices for resolving conflicts and ways to break down barriers to make it
easier to use our legal system. The Fair Housing Specialist serves as the City's
representative to the collaborative, which includes representation from the local bar
association, social services agencies and area advocacy groups.
Knoxville Analysis of the Impediments to Fair Housing 2010 Page 79
SECTION V: Fair Housing and Knoxville’s Private Sector Homeownership rates are important to a community’s financial well‐being. Prospective
homebuyers expect to have access to mortgage credit; and home ownership programs
must be available without regard to discrimination, income, or profession. To truly live
up to fair housing laws, all persons must have the ability to live where they want and
can afford.
Access to mortgage credit enables residents to own their homes, and access to home
improvement loans allows them to keep older houses in good condition. Access to
refinancing loans allows homeowners to make use of the equity in their home for other
expenses. Mortgage credit, home improvement loans, and refinancing loans together
keep neighborhoods attractive and keep residents vested in their communities.13
LENDERS IN THE CITY OF KNOXVILLE
Poor lending performance results in various long‐term and far ranging community
problems. Of these, disinvestment is probably the most troubling. Disinvestment in the
City of Knoxville by its lenders would reduce housing finance options for borrowers and
weaken competition in the mortgage market for low‐moderate income neighborhoods.
High mortgage costs, less favorable mortgage loan terms, deteriorating neighborhoods,
reduced opportunities for home ownership, reduced opportunities for home
improvement and the lack of affordable housing are only a few of the consequences of
inadequate lending performance. Financial decay in the business sector as well as in the
private sector is also a result of disinvestment in the form of business relocation,
closure, and bankruptcy. Full service local lenders that have traditionally served
residents and businesses are one of the main elements that keep neighborhoods stable.
Significant changes are occurring in the lending market not only in the City of Knoxville
but throughout the United States. The number and type of lenders have changed over
13 Profile of Lima, Ohio, Federal Reserve Bank of Cleveland, Fall 2000.
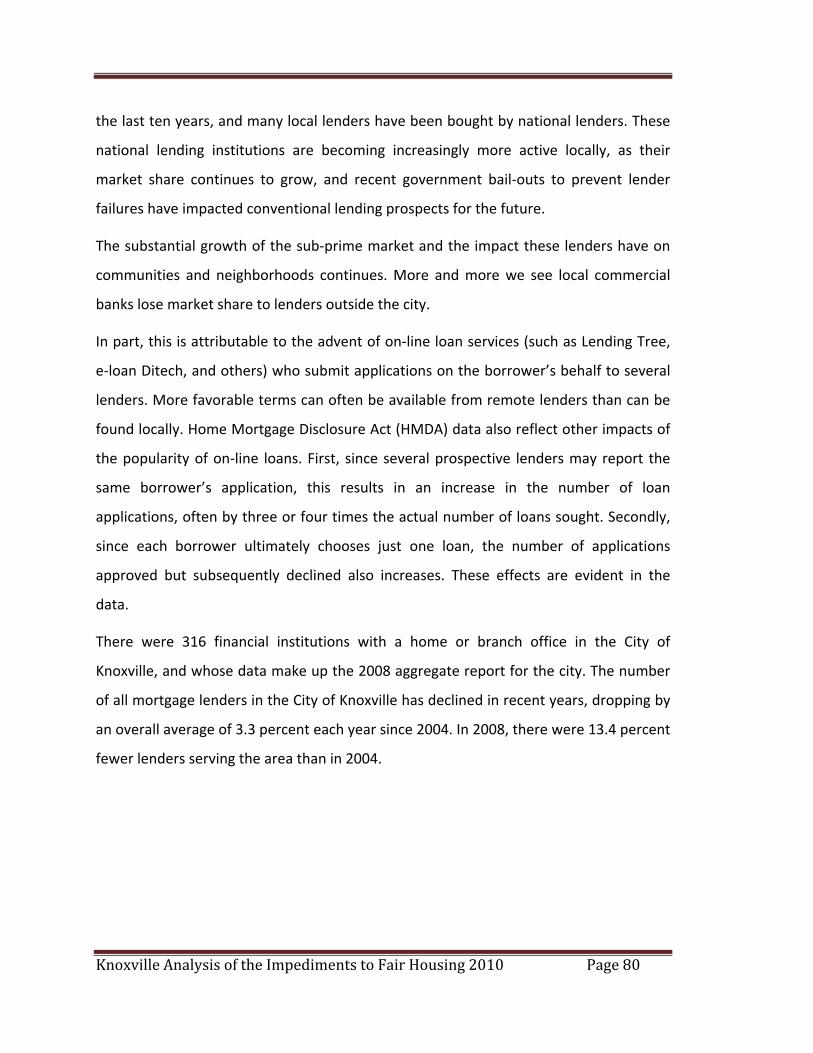
Knoxville Analysis of the Impediments to Fair Housing 2010 Page 80
the last ten years, and many local lenders have been bought by national lenders. These
national lending institutions are becoming increasingly more active locally, as their
market share continues to grow, and recent government bail‐outs to prevent lender
failures have impacted conventional lending prospects for the future.
The substantial growth of the sub‐prime market and the impact these lenders have on
communities and neighborhoods continues. More and more we see local commercial
banks lose market share to lenders outside the city.
In part, this is attributable to the advent of on‐line loan services (such as Lending Tree,
e‐loan Ditech, and others) who submit applications on the borrower’s behalf to several
lenders. More favorable terms can often be available from remote lenders than can be
found locally. Home Mortgage Disclosure Act (HMDA) data also reflect other impacts of
the popularity of on‐line loans. First, since several prospective lenders may report the
same borrower’s application, this results in an increase in the number of loan
applications, often by three or four times the actual number of loans sought. Secondly,
since each borrower ultimately chooses just one loan, the number of applications
approved but subsequently declined also increases. These effects are evident in the
data.
There were 316 financial institutions with a home or branch office in the City of
Knoxville, and whose data make up the 2008 aggregate report for the city. The number
of all mortgage lenders in the City of Knoxville has declined in recent years, dropping by
an overall average of 3.3 percent each year since 2004. In 2008, there were 13.4 percent
fewer lenders serving the area than in 2004.
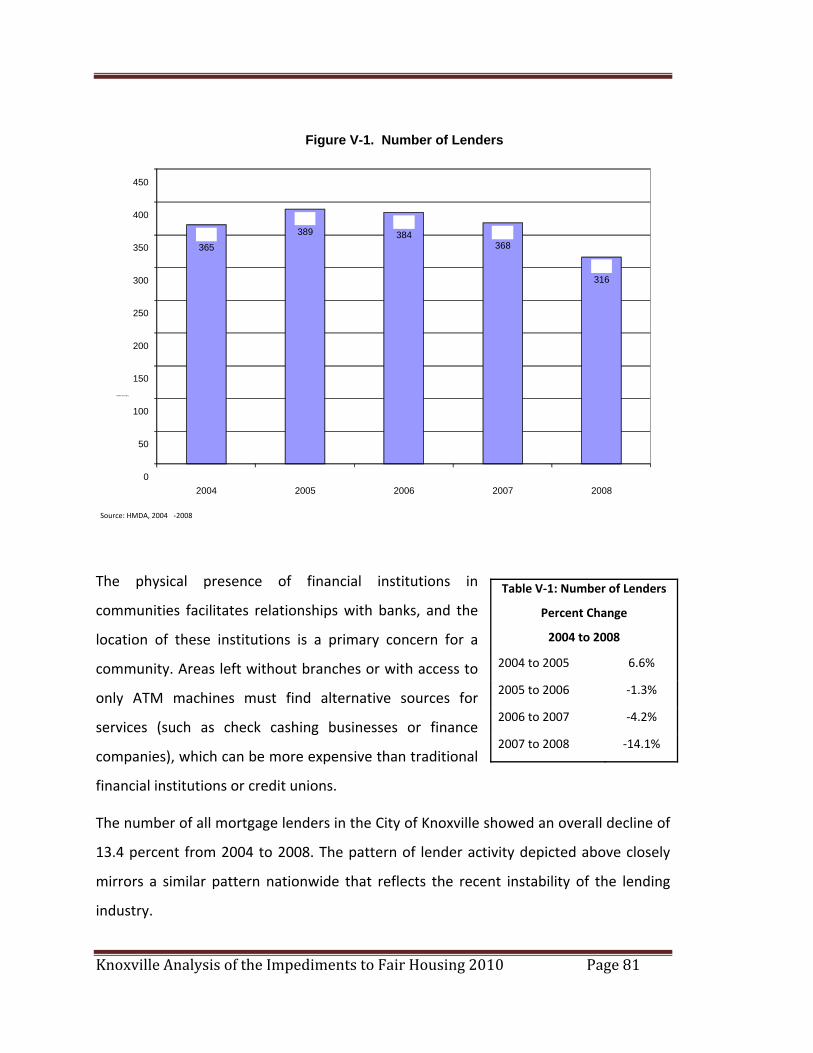
Knoxville Analysis of the Impediments to Fair Housing 2010 Page 81
Figure V-1. Number of Lenders
The physical presence of financial institutions in
communities facilitates relationships with banks, and the
location of these institutions is a primary concern for a
community. Areas left without branches or with access to
only ATM machines must find alternative sources for
services (such as check cashing businesses or finance
companies), which can be more expensive than traditional
financial institutions or credit unions.
The number of all mortgage lenders in the City of Knoxville showed an overall decline of
13.4 percent from 2004 to 2008. The pattern of lender activity depicted above closely
mirrors a similar pattern nationwide that reflects the recent instability of the lending
industry.
Table V‐1: Number of Lenders
Percent Change
2004 to 2008
2004 to 2005 6.6%
2005 to 2006 ‐1.3%
2006 to 2007 ‐4.2%
2007 to 2008 ‐14.1%
450
400
389 384368365350
316300
250
200
150Number of Lenders
100
50
02004 2005 2006 2007 2008
2008 Source: HMDA, 2004 ‐
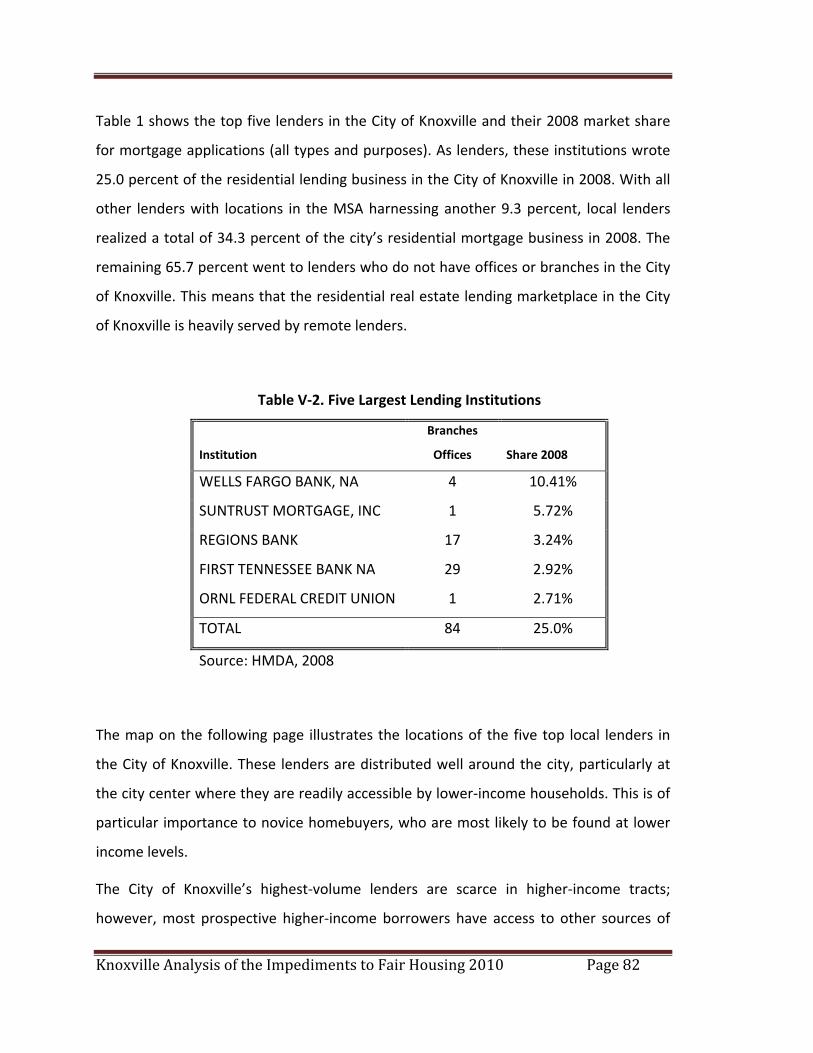
Knoxville Analysis of the Impediments to Fair Housing 2010 Page 82
Table 1 shows the top five lenders in the City of Knoxville and their 2008 market share
for mortgage applications (all types and purposes). As lenders, these institutions wrote
25.0 percent of the residential lending business in the City of Knoxville in 2008. With all
other lenders with locations in the MSA harnessing another 9.3 percent, local lenders
realized a total of 34.3 percent of the city’s residential mortgage business in 2008. The
remaining 65.7 percent went to lenders who do not have offices or branches in the City
of Knoxville. This means that the residential real estate lending marketplace in the City
of Knoxville is heavily served by remote lenders.
Table V‐2. Five Largest Lending Institutions
Institution
Branches
Offices Share 2008
WELLS FARGO BANK, NA 4 10.41%
SUNTRUST MORTGAGE, INC 1 5.72%
REGIONS BANK 17 3.24%
FIRST TENNESSEE BANK NA 29 2.92%
ORNL FEDERAL CREDIT UNION 1 2.71%
TOTAL 84 25.0%
Source: HMDA, 2008
The map on the following page illustrates the locations of the five top local lenders in
the City of Knoxville. These lenders are distributed well around the city, particularly at
the city center where they are readily accessible by lower‐income households. This is of
particular importance to novice homebuyers, who are most likely to be found at lower
income levels.
The City of Knoxville’s highest‐volume lenders are scarce in higher‐income tracts;
however, most prospective higher‐income borrowers have access to other sources of
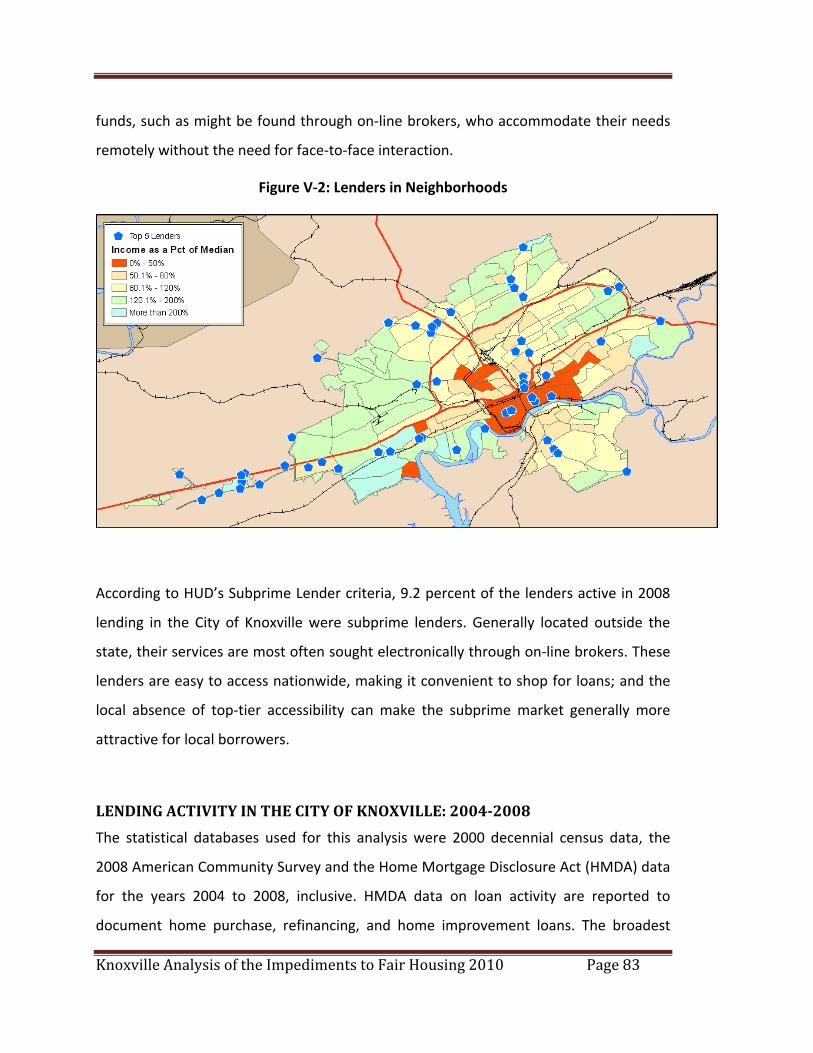
Knoxville Analysis of the Impediments to Fair Housing 2010 Page 83
funds, such as might be found through on‐line brokers, who accommodate their needs
remotely without the need for face‐to‐face interaction.
Figure V‐2: Lenders in Neighborhoods
According to HUD’s Subprime Lender criteria, 9.2 percent of the lenders active in 2008
lending in the City of Knoxville were subprime lenders. Generally located outside the
state, their services are most often sought electronically through on‐line brokers. These
lenders are easy to access nationwide, making it convenient to shop for loans; and the
local absence of top‐tier accessibility can make the subprime market generally more
attractive for local borrowers.
LENDING ACTIVITY IN THE CITY OF KNOXVILLE: 20042008
The statistical databases used for this analysis were 2000 decennial census data, the
2008 American Community Survey and the Home Mortgage Disclosure Act (HMDA) data
for the years 2004 to 2008, inclusive. HMDA data on loan activity are reported to
document home purchase, refinancing, and home improvement loans. The broadest
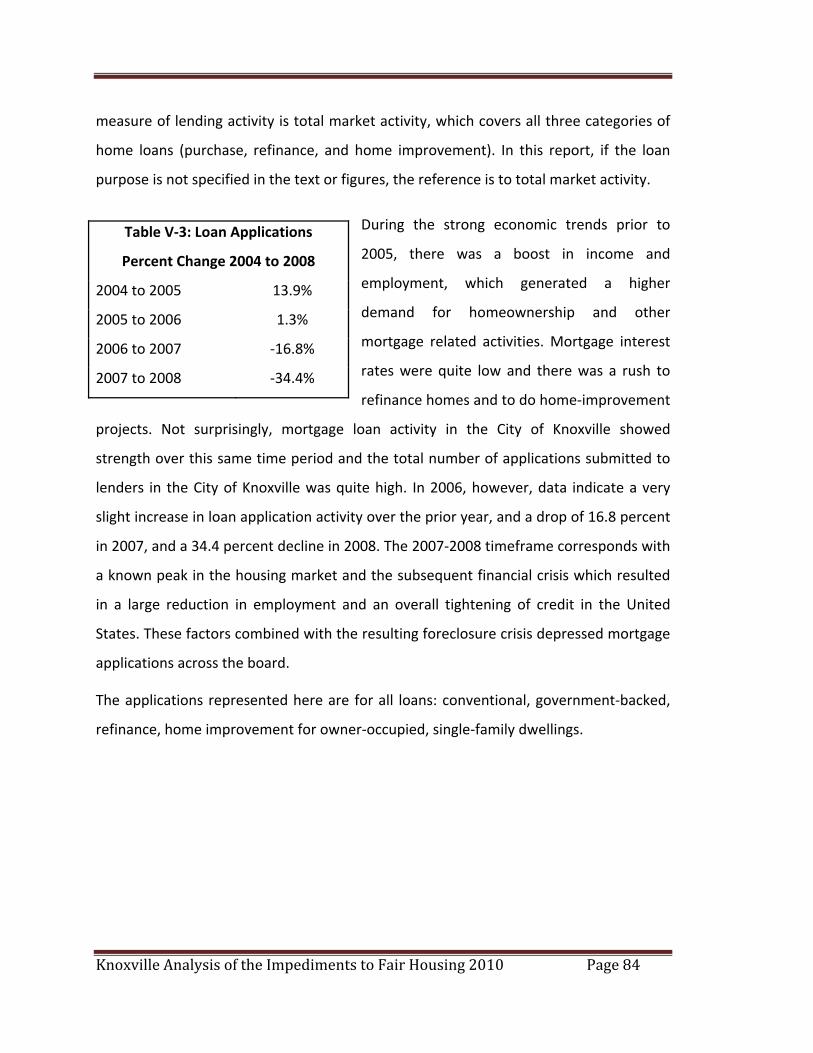
Knoxville Analysis of the Impediments to Fair Housing 2010 Page 84
measure of lending activity is total market activity, which covers all three categories of
home loans (purchase, refinance, and home improvement). In this report, if the loan
purpose is not specified in the text or figures, the reference is to total market activity.
During the strong economic trends prior to
2005, there was a boost in income and
employment, which generated a higher
demand for homeownership and other
mortgage related activities. Mortgage interest
rates were quite low and there was a rush to
refinance homes and to do home‐improvement
projects. Not surprisingly, mortgage loan activity in the City of Knoxville showed
strength over this same time period and the total number of applications submitted to
lenders in the City of Knoxville was quite high. In 2006, however, data indicate a very
slight increase in loan application activity over the prior year, and a drop of 16.8 percent
in 2007, and a 34.4 percent decline in 2008. The 2007‐2008 timeframe corresponds with
a known peak in the housing market and the subsequent financial crisis which resulted
in a large reduction in employment and an overall tightening of credit in the United
States. These factors combined with the resulting foreclosure crisis depressed mortgage
applications across the board.
Table V‐3: Loan Applications
Percent Change 2004 to 2008
2004 to 2005 13.9%
2005 to 2006 1.3%
2006 to 2007 ‐16.8%
2007 to 2008 ‐34.4%
The applications represented here are for all loans: conventional, government‐backed,
refinance, home improvement for owner‐occupied, single‐family dwellings.
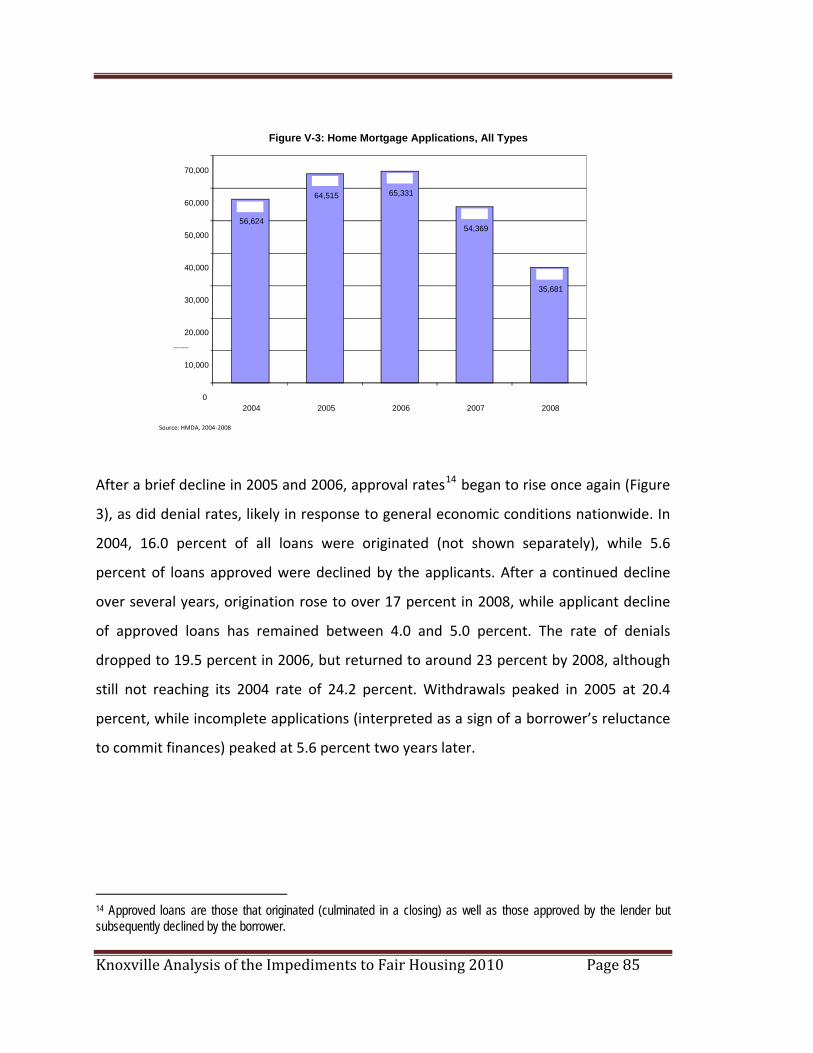
Knoxville Analysis of the Impediments to Fair Housing 2010 Page 85
Figure V-3: Home Mortgage Applications, All Types
70,000
65,33164,51560,000
56,62454,369
50,000
40,000
35,68130,000
20,000Number of Applications
10,000
02004 2005 2006 2007 2008
After a brief decline in 2005 and 2006, approval rates14 began to rise once again (Figure
3), as did denial rates, likely in response to general economic conditions nationwide. In
2004, 16.0 percent of all loans were originated (not shown separately), while 5.6
percent of loans approved were declined by the applicants. After a continued decline
over several years, origination rose to over 17 percent in 2008, while applicant decline
of approved loans has remained between 4.0 and 5.0 percent. The rate of denials
dropped to 19.5 percent in 2006, but returned to around 23 percent by 2008, although
still not reaching its 2004 rate of 24.2 percent. Withdrawals peaked in 2005 at 20.4
percent, while incomplete applications (interpreted as a sign of a borrower’s reluctance
to commit finances) peaked at 5.6 percent two years later.
14 Approved loans are those that originated (culminated in a closing) as well as those approved by the lender but subsequently declined by the borrower.
Source: HMDA, 2004 ‐ 2008
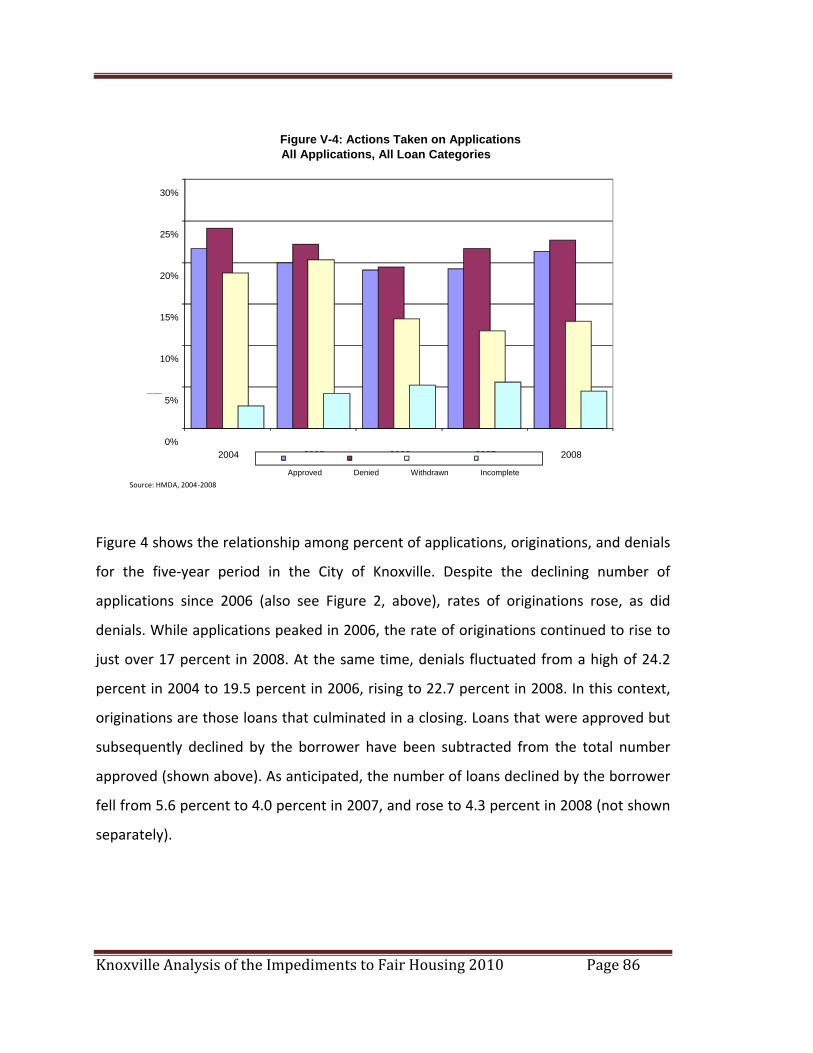
Knoxville Analysis of the Impediments to Fair Housing 2010 Page 86
Figure V-4: Actions Taken on ApplicationsAll Applications, All Loan Categories
30%
25%
20%
15%
10%
5%Percent of Applications
0%2005 2004 2006 2007 2008
Approved Denied Withdrawn IncompleteSource: HMDA, 2004‐2008
Figure 4 shows the relationship among percent of applications, originations, and denials
for the five‐year period in the City of Knoxville. Despite the declining number of
applications since 2006 (also see Figure 2, above), rates of originations rose, as did
denials. While applications peaked in 2006, the rate of originations continued to rise to
just over 17 percent in 2008. At the same time, denials fluctuated from a high of 24.2
percent in 2004 to 19.5 percent in 2006, rising to 22.7 percent in 2008. In this context,
originations are those loans that culminated in a closing. Loans that were approved but
subsequently declined by the borrower have been subtracted from the total number
approved (shown above). As anticipated, the number of loans declined by the borrower
fell from 5.6 percent to 4.0 percent in 2007, and rose to 4.3 percent in 2008 (not shown
separately).
Knoxville Analysis of the Impediments to Fair Housing 2010 Page 87
Figure V-5: Change in Applications Submitted, Originations and Denials
70,000 30%
60,000 25%
50,000 20%
40,000 15%
30,000 10%
20,000 Percent Disposition
10,000 Number Applications
5%
0%02004 2005 2006 2007 2008
Total Loan Originated Denied
One factor that might contribute to a change in the rate of loan originations is the
difference in the types of loans applicants seek. A review of applications by type (Figure
5) reveals that refinancing was the most sought‐after loan type throughout the five‐year
period. Refinancing is a common way for homeowners to access cash. Undoubtedly, the
increase in applications in 2004 and 2005 is an indication of homeowners taking
advantage of the low interest rates of those years. In subsequent years, applications for
refinances dropped off, although still considerably above those for any other loan type.
The sudden decline in conventional applications for purchase in 2008 to just over 3,000
applications (a drop of over 57 percent) as compared to a much smaller decline in
applications for refinances (almost 40 percent decline) reiterates efforts of borrowers
seeking to take advantage of low interest rates to extract equity from their existing
homes rather than committing to a new purchase. The increase in the use of on‐line
lending brokers helped fuel the ease of seeking out loans until cautions about an
unstable economy stopped the flow. In general, home improvement loan applications
Source: HMDA, 2004 ‐ 2008
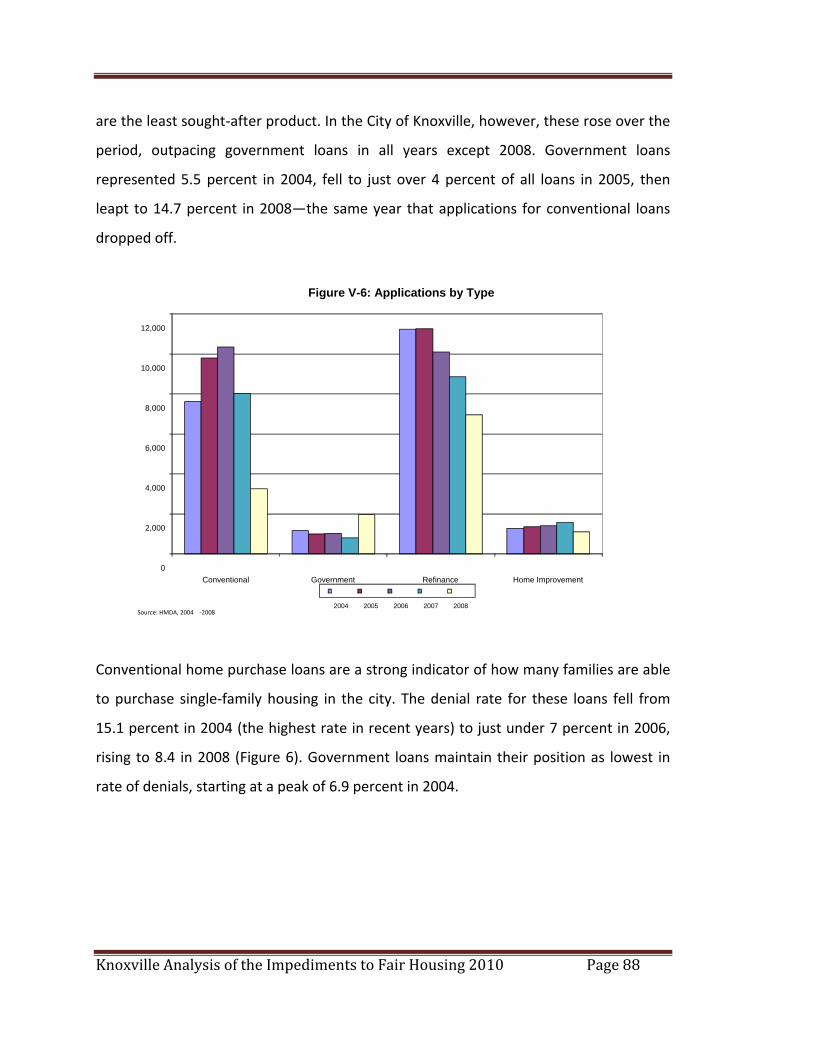
Knoxville Analysis of the Impediments to Fair Housing 2010 Page 88
are the least sought‐after product. In the City of Knoxville, however, these rose over the
period, outpacing government loans in all years except 2008. Government loans
represented 5.5 percent in 2004, fell to just over 4 percent of all loans in 2005, then
leapt to 14.7 percent in 2008—the same year that applications for conventional loans
dropped off.
Figure V-6: Applications by Type
12,000
10,000
8,000
6,000
4,000
2,000
0Home Improvement Conventional Government Refinance
Source: HMDA, 2004
Conventional home purchase loans are a strong indicator of how many families are able
to purchase single‐family housing in the city. The denial rate for these loans fell from
15.1 percent in 2004 (the highest rate in recent years) to just under 7 percent in 2006,
rising to 8.4 in 2008 (Figure 6). Government loans maintain their position as lowest in
rate of denials, starting at a peak of 6.9 percent in 2004.
2004 2005 2006 2007 2008‐ 2008
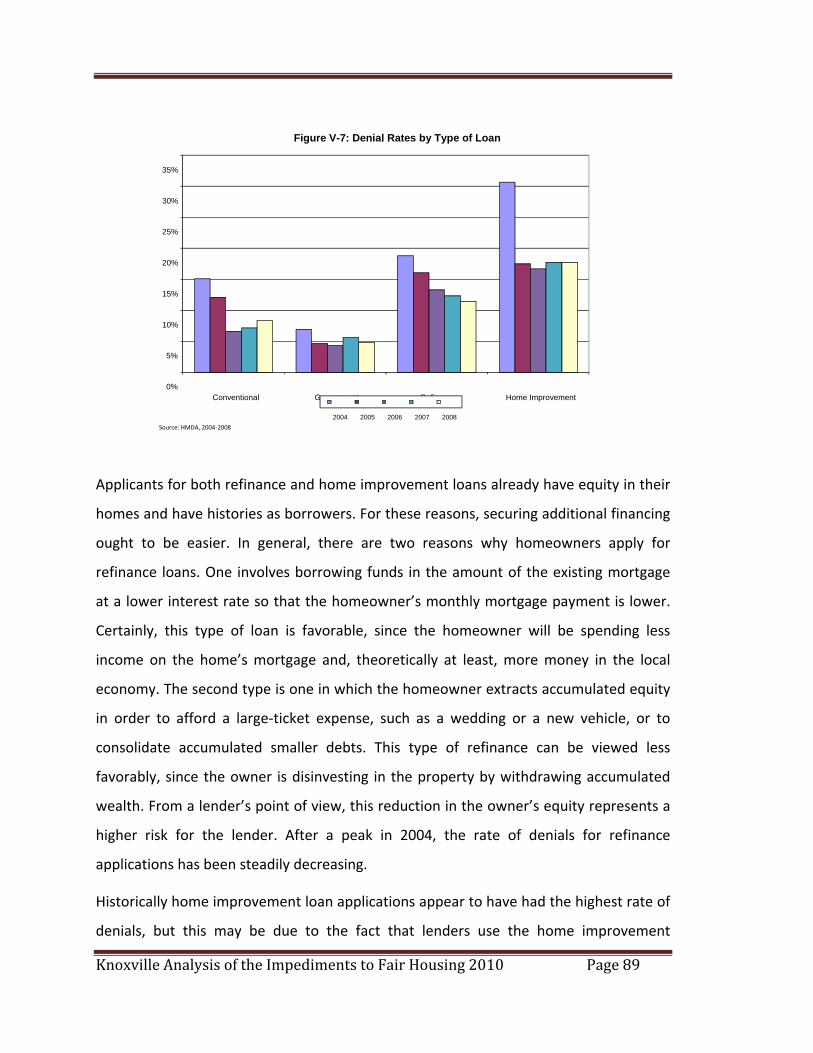
Knoxville Analysis of the Impediments to Fair Housing 2010 Page 89
Figure V-7: Denial Rates by Type of Loan
35%
30%
25%
20%
15%
10%
5%
0% Conventional Home Improvement Government Refinance
2004 2005 2006 2007 2008
Applicants for both refinance and home improvement loans already have equity in their
homes and have histories as borrowers. For these reasons, securing additional financing
ought to be easier. In general, there are two reasons why homeowners apply for
refinance loans. One involves borrowing funds in the amount of the existing mortgage
at a lower interest rate so that the homeowner’s monthly mortgage payment is lower.
Certainly, this type of loan is favorable, since the homeowner will be spending less
income on the home’s mortgage and, theoretically at least, more money in the local
economy. The second type is one in which the homeowner extracts accumulated equity
in order to afford a large‐ticket expense, such as a wedding or a new vehicle, or to
consolidate accumulated smaller debts. This type of refinance can be viewed less
favorably, since the owner is disinvesting in the property by withdrawing accumulated
wealth. From a lender’s point of view, this reduction in the owner’s equity represents a
higher risk for the lender. After a peak in 2004, the rate of denials for refinance
applications has been steadily decreasing.
Historically home improvement loan applications appear to have had the highest rate of
denials, but this may be due to the fact that lenders use the home improvement
Source: HMDA, 2004 ‐ 2008
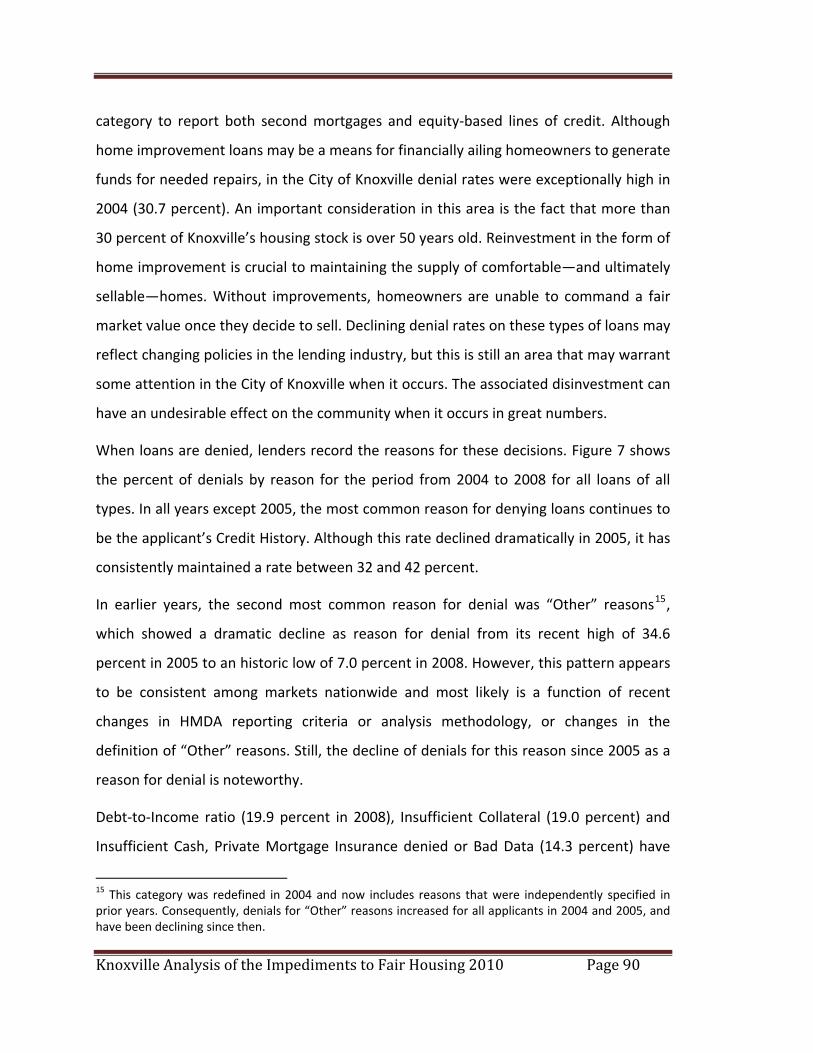
Knoxville Analysis of the Impediments to Fair Housing 2010 Page 90
category to report both second mortgages and equity‐based lines of credit. Although
home improvement loans may be a means for financially ailing homeowners to generate
funds for needed repairs, in the City of Knoxville denial rates were exceptionally high in
2004 (30.7 percent). An important consideration in this area is the fact that more than
30 percent of Knoxville’s housing stock is over 50 years old. Reinvestment in the form of
home improvement is crucial to maintaining the supply of comfortable—and ultimately
sellable—homes. Without improvements, homeowners are unable to command a fair
market value once they decide to sell. Declining denial rates on these types of loans may
reflect changing policies in the lending industry, but this is still an area that may warrant
some attention in the City of Knoxville when it occurs. The associated disinvestment can
have an undesirable effect on the community when it occurs in great numbers.
When loans are denied, lenders record the reasons for these decisions. Figure 7 shows
the percent of denials by reason for the period from 2004 to 2008 for all loans of all
types. In all years except 2005, the most common reason for denying loans continues to
be the applicant’s Credit History. Although this rate declined dramatically in 2005, it has
consistently maintained a rate between 32 and 42 percent.
In earlier years, the second most common reason for denial was “Other” reasons15,
which showed a dramatic decline as reason for denial from its recent high of 34.6
percent in 2005 to an historic low of 7.0 percent in 2008. However, this pattern appears
to be consistent among markets nationwide and most likely is a function of recent
changes in HMDA reporting criteria or analysis methodology, or changes in the
definition of “Other” reasons. Still, the decline of denials for this reason since 2005 as a
reason for denial is noteworthy.
Debt‐to‐Income ratio (19.9 percent in 2008), Insufficient Collateral (19.0 percent) and
Insufficient Cash, Private Mortgage Insurance denied or Bad Data (14.3 percent) have
15 This category was redefined in 2004 and now includes reasons that were independently specified in prior years. Consequently, denials for “Other” reasons increased for all applicants in 2004 and 2005, and have been declining since then.
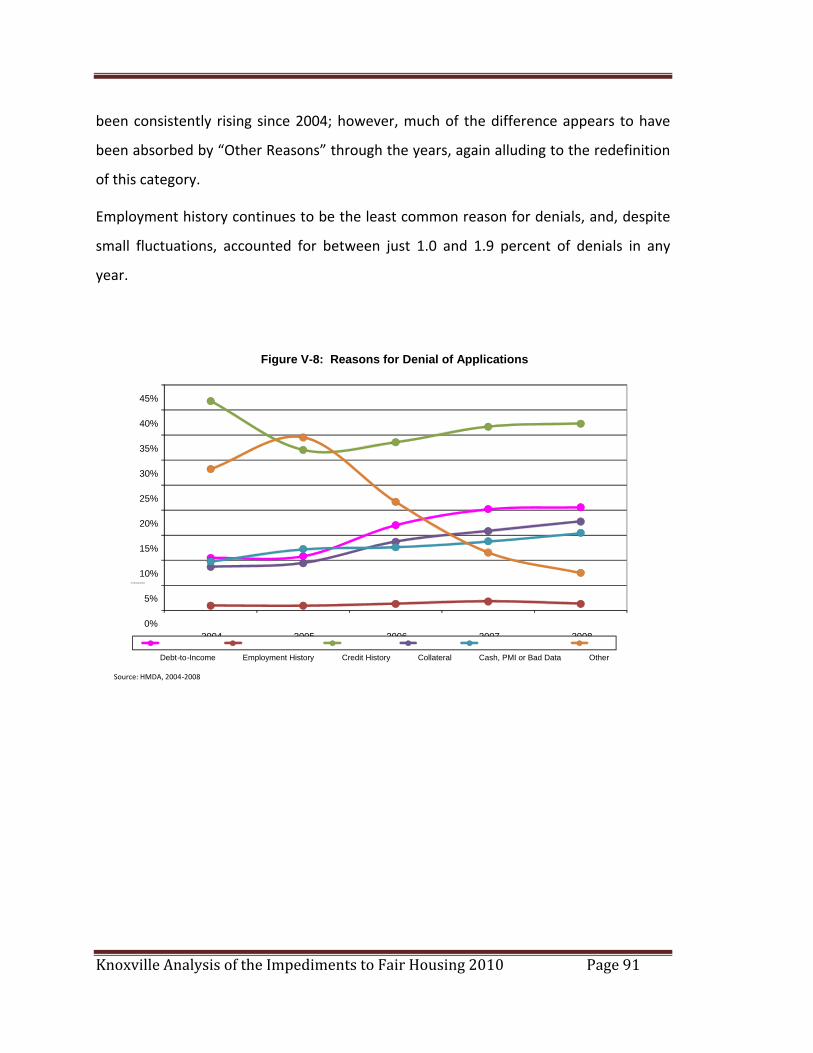
Knoxville Analysis of the Impediments to Fair Housing 2010 Page 91
been consistently rising since 2004; however, much of the difference appears to have
been absorbed by “Other Reasons” through the years, again alluding to the redefinition
of this category.
Employment history continues to be the least common reason for denials, and, despite
small fluctuations, accounted for between just 1.0 and 1.9 percent of denials in any
year.
Figure V-8: Reasons for Denial of Applications
45%
40%
35%
30%
25%
20%
15%
10%
5% % of All Loans Denied
0% 2004 2005 2006 2007 2008
Debt- to - Income Employment History Credit History Collateral Cash, PMI or Bad Data Other
Source: HMDA, 2004 ‐ 2008
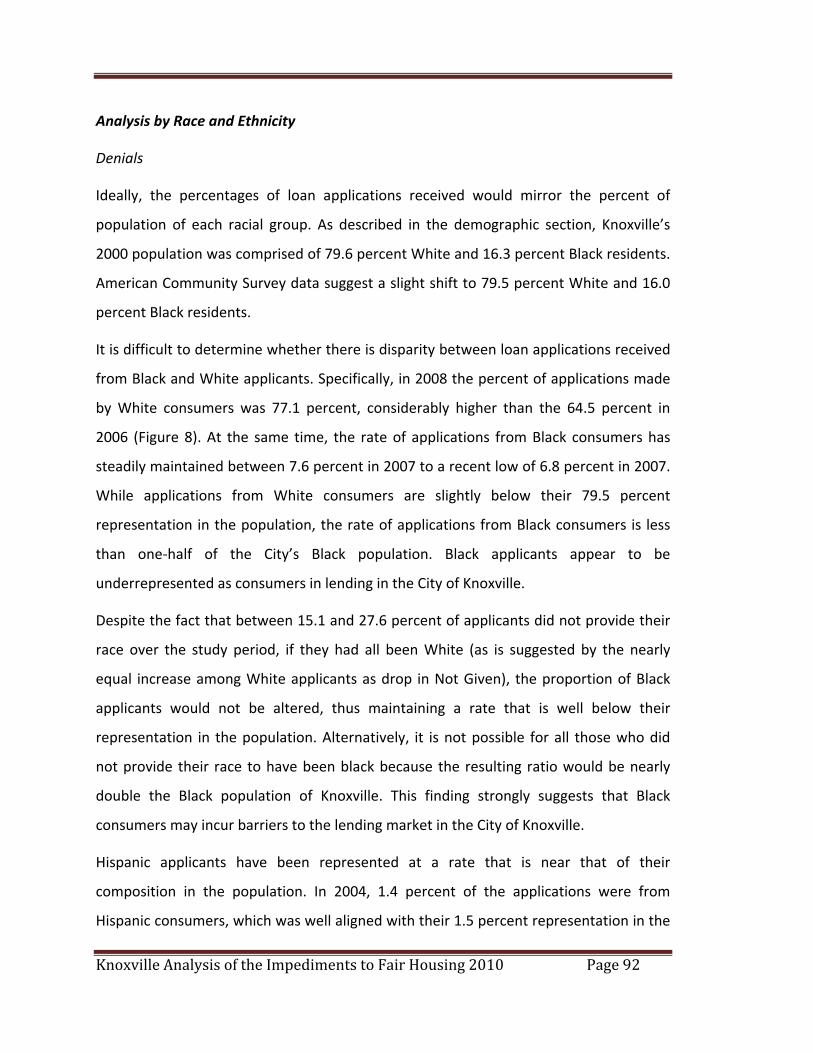
Knoxville Analysis of the Impediments to Fair Housing 2010 Page 92
Analysis by Race and Ethnicity
Denials
Ideally, the percentages of loan applications received would mirror the percent of
population of each racial group. As described in the demographic section, Knoxville’s
2000 population was comprised of 79.6 percent White and 16.3 percent Black residents.
American Community Survey data suggest a slight shift to 79.5 percent White and 16.0
percent Black residents.
It is difficult to determine whether there is disparity between loan applications received
from Black and White applicants. Specifically, in 2008 the percent of applications made
by White consumers was 77.1 percent, considerably higher than the 64.5 percent in
2006 (Figure 8). At the same time, the rate of applications from Black consumers has
steadily maintained between 7.6 percent in 2007 to a recent low of 6.8 percent in 2007.
While applications from White consumers are slightly below their 79.5 percent
representation in the population, the rate of applications from Black consumers is less
than one‐half of the City’s Black population. Black applicants appear to be
underrepresented as consumers in lending in the City of Knoxville.
Despite the fact that between 15.1 and 27.6 percent of applicants did not provide their
race over the study period, if they had all been White (as is suggested by the nearly
equal increase among White applicants as drop in Not Given), the proportion of Black
applicants would not be altered, thus maintaining a rate that is well below their
representation in the population. Alternatively, it is not possible for all those who did
not provide their race to have been black because the resulting ratio would be nearly
double the Black population of Knoxville. This finding strongly suggests that Black
consumers may incur barriers to the lending market in the City of Knoxville.
Hispanic applicants have been represented at a rate that is near that of their
composition in the population. In 2004, 1.4 percent of the applications were from
Hispanic consumers, which was well aligned with their 1.5 percent representation in the
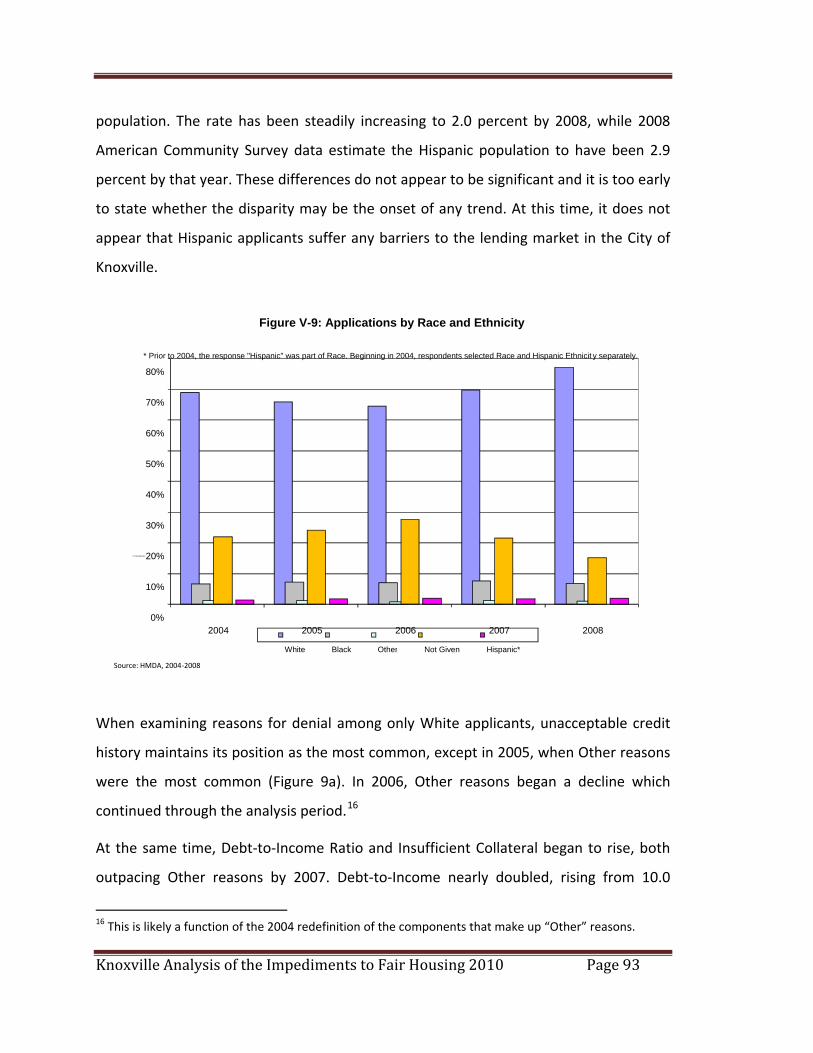
Knoxville Analysis of the Impediments to Fair Housing 2010 Page 93
population. The rate has been steadily increasing to 2.0 percent by 2008, while 2008
American Community Survey data estimate the Hispanic population to have been 2.9
percent by that year. These differences do not appear to be significant and it is too early
to state whether the disparity may be the onset of any trend. At this time, it does not
appear that Hispanic applicants suffer any barriers to the lending market in the City of
Knoxville.
Figure V-9: Applications by Race and Ethnicity
y s eparately.* Prior to 2004, the response "Hispanic" was part of Race. Beginning in 2004, respondents selected Race and Hispanic Ethnicit
80%
70%
60%
50%
40%
30%
2% of all applications 0%
10%
0%2004 2005 2006 2007 2008
White Black Other Not Given Hispanic*
When examining reasons for denial among only White applicants, unacceptable credit
history maintains its position as the most common, except in 2005, when Other reasons
were the most common (Figure 9a). In 2006, Other reasons began a decline which
continued through the analysis period.16
At the same time, Debt‐to‐Income Ratio and Insufficient Collateral began to rise, both
outpacing Other reasons by 2007. Debt‐to‐Income nearly doubled, rising from 10.0
16 This is likely a function of the 2004 redefinition of the components that make up “Other” reasons.
Source: HMDA, 2004 ‐ 2008
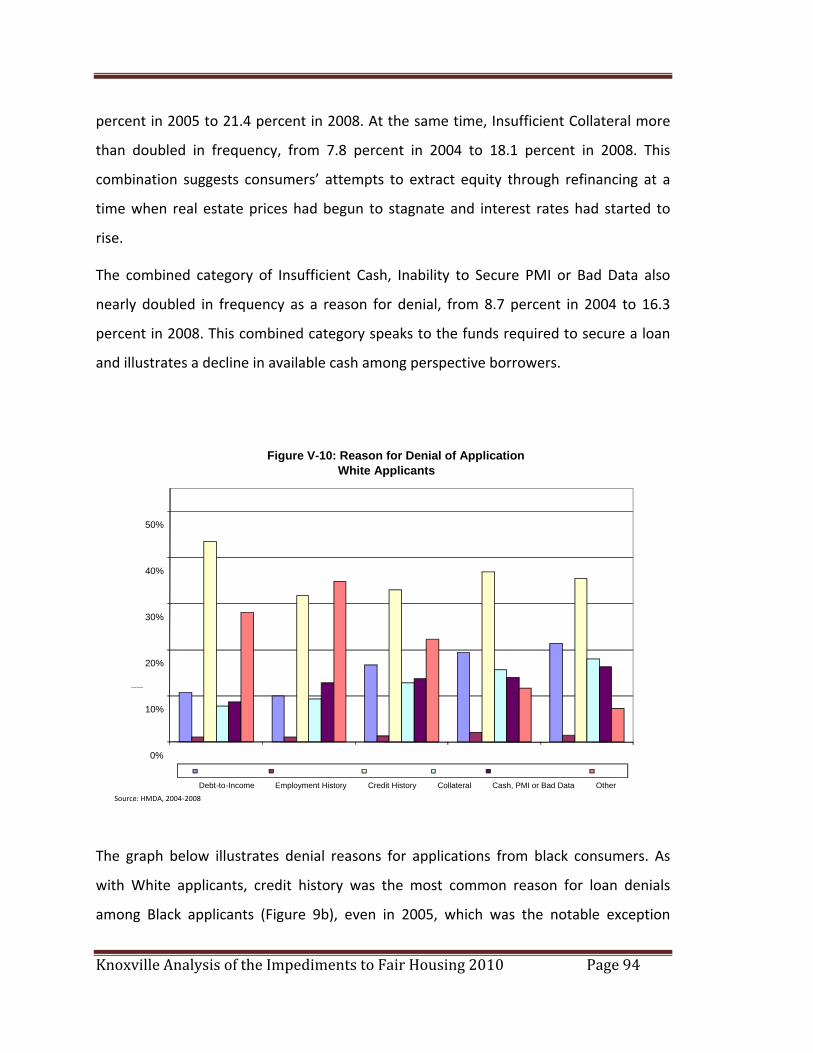
Knoxville Analysis of the Impediments to Fair Housing 2010 Page 94
percent in 2005 to 21.4 percent in 2008. At the same time, Insufficient Collateral more
than doubled in frequency, from 7.8 percent in 2004 to 18.1 percent in 2008. This
combination suggests consumers’ attempts to extract equity through refinancing at a
time when real estate prices had begun to stagnate and interest rates had started to
rise.
The combined category of Insufficient Cash, Inability to Secure PMI or Bad Data also
nearly doubled in frequency as a reason for denial, from 8.7 percent in 2004 to 16.3
percent in 2008. This combined category speaks to the funds required to secure a loan
and illustrates a decline in available cash among perspective borrowers.
Figure V-10: Reason for Denial of ApplicationWhite Applicants
50%
40%
30%
20% Percent all denials
10%
0%2005 2004 2006 2007 2008
Cash, PMI or Bad Data Debt-to-Income Employment History Credit History Collateral Other
The graph below illustrates denial reasons for applications from black consumers. As
with White applicants, credit history was the most common reason for loan denials
among Black applicants (Figure 9b), even in 2005, which was the notable exception
Source: HMDA, 2004 ‐ 2008
Knoxville Analysis of the Impediments to Fair Housing 2010 Page 95
among White applicants. After a decline to 35.5 percent in 2005, the rate began to rise
again in 2006, returning to 42.7 percent, near its 2004 high of 44.8 percent.
The pattern of denials due to Other reasons mirrors that of denials among White
applicants, peaking in 2005 and declining dramatically since that year. The numeric
range is comparable to that of White applicants, with Other reasons for Black applicants
dropping to 4.9 percent in 2008, as compared to 7.3 percent among White applicants.
Denials due to Debt‐to‐Income and Insufficient Collateral also rose throughout the
period, as was the case among White applicants. Debt‐to‐Income increased nearly four‐
fold, rising from 6.5 percent in 2004 to 24.5 in 2008. At the same time, Insufficient
Collateral rose from 8.9 in 2005 and peaked at 17.5 percent in 2008. This rate has been
on par with that of White applicants and follows a similar pattern.
Employment History remains low as a reason for denial of loans—there were no
applicants denied for this reason in 2005—but Insufficient Cash, inability to secure
Private Mortgage Insurance and Bad Data fluctuated from 7.2 to 14.0 percent across the
analysis period.
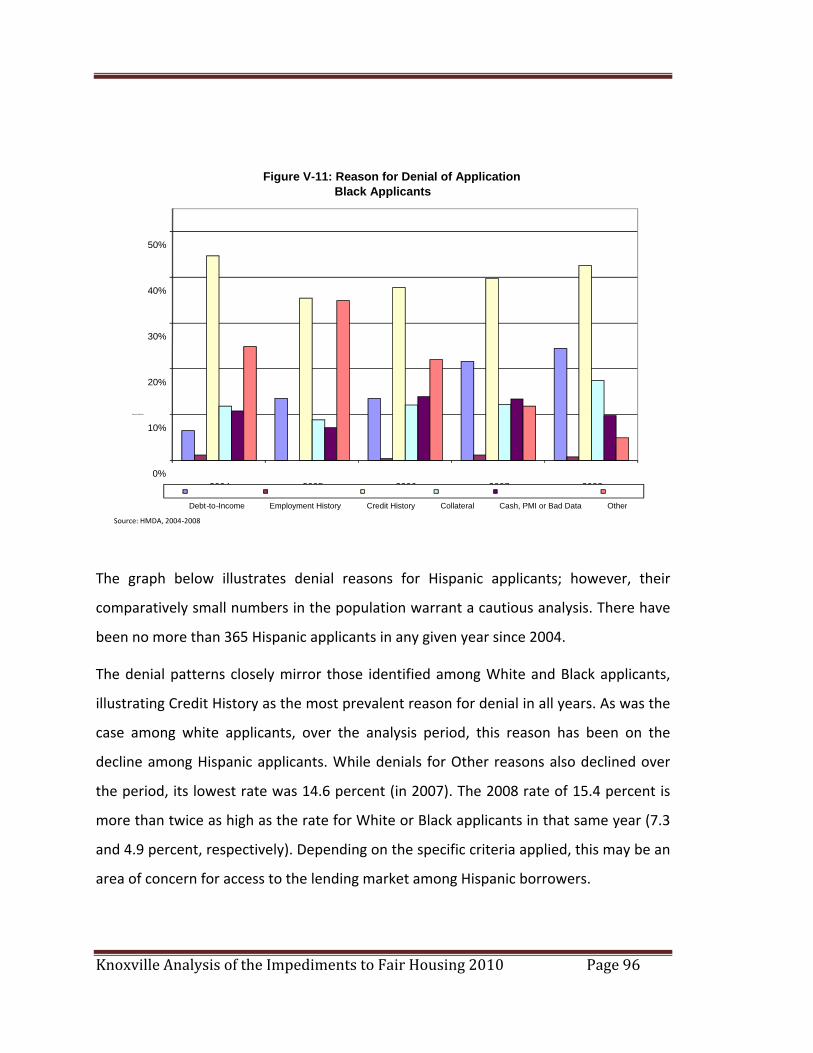
Knoxville Analysis of the Impediments to Fair Housing 2010 Page 96
Figure V-11: Reason for Denial of ApplicationBlack Applicants
50%
40%
30%
20%
Percent all denials 10%
0%2004 2005 2006 2007 2008
The graph below illustrates denial reasons for Hispanic applicants; however, their
comparatively small numbers in the population warrant a cautious analysis. There have
been no more than 365 Hispanic applicants in any given year since 2004.
The denial patterns closely mirror those identified among White and Black applicants,
illustrating Credit History as the most prevalent reason for denial in all years. As was the
case among white applicants, over the analysis period, this reason has been on the
decline among Hispanic applicants. While denials for Other reasons also declined over
the period, its lowest rate was 14.6 percent (in 2007). The 2008 rate of 15.4 percent is
more than twice as high as the rate for White or Black applicants in that same year (7.3
and 4.9 percent, respectively). Depending on the specific criteria applied, this may be an
area of concern for access to the lending market among Hispanic borrowers.
Debt-to- Income Cash, PMI or Bad Data Employment History Credit History Collateral Other
Source: HMDA, 2004 ‐ 2008
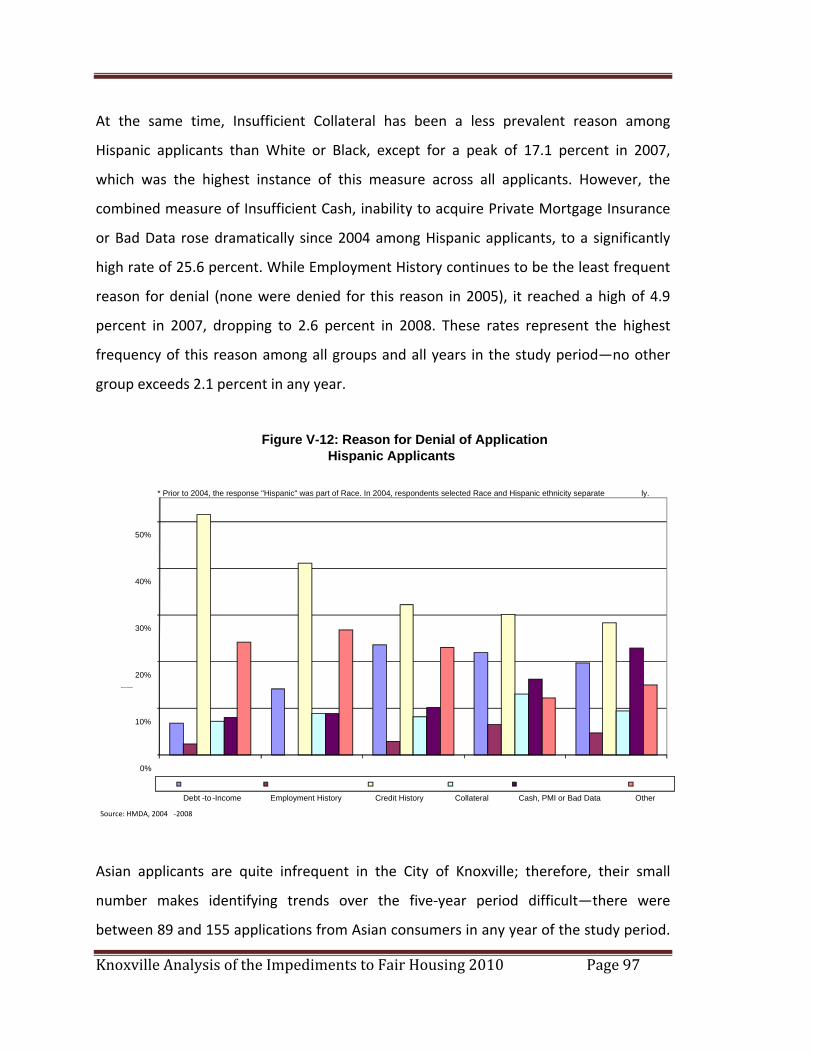
Knoxville Analysis of the Impediments to Fair Housing 2010 Page 97
At the same time, Insufficient Collateral has been a less prevalent reason among
Hispanic applicants than White or Black, except for a peak of 17.1 percent in 2007,
which was the highest instance of this measure across all applicants. However, the
combined measure of Insufficient Cash, inability to acquire Private Mortgage Insurance
or Bad Data rose dramatically since 2004 among Hispanic applicants, to a significantly
high rate of 25.6 percent. While Employment History continues to be the least frequent
reason for denial (none were denied for this reason in 2005), it reached a high of 4.9
percent in 2007, dropping to 2.6 percent in 2008. These rates represent the highest
frequency of this reason among all groups and all years in the study period—no other
group exceeds 2.1 percent in any year.
Figure V-12: Reason for Denial of ApplicationHispanic Applicants
ly. * Prior to 2004, the response "Hispanic" was part of Race. In 2004, respondents selected Race and Hispanic ethnicity separate
50%
40%
30%
20%Percent all denials
10%
0%
2004 2005 2006 2007 2008
-Income Cash, PMI or Bad Data Debt -to Employment History Credit History Collateral Other
2008 Source: HMDA, 2004 ‐
Asian applicants are quite infrequent in the City of Knoxville; therefore, their small
number makes identifying trends over the five‐year period difficult—there were
between 89 and 155 applications from Asian consumers in any year of the study period.
Knoxville Analysis of the Impediments to Fair Housing 2010 Page 98
According to the Demographic overview (Section 2 of this report), Asians make up 1.3
percent of the city’s population. Still, since 2004 they have accounted for between just
0.2 and 0.3 percent of loan applications—a rate that is about one‐fourth of their
representation in the population. While this may signal low access to the lending
marketplace, this may also be a reflection of cultural traditions that promote “lending
circles” or “lending clubs” through which individuals rely on social networks to help
them acquire funds for large purchases.
While there do appear to be some inconsistencies with regards to reasons of denial for
one race over the other, in general, rates of reasons for denial somewhat closely mirror
those for all races combined (Figure 7).
On average, White applicants were most frequently denied on the basis of Insufficient
Collateral and Credit History at a rate that does not differ significantly from Black
applicants, but is three points higher than Hispanic consumers.
Black applicants are more frequently denied on the basis of Credit History, but the
difference across all races is very small (fewer than 4 points, or 10 percent). Black
applicants are denied on the basis of Employment History least frequently than any
other group.
On average, Hispanic applicants are more frequently denied on all other measures than
any other group, but most of the differences are small. Hispanic applicants are also
more frequently denied on the basis of Insufficient Cash, Inability to acquire private
mortgage insurance or bad data. This measure differs by 2 points across all groups or
about 16 percent. While Employment History is the least frequent reason for denial,
Hispanic consumers are denied for this reason almost three times as frequently as are
White consumers, and nearly five times more than Black applicants.
While this finding becomes apparent through lending data, this may not necessarily be a
sign of discrimination in lending, but a signal of discrimination in other areas. For
example, such a finding may suggest that Hispanic consumers do not have the
Knoxville Analysis of the Impediments to Fair Housing 2010 Page 99
opportunities to maintain steady employment in Knoxville. This should be an area of
concern and may warrant monitoring in the City of Knoxville.
In general, the results of this analysis do not indicate any significant patterns to report
that might suggest unfair practices in the lending industry with regards to the
application process. While, overall, this signals good news for fair lending with respect
to racial discrimination, these data show only a small piece of the lending picture.
Purpose of Loan
In 2008, White applicants were denied most frequently on applications made for the
purpose of home purchase (77.8 percent), which was also the case for those who
identified their race as “Other” (2.1 percent). In that same year, Black applicants were
denied most frequently on home improvement applications (14.8 percent), as was the
case among those who chose not to give their race (23.0 percent). Hispanic applicants
were denied most frequently on refinance applications (3.3 percent).
This information notwithstanding, with nearly 8 percent of homebuyers, nearly 14
percent of applicants for refinance loans, and an additional 23 percent of those seeking
home improvement loans not reporting their race, any conclusions attempted from
comparing data in these areas may be critically flawed. Nonetheless, the finding that
Black applicants and those who did not give their race are denied loans for home
improvement may be significant in that their homes require maintenance. Conversely,
since this category also includes equity loans and lines of credit, it is possible that
applicants sought cash from the equity in their homes for purposes other than home
improvement. This is an area that may merit continued attention.
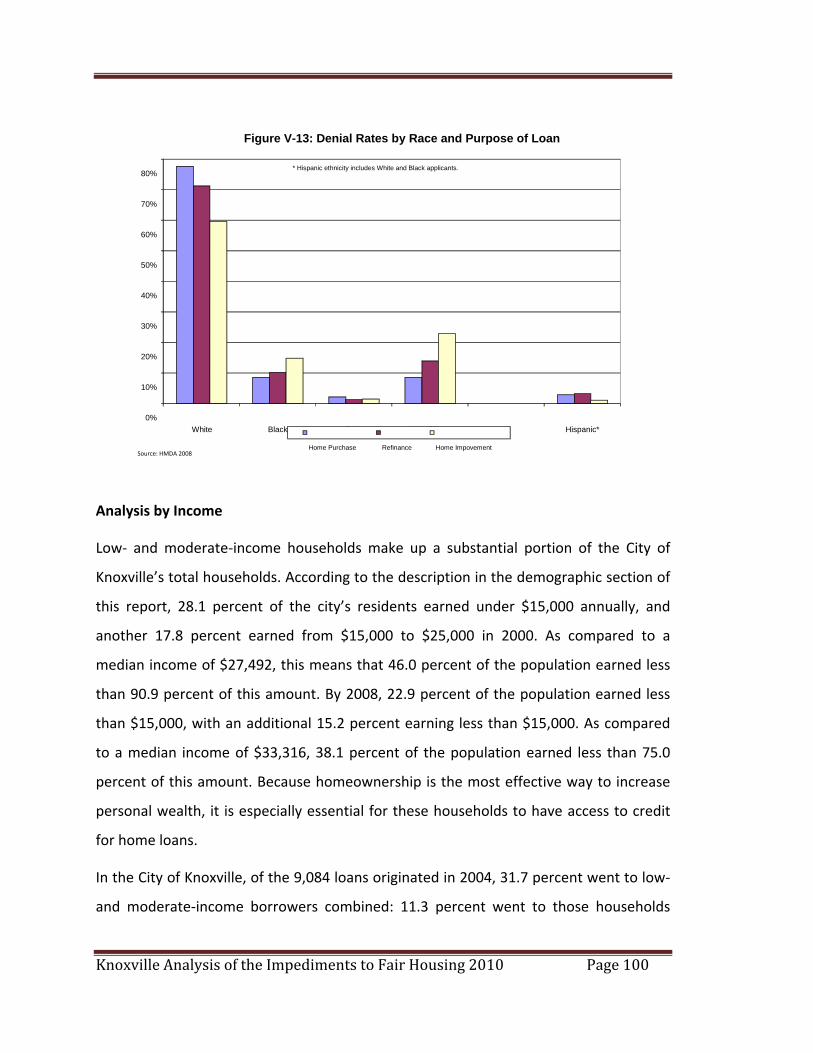
Knoxville Analysis of the Impediments to Fair Housing 2010 Page 100
Figure V-13: Denial Rates by Race and Purpose of Loan
* Hispanic ethnicity includes White and Black applicants.80%
70%
60%
50%
40%
30%
20%
10%
0%Black White Other Not Given Hispanic*
Source: HMDA 2008 Home Purchase Refinance Home Impovement
Analysis by Income
Low‐ and moderate‐income households make up a substantial portion of the City of
Knoxville’s total households. According to the description in the demographic section of
this report, 28.1 percent of the city’s residents earned under $15,000 annually, and
another 17.8 percent earned from $15,000 to $25,000 in 2000. As compared to a
median income of $27,492, this means that 46.0 percent of the population earned less
than 90.9 percent of this amount. By 2008, 22.9 percent of the population earned less
than $15,000, with an additional 15.2 percent earning less than $15,000. As compared
to a median income of $33,316, 38.1 percent of the population earned less than 75.0
percent of this amount. Because homeownership is the most effective way to increase
personal wealth, it is especially essential for these households to have access to credit
for home loans.
In the City of Knoxville, of the 9,084 loans originated in 2004, 31.7 percent went to low‐
and moderate‐income borrowers combined: 11.3 percent went to those households
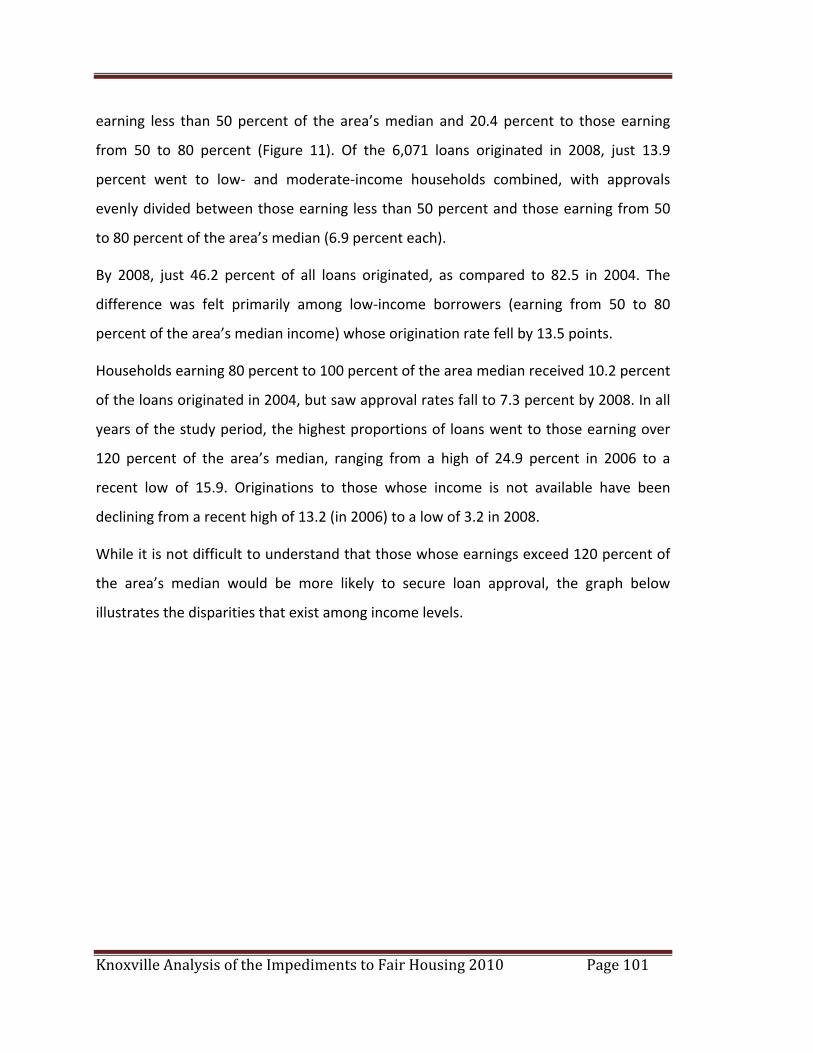
Knoxville Analysis of the Impediments to Fair Housing 2010 Page 101
earning less than 50 percent of the area’s median and 20.4 percent to those earning
from 50 to 80 percent (Figure 11). Of the 6,071 loans originated in 2008, just 13.9
percent went to low‐ and moderate‐income households combined, with approvals
evenly divided between those earning less than 50 percent and those earning from 50
to 80 percent of the area’s median (6.9 percent each).
By 2008, just 46.2 percent of all loans originated, as compared to 82.5 in 2004. The
difference was felt primarily among low‐income borrowers (earning from 50 to 80
percent of the area’s median income) whose origination rate fell by 13.5 points.
Households earning 80 percent to 100 percent of the area median received 10.2 percent
of the loans originated in 2004, but saw approval rates fall to 7.3 percent by 2008. In all
years of the study period, the highest proportions of loans went to those earning over
120 percent of the area’s median, ranging from a high of 24.9 percent in 2006 to a
recent low of 15.9. Originations to those whose income is not available have been
declining from a recent high of 13.2 (in 2006) to a low of 3.2 in 2008.
While it is not difficult to understand that those whose earnings exceed 120 percent of
the area’s median would be more likely to secure loan approval, the graph below
illustrates the disparities that exist among income levels.
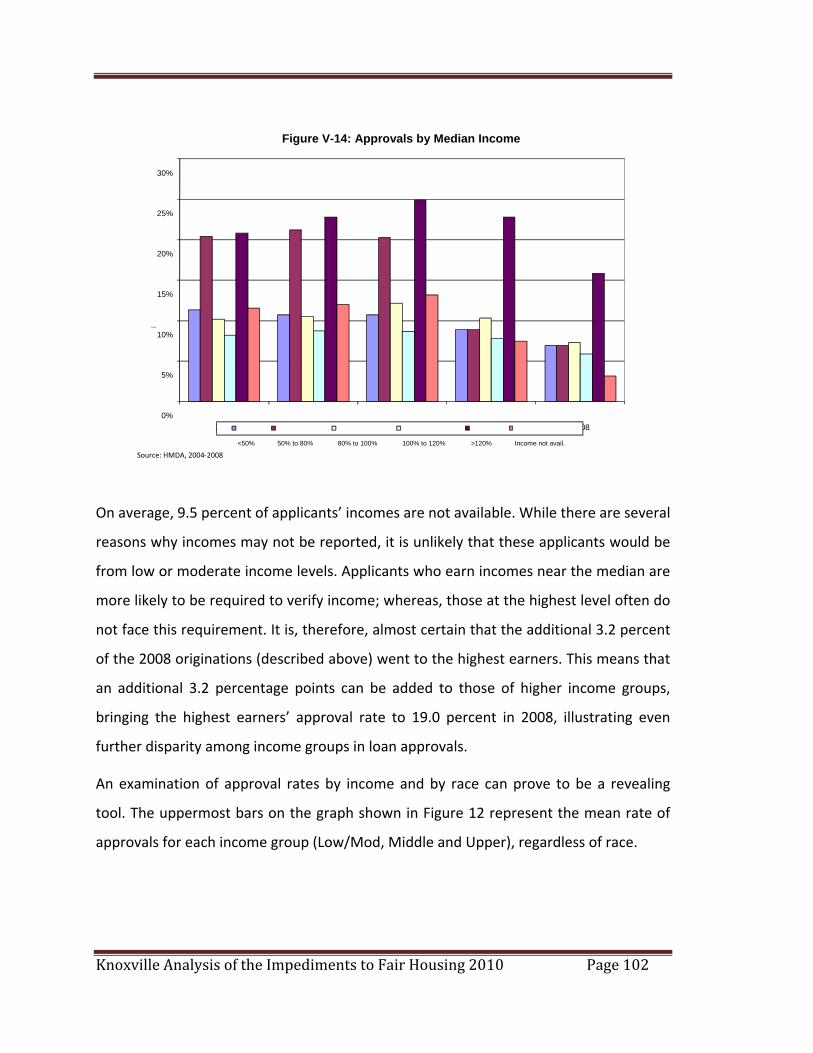
Knoxville Analysis of the Impediments to Fair Housing 2010 Page 102
Figure V-14: Approvals by Median Income
30%
25%
20%
15%
10%Percent
5%
0%2004 2005 2006 2007 2008
<50% 50% to 80% 80% to 100% 100% to 120% >120% Income not avail.
Source: HMDA, 2004‐2008
On average, 9.5 percent of applicants’ incomes are not available. While there are several
reasons why incomes may not be reported, it is unlikely that these applicants would be
from low or moderate income levels. Applicants who earn incomes near the median are
more likely to be required to verify income; whereas, those at the highest level often do
not face this requirement. It is, therefore, almost certain that the additional 3.2 percent
of the 2008 originations (described above) went to the highest earners. This means that
an additional 3.2 percentage points can be added to those of higher income groups,
bringing the highest earners’ approval rate to 19.0 percent in 2008, illustrating even
further disparity among income groups in loan approvals.
An examination of approval rates by income and by race can prove to be a revealing
tool. The uppermost bars on the graph shown in Figure 12 represent the mean rate of
approvals for each income group (Low/Mod, Middle and Upper), regardless of race.
Knoxville Analysis of the Impediments to Fair Housing 2010 Page 103
White applicants (represented by the second set of bars) were the only group
consistently above the mean at all income levels, by an average of 8.2 points overall. All
other groups fell below the mean in all income levels.
Black applicants were well below the mean, falling over 46 points below the mean
overall—the greatest disparity of all racial groups. Applicants who reported their race as
Other also fell below the mean with an aggregate difference of over 41 points. The
aggregate among Hispanic applicants was more than 14 points below the mean. Those
who did not specify race experienced an approval rate at an aggregate of more than 27
points below the mean. However, low approval rates among applicants who did not
specify race might be more a function of income and other measures of
creditworthiness than of race. Since there is no way to know who declines to specify
race, this cannot be ascertained.
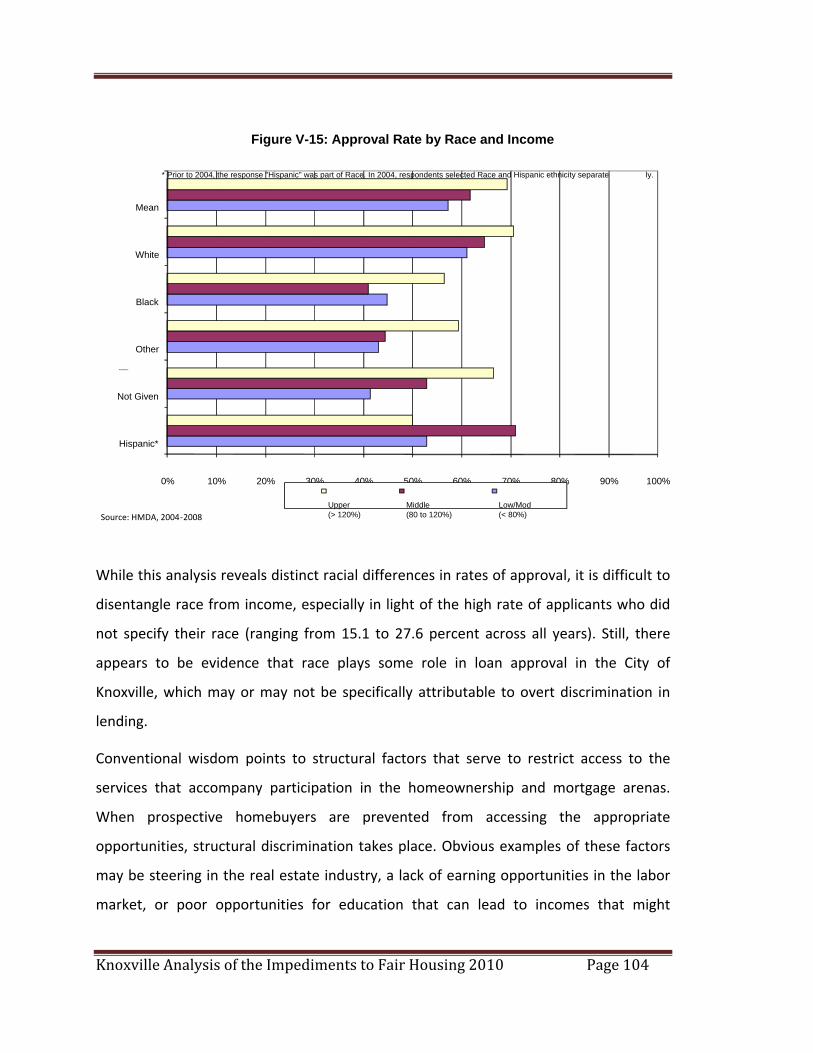
Knoxville Analysis of the Impediments to Fair Housing 2010 Page 104
Figure V-15: Approval Rate by Race and Income
ly. * Prior to 2004, the response "Hispanic" was part of Race. In 2004, respondents selected Race and Hispanic ethnicity separate
Mean
White
Black
Other
Not Given
Hispanic*
Race/Ethnicity
10% 20% 30% 40% 50% 60% 70% 80%
Low/Mod(< 80%)
Middle(80 to 120%)
Upper(> 120%)
0% 90% 100%
2008 Source: HMDA, 2004‐
While this analysis reveals distinct racial differences in rates of approval, it is difficult to
disentangle race from income, especially in light of the high rate of applicants who did
not specify their race (ranging from 15.1 to 27.6 percent across all years). Still, there
appears to be evidence that race plays some role in loan approval in the City of
Knoxville, which may or may not be specifically attributable to overt discrimination in
lending.
Conventional wisdom points to structural factors that serve to restrict access to the
services that accompany participation in the homeownership and mortgage arenas.
When prospective homebuyers are prevented from accessing the appropriate
opportunities, structural discrimination takes place. Obvious examples of these factors
may be steering in the real estate industry, a lack of earning opportunities in the labor
market, or poor opportunities for education that can lead to incomes that might
Knoxville Analysis of the Impediments to Fair Housing 2010 Page 105
improve creditworthiness. While these examples are easy to cite, most structural
discrimination is quite unintentional, very subtle and extremely difficult to identify.
ALTERNATIVE LENDING SOURCES
Sub‐Prime Lenders
While conventional lenders focus their marketing efforts on consumers with few or no
credit blemishes (those with “A” credit), an alternative source of loan funds for
consumers with lower credit scores (“B” or “C” credit) is sub‐prime lending institutions.
While sub‐prime lenders simplify the application process and approve loan applications
more quickly and more often, these lenders also charge higher interest rates to help
mitigate the increased risk in lending to consumers with poorer credit histories.
Interestingly, consumers who borrow from sub‐prime lenders often do qualify for loans
from conventional lenders, but succumb to marketing tactics that encourage them to
choose sub‐prime institutions over conventional. Recent studies by Freddie Mac, the
government‐sponsored entity that purchases mortgages from lenders and packages
them into securities that are sold to investors, show that between 25 percent and 35
percent of consumers receiving high cost loans in the sub‐prime market qualify for
conventional loans.17 This may be a result of the loss of conventional lenders in the
community. Having fewer lenders from which to choose, consumers select those that
are conveniently located, even at a higher price.
“Payday Lenders”
Another source of loans is check cashing or “payday” lenders. Check cashing outlets
(such as currency exchanges) cash payroll, government, and personal checks for a fee.
Their popularity increases as customers lose access to banks or cannot afford rising fees
associated with the inability to maintain minimum balance requirements. Consumers
use these outlets for their banking needs and are charged for the services they receive.
These businesses offer temporary “payday loans” by accepting a postdated check from
17 Information for this discussion provided by Miami Valley Fair Housing Center.
Knoxville Analysis of the Impediments to Fair Housing 2010 Page 106
the customer, who receives the funds immediately, minus a fee. When used regularly,
these fees can equate to double‐digit interest rates.
Although these services tend to be located in areas of highest minority and low‐income
concentration, they are also found in very close proximity to local lenders. Customarily,
however, they fill the void left by banks that do not service an area or have moved away
from it.
Predatory Lenders
While most sub‐prime lenders serve a need by targeting borrowers with sub‐par credit
histories, some go too far. Those that do are known as predatory lenders. Lending
becomes predatory when lenders target specific populations (such as low‐income,
minority, or elderly homeowners), charge excessive fees, frequently refinance the loan,
and often mislead the borrower. Since wealth is often tied to property ownership, this
system threatens to deprive residents of their assets by overextending their home’s
equity and, in some cases, foreclosing on the homes of people who cannot afford the
high interest rates and associated fees.
Mainstream financial institutions often unwittingly exclude the very groups targeted by
predatory lenders when they market loan products. Additionally, unknowing consumers
find themselves at a disadvantage due to a lack of financial savvy. The lending process
can be complicated, and often consumers are ill‐prepared to deal with the large volume
of paperwork required for the loan process. Most predatory lenders use their clients’
inexperience to their advantage, however, and do not provide quality counseling for
consumers seeking their products. They use the consumers’ ignorance as their
opportunity to reap profits. In the end, borrowers pay substantially higher interest rates
and purchase unnecessary credit, life, and disability insurance products.
Sub‐prime lenders charge higher rates to compensate for higher risk. While these types
of loans and lenders provide an important service to those without opportunities, these
institutions have been associated with predatory lending nationally and are a source of
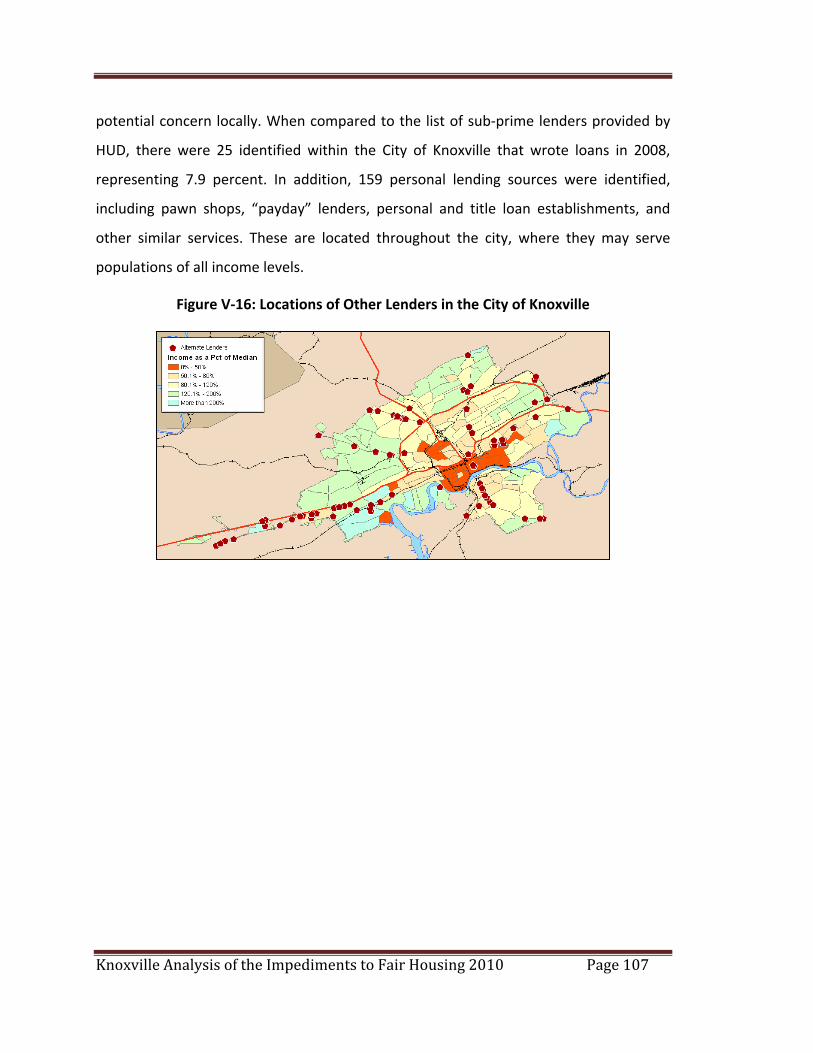
Knoxville Analysis of the Impediments to Fair Housing 2010 Page 107
potential concern locally. When compared to the list of sub‐prime lenders provided by
HUD, there were 25 identified within the City of Knoxville that wrote loans in 2008,
representing 7.9 percent. In addition, 159 personal lending sources were identified,
including pawn shops, “payday” lenders, personal and title loan establishments, and
other similar services. These are located throughout the city, where they may serve
populations of all income levels.
Figure V‐16: Locations of Other Lenders in the City of Knoxville
Knoxville Analysis of the Impediments to Fair Housing 2010 Page 108
OTHER PRIVATE ENTITIES THAT IMPACT FAIR HOUSING CHOICE
Real Estate and Housing Development Industry
Throughout the analysis period, the nation’s economy experienced a sustained
economic decline. The period 1998 through 2008 saw a housing boom during which
housing prices increased while incomes were unable to keep pace. The median price of
single family housing in Knox County was the seventh (7th) highest in the State of
Tennessee in 200818. By the fourth quarter of 2008 housing prices in the City had
peaked and begun to fall At this writing prices have declined between 6 percent and 30
percent depending on the sub‐market within the City. The largest price declines appear
to be occurring in units priced above 200% of the median statewide price of $150,00019.
The housing development industry has been hit hard by the lack of buyers in all price
ranges except those homes considered “starter homes”, valued at or below the median
statewide price of $150,000 for a three bedroom, two bath single family unit20. These
units are currently being subsidized by a Federal Tax Credit for first time homebuyers.
Housing starts for all types of units have declined from a high of 1,105 units permitted
annually in 2005 to an estimated 320 units permitted in 2008, a decline in annual starts
of 71% over the three year period21.
While the result of declining prices has been greater affordability, the simultaneous
tightening of credit criteria for real estate loans of all types has offset the trend toward
greater affordability by making it more difficult for buyers to find financing. These
18 Tennessee Housing Market at a Glance 2009, Tennessee Housing Development Agency, pg 4; (http://www.thda.org/news/hsgglance09.pdf ) 19 Knoxville News Sentinel; 28 Feb 2009; “According to the Knoxville Area Association of Realtors, for example, the median sale price of a three‐bedroom home in East Tennessee fell by more than 6 percent in the fourth quarter”. 20 US Census Bureau; Building Permits Database; 2005 through 2009 (http://censtats.census.gov/cgi‐bin/bldgprmt ) 21 Tennessee Housing Market at a Glance 2009, Tennessee Housing Development Agency, pg 4; (http://www.thda.org/news/hsgglance09.pdf )
Knoxville Analysis of the Impediments to Fair Housing 2010 Page 109
factors have had a negative impact on both the real estate and housing development
industry.
Three questions were asked of a representative sample of realtors in Knoxville during
November 2009.
1. Has your company encountered any acts of discrimination by others against the
families your company serves over the last five years?
2. Does your company sponsor any training or educational opportunities on equal
opportunity and/or fair housing?
3. Does your company sponsor any training or educational opportunities on equal
opportunity and/or fair housing?
A representative sample of Realtors indicated no acts of discrimination in the last five
years. A hundred percent (100%) of the Realtors surveyed indicated educational
opportunities on Fair Housing were available and employees were encouraged to
attend, and none of the Realtors directly sponsored Equal Opportunity training. The
Tennessee Real Estate Commission has a continuing education credit course available in
Fair Housing.
Homeowners Insurance Industry
Fair housing is about expanding the housing choice for those restricted by economic,
social, political, and other forces. The persistence of unfair housing underlies unequal
education, unequal access to jobs, unequal income, and redlining. Redlining is an
exclusionary practice of real estate agents, insurance companies, and financial
institutions that exists when ‘there is a lack of activity by [an] institution to extend credit
or coverage to certain urban neighborhoods because of their racial composition; or they
are denied because of the year‐to‐year change in racial composition and the age of
Knoxville Analysis of the Impediments to Fair Housing 2010 Page 110
structure in a neighborhood regardless of the creditworthiness or insurability of the
potential buyer and policy holder or the condition of the property.”22
Over 40 years ago, an observation was made that “insurance is essential to revitalize our
[American] cities. It is the cornerstone of credit. Without insurance, banks and other
financial institutions will not—and cannot—make loans. New housing cannot be
repaired. New businesses cannot expand, or survive. Without insurance, buildings are
left to deteriorate, and services, goods and jobs diminish.”23 This statement can
accurately describe many cities in 2008 as well as those in 1968. Investigations and
statistical and applied research throughout the United States has shown that residents
of minority communities have been discouraged in pursuit of homeownership, while
many predominantly White neighborhoods have been successful in attracting those
seeking the American dream of owning a home.
Discrimination in the provision of housing insurance has a lasting effect on the vitality of
America’s neighborhoods. Many traditional industry underwriting practices which may
have some legitimate business purpose also adversely affect minorities and minority
neighborhoods. While more recent studies have found little evidence of differential
treatment of mortgage applications, evidence does suggest that lenders may favor
applicants from Community Reinvestment Act (CRA)‐protected neighborhoods if they
obtain private mortgage insurance (PMI). The requirement of obtaining this additional
type of insurance may actually mask lender redlining of low‐income and minority
neighborhoods. For loan applicants who are not covered by PMI, there is strong
evidence that applications for units in low‐income neighborhoods are less likely to be
approved. Furthermore, these potential homeowners are more likely to be subject to
22 Hutchinson, Peter M., James R. Ostas, and J. David Reed, 1977, A Survey and Comparison of Redlining Influences in Urban Mortgage Lending
Markets. AREUEA Journal 5(4):463-72.
23 National Advisory Panel on Insurance in Riot Affected Areas, 1968.
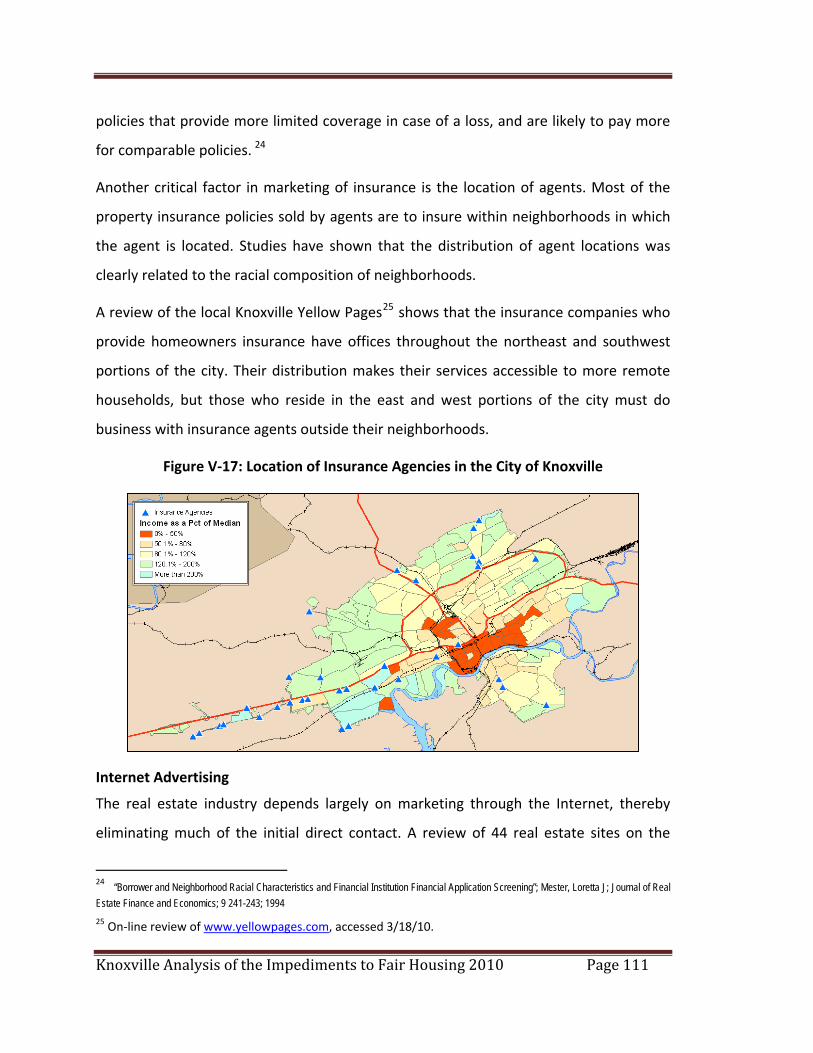
Knoxville Analysis of the Impediments to Fair Housing 2010 Page 111
policies that provide more limited coverage in case of a loss, and are likely to pay more
for comparable policies. 24
Another critical factor in marketing of insurance is the location of agents. Most of the
property insurance policies sold by agents are to insure within neighborhoods in which
the agent is located. Studies have shown that the distribution of agent locations was
clearly related to the racial composition of neighborhoods.
A review of the local Knoxville Yellow Pages25 shows that the insurance companies who
provide homeowners insurance have offices throughout the northeast and southwest
portions of the city. Their distribution makes their services accessible to more remote
households, but those who reside in the east and west portions of the city must do
business with insurance agents outside their neighborhoods.
Figure V‐17: Location of Insurance Agencies in the City of Knoxville
Internet Advertising
The real estate industry depends largely on marketing through the Internet, thereby
eliminating much of the initial direct contact. A review of 44 real estate sites on the
24 “Borrower and Neighborhood Racial Characteristics and Financial Institution Financial Application Screening”; Mester, Loretta J; Journal of Real Estate Finance and Economics; 9 241-243; 1994 25 On‐line review of www.yellowpages.com, accessed 3/18/10.
Knoxville Analysis of the Impediments to Fair Housing 2010 Page 112
Internet revealed no use of human models that would suggest discriminatory
advertising. However, just 19 (43.2%) displayed the HUD fair housing logo somewhere
on the web page.
Print Media Advertising
In the context of fair housing, discriminatory advertising is any advertising that indicates
any preference, limitation, or discrimination based on race, color, religion, sex,
disability, familial status or national original, or an intention to make any such
preference, limitation, or discrimination. Overt or tacit discriminatory preferences or
limitations are often conveyed through the use of particular words, phrases, or symbols.
In a general review of several local Knox County and regional publications carrying ads
for housing, no systematic attempt to exclude particular demographic groups was
observed. Still, there were several incidents found that suggest that there is a need for
fair housing training review sessions for real estate agents, mortgage brokers, and
significant players in the real estate market, including the local press. Inconsistency was
noted in the display of equal opportunity logos within the housing advertisements
analyzed in local and regional newspapers from three separate dates. For instance,
while most real estate agents displayed consistently the HUD equal opportunity logo, in
one instance, a twenty‐page advertising insert by a nationally sponsored real estate firm
did not mention fair housing and did not have the equal housing opportunity logo. The
real estate directed publications Homes & Lands, the Real Estate Book and numerous
smaller publications all carried the equal opportunity logo on the cover or by the table
of contents. Individual ads by real estate brokers within these publications were less
consistent, with fewer than 30% of the ads having a fair housing logo.
An analysis of the apartment listings in the local the Knoxville Area Yellow Pages and
Yellow Book showed that none of the apartment complexes or purveyors carried a
display ad. There was no equal opportunity logo in either publication related to
apartment listings.
Knoxville Analysis of the Impediments to Fair Housing 2010 Page 113
The Knoxville Apartment Guide does have both the equal opportunity logo and a strong
statement affirming equal opportunity in housing: “All persons are hereby informed that
all dwellings advertised are available on an equal opportunity basis.” In many cases
accessibility for persons with disabilities was advertised utilizing the international
symbol for wheelchair access and over 60% of the individual ads carried the equal
opportunity logo.
An analysis of the real estate listings in the local Knoxville Area Yellow Pages revealed
that only 20% of the display ad listings had an equal opportunity logo.
An analysis of the classified real estate ads in selected Sunday editions of the Knoxville
News Sentinel (November 15th, November 22nd, and November 29th issues) revealed
eighteen (18) ads of 170 ads on average, or 10.6 percent (10.6%) of real estate ads had
no equal opportunity logo. An estimated twelve (12) ads on average mentioned “schools
nearby” or “family friendly” language positively affirming fair housing by reaching out to
one of the protected classes—familial status. One firm showed properties with “Section
8 availability” in each issue, therefore reaching out to low‐income residents.
The General Public
A focus group for providers of affordable and special needs housing held in November of
2009 did not generate a single concern or complaint related to Fair Housing.
Section VI: Conclusions and Recommendations This section presents the Fair Housing Analysis Update for the Knoxville 2010‐2015
Consolidated Plan. It includes existing impediments to fair housing choice currently
being addressed – and the plans recommended to remedy them. The City’s prior
Analysis of Impediments was conducted in 2005 and included issues that are carried
over to this update. This update is based on available public/private information from
the City Fair Housing Staff, the real estate, insurance and banking industries, the
Knoxville Analysis of the Impediments to Fair Housing 2010 Page 114
Knoxville’s Community Development Corporation, the Tennessee Human Rights
Commission, the Tennessee Department of Commerce and Insurance, and the Atlanta
and Knoxville HUD Offices of Fair Housing and Equal Opportunity and Community
Planning and Development.
IMPORTANT CONSIDERATIONS
Three key housing related groups in the City—the Department of Community
Development, the non‐profit assistance and development sector and Knoxville’s
Community Development Corporation, as the provider of public housing, must all work
continually with the private sector to promote and explain the requirements of the Fair
Housing Act. Local housing providers do receive calls when an alleged violation occurs,
and provide information on the Act, and provide guidance on how to lodge a formal
complaint. Complaints relative to projects funded with federal dollars are directed to
HUD and all other situations are investigated by the City Fair Housing Staff as an
equivalent agency to HUD as described in the Introduction.
Throughout the year, the City and local housing providers must work together to
promote fair housing, hold conferences, distribute materials, educate both tenants and
landlords, and continually strive to limit the local violations of the Fair Housing Act.
Discussions are and should continue to be held with the Chamber of Commerce,
government officials, Realtors® and individuals regarding discriminatory practices and
complaints lodged and resolved successfully through mediation. The more widely
distributed resolved complaints are the higher the educational value to the community.
The City joins with Realtors® to disseminate current information on fair housing as
training tools for housing industry professionals. In general, Realtors in the home sales
portion of the business do not currently utilize the Equal Opportunity logo effectively in
either print or electronic media.
Knoxville Analysis of the Impediments to Fair Housing 2010 Page 115
Home Mortgage Disclosure Act (HMDA) data suggests that the lending practices of
major lending institutions in the City indicate some disparities in accessibility to home
mortgage financing by race, income and geographic concentration. The City encourages
lenders to participate in educational workshops on Fair Housing/Equal Opportunity.
One frequent threat to Fair Housing is the development of housing options for special
needs populations. In some instances, residents place significant pressure on local
elected officials and zoning officers to deny variances, permits, etc.
As housing markets expand and become more competitive in the City, instances of
NIMBYism, or “not in my backyard”, may become more common. Whether it is
neighborhood opposition to density, low‐income housing or housing for special
population groups, obtaining a site and approval by communities is difficult. In many
cases, the process leads to greater costs, making it difficult to maintain affordability for
those who need them. In an effort to open the doors wider to fair housing options for all
individuals, the City works closely with local public housing providers, landlords, non‐
profits government, service providers, and funding institutions to assess the housing
needs and promote an organized mechanism for addressing these needs.
At the same time, discussion about limiting sprawl, improving social service delivery
centers, and placing special need populations back in the community will continue. This
discussion will result in continued conflicts between identifying appropriate housing for
those who need the most assistance and finding a place for them to live. Therefore, it
will be important to continue to provide community education to ensure the ability of
the community to develop affordable housing. Community education should also take
into account: economic and health issues that are directly related the problems of
deteriorated housing (including the presence of lead based paint); and economic
literacy as it relates to employment and access to credit.
Implementation of activities includes:
• Developing fair housing brochures and flyers
Knoxville Analysis of the Impediments to Fair Housing 2010 Page 116
• Disseminating fair housing brochures and flyers throughout the community, via
conferences, housing fairs, information racks in public facilities, etc.
• Reviewing proposed policies in the City land use plans, codes, and zoning
• Recommending the inclusion of policies allowing for a diversity of housing types
and locations
• Reviewing existing zoning and land development policies for possible revisions to
permit more affordable housing
• Reviewing successful models for developing new low‐ and moderate‐income
housing by other communities and private developers.
Finally, the City guides the work of fair housing enforcement and outreach strategies. By
approaching the issue of fair housing in a comprehensive way, the City identifies the
most effective means to achieving compliance and enforcement through outreach,
advocacy, investigative services, and testing. All of these efforts contribute to a more
educated citizenry relative to increased public awareness and understanding of the
issue of fair housing and of the appropriated corrective resources available to residents
of the City.
Specifically based upon the current data available, the following are the impediments
and suggested actions that have been identified for the City. The City will document
and report its actions to HUD on the removal of impediments through Annual Reports
which are a part of the Consolidated Plan Process.
IMPEDIMENT #1
Market Availability
The unwillingness of some members of the community to support the development of
affordable housing within their neighborhoods has resulted in a lack of affordable
housing for protected class persons, especially those persons with disabilities. This is
referred to as the “Not In My Back Yard” or “NIMBY” syndrome. Additionally, some
landlords do not want to rent to people with disabilities. Unfortunately, this syndrome
Knoxville Analysis of the Impediments to Fair Housing 2010 Page 117
continues to be a significant impediment to fair housing choice. Public hearings
concerning proposed affordable housing projects bring objections mostly from
neighbors who cite adverse effects on traffic, infrastructure, and public services,
schools, the environment, property values, and crime rates. However, the desire to
maintain a neighborhood's socioeconomic homogeneity and exclusivity is frequently
unstated.
Suggested Steps to Remove this Impediment
Since this is partially a continuing impediment from the 2005 A.I. and similar to one in
Knox County, the City should continue to expand affordable housing options for very
low, low and moderate‐income residents, including subsidized housing residents and
homeless persons who seek to move into subsidized private housing.
Through communication and outreach to neighborhoods, the City should continue to
address objections to siting affordable housing and continue to make effective use of its
HOME, CDBG, ESG and other housing resources to encourage the development of safe,
decent and sanitary affordable housing to such residents.
The City should continue to coordinate efforts with the County in order to maximize
response efforts on regional NIMBY issues.
IMPEDIMENT #2
Potential Protected Class Discrimination in the Homebuyer Lending Market
Often Protected Classes are not equal partners in the home buying market in the City.
Prime lenders had few applications and high originations and sub‐prime lenders had
high applications and few originations.
Loan data show an under representation of applicants for loan applications and denials
based on debt to income ratios and credit history. These are factors which could point
to disinvestment in low/mod neighborhoods which limit access to home improvement
Knoxville Analysis of the Impediments to Fair Housing 2010 Page 118
loans, access to refinancing loans and access to funds to afford new homes. This
situation is similar to Knox County.
Suggested Steps to Remove this Impediment
Lenders need to be made aware of this issue and initiate positive efforts in establishing
a broader market.
Working with local lenders, the City should do further analysis of lending data to
determine to what extent disparate treatment of protected classes accounts for loan
denials.
The City should take an active role in monitoring Home Mortgage Disclosure Act
(HMDA) data to insure that lenders continue to equalize lending practices. The city
should continue to encourage programs that provide credit counseling and repair,
financial fitness and provide down‐payment assistance for qualified low‐income buyers.
IMPEDIMENT #3
Public Policy Implementation
Public policy implementation and lack of fair housing training often lead to
misunderstanding in local housing initiatives. As is the case in any local governmental
operation, elected official and staff turnover requires periodic training to stay up to date
in various requirements such as addressing fair housing and civil rights policies. While
various City staff have key assignments and serve on supportive committees for fair
housing, representatives need to be aware that certain public policies such as building
requirements, lack of public infrastructure, taxes, land use and zoning could lead to
unintended discriminatory actions.
Suggested Steps to Remove this Impediment
City Staff should continue the current strategy of addressing fair housing in all
departments and programs by articulating supportive government‐wide civil rights
Knoxville Analysis of the Impediments to Fair Housing 2010 Page 119
policies and training for staff involved in activities related to fair housing. The City
should also be careful in adopting land use policies and related zoning that would have
the effect of limiting fair and affordable housing opportunities. Additionally, the City
needs to continue support of rental and homeownership development in areas where
assisted and affordable housing may not be readily available to protected classes.
Finally, the City needs to continue to support the development of affordable housing
through strategies such as the homemakers program that help to incentivize the
purchase of real estate in low‐mod areas.
IMPEDIMENT #4
Need for Permanent Supportive Housing
There are limited housing opportunities for persons that are homeless, those who are at
risk of homelessness, and special needs populations. There is limited funding for the
development of permanent supportive housing, and as mentioned in Impediment #1,
opposition to building such housing throughout the City The City faces the challenge of
securing funds to build and operate permanent supportive housing and finding locations
to meet the needs of the residents.
Suggested Steps to Remove this Impediment
The City will continue to use its CDBG, HOME and ESG as well as NSP funds to increase
the number of permanent supportive housing units in Knoxville and support the case
management activities needed to assist the chronically homeless population and those
at risk of homelessness.