Embed Size (px)
Citation preview
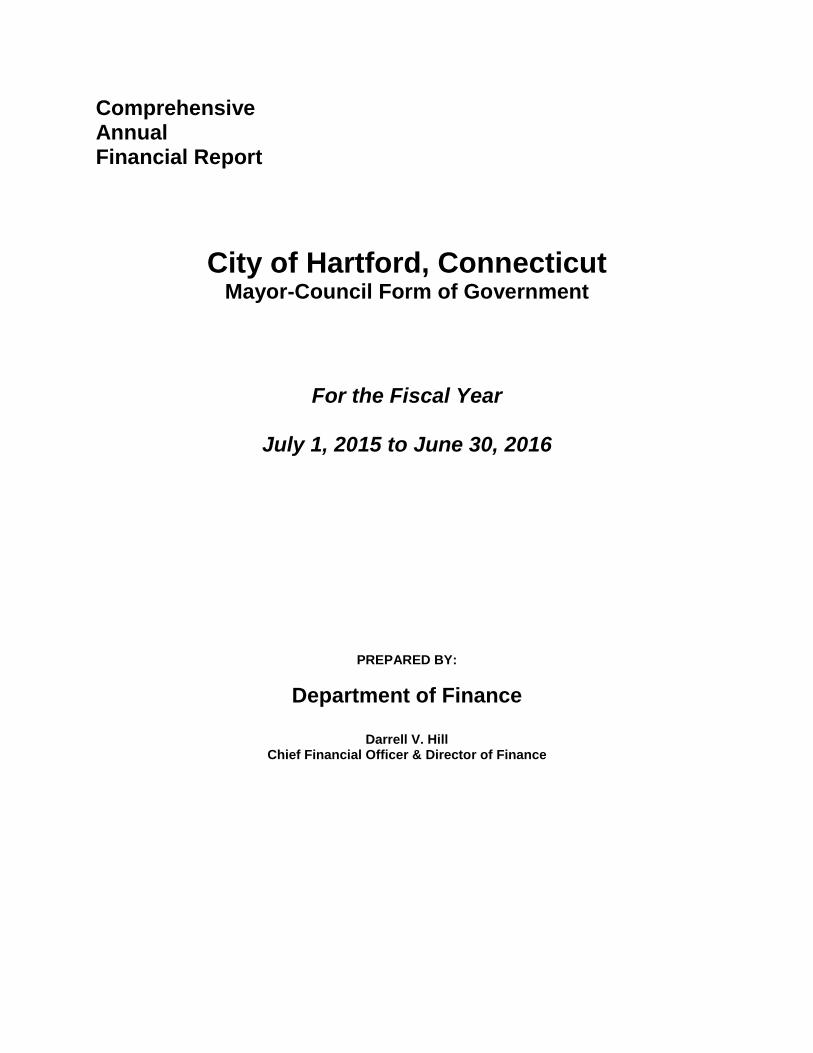
Comprehensive Annual Financial Report
City of Hartford, Connecticut Mayor-Council Form of Government
For the Fiscal Year
July 1, 2015 to June 30, 2016
PREPARED BY:
Department of Finance
Darrell V. Hill Chief Financial Officer & Director of Finance
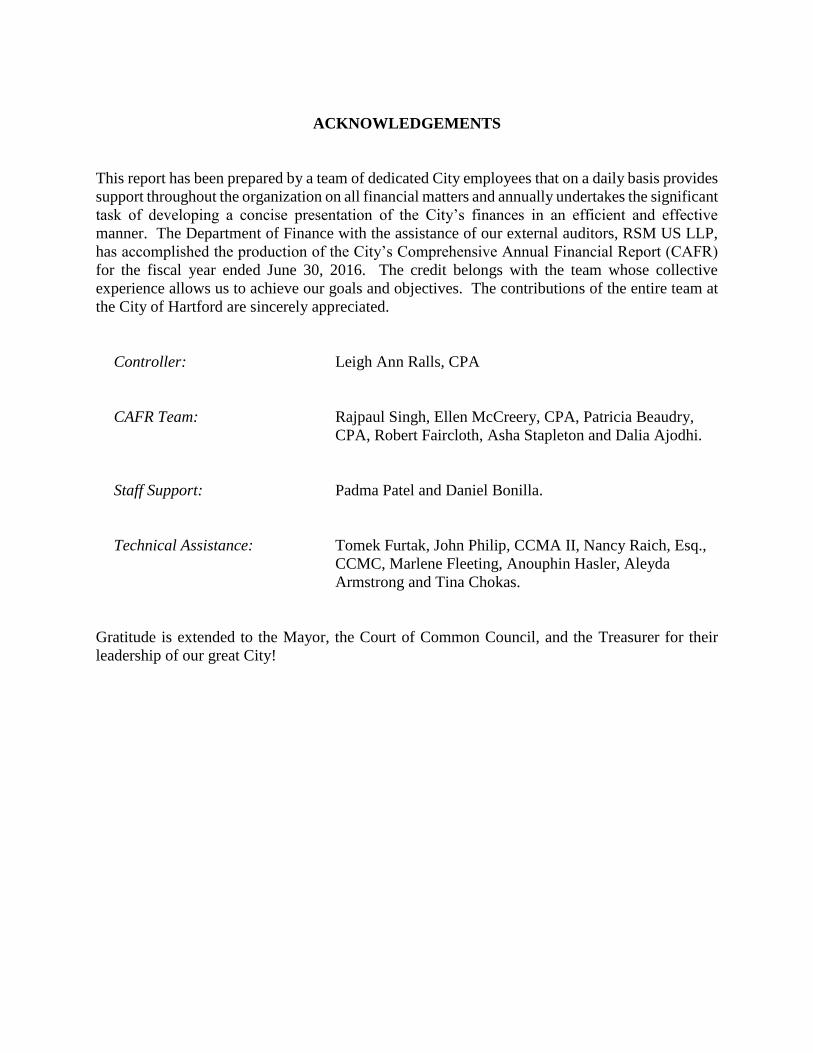
ACKNOWLEDGEMENTS
This report has been prepared by a team of dedicated City employees that on a daily basis provides
support throughout the organization on all financial matters and annually undertakes the significant
task of developing a concise presentation of the City’s finances in an efficient and effective
manner. The Department of Finance with the assistance of our external auditors, RSM US LLP,
has accomplished the production of the City’s Comprehensive Annual Financial Report (CAFR)
for the fiscal year ended June 30, 2016. The credit belongs with the team whose collective
experience allows us to achieve our goals and objectives. The contributions of the entire team at
the City of Hartford are sincerely appreciated.
Controller: Leigh Ann Ralls, CPA
CAFR Team: Rajpaul Singh, Ellen McCreery, CPA, Patricia Beaudry,
CPA, Robert Faircloth, Asha Stapleton and Dalia Ajodhi.
Staff Support: Padma Patel and Daniel Bonilla.
Technical Assistance: Tomek Furtak, John Philip, CCMA II, Nancy Raich, Esq.,
CCMC, Marlene Fleeting, Anouphin Hasler, Aleyda
Armstrong and Tina Chokas.
Gratitude is extended to the Mayor, the Court of Common Council, and the Treasurer for their
leadership of our great City!
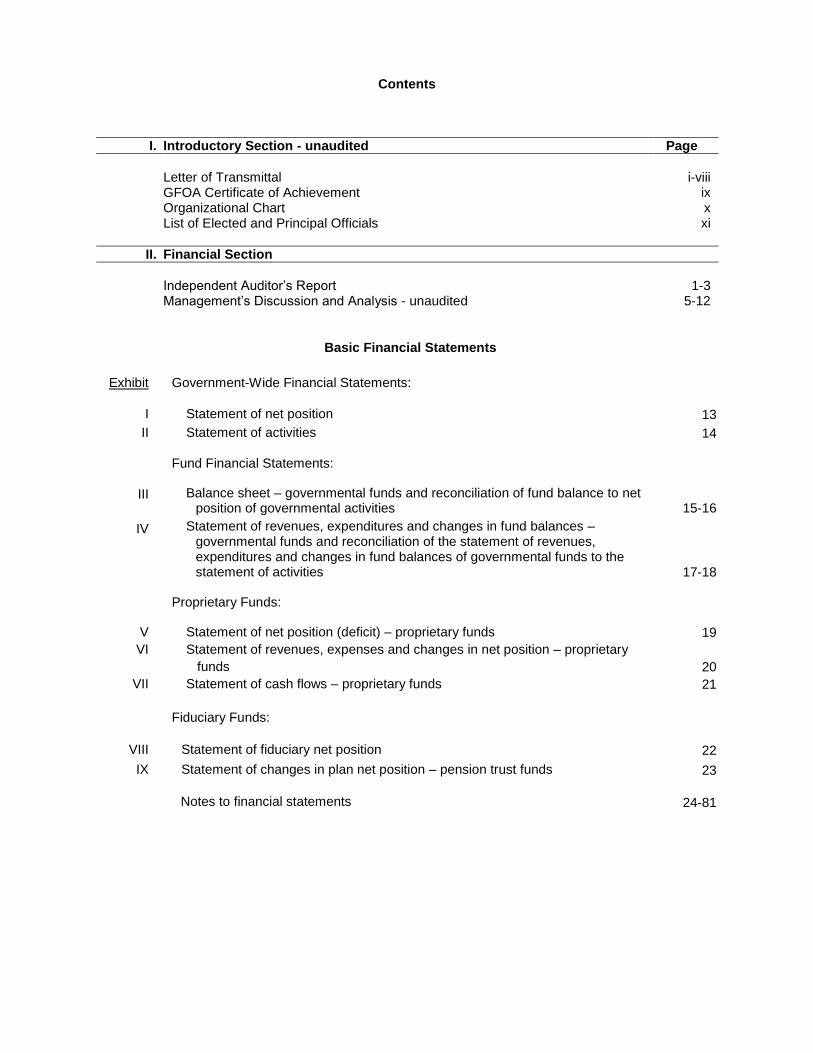
Contents
I. Introductory Section - unaudited Page
Letter of Transmittal i-viii GFOA Certificate of Achievement ix Organizational Chart x List of Elected and Principal Officials xi
II. Financial Section
Independent Auditor’s Report 1-3 Management’s Discussion and Analysis - unaudited 5-12
Basic Financial Statements
Exhibit Government-Wide Financial Statements:
I Statement of net position 13
II Statement of activities 14
Fund Financial Statements:
III Balance sheet – governmental funds and reconciliation of fund balance to net position of governmental activities 15-16
IV Statement of revenues, expenditures and changes in fund balances – governmental funds and reconciliation of the statement of revenues, expenditures and changes in fund balances of governmental funds to the statement of activities 17-18
Proprietary Funds:
V Statement of net position (deficit) – proprietary funds 19
VI Statement of revenues, expenses and changes in net position – proprietary
funds 20
VII Statement of cash flows – proprietary funds 21
Fiduciary Funds:
VIII Statement of fiduciary net position 22
IX Statement of changes in plan net position – pension trust funds 23
Notes to financial statements 24-81
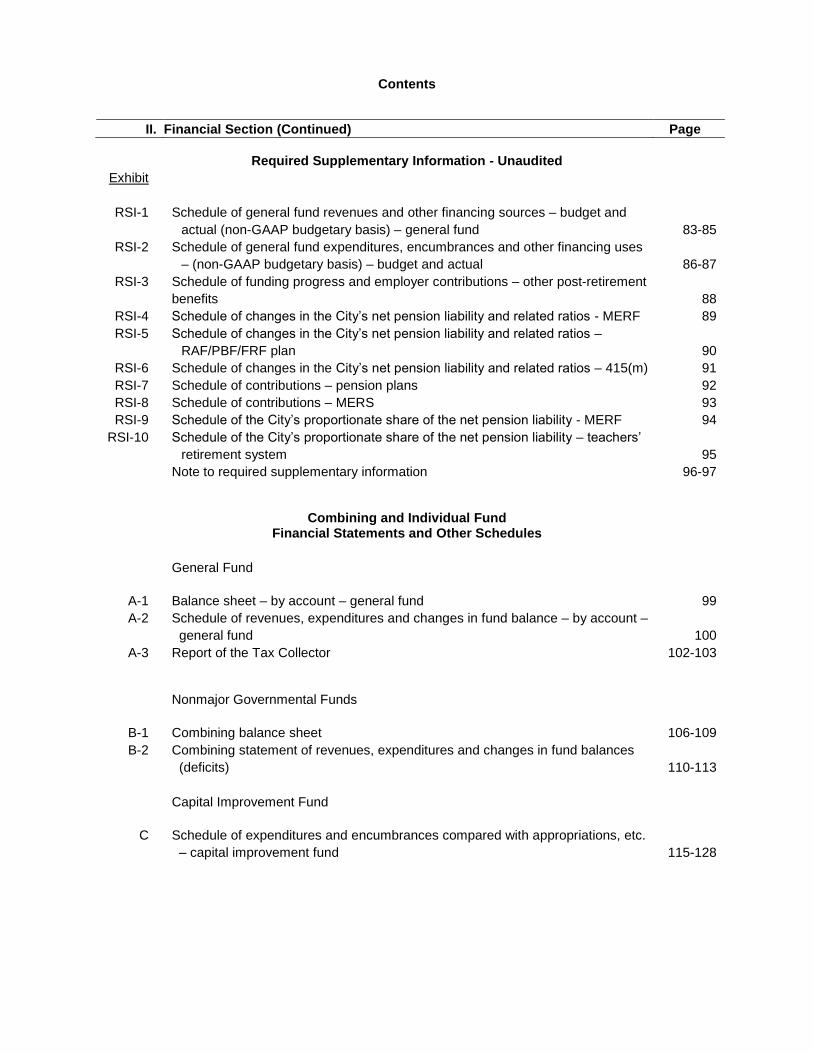
Contents
II. Financial Section (Continued) Page
Required Supplementary Information - Unaudited
Exhibit
RSI-1 Schedule of general fund revenues and other financing sources – budget and
actual (non-GAAP budgetary basis) – general fund 83-85
RSI-2 Schedule of general fund expenditures, encumbrances and other financing uses
– (non-GAAP budgetary basis) – budget and actual 86-87
RSI-3 Schedule of funding progress and employer contributions – other post-retirement
benefits 88
RSI-4 Schedule of changes in the City’s net pension liability and related ratios - MERF 89
RSI-5 Schedule of changes in the City’s net pension liability and related ratios –
RAF/PBF/FRF plan 90
RSI-6 Schedule of changes in the City’s net pension liability and related ratios – 415(m) 91
RSI-7 Schedule of contributions – pension plans 92
RSI-8 Schedule of contributions – MERS 93
RSI-9 Schedule of the City’s proportionate share of the net pension liability - MERF 94
RSI-10 Schedule of the City’s proportionate share of the net pension liability – teachers’
retirement system 95
Note to required supplementary information 96-97
Combining and Individual Fund Financial Statements and Other Schedules
General Fund
A-1 Balance sheet – by account – general fund 99
A-2 Schedule of revenues, expenditures and changes in fund balance – by account –
general fund 100
A-3 Report of the Tax Collector 102-103
Nonmajor Governmental Funds
B-1 Combining balance sheet 106-109
B-2 Combining statement of revenues, expenditures and changes in fund balances
(deficits) 110-113
Capital Improvement Fund
C Schedule of expenditures and encumbrances compared with appropriations, etc.
– capital improvement fund 115-128
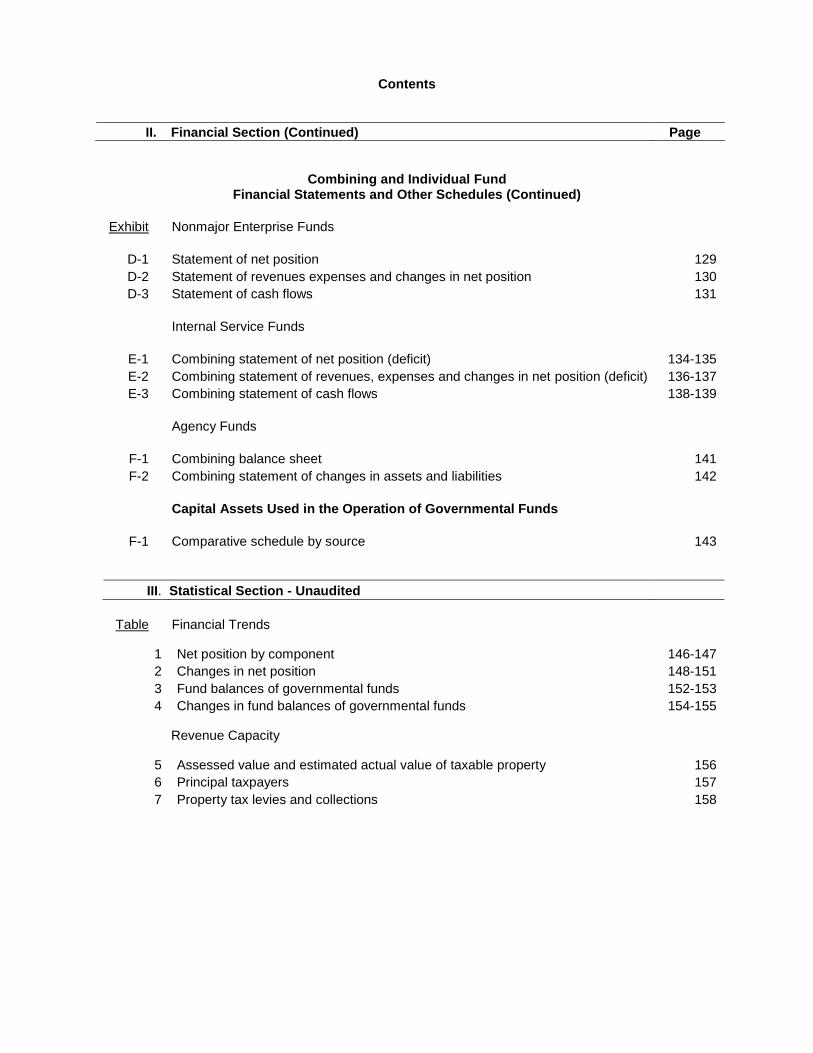
Contents
II. Financial Section (Continued) Page
Combining and Individual Fund Financial Statements and Other Schedules (Continued)
Exhibit Nonmajor Enterprise Funds
D-1 Statement of net position 129
D-2 Statement of revenues expenses and changes in net position 130
D-3 Statement of cash flows 131
Internal Service Funds
E-1 Combining statement of net position (deficit) 134-135
E-2 Combining statement of revenues, expenses and changes in net position (deficit) 136-137
E-3 Combining statement of cash flows 138-139
Agency Funds
F-1 Combining balance sheet 141
F-2 Combining statement of changes in assets and liabilities 142
Capital Assets Used in the Operation of Governmental Funds
F-1 Comparative schedule by source 143
III. Statistical Section - Unaudited
Table Financial Trends
1 Net position by component 146-147
2 Changes in net position 148-151
3 Fund balances of governmental funds 152-153
4 Changes in fund balances of governmental funds 154-155
Revenue Capacity
5 Assessed value and estimated actual value of taxable property 156
6 Principal taxpayers 157
7 Property tax levies and collections 158
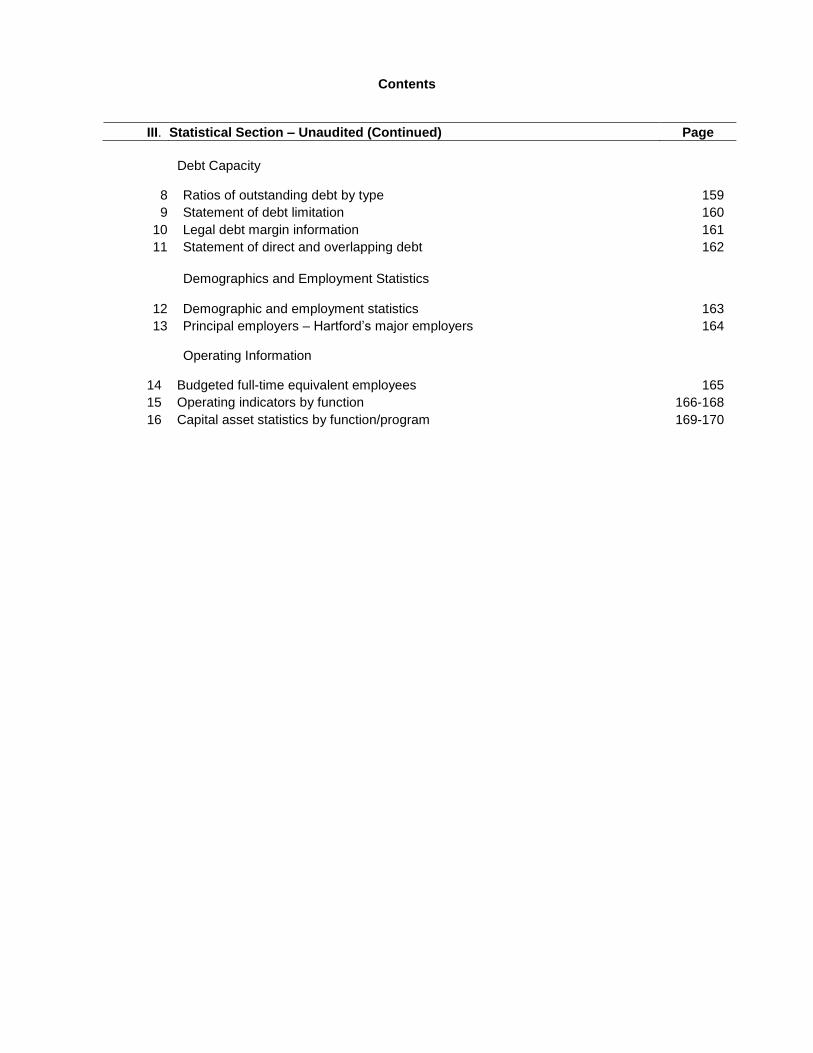
Contents
III. Statistical Section – Unaudited (Continued) Page
Debt Capacity
8 Ratios of outstanding debt by type 159
9 Statement of debt limitation 160
10 Legal debt margin information 161
11 Statement of direct and overlapping debt 162
Demographics and Employment Statistics
12 Demographic and employment statistics 163
13 Principal employers – Hartford’s major employers 164
Operating Information
14 Budgeted full-time equivalent employees 165
15 Operating indicators by function 166-168
16 Capital asset statistics by function/program 169-170

Introductory Section

CITY OF HARTFORD
DEPARTMENT OF FINANCE 550 Main Street, Suite 303
Hartford, Connecticut 06103
P: (860) 757-9606 F: (860) 722-6619 www.hartford.gov
LUKE A. BRONIN
Mayor DARRELL V. HILL
Chief Financial Officer & Director of Finance
i
December 30, 2016
The Honorable Mayor Luke A. Bronin,
and Court of Common Council
City of Hartford, Connecticut
Dear Mayor and Members of Council:
In accordance with Chapter VIII, Section 5. (a)(1)(iv) of the City of Hartford’s Charter, I am pleased
to submit the Comprehensive Annual Financial Report (CAFR) of the City of Hartford (City) for the
fiscal year ended June 30, 2016. This report was prepared in its entirety by the Department of Finance.
Responsibility for the accuracy of the data and the completeness and fairness of the presentation of the
financial statements, supporting schedules and statistical tables rests with the City. To the best of our
knowledge and belief, the information provided is accurate in all material respects and is reported to
present fairly the financial position of the City as of June 30, 2016. I extend my sincere appreciation
and gratitude to our dedicated employees in the Department of Finance and throughout the City for
their significant efforts that have resulted in the presentation of this FY2016 CAFR.
The CAFR is designed and prepared in conformance with Generally Accepted Accounting Principles
(GAAP) for governmental units as well as the standards of financial reporting promulgated by the
Governmental Accounting Standards Board (GASB), the American Institute of Certified Public
Accountants (AICPA) and the laws of the State of Connecticut. We believe this report presents fairly
and accurately the financial position of the City and the results of its operations during FY2016. This
CAFR is consistent with the principles of full disclosure so that the reader may gain the maximum
understanding of the City's financial affairs.
GAAP requires that management provide a narrative introduction, overview, and analysis to
accompany the basic financial statements in the Management Discussion & Analysis (MD&A). This
letter of transmittal is designed to complement the MD&A and should be read in conjunction with the
MD&A. The City's MD&A can be found immediately following the Report of the Independent
Auditors.
The City is required to undergo an annual Single Audit in conformity with the provisions of the Federal
Single Audit Act and United States Office of Management & Budget Circular A-133, "Audits of States,
Local Governments and Non-Profit Organizations". Information related to this Single Audit, including
the Schedule of Expenditures of Federal Awards, Findings, Recommendations and Auditors' Reports
on the Internal Control over Financial Reporting and Compliance with Applicable Laws and
ii
Regulations are issued under separate cover and are not included in this CAFR. The City is also
required to undergo a State Single Audit. Information and reporting related to the State Single Audit
is also issued under separate cover.
PROFILE OF THE CITY
The City was founded by Thomas Hooker and his followers in 1635 and was incorporated in 1784.
The City is the Capital of the State of Connecticut and the employment and cultural core of a
metropolitan area with a population of over one million people. Hartford has an estimated 125,017
residents in its 18.4 square mile area. The City lies on the west bank of the Connecticut River in the
center of the State, midway between New York City and Boston.
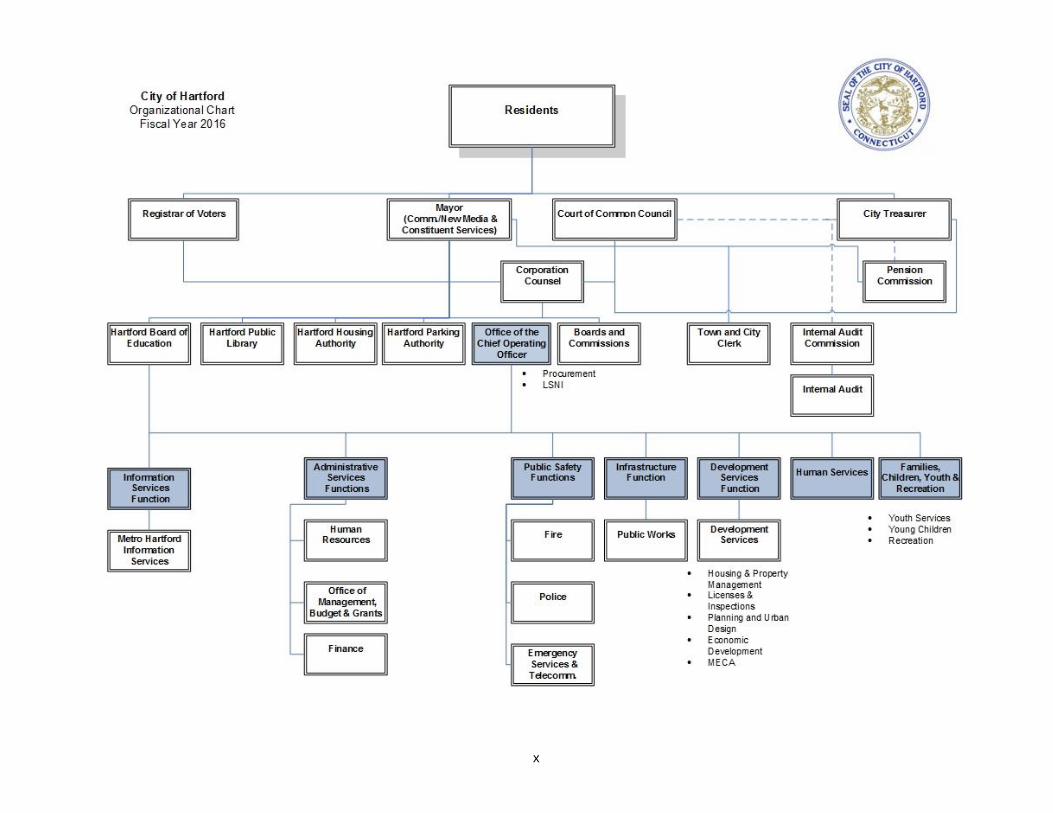
The Mayor is the Chief Executive Officer. The Court of Common Council (Council) is comprised of
nine members who are elected at large to serve a four-year term in odd numbered years on a partisan
basis. The Mayor, who is elected directly to serve a four-year term, acts upon ordinances and
resolutions adopted by Council by approving, disapproving or taking no action. The Board of
Education (BOE) is composed of nine members; five appointed by the Mayor and four elected by the
voters, all to serve a four-year term. The BOE operates independently of the Council, although the
overall general fund budget for the Hartford public school system must be approved by the Council as
part of the annual City budget. The City Treasurer is independently elected to serve a four-year term
and serves without vote as the Secretary of the City’s Pension Commission. The Chief Operating
Officer (principal administrative aide of the Mayor), Corporation Counsel, City Clerk, department
heads and members of all boards, commissions, agencies and authorities are appointed by the Mayor
subject to Council confirmation with the exception of the Pension Commission.
The City provides a broad range of services including public safety, street and road maintenance, flood
control, solid waste collection, health, social services, parks and recreation, education, planning,
development, zoning and general administrative services. The services the City provides originate from
a variety of departments and offices as follows:
Mayor’s Office Court of Common Council
City Treasurer Registrar of Voters
Hartford Public Schools Hartford Public Library
Corporation Counsel Town and City Clerk
Office of the Chief Operating Officer Internal Audit
Public Works Families, Children, Youth & Recreation
Development Services Health & Human Services
Police Fire
Emergency Services & Telecommunications Human Resources
Finance Management, Budget & Grants
Metro Hartford Innovation Services Communication & New Media
The services the City provides its residents and businesses also support the seat of State government,
several higher education institutions, and the region’s health care hub.
iii
ECONOMIC CONDITION AND OUTLOOK
The City's Department of Development Services (DDS), which includes the following four (4)
divisions:
Planning & Economic Development Housing
Community & Small Business Development Licenses & Inspections
continues to promote efforts that create jobs and improve Hartford’s economy, enhance the cityscape,
and expand and diversify the housing stock. In addition to its diverse functional portfolio, the DDS
acts as a liaison and facilitator for residents and businesses in support of their endeavors. The DDS’s
two service counters assist an average of 100 “walk-in” customers per day, who seek guidance and
assistance with zoning issues, building permits, housing assistance programs, and a variety of other
service areas.
The DDS also functions as the single point of contact with the City for commercial and residential
development projects. As public resources are limited, the DDS works closely with federal and state
agencies, such as the United States Department of Housing & Urban Development (HUD),
Connecticut’s Capital Region Development Authority (CRDA) and Connecticut’s Department of
Economic & Community Development (DECD) to leverage scarce local resources through
interagency partnerships on significant development projects. Examples of these projects include the
conversion of downtown office buildings to residential units and the construction of the new Front
Street theater and entertainment district.
At the direction of the Mayor, the DDS has focused its economic development efforts on three major
priorities:
Strengthen investment in Hartford’s neighborhoods by targeting strategic locations, including
primary commercial corridors such as Albany and Franklin Avenues;
Continue the momentum of commercial and residential development Downtown, in
partnership with the Capital Region Development Authority (CRDA), and leverage the
approaching completion of the improved vehicular and pedestrian connectivity achieved by the
Intermodal Triangle project, significant expansion of the University of Connecticut into the
downtown core, and new transit options that include CT Fastrak and the “Hartford Line”
commuter rail; and
Develop and implement an effective and efficient anti-blight and rehabilitation program to
restore damaged and neglected residential and commercial properties into productive
community assets.
ECONOMIC DEVELOPMENT
Broadened Economic Development Focus - In January 2016, the DDS was reorganized to better
align core functions and provide for more efficient and effective management of the DDS’s
initiatives. A new division - Community & Small Business Development - was created to achieve
a new focus on economic development throughout the City, in businesses both large and small.
This new approach combined the functions of two predecessor divisions, which had separately
iv
focused on small business development in neighborhoods and cultural events. In addition, the
Planning Division—charged with administering the City’s land-use regulations and optimizing its
cityscape – combined with the previously separate division that was responsible for major
economic development projects citywide, promoting effective oversight of all aspects of these
projects as well as a more agile and responsive approach to emerging opportunities.
New “Form-Based” Zoning Code - Hartford’s Planning & Zoning Commission enacted a new,
form-based Zoning Code for the City in January 2016. This significant endeavor followed a
three-year research and development effort. The new Zoning Code, which streamlines the
approval process for development consistent with the City’s guidelines in various areas and
facilitates transit-oriented development, has since garnered numerous awards for its ease of use,
progressive approach, and focus on promoting a more livable and workable City.
Front Street District - The HB Nitkin Group was selected by the Capital City Economic
Development Authority, the predecessor agency to CRDA, as the developer for this project,
which includes 60,000 square feet of retail, restaurant and entertainment space and a 286 space
garage in its initial phase. Several high profile tenants including The Capital Grille, Ted’s
Montana Grill, Nix’s, Infinity Music Hall & Bistro, Spotlight Theaters, Front Street Bistro, Qdoba
Mexican Grill, and Bear’s Smokehouse BBQ have opened. In the spring of 2016, 115 residential
units (the “Front Street Lofts”) were completed with approximately 5,000 square feet of new
commercial space. The HB Nitkin Group has recently approached the City and CRDA with a
proposal for the final phase of this development, which is proposed to include a 54-unit apartment
building with 11,000 square feet of commercial space to be constructed on Arch Street adjacent to
the Front Street complex.
UConn Downtown Relocation - The University of Connecticut’s new Downtown Hartford
Campus will be centered in the historic Hartford Times Building located on Prospect Street,
across from City Hall. The Downtown Hartford Campus will bring approximately 2,500
undergraduate and graduate students, and 250 faculty to Hartford’s center beginning in 2017. The
new campus will connect the Front Street District to the heart of Downtown. In addition to its
new campus center, UConn will also utilize space at the adjacent main branch of the Hartford
Public Library system and has decided to retain its Business School location at Constitution Plaza,
which is a short walk from the new main campus on Prospect Street.
TIGER/Intermodal Triangle - This federally-funded, $35 million project is nearing completion.
The goal of this project is to strengthen the Capital Region’s economic and employment core by
improving downtown intermodal connections within the Union Station-Bushnell Park-State
House Square triangle by creating transit hubs, complete green streets, and the innovative iQuilt
pedestrian network. As part of the City’s TIGER Intermodal Triangle project, the following
initiatives will be undertaken:
Narrowing of Ford, Jewell, and Wells streets to create a promenade along Bushnell Park
North;
Improvements to Union Station and Union Place to accommodate increased transit;
Streetscape improvements along Asylum and Pearl Streets; and
Plaza improvements around State House Square.
v
In addition to these improvements, the newly-configured Gold Street, and its adjacent green
space, together with the recent improvement and reopening of Atheneum Square to the east, are
major steps toward completing a pedestrian-friendly corridor from Riverfront Park located on the
Connecticut River to Bushnell Park at the center of the City.
Dunkin’ Donuts Park and Downtown North Development - The construction of Dunkin’
Donuts Park (home of MiLB’s Hartford Yard Goats) and planned mixed-use development of six
adjacent parcels located in the Downtown North section of the City stalled in the Winter of
FY2016. The construction of Dunkin’ Donuts Park has resumed and is scheduled to be
completed in time for the opening of the 2017 baseball season. The City is continuing to pursue
the planned mixed-use development of the six adjacent parcels.
HOUSING
The City is committed to continuing to enhance our livable and sustainable capital city and has
experienced tremendous progress in the last two decades in the area of residential development.
Ongoing efforts range from the expansion of residential conversions and construction of new living
space in the City’s Downtown and adjacent neighborhoods, new home ownership opportunities
throughout the City, and the rebuilding of the City’s two largest housing developments.
Notable initiatives include:
Expansion of Residential Conversions - Building on the successful program of residential
conversions in the Downtown area, which has brought 650 new apartment units to the City over
the past five years, the DDS is working with the CRDA on several new projects on the periphery
of the Downtown area including: the 72 unit Capewell Lofts in a fully renovated former horse nail
factory located on Charter Oak Avenue, the 112 unit former Hartford Office Supply building on
Capital Avenue, and the 60 unit Teacher’s Corner building on Asylum Avenue near Union
Station.
Bracket Knoll - The six homes built in Phase I are complete. Phase II of this residential
development will add 14 new two-family homes. This residential development is designed to
provide the owner-occupants with a rentable second unit.
Chester A. Bowles Park & Westbrook Village Redevelopments - The DDS is working with the
Hartford Housing Authority and a number of state agencies to redevelop these two residential
communities located in the Blue Hills neighborhood. The new communities are being developed
for mixed-income residents offering rental and home-ownership opportunities. Chester A.
Bowles Park, now named Willow Creek, will be the first to be redeveloped. Demolition of the
existing structures at Chester A. Bowles Park is expected to commence in 2017.
NEIGHBORHOOD
Coltsville - In July 2010, Colt Gateway LLC gained control of the site as the developer to reclaim
the historic Colt firearms factory and adjacent buildings located south of downtown. All 50 fully
renovated residential units are now leased. In addition, the campus is home to two Capital Region
vi
Education Council (CREC) regional magnet schools and Insurity, a software company. In the
summer of 2012, Insurity extended the term of its lease by seven years. Environmental
remediation of the courtyard is scheduled and a new streetscape will continue the redevelopment
of this area. The National Trust Community Investment Corporation provided a portion of its
New Market Tax Credit (“NMTC”) allocation to Chevron TCI, the historic tax credit investor,
resulting in a combined $23 million historic NMTC investment. The City also committed $5
million in funding to assist with the ongoing renovation of 79 apartments within this complex. In
December 2016, the City entered into an agreement with the United States National Park Service
creating the Coltsville National Historical Park, pursuant to an authorization from the United
States Congress.
Swift Factory - Revitalization of the former Swift Factory gold leafing complex north of
downtown is underway. The property consists of a 65,000 square foot manufacturing factory, two
houses and vacant land. The project will offer workspaces for small manufacturing enterprises
and an urban farm.
Albany Avenue Streetscape and Safety Improvements Project - This project consists of a 1.1-
mile arterial street (State Route 44) project involving one of the City’s primary commercial
corridors. The project includes roadway safety improvements, streetscape and pedestrian
amenities including sidewalk repairs, curb bump-outs, crosswalks, and traffic signal equipment
from Westbourne Parkway to Bedford Street. This project is in the design phase. Construction
on this project is anticipated to begin in the summer of 2017.
Expanded Blight-Remediation Program - The City has reorganized its approach to remediating
blight. The Director of Blight Remediation will lead the interdepartmental efforts coordinating all
City employees engaged in the City’s blight remediation efforts. In addition, the City in 2016
obtained $5 million of State funding to create an anti-blight “land bank” to assist in gaining
control, remediating, and re-selling blighted properties.
LONG TERM FINANCIAL PLANNING
The City's long-term financial planning is conducted in six primary areas during the annual budget
process. The six primary areas are:
General Fund Capital
Internal Service Funds Vehicles and Equipment
Pension Debt
Capital planning and debt planning are naturally coordinated with the timing of future infrastructure
maintenance and enhancements and ongoing construction providing the most significant inputs for the
debt planning process. Bricks and mortar and longer lived projects are identified and tracked using a
five-year Capital Improvement Plan. Project requests are received and reviewed by a capital planning
committee led by the Chief Financial Officer and comprised of the Director of Planning & Economic
Development and various department heads or their designees. The five-year Capital Improvement
Plan, including each individual project, is adopted annually upon the recommendation of the Mayor
and approval by Council. The first year of the five-year Capital Improvement Plan is adopted and
vii
authorized annually as the “Capital Budget.” The second through the fifth year of the five-year Capital
Improvement Plan is adopted as “planned” without authorization to spend.
In addition to the selection of individual capital projects included in the five-year Capital Improvement
Plan, sources of funding are identified including state and federal grants as well as bonding and cash
contributions. Based upon the cumulative capital expenditure projections including previously
authorized projects and new authorization, bond issuances are planned and debt service requirements
quantified.
Simultaneous with the five-year capital plan, a vehicle and equipment replacement plan is formulated
and reviewed annually. The requested items are reviewed and approved by the capital planning
committee and the appropriate funding sources are identified: cash contributions, capital leases and/or
bonding.
These discrete planning areas provide inputs for the General Fund long-term planning process. General
Fund revenues and expenditures are forecast for five years by both function and category. The long-
term planning process is driven by the City's core goals and objectives to maintain its infrastructure,
provide essential services that support a safe and health community for residents, business and visitors.
In addition, the City continuously strives to enhance its fiscal administration by reviewing existing
policies and procedures, revising as necessary, and creating new policies and/or procedures that support
our evolving environment. The City is working closely with its advisors and consultants on a plan to
improve its bond rating over the near-term and long-term horizons and has contracted with actuarial
firms to assist in benefits and pension planning.
RELEVANT FINANCIAL POLICIES
The Department of Finance encompasses seven divisions: Administration, Accounting & Control,
Procurement, Revenue Management, Risk Management, Tax Assessment, and Tax Collection. The
Department's major responsibilities include general accounting and financial reporting, accounts
payable, risk management (other than employee benefits), property assessment, tax collection, debt
administration, revenue management, the procurement of goods and services, and payroll and revenue
budget preparation in conjunction with the Office of Management, Budget & Grants. The Chief
Financial Officer & Director of Finance is an appointee of the Mayor, subject to confirmation by the
Council.
Internal Controls
All financial transactions are subject to pre-audit before processing as well as an annual audit by an
independent auditing firm selected by the Council. The independent auditor and staff from the
Department's Accounting & Control Division monitor financial policies and procedures prescribed by
the Director of Finance for the City’s various departments. Within this framework, we believe that the
City's internal accounting controls adequately safeguard assets and provide reasonable assurance of
proper recording and reporting of financial activity.
Budgetary Control
Centralized budgetary control of encumbrances and disbursements against appropriations is maintained
by department, by major program or activity and by principal object of expenditure. The BOE budget
is controlled only as to its total appropriation. The objective of these budgetary controls is to ensure
compliance with legal provisions embodied in the annual appropriated budget approved by the Council.
viii
Cash Management
During the fiscal year, idle cash was invested in legally permitted investments on a short-term basis by
the City Treasurer as the fiduciary for all City funds. Connecticut Statutes restrict the investment of
municipal funds to direct and indirect securities of the United States Government and certificates of
deposit issued by commercial banks located within the State. Bank certificates of deposit are a
component of the City's short-term investment portfolio. However, money market fund investments in
a portfolio of United States Treasury securities, and the Short Term Investment Fund (STIF)
administered by the Office of the State Treasurer represent the major share of the City's short-term
investments.
Risk Management
The City has established a risk management program to account for and finance risk of loss for
employee benefits, workers' compensation, and general liability, including property damage.
Commercial insurance is purchased for claims in excess of amounts determined to be self-insured under
the program. Internal service funds are maintained for each of the three risk management programs
and funding is received from the participating funds and functions of the City. Settlement claims have
not exceeded either the self-insured retention or the commercial coverage in any of the past three fiscal
years.
AWARDS AND ACKNOWLEDGEMENTS
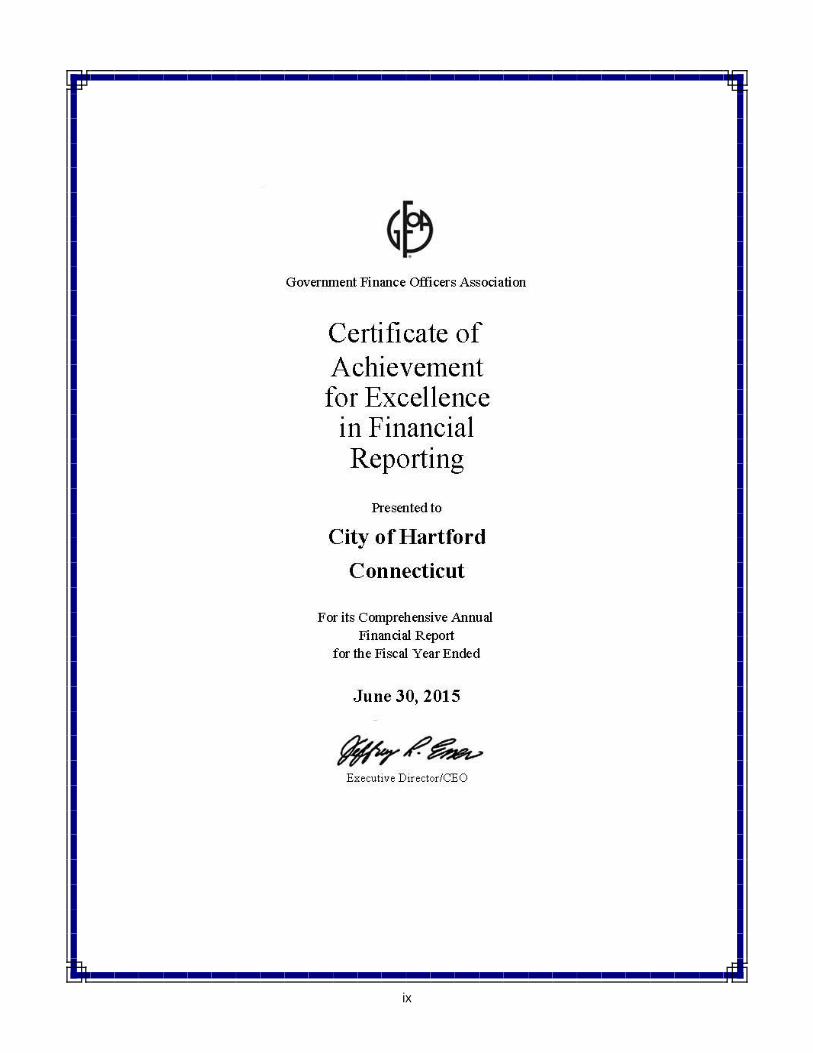
The Government Finance Officers Association of the United States and Canada (GFOA) awarded the
Certificate of Achievement for Excellence in Financial Reporting to the City for its CAFR for the fiscal
year ended June 30, 2015. In order to be awarded a Certificate of Achievement, the government had
to publish an easily readable and efficiently organized CAFR that satisfied both GAAP and applicable
legal requirements.
A Certificate of Achievement for Excellence in Financial Reporting is valid for a period of one year
only. We believe that this CAFR continues to meet the Certificate of Achievement Program's
requirements and will submit it to the GFOA to determine its eligibility for another Certificate of
Achievement for Excellence in Financial Reporting.
The preparation of this CAFR would not have been possible without the significant efforts of staff in
the Finance Department. I express my sincere appreciation to all the members of the Finance
Department, especially Leigh Ann Ralls, CPA, Controller, and the entire Accounting & Control
Division who once again have successfully accounted for and reported the financial activities of our
City. I also acknowledge the considerable contributions of the Office of the City Treasurer; Hartford
Public Schools; Hartford Public Library; Hartford Parking Authority; Office of Management, Budget,
& Grants; and the Department of Development Services.
Finally, thanks are extended to the City's independent auditors, RSM US LLP, for their efforts and
counsel during the audit, CAFR preparation and submission process.
Respectfully submitted,
Darrell V. Hill
ix
x
xi
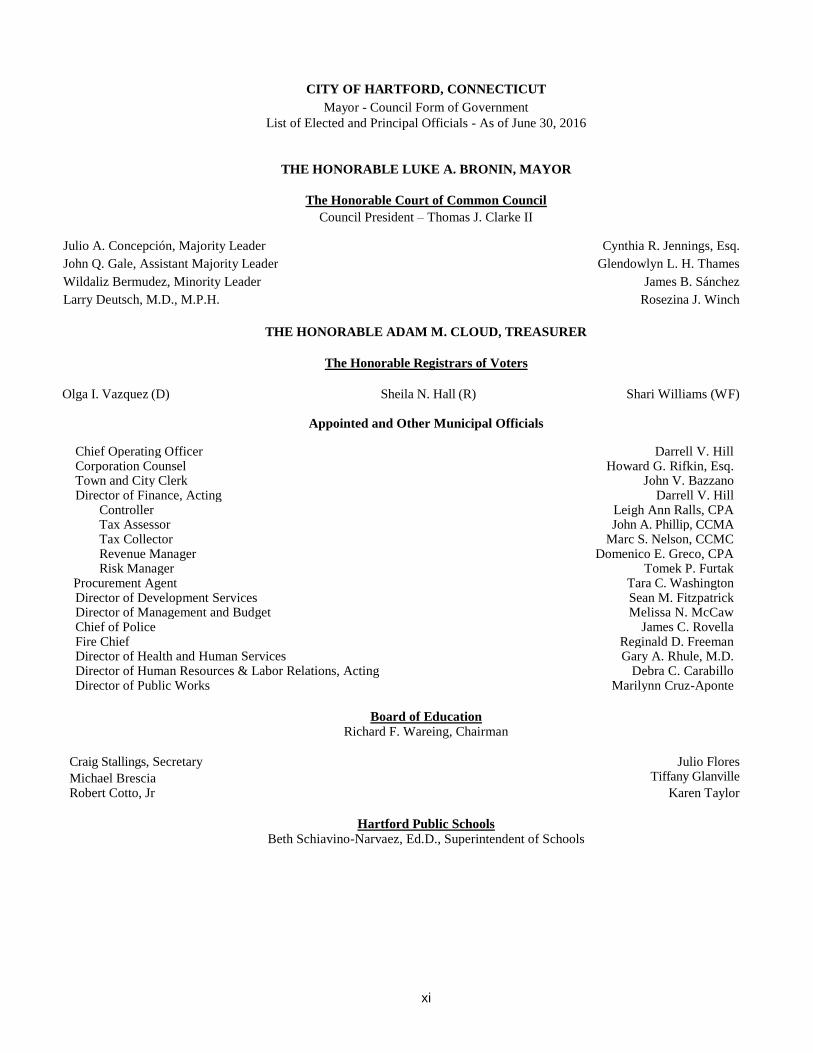
CITY OF HARTFORD, CONNECTICUT
Mayor - Council Form of Government
List of Elected and Principal Officials - As of June 30, 2016
THE HONORABLE LUKE A. BRONIN, MAYOR
The Honorable Court of Common Council
Council President – Thomas J. Clarke II
Julio A. Concepción, Majority Leader Cynthia R. Jennings, Esq.
John Q. Gale, Assistant Majority Leader Glendowlyn L. H. Thames
Wildaliz Bermudez, Minority Leader James B. Sánchez
Larry Deutsch, M.D., M.P.H. Rosezina J. Winch
THE HONORABLE ADAM M. CLOUD, TREASURER
The Honorable Registrars of Voters
Olga I. Vazquez (D) Sheila N. Hall (R) Shari Williams (WF)
Appointed and Other Municipal Officials
Chief Operating Officer Darrell V. Hill Corporation Counsel Howard G. Rifkin, Esq. Town and City Clerk John V. Bazzano Director of Finance, Acting Darrell V. Hill
Controller Leigh Ann Ralls, CPA Tax Assessor John A. Phillip, CCMA Tax Collector Marc S. Nelson, CCMC Revenue Manager Domenico E. Greco, CPA Risk Manager Tomek P. Furtak
Procurement Agent Tara C. Washington Director of Development Services Sean M. Fitzpatrick Director of Management and Budget Melissa N. McCaw Chief of Police James C. Rovella Fire Chief Reginald D. Freeman Director of Health and Human Services Gary A. Rhule, M.D. Director of Human Resources & Labor Relations, Acting Debra C. Carabillo Director of Public Works Marilynn Cruz-Aponte
Board of Education
Richard F. Wareing, Chairman
Craig Stallings, Secretary Julio Flores
Michael Brescia Tiffany Glanville
Robert Cotto, Jr Karen Taylor
Hartford Public Schools
Beth Schiavino-Narvaez, Ed.D., Superintendent of Schools

xii
This page intentionally left blank.

Financial Section

1
Independent Auditor’s Report The Honorable Mayor and Members of the Court of Common Council City of Hartford, Connecticut Report on the Financial Statements We have audited the accompanying financial statements of the governmental activities, the business type activities, the dicretely presented component unit, each major fund and the aggregate remaining fund information of the City of Hartford, Connecticut (the City) as of and for the fiscal year ended June 30, 2016, and the related notes to the financial statements, which collectively comprise the City’s basic financial statements as listed in the table of contents. Management’s Responsibility for the Financial Statements Management is responsible for the preparation and fair presentation of these financial statements in accordance with accounting principles generally accepted in the United States of America; this includes the design, implementation, and maintenance of internal control relevant to the preparation and fair presentation of financial statements that are free from material misstatement, whether due to fraud or error. Auditor’s Responsibility Our responsibility is to express opinions on these financial statements based on our audit. We did not audit the financial statements of the Hartford Parking Authority, a component unit of the City, which represents 100 percent of the assets, net position and revenues of the discretely presented component unit. Those statements were audited by other auditors whose report thereon has been furnished to us, and our opinion, insofar as it relates to the amounts included for the Hartford Parking Authority, is based solely on the report of the other auditors. We conducted our audit in accordance with auditing standards generally accepted in the United States of America and the standards applicable to financial audits contained in Government Auditing Standards, issued by the Comptroller General of the United States. Those standards require that we plan and perform the audit to obtain reasonable assurance about whether the financial statements are free of material misstatement. An audit involves performing procedures to obtain audit evidence about the amounts and disclosures in the financial statements. The procedures selected depend on the auditor’s judgment, including the assessment of the risks of material misstatement of the financial statements, whether due to fraud or error. In making those risk assessments, the auditor considers internal control relevant to the City’s preparation and fair presentation of the financial statements in order to design audit procedures that are appropriate in the circumstances, but not for the purpose of expressing an opinion on the effectiveness of the entity’s internal control. Accordingly, we express no such opinion. An audit also includes evaluating the appropriateness of accounting policies used and the reasonableness of significant accounting estimates made by management, as well as evaluating the overall presentation of the financial statements. We believe that the audit evidence we have obtained is sufficient and appropriate to provide a basis for our audit opinions.
2
Opinions In our opinion, based on our audit and the report of other auditors, the financial statements referred to above present fairly, in all material respects, the respective financial position of the governmental activities, the business-type activities, the discretely presented component unit, each major fund, and the aggregate remaining fund information of the City of Hartford, Connecticut as of June 30, 2016, and the respective changes in financial position and, where applicable, cash flows thereof for the year then ended in accordance with accounting principles generally accepted in the United States of America Other Matters Required Supplementary Information Accounting principles generally accepted in the United States of America require that the management’s discussion and analysis, the budgetary comparison information, the pension and other post-employment schedules, as listed in the table of contents, be presented to supplement the basic financial statements. Such information, although not a part of the basic financial statements, is required by the Governmental Accounting Standards Board, which considers it to be an essential part of financial reporting for placing the basic financial statements in an appropriate operational, economic or historical context. We have applied certain limited procedures to the required supplementary information in accordance with auditing standards generally accepted in the United States of America, which consisted of inquiries of management about the methods of preparing the information and comparing the information for consistency with management’s responses to our inquiries, the basic financial statements and other knowledge we obtained during our audit of the basic financial statements. We do not express an opinion or provide any assurance on the information because the limited procedures do not provide us with sufficient evidence to express an opinion or provide any assurance. Supplementary and Other Information Our audit was conducted for the purpose of forming opinions on the financial statements that collectively comprise the City of Hartford Connecticut’s basic financial statements. The introductory section, the individual and combining fund financial statements and other schedules, and statistical section are presented for purposes of additional analysis and are not a required part of the basic financial statements. The combining and individual fund financial statements and other schedules are the responsibility of management and were derived from and relates directly to the underlying accounting and other records used to prepare the basic financial statements. Such information has been subjected to the auditing procedures applied in the audit of the basic financial statements and certain additional procedures, including comparing and reconciling such information directly to the underlying accounting and other records used to prepare the basic financial statements or to the basic financial statements themselves, and other additional procedures in accordance with auditing standards generally accepted in the United States of America. In our opinion, the combining and individual fund financial statements and other schedules are fairly stated, in all material respects, in relation to the basic financial statements as a whole. The introductory section and statistical section have not been subjected to the auditing procedures applied in the audit of the basic financial statements and, accordingly, we do not express an opinion or provide any assurance on them.
3
Other Reporting Required by Government Auditing Standards In accordance with Government Auditing Standards, we have also issued our report dated December 30, 2016, on our consideration of the City’s internal control over financial reporting and on our tests of its compliance with certain provisions of laws, regulations, contracts, and grant agreements and other matters. The purpose of that report is to describe the scope of our testing of internal control over financial reporting and compliance and the results of that testing, and not to provide an opinion on internal control over financial reporting or on compliance. That report is an integral part of an audit performed in accordance with Government Auditing Standards in considering the City’s internal control over financial reporting and compliance.
New Haven, Connecticut December 30, 2016

4
This page intentionally left blank.
5
City of Hartford, Connecticut Management’s Discussion and Analysis - Unaudited
June 30, 2016
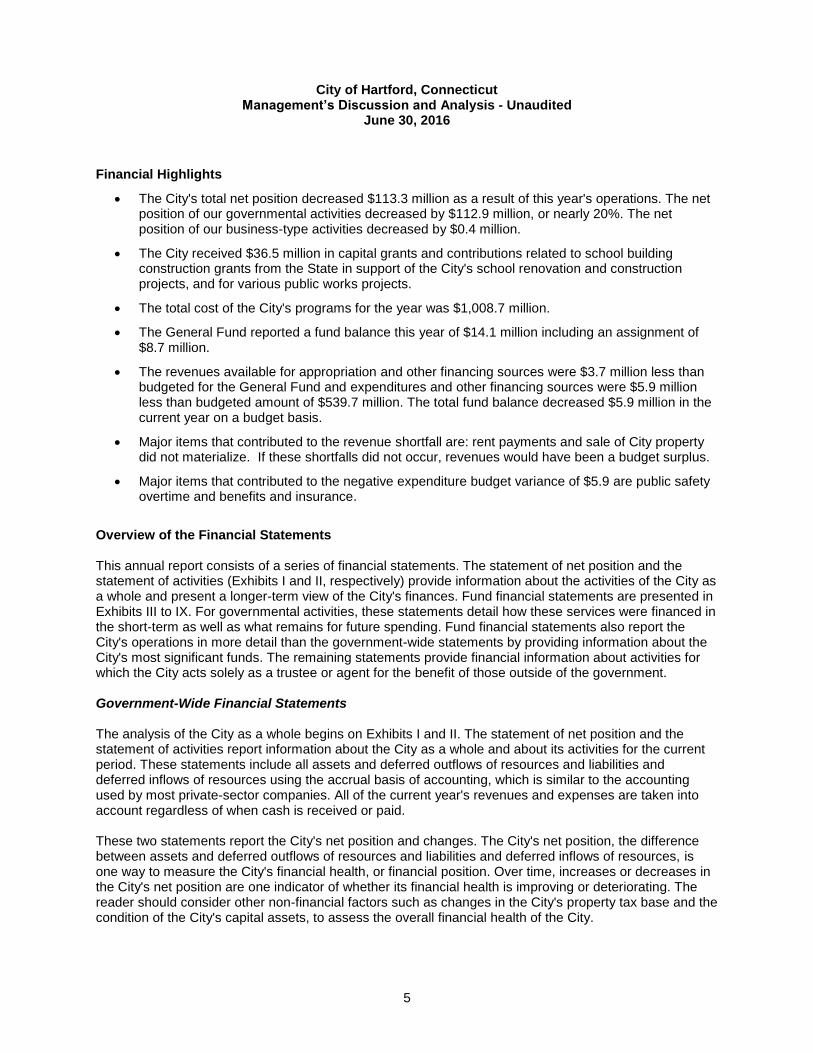
Financial Highlights
The City's total net position decreased $113.3 million as a result of this year's operations. The net position of our governmental activities decreased by $112.9 million, or nearly 20%. The net position of our business-type activities decreased by $0.4 million.
The City received $36.5 million in capital grants and contributions related to school building construction grants from the State in support of the City's school renovation and construction projects, and for various public works projects.
The total cost of the City's programs for the year was $1,008.7 million.
The General Fund reported a fund balance this year of $14.1 million including an assignment of $8.7 million.
The revenues available for appropriation and other financing sources were $3.7 million less than budgeted for the General Fund and expenditures and other financing sources were $5.9 million less than budgeted amount of $539.7 million. The total fund balance decreased $5.9 million in the current year on a budget basis.
Major items that contributed to the revenue shortfall are: rent payments and sale of City property did not materialize. If these shortfalls did not occur, revenues would have been a budget surplus.
Major items that contributed to the negative expenditure budget variance of $5.9 are public safety overtime and benefits and insurance.
Overview of the Financial Statements This annual report consists of a series of financial statements. The statement of net position and the statement of activities (Exhibits I and II, respectively) provide information about the activities of the City as a whole and present a longer-term view of the City's finances. Fund financial statements are presented in Exhibits III to IX. For governmental activities, these statements detail how these services were financed in the short-term as well as what remains for future spending. Fund financial statements also report the City's operations in more detail than the government-wide statements by providing information about the City's most significant funds. The remaining statements provide financial information about activities for which the City acts solely as a trustee or agent for the benefit of those outside of the government. Government-Wide Financial Statements The analysis of the City as a whole begins on Exhibits I and II. The statement of net position and the statement of activities report information about the City as a whole and about its activities for the current period. These statements include all assets and deferred outflows of resources and liabilities and deferred inflows of resources using the accrual basis of accounting, which is similar to the accounting used by most private-sector companies. All of the current year's revenues and expenses are taken into account regardless of when cash is received or paid. These two statements report the City's net position and changes. The City's net position, the difference between assets and deferred outflows of resources and liabilities and deferred inflows of resources, is one way to measure the City's financial health, or financial position. Over time, increases or decreases in the City's net position are one indicator of whether its financial health is improving or deteriorating. The reader should consider other non-financial factors such as changes in the City's property tax base and the condition of the City's capital assets, to assess the overall financial health of the City.
6
In the statement of net position and the statement of activities, the City is divided into three types of activities for accounting purposes:
Governmental activities: This is where most of the City's basic services are reported, including education, public safety, public works, development and community affairs, human services, recreation and culture, and general administration. Property taxes, charges for services, and state and federal grants finance most of these activities.
Business - type activities: The City charges a fee to customers to help it cover all or most of the cost of certain services it provides. The City's Hartford Parking Facilities Fund, the Hartford Stadium Authority (a blended component unit) and the Golf Courses are reported here.
Component units: The City includes a separate legal entity in its report; the Hartford Parking Authority. Although legally separate, this "component unit" is reported because the City is financially accountable for them.
Fund Financial Statements The fund financial statements begin with Exhibit III and provide detailed information about the most significant funds - not the City as a whole. Some funds are required to be established by Charter. In addition to the Charter required funds, the Court of Common Council establishes other funds to organize, control and manage financial activities for specific purposes (e.g., Capital Improvement Fund) or to demonstrate that the City is meeting legal responsibilities for using grants, and other money (e.g., Educational Grants, Health Grants and Miscellaneous Grants Funds). The City's funds are divided into three categories for accounting purposes:
Governmental funds (Exhibits III and IV): Most of the City's basic services are reported in governmental funds, which focus on how resources flow into and out of those funds and the remaining balances at year-end that are available for spending. These funds are reported using an accounting method called modified accrual accounting, which measures cash and all other financial assets that can readily be converted to cash. The governmental fund statements provide a detailed short-term view of the City's general government operations and the basic services it provides. Governmental fund information helps the reader determine whether there are greater or fewer financial resources that can be spent in the near future to finance the City's operations and programs. The relationship between governmental activities (reported in the statement of net position and the statement of activities) and governmental funds is described in a reconciliation at the bottom of the fund financial statements.
Proprietary funds (Exhibits V, VI, and VII): When the City charges a fee to customers for the services it provides, whether to other units of the City or non-City individuals or entities, these services are generally reported in proprietary funds. Proprietary funds are reported in the same way that all activities are reported in the statement of net position and the statement of activities. In fact, the City's enterprise funds (a component of proprietary funds) are the same as the business-type activities reported in the government-wide statements, but provide more detail and additional information, such as cash flows, for proprietary funds. Internal service funds (the other component of proprietary funds) are used to report activities that provide supplies and services for the City's other programs and activities - such as the City's Self-Insurance Internal Service Funds and the City's Metro Hartford Innovation Services Fund.
Fiduciary funds (Exhibits VIII and IX): The City is the trustee, or fiduciary, for its employees' pension plans. It is also responsible for other assets that, because of a trust arrangement, can be used only for the trust beneficiaries. All of the City's fiduciary activities are reported in separate statements of fiduciary net position and changes in fiduciary net position. These activities are excluded from the City's other financial statements because the City cannot use these assets to finance its operations. The City is responsible for ensuring that the assets reported in these funds are used for their intended purposes.
7
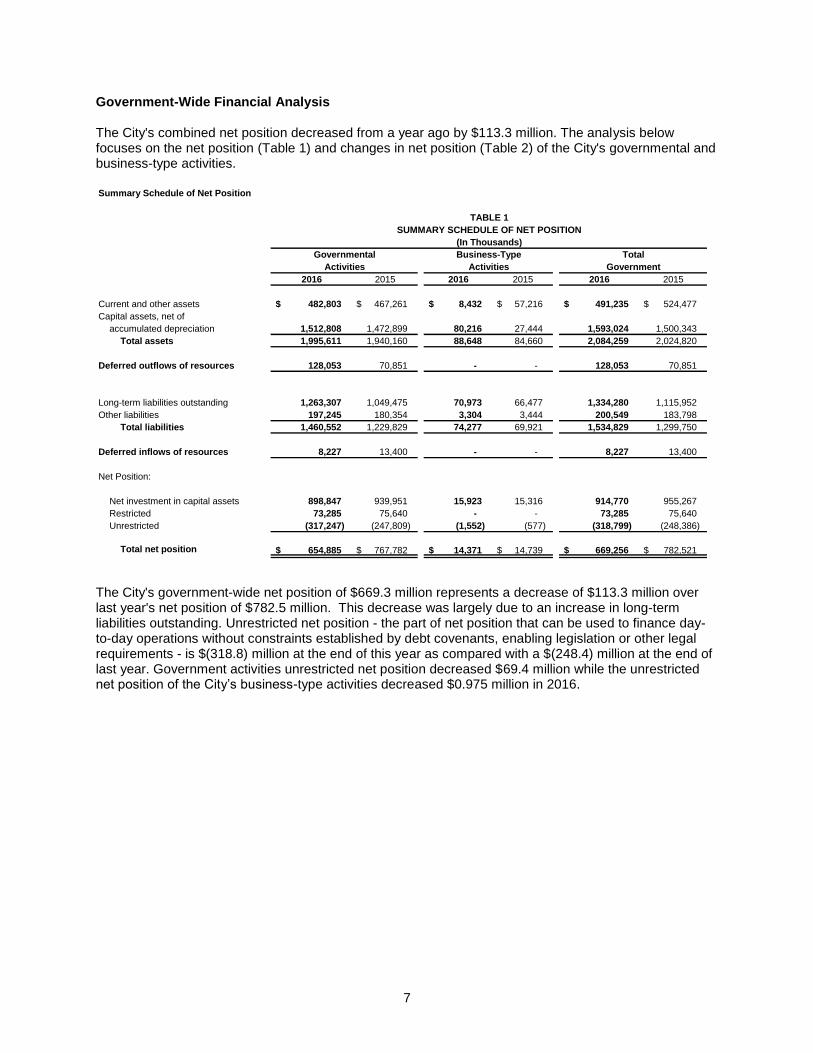
Government-Wide Financial Analysis The City's combined net position decreased from a year ago by $113.3 million. The analysis below focuses on the net position (Table 1) and changes in net position (Table 2) of the City's governmental and business-type activities. Summary Schedule of Net Position
2016 2015 2016 2015 2016 2015
Current and other assets 482,803 $ 467,261 $ 8,432 $ 57,216 $ 491,235 $ 524,477 $
Capital assets, net of
accumulated depreciation 1,512,808 1,472,899 80,216 27,444 1,593,024 1,500,343
Total assets 1,995,611 1,940,160 88,648 84,660 2,084,259 2,024,820
Deferred outflows of resources 128,053 70,851 - - 128,053 70,851
Long-term liabilities outstanding 1,263,307 1,049,475 70,973 66,477 1,334,280 1,115,952
Other liabilities 197,245 180,354 3,304 3,444 200,549 183,798
Total liabilities 1,460,552 1,229,829 74,277 69,921 1,534,829 1,299,750
Deferred inflows of resources 8,227 13,400 - - 8,227 13,400
Net Position:
Net investment in capital assets 898,847 939,951 15,923 15,316 914,770 955,267
Restricted 73,285 75,640 - - 73,285 75,640
Unrestricted (317,247) (247,809) (1,552) (577) (318,799) (248,386)
Total net position 654,885 $ 767,782 $ 14,371 $ 14,739 $ 669,256 $ 782,521 $
Activities Activities Government
TABLE 1
SUMMARY SCHEDULE OF NET POSITION
(In Thousands)
Governmental Business-Type Total
The City's government-wide net position of $669.3 million represents a decrease of $113.3 million over last year's net position of $782.5 million. This decrease was largely due to an increase in long-term liabilities outstanding. Unrestricted net position - the part of net position that can be used to finance day-to-day operations without constraints established by debt covenants, enabling legislation or other legal requirements - is $(318.8) million at the end of this year as compared with a $(248.4) million at the end of last year. Government activities unrestricted net position decreased $69.4 million while the unrestricted net position of the City’s business-type activities decreased $0.975 million in 2016.
8
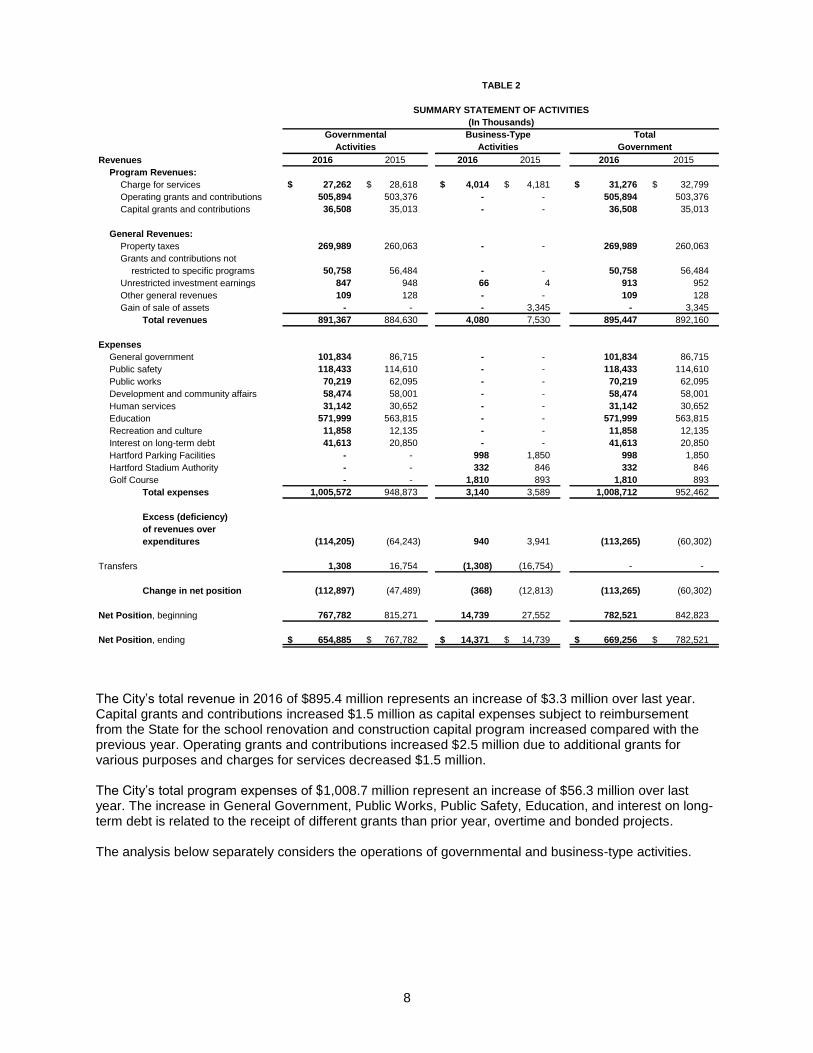
Revenues 2016 2015 2016 2015 2016 2015
Program Revenues:
Charge for services 27,262 $ 28,618 $ 4,014 $ 4,181 $ 31,276 $ 32,799 $
Operating grants and contributions 505,894 503,376 - - 505,894 503,376
Capital grants and contributions 36,508 35,013 - - 36,508 35,013
General Revenues:
Property taxes 269,989 260,063 - - 269,989 260,063
Grants and contributions not
restricted to specific programs 50,758 56,484 - - 50,758 56,484
Unrestricted investment earnings 847 948 66 4 913 952
Other general revenues 109 128 - - 109 128
Gain of sale of assets - - - 3,345 - 3,345
Total revenues 891,367 884,630 4,080 7,530 895,447 892,160
Expenses
General government 101,834 86,715 - - 101,834 86,715
Public safety 118,433 114,610 - - 118,433 114,610
Public works 70,219 62,095 - - 70,219 62,095
Development and community affairs 58,474 58,001 - - 58,474 58,001
Human services 31,142 30,652 - - 31,142 30,652
Education 571,999 563,815 - - 571,999 563,815
Recreation and culture 11,858 12,135 - - 11,858 12,135
Interest on long-term debt 41,613 20,850 - - 41,613 20,850
Hartford Parking Facilities - - 998 1,850 998 1,850
Hartford Stadium Authority - - 332 846 332 846
Golf Course - - 1,810 893 1,810 893
Total expenses 1,005,572 948,873 3,140 3,589 1,008,712 952,462
Excess (deficiency)
of revenues over
expenditures (114,205) (64,243) 940 3,941 (113,265) (60,302)
Transfers 1,308 16,754 (1,308) (16,754) - -
Change in net position (112,897) (47,489) (368) (12,813) (113,265) (60,302)
Net Position, beginning 767,782 815,271 14,739 27,552 782,521 842,823
Net Position, ending 654,885 $ 767,782 $ 14,371 $ 14,739 $ 669,256 $ 782,521 $
Activities Activities Government
TABLE 2
SUMMARY STATEMENT OF ACTIVITIES
(In Thousands)
Governmental Business-Type Total
The City’s total revenue in 2016 of $895.4 million represents an increase of $3.3 million over last year. Capital grants and contributions increased $1.5 million as capital expenses subject to reimbursement from the State for the school renovation and construction capital program increased compared with the previous year. Operating grants and contributions increased $2.5 million due to additional grants for various purposes and charges for services decreased $1.5 million. The City’s total program expenses of $1,008.7 million represent an increase of $56.3 million over last year. The increase in General Government, Public Works, Public Safety, Education, and interest on long-term debt is related to the receipt of different grants than prior year, overtime and bonded projects. The analysis below separately considers the operations of governmental and business-type activities.
9
Governmental Activities
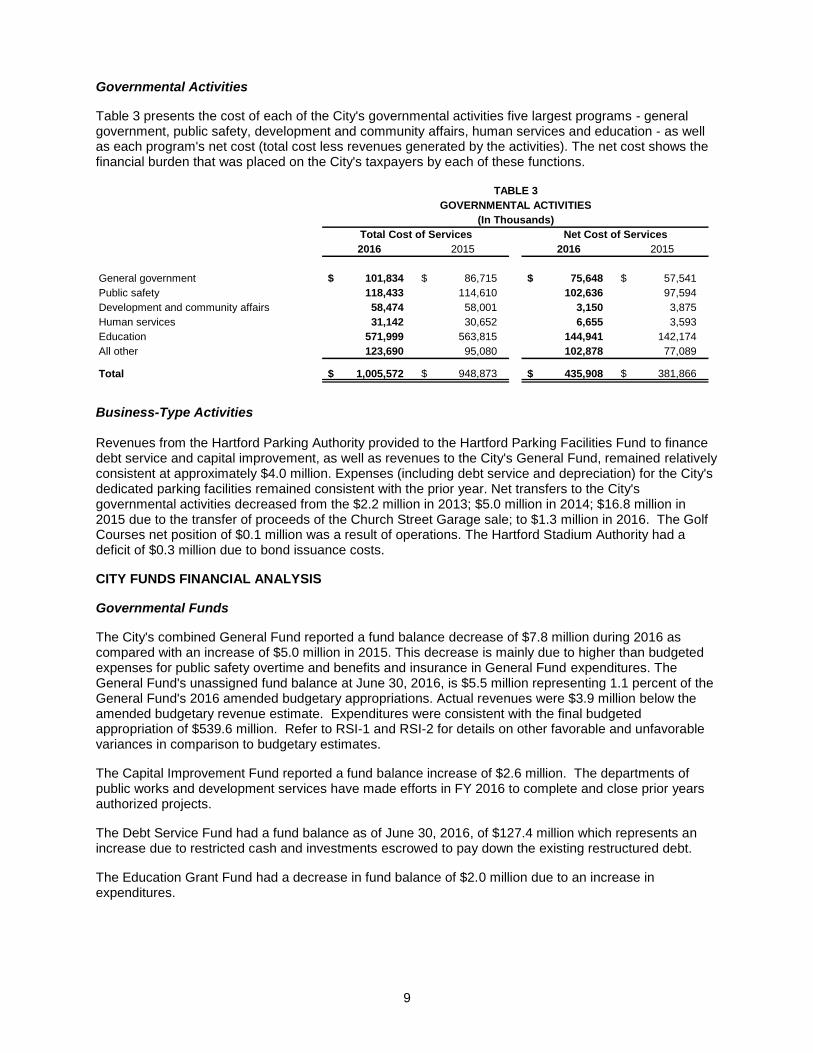
Table 3 presents the cost of each of the City's governmental activities five largest programs - general government, public safety, development and community affairs, human services and education - as well as each program's net cost (total cost less revenues generated by the activities). The net cost shows the financial burden that was placed on the City's taxpayers by each of these functions.
2016 2015 2016 2015
General government 101,834 $ 86,715 $ 75,648 $ 57,541 $
Public safety 118,433 114,610 102,636 97,594
Development and community affairs 58,474 58,001 3,150 3,875
Human services 31,142 30,652 6,655 3,593
Education 571,999 563,815 144,941 142,174
All other 123,690 95,080 102,878 77,089
Total 1,005,572 $ 948,873 $ 435,908 $ 381,866 $
TABLE 3
GOVERNMENTAL ACTIVITIES
(In Thousands)
Total Cost of Services Net Cost of Services
Business-Type Activities Revenues from the Hartford Parking Authority provided to the Hartford Parking Facilities Fund to finance debt service and capital improvement, as well as revenues to the City's General Fund, remained relatively consistent at approximately $4.0 million. Expenses (including debt service and depreciation) for the City's dedicated parking facilities remained consistent with the prior year. Net transfers to the City's governmental activities decreased from the $2.2 million in 2013; $5.0 million in 2014; $16.8 million in 2015 due to the transfer of proceeds of the Church Street Garage sale; to $1.3 million in 2016. The Golf Courses net position of $0.1 million was a result of operations. The Hartford Stadium Authority had a deficit of $0.3 million due to bond issuance costs.
CITY FUNDS FINANCIAL ANALYSIS
Governmental Funds
The City's combined General Fund reported a fund balance decrease of $7.8 million during 2016 as compared with an increase of $5.0 million in 2015. This decrease is mainly due to higher than budgeted expenses for public safety overtime and benefits and insurance in General Fund expenditures. The General Fund's unassigned fund balance at June 30, 2016, is $5.5 million representing 1.1 percent of the General Fund's 2016 amended budgetary appropriations. Actual revenues were $3.9 million below the amended budgetary revenue estimate. Expenditures were consistent with the final budgeted appropriation of $539.6 million. Refer to RSI-1 and RSI-2 for details on other favorable and unfavorable variances in comparison to budgetary estimates.
The Capital Improvement Fund reported a fund balance increase of $2.6 million. The departments of public works and development services have made efforts in FY 2016 to complete and close prior years authorized projects.
The Debt Service Fund had a fund balance as of June 30, 2016, of $127.4 million which represents an increase due to restricted cash and investments escrowed to pay down the existing restructured debt.
The Education Grant Fund had a decrease in fund balance of $2.0 million due to an increase in expenditures.
10
The Community Development Loan and Grant Fund had a decrease in fund balance of $0.4 million due to increased financing of more loans in fiscal year 2016. The City’s other governmental funds reported a decrease of $1.4 million in fund balance for the year, mainly due to recreation and culture. Internal Service Funds
The net position of the City's self-insurance programs decreased $36.8 million, decreasing the total net position of the City's internal service programs from $18.8 million to an $(18.0) million deficit. The City used $14.2 million of net position to fund current year claims and $19.2 million to fund post-retirement benefits for the Board of Education. The City will continue its efforts to develop a funding plan for its post-retirement benefits liabilities based on the actuaries’ estimates.
General Fund Budgetary Highlights
There were two supplemental appropriations for the use of FY2015 unassigned fund balance of $5.9 million, which is reflected in RSI-2. Capital Asset and Debt Administration
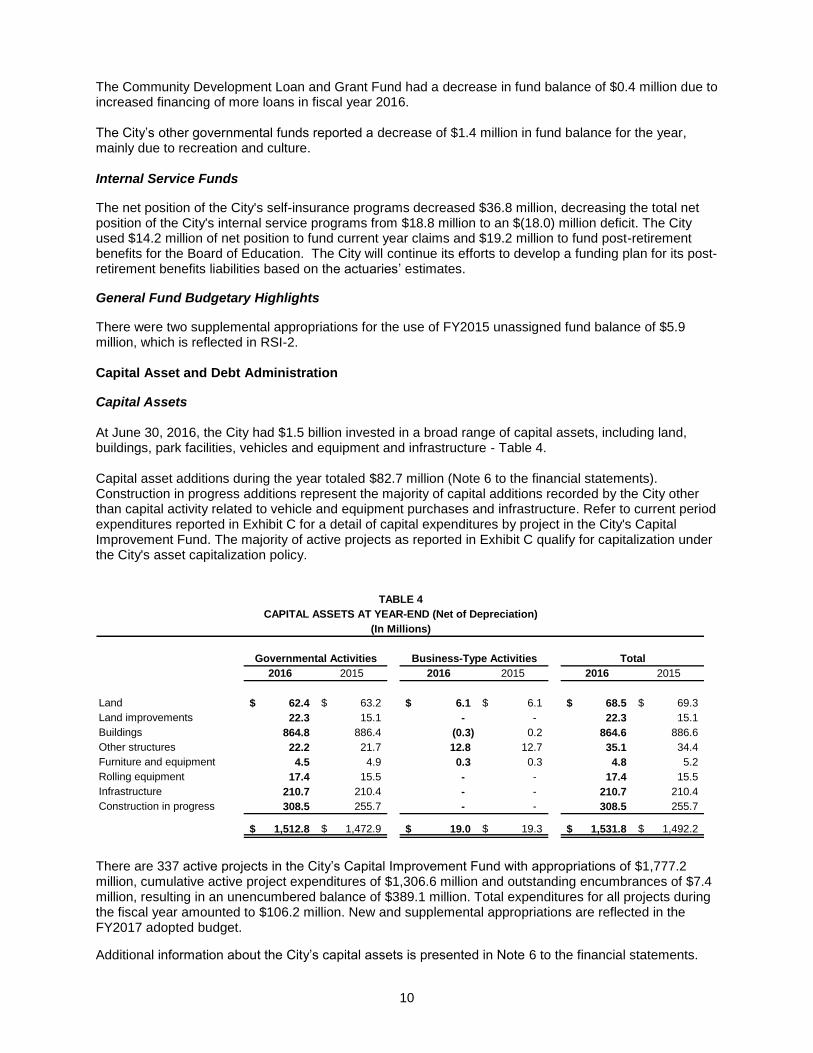
Capital Assets At June 30, 2016, the City had $1.5 billion invested in a broad range of capital assets, including land, buildings, park facilities, vehicles and equipment and infrastructure - Table 4. Capital asset additions during the year totaled $82.7 million (Note 6 to the financial statements). Construction in progress additions represent the majority of capital additions recorded by the City other than capital activity related to vehicle and equipment purchases and infrastructure. Refer to current period expenditures reported in Exhibit C for a detail of capital expenditures by project in the City's Capital Improvement Fund. The majority of active projects as reported in Exhibit C qualify for capitalization under the City's asset capitalization policy.
TABLE 4
CAPITAL ASSETS AT YEAR-END (Net of Depreciation)
(In Millions)
2016 2015 2016 2015 2016 2015
Land 62.4$ 63.2$ 6.1$ 6.1$ 68.5$ 69.3$
Land improvements 22.3 15.1 - - 22.3 15.1
Buildings 864.8 886.4 (0.3) 0.2 864.6 886.6
Other structures 22.2 21.7 12.8 12.7 35.1 34.4
Furniture and equipment 4.5 4.9 0.3 0.3 4.8 5.2
Rolling equipment 17.4 15.5 - - 17.4 15.5
Infrastructure 210.7 210.4 - - 210.7 210.4
Construction in progress 308.5 255.7 - - 308.5 255.7
1,512.8$ 1,472.9$ 19.0$ 19.3$ 1,531.8$ 1,492.2$
Governmental Activities Business-Type Activities Total
There are 337 active projects in the City’s Capital Improvement Fund with appropriations of $1,777.2 million, cumulative active project expenditures of $1,306.6 million and outstanding encumbrances of $7.4 million, resulting in an unencumbered balance of $389.1 million. Total expenditures for all projects during the fiscal year amounted to $106.2 million. New and supplemental appropriations are reflected in the FY2017 adopted budget.
Additional information about the City’s capital assets is presented in Note 6 to the financial statements.
11
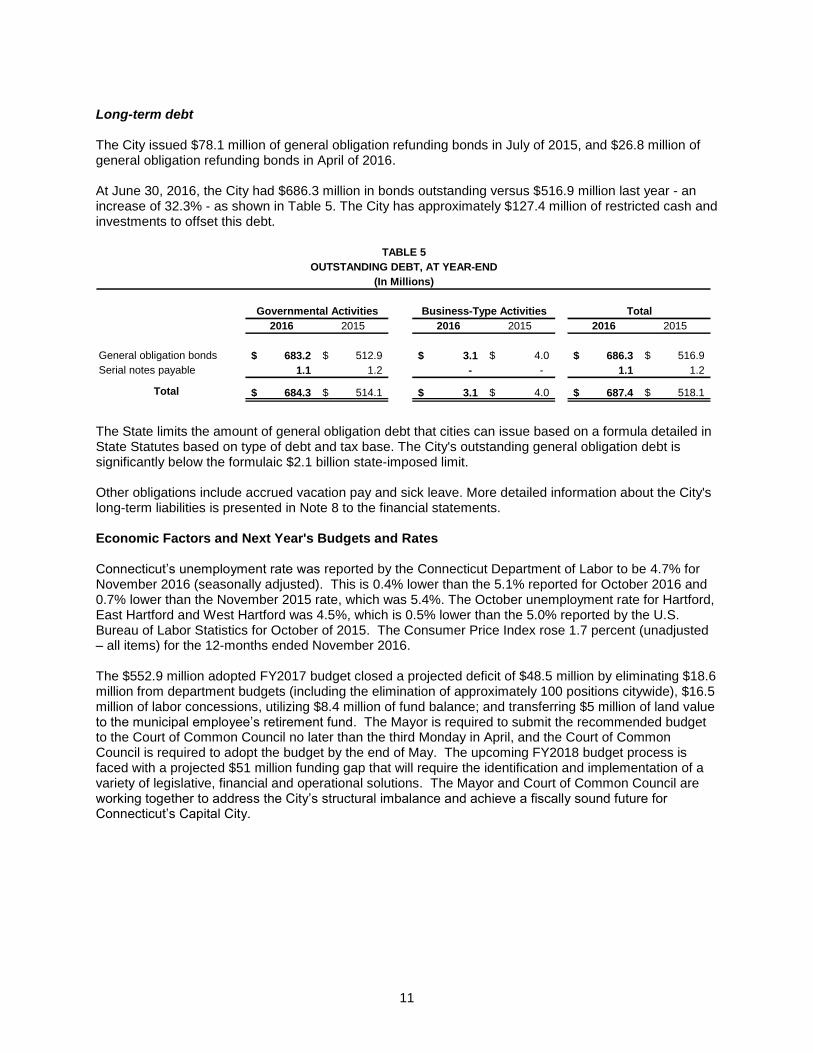
Long-term debt The City issued $78.1 million of general obligation refunding bonds in July of 2015, and $26.8 million of general obligation refunding bonds in April of 2016. At June 30, 2016, the City had $686.3 million in bonds outstanding versus $516.9 million last year - an increase of 32.3% - as shown in Table 5. The City has approximately $127.4 million of restricted cash and investments to offset this debt.
TABLE 5
OUTSTANDING DEBT, AT YEAR-END
(In Millions)
2016 2015 2016 2015 2016 2015
General obligation bonds 683.2$ 512.9$ 3.1$ 4.0$ 686.3$ 516.9$
Serial notes payable 1.1 1.2 - - 1.1 1.2
Total 684.3$ 514.1$ 3.1$ 4.0$ 687.4$ 518.1$
Governmental Activities Business-Type Activities Total
The State limits the amount of general obligation debt that cities can issue based on a formula detailed in State Statutes based on type of debt and tax base. The City's outstanding general obligation debt is significantly below the formulaic $2.1 billion state-imposed limit. Other obligations include accrued vacation pay and sick leave. More detailed information about the City's long-term liabilities is presented in Note 8 to the financial statements. Economic Factors and Next Year's Budgets and Rates Connecticut’s unemployment rate was reported by the Connecticut Department of Labor to be 4.7% for November 2016 (seasonally adjusted). This is 0.4% lower than the 5.1% reported for October 2016 and 0.7% lower than the November 2015 rate, which was 5.4%. The October unemployment rate for Hartford, East Hartford and West Hartford was 4.5%, which is 0.5% lower than the 5.0% reported by the U.S. Bureau of Labor Statistics for October of 2015. The Consumer Price Index rose 1.7 percent (unadjusted – all items) for the 12-months ended November 2016. The $552.9 million adopted FY2017 budget closed a projected deficit of $48.5 million by eliminating $18.6 million from department budgets (including the elimination of approximately 100 positions citywide), $16.5 million of labor concessions, utilizing $8.4 million of fund balance; and transferring $5 million of land value to the municipal employee’s retirement fund. The Mayor is required to submit the recommended budget to the Court of Common Council no later than the third Monday in April, and the Court of Common Council is required to adopt the budget by the end of May. The upcoming FY2018 budget process is faced with a projected $51 million funding gap that will require the identification and implementation of a variety of legislative, financial and operational solutions. The Mayor and Court of Common Council are working together to address the City’s structural imbalance and achieve a fiscally sound future for Connecticut’s Capital City.

12
Contacting the City’s Financial Management This financial report is designed to provide residents, taxpayers, customers, investors, and creditors with a general overview of the City’s finances and to demonstrate the City’s accountability for the monies it receives. If you have questions about this report or need additional financial information, contact the Finance Department, City of Hartford, 550 Main Street, Hartford, Connecticut 06103, or by telephone (860) 757-9606.

Basic Financial Statements

13
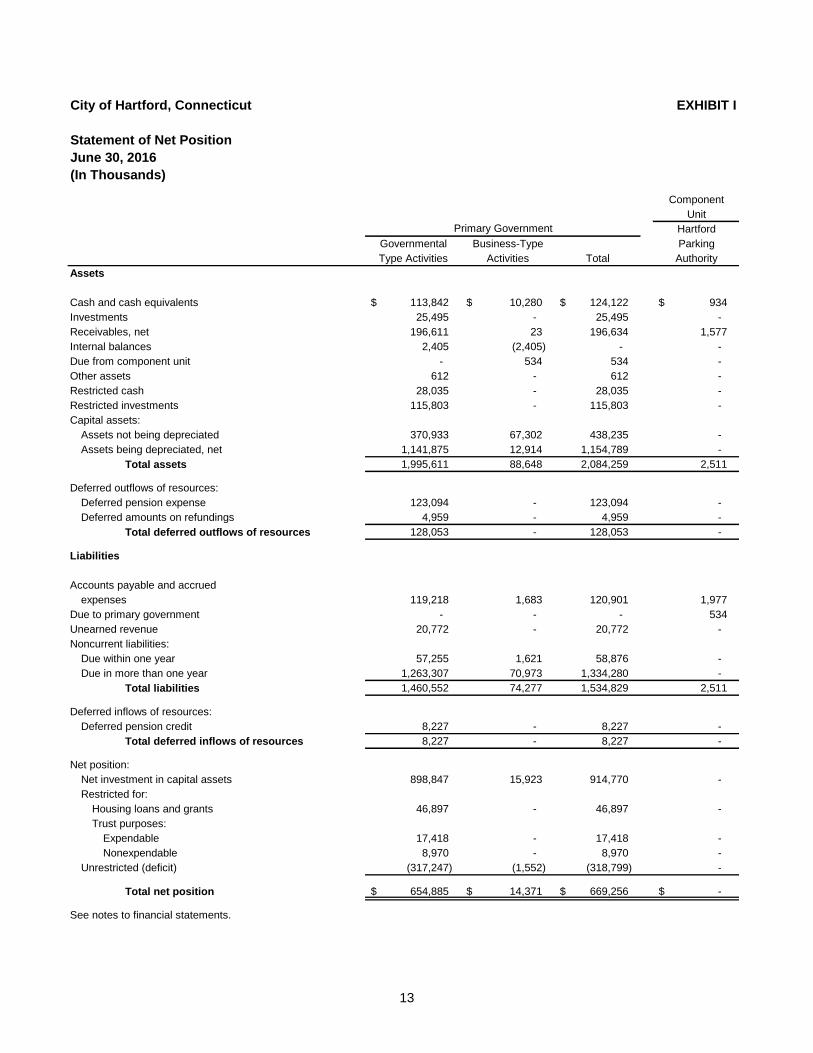
City of Hartford, Connecticut EXHIBIT I
Statement of Net Position
June 30, 2016
(In Thousands)
Component
Unit
Hartford
Governmental Business-Type Parking
Type Activities Activities Total Authority
Assets
Cash and cash equivalents 113,842 $ 10,280 $ 124,122 $ 934 $
Investments 25,495 - 25,495 -
Receivables, net 196,611 23 196,634 1,577
Internal balances 2,405 (2,405) - -
Due from component unit - 534 534 -
Other assets 612 - 612 -
Restricted cash 28,035 - 28,035 -
Restricted investments 115,803 - 115,803 -
Capital assets:
Assets not being depreciated 370,933 67,302 438,235 -
Assets being depreciated, net 1,141,875 12,914 1,154,789 -
Total assets 1,995,611 88,648 2,084,259 2,511
Deferred outflows of resources:
Deferred pension expense 123,094 - 123,094 -
Deferred amounts on refundings 4,959 - 4,959 -
Total deferred outflows of resources 128,053 - 128,053 -
Liabilities
Accounts payable and accrued
expenses 119,218 1,683 120,901 1,977
Due to primary government - - - 534
Unearned revenue 20,772 - 20,772 -
Noncurrent liabilities:
Due within one year 57,255 1,621 58,876 -
Due in more than one year 1,263,307 70,973 1,334,280 -
Total liabilities 1,460,552 74,277 1,534,829 2,511
Deferred inflows of resources:
Deferred pension credit 8,227 - 8,227 -
Total deferred inflows of resources 8,227 - 8,227 -
Net position:
Net investment in capital assets 898,847 15,923 914,770 -
Restricted for:
Housing loans and grants 46,897 - 46,897 -
Trust purposes:
Expendable 17,418 - 17,418 -
Nonexpendable 8,970 - 8,970 -
Unrestricted (deficit) (317,247) (1,552) (318,799) -
Total net position 654,885 $ 14,371 $ 669,256 $ -$
See notes to financial statements.
Primary Government
14
City of Hartford, Connecticut EXHIBIT II
For the Year Ended June 30, 2016
(In Thousands)
Component
Unit
Operating Capital Hartford
Charges for Grants and Grants and Governmental Business-type Parking
Functions/Programs Expenses Services Contributions Contributions Activities Activities Total Authority
Primary government:
Governmental activities:
General government (101,834) $ 7,568 $ 18,618 $ -$ (75,648) $ -$ (75,648) $ -$
Public safety (118,433) 2,977 12,820 - (102,636) - (102,636) -
Public works (70,219) 9,353 1,568 8,169 (51,129) - (51,129) -
Development and community
affairs (58,474) - 55,324 - (3,150) - (3,150) -
Human services (31,142) 2,941 21,546 - (6,655) - (6,655) -
Education (571,999) 4,293 394,426 28,339 (144,941) - (144,941) -
Recreation and culture (11,858) 130 1,592 - (10,136) - (10,136) -
Interest on long-term debt (41,613) - - - (41,613) - (41,613) -
Total governmental
activities (1,005,572) 27,262 505,894 36,508 (435,908) - (435,908) -
Business-type activities:
Hartford parking facilities (998) 2,561 - - - 1,563 1,563 -
Golf course (1,810) 1,453 - - - (357) (357) -
Stadium authority (332) - - - - (332) (332) -
Total business-type
activities (3,140) 4,014 - - - 874 874 -
Total primary government (1,008,712) $ 31,276 $ 505,894 $ 36,508 $ (435,908) 874 (435,034) -
Component units:
Hartford Parking Authority -$ -$ -$ -$ - - - -
General revenues:
Property taxes 269,989 - 269,989 -
Grants and contributions not restricted to
specific programs 50,758 - 50,758 -
Unrestricted investment earnings 847 66 913 -
Miscellaneous 109 - 109 -
Transfers 1,308 (1,308) - -
Total general revenues and transfers 323,011 (1,242) 321,769 -
Change in net position (112,897) (368) (113,265) -
Net position - beginning 767,782 14,739 782,521 -
Net position - ending 654,885 $ 14,371 $ 669,256 $ -$
See notes to financial statements.
Statement of Activities
Program Revenues Primary Government
Net (Expense) Revenue and Changes in Net Position
15
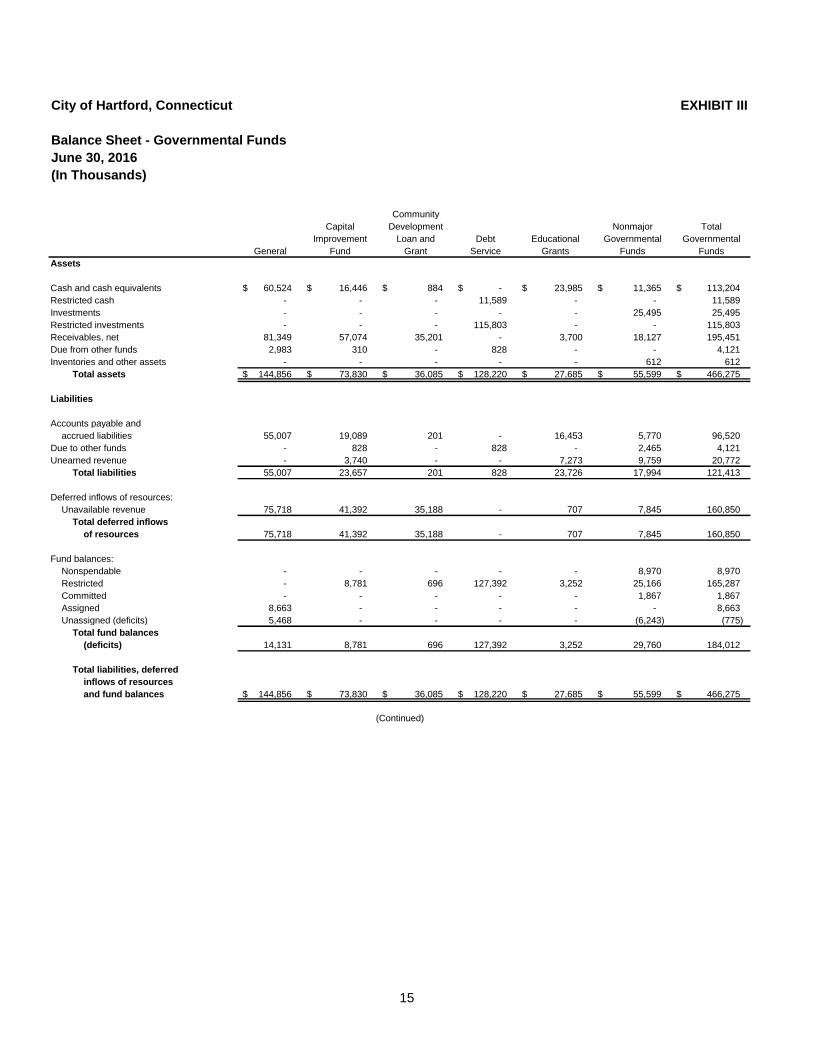
City of Hartford, Connecticut EXHIBIT III
Balance Sheet - Governmental Funds
June 30, 2016
(In Thousands)
Community
Capital Development Nonmajor Total
Improvement Loan and Debt Educational Governmental Governmental
General Fund Grant Service Grants Funds Funds
Assets
Cash and cash equivalents 60,524 $ 16,446 $ 884 $ -$ 23,985 $ 11,365 $ 113,204 $
Restricted cash - - - 11,589 - - 11,589
Investments - - - - - 25,495 25,495
Restricted investments - - - 115,803 - - 115,803
Receivables, net 81,349 57,074 35,201 - 3,700 18,127 195,451
Due from other funds 2,983 310 - 828 - - 4,121
Inventories and other assets - - - - - 612 612
Total assets 144,856 $ 73,830 $ 36,085 $ 128,220 $ 27,685 $ 55,599 $ 466,275 $
Liabilities
Accounts payable and
accrued liabilities 55,007 19,089 201 - 16,453 5,770 96,520
Due to other funds - 828 - 828 - 2,465 4,121
Unearned revenue - 3,740 - - 7,273 9,759 20,772
Total liabilities 55,007 23,657 201 828 23,726 17,994 121,413
Deferred inflows of resources:
Unavailable revenue 75,718 41,392 35,188 - 707 7,845 160,850
Total deferred inflows
of resources 75,718 41,392 35,188 - 707 7,845 160,850
Fund balances:
Nonspendable - - - - - 8,970 8,970
Restricted - 8,781 696 127,392 3,252 25,166 165,287
Committed - - - - - 1,867 1,867
Assigned 8,663 - - - - - 8,663
Unassigned (deficits) 5,468 - - - - (6,243) (775)
Total fund balances
(deficits) 14,131 8,781 696 127,392 3,252 29,760 184,012
Total liabilities, deferred
inflows of resources
and fund balances 144,856 $ 73,830 $ 36,085 $ 128,220 $ 27,685 $ 55,599 $ 466,275 $
(Continued)
16
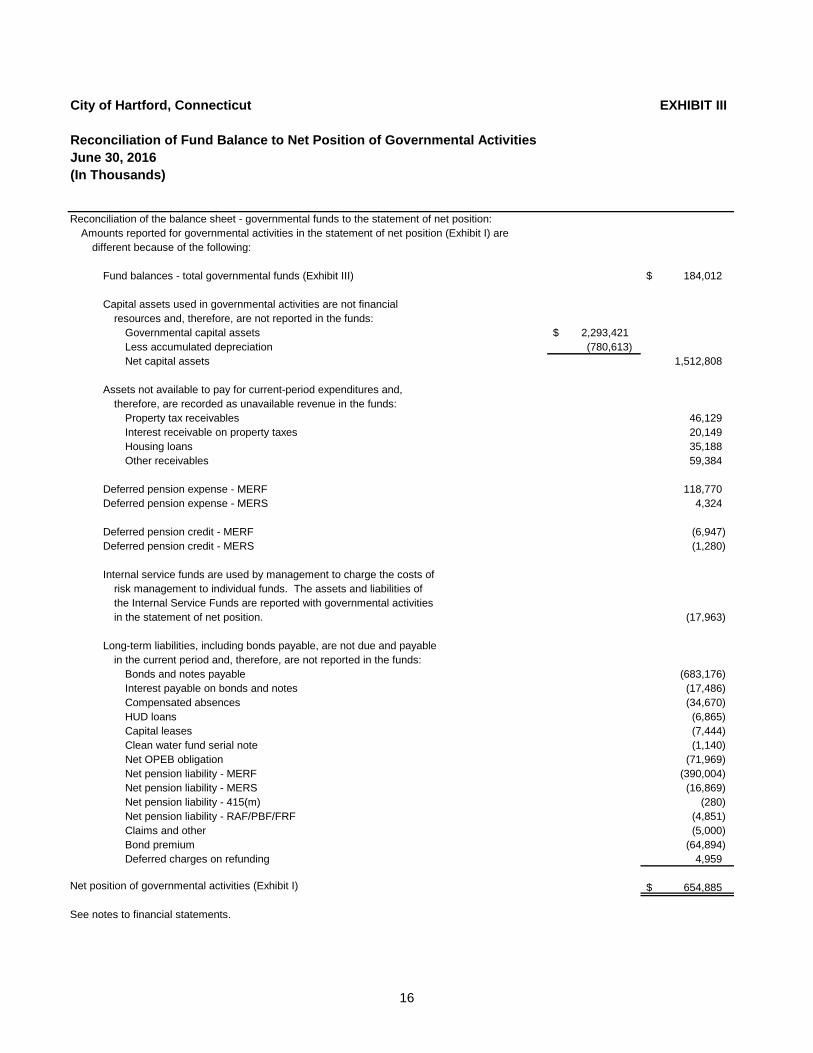
City of Hartford, Connecticut EXHIBIT III
Reconciliation of Fund Balance to Net Position of Governmental Activities
June 30, 2016
(In Thousands)
Reconciliation of the balance sheet - governmental funds to the statement of net position:
Amounts reported for governmental activities in the statement of net position (Exhibit I) are
different because of the following:
Fund balances - total governmental funds (Exhibit III) 184,012 $
Capital assets used in governmental activities are not financial
resources and, therefore, are not reported in the funds:
Governmental capital assets 2,293,421 $
Less accumulated depreciation (780,613)
Net capital assets 1,512,808
Assets not available to pay for current-period expenditures and,
therefore, are recorded as unavailable revenue in the funds:
Property tax receivables 46,129
Interest receivable on property taxes 20,149
Housing loans 35,188
Other receivables 59,384
Deferred pension expense - MERF 118,770
Deferred pension expense - MERS 4,324
Deferred pension credit - MERF (6,947)
Deferred pension credit - MERS (1,280)
Internal service funds are used by management to charge the costs of
risk management to individual funds. The assets and liabilities of
the Internal Service Funds are reported with governmental activities
in the statement of net position. (17,963)
Long-term liabilities, including bonds payable, are not due and payable
in the current period and, therefore, are not reported in the funds:
Bonds and notes payable (683,176)
Interest payable on bonds and notes (17,486)
Compensated absences (34,670)
HUD loans (6,865)
Capital leases (7,444)
Clean water fund serial note (1,140)
Net OPEB obligation (71,969)
Net pension liability - MERF (390,004)
Net pension liability - MERS (16,869)
Net pension liability - 415(m) (280)
Net pension liability - RAF/PBF/FRF (4,851)
Claims and other (5,000)
Bond premium (64,894)
Deferred charges on refunding 4,959
Net position of governmental activities (Exhibit I) 654,885 $
See notes to financial statements.
17
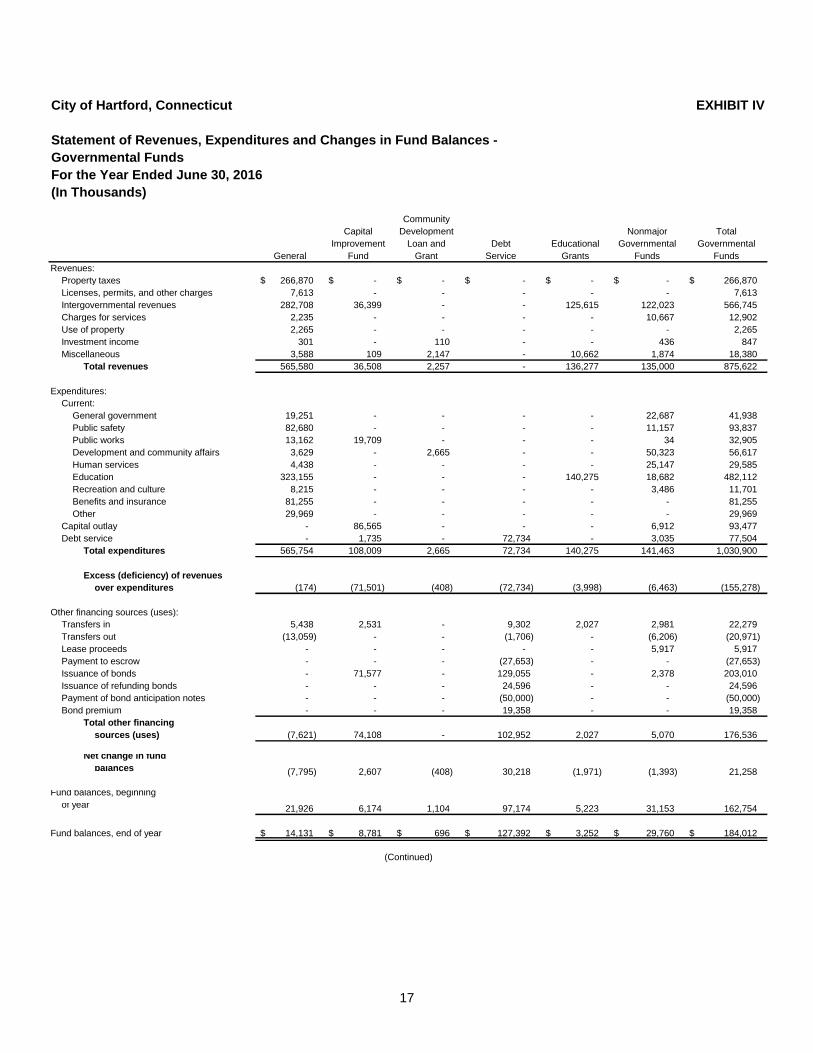
City of Hartford, Connecticut EXHIBIT IV
Statement of Revenues, Expenditures and Changes in Fund Balances -
Governmental Funds
For the Year Ended June 30, 2016
(In Thousands)
Community
Capital Development Nonmajor Total
Improvement Loan and Debt Educational Governmental Governmental
General Fund Grant Service Grants Funds Funds
Revenues:
Property taxes 266,870 $ -$ -$ -$ -$ -$ 266,870 $
Licenses, permits, and other charges 7,613 - - - - - 7,613
Intergovernmental revenues 282,708 36,399 - - 125,615 122,023 566,745
Charges for services 2,235 - - - - 10,667 12,902
Use of property 2,265 - - - - - 2,265
Investment income 301 - 110 - - 436 847
Miscellaneous 3,588 109 2,147 - 10,662 1,874 18,380
Total revenues 565,580 36,508 2,257 - 136,277 135,000 875,622
Expenditures:
Current:
General government 19,251 - - - - 22,687 41,938
Public safety 82,680 - - - - 11,157 93,837
Public works 13,162 19,709 - - - 34 32,905
Development and community affairs 3,629 - 2,665 - - 50,323 56,617
Human services 4,438 - - - - 25,147 29,585
Education 323,155 - - - 140,275 18,682 482,112
Recreation and culture 8,215 - - - - 3,486 11,701
Benefits and insurance 81,255 - - - - - 81,255
Other 29,969 - - - - - 29,969
Capital outlay - 86,565 - - - 6,912 93,477
Debt service - 1,735 - 72,734 - 3,035 77,504
Total expenditures 565,754 108,009 2,665 72,734 140,275 141,463 1,030,900
Excess (deficiency) of revenues
over expenditures (174) (71,501) (408) (72,734) (3,998) (6,463) (155,278)
Other financing sources (uses):
Transfers in 5,438 2,531 - 9,302 2,027 2,981 22,279
Transfers out (13,059) - - (1,706) - (6,206) (20,971)
Lease proceeds - - - - - 5,917 5,917
Payment to escrow - - - (27,653) - - (27,653)
Issuance of bonds - 71,577 - 129,055 - 2,378 203,010
Issuance of refunding bonds - - - 24,596 - - 24,596
Payment of bond anticipation notes - - - (50,000) - - (50,000)
Bond premium - - - 19,358 - - 19,358
Total other financing
sources (uses) (7,621) 74,108 - 102,952 2,027 5,070 176,536
Net change in fund
balances (7,795) 2,607 (408) 30,218 (1,971) (1,393) 21,258
Fund balances, beginning
of year 21,926 6,174 1,104 97,174 5,223 31,153 162,754
Fund balances, end of year 14,131 $ 8,781 $ 696 $ 127,392 $ 3,252 $ 29,760 $ 184,012 $
(Continued)
18
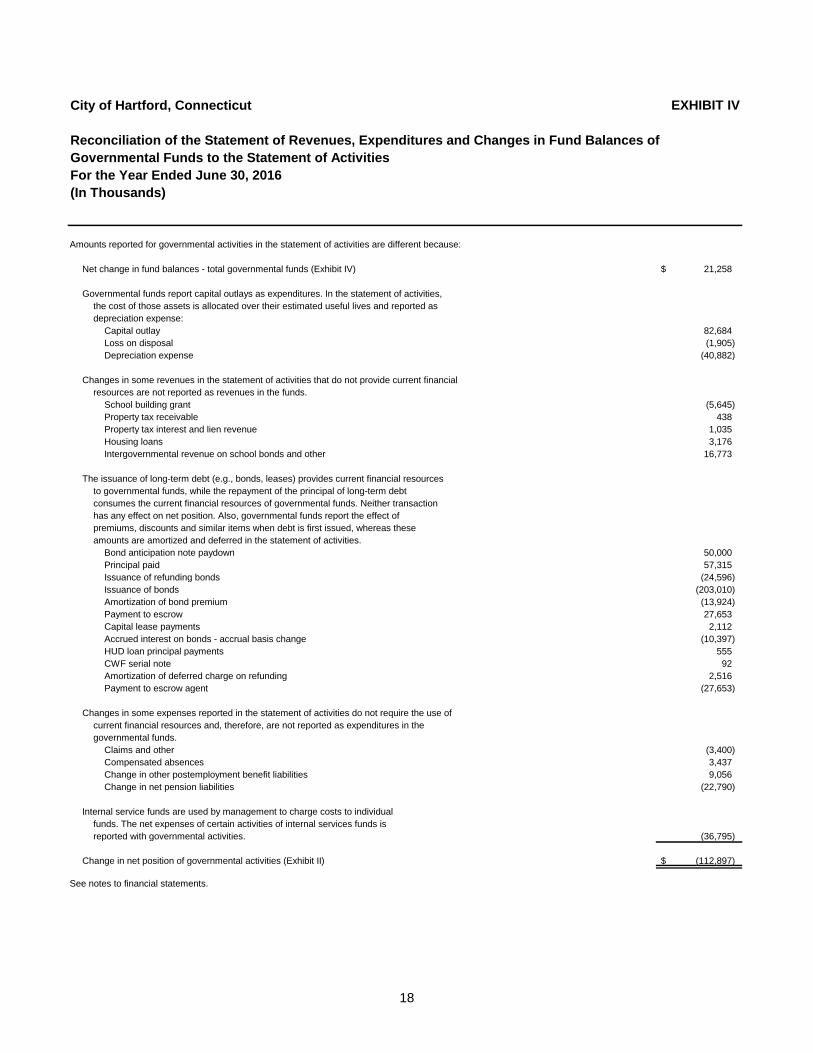
City of Hartford, Connecticut EXHIBIT IV
Reconciliation of the Statement of Revenues, Expenditures and Changes in Fund Balances of
Governmental Funds to the Statement of Activities
For the Year Ended June 30, 2016
(In Thousands)
Amounts reported for governmental activities in the statement of activities are different because:
Net change in fund balances - total governmental funds (Exhibit IV) 21,258 $
Governmental funds report capital outlays as expenditures. In the statement of activities,
the cost of those assets is allocated over their estimated useful lives and reported as
depreciation expense:
Capital outlay 82,684
Loss on disposal (1,905)
Depreciation expense (40,882)
Changes in some revenues in the statement of activities that do not provide current financial
resources are not reported as revenues in the funds.
School building grant (5,645)
Property tax receivable 438
Property tax interest and lien revenue 1,035
Housing loans 3,176
Intergovernmental revenue on school bonds and other 16,773
The issuance of long-term debt (e.g., bonds, leases) provides current financial resources
to governmental funds, while the repayment of the principal of long-term debt
consumes the current financial resources of governmental funds. Neither transaction
has any effect on net position. Also, governmental funds report the effect of
premiums, discounts and similar items when debt is first issued, whereas these
amounts are amortized and deferred in the statement of activities.
Bond anticipation note paydown 50,000
Principal paid 57,315
Issuance of refunding bonds (24,596)
Issuance of bonds (203,010)
Amortization of bond premium (13,924)
Payment to escrow 27,653
Capital lease payments 2,112
Accrued interest on bonds - accrual basis change (10,397)
HUD loan principal payments 555
CWF serial note 92
Amortization of deferred charge on refunding 2,516
Payment to escrow agent (27,653)
Changes in some expenses reported in the statement of activities do not require the use of
current financial resources and, therefore, are not reported as expenditures in the
governmental funds.
Claims and other (3,400)
Compensated absences 3,437
Change in other postemployment benefit liabilities 9,056
Change in net pension liabilities (22,790)
Internal service funds are used by management to charge costs to individual
funds. The net expenses of certain activities of internal services funds is
reported with governmental activities. (36,795)
Change in net position of governmental activities (Exhibit II) (112,897) $
See notes to financial statements.
19
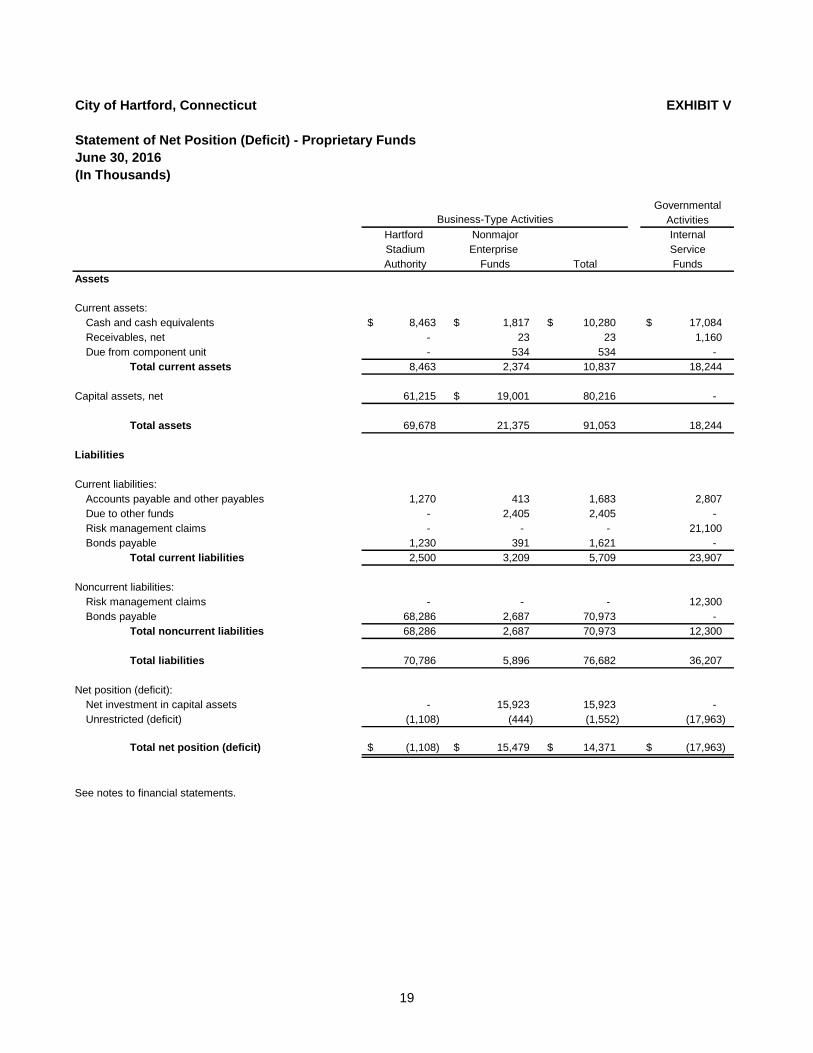
City of Hartford, Connecticut EXHIBIT V
Statement of Net Position (Deficit) - Proprietary Funds
June 30, 2016
(In Thousands)
Governmental
Activities
Hartford Nonmajor Internal
Stadium Enterprise Service
Authority Funds Total Funds
Assets
Current assets:
Cash and cash equivalents 8,463 $ 1,817 $ 10,280 $ 17,084 $
Receivables, net - 23 23 1,160
Due from component unit - 534 534 -
Total current assets 8,463 2,374 10,837 18,244
Capital assets, net 61,215 19,001 $ 80,216 -
Total assets 69,678 21,375 91,053 18,244
Liabilities
Current liabilities:
Accounts payable and other payables 1,270 413 1,683 2,807
Due to other funds - 2,405 2,405 -
Risk management claims - - - 21,100
Bonds payable 1,230 391 1,621 -
Total current liabilities 2,500 3,209 5,709 23,907
Noncurrent liabilities:
Risk management claims - - - 12,300
Bonds payable 68,286 2,687 70,973 -
Total noncurrent liabilities 68,286 2,687 70,973 12,300
Total liabilities 70,786 5,896 76,682 36,207
Net position (deficit):
Net investment in capital assets - 15,923 15,923 -
Unrestricted (deficit) (1,108) (444) (1,552) (17,963)
Total net position (deficit) (1,108) $ 15,479 $ 14,371 $ (17,963) $
See notes to financial statements.
Business-Type Activities
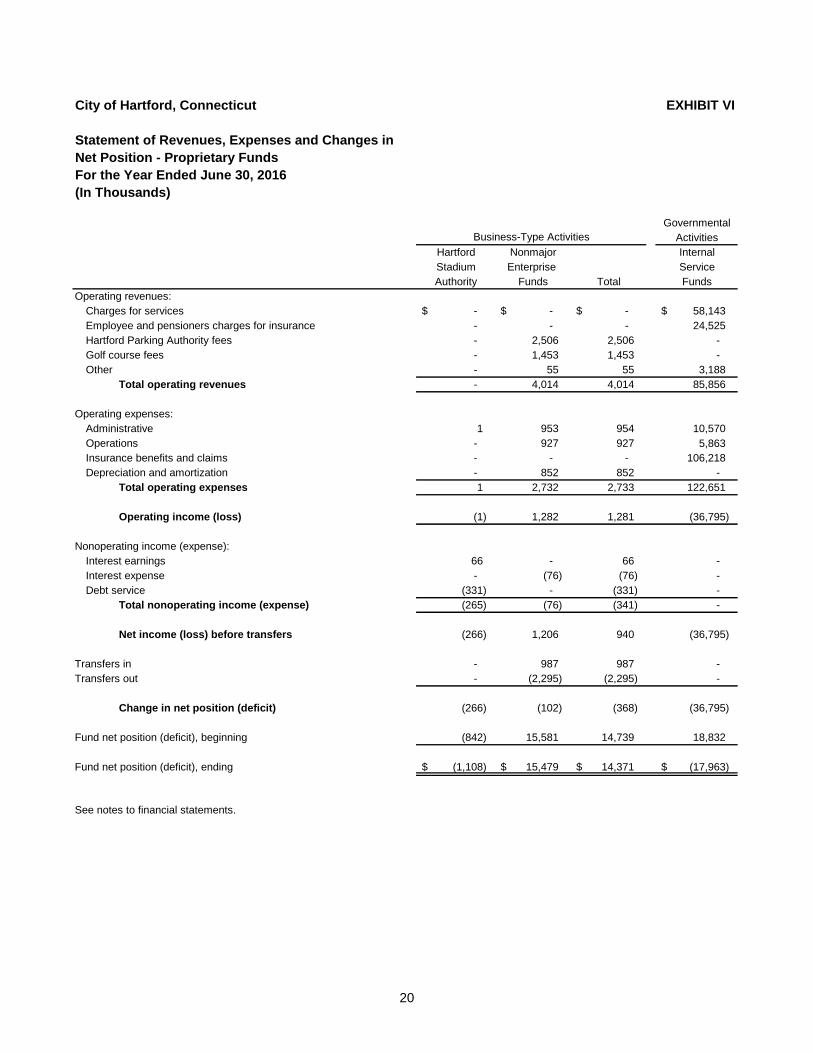
20
City of Hartford, Connecticut EXHIBIT VI
Statement of Revenues, Expenses and Changes in
Net Position - Proprietary Funds
For the Year Ended June 30, 2016
(In Thousands)
Governmental
Activities
Hartford Nonmajor Internal
Stadium Enterprise Service
Authority Funds Total Funds
Operating revenues:
Charges for services -$ -$ -$ 58,143 $
Employee and pensioners charges for insurance - - - 24,525
Hartford Parking Authority fees - 2,506 2,506 -
Golf course fees - 1,453 1,453 -
Other - 55 55 3,188
Total operating revenues - 4,014 4,014 85,856
Operating expenses:
Administrative 1 953 954 10,570
Operations - 927 927 5,863
Insurance benefits and claims - - - 106,218
Depreciation and amortization - 852 852 -
Total operating expenses 1 2,732 2,733 122,651
Operating income (loss) (1) 1,282 1,281 (36,795)
Nonoperating income (expense):
Interest earnings 66 - 66 -
Interest expense - (76) (76) -
Debt service (331) - (331) -
Total nonoperating income (expense) (265) (76) (341) -
Net income (loss) before transfers (266) 1,206 940 (36,795)
Transfers in - 987 987 -
Transfers out - (2,295) (2,295) -
Change in net position (deficit) (266) (102) (368) (36,795)
Fund net position (deficit), beginning (842) 15,581 14,739 18,832
Fund net position (deficit), ending (1,108) $ 15,479 $ 14,371 $ (17,963) $
See notes to financial statements.
Business-Type Activities
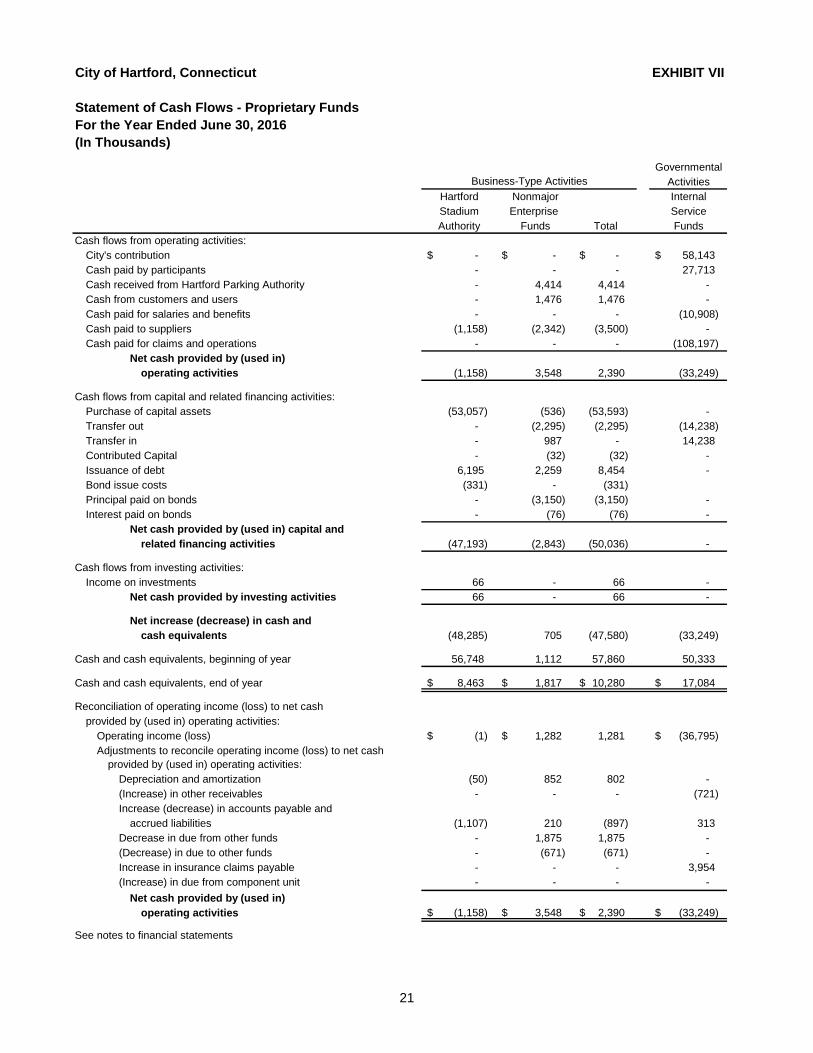
21
City of Hartford, Connecticut EXHIBIT VII
Statement of Cash Flows - Proprietary Funds
For the Year Ended June 30, 2016
(In Thousands)
Governmental
Activities
Hartford Nonmajor Internal
Stadium Enterprise Service
Authority Funds Total Funds
Cash flows from operating activities:
City's contribution -$ -$ -$ 58,143 $
Cash paid by participants - - - 27,713
Cash received from Hartford Parking Authority - 4,414 4,414 -
Cash from customers and users - 1,476 1,476 -
Cash paid for salaries and benefits - - - (10,908)
Cash paid to suppliers (1,158) (2,342) (3,500) -
Cash paid for claims and operations - - - (108,197)
Net cash provided by (used in)
operating activities (1,158) 3,548 2,390 (33,249)
Cash flows from capital and related financing activities:
Purchase of capital assets (53,057) (536) (53,593) -
Transfer out - (2,295) (2,295) (14,238)
Transfer in - 987 - 14,238
Contributed Capital - (32) (32) -
Issuance of debt 6,195 2,259 8,454 -
Bond issue costs (331) - (331)
Principal paid on bonds - (3,150) (3,150) -
Interest paid on bonds - (76) (76) -
Net cash provided by (used in) capital and
related financing activities (47,193) (2,843) (50,036) -
Cash flows from investing activities:
Income on investments 66 - 66 -
Net cash provided by investing activities 66 - 66 -
Net increase (decrease) in cash and
cash equivalents (48,285) 705 (47,580) (33,249)
Cash and cash equivalents, beginning of year 56,748 1,112 57,860 50,333
Cash and cash equivalents, end of year 8,463 $ 1,817 $ 10,280 $ 17,084 $
Reconciliation of operating income (loss) to net cash
provided by (used in) operating activities:
Operating income (loss) (1) $ 1,282 $ 1,281 (36,795) $
Adjustments to reconcile operating income (loss) to net cash
provided by (used in) operating activities:
Depreciation and amortization (50) 852 802 -
(Increase) in other receivables - - - (721)
Increase (decrease) in accounts payable and
accrued liabilities (1,107) 210 (897) 313
Decrease in due from other funds - 1,875 1,875 -
(Decrease) in due to other funds - (671) (671) -
Increase in insurance claims payable - - - 3,954
(Increase) in due from component unit - - - -
Net cash provided by (used in)
operating activities (1,158) $ 3,548 $ 2,390 $ (33,249) $
See notes to financial statements
Business-Type Activities
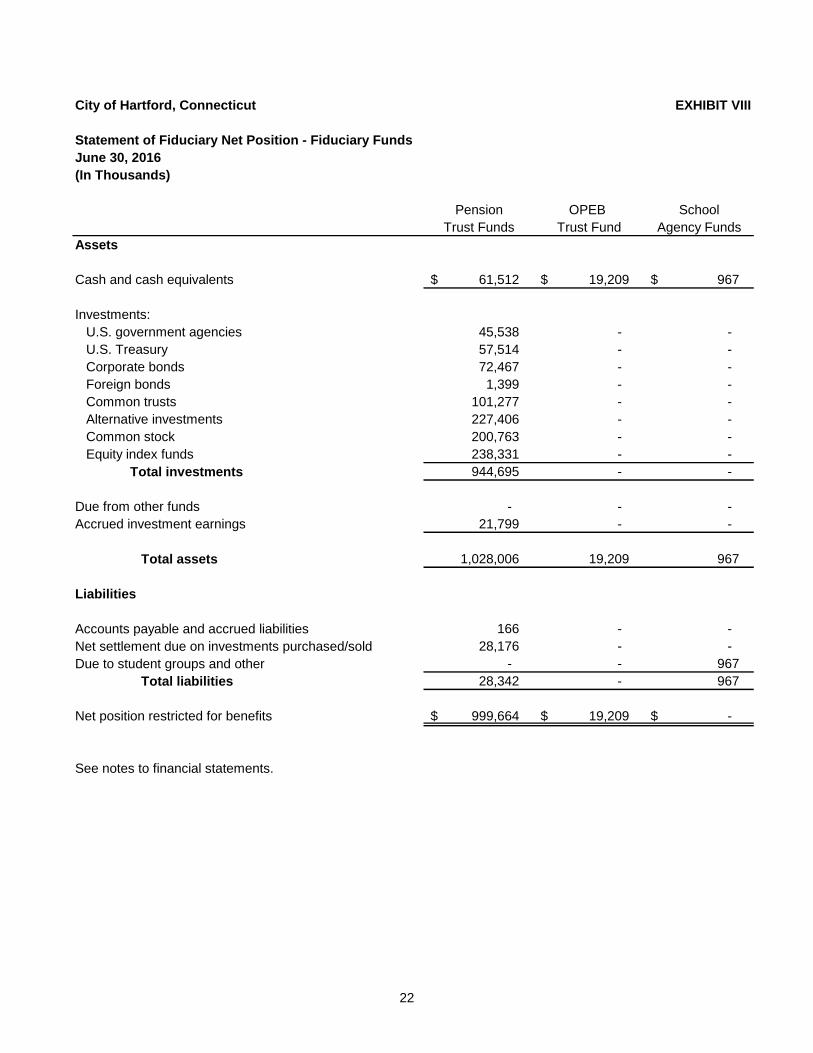
22
City of Hartford, Connecticut EXHIBIT VIII
Statement of Fiduciary Net Position - Fiduciary Funds
June 30, 2016
(In Thousands)
Pension OPEB School
Trust Funds Trust Fund Agency Funds
Assets
Cash and cash equivalents 61,512 $ 19,209 $ 967 $
Investments:
U.S. government agencies 45,538 - -
U.S. Treasury 57,514 - -
Corporate bonds 72,467 - -
Foreign bonds 1,399 - -
Common trusts 101,277 - -
Alternative investments 227,406 - -
Common stock 200,763 - -
Equity index funds 238,331 - -
Total investments 944,695 - -
Due from other funds - - -
Accrued investment earnings 21,799 - -
Total assets 1,028,006 19,209 967
Liabilities
Accounts payable and accrued liabilities 166 - -
Net settlement due on investments purchased/sold 28,176 - -
Due to student groups and other - - 967
Total liabilities 28,342 - 967
Net position restricted for benefits 999,664 $ 19,209 $ -$
See notes to financial statements.
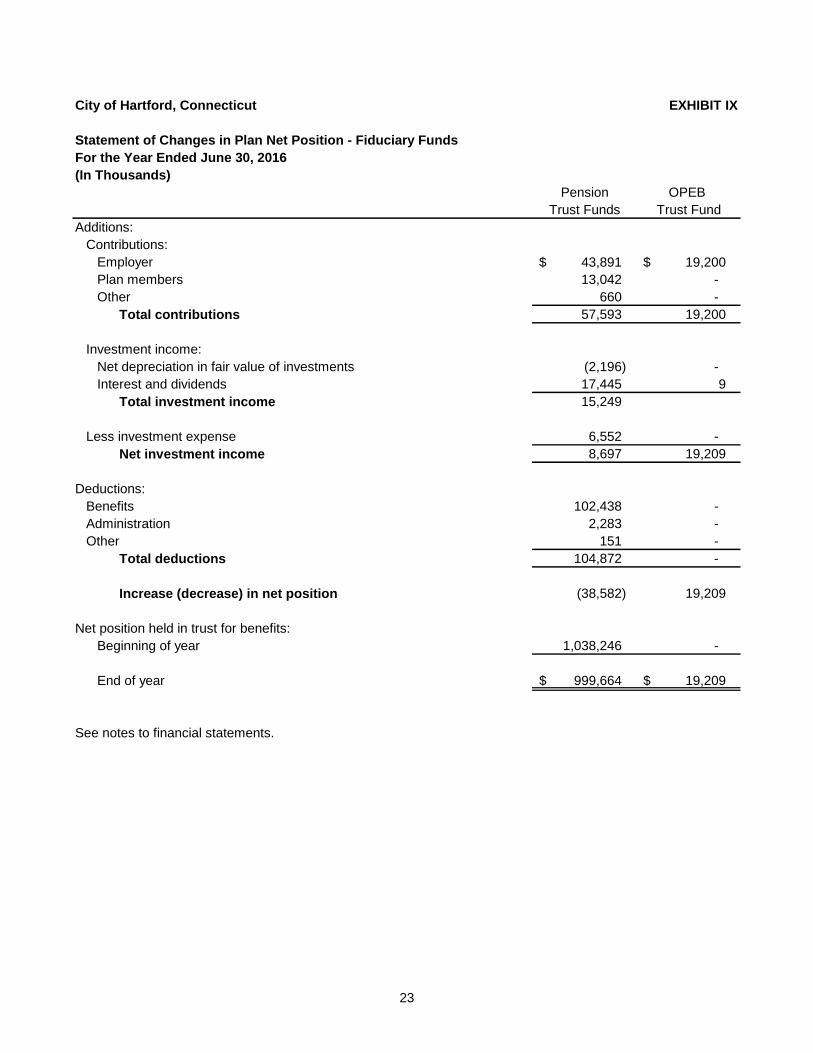
23
City of Hartford, Connecticut EXHIBIT IX
Statement of Changes in Plan Net Position - Fiduciary Funds
For the Year Ended June 30, 2016
(In Thousands)
Pension OPEB
Trust Funds Trust Fund
Additions:
Contributions:
Employer 43,891 $ 19,200 $
Plan members 13,042 -
Other 660 -
Total contributions 57,593 19,200
Investment income:
Net depreciation in fair value of investments (2,196) -
Interest and dividends 17,445 9
Total investment income 15,249
Less investment expense 6,552 -
Net investment income 8,697 19,209
Deductions:
Benefits 102,438 -
Administration 2,283 -
Other 151 -
Total deductions 104,872 -
Increase (decrease) in net position (38,582) 19,209
Net position held in trust for benefits:
Beginning of year 1,038,246 -
End of year 999,664 $ 19,209 $
See notes to financial statements.
City of Hartford, Connecticut Notes to Financial Statements, in thousands (000’s)
24
Note 1. Summary of Significant Accounting Policies
The financial statements of the City of Hartford, Connecticut (the City) have been prepared in conformity with accounting principles generally accepted in the United States of America (GAAP) as applied to government units. The Governmental Accounting Standards Board (GASB) is the accepted standard setting body for establishing governmental accounting and financial reporting principles. The more significant policies of the City are described below. Reporting entity: The City of Hartford, Connecticut was incorporated May 29, 1784, and the City consolidated in April, 1896. The City operates under a Mayor-Council form of government and provides a full range of services including public safety, roads, solid waste collection, health, social services, culture and recreation, education, planning, development, zoning and general administrative services. Accounting principles generally accepted in the United States of America require that the reporting entity include (1) the primary government; (2) organizations for which the primary government is financially accountable; and (3) other organizations for which the nature and significance of their relationship with the primary government are such that exclusion would cause the reporting entity's financial statements to be misleading or incomplete. The criteria provided in Government Accounting Standards Board Codification 2100 have been considered, as a result, the component unit discussed below is included in the City's reporting entity because of its operational significance or financial relationship with the City. Blended component unit: The Hartford Stadium Authority (Authority) serves all the citizens of the government and is governed by a commission, which consists of five members appointed by the Common Council. The Authority does not have any other staff members presently, the operational, administrative and legal services for the Authority will be handled by the City Departments of Finance, Public Work and the Office of Corporation Council and the government is legally obligated to provide resources in case there are deficiencies in debt service payments and resources are not available from any other remedies. The Authority is reported as an enterprise fund and does not issue separate financial statements. The Authority is reported as a blended component unit as the City is responsible for payment of the Authority’ debt through a signed lease agreement. Discretely presented component unit: The discretely presented component unit is reported in a separate column in the government-wide financial statements to emphasize that it is legally separate from the City. It is financially accountable to the City, or has a relationship with the City such that exclusion would cause the reporting entity's financial statements to be misleading or incomplete. For the discretely presented component unit the potential exists for a financial burden or benefit to be imposed on the City as a result of the existence of the component unit. For the discretely presented component unit included in the City’s financial statements, the City, generally acting through the Mayor, appoints a voting majority of the component unit’s governing boards. The Hartford Parking Authority (the Authority) was created pursuant to Chapter 100 of the General Statutes of Connecticut and is governed by five members appointed by the Mayor. The purpose of the Authority is to create, establish, finance, maintain, and operate the City of Hartford’s dedicated parking facilities, and regulate the uses and parking rates to be charged at other regulated parking facilities. The Authority is reported as a component unit as the Mayor appoints and the City Council approves its governing board of 5 members. Separately issued financial statements are available at available at www.hartfordparkingauthority.com.
City of Hartford, Connecticut Notes to Financial Statements, in thousands (000’s)
25
Note 1. Summary of Significant Accounting Policies (Continued)
Accounting standards adopted in the current year: GASB Statement No. 72, Fair Value Measurement and Application. This statement addresses accounting and financial reporting issues related to fair value measurements. The definition of fair value is the price that would be received to sell an asset or paid to transfer a liability in an orderly transaction between market participants at the measurement date. This statement provides guidance for determining a fair value measurement for financial reporting purposes. This statement also provides guidance for applying fair value to certain investments and disclosures related to all fair value measurements. The implementation of this statement added additional disclosures to Note 2. GASB Statement No. 73, Accounting and Financial Reporting for Pensions and Related Assets that are not Within the Scope of GASB Statement 68, and Amendments to Certain Provisions of GASB Statement Nos. 67 and 68. This statement completes the suite of pension standards. Statement No. 73 establishes requirements for those pensions and pension plans that are not administered through a trust meeting specified criteria (in other words, those not covered by Statement Nos. 67 and 68). The requirements in Statement No. 73 for reporting pensions generally are the same as in Statement No. 68. However, the lack of a pension plan that is administered through a trust that meets specified criteria is reflected in the measurements. The implementation of this statement had no impact on the City’s financial statements. GASB Statement No. 76, The Hierarchy of Generally Accepted Accounting Principles for State and Local Governments. This statement reduces the GAAP hierarchy to two categories of authoritative GAAP and addresses the use of authoritative and nonauthoritative literature in the event that the accounting treatment for a transaction or other event is not specified within a source of authoritative GAAP. The implementation of this statement had no impact on the City’s financial statements. GASB Statement No. 79, Certain External Investment Pools and Pool Participants. This standard establishes new criteria to continue amortization cost accounting for certain external investment pools in light of recent changes to money market fund criteria. The requirements of this statement are effective for financial statements for periods beginning after June 15, 2015. Portfolio quality and monthly shadow pricing are effective for periods beginning after December 15, 2015. The implementation of this statement had no impact on the City’s financial statements. Government-wide and fund financial statements: The government-wide financial statements (i.e., the statement of net position and the statement of activities) report information on all of the nonfiduciary activities of the City and its component unit. For the most part, the effect of interfund activity has been removed from these statements. Governmental activities, which normally are supported by taxes and intergovernmental revenues, are reported separately from business-type activities, which rely to a significant extent on fees and charges for support. Likewise, the City is reported separately from certain legally separate component units for which the primary government is financially accountable. The statement of activities demonstrates the degree to which the direct expenses of a given function or segment are offset by program revenues. Direct expenses are those that are clearly identifiable with a specific function or segment. Program revenues include 1) charges to customers or applicants who purchase, use, or directly benefit from goods, services, or privileges provided by a given function or segment and 2) grants and contributions that are restricted to meeting the operational or capital requirements of a particular function or segment. Taxes and other items not properly included among program revenues are reported instead as general revenues. Separate financial statements are provided for governmental funds, proprietary funds, and fiduciary funds, even though the latter are excluded from the government-wide financial statements. Major individual governmental funds and major individual enterprise funds are reported as separate columns in the fund financial statements.
City of Hartford, Connecticut Notes to Financial Statements, in thousands (000’s)
26
Note 1. Summary of Significant Accounting Policies (Continued)
The various fund types included in the financial statements are described below: Governmental funds: Governmental funds are those through which most governmental functions typically are financed. General Fund: the primary operating fund of the City. This fund is used to account for all financial transactions and resources except those required to be accounted for in another fund. Revenues are derived primarily from property taxes, state and federal grants, licenses, permits, charges for service, and interest income. Special Revenue Funds: accounts for specific revenue sources that are restricted or committed to expenditures for specific purposes other than debt service of capital projects. Debt Service Fund: accounts for the payment of principal and interest on general long-term debt of the City. This funds accounts for the amounts held in escrow for future payoff of defeased debt. Capital Project Funds: accounts for all financial resources used for the acquisition or construction of major capital facilities not being financed by proprietary funds. Permanent Funds: used to report resources that are legally restricted to the extent that only earnings, and not principal, may be used for purposes that support the City’s programs. Proprietary funds: Proprietary funds are used to account for activities that are similar to those often found in the private sector. These funds are accounted for on the flow of economic resources measurement focus and use the accrual basis of accounting. The following are the City’s proprietary funds: Enterprise Funds: account for operations that are financed in a manner similar to private business enterprises, where the intent is that costs of providing goods or services to the general public on a continuing basis be financed or recovered primarily through user charges. The reported enterprise funds of the City accounts for activities of the Hartford Parking Facilities, the Hartford Stadium Authority and the Golf Course. Internal Service Funds: account for the financing of goods or services provided by one department to other departments or agencies of the City on a cost-reimbursement basis. The reported internal service funds of the City include self-insured funds for Employee Benefits, Workers’ Compensation, and Liability and Property Damage and a fund used to account for the centralized operations of the Metro Hartford Information Services. Fiduciary funds: Fiduciary funds are used to account for assets held by the City in a trustee capacity or as an agent for individuals, private organizations, and other governments. Fiduciary funds are not included in the government-wide statements. The fiduciary funds are as follows: Pension Trust Funds: account for the Municipal Employees’ Retirement System. Agency Funds: are custodial in nature (assets equal liabilities). Agency Funds apply the accrual basis of accounting but do not involve measurement of results of operation. The School System Student Activity Fund and Adult Education Book Fund are the City’s only agency funds.
City of Hartford, Connecticut Notes to Financial Statements, in thousands (000’s)
27
Note 1. Summary of Significant Accounting Policies (Continued)
Measurement focus, basis of accounting, and financial statement presentation: The government-wide financial statements are reported using the economic resources measurement focus and the accrual basis of accounting, as are the proprietary fund and fiduciary fund financial statements (except for agency funds which have no measurement focus). Revenues are recorded when earned and expenses are recorded when a liability is incurred, regardless of the timing of related cash flows. Property taxes are recognized as revenues in the year for which they are levied for. Grants and similar items are recognized as revenue as soon as all eligibility requirements imposed by the provider have been met. Governmental fund financial statements are reported using the current financial resources measurement focus and the modified accrual basis of accounting. Revenues are recognized as soon as they are both measurable and available. Revenues are considered to be available when they are collectible within the current period or soon enough thereafter to pay liabilities of the current period (generally 60 days). A 90 day period is used for construction grants.Expenditures generally are recorded when a liability is incurred, as under accrual accounting. However, debt service expenditures, as well as expenditures related to compensated absences, pension liabilities, other post-employment obligations, and claims and judgments, are recorded only when payment is due (matured). Property taxes, when levied for, intergovernmental revenues, when eligibility requirements are met, charges for services, and interest associated with the current fiscal period are all considered to be measurable and so have been recognized as revenues of the current fiscal period, if available. All other revenue items, primarily licenses and fees, are considered to be available only when cash is received. The City reports the following major governmental funds: The General Fund is the City’s primary operating fund. It accounts for all financial resources of the City, except those required to be accounted for in another fund.
The Capital Improvement Fund accounts for the proceeds of general obligation bonds and grants for various construction and reconstruction projects.
The Community Development Loan and Grant Fund accounts for loan and grant activities associated with the housing and development program.
The Debt Service Fund: accounts for the payment of principal and interest on general long-term debt of the City. This funds accounts for the amounts held in escrow for future payoff of defeased debt.
The Educational Grants Fund accounts for State and Federal grants received and expended for educational purposes. The City reports the following major enterprise funds: The Hartford Stadium Authority Fund accounts for the operations of the City’s Dillon Stadium currently in construction. It is a blended component unit of the City. Additionally, the City reports the following fund types: The Internal Service Funds account for the risk management program of the City and the centralized operations of the Metro Hartford Information Services.
The Pension Trust Funds, fiduciary funds, account for the activities of the Hartford Retirement System, which accumulates resources for pension benefit payments to qualified City employees.
City of Hartford, Connecticut Notes to Financial Statements, in thousands (000’s)
28
Note 1. Summary of Significant Accounting Policies (Continued)
The Agency Funds, fiduciary fund, account for monies held as a custodian for outside student groups.
As a general rule the effect of interfund activity has been eliminated from the government-wide financial statements, however, interfund services in the government-wide financial statements. Provided and used have not been eliminated in the process of consolidation. Amounts reported as program revenues include 1) charges to customers or applicants for goods, services, or privileges provided, 2) operating grants and contributions, and 3) capital grants and contributions, including special assessments. Internally dedicated resources are reported as general revenues rather than as program revenues. Likewise, general revenues include property taxes.
Proprietary funds are financed and operated in a manner similar to private business enterprises.
Proprietary funds distinguish operating revenues and expenses from nonoperating items. Operating revenues and expenses generally result from providing services and producing and delivering goods in connection with a proprietary fund’s principal ongoing operations. The principal operating revenues of the City’s enterprise fund is net revenues from operations of the parking facilities and of the City’s internal service funds are charges from participants and premiums from the City. Operating expenses for the enterprise fund include operating expenses, administrative expenses, and depreciation on capital assets. For the internal service funds, expenses represent claims paid. All revenues and expenses not meeting this definition are reported as nonoperating revenues and expenses. When both restricted and unrestricted resources are available for use, it is the City’s policy to use restricted resources first, then unrestricted resources as they are needed. Accounting estimates: The preparation of financial statements in conformity with GAAP requires management to make estimates and assumptions that affect the amounts reported and disclosures in the financial statements. Actual results could differ from those estimates. Cash and cash equivalents: The City’s cash and cash equivalents are considered to be cash on hand, demand deposits, and short-term investments with original maturities of three months or less from the date of acquisition. Restricted cash and investments: Certain assets are classified as restricted because their use is limited. Restricted asset cash and investments are to be used for construction purposes and the repayment of the 2013, 2014, 2015, and 2016 Refunded Bonds. Investments: Investments are stated at fair value. The pension fund allows for investments in certain alternative investments. Alternative investments may include private equity partnerships, hedge and absolute return funds for which there may be no ready market to determine fair value. These investments are valued using the most recent valuation available from the external fund manager that represents the net asset value of these funds. These estimated values do not necessarily represent the amounts that will ultimately be realized upon the disposition of those assets, which may be materially higher or lower than values determined if a ready market for the securities existed. The Connecticut State Treasurer’s Short-Term Investment Fund is an investment pool managed by the State of Connecticut Office of the State Treasurer. Investments must be made in instruments authorized by Connecticut General Statutes 3-27c through 3-27e. Investment guidelines are adopted by the State Treasurer. The fair value of the position in the pool is the same as the value of the pool shares.
City of Hartford, Connecticut Notes to Financial Statements, in thousands (000’s)
29
Note 1. Summary of Significant Accounting Policies (Continued)
The investments in the pool adhere to GASB Statement No. 79, Certain External Investment Pools and Pool Participants, which accounts for the asset investment. The value of the position in the pool is the same as the value of the pool shares. These investments are stated at amortized cost. Fair value: The City uses fair value measurements to record fair value adjustments to certain assets and to determine fair value disclosures. Fair value is the price that would be received to sell an asset or paid to transfer a liability in an orderly transaction between market participants at the measurement date. Fair value is best determined based upon quoted market prices. However, in certain instances, there are no quoted market prices for certain assets or liabilities. In cases where quoted market prices are not available, fair values are based on estimates using present value or other valuation techniques. Those techniques are significantly affected by the assumptions used, including the discount rate and estimates of future cash flows. Accordingly, the fair value estimates may not be realized in an immediate settlement of the asset or liability. Fair value measurements focus on exit prices in an orderly transaction (that is, not a forced liquidation or distressed sale) between market participants at the measurement date under current market conditions. If there has been a significant decrease in the volume and level of activity for the asset or liability, a change in valuation technique or the use of multiple valuation techniques may be appropriate. In such instances, determining the price at which willing market participants would transact at the measurement date under current market conditions depends on the facts and circumstances and requires the use of significant judgment. The City’s fair value measurements are classified into a fair value hierarchy based on the markets in which the assets and liabilities are traded and the reliability of the assumptions used to determine fair value. The three categories within the hierarchy are as follows: Level 1: Quoted prices in active markets for identical assets and liabilities. Level 2: Inputs other than quoted prices included within Level 1 that are observable for the asset or
liability, either directly or indirectly, including quoted prices for similar assets or liabilities in active markets, quoted prices for identical or similar assets or liabilities in markets that are not active, interest rates and yield curves observable at commonly quoted intervals, implied volatilities, credit spreads, and market-corroborated inputs.
Level 3: Unobservable inputs shall be used to measure fair value to the extent that relevant observable
inputs are not available, thereby allowing for situations in which there is little, if any, market activity for the asset or liability at the measurement date. Level 3 assets and liabilities include financial instruments whose value is determined using pricing models, discounted cash flows methodologies, or similar techniques, as well as instruments for which the determination of fair value requires significant management judgement.
See Note 2 for additional information regarding fair value. Due to/from other funds: Activity between funds that are representative of lending/borrowing arrangements outstanding at the end of the fiscal year are referred to as either “due to/from other funds” (i.e., the current portion of interfund loans). Any residual balances outstanding between the governmental activities and business-type activities are reported in the government-wide financial statements as “internal balances”.
City of Hartford, Connecticut Notes to Financial Statements, in thousands (000’s)
30
Note 1. Summary of Significant Accounting Policies (Continued)
Receivables: All trade and property tax receivables, including those for component units, are reported net of an allowance for uncollectibles. The property tax receivable allowance of $7.827 million is equal to approximately 18% of outstanding property taxes at June 30, 2016. The City’s property tax is levied each May on the assessed value listed as of the prior October 1 for all taxable real and personal property located in the City. The lien date is July 1 on the May 1 levy. Assessed values are established by the City Assessor at 70% of fair market value for all properties on the Grand List as of October 1 each year. Taxes under $100 (amount not rounded) are due in one installment July 1; real and personal property taxes of over $100 (amount not rounded) are due in two installments July 1 and January 1. Motor vehicle taxes in excess of $100 (amount not rounded) are due in two installments July 1 and January 1. Delinquent taxes are assessed interest of 1.5% per month. The City has also entered into various loan agreements with third parties related to its public housing programs. These loan agreements have been recorded as notes receivable within the Community Development Loan and Grant Fund. Under these agreements, the City has loaned money for the purpose of establishing and/or improving public housing units. The loans are secured by an interest in the property being acquired and/or improved. The programs consist of the House Hartford Program, the Home Ownership Appraisal GAP Financing Program, Home Program, Lead Abatement Program, Façade Program, Anti-Blight Program and the Housing Preservation Loan Program. In addition, the City has two outstanding loans under the HUD Section 108 Program. All other receivables, including intergovernmental receivables, are reported net of an allowance for uncollectibles. Allowances for doubtful accounts: Accounts including property taxes and notes receivable for the primary government are reported net of allowance for doubtful accounts. The allowance for doubtful accounts represents those accounts which are deemed uncollectible based upon collection history and analysis of creditor’s ability to pay. The majority of amount relates to taxes receivable, housing loans (for which the City develops an allowance for uncollectible amounts on a loan-by-loan basis) and police special duty charges for services. Inventories: All inventories are valued at cost using the first-in/first-out (FIFO) method. Inventories of governmental funds are recorded as expenditures when consumed rather than when purchased. Capital assets: Capital assets, which include land, buildings, equipment, and infrastructure assets, (e.g., roads, bridges, sidewalks, and similar items), are reported in the applicable governmental or business-type activities columns in the government-wide financial statements and proprietary fund financial statements. Capital assets are defined by the government as assets with an initial, individual cost of more than $5,000 (amount not rounded) and an estimated useful life in excess of one year. Such assets are recorded at historical cost or estimated historical cost if purchased or constructed. Donated capital assets are recorded at estimated fair market value at the date of donation. The costs of normal maintenance and repairs that do not add to the value of the asset or materially extend assets lives are not capitalized. Major outlays for capital assets and improvements are capitalized as projects are constructed. Interest is capitalized in accordance with related guidance on enterprise and business-type capital assets.
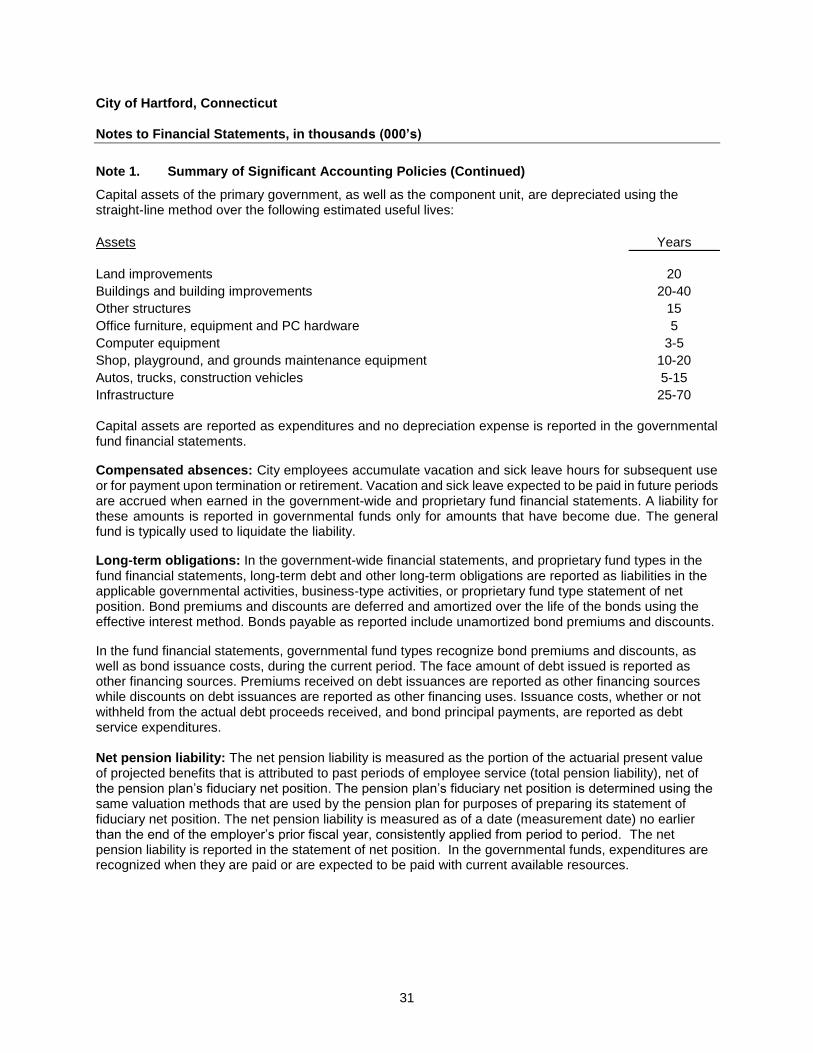
City of Hartford, Connecticut Notes to Financial Statements, in thousands (000’s)
31
Note 1. Summary of Significant Accounting Policies (Continued)
Capital assets of the primary government, as well as the component unit, are depreciated using the straight-line method over the following estimated useful lives:
Assets Years
Land improvements 20
Buildings and building improvements 20-40
Other structures 15
Office furniture, equipment and PC hardware 5
Computer equipment 3-5
Shop, playground, and grounds maintenance equipment 10-20
Autos, trucks, construction vehicles 5-15
Infrastructure 25-70
Capital assets are reported as expenditures and no depreciation expense is reported in the governmental fund financial statements.
Compensated absences: City employees accumulate vacation and sick leave hours for subsequent use or for payment upon termination or retirement. Vacation and sick leave expected to be paid in future periods are accrued when earned in the government-wide and proprietary fund financial statements. A liability for these amounts is reported in governmental funds only for amounts that have become due. The general fund is typically used to liquidate the liability.
Long-term obligations: In the government-wide financial statements, and proprietary fund types in the fund financial statements, long-term debt and other long-term obligations are reported as liabilities in the applicable governmental activities, business-type activities, or proprietary fund type statement of net position. Bond premiums and discounts are deferred and amortized over the life of the bonds using the effective interest method. Bonds payable as reported include unamortized bond premiums and discounts.
In the fund financial statements, governmental fund types recognize bond premiums and discounts, as well as bond issuance costs, during the current period. The face amount of debt issued is reported as other financing sources. Premiums received on debt issuances are reported as other financing sources while discounts on debt issuances are reported as other financing uses. Issuance costs, whether or not withheld from the actual debt proceeds received, and bond principal payments, are reported as debt service expenditures. Net pension liability: The net pension liability is measured as the portion of the actuarial present value of projected benefits that is attributed to past periods of employee service (total pension liability), net of the pension plan’s fiduciary net position. The pension plan’s fiduciary net position is determined using the same valuation methods that are used by the pension plan for purposes of preparing its statement of fiduciary net position. The net pension liability is measured as of a date (measurement date) no earlier than the end of the employer’s prior fiscal year, consistently applied from period to period. The net pension liability is reported in the statement of net position. In the governmental funds, expenditures are recognized when they are paid or are expected to be paid with current available resources.
City of Hartford, Connecticut Notes to Financial Statements, in thousands (000’s)
32
Note 1. Summary of Significant Accounting Policies (Continued)
Deferred outflows/inflows of resources: In addition to assets, the statement of net position will sometimes report a separate section for deferred outflows of resources. This separate financial statement element, deferred outflows of resources, represents a consumption of net position or fund balance that applies to a future period or periods and so will not be recognized as an outflow of resources (expense/expenditure) until then. The City reports deferred outflows related to pension in the government-wide statement of net position. A deferred outflow of resources related to pension results from differences between expected and actual experience, changes in assumptions or other inputs. These amounts are deferred and included in pension expense in a systematic and rational manner over a period equal to the average of the expected remaining service lives of all employees that are provided with benefits through the pension plan (active employees and inactive employees). In addition to liabilities, the statement of net position will sometimes report a separate section for deferred inflows of resources. This separate financial statement element, deferred inflows of resources, represents an acquisition of net position or fund balance that applies to a future period or periods and so will not be recognized as an inflow of resources (revenue) until that time. The City reports a deferred inflow of resources related to pensions in the government-wide statement of net position. A deferred inflow of resources related to pension results from differences between expected and actual experience, changes in assumptions or other inputs. These amounts are deferred and included in pension expense in a systematic and rational manner over a period equal to the average of the expected remaining service lives of all employees that are provided with benefits through the pension plan (active employees and inactive employees). The governmental funds report unavailable revenues from property taxes, interest on property taxes, intergovernmental revenues, and charges for services. These amounts are deferred and recognized as an inflow of resources (revenue) in the period during which the amounts become available, in accordance with the modified accrual basis of accounting. Fund equity and net position: In the government-wide and proprietary fund financial statements, net position is classified in the following categories: Net investment in capital assets: The net investment in capital assets component of net position consists of capital assets, net of accumulated depreciation, reduced by the outstanding balances (net of unspent bond proceeds) of bonds, notes, or other borrowings that are attributable to the acquisition, construction or improvement of those assets. Deferred outflows of resources and deferred inflows of resources that are attributable to the acquisition, construction, or improvement of those assets or related debt are included in this component of net position. Restricted net position: These amounts are restricted to specific purposes when constraints placed on the use of resources are either (a) externally imposed by creditors (such as debt covenants), grantors, contributors, or laws or regulations of other governments; or (b) imposed by law through constitutional provisions or enabling legislations. Unrestricted net position or (deficit): This category represents the net position of the City, not included in the other two categories, which are not restricted. A deficit will require future funding. In the fund financial statements, the City reported the following governmental fund balance categories: Nonspendable fund balance: These amounts cannot be spent because they are not in spendable form, or because they are legally or contractually required to be maintained intact.
City of Hartford, Connecticut Notes to Financial Statements, in thousands (000’s)
33
Note 1. Summary of Significant Accounting Policies (Continued)
Restricted fund balance: These amounts are restricted to specific purposes when constraints placed on the use of resources are either (a) externally imposed by creditors (such as debt covenants), grantors, contributors, or laws or regulations of other governments; or (b) imposed by law through constitutional provisions or enabling legislations. Committed fund balance: This represents amounts constrained prior to year-end for a specific purpose by the City using its highest level of decision-making authority (City of Hartford Court of Common Council). Amounts remain committed until action, in the form of a Resolution, is taken by the Court of Common Council to remove or revise the limitations. Assigned fund balance: For all governmental funds other than the General Fund, this represents any remaining positive amounts not classified as restricted or committed. For the General Fund, this includes amounts constrained for the intent to be used for a specific purpose by the Court of Common Council and finance department, who have been delegated to assign amounts by the City Charter. Unassigned fund balance: includes residual positive fund balance within the General Fund which has not been classified within the other abovementioned categories. Unassigned fund balance may also include negative balances for any governmental fund if expenditures exceed amounts restricted, committed, or assigned for those specific purposes. When both restricted and unrestricted amounts are available for use, it is the City’s practice to use restricted resources first. Additionally, the City would first use committed, then assigned, and lastly unassigned amounts of unrestricted fund balance. Other post-employment obligations (OPEB) accounting: Governmental funds and governmental activities: In governmental funds, expenditures are recognized when they are paid or are expected to be paid with current available resources. In governmental activities, expense is recognized based on actuarially required contributions. The net OPEB obligation, the cumulative difference between annual OPEB cost and the City’s contributions to the plan since July 1, 2007, is calculated on an actuarial basis consistent with the requirements of Government Accounting Standards Board Statement No. 45. The OPEB obligation is recorded as a noncurrent liability in the government-wide financial statements. Funding policy: The City makes annual contributions based on the Common Council’s decisions using the actuaries’ recommendation. The post-employment benefits are paid from the City’s internal service funds.
Note 2. Cash, Cash Equivalents and Investments
The deposit of public funds is controlled by the Connecticut General Statutes (Section 7-402). Deposits may be made in a “qualified public depository” as defined by Statute, or, in amounts not exceeding the Federal Deposit Insurance Corporation insurance limit, in an “out of state bank,” as defined by the Statutes, which is not a “qualified public depository.”
City of Hartford, Connecticut Notes to Financial Statements, in thousands (000’s)
34
Note 2. Cash, Cash Equivalents and Investments (Continued)
The Connecticut General Statutes (Section 7-400) permit municipalities to invest in: 1) obligations of the United States and its agencies, 2) highly rated obligations of any state of the United States or of any political subdivision, authority or agency thereof, and 3) shares or other interests in custodial arrangements or pools maintaining constant net asset values and in highly rated no-load open end money market and mutual funds (with constant or fluctuating net asset values) whose portfolios are limited to obligations of the United States and its agencies, and repurchase agreements fully collateralized by such obligations. Other provisions of the Statutes cover specific municipal funds with particular investment authority. The provisions of the Statutes regarding the investment of municipal pension funds do not specify permitted investments. Therefore, investment of such funds is generally controlled by the laws applicable to fiduciaries and the provisions of the applicable plan. The Statutes (Sections 3-24f and 3-27f) also provide for investment in shares of the State Short-Term Investment Fund (STIF). The investment pool is under control of the State Treasurer with oversight provided by the Treasurer’s Cash Management Advisory Board, and is regulated under the State Statutes and subject to annual audit by the Auditors of Public Accountants. Investment yields are accounted for on an amortized-cost basis with an investment portfolio that is designed to attain a market-average rate of return throughout budgetary and economic cycles. The STIF accounts are recorded at amortized cost. The City’s MERF Plan has additional commitments to invest in certain alternative investments of approximately $57 million at June 30, 2016. Deposits: City: Custodial credit risk: Custodial credit risk is the risk that in the event of a bank failure, the City’s deposits may not be returned to it. The City’s deposit policy includes policies on the safety of principal, prudence, and financial dealings with institutions designed to mitigate custodial credit risk. As of June 30, 2016, $173.5 of the City’s bank balance of $195.9 was uninsured and uncollateralized. Hartford Parking Authority: Custodial credit risk: Custodial credit risk is the risk that in the event of a bank failure, the Authority’s deposits may not be returned to it. The Authority’ follows the City’s deposit policies which include policies on the safety of principal, prudence, and financial dealings with institutions to mitigate custodial credit risk. As of June 30, 2016, $1,209 of the Authority’s bank balance of $1,959 was uninsured and uncollateralized.
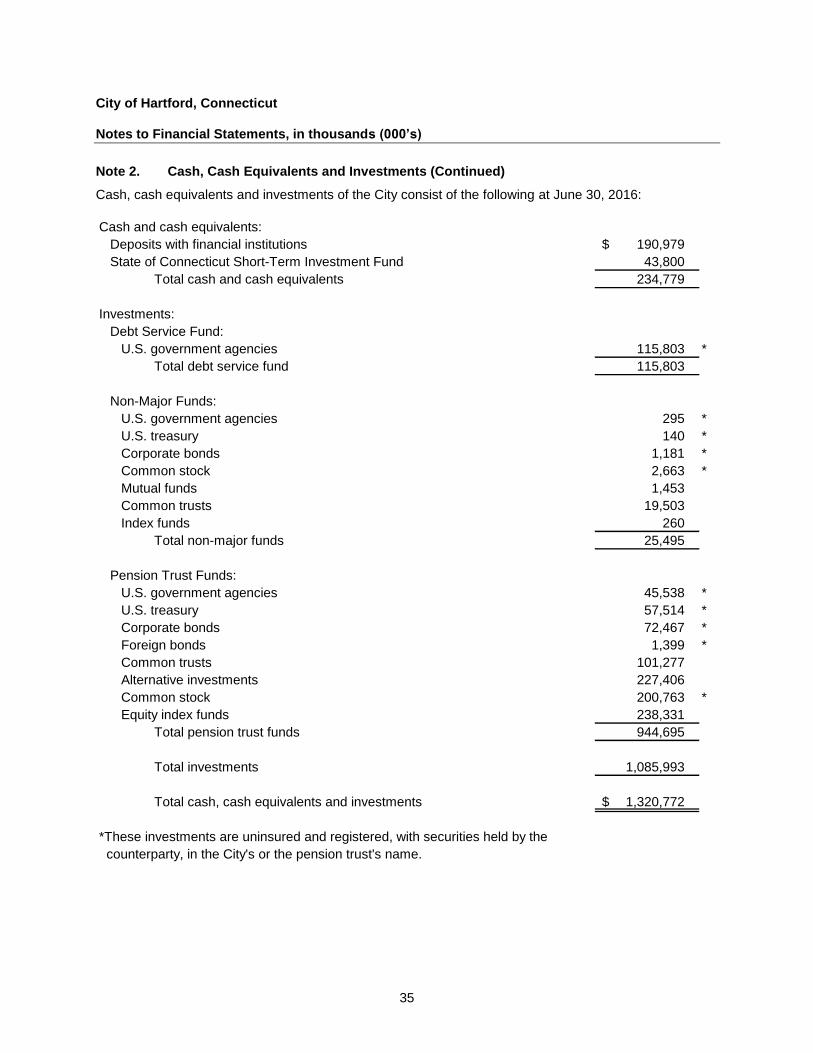
City of Hartford, Connecticut Notes to Financial Statements, in thousands (000’s)
35
Note 2. Cash, Cash Equivalents and Investments (Continued)
Cash, cash equivalents and investments of the City consist of the following at June 30, 2016:
Cash and cash equivalents:
Deposits with financial institutions 190,979 $
State of Connecticut Short-Term Investment Fund 43,800
Total cash and cash equivalents 234,779
Investments:
Debt Service Fund:
U.S. government agencies 115,803 *
Total debt service fund 115,803
Non-Major Funds:
U.S. government agencies 295 *
U.S. treasury 140 *
Corporate bonds 1,181 *
Common stock 2,663 *
Mutual funds 1,453
Common trusts 19,503
Index funds 260
Total non-major funds 25,495
Pension Trust Funds:
U.S. government agencies 45,538 *
U.S. treasury 57,514 *
Corporate bonds 72,467 *
Foreign bonds 1,399 *
Common trusts 101,277
Alternative investments 227,406
Common stock 200,763 *
Equity index funds 238,331
Total pension trust funds 944,695
Total investments 1,085,993
Total cash, cash equivalents and investments 1,320,772 $
*These investments are uninsured and registered, with securities held by the
counterparty, in the City's or the pension trust's name.
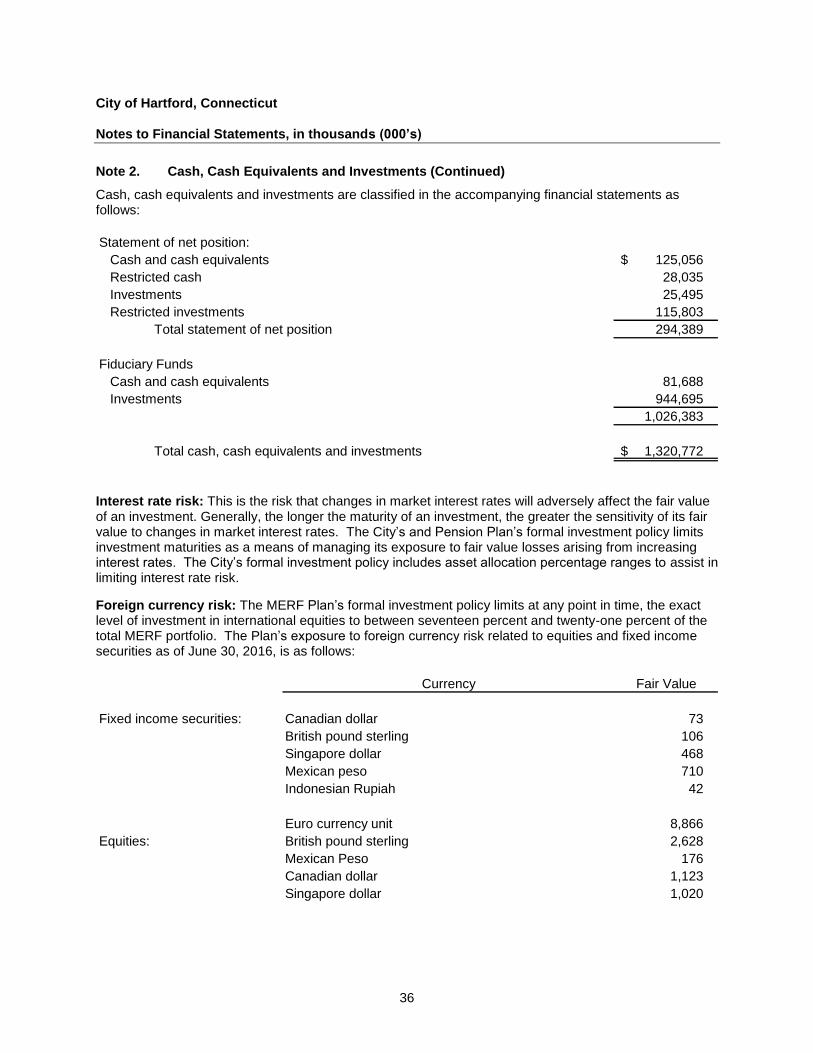
City of Hartford, Connecticut Notes to Financial Statements, in thousands (000’s)
36
Note 2. Cash, Cash Equivalents and Investments (Continued)
Cash, cash equivalents and investments are classified in the accompanying financial statements as follows:
Statement of net position:
Cash and cash equivalents 125,056 $
Restricted cash 28,035
Investments 25,495
Restricted investments 115,803
Total statement of net position 294,389
Fiduciary Funds
Cash and cash equivalents 81,688
Investments 944,695
1,026,383
Total cash, cash equivalents and investments 1,320,772 $
Interest rate risk: This is the risk that changes in market interest rates will adversely affect the fair value of an investment. Generally, the longer the maturity of an investment, the greater the sensitivity of its fair value to changes in market interest rates. The City’s and Pension Plan’s formal investment policy limits investment maturities as a means of managing its exposure to fair value losses arising from increasing interest rates. The City’s formal investment policy includes asset allocation percentage ranges to assist in limiting interest rate risk.
Foreign currency risk: The MERF Plan’s formal investment policy limits at any point in time, the exact level of investment in international equities to between seventeen percent and twenty-one percent of the total MERF portfolio. The Plan’s exposure to foreign currency risk related to equities and fixed income securities as of June 30, 2016, is as follows:
Currency Fair Value
Fixed income securities: Canadian dollar 73
British pound sterling 106
Singapore dollar 468
Mexican peso 710
Indonesian Rupiah 42
Euro currency unit 8,866
Equities: British pound sterling 2,628
Mexican Peso 176
Canadian dollar 1,123
Singapore dollar 1,020
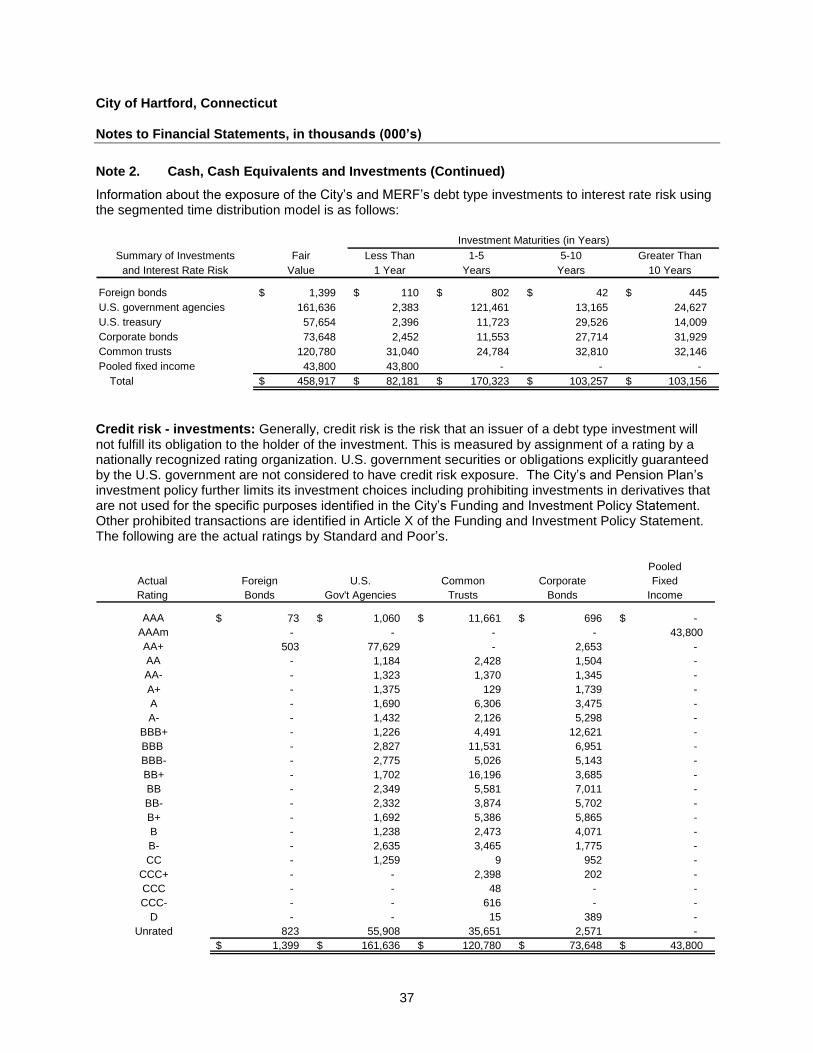
City of Hartford, Connecticut Notes to Financial Statements, in thousands (000’s)
37
Note 2. Cash, Cash Equivalents and Investments (Continued)
Information about the exposure of the City’s and MERF’s debt type investments to interest rate risk using the segmented time distribution model is as follows:
Summary of Investments Fair Less Than 1-5 5-10 Greater Than
and Interest Rate Risk Value 1 Year Years Years 10 Years
Foreign bonds 1,399 $ 110 $ 802 $ 42 $ 445 $
U.S. government agencies 161,636 2,383 121,461 13,165 24,627
U.S. treasury 57,654 2,396 11,723 29,526 14,009
Corporate bonds 73,648 2,452 11,553 27,714 31,929
Common trusts 120,780 31,040 24,784 32,810 32,146
Pooled fixed income 43,800 43,800 - - -
Total 458,917 $ 82,181 $ 170,323 $ 103,257 $ 103,156 $
Investment Maturities (in Years)
Credit risk - investments: Generally, credit risk is the risk that an issuer of a debt type investment will not fulfill its obligation to the holder of the investment. This is measured by assignment of a rating by a nationally recognized rating organization. U.S. government securities or obligations explicitly guaranteed by the U.S. government are not considered to have credit risk exposure. The City’s and Pension Plan’s investment policy further limits its investment choices including prohibiting investments in derivatives that are not used for the specific purposes identified in the City’s Funding and Investment Policy Statement. Other prohibited transactions are identified in Article X of the Funding and Investment Policy Statement. The following are the actual ratings by Standard and Poor’s.
Pooled
Actual Foreign U.S. Common Corporate Fixed
Rating Bonds Gov't Agencies Trusts Bonds Income
AAA 73 $ 1,060 $ 11,661 $ 696 $ -$
AAAm - - - - 43,800
AA+ 503 77,629 - 2,653 -
AA - 1,184 2,428 1,504 -
AA- - 1,323 1,370 1,345 -
A+ - 1,375 129 1,739 -
A - 1,690 6,306 3,475 -
A- - 1,432 2,126 5,298 -
BBB+ - 1,226 4,491 12,621 -
BBB - 2,827 11,531 6,951 -
BBB- - 2,775 5,026 5,143 -
BB+ - 1,702 16,196 3,685 -
BB - 2,349 5,581 7,011 -
BB- - 2,332 3,874 5,702 -
B+ - 1,692 5,386 5,865 -
B - 1,238 2,473 4,071 -
B- - 2,635 3,465 1,775 -
CC - 1,259 9 952 -
CCC+ - - 2,398 202 -
CCC - - 48 - -
CCC- - - 616 - -
D - - 15 389 -
Unrated 823 55,908 35,651 2,571 -
1,399 $ 161,636 $ 120,780 $ 73,648 $ 43,800 $
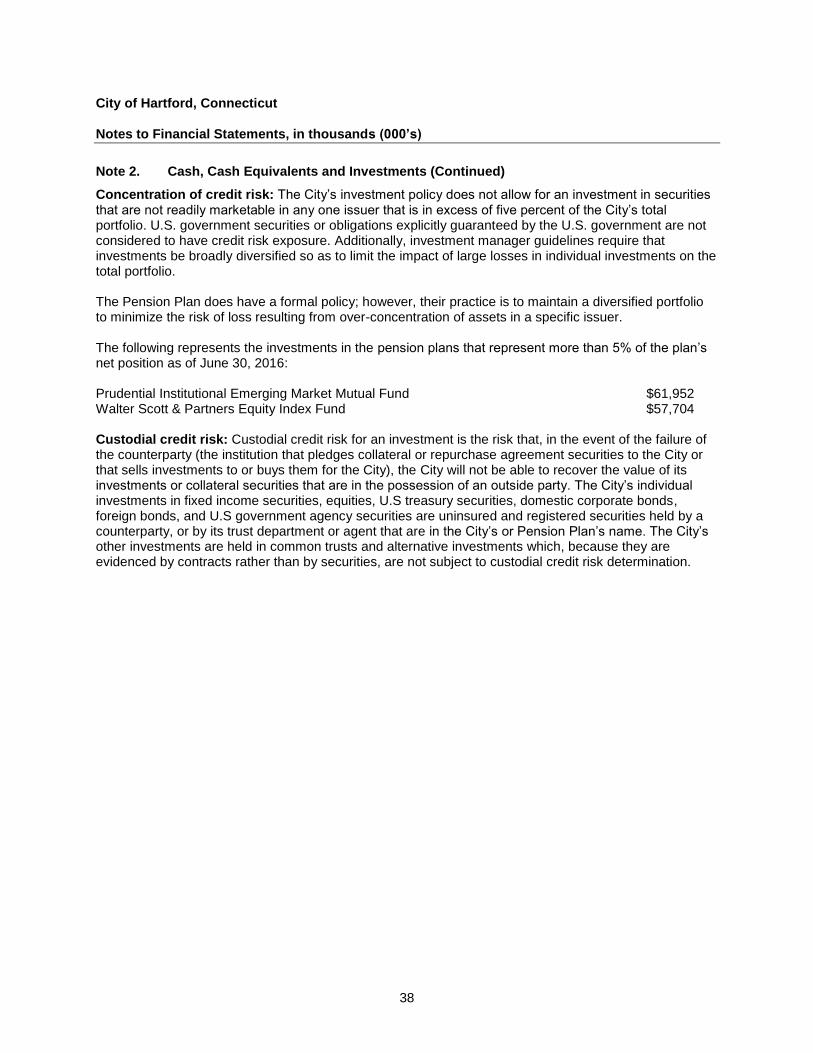
City of Hartford, Connecticut Notes to Financial Statements, in thousands (000’s)
38
Note 2. Cash, Cash Equivalents and Investments (Continued)
Concentration of credit risk: The City’s investment policy does not allow for an investment in securities that are not readily marketable in any one issuer that is in excess of five percent of the City’s total portfolio. U.S. government securities or obligations explicitly guaranteed by the U.S. government are not considered to have credit risk exposure. Additionally, investment manager guidelines require that investments be broadly diversified so as to limit the impact of large losses in individual investments on the total portfolio. The Pension Plan does have a formal policy; however, their practice is to maintain a diversified portfolio to minimize the risk of loss resulting from over-concentration of assets in a specific issuer. The following represents the investments in the pension plans that represent more than 5% of the plan’s net position as of June 30, 2016: Prudential Institutional Emerging Market Mutual Fund $61,952 Walter Scott & Partners Equity Index Fund $57,704 Custodial credit risk: Custodial credit risk for an investment is the risk that, in the event of the failure of the counterparty (the institution that pledges collateral or repurchase agreement securities to the City or that sells investments to or buys them for the City), the City will not be able to recover the value of its investments or collateral securities that are in the possession of an outside party. The City’s individual investments in fixed income securities, equities, U.S treasury securities, domestic corporate bonds, foreign bonds, and U.S government agency securities are uninsured and registered securities held by a counterparty, or by its trust department or agent that are in the City’s or Pension Plan’s name. The City’s other investments are held in common trusts and alternative investments which, because they are evidenced by contracts rather than by securities, are not subject to custodial credit risk determination.
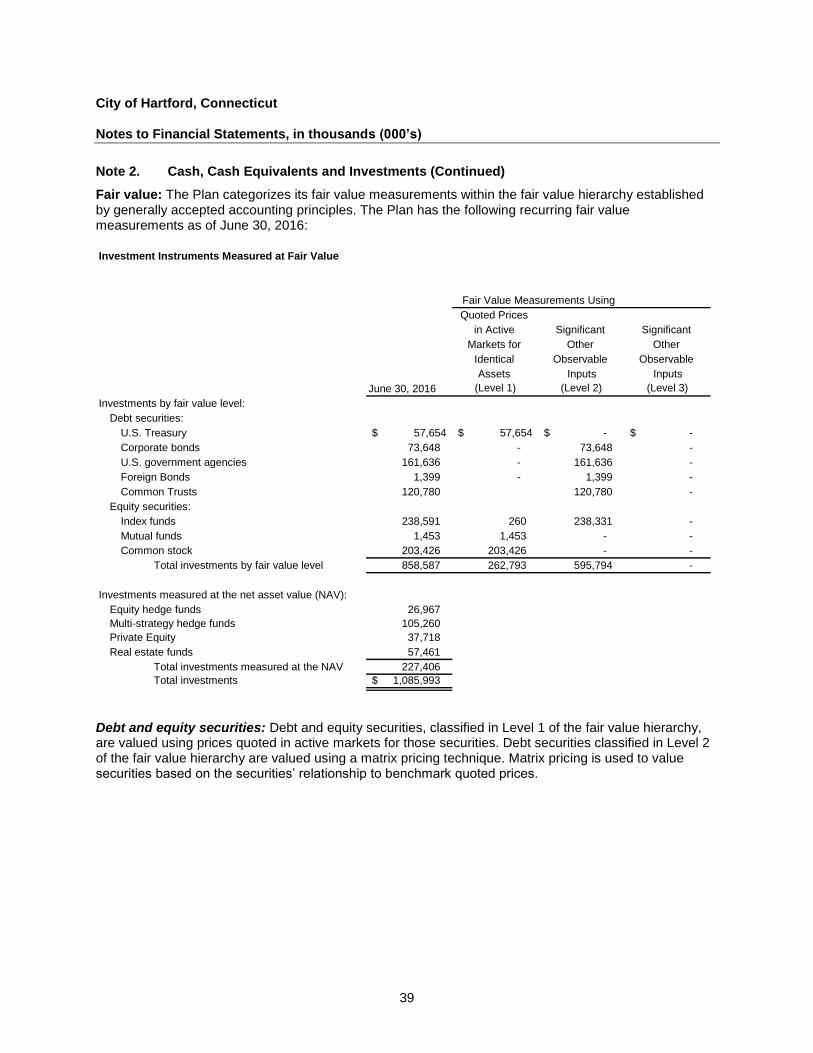
City of Hartford, Connecticut Notes to Financial Statements, in thousands (000’s)
39
Note 2. Cash, Cash Equivalents and Investments (Continued)
Fair value: The Plan categorizes its fair value measurements within the fair value hierarchy established by generally accepted accounting principles. The Plan has the following recurring fair value measurements as of June 30, 2016: Investment Instruments Measured at Fair Value
Quoted Prices
in Active Significant Significant
Markets for Other Other
Identical Observable Observable
Assets Inputs Inputs
June 30, 2016 (Level 1) (Level 2) (Level 3)
Investments by fair value level:
Debt securities:
U.S. Treasury 57,654$ 57,654$ -$ -$
Corporate bonds 73,648 - 73,648 -
U.S. government agencies 161,636 - 161,636 -
Foreign Bonds 1,399 - 1,399 -
Common Trusts 120,780 120,780 -
Equity securities:
Index funds 238,591 260 238,331 -
Mutual funds 1,453 1,453 - -
Common stock 203,426 203,426 - -
Total investments by fair value level 858,587 262,793 595,794 -
Investments measured at the net asset value (NAV):
Equity hedge funds 26,967
Multi-strategy hedge funds 105,260
Private Equity 37,718
Real estate funds 57,461
Total investments measured at the NAV 227,406
Total investments 1,085,993 $
Fair Value Measurements Using
Debt and equity securities: Debt and equity securities, classified in Level 1 of the fair value hierarchy, are valued using prices quoted in active markets for those securities. Debt securities classified in Level 2 of the fair value hierarchy are valued using a matrix pricing technique. Matrix pricing is used to value securities based on the securities’ relationship to benchmark quoted prices.
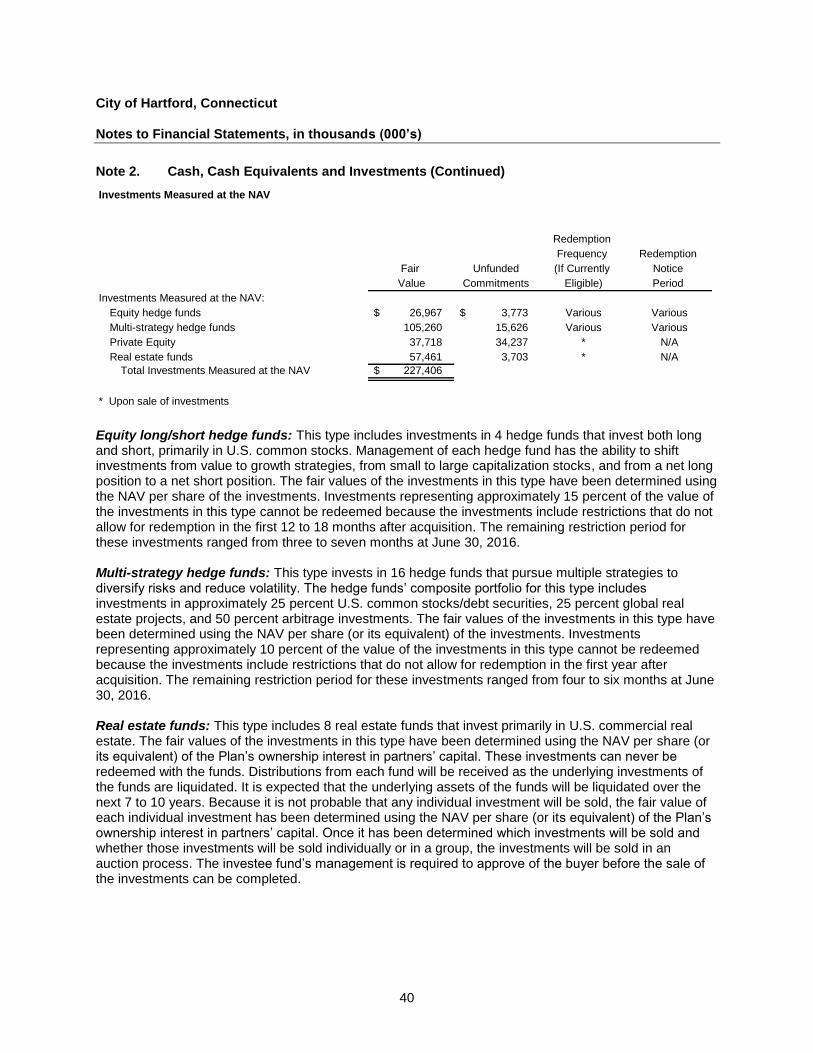
City of Hartford, Connecticut Notes to Financial Statements, in thousands (000’s)
40
Note 2. Cash, Cash Equivalents and Investments (Continued)
Investments Measured at the NAV
Redemption
Frequency Redemption
Fair Unfunded (If Currently Notice
Value Commitments Eligible) Period
Investments Measured at the NAV:
Equity hedge funds 26,967 $ 3,773 $ Various Various
Multi-strategy hedge funds 105,260 15,626 Various Various
Private Equity 37,718 34,237 * N/A
Real estate funds 57,461 3,703 * N/A
Total Investments Measured at the NAV 227,406 $
* Upon sale of investments
Equity long/short hedge funds: This type includes investments in 4 hedge funds that invest both long and short, primarily in U.S. common stocks. Management of each hedge fund has the ability to shift investments from value to growth strategies, from small to large capitalization stocks, and from a net long position to a net short position. The fair values of the investments in this type have been determined using the NAV per share of the investments. Investments representing approximately 15 percent of the value of the investments in this type cannot be redeemed because the investments include restrictions that do not allow for redemption in the first 12 to 18 months after acquisition. The remaining restriction period for these investments ranged from three to seven months at June 30, 2016. Multi-strategy hedge funds: This type invests in 16 hedge funds that pursue multiple strategies to diversify risks and reduce volatility. The hedge funds’ composite portfolio for this type includes investments in approximately 25 percent U.S. common stocks/debt securities, 25 percent global real estate projects, and 50 percent arbitrage investments. The fair values of the investments in this type have been determined using the NAV per share (or its equivalent) of the investments. Investments representing approximately 10 percent of the value of the investments in this type cannot be redeemed because the investments include restrictions that do not allow for redemption in the first year after acquisition. The remaining restriction period for these investments ranged from four to six months at June 30, 2016. Real estate funds: This type includes 8 real estate funds that invest primarily in U.S. commercial real estate. The fair values of the investments in this type have been determined using the NAV per share (or its equivalent) of the Plan’s ownership interest in partners’ capital. These investments can never be redeemed with the funds. Distributions from each fund will be received as the underlying investments of the funds are liquidated. It is expected that the underlying assets of the funds will be liquidated over the next 7 to 10 years. Because it is not probable that any individual investment will be sold, the fair value of each individual investment has been determined using the NAV per share (or its equivalent) of the Plan’s ownership interest in partners’ capital. Once it has been determined which investments will be sold and whether those investments will be sold individually or in a group, the investments will be sold in an auction process. The investee fund’s management is required to approve of the buyer before the sale of the investments can be completed.
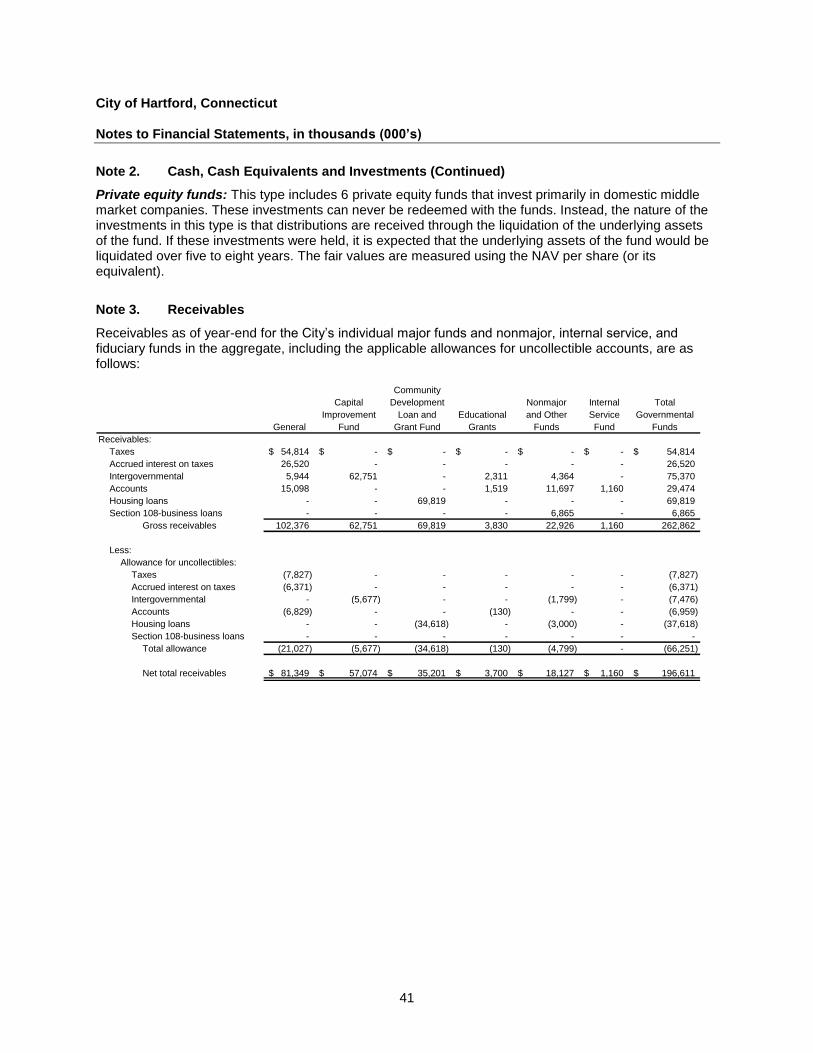
City of Hartford, Connecticut Notes to Financial Statements, in thousands (000’s)
41
Note 2. Cash, Cash Equivalents and Investments (Continued)
Private equity funds: This type includes 6 private equity funds that invest primarily in domestic middle market companies. These investments can never be redeemed with the funds. Instead, the nature of the investments in this type is that distributions are received through the liquidation of the underlying assets of the fund. If these investments were held, it is expected that the underlying assets of the fund would be liquidated over five to eight years. The fair values are measured using the NAV per share (or its equivalent).
Note 3. Receivables
Receivables as of year-end for the City’s individual major funds and nonmajor, internal service, and fiduciary funds in the aggregate, including the applicable allowances for uncollectible accounts, are as follows:
Community
Capital Development Nonmajor Internal Total
Improvement Loan and Educational and Other Service Governmental
General Fund Grant Fund Grants Funds Fund Funds
Receivables:
Taxes 54,814$ -$ -$ -$ -$ -$ 54,814$
Accrued interest on taxes 26,520 - - - - - 26,520
Intergovernmental 5,944 62,751 - 2,311 4,364 - 75,370
Accounts 15,098 - - 1,519 11,697 1,160 29,474
Housing loans - - 69,819 - - - 69,819
Section 108-business loans - - - - 6,865 - 6,865
Gross receivables 102,376 62,751 69,819 3,830 22,926 1,160 262,862
Less:
Allowance for uncollectibles:
Taxes (7,827) - - - - - (7,827)
Accrued interest on taxes (6,371) - - - - - (6,371)
Intergovernmental - (5,677) - - (1,799) - (7,476)
Accounts (6,829) - - (130) - - (6,959)
Housing loans - - (34,618) - (3,000) - (37,618)
Section 108-business loans - - - - - - -
Total allowance (21,027) (5,677) (34,618) (130) (4,799) - (66,251)
Net total receivables 81,349$ 57,074$ 35,201$ 3,700$ 18,127$ 1,160$ 196,611$
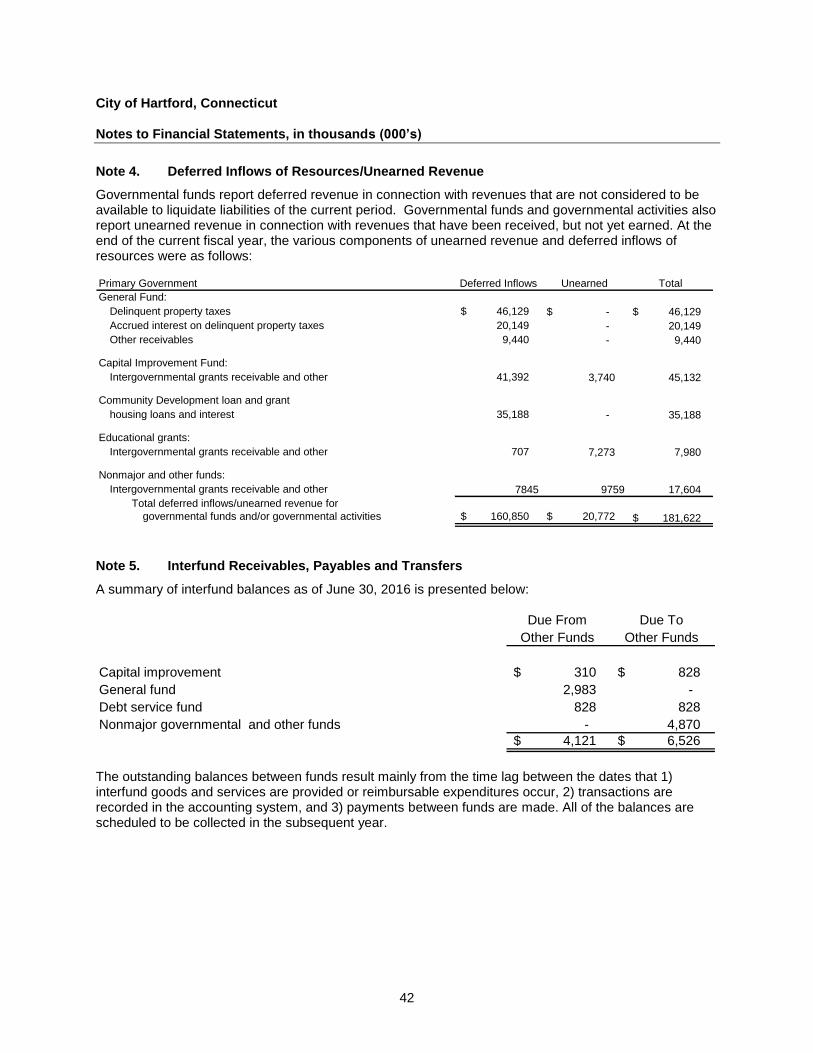
City of Hartford, Connecticut Notes to Financial Statements, in thousands (000’s)
42
Note 4. Deferred Inflows of Resources/Unearned Revenue
Governmental funds report deferred revenue in connection with revenues that are not considered to be available to liquidate liabilities of the current period. Governmental funds and governmental activities also report unearned revenue in connection with revenues that have been received, but not yet earned. At the end of the current fiscal year, the various components of unearned revenue and deferred inflows of resources were as follows:
Primary Government Deferred Inflows Unearned Total
General Fund:
Delinquent property taxes 46,129 $ -$ 46,129 $
Accrued interest on delinquent property taxes 20,149 - 20,149
Other receivables 9,440 - 9,440
Capital Improvement Fund:
Intergovernmental grants receivable and other 41,392 3,740 45,132
Community Development loan and grant
housing loans and interest 35,188 - 35,188
Educational grants:
Intergovernmental grants receivable and other 707 7,273 7,980
Nonmajor and other funds:
Intergovernmental grants receivable and other 7845 9759 17,604
Total deferred inflows/unearned revenue for
governmental funds and/or governmental activities 160,850 $ 20,772 $ 181,622 $
Note 5. Interfund Receivables, Payables and Transfers
A summary of interfund balances as of June 30, 2016 is presented below:
Due From Due To
Other Funds Other Funds
Capital improvement 310 $ 828 $
General fund 2,983 -
Debt service fund 828 828
Nonmajor governmental and other funds - 4,870
4,121 $ 6,526 $
The outstanding balances between funds result mainly from the time lag between the dates that 1) interfund goods and services are provided or reimbursable expenditures occur, 2) transactions are recorded in the accounting system, and 3) payments between funds are made. All of the balances are scheduled to be collected in the subsequent year.
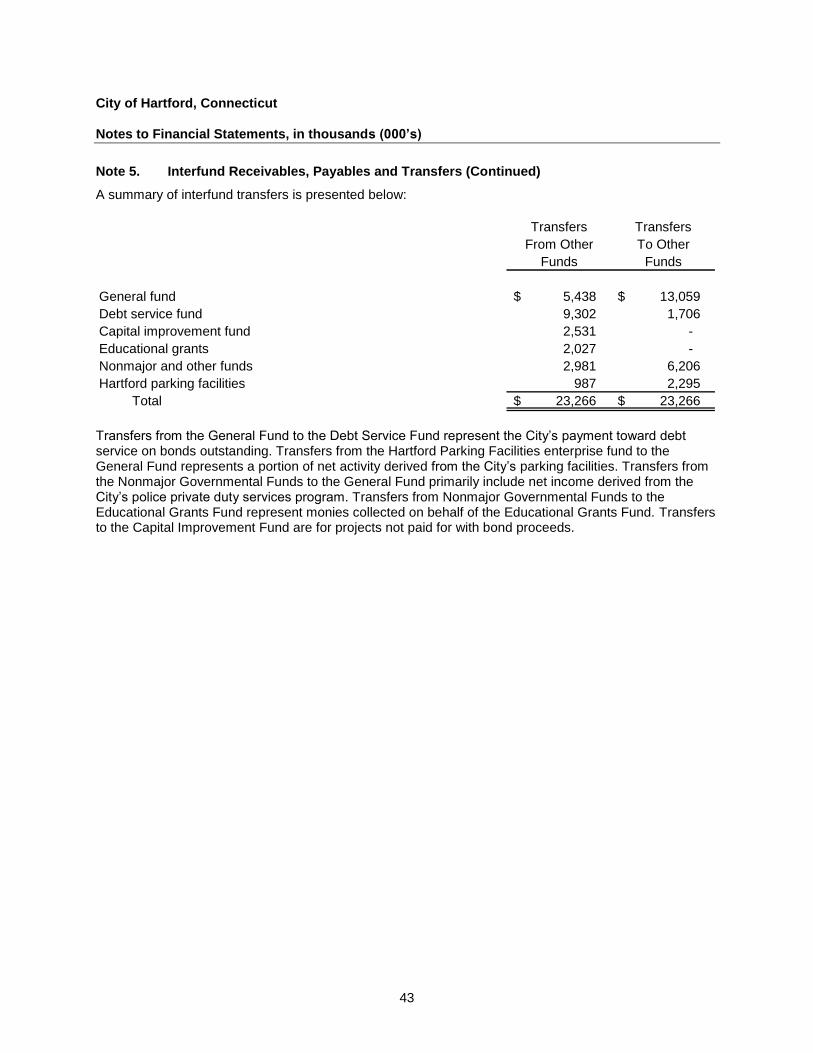
City of Hartford, Connecticut Notes to Financial Statements, in thousands (000’s)
43
Note 5. Interfund Receivables, Payables and Transfers (Continued)
A summary of interfund transfers is presented below:
Transfers Transfers
From Other To Other
Funds Funds
General fund 5,438 $ 13,059 $
Debt service fund 9,302 1,706
Capital improvement fund 2,531 -
Educational grants 2,027 -
Nonmajor and other funds 2,981 6,206
Hartford parking facilities 987 2,295
Total 23,266 $ 23,266 $
Transfers from the General Fund to the Debt Service Fund represent the City’s payment toward debt service on bonds outstanding. Transfers from the Hartford Parking Facilities enterprise fund to the General Fund represents a portion of net activity derived from the City’s parking facilities. Transfers from the Nonmajor Governmental Funds to the General Fund primarily include net income derived from the City’s police private duty services program. Transfers from Nonmajor Governmental Funds to the Educational Grants Fund represent monies collected on behalf of the Educational Grants Fund. Transfers to the Capital Improvement Fund are for projects not paid for with bond proceeds.
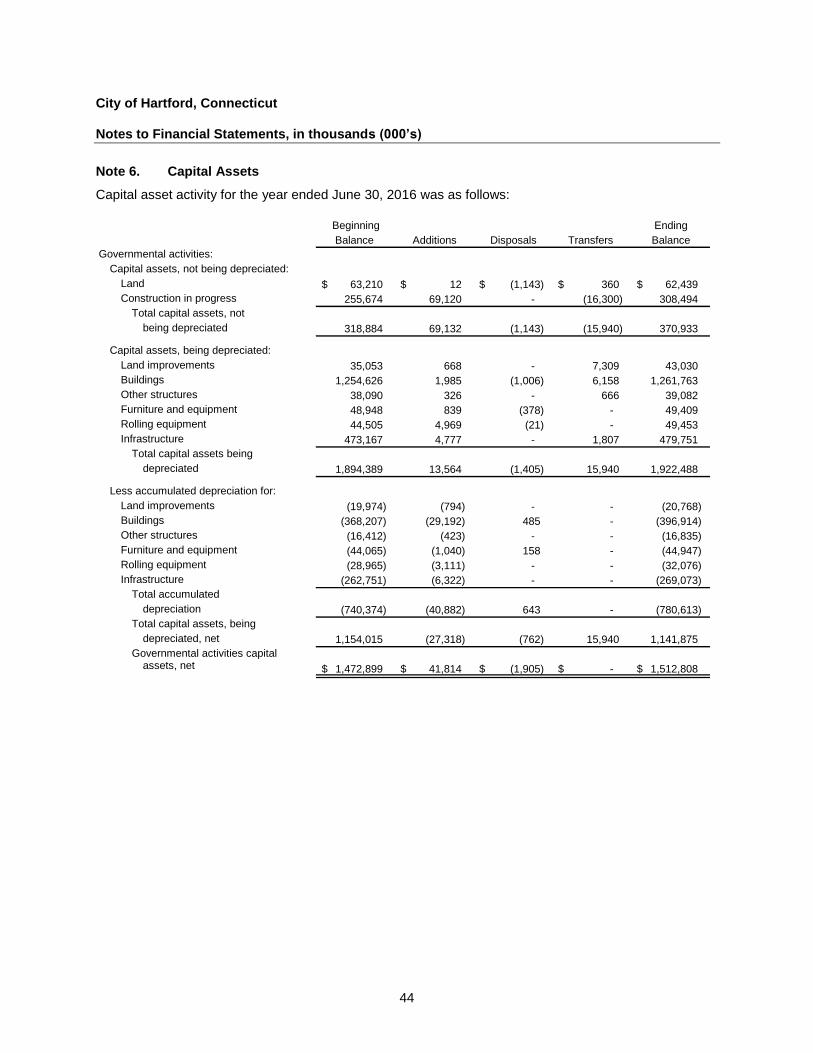
City of Hartford, Connecticut Notes to Financial Statements, in thousands (000’s)
44
Note 6. Capital Assets
Capital asset activity for the year ended June 30, 2016 was as follows:
Beginning Ending
Balance Additions Disposals Transfers Balance
Governmental activities:
Capital assets, not being depreciated:
Land 63,210 $ 12 $ (1,143) $ 360 $ 62,439 $
Construction in progress 255,674 69,120 - (16,300) 308,494
Total capital assets, not
being depreciated 318,884 69,132 (1,143) (15,940) 370,933
Capital assets, being depreciated:
Land improvements 35,053 668 - 7,309 43,030
Buildings 1,254,626 1,985 (1,006) 6,158 1,261,763
Other structures 38,090 326 - 666 39,082
Furniture and equipment 48,948 839 (378) - 49,409
Rolling equipment 44,505 4,969 (21) - 49,453
Infrastructure 473,167 4,777 - 1,807 479,751
Total capital assets being
depreciated 1,894,389 13,564 (1,405) 15,940 1,922,488
Less accumulated depreciation for:
Land improvements (19,974) (794) - - (20,768)
Buildings (368,207) (29,192) 485 - (396,914)
Other structures (16,412) (423) - - (16,835)
Furniture and equipment (44,065) (1,040) 158 - (44,947)
Rolling equipment (28,965) (3,111) - - (32,076)
Infrastructure (262,751) (6,322) - - (269,073)
Total accumulated
depreciation (740,374) (40,882) 643 - (780,613)
Total capital assets, being
depreciated, net 1,154,015 (27,318) (762) 15,940 1,141,875
Governmental activities capital assets, net 1,472,899 $ 41,814 $ (1,905) $ -$ 1,512,808 $
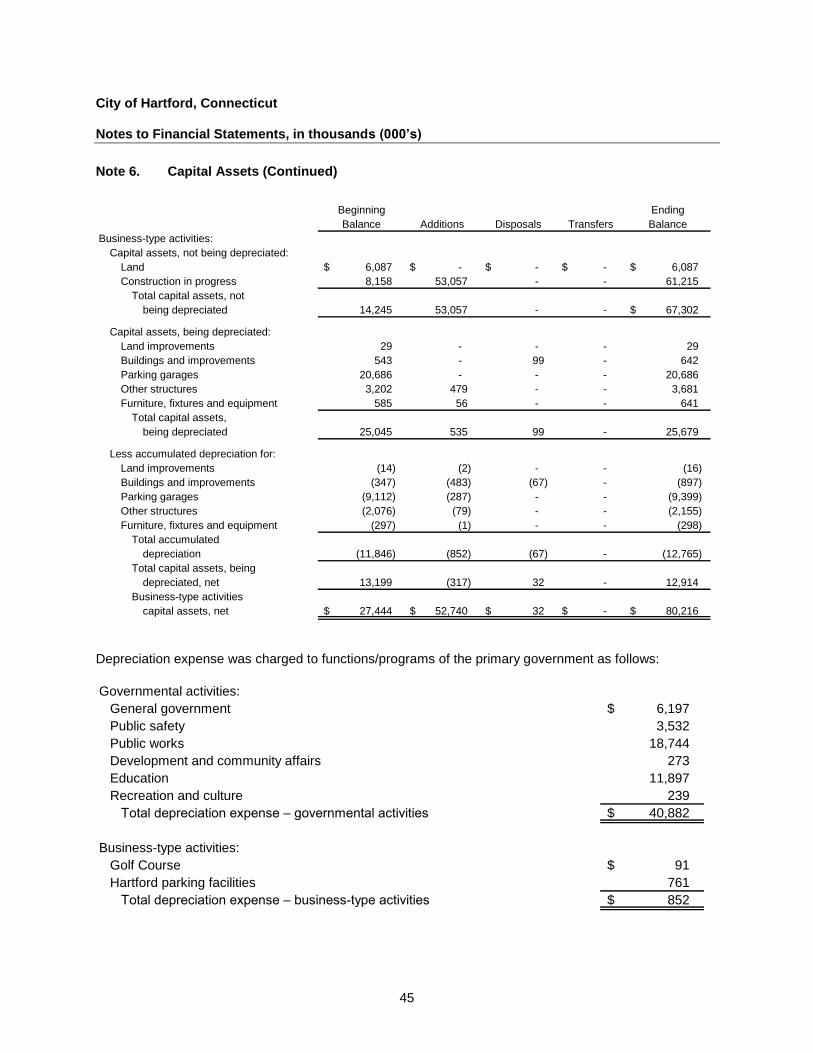
City of Hartford, Connecticut Notes to Financial Statements, in thousands (000’s)
45
Note 6. Capital Assets (Continued)
Beginning Ending
Balance Additions Disposals Transfers Balance
Business-type activities:
Capital assets, not being depreciated:
Land 6,087 $ -$ -$ -$ 6,087 $
Construction in progress 8,158 53,057 - - 61,215
Total capital assets, not
being depreciated 14,245 53,057 - - 67,302 $
Capital assets, being depreciated:
Land improvements 29 - - - 29
Buildings and improvements 543 - 99 - 642
Parking garages 20,686 - - - 20,686
Other structures 3,202 479 - - 3,681
Furniture, fixtures and equipment 585 56 - - 641
Total capital assets,
being depreciated 25,045 535 99 - 25,679
Less accumulated depreciation for:
Land improvements (14) (2) - - (16)
Buildings and improvements (347) (483) (67) - (897)
Parking garages (9,112) (287) - - (9,399)
Other structures (2,076) (79) - - (2,155)
Furniture, fixtures and equipment (297) (1) - - (298)
Total accumulated
depreciation (11,846) (852) (67) - (12,765)
Total capital assets, being
depreciated, net 13,199 (317) 32 - 12,914
Business-type activities
capital assets, net 27,444 $ 52,740 $ 32 $ -$ 80,216 $
Depreciation expense was charged to functions/programs of the primary government as follows:
Governmental activities:
General government 6,197 $
Public safety 3,532
Public works 18,744
Development and community affairs 273
Education 11,897
Recreation and culture 239
Total depreciation expense – governmental activities 40,882 $
Business-type activities:
Golf Course 91 $
Hartford parking facilities 761
Total depreciation expense – business-type activities 852 $
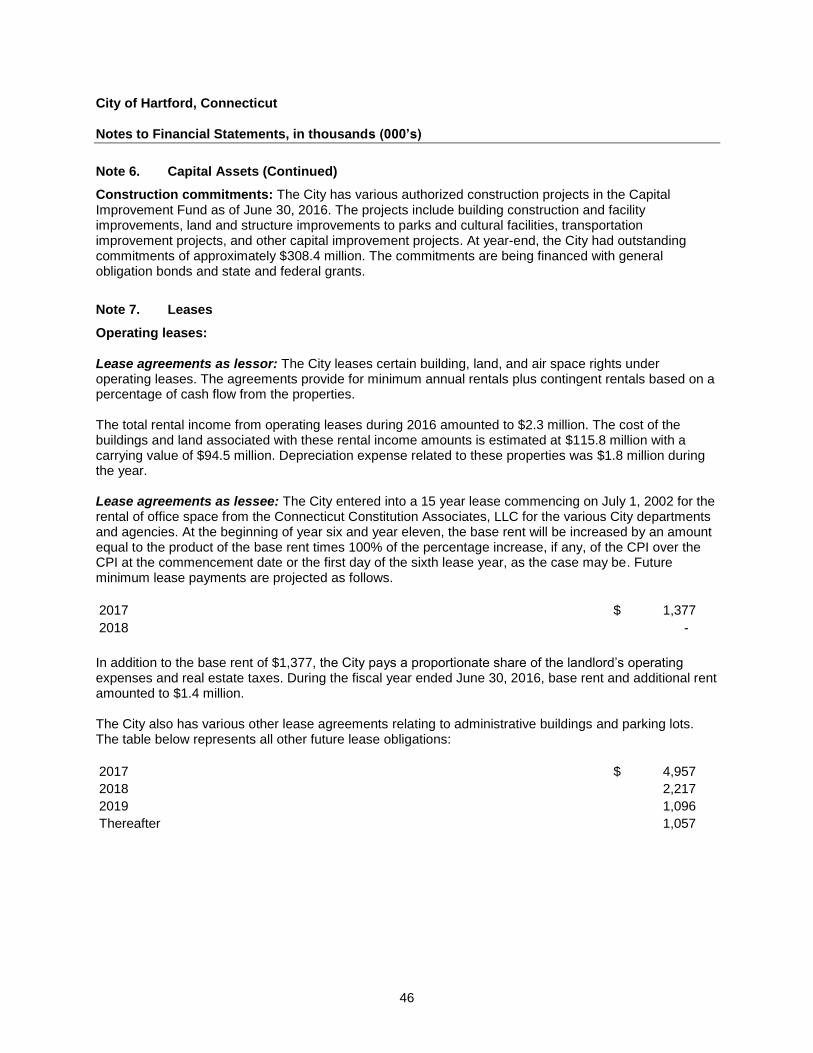
City of Hartford, Connecticut Notes to Financial Statements, in thousands (000’s)
46
Note 6. Capital Assets (Continued)
Construction commitments: The City has various authorized construction projects in the Capital Improvement Fund as of June 30, 2016. The projects include building construction and facility improvements, land and structure improvements to parks and cultural facilities, transportation improvement projects, and other capital improvement projects. At year-end, the City had outstanding commitments of approximately $308.4 million. The commitments are being financed with general obligation bonds and state and federal grants.
Note 7. Leases
Operating leases: Lease agreements as lessor: The City leases certain building, land, and air space rights under operating leases. The agreements provide for minimum annual rentals plus contingent rentals based on a percentage of cash flow from the properties. The total rental income from operating leases during 2016 amounted to $2.3 million. The cost of the buildings and land associated with these rental income amounts is estimated at $115.8 million with a carrying value of $94.5 million. Depreciation expense related to these properties was $1.8 million during the year. Lease agreements as lessee: The City entered into a 15 year lease commencing on July 1, 2002 for the rental of office space from the Connecticut Constitution Associates, LLC for the various City departments and agencies. At the beginning of year six and year eleven, the base rent will be increased by an amount equal to the product of the base rent times 100% of the percentage increase, if any, of the CPI over the CPI at the commencement date or the first day of the sixth lease year, as the case may be. Future minimum lease payments are projected as follows.
2017 1,377 $
2018 -
In addition to the base rent of $1,377, the City pays a proportionate share of the landlord’s operating expenses and real estate taxes. During the fiscal year ended June 30, 2016, base rent and additional rent amounted to $1.4 million. The City also has various other lease agreements relating to administrative buildings and parking lots. The table below represents all other future lease obligations:
2017 4,957 $
2018 2,217
2019 1,096
Thereafter 1,057
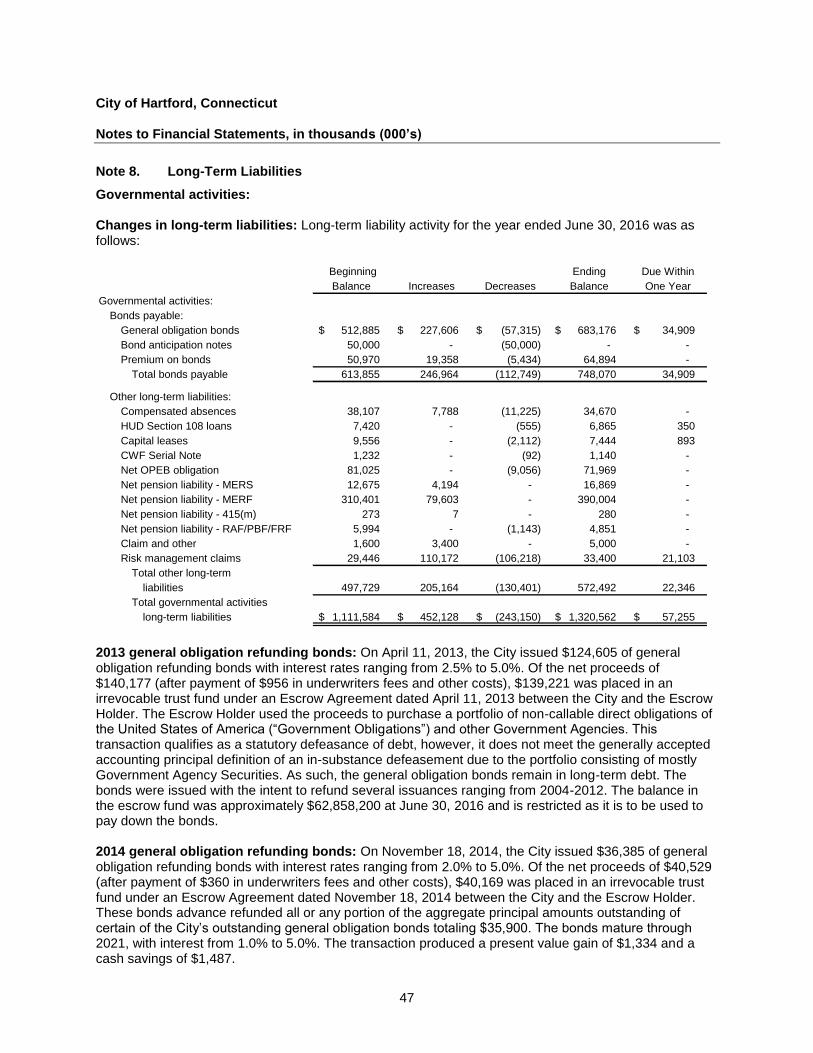
City of Hartford, Connecticut Notes to Financial Statements, in thousands (000’s)
47
Note 8. Long-Term Liabilities
Governmental activities: Changes in long-term liabilities: Long-term liability activity for the year ended June 30, 2016 was as follows:
Beginning Ending Due Within
Balance Increases Decreases Balance One Year
Governmental activities:
Bonds payable:
General obligation bonds 512,885 $ 227,606 $ (57,315) $ 683,176 $ 34,909 $
Bond anticipation notes 50,000 - (50,000) - -
Premium on bonds 50,970 19,358 (5,434) 64,894 -
Total bonds payable 613,855 246,964 (112,749) 748,070 34,909
Other long-term liabilities:
Compensated absences 38,107 7,788 (11,225) 34,670 -
HUD Section 108 loans 7,420 - (555) 6,865 350
Capital leases 9,556 - (2,112) 7,444 893
CWF Serial Note 1,232 - (92) 1,140 -
Net OPEB obligation 81,025 - (9,056) 71,969 -
Net pension liability - MERS 12,675 4,194 - 16,869 -
Net pension liability - MERF 310,401 79,603 - 390,004 -
Net pension liability - 415(m) 273 7 - 280 -
Net pension liability - RAF/PBF/FRF 5,994 - (1,143) 4,851 -
Claim and other 1,600 3,400 - 5,000 -
Risk management claims 29,446 110,172 (106,218) 33,400 21,103
Total other long-term
liabilities 497,729 205,164 (130,401) 572,492 22,346
Total governmental activities
long-term liabilities 1,111,584 $ 452,128 $ (243,150) $ 1,320,562 $ 57,255 $
2013 general obligation refunding bonds: On April 11, 2013, the City issued $124,605 of general obligation refunding bonds with interest rates ranging from 2.5% to 5.0%. Of the net proceeds of $140,177 (after payment of $956 in underwriters fees and other costs), $139,221 was placed in an irrevocable trust fund under an Escrow Agreement dated April 11, 2013 between the City and the Escrow Holder. The Escrow Holder used the proceeds to purchase a portfolio of non-callable direct obligations of the United States of America (“Government Obligations”) and other Government Agencies. This transaction qualifies as a statutory defeasance of debt, however, it does not meet the generally accepted accounting principal definition of an in-substance defeasement due to the portfolio consisting of mostly Government Agency Securities. As such, the general obligation bonds remain in long-term debt. The bonds were issued with the intent to refund several issuances ranging from 2004-2012. The balance in the escrow fund was approximately $62,858,200 at June 30, 2016 and is restricted as it is to be used to pay down the bonds. 2014 general obligation refunding bonds: On November 18, 2014, the City issued $36,385 of general obligation refunding bonds with interest rates ranging from 2.0% to 5.0%. Of the net proceeds of $40,529 (after payment of $360 in underwriters fees and other costs), $40,169 was placed in an irrevocable trust fund under an Escrow Agreement dated November 18, 2014 between the City and the Escrow Holder. These bonds advance refunded all or any portion of the aggregate principal amounts outstanding of certain of the City’s outstanding general obligation bonds totaling $35,900. The bonds mature through 2021, with interest from 1.0% to 5.0%. The transaction produced a present value gain of $1,334 and a cash savings of $1,487.
City of Hartford, Connecticut Notes to Financial Statements, in thousands (000’s)
48
Note 8. Long-Term Liabilities (Continued)
2015 general obligation bonds: On October 7, 2015, the City issued $125,000 of general obligation bonds. The bonds mature through 2035, with interest from 3.0% to 5.0%. 2015 general obligation refunding bonds: On July 8, 2015, the City issued $78,060 of general obligation refunding bonds with interest rates ranging from 3.0% to 5.0%. Of the net proceeds of $83,603 (after payment of $976 in underwriters fees and other costs), $82,627 was placed in an irrevocable trust fund under an Escrow Agreement dated July 8, 2015 between the City and the Escrow Holder. The transaction produced a present value loss of $6,346. The Escrow Holder used the proceeds to purchase a portfolio of non-callable direct obligations of the United States of America (“Government Obligations”) and other Government Agencies. This transaction qualifies as a statutory defeasance of debt, however, it does not meet the generally accepted accounting principal definition of an in-substance defeasement due to the portfolio consisting of mostly Government Agency Securities. As such, the general obligation bonds remain in long-term debt. The balance in the escrow fund was approximately $64,534 at June 30, 2016 and is restricted as it is to be used to pay down the bonds. 2016 general obligation refunding bonds: On April 28, 2016, the City issued $26,805 of general obligation refunding bonds with interest rates ranging from 2.0% to 5.0%. Of the net proceeds of $30,657 (after payment of $460 in underwriters fees and other costs), $30,197 was placed in an irrevocable trust fund under an Escrow Agreement dated April 28, 2016 between the City and the Escrow Holder. These bonds advance refunded all or any portion of the aggregate principal amounts outstanding of certain of the City’s outstanding general obligation bonds totaling $24,546, with the remaining $2,259 within the Hartford Parking Facilities fund. The bonds mature through 2034, with interest from 3.0% to 5.0%. The transaction produced a present value gain of $509 and cash savings of $719.
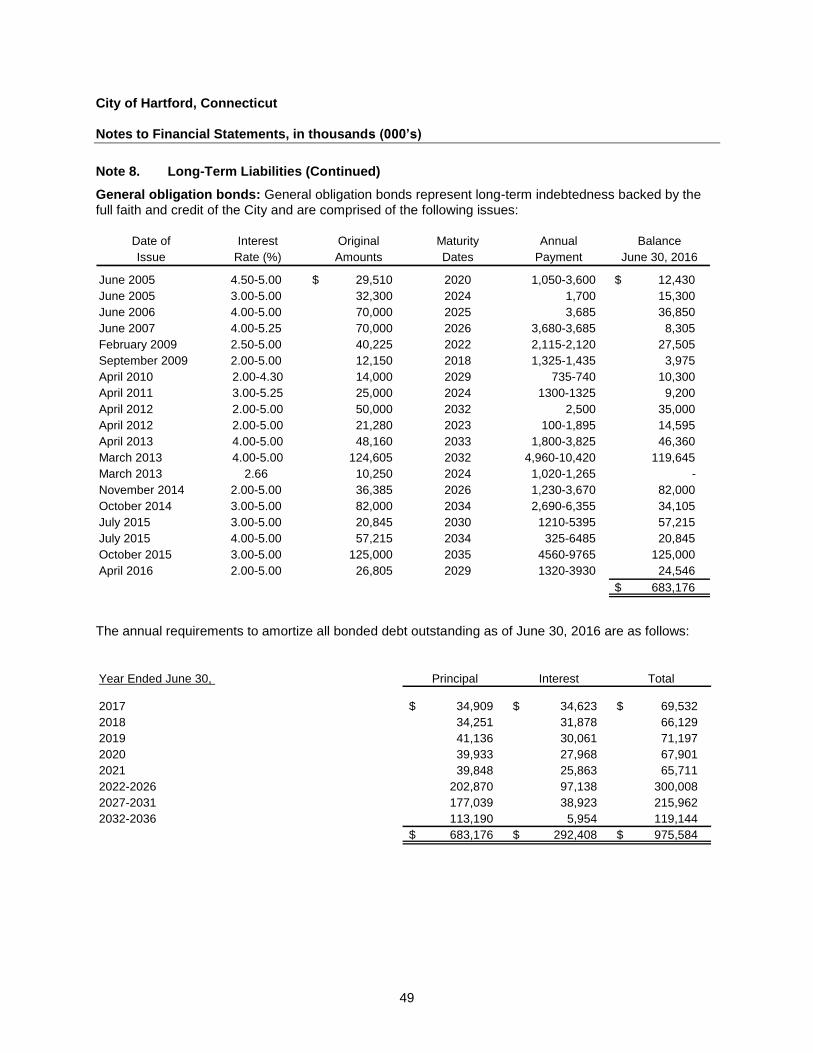
City of Hartford, Connecticut Notes to Financial Statements, in thousands (000’s)
49
Note 8. Long-Term Liabilities (Continued)
General obligation bonds: General obligation bonds represent long-term indebtedness backed by the full faith and credit of the City and are comprised of the following issues:
Date of Interest Original Maturity Annual Balance
Issue Rate (%) Amounts Dates Payment June 30, 2016
June 2005 4.50-5.00 $ 29,510 2020 1,050-3,600 $ 12,430
June 2005 3.00-5.00 32,300 2024 1,700 15,300
June 2006 4.00-5.00 70,000 2025 3,685 36,850
June 2007 4.00-5.25 70,000 2026 3,680-3,685 8,305
February 2009 2.50-5.00 40,225 2022 2,115-2,120 27,505
September 2009 2.00-5.00 12,150 2018 1,325-1,435 3,975
April 2010 2.00-4.30 14,000 2029 735-740 10,300
April 2011 3.00-5.25 25,000 2024 1300-1325 9,200
April 2012 2.00-5.00 50,000 2032 2,500 35,000
April 2012 2.00-5.00 21,280 2023 100-1,895 14,595
April 2013 4.00-5.00 48,160 2033 1,800-3,825 46,360
March 2013 4.00-5.00 124,605 2032 4,960-10,420 119,645
March 2013 2.66 10,250 2024 1,020-1,265 -
November 2014 2.00-5.00 36,385 2026 1,230-3,670 82,000
October 2014 3.00-5.00 82,000 2034 2,690-6,355 34,105
July 2015 3.00-5.00 20,845 2030 1210-5395 57,215
July 2015 4.00-5.00 57,215 2034 325-6485 20,845
October 2015 3.00-5.00 125,000 2035 4560-9765 125,000
April 2016 2.00-5.00 26,805 2029 1320-3930 24,546
$ 683,176
The annual requirements to amortize all bonded debt outstanding as of June 30, 2016 are as follows:
Year Ended June 30, Principal Interest Total
2017 34,909 $ 34,623 $ 69,532 $
2018 34,251 31,878 66,129
2019 41,136 30,061 71,197
2020 39,933 27,968 67,901
2021 39,848 25,863 65,711
2022-2026 202,870 97,138 300,008
2027-2031 177,039 38,923 215,962
2032-2036 113,190 5,954 119,144
683,176 $ 292,408 $ 975,584 $
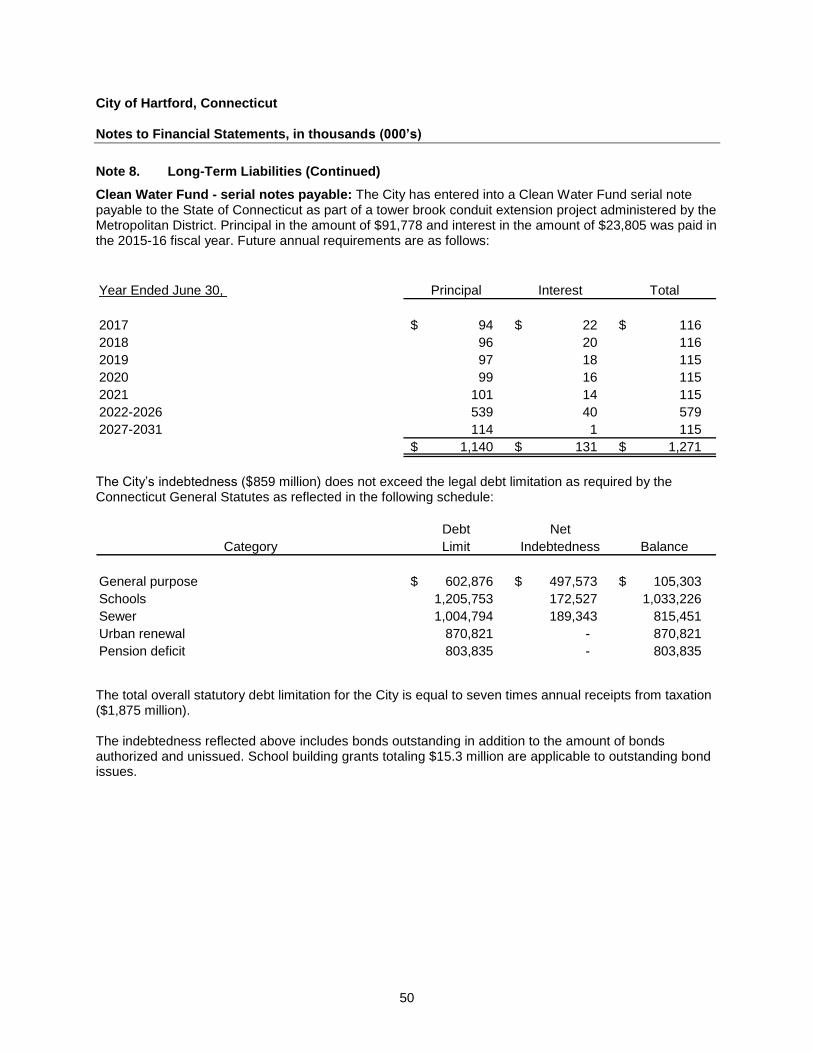
City of Hartford, Connecticut Notes to Financial Statements, in thousands (000’s)
50
Note 8. Long-Term Liabilities (Continued)
Clean Water Fund - serial notes payable: The City has entered into a Clean Water Fund serial note payable to the State of Connecticut as part of a tower brook conduit extension project administered by the Metropolitan District. Principal in the amount of $91,778 and interest in the amount of $23,805 was paid in the 2015-16 fiscal year. Future annual requirements are as follows:
Year Ended June 30, Principal Interest Total
2017 94 $ 22 $ 116 $
2018 96 20 116
2019 97 18 115
2020 99 16 115
2021 101 14 115
2022-2026 539 40 579
2027-2031 114 1 115
1,140 $ 131 $ 1,271 $
The City’s indebtedness ($859 million) does not exceed the legal debt limitation as required by the Connecticut General Statutes as reflected in the following schedule:
Debt Net
Category Limit Indebtedness Balance
General purpose 602,876 $ 497,573 $ 105,303 $
Schools 1,205,753 172,527 1,033,226
Sewer 1,004,794 189,343 815,451
Urban renewal 870,821 - 870,821
Pension deficit 803,835 - 803,835
The total overall statutory debt limitation for the City is equal to seven times annual receipts from taxation ($1,875 million). The indebtedness reflected above includes bonds outstanding in addition to the amount of bonds authorized and unissued. School building grants totaling $15.3 million are applicable to outstanding bond issues.
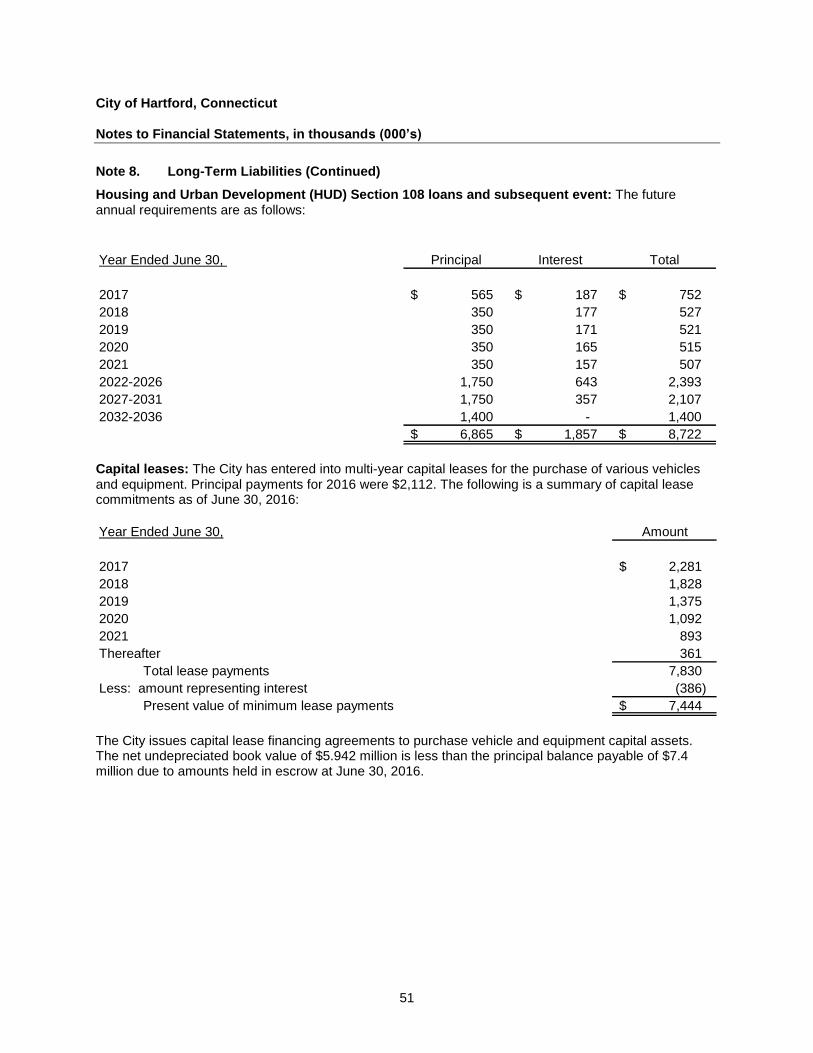
City of Hartford, Connecticut Notes to Financial Statements, in thousands (000’s)
51
Note 8. Long-Term Liabilities (Continued)
Housing and Urban Development (HUD) Section 108 loans and subsequent event: The future annual requirements are as follows:
Year Ended June 30, Principal Interest Total
2017 565 $ 187 $ 752 $
2018 350 177 527
2019 350 171 521
2020 350 165 515
2021 350 157 507
2022-2026 1,750 643 2,393
2027-2031 1,750 357 2,107
2032-2036 1,400 - 1,400
6,865 $ 1,857 $ 8,722 $
Capital leases: The City has entered into multi-year capital leases for the purchase of various vehicles and equipment. Principal payments for 2016 were $2,112. The following is a summary of capital lease commitments as of June 30, 2016:
Year Ended June 30, Amount
2017 2,281 $
2018 1,828
2019 1,375
2020 1,092
2021 893
Thereafter 361
Total lease payments 7,830
Less: amount representing interest (386)
Present value of minimum lease payments 7,444 $
The City issues capital lease financing agreements to purchase vehicle and equipment capital assets. The net undepreciated book value of $5.942 million is less than the principal balance payable of $7.4 million due to amounts held in escrow at June 30, 2016.
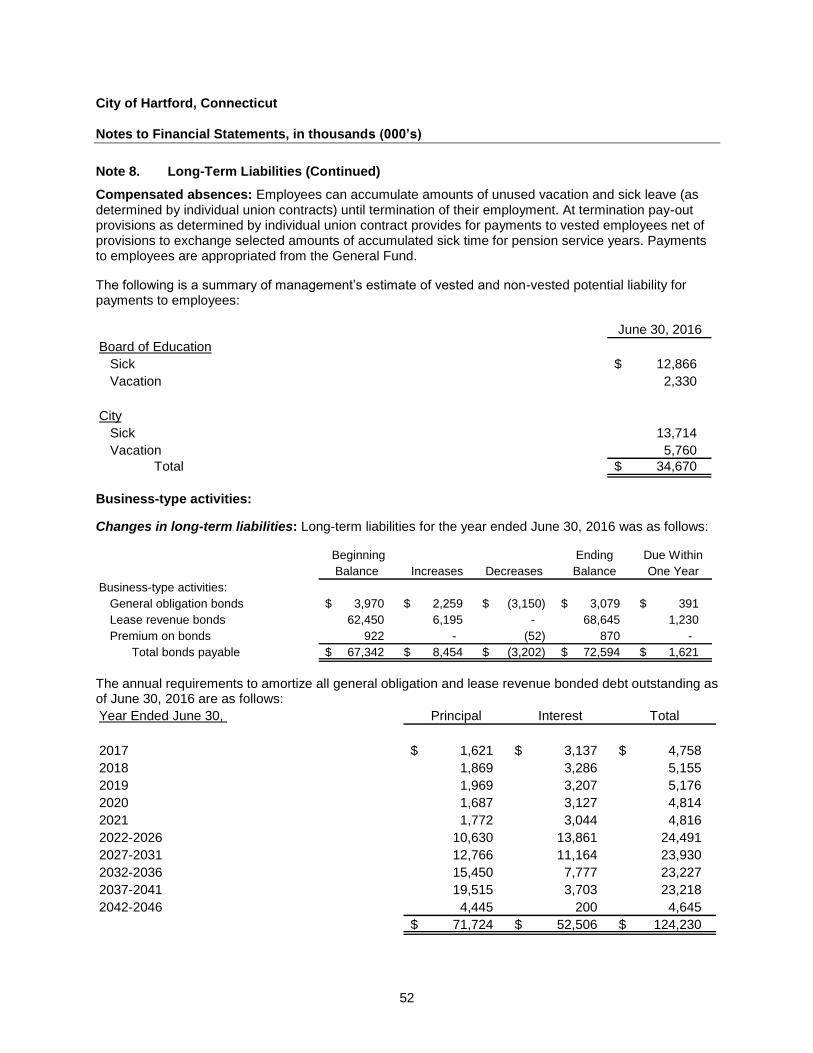
City of Hartford, Connecticut Notes to Financial Statements, in thousands (000’s)
52
Note 8. Long-Term Liabilities (Continued)
Compensated absences: Employees can accumulate amounts of unused vacation and sick leave (as determined by individual union contracts) until termination of their employment. At termination pay-out provisions as determined by individual union contract provides for payments to vested employees net of provisions to exchange selected amounts of accumulated sick time for pension service years. Payments to employees are appropriated from the General Fund.
The following is a summary of management’s estimate of vested and non-vested potential liability for payments to employees:
June 30, 2016
Board of Education
Sick 12,866 $
Vacation 2,330
City
Sick 13,714
Vacation 5,760
Total 34,670 $
Business-type activities:
Changes in long-term liabilities: Long-term liabilities for the year ended June 30, 2016 was as follows:
Beginning Ending Due Within
Balance Increases Decreases Balance One Year
Business-type activities:
General obligation bonds 3,970 $ 2,259 $ (3,150) $ 3,079 $ 391 $
Lease revenue bonds 62,450 6,195 - 68,645 1,230
Premium on bonds 922 - (52) 870 -
Total bonds payable 67,342 $ 8,454 $ (3,202) $ 72,594 $ 1,621 $
The annual requirements to amortize all general obligation and lease revenue bonded debt outstanding as of June 30, 2016 are as follows:
Year Ended June 30, Principal Interest Total
2017 1,621 $ 3,137 $ 4,758 $
2018 1,869 3,286 5,155
2019 1,969 3,207 5,176
2020 1,687 3,127 4,814
2021 1,772 3,044 4,816
2022-2026 10,630 13,861 24,491
2027-2031 12,766 11,164 23,930
2032-2036 15,450 7,777 23,227
2037-2041 19,515 3,703 23,218
2042-2046 4,445 200 4,645
71,724 $ 52,506 $ 124,230 $
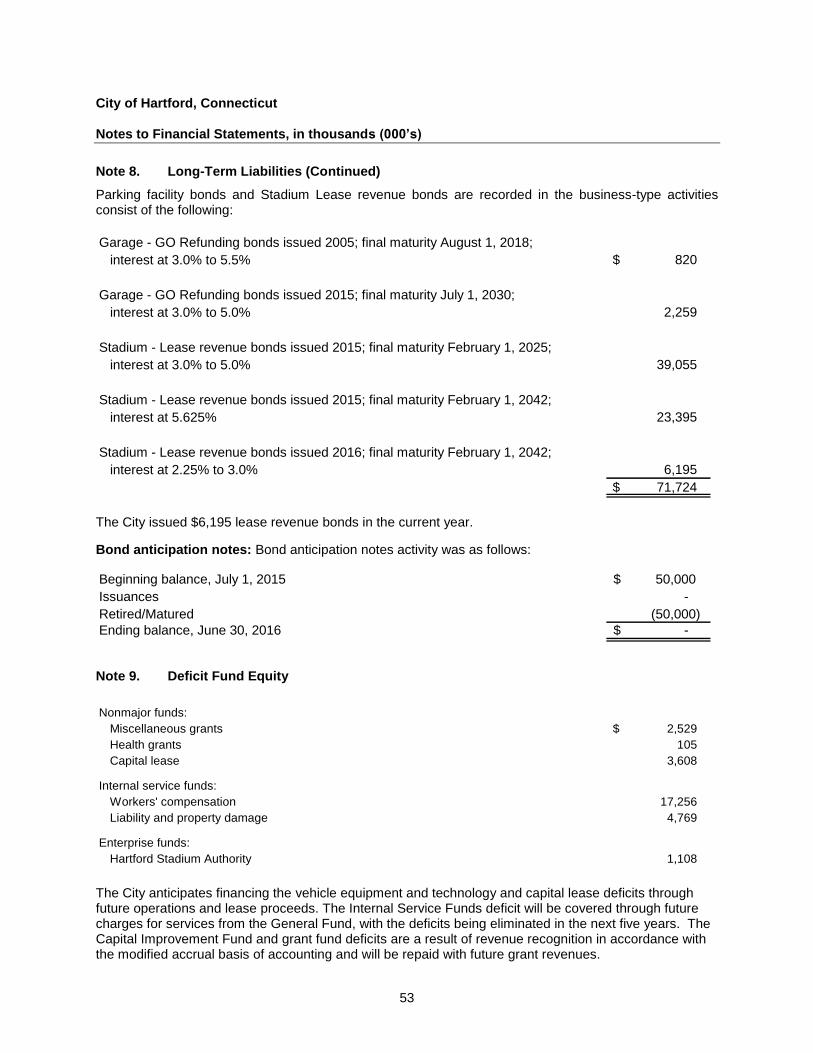
City of Hartford, Connecticut Notes to Financial Statements, in thousands (000’s)
53
Note 8. Long-Term Liabilities (Continued)
Parking facility bonds and Stadium Lease revenue bonds are recorded in the business-type activities consist of the following:
Garage - GO Refunding bonds issued 2005; final maturity August 1, 2018;
interest at 3.0% to 5.5% $ 820
Garage - GO Refunding bonds issued 2015; final maturity July 1, 2030;
interest at 3.0% to 5.0% 2,259
Stadium - Lease revenue bonds issued 2015; final maturity February 1, 2025;
interest at 3.0% to 5.0% 39,055
Stadium - Lease revenue bonds issued 2015; final maturity February 1, 2042;
interest at 5.625% 23,395
Stadium - Lease revenue bonds issued 2016; final maturity February 1, 2042;
interest at 2.25% to 3.0% 6,195
$ 71,724
The City issued $6,195 lease revenue bonds in the current year.
Bond anticipation notes: Bond anticipation notes activity was as follows:
Beginning balance, July 1, 2015 50,000 $
Issuances -
Retired/Matured (50,000)
Ending balance, June 30, 2016 -$
Note 9. Deficit Fund Equity
Nonmajor funds:
Miscellaneous grants 2,529 $
Health grants 105
Capital lease 3,608
Internal service funds:
Workers' compensation 17,256
Liability and property damage 4,769
Enterprise funds:
Hartford Stadium Authority 1,108
The City anticipates financing the vehicle equipment and technology and capital lease deficits through future operations and lease proceeds. The Internal Service Funds deficit will be covered through future charges for services from the General Fund, with the deficits being eliminated in the next five years. The Capital Improvement Fund and grant fund deficits are a result of revenue recognition in accordance with the modified accrual basis of accounting and will be repaid with future grant revenues.
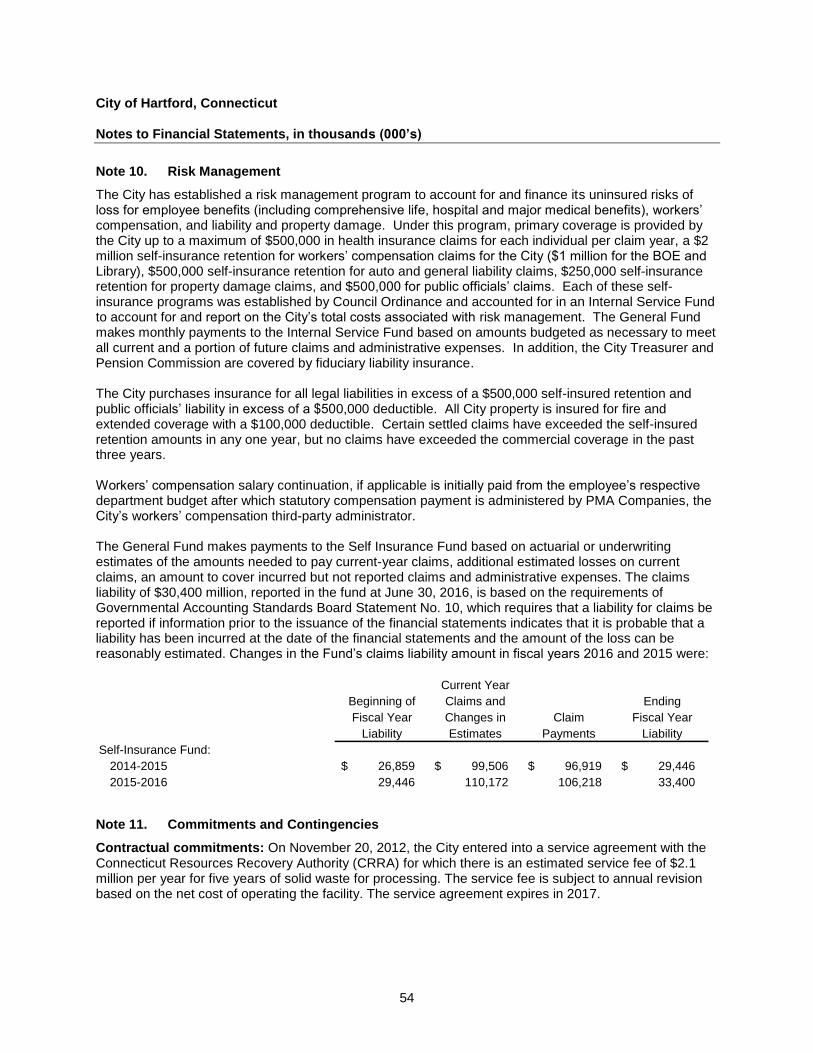
City of Hartford, Connecticut Notes to Financial Statements, in thousands (000’s)
54
Note 10. Risk Management
The City has established a risk management program to account for and finance its uninsured risks of loss for employee benefits (including comprehensive life, hospital and major medical benefits), workers’ compensation, and liability and property damage. Under this program, primary coverage is provided by the City up to a maximum of $500,000 in health insurance claims for each individual per claim year, a $2 million self-insurance retention for workers’ compensation claims for the City ($1 million for the BOE and Library), $500,000 self-insurance retention for auto and general liability claims, $250,000 self-insurance retention for property damage claims, and $500,000 for public officials’ claims. Each of these self-insurance programs was established by Council Ordinance and accounted for in an Internal Service Fund to account for and report on the City’s total costs associated with risk management. The General Fund makes monthly payments to the Internal Service Fund based on amounts budgeted as necessary to meet all current and a portion of future claims and administrative expenses. In addition, the City Treasurer and Pension Commission are covered by fiduciary liability insurance. The City purchases insurance for all legal liabilities in excess of a $500,000 self-insured retention and public officials’ liability in excess of a $500,000 deductible. All City property is insured for fire and extended coverage with a $100,000 deductible. Certain settled claims have exceeded the self-insured retention amounts in any one year, but no claims have exceeded the commercial coverage in the past three years. Workers’ compensation salary continuation, if applicable is initially paid from the employee’s respective department budget after which statutory compensation payment is administered by PMA Companies, the City’s workers’ compensation third-party administrator. The General Fund makes payments to the Self Insurance Fund based on actuarial or underwriting estimates of the amounts needed to pay current-year claims, additional estimated losses on current claims, an amount to cover incurred but not reported claims and administrative expenses. The claims liability of $30,400 million, reported in the fund at June 30, 2016, is based on the requirements of Governmental Accounting Standards Board Statement No. 10, which requires that a liability for claims be reported if information prior to the issuance of the financial statements indicates that it is probable that a liability has been incurred at the date of the financial statements and the amount of the loss can be reasonably estimated. Changes in the Fund’s claims liability amount in fiscal years 2016 and 2015 were:
Current Year
Beginning of Claims and Ending
Fiscal Year Changes in Claim Fiscal Year
Liability Estimates Payments Liability
Self-Insurance Fund:
2014-2015 26,859 $ 99,506 $ 96,919 $ 29,446 $
2015-2016 29,446 110,172 106,218 33,400
Note 11. Commitments and Contingencies
Contractual commitments: On November 20, 2012, the City entered into a service agreement with the Connecticut Resources Recovery Authority (CRRA) for which there is an estimated service fee of $2.1 million per year for five years of solid waste for processing. The service fee is subject to annual revision based on the net cost of operating the facility. The service agreement expires in 2017.
City of Hartford, Connecticut Notes to Financial Statements, in thousands (000’s)
55
Note 11. Commitments and Contingencies (Continued)
Contingencies: The City, its officers and employees, are defendants in numerous lawsuits. The City is insured for damages (see Note 10). Judgments or settlements for less than the deductible are paid from the General Fund. Corporation Counsel expects that none of the cases currently in litigation, if adversely decided, would have a negative impact on the finances of the City. The City has recorded $2 million in the government-wide financial statements to cover probable claims.
Note 12. Other Postemployment Benefits
The City, in accordance with various collective bargaining agreements, is committed to provide health and other benefits to eligible retirees and their spouses. Benefits are established and amended through negotiations between the City and the various unions representing City employees. The City pays the full cost of life insurance premiums. The percentage contribution of employees and retirees for medical benefits are negotiated with the various unions representing the employees. Retired plan members and beneficiaries currently receiving benefits are required to contribute specified amounts towards the cost of receiving benefits under the City’s self-insured medical benefits program. The City provides post-retirement benefits through a single-employer defined benefit plan. The post-retirement plan does not issue stand-alone financial reports. Funding policy: The City currently funds claims and administrative costs for postemployment benefits through its self-insured internal service funds. The City has worked in conjunction with health benefits consultants to establish a health benefits fund structure that is both premium-based, similar to a fully insured process, and isolates legacy costs versus ongoing employees while combining actives and retirees into one process. In order to isolate legacy costs from ongoing employees, three groups were created that support a phased strategy to funding where the first group is retirees before June 30, 2009 which remains pay-as-you-go with no amortization of prior service cost. The second group includes actives hired prior to July 1, 2009, and retired since then and provides funding of normal cost, including an accrual for future benefits, but no amortization of prior service cost. Finally, the third group is comprised of new hires since July 1, 2009, for which both current and future benefits are paid and actuarially funded. Groups 2 and 3 envision that a trust fund will be established while all 3 groups have the same discount rates as provide for by GASB. The following is the current census of City benefit participants as of July 1, 2013:
City Board of Education
(not rounded) (not rounded)
Active members 1,551 3,186
Retirees 1,301 499
Total 2,852 3,685
Postemployment retiree benefit payments for the year ended June 30, 2016, net of retiree and other contributions, amounted to $33,683.
City of Hartford, Connecticut Notes to Financial Statements, in thousands (000’s)
56
Note 12. Other Postemployment Benefits (Continued)
Annual OPEB cost and net OPEB obligations: The City of Hartford’s annual other postemployment benefit (OPEB) cost is calculated based on the annual required contribution (ARC), an amount actuarially determined in accordance with the parameters of GASB Statement No. 45. Actuarial valuations involve estimates of the value of reported amounts and assumptions about the probability of occurrence of future events. Assumptions include future employment, mortality, and healthcare and other benefit cost trends. Amounts determined regarding the funded status of the plan and the annual required contributions of the employer are subject to continual revision as actuarial results are compared with past expectations and new estimates are made about the future. The ARC represents a level of funding that, if paid on an ongoing basis, is projected to cover normal cost each year and amortize any unfunded actuarial liabilities (or funding excess) over a period not to exceed thirty years. The following table shows the components of the City’s annual OPEB cost for the year, the amount actually contributed to the plan, and changes in the City’s net OPEB obligation:
Other Post-
Employment
Benefits (OPEB)
Annual required contribution (ARC) 24,394 $
Interest on net OPEB obligation 3,646
Adjustment for Net OPEB obligation (3,413)
Annual OPEB cost 24,627
Contributions made (33,683)
Decrease in net OPEB obligation (9,056)
Net OPEB obligation, beginning of year 81,025
Net OPEB obligation, end of year 71,969 $
The City’s annual OPEB cost, the percentage of annual OPEB cost contributed to the plan and the net OPEB obligation for the fiscal years ended June 30, 2014, 2015 and 2016 is presented below.
Fiscal Annual Percentage Net
Year OPEB Actual of AOC OPEB
Ending Cost (AOC) Contribution Contributed Obligation
6/30/14 20,144 $ 11,650 $ 57.8% 81,025 $
6/30/15 21,128 12,995 61.5% 81,025
6/30/16 24,394 33,683 138.1% 71,969
Projections for benefits for financial reporting purposes are based on the substantive plan (the plan as understood by the employer and plan members) and include the types of benefits provided at the time of each valuation and the historical pattern of sharing benefit costs between the employer and plan members to that point. The actuarial methods and assumptions used include techniques that are designed to reduce the effects of short term volatility in actuarial accrued liabilities and the actuarial value of assets, consistent with the long-term perspective of the calculations.
City of Hartford, Connecticut Notes to Financial Statements, in thousands (000’s)
57
Note 12. Other Postemployment Benefits (Continued)
Actuarial Assumptions - OPEB
Valuation date July 1, 2013
Actuarial cost method Projected unit credit
Asset valuation method N/A
Amortization method Level percent, closed
Remaining amortization period Open 30 year period
Actuarial assumptions
Discount rate 4.5% per annum
Projected salary increase 3.0%
Inflation rate 3.5%
Drug and medical cost trend rate 7.0% graded to 5.0% over 9 years
Administrative fee trend rate 4.0%
Dental trend rate 5.0%
The schedule of funding progress is as follows:
Unfunded UAAL as a
Actuarial Actuarial Accrued Percentage
Actuarial Valuation Valuation of Accrued Liability Funded Covered of Covered
Date Assets Liability (AAL) (UAL) Ratio Payroll Payroll
7/1/2015 17,868 $ 313,061 $ 295,193 $ 6.0% N/A N/A
Schedule of Funding Progress
The schedules of funding progress, presented as required supplementary information (RSI) following the notes to the financial statements, present multi-year trend information about whether the actuarial values of plan assets are increasing or decreasing over time relative to the AALs for benefits.
Note 13. Employee Retirement Systems and Pension Plans
There are four defined benefit pension plans for employees of the City of Hartford. Two are single-employer plans, one is a cost sharing multiple-employer plan with the State of Connecticut, and one is a plan with the State of Connecticut for certified teachers at the Board of Education in which the City is a noncontributing employer.
The two single employer plans are administered by the City. The plans provide retirement, disability and survivorship benefits for all retired employees, in accordance with provisions which are subject to bargaining with unions representing most of the employees. The City provides retirement benefits for employees hired since 1947, through the City MERF, a contributory, defined benefit plan. Employees hired before the current City MERF went into effect on May 1, 1947 are paid from an unfunded program known as the RAF/PBF/FRF Plan. There are no remaining active members and the unfunded liability is decreasing rapidly. Administrative fees are paid through the plans. An actuarial valuation survey is made annually on the City Municipal Employees’ Retirement Fund (City MERF) and the Section 415 Plan, and at least every five years for the RAF/PBF/FRF Plan. The City also administers an excess benefit plan established to fund that portion of certain retirees’ pension benefits that exceed the limits permitted under Section 415 of the Federal Internal Revenue Code (IRC).
City of Hartford, Connecticut Notes to Financial Statements, in thousands (000’s)
58
Note 13. Employee Retirement Systems and Pension Plans (Continued)
Connecticut Municipal Employees’ Retirement System:
Plan description: Certain employees of the City participate in a cost-sharing multiple-employer defined benefit pension plan administered by the State of Connecticut Municipal Employees’ Retirement System (MERS). Under a cost-sharing plan, pension obligations for employees of all employers are pooled and plan assets are available to pay the benefits of the employees of any participating employer providing pension benefits through the plan, regardless of the status of the employers’ payment of its pension obligation to the plan. The plan provides retirement and disability benefits and death benefits to plan members and beneficiaries.
The System issues a publicly available financial report that includes financial statements and required supplementary information for the plans. The report may be obtained at www.ct.gov.
Benefit provisions: Plan provisions are set by Statute of the State of Connecticut. MERS provides retirement benefits, as well as death and disability benefits. Membership is mandatory for all regular full time employees of participating departments except Police and Fire hired after age 60.
Average final compensation: Average of the three highest paid years of service.
Normal form of benefit: Life annuity.
Service retirement allowance:
Condition for allowance: Age 55 and 5 years of continuous service, or 15 years of active aggregate service, or 25 years of aggregate service. Compulsory retirement at age 65 for police and fire members.
Amount of allowance: For members not covered by Social Security: 2% of average final compensation times years of service. For members covered by Social Security: 1-1/2% of the average final compensation not in excess of the year’s breakpoint plus 2% of average final compensation in excess of the year’s breakpoint, times years of service. The maximum benefit is 100% of average final compensation and the minimum benefit is $1,000 annually. Both the minimum and the maximum include Workers Compensation and Social Security benefits. If any member covered by Social Security retires before age 62, his/her benefit until he/she reaches age 62 or receives a Social Security disability award is computed as if he/she were not under Social Security.
Disability retirement allowance:
Condition for allowance: 10 years of service and permanently and totally disabled from engaging in any gainful employment in the service of the Municipality.
Amount of allowance: Calculated as a service retirement allowance based on compensation and service to the date of the disability.
Service connected disability:
Condition for allowance: Totally and permanently disabled from engaging in any gainful employment in the service of the Municipality provided such disability has arisen out of and in the course of his/her employment with the Municipality. Disability due to hypertension or heart disease, in the case of firemen and policemen, is presumed to have been suffered in the line of duty.
Amount of allowance: Calculated as a service retirement allowance based on compensation and service to the date of the disability with a minimum benefit (including Worker’s Compensation benefits) of 50% of compensation at the time of the disability.
City of Hartford, Connecticut Notes to Financial Statements, in thousands (000’s)
59
Note 13. Employee Retirement Systems and Pension Plans (Continued)
Vesting retirement allowance:
Condition for allowance: 5 years of continuous or 15 years of active aggregate service.
Amount of allowance: Calculated as a service retirement allowance on the basis of average final compensation and service to the date of termination. Deferred to normal retirement age, or an actuarially reduced allowance may begin at the time of separation.
Death benefit:
Condition for benefit: Eligible for service, disability retirement, or vested allowance, and married for at least 12 months preceding death.
Amount of benefit: Computed on the basis of the member’s average final compensation and creditable service at date of death, payable to the spouse. Benefit is equal to 50% of the average of the life annuity allowance and the reduced 50% joint and survivor allowance. Return of deductions: Upon the withdrawal of a member the amount of their accumulated deductions is payable to him/her on demand, with 5% interest from July 1, 1983.
Optional benefits: Prior to the retirement, a member may elect to convert his retirement allowance into a benefit of equivalent actuarial value in accordance with one of the optional forms described below: 1. A reduced retirement allowance payable during his life with the provision that after his death the beneficiary designated by him at the time of his retirement; or 2. A reduced retirement allowance payable during his life with the provision that after his death an allowance of one half of his reduced allowance will be continued for life to the beneficiary designated by him at the time of his retirement; 3. A reduced retirement allowance payable during his life with a guarantee of 120 or 240 monthly payments to the member or his designated beneficiary.
Cost-of-living adjustment: For those retired prior to January 1, 2002: (i) the benefits of disabled retirees, service retirees who have reached age 65, and beneficiaries of deceased retirees who would have reached age 65 are adjusted each July 1. The difference between the actual annual yield of the actuarial value of assets on a calendar year basis to a 6% yield is calculated. This difference is the adjustment applied the following July 1. The minimum adjustment is 3% and the maximum is 5%. (ii) The benefits for all others on the roll are adjusted on January 1, 2002 and on each subsequent July 1. The amount of each adjustment is 2.5%. For those retiring in or after January 1, 2002, benefits are adjusted each July 1.
The adjustment is 60% of the annual increase in the CPI up to 6%. The minimum annual COLA is 2.5%; the maximum is 6%.
Contributions - by members: For members not covered by Social Security: 5% of compensation. For members covered by the Social Security: 2-1/4% of compensation up to the Social Security taxable wage base plus 5% of compensation, if any, in excess of such base.
Contributions - by municipalities: Participating Municipalities make annual contributions consisting of a normal cost contribution, a contribution for the amortization of the net unfunded accrued liability and a prior service amortization payment which covers the liabilities of the system not met by member contributions.
City of Hartford, Connecticut Notes to Financial Statements, in thousands (000’s)
60
Note 13. Employee Retirement Systems and Pension Plans (Continued)
Assumptions: The total pension liability was determined using the following actuarial assumptions, applied to all periods included in the measurement:
Valuation date: 7/1/2015
Actuarial cost method: Entry Age Normal
Amortization method: Level dollar, closed
Remaining amortization period: 27 years
Asset valuation method: 5-year smoothed market with 20% recognition of investment gains and losses
Investment rate return*: 8.00%, net of investment related expense
Projected salary increases*: 4.25-11.00%
Social Security Wage Base: 3.50%
* Includes inflation at 3.25%
Mortality The RP2000 Mortality Table for Annuitants and Non-Annuitants (set forward one year for males and set back one year for females). For disabled retirees, the same table is used, adjusted with the male table set forward five years and the female table set forward one year
Summary of significant accounting policies: The schedules of employer allocations, schedules of pension amounts by employer and schedules of sensitivity analysis and deferred inflow amounts by employer (the Schedules) are prepared on the accrual basis of accounting in accordance with accounting principles generally accepted in the United States of America. Contributions from employers are recognized when legally due, based upon statutory requirements. Payable to MERS: The City has recorded $3,000 as a long-term payable (claims and other) to MERS at June 30, 2016. This amount represents prior service costs when the City entered the Plan.
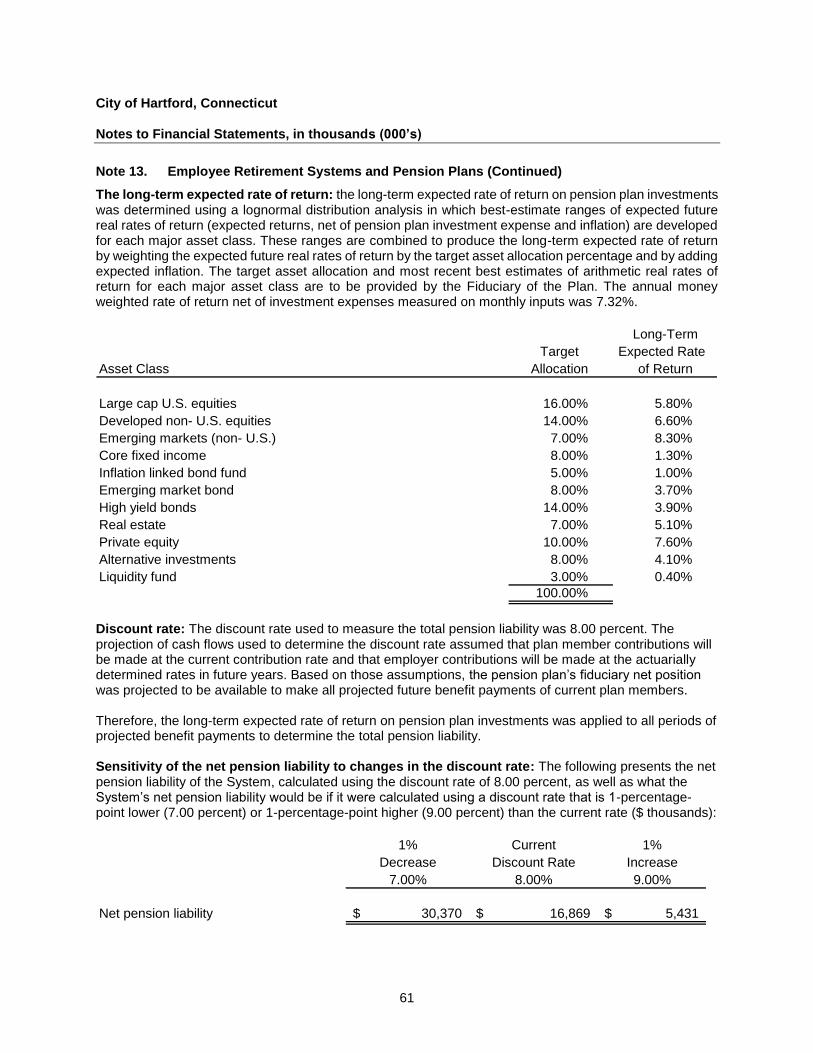
City of Hartford, Connecticut Notes to Financial Statements, in thousands (000’s)
61
Note 13. Employee Retirement Systems and Pension Plans (Continued)
The long-term expected rate of return: the long-term expected rate of return on pension plan investments was determined using a lognormal distribution analysis in which best-estimate ranges of expected future real rates of return (expected returns, net of pension plan investment expense and inflation) are developed for each major asset class. These ranges are combined to produce the long-term expected rate of return by weighting the expected future real rates of return by the target asset allocation percentage and by adding expected inflation. The target asset allocation and most recent best estimates of arithmetic real rates of return for each major asset class are to be provided by the Fiduciary of the Plan. The annual money weighted rate of return net of investment expenses measured on monthly inputs was 7.32%.
Long-Term
Target Expected Rate
Asset Class Allocation of Return
Large cap U.S. equities 16.00% 5.80%
Developed non- U.S. equities 14.00% 6.60%
Emerging markets (non- U.S.) 7.00% 8.30%
Core fixed income 8.00% 1.30%
Inflation linked bond fund 5.00% 1.00%
Emerging market bond 8.00% 3.70%
High yield bonds 14.00% 3.90%
Real estate 7.00% 5.10%
Private equity 10.00% 7.60%
Alternative investments 8.00% 4.10%
Liquidity fund 3.00% 0.40%
100.00%
Discount rate: The discount rate used to measure the total pension liability was 8.00 percent. The projection of cash flows used to determine the discount rate assumed that plan member contributions will be made at the current contribution rate and that employer contributions will be made at the actuarially determined rates in future years. Based on those assumptions, the pension plan’s fiduciary net position was projected to be available to make all projected future benefit payments of current plan members. Therefore, the long-term expected rate of return on pension plan investments was applied to all periods of projected benefit payments to determine the total pension liability. Sensitivity of the net pension liability to changes in the discount rate: The following presents the net pension liability of the System, calculated using the discount rate of 8.00 percent, as well as what the System’s net pension liability would be if it were calculated using a discount rate that is 1-percentage-point lower (7.00 percent) or 1-percentage-point higher (9.00 percent) than the current rate ($ thousands):
1% Current 1%
Decrease Discount Rate Increase
7.00% 8.00% 9.00%
Net pension liability 30,370$ 16,869$ 5,431$
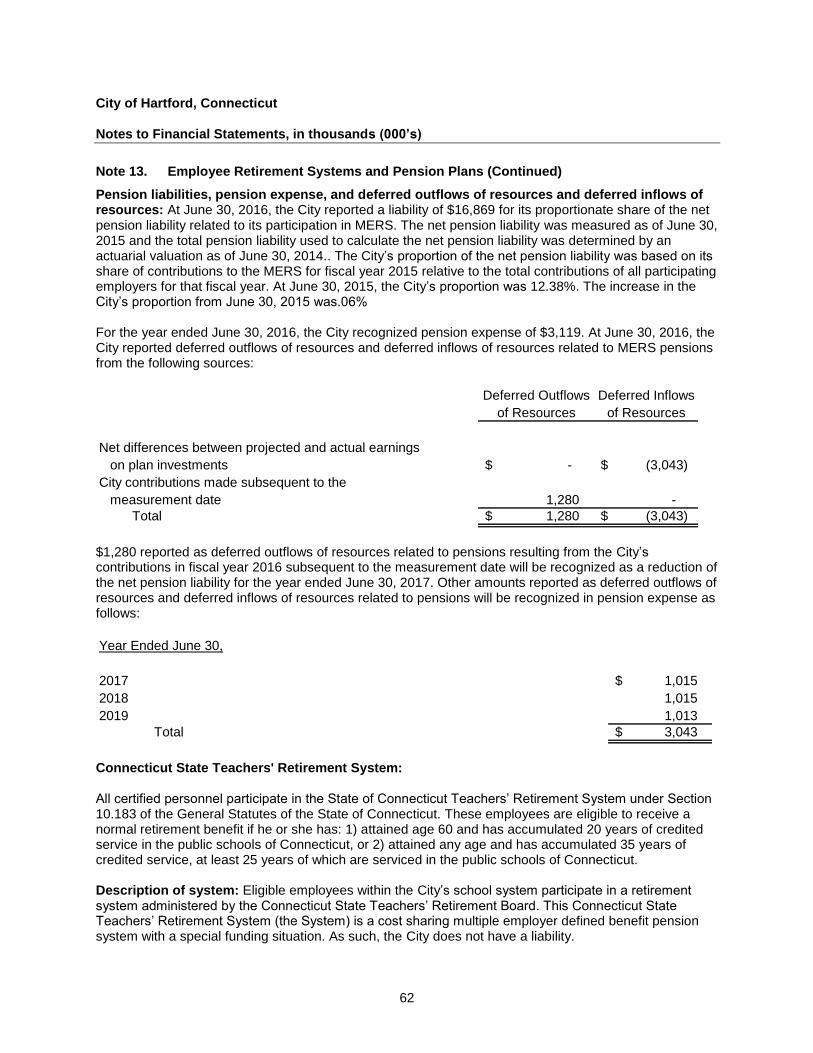
City of Hartford, Connecticut Notes to Financial Statements, in thousands (000’s)
62
Note 13. Employee Retirement Systems and Pension Plans (Continued)
Pension liabilities, pension expense, and deferred outflows of resources and deferred inflows of resources: At June 30, 2016, the City reported a liability of $16,869 for its proportionate share of the net pension liability related to its participation in MERS. The net pension liability was measured as of June 30, 2015 and the total pension liability used to calculate the net pension liability was determined by an actuarial valuation as of June 30, 2014.. The City’s proportion of the net pension liability was based on its share of contributions to the MERS for fiscal year 2015 relative to the total contributions of all participating employers for that fiscal year. At June 30, 2015, the City’s proportion was 12.38%. The increase in the City’s proportion from June 30, 2015 was.06% For the year ended June 30, 2016, the City recognized pension expense of $3,119. At June 30, 2016, the City reported deferred outflows of resources and deferred inflows of resources related to MERS pensions from the following sources:
Deferred Outflows Deferred Inflows
of Resources of Resources
Net differences between projected and actual earnings
on plan investments -$ (3,043) $
City contributions made subsequent to the
measurement date 1,280 -
Total 1,280 $ (3,043) $
$1,280 reported as deferred outflows of resources related to pensions resulting from the City’s contributions in fiscal year 2016 subsequent to the measurement date will be recognized as a reduction of the net pension liability for the year ended June 30, 2017. Other amounts reported as deferred outflows of resources and deferred inflows of resources related to pensions will be recognized in pension expense as follows:
Year Ended June 30,
2017 1,015 $
2018 1,015
2019 1,013
Total 3,043 $
Connecticut State Teachers' Retirement System: All certified personnel participate in the State of Connecticut Teachers’ Retirement System under Section 10.183 of the General Statutes of the State of Connecticut. These employees are eligible to receive a normal retirement benefit if he or she has: 1) attained age 60 and has accumulated 20 years of credited service in the public schools of Connecticut, or 2) attained any age and has accumulated 35 years of credited service, at least 25 years of which are serviced in the public schools of Connecticut. Description of system: Eligible employees within the City’s school system participate in a retirement system administered by the Connecticut State Teachers’ Retirement Board. This Connecticut State Teachers’ Retirement System (the System) is a cost sharing multiple employer defined benefit pension system with a special funding situation. As such, the City does not have a liability.
City of Hartford, Connecticut Notes to Financial Statements, in thousands (000’s)
63
Note 13. Employee Retirement Systems and Pension Plans (Continued)
The System is considered a part of the State of Connecticut financial reporting entity and is included in the State’s financial reports as a pension trust fund. Those reports may be obtained at www.ct.gov. The System is administered under the provisions of Chapter 167a of the Connecticut General Statutes (CGS). Participation in the System is restricted to certified staff employed in the public schools of Connecticut and members of the professional staff of the State Department of Education or the board of Governors of Higher Education and their constituent units. Participation in the System is mandatory for certified personnel of local boards of education who are employed for an average of at least one-half of a school day. Members of the professional staff of the State Department of Education or the Board of Governors of Higher Education and their constituent units may elect to participate in this system, the State Employees’ Retirement System, or the Alternate Retirement System (TIAA-CREF). Summary of significant accounting policies: For purposes of measuring the liability, deferred outflows of resources and deferred inflows of resources, and expense associated with the State’s requirement to contribute to the System, information about System’s fiduciary net position and additions to/deductions from the System’s fiduciary net position have been determined on the same basis as they are reported by the System. For this purpose, benefit payments (including refunds of contributions) are recognized when due and payable in accordance with the benefit terms. Investments are reported at fair value. The City has recorded, in the General Fund, intergovernmental revenue and education expenditures in the amount of $38,781,000 as payments made by the State of Connecticut on-behalf of the City. The City does not have any liability for teacher pensions. Benefits provided: The benefits provided to participants by the System are as follows: Normal benefit: A member at age 60 with 20 years of Credited Service in Connecticut, or 35 years of Credited Service including at least 25 years of service in Connecticut is eligible for vested benefits of 2% of average annual salary times years of credited service (maximum benefit is 75% of average annual salary.) Prorated benefit: A member who completes 10 years of Connecticut public school service is eligible for a vested benefit commencing at age 60. The benefit is 2% less 0.1% for each year less than 20 years of average annual salary times years of credited service. Minimum benefit: Effective January 1, 1999, Public Act 98-251 provides a minimum monthly retirement benefit of $1,200 to teachers who retire under the Normal Benefit provisions and who have completed at least 25 years of full time Connecticut service at retirement. Contribution requirements: The pension contributions made by the State to the System are determined on an actuarial reserve basis as described in CGS Sections 10-1831 and 10-183z. Employees are required to contribute 6.0% of their annual salary rate to the System as required by CGS Section 10-183b (7). For the 2015/2016 school year, $11,508 mandatory contributions were deducted from the salaries of teachers who were participants of the System during that school year. The estimated covered payroll for the City is $158,736. Employers are not required to make contributions to the Plan.
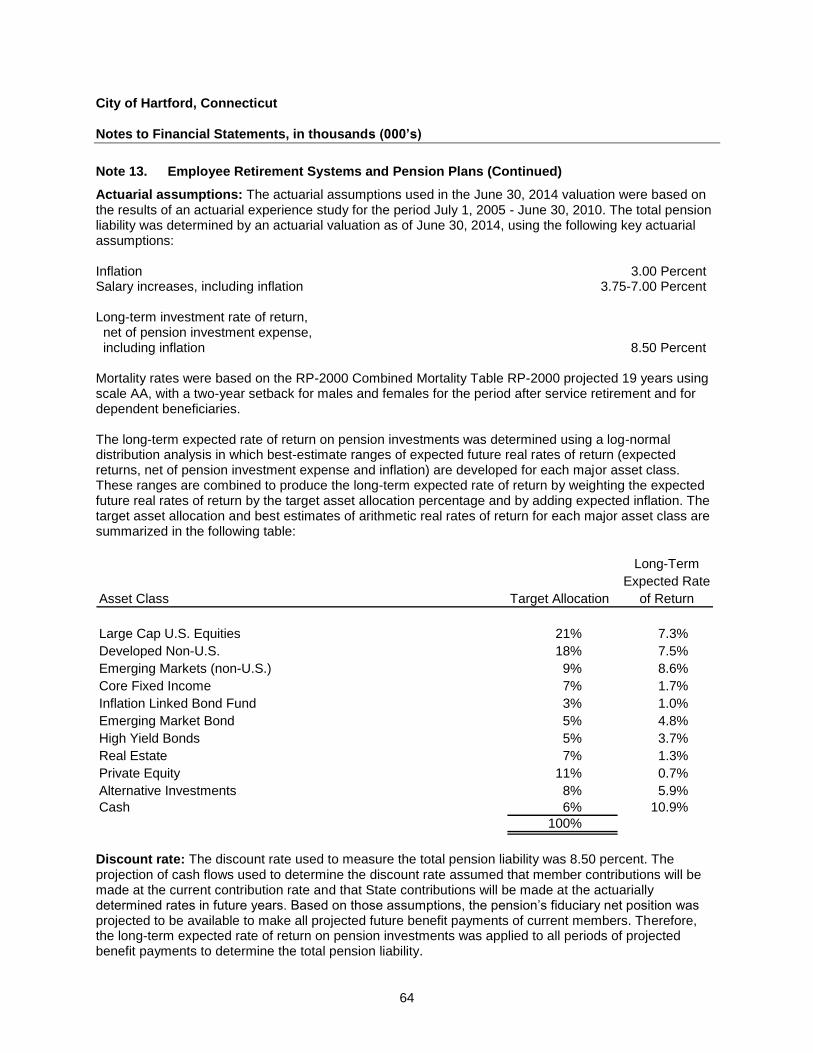
City of Hartford, Connecticut Notes to Financial Statements, in thousands (000’s)
64
Note 13. Employee Retirement Systems and Pension Plans (Continued)
Actuarial assumptions: The actuarial assumptions used in the June 30, 2014 valuation were based on the results of an actuarial experience study for the period July 1, 2005 - June 30, 2010. The total pension liability was determined by an actuarial valuation as of June 30, 2014, using the following key actuarial assumptions: Inflation 3.00 Percent Salary increases, including inflation 3.75-7.00 Percent Long-term investment rate of return, net of pension investment expense, including inflation 8.50 Percent Mortality rates were based on the RP-2000 Combined Mortality Table RP-2000 projected 19 years using scale AA, with a two-year setback for males and females for the period after service retirement and for dependent beneficiaries. The long-term expected rate of return on pension investments was determined using a log-normal distribution analysis in which best-estimate ranges of expected future real rates of return (expected returns, net of pension investment expense and inflation) are developed for each major asset class. These ranges are combined to produce the long-term expected rate of return by weighting the expected future real rates of return by the target asset allocation percentage and by adding expected inflation. The target asset allocation and best estimates of arithmetic real rates of return for each major asset class are summarized in the following table:
Long-Term
Expected Rate
Asset Class Target Allocation of Return
Large Cap U.S. Equities 21% 7.3%
Developed Non-U.S. 18% 7.5%
Emerging Markets (non-U.S.) 9% 8.6%
Core Fixed Income 7% 1.7%
Inflation Linked Bond Fund 3% 1.0%
Emerging Market Bond 5% 4.8%
High Yield Bonds 5% 3.7%
Real Estate 7% 1.3%
Private Equity 11% 0.7%
Alternative Investments 8% 5.9%
Cash 6% 10.9%
100%
Discount rate: The discount rate used to measure the total pension liability was 8.50 percent. The projection of cash flows used to determine the discount rate assumed that member contributions will be made at the current contribution rate and that State contributions will be made at the actuarially determined rates in future years. Based on those assumptions, the pension’s fiduciary net position was projected to be available to make all projected future benefit payments of current members. Therefore, the long-term expected rate of return on pension investments was applied to all periods of projected benefit payments to determine the total pension liability.
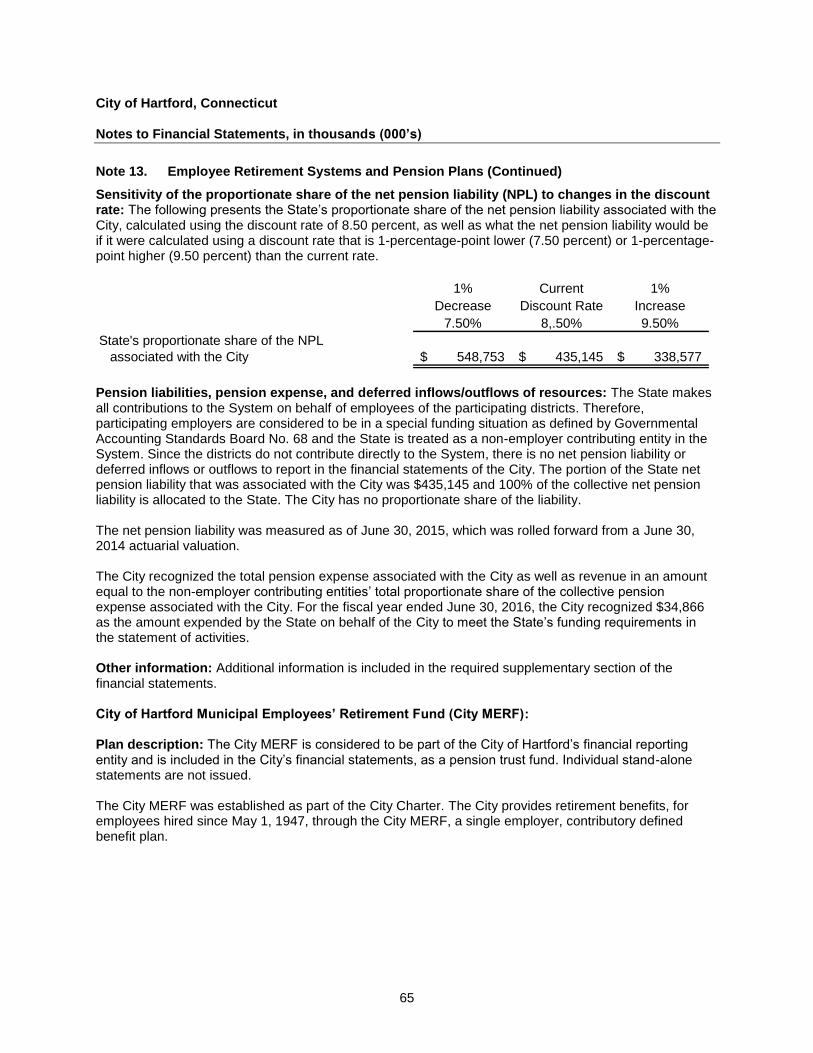
City of Hartford, Connecticut Notes to Financial Statements, in thousands (000’s)
65
Note 13. Employee Retirement Systems and Pension Plans (Continued)
Sensitivity of the proportionate share of the net pension liability (NPL) to changes in the discount rate: The following presents the State’s proportionate share of the net pension liability associated with the City, calculated using the discount rate of 8.50 percent, as well as what the net pension liability would be if it were calculated using a discount rate that is 1-percentage-point lower (7.50 percent) or 1-percentage-point higher (9.50 percent) than the current rate.
1% Current 1%
Decrease Discount Rate Increase
7.50% 8,.50% 9.50%
State's proportionate share of the NPL
associated with the City 548,753$ 435,145$ 338,577$
Pension liabilities, pension expense, and deferred inflows/outflows of resources: The State makes all contributions to the System on behalf of employees of the participating districts. Therefore, participating employers are considered to be in a special funding situation as defined by Governmental Accounting Standards Board No. 68 and the State is treated as a non-employer contributing entity in the System. Since the districts do not contribute directly to the System, there is no net pension liability or deferred inflows or outflows to report in the financial statements of the City. The portion of the State net pension liability that was associated with the City was $435,145 and 100% of the collective net pension liability is allocated to the State. The City has no proportionate share of the liability. The net pension liability was measured as of June 30, 2015, which was rolled forward from a June 30, 2014 actuarial valuation. The City recognized the total pension expense associated with the City as well as revenue in an amount equal to the non-employer contributing entities’ total proportionate share of the collective pension expense associated with the City. For the fiscal year ended June 30, 2016, the City recognized $34,866 as the amount expended by the State on behalf of the City to meet the State’s funding requirements in the statement of activities. Other information: Additional information is included in the required supplementary section of the financial statements. City of Hartford Municipal Employees’ Retirement Fund (City MERF): Plan description: The City MERF is considered to be part of the City of Hartford’s financial reporting entity and is included in the City’s financial statements, as a pension trust fund. Individual stand-alone statements are not issued. The City MERF was established as part of the City Charter. The City provides retirement benefits, for employees hired since May 1, 1947, through the City MERF, a single employer, contributory defined benefit plan.
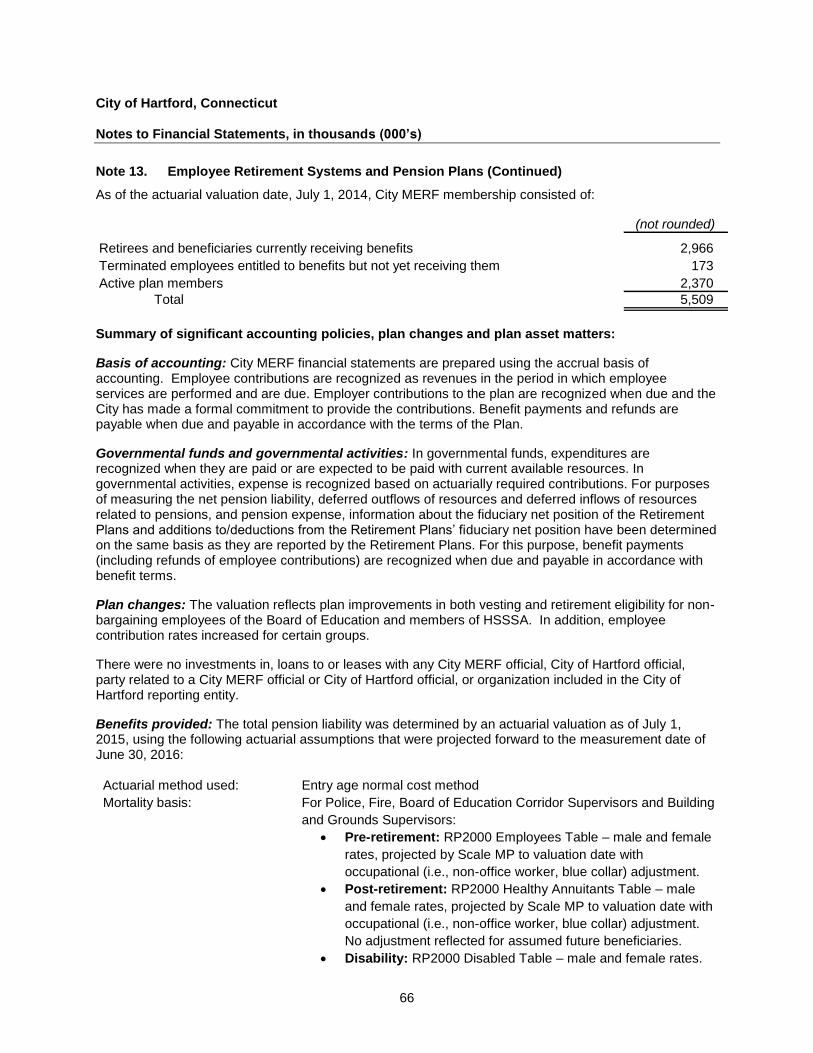
City of Hartford, Connecticut Notes to Financial Statements, in thousands (000’s)
66
Note 13. Employee Retirement Systems and Pension Plans (Continued)
As of the actuarial valuation date, July 1, 2014, City MERF membership consisted of:
(not rounded)
Retirees and beneficiaries currently receiving benefits 2,966
Terminated employees entitled to benefits but not yet receiving them 173
Active plan members 2,370
Total 5,509
Summary of significant accounting policies, plan changes and plan asset matters:
Basis of accounting: City MERF financial statements are prepared using the accrual basis of accounting. Employee contributions are recognized as revenues in the period in which employee services are performed and are due. Employer contributions to the plan are recognized when due and the City has made a formal commitment to provide the contributions. Benefit payments and refunds are payable when due and payable in accordance with the terms of the Plan.
Governmental funds and governmental activities: In governmental funds, expenditures are recognized when they are paid or are expected to be paid with current available resources. In governmental activities, expense is recognized based on actuarially required contributions. For purposes of measuring the net pension liability, deferred outflows of resources and deferred inflows of resources related to pensions, and pension expense, information about the fiduciary net position of the Retirement Plans and additions to/deductions from the Retirement Plans’ fiduciary net position have been determined on the same basis as they are reported by the Retirement Plans. For this purpose, benefit payments (including refunds of employee contributions) are recognized when due and payable in accordance with benefit terms.
Plan changes: The valuation reflects plan improvements in both vesting and retirement eligibility for non-bargaining employees of the Board of Education and members of HSSSA. In addition, employee contribution rates increased for certain groups.
There were no investments in, loans to or leases with any City MERF official, City of Hartford official, party related to a City MERF official or City of Hartford official, or organization included in the City of Hartford reporting entity.
Benefits provided: The total pension liability was determined by an actuarial valuation as of July 1, 2015, using the following actuarial assumptions that were projected forward to the measurement date of June 30, 2016:
Actuarial method used: Entry age normal cost method
Mortality basis: For Police, Fire, Board of Education Corridor Supervisors and Building
and Grounds Supervisors:
Pre-retirement: RP2000 Employees Table – male and female
rates, projected by Scale MP to valuation date with
occupational (i.e., non-office worker, blue collar) adjustment.
Post-retirement: RP2000 Healthy Annuitants Table – male
and female rates, projected by Scale MP to valuation date with
occupational (i.e., non-office worker, blue collar) adjustment.
No adjustment reflected for assumed future beneficiaries.
Disability: RP2000 Disabled Table – male and female rates.
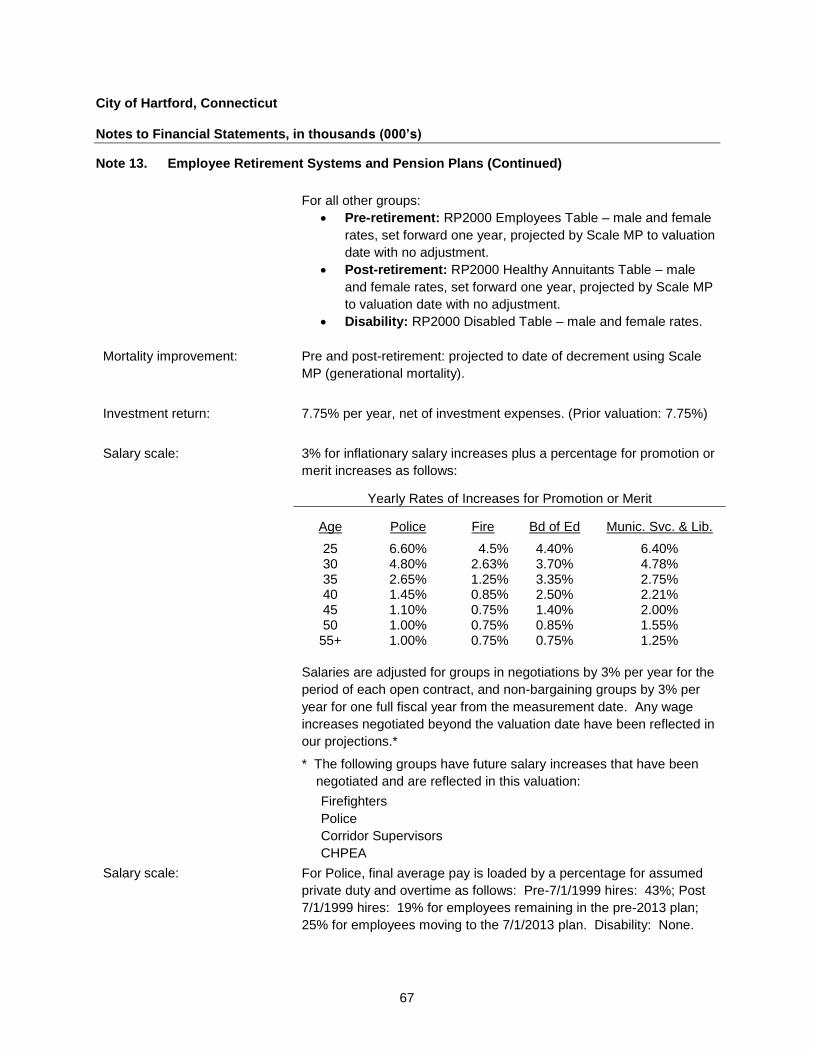
City of Hartford, Connecticut Notes to Financial Statements, in thousands (000’s)
67
Note 13. Employee Retirement Systems and Pension Plans (Continued)
For all other groups:
Pre-retirement: RP2000 Employees Table – male and female
rates, set forward one year, projected by Scale MP to valuation
date with no adjustment.
Post-retirement: RP2000 Healthy Annuitants Table – male
and female rates, set forward one year, projected by Scale MP
to valuation date with no adjustment.
Disability: RP2000 Disabled Table – male and female rates.
Mortality improvement: Pre and post-retirement: projected to date of decrement using Scale
MP (generational mortality).
Investment return: 7.75% per year, net of investment expenses. (Prior valuation: 7.75%)
Salary scale: 3% for inflationary salary increases plus a percentage for promotion or
merit increases as follows:
Yearly Rates of Increases for Promotion or Merit
Age Police Fire Bd of Ed Munic. Svc. & Lib.
25 6.60% 4.5% 4.40% 6.40% 30 4.80% 2.63% 3.70% 4.78% 35 2.65% 1.25% 3.35% 2.75% 40 1.45% 0.85% 2.50% 2.21% 45 1.10% 0.75% 1.40% 2.00% 50 1.00% 0.75% 0.85% 1.55%
55+ 1.00% 0.75% 0.75% 1.25%
Salaries are adjusted for groups in negotiations by 3% per year for the
period of each open contract, and non-bargaining groups by 3% per
year for one full fiscal year from the measurement date. Any wage
increases negotiated beyond the valuation date have been reflected in
our projections.*
* The following groups have future salary increases that have been
negotiated and are reflected in this valuation:
Firefighters
Police
Corridor Supervisors
CHPEA
Salary scale: For Police, final average pay is loaded by a percentage for assumed
private duty and overtime as follows: Pre-7/1/1999 hires: 43%; Post
7/1/1999 hires: 19% for employees remaining in the pre-2013 plan;
25% for employees moving to the 7/1/2013 plan. Disability: None.
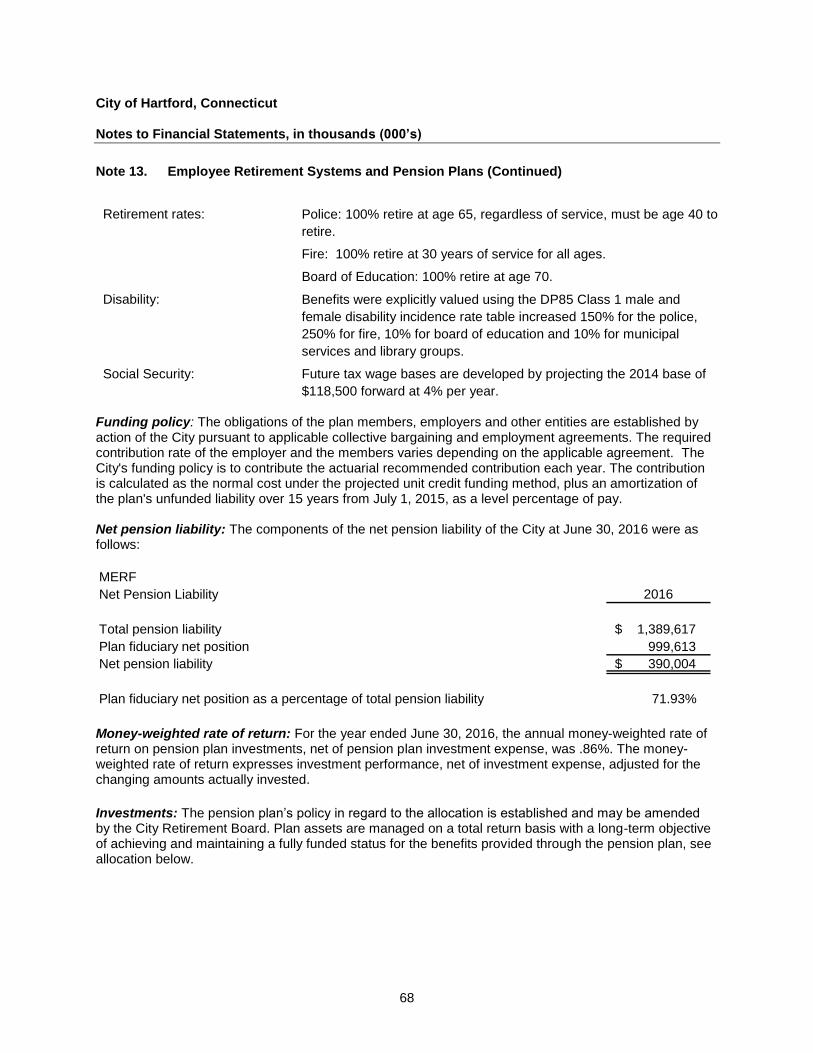
City of Hartford, Connecticut Notes to Financial Statements, in thousands (000’s)
68
Note 13. Employee Retirement Systems and Pension Plans (Continued)
Retirement rates: Police: 100% retire at age 65, regardless of service, must be age 40 to
retire.
Fire: 100% retire at 30 years of service for all ages.
Board of Education: 100% retire at age 70.
Disability: Benefits were explicitly valued using the DP85 Class 1 male and
female disability incidence rate table increased 150% for the police,
250% for fire, 10% for board of education and 10% for municipal
services and library groups.
Social Security: Future tax wage bases are developed by projecting the 2014 base of
$118,500 forward at 4% per year.
Funding policy: The obligations of the plan members, employers and other entities are established by action of the City pursuant to applicable collective bargaining and employment agreements. The required contribution rate of the employer and the members varies depending on the applicable agreement. The City's funding policy is to contribute the actuarial recommended contribution each year. The contribution is calculated as the normal cost under the projected unit credit funding method, plus an amortization of the plan's unfunded liability over 15 years from July 1, 2015, as a level percentage of pay. Net pension liability: The components of the net pension liability of the City at June 30, 2016 were as follows:
MERF
Net Pension Liability 2016
Total pension liability 1,389,617 $
Plan fiduciary net position 999,613
Net pension liability 390,004 $
Plan fiduciary net position as a percentage of total pension liability 71.93%
Money-weighted rate of return: For the year ended June 30, 2016, the annual money-weighted rate of return on pension plan investments, net of pension plan investment expense, was .86%. The money-weighted rate of return expresses investment performance, net of investment expense, adjusted for the changing amounts actually invested.
Investments: The pension plan’s policy in regard to the allocation is established and may be amended by the City Retirement Board. Plan assets are managed on a total return basis with a long-term objective of achieving and maintaining a fully funded status for the benefits provided through the pension plan, see allocation below.
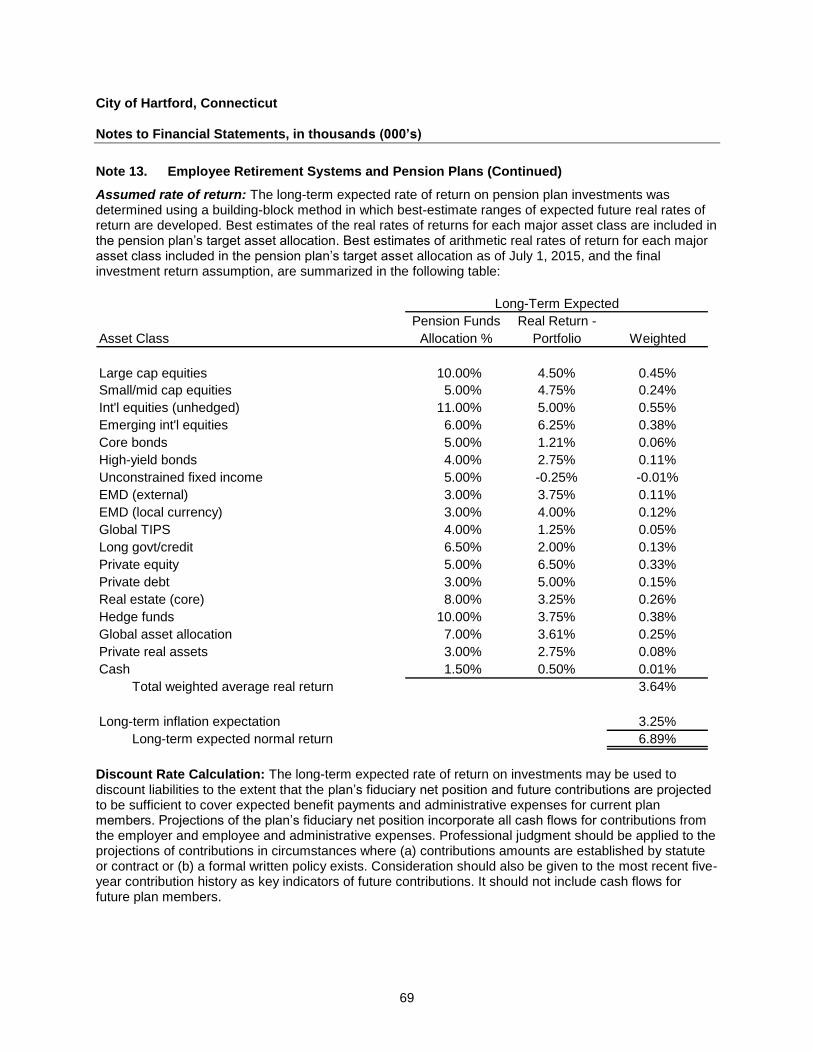
City of Hartford, Connecticut Notes to Financial Statements, in thousands (000’s)
69
Note 13. Employee Retirement Systems and Pension Plans (Continued)
Assumed rate of return: The long-term expected rate of return on pension plan investments was determined using a building-block method in which best-estimate ranges of expected future real rates of return are developed. Best estimates of the real rates of returns for each major asset class are included in the pension plan’s target asset allocation. Best estimates of arithmetic real rates of return for each major asset class included in the pension plan’s target asset allocation as of July 1, 2015, and the final investment return assumption, are summarized in the following table:
Pension Funds Real Return -
Asset Class Allocation % Portfolio Weighted
Large cap equities 10.00% 4.50% 0.45%
Small/mid cap equities 5.00% 4.75% 0.24%
Int'l equities (unhedged) 11.00% 5.00% 0.55%
Emerging int'l equities 6.00% 6.25% 0.38%
Core bonds 5.00% 1.21% 0.06%
High-yield bonds 4.00% 2.75% 0.11%
Unconstrained fixed income 5.00% -0.25% -0.01%
EMD (external) 3.00% 3.75% 0.11%
EMD (local currency) 3.00% 4.00% 0.12%
Global TIPS 4.00% 1.25% 0.05%
Long govt/credit 6.50% 2.00% 0.13%
Private equity 5.00% 6.50% 0.33%
Private debt 3.00% 5.00% 0.15%
Real estate (core) 8.00% 3.25% 0.26%
Hedge funds 10.00% 3.75% 0.38%
Global asset allocation 7.00% 3.61% 0.25%
Private real assets 3.00% 2.75% 0.08%
Cash 1.50% 0.50% 0.01%
Total weighted average real return 3.64%
Long-term inflation expectation 3.25%
Long-term expected normal return 6.89%
Long-Term Expected
Discount Rate Calculation: The long-term expected rate of return on investments may be used to discount liabilities to the extent that the plan’s fiduciary net position and future contributions are projected to be sufficient to cover expected benefit payments and administrative expenses for current plan members. Projections of the plan’s fiduciary net position incorporate all cash flows for contributions from the employer and employee and administrative expenses. Professional judgment should be applied to the projections of contributions in circumstances where (a) contributions amounts are established by statute or contract or (b) a formal written policy exists. Consideration should also be given to the most recent five-year contribution history as key indicators of future contributions. It should not include cash flows for future plan members.
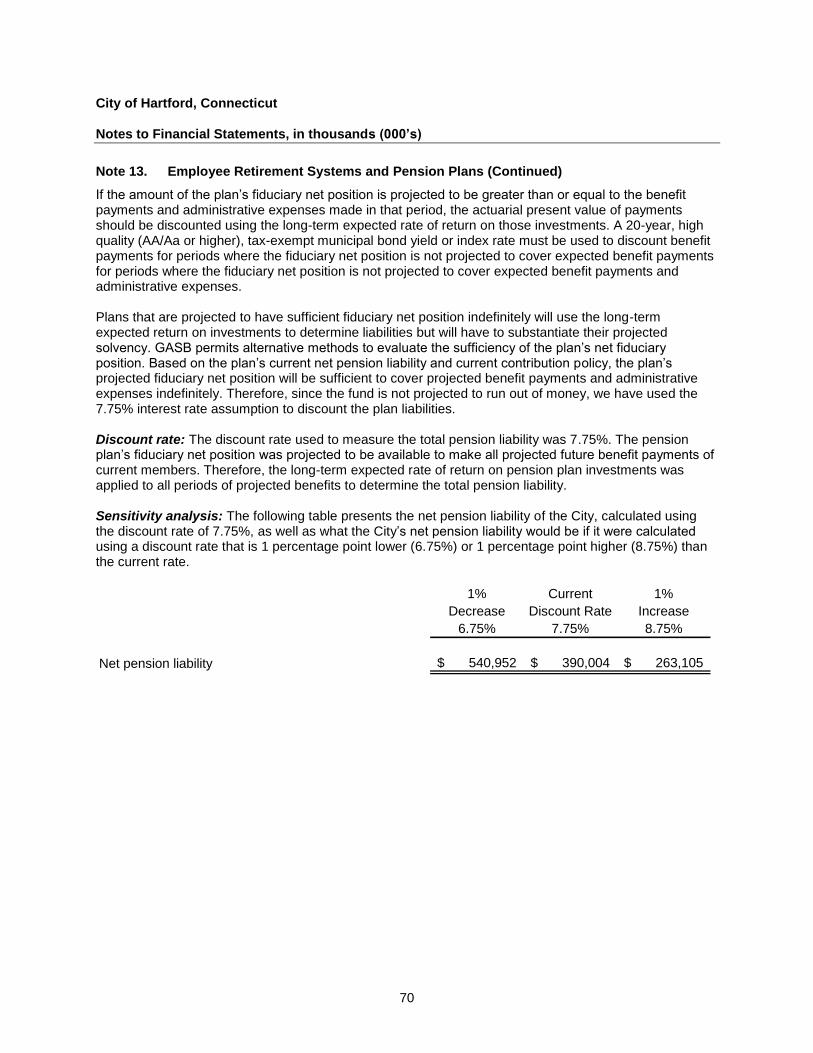
City of Hartford, Connecticut Notes to Financial Statements, in thousands (000’s)
70
Note 13. Employee Retirement Systems and Pension Plans (Continued)
If the amount of the plan’s fiduciary net position is projected to be greater than or equal to the benefit payments and administrative expenses made in that period, the actuarial present value of payments should be discounted using the long-term expected rate of return on those investments. A 20-year, high quality (AA/Aa or higher), tax-exempt municipal bond yield or index rate must be used to discount benefit payments for periods where the fiduciary net position is not projected to cover expected benefit payments for periods where the fiduciary net position is not projected to cover expected benefit payments and administrative expenses. Plans that are projected to have sufficient fiduciary net position indefinitely will use the long-term expected return on investments to determine liabilities but will have to substantiate their projected solvency. GASB permits alternative methods to evaluate the sufficiency of the plan’s net fiduciary position. Based on the plan’s current net pension liability and current contribution policy, the plan’s projected fiduciary net position will be sufficient to cover projected benefit payments and administrative expenses indefinitely. Therefore, since the fund is not projected to run out of money, we have used the 7.75% interest rate assumption to discount the plan liabilities. Discount rate: The discount rate used to measure the total pension liability was 7.75%. The pension plan’s fiduciary net position was projected to be available to make all projected future benefit payments of current members. Therefore, the long-term expected rate of return on pension plan investments was applied to all periods of projected benefits to determine the total pension liability. Sensitivity analysis: The following table presents the net pension liability of the City, calculated using the discount rate of 7.75%, as well as what the City’s net pension liability would be if it were calculated using a discount rate that is 1 percentage point lower (6.75%) or 1 percentage point higher (8.75%) than the current rate.
1% Current 1%
Decrease Discount Rate Increase
6.75% 7.75% 8.75%
Net pension liability 540,952$ 390,004$ 263,105$
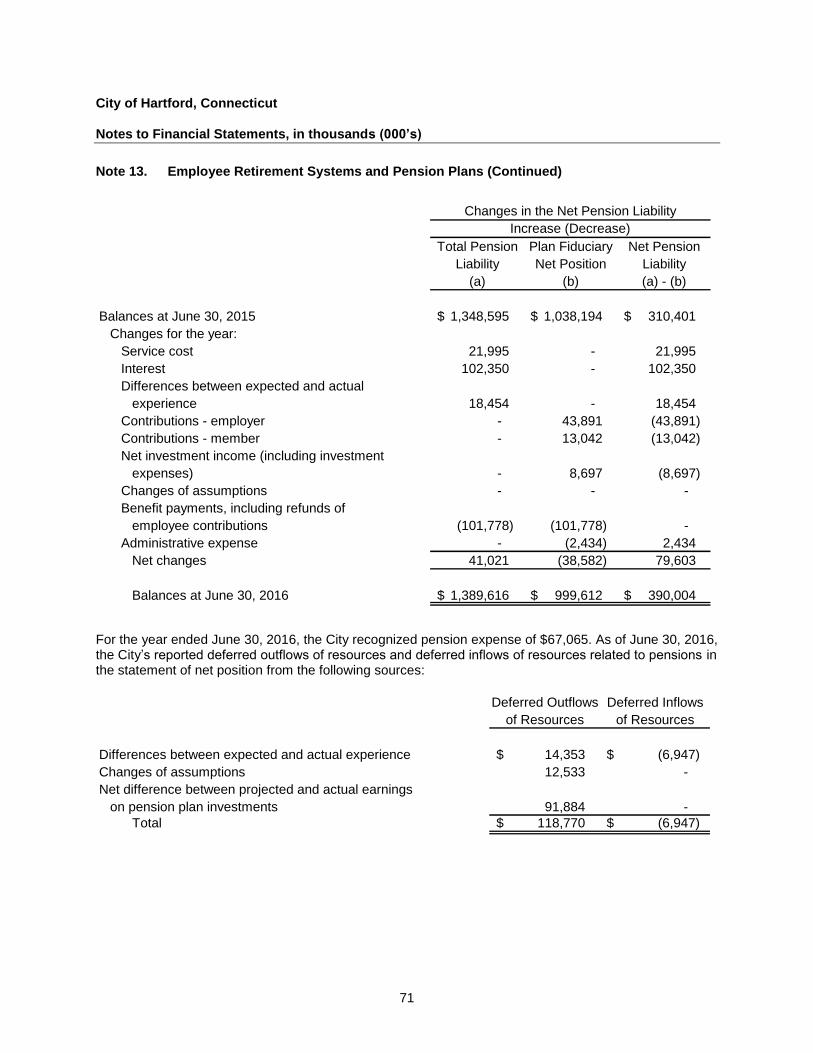
City of Hartford, Connecticut Notes to Financial Statements, in thousands (000’s)
71
Note 13. Employee Retirement Systems and Pension Plans (Continued)
Total Pension Plan Fiduciary Net Pension
Liability Net Position Liability
(a) (b) (a) - (b)
Balances at June 30, 2015 1,348,595 $ 1,038,194 $ 310,401 $
Changes for the year:
Service cost 21,995 - 21,995
Interest 102,350 - 102,350
Differences between expected and actual
experience 18,454 - 18,454
Contributions - employer - 43,891 (43,891)
Contributions - member - 13,042 (13,042)
Net investment income (including investment
expenses) - 8,697 (8,697)
Changes of assumptions - - -
Benefit payments, including refunds of
employee contributions (101,778) (101,778) -
Administrative expense - (2,434) 2,434
Net changes 41,021 (38,582) 79,603
Balances at June 30, 2016 1,389,616 $ 999,612 $ 390,004 $
Changes in the Net Pension Liability
Increase (Decrease)
For the year ended June 30, 2016, the City recognized pension expense of $67,065. As of June 30, 2016, the City’s reported deferred outflows of resources and deferred inflows of resources related to pensions in the statement of net position from the following sources:
Deferred Outflows Deferred Inflows
of Resources of Resources
Differences between expected and actual experience 14,353 $ (6,947) $
Changes of assumptions 12,533 -
Net difference between projected and actual earnings
on pension plan investments 91,884 -
Total 118,770 $ (6,947) $
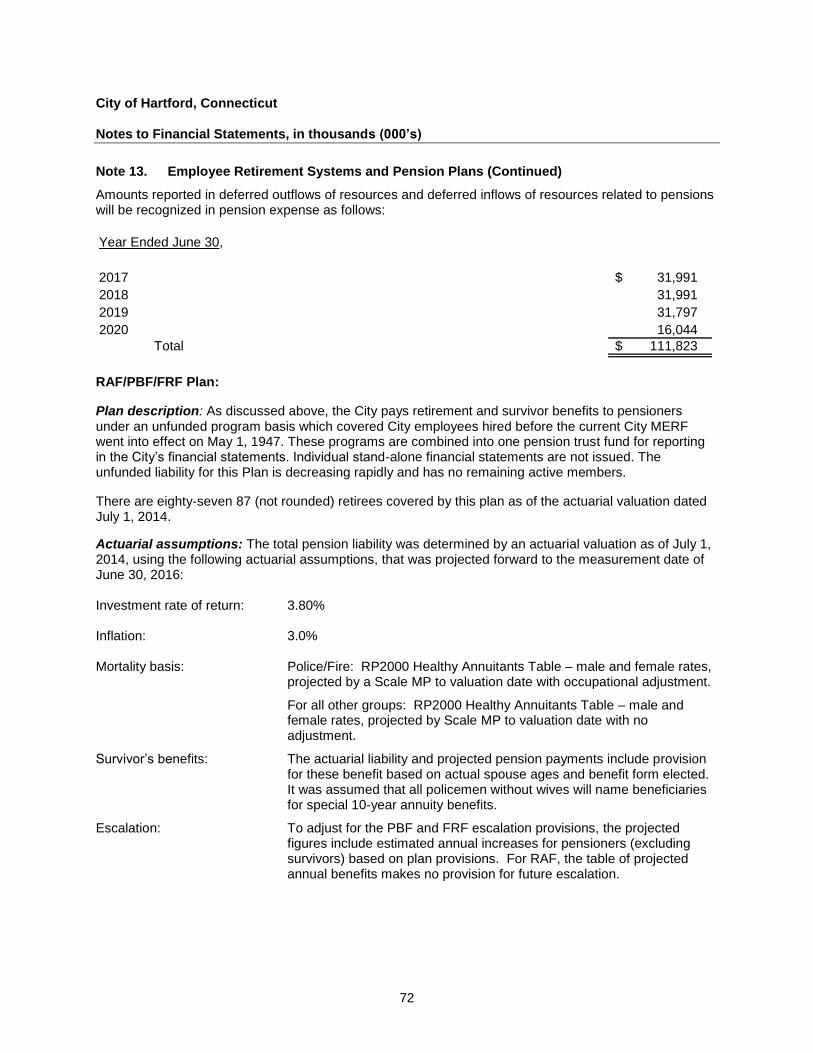
City of Hartford, Connecticut Notes to Financial Statements, in thousands (000’s)
72
Note 13. Employee Retirement Systems and Pension Plans (Continued)
Amounts reported in deferred outflows of resources and deferred inflows of resources related to pensions will be recognized in pension expense as follows:
Year Ended June 30,
2017 31,991 $
2018 31,991
2019 31,797
2020 16,044
Total 111,823 $
RAF/PBF/FRF Plan:
Plan description: As discussed above, the City pays retirement and survivor benefits to pensioners under an unfunded program basis which covered City employees hired before the current City MERF went into effect on May 1, 1947. These programs are combined into one pension trust fund for reporting in the City’s financial statements. Individual stand-alone financial statements are not issued. The unfunded liability for this Plan is decreasing rapidly and has no remaining active members.
There are eighty-seven 87 (not rounded) retirees covered by this plan as of the actuarial valuation dated July 1, 2014.
Actuarial assumptions: The total pension liability was determined by an actuarial valuation as of July 1, 2014, using the following actuarial assumptions, that was projected forward to the measurement date of June 30, 2016: Investment rate of return: 3.80% Inflation: 3.0% Mortality basis: Police/Fire: RP2000 Healthy Annuitants Table – male and female rates,
projected by a Scale MP to valuation date with occupational adjustment.
For all other groups: RP2000 Healthy Annuitants Table – male and female rates, projected by Scale MP to valuation date with no adjustment.
Survivor’s benefits: The actuarial liability and projected pension payments include provision for these benefit based on actual spouse ages and benefit form elected. It was assumed that all policemen without wives will name beneficiaries for special 10-year annuity benefits.
Escalation: To adjust for the PBF and FRF escalation provisions, the projected figures include estimated annual increases for pensioners (excluding survivors) based on plan provisions. For RAF, the table of projected annual benefits makes no provision for future escalation.
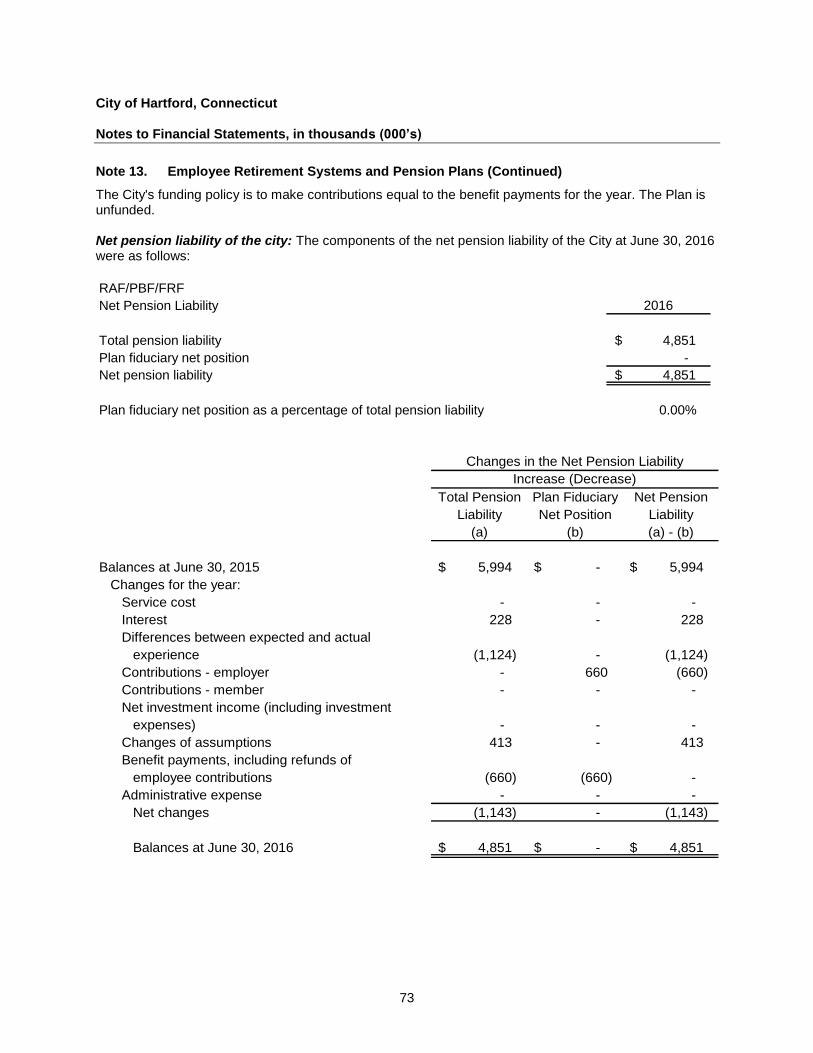
City of Hartford, Connecticut Notes to Financial Statements, in thousands (000’s)
73
Note 13. Employee Retirement Systems and Pension Plans (Continued)
The City's funding policy is to make contributions equal to the benefit payments for the year. The Plan is unfunded. Net pension liability of the city: The components of the net pension liability of the City at June 30, 2016 were as follows:
RAF/PBF/FRF
Net Pension Liability 2016
Total pension liability 4,851 $
Plan fiduciary net position -
Net pension liability 4,851 $
Plan fiduciary net position as a percentage of total pension liability 0.00%
Total Pension Plan Fiduciary Net Pension
Liability Net Position Liability
(a) (b) (a) - (b)
Balances at June 30, 2015 5,994 $ -$ 5,994 $
Changes for the year:
Service cost - - -
Interest 228 - 228
Differences between expected and actual
experience (1,124) - (1,124)
Contributions - employer - 660 (660)
Contributions - member - - -
Net investment income (including investment
expenses) - - -
Changes of assumptions 413 - 413
Benefit payments, including refunds of
employee contributions (660) (660) -
Administrative expense - - -
Net changes (1,143) - (1,143)
Balances at June 30, 2016 4,851 $ -$ 4,851 $
Changes in the Net Pension Liability
Increase (Decrease)
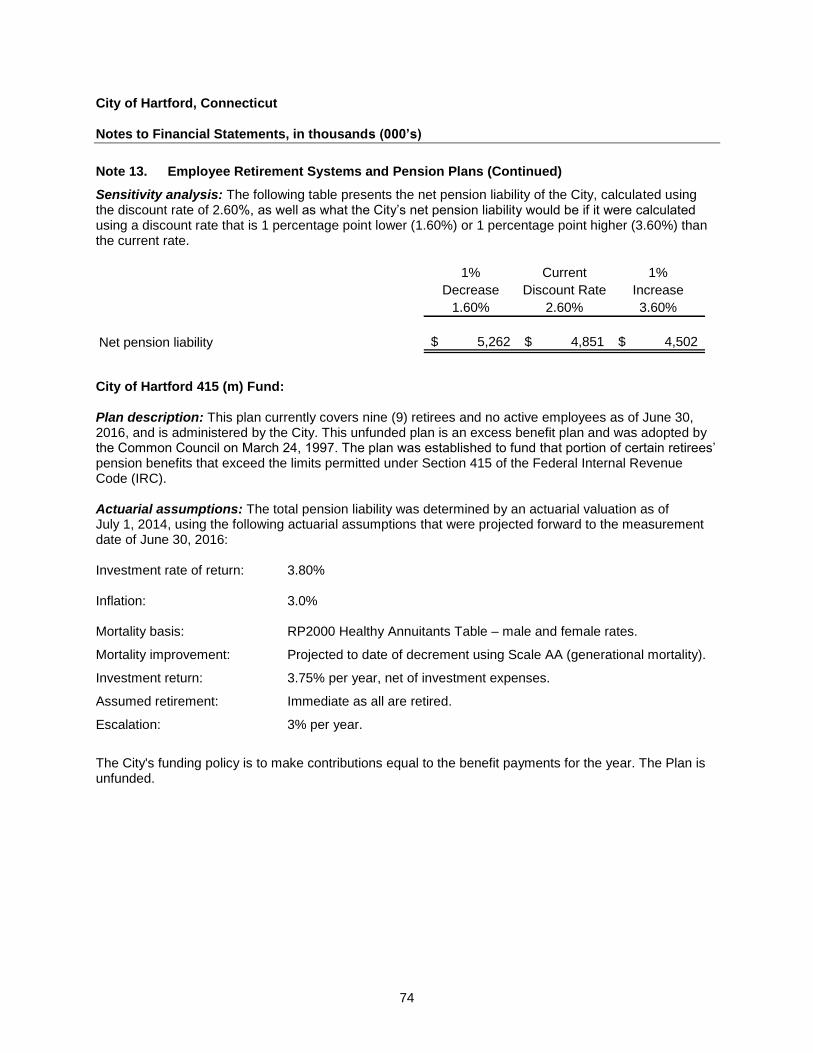
City of Hartford, Connecticut Notes to Financial Statements, in thousands (000’s)
74
Note 13. Employee Retirement Systems and Pension Plans (Continued)
Sensitivity analysis: The following table presents the net pension liability of the City, calculated using the discount rate of 2.60%, as well as what the City’s net pension liability would be if it were calculated using a discount rate that is 1 percentage point lower (1.60%) or 1 percentage point higher (3.60%) than the current rate.
1% Current 1%
Decrease Discount Rate Increase
1.60% 2.60% 3.60%
Net pension liability 5,262$ 4,851$ 4,502$
City of Hartford 415 (m) Fund: Plan description: This plan currently covers nine (9) retirees and no active employees as of June 30, 2016, and is administered by the City. This unfunded plan is an excess benefit plan and was adopted by the Common Council on March 24, 1997. The plan was established to fund that portion of certain retirees’ pension benefits that exceed the limits permitted under Section 415 of the Federal Internal Revenue Code (IRC). Actuarial assumptions: The total pension liability was determined by an actuarial valuation as of July 1, 2014, using the following actuarial assumptions that were projected forward to the measurement date of June 30, 2016: Investment rate of return: 3.80% Inflation: 3.0% Mortality basis: RP2000 Healthy Annuitants Table – male and female rates.
Mortality improvement: Projected to date of decrement using Scale AA (generational mortality).
Investment return: 3.75% per year, net of investment expenses.
Assumed retirement: Immediate as all are retired.
Escalation: 3% per year.
The City's funding policy is to make contributions equal to the benefit payments for the year. The Plan is unfunded.
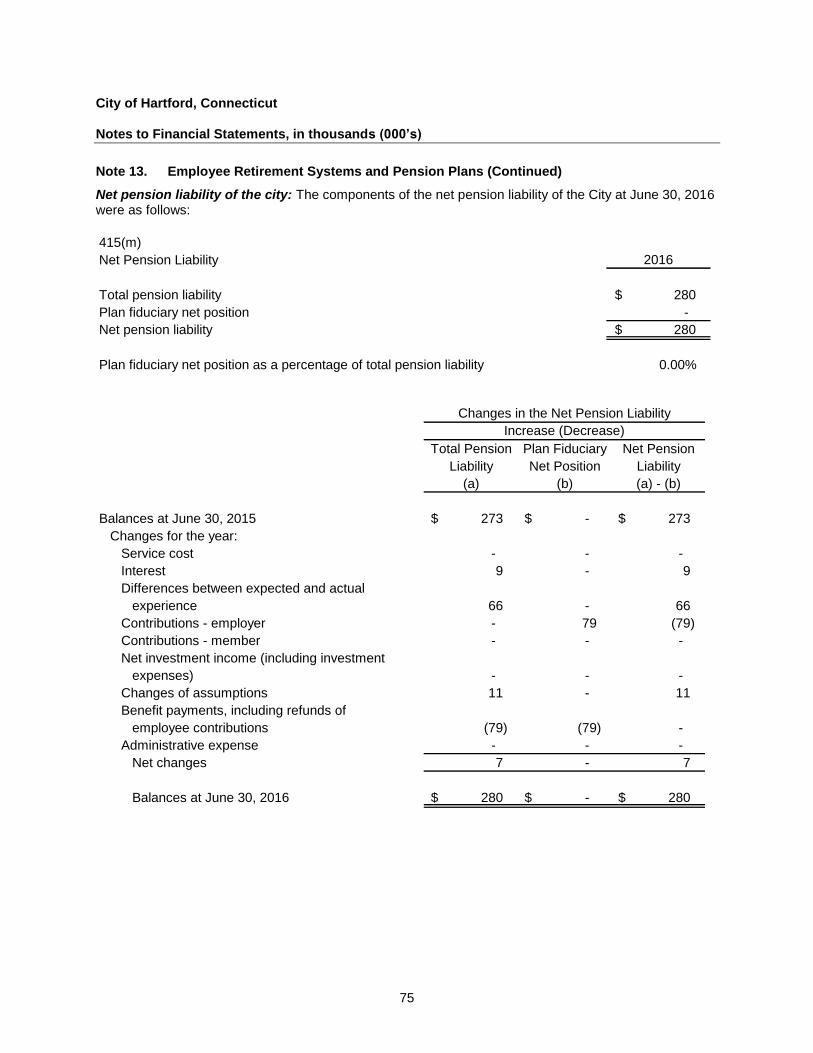
City of Hartford, Connecticut Notes to Financial Statements, in thousands (000’s)
75
Note 13. Employee Retirement Systems and Pension Plans (Continued)
Net pension liability of the city: The components of the net pension liability of the City at June 30, 2016 were as follows:
415(m)
Net Pension Liability 2016
Total pension liability 280 $
Plan fiduciary net position -
Net pension liability 280 $
Plan fiduciary net position as a percentage of total pension liability 0.00%
Total Pension Plan Fiduciary Net Pension
Liability Net Position Liability
(a) (b) (a) - (b)
Balances at June 30, 2015 273 $ -$ 273 $
Changes for the year:
Service cost - - -
Interest 9 - 9
Differences between expected and actual
experience 66 - 66
Contributions - employer - 79 (79)
Contributions - member - - -
Net investment income (including investment
expenses) - - -
Changes of assumptions 11 - 11
Benefit payments, including refunds of
employee contributions (79) (79) -
Administrative expense - - -
Net changes 7 - 7
Balances at June 30, 2016 280 $ -$ 280 $
Changes in the Net Pension Liability
Increase (Decrease)
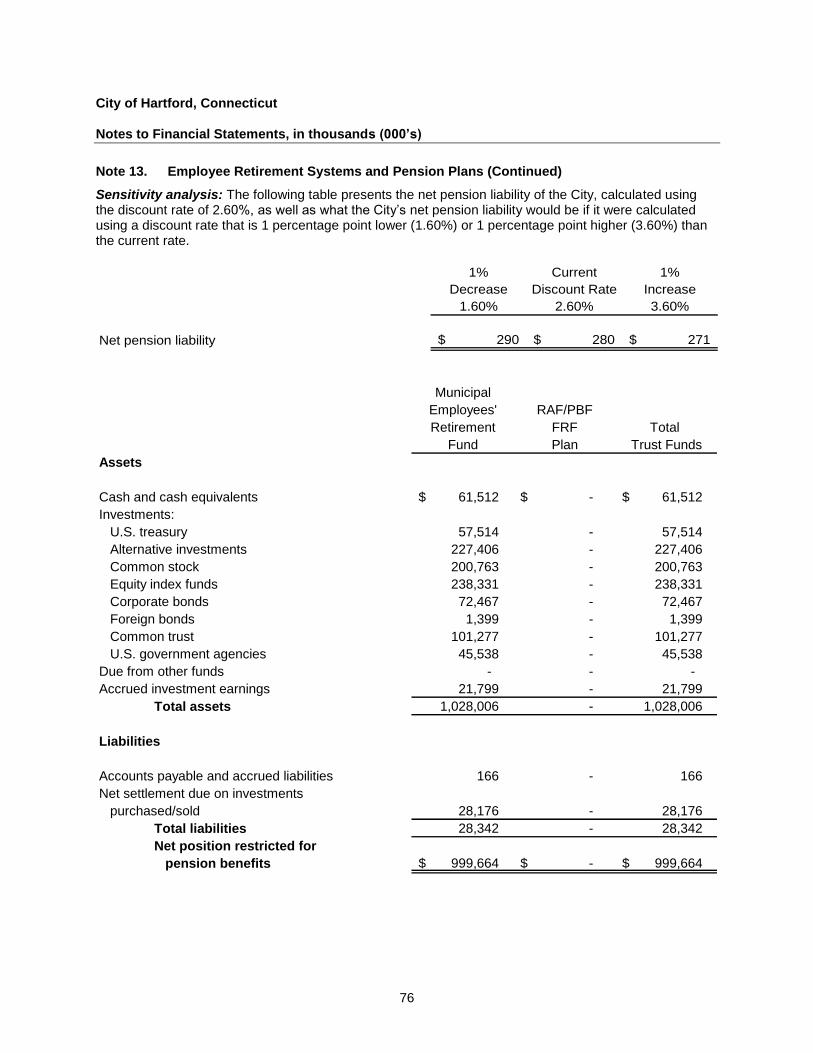
City of Hartford, Connecticut Notes to Financial Statements, in thousands (000’s)
76
Note 13. Employee Retirement Systems and Pension Plans (Continued)
Sensitivity analysis: The following table presents the net pension liability of the City, calculated using the discount rate of 2.60%, as well as what the City’s net pension liability would be if it were calculated using a discount rate that is 1 percentage point lower (1.60%) or 1 percentage point higher (3.60%) than the current rate.
1% Current 1%
Decrease Discount Rate Increase
1.60% 2.60% 3.60%
Net pension liability 290$ 280$ 271$
Municipal
Employees' RAF/PBF
Retirement FRF Total
Fund Plan Trust Funds
Assets
Cash and cash equivalents 61,512 $ -$ 61,512 $
Investments:
U.S. treasury 57,514 - 57,514
Alternative investments 227,406 - 227,406
Common stock 200,763 - 200,763
Equity index funds 238,331 - 238,331
Corporate bonds 72,467 - 72,467
Foreign bonds 1,399 - 1,399
Common trust 101,277 - 101,277
U.S. government agencies 45,538 - 45,538
Due from other funds - - -
Accrued investment earnings 21,799 - 21,799
Total assets 1,028,006 - 1,028,006
Liabilities
Accounts payable and accrued liabilities 166 - 166
Net settlement due on investments
purchased/sold 28,176 - 28,176
Total liabilities 28,342 - 28,342
Net position restricted for
pension benefits 999,664 $ -$ 999,664 $
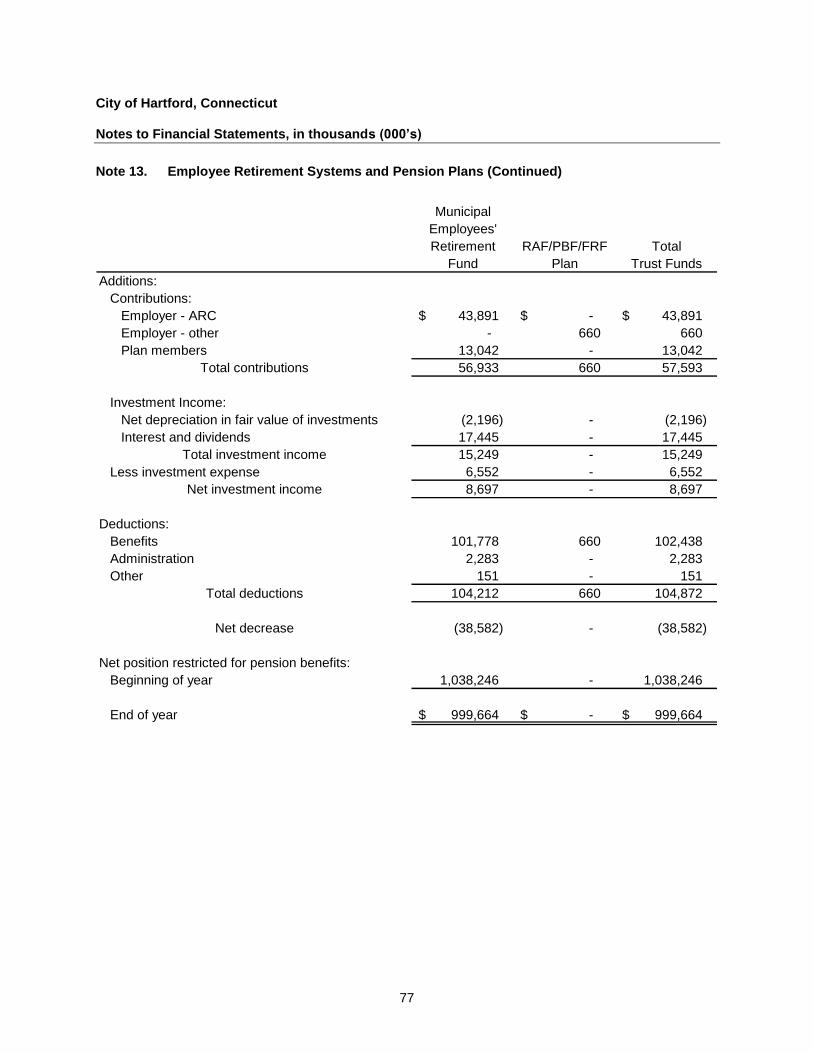
City of Hartford, Connecticut Notes to Financial Statements, in thousands (000’s)
77
Note 13. Employee Retirement Systems and Pension Plans (Continued)
Municipal
Employees'
Retirement RAF/PBF/FRF Total
Fund Plan Trust Funds
Additions:
Contributions:
Employer - ARC 43,891 $ -$ 43,891 $
Employer - other - 660 660
Plan members 13,042 - 13,042
Total contributions 56,933 660 57,593
Investment Income:
Net depreciation in fair value of investments (2,196) - (2,196)
Interest and dividends 17,445 - 17,445
Total investment income 15,249 - 15,249
Less investment expense 6,552 - 6,552
Net investment income 8,697 - 8,697
Deductions:
Benefits 101,778 660 102,438
Administration 2,283 - 2,283
Other 151 - 151
Total deductions 104,212 660 104,872
Net decrease (38,582) - (38,582)
Net position restricted for pension benefits:
Beginning of year 1,038,246 - 1,038,246
End of year 999,664 $ -$ 999,664 $
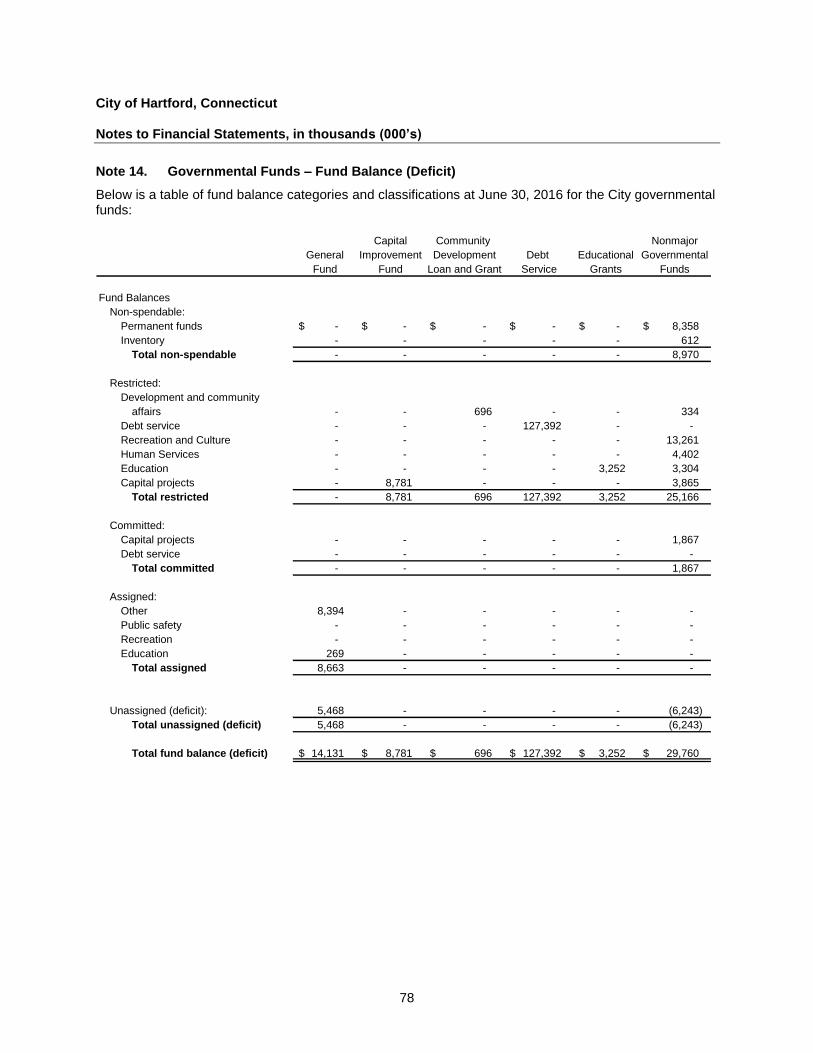
City of Hartford, Connecticut Notes to Financial Statements, in thousands (000’s)
78
Note 14. Governmental Funds – Fund Balance (Deficit)
Below is a table of fund balance categories and classifications at June 30, 2016 for the City governmental funds:
Capital Community Nonmajor
General Improvement Development Debt Educational Governmental
Fund Fund Loan and Grant Service Grants Funds
Fund Balances
Non-spendable:
Permanent funds -$ -$ -$ -$ -$ 8,358 $
Inventory - - - - - 612
Total non-spendable - - - - - 8,970
Restricted:
Development and community
affairs - - 696 - - 334
Debt service - - - 127,392 - -
Recreation and Culture - - - - - 13,261
Human Services - - - - - 4,402
Education - - - - 3,252 3,304
Capital projects - 8,781 - - - 3,865
Total restricted - 8,781 696 127,392 3,252 25,166
Committed:
Capital projects - - - - - 1,867
Debt service - - - - - -
Total committed - - - - - 1,867
Assigned:
Other 8,394 - - - - -
Public safety - - - - - -
Recreation - - - - - -
Education 269 - - - - -
Total assigned 8,663 - - - - -
Unassigned (deficit): 5,468 - - - - (6,243)
Total unassigned (deficit) 5,468 - - - - (6,243)
Total fund balance (deficit) 14,131 $ 8,781 $ 696 $ 127,392 $ 3,252 $ 29,760 $
City of Hartford, Connecticut Notes to Financial Statements, in thousands (000’s)
79
Note 15. Governmental Accounting Standards Board (GASB) Statements
The Governmental Accounting Standards Board (GASB) has issued several pronouncements that have effective dates that may impact future financial presentations. Management has not currently determined what, if any, impact implementation of the following statements may have on the financial statements, except for GASB 75, which will most likely have a material impact, though the amount has not yet been determined:
GASB Statement No. 74, Financial Reporting for Postemployment Benefit Plans Other Than Pension Plans, addresses reporting by OPEB plans that administer benefits on behalf of governments. Statement 74 addresses the financial reports of defined benefit OPEB plans that are administered through trusts that meet specified criteria. The Statement follows the framework for financial reporting for defined benefit OPEB plans in Statement 45 by requiring a statement of fiduciary net position and a statement of changes in fiduciary net position. The Statement requires more extensive note disclosures and RSI related to the measurement of the OPEB liabilities for which assets have been accumulated, including information about the annual money-weighted rates of return on plan investments. Statement 74 also sets forth note disclosure requirements for defined contribution OPEB plans. The provisions of this Statement are effective for fiscal years beginning after June 15, 2016.
GASB Statement No. 75, Accounting and Financial Reporting for Postemployment Benefits Other Than Pensions, addresses reporting by governments that provide OPEB to their employees and for governments that finance OPEB for employees of other governments. Statement 75 requires governments to report a liability on the face of the financial statements for the OPEB that they provide:
Governments that are responsible only for OPEB liabilities related to their own employees and that provide OPEB through a defined benefit OPEB plan administered through a trust that meets specified criteria will report a net OPEB liability—the difference between the total OPEB liability and assets accumulated in the trust and restricted to making benefit payments.
Governments that participate in a cost-sharing OPEB plan that is administered through a trust that meets the specified criteria will report a liability equal to their proportionate share of the collective OPEB liability for all entities participating in the cost-sharing plan.
Governments that do not provide OPEB through a trust that meets specified criteria will report the total OPEB liability related to their employees.
Statement 75 carries forward from Statement 45 the option to use a specified alternative measurement method in place of an actuarial valuation for purposes of determining the total OPEB liability for benefits provided through OPEB plans in which there are fewer than 100 plan members (active and inactive). This option was retained in order to reduce costs for smaller governments. The provisions of this Statement are effective for fiscal years beginning after June 15, 2017.
City of Hartford, Connecticut Notes to Financial Statements, in thousands (000’s)
80
Note 15. Governmental Accounting Standards Board (GASB) Statements (Continued)
GASB Statement No. 77, Tax Abatement Disclosures. Financial statements prepared by state and local governments in conformity with generally accepted accounting principles provide citizens and taxpayers, legislative and oversight bodies, municipal bond analysts, and others with information they need to evaluate the financial health of governments, make decisions, and assess accountability. This information is intended, among other things, to assist these users of financial statements in assessing (1) whether a government’s current-year revenues were sufficient to pay for current-year services (known as interperiod equity), (2) whether a government complied with finance-related legal and contractual obligations, (3) where a government’s financial resources come from and how it uses them, and (4) a government’s financial position and economic condition and how they have changed over time. This Statement requires governments that enter into tax abatement agreements to disclose the following information about the agreements:
Brief descriptive information, such as the tax being abated, the authority under which tax abatements are provided, eligibility criteria, the mechanism by which taxes are abated, provisions for recapturing abated taxes, and the types of commitments made by tax abatement recipients
The gross dollar amount of taxes abated during the period
Commitments made by a government, other than to abate taxes, as part of a tax abatement agreement.
Governments should organize those disclosures by major tax abatement program and may disclose information for individual tax abatement agreements within those programs. Tax abatement agreements of other governments should be organized by the government that entered into the tax abatement agreement and the specific tax being abated. Governments may disclose information for individual tax abatement agreements of other governments within the specific tax being abated. For those tax abatement agreements, a reporting government should disclose:
The names of the governments that entered into the agreements
The specific taxes being abated
The gross dollar amount of taxes abated during the period.
The requirements of this Statement are effective for financial statements for periods beginning after December 15, 2015. Earlier application is encouraged.
GASB Statement No. 78, Pensions Provided through Certain Multiple-Employer Defined Benefit Pension Plans. This standard narrows the scope and applicability of GASB Statement No. 68, Accounting and Financial Reporting for Pensions, to exclude pensions provided to employees of state or local governmental employers through a cost-sharing multiple-employer defined benefit pension plan meeting specific criteria; establishes new guidance for these employers, including separate requirements for recognition and measurement of pension expense or expenditures and liabilities, note disclosures and required supplementary information (RSI). The requirements of this Statement are effective for financial statements for periods beginning after December 15, 2015. Earlier application is encouraged.
City of Hartford, Connecticut Notes to Financial Statements, in thousands (000’s)
81
Note 15. Governmental Accounting Standards Board (GASB) Statements (Continued)
GASB Statement No. 80, Blending Requirements for Certain Component Units – An Amendment of GASB Statement No.14. The objective of this Statement is to improve financial reporting by clarifying the financial statement presentation requirements for certain component units. This Statement amends the blending requirements established in paragraph 53 of Statement No. 14, The Financial Reporting Entity, as amended. This Statement amends the blending requirements for the financial statement presentation of component units of all state and local governments. The additional criterion requires blending of a component unit incorporated as a not-for-profit corporation in which the primary government is the sole corporate member. The additional criterion does not apply to component units included in the financial reporting entity pursuant to the provisions of Statement No. 39, Determining Whether Certain Organizations Are Component Units. The requirements of this Statement are effective for reporting periods beginning after June 15, 2016. Earlier application is encouraged.
GASB Statement No. 81, Irrevocable Split-Interest Agreements. This Statement requires that a government that receives resources pursuant to an irrevocable split-interest agreement recognize assets, liabilities, and deferred inflows of resources at the inception of the agreement. Furthermore, this Statement requires that a government recognize assets representing its beneficial interests in irrevocable split-interest agreements that are administered by a third party, if the government controls the present service capacity of the beneficial interests. This Statement requires that a government recognize revenue when the resources become applicable to the reporting period. The requirements of this Statement are effective for financial statements for periods beginning after December 15, 2016, and should be applied retroactively. Earlier application is encouraged.
GASB Statement No. 82, Pension Issues—an amendment of GASB Statements No. 67, No. 68, and No. 73. The requirements of this Statement are effective for reporting periods beginning after June 15, 2016, except for the requirements of paragraph 7 in a circumstance in which an employer’s pension liability is measured as of a date other than the employer’s most recent fiscal year-end. In that circumstance, the requirements of paragraph 7 are effective for that employer in the first reporting period in which the measurement date of the pension liability is on or after June 15, 2017. Earlier application is encouraged.
GASB Statement No. 83, Certain Asset Retirement Obligations. This Statement addresses accounting and financial reporting for certain asset retirement obligations (AROs). An ARO is a legally enforceable liability associated with the retirement of a tangible capital asset. .A government that has legal obligations to perform future asset retirement activities related to its tangible capital assets should recognize a liability based on the guidance in this Statement. The requirements of this Statement are effective for reporting periods beginning after June 15, 2018. Earlier application is encouraged.

82
This page intentionally left blank.

Required Supplementary Information - Unaudited

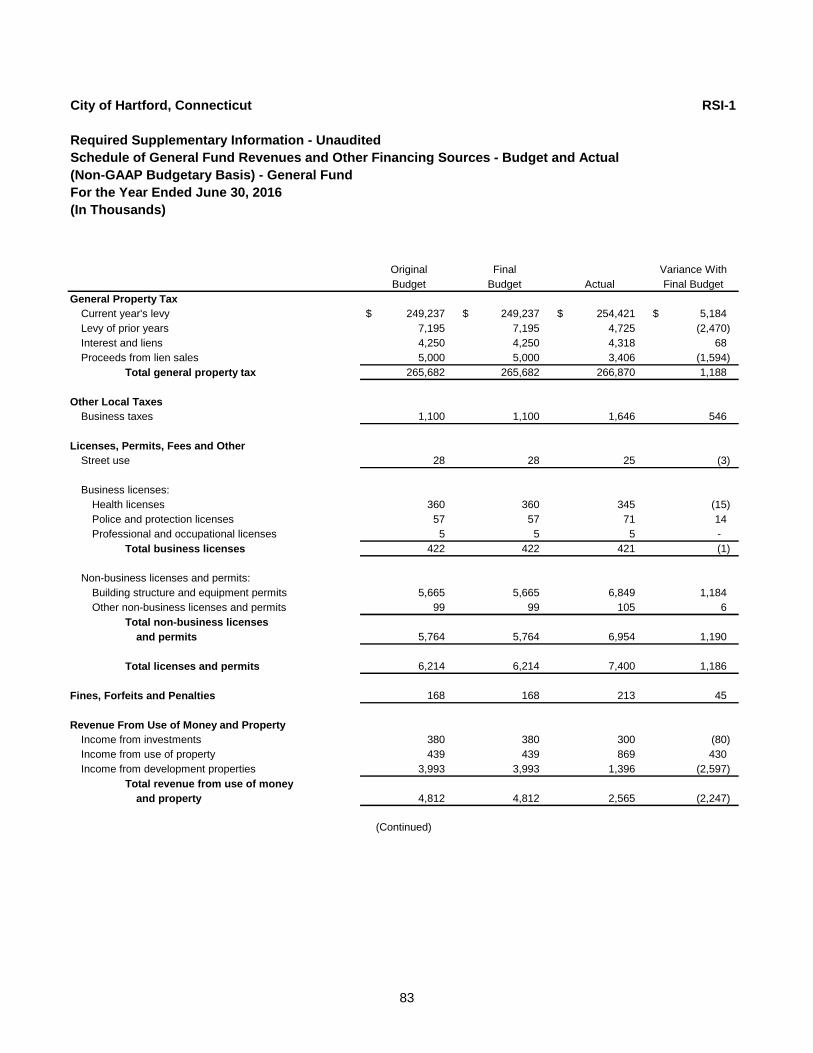
83
City of Hartford, Connecticut RSI-1
Required Supplementary Information - Unaudited
Schedule of General Fund Revenues and Other Financing Sources - Budget and Actual
(Non-GAAP Budgetary Basis) - General Fund
For the Year Ended June 30, 2016
(In Thousands)
Original Final Variance With
Budget Budget Actual Final Budget
General Property Tax
Current year's levy 249,237 $ 249,237 $ 254,421 $ 5,184 $
Levy of prior years 7,195 7,195 4,725 (2,470)
Interest and liens 4,250 4,250 4,318 68
Proceeds from lien sales 5,000 5,000 3,406 (1,594)
Total general property tax 265,682 265,682 266,870 1,188
Other Local Taxes
Business taxes 1,100 1,100 1,646 546
Licenses, Permits, Fees and Other
Street use 28 28 25 (3)
Business licenses:
Health licenses 360 360 345 (15)
Police and protection licenses 57 57 71 14
Professional and occupational licenses 5 5 5 -
Total business licenses 422 422 421 (1)
Non-business licenses and permits:
Building structure and equipment permits 5,665 5,665 6,849 1,184
Other non-business licenses and permits 99 99 105 6
Total non-business licenses
and permits 5,764 5,764 6,954 1,190
Total licenses and permits 6,214 6,214 7,400 1,186
Fines, Forfeits and Penalties 168 168 213 45
Revenue From Use of Money and Property
Income from investments 380 380 300 (80)
Income from use of property 439 439 869 430
Income from development properties 3,993 3,993 1,396 (2,597)
Total revenue from use of money
and property 4,812 4,812 2,565 (2,247)
(Continued)
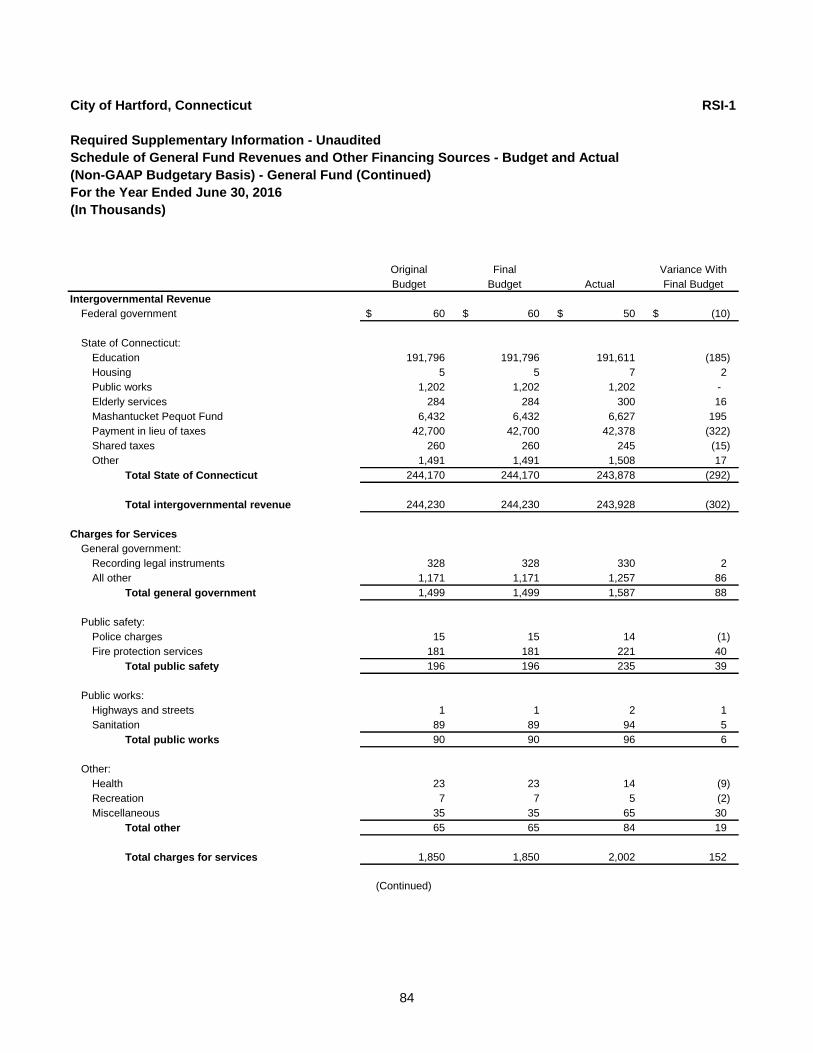
84
City of Hartford, Connecticut RSI-1
Required Supplementary Information - Unaudited
Schedule of General Fund Revenues and Other Financing Sources - Budget and Actual
(Non-GAAP Budgetary Basis) - General Fund (Continued)
For the Year Ended June 30, 2016
(In Thousands)
Original Final Variance With
Budget Budget Actual Final Budget
Intergovernmental Revenue
Federal government 60 $ 60 $ 50 $ (10) $
State of Connecticut:
Education 191,796 191,796 191,611 (185)
Housing 5 5 7 2
Public works 1,202 1,202 1,202 -
Elderly services 284 284 300 16
Mashantucket Pequot Fund 6,432 6,432 6,627 195
Payment in lieu of taxes 42,700 42,700 42,378 (322)
Shared taxes 260 260 245 (15)
Other 1,491 1,491 1,508 17
Total State of Connecticut 244,170 244,170 243,878 (292)
Total intergovernmental revenue 244,230 244,230 243,928 (302)
Charges for Services
General government:
Recording legal instruments 328 328 330 2
All other 1,171 1,171 1,257 86
Total general government 1,499 1,499 1,587 88
Public safety:
Police charges 15 15 14 (1)
Fire protection services 181 181 221 40
Total public safety 196 196 235 39
Public works:
Highways and streets 1 1 2 1
Sanitation 89 89 94 5
Total public works 90 90 96 6
Other:
Health 23 23 14 (9)
Recreation 7 7 5 (2)
Miscellaneous 35 35 65 30
Total other 65 65 84 19
Total charges for services 1,850 1,850 2,002 152
(Continued)
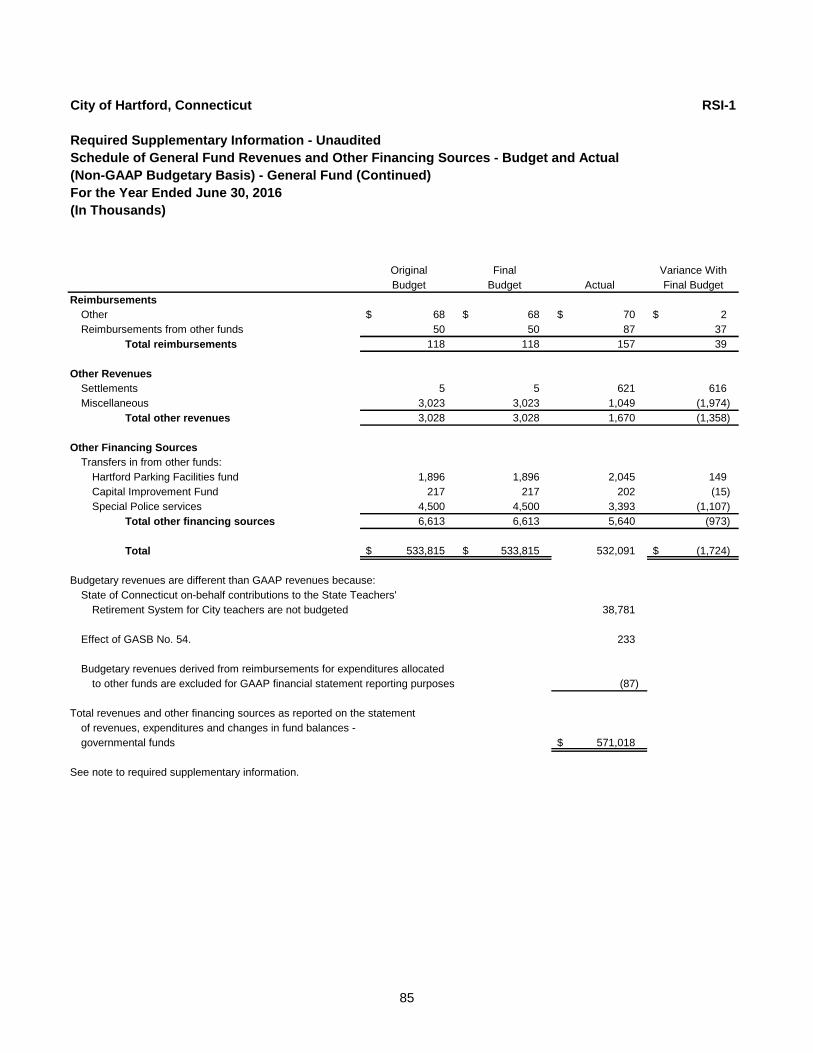
85
City of Hartford, Connecticut RSI-1
Required Supplementary Information - Unaudited
Schedule of General Fund Revenues and Other Financing Sources - Budget and Actual
(Non-GAAP Budgetary Basis) - General Fund (Continued)
For the Year Ended June 30, 2016
(In Thousands)
Original Final Variance With
Budget Budget Actual Final Budget
Reimbursements
Other 68 $ 68 $ 70 $ 2 $
Reimbursements from other funds 50 50 87 37
Total reimbursements 118 118 157 39
Other Revenues
Settlements 5 5 621 616
Miscellaneous 3,023 3,023 1,049 (1,974)
Total other revenues 3,028 3,028 1,670 (1,358)
Other Financing Sources
Transfers in from other funds:
Hartford Parking Facilities fund 1,896 1,896 2,045 149
Capital Improvement Fund 217 217 202 (15)
Special Police services 4,500 4,500 3,393 (1,107)
Total other financing sources 6,613 6,613 5,640 (973)
Total 533,815 $ 533,815 $ 532,091 (1,724) $
Budgetary revenues are different than GAAP revenues because:
State of Connecticut on-behalf contributions to the State Teachers'
Retirement System for City teachers are not budgeted 38,781
Effect of GASB No. 54. 233
Budgetary revenues derived from reimbursements for expenditures allocated
to other funds are excluded for GAAP financial statement reporting purposes (87)
Total revenues and other financing sources as reported on the statement
of revenues, expenditures and changes in fund balances -
governmental funds 571,018 $
See note to required supplementary information.
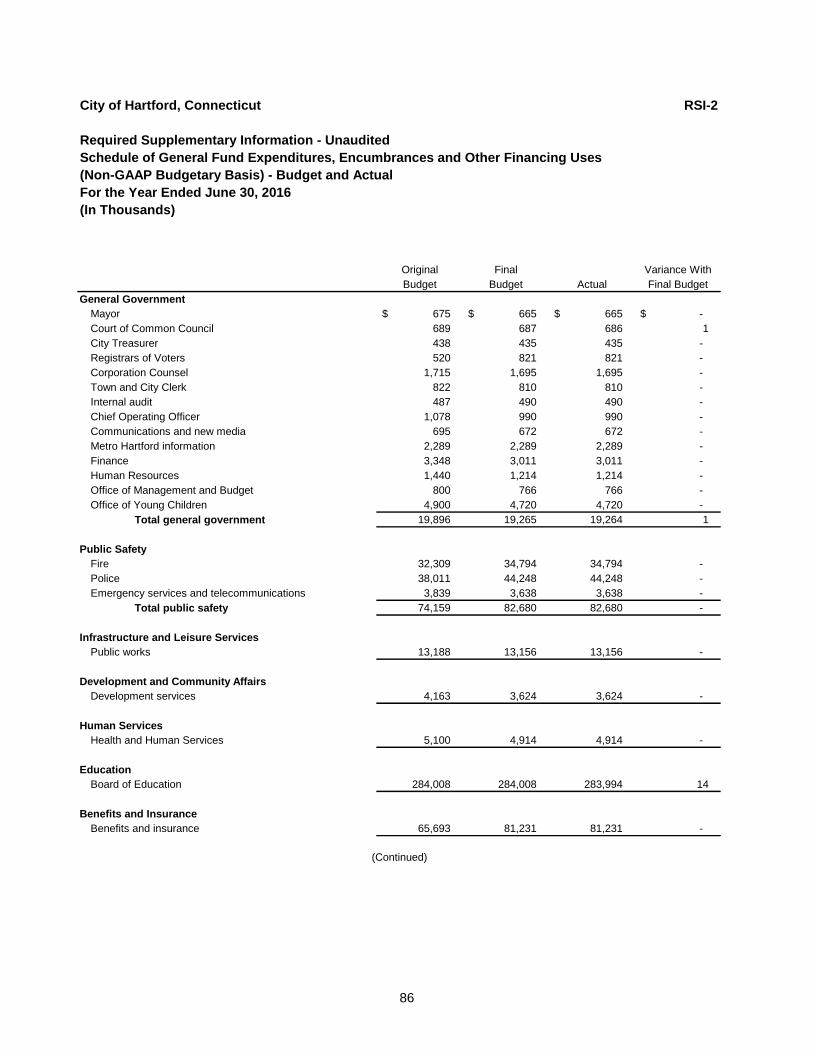
86
City of Hartford, Connecticut RSI-2
Required Supplementary Information - Unaudited
Schedule of General Fund Expenditures, Encumbrances and Other Financing Uses
(Non-GAAP Budgetary Basis) - Budget and Actual
For the Year Ended June 30, 2016
(In Thousands)
Original Final Variance With
Budget Budget Actual Final Budget
General Government
Mayor 675 $ 665 $ 665 $ -$
Court of Common Council 689 687 686 1
City Treasurer 438 435 435 -
Registrars of Voters 520 821 821 -
Corporation Counsel 1,715 1,695 1,695 -
Town and City Clerk 822 810 810 -
Internal audit 487 490 490 -
Chief Operating Officer 1,078 990 990 -
Communications and new media 695 672 672 -
Metro Hartford information 2,289 2,289 2,289 -
Finance 3,348 3,011 3,011 -
Human Resources 1,440 1,214 1,214 -
Office of Management and Budget 800 766 766 -
Office of Young Children 4,900 4,720 4,720 -
Total general government 19,896 19,265 19,264 1
Public Safety
Fire 32,309 34,794 34,794 -
Police 38,011 44,248 44,248 -
Emergency services and telecommunications 3,839 3,638 3,638 -
Total public safety 74,159 82,680 82,680 -
Infrastructure and Leisure Services
Public works 13,188 13,156 13,156 -
Development and Community Affairs
Development services 4,163 3,624 3,624 -
Human Services
Health and Human Services 5,100 4,914 4,914 -
Education
Board of Education 284,008 284,008 283,994 14
Benefits and Insurance
Benefits and insurance 65,693 81,231 81,231 -
(Continued)
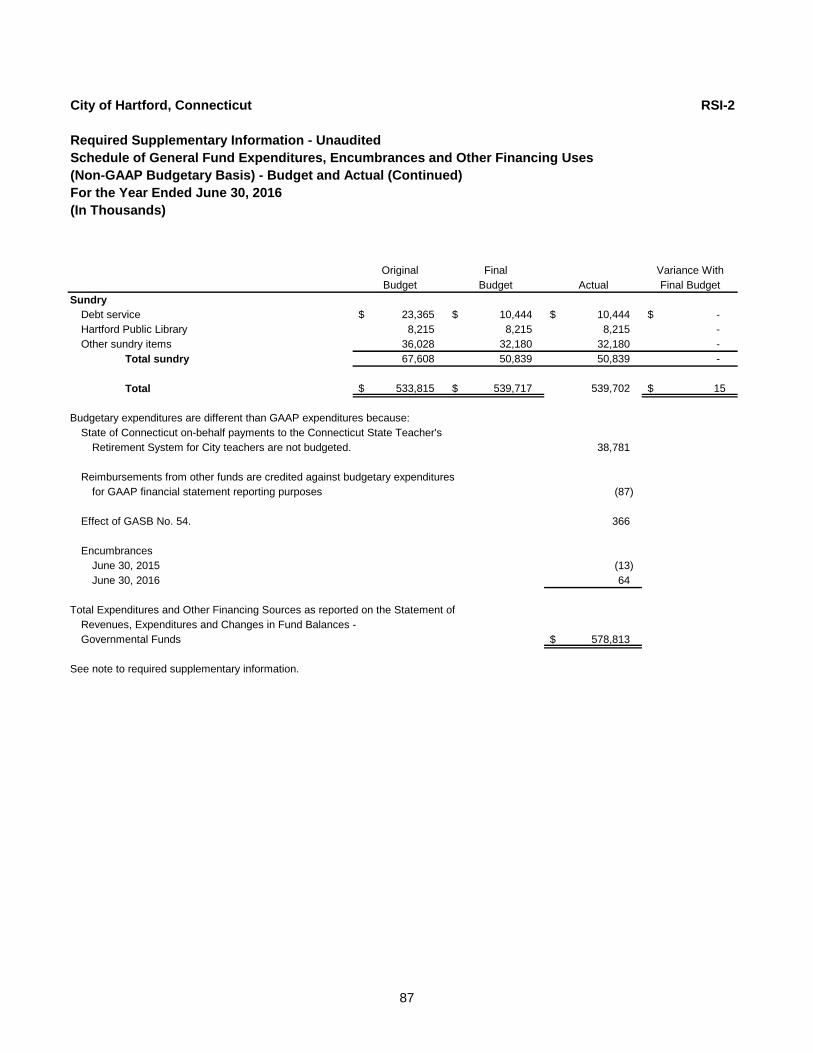
87
City of Hartford, Connecticut RSI-2
Required Supplementary Information - Unaudited
Schedule of General Fund Expenditures, Encumbrances and Other Financing Uses
(Non-GAAP Budgetary Basis) - Budget and Actual (Continued)
For the Year Ended June 30, 2016
(In Thousands)
Original Final Variance With
Budget Budget Actual Final Budget
Sundry
Debt service 23,365 $ 10,444 $ 10,444 $ -$
Hartford Public Library 8,215 8,215 8,215 -
Other sundry items 36,028 32,180 32,180 -
Total sundry 67,608 50,839 50,839 -
Total 533,815 $ 539,717 $ 539,702 15 $
Budgetary expenditures are different than GAAP expenditures because:
State of Connecticut on-behalf payments to the Connecticut State Teacher's
Retirement System for City teachers are not budgeted. 38,781
Reimbursements from other funds are credited against budgetary expenditures
for GAAP financial statement reporting purposes (87)
Effect of GASB No. 54. 366
Encumbrances
June 30, 2015 (13)
June 30, 2016 64
Total Expenditures and Other Financing Sources as reported on the Statement of
Revenues, Expenditures and Changes in Fund Balances -
Governmental Funds 578,813 $
See note to required supplementary information.
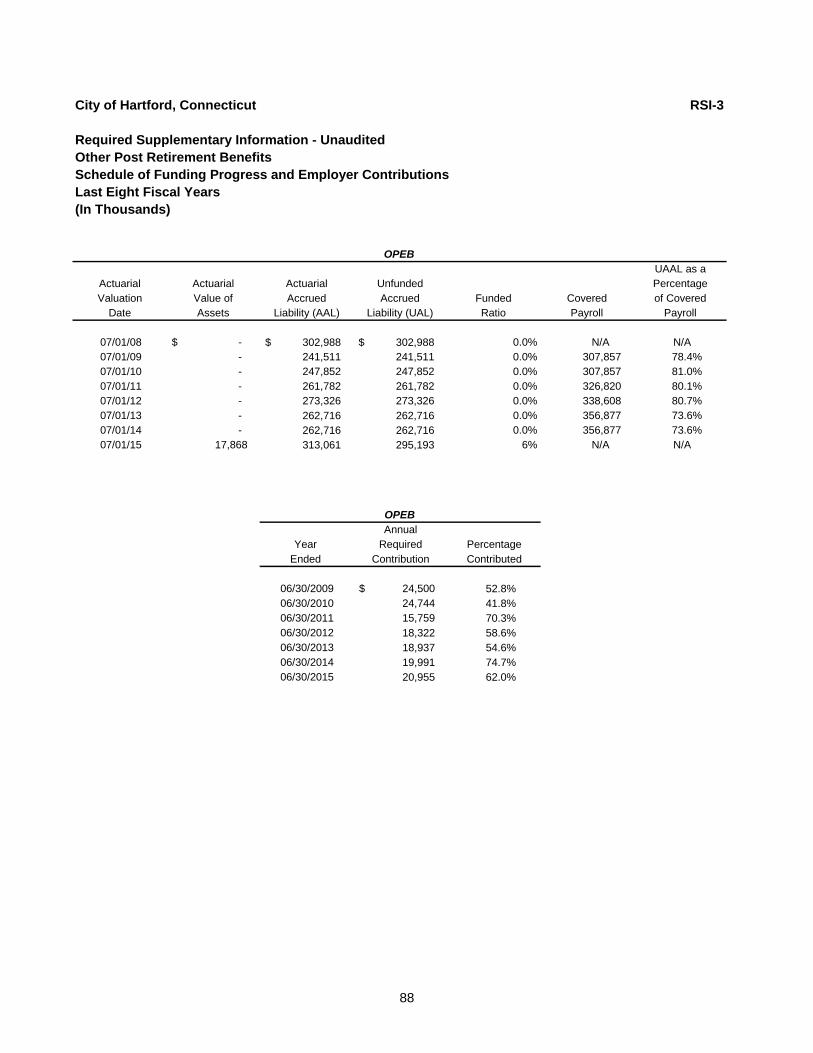
88
City of Hartford, Connecticut RSI-3
Required Supplementary Information - Unaudited
Other Post Retirement Benefits
Schedule of Funding Progress and Employer Contributions
Last Eight Fiscal Years
(In Thousands)
UAAL as a
Actuarial Actuarial Actuarial Unfunded Percentage
Valuation Value of Accrued Accrued Funded Covered of Covered
Date Assets Liability (AAL) Liability (UAL) Ratio Payroll Payroll
07/01/08 -$ 302,988 $ 302,988 $ 0.0% N/A N/A
07/01/09 - 241,511 241,511 0.0% 307,857 78.4%
07/01/10 - 247,852 247,852 0.0% 307,857 81.0%
07/01/11 - 261,782 261,782 0.0% 326,820 80.1%
07/01/12 - 273,326 273,326 0.0% 338,608 80.7%
07/01/13 - 262,716 262,716 0.0% 356,877 73.6%
07/01/14 - 262,716 262,716 0.0% 356,877 73.6%
07/01/15 17,868 313,061 295,193 6% N/A N/A
OPEB
Annual
Year Required Percentage
Ended Contribution Contributed
06/30/2009 24,500 $ 52.8%
06/30/2010 24,744 41.8%
06/30/2011 15,759 70.3%
06/30/2012 18,322 58.6%
06/30/2013 18,937 54.6%
06/30/2014 19,991 74.7%
06/30/2015 20,955 62.0%
OPEB
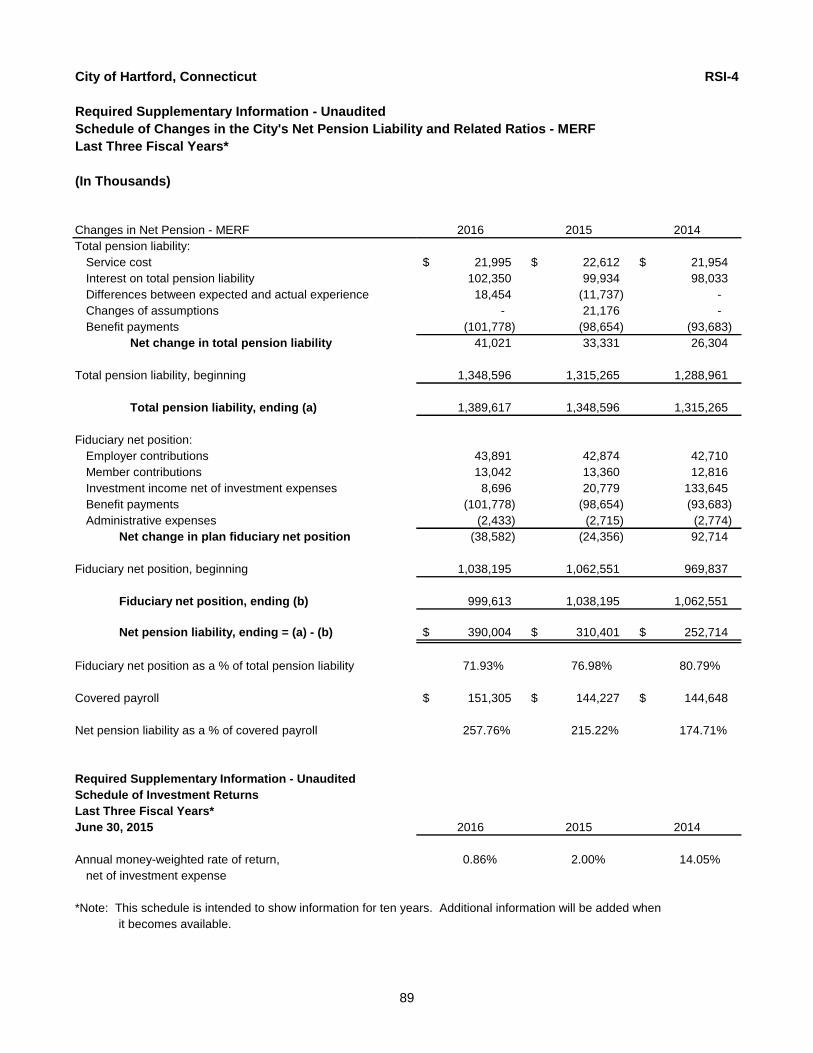
89
City of Hartford, Connecticut RSI-4
Required Supplementary Information - Unaudited
Schedule of Changes in the City's Net Pension Liability and Related Ratios - MERF
Last Three Fiscal Years*
(In Thousands)
Changes in Net Pension - MERF 2016 2015 2014
Total pension liability:
Service cost 21,995 $ 22,612 $ 21,954 $
Interest on total pension liability 102,350 99,934 98,033
Differences between expected and actual experience 18,454 (11,737) -
Changes of assumptions - 21,176 -
Benefit payments (101,778) (98,654) (93,683)
Net change in total pension liability 41,021 33,331 26,304
Total pension liability, beginning 1,348,596 1,315,265 1,288,961
Total pension liability, ending (a) 1,389,617 1,348,596 1,315,265
Fiduciary net position:
Employer contributions 43,891 42,874 42,710
Member contributions 13,042 13,360 12,816
Investment income net of investment expenses 8,696 20,779 133,645
Benefit payments (101,778) (98,654) (93,683)
Administrative expenses (2,433) (2,715) (2,774)
Net change in plan fiduciary net position (38,582) (24,356) 92,714
Fiduciary net position, beginning 1,038,195 1,062,551 969,837
Fiduciary net position, ending (b) 999,613 1,038,195 1,062,551
Net pension liability, ending = (a) - (b) 390,004 $ 310,401 $ 252,714 $
Fiduciary net position as a % of total pension liability 71.93% 76.98% 80.79%
Covered payroll 151,305 $ 144,227 $ 144,648 $
Net pension liability as a % of covered payroll 257.76% 215.22% 174.71%
Required Supplementary Information - Unaudited
Schedule of Investment Returns
Last Three Fiscal Years*
June 30, 2015 2016 2015 2014
Annual money-weighted rate of return, 0.86% 2.00% 14.05%
net of investment expense
*Note: This schedule is intended to show information for ten years. Additional information will be added when
it becomes available.
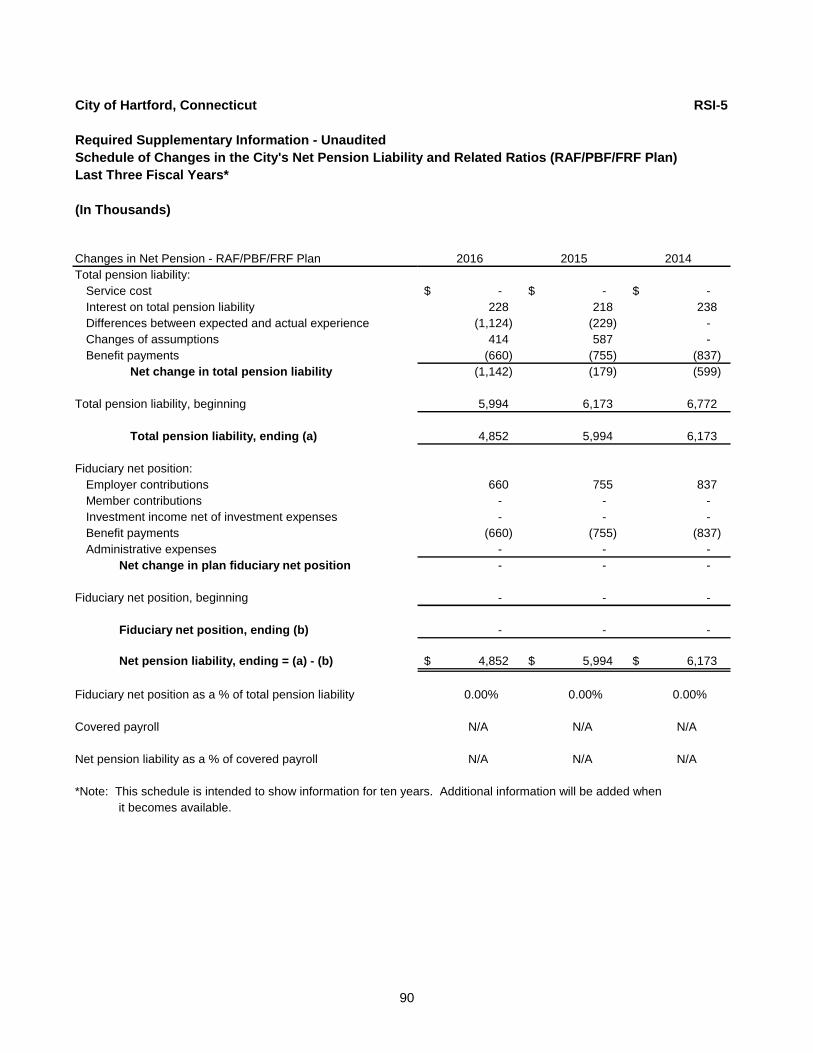
90
City of Hartford, Connecticut RSI-5
Required Supplementary Information - Unaudited
Schedule of Changes in the City's Net Pension Liability and Related Ratios (RAF/PBF/FRF Plan)
Last Three Fiscal Years*
(In Thousands)
Changes in Net Pension - RAF/PBF/FRF Plan 2016 2015 2014
Total pension liability:
Service cost -$ -$ -$
Interest on total pension liability 228 218 238
Differences between expected and actual experience (1,124) (229) -
Changes of assumptions 414 587 -
Benefit payments (660) (755) (837)
Net change in total pension liability (1,142) (179) (599)
Total pension liability, beginning 5,994 6,173 6,772
Total pension liability, ending (a) 4,852 5,994 6,173
Fiduciary net position:
Employer contributions 660 755 837
Member contributions - - -
Investment income net of investment expenses - - -
Benefit payments (660) (755) (837)
Administrative expenses - - -
Net change in plan fiduciary net position - - -
Fiduciary net position, beginning - - -
Fiduciary net position, ending (b) - - -
Net pension liability, ending = (a) - (b) 4,852 $ 5,994 $ 6,173 $
Fiduciary net position as a % of total pension liability 0.00% 0.00% 0.00%
Covered payroll N/A N/A N/A
Net pension liability as a % of covered payroll N/A N/A N/A
*Note: This schedule is intended to show information for ten years. Additional information will be added when
it becomes available.
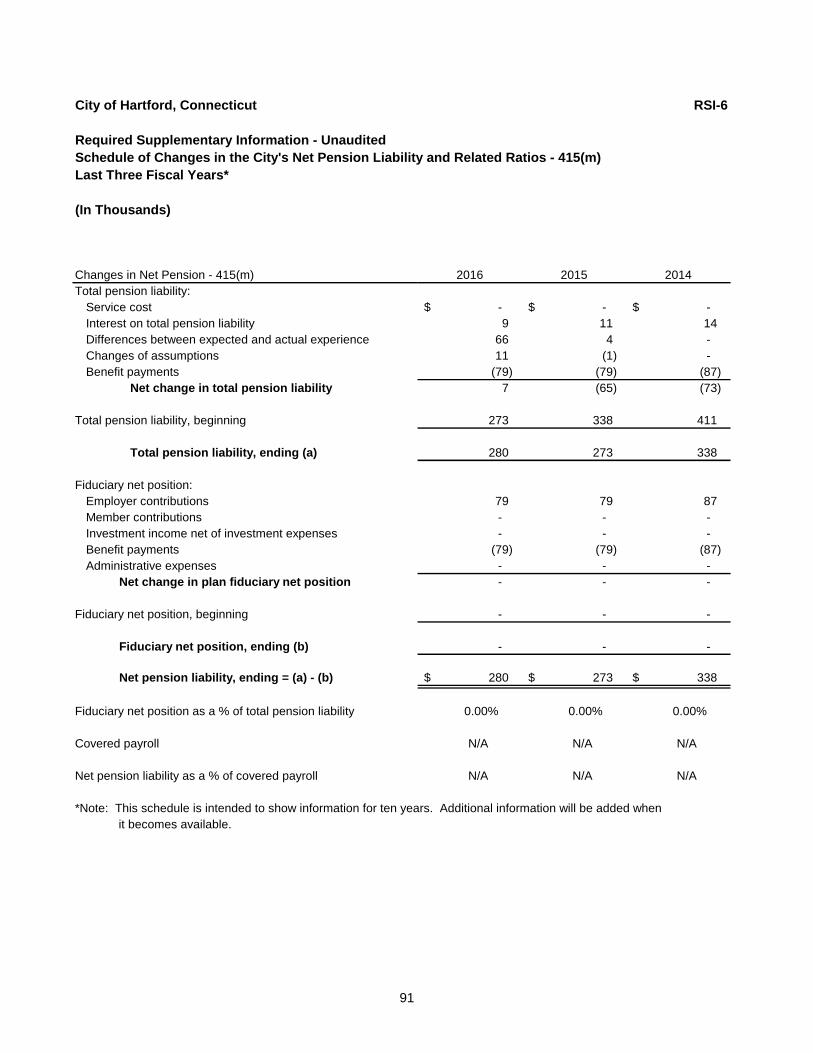
91
City of Hartford, Connecticut RSI-6
Required Supplementary Information - Unaudited
Schedule of Changes in the City's Net Pension Liability and Related Ratios - 415(m)
Last Three Fiscal Years*
(In Thousands)
Changes in Net Pension - 415(m) 2016 2015 2014
Total pension liability:
Service cost -$ -$ -$
Interest on total pension liability 9 11 14
Differences between expected and actual experience 66 4 -
Changes of assumptions 11 (1) -
Benefit payments (79) (79) (87)
Net change in total pension liability 7 (65) (73)
Total pension liability, beginning 273 338 411
Total pension liability, ending (a) 280 273 338
Fiduciary net position:
Employer contributions 79 79 87
Member contributions - - -
Investment income net of investment expenses - - -
Benefit payments (79) (79) (87)
Administrative expenses - - -
Net change in plan fiduciary net position - - -
Fiduciary net position, beginning - - -
Fiduciary net position, ending (b) - - -
Net pension liability, ending = (a) - (b) 280 $ 273 $ 338 $
Fiduciary net position as a % of total pension liability 0.00% 0.00% 0.00%
Covered payroll N/A N/A N/A
Net pension liability as a % of covered payroll N/A N/A N/A
*Note: This schedule is intended to show information for ten years. Additional information will be added when
it becomes available.
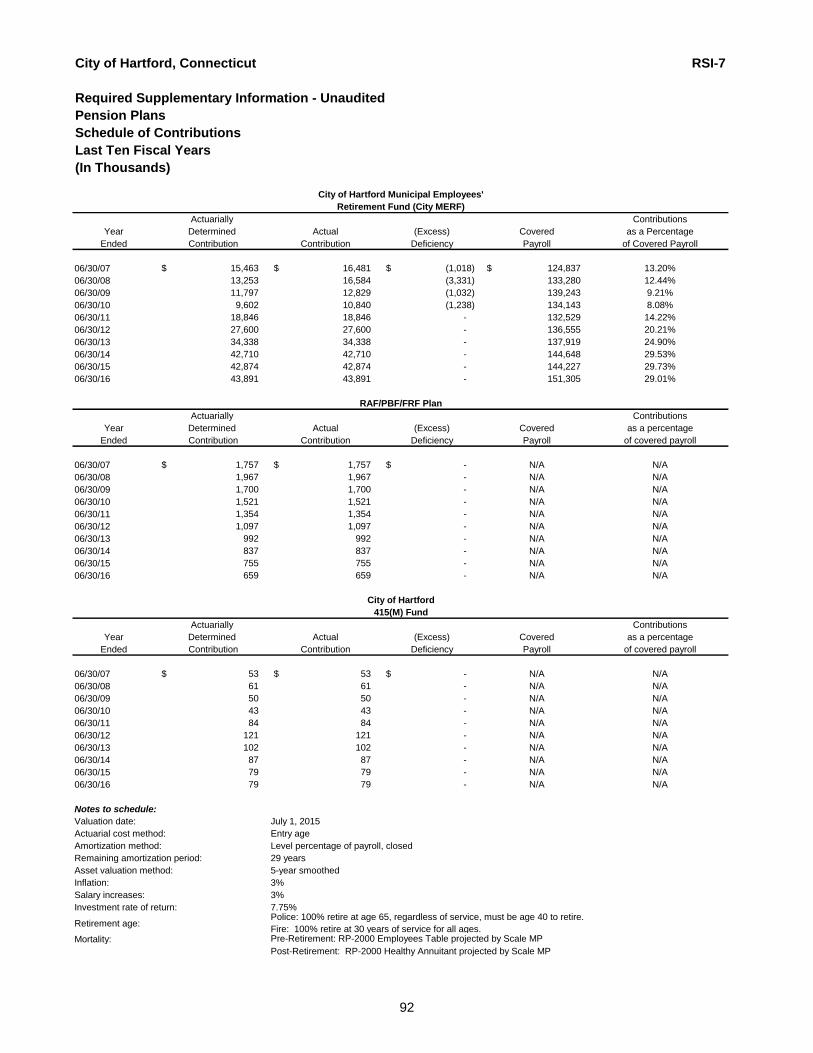
92
City of Hartford, Connecticut RSI-7
Required Supplementary Information - Unaudited
Pension Plans
Schedule of Contributions
Last Ten Fiscal Years
(In Thousands)
Actuarially Contributions
Year Determined Actual (Excess) Covered as a Percentage
Ended Contribution Contribution Deficiency Payroll of Covered Payroll
06/30/07 15,463 $ 16,481 $ (1,018) $ 124,837 $ 13.20%
06/30/08 13,253 16,584 (3,331) 133,280 12.44%
06/30/09 11,797 12,829 (1,032) 139,243 9.21%
06/30/10 9,602 10,840 (1,238) 134,143 8.08%
06/30/11 18,846 18,846 - 132,529 14.22%
06/30/12 27,600 27,600 - 136,555 20.21%
06/30/13 34,338 34,338 - 137,919 24.90%
06/30/14 42,710 42,710 - 144,648 29.53%
06/30/15 42,874 42,874 - 144,227 29.73%
06/30/16 43,891 43,891 - 151,305 29.01%
Actuarially Contributions
Year Determined Actual (Excess) Covered as a percentage
Ended Contribution Contribution Deficiency Payroll of covered payroll
06/30/07 1,757 $ 1,757 $ -$ N/A N/A
06/30/08 1,967 1,967 - N/A N/A
06/30/09 1,700 1,700 - N/A N/A
06/30/10 1,521 1,521 - N/A N/A
06/30/11 1,354 1,354 - N/A N/A
06/30/12 1,097 1,097 - N/A N/A
06/30/13 992 992 - N/A N/A
06/30/14 837 837 - N/A N/A
06/30/15 755 755 - N/A N/A
06/30/16 659 659 - N/A N/A
Actuarially Contributions
Year Determined Actual (Excess) Covered as a percentage
Ended Contribution Contribution Deficiency Payroll of covered payroll
06/30/07 53 $ 53 $ -$ N/A N/A
06/30/08 61 61 - N/A N/A
06/30/09 50 50 - N/A N/A
06/30/10 43 43 - N/A N/A
06/30/11 84 84 - N/A N/A
06/30/12 121 121 - N/A N/A
06/30/13 102 102 - N/A N/A
06/30/14 87 87 - N/A N/A
06/30/15 79 79 - N/A N/A
06/30/16 79 79 - N/A N/A
Notes to schedule:
Valuation date: July 1, 2015
Actuarial cost method: Entry age
Amortization method: Level percentage of payroll, closed
Remaining amortization period: 29 years
Asset valuation method: 5-year smoothed
Inflation: 3%
Salary increases: 3%
Investment rate of return: 7.75%
Retirement age:
Mortality:
Post-Retirement: RP-2000 Healthy Annuitant projected by Scale MP
Police: 100% retire at age 65, regardless of service, must be age 40 to retire.
Fire: 100% retire at 30 years of service for all ages.Pre-Retirement: RP-2000 Employees Table projected by Scale MP
City of Hartford Municipal Employees'
Retirement Fund (City MERF)
RAF/PBF/FRF Plan
415(M) Fund
City of Hartford
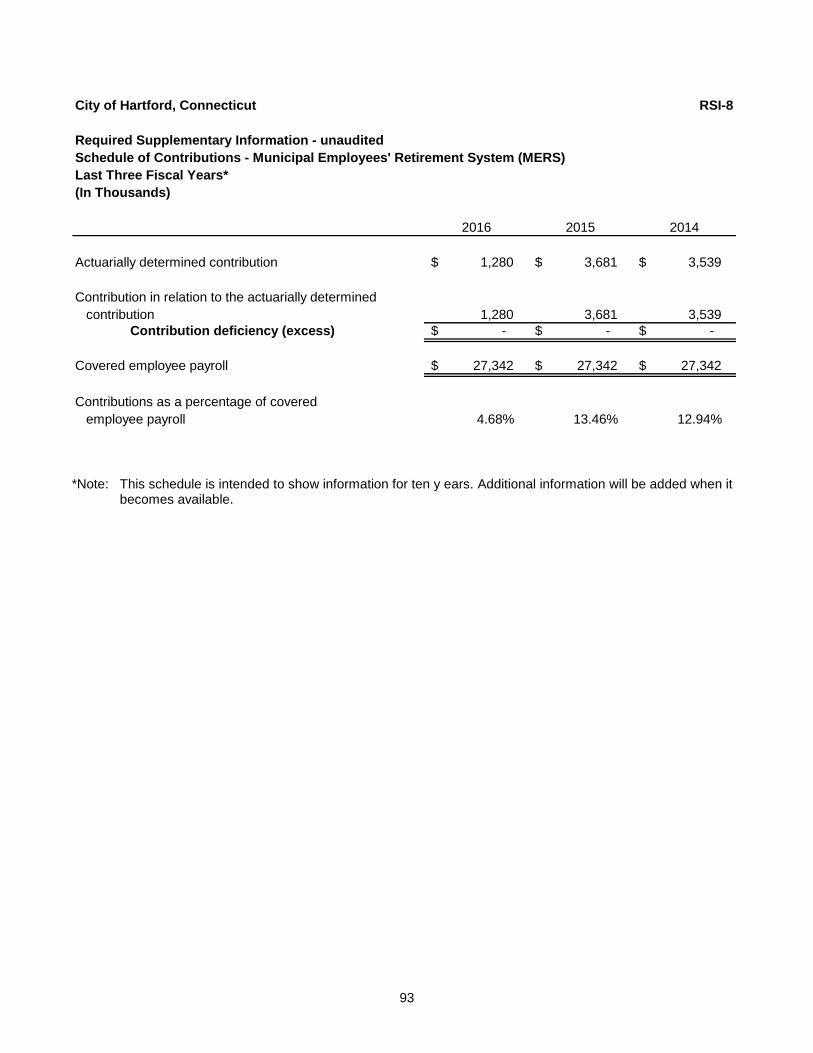
93
City of Hartford, Connecticut RSI-8
Required Supplementary Information - unaudited
Schedule of Contributions - Municipal Employees' Retirement System (MERS)
Last Three Fiscal Years*
(In Thousands)
2016 2015 2014
Actuarially determined contribution 1,280 $ 3,681 $ 3,539 $
Contribution in relation to the actuarially determined
contribution 1,280 3,681 3,539
Contribution deficiency (excess) -$ -$ -$
Covered employee payroll 27,342 $ 27,342 $ 27,342 $
Contributions as a percentage of covered
employee payroll 4.68% 13.46% 12.94%
*Note: This schedule is intended to show information for ten y ears. Additional information will be added when it becomes available.
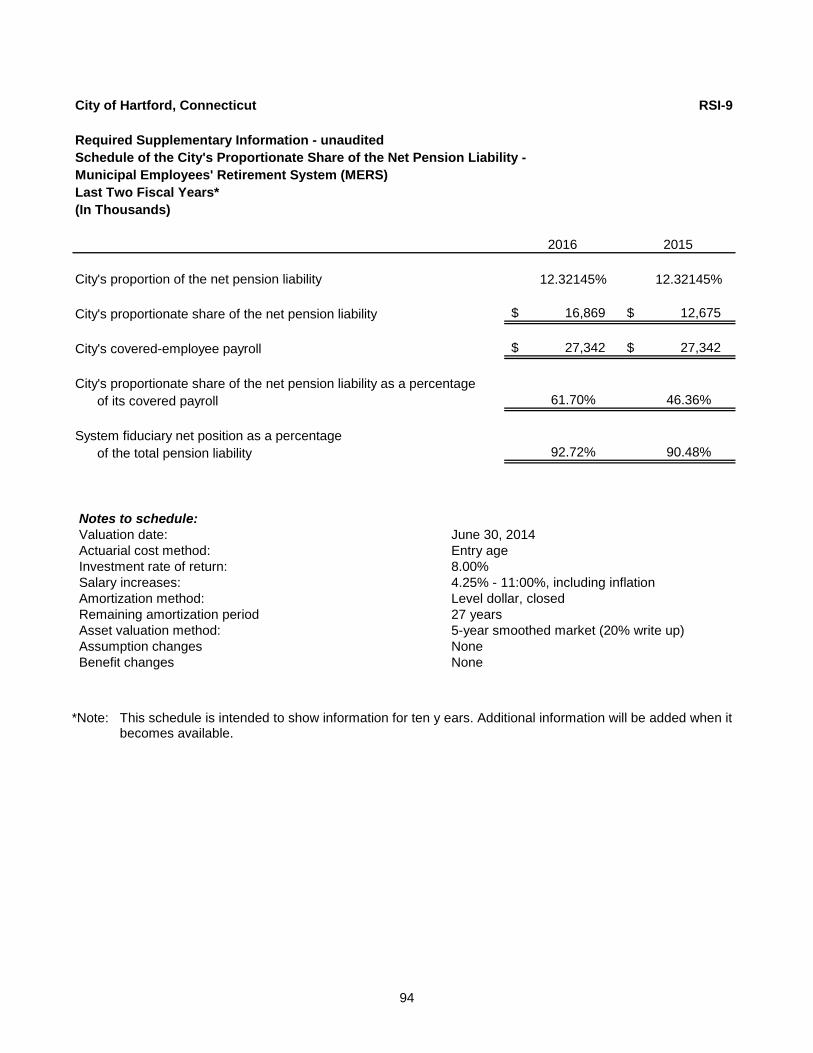
94
City of Hartford, Connecticut RSI-9
Required Supplementary Information - unaudited
Schedule of the City's Proportionate Share of the Net Pension Liability -
Municipal Employees' Retirement System (MERS)
Last Two Fiscal Years*
(In Thousands)
2016 2015
City's proportion of the net pension liability 12.32145% 12.32145%
City's proportionate share of the net pension liability 16,869 $ 12,675 $
City's covered-employee payroll 27,342 $ 27,342 $
City's proportionate share of the net pension liability as a percentage
of its covered payroll 61.70% 46.36%
System fiduciary net position as a percentage
of the total pension liability 92.72% 90.48%
Notes to schedule:
Valuation date: June 30, 2014
Actuarial cost method: Entry age
Investment rate of return: 8.00%
Salary increases: 4.25% - 11:00%, including inflation
Amortization method: Level dollar, closed
Remaining amortization period 27 years
Asset valuation method: 5-year smoothed market (20% write up)
Assumption changes None
Benefit changes None
*Note: This schedule is intended to show information for ten y ears. Additional information will be added when it becomes available.
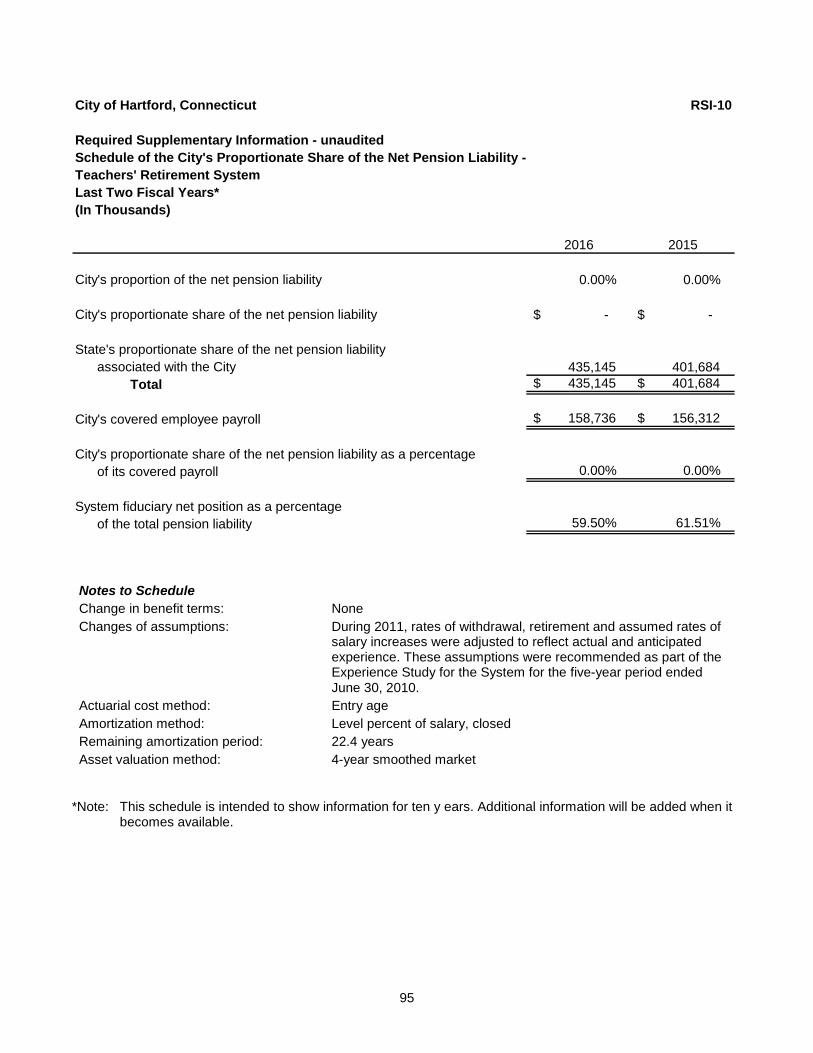
95
City of Hartford, Connecticut RSI-10
Required Supplementary Information - unaudited
Schedule of the City's Proportionate Share of the Net Pension Liability -
Teachers' Retirement System
Last Two Fiscal Years*
(In Thousands)
2016 2015
City's proportion of the net pension liability 0.00% 0.00%
City's proportionate share of the net pension liability -$ -$
State's proportionate share of the net pension liability
associated with the City 435,145 401,684
Total 435,145 $ 401,684 $
City's covered employee payroll 158,736 $ 156,312 $
City's proportionate share of the net pension liability as a percentage
of its covered payroll 0.00% 0.00%
System fiduciary net position as a percentage
of the total pension liability 59.50% 61.51%
Notes to Schedule
Change in benefit terms: None
Changes of assumptions: During 2011, rates of withdrawal, retirement and assumed rates of salary increases were adjusted to reflect actual and anticipated experience. These assumptions were recommended as part of the Experience Study for the System for the five-year period ended June 30, 2010.
Actuarial cost method: Entry age
Amortization method: Level percent of salary, closed
Remaining amortization period: 22.4 years
Asset valuation method: 4-year smoothed market
*Note: This schedule is intended to show information for ten y ears. Additional information will be added when it becomes available.
City of Hartford, Connecticut Required Supplementary Information - Unaudited Note to Required Supplementary Information (In Thousands)
96
Note 1. Stewardship, Compliance and Accountability
Budgetary information: The City adopted the legal budget for the 2015-2016 General Fund in accordance with the procedures summarized below:
By the third Monday in April, the Mayor must submit to the City Council a recommended operating budget for the fiscal year commencing the following July 1st. The operating budget includes proposed expenditures and the means of financing them.
Through direction of the Mayor and the City Council, open meetings and public hearings are held to obtain residents’ and taxpayers’ comments on the recommended budget.
The City Council modifies the budget by resolution (except revenues, debt service and pension requirements) and then submits the budget as amended to the Mayor for certification no later than May 21.
The Mayor may approve, reduce, and/or disapprove the budget within 48 hours, but no later than May 23.
Upon action by the Mayor, Council has until May 31 to adopt the budget, the appropriation ordinance and the tax levy ordinance. If it fails to adopt the budget by that date the budget as certified by the Mayor shall be deemed to be the budget of the City for the ensuing fiscal year and expenditures shall be made in accordance therewith (Hartford Municipal Code Sec. 9).
After the budget has been adopted and the new fiscal year begins, an appropriation may be amended. The Mayor may, at any time, transfer any unencumbered balance or portion thereof, from one classification of expenditures to another within the same department.
At the request of the Mayor, but only within the last three months of the fiscal year, the Court of Common Council may transfer by resolution, any unencumbered appropriation balance or portion thereof from one department or agency to another.
Supplemental appropriations are made on the recommendation of the Mayor upon certification by the Director of Finance that there exists an available general fund cash surplus to meet this appropriation.
Budgets for General Fund are presented on a basis consistent with generally accepted accounting principles except that encumbrances and transfers out are shown as budgetary obligations, transfers in are shown as revenues, State of Connecticut on-behalf contributions are shown as revenues and expenses, and reimbursements to and from other funds are shown as reductions of revenues and expenses.
The General Fund budget is the City’s only legally adopted annual budget. Budgets for Special Revenue and Capital Projects Funds are adopted on a project length basis in accordance with related grant or funding agreements. The level of control for the General Fund budget is at the department/major activity level which are authorized by ordinance. The level of control for Capital Projects Funds is appropriations at the project level. Total expenditures cannot exceed total appropriations by project, over the length of the project.
City of Hartford, Connecticut Required Supplementary Information - Unaudited Note to Required Supplementary Information (In Thousands)
97
Note 1. Stewardship, Compliance and Accountability (Continued)
The Community Development Block Grant (Special Revenue) project budgets are approved by City Council. The level of control for all other Special Revenue Funds is at the project or program level in accordance with agreement provisions and various budgetary periods. All unencumbered and unexpended appropriations lapse at year end for the General Fund. Appropriations do not lapse at year end for Special Revenue Funds. Appropriations for capital projects are carried forward until such time as the project is completed or terminated. During the fiscal year ended June 30, 2016, there were no supplemental budget appropriations and two additional appropriations $5.7 and $.117 against fund balance Encumbrance accounting is employed in governmental funds. Encumbrances (e.g., purchase orders, contracts) outstanding at year end are reported as assigned fund balances and do not constitute expenditures or liabilities because the commitments will be re-appropriated and honored during the subsequent year.

98
This page intentionally left blank.

Combining and Individual Fund Financial Statements and Other Schedules


General Fund

General Fund The General Fund is the City’s primary operating fund. It accounts for all financial resources of the general government, except those required to be accounted for in another fund.
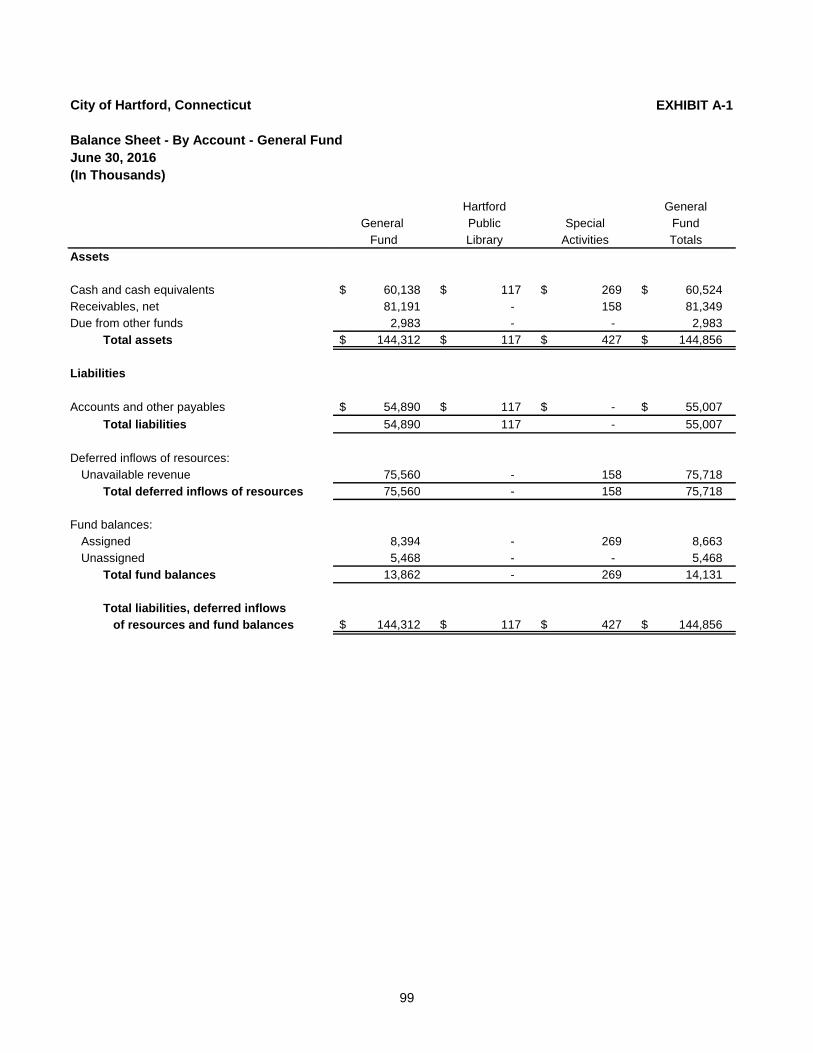
99
City of Hartford, Connecticut EXHIBIT A-1
Balance Sheet - By Account - General Fund
June 30, 2016
(In Thousands)
Hartford General
General Public Special Fund
Fund Library Activities Totals
Assets
Cash and cash equivalents 60,138 $ 117 $ 269 $ 60,524 $
Receivables, net 81,191 - 158 81,349
Due from other funds 2,983 - - 2,983
Total assets 144,312 $ 117 $ 427 $ 144,856 $
Liabilities
Accounts and other payables 54,890 $ 117 $ -$ 55,007 $
Total liabilities 54,890 117 - 55,007
Deferred inflows of resources:
Unavailable revenue 75,560 - 158 75,718
Total deferred inflows of resources 75,560 - 158 75,718
Fund balances:
Assigned 8,394 - 269 8,663
Unassigned 5,468 - - 5,468
Total fund balances 13,862 - 269 14,131
Total liabilities, deferred inflows
of resources and fund balances 144,312 $ 117 $ 427 $ 144,856 $
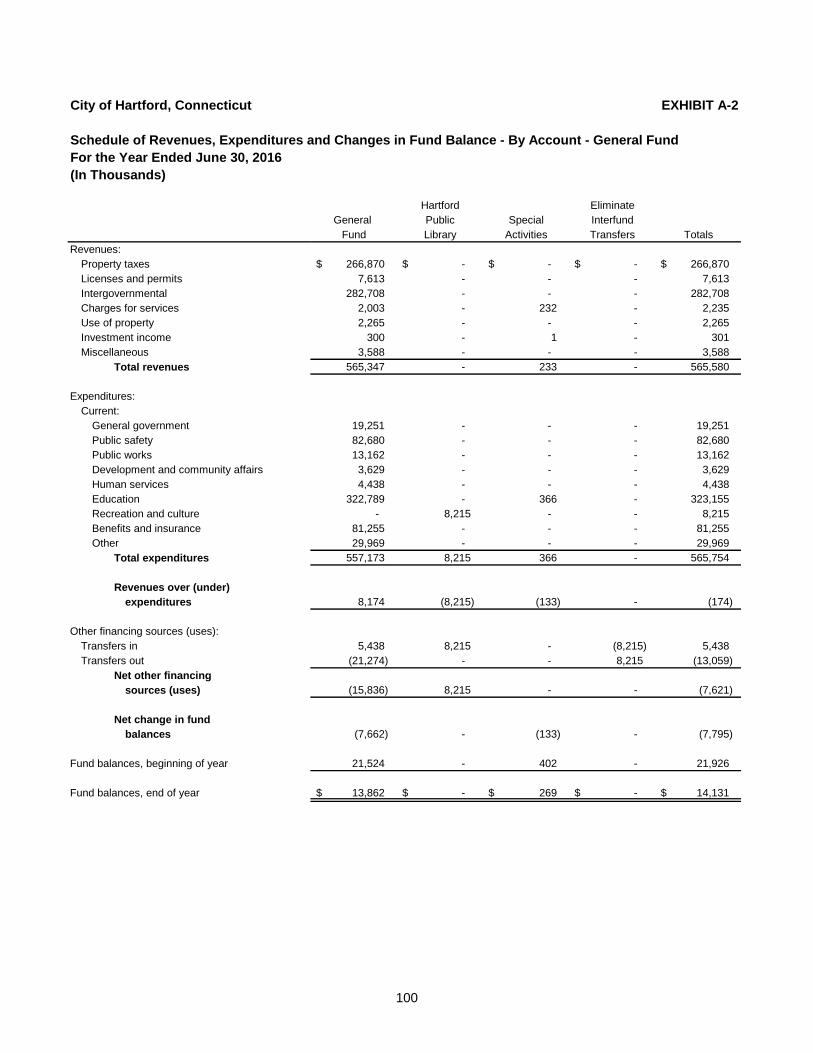
100
City of Hartford, Connecticut EXHIBIT A-2
Schedule of Revenues, Expenditures and Changes in Fund Balance - By Account - General Fund
For the Year Ended June 30, 2016
(In Thousands)
Hartford Eliminate
General Public Special Interfund
Fund Library Activities Transfers Totals
Revenues:
Property taxes 266,870 $ -$ -$ -$ 266,870 $
Licenses and permits 7,613 - - - 7,613
Intergovernmental 282,708 - - - 282,708
Charges for services 2,003 - 232 - 2,235
Use of property 2,265 - - - 2,265
Investment income 300 - 1 - 301
Miscellaneous 3,588 - - - 3,588
Total revenues 565,347 - 233 - 565,580
Expenditures:
Current:
General government 19,251 - - - 19,251
Public safety 82,680 - - - 82,680
Public works 13,162 - - - 13,162
Development and community affairs 3,629 - - - 3,629
Human services 4,438 - - - 4,438
Education 322,789 - 366 - 323,155
Recreation and culture - 8,215 - - 8,215
Benefits and insurance 81,255 - - - 81,255
Other 29,969 - - - 29,969
Total expenditures 557,173 8,215 366 - 565,754
Revenues over (under)
expenditures 8,174 (8,215) (133) - (174)
Other financing sources (uses):
Transfers in 5,438 8,215 - (8,215) 5,438
Transfers out (21,274) - - 8,215 (13,059)
Net other financing
sources (uses) (15,836) 8,215 - - (7,621)
Net change in fund
balances (7,662) - (133) - (7,795)
Fund balances, beginning of year 21,524 - 402 - 21,926
Fund balances, end of year 13,862 $ -$ 269 $ -$ 14,131 $

101
This page intentionally left blank.
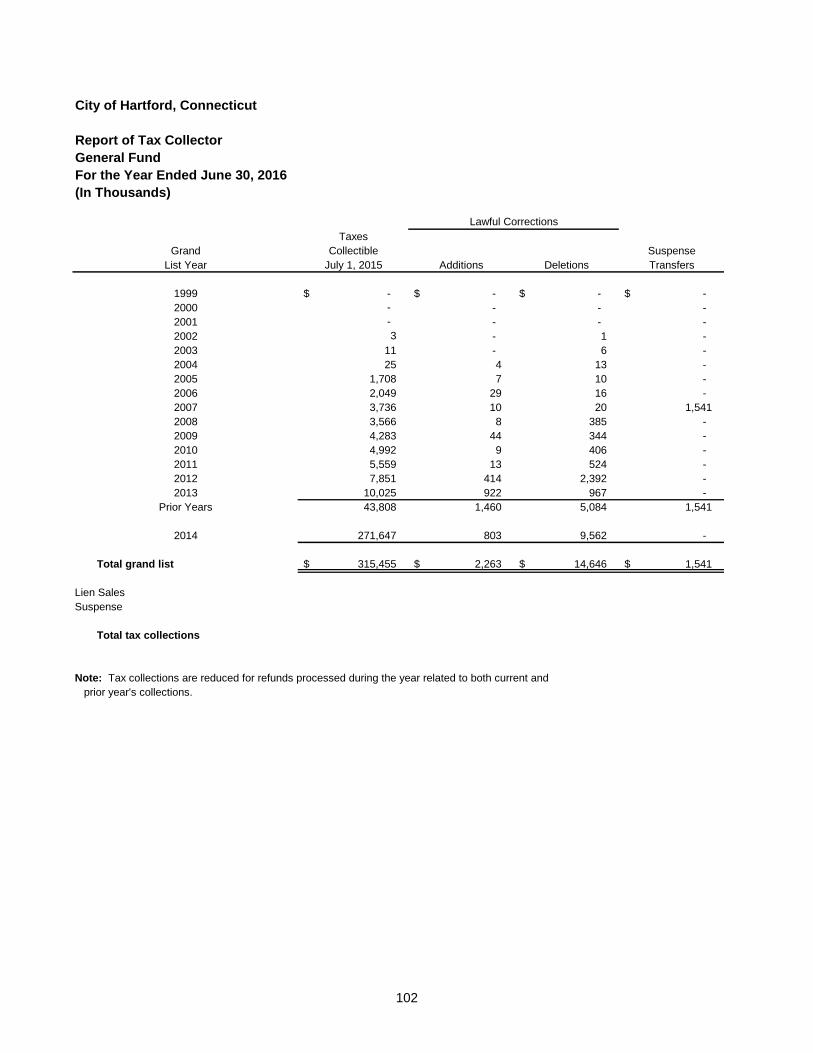
102
City of Hartford, Connecticut
Report of Tax Collector
General Fund
For the Year Ended June 30, 2016
(In Thousands)
Taxes
Grand Collectible Suspense
List Year July 1, 2015 Additions Deletions Transfers
1999 -$ -$ -$ -$
2000 - - - -
2001 - - - -
2002 3 - 1 -
2003 11 - 6 -
2004 25 4 13 -
2005 1,708 7 10 -
2006 2,049 29 16 -
2007 3,736 10 20 1,541
2008 3,566 8 385 -
2009 4,283 44 344 -
2010 4,992 9 406 -
2011 5,559 13 524 -
2012 7,851 414 2,392 -
2013 10,025 922 967 -
Prior Years 43,808 1,460 5,084 1,541
2014 271,647 803 9,562 -
Total grand list 315,455 $ 2,263 $ 14,646 $ 1,541 $
Lien Sales
Suspense
Total tax collections
Note: Tax collections are reduced for refunds processed during the year related to both current and
prior year's collections.
Lawful Corrections
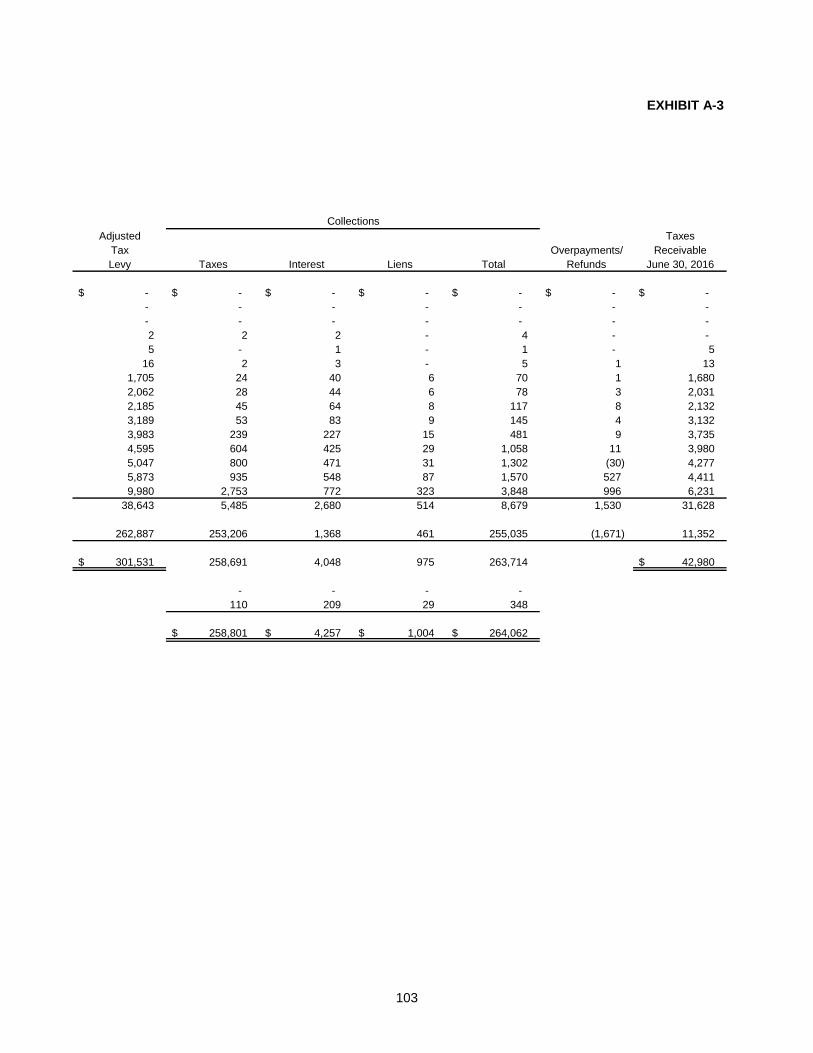
103
EXHIBIT A-3
Adjusted Taxes
Tax Overpayments/ Receivable
Levy Taxes Interest Liens Total Refunds June 30, 2016
-$ -$ -$ -$ -$ -$ -$
- - - - - - -
- - - - - - -
2 2 2 - 4 - -
5 - 1 - 1 - 5
16 2 3 - 5 1 13
1,705 24 40 6 70 1 1,680
2,062 28 44 6 78 3 2,031
2,185 45 64 8 117 8 2,132
3,189 53 83 9 145 4 3,132
3,983 239 227 15 481 9 3,735
4,595 604 425 29 1,058 11 3,980
5,047 800 471 31 1,302 (30) 4,277
5,873 935 548 87 1,570 527 4,411
9,980 2,753 772 323 3,848 996 6,231
38,643 5,485 2,680 514 8,679 1,530 31,628
262,887 253,206 1,368 461 255,035 (1,671) 11,352
301,531 $ 258,691 4,048 975 263,714 42,980 $
- - - -
110 209 29 348
258,801 $ 4,257 $ 1,004 $ 264,062 $
Collections

104
This page intentionally left blank.

Nonmajor Governmental Funds
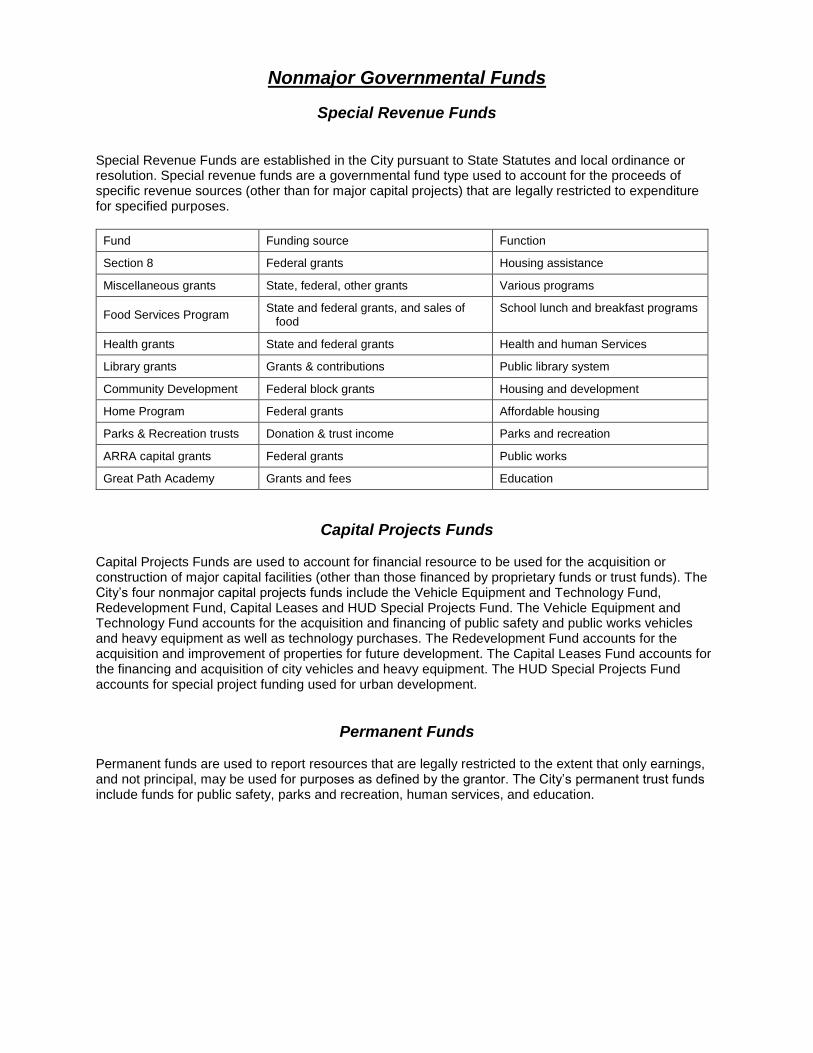
Nonmajor Governmental Funds
Special Revenue Funds Special Revenue Funds are established in the City pursuant to State Statutes and local ordinance or resolution. Special revenue funds are a governmental fund type used to account for the proceeds of specific revenue sources (other than for major capital projects) that are legally restricted to expenditure for specified purposes.
Fund Funding source Function
Section 8 Federal grants Housing assistance
Miscellaneous grants State, federal, other grants Various programs
Food Services Program State and federal grants, and sales of
food School lunch and breakfast programs
Health grants State and federal grants Health and human Services
Library grants Grants & contributions Public library system
Community Development Federal block grants Housing and development
Home Program Federal grants Affordable housing
Parks & Recreation trusts Donation & trust income Parks and recreation
ARRA capital grants Federal grants Public works
Great Path Academy Grants and fees Education
Capital Projects Funds Capital Projects Funds are used to account for financial resource to be used for the acquisition or construction of major capital facilities (other than those financed by proprietary funds or trust funds). The City’s four nonmajor capital projects funds include the Vehicle Equipment and Technology Fund, Redevelopment Fund, Capital Leases and HUD Special Projects Fund. The Vehicle Equipment and Technology Fund accounts for the acquisition and financing of public safety and public works vehicles and heavy equipment as well as technology purchases. The Redevelopment Fund accounts for the acquisition and improvement of properties for future development. The Capital Leases Fund accounts for the financing and acquisition of city vehicles and heavy equipment. The HUD Special Projects Fund accounts for special project funding used for urban development.
Permanent Funds Permanent funds are used to report resources that are legally restricted to the extent that only earnings, and not principal, may be used for purposes as defined by the grantor. The City’s permanent trust funds include funds for public safety, parks and recreation, human services, and education.

105
This page intentionally left blank.
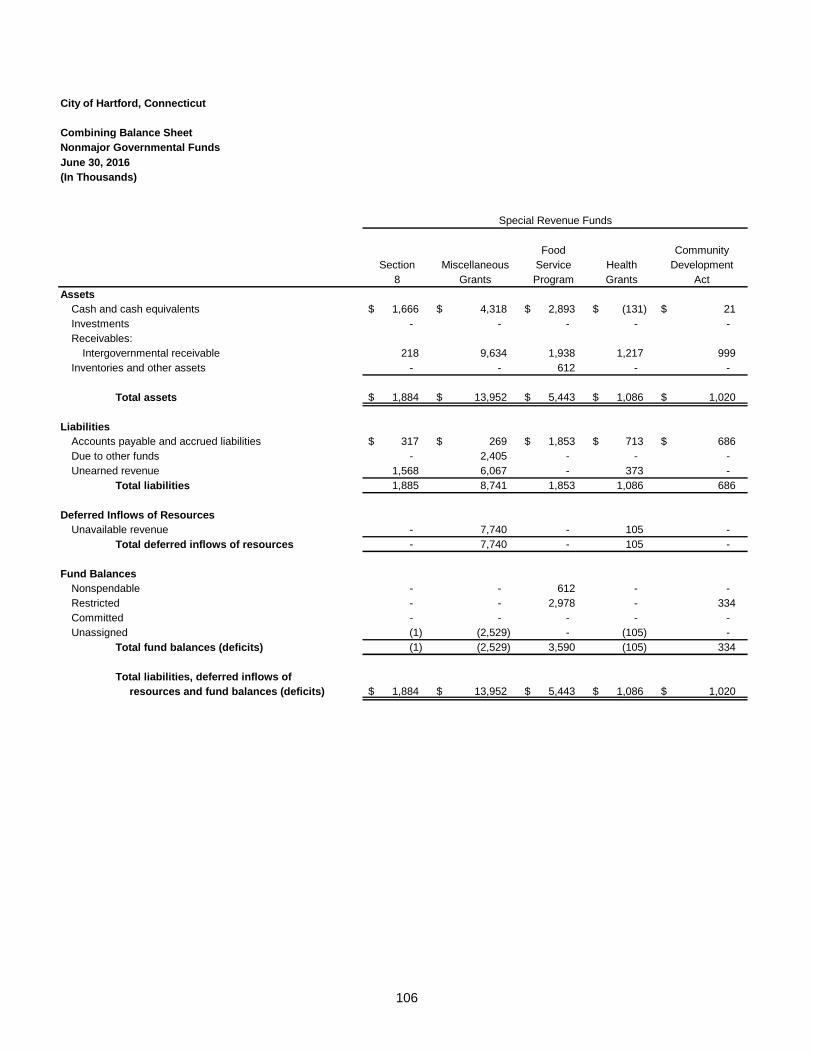
106
City of Hartford, Connecticut
Combining Balance Sheet
Nonmajor Governmental Funds
June 30, 2016
(In Thousands)
Food Community
Section Miscellaneous Service Health Development
8 Grants Program Grants Act
Assets
Cash and cash equivalents 1,666 $ 4,318 $ 2,893 $ (131) $ 21 $
Investments - - - - -
Receivables:
Intergovernmental receivable 218 9,634 1,938 1,217 999
Inventories and other assets - - 612 - -
Total assets 1,884 $ 13,952 $ 5,443 $ 1,086 $ 1,020 $
Liabilities
Accounts payable and accrued liabilities 317 $ 269 $ 1,853 $ 713 $ 686 $
Due to other funds - 2,405 - - -
Unearned revenue 1,568 6,067 - 373 -
Total liabilities 1,885 8,741 1,853 1,086 686
Deferred Inflows of Resources
Unavailable revenue - 7,740 - 105 -
Total deferred inflows of resources - 7,740 - 105 -
Fund Balances
Nonspendable - - 612 - -
Restricted - - 2,978 - 334
Committed - - - - -
Unassigned (1) (2,529) - (105) -
Total fund balances (deficits) (1) (2,529) 3,590 (105) 334
Total liabilities, deferred inflows of
resources and fund balances (deficits) 1,884 $ 13,952 $ 5,443 $ 1,086 $ 1,020 $
Special Revenue Funds
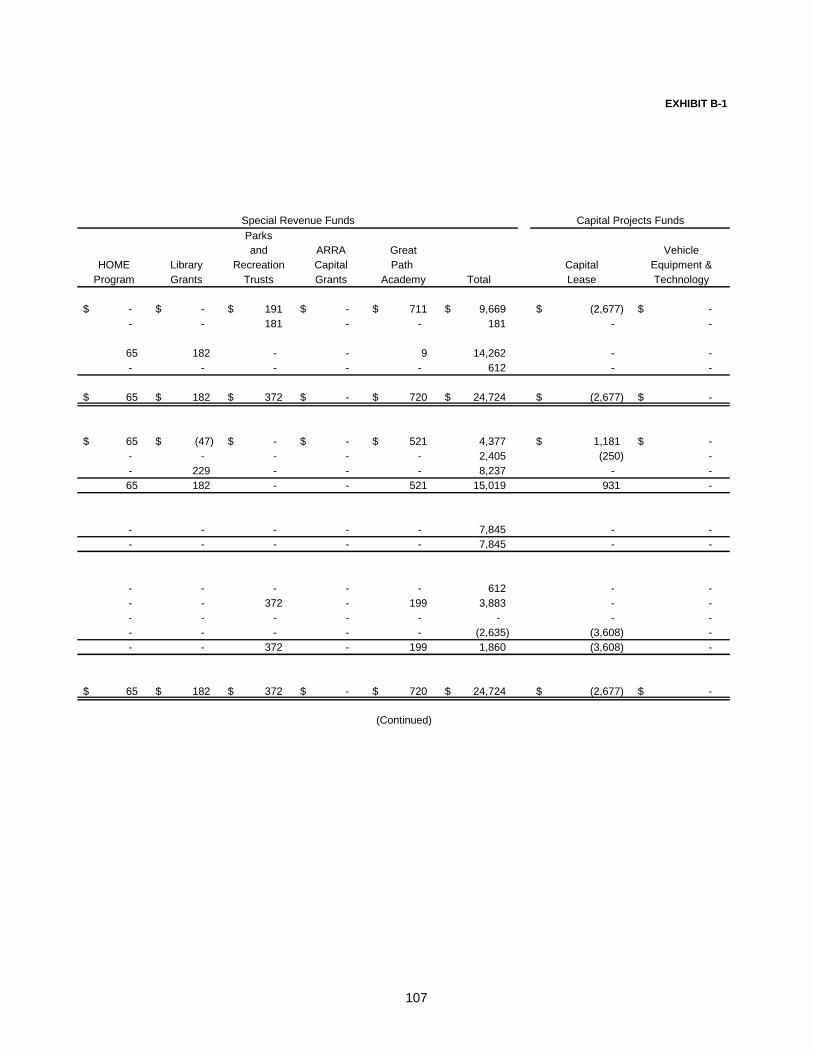
107
EXHIBIT B-1
Parks
and ARRA Great Vehicle
HOME Library Recreation Capital Path Capital Equipment &
Program Grants Trusts Grants Academy Total Lease Technology
-$ -$ 191 $ -$ 711 $ 9,669 $ (2,677) $ -$
- - 181 - - 181 - -
65 182 - - 9 14,262 - -
- - - - - 612 - -
65 $ 182 $ 372 $ -$ 720 $ 24,724 $ (2,677) $ -$
65 $ (47) $ -$ -$ 521 $ 4,377 1,181 $ -$
- - - - - 2,405 (250) -
- 229 - - - 8,237 - -
65 182 - - 521 15,019 931 -
- - - - - 7,845 - -
- - - - - 7,845 - -
- - - - - 612 - -
- - 372 - 199 3,883 - -
- - - - - - - -
- - - - - (2,635) (3,608) -
- - 372 - 199 1,860 (3,608) -
65 $ 182 $ 372 $ -$ 720 $ 24,724 $ (2,677) $ -$
(Continued)
Special Revenue Funds Capital Projects Funds
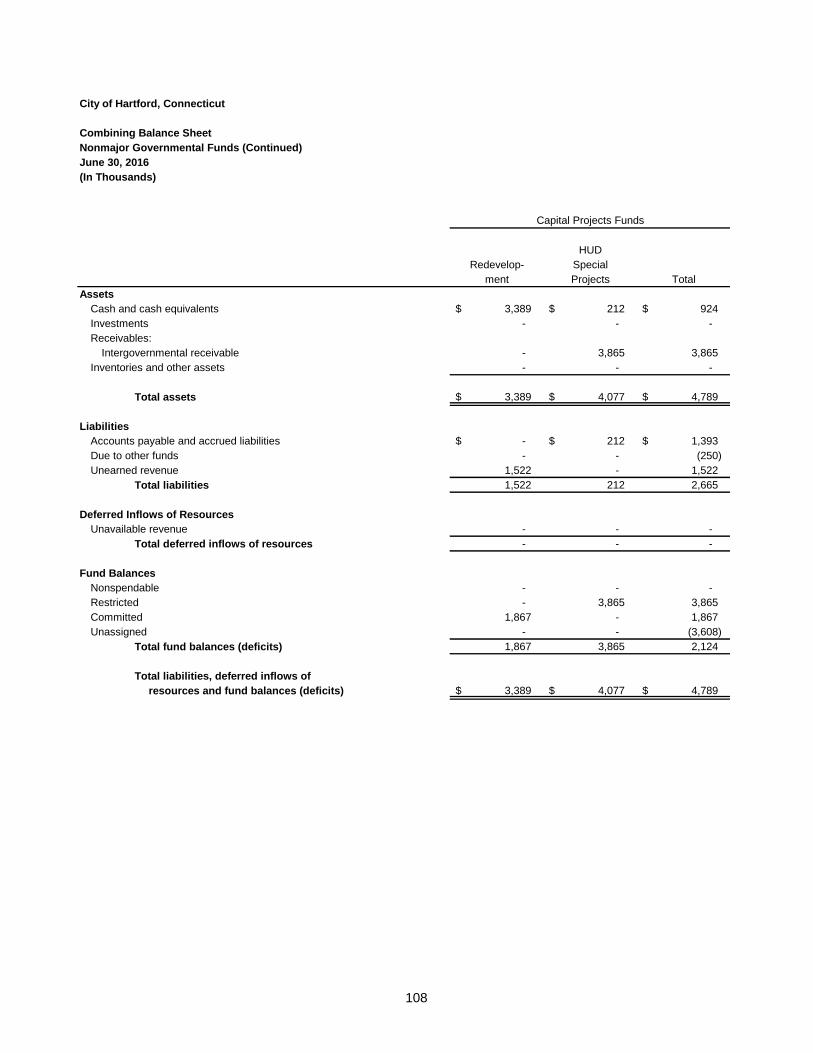
108
City of Hartford, Connecticut
Combining Balance Sheet
Nonmajor Governmental Funds (Continued)
June 30, 2016
(In Thousands)
HUD
Redevelop- Special
ment Projects Total
Assets
Cash and cash equivalents 3,389 $ 212 $ 924 $
Investments - - -
Receivables:
Intergovernmental receivable - 3,865 3,865
Inventories and other assets - - -
Total assets 3,389 $ 4,077 $ 4,789 $
Liabilities
Accounts payable and accrued liabilities -$ 212 $ 1,393 $
Due to other funds - - (250)
Unearned revenue 1,522 - 1,522
Total liabilities 1,522 212 2,665
Deferred Inflows of Resources
Unavailable revenue - - -
Total deferred inflows of resources - - -
Fund Balances
Nonspendable - - -
Restricted - 3,865 3,865
Committed 1,867 - 1,867
Unassigned - - (3,608)
Total fund balances (deficits) 1,867 3,865 2,124
Total liabilities, deferred inflows of
resources and fund balances (deficits) 3,389 $ 4,077 $ 4,789 $
Capital Projects Funds
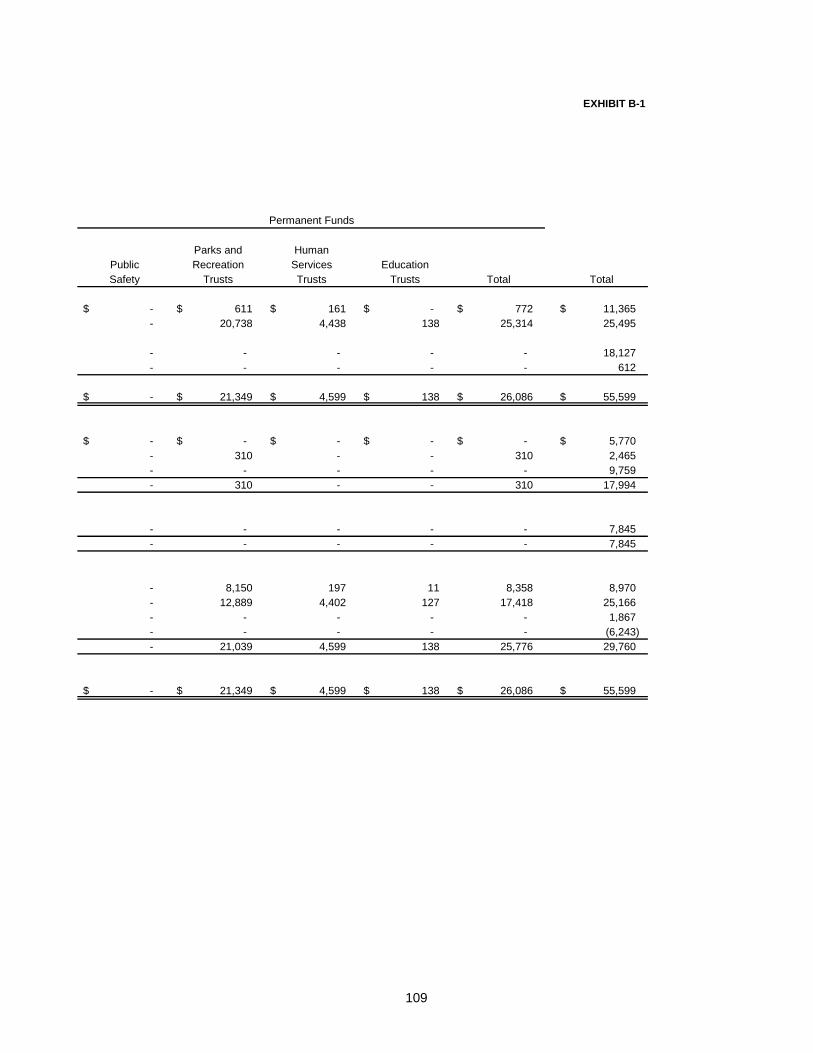
109
EXHIBIT B-1
Parks and Human
Public Recreation Services Education
Safety Trusts Trusts Trusts Total Total
-$ 611 $ 161 $ -$ 772 $ 11,365 $
- 20,738 4,438 138 25,314 25,495
- - - - - 18,127
- - - - - 612
-$ 21,349 $ 4,599 $ 138 $ 26,086 $ 55,599 $
-$ -$ -$ -$ -$ 5,770 $
- 310 - - 310 2,465
- - - - - 9,759
- 310 - - 310 17,994
- - - - - 7,845
- - - - - 7,845
- 8,150 197 11 8,358 8,970
- 12,889 4,402 127 17,418 25,166
- - - - - 1,867
- - - - - (6,243)
- 21,039 4,599 138 25,776 29,760
-$ 21,349 $ 4,599 $ 138 $ 26,086 $ 55,599 $
Permanent Funds
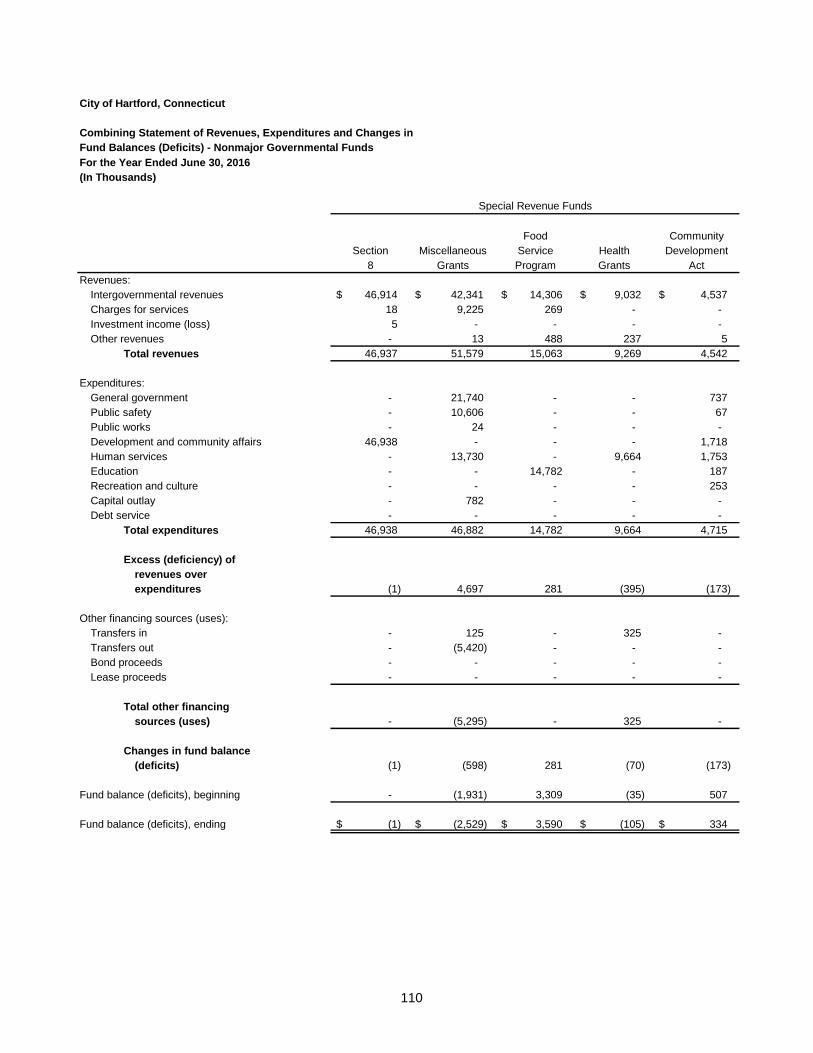
110
City of Hartford, Connecticut
Combining Statement of Revenues, Expenditures and Changes in
Fund Balances (Deficits) - Nonmajor Governmental Funds
For the Year Ended June 30, 2016
(In Thousands)
Food Community
Section Miscellaneous Service Health Development
8 Grants Program Grants Act
Revenues:
Intergovernmental revenues 46,914 $ 42,341 $ 14,306 $ 9,032 $ 4,537 $
Charges for services 18 9,225 269 - -
Investment income (loss) 5 - - - -
Other revenues - 13 488 237 5
Total revenues 46,937 51,579 15,063 9,269 4,542
Expenditures:
General government - 21,740 - - 737
Public safety - 10,606 - - 67
Public works - 24 - - -
Development and community affairs 46,938 - - - 1,718
Human services - 13,730 - 9,664 1,753
Education - - 14,782 - 187
Recreation and culture - - - - 253
Capital outlay - 782 - - -
Debt service - - - - -
Total expenditures 46,938 46,882 14,782 9,664 4,715
Excess (deficiency) of
revenues over
expenditures (1) 4,697 281 (395) (173)
Other financing sources (uses):
Transfers in - 125 - 325 -
Transfers out - (5,420) - - -
Bond proceeds - - - - -
Lease proceeds - - - - -
Total other financing
sources (uses) - (5,295) - 325 -
Changes in fund balance
(deficits) (1) (598) 281 (70) (173)
Fund balance (deficits), beginning - (1,931) 3,309 (35) 507
Fund balance (deficits), ending (1) $ (2,529) $ 3,590 $ (105) $ 334 $
Special Revenue Funds
111
EXHIBIT B-2
Parks
and ARRA Great Vehicle
HOME Library Recreation Capital Path Capital Equipment &
Program Grants Trusts Grants Academy Total Lease Technology
1,683 $ 402 $ -$ 10 $ 2,798 $ 122,023 $ -$ -$
- 131 - - 1,032 10,675 - -
- - 31 - - 36 - -
- 1,131 - - - 1,874 - -
1,683 1,664 31 10 3,830 134,608 - -
- - - - - 22,477 81 -
- - - - - 10,673 483 -
- - - 10 - 34 - -
1,683 - - - - 50,339 - -
- - - - - 25,147 - -
- - - - 3,711 18,680 - -
- 1,664 5 - - 1,922 - -
- - - - - 782 6,099 31
- - - - - - 2,281 -
1,683 1,664 5 10 3,711 130,054 8,944 31
- - 26 - 119 4,554 (8,944) (31)
- - - - - 450 2,531 -
- - - - - (5,420) - -
- - - - - - - 2,378
- - - - - - 5,917 -
- - - - - (4,970) 8,448 2,378
- - 26 - 119 (416) (496) 2,347
- - 346 - 80 2,276 (3,112) (2,347)
-$ -$ 372 $ -$ 199 $ 1,860 $ (3,608) $ -$
(Continued)
Special Revenue Funds Capital Projects Funds
112
City of Hartford, Connecticut
Combining Statement of Revenues, Expenditures and Changes in
Fund Balances (Deficits) - Nonmajor Governmental Funds (Continued)
For the Year Ended June 30, 2016
(In Thousands)
HUD
Redevelop- Special
ment Projects Total
Revenues:
Intergovernmental revenues -$ -$ -$
Charges for services (8) - (8)
Investment income (loss) 2 199 201
Other revenues - - -
Total revenues (6) 199 193
Expenditures:
General government - - 81
Public safety - - 483
Public works - - -
Development and community affairs (16) - (16)
Human services - - -
Education - - -
Recreation and culture - - -
Capital outlay - - 6,130
Debt service - 754 3,035
Total expenditures (16) 754 9,713
Excess (deficiency) of
revenues over
expenditures 10 (555) (9,520)
Other financing sources (uses):
Transfers in - - 2,531
Transfers out - - -
Bond proceeds - - 2,378
Lease proceeds - - 5,917
Total other financing
sources (uses) - - 10,826
Changes in fund balance
(deficits) 10 (555) 1,306
Fund balance (deficits), beginning 1,857 4,420 818
Fund balance (deficits), ending 1,867 $ 3,865 $ 2,124 $
Capital Projects Funds
113
EXHIBIT B-2
Parks and Human
Public Recreation Services Education
Safety Trusts Trusts Trusts Total Total
-$ -$ -$ -$ -$ 122,023 $
- - - - - 10,667
- - 194 5 199 436
- - - - - 1,874
- - 194 5 199 135,000
- 22 107 - 129 22,687
1 - - - 1 11,157
- - - - - 34
- - - - - 50,323
- - - - - 25,147
- - - 2 2 18,682
- 1,564 - - 1,564 3,486
- - - - - 6,912
- - - - - 3,035
1 1,586 107 2 1,696 141,463
(1) (1,586) 87 3 (1,497) (6,463)
- - - - - 2,981
- (786) - - (786) (6,206)
- - - - - 2,378
- - - - - 5,917
- (786) - - (786) 5,070
(1) (2,372) 87 3 (2,283) (1,393)
1 23,411 4,512 135 28,059 31,153
-$ 21,039 $ 4,599 $ 138 $ 25,776 $ 29,760 $
Permanent Funds

114
This page intentionally left blank.

Capital Improvement Fund

Capital Improvement Fund The Capital Improvement Fund accounts for the purchase, construction or renovation of major capital assets. These activities are funded primarily from general obligation bonds and intergovernmental revenues.
City of Hartford, Connecticut Exhibit C
Schedule of Expenditures and Encumbrances Compared With Appropriations, Etc. – Capital Improvement Fund For the Year Ended June 30, 2016 (In Thousands)
Appropriations Expenditures
Date Prior to Prior to
Project Project July 1, Current Cumulative July 1, Current Cumulative Outstanding Unencumbered
Number Description Approved 2015 Period Total 2015 Period Total Encumbrances Balance
115
Facility Services
Public Works Projects:
W6264 City Buildings Energy
Conservation, Security
Technology and Communication 11/12/2005 600$ -$ 600$ 600$ -$ 600$ -$ -$
W6269 Municipal Facility Renovations
and Consolidation Study 11/12/2005 1,800 - 1,800 1,800 - 1,800 - -
A6500 Church Street Garage
Structural Repairs 1/12/2005 3,000 - 3,000 2,989 - 2,989 - 11
A6501 Church Street Façade
Restoration 1/12/2005 1,810 - 1,810 1,429 - 1,429 - 381
A6502 MAT Street Garage Façade
Restoration 1/12/2005 2,300 - 2,300 1,820 113 1,933 29 338
A6503 Remainder of Construction
Contract at Morgan St Garage 1/12/2005 1,590 - 1,590 1,524 - 1,524 - 66
A6504 Remainder of Repair Contracts
at MAT Garage 1/12/2005 500 - 500 304 - 304 - 196
A6505 Remainder of Repairs Contracts
at Church St Garage 1/12/2005 1,000 - 1,000 856 - 856 4 140
A6507 Streetscape Improvements - -
at Church St Garage 1/12/2005 280 - 280 258 - 258 10 12
A6508 Landscaping/Lighting Improve-
ments opposite Morgan St Garage 1/12/2005 432 - 432 263 - 263 9 160
W7268 Long Term Document Archive
and Storage 7/1/2006 200 - 200 198 2 200 - -
D6576 Acquisition of Land
Woodland St./Albany Avenue 11/29/2005 1,325 - 1,325 1,320 - 1,320 - 5
D7576 Economic Development Site
Acquisition 7/1/2006 1,450 - 1,450 698 - 698 2 750
W8262 City Buildings ADA Modifications
FYE 2008 Appropriation 8/14/2007 950 - 950 948 - 948 - 2
W8270 Salt, Sand & Truck Wash
at 40 Jennings Road 8/14/2007 500 - 500 305 - 305 - 195
W8279 525 Main St. Building
Renovations 8/14/2007 550 - 550 302 - 302 - 248
W8281 City Hall Entrance Plaza
Improvements 8/14/2007 950 - 950 919 - 919 - 31
W8282 Burgdorf Environmental
Clean-up & Campus Planning 8/14/2007 250 - 250 180 - 180 - 70
W8202 Energy Projects 11/27/2007 2,000 - 2,000 1,940 1 1,941 - 59
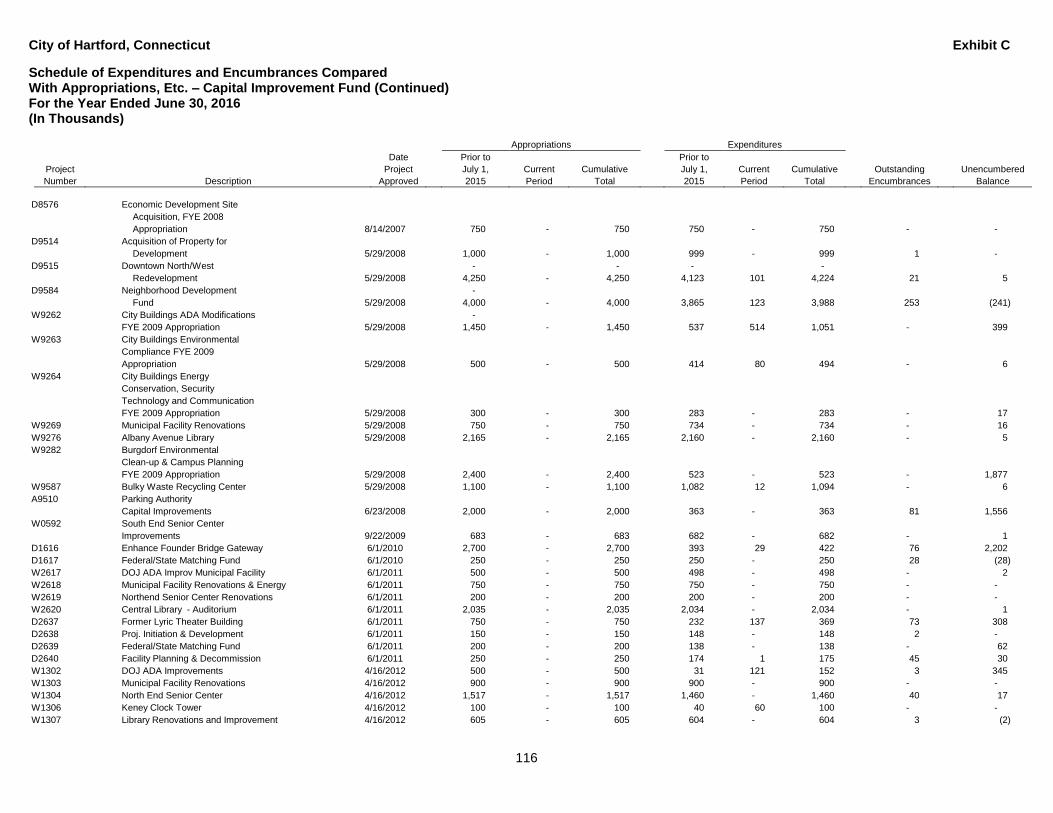
City of Hartford, Connecticut Exhibit C
Schedule of Expenditures and Encumbrances Compared With Appropriations, Etc. – Capital Improvement Fund (Continued) For the Year Ended June 30, 2016 (In Thousands)
Appropriations Expenditures
Date Prior to Prior to
Project Project July 1, Current Cumulative July 1, Current Cumulative Outstanding Unencumbered
Number Description Approved 2015 Period Total 2015 Period Total Encumbrances Balance
116
D8576 Economic Development Site
Acquisition, FYE 2008
Appropriation 8/14/2007 750 - 750 750 - 750 - -
D9514 Acquisition of Property for
Development 5/29/2008 1,000 - 1,000 999 - 999 1 -
D9515 Downtown North/West - - - -
Redevelopment 5/29/2008 4,250 - 4,250 4,123 101 4,224 21 5
D9584 Neighborhood Development -
Fund 5/29/2008 4,000 - 4,000 3,865 123 3,988 253 (241)
W9262 City Buildings ADA Modifications -
FYE 2009 Appropriation 5/29/2008 1,450 - 1,450 537 514 1,051 - 399
W9263 City Buildings Environmental
Compliance FYE 2009
Appropriation 5/29/2008 500 - 500 414 80 494 - 6
W9264 City Buildings Energy
Conservation, Security
Technology and Communication
FYE 2009 Appropriation 5/29/2008 300 - 300 283 - 283 - 17
W9269 Municipal Facility Renovations 5/29/2008 750 - 750 734 - 734 - 16
W9276 Albany Avenue Library 5/29/2008 2,165 - 2,165 2,160 - 2,160 - 5
W9282 Burgdorf Environmental
Clean-up & Campus Planning
FYE 2009 Appropriation 5/29/2008 2,400 - 2,400 523 - 523 - 1,877
W9587 Bulky Waste Recycling Center 5/29/2008 1,100 - 1,100 1,082 12 1,094 - 6
A9510 Parking Authority
Capital Improvements 6/23/2008 2,000 - 2,000 363 - 363 81 1,556
W0592 South End Senior Center
Improvements 9/22/2009 683 - 683 682 - 682 - 1
D1616 Enhance Founder Bridge Gateway 6/1/2010 2,700 - 2,700 393 29 422 76 2,202
D1617 Federal/State Matching Fund 6/1/2010 250 - 250 250 - 250 28 (28)
W2617 DOJ ADA Improv Municipal Facility 6/1/2011 500 - 500 498 - 498 - 2
W2618 Municipal Facility Renovations & Energy 6/1/2011 750 - 750 750 - 750 - -
W2619 Northend Senior Center Renovations 6/1/2011 200 - 200 200 - 200 - -
W2620 Central Library - Auditorium 6/1/2011 2,035 - 2,035 2,034 - 2,034 - 1
D2637 Former Lyric Theater Building 6/1/2011 750 - 750 232 137 369 73 308
D2638 Proj. Initiation & Development 6/1/2011 150 - 150 148 - 148 2 -
D2639 Federal/State Matching Fund 6/1/2011 200 - 200 138 - 138 - 62
D2640 Facility Planning & Decommission 6/1/2011 250 - 250 174 1 175 45 30
W1302 DOJ ADA Improvements 4/16/2012 500 - 500 31 121 152 3 345
W1303 Municipal Facility Renovations 4/16/2012 900 - 900 900 - 900 - -
W1304 North End Senior Center 4/16/2012 1,517 - 1,517 1,460 - 1,460 40 17
W1306 Keney Clock Tower 4/16/2012 100 - 100 40 60 100 - -
W1307 Library Renovations and Improvement 4/16/2012 605 - 605 604 - 604 3 (2)
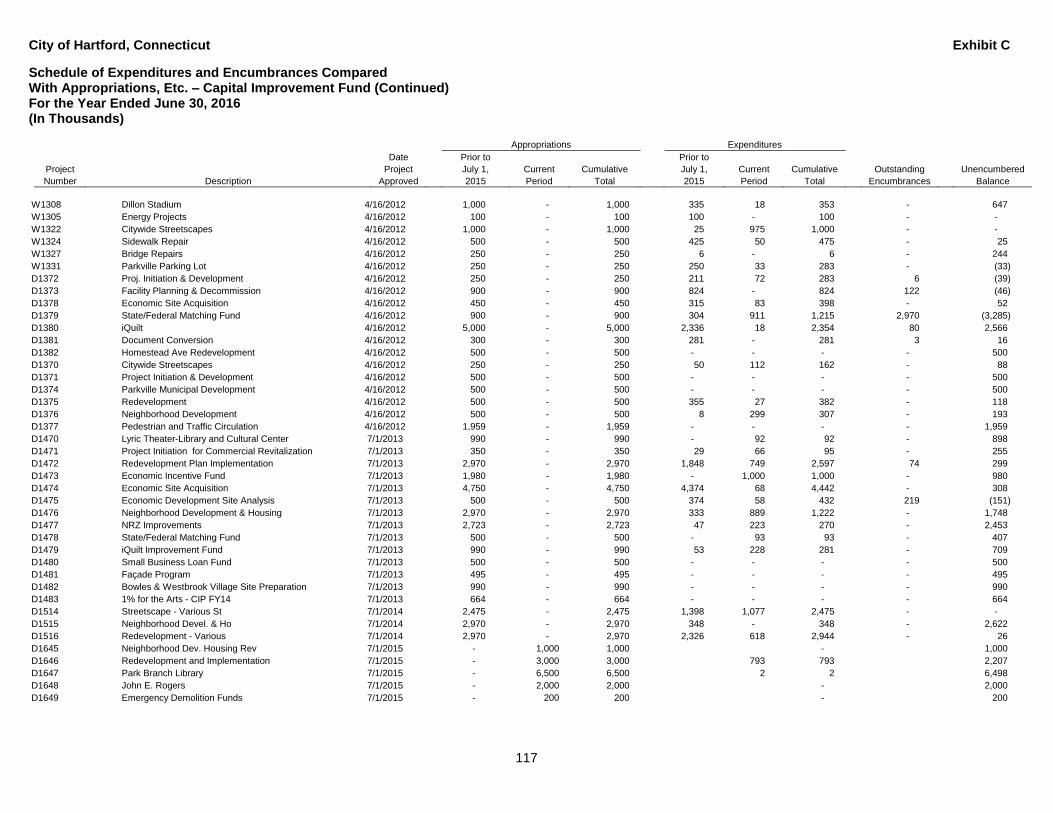
City of Hartford, Connecticut Exhibit C
Schedule of Expenditures and Encumbrances Compared With Appropriations, Etc. – Capital Improvement Fund (Continued) For the Year Ended June 30, 2016 (In Thousands)
Appropriations Expenditures
Date Prior to Prior to
Project Project July 1, Current Cumulative July 1, Current Cumulative Outstanding Unencumbered
Number Description Approved 2015 Period Total 2015 Period Total Encumbrances Balance
117
W1308 Dillon Stadium 4/16/2012 1,000 - 1,000 335 18 353 - 647
W1305 Energy Projects 4/16/2012 100 - 100 100 - 100 - -
W1322 Citywide Streetscapes 4/16/2012 1,000 - 1,000 25 975 1,000 - -
W1324 Sidewalk Repair 4/16/2012 500 - 500 425 50 475 - 25
W1327 Bridge Repairs 4/16/2012 250 - 250 6 - 6 - 244
W1331 Parkville Parking Lot 4/16/2012 250 - 250 250 33 283 - (33)
D1372 Proj. Initiation & Development 4/16/2012 250 - 250 211 72 283 6 (39)
D1373 Facility Planning & Decommission 4/16/2012 900 - 900 824 - 824 122 (46)
D1378 Economic Site Acquisition 4/16/2012 450 - 450 315 83 398 - 52
D1379 State/Federal Matching Fund 4/16/2012 900 - 900 304 911 1,215 2,970 (3,285)
D1380 iQuilt 4/16/2012 5,000 - 5,000 2,336 18 2,354 80 2,566
D1381 Document Conversion 4/16/2012 300 - 300 281 - 281 3 16
D1382 Homestead Ave Redevelopment 4/16/2012 500 - 500 - - - - 500
D1370 Citywide Streetscapes 4/16/2012 250 - 250 50 112 162 - 88
D1371 Project Initiation & Development 4/16/2012 500 - 500 - - - - 500
D1374 Parkville Municipal Development 4/16/2012 500 - 500 - - - - 500
D1375 Redevelopment 4/16/2012 500 - 500 355 27 382 - 118
D1376 Neighborhood Development 4/16/2012 500 - 500 8 299 307 - 193
D1377 Pedestrian and Traffic Circulation 4/16/2012 1,959 - 1,959 - - - - 1,959
D1470 Lyric Theater-Library and Cultural Center 7/1/2013 990 - 990 - 92 92 - 898
D1471 Project Initiation for Commercial Revitalization 7/1/2013 350 - 350 29 66 95 - 255
D1472 Redevelopment Plan Implementation 7/1/2013 2,970 - 2,970 1,848 749 2,597 74 299
D1473 Economic Incentive Fund 7/1/2013 1,980 - 1,980 - 1,000 1,000 - 980
D1474 Economic Site Acquisition 7/1/2013 4,750 - 4,750 4,374 68 4,442 - 308
D1475 Economic Development Site Analysis 7/1/2013 500 - 500 374 58 432 219 (151)
D1476 Neighborhood Development & Housing 7/1/2013 2,970 - 2,970 333 889 1,222 - 1,748
D1477 NRZ Improvements 7/1/2013 2,723 - 2,723 47 223 270 - 2,453
D1478 State/Federal Matching Fund 7/1/2013 500 - 500 - 93 93 - 407
D1479 iQuilt Improvement Fund 7/1/2013 990 - 990 53 228 281 - 709
D1480 Small Business Loan Fund 7/1/2013 500 - 500 - - - - 500
D1481 Façade Program 7/1/2013 495 - 495 - - - - 495
D1482 Bowles & Westbrook Village Site Preparation 7/1/2013 990 - 990 - - - - 990
D1483 1% for the Arts - CIP FY14 7/1/2013 664 - 664 - - - - 664
D1514 Streetscape - Various St 7/1/2014 2,475 - 2,475 1,398 1,077 2,475 - -
D1515 Neighborhood Devel. & Ho 7/1/2014 2,970 - 2,970 348 - 348 - 2,622
D1516 Redevelopment - Various 7/1/2014 2,970 - 2,970 2,326 618 2,944 - 26
D1645 Neighborhood Dev. Housing Rev 7/1/2015 - 1,000 1,000 - 1,000
D1646 Redevelopment and Implementation 7/1/2015 - 3,000 3,000 793 793 2,207
D1647 Park Branch Library 7/1/2015 - 6,500 6,500 2 2 6,498
D1648 John E. Rogers 7/1/2015 - 2,000 2,000 - 2,000
D1649 Emergency Demolition Funds 7/1/2015 - 200 200 - 200
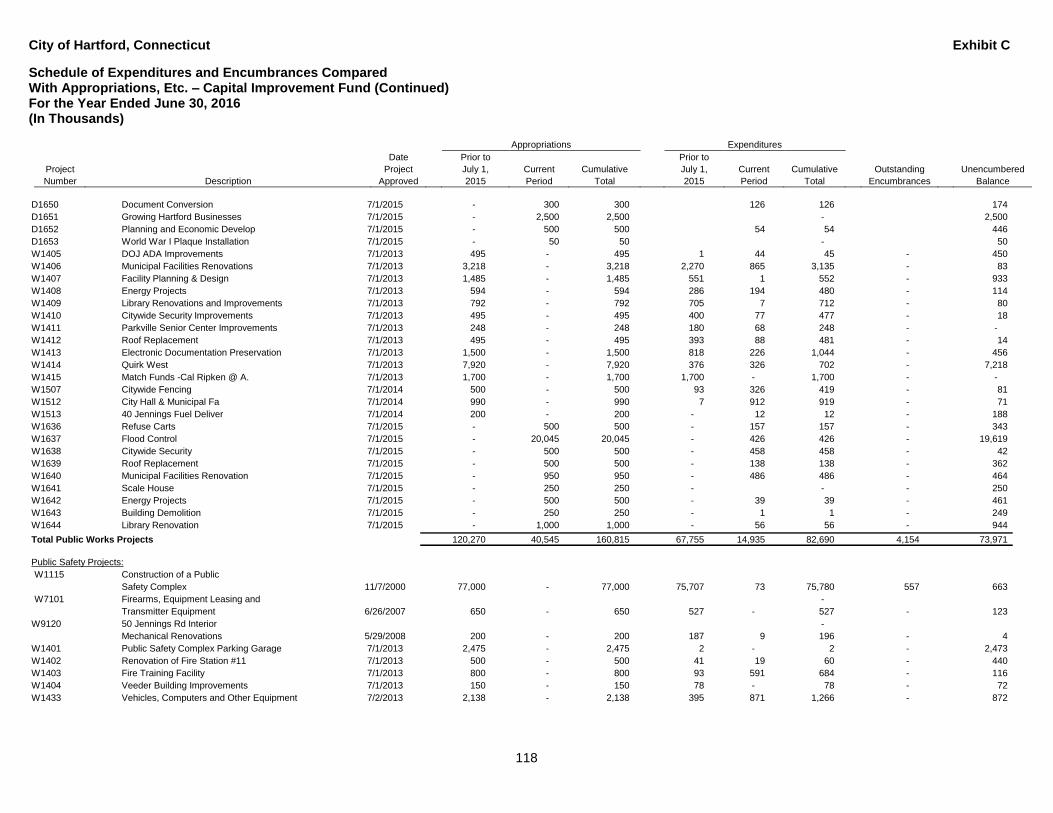
City of Hartford, Connecticut Exhibit C
Schedule of Expenditures and Encumbrances Compared With Appropriations, Etc. – Capital Improvement Fund (Continued) For the Year Ended June 30, 2016 (In Thousands)
Appropriations Expenditures
Date Prior to Prior to
Project Project July 1, Current Cumulative July 1, Current Cumulative Outstanding Unencumbered
Number Description Approved 2015 Period Total 2015 Period Total Encumbrances Balance
118
D1650 Document Conversion 7/1/2015 - 300 300 126 126 174
D1651 Growing Hartford Businesses 7/1/2015 - 2,500 2,500 - 2,500
D1652 Planning and Economic Develop 7/1/2015 - 500 500 54 54 446
D1653 World War I Plaque Installation 7/1/2015 - 50 50 - 50
W1405 DOJ ADA Improvements 7/1/2013 495 - 495 1 44 45 - 450
W1406 Municipal Facilities Renovations 7/1/2013 3,218 - 3,218 2,270 865 3,135 - 83
W1407 Facility Planning & Design 7/1/2013 1,485 - 1,485 551 1 552 - 933
W1408 Energy Projects 7/1/2013 594 - 594 286 194 480 - 114
W1409 Library Renovations and Improvements 7/1/2013 792 - 792 705 7 712 - 80
W1410 Citywide Security Improvements 7/1/2013 495 - 495 400 77 477 - 18
W1411 Parkville Senior Center Improvements 7/1/2013 248 - 248 180 68 248 - -
W1412 Roof Replacement 7/1/2013 495 - 495 393 88 481 - 14
W1413 Electronic Documentation Preservation 7/1/2013 1,500 - 1,500 818 226 1,044 - 456
W1414 Quirk West 7/1/2013 7,920 - 7,920 376 326 702 - 7,218
W1415 Match Funds -Cal Ripken @ A. 7/1/2013 1,700 - 1,700 1,700 - 1,700 - -
W1507 Citywide Fencing 7/1/2014 500 - 500 93 326 419 - 81
W1512 City Hall & Municipal Fa 7/1/2014 990 - 990 7 912 919 - 71
W1513 40 Jennings Fuel Deliver 7/1/2014 200 - 200 - 12 12 - 188
W1636 Refuse Carts 7/1/2015 - 500 500 - 157 157 - 343
W1637 Flood Control 7/1/2015 - 20,045 20,045 - 426 426 - 19,619
W1638 Citywide Security 7/1/2015 - 500 500 - 458 458 - 42
W1639 Roof Replacement 7/1/2015 - 500 500 - 138 138 - 362
W1640 Municipal Facilities Renovation 7/1/2015 - 950 950 - 486 486 - 464
W1641 Scale House 7/1/2015 - 250 250 - - - 250
W1642 Energy Projects 7/1/2015 - 500 500 - 39 39 - 461
W1643 Building Demolition 7/1/2015 - 250 250 - 1 1 - 249
W1644 Library Renovation 7/1/2015 - 1,000 1,000 - 56 56 - 944
Total Public Works Projects 120,270 40,545 160,815 67,755 14,935 82,690 4,154 73,971
Public Safety Projects:
W1115 Construction of a Public
Safety Complex 11/7/2000 77,000 - 77,000 75,707 73 75,780 557 663
W7101 Firearms, Equipment Leasing and -
Transmitter Equipment 6/26/2007 650 - 650 527 - 527 - 123
W9120 50 Jennings Rd Interior -
Mechanical Renovations 5/29/2008 200 - 200 187 9 196 - 4
W1401 Public Safety Complex Parking Garage 7/1/2013 2,475 - 2,475 2 - 2 - 2,473
W1402 Renovation of Fire Station #11 7/1/2013 500 - 500 41 19 60 - 440
W1403 Fire Training Facility 7/1/2013 800 - 800 93 591 684 - 116
W1404 Veeder Building Improvements 7/1/2013 150 - 150 78 - 78 - 72
W1433 Vehicles, Computers and Other Equipment 7/2/2013 2,138 - 2,138 395 871 1,266 - 872
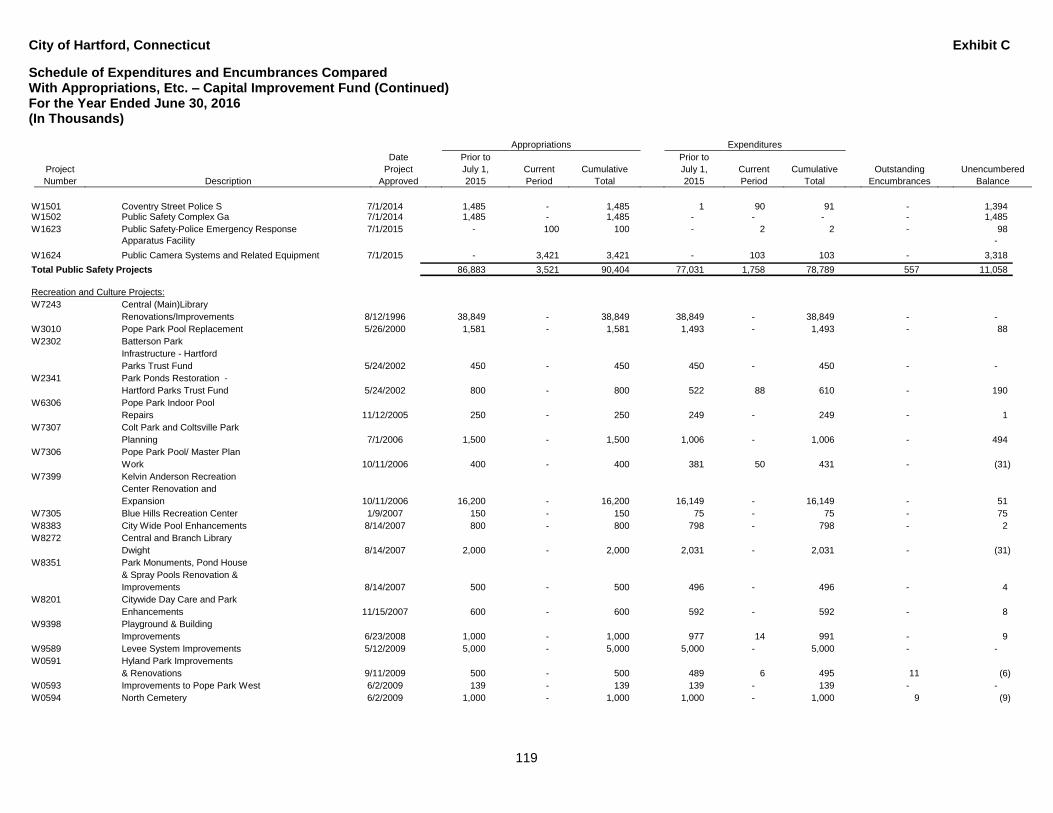
City of Hartford, Connecticut Exhibit C
Schedule of Expenditures and Encumbrances Compared With Appropriations, Etc. – Capital Improvement Fund (Continued) For the Year Ended June 30, 2016 (In Thousands)
Appropriations Expenditures
Date Prior to Prior to
Project Project July 1, Current Cumulative July 1, Current Cumulative Outstanding Unencumbered
Number Description Approved 2015 Period Total 2015 Period Total Encumbrances Balance
119
W1501 Coventry Street Police S 7/1/2014 1,485 - 1,485 1 90 91 - 1,394 W1502 Public Safety Complex Ga 7/1/2014 1,485 - 1,485 - - - - 1,485
W1623 Public Safety-Police Emergency Response 7/1/2015 - 100 100 - 2 2 - 98
Apparatus Facility -
W1624 Public Camera Systems and Related Equipment 7/1/2015 - 3,421 3,421 - 103 103 - 3,318
Total Public Safety Projects 86,883 3,521 90,404 77,031 1,758 78,789 557 11,058
Recreation and Culture Projects:
W7243 Central (Main)Library
Renovations/Improvements 8/12/1996 38,849 - 38,849 38,849 - 38,849 - -
W3010 Pope Park Pool Replacement 5/26/2000 1,581 - 1,581 1,493 - 1,493 - 88
W2302 Batterson Park
Infrastructure - Hartford
Parks Trust Fund 5/24/2002 450 - 450 450 - 450 - -
W2341 Park Ponds Restoration -
Hartford Parks Trust Fund 5/24/2002 800 - 800 522 88 610 - 190
W6306 Pope Park Indoor Pool
Repairs 11/12/2005 250 - 250 249 - 249 - 1
W7307 Colt Park and Coltsville Park
Planning 7/1/2006 1,500 - 1,500 1,006 - 1,006 - 494
W7306 Pope Park Pool/ Master Plan
Work 10/11/2006 400 - 400 381 50 431 - (31)
W7399 Kelvin Anderson Recreation
Center Renovation and
Expansion 10/11/2006 16,200 - 16,200 16,149 - 16,149 - 51
W7305 Blue Hills Recreation Center 1/9/2007 150 - 150 75 - 75 - 75
W8383 City Wide Pool Enhancements 8/14/2007 800 - 800 798 - 798 - 2
W8272 Central and Branch Library
Dwight 8/14/2007 2,000 - 2,000 2,031 - 2,031 - (31)
W8351 Park Monuments, Pond House
& Spray Pools Renovation &
Improvements 8/14/2007 500 - 500 496 - 496 - 4
W8201 Citywide Day Care and Park
Enhancements 11/15/2007 600 - 600 592 - 592 - 8
W9398 Playground & Building
Improvements 6/23/2008 1,000 - 1,000 977 14 991 - 9
W9589 Levee System Improvements 5/12/2009 5,000 - 5,000 5,000 - 5,000 - -
W0591 Hyland Park Improvements
& Renovations 9/11/2009 500 - 500 489 6 495 11 (6)
W0593 Improvements to Pope Park West 6/2/2009 139 - 139 139 - 139 - -
W0594 North Cemetery 6/2/2009 1,000 - 1,000 1,000 - 1,000 9 (9)
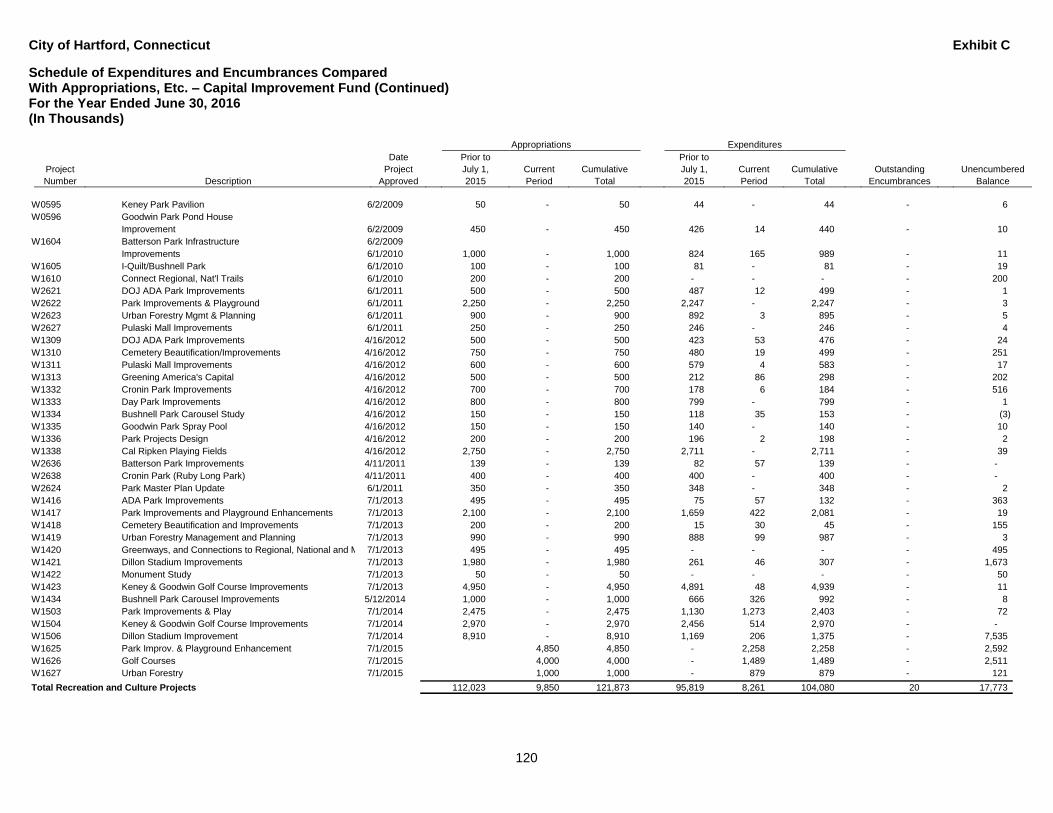
City of Hartford, Connecticut Exhibit C
Schedule of Expenditures and Encumbrances Compared With Appropriations, Etc. – Capital Improvement Fund (Continued) For the Year Ended June 30, 2016 (In Thousands)
Appropriations Expenditures
Date Prior to Prior to
Project Project July 1, Current Cumulative July 1, Current Cumulative Outstanding Unencumbered
Number Description Approved 2015 Period Total 2015 Period Total Encumbrances Balance
120
W0595 Keney Park Pavilion 6/2/2009 50 - 50 44 - 44 - 6
W0596 Goodwin Park Pond House
Improvement 6/2/2009 450 - 450 426 14 440 - 10
W1604 Batterson Park Infrastructure 6/2/2009
Improvements 6/1/2010 1,000 - 1,000 824 165 989 - 11
W1605 I-Quilt/Bushnell Park 6/1/2010 100 - 100 81 - 81 - 19
W1610 Connect Regional, Nat'l Trails 6/1/2010 200 - 200 - - - - 200
W2621 DOJ ADA Park Improvements 6/1/2011 500 - 500 487 12 499 - 1
W2622 Park Improvements & Playground 6/1/2011 2,250 - 2,250 2,247 - 2,247 - 3
W2623 Urban Forestry Mgmt & Planning 6/1/2011 900 - 900 892 3 895 - 5
W2627 Pulaski Mall Improvements 6/1/2011 250 - 250 246 - 246 - 4
W1309 DOJ ADA Park Improvements 4/16/2012 500 - 500 423 53 476 - 24
W1310 Cemetery Beautification/Improvements 4/16/2012 750 - 750 480 19 499 - 251
W1311 Pulaski Mall Improvements 4/16/2012 600 - 600 579 4 583 - 17
W1313 Greening America's Capital 4/16/2012 500 - 500 212 86 298 - 202
W1332 Cronin Park Improvements 4/16/2012 700 - 700 178 6 184 - 516
W1333 Day Park Improvements 4/16/2012 800 - 800 799 - 799 - 1
W1334 Bushnell Park Carousel Study 4/16/2012 150 - 150 118 35 153 - (3)
W1335 Goodwin Park Spray Pool 4/16/2012 150 - 150 140 - 140 - 10
W1336 Park Projects Design 4/16/2012 200 - 200 196 2 198 - 2
W1338 Cal Ripken Playing Fields 4/16/2012 2,750 - 2,750 2,711 - 2,711 - 39
W2636 Batterson Park Improvements 4/11/2011 139 - 139 82 57 139 - -
W2638 Cronin Park (Ruby Long Park) 4/11/2011 400 - 400 400 - 400 - -
W2624 Park Master Plan Update 6/1/2011 350 - 350 348 - 348 - 2
W1416 ADA Park Improvements 7/1/2013 495 - 495 75 57 132 - 363
W1417 Park Improvements and Playground Enhancements 7/1/2013 2,100 - 2,100 1,659 422 2,081 - 19
W1418 Cemetery Beautification and Improvements 7/1/2013 200 - 200 15 30 45 - 155
W1419 Urban Forestry Management and Planning 7/1/2013 990 - 990 888 99 987 - 3
W1420 Greenways, and Connections to Regional, National and Multiuse Trails7/1/2013 495 - 495 - - - - 495
W1421 Dillon Stadium Improvements 7/1/2013 1,980 - 1,980 261 46 307 - 1,673
W1422 Monument Study 7/1/2013 50 - 50 - - - - 50
W1423 Keney & Goodwin Golf Course Improvements 7/1/2013 4,950 - 4,950 4,891 48 4,939 - 11
W1434 Bushnell Park Carousel Improvements 5/12/2014 1,000 - 1,000 666 326 992 - 8
W1503 Park Improvements & Play 7/1/2014 2,475 - 2,475 1,130 1,273 2,403 - 72
W1504 Keney & Goodwin Golf Course Improvements 7/1/2014 2,970 - 2,970 2,456 514 2,970 - -
W1506 Dillon Stadium Improvement 7/1/2014 8,910 - 8,910 1,169 206 1,375 - 7,535
W1625 Park Improv. & Playground Enhancement 7/1/2015 4,850 4,850 - 2,258 2,258 - 2,592
W1626 Golf Courses 7/1/2015 4,000 4,000 - 1,489 1,489 - 2,511
W1627 Urban Forestry 7/1/2015 1,000 1,000 - 879 879 - 121
Total Recreation and Culture Projects 112,023 9,850 121,873 95,819 8,261 104,080 20 17,773
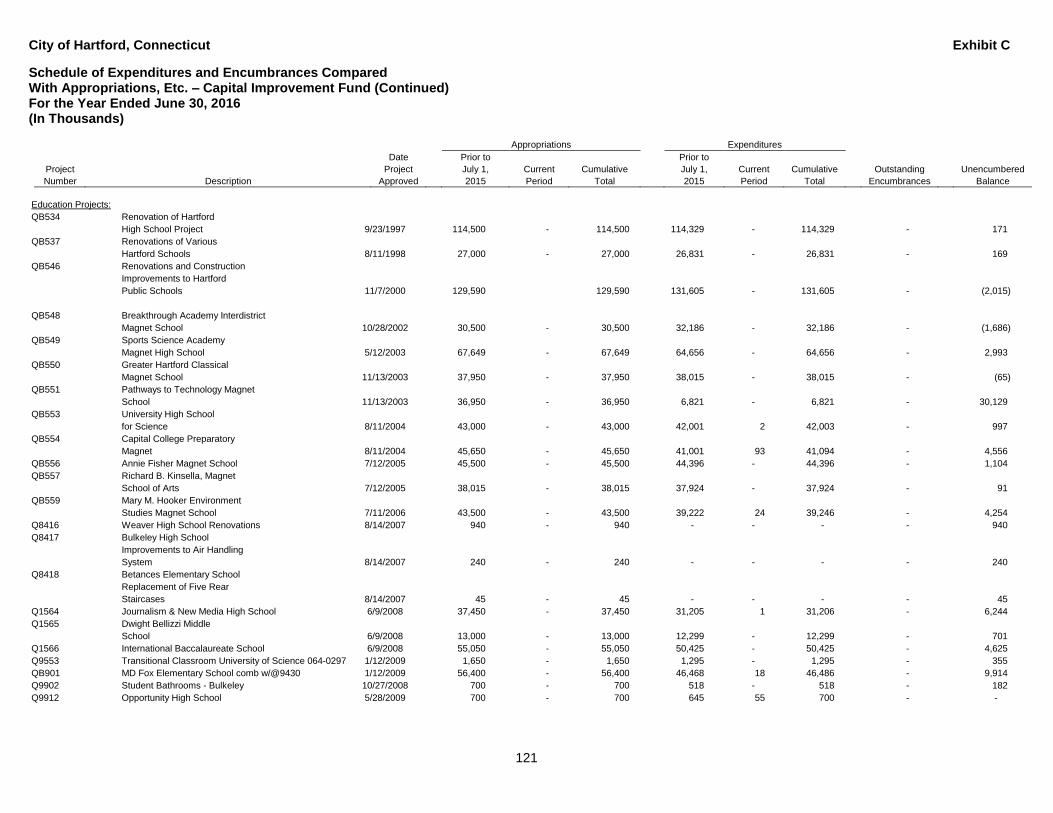
City of Hartford, Connecticut Exhibit C
Schedule of Expenditures and Encumbrances Compared With Appropriations, Etc. – Capital Improvement Fund (Continued) For the Year Ended June 30, 2016 (In Thousands)
Appropriations Expenditures
Date Prior to Prior to
Project Project July 1, Current Cumulative July 1, Current Cumulative Outstanding Unencumbered
Number Description Approved 2015 Period Total 2015 Period Total Encumbrances Balance
121
Education Projects:
QB534 Renovation of Hartford
High School Project 9/23/1997 114,500 - 114,500 114,329 - 114,329 - 171
QB537 Renovations of Various
Hartford Schools 8/11/1998 27,000 - 27,000 26,831 - 26,831 - 169
QB546 Renovations and Construction
Improvements to Hartford
Public Schools 11/7/2000 129,590 129,590 131,605 - 131,605 - (2,015)
QB548 Breakthrough Academy Interdistrict
Magnet School 10/28/2002 30,500 - 30,500 32,186 - 32,186 - (1,686)
QB549 Sports Science Academy
Magnet High School 5/12/2003 67,649 - 67,649 64,656 - 64,656 - 2,993
QB550 Greater Hartford Classical
Magnet School 11/13/2003 37,950 - 37,950 38,015 - 38,015 - (65)
QB551 Pathways to Technology Magnet
School 11/13/2003 36,950 - 36,950 6,821 - 6,821 - 30,129
QB553 University High School
for Science 8/11/2004 43,000 - 43,000 42,001 2 42,003 - 997
QB554 Capital College Preparatory
Magnet 8/11/2004 45,650 - 45,650 41,001 93 41,094 - 4,556
QB556 Annie Fisher Magnet School 7/12/2005 45,500 - 45,500 44,396 - 44,396 - 1,104
QB557 Richard B. Kinsella, Magnet
School of Arts 7/12/2005 38,015 - 38,015 37,924 - 37,924 - 91
QB559 Mary M. Hooker Environment
Studies Magnet School 7/11/2006 43,500 - 43,500 39,222 24 39,246 - 4,254
Q8416 Weaver High School Renovations 8/14/2007 940 - 940 - - - - 940
Q8417 Bulkeley High School
Improvements to Air Handling
System 8/14/2007 240 - 240 - - - - 240
Q8418 Betances Elementary School
Replacement of Five Rear
Staircases 8/14/2007 45 - 45 - - - - 45
Q1564 Journalism & New Media High School 6/9/2008 37,450 - 37,450 31,205 1 31,206 - 6,244
Q1565 Dwight Bellizzi Middle
School 6/9/2008 13,000 - 13,000 12,299 - 12,299 - 701
Q1566 International Baccalaureate School 6/9/2008 55,050 - 55,050 50,425 - 50,425 - 4,625
Q9553 Transitional Classroom University of Science 064-0297 1/12/2009 1,650 - 1,650 1,295 - 1,295 - 355
QB901 MD Fox Elementary School comb w/@9430 1/12/2009 56,400 - 56,400 46,468 18 46,486 - 9,914
Q9902 Student Bathrooms - Bulkeley 10/27/2008 700 - 700 518 - 518 - 182
Q9912 Opportunity High School 5/28/2009 700 - 700 645 55 700 - -
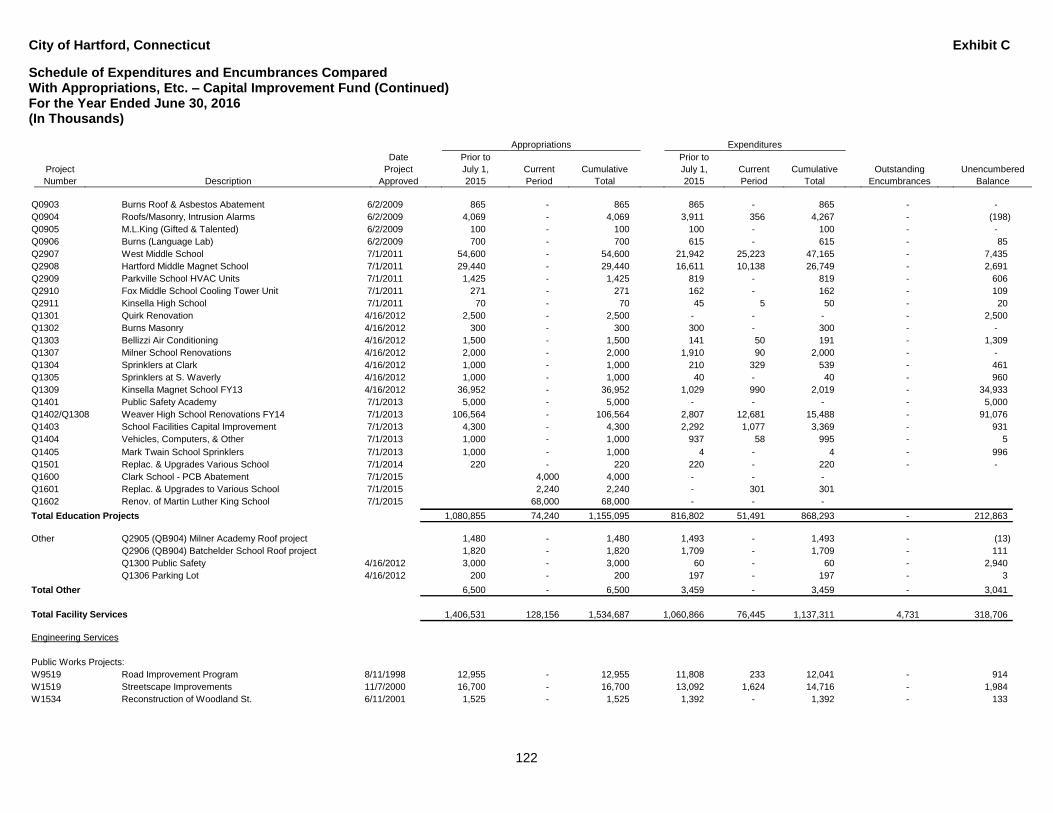
City of Hartford, Connecticut Exhibit C
Schedule of Expenditures and Encumbrances Compared With Appropriations, Etc. – Capital Improvement Fund (Continued) For the Year Ended June 30, 2016 (In Thousands)
Appropriations Expenditures
Date Prior to Prior to
Project Project July 1, Current Cumulative July 1, Current Cumulative Outstanding Unencumbered
Number Description Approved 2015 Period Total 2015 Period Total Encumbrances Balance
122
Q0903 Burns Roof & Asbestos Abatement 6/2/2009 865 - 865 865 - 865 - -
Q0904 Roofs/Masonry, Intrusion Alarms 6/2/2009 4,069 - 4,069 3,911 356 4,267 - (198)
Q0905 M.L.King (Gifted & Talented) 6/2/2009 100 - 100 100 - 100 - -
Q0906 Burns (Language Lab) 6/2/2009 700 - 700 615 - 615 - 85
Q2907 West Middle School 7/1/2011 54,600 - 54,600 21,942 25,223 47,165 - 7,435
Q2908 Hartford Middle Magnet School 7/1/2011 29,440 - 29,440 16,611 10,138 26,749 - 2,691
Q2909 Parkville School HVAC Units 7/1/2011 1,425 - 1,425 819 - 819 - 606
Q2910 Fox Middle School Cooling Tower Unit 7/1/2011 271 - 271 162 - 162 - 109
Q2911 Kinsella High School 7/1/2011 70 - 70 45 5 50 - 20
Q1301 Quirk Renovation 4/16/2012 2,500 - 2,500 - - - - 2,500
Q1302 Burns Masonry 4/16/2012 300 - 300 300 - 300 - -
Q1303 Bellizzi Air Conditioning 4/16/2012 1,500 - 1,500 141 50 191 - 1,309
Q1307 Milner School Renovations 4/16/2012 2,000 - 2,000 1,910 90 2,000 - -
Q1304 Sprinklers at Clark 4/16/2012 1,000 - 1,000 210 329 539 - 461
Q1305 Sprinklers at S. Waverly 4/16/2012 1,000 - 1,000 40 - 40 - 960
Q1309 Kinsella Magnet School FY13 4/16/2012 36,952 - 36,952 1,029 990 2,019 - 34,933
Q1401 Public Safety Academy 7/1/2013 5,000 - 5,000 - - - - 5,000
Q1402/Q1308 Weaver High School Renovations FY14 7/1/2013 106,564 - 106,564 2,807 12,681 15,488 - 91,076
Q1403 School Facilities Capital Improvement 7/1/2013 4,300 - 4,300 2,292 1,077 3,369 - 931
Q1404 Vehicles, Computers, & Other 7/1/2013 1,000 - 1,000 937 58 995 - 5
Q1405 Mark Twain School Sprinklers 7/1/2013 1,000 - 1,000 4 - 4 - 996
Q1501 Replac. & Upgrades Various School 7/1/2014 220 - 220 220 - 220 - -
Q1600 Clark School - PCB Abatement 7/1/2015 4,000 4,000 - - -
Q1601 Replac. & Upgrades to Various School 7/1/2015 2,240 2,240 - 301 301
Q1602 Renov. of Martin Luther King School 7/1/2015 68,000 68,000 - - -
Total Education Projects 1,080,855 74,240 1,155,095 816,802 51,491 868,293 - 212,863
Other Q2905 (QB904) Milner Academy Roof project 1,480 - 1,480 1,493 - 1,493 - (13)
Q2906 (QB904) Batchelder School Roof project 1,820 - 1,820 1,709 - 1,709 - 111
Q1300 Public Safety 4/16/2012 3,000 - 3,000 60 - 60 - 2,940
Q1306 Parking Lot 4/16/2012 200 - 200 197 - 197 - 3
Total Other 6,500 - 6,500 3,459 - 3,459 - 3,041
Total Facility Services 1,406,531 128,156 1,534,687 1,060,866 76,445 1,137,311 4,731 318,706
Engineering Services
Public Works Projects:
W9519 Road Improvement Program 8/11/1998 12,955 - 12,955 11,808 233 12,041 - 914
W1519 Streetscape Improvements 11/7/2000 16,700 - 16,700 13,092 1,624 14,716 - 1,984
W1534 Reconstruction of Woodland St. 6/11/2001 1,525 - 1,525 1,392 - 1,392 - 133
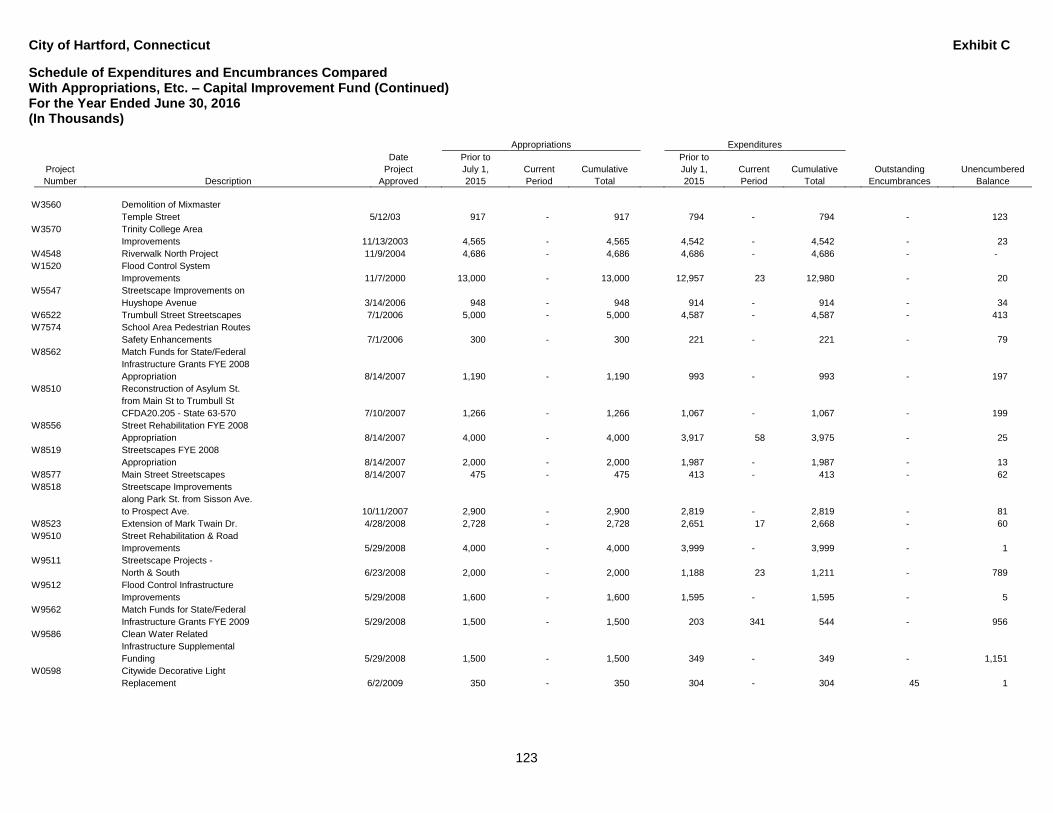
City of Hartford, Connecticut Exhibit C
Schedule of Expenditures and Encumbrances Compared With Appropriations, Etc. – Capital Improvement Fund (Continued) For the Year Ended June 30, 2016 (In Thousands)
Appropriations Expenditures
Date Prior to Prior to
Project Project July 1, Current Cumulative July 1, Current Cumulative Outstanding Unencumbered
Number Description Approved 2015 Period Total 2015 Period Total Encumbrances Balance
123
W3560 Demolition of Mixmaster
Temple Street 5/12/03 917 - 917 794 - 794 - 123
W3570 Trinity College Area
Improvements 11/13/2003 4,565 - 4,565 4,542 - 4,542 - 23
W4548 Riverwalk North Project 11/9/2004 4,686 - 4,686 4,686 - 4,686 - -
W1520 Flood Control System
Improvements 11/7/2000 13,000 - 13,000 12,957 23 12,980 - 20
W5547 Streetscape Improvements on
Huyshope Avenue 3/14/2006 948 - 948 914 - 914 - 34
W6522 Trumbull Street Streetscapes 7/1/2006 5,000 - 5,000 4,587 - 4,587 - 413
W7574 School Area Pedestrian Routes
Safety Enhancements 7/1/2006 300 - 300 221 - 221 - 79
W8562 Match Funds for State/Federal
Infrastructure Grants FYE 2008
Appropriation 8/14/2007 1,190 - 1,190 993 - 993 - 197
W8510 Reconstruction of Asylum St.
from Main St to Trumbull St
CFDA20.205 - State 63-570 7/10/2007 1,266 - 1,266 1,067 - 1,067 - 199
W8556 Street Rehabilitation FYE 2008
Appropriation 8/14/2007 4,000 - 4,000 3,917 58 3,975 - 25
W8519 Streetscapes FYE 2008
Appropriation 8/14/2007 2,000 - 2,000 1,987 - 1,987 - 13
W8577 Main Street Streetscapes 8/14/2007 475 - 475 413 - 413 - 62
W8518 Streetscape Improvements
along Park St. from Sisson Ave.
to Prospect Ave. 10/11/2007 2,900 - 2,900 2,819 - 2,819 - 81
W8523 Extension of Mark Twain Dr. 4/28/2008 2,728 - 2,728 2,651 17 2,668 - 60
W9510 Street Rehabilitation & Road
Improvements 5/29/2008 4,000 - 4,000 3,999 - 3,999 - 1
W9511 Streetscape Projects -
North & South 6/23/2008 2,000 - 2,000 1,188 23 1,211 - 789
W9512 Flood Control Infrastructure
Improvements 5/29/2008 1,600 - 1,600 1,595 - 1,595 - 5
W9562 Match Funds for State/Federal
Infrastructure Grants FYE 2009 5/29/2008 1,500 - 1,500 203 341 544 - 956
W9586 Clean Water Related
Infrastructure Supplemental
Funding 5/29/2008 1,500 - 1,500 349 - 349 - 1,151
W0598 Citywide Decorative Light
Replacement 6/2/2009 350 - 350 304 - 304 45 1
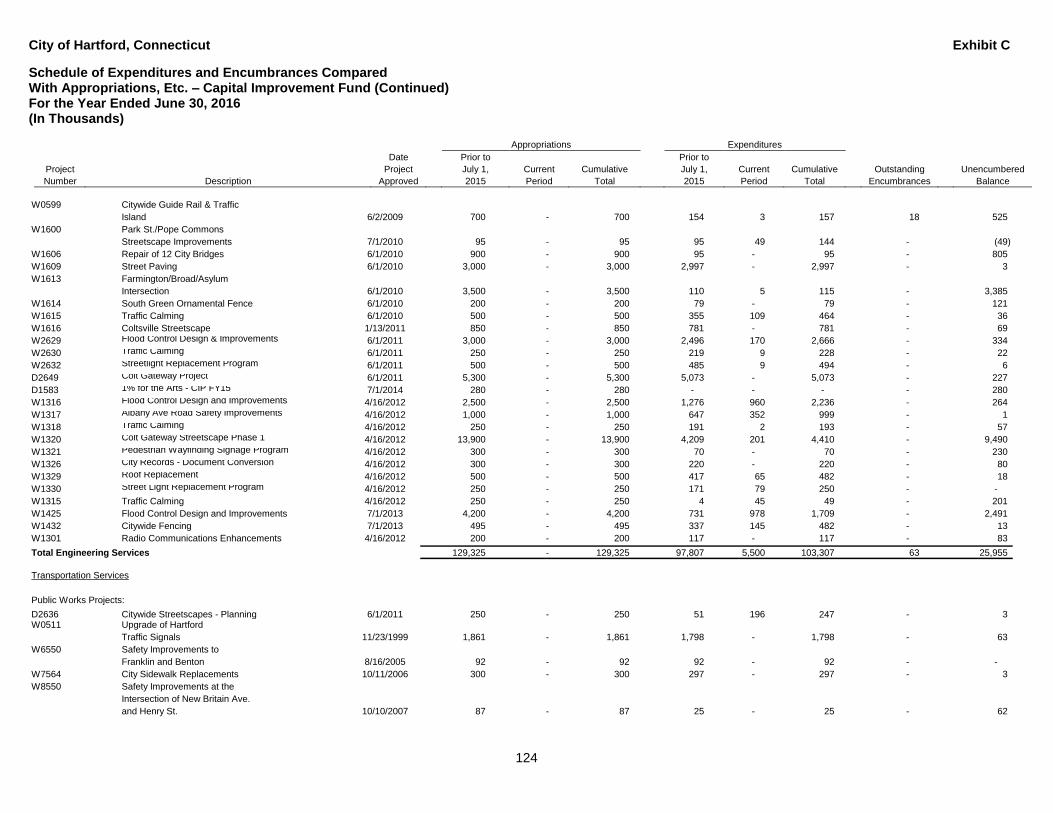
City of Hartford, Connecticut Exhibit C
Schedule of Expenditures and Encumbrances Compared With Appropriations, Etc. – Capital Improvement Fund (Continued) For the Year Ended June 30, 2016 (In Thousands)
Appropriations Expenditures
Date Prior to Prior to
Project Project July 1, Current Cumulative July 1, Current Cumulative Outstanding Unencumbered
Number Description Approved 2015 Period Total 2015 Period Total Encumbrances Balance
124
W0599 Citywide Guide Rail & Traffic
Island 6/2/2009 700 - 700 154 3 157 18 525
W1600 Park St./Pope Commons
Streetscape Improvements 7/1/2010 95 - 95 95 49 144 - (49)
W1606 Repair of 12 City Bridges 6/1/2010 900 - 900 95 - 95 - 805
W1609 Street Paving 6/1/2010 3,000 - 3,000 2,997 - 2,997 - 3
W1613 Farmington/Broad/Asylum
Intersection 6/1/2010 3,500 - 3,500 110 5 115 - 3,385
W1614 South Green Ornamental Fence 6/1/2010 200 - 200 79 - 79 - 121
W1615 Traffic Calming 6/1/2010 500 - 500 355 109 464 - 36
W1616 Coltsville Streetscape 1/13/2011 850 - 850 781 - 781 - 69
W2629 Flood Control Design & Improvements 6/1/2011 3,000 - 3,000 2,496 170 2,666 - 334
W2630 Traffic Calming 6/1/2011 250 - 250 219 9 228 - 22
W2632 Streetlight Replacement Program 6/1/2011 500 - 500 485 9 494 - 6
D2649 Colt Gateway Project 6/1/2011 5,300 - 5,300 5,073 - 5,073 - 227
D1583 1% for the Arts - CIP FY15 7/1/2014 280 - 280 - - - - 280
W1316 Flood Control Design and Improvements 4/16/2012 2,500 - 2,500 1,276 960 2,236 - 264
W1317 Albany Ave Road Safety Improvements 4/16/2012 1,000 - 1,000 647 352 999 - 1
W1318 Traffic Calming 4/16/2012 250 - 250 191 2 193 - 57
W1320 Colt Gateway Streetscape Phase 1 4/16/2012 13,900 - 13,900 4,209 201 4,410 - 9,490
W1321 Pedestrian Wayfinding Signage Program 4/16/2012 300 - 300 70 - 70 - 230
W1326 City Records - Document Conversion 4/16/2012 300 - 300 220 - 220 - 80
W1329 Roof Replacement 4/16/2012 500 - 500 417 65 482 - 18
W1330 Street Light Replacement Program 4/16/2012 250 - 250 171 79 250 - -
W1315 Traffic Calming 4/16/2012 250 - 250 4 45 49 - 201
W1425 Flood Control Design and Improvements 7/1/2013 4,200 - 4,200 731 978 1,709 - 2,491
W1432 Citywide Fencing 7/1/2013 495 - 495 337 145 482 - 13
W1301 Radio Communications Enhancements 4/16/2012 200 - 200 117 - 117 - 83
Total Engineering Services 129,325 - 129,325 97,807 5,500 103,307 63 25,955
Transportation Services
Public Works Projects:
D2636 Citywide Streetscapes - Planning 6/1/2011 250 - 250 51 196 247 - 3 W0511 Upgrade of Hartford
Traffic Signals 11/23/1999 1,861 - 1,861 1,798 - 1,798 - 63
W6550 Safety Improvements to
Franklin and Benton 8/16/2005 92 - 92 92 - 92 - -
W7564 City Sidewalk Replacements 10/11/2006 300 - 300 297 - 297 - 3
W8550 Safety Improvements at the
Intersection of New Britain Ave.
and Henry St. 10/10/2007 87 - 87 25 - 25 - 62
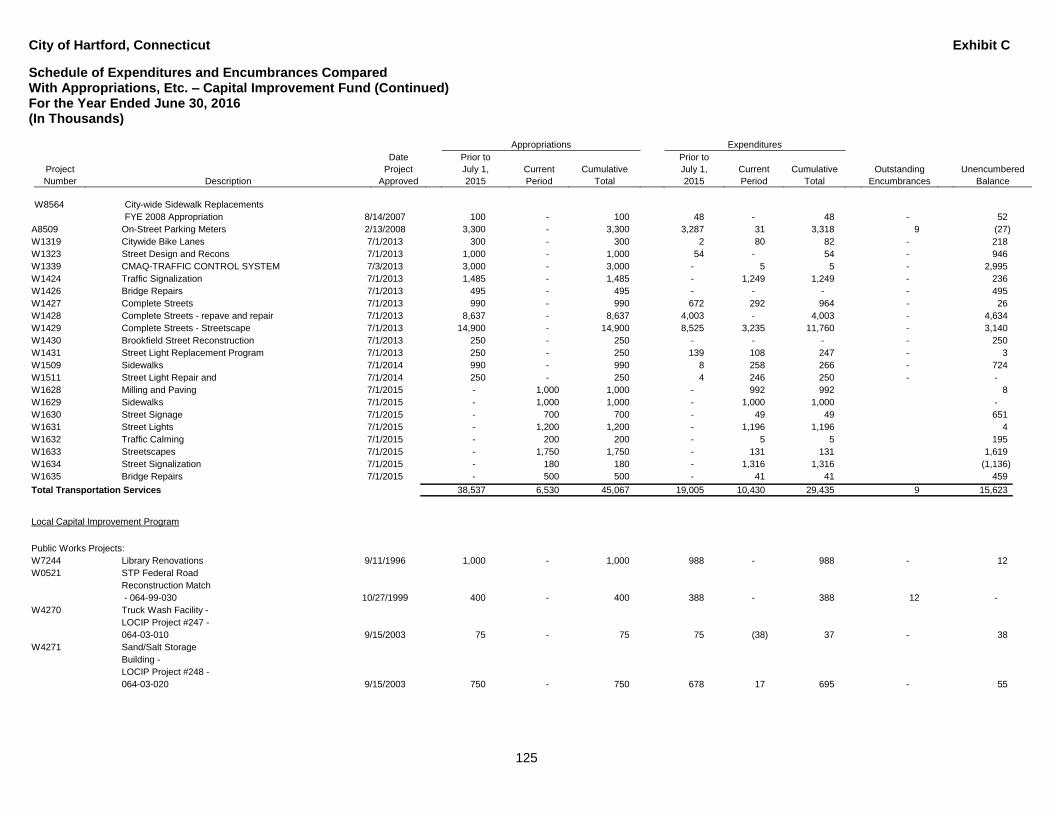
City of Hartford, Connecticut Exhibit C
Schedule of Expenditures and Encumbrances Compared With Appropriations, Etc. – Capital Improvement Fund (Continued) For the Year Ended June 30, 2016 (In Thousands)
Appropriations Expenditures
Date Prior to Prior to
Project Project July 1, Current Cumulative July 1, Current Cumulative Outstanding Unencumbered
Number Description Approved 2015 Period Total 2015 Period Total Encumbrances Balance
125
W8564 City-wide Sidewalk Replacements
FYE 2008 Appropriation 8/14/2007 100 - 100 48 - 48 - 52
A8509 On-Street Parking Meters 2/13/2008 3,300 - 3,300 3,287 31 3,318 9 (27)
W1319 Citywide Bike Lanes 7/1/2013 300 - 300 2 80 82 - 218
W1323 Street Design and Recons 7/1/2013 1,000 - 1,000 54 - 54 - 946
W1339 CMAQ-TRAFFIC CONTROL SYSTEM 7/3/2013 3,000 - 3,000 - 5 5 - 2,995
W1424 Traffic Signalization 7/1/2013 1,485 - 1,485 - 1,249 1,249 - 236
W1426 Bridge Repairs 7/1/2013 495 - 495 - - - - 495
W1427 Complete Streets 7/1/2013 990 - 990 672 292 964 - 26
W1428 Complete Streets - repave and repair 7/1/2013 8,637 - 8,637 4,003 - 4,003 - 4,634
W1429 Complete Streets - Streetscape 7/1/2013 14,900 - 14,900 8,525 3,235 11,760 - 3,140
W1430 Brookfield Street Reconstruction 7/1/2013 250 - 250 - - - - 250
W1431 Street Light Replacement Program 7/1/2013 250 - 250 139 108 247 - 3
W1509 Sidewalks 7/1/2014 990 - 990 8 258 266 - 724
W1511 Street Light Repair and 7/1/2014 250 - 250 4 246 250 - -
W1628 Milling and Paving 7/1/2015 - 1,000 1,000 - 992 992 8
W1629 Sidewalks 7/1/2015 - 1,000 1,000 - 1,000 1,000 -
W1630 Street Signage 7/1/2015 - 700 700 - 49 49 651
W1631 Street Lights 7/1/2015 - 1,200 1,200 - 1,196 1,196 4
W1632 Traffic Calming 7/1/2015 - 200 200 - 5 5 195
W1633 Streetscapes 7/1/2015 - 1,750 1,750 - 131 131 1,619
W1634 Street Signalization 7/1/2015 - 180 180 - 1,316 1,316 (1,136)
W1635 Bridge Repairs 7/1/2015 - 500 500 - 41 41 459
Total Transportation Services 38,537 6,530 45,067 19,005 10,430 29,435 9 15,623
Local Capital Improvement Program
Public Works Projects:
W7244 Library Renovations 9/11/1996 1,000 - 1,000 988 - 988 - 12
W0521 STP Federal Road
Reconstruction Match
- 064-99-030 10/27/1999 400 - 400 388 - 388 12 -
W4270 Truck Wash Facility -
LOCIP Project #247 -
064-03-010 9/15/2003 75 - 75 75 (38) 37 - 38
W4271 Sand/Salt Storage
Building -
LOCIP Project #248 -
064-03-020 9/15/2003 750 - 750 678 17 695 - 55
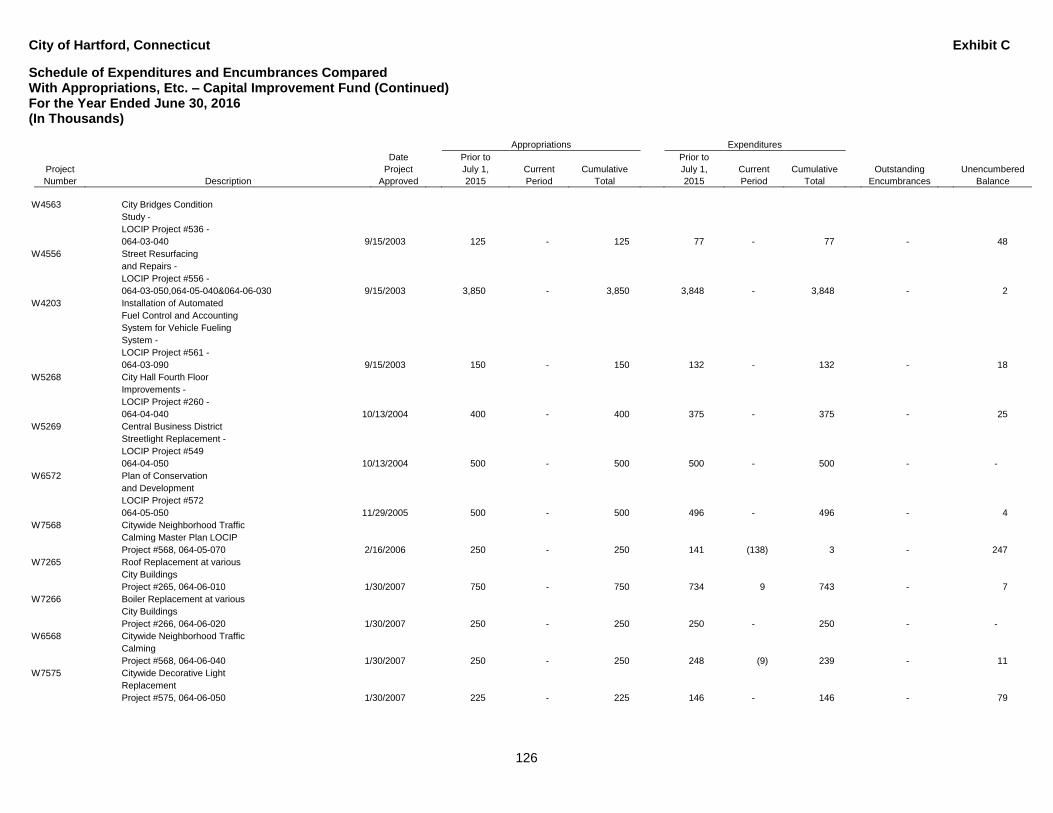
City of Hartford, Connecticut Exhibit C
Schedule of Expenditures and Encumbrances Compared With Appropriations, Etc. – Capital Improvement Fund (Continued) For the Year Ended June 30, 2016 (In Thousands)
Appropriations Expenditures
Date Prior to Prior to
Project Project July 1, Current Cumulative July 1, Current Cumulative Outstanding Unencumbered
Number Description Approved 2015 Period Total 2015 Period Total Encumbrances Balance
126
W4563 City Bridges Condition
Study -
LOCIP Project #536 -
064-03-040 9/15/2003 125 - 125 77 - 77 - 48
W4556 Street Resurfacing
and Repairs -
LOCIP Project #556 -
064-03-050,064-05-040&064-06-030 9/15/2003 3,850 - 3,850 3,848 - 3,848 - 2
W4203 Installation of Automated
Fuel Control and Accounting
System for Vehicle Fueling
System -
LOCIP Project #561 -
064-03-090 9/15/2003 150 - 150 132 - 132 - 18
W5268 City Hall Fourth Floor
Improvements -
LOCIP Project #260 -
064-04-040 10/13/2004 400 - 400 375 - 375 - 25
W5269 Central Business District
Streetlight Replacement -
LOCIP Project #549
064-04-050 10/13/2004 500 - 500 500 - 500 - -
W6572 Plan of Conservation
and Development
LOCIP Project #572
064-05-050 11/29/2005 500 - 500 496 - 496 - 4
W7568 Citywide Neighborhood Traffic
Calming Master Plan LOCIP
Project #568, 064-05-070 2/16/2006 250 - 250 141 (138) 3 - 247
W7265 Roof Replacement at various
City Buildings
Project #265, 064-06-010 1/30/2007 750 - 750 734 9 743 - 7
W7266 Boiler Replacement at various
City Buildings
Project #266, 064-06-020 1/30/2007 250 - 250 250 - 250 - -
W6568 Citywide Neighborhood Traffic
Calming
Project #568, 064-06-040 1/30/2007 250 - 250 248 (9) 239 - 11
W7575 Citywide Decorative Light
Replacement
Project #575, 064-06-050 1/30/2007 225 - 225 146 - 146 - 79
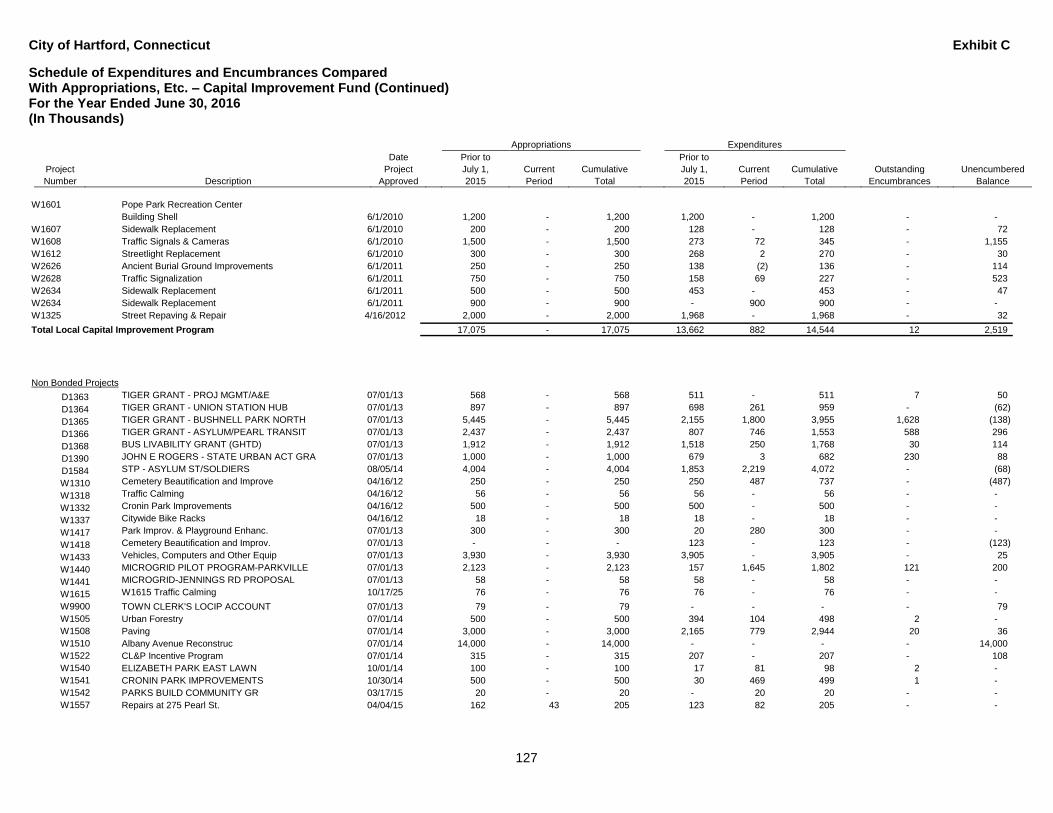
City of Hartford, Connecticut Exhibit C
Schedule of Expenditures and Encumbrances Compared With Appropriations, Etc. – Capital Improvement Fund (Continued) For the Year Ended June 30, 2016 (In Thousands)
Appropriations Expenditures
Date Prior to Prior to
Project Project July 1, Current Cumulative July 1, Current Cumulative Outstanding Unencumbered
Number Description Approved 2015 Period Total 2015 Period Total Encumbrances Balance
127
W1601 Pope Park Recreation Center
Building Shell 6/1/2010 1,200 - 1,200 1,200 - 1,200 - -
W1607 Sidewalk Replacement 6/1/2010 200 - 200 128 - 128 - 72
W1608 Traffic Signals & Cameras 6/1/2010 1,500 - 1,500 273 72 345 - 1,155
W1612 Streetlight Replacement 6/1/2010 300 - 300 268 2 270 - 30
W2626 Ancient Burial Ground Improvements 6/1/2011 250 - 250 138 (2) 136 - 114
W2628 Traffic Signalization 6/1/2011 750 - 750 158 69 227 - 523
W2634 Sidewalk Replacement 6/1/2011 500 - 500 453 - 453 - 47
W2634 Sidewalk Replacement 6/1/2011 900 - 900 - 900 900 - -
W1325 Street Repaving & Repair 4/16/2012 2,000 - 2,000 1,968 - 1,968 - 32
Total Local Capital Improvement Program 17,075 - 17,075 13,662 882 14,544 12 2,519
Non Bonded Projects
D1363 TIGER GRANT - PROJ MGMT/A&E 07/01/13 568 - 568 511 - 511 7 50
D1364 TIGER GRANT - UNION STATION HUB 07/01/13 897 - 897 698 261 959 - (62)
D1365 TIGER GRANT - BUSHNELL PARK NORTH 07/01/13 5,445 - 5,445 2,155 1,800 3,955 1,628 (138)
D1366 TIGER GRANT - ASYLUM/PEARL TRANSIT 07/01/13 2,437 - 2,437 807 746 1,553 588 296
D1368 BUS LIVABILITY GRANT (GHTD) 07/01/13 1,912 - 1,912 1,518 250 1,768 30 114
D1390 JOHN E ROGERS - STATE URBAN ACT GRA 07/01/13 1,000 - 1,000 679 3 682 230 88
D1584 STP - ASYLUM ST/SOLDIERS 08/05/14 4,004 - 4,004 1,853 2,219 4,072 - (68)
W1310 Cemetery Beautification and Improve 04/16/12 250 - 250 250 487 737 - (487)
W1318 Traffic Calming 04/16/12 56 - 56 56 - 56 - -
W1332 Cronin Park Improvements 04/16/12 500 - 500 500 - 500 - -
W1337 Citywide Bike Racks 04/16/12 18 - 18 18 - 18 - -
W1417 Park Improv. & Playground Enhanc. 07/01/13 300 - 300 20 280 300 - -
W1418 Cemetery Beautification and Improv. 07/01/13 - - - 123 - 123 - (123)
W1433 Vehicles, Computers and Other Equip 07/01/13 3,930 - 3,930 3,905 - 3,905 - 25
W1440 MICROGRID PILOT PROGRAM-PARKVILLE 07/01/13 2,123 - 2,123 157 1,645 1,802 121 200
W1441 MICROGRID-JENNINGS RD PROPOSAL 07/01/13 58 - 58 58 - 58 - -
W1615 W1615 Traffic Calming 10/17/25 76 - 76 76 - 76 - -
W9900 TOWN CLERK'S LOCIP ACCOUNT 07/01/13 79 - 79 - - - - 79
W1505 Urban Forestry 07/01/14 500 - 500 394 104 498 2 -
W1508 Paving 07/01/14 3,000 - 3,000 2,165 779 2,944 20 36
W1510 Albany Avenue Reconstruc 07/01/14 14,000 - 14,000 - - - - 14,000
W1522 CL&P Incentive Program 07/01/14 315 - 315 207 - 207 - 108
W1540 ELIZABETH PARK EAST LAWN 10/01/14 100 - 100 17 81 98 2 -
W1541 CRONIN PARK IMPROVEMENTS 10/30/14 500 - 500 30 469 499 1 -
W1542 PARKS BUILD COMMUNITY GR 03/17/15 20 - 20 - 20 20 - -
W1557 Repairs at 275 Pearl St. 04/04/15 162 43 205 123 82 205 - -
City of Hartford, Connecticut Exhibit C
Schedule of Expenditures and Encumbrances Compared With Appropriations, Etc. – Capital Improvement Fund (Continued) For the Year Ended June 30, 2016 (In Thousands)
Appropriations Expenditures
Date Prior to Prior to
Project Project July 1, Current Cumulative July 1, Current Cumulative Outstanding Unencumbered
Number Description Approved 2015 Period Total 2015 Period Total Encumbrances Balance
128
W1628 Milling and Paving 07/01/15 - 2,000 2,000 - 2,000 2,000 - -
W1633 Streetscapes 07/01/15 - 2,250 2,250 - - - - 2,250
W1645 Coventry Street Substation 09/28/15 - 1,500 1,500 - - - - 1,500
W1646 Broad Street Reconstruction 09/28/15 - 2,956 2,956 - - - - 2,956
Total Non Bonded Projects 42,250 8,749 50,999 16,320 11,226 27,546 2,629 20,824
TOTAL CAPITAL IMPROVEMENT FUND 1,633,718$ 143,435$ 1,777,153$ 1,207,660$ 104,483 1,312,143$ 7,444$ 383,627$
Conversion to GAAP based financial statement reporting:
Previous year retainage and off system accrued payables (3,334) (3,334)
Current year retainage and off system accrued payables 5,092 5,092
TOTAL 106,241$ 9,202$

Nonmajor Enterprise Funds
Nonmajor Enterprise Funds
Nonmajor Enterprise Funds are used to account for ongoing organizations and activities which are similar to those found in the private sector. Hartford Parking Facilities – is used to account for revenues and expenditures related to the Parking Fund. Golf Course – is used to account for revenues and expenditures related to the City Golf Course.
129
City of Hartford, Connecticut EXHIBIT D-1
Statement of Net Position - Nonmajor Enterprise Funds
June 30, 2016
(In Thousands)
Hartford
Parking Golf
Facilities Course Total
Assets
Current assets:
Cash and cash equivalents 1,317 $ 500 $ 1,817 $
Receivables, net - 23 23
Due from component unit 534 - 534
Total current assets 1,851 523 2,374
Capital assets, net 17,945 1,056 19,001
Total assets 19,796 1,579 21,375
Liabilities
Current liabilities:
Accounts payable and other payables 50 363 413
Due to other funds 1,295 1,110 2,405
Bonds payable 391 - 391
Total current liabilities 1,736 1,473 3,209
Noncurrent liabilities:
Bonds payable 2,687 - 2,687
Total noncurrent liabilities 2,687 - 2,687
Total liabilities 4,423 1,473 5,896
Net position:
Net investment in capital assets 14,867 1,056 15,923
Unrestricted (deficit) 506 (950) (444)
Total net position 15,373 $ 106 $ 15,479 $
See notes to financial statements.
130
City of Hartford, Connecticut EXHIBIT D-2
Statement of Revenues, Expenses and Changes in
Net Position - Nonmajor Enterprise Funds
For the Year Ended June 30, 2016
(In Thousands)
Hartford
Parking Golf
Facilities Course Total
Operating revenues:
Hartford Parking Authority fees 2,506 $ -$ 2,506 $
Golf Course fees - 1,453 1,453
Other 55 - 55
Total operating revenues 2,561 1,453 4,014
Operating expenses:
Administrative 162 791 953
Operations - 927 927
Depreciation and amortization 760 92 852
Total operating expenses 922 1,810 2,732
Operating income (loss) 1,639 (357) 1,282
Nonoperating income (expense):
Interest expense (76) - (76)
Total nonoperating income (expense) (76) - (76)
Net income (loss) before transfers 1,563 (357) 1,206
Transfers in 987 - 987
Transfers out (2,295) - (2,295)
Change in net position 255 (357) (102)
Fund net position, beginning 15,118 463 15,581
Fund net position, ending 15,373 $ 106 $ 15,479 $
See notes to financial statements.
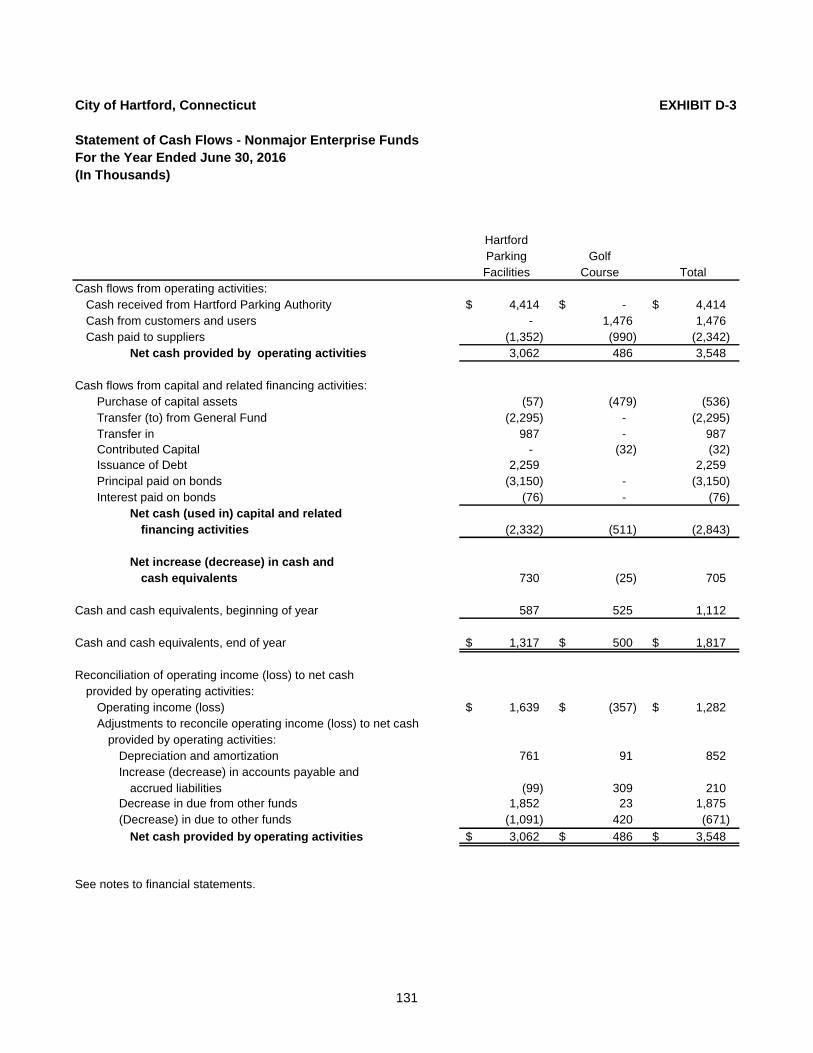
131
City of Hartford, Connecticut EXHIBIT D-3
Statement of Cash Flows - Nonmajor Enterprise Funds
For the Year Ended June 30, 2016
(In Thousands)
Hartford
Parking Golf
Facilities Course Total
Cash flows from operating activities:
Cash received from Hartford Parking Authority 4,414 $ -$ 4,414 $
Cash from customers and users - 1,476 1,476
Cash paid to suppliers (1,352) (990) (2,342)
Net cash provided by operating activities 3,062 486 3,548
Cash flows from capital and related financing activities:
Purchase of capital assets (57) (479) (536)
Transfer (to) from General Fund (2,295) - (2,295)
Transfer in 987 - 987
Contributed Capital - (32) (32)
Issuance of Debt 2,259 2,259
Principal paid on bonds (3,150) - (3,150)
Interest paid on bonds (76) - (76)
Net cash (used in) capital and related
financing activities (2,332) (511) (2,843)
Net increase (decrease) in cash and
cash equivalents 730 (25) 705
Cash and cash equivalents, beginning of year 587 525 1,112
Cash and cash equivalents, end of year 1,317 $ 500 $ 1,817 $
Reconciliation of operating income (loss) to net cash
provided by operating activities:
Operating income (loss) 1,639 $ (357) $ 1,282 $
Adjustments to reconcile operating income (loss) to net cash
provided by operating activities:
Depreciation and amortization 761 91 852
Increase (decrease) in accounts payable and
accrued liabilities (99) 309 210
Decrease in due from other funds 1,852 23 1,875
(Decrease) in due to other funds (1,091) 420 (671)
Net cash provided by operating activities 3,062 $ 486 $ 3,548 $
See notes to financial statements.

132
This page intentionally left blank.

Internal Service Funds
Internal Service Funds Internal service funds are used to report any activity that provides goods or services to other funds, departments, or agencies of the City, or to other governments, on a cost-reimbursement basis. The City maintains seven (7) internal service funds to account for the risk management program for employee benefits including retirees, municipal actives, BOE actives, new hires, VEBA, workers’ compensation, and general liability, including property damage. An internal service fund is also maintained for the Metro Hartford Information Services Fund (MHIS). The accounting and reporting for the centralized computer services, including communication systems, is maintained through this internal service fund.

133
This page intentionally left blank.
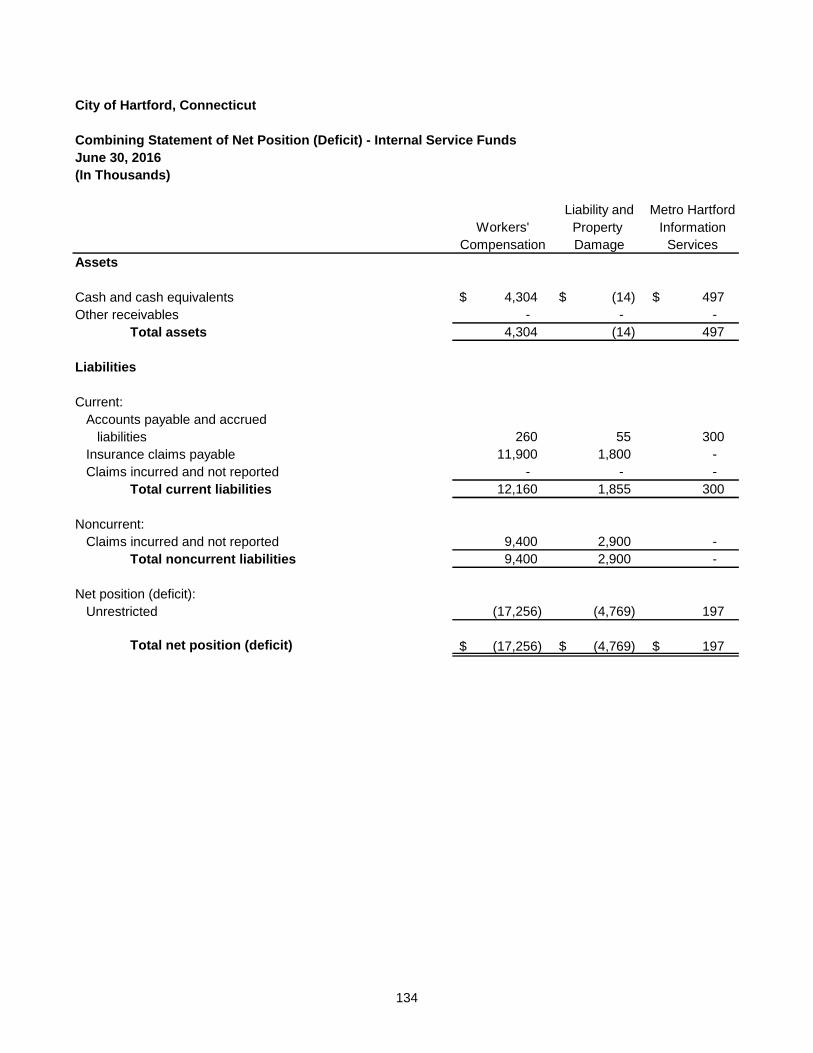
134
City of Hartford, Connecticut
Combining Statement of Net Position (Deficit) - Internal Service Funds
June 30, 2016
(In Thousands)
Liability and Metro Hartford
Workers' Property Information
Compensation Damage Services
Assets
Cash and cash equivalents 4,304 $ (14) $ 497 $
Other receivables - - -
Total assets 4,304 (14) 497
Liabilities
Current:
Accounts payable and accrued
liabilities 260 55 300
Insurance claims payable 11,900 1,800 -
Claims incurred and not reported - - -
Total current liabilities 12,160 1,855 300
Noncurrent:
Claims incurred and not reported 9,400 2,900 -
Total noncurrent liabilities 9,400 2,900 -
Net position (deficit):
Unrestricted (17,256) (4,769) 197
Total net position (deficit) (17,256) $ (4,769) $ 197 $
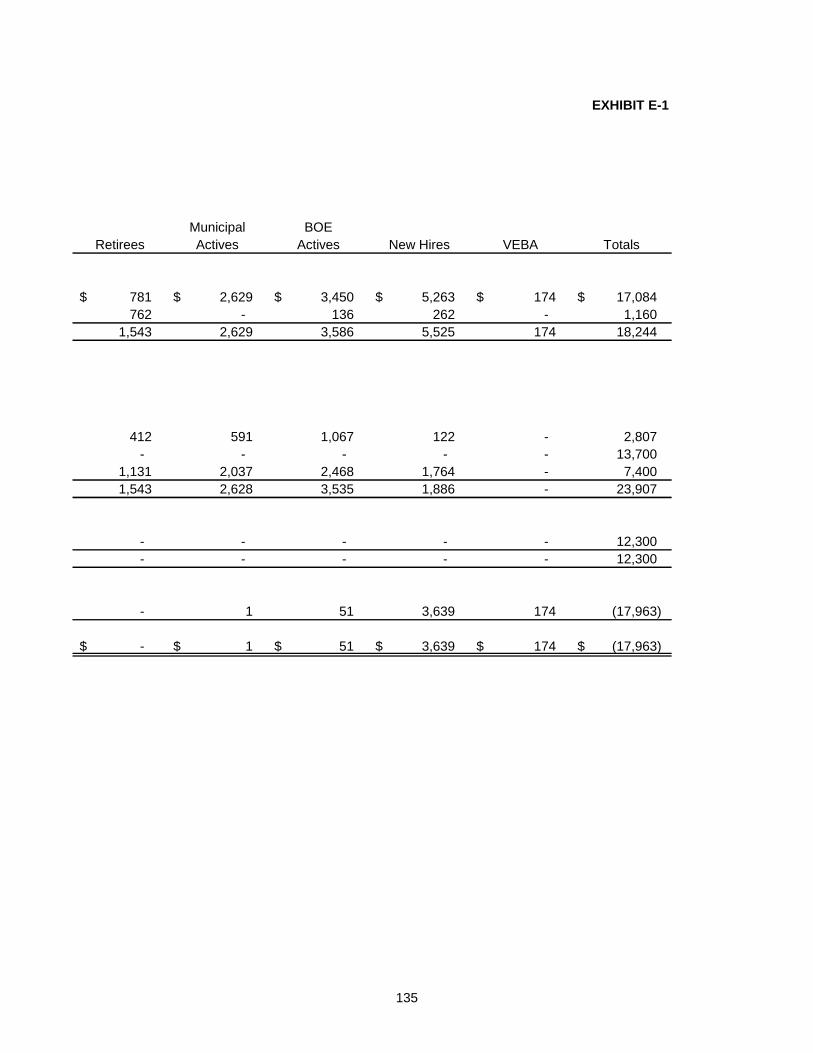
135
EXHIBIT E-1
Municipal BOE
Retirees Actives Actives New Hires VEBA Totals
781 $ 2,629 $ 3,450 $ 5,263 $ 174 $ 17,084 $
762 - 136 262 - 1,160
1,543 2,629 3,586 5,525 174 18,244
412 591 1,067 122 - 2,807
- - - - - 13,700
1,131 2,037 2,468 1,764 - 7,400
1,543 2,628 3,535 1,886 - 23,907
- - - - - 12,300
- - - - - 12,300
- 1 51 3,639 174 (17,963)
-$ 1 $ 51 $ 3,639 $ 174 $ (17,963) $
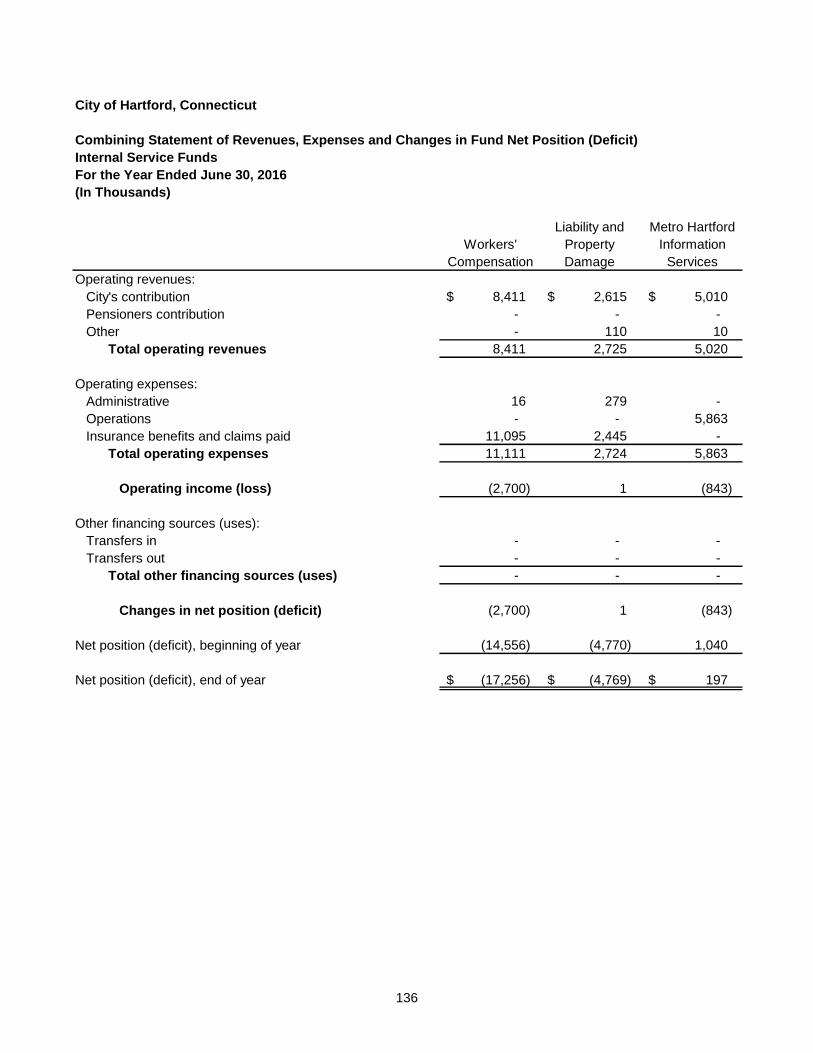
136
City of Hartford, Connecticut
Combining Statement of Revenues, Expenses and Changes in Fund Net Position (Deficit)
Internal Service Funds
For the Year Ended June 30, 2016
(In Thousands)
Liability and Metro Hartford
Workers' Property Information
Compensation Damage Services
Operating revenues:
City's contribution 8,411 $ 2,615 $ 5,010 $
Pensioners contribution - - -
Other - 110 10
Total operating revenues 8,411 2,725 5,020
Operating expenses:
Administrative 16 279 -
Operations - - 5,863
Insurance benefits and claims paid 11,095 2,445 -
Total operating expenses 11,111 2,724 5,863
Operating income (loss) (2,700) 1 (843)
Other financing sources (uses):
Transfers in - - -
Transfers out - - -
Total other financing sources (uses) - - -
Changes in net position (deficit) (2,700) 1 (843)
Net position (deficit), beginning of year (14,556) (4,770) 1,040
Net position (deficit), end of year (17,256) $ (4,769) $ 197 $
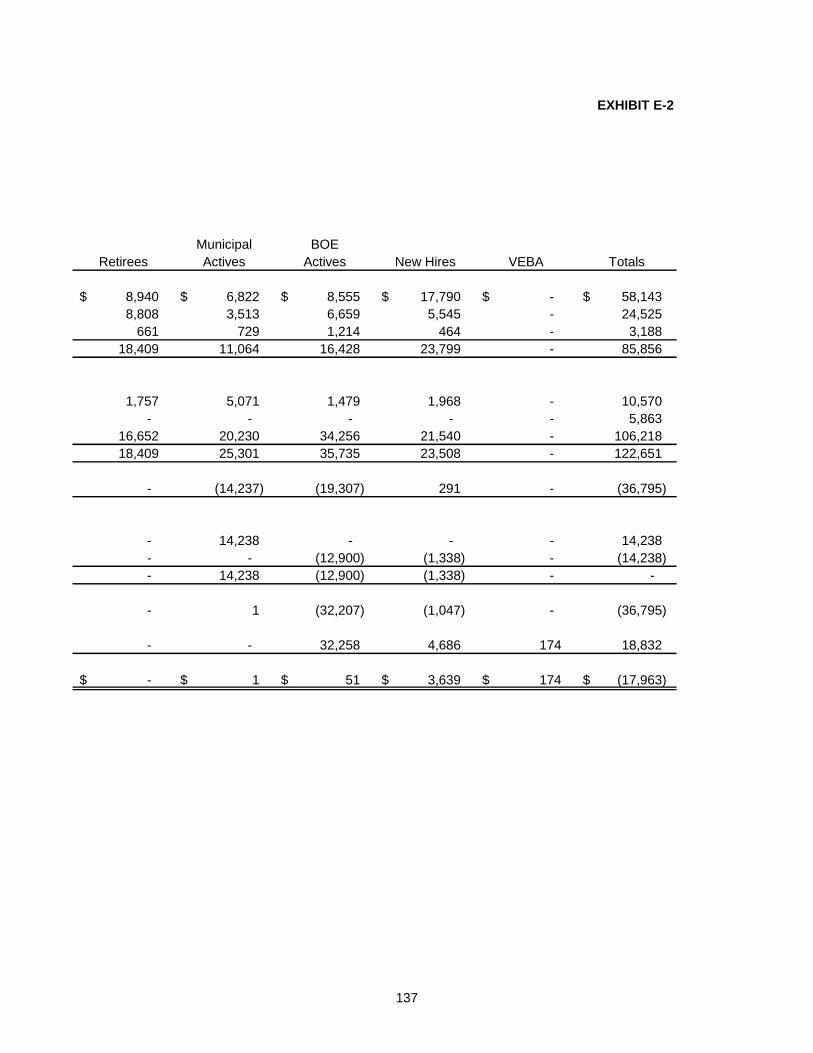
137
EXHIBIT E-2
Municipal BOE
Retirees Actives Actives New Hires VEBA Totals
8,940 $ 6,822 $ 8,555 $ 17,790 $ -$ 58,143 $
8,808 3,513 6,659 5,545 - 24,525
661 729 1,214 464 - 3,188
18,409 11,064 16,428 23,799 - 85,856
1,757 5,071 1,479 1,968 - 10,570
- - - - - 5,863
16,652 20,230 34,256 21,540 - 106,218
18,409 25,301 35,735 23,508 - 122,651
- (14,237) (19,307) 291 - (36,795)
- 14,238 - - - 14,238
- - (12,900) (1,338) - (14,238)
- 14,238 (12,900) (1,338) - -
- 1 (32,207) (1,047) - (36,795)
- - 32,258 4,686 174 18,832
-$ 1 $ 51 $ 3,639 $ 174 $ (17,963) $
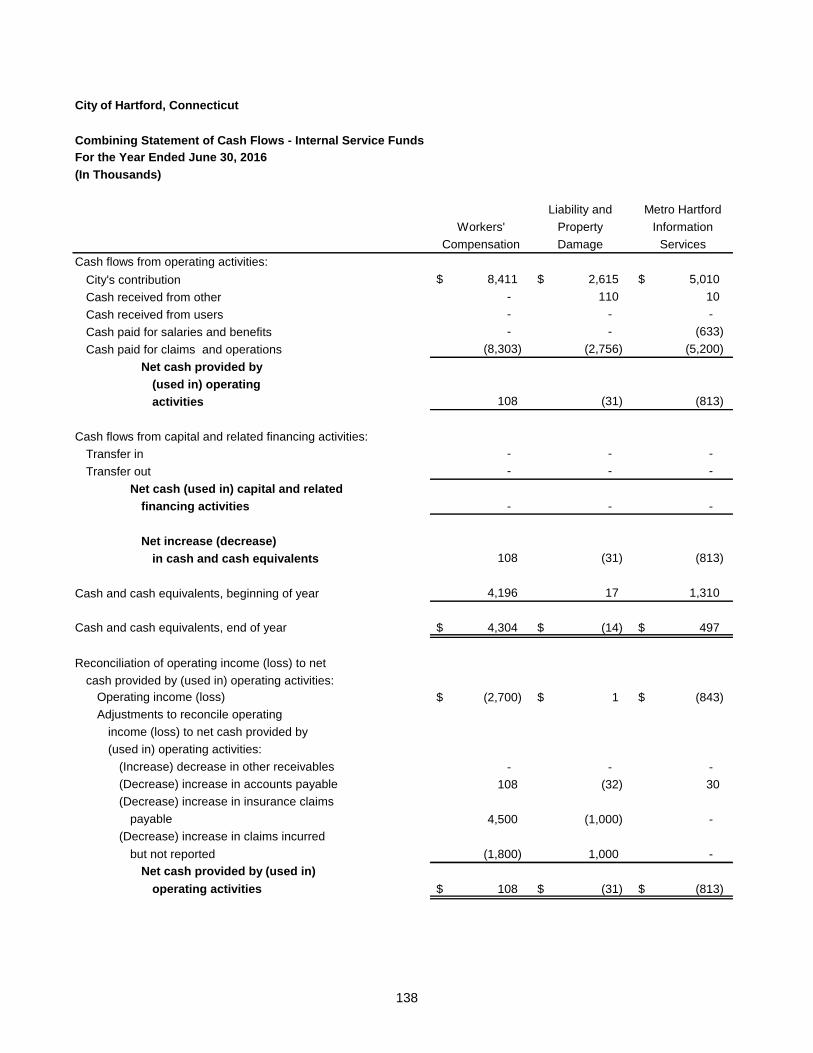
138
City of Hartford, Connecticut
Combining Statement of Cash Flows - Internal Service Funds
For the Year Ended June 30, 2016
(In Thousands)
Liability and Metro Hartford
Workers' Property Information
Compensation Damage Services
Cash flows from operating activities:
City's contribution 8,411 $ 2,615 $ 5,010 $
Cash received from other - 110 10
Cash received from users - - -
Cash paid for salaries and benefits - - (633)
Cash paid for claims and operations (8,303) (2,756) (5,200)
Net cash provided by
(used in) operating
activities 108 (31) (813)
Cash flows from capital and related financing activities:
Transfer in - - -
Transfer out - - -
Net cash (used in) capital and related
financing activities - - -
Net increase (decrease)
in cash and cash equivalents 108 (31) (813)
Cash and cash equivalents, beginning of year 4,196 17 1,310
Cash and cash equivalents, end of year 4,304 $ (14) $ 497 $
Reconciliation of operating income (loss) to net
cash provided by (used in) operating activities:
Operating income (loss) (2,700) $ 1 $ (843) $
Adjustments to reconcile operating
income (loss) to net cash provided by
(used in) operating activities:
(Increase) decrease in other receivables - - -
(Decrease) increase in accounts payable 108 (32) 30
(Decrease) increase in insurance claims
payable 4,500 (1,000) -
(Decrease) increase in claims incurred
but not reported (1,800) 1,000 -
Net cash provided by (used in)
operating activities 108 $ (31) $ (813) $
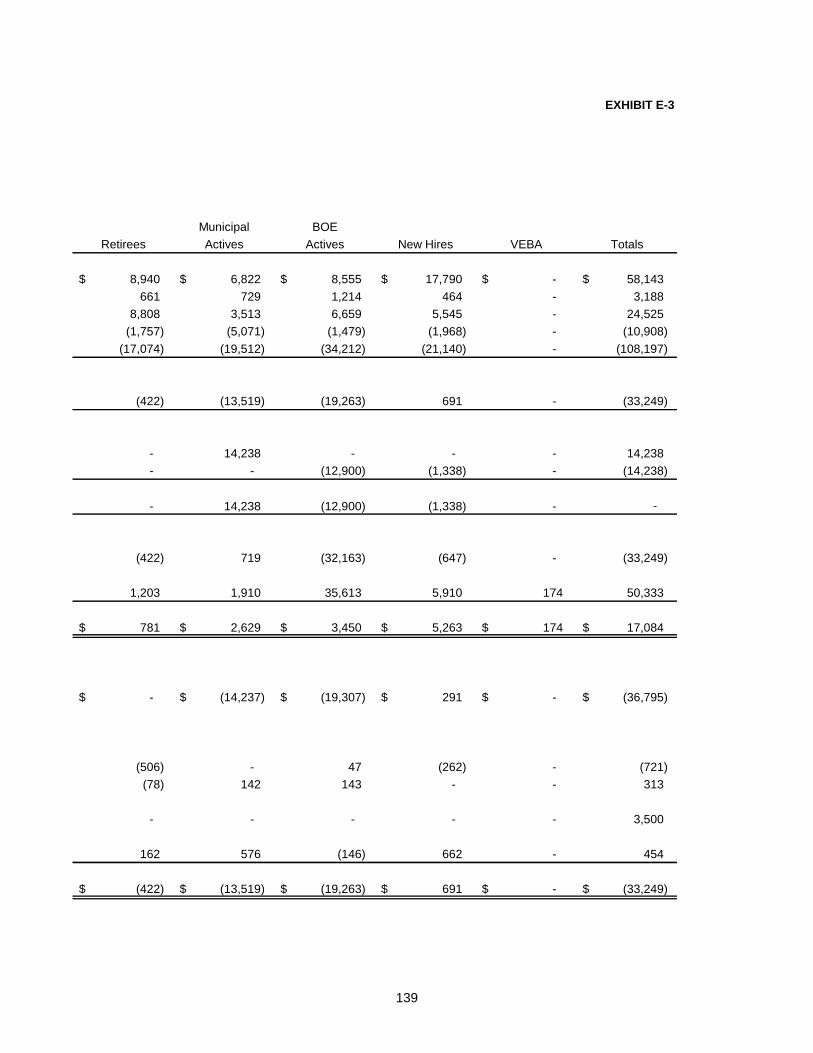
139
EXHIBIT E-3
Municipal BOE
Retirees Actives Actives New Hires VEBA Totals
8,940 $ 6,822 $ 8,555 $ 17,790 $ -$ 58,143 $
661 729 1,214 464 - 3,188
8,808 3,513 6,659 5,545 - 24,525
(1,757) (5,071) (1,479) (1,968) - (10,908)
(17,074) (19,512) (34,212) (21,140) - (108,197)
(422) (13,519) (19,263) 691 - (33,249)
- 14,238 - - - 14,238
- - (12,900) (1,338) - (14,238)
- 14,238 (12,900) (1,338) - -
(422) 719 (32,163) (647) - (33,249)
1,203 1,910 35,613 5,910 174 50,333
781 $ 2,629 $ 3,450 $ 5,263 $ 174 $ 17,084 $
-$ (14,237) $ (19,307) $ 291 $ -$ (36,795) $
(506) - 47 (262) - (721)
(78) 142 143 - - 313
- - - - - 3,500
162 576 (146) 662 - 454
(422) $ (13,519) $ (19,263) $ 691 $ -$ (33,249) $

140
This page intentionally left blank.

Agency Funds

Agency Funds Agency funds are used to report resources held by the City in a purely custodial capacity (assets equal liabilities). The City reports student activities, including class events and various other functions of the Hartford Public School System, within the School Agency Funds.
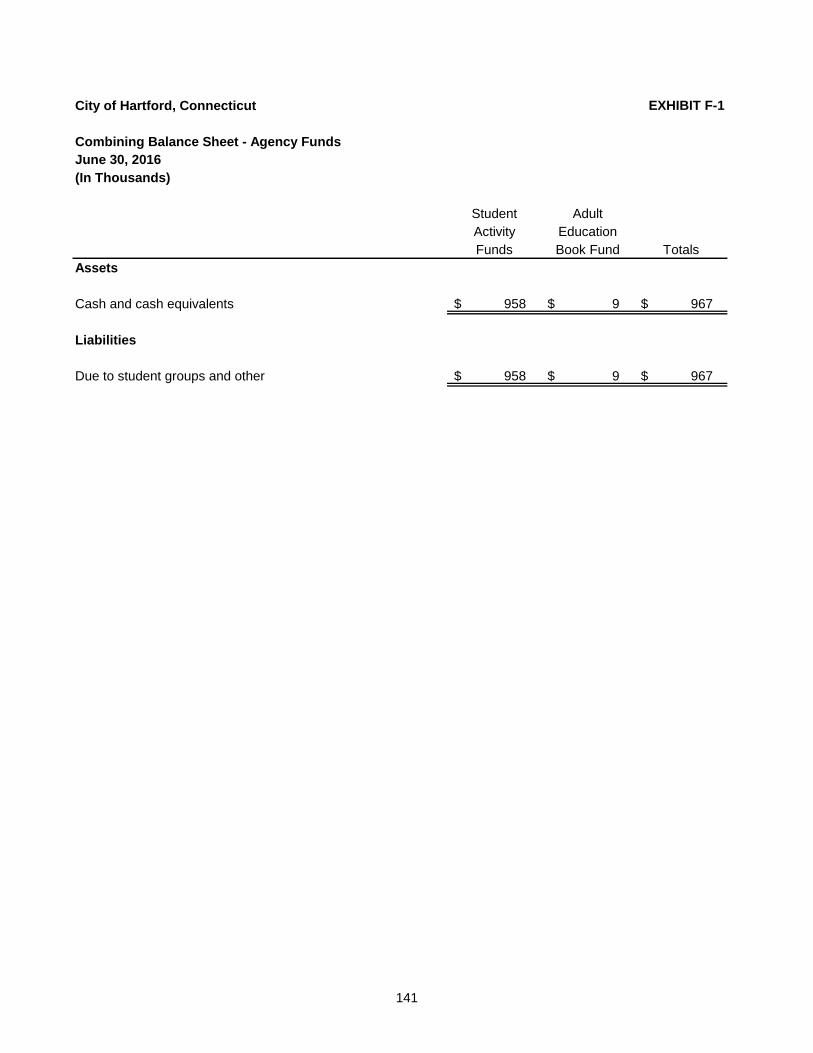
141
City of Hartford, Connecticut EXHIBIT F-1
Combining Balance Sheet - Agency Funds
June 30, 2016
(In Thousands)
Student Adult
Activity Education
Funds Book Fund Totals
Assets
Cash and cash equivalents 958 $ 9 $ 967 $
Liabilities
Due to student groups and other 958 $ 9 $ 967 $
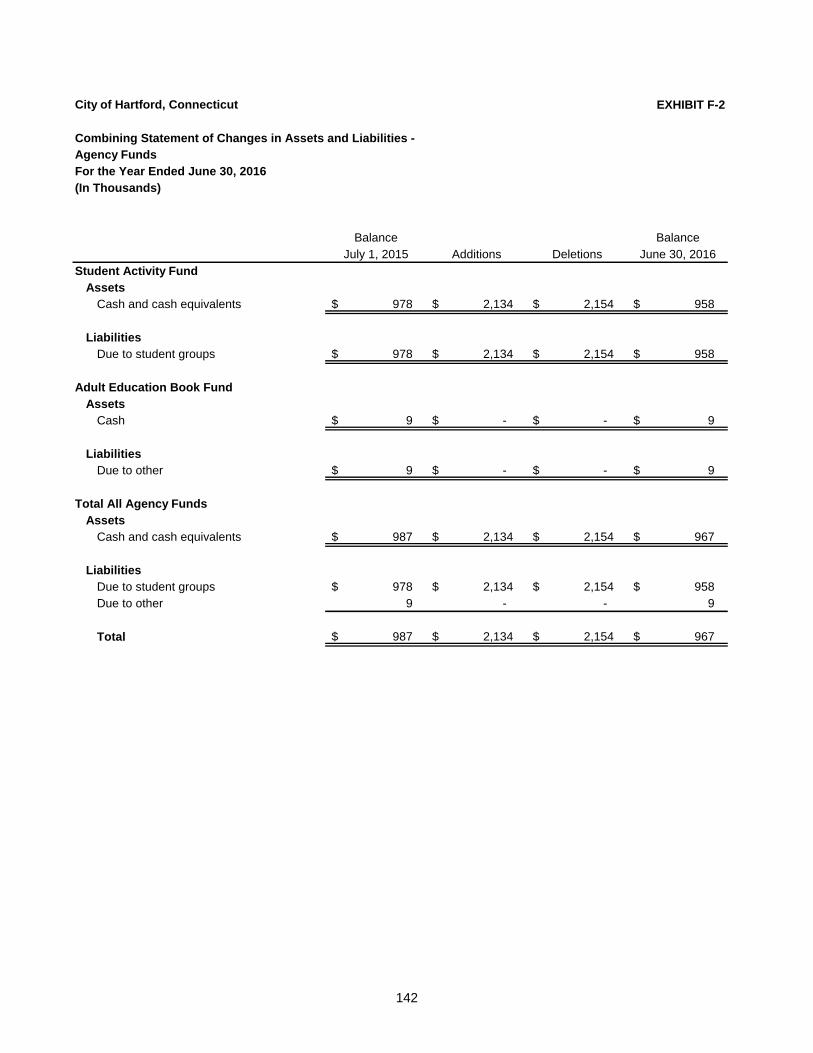
142
City of Hartford, Connecticut EXHIBIT F-2
Agency Funds
For the Year Ended June 30, 2016
(In Thousands)
Balance Balance
July 1, 2015 Additions Deletions June 30, 2016
Student Activity Fund
Assets
Cash and cash equivalents 978 $ 2,134 $ 2,154 $ 958 $
Liabilities
Due to student groups 978 $ 2,134 $ 2,154 $ 958 $
Adult Education Book Fund
Assets
Cash 9 $ -$ -$ 9 $
Liabilities
Due to other 9 $ -$ -$ 9 $
Total All Agency Funds
Assets
Cash and cash equivalents 987 $ 2,134 $ 2,154 $ 967 $
Liabilities
Due to student groups 978 $ 2,134 $ 2,154 $ 958 $
Due to other 9 - - 9
Total 987 $ 2,134 $ 2,154 $ 967 $
Combining Statement of Changes in Assets and Liabilities -

Capital Assets Used in the Operation of Governmental Funds

Capital Assets Used in the Operation of Governmental Funds
Capital asset reporting by function and source is presented in these schedules. Assets are reported primarily at historical cost or estimated historical cost. Current and accumulated provisions for depreciation are not included in the schedules.
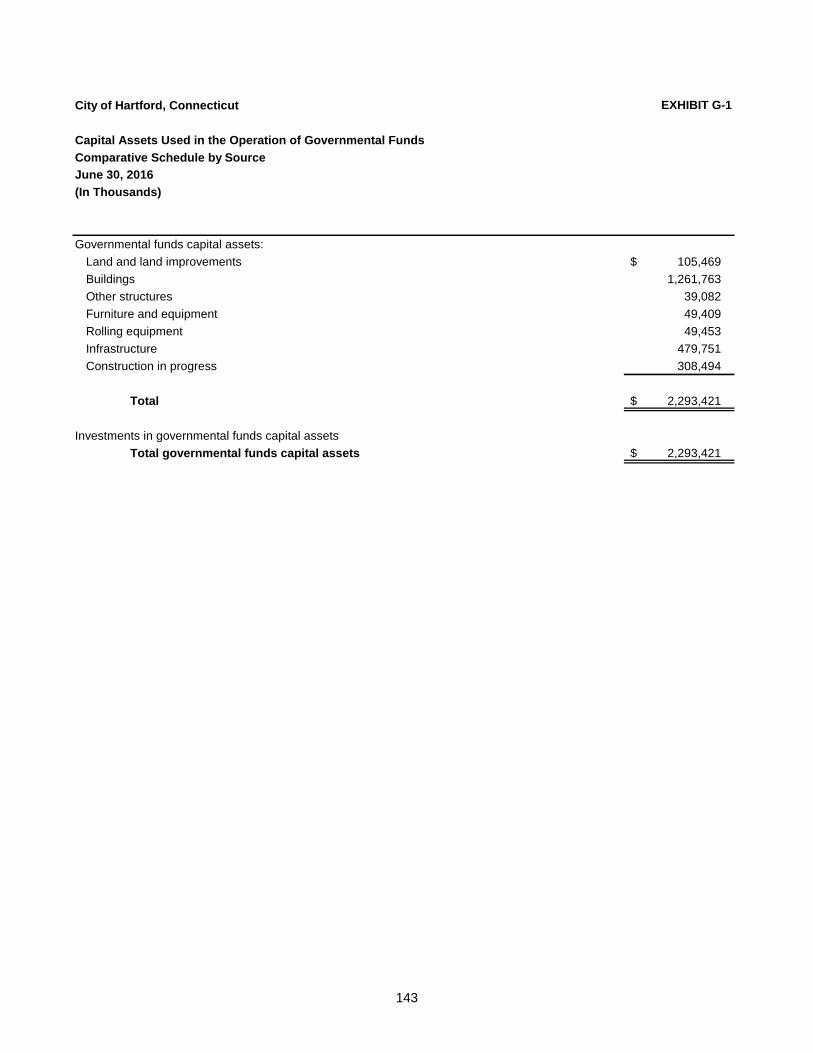
143
City of Hartford, Connecticut EXHIBIT G-1
Capital Assets Used in the Operation of Governmental Funds
Comparative Schedule by Source
June 30, 2016
(In Thousands)
Governmental funds capital assets:
Land and land improvements 105,469 $
Buildings 1,261,763
Other structures 39,082
Furniture and equipment 49,409
Rolling equipment 49,453
Infrastructure 479,751
Construction in progress 308,494
Total 2,293,421 $
Investments in governmental funds capital assets
Total governmental funds capital assets 2,293,421 $

144
This page intentionally left blank.

Statistical Section
Statistical Section Information The objectives of statistical section information are to provide financial statement users with additional historical perspective, context, and detail to assist in using the information in the financial statements, notes to financial statements, and required supplementary information to understand and assess economic condition. Statistical section information is presented in the following categories:
Financial trends information is intended to assist users in understanding and assessing how financial position has changed over time.
Revenue capacity information is intended to assist users in understanding and assessing the factors affecting the ability to generate own-source revenues (property taxes, charges for services, etc.).
Debt capacity information is intended to assist users in understanding and assessing debt burden and the ability to issue additional debt.
Demographic and economic information is intended (1) to assist users in understanding the socioeconomic environment and (2) to provide information that facilitates comparisons of financial statement information over time and among governments.
Operating information is intended to provide contextual information about operations and resources to assist readers in using financial statement information to understand and assess economic condition.
The accompanying tables are presented in the above order. Refer to the Table of Contents for applicable page number locations. __________ Sources: Unless otherwise noted, the information in the tables is derived from the comprehensive annual financial reports for the relevant year.

145
This page intentionally left blank.
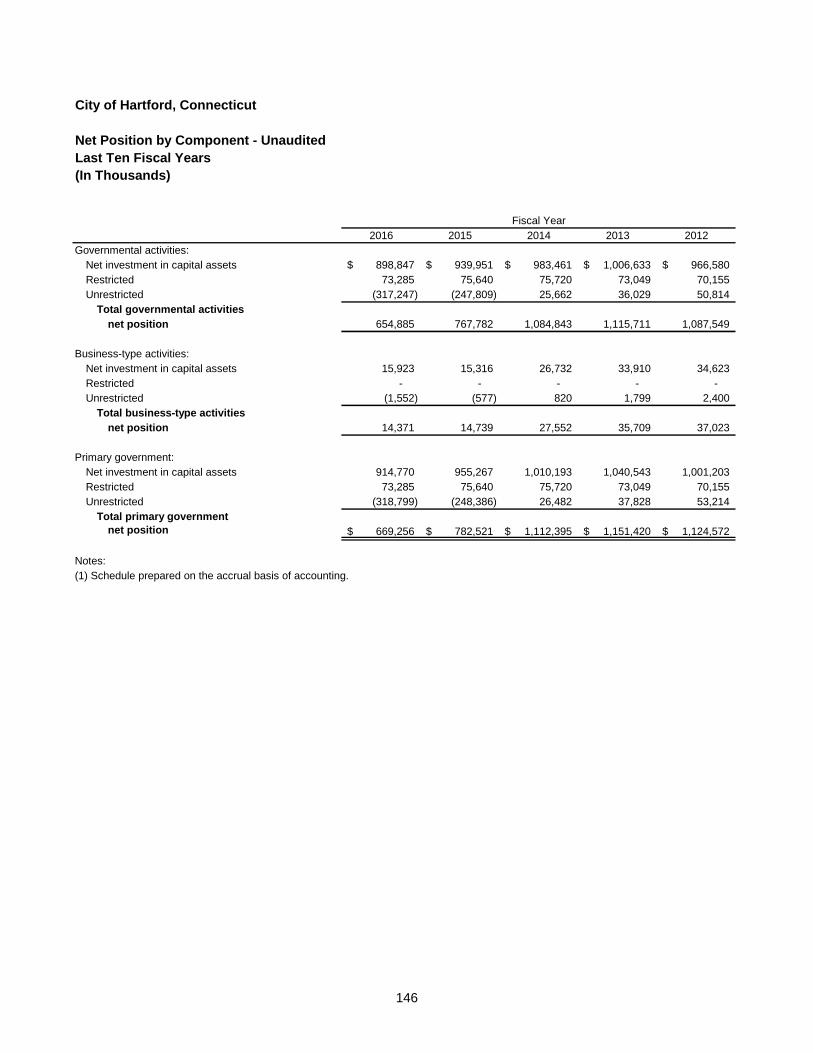
146
City of Hartford, Connecticut
Net Position by Component - Unaudited
Last Ten Fiscal Years
(In Thousands)
2016 2015 2014 2013 2012
Governmental activities:
Net investment in capital assets 898,847$ 939,951$ 983,461$ 1,006,633$ 966,580$
Restricted 73,285 75,640 75,720 73,049 70,155
Unrestricted (317,247) (247,809) 25,662 36,029 50,814
Total governmental activities
net position 654,885 767,782 1,084,843 1,115,711 1,087,549
Business-type activities:
Net investment in capital assets 15,923 15,316 26,732 33,910 34,623
Restricted - - - - -
Unrestricted (1,552) (577) 820 1,799 2,400
Total business-type activities
net position 14,371 14,739 27,552 35,709 37,023
Primary government:
Net investment in capital assets 914,770 955,267 1,010,193 1,040,543 1,001,203
Restricted 73,285 75,640 75,720 73,049 70,155
Unrestricted (318,799) (248,386) 26,482 37,828 53,214
Total primary government
net position 669,256$ 782,521$ 1,112,395$ 1,151,420$ 1,124,572$
Notes:
(1) Schedule prepared on the accrual basis of accounting.
Fiscal Year
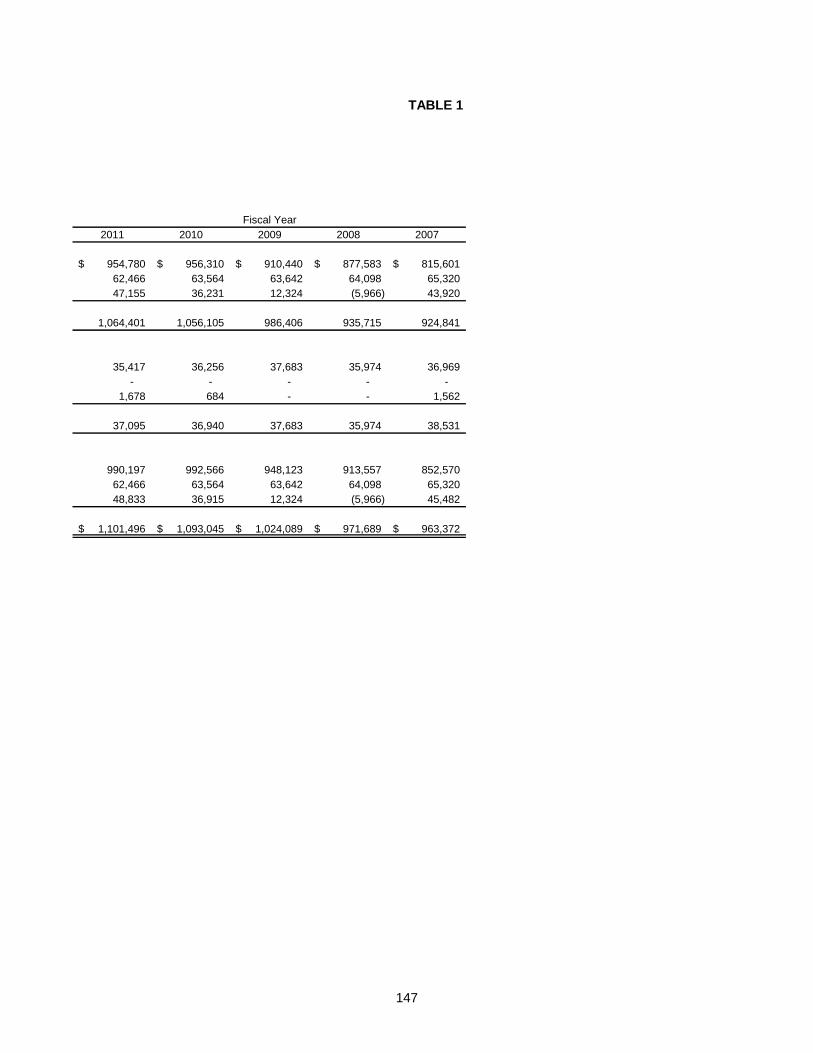
147
TABLE 1
2011 2010 2009 2008 2007
954,780$ 956,310$ 910,440$ 877,583$ 815,601$
62,466 63,564 63,642 64,098 65,320
47,155 36,231 12,324 (5,966) 43,920
1,064,401 1,056,105 986,406 935,715 924,841
35,417 36,256 37,683 35,974 36,969
- - - - -
1,678 684 - - 1,562
37,095 36,940 37,683 35,974 38,531
990,197 992,566 948,123 913,557 852,570
62,466 63,564 63,642 64,098 65,320
48,833 36,915 12,324 (5,966) 45,482
1,101,496$ 1,093,045$ 1,024,089$ 971,689$ 963,372$
Fiscal Year
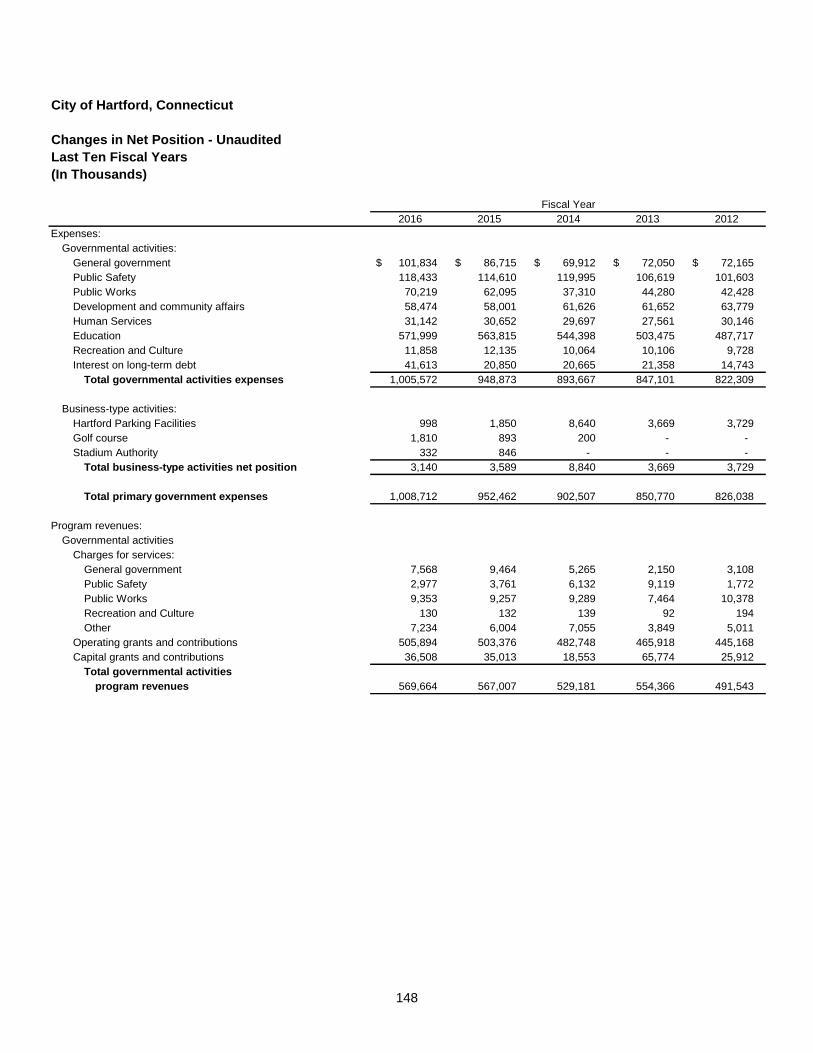
148
City of Hartford, Connecticut
Changes in Net Position - Unaudited
Last Ten Fiscal Years
(In Thousands)
2016 2015 2014 2013 2012
Expenses:
Governmental activities:
General government 101,834 $ 86,715 $ 69,912 $ 72,050 $ 72,165 $
Public Safety 118,433 114,610 119,995 106,619 101,603
Public Works 70,219 62,095 37,310 44,280 42,428
Development and community affairs 58,474 58,001 61,626 61,652 63,779
Human Services 31,142 30,652 29,697 27,561 30,146
Education 571,999 563,815 544,398 503,475 487,717
Recreation and Culture 11,858 12,135 10,064 10,106 9,728
Interest on long-term debt 41,613 20,850 20,665 21,358 14,743
Total governmental activities expenses 1,005,572 948,873 893,667 847,101 822,309
Business-type activities:
Hartford Parking Facilities 998 1,850 8,640 3,669 3,729
Golf course 1,810 893 200 - -
Stadium Authority 332 846 - - -
Total business-type activities net position 3,140 3,589 8,840 3,669 3,729
Total primary government expenses 1,008,712 952,462 902,507 850,770 826,038
Program revenues:
Governmental activities
Charges for services:
General government 7,568 9,464 5,265 2,150 3,108
Public Safety 2,977 3,761 6,132 9,119 1,772
Public Works 9,353 9,257 9,289 7,464 10,378
Recreation and Culture 130 132 139 92 194
Other 7,234 6,004 7,055 3,849 5,011
Operating grants and contributions 505,894 503,376 482,748 465,918 445,168
Capital grants and contributions 36,508 35,013 18,553 65,774 25,912
Total governmental activities
program revenues 569,664 567,007 529,181 554,366 491,543
Fiscal Year
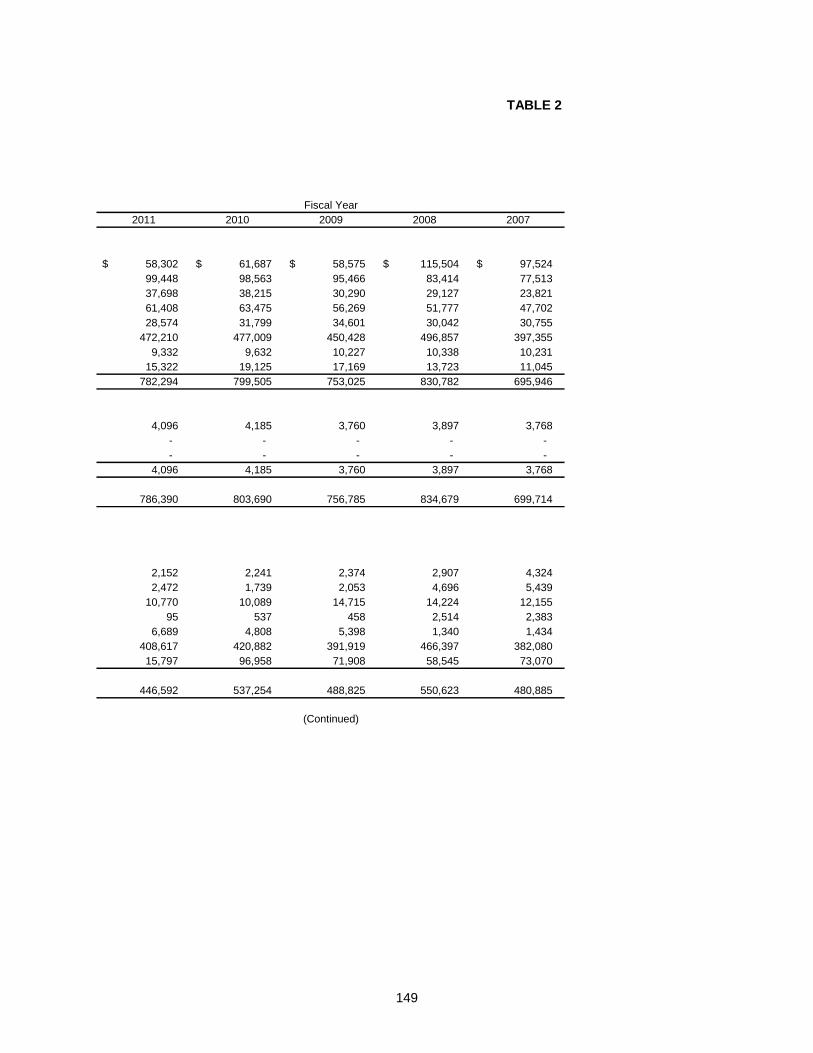
149
TABLE 2
2011 2010 2009 2008 2007
58,302 $ 61,687 $ 58,575 $ 115,504 $ 97,524 $
99,448 98,563 95,466 83,414 77,513
37,698 38,215 30,290 29,127 23,821
61,408 63,475 56,269 51,777 47,702
28,574 31,799 34,601 30,042 30,755
472,210 477,009 450,428 496,857 397,355
9,332 9,632 10,227 10,338 10,231
15,322 19,125 17,169 13,723 11,045
782,294 799,505 753,025 830,782 695,946
4,096 4,185 3,760 3,897 3,768
- - - - -
- - - - -
4,096 4,185 3,760 3,897 3,768
786,390 803,690 756,785 834,679 699,714
2,152 2,241 2,374 2,907 4,324
2,472 1,739 2,053 4,696 5,439
10,770 10,089 14,715 14,224 12,155
95 537 458 2,514 2,383
6,689 4,808 5,398 1,340 1,434
408,617 420,882 391,919 466,397 382,080
15,797 96,958 71,908 58,545 73,070
446,592 537,254 488,825 550,623 480,885
Fiscal Year
(Continued)
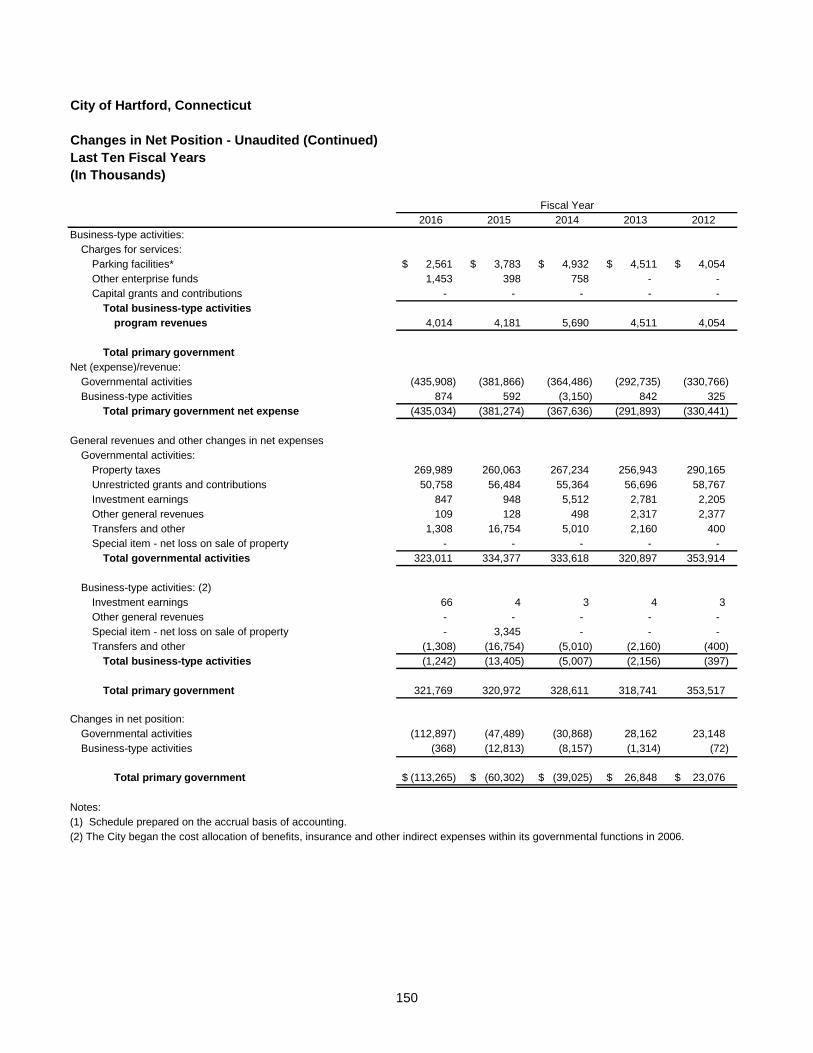
150
City of Hartford, Connecticut
Changes in Net Position - Unaudited (Continued)
Last Ten Fiscal Years
(In Thousands)
2016 2015 2014 2013 2012
Business-type activities:
Charges for services:
Parking facilities* 2,561 $ 3,783 $ 4,932 $ 4,511 $ 4,054 $
Other enterprise funds 1,453 398 758 - -
Capital grants and contributions - - - - -
Total business-type activities
program revenues 4,014 4,181 5,690 4,511 4,054
Total primary government
Net (expense)/revenue:
Governmental activities (435,908) (381,866) (364,486) (292,735) (330,766)
Business-type activities 874 592 (3,150) 842 325
Total primary government net expense (435,034) (381,274) (367,636) (291,893) (330,441)
General revenues and other changes in net expenses
Governmental activities:
Property taxes 269,989 260,063 267,234 256,943 290,165
Unrestricted grants and contributions 50,758 56,484 55,364 56,696 58,767
Investment earnings 847 948 5,512 2,781 2,205
Other general revenues 109 128 498 2,317 2,377
Transfers and other 1,308 16,754 5,010 2,160 400
Special item - net loss on sale of property - - - - -
Total governmental activities 323,011 334,377 333,618 320,897 353,914
Business-type activities: (2)
Investment earnings 66 4 3 4 3
Other general revenues - - - - -
Special item - net loss on sale of property - 3,345 - - -
Transfers and other (1,308) (16,754) (5,010) (2,160) (400)
Total business-type activities (1,242) (13,405) (5,007) (2,156) (397)
Total primary government 321,769 320,972 328,611 318,741 353,517
Changes in net position:
Governmental activities (112,897) (47,489) (30,868) 28,162 23,148
Business-type activities (368) (12,813) (8,157) (1,314) (72)
Total primary government (113,265) $ (60,302) $ (39,025) $ 26,848 $ 23,076 $
Notes:
(1) Schedule prepared on the accrual basis of accounting.
(2) The City began the cost allocation of benefits, insurance and other indirect expenses within its governmental functions in 2006.
Fiscal Year
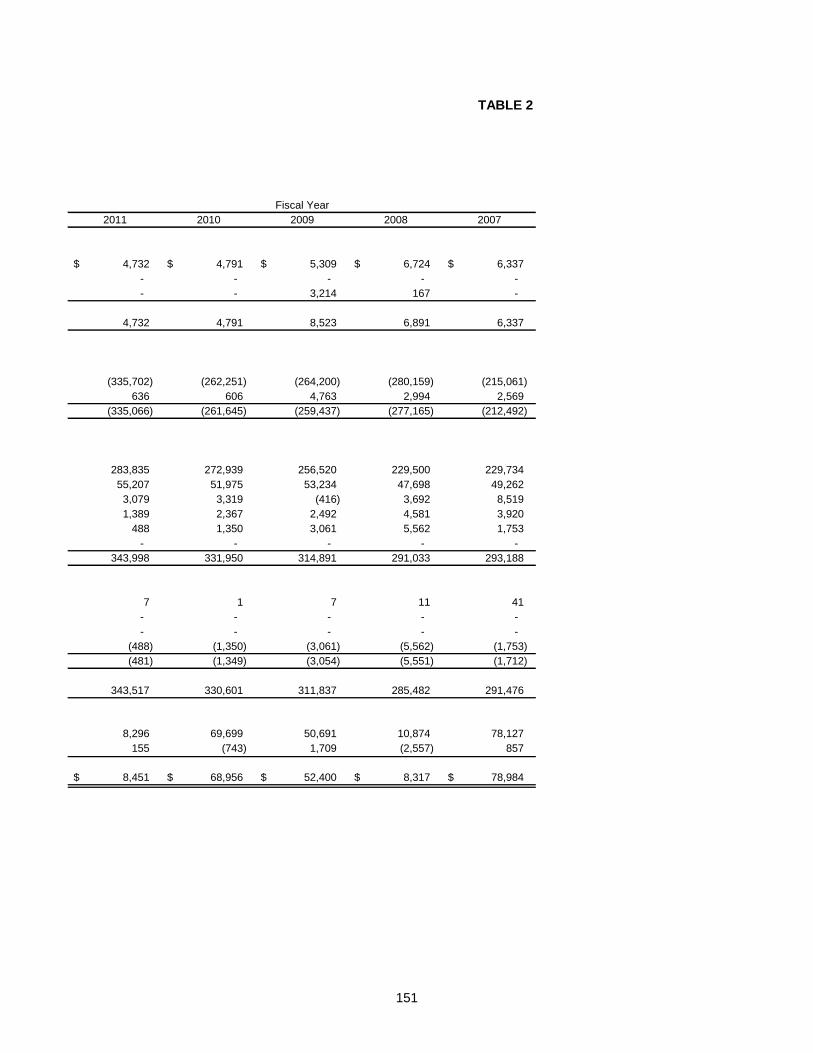
151
TABLE 2
2011 2010 2009 2008 2007
4,732 $ 4,791 $ 5,309 $ 6,724 $ 6,337 $
- - - - -
- - 3,214 167 -
4,732 4,791 8,523 6,891 6,337
(335,702) (262,251) (264,200) (280,159) (215,061)
636 606 4,763 2,994 2,569
(335,066) (261,645) (259,437) (277,165) (212,492)
283,835 272,939 256,520 229,500 229,734
55,207 51,975 53,234 47,698 49,262
3,079 3,319 (416) 3,692 8,519
1,389 2,367 2,492 4,581 3,920
488 1,350 3,061 5,562 1,753
- - - - -
343,998 331,950 314,891 291,033 293,188
7 1 7 11 41
- - - - -
- - - - -
(488) (1,350) (3,061) (5,562) (1,753)
(481) (1,349) (3,054) (5,551) (1,712)
343,517 330,601 311,837 285,482 291,476
8,296 69,699 50,691 10,874 78,127
155 (743) 1,709 (2,557) 857
8,451 $ 68,956 $ 52,400 $ 8,317 $ 78,984 $
Fiscal Year
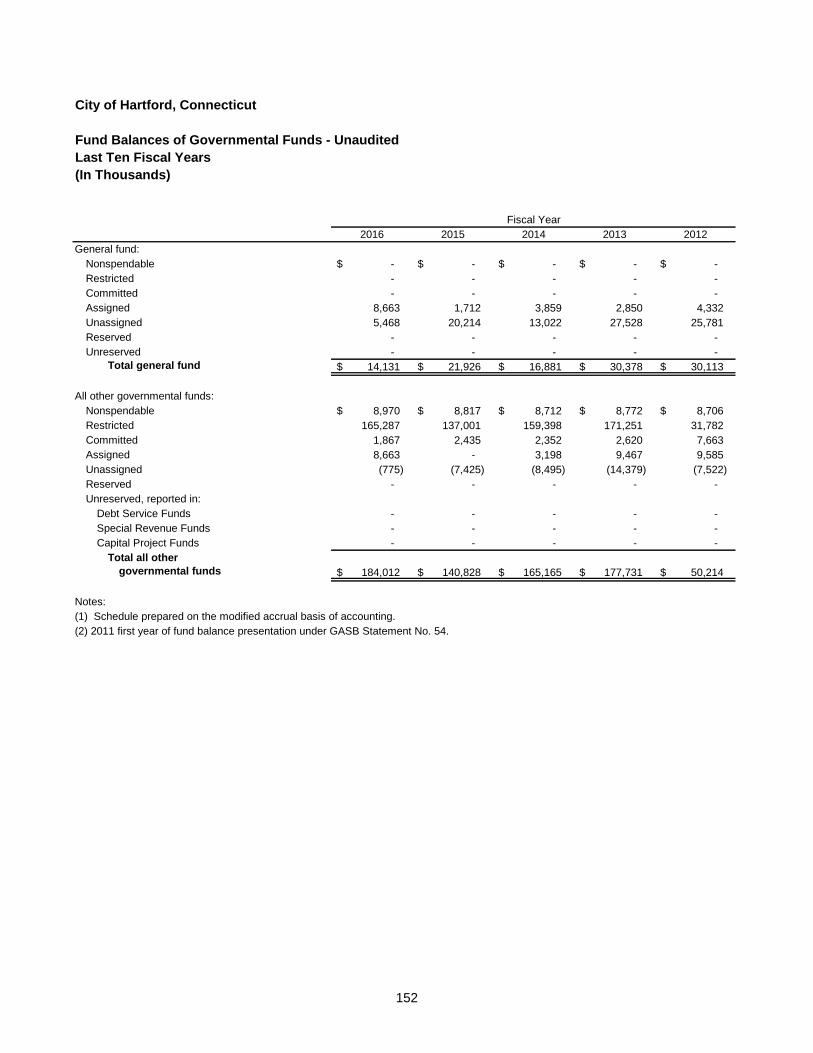
152
City of Hartford, Connecticut
Fund Balances of Governmental Funds - Unaudited
Last Ten Fiscal Years
(In Thousands)
2016 2015 2014 2013 2012
General fund:
Nonspendable -$ -$ -$ -$ -$
Restricted - - - - -
Committed - - - - -
Assigned 8,663 1,712 3,859 2,850 4,332
Unassigned 5,468 20,214 13,022 27,528 25,781
Reserved - - - - -
Unreserved - - - - -
Total general fund 14,131 $ 21,926 $ 16,881 $ 30,378 $ 30,113 $
All other governmental funds:
Nonspendable 8,970 $ 8,817 $ 8,712 $ 8,772 $ 8,706 $
Restricted 165,287 137,001 159,398 171,251 31,782
Committed 1,867 2,435 2,352 2,620 7,663
Assigned 8,663 - 3,198 9,467 9,585
Unassigned (775) (7,425) (8,495) (14,379) (7,522)
Reserved - - - - -
Unreserved, reported in:
Debt Service Funds - - - - -
Special Revenue Funds - - - - -
Capital Project Funds - - - - -
Total all other
governmental funds 184,012 $ 140,828 $ 165,165 $ 177,731 $ 50,214 $
Notes:
(1) Schedule prepared on the modified accrual basis of accounting.
(2) 2011 first year of fund balance presentation under GASB Statement No. 54.
Fiscal Year
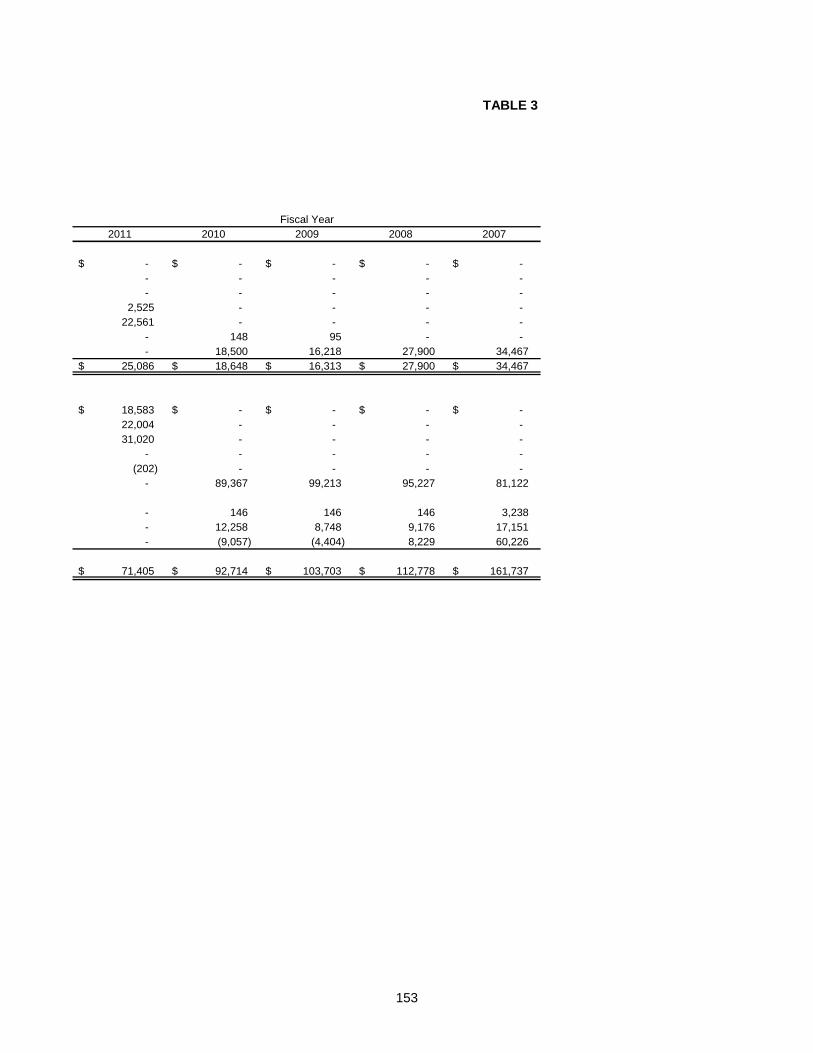
153
TABLE 3
2011 2010 2009 2008 2007
-$ -$ -$ -$ -$
- - - - -
- - - - -
2,525 - - - -
22,561 - - - -
- 148 95 - -
- 18,500 16,218 27,900 34,467
25,086 $ 18,648 $ 16,313 $ 27,900 $ 34,467 $
18,583 $ -$ -$ -$ -$
22,004 - - - -
31,020 - - - -
- - - - -
(202) - - - -
- 89,367 99,213 95,227 81,122
- 146 146 146 3,238
- 12,258 8,748 9,176 17,151
- (9,057) (4,404) 8,229 60,226
71,405 $ 92,714 $ 103,703 $ 112,778 $ 161,737 $
Fiscal Year
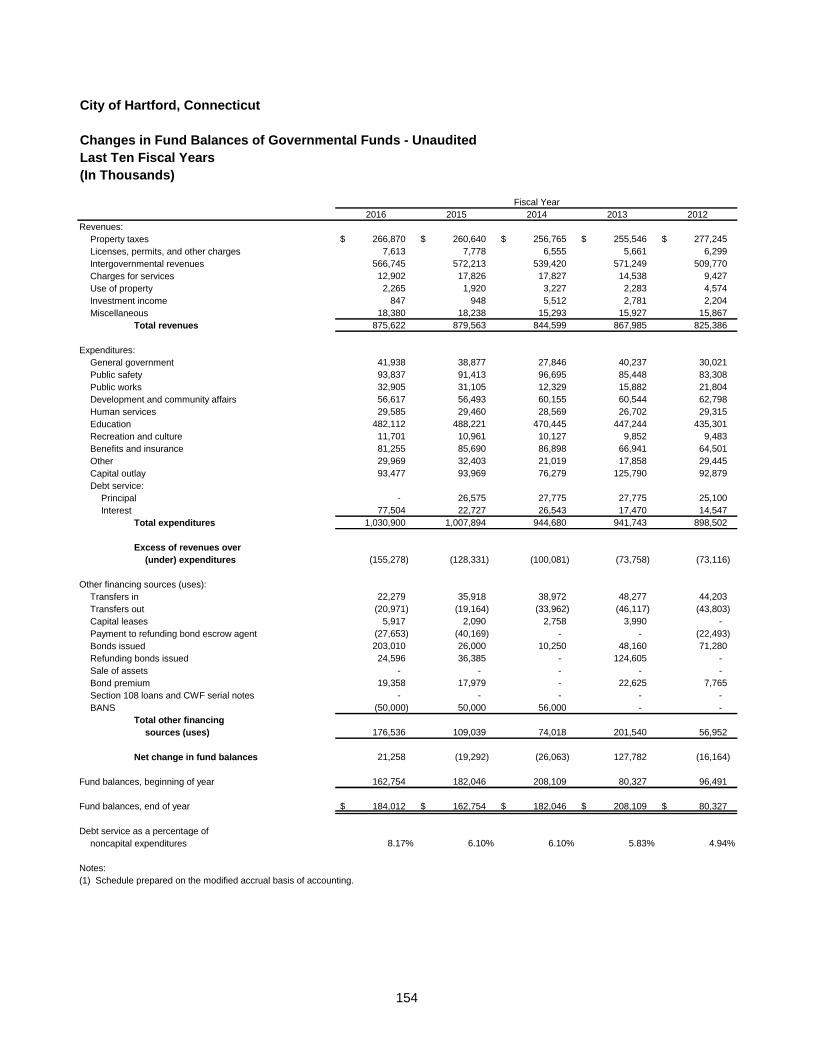
154
City of Hartford, Connecticut
Changes in Fund Balances of Governmental Funds - Unaudited
Last Ten Fiscal Years
(In Thousands)
2016 2015 2014 2013 2012
Revenues:
Property taxes 266,870 $ 260,640 $ 256,765 $ 255,546 $ 277,245 $
Licenses, permits, and other charges 7,613 7,778 6,555 5,661 6,299
Intergovernmental revenues 566,745 572,213 539,420 571,249 509,770
Charges for services 12,902 17,826 17,827 14,538 9,427
Use of property 2,265 1,920 3,227 2,283 4,574
Investment income 847 948 5,512 2,781 2,204
Miscellaneous 18,380 18,238 15,293 15,927 15,867
Total revenues 875,622 879,563 844,599 867,985 825,386
Expenditures:
General government 41,938 38,877 27,846 40,237 30,021
Public safety 93,837 91,413 96,695 85,448 83,308
Public works 32,905 31,105 12,329 15,882 21,804
Development and community affairs 56,617 56,493 60,155 60,544 62,798
Human services 29,585 29,460 28,569 26,702 29,315
Education 482,112 488,221 470,445 447,244 435,301
Recreation and culture 11,701 10,961 10,127 9,852 9,483
Benefits and insurance 81,255 85,690 86,898 66,941 64,501
Other 29,969 32,403 21,019 17,858 29,445
Capital outlay 93,477 93,969 76,279 125,790 92,879
Debt service:
Principal - 26,575 27,775 27,775 25,100
Interest 77,504 22,727 26,543 17,470 14,547
Total expenditures 1,030,900 1,007,894 944,680 941,743 898,502
Excess of revenues over
(under) expenditures (155,278) (128,331) (100,081) (73,758) (73,116)
Other financing sources (uses):
Transfers in 22,279 35,918 38,972 48,277 44,203
Transfers out (20,971) (19,164) (33,962) (46,117) (43,803)
Capital leases 5,917 2,090 2,758 3,990 -
Payment to refunding bond escrow agent (27,653) (40,169) - - (22,493)
Bonds issued 203,010 26,000 10,250 48,160 71,280
Refunding bonds issued 24,596 36,385 - 124,605 -
Sale of assets - - - - -
Bond premium 19,358 17,979 - 22,625 7,765
Section 108 loans and CWF serial notes - - - - -
BANS (50,000) 50,000 56,000 - -
Total other financing
sources (uses) 176,536 109,039 74,018 201,540 56,952
Net change in fund balances 21,258 (19,292) (26,063) 127,782 (16,164)
Fund balances, beginning of year 162,754 182,046 208,109 80,327 96,491
Fund balances, end of year 184,012 $ 162,754 $ 182,046 $ 208,109 $ 80,327 $
Debt service as a percentage of
noncapital expenditures 8.17% 6.10% 6.10% 5.83% 4.94%
Notes:
(1) Schedule prepared on the modified accrual basis of accounting.
Fiscal Year
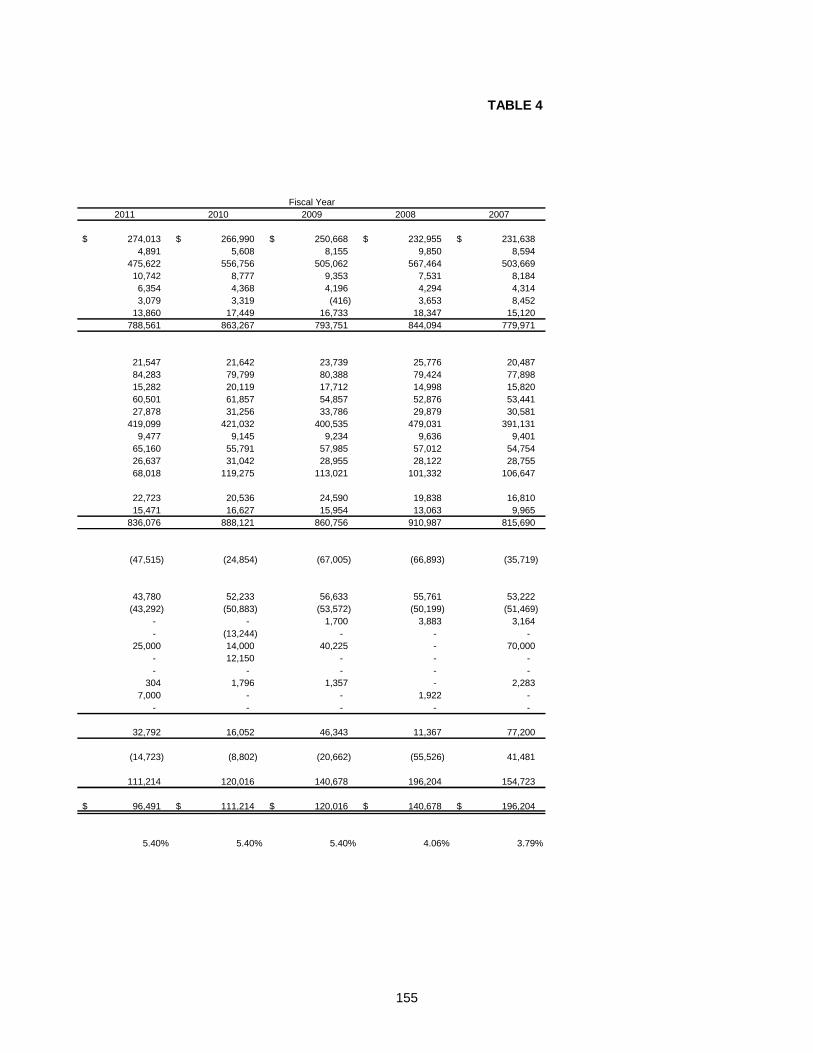
155
TABLE 4
2011 2010 2009 2008 2007
274,013 $ 266,990 $ 250,668 $ 232,955 $ 231,638 $
4,891 5,608 8,155 9,850 8,594
475,622 556,756 505,062 567,464 503,669
10,742 8,777 9,353 7,531 8,184
6,354 4,368 4,196 4,294 4,314
3,079 3,319 (416) 3,653 8,452
13,860 17,449 16,733 18,347 15,120
788,561 863,267 793,751 844,094 779,971
21,547 21,642 23,739 25,776 20,487
84,283 79,799 80,388 79,424 77,898
15,282 20,119 17,712 14,998 15,820
60,501 61,857 54,857 52,876 53,441
27,878 31,256 33,786 29,879 30,581
419,099 421,032 400,535 479,031 391,131
9,477 9,145 9,234 9,636 9,401
65,160 55,791 57,985 57,012 54,754
26,637 31,042 28,955 28,122 28,755
68,018 119,275 113,021 101,332 106,647
22,723 20,536 24,590 19,838 16,810
15,471 16,627 15,954 13,063 9,965
836,076 888,121 860,756 910,987 815,690
(47,515) (24,854) (67,005) (66,893) (35,719)
43,780 52,233 56,633 55,761 53,222
(43,292) (50,883) (53,572) (50,199) (51,469)
- - 1,700 3,883 3,164
- (13,244) - - -
25,000 14,000 40,225 - 70,000
- 12,150 - - -
- - - - -
304 1,796 1,357 - 2,283
7,000 - - 1,922 -
- - - - -
32,792 16,052 46,343 11,367 77,200
(14,723) (8,802) (20,662) (55,526) 41,481
111,214 120,016 140,678 196,204 154,723
96,491 $ 111,214 $ 120,016 $ 140,678 $ 196,204 $
5.40% 5.40% 5.40% 4.06% 3.79%
Fiscal Year
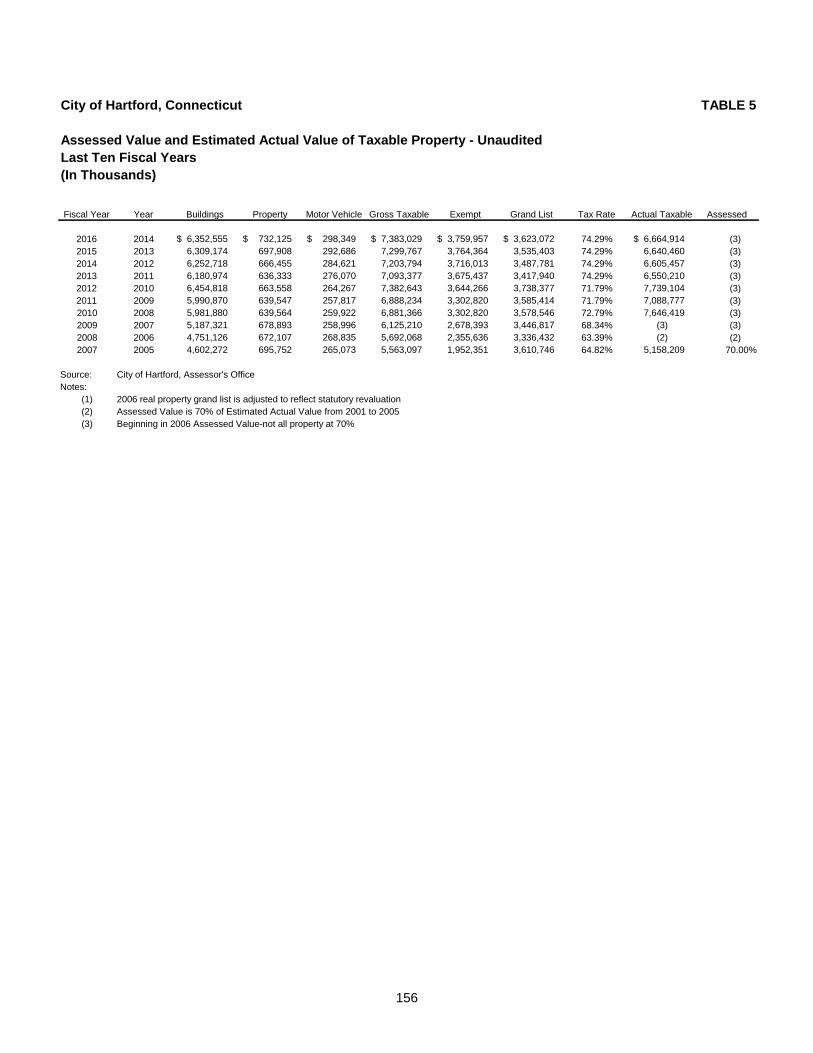
156
City of Hartford, Connecticut TABLE 5
Assessed Value and Estimated Actual Value of Taxable Property - Unaudited
Last Ten Fiscal Years
(In Thousands)
Fiscal Year
Grand List
Year
Land and
Buildings
Personal
Property Motor Vehicle Gross Taxable
Less Tax
Exempt
Net Taxable
Grand List
Total Direct
Tax Rate
Estimated
Actual Taxable
Taxable
Assessed
2016 2014 6,352,555 $ 732,125 $ 298,349 $ 7,383,029 $ 3,759,957 $ 3,623,072 $ 74.29% 6,664,914 $ (3)
2015 2013 6,309,174 697,908 292,686 7,299,767 3,764,364 3,535,403 74.29% 6,640,460 (3)
2014 2012 6,252,718 666,455 284,621 7,203,794 3,716,013 3,487,781 74.29% 6,605,457 (3)
2013 2011 6,180,974 636,333 276,070 7,093,377 3,675,437 3,417,940 74.29% 6,550,210 (3)
2012 2010 6,454,818 663,558 264,267 7,382,643 3,644,266 3,738,377 71.79% 7,739,104 (3)
2011 2009 5,990,870 639,547 257,817 6,888,234 3,302,820 3,585,414 71.79% 7,088,777 (3)
2010 2008 5,981,880 639,564 259,922 6,881,366 3,302,820 3,578,546 72.79% 7,646,419 (3)
2009 2007 5,187,321 678,893 258,996 6,125,210 2,678,393 3,446,817 68.34% (3) (3)
2008 2006 4,751,126 672,107 268,835 5,692,068 2,355,636 3,336,432 63.39% (2) (2)
2007 2005 4,602,272 695,752 265,073 5,563,097 1,952,351 3,610,746 64.82% 5,158,209 70.00%
Source: City of Hartford, Assessor's Office
Notes:
(1) 2006 real property grand list is adjusted to reflect statutory revaluation
(2) Assessed Value is 70% of Estimated Actual Value from 2001 to 2005
(3) Beginning in 2006 Assessed Value-not all property at 70%
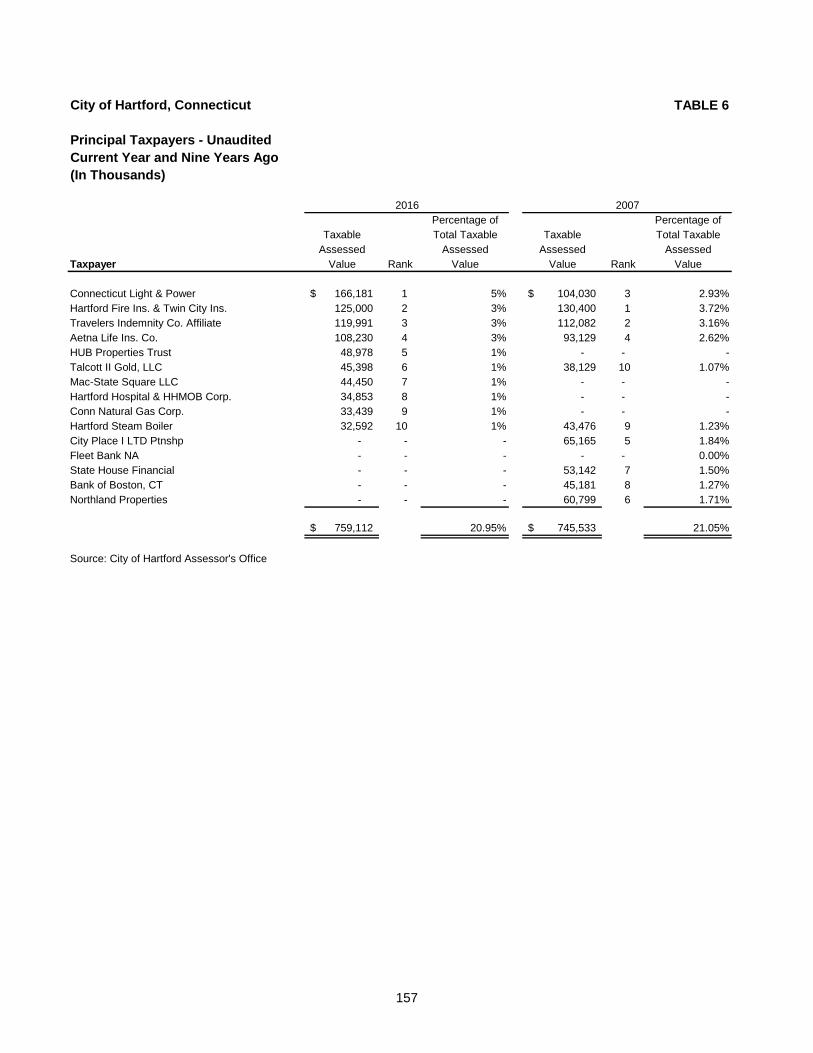
157
City of Hartford, Connecticut TABLE 6
Principal Taxpayers - Unaudited
Current Year and Nine Years Ago
(In Thousands)
Percentage of Percentage of
Taxable Total Taxable Taxable Total Taxable
Assessed Assessed Assessed Assessed
Taxpayer Value Rank Value Value Rank Value
Connecticut Light & Power 166,181$ 1 5% 104,030$ 3 2.93%
Hartford Fire Ins. & Twin City Ins. 125,000 2 3% 130,400 1 3.72%
Travelers Indemnity Co. Affiliate 119,991 3 3% 112,082 2 3.16%
Aetna Life Ins. Co. 108,230 4 3% 93,129 4 2.62%
HUB Properties Trust 48,978 5 1% - - -
Talcott II Gold, LLC 45,398 6 1% 38,129 10 1.07%
Mac-State Square LLC 44,450 7 1% - - -
Hartford Hospital & HHMOB Corp. 34,853 8 1% - - -
Conn Natural Gas Corp. 33,439 9 1% - - -
Hartford Steam Boiler 32,592 10 1% 43,476 9 1.23%
City Place I LTD Ptnshp - - - 65,165 5 1.84%
Fleet Bank NA - - - - - 0.00%
State House Financial - - - 53,142 7 1.50%
Bank of Boston, CT - - - 45,181 8 1.27%
Northland Properties - - - 60,799 6 1.71%
759,112$ 20.95% 745,533$ 21.05%
Source: City of Hartford Assessor's Office
2016 2007
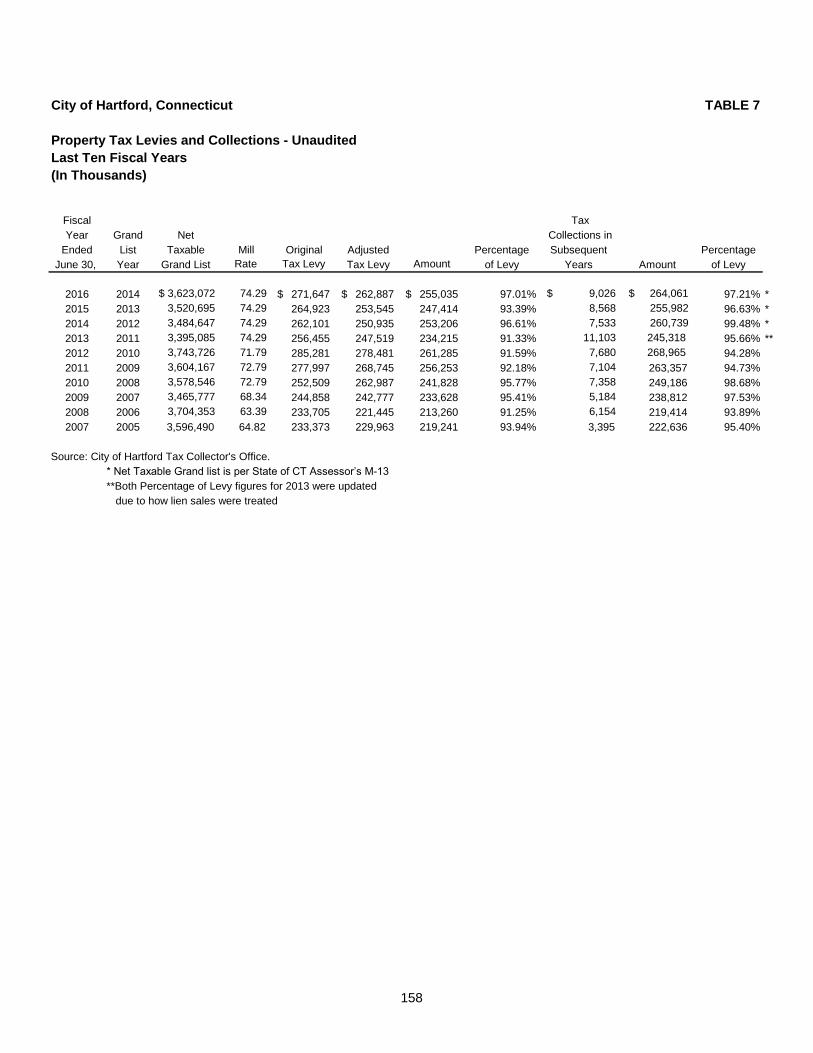
158
TABLE 7
Last Ten Fiscal Years
(In Thousands)
Fiscal Tax
Year Grand Net Collections in
Ended List Taxable Mill Original Adjusted Percentage Subsequent Percentage
June 30, Year Grand List Rate Tax Levy Tax Levy Amount of Levy Years Amount of Levy
2016 2014 $ 3,623,072 74.29 271,647$ 262,887$ 255,035$ 97.01% $ 9,026 $ 264,061 97.21% *
2015 2013 3,520,695 74.29 264,923 253,545 247,414 93.39% 8,568 255,982 96.63% *
2014 2012 3,484,647 74.29 262,101 250,935 253,206 96.61% 7,533 260,739 99.48% *
2013 2011 3,395,085 74.29 256,455 247,519 234,215 91.33% 11,103 245,318 95.66% **
2012 2010 3,743,726 71.79 285,281 278,481 261,285 91.59% 7,680 268,965 94.28%
2011 2009 3,604,167 72.79 277,997 268,745 256,253 92.18% 7,104 263,357 94.73%
2010 2008 3,578,546 72.79 252,509 262,987 241,828 95.77% 7,358 249,186 98.68%
2009 2007 3,465,777 68.34 244,858 242,777 233,628 95.41% 5,184 238,812 97.53%
2008 2006 3,704,353 63.39 233,705 221,445 213,260 91.25% 6,154 219,414 93.89%
2007 2005 3,596,490 64.82 233,373 229,963 219,241 93.94% 3,395 222,636 95.40%
Source: City of Hartford Tax Collector's Office.
* Net Taxable Grand list is per State of CT Assessor’s M-13
**Both Percentage of Levy figures for 2013 were updated
due to how lien sales were treated
City of Hartford, Connecticut
Property Tax Levies and Collections - Unaudited
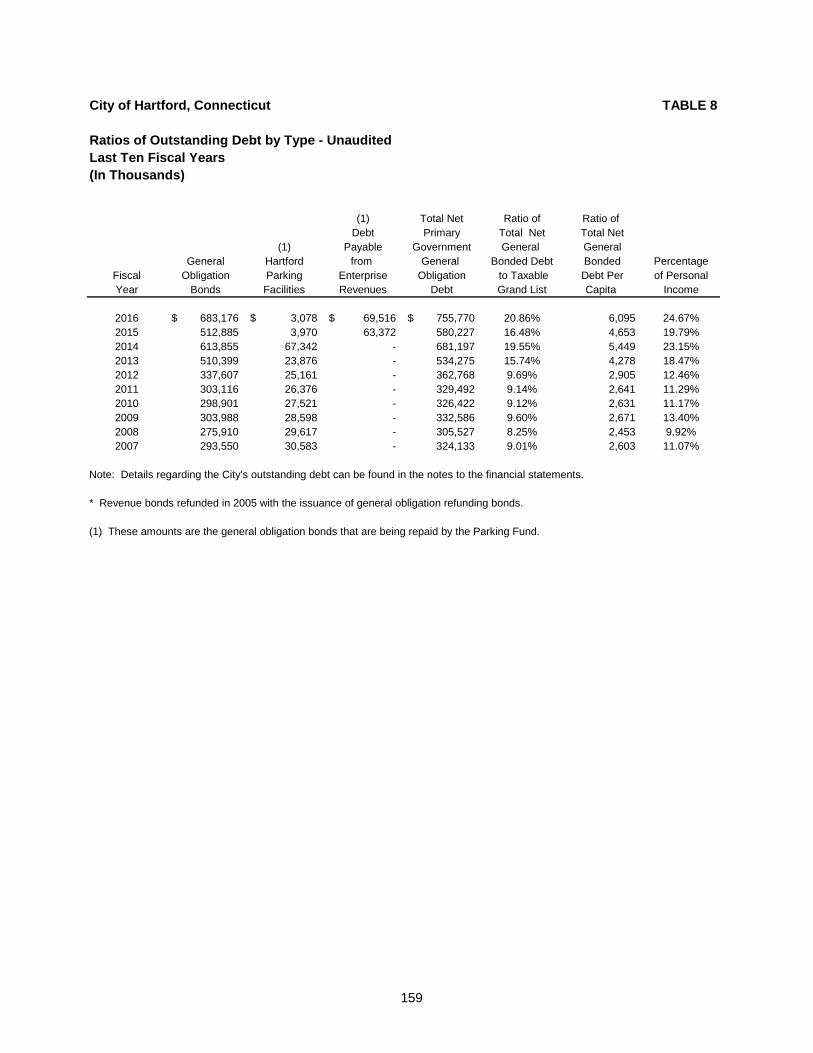
159
City of Hartford, Connecticut TABLE 8
Ratios of Outstanding Debt by Type - Unaudited
Last Ten Fiscal Years
(In Thousands)
(1) Total Net Ratio of Ratio of
Debt Primary Total Net Total Net
(1) Payable Government General General
General Hartford from General Bonded Debt Bonded Percentage
Fiscal Obligation Parking Enterprise Obligation to Taxable Debt Per of Personal
Year Bonds Facilities Revenues Debt Grand List Capita Income
2016 683,176$ 3,078$ 69,516$ 755,770$ 20.86% 6,095 24.67%
2015 512,885 3,970 63,372 580,227 16.48% 4,653 19.79%
2014 613,855 67,342 - 681,197 19.55% 5,449 23.15%
2013 510,399 23,876 - 534,275 15.74% 4,278 18.47%
2012 337,607 25,161 - 362,768 9.69% 2,905 12.46%
2011 303,116 26,376 - 329,492 9.14% 2,641 11.29%
2010 298,901 27,521 - 326,422 9.12% 2,631 11.17%
2009 303,988 28,598 - 332,586 9.60% 2,671 13.40%
2008 275,910 29,617 - 305,527 8.25% 2,453 9.92%
2007 293,550 30,583 - 324,133 9.01% 2,603 11.07%
Note: Details regarding the City's outstanding debt can be found in the notes to the financial statements.
* Revenue bonds refunded in 2005 with the issuance of general obligation refunding bonds.
(1) These amounts are the general obligation bonds that are being repaid by the Parking Fund.
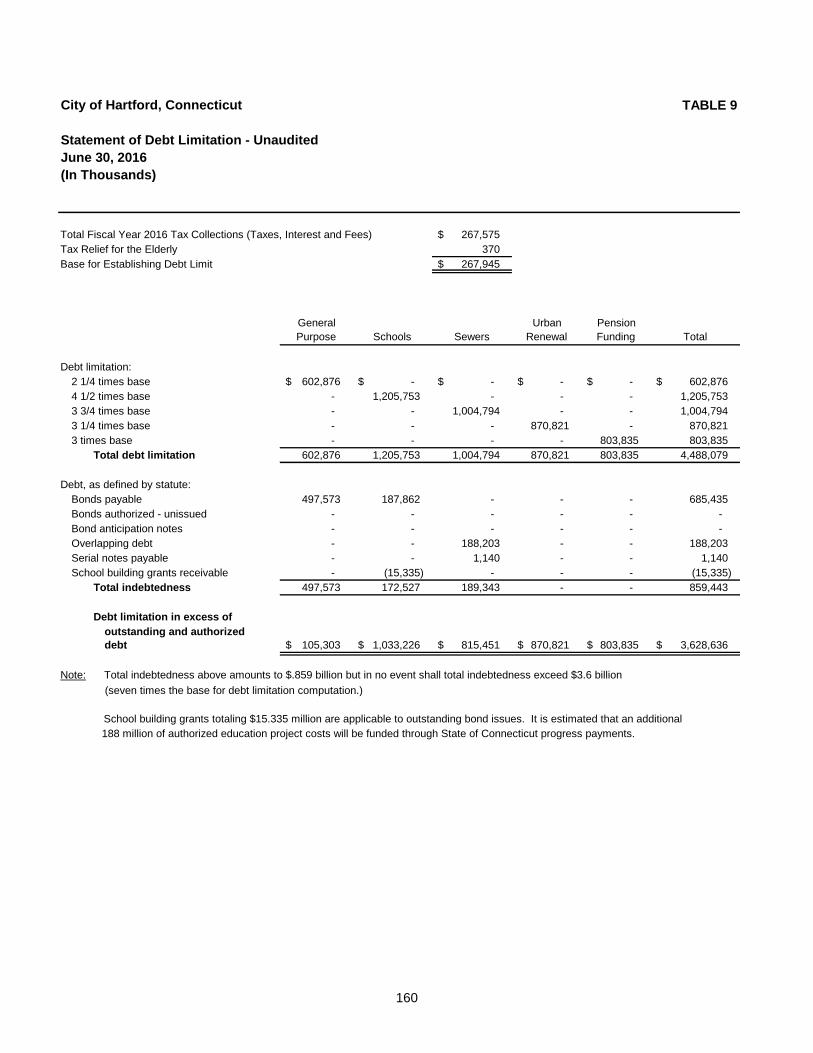
160
City of Hartford, Connecticut TABLE 9
Statement of Debt Limitation - Unaudited
June 30, 2016
(In Thousands)
Total Fiscal Year 2016 Tax Collections (Taxes, Interest and Fees) 267,575 $
Tax Relief for the Elderly 370
Base for Establishing Debt Limit 267,945 $
General Urban Pension
Purpose Schools Sewers Renewal Funding Total
Debt limitation:
2 1/4 times base 602,876 $ -$ -$ -$ -$ 602,876 $
4 1/2 times base - 1,205,753 - - - 1,205,753
3 3/4 times base - - 1,004,794 - - 1,004,794
3 1/4 times base - - - 870,821 - 870,821
3 times base - - - - 803,835 803,835
Total debt limitation 602,876 1,205,753 1,004,794 870,821 803,835 4,488,079
Debt, as defined by statute:
Bonds payable 497,573 187,862 - - - 685,435
Bonds authorized - unissued - - - - - -
Bond anticipation notes - - - - - -
Overlapping debt - - 188,203 - - 188,203
Serial notes payable - - 1,140 - - 1,140
School building grants receivable - (15,335) - - - (15,335)
Total indebtedness 497,573 172,527 189,343 - - 859,443
Debt limitation in excess of
outstanding and authorized
debt 105,303 $ 1,033,226 $ 815,451 $ 870,821 $ 803,835 $ 3,628,636 $
Note: Total indebtedness above amounts to $.859 billion but in no event shall total indebtedness exceed $3.6 billion
(seven times the base for debt limitation computation.)
School building grants totaling $15.335 million are applicable to outstanding bond issues. It is estimated that an additional
188 million of authorized education project costs will be funded through State of Connecticut progress payments.
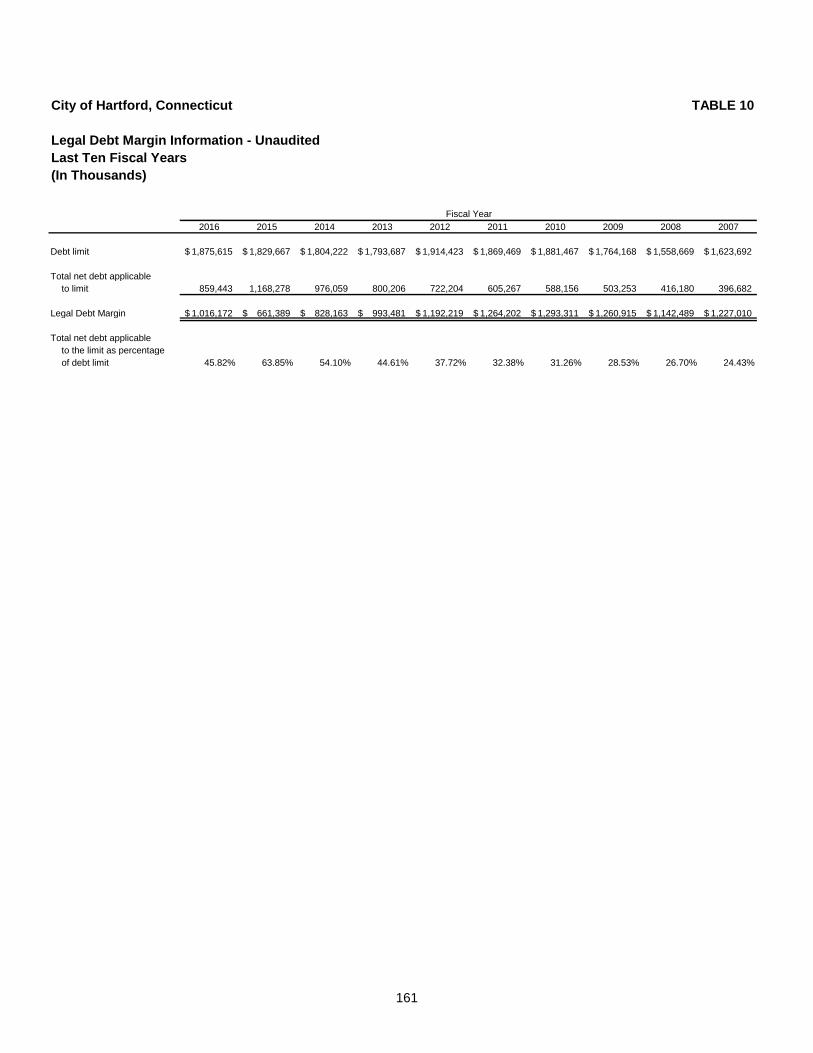
161
TABLE 10
Legal Debt Margin Information - Unaudited
Last Ten Fiscal Years
(In Thousands)
2016 2015 2014 2013 2012 2011 2010 2009 2008 2007
Debt limit 1,875,615$ 1,829,667$ 1,804,222$ 1,793,687$ 1,914,423$ 1,869,469$ 1,881,467$ 1,764,168$ 1,558,669$ 1,623,692$
Total net debt applicable
to limit 859,443 1,168,278 976,059 800,206 722,204 605,267 588,156 503,253 416,180 396,682
Legal Debt Margin 1,016,172$ 661,389$ 828,163$ 993,481$ 1,192,219$ 1,264,202$ 1,293,311$ 1,260,915$ 1,142,489$ 1,227,010$
Total net debt applicable
to the limit as percentage
of debt limit 45.82% 63.85% 54.10% 44.61% 37.72% 32.38% 31.26% 28.53% 26.70% 24.43%
Fiscal Year
City of Hartford, Connecticut
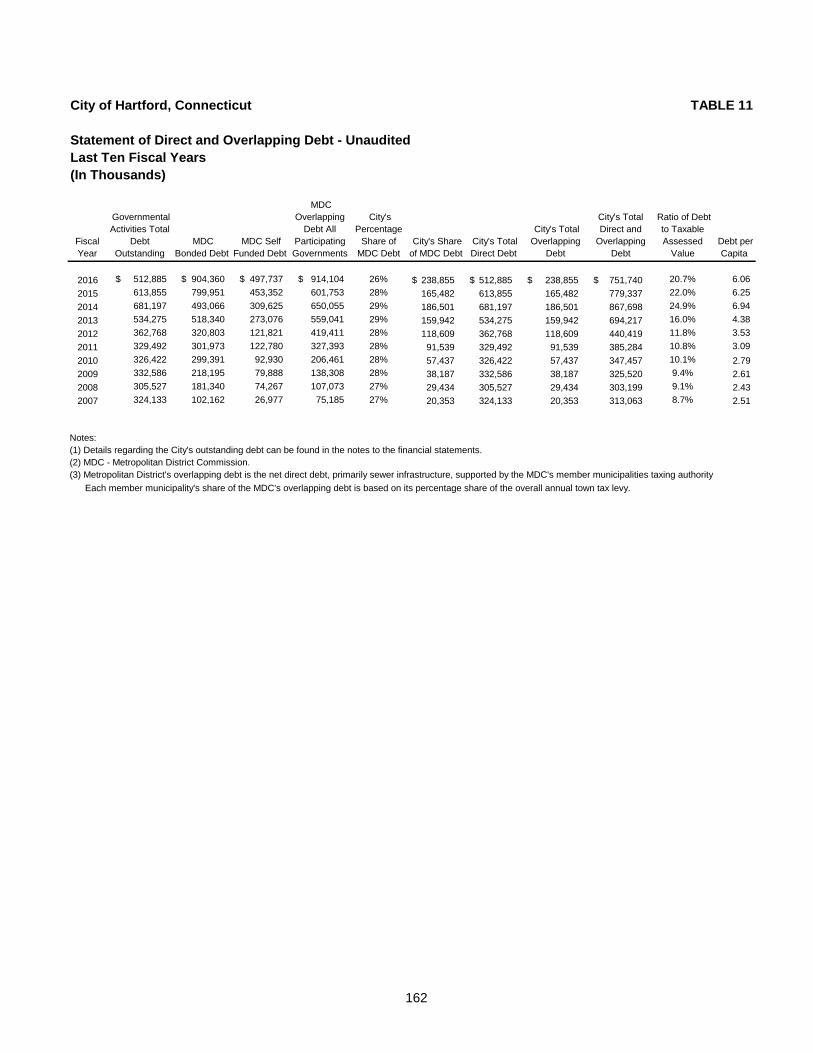
162
TABLE 11
Statement of Direct and Overlapping Debt - Unaudited
Last Ten Fiscal Years
(In Thousands)
Fiscal
Year
Governmental
Activities Total
Debt
Outstanding
MDC
Bonded Debt
MDC Self
Funded Debt
MDC
Overlapping
Debt All
Participating
Governments
City's
Percentage
Share of
MDC Debt
City's Share
of MDC Debt
City's Total
Direct Debt
City's Total
Overlapping
Debt
City's Total
Direct and
Overlapping
Debt
Ratio of Debt
to Taxable
Assessed
Value
Debt per
Capita
2016 $ 512,885 $ 904,360 $ 497,737 $ 914,104 26% 238,855 $ 512,885 $ 238,855 $ 751,740 $ 20.7% 6.06
2015 613,855 799,951 453,352 601,753 28% 165,482 613,855 165,482 779,337 22.0% 6.25
2014 681,197 493,066 309,625 650,055 29% 186,501 681,197 186,501 867,698 24.9% 6.94
2013 534,275 518,340 273,076 559,041 29% 159,942 534,275 159,942 694,217 16.0% 4.38
2012 362,768 320,803 121,821 419,411 28% 118,609 362,768 118,609 440,419 11.8% 3.53
2011 329,492 301,973 122,780 327,393 28% 91,539 329,492 91,539 385,284 10.8% 3.09
2010 326,422 299,391 92,930 206,461 28% 57,437 326,422 57,437 347,457 10.1% 2.79
2009 332,586 218,195 79,888 138,308 28% 38,187 332,586 38,187 325,520 9.4% 2.61
2008 305,527 181,340 74,267 107,073 27% 29,434 305,527 29,434 303,199 9.1% 2.43
2007 324,133 102,162 26,977 75,185 27% 20,353 324,133 20,353 313,063 8.7% 2.51
Notes:
(1) Details regarding the City's outstanding debt can be found in the notes to the financial statements.
(2) MDC - Metropolitan District Commission.
(3) Metropolitan District's overlapping debt is the net direct debt, primarily sewer infrastructure, supported by the MDC's member municipalities taxing authority
Each member municipality's share of the MDC's overlapping debt is based on its percentage share of the overall annual town tax levy.
City of Hartford, Connecticut
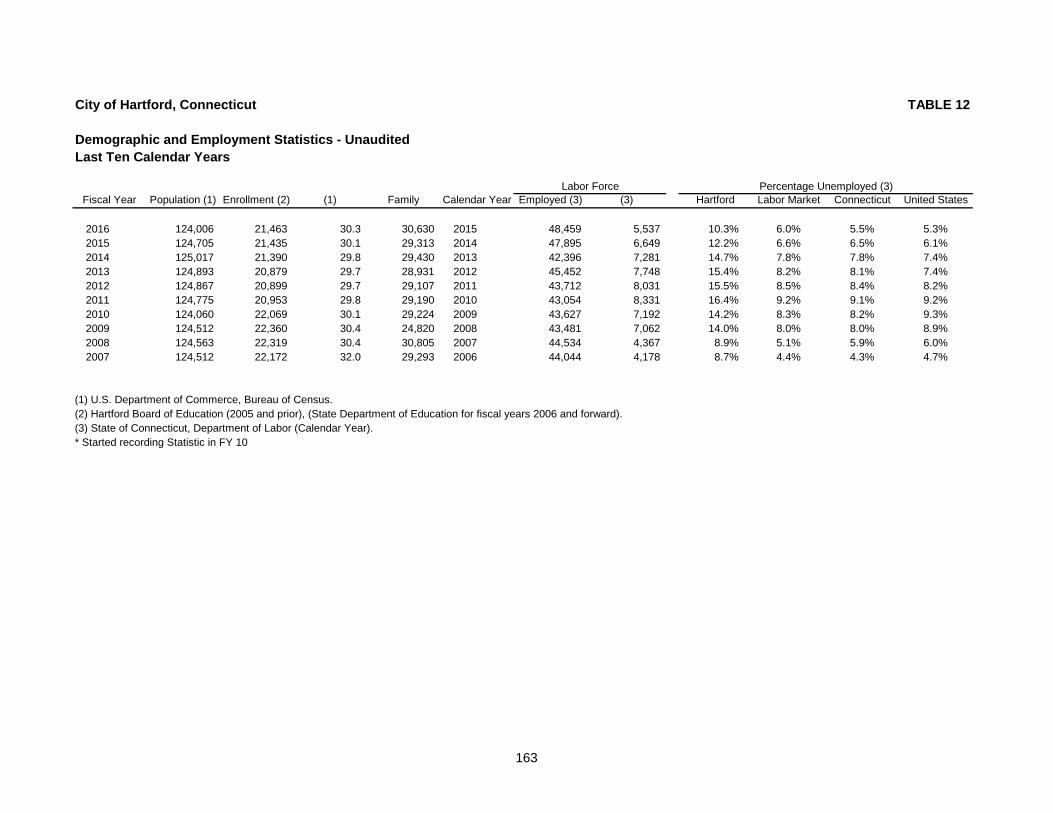
163
TABLE 12
Last Ten Calendar Years
Fiscal Year Population (1)
School
Enrollment (2)
Median Age
(1)
Median
Family Calendar Year Employed (3)
Unemployed
(3)
City of
Hartford
Hartford
Labor Market
State of
Connecticut United States
2016 124,006 21,463 30.3 30,630 2015 48,459 5,537 10.3% 6.0% 5.5% 5.3%
2015 124,705 21,435 30.1 29,313 2014 47,895 6,649 12.2% 6.6% 6.5% 6.1%
2014 125,017 21,390 29.8 29,430 2013 42,396 7,281 14.7% 7.8% 7.8% 7.4%
2013 124,893 20,879 29.7 28,931 2012 45,452 7,748 15.4% 8.2% 8.1% 7.4%
2012 124,867 20,899 29.7 29,107 2011 43,712 8,031 15.5% 8.5% 8.4% 8.2%
2011 124,775 20,953 29.8 29,190 2010 43,054 8,331 16.4% 9.2% 9.1% 9.2%
2010 124,060 22,069 30.1 29,224 2009 43,627 7,192 14.2% 8.3% 8.2% 9.3%
2009 124,512 22,360 30.4 24,820 2008 43,481 7,062 14.0% 8.0% 8.0% 8.9%
2008 124,563 22,319 30.4 30,805 2007 44,534 4,367 8.9% 5.1% 5.9% 6.0%
2007 124,512 22,172 32.0 29,293 2006 44,044 4,178 8.7% 4.4% 4.3% 4.7%
(1) U.S. Department of Commerce, Bureau of Census.
(2) Hartford Board of Education (2005 and prior), (State Department of Education for fiscal years 2006 and forward).
(3) State of Connecticut, Department of Labor (Calendar Year).
* Started recording Statistic in FY 10
Labor Force Percentage Unemployed (3)
City of Hartford, Connecticut
Demographic and Employment Statistics - Unaudited
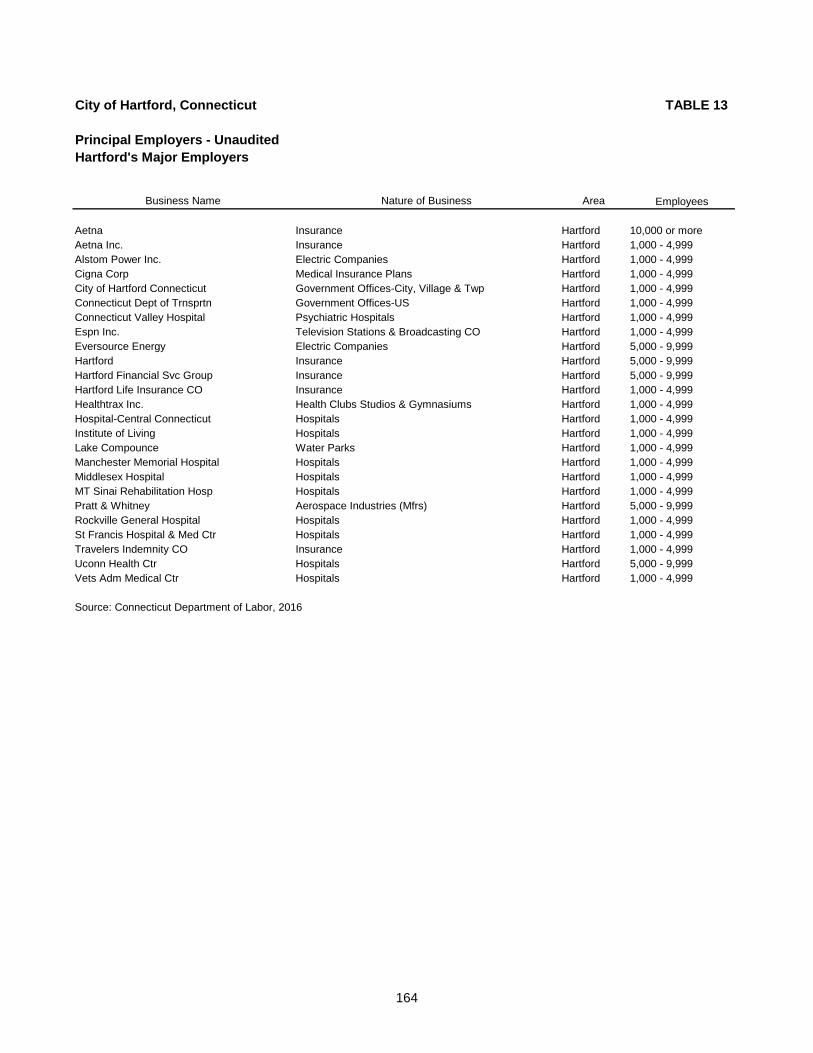
164
City of Hartford, Connecticut TABLE 13
Principal Employers - Unaudited
Hartford's Major Employers
Business Name Nature of Business Area Employees
Aetna Insurance Hartford 10,000 or more
Aetna Inc. Insurance Hartford 1,000 - 4,999
Alstom Power Inc. Electric Companies Hartford 1,000 - 4,999
Cigna Corp Medical Insurance Plans Hartford 1,000 - 4,999
City of Hartford Connecticut Government Offices-City, Village & Twp Hartford 1,000 - 4,999
Connecticut Dept of Trnsprtn Government Offices-US Hartford 1,000 - 4,999
Connecticut Valley Hospital Psychiatric Hospitals Hartford 1,000 - 4,999
Espn Inc. Television Stations & Broadcasting CO Hartford 1,000 - 4,999
Eversource Energy Electric Companies Hartford 5,000 - 9,999
Hartford Insurance Hartford 5,000 - 9,999
Hartford Financial Svc Group Insurance Hartford 5,000 - 9,999
Hartford Life Insurance CO Insurance Hartford 1,000 - 4,999
Healthtrax Inc. Health Clubs Studios & Gymnasiums Hartford 1,000 - 4,999
Hospital-Central Connecticut Hospitals Hartford 1,000 - 4,999
Institute of Living Hospitals Hartford 1,000 - 4,999
Lake Compounce Water Parks Hartford 1,000 - 4,999
Manchester Memorial Hospital Hospitals Hartford 1,000 - 4,999
Middlesex Hospital Hospitals Hartford 1,000 - 4,999
MT Sinai Rehabilitation Hosp Hospitals Hartford 1,000 - 4,999
Pratt & Whitney Aerospace Industries (Mfrs) Hartford 5,000 - 9,999
Rockville General Hospital Hospitals Hartford 1,000 - 4,999
St Francis Hospital & Med Ctr Hospitals Hartford 1,000 - 4,999
Travelers Indemnity CO Insurance Hartford 1,000 - 4,999
Uconn Health Ctr Hospitals Hartford 5,000 - 9,999
Vets Adm Medical Ctr Hospitals Hartford 1,000 - 4,999
Source: Connecticut Department of Labor, 2016
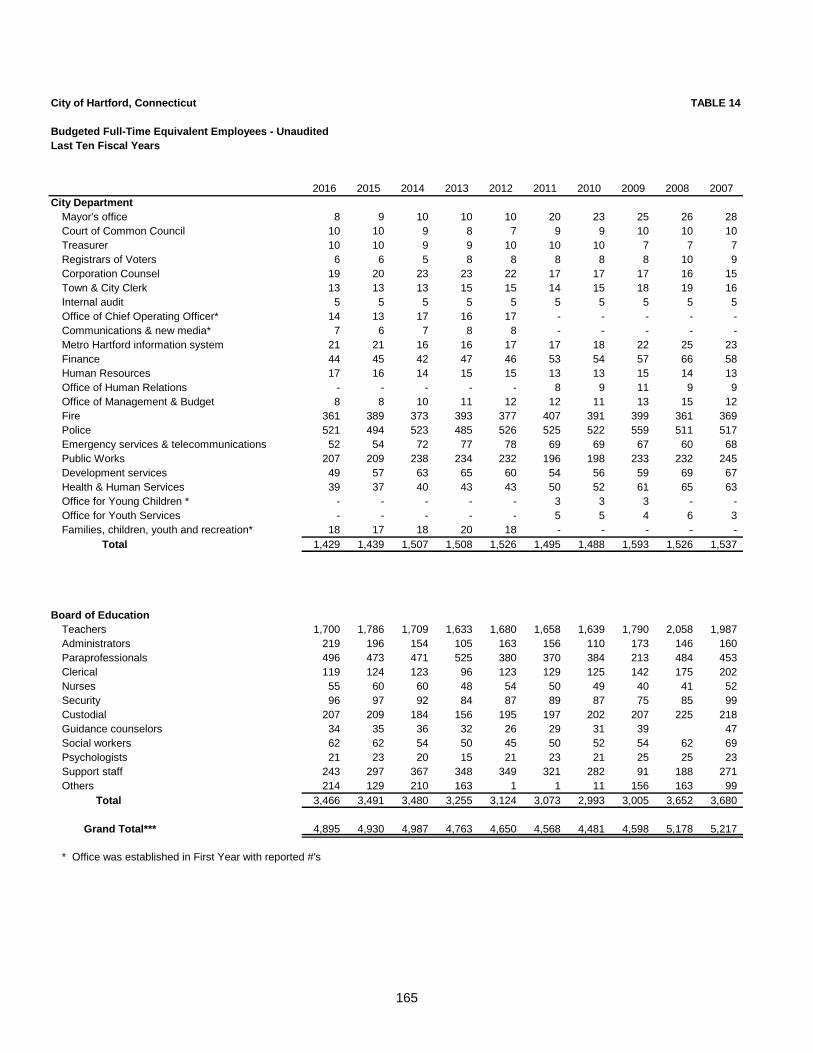
165
City of Hartford, Connecticut TABLE 14
Last Ten Fiscal Years
2016 2015 2014 2013 2012 2011 2010 2009 2008 2007
City Department
Mayor's office 8 9 10 10 10 20 23 25 26 28
Court of Common Council 10 10 9 8 7 9 9 10 10 10
Treasurer 10 10 9 9 10 10 10 7 7 7
Registrars of Voters 6 6 5 8 8 8 8 8 10 9
Corporation Counsel 19 20 23 23 22 17 17 17 16 15
Town & City Clerk 13 13 13 15 15 14 15 18 19 16
Internal audit 5 5 5 5 5 5 5 5 5 5
Office of Chief Operating Officer* 14 13 17 16 17 - - - - -
Communications & new media* 7 6 7 8 8 - - - - -
Metro Hartford information system 21 21 16 16 17 17 18 22 25 23
Finance 44 45 42 47 46 53 54 57 66 58
Human Resources 17 16 14 15 15 13 13 15 14 13
Office of Human Relations - - - - - 8 9 11 9 9
Office of Management & Budget 8 8 10 11 12 12 11 13 15 12
Fire 361 389 373 393 377 407 391 399 361 369
Police 521 494 523 485 526 525 522 559 511 517
Emergency services & telecommunications 52 54 72 77 78 69 69 67 60 68
Public Works 207 209 238 234 232 196 198 233 232 245
Development services 49 57 63 65 60 54 56 59 69 67
Health & Human Services 39 37 40 43 43 50 52 61 65 63
Office for Young Children * - - - - - 3 3 3 - -
Office for Youth Services - - - - - 5 5 4 6 3
Families, children, youth and recreation* 18 17 18 20 18 - - - - -
Total 1,429 1,439 1,507 1,508 1,526 1,495 1,488 1,593 1,526 1,537
Board of Education
Teachers 1,700 1,786 1,709 1,633 1,680 1,658 1,639 1,790 2,058 1,987
Administrators 219 196 154 105 163 156 110 173 146 160
Paraprofessionals 496 473 471 525 380 370 384 213 484 453
Clerical 119 124 123 96 123 129 125 142 175 202
Nurses 55 60 60 48 54 50 49 40 41 52
Security 96 97 92 84 87 89 87 75 85 99
Custodial 207 209 184 156 195 197 202 207 225 218
Guidance counselors 34 35 36 32 26 29 31 39 47
Social workers 62 62 54 50 45 50 52 54 62 69
Psychologists 21 23 20 15 21 23 21 25 25 23
Support staff 243 297 367 348 349 321 282 91 188 271
Others 214 129 210 163 1 1 11 156 163 99
Total 3,466 3,491 3,480 3,255 3,124 3,073 2,993 3,005 3,652 3,680
Grand Total*** 4,895 4,930 4,987 4,763 4,650 4,568 4,481 4,598 5,178 5,217
* Office was established in First Year with reported #'s
Budgeted Full-Time Equivalent Employees - Unaudited
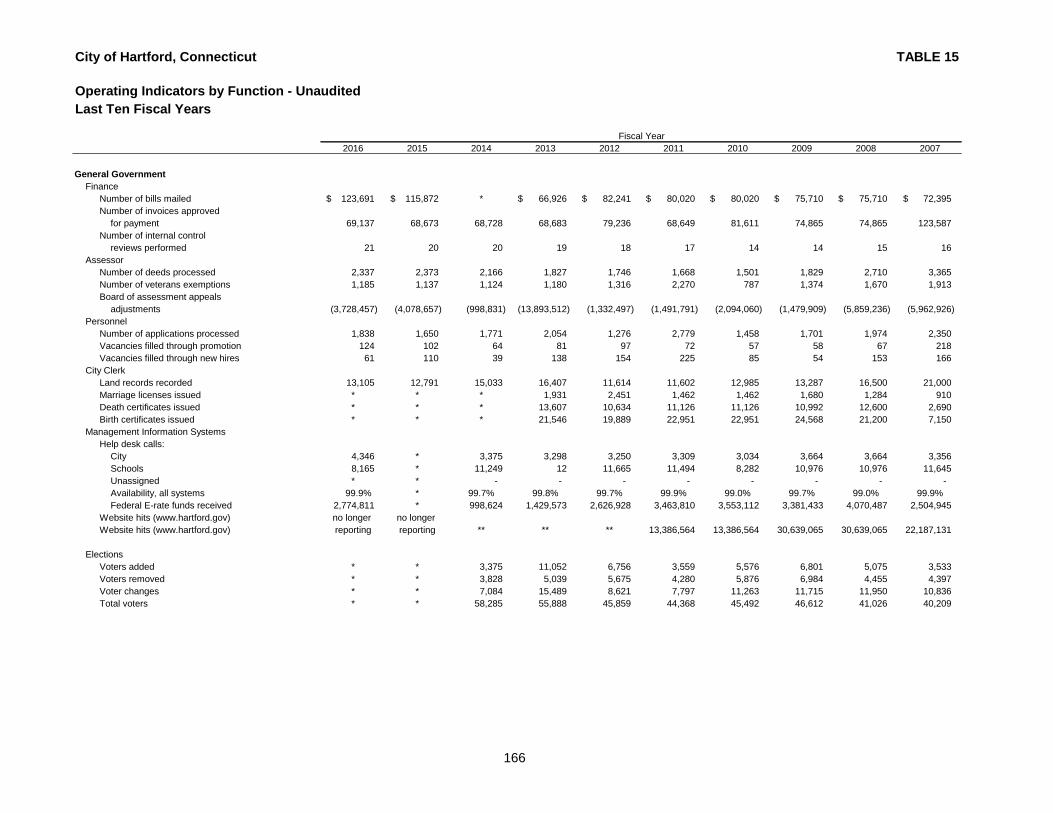
City of Hartford, Connecticut TABLE 15
Last Ten Fiscal Years
2016 2015 2014 2013 2012 2011 2010 2009 2008 2007
Operating Indicators by Function - Unaudited
Fiscal Year
166
General Government
Finance
Number of bills mailed 123,691 $ 115,872 $ * 66,926 $ 82,241 $ 80,020 $ 80,020 $ 75,710 $ 75,710 $ 72,395 $
Number of invoices approved
for payment 69,137 68,673 68,728 68,683 79,236 68,649 81,611 74,865 74,865 123,587
Number of internal control
reviews performed 21 20 20 19 18 17 14 14 15 16
Assessor
Number of deeds processed 2,337 2,373 2,166 1,827 1,746 1,668 1,501 1,829 2,710 3,365
Number of veterans exemptions 1,185 1,137 1,124 1,180 1,316 2,270 787 1,374 1,670 1,913
Board of assessment appeals
adjustments (3,728,457) (4,078,657) (998,831) (13,893,512) (1,332,497) (1,491,791) (2,094,060) (1,479,909) (5,859,236) (5,962,926)
Personnel
Number of applications processed 1,838 1,650 1,771 2,054 1,276 2,779 1,458 1,701 1,974 2,350
Vacancies filled through promotion 124 102 64 81 97 72 57 58 67 218
Vacancies filled through new hires 61 110 39 138 154 225 85 54 153 166
City Clerk
Land records recorded 13,105 12,791 15,033 16,407 11,614 11,602 12,985 13,287 16,500 21,000
Marriage licenses issued * * * 1,931 2,451 1,462 1,462 1,680 1,284 910
Death certificates issued * * * 13,607 10,634 11,126 11,126 10,992 12,600 2,690
Birth certificates issued * * * 21,546 19,889 22,951 22,951 24,568 21,200 7,150
Management Information Systems
Help desk calls:
City 4,346 * 3,375 3,298 3,250 3,309 3,034 3,664 3,664 3,356
Schools 8,165 * 11,249 12 11,665 11,494 8,282 10,976 10,976 11,645
Unassigned * * - - - - - - - -
Availability, all systems 99.9% * 99.7% 99.8% 99.7% 99.9% 99.0% 99.7% 99.0% 99.9%
Federal E-rate funds received 2,774,811 * 998,624 1,429,573 2,626,928 3,463,810 3,553,112 3,381,433 4,070,487 2,504,945
Website hits (www.hartford.gov) no longer no longer
Website hits (www.hartford.gov) reporting reporting ** ** ** 13,386,564 13,386,564 30,639,065 30,639,065 22,187,131
Elections
Voters added * * 3,375 11,052 6,756 3,559 5,576 6,801 5,075 3,533
Voters removed * * 3,828 5,039 5,675 4,280 5,876 6,984 4,455 4,397
Voter changes * * 7,084 15,489 8,621 7,797 11,263 11,715 11,950 10,836
Total voters * * 58,285 55,888 45,859 44,368 45,492 46,612 41,026 40,209
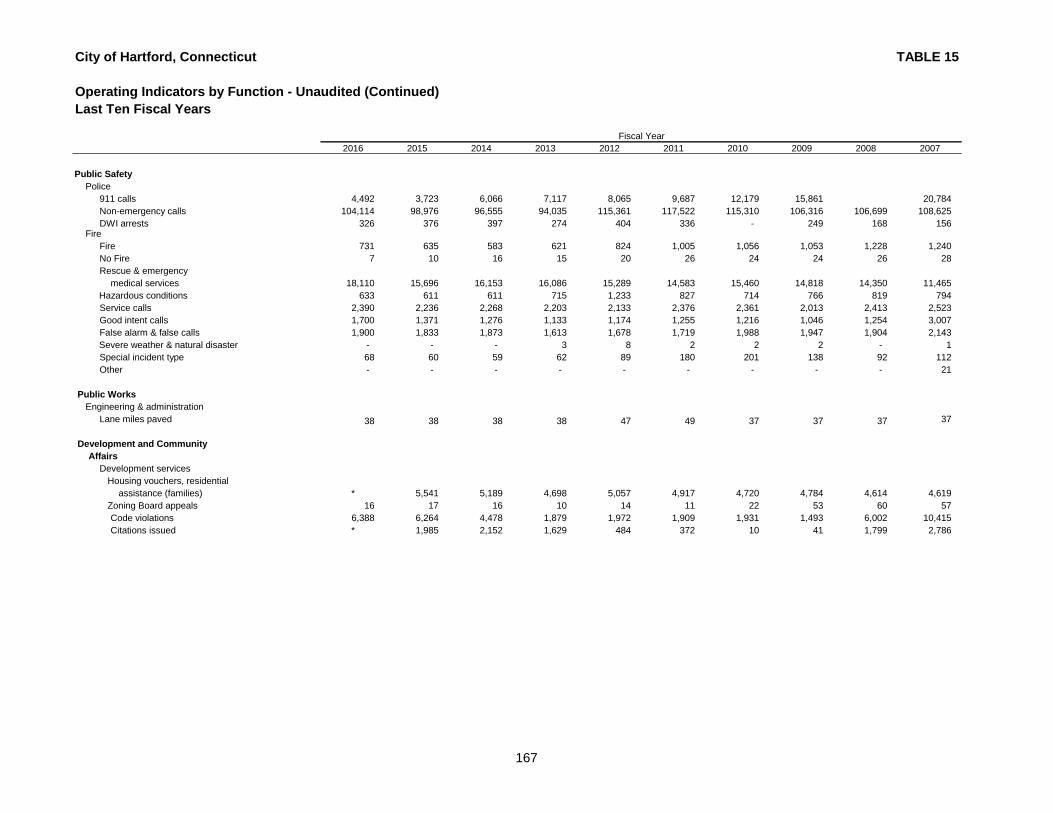
City of Hartford, Connecticut TABLE 15
Operating Indicators by Function - Unaudited (Continued)
Last Ten Fiscal Years
2016 2015 2014 2013 2012 2011 2010 2009 2008 2007
Fiscal Year
167
Public Safety
Police
911 calls 4,492 3,723 6,066 7,117 8,065 9,687 12,179 15,861 20,784
Non-emergency calls 104,114 98,976 96,555 94,035 115,361 117,522 115,310 106,316 106,699 108,625
DWI arrests 326 376 397 274 404 336 - 249 168 156 Fire
Fire 731 635 583 621 824 1,005 1,056 1,053 1,228 1,240
No Fire 7 10 16 15 20 26 24 24 26 28
Rescue & emergency
medical services 18,110 15,696 16,153 16,086 15,289 14,583 15,460 14,818 14,350 11,465
Hazardous conditions 633 611 611 715 1,233 827 714 766 819 794
Service calls 2,390 2,236 2,268 2,203 2,133 2,376 2,361 2,013 2,413 2,523
Good intent calls 1,700 1,371 1,276 1,133 1,174 1,255 1,216 1,046 1,254 3,007
False alarm & false calls 1,900 1,833 1,873 1,613 1,678 1,719 1,988 1,947 1,904 2,143
Severe weather & natural disaster - - - 3 8 2 2 2 - 1
Special incident type 68 60 59 62 89 180 201 138 92 112
Other - - - - - - - - - 21
Public Works
Engineering & administration
Lane miles paved 38 38 38 38 47 49 37 37 37 37
Development and Community
Affairs
Development services
Housing vouchers, residential
assistance (families) * 5,541 5,189 4,698 5,057 4,917 4,720 4,784 4,614 4,619
Zoning Board appeals 16 17 16 10 14 11 22 53 60 57
Code violations 6,388 6,264 4,478 1,879 1,972 1,909 1,931 1,493 6,002 10,415
Citations issued * 1,985 2,152 1,629 484 372 10 41 1,799 2,786
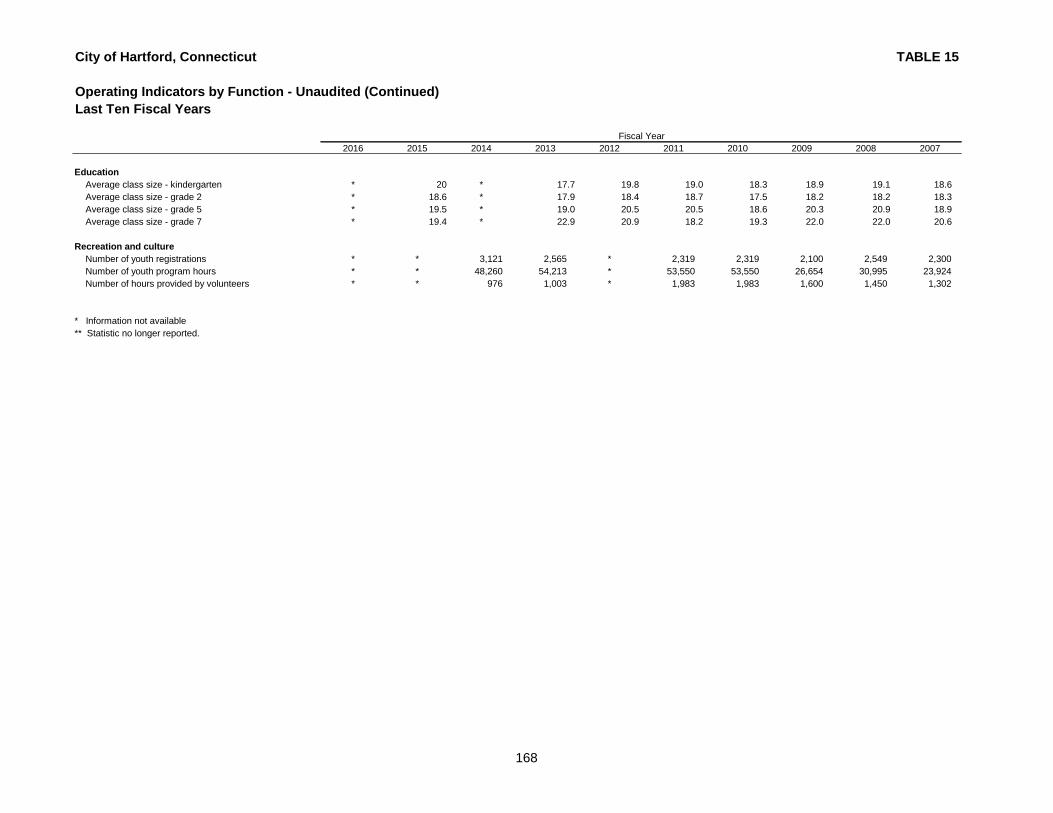
City of Hartford, Connecticut TABLE 15
Operating Indicators by Function - Unaudited (Continued)
Last Ten Fiscal Years
2016 2015 2014 2013 2012 2011 2010 2009 2008 2007
Fiscal Year
168
Education
Average class size - kindergarten * 20 * 17.7 19.8 19.0 18.3 18.9 19.1 18.6
Average class size - grade 2 * 18.6 * 17.9 18.4 18.7 17.5 18.2 18.2 18.3
Average class size - grade 5 * 19.5 * 19.0 20.5 20.5 18.6 20.3 20.9 18.9
Average class size - grade 7 * 19.4 * 22.9 20.9 18.2 19.3 22.0 22.0 20.6
Recreation and culture
Number of youth registrations * * 3,121 2,565 * 2,319 2,319 2,100 2,549 2,300
Number of youth program hours * * 48,260 54,213 * 53,550 53,550 26,654 30,995 23,924
Number of hours provided by volunteers * * 976 1,003 * 1,983 1,983 1,600 1,450 1,302
* Information not available
** Statistic no longer reported.
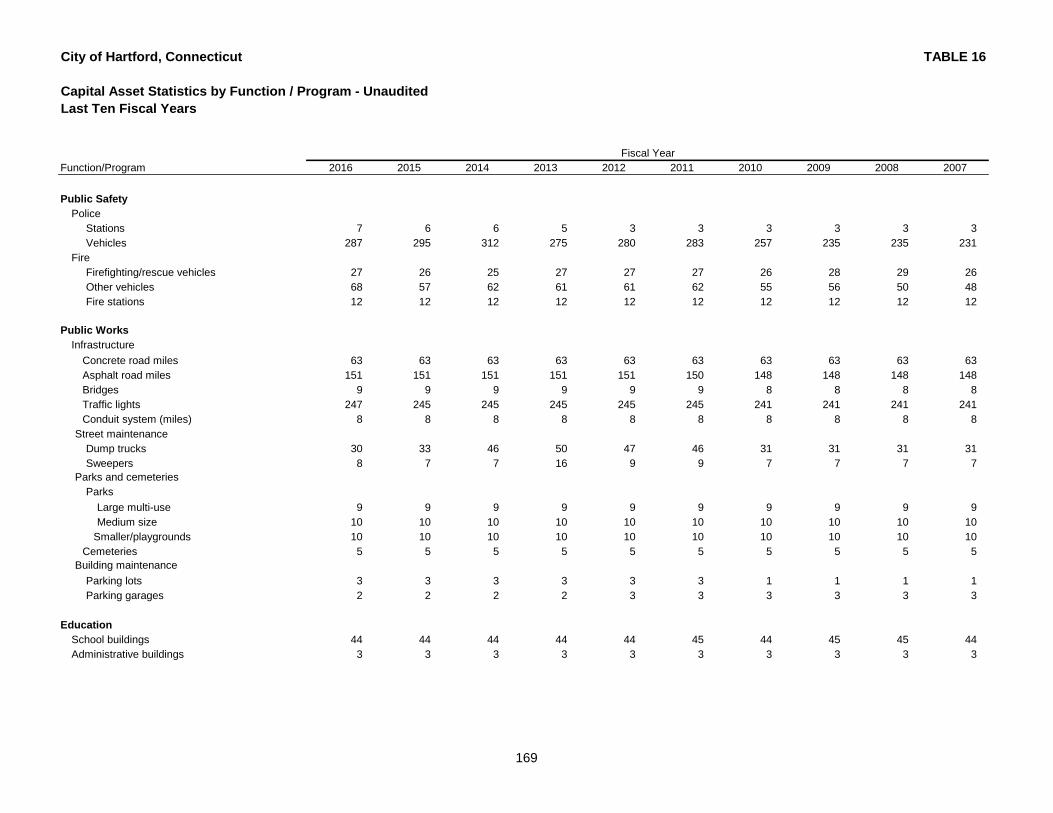
City of Hartford, Connecticut TABLE 16
Capital Asset Statistics by Function / Program - Unaudited
Last Ten Fiscal Years
Function/Program 2016 2015 2014 2013 2012 2011 2010 2009 2008 2007
Fiscal Year
169
Public Safety
Police
Stations 7 6 6 5 3 3 3 3 3 3
Vehicles 287 295 312 275 280 283 257 235 235 231
Fire
Firefighting/rescue vehicles 27 26 25 27 27 27 26 28 29 26
Other vehicles 68 57 62 61 61 62 55 56 50 48
Fire stations 12 12 12 12 12 12 12 12 12 12
Public Works
Infrastructure
Concrete road miles 63 63 63 63 63 63 63 63 63 63
Asphalt road miles 151 151 151 151 151 150 148 148 148 148
Bridges 9 9 9 9 9 9 8 8 8 8
Traffic lights 247 245 245 245 245 245 241 241 241 241
Conduit system (miles) 8 8 8 8 8 8 8 8 8 8
Street maintenance
Dump trucks 30 33 46 50 47 46 31 31 31 31
Sweepers 8 7 7 16 9 9 7 7 7 7
Parks and cemeteries
Parks
Large multi-use 9 9 9 9 9 9 9 9 9 9
Medium size 10 10 10 10 10 10 10 10 10 10
Smaller/playgrounds 10 10 10 10 10 10 10 10 10 10
Cemeteries 5 5 5 5 5 5 5 5 5 5
Building maintenance
Parking lots 3 3 3 3 3 3 1 1 1 1
Parking garages 2 2 2 2 3 3 3 3 3 3
Education
School buildings 44 44 44 44 44 45 44 45 45 44
Administrative buildings 3 3 3 3 3 3 3 3 3 3
City of Hartford, Connecticut TABLE 16
Capital Asset Statistics by Function / Program - Unaudited (Continued)
Last Ten Fiscal Years
Function/Program 2016 2015 2014 2013 2012 2011 2010 2009 2008 2007
Fiscal Year
170
Recreation and Culture
Recreation
Number of basketball courts 29 29 29 30 32 29 32 33 32 32
Number of football fields 4 4 4 4 5 4 6 6 6
Number of multi-use fields 3 3 3 3 3 3 4 4 4 4
Number of playscapes/grounds 22 22 22 29 28 27 27 28 27 27
Number of soccer fields 7 7 6 9 9 3 6 6 6 6
Number of softball fields 6 6 6 9 9 9 16 16 16 16
Number of tennis courts 24 24 24 24 25 25 24 27 27 27
Mowers 45 45 45 45 46 42 42 35 35 35
Other vehicles 32 32 30 30 31 33 33 47 47 47
Libraries
Central 1 1 1 1 1 1 1 1 1 1
Number of branches 9 9 9 9 9 9 9 9 9 9
Library on wheels - - - - - - - 1 1 1


![NATIONAL INDEPENDENT AUTOMOBILE DEALERS ASSOCIATION … ン ] ORY Z... · CONNECTICUT CARMAX CONNECTICUT CarMax Hartford 89 Weston St. Hartford, CT 06120 Every Monday at 9:30am](https://img.pdfslide.us/doc/110x75/5f2a309c7fe1a033d770d656/national-independent-automobile-dealers-association-i-ory-z-connecticut.jpg)