Embed Size (px)
Citation preview
City of Fort Worth Natural Gas Air Quality Study July 13, 2011
City of Fort Worth Natural Gas Air Quality Study
Final Report
Prepared for:
City of Fort Worth 1000 Throckmorton Street
Fort Worth, Texas 76102-6311
Eastern Research Group, Inc. 1600 Perimeter Park Drive, Suite 200
Morrisville, NC 27560
July 13, 2011
Sage Environmental Consulting, LP
4611 Bee Caves Road, Suite 100 Austin, TX 78746
Fort Worth Natural Gas Air Quality Study Final Report July 13, 2011
i
Table of Contents Page
Executive Summary ..................................................................................................... xii
1.0 Introduction ..................................................................................................... 1-1
2.0 Ambient Air Monitoring.................................................................................. 2-1
2.1 Site Selection ................................................................................................... 2-2
2.1.1 Site S-1 (Background Site) ................................................................. 2-4
2.1.2 Site S-2 (Mobile Sources Site)............................................................ 2-6
2.1.3 Site S-3 (Pre-Production Site)............................................................. 2-6
2.1.4 Site S-4 (High-Level Activity Site, Collocated) .................................. 2-8
2.1.5 Site S-5 (High-Level Activity Site, Collocated) .................................. 2-9
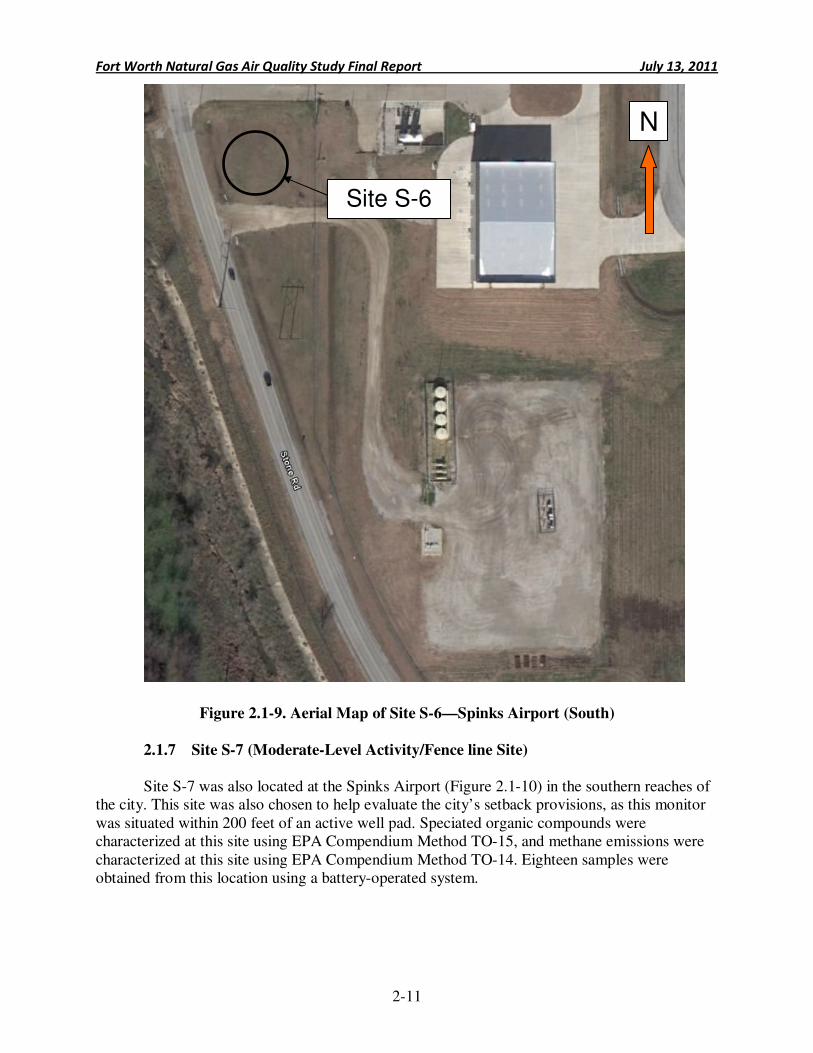
2.1.6 Site S-6 (Moderate-Level Activity/Fence line Site) ...........................2-10
2.1.7 Site S-7 (Moderate-Level Activity/Fence line Site) ...........................2-11
2.2 Sampling Protocol .......................................................................................... 2-12
2.3 Sample Analysis ............................................................................................ 2-15
2.4 Quality Assurance/Quality Control................................................................. 2-18
2.4.1 Completeness ....................................................................................2-19
2.4.2 Measurement Precision .....................................................................2-20
2.4.3 Measurement Accuracy .....................................................................2-22
2.5 Ambient Air Monitoring Results .................................................................... 2-22
2.5.1 Summary Statistics ............................................................................2-22
2.5.2 Study Period Averaging ....................................................................2-28
2.5.3 Key Pollutants ...................................................................................2-50
2.5.4 Integration with Meteorology ............................................................2-51
2.6 Ambient Air Monitoring Conclusions ............................................................ 2-73
3.0 Point Source Testing ........................................................................................ 3-1
3.1 Introduction ..................................................................................................... 3-1
3.2 Point Source Emissions Survey Sampling Equipment ...................................... 3-3
3.2.1 The FLIR™ Infrared Camera ............................................................. 3-6
3.2.2 The Toxic Vapor Analyzer (TVA) ...................................................... 3-7
3.2.3 The Hi Flow Sampler ......................................................................... 3-8
3.2.4 Summa Canisters................................................................................ 3-9
3.2.5 Miscellaneous Equipment .................................................................3-10
3.3 Point Source Survey and Sampling Procedures............................................... 3-10
3.3.1 Pre-Test Equipment Preparation ........................................................3-11
3.3.2 Final Preparations .............................................................................3-12
3.3.3 Site Arrival .......................................................................................3-12
3.3.4 IR Camera Survey .............................................................................3-14
3.3.5 Method 21 Site Survey with the Toxic Vapor Analyzer .....................3-15
3.3.6 Hi Flow Sampler Emissions Testing ..................................................3-17
3.3.7 Canister Sampling .............................................................................3-17
3.3.8 Completion of the Site Survey ...........................................................3-20
3.4 Emissions Calculation Procedures .................................................................. 3-23
Fort Worth Natural Gas Air Quality Study Final Report July 13, 2011
ii
3.4.1 Well Pad, Compressor Station, Gas Plant, and Salt Water Disposal Facility Emissions .............................................................................3-23
3.4.2 Direct Emission Calculations ............................................................3-24
3.4.3 Indirect Emission Calculations -- Correlation Equation Development .....................................................................................3-26
3.4.4 Applying Canister Results to Non-Canister Emission Points .............3-27
3.4.5 Surrogate Canister Profiles ................................................................3-29
3.4.6 Calculation of Non-Sampled Low Level Emission Points ..................3-30
3.4.7 Compressor Engine Emissions ..........................................................3-32
3.4.8 Well Drilling and Fracking Engine Emissions ...................................3-32
3.4.9 Calculation of Method 21 TOC Screening Emission Factors .............3-32
3.5 Point Source Emissions Results...................................................................... 3-33
3.5.1 Well Activity Emissions ....................................................................3-62
3.5.2 Method 21 TOC Screening Emission Factors ....................................3-64
3.6 Quality Control Results .................................................................................. 3-64
3.6.1 IR Camera Daily Demo Results .........................................................3-65
3.6.2 Hi Flow Sampler Calibration Verification .........................................3-65
3.6.3 TVA Calibration Procedures .............................................................3-79
3.6.4 Field Data Review .............................................................................3-89
3.6.5 Canister Sample Collection QC .........................................................3-89
3.6.6 Analytical QC Results .......................................................................3-97
3.7 Point Source Testing Conclusions .................................................................. 3-98
4.0 Air Dispersion Modeling.................................................................................. 4-1
4.1 Modeling Scenarios and Source Parameters ..................................................... 4-1
4.1.1 Scenario 1 (Typical Well Pad) ............................................................ 4-4
4.1.2 Scenario 2 (Worst-Case Well Pad) ..................................................... 4-7
4.1.3 Scenario 3 (Worst-Case Compressor Station) ....................................4-11
4.1.4 Scenario 4 (Co-located Worst-Case Well Pad and Worst-Case Compressor Station) ..........................................................................4-14
4.2 Model Setup and Options ............................................................................... 4-15
4.2.1 Receptor Grids ..................................................................................4-15
4.2.2 Meteorological Data and Surface Parameters.....................................4-16
4.3 Model Output ................................................................................................. 4-16
4.4 Electronic Modeling Files .............................................................................. 4-28
4.5 Air Dispersion Modeling Conclusions ............................................................ 4-31
5.0 Public Health Evaluation ................................................................................. 5-1
5.1 Methodology .................................................................................................... 5-1
5.2 Interpretation of Ambient Air Monitoring Data ................................................ 5-3
5.2.1 Sensitivity of Monitoring Methods ..................................................... 5-3
5.2.2 Health Evaluation for Measured 24-Hour Average Concentrations ..... 5-9
5.2.3 Health Evaluation for Program-Average Concentrations ...................5-17
5.2.4 Measured Concentrations: Main Findings, Limitations, and Uncertainties .....................................................................................5-23
5.3 Interpretation of Dispersion Modeling Data.................................................... 5-23
5.3.1 Comparison of Modeled and Measured Air Pollution Levels .............5-24
Fort Worth Natural Gas Air Quality Study Final Report July 13, 2011
iii
5.3.2 Health Evaluation for Modeled 1-Hour Average Concentrations .......5-25
5.3.3 Health Evaluation for Modeled Annual Average Concentrations .......5-32
5.3.4 Adequacy of Setback Limits ..............................................................5-36
5.3.5 Modeled Concentrations: Main Findings, Limitations, and Uncertainties .....................................................................................5-41
5.4 Additional Context for Selected Pollutants ..................................................... 5-41
5.5 Public Health Evaluation Conclusions ............................................................ 5-51
6.0 Regulatory Assessment .................................................................................... 6-1
6.1 Federal Air Quality Rules................................................................................. 6-1
6.1.1 Operating Permits .............................................................................. 6-1
6.1.2 Construction Permits .......................................................................... 6-2
6.1.3 New Source Performance Standards ................................................... 6-2
6.1.4 National Emission Standards for Hazardous Air Pollutants ................. 6-4
6.1.5 Greenhouse Gas Reporting Program ................................................... 6-6
6.2 Texas Commission on Environmental Quality Air Quality Rules ..................... 6-6
6.2.1 Permit-by-Rules ................................................................................. 6-7
6.2.2 Standard Permit .................................................................................. 6-8
6.2.3 New Source Review Permits .............................................................. 6-9
6.2.4 Control of Air Pollution from Visible Emissions and Particulate Matter ................................................................................................ 6-9
6.2.5 Control of Air Pollution from Sulfur Compounds ............................... 6-9
6.2.6 Standards of Performance for Hazardous Air Pollutants and for Designated Facilities and Pollutants ..................................................6-10
6.2.7 Control of Air Pollution from Volatile Organic Compounds ..............6-10
6.2.8 Control of Air Pollution from Nitrogen Compounds ..........................6-10
6.2.9 Federal Operating Permits .................................................................6-11
6.3 City of Fort Worth Air Quality Rules ............................................................. 6-11
6.4 Regulatory Assessment Conclusions .............................................................. 6-11
7.0 Full Build-Out Estimates ................................................................................. 7-1
7.1 Factors Affecting Natural Gas Production ........................................................ 7-2
7.2 Methodology for Forecasting Natural Gas Production ...................................... 7-5
7.3 2010 Base Year Emissions Inventory ............................................................... 7-6
7.4 2010 through 2018 Projected Emissions Inventories ....................................... 7-16
7.5 Full Build-Out Estimates Conclusions ............................................................ 7-21
8.0 Conclusions and Recommendations ................................................................ 8-1
8.1 Task Level Conclusions ................................................................................... 8-1
8.2 Study Question Answers .................................................................................. 8-3
8.3 Recommendations ............................................................................................ 8-6
9.0 References ........................................................................................................ 9-1
Fort Worth Natural Gas Air Quality Study Final Report July 13, 2011
iv
Appendix 2-A—COC Forms for Sites S-1 and S-5 Appendix 2-B—Analytical Results for SNMOC at Sites S-1 through S-5 Appendix 2-C—Analytical Results for EPA Compendium Method TO-15 at Sites S-1 through S-5 Appendix 2-D—Analytical Results for EPA Compendium Method TO-11A at Sites S-4 and S-5 Appendix 2-E—COC Forms and Analytical Results for Sites S-6 and S-7 Appendix 2-F—Final Concentration Data Appendix 2-G—NATA Lowest Comparison Levels Appendix 2-H—Final Meteorological Data Appendix 3-A—Site Emissions Summary Appendix 3-B—Emissions Workbook and Field Data Appendix 3-C—Canister Data (Electronic) Appendix 4-A—Electronic Modeling Files Appendix 5-A—Additional Information on Health-Based Screening Values
Fort Worth Natural Gas Air Quality Study Final Report July 13, 2011
v
List of Tables
Page
Table 2.1-1. Final Ambient Air Network Monitoring Sites ...................................................... 2-2
Table 2.2-1. Schedule of Collection Events ........................................................................... 2-13
Table 2.3-1. EPA Compendium Method TO-15 Target Compounds and Method Detection Limits ..................................................................................................... 2-15
Table 2.3-2. SNMOC Target Compounds and Method Detection Limits ............................... 2-17
Table 2.3-3. Carbonyl Target Compounds and Method Detection Limits ............................... 2-18
Table 2.3-4. Methane Method Detection Limit ...................................................................... 2-18
Table 2.4-1. Data Quality Objectives ..................................................................................... 2-19
Table 2.4-2. DQO: Overall Completeness ............................................................................. 2-20
Table 2.4-3. DQO: RSD Precision Calculation for Collocated VOC, Carbonyl, and SNMOC Instruments .............................................................................................. 2-21
Table 2.4-4. DQO: RSD Precision Calculation for Collocated and Replicate VOC and SNMOC Analyses .................................................................................................. 2-21
Table 2.4-5. VOC and Carbonyl HAP Audit Results ............................................................. 2-22
Table 2.5-1. Summary of VOC Measurements Across the Entire Monitoring Network .......... 2-24
Table 2.5-2. Summary of Carbonyl Measurements Across the Entire Monitoring Network ... 2-27
Table 2.5-3. Summary of Methane and Speciated Non-Methane Organic Compounds Across the Entire Monitoring Network ................................................................... 2-29
Table 2.5-4. Site S-1 Pollutant Study Averages ..................................................................... 2-33
Table 2.5-5. Site S-2 Pollutant Study Averages ..................................................................... 2-36
Table 2.5-6. Site S-3A Pollutant Study Averages .................................................................. 2-38
Table 2.5-7. Site S-3B Pollutant Study Averages ................................................................... 2-40
Table 2.5-8. Site S-4 Pollutant Study Averages ..................................................................... 2-42
Table 2.5-9. Site 5 Pollutant Study Averages ......................................................................... 2-45
Table 2.5-10. Site S-6 Pollutant Study Averages ................................................................... 2-48
Table 2.5-11. Site S-7 Pollutant Study Averages ................................................................... 2-49
Table 2.5-12. Site S-1 Key Pollutant Averages ...................................................................... 2-52
Table 2.5-13. Site S-2 Key Pollutant Averages ...................................................................... 2-53
Table 2.5-14. Site S-3A Key Pollutant Averages ................................................................... 2-53
Table 2.5-15. Site S-3B Key Pollutant Averages ................................................................... 2-54
Table 2.5-16. Site S-4 Key Pollutant Averages ...................................................................... 2-54
Table 2.5-17. Site S-5 Key Pollutant Averages ...................................................................... 2-55
Table 2.5-18. Site S-6 Key Pollutant Averages ...................................................................... 2-55
Table 2.5-19. Site S-7 Key Pollutant Averages ...................................................................... 2-56
Table 2.5-20. Meteorological Stations Used in This Study .................................................... 2-61
Table 3.1-1. Point Source Sites by Owner and Type ................................................................ 3-4
Table 3.4-1. Comparison of Emissions Between Tank and Non-Tank Emission Sources ...... 3-27
Table 3.4-2. Non-Canister Methane Emissions Calculation Example ..................................... 3-29
Table 3.4-3. Surrogate Tank and Non-Tank Emission Profiles............................................... 3-29
Table 3.5-1. Average and Maximum Point Source Emission Rates by Site Typea .................. 3-33
Table 3.5-2. Average Point Source Emission Volumes by Site Type ..................................... 3-34
Table 3.5-3. Point Source Emissions Summary by Site a........................................................ 3-35
Table 3.5-4. Summary of Repeat Surveysa............................................................................. 3-62
Fort Worth Natural Gas Air Quality Study Final Report July 13, 2011
vi
Table 3.5-5. TOC Screening Emission Factors ...................................................................... 3-64
Table 3.6-1. IR Camera ID: GasFindIR Daily Demo September – October, 2010 .................. 3-66
Table 3.6-2. IR Camera ID: GF-320 Daily Demo September – October, 2010 ....................... 3-68
Table 3.6-3. IR Camera ID: Dexter Daily Demo September – October, 2010 ........................ 3-70
Table 3.6-4. IR Camera ID: GasFindIR Daily Demo January – February, 2011 ..................... 3-71
Table 3.6-5. IR Camera ID: GF-320 Daily Demo January – February, 2011 .......................... 3-73
Table 3.6-6. Hi Flow ID: QS1002 Verification September – October 2010 ............................ 3-75
Table 3.6-7. Hi Flow ID: QS1005 Verification September – October 2010 ............................ 3-76
Table 3.6-8. Hi Flow ID: QS1002 Verification January – February, 2011 .............................. 3-77
Table 3.6-9. Hi Flow ID: QX1007 Verification January – February, 2011 ............................. 3-78
Table 3.6-10. TVA S/N: 5362 Calibration and Drift Check Results September – October 2010 .......................................................................................................... 3-79
Table 3.6-11. TVA S/N: K10419 Calibration and Drift Check Results September – October 2010 .......................................................................................................... 3-81
Table 3.6-12. TVA S/N: 5362 Calibration and Drift Check Results January – February 2011 ........................................................................................................ 3-83
Table 3.6-13. TVA S/N: 0528413543 Calibration and Drift Check Results January – February 2011 ........................................................................................................ 3-85
Table 3.6-14. TVA S/N: R6488 Calibration and Drift Check Results January – February 2011 ........................................................................................................ 3-86
Table 3.6-15. TVA S/N: R1376 Calibration and Drift Check Results January – February 2011 ........................................................................................................ 3-88
Table 3.6-16. Duplicate Canister Results ............................................................................... 3-90
Table 4.1-1. Source Types Modeled ........................................................................................ 4-4
Table 4.1-2. Scenario 1 (Typical Well Pad) Model Input Emission Rates ................................ 4-5
Table 4.1-3. Scenario 2 (Worst-Case Well Pad) Model Input Emission Rates .......................... 4-8
Table 4.1-4. Scenario 3 (Worst-Case Compressor Station) Model Input Emission Rates ....... 4-11
Table 4.3-1. Modeled Impacts—Scenario 1 (Typical Well Pad) ............................................ 4-16
Table 4.3-2. Modeled Impacts—Scenario 2 (Worst-Case Scenario Well Pad)........................ 4-18
Table 4.3-3. Modeled Impacts—Scenario 3 (Worst-Case Compressor Station) ...................... 4-21
Table 4.3-4. Modeled Impacts—Scenario 4 (Co-located Well Pad and Compressor Station) . 4-24
Table 4.4-1. BEEST Pollutant Abbreviation Crosswalk ......................................................... 4-29
Table 5.2-1. Ranges of Detection Limits, by Laboratory .......................................................... 5-4
Table 5.2-2. Highest Measured Concentrations and TCEQ Short-Term Screening Levels...... 5-10
Table 5.2-3. Program-Average Concentrations and TCEQ Long-Term Screening Levels ...... 5-18
Table 5.3-1. Monitor-to-Model Comparisons for Selected Pollutants ..................................... 5-24
Table 5.3-2. Modeled 1-Hour Average Concentrations and TCEQ Short-Term Screening Levels ..................................................................................................................... 5-26
Table 5.3-3. Modeled Annual Average Concentrations and TCEQ Long-Term Screening Levels ..................................................................................................................... 5-33
Table 5.5-1. Key Findings for Health Evaluation ................................................................... 5-53
Table 6.2-1. New PBR Emission Rates.................................................................................... 6-7
Table 6.4-1. Sources Above Regulatory Thresholds .............................................................. 6-12
Table 7.3-1. 2010 Base Year Well Pad Emissions Inventory ................................................... 7-7
Table 7.3-2. 2010 Base Year Compressor Station Emissions Inventory ................................. 7-10
Table 7.3-3. 2010 Base Year Cumulative Emissions Inventory .............................................. 7-13
Fort Worth Natural Gas Air Quality Study Final Report July 13, 2011
vii
Table 7.4-1. Growth Factors for Years 2010–2018 ................................................................ 7-16
Table 7.4-2. Projected Emissions for Years 2010–2018 ......................................................... 7-17
Table 8.2-1. Average Emissions by Site Type ......................................................................... 8-3
Table 8.2-2. Total City-Wide Emissions from Natural Gas Production Activity, by Pollutant Category ................................................................................................................... 8-3
Table 8.2-3. Sources Above Regulatory Thresholds ................................................................ 8-4
Table 8.2-4. Off-Site Air Pollution Levels for Selected Pollutants as Determined Through the Ambient Air Monitoring Network ....................................................................... 8-5
Table 8.2-5. Off-Site Air Pollution Levels for Selected Pollutants as Determined Through Air Dispersion Modeling .......................................................................................... 8-5
Fort Worth Natural Gas Air Quality Study Final Report July 13, 2011
viii
List of Figures
Page
Figure 2.1-1. Ambient Air Monitoring Sites ............................................................................ 2-3
Figure 2.1-2. Aerial Map of Site S-1—Fire Station 33 ............................................................. 2-4
Figure 2.1-3. Overview of Barnett Shale Well Pads Near Site S-1 ........................................... 2-5
Figure 2.1-4. Aerial Map of Site S-2—Environmental Collection Center ................................. 2-6
Figure 2.1-5. Aerial Map of Site S-3A—Eastside Landfill ....................................................... 2-7
Figure 2.1-6. Aerial Map of Site S-3B—Devon Energy Lease ................................................. 2-8
Figure 2.1-7. Aerial Map of Site S-4—Brennan Service Center ............................................... 2-9
Figure 2.1-8. Aerial Map of Site S-5—Fire Station 34 ........................................................... 2-10
Figure 2.1-9. Aerial Map of Site S-6—Spinks Airport (South) .............................................. 2-11
Figure 2.1-10. Aerial Map of Site S-7—Spinks Airport (North) ............................................ 2-12
Figure 2.5-1. Acetaldehyde Average Concentrations by Site ................................................. 2-57
Figure 2.5-2. Benzene Average Concentrations by Site ......................................................... 2-57
Figure 2.5-3. 1,3-Butadiene Average Concentrations by Site ................................................. 2-58
Figure 2.5-4. Carbon Tetrachloride Average Concentrations by Site...................................... 2-58
Figure 2.5-5. p-Dichlorobenzene Average Concentrations by Site ......................................... 2-59
Figure 2.5-6. Formaldehyde Average Concentrations by Site ................................................ 2-59
Figure 2.5-7. Tetrachloroethylene Average Concentrations by Site........................................ 2-60
Figure 2.5-8. Meteorological Stations and Monitoring Site Locations .................................... 2-64
Figure 2.5-9. Site S-1 Windrose Comparisons ....................................................................... 2-65
Figure 2.5-10. Site S-2 Windrose Comparisons ..................................................................... 2-66
Figure 2.5-11. Site S-3A Windrose Comparisons .................................................................. 2-67
Figure 2.5-12. Site S-3B Windrose Comparisons ................................................................... 2-68
Figure 2.5-13. Site S-4 Windrose Comparisons ..................................................................... 2-69
Figure 2.5-14. Site S-5 Windrose Comparisons ..................................................................... 2-70
Figure 2.5-15. Site S-6 Windrose Comparisons ..................................................................... 2-71
Figure 2.5-16. Site S-7 Windrose Comparisons ..................................................................... 2-72
Figure 3.1-1. Point Source Survey Sites (August 2010 – February 2011) ................................. 3-5
Figure 3.1-2. Wet Gas and Dry Gas Well Pads ........................................................................ 3-6
Figure 3.2-1. IR Camera Imaging at a Well Site ...................................................................... 3-7
Figure 3.2-2. Method 21 Screening with the TVA at a Well Site ............................................. 3-8
Figure 3.2-3. Sampling a Tank Vent with the Hi Flow Sampler ............................................... 3-9
Figure 3.2-4. Collecting a Canister Sample from the Exhaust Port of the Hi Flow Sampler .. 3-10
Figure 3.3-1. Front Gate Signage ........................................................................................... 3-13
Figure 3.3-2. Point Source Site Characterization Form .......................................................... 3-14
Figure 3.3-3. Canister Sample Locations ............................................................................... 3-19
Figure 3.3-4. Canister Sampling Manifold ............................................................................. 3-20
Figure 3.3-5. Site Documentation – Wells ............................................................................. 3-21
Figure 3.3-6. Site Documentation – Tanks and Separators ..................................................... 3-21
Figure 3.3-7. Site Documentation – Lift Compressor ............................................................. 3-22
Figure 3.3-8. Example Site Sketch ........................................................................................ 3-22
Figure 3.4-1. Emissions Calculation Flowchart ..................................................................... 3-25
Figure 3.4-2. Default-Zero Values ......................................................................................... 3-31
Fort Worth Natural Gas Air Quality Study Final Report July 13, 2011
ix
Figure 3.5-1. The Effect of Compressors on Site Emissions .................................................. 3-34
Figure 3.5-2. Average TOC Emissions by Component Category ........................................... 3-59
Figure 3.5-3. Average TOC Emissions in Category “Other” .................................................. 3-59
Figure 3.5-4. Average Annual Emissions from Well Pad Compressor Engines ...................... 3-60
Figure 3.5-5. Non-Tank vs. Tank: Average VOC and HAP Emissions .................................. 3-60
Figure 3.5-6. Average Wet Gas vs. Dry Gas TOC Emissions................................................. 3-61
Figure 3.5-7. Average Wet Gas vs. Dry Gas VOC and HAP Emissions ................................. 3-61
Figure 3.5-8. Well Activity Emissions (lbs/hr) ...................................................................... 3-63
Figure 3.7-1. Thief Hatch Left Open ..................................................................................... 3-99
Figure 3.7-2. Pneumatic Valve Controller on Separator ....................................................... 3-100
Figure 3.7-3. Storage Tank Vent ......................................................................................... 3-101
Figure 3.7-4. Natural Gas Pressure Regulator ...................................................................... 3-101
Figure 3.7-5. Hole in Tank Roof - Miscellaneous Emission Source ..................................... 3-102
Figure 4.1-1. Storage Tanks .................................................................................................... 4-2
Figure 4.1-2. Fugitive Emission Points .................................................................................... 4-3
Figure 4.1-3. Natural Gas Compression Engine ....................................................................... 4-4
Figure 4.1-4. Scenario 1 Layout (Typical Well Pad) ................................................................ 4-7
Figure 4.1-5. Scenario 2 Layout (Worst-Case Well Pad)........................................................ 4-10
Figure 4.1-6. Scenario 3 Layout (Worst-Case Compressor Station) ....................................... 4-14
Figure 4.1-7. Scenario 4 Layout (Co-located Well Pad and Compressor Station) ................... 4-15
Figure 4.3-1. Formaldehyde Modeling Results for Scenarios 1 - 4 ......................................... 4-27
Figure 5.2-1. All Measurements of Hexachloro-1,3-Butadiene during the Ambient Air Monitoring Program ............................................................................................... 5-16
Figure 5.3-1. Locations of Estimated Annual Average Benzene Concentrations Greater Than TCEQ’s Long-Term ESL, by Modeling Scenario .................................................... 5-38
Figure 5.3-3. Locations of Estimated Annual Average Formaldehyde Concentrations Greater Than TCEQ’s Long-Term ESL, by Modeling Scenario ........................................... 5-40
Figure 5.4-1. Comparison of Program-Average Benzene Concentrations in Fort Worth to 2010 Annual Average Benzene Concentrations Statewide (see Section 5.4) .................... 5-43
Figure 5.4-2. Toxicity of Acrolein: Short-Term Exposures .................................................... 5-45
Figure 5.4-3. Toxicity of Acrolein: Long-Term Exposures .................................................... 5-46
Figure 5.4-4. Comparison of Program-Average Formaldehyde Concentrations in Fort Worth to 2010 Annual Average Formaldehyde Concentrations Statewide (see Section 5.4) ... 5-48
Figure 5.4-5. Toxicity of Formaldehyde: Short-Term Exposures ........................................... 5-49
Figure 5.4-6. Toxicity of Formaldehyde: Long-Term Exposures ........................................... 5-50
Figure 7.1-1. Natural Gas Production in the Barnett Shale and Tarrant County (1993–2010) ... 7-3
Figure 7.1-2. Texas Natural Gas Wellhead Price (2000–2010) ................................................ 7-3
Figure 7.1-3. Permits, Rig Counts, and Wellhead Gas Prices in Tarrant County (2000–2010) .. 7-4
Figure 7.2-1. Projected Production in Eight Shale Plays (BCF) (1998–2018)........................... 7-5
Figure 7.2-2. Barnett Shale and Tarrant County Actual and Projected Natural Gas Production (2000–2018) ............................................................................................................. 7-6
Fort Worth Natural Gas Air Quality Study Final Report July 13, 2011
x
Abbreviations
% CH4 Leak expressed as percent methane µg/m3 Micrograms per cubic meter AQS Air Quality Subsystem ATSDR Agency for Toxic Substances and Disease Registry BACT Best available control technology BP Barometric Pressure Btu British thermal unit CCV Continuing Calibration Verification CFM Cubic feet per minute CH4 Methane CO Carbon monoxide CO2 Carbon dioxide COC Chain of custody CV Coefficient of variation DNPH 2,4-dinitrophenylhydrazine DQO Data Quality Objective EPA U.S. Environmental Protection Agency ERG Eastern Research Group, Inc. FID Flame ionization detector GC Gas chromatograph GC/MS Gas chromatograph/Mass spectrometer GIS Geographic information system GPS Global Positioning System H2S Hydrogen sulfide HAP Hazardous Air Pollutants Hg Mercury HI Hi hp Horsepower ID Identification IR Infrared IRIS Integrated Risk Information System kPa Kilopascals lb Pound lbs/yr Pounds per year LCL Lowest Comparison Level LCS Laboratory Control Standard MDL Method Detection Limit mm Millimeter NA Not available/not applicable NATA National-Scale Air Toxics Assessment NESHAP National Emissions Standard for Hazardous Air Pollutants NM Not monitored NOx Oxides of nitrogen NSPS New Source Performance Standards
Fort Worth Natural Gas Air Quality Study Final Report July 13, 2011
xi
NSR New Source Review NWS National Weather Service oF Degrees Fahrenheit PBR Permit-by-Rule PM Particulate matter PM2.5 Particulate matter with a diameter of 2.5 micrometers or less PM10 Particulate matter with a diameter of 10 micrometers or less ppbC Parts per billion by carbon ppbv Parts per billion by volume ppmv Parts per million by volume PRV Pressure Relief Valve QA/QC Quality Assurance/Quality Control QAPP Quality Assurance Project Plan RH Relative Humidity RRC Railroad Commission RSD Relative standard deviation S/N Serial Number SATMP Schools Air Toxic Monitoring Program SCFM Standard Cubic Feet per Minute SIM Selected ion monitoring SNMOC Speciated Non-Methane Organic Compounds SO2 Sulfur dioxide SOCMI Synthetic Organic Chemical Manufacturing Industry TCD Thermal Conductivity Detector TCEQ Texas Commission on Environmental Quality TEMP Temperature TOC Total Organic Compounds tpy Tons per year TVA Toxic Vapor Analyzer VOC Volatile Organic Compounds WBAN Weather Bureau/Air Force Number WD Wind Direction WS Wind Speed
Fort Worth Natural Gas Air Quality Study Final Report July 13, 2011
xii
Executive Summary
The city of Fort Worth is home to extensive natural gas production and exploration as it lies on top of the Barnett Shale, a highly productive natural gas shale formation in north-central Texas. The Barnett Shale underlies 23 counties, including four (Tarrant, Denton, Wise, and Parker) that lie partly within the Fort Worth city boundaries. Over the last several years, natural gas production in the Barnett Shale has increased dramatically. This increase in activity has been brought about by advancements in drilling technologies, most notably hydraulic fracturing (fracking) and horizontal drilling.
As the Barnett Shale formation is located beneath a highly populated urban environment, extraction of natural gas from it has involved exploration and production operations in residential areas, near public roads and schools, and close to where the citizens of Fort Worth live and work. Due to the highly visible nature of natural gas drilling, fracturing, compression, and collection activities, many individual citizens and community groups in the Fort Worth area have become concerned that these activities could have an adverse effect on their quality of life.
In response to these concerns, on March 9, 2010, the Fort Worth City Council adopted Resolution 3866-03-2010 appointing a committee to review air quality issues associated with natural gas exploration and production. This committee was composed of private citizens, members of local community groups, members of environmental advocacy groups, and representatives from industry. The committee was charged to make recommendations to the City Council on a scope of work for a comprehensive air quality assessment to evaluate the impacts of natural gas exploration and production, to evaluate proposals submitted in response to a solicitation for conducting this study, and to ultimately choose a qualified organization to conduct the study.
Following an open bidding process, Eastern Research Group, Inc. (ERG) was selected to perform the Fort Worth Natural Gas Air Quality Study (FWNGAQS). ERG was asked to design a study that answered four key questions, originally established by the air quality committee. Since that time, ERG has completed extensive sampling activity throughout Fort Worth, and the sampling results support the following main conclusions:
• How much air pollution is being released by natural gas exploration in Fort Worth? ERG estimated emissions for 375 well pads, 8 compressor stations, one gas processing plant, a saltwater treatment facility, a drilling operation, a fracking operation, and a completion operation. Summed across all these sites, the total estimated emissions of organic compounds was 20,818 tons per year, with well pads accounting for more than three-fourths of those total emissions. The emissions contained dozens of pollutants with varying toxicities. Pollutants with relatively low toxicities (e.g., methane, ethane, propane, and butane) accounted for the overwhelming majority—approximately 98%—of the city-wide emissions. However, several pollutants with relatively high toxicities (e.g., benzene) were also emitted from these sites, though in considerably lower quantities. At a small subset of sites, the point source testing team noted signs of malfunctioning equipment that likely caused increased emissions. For example, some hatches atop tanks were ajar and not closed, and corrosion had apparently caused a hole to form on the roof of at least
Fort Worth Natural Gas Air Quality Study Final Report July 13, 2011
xiii
one tank. Enhanced inspection and maintenance of equipment at the sites can help ensure that these preventable emissions are greatly reduced or eliminated. ERG also projected future emission rates based on an analysis of market forces, natural gas reserves, and other factors. This analysis found that city-wide emissions from the production of natural gas are projected to peak in 2012 and 2013 at 9% above 2010 levels. More detailed and technical information on emissions from natural gas sites is found in Sections 3 and 7 of this report.
• Do sites comply with environmental regulation? Numerous state and federal regulations could apply to natural gas production sites, but applicability of all regulations depends on site-specific nuances. The primary environmental regulation that would apply to natural gas extraction sites is TCEQ’s oil and gas “permit-by-rule”. This regulation is in the Texas Administrative Code and sets criteria for air permitting, based on the amount and type of emissions from a given facility. Based on the emission rates that ERG calculated for this project, five sites—a processing facility, three compressor stations, and one well pad—had overall emission rates that exceed regulatory thresholds that are supposed to trigger certain permitting requirements. Section 6 of this report identifies these five sites and presents their estimated emission rates.
• How do releases from these sites affect off-site air pollution levels? Scientists typically use two different methods when trying to understand how a given air pollution source affects local air quality. One approach is to conduct ambient air monitoring, which is directly measuring air pollution levels that people breathe. Another approach is to use dispersion modeling, which is estimating air pollution levels using models that predict how pollutants move through the air from the point where they are released. ERG used both approaches in the FWNGAQS. The ambient air monitoring program identified actual air pollution levels of nearly 140 pollutants at eight locations throughout the city, and the dispersion modeling study estimated air pollution levels at times when, and locations where, ambient monitoring did not take place.
A health-screening analysis of the measured and estimated air pollution levels identified three pollutants—acrolein, benzene, and formaldehyde—as the most important from a risk perspective. While Fort Worth residents are exposed to these and other pollutants released from natural gas sites, the measured and estimated air pollution levels did not reach levels that have been observed to cause adverse health effects. Further, the measured benzene and formaldehyde levels in Fort Worth were not unusually elevated when compared to levels currently measured by TCEQ elsewhere in Texas. There was insufficient data available to do a similar comparison for acrolein. ERG recommended focused additional study to ensure that these pollutants do not reach unhealthy levels in the future. Sections 2, 4, and 5 describe the monitoring, modeling, and health-screening analysis in greater technical detail.
• Are the city’s required setbacks for these sites adequate to protect public health? For the overwhelming majority of sites considered in this study, the modeling analysis indicates that Fort Worth’s 600-foot setback distance is adequate. For the relatively few sites with multiple, large line compressor engines, the modeling analysis found some areas beyond
Fort Worth Natural Gas Air Quality Study Final Report July 13, 2011
xiv
the setbacks to have estimated acrolein and formaldehyde concentrations greater than protective health-based screening levels published by TCEQ. However, the estimated air pollution levels did not reach levels that have actually been found to cause symptoms or illness among exposed populations. Because the findings for these two pollutants are based entirely on estimated emission rates and modeled air quality impacts (as opposed to measured values), ERG recommends further evaluations of acrolein and formaldehyde at sites with multiple, large line engines to provide greater confidence in the adequacy and protectiveness of the city’s setbacks. Some recent, short-term studies of limited scope have monitored for these pollutants, but a longer-term monitoring program is better suited for confirming this study’s findings for acrolein and formaldehyde. Section 5 describes how ERG reached its conclusions regarding the adequacy of the city’s setback distances.
Although this study did not reveal any significant health threats beyond setback distances,
it is important to remember that the sources of concern for this project—natural gas exploration and production activity—are located in residential settings throughout a metropolitan area. Though the most toxic pollutants these sources emit are released in relatively low quantities, ERG fully supports implementing all reasonable precautions to reduce emissions from the well pads and compressor stations. Our recommendations in Section 8 of this report identify several specific opportunities for reducing emissions from natural gas production sites in Fort Worth.
Fort Worth Natural Gas Air Quality Study Final Report July 13, 2011
1-1
1.0 Introduction
The city of Fort Worth is home to extensive natural gas production and exploration as it lies on top of the Barnett Shale, a highly productive natural gas shale formation in north-central Texas. The Barnett Shale underlies 23 counties, including four (Tarrant, Denton, Wise, and Parker) that lie partly within the Fort Worth city boundaries. Over the last several years, natural gas production in the Barnett Shale has increased dramatically. This increase in activity has been brought about by advancements in drilling technologies, most notably hydraulic fracturing and horizontal drilling.
As the Barnett Shale formation is located beneath a highly populated urban environment, extraction of natural gas from it has involved exploration and production operations in residential areas, near public roads and schools, and close to where the citizens of Fort Worth live and work. Due to the highly visible nature of natural gas drilling, fracturing, compression, and collection activities, many individual citizens and community groups in the Fort Worth area have become concerned that these activities could have an adverse effect on their quality of life.
In response to these concerns, on March 9, 2010, the Fort Worth City Council adopted Resolution 3866-03-2010 appointing a committee to review air quality issues associated with natural gas exploration and production. This committee was composed of private citizens, members of local community groups, members of environmental advocacy groups, and representatives from industry. The committee was charged to make recommendations to the City Council on a scope of work for a comprehensive air quality assessment to evaluate the impacts of natural gas exploration and production, to evaluate proposals submitted in response to a solicitation for conducting this study, and to ultimately choose a qualified organization to conduct the study.
The goals of the air quality study, as established by the air quality committee, are to help city officials answer the following four questions:
• How much air pollution is being released by natural gas exploration in Fort Worth?
• Do sites comply with environmental regulation?
• How do releases from these sites affect off-site air pollution levels?
• Are the city’s required setbacks for these sites adequate to protect public health?
In order to answer these questions, the air quality committee identified several key tasks that should be included in this study: ambient air monitoring, point source testing, and air dispersion modeling.
Ambient air monitoring was conducted to measure outdoor pollution levels. Ambient air monitoring was included in the Fort Worth Natural Gas Air Quality Study to measure air pollution levels near selected natural gas facilities.
Point source testing was conducted to determine how much air pollution is being released by natural gas production in Fort Worth, and if natural gas extraction and processing sites
Fort Worth Natural Gas Air Quality Study Final Report July 13, 2011
1-2
comply with environmental regulations. Under this task, various types of air testing equipment were used to detect, identify, and quantify the type and amount of air pollutants being emitted.
Air dispersion modeling was used to estimate the incremental air quality impacts caused by emissions from natural gas facilities. The modeling results provide perspective on air pollution levels at locations where, and at times when, ambient air samples were not collected. The results were used to assess whether the city’s required setbacks (as published in City Ordinance No. 18449-02-2009) are adequately protective of public health.
Finally, a health evaluation compared the results of the ambient air monitoring program and air dispersion modeling to protective health-based screening levels. For selected pollutants, additional context was provided on toxicity and pollution levels typically observed at other locations in Texas.
This report presents the results of each of these tasks and activities, and is organized into eight sections as follows:
• Section 1 – Introduction. This section provides background information on the study.
• Section 2 – Ambient Air Monitoring. This section describes how the ambient air monitoring network was designed and implemented, and presents the ambient air monitoring results.
• Section 3 – Point Source Testing. This section describes how the point source testing task was conducted, what equipment was used, and how the data obtained was used to estimate emissions. The section also summarizes point source testing results.
• Section 4 – Air Dispersion Modeling. This section describes the air dispersion modeling task. It documents the major inputs, assumptions, site configurations, and results.
• Section 5 – Public Health Evaluation. This section interprets the ambient air monitoring data and the air dispersion modeling data from a public health perspective. It also comments on whether the setbacks are adequately protective of public health.
• Section 6 – Regulatory Assessment. This section provides details on the types of air quality regulations that may apply to natural gas exploration and production activities, and draws conclusions (where appropriate) on whether the sites visited under the point source task comply with applicable regulatory thresholds.
• Section 7 – Full Build-Out Estimates. This section discusses the factors expected to affect the growth of natural gas exploration and production in Fort Worth in the coming years and estimates future peak air emissions in Fort Worth.
• Section 8 – Conclusions and Recommendations. This section draws upon the results of each of the project activities to answer the four questions that defined the overall scope of this study. Several recommendations are also provided.
Fort Worth Natural Gas Air Quality Study Final Report July 13, 2011
2-1
2.0 Ambient Air Monitoring
This section presents the findings of the ambient air monitoring component of this study, and contains six sub-sections.
• 2.1 Site Selection – Describes how the monitoring sites were identified.
• 2.2 Sampling Protocol – Describes how the ambient air monitoring samples were obtained.
• 2.3 Sample Analysis – Describes how the ambient air moniroting samples were analyzed at the laboratory.
• 2.4 Quality Assurance/Quality Control – This section describes the quality assurance and quality control (QA/QC) procedures employed during collection and analysis of the ambient air samples.
• 2.5 Ambient Air Monitoring Results – The results of the ambient air monitoring program are discussed in this section, including site-by-site study results.
• 2.6 Ambient Air Monitoring Conclusions – This section presents the conclusions of the ambient air monitoring program.
Ambient air is the air that people might expect to be exposed to at a road, school, or park
near an air pollution emission source, such as a natural gas well pad or compressor station. Ambient air monitors are instruments that measure outdoor pollution levels in the ambient air. In this study, ambient air monitoring was conducted to assess the short-term prevalence and magnitude of concentrations of selected air toxics present in the air outside the property boundaries of air emissions sources such as a natural gas well pad or compressor station.
In this study, air pollution levels of nearly 140 pollutants (including over 40 Hazardous Air Pollutants (HAPs)) were measured over a two-month period with ambient air monitoring stations at eight different locations in Fort Worth. Sampling commenced on September 4, 2010, and concluded on October 31. Data obtained from this ambient air monitoring network can be used to:
• Assist in a better understanding of conclusions drawn from the point source sampling and analysis efforts.
• Characterize exposure to selected air toxics in ambient air at various locations in the city, as related to the proximity to certain natural gas activities (well pads, compressor stations, fracturing operations, etc.).
• Establish a representative determination of the concentration of air toxics, such as benzene, present in the ambient air in the area.
• Allow for a public health evaluation (See Section 5 for the full public health evaluation).
Fort Worth Natural Gas Air Quality Study Final Report July 13, 2011
2-2
The ambient air monitoring network deployed in the field under this project was implemented in accordance with the Ambient Air Monitoring Plan, drafted in August 2010 and finalized on September 15, 2010. The Ambient Air Monitoring Plan identifies the goals and objectives of the ambient air monitoring network, provides technical background information (such as historical meteorological data) needed to identify candidate monitoring site locations, specifies the technical approach used to focus the list of candidate monitoring sites, and provides the final list of sites used in the study. Also, prior to implementation of the monitoring study, ERG prepared an approved Level 1 Ambient Air Monitoring Quality Assurance Project Plan
(QAPP) which provided specific information on the sampling protocols, sampling analyses, and data reporting. 2.1 Site Selection
The final selection of eight monitoring sites occurred in two phases.
In Phase 1, geographic information system (GIS) data was obtained from the city of Fort
Worth showing the locations of active and permitted natural gas activities, compressor stations, city property, nearby roadways, meteorological stations, and other features. These data and maps were overlaid to show natural gas activities in relation to residences, schools, businesses, existing (non-natural-gas) emission sources, and city-owned property. Monitoring on city-owned property was desirable for several reasons, including ensuring that the project team had site access seven days a week, maintaining the security of project staff and sampling equipment, and maintaining the integrity of the air sample by limiting the chance of vandalism or other tampering. During Phase 1, 20 potential monitoring site locations were identified.
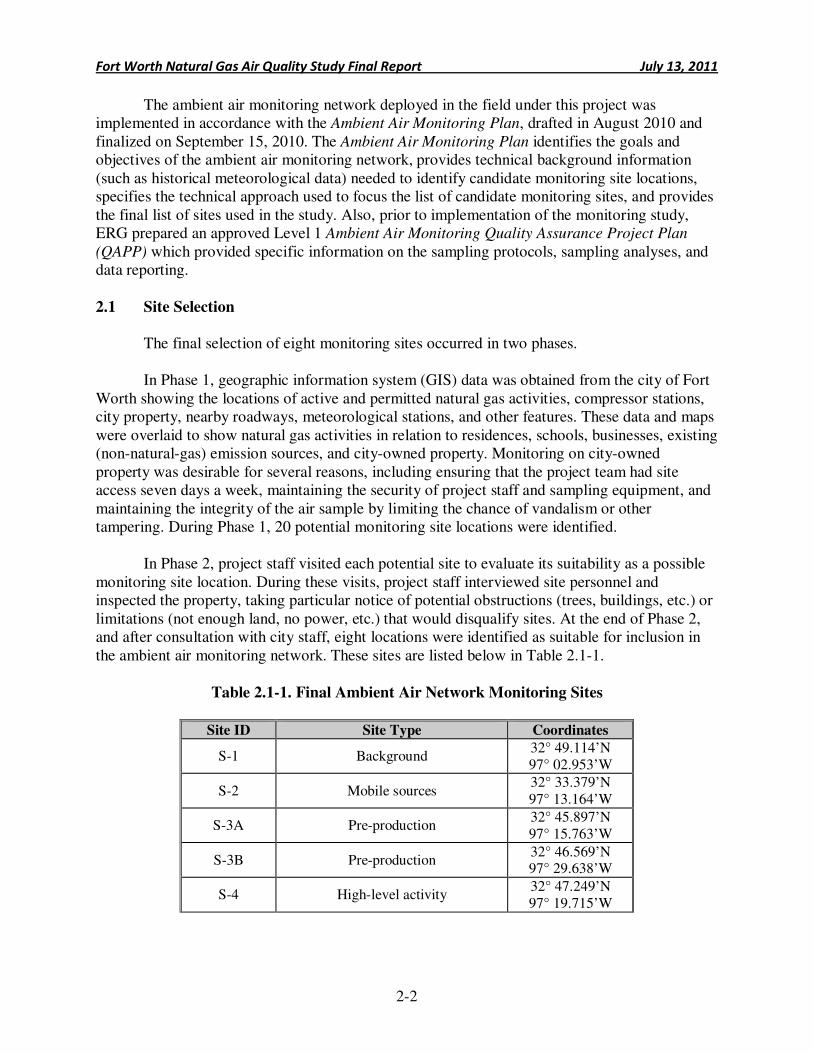
In Phase 2, project staff visited each potential site to evaluate its suitability as a possible monitoring site location. During these visits, project staff interviewed site personnel and inspected the property, taking particular notice of potential obstructions (trees, buildings, etc.) or limitations (not enough land, no power, etc.) that would disqualify sites. At the end of Phase 2, and after consultation with city staff, eight locations were identified as suitable for inclusion in the ambient air monitoring network. These sites are listed below in Table 2.1-1.
Table 2.1-1. Final Ambient Air Network Monitoring Sites
Site ID Site Type Coordinates
S-1 Background 32° 49.114’N 97° 02.953’W
S-2 Mobile sources 32° 33.379’N 97° 13.164’W
S-3A Pre-production 32° 45.897’N 97° 15.763’W
S-3B Pre-production 32° 46.569’N 97° 29.638’W
S-4 High-level activity 32° 47.249’N 97° 19.715’W
Fort Worth Natural Gas Air Quality Study Final Report July 13, 2011
2-3
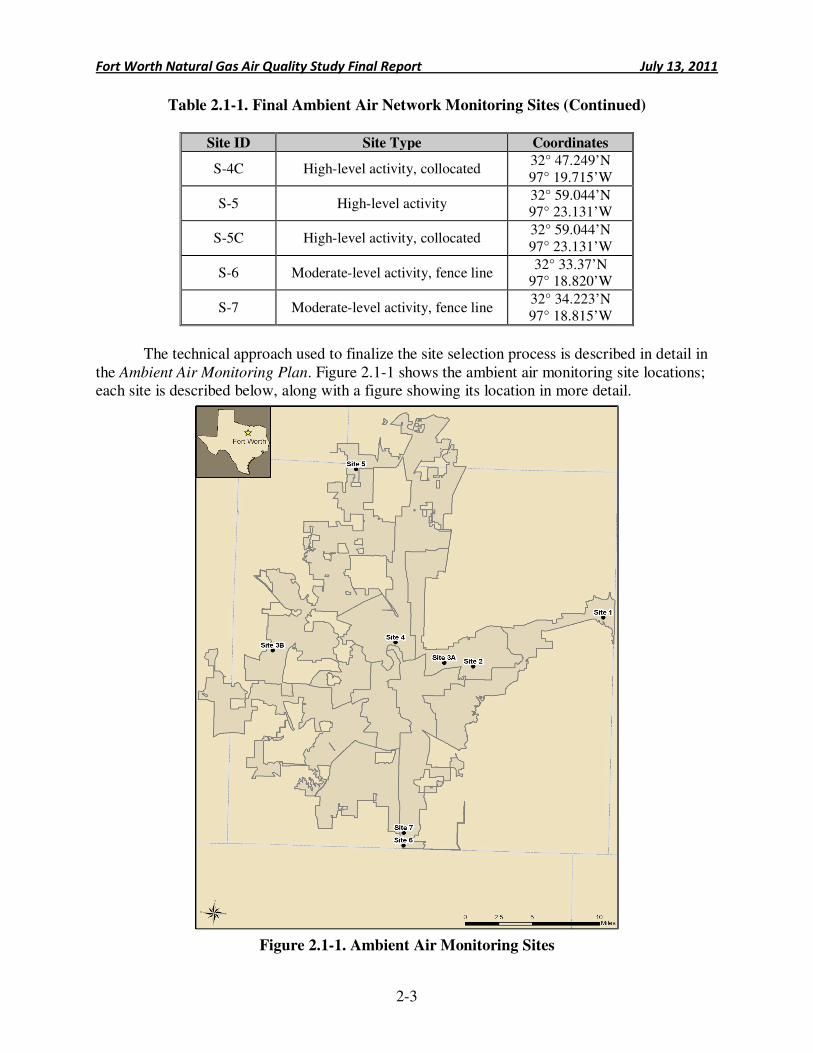
Table 2.1-1. Final Ambient Air Network Monitoring Sites (Continued)
Site ID Site Type Coordinates
S-4C High-level activity, collocated 32° 47.249’N 97° 19.715’W
S-5 High-level activity 32° 59.044’N 97° 23.131’W
S-5C High-level activity, collocated 32° 59.044’N 97° 23.131’W
S-6 Moderate-level activity, fence line 32° 33.37’N
97° 18.820’W
S-7 Moderate-level activity, fence line 32° 34.223’N 97° 18.815’W
The technical approach used to finalize the site selection process is described in detail in
the Ambient Air Monitoring Plan. Figure 2.1-1 shows the ambient air monitoring site locations; each site is described below, along with a figure showing its location in more detail.
Figure 2.1-1. Ambient Air Monitoring Sites
Fort Worth Natural Gas Air Quality Study Final Report July 13, 2011
2-4
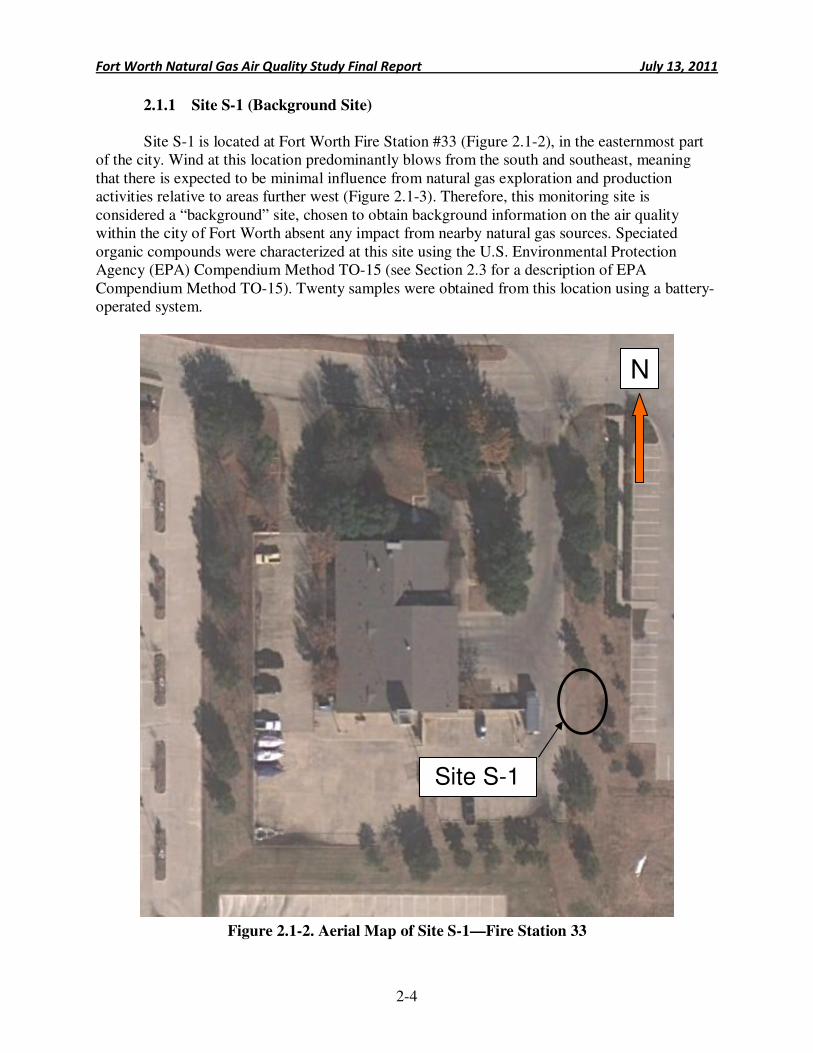
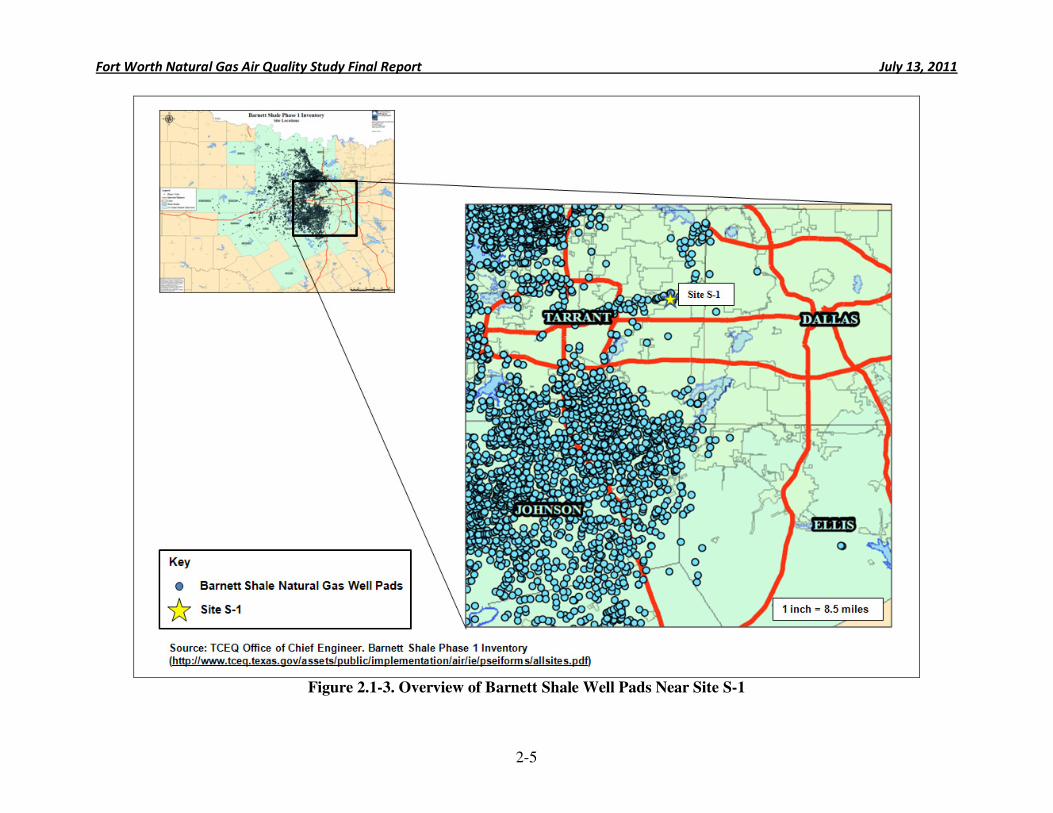
2.1.1 Site S-1 (Background Site)
Site S-1 is located at Fort Worth Fire Station #33 (Figure 2.1-2), in the easternmost part of the city. Wind at this location predominantly blows from the south and southeast, meaning that there is expected to be minimal influence from natural gas exploration and production activities relative to areas further west (Figure 2.1-3). Therefore, this monitoring site is considered a “background” site, chosen to obtain background information on the air quality within the city of Fort Worth absent any impact from nearby natural gas sources. Speciated organic compounds were characterized at this site using the U.S. Environmental Protection Agency (EPA) Compendium Method TO-15 (see Section 2.3 for a description of EPA Compendium Method TO-15). Twenty samples were obtained from this location using a battery-operated system.
Figure 2.1-2. Aerial Map of Site S-1—Fire Station 33
Site S-1
N
Fort Worth Natural Gas Air Quality Study Final Report July 13, 2011
2-5
Figure 2.1-3. Overview of Barnett Shale Well Pads Near Site S-1 N
Fort Worth Natural Gas Air Quality Study Final Report July 13, 2011
2-6
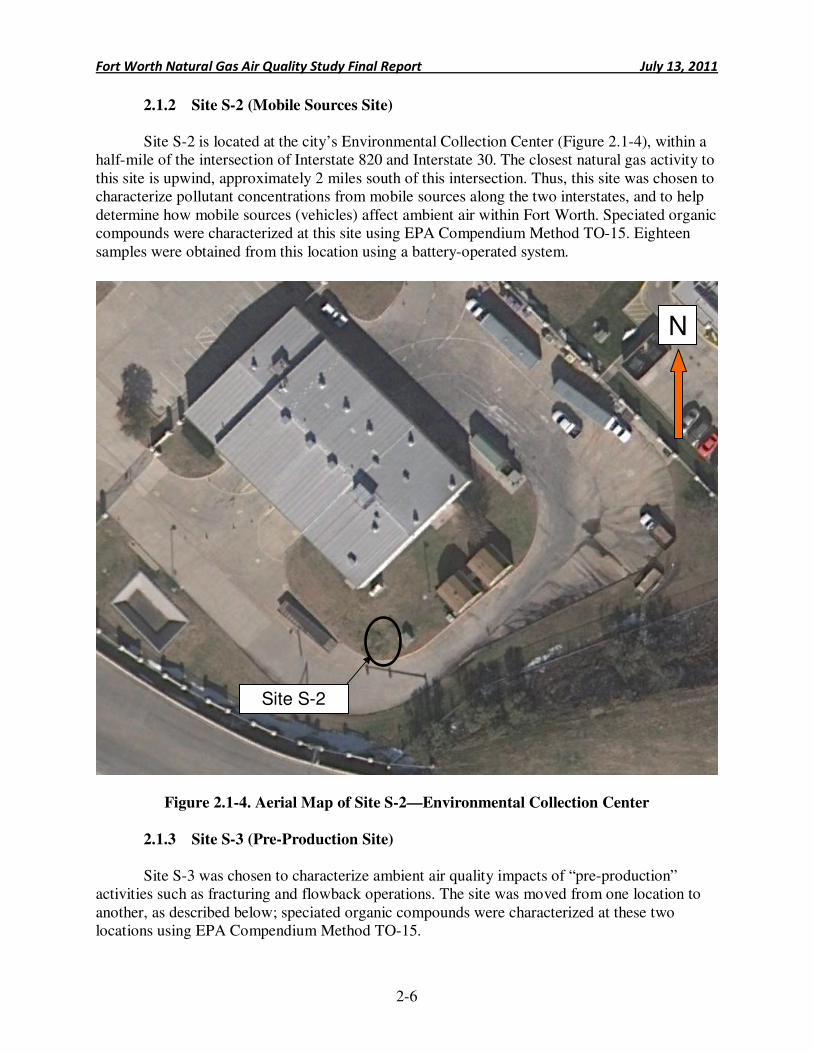
2.1.2 Site S-2 (Mobile Sources Site)
Site S-2 is located at the city’s Environmental Collection Center (Figure 2.1-4), within a half-mile of the intersection of Interstate 820 and Interstate 30. The closest natural gas activity to this site is upwind, approximately 2 miles south of this intersection. Thus, this site was chosen to characterize pollutant concentrations from mobile sources along the two interstates, and to help determine how mobile sources (vehicles) affect ambient air within Fort Worth. Speciated organic compounds were characterized at this site using EPA Compendium Method TO-15. Eighteen samples were obtained from this location using a battery-operated system.
Figure 2.1-4. Aerial Map of Site S-2—Environmental Collection Center
2.1.3 Site S-3 (Pre-Production Site)
Site S-3 was chosen to characterize ambient air quality impacts of “pre-production”
activities such as fracturing and flowback operations. The site was moved from one location to another, as described below; speciated organic compounds were characterized at these two locations using EPA Compendium Method TO-15.
Site S-2
N
Fort Worth Natural Gas Air Quality Study Final Report July 13, 2011
2-7
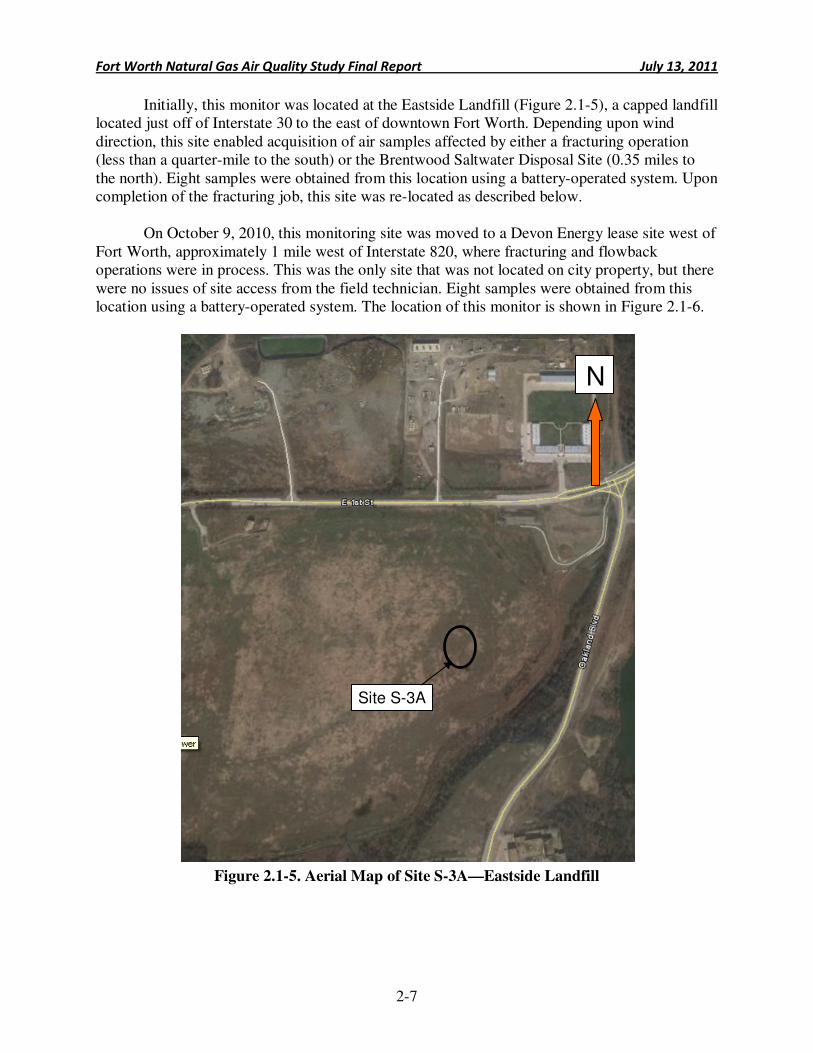
Initially, this monitor was located at the Eastside Landfill (Figure 2.1-5), a capped landfill located just off of Interstate 30 to the east of downtown Fort Worth. Depending upon wind direction, this site enabled acquisition of air samples affected by either a fracturing operation (less than a quarter-mile to the south) or the Brentwood Saltwater Disposal Site (0.35 miles to the north). Eight samples were obtained from this location using a battery-operated system. Upon completion of the fracturing job, this site was re-located as described below.
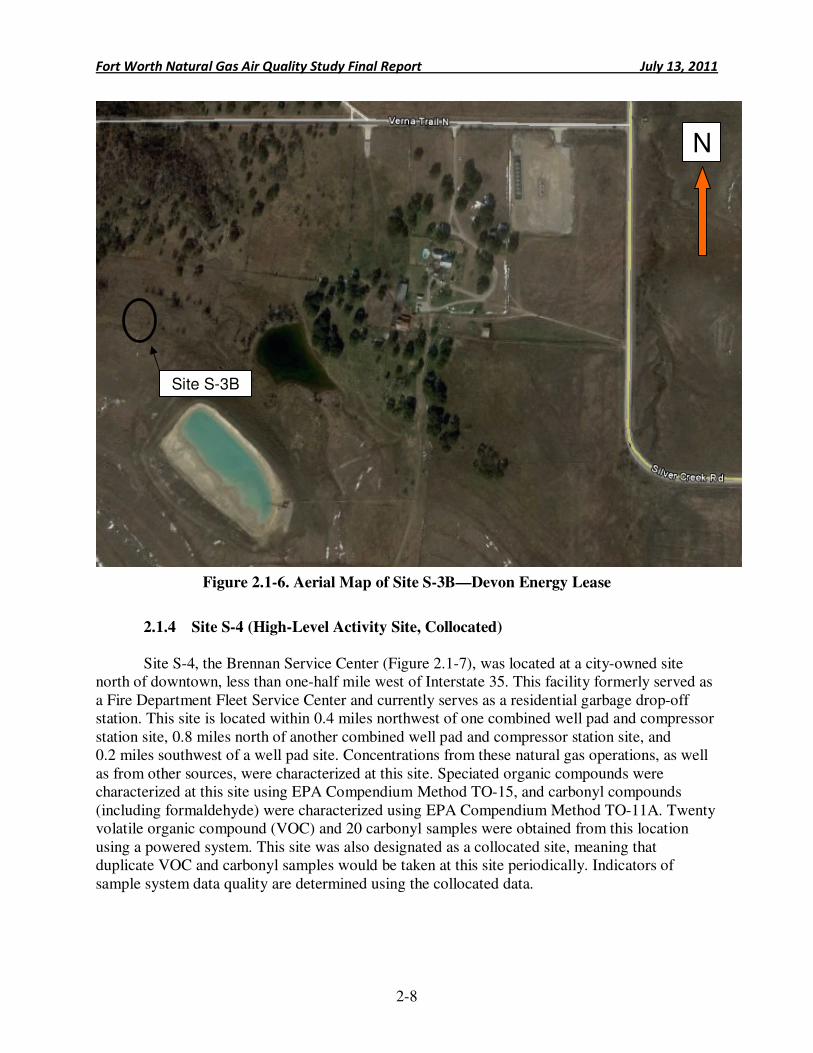
On October 9, 2010, this monitoring site was moved to a Devon Energy lease site west of Fort Worth, approximately 1 mile west of Interstate 820, where fracturing and flowback operations were in process. This was the only site that was not located on city property, but there were no issues of site access from the field technician. Eight samples were obtained from this location using a battery-operated system. The location of this monitor is shown in Figure 2.1-6.
Figure 2.1-5. Aerial Map of Site S-3A—Eastside Landfill
Site S-3A
N
Fort Worth Natural Gas Air Quality Study Final Report July 13, 2011
2-8
Figure 2.1-6. Aerial Map of Site S-3B—Devon Energy Lease
2.1.4 Site S-4 (High-Level Activity Site, Collocated)
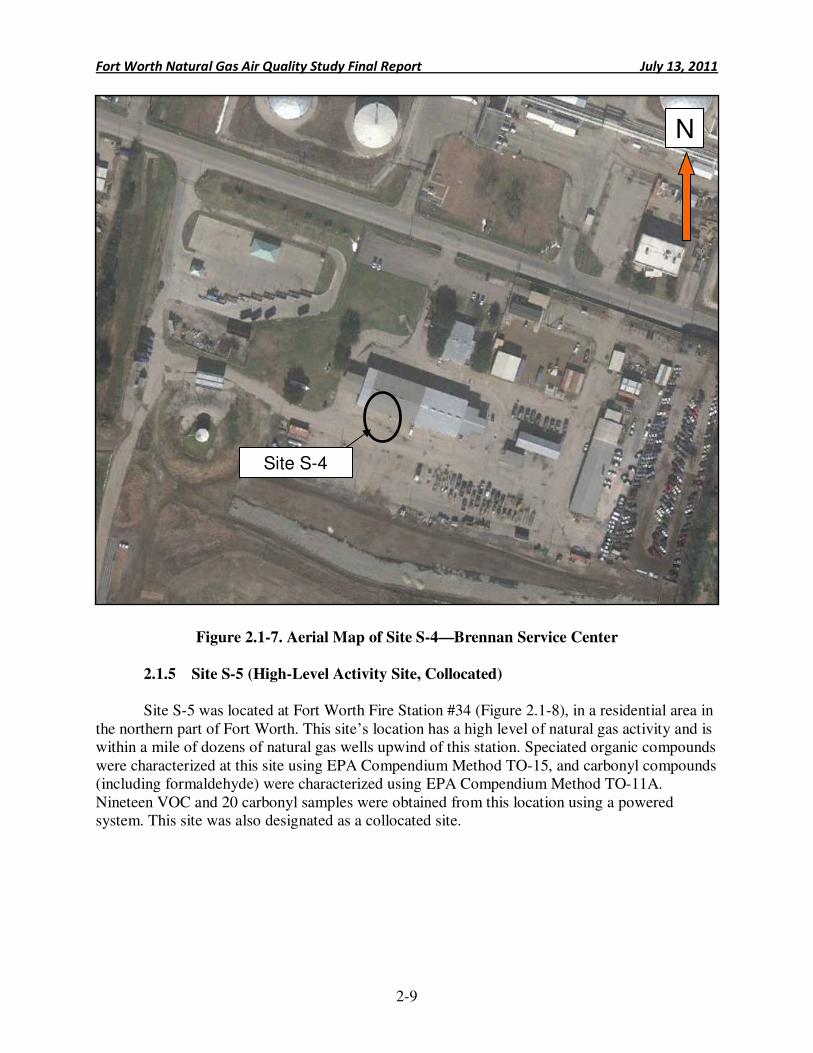
Site S-4, the Brennan Service Center (Figure 2.1-7), was located at a city-owned site
north of downtown, less than one-half mile west of Interstate 35. This facility formerly served as a Fire Department Fleet Service Center and currently serves as a residential garbage drop-off station. This site is located within 0.4 miles northwest of one combined well pad and compressor station site, 0.8 miles north of another combined well pad and compressor station site, and 0.2 miles southwest of a well pad site. Concentrations from these natural gas operations, as well as from other sources, were characterized at this site. Speciated organic compounds were characterized at this site using EPA Compendium Method TO-15, and carbonyl compounds (including formaldehyde) were characterized using EPA Compendium Method TO-11A. Twenty volatile organic compound (VOC) and 20 carbonyl samples were obtained from this location using a powered system. This site was also designated as a collocated site, meaning that duplicate VOC and carbonyl samples would be taken at this site periodically. Indicators of sample system data quality are determined using the collocated data.
Site S-3B
N
Fort Worth Natural Gas Air Quality Study Final Report July 13, 2011
2-9
Figure 2.1-7. Aerial Map of Site S-4—Brennan Service Center
2.1.5 Site S-5 (High-Level Activity Site, Collocated)
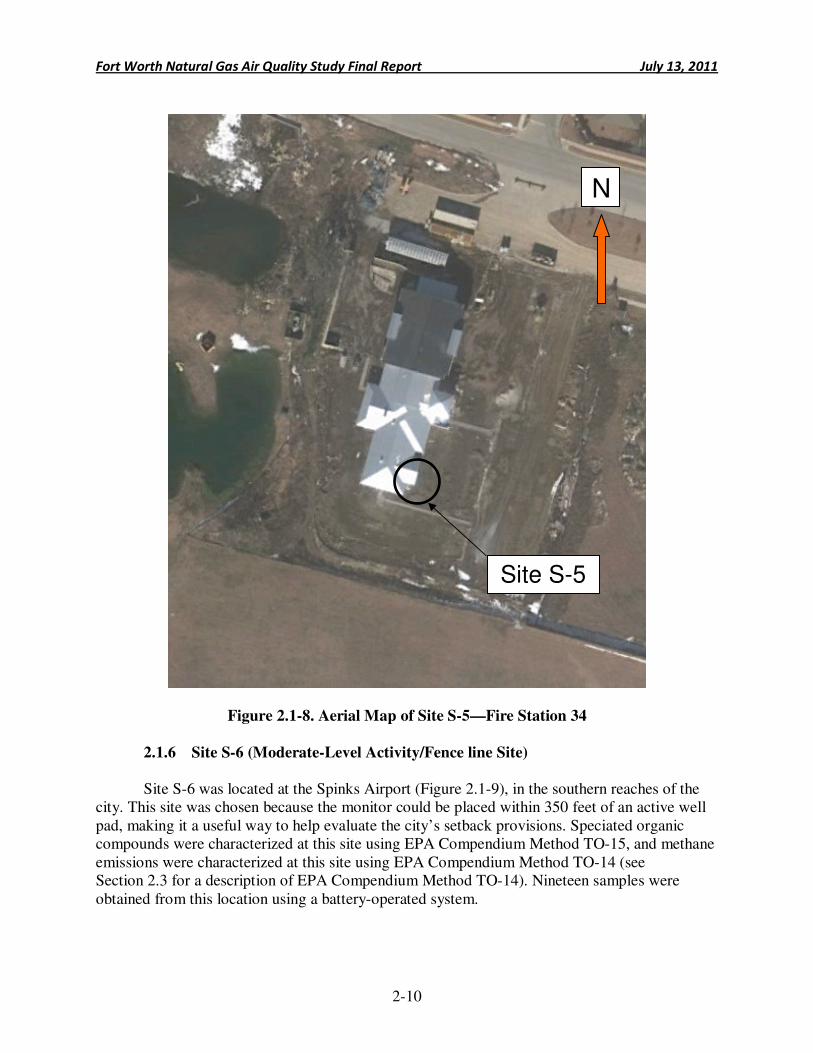
Site S-5 was located at Fort Worth Fire Station #34 (Figure 2.1-8), in a residential area in
the northern part of Fort Worth. This site’s location has a high level of natural gas activity and is within a mile of dozens of natural gas wells upwind of this station. Speciated organic compounds were characterized at this site using EPA Compendium Method TO-15, and carbonyl compounds (including formaldehyde) were characterized using EPA Compendium Method TO-11A. Nineteen VOC and 20 carbonyl samples were obtained from this location using a powered system. This site was also designated as a collocated site.
Site S-4
N
Fort Worth Natural Gas Air Quality Study Final Report July 13, 2011
2-10
Figure 2.1-8. Aerial Map of Site S-5—Fire Station 34
2.1.6 Site S-6 (Moderate-Level Activity/Fence line Site)
Site S-6 was located at the Spinks Airport (Figure 2.1-9), in the southern reaches of the city. This site was chosen because the monitor could be placed within 350 feet of an active well pad, making it a useful way to help evaluate the city’s setback provisions. Speciated organic compounds were characterized at this site using EPA Compendium Method TO-15, and methane emissions were characterized at this site using EPA Compendium Method TO-14 (see Section 2.3 for a description of EPA Compendium Method TO-14). Nineteen samples were obtained from this location using a battery-operated system.
Site S-5
N
Fort Worth Natural Gas Air Quality Study Final Report July 13, 2011
2-11
9
Figure 2.1-9. Aerial Map of Site S-6—Spinks Airport (South)
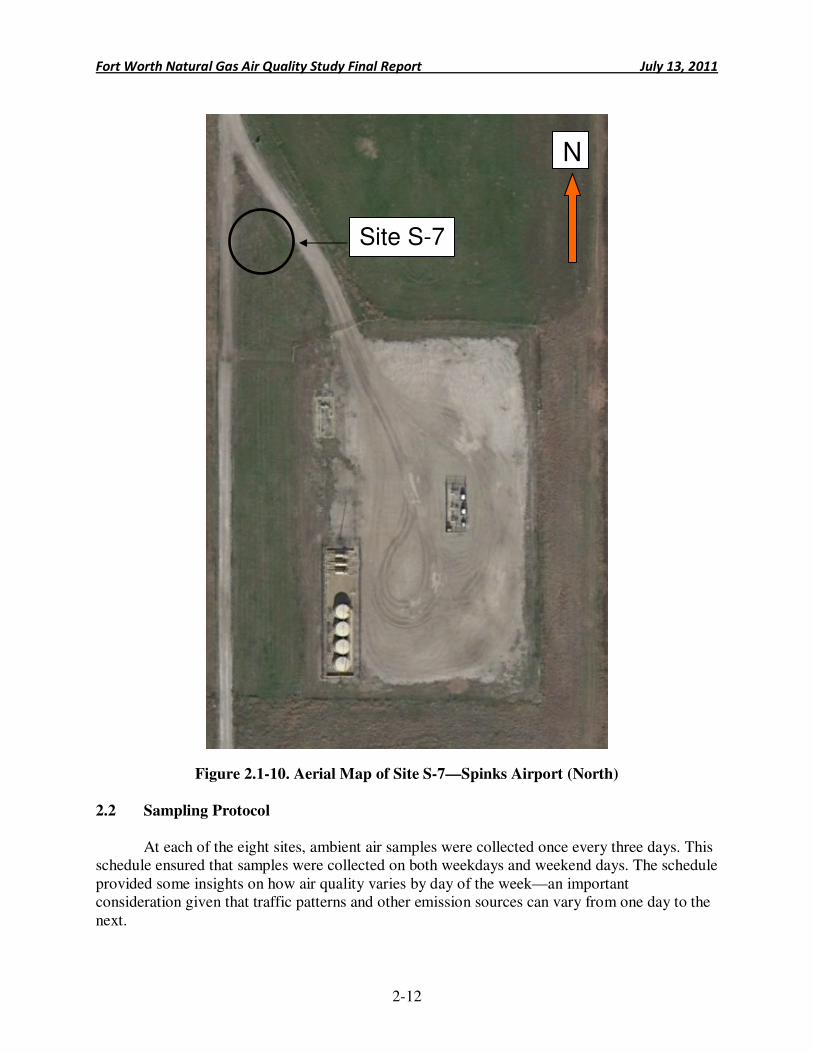
2.1.7 Site S-7 (Moderate-Level Activity/Fence line Site)
Site S-7 was also located at the Spinks Airport (Figure 2.1-10) in the southern reaches of the city. This site was also chosen to help evaluate the city’s setback provisions, as this monitor was situated within 200 feet of an active well pad. Speciated organic compounds were characterized at this site using EPA Compendium Method TO-15, and methane emissions were characterized at this site using EPA Compendium Method TO-14. Eighteen samples were obtained from this location using a battery-operated system.
Site S-6
N
Fort Worth Natural Gas Air Quality Study Final Report July 13, 2011
2-12
Figure 2.1-10. Aerial Map of Site S-7—Spinks Airport (North) 2.2 Sampling Protocol
At each of the eight sites, ambient air samples were collected once every three days. This schedule ensured that samples were collected on both weekdays and weekend days. The schedule provided some insights on how air quality varies by day of the week—an important consideration given that traffic patterns and other emission sources can vary from one day to the next.
Site S-7
N
Fort Worth Natural Gas Air Quality Study Final Report July 13, 2011
2-13
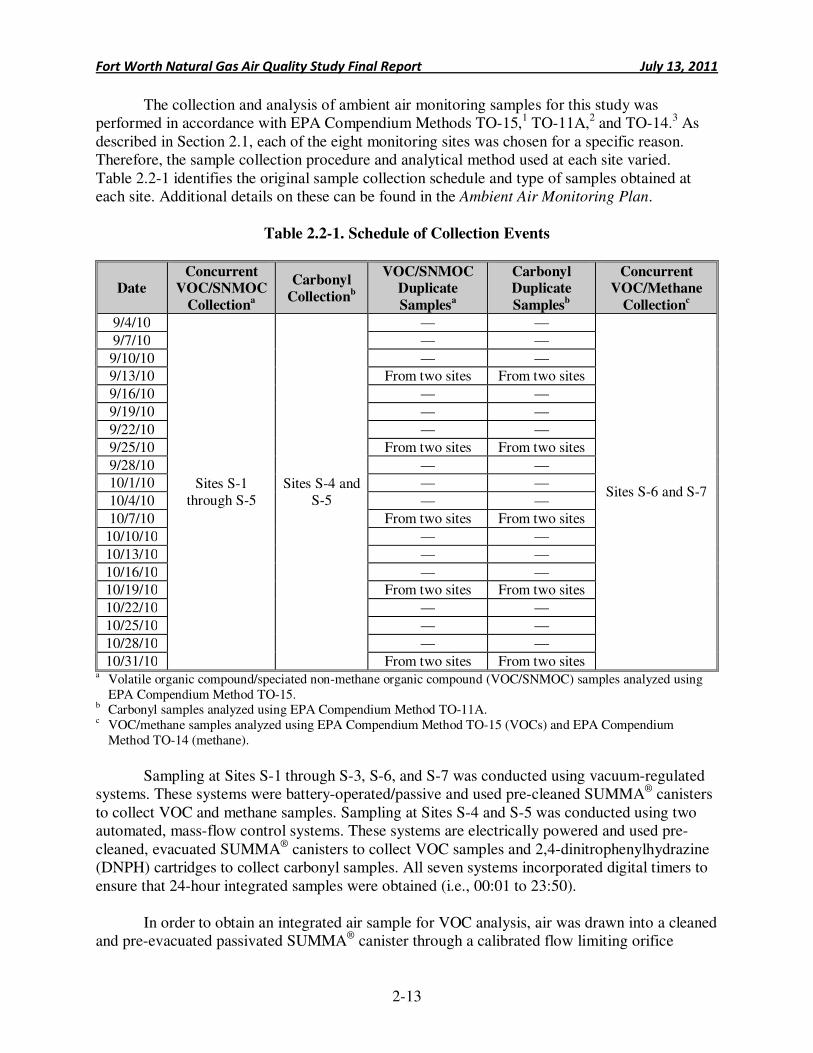
The collection and analysis of ambient air monitoring samples for this study was performed in accordance with EPA Compendium Methods TO-15,1 TO-11A,2 and TO-14.3 As described in Section 2.1, each of the eight monitoring sites was chosen for a specific reason. Therefore, the sample collection procedure and analytical method used at each site varied. Table 2.2-1 identifies the original sample collection schedule and type of samples obtained at each site. Additional details on these can be found in the Ambient Air Monitoring Plan.
Table 2.2-1. Schedule of Collection Events
Date Concurrent
VOC/SNMOC
Collectiona
Carbonyl
Collectionb
VOC/SNMOC Duplicate
Samplesa
Carbonyl Duplicate
Samplesb
Concurrent VOC/Methane
Collectionc
9/4/10
Sites S-1 through S-5
Sites S-4 and S-5
— —
Sites S-6 and S-7
9/7/10 — —
9/10/10 — —
9/13/10 From two sites From two sites
9/16/10 — —
9/19/10 — —
9/22/10 — —
9/25/10 From two sites From two sites
9/28/10 — —
10/1/10 — —
10/4/10 — —
10/7/10 From two sites From two sites
10/10/10 — —
10/13/10 — —
10/16/10 — —
10/19/10 From two sites From two sites
10/22/10 — —
10/25/10 — —
10/28/10 — —
10/31/10 From two sites From two sites a Volatile organic compound/speciated non-methane organic compound (VOC/SNMOC) samples analyzed using
EPA Compendium Method TO-15. b Carbonyl samples analyzed using EPA Compendium Method TO-11A. c VOC/methane samples analyzed using EPA Compendium Method TO-15 (VOCs) and EPA Compendium
Method TO-14 (methane).
Sampling at Sites S-1 through S-3, S-6, and S-7 was conducted using vacuum-regulated systems. These systems were battery-operated/passive and used pre-cleaned SUMMA® canisters to collect VOC and methane samples. Sampling at Sites S-4 and S-5 was conducted using two automated, mass-flow control systems. These systems are electrically powered and used pre-cleaned, evacuated SUMMA® canisters to collect VOC samples and 2,4-dinitrophenylhydrazine (DNPH) cartridges to collect carbonyl samples. All seven systems incorporated digital timers to ensure that 24-hour integrated samples were obtained (i.e., 00:01 to 23:50).
In order to obtain an integrated air sample for VOC analysis, air was drawn into a cleaned and pre-evacuated passivated SUMMA® canister through a calibrated flow limiting orifice
Fort Worth Natural Gas Air Quality Study Final Report July 13, 2011
2-14
assembly that regulated the rate and duration of sampling. After the air sample was collected, the canister valve was closed automatically. The day following the sample collection, project staff visited each site; inspected the sample media for any errors, inconsistencies, or signs of tampering; and completed a chain-of-custody (COC) form for each of the samples. For each sample that was deemed viable for analysis, the sample and the COC form were shipped together to the laboratory for analysis. The information on the COC form included the following:
• Sample ID number
• Sampling equipment identification
• Sampling date
• Sampling start time
• Sampling end time
• Elapsed time
• Initial flowrate
• End flowrate
• Average flowrate
• Sample volume (total liters)
• Comments (field observations and/or anomalies during sampling)
• Name and signature of field operator releasing samples for shipment
• Condition of custody seal upon receipt by laboratory
• Condition of samples upon receipt by laboratory
• Signature of laboratory representative receiving shipment
• Date of sample receipt at laboratory
The samples obtained at Sites S-1 through S-5 were analyzed at Eastern Research Group’s (ERG’s) laboratory in Morrisville, North Carolina, while the samples obtained at Sites S-6 and S-7 were analyzed at TestAmerica’s™ laboratory in Austin, Texas. Appendix 2-A contains the COC forms for Sites S-1 through S-5, Appendix 2-B contains the analytical results for SNMOCs at Sites S-1 through S-5, Appendix 2-C contains the analytical results for EPA Compendium Method TO-15 at Sites S-1 through S-5, Appendix 2-D contains the analytical results for EPA Compendium Method TO-11A at Sites S-4 and S-5, and Appendix 2-E contains the COC forms and analytical results for Sites S-6 and S-7.
Upon receipt, the canister information was recorded and the sample stored until analysis. Storage times of up to 45 days without compound concentration losses have been demonstrated for many of the VOCs (e.g., benzene, toluene, ethylbenzene, and xylenes) found in urban atmospheres. Although the required turnaround time under the method guidelines is 45 days, an actual turnaround time of approximately 30 days from sample receipt to sample analysis was typical.
Fort Worth Natural Gas Air Quality Study Final Report July 13, 2011
2-15
2.3 Sample Analysis
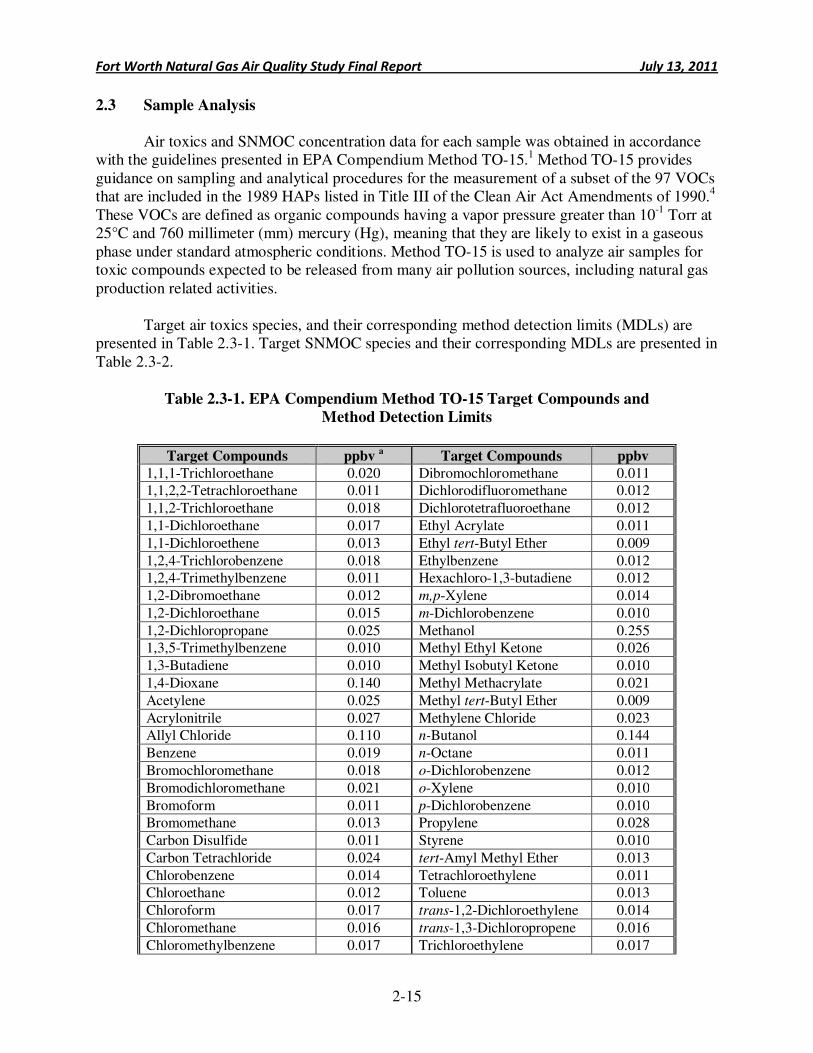
Air toxics and SNMOC concentration data for each sample was obtained in accordance with the guidelines presented in EPA Compendium Method TO-15.1 Method TO-15 provides guidance on sampling and analytical procedures for the measurement of a subset of the 97 VOCs that are included in the 1989 HAPs listed in Title III of the Clean Air Act Amendments of 1990.4 These VOCs are defined as organic compounds having a vapor pressure greater than 10-1 Torr at 25°C and 760 millimeter (mm) mercury (Hg), meaning that they are likely to exist in a gaseous phase under standard atmospheric conditions. Method TO-15 is used to analyze air samples for toxic compounds expected to be released from many air pollution sources, including natural gas production related activities.
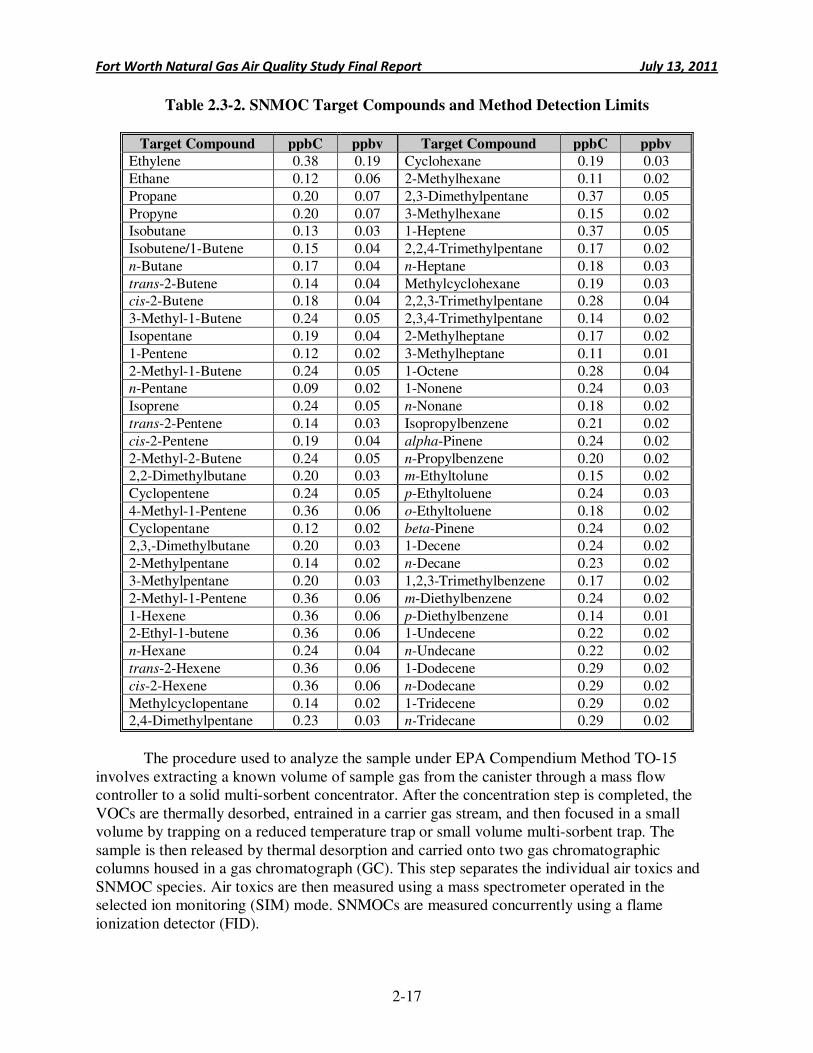
Target air toxics species, and their corresponding method detection limits (MDLs) are presented in Table 2.3-1. Target SNMOC species and their corresponding MDLs are presented in Table 2.3-2.
Table 2.3-1. EPA Compendium Method TO-15 Target Compounds and
Method Detection Limits
Target Compounds ppbv a Target Compounds ppbv
1,1,1-Trichloroethane 0.020 Dibromochloromethane 0.011 1,1,2,2-Tetrachloroethane 0.011 Dichlorodifluoromethane 0.012
1,1,2-Trichloroethane 0.018 Dichlorotetrafluoroethane 0.012
1,1-Dichloroethane 0.017 Ethyl Acrylate 0.011
1,1-Dichloroethene 0.013 Ethyl tert-Butyl Ether 0.009
1,2,4-Trichlorobenzene 0.018 Ethylbenzene 0.012 1,2,4-Trimethylbenzene 0.011 Hexachloro-1,3-butadiene 0.012
1,2-Dibromoethane 0.012 m,p-Xylene 0.014
1,2-Dichloroethane 0.015 m-Dichlorobenzene 0.010
1,2-Dichloropropane 0.025 Methanol 0.255 1,3,5-Trimethylbenzene 0.010 Methyl Ethyl Ketone 0.026
1,3-Butadiene 0.010 Methyl Isobutyl Ketone 0.010
1,4-Dioxane 0.140 Methyl Methacrylate 0.021
Acetylene 0.025 Methyl tert-Butyl Ether 0.009
Acrylonitrile 0.027 Methylene Chloride 0.023 Allyl Chloride 0.110 n-Butanol 0.144
Benzene 0.019 n-Octane 0.011
Bromochloromethane 0.018 o-Dichlorobenzene 0.012
Bromodichloromethane 0.021 o-Xylene 0.010
Bromoform 0.011 p-Dichlorobenzene 0.010 Bromomethane 0.013 Propylene 0.028
Carbon Disulfide 0.011 Styrene 0.010
Carbon Tetrachloride 0.024 tert-Amyl Methyl Ether 0.013
Chlorobenzene 0.014 Tetrachloroethylene 0.011 Chloroethane 0.012 Toluene 0.013
Chloroform 0.017 trans-1,2-Dichloroethylene 0.014
Chloromethane 0.016 trans-1,3-Dichloropropene 0.016
Chloromethylbenzene 0.017 Trichloroethylene 0.017
Fort Worth Natural Gas Air Quality Study Final Report July 13, 2011
2-16
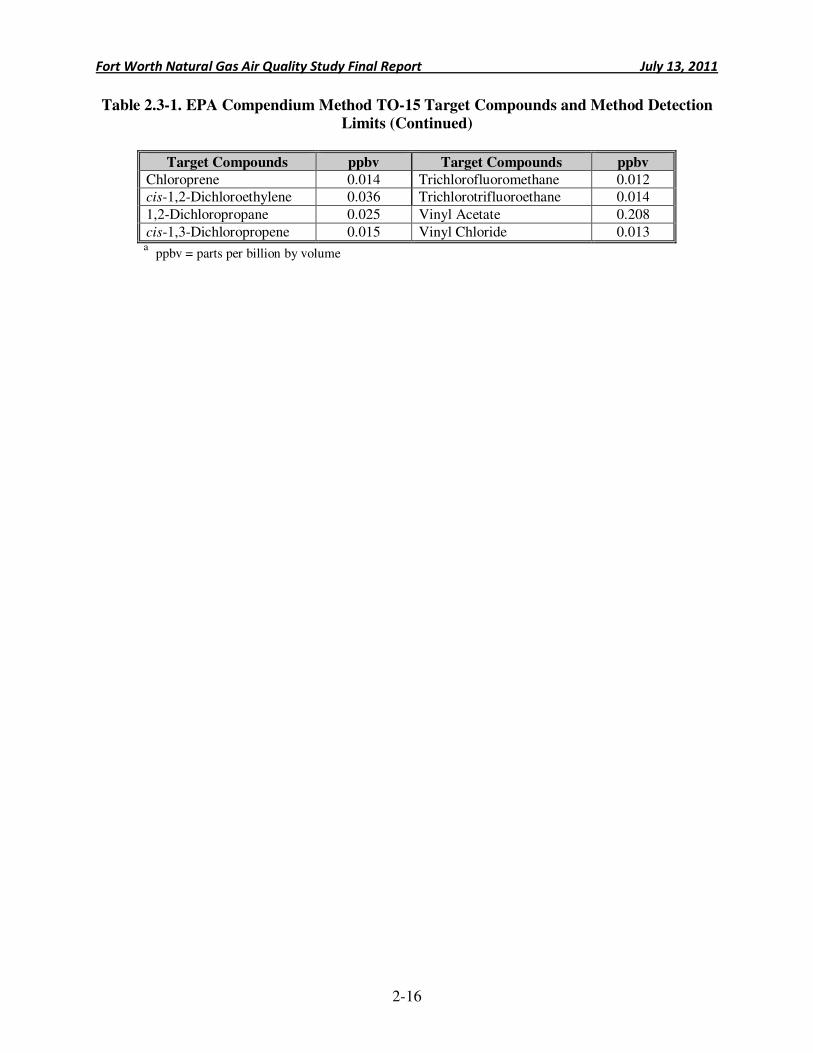
Table 2.3-1. EPA Compendium Method TO-15 Target Compounds and Method Detection
Limits (Continued)
Target Compounds ppbv Target Compounds ppbv
Chloroprene 0.014 Trichlorofluoromethane 0.012 cis-1,2-Dichloroethylene 0.036 Trichlorotrifluoroethane 0.014
1,2-Dichloropropane 0.025 Vinyl Acetate 0.208
cis-1,3-Dichloropropene 0.015 Vinyl Chloride 0.013 a
ppbv = parts per billion by volume
Fort Worth Natural Gas Air Quality Study Final Report July 13, 2011
2-17
Table 2.3-2. SNMOC Target Compounds and Method Detection Limits
Target Compound ppbC ppbv Target Compound ppbC ppbv
Ethylene 0.38 0.19 Cyclohexane 0.19 0.03
Ethane 0.12 0.06 2-Methylhexane 0.11 0.02
Propane 0.20 0.07 2,3-Dimethylpentane 0.37 0.05
Propyne 0.20 0.07 3-Methylhexane 0.15 0.02 Isobutane 0.13 0.03 1-Heptene 0.37 0.05
Isobutene/1-Butene 0.15 0.04 2,2,4-Trimethylpentane 0.17 0.02
n-Butane 0.17 0.04 n-Heptane 0.18 0.03
trans-2-Butene 0.14 0.04 Methylcyclohexane 0.19 0.03 cis-2-Butene 0.18 0.04 2,2,3-Trimethylpentane 0.28 0.04
3-Methyl-1-Butene 0.24 0.05 2,3,4-Trimethylpentane 0.14 0.02
Isopentane 0.19 0.04 2-Methylheptane 0.17 0.02
1-Pentene 0.12 0.02 3-Methylheptane 0.11 0.01
2-Methyl-1-Butene 0.24 0.05 1-Octene 0.28 0.04 n-Pentane 0.09 0.02 1-Nonene 0.24 0.03
Isoprene 0.24 0.05 n-Nonane 0.18 0.02
trans-2-Pentene 0.14 0.03 Isopropylbenzene 0.21 0.02
cis-2-Pentene 0.19 0.04 alpha-Pinene 0.24 0.02
2-Methyl-2-Butene 0.24 0.05 n-Propylbenzene 0.20 0.02 2,2-Dimethylbutane 0.20 0.03 m-Ethyltolune 0.15 0.02
Cyclopentene 0.24 0.05 p-Ethyltoluene 0.24 0.03
4-Methyl-1-Pentene 0.36 0.06 o-Ethyltoluene 0.18 0.02
Cyclopentane 0.12 0.02 beta-Pinene 0.24 0.02 2,3,-Dimethylbutane 0.20 0.03 1-Decene 0.24 0.02
2-Methylpentane 0.14 0.02 n-Decane 0.23 0.02
3-Methylpentane 0.20 0.03 1,2,3-Trimethylbenzene 0.17 0.02
2-Methyl-1-Pentene 0.36 0.06 m-Diethylbenzene 0.24 0.02
1-Hexene 0.36 0.06 p-Diethylbenzene 0.14 0.01 2-Ethyl-1-butene 0.36 0.06 1-Undecene 0.22 0.02
n-Hexane 0.24 0.04 n-Undecane 0.22 0.02
trans-2-Hexene 0.36 0.06 1-Dodecene 0.29 0.02
cis-2-Hexene 0.36 0.06 n-Dodecane 0.29 0.02
Methylcyclopentane 0.14 0.02 1-Tridecene 0.29 0.02 2,4-Dimethylpentane 0.23 0.03 n-Tridecane 0.29 0.02
The procedure used to analyze the sample under EPA Compendium Method TO-15 involves extracting a known volume of sample gas from the canister through a mass flow controller to a solid multi-sorbent concentrator. After the concentration step is completed, the VOCs are thermally desorbed, entrained in a carrier gas stream, and then focused in a small volume by trapping on a reduced temperature trap or small volume multi-sorbent trap. The sample is then released by thermal desorption and carried onto two gas chromatographic columns housed in a gas chromatograph (GC). This step separates the individual air toxics and SNMOC species. Air toxics are then measured using a mass spectrometer operated in the selected ion monitoring (SIM) mode. SNMOCs are measured concurrently using a flame ionization detector (FID).
Fort Worth Natural Gas Air Quality Study Final Report July 13, 2011
2-18
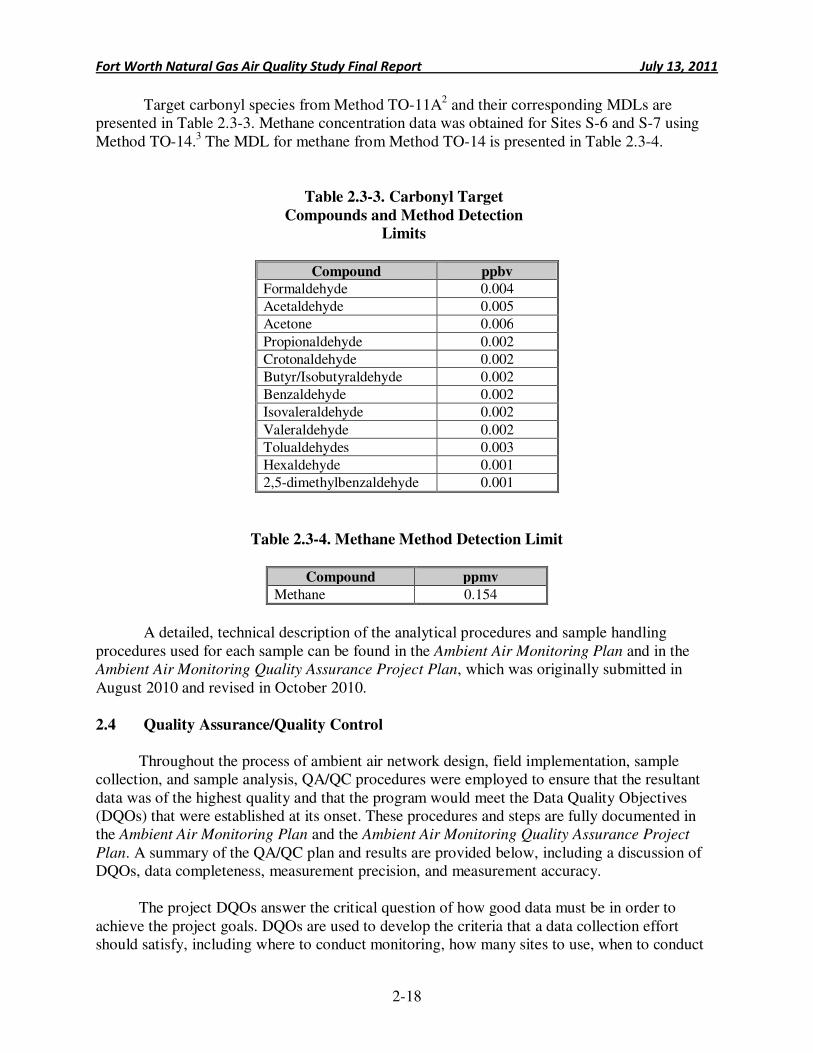
Target carbonyl species from Method TO-11A2 and their corresponding MDLs are presented in Table 2.3-3. Methane concentration data was obtained for Sites S-6 and S-7 using Method TO-14.3 The MDL for methane from Method TO-14 is presented in Table 2.3-4.
Table 2.3-3. Carbonyl Target
Compounds and Method Detection
Limits
Compound ppbv
Formaldehyde 0.004
Acetaldehyde 0.005
Acetone 0.006
Propionaldehyde 0.002
Crotonaldehyde 0.002
Butyr/Isobutyraldehyde 0.002
Benzaldehyde 0.002
Isovaleraldehyde 0.002
Valeraldehyde 0.002
Tolualdehydes 0.003
Hexaldehyde 0.001
2,5-dimethylbenzaldehyde 0.001
Table 2.3-4. Methane Method Detection Limit
Compound ppmv
Methane 0.154
A detailed, technical description of the analytical procedures and sample handling
procedures used for each sample can be found in the Ambient Air Monitoring Plan and in the Ambient Air Monitoring Quality Assurance Project Plan, which was originally submitted in August 2010 and revised in October 2010. 2.4 Quality Assurance/Quality Control
Throughout the process of ambient air network design, field implementation, sample collection, and sample analysis, QA/QC procedures were employed to ensure that the resultant data was of the highest quality and that the program would meet the Data Quality Objectives (DQOs) that were established at its onset. These procedures and steps are fully documented in the Ambient Air Monitoring Plan and the Ambient Air Monitoring Quality Assurance Project
Plan. A summary of the QA/QC plan and results are provided below, including a discussion of DQOs, data completeness, measurement precision, and measurement accuracy.
The project DQOs answer the critical question of how good data must be in order to achieve the project goals. DQOs are used to develop the criteria that a data collection effort should satisfy, including where to conduct monitoring, how many sites to use, when to conduct
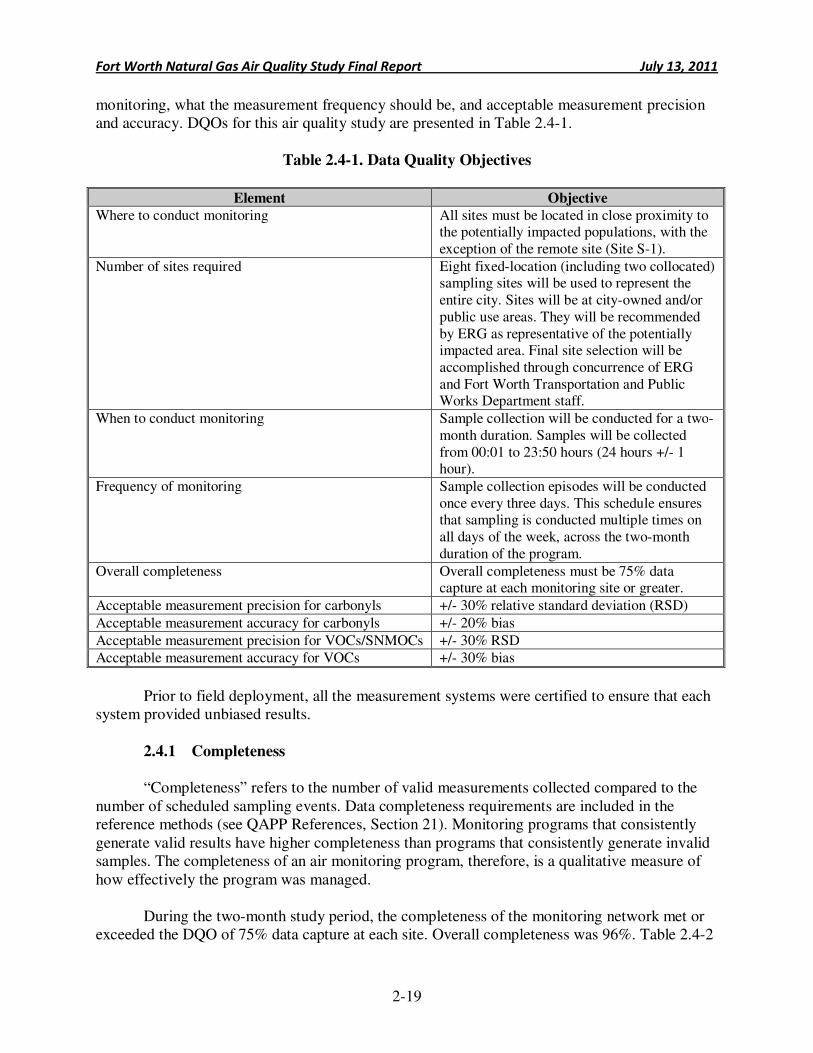
Fort Worth Natural Gas Air Quality Study Final Report July 13, 2011
2-19
monitoring, what the measurement frequency should be, and acceptable measurement precision and accuracy. DQOs for this air quality study are presented in Table 2.4-1.
Table 2.4-1. Data Quality Objectives
Element Objective Where to conduct monitoring All sites must be located in close proximity to
the potentially impacted populations, with the exception of the remote site (Site S-1).
Number of sites required Eight fixed-location (including two collocated) sampling sites will be used to represent the entire city. Sites will be at city-owned and/or public use areas. They will be recommended by ERG as representative of the potentially impacted area. Final site selection will be accomplished through concurrence of ERG and Fort Worth Transportation and Public Works Department staff.
When to conduct monitoring Sample collection will be conducted for a two-month duration. Samples will be collected from 00:01 to 23:50 hours (24 hours +/- 1 hour).
Frequency of monitoring Sample collection episodes will be conducted once every three days. This schedule ensures that sampling is conducted multiple times on all days of the week, across the two-month duration of the program.
Overall completeness Overall completeness must be 75% data capture at each monitoring site or greater.
Acceptable measurement precision for carbonyls +/- 30% relative standard deviation (RSD)
Acceptable measurement accuracy for carbonyls +/- 20% bias
Acceptable measurement precision for VOCs/SNMOCs +/- 30% RSD Acceptable measurement accuracy for VOCs +/- 30% bias
Prior to field deployment, all the measurement systems were certified to ensure that each
system provided unbiased results.
2.4.1 Completeness
“Completeness” refers to the number of valid measurements collected compared to the
number of scheduled sampling events. Data completeness requirements are included in the reference methods (see QAPP References, Section 21). Monitoring programs that consistently generate valid results have higher completeness than programs that consistently generate invalid samples. The completeness of an air monitoring program, therefore, is a qualitative measure of how effectively the program was managed.
During the two-month study period, the completeness of the monitoring network met or exceeded the DQO of 75% data capture at each site. Overall completeness was 96%. Table 2.4-2
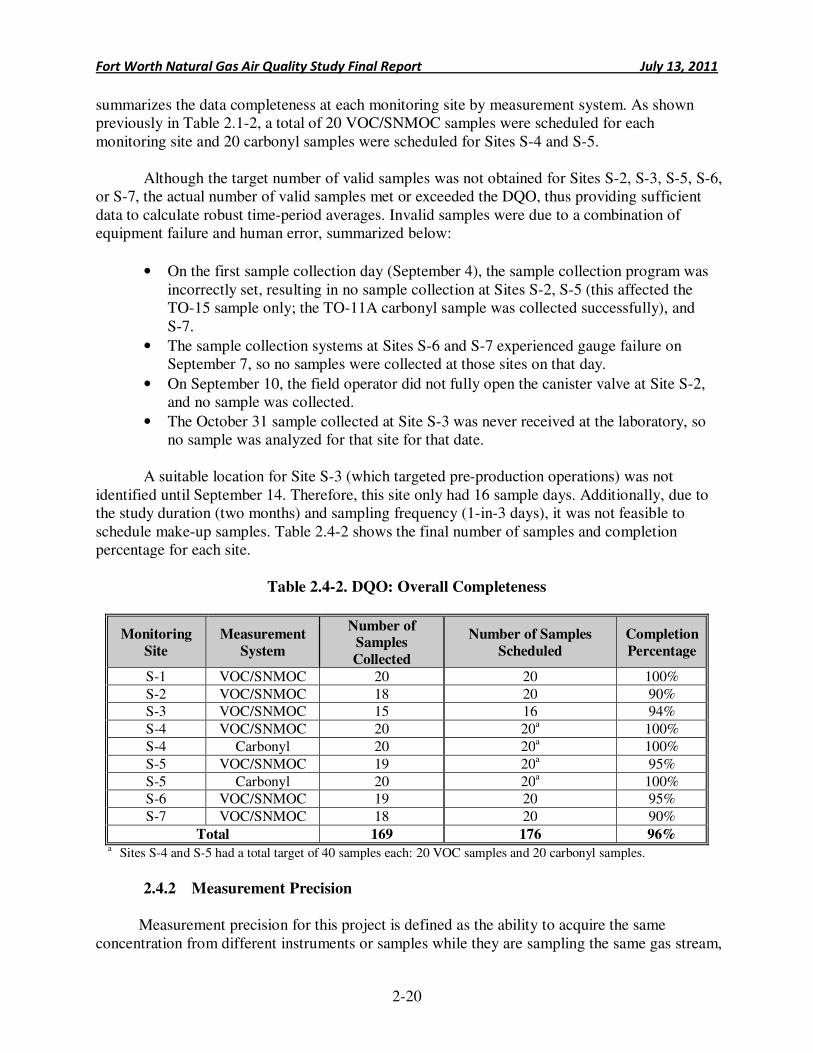
Fort Worth Natural Gas Air Quality Study Final Report July 13, 2011
2-20
summarizes the data completeness at each monitoring site by measurement system. As shown previously in Table 2.1-2, a total of 20 VOC/SNMOC samples were scheduled for each monitoring site and 20 carbonyl samples were scheduled for Sites S-4 and S-5.
Although the target number of valid samples was not obtained for Sites S-2, S-3, S-5, S-6, or S-7, the actual number of valid samples met or exceeded the DQO, thus providing sufficient data to calculate robust time-period averages. Invalid samples were due to a combination of equipment failure and human error, summarized below:
• On the first sample collection day (September 4), the sample collection program was incorrectly set, resulting in no sample collection at Sites S-2, S-5 (this affected the TO-15 sample only; the TO-11A carbonyl sample was collected successfully), and S-7.
• The sample collection systems at Sites S-6 and S-7 experienced gauge failure on September 7, so no samples were collected at those sites on that day.
• On September 10, the field operator did not fully open the canister valve at Site S-2, and no sample was collected.
• The October 31 sample collected at Site S-3 was never received at the laboratory, so no sample was analyzed for that site for that date.
A suitable location for Site S-3 (which targeted pre-production operations) was not
identified until September 14. Therefore, this site only had 16 sample days. Additionally, due to the study duration (two months) and sampling frequency (1-in-3 days), it was not feasible to schedule make-up samples. Table 2.4-2 shows the final number of samples and completion percentage for each site.
Table 2.4-2. DQO: Overall Completeness
Monitoring
Site
Measurement
System
Number of Samples
Collected
Number of Samples
Scheduled
Completion
Percentage
S-1 VOC/SNMOC 20 20 100%
S-2 VOC/SNMOC 18 20 90% S-3 VOC/SNMOC 15 16 94%
S-4 VOC/SNMOC 20 20a 100%
S-4 Carbonyl 20 20a 100%
S-5 VOC/SNMOC 19 20a 95%
S-5 Carbonyl 20 20a 100% S-6 VOC/SNMOC 19 20 95%
S-7 VOC/SNMOC 18 20 90%
Total 169 176 96% a Sites S-4 and S-5 had a total target of 40 samples each: 20 VOC samples and 20 carbonyl samples.
2.4.2 Measurement Precision
Measurement precision for this project is defined as the ability to acquire the same
concentration from different instruments or samples while they are sampling the same gas stream,
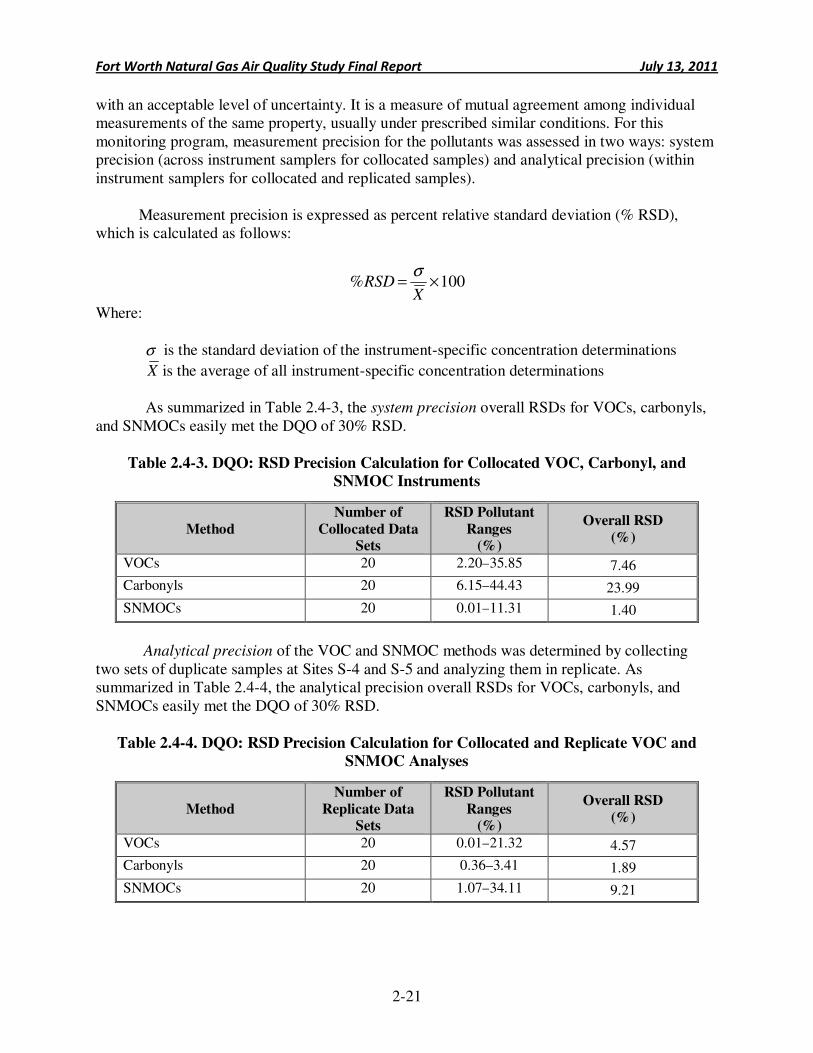
Fort Worth Natural Gas Air Quality Study Final Report July 13, 2011
2-21
with an acceptable level of uncertainty. It is a measure of mutual agreement among individual measurements of the same property, usually under prescribed similar conditions. For this monitoring program, measurement precision for the pollutants was assessed in two ways: system precision (across instrument samplers for collocated samples) and analytical precision (within instrument samplers for collocated and replicated samples).
Measurement precision is expressed as percent relative standard deviation (% RSD), which is calculated as follows:
100% ×=X
RSDσ
Where:
σ is the standard deviation of the instrument-specific concentration determinations
X is the average of all instrument-specific concentration determinations
As summarized in Table 2.4-3, the system precision overall RSDs for VOCs, carbonyls, and SNMOCs easily met the DQO of 30% RSD.
Table 2.4-3. DQO: RSD Precision Calculation for Collocated VOC, Carbonyl, and
SNMOC Instruments
Analytical precision of the VOC and SNMOC methods was determined by collecting
two sets of duplicate samples at Sites S-4 and S-5 and analyzing them in replicate. As summarized in Table 2.4-4, the analytical precision overall RSDs for VOCs, carbonyls, and SNMOCs easily met the DQO of 30% RSD.
Table 2.4-4. DQO: RSD Precision Calculation for Collocated and Replicate VOC and
SNMOC Analyses
Method
Number of
Collocated Data Sets
RSD Pollutant
Ranges (%)
Overall RSD
(%)
VOCs 20 2.20–35.85 7.46
Carbonyls 20 6.15–44.43 23.99
SNMOCs 20 0.01–11.31 1.40
Method
Number of
Replicate Data Sets
RSD Pollutant
Ranges (%)
Overall RSD
(%)
VOCs 20 0.01–21.32 4.57
Carbonyls 20 0.36–3.41 1.89
SNMOCs 20 1.07–34.11 9.21
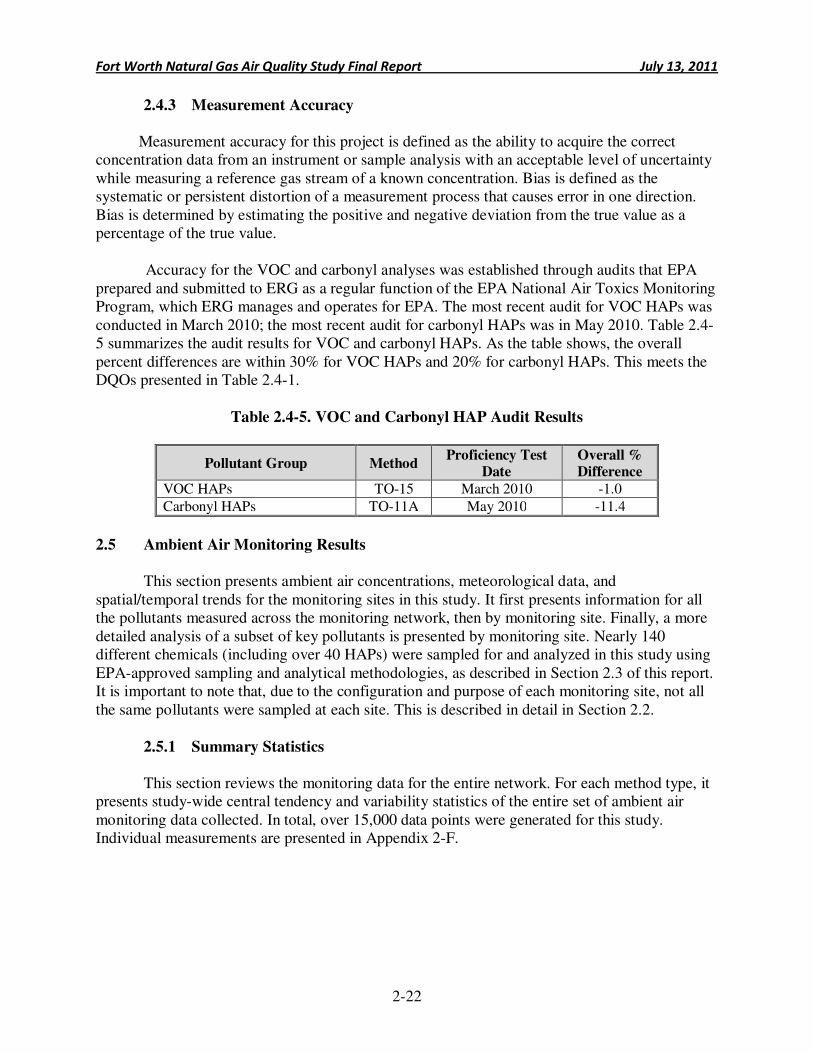
Fort Worth Natural Gas Air Quality Study Final Report July 13, 2011
2-22
2.4.3 Measurement Accuracy
Measurement accuracy for this project is defined as the ability to acquire the correct concentration data from an instrument or sample analysis with an acceptable level of uncertainty while measuring a reference gas stream of a known concentration. Bias is defined as the systematic or persistent distortion of a measurement process that causes error in one direction. Bias is determined by estimating the positive and negative deviation from the true value as a percentage of the true value.
Accuracy for the VOC and carbonyl analyses was established through audits that EPA prepared and submitted to ERG as a regular function of the EPA National Air Toxics Monitoring Program, which ERG manages and operates for EPA. The most recent audit for VOC HAPs was conducted in March 2010; the most recent audit for carbonyl HAPs was in May 2010. Table 2.4-5 summarizes the audit results for VOC and carbonyl HAPs. As the table shows, the overall percent differences are within 30% for VOC HAPs and 20% for carbonyl HAPs. This meets the DQOs presented in Table 2.4-1.
Table 2.4-5. VOC and Carbonyl HAP Audit Results
Pollutant Group Method Proficiency Test
Date Overall % Difference
VOC HAPs TO-15 March 2010 -1.0
Carbonyl HAPs TO-11A May 2010 -11.4
2.5 Ambient Air Monitoring Results
This section presents ambient air concentrations, meteorological data, and
spatial/temporal trends for the monitoring sites in this study. It first presents information for all the pollutants measured across the monitoring network, then by monitoring site. Finally, a more detailed analysis of a subset of key pollutants is presented by monitoring site. Nearly 140 different chemicals (including over 40 HAPs) were sampled for and analyzed in this study using EPA-approved sampling and analytical methodologies, as described in Section 2.3 of this report. It is important to note that, due to the configuration and purpose of each monitoring site, not all the same pollutants were sampled at each site. This is described in detail in Section 2.2.
2.5.1 Summary Statistics
This section reviews the monitoring data for the entire network. For each method type, it presents study-wide central tendency and variability statistics of the entire set of ambient air monitoring data collected. In total, over 15,000 data points were generated for this study. Individual measurements are presented in Appendix 2-F.
Fort Worth Natural Gas Air Quality Study Final Report July 13, 2011
2-23
VOCs
A total of 59 VOCs were sampled, analyzed, and reported for in this study (Table 2.5-1). Eight VOCs had detection rates greater than 90%: benzene (94%), carbon tetrachloride (98%), chloromethane (100%), dichlorodifluoromethane (100%), methyl ethyl ketone (99%), propylene (98%), toluene (99%), and trichlorofluoromethane (100%). Acetone (2.807 ppbv), toluene (0.876 ppbv), and methyl ethyl ketone (0.827 ppbv) were the three VOCs with the highest average detected concentrations.
Table 2.5-1 also presents data distribution statistics, such as the minimum value, the maximum value, and the 25th, 50th, and 75th percentile values for the VOCs. As an indicator of variability of the VOC concentrations across the entire monitoring network, the coefficient of variation (CV) ratio is calculated. The CV ratio is the standard deviation divided by the mean, and is used to compare the relative dispersion in one set of data with the relative dispersion of another set of data. The lower the CV ratio, the less variability in the data measurements. The five VOCs with the lowest CV ratios and a minimum of 70% detects are trichlorofluoromethane (0.09), dichlorodifluoromethane (0.10), trichlorotrifluoroethane (0.10), dichlorotetrafluoroethane (0.13), and carbon tetrachloride (0.14). Conversely, the five VOCs with the highest CV ratios and a minimum of 70% detects are toluene (1.84), carbon disulfide (1.61), dichloromethane (1.39), m,p-xylene (1.24), and 1,2,4-trimethylbenzene (1.22).
Carbonyls
A total of 11 carbonyl pollutants were sampled, analyzed, and reported for in this study
(Table 2.5-2). As described in Section 2.2, carbonyls were only sampled at Sites S-4 and S-5. Eight carbonyls had detection rates greater than 90%: acetaldehyde (100%), benzaldehyde (95%), butyraldehyde (100%), crotonaldehyde (100%), formaldehyde (100%), hexaldehyde (100%), propionaldehyde (100%), and valeradehyde (93%). Acetaldehyde (2.81 ppbv), formaldehyde (0.931 ppbv), and butyraldehyde (0.110 ppbv) were the three carbonyls with the highest average detected concentrations.
Table 2.5-2 also presents data distribution statistics and CV ratios for the carbonyls. The four carbonyls with the lowest CV ratios and a minimum of 70% detects are crotonaldehyde (0.59), formaldehyde (0.71), acetaldehyde (0.73), and propionaldehyde (0.96). Conversely, the four carbonyls with the highest CV ratios and a minimum of 70% detects are hexaldehyde (1.98), butyraldehyde (1.29), valeraldehyde (1.20), and benzaldehyde (1.11).
Two carbonyls were not detected at either Site S-4 or Site S-5: 2,5-dimethylbenzaldehyde and isovaleraldehyde.
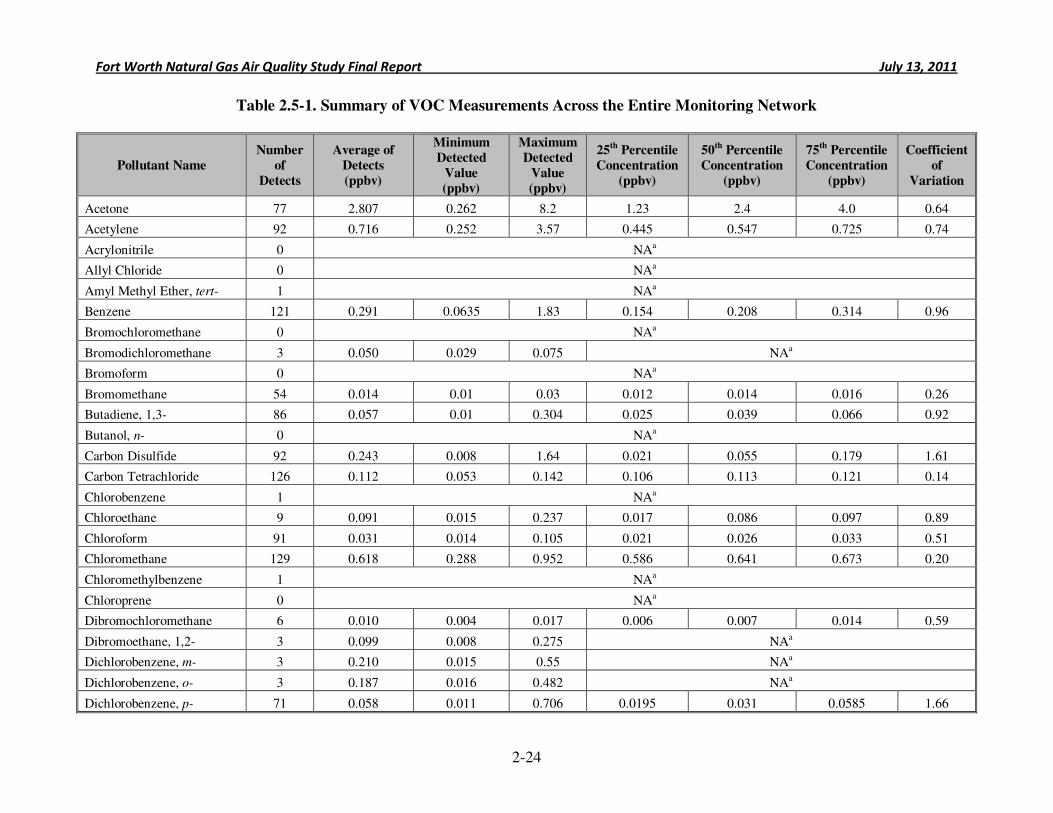
Fort Worth Natural Gas Air Quality Study Final Report July 13, 2011
2-24
Table 2.5-1. Summary of VOC Measurements Across the Entire Monitoring Network
Pollutant Name
Number
of
Detects
Average of
Detects
(ppbv)
Minimum
Detected
Value
(ppbv)
Maximum
Detected
Value
(ppbv)
25th Percentile
Concentration
(ppbv)
50th Percentile
Concentration
(ppbv)
75th Percentile
Concentration
(ppbv)
Coefficient
of
Variation
Acetone 77 2.807 0.262 8.2 1.23 2.4 4.0 0.64
Acetylene 92 0.716 0.252 3.57 0.445 0.547 0.725 0.74
Acrylonitrile 0 NAa
Allyl Chloride 0 NAa
Amyl Methyl Ether, tert- 1 NAa
Benzene 121 0.291 0.0635 1.83 0.154 0.208 0.314 0.96
Bromochloromethane 0 NAa
Bromodichloromethane 3 0.050 0.029 0.075 NAa
Bromoform 0 NAa
Bromomethane 54 0.014 0.01 0.03 0.012 0.014 0.016 0.26
Butadiene, 1,3- 86 0.057 0.01 0.304 0.025 0.039 0.066 0.92
Butanol, n- 0 NAa
Carbon Disulfide 92 0.243 0.008 1.64 0.021 0.055 0.179 1.61
Carbon Tetrachloride 126 0.112 0.053 0.142 0.106 0.113 0.121 0.14
Chlorobenzene 1 NAa
Chloroethane 9 0.091 0.015 0.237 0.017 0.086 0.097 0.89
Chloroform 91 0.031 0.014 0.105 0.021 0.026 0.033 0.51
Chloromethane 129 0.618 0.288 0.952 0.586 0.641 0.673 0.20
Chloromethylbenzene 1 NAa
Chloroprene 0 NAa
Dibromochloromethane 6 0.010 0.004 0.017 0.006 0.007 0.014 0.59
Dibromoethane, 1,2- 3 0.099 0.008 0.275 NAa
Dichlorobenzene, m- 3 0.210 0.015 0.55 NAa
Dichlorobenzene, o- 3 0.187 0.016 0.482 NAa
Dichlorobenzene, p- 71 0.058 0.011 0.706 0.0195 0.031 0.0585 1.66
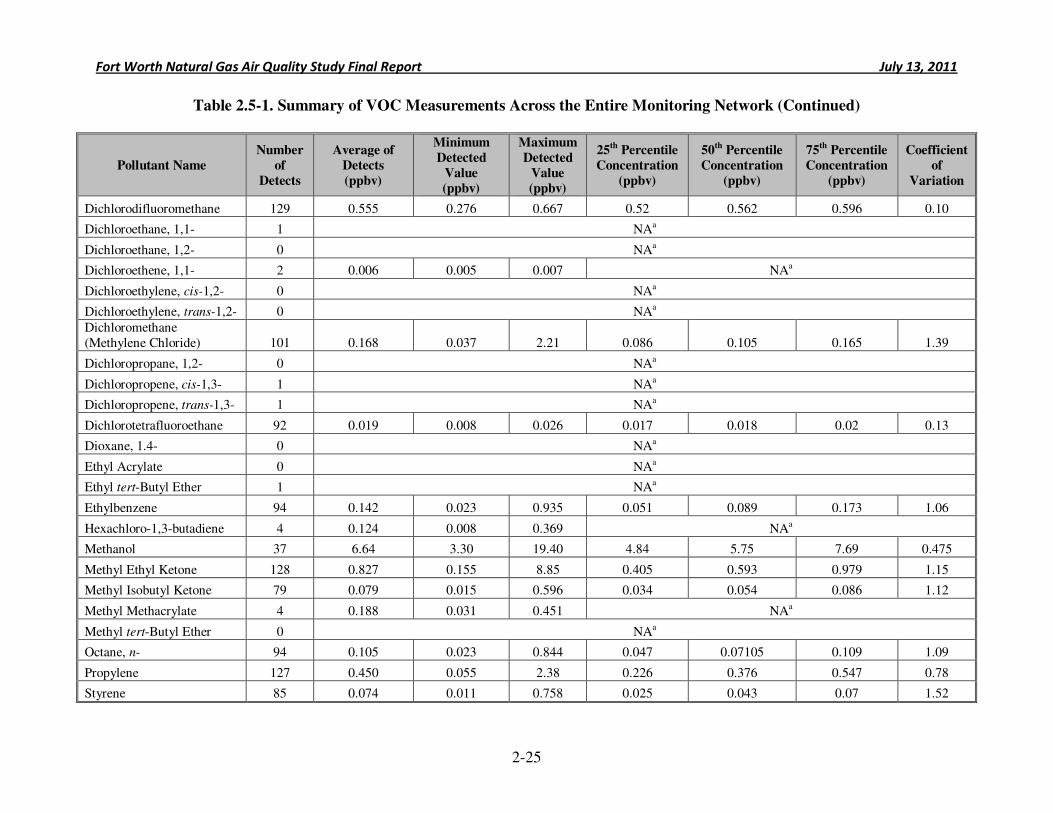
Fort Worth Natural Gas Air Quality Study Final Report July 13, 2011
2-25
Table 2.5-1. Summary of VOC Measurements Across the Entire Monitoring Network (Continued)
Pollutant Name
Number
of
Detects
Average of
Detects
(ppbv)
Minimum
Detected
Value
(ppbv)
Maximum
Detected
Value
(ppbv)
25th Percentile
Concentration
(ppbv)
50th Percentile
Concentration
(ppbv)
75th Percentile
Concentration
(ppbv)
Coefficient
of
Variation
Dichlorodifluoromethane 129 0.555 0.276 0.667 0.52 0.562 0.596 0.10
Dichloroethane, 1,1- 1 NAa
Dichloroethane, 1,2- 0 NAa
Dichloroethene, 1,1- 2 0.006 0.005 0.007 NAa
Dichloroethylene, cis-1,2- 0 NAa
Dichloroethylene, trans-1,2- 0 NAa
Dichloromethane (Methylene Chloride) 101 0.168 0.037 2.21 0.086 0.105 0.165 1.39
Dichloropropane, 1,2- 0 NAa
Dichloropropene, cis-1,3- 1 NAa
Dichloropropene, trans-1,3- 1 NAa
Dichlorotetrafluoroethane 92 0.019 0.008 0.026 0.017 0.018 0.02 0.13
Dioxane, 1.4- 0 NAa
Ethyl Acrylate 0 NAa
Ethyl tert-Butyl Ether 1 NAa
Ethylbenzene 94 0.142 0.023 0.935 0.051 0.089 0.173 1.06
Hexachloro-1,3-butadiene 4 0.124 0.008 0.369 NAa
Methanol 37 6.64 3.30 19.40 4.84 5.75 7.69 0.475
Methyl Ethyl Ketone 128 0.827 0.155 8.85 0.405 0.593 0.979 1.15
Methyl Isobutyl Ketone 79 0.079 0.015 0.596 0.034 0.054 0.086 1.12
Methyl Methacrylate 4 0.188 0.031 0.451 NAa
Methyl tert-Butyl Ether 0 NAa
Octane, n- 94 0.105 0.023 0.844 0.047 0.07105 0.109 1.09
Propylene 127 0.450 0.055 2.38 0.226 0.376 0.547 0.78
Styrene 85 0.074 0.011 0.758 0.025 0.043 0.07 1.52
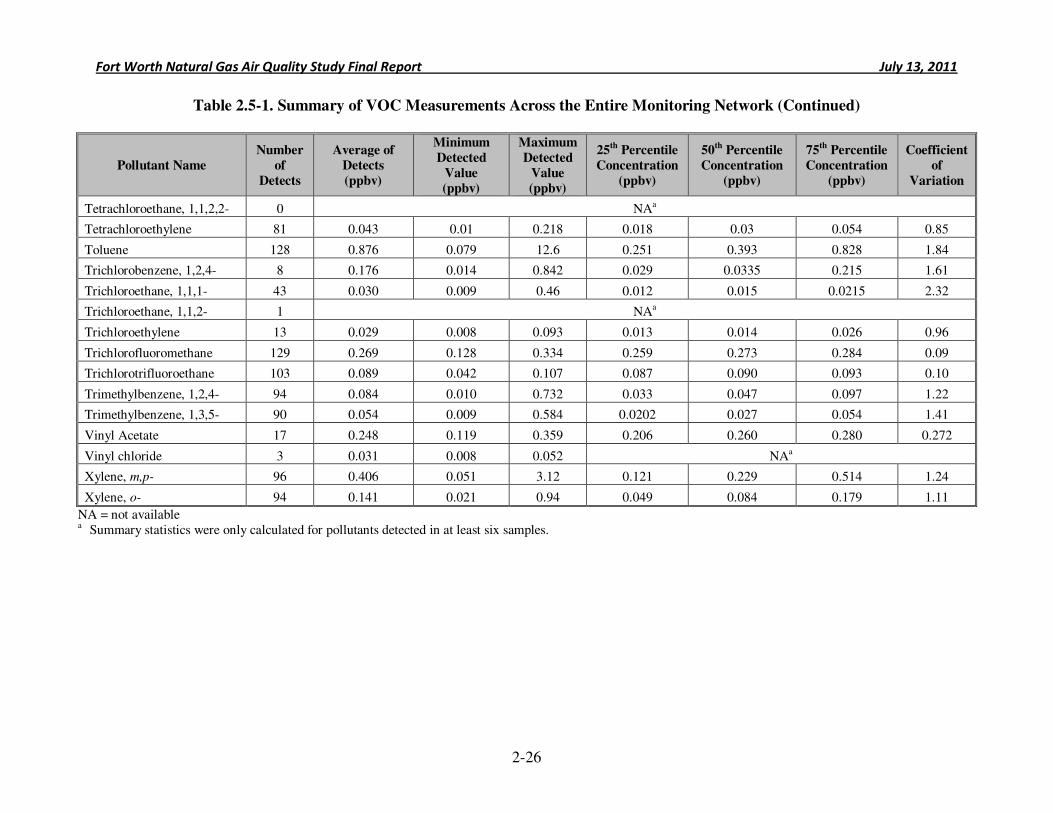
Fort Worth Natural Gas Air Quality Study Final Report July 13, 2011
2-26
Table 2.5-1. Summary of VOC Measurements Across the Entire Monitoring Network (Continued)
Pollutant Name
Number
of
Detects
Average of
Detects
(ppbv)
Minimum
Detected
Value
(ppbv)
Maximum
Detected
Value
(ppbv)
25th Percentile
Concentration
(ppbv)
50th Percentile
Concentration
(ppbv)
75th Percentile
Concentration
(ppbv)
Coefficient
of
Variation
Tetrachloroethane, 1,1,2,2- 0 NAa
Tetrachloroethylene 81 0.043 0.01 0.218 0.018 0.03 0.054 0.85
Toluene 128 0.876 0.079 12.6 0.251 0.393 0.828 1.84
Trichlorobenzene, 1,2,4- 8 0.176 0.014 0.842 0.029 0.0335 0.215 1.61
Trichloroethane, 1,1,1- 43 0.030 0.009 0.46 0.012 0.015 0.0215 2.32
Trichloroethane, 1,1,2- 1 NAa
Trichloroethylene 13 0.029 0.008 0.093 0.013 0.014 0.026 0.96
Trichlorofluoromethane 129 0.269 0.128 0.334 0.259 0.273 0.284 0.09
Trichlorotrifluoroethane 103 0.089 0.042 0.107 0.087 0.090 0.093 0.10
Trimethylbenzene, 1,2,4- 94 0.084 0.010 0.732 0.033 0.047 0.097 1.22
Trimethylbenzene, 1,3,5- 90 0.054 0.009 0.584 0.0202 0.027 0.054 1.41
Vinyl Acetate 17 0.248 0.119 0.359 0.206 0.260 0.280 0.272
Vinyl chloride 3 0.031 0.008 0.052 NAa
Xylene, m,p- 96 0.406 0.051 3.12 0.121 0.229 0.514 1.24
Xylene, o- 94 0.141 0.021 0.94 0.049 0.084 0.179 1.11
NA = not available a Summary statistics were only calculated for pollutants detected in at least six samples.
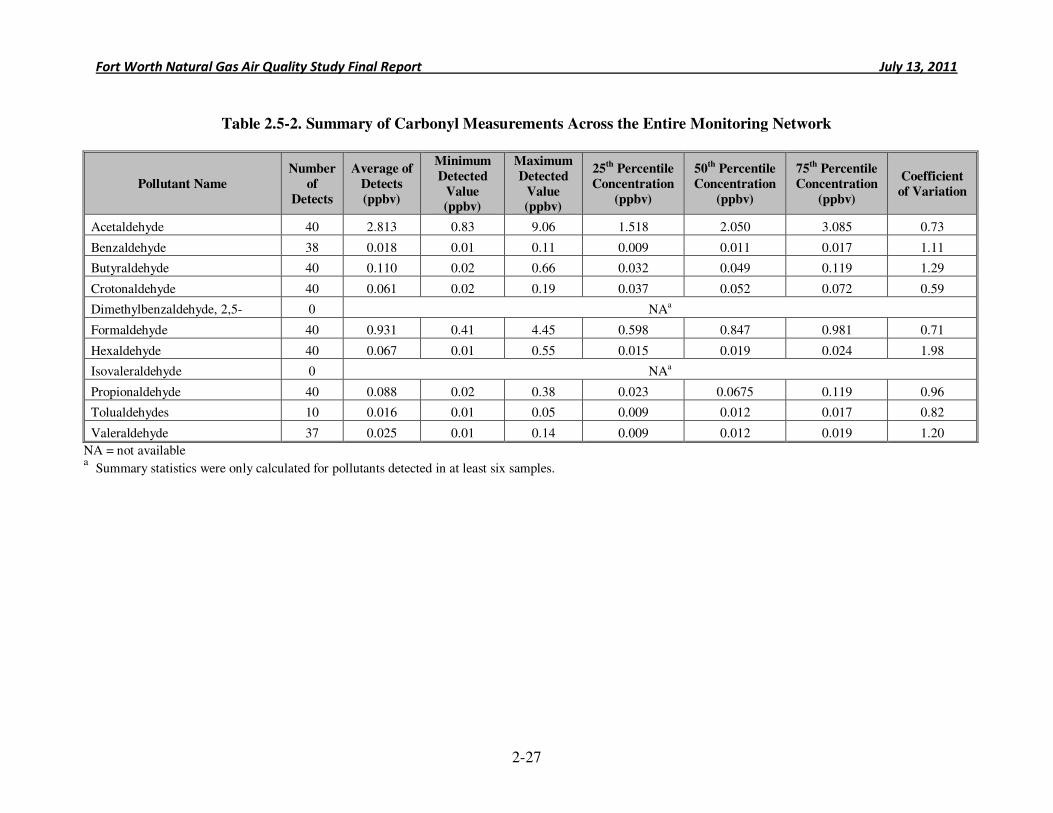
Fort Worth Natural Gas Air Quality Study Final Report July 13, 2011
2-27
Table 2.5-2. Summary of Carbonyl Measurements Across the Entire Monitoring Network
Pollutant Name
Number
of
Detects
Average of
Detects
(ppbv)
Minimum
Detected
Value (ppbv)
Maximum
Detected
Value (ppbv)
25th Percentile
Concentration
(ppbv)
50th Percentile
Concentration
(ppbv)
75th Percentile
Concentration
(ppbv)
Coefficient
of Variation
Acetaldehyde 40 2.813 0.83 9.06 1.518 2.050 3.085 0.73
Benzaldehyde 38 0.018 0.01 0.11 0.009 0.011 0.017 1.11
Butyraldehyde 40 0.110 0.02 0.66 0.032 0.049 0.119 1.29
Crotonaldehyde 40 0.061 0.02 0.19 0.037 0.052 0.072 0.59
Dimethylbenzaldehyde, 2,5- 0 NAa
Formaldehyde 40 0.931 0.41 4.45 0.598 0.847 0.981 0.71
Hexaldehyde 40 0.067 0.01 0.55 0.015 0.019 0.024 1.98
Isovaleraldehyde 0 NAa
Propionaldehyde 40 0.088 0.02 0.38 0.023 0.0675 0.119 0.96
Tolualdehydes 10 0.016 0.01 0.05 0.009 0.012 0.017 0.82
Valeraldehyde 37 0.025 0.01 0.14 0.009 0.012 0.019 1.20
NA = not available a
Summary statistics were only calculated for pollutants detected in at least six samples.
Fort Worth Natural Gas Air Quality Study Final Report July 13, 2011
2-28
Methane and Speciated Non-Methane Organics
Methane was detected in each sample taken (100%)—37 samples at Sites S-6 and S-7 (Table 2.5-3). Methane had the highest concentrations of the study analytes (average of detects = 5,686 ppbv). Methane is not a HAP, and the overall CV ratio was 0.24.
A total of 67 SNMOCs were sampled, analyzed, and reported for in this study (Table 2.5-3). Seven speciated organics had detection rates greater than 90%: n-butane (93%), ethane (100%), ethylene (99%), isobutane (97%), isobutene/1-butene (97%), n-pentane (98%), and propane (100%). Ethane (16.028 ppbv), propane (5.325 ppbv), and isopentane (4.028 ppbv) were the three SNMOCs with the highest average detected concentrations.
Data distribution statistics and CV ratios for methane and the SNMOCs are also presented in Table 2.5-3. The five SNMOCs with the lowest CV ratios and a minimum of 70% detects are 1-hexene (0.48), isoprene (0.63), ethylene (0.69), 3-methylehexane (0.77), and 2-methylheptane (0.85). Conversely, the five VOCs with the highest CV ratios and a minimum of 70% detects are n-decane (1.92), n-nonane (1.90), isopentane (1.84), trans-2-butene (1.83), and n-Pentane (1.80).
All SNMOCs were detected at least once during the study period.
2.5.2 Study Period Averaging
This section presents information on the average pollutant concentrations, at each
monitoring site, for the study period. Non-detect observations were replaced with zeroes when calculating these averages. This section focuses only on pollutants that were detected in at least 70% of the samples, because average concentrations for these pollutants have the least influence from non-detect observations. Thus, study period averages for pollutants that had more than 30% of their samples as non-detects were not calculated. This averaging technique is consistent with the study period averaging EPA uses in its Schools Air Toxics Monitoring Program (SATMP)5 and National-Scale Air Toxics Assessment (NATA) model-to-monitor comparison.6 In addition to the study period average, this section presents the confidence intervals for the study period average concentrations. The confidence interval is calculated using Student’s T-test at the 95th percentile confidence level.

Fort Worth Natural Gas Air Quality Study Final Report July 13, 2011
2-29
Table 2.5-3. Summary of Methane and Speciated Non-Methane Organic Compounds Across the Entire Monitoring Network
Pollutant Name
Number
of
Detects
Average
of Detects
(ppbv)
Minimum
Detected
Value
(ppbv)
Maximum
Detected
Value
(ppbv)
25th Percentile
Concentration
(ppbv)
50th Percentile
Concentration
(ppbv)
75th Percentile
Concentration
(ppbv)
Coefficient of
Variation
Methane 37 5686.486 4180 9890 4670 5570 5720 0.24
Speciated Non-Methane Organic Compounds
Butane, n- 120 3.549 0.149 35.750 0.602 1.566 3.369 1.72
Butene, cis-2- 89 0.157 0.020 3.425 0.040 0.052 0.088 2.52
Butene, trans-2- 93 0.132 0.018 1.243 0.032 0.042 0.079 1.83
Cyclohexane 97 0.128 0.031 0.708 0.050 0.077 0.141 1.03
Cyclopentane 92 0.171 0.041 1.200 0.054 0.071 0.140 1.46
Cyclopentene 2 0.040 0.030 0.049 NAa
Decane, n- 93 0.102 0.012 1.440 0.025 0.037 0.071 1.92
Decene, 1- 3 0.024 0.020 0.031 NAa
Diethylbenzene, m- 17 0.020 0.009 0.082 0.011 0.017 0.020 0.85
Diethylbenzene, p- 40 0.028 0.009 0.102 0.015 0.022 0.032 0.76
Dimethylbutane, 2,2- 92 0.132 0.031 0.805 0.058 0.079 0.140 1.09
Dimethylbutane, 2,3- 92 0.306 0.040 2.517 0.070 0.098 0.230 1.65
Dimethylpentane, 2,3- 92 0.169 0.041 0.729 0.087 0.122 0.190 0.80
Dimethylpentane, 2,4- 92 0.114 0.020 0.821 0.033 0.045 0.114 1.42
Dodecane, n- 90 0.038 0.006 0.327 0.018 0.029 0.038 1.22
Dodecene, 1- 57 0.023 0.006 0.225 0.011 0.016 0.024 1.31
Ethane 129 16.028 2.08 93.2 5.2 9.45 20.7 1.00
Ethyl-1-butene, 2- 9 0.284 0.049 0.870 0.074 0.250 0.395 0.95
Ethylene 128 1.118 0.275 5.400 0.671 0.985 1.270 0.69
Ethyltoluene, m- 91 0.054 0.010 0.301 0.026 0.036 0.068 0.92
Ethyltoluene, o- 76 0.044 0.012 0.386 0.019 0.027 0.045 1.18
Ethyltoluene, p- 90 0.042 0.010 0.340 0.020 0.026 0.043 1.10
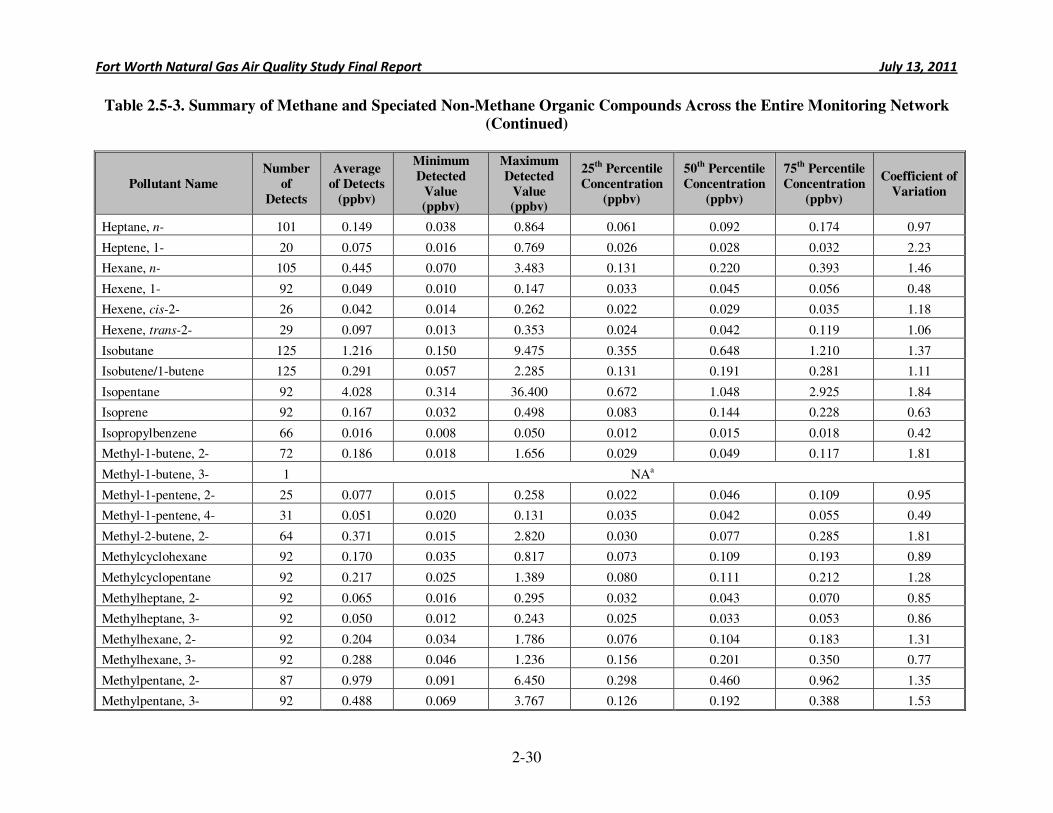
Fort Worth Natural Gas Air Quality Study Final Report July 13, 2011
2-30
Table 2.5-3. Summary of Methane and Speciated Non-Methane Organic Compounds Across the Entire Monitoring Network
(Continued)
Pollutant Name
Number
of
Detects
Average
of Detects
(ppbv)
Minimum
Detected
Value (ppbv)
Maximum
Detected
Value (ppbv)
25th Percentile
Concentration
(ppbv)
50th Percentile
Concentration
(ppbv)
75th Percentile
Concentration
(ppbv)
Coefficient of
Variation
Heptane, n- 101 0.149 0.038 0.864 0.061 0.092 0.174 0.97
Heptene, 1- 20 0.075 0.016 0.769 0.026 0.028 0.032 2.23
Hexane, n- 105 0.445 0.070 3.483 0.131 0.220 0.393 1.46
Hexene, 1- 92 0.049 0.010 0.147 0.033 0.045 0.056 0.48
Hexene, cis-2- 26 0.042 0.014 0.262 0.022 0.029 0.035 1.18
Hexene, trans-2- 29 0.097 0.013 0.353 0.024 0.042 0.119 1.06
Isobutane 125 1.216 0.150 9.475 0.355 0.648 1.210 1.37
Isobutene/1-butene 125 0.291 0.057 2.285 0.131 0.191 0.281 1.11
Isopentane 92 4.028 0.314 36.400 0.672 1.048 2.925 1.84
Isoprene 92 0.167 0.032 0.498 0.083 0.144 0.228 0.63
Isopropylbenzene 66 0.016 0.008 0.050 0.012 0.015 0.018 0.42
Methyl-1-butene, 2- 72 0.186 0.018 1.656 0.029 0.049 0.117 1.81
Methyl-1-butene, 3- 1 NAa
Methyl-1-pentene, 2- 25 0.077 0.015 0.258 0.022 0.046 0.109 0.95
Methyl-1-pentene, 4- 31 0.051 0.020 0.131 0.035 0.042 0.055 0.49
Methyl-2-butene, 2- 64 0.371 0.015 2.820 0.030 0.077 0.285 1.81
Methylcyclohexane 92 0.170 0.035 0.817 0.073 0.109 0.193 0.89
Methylcyclopentane 92 0.217 0.025 1.389 0.080 0.111 0.212 1.28
Methylheptane, 2- 92 0.065 0.016 0.295 0.032 0.043 0.070 0.85
Methylheptane, 3- 92 0.050 0.012 0.243 0.025 0.033 0.053 0.86
Methylhexane, 2- 92 0.204 0.034 1.786 0.076 0.104 0.183 1.31
Methylhexane, 3- 92 0.288 0.046 1.236 0.156 0.201 0.350 0.77
Methylpentane, 2- 87 0.979 0.091 6.450 0.298 0.460 0.962 1.35
Methylpentane, 3- 92 0.488 0.069 3.767 0.126 0.192 0.388 1.53
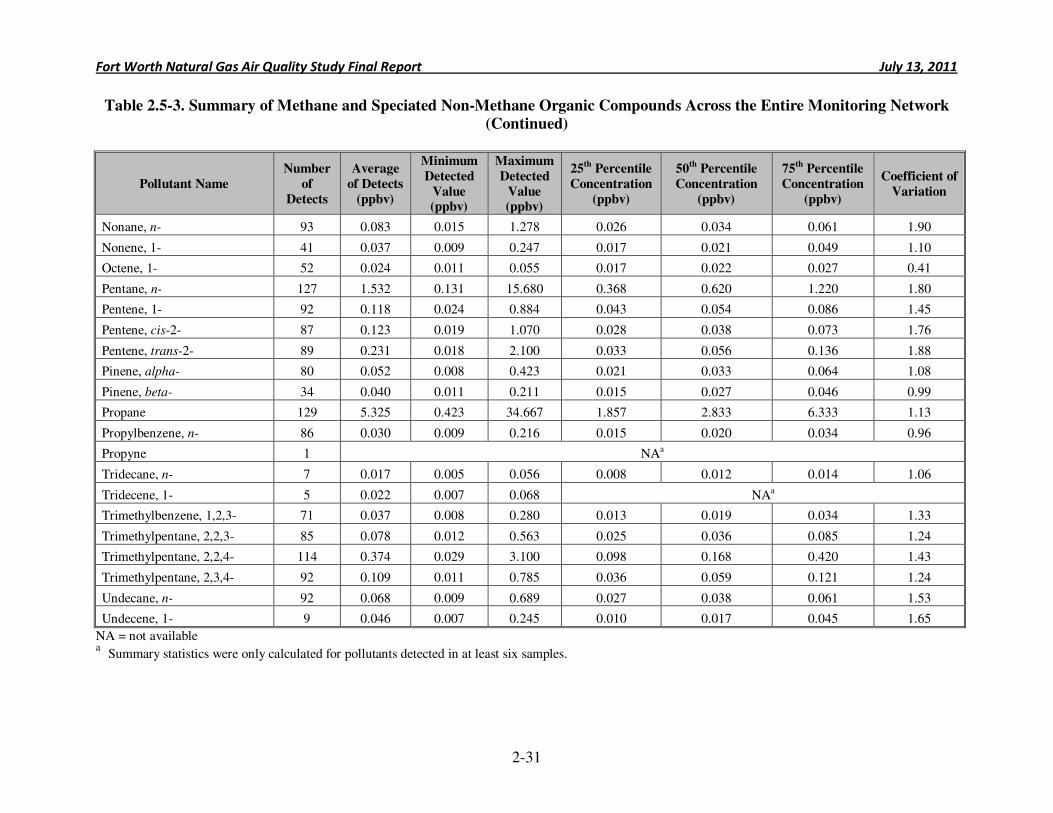
Fort Worth Natural Gas Air Quality Study Final Report July 13, 2011
2-31
Table 2.5-3. Summary of Methane and Speciated Non-Methane Organic Compounds Across the Entire Monitoring Network
(Continued)
Pollutant Name
Number
of
Detects
Average
of Detects
(ppbv)
Minimum
Detected
Value (ppbv)
Maximum
Detected
Value (ppbv)
25th Percentile
Concentration
(ppbv)
50th Percentile
Concentration
(ppbv)
75th Percentile
Concentration
(ppbv)
Coefficient of
Variation
Nonane, n- 93 0.083 0.015 1.278 0.026 0.034 0.061 1.90
Nonene, 1- 41 0.037 0.009 0.247 0.017 0.021 0.049 1.10
Octene, 1- 52 0.024 0.011 0.055 0.017 0.022 0.027 0.41
Pentane, n- 127 1.532 0.131 15.680 0.368 0.620 1.220 1.80
Pentene, 1- 92 0.118 0.024 0.884 0.043 0.054 0.086 1.45
Pentene, cis-2- 87 0.123 0.019 1.070 0.028 0.038 0.073 1.76
Pentene, trans-2- 89 0.231 0.018 2.100 0.033 0.056 0.136 1.88
Pinene, alpha- 80 0.052 0.008 0.423 0.021 0.033 0.064 1.08
Pinene, beta- 34 0.040 0.011 0.211 0.015 0.027 0.046 0.99
Propane 129 5.325 0.423 34.667 1.857 2.833 6.333 1.13
Propylbenzene, n- 86 0.030 0.009 0.216 0.015 0.020 0.034 0.96
Propyne 1 NAa
Tridecane, n- 7 0.017 0.005 0.056 0.008 0.012 0.014 1.06
Tridecene, 1- 5 0.022 0.007 0.068 NAa
Trimethylbenzene, 1,2,3- 71 0.037 0.008 0.280 0.013 0.019 0.034 1.33
Trimethylpentane, 2,2,3- 85 0.078 0.012 0.563 0.025 0.036 0.085 1.24
Trimethylpentane, 2,2,4- 114 0.374 0.029 3.100 0.098 0.168 0.420 1.43
Trimethylpentane, 2,3,4- 92 0.109 0.011 0.785 0.036 0.059 0.121 1.24
Undecane, n- 92 0.068 0.009 0.689 0.027 0.038 0.061 1.53
Undecene, 1- 9 0.046 0.007 0.245 0.010 0.017 0.045 1.65
NA = not available a
Summary statistics were only calculated for pollutants detected in at least six samples.
Fort Worth Natural Gas Air Quality Study Final Report July 13, 2011
2-32
The following observations were made:
• Site S-1 (background site): A total of 71 out of 124 pollutants had at least 70% detects to compute study period averages (Table 2.5-4). The five pollutants with the highest average concentrations were ethane (6.474 ± 3.041 ppbv), propane (3.498 ± 1.207 ppbv), n-butane (2.262 ± 1.500 ppbv), isopentane (1.929 ± 1.172 ppbv), and isobutane (1.324 ± 0.727 ppbv). Site S-1 was located in an area with no natural gas wells typically upwind.
• Site S-2 (mobile sources site): A total of 73 out of 124 pollutants had at least 70% detects to compute study period averages (Table 2.5-5). The five pollutants with the highest average concentrations were ethane (10.437 ± 4.571 ppbv), propane (4.812 ± 3.222 ppbv), n-butane (2.729 ± 1.574 ppbv), toluene (2.311 ± 1.803 ppbv), and isopentane (1.680 ± 0.615 ppbv). Site S-2 was located in an area next to major roadways.
• Site S-3A (pre-production activity site): Note that this site conducted only nine samples over a three-week time frame. Thus, the average concentrations presented for this site may not be representative of the study period. Nevertheless, a total of 69 out of 124 pollutants had at least 70% detects to compute three-week averages (Table 2.5-6). The five pollutants with the highest average concentrations were ethane (16.133 ± 10.964 ppbv), propane (4.456 ± 3.073 ppbv), n-butane (1.408 ± 1.245 ppbv), ethylene (1.364 ± 0.528 ppbv), and isopentane (1.217 ± 0.627 ppbv). Site S-3A was located in an area downwind of fracturing fluid flowback operations.
• Site S-3B (pre-production activity site): When pre-production operations were completed at Site S-3A, this monitoring site was moved to an area where additional pre-production activities were occurring. Thus, this site conducted only six samples over a two-week time frame, and the average concentrations presented for this site may not be representative of the study period. Nevertheless, a total of 63 out of 124 pollutants had at least 70% detects to compute two-week averages (Table 2.5-7). The five pollutants with the highest average concentrations were ethane (22.592 ± 11.170 ppbv), propane (8.844 ± 4.215 ppbv), n-butane (3.195 ± 1.526 ppbv), isobutane (1.588 ± 0.769 ppbv), and isopentane (1.087 ± 0.444 ppbv). Site S-3B was located in an area downwind of hydraulic fracturing activities.
• Site S-4 (high-level activity site): A total of 82 out of 136 pollutants had at least 70% detects to compute study period averages (Table 2.5-8). The five pollutants with the highest average concentrations were ethane (18.229 ± 8.241 ppbv), isopentane (12.985 ± 5.511 ppbv), n-butane (10.993 ± 5.385 ppbv), propane (10.683 ± 4.918 ppbv), and n-pentane (5.491 ± 2.336 ppbv). Site S-4 was located in an area with high levels of well pad and compressor station activity.
• Site S-5 (high-level activity site): A total of 75 out of 136 pollutants had at least 70% detects to compute study period averages (Table 2.5-9). The five pollutants with the highest average concentrations were ethane (14.077 ± 4.074 ppbv), propane (5.049 ± 1.773 ppbv), n-butane (2.072 ± 1.109 ppbv), acetaldehyde (1.824 ± 0.408 ppbv), and
Key Point: Pollutant Concentrations Concentrations measured at Site S-4 were generally higher than at other sites. Concentrations measured at Sites S-6 and S-7 were generally lower relative to other sites.
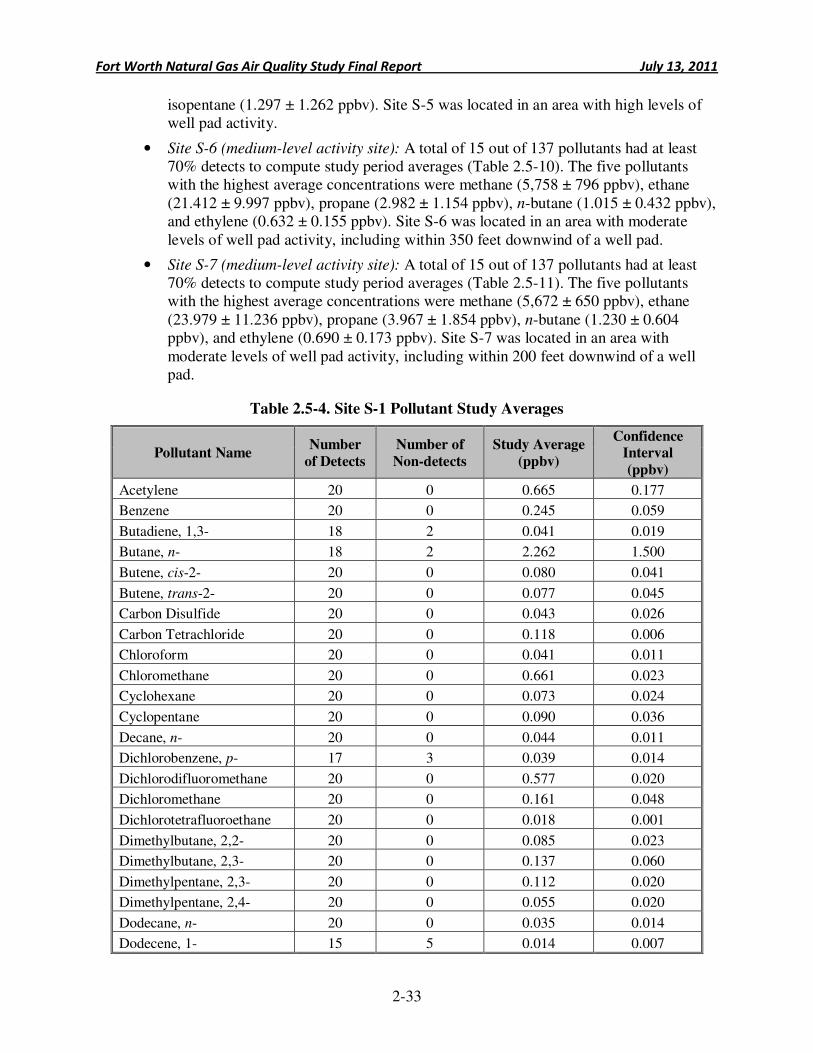
Fort Worth Natural Gas Air Quality Study Final Report July 13, 2011
2-33
isopentane (1.297 ± 1.262 ppbv). Site S-5 was located in an area with high levels of well pad activity.
• Site S-6 (medium-level activity site): A total of 15 out of 137 pollutants had at least 70% detects to compute study period averages (Table 2.5-10). The five pollutants with the highest average concentrations were methane (5,758 ± 796 ppbv), ethane (21.412 ± 9.997 ppbv), propane (2.982 ± 1.154 ppbv), n-butane (1.015 ± 0.432 ppbv), and ethylene (0.632 ± 0.155 ppbv). Site S-6 was located in an area with moderate levels of well pad activity, including within 350 feet downwind of a well pad.
• Site S-7 (medium-level activity site): A total of 15 out of 137 pollutants had at least 70% detects to compute study period averages (Table 2.5-11). The five pollutants with the highest average concentrations were methane (5,672 ± 650 ppbv), ethane (23.979 ± 11.236 ppbv), propane (3.967 ± 1.854 ppbv), n-butane (1.230 ± 0.604 ppbv), and ethylene (0.690 ± 0.173 ppbv). Site S-7 was located in an area with moderate levels of well pad activity, including within 200 feet downwind of a well pad.
Table 2.5-4. Site S-1 Pollutant Study Averages
Pollutant Name Number
of Detects
Number of
Non-detects
Study Average
(ppbv)
Confidence Interval
(ppbv)
Acetylene 20 0 0.665 0.177
Benzene 20 0 0.245 0.059
Butadiene, 1,3- 18 2 0.041 0.019
Butane, n- 18 2 2.262 1.500
Butene, cis-2- 20 0 0.080 0.041
Butene, trans-2- 20 0 0.077 0.045
Carbon Disulfide 20 0 0.043 0.026
Carbon Tetrachloride 20 0 0.118 0.006
Chloroform 20 0 0.041 0.011
Chloromethane 20 0 0.661 0.023
Cyclohexane 20 0 0.073 0.024
Cyclopentane 20 0 0.090 0.036
Decane, n- 20 0 0.044 0.011
Dichlorobenzene, p- 17 3 0.039 0.014
Dichlorodifluoromethane 20 0 0.577 0.020
Dichloromethane 20 0 0.161 0.048
Dichlorotetrafluoroethane 20 0 0.018 0.001
Dimethylbutane, 2,2- 20 0 0.085 0.023
Dimethylbutane, 2,3- 20 0 0.137 0.060
Dimethylpentane, 2,3- 20 0 0.112 0.020
Dimethylpentane, 2,4- 20 0 0.055 0.020
Dodecane, n- 20 0 0.035 0.014
Dodecene, 1- 15 5 0.014 0.007
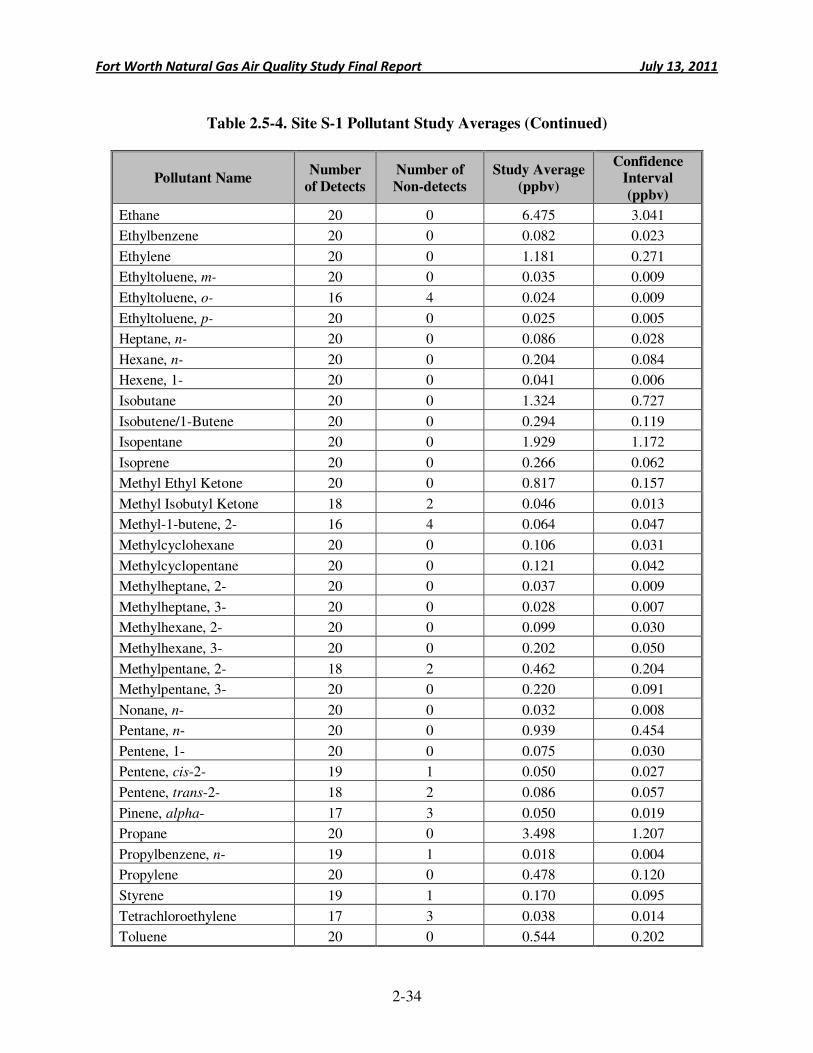
Fort Worth Natural Gas Air Quality Study Final Report July 13, 2011
2-34
Table 2.5-4. Site S-1 Pollutant Study Averages (Continued)
Pollutant Name Number
of Detects
Number of
Non-detects
Study Average
(ppbv)
Confidence Interval
(ppbv)
Ethane 20 0 6.475 3.041
Ethylbenzene 20 0 0.082 0.023
Ethylene 20 0 1.181 0.271
Ethyltoluene, m- 20 0 0.035 0.009
Ethyltoluene, o- 16 4 0.024 0.009
Ethyltoluene, p- 20 0 0.025 0.005
Heptane, n- 20 0 0.086 0.028
Hexane, n- 20 0 0.204 0.084
Hexene, 1- 20 0 0.041 0.006
Isobutane 20 0 1.324 0.727
Isobutene/1-Butene 20 0 0.294 0.119
Isopentane 20 0 1.929 1.172
Isoprene 20 0 0.266 0.062
Methyl Ethyl Ketone 20 0 0.817 0.157
Methyl Isobutyl Ketone 18 2 0.046 0.013
Methyl-1-butene, 2- 16 4 0.064 0.047
Methylcyclohexane 20 0 0.106 0.031
Methylcyclopentane 20 0 0.121 0.042
Methylheptane, 2- 20 0 0.037 0.009
Methylheptane, 3- 20 0 0.028 0.007
Methylhexane, 2- 20 0 0.099 0.030
Methylhexane, 3- 20 0 0.202 0.050
Methylpentane, 2- 18 2 0.462 0.204
Methylpentane, 3- 20 0 0.220 0.091
Nonane, n- 20 0 0.032 0.008
Pentane, n- 20 0 0.939 0.454
Pentene, 1- 20 0 0.075 0.030
Pentene, cis-2- 19 1 0.050 0.027
Pentene, trans-2- 18 2 0.086 0.057
Pinene, alpha- 17 3 0.050 0.019
Propane 20 0 3.498 1.207
Propylbenzene, n- 19 1 0.018 0.004
Propylene 20 0 0.478 0.120
Styrene 19 1 0.170 0.095
Tetrachloroethylene 17 3 0.038 0.014
Toluene 20 0 0.544 0.202
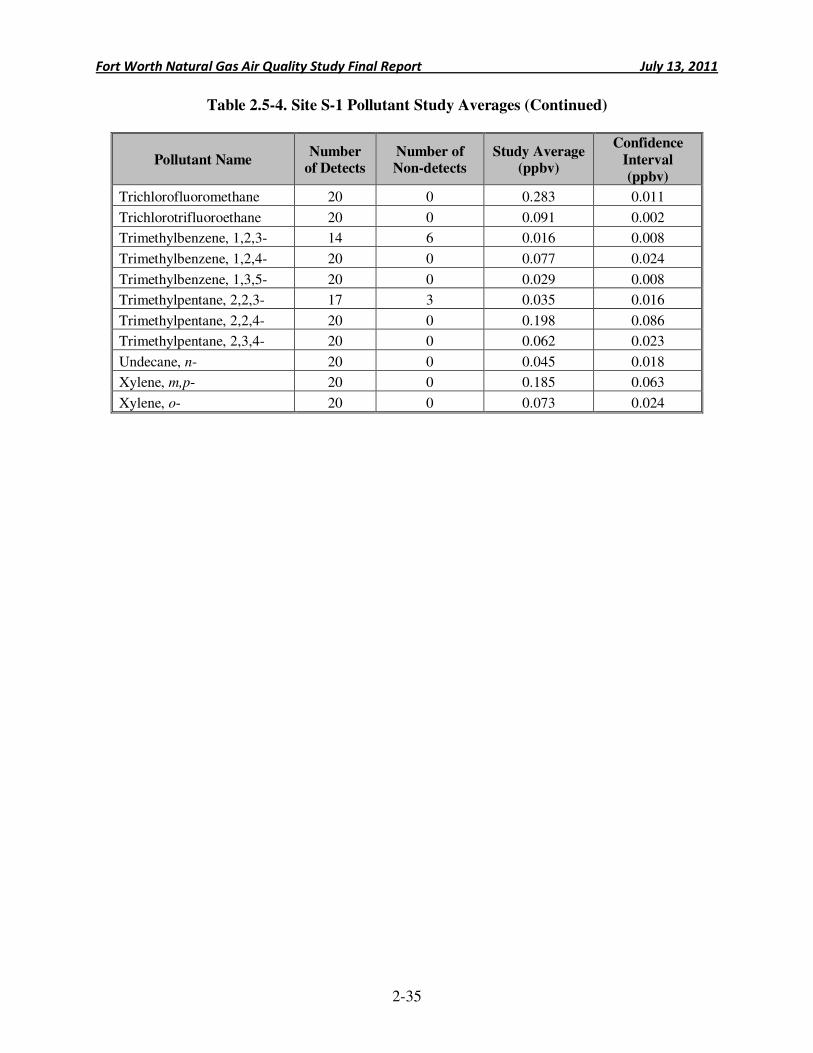
Fort Worth Natural Gas Air Quality Study Final Report July 13, 2011
2-35
Table 2.5-4. Site S-1 Pollutant Study Averages (Continued)
Pollutant Name Number
of Detects Number of Non-detects
Study Average (ppbv)
Confidence
Interval
(ppbv)
Trichlorofluoromethane 20 0 0.283 0.011
Trichlorotrifluoroethane 20 0 0.091 0.002
Trimethylbenzene, 1,2,3- 14 6 0.016 0.008
Trimethylbenzene, 1,2,4- 20 0 0.077 0.024
Trimethylbenzene, 1,3,5- 20 0 0.029 0.008
Trimethylpentane, 2,2,3- 17 3 0.035 0.016
Trimethylpentane, 2,2,4- 20 0 0.198 0.086
Trimethylpentane, 2,3,4- 20 0 0.062 0.023
Undecane, n- 20 0 0.045 0.018
Xylene, m,p- 20 0 0.185 0.063
Xylene, o- 20 0 0.073 0.024
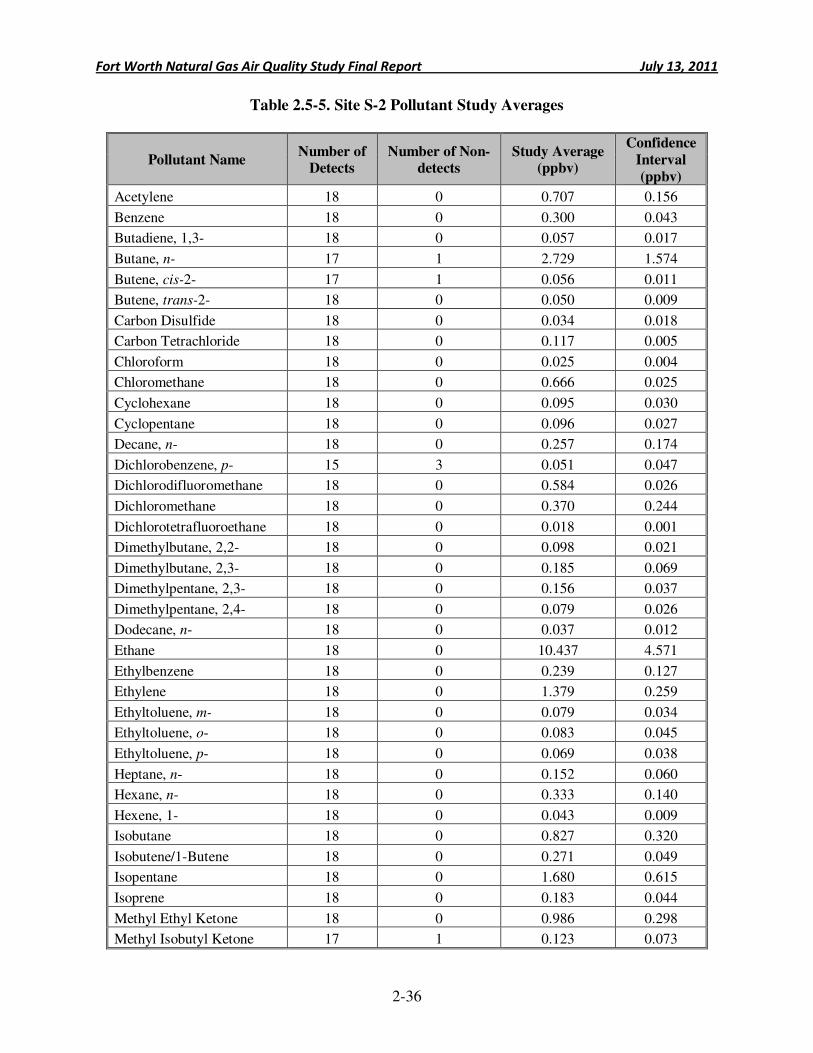
Fort Worth Natural Gas Air Quality Study Final Report July 13, 2011
2-36
Table 2.5-5. Site S-2 Pollutant Study Averages
Pollutant Name Number of
Detects Number of Non-
detects Study Average
(ppbv)
Confidence
Interval
(ppbv)
Acetylene 18 0 0.707 0.156
Benzene 18 0 0.300 0.043
Butadiene, 1,3- 18 0 0.057 0.017
Butane, n- 17 1 2.729 1.574
Butene, cis-2- 17 1 0.056 0.011
Butene, trans-2- 18 0 0.050 0.009
Carbon Disulfide 18 0 0.034 0.018
Carbon Tetrachloride 18 0 0.117 0.005
Chloroform 18 0 0.025 0.004
Chloromethane 18 0 0.666 0.025
Cyclohexane 18 0 0.095 0.030
Cyclopentane 18 0 0.096 0.027
Decane, n- 18 0 0.257 0.174
Dichlorobenzene, p- 15 3 0.051 0.047
Dichlorodifluoromethane 18 0 0.584 0.026
Dichloromethane 18 0 0.370 0.244
Dichlorotetrafluoroethane 18 0 0.018 0.001
Dimethylbutane, 2,2- 18 0 0.098 0.021
Dimethylbutane, 2,3- 18 0 0.185 0.069
Dimethylpentane, 2,3- 18 0 0.156 0.037
Dimethylpentane, 2,4- 18 0 0.079 0.026
Dodecane, n- 18 0 0.037 0.012
Ethane 18 0 10.437 4.571
Ethylbenzene 18 0 0.239 0.127
Ethylene 18 0 1.379 0.259
Ethyltoluene, m- 18 0 0.079 0.034
Ethyltoluene, o- 18 0 0.083 0.045
Ethyltoluene, p- 18 0 0.069 0.038
Heptane, n- 18 0 0.152 0.060
Hexane, n- 18 0 0.333 0.140
Hexene, 1- 18 0 0.043 0.009
Isobutane 18 0 0.827 0.320
Isobutene/1-Butene 18 0 0.271 0.049
Isopentane 18 0 1.680 0.615
Isoprene 18 0 0.183 0.044
Methyl Ethyl Ketone 18 0 0.986 0.298
Methyl Isobutyl Ketone 17 1 0.123 0.073
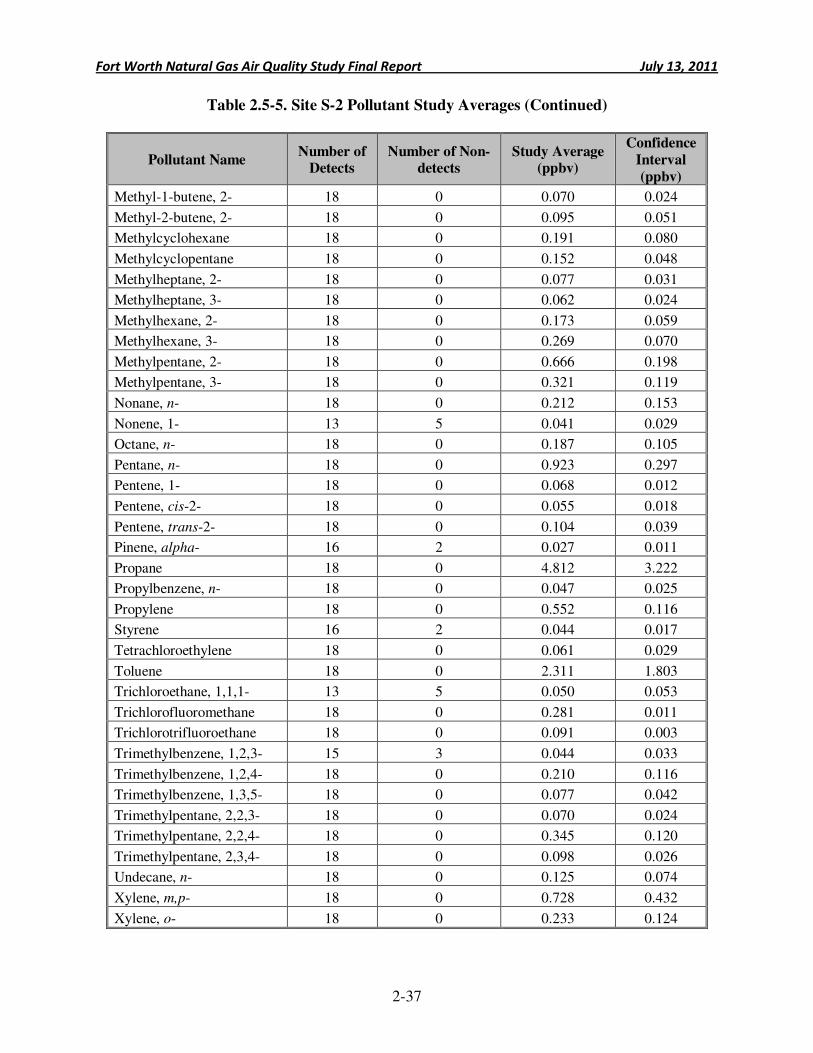
Fort Worth Natural Gas Air Quality Study Final Report July 13, 2011
2-37
Table 2.5-5. Site S-2 Pollutant Study Averages (Continued)
Pollutant Name Number of
Detects Number of Non-
detects Study Average
(ppbv)
Confidence
Interval
(ppbv)
Methyl-1-butene, 2- 18 0 0.070 0.024
Methyl-2-butene, 2- 18 0 0.095 0.051
Methylcyclohexane 18 0 0.191 0.080
Methylcyclopentane 18 0 0.152 0.048
Methylheptane, 2- 18 0 0.077 0.031
Methylheptane, 3- 18 0 0.062 0.024
Methylhexane, 2- 18 0 0.173 0.059
Methylhexane, 3- 18 0 0.269 0.070
Methylpentane, 2- 18 0 0.666 0.198
Methylpentane, 3- 18 0 0.321 0.119
Nonane, n- 18 0 0.212 0.153
Nonene, 1- 13 5 0.041 0.029
Octane, n- 18 0 0.187 0.105
Pentane, n- 18 0 0.923 0.297
Pentene, 1- 18 0 0.068 0.012
Pentene, cis-2- 18 0 0.055 0.018
Pentene, trans-2- 18 0 0.104 0.039
Pinene, alpha- 16 2 0.027 0.011
Propane 18 0 4.812 3.222
Propylbenzene, n- 18 0 0.047 0.025
Propylene 18 0 0.552 0.116
Styrene 16 2 0.044 0.017
Tetrachloroethylene 18 0 0.061 0.029
Toluene 18 0 2.311 1.803
Trichloroethane, 1,1,1- 13 5 0.050 0.053
Trichlorofluoromethane 18 0 0.281 0.011
Trichlorotrifluoroethane 18 0 0.091 0.003
Trimethylbenzene, 1,2,3- 15 3 0.044 0.033
Trimethylbenzene, 1,2,4- 18 0 0.210 0.116
Trimethylbenzene, 1,3,5- 18 0 0.077 0.042
Trimethylpentane, 2,2,3- 18 0 0.070 0.024
Trimethylpentane, 2,2,4- 18 0 0.345 0.120
Trimethylpentane, 2,3,4- 18 0 0.098 0.026
Undecane, n- 18 0 0.125 0.074
Xylene, m,p- 18 0 0.728 0.432
Xylene, o- 18 0 0.233 0.124
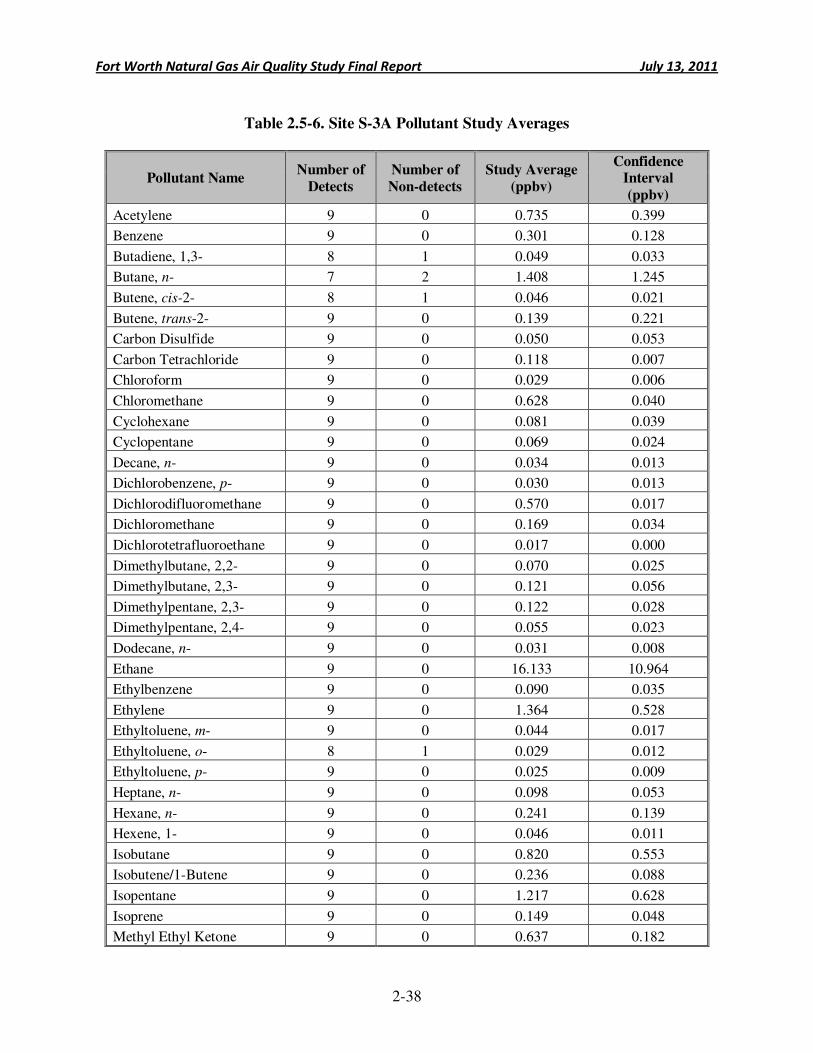
Fort Worth Natural Gas Air Quality Study Final Report July 13, 2011
2-38
Table 2.5-6. Site S-3A Pollutant Study Averages
Pollutant Name Number of
Detects
Number of
Non-detects
Study Average
(ppbv)
Confidence Interval
(ppbv)
Acetylene 9 0 0.735 0.399
Benzene 9 0 0.301 0.128
Butadiene, 1,3- 8 1 0.049 0.033
Butane, n- 7 2 1.408 1.245
Butene, cis-2- 8 1 0.046 0.021
Butene, trans-2- 9 0 0.139 0.221
Carbon Disulfide 9 0 0.050 0.053
Carbon Tetrachloride 9 0 0.118 0.007
Chloroform 9 0 0.029 0.006
Chloromethane 9 0 0.628 0.040
Cyclohexane 9 0 0.081 0.039
Cyclopentane 9 0 0.069 0.024
Decane, n- 9 0 0.034 0.013
Dichlorobenzene, p- 9 0 0.030 0.013
Dichlorodifluoromethane 9 0 0.570 0.017
Dichloromethane 9 0 0.169 0.034
Dichlorotetrafluoroethane 9 0 0.017 0.000
Dimethylbutane, 2,2- 9 0 0.070 0.025
Dimethylbutane, 2,3- 9 0 0.121 0.056
Dimethylpentane, 2,3- 9 0 0.122 0.028
Dimethylpentane, 2,4- 9 0 0.055 0.023
Dodecane, n- 9 0 0.031 0.008
Ethane 9 0 16.133 10.964
Ethylbenzene 9 0 0.090 0.035
Ethylene 9 0 1.364 0.528
Ethyltoluene, m- 9 0 0.044 0.017
Ethyltoluene, o- 8 1 0.029 0.012
Ethyltoluene, p- 9 0 0.025 0.009
Heptane, n- 9 0 0.098 0.053
Hexane, n- 9 0 0.241 0.139
Hexene, 1- 9 0 0.046 0.011
Isobutane 9 0 0.820 0.553
Isobutene/1-Butene 9 0 0.236 0.088
Isopentane 9 0 1.217 0.628
Isoprene 9 0 0.149 0.048
Methyl Ethyl Ketone 9 0 0.637 0.182
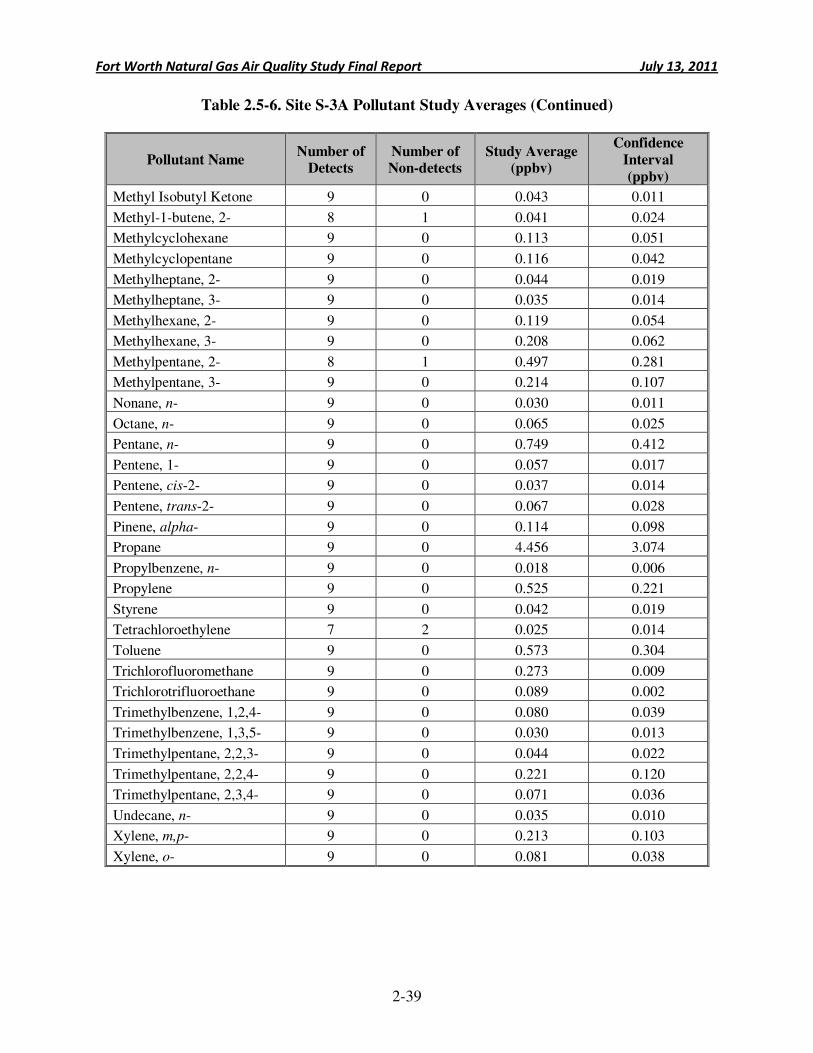
Fort Worth Natural Gas Air Quality Study Final Report July 13, 2011
2-39
Table 2.5-6. Site S-3A Pollutant Study Averages (Continued)
Pollutant Name Number of
Detects Number of Non-detects
Study Average (ppbv)
Confidence
Interval
(ppbv)
Methyl Isobutyl Ketone 9 0 0.043 0.011
Methyl-1-butene, 2- 8 1 0.041 0.024
Methylcyclohexane 9 0 0.113 0.051
Methylcyclopentane 9 0 0.116 0.042
Methylheptane, 2- 9 0 0.044 0.019
Methylheptane, 3- 9 0 0.035 0.014
Methylhexane, 2- 9 0 0.119 0.054
Methylhexane, 3- 9 0 0.208 0.062
Methylpentane, 2- 8 1 0.497 0.281
Methylpentane, 3- 9 0 0.214 0.107
Nonane, n- 9 0 0.030 0.011
Octane, n- 9 0 0.065 0.025
Pentane, n- 9 0 0.749 0.412
Pentene, 1- 9 0 0.057 0.017
Pentene, cis-2- 9 0 0.037 0.014
Pentene, trans-2- 9 0 0.067 0.028
Pinene, alpha- 9 0 0.114 0.098
Propane 9 0 4.456 3.074
Propylbenzene, n- 9 0 0.018 0.006
Propylene 9 0 0.525 0.221
Styrene 9 0 0.042 0.019
Tetrachloroethylene 7 2 0.025 0.014
Toluene 9 0 0.573 0.304
Trichlorofluoromethane 9 0 0.273 0.009
Trichlorotrifluoroethane 9 0 0.089 0.002
Trimethylbenzene, 1,2,4- 9 0 0.080 0.039
Trimethylbenzene, 1,3,5- 9 0 0.030 0.013
Trimethylpentane, 2,2,3- 9 0 0.044 0.022
Trimethylpentane, 2,2,4- 9 0 0.221 0.120
Trimethylpentane, 2,3,4- 9 0 0.071 0.036
Undecane, n- 9 0 0.035 0.010
Xylene, m,p- 9 0 0.213 0.103
Xylene, o- 9 0 0.081 0.038
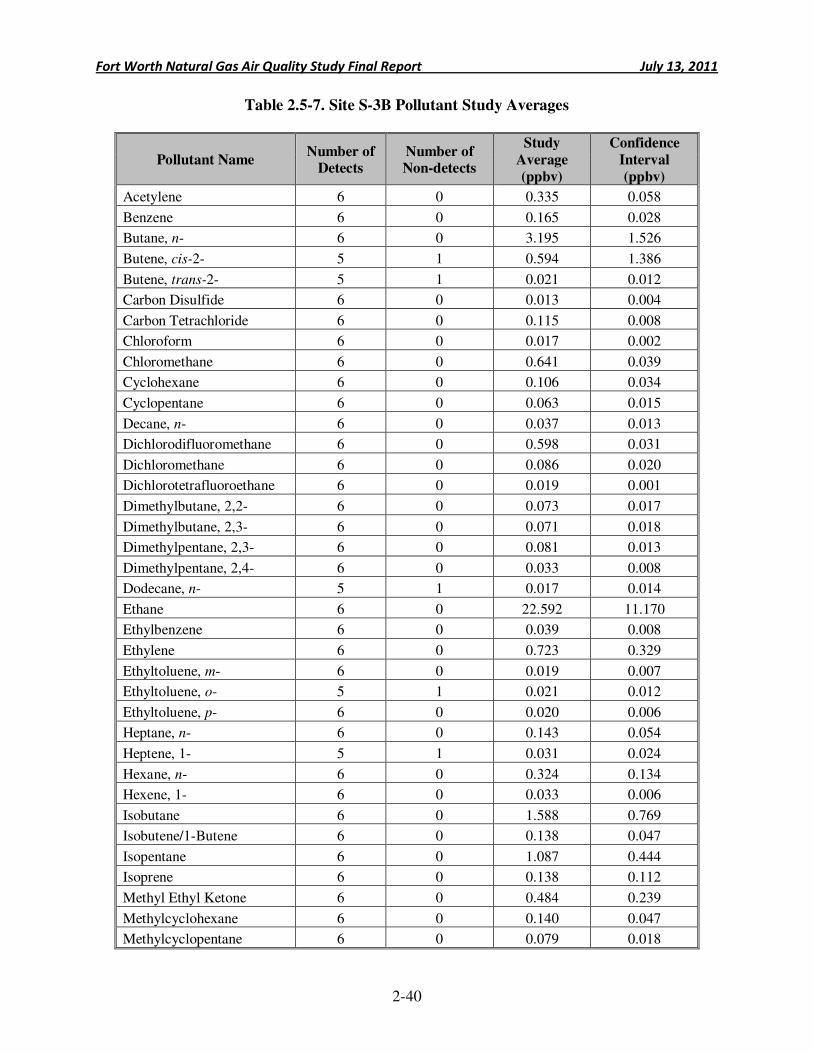
Fort Worth Natural Gas Air Quality Study Final Report July 13, 2011
2-40
Table 2.5-7. Site S-3B Pollutant Study Averages
Pollutant Name Number of
Detects Number of Non-detects
Study
Average
(ppbv)
Confidence
Interval
(ppbv)
Acetylene 6 0 0.335 0.058
Benzene 6 0 0.165 0.028
Butane, n- 6 0 3.195 1.526
Butene, cis-2- 5 1 0.594 1.386
Butene, trans-2- 5 1 0.021 0.012
Carbon Disulfide 6 0 0.013 0.004
Carbon Tetrachloride 6 0 0.115 0.008
Chloroform 6 0 0.017 0.002
Chloromethane 6 0 0.641 0.039
Cyclohexane 6 0 0.106 0.034
Cyclopentane 6 0 0.063 0.015
Decane, n- 6 0 0.037 0.013
Dichlorodifluoromethane 6 0 0.598 0.031
Dichloromethane 6 0 0.086 0.020
Dichlorotetrafluoroethane 6 0 0.019 0.001
Dimethylbutane, 2,2- 6 0 0.073 0.017
Dimethylbutane, 2,3- 6 0 0.071 0.018
Dimethylpentane, 2,3- 6 0 0.081 0.013
Dimethylpentane, 2,4- 6 0 0.033 0.008
Dodecane, n- 5 1 0.017 0.014
Ethane 6 0 22.592 11.170
Ethylbenzene 6 0 0.039 0.008
Ethylene 6 0 0.723 0.329
Ethyltoluene, m- 6 0 0.019 0.007
Ethyltoluene, o- 5 1 0.021 0.012
Ethyltoluene, p- 6 0 0.020 0.006
Heptane, n- 6 0 0.143 0.054
Heptene, 1- 5 1 0.031 0.024
Hexane, n- 6 0 0.324 0.134
Hexene, 1- 6 0 0.033 0.006
Isobutane 6 0 1.588 0.769
Isobutene/1-Butene 6 0 0.138 0.047
Isopentane 6 0 1.087 0.444
Isoprene 6 0 0.138 0.112
Methyl Ethyl Ketone 6 0 0.484 0.239
Methylcyclohexane 6 0 0.140 0.047
Methylcyclopentane 6 0 0.079 0.018
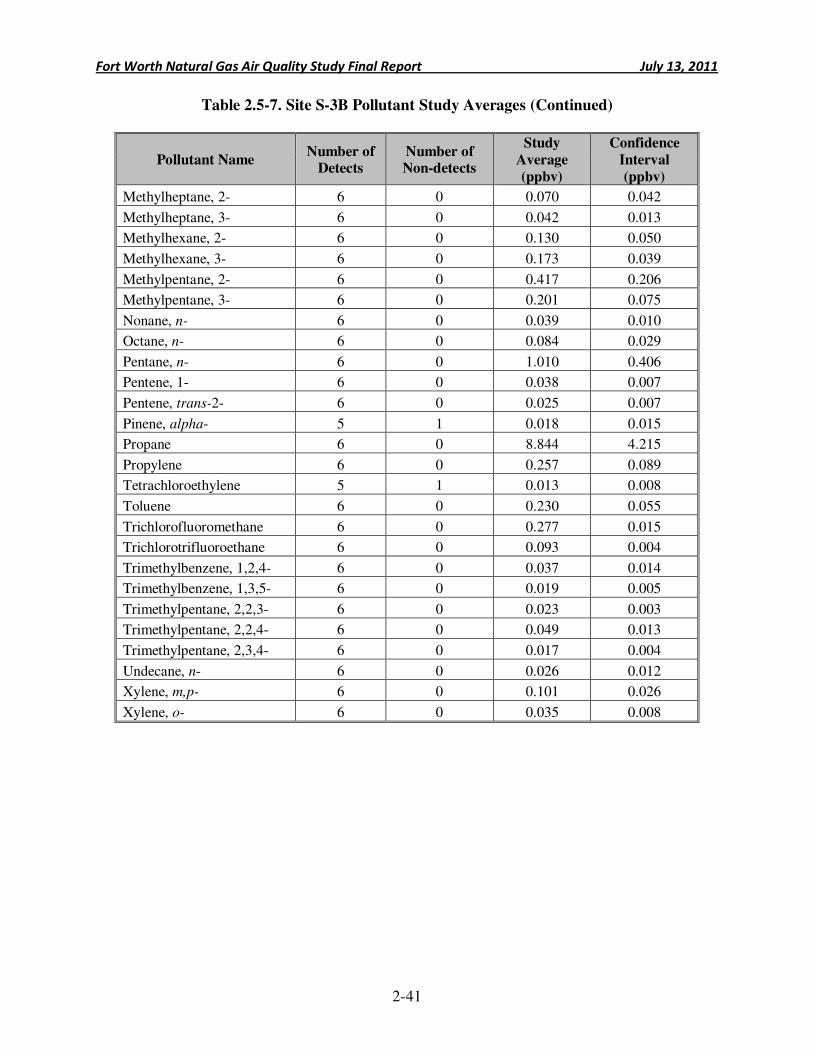
Fort Worth Natural Gas Air Quality Study Final Report July 13, 2011
2-41
Table 2.5-7. Site S-3B Pollutant Study Averages (Continued)
Pollutant Name Number of
Detects Number of Non-detects
Study
Average
(ppbv)
Confidence
Interval
(ppbv)
Methylheptane, 2- 6 0 0.070 0.042
Methylheptane, 3- 6 0 0.042 0.013
Methylhexane, 2- 6 0 0.130 0.050
Methylhexane, 3- 6 0 0.173 0.039
Methylpentane, 2- 6 0 0.417 0.206
Methylpentane, 3- 6 0 0.201 0.075
Nonane, n- 6 0 0.039 0.010
Octane, n- 6 0 0.084 0.029
Pentane, n- 6 0 1.010 0.406
Pentene, 1- 6 0 0.038 0.007
Pentene, trans-2- 6 0 0.025 0.007
Pinene, alpha- 5 1 0.018 0.015
Propane 6 0 8.844 4.215
Propylene 6 0 0.257 0.089
Tetrachloroethylene 5 1 0.013 0.008
Toluene 6 0 0.230 0.055
Trichlorofluoromethane 6 0 0.277 0.015
Trichlorotrifluoroethane 6 0 0.093 0.004
Trimethylbenzene, 1,2,4- 6 0 0.037 0.014
Trimethylbenzene, 1,3,5- 6 0 0.019 0.005
Trimethylpentane, 2,2,3- 6 0 0.023 0.003
Trimethylpentane, 2,2,4- 6 0 0.049 0.013
Trimethylpentane, 2,3,4- 6 0 0.017 0.004
Undecane, n- 6 0 0.026 0.012
Xylene, m,p- 6 0 0.101 0.026
Xylene, o- 6 0 0.035 0.008
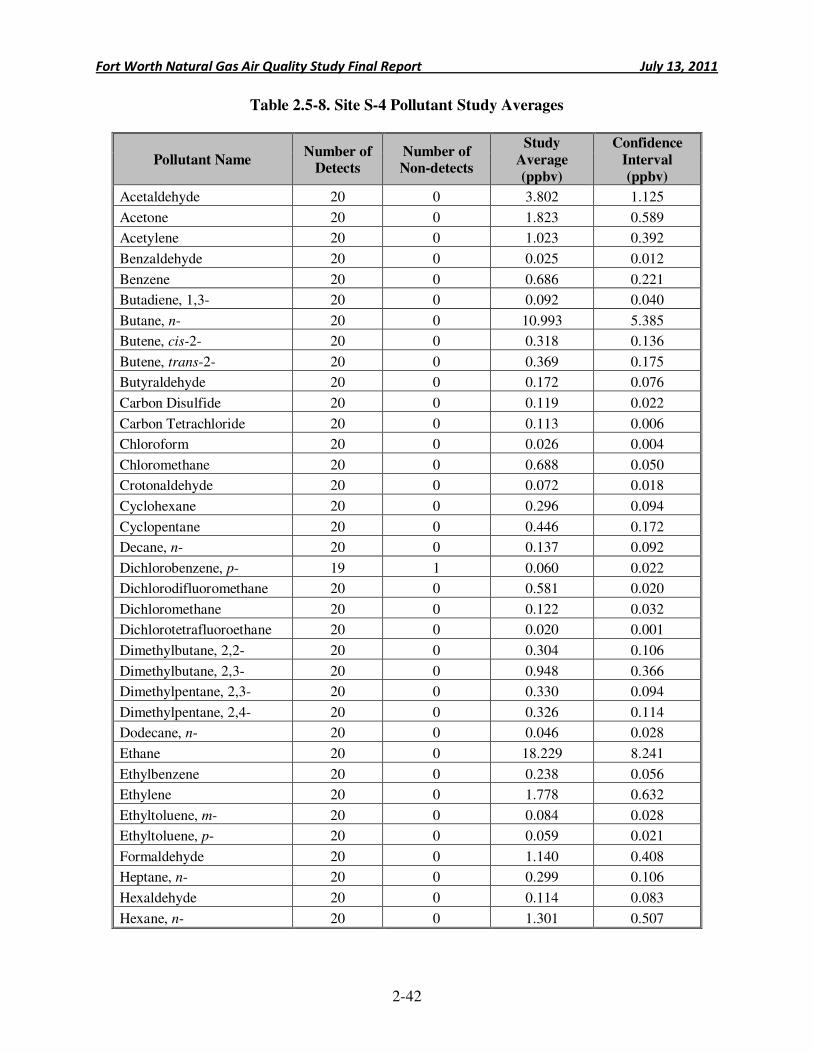
Fort Worth Natural Gas Air Quality Study Final Report July 13, 2011
2-42
Table 2.5-8. Site S-4 Pollutant Study Averages
Pollutant Name Number of
Detects Number of Non-detects
Study
Average
(ppbv)
Confidence
Interval
(ppbv)
Acetaldehyde 20 0 3.802 1.125
Acetone 20 0 1.823 0.589
Acetylene 20 0 1.023 0.392
Benzaldehyde 20 0 0.025 0.012
Benzene 20 0 0.686 0.221
Butadiene, 1,3- 20 0 0.092 0.040
Butane, n- 20 0 10.993 5.385
Butene, cis-2- 20 0 0.318 0.136
Butene, trans-2- 20 0 0.369 0.175
Butyraldehyde 20 0 0.172 0.076
Carbon Disulfide 20 0 0.119 0.022
Carbon Tetrachloride 20 0 0.113 0.006
Chloroform 20 0 0.026 0.004
Chloromethane 20 0 0.688 0.050
Crotonaldehyde 20 0 0.072 0.018
Cyclohexane 20 0 0.296 0.094
Cyclopentane 20 0 0.446 0.172
Decane, n- 20 0 0.137 0.092
Dichlorobenzene, p- 19 1 0.060 0.022
Dichlorodifluoromethane 20 0 0.581 0.020
Dichloromethane 20 0 0.122 0.032
Dichlorotetrafluoroethane 20 0 0.020 0.001
Dimethylbutane, 2,2- 20 0 0.304 0.106
Dimethylbutane, 2,3- 20 0 0.948 0.366
Dimethylpentane, 2,3- 20 0 0.330 0.094
Dimethylpentane, 2,4- 20 0 0.326 0.114
Dodecane, n- 20 0 0.046 0.028
Ethane 20 0 18.229 8.241
Ethylbenzene 20 0 0.238 0.056
Ethylene 20 0 1.778 0.632
Ethyltoluene, m- 20 0 0.084 0.028
Ethyltoluene, p- 20 0 0.059 0.021
Formaldehyde 20 0 1.140 0.408
Heptane, n- 20 0 0.299 0.106
Hexaldehyde 20 0 0.114 0.083
Hexane, n- 20 0 1.301 0.507
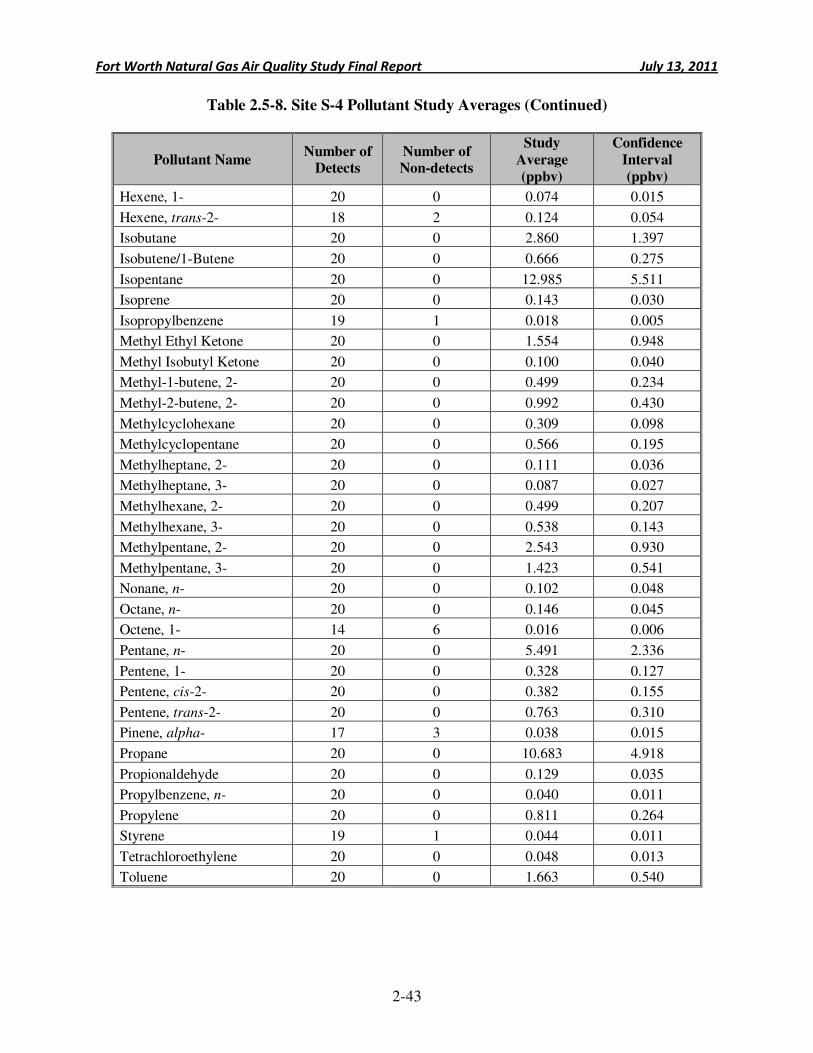
Fort Worth Natural Gas Air Quality Study Final Report July 13, 2011
2-43
Table 2.5-8. Site S-4 Pollutant Study Averages (Continued)
Pollutant Name Number of
Detects Number of Non-detects
Study
Average
(ppbv)
Confidence
Interval
(ppbv)
Hexene, 1- 20 0 0.074 0.015
Hexene, trans-2- 18 2 0.124 0.054
Isobutane 20 0 2.860 1.397
Isobutene/1-Butene 20 0 0.666 0.275
Isopentane 20 0 12.985 5.511
Isoprene 20 0 0.143 0.030
Isopropylbenzene 19 1 0.018 0.005
Methyl Ethyl Ketone 20 0 1.554 0.948
Methyl Isobutyl Ketone 20 0 0.100 0.040
Methyl-1-butene, 2- 20 0 0.499 0.234
Methyl-2-butene, 2- 20 0 0.992 0.430
Methylcyclohexane 20 0 0.309 0.098
Methylcyclopentane 20 0 0.566 0.195
Methylheptane, 2- 20 0 0.111 0.036
Methylheptane, 3- 20 0 0.087 0.027
Methylhexane, 2- 20 0 0.499 0.207
Methylhexane, 3- 20 0 0.538 0.143
Methylpentane, 2- 20 0 2.543 0.930
Methylpentane, 3- 20 0 1.423 0.541
Nonane, n- 20 0 0.102 0.048
Octane, n- 20 0 0.146 0.045
Octene, 1- 14 6 0.016 0.006
Pentane, n- 20 0 5.491 2.336
Pentene, 1- 20 0 0.328 0.127
Pentene, cis-2- 20 0 0.382 0.155
Pentene, trans-2- 20 0 0.763 0.310
Pinene, alpha- 17 3 0.038 0.015
Propane 20 0 10.683 4.918
Propionaldehyde 20 0 0.129 0.035
Propylbenzene, n- 20 0 0.040 0.011
Propylene 20 0 0.811 0.264
Styrene 19 1 0.044 0.011
Tetrachloroethylene 20 0 0.048 0.013
Toluene 20 0 1.663 0.540
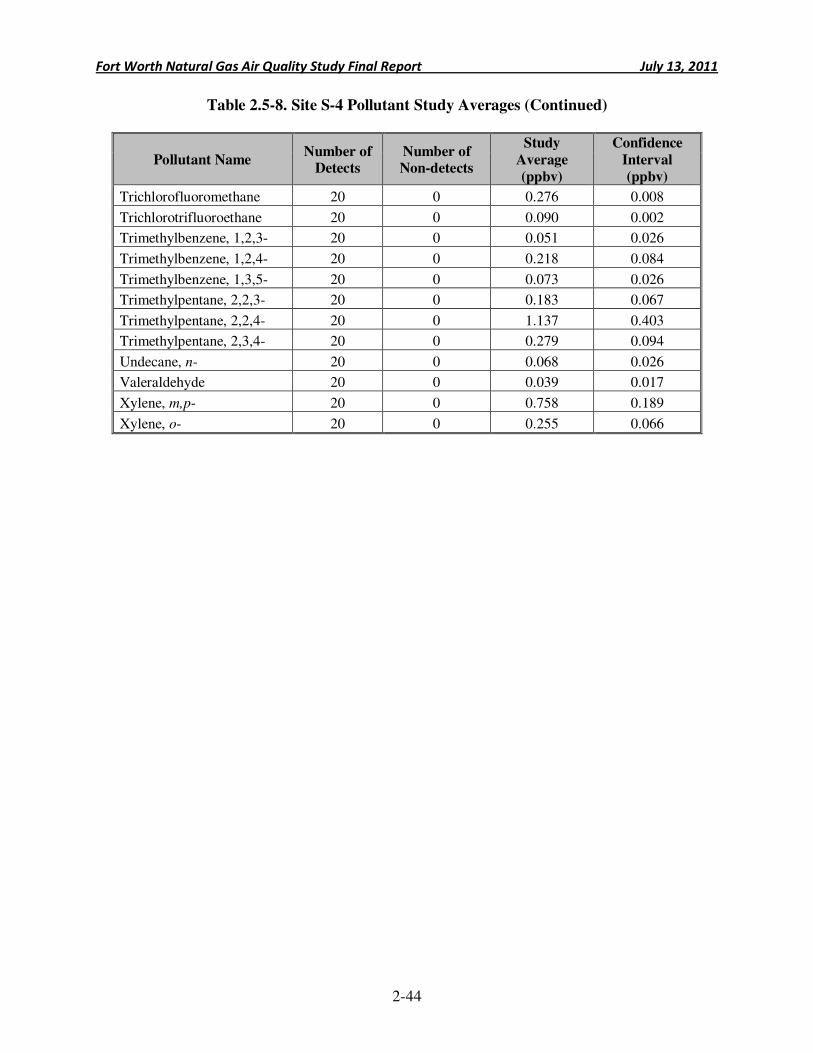
Fort Worth Natural Gas Air Quality Study Final Report July 13, 2011
2-44
Table 2.5-8. Site S-4 Pollutant Study Averages (Continued)
Pollutant Name Number of
Detects Number of Non-detects
Study
Average
(ppbv)
Confidence
Interval
(ppbv)
Trichlorofluoromethane 20 0 0.276 0.008
Trichlorotrifluoroethane 20 0 0.090 0.002
Trimethylbenzene, 1,2,3- 20 0 0.051 0.026
Trimethylbenzene, 1,2,4- 20 0 0.218 0.084
Trimethylbenzene, 1,3,5- 20 0 0.073 0.026
Trimethylpentane, 2,2,3- 20 0 0.183 0.067
Trimethylpentane, 2,2,4- 20 0 1.137 0.403
Trimethylpentane, 2,3,4- 20 0 0.279 0.094
Undecane, n- 20 0 0.068 0.026
Valeraldehyde 20 0 0.039 0.017
Xylene, m,p- 20 0 0.758 0.189
Xylene, o- 20 0 0.255 0.066
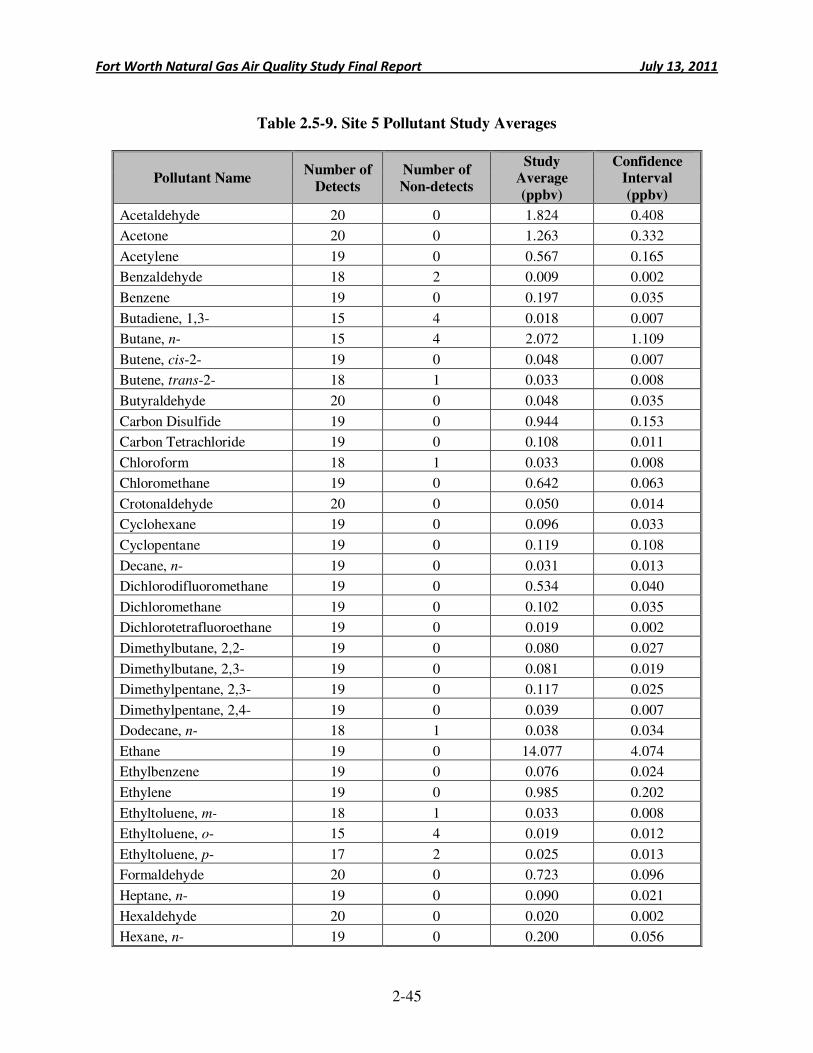
Fort Worth Natural Gas Air Quality Study Final Report July 13, 2011
2-45
Table 2.5-9. Site 5 Pollutant Study Averages
Pollutant Name Number of
Detects
Number of
Non-detects
Study Average
(ppbv)
Confidence Interval
(ppbv)
Acetaldehyde 20 0 1.824 0.408
Acetone 20 0 1.263 0.332
Acetylene 19 0 0.567 0.165
Benzaldehyde 18 2 0.009 0.002
Benzene 19 0 0.197 0.035
Butadiene, 1,3- 15 4 0.018 0.007
Butane, n- 15 4 2.072 1.109
Butene, cis-2- 19 0 0.048 0.007
Butene, trans-2- 18 1 0.033 0.008
Butyraldehyde 20 0 0.048 0.035
Carbon Disulfide 19 0 0.944 0.153
Carbon Tetrachloride 19 0 0.108 0.011
Chloroform 18 1 0.033 0.008
Chloromethane 19 0 0.642 0.063
Crotonaldehyde 20 0 0.050 0.014
Cyclohexane 19 0 0.096 0.033
Cyclopentane 19 0 0.119 0.108
Decane, n- 19 0 0.031 0.013
Dichlorodifluoromethane 19 0 0.534 0.040
Dichloromethane 19 0 0.102 0.035
Dichlorotetrafluoroethane 19 0 0.019 0.002
Dimethylbutane, 2,2- 19 0 0.080 0.027
Dimethylbutane, 2,3- 19 0 0.081 0.019
Dimethylpentane, 2,3- 19 0 0.117 0.025
Dimethylpentane, 2,4- 19 0 0.039 0.007
Dodecane, n- 18 1 0.038 0.034
Ethane 19 0 14.077 4.074
Ethylbenzene 19 0 0.076 0.024
Ethylene 19 0 0.985 0.202
Ethyltoluene, m- 18 1 0.033 0.008
Ethyltoluene, o- 15 4 0.019 0.012
Ethyltoluene, p- 17 2 0.025 0.013
Formaldehyde 20 0 0.723 0.096
Heptane, n- 19 0 0.090 0.021
Hexaldehyde 20 0 0.020 0.002
Hexane, n- 19 0 0.200 0.056
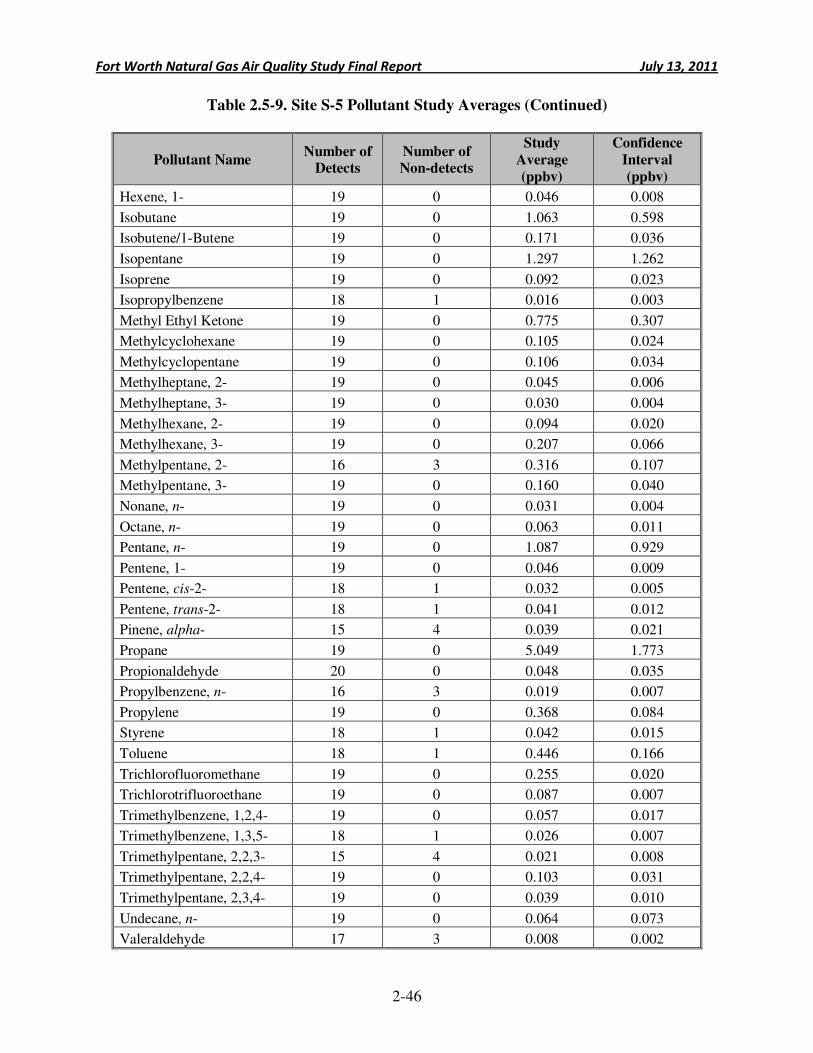
Fort Worth Natural Gas Air Quality Study Final Report July 13, 2011
2-46
Table 2.5-9. Site S-5 Pollutant Study Averages (Continued)
Pollutant Name Number of
Detects Number of Non-detects
Study
Average
(ppbv)
Confidence
Interval
(ppbv)
Hexene, 1- 19 0 0.046 0.008
Isobutane 19 0 1.063 0.598
Isobutene/1-Butene 19 0 0.171 0.036
Isopentane 19 0 1.297 1.262
Isoprene 19 0 0.092 0.023
Isopropylbenzene 18 1 0.016 0.003
Methyl Ethyl Ketone 19 0 0.775 0.307
Methylcyclohexane 19 0 0.105 0.024
Methylcyclopentane 19 0 0.106 0.034
Methylheptane, 2- 19 0 0.045 0.006
Methylheptane, 3- 19 0 0.030 0.004
Methylhexane, 2- 19 0 0.094 0.020
Methylhexane, 3- 19 0 0.207 0.066
Methylpentane, 2- 16 3 0.316 0.107
Methylpentane, 3- 19 0 0.160 0.040
Nonane, n- 19 0 0.031 0.004
Octane, n- 19 0 0.063 0.011
Pentane, n- 19 0 1.087 0.929
Pentene, 1- 19 0 0.046 0.009
Pentene, cis-2- 18 1 0.032 0.005
Pentene, trans-2- 18 1 0.041 0.012
Pinene, alpha- 15 4 0.039 0.021
Propane 19 0 5.049 1.773
Propionaldehyde 20 0 0.048 0.035
Propylbenzene, n- 16 3 0.019 0.007
Propylene 19 0 0.368 0.084
Styrene 18 1 0.042 0.015
Toluene 18 1 0.446 0.166
Trichlorofluoromethane 19 0 0.255 0.020
Trichlorotrifluoroethane 19 0 0.087 0.007
Trimethylbenzene, 1,2,4- 19 0 0.057 0.017
Trimethylbenzene, 1,3,5- 18 1 0.026 0.007
Trimethylpentane, 2,2,3- 15 4 0.021 0.008
Trimethylpentane, 2,2,4- 19 0 0.103 0.031
Trimethylpentane, 2,3,4- 19 0 0.039 0.010
Undecane, n- 19 0 0.064 0.073
Valeraldehyde 17 3 0.008 0.002

Fort Worth Natural Gas Air Quality Study Final Report July 13, 2011
2-47
Table 2.5-9. Site S-5 Pollutant Study Averages (Continued)
Pollutant Name Number of
Detects Number of Non-detects
Study
Average
(ppbv)
Confidence
Interval
(ppbv)
Xylene, m,p- 19 0 0.198 0.060
Xylene, o- 19 0 0.071 0.020

Fort Worth Natural Gas Air Quality Study Final Report July 13, 2011
2-48
Table 2.5-10. Site S-6 Pollutant Study Averages
Pollutant Name Number of
Detects Number of Non-detects
Study
Average
(ppbv)
Confidence
Interval
(ppbv)
Benzene 15 4 0.097 0.036
Butane, n- 19 0 1.015 0.432
Carbon Tetrachloride 18 1 0.097 0.013
Chloromethane 19 0 0.510 0.061
Dichlorodifluoromethane 19 0 0.511 0.017
Ethane 19 0 21.412 9.997
Ethylene 18 1 0.632 0.155
Isobutane 17 2 0.418 0.180
Methane 17 0 5758.824 795.537
Methanol 10 0 6.545 1.681
Methyl Ethyl Ketone 18 1 0.427 0.121
Pentane, n- 18 1 0.399 0.146
Propane 19 0 2.982 1.154
Propylene 18 1 0.210 0.074
Toluene 19 0 0.305 0.083
Trichlorofluoromethane 19 0 0.257 0.008
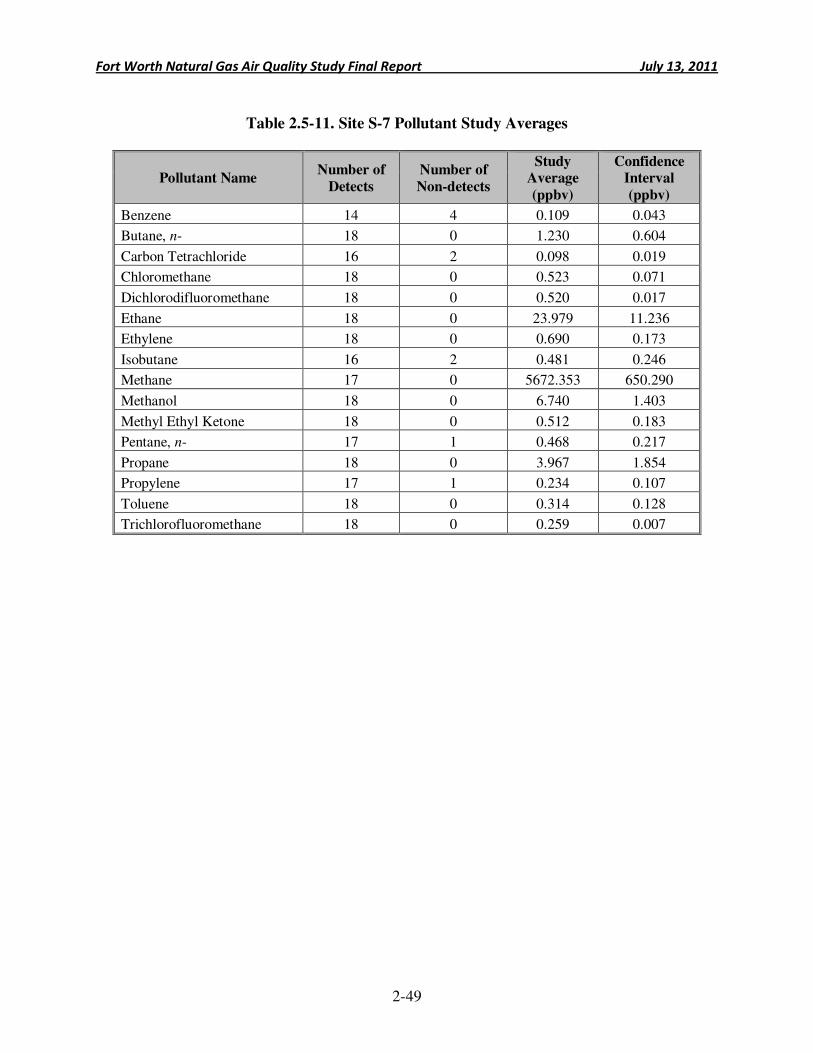
Fort Worth Natural Gas Air Quality Study Final Report July 13, 2011
2-49
Table 2.5-11. Site S-7 Pollutant Study Averages
Pollutant Name Number of
Detects
Number of
Non-detects
Study Average
(ppbv)
Confidence Interval
(ppbv)
Benzene 14 4 0.109 0.043
Butane, n- 18 0 1.230 0.604
Carbon Tetrachloride 16 2 0.098 0.019
Chloromethane 18 0 0.523 0.071
Dichlorodifluoromethane 18 0 0.520 0.017
Ethane 18 0 23.979 11.236
Ethylene 18 0 0.690 0.173
Isobutane 16 2 0.481 0.246
Methane 17 0 5672.353 650.290
Methanol 18 0 6.740 1.403
Methyl Ethyl Ketone 18 0 0.512 0.183
Pentane, n- 17 1 0.468 0.217
Propane 18 0 3.967 1.854
Propylene 17 1 0.234 0.107
Toluene 18 0 0.314 0.128
Trichlorofluoromethane 18 0 0.259 0.007
Fort Worth Natural Gas Air Quality Study Final Report July 13, 2011
2-50
Key Point: Key Pollutants The key pollutants, based on the ambient monitoring data, were:
• Acetaldehyde
• Benzene
• 1,3-Butadiene
• Carbon tetrachloride
• p-Dichlorobenzene
• Formaldehyde
• Tetrachloroethylene
2.5.3 Key Pollutants
At the conclusion of the ambient air monitoring
data collection, ERG conducted an initial public health screening to determine whether selected pollutants were found at levels indicating an urgent health hazard. This screening was conducted using the same health screening values that EPA uses in its NATA (see Appendix 2-G), which are available for 40 pollutants in this study. In Section 5 of this report, ERG presents a broader health evaluation that considers health screening values for all 138 pollutants considered in the monitoring program, as well as the results of the air dispersion modeling effort discussed in Section 4.
In reviewing this initial screening of key pollutants, note that:
• With one exception, ERG found no pollutant concentrations that exceeded any published short-term health benchmark published by the Texas Commission on Environmental Quality (TCEQ), EPA, or the Agency for Toxic Substances and Disease Registry (ATSDR). A single sample was found to have a hexachloro-1,3-butadiene concentration of 0.369 ppb, which is higher than TCEQ’s short-term effects screening level (0.2 ppb). However, this particular sample was not analyzed within the method’s required holding time, and the testing laboratory cautioned that the measurement is of limited reliability. Further discussion of this pollutant is found in Section 5.2.
• It is only appropriate to compare annual average concentrations, not individual measurements, to long-term health benchmark values such as the EPA NATA values.
• The study period was only for two months at eight sites; the study period averages at these eight sites are assumed to be an estimate of typical annual conditions. This approach is similar to EPA’s SATMP study.
• The initial screening presented in this report only addresses 40 pollutants. The health evaluation in Section 5 presents interpretations for all pollutants considered in this monitoring program.
Tables 2.5-12 through 2.5-19 present average concentration summaries of the key
pollutants of interest for each site. Key pollutants are ones whose average concentrations were greater than the Lowest Comparison Levels (LCLs) used in this study. Thus, these tables present a “factor of LCL” for each pollutant, and pollutants with a “factor of LCL” greater than 1 are identified as key. Additionally, Figures 2.5-1 through 2.5-7 present each key pollutant’s study average confidence interval, which is useful in identifying statistically significant differences.
Fort Worth Natural Gas Air Quality Study Final Report July 13, 2011
2-51
The following observations were made:
• Benzene and carbon tetrachloride were key HAPs at each site.
• The average acetaldehyde concentration at Site S-4 was considerably higher than the average acetaldehyde concentration at Site S-5 (Figure 2.5-1).
• The average benzene concentration at Site S-4 was considerably higher than all other average benzene concentrations at the other sites. The average benzene concentrations at Sites S-6 and S-7 were also considerably lower than those for Sites S-1, S-2, S-3A, and S-5 (Figure 2.5-2).
• The average 1,3-butadiene concentrations at Sites S-2 and S-4 were considerably higher than the average 1,3-butadiene concentration at Site S-5 (Figure 2.5-3).
• The average carbon tetrachloride concentration at Site S-1 was only considerably higher than the average carbon tetrachloride concentration at Site S-6 (Figure 2.5-4).
• There were no statistically significant differences in average p-dichlorobenzene concentrations across Sites S-1, S-2, S-3A, and S-4 (Figure 2.5-5).
• There were no statistically significant differences in average formaldehyde concentrations across Sites S-4 and S-5 (Figure 2.5-6).
• There were no statistically significant differences in average tetrachloroethylene concentrations across Sites S-1, S-2, S-3A, and S-4 (Figure 2.5-7).
2.5.4 Integration with Meteorology
Meteorological observations, such as wind speed and wind direction, can be useful in
helping characterize the behavior of the ambient air monitoring data. For this study, no meteorological towers were placed at the monitoring locations, largely because more than 40 National Weather Service (NWS) and TCEQ meteorological stations in and around the city of Fort Worth operated during this monitoring program. Additionally, another dozen meteorological stations from the Weatherbug Network were available to be used.
Closest Meteorological Station
For each monitoring site, ERG identified the closest meteorological station that was
operating during the monitoring timeframe. Table 2.5-20 identifies those stations. If observations were missing, or if a significant portion of a day’s observations were identified as “calm” (less than 5 miles per hour), surrogate data was used to supplement the meteorological observations. Surrogate data sources include the NWS 1-minute data, TCEQ meteorological stations, and the Weatherbug Network. Table 2.5-20 also presents the surrogate data locations relative to the monitoring sites. All meteorological observations of wind speed, wind direction, temperature, and precipitation are presented in Appendix 2-H.
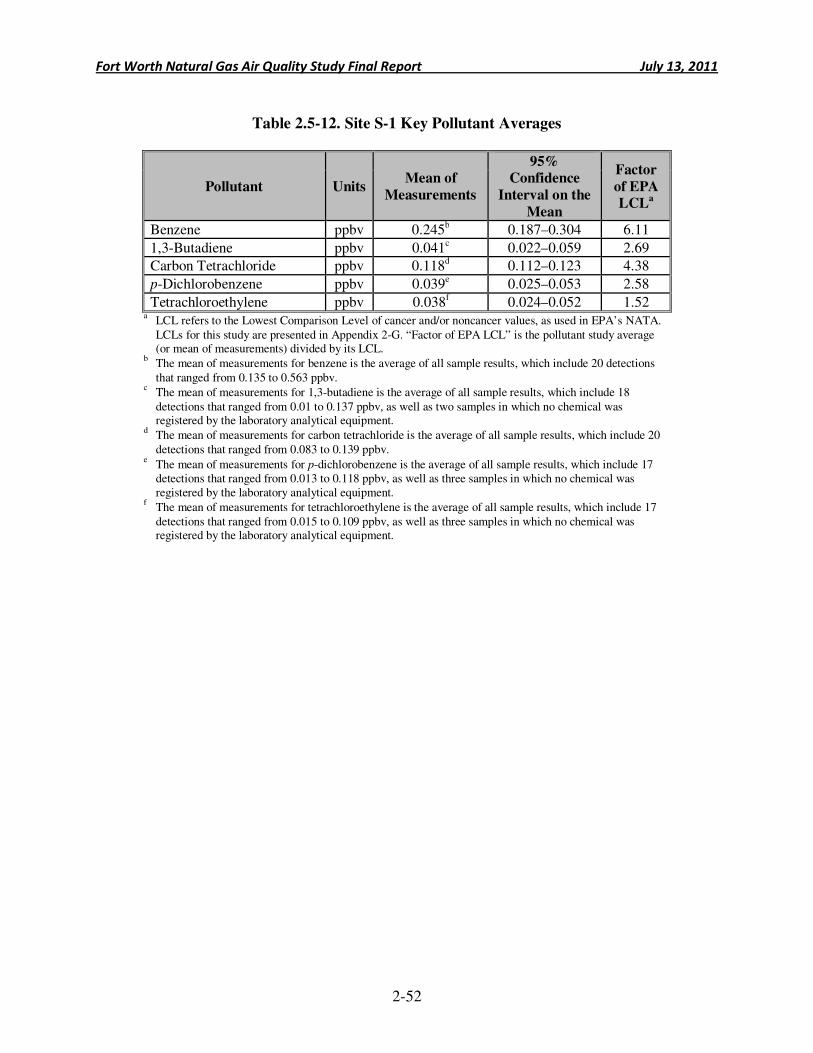
Fort Worth Natural Gas Air Quality Study Final Report July 13, 2011
2-52
Table 2.5-12. Site S-1 Key Pollutant Averages
Pollutant Units Mean of
Measurements
95% Confidence
Interval on the
Mean
Factor
of EPA LCL
a
Benzene ppbv 0.245b 0.187–0.304 6.11
1,3-Butadiene ppbv 0.041c 0.022–0.059 2.69
Carbon Tetrachloride ppbv 0.118d 0.112–0.123 4.38
p-Dichlorobenzene ppbv 0.039e 0.025–0.053 2.58
Tetrachloroethylene ppbv 0.038f 0.024–0.052 1.52 a
LCL refers to the Lowest Comparison Level of cancer and/or noncancer values, as used in EPA’s NATA.
LCLs for this study are presented in Appendix 2-G. “Factor of EPA LCL” is the pollutant study average (or mean of measurements) divided by its LCL.
b The mean of measurements for benzene is the average of all sample results, which include 20 detections
that ranged from 0.135 to 0.563 ppbv. c
The mean of measurements for 1,3-butadiene is the average of all sample results, which include 18
detections that ranged from 0.01 to 0.137 ppbv, as well as two samples in which no chemical was registered by the laboratory analytical equipment.
d The mean of measurements for carbon tetrachloride is the average of all sample results, which include 20
detections that ranged from 0.083 to 0.139 ppbv. e
The mean of measurements for p-dichlorobenzene is the average of all sample results, which include 17 detections that ranged from 0.013 to 0.118 ppbv, as well as three samples in which no chemical was registered by the laboratory analytical equipment.
f The mean of measurements for tetrachloroethylene is the average of all sample results, which include 17
detections that ranged from 0.015 to 0.109 ppbv, as well as three samples in which no chemical was registered by the laboratory analytical equipment.
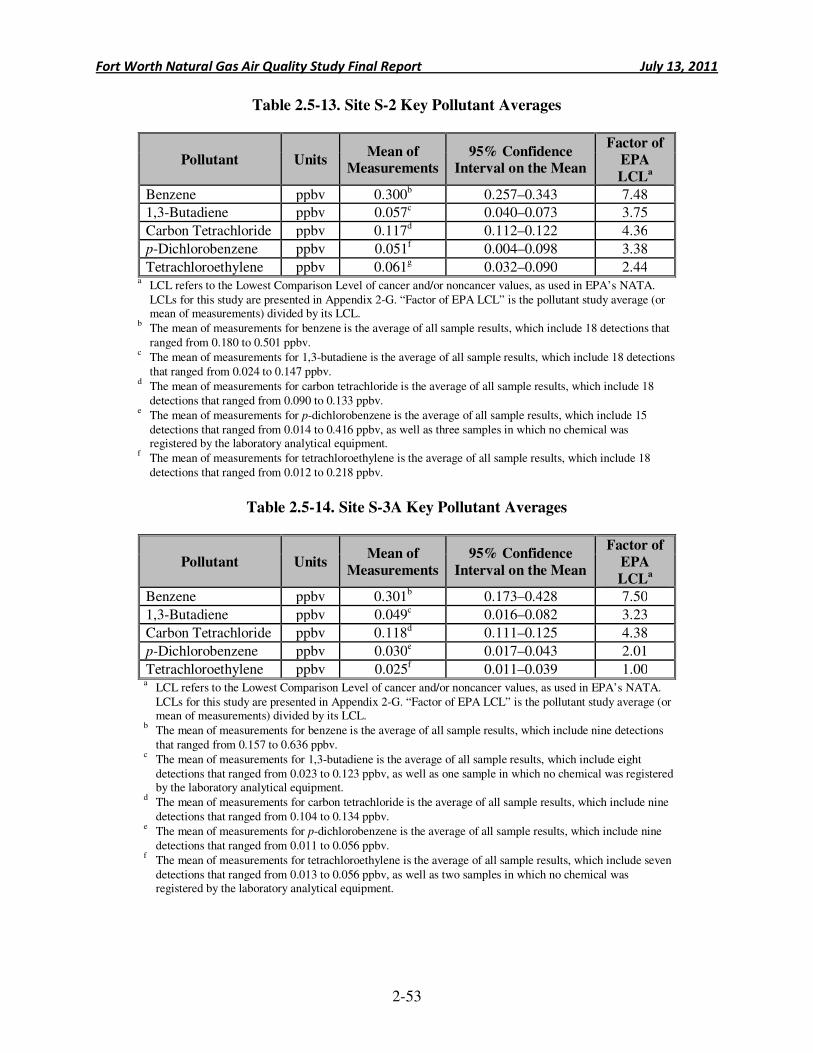
Fort Worth Natural Gas Air Quality Study Final Report July 13, 2011
2-53
Table 2.5-13. Site S-2 Key Pollutant Averages
Pollutant Units Mean of
Measurements 95% Confidence
Interval on the Mean
Factor of
EPA
LCLa
Benzene ppbv 0.300b 0.257–0.343 7.48
1,3-Butadiene ppbv 0.057c 0.040–0.073 3.75
Carbon Tetrachloride ppbv 0.117d 0.112–0.122 4.36
p-Dichlorobenzene ppbv 0.051f 0.004–0.098 3.38
Tetrachloroethylene ppbv 0.061g 0.032–0.090 2.44 a
LCL refers to the Lowest Comparison Level of cancer and/or noncancer values, as used in EPA’s NATA.
LCLs for this study are presented in Appendix 2-G. “Factor of EPA LCL” is the pollutant study average (or mean of measurements) divided by its LCL.
b The mean of measurements for benzene is the average of all sample results, which include 18 detections that
ranged from 0.180 to 0.501 ppbv. c
The mean of measurements for 1,3-butadiene is the average of all sample results, which include 18 detections
that ranged from 0.024 to 0.147 ppbv. d The mean of measurements for carbon tetrachloride is the average of all sample results, which include 18
detections that ranged from 0.090 to 0.133 ppbv. e The mean of measurements for p-dichlorobenzene is the average of all sample results, which include 15
detections that ranged from 0.014 to 0.416 ppbv, as well as three samples in which no chemical was registered by the laboratory analytical equipment.
f The mean of measurements for tetrachloroethylene is the average of all sample results, which include 18
detections that ranged from 0.012 to 0.218 ppbv.
Table 2.5-14. Site S-3A Key Pollutant Averages
Pollutant Units Mean of
Measurements
95% Confidence
Interval on the Mean
Factor of
EPA
LCLa
Benzene ppbv 0.301b 0.173–0.428 7.50
1,3-Butadiene ppbv 0.049c 0.016–0.082 3.23
Carbon Tetrachloride ppbv 0.118d 0.111–0.125 4.38
p-Dichlorobenzene ppbv 0.030e 0.017–0.043 2.01
Tetrachloroethylene ppbv 0.025f 0.011–0.039 1.00 a
LCL refers to the Lowest Comparison Level of cancer and/or noncancer values, as used in EPA’s NATA.
LCLs for this study are presented in Appendix 2-G. “Factor of EPA LCL” is the pollutant study average (or mean of measurements) divided by its LCL.
b The mean of measurements for benzene is the average of all sample results, which include nine detections
that ranged from 0.157 to 0.636 ppbv. c
The mean of measurements for 1,3-butadiene is the average of all sample results, which include eight
detections that ranged from 0.023 to 0.123 ppbv, as well as one sample in which no chemical was registered by the laboratory analytical equipment.
d The mean of measurements for carbon tetrachloride is the average of all sample results, which include nine
detections that ranged from 0.104 to 0.134 ppbv. e
The mean of measurements for p-dichlorobenzene is the average of all sample results, which include nine
detections that ranged from 0.011 to 0.056 ppbv. f
The mean of measurements for tetrachloroethylene is the average of all sample results, which include seven
detections that ranged from 0.013 to 0.056 ppbv, as well as two samples in which no chemical was registered by the laboratory analytical equipment.
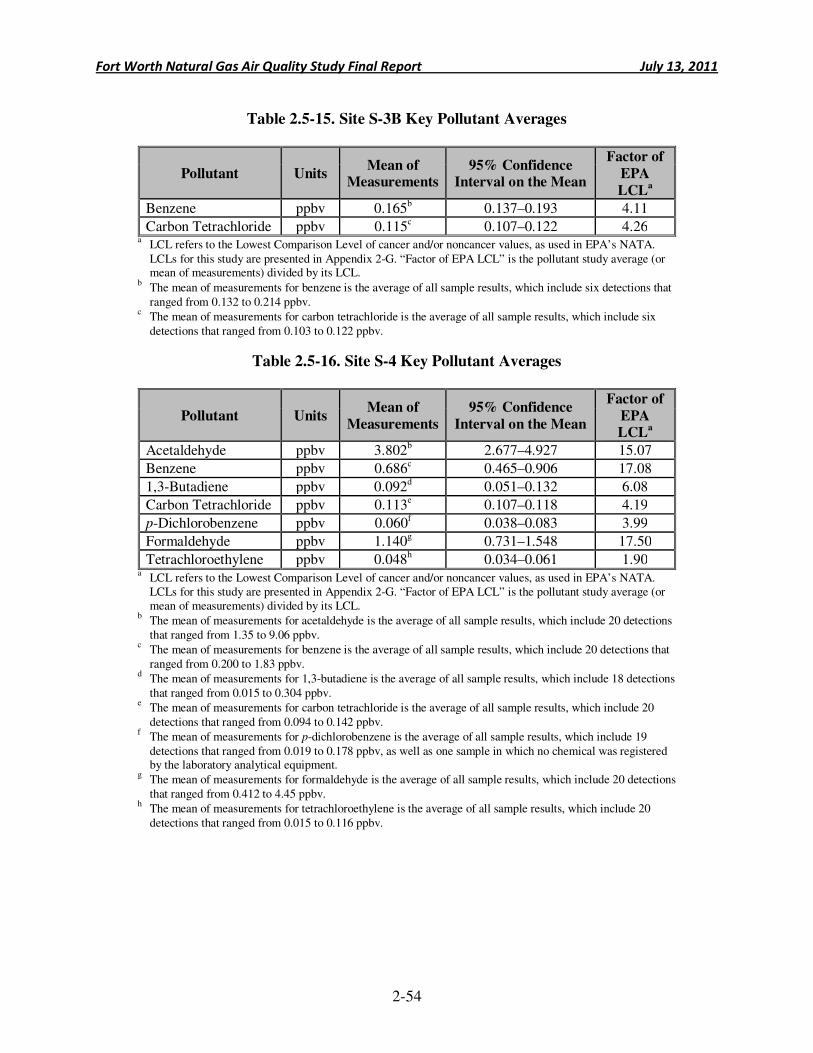
Fort Worth Natural Gas Air Quality Study Final Report July 13, 2011
2-54
Table 2.5-15. Site S-3B Key Pollutant Averages
Pollutant Units Mean of
Measurements 95% Confidence
Interval on the Mean
Factor of
EPA
LCLa
Benzene ppbv 0.165b 0.137–0.193 4.11
Carbon Tetrachloride ppbv 0.115c 0.107–0.122 4.26 a
LCL refers to the Lowest Comparison Level of cancer and/or noncancer values, as used in EPA’s NATA.
LCLs for this study are presented in Appendix 2-G. “Factor of EPA LCL” is the pollutant study average (or mean of measurements) divided by its LCL.
b The mean of measurements for benzene is the average of all sample results, which include six detections that
ranged from 0.132 to 0.214 ppbv. c
The mean of measurements for carbon tetrachloride is the average of all sample results, which include six
detections that ranged from 0.103 to 0.122 ppbv.
Table 2.5-16. Site S-4 Key Pollutant Averages
Pollutant Units Mean of
Measurements
95% Confidence
Interval on the Mean
Factor of
EPA LCL
a
Acetaldehyde ppbv 3.802b 2.677–4.927 15.07
Benzene ppbv 0.686c 0.465–0.906 17.08
1,3-Butadiene ppbv 0.092d 0.051–0.132 6.08
Carbon Tetrachloride ppbv 0.113e 0.107–0.118 4.19
p-Dichlorobenzene ppbv 0.060f 0.038–0.083 3.99
Formaldehyde ppbv 1.140g 0.731–1.548 17.50
Tetrachloroethylene ppbv 0.048h 0.034–0.061 1.90 a
LCL refers to the Lowest Comparison Level of cancer and/or noncancer values, as used in EPA’s NATA. LCLs for this study are presented in Appendix 2-G. “Factor of EPA LCL” is the pollutant study average (or mean of measurements) divided by its LCL.
b The mean of measurements for acetaldehyde is the average of all sample results, which include 20 detections
that ranged from 1.35 to 9.06 ppbv. c
The mean of measurements for benzene is the average of all sample results, which include 20 detections that
ranged from 0.200 to 1.83 ppbv. d
The mean of measurements for 1,3-butadiene is the average of all sample results, which include 18 detections
that ranged from 0.015 to 0.304 ppbv. e
The mean of measurements for carbon tetrachloride is the average of all sample results, which include 20
detections that ranged from 0.094 to 0.142 ppbv. f
The mean of measurements for p-dichlorobenzene is the average of all sample results, which include 19
detections that ranged from 0.019 to 0.178 ppbv, as well as one sample in which no chemical was registered by the laboratory analytical equipment.
g The mean of measurements for formaldehyde is the average of all sample results, which include 20 detections
that ranged from 0.412 to 4.45 ppbv. h
The mean of measurements for tetrachloroethylene is the average of all sample results, which include 20
detections that ranged from 0.015 to 0.116 ppbv.
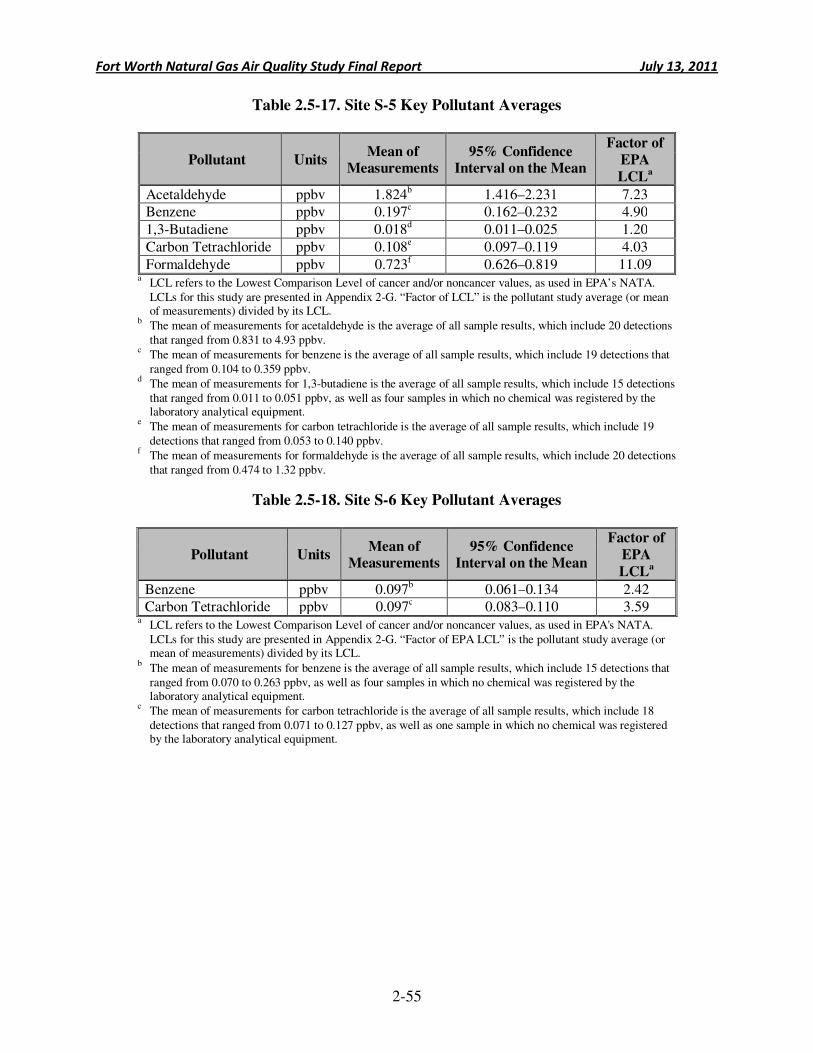
Fort Worth Natural Gas Air Quality Study Final Report July 13, 2011
2-55
Table 2.5-17. Site S-5 Key Pollutant Averages
Pollutant Units Mean of
Measurements 95% Confidence
Interval on the Mean
Factor of
EPA
LCLa
Acetaldehyde ppbv 1.824b 1.416–2.231 7.23 Benzene ppbv 0.197c 0.162–0.232 4.90
1,3-Butadiene ppbv 0.018d 0.011–0.025 1.20
Carbon Tetrachloride ppbv 0.108e 0.097–0.119 4.03
Formaldehyde ppbv 0.723f 0.626–0.819 11.09 a
LCL refers to the Lowest Comparison Level of cancer and/or noncancer values, as used in EPA’s NATA.
LCLs for this study are presented in Appendix 2-G. “Factor of LCL” is the pollutant study average (or mean of measurements) divided by its LCL.
b The mean of measurements for acetaldehyde is the average of all sample results, which include 20 detections
that ranged from 0.831 to 4.93 ppbv. c
The mean of measurements for benzene is the average of all sample results, which include 19 detections that
ranged from 0.104 to 0.359 ppbv. d
The mean of measurements for 1,3-butadiene is the average of all sample results, which include 15 detections
that ranged from 0.011 to 0.051 ppbv, as well as four samples in which no chemical was registered by the laboratory analytical equipment.
e The mean of measurements for carbon tetrachloride is the average of all sample results, which include 19
detections that ranged from 0.053 to 0.140 ppbv. f
The mean of measurements for formaldehyde is the average of all sample results, which include 20 detections
that ranged from 0.474 to 1.32 ppbv.
Table 2.5-18. Site S-6 Key Pollutant Averages
Pollutant Units Mean of
Measurements 95% Confidence
Interval on the Mean
Factor of
EPA
LCLa
Benzene ppbv 0.097b 0.061–0.134 2.42 Carbon Tetrachloride ppbv 0.097c 0.083–0.110 3.59
a LCL refers to the Lowest Comparison Level of cancer and/or noncancer values, as used in EPA's NATA.
LCLs for this study are presented in Appendix 2-G. “Factor of EPA LCL” is the pollutant study average (or mean of measurements) divided by its LCL.
b The mean of measurements for benzene is the average of all sample results, which include 15 detections that
ranged from 0.070 to 0.263 ppbv, as well as four samples in which no chemical was registered by the laboratory analytical equipment.
c The mean of measurements for carbon tetrachloride is the average of all sample results, which include 18
detections that ranged from 0.071 to 0.127 ppbv, as well as one sample in which no chemical was registered by the laboratory analytical equipment.
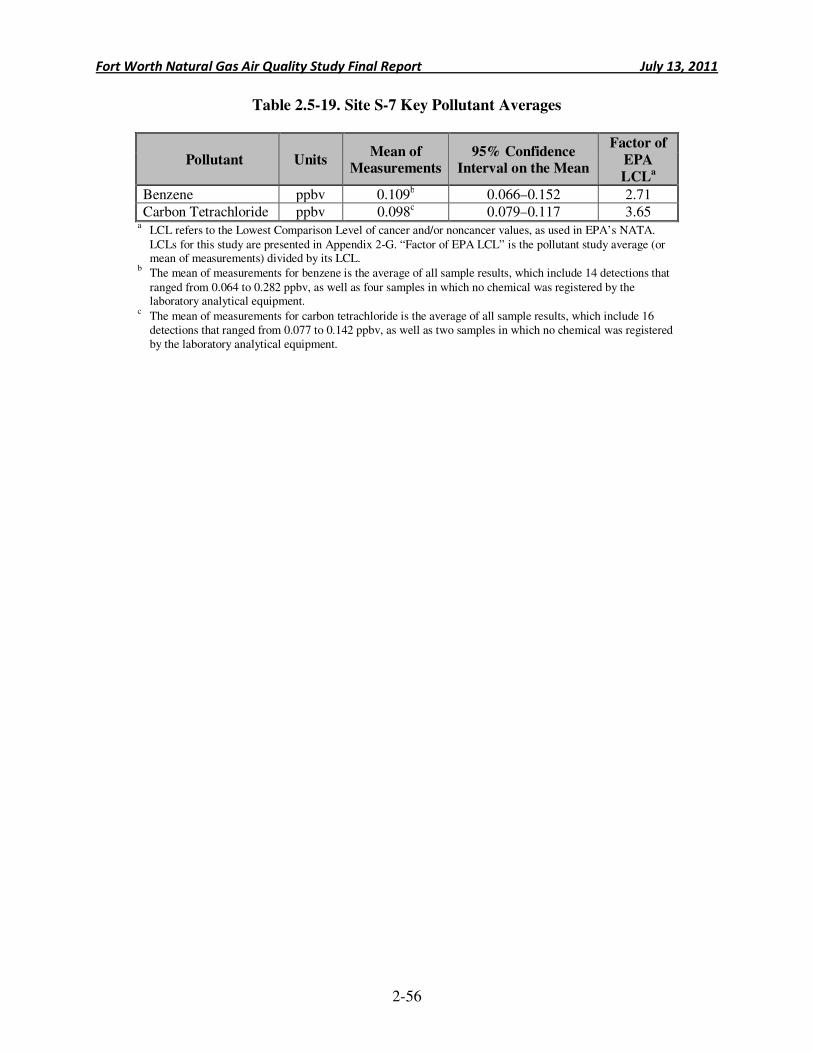
Fort Worth Natural Gas Air Quality Study Final Report July 13, 2011
2-56
Table 2.5-19. Site S-7 Key Pollutant Averages
Pollutant Units Mean of
Measurements 95% Confidence
Interval on the Mean
Factor of
EPA
LCLa
Benzene ppbv 0.109b 0.066–0.152 2.71 Carbon Tetrachloride ppbv 0.098c 0.079–0.117 3.65
a LCL refers to the Lowest Comparison Level of cancer and/or noncancer values, as used in EPA’s NATA.
LCLs for this study are presented in Appendix 2-G. “Factor of EPA LCL” is the pollutant study average (or mean of measurements) divided by its LCL.
b The mean of measurements for benzene is the average of all sample results, which include 14 detections that
ranged from 0.064 to 0.282 ppbv, as well as four samples in which no chemical was registered by the laboratory analytical equipment.
c The mean of measurements for carbon tetrachloride is the average of all sample results, which include 16 detections that ranged from 0.077 to 0.142 ppbv, as well as two samples in which no chemical was registered by the laboratory analytical equipment.
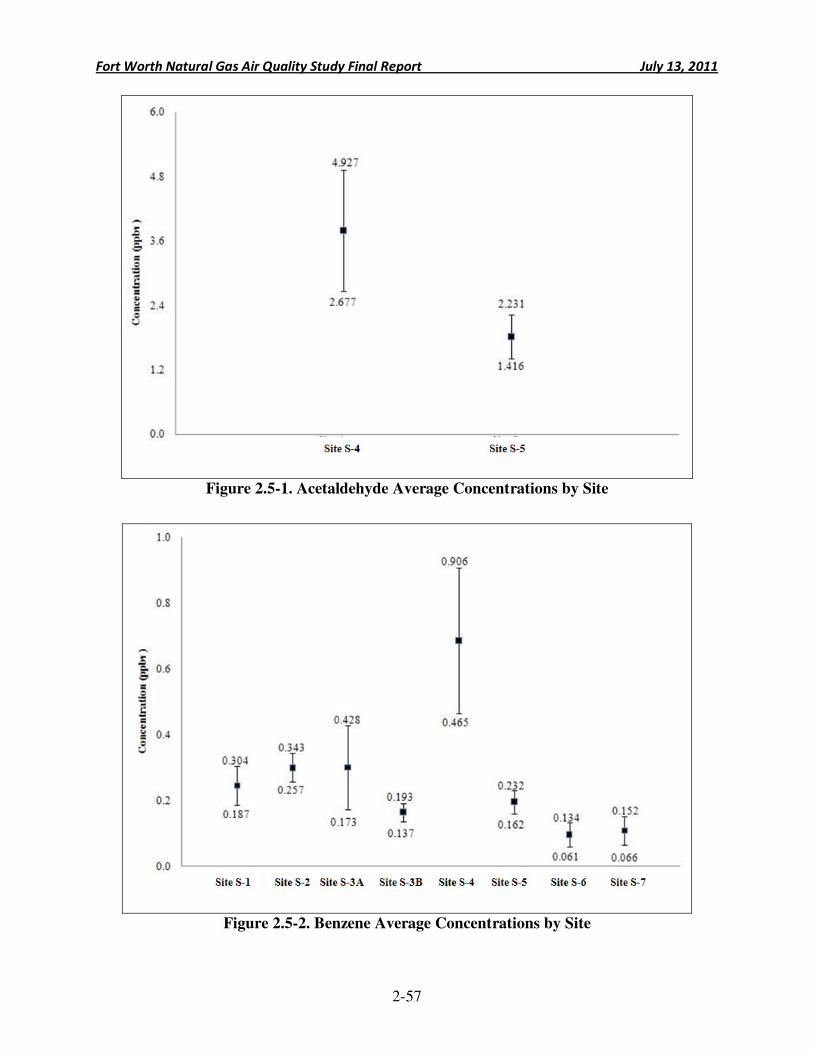
Fort Worth Natural Gas Air Quality Study Final Report July 13, 2011
2-57
Figure 2.5-1. Acetaldehyde Average Concentrations by Site
Figure 2.5-2. Benzene Average Concentrations by Site
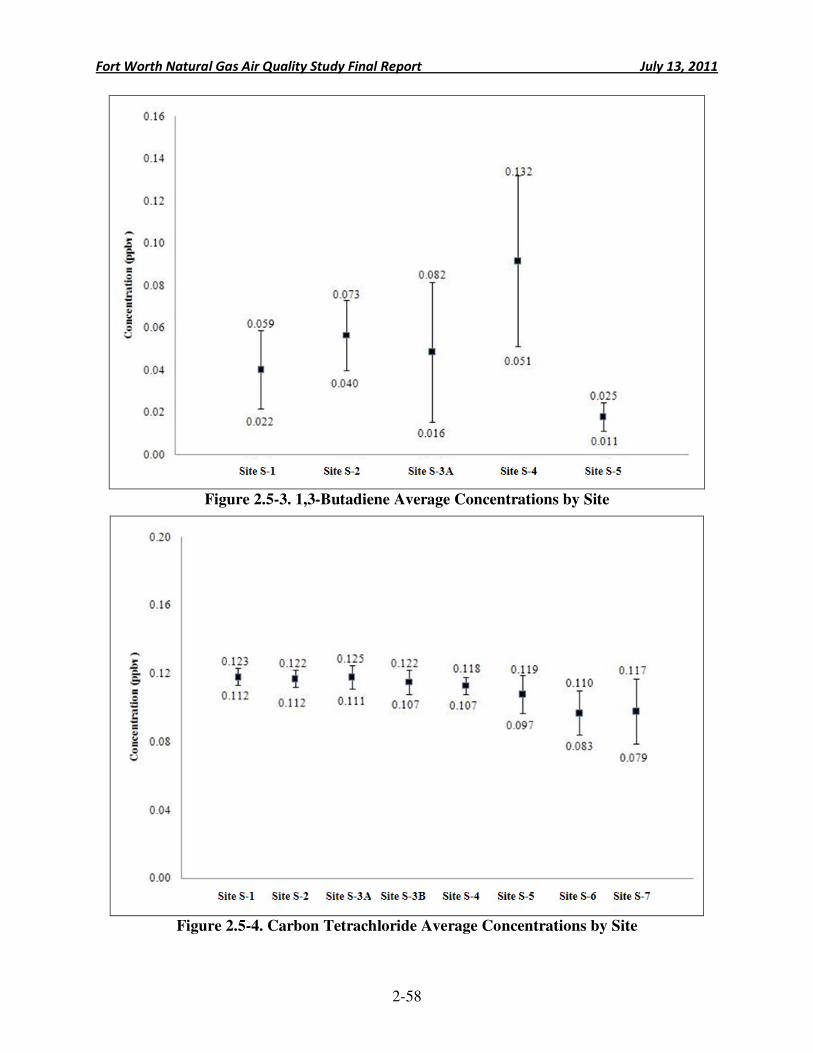
Fort Worth Natural Gas Air Quality Study Final Report July 13, 2011
2-58
Figure 2.5-3. 1,3-Butadiene Average Concentrations by Site
Figure 2.5-4. Carbon Tetrachloride Average Concentrations by Site
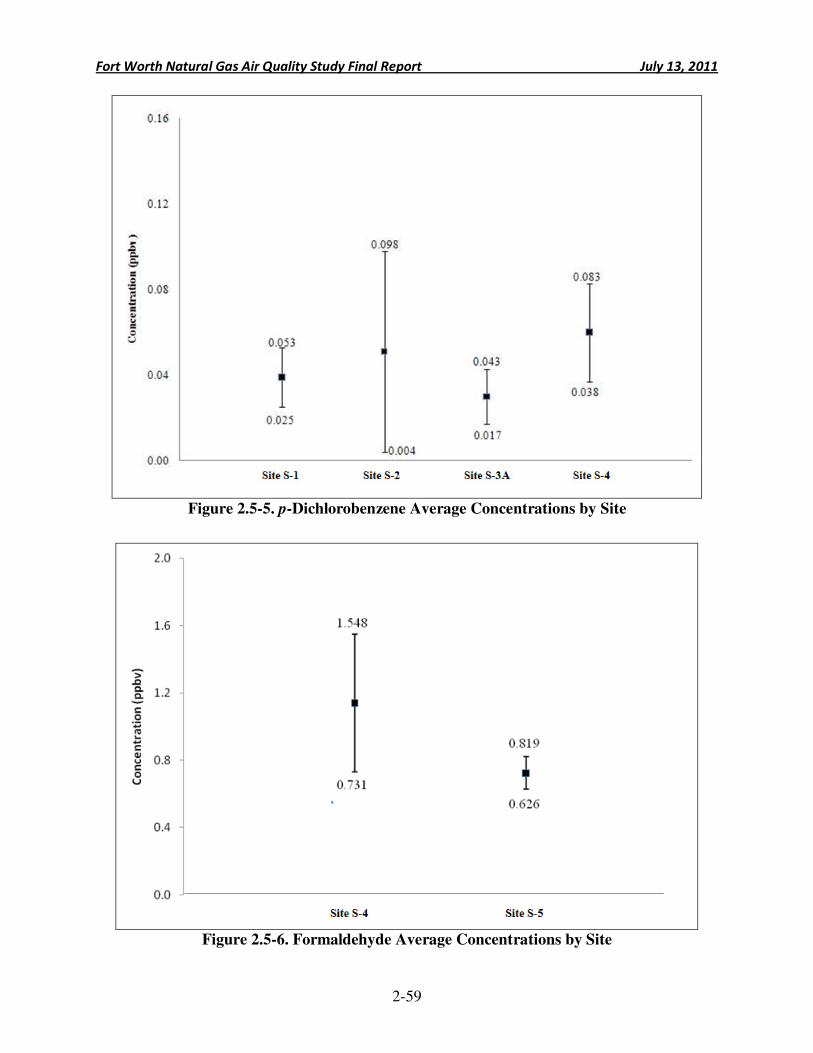
Fort Worth Natural Gas Air Quality Study Final Report July 13, 2011
2-59
Figure 2.5-5. p-Dichlorobenzene Average Concentrations by Site
Figure 2.5-6. Formaldehyde Average Concentrations by Site
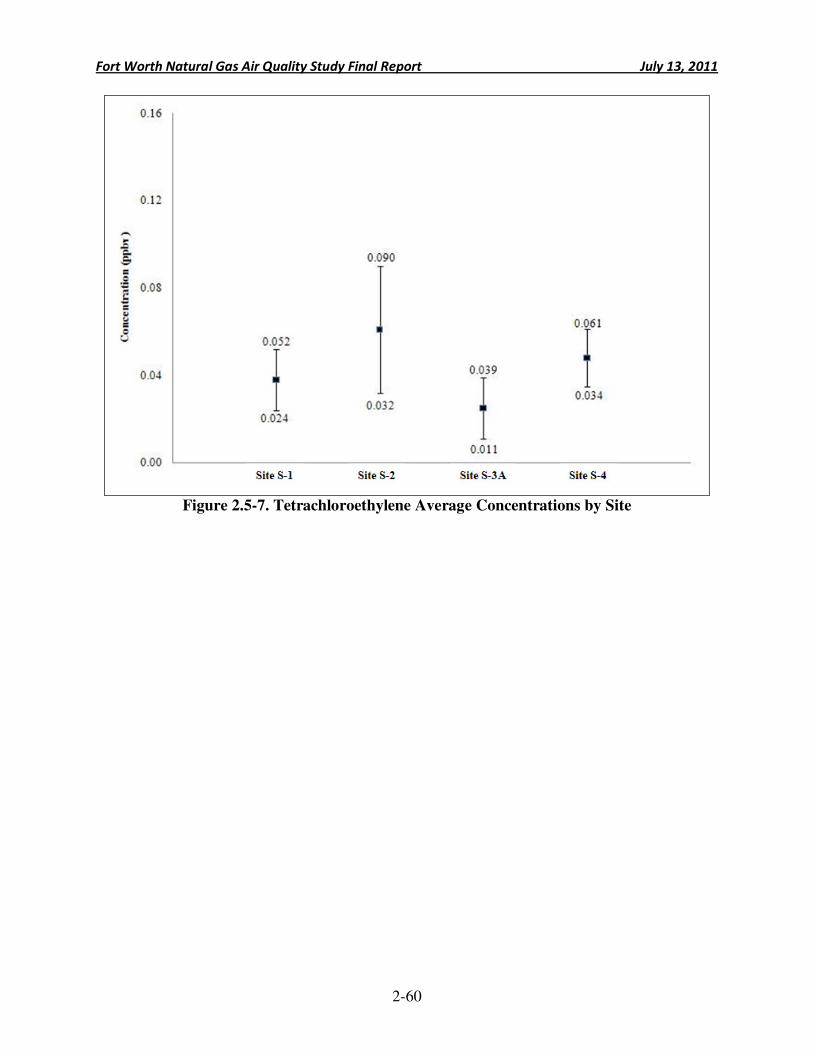
Fort Worth Natural Gas Air Quality Study Final Report July 13, 2011
2-60
Figure 2.5-7. Tetrachloroethylene Average Concentrations by Site
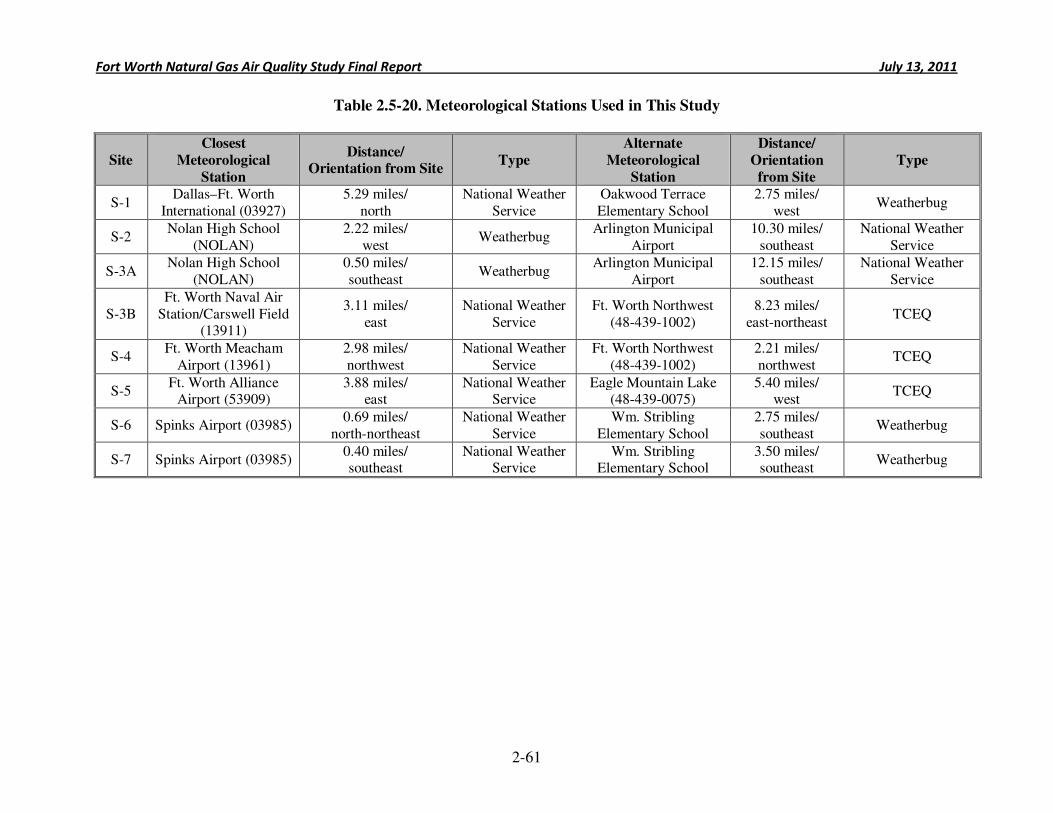
Fort Worth Natural Gas Air Quality Study Final Report July 13, 2011
2-61
Table 2.5-20. Meteorological Stations Used in This Study
Site
Closest
Meteorological
Station
Distance/ Orientation from Site
Type
Alternate
Meteorological
Station
Distance/
Orientation
from Site
Type
S-1 Dallas–Ft. Worth
International (03927) 5.29 miles/
north National Weather
Service Oakwood Terrace Elementary School
2.75 miles/ west
Weatherbug
S-2 Nolan High School
(NOLAN) 2.22 miles/
west Weatherbug
Arlington Municipal Airport
10.30 miles/ southeast
National Weather Service
S-3A Nolan High School
(NOLAN) 0.50 miles/ southeast
Weatherbug Arlington Municipal
Airport 12.15 miles/
southeast National Weather
Service
S-3B Ft. Worth Naval Air
Station/Carswell Field (13911)
3.11 miles/ east
National Weather Service
Ft. Worth Northwest (48-439-1002)
8.23 miles/ east-northeast
TCEQ
S-4 Ft. Worth Meacham
Airport (13961) 2.98 miles/ northwest
National Weather Service
Ft. Worth Northwest (48-439-1002)
2.21 miles/ northwest
TCEQ
S-5 Ft. Worth Alliance
Airport (53909) 3.88 miles/
east National Weather
Service Eagle Mountain Lake
(48-439-0075) 5.40 miles/
west TCEQ
S-6 Spinks Airport (03985) 0.69 miles/
north-northeast National Weather
Service Wm. Stribling
Elementary School 2.75 miles/ southeast
Weatherbug
S-7 Spinks Airport (03985) 0.40 miles/ southeast
National Weather Service
Wm. Stribling Elementary School
3.50 miles/ southeast
Weatherbug
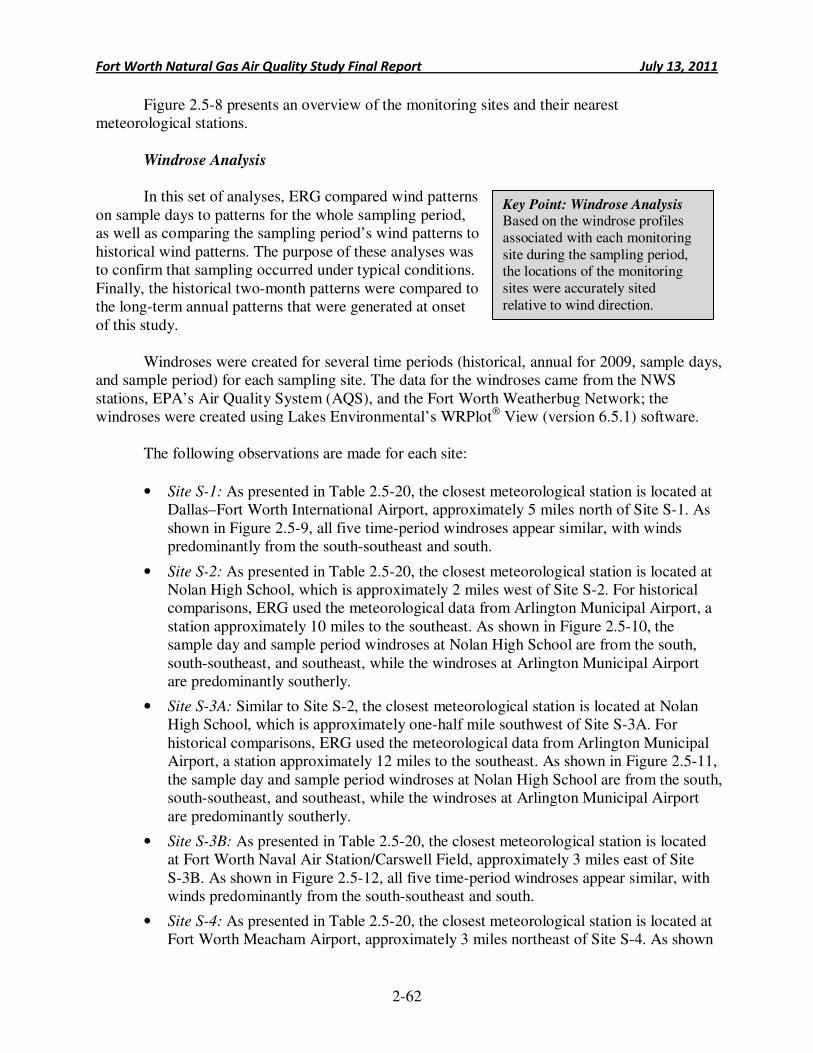
Fort Worth Natural Gas Air Quality Study Final Report July 13, 2011
2-62
Key Point: Windrose Analysis Based on the windrose profiles associated with each monitoring site during the sampling period, the locations of the monitoring sites were accurately sited relative to wind direction.
Figure 2.5-8 presents an overview of the monitoring sites and their nearest meteorological stations.
Windrose Analysis
In this set of analyses, ERG compared wind patterns
on sample days to patterns for the whole sampling period, as well as comparing the sampling period’s wind patterns to historical wind patterns. The purpose of these analyses was to confirm that sampling occurred under typical conditions. Finally, the historical two-month patterns were compared to the long-term annual patterns that were generated at onset of this study.
Windroses were created for several time periods (historical, annual for 2009, sample days, and sample period) for each sampling site. The data for the windroses came from the NWS stations, EPA’s Air Quality System (AQS), and the Fort Worth Weatherbug Network; the windroses were created using Lakes Environmental’s WRPlot® View (version 6.5.1) software.
The following observations are made for each site:
• Site S-1: As presented in Table 2.5-20, the closest meteorological station is located at Dallas–Fort Worth International Airport, approximately 5 miles north of Site S-1. As shown in Figure 2.5-9, all five time-period windroses appear similar, with winds predominantly from the south-southeast and south.
• Site S-2: As presented in Table 2.5-20, the closest meteorological station is located at Nolan High School, which is approximately 2 miles west of Site S-2. For historical comparisons, ERG used the meteorological data from Arlington Municipal Airport, a station approximately 10 miles to the southeast. As shown in Figure 2.5-10, the sample day and sample period windroses at Nolan High School are from the south, south-southeast, and southeast, while the windroses at Arlington Municipal Airport are predominantly southerly.
• Site S-3A: Similar to Site S-2, the closest meteorological station is located at Nolan High School, which is approximately one-half mile southwest of Site S-3A. For historical comparisons, ERG used the meteorological data from Arlington Municipal Airport, a station approximately 12 miles to the southeast. As shown in Figure 2.5-11, the sample day and sample period windroses at Nolan High School are from the south, south-southeast, and southeast, while the windroses at Arlington Municipal Airport are predominantly southerly.
• Site S-3B: As presented in Table 2.5-20, the closest meteorological station is located at Fort Worth Naval Air Station/Carswell Field, approximately 3 miles east of Site S-3B. As shown in Figure 2.5-12, all five time-period windroses appear similar, with winds predominantly from the south-southeast and south.
• Site S-4: As presented in Table 2.5-20, the closest meteorological station is located at Fort Worth Meacham Airport, approximately 3 miles northeast of Site S-4. As shown
Fort Worth Natural Gas Air Quality Study Final Report July 13, 2011
2-63
in Figure 2.5-13, all five time-period windroses appear similar, with winds predominantly from the south-southeast and south.
• Site S-5: As presented in Table 2.5-20, the closest meteorological station is located at Fort Worth Alliance Airport, approximately 4 miles east of Site S-5. As shown in Figure 2.5-14, all five time-period windroses appear similar, with winds predominantly from the south-southeast and south.
• Site S-6: As presented in Table 2.5-20, the closest meteorological station is located at Spinks Airport, less than 0.75 miles north-northeast of Site S-6. As shown in Figure 2.5-15, all five time-period windroses appear similar, with winds predominantly from the south-southeast and south.
• Site S-7: Similar to Site S-6, the closest meteorological station is located at Spinks Airport, less than half a mile southeast of Site S-7. As shown in Figure 2.5-16, all five time-period windroses appear similar, with winds predominantly from the south-southeast and south.
As described in the Ambient Air Monitoring Plan, the monitoring network was designed
in part after understanding typical wind patterns in and around the City of Fort Worth through the use of historical windroses. Monitoring sites were placed to capture ambient air downwind of the target areas of interest. The general conclusion from the above windrose comparisons at each monitoring site during the study period is that wind patterns on sample days were generally typical of year-round and long-term historical wind patterns, indicating that the monitoring sites were able to collect samples from the target direction.
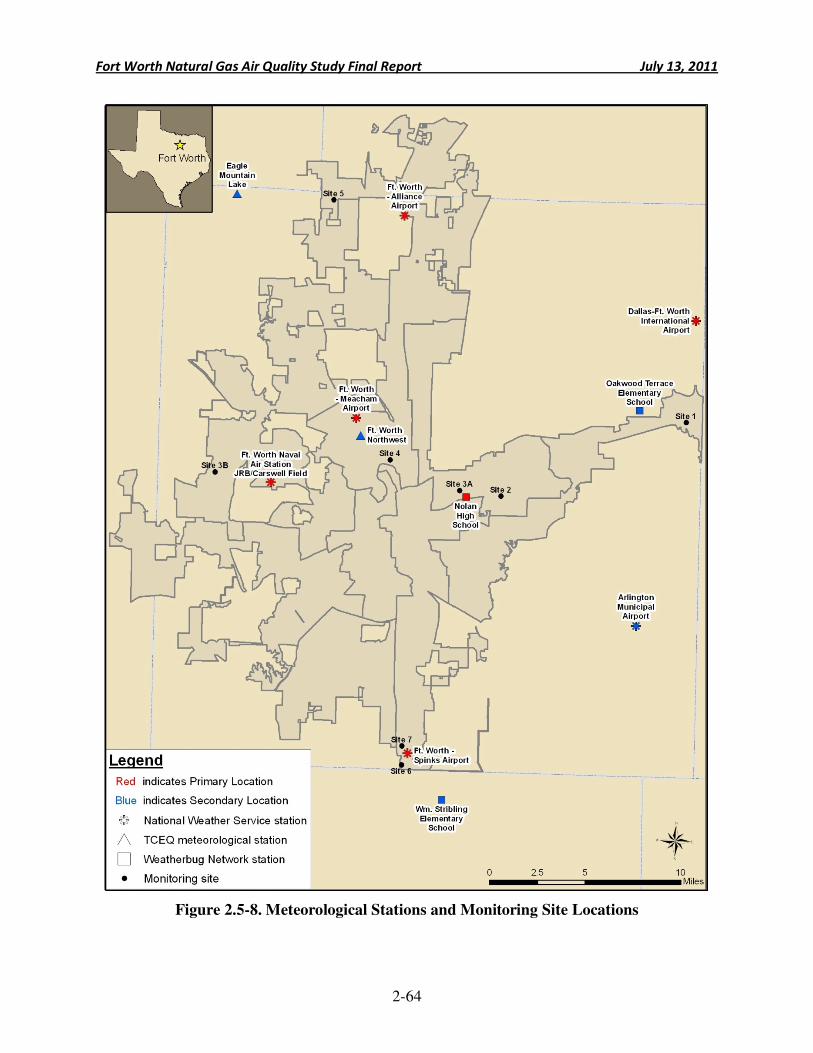
Fort Worth Natural Gas Air Quality Study Final Report July 13, 2011
2-64
Figure 2.5-8. Meteorological Stations and Monitoring Site Locations
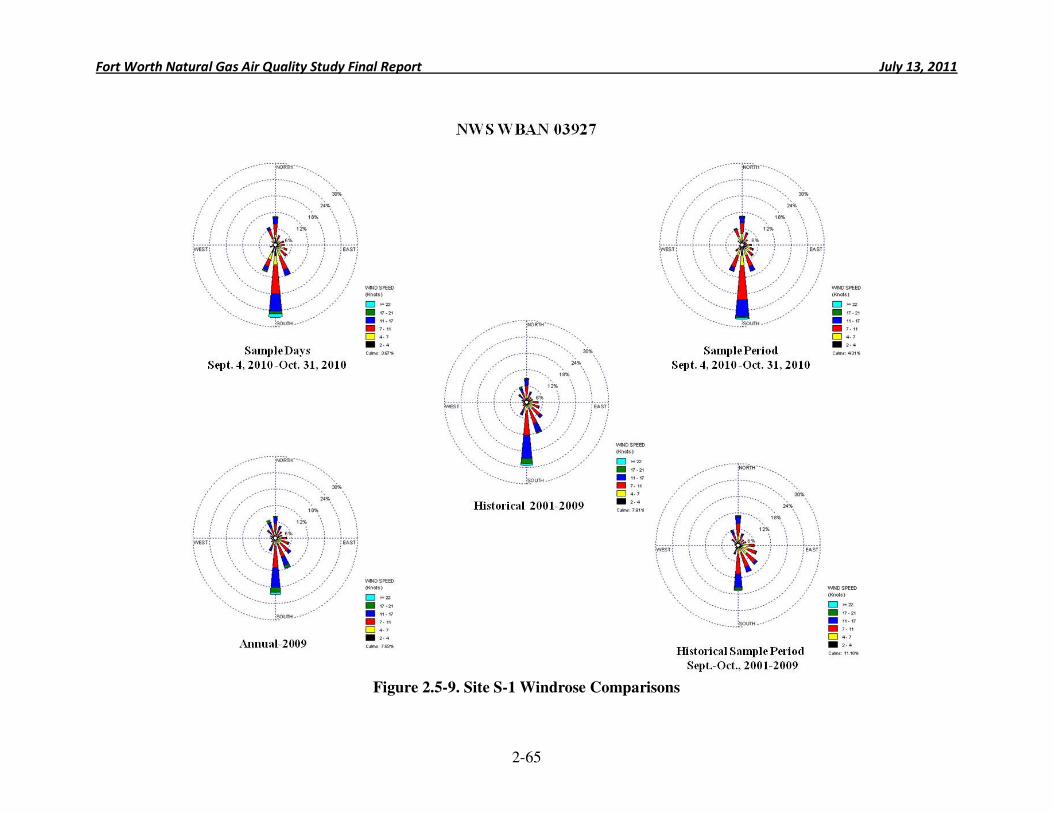
Fort Worth Natural Gas Air Quality Study Final Report July 13, 2011
2-65
Figure 2.5-9. Site S-1 Windrose Comparisons
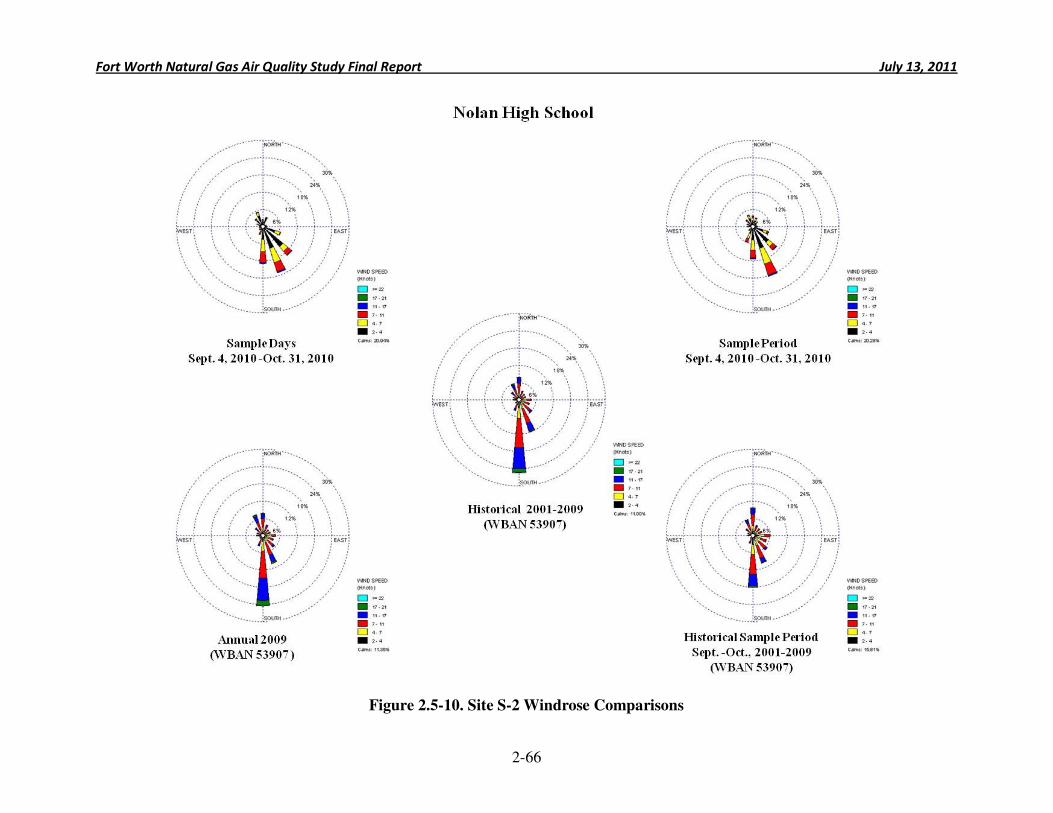
Fort Worth Natural Gas Air Quality Study Final Report July 13, 2011
2-66
Figure 2.5-10. Site S-2 Windrose Comparisons
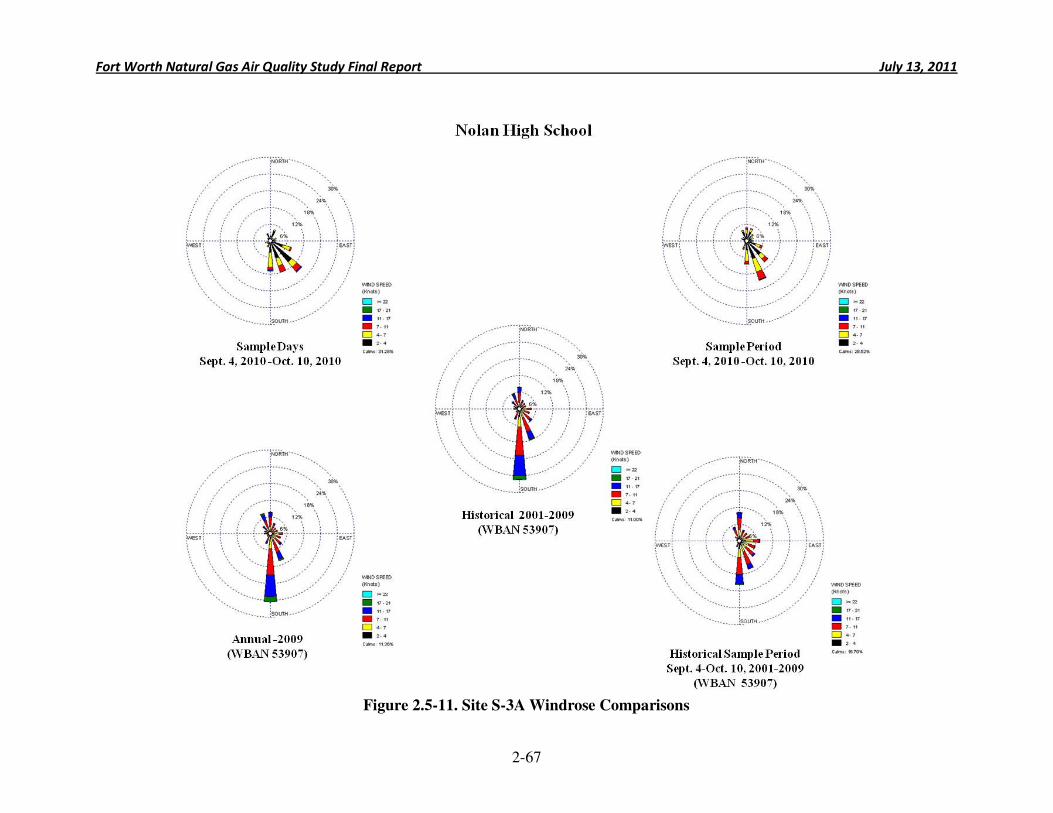
Fort Worth Natural Gas Air Quality Study Final Report July 13, 2011
2-67
Figure 2.5-11. Site S-3A Windrose Comparisons
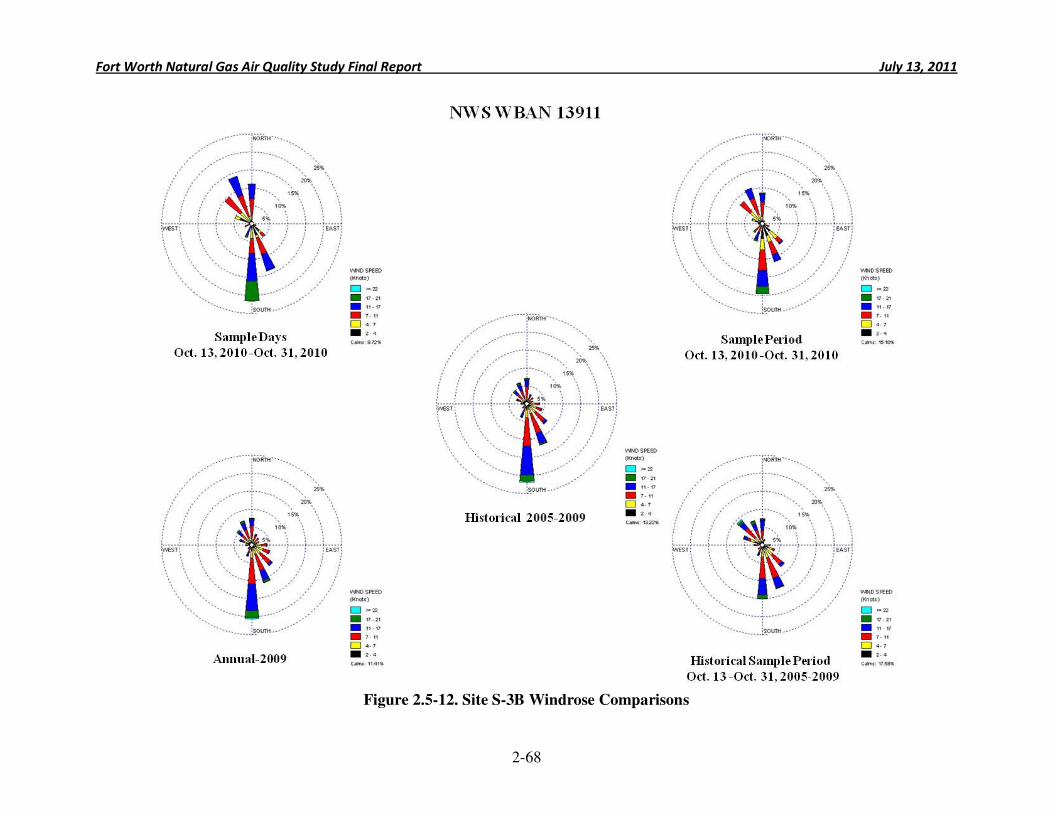
Fort Worth Natural Gas Air Quality Study Final Report July 13, 2011
2-68
Figure 2.5-12. Site S-3B Windrose Comparisons
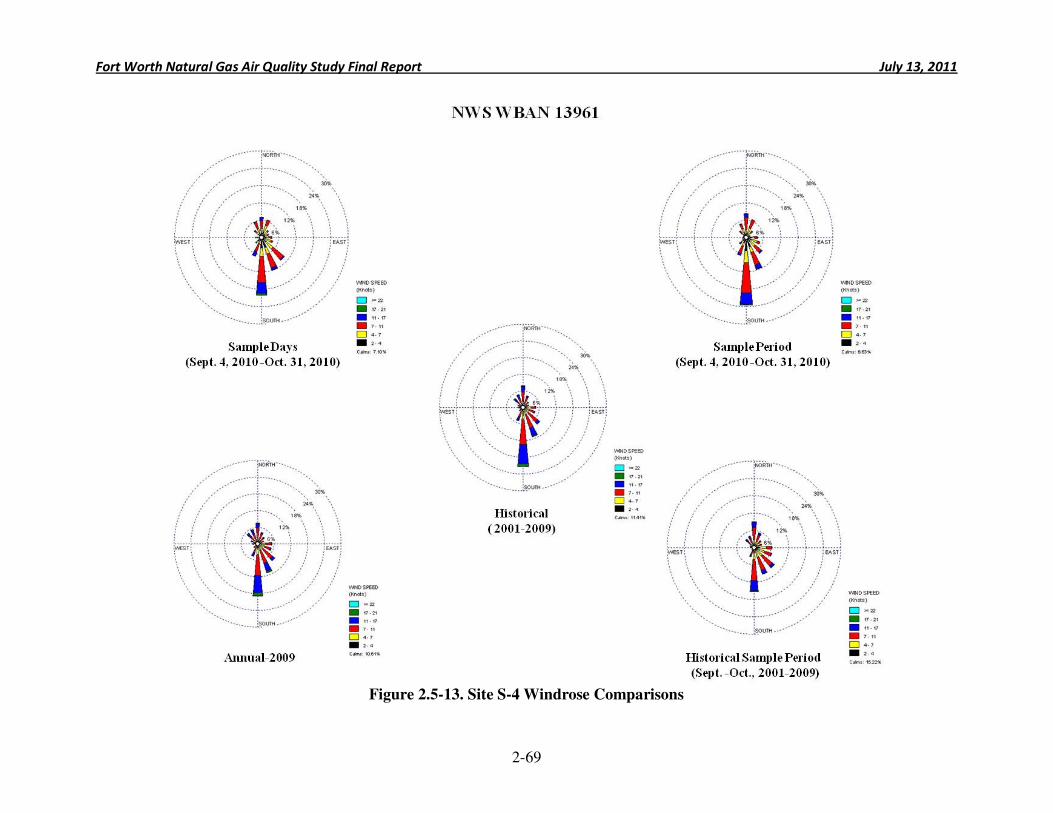
Fort Worth Natural Gas Air Quality Study Final Report July 13, 2011
2-69
Figure 2.5-13. Site S-4 Windrose Comparisons
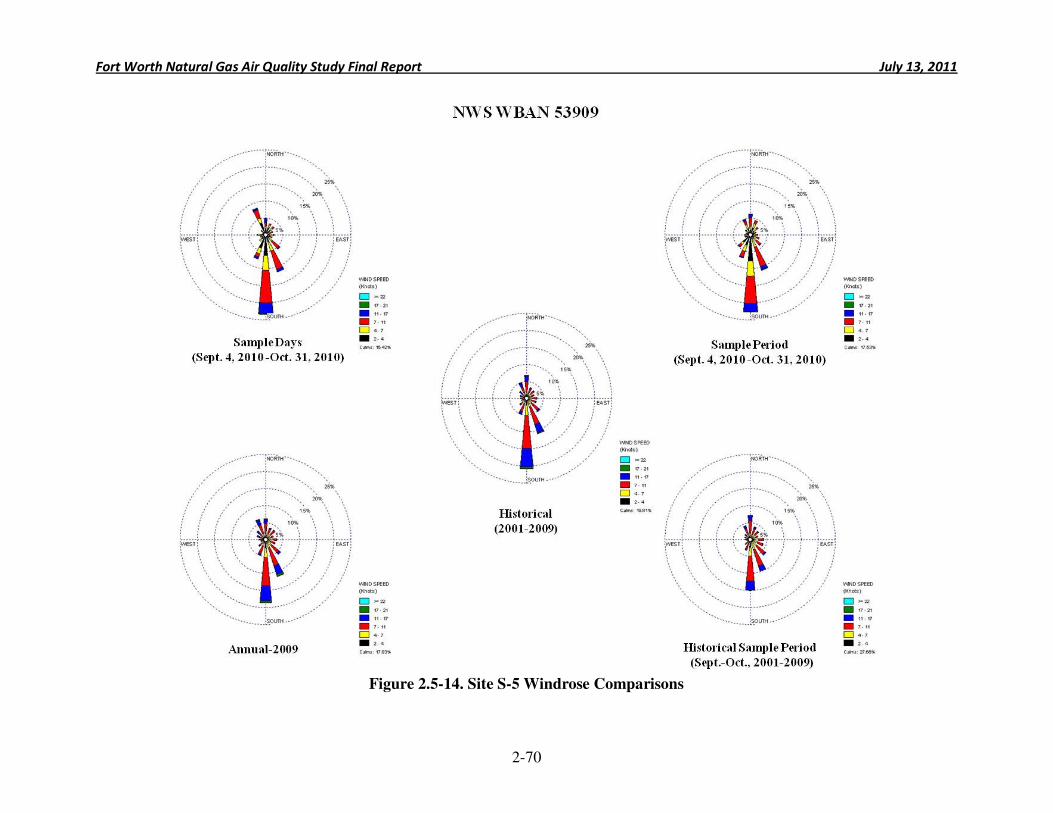
Fort Worth Natural Gas Air Quality Study Final Report July 13, 2011
2-70
Figure 2.5-14. Site S-5 Windrose Comparisons
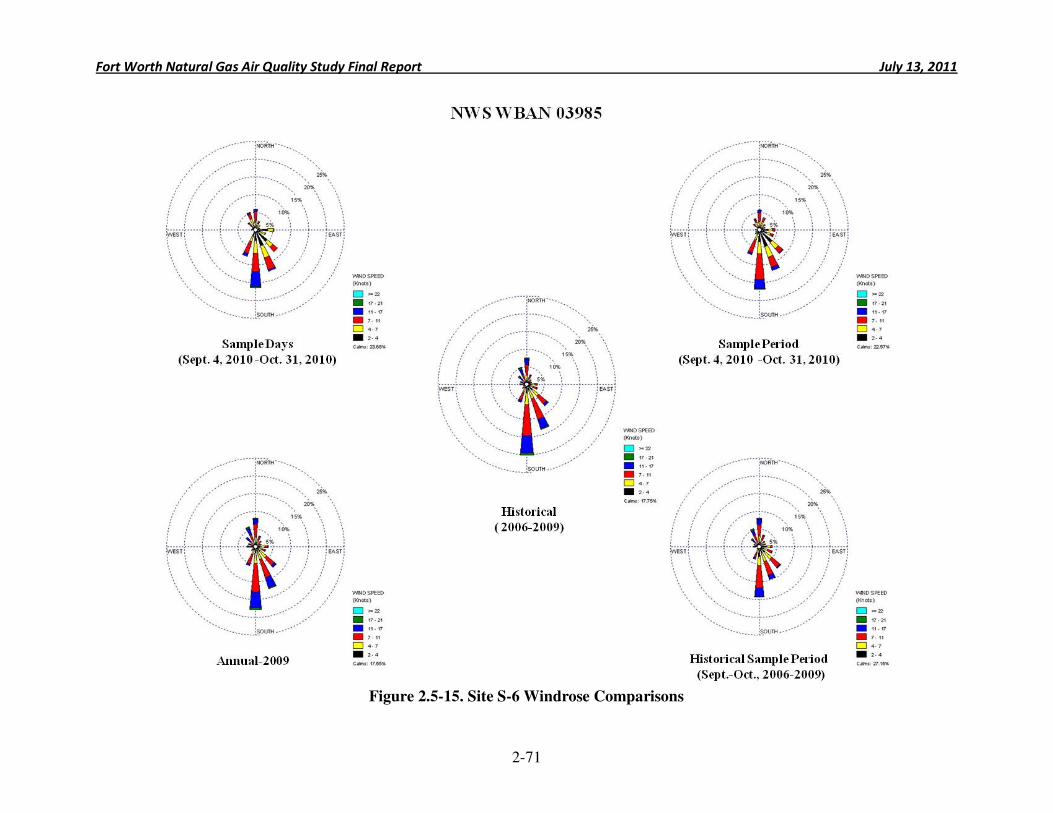
Fort Worth Natural Gas Air Quality Study Final Report July 13, 2011
2-71
Figure 2.5-15. Site S-6 Windrose Comparisons
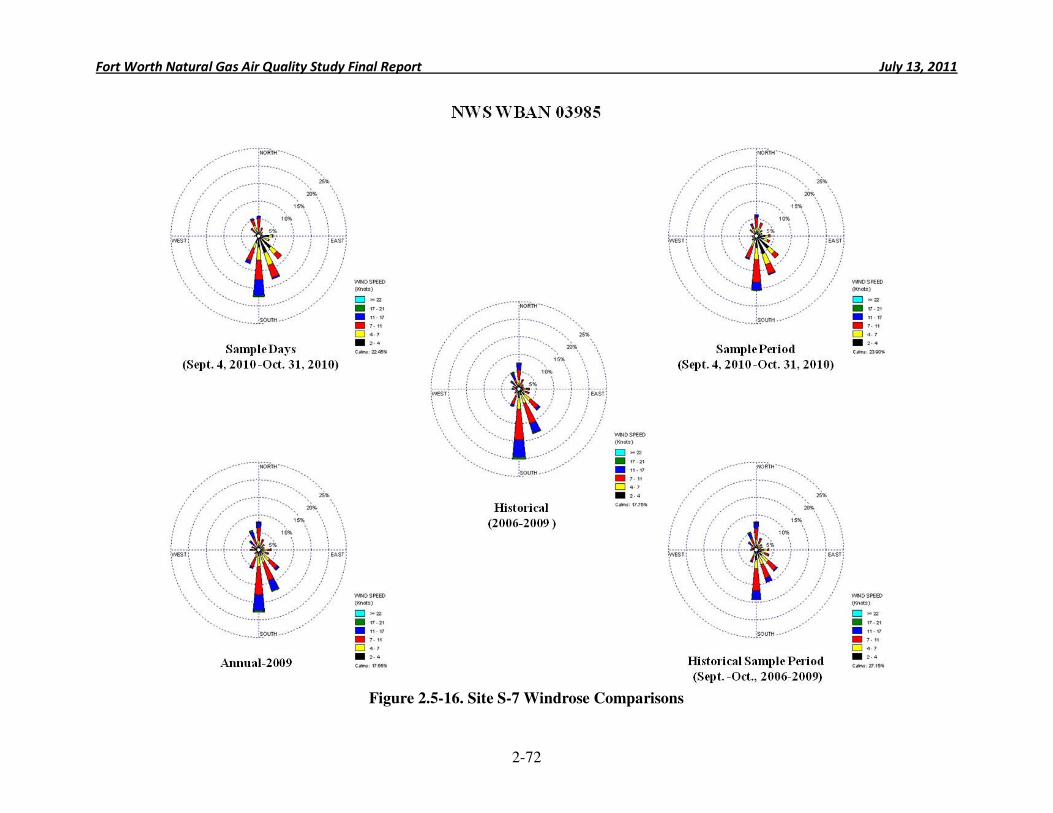
Fort Worth Natural Gas Air Quality Study Final Report July 13, 2011
2-72
Figure 2.5-16. Site S-7 Windrose Comparisons
Fort Worth Natural Gas Air Quality Study Final Report July 13, 2011
2-73
2.6 Ambient Air Monitoring Conclusions
Ambient air monitoring sampling at eight monitoring sites for nearly 140 pollutants yielded over 15,000 data points for this study. The ambient monitoring data presented in this report is based on air samples collected during a two-month timeframe at eight locations. The data should not be used to make inferences about air quality during times when, and locations where, samples were not collected. Insights from the dispersion modeling analysis have been used to help address this inherent limitation of the ambient air monitoring program, and a full discussion of the health implications of this study are presented in Section 5 of this report.
Key findings from the ambient monitoring study are as follows:
• 169 ambient air samples from 8 locations in Fort Worth were collected and analyzed, resulting in over 15,000 ambient air data points generated for this study.
• ERG found little variability across the sampling network for certain pollutants, such as carbon tetrachloride, chloroform, chloromethane, crotonaldehyde, dichlorodifluoromethane, dichlorotetrafluoroethane, ethylene, 1-hexene, isoprene, propylene, trichlorotrifluoromethane, and trichlorotrifluoroethane. The low variability across the entire network suggests that these pollutants are not affected by localized, anthropogenic sources, but rather exist as background pollutants.
• Benzene and carbon tetrachloride were identified as key VOCs at each site.
• Acetaldehyde and formaldehyde were identified as key carbonyls at Sites S-4 and S-5.
• No SNMOCs were identified as key pollutants.
• Concentrations measured at Site S-4 (located in a high-level activity area near compressor stations, well pads, and mobile sources) were generally higher than at other sites. For some of the key pollutants (acetaldehyde and benzene), concentrations at this site were considerably higher.
• Pollutant concentrations at Sites S-6 and S-7 (located in a medium-level activity area) were surprisingly low relative to other sites, especially given their close proximity to active well pad locations.
• Concentrations at Site S-1 (“background” site with no nearby natural gas well pads upwind) were generally similar to Site S-2 (“mobile sources” site). Concentrations at these two sites were slightly higher than Sites S-6 and S-7.
• Concentrations at the two “preproduction” sites did not display higher pollutant concentrations than the two monitoring stations designated as “background” and “mobile source” sites.
• Wind patterns observed during the sampling period were consistent with historical wind patterns, indicating proper placement of the ambient air monitors.
Fort Worth Natural Gas Air Quality Study Final Report July 13, 2011
3-1
3.0 Point Source Testing
ERG subcontracted the point source testing task to Sage Environmental Consulting LP (Sage). This section discusses how the point source testing task was conducted and the results that were obtained.
This section has seven sub-sections:
• 3.1 Introduction – Provides a summary of the purpose of the point source study, the scope of work, and the project timeline.
• 3.2 Point Source Survey Sampling Equipment – This section describes the field instrumentation.
• 3.3 Point Source Survey and Sampling Procedures – This section discusses survey procedures, documentation of emission points, the collection of emission data, canister sampling, and data archival procedures.
• 3.4 Emissions Calculation Procedures – The development of canister-derived emissions, the application of correlation equations, the creation of surrogate tank and non-tank emissions profiles, the use of EPA default-zero emissions factors, the use of engine emissions tables, and the calculation of Screening Emissions Factors are discussed in this section.
• 3.5 Point Source Emissions Results – The results of the point source study are provided in the charts and tables of this section.
• 3.6 Quality Control (QC) Results – This section contains the results of the QC procedures specified in the Final Point Source Test Plan including instrument calibration checks, canister sample collection procedures, and laboratory analytical checks.
• 3.7 Point Source Testing Conclusions – This section presents conclusions of the point source testing task.
• Appendix 3-A: Emissions summary for each point source site surveyed.
• Appendix 3-B: Two DVD discs containing the emissions calculation workbook, “MASTER - Well Char Emission Data 2011-07-13_FINAL” together with the data collected for each point source site.
• Appendix 3-C: One DVD containing the canister sample logbooks and the canister analytical results, the laboratory quality control results and the canister chain-of custody documentation.
3.1 Introduction
The purpose of the point source emissions study was to characterize emissions from natural gas-related point sources located within the Fort Worth city limits. These sources are categorized in seven groups:
• Well Pads – Comprising the largest group of sites visited, natural gas well pads typically contained several active wells, produced water storage tanks, separators, and
Fort Worth Natural Gas Air Quality Study Final Report July 13, 2011
3-2
metering runs (piping). Approximately one-third (123) of the well pads also had lift compressors used to increase a well’s gas production rate. Emission sources typically related with well pads include equipment leaks, produced water and condensate storage and loading, and lift compressors. The amount of condensate production and related emissions are usually dependant on whether the produced gas is wet or dry gas.
• Compressor Stations – Compressor stations contain one or more large (generally 250 horsepower (hp) or greater) line compressors which provide the necessary pressure to move the natural gas through many miles of transmission lines. The most significant emissions from compressors stations are usually from combustion at the compressor engines or turbines. Other emissions sources may include equipment leaks, storage tanks, glycol dehydrators, flares, and condensate and/or wastewater loading. None of the compressor stations visited included turbines.
• Processing Facilities – Processing facilities generally remove impurities from the natural gas, such as carbon dioxide, water, and hydrogen sulfide. These facilities may also be designed to remove ethane, propane, and butane fractions from the natural gas for downstream marketing. Processing facilities are usually the largest emitting natural gas-related point sources including multiple emission sources such as, but not limited to equipment leaks, storage tanks, separator vents, glycol dehydrators, flares, condensate and wastewater loading, compressors, amine treatment and sulfur recovery units. The Processing Plant visited included most of these sources except for sulfur recovery units.
• Saltwater Treatment Facility – The single saltwater treatment facility permitted for operation within the City’s boundaries uses underground injection to dispose of well production liquids such as oilfield brine, drilling mud, fracture materials, and well treatment fluids. Emission sources typically related with salt water treatment facilities include equipment leaks, storage tanks, and generators.
• Drilling Operation – Drilling of a new well is typically a two to three week process from start to finish and involves several large diesel-fueled generators. Other emission sources related to drilling operations may include equipment leaks and waste storage.
• Fracking Operation – Fracking is the high pressure injection of water mixed with sand and a variety of chemical additives into the well to fracture the shale and stimulate natural gas production from the well. Fracking operations can last for several weeks and involve many large diesel-fueled generators. Other emission sources related to fracking operations may include equipment leaks and waste storage.
• Flowback – Flowback is a well completion activity that occurs following the conclusion of a fracking operation. Flowback thus entails the removal of fracking fluids from the well in preparation either for a subsequent phase of treatment or for cleanup and returning the well to production. Similar to fracking operations, other related emission sources may include equipment leaks and waste storage.
Fort Worth Natural Gas Air Quality Study Final Report July 13, 2011
3-3
The point source teams surveyed a total of 388 sites (including repeat visits at two sites). The sites are identified by owner and type in Table 3.1-1. Figure 3.1-1 locates each site on an overlay map of Fort Worth. Figure 3.1-2 indicates which well pads were considered to be wet gas, and which were considered to be dry gas. For purposes of this study, a site was considered to be a wet gas site if it produced more than 1 barrel of condensate/day as indicated by the Texas Railroad Commission records.
The point source emissions survey occurred in two phases. Phase I was completed in the
fall of 2010 (August 30 – October 21, 2010). Phase II took place during the beginning months of 2011 (January 4 – February 16, 2011). There were no significant differences in methodology or scope between the two phases. Any slight differences between the methodologies are discussed below. During Phase I, 199 point source sites were surveyed and are identified using Point Source ID’s PS-001 through PS-201. An additional 189 sites were completed in Phase II and are identified as Point Source ID’s 6 through 487.
Quality Control results indicate that the field and the laboratory equipment were in a state of control during the point source survey and that project quality control checks were followed. Site-by-site emission summaries are provided in Appendix 3-A of this report. Appendix 3-B provides the field data and emission calculation workbook on two DVD discs. Appendix 3-C contains the canister analytical data on one DVD disc.
3.2 Point Source Emissions Survey Sampling Equipment
The point source surveys were carried out by two teams of two persons each. In Phase I each team was staffed by a Sage employee and an employee from Hicks & Co. Environmental (Hicks). This changed in Phase II to one team of two Sage employees while the other team remained a Sage and a Hicks employee. The point source teams were equipped with the following test equipment:
• FLIR™ Infrared (IR) Camera.
• Thermo Environmental ™ Toxic Vapor Analyzer.
• Bacharach™ Hi Flow Sampler.
• Summa Passivated Stainless Steel Canisters from TestAmerica™.
• Miscellaneous Support Equipment (Global Positioning System (GPS) Finder, Laser Distance Finder, Weather meter, Digital Camera).
Key Point: Sites Surveyed This study included surveying a total of 388 sites comprised of well pads, compressor stations, processing facilities, a salt water treatment facility, drilling operations, fracking operations, and completion operations.
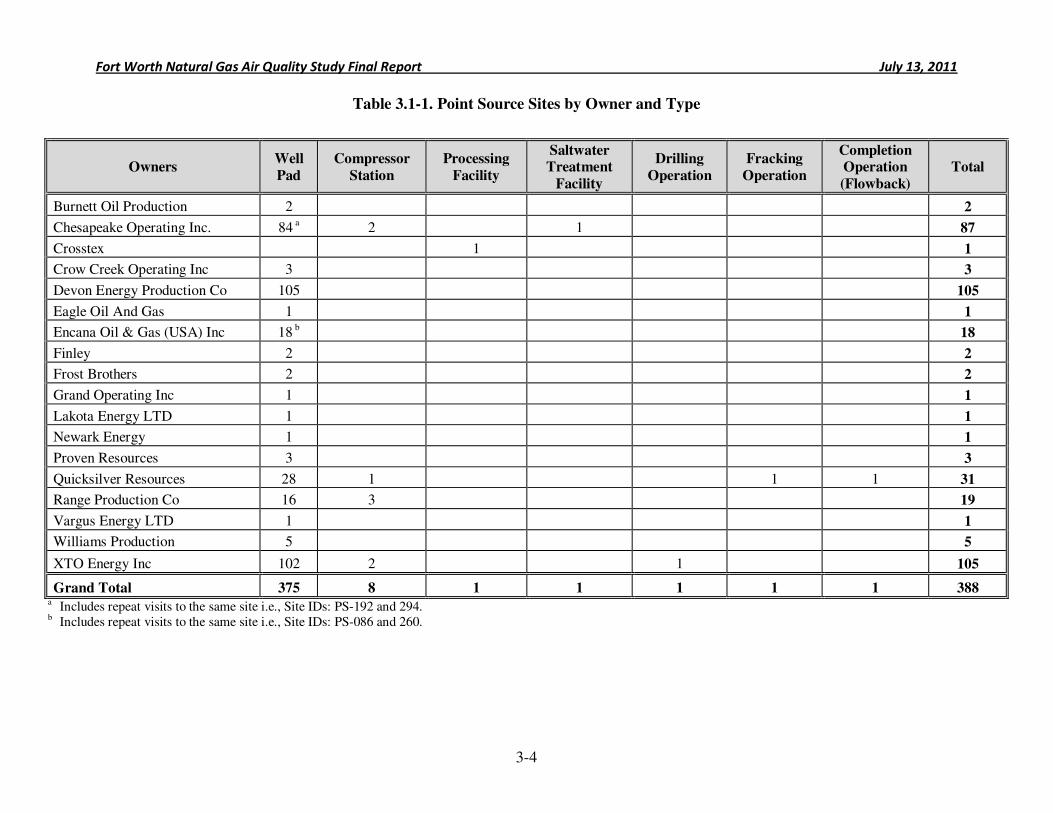
Fort Worth Natural Gas Air Quality Study Final Report July 13, 2011
3-4
a Includes repeat visits to the same site i.e., Site IDs: PS-192 and 294. b Includes repeat visits to the same site i.e., Site IDs: PS-086 and 260.
Table 3.1-1. Point Source Sites by Owner and Type
Owners Well
Pad
Compressor
Station
Processing
Facility
Saltwater Treatment
Facility
Drilling
Operation
Fracking
Operation
Completion Operation
(Flowback)
Total
Burnett Oil Production 2
2
Chesapeake Operating Inc. 84 a 2
1
87
Crosstex
1
1
Crow Creek Operating Inc 3
3
Devon Energy Production Co 105
105
Eagle Oil And Gas 1
1
Encana Oil & Gas (USA) Inc 18 b
18
Finley 2
2
Frost Brothers 2
2
Grand Operating Inc 1
1
Lakota Energy LTD 1
1
Newark Energy 1
1
Proven Resources 3
3
Quicksilver Resources 28 1
1 1 31
Range Production Co 16 3
19
Vargus Energy LTD 1
1
Williams Production 5
5
XTO Energy Inc 102 2 1 105
Grand Total 375 8 1 1 1 1 1 388
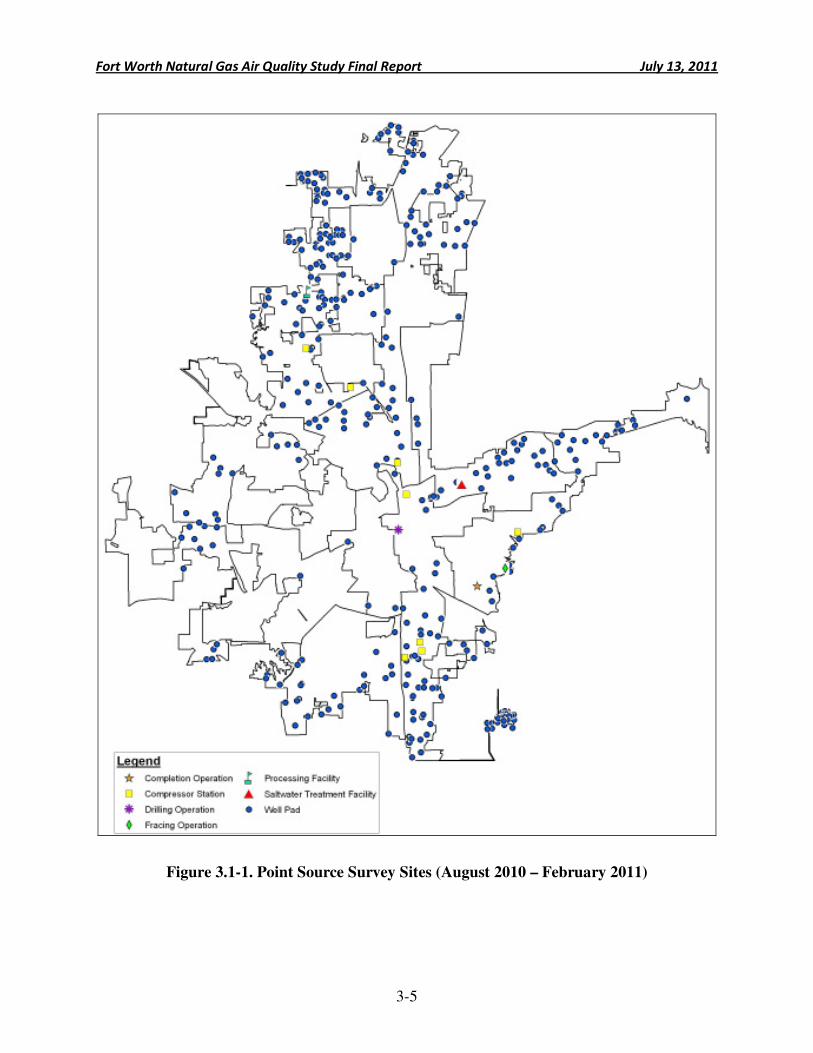
Fort Worth Natural Gas Air Quality Study Final Report July 13, 2011
3-5
Figure 3.1-1. Point Source Survey Sites (August 2010 – February 2011)
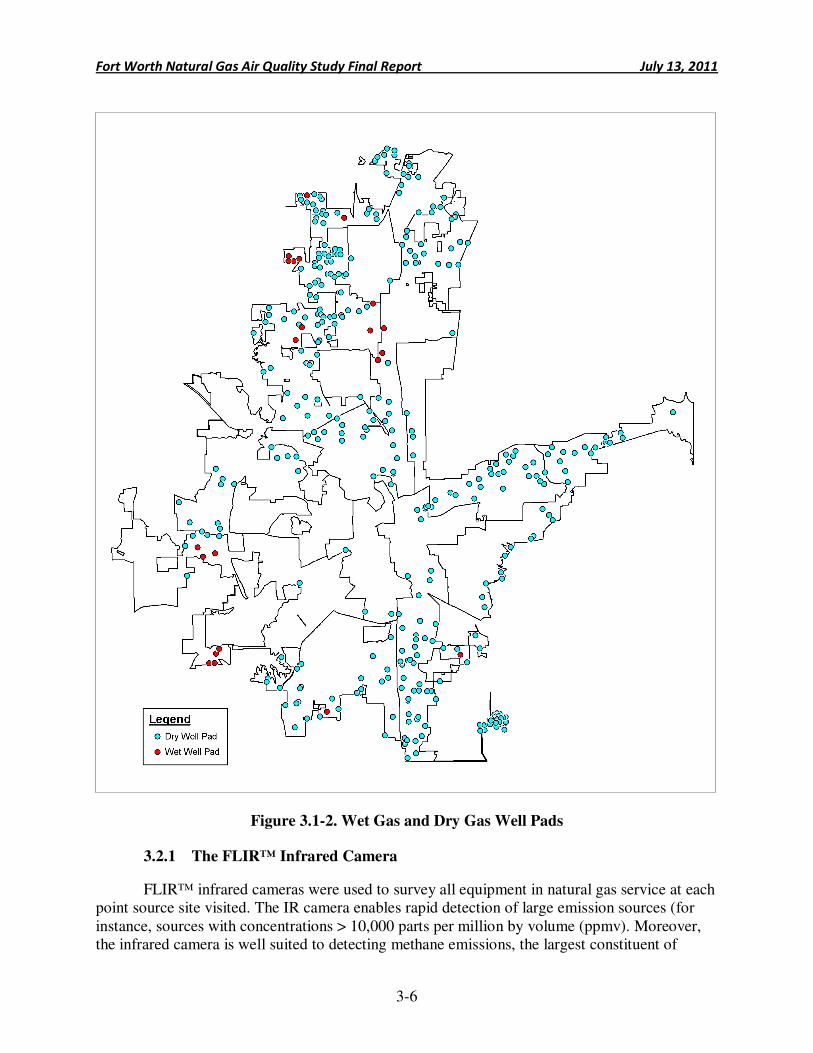
Fort Worth Natural Gas Air Quality Study Final Report July 13, 2011
3-6
Figure 3.1-2. Wet Gas and Dry Gas Well Pads
3.2.1 The FLIR™ Infrared Camera
FLIR™ infrared cameras were used to survey all equipment in natural gas service at each point source site visited. The IR camera enables rapid detection of large emission sources (for instance, sources with concentrations > 10,000 parts per million by volume (ppmv). Moreover, the infrared camera is well suited to detecting methane emissions, the largest constituent of
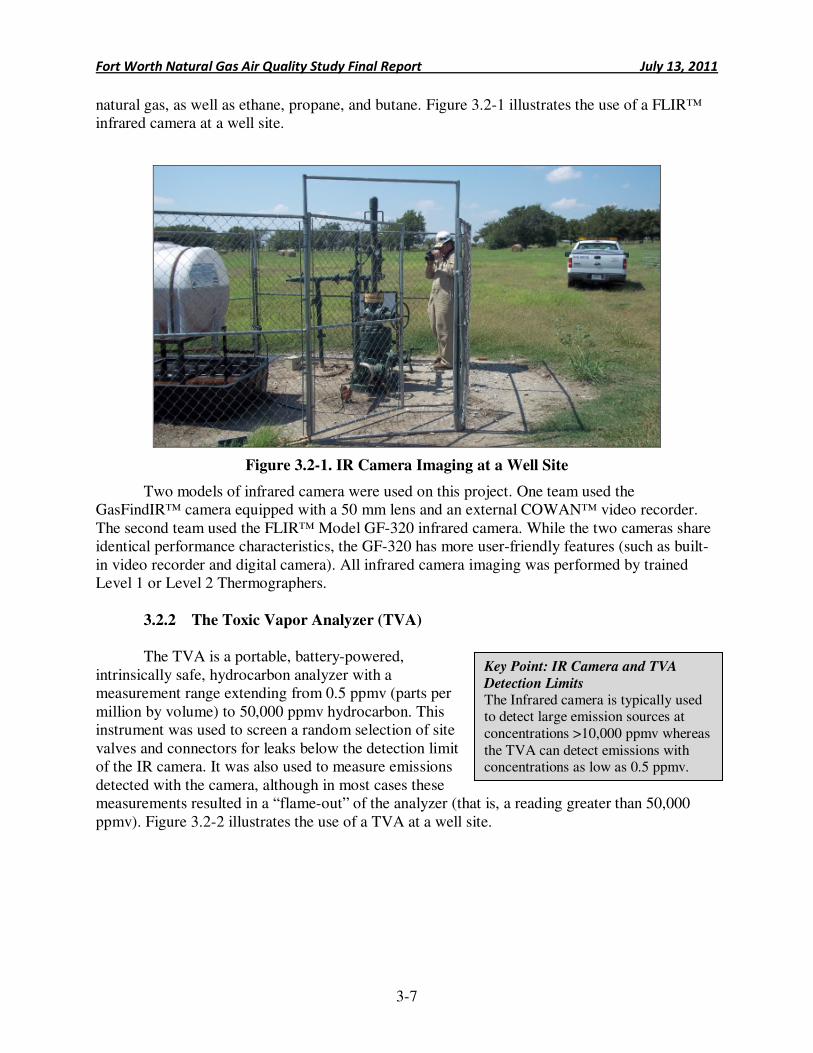
Fort Worth Natural Gas Air Quality Study Final Report July 13, 2011
3-7
natural gas, as well as ethane, propane, and butane. Figure 3.2-1 illustrates the use of a FLIR™ infrared camera at a well site.
Figure 3.2-1. IR Camera Imaging at a Well Site
Two models of infrared camera were used on this project. One team used the GasFindIR™ camera equipped with a 50 mm lens and an external COWAN™ video recorder. The second team used the FLIR™ Model GF-320 infrared camera. While the two cameras share identical performance characteristics, the GF-320 has more user-friendly features (such as built-in video recorder and digital camera). All infrared camera imaging was performed by trained Level 1 or Level 2 Thermographers.
3.2.2 The Toxic Vapor Analyzer (TVA)
The TVA is a portable, battery-powered,
intrinsically safe, hydrocarbon analyzer with a measurement range extending from 0.5 ppmv (parts per million by volume) to 50,000 ppmv hydrocarbon. This instrument was used to screen a random selection of site valves and connectors for leaks below the detection limit of the IR camera. It was also used to measure emissions detected with the camera, although in most cases these measurements resulted in a “flame-out” of the analyzer (that is, a reading greater than 50,000 ppmv). Figure 3.2-2 illustrates the use of a TVA at a well site.
Key Point: IR Camera and TVA
Detection Limits The Infrared camera is typically used to detect large emission sources at concentrations >10,000 ppmv whereas the TVA can detect emissions with concentrations as low as 0.5 ppmv.
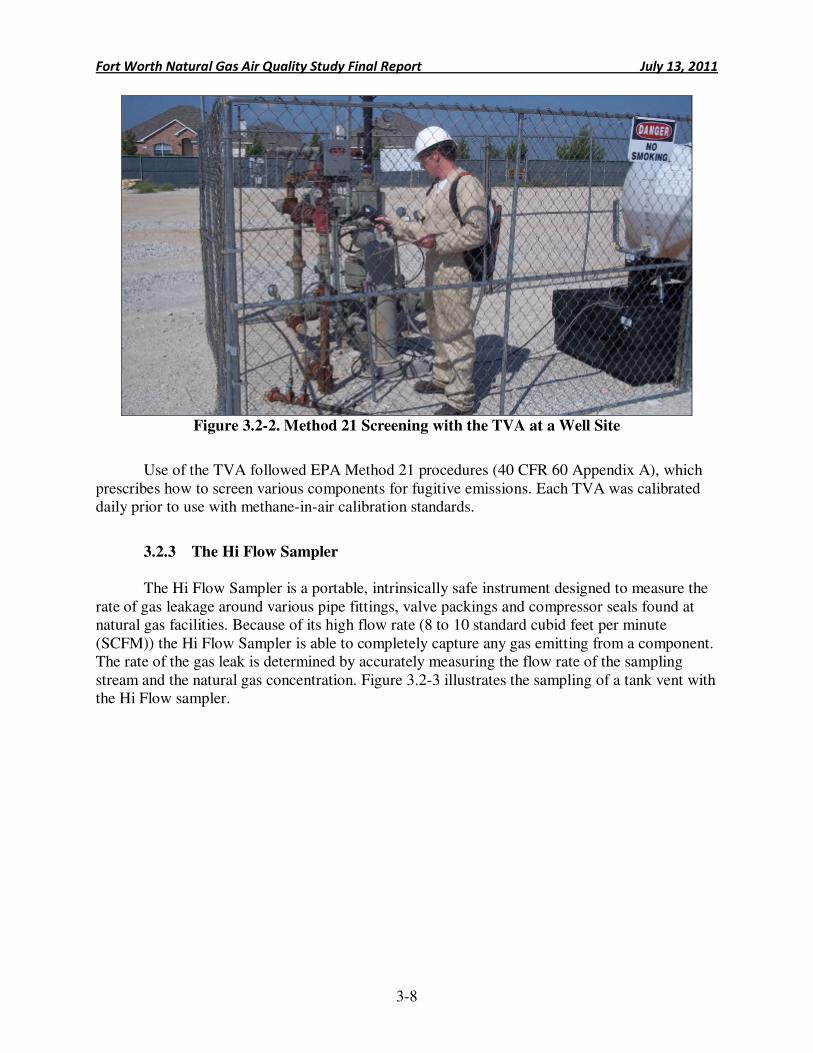
Fort Worth Natural Gas Air Quality Study Final Report July 13, 2011
3-8
Figure 3.2-2. Method 21 Screening with the TVA at a Well Site
Use of the TVA followed EPA Method 21 procedures (40 CFR 60 Appendix A), which
prescribes how to screen various components for fugitive emissions. Each TVA was calibrated daily prior to use with methane-in-air calibration standards.
3.2.3 The Hi Flow Sampler
The Hi Flow Sampler is a portable, intrinsically safe instrument designed to measure the
rate of gas leakage around various pipe fittings, valve packings and compressor seals found at natural gas facilities. Because of its high flow rate (8 to 10 standard cubid feet per minute (SCFM)) the Hi Flow Sampler is able to completely capture any gas emitting from a component. The rate of the gas leak is determined by accurately measuring the flow rate of the sampling stream and the natural gas concentration. Figure 3.2-3 illustrates the sampling of a tank vent with the Hi Flow sampler.
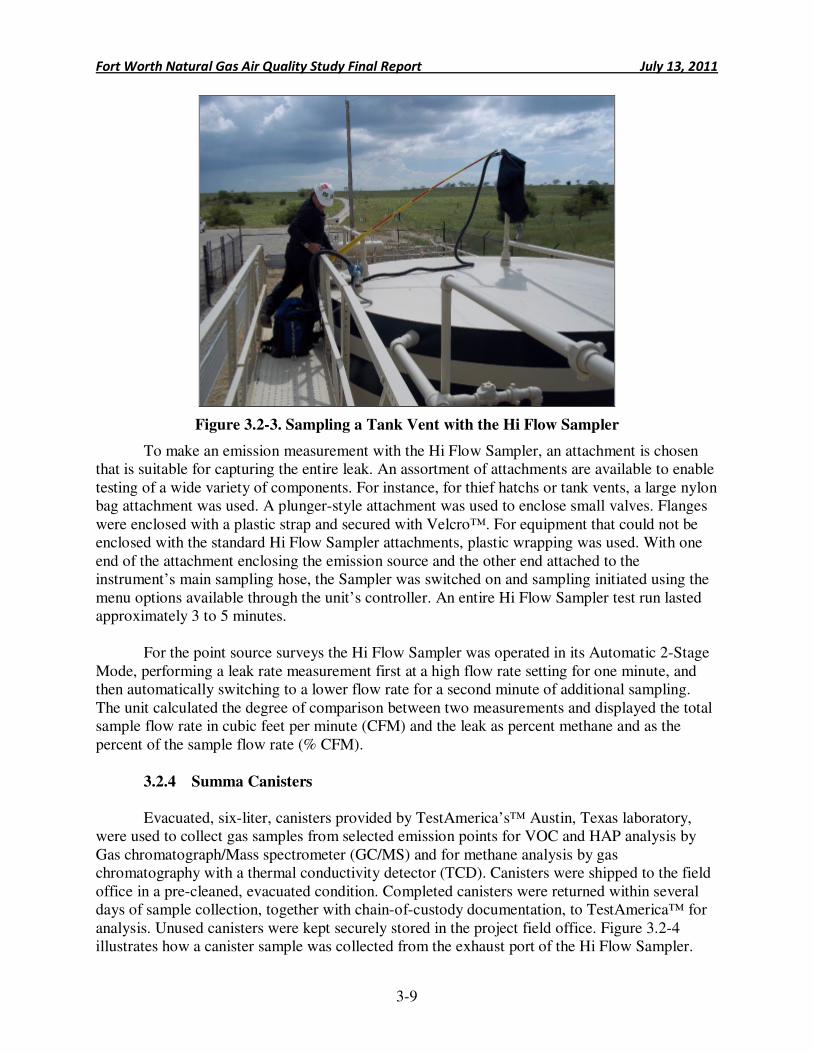
Fort Worth Natural Gas Air Quality Study Final Report July 13, 2011
3-9
Figure 3.2-3. Sampling a Tank Vent with the Hi Flow Sampler
To make an emission measurement with the Hi Flow Sampler, an attachment is chosen that is suitable for capturing the entire leak. An assortment of attachments are available to enable testing of a wide variety of components. For instance, for thief hatchs or tank vents, a large nylon bag attachment was used. A plunger-style attachment was used to enclose small valves. Flanges were enclosed with a plastic strap and secured with Velcro™. For equipment that could not be enclosed with the standard Hi Flow Sampler attachments, plastic wrapping was used. With one end of the attachment enclosing the emission source and the other end attached to the instrument’s main sampling hose, the Sampler was switched on and sampling initiated using the menu options available through the unit’s controller. An entire Hi Flow Sampler test run lasted approximately 3 to 5 minutes.
For the point source surveys the Hi Flow Sampler was operated in its Automatic 2-Stage Mode, performing a leak rate measurement first at a high flow rate setting for one minute, and then automatically switching to a lower flow rate for a second minute of additional sampling. The unit calculated the degree of comparison between two measurements and displayed the total sample flow rate in cubic feet per minute (CFM) and the leak as percent methane and as the percent of the sample flow rate (% CFM).
3.2.4 Summa Canisters
Evacuated, six-liter, canisters provided by TestAmerica’s™ Austin, Texas laboratory, were used to collect gas samples from selected emission points for VOC and HAP analysis by Gas chromatograph/Mass spectrometer (GC/MS) and for methane analysis by gas chromatography with a thermal conductivity detector (TCD). Canisters were shipped to the field office in a pre-cleaned, evacuated condition. Completed canisters were returned within several days of sample collection, together with chain-of-custody documentation, to TestAmerica™ for analysis. Unused canisters were kept securely stored in the project field office. Figure 3.2-4 illustrates how a canister sample was collected from the exhaust port of the Hi Flow Sampler.
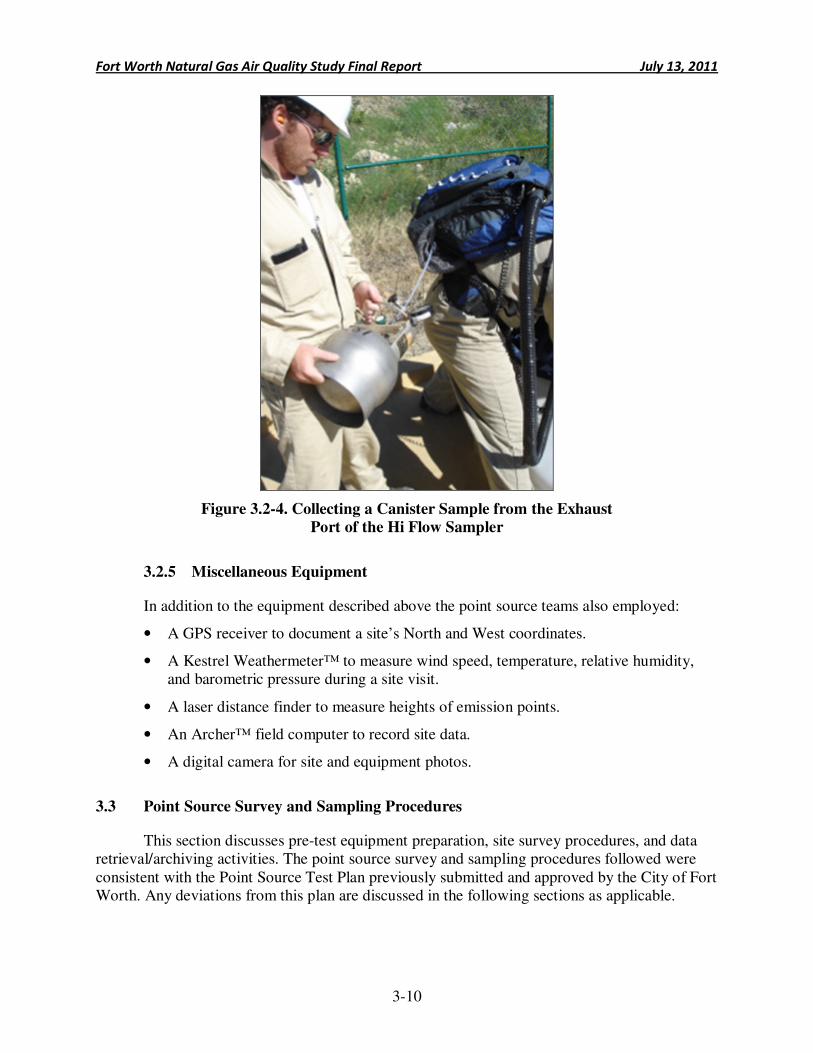
Fort Worth Natural Gas Air Quality Study Final Report July 13, 2011
3-10
Figure 3.2-4. Collecting a Canister Sample from the Exhaust
Port of the Hi Flow Sampler
3.2.5 Miscellaneous Equipment
In addition to the equipment described above the point source teams also employed:
• A GPS receiver to document a site’s North and West coordinates.
• A Kestrel Weathermeter™ to measure wind speed, temperature, relative humidity, and barometric pressure during a site visit.
• A laser distance finder to measure heights of emission points.
• An Archer™ field computer to record site data.
• A digital camera for site and equipment photos.
3.3 Point Source Survey and Sampling Procedures
This section discusses pre-test equipment preparation, site survey procedures, and data retrieval/archiving activities. The point source survey and sampling procedures followed were consistent with the Point Source Test Plan previously submitted and approved by the City of Fort Worth. Any deviations from this plan are discussed in the following sections as applicable.
Fort Worth Natural Gas Air Quality Study Final Report July 13, 2011
3-11
3.3.1 Pre-Test Equipment Preparation
Equipment was prepared for use each morning prior to the first site visit. Preparations included:
• The IR Camera Daily Demo.
• A calibration check of the Hi Flow Sampler.
• A multipoint calibration of the TVA.
IR Camera Daily Demo Quality Assurance Check
The IR Camera Daily Demo provides a validation of the camera’s operation by releasing
a known mass emission rate of gas (100% propane) and measuring the distance from which the release can be reliably viewed. This validation was performed first thing each morning with both cameras at two mass emission rates: a low emission rate of 10 grams/hour propane and a higher emission rate of 31 grams/hour propane. The distance from which each emission rate could be detected (i.e. sighting distance) was recorded, together with wind direction, wind speed, temperature, relative humidity, barometric pressure, and percent cloud cover information. The equipment used to perform the daily demo included a steel compressed gas cylinder of 100% propane gas, a single stage gas regulator, a calibrated rotameter, flow control valves and tubing to position the emission flow at eye-level. The results of the daily demos are provided in Section 3.6 of this report and further documented in the field log notes included in Appendix 3-B. Calibration Check of the Hi Flow Samplers
The Hi Flow Sampler contains two sensors – a background sensor and a leak sensor. Both
sensors were calibrated at the start of Phase I and at the start of Phase II using certified standards of 2.5% methane-in-air and 100% methane. On a daily basis, prior to testing, the background and leak sensors of each Sampler were calibration-checked with the 2.5% methane standard. If an error greater than 10% resulted, the instrument was re-calibrated. Each Monday, the background and leak sensors of both instruments were calibration-checked with both the 2.5% and the 100% methane standards. Again, errors above 10% required re-calibration of the instrument.
The results of the Hi Flow Sampler daily calibration checks are provided in Section 3.6 of this report and further documented in the field log notes included in Appendix 3-B. Multipoint Calibration of the TVAs
A multipoint calibration of each TVA was performed daily prior to testing with the following gases:
• Zero gas (<0.1 ppmv total hydrocarbon).
• Low Level Span gas (nominally 500 ppmv methane-in-air).
• Mid Level Span gas (nominally 1,000 ppmv methane-in-air).
• High Level Span gas (nominally 10,000 ppmv methane-in-air).
Fort Worth Natural Gas Air Quality Study Final Report July 13, 2011
3-12
Following the calibration, each TVA would be re-checked with the same gases. The instrument was considered to be in a state of control if its response to each gas was accurate to within +/- 10%. Failure to meet this criterion required recalibration, repair, or replacement of the instrument.
3.3.2 Final Preparations
Following the instrument performance checks,
data from the previous day would be reviewed for completeness and accuracy, the City Chief Gas Inspector would be called with the addresses of the first sites to be visited, and the vans would be loaded with the instrumentation and canisters. There would be a brief group safety discussion, the field office would then be locked, and the each team would depart to the first of their assigned sites for the day.
Sites were selected for surveying on a random basis. During the day, City Gas Inspectors were only told of the next scheduled site upon departure. These procedures were followed to avoid the possibility of site owners learning of the survey schedule in advance.
3.3.3 Site Arrival
Upon arrival at the designated point source site, the survey team met with the City Gas Inspector who unlocked the site gate to allow entrance to the site. On no occasion did the team enter a site without the City Gas Inspector also being present. Customarily at this time, a picture was taken of the front gate signage as part of the site documentation (Figure 3.3-1 shows an example of front gate signage).
KeyPoint: Random Site Selection To reduce bias in the survey relative to owner, operator, location, or any other variable, sites were selected for surveying on a random basis.
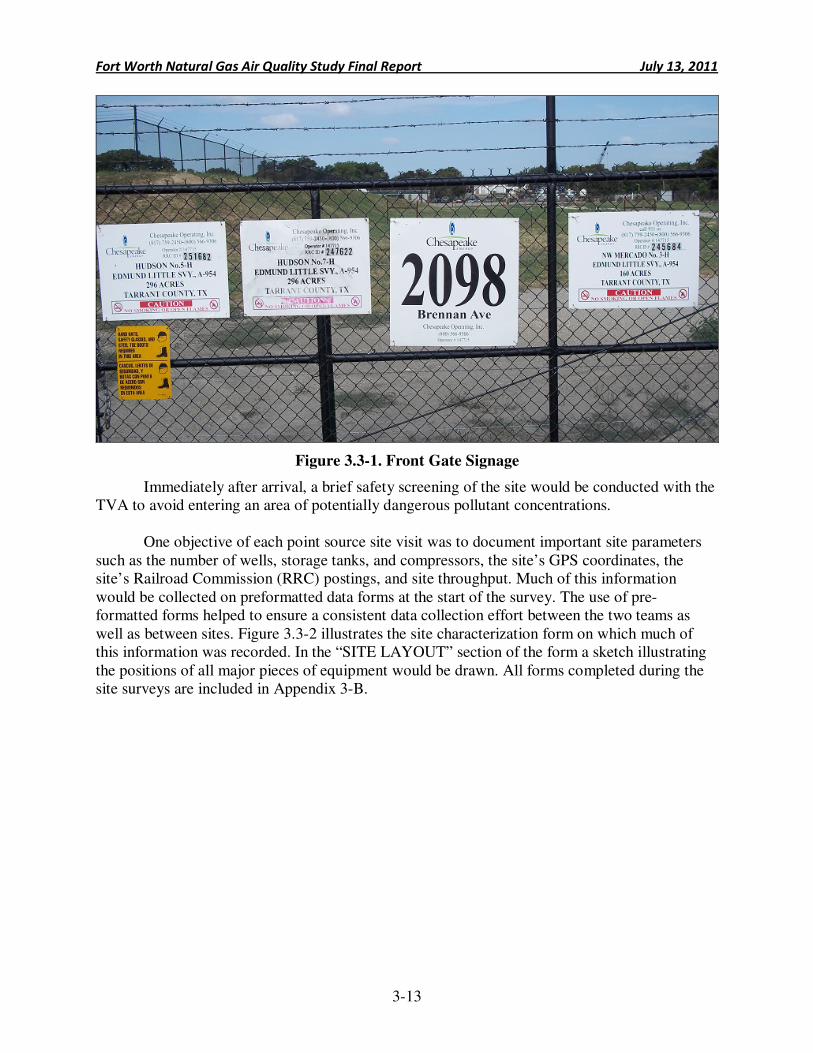
Fort Worth Natural Gas Air Quality Study Final Report July 13, 2011
3-13
Figure 3.3-1. Front Gate Signage
Immediately after arrival, a brief safety screening of the site would be conducted with the TVA to avoid entering an area of potentially dangerous pollutant concentrations.
One objective of each point source site visit was to document important site parameters such as the number of wells, storage tanks, and compressors, the site’s GPS coordinates, the site’s Railroad Commission (RRC) postings, and site throughput. Much of this information would be collected on preformatted data forms at the start of the survey. The use of pre-formatted forms helped to ensure a consistent data collection effort between the two teams as well as between sites. Figure 3.3-2 illustrates the site characterization form on which much of this information was recorded. In the “SITE LAYOUT” section of the form a sketch illustrating the positions of all major pieces of equipment would be drawn. All forms completed during the site surveys are included in Appendix 3-B.
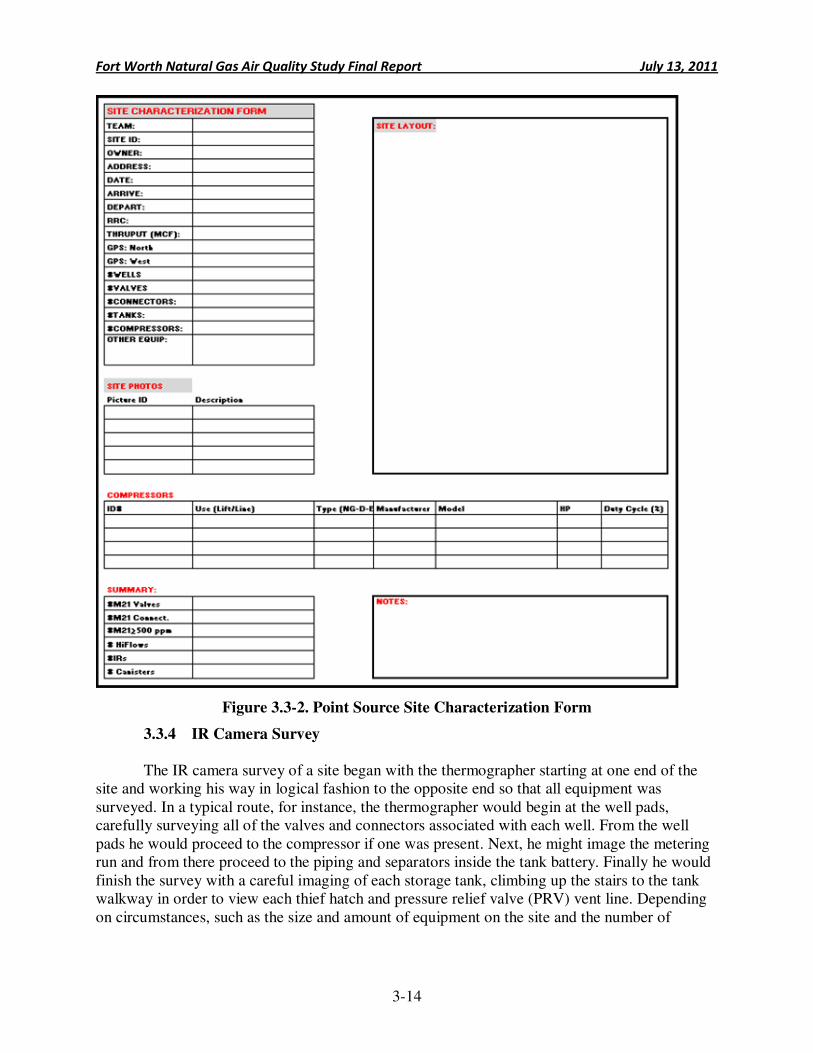
Fort Worth Natural Gas Air Quality Study Final Report July 13, 2011
3-14
Figure 3.3-2. Point Source Site Characterization Form
3.3.4 IR Camera Survey
The IR camera survey of a site began with the thermographer starting at one end of the site and working his way in logical fashion to the opposite end so that all equipment was surveyed. In a typical route, for instance, the thermographer would begin at the well pads, carefully surveying all of the valves and connectors associated with each well. From the well pads he would proceed to the compressor if one was present. Next, he might image the metering run and from there proceed to the piping and separators inside the tank battery. Finally he would finish the survey with a careful imaging of each storage tank, climbing up the stairs to the tank walkway in order to view each thief hatch and pressure relief valve (PRV) vent line. Depending on circumstances, such as the size and amount of equipment on the site and the number of
Fort Worth Natural Gas Air Quality Study Final Report July 13, 2011
3-15
detected emission points, an IR camera site survey of a typical well pad might last from one to several hours.
When an emission was detected with the IR camera, a video recording of the IR imaging would be made, a photograph of the emission source would be taken and the following data documented:
• Date and time.
• Equipment description and size.
• Emission point height above ground (feet).
• GPS coordinates of emission point (Phase II only).
• Sighting distance (feet).
• TVA reading of emission (ppmv).
• Tank height and radius if tank emission (feet).
• Video file name.
• Maximum sighting distance (feet) – The maximum sighting distance is the distance from which the emission can be reliably detected with the IR camera and provides a measure of the emission’s magnitude (i.e. large emissions can be detected from further away).
• Weather conditions (Wind Direction, Wind Speed, Temperature, Relative Humidity, Barometric Pressure, and Cloud Cover).
As standard practice, the thermographer would image equipment from different angles. This is necessary since environmental conditions such as sunlight, wind, and background (i.e. air, piping, concrete or heat profiles) can cause an emission stream to be difficult to see from one angle, but easily detected from another.
With the GasFindIR™ camera integration settings would be switched to enable viewing of very hot surfaces (typically found at compressors), manual mode would be used on occasion to verify the absence or presence of a subtle emission, and “nuking” would be employed as required to eliminate optical background noise. Nuking adjusts the GasFindIR’s background so that a more uniform pixel response is obtained.
With the GF-320 camera the thermographer would frequently shift to High Sensitivity mode to confirm or detect a more subtle emission that was hard to see. All field data forms, digital photographs and videos are provided in electronic form in Appendix 3-B.
3.3.5 Method 21 Site Survey with the Toxic Vapor Analyzer
While one team member conducted the IR camera site survey, the second member calculated the total number of site valves and connectors. This was done by first determining the valve count and then applying a multiplying factor to arrive at the number of connectors. For this
Fort Worth Natural Gas Air Quality Study Final Report July 13, 2011
3-16
project, a connector multiplier of 7 was conservatively used, based upon detailed connector counts performed at the beginning of both Phase I and Phase II. Thus if it was determined that a site contained 245 valves, then a connector count of 1,715 (7 x 245) was assumed. The 7:1 connector to valve ratio held true for all equipment except at compressor skids where a higher ratio was often noted. Consequently the number of connectors at compressor skids was estimated separately by multiplying the number of compressor valves by factors ranging from 10 to 15, depending on the size and complexity of the compressor.
These component counts were necessary since one objective of the point source testing was to estimate low level emissions (i.e. emissions below the detection limits of the IR camera) from fugitive equipment leaks. This objective was accomplished by screening at least ten percent of the valve and connector population at each point source site with the TVA. Thus while the IR camera survey was in progress, Method 21 screening of the site’s valves and connectors was performed with the TVA on one of every ten valves and one of every ten connectors until ten percent of the total valve and connector counts was reached. This procedure ensured that the required number of components was screened and that the screening population was evenly distributed across all areas of the site. This screening was conducted independent of the IR camera survey. Once it was completed, the TVA was then used to screen any emission points identified by the IR camera.
Following Method 21 procedures, valves were screened at their three primary leak areas: the stem, the packing, and the bonnet flange. Method 21 screening entails placing the TVA’s probe at the various leak interfaces and sampling the complete circumference. Flanges were screened by placing the TVA probe at the edge of the flange-gasket interface. Connectors were screened by sampling the circumference of the threaded sections. All other components were monitored through a peripheral traverse of the seal interface. Whenever an elevated reading was obtained the sample probe was left at this elevated point for at least twice the instrument’s response time (i.e. at least for 8 seconds) to ensure that the maximum concentration was measured.
When an emission at or above 500 ppmv was detected with the TVA the following data would be recorded:
• Date and time.
• Screening concentration (ppmv).
• Equipment Description.
• Equipment Location (GPS coordinates in Phase II only).
Key Point: Method 21 Screening To estimate low level emissions from fugitive equipment leaks, at least 10% of the valve and connector population at each site surveyed was screened.
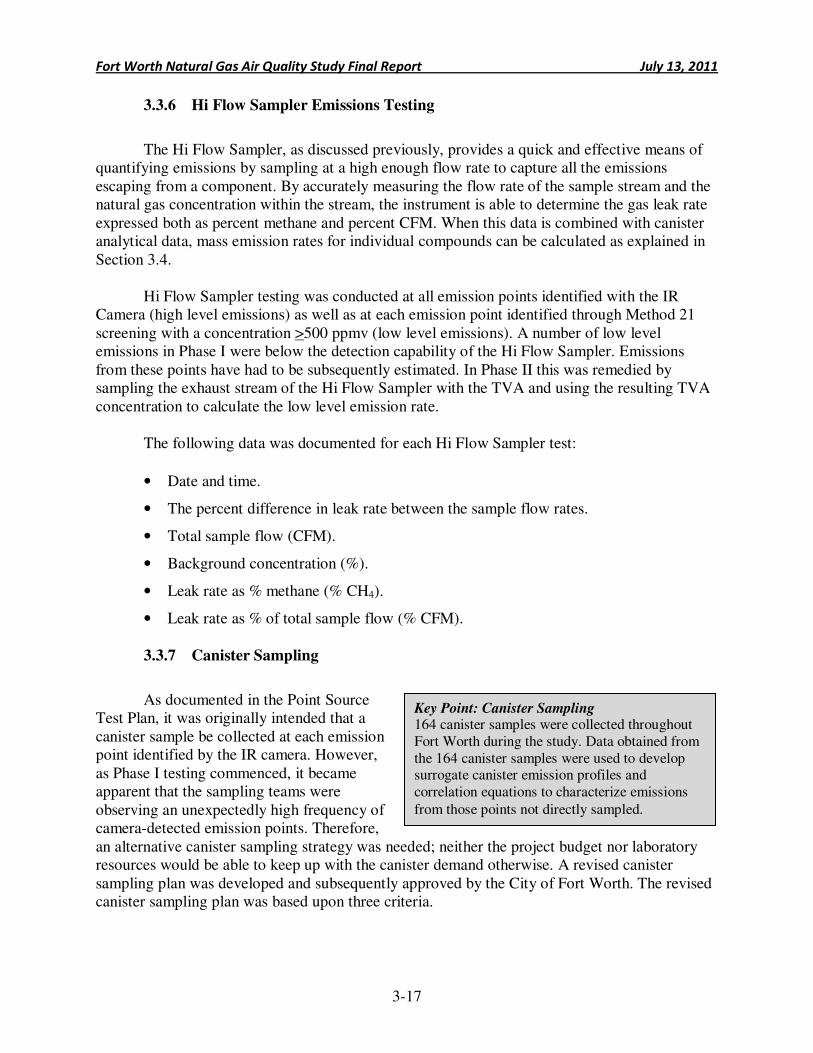
Fort Worth Natural Gas Air Quality Study Final Report July 13, 2011
3-17
3.3.6 Hi Flow Sampler Emissions Testing
The Hi Flow Sampler, as discussed previously, provides a quick and effective means of quantifying emissions by sampling at a high enough flow rate to capture all the emissions escaping from a component. By accurately measuring the flow rate of the sample stream and the natural gas concentration within the stream, the instrument is able to determine the gas leak rate expressed both as percent methane and percent CFM. When this data is combined with canister analytical data, mass emission rates for individual compounds can be calculated as explained in Section 3.4.
Hi Flow Sampler testing was conducted at all emission points identified with the IR Camera (high level emissions) as well as at each emission point identified through Method 21 screening with a concentration >500 ppmv (low level emissions). A number of low level emissions in Phase I were below the detection capability of the Hi Flow Sampler. Emissions from these points have had to be subsequently estimated. In Phase II this was remedied by sampling the exhaust stream of the Hi Flow Sampler with the TVA and using the resulting TVA concentration to calculate the low level emission rate.
The following data was documented for each Hi Flow Sampler test:
• Date and time.
• The percent difference in leak rate between the sample flow rates.
• Total sample flow (CFM).
• Background concentration (%).
• Leak rate as % methane (% CH4).
• Leak rate as % of total sample flow (% CFM).
3.3.7 Canister Sampling
As documented in the Point Source Test Plan, it was originally intended that a canister sample be collected at each emission point identified by the IR camera. However, as Phase I testing commenced, it became apparent that the sampling teams were observing an unexpectedly high frequency of camera-detected emission points. Therefore, an alternative canister sampling strategy was needed; neither the project budget nor laboratory resources would be able to keep up with the canister demand otherwise. A revised canister sampling plan was developed and subsequently approved by the City of Fort Worth. The revised canister sampling plan was based upon three criteria.
Key Point: Canister Sampling 164 canister samples were collected throughout Fort Worth during the study. Data obtained from the 164 canister samples were used to develop surrogate canister emission profiles and correlation equations to characterize emissions
from those points not directly sampled.
Fort Worth Natural Gas Air Quality Study Final Report July 13, 2011
3-18
A canister sample would be collected from an emission point only if:
1. The % CFM reading obtained with the Hi Flow Sampler from that point exceeded the daily rolling average % CFM for all Hi Flow Sampler tests conducted thus far. In other words, the emission rate had to equal or exceed the average emission rate. The average emission rate was originally expressed as the rolling average of the third quartile % CFM; this was later changed to the rolling average % CFM.
2. Less than three canister samples have been collected from a similar component at other sites.
3. Less than three canister samples had been collected in the general geographical region. Geographical regions will be defined as the north, east, south, and west quadrants of the City of Fort Worth as well as any particular region in which the characteristics of the natural gas are substantially different from other regions (for instance, regions with wet gas and regions with dry gas).
If all of these conditions were not met, a canister sample was not collected. This approach succeeded in reducing the canister demand to a manageable level and was followed through the remainder of Phase I and through all of Phase II (a total of 164 canister samples were collected, not including 8 duplicate canister samples). Data obtained from these 164 canister samples were then used to develop surrogate canister emission profiles and correlation equations to characterize points for which no canister sample was taken.
Figure 3.3-3 provides a map of Fort Worth indicating the locations where canister samples were collected, as well as those locations where no samples were taken. As indicated in the map, the locations where canister samples were collected provide a well distributed characterization of canister samples. In other words, there were no large geographic locations in which there were no canister samples taken.
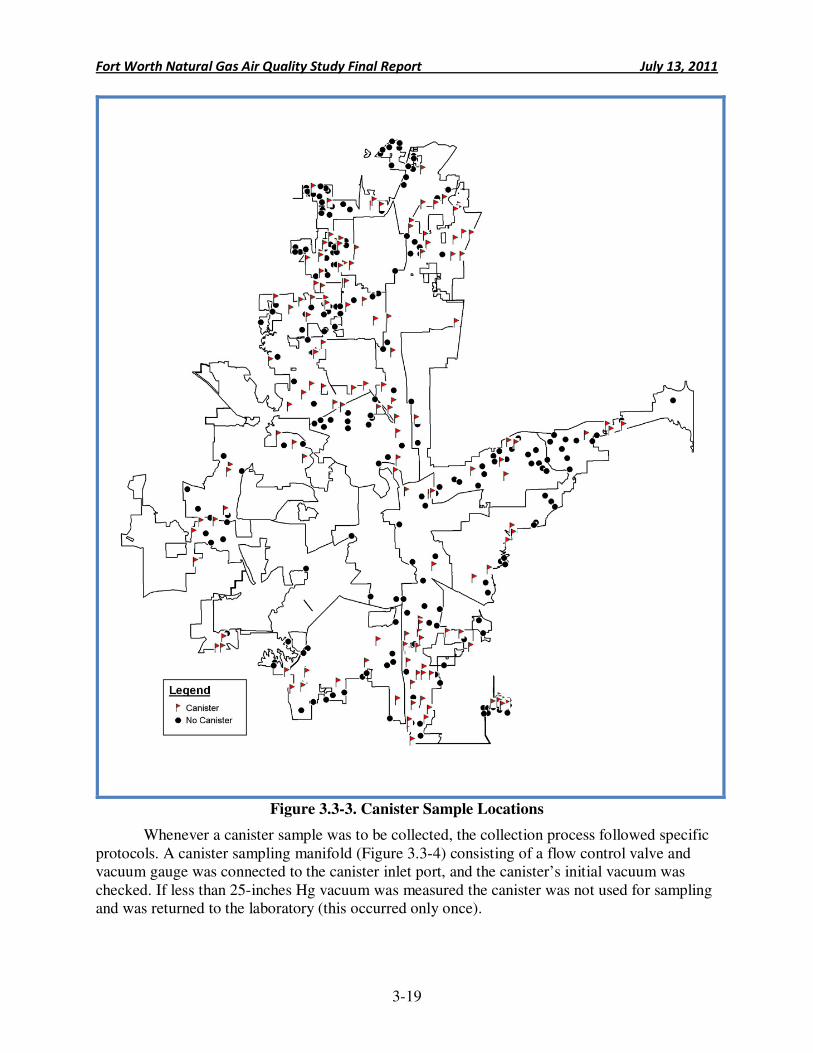
Fort Worth Natural Gas Air Quality Study Final Report July 13, 2011
3-19
Figure 3.3-3. Canister Sample Locations
Whenever a canister sample was to be collected, the collection process followed specific protocols. A canister sampling manifold (Figure 3.3-4) consisting of a flow control valve and vacuum gauge was connected to the canister inlet port, and the canister’s initial vacuum was checked. If less than 25-inches Hg vacuum was measured the canister was not used for sampling and was returned to the laboratory (this occurred only once).
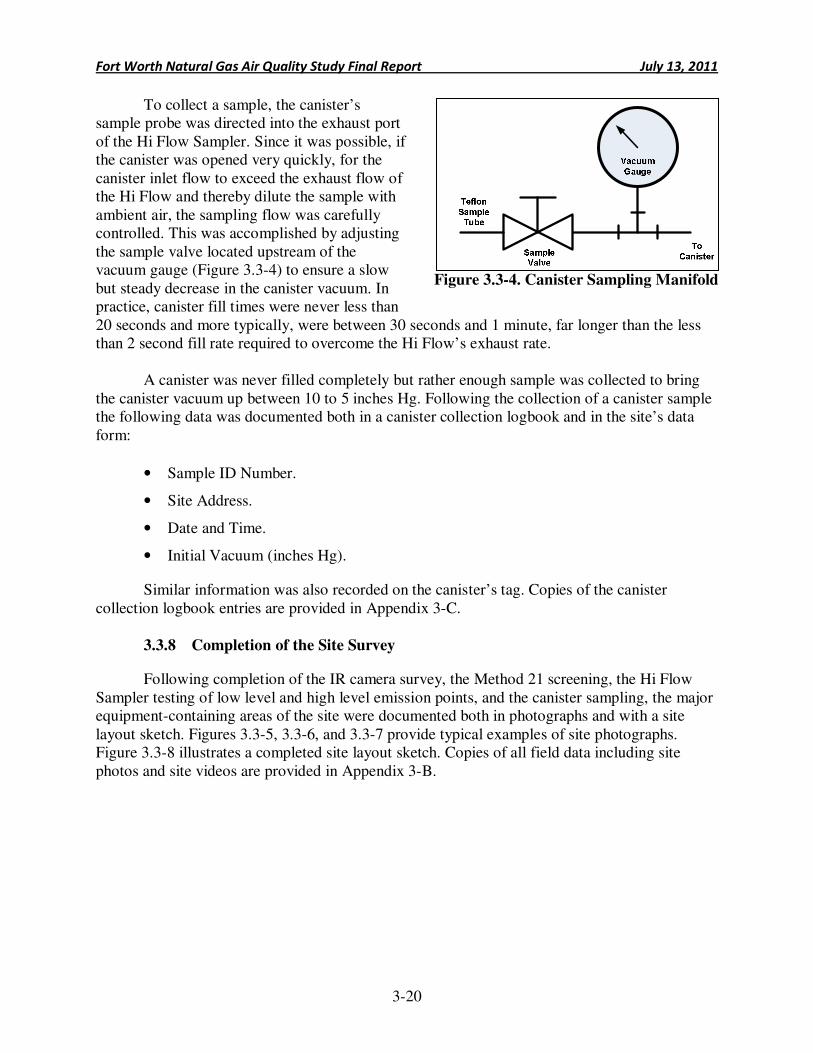
Fort Worth Natural Gas Air Quality Study Final Report July 13, 2011
3-20
Figure 3.3-4. Canister Sampling Manifold
To collect a sample, the canister’s sample probe was directed into the exhaust port of the Hi Flow Sampler. Since it was possible, if the canister was opened very quickly, for the canister inlet flow to exceed the exhaust flow of the Hi Flow and thereby dilute the sample with ambient air, the sampling flow was carefully controlled. This was accomplished by adjusting the sample valve located upstream of the vacuum gauge (Figure 3.3-4) to ensure a slow but steady decrease in the canister vacuum. In practice, canister fill times were never less than 20 seconds and more typically, were between 30 seconds and 1 minute, far longer than the less than 2 second fill rate required to overcome the Hi Flow’s exhaust rate.
A canister was never filled completely but rather enough sample was collected to bring the canister vacuum up between 10 to 5 inches Hg. Following the collection of a canister sample the following data was documented both in a canister collection logbook and in the site’s data form:
• Sample ID Number.
• Site Address.
• Date and Time.
• Initial Vacuum (inches Hg).
Similar information was also recorded on the canister’s tag. Copies of the canister collection logbook entries are provided in Appendix 3-C.
3.3.8 Completion of the Site Survey
Following completion of the IR camera survey, the Method 21 screening, the Hi Flow Sampler testing of low level and high level emission points, and the canister sampling, the major equipment-containing areas of the site were documented both in photographs and with a site layout sketch. Figures 3.3-5, 3.3-6, and 3.3-7 provide typical examples of site photographs. Figure 3.3-8 illustrates a completed site layout sketch. Copies of all field data including site photos and site videos are provided in Appendix 3-B.
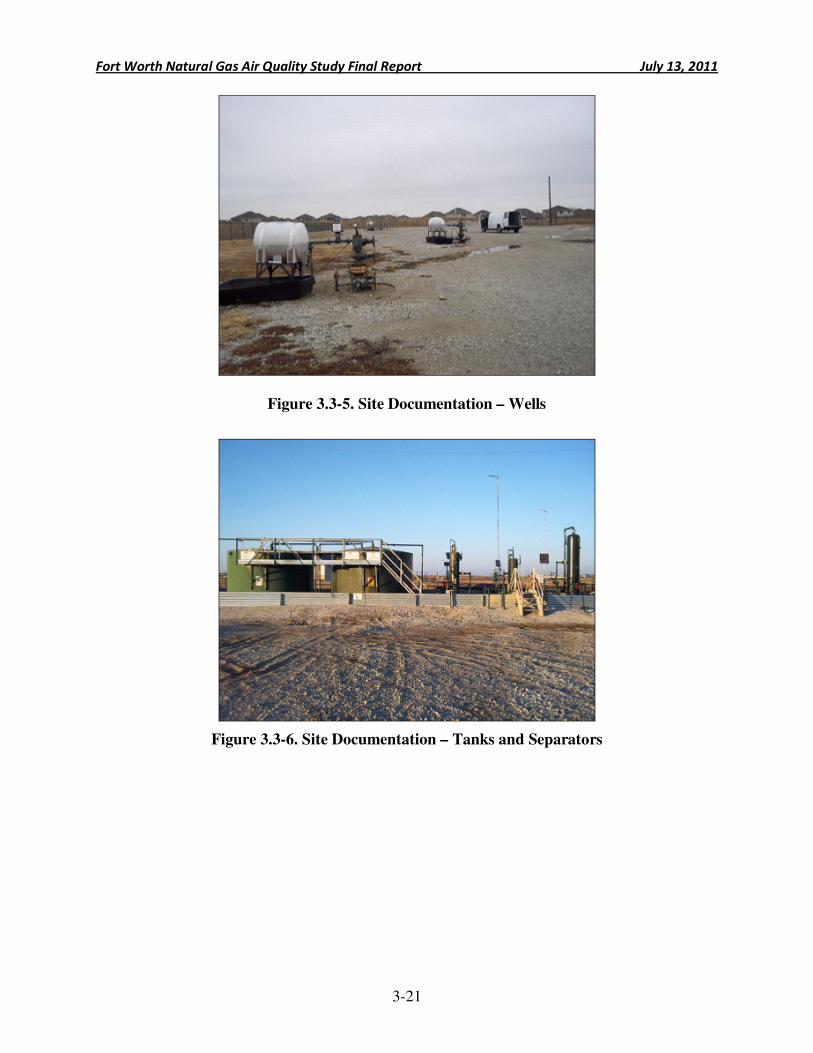
Fort Worth Natural Gas Air Quality Study Final Report July 13, 2011
3-21
Figure 3.3-5. Site Documentation – Wells
Figure 3.3-6. Site Documentation – Tanks and Separators
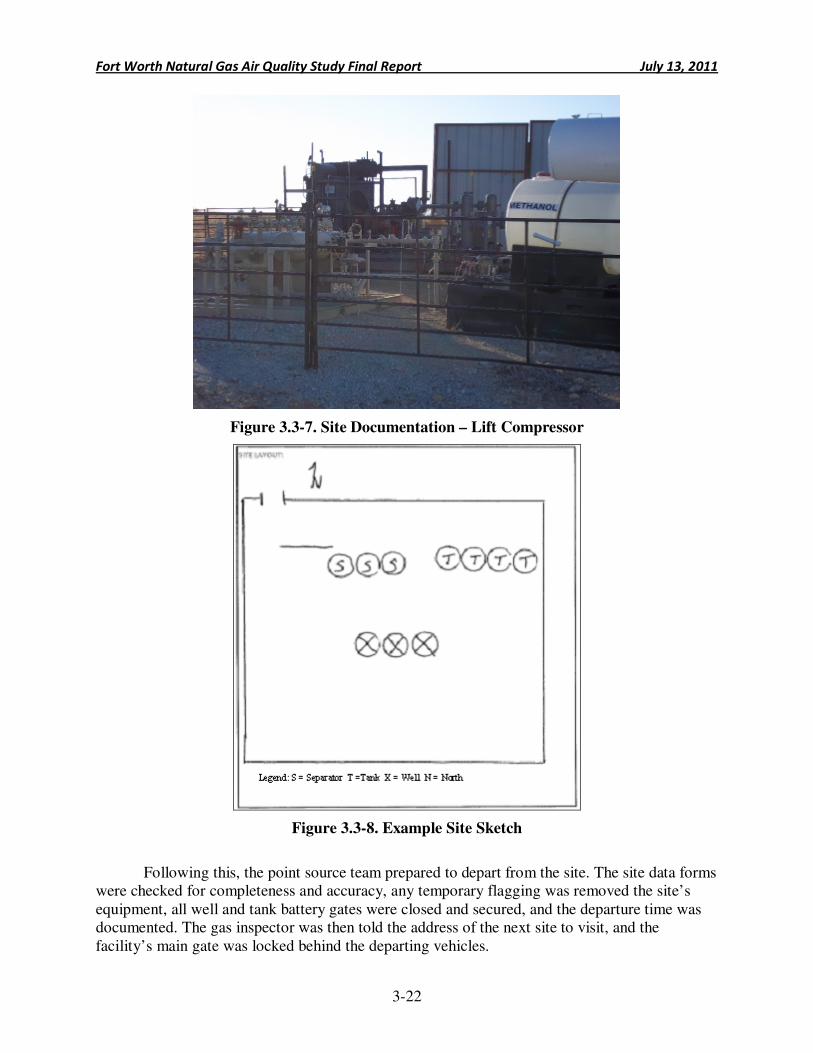
Fort Worth Natural Gas Air Quality Study Final Report July 13, 2011
3-22
Figure 3.3-7. Site Documentation – Lift Compressor
Figure 3.3-8. Example Site Sketch
Following this, the point source team prepared to depart from the site. The site data forms
were checked for completeness and accuracy, any temporary flagging was removed the site’s equipment, all well and tank battery gates were closed and secured, and the departure time was documented. The gas inspector was then told the address of the next site to visit, and the facility’s main gate was locked behind the departing vehicles.
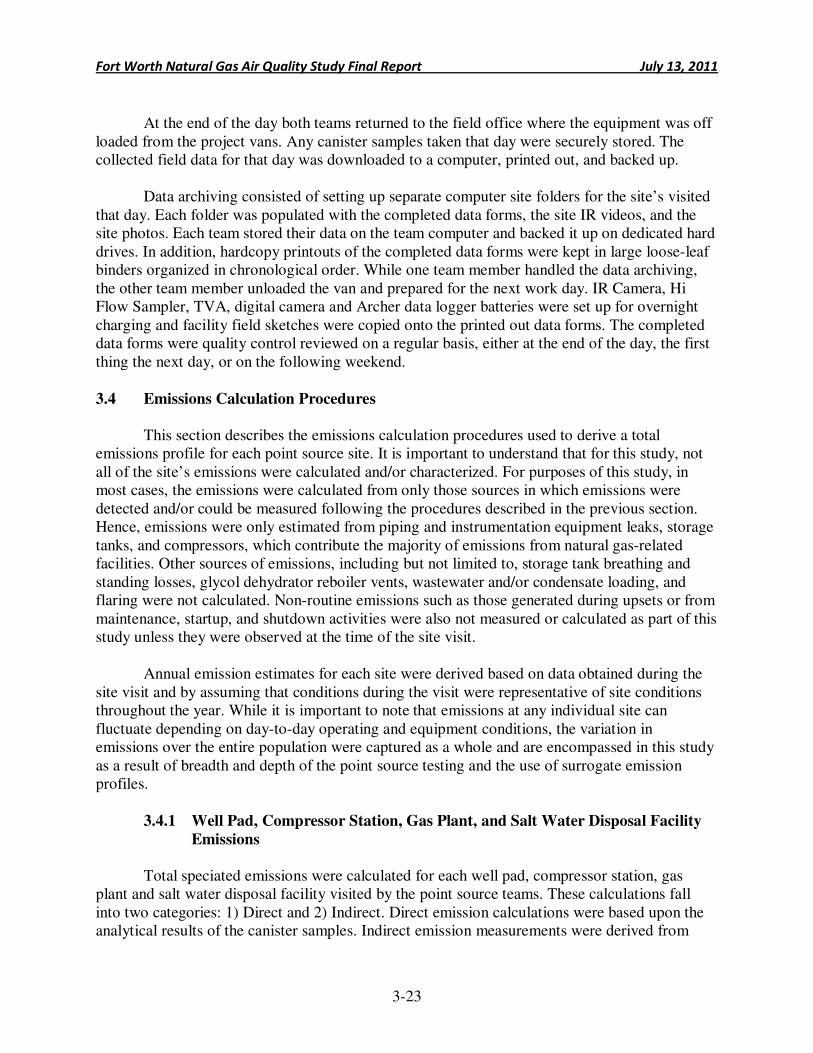
Fort Worth Natural Gas Air Quality Study Final Report July 13, 2011
3-23
At the end of the day both teams returned to the field office where the equipment was off
loaded from the project vans. Any canister samples taken that day were securely stored. The collected field data for that day was downloaded to a computer, printed out, and backed up.
Data archiving consisted of setting up separate computer site folders for the site’s visited that day. Each folder was populated with the completed data forms, the site IR videos, and the site photos. Each team stored their data on the team computer and backed it up on dedicated hard drives. In addition, hardcopy printouts of the completed data forms were kept in large loose-leaf binders organized in chronological order. While one team member handled the data archiving, the other team member unloaded the van and prepared for the next work day. IR Camera, Hi Flow Sampler, TVA, digital camera and Archer data logger batteries were set up for overnight charging and facility field sketches were copied onto the printed out data forms. The completed data forms were quality control reviewed on a regular basis, either at the end of the day, the first thing the next day, or on the following weekend. 3.4 Emissions Calculation Procedures
This section describes the emissions calculation procedures used to derive a total emissions profile for each point source site. It is important to understand that for this study, not all of the site’s emissions were calculated and/or characterized. For purposes of this study, in most cases, the emissions were calculated from only those sources in which emissions were detected and/or could be measured following the procedures described in the previous section. Hence, emissions were only estimated from piping and instrumentation equipment leaks, storage tanks, and compressors, which contribute the majority of emissions from natural gas-related facilities. Other sources of emissions, including but not limited to, storage tank breathing and standing losses, glycol dehydrator reboiler vents, wastewater and/or condensate loading, and flaring were not calculated. Non-routine emissions such as those generated during upsets or from maintenance, startup, and shutdown activities were also not measured or calculated as part of this study unless they were observed at the time of the site visit.
Annual emission estimates for each site were derived based on data obtained during the site visit and by assuming that conditions during the visit were representative of site conditions throughout the year. While it is important to note that emissions at any individual site can fluctuate depending on day-to-day operating and equipment conditions, the variation in emissions over the entire population were captured as a whole and are encompassed in this study as a result of breadth and depth of the point source testing and the use of surrogate emission profiles.
3.4.1 Well Pad, Compressor Station, Gas Plant, and Salt Water Disposal Facility
Emissions
Total speciated emissions were calculated for each well pad, compressor station, gas plant and salt water disposal facility visited by the point source teams. These calculations fall into two categories: 1) Direct and 2) Indirect. Direct emission calculations were based upon the analytical results of the canister samples. Indirect emission measurements were derived from
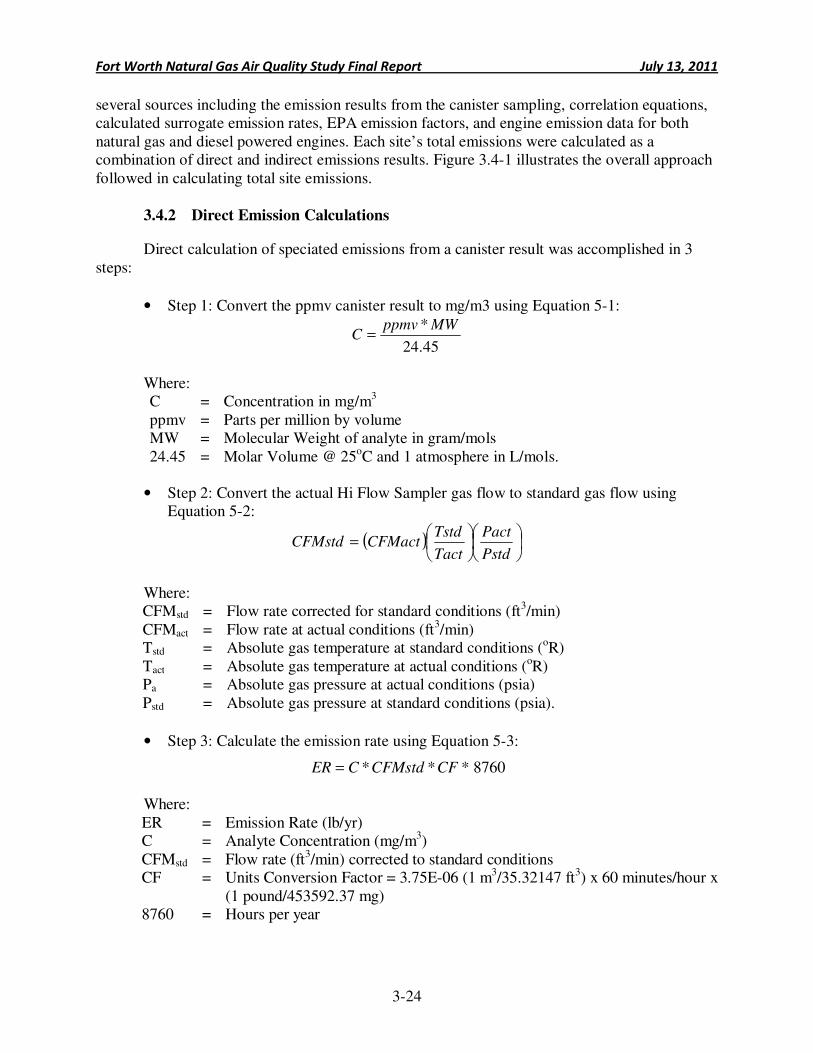
Fort Worth Natural Gas Air Quality Study Final Report July 13, 2011
3-24
several sources including the emission results from the canister sampling, correlation equations, calculated surrogate emission rates, EPA emission factors, and engine emission data for both natural gas and diesel powered engines. Each site’s total emissions were calculated as a combination of direct and indirect emissions results. Figure 3.4-1 illustrates the overall approach followed in calculating total site emissions.
3.4.2 Direct Emission Calculations
Direct calculation of speciated emissions from a canister result was accomplished in 3 steps:
• Step 1: Convert the ppmv canister result to mg/m3 using Equation 5-1:
45.24
* MWppmvC =
Where: C = Concentration in mg/m3 ppmv = Parts per million by volume MW = Molecular Weight of analyte in gram/mols 24.45 = Molar Volume @ 25oC and 1 atmosphere in L/mols.
• Step 2: Convert the actual Hi Flow Sampler gas flow to standard gas flow using Equation 5-2:
( )
=
Pstd
Pact
Tact
TstdCFMactCFMstd
Where: CFMstd = Flow rate corrected for standard conditions (ft3/min) CFMact = Flow rate at actual conditions (ft3/min) Tstd = Absolute gas temperature at standard conditions (oR) Tact = Absolute gas temperature at actual conditions (oR) Pa = Absolute gas pressure at actual conditions (psia) Pstd = Absolute gas pressure at standard conditions (psia).
• Step 3: Calculate the emission rate using Equation 5-3:
CFCFMstdCER **= * 8760 Where: ER = Emission Rate (lb/yr) C = Analyte Concentration (mg/m3) CFMstd = Flow rate (ft3/min) corrected to standard conditions CF = Units Conversion Factor = 3.75E-06 (1 m3/35.32147 ft3) x 60 minutes/hour x
(1 pound/453592.37 mg) 8760 = Hours per year
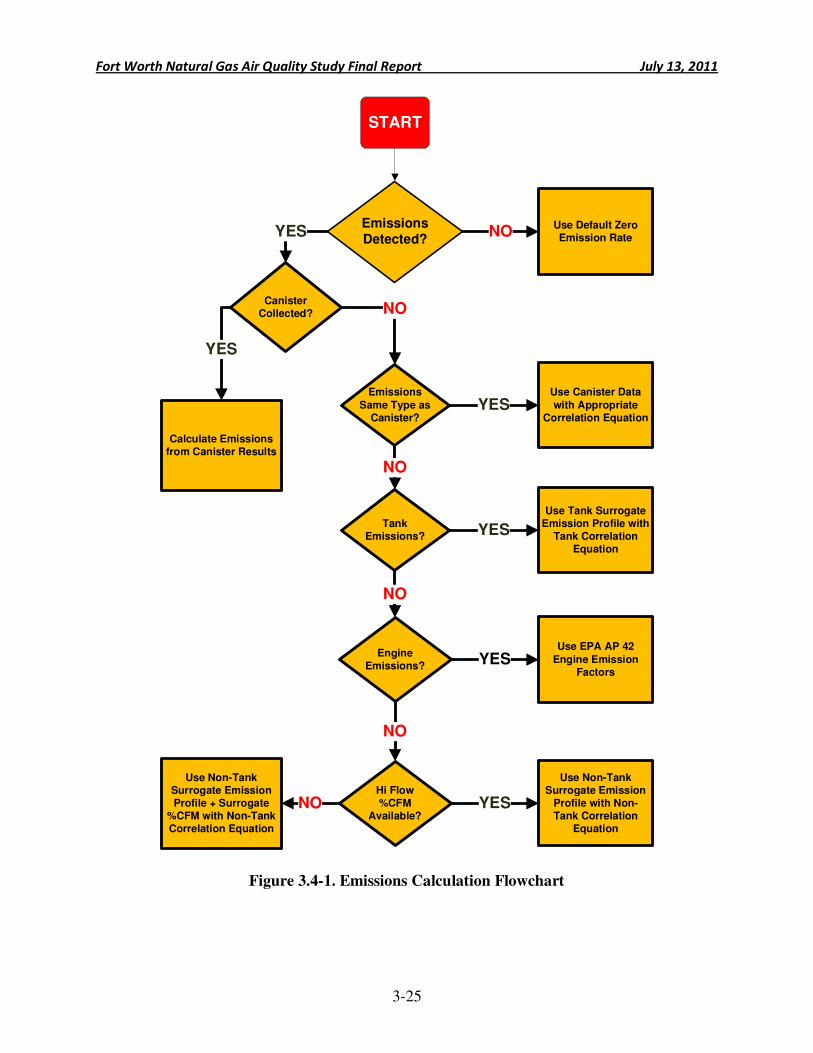
Fort Worth Natural Gas Air Quality Study Final Report July 13, 2011
3-25
Emissions Detected?
Use Default Zero Emission RateNO
Canister Collected?
YES
Calculate Emissions from Canister Results
YES
Emissions
Same Type as Canister?
NO
Use Canister Data
with Appropriate Correlation Equation
YES
Tank Emissions?
NO
Use Tank Surrogate Emission Profile with
Tank Correlation Equation
YES
Use Non-Tank Surrogate Emission
Profile with Non-Tank Correlation
Equation
Hi Flow %CFM
Available?YESNO
NO
START
Engine Emissions?
Use EPA AP 42
Engine Emission Factors
YES
NO
Use Non-Tank Surrogate Emission Profile + Surrogate
%CFM with Non-Tank Correlation Equation
Figure 3.4-1. Emissions Calculation Flowchart
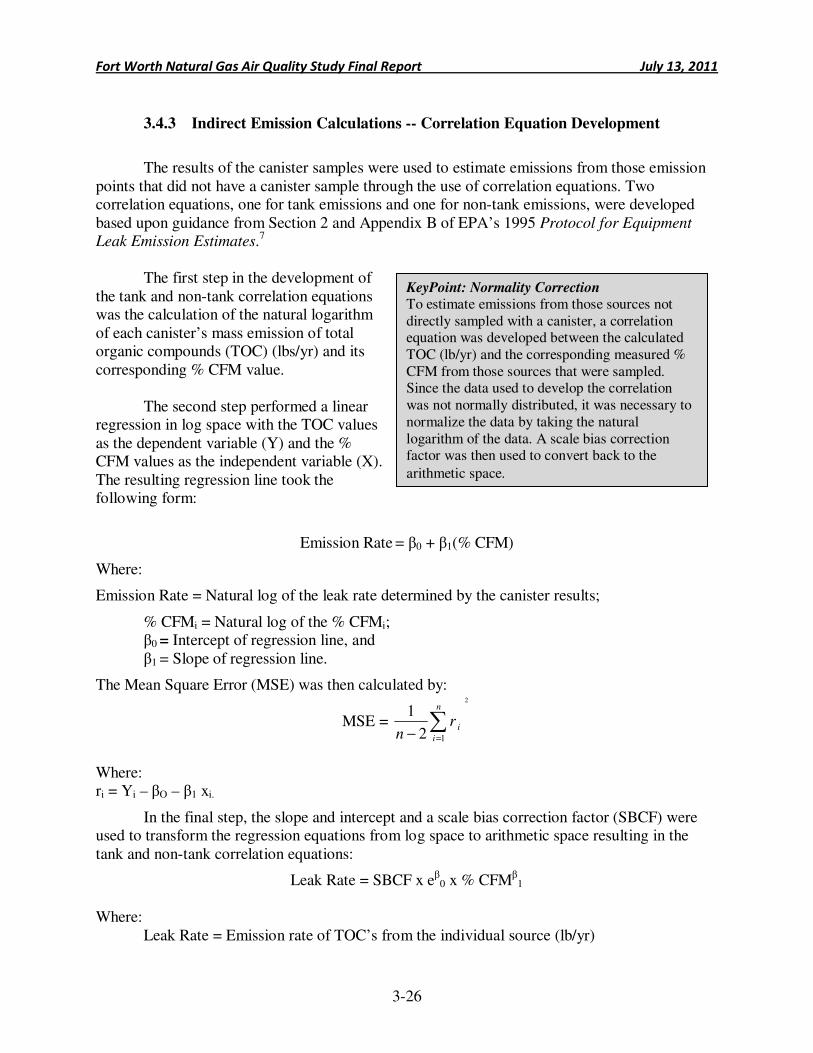
Fort Worth Natural Gas Air Quality Study Final Report July 13, 2011
3-26
3.4.3 Indirect Emission Calculations -- Correlation Equation Development
The results of the canister samples were used to estimate emissions from those emission points that did not have a canister sample through the use of correlation equations. Two correlation equations, one for tank emissions and one for non-tank emissions, were developed based upon guidance from Section 2 and Appendix B of EPA’s 1995 Protocol for Equipment
Leak Emission Estimates.7
The first step in the development of the tank and non-tank correlation equations was the calculation of the natural logarithm of each canister’s mass emission of total organic compounds (TOC) (lbs/yr) and its corresponding % CFM value.
The second step performed a linear regression in log space with the TOC values as the dependent variable (Y) and the % CFM values as the independent variable (X). The resulting regression line took the following form:
Emission Rate = β0 + β1(% CFM)
Where:
Emission Rate = Natural log of the leak rate determined by the canister results;
% CFMi = Natural log of the % CFMi; β0 = Intercept of regression line, and β1 = Slope of regression line.
The Mean Square Error (MSE) was then calculated by:
MSE =
2
12
1∑
=−
n
i
irn
Where: ri = Yi – βO – β1 xi.
In the final step, the slope and intercept and a scale bias correction factor (SBCF) were used to transform the regression equations from log space to arithmetic space resulting in the tank and non-tank correlation equations:
Leak Rate = SBCF x eβ0 x % CFMβ1
Where: Leak Rate = Emission rate of TOC’s from the individual source (lb/yr)
KeyPoint: Normality Correction To estimate emissions from those sources not directly sampled with a canister, a correlation equation was developed between the calculated TOC (lb/yr) and the corresponding measured % CFM from those sources that were sampled. Since the data used to develop the correlation was not normally distributed, it was necessary to normalize the data by taking the natural logarithm of the data. A scale bias correction factor was then used to convert back to the
arithmetic space.
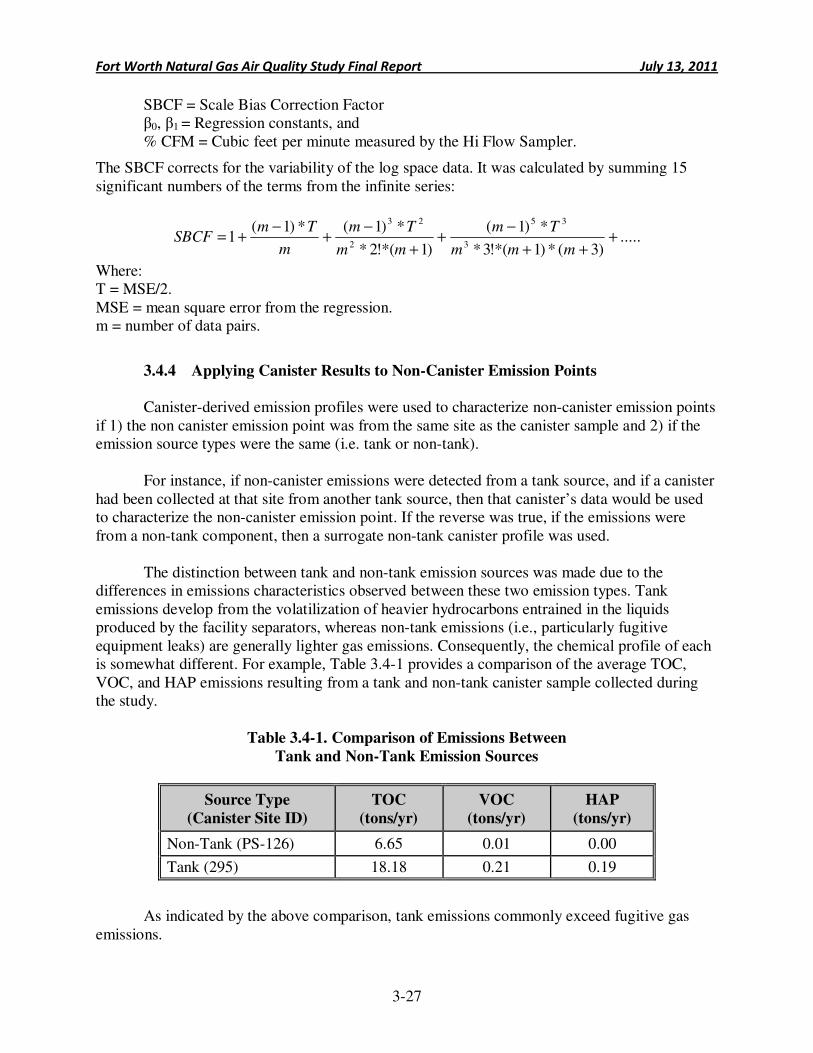
Fort Worth Natural Gas Air Quality Study Final Report July 13, 2011
3-27
SBCF = Scale Bias Correction Factor β0, β1 = Regression constants, and % CFM = Cubic feet per minute measured by the Hi Flow Sampler.
The SBCF corrects for the variability of the log space data. It was calculated by summing 15 significant numbers of the terms from the infinite series:
.....)3(*)1!*(3*
*)1(
)1!*(2*
*)1(*)1(1
3
35
2
23
+++
−+
+
−+
−+=
mmm
Tm
mm
Tm
m
TmSBCF
Where: T = MSE/2. MSE = mean square error from the regression. m = number of data pairs.
3.4.4 Applying Canister Results to Non-Canister Emission Points
Canister-derived emission profiles were used to characterize non-canister emission points
if 1) the non canister emission point was from the same site as the canister sample and 2) if the emission source types were the same (i.e. tank or non-tank).
For instance, if non-canister emissions were detected from a tank source, and if a canister had been collected at that site from another tank source, then that canister’s data would be used to characterize the non-canister emission point. If the reverse was true, if the emissions were from a non-tank component, then a surrogate non-tank canister profile was used.
The distinction between tank and non-tank emission sources was made due to the differences in emissions characteristics observed between these two emission types. Tank emissions develop from the volatilization of heavier hydrocarbons entrained in the liquids produced by the facility separators, whereas non-tank emissions (i.e., particularly fugitive equipment leaks) are generally lighter gas emissions. Consequently, the chemical profile of each is somewhat different. For example, Table 3.4-1 provides a comparison of the average TOC, VOC, and HAP emissions resulting from a tank and non-tank canister sample collected during the study.
Table 3.4-1. Comparison of Emissions Between
Tank and Non-Tank Emission Sources
Source Type
(Canister Site ID)
TOC
(tons/yr)
VOC
(tons/yr)
HAP
(tons/yr)
Non-Tank (PS-126) 6.65 0.01 0.00
Tank (295) 18.18 0.21 0.19
As indicated by the above comparison, tank emissions commonly exceed fugitive gas emissions.
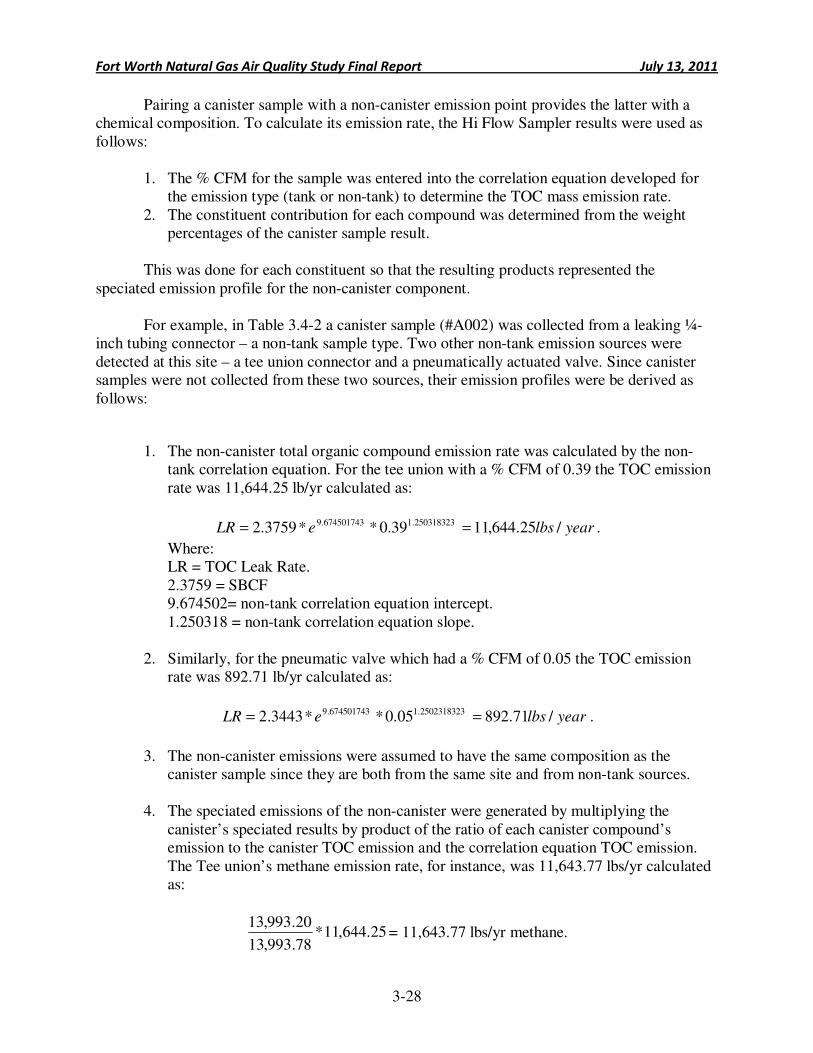
Fort Worth Natural Gas Air Quality Study Final Report July 13, 2011
3-28
Pairing a canister sample with a non-canister emission point provides the latter with a chemical composition. To calculate its emission rate, the Hi Flow Sampler results were used as follows:
1. The % CFM for the sample was entered into the correlation equation developed for the emission type (tank or non-tank) to determine the TOC mass emission rate.
2. The constituent contribution for each compound was determined from the weight percentages of the canister sample result.
This was done for each constituent so that the resulting products represented the
speciated emission profile for the non-canister component.
For example, in Table 3.4-2 a canister sample (#A002) was collected from a leaking ¼-inch tubing connector – a non-tank sample type. Two other non-tank emission sources were detected at this site – a tee union connector and a pneumatically actuated valve. Since canister samples were not collected from these two sources, their emission profiles were be derived as follows:
1. The non-canister total organic compound emission rate was calculated by the non-tank correlation equation. For the tee union with a % CFM of 0.39 the TOC emission rate was 11,644.25 lb/yr calculated as:
yearlbseLR /25.644,1139.0**3759.2 250318323.1674501743.9== .
Where: LR = TOC Leak Rate. 2.3759 = SBCF 9.674502= non-tank correlation equation intercept. 1.250318 = non-tank correlation equation slope.
2. Similarly, for the pneumatic valve which had a % CFM of 0.05 the TOC emission
rate was 892.71 lb/yr calculated as:
yearlbseLR /71.89205.0**3443.2 2502318323.1674501743.9== .
3. The non-canister emissions were assumed to have the same composition as the
canister sample since they are both from the same site and from non-tank sources.
4. The speciated emissions of the non-canister were generated by multiplying the canister’s speciated results by product of the ratio of each canister compound’s emission to the canister TOC emission and the correlation equation TOC emission. The Tee union’s methane emission rate, for instance, was 11,643.77 lbs/yr calculated as:
25.644,11*78.993,13
20.993,13= 11,643.77 lbs/yr methane.
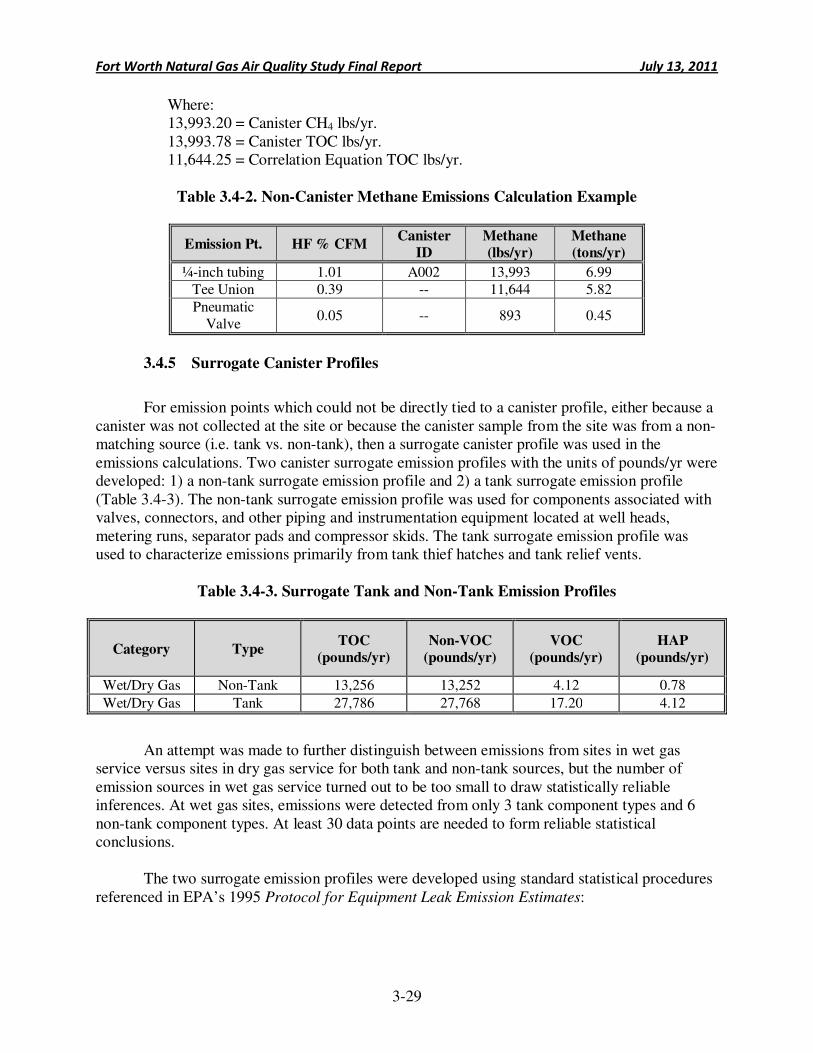
Fort Worth Natural Gas Air Quality Study Final Report July 13, 2011
3-29
Where: 13,993.20 = Canister CH4 lbs/yr. 13,993.78 = Canister TOC lbs/yr. 11,644.25 = Correlation Equation TOC lbs/yr.
Table 3.4-2. Non-Canister Methane Emissions Calculation Example
Emission Pt. HF % CFM Canister
ID
Methane
(lbs/yr)
Methane
(tons/yr)
¼-inch tubing 1.01 A002 13,993 6.99 Tee Union 0.39 -- 11,644 5.82
Pneumatic Valve
0.05 -- 893 0.45
3.4.5 Surrogate Canister Profiles
For emission points which could not be directly tied to a canister profile, either because a canister was not collected at the site or because the canister sample from the site was from a non-matching source (i.e. tank vs. non-tank), then a surrogate canister profile was used in the emissions calculations. Two canister surrogate emission profiles with the units of pounds/yr were developed: 1) a non-tank surrogate emission profile and 2) a tank surrogate emission profile (Table 3.4-3). The non-tank surrogate emission profile was used for components associated with valves, connectors, and other piping and instrumentation equipment located at well heads, metering runs, separator pads and compressor skids. The tank surrogate emission profile was used to characterize emissions primarily from tank thief hatches and tank relief vents.
Table 3.4-3. Surrogate Tank and Non-Tank Emission Profiles
Category Type TOC
(pounds/yr)
Non-VOC
(pounds/yr)
VOC
(pounds/yr)
HAP
(pounds/yr)
Wet/Dry Gas Non-Tank 13,256 13,252 4.12 0.78
Wet/Dry Gas Tank 27,786 27,768 17.20 4.12
An attempt was made to further distinguish between emissions from sites in wet gas service versus sites in dry gas service for both tank and non-tank sources, but the number of emission sources in wet gas service turned out to be too small to draw statistically reliable inferences. At wet gas sites, emissions were detected from only 3 tank component types and 6 non-tank component types. At least 30 data points are needed to form reliable statistical conclusions.
The two surrogate emission profiles were developed using standard statistical procedures referenced in EPA’s 1995 Protocol for Equipment Leak Emission Estimates:
Fort Worth Natural Gas Air Quality Study Final Report July 13, 2011
3-30
1. The canister data for each emission type was checked for normality using probability plots to evaluate the correlation between the data and a normal distribution.
2. Since, in both cases, the data turned out to be non-normal, a natural logarithmic transformation of both sets of canister data was performed.
3. The normality of the transformed data was again checked using probability plots and found to be sufficiently linear.
4. The surrogate compositions were determined as the anti-logarithmic mean of the transformed data.
For summary purposes, Table 3.4-2 indicates the surrogate emission profiles only for
categories of compounds (i.e. TOC, VOC, etc.). It is important to note that each surrogate profile also contains the emission rates for all of the individual compounds found in the aggregate canister samples used to generate the surrogate emission profiles.
Once the use of a surrogate canister profile was applied to an emission point, the emission calculation was performed according to the procedures described above in Section 3.4.3.
In Phase I there were several instances in which a low level emission fell below the detection limit of the Hi Flow Sampler (this limitation was overcome in Phase II by measuring the hydrocarbon concentration of the Hi Flow Sampler’s exhaust stream with the TVA). For these occasions a surrogate % CFM was derived as the anti-log mean value of the normalized % CFM readings recorded in Phase II with the TVA.
3.4.6 Calculation of Non-Sampled Low Level Emission Points
While all site piping and instrumentation equipment was surveyed with the IR camera for high level emissions, only ten percent of the components at a site were sampled for low level emissions using a TVA following Method 21 screening procedures. Two separate emission calculations were used to arrive at emission rate estimates for the ninety percent not screened with the TVA:
1. The percent of components found leaking in the Method 21 screening was applied to the total non-sampled population of valves and connectors at the site and the non-tank correlation equation was used to estimate their emissions.
2. The remaining components were assumed to be non-leaking and their emissions were
calculated using the Synthetic Organic Chemical Manufacturing Industry (SOCMI) default zero values listed in EPA's 1995 Protocol for Equipment Leak Emission
Estimates (Figure 3.4-2). Studies by EPA have demonstrated that non-leaking equipment actually have low level emissions. These emission values are termed “default zeros” and are routinely used across the petroleum industry in the calculation of emission inventories.
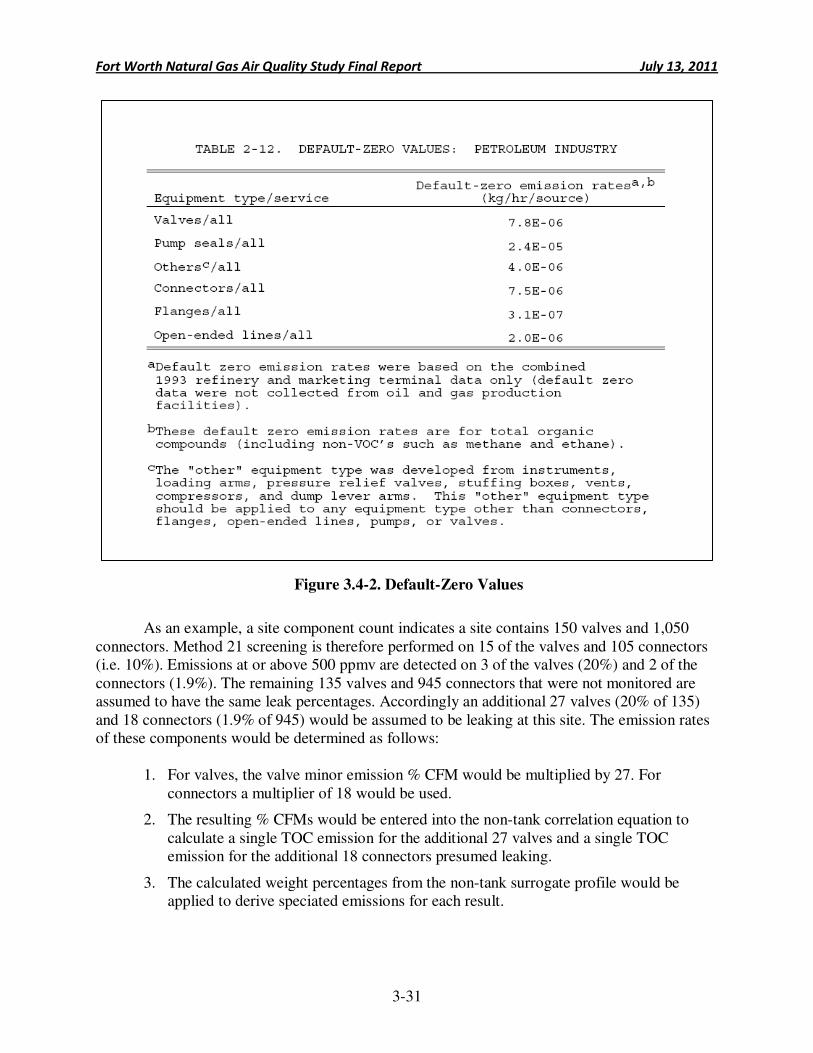
Fort Worth Natural Gas Air Quality Study Final Report July 13, 2011
3-31
As an example, a site component count indicates a site contains 150 valves and 1,050
connectors. Method 21 screening is therefore performed on 15 of the valves and 105 connectors (i.e. 10%). Emissions at or above 500 ppmv are detected on 3 of the valves (20%) and 2 of the connectors (1.9%). The remaining 135 valves and 945 connectors that were not monitored are assumed to have the same leak percentages. Accordingly an additional 27 valves (20% of 135) and 18 connectors (1.9% of 945) would be assumed to be leaking at this site. The emission rates of these components would be determined as follows:
1. For valves, the valve minor emission % CFM would be multiplied by 27. For connectors a multiplier of 18 would be used.
2. The resulting % CFMs would be entered into the non-tank correlation equation to calculate a single TOC emission for the additional 27 valves and a single TOC emission for the additional 18 connectors presumed leaking.
3. The calculated weight percentages from the non-tank surrogate profile would be applied to derive speciated emissions for each result.
Figure 3.4-2. Default-Zero Values
Fort Worth Natural Gas Air Quality Study Final Report July 13, 2011
3-32
The remaining 108 valves (135-27) and 927 connectors (945-18) would have the valve and connector default zero emission rates applied to them. This would be done by converting the default zero kg/hr emission rates to % CFM as methane. The resulting value would be then entered into the non-tank correlation equation to calculate TOC emissions. Speciated results would be obtained using the calculated weight percentages from the non-tank surrogate profile.
3.4.7 Compressor Engine Emissions
A total of 186 natural gas compressor engines were encountered during the site surveys. Of these, 150 were located at 123 well pad sites, 12 were located at the gas processing facility, 1 was located at the salt water treatment facility, and 23 were located at the eight line compressor stations. The majority of the compressor engines located on well pads functioned as lift compressors.
Emissions from compressor engines were derived from field data collected during the site surveys, vendor specification sheets and published emission factors. In calculating emissions for compressor engines, a 100% compressor duty cycle was conservatively assumed (i.e. 24 hours/day/ for 365 days/year). In addition, it was conservatively assumed that these engines were uncontrolled. Multiple XTO facilities were noted as having catalyst controls on their engines, but as stack testing of the exhaust from compressor engines was not included in the scope of this study, the control efficiency of these engines is unknown.
3.4.8 Well Drilling and Fracking Engine Emissions
Criteria pollutant, VOC and HAP emissions from natural gas and diesel engines used in
well drilling and fracking operations were conservatively estimated based upon vendor specifications and published emission factors. Engine emissions from well drilling assume 504 hours of continuous operation (3 weeks, 7 days/week, 24 hours/day). Engine emissions associated with a fracking operation are based upon 120 hours of non-continuous operation (3 weeks, 5 days/week, 8 hours/day).
3.4.9 Calculation of Method 21 TOC Screening Emission Factors
Method 21 screening results were used to calculate VOC emission factors for non-tank equipment in natural gas service so that emissions due to future build out can be predicted based upon Method 21 monitoring results. Emission factors were calculated for the following equipment /screening categories:
• Valves: 500 ppmv to 999 ppmv and 1,000 ppmv to 10,000 ppmv.
• Connectors: 500 ppmv to 999 ppmv and 1,000 ppmv to 10,000 ppmv
Key Point: Compressor Engine Controls Emissions from compressor engines were estimated using the best available data collected during the point source testing. Where data was limited, conservative assumptions were used including but not limited to, the use of uncontrolled emission factors where controls where known to be present but no control efficiency data was readily available.
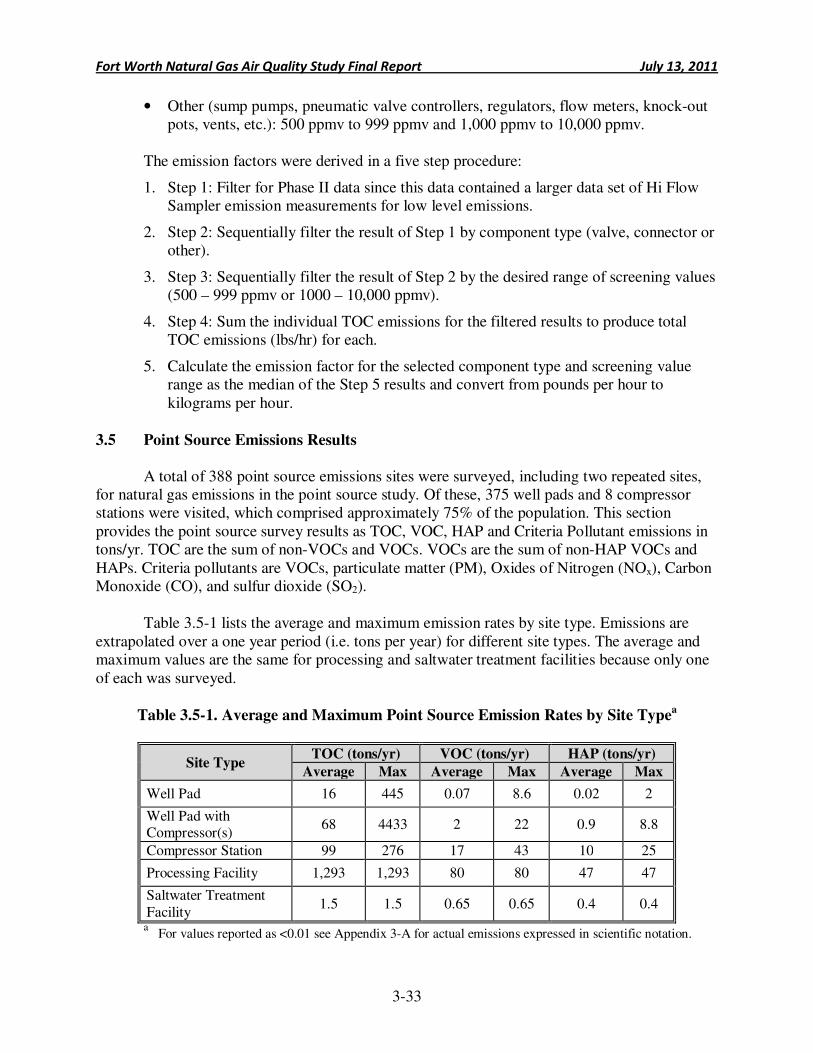
Fort Worth Natural Gas Air Quality Study Final Report July 13, 2011
3-33
• Other (sump pumps, pneumatic valve controllers, regulators, flow meters, knock-out pots, vents, etc.): 500 ppmv to 999 ppmv and 1,000 ppmv to 10,000 ppmv.
The emission factors were derived in a five step procedure:
1. Step 1: Filter for Phase II data since this data contained a larger data set of Hi Flow Sampler emission measurements for low level emissions.
2. Step 2: Sequentially filter the result of Step 1 by component type (valve, connector or other).
3. Step 3: Sequentially filter the result of Step 2 by the desired range of screening values (500 – 999 ppmv or 1000 – 10,000 ppmv).
4. Step 4: Sum the individual TOC emissions for the filtered results to produce total TOC emissions (lbs/hr) for each.
5. Calculate the emission factor for the selected component type and screening value range as the median of the Step 5 results and convert from pounds per hour to kilograms per hour.
3.5 Point Source Emissions Results
A total of 388 point source emissions sites were surveyed, including two repeated sites, for natural gas emissions in the point source study. Of these, 375 well pads and 8 compressor stations were visited, which comprised approximately 75% of the population. This section provides the point source survey results as TOC, VOC, HAP and Criteria Pollutant emissions in tons/yr. TOC are the sum of non-VOCs and VOCs. VOCs are the sum of non-HAP VOCs and HAPs. Criteria pollutants are VOCs, particulate matter (PM), Oxides of Nitrogen (NOx), Carbon Monoxide (CO), and sulfur dioxide (SO2).
Table 3.5-1 lists the average and maximum emission rates by site type. Emissions are extrapolated over a one year period (i.e. tons per year) for different site types. The average and maximum values are the same for processing and saltwater treatment facilities because only one of each was surveyed.
Table 3.5-1. Average and Maximum Point Source Emission Rates by Site Typea
Site Type TOC (tons/yr) VOC (tons/yr) HAP (tons/yr)
Average Max Average Max Average Max
Well Pad 16 445 0.07 8.6 0.02 2
Well Pad with Compressor(s)
68 4433 2 22 0.9 8.8
Compressor Station 99 276 17 43 10 25
Processing Facility 1,293 1,293 80 80 47 47
Saltwater Treatment Facility
1.5 1.5 0.65 0.65 0.4 0.4
a For values reported as <0.01 see Appendix 3-A for actual emissions expressed in scientific notation.
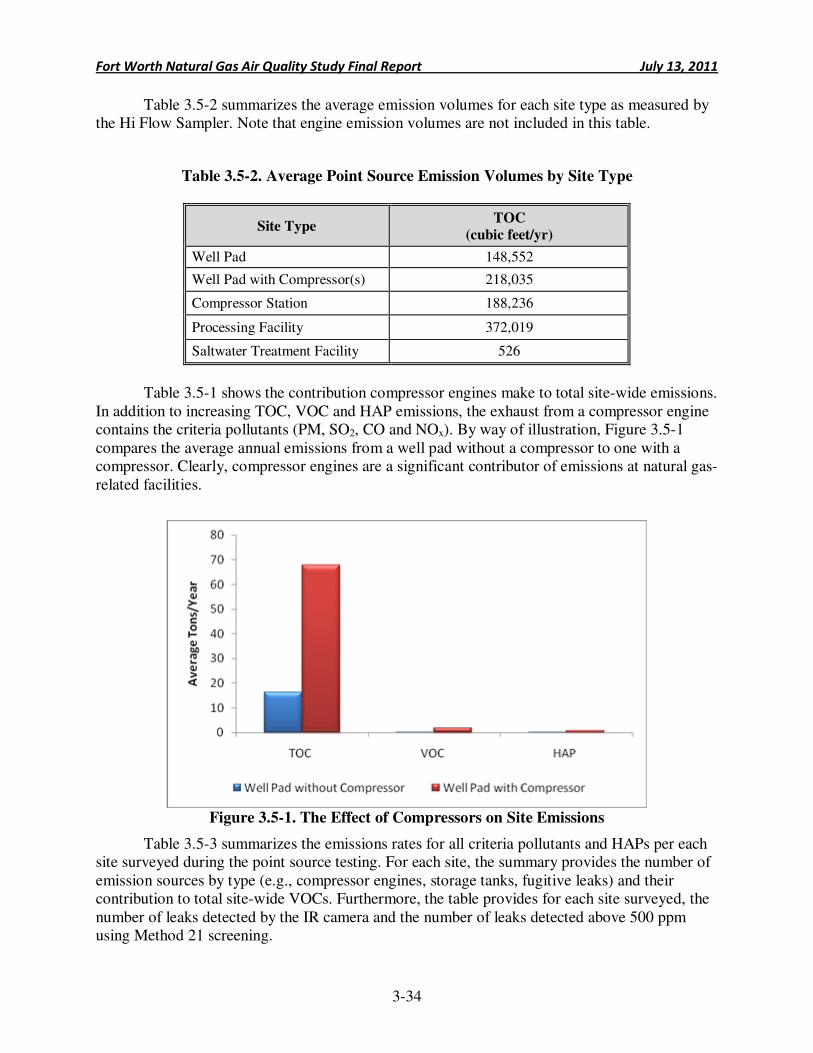
Fort Worth Natural Gas Air Quality Study Final Report July 13, 2011
3-34
Table 3.5-2 summarizes the average emission volumes for each site type as measured by the Hi Flow Sampler. Note that engine emission volumes are not included in this table.
Table 3.5-2. Average Point Source Emission Volumes by Site Type
Site Type TOC
(cubic feet/yr)
Well Pad 148,552
Well Pad with Compressor(s) 218,035
Compressor Station 188,236
Processing Facility 372,019
Saltwater Treatment Facility 526
Table 3.5-1 shows the contribution compressor engines make to total site-wide emissions.
In addition to increasing TOC, VOC and HAP emissions, the exhaust from a compressor engine contains the criteria pollutants (PM, SO2, CO and NOx). By way of illustration, Figure 3.5-1 compares the average annual emissions from a well pad without a compressor to one with a compressor. Clearly, compressor engines are a significant contributor of emissions at natural gas-related facilities.
Figure 3.5-1. The Effect of Compressors on Site Emissions
Table 3.5-3 summarizes the emissions rates for all criteria pollutants and HAPs per each site surveyed during the point source testing. For each site, the summary provides the number of emission sources by type (e.g., compressor engines, storage tanks, fugitive leaks) and their contribution to total site-wide VOCs. Furthermore, the table provides for each site surveyed, the number of leaks detected by the IR camera and the number of leaks detected above 500 ppm using Method 21 screening.
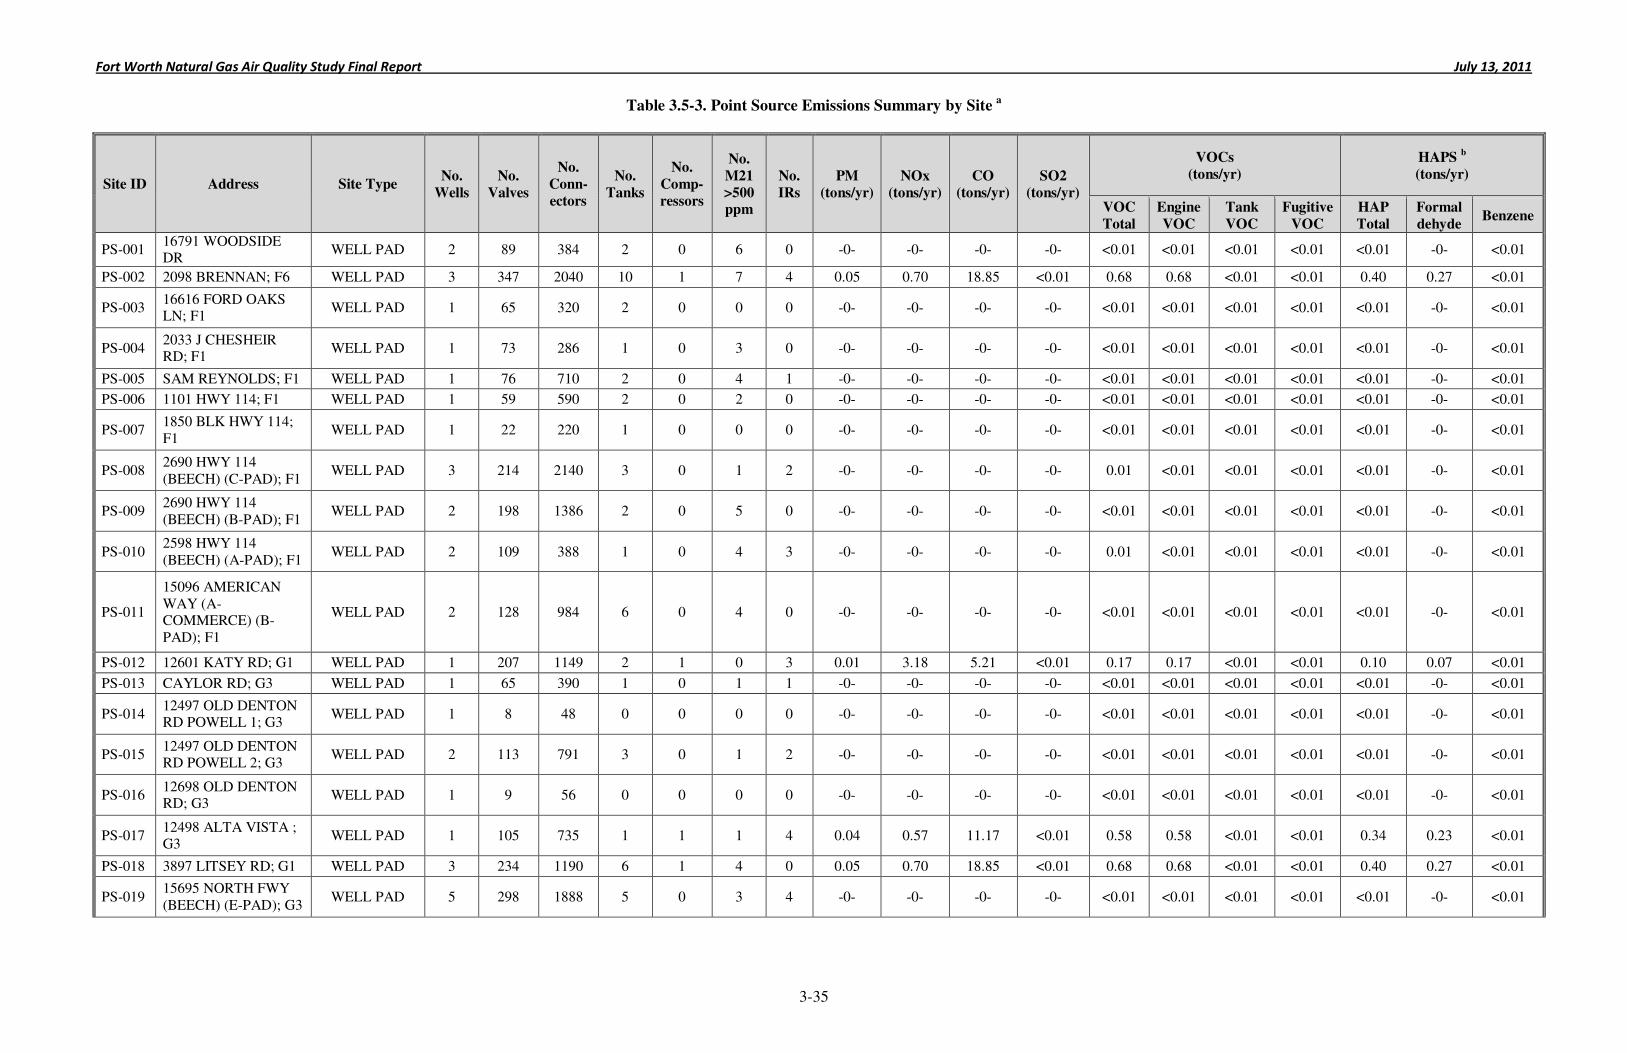
Fort Worth Natural Gas Air Quality Study Final Report July 13, 2011
3-35
Table 3.5-3. Point Source Emissions Summary by Site a
Site ID Address Site Type No.
Wells
No.
Valves
No.
Conn-
ectors
No.
Tanks
No.
Comp-
ressors
No.
M21
>500 ppm
No.
IRs
PM
(tons/yr)
NOx
(tons/yr)
CO
(tons/yr)
SO2
(tons/yr)
VOCs
(tons/yr)
HAPS b
(tons/yr)
VOC
Total
Engine
VOC
Tank
VOC
Fugitive
VOC
HAP
Total
Formal
dehyde Benzene
PS-001 16791 WOODSIDE DR
WELL PAD 2 89 384 2 0 6 0 -0- -0- -0- -0- <0.01 <0.01 <0.01 <0.01 <0.01 -0- <0.01
PS-002 2098 BRENNAN; F6 WELL PAD 3 347 2040 10 1 7 4 0.05 0.70 18.85 <0.01 0.68 0.68 <0.01 <0.01 0.40 0.27 <0.01
PS-003 16616 FORD OAKS LN; F1
WELL PAD 1 65 320 2 0 0 0 -0- -0- -0- -0- <0.01 <0.01 <0.01 <0.01 <0.01 -0- <0.01
PS-004 2033 J CHESHEIR RD; F1
WELL PAD 1 73 286 1 0 3 0 -0- -0- -0- -0- <0.01 <0.01 <0.01 <0.01 <0.01 -0- <0.01
PS-005 SAM REYNOLDS; F1 WELL PAD 1 76 710 2 0 4 1 -0- -0- -0- -0- <0.01 <0.01 <0.01 <0.01 <0.01 -0- <0.01
PS-006 1101 HWY 114; F1 WELL PAD 1 59 590 2 0 2 0 -0- -0- -0- -0- <0.01 <0.01 <0.01 <0.01 <0.01 -0- <0.01
PS-007 1850 BLK HWY 114; F1
WELL PAD 1 22 220 1 0 0 0 -0- -0- -0- -0- <0.01 <0.01 <0.01 <0.01 <0.01 -0- <0.01
PS-008 2690 HWY 114 (BEECH) (C-PAD); F1
WELL PAD 3 214 2140 3 0 1 2 -0- -0- -0- -0- 0.01 <0.01 <0.01 <0.01 <0.01 -0- <0.01
PS-009 2690 HWY 114 (BEECH) (B-PAD); F1
WELL PAD 2 198 1386 2 0 5 0 -0- -0- -0- -0- <0.01 <0.01 <0.01 <0.01 <0.01 -0- <0.01
PS-010 2598 HWY 114 (BEECH) (A-PAD); F1
WELL PAD 2 109 388 1 0 4 3 -0- -0- -0- -0- 0.01 <0.01 <0.01 <0.01 <0.01 -0- <0.01
PS-011
15096 AMERICAN WAY (A-COMMERCE) (B-PAD); F1
WELL PAD 2 128 984 6 0 4 0 -0- -0- -0- -0- <0.01 <0.01 <0.01 <0.01 <0.01 -0- <0.01
PS-012 12601 KATY RD; G1 WELL PAD 1 207 1149 2 1 0 3 0.01 3.18 5.21 <0.01 0.17 0.17 <0.01 <0.01 0.10 0.07 <0.01
PS-013 CAYLOR RD; G3 WELL PAD 1 65 390 1 0 1 1 -0- -0- -0- -0- <0.01 <0.01 <0.01 <0.01 <0.01 -0- <0.01
PS-014 12497 OLD DENTON RD POWELL 1; G3
WELL PAD 1 8 48 0 0 0 0 -0- -0- -0- -0- <0.01 <0.01 <0.01 <0.01 <0.01 -0- <0.01
PS-015 12497 OLD DENTON RD POWELL 2; G3
WELL PAD 2 113 791 3 0 1 2 -0- -0- -0- -0- <0.01 <0.01 <0.01 <0.01 <0.01 -0- <0.01
PS-016 12698 OLD DENTON RD; G3
WELL PAD 1 9 56 0 0 0 0 -0- -0- -0- -0- <0.01 <0.01 <0.01 <0.01 <0.01 -0- <0.01
PS-017 12498 ALTA VISTA ; G3
WELL PAD 1 105 735 1 1 1 4 0.04 0.57 11.17 <0.01 0.58 0.58 <0.01 <0.01 0.34 0.23 <0.01
PS-018 3897 LITSEY RD; G1 WELL PAD 3 234 1190 6 1 4 0 0.05 0.70 18.85 <0.01 0.68 0.68 <0.01 <0.01 0.40 0.27 <0.01
PS-019 15695 NORTH FWY (BEECH) (E-PAD); G3
WELL PAD 5 298 1888 5 0 3 4 -0- -0- -0- -0- <0.01 <0.01 <0.01 <0.01 <0.01 -0- <0.01

Fort Worth Natural Gas Air Quality Study Final Report July 13, 2011
3-36
Table 3.5-3. Point Source Emissions Summary by Site (Continued)
Site ID Address Site Type No.
Wells
No.
Valves
No.
Conn-ectors
No.
Tanks
No.
Comp-ressors
No. M21
>500
ppm
No.
IRs
PM
(tons/yr)
NOx
(tons/yr)
CO
(tons/yr)
SO2
(tons/yr)
VOCs
(tons/yr)
HAPS b
(tons/yr)
VOC Total
Engine VOC
Tank VOC
Fugitive VOC
HAP Total
Formaldehyde
Benzene
PS-020 2660 PETTY PLACE; G1
WELL PAD 1 77 548 2 0 0 1 -0- -0- -0- -0- <0.01 <0.01 <0.01 <0.01 <0.01 -0- <0.01
PS-021 16280 3 WILD DRIVE; G1
WELL PAD 3 172 1204 3 0 0 0 -0- -0- -0- -0- <0.01 <0.01 <0.01 <0.01 <0.01 -0- <0.01
PS-022 2898 HWY 114; G1 WELL PAD 2 87 609 2 0 1 1 -0- -0- -0- -0- <0.01 <0.01 <0.01 <0.01 <0.01 -0- <0.01
PS-023 2297 SILVER CREEK RD; C6
WELL PAD 1 53 371 2 0 1 3 -0- -0- -0- -0- <0.01 <0.01 <0.01 <0.01 <0.01 -0- <0.01
PS-024 2297 SILVER CREEK RD (PAD 2); C6
WELL PAD 2 82 574 3 0 0 2 -0- -0- -0- -0- <0.01 <0.01 <0.01 <0.01 <0.01 -0- <0.01
PS-025 3193 JIMISONS LN (XTO) (SURBER CA/CWS); J6
WELL PAD 3 209 1254 4 0 2 1 -0- -0- -0- -0- <0.01 <0.01 <0.01 <0.01 <0.01 -0- <0.01
PS-026 11494 MOSIER VALLEY RD (XTO) (REGAN); J6
WELL PAD 1 77 440 1 0 0 0 -0- -0- -0- -0- <0.01 <0.01 <0.01 <0.01 <0.01 -0- <0.01
PS-027 11468 MOSIER VALLEY RD (XTO) (KNAPP); J6
WELL PAD 1 84 500 1 0 0 3 -0- -0- -0- -0- 0.01 <0.01 0.01 <0.01 <0.01 -0- <0.01
PS-028 11693 MOSIER VALLEY RD (XTO) (EULESS A); J6
WELL PAD 4 273 1530 4 0 3 2 -0- -0- -0- -0- <0.01 <0.01 <0.01 <0.01 <0.01 -0- <0.01
PS-028.1
14193 JOHN DAY RD (H-PAD); E1
WELL PAD 2 96 672 2 0 0 0 -0- -0- -0- -0- <0.01 <0.01 <0.01 <0.01 <0.01 -0- <0.01
PS-029 14193 JOHN DAY RD (G-PAD); E1
WELL PAD 4 209 1449 4 0 0 1 -0- -0- -0- -0- <0.01 <0.01 <0.01 <0.01 <0.01 -0- <0.01
PS-030 14193 JOHN DAY RD (F-PAD); E1
WELL PAD 3 136 952 3 0 1 1 -0- -0- -0- -0- <0.01 <0.01 <0.01 <0.01 <0.01 -0- <0.01
PS-031 14193 JOHN DAY RD (D-PAD); E1
WELL PAD 1 48 336 1 0 1 0 -0- -0- -0- -0- <0.01 <0.01 <0.01 <0.01 <0.01 -0- <0.01
PS-032 11591 TRINITY BLVD (XTO) (EULESS C); J6
WELL PAD 1 78 468 1 0 1 2 -0- -0- -0- -0- <0.01 <0.01 <0.01 <0.01 <0.01 -0- <0.01
PS-033 11696 MOSIER VALLEY RD (XTO) (JW ARLINGTON); J6
WELL PAD 4 255 1300 4 0 2 3 -0- -0- -0- -0- 0.01 <0.01 <0.01 <0.01 <0.01 -0- <0.01

Fort Worth Natural Gas Air Quality Study Final Report July 13, 2011
3-37
Table 3.5-3. Point Source Emissions Summary by Site (Continued)
Site ID Address Site Type No.
Wells
No.
Valves
No.
Conn-
ectors
No.
Tanks
No.
Comp-
ressors
No.
M21
>500 ppm
No.
IRs
PM
(tons/yr)
NOx
(tons/yr)
CO
(tons/yr)
SO2
(tons/yr)
VOCs
(tons/yr)
HAPS b
(tons/yr)
VOC
Total
Engine
VOC
Tank
VOC
Fugitive
VOC
HAP
Total
Formal
dehyde Benzene
PS-034 12196 TRINITY BLVD (XTO) (EULESS B); J6
WELL PAD 5 214 1284 5 0 0 2 -0- -0- -0- -0- 0.01 <0.01 0.01 <0.01 <0.01 -0- <0.01
PS-035 141931 JOHN DAY RD (C-PAD); E1
WELL PAD 1 50 350 1 0 1 2 -0- -0- -0- -0- <0.01 <0.01 <0.01 <0.01 <0.01 -0- <0.01
PS-036 14193 JOHN DAY RD (A-PAD); E1
WELL PAD 2 117 819 2 0 1 1 -0- -0- -0- -0- <0.01 <0.01 <0.01 <0.01 <0.01 -0- <0.01
PS-037 14193 JOHN DAY RD (E-PAD); E1
WELL PAD 2 105 735 2 0 0 1 -0- -0- -0- -0- <0.01 <0.01 <0.01 <0.01 <0.01 -0- <0.01
PS-038 14193 JOHN DAY RD (B-PAD); E1
WELL PAD 1 65 455 1 0 1 1 -0- -0- -0- -0- <0.01 <0.01 <0.01 <0.01 <0.01 -0- <0.01
PS-039
493 AVONDALE HASLET RD (DEVON) (GARNETT-LAPRELLE); E2
WELL PAD 2 194 1620 2 0 0 1 -0- -0- -0- -0- <0.01 <0.01 <0.01 <0.01 <0.01 -0- <0.01
PS-040 493 AVONDALE HASLET RD (XTO) (HUFFMAN); E2
WELL PAD 2 137 1218 3 0 2 2 -0- -0- -0- -0- <0.01 <0.01 <0.01 <0.01 <0.01 -0- <0.01
PS-041
1701 AVONDALE HASLET RD (DEVON) (MOSS) (A-PAD); E2
WELL PAD 2 140 840 1 0 1 0 -0- -0- -0- -0- <0.01 <0.01 <0.01 <0.01 <0.01 -0- <0.01
PS-042
1701 AVONDALE HASLET RD (DEVON) (MOSS) (B-PAD); E2
WELL PAD 2 150 1244 2 0 2 1 -0- -0- -0- -0- <0.01 <0.01 <0.01 <0.01 <0.01 -0- <0.01
PS-043
1502 AVONDALE HASLET RD (DEVON) (MORRIS HARMONSON) (F-PAD); E2
WELL PAD 2 131 917 2 0 1 1 -0- -0- -0- -0- <0.01 <0.01 <0.01 <0.01 <0.01 -0- <0.01
PS-044
1400 AVONDALE HASLET RD (DEVON) (MORRIS HARMONSON) (C-PAD); E2
WELL PAD 1 57 342 2 0 2 0 -0- -0- -0- -0- <0.01 <0.01 <0.01 <0.01 <0.01 -0- <0.01
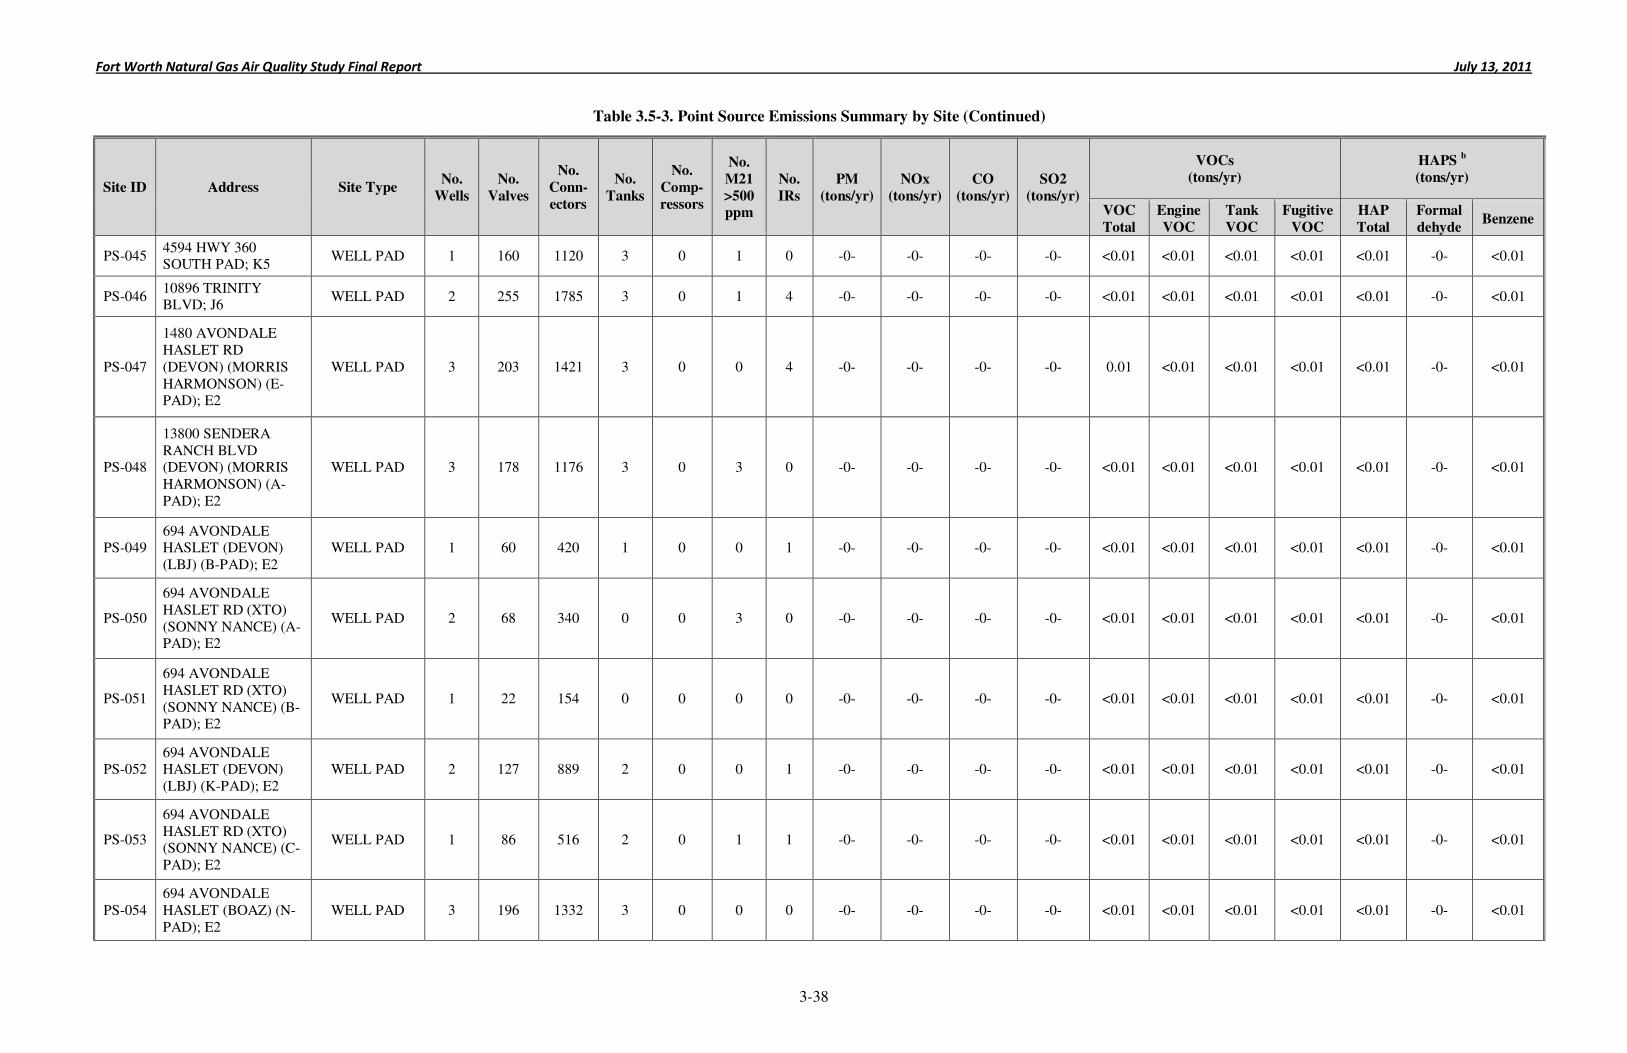
Fort Worth Natural Gas Air Quality Study Final Report July 13, 2011
3-38
Table 3.5-3. Point Source Emissions Summary by Site (Continued)
Site ID Address Site Type No.
Wells
No.
Valves
No.
Conn-
ectors
No.
Tanks
No.
Comp-
ressors
No.
M21
>500 ppm
No.
IRs
PM
(tons/yr)
NOx
(tons/yr)
CO
(tons/yr)
SO2
(tons/yr)
VOCs
(tons/yr)
HAPS b
(tons/yr)
VOC
Total
Engine
VOC
Tank
VOC
Fugitive
VOC
HAP
Total
Formal
dehyde Benzene
PS-045 4594 HWY 360 SOUTH PAD; K5
WELL PAD 1 160 1120 3 0 1 0 -0- -0- -0- -0- <0.01 <0.01 <0.01 <0.01 <0.01 -0- <0.01
PS-046 10896 TRINITY BLVD; J6
WELL PAD 2 255 1785 3 0 1 4 -0- -0- -0- -0- <0.01 <0.01 <0.01 <0.01 <0.01 -0- <0.01
PS-047
1480 AVONDALE HASLET RD (DEVON) (MORRIS HARMONSON) (E-PAD); E2
WELL PAD 3 203 1421 3 0 0 4 -0- -0- -0- -0- 0.01 <0.01 <0.01 <0.01 <0.01 -0- <0.01
PS-048
13800 SENDERA RANCH BLVD (DEVON) (MORRIS HARMONSON) (A-PAD); E2
WELL PAD 3 178 1176 3 0 3 0 -0- -0- -0- -0- <0.01 <0.01 <0.01 <0.01 <0.01 -0- <0.01
PS-049 694 AVONDALE HASLET (DEVON) (LBJ) (B-PAD); E2
WELL PAD 1 60 420 1 0 0 1 -0- -0- -0- -0- <0.01 <0.01 <0.01 <0.01 <0.01 -0- <0.01
PS-050
694 AVONDALE HASLET RD (XTO) (SONNY NANCE) (A-PAD); E2
WELL PAD 2 68 340 0 0 3 0 -0- -0- -0- -0- <0.01 <0.01 <0.01 <0.01 <0.01 -0- <0.01
PS-051
694 AVONDALE HASLET RD (XTO) (SONNY NANCE) (B-PAD); E2
WELL PAD 1 22 154 0 0 0 0 -0- -0- -0- -0- <0.01 <0.01 <0.01 <0.01 <0.01 -0- <0.01
PS-052 694 AVONDALE HASLET (DEVON) (LBJ) (K-PAD); E2
WELL PAD 2 127 889 2 0 0 1 -0- -0- -0- -0- <0.01 <0.01 <0.01 <0.01 <0.01 -0- <0.01
PS-053
694 AVONDALE HASLET RD (XTO) (SONNY NANCE) (C-PAD); E2
WELL PAD 1 86 516 2 0 1 1 -0- -0- -0- -0- <0.01 <0.01 <0.01 <0.01 <0.01 -0- <0.01
PS-054 694 AVONDALE HASLET (BOAZ) (N-PAD); E2
WELL PAD 3 196 1332 3 0 0 0 -0- -0- -0- -0- <0.01 <0.01 <0.01 <0.01 <0.01 -0- <0.01
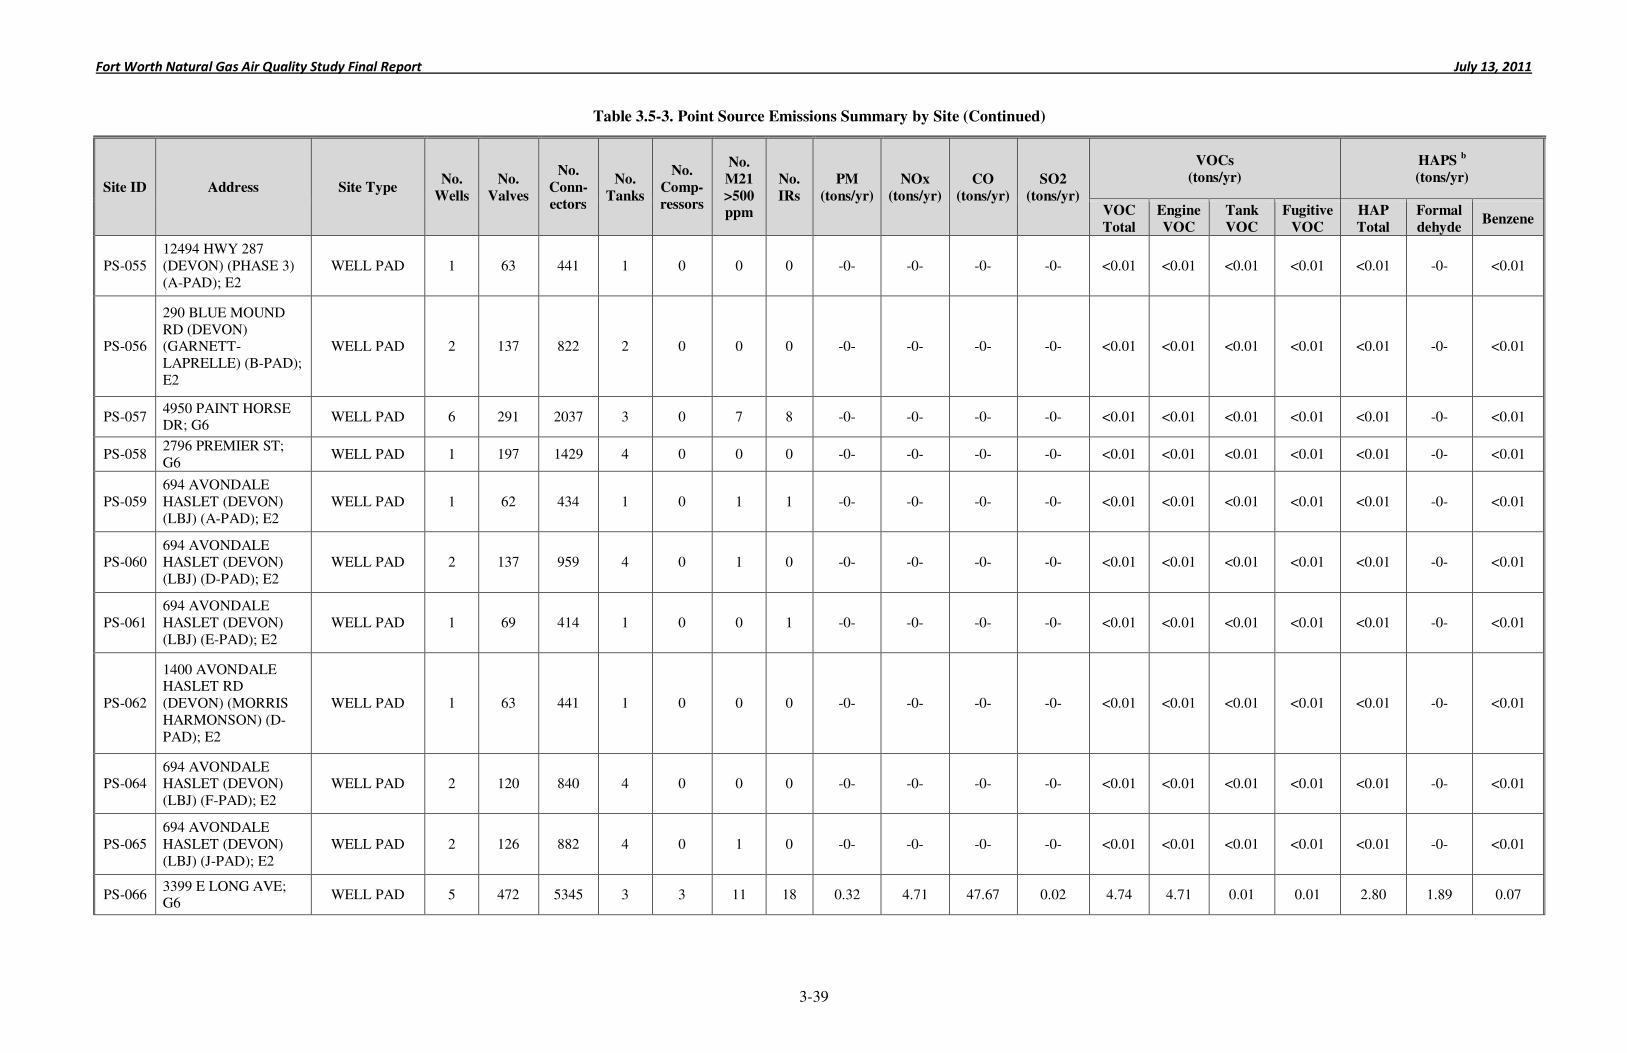
Fort Worth Natural Gas Air Quality Study Final Report July 13, 2011
3-39
Table 3.5-3. Point Source Emissions Summary by Site (Continued)
Site ID Address Site Type No.
Wells
No.
Valves
No.
Conn-
ectors
No.
Tanks
No.
Comp-
ressors
No.
M21
>500 ppm
No.
IRs
PM
(tons/yr)
NOx
(tons/yr)
CO
(tons/yr)
SO2
(tons/yr)
VOCs
(tons/yr)
HAPS b
(tons/yr)
VOC
Total
Engine
VOC
Tank
VOC
Fugitive
VOC
HAP
Total
Formal
dehyde Benzene
PS-055 12494 HWY 287 (DEVON) (PHASE 3) (A-PAD); E2
WELL PAD 1 63 441 1 0 0 0 -0- -0- -0- -0- <0.01 <0.01 <0.01 <0.01 <0.01 -0- <0.01
PS-056
290 BLUE MOUND RD (DEVON) (GARNETT-LAPRELLE) (B-PAD); E2
WELL PAD 2 137 822 2 0 0 0 -0- -0- -0- -0- <0.01 <0.01 <0.01 <0.01 <0.01 -0- <0.01
PS-057 4950 PAINT HORSE DR; G6
WELL PAD 6 291 2037 3 0 7 8 -0- -0- -0- -0- <0.01 <0.01 <0.01 <0.01 <0.01 -0- <0.01
PS-058 2796 PREMIER ST; G6
WELL PAD 1 197 1429 4 0 0 0 -0- -0- -0- -0- <0.01 <0.01 <0.01 <0.01 <0.01 -0- <0.01
PS-059 694 AVONDALE HASLET (DEVON) (LBJ) (A-PAD); E2
WELL PAD 1 62 434 1 0 1 1 -0- -0- -0- -0- <0.01 <0.01 <0.01 <0.01 <0.01 -0- <0.01
PS-060 694 AVONDALE HASLET (DEVON) (LBJ) (D-PAD); E2
WELL PAD 2 137 959 4 0 1 0 -0- -0- -0- -0- <0.01 <0.01 <0.01 <0.01 <0.01 -0- <0.01
PS-061 694 AVONDALE HASLET (DEVON) (LBJ) (E-PAD); E2
WELL PAD 1 69 414 1 0 0 1 -0- -0- -0- -0- <0.01 <0.01 <0.01 <0.01 <0.01 -0- <0.01
PS-062
1400 AVONDALE HASLET RD (DEVON) (MORRIS HARMONSON) (D-PAD); E2
WELL PAD 1 63 441 1 0 0 0 -0- -0- -0- -0- <0.01 <0.01 <0.01 <0.01 <0.01 -0- <0.01
PS-064 694 AVONDALE HASLET (DEVON) (LBJ) (F-PAD); E2
WELL PAD 2 120 840 4 0 0 0 -0- -0- -0- -0- <0.01 <0.01 <0.01 <0.01 <0.01 -0- <0.01
PS-065 694 AVONDALE HASLET (DEVON) (LBJ) (J-PAD); E2
WELL PAD 2 126 882 4 0 1 0 -0- -0- -0- -0- <0.01 <0.01 <0.01 <0.01 <0.01 -0- <0.01
PS-066 3399 E LONG AVE; G6
WELL PAD 5 472 5345 3 3 11 18 0.32 4.71 47.67 0.02 4.74 4.71 0.01 0.01 2.80 1.89 0.07
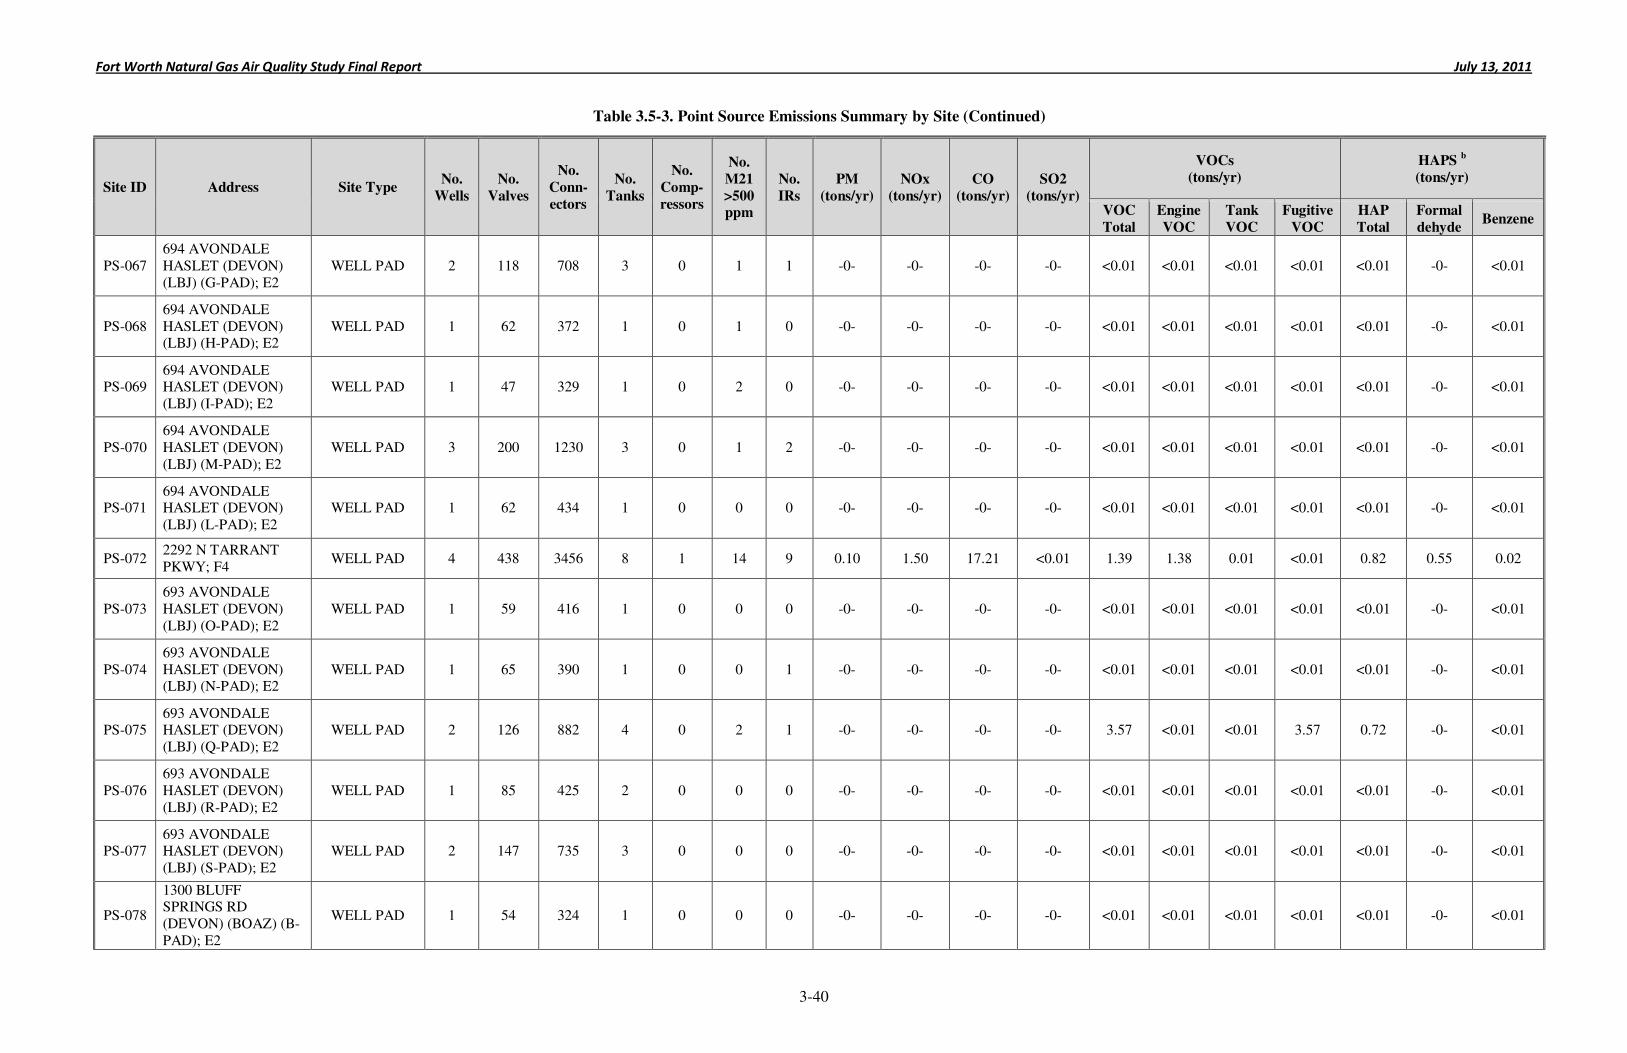
Fort Worth Natural Gas Air Quality Study Final Report July 13, 2011
3-40
Table 3.5-3. Point Source Emissions Summary by Site (Continued)
Site ID Address Site Type No.
Wells
No.
Valves
No.
Conn-
ectors
No.
Tanks
No.
Comp-
ressors
No.
M21
>500 ppm
No.
IRs
PM
(tons/yr)
NOx
(tons/yr)
CO
(tons/yr)
SO2
(tons/yr)
VOCs
(tons/yr)
HAPS b
(tons/yr)
VOC
Total
Engine
VOC
Tank
VOC
Fugitive
VOC
HAP
Total
Formal
dehyde Benzene
PS-067 694 AVONDALE HASLET (DEVON) (LBJ) (G-PAD); E2
WELL PAD 2 118 708 3 0 1 1 -0- -0- -0- -0- <0.01 <0.01 <0.01 <0.01 <0.01 -0- <0.01
PS-068 694 AVONDALE HASLET (DEVON) (LBJ) (H-PAD); E2
WELL PAD 1 62 372 1 0 1 0 -0- -0- -0- -0- <0.01 <0.01 <0.01 <0.01 <0.01 -0- <0.01
PS-069 694 AVONDALE HASLET (DEVON) (LBJ) (I-PAD); E2
WELL PAD 1 47 329 1 0 2 0 -0- -0- -0- -0- <0.01 <0.01 <0.01 <0.01 <0.01 -0- <0.01
PS-070 694 AVONDALE HASLET (DEVON) (LBJ) (M-PAD); E2
WELL PAD 3 200 1230 3 0 1 2 -0- -0- -0- -0- <0.01 <0.01 <0.01 <0.01 <0.01 -0- <0.01
PS-071 694 AVONDALE HASLET (DEVON) (LBJ) (L-PAD); E2
WELL PAD 1 62 434 1 0 0 0 -0- -0- -0- -0- <0.01 <0.01 <0.01 <0.01 <0.01 -0- <0.01
PS-072 2292 N TARRANT PKWY; F4
WELL PAD 4 438 3456 8 1 14 9 0.10 1.50 17.21 <0.01 1.39 1.38 0.01 <0.01 0.82 0.55 0.02
PS-073 693 AVONDALE HASLET (DEVON) (LBJ) (O-PAD); E2
WELL PAD 1 59 416 1 0 0 0 -0- -0- -0- -0- <0.01 <0.01 <0.01 <0.01 <0.01 -0- <0.01
PS-074 693 AVONDALE HASLET (DEVON) (LBJ) (N-PAD); E2
WELL PAD 1 65 390 1 0 0 1 -0- -0- -0- -0- <0.01 <0.01 <0.01 <0.01 <0.01 -0- <0.01
PS-075 693 AVONDALE HASLET (DEVON) (LBJ) (Q-PAD); E2
WELL PAD 2 126 882 4 0 2 1 -0- -0- -0- -0- 3.57 <0.01 <0.01 3.57 0.72 -0- <0.01
PS-076 693 AVONDALE HASLET (DEVON) (LBJ) (R-PAD); E2
WELL PAD 1 85 425 2 0 0 0 -0- -0- -0- -0- <0.01 <0.01 <0.01 <0.01 <0.01 -0- <0.01
PS-077 693 AVONDALE HASLET (DEVON) (LBJ) (S-PAD); E2
WELL PAD 2 147 735 3 0 0 0 -0- -0- -0- -0- <0.01 <0.01 <0.01 <0.01 <0.01 -0- <0.01
PS-078
1300 BLUFF SPRINGS RD (DEVON) (BOAZ) (B-PAD); E2
WELL PAD 1 54 324 1 0 0 0 -0- -0- -0- -0- <0.01 <0.01 <0.01 <0.01 <0.01 -0- <0.01
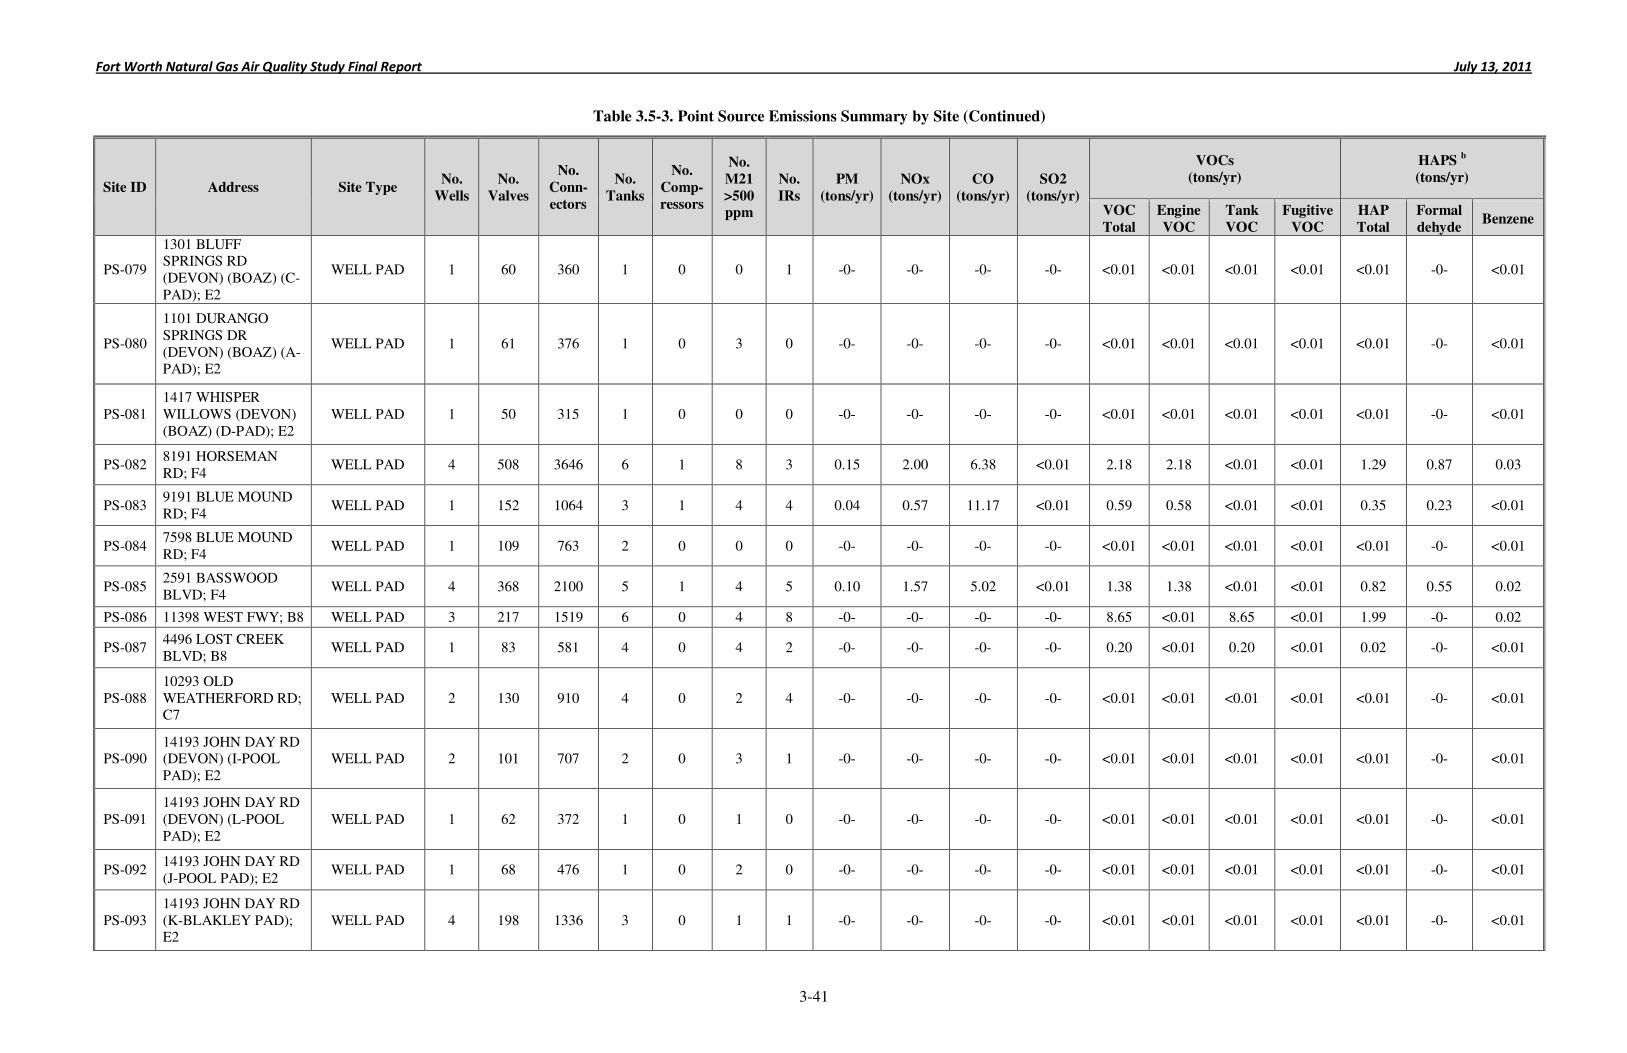
Fort Worth Natural Gas Air Quality Study Final Report July 13, 2011
3-41
Table 3.5-3. Point Source Emissions Summary by Site (Continued)
Site ID Address Site Type No.
Wells
No.
Valves
No.
Conn-
ectors
No.
Tanks
No.
Comp-
ressors
No.
M21
>500 ppm
No.
IRs
PM
(tons/yr)
NOx
(tons/yr)
CO
(tons/yr)
SO2
(tons/yr)
VOCs
(tons/yr)
HAPS b
(tons/yr)
VOC
Total
Engine
VOC
Tank
VOC
Fugitive
VOC
HAP
Total
Formal
dehyde Benzene
PS-079
1301 BLUFF SPRINGS RD (DEVON) (BOAZ) (C-PAD); E2
WELL PAD 1 60 360 1 0 0 1 -0- -0- -0- -0- <0.01 <0.01 <0.01 <0.01 <0.01 -0- <0.01
PS-080
1101 DURANGO SPRINGS DR (DEVON) (BOAZ) (A-PAD); E2
WELL PAD 1 61 376 1 0 3 0 -0- -0- -0- -0- <0.01 <0.01 <0.01 <0.01 <0.01 -0- <0.01
PS-081 1417 WHISPER WILLOWS (DEVON) (BOAZ) (D-PAD); E2
WELL PAD 1 50 315 1 0 0 0 -0- -0- -0- -0- <0.01 <0.01 <0.01 <0.01 <0.01 -0- <0.01
PS-082 8191 HORSEMAN RD; F4
WELL PAD 4 508 3646 6 1 8 3 0.15 2.00 6.38 <0.01 2.18 2.18 <0.01 <0.01 1.29 0.87 0.03
PS-083 9191 BLUE MOUND RD; F4
WELL PAD 1 152 1064 3 1 4 4 0.04 0.57 11.17 <0.01 0.59 0.58 <0.01 <0.01 0.35 0.23 <0.01
PS-084 7598 BLUE MOUND RD; F4
WELL PAD 1 109 763 2 0 0 0 -0- -0- -0- -0- <0.01 <0.01 <0.01 <0.01 <0.01 -0- <0.01
PS-085 2591 BASSWOOD BLVD; F4
WELL PAD 4 368 2100 5 1 4 5 0.10 1.57 5.02 <0.01 1.38 1.38 <0.01 <0.01 0.82 0.55 0.02
PS-086 11398 WEST FWY; B8 WELL PAD 3 217 1519 6 0 4 8 -0- -0- -0- -0- 8.65 <0.01 8.65 <0.01 1.99 -0- 0.02
PS-087 4496 LOST CREEK BLVD; B8
WELL PAD 1 83 581 4 0 4 2 -0- -0- -0- -0- 0.20 <0.01 0.20 <0.01 0.02 -0- <0.01
PS-088 10293 OLD WEATHERFORD RD; C7
WELL PAD 2 130 910 4 0 2 4 -0- -0- -0- -0- <0.01 <0.01 <0.01 <0.01 <0.01 -0- <0.01
PS-090 14193 JOHN DAY RD (DEVON) (I-POOL PAD); E2
WELL PAD 2 101 707 2 0 3 1 -0- -0- -0- -0- <0.01 <0.01 <0.01 <0.01 <0.01 -0- <0.01
PS-091 14193 JOHN DAY RD (DEVON) (L-POOL PAD); E2
WELL PAD 1 62 372 1 0 1 0 -0- -0- -0- -0- <0.01 <0.01 <0.01 <0.01 <0.01 -0- <0.01
PS-092 14193 JOHN DAY RD (J-POOL PAD); E2
WELL PAD 1 68 476 1 0 2 0 -0- -0- -0- -0- <0.01 <0.01 <0.01 <0.01 <0.01 -0- <0.01
PS-093 14193 JOHN DAY RD (K-BLAKLEY PAD); E2
WELL PAD 4 198 1336 3 0 1 1 -0- -0- -0- -0- <0.01 <0.01 <0.01 <0.01 <0.01 -0- <0.01
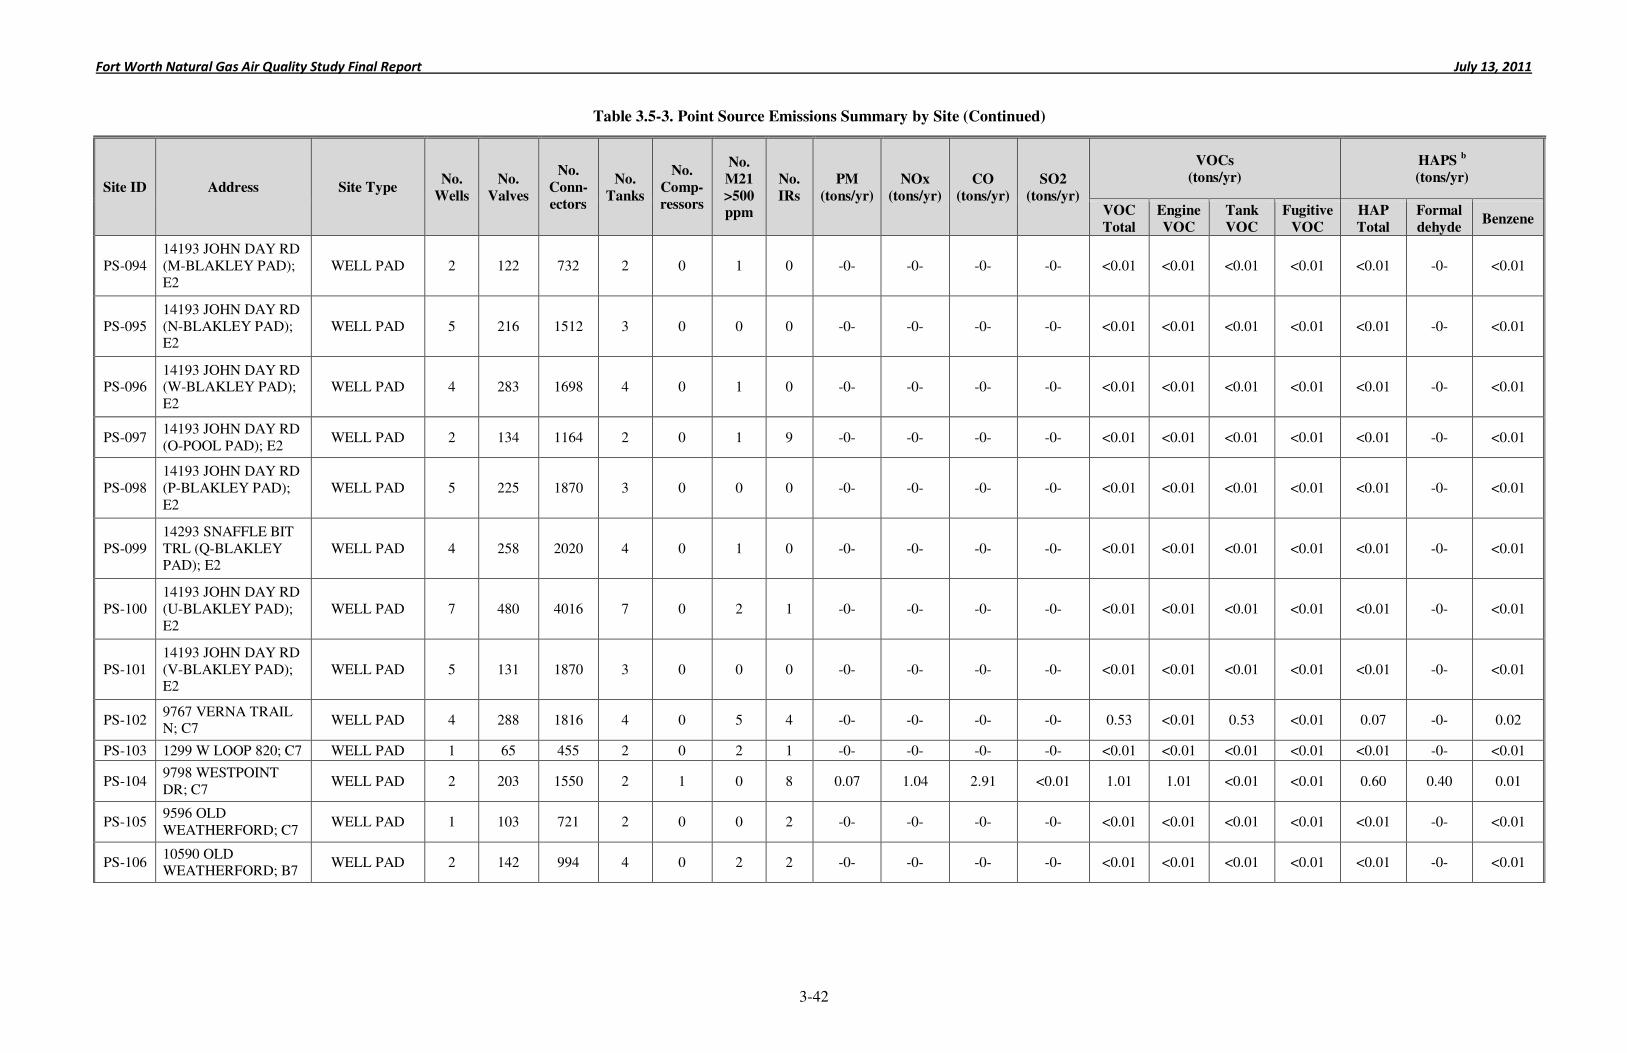
Fort Worth Natural Gas Air Quality Study Final Report July 13, 2011
3-42
Table 3.5-3. Point Source Emissions Summary by Site (Continued)
Site ID Address Site Type No.
Wells
No.
Valves
No.
Conn-
ectors
No.
Tanks
No.
Comp-
ressors
No.
M21
>500 ppm
No.
IRs
PM
(tons/yr)
NOx
(tons/yr)
CO
(tons/yr)
SO2
(tons/yr)
VOCs
(tons/yr)
HAPS b
(tons/yr)
VOC
Total
Engine
VOC
Tank
VOC
Fugitive
VOC
HAP
Total
Formal
dehyde Benzene
PS-094 14193 JOHN DAY RD (M-BLAKLEY PAD); E2
WELL PAD 2 122 732 2 0 1 0 -0- -0- -0- -0- <0.01 <0.01 <0.01 <0.01 <0.01 -0- <0.01
PS-095 14193 JOHN DAY RD (N-BLAKLEY PAD); E2
WELL PAD 5 216 1512 3 0 0 0 -0- -0- -0- -0- <0.01 <0.01 <0.01 <0.01 <0.01 -0- <0.01
PS-096 14193 JOHN DAY RD (W-BLAKLEY PAD); E2
WELL PAD 4 283 1698 4 0 1 0 -0- -0- -0- -0- <0.01 <0.01 <0.01 <0.01 <0.01 -0- <0.01
PS-097 14193 JOHN DAY RD (O-POOL PAD); E2
WELL PAD 2 134 1164 2 0 1 9 -0- -0- -0- -0- <0.01 <0.01 <0.01 <0.01 <0.01 -0- <0.01
PS-098 14193 JOHN DAY RD (P-BLAKLEY PAD); E2
WELL PAD 5 225 1870 3 0 0 0 -0- -0- -0- -0- <0.01 <0.01 <0.01 <0.01 <0.01 -0- <0.01
PS-099 14293 SNAFFLE BIT TRL (Q-BLAKLEY PAD); E2
WELL PAD 4 258 2020 4 0 1 0 -0- -0- -0- -0- <0.01 <0.01 <0.01 <0.01 <0.01 -0- <0.01
PS-100 14193 JOHN DAY RD (U-BLAKLEY PAD); E2
WELL PAD 7 480 4016 7 0 2 1 -0- -0- -0- -0- <0.01 <0.01 <0.01 <0.01 <0.01 -0- <0.01
PS-101 14193 JOHN DAY RD (V-BLAKLEY PAD); E2
WELL PAD 5 131 1870 3 0 0 0 -0- -0- -0- -0- <0.01 <0.01 <0.01 <0.01 <0.01 -0- <0.01
PS-102 9767 VERNA TRAIL N; C7
WELL PAD 4 288 1816 4 0 5 4 -0- -0- -0- -0- 0.53 <0.01 0.53 <0.01 0.07 -0- 0.02
PS-103 1299 W LOOP 820; C7 WELL PAD 1 65 455 2 0 2 1 -0- -0- -0- -0- <0.01 <0.01 <0.01 <0.01 <0.01 -0- <0.01
PS-104 9798 WESTPOINT DR; C7
WELL PAD 2 203 1550 2 1 0 8 0.07 1.04 2.91 <0.01 1.01 1.01 <0.01 <0.01 0.60 0.40 0.01
PS-105 9596 OLD WEATHERFORD; C7
WELL PAD 1 103 721 2 0 0 2 -0- -0- -0- -0- <0.01 <0.01 <0.01 <0.01 <0.01 -0- <0.01
PS-106 10590 OLD WEATHERFORD; B7
WELL PAD 2 142 994 4 0 2 2 -0- -0- -0- -0- <0.01 <0.01 <0.01 <0.01 <0.01 -0- <0.01
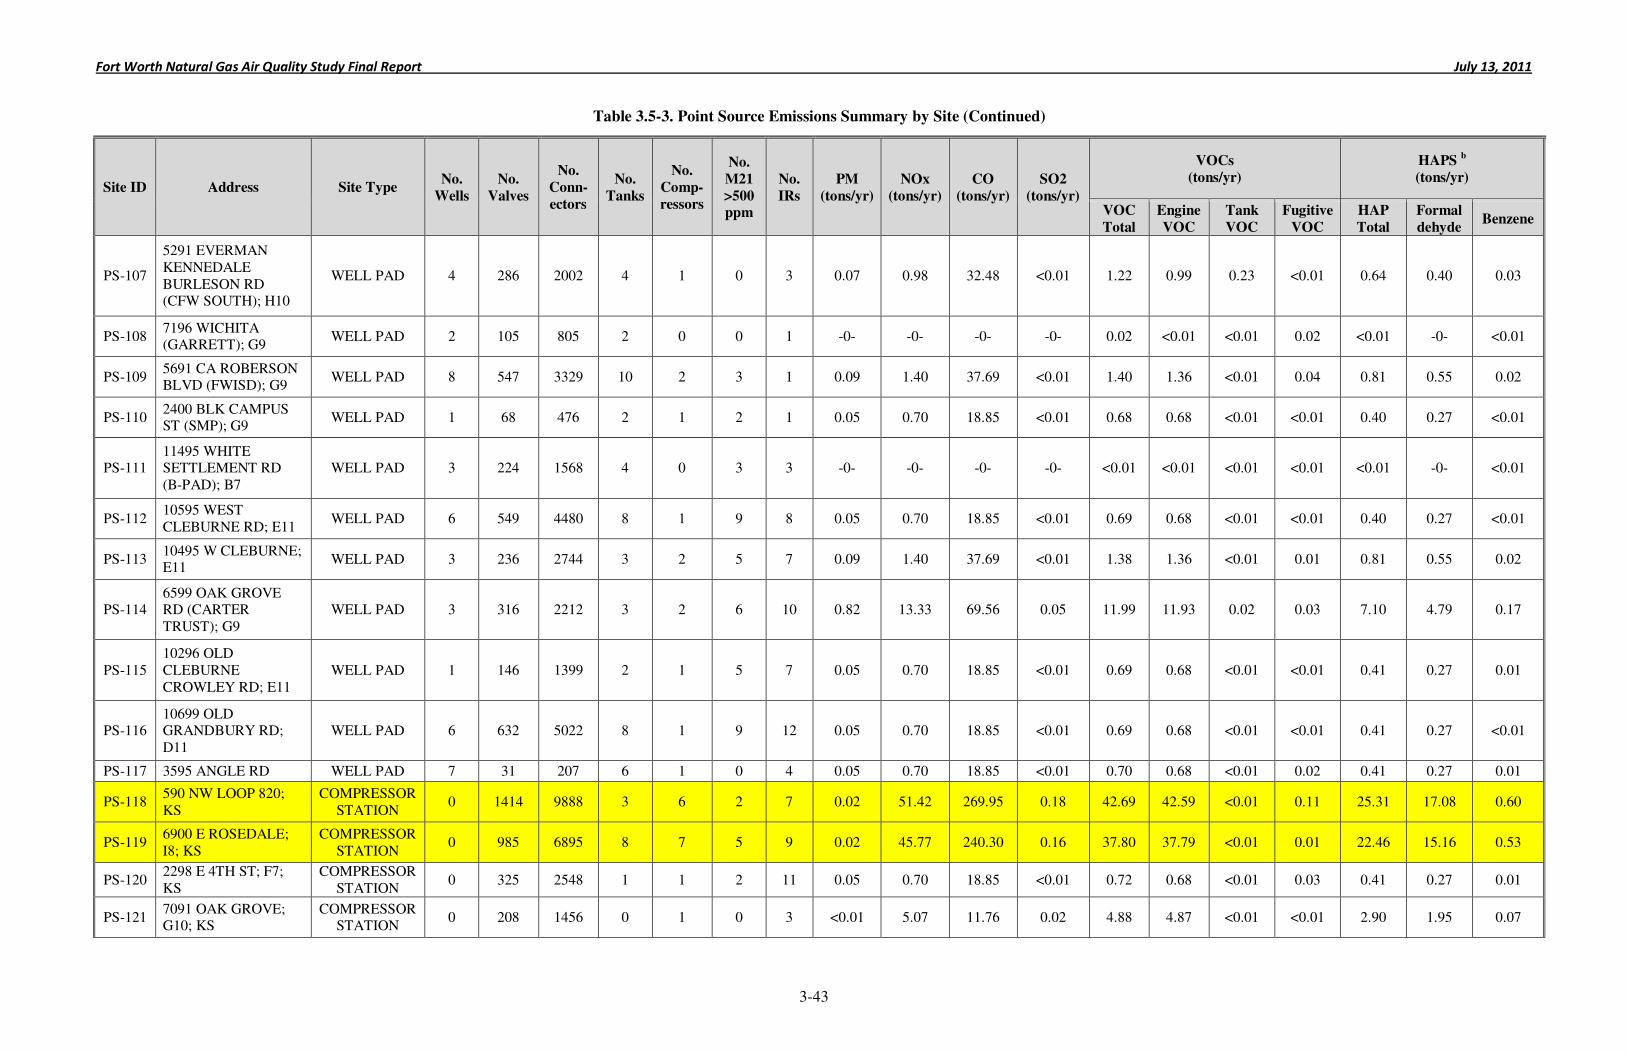
Fort Worth Natural Gas Air Quality Study Final Report July 13, 2011
3-43
Table 3.5-3. Point Source Emissions Summary by Site (Continued)
Site ID Address Site Type No.
Wells
No.
Valves
No.
Conn-
ectors
No.
Tanks
No.
Comp-
ressors
No.
M21
>500 ppm
No.
IRs
PM
(tons/yr)
NOx
(tons/yr)
CO
(tons/yr)
SO2
(tons/yr)
VOCs
(tons/yr)
HAPS b
(tons/yr)
VOC
Total
Engine
VOC
Tank
VOC
Fugitive
VOC
HAP
Total
Formal
dehyde Benzene
PS-107
5291 EVERMAN KENNEDALE BURLESON RD (CFW SOUTH); H10
WELL PAD 4 286 2002 4 1 0 3 0.07 0.98 32.48 <0.01 1.22 0.99 0.23 <0.01 0.64 0.40 0.03
PS-108 7196 WICHITA (GARRETT); G9
WELL PAD 2 105 805 2 0 0 1 -0- -0- -0- -0- 0.02 <0.01 <0.01 0.02 <0.01 -0- <0.01
PS-109 5691 CA ROBERSON BLVD (FWISD); G9
WELL PAD 8 547 3329 10 2 3 1 0.09 1.40 37.69 <0.01 1.40 1.36 <0.01 0.04 0.81 0.55 0.02
PS-110 2400 BLK CAMPUS ST (SMP); G9
WELL PAD 1 68 476 2 1 2 1 0.05 0.70 18.85 <0.01 0.68 0.68 <0.01 <0.01 0.40 0.27 <0.01
PS-111 11495 WHITE SETTLEMENT RD (B-PAD); B7
WELL PAD 3 224 1568 4 0 3 3 -0- -0- -0- -0- <0.01 <0.01 <0.01 <0.01 <0.01 -0- <0.01
PS-112 10595 WEST CLEBURNE RD; E11
WELL PAD 6 549 4480 8 1 9 8 0.05 0.70 18.85 <0.01 0.69 0.68 <0.01 <0.01 0.40 0.27 <0.01
PS-113 10495 W CLEBURNE; E11
WELL PAD 3 236 2744 3 2 5 7 0.09 1.40 37.69 <0.01 1.38 1.36 <0.01 0.01 0.81 0.55 0.02
PS-114 6599 OAK GROVE RD (CARTER TRUST); G9
WELL PAD 3 316 2212 3 2 6 10 0.82 13.33 69.56 0.05 11.99 11.93 0.02 0.03 7.10 4.79 0.17
PS-115 10296 OLD CLEBURNE CROWLEY RD; E11
WELL PAD 1 146 1399 2 1 5 7 0.05 0.70 18.85 <0.01 0.69 0.68 <0.01 <0.01 0.41 0.27 0.01
PS-116 10699 OLD GRANDBURY RD; D11
WELL PAD 6 632 5022 8 1 9 12 0.05 0.70 18.85 <0.01 0.69 0.68 <0.01 <0.01 0.41 0.27 <0.01
PS-117 3595 ANGLE RD WELL PAD 7 31 207 6 1 0 4 0.05 0.70 18.85 <0.01 0.70 0.68 <0.01 0.02 0.41 0.27 0.01
PS-118 590 NW LOOP 820; KS
COMPRESSOR STATION
0 1414 9888 3 6 2 7 0.02 51.42 269.95 0.18 42.69 42.59 <0.01 0.11 25.31 17.08 0.60
PS-119 6900 E ROSEDALE; I8; KS
COMPRESSOR STATION
0 985 6895 8 7 5 9 0.02 45.77 240.30 0.16 37.80 37.79 <0.01 0.01 22.46 15.16 0.53
PS-120 2298 E 4TH ST; F7; KS
COMPRESSOR STATION
0 325 2548 1 1 2 11 0.05 0.70 18.85 <0.01 0.72 0.68 <0.01 0.03 0.41 0.27 0.01
PS-121 7091 OAK GROVE; G10; KS
COMPRESSOR STATION
0 208 1456 0 1 0 3 <0.01 5.07 11.76 0.02 4.88 4.87 <0.01 <0.01 2.90 1.95 0.07
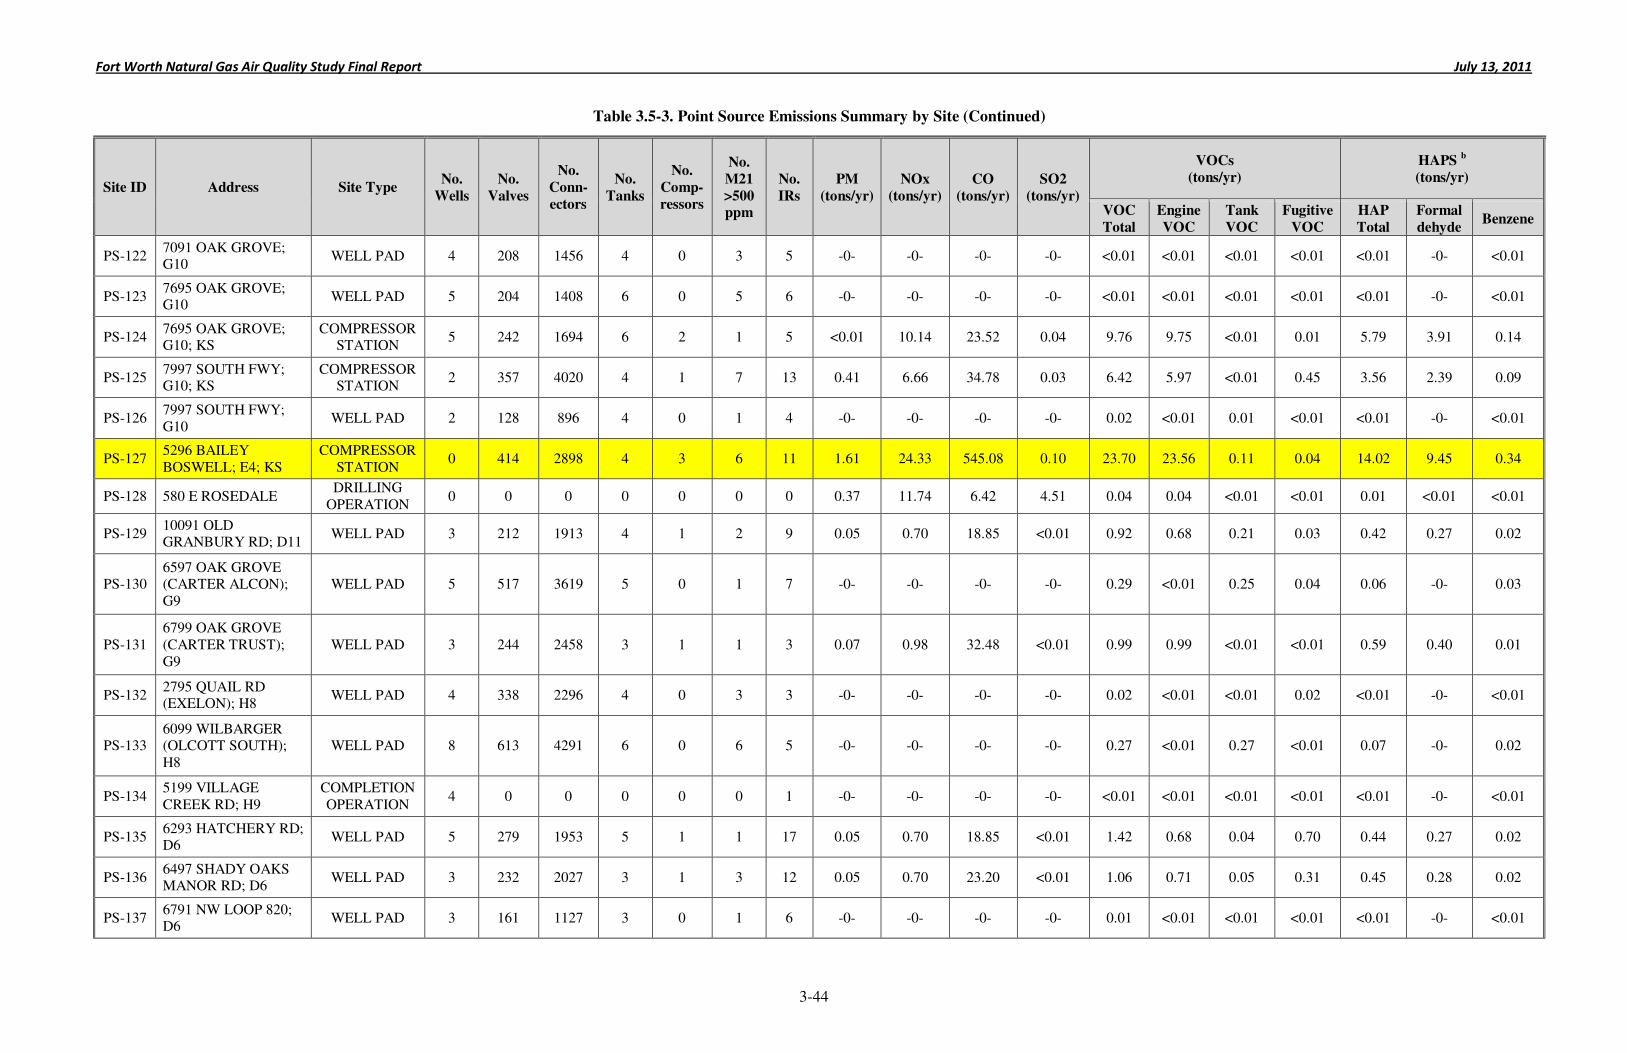
Fort Worth Natural Gas Air Quality Study Final Report July 13, 2011
3-44
Table 3.5-3. Point Source Emissions Summary by Site (Continued)
Site ID Address Site Type No.
Wells
No.
Valves
No.
Conn-
ectors
No.
Tanks
No.
Comp-
ressors
No.
M21
>500 ppm
No.
IRs
PM
(tons/yr)
NOx
(tons/yr)
CO
(tons/yr)
SO2
(tons/yr)
VOCs
(tons/yr)
HAPS b
(tons/yr)
VOC
Total
Engine
VOC
Tank
VOC
Fugitive
VOC
HAP
Total
Formal
dehyde Benzene
PS-122 7091 OAK GROVE; G10
WELL PAD 4 208 1456 4 0 3 5 -0- -0- -0- -0- <0.01 <0.01 <0.01 <0.01 <0.01 -0- <0.01
PS-123 7695 OAK GROVE; G10
WELL PAD 5 204 1408 6 0 5 6 -0- -0- -0- -0- <0.01 <0.01 <0.01 <0.01 <0.01 -0- <0.01
PS-124 7695 OAK GROVE; G10; KS
COMPRESSOR STATION
5 242 1694 6 2 1 5 <0.01 10.14 23.52 0.04 9.76 9.75 <0.01 0.01 5.79 3.91 0.14
PS-125 7997 SOUTH FWY; G10; KS
COMPRESSOR STATION
2 357 4020 4 1 7 13 0.41 6.66 34.78 0.03 6.42 5.97 <0.01 0.45 3.56 2.39 0.09
PS-126 7997 SOUTH FWY; G10
WELL PAD 2 128 896 4 0 1 4 -0- -0- -0- -0- 0.02 <0.01 0.01 <0.01 <0.01 -0- <0.01
PS-127 5296 BAILEY BOSWELL; E4; KS
COMPRESSOR STATION
0 414 2898 4 3 6 11 1.61 24.33 545.08 0.10 23.70 23.56 0.11 0.04 14.02 9.45 0.34
PS-128 580 E ROSEDALE DRILLING
OPERATION 0 0 0 0 0 0 0 0.37 11.74 6.42 4.51 0.04 0.04 <0.01 <0.01 0.01 <0.01 <0.01
PS-129 10091 OLD GRANBURY RD; D11
WELL PAD 3 212 1913 4 1 2 9 0.05 0.70 18.85 <0.01 0.92 0.68 0.21 0.03 0.42 0.27 0.02
PS-130 6597 OAK GROVE (CARTER ALCON); G9
WELL PAD 5 517 3619 5 0 1 7 -0- -0- -0- -0- 0.29 <0.01 0.25 0.04 0.06 -0- 0.03
PS-131 6799 OAK GROVE (CARTER TRUST); G9
WELL PAD 3 244 2458 3 1 1 3 0.07 0.98 32.48 <0.01 0.99 0.99 <0.01 <0.01 0.59 0.40 0.01
PS-132 2795 QUAIL RD (EXELON); H8
WELL PAD 4 338 2296 4 0 3 3 -0- -0- -0- -0- 0.02 <0.01 <0.01 0.02 <0.01 -0- <0.01
PS-133 6099 WILBARGER (OLCOTT SOUTH); H8
WELL PAD 8 613 4291 6 0 6 5 -0- -0- -0- -0- 0.27 <0.01 0.27 <0.01 0.07 -0- 0.02
PS-134 5199 VILLAGE CREEK RD; H9
COMPLETION OPERATION
4 0 0 0 0 0 1 -0- -0- -0- -0- <0.01 <0.01 <0.01 <0.01 <0.01 -0- <0.01
PS-135 6293 HATCHERY RD; D6
WELL PAD 5 279 1953 5 1 1 17 0.05 0.70 18.85 <0.01 1.42 0.68 0.04 0.70 0.44 0.27 0.02
PS-136 6497 SHADY OAKS MANOR RD; D6
WELL PAD 3 232 2027 3 1 3 12 0.05 0.70 23.20 <0.01 1.06 0.71 0.05 0.31 0.45 0.28 0.02
PS-137 6791 NW LOOP 820; D6
WELL PAD 3 161 1127 3 0 1 6 -0- -0- -0- -0- 0.01 <0.01 <0.01 <0.01 <0.01 -0- <0.01
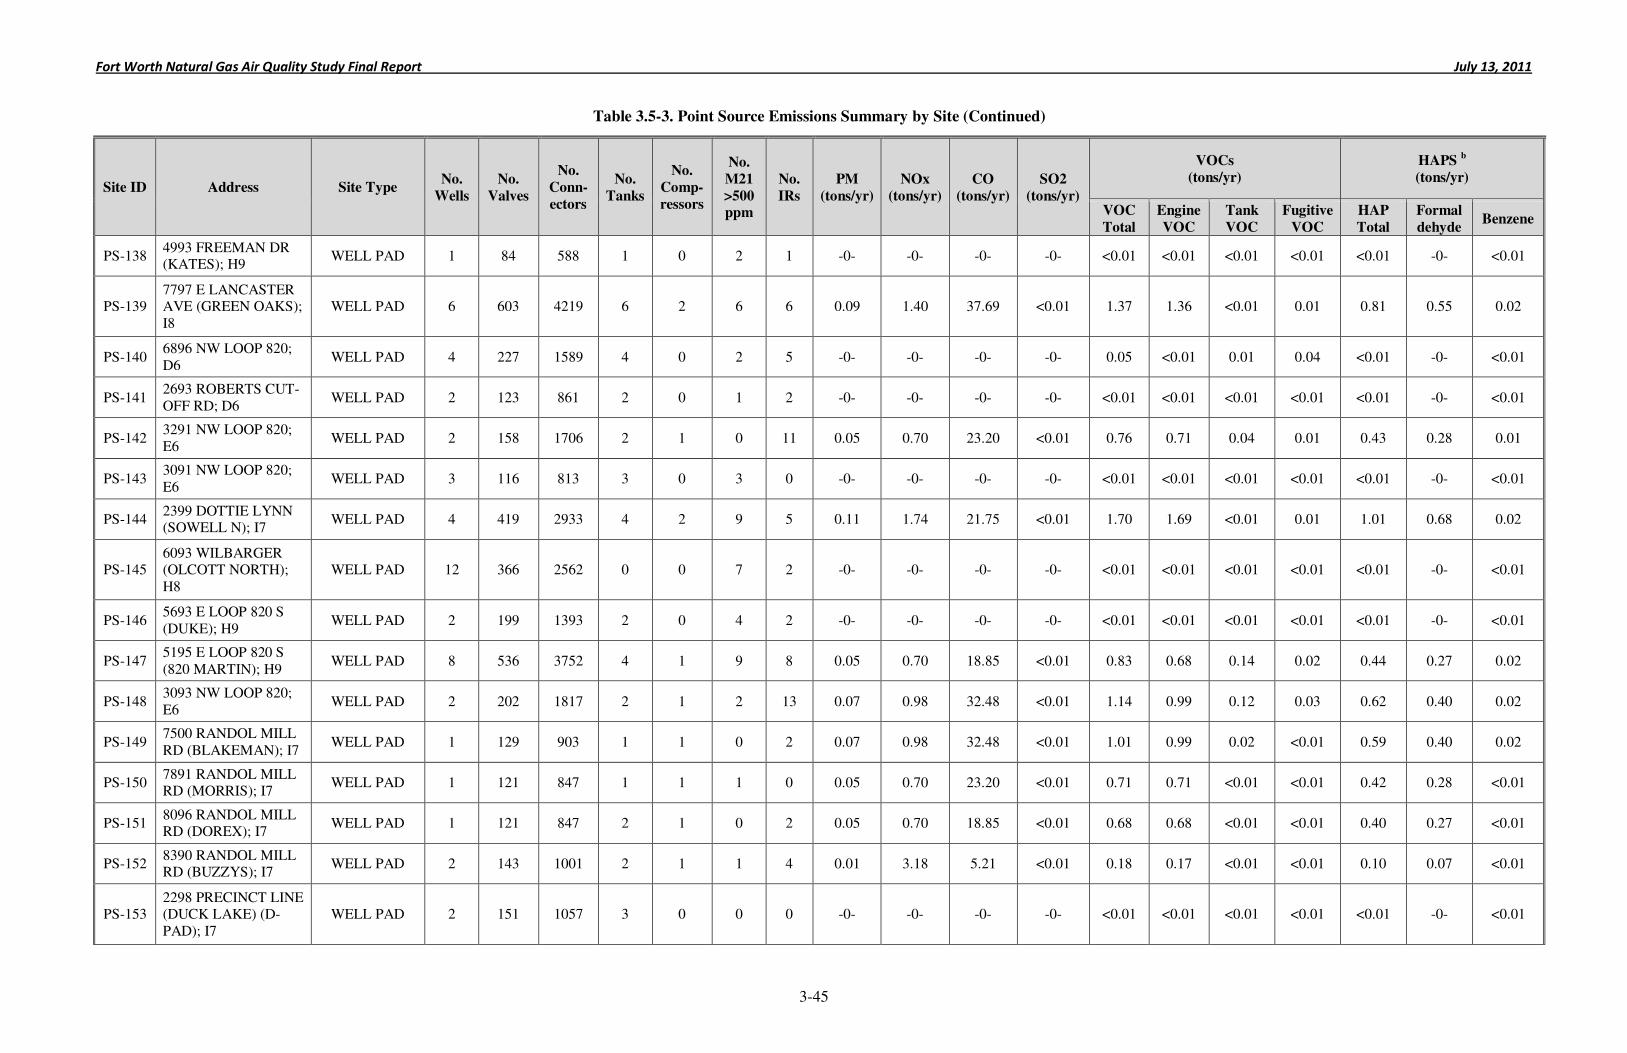
Fort Worth Natural Gas Air Quality Study Final Report July 13, 2011
3-45
Table 3.5-3. Point Source Emissions Summary by Site (Continued)
Site ID Address Site Type No.
Wells
No.
Valves
No.
Conn-
ectors
No.
Tanks
No.
Comp-
ressors
No.
M21
>500 ppm
No.
IRs
PM
(tons/yr)
NOx
(tons/yr)
CO
(tons/yr)
SO2
(tons/yr)
VOCs
(tons/yr)
HAPS b
(tons/yr)
VOC
Total
Engine
VOC
Tank
VOC
Fugitive
VOC
HAP
Total
Formal
dehyde Benzene
PS-138 4993 FREEMAN DR (KATES); H9
WELL PAD 1 84 588 1 0 2 1 -0- -0- -0- -0- <0.01 <0.01 <0.01 <0.01 <0.01 -0- <0.01
PS-139 7797 E LANCASTER AVE (GREEN OAKS); I8
WELL PAD 6 603 4219 6 2 6 6 0.09 1.40 37.69 <0.01 1.37 1.36 <0.01 0.01 0.81 0.55 0.02
PS-140 6896 NW LOOP 820; D6
WELL PAD 4 227 1589 4 0 2 5 -0- -0- -0- -0- 0.05 <0.01 0.01 0.04 <0.01 -0- <0.01
PS-141 2693 ROBERTS CUT-OFF RD; D6
WELL PAD 2 123 861 2 0 1 2 -0- -0- -0- -0- <0.01 <0.01 <0.01 <0.01 <0.01 -0- <0.01
PS-142 3291 NW LOOP 820; E6
WELL PAD 2 158 1706 2 1 0 11 0.05 0.70 23.20 <0.01 0.76 0.71 0.04 0.01 0.43 0.28 0.01
PS-143 3091 NW LOOP 820; E6
WELL PAD 3 116 813 3 0 3 0 -0- -0- -0- -0- <0.01 <0.01 <0.01 <0.01 <0.01 -0- <0.01
PS-144 2399 DOTTIE LYNN (SOWELL N); I7
WELL PAD 4 419 2933 4 2 9 5 0.11 1.74 21.75 <0.01 1.70 1.69 <0.01 0.01 1.01 0.68 0.02
PS-145 6093 WILBARGER (OLCOTT NORTH); H8
WELL PAD 12 366 2562 0 0 7 2 -0- -0- -0- -0- <0.01 <0.01 <0.01 <0.01 <0.01 -0- <0.01
PS-146 5693 E LOOP 820 S (DUKE); H9
WELL PAD 2 199 1393 2 0 4 2 -0- -0- -0- -0- <0.01 <0.01 <0.01 <0.01 <0.01 -0- <0.01
PS-147 5195 E LOOP 820 S (820 MARTIN); H9
WELL PAD 8 536 3752 4 1 9 8 0.05 0.70 18.85 <0.01 0.83 0.68 0.14 0.02 0.44 0.27 0.02
PS-148 3093 NW LOOP 820; E6
WELL PAD 2 202 1817 2 1 2 13 0.07 0.98 32.48 <0.01 1.14 0.99 0.12 0.03 0.62 0.40 0.02
PS-149 7500 RANDOL MILL RD (BLAKEMAN); I7
WELL PAD 1 129 903 1 1 0 2 0.07 0.98 32.48 <0.01 1.01 0.99 0.02 <0.01 0.59 0.40 0.02
PS-150 7891 RANDOL MILL RD (MORRIS); I7
WELL PAD 1 121 847 1 1 1 0 0.05 0.70 23.20 <0.01 0.71 0.71 <0.01 <0.01 0.42 0.28 <0.01
PS-151 8096 RANDOL MILL RD (DOREX); I7
WELL PAD 1 121 847 2 1 0 2 0.05 0.70 18.85 <0.01 0.68 0.68 <0.01 <0.01 0.40 0.27 <0.01
PS-152 8390 RANDOL MILL RD (BUZZYS); I7
WELL PAD 2 143 1001 2 1 1 4 0.01 3.18 5.21 <0.01 0.18 0.17 <0.01 <0.01 0.10 0.07 <0.01
PS-153 2298 PRECINCT LINE (DUCK LAKE) (D-PAD); I7
WELL PAD 2 151 1057 3 0 0 0 -0- -0- -0- -0- <0.01 <0.01 <0.01 <0.01 <0.01 -0- <0.01
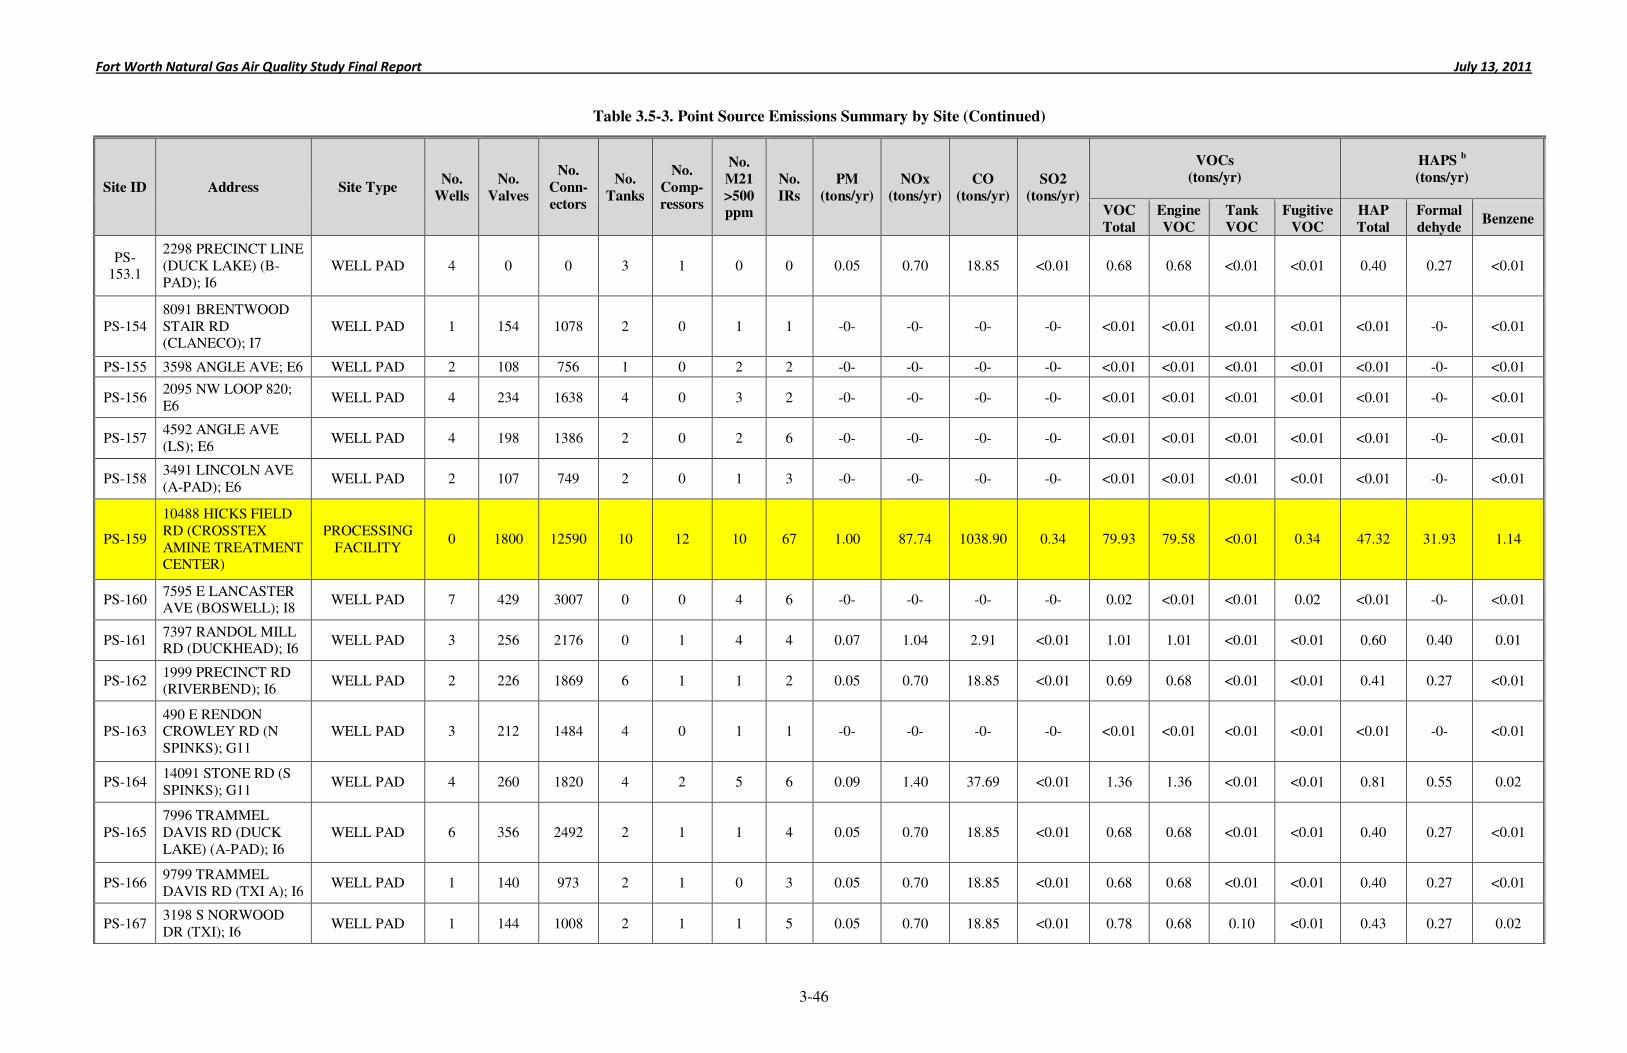
Fort Worth Natural Gas Air Quality Study Final Report July 13, 2011
3-46
Table 3.5-3. Point Source Emissions Summary by Site (Continued)
Site ID Address Site Type No.
Wells
No.
Valves
No.
Conn-
ectors
No.
Tanks
No.
Comp-
ressors
No.
M21
>500 ppm
No.
IRs
PM
(tons/yr)
NOx
(tons/yr)
CO
(tons/yr)
SO2
(tons/yr)
VOCs
(tons/yr)
HAPS b
(tons/yr)
VOC
Total
Engine
VOC
Tank
VOC
Fugitive
VOC
HAP
Total
Formal
dehyde Benzene
PS-153.1
2298 PRECINCT LINE (DUCK LAKE) (B-PAD); I6
WELL PAD 4 0 0 3 1 0 0 0.05 0.70 18.85 <0.01 0.68 0.68 <0.01 <0.01 0.40 0.27 <0.01
PS-154 8091 BRENTWOOD STAIR RD (CLANECO); I7
WELL PAD 1 154 1078 2 0 1 1 -0- -0- -0- -0- <0.01 <0.01 <0.01 <0.01 <0.01 -0- <0.01
PS-155 3598 ANGLE AVE; E6 WELL PAD 2 108 756 1 0 2 2 -0- -0- -0- -0- <0.01 <0.01 <0.01 <0.01 <0.01 -0- <0.01
PS-156 2095 NW LOOP 820; E6
WELL PAD 4 234 1638 4 0 3 2 -0- -0- -0- -0- <0.01 <0.01 <0.01 <0.01 <0.01 -0- <0.01
PS-157 4592 ANGLE AVE (LS); E6
WELL PAD 4 198 1386 2 0 2 6 -0- -0- -0- -0- <0.01 <0.01 <0.01 <0.01 <0.01 -0- <0.01
PS-158 3491 LINCOLN AVE (A-PAD); E6
WELL PAD 2 107 749 2 0 1 3 -0- -0- -0- -0- <0.01 <0.01 <0.01 <0.01 <0.01 -0- <0.01
PS-159
10488 HICKS FIELD RD (CROSSTEX AMINE TREATMENT CENTER)
PROCESSING FACILITY
0 1800 12590 10 12 10 67 1.00 87.74 1038.90 0.34 79.93 79.58 <0.01 0.34 47.32 31.93 1.14
PS-160 7595 E LANCASTER AVE (BOSWELL); I8
WELL PAD 7 429 3007 0 0 4 6 -0- -0- -0- -0- 0.02 <0.01 <0.01 0.02 <0.01 -0- <0.01
PS-161 7397 RANDOL MILL RD (DUCKHEAD); I6
WELL PAD 3 256 2176 0 1 4 4 0.07 1.04 2.91 <0.01 1.01 1.01 <0.01 <0.01 0.60 0.40 0.01
PS-162 1999 PRECINCT RD (RIVERBEND); I6
WELL PAD 2 226 1869 6 1 1 2 0.05 0.70 18.85 <0.01 0.69 0.68 <0.01 <0.01 0.41 0.27 <0.01
PS-163 490 E RENDON CROWLEY RD (N SPINKS); G11
WELL PAD 3 212 1484 4 0 1 1 -0- -0- -0- -0- <0.01 <0.01 <0.01 <0.01 <0.01 -0- <0.01
PS-164 14091 STONE RD (S SPINKS); G11
WELL PAD 4 260 1820 4 2 5 6 0.09 1.40 37.69 <0.01 1.36 1.36 <0.01 <0.01 0.81 0.55 0.02
PS-165 7996 TRAMMEL DAVIS RD (DUCK LAKE) (A-PAD); I6
WELL PAD 6 356 2492 2 1 1 4 0.05 0.70 18.85 <0.01 0.68 0.68 <0.01 <0.01 0.40 0.27 <0.01
PS-166 9799 TRAMMEL DAVIS RD (TXI A); I6
WELL PAD 1 140 973 2 1 0 3 0.05 0.70 18.85 <0.01 0.68 0.68 <0.01 <0.01 0.40 0.27 <0.01
PS-167 3198 S NORWOOD DR (TXI); I6
WELL PAD 1 144 1008 2 1 1 5 0.05 0.70 18.85 <0.01 0.78 0.68 0.10 <0.01 0.43 0.27 0.02
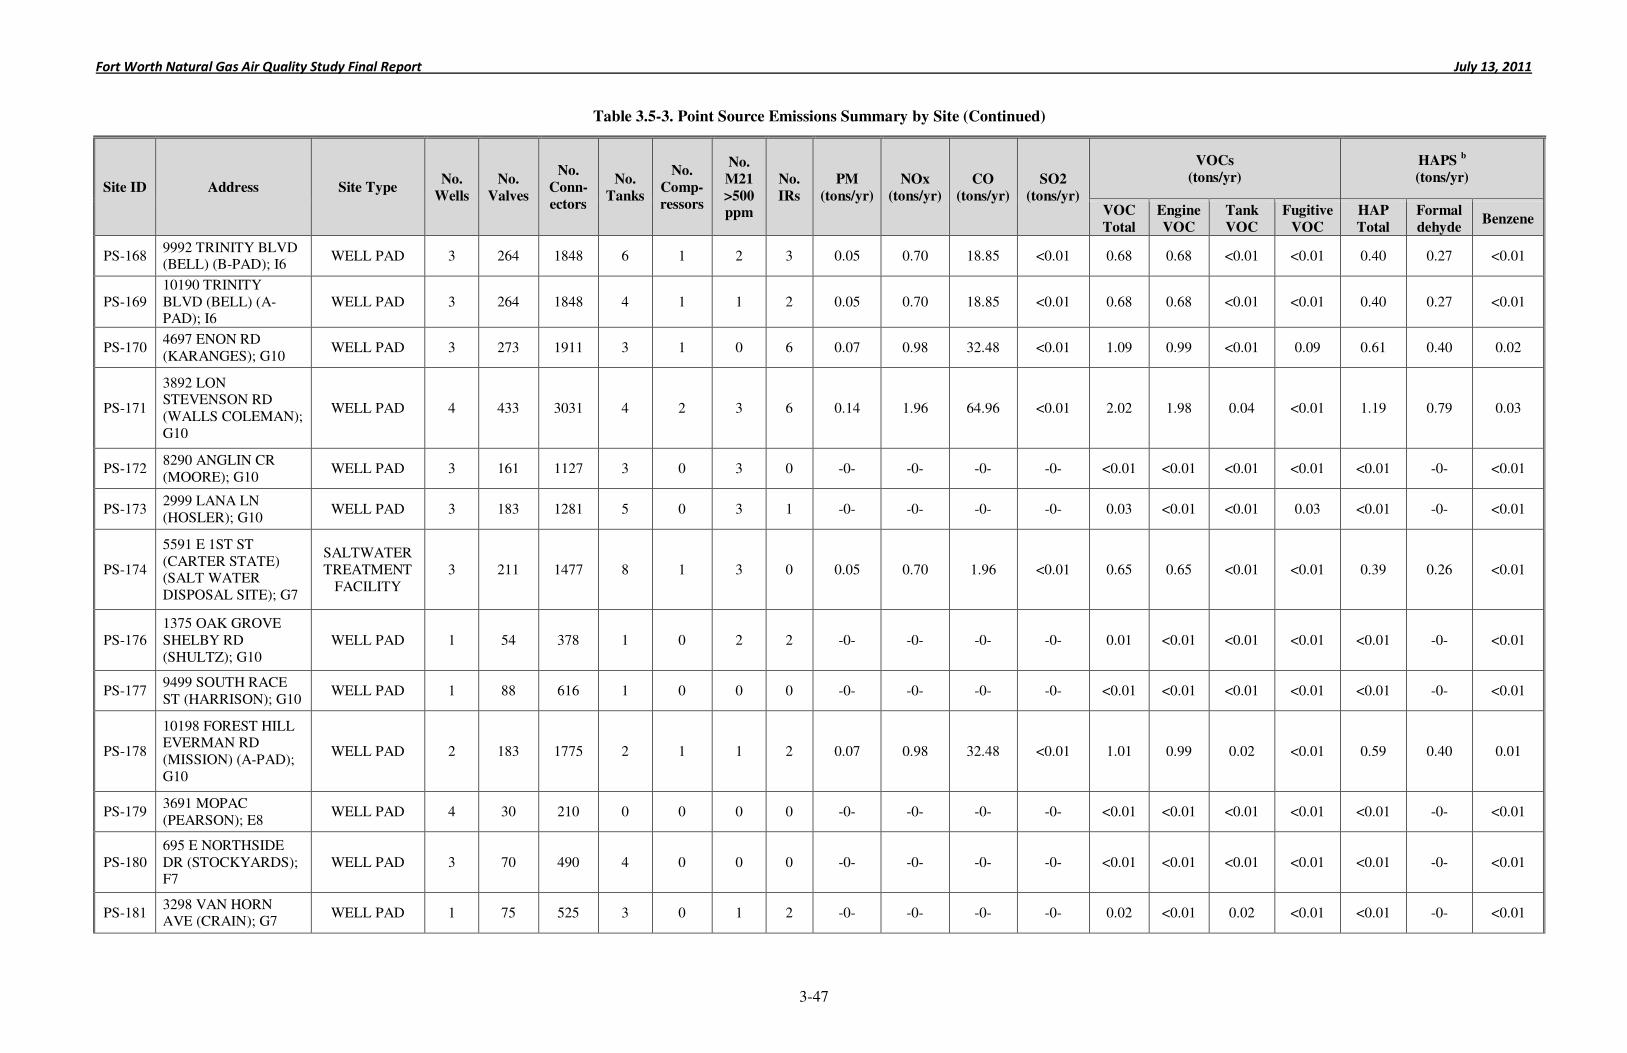
Fort Worth Natural Gas Air Quality Study Final Report July 13, 2011
3-47
Table 3.5-3. Point Source Emissions Summary by Site (Continued)
Site ID Address Site Type No.
Wells
No.
Valves
No.
Conn-
ectors
No.
Tanks
No.
Comp-
ressors
No.
M21
>500 ppm
No.
IRs
PM
(tons/yr)
NOx
(tons/yr)
CO
(tons/yr)
SO2
(tons/yr)
VOCs
(tons/yr)
HAPS b
(tons/yr)
VOC
Total
Engine
VOC
Tank
VOC
Fugitive
VOC
HAP
Total
Formal
dehyde Benzene
PS-168 9992 TRINITY BLVD (BELL) (B-PAD); I6
WELL PAD 3 264 1848 6 1 2 3 0.05 0.70 18.85 <0.01 0.68 0.68 <0.01 <0.01 0.40 0.27 <0.01
PS-169 10190 TRINITY BLVD (BELL) (A-PAD); I6
WELL PAD 3 264 1848 4 1 1 2 0.05 0.70 18.85 <0.01 0.68 0.68 <0.01 <0.01 0.40 0.27 <0.01
PS-170 4697 ENON RD (KARANGES); G10
WELL PAD 3 273 1911 3 1 0 6 0.07 0.98 32.48 <0.01 1.09 0.99 <0.01 0.09 0.61 0.40 0.02
PS-171
3892 LON STEVENSON RD (WALLS COLEMAN); G10
WELL PAD 4 433 3031 4 2 3 6 0.14 1.96 64.96 <0.01 2.02 1.98 0.04 <0.01 1.19 0.79 0.03
PS-172 8290 ANGLIN CR (MOORE); G10
WELL PAD 3 161 1127 3 0 3 0 -0- -0- -0- -0- <0.01 <0.01 <0.01 <0.01 <0.01 -0- <0.01
PS-173 2999 LANA LN (HOSLER); G10
WELL PAD 3 183 1281 5 0 3 1 -0- -0- -0- -0- 0.03 <0.01 <0.01 0.03 <0.01 -0- <0.01
PS-174
5591 E 1ST ST (CARTER STATE) (SALT WATER DISPOSAL SITE); G7
SALTWATER TREATMENT
FACILITY 3 211 1477 8 1 3 0 0.05 0.70 1.96 <0.01 0.65 0.65 <0.01 <0.01 0.39 0.26 <0.01
PS-176 1375 OAK GROVE SHELBY RD (SHULTZ); G10
WELL PAD 1 54 378 1 0 2 2 -0- -0- -0- -0- 0.01 <0.01 <0.01 <0.01 <0.01 -0- <0.01
PS-177 9499 SOUTH RACE ST (HARRISON); G10
WELL PAD 1 88 616 1 0 0 0 -0- -0- -0- -0- <0.01 <0.01 <0.01 <0.01 <0.01 -0- <0.01
PS-178
10198 FOREST HILL EVERMAN RD (MISSION) (A-PAD); G10
WELL PAD 2 183 1775 2 1 1 2 0.07 0.98 32.48 <0.01 1.01 0.99 0.02 <0.01 0.59 0.40 0.01
PS-179 3691 MOPAC (PEARSON); E8
WELL PAD 4 30 210 0 0 0 0 -0- -0- -0- -0- <0.01 <0.01 <0.01 <0.01 <0.01 -0- <0.01
PS-180 695 E NORTHSIDE DR (STOCKYARDS); F7
WELL PAD 3 70 490 4 0 0 0 -0- -0- -0- -0- <0.01 <0.01 <0.01 <0.01 <0.01 -0- <0.01
PS-181 3298 VAN HORN AVE (CRAIN); G7
WELL PAD 1 75 525 3 0 1 2 -0- -0- -0- -0- 0.02 <0.01 0.02 <0.01 <0.01 -0- <0.01
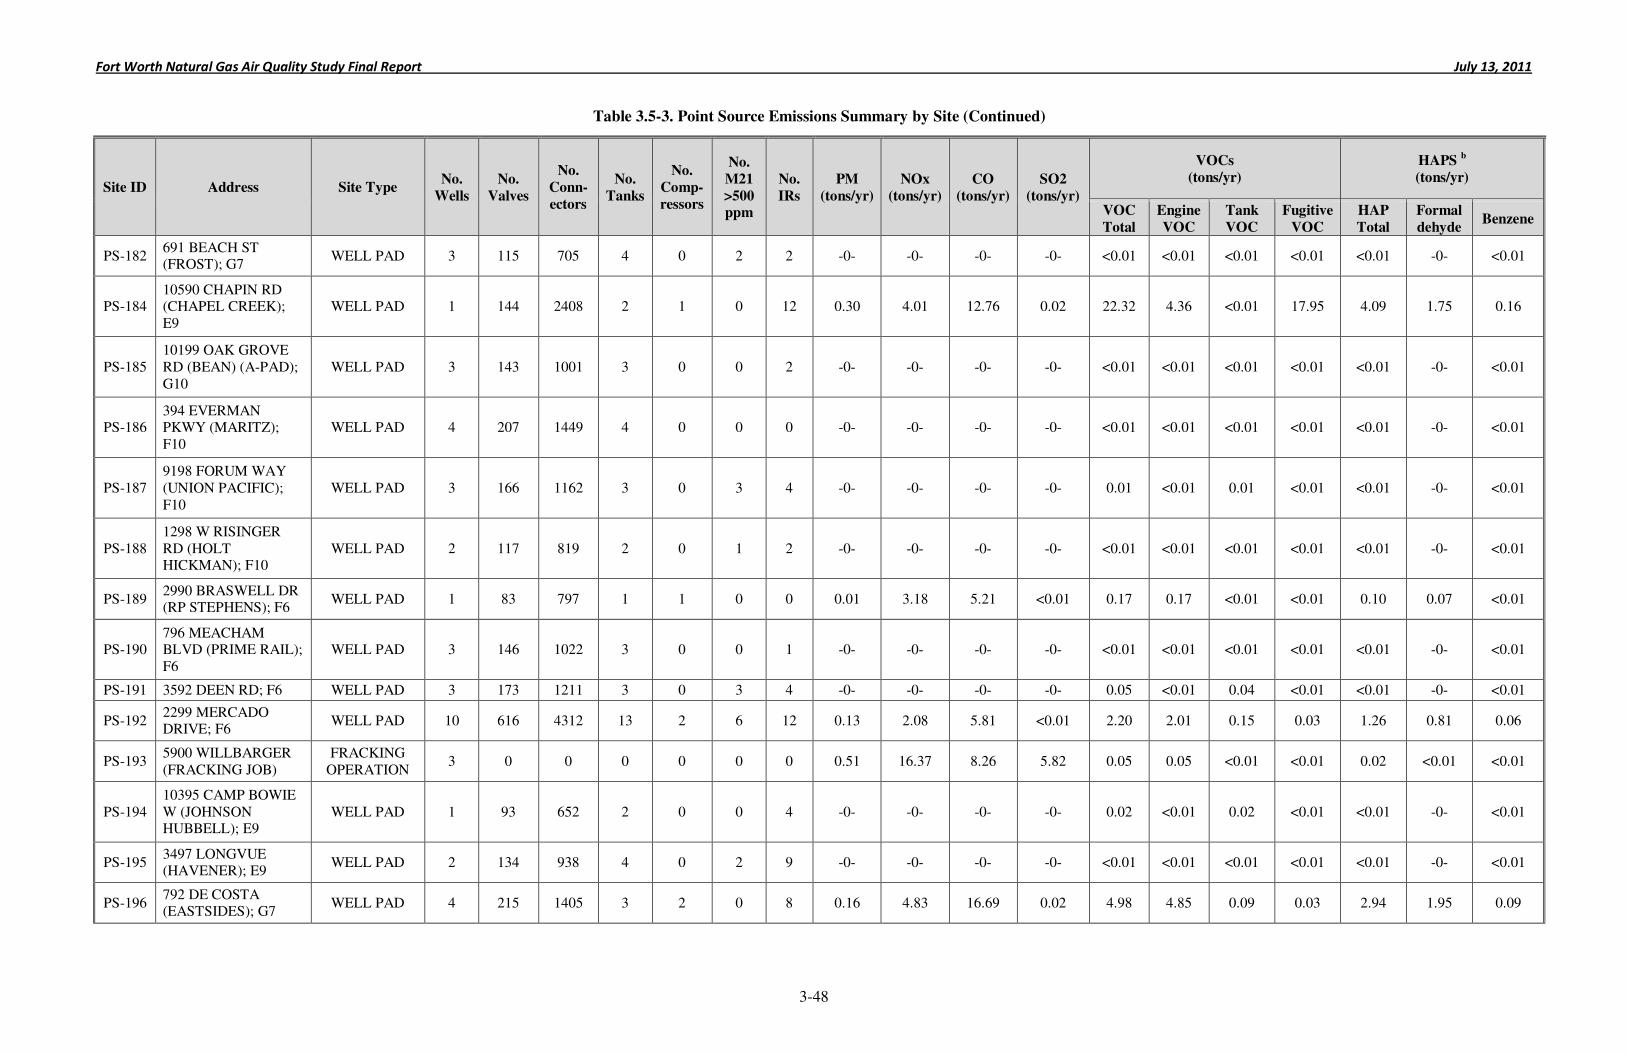
Fort Worth Natural Gas Air Quality Study Final Report July 13, 2011
3-48
Table 3.5-3. Point Source Emissions Summary by Site (Continued)
Site ID Address Site Type No.
Wells
No.
Valves
No.
Conn-
ectors
No.
Tanks
No.
Comp-
ressors
No.
M21
>500 ppm
No.
IRs
PM
(tons/yr)
NOx
(tons/yr)
CO
(tons/yr)
SO2
(tons/yr)
VOCs
(tons/yr)
HAPS b
(tons/yr)
VOC
Total
Engine
VOC
Tank
VOC
Fugitive
VOC
HAP
Total
Formal
dehyde Benzene
PS-182 691 BEACH ST (FROST); G7
WELL PAD 3 115 705 4 0 2 2 -0- -0- -0- -0- <0.01 <0.01 <0.01 <0.01 <0.01 -0- <0.01
PS-184 10590 CHAPIN RD (CHAPEL CREEK); E9
WELL PAD 1 144 2408 2 1 0 12 0.30 4.01 12.76 0.02 22.32 4.36 <0.01 17.95 4.09 1.75 0.16
PS-185 10199 OAK GROVE RD (BEAN) (A-PAD); G10
WELL PAD 3 143 1001 3 0 0 2 -0- -0- -0- -0- <0.01 <0.01 <0.01 <0.01 <0.01 -0- <0.01
PS-186 394 EVERMAN PKWY (MARITZ); F10
WELL PAD 4 207 1449 4 0 0 0 -0- -0- -0- -0- <0.01 <0.01 <0.01 <0.01 <0.01 -0- <0.01
PS-187 9198 FORUM WAY (UNION PACIFIC); F10
WELL PAD 3 166 1162 3 0 3 4 -0- -0- -0- -0- 0.01 <0.01 0.01 <0.01 <0.01 -0- <0.01
PS-188 1298 W RISINGER RD (HOLT HICKMAN); F10
WELL PAD 2 117 819 2 0 1 2 -0- -0- -0- -0- <0.01 <0.01 <0.01 <0.01 <0.01 -0- <0.01
PS-189 2990 BRASWELL DR (RP STEPHENS); F6
WELL PAD 1 83 797 1 1 0 0 0.01 3.18 5.21 <0.01 0.17 0.17 <0.01 <0.01 0.10 0.07 <0.01
PS-190 796 MEACHAM BLVD (PRIME RAIL); F6
WELL PAD 3 146 1022 3 0 0 1 -0- -0- -0- -0- <0.01 <0.01 <0.01 <0.01 <0.01 -0- <0.01
PS-191 3592 DEEN RD; F6 WELL PAD 3 173 1211 3 0 3 4 -0- -0- -0- -0- 0.05 <0.01 0.04 <0.01 <0.01 -0- <0.01
PS-192 2299 MERCADO DRIVE; F6
WELL PAD 10 616 4312 13 2 6 12 0.13 2.08 5.81 <0.01 2.20 2.01 0.15 0.03 1.26 0.81 0.06
PS-193 5900 WILLBARGER (FRACKING JOB)
FRACKING OPERATION
3 0 0 0 0 0 0 0.51 16.37 8.26 5.82 0.05 0.05 <0.01 <0.01 0.02 <0.01 <0.01
PS-194 10395 CAMP BOWIE W (JOHNSON HUBBELL); E9
WELL PAD 1 93 652 2 0 0 4 -0- -0- -0- -0- 0.02 <0.01 0.02 <0.01 <0.01 -0- <0.01
PS-195 3497 LONGVUE (HAVENER); E9
WELL PAD 2 134 938 4 0 2 9 -0- -0- -0- -0- <0.01 <0.01 <0.01 <0.01 <0.01 -0- <0.01
PS-196 792 DE COSTA (EASTSIDES); G7
WELL PAD 4 215 1405 3 2 0 8 0.16 4.83 16.69 0.02 4.98 4.85 0.09 0.03 2.94 1.95 0.09
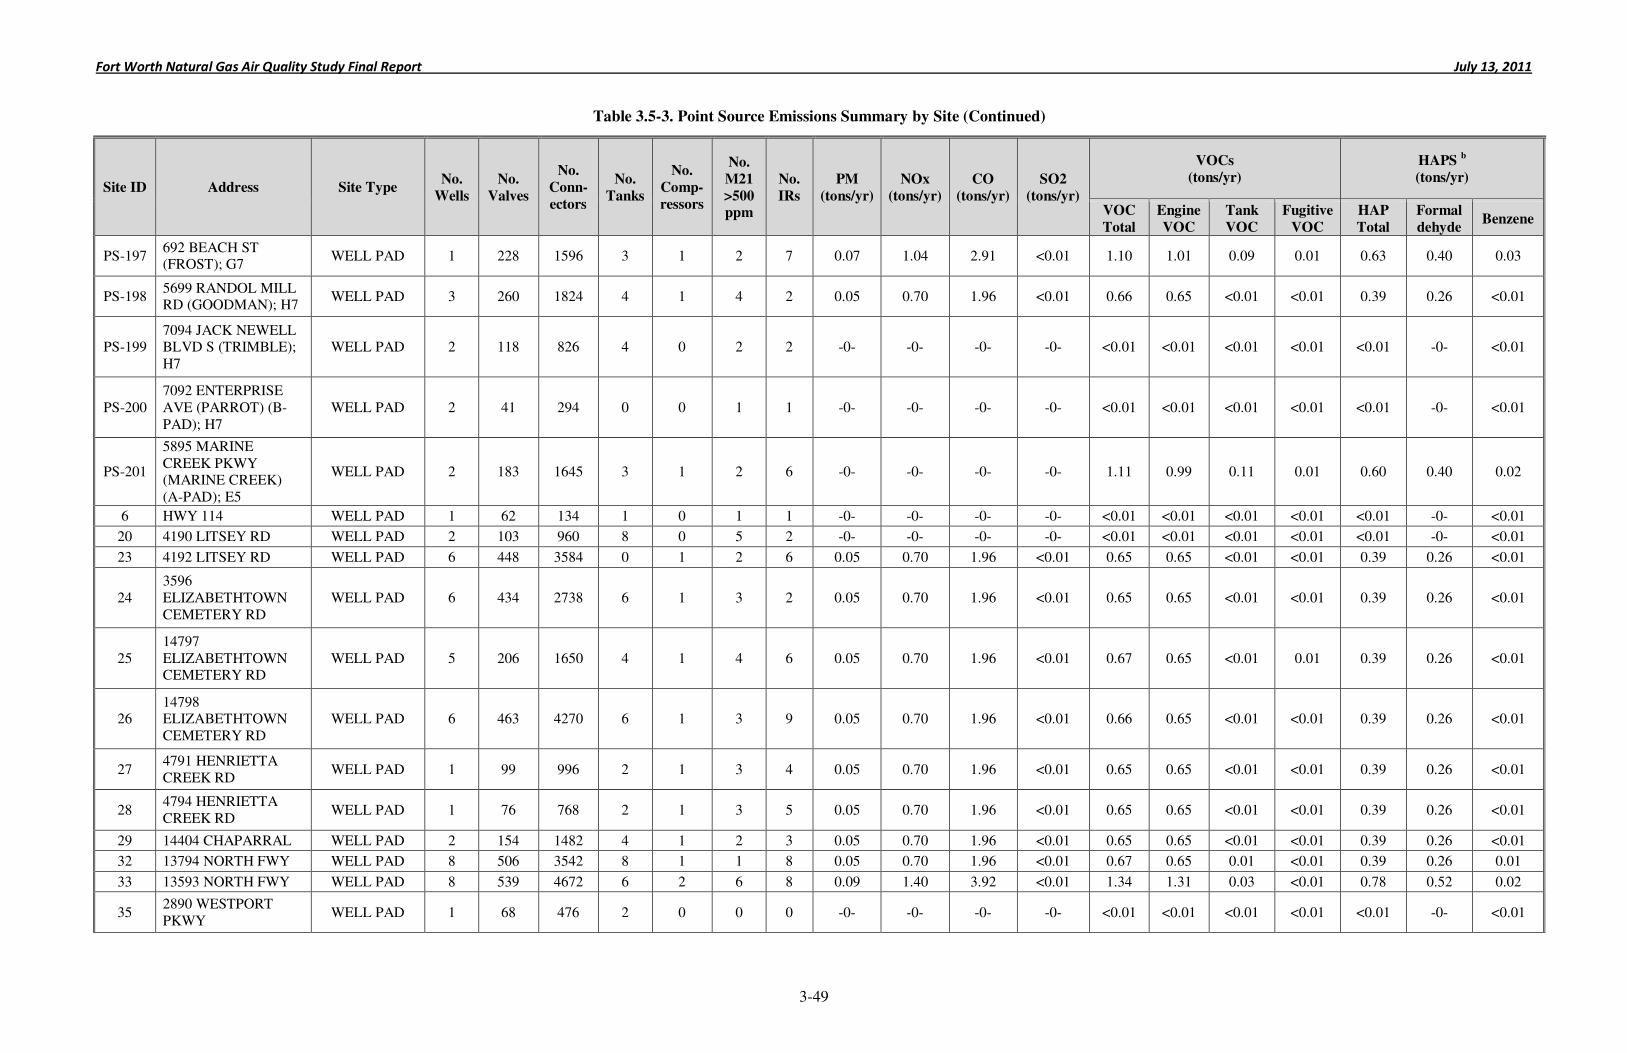
Fort Worth Natural Gas Air Quality Study Final Report July 13, 2011
3-49
Table 3.5-3. Point Source Emissions Summary by Site (Continued)
Site ID Address Site Type No.
Wells
No.
Valves
No.
Conn-
ectors
No.
Tanks
No.
Comp-
ressors
No.
M21
>500 ppm
No.
IRs
PM
(tons/yr)
NOx
(tons/yr)
CO
(tons/yr)
SO2
(tons/yr)
VOCs
(tons/yr)
HAPS b
(tons/yr)
VOC
Total
Engine
VOC
Tank
VOC
Fugitive
VOC
HAP
Total
Formal
dehyde Benzene
PS-197 692 BEACH ST (FROST); G7
WELL PAD 1 228 1596 3 1 2 7 0.07 1.04 2.91 <0.01 1.10 1.01 0.09 0.01 0.63 0.40 0.03
PS-198 5699 RANDOL MILL RD (GOODMAN); H7
WELL PAD 3 260 1824 4 1 4 2 0.05 0.70 1.96 <0.01 0.66 0.65 <0.01 <0.01 0.39 0.26 <0.01
PS-199 7094 JACK NEWELL BLVD S (TRIMBLE); H7
WELL PAD 2 118 826 4 0 2 2 -0- -0- -0- -0- <0.01 <0.01 <0.01 <0.01 <0.01 -0- <0.01
PS-200 7092 ENTERPRISE AVE (PARROT) (B-PAD); H7
WELL PAD 2 41 294 0 0 1 1 -0- -0- -0- -0- <0.01 <0.01 <0.01 <0.01 <0.01 -0- <0.01
PS-201
5895 MARINE CREEK PKWY (MARINE CREEK) (A-PAD); E5
WELL PAD 2 183 1645 3 1 2 6 -0- -0- -0- -0- 1.11 0.99 0.11 0.01 0.60 0.40 0.02
6 HWY 114 WELL PAD 1 62 134 1 0 1 1 -0- -0- -0- -0- <0.01 <0.01 <0.01 <0.01 <0.01 -0- <0.01
20 4190 LITSEY RD WELL PAD 2 103 960 8 0 5 2 -0- -0- -0- -0- <0.01 <0.01 <0.01 <0.01 <0.01 -0- <0.01
23 4192 LITSEY RD WELL PAD 6 448 3584 0 1 2 6 0.05 0.70 1.96 <0.01 0.65 0.65 <0.01 <0.01 0.39 0.26 <0.01
24 3596 ELIZABETHTOWN CEMETERY RD
WELL PAD 6 434 2738 6 1 3 2 0.05 0.70 1.96 <0.01 0.65 0.65 <0.01 <0.01 0.39 0.26 <0.01
25 14797 ELIZABETHTOWN CEMETERY RD
WELL PAD 5 206 1650 4 1 4 6 0.05 0.70 1.96 <0.01 0.67 0.65 <0.01 0.01 0.39 0.26 <0.01
26 14798 ELIZABETHTOWN CEMETERY RD
WELL PAD 6 463 4270 6 1 3 9 0.05 0.70 1.96 <0.01 0.66 0.65 <0.01 <0.01 0.39 0.26 <0.01
27 4791 HENRIETTA CREEK RD
WELL PAD 1 99 996 2 1 3 4 0.05 0.70 1.96 <0.01 0.65 0.65 <0.01 <0.01 0.39 0.26 <0.01
28 4794 HENRIETTA CREEK RD
WELL PAD 1 76 768 2 1 3 5 0.05 0.70 1.96 <0.01 0.65 0.65 <0.01 <0.01 0.39 0.26 <0.01
29 14404 CHAPARRAL WELL PAD 2 154 1482 4 1 2 3 0.05 0.70 1.96 <0.01 0.65 0.65 <0.01 <0.01 0.39 0.26 <0.01
32 13794 NORTH FWY WELL PAD 8 506 3542 8 1 1 8 0.05 0.70 1.96 <0.01 0.67 0.65 0.01 <0.01 0.39 0.26 0.01
33 13593 NORTH FWY WELL PAD 8 539 4672 6 2 6 8 0.09 1.40 3.92 <0.01 1.34 1.31 0.03 <0.01 0.78 0.52 0.02
35 2890 WESTPORT PKWY
WELL PAD 1 68 476 2 0 0 0 -0- -0- -0- -0- <0.01 <0.01 <0.01 <0.01 <0.01 -0- <0.01
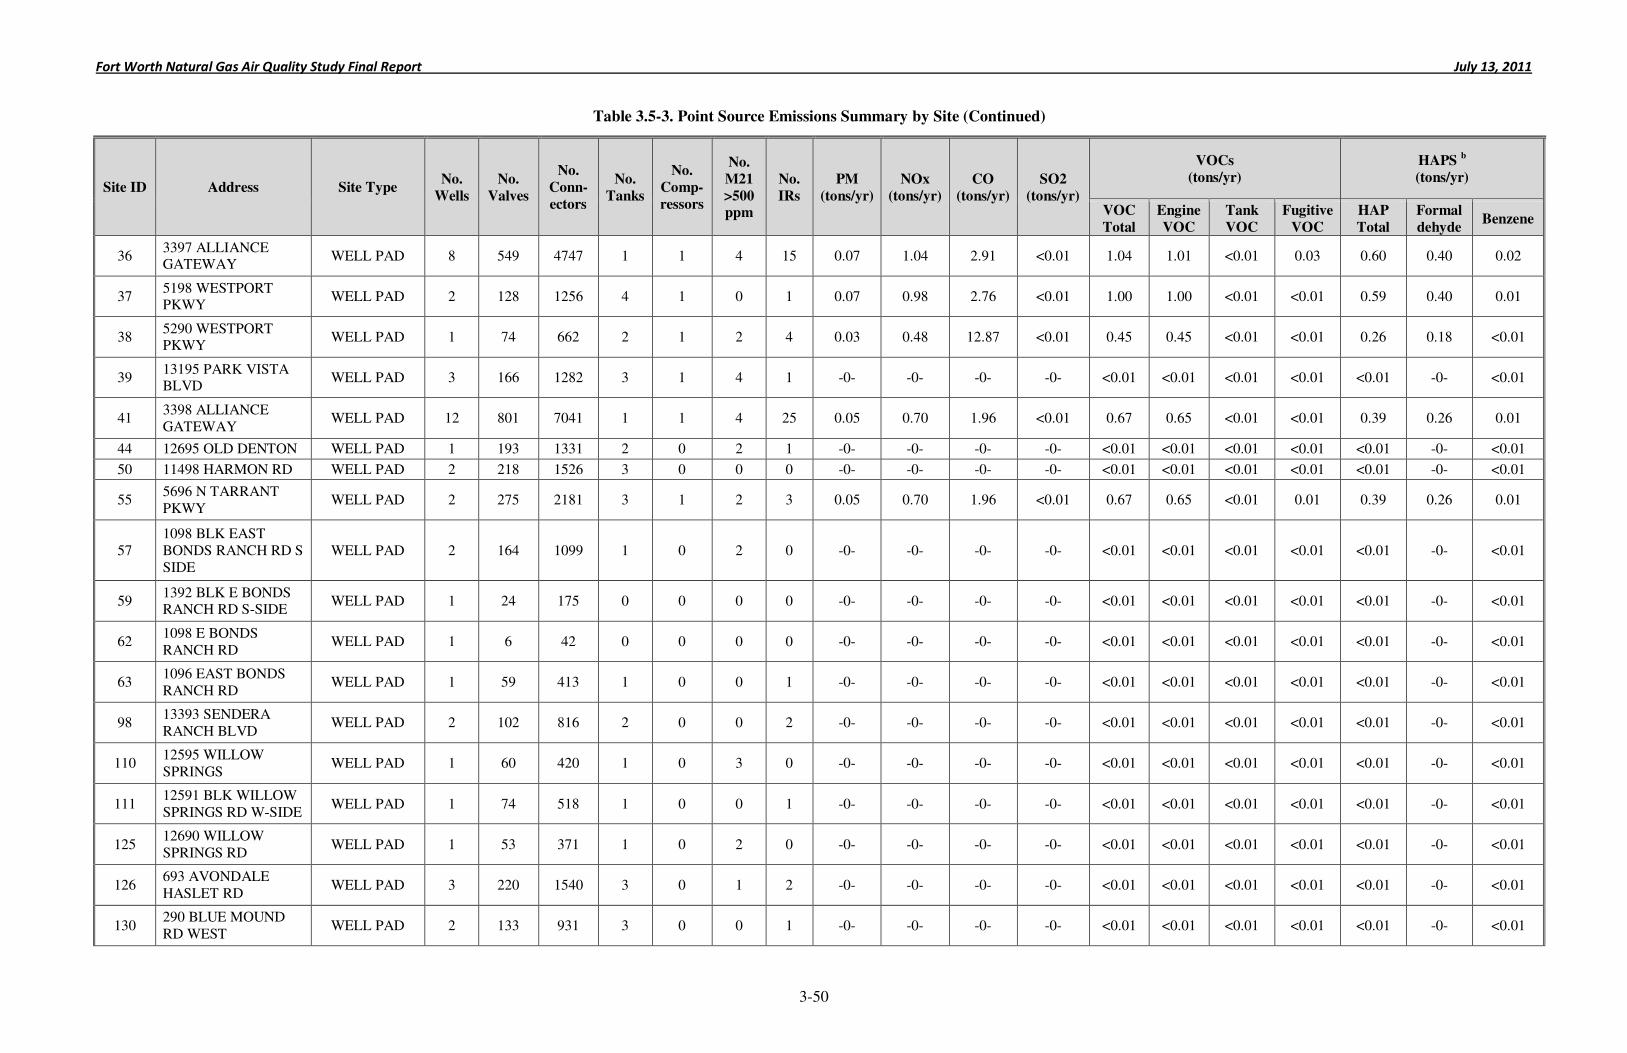
Fort Worth Natural Gas Air Quality Study Final Report July 13, 2011
3-50
Table 3.5-3. Point Source Emissions Summary by Site (Continued)
Site ID Address Site Type No.
Wells
No.
Valves
No.
Conn-
ectors
No.
Tanks
No.
Comp-
ressors
No.
M21
>500 ppm
No.
IRs
PM
(tons/yr)
NOx
(tons/yr)
CO
(tons/yr)
SO2
(tons/yr)
VOCs
(tons/yr)
HAPS b
(tons/yr)
VOC
Total
Engine
VOC
Tank
VOC
Fugitive
VOC
HAP
Total
Formal
dehyde Benzene
36 3397 ALLIANCE GATEWAY
WELL PAD 8 549 4747 1 1 4 15 0.07 1.04 2.91 <0.01 1.04 1.01 <0.01 0.03 0.60 0.40 0.02
37 5198 WESTPORT PKWY
WELL PAD 2 128 1256 4 1 0 1 0.07 0.98 2.76 <0.01 1.00 1.00 <0.01 <0.01 0.59 0.40 0.01
38 5290 WESTPORT PKWY
WELL PAD 1 74 662 2 1 2 4 0.03 0.48 12.87 <0.01 0.45 0.45 <0.01 <0.01 0.26 0.18 <0.01
39 13195 PARK VISTA BLVD
WELL PAD 3 166 1282 3 1 4 1 -0- -0- -0- -0- <0.01 <0.01 <0.01 <0.01 <0.01 -0- <0.01
41 3398 ALLIANCE GATEWAY
WELL PAD 12 801 7041 1 1 4 25 0.05 0.70 1.96 <0.01 0.67 0.65 <0.01 <0.01 0.39 0.26 0.01
44 12695 OLD DENTON WELL PAD 1 193 1331 2 0 2 1 -0- -0- -0- -0- <0.01 <0.01 <0.01 <0.01 <0.01 -0- <0.01
50 11498 HARMON RD WELL PAD 2 218 1526 3 0 0 0 -0- -0- -0- -0- <0.01 <0.01 <0.01 <0.01 <0.01 -0- <0.01
55 5696 N TARRANT PKWY
WELL PAD 2 275 2181 3 1 2 3 0.05 0.70 1.96 <0.01 0.67 0.65 <0.01 0.01 0.39 0.26 0.01
57 1098 BLK EAST BONDS RANCH RD S SIDE
WELL PAD 2 164 1099 1 0 2 0 -0- -0- -0- -0- <0.01 <0.01 <0.01 <0.01 <0.01 -0- <0.01
59 1392 BLK E BONDS RANCH RD S-SIDE
WELL PAD 1 24 175 0 0 0 0 -0- -0- -0- -0- <0.01 <0.01 <0.01 <0.01 <0.01 -0- <0.01
62 1098 E BONDS RANCH RD
WELL PAD 1 6 42 0 0 0 0 -0- -0- -0- -0- <0.01 <0.01 <0.01 <0.01 <0.01 -0- <0.01
63 1096 EAST BONDS RANCH RD
WELL PAD 1 59 413 1 0 0 1 -0- -0- -0- -0- <0.01 <0.01 <0.01 <0.01 <0.01 -0- <0.01
98 13393 SENDERA RANCH BLVD
WELL PAD 2 102 816 2 0 0 2 -0- -0- -0- -0- <0.01 <0.01 <0.01 <0.01 <0.01 -0- <0.01
110 12595 WILLOW SPRINGS
WELL PAD 1 60 420 1 0 3 0 -0- -0- -0- -0- <0.01 <0.01 <0.01 <0.01 <0.01 -0- <0.01
111 12591 BLK WILLOW SPRINGS RD W-SIDE
WELL PAD 1 74 518 1 0 0 1 -0- -0- -0- -0- <0.01 <0.01 <0.01 <0.01 <0.01 -0- <0.01
125 12690 WILLOW SPRINGS RD
WELL PAD 1 53 371 1 0 2 0 -0- -0- -0- -0- <0.01 <0.01 <0.01 <0.01 <0.01 -0- <0.01
126 693 AVONDALE HASLET RD
WELL PAD 3 220 1540 3 0 1 2 -0- -0- -0- -0- <0.01 <0.01 <0.01 <0.01 <0.01 -0- <0.01
130 290 BLUE MOUND RD WEST
WELL PAD 2 133 931 3 0 0 1 -0- -0- -0- -0- <0.01 <0.01 <0.01 <0.01 <0.01 -0- <0.01
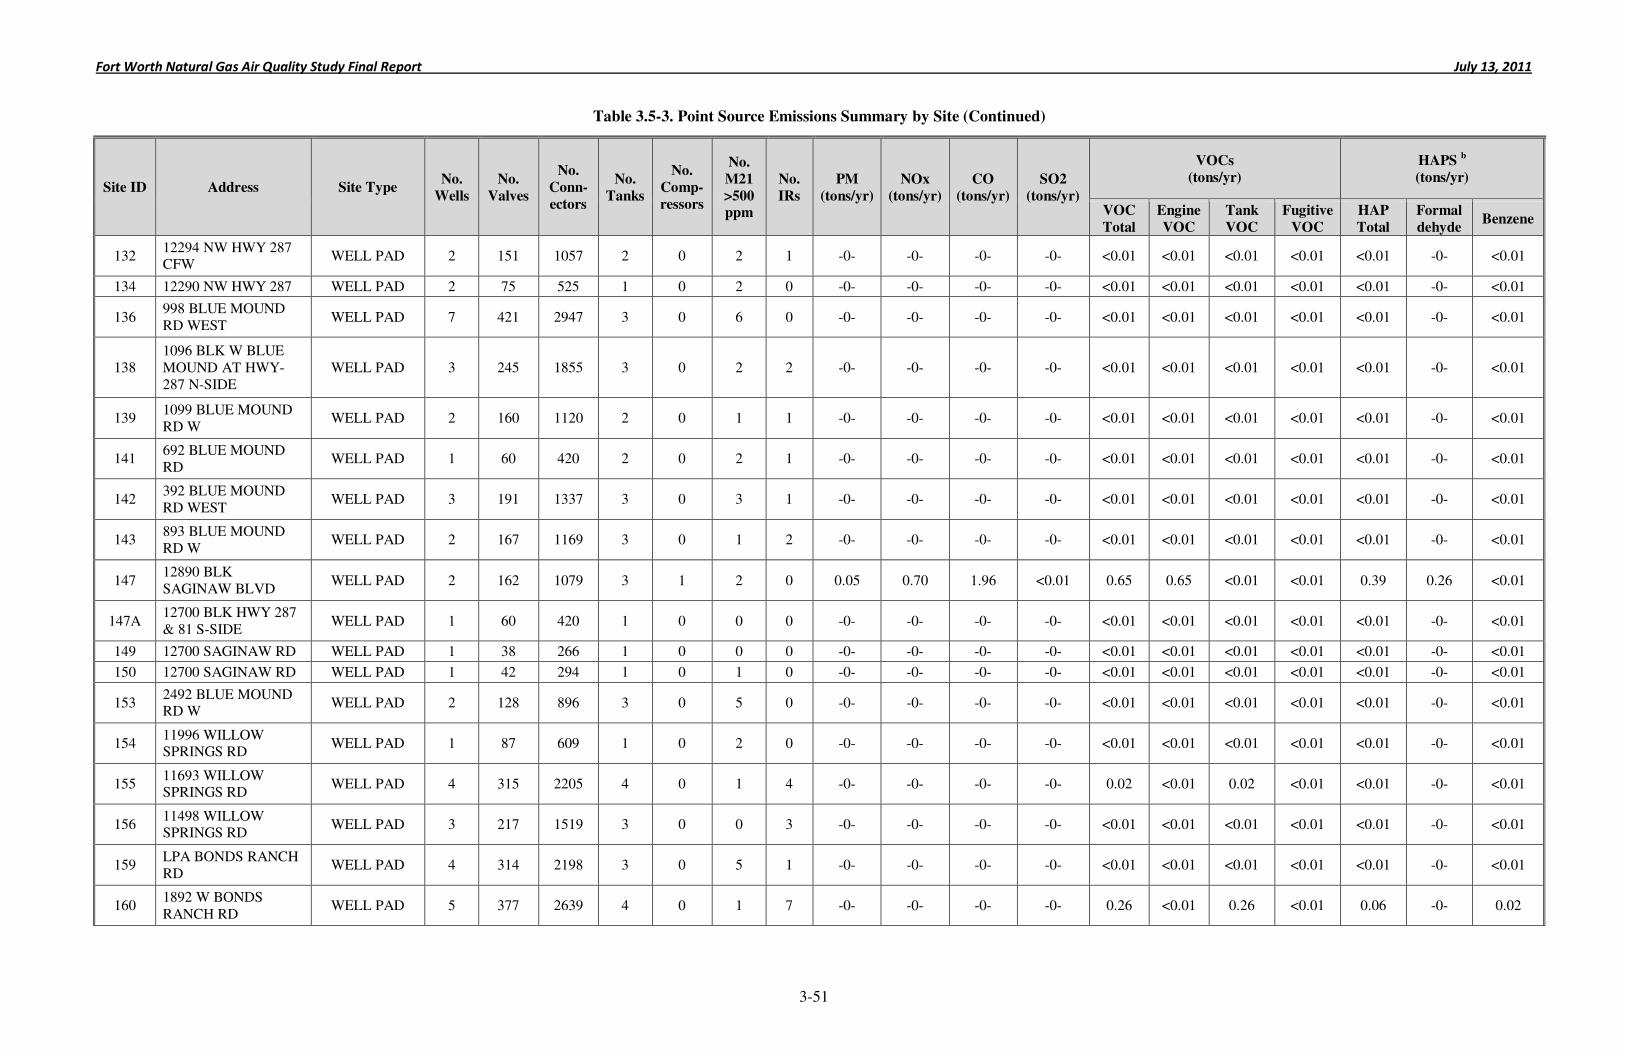
Fort Worth Natural Gas Air Quality Study Final Report July 13, 2011
3-51
Table 3.5-3. Point Source Emissions Summary by Site (Continued)
Site ID Address Site Type No.
Wells
No.
Valves
No.
Conn-
ectors
No.
Tanks
No.
Comp-
ressors
No.
M21
>500 ppm
No.
IRs
PM
(tons/yr)
NOx
(tons/yr)
CO
(tons/yr)
SO2
(tons/yr)
VOCs
(tons/yr)
HAPS b
(tons/yr)
VOC
Total
Engine
VOC
Tank
VOC
Fugitive
VOC
HAP
Total
Formal
dehyde Benzene
132 12294 NW HWY 287 CFW
WELL PAD 2 151 1057 2 0 2 1 -0- -0- -0- -0- <0.01 <0.01 <0.01 <0.01 <0.01 -0- <0.01
134 12290 NW HWY 287 WELL PAD 2 75 525 1 0 2 0 -0- -0- -0- -0- <0.01 <0.01 <0.01 <0.01 <0.01 -0- <0.01
136 998 BLUE MOUND RD WEST
WELL PAD 7 421 2947 3 0 6 0 -0- -0- -0- -0- <0.01 <0.01 <0.01 <0.01 <0.01 -0- <0.01
138 1096 BLK W BLUE MOUND AT HWY-287 N-SIDE
WELL PAD 3 245 1855 3 0 2 2 -0- -0- -0- -0- <0.01 <0.01 <0.01 <0.01 <0.01 -0- <0.01
139 1099 BLUE MOUND RD W
WELL PAD 2 160 1120 2 0 1 1 -0- -0- -0- -0- <0.01 <0.01 <0.01 <0.01 <0.01 -0- <0.01
141 692 BLUE MOUND RD
WELL PAD 1 60 420 2 0 2 1 -0- -0- -0- -0- <0.01 <0.01 <0.01 <0.01 <0.01 -0- <0.01
142 392 BLUE MOUND RD WEST
WELL PAD 3 191 1337 3 0 3 1 -0- -0- -0- -0- <0.01 <0.01 <0.01 <0.01 <0.01 -0- <0.01
143 893 BLUE MOUND RD W
WELL PAD 2 167 1169 3 0 1 2 -0- -0- -0- -0- <0.01 <0.01 <0.01 <0.01 <0.01 -0- <0.01
147 12890 BLK SAGINAW BLVD
WELL PAD 2 162 1079 3 1 2 0 0.05 0.70 1.96 <0.01 0.65 0.65 <0.01 <0.01 0.39 0.26 <0.01
147A 12700 BLK HWY 287 & 81 S-SIDE
WELL PAD 1 60 420 1 0 0 0 -0- -0- -0- -0- <0.01 <0.01 <0.01 <0.01 <0.01 -0- <0.01
149 12700 SAGINAW RD WELL PAD 1 38 266 1 0 0 0 -0- -0- -0- -0- <0.01 <0.01 <0.01 <0.01 <0.01 -0- <0.01
150 12700 SAGINAW RD WELL PAD 1 42 294 1 0 1 0 -0- -0- -0- -0- <0.01 <0.01 <0.01 <0.01 <0.01 -0- <0.01
153 2492 BLUE MOUND RD W
WELL PAD 2 128 896 3 0 5 0 -0- -0- -0- -0- <0.01 <0.01 <0.01 <0.01 <0.01 -0- <0.01
154 11996 WILLOW SPRINGS RD
WELL PAD 1 87 609 1 0 2 0 -0- -0- -0- -0- <0.01 <0.01 <0.01 <0.01 <0.01 -0- <0.01
155 11693 WILLOW SPRINGS RD
WELL PAD 4 315 2205 4 0 1 4 -0- -0- -0- -0- 0.02 <0.01 0.02 <0.01 <0.01 -0- <0.01
156 11498 WILLOW SPRINGS RD
WELL PAD 3 217 1519 3 0 0 3 -0- -0- -0- -0- <0.01 <0.01 <0.01 <0.01 <0.01 -0- <0.01
159 LPA BONDS RANCH RD
WELL PAD 4 314 2198 3 0 5 1 -0- -0- -0- -0- <0.01 <0.01 <0.01 <0.01 <0.01 -0- <0.01
160 1892 W BONDS RANCH RD
WELL PAD 5 377 2639 4 0 1 7 -0- -0- -0- -0- 0.26 <0.01 0.26 <0.01 0.06 -0- 0.02
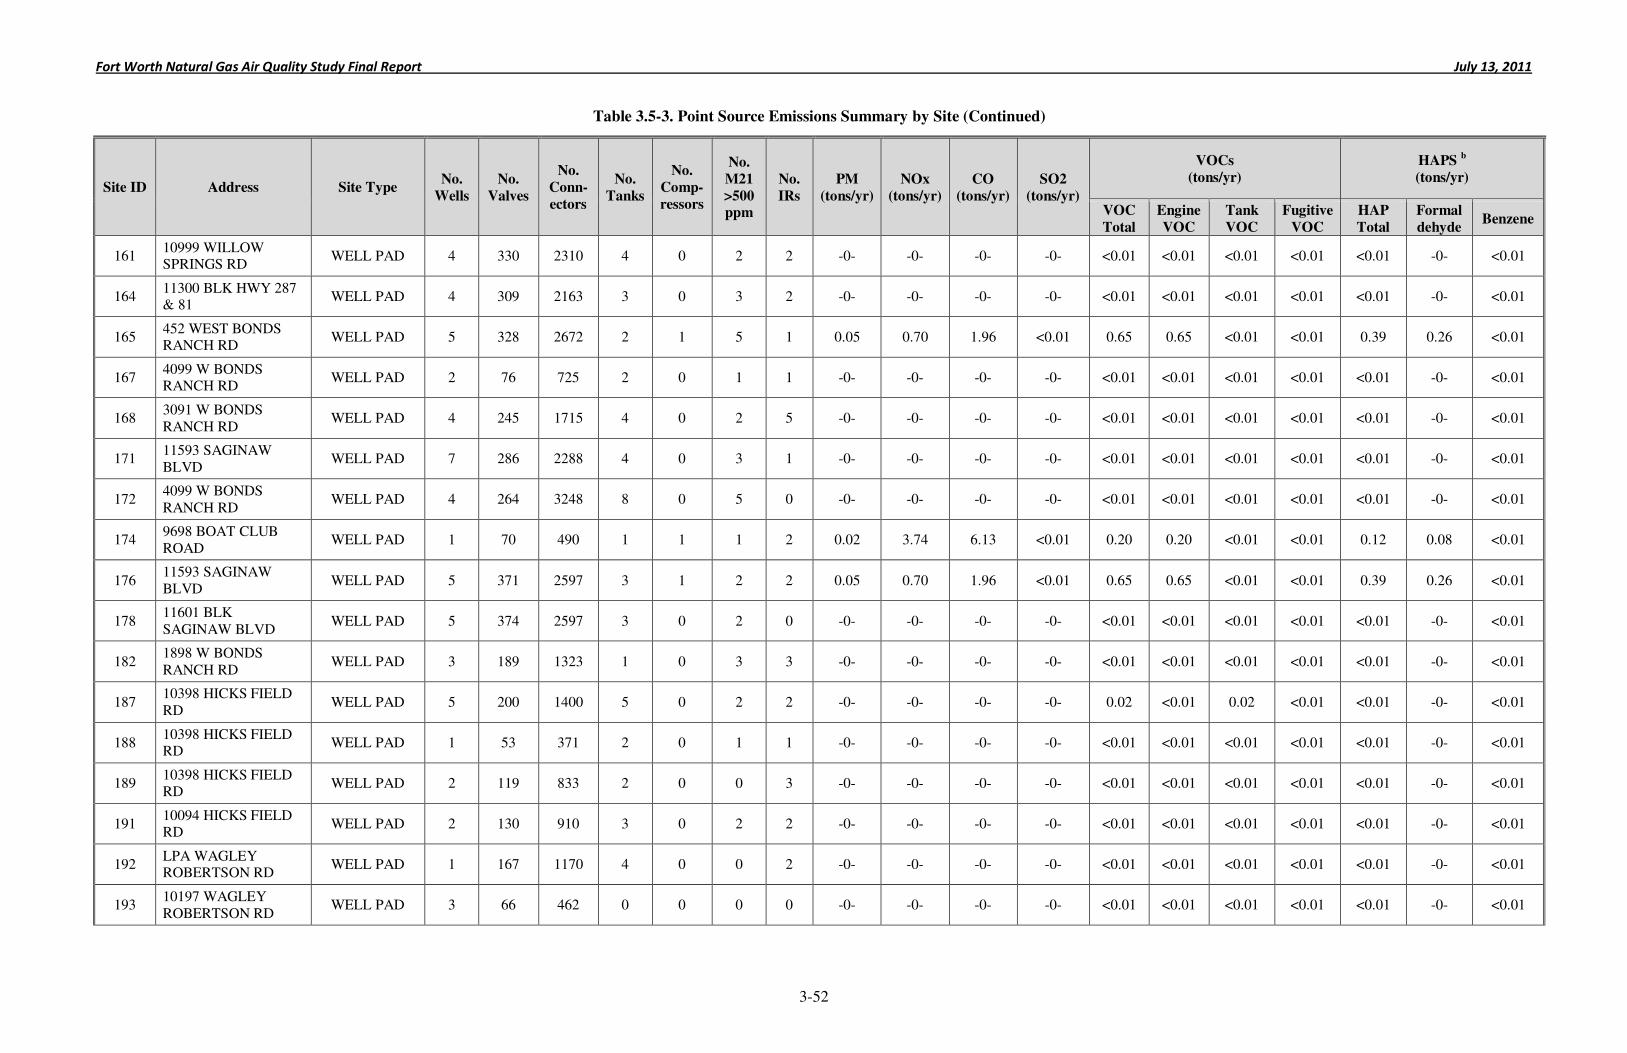
Fort Worth Natural Gas Air Quality Study Final Report July 13, 2011
3-52
Table 3.5-3. Point Source Emissions Summary by Site (Continued)
Site ID Address Site Type No.
Wells
No.
Valves
No.
Conn-
ectors
No.
Tanks
No.
Comp-
ressors
No.
M21
>500 ppm
No.
IRs
PM
(tons/yr)
NOx
(tons/yr)
CO
(tons/yr)
SO2
(tons/yr)
VOCs
(tons/yr)
HAPS b
(tons/yr)
VOC
Total
Engine
VOC
Tank
VOC
Fugitive
VOC
HAP
Total
Formal
dehyde Benzene
161 10999 WILLOW SPRINGS RD
WELL PAD 4 330 2310 4 0 2 2 -0- -0- -0- -0- <0.01 <0.01 <0.01 <0.01 <0.01 -0- <0.01
164 11300 BLK HWY 287 & 81
WELL PAD 4 309 2163 3 0 3 2 -0- -0- -0- -0- <0.01 <0.01 <0.01 <0.01 <0.01 -0- <0.01
165 452 WEST BONDS RANCH RD
WELL PAD 5 328 2672 2 1 5 1 0.05 0.70 1.96 <0.01 0.65 0.65 <0.01 <0.01 0.39 0.26 <0.01
167 4099 W BONDS RANCH RD
WELL PAD 2 76 725 2 0 1 1 -0- -0- -0- -0- <0.01 <0.01 <0.01 <0.01 <0.01 -0- <0.01
168 3091 W BONDS RANCH RD
WELL PAD 4 245 1715 4 0 2 5 -0- -0- -0- -0- <0.01 <0.01 <0.01 <0.01 <0.01 -0- <0.01
171 11593 SAGINAW BLVD
WELL PAD 7 286 2288 4 0 3 1 -0- -0- -0- -0- <0.01 <0.01 <0.01 <0.01 <0.01 -0- <0.01
172 4099 W BONDS RANCH RD
WELL PAD 4 264 3248 8 0 5 0 -0- -0- -0- -0- <0.01 <0.01 <0.01 <0.01 <0.01 -0- <0.01
174 9698 BOAT CLUB ROAD
WELL PAD 1 70 490 1 1 1 2 0.02 3.74 6.13 <0.01 0.20 0.20 <0.01 <0.01 0.12 0.08 <0.01
176 11593 SAGINAW BLVD
WELL PAD 5 371 2597 3 1 2 2 0.05 0.70 1.96 <0.01 0.65 0.65 <0.01 <0.01 0.39 0.26 <0.01
178 11601 BLK SAGINAW BLVD
WELL PAD 5 374 2597 3 0 2 0 -0- -0- -0- -0- <0.01 <0.01 <0.01 <0.01 <0.01 -0- <0.01
182 1898 W BONDS RANCH RD
WELL PAD 3 189 1323 1 0 3 3 -0- -0- -0- -0- <0.01 <0.01 <0.01 <0.01 <0.01 -0- <0.01
187 10398 HICKS FIELD RD
WELL PAD 5 200 1400 5 0 2 2 -0- -0- -0- -0- 0.02 <0.01 0.02 <0.01 <0.01 -0- <0.01
188 10398 HICKS FIELD RD
WELL PAD 1 53 371 2 0 1 1 -0- -0- -0- -0- <0.01 <0.01 <0.01 <0.01 <0.01 -0- <0.01
189 10398 HICKS FIELD RD
WELL PAD 2 119 833 2 0 0 3 -0- -0- -0- -0- <0.01 <0.01 <0.01 <0.01 <0.01 -0- <0.01
191 10094 HICKS FIELD RD
WELL PAD 2 130 910 3 0 2 2 -0- -0- -0- -0- <0.01 <0.01 <0.01 <0.01 <0.01 -0- <0.01
192 LPA WAGLEY ROBERTSON RD
WELL PAD 1 167 1170 4 0 0 2 -0- -0- -0- -0- <0.01 <0.01 <0.01 <0.01 <0.01 -0- <0.01
193 10197 WAGLEY ROBERTSON RD
WELL PAD 3 66 462 0 0 0 0 -0- -0- -0- -0- <0.01 <0.01 <0.01 <0.01 <0.01 -0- <0.01
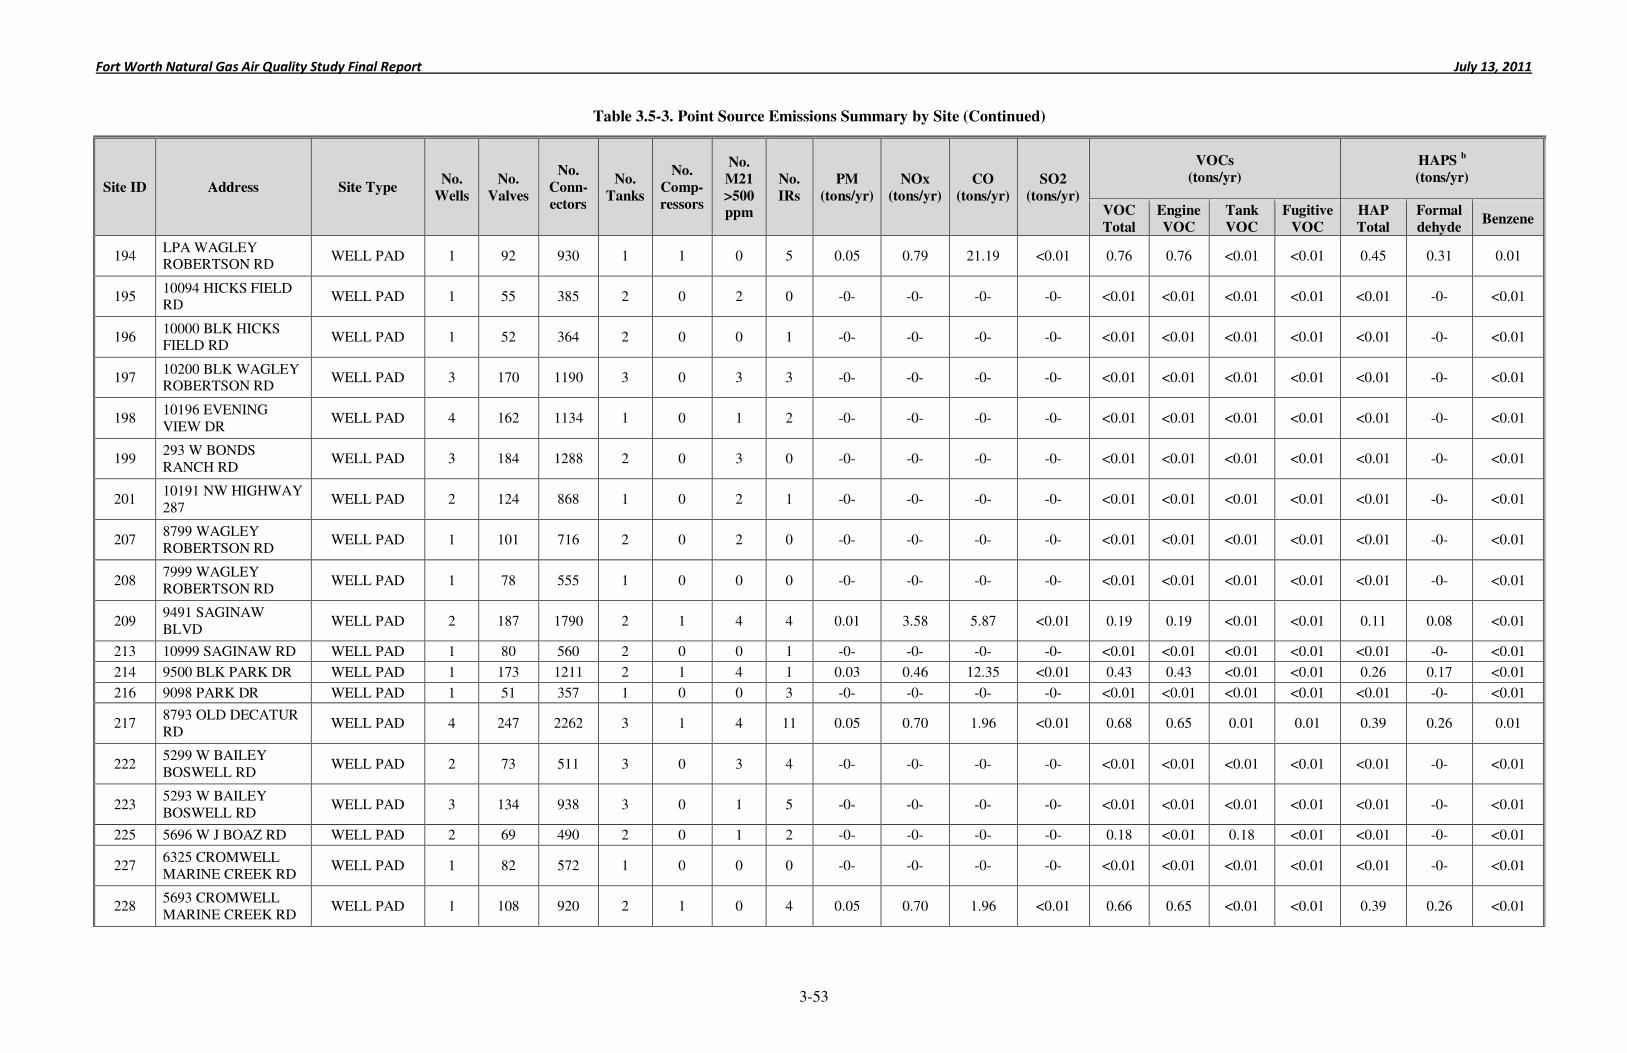
Fort Worth Natural Gas Air Quality Study Final Report July 13, 2011
3-53
Table 3.5-3. Point Source Emissions Summary by Site (Continued)
Site ID Address Site Type No.
Wells
No.
Valves
No.
Conn-
ectors
No.
Tanks
No.
Comp-
ressors
No.
M21
>500 ppm
No.
IRs
PM
(tons/yr)
NOx
(tons/yr)
CO
(tons/yr)
SO2
(tons/yr)
VOCs
(tons/yr)
HAPS b
(tons/yr)
VOC
Total
Engine
VOC
Tank
VOC
Fugitive
VOC
HAP
Total
Formal
dehyde Benzene
194 LPA WAGLEY ROBERTSON RD
WELL PAD 1 92 930 1 1 0 5 0.05 0.79 21.19 <0.01 0.76 0.76 <0.01 <0.01 0.45 0.31 0.01
195 10094 HICKS FIELD RD
WELL PAD 1 55 385 2 0 2 0 -0- -0- -0- -0- <0.01 <0.01 <0.01 <0.01 <0.01 -0- <0.01
196 10000 BLK HICKS FIELD RD
WELL PAD 1 52 364 2 0 0 1 -0- -0- -0- -0- <0.01 <0.01 <0.01 <0.01 <0.01 -0- <0.01
197 10200 BLK WAGLEY ROBERTSON RD
WELL PAD 3 170 1190 3 0 3 3 -0- -0- -0- -0- <0.01 <0.01 <0.01 <0.01 <0.01 -0- <0.01
198 10196 EVENING VIEW DR
WELL PAD 4 162 1134 1 0 1 2 -0- -0- -0- -0- <0.01 <0.01 <0.01 <0.01 <0.01 -0- <0.01
199 293 W BONDS RANCH RD
WELL PAD 3 184 1288 2 0 3 0 -0- -0- -0- -0- <0.01 <0.01 <0.01 <0.01 <0.01 -0- <0.01
201 10191 NW HIGHWAY 287
WELL PAD 2 124 868 1 0 2 1 -0- -0- -0- -0- <0.01 <0.01 <0.01 <0.01 <0.01 -0- <0.01
207 8799 WAGLEY ROBERTSON RD
WELL PAD 1 101 716 2 0 2 0 -0- -0- -0- -0- <0.01 <0.01 <0.01 <0.01 <0.01 -0- <0.01
208 7999 WAGLEY ROBERTSON RD
WELL PAD 1 78 555 1 0 0 0 -0- -0- -0- -0- <0.01 <0.01 <0.01 <0.01 <0.01 -0- <0.01
209 9491 SAGINAW BLVD
WELL PAD 2 187 1790 2 1 4 4 0.01 3.58 5.87 <0.01 0.19 0.19 <0.01 <0.01 0.11 0.08 <0.01
213 10999 SAGINAW RD WELL PAD 1 80 560 2 0 0 1 -0- -0- -0- -0- <0.01 <0.01 <0.01 <0.01 <0.01 -0- <0.01
214 9500 BLK PARK DR WELL PAD 1 173 1211 2 1 4 1 0.03 0.46 12.35 <0.01 0.43 0.43 <0.01 <0.01 0.26 0.17 <0.01
216 9098 PARK DR WELL PAD 1 51 357 1 0 0 3 -0- -0- -0- -0- <0.01 <0.01 <0.01 <0.01 <0.01 -0- <0.01
217 8793 OLD DECATUR RD
WELL PAD 4 247 2262 3 1 4 11 0.05 0.70 1.96 <0.01 0.68 0.65 0.01 0.01 0.39 0.26 0.01
222 5299 W BAILEY BOSWELL RD
WELL PAD 2 73 511 3 0 3 4 -0- -0- -0- -0- <0.01 <0.01 <0.01 <0.01 <0.01 -0- <0.01
223 5293 W BAILEY BOSWELL RD
WELL PAD 3 134 938 3 0 1 5 -0- -0- -0- -0- <0.01 <0.01 <0.01 <0.01 <0.01 -0- <0.01
225 5696 W J BOAZ RD WELL PAD 2 69 490 2 0 1 2 -0- -0- -0- -0- 0.18 <0.01 0.18 <0.01 <0.01 -0- <0.01
227 6325 CROMWELL MARINE CREEK RD
WELL PAD 1 82 572 1 0 0 0 -0- -0- -0- -0- <0.01 <0.01 <0.01 <0.01 <0.01 -0- <0.01
228 5693 CROMWELL MARINE CREEK RD
WELL PAD 1 108 920 2 1 0 4 0.05 0.70 1.96 <0.01 0.66 0.65 <0.01 <0.01 0.39 0.26 <0.01
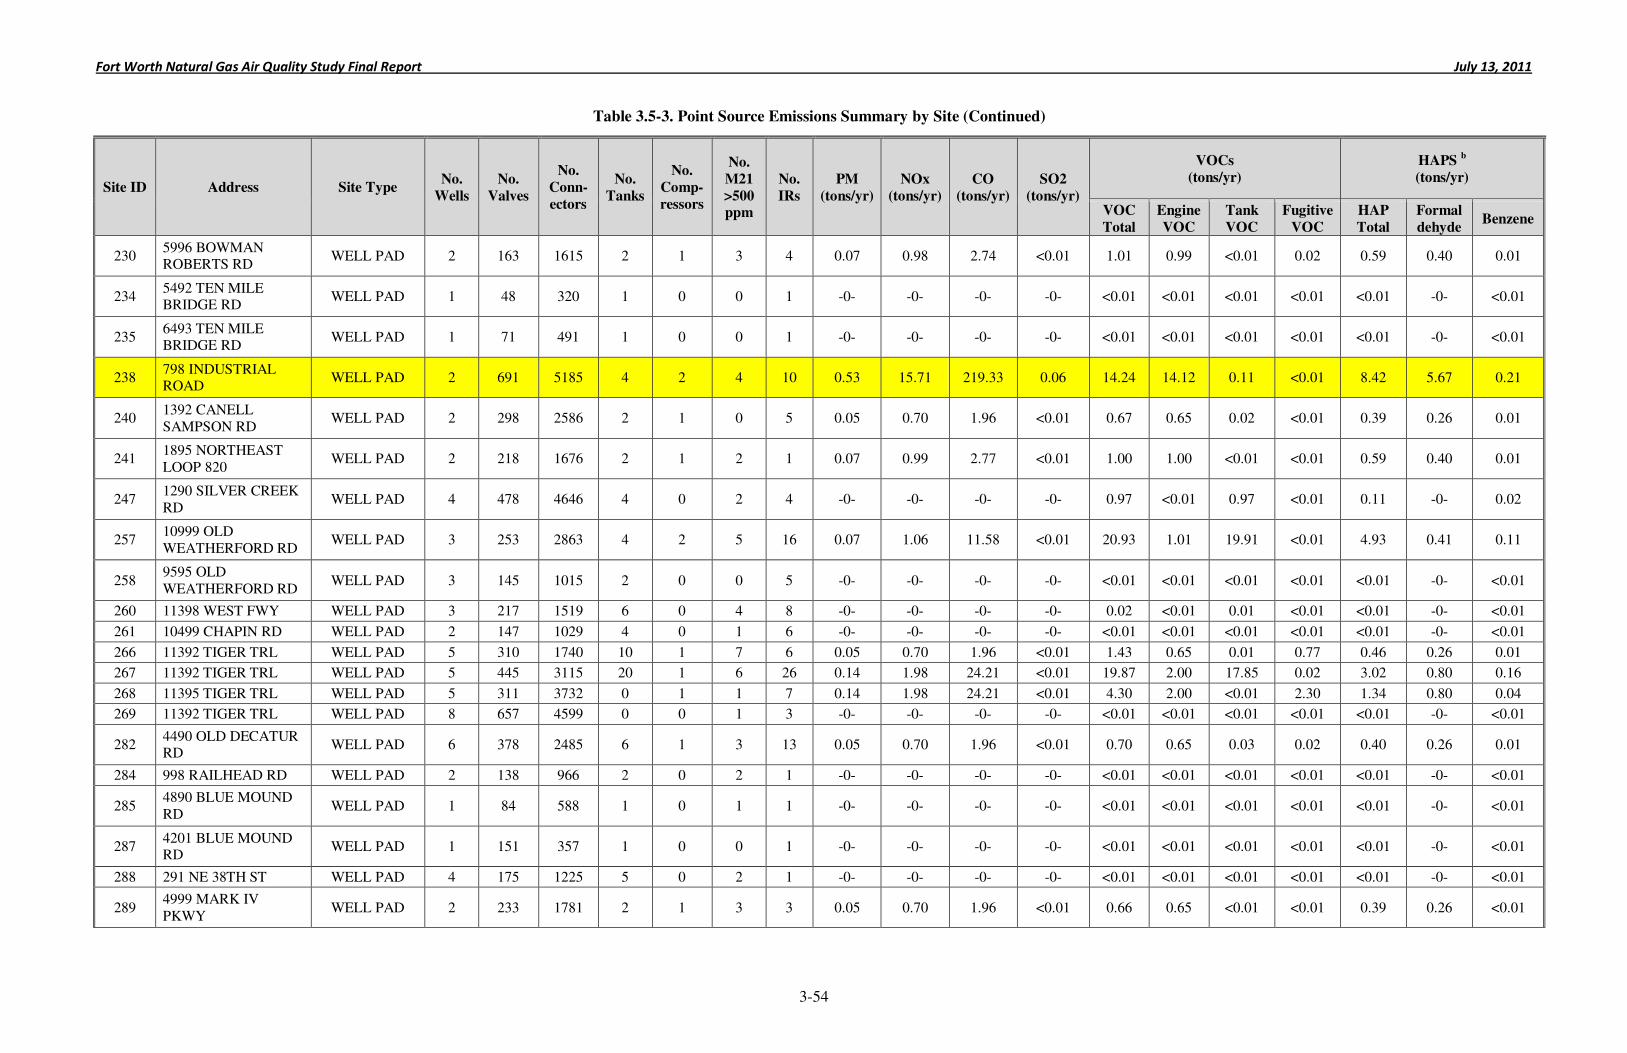
Fort Worth Natural Gas Air Quality Study Final Report July 13, 2011
3-54
Table 3.5-3. Point Source Emissions Summary by Site (Continued)
Site ID Address Site Type No.
Wells
No.
Valves
No.
Conn-
ectors
No.
Tanks
No.
Comp-
ressors
No.
M21
>500 ppm
No.
IRs
PM
(tons/yr)
NOx
(tons/yr)
CO
(tons/yr)
SO2
(tons/yr)
VOCs
(tons/yr)
HAPS b
(tons/yr)
VOC
Total
Engine
VOC
Tank
VOC
Fugitive
VOC
HAP
Total
Formal
dehyde Benzene
230 5996 BOWMAN ROBERTS RD
WELL PAD 2 163 1615 2 1 3 4 0.07 0.98 2.74 <0.01 1.01 0.99 <0.01 0.02 0.59 0.40 0.01
234 5492 TEN MILE BRIDGE RD
WELL PAD 1 48 320 1 0 0 1 -0- -0- -0- -0- <0.01 <0.01 <0.01 <0.01 <0.01 -0- <0.01
235 6493 TEN MILE BRIDGE RD
WELL PAD 1 71 491 1 0 0 1 -0- -0- -0- -0- <0.01 <0.01 <0.01 <0.01 <0.01 -0- <0.01
238 798 INDUSTRIAL ROAD
WELL PAD 2 691 5185 4 2 4 10 0.53 15.71 219.33 0.06 14.24 14.12 0.11 <0.01 8.42 5.67 0.21
240 1392 CANELL SAMPSON RD
WELL PAD 2 298 2586 2 1 0 5 0.05 0.70 1.96 <0.01 0.67 0.65 0.02 <0.01 0.39 0.26 0.01
241 1895 NORTHEAST LOOP 820
WELL PAD 2 218 1676 2 1 2 1 0.07 0.99 2.77 <0.01 1.00 1.00 <0.01 <0.01 0.59 0.40 0.01
247 1290 SILVER CREEK RD
WELL PAD 4 478 4646 4 0 2 4 -0- -0- -0- -0- 0.97 <0.01 0.97 <0.01 0.11 -0- 0.02
257 10999 OLD WEATHERFORD RD
WELL PAD 3 253 2863 4 2 5 16 0.07 1.06 11.58 <0.01 20.93 1.01 19.91 <0.01 4.93 0.41 0.11
258 9595 OLD WEATHERFORD RD
WELL PAD 3 145 1015 2 0 0 5 -0- -0- -0- -0- <0.01 <0.01 <0.01 <0.01 <0.01 -0- <0.01
260 11398 WEST FWY WELL PAD 3 217 1519 6 0 4 8 -0- -0- -0- -0- 0.02 <0.01 0.01 <0.01 <0.01 -0- <0.01
261 10499 CHAPIN RD WELL PAD 2 147 1029 4 0 1 6 -0- -0- -0- -0- <0.01 <0.01 <0.01 <0.01 <0.01 -0- <0.01
266 11392 TIGER TRL WELL PAD 5 310 1740 10 1 7 6 0.05 0.70 1.96 <0.01 1.43 0.65 0.01 0.77 0.46 0.26 0.01
267 11392 TIGER TRL WELL PAD 5 445 3115 20 1 6 26 0.14 1.98 24.21 <0.01 19.87 2.00 17.85 0.02 3.02 0.80 0.16
268 11395 TIGER TRL WELL PAD 5 311 3732 0 1 1 7 0.14 1.98 24.21 <0.01 4.30 2.00 <0.01 2.30 1.34 0.80 0.04
269 11392 TIGER TRL WELL PAD 8 657 4599 0 0 1 3 -0- -0- -0- -0- <0.01 <0.01 <0.01 <0.01 <0.01 -0- <0.01
282 4490 OLD DECATUR RD
WELL PAD 6 378 2485 6 1 3 13 0.05 0.70 1.96 <0.01 0.70 0.65 0.03 0.02 0.40 0.26 0.01
284 998 RAILHEAD RD WELL PAD 2 138 966 2 0 2 1 -0- -0- -0- -0- <0.01 <0.01 <0.01 <0.01 <0.01 -0- <0.01
285 4890 BLUE MOUND RD
WELL PAD 1 84 588 1 0 1 1 -0- -0- -0- -0- <0.01 <0.01 <0.01 <0.01 <0.01 -0- <0.01
287 4201 BLUE MOUND RD
WELL PAD 1 151 357 1 0 0 1 -0- -0- -0- -0- <0.01 <0.01 <0.01 <0.01 <0.01 -0- <0.01
288 291 NE 38TH ST WELL PAD 4 175 1225 5 0 2 1 -0- -0- -0- -0- <0.01 <0.01 <0.01 <0.01 <0.01 -0- <0.01
289 4999 MARK IV PKWY
WELL PAD 2 233 1781 2 1 3 3 0.05 0.70 1.96 <0.01 0.66 0.65 <0.01 <0.01 0.39 0.26 <0.01
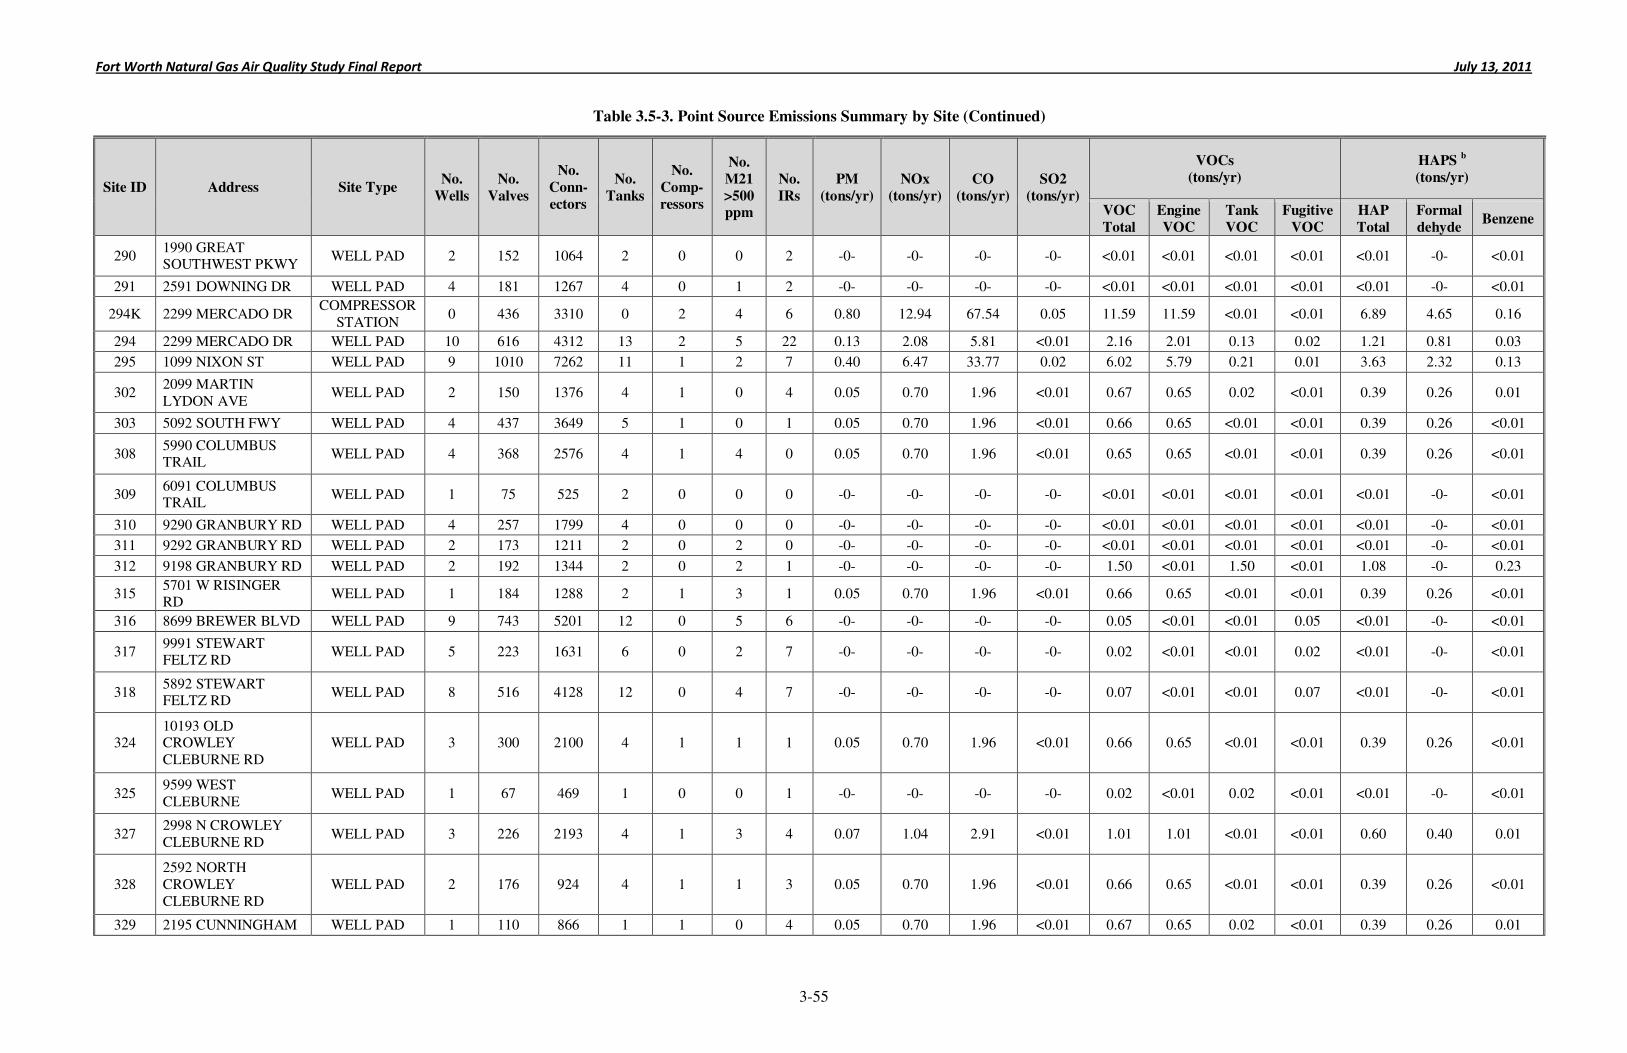
Fort Worth Natural Gas Air Quality Study Final Report July 13, 2011
3-55
Table 3.5-3. Point Source Emissions Summary by Site (Continued)
Site ID Address Site Type No.
Wells
No.
Valves
No.
Conn-
ectors
No.
Tanks
No.
Comp-
ressors
No.
M21
>500 ppm
No.
IRs
PM
(tons/yr)
NOx
(tons/yr)
CO
(tons/yr)
SO2
(tons/yr)
VOCs
(tons/yr)
HAPS b
(tons/yr)
VOC
Total
Engine
VOC
Tank
VOC
Fugitive
VOC
HAP
Total
Formal
dehyde Benzene
290 1990 GREAT SOUTHWEST PKWY
WELL PAD 2 152 1064 2 0 0 2 -0- -0- -0- -0- <0.01 <0.01 <0.01 <0.01 <0.01 -0- <0.01
291 2591 DOWNING DR WELL PAD 4 181 1267 4 0 1 2 -0- -0- -0- -0- <0.01 <0.01 <0.01 <0.01 <0.01 -0- <0.01
294K 2299 MERCADO DR COMPRESSOR
STATION 0 436 3310 0 2 4 6 0.80 12.94 67.54 0.05 11.59 11.59 <0.01 <0.01 6.89 4.65 0.16
294 2299 MERCADO DR WELL PAD 10 616 4312 13 2 5 22 0.13 2.08 5.81 <0.01 2.16 2.01 0.13 0.02 1.21 0.81 0.03
295 1099 NIXON ST WELL PAD 9 1010 7262 11 1 2 7 0.40 6.47 33.77 0.02 6.02 5.79 0.21 0.01 3.63 2.32 0.13
302 2099 MARTIN LYDON AVE
WELL PAD 2 150 1376 4 1 0 4 0.05 0.70 1.96 <0.01 0.67 0.65 0.02 <0.01 0.39 0.26 0.01
303 5092 SOUTH FWY WELL PAD 4 437 3649 5 1 0 1 0.05 0.70 1.96 <0.01 0.66 0.65 <0.01 <0.01 0.39 0.26 <0.01
308 5990 COLUMBUS TRAIL
WELL PAD 4 368 2576 4 1 4 0 0.05 0.70 1.96 <0.01 0.65 0.65 <0.01 <0.01 0.39 0.26 <0.01
309 6091 COLUMBUS TRAIL
WELL PAD 1 75 525 2 0 0 0 -0- -0- -0- -0- <0.01 <0.01 <0.01 <0.01 <0.01 -0- <0.01
310 9290 GRANBURY RD WELL PAD 4 257 1799 4 0 0 0 -0- -0- -0- -0- <0.01 <0.01 <0.01 <0.01 <0.01 -0- <0.01
311 9292 GRANBURY RD WELL PAD 2 173 1211 2 0 2 0 -0- -0- -0- -0- <0.01 <0.01 <0.01 <0.01 <0.01 -0- <0.01
312 9198 GRANBURY RD WELL PAD 2 192 1344 2 0 2 1 -0- -0- -0- -0- 1.50 <0.01 1.50 <0.01 1.08 -0- 0.23
315 5701 W RISINGER RD
WELL PAD 1 184 1288 2 1 3 1 0.05 0.70 1.96 <0.01 0.66 0.65 <0.01 <0.01 0.39 0.26 <0.01
316 8699 BREWER BLVD WELL PAD 9 743 5201 12 0 5 6 -0- -0- -0- -0- 0.05 <0.01 <0.01 0.05 <0.01 -0- <0.01
317 9991 STEWART FELTZ RD
WELL PAD 5 223 1631 6 0 2 7 -0- -0- -0- -0- 0.02 <0.01 <0.01 0.02 <0.01 -0- <0.01
318 5892 STEWART FELTZ RD
WELL PAD 8 516 4128 12 0 4 7 -0- -0- -0- -0- 0.07 <0.01 <0.01 0.07 <0.01 -0- <0.01
324 10193 OLD CROWLEY CLEBURNE RD
WELL PAD 3 300 2100 4 1 1 1 0.05 0.70 1.96 <0.01 0.66 0.65 <0.01 <0.01 0.39 0.26 <0.01
325 9599 WEST CLEBURNE
WELL PAD 1 67 469 1 0 0 1 -0- -0- -0- -0- 0.02 <0.01 0.02 <0.01 <0.01 -0- <0.01
327 2998 N CROWLEY CLEBURNE RD
WELL PAD 3 226 2193 4 1 3 4 0.07 1.04 2.91 <0.01 1.01 1.01 <0.01 <0.01 0.60 0.40 0.01
328 2592 NORTH CROWLEY CLEBURNE RD
WELL PAD 2 176 924 4 1 1 3 0.05 0.70 1.96 <0.01 0.66 0.65 <0.01 <0.01 0.39 0.26 <0.01
329 2195 CUNNINGHAM WELL PAD 1 110 866 1 1 0 4 0.05 0.70 1.96 <0.01 0.67 0.65 0.02 <0.01 0.39 0.26 0.01

Fort Worth Natural Gas Air Quality Study Final Report July 13, 2011
3-56
Table 3.5-3. Point Source Emissions Summary by Site (Continued)
Site ID Address Site Type No.
Wells
No.
Valves
No.
Conn-
ectors
No.
Tanks
No.
Comp-
ressors
No.
M21
>500 ppm
No.
IRs
PM
(tons/yr)
NOx
(tons/yr)
CO
(tons/yr)
SO2
(tons/yr)
VOCs
(tons/yr)
HAPS b
(tons/yr)
VOC
Total
Engine
VOC
Tank
VOC
Fugitive
VOC
HAP
Total
Formal
dehyde Benzene
332 9590 TECHNOLOGY RD
WELL PAD 2 95 665 2 0 2 0 -0- -0- -0- -0- <0.01 <0.01 <0.01 <0.01 <0.01 -0- <0.01
335 7393 CROWLEY RD WELL PAD 1 95 897 1 1 1 4 0.05 0.70 1.96 <0.01 0.69 0.65 0.03 <0.01 0.39 0.26 0.01
336 293 ALTAMESA BLVD
WELL PAD 4 416 2912 4 0 3 0 -0- -0- -0- -0- <0.01 <0.01 <0.01 <0.01 <0.01 -0- <0.01
338 11790 SOUTH FWY WELL PAD 3 733 5805 4 2 8 7 <0.01 17.85 93.74 0.06 14.86 14.74 0.11 0.01 8.83 5.91 0.24
339 599 W RENDON CROWLEY RD
WELL PAD 6 492 3444 7 0 10 0 -0- -0- -0- -0- <0.01 <0.01 <0.01 <0.01 <0.01 -0- <0.01
341 13790 WILDCAT WAY SOUTH
WELL PAD 3 263 1641 4 0 3 2 -0- -0- -0- -0- <0.01 <0.01 <0.01 <0.01 <0.01 -0- <0.01
342 296 PACE ALSBURY COURT
WELL PAD 1 80 560 1 0 0 1 -0- -0- -0- -0- <0.01 <0.01 <0.01 <0.01 <0.01 -0- <0.01
344 12795 SOUTH FWY WELL PAD 1 223 1561 4 0 1 3 -0- -0- -0- -0- 0.01 <0.01 0.01 <0.01 <0.01 -0- <0.01
346 13790 WILDCAT WAY SOUTH
WELL PAD 3 198 1386 4 0 4 2 -0- -0- -0- -0- <0.01 <0.01 <0.01 <0.01 <0.01 -0- <0.01
348 12298 OAK GROVE ROAD SOUTH
WELL PAD 8 553 5301 10 3 5 15 0.12 1.86 16.27 <0.01 1.77 1.74 0.02 <0.01 1.04 0.70 0.03
349 1297 E RENDON CROWLEY
WELL PAD 5 272 1904 4 0 1 1 -0- -0- -0- -0- <0.01 <0.01 <0.01 <0.01 <0.01 -0- <0.01
350 495 OLD HWY 1187 WELL PAD 5 410 2870 5 0 6 2 -0- -0- -0- -0- <0.01 <0.01 <0.01 <0.01 <0.01 -0- <0.01
351 1099 E RENDON CROWLEY RD
WELL PAD 4 268 1966 4 1 2 8 0.05 0.70 1.96 <0.01 0.67 0.65 <0.01 <0.01 0.39 0.26 0.01
352 1099 E RENDON CROWLEY RD
WELL PAD 4 230 1610 5 0 0 2 -0- -0- -0- -0- <0.01 <0.01 <0.01 <0.01 <0.01 -0- <0.01
353 11799 SOUTH FWY WELL PAD 2 130 910 2 0 5 1 -0- -0- -0- -0- <0.01 <0.01 <0.01 <0.01 <0.01 -0- <0.01
354 492 GARDEN ACRES DR
WELL PAD 3 432 4064 3 1 2 1 0.05 0.70 1.96 <0.01 0.66 0.65 <0.01 <0.01 0.39 0.26 <0.01
355 10598 OAK GROVE RD
WELL PAD 2 224 1568 4 0 1 0 -0- -0- -0- -0- <0.01 <0.01 <0.01 <0.01 <0.01 -0- <0.01
356 9798 OLD BURLESON RD
WELL PAD 3 276 2308 4 1 4 3 0.07 1.04 2.91 <0.01 1.01 1.01 <0.01 <0.01 0.60 0.40 0.01
357 10199 OAK GROVE RD
WELL PAD 3 208 1728 3 1 1 6 0.05 0.70 1.96 <0.01 0.67 0.65 <0.01 0.01 0.39 0.26 <0.01
360 10596 FOREST HILL-EVERMAN RD
WELL PAD 4 288 2016 5 0 2 4 -0- -0- -0- -0- <0.01 <0.01 <0.01 <0.01 <0.01 -0- <0.01
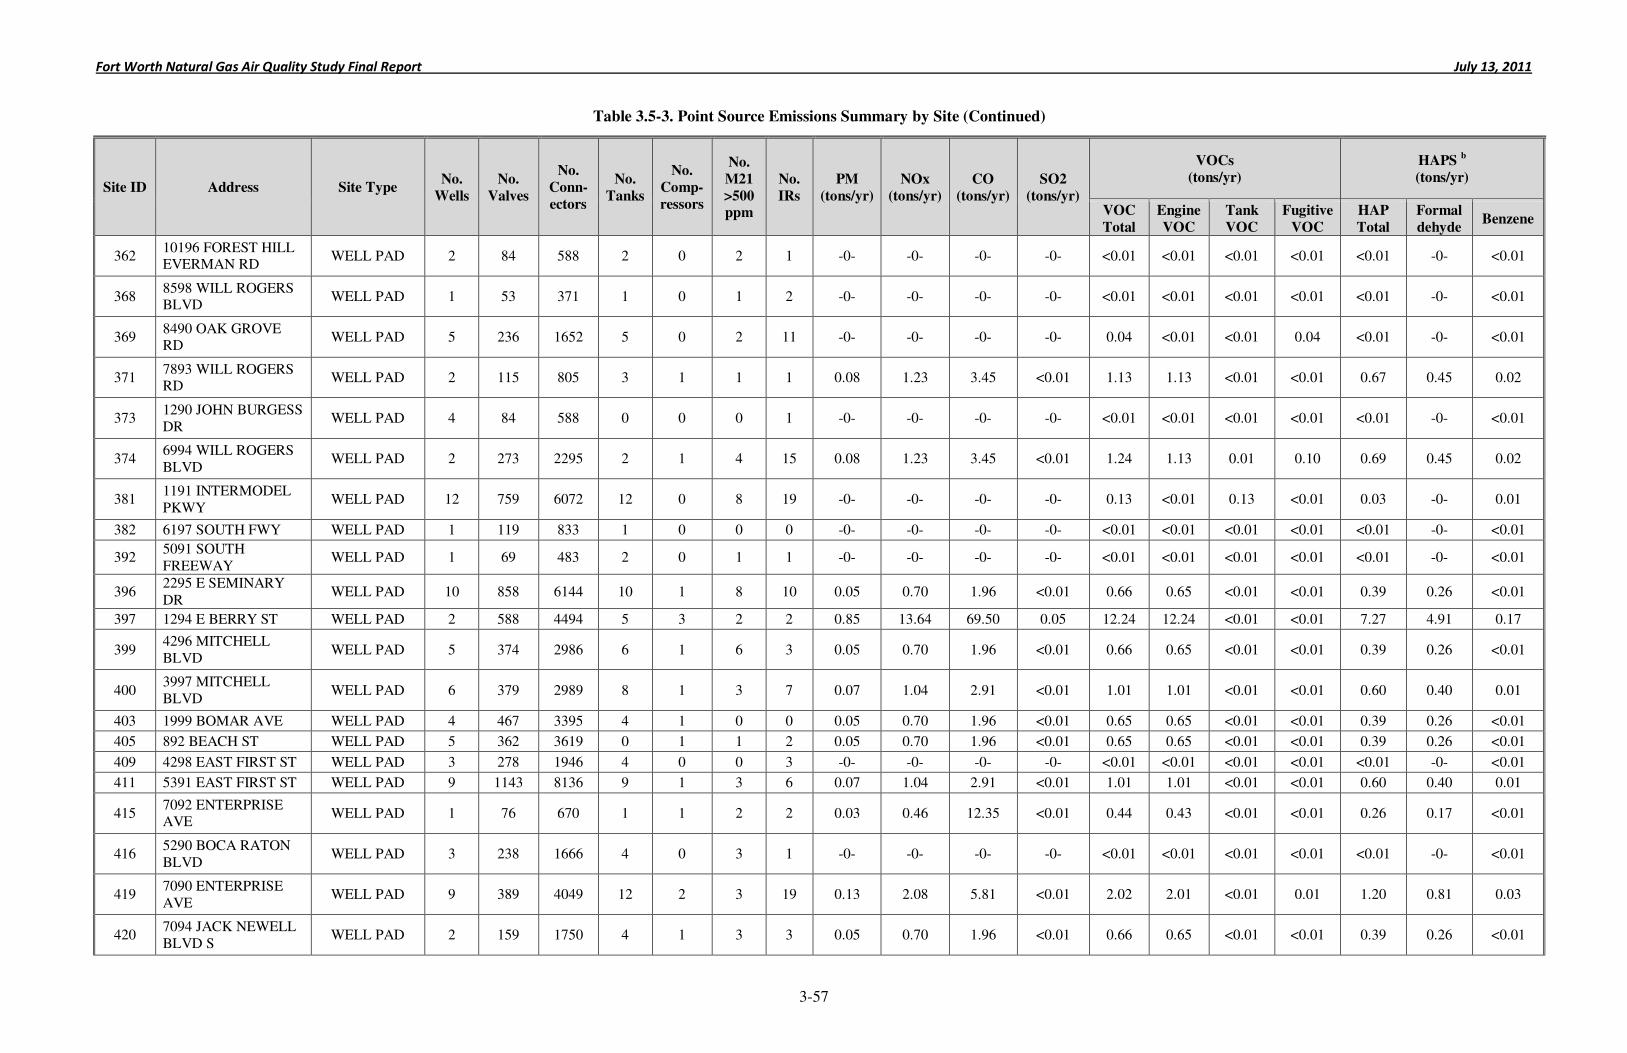
Fort Worth Natural Gas Air Quality Study Final Report July 13, 2011
3-57
Table 3.5-3. Point Source Emissions Summary by Site (Continued)
Site ID Address Site Type No.
Wells
No.
Valves
No.
Conn-
ectors
No.
Tanks
No.
Comp-
ressors
No.
M21
>500 ppm
No.
IRs
PM
(tons/yr)
NOx
(tons/yr)
CO
(tons/yr)
SO2
(tons/yr)
VOCs
(tons/yr)
HAPS b
(tons/yr)
VOC
Total
Engine
VOC
Tank
VOC
Fugitive
VOC
HAP
Total
Formal
dehyde Benzene
362 10196 FOREST HILL EVERMAN RD
WELL PAD 2 84 588 2 0 2 1 -0- -0- -0- -0- <0.01 <0.01 <0.01 <0.01 <0.01 -0- <0.01
368 8598 WILL ROGERS BLVD
WELL PAD 1 53 371 1 0 1 2 -0- -0- -0- -0- <0.01 <0.01 <0.01 <0.01 <0.01 -0- <0.01
369 8490 OAK GROVE RD
WELL PAD 5 236 1652 5 0 2 11 -0- -0- -0- -0- 0.04 <0.01 <0.01 0.04 <0.01 -0- <0.01
371 7893 WILL ROGERS RD
WELL PAD 2 115 805 3 1 1 1 0.08 1.23 3.45 <0.01 1.13 1.13 <0.01 <0.01 0.67 0.45 0.02
373 1290 JOHN BURGESS DR
WELL PAD 4 84 588 0 0 0 1 -0- -0- -0- -0- <0.01 <0.01 <0.01 <0.01 <0.01 -0- <0.01
374 6994 WILL ROGERS BLVD
WELL PAD 2 273 2295 2 1 4 15 0.08 1.23 3.45 <0.01 1.24 1.13 0.01 0.10 0.69 0.45 0.02
381 1191 INTERMODEL PKWY
WELL PAD 12 759 6072 12 0 8 19 -0- -0- -0- -0- 0.13 <0.01 0.13 <0.01 0.03 -0- 0.01
382 6197 SOUTH FWY WELL PAD 1 119 833 1 0 0 0 -0- -0- -0- -0- <0.01 <0.01 <0.01 <0.01 <0.01 -0- <0.01
392 5091 SOUTH FREEWAY
WELL PAD 1 69 483 2 0 1 1 -0- -0- -0- -0- <0.01 <0.01 <0.01 <0.01 <0.01 -0- <0.01
396 2295 E SEMINARY DR
WELL PAD 10 858 6144 10 1 8 10 0.05 0.70 1.96 <0.01 0.66 0.65 <0.01 <0.01 0.39 0.26 <0.01
397 1294 E BERRY ST WELL PAD 2 588 4494 5 3 2 2 0.85 13.64 69.50 0.05 12.24 12.24 <0.01 <0.01 7.27 4.91 0.17
399 4296 MITCHELL BLVD
WELL PAD 5 374 2986 6 1 6 3 0.05 0.70 1.96 <0.01 0.66 0.65 <0.01 <0.01 0.39 0.26 <0.01
400 3997 MITCHELL BLVD
WELL PAD 6 379 2989 8 1 3 7 0.07 1.04 2.91 <0.01 1.01 1.01 <0.01 <0.01 0.60 0.40 0.01
403 1999 BOMAR AVE WELL PAD 4 467 3395 4 1 0 0 0.05 0.70 1.96 <0.01 0.65 0.65 <0.01 <0.01 0.39 0.26 <0.01
405 892 BEACH ST WELL PAD 5 362 3619 0 1 1 2 0.05 0.70 1.96 <0.01 0.65 0.65 <0.01 <0.01 0.39 0.26 <0.01
409 4298 EAST FIRST ST WELL PAD 3 278 1946 4 0 0 3 -0- -0- -0- -0- <0.01 <0.01 <0.01 <0.01 <0.01 -0- <0.01
411 5391 EAST FIRST ST WELL PAD 9 1143 8136 9 1 3 6 0.07 1.04 2.91 <0.01 1.01 1.01 <0.01 <0.01 0.60 0.40 0.01
415 7092 ENTERPRISE AVE
WELL PAD 1 76 670 1 1 2 2 0.03 0.46 12.35 <0.01 0.44 0.43 <0.01 <0.01 0.26 0.17 <0.01
416 5290 BOCA RATON BLVD
WELL PAD 3 238 1666 4 0 3 1 -0- -0- -0- -0- <0.01 <0.01 <0.01 <0.01 <0.01 -0- <0.01
419 7090 ENTERPRISE AVE
WELL PAD 9 389 4049 12 2 3 19 0.13 2.08 5.81 <0.01 2.02 2.01 <0.01 0.01 1.20 0.81 0.03
420 7094 JACK NEWELL BLVD S
WELL PAD 2 159 1750 4 1 3 3 0.05 0.70 1.96 <0.01 0.66 0.65 <0.01 <0.01 0.39 0.26 <0.01
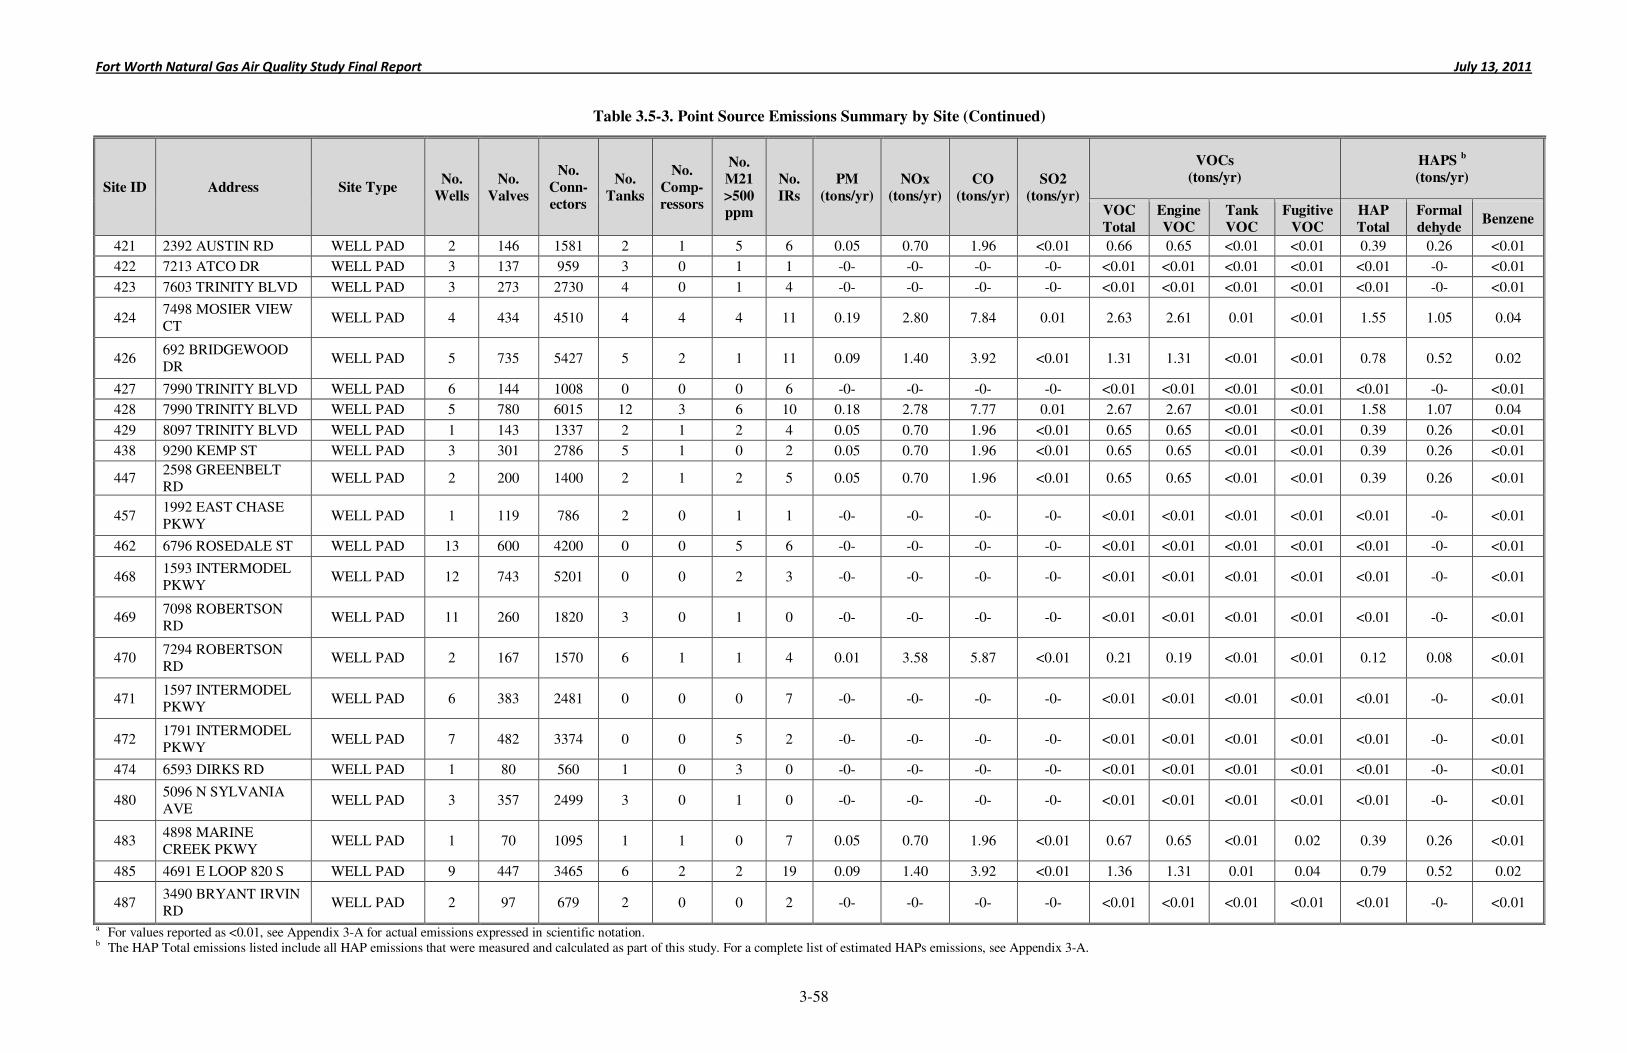
Fort Worth Natural Gas Air Quality Study Final Report July 13, 2011
3-58
Table 3.5-3. Point Source Emissions Summary by Site (Continued)
Site ID Address Site Type No.
Wells
No.
Valves
No.
Conn-
ectors
No.
Tanks
No.
Comp-
ressors
No.
M21
>500 ppm
No.
IRs
PM
(tons/yr)
NOx
(tons/yr)
CO
(tons/yr)
SO2
(tons/yr)
VOCs
(tons/yr)
HAPS b
(tons/yr)
VOC
Total
Engine
VOC
Tank
VOC
Fugitive
VOC
HAP
Total
Formal
dehyde Benzene
421 2392 AUSTIN RD WELL PAD 2 146 1581 2 1 5 6 0.05 0.70 1.96 <0.01 0.66 0.65 <0.01 <0.01 0.39 0.26 <0.01
422 7213 ATCO DR WELL PAD 3 137 959 3 0 1 1 -0- -0- -0- -0- <0.01 <0.01 <0.01 <0.01 <0.01 -0- <0.01
423 7603 TRINITY BLVD WELL PAD 3 273 2730 4 0 1 4 -0- -0- -0- -0- <0.01 <0.01 <0.01 <0.01 <0.01 -0- <0.01
424 7498 MOSIER VIEW CT
WELL PAD 4 434 4510 4 4 4 11 0.19 2.80 7.84 0.01 2.63 2.61 0.01 <0.01 1.55 1.05 0.04
426 692 BRIDGEWOOD DR
WELL PAD 5 735 5427 5 2 1 11 0.09 1.40 3.92 <0.01 1.31 1.31 <0.01 <0.01 0.78 0.52 0.02
427 7990 TRINITY BLVD WELL PAD 6 144 1008 0 0 0 6 -0- -0- -0- -0- <0.01 <0.01 <0.01 <0.01 <0.01 -0- <0.01
428 7990 TRINITY BLVD WELL PAD 5 780 6015 12 3 6 10 0.18 2.78 7.77 0.01 2.67 2.67 <0.01 <0.01 1.58 1.07 0.04
429 8097 TRINITY BLVD WELL PAD 1 143 1337 2 1 2 4 0.05 0.70 1.96 <0.01 0.65 0.65 <0.01 <0.01 0.39 0.26 <0.01
438 9290 KEMP ST WELL PAD 3 301 2786 5 1 0 2 0.05 0.70 1.96 <0.01 0.65 0.65 <0.01 <0.01 0.39 0.26 <0.01
447 2598 GREENBELT RD
WELL PAD 2 200 1400 2 1 2 5 0.05 0.70 1.96 <0.01 0.65 0.65 <0.01 <0.01 0.39 0.26 <0.01
457 1992 EAST CHASE PKWY
WELL PAD 1 119 786 2 0 1 1 -0- -0- -0- -0- <0.01 <0.01 <0.01 <0.01 <0.01 -0- <0.01
462 6796 ROSEDALE ST WELL PAD 13 600 4200 0 0 5 6 -0- -0- -0- -0- <0.01 <0.01 <0.01 <0.01 <0.01 -0- <0.01
468 1593 INTERMODEL PKWY
WELL PAD 12 743 5201 0 0 2 3 -0- -0- -0- -0- <0.01 <0.01 <0.01 <0.01 <0.01 -0- <0.01
469 7098 ROBERTSON RD
WELL PAD 11 260 1820 3 0 1 0 -0- -0- -0- -0- <0.01 <0.01 <0.01 <0.01 <0.01 -0- <0.01
470 7294 ROBERTSON RD
WELL PAD 2 167 1570 6 1 1 4 0.01 3.58 5.87 <0.01 0.21 0.19 <0.01 <0.01 0.12 0.08 <0.01
471 1597 INTERMODEL PKWY
WELL PAD 6 383 2481 0 0 0 7 -0- -0- -0- -0- <0.01 <0.01 <0.01 <0.01 <0.01 -0- <0.01
472 1791 INTERMODEL PKWY
WELL PAD 7 482 3374 0 0 5 2 -0- -0- -0- -0- <0.01 <0.01 <0.01 <0.01 <0.01 -0- <0.01
474 6593 DIRKS RD WELL PAD 1 80 560 1 0 3 0 -0- -0- -0- -0- <0.01 <0.01 <0.01 <0.01 <0.01 -0- <0.01
480 5096 N SYLVANIA AVE
WELL PAD 3 357 2499 3 0 1 0 -0- -0- -0- -0- <0.01 <0.01 <0.01 <0.01 <0.01 -0- <0.01
483 4898 MARINE CREEK PKWY
WELL PAD 1 70 1095 1 1 0 7 0.05 0.70 1.96 <0.01 0.67 0.65 <0.01 0.02 0.39 0.26 <0.01
485 4691 E LOOP 820 S WELL PAD 9 447 3465 6 2 2 19 0.09 1.40 3.92 <0.01 1.36 1.31 0.01 0.04 0.79 0.52 0.02
487 3490 BRYANT IRVIN RD
WELL PAD 2 97 679 2 0 0 2 -0- -0- -0- -0- <0.01 <0.01 <0.01 <0.01 <0.01 -0- <0.01
a For values reported as <0.01, see Appendix 3-A for actual emissions expressed in scientific notation. b The HAP Total emissions listed include all HAP emissions that were measured and calculated as part of this study. For a complete list of estimated HAPs emissions, see Appendix 3-A.
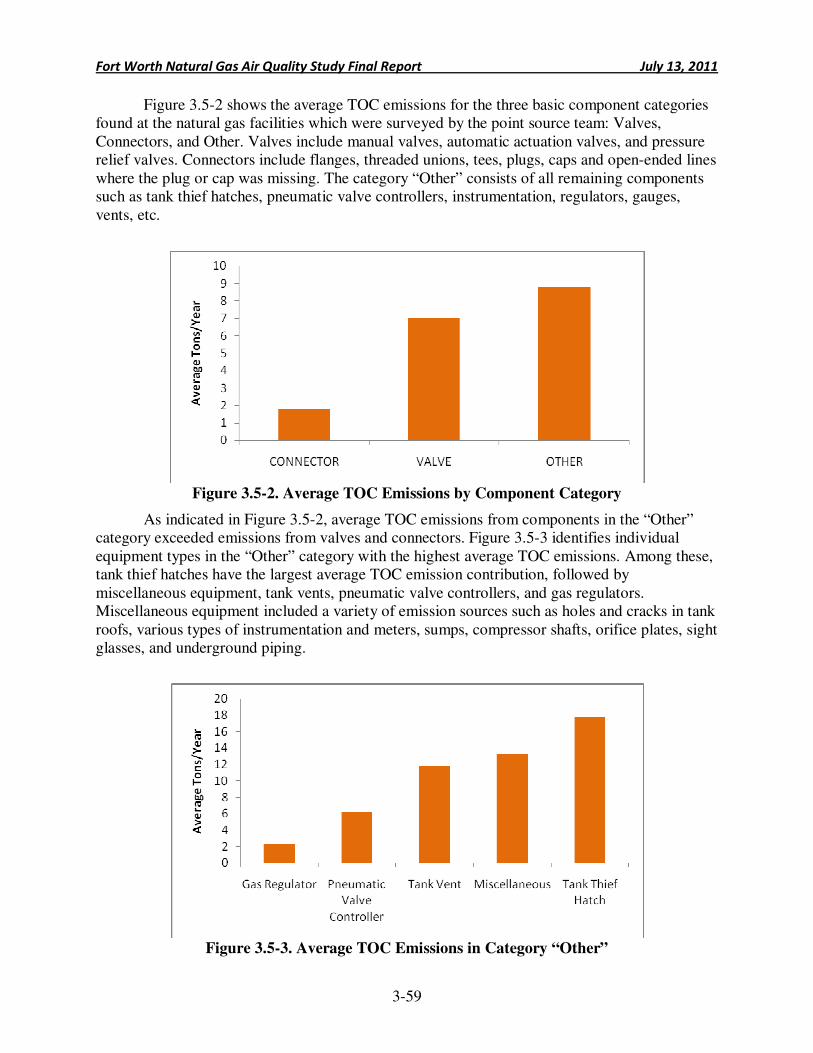
Fort Worth Natural Gas Air Quality Study Final Report July 13, 2011
3-59
Figure 3.5-2 shows the average TOC emissions for the three basic component categories found at the natural gas facilities which were surveyed by the point source team: Valves, Connectors, and Other. Valves include manual valves, automatic actuation valves, and pressure relief valves. Connectors include flanges, threaded unions, tees, plugs, caps and open-ended lines where the plug or cap was missing. The category “Other” consists of all remaining components such as tank thief hatches, pneumatic valve controllers, instrumentation, regulators, gauges, vents, etc.
Figure 3.5-2. Average TOC Emissions by Component Category
As indicated in Figure 3.5-2, average TOC emissions from components in the “Other” category exceeded emissions from valves and connectors. Figure 3.5-3 identifies individual equipment types in the “Other” category with the highest average TOC emissions. Among these, tank thief hatches have the largest average TOC emission contribution, followed by miscellaneous equipment, tank vents, pneumatic valve controllers, and gas regulators. Miscellaneous equipment included a variety of emission sources such as holes and cracks in tank roofs, various types of instrumentation and meters, sumps, compressor shafts, orifice plates, sight glasses, and underground piping.
Figure 3.5-3. Average TOC Emissions in Category “Other”
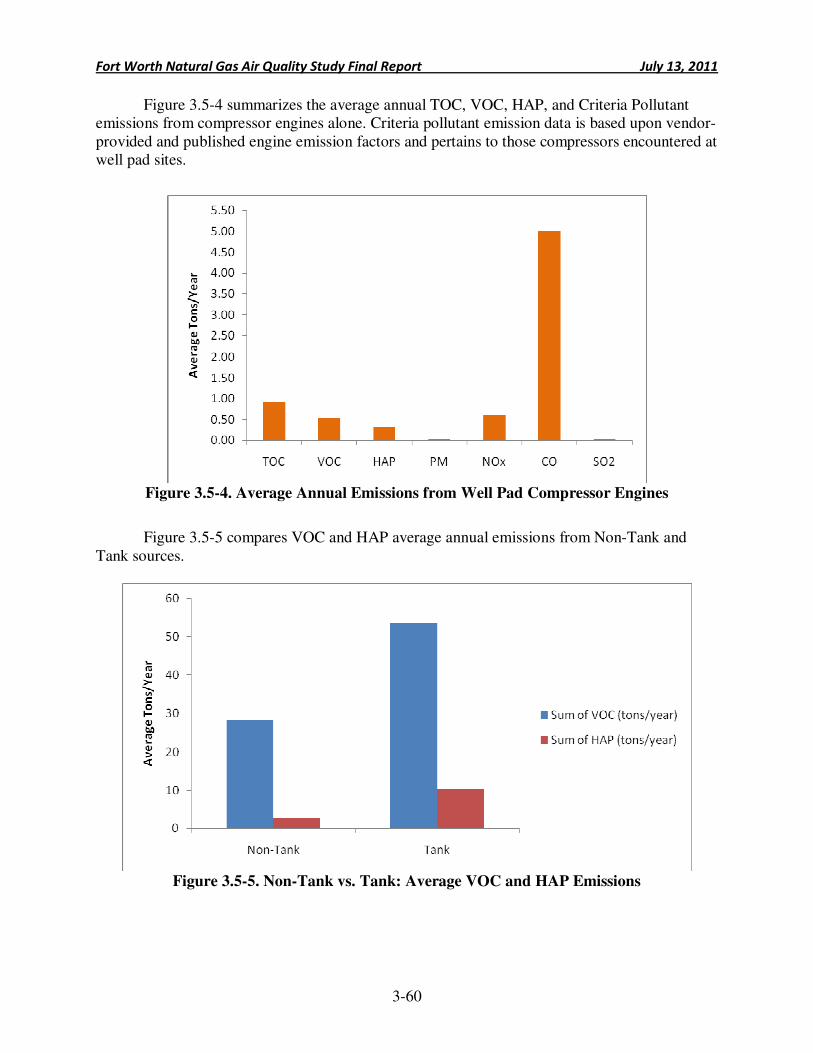
Fort Worth Natural Gas Air Quality Study Final Report July 13, 2011
3-60
Figure 3.5-4 summarizes the average annual TOC, VOC, HAP, and Criteria Pollutant emissions from compressor engines alone. Criteria pollutant emission data is based upon vendor-provided and published engine emission factors and pertains to those compressors encountered at well pad sites.
Figure 3.5-4. Average Annual Emissions from Well Pad Compressor Engines
Figure 3.5-5 compares VOC and HAP average annual emissions from Non-Tank and
Tank sources.
Figure 3.5-5. Non-Tank vs. Tank: Average VOC and HAP Emissions
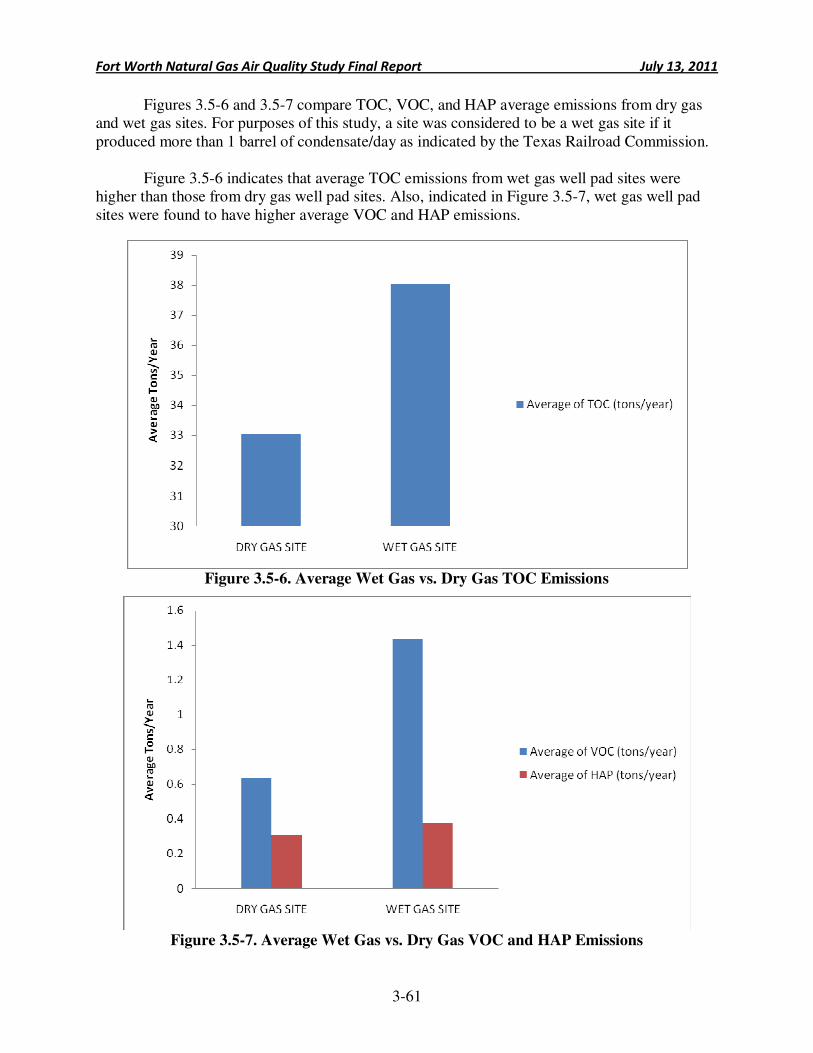
Fort Worth Natural Gas Air Quality Study Final Report July 13, 2011
3-61
Figures 3.5-6 and 3.5-7 compare TOC, VOC, and HAP average emissions from dry gas and wet gas sites. For purposes of this study, a site was considered to be a wet gas site if it produced more than 1 barrel of condensate/day as indicated by the Texas Railroad Commission.
Figure 3.5-6 indicates that average TOC emissions from wet gas well pad sites were higher than those from dry gas well pad sites. Also, indicated in Figure 3.5-7, wet gas well pad sites were found to have higher average VOC and HAP emissions.
Figure 3.5-6. Average Wet Gas vs. Dry Gas TOC Emissions
Figure 3.5-7. Average Wet Gas vs. Dry Gas VOC and HAP Emissions
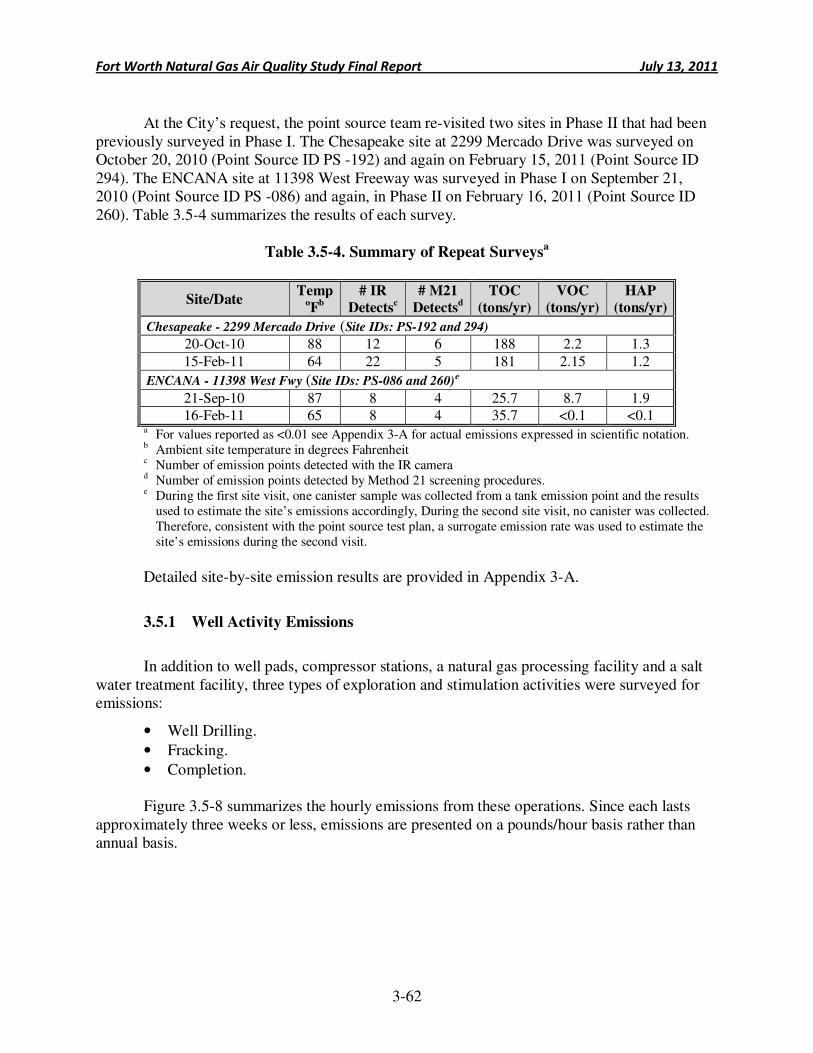
Fort Worth Natural Gas Air Quality Study Final Report July 13, 2011
3-62
At the City’s request, the point source team re-visited two sites in Phase II that had been
previously surveyed in Phase I. The Chesapeake site at 2299 Mercado Drive was surveyed on October 20, 2010 (Point Source ID PS -192) and again on February 15, 2011 (Point Source ID 294). The ENCANA site at 11398 West Freeway was surveyed in Phase I on September 21, 2010 (Point Source ID PS -086) and again, in Phase II on February 16, 2011 (Point Source ID 260). Table 3.5-4 summarizes the results of each survey.
Table 3.5-4. Summary of Repeat Surveysa
Site/Date Temp
oF
b
# IR
Detectsc
# M21
Detectsd
TOC
(tons/yr)
VOC
(tons/yr)
HAP
(tons/yr)
Chesapeake - 2299 Mercado Drive (Site IDs: PS-192 and 294)
20-Oct-10 88 12 6 188 2.2 1.3
15-Feb-11 64 22 5 181 2.15 1.2
ENCANA - 11398 West Fwy (Site IDs: PS-086 and 260)e
21-Sep-10 87 8 4 25.7 8.7 1.9 16-Feb-11 65 8 4 35.7 <0.1 <0.1
a For values reported as <0.01 see Appendix 3-A for actual emissions expressed in scientific notation. b Ambient site temperature in degrees Fahrenheit c Number of emission points detected with the IR camera d Number of emission points detected by Method 21 screening procedures. e During the first site visit, one canister sample was collected from a tank emission point and the results
used to estimate the site’s emissions accordingly, During the second site visit, no canister was collected. Therefore, consistent with the point source test plan, a surrogate emission rate was used to estimate the site’s emissions during the second visit.
Detailed site-by-site emission results are provided in Appendix 3-A.
3.5.1 Well Activity Emissions
In addition to well pads, compressor stations, a natural gas processing facility and a salt water treatment facility, three types of exploration and stimulation activities were surveyed for emissions:
• Well Drilling.
• Fracking.
• Completion.
Figure 3.5-8 summarizes the hourly emissions from these operations. Since each lasts approximately three weeks or less, emissions are presented on a pounds/hour basis rather than annual basis.
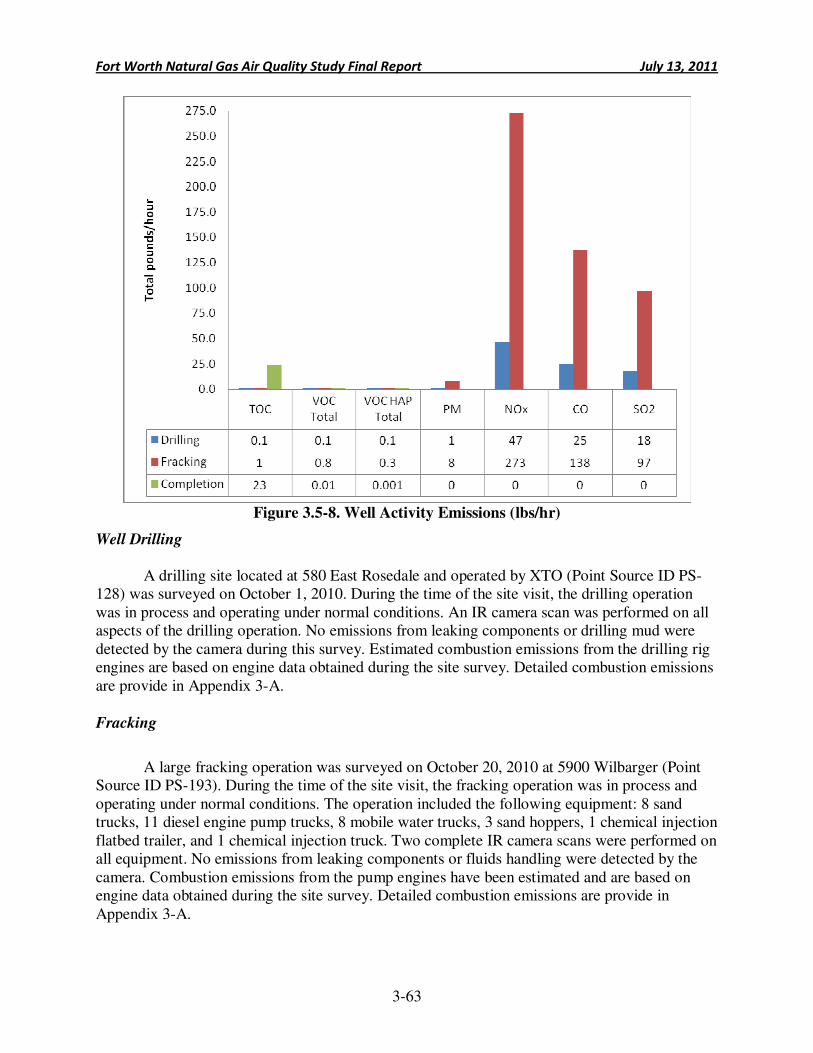
Fort Worth Natural Gas Air Quality Study Final Report July 13, 2011
3-63
Figure 3.5-8. Well Activity Emissions (lbs/hr)
Well Drilling
A drilling site located at 580 East Rosedale and operated by XTO (Point Source ID PS-128) was surveyed on October 1, 2010. During the time of the site visit, the drilling operation was in process and operating under normal conditions. An IR camera scan was performed on all aspects of the drilling operation. No emissions from leaking components or drilling mud were detected by the camera during this survey. Estimated combustion emissions from the drilling rig engines are based on engine data obtained during the site survey. Detailed combustion emissions are provide in Appendix 3-A. Fracking
A large fracking operation was surveyed on October 20, 2010 at 5900 Wilbarger (Point Source ID PS-193). During the time of the site visit, the fracking operation was in process and operating under normal conditions. The operation included the following equipment: 8 sand trucks, 11 diesel engine pump trucks, 8 mobile water trucks, 3 sand hoppers, 1 chemical injection flatbed trailer, and 1 chemical injection truck. Two complete IR camera scans were performed on all equipment. No emissions from leaking components or fluids handling were detected by the camera. Combustion emissions from the pump engines have been estimated and are based on engine data obtained during the site survey. Detailed combustion emissions are provide in Appendix 3-A.
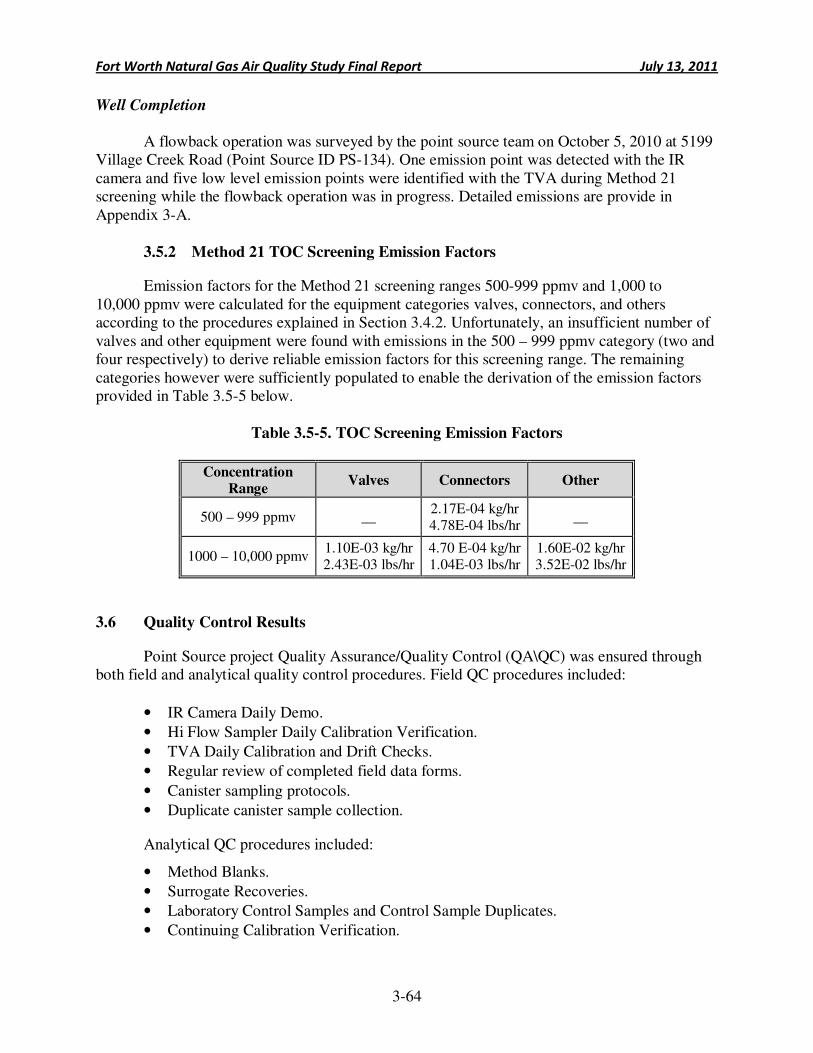
Fort Worth Natural Gas Air Quality Study Final Report July 13, 2011
3-64
Well Completion
A flowback operation was surveyed by the point source team on October 5, 2010 at 5199 Village Creek Road (Point Source ID PS-134). One emission point was detected with the IR camera and five low level emission points were identified with the TVA during Method 21 screening while the flowback operation was in progress. Detailed emissions are provide in Appendix 3-A.
3.5.2 Method 21 TOC Screening Emission Factors
Emission factors for the Method 21 screening ranges 500-999 ppmv and 1,000 to 10,000 ppmv were calculated for the equipment categories valves, connectors, and others according to the procedures explained in Section 3.4.2. Unfortunately, an insufficient number of valves and other equipment were found with emissions in the 500 – 999 ppmv category (two and four respectively) to derive reliable emission factors for this screening range. The remaining categories however were sufficiently populated to enable the derivation of the emission factors provided in Table 3.5-5 below.
Table 3.5-5. TOC Screening Emission Factors
Concentration Range
Valves Connectors Other
500 – 999 ppmv __ 2.17E-04 kg/hr 4.78E-04 lbs/hr
__
1000 – 10,000 ppmv 1.10E-03 kg/hr 2.43E-03 lbs/hr
4.70 E-04 kg/hr 1.04E-03 lbs/hr
1.60E-02 kg/hr 3.52E-02 lbs/hr
3.6 Quality Control Results
Point Source project Quality Assurance/Quality Control (QA\QC) was ensured through both field and analytical quality control procedures. Field QC procedures included:
• IR Camera Daily Demo.
• Hi Flow Sampler Daily Calibration Verification.
• TVA Daily Calibration and Drift Checks.
• Regular review of completed field data forms.
• Canister sampling protocols.
• Duplicate canister sample collection.
Analytical QC procedures included:
• Method Blanks.
• Surrogate Recoveries.
• Laboratory Control Samples and Control Sample Duplicates.
• Continuing Calibration Verification.
Fort Worth Natural Gas Air Quality Study Final Report July 13, 2011
3-65
The results of the field QC checks are provided in the tables following. The results of the analytical QC are provided with the TestAmerica™ laboratory reports in the Appendix 3-C.
3.6.1 IR Camera Daily Demo Results
Three IR cameras were used during this project. IR cameras “GasFindIR” and “GF-320
were used continuously throughout the project. IR camera “Dexter” was used only for one day as a temporary replacement. The sensitivity of each IR camera was evaluated daily prior to testing (i.e. Daily Demo). The Daily Demo was performed at two flow rates: ~10 grams/hour propane and ~30 grams/hour propane. The maximum distance from which the two flow rates could be observed with the cameras was recorded together with current weather data. The results of the IR camera daily demos are provided in Tables 3.6-1 through 3.6-5.
3.6.2 Hi Flow Sampler Calibration Verification
Three Hi Flow Samplers were used during the project. Hi Flow Samplers #QS1002 was used in both Phase I and II. Hi Flow Sampler #QS 1005 was used in Phase I and was replaced in Phase II with Hi Flow Sampler #QX 1007. Each Hi Flow Sampler was calibrated at the start of Phase I and Phase II testing using certified gas cylinders of 2.5% and 99% methane. A calibration verification check of both background and sample sensors was performed daily prior to testing with the 2.5% methane standard. Once each week the calibration verification check of both sensors was performed with the 2.5% and the 99% methane gas standards with an acceptance criterion of +/- 10% agreement. The results of Hi Flow Sampler daily calibration verification checks are summarized in Tables 3.6-6 through 3.6-9.
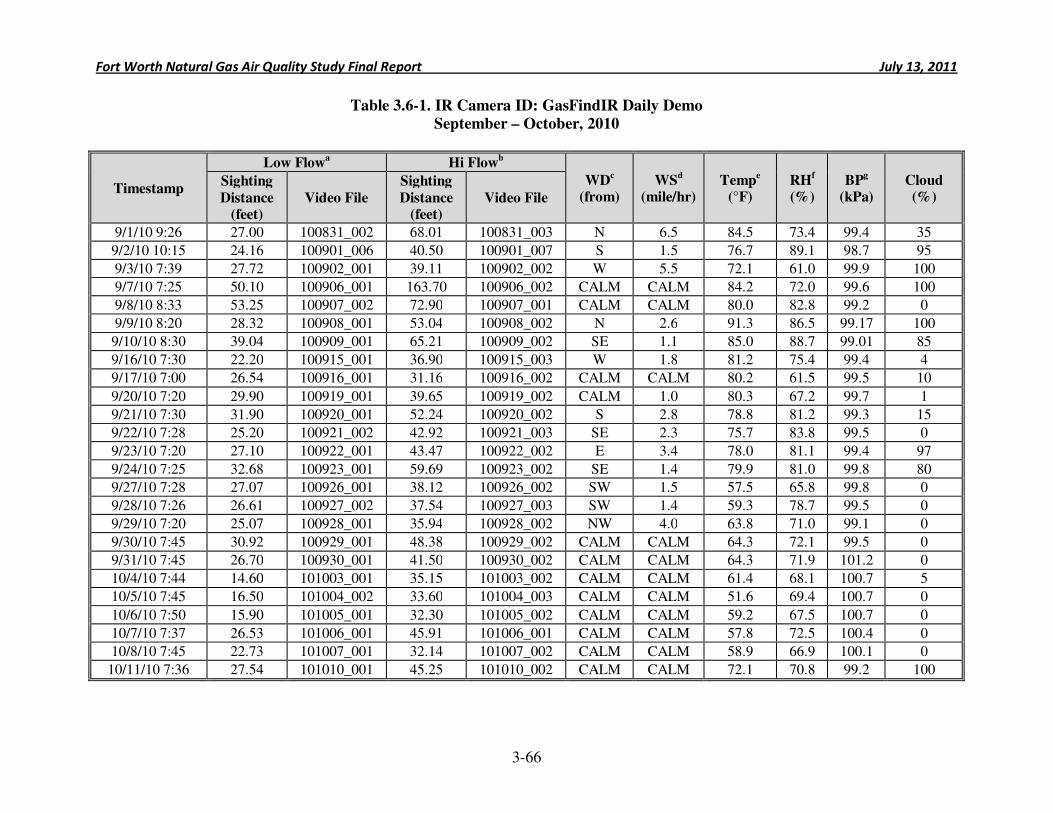
Fort Worth Natural Gas Air Quality Study Final Report July 13, 2011
3-66
Table 3.6-1. IR Camera ID: GasFindIR Daily Demo
September – October, 2010
Timestamp
Low Flowa Hi Flow
b
WDc
(from) WS
d
(mile/hr) Temp
e
(°F) RH
f
(%) BP
g
(kPa) Cloud (%)
Sighting
Distance (feet)
Video File
Sighting
Distance (feet)
Video File
9/1/10 9:26 27.00 100831_002 68.01 100831_003 N 6.5 84.5 73.4 99.4 35
9/2/10 10:15 24.16 100901_006 40.50 100901_007 S 1.5 76.7 89.1 98.7 95
9/3/10 7:39 27.72 100902_001 39.11 100902_002 W 5.5 72.1 61.0 99.9 100
9/7/10 7:25 50.10 100906_001 163.70 100906_002 CALM CALM 84.2 72.0 99.6 100
9/8/10 8:33 53.25 100907_002 72.90 100907_001 CALM CALM 80.0 82.8 99.2 0
9/9/10 8:20 28.32 100908_001 53.04 100908_002 N 2.6 91.3 86.5 99.17 100
9/10/10 8:30 39.04 100909_001 65.21 100909_002 SE 1.1 85.0 88.7 99.01 85
9/16/10 7:30 22.20 100915_001 36.90 100915_003 W 1.8 81.2 75.4 99.4 4
9/17/10 7:00 26.54 100916_001 31.16 100916_002 CALM CALM 80.2 61.5 99.5 10
9/20/10 7:20 29.90 100919_001 39.65 100919_002 CALM 1.0 80.3 67.2 99.7 1
9/21/10 7:30 31.90 100920_001 52.24 100920_002 S 2.8 78.8 81.2 99.3 15
9/22/10 7:28 25.20 100921_002 42.92 100921_003 SE 2.3 75.7 83.8 99.5 0
9/23/10 7:20 27.10 100922_001 43.47 100922_002 E 3.4 78.0 81.1 99.4 97
9/24/10 7:25 32.68 100923_001 59.69 100923_002 SE 1.4 79.9 81.0 99.8 80
9/27/10 7:28 27.07 100926_001 38.12 100926_002 SW 1.5 57.5 65.8 99.8 0
9/28/10 7:26 26.61 100927_002 37.54 100927_003 SW 1.4 59.3 78.7 99.5 0
9/29/10 7:20 25.07 100928_001 35.94 100928_002 NW 4.0 63.8 71.0 99.1 0
9/30/10 7:45 30.92 100929_001 48.38 100929_002 CALM CALM 64.3 72.1 99.5 0
9/31/10 7:45 26.70 100930_001 41.50 100930_002 CALM CALM 64.3 71.9 101.2 0
10/4/10 7:44 14.60 101003_001 35.15 101003_002 CALM CALM 61.4 68.1 100.7 5
10/5/10 7:45 16.50 101004_002 33.60 101004_003 CALM CALM 51.6 69.4 100.7 0
10/6/10 7:50 15.90 101005_001 32.30 101005_002 CALM CALM 59.2 67.5 100.7 0
10/7/10 7:37 26.53 101006_001 45.91 101006_001 CALM CALM 57.8 72.5 100.4 0
10/8/10 7:45 22.73 101007_001 32.14 101007_002 CALM CALM 58.9 66.9 100.1 0
10/11/10 7:36 27.54 101010_001 45.25 101010_002 CALM CALM 72.1 70.8 99.2 100
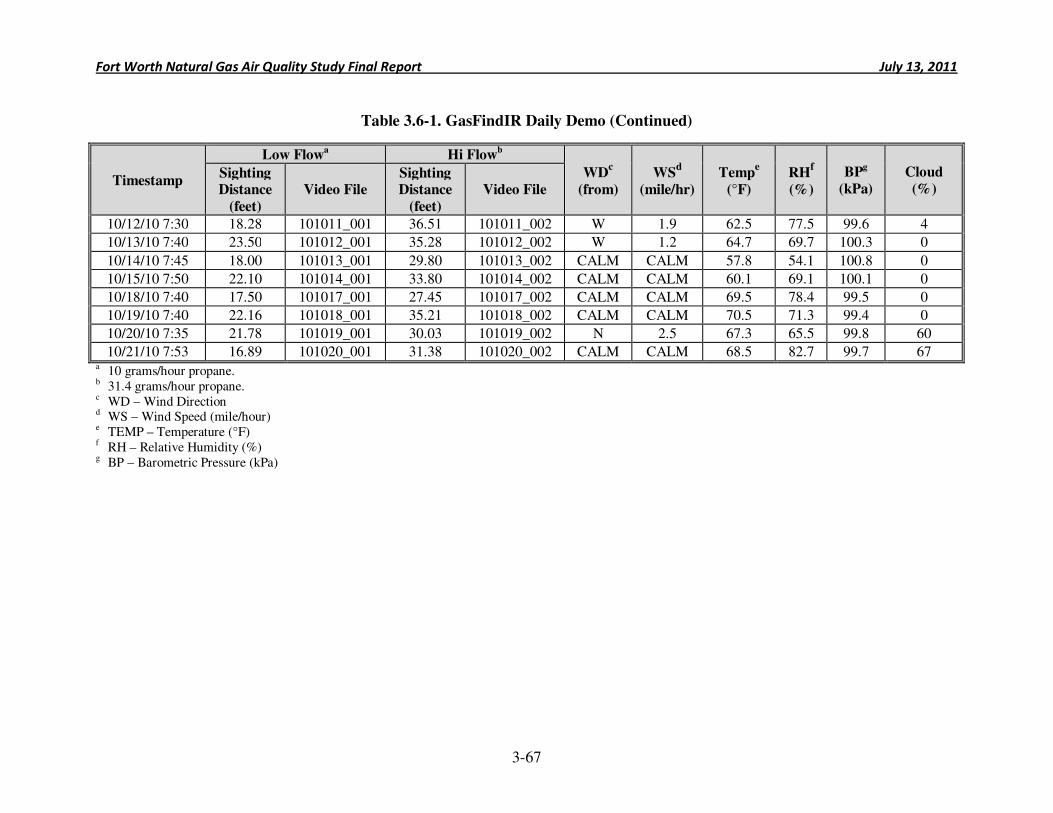
Fort Worth Natural Gas Air Quality Study Final Report July 13, 2011
3-67
Table 3.6-1. GasFindIR Daily Demo (Continued)
Timestamp
Low Flowa Hi Flow
b
WDc
(from)
WSd
(mile/hr)
Tempe
(°F)
RHf
(%)
BPg
(kPa)
Cloud
(%) Sighting Distance
(feet)
Video File Sighting Distance
(feet)
Video File
10/12/10 7:30 18.28 101011_001 36.51 101011_002 W 1.9 62.5 77.5 99.6 4
10/13/10 7:40 23.50 101012_001 35.28 101012_002 W 1.2 64.7 69.7 100.3 0
10/14/10 7:45 18.00 101013_001 29.80 101013_002 CALM CALM 57.8 54.1 100.8 0
10/15/10 7:50 22.10 101014_001 33.80 101014_002 CALM CALM 60.1 69.1 100.1 0
10/18/10 7:40 17.50 101017_001 27.45 101017_002 CALM CALM 69.5 78.4 99.5 0
10/19/10 7:40 22.16 101018_001 35.21 101018_002 CALM CALM 70.5 71.3 99.4 0
10/20/10 7:35 21.78 101019_001 30.03 101019_002 N 2.5 67.3 65.5 99.8 60
10/21/10 7:53 16.89 101020_001 31.38 101020_002 CALM CALM 68.5 82.7 99.7 67 a 10 grams/hour propane. b 31.4 grams/hour propane. c WD – Wind Direction d WS – Wind Speed (mile/hour) e TEMP – Temperature (°F) f RH – Relative Humidity (%) g BP – Barometric Pressure (kPa)
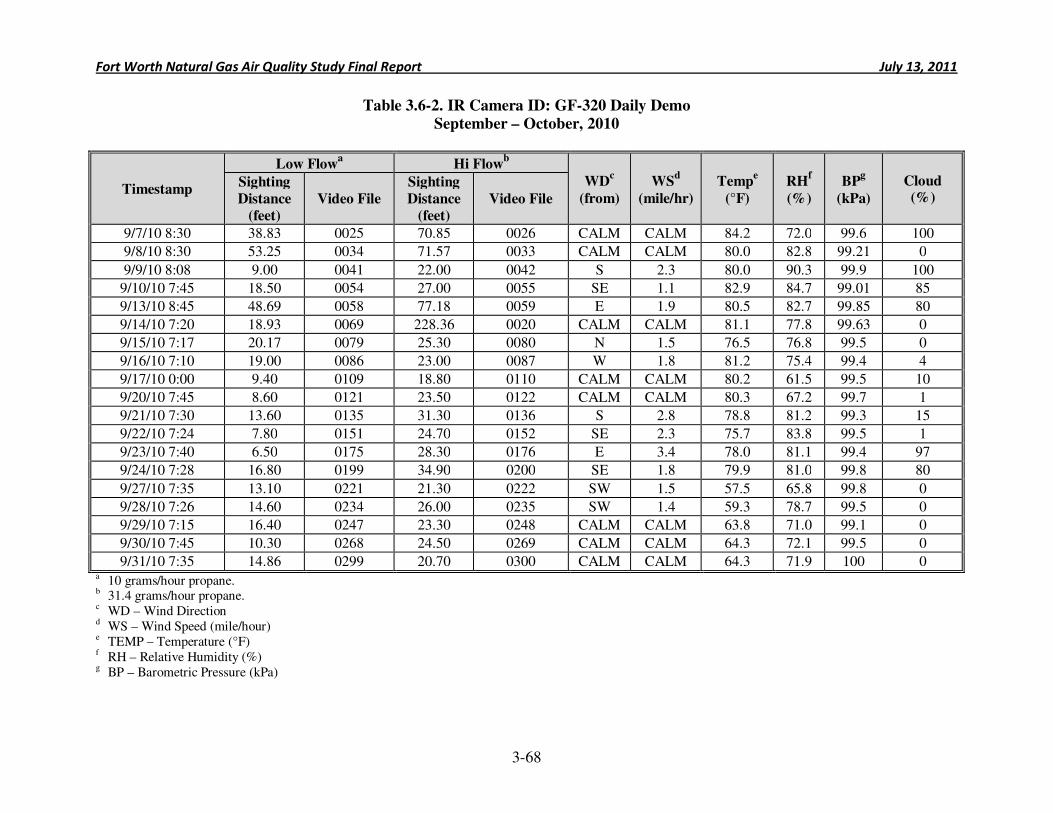
Fort Worth Natural Gas Air Quality Study Final Report July 13, 2011
3-68
Table 3.6-2. IR Camera ID: GF-320 Daily Demo
September – October, 2010
Timestamp
Low Flowa Hi Flow
b
WDc
(from)
WSd
(mile/hr)
Tempe
(°F)
RHf
(%)
BPg
(kPa)
Cloud (%)
Sighting
Distance
(feet)
Video File
Sighting
Distance
(feet)
Video File
9/7/10 8:30 38.83 0025 70.85 0026 CALM CALM 84.2 72.0 99.6 100
9/8/10 8:30 53.25 0034 71.57 0033 CALM CALM 80.0 82.8 99.21 0
9/9/10 8:08 9.00 0041 22.00 0042 S 2.3 80.0 90.3 99.9 100
9/10/10 7:45 18.50 0054 27.00 0055 SE 1.1 82.9 84.7 99.01 85
9/13/10 8:45 48.69 0058 77.18 0059 E 1.9 80.5 82.7 99.85 80
9/14/10 7:20 18.93 0069 228.36 0020 CALM CALM 81.1 77.8 99.63 0
9/15/10 7:17 20.17 0079 25.30 0080 N 1.5 76.5 76.8 99.5 0
9/16/10 7:10 19.00 0086 23.00 0087 W 1.8 81.2 75.4 99.4 4
9/17/10 0:00 9.40 0109 18.80 0110 CALM CALM 80.2 61.5 99.5 10
9/20/10 7:45 8.60 0121 23.50 0122 CALM CALM 80.3 67.2 99.7 1
9/21/10 7:30 13.60 0135 31.30 0136 S 2.8 78.8 81.2 99.3 15
9/22/10 7:24 7.80 0151 24.70 0152 SE 2.3 75.7 83.8 99.5 1
9/23/10 7:40 6.50 0175 28.30 0176 E 3.4 78.0 81.1 99.4 97
9/24/10 7:28 16.80 0199 34.90 0200 SE 1.8 79.9 81.0 99.8 80
9/27/10 7:35 13.10 0221 21.30 0222 SW 1.5 57.5 65.8 99.8 0
9/28/10 7:26 14.60 0234 26.00 0235 SW 1.4 59.3 78.7 99.5 0
9/29/10 7:15 16.40 0247 23.30 0248 CALM CALM 63.8 71.0 99.1 0
9/30/10 7:45 10.30 0268 24.50 0269 CALM CALM 64.3 72.1 99.5 0
9/31/10 7:35 14.86 0299 20.70 0300 CALM CALM 64.3 71.9 100 0 a 10 grams/hour propane. b 31.4 grams/hour propane. c WD – Wind Direction d WS – Wind Speed (mile/hour) e TEMP – Temperature (°F) f RH – Relative Humidity (%) g BP – Barometric Pressure (kPa)
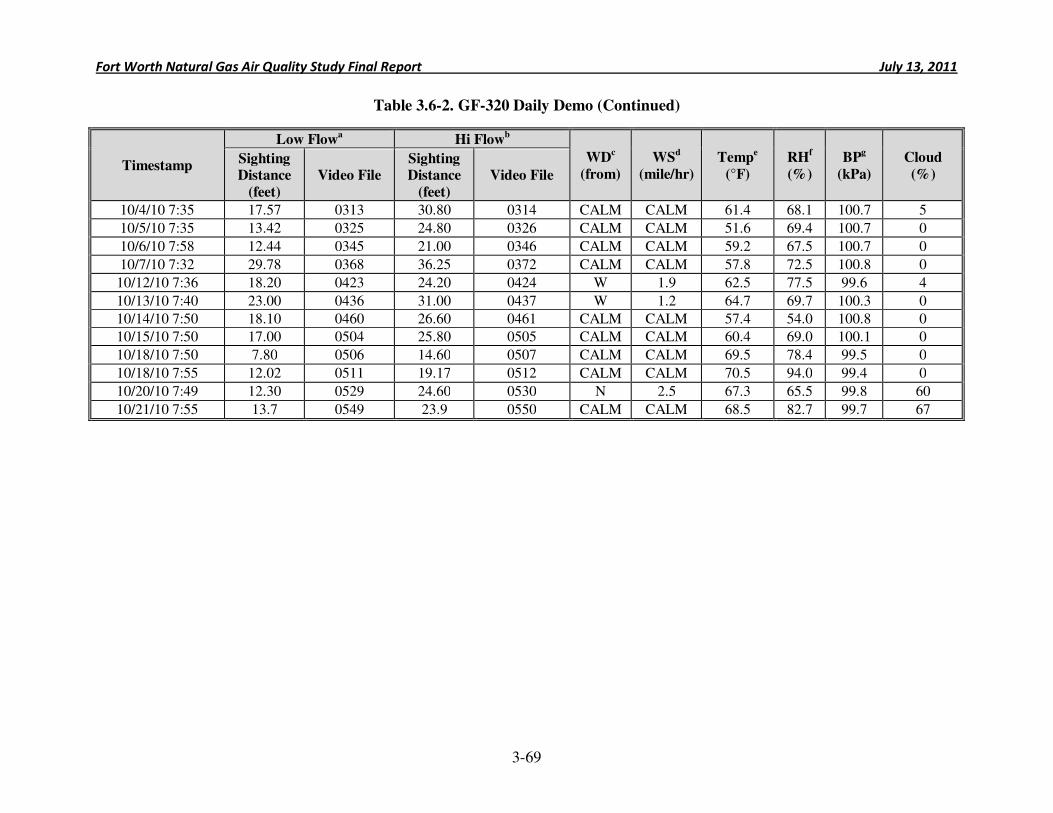
Fort Worth Natural Gas Air Quality Study Final Report July 13, 2011
3-69
Table 3.6-2. GF-320 Daily Demo (Continued)
Timestamp
Low Flowa Hi Flow
b
WDc
(from)
WSd
(mile/hr)
Tempe
(°F)
RHf
(%)
BPg
(kPa)
Cloud
(%) Sighting Distance
(feet)
Video File Sighting Distance
(feet)
Video File
10/4/10 7:35 17.57 0313 30.80 0314 CALM CALM 61.4 68.1 100.7 5
10/5/10 7:35 13.42 0325 24.80 0326 CALM CALM 51.6 69.4 100.7 0
10/6/10 7:58 12.44 0345 21.00 0346 CALM CALM 59.2 67.5 100.7 0
10/7/10 7:32 29.78 0368 36.25 0372 CALM CALM 57.8 72.5 100.8 0
10/12/10 7:36 18.20 0423 24.20 0424 W 1.9 62.5 77.5 99.6 4
10/13/10 7:40 23.00 0436 31.00 0437 W 1.2 64.7 69.7 100.3 0
10/14/10 7:50 18.10 0460 26.60 0461 CALM CALM 57.4 54.0 100.8 0
10/15/10 7:50 17.00 0504 25.80 0505 CALM CALM 60.4 69.0 100.1 0
10/18/10 7:50 7.80 0506 14.60 0507 CALM CALM 69.5 78.4 99.5 0
10/18/10 7:55 12.02 0511 19.17 0512 CALM CALM 70.5 94.0 99.4 0
10/20/10 7:49 12.30 0529 24.60 0530 N 2.5 67.3 65.5 99.8 60
10/21/10 7:55 13.7 0549 23.9 0550 CALM CALM 68.5 82.7 99.7 67
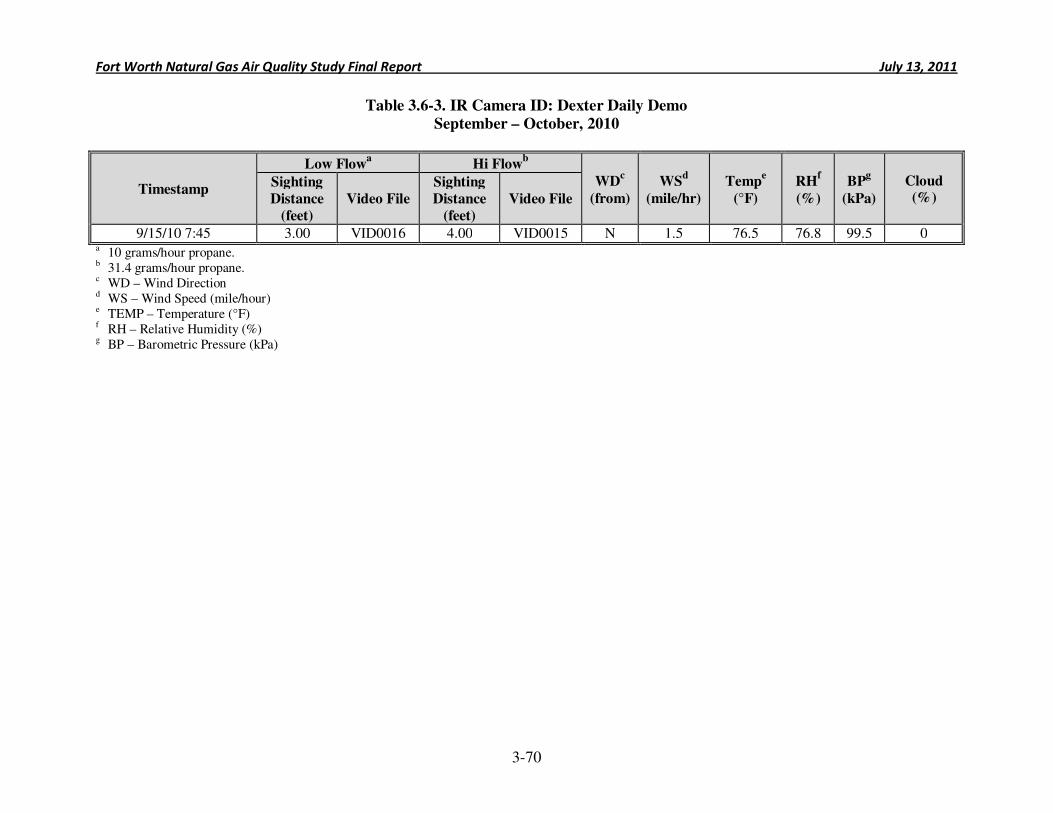
Fort Worth Natural Gas Air Quality Study Final Report July 13, 2011
3-70
Table 3.6-3. IR Camera ID: Dexter Daily Demo
September – October, 2010
Timestamp
Low Flowa Hi Flow
b
WDc
(from)
WSd
(mile/hr)
Tempe
(°F)
RHf
(%)
BPg
(kPa)
Cloud (%)
Sighting
Distance
(feet)
Video File
Sighting
Distance
(feet)
Video File
9/15/10 7:45 3.00 VID0016 4.00 VID0015 N 1.5 76.5 76.8 99.5 0 a 10 grams/hour propane. b 31.4 grams/hour propane. c WD – Wind Direction d WS – Wind Speed (mile/hour) e TEMP – Temperature (°F) f RH – Relative Humidity (%) g BP – Barometric Pressure (kPa)
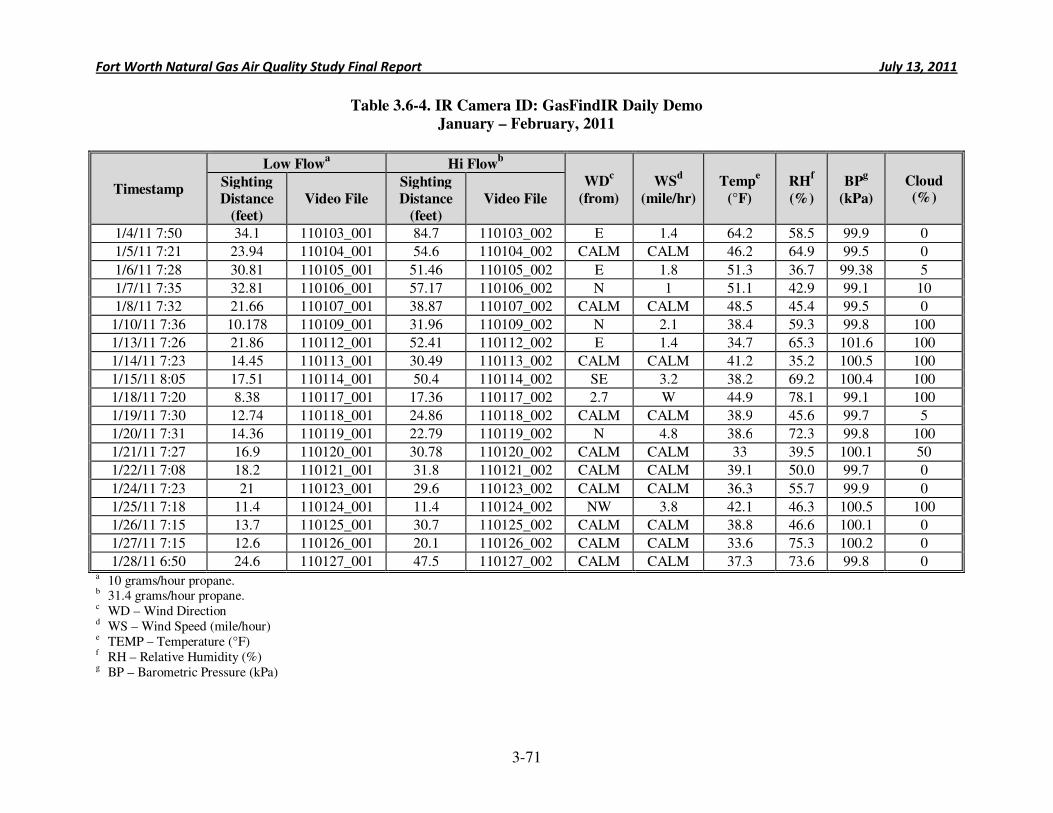
Fort Worth Natural Gas Air Quality Study Final Report July 13, 2011
3-71
Table 3.6-4. IR Camera ID: GasFindIR Daily Demo
January – February, 2011
Timestamp
Low Flowa Hi Flow
b
WDc
(from)
WSd
(mile/hr)
Tempe
(°F)
RHf
(%)
BPg
(kPa)
Cloud (%)
Sighting
Distance
(feet)
Video File
Sighting
Distance
(feet)
Video File
1/4/11 7:50 34.1 110103_001 84.7 110103_002 E 1.4 64.2 58.5 99.9 0
1/5/11 7:21 23.94 110104_001 54.6 110104_002 CALM CALM 46.2 64.9 99.5 0
1/6/11 7:28 30.81 110105_001 51.46 110105_002 E 1.8 51.3 36.7 99.38 5
1/7/11 7:35 32.81 110106_001 57.17 110106_002 N 1 51.1 42.9 99.1 10
1/8/11 7:32 21.66 110107_001 38.87 110107_002 CALM CALM 48.5 45.4 99.5 0
1/10/11 7:36 10.178 110109_001 31.96 110109_002 N 2.1 38.4 59.3 99.8 100
1/13/11 7:26 21.86 110112_001 52.41 110112_002 E 1.4 34.7 65.3 101.6 100
1/14/11 7:23 14.45 110113_001 30.49 110113_002 CALM CALM 41.2 35.2 100.5 100
1/15/11 8:05 17.51 110114_001 50.4 110114_002 SE 3.2 38.2 69.2 100.4 100
1/18/11 7:20 8.38 110117_001 17.36 110117_002 2.7 W 44.9 78.1 99.1 100
1/19/11 7:30 12.74 110118_001 24.86 110118_002 CALM CALM 38.9 45.6 99.7 5
1/20/11 7:31 14.36 110119_001 22.79 110119_002 N 4.8 38.6 72.3 99.8 100
1/21/11 7:27 16.9 110120_001 30.78 110120_002 CALM CALM 33 39.5 100.1 50
1/22/11 7:08 18.2 110121_001 31.8 110121_002 CALM CALM 39.1 50.0 99.7 0
1/24/11 7:23 21 110123_001 29.6 110123_002 CALM CALM 36.3 55.7 99.9 0
1/25/11 7:18 11.4 110124_001 11.4 110124_002 NW 3.8 42.1 46.3 100.5 100
1/26/11 7:15 13.7 110125_001 30.7 110125_002 CALM CALM 38.8 46.6 100.1 0
1/27/11 7:15 12.6 110126_001 20.1 110126_002 CALM CALM 33.6 75.3 100.2 0
1/28/11 6:50 24.6 110127_001 47.5 110127_002 CALM CALM 37.3 73.6 99.8 0 a 10 grams/hour propane. b 31.4 grams/hour propane. c WD – Wind Direction d WS – Wind Speed (mile/hour) e TEMP – Temperature (°F) f RH – Relative Humidity (%) g BP – Barometric Pressure (kPa)
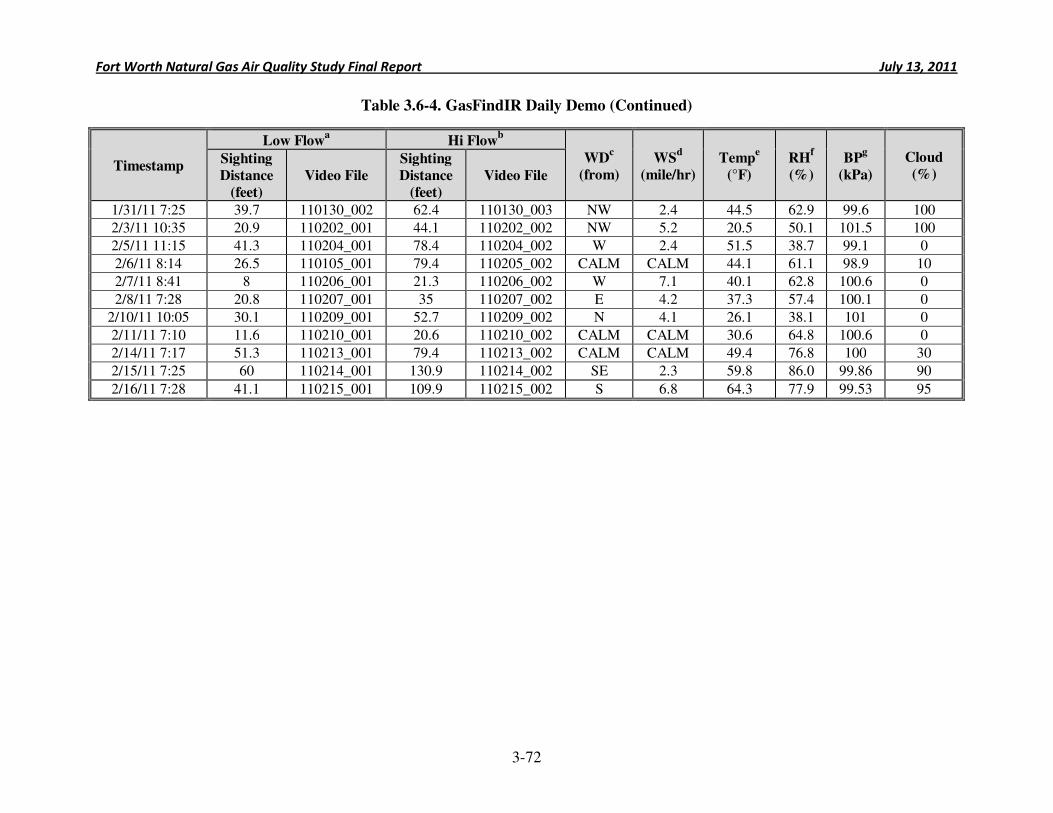
Fort Worth Natural Gas Air Quality Study Final Report July 13, 2011
3-72
Table 3.6-4. GasFindIR Daily Demo (Continued)
Timestamp
Low Flowa Hi Flow
b
WDc
(from)
WSd
(mile/hr)
Tempe
(°F)
RHf
(%)
BPg
(kPa)
Cloud
(%) Sighting
Distance
(feet)
Video File
Sighting
Distance
(feet)
Video File
1/31/11 7:25 39.7 110130_002 62.4 110130_003 NW 2.4 44.5 62.9 99.6 100
2/3/11 10:35 20.9 110202_001 44.1 110202_002 NW 5.2 20.5 50.1 101.5 100
2/5/11 11:15 41.3 110204_001 78.4 110204_002 W 2.4 51.5 38.7 99.1 0
2/6/11 8:14 26.5 110105_001 79.4 110205_002 CALM CALM 44.1 61.1 98.9 10
2/7/11 8:41 8 110206_001 21.3 110206_002 W 7.1 40.1 62.8 100.6 0
2/8/11 7:28 20.8 110207_001 35 110207_002 E 4.2 37.3 57.4 100.1 0
2/10/11 10:05 30.1 110209_001 52.7 110209_002 N 4.1 26.1 38.1 101 0
2/11/11 7:10 11.6 110210_001 20.6 110210_002 CALM CALM 30.6 64.8 100.6 0
2/14/11 7:17 51.3 110213_001 79.4 110213_002 CALM CALM 49.4 76.8 100 30
2/15/11 7:25 60 110214_001 130.9 110214_002 SE 2.3 59.8 86.0 99.86 90
2/16/11 7:28 41.1 110215_001 109.9 110215_002 S 6.8 64.3 77.9 99.53 95
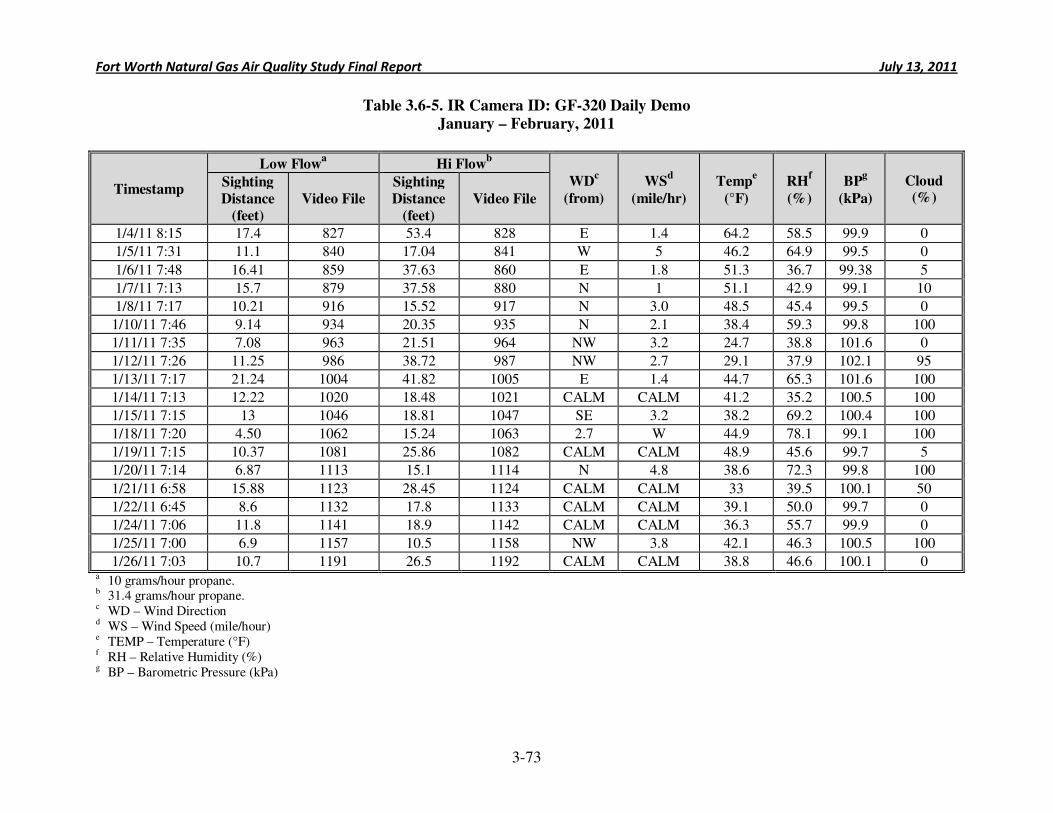
Fort Worth Natural Gas Air Quality Study Final Report July 13, 2011
3-73
Table 3.6-5. IR Camera ID: GF-320 Daily Demo
January – February, 2011
Timestamp
Low Flowa Hi Flow
b
WDc
(from)
WSd
(mile/hr)
Tempe
(°F)
RHf
(%)
BPg
(kPa)
Cloud (%)
Sighting
Distance
(feet)
Video File
Sighting
Distance
(feet)
Video File
1/4/11 8:15 17.4 827 53.4 828 E 1.4 64.2 58.5 99.9 0
1/5/11 7:31 11.1 840 17.04 841 W 5 46.2 64.9 99.5 0
1/6/11 7:48 16.41 859 37.63 860 E 1.8 51.3 36.7 99.38 5
1/7/11 7:13 15.7 879 37.58 880 N 1 51.1 42.9 99.1 10
1/8/11 7:17 10.21 916 15.52 917 N 3.0 48.5 45.4 99.5 0
1/10/11 7:46 9.14 934 20.35 935 N 2.1 38.4 59.3 99.8 100
1/11/11 7:35 7.08 963 21.51 964 NW 3.2 24.7 38.8 101.6 0
1/12/11 7:26 11.25 986 38.72 987 NW 2.7 29.1 37.9 102.1 95
1/13/11 7:17 21.24 1004 41.82 1005 E 1.4 44.7 65.3 101.6 100
1/14/11 7:13 12.22 1020 18.48 1021 CALM CALM 41.2 35.2 100.5 100
1/15/11 7:15 13 1046 18.81 1047 SE 3.2 38.2 69.2 100.4 100
1/18/11 7:20 4.50 1062 15.24 1063 2.7 W 44.9 78.1 99.1 100
1/19/11 7:15 10.37 1081 25.86 1082 CALM CALM 48.9 45.6 99.7 5
1/20/11 7:14 6.87 1113 15.1 1114 N 4.8 38.6 72.3 99.8 100
1/21/11 6:58 15.88 1123 28.45 1124 CALM CALM 33 39.5 100.1 50
1/22/11 6:45 8.6 1132 17.8 1133 CALM CALM 39.1 50.0 99.7 0
1/24/11 7:06 11.8 1141 18.9 1142 CALM CALM 36.3 55.7 99.9 0
1/25/11 7:00 6.9 1157 10.5 1158 NW 3.8 42.1 46.3 100.5 100
1/26/11 7:03 10.7 1191 26.5 1192 CALM CALM 38.8 46.6 100.1 0 a 10 grams/hour propane. b 31.4 grams/hour propane. c WD – Wind Direction d WS – Wind Speed (mile/hour) e TEMP – Temperature (°F) f RH – Relative Humidity (%) g BP – Barometric Pressure (kPa)
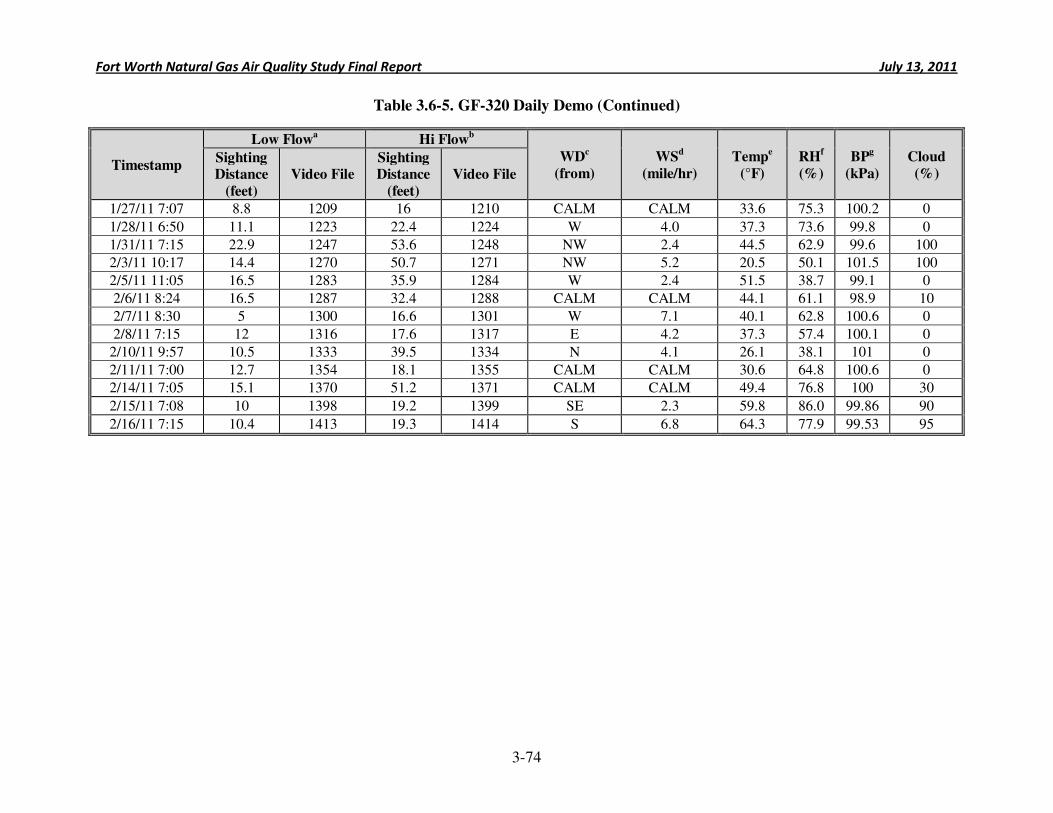
Fort Worth Natural Gas Air Quality Study Final Report July 13, 2011
3-74
Table 3.6-5. GF-320 Daily Demo (Continued)
Timestamp
Low Flowa Hi Flow
b
WDc
(from)
WSd
(mile/hr)
Tempe
(°F)
RHf
(%)
BPg
(kPa)
Cloud
(%) Sighting Distance
(feet) Video File
Sighting Distance
(feet)
Video File
1/27/11 7:07 8.8 1209 16 1210 CALM CALM 33.6 75.3 100.2 0
1/28/11 6:50 11.1 1223 22.4 1224 W 4.0 37.3 73.6 99.8 0
1/31/11 7:15 22.9 1247 53.6 1248 NW 2.4 44.5 62.9 99.6 100
2/3/11 10:17 14.4 1270 50.7 1271 NW 5.2 20.5 50.1 101.5 100
2/5/11 11:05 16.5 1283 35.9 1284 W 2.4 51.5 38.7 99.1 0
2/6/11 8:24 16.5 1287 32.4 1288 CALM CALM 44.1 61.1 98.9 10
2/7/11 8:30 5 1300 16.6 1301 W 7.1 40.1 62.8 100.6 0
2/8/11 7:15 12 1316 17.6 1317 E 4.2 37.3 57.4 100.1 0
2/10/11 9:57 10.5 1333 39.5 1334 N 4.1 26.1 38.1 101 0
2/11/11 7:00 12.7 1354 18.1 1355 CALM CALM 30.6 64.8 100.6 0
2/14/11 7:05 15.1 1370 51.2 1371 CALM CALM 49.4 76.8 100 30
2/15/11 7:08 10 1398 19.2 1399 SE 2.3 59.8 86.0 99.86 90
2/16/11 7:15 10.4 1413 19.3 1414 S 6.8 64.3 77.9 99.53 95
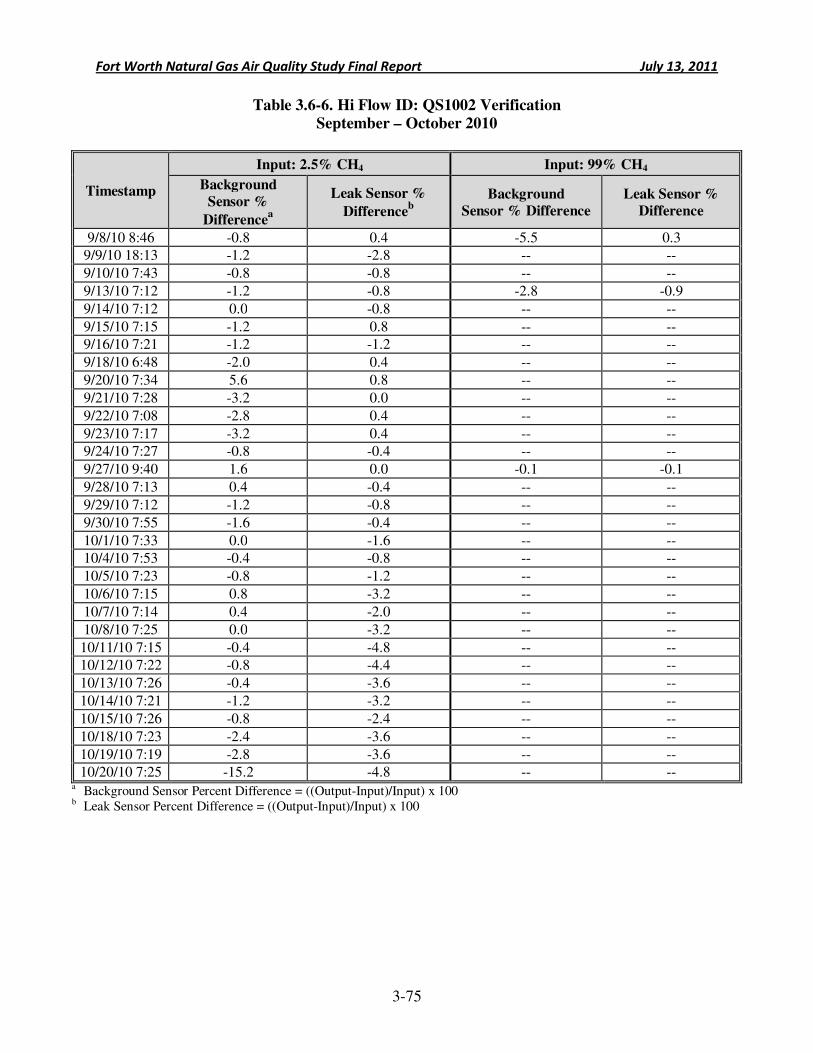
Fort Worth Natural Gas Air Quality Study Final Report July 13, 2011
3-75
Table 3.6-6. Hi Flow ID: QS1002 Verification
September – October 2010
Timestamp
Input: 2.5% CH4 Input: 99% CH4
Background
Sensor %
Differencea
Leak Sensor %
Differenceb
Background
Sensor % Difference
Leak Sensor %
Difference
9/8/10 8:46 -0.8 0.4 -5.5 0.3
9/9/10 18:13 -1.2 -2.8 -- --
9/10/10 7:43 -0.8 -0.8 -- --
9/13/10 7:12 -1.2 -0.8 -2.8 -0.9
9/14/10 7:12 0.0 -0.8 -- --
9/15/10 7:15 -1.2 0.8 -- --
9/16/10 7:21 -1.2 -1.2 -- --
9/18/10 6:48 -2.0 0.4 -- --
9/20/10 7:34 5.6 0.8 -- --
9/21/10 7:28 -3.2 0.0 -- --
9/22/10 7:08 -2.8 0.4 -- --
9/23/10 7:17 -3.2 0.4 -- --
9/24/10 7:27 -0.8 -0.4 -- --
9/27/10 9:40 1.6 0.0 -0.1 -0.1
9/28/10 7:13 0.4 -0.4 -- --
9/29/10 7:12 -1.2 -0.8 -- --
9/30/10 7:55 -1.6 -0.4 -- --
10/1/10 7:33 0.0 -1.6 -- --
10/4/10 7:53 -0.4 -0.8 -- --
10/5/10 7:23 -0.8 -1.2 -- --
10/6/10 7:15 0.8 -3.2 -- --
10/7/10 7:14 0.4 -2.0 -- --
10/8/10 7:25 0.0 -3.2 -- --
10/11/10 7:15 -0.4 -4.8 -- --
10/12/10 7:22 -0.8 -4.4 -- --
10/13/10 7:26 -0.4 -3.6 -- --
10/14/10 7:21 -1.2 -3.2 -- --
10/15/10 7:26 -0.8 -2.4 -- --
10/18/10 7:23 -2.4 -3.6 -- --
10/19/10 7:19 -2.8 -3.6 -- --
10/20/10 7:25 -15.2 -4.8 -- -- a Background Sensor Percent Difference = ((Output-Input)/Input) x 100 b Leak Sensor Percent Difference = ((Output-Input)/Input) x 100
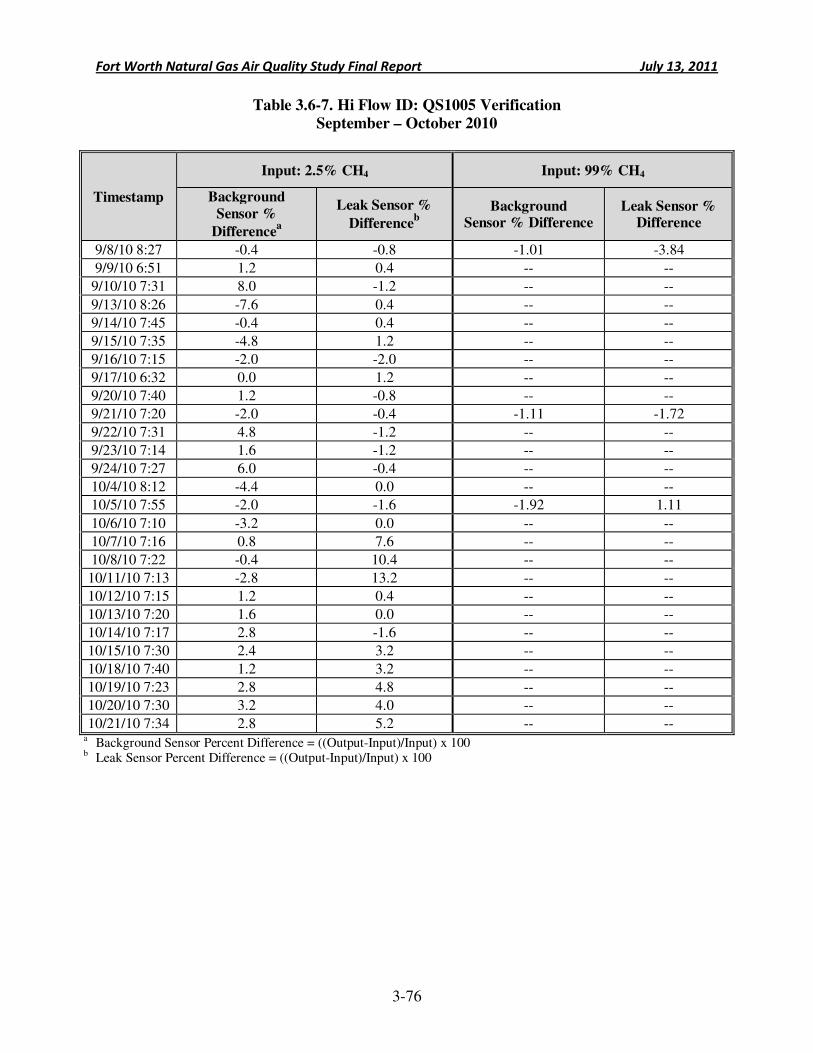
Fort Worth Natural Gas Air Quality Study Final Report July 13, 2011
3-76
Table 3.6-7. Hi Flow ID: QS1005 Verification
September – October 2010
Timestamp
Input: 2.5% CH4 Input: 99% CH4
Background
Sensor %
Differencea
Leak Sensor %
Differenceb
Background Sensor % Difference
Leak Sensor % Difference
9/8/10 8:27 -0.4 -0.8 -1.01 -3.84
9/9/10 6:51 1.2 0.4 -- --
9/10/10 7:31 8.0 -1.2 -- --
9/13/10 8:26 -7.6 0.4 -- --
9/14/10 7:45 -0.4 0.4 -- --
9/15/10 7:35 -4.8 1.2 -- --
9/16/10 7:15 -2.0 -2.0 -- --
9/17/10 6:32 0.0 1.2 -- --
9/20/10 7:40 1.2 -0.8 -- --
9/21/10 7:20 -2.0 -0.4 -1.11 -1.72
9/22/10 7:31 4.8 -1.2 -- --
9/23/10 7:14 1.6 -1.2 -- --
9/24/10 7:27 6.0 -0.4 -- --
10/4/10 8:12 -4.4 0.0 -- --
10/5/10 7:55 -2.0 -1.6 -1.92 1.11
10/6/10 7:10 -3.2 0.0 -- --
10/7/10 7:16 0.8 7.6 -- --
10/8/10 7:22 -0.4 10.4 -- --
10/11/10 7:13 -2.8 13.2 -- --
10/12/10 7:15 1.2 0.4 -- --
10/13/10 7:20 1.6 0.0 -- --
10/14/10 7:17 2.8 -1.6 -- --
10/15/10 7:30 2.4 3.2 -- --
10/18/10 7:40 1.2 3.2 -- --
10/19/10 7:23 2.8 4.8 -- --
10/20/10 7:30 3.2 4.0 -- --
10/21/10 7:34 2.8 5.2 -- -- a Background Sensor Percent Difference = ((Output-Input)/Input) x 100 b Leak Sensor Percent Difference = ((Output-Input)/Input) x 100
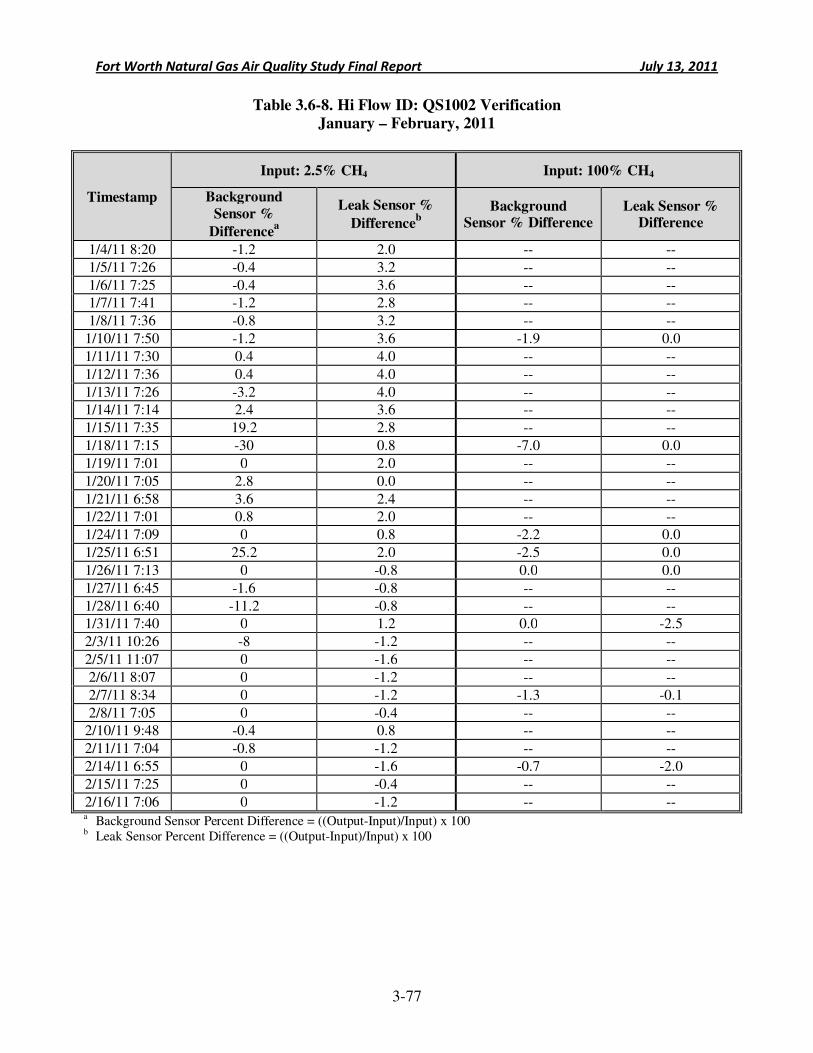
Fort Worth Natural Gas Air Quality Study Final Report July 13, 2011
3-77
Table 3.6-8. Hi Flow ID: QS1002 Verification
January – February, 2011
Timestamp
Input: 2.5% CH4 Input: 100% CH4
Background
Sensor %
Differencea
Leak Sensor %
Differenceb
Background Sensor % Difference
Leak Sensor % Difference
1/4/11 8:20 -1.2 2.0 -- --
1/5/11 7:26 -0.4 3.2 -- --
1/6/11 7:25 -0.4 3.6 -- --
1/7/11 7:41 -1.2 2.8 -- --
1/8/11 7:36 -0.8 3.2 -- --
1/10/11 7:50 -1.2 3.6 -1.9 0.0
1/11/11 7:30 0.4 4.0 -- --
1/12/11 7:36 0.4 4.0 -- --
1/13/11 7:26 -3.2 4.0 -- --
1/14/11 7:14 2.4 3.6 -- --
1/15/11 7:35 19.2 2.8 -- --
1/18/11 7:15 -30 0.8 -7.0 0.0
1/19/11 7:01 0 2.0 -- --
1/20/11 7:05 2.8 0.0 -- --
1/21/11 6:58 3.6 2.4 -- --
1/22/11 7:01 0.8 2.0 -- --
1/24/11 7:09 0 0.8 -2.2 0.0
1/25/11 6:51 25.2 2.0 -2.5 0.0
1/26/11 7:13 0 -0.8 0.0 0.0
1/27/11 6:45 -1.6 -0.8 -- --
1/28/11 6:40 -11.2 -0.8 -- --
1/31/11 7:40 0 1.2 0.0 -2.5
2/3/11 10:26 -8 -1.2 -- --
2/5/11 11:07 0 -1.6 -- --
2/6/11 8:07 0 -1.2 -- --
2/7/11 8:34 0 -1.2 -1.3 -0.1
2/8/11 7:05 0 -0.4 -- --
2/10/11 9:48 -0.4 0.8 -- --
2/11/11 7:04 -0.8 -1.2 -- --
2/14/11 6:55 0 -1.6 -0.7 -2.0
2/15/11 7:25 0 -0.4 -- --
2/16/11 7:06 0 -1.2 -- -- a Background Sensor Percent Difference = ((Output-Input)/Input) x 100 b Leak Sensor Percent Difference = ((Output-Input)/Input) x 100
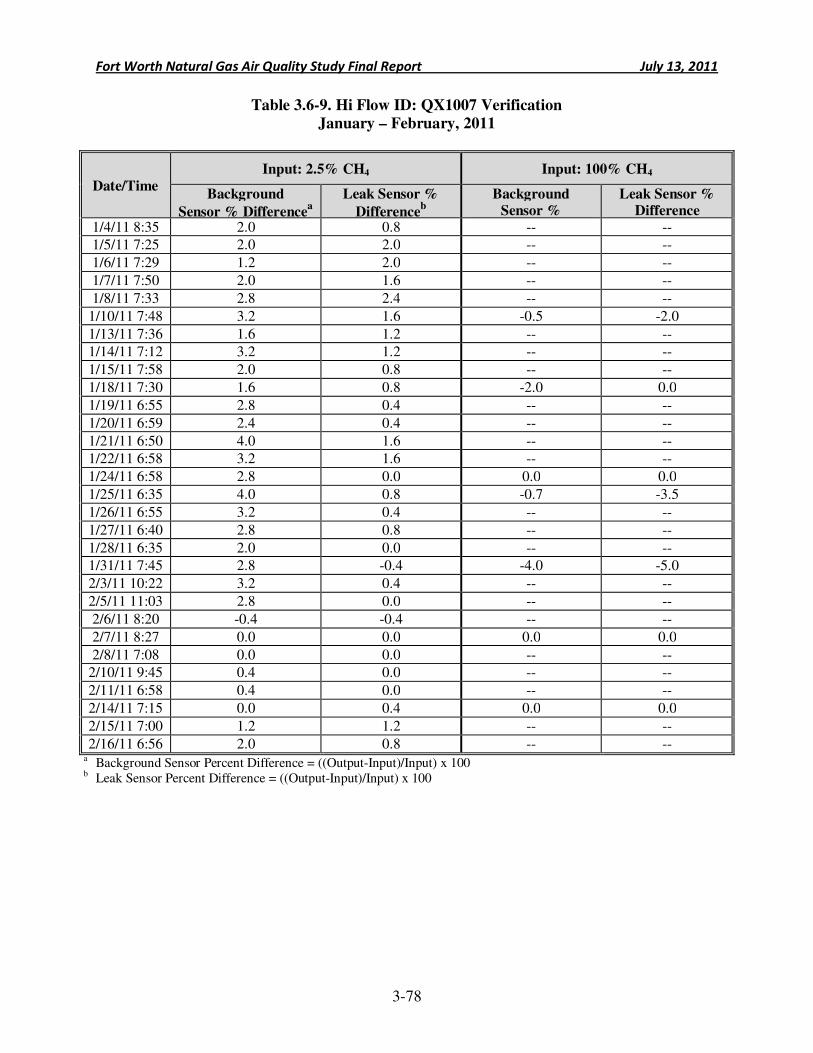
Fort Worth Natural Gas Air Quality Study Final Report July 13, 2011
3-78
Table 3.6-9. Hi Flow ID: QX1007 Verification
January – February, 2011
Date/Time
Input: 2.5% CH4 Input: 100% CH4
Background
Sensor % Differencea
Leak Sensor %
Differenceb
Background Sensor %
Leak Sensor % Difference
1/4/11 8:35 2.0 0.8 -- --
1/5/11 7:25 2.0 2.0 -- --
1/6/11 7:29 1.2 2.0 -- --
1/7/11 7:50 2.0 1.6 -- --
1/8/11 7:33 2.8 2.4 -- --
1/10/11 7:48 3.2 1.6 -0.5 -2.0
1/13/11 7:36 1.6 1.2 -- --
1/14/11 7:12 3.2 1.2 -- --
1/15/11 7:58 2.0 0.8 -- --
1/18/11 7:30 1.6 0.8 -2.0 0.0
1/19/11 6:55 2.8 0.4 -- --
1/20/11 6:59 2.4 0.4 -- --
1/21/11 6:50 4.0 1.6 -- --
1/22/11 6:58 3.2 1.6 -- --
1/24/11 6:58 2.8 0.0 0.0 0.0
1/25/11 6:35 4.0 0.8 -0.7 -3.5
1/26/11 6:55 3.2 0.4 -- --
1/27/11 6:40 2.8 0.8 -- --
1/28/11 6:35 2.0 0.0 -- --
1/31/11 7:45 2.8 -0.4 -4.0 -5.0
2/3/11 10:22 3.2 0.4 -- --
2/5/11 11:03 2.8 0.0 -- --
2/6/11 8:20 -0.4 -0.4 -- --
2/7/11 8:27 0.0 0.0 0.0 0.0
2/8/11 7:08 0.0 0.0 -- --
2/10/11 9:45 0.4 0.0 -- --
2/11/11 6:58 0.4 0.0 -- --
2/14/11 7:15 0.0 0.4 0.0 0.0
2/15/11 7:00 1.2 1.2 -- --
2/16/11 6:56 2.0 0.8 -- -- a Background Sensor Percent Difference = ((Output-Input)/Input) x 100 b Leak Sensor Percent Difference = ((Output-Input)/Input) x 100
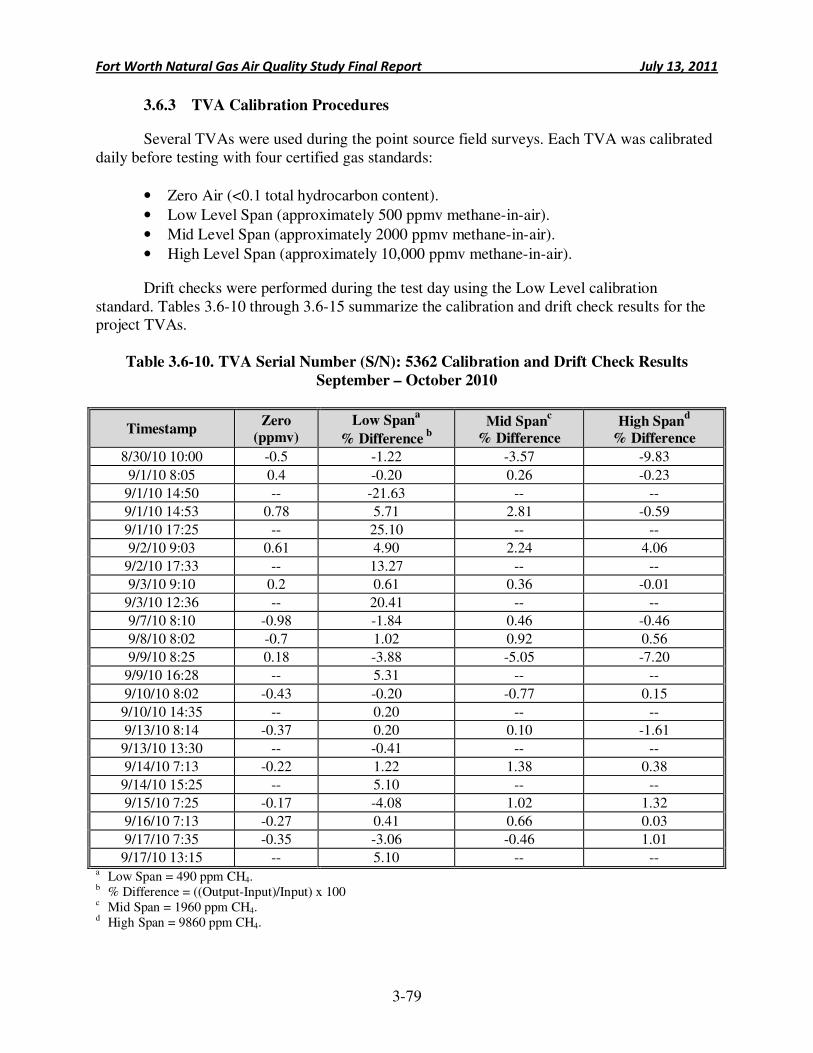
Fort Worth Natural Gas Air Quality Study Final Report July 13, 2011
3-79
3.6.3 TVA Calibration Procedures
Several TVAs were used during the point source field surveys. Each TVA was calibrated daily before testing with four certified gas standards:
• Zero Air (<0.1 total hydrocarbon content).
• Low Level Span (approximately 500 ppmv methane-in-air).
• Mid Level Span (approximately 2000 ppmv methane-in-air).
• High Level Span (approximately 10,000 ppmv methane-in-air).
Drift checks were performed during the test day using the Low Level calibration standard. Tables 3.6-10 through 3.6-15 summarize the calibration and drift check results for the project TVAs.
Table 3.6-10. TVA Serial Number (S/N): 5362 Calibration and Drift Check Results
September – October 2010
Timestamp Zero
(ppmv)
Low Spana
% Difference b
Mid Spanc
% Difference
High Spand
% Difference
8/30/10 10:00 -0.5 -1.22 -3.57 -9.83
9/1/10 8:05 0.4 -0.20 0.26 -0.23
9/1/10 14:50 -- -21.63 -- --
9/1/10 14:53 0.78 5.71 2.81 -0.59
9/1/10 17:25 -- 25.10 -- --
9/2/10 9:03 0.61 4.90 2.24 4.06
9/2/10 17:33 -- 13.27 -- --
9/3/10 9:10 0.2 0.61 0.36 -0.01
9/3/10 12:36 -- 20.41 -- --
9/7/10 8:10 -0.98 -1.84 0.46 -0.46
9/8/10 8:02 -0.7 1.02 0.92 0.56
9/9/10 8:25 0.18 -3.88 -5.05 -7.20
9/9/10 16:28 -- 5.31 -- --
9/10/10 8:02 -0.43 -0.20 -0.77 0.15
9/10/10 14:35 -- 0.20 -- --
9/13/10 8:14 -0.37 0.20 0.10 -1.61
9/13/10 13:30 -- -0.41 -- --
9/14/10 7:13 -0.22 1.22 1.38 0.38
9/14/10 15:25 -- 5.10 -- --
9/15/10 7:25 -0.17 -4.08 1.02 1.32
9/16/10 7:13 -0.27 0.41 0.66 0.03
9/17/10 7:35 -0.35 -3.06 -0.46 1.01
9/17/10 13:15 -- 5.10 -- -- a Low Span = 490 ppm CH4. b % Difference = ((Output-Input)/Input) x 100 c Mid Span = 1960 ppm CH4. d High Span = 9860 ppm CH4.
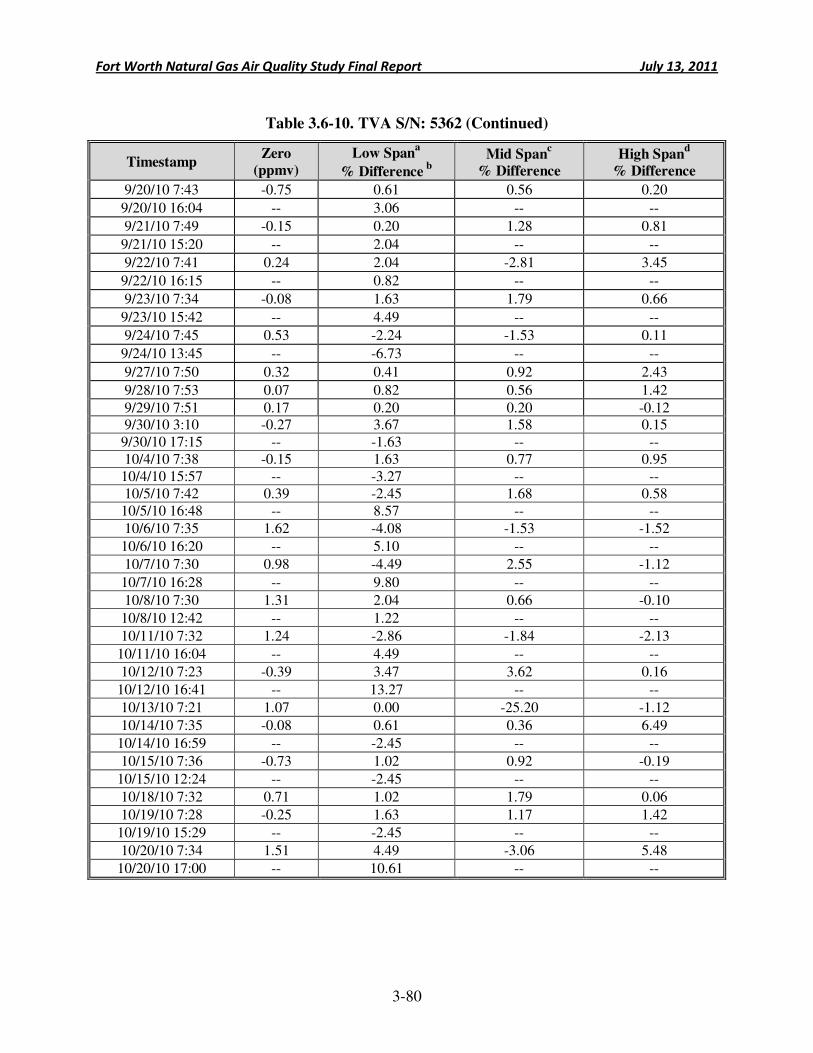
Fort Worth Natural Gas Air Quality Study Final Report July 13, 2011
3-80
Table 3.6-10. TVA S/N: 5362 (Continued)
Timestamp Zero
(ppmv)
Low Spana
% Difference b
Mid Spanc
% Difference
High Spand
% Difference
9/20/10 7:43 -0.75 0.61 0.56 0.20
9/20/10 16:04 -- 3.06 -- --
9/21/10 7:49 -0.15 0.20 1.28 0.81
9/21/10 15:20 -- 2.04 -- --
9/22/10 7:41 0.24 2.04 -2.81 3.45
9/22/10 16:15 -- 0.82 -- --
9/23/10 7:34 -0.08 1.63 1.79 0.66
9/23/10 15:42 -- 4.49 -- --
9/24/10 7:45 0.53 -2.24 -1.53 0.11
9/24/10 13:45 -- -6.73 -- --
9/27/10 7:50 0.32 0.41 0.92 2.43
9/28/10 7:53 0.07 0.82 0.56 1.42
9/29/10 7:51 0.17 0.20 0.20 -0.12 9/30/10 3:10 -0.27 3.67 1.58 0.15 9/30/10 17:15 -- -1.63 -- -- 10/4/10 7:38 -0.15 1.63 0.77 0.95 10/4/10 15:57 -- -3.27 -- -- 10/5/10 7:42 0.39 -2.45 1.68 0.58 10/5/10 16:48 -- 8.57 -- --
10/6/10 7:35 1.62 -4.08 -1.53 -1.52
10/6/10 16:20 -- 5.10 -- --
10/7/10 7:30 0.98 -4.49 2.55 -1.12
10/7/10 16:28 -- 9.80 -- --
10/8/10 7:30 1.31 2.04 0.66 -0.10
10/8/10 12:42 -- 1.22 -- --
10/11/10 7:32 1.24 -2.86 -1.84 -2.13
10/11/10 16:04 -- 4.49 -- --
10/12/10 7:23 -0.39 3.47 3.62 0.16
10/12/10 16:41 -- 13.27 -- --
10/13/10 7:21 1.07 0.00 -25.20 -1.12
10/14/10 7:35 -0.08 0.61 0.36 6.49
10/14/10 16:59 -- -2.45 -- --
10/15/10 7:36 -0.73 1.02 0.92 -0.19
10/15/10 12:24 -- -2.45 -- --
10/18/10 7:32 0.71 1.02 1.79 0.06
10/19/10 7:28 -0.25 1.63 1.17 1.42
10/19/10 15:29 -- -2.45 -- --
10/20/10 7:34 1.51 4.49 -3.06 5.48
10/20/10 17:00 -- 10.61 -- --
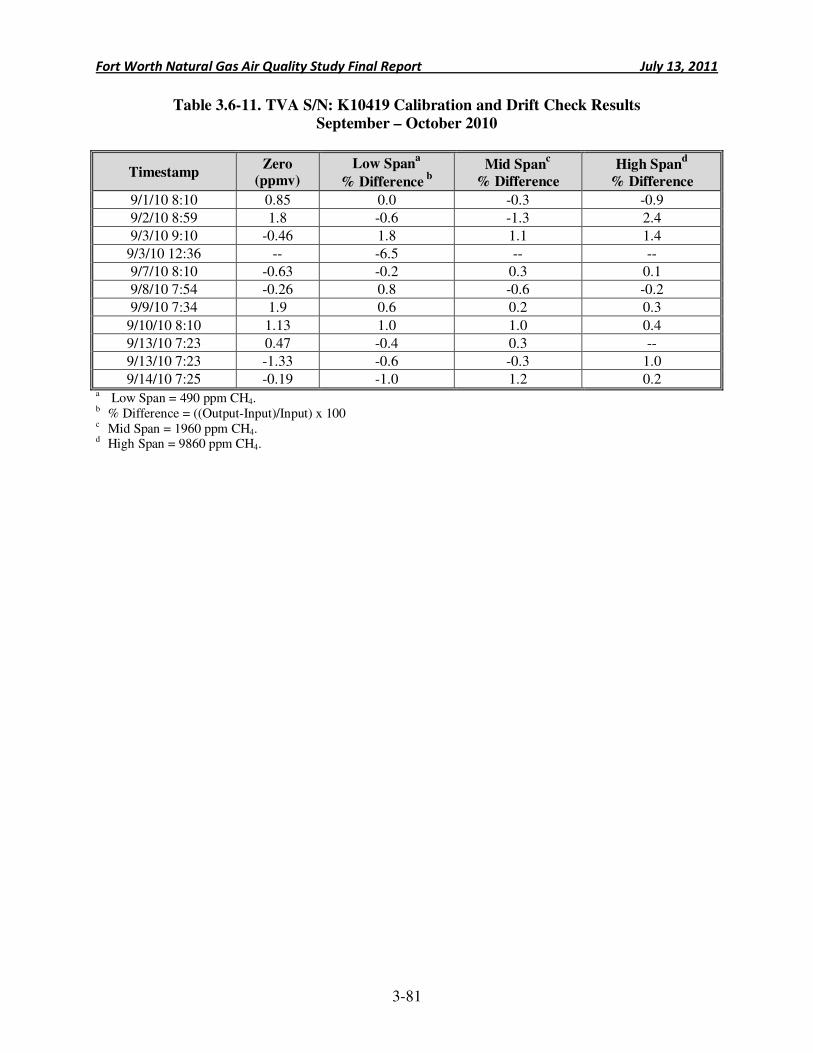
Fort Worth Natural Gas Air Quality Study Final Report July 13, 2011
3-81
Table 3.6-11. TVA S/N: K10419 Calibration and Drift Check Results
September – October 2010
Timestamp Zero
(ppmv)
Low Spana
% Difference b
Mid Spanc
% Difference
High Spand
% Difference
9/1/10 8:10 0.85 0.0 -0.3 -0.9
9/2/10 8:59 1.8 -0.6 -1.3 2.4
9/3/10 9:10 -0.46 1.8 1.1 1.4
9/3/10 12:36 -- -6.5 -- --
9/7/10 8:10 -0.63 -0.2 0.3 0.1
9/8/10 7:54 -0.26 0.8 -0.6 -0.2
9/9/10 7:34 1.9 0.6 0.2 0.3
9/10/10 8:10 1.13 1.0 1.0 0.4
9/13/10 7:23 0.47 -0.4 0.3 --
9/13/10 7:23 -1.33 -0.6 -0.3 1.0
9/14/10 7:25 -0.19 -1.0 1.2 0.2 a Low Span = 490 ppm CH4. b % Difference = ((Output-Input)/Input) x 100 c Mid Span = 1960 ppm CH4. d High Span = 9860 ppm CH4.
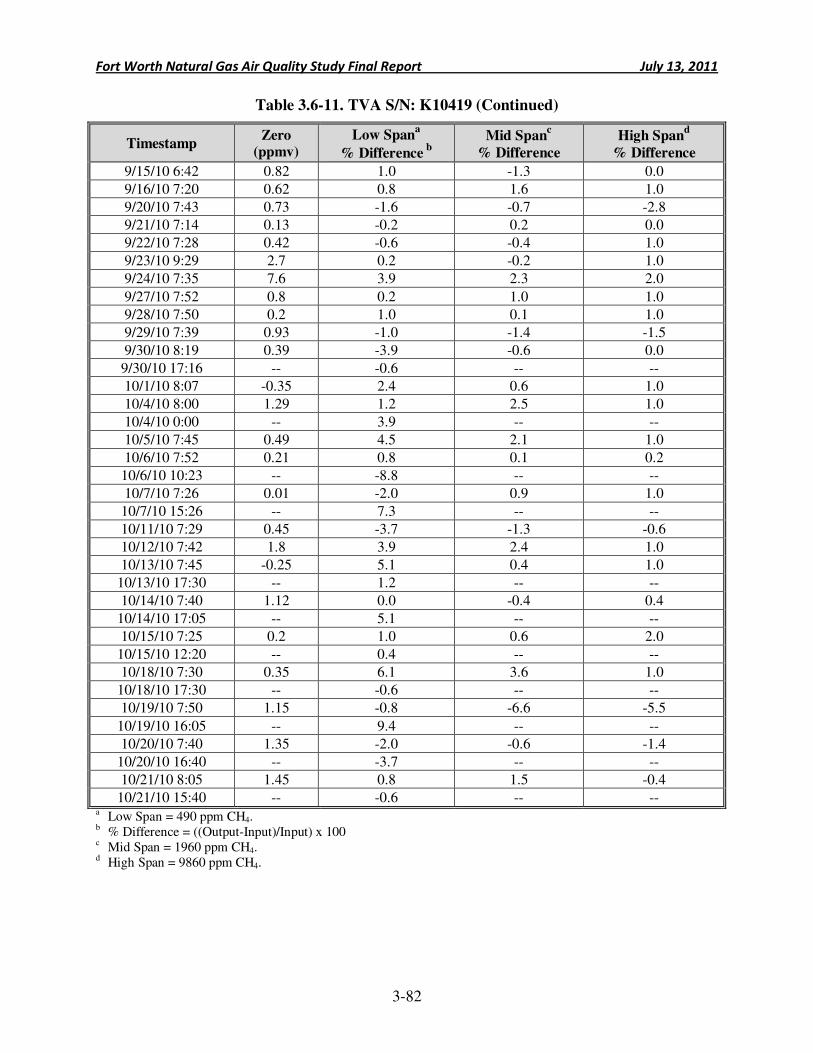
Fort Worth Natural Gas Air Quality Study Final Report July 13, 2011
3-82
Table 3.6-11. TVA S/N: K10419 (Continued)
Timestamp Zero
(ppmv)
Low Spana
% Difference b
Mid Spanc
% Difference
High Spand
% Difference
9/15/10 6:42 0.82 1.0 -1.3 0.0
9/16/10 7:20 0.62 0.8 1.6 1.0
9/20/10 7:43 0.73 -1.6 -0.7 -2.8
9/21/10 7:14 0.13 -0.2 0.2 0.0
9/22/10 7:28 0.42 -0.6 -0.4 1.0
9/23/10 9:29 2.7 0.2 -0.2 1.0
9/24/10 7:35 7.6 3.9 2.3 2.0
9/27/10 7:52 0.8 0.2 1.0 1.0
9/28/10 7:50 0.2 1.0 0.1 1.0
9/29/10 7:39 0.93 -1.0 -1.4 -1.5
9/30/10 8:19 0.39 -3.9 -0.6 0.0
9/30/10 17:16 -- -0.6 -- --
10/1/10 8:07 -0.35 2.4 0.6 1.0
10/4/10 8:00 1.29 1.2 2.5 1.0
10/4/10 0:00 -- 3.9 -- --
10/5/10 7:45 0.49 4.5 2.1 1.0
10/6/10 7:52 0.21 0.8 0.1 0.2
10/6/10 10:23 -- -8.8 -- --
10/7/10 7:26 0.01 -2.0 0.9 1.0
10/7/10 15:26 -- 7.3 -- --
10/11/10 7:29 0.45 -3.7 -1.3 -0.6
10/12/10 7:42 1.8 3.9 2.4 1.0
10/13/10 7:45 -0.25 5.1 0.4 1.0
10/13/10 17:30 -- 1.2 -- --
10/14/10 7:40 1.12 0.0 -0.4 0.4
10/14/10 17:05 -- 5.1 -- --
10/15/10 7:25 0.2 1.0 0.6 2.0
10/15/10 12:20 -- 0.4 -- --
10/18/10 7:30 0.35 6.1 3.6 1.0
10/18/10 17:30 -- -0.6 -- --
10/19/10 7:50 1.15 -0.8 -6.6 -5.5
10/19/10 16:05 -- 9.4 -- --
10/20/10 7:40 1.35 -2.0 -0.6 -1.4
10/20/10 16:40 -- -3.7 -- --
10/21/10 8:05 1.45 0.8 1.5 -0.4
10/21/10 15:40 -- -0.6 -- -- a Low Span = 490 ppm CH4. b % Difference = ((Output-Input)/Input) x 100 c Mid Span = 1960 ppm CH4. d High Span = 9860 ppm CH4.
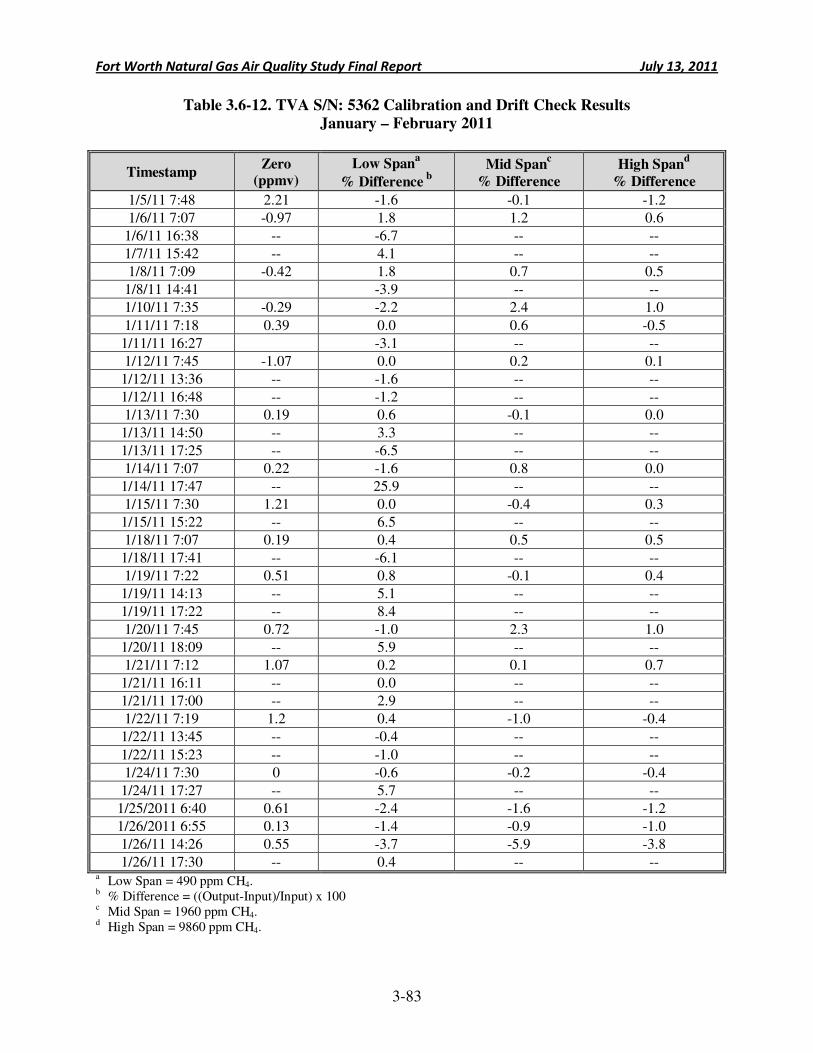
Fort Worth Natural Gas Air Quality Study Final Report July 13, 2011
3-83
Table 3.6-12. TVA S/N: 5362 Calibration and Drift Check Results
January – February 2011
Timestamp Zero
(ppmv)
Low Spana
% Difference b
Mid Spanc
% Difference
High Spand
% Difference
1/5/11 7:48 2.21 -1.6 -0.1 -1.2
1/6/11 7:07 -0.97 1.8 1.2 0.6
1/6/11 16:38 -- -6.7 -- --
1/7/11 15:42 -- 4.1 -- --
1/8/11 7:09 -0.42 1.8 0.7 0.5
1/8/11 14:41
-3.9 -- --
1/10/11 7:35 -0.29 -2.2 2.4 1.0
1/11/11 7:18 0.39 0.0 0.6 -0.5
1/11/11 16:27
-3.1 -- --
1/12/11 7:45 -1.07 0.0 0.2 0.1
1/12/11 13:36 -- -1.6 -- --
1/12/11 16:48 -- -1.2 -- --
1/13/11 7:30 0.19 0.6 -0.1 0.0
1/13/11 14:50 -- 3.3 -- --
1/13/11 17:25 -- -6.5 -- --
1/14/11 7:07 0.22 -1.6 0.8 0.0
1/14/11 17:47 -- 25.9 -- --
1/15/11 7:30 1.21 0.0 -0.4 0.3
1/15/11 15:22 -- 6.5 -- --
1/18/11 7:07 0.19 0.4 0.5 0.5
1/18/11 17:41 -- -6.1 -- --
1/19/11 7:22 0.51 0.8 -0.1 0.4
1/19/11 14:13 -- 5.1 -- --
1/19/11 17:22 -- 8.4 -- --
1/20/11 7:45 0.72 -1.0 2.3 1.0
1/20/11 18:09 -- 5.9 -- --
1/21/11 7:12 1.07 0.2 0.1 0.7
1/21/11 16:11 -- 0.0 -- --
1/21/11 17:00 -- 2.9 -- --
1/22/11 7:19 1.2 0.4 -1.0 -0.4
1/22/11 13:45 -- -0.4 -- --
1/22/11 15:23 -- -1.0 -- --
1/24/11 7:30 0 -0.6 -0.2 -0.4
1/24/11 17:27 -- 5.7 -- --
1/25/2011 6:40 0.61 -2.4 -1.6 -1.2
1/26/2011 6:55 0.13 -1.4 -0.9 -1.0
1/26/11 14:26 0.55 -3.7 -5.9 -3.8
1/26/11 17:30 -- 0.4 -- -- a Low Span = 490 ppm CH4. b % Difference = ((Output-Input)/Input) x 100 c Mid Span = 1960 ppm CH4. d High Span = 9860 ppm CH4.
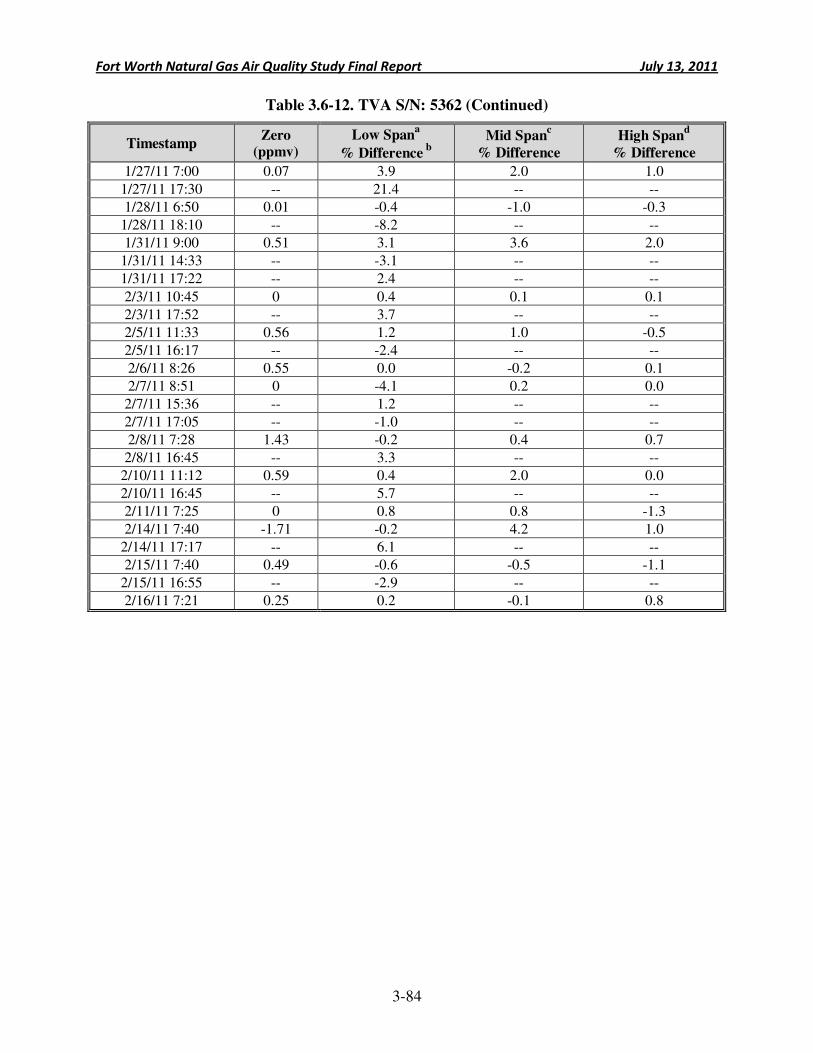
Fort Worth Natural Gas Air Quality Study Final Report July 13, 2011
3-84
Table 3.6-12. TVA S/N: 5362 (Continued)
Timestamp Zero
(ppmv)
Low Spana
% Difference b
Mid Spanc
% Difference
High Spand
% Difference
1/27/11 7:00 0.07 3.9 2.0 1.0
1/27/11 17:30 -- 21.4 -- --
1/28/11 6:50 0.01 -0.4 -1.0 -0.3
1/28/11 18:10 -- -8.2 -- --
1/31/11 9:00 0.51 3.1 3.6 2.0
1/31/11 14:33 -- -3.1 -- --
1/31/11 17:22 -- 2.4 -- --
2/3/11 10:45 0 0.4 0.1 0.1
2/3/11 17:52 -- 3.7 -- --
2/5/11 11:33 0.56 1.2 1.0 -0.5
2/5/11 16:17 -- -2.4 -- --
2/6/11 8:26 0.55 0.0 -0.2 0.1
2/7/11 8:51 0 -4.1 0.2 0.0
2/7/11 15:36 -- 1.2 -- --
2/7/11 17:05 -- -1.0 -- --
2/8/11 7:28 1.43 -0.2 0.4 0.7
2/8/11 16:45 -- 3.3 -- --
2/10/11 11:12 0.59 0.4 2.0 0.0
2/10/11 16:45 -- 5.7 -- --
2/11/11 7:25 0 0.8 0.8 -1.3
2/14/11 7:40 -1.71 -0.2 4.2 1.0
2/14/11 17:17 -- 6.1 -- --
2/15/11 7:40 0.49 -0.6 -0.5 -1.1
2/15/11 16:55 -- -2.9 -- --
2/16/11 7:21 0.25 0.2 -0.1 0.8
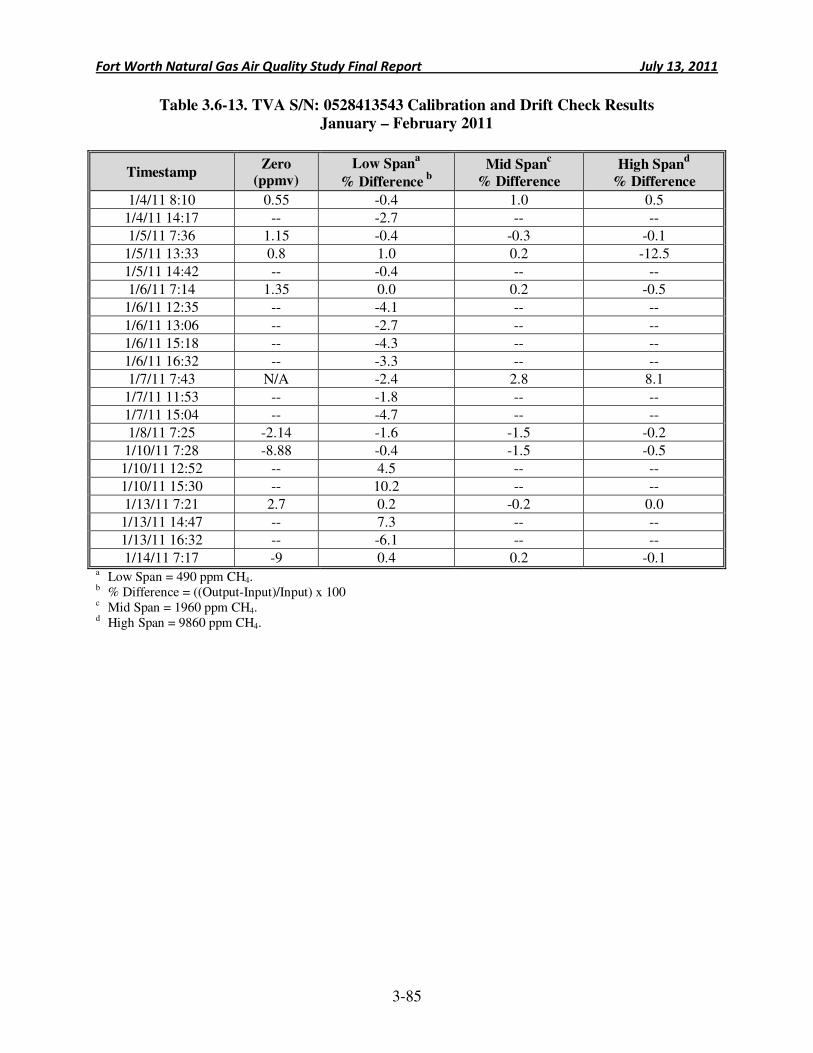
Fort Worth Natural Gas Air Quality Study Final Report July 13, 2011
3-85
Table 3.6-13. TVA S/N: 0528413543 Calibration and Drift Check Results
January – February 2011
Timestamp Zero
(ppmv)
Low Spana
% Difference b
Mid Spanc
% Difference
High Spand
% Difference
1/4/11 8:10 0.55 -0.4 1.0 0.5
1/4/11 14:17 -- -2.7 -- --
1/5/11 7:36 1.15 -0.4 -0.3 -0.1
1/5/11 13:33 0.8 1.0 0.2 -12.5
1/5/11 14:42 -- -0.4 -- --
1/6/11 7:14 1.35 0.0 0.2 -0.5
1/6/11 12:35 -- -4.1 -- --
1/6/11 13:06 -- -2.7 -- --
1/6/11 15:18 -- -4.3 -- --
1/6/11 16:32 -- -3.3 -- --
1/7/11 7:43 N/A -2.4 2.8 8.1
1/7/11 11:53 -- -1.8 -- --
1/7/11 15:04 -- -4.7 -- --
1/8/11 7:25 -2.14 -1.6 -1.5 -0.2
1/10/11 7:28 -8.88 -0.4 -1.5 -0.5
1/10/11 12:52 -- 4.5 -- --
1/10/11 15:30 -- 10.2 -- --
1/13/11 7:21 2.7 0.2 -0.2 0.0
1/13/11 14:47 -- 7.3 -- --
1/13/11 16:32 -- -6.1 -- --
1/14/11 7:17 -9 0.4 0.2 -0.1 a Low Span = 490 ppm CH4. b % Difference = ((Output-Input)/Input) x 100 c Mid Span = 1960 ppm CH4. d High Span = 9860 ppm CH4.
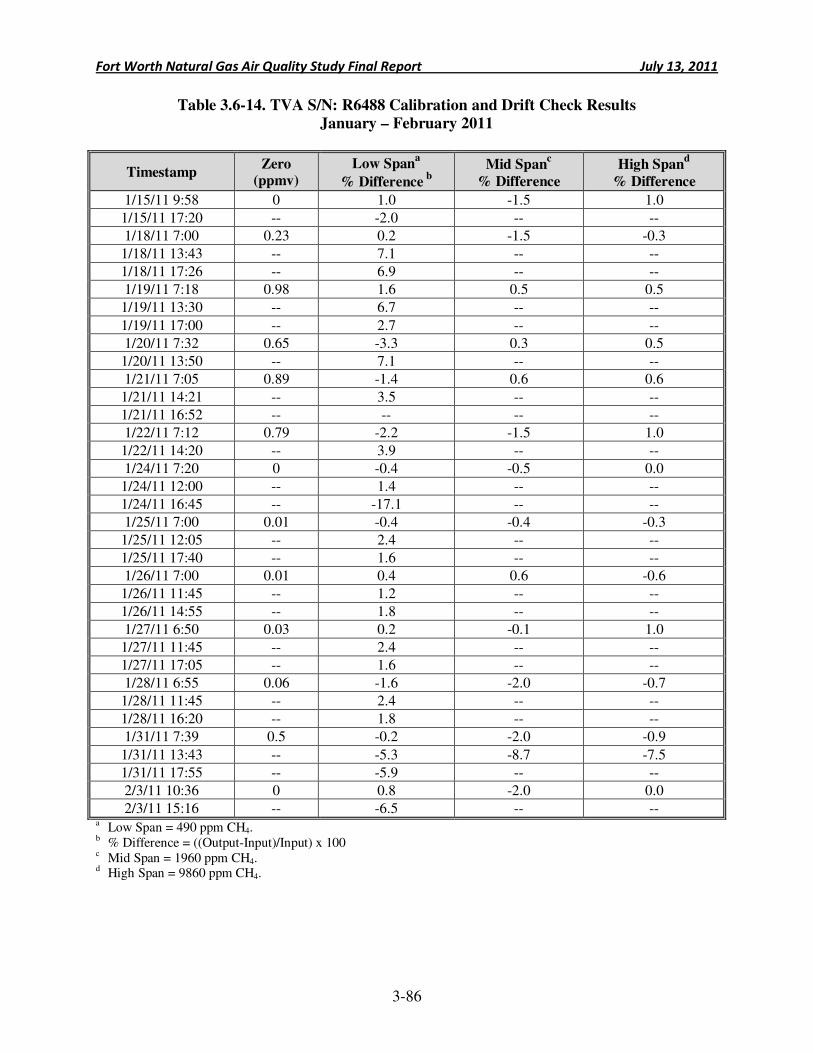
Fort Worth Natural Gas Air Quality Study Final Report July 13, 2011
3-86
Table 3.6-14. TVA S/N: R6488 Calibration and Drift Check Results
January – February 2011
Timestamp Zero
(ppmv)
Low Spana
% Difference b
Mid Spanc
% Difference
High Spand
% Difference
1/15/11 9:58 0 1.0 -1.5 1.0
1/15/11 17:20 -- -2.0 -- --
1/18/11 7:00 0.23 0.2 -1.5 -0.3
1/18/11 13:43 -- 7.1 -- --
1/18/11 17:26 -- 6.9 -- --
1/19/11 7:18 0.98 1.6 0.5 0.5
1/19/11 13:30 -- 6.7 -- --
1/19/11 17:00 -- 2.7 -- --
1/20/11 7:32 0.65 -3.3 0.3 0.5
1/20/11 13:50 -- 7.1 -- --
1/21/11 7:05 0.89 -1.4 0.6 0.6
1/21/11 14:21 -- 3.5 -- --
1/21/11 16:52 -- -- -- --
1/22/11 7:12 0.79 -2.2 -1.5 1.0
1/22/11 14:20 -- 3.9 -- --
1/24/11 7:20 0 -0.4 -0.5 0.0
1/24/11 12:00 -- 1.4 -- --
1/24/11 16:45 -- -17.1 -- --
1/25/11 7:00 0.01 -0.4 -0.4 -0.3
1/25/11 12:05 -- 2.4 -- --
1/25/11 17:40 -- 1.6 -- --
1/26/11 7:00 0.01 0.4 0.6 -0.6
1/26/11 11:45 -- 1.2 -- --
1/26/11 14:55 -- 1.8 -- --
1/27/11 6:50 0.03 0.2 -0.1 1.0
1/27/11 11:45 -- 2.4 -- --
1/27/11 17:05 -- 1.6 -- --
1/28/11 6:55 0.06 -1.6 -2.0 -0.7
1/28/11 11:45 -- 2.4 -- --
1/28/11 16:20 -- 1.8 -- --
1/31/11 7:39 0.5 -0.2 -2.0 -0.9
1/31/11 13:43 -- -5.3 -8.7 -7.5
1/31/11 17:55 -- -5.9 -- --
2/3/11 10:36 0 0.8 -2.0 0.0
2/3/11 15:16 -- -6.5 -- -- a Low Span = 490 ppm CH4. b % Difference = ((Output-Input)/Input) x 100 c Mid Span = 1960 ppm CH4. d High Span = 9860 ppm CH4.
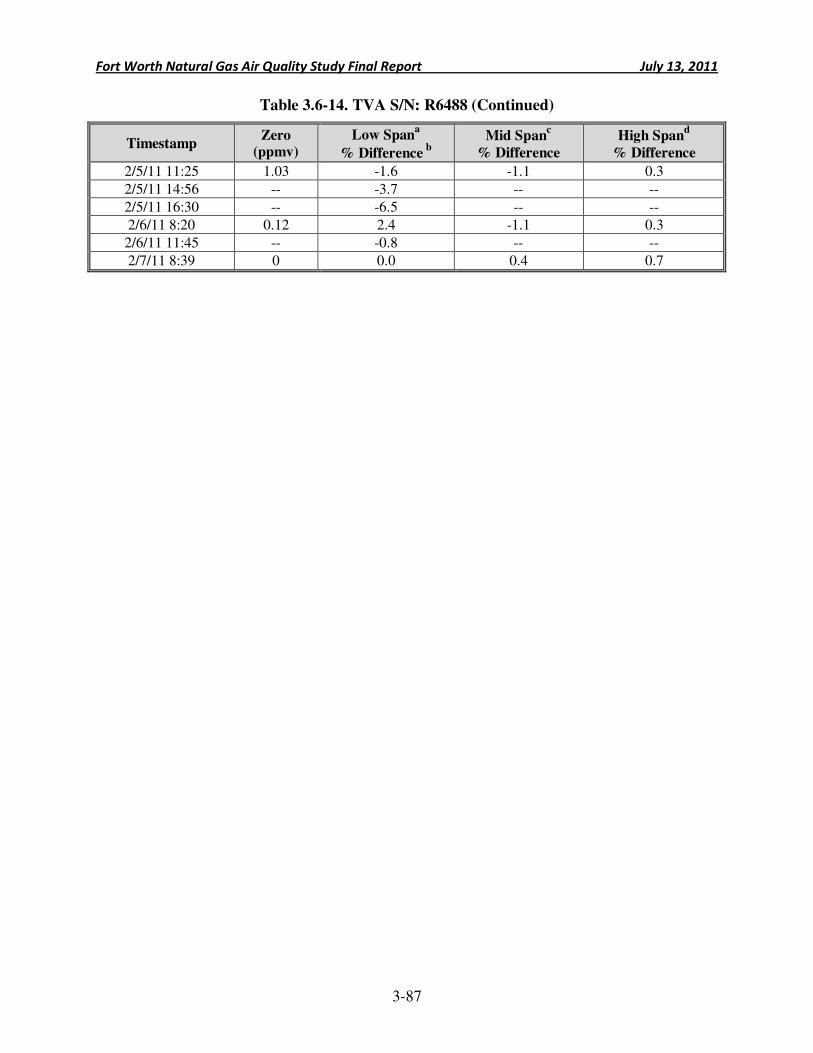
Fort Worth Natural Gas Air Quality Study Final Report July 13, 2011
3-87
Table 3.6-14. TVA S/N: R6488 (Continued)
Timestamp Zero
(ppmv)
Low Spana
% Difference b
Mid Spanc
% Difference
High Spand
% Difference
2/5/11 11:25 1.03 -1.6 -1.1 0.3
2/5/11 14:56 -- -3.7 -- --
2/5/11 16:30 -- -6.5 -- --
2/6/11 8:20 0.12 2.4 -1.1 0.3
2/6/11 11:45 -- -0.8 -- --
2/7/11 8:39 0 0.0 0.4 0.7
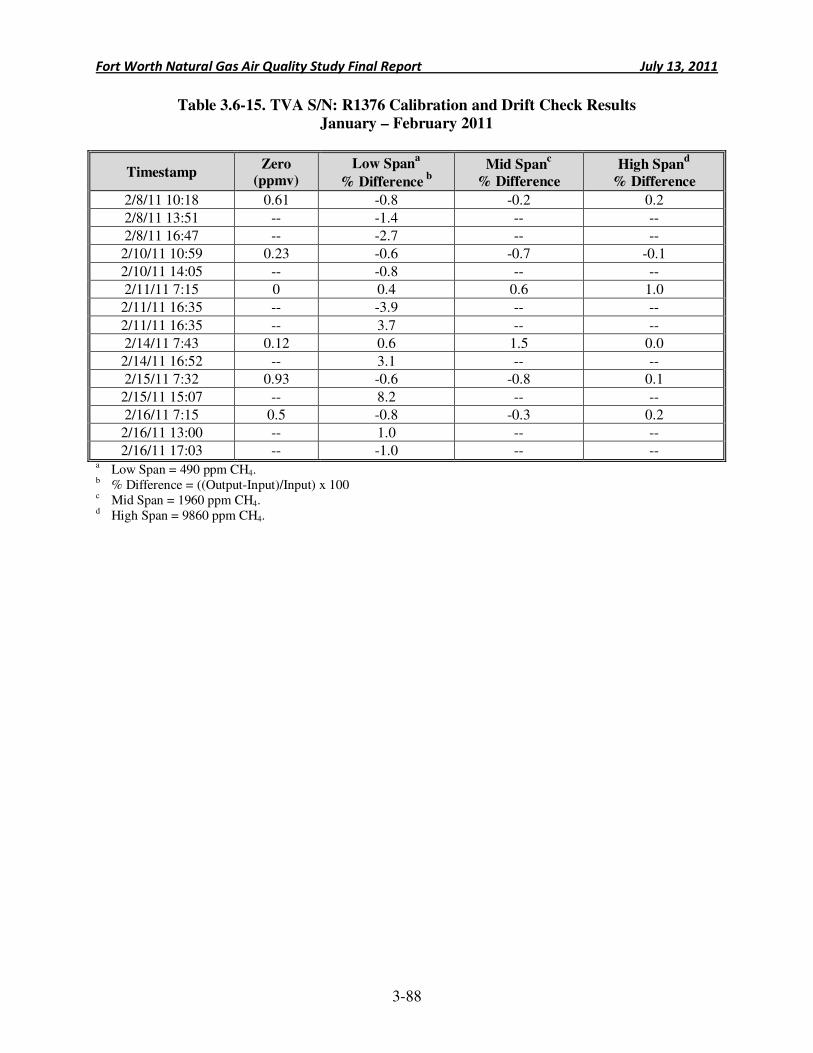
Fort Worth Natural Gas Air Quality Study Final Report July 13, 2011
3-88
Table 3.6-15. TVA S/N: R1376 Calibration and Drift Check Results
January – February 2011
Timestamp Zero
(ppmv)
Low Spana
% Difference b
Mid Spanc
% Difference
High Spand
% Difference
2/8/11 10:18 0.61 -0.8 -0.2 0.2
2/8/11 13:51 -- -1.4 -- --
2/8/11 16:47 -- -2.7 -- --
2/10/11 10:59 0.23 -0.6 -0.7 -0.1
2/10/11 14:05 -- -0.8 -- --
2/11/11 7:15 0 0.4 0.6 1.0
2/11/11 16:35 -- -3.9 -- --
2/11/11 16:35 -- 3.7 -- --
2/14/11 7:43 0.12 0.6 1.5 0.0
2/14/11 16:52 -- 3.1 -- --
2/15/11 7:32 0.93 -0.6 -0.8 0.1
2/15/11 15:07 -- 8.2 -- --
2/16/11 7:15 0.5 -0.8 -0.3 0.2
2/16/11 13:00 -- 1.0 -- --
2/16/11 17:03 -- -1.0 -- -- a Low Span = 490 ppm CH4. b % Difference = ((Output-Input)/Input) x 100 c Mid Span = 1960 ppm CH4. d High Span = 9860 ppm CH4.
Fort Worth Natural Gas Air Quality Study Final Report July 13, 2011
3-89
3.6.4 Field Data Review
Field data was reviewed each week in Phase I by the acting QA|QC Officer. In Phase II, this role was divided between the two field team leaders. Each team leader checked the other team's field data for completeness and accuracy on a daily basis. The team leaders also checked periodically for consistency in sampling procedures and data recording between the two teams.
3.6.5 Canister Sample Collection QC
A strict canister sampling protocol was followed to ensure quality sampling results:
1. All canisters were vacuum checked prior to sampling. Canisters with vacuums less than 25 inches Hg were rejected.
2. Residual vacuums of 2 to 10 inches Hg were left in canisters following sample collection.
3. Canister collection data was recorded on data forms as well as in canister logbooks (one per team).
4. Standard canister Chain-of-Custody procedures were observed.
5. Between use and prior to shipping, canisters were kept securely in the project field office.
6. Five percent of the canister samples were collected in duplicate to provide a measure of total sampling and analytical variability.
Eight duplicate canister samples were collected. Comparisons of the analytical results for each duplicate pair are provided in Table 3.6-16 as the relative percent differences (% RPD) between analytes. Since each canister sample was analyzed by EPA Method TO-15 for VOCs and by ASTM D1946 for methane, Table 3.6-16 includes the results for both analytical techniques. The average percent relative differences for the duplicate canisters range between 11 to 61 percent. This is considered an acceptable result for field samples.
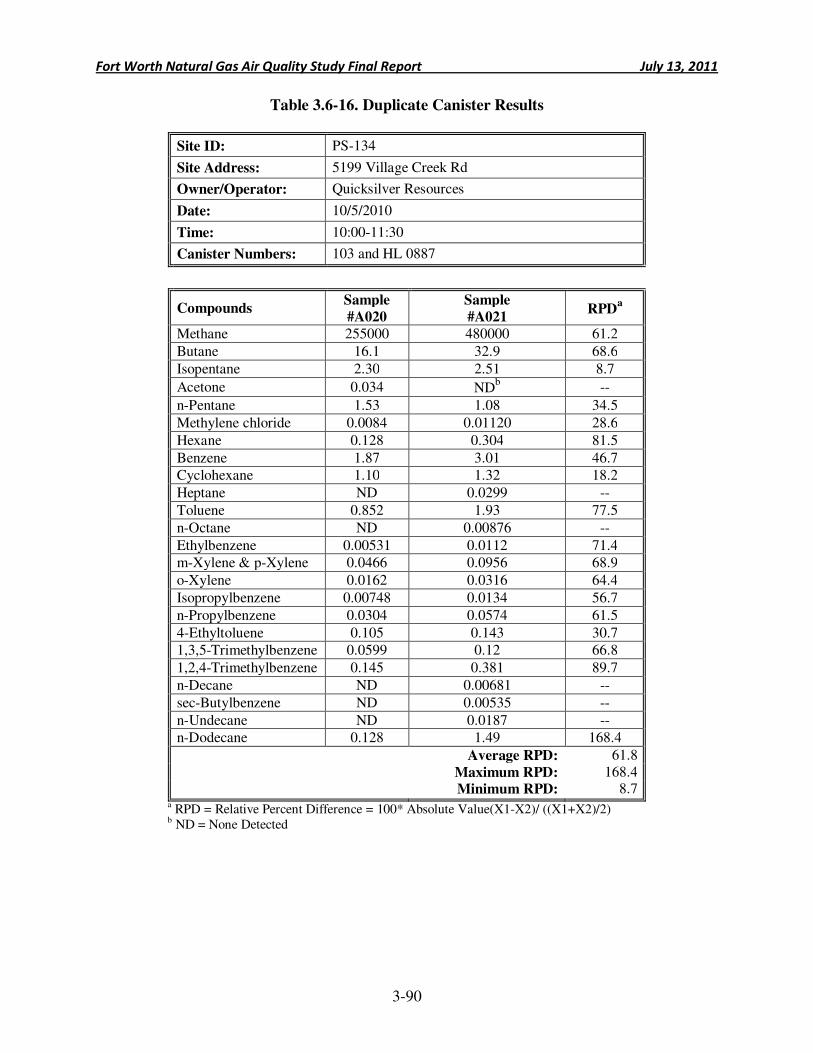
Fort Worth Natural Gas Air Quality Study Final Report July 13, 2011
3-90
Table 3.6-16. Duplicate Canister Results
Site ID: PS-134
Site Address: 5199 Village Creek Rd
Owner/Operator: Quicksilver Resources
Date: 10/5/2010
Time: 10:00-11:30
Canister Numbers: 103 and HL 0887
Compounds Sample
#A020
Sample
#A021 RPD
a
Methane 255000 480000 61.2
Butane 16.1 32.9 68.6
Isopentane 2.30 2.51 8.7
Acetone 0.034 NDb --
n-Pentane 1.53 1.08 34.5
Methylene chloride 0.0084 0.01120 28.6
Hexane 0.128 0.304 81.5
Benzene 1.87 3.01 46.7 Cyclohexane 1.10 1.32 18.2
Heptane ND 0.0299 --
Toluene 0.852 1.93 77.5
n-Octane ND 0.00876 --
Ethylbenzene 0.00531 0.0112 71.4 m-Xylene & p-Xylene 0.0466 0.0956 68.9
o-Xylene 0.0162 0.0316 64.4
Isopropylbenzene 0.00748 0.0134 56.7
n-Propylbenzene 0.0304 0.0574 61.5
4-Ethyltoluene 0.105 0.143 30.7 1,3,5-Trimethylbenzene 0.0599 0.12 66.8
1,2,4-Trimethylbenzene 0.145 0.381 89.7
n-Decane ND 0.00681 --
sec-Butylbenzene ND 0.00535 --
n-Undecane ND 0.0187 -- n-Dodecane 0.128 1.49 168.4
Average RPD: 61.8
Maximum RPD: 168.4
Minimum RPD: 8.7
a RPD = Relative Percent Difference = 100* Absolute Value(X1-X2)/ ((X1+X2)/2) b ND = None Detected
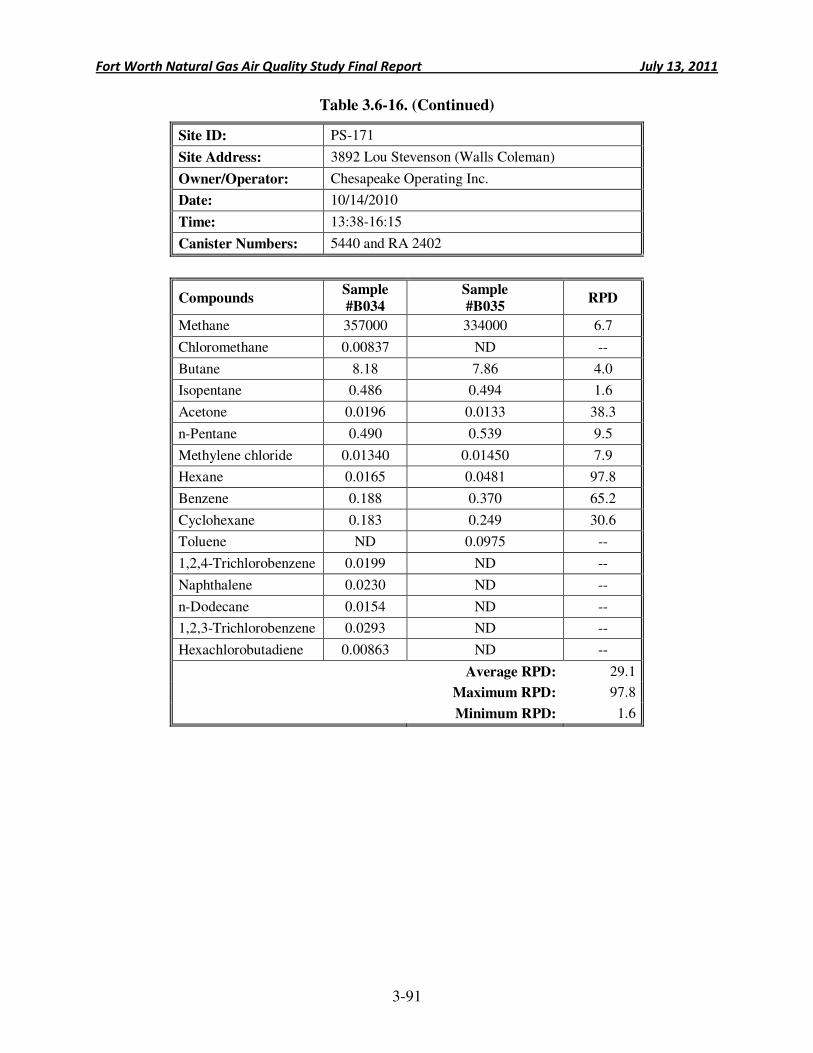
Fort Worth Natural Gas Air Quality Study Final Report July 13, 2011
3-91
Table 3.6-16. (Continued)
Site ID: PS-171
Site Address: 3892 Lou Stevenson (Walls Coleman)
Owner/Operator: Chesapeake Operating Inc.
Date: 10/14/2010
Time: 13:38-16:15
Canister Numbers: 5440 and RA 2402
Compounds Sample
#B034
Sample
#B035 RPD
Methane 357000 334000 6.7
Chloromethane 0.00837 ND --
Butane 8.18 7.86 4.0
Isopentane 0.486 0.494 1.6
Acetone 0.0196 0.0133 38.3
n-Pentane 0.490 0.539 9.5
Methylene chloride 0.01340 0.01450 7.9
Hexane 0.0165 0.0481 97.8
Benzene 0.188 0.370 65.2
Cyclohexane 0.183 0.249 30.6
Toluene ND 0.0975 --
1,2,4-Trichlorobenzene 0.0199 ND --
Naphthalene 0.0230 ND --
n-Dodecane 0.0154 ND --
1,2,3-Trichlorobenzene 0.0293 ND --
Hexachlorobutadiene 0.00863 ND --
Average RPD: 29.1
Maximum RPD: 97.8
Minimum RPD: 1.6
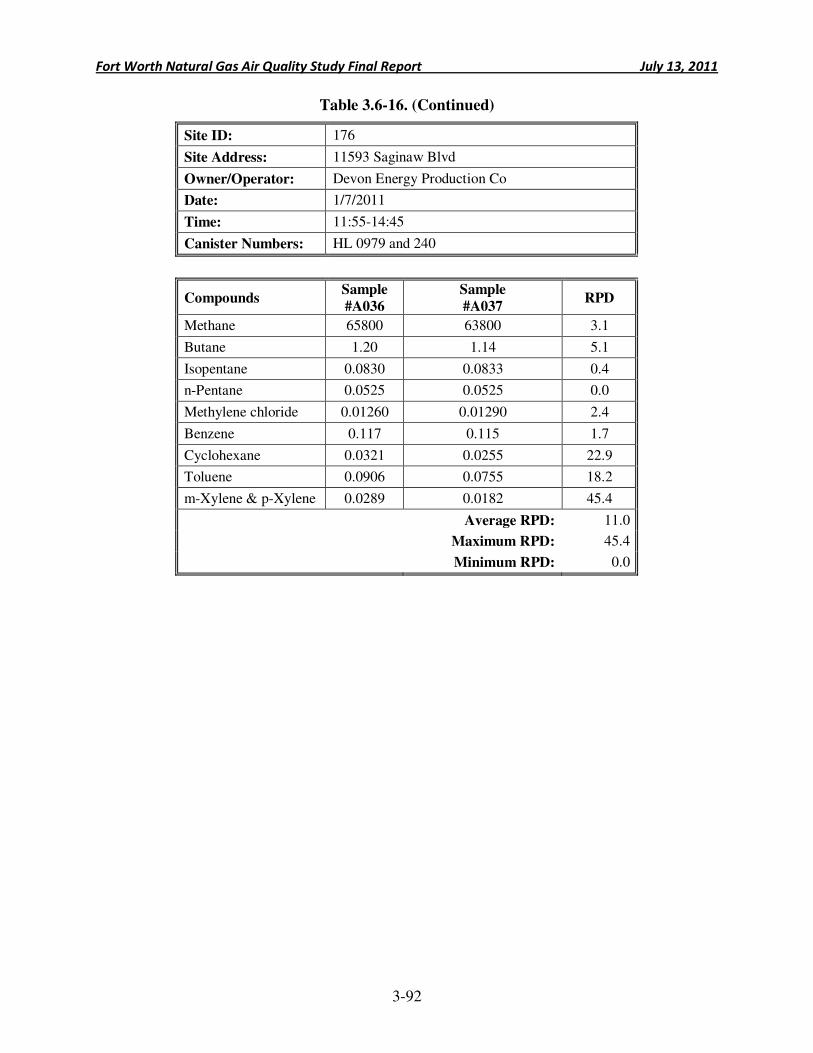
Fort Worth Natural Gas Air Quality Study Final Report July 13, 2011
3-92
Table 3.6-16. (Continued)
Site ID: 176
Site Address: 11593 Saginaw Blvd
Owner/Operator: Devon Energy Production Co
Date: 1/7/2011
Time: 11:55-14:45
Canister Numbers: HL 0979 and 240
Compounds Sample
#A036
Sample
#A037 RPD
Methane 65800 63800 3.1
Butane 1.20 1.14 5.1
Isopentane 0.0830 0.0833 0.4
n-Pentane 0.0525 0.0525 0.0
Methylene chloride 0.01260 0.01290 2.4
Benzene 0.117 0.115 1.7
Cyclohexane 0.0321 0.0255 22.9
Toluene 0.0906 0.0755 18.2
m-Xylene & p-Xylene 0.0289 0.0182 45.4
Average RPD: 11.0
Maximum RPD: 45.4
Minimum RPD: 0.0
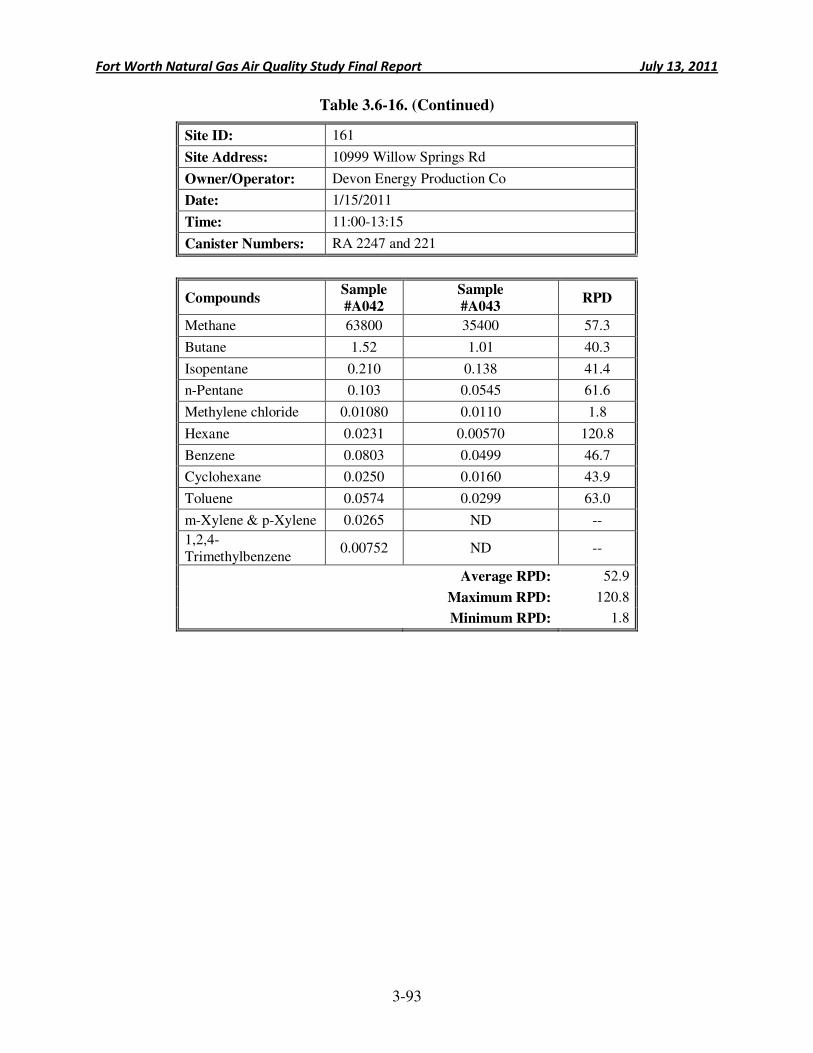
Fort Worth Natural Gas Air Quality Study Final Report July 13, 2011
3-93
Table 3.6-16. (Continued)
Site ID: 161
Site Address: 10999 Willow Springs Rd
Owner/Operator: Devon Energy Production Co
Date: 1/15/2011
Time: 11:00-13:15
Canister Numbers: RA 2247 and 221
Compounds Sample
#A042
Sample
#A043 RPD
Methane 63800 35400 57.3
Butane 1.52 1.01 40.3
Isopentane 0.210 0.138 41.4
n-Pentane 0.103 0.0545 61.6
Methylene chloride 0.01080 0.0110 1.8
Hexane 0.0231 0.00570 120.8
Benzene 0.0803 0.0499 46.7
Cyclohexane 0.0250 0.0160 43.9
Toluene 0.0574 0.0299 63.0
m-Xylene & p-Xylene 0.0265 ND --
1,2,4-Trimethylbenzene
0.00752 ND --
Average RPD: 52.9
Maximum RPD: 120.8
Minimum RPD: 1.8
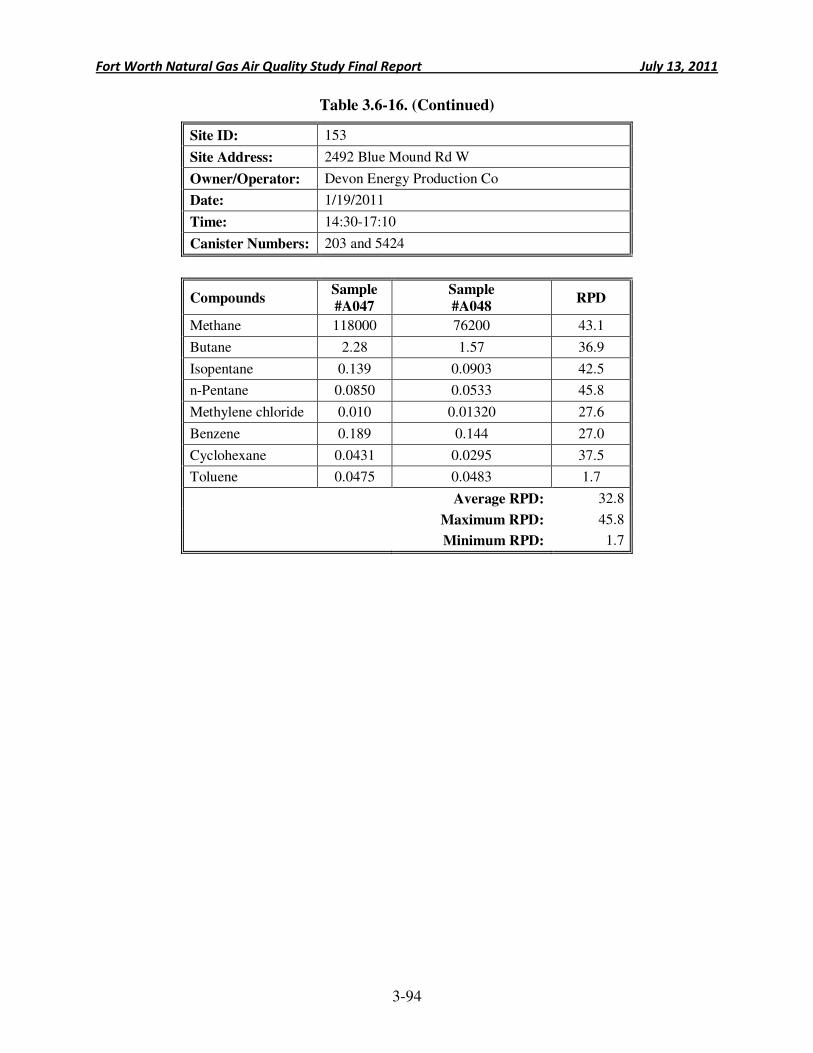
Fort Worth Natural Gas Air Quality Study Final Report July 13, 2011
3-94
Table 3.6-16. (Continued)
Site ID: 153
Site Address: 2492 Blue Mound Rd W
Owner/Operator: Devon Energy Production Co
Date: 1/19/2011
Time: 14:30-17:10
Canister Numbers: 203 and 5424
Compounds Sample
#A047
Sample
#A048 RPD
Methane 118000 76200 43.1
Butane 2.28 1.57 36.9
Isopentane 0.139 0.0903 42.5
n-Pentane 0.0850 0.0533 45.8
Methylene chloride 0.010 0.01320 27.6
Benzene 0.189 0.144 27.0
Cyclohexane 0.0431 0.0295 37.5
Toluene 0.0475 0.0483 1.7
Average RPD: 32.8
Maximum RPD: 45.8
Minimum RPD: 1.7
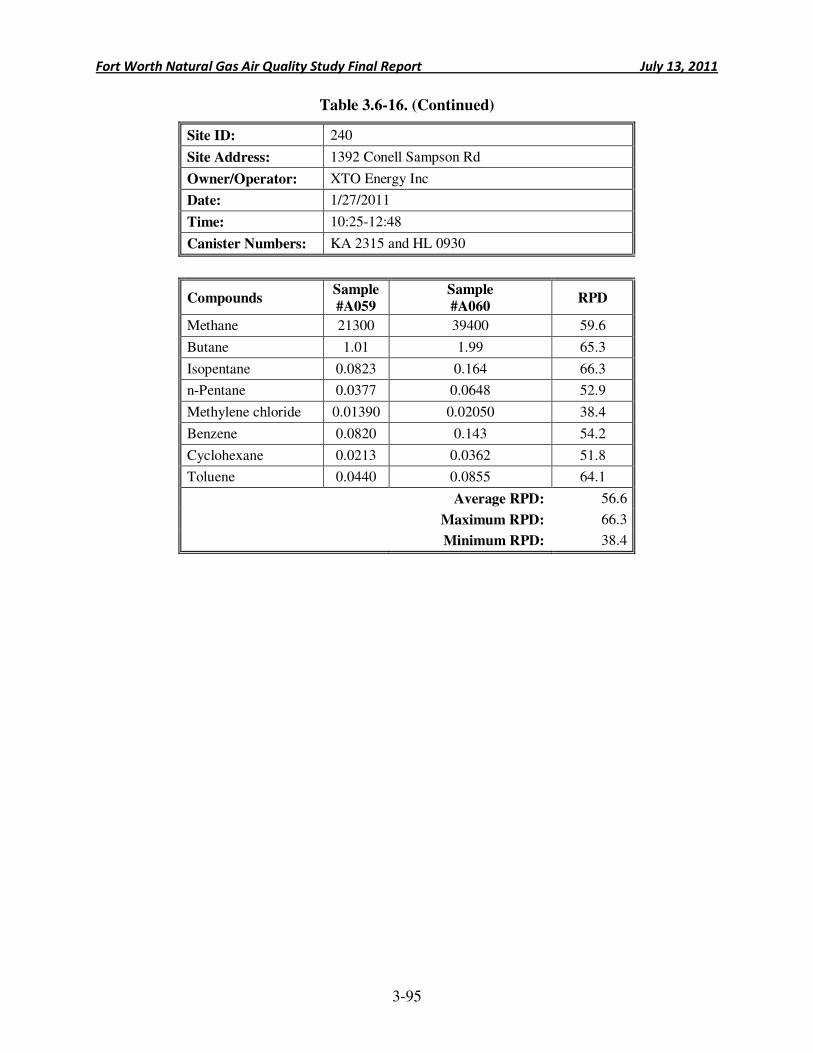
Fort Worth Natural Gas Air Quality Study Final Report July 13, 2011
3-95
Table 3.6-16. (Continued)
Site ID: 240
Site Address: 1392 Conell Sampson Rd
Owner/Operator: XTO Energy Inc
Date: 1/27/2011
Time: 10:25-12:48
Canister Numbers: KA 2315 and HL 0930
Compounds Sample
#A059
Sample
#A060 RPD
Methane 21300 39400 59.6
Butane 1.01 1.99 65.3
Isopentane 0.0823 0.164 66.3
n-Pentane 0.0377 0.0648 52.9
Methylene chloride 0.01390 0.02050 38.4
Benzene 0.0820 0.143 54.2
Cyclohexane 0.0213 0.0362 51.8
Toluene 0.0440 0.0855 64.1
Average RPD: 56.6
Maximum RPD: 66.3
Minimum RPD: 38.4
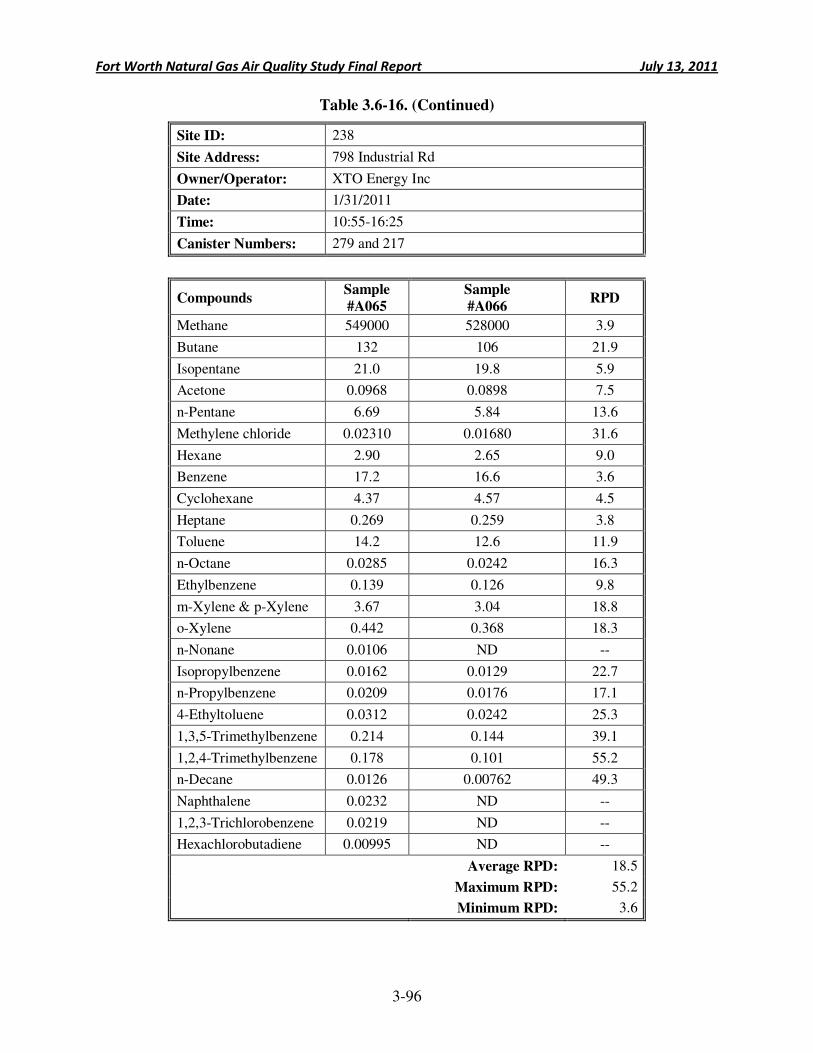
Fort Worth Natural Gas Air Quality Study Final Report July 13, 2011
3-96
Table 3.6-16. (Continued)
Site ID: 238
Site Address: 798 Industrial Rd
Owner/Operator: XTO Energy Inc
Date: 1/31/2011
Time: 10:55-16:25
Canister Numbers: 279 and 217
Compounds Sample
#A065
Sample
#A066 RPD
Methane 549000 528000 3.9
Butane 132 106 21.9
Isopentane 21.0 19.8 5.9
Acetone 0.0968 0.0898 7.5
n-Pentane 6.69 5.84 13.6
Methylene chloride 0.02310 0.01680 31.6
Hexane 2.90 2.65 9.0
Benzene 17.2 16.6 3.6
Cyclohexane 4.37 4.57 4.5
Heptane 0.269 0.259 3.8
Toluene 14.2 12.6 11.9
n-Octane 0.0285 0.0242 16.3
Ethylbenzene 0.139 0.126 9.8
m-Xylene & p-Xylene 3.67 3.04 18.8
o-Xylene 0.442 0.368 18.3
n-Nonane 0.0106 ND --
Isopropylbenzene 0.0162 0.0129 22.7
n-Propylbenzene 0.0209 0.0176 17.1
4-Ethyltoluene 0.0312 0.0242 25.3
1,3,5-Trimethylbenzene 0.214 0.144 39.1
1,2,4-Trimethylbenzene 0.178 0.101 55.2
n-Decane 0.0126 0.00762 49.3
Naphthalene 0.0232 ND --
1,2,3-Trichlorobenzene 0.0219 ND --
Hexachlorobutadiene 0.00995 ND --
Average RPD: 18.5
Maximum RPD: 55.2
Minimum RPD: 3.6
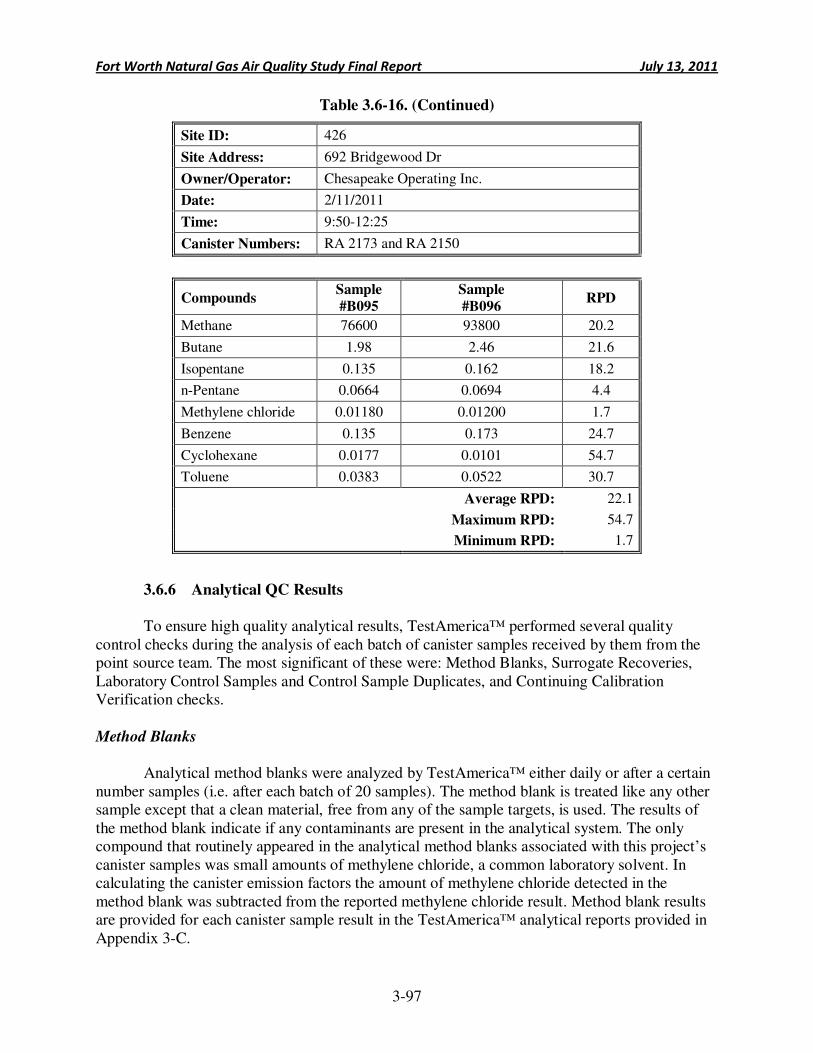
Fort Worth Natural Gas Air Quality Study Final Report July 13, 2011
3-97
Table 3.6-16. (Continued)
Site ID: 426
Site Address: 692 Bridgewood Dr
Owner/Operator: Chesapeake Operating Inc.
Date: 2/11/2011
Time: 9:50-12:25
Canister Numbers: RA 2173 and RA 2150
Compounds Sample
#B095
Sample
#B096 RPD
Methane 76600 93800 20.2
Butane 1.98 2.46 21.6
Isopentane 0.135 0.162 18.2
n-Pentane 0.0664 0.0694 4.4
Methylene chloride 0.01180 0.01200 1.7
Benzene 0.135 0.173 24.7
Cyclohexane 0.0177 0.0101 54.7
Toluene 0.0383 0.0522 30.7
Average RPD: 22.1
Maximum RPD: 54.7
Minimum RPD: 1.7
3.6.6 Analytical QC Results
To ensure high quality analytical results, TestAmerica™ performed several quality
control checks during the analysis of each batch of canister samples received by them from the point source team. The most significant of these were: Method Blanks, Surrogate Recoveries, Laboratory Control Samples and Control Sample Duplicates, and Continuing Calibration Verification checks. Method Blanks
Analytical method blanks were analyzed by TestAmerica™ either daily or after a certain
number samples (i.e. after each batch of 20 samples). The method blank is treated like any other sample except that a clean material, free from any of the sample targets, is used. The results of the method blank indicate if any contaminants are present in the analytical system. The only compound that routinely appeared in the analytical method blanks associated with this project’s canister samples was small amounts of methylene chloride, a common laboratory solvent. In calculating the canister emission factors the amount of methylene chloride detected in the method blank was subtracted from the reported methylene chloride result. Method blank results are provided for each canister sample result in the TestAmerica™ analytical reports provided in Appendix 3-C.
Fort Worth Natural Gas Air Quality Study Final Report July 13, 2011
3-98
Surrogate Recoveries
A surrogate standard is a non-target analyte having a chemical structure similar to the target analytes that is added to a sample prior to extraction. Six surrogate standards were added to each point source canister sample prior to extraction and their percent recoveries were evaluated following analysis of the canister’s contents. The surrogates monitor the efficiency of the extraction, the cleanup, and evaporation of the solvent if any has been used on the sample. Surrogate percent recoveries for each canister result together with acceptable recovery limits are provided with each of TestAmerica’s™ analytical reports contained in Appendix 3-C.
Laboratory Control Samples and Control Sample Duplicates
The Laboratory Control Sample (LCS) is a clean matrix that is fortified with the target analytes and analyzed in the same manner as a batch of samples is analyzed. Since in this case the concentration of each analyte is known, the resulting values provide a measure of the accuracy of the system for each analyte. As a further measure of quality control, the LCS is analyzed in duplicate and the relative percent difference between the two results is calculated and evaluated against the laboratory’s acceptance criteria. Both LCS and LCS duplicate results are provided towards the conclusion of each TestAmerica™ report. Continuing Calibration Verification
Continuing Calibration Verification (CCV) checks are performed over specific time periods during sample analysis to confirm the instrument’s calibration and performance. A CCV check was performed by TestAmerica™ with each batch of sample analyses. The results are evaluated as the percent recoveries of the known analyte concentrations making up the CCV spike. The results of each CCV check are reported under the heading “Calibration Check” in the TestAmerica™ documentation located in Appendix 3-C.
3.7 Point Source Testing Conclusions
Point source testing was conducted to determine how much air pollution is being released by natural gas exploration in Fort Worth, and if natural gas extraction and processing sites comply with environmental regulations. The point source testing program occurred in two phases, with Phase I occurring from August through October of 2010, and Phase II occurring in January and February of 2011. Under the point source testing program, field personnel determined the amount of air pollution released at individual well pads, compressor stations, and other natural gas processing facilities by visiting 388 sites, includes two repeat visits, and testing the equipment at each site for emissions using infrared cameras, toxic vapor analyzers (TVAs), Hi Flow Samplers, and evacuated canisters to collect emission samples for laboratory analysis.
TOC, VOC, and HAP emissions were calculated on an annual basis for each site as the sum of 1) direct canister sample results; 2) adjusted canister results using correlation equations; 3) tank and non-tank surrogate emission profiles; 4) engine emission data; and 5) default zero emission factors. Emissions associated with tank unloading, tank flashing, well snubbing, glycol
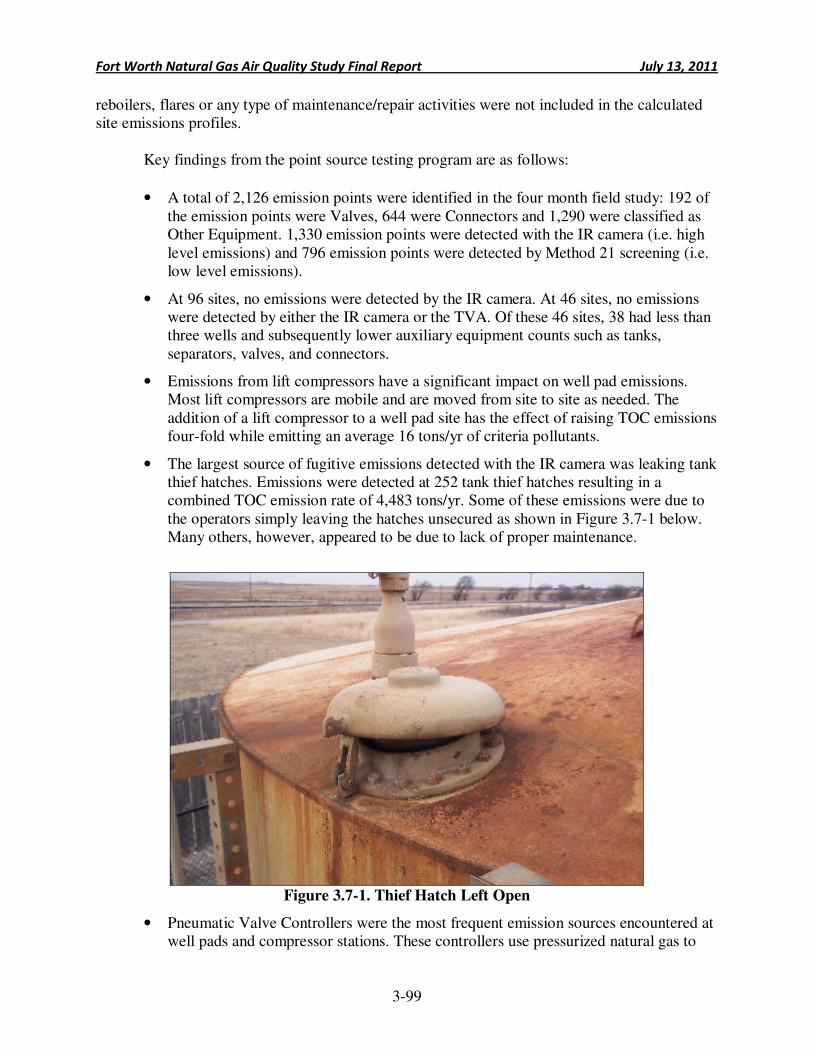
Fort Worth Natural Gas Air Quality Study Final Report July 13, 2011
3-99
reboilers, flares or any type of maintenance/repair activities were not included in the calculated site emissions profiles.
Key findings from the point source testing program are as follows:
• A total of 2,126 emission points were identified in the four month field study: 192 of the emission points were Valves, 644 were Connectors and 1,290 were classified as Other Equipment. 1,330 emission points were detected with the IR camera (i.e. high level emissions) and 796 emission points were detected by Method 21 screening (i.e. low level emissions).
• At 96 sites, no emissions were detected by the IR camera. At 46 sites, no emissions were detected by either the IR camera or the TVA. Of these 46 sites, 38 had less than three wells and subsequently lower auxiliary equipment counts such as tanks, separators, valves, and connectors.
• Emissions from lift compressors have a significant impact on well pad emissions. Most lift compressors are mobile and are moved from site to site as needed. The addition of a lift compressor to a well pad site has the effect of raising TOC emissions four-fold while emitting an average 16 tons/yr of criteria pollutants.
• The largest source of fugitive emissions detected with the IR camera was leaking tank thief hatches. Emissions were detected at 252 tank thief hatches resulting in a combined TOC emission rate of 4,483 tons/yr. Some of these emissions were due to the operators simply leaving the hatches unsecured as shown in Figure 3.7-1 below. Many others, however, appeared to be due to lack of proper maintenance.
Figure 3.7-1. Thief Hatch Left Open
• Pneumatic Valve Controllers were the most frequent emission sources encountered at well pads and compressor stations. These controllers use pressurized natural gas to
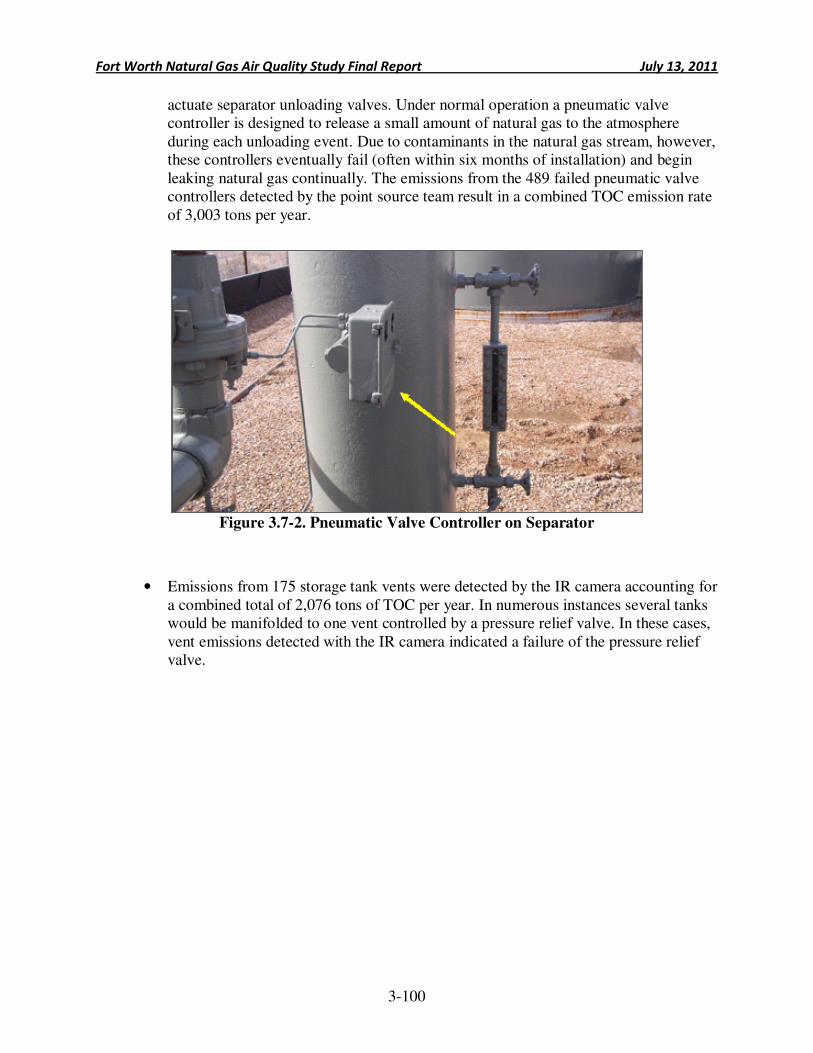
Fort Worth Natural Gas Air Quality Study Final Report July 13, 2011
3-100
actuate separator unloading valves. Under normal operation a pneumatic valve controller is designed to release a small amount of natural gas to the atmosphere during each unloading event. Due to contaminants in the natural gas stream, however, these controllers eventually fail (often within six months of installation) and begin leaking natural gas continually. The emissions from the 489 failed pneumatic valve controllers detected by the point source team result in a combined TOC emission rate of 3,003 tons per year.
Figure 3.7-2. Pneumatic Valve Controller on Separator
• Emissions from 175 storage tank vents were detected by the IR camera accounting for a combined total of 2,076 tons of TOC per year. In numerous instances several tanks would be manifolded to one vent controlled by a pressure relief valve. In these cases, vent emissions detected with the IR camera indicated a failure of the pressure relief valve.
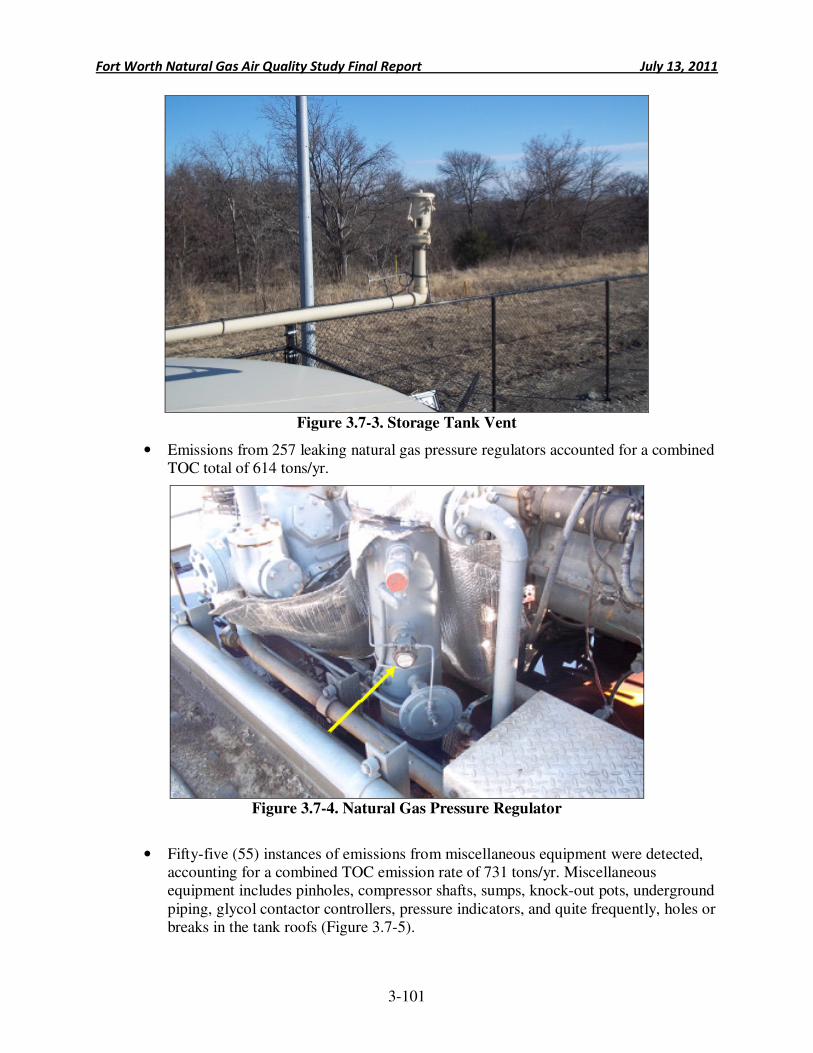
Fort Worth Natural Gas Air Quality Study Final Report July 13, 2011
3-101
Figure 3.7-3. Storage Tank Vent
• Emissions from 257 leaking natural gas pressure regulators accounted for a combined TOC total of 614 tons/yr.
Figure 3.7-4. Natural Gas Pressure Regulator
• Fifty-five (55) instances of emissions from miscellaneous equipment were detected, accounting for a combined TOC emission rate of 731 tons/yr. Miscellaneous equipment includes pinholes, compressor shafts, sumps, knock-out pots, underground piping, glycol contactor controllers, pressure indicators, and quite frequently, holes or breaks in the tank roofs (Figure 3.7-5).
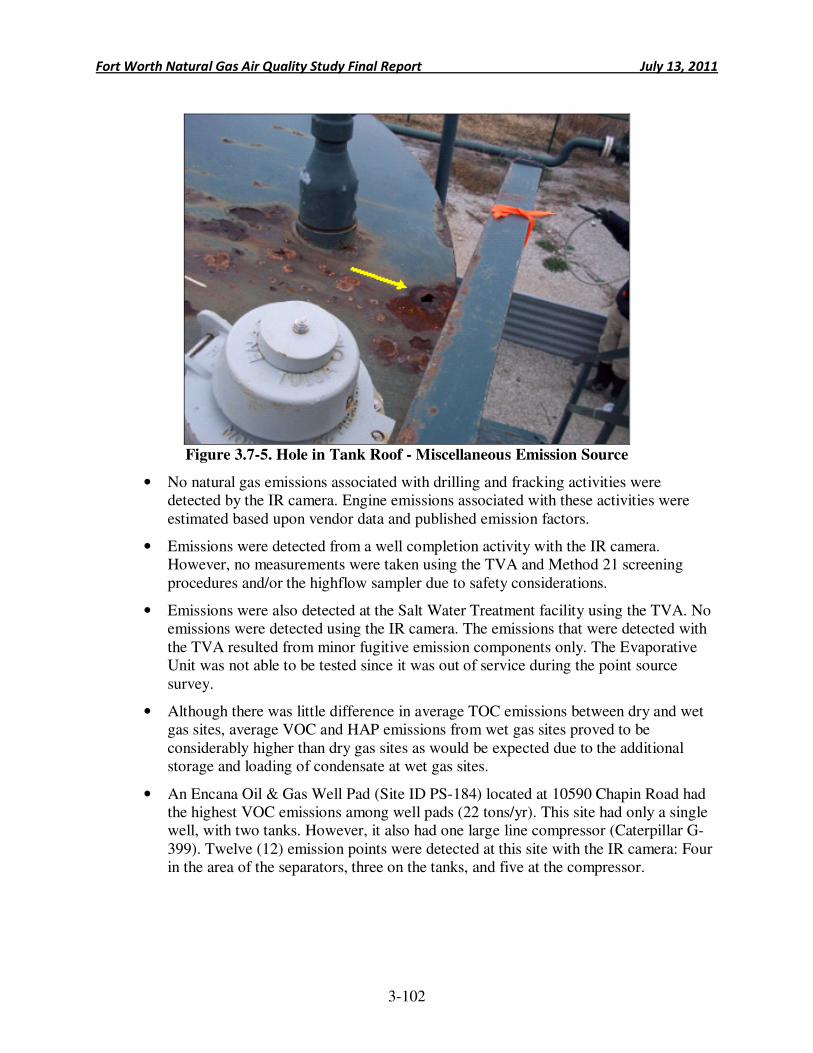
Fort Worth Natural Gas Air Quality Study Final Report July 13, 2011
3-102
Figure 3.7-5. Hole in Tank Roof - Miscellaneous Emission Source
• No natural gas emissions associated with drilling and fracking activities were detected by the IR camera. Engine emissions associated with these activities were estimated based upon vendor data and published emission factors.
• Emissions were detected from a well completion activity with the IR camera. However, no measurements were taken using the TVA and Method 21 screening procedures and/or the highflow sampler due to safety considerations.
• Emissions were also detected at the Salt Water Treatment facility using the TVA. No emissions were detected using the IR camera. The emissions that were detected with the TVA resulted from minor fugitive emission components only. The Evaporative Unit was not able to be tested since it was out of service during the point source survey.
• Although there was little difference in average TOC emissions between dry and wet gas sites, average VOC and HAP emissions from wet gas sites proved to be considerably higher than dry gas sites as would be expected due to the additional storage and loading of condensate at wet gas sites.
• An Encana Oil & Gas Well Pad (Site ID PS-184) located at 10590 Chapin Road had the highest VOC emissions among well pads (22 tons/yr). This site had only a single well, with two tanks. However, it also had one large line compressor (Caterpillar G-399). Twelve (12) emission points were detected at this site with the IR camera: Four in the area of the separators, three on the tanks, and five at the compressor.
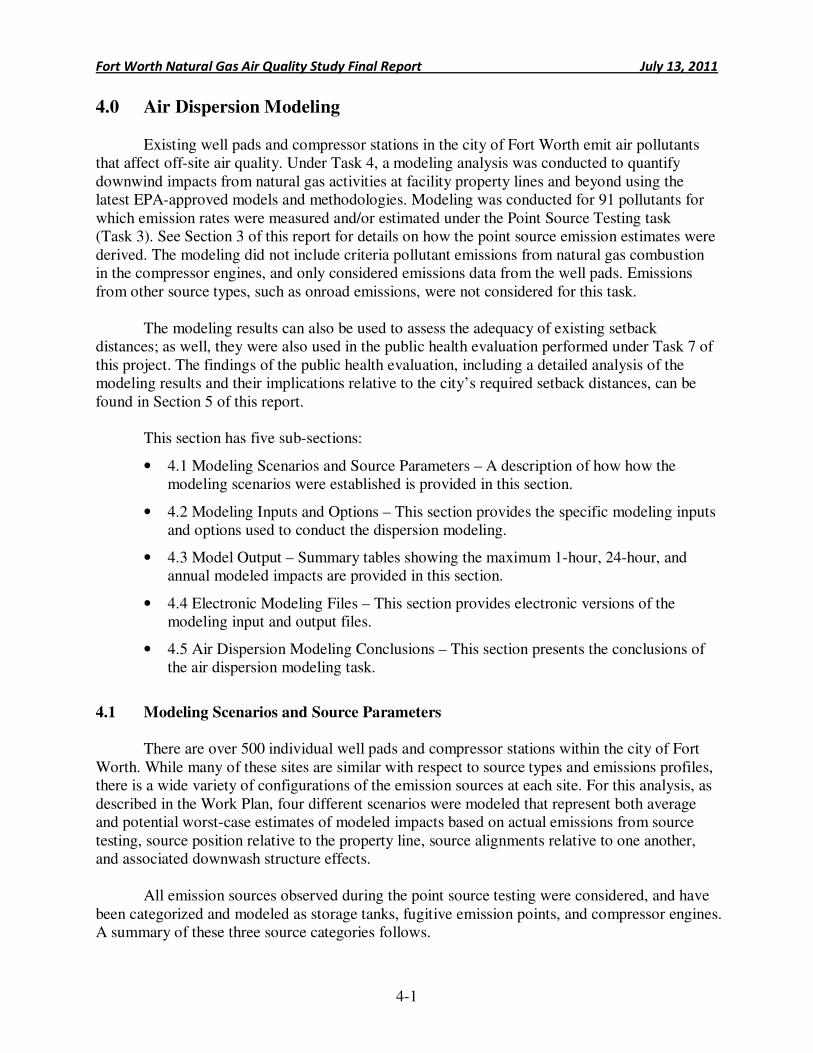
Fort Worth Natural Gas Air Quality Study Final Report July 13, 2011
4-1
4.0 Air Dispersion Modeling
Existing well pads and compressor stations in the city of Fort Worth emit air pollutants that affect off-site air quality. Under Task 4, a modeling analysis was conducted to quantify downwind impacts from natural gas activities at facility property lines and beyond using the latest EPA-approved models and methodologies. Modeling was conducted for 91 pollutants for which emission rates were measured and/or estimated under the Point Source Testing task (Task 3). See Section 3 of this report for details on how the point source emission estimates were derived. The modeling did not include criteria pollutant emissions from natural gas combustion in the compressor engines, and only considered emissions data from the well pads. Emissions from other source types, such as onroad emissions, were not considered for this task.
The modeling results can also be used to assess the adequacy of existing setback distances; as well, they were also used in the public health evaluation performed under Task 7 of this project. The findings of the public health evaluation, including a detailed analysis of the modeling results and their implications relative to the city’s required setback distances, can be found in Section 5 of this report.
This section has five sub-sections:
• 4.1 Modeling Scenarios and Source Parameters – A description of how how the modeling scenarios were established is provided in this section.
• 4.2 Modeling Inputs and Options – This section provides the specific modeling inputs and options used to conduct the dispersion modeling.
• 4.3 Model Output – Summary tables showing the maximum 1-hour, 24-hour, and annual modeled impacts are provided in this section.
• 4.4 Electronic Modeling Files – This section provides electronic versions of the modeling input and output files.
• 4.5 Air Dispersion Modeling Conclusions – This section presents the conclusions of the air dispersion modeling task.
4.1 Modeling Scenarios and Source Parameters
There are over 500 individual well pads and compressor stations within the city of Fort
Worth. While many of these sites are similar with respect to source types and emissions profiles, there is a wide variety of configurations of the emission sources at each site. For this analysis, as described in the Work Plan, four different scenarios were modeled that represent both average and potential worst-case estimates of modeled impacts based on actual emissions from source testing, source position relative to the property line, source alignments relative to one another, and associated downwash structure effects.
All emission sources observed during the point source testing were considered, and have been categorized and modeled as storage tanks, fugitive emission points, and compressor engines. A summary of these three source categories follows.
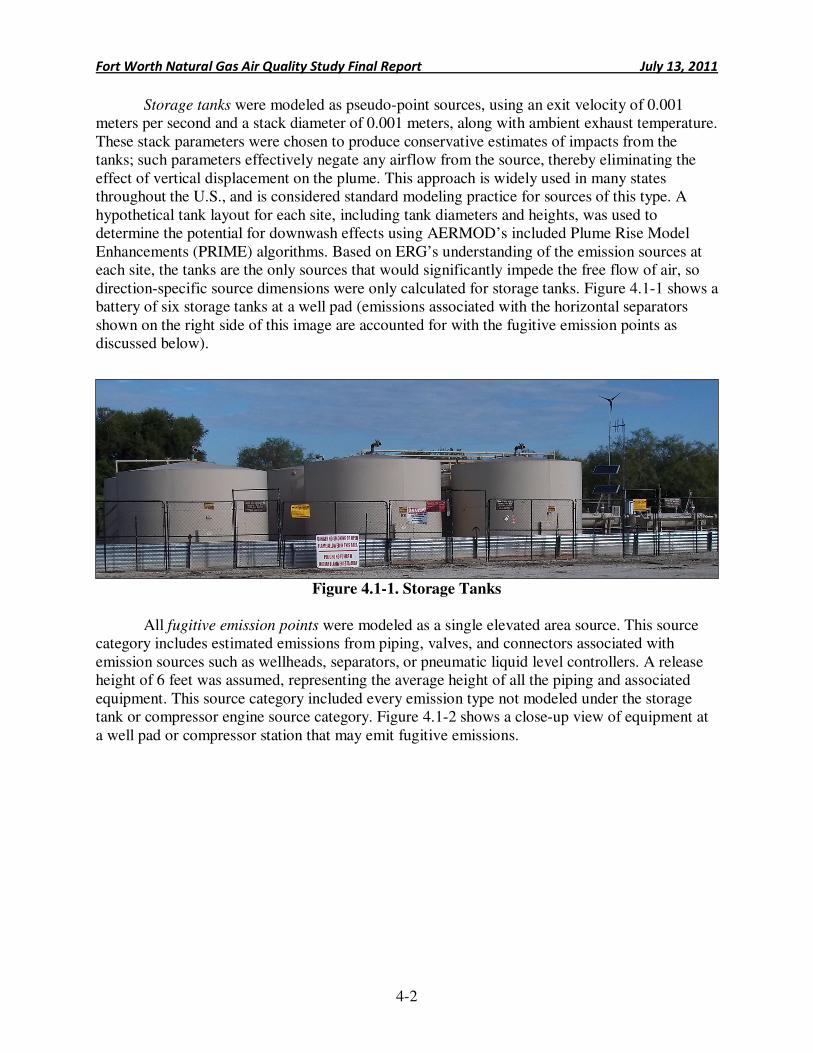
Fort Worth Natural Gas Air Quality Study Final Report July 13, 2011
4-2
Storage tanks were modeled as pseudo-point sources, using an exit velocity of 0.001 meters per second and a stack diameter of 0.001 meters, along with ambient exhaust temperature. These stack parameters were chosen to produce conservative estimates of impacts from the tanks; such parameters effectively negate any airflow from the source, thereby eliminating the effect of vertical displacement on the plume. This approach is widely used in many states throughout the U.S., and is considered standard modeling practice for sources of this type. A hypothetical tank layout for each site, including tank diameters and heights, was used to determine the potential for downwash effects using AERMOD’s included Plume Rise Model Enhancements (PRIME) algorithms. Based on ERG’s understanding of the emission sources at each site, the tanks are the only sources that would significantly impede the free flow of air, so direction-specific source dimensions were only calculated for storage tanks. Figure 4.1-1 shows a battery of six storage tanks at a well pad (emissions associated with the horizontal separators shown on the right side of this image are accounted for with the fugitive emission points as discussed below).
Figure 4.1-1. Storage Tanks
All fugitive emission points were modeled as a single elevated area source. This source category includes estimated emissions from piping, valves, and connectors associated with emission sources such as wellheads, separators, or pneumatic liquid level controllers. A release height of 6 feet was assumed, representing the average height of all the piping and associated equipment. This source category included every emission type not modeled under the storage tank or compressor engine source category. Figure 4.1-2 shows a close-up view of equipment at a well pad or compressor station that may emit fugitive emissions.
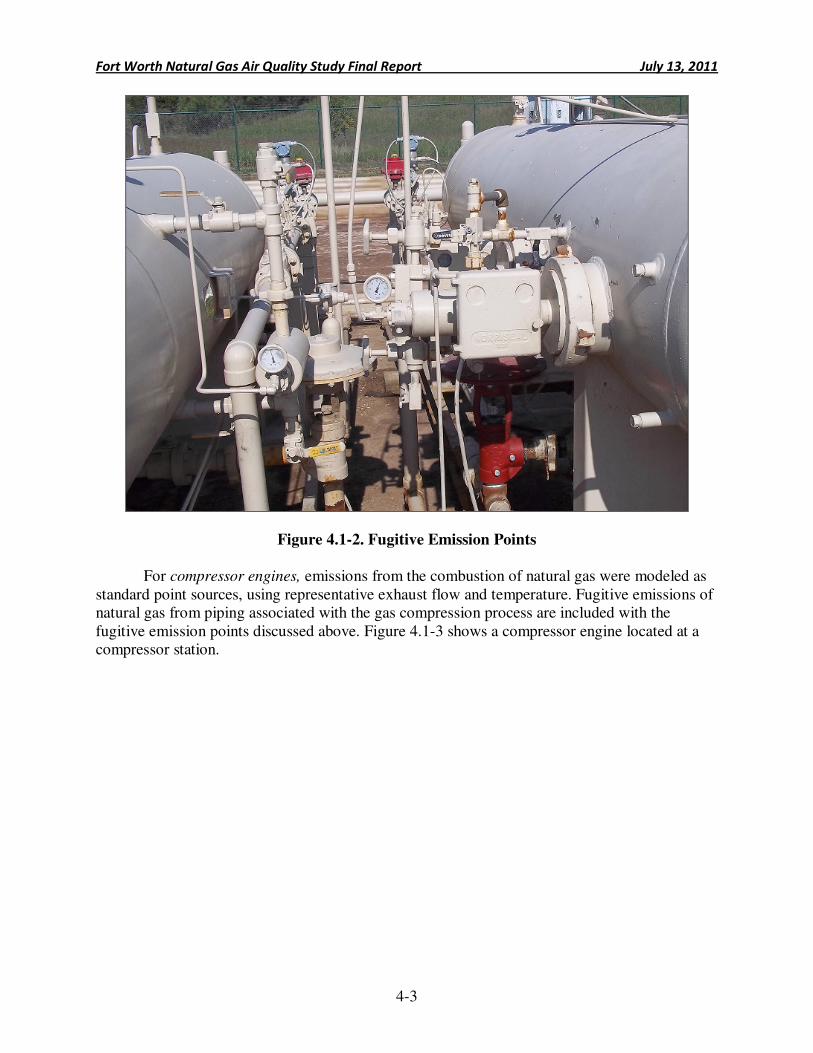
Fort Worth Natural Gas Air Quality Study Final Report July 13, 2011
4-3
Figure 4.1-2. Fugitive Emission Points
For compressor engines, emissions from the combustion of natural gas were modeled as
standard point sources, using representative exhaust flow and temperature. Fugitive emissions of natural gas from piping associated with the gas compression process are included with the fugitive emission points discussed above. Figure 4.1-3 shows a compressor engine located at a compressor station.
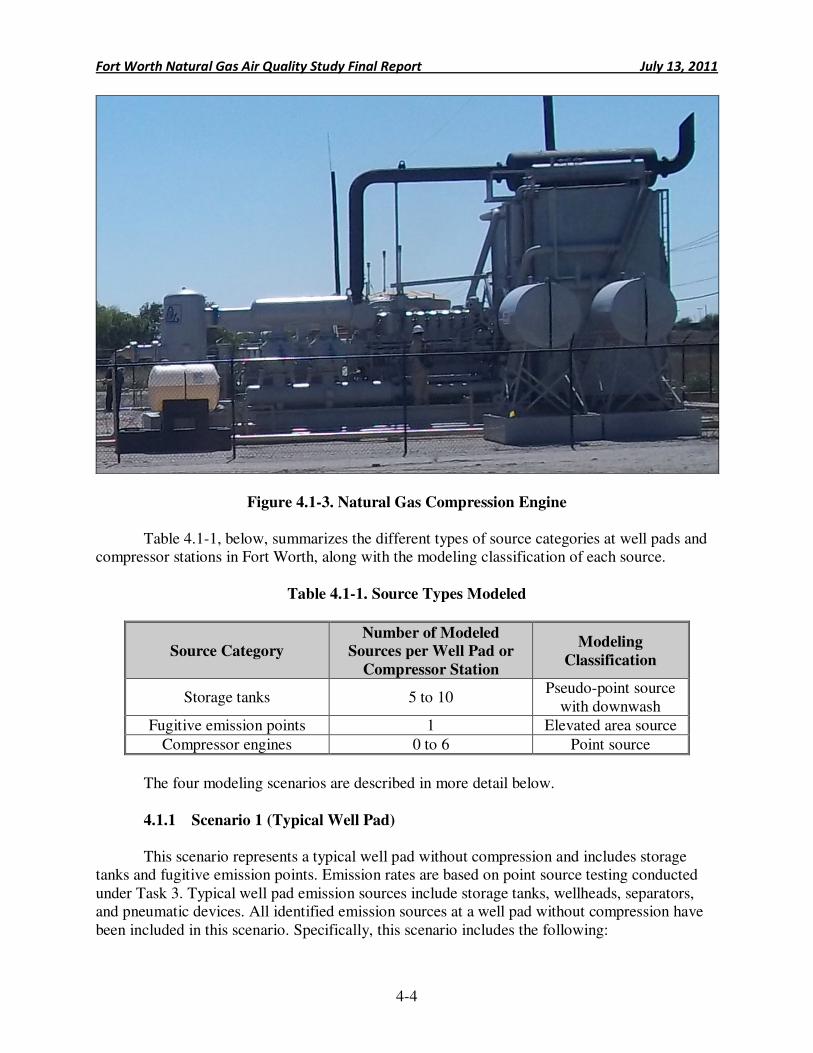
Fort Worth Natural Gas Air Quality Study Final Report July 13, 2011
4-4
Figure 4.1-3. Natural Gas Compression Engine
Table 4.1-1, below, summarizes the different types of source categories at well pads and compressor stations in Fort Worth, along with the modeling classification of each source.
Table 4.1-1. Source Types Modeled
Source Category
Number of Modeled
Sources per Well Pad or
Compressor Station
Modeling
Classification
Storage tanks 5 to 10 Pseudo-point source
with downwash Fugitive emission points 1 Elevated area source
Compressor engines 0 to 6 Point source
The four modeling scenarios are described in more detail below.
4.1.1 Scenario 1 (Typical Well Pad)
This scenario represents a typical well pad without compression and includes storage
tanks and fugitive emission points. Emission rates are based on point source testing conducted under Task 3. Typical well pad emission sources include storage tanks, wellheads, separators, and pneumatic devices. All identified emission sources at a well pad without compression have been included in this scenario. Specifically, this scenario includes the following:
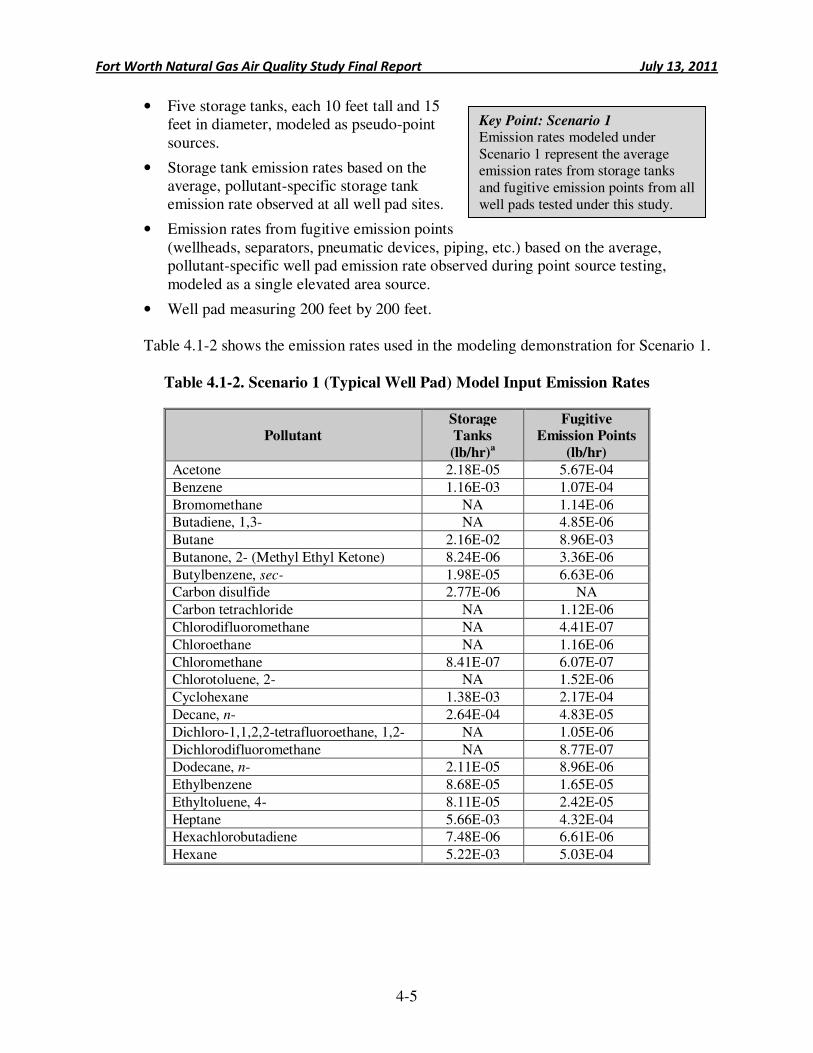
Fort Worth Natural Gas Air Quality Study Final Report July 13, 2011
4-5
• Five storage tanks, each 10 feet tall and 15 feet in diameter, modeled as pseudo-point sources.
• Storage tank emission rates based on the average, pollutant-specific storage tank emission rate observed at all well pad sites.
• Emission rates from fugitive emission points (wellheads, separators, pneumatic devices, piping, etc.) based on the average, pollutant-specific well pad emission rate observed during point source testing, modeled as a single elevated area source.
• Well pad measuring 200 feet by 200 feet.
Table 4.1-2 shows the emission rates used in the modeling demonstration for Scenario 1.
Table 4.1-2. Scenario 1 (Typical Well Pad) Model Input Emission Rates
Pollutant Storage Tanks
(lb/hr)a
Fugitive Emission Points
(lb/hr)
Acetone 2.18E-05 5.67E-04
Benzene 1.16E-03 1.07E-04
Bromomethane NA 1.14E-06 Butadiene, 1,3- NA 4.85E-06
Butane 2.16E-02 8.96E-03
Butanone, 2- (Methyl Ethyl Ketone) 8.24E-06 3.36E-06
Butylbenzene, sec- 1.98E-05 6.63E-06 Carbon disulfide 2.77E-06 NA
Carbon tetrachloride NA 1.12E-06
Chlorodifluoromethane NA 4.41E-07
Chloroethane NA 1.16E-06
Chloromethane 8.41E-07 6.07E-07 Chlorotoluene, 2- NA 1.52E-06
Cyclohexane 1.38E-03 2.17E-04
Decane, n- 2.64E-04 4.83E-05
Dichloro-1,1,2,2-tetrafluoroethane, 1,2- NA 1.05E-06
Dichlorodifluoromethane NA 8.77E-07 Dodecane, n- 2.11E-05 8.96E-06
Ethylbenzene 8.68E-05 1.65E-05
Ethyltoluene, 4- 8.11E-05 2.42E-05
Heptane 5.66E-03 4.32E-04 Hexachlorobutadiene 7.48E-06 6.61E-06
Hexane 5.22E-03 5.03E-04
Key Point: Scenario 1 Emission rates modeled under Scenario 1 represent the average emission rates from storage tanks and fugitive emission points from all well pads tested under this study.
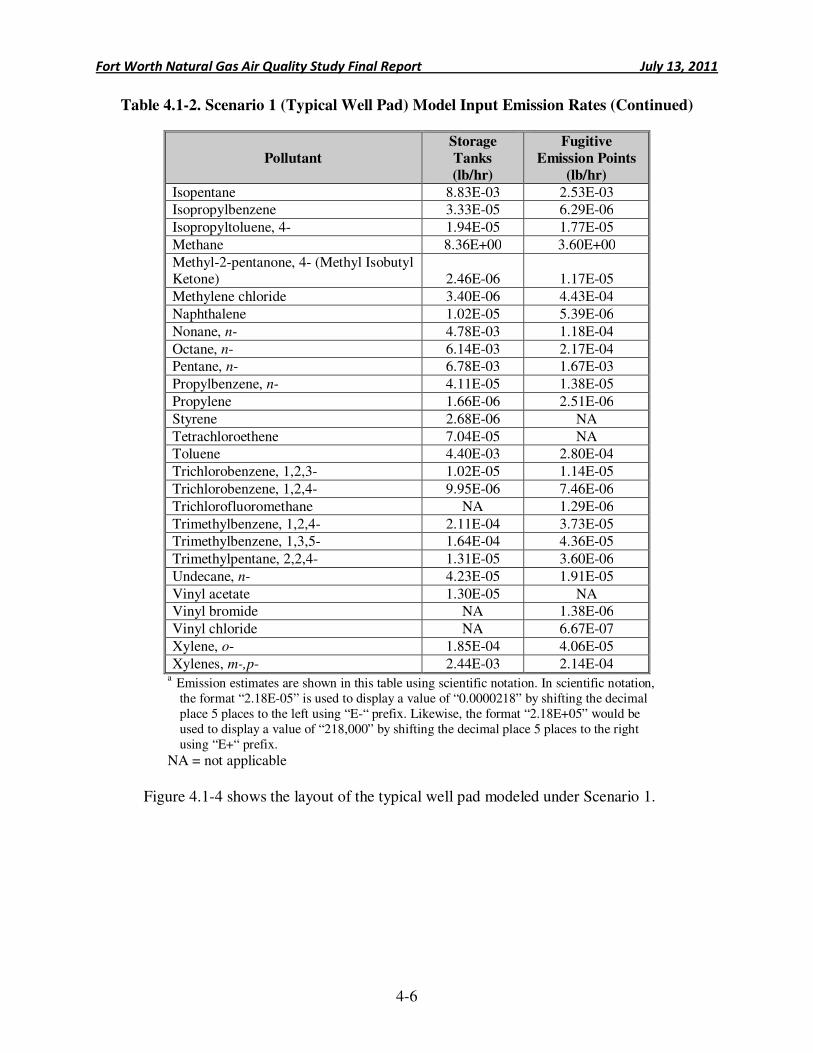
Fort Worth Natural Gas Air Quality Study Final Report July 13, 2011
4-6
Table 4.1-2. Scenario 1 (Typical Well Pad) Model Input Emission Rates (Continued)
Pollutant
Storage
Tanks
(lb/hr)
Fugitive
Emission Points
(lb/hr)
Isopentane 8.83E-03 2.53E-03 Isopropylbenzene 3.33E-05 6.29E-06
Isopropyltoluene, 4- 1.94E-05 1.77E-05
Methane 8.36E+00 3.60E+00
Methyl-2-pentanone, 4- (Methyl Isobutyl Ketone) 2.46E-06 1.17E-05
Methylene chloride 3.40E-06 4.43E-04
Naphthalene 1.02E-05 5.39E-06
Nonane, n- 4.78E-03 1.18E-04
Octane, n- 6.14E-03 2.17E-04 Pentane, n- 6.78E-03 1.67E-03
Propylbenzene, n- 4.11E-05 1.38E-05
Propylene 1.66E-06 2.51E-06
Styrene 2.68E-06 NA
Tetrachloroethene 7.04E-05 NA Toluene 4.40E-03 2.80E-04
Trichlorobenzene, 1,2,3- 1.02E-05 1.14E-05
Trichlorobenzene, 1,2,4- 9.95E-06 7.46E-06
Trichlorofluoromethane NA 1.29E-06
Trimethylbenzene, 1,2,4- 2.11E-04 3.73E-05 Trimethylbenzene, 1,3,5- 1.64E-04 4.36E-05
Trimethylpentane, 2,2,4- 1.31E-05 3.60E-06
Undecane, n- 4.23E-05 1.91E-05
Vinyl acetate 1.30E-05 NA Vinyl bromide NA 1.38E-06
Vinyl chloride NA 6.67E-07
Xylene, o- 1.85E-04 4.06E-05
Xylenes, m-,p- 2.44E-03 2.14E-04 a Emission estimates are shown in this table using scientific notation. In scientific notation,
the format “2.18E-05” is used to display a value of “0.0000218” by shifting the decimal place 5 places to the left using “E-“ prefix. Likewise, the format “2.18E+05” would be used to display a value of “218,000” by shifting the decimal place 5 places to the right using “E+“ prefix.
NA = not applicable
Figure 4.1-4 shows the layout of the typical well pad modeled under Scenario 1.
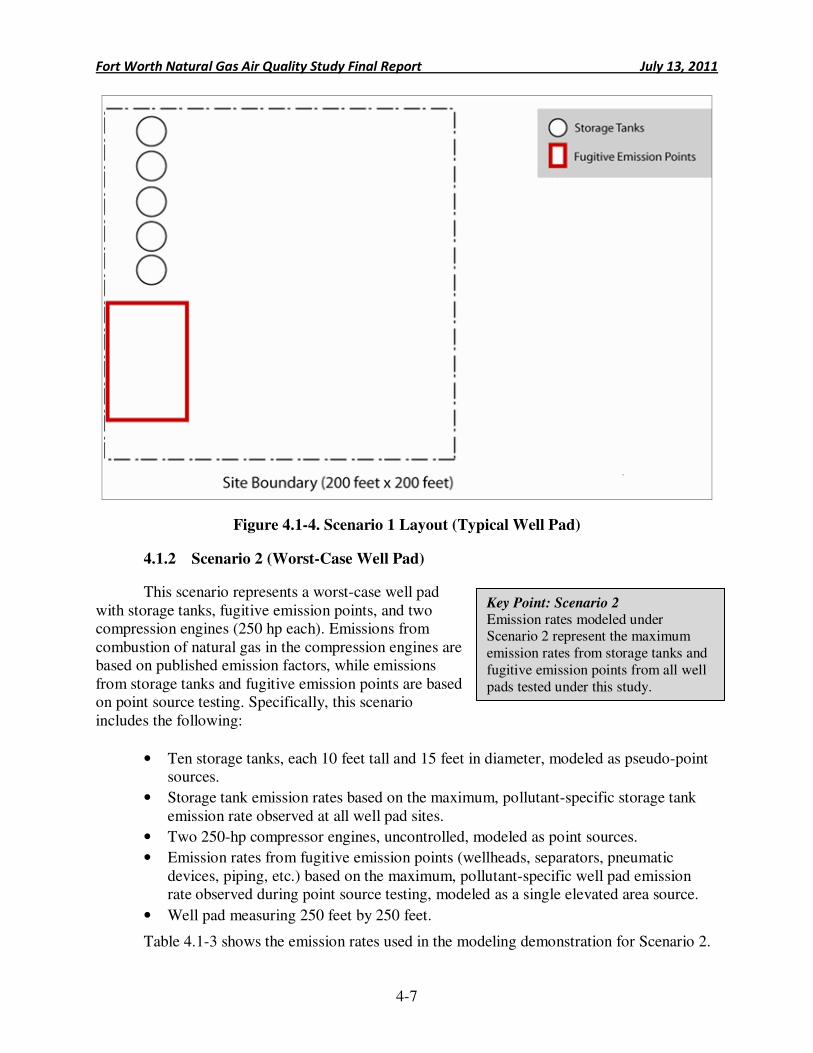
Fort Worth Natural Gas Air Quality Study Final Report July 13, 2011
4-7
Figure 4.1-4. Scenario 1 Layout (Typical Well Pad)
4.1.2 Scenario 2 (Worst-Case Well Pad)
This scenario represents a worst-case well pad with storage tanks, fugitive emission points, and two compression engines (250 hp each). Emissions from combustion of natural gas in the compression engines are based on published emission factors, while emissions from storage tanks and fugitive emission points are based on point source testing. Specifically, this scenario includes the following:
• Ten storage tanks, each 10 feet tall and 15 feet in diameter, modeled as pseudo-point sources.
• Storage tank emission rates based on the maximum, pollutant-specific storage tank emission rate observed at all well pad sites.
• Two 250-hp compressor engines, uncontrolled, modeled as point sources.
• Emission rates from fugitive emission points (wellheads, separators, pneumatic devices, piping, etc.) based on the maximum, pollutant-specific well pad emission rate observed during point source testing, modeled as a single elevated area source.
• Well pad measuring 250 feet by 250 feet.
Table 4.1-3 shows the emission rates used in the modeling demonstration for Scenario 2.
Key Point: Scenario 2 Emission rates modeled under Scenario 2 represent the maximum emission rates from storage tanks and fugitive emission points from all well pads tested under this study.
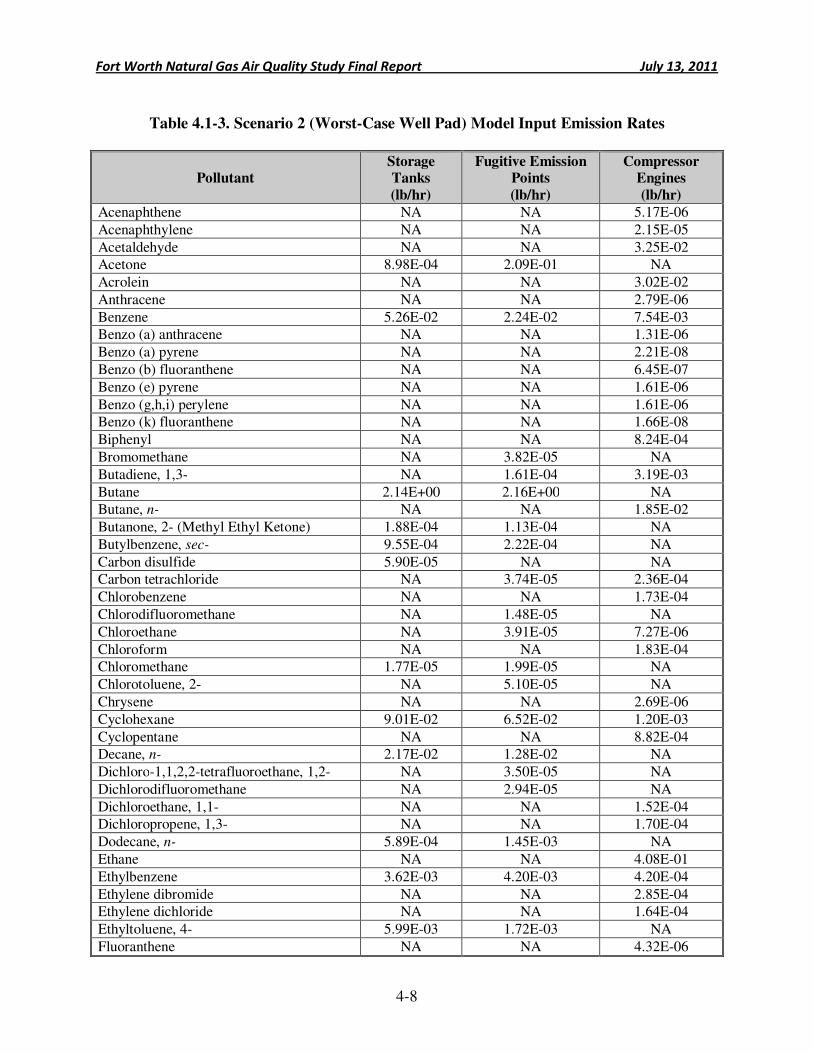
Fort Worth Natural Gas Air Quality Study Final Report July 13, 2011
4-8
Table 4.1-3. Scenario 2 (Worst-Case Well Pad) Model Input Emission Rates
Pollutant Storage Tanks
(lb/hr)
Fugitive Emission Points
(lb/hr)
Compressor Engines
(lb/hr)
Acenaphthene NA NA 5.17E-06
Acenaphthylene NA NA 2.15E-05
Acetaldehyde NA NA 3.25E-02 Acetone 8.98E-04 2.09E-01 NA
Acrolein NA NA 3.02E-02
Anthracene NA NA 2.79E-06
Benzene 5.26E-02 2.24E-02 7.54E-03 Benzo (a) anthracene NA NA 1.31E-06
Benzo (a) pyrene NA NA 2.21E-08
Benzo (b) fluoranthene NA NA 6.45E-07
Benzo (e) pyrene NA NA 1.61E-06
Benzo (g,h,i) perylene NA NA 1.61E-06 Benzo (k) fluoranthene NA NA 1.66E-08
Biphenyl NA NA 8.24E-04
Bromomethane NA 3.82E-05 NA
Butadiene, 1,3- NA 1.61E-04 3.19E-03
Butane 2.14E+00 2.16E+00 NA Butane, n- NA NA 1.85E-02
Butanone, 2- (Methyl Ethyl Ketone) 1.88E-04 1.13E-04 NA
Butylbenzene, sec- 9.55E-04 2.22E-04 NA
Carbon disulfide 5.90E-05 NA NA Carbon tetrachloride NA 3.74E-05 2.36E-04
Chlorobenzene NA NA 1.73E-04
Chlorodifluoromethane NA 1.48E-05 NA
Chloroethane NA 3.91E-05 7.27E-06
Chloroform NA NA 1.83E-04 Chloromethane 1.77E-05 1.99E-05 NA
Chlorotoluene, 2- NA 5.10E-05 NA
Chrysene NA NA 2.69E-06
Cyclohexane 9.01E-02 6.52E-02 1.20E-03
Cyclopentane NA NA 8.82E-04 Decane, n- 2.17E-02 1.28E-02 NA
Dichloro-1,1,2,2-tetrafluoroethane, 1,2- NA 3.50E-05 NA
Dichlorodifluoromethane NA 2.94E-05 NA
Dichloroethane, 1,1- NA NA 1.52E-04 Dichloropropene, 1,3- NA NA 1.70E-04
Dodecane, n- 5.89E-04 1.45E-03 NA
Ethane NA NA 4.08E-01
Ethylbenzene 3.62E-03 4.20E-03 4.20E-04
Ethylene dibromide NA NA 2.85E-04 Ethylene dichloride NA NA 1.64E-04
Ethyltoluene, 4- 5.99E-03 1.72E-03 NA
Fluoranthene NA NA 4.32E-06
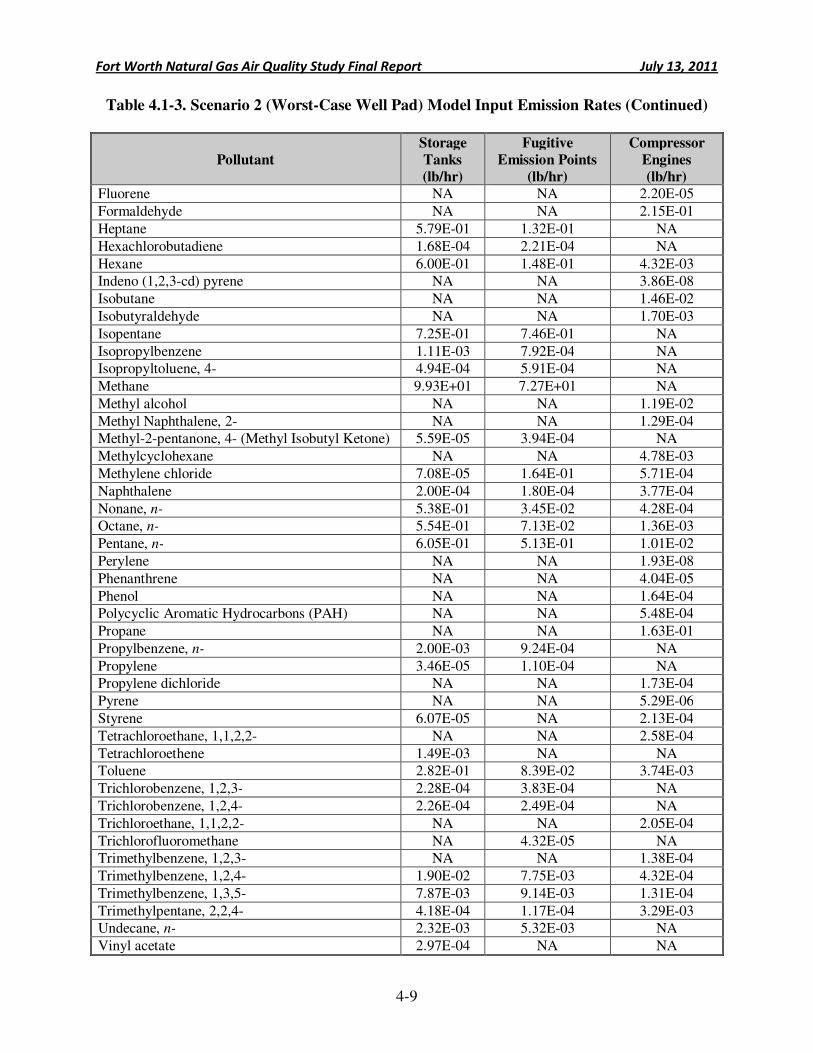
Fort Worth Natural Gas Air Quality Study Final Report July 13, 2011
4-9
Table 4.1-3. Scenario 2 (Worst-Case Well Pad) Model Input Emission Rates (Continued)
Pollutant
Storage
Tanks
(lb/hr)
Fugitive
Emission Points
(lb/hr)
Compressor
Engines
(lb/hr)
Fluorene NA NA 2.20E-05
Formaldehyde NA NA 2.15E-01
Heptane 5.79E-01 1.32E-01 NA
Hexachlorobutadiene 1.68E-04 2.21E-04 NA
Hexane 6.00E-01 1.48E-01 4.32E-03 Indeno (1,2,3-cd) pyrene NA NA 3.86E-08
Isobutane NA NA 1.46E-02
Isobutyraldehyde NA NA 1.70E-03
Isopentane 7.25E-01 7.46E-01 NA
Isopropylbenzene 1.11E-03 7.92E-04 NA Isopropyltoluene, 4- 4.94E-04 5.91E-04 NA
Methane 9.93E+01 7.27E+01 NA
Methyl alcohol NA NA 1.19E-02
Methyl Naphthalene, 2- NA NA 1.29E-04 Methyl-2-pentanone, 4- (Methyl Isobutyl Ketone) 5.59E-05 3.94E-04 NA
Methylcyclohexane NA NA 4.78E-03
Methylene chloride 7.08E-05 1.64E-01 5.71E-04
Naphthalene 2.00E-04 1.80E-04 3.77E-04
Nonane, n- 5.38E-01 3.45E-02 4.28E-04 Octane, n- 5.54E-01 7.13E-02 1.36E-03
Pentane, n- 6.05E-01 5.13E-01 1.01E-02
Perylene NA NA 1.93E-08
Phenanthrene NA NA 4.04E-05
Phenol NA NA 1.64E-04 Polycyclic Aromatic Hydrocarbons (PAH) NA NA 5.48E-04
Propane NA NA 1.63E-01
Propylbenzene, n- 2.00E-03 9.24E-04 NA
Propylene 3.46E-05 1.10E-04 NA Propylene dichloride NA NA 1.73E-04
Pyrene NA NA 5.29E-06
Styrene 6.07E-05 NA 2.13E-04
Tetrachloroethane, 1,1,2,2- NA NA 2.58E-04
Tetrachloroethene 1.49E-03 NA NA Toluene 2.82E-01 8.39E-02 3.74E-03
Trichlorobenzene, 1,2,3- 2.28E-04 3.83E-04 NA
Trichlorobenzene, 1,2,4- 2.26E-04 2.49E-04 NA
Trichloroethane, 1,1,2,2- NA NA 2.05E-04
Trichlorofluoromethane NA 4.32E-05 NA Trimethylbenzene, 1,2,3- NA NA 1.38E-04
Trimethylbenzene, 1,2,4- 1.90E-02 7.75E-03 4.32E-04
Trimethylbenzene, 1,3,5- 7.87E-03 9.14E-03 1.31E-04
Trimethylpentane, 2,2,4- 4.18E-04 1.17E-04 3.29E-03 Undecane, n- 2.32E-03 5.32E-03 NA
Vinyl acetate 2.97E-04 NA NA
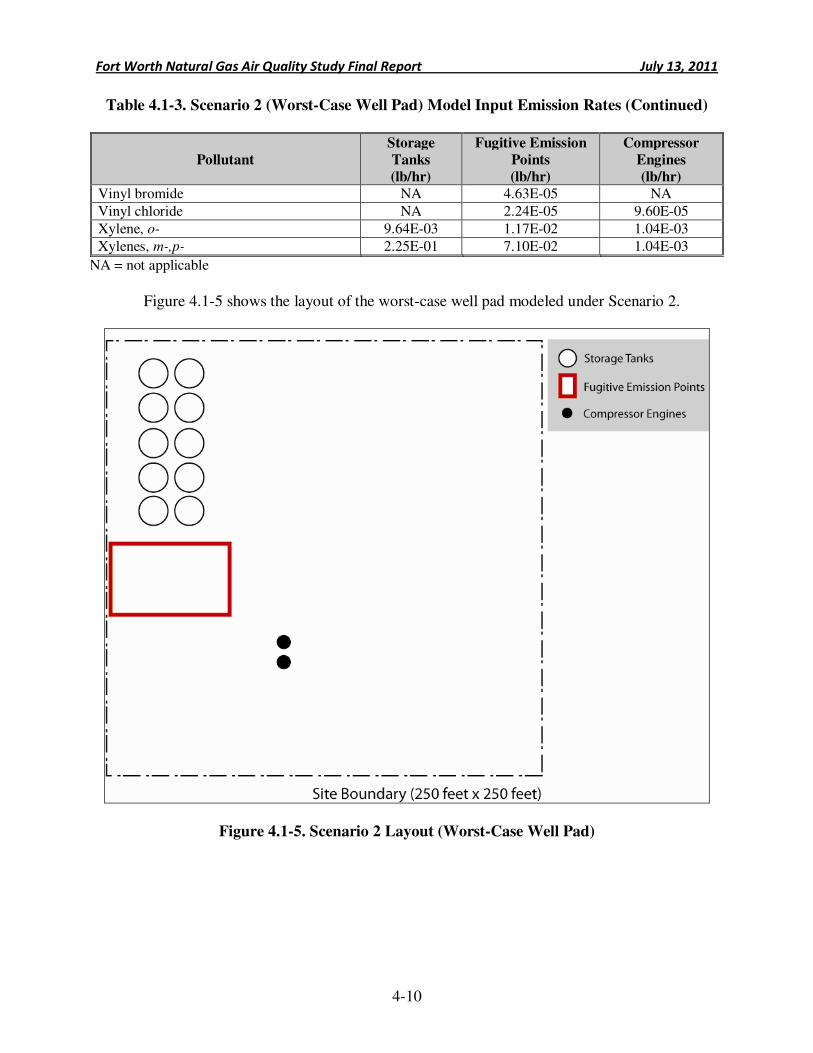
Fort Worth Natural Gas Air Quality Study Final Report July 13, 2011
4-10
Table 4.1-3. Scenario 2 (Worst-Case Well Pad) Model Input Emission Rates (Continued)
Pollutant
Storage
Tanks
(lb/hr)
Fugitive Emission
Points
(lb/hr)
Compressor
Engines
(lb/hr)
Vinyl bromide NA 4.63E-05 NA
Vinyl chloride NA 2.24E-05 9.60E-05
Xylene, o- 9.64E-03 1.17E-02 1.04E-03
Xylenes, m-,p- 2.25E-01 7.10E-02 1.04E-03
NA = not applicable
Figure 4.1-5 shows the layout of the worst-case well pad modeled under Scenario 2.
Figure 4.1-5. Scenario 2 Layout (Worst-Case Well Pad)
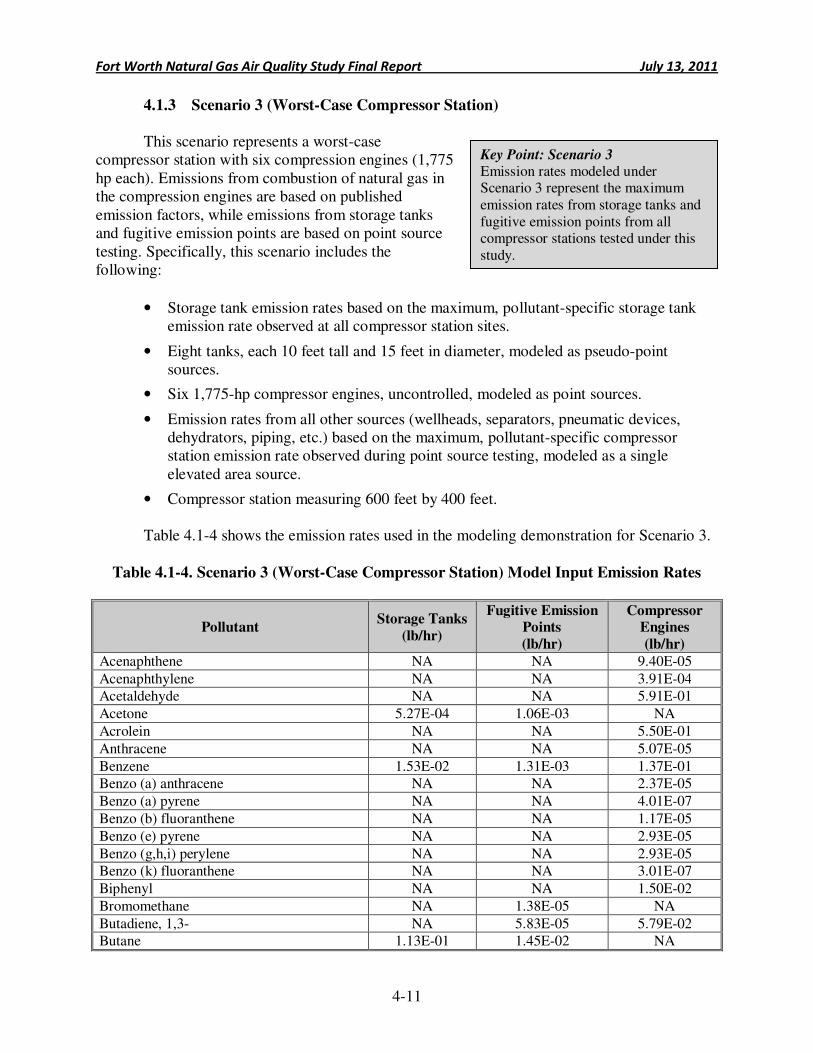
Fort Worth Natural Gas Air Quality Study Final Report July 13, 2011
4-11
4.1.3 Scenario 3 (Worst-Case Compressor Station)
This scenario represents a worst-case compressor station with six compression engines (1,775 hp each). Emissions from combustion of natural gas in the compression engines are based on published emission factors, while emissions from storage tanks and fugitive emission points are based on point source testing. Specifically, this scenario includes the following:
• Storage tank emission rates based on the maximum, pollutant-specific storage tank emission rate observed at all compressor station sites.
• Eight tanks, each 10 feet tall and 15 feet in diameter, modeled as pseudo-point sources.
• Six 1,775-hp compressor engines, uncontrolled, modeled as point sources.
• Emission rates from all other sources (wellheads, separators, pneumatic devices, dehydrators, piping, etc.) based on the maximum, pollutant-specific compressor station emission rate observed during point source testing, modeled as a single elevated area source.
• Compressor station measuring 600 feet by 400 feet.
Table 4.1-4 shows the emission rates used in the modeling demonstration for Scenario 3.
Table 4.1-4. Scenario 3 (Worst-Case Compressor Station) Model Input Emission Rates
Pollutant Storage Tanks
(lb/hr)
Fugitive Emission Points
(lb/hr)
Compressor Engines
(lb/hr)
Acenaphthene NA NA 9.40E-05
Acenaphthylene NA NA 3.91E-04 Acetaldehyde NA NA 5.91E-01
Acetone 5.27E-04 1.06E-03 NA
Acrolein NA NA 5.50E-01
Anthracene NA NA 5.07E-05
Benzene 1.53E-02 1.31E-03 1.37E-01 Benzo (a) anthracene NA NA 2.37E-05
Benzo (a) pyrene NA NA 4.01E-07
Benzo (b) fluoranthene NA NA 1.17E-05
Benzo (e) pyrene NA NA 2.93E-05
Benzo (g,h,i) perylene NA NA 2.93E-05 Benzo (k) fluoranthene NA NA 3.01E-07
Biphenyl NA NA 1.50E-02
Bromomethane NA 1.38E-05 NA
Butadiene, 1,3- NA 5.83E-05 5.79E-02 Butane 1.13E-01 1.45E-02 NA
Key Point: Scenario 3 Emission rates modeled under Scenario 3 represent the maximum emission rates from storage tanks and fugitive emission points from all compressor stations tested under this study.
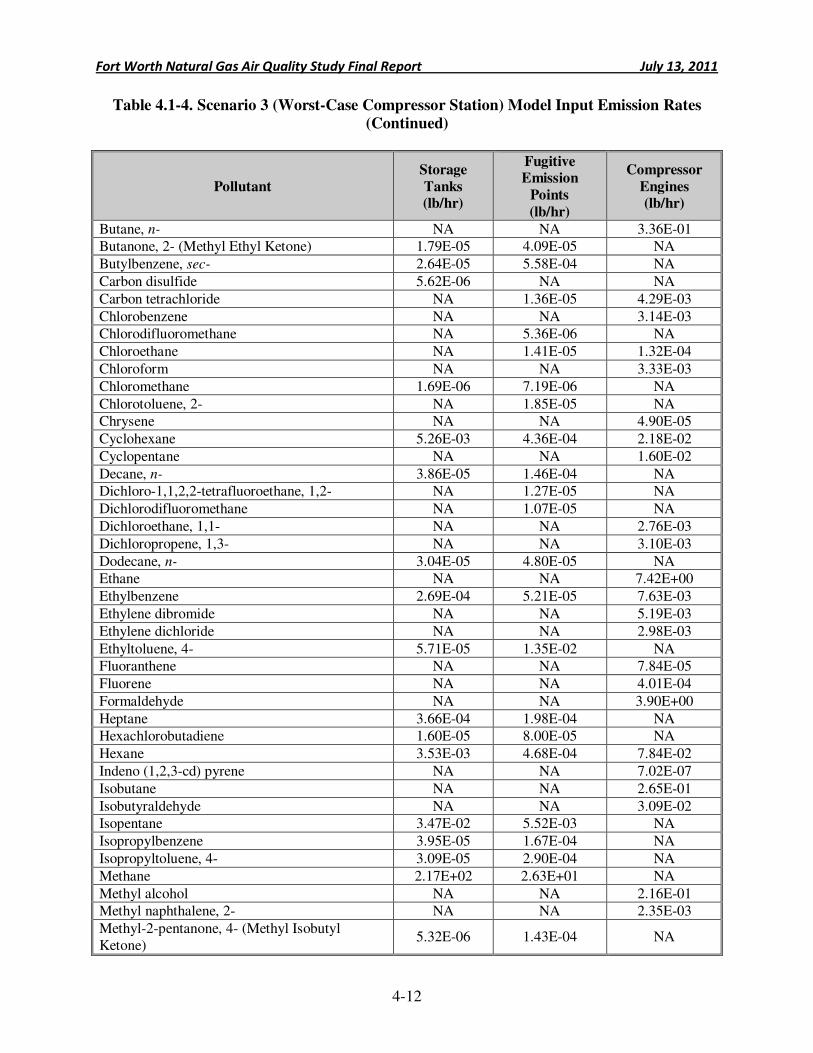
Fort Worth Natural Gas Air Quality Study Final Report July 13, 2011
4-12
Table 4.1-4. Scenario 3 (Worst-Case Compressor Station) Model Input Emission Rates
(Continued)
Pollutant
Storage
Tanks (lb/hr)
Fugitive Emission
Points
(lb/hr)
Compressor
Engines (lb/hr)
Butane, n- NA NA 3.36E-01 Butanone, 2- (Methyl Ethyl Ketone) 1.79E-05 4.09E-05 NA
Butylbenzene, sec- 2.64E-05 5.58E-04 NA
Carbon disulfide 5.62E-06 NA NA
Carbon tetrachloride NA 1.36E-05 4.29E-03
Chlorobenzene NA NA 3.14E-03 Chlorodifluoromethane NA 5.36E-06 NA
Chloroethane NA 1.41E-05 1.32E-04
Chloroform NA NA 3.33E-03
Chloromethane 1.69E-06 7.19E-06 NA
Chlorotoluene, 2- NA 1.85E-05 NA Chrysene NA NA 4.90E-05
Cyclohexane 5.26E-03 4.36E-04 2.18E-02
Cyclopentane NA NA 1.60E-02
Decane, n- 3.86E-05 1.46E-04 NA Dichloro-1,1,2,2-tetrafluoroethane, 1,2- NA 1.27E-05 NA
Dichlorodifluoromethane NA 1.07E-05 NA
Dichloroethane, 1,1- NA NA 2.76E-03
Dichloropropene, 1,3- NA NA 3.10E-03
Dodecane, n- 3.04E-05 4.80E-05 NA Ethane NA NA 7.42E+00
Ethylbenzene 2.69E-04 5.21E-05 7.63E-03
Ethylene dibromide NA NA 5.19E-03
Ethylene dichloride NA NA 2.98E-03
Ethyltoluene, 4- 5.71E-05 1.35E-02 NA Fluoranthene NA NA 7.84E-05
Fluorene NA NA 4.01E-04
Formaldehyde NA NA 3.90E+00
Heptane 3.66E-04 1.98E-04 NA Hexachlorobutadiene 1.60E-05 8.00E-05 NA
Hexane 3.53E-03 4.68E-04 7.84E-02
Indeno (1,2,3-cd) pyrene NA NA 7.02E-07
Isobutane NA NA 2.65E-01
Isobutyraldehyde NA NA 3.09E-02 Isopentane 3.47E-02 5.52E-03 NA
Isopropylbenzene 3.95E-05 1.67E-04 NA
Isopropyltoluene, 4- 3.09E-05 2.90E-04 NA
Methane 2.17E+02 2.63E+01 NA
Methyl alcohol NA NA 2.16E-01 Methyl naphthalene, 2- NA NA 2.35E-03
Methyl-2-pentanone, 4- (Methyl Isobutyl Ketone)
5.32E-06 1.43E-04 NA
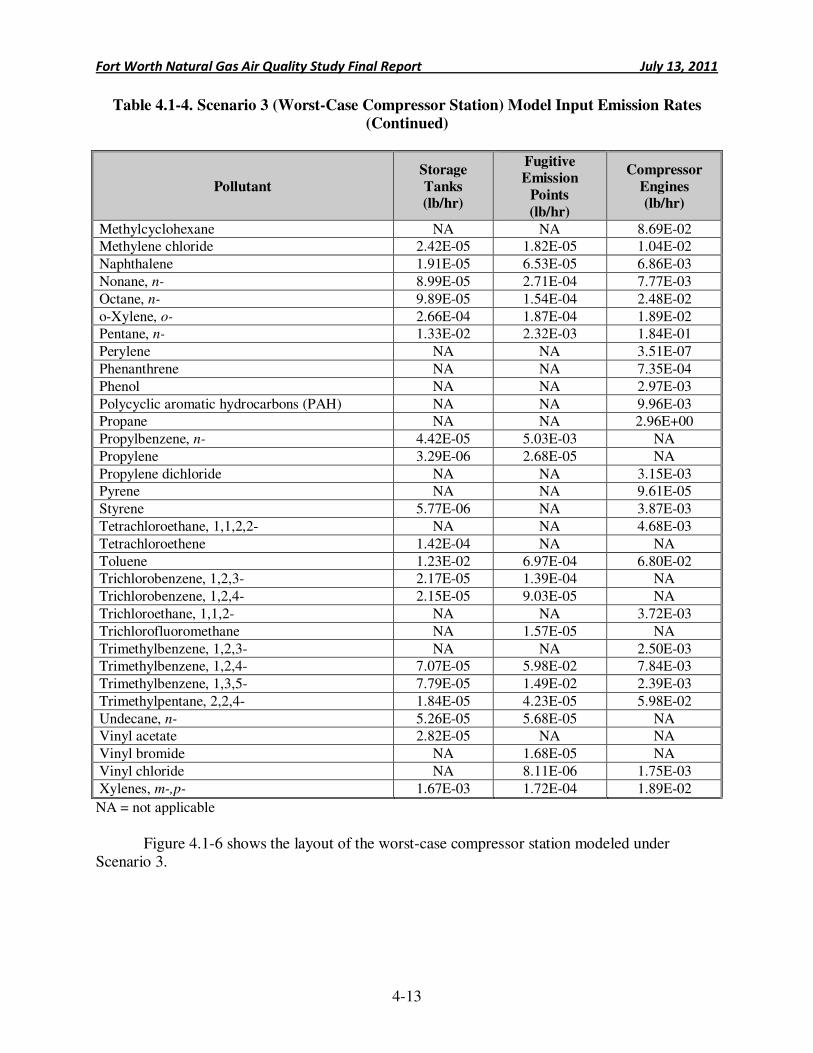
Fort Worth Natural Gas Air Quality Study Final Report July 13, 2011
4-13
Table 4.1-4. Scenario 3 (Worst-Case Compressor Station) Model Input Emission Rates
(Continued)
Pollutant
Storage
Tanks (lb/hr)
Fugitive Emission
Points
(lb/hr)
Compressor
Engines (lb/hr)
Methylcyclohexane NA NA 8.69E-02 Methylene chloride 2.42E-05 1.82E-05 1.04E-02
Naphthalene 1.91E-05 6.53E-05 6.86E-03
Nonane, n- 8.99E-05 2.71E-04 7.77E-03
Octane, n- 9.89E-05 1.54E-04 2.48E-02
o-Xylene, o- 2.66E-04 1.87E-04 1.89E-02 Pentane, n- 1.33E-02 2.32E-03 1.84E-01
Perylene NA NA 3.51E-07
Phenanthrene NA NA 7.35E-04
Phenol NA NA 2.97E-03
Polycyclic aromatic hydrocarbons (PAH) NA NA 9.96E-03 Propane NA NA 2.96E+00
Propylbenzene, n- 4.42E-05 5.03E-03 NA
Propylene 3.29E-06 2.68E-05 NA
Propylene dichloride NA NA 3.15E-03 Pyrene NA NA 9.61E-05
Styrene 5.77E-06 NA 3.87E-03
Tetrachloroethane, 1,1,2,2- NA NA 4.68E-03
Tetrachloroethene 1.42E-04 NA NA
Toluene 1.23E-02 6.97E-04 6.80E-02 Trichlorobenzene, 1,2,3- 2.17E-05 1.39E-04 NA
Trichlorobenzene, 1,2,4- 2.15E-05 9.03E-05 NA
Trichloroethane, 1,1,2- NA NA 3.72E-03
Trichlorofluoromethane NA 1.57E-05 NA
Trimethylbenzene, 1,2,3- NA NA 2.50E-03 Trimethylbenzene, 1,2,4- 7.07E-05 5.98E-02 7.84E-03
Trimethylbenzene, 1,3,5- 7.79E-05 1.49E-02 2.39E-03
Trimethylpentane, 2,2,4- 1.84E-05 4.23E-05 5.98E-02
Undecane, n- 5.26E-05 5.68E-05 NA Vinyl acetate 2.82E-05 NA NA
Vinyl bromide NA 1.68E-05 NA
Vinyl chloride NA 8.11E-06 1.75E-03
Xylenes, m-,p- 1.67E-03 1.72E-04 1.89E-02
NA = not applicable
Figure 4.1-6 shows the layout of the worst-case compressor station modeled under
Scenario 3.
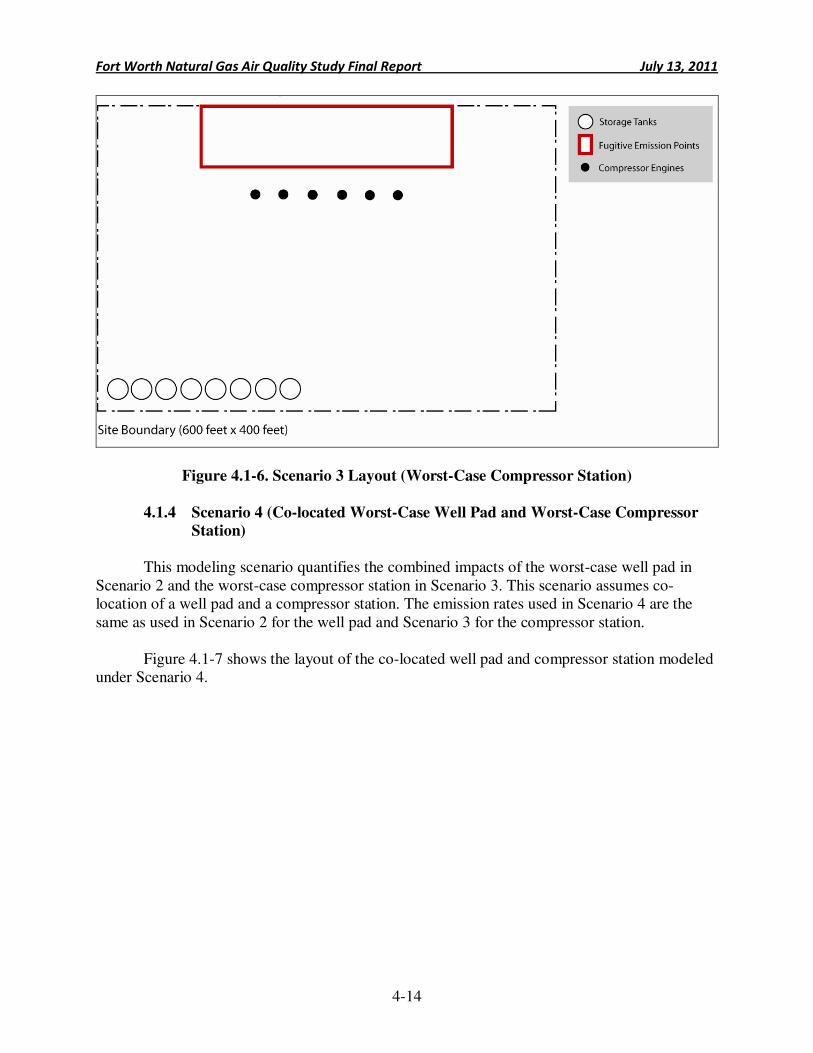
Fort Worth Natural Gas Air Quality Study Final Report July 13, 2011
4-14
Figure 4.1-6. Scenario 3 Layout (Worst-Case Compressor Station)
4.1.4 Scenario 4 (Co-located Worst-Case Well Pad and Worst-Case Compressor
Station)
This modeling scenario quantifies the combined impacts of the worst-case well pad in
Scenario 2 and the worst-case compressor station in Scenario 3. This scenario assumes co-location of a well pad and a compressor station. The emission rates used in Scenario 4 are the same as used in Scenario 2 for the well pad and Scenario 3 for the compressor station.
Figure 4.1-7 shows the layout of the co-located well pad and compressor station modeled under Scenario 4.
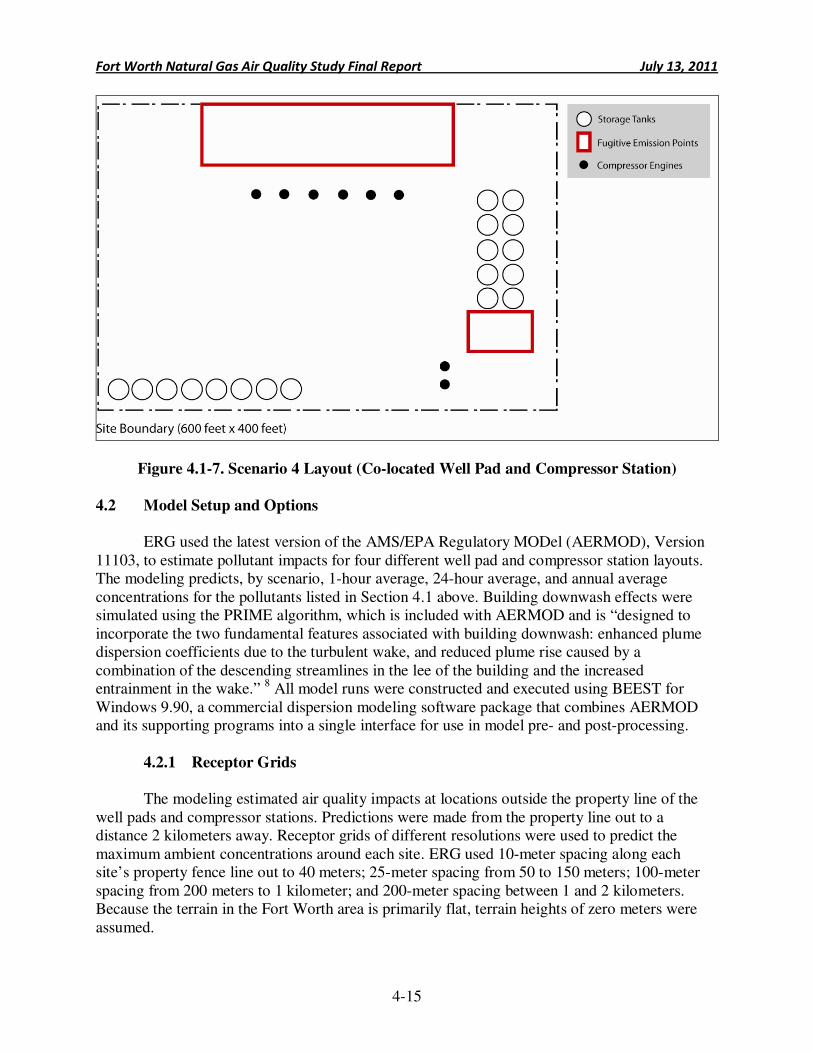
Fort Worth Natural Gas Air Quality Study Final Report July 13, 2011
4-15
Figure 4.1-7. Scenario 4 Layout (Co-located Well Pad and Compressor Station)
4.2 Model Setup and Options
ERG used the latest version of the AMS/EPA Regulatory MODel (AERMOD), Version
11103, to estimate pollutant impacts for four different well pad and compressor station layouts. The modeling predicts, by scenario, 1-hour average, 24-hour average, and annual average concentrations for the pollutants listed in Section 4.1 above. Building downwash effects were simulated using the PRIME algorithm, which is included with AERMOD and is “designed to incorporate the two fundamental features associated with building downwash: enhanced plume dispersion coefficients due to the turbulent wake, and reduced plume rise caused by a combination of the descending streamlines in the lee of the building and the increased entrainment in the wake.” 8 All model runs were constructed and executed using BEEST for Windows 9.90, a commercial dispersion modeling software package that combines AERMOD and its supporting programs into a single interface for use in model pre- and post-processing.
4.2.1 Receptor Grids
The modeling estimated air quality impacts at locations outside the property line of the
well pads and compressor stations. Predictions were made from the property line out to a distance 2 kilometers away. Receptor grids of different resolutions were used to predict the maximum ambient concentrations around each site. ERG used 10-meter spacing along each site’s property fence line out to 40 meters; 25-meter spacing from 50 to 150 meters; 100-meter spacing from 200 meters to 1 kilometer; and 200-meter spacing between 1 and 2 kilometers. Because the terrain in the Fort Worth area is primarily flat, terrain heights of zero meters were assumed.
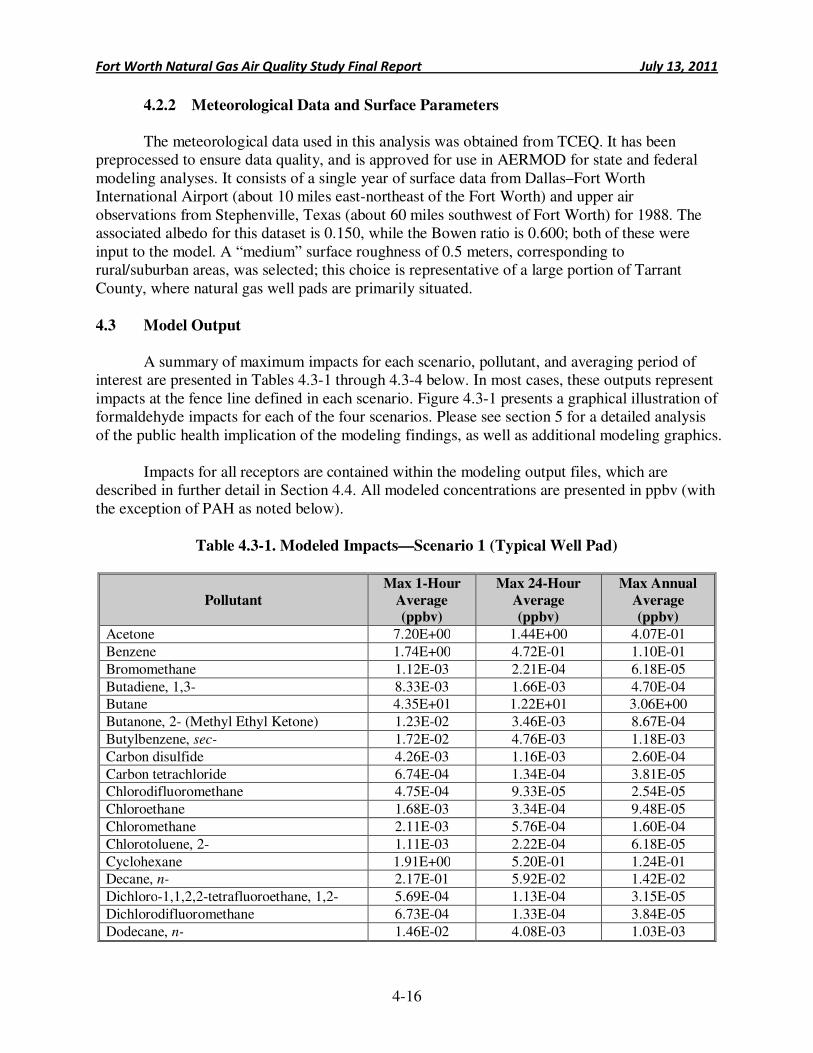
Fort Worth Natural Gas Air Quality Study Final Report July 13, 2011
4-16
4.2.2 Meteorological Data and Surface Parameters
The meteorological data used in this analysis was obtained from TCEQ. It has been preprocessed to ensure data quality, and is approved for use in AERMOD for state and federal modeling analyses. It consists of a single year of surface data from Dallas–Fort Worth International Airport (about 10 miles east-northeast of the Fort Worth) and upper air observations from Stephenville, Texas (about 60 miles southwest of Fort Worth) for 1988. The associated albedo for this dataset is 0.150, while the Bowen ratio is 0.600; both of these were input to the model. A “medium” surface roughness of 0.5 meters, corresponding to rural/suburban areas, was selected; this choice is representative of a large portion of Tarrant County, where natural gas well pads are primarily situated. 4.3 Model Output
A summary of maximum impacts for each scenario, pollutant, and averaging period of interest are presented in Tables 4.3-1 through 4.3-4 below. In most cases, these outputs represent impacts at the fence line defined in each scenario. Figure 4.3-1 presents a graphical illustration of formaldehyde impacts for each of the four scenarios. Please see section 5 for a detailed analysis of the public health implication of the modeling findings, as well as additional modeling graphics.
Impacts for all receptors are contained within the modeling output files, which are described in further detail in Section 4.4. All modeled concentrations are presented in ppbv (with the exception of PAH as noted below).
Table 4.3-1. Modeled Impacts—Scenario 1 (Typical Well Pad)
Pollutant
Max 1-Hour
Average (ppbv)
Max 24-Hour
Average (ppbv)
Max Annual
Average (ppbv)
Acetone 7.20E+00 1.44E+00 4.07E-01
Benzene 1.74E+00 4.72E-01 1.10E-01
Bromomethane 1.12E-03 2.21E-04 6.18E-05
Butadiene, 1,3- 8.33E-03 1.66E-03 4.70E-04 Butane 4.35E+01 1.22E+01 3.06E+00
Butanone, 2- (Methyl Ethyl Ketone) 1.23E-02 3.46E-03 8.67E-04
Butylbenzene, sec- 1.72E-02 4.76E-03 1.18E-03
Carbon disulfide 4.26E-03 1.16E-03 2.60E-04
Carbon tetrachloride 6.74E-04 1.34E-04 3.81E-05 Chlorodifluoromethane 4.75E-04 9.33E-05 2.54E-05
Chloroethane 1.68E-03 3.34E-04 9.48E-05
Chloromethane 2.11E-03 5.76E-04 1.60E-04
Chlorotoluene, 2- 1.11E-03 2.22E-04 6.18E-05
Cyclohexane 1.91E+00 5.20E-01 1.24E-01 Decane, n- 2.17E-01 5.92E-02 1.42E-02
Dichloro-1,1,2,2-tetrafluoroethane, 1,2- 5.69E-04 1.13E-04 3.15E-05
Dichlorodifluoromethane 6.73E-04 1.33E-04 3.84E-05
Dodecane, n- 1.46E-02 4.08E-03 1.03E-03
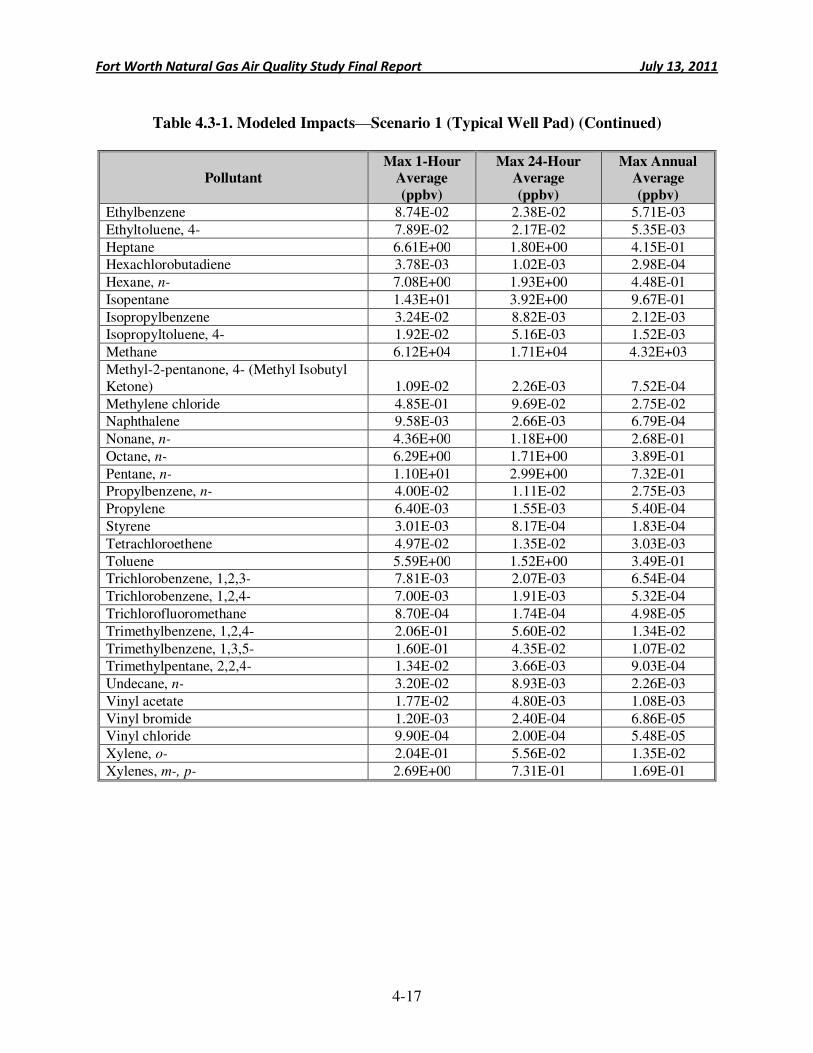
Fort Worth Natural Gas Air Quality Study Final Report July 13, 2011
4-17
Table 4.3-1. Modeled Impacts—Scenario 1 (Typical Well Pad) (Continued)
Pollutant Max 1-Hour
Average
(ppbv)
Max 24-Hour Average
(ppbv)
Max Annual Average
(ppbv)
Ethylbenzene 8.74E-02 2.38E-02 5.71E-03
Ethyltoluene, 4- 7.89E-02 2.17E-02 5.35E-03
Heptane 6.61E+00 1.80E+00 4.15E-01 Hexachlorobutadiene 3.78E-03 1.02E-03 2.98E-04
Hexane, n- 7.08E+00 1.93E+00 4.48E-01
Isopentane 1.43E+01 3.92E+00 9.67E-01
Isopropylbenzene 3.24E-02 8.82E-03 2.12E-03 Isopropyltoluene, 4- 1.92E-02 5.16E-03 1.52E-03
Methane 6.12E+04 1.71E+04 4.32E+03
Methyl-2-pentanone, 4- (Methyl Isobutyl Ketone) 1.09E-02 2.26E-03 7.52E-04
Methylene chloride 4.85E-01 9.69E-02 2.75E-02 Naphthalene 9.58E-03 2.66E-03 6.79E-04
Nonane, n- 4.36E+00 1.18E+00 2.68E-01
Octane, n- 6.29E+00 1.71E+00 3.89E-01
Pentane, n- 1.10E+01 2.99E+00 7.32E-01 Propylbenzene, n- 4.00E-02 1.11E-02 2.75E-03
Propylene 6.40E-03 1.55E-03 5.40E-04
Styrene 3.01E-03 8.17E-04 1.83E-04
Tetrachloroethene 4.97E-02 1.35E-02 3.03E-03
Toluene 5.59E+00 1.52E+00 3.49E-01 Trichlorobenzene, 1,2,3- 7.81E-03 2.07E-03 6.54E-04
Trichlorobenzene, 1,2,4- 7.00E-03 1.91E-03 5.32E-04
Trichlorofluoromethane 8.70E-04 1.74E-04 4.98E-05
Trimethylbenzene, 1,2,4- 2.06E-01 5.60E-02 1.34E-02
Trimethylbenzene, 1,3,5- 1.60E-01 4.35E-02 1.07E-02 Trimethylpentane, 2,2,4- 1.34E-02 3.66E-03 9.03E-04
Undecane, n- 3.20E-02 8.93E-03 2.26E-03
Vinyl acetate 1.77E-02 4.80E-03 1.08E-03
Vinyl bromide 1.20E-03 2.40E-04 6.86E-05 Vinyl chloride 9.90E-04 2.00E-04 5.48E-05
Xylene, o- 2.04E-01 5.56E-02 1.35E-02
Xylenes, m-, p- 2.69E+00 7.31E-01 1.69E-01

Fort Worth Natural Gas Air Quality Study Final Report July 13, 2011
4-18
Table 4.3-2. Modeled Impacts—Scenario 2 (Worst-Case Scenario Well Pad)
Pollutant
Max 1-Hour
Average
(ppbv)
Max 24-Hour
Average
(ppbv)
Max Annual
Average
(ppbv)
Acenaphthene 1.08E-04 7.13E-05 1.43E-05
Acenaphthylene 4.53E-04 2.97E-04 6.27E-05
Acetaldehyde 2.37E+00 1.56E+00 3.27E-01
Acetone 2.71E+02 5.07E+01 1.55E+01
Acrolein 1.74E+00 1.14E+00 2.39E-01 Anthracene 5.08E-05 3.29E-05 6.86E-06
Benzene 5.95E+01 1.34E+01 3.99E+00
Benzo (a) anthracene 1.82E-05 1.18E-05 2.14E-06
Benzo (a) pyrene 0.00E+00 0.00E+00 0.00E+00
Benzo (b) fluoranthene 8.72E-06 5.81E-06 9.69E-07 Benzo (e) pyrene 2.04E-05 1.36E-05 2.91E-06
Benzo (g,h,i) perylene 1.86E-05 1.24E-05 2.65E-06
Benzo (k) fluoranthene 0.00E+00 0.00E+00 0.00E+00
Biphenyl 1.72E-02 1.13E-02 2.38E-03 Bromomethane 3.02E-02 5.66E-03 1.73E-03
Butadiene, 1,3- 2.24E-01 1.29E-01 3.40E-02
Butane 4.00E+03 8.60E+02 2.38E+02
Butane, n- 1.02E+00 6.73E-01 1.41E-01
Butanone , 2- (Methyl Ethyl Ketone) 2.27E-01 5.03E-02 1.46E-02 Butylbenzene, sec- 5.80E-01 1.33E-01 4.07E-02
Carbon disulfide 5.70E-02 1.36E-02 4.27E-03
Carbon tetrachloride 1.83E-02 4.74E-03 1.60E-03
Chlorobenzene 4.94E-03 3.25E-03 6.82E-04
Chlorodifluoromethane 1.29E-02 2.41E-03 7.35E-04 Chloroethane 4.55E-02 8.55E-03 2.64E-03
Chloroform 4.95E-03 3.25E-03 6.82E-04
Chloromethane 3.95E-02 8.45E-03 2.44E-03
Chlorotoluene, 2- 3.03E-02 5.67E-03 1.73E-03 Chrysene 3.86E-05 2.46E-05 5.36E-06
Cyclohexane 1.06E+02 2.32E+01 6.60E+00
Cyclopentane 4.05E-02 2.66E-02 5.59E-03
Decane, n- 1.44E+01 3.18E+00 9.22E-01
Dichloro-1,1,2,2-tetrafluoroethane, 1,2- 1.54E-02 2.88E-03 8.81E-04 Dichlorodifluoromethane 1.83E-02 3.42E-03 1.05E-03
Dichloroethane, 1,1- 4.95E-03 3.25E-03 6.82E-04
Dichloropropene, 1,3- 4.94E-03 3.25E-03 6.81E-04
Dodecane, n- 7.04E-01 1.33E-01 4.40E-02
Ethane 4.37E+01 2.87E+01 6.03E+00 Ethylbenzene 3.55E+00 7.58E-01 2.23E-01
Ethylene dibromide 4.91E-03 3.23E-03 6.77E-04
Ethylene dichloride 5.34E-03 3.51E-03 7.36E-04
Ethyltoluene, 4- 4.16E+00 9.46E-01 2.87E-01 Fluoranthene 6.89E-05 4.47E-05 9.67E-06
Fluorene 4.27E-04 2.81E-04 5.88E-05
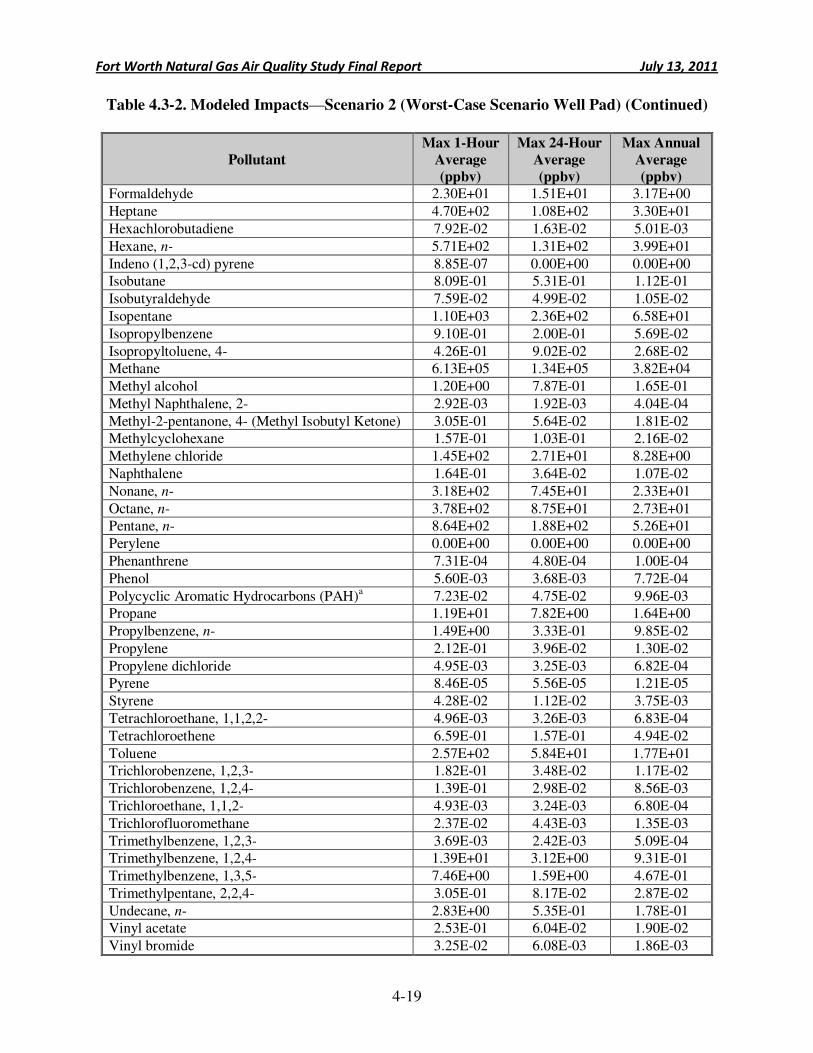
Fort Worth Natural Gas Air Quality Study Final Report July 13, 2011
4-19
Table 4.3-2. Modeled Impacts—Scenario 2 (Worst-Case Scenario Well Pad) (Continued)
Pollutant
Max 1-Hour
Average
(ppbv)
Max 24-Hour
Average
(ppbv)
Max Annual
Average
(ppbv)
Formaldehyde 2.30E+01 1.51E+01 3.17E+00
Heptane 4.70E+02 1.08E+02 3.30E+01
Hexachlorobutadiene 7.92E-02 1.63E-02 5.01E-03
Hexane, n- 5.71E+02 1.31E+02 3.99E+01
Indeno (1,2,3-cd) pyrene 8.85E-07 0.00E+00 0.00E+00 Isobutane 8.09E-01 5.31E-01 1.12E-01
Isobutyraldehyde 7.59E-02 4.99E-02 1.05E-02
Isopentane 1.10E+03 2.36E+02 6.58E+01
Isopropylbenzene 9.10E-01 2.00E-01 5.69E-02
Isopropyltoluene, 4- 4.26E-01 9.02E-02 2.68E-02 Methane 6.13E+05 1.34E+05 3.82E+04
Methyl alcohol 1.20E+00 7.87E-01 1.65E-01
Methyl Naphthalene, 2- 2.92E-03 1.92E-03 4.04E-04
Methyl-2-pentanone, 4- (Methyl Isobutyl Ketone) 3.05E-01 5.64E-02 1.81E-02 Methylcyclohexane 1.57E-01 1.03E-01 2.16E-02
Methylene chloride 1.45E+02 2.71E+01 8.28E+00
Naphthalene 1.64E-01 3.64E-02 1.07E-02
Nonane, n- 3.18E+02 7.45E+01 2.33E+01
Octane, n- 3.78E+02 8.75E+01 2.73E+01 Pentane, n- 8.64E+02 1.88E+02 5.26E+01
Perylene 0.00E+00 0.00E+00 0.00E+00
Phenanthrene 7.31E-04 4.80E-04 1.00E-04
Phenol 5.60E-03 3.68E-03 7.72E-04
Polycyclic Aromatic Hydrocarbons (PAH)a 7.23E-02 4.75E-02 9.96E-03 Propane 1.19E+01 7.82E+00 1.64E+00
Propylbenzene, n- 1.49E+00 3.33E-01 9.85E-02
Propylene 2.12E-01 3.96E-02 1.30E-02
Propylene dichloride 4.95E-03 3.25E-03 6.82E-04 Pyrene 8.46E-05 5.56E-05 1.21E-05
Styrene 4.28E-02 1.12E-02 3.75E-03
Tetrachloroethane, 1,1,2,2- 4.96E-03 3.26E-03 6.83E-04
Tetrachloroethene 6.59E-01 1.57E-01 4.94E-02
Toluene 2.57E+02 5.84E+01 1.77E+01 Trichlorobenzene, 1,2,3- 1.82E-01 3.48E-02 1.17E-02
Trichlorobenzene, 1,2,4- 1.39E-01 2.98E-02 8.56E-03
Trichloroethane, 1,1,2- 4.93E-03 3.24E-03 6.80E-04
Trichlorofluoromethane 2.37E-02 4.43E-03 1.35E-03
Trimethylbenzene, 1,2,3- 3.69E-03 2.42E-03 5.09E-04 Trimethylbenzene, 1,2,4- 1.39E+01 3.12E+00 9.31E-01
Trimethylbenzene, 1,3,5- 7.46E+00 1.59E+00 4.67E-01
Trimethylpentane, 2,2,4- 3.05E-01 8.17E-02 2.87E-02
Undecane, n- 2.83E+00 5.35E-01 1.78E-01 Vinyl acetate 2.53E-01 6.04E-02 1.90E-02
Vinyl bromide 3.25E-02 6.08E-03 1.86E-03
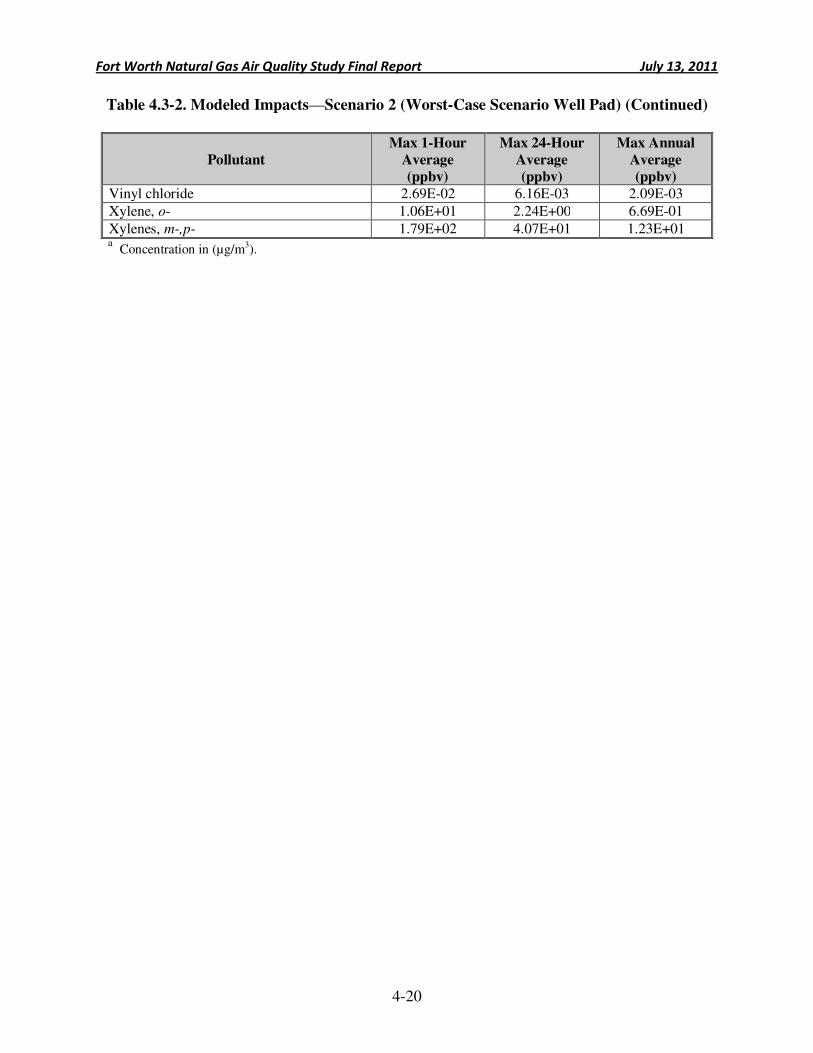
Fort Worth Natural Gas Air Quality Study Final Report July 13, 2011
4-20
Table 4.3-2. Modeled Impacts—Scenario 2 (Worst-Case Scenario Well Pad) (Continued)
Pollutant
Max 1-Hour
Average
(ppbv)
Max 24-Hour
Average
(ppbv)
Max Annual
Average
(ppbv)
Vinyl chloride 2.69E-02 6.16E-03 2.09E-03
Xylene, o- 1.06E+01 2.24E+00 6.69E-01
Xylenes, m-,p- 1.79E+02 4.07E+01 1.23E+01 a
Concentration in (µg/m3).
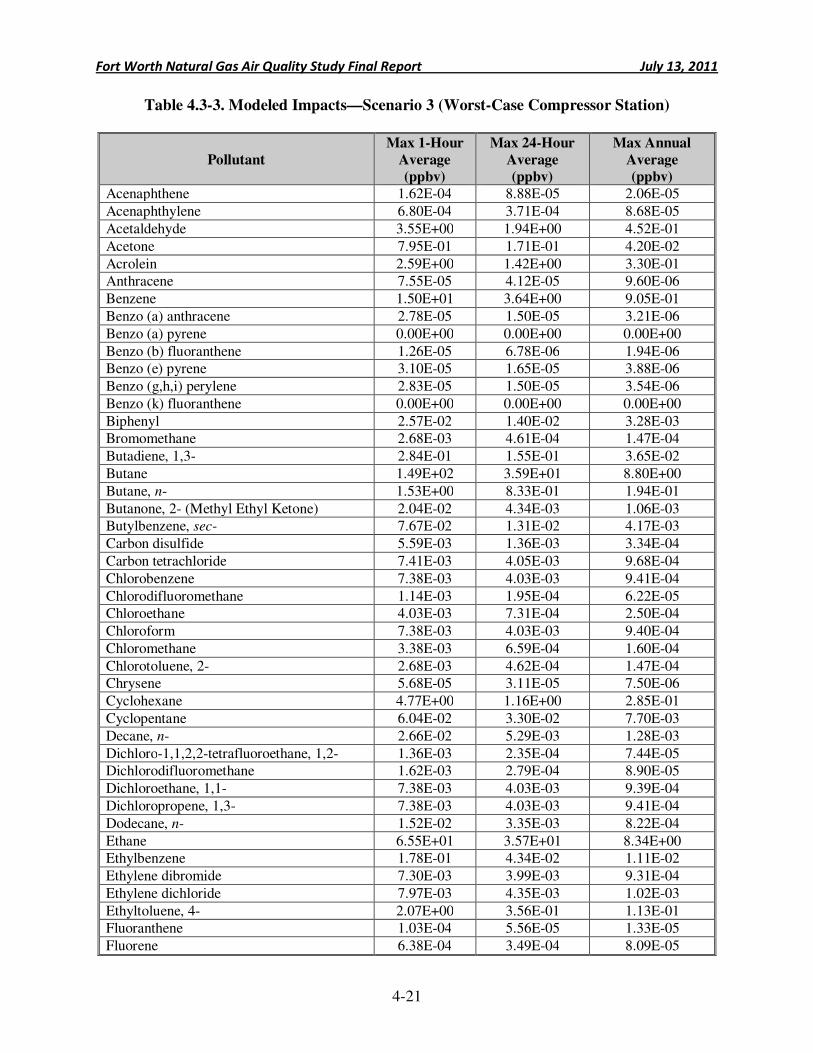
Fort Worth Natural Gas Air Quality Study Final Report July 13, 2011
4-21
Table 4.3-3. Modeled Impacts—Scenario 3 (Worst-Case Compressor Station)
Pollutant
Max 1-Hour
Average
(ppbv)
Max 24-Hour
Average
(ppbv)
Max Annual
Average
(ppbv)
Acenaphthene 1.62E-04 8.88E-05 2.06E-05
Acenaphthylene 6.80E-04 3.71E-04 8.68E-05
Acetaldehyde 3.55E+00 1.94E+00 4.52E-01
Acetone 7.95E-01 1.71E-01 4.20E-02
Acrolein 2.59E+00 1.42E+00 3.30E-01 Anthracene 7.55E-05 4.12E-05 9.60E-06
Benzene 1.50E+01 3.64E+00 9.05E-01
Benzo (a) anthracene 2.78E-05 1.50E-05 3.21E-06
Benzo (a) pyrene 0.00E+00 0.00E+00 0.00E+00
Benzo (b) fluoranthene 1.26E-05 6.78E-06 1.94E-06 Benzo (e) pyrene 3.10E-05 1.65E-05 3.88E-06
Benzo (g,h,i) perylene 2.83E-05 1.50E-05 3.54E-06
Benzo (k) fluoranthene 0.00E+00 0.00E+00 0.00E+00
Biphenyl 2.57E-02 1.40E-02 3.28E-03 Bromomethane 2.68E-03 4.61E-04 1.47E-04
Butadiene, 1,3- 2.84E-01 1.55E-01 3.65E-02
Butane 1.49E+02 3.59E+01 8.80E+00
Butane, n- 1.53E+00 8.33E-01 1.94E-01
Butanone, 2- (Methyl Ethyl Ketone) 2.04E-02 4.34E-03 1.06E-03 Butylbenzene, sec- 7.67E-02 1.31E-02 4.17E-03
Carbon disulfide 5.59E-03 1.36E-03 3.34E-04
Carbon tetrachloride 7.41E-03 4.05E-03 9.68E-04
Chlorobenzene 7.38E-03 4.03E-03 9.41E-04
Chlorodifluoromethane 1.14E-03 1.95E-04 6.22E-05 Chloroethane 4.03E-03 7.31E-04 2.50E-04
Chloroform 7.38E-03 4.03E-03 9.40E-04
Chloromethane 3.38E-03 6.59E-04 1.60E-04
Chlorotoluene, 2- 2.68E-03 4.62E-04 1.47E-04 Chrysene 5.68E-05 3.11E-05 7.50E-06
Cyclohexane 4.77E+00 1.16E+00 2.85E-01
Cyclopentane 6.04E-02 3.30E-02 7.70E-03
Decane, n- 2.66E-02 5.29E-03 1.28E-03
Dichloro-1,1,2,2-tetrafluoroethane, 1,2- 1.36E-03 2.35E-04 7.44E-05 Dichlorodifluoromethane 1.62E-03 2.79E-04 8.90E-05
Dichloroethane, 1,1- 7.38E-03 4.03E-03 9.39E-04
Dichloropropene, 1,3- 7.38E-03 4.03E-03 9.41E-04
Dodecane, n- 1.52E-02 3.35E-03 8.22E-04
Ethane 6.55E+01 3.57E+01 8.34E+00 Ethylbenzene 1.78E-01 4.34E-02 1.11E-02
Ethylene dibromide 7.30E-03 3.99E-03 9.31E-04
Ethylene dichloride 7.97E-03 4.35E-03 1.02E-03
Ethyltoluene, 4- 2.07E+00 3.56E-01 1.13E-01 Fluoranthene 1.03E-04 5.56E-05 1.33E-05
Fluorene 6.38E-04 3.49E-04 8.09E-05
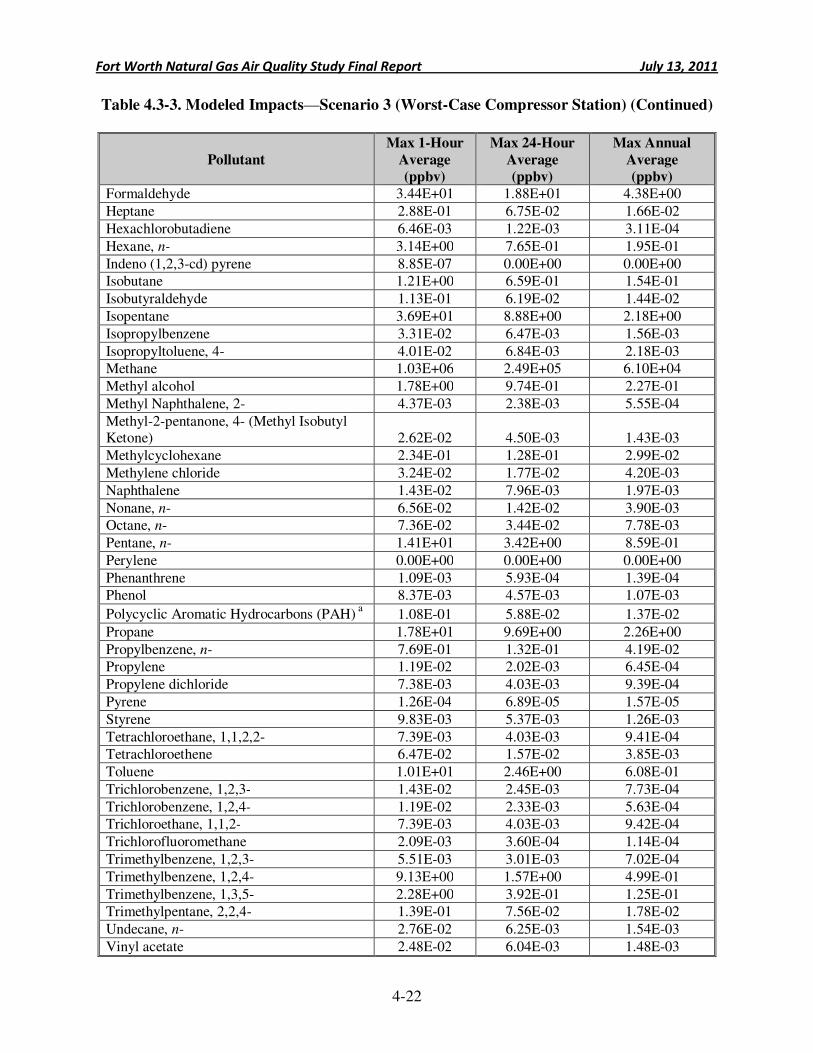
Fort Worth Natural Gas Air Quality Study Final Report July 13, 2011
4-22
Table 4.3-3. Modeled Impacts—Scenario 3 (Worst-Case Compressor Station) (Continued)
Pollutant
Max 1-Hour
Average
(ppbv)
Max 24-Hour
Average
(ppbv)
Max Annual
Average
(ppbv)
Formaldehyde 3.44E+01 1.88E+01 4.38E+00
Heptane 2.88E-01 6.75E-02 1.66E-02
Hexachlorobutadiene 6.46E-03 1.22E-03 3.11E-04
Hexane, n- 3.14E+00 7.65E-01 1.95E-01
Indeno (1,2,3-cd) pyrene 8.85E-07 0.00E+00 0.00E+00 Isobutane 1.21E+00 6.59E-01 1.54E-01
Isobutyraldehyde 1.13E-01 6.19E-02 1.44E-02
Isopentane 3.69E+01 8.88E+00 2.18E+00
Isopropylbenzene 3.31E-02 6.47E-03 1.56E-03
Isopropyltoluene, 4- 4.01E-02 6.84E-03 2.18E-03 Methane 1.03E+06 2.49E+05 6.10E+04
Methyl alcohol 1.78E+00 9.74E-01 2.27E-01
Methyl Naphthalene, 2- 4.37E-03 2.38E-03 5.55E-04
Methyl-2-pentanone, 4- (Methyl Isobutyl Ketone) 2.62E-02 4.50E-03 1.43E-03
Methylcyclohexane 2.34E-01 1.28E-01 2.99E-02
Methylene chloride 3.24E-02 1.77E-02 4.20E-03
Naphthalene 1.43E-02 7.96E-03 1.97E-03
Nonane, n- 6.56E-02 1.42E-02 3.90E-03 Octane, n- 7.36E-02 3.44E-02 7.78E-03
Pentane, n- 1.41E+01 3.42E+00 8.59E-01
Perylene 0.00E+00 0.00E+00 0.00E+00
Phenanthrene 1.09E-03 5.93E-04 1.39E-04 Phenol 8.37E-03 4.57E-03 1.07E-03
Polycyclic Aromatic Hydrocarbons (PAH) a
1.08E-01 5.88E-02 1.37E-02
Propane 1.78E+01 9.69E+00 2.26E+00
Propylbenzene, n- 7.69E-01 1.32E-01 4.19E-02 Propylene 1.19E-02 2.02E-03 6.45E-04
Propylene dichloride 7.38E-03 4.03E-03 9.39E-04
Pyrene 1.26E-04 6.89E-05 1.57E-05
Styrene 9.83E-03 5.37E-03 1.26E-03
Tetrachloroethane, 1,1,2,2- 7.39E-03 4.03E-03 9.41E-04 Tetrachloroethene 6.47E-02 1.57E-02 3.85E-03
Toluene 1.01E+01 2.46E+00 6.08E-01
Trichlorobenzene, 1,2,3- 1.43E-02 2.45E-03 7.73E-04
Trichlorobenzene, 1,2,4- 1.19E-02 2.33E-03 5.63E-04 Trichloroethane, 1,1,2- 7.39E-03 4.03E-03 9.42E-04
Trichlorofluoromethane 2.09E-03 3.60E-04 1.14E-04
Trimethylbenzene, 1,2,3- 5.51E-03 3.01E-03 7.02E-04
Trimethylbenzene, 1,2,4- 9.13E+00 1.57E+00 4.99E-01
Trimethylbenzene, 1,3,5- 2.28E+00 3.92E-01 1.25E-01 Trimethylpentane, 2,2,4- 1.39E-01 7.56E-02 1.78E-02
Undecane, n- 2.76E-02 6.25E-03 1.54E-03
Vinyl acetate 2.48E-02 6.04E-03 1.48E-03
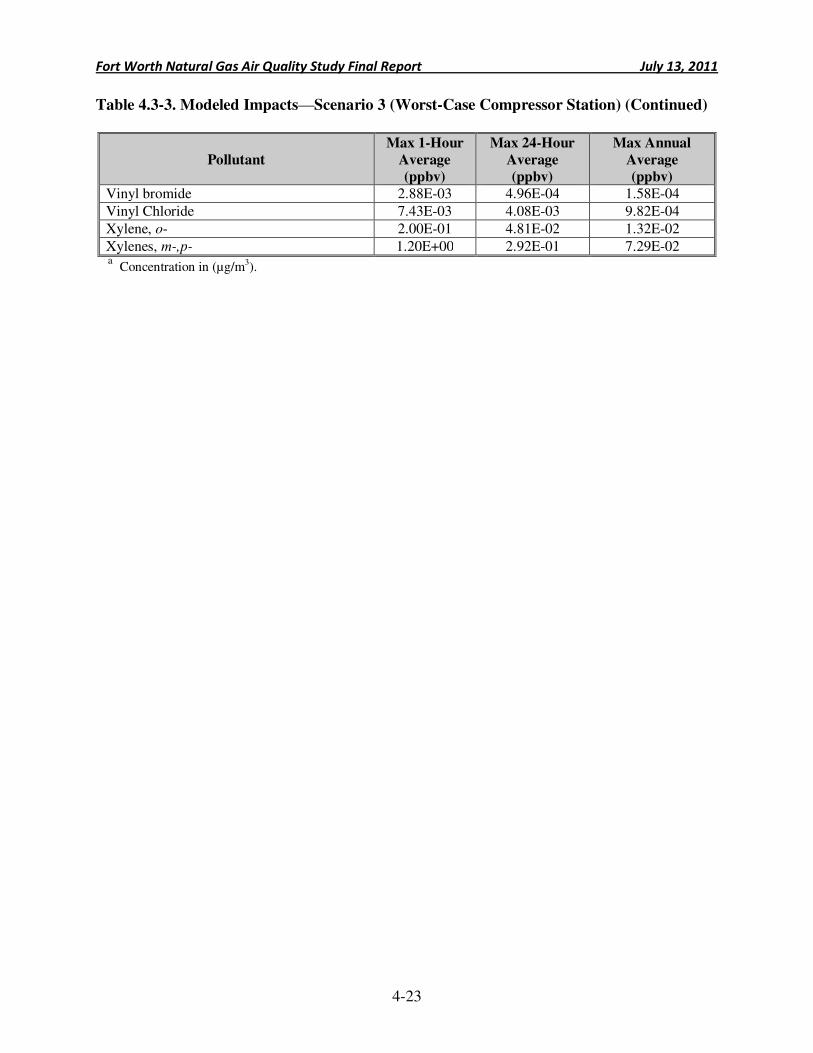
Fort Worth Natural Gas Air Quality Study Final Report July 13, 2011
4-23
Table 4.3-3. Modeled Impacts—Scenario 3 (Worst-Case Compressor Station) (Continued)
Pollutant
Max 1-Hour
Average
(ppbv)
Max 24-Hour
Average
(ppbv)
Max Annual
Average
(ppbv)
Vinyl bromide 2.88E-03 4.96E-04 1.58E-04
Vinyl Chloride 7.43E-03 4.08E-03 9.82E-04
Xylene, o- 2.00E-01 4.81E-02 1.32E-02
Xylenes, m-,p- 1.20E+00 2.92E-01 7.29E-02 a
Concentration in (µg/m3).
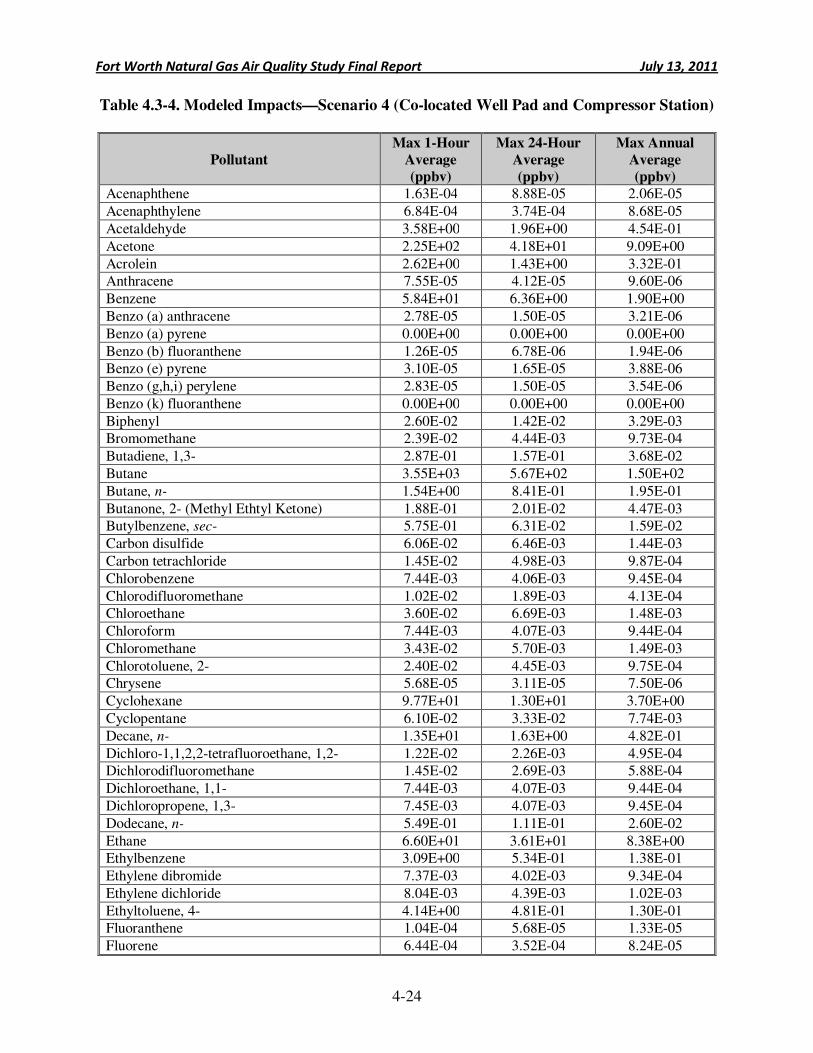
Fort Worth Natural Gas Air Quality Study Final Report July 13, 2011
4-24
Table 4.3-4. Modeled Impacts—Scenario 4 (Co-located Well Pad and Compressor Station)
Pollutant
Max 1-Hour
Average
(ppbv)
Max 24-Hour
Average
(ppbv)
Max Annual
Average
(ppbv)
Acenaphthene 1.63E-04 8.88E-05 2.06E-05
Acenaphthylene 6.84E-04 3.74E-04 8.68E-05
Acetaldehyde 3.58E+00 1.96E+00 4.54E-01
Acetone 2.25E+02 4.18E+01 9.09E+00
Acrolein 2.62E+00 1.43E+00 3.32E-01 Anthracene 7.55E-05 4.12E-05 9.60E-06
Benzene 5.84E+01 6.36E+00 1.90E+00
Benzo (a) anthracene 2.78E-05 1.50E-05 3.21E-06
Benzo (a) pyrene 0.00E+00 0.00E+00 0.00E+00
Benzo (b) fluoranthene 1.26E-05 6.78E-06 1.94E-06 Benzo (e) pyrene 3.10E-05 1.65E-05 3.88E-06
Benzo (g,h,i) perylene 2.83E-05 1.50E-05 3.54E-06
Benzo (k) fluoranthene 0.00E+00 0.00E+00 0.00E+00
Biphenyl 2.60E-02 1.42E-02 3.29E-03 Bromomethane 2.39E-02 4.44E-03 9.73E-04
Butadiene, 1,3- 2.87E-01 1.57E-01 3.68E-02
Butane 3.55E+03 5.67E+02 1.50E+02
Butane, n- 1.54E+00 8.41E-01 1.95E-01
Butanone, 2- (Methyl Ethtyl Ketone) 1.88E-01 2.01E-02 4.47E-03 Butylbenzene, sec- 5.75E-01 6.31E-02 1.59E-02
Carbon disulfide 6.06E-02 6.46E-03 1.44E-03
Carbon tetrachloride 1.45E-02 4.98E-03 9.87E-04
Chlorobenzene 7.44E-03 4.06E-03 9.45E-04
Chlorodifluoromethane 1.02E-02 1.89E-03 4.13E-04 Chloroethane 3.60E-02 6.69E-03 1.48E-03
Chloroform 7.44E-03 4.07E-03 9.44E-04
Chloromethane 3.43E-02 5.70E-03 1.49E-03
Chlorotoluene, 2- 2.40E-02 4.45E-03 9.75E-04 Chrysene 5.68E-05 3.11E-05 7.50E-06
Cyclohexane 9.77E+01 1.30E+01 3.70E+00
Cyclopentane 6.10E-02 3.33E-02 7.74E-03
Decane, n- 1.35E+01 1.63E+00 4.82E-01
Dichloro-1,1,2,2-tetrafluoroethane, 1,2- 1.22E-02 2.26E-03 4.95E-04 Dichlorodifluoromethane 1.45E-02 2.69E-03 5.88E-04
Dichloroethane, 1,1- 7.44E-03 4.07E-03 9.44E-04
Dichloropropene, 1,3- 7.45E-03 4.07E-03 9.45E-04
Dodecane, n- 5.49E-01 1.11E-01 2.60E-02
Ethane 6.60E+01 3.61E+01 8.38E+00 Ethylbenzene 3.09E+00 5.34E-01 1.38E-01
Ethylene dibromide 7.37E-03 4.02E-03 9.34E-04
Ethylene dichloride 8.04E-03 4.39E-03 1.02E-03
Ethyltoluene, 4- 4.14E+00 4.81E-01 1.30E-01 Fluoranthene 1.04E-04 5.68E-05 1.33E-05
Fluorene 6.44E-04 3.52E-04 8.24E-05
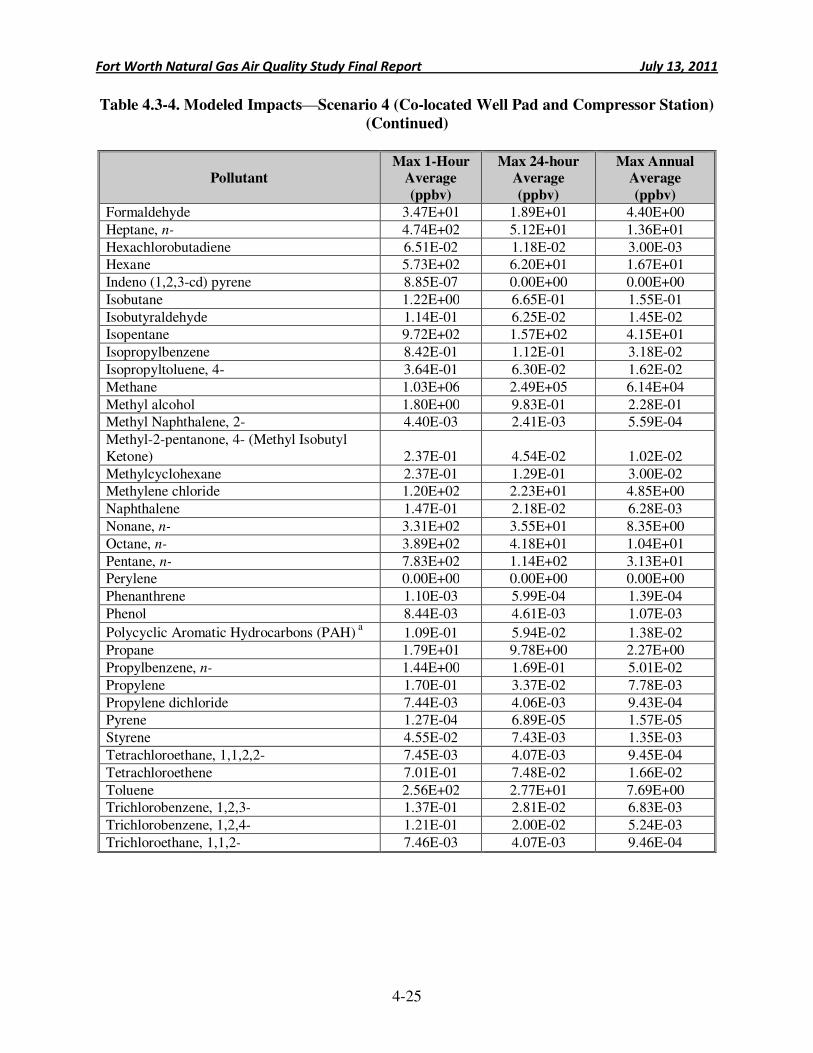
Fort Worth Natural Gas Air Quality Study Final Report July 13, 2011
4-25
Table 4.3-4. Modeled Impacts—Scenario 4 (Co-located Well Pad and Compressor Station)
(Continued)
Pollutant Max 1-Hour
Average
(ppbv)
Max 24-hour Average
(ppbv)
Max Annual Average
(ppbv)
Formaldehyde 3.47E+01 1.89E+01 4.40E+00
Heptane, n- 4.74E+02 5.12E+01 1.36E+01
Hexachlorobutadiene 6.51E-02 1.18E-02 3.00E-03 Hexane 5.73E+02 6.20E+01 1.67E+01
Indeno (1,2,3-cd) pyrene 8.85E-07 0.00E+00 0.00E+00
Isobutane 1.22E+00 6.65E-01 1.55E-01
Isobutyraldehyde 1.14E-01 6.25E-02 1.45E-02 Isopentane 9.72E+02 1.57E+02 4.15E+01
Isopropylbenzene 8.42E-01 1.12E-01 3.18E-02
Isopropyltoluene, 4- 3.64E-01 6.30E-02 1.62E-02
Methane 1.03E+06 2.49E+05 6.14E+04
Methyl alcohol 1.80E+00 9.83E-01 2.28E-01 Methyl Naphthalene, 2- 4.40E-03 2.41E-03 5.59E-04
Methyl-2-pentanone, 4- (Methyl Isobutyl Ketone) 2.37E-01 4.54E-02 1.02E-02
Methylcyclohexane 2.37E-01 1.29E-01 3.00E-02 Methylene chloride 1.20E+02 2.23E+01 4.85E+00
Naphthalene 1.47E-01 2.18E-02 6.28E-03
Nonane, n- 3.31E+02 3.55E+01 8.35E+00
Octane, n- 3.89E+02 4.18E+01 1.04E+01
Pentane, n- 7.83E+02 1.14E+02 3.13E+01 Perylene 0.00E+00 0.00E+00 0.00E+00
Phenanthrene 1.10E-03 5.99E-04 1.39E-04
Phenol 8.44E-03 4.61E-03 1.07E-03
Polycyclic Aromatic Hydrocarbons (PAH) a
1.09E-01 5.94E-02 1.38E-02 Propane 1.79E+01 9.78E+00 2.27E+00
Propylbenzene, n- 1.44E+00 1.69E-01 5.01E-02
Propylene 1.70E-01 3.37E-02 7.78E-03
Propylene dichloride 7.44E-03 4.06E-03 9.43E-04 Pyrene 1.27E-04 6.89E-05 1.57E-05
Styrene 4.55E-02 7.43E-03 1.35E-03
Tetrachloroethane, 1,1,2,2- 7.45E-03 4.07E-03 9.45E-04
Tetrachloroethene 7.01E-01 7.48E-02 1.66E-02
Toluene 2.56E+02 2.77E+01 7.69E+00 Trichlorobenzene, 1,2,3- 1.37E-01 2.81E-02 6.83E-03
Trichlorobenzene, 1,2,4- 1.21E-01 2.00E-02 5.24E-03
Trichloroethane, 1,1,2- 7.46E-03 4.07E-03 9.46E-04
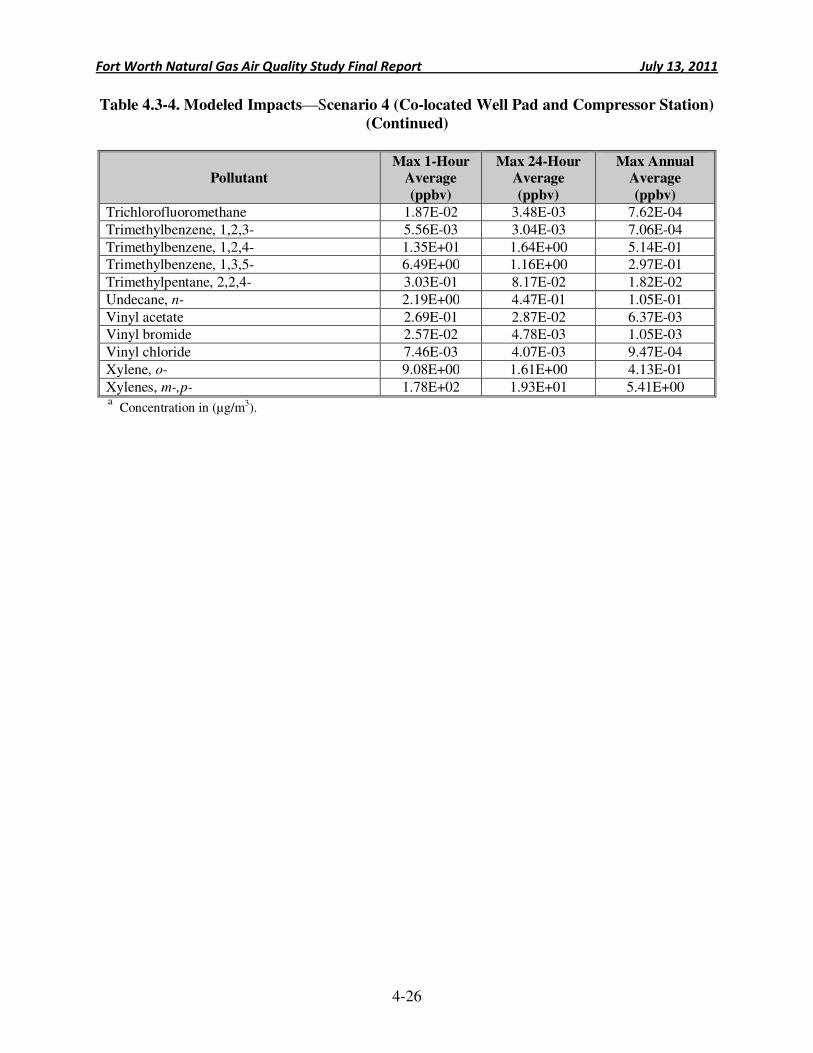
Fort Worth Natural Gas Air Quality Study Final Report July 13, 2011
4-26
Table 4.3-4. Modeled Impacts—Scenario 4 (Co-located Well Pad and Compressor Station)
(Continued)
Pollutant Max 1-Hour
Average
(ppbv)
Max 24-Hour Average
(ppbv)
Max Annual Average
(ppbv)
Trichlorofluoromethane 1.87E-02 3.48E-03 7.62E-04
Trimethylbenzene, 1,2,3- 5.56E-03 3.04E-03 7.06E-04
Trimethylbenzene, 1,2,4- 1.35E+01 1.64E+00 5.14E-01 Trimethylbenzene, 1,3,5- 6.49E+00 1.16E+00 2.97E-01
Trimethylpentane, 2,2,4- 3.03E-01 8.17E-02 1.82E-02
Undecane, n- 2.19E+00 4.47E-01 1.05E-01
Vinyl acetate 2.69E-01 2.87E-02 6.37E-03 Vinyl bromide 2.57E-02 4.78E-03 1.05E-03
Vinyl chloride 7.46E-03 4.07E-03 9.47E-04
Xylene, o- 9.08E+00 1.61E+00 4.13E-01
Xylenes, m-,p- 1.78E+02 1.93E+01 5.41E+00 a Concentration in (µg/m3).
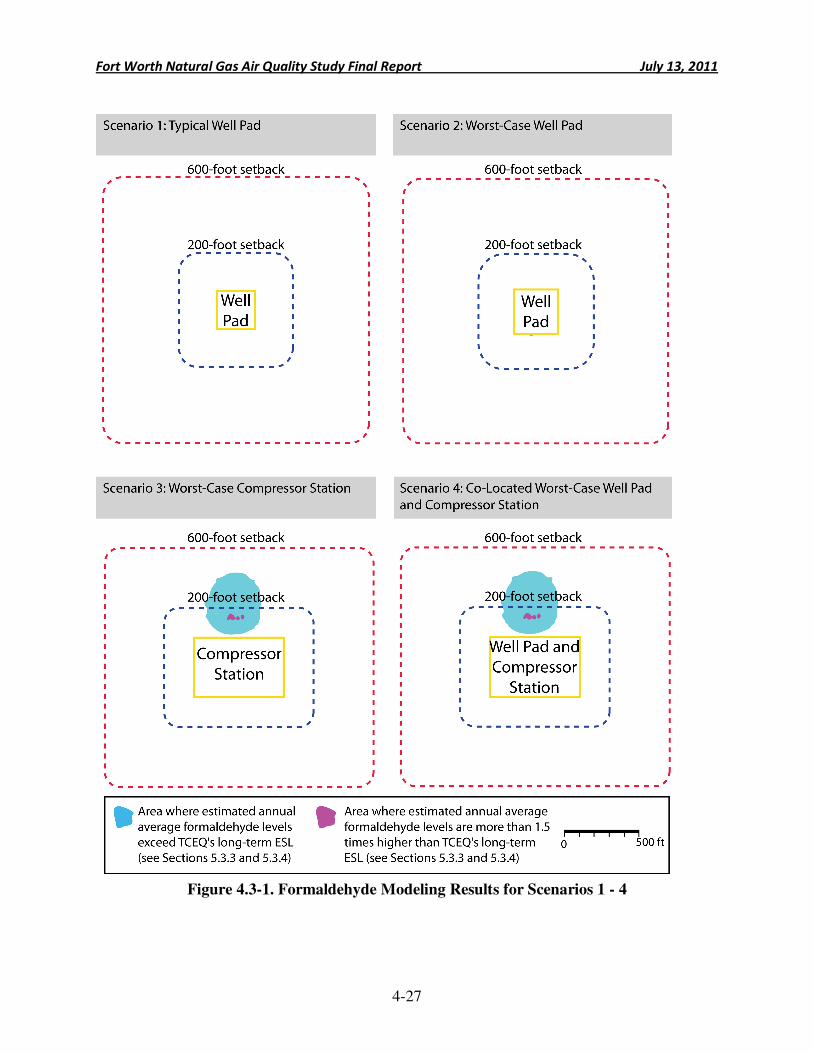
Fort Worth Natural Gas Air Quality Study Final Report July 13, 2011
4-27
Figure 4.3-1. Formaldehyde Modeling Results for Scenarios 1 - 4
Fort Worth Natural Gas Air Quality Study Final Report July 13, 2011
4-28
4.4 Electronic Modeling Files
Modeling input and output files are provided electronically in Appendix 4-A. This
includes files associated with AERMOD as well as its downwash processing program, BPIP-PRIME, along with meteorological files. AERMOD inputs and outputs follow a specific naming convention: “ScenXX_1988_Pollutant.ext,” where XX is the scenario of interest (01 through 04), Pollutant is an abbreviation for the compound modeled, and ext is the extension denoting the file type. BPIP-PRIME files follow a similar convention, “ScenXX-Prime.ext.” The various types of files included in Appendix 4-A are described below. Table 4.4-1 contains a crosswalk table which associates the compound abbreviations used in the BEEST modeling package with their proper chemical names.
Model Input Extensions
• DTA—AERMOD runstream files
• PIP—BPIP-PRIME inputs files
• SFC—Surface meteorological data
• PFL—Upper Air meteorological data
Model Output Extensions
• GRF—AERMOD detailed plot files
• LST—AERMOD detailed list files
• SUM—AERMOD summary files
• TAB—BPIP-PRIME detailed results
• SO—BPIP-PRIME block outputs for use in the model runstream
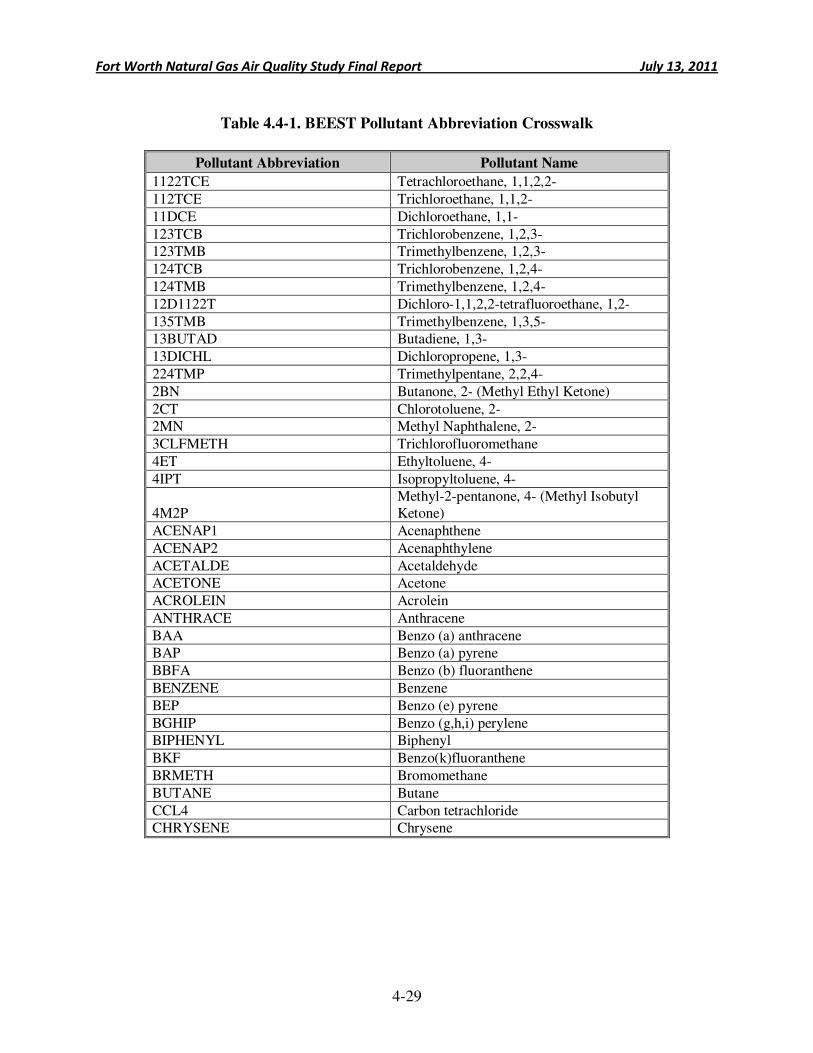
Fort Worth Natural Gas Air Quality Study Final Report July 13, 2011
4-29
Table 4.4-1. BEEST Pollutant Abbreviation Crosswalk
Pollutant Abbreviation Pollutant Name
1122TCE Tetrachloroethane, 1,1,2,2-
112TCE Trichloroethane, 1,1,2-
11DCE Dichloroethane, 1,1-
123TCB Trichlorobenzene, 1,2,3- 123TMB Trimethylbenzene, 1,2,3-
124TCB Trichlorobenzene, 1,2,4-
124TMB Trimethylbenzene, 1,2,4-
12D1122T Dichloro-1,1,2,2-tetrafluoroethane, 1,2-
135TMB Trimethylbenzene, 1,3,5- 13BUTAD Butadiene, 1,3-
13DICHL Dichloropropene, 1,3-
224TMP Trimethylpentane, 2,2,4-
2BN Butanone, 2- (Methyl Ethyl Ketone)
2CT Chlorotoluene, 2- 2MN Methyl Naphthalene, 2-
3CLFMETH Trichlorofluoromethane
4ET Ethyltoluene, 4-
4IPT Isopropyltoluene, 4-
4M2P Methyl-2-pentanone, 4- (Methyl Isobutyl Ketone)
ACENAP1 Acenaphthene
ACENAP2 Acenaphthylene
ACETALDE Acetaldehyde ACETONE Acetone
ACROLEIN Acrolein
ANTHRACE Anthracene
BAA Benzo (a) anthracene BAP Benzo (a) pyrene
BBFA Benzo (b) fluoranthene
BENZENE Benzene
BEP Benzo (e) pyrene
BGHIP Benzo (g,h,i) perylene BIPHENYL Biphenyl
BKF Benzo(k)fluoranthene
BRMETH Bromomethane
BUTANE Butane
CCL4 Carbon tetrachloride CHRYSENE Chrysene
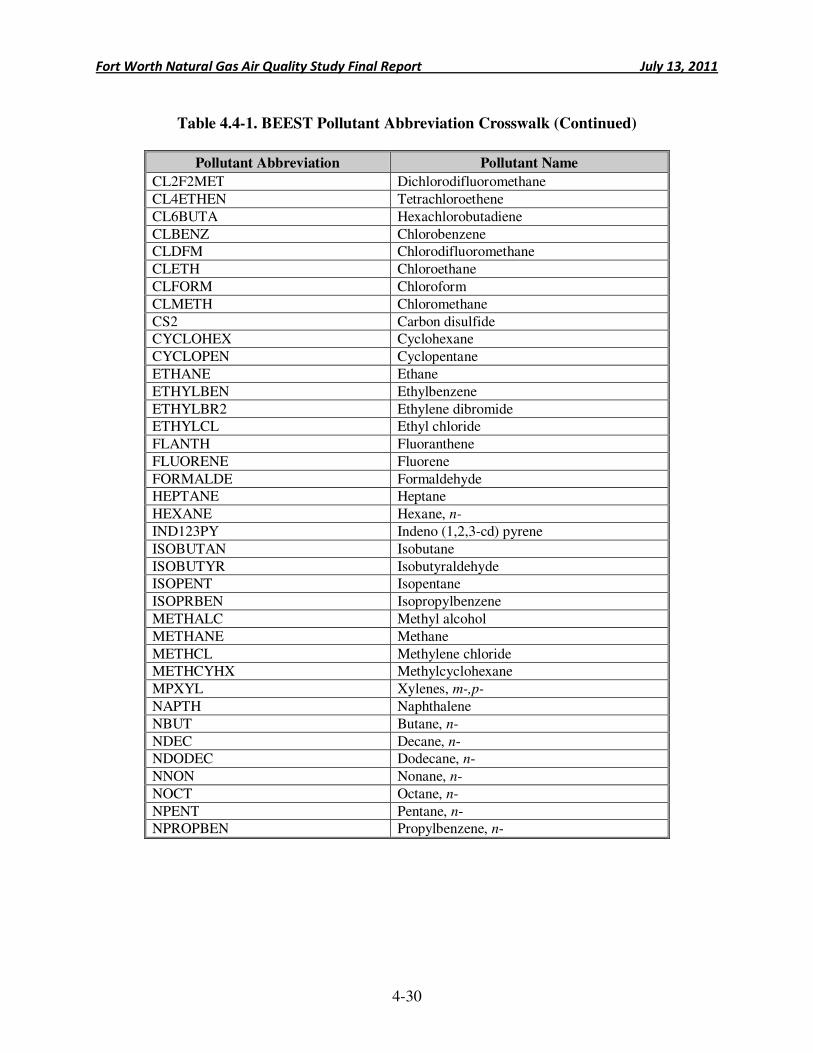
Fort Worth Natural Gas Air Quality Study Final Report July 13, 2011
4-30
Table 4.4-1. BEEST Pollutant Abbreviation Crosswalk (Continued)
Pollutant Abbreviation Pollutant Name
CL2F2MET Dichlorodifluoromethane
CL4ETHEN Tetrachloroethene
CL6BUTA Hexachlorobutadiene
CLBENZ Chlorobenzene CLDFM Chlorodifluoromethane
CLETH Chloroethane
CLFORM Chloroform
CLMETH Chloromethane
CS2 Carbon disulfide CYCLOHEX Cyclohexane
CYCLOPEN Cyclopentane
ETHANE Ethane
ETHYLBEN Ethylbenzene
ETHYLBR2 Ethylene dibromide ETHYLCL Ethyl chloride
FLANTH Fluoranthene
FLUORENE Fluorene
FORMALDE Formaldehyde HEPTANE Heptane
HEXANE Hexane, n-
IND123PY Indeno (1,2,3-cd) pyrene
ISOBUTAN Isobutane
ISOBUTYR Isobutyraldehyde ISOPENT Isopentane
ISOPRBEN Isopropylbenzene
METHALC Methyl alcohol
METHANE Methane
METHCL Methylene chloride METHCYHX Methylcyclohexane
MPXYL Xylenes, m-,p-
NAPTH Naphthalene
NBUT Butane, n-
NDEC Decane, n- NDODEC Dodecane, n-
NNON Nonane, n-
NOCT Octane, n-
NPENT Pentane, n- NPROPBEN Propylbenzene, n-
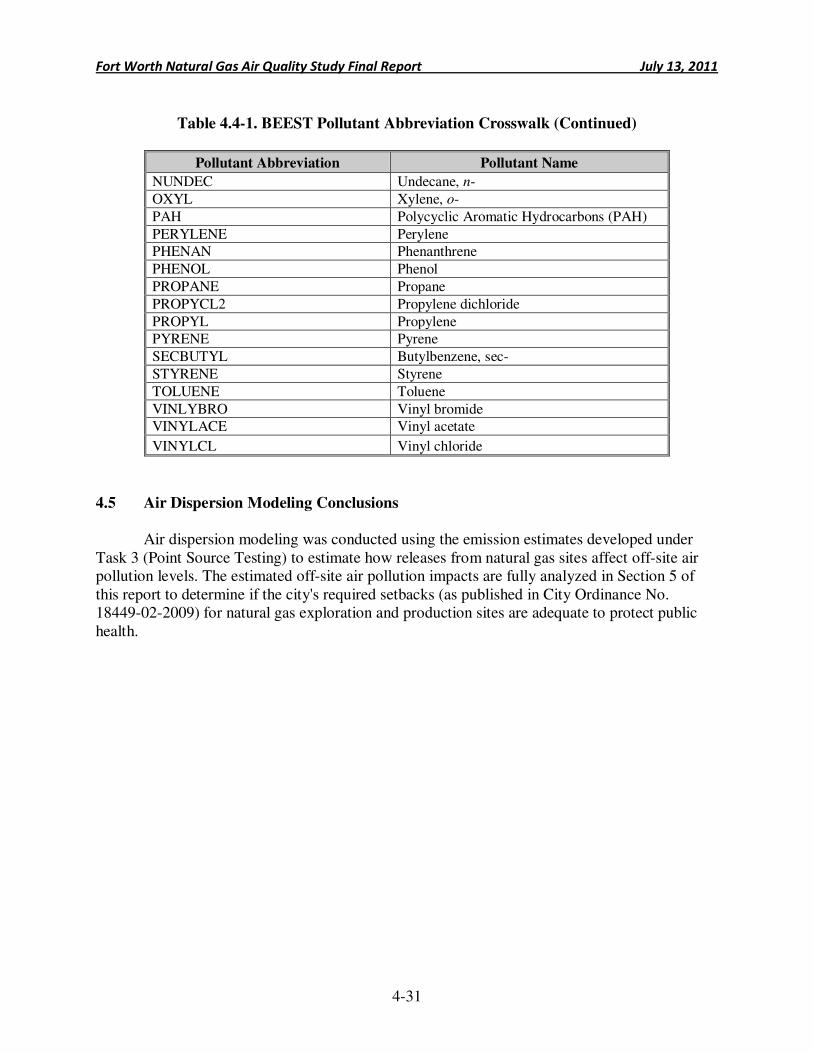
Fort Worth Natural Gas Air Quality Study Final Report July 13, 2011
4-31
Table 4.4-1. BEEST Pollutant Abbreviation Crosswalk (Continued)
Pollutant Abbreviation Pollutant Name
NUNDEC Undecane, n-
OXYL Xylene, o-
PAH Polycyclic Aromatic Hydrocarbons (PAH)
PERYLENE Perylene PHENAN Phenanthrene
PHENOL Phenol
PROPANE Propane
PROPYCL2 Propylene dichloride
PROPYL Propylene PYRENE Pyrene
SECBUTYL Butylbenzene, sec-
STYRENE Styrene
TOLUENE Toluene
VINLYBRO Vinyl bromide VINYLACE Vinyl acetate
VINYLCL Vinyl chloride
4.5 Air Dispersion Modeling Conclusions
Air dispersion modeling was conducted using the emission estimates developed under
Task 3 (Point Source Testing) to estimate how releases from natural gas sites affect off-site air pollution levels. The estimated off-site air pollution impacts are fully analyzed in Section 5 of this report to determine if the city's required setbacks (as published in City Ordinance No. 18449-02-2009) for natural gas exploration and production sites are adequate to protect public health.
Fort Worth Natural Gas Air Quality Study Final Report July 13, 2011
5-1
5.0 Public Health Evaluation
This section evaluates the ambient air monitoring data and the dispersion modeling results from a public health perspective. The evaluation compares measured and modeled air pollution levels to TCEQ’s health-based screening levels. Additional context and more detailed evaluations are presented for the pollutants with estimated or measured air concentrations greater than these screening levels. The monitoring and modeling results are also used to assess the adequacy of the city of Fort Worth’s setback distances for sites with natural gas exploration and production activity. Text boxes throughout this section highlight important findings for specific topics. This section has five sub-sections:
• 5.1 Methodology – Describes the approach used to evaluate the air data.
• 5.2 Interpretation of Ambient Air Monitoring Data – Includes a health screening analysis for the measured air pollution levels.
• 5.3 Interpretation of Dispersion Modeling Data – Includes a health screening analysis for the modeled air pollution levels.
• 5.4 Additional Context for Selected Pollutants – Provides further perspective for pollutants selected for further evaluation.
• 5.5 Public Health Evaluation Conclusions – Concisely summarizes the public health evaluation.
5.1 Methodology
The point source testing identified numerous pollutants that natural gas exploration and production activities in Fort Worth release to the air. Once emitted, these pollutants move through the air to downwind locations where residents can be exposed. Air pollution levels at a given time and location in Fort Worth are ultimately influenced by emissions from a wide range of sources, not just releases from natural gas exploration and production activity. Examples of other sources that affect Fort Worth’s outdoor air quality include industrial facilities, motor vehicles, and gasoline stations.
Several factors must be considered when evaluating the public health implications of outdoor air pollution levels. Which pollutants are found in the air and at what concentrations? Over what duration are people exposed? Are the exposed populations uniquely susceptible to the effects of air pollution? Environmental and health agencies use different approaches when evaluating the public health implications of exposure to outdoor air pollution. In cases with thousands of measurements and estimates of outdoor air quality for numerous pollutants, a commonly applied methodology is to use health-based screening levels to determine which subsets of pollutants are of potential health concern.
Health-based screening levels are developed from scientific studies that have examined links between air pollution and health effects. To ensure that screening levels are protective of public health, the agencies that derive these values set them at levels considerably lower than
Key Point: Screening Methodology This study presents measured and modeled air pollution levels for more than 150 different pollutants. Health-based screening levels are used to identify which pollutants are most important from a health perspective.
Fort Worth Natural Gas Air Quality Study Final Report July 13, 2011
5-2
concentrations found to have been associated with adverse health effects. This means that residents are generally not expected to experience health effects when exposed to air pollution levels that are lower than health-based screening levels—but also that the levels are not thresholds for toxicity. Measured or modeled air pollution levels above a health-based screening level are not necessarily harmful, but they do require a more detailed evaluation to assess public health implications. Broadly speaking, this document uses the health-based screening levels to identify the subset of pollutants that require more thorough health evaluations.
This report primarily relies on screening levels published by TCEQ for evaluating the implications of inhalation exposure to outdoor air pollution, considering both measured and estimated air pollution levels. TCEQ has published two sets of screening levels for use in evaluating outdoor air quality issues:
• Effects Screening Levels (ESLs). For many years, TCEQ has published and updated its ESLs. These values are primarily used in the permitting process, particularly when reviewing dispersion modeling data. TCEQ has developed separate ESLs for short-term and long-term exposure durations, where short-term values are typically used for assessing 1-hour average concentrations and long-term values are typically used for assessing annual average concentrations. Most of TCEQ’s ESLs were developed based on health effects, but some were developed to protect vegetation or based on odor detection. The ESLs are not regulatory standards, but are used to interpret potential exposures to air pollution, primarily pollution levels predicted by models.
TCEQ advises that estimated air quality impacts and ESLs should be interpreted as follows: “If predicted airborne levels of a constituent do not exceed the screening level, adverse health or welfare effects are not expected. If predicted ambient levels of constituents in air exceed the screening levels, it does not necessarily indicate a problem but rather triggers a review in more depth.” The complete set of ESLs is available at http://www.tceq.texas.gov/toxicology/esl.
• Air Monitoring Comparison Values (AMCVs). In addition to ESLs, TCEQ has more recently developed AMCVs, which are pollutant-specific ambient air concentrations that the agency has established to protect human health and welfare. In contrast to ESLs, which are primarily used when evaluating air pollution levels predicted by models, AMCVs are used when conducting health screening evaluations of air monitoring data. The complete set of AMCVs is also available online at http://www.tceq.texas.gov/toxicology/AirToxics.html#amcv.
In this section, the modeled and measured air pollution levels are presented alongside the
corresponding health-based ESLs and AMCVs. For pollutants with air concentrations above the TCEQ screening levels, additional context is provided in Section 5.4 by presenting screening levels published by ATSDR and EPA. All screening values used in this report were accessed from agency publications in March 2011.
Fort Worth Natural Gas Air Quality Study Final Report July 13, 2011
5-3
5.2 Interpretation of Ambient Air Monitoring Data
This section presents a health screening analysis for this program’s ambient air monitoring data—the air pollution levels that were measured at eight locations in Fort Worth in September and October, 2010. Ambient air monitoring data are particularly useful for health evaluations, because they represent direct measurements of the air pollution levels that residents actually breathe, without introducing the uncertainty of models. These measurements reflect contributions from many different local emission sources. While many pollutants found in the air samples are emitted from natural gas exploration and production activity, not every pollutant is associated with this source. The dispersion modeling analysis (Section 5.3) comments further on incremental air quality impacts attributable specifically to the well pads and compressor stations.
The section first evaluates the sensitivity of the monitoring methods (Section 5.2.1) and then compares the measured concentrations for nearly 150 pollutants to health-based screening levels, for both short-term (Section 5.2.2) and long-term (Section 5.2.3) exposure durations. The purpose of the health screening analysis is to identify the subset of pollutants requiring further evaluation. The section concludes by acknowledging limitations and uncertainties inherent in the screening of the ambient air monitoring data (Section 5.2.4).
5.2.1 Sensitivity of Monitoring Methods
An important consideration when evaluating
ambient air monitoring data is whether the measurement methods are capable of detecting air pollution at levels of interest. As Section 2 of this report describes, all ambient air monitoring for this study was conducted with methods developed by EPA and widely used in air toxics monitoring programs nationwide. To assess whether the methods were adequately sensitive to support a health evaluation, this section compares the detection limits achieved in this monitoring program to the pollutants’ lowest health-based screening levels published by TCEQ, considering both short-term and long-term values.
Table 5.2-1 compares the ranges of pollutant detection limits for the two laboratories that analyzed samples to the lowest health-based screening levels published by TCEQ, whether for short-term or long-term exposure durations. The ERG laboratory analyzed all samples collected from Sites S-1 through S-5, and the TestAmerica™ laboratory analyzed all samples collected from Sites S-6 and S-7. When planning this program, ERG’s goal was to achieve detection limits lower than health-based screening values for as many pollutants as possible, but particularly for pollutants that had previously been identified as potential concerns for these operations (e.g., benzene, formaldehyde). Shading is used in the table to identify pollutants whose ranges of detection limits were not lower than TCEQ screening levels.
As Table 5.2-1 shows, the ERG laboratory’s detection limits were below the TCEQ health-based screening values for every pollutant considered, including for benzene and
Key Point: Measurement Sensitivity The ambient air monitoring program used highly sensitive measurement methods. For all but two pollutants, the methods were capable of detecting air concentrations at levels below TCEQ’s most protective health-based screening values. Therefore, the air pollution measurements were sensitive enough to support health evaluations.
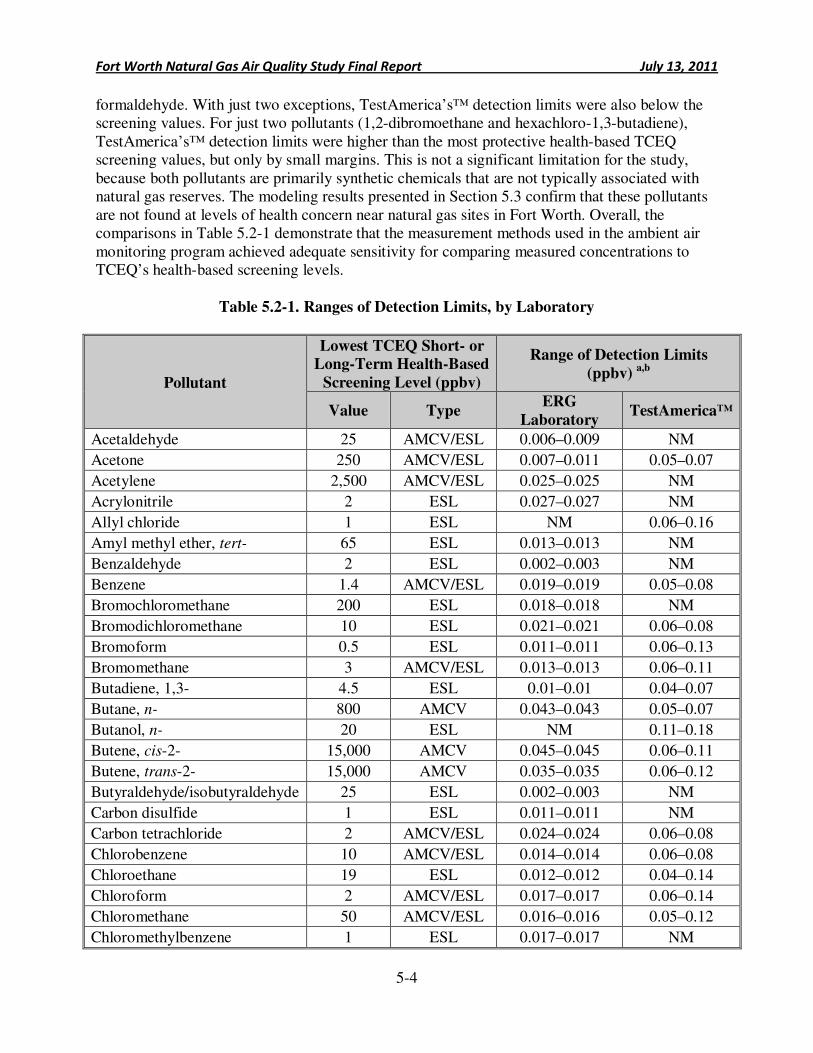
Fort Worth Natural Gas Air Quality Study Final Report July 13, 2011
5-4
formaldehyde. With just two exceptions, TestAmerica’s™ detection limits were also below the screening values. For just two pollutants (1,2-dibromoethane and hexachloro-1,3-butadiene), TestAmerica’s™ detection limits were higher than the most protective health-based TCEQ screening values, but only by small margins. This is not a significant limitation for the study, because both pollutants are primarily synthetic chemicals that are not typically associated with natural gas reserves. The modeling results presented in Section 5.3 confirm that these pollutants are not found at levels of health concern near natural gas sites in Fort Worth. Overall, the comparisons in Table 5.2-1 demonstrate that the measurement methods used in the ambient air monitoring program achieved adequate sensitivity for comparing measured concentrations to TCEQ’s health-based screening levels.
Table 5.2-1. Ranges of Detection Limits, by Laboratory
Pollutant
Lowest TCEQ Short- or
Long-Term Health-Based
Screening Level (ppbv)
Range of Detection Limits
(ppbv) a,b
Value Type ERG
Laboratory TestAmerica™
Acetaldehyde 25 AMCV/ESL 0.006–0.009 NM
Acetone 250 AMCV/ESL 0.007–0.011 0.05–0.07
Acetylene 2,500 AMCV/ESL 0.025–0.025 NM
Acrylonitrile 2 ESL 0.027–0.027 NM
Allyl chloride 1 ESL NM 0.06–0.16
Amyl methyl ether, tert- 65 ESL 0.013–0.013 NM
Benzaldehyde 2 ESL 0.002–0.003 NM
Benzene 1.4 AMCV/ESL 0.019–0.019 0.05–0.08
Bromochloromethane 200 ESL 0.018–0.018 NM
Bromodichloromethane 10 ESL 0.021–0.021 0.06–0.08
Bromoform 0.5 ESL 0.011–0.011 0.06–0.13
Bromomethane 3 AMCV/ESL 0.013–0.013 0.06–0.11
Butadiene, 1,3- 4.5 ESL 0.01–0.01 0.04–0.07
Butane, n- 800 AMCV 0.043–0.043 0.05–0.07
Butanol, n- 20 ESL NM 0.11–0.18
Butene, cis-2- 15,000 AMCV 0.045–0.045 0.06–0.11
Butene, trans-2- 15,000 AMCV 0.035–0.035 0.06–0.12
Butyraldehyde/isobutyraldehyde 25 ESL 0.002–0.003 NM
Carbon disulfide 1 ESL 0.011–0.011 NM
Carbon tetrachloride 2 AMCV/ESL 0.024–0.024 0.06–0.08
Chlorobenzene 10 AMCV/ESL 0.014–0.014 0.06–0.08
Chloroethane 19 ESL 0.012–0.012 0.04–0.14
Chloroform 2 AMCV/ESL 0.017–0.017 0.06–0.14
Chloromethane 50 AMCV/ESL 0.016–0.016 0.05–0.12
Chloromethylbenzene 1 ESL 0.017–0.017 NM
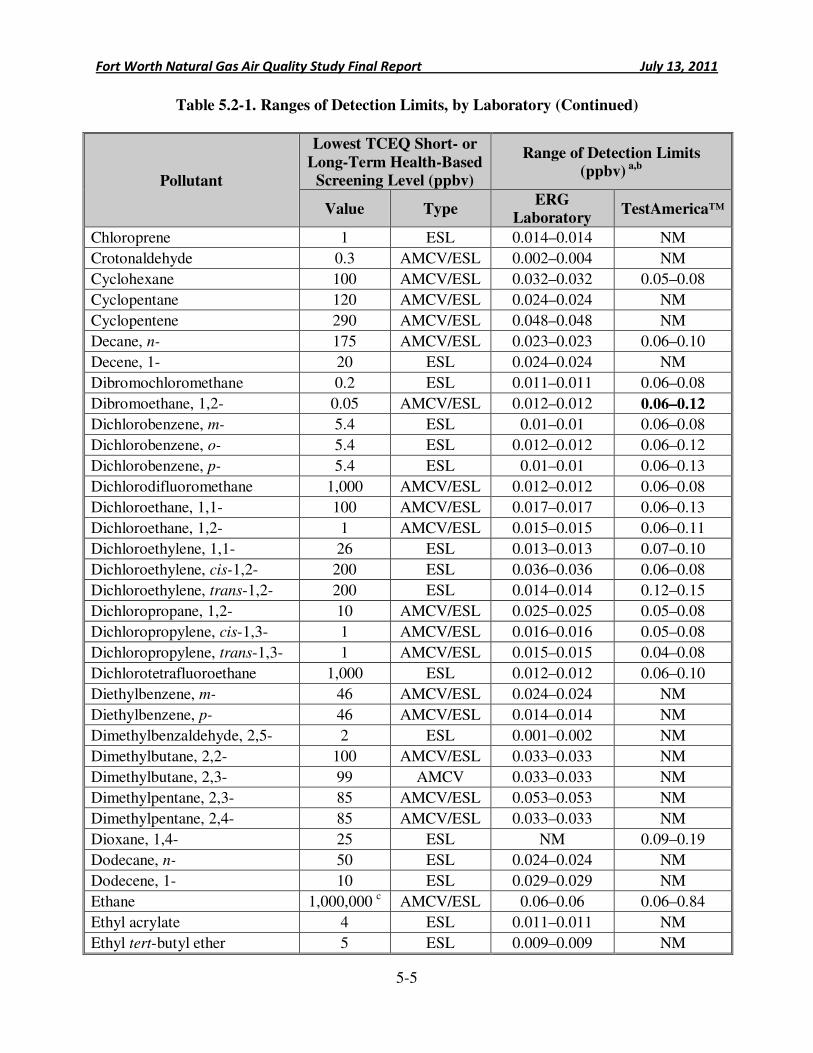
Fort Worth Natural Gas Air Quality Study Final Report July 13, 2011
5-5
Table 5.2-1. Ranges of Detection Limits, by Laboratory (Continued)
Pollutant
Lowest TCEQ Short- or
Long-Term Health-Based
Screening Level (ppbv)
Range of Detection Limits
(ppbv) a,b
Value Type ERG
Laboratory TestAmerica™
Chloroprene 1 ESL 0.014–0.014 NM
Crotonaldehyde 0.3 AMCV/ESL 0.002–0.004 NM
Cyclohexane 100 AMCV/ESL 0.032–0.032 0.05–0.08
Cyclopentane 120 AMCV/ESL 0.024–0.024 NM
Cyclopentene 290 AMCV/ESL 0.048–0.048 NM
Decane, n- 175 AMCV/ESL 0.023–0.023 0.06–0.10
Decene, 1- 20 ESL 0.024–0.024 NM
Dibromochloromethane 0.2 ESL 0.011–0.011 0.06–0.08
Dibromoethane, 1,2- 0.05 AMCV/ESL 0.012–0.012 0.06–0.12
Dichlorobenzene, m- 5.4 ESL 0.01–0.01 0.06–0.08
Dichlorobenzene, o- 5.4 ESL 0.012–0.012 0.06–0.12
Dichlorobenzene, p- 5.4 ESL 0.01–0.01 0.06–0.13
Dichlorodifluoromethane 1,000 AMCV/ESL 0.012–0.012 0.06–0.08
Dichloroethane, 1,1- 100 AMCV/ESL 0.017–0.017 0.06–0.13
Dichloroethane, 1,2- 1 AMCV/ESL 0.015–0.015 0.06–0.11
Dichloroethylene, 1,1- 26 ESL 0.013–0.013 0.07–0.10
Dichloroethylene, cis-1,2- 200 ESL 0.036–0.036 0.06–0.08
Dichloroethylene, trans-1,2- 200 ESL 0.014–0.014 0.12–0.15
Dichloropropane, 1,2- 10 AMCV/ESL 0.025–0.025 0.05–0.08
Dichloropropylene, cis-1,3- 1 AMCV/ESL 0.016–0.016 0.05–0.08
Dichloropropylene, trans-1,3- 1 AMCV/ESL 0.015–0.015 0.04–0.08
Dichlorotetrafluoroethane 1,000 ESL 0.012–0.012 0.06–0.10
Diethylbenzene, m- 46 AMCV/ESL 0.024–0.024 NM
Diethylbenzene, p- 46 AMCV/ESL 0.014–0.014 NM
Dimethylbenzaldehyde, 2,5- 2 ESL 0.001–0.002 NM
Dimethylbutane, 2,2- 100 AMCV/ESL 0.033–0.033 NM
Dimethylbutane, 2,3- 99 AMCV 0.033–0.033 NM
Dimethylpentane, 2,3- 85 AMCV/ESL 0.053–0.053 NM
Dimethylpentane, 2,4- 85 AMCV/ESL 0.033–0.033 NM
Dioxane, 1,4- 25 ESL NM 0.09–0.19
Dodecane, n- 50 ESL 0.024–0.024 NM
Dodecene, 1- 10 ESL 0.029–0.029 NM
Ethane 1,000,000 c AMCV/ESL 0.06–0.06 0.06–0.84
Ethyl acrylate 4 ESL 0.011–0.011 NM
Ethyl tert-butyl ether 5 ESL 0.009–0.009 NM
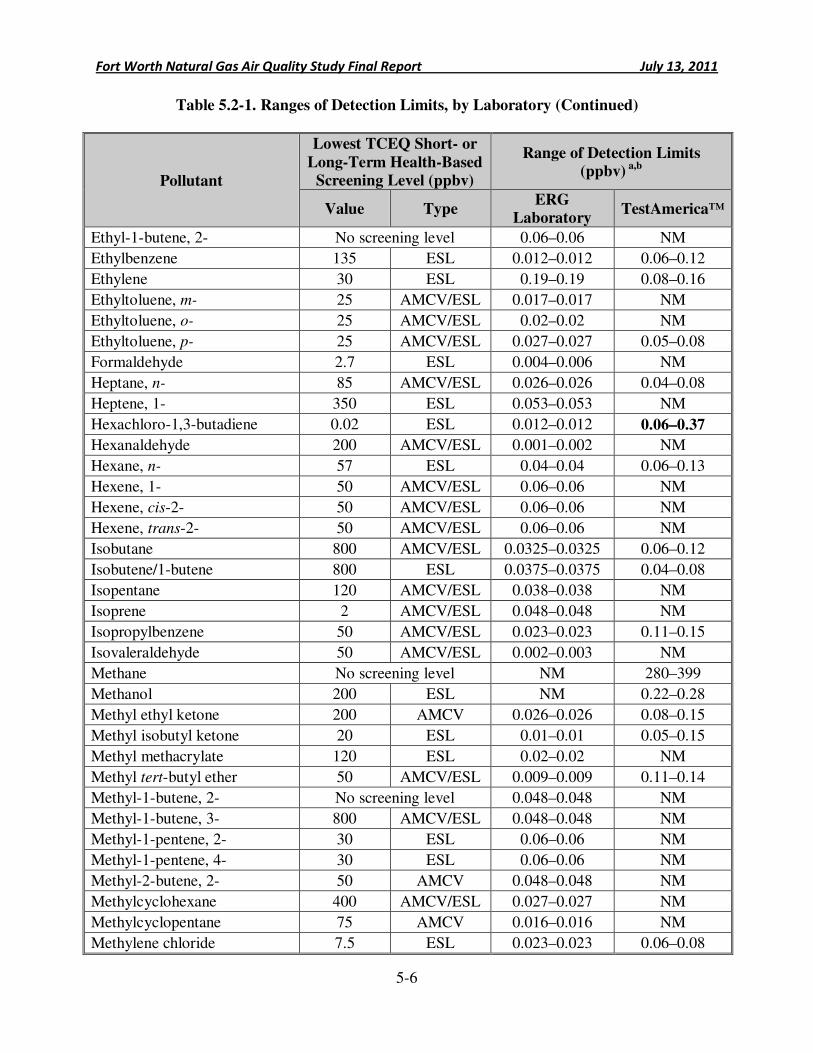
Fort Worth Natural Gas Air Quality Study Final Report July 13, 2011
5-6
Table 5.2-1. Ranges of Detection Limits, by Laboratory (Continued)
Pollutant
Lowest TCEQ Short- or
Long-Term Health-Based
Screening Level (ppbv)
Range of Detection Limits
(ppbv) a,b
Value Type ERG
Laboratory TestAmerica™
Ethyl-1-butene, 2- No screening level 0.06–0.06 NM
Ethylbenzene 135 ESL 0.012–0.012 0.06–0.12
Ethylene 30 ESL 0.19–0.19 0.08–0.16
Ethyltoluene, m- 25 AMCV/ESL 0.017–0.017 NM
Ethyltoluene, o- 25 AMCV/ESL 0.02–0.02 NM
Ethyltoluene, p- 25 AMCV/ESL 0.027–0.027 0.05–0.08
Formaldehyde 2.7 ESL 0.004–0.006 NM
Heptane, n- 85 AMCV/ESL 0.026–0.026 0.04–0.08
Heptene, 1- 350 ESL 0.053–0.053 NM
Hexachloro-1,3-butadiene 0.02 ESL 0.012–0.012 0.06–0.37
Hexanaldehyde 200 AMCV/ESL 0.001–0.002 NM
Hexane, n- 57 ESL 0.04–0.04 0.06–0.13
Hexene, 1- 50 AMCV/ESL 0.06–0.06 NM
Hexene, cis-2- 50 AMCV/ESL 0.06–0.06 NM
Hexene, trans-2- 50 AMCV/ESL 0.06–0.06 NM
Isobutane 800 AMCV/ESL 0.0325–0.0325 0.06–0.12
Isobutene/1-butene 800 ESL 0.0375–0.0375 0.04–0.08
Isopentane 120 AMCV/ESL 0.038–0.038 NM
Isoprene 2 AMCV/ESL 0.048–0.048 NM
Isopropylbenzene 50 AMCV/ESL 0.023–0.023 0.11–0.15
Isovaleraldehyde 50 AMCV/ESL 0.002–0.003 NM
Methane No screening level NM 280–399
Methanol 200 ESL NM 0.22–0.28
Methyl ethyl ketone 200 AMCV 0.026–0.026 0.08–0.15
Methyl isobutyl ketone 20 ESL 0.01–0.01 0.05–0.15
Methyl methacrylate 120 ESL 0.02–0.02 NM
Methyl tert-butyl ether 50 AMCV/ESL 0.009–0.009 0.11–0.14
Methyl-1-butene, 2- No screening level 0.048–0.048 NM
Methyl-1-butene, 3- 800 AMCV/ESL 0.048–0.048 NM
Methyl-1-pentene, 2- 30 ESL 0.06–0.06 NM
Methyl-1-pentene, 4- 30 ESL 0.06–0.06 NM
Methyl-2-butene, 2- 50 AMCV 0.048–0.048 NM
Methylcyclohexane 400 AMCV/ESL 0.027–0.027 NM
Methylcyclopentane 75 AMCV 0.016–0.016 NM
Methylene chloride 7.5 ESL 0.023–0.023 0.06–0.08
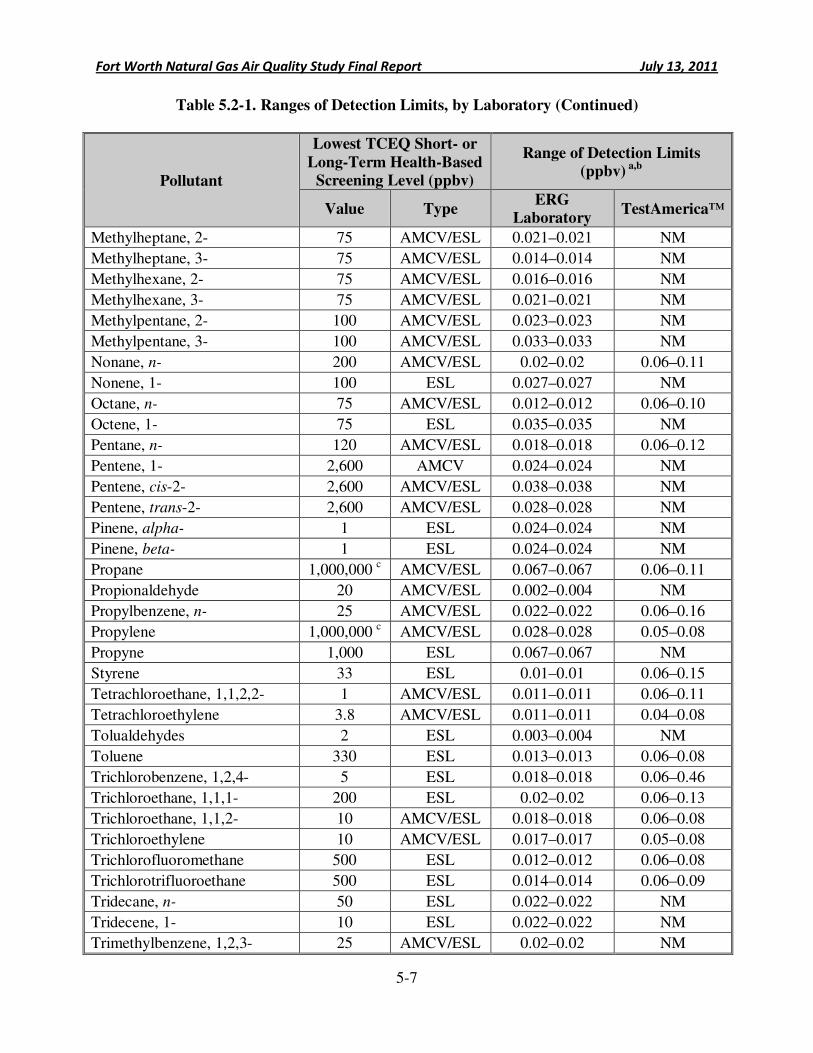
Fort Worth Natural Gas Air Quality Study Final Report July 13, 2011
5-7
Table 5.2-1. Ranges of Detection Limits, by Laboratory (Continued)
Pollutant
Lowest TCEQ Short- or
Long-Term Health-Based
Screening Level (ppbv)
Range of Detection Limits
(ppbv) a,b
Value Type ERG
Laboratory TestAmerica™
Methylheptane, 2- 75 AMCV/ESL 0.021–0.021 NM
Methylheptane, 3- 75 AMCV/ESL 0.014–0.014 NM
Methylhexane, 2- 75 AMCV/ESL 0.016–0.016 NM
Methylhexane, 3- 75 AMCV/ESL 0.021–0.021 NM
Methylpentane, 2- 100 AMCV/ESL 0.023–0.023 NM
Methylpentane, 3- 100 AMCV/ESL 0.033–0.033 NM
Nonane, n- 200 AMCV/ESL 0.02–0.02 0.06–0.11
Nonene, 1- 100 ESL 0.027–0.027 NM
Octane, n- 75 AMCV/ESL 0.012–0.012 0.06–0.10
Octene, 1- 75 ESL 0.035–0.035 NM
Pentane, n- 120 AMCV/ESL 0.018–0.018 0.06–0.12
Pentene, 1- 2,600 AMCV 0.024–0.024 NM
Pentene, cis-2- 2,600 AMCV/ESL 0.038–0.038 NM
Pentene, trans-2- 2,600 AMCV/ESL 0.028–0.028 NM
Pinene, alpha- 1 ESL 0.024–0.024 NM
Pinene, beta- 1 ESL 0.024–0.024 NM
Propane 1,000,000 c AMCV/ESL 0.067–0.067 0.06–0.11
Propionaldehyde 20 AMCV/ESL 0.002–0.004 NM
Propylbenzene, n- 25 AMCV/ESL 0.022–0.022 0.06–0.16
Propylene 1,000,000 c AMCV/ESL 0.028–0.028 0.05–0.08
Propyne 1,000 ESL 0.067–0.067 NM
Styrene 33 ESL 0.01–0.01 0.06–0.15
Tetrachloroethane, 1,1,2,2- 1 AMCV/ESL 0.011–0.011 0.06–0.11
Tetrachloroethylene 3.8 AMCV/ESL 0.011–0.011 0.04–0.08
Tolualdehydes 2 ESL 0.003–0.004 NM
Toluene 330 ESL 0.013–0.013 0.06–0.08
Trichlorobenzene, 1,2,4- 5 ESL 0.018–0.018 0.06–0.46
Trichloroethane, 1,1,1- 200 ESL 0.02–0.02 0.06–0.13
Trichloroethane, 1,1,2- 10 AMCV/ESL 0.018–0.018 0.06–0.08
Trichloroethylene 10 AMCV/ESL 0.017–0.017 0.05–0.08
Trichlorofluoromethane 500 ESL 0.012–0.012 0.06–0.08
Trichlorotrifluoroethane 500 ESL 0.014–0.014 0.06–0.09
Tridecane, n- 50 ESL 0.022–0.022 NM
Tridecene, 1- 10 ESL 0.022–0.022 NM
Trimethylbenzene, 1,2,3- 25 AMCV/ESL 0.02–0.02 NM
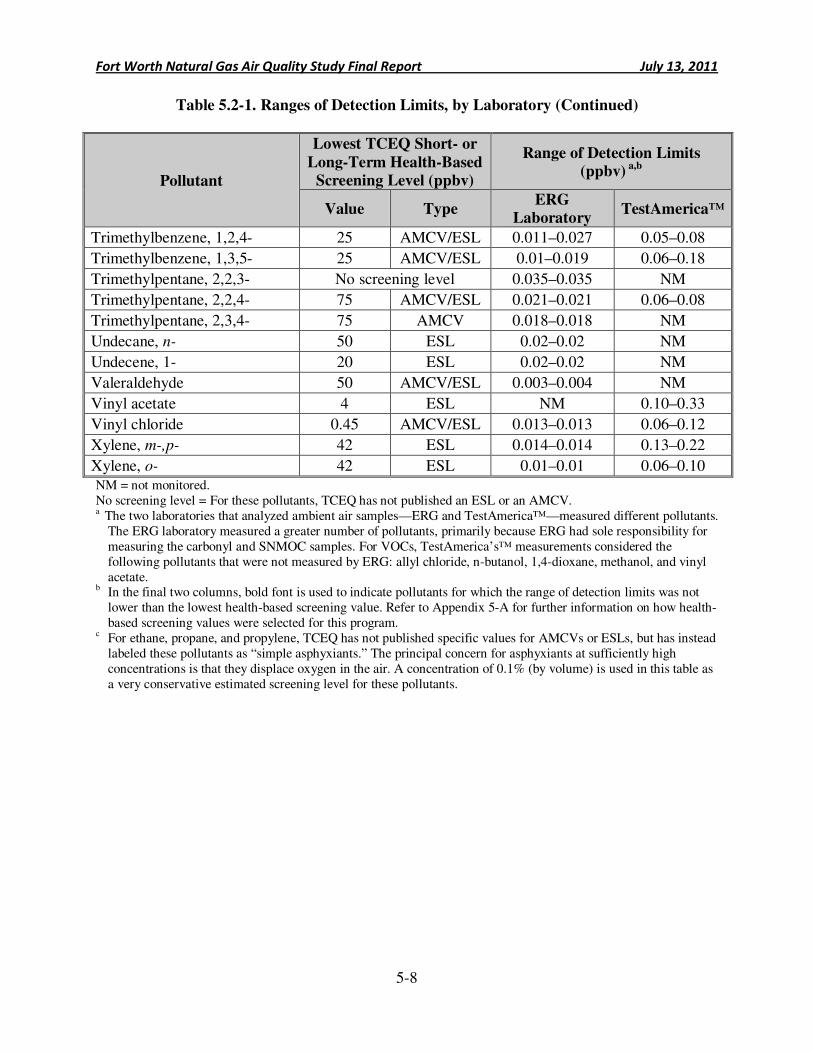
Fort Worth Natural Gas Air Quality Study Final Report July 13, 2011
5-8
Table 5.2-1. Ranges of Detection Limits, by Laboratory (Continued)
Pollutant
Lowest TCEQ Short- or
Long-Term Health-Based
Screening Level (ppbv)
Range of Detection Limits
(ppbv) a,b
Value Type ERG
Laboratory TestAmerica™
Trimethylbenzene, 1,2,4- 25 AMCV/ESL 0.011–0.027 0.05–0.08
Trimethylbenzene, 1,3,5- 25 AMCV/ESL 0.01–0.019 0.06–0.18
Trimethylpentane, 2,2,3- No screening level 0.035–0.035 NM
Trimethylpentane, 2,2,4- 75 AMCV/ESL 0.021–0.021 0.06–0.08
Trimethylpentane, 2,3,4- 75 AMCV 0.018–0.018 NM
Undecane, n- 50 ESL 0.02–0.02 NM
Undecene, 1- 20 ESL 0.02–0.02 NM
Valeraldehyde 50 AMCV/ESL 0.003–0.004 NM
Vinyl acetate 4 ESL NM 0.10–0.33
Vinyl chloride 0.45 AMCV/ESL 0.013–0.013 0.06–0.12
Xylene, m-,p- 42 ESL 0.014–0.014 0.13–0.22
Xylene, o- 42 ESL 0.01–0.01 0.06–0.10 NM = not monitored. No screening level = For these pollutants, TCEQ has not published an ESL or an AMCV. a The two laboratories that analyzed ambient air samples—ERG and TestAmerica™—measured different pollutants.
The ERG laboratory measured a greater number of pollutants, primarily because ERG had sole responsibility for measuring the carbonyl and SNMOC samples. For VOCs, TestAmerica’s™ measurements considered the following pollutants that were not measured by ERG: allyl chloride, n-butanol, 1,4-dioxane, methanol, and vinyl acetate.
b In the final two columns, bold font is used to indicate pollutants for which the range of detection limits was not lower than the lowest health-based screening value. Refer to Appendix 5-A for further information on how health-based screening values were selected for this program.
c For ethane, propane, and propylene, TCEQ has not published specific values for AMCVs or ESLs, but has instead labeled these pollutants as “simple asphyxiants.” The principal concern for asphyxiants at sufficiently high concentrations is that they displace oxygen in the air. A concentration of 0.1% (by volume) is used in this table as a very conservative estimated screening level for these pollutants.
Fort Worth Natural Gas Air Quality Study Final Report July 13, 2011
5-9
5.2.2 Health Evaluation for Measured 24-Hour Average Concentrations
As described previously, ambient air monitoring occurred for two months at eight locations throughout the city of Fort Worth, and concentrations were measured for nearly 150 pollutants. All measurements were based on 24-hour average samples, and more than 15,000 observations were recorded over the course of the program.
When evaluating the monitoring data, ERG first considered whether the highest measured 24-hour average concentrations exceeded TCEQ’s short-term health-based screening levels. Throughout the monitoring program in 2010, ERG made these comparisons in order to promptly identify any indications of imminent health hazards, but none occurred. Comparing 24-hour average measurements to long-term health-based screening values is scientifically inappropriate and is not done in this report. For every pollutant considered in the ambient monitoring program, Table 5.2-2 lists the highest 24-hour average concentration detected during the program, the location where this value was detected, and the lowest short-term, health-based screening level published by TCEQ. For this evaluation, the hierarchy for selecting screening levels follows: First, if a pollutant has a short-term health-based AMCV, that value was used in Table 5.2-1, even if a different ESL is available. The preference for AMCVs over ESLs was applied here because this is an evaluation of ambient air monitoring data, not modeling data. Next, if a pollutant does not have a health-based AMCV, the table displays the pollutant’s short-term health-based ESL. If neither value is available for the pollutant, short-term odor-based ESLs are used, if available. The table also indicates which pollutants have no TCEQ screening values. Shading is used in the table to identify pollutants that had at least one measured 24-hour average concentration higher than the TCEQ short-term screening level.
Key Point: Short-Term Air Pollution
Measurements The ambient air monitoring data provide no evidence of 24-hour average concentrations reaching levels of health concern. Out of more than 15,000 air pollution measurements, only one exceeded a TCEQ health-based screening level for short-term exposures; but that one measurement was of questionable quality and was for a pollutant not typically associated with natural gas activity.
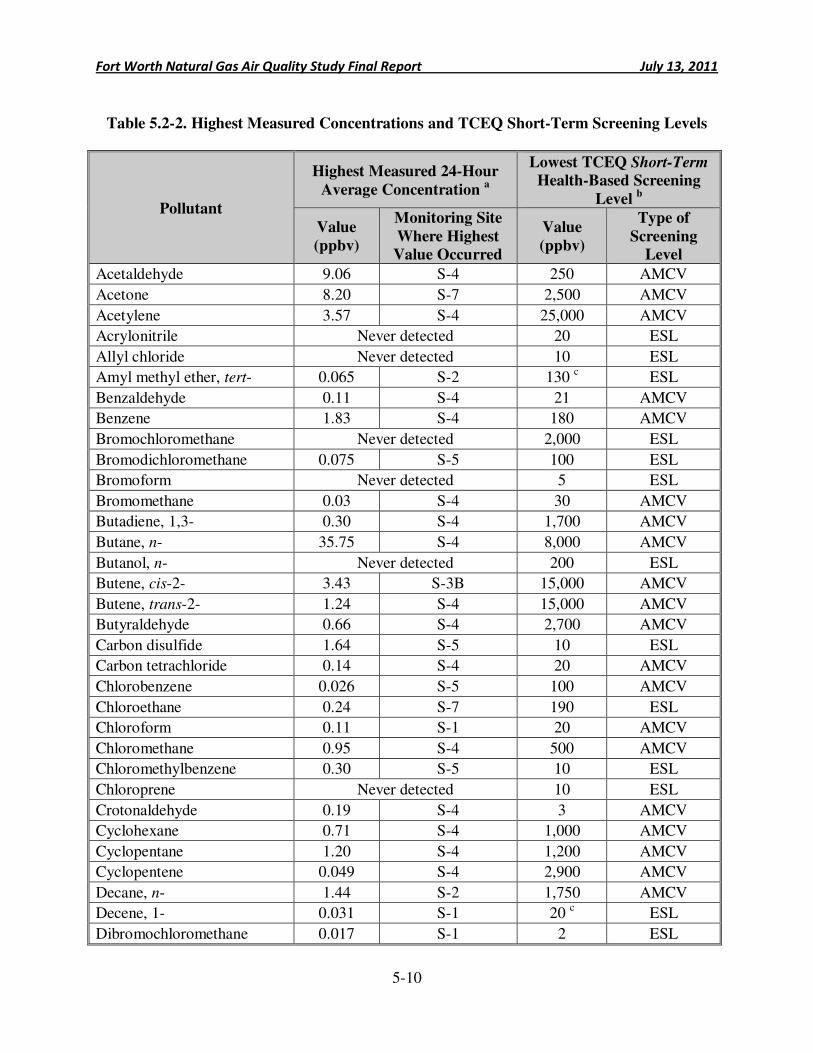
Fort Worth Natural Gas Air Quality Study Final Report July 13, 2011
5-10
Table 5.2-2. Highest Measured Concentrations and TCEQ Short-Term Screening Levels
Pollutant
Highest Measured 24-Hour
Average Concentration a
Lowest TCEQ Short-Term
Health-Based Screening
Level b
Value
(ppbv)
Monitoring Site
Where Highest
Value Occurred
Value
(ppbv)
Type of
Screening
Level
Acetaldehyde 9.06 S-4 250 AMCV
Acetone 8.20 S-7 2,500 AMCV
Acetylene 3.57 S-4 25,000 AMCV
Acrylonitrile Never detected 20 ESL
Allyl chloride Never detected 10 ESL
Amyl methyl ether, tert- 0.065 S-2 130 c ESL
Benzaldehyde 0.11 S-4 21 AMCV
Benzene 1.83 S-4 180 AMCV
Bromochloromethane Never detected 2,000 ESL
Bromodichloromethane 0.075 S-5 100 ESL
Bromoform Never detected 5 ESL
Bromomethane 0.03 S-4 30 AMCV
Butadiene, 1,3- 0.30 S-4 1,700 AMCV
Butane, n- 35.75 S-4 8,000 AMCV
Butanol, n- Never detected 200 ESL
Butene, cis-2- 3.43 S-3B 15,000 AMCV
Butene, trans-2- 1.24 S-4 15,000 AMCV
Butyraldehyde 0.66 S-4 2,700 AMCV
Carbon disulfide 1.64 S-5 10 ESL
Carbon tetrachloride 0.14 S-4 20 AMCV
Chlorobenzene 0.026 S-5 100 AMCV
Chloroethane 0.24 S-7 190 ESL
Chloroform 0.11 S-1 20 AMCV
Chloromethane 0.95 S-4 500 AMCV
Chloromethylbenzene 0.30 S-5 10 ESL
Chloroprene Never detected 10 ESL
Crotonaldehyde 0.19 S-4 3 AMCV
Cyclohexane 0.71 S-4 1,000 AMCV
Cyclopentane 1.20 S-4 1,200 AMCV
Cyclopentene 0.049 S-4 2,900 AMCV
Decane, n- 1.44 S-2 1,750 AMCV
Decene, 1- 0.031 S-1 20 c ESL
Dibromochloromethane 0.017 S-1 2 ESL
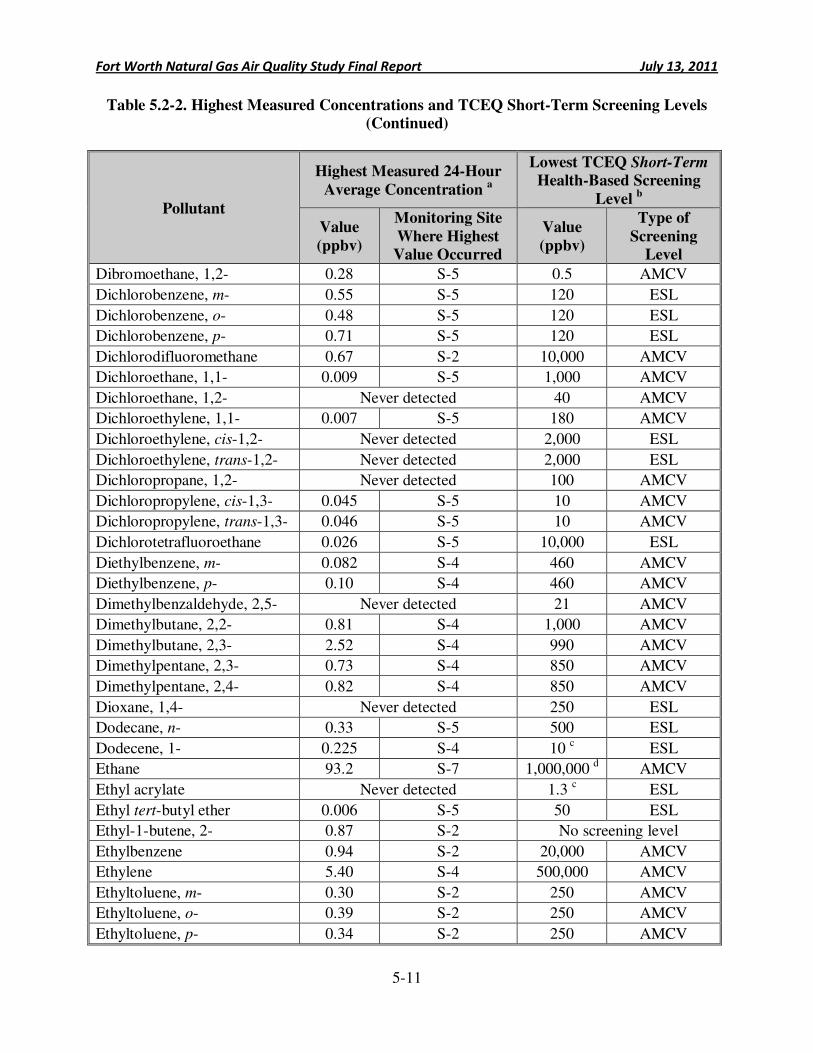
Fort Worth Natural Gas Air Quality Study Final Report July 13, 2011
5-11
Table 5.2-2. Highest Measured Concentrations and TCEQ Short-Term Screening Levels
(Continued)
Pollutant
Highest Measured 24-Hour
Average Concentration a
Lowest TCEQ Short-Term
Health-Based Screening
Level b
Value
(ppbv)
Monitoring Site
Where Highest
Value Occurred
Value
(ppbv)
Type of
Screening
Level
Dibromoethane, 1,2- 0.28 S-5 0.5 AMCV
Dichlorobenzene, m- 0.55 S-5 120 ESL
Dichlorobenzene, o- 0.48 S-5 120 ESL
Dichlorobenzene, p- 0.71 S-5 120 ESL
Dichlorodifluoromethane 0.67 S-2 10,000 AMCV
Dichloroethane, 1,1- 0.009 S-5 1,000 AMCV
Dichloroethane, 1,2- Never detected 40 AMCV
Dichloroethylene, 1,1- 0.007 S-5 180 AMCV
Dichloroethylene, cis-1,2- Never detected 2,000 ESL
Dichloroethylene, trans-1,2- Never detected 2,000 ESL
Dichloropropane, 1,2- Never detected 100 AMCV
Dichloropropylene, cis-1,3- 0.045 S-5 10 AMCV
Dichloropropylene, trans-1,3- 0.046 S-5 10 AMCV
Dichlorotetrafluoroethane 0.026 S-5 10,000 ESL
Diethylbenzene, m- 0.082 S-4 460 AMCV
Diethylbenzene, p- 0.10 S-4 460 AMCV
Dimethylbenzaldehyde, 2,5- Never detected 21 AMCV
Dimethylbutane, 2,2- 0.81 S-4 1,000 AMCV
Dimethylbutane, 2,3- 2.52 S-4 990 AMCV
Dimethylpentane, 2,3- 0.73 S-4 850 AMCV
Dimethylpentane, 2,4- 0.82 S-4 850 AMCV
Dioxane, 1,4- Never detected 250 ESL
Dodecane, n- 0.33 S-5 500 ESL
Dodecene, 1- 0.225 S-4 10 c ESL
Ethane 93.2 S-7 1,000,000 d AMCV
Ethyl acrylate Never detected 1.3 c ESL
Ethyl tert-butyl ether 0.006 S-5 50 ESL
Ethyl-1-butene, 2- 0.87 S-2 No screening level
Ethylbenzene 0.94 S-2 20,000 AMCV
Ethylene 5.40 S-4 500,000 AMCV
Ethyltoluene, m- 0.30 S-2 250 AMCV
Ethyltoluene, o- 0.39 S-2 250 AMCV
Ethyltoluene, p- 0.34 S-2 250 AMCV
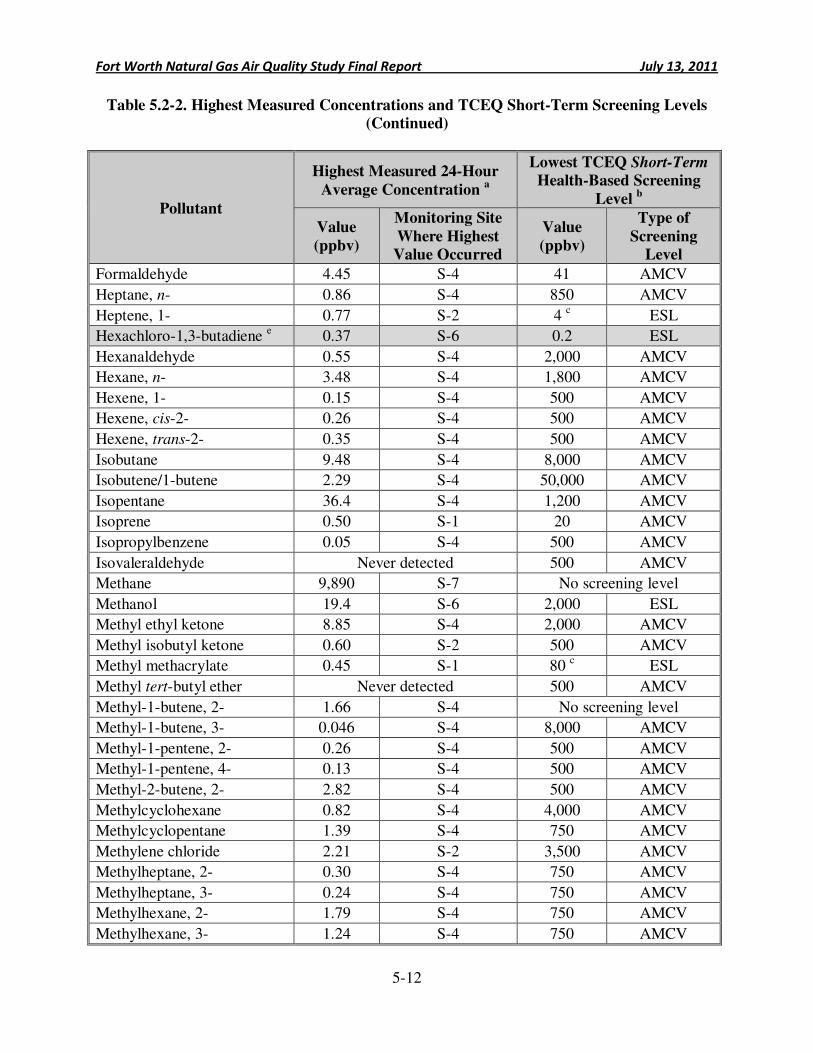
Fort Worth Natural Gas Air Quality Study Final Report July 13, 2011
5-12
Table 5.2-2. Highest Measured Concentrations and TCEQ Short-Term Screening Levels
(Continued)
Pollutant
Highest Measured 24-Hour
Average Concentration a
Lowest TCEQ Short-Term
Health-Based Screening
Level b
Value
(ppbv)
Monitoring Site
Where Highest
Value Occurred
Value
(ppbv)
Type of
Screening
Level
Formaldehyde 4.45 S-4 41 AMCV
Heptane, n- 0.86 S-4 850 AMCV
Heptene, 1- 0.77 S-2 4 c ESL
Hexachloro-1,3-butadiene e 0.37 S-6 0.2 ESL
Hexanaldehyde 0.55 S-4 2,000 AMCV
Hexane, n- 3.48 S-4 1,800 AMCV
Hexene, 1- 0.15 S-4 500 AMCV
Hexene, cis-2- 0.26 S-4 500 AMCV
Hexene, trans-2- 0.35 S-4 500 AMCV
Isobutane 9.48 S-4 8,000 AMCV
Isobutene/1-butene 2.29 S-4 50,000 AMCV
Isopentane 36.4 S-4 1,200 AMCV
Isoprene 0.50 S-1 20 AMCV
Isopropylbenzene 0.05 S-4 500 AMCV
Isovaleraldehyde Never detected 500 AMCV
Methane 9,890 S-7 No screening level
Methanol 19.4 S-6 2,000 ESL
Methyl ethyl ketone 8.85 S-4 2,000 AMCV
Methyl isobutyl ketone 0.60 S-2 500 AMCV
Methyl methacrylate 0.45 S-1 80 c ESL
Methyl tert-butyl ether Never detected 500 AMCV
Methyl-1-butene, 2- 1.66 S-4 No screening level
Methyl-1-butene, 3- 0.046 S-4 8,000 AMCV
Methyl-1-pentene, 2- 0.26 S-4 500 AMCV
Methyl-1-pentene, 4- 0.13 S-4 500 AMCV
Methyl-2-butene, 2- 2.82 S-4 500 AMCV
Methylcyclohexane 0.82 S-4 4,000 AMCV
Methylcyclopentane 1.39 S-4 750 AMCV
Methylene chloride 2.21 S-2 3,500 AMCV
Methylheptane, 2- 0.30 S-4 750 AMCV
Methylheptane, 3- 0.24 S-4 750 AMCV
Methylhexane, 2- 1.79 S-4 750 AMCV
Methylhexane, 3- 1.24 S-4 750 AMCV
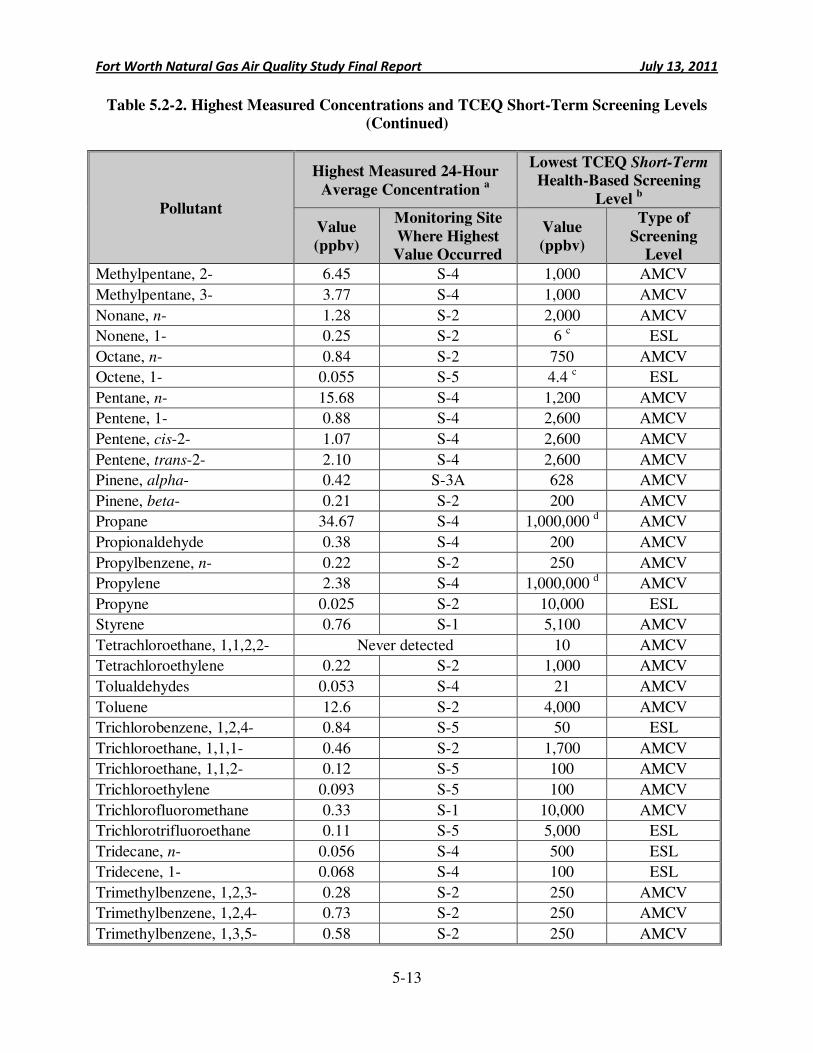
Fort Worth Natural Gas Air Quality Study Final Report July 13, 2011
5-13
Table 5.2-2. Highest Measured Concentrations and TCEQ Short-Term Screening Levels
(Continued)
Pollutant
Highest Measured 24-Hour
Average Concentration a
Lowest TCEQ Short-Term
Health-Based Screening
Level b
Value
(ppbv)
Monitoring Site
Where Highest
Value Occurred
Value
(ppbv)
Type of
Screening
Level
Methylpentane, 2- 6.45 S-4 1,000 AMCV
Methylpentane, 3- 3.77 S-4 1,000 AMCV
Nonane, n- 1.28 S-2 2,000 AMCV
Nonene, 1- 0.25 S-2 6 c ESL
Octane, n- 0.84 S-2 750 AMCV
Octene, 1- 0.055 S-5 4.4 c ESL
Pentane, n- 15.68 S-4 1,200 AMCV
Pentene, 1- 0.88 S-4 2,600 AMCV
Pentene, cis-2- 1.07 S-4 2,600 AMCV
Pentene, trans-2- 2.10 S-4 2,600 AMCV
Pinene, alpha- 0.42 S-3A 628 AMCV
Pinene, beta- 0.21 S-2 200 AMCV
Propane 34.67 S-4 1,000,000 d AMCV
Propionaldehyde 0.38 S-4 200 AMCV
Propylbenzene, n- 0.22 S-2 250 AMCV
Propylene 2.38 S-4 1,000,000 d AMCV
Propyne 0.025 S-2 10,000 ESL
Styrene 0.76 S-1 5,100 AMCV
Tetrachloroethane, 1,1,2,2- Never detected 10 AMCV
Tetrachloroethylene 0.22 S-2 1,000 AMCV
Tolualdehydes 0.053 S-4 21 AMCV
Toluene 12.6 S-2 4,000 AMCV
Trichlorobenzene, 1,2,4- 0.84 S-5 50 ESL
Trichloroethane, 1,1,1- 0.46 S-2 1,700 AMCV
Trichloroethane, 1,1,2- 0.12 S-5 100 AMCV
Trichloroethylene 0.093 S-5 100 AMCV
Trichlorofluoromethane 0.33 S-1 10,000 AMCV
Trichlorotrifluoroethane 0.11 S-5 5,000 ESL
Tridecane, n- 0.056 S-4 500 ESL
Tridecene, 1- 0.068 S-4 100 ESL
Trimethylbenzene, 1,2,3- 0.28 S-2 250 AMCV
Trimethylbenzene, 1,2,4- 0.73 S-2 250 AMCV
Trimethylbenzene, 1,3,5- 0.58 S-2 250 AMCV
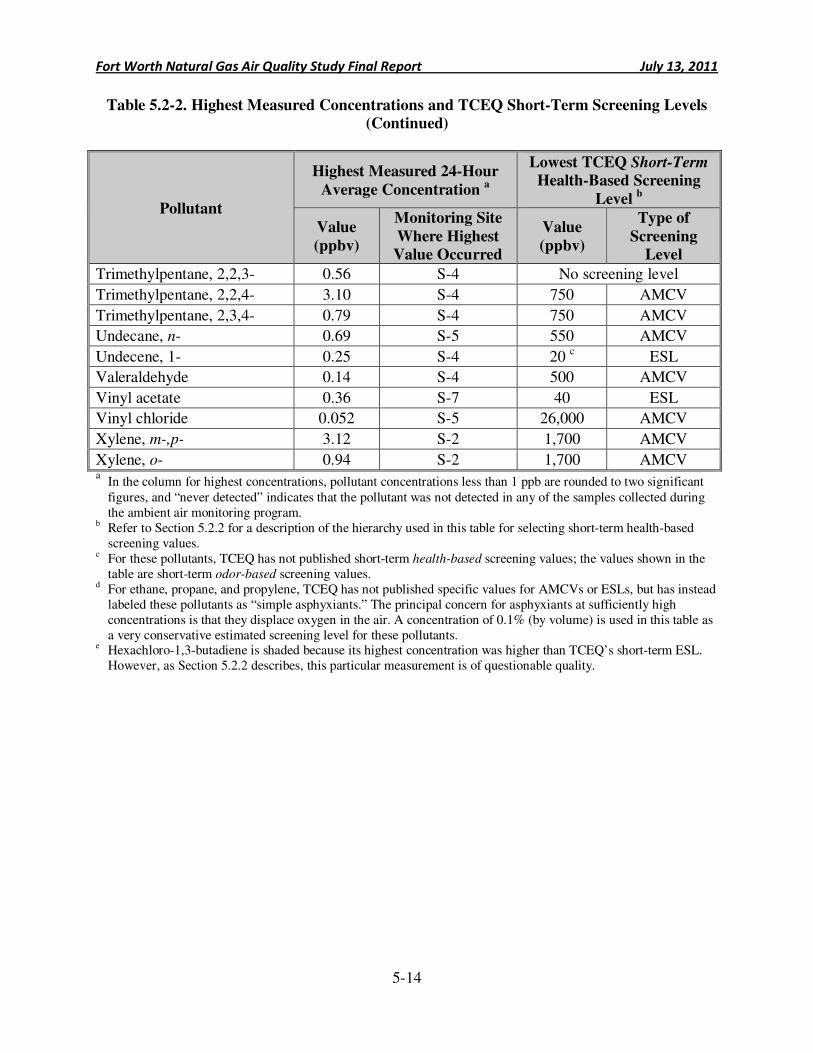
Fort Worth Natural Gas Air Quality Study Final Report July 13, 2011
5-14
Table 5.2-2. Highest Measured Concentrations and TCEQ Short-Term Screening Levels
(Continued)
Pollutant
Highest Measured 24-Hour
Average Concentration a
Lowest TCEQ Short-Term
Health-Based Screening
Level b
Value
(ppbv)
Monitoring Site
Where Highest
Value Occurred
Value
(ppbv)
Type of
Screening
Level
Trimethylpentane, 2,2,3- 0.56 S-4 No screening level
Trimethylpentane, 2,2,4- 3.10 S-4 750 AMCV
Trimethylpentane, 2,3,4- 0.79 S-4 750 AMCV
Undecane, n- 0.69 S-5 550 AMCV
Undecene, 1- 0.25 S-4 20 c ESL
Valeraldehyde 0.14 S-4 500 AMCV
Vinyl acetate 0.36 S-7 40 ESL
Vinyl chloride 0.052 S-5 26,000 AMCV
Xylene, m-,p- 3.12 S-2 1,700 AMCV
Xylene, o- 0.94 S-2 1,700 AMCV a
In the column for highest concentrations, pollutant concentrations less than 1 ppb are rounded to two significant figures, and “never detected” indicates that the pollutant was not detected in any of the samples collected during the ambient air monitoring program.
b Refer to Section 5.2.2 for a description of the hierarchy used in this table for selecting short-term health-based screening values.
c For these pollutants, TCEQ has not published short-term health-based screening values; the values shown in the table are short-term odor-based screening values.
d For ethane, propane, and propylene, TCEQ has not published specific values for AMCVs or ESLs, but has instead labeled these pollutants as “simple asphyxiants.” The principal concern for asphyxiants at sufficiently high concentrations is that they displace oxygen in the air. A concentration of 0.1% (by volume) is used in this table as a very conservative estimated screening level for these pollutants.
e Hexachloro-1,3-butadiene is shaded because its highest concentration was higher than TCEQ’s short-term ESL. However, as Section 5.2.2 describes, this particular measurement is of questionable quality.
Fort Worth Natural Gas Air Quality Study Final Report July 13, 2011
5-15
With one exception, every measurement made during the program was lower than TCEQ’s short-term health-based screening levels, suggesting that the pollution levels would not cause adverse health effects among exposed populations. As the exception, a single detection of hexachloro-1,3-butadiene exceeded TCEQ’s short-term health-based ESL. For the air sample collected at Site S-6 on October 7, 2010, TestAmerica™ reported a hexachloro-1,3-butadiene concentration of 0.369 ppbv, and TCEQ’s ESL is 0.2 ppbv. For further context on this issue, ERG plotted the results of all 129 ambient air monitoring measurements for this pollutant (Figure 5.2-1). The following important observations are made about these measurements:
• The highest detected concentration (0.369 ppbv) exceeded the short-term ESL (0.2 ppbv) by a relatively small margin. This was the only sample with a measured concentration higher than the ESL.
• The highest measurement is of questionable quality. When originally reporting this sample result, TestAmerica™ noted two data quality issues. First, the analytical report indicates that the measured concentration (0.369 ppb) is higher than the method detection limit, but lower than the laboratory’s reporting limit. The report further indicated that “…the user of this data should be aware that this data is of limited reliability.” Second, the testing laboratory reported that the sample was analyzed after the recommended holding time for this particular monitoring method had passed, which introduces additional uncertainty into the result.
• The 128 other measurements (see Figure 5.2-1), including every measurement at the two monitoring stations near the highest natural gas production activity, were all lower than the ESL; and 125 of these measurements were non-detects.
• For further context, ERG also considered the outputs from the dispersion modeling analysis, including those based on well pads found to have the highest emission rates throughout Fort Worth. The comparison (see Section 5.3.1) showed that the highest outputs predicted by the model were considerably lower than the average concentrations of hexachloro-1,3-butadiene observed during the ambient air monitoring data.
The most logical and consistent explanation for the above observations is that the single
hexachloro-1,3-butadiene concentration above TCEQ’s ESL is not a reliable measurement.
In summary, for every pollutant considered in this program, ERG concludes that the ambient air monitoring data provide no evidence of 24-hour average concentrations reaching levels of health concern for acute exposures. Few pollutants shown in Table 5.2-2 do not have published short-term health-based screening levels. However, with the exception of methane, these pollutants were detected at relatively low quantities. The measured methane concentrations ranked the highest of all pollutants considered, which was not a surprising result considering that measurements occurred in close proximity to active well pads. Though elevated, these methane concentrations did not approach values that would present a physical hazard (such as the lower explosive limit of 5%, or 50,000,000 ppbv) or an asphyxiation hazard, which are the two safety and health endpoints most frequently evaluated for this pollutant. A recent literature review
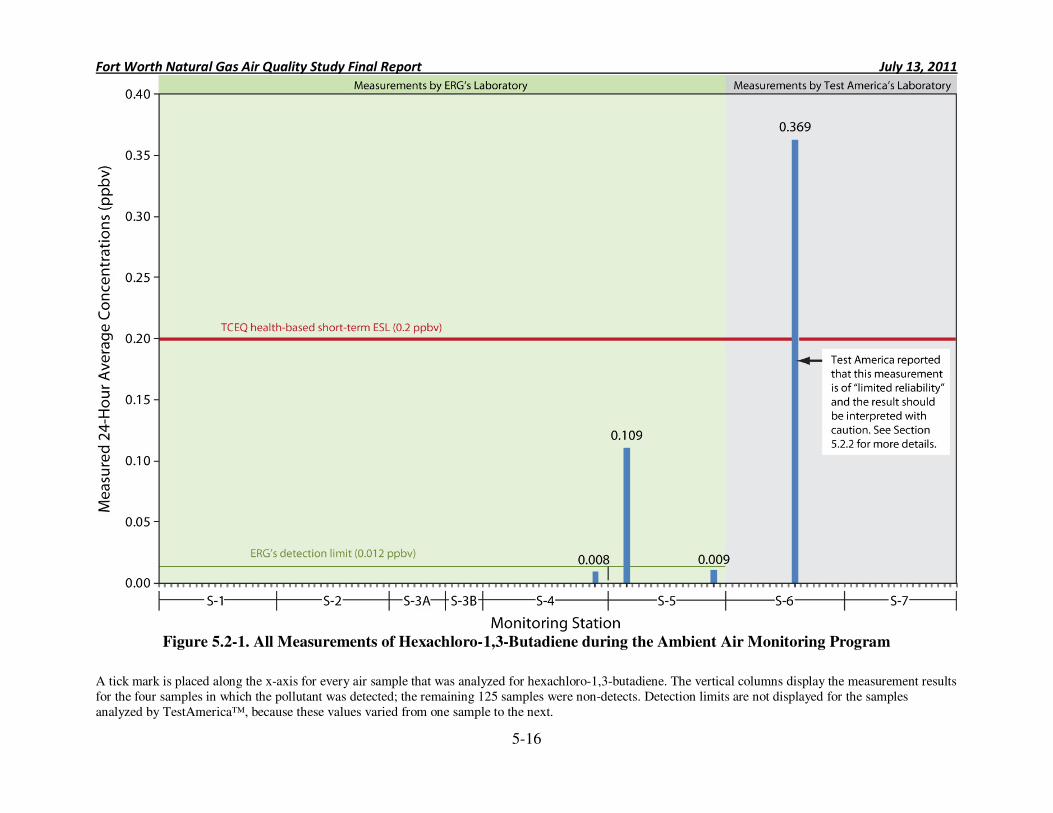
Fort Worth Natural Gas Air Quality Study Final Report July 13, 2011
5-16
Figure 5.2-1. All Measurements of Hexachloro-1,3-Butadiene during the Ambient Air Monitoring Program
A tick mark is placed along the x-axis for every air sample that was analyzed for hexachloro-1,3-butadiene. The vertical columns display the measurement results for the four samples in which the pollutant was detected; the remaining 125 samples were non-detects. Detection limits are not displayed for the samples analyzed by TestAmerica™, because these values varied from one sample to the next.
Fort Worth Natural Gas Air Quality Study Final Report July 13, 2011
5-17
documented in conference proceedings concluded that methane exhibits “no systemic toxicity” and supported the approach of assessing methane exposures by focusing on asphyxiation hazards.9 Similarly, the Canadian Centre for Occupational Health and Safety has concluded that “harmful effects are not expected following long-term exposure” to methane, though this same finding acknowledges a lack of information about underlying human studies.10 ERG conducted a supplemental literature search, but found no studies documenting advrse health effects in humans following long-term inhalation exposures to airborne methane. 5.2.3 Health Evaluation for Program-Average Concentrations
During this study, ambient air samples were collected every three days for two months. To assess the implications of longer-term exposures to the measured air pollution levels, ERG calculated average (i.e., arithmetic mean) concentrations for the individual pollutants at the eight different sites. These average concentrations represent two months of potential exposures, and were compared to longer-term health-based screening levels. The following paragraphs discuss this analysis.
When calculating average concentrations from individual sampling results, a decision must be made about how to handle non-detect observations, which are valid observations suggesting that a pollutant’s actual concentration in a sample had a value between zero and the detection limit. An approach commonly used when conducting health screening evaluations is to replace non-detects with a surrogate concentration of one-half the detection limit, and that approach is applied here. In cases where pollutants were detected in a large fraction of a site’s valid air samples, the approach used for replacing non-detects has little bearing on the magnitude of the calculated average concentrations, and the program-averages for the frequently detected pollutants are known to a high degree of confidence. On the other hand, for pollutants rarely detected in the air samples, there is considerable uncertainty associated with calculating the actual average concentrations—an observation revisited later in this section. Nonetheless, for sake of completeness, this analysis presents average concentrations for all pollutants detected in at least one sample.
For every pollutant detected in the ambient air monitoring program, ERG compared the highest program-average concentrations to TCEQ’s corresponding long-term health-based screening levels. Table 5.2-3 lists the highest program-average concentration for each pollutant, the location where this value was observed, and the TCEQ screening level. For this evaluation, the hierarchy for selecting screening levels follows: If a pollutant has a long-term health-based AMCV, that value is used in Table 5.2-3 even if a different ESL is available; this preference again reflects the fact that TCEQ specifically derived AMCVs for evaluating ambient air monitoring data. Next, for pollutants that do not have AMCVs, the table displays the long-term health-based ESLs; and when no AMCV or ESL has been published for the pollutant, then “no screening level” appears in the table. Shading is used in the table to identify pollutants that had program-average concentrations higher than the TCEQ long-term screening level.
Key Point: Program-Average Air Pollution Measurements At the eight monitoring stations considered in this study, program-average concentrations for all but one pollutant were below levels of health concern. As the one exception, the program-average concentration of hexachloro-1,3-butadiene was higher than the TCEQ long-term effects screening level. However, this result is driven by a single unreliable measurement and is therefore of limited significance.
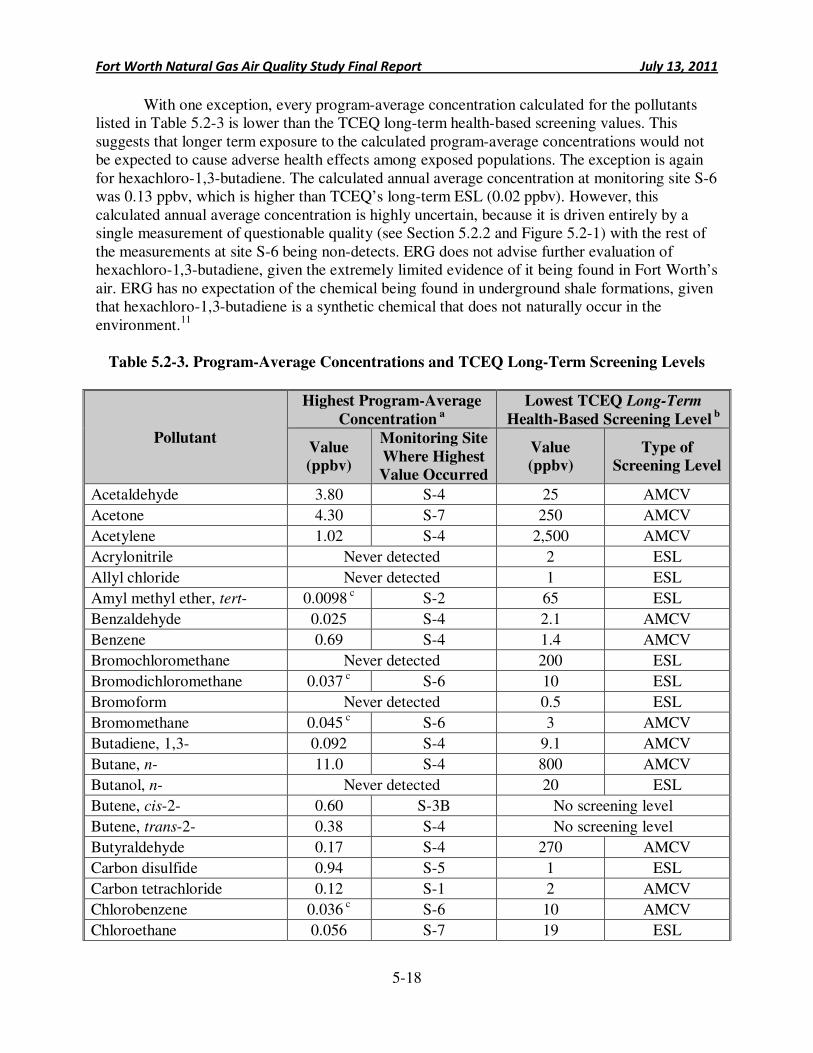
Fort Worth Natural Gas Air Quality Study Final Report July 13, 2011
5-18
With one exception, every program-average concentration calculated for the pollutants listed in Table 5.2-3 is lower than the TCEQ long-term health-based screening values. This suggests that longer term exposure to the calculated program-average concentrations would not be expected to cause adverse health effects among exposed populations. The exception is again for hexachloro-1,3-butadiene. The calculated annual average concentration at monitoring site S-6 was 0.13 ppbv, which is higher than TCEQ’s long-term ESL (0.02 ppbv). However, this calculated annual average concentration is highly uncertain, because it is driven entirely by a single measurement of questionable quality (see Section 5.2.2 and Figure 5.2-1) with the rest of the measurements at site S-6 being non-detects. ERG does not advise further evaluation of hexachloro-1,3-butadiene, given the extremely limited evidence of it being found in Fort Worth’s air. ERG has no expectation of the chemical being found in underground shale formations, given that hexachloro-1,3-butadiene is a synthetic chemical that does not naturally occur in the environment.11
Table 5.2-3. Program-Average Concentrations and TCEQ Long-Term Screening Levels
Pollutant
Highest Program-Average
Concentration a
Lowest TCEQ Long-Term
Health-Based Screening Level b
Value
(ppbv)
Monitoring Site
Where Highest
Value Occurred
Value
(ppbv)
Type of
Screening Level
Acetaldehyde 3.80 S-4 25 AMCV
Acetone 4.30 S-7 250 AMCV
Acetylene 1.02 S-4 2,500 AMCV
Acrylonitrile Never detected 2 ESL
Allyl chloride Never detected 1 ESL
Amyl methyl ether, tert- 0.0098 c S-2 65 ESL
Benzaldehyde 0.025 S-4 2.1 AMCV
Benzene 0.69 S-4 1.4 AMCV
Bromochloromethane Never detected 200 ESL
Bromodichloromethane 0.037 c S-6 10 ESL
Bromoform Never detected 0.5 ESL
Bromomethane 0.045 c S-6 3 AMCV
Butadiene, 1,3- 0.092 S-4 9.1 AMCV
Butane, n- 11.0 S-4 800 AMCV
Butanol, n- Never detected 20 ESL
Butene, cis-2- 0.60 S-3B No screening level
Butene, trans-2- 0.38 S-4 No screening level
Butyraldehyde 0.17 S-4 270 AMCV
Carbon disulfide 0.94 S-5 1 ESL
Carbon tetrachloride 0.12 S-1 2 AMCV
Chlorobenzene 0.036 c S-6 10 AMCV
Chloroethane 0.056 S-7 19 ESL
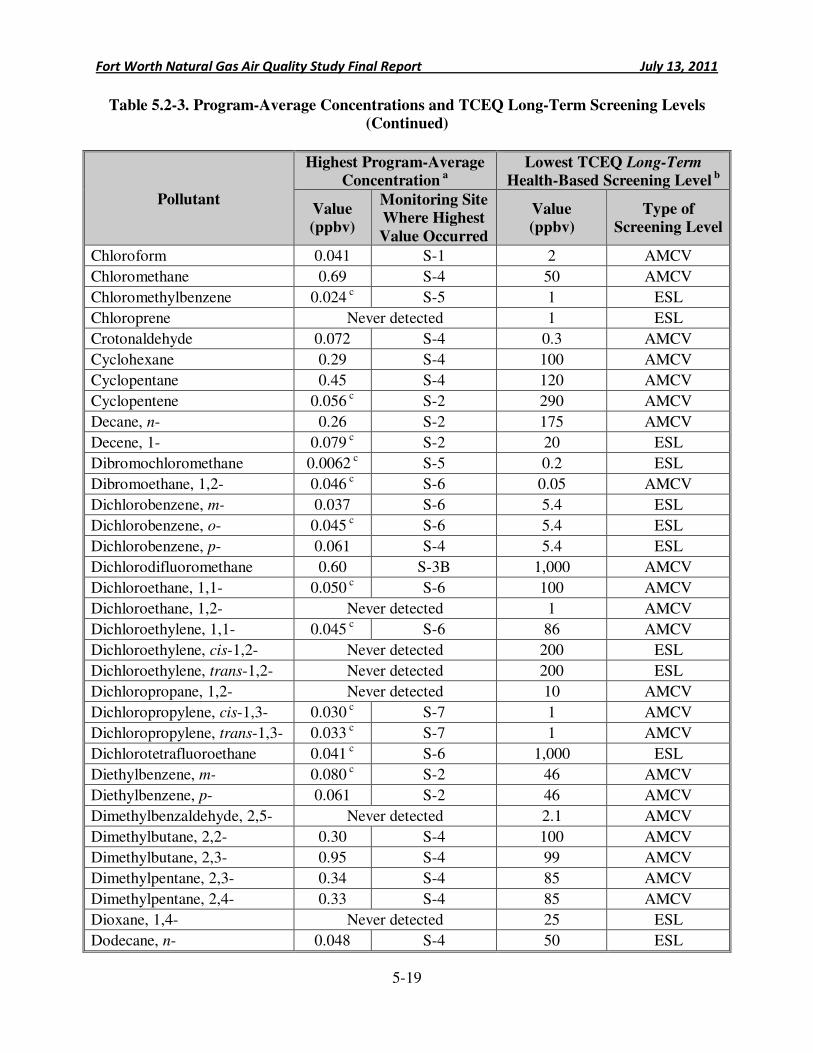
Fort Worth Natural Gas Air Quality Study Final Report July 13, 2011
5-19
Table 5.2-3. Program-Average Concentrations and TCEQ Long-Term Screening Levels
(Continued)
Pollutant
Highest Program-Average
Concentration a
Lowest TCEQ Long-Term
Health-Based Screening Level b
Value
(ppbv)
Monitoring Site
Where Highest
Value Occurred
Value
(ppbv)
Type of
Screening Level
Chloroform 0.041 S-1 2 AMCV
Chloromethane 0.69 S-4 50 AMCV
Chloromethylbenzene 0.024 c S-5 1 ESL
Chloroprene Never detected 1 ESL
Crotonaldehyde 0.072 S-4 0.3 AMCV
Cyclohexane 0.29 S-4 100 AMCV
Cyclopentane 0.45 S-4 120 AMCV
Cyclopentene 0.056 c S-2 290 AMCV
Decane, n- 0.26 S-2 175 AMCV
Decene, 1- 0.079 c S-2 20 ESL
Dibromochloromethane 0.0062 c S-5 0.2 ESL
Dibromoethane, 1,2- 0.046 c S-6 0.05 AMCV
Dichlorobenzene, m- 0.037 S-6 5.4 ESL
Dichlorobenzene, o- 0.045 c S-6 5.4 ESL
Dichlorobenzene, p- 0.061 S-4 5.4 ESL
Dichlorodifluoromethane 0.60 S-3B 1,000 AMCV
Dichloroethane, 1,1- 0.050 c S-6 100 AMCV
Dichloroethane, 1,2- Never detected 1 AMCV
Dichloroethylene, 1,1- 0.045 c S-6 86 AMCV
Dichloroethylene, cis-1,2- Never detected 200 ESL
Dichloroethylene, trans-1,2- Never detected 200 ESL
Dichloropropane, 1,2- Never detected 10 AMCV
Dichloropropylene, cis-1,3- 0.030 c S-7 1 AMCV
Dichloropropylene, trans-1,3- 0.033 c S-7 1 AMCV
Dichlorotetrafluoroethane 0.041 c S-6 1,000 ESL
Diethylbenzene, m- 0.080 c S-2 46 AMCV
Diethylbenzene, p- 0.061 S-2 46 AMCV
Dimethylbenzaldehyde, 2,5- Never detected 2.1 AMCV
Dimethylbutane, 2,2- 0.30 S-4 100 AMCV
Dimethylbutane, 2,3- 0.95 S-4 99 AMCV
Dimethylpentane, 2,3- 0.34 S-4 85 AMCV
Dimethylpentane, 2,4- 0.33 S-4 85 AMCV
Dioxane, 1,4- Never detected 25 ESL
Dodecane, n- 0.048 S-4 50 ESL
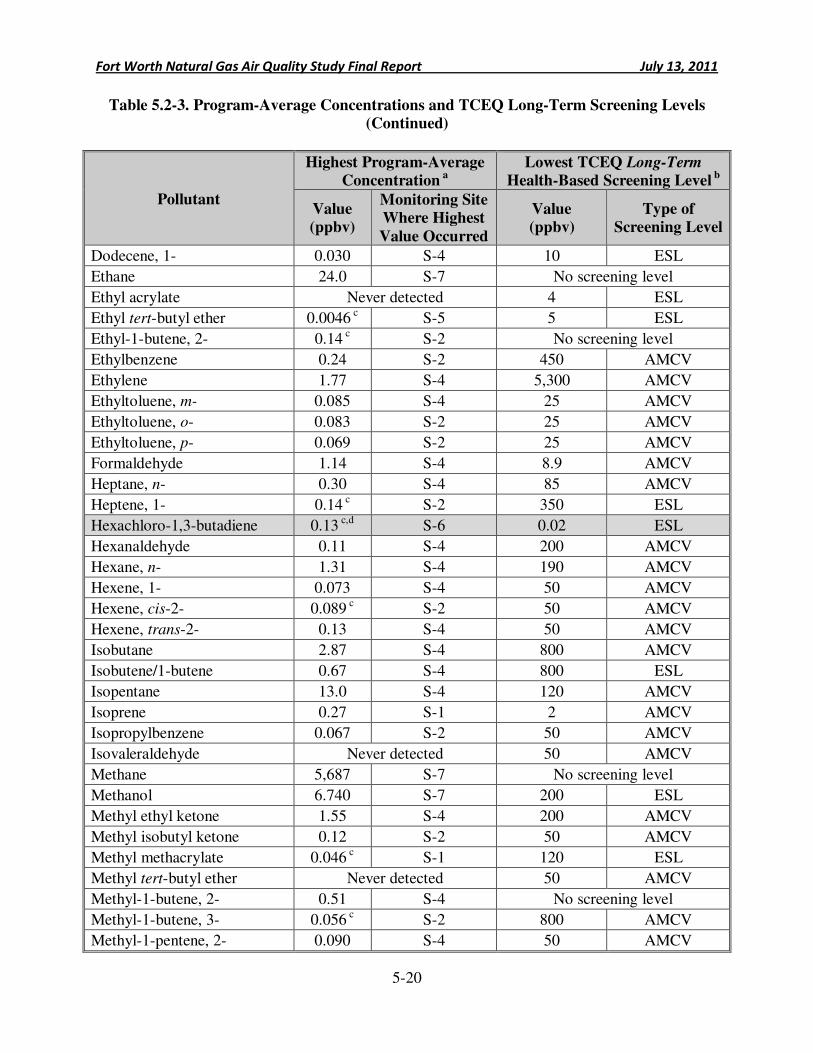
Fort Worth Natural Gas Air Quality Study Final Report July 13, 2011
5-20
Table 5.2-3. Program-Average Concentrations and TCEQ Long-Term Screening Levels
(Continued)
Pollutant
Highest Program-Average
Concentration a
Lowest TCEQ Long-Term
Health-Based Screening Level b
Value
(ppbv)
Monitoring Site
Where Highest
Value Occurred
Value
(ppbv)
Type of
Screening Level
Dodecene, 1- 0.030 S-4 10 ESL
Ethane 24.0 S-7 No screening level
Ethyl acrylate Never detected 4 ESL
Ethyl tert-butyl ether 0.0046 c S-5 5 ESL
Ethyl-1-butene, 2- 0.14 c S-2 No screening level
Ethylbenzene 0.24 S-2 450 AMCV
Ethylene 1.77 S-4 5,300 AMCV
Ethyltoluene, m- 0.085 S-4 25 AMCV
Ethyltoluene, o- 0.083 S-2 25 AMCV
Ethyltoluene, p- 0.069 S-2 25 AMCV
Formaldehyde 1.14 S-4 8.9 AMCV
Heptane, n- 0.30 S-4 85 AMCV
Heptene, 1- 0.14 c S-2 350 ESL
Hexachloro-1,3-butadiene 0.13 c,d S-6 0.02 ESL
Hexanaldehyde 0.11 S-4 200 AMCV
Hexane, n- 1.31 S-4 190 AMCV
Hexene, 1- 0.073 S-4 50 AMCV
Hexene, cis-2- 0.089 c S-2 50 AMCV
Hexene, trans-2- 0.13 S-4 50 AMCV
Isobutane 2.87 S-4 800 AMCV
Isobutene/1-butene 0.67 S-4 800 ESL
Isopentane 13.0 S-4 120 AMCV
Isoprene 0.27 S-1 2 AMCV
Isopropylbenzene 0.067 S-2 50 AMCV
Isovaleraldehyde Never detected 50 AMCV
Methane 5,687 S-7 No screening level
Methanol 6.740 S-7 200 ESL
Methyl ethyl ketone 1.55 S-4 200 AMCV
Methyl isobutyl ketone 0.12 S-2 50 AMCV
Methyl methacrylate 0.046 c S-1 120 ESL
Methyl tert-butyl ether Never detected 50 AMCV
Methyl-1-butene, 2- 0.51 S-4 No screening level
Methyl-1-butene, 3- 0.056 c S-2 800 AMCV
Methyl-1-pentene, 2- 0.090 S-4 50 AMCV
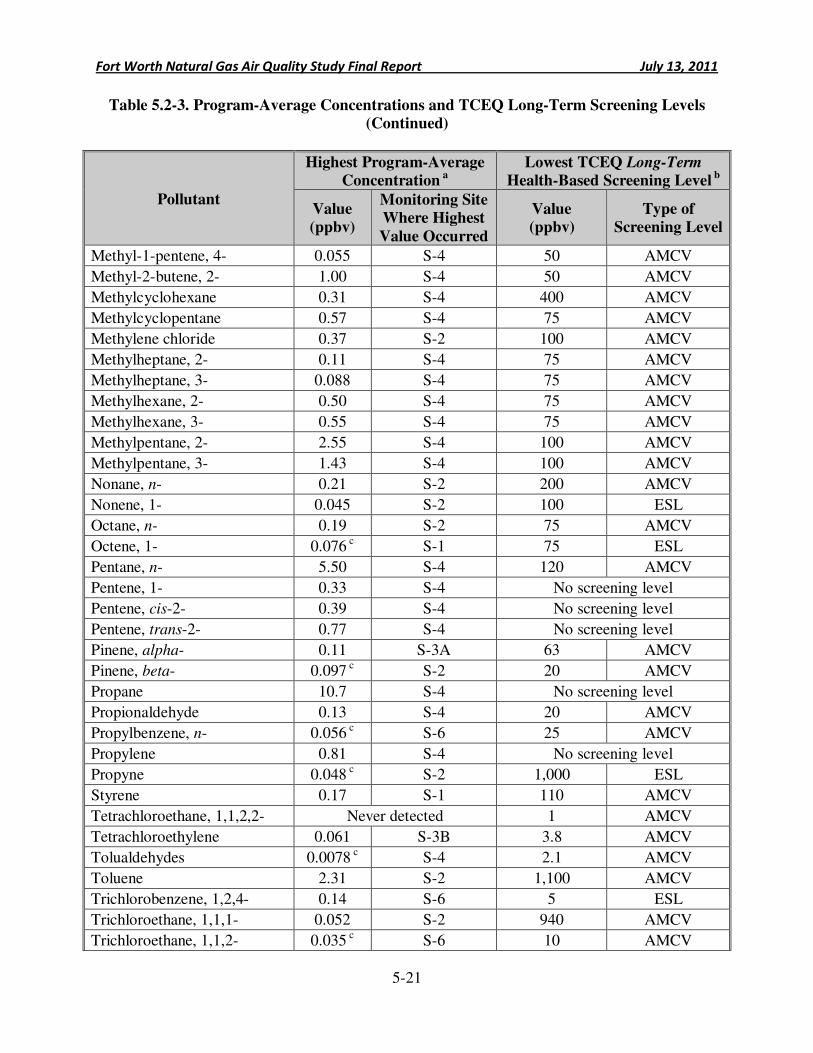
Fort Worth Natural Gas Air Quality Study Final Report July 13, 2011
5-21
Table 5.2-3. Program-Average Concentrations and TCEQ Long-Term Screening Levels
(Continued)
Pollutant
Highest Program-Average
Concentration a
Lowest TCEQ Long-Term
Health-Based Screening Level b
Value
(ppbv)
Monitoring Site
Where Highest
Value Occurred
Value
(ppbv)
Type of
Screening Level
Methyl-1-pentene, 4- 0.055 S-4 50 AMCV
Methyl-2-butene, 2- 1.00 S-4 50 AMCV
Methylcyclohexane 0.31 S-4 400 AMCV
Methylcyclopentane 0.57 S-4 75 AMCV
Methylene chloride 0.37 S-2 100 AMCV
Methylheptane, 2- 0.11 S-4 75 AMCV
Methylheptane, 3- 0.088 S-4 75 AMCV
Methylhexane, 2- 0.50 S-4 75 AMCV
Methylhexane, 3- 0.55 S-4 75 AMCV
Methylpentane, 2- 2.55 S-4 100 AMCV
Methylpentane, 3- 1.43 S-4 100 AMCV
Nonane, n- 0.21 S-2 200 AMCV
Nonene, 1- 0.045 S-2 100 ESL
Octane, n- 0.19 S-2 75 AMCV
Octene, 1- 0.076 c S-1 75 ESL
Pentane, n- 5.50 S-4 120 AMCV
Pentene, 1- 0.33 S-4 No screening level
Pentene, cis-2- 0.39 S-4 No screening level
Pentene, trans-2- 0.77 S-4 No screening level
Pinene, alpha- 0.11 S-3A 63 AMCV
Pinene, beta- 0.097 c S-2 20 AMCV
Propane 10.7 S-4 No screening level
Propionaldehyde 0.13 S-4 20 AMCV
Propylbenzene, n- 0.056 c S-6 25 AMCV
Propylene 0.81 S-4 No screening level
Propyne 0.048 c S-2 1,000 ESL
Styrene 0.17 S-1 110 AMCV
Tetrachloroethane, 1,1,2,2- Never detected 1 AMCV
Tetrachloroethylene 0.061 S-3B 3.8 AMCV
Tolualdehydes 0.0078 c S-4 2.1 AMCV
Toluene 2.31 S-2 1,100 AMCV
Trichlorobenzene, 1,2,4- 0.14 S-6 5 ESL
Trichloroethane, 1,1,1- 0.052 S-2 940 AMCV
Trichloroethane, 1,1,2- 0.035 c S-6 10 AMCV
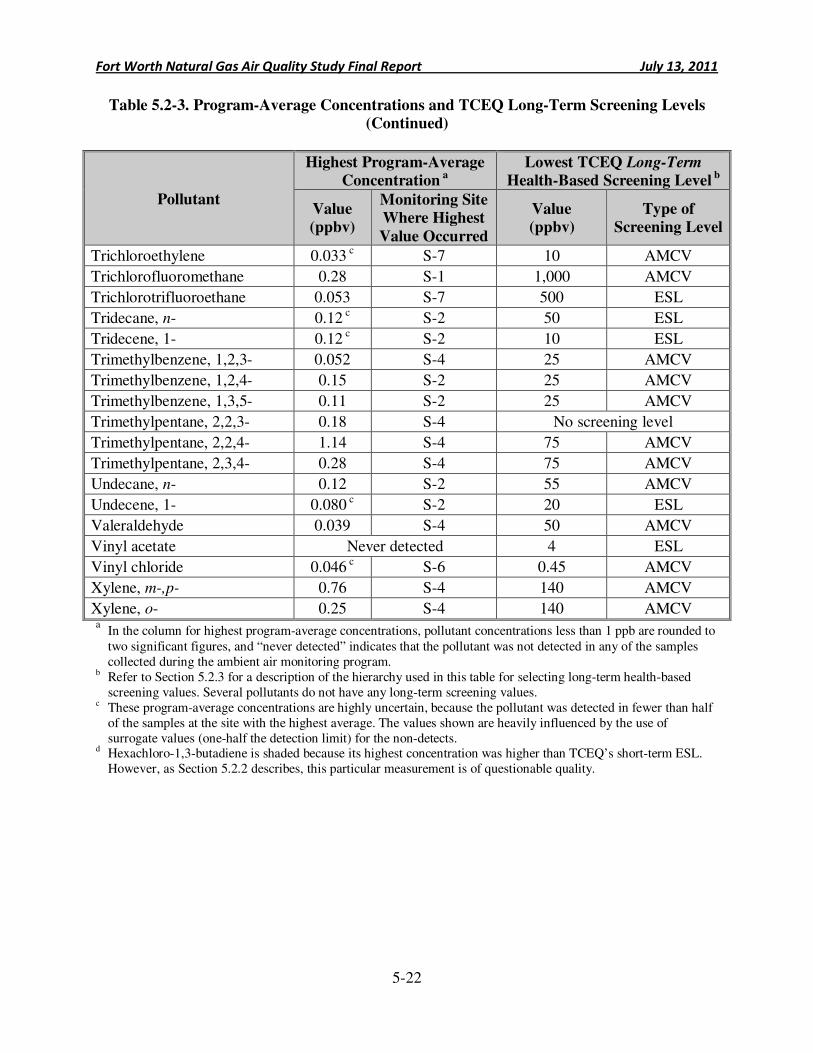
Fort Worth Natural Gas Air Quality Study Final Report July 13, 2011
5-22
Table 5.2-3. Program-Average Concentrations and TCEQ Long-Term Screening Levels
(Continued)
Pollutant
Highest Program-Average
Concentration a
Lowest TCEQ Long-Term
Health-Based Screening Level b
Value
(ppbv)
Monitoring Site
Where Highest
Value Occurred
Value
(ppbv)
Type of
Screening Level
Trichloroethylene 0.033 c S-7 10 AMCV
Trichlorofluoromethane 0.28 S-1 1,000 AMCV
Trichlorotrifluoroethane 0.053 S-7 500 ESL
Tridecane, n- 0.12 c S-2 50 ESL
Tridecene, 1- 0.12 c S-2 10 ESL
Trimethylbenzene, 1,2,3- 0.052 S-4 25 AMCV
Trimethylbenzene, 1,2,4- 0.15 S-2 25 AMCV
Trimethylbenzene, 1,3,5- 0.11 S-2 25 AMCV
Trimethylpentane, 2,2,3- 0.18 S-4 No screening level
Trimethylpentane, 2,2,4- 1.14 S-4 75 AMCV
Trimethylpentane, 2,3,4- 0.28 S-4 75 AMCV
Undecane, n- 0.12 S-2 55 AMCV
Undecene, 1- 0.080 c S-2 20 ESL
Valeraldehyde 0.039 S-4 50 AMCV
Vinyl acetate Never detected 4 ESL
Vinyl chloride 0.046 c S-6 0.45 AMCV
Xylene, m-,p- 0.76 S-4 140 AMCV
Xylene, o- 0.25 S-4 140 AMCV a
In the column for highest program-average concentrations, pollutant concentrations less than 1 ppb are rounded to two significant figures, and “never detected” indicates that the pollutant was not detected in any of the samples collected during the ambient air monitoring program.
b Refer to Section 5.2.3 for a description of the hierarchy used in this table for selecting long-term health-based screening values. Several pollutants do not have any long-term screening values.
c These program-average concentrations are highly uncertain, because the pollutant was detected in fewer than half of the samples at the site with the highest average. The values shown are heavily influenced by the use of surrogate values (one-half the detection limit) for the non-detects.
d Hexachloro-1,3-butadiene is shaded because its highest concentration was higher than TCEQ’s short-term ESL. However, as Section 5.2.2 describes, this particular measurement is of questionable quality.
Fort Worth Natural Gas Air Quality Study Final Report July 13, 2011
5-23
Key Point: Air Monitoring Data Overall, the short-term and long-term air pollution levels measured during the monitoring program did not reach levels of public health concern. However, this finding pertains only to the pollutants considered in this study and the locations where measurements were made.
5.2.4 Measured Concentrations: Main Findings, Limitations, and Uncertainties
The ambient air monitoring program was
designed to provide insights into the nature and magnitude of air pollution levels at eight locations in Fort Worth. The more than 15,000 individual measurements of outdoor air pollution levels allowed for a health evaluation that considered both peak and average air pollution levels. The program found no evidence of air pollution reaching levels of health concern at these eight monitoring locations. However, the ambient air monitoring program has some inherent limitations that should be acknowledged:
• The analyses throughout Section 5.2 are based strictly on the air samples that ERG collected at eight locations in Fort Worth over a two-month time frame. The data should not be used to make inferences about air quality during times when, and at locations where, samples were not collected. This does not mean that this study failed to meet its stated goals, because a dispersion modeling analysis was conducted to help characterize potential air pollution levels at locations that were not sampled. Thus, the interpretations of the modeling data (see Section 5.3) help address this inherent limitation of the monitoring program.
• The ambient air monitoring program considered nearly 150 air pollutants, including dozens that were also detected during point source testing. The coverage of the monitoring data is therefore very extensive, but not necessarily comprehensive. This program did not consider the complete range of air pollutants that might be emitted from natural gas sites. For example, the monitoring program did not measure acrolein, which the modeling (see Section 5.3) identified as a pollutant of potential concern for certain sites. Therefore, this study’s findings apply only to the pollutants considered in the ambient air monitoring program and point source testing program, and should not be assumed to apply to a broader range of pollutants.
5.3 Interpretation of Dispersion Modeling Data
The dispersion modeling analysis conducted by ERG is an important complement to the ambient air monitoring data presented in Section 5.2. While the ambient air monitoring data has the advantage of directly measuring air pollution levels that residents might breathe, those data do not quantify how much different emission sources contribute to the measured concentrations. Further, the monitoring data do not characterize air quality for the entire range of well pad configurations. Dispersion modeling analysis was used to help fill these gaps. These models have the advantage of quantifying the incremental air quality impacts that can be attributed to natural gas exploration and production activity, based on the measured emission rates from the point source testing program. Section 4 of this report describes in detail the scope of the dispersion
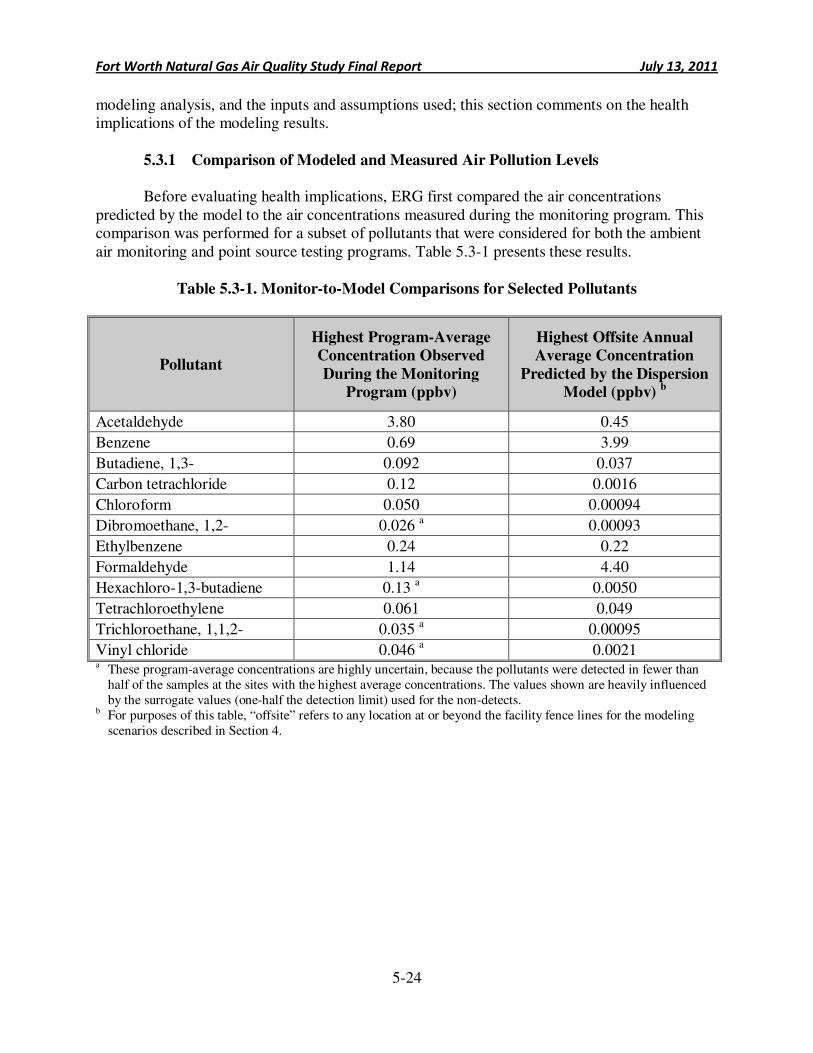
Fort Worth Natural Gas Air Quality Study Final Report July 13, 2011
5-24
modeling analysis, and the inputs and assumptions used; this section comments on the health implications of the modeling results.
5.3.1 Comparison of Modeled and Measured Air Pollution Levels
Before evaluating health implications, ERG first compared the air concentrations
predicted by the model to the air concentrations measured during the monitoring program. This comparison was performed for a subset of pollutants that were considered for both the ambient air monitoring and point source testing programs. Table 5.3-1 presents these results.
Table 5.3-1. Monitor-to-Model Comparisons for Selected Pollutants
Pollutant
Highest Program-Average
Concentration Observed
During the Monitoring
Program (ppbv)
Highest Offsite Annual
Average Concentration
Predicted by the Dispersion
Model (ppbv) b
Acetaldehyde 3.80 0.45
Benzene 0.69 3.99
Butadiene, 1,3- 0.092 0.037
Carbon tetrachloride 0.12 0.0016
Chloroform 0.050 0.00094
Dibromoethane, 1,2- 0.026 a 0.00093
Ethylbenzene 0.24 0.22
Formaldehyde 1.14 4.40
Hexachloro-1,3-butadiene 0.13 a 0.0050
Tetrachloroethylene 0.061 0.049
Trichloroethane, 1,1,2- 0.035 a 0.00095
Vinyl chloride 0.046 a 0.0021 a These program-average concentrations are highly uncertain, because the pollutants were detected in fewer than
half of the samples at the sites with the highest average concentrations. The values shown are heavily influenced by the surrogate values (one-half the detection limit) used for the non-detects.
b For purposes of this table, “offsite” refers to any location at or beyond the facility fence lines for the modeling scenarios described in Section 4.
Fort Worth Natural Gas Air Quality Study Final Report July 13, 2011
5-25
Key Point: Short-Term Modeling A model estimated how emissions from certain well pad and compressor station configurations affect local air quality. Of all pollutants considered, only acrolein, benzene, and formaldehyde had estimated 1-hour average concentrations greater than TCEQ’s short-term ESLs. The model output suggested that estimated methylene chloride concentrations might also exceed health-based screening levels, but this was based on a suspect measurement and is not a robust finding.
For many pollutants in the table, the highest program-average concentration observed during the monitoring program was considerably higher than the highest offsite annual average concentration predicted by the dispersion model—a trend that was particularly evident for the halogenated hydrocarbons. For purposes of this analysis, “offsite” refers to any location at or beyond the facility fence lines. Considering that the specific modeling results shown in Table 5.3-1 were based on the highest emission rates measured during the point source testing program, the substantially lower modeling results suggest that well pad and compressor stations emissions are not major contributors to the measured concentrations found during the ambient air monitoring program. In other words, even the highest emissions from well pads and compressor stations would not be expected to account for the levels measured in the ambient air for this subset of pollutants. ERG also considered the possibility that the modeling results might be biased low and therefore underestimating air quality impacts; however, this explanation does not appear to be likely, considering the fact that the modeling is based on the highest emission rates observed across all well pads that were tested. For the reasons stated above, ERG concludes that trace levels of halogenated hydrocarbons detected during the ambient air monitoring program cannot be attributed primarily to emissions from the natural gas exploration and production activity.
Conversely, for other pollutants listed in Table 5.3-1, the highest annual average concentration predicted by the modeling analysis was considerably higher than the highest program-average concentration calculated from the air sampling results. For benzene, the modeled concentration was nearly 6 times greater than the highest measured value; for formaldehyde, the measured and modeled values differed by nearly a factor of 4. For these two pollutants, the differences between the measured and modeled results most likely reflect the different scenarios portrayed by these data points. Specifically, the modeled values are estimates of the highest offsite annual average concentrations at the well pad or compressor station with the highest emissions—or the highest concentrations at or beyond the facility fence lines. On the other hand, the measured concentrations were intended to reflect some of the highest site-related air quality impacts; however, the monitoring generally did not occur at fence line locations, and the point source testing revealed that the ambient air monitoring stations were not close to some of the highest-emitting well pads. This discrepancy most likely explains why, for these two pollutants, the modeled concentrations were considerably higher than the measured ones.
5.3.2 Health Evaluation for Modeled 1-Hour Average Concentrations
As Section 4 describes, the dispersion
modeling analysis was conducted for four different hypothetical scenarios, including some anticipated to represent the worst-case conditions for offsite air quality impacts. As noted previously, “offsite” in this section refers to any receptor location at or beyond the facility fence lines for the four modeling scenarios. Modeling was conducted for nearly 90 pollutants, depending on the scenario. Potential short-term air quality impacts are assessed here using the highest 1-hour average
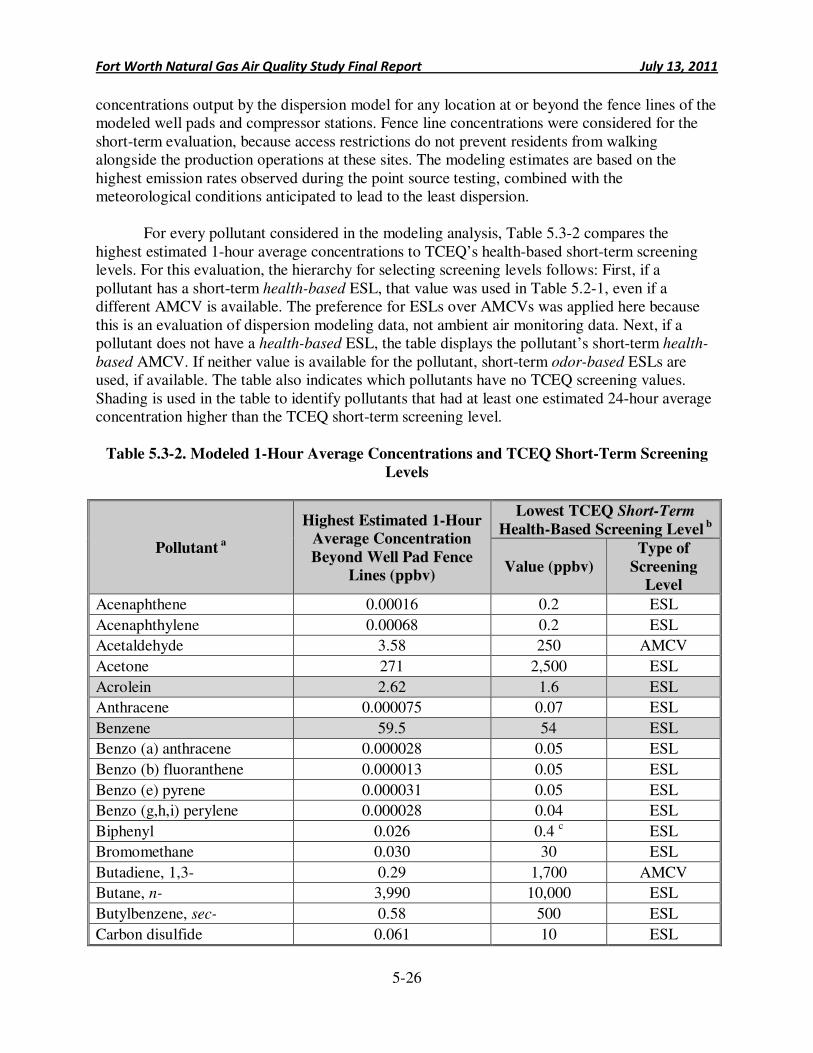
Fort Worth Natural Gas Air Quality Study Final Report July 13, 2011
5-26
concentrations output by the dispersion model for any location at or beyond the fence lines of the modeled well pads and compressor stations. Fence line concentrations were considered for the short-term evaluation, because access restrictions do not prevent residents from walking alongside the production operations at these sites. The modeling estimates are based on the highest emission rates observed during the point source testing, combined with the meteorological conditions anticipated to lead to the least dispersion.
For every pollutant considered in the modeling analysis, Table 5.3-2 compares the
highest estimated 1-hour average concentrations to TCEQ’s health-based short-term screening levels. For this evaluation, the hierarchy for selecting screening levels follows: First, if a pollutant has a short-term health-based ESL, that value was used in Table 5.2-1, even if a different AMCV is available. The preference for ESLs over AMCVs was applied here because this is an evaluation of dispersion modeling data, not ambient air monitoring data. Next, if a pollutant does not have a health-based ESL, the table displays the pollutant’s short-term health-
based AMCV. If neither value is available for the pollutant, short-term odor-based ESLs are used, if available. The table also indicates which pollutants have no TCEQ screening values. Shading is used in the table to identify pollutants that had at least one estimated 24-hour average concentration higher than the TCEQ short-term screening level.
Table 5.3-2. Modeled 1-Hour Average Concentrations and TCEQ Short-Term Screening
Levels
Pollutant a
Highest Estimated 1-Hour
Average Concentration
Beyond Well Pad Fence
Lines (ppbv)
Lowest TCEQ Short-Term
Health-Based Screening Level b
Value (ppbv)
Type of
Screening
Level
Acenaphthene 0.00016 0.2 ESL
Acenaphthylene 0.00068 0.2 ESL
Acetaldehyde 3.58 250 AMCV
Acetone 271 2,500 ESL
Acrolein 2.62 1.6 ESL
Anthracene 0.000075 0.07 ESL
Benzene 59.5 54 ESL
Benzo (a) anthracene 0.000028 0.05 ESL
Benzo (b) fluoranthene 0.000013 0.05 ESL
Benzo (e) pyrene 0.000031 0.05 ESL
Benzo (g,h,i) perylene 0.000028 0.04 ESL
Biphenyl 0.026 0.4 c ESL
Bromomethane 0.030 30 ESL
Butadiene, 1,3- 0.29 1,700 AMCV
Butane, n- 3,990 10,000 ESL
Butylbenzene, sec- 0.58 500 ESL
Carbon disulfide 0.061 10 ESL
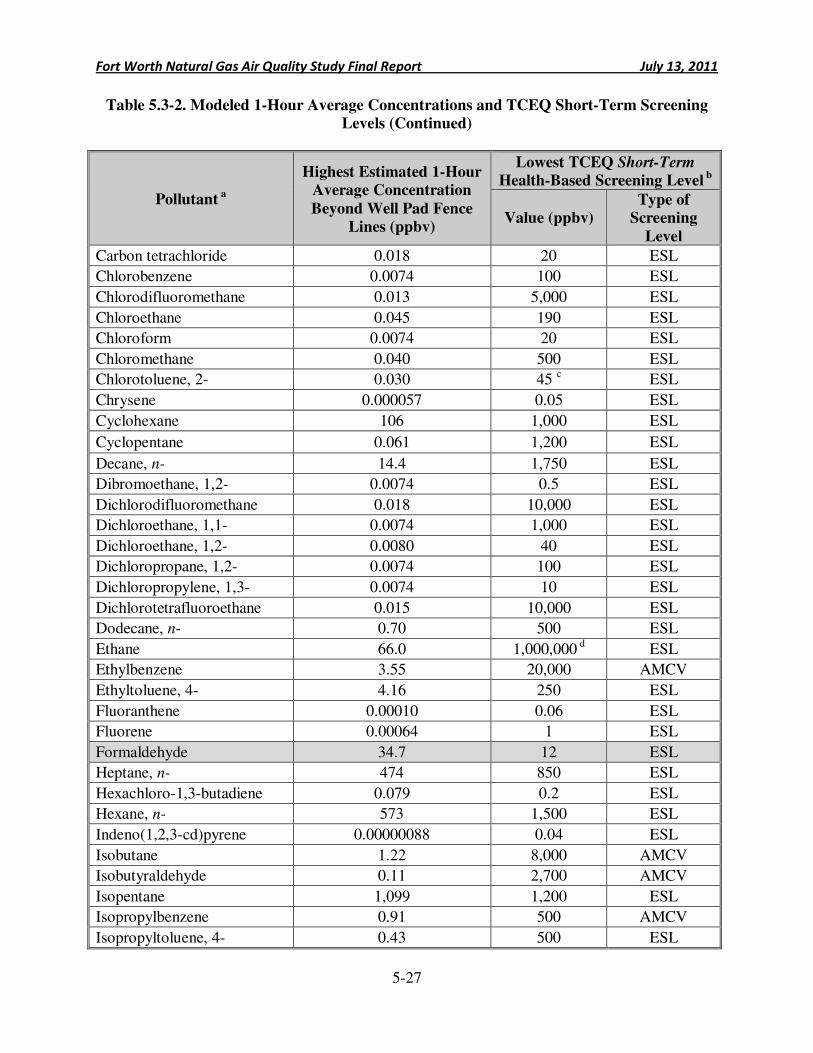
Fort Worth Natural Gas Air Quality Study Final Report July 13, 2011
5-27
Table 5.3-2. Modeled 1-Hour Average Concentrations and TCEQ Short-Term Screening
Levels (Continued)
Pollutant a
Highest Estimated 1-Hour
Average Concentration
Beyond Well Pad Fence
Lines (ppbv)
Lowest TCEQ Short-Term
Health-Based Screening Level b
Value (ppbv)
Type of
Screening
Level
Carbon tetrachloride 0.018 20 ESL
Chlorobenzene 0.0074 100 ESL
Chlorodifluoromethane 0.013 5,000 ESL
Chloroethane 0.045 190 ESL
Chloroform 0.0074 20 ESL
Chloromethane 0.040 500 ESL
Chlorotoluene, 2- 0.030 45 c ESL
Chrysene 0.000057 0.05 ESL
Cyclohexane 106 1,000 ESL
Cyclopentane 0.061 1,200 ESL
Decane, n- 14.4 1,750 ESL
Dibromoethane, 1,2- 0.0074 0.5 ESL
Dichlorodifluoromethane 0.018 10,000 ESL
Dichloroethane, 1,1- 0.0074 1,000 ESL
Dichloroethane, 1,2- 0.0080 40 ESL
Dichloropropane, 1,2- 0.0074 100 ESL
Dichloropropylene, 1,3- 0.0074 10 ESL
Dichlorotetrafluoroethane 0.015 10,000 ESL
Dodecane, n- 0.70 500 ESL
Ethane 66.0 1,000,000 d ESL
Ethylbenzene 3.55 20,000 AMCV
Ethyltoluene, 4- 4.16 250 ESL
Fluoranthene 0.00010 0.06 ESL
Fluorene 0.00064 1 ESL
Formaldehyde 34.7 12 ESL
Heptane, n- 474 850 ESL
Hexachloro-1,3-butadiene 0.079 0.2 ESL
Hexane, n- 573 1,500 ESL
Indeno(1,2,3-cd)pyrene 0.00000088 0.04 ESL
Isobutane 1.22 8,000 AMCV
Isobutyraldehyde 0.11 2,700 AMCV
Isopentane 1,099 1,200 ESL
Isopropylbenzene 0.91 500 AMCV
Isopropyltoluene, 4- 0.43 500 ESL
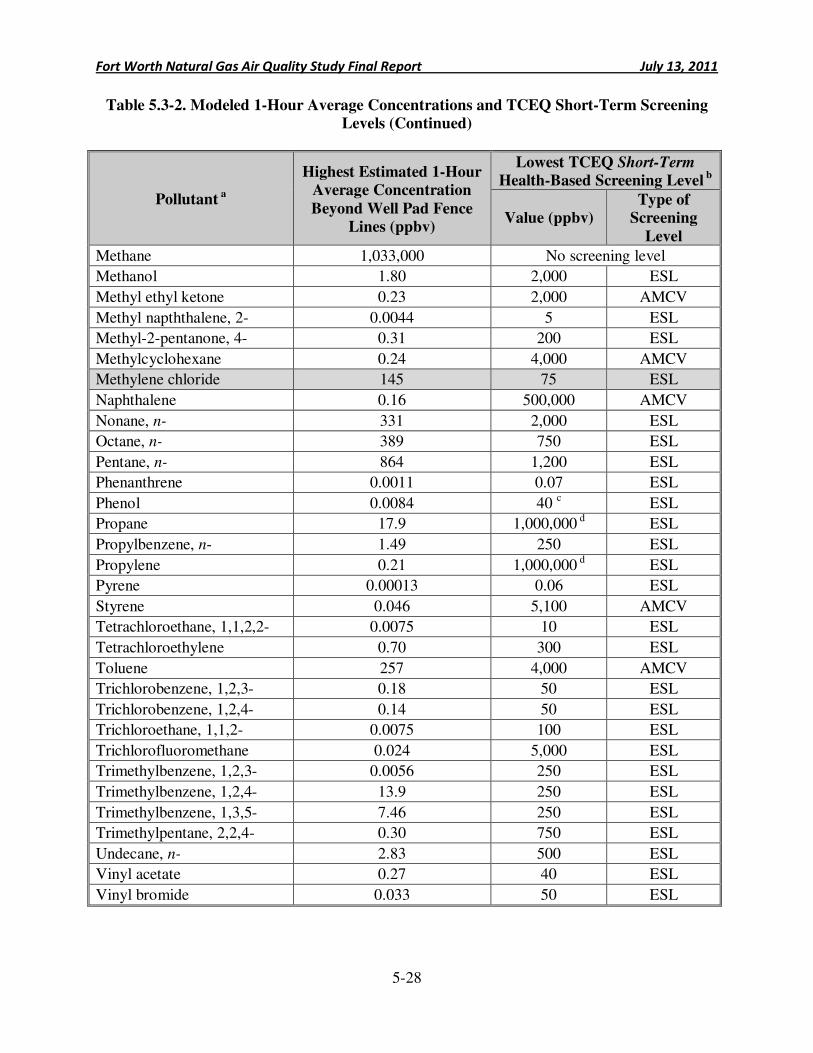
Fort Worth Natural Gas Air Quality Study Final Report July 13, 2011
5-28
Table 5.3-2. Modeled 1-Hour Average Concentrations and TCEQ Short-Term Screening
Levels (Continued)
Pollutant a
Highest Estimated 1-Hour
Average Concentration
Beyond Well Pad Fence
Lines (ppbv)
Lowest TCEQ Short-Term
Health-Based Screening Level b
Value (ppbv)
Type of
Screening
Level
Methane 1,033,000 No screening level
Methanol 1.80 2,000 ESL
Methyl ethyl ketone 0.23 2,000 AMCV
Methyl napththalene, 2- 0.0044 5 ESL
Methyl-2-pentanone, 4- 0.31 200 ESL
Methylcyclohexane 0.24 4,000 AMCV
Methylene chloride 145 75 ESL
Naphthalene 0.16 500,000 AMCV
Nonane, n- 331 2,000 ESL
Octane, n- 389 750 ESL
Pentane, n- 864 1,200 ESL
Phenanthrene 0.0011 0.07 ESL
Phenol 0.0084 40 c ESL
Propane 17.9 1,000,000 d ESL
Propylbenzene, n- 1.49 250 ESL
Propylene 0.21 1,000,000 d ESL
Pyrene 0.00013 0.06 ESL
Styrene 0.046 5,100 AMCV
Tetrachloroethane, 1,1,2,2- 0.0075 10 ESL
Tetrachloroethylene 0.70 300 ESL
Toluene 257 4,000 AMCV
Trichlorobenzene, 1,2,3- 0.18 50 ESL
Trichlorobenzene, 1,2,4- 0.14 50 ESL
Trichloroethane, 1,1,2- 0.0075 100 ESL
Trichlorofluoromethane 0.024 5,000 ESL
Trimethylbenzene, 1,2,3- 0.0056 250 ESL
Trimethylbenzene, 1,2,4- 13.9 250 ESL
Trimethylbenzene, 1,3,5- 7.46 250 ESL
Trimethylpentane, 2,2,4- 0.30 750 ESL
Undecane, n- 2.83 500 ESL
Vinyl acetate 0.27 40 ESL
Vinyl bromide 0.033 50 ESL
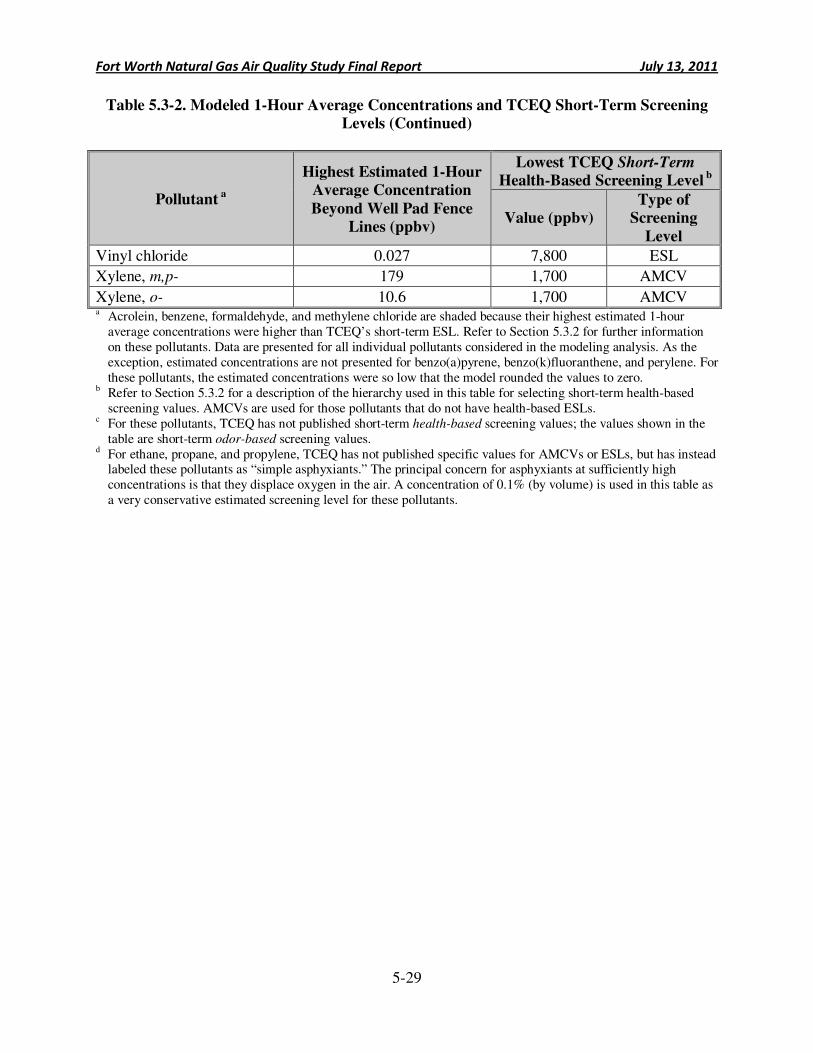
Fort Worth Natural Gas Air Quality Study Final Report July 13, 2011
5-29
Table 5.3-2. Modeled 1-Hour Average Concentrations and TCEQ Short-Term Screening
Levels (Continued)
Pollutant a
Highest Estimated 1-Hour
Average Concentration
Beyond Well Pad Fence
Lines (ppbv)
Lowest TCEQ Short-Term
Health-Based Screening Level b
Value (ppbv)
Type of
Screening
Level
Vinyl chloride 0.027 7,800 ESL
Xylene, m,p- 179 1,700 AMCV
Xylene, o- 10.6 1,700 AMCV a Acrolein, benzene, formaldehyde, and methylene chloride are shaded because their highest estimated 1-hour
average concentrations were higher than TCEQ’s short-term ESL. Refer to Section 5.3.2 for further information on these pollutants. Data are presented for all individual pollutants considered in the modeling analysis. As the exception, estimated concentrations are not presented for benzo(a)pyrene, benzo(k)fluoranthene, and perylene. For these pollutants, the estimated concentrations were so low that the model rounded the values to zero.
b Refer to Section 5.3.2 for a description of the hierarchy used in this table for selecting short-term health-based screening values. AMCVs are used for those pollutants that do not have health-based ESLs.
c For these pollutants, TCEQ has not published short-term health-based screening values; the values shown in the table are short-term odor-based screening values.
d For ethane, propane, and propylene, TCEQ has not published specific values for AMCVs or ESLs, but has instead labeled these pollutants as “simple asphyxiants.” The principal concern for asphyxiants at sufficiently high concentrations is that they displace oxygen in the air. A concentration of 0.1% (by volume) is used in this table as a very conservative estimated screening level for these pollutants.
Fort Worth Natural Gas Air Quality Study Final Report July 13, 2011
5-30
The highest offsite air quality impacts were found for Scenarios 2, 3, and 4 in the
modeling analysis. For pollutants emitted primarily by tanks, modeling Scenario 2 yielded the highest offsite 1-hour average concentration, primarily because this scenario had tanks placed along the northern fence line and southerly winds (i.e., winds blowing from south to north) prevail in Fort Worth. On the other hand, for pollutants released largely by engines, Scenarios 3 and 4 predicted the highest offsite air quality impacts, because these scenarios considered the largest engines.
As Table 5.3-2 shows, four pollutants considered in the modeling analysis had at least
one estimated 1-hour average concentrations greater than lowest short-term health-based TCEQ screening levels. When reviewing these results, it is important to remember that the model estimates are based on the least favorable meteorological conditions for dispersion and for the highest-emitting well pads and compressor stations. Modeling Scenario 1, which was based on typical well pad emissions, had considerably lower estimated air quality impacts—and no 1-hour average concentrations greater than short-term screening levels.
ERG further examined the underlying modeling outputs and screening levels, and notes
the following important observations:
• Benzene. ERG modeled air quality impacts of benzene at hundreds of offsite locations, commonly referred to as receptors. In Scenarios 1 and 3, every estimated 1-hour average concentration at every receptor was below TCEQ’s short-term ESL. In Scenarios 2 and 4, only a single receptor—out of the hundreds modeled—had at least one estimated 1-hour average concentration greater than the ESL, and this occurred at just one receptor located at the fence line within a few feet of the tanks themselves. Receptors just 30 feet downwind showed no concentrations above the ESL. Further, at this one receptor, estimated 1-hour average benzene concentrations above the ESL occurred no more than 6 hours per year, and these values (54–59.5 ppbv) were only marginally above the health-protective ESL (54 ppbv). Recalling that these estimates are based on the highest emission rates measured in the point source testing program, the available modeling data suggest that only the single well pad found to have the highest benzene emissions would likely lead to offsite concentrations above the short-term ESL, and this would occur infrequently and only within a few feet of the highest-emitting tanks. ERG’s main recommendation for benzene (see Section 5.5) is that city officials periodically review TCEQ’s “auto-GC” sampling data for sites throughout the Barnett Shale formation, and evaluate whether any benzene concentrations ever exceed short-term screening levels. Should this occur, city officials should confer with TCEQ about proper interpretation of the monitoring data and the health implications for the particular monitoring site and for unmonitored locations.
• Acrolein and formaldehyde. These two pollutants are combustion by-products emitted by engines at the well pads and compressor stations. The magnitude of emissions—and offsite air quality impacts—depends on the type of engines used. Modeling Scenario 2 considered the smaller “lift engines,” which typically fall between 150 and
Fort Worth Natural Gas Air Quality Study Final Report July 13, 2011
5-31
250 hp. For this scenario, highest 1-hour average concentrations of acrolein and formaldehyde exceeded TCEQ’s short-term ESL, but this only occurred at fence line locations for acrolein and at receptors within 100 feet of fence lines for formaldehyde. On the other hand, Scenarios 3 and 4 considered the larger “line engines,” which operate at roughly 1,500 hp. For these scenarios, 1-hour average concentrations of acrolein greater than TCEQ’s short-term ESL extended approximately 400 feet from the fence lines, and 1-hour average concentrations of formaldehyde greater than TCEQ’s ESL were estimated to occur up to 750 feet beyond the fence lines. In the case of formaldehyde, the highest offsite 1-hour average concentration was estimated to be nearly 3 times higher than TCEQ’s short-term ESL. Section 5.4 presents further information on the health implications of the estimated concentrations for these pollutants.
• Methylene chloride. As Table 5.3-2 shows, the highest estimated 1-hour average concentration of methylene chloride (145 ppbv) is higher than TCEQ’s short-term ESL (75 ppbv). However, the modeling output for methylene chloride is based on an emissions measurement of suspect quality. Specifically, the emission rate used in the modeling analysis is based on a sample (#B015) collected on September 20, 2010, at a well pad (Site #PS-075). However, the analytical report for this sample includes two qualifiers. First, the laboratory reported a “B” qualifier, which indicates that methylene chloride was also detected in the method blank, raising questions about contamination of the sampling equipment. Second, the laboratory reported a “J” qualifier, which means the measured concentration was higher than the MDL but lower than the laboratory’s reporting limit; the analytical report further states that “…the user of [J-qualified] data should be aware that this data is of limited reliability.” For these reasons, ERG concludes that the highest estimated methylene chloride concentration shown in Table 5.3-2 is of questionable quality. If this one sample were omitted from the emissions estimation analysis, the next highest 1-hour average concentrations of methylene chloride predicted by the model would be substantially lower than TCEQ’s short-term ESL. Accordingly, ERG does not recommend further evaluation of this pollutant.
Overall, the highest estimated 1-hour average concentrations predicted by the dispersion
model are below TCEQ’s health-based short-term screening levels for nearly every pollutant considered. For reasons stated above, ERG concludes that further evaluation is warranted for the air quality impacts of acrolein and formaldehyde, which had 1-hour concentrations above screening levels beyond the fence line of any site with operating lift engines or line engines. Section 5.4 provides further insights on these two pollutants.
Fort Worth Natural Gas Air Quality Study Final Report July 13, 2011
5-32
Key Point: Long-Term Modeling A model was used to estimate annual average air quality impacts caused by emissions from well pads and compressor stations. Of all pollutants considered, only acrolein and formaldehyde had estimated annual average concentrations at locations at least 200 feet from fence lines greater than TCEQ screening levels. These air quality impacts are greatest for well pads and compressor stations with large line engines.
5.3.3 Health Evaluation for Modeled Annual Average Concentrations
ERG assessed potential long-term
exposures to site-related pollutants by evaluating the highest annual average concentrations output by the dispersion model. This comparison considered all locations more than 200 feet from fence lines of well pads and compressor stations. This downwind distance was selected because, although most gas well must be at least 600 feet from residences, city variances allow setback distances as low as 200 feet. The comparisons presented here represent a worst-case scenario: a full-time resident living just 200 feet from the highest-emitting well pads and compressor stations.
For every pollutant considered in the modeling analysis, Table 5.3-3 compares the highest estimated annual average concentrations to TCEQ’s health-based, long-term screening levels. For this evaluation, the hierarchy for selecting screening levels follows: If a pollutant has a long-term health-based ESL, that value is used in Table 5.3-3, even if a different AMCV is available for the pollutant. This preference again reflects the fact that TCEQ specifically derived ESLs for evaluating dispersion modeling data, whereas AMCVs are the screening levels of choice when assessing ambient air monitoring data. The few pollutants that do not have long-term ESLs do not have any TCEQ health-based screening values, as indicated in the table. Shading is used in the table to identify pollutants that had at least one estimated annual average concentration at distances more than 200 feet from the fence lines higher than the TCEQ long-term screening level.
As Table 5.3-3 shows, only two pollutants considered in the modeling analysis—acrolein and formaldehyde—had estimated annual average concentrations greater than TCEQ’s health-based, long-term ESLs. Across all pollutants, the highest annual average concentrations reported in the table were all observed for modeling Scenarios 2, 3, or 4. In contrast, Scenario 1, which was based on typical well pad emissions, had considerably lower estimated air quality impacts—and no annual average concentrations greater than long-term screening levels at any locations beyond the fence lines. Further information follows for the two pollutants with estimated annual average concentrations greater than screening levels:
• Acrolein. The highest annual average concentration of acrolein at locations at least 200 feet from fence lines predicted by the model (0.33 ppbv) was higher than TCEQ’s health-based, long-term ESL (0.066 ppbv). However, considering receptors at least 200 feet from fence lines, only Scenarios 3 and 4 had at least one estimated annual average concentration of acrolein greater than TCEQ’s ESL. This suggests that emissions from the larger line engines account for the only instances where estimated acrolein levels exceeded TCEQ’s long-term ESL.
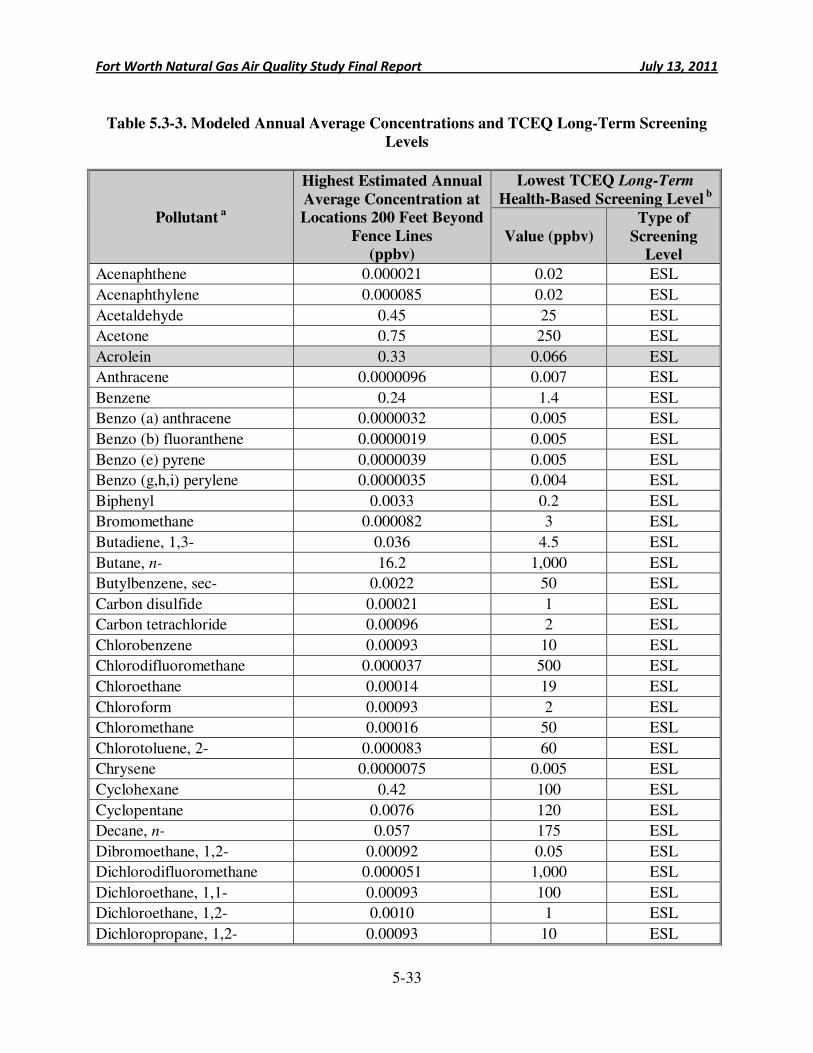
Fort Worth Natural Gas Air Quality Study Final Report July 13, 2011
5-33
Table 5.3-3. Modeled Annual Average Concentrations and TCEQ Long-Term Screening
Levels
Pollutant a
Highest Estimated Annual
Average Concentration at
Locations 200 Feet Beyond
Fence Lines
(ppbv)
Lowest TCEQ Long-Term
Health-Based Screening Level b
Value (ppbv)
Type of
Screening
Level
Acenaphthene 0.000021 0.02 ESL
Acenaphthylene 0.000085 0.02 ESL
Acetaldehyde 0.45 25 ESL
Acetone 0.75 250 ESL
Acrolein 0.33 0.066 ESL
Anthracene 0.0000096 0.007 ESL
Benzene 0.24 1.4 ESL
Benzo (a) anthracene 0.0000032 0.005 ESL
Benzo (b) fluoranthene 0.0000019 0.005 ESL
Benzo (e) pyrene 0.0000039 0.005 ESL
Benzo (g,h,i) perylene 0.0000035 0.004 ESL
Biphenyl 0.0033 0.2 ESL
Bromomethane 0.000082 3 ESL
Butadiene, 1,3- 0.036 4.5 ESL
Butane, n- 16.2 1,000 ESL
Butylbenzene, sec- 0.0022 50 ESL
Carbon disulfide 0.00021 1 ESL
Carbon tetrachloride 0.00096 2 ESL
Chlorobenzene 0.00093 10 ESL
Chlorodifluoromethane 0.000037 500 ESL
Chloroethane 0.00014 19 ESL
Chloroform 0.00093 2 ESL
Chloromethane 0.00016 50 ESL
Chlorotoluene, 2- 0.000083 60 ESL
Chrysene 0.0000075 0.005 ESL
Cyclohexane 0.42 100 ESL
Cyclopentane 0.0076 120 ESL
Decane, n- 0.057 175 ESL
Dibromoethane, 1,2- 0.00092 0.05 ESL
Dichlorodifluoromethane 0.000051 1,000 ESL
Dichloroethane, 1,1- 0.00093 100 ESL
Dichloroethane, 1,2- 0.0010 1 ESL
Dichloropropane, 1,2- 0.00093 10 ESL
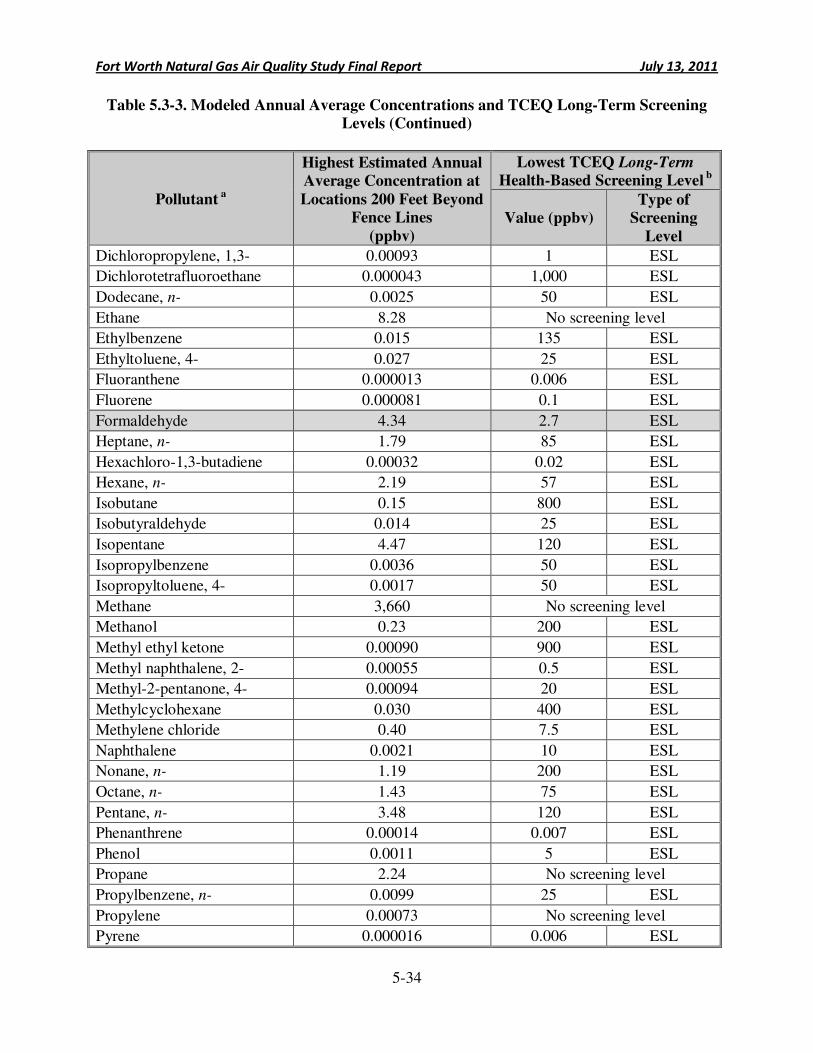
Fort Worth Natural Gas Air Quality Study Final Report July 13, 2011
5-34
Table 5.3-3. Modeled Annual Average Concentrations and TCEQ Long-Term Screening
Levels (Continued)
Pollutant a
Highest Estimated Annual
Average Concentration at
Locations 200 Feet Beyond
Fence Lines
(ppbv)
Lowest TCEQ Long-Term
Health-Based Screening Level b
Value (ppbv)
Type of
Screening
Level
Dichloropropylene, 1,3- 0.00093 1 ESL
Dichlorotetrafluoroethane 0.000043 1,000 ESL
Dodecane, n- 0.0025 50 ESL
Ethane 8.28 No screening level
Ethylbenzene 0.015 135 ESL
Ethyltoluene, 4- 0.027 25 ESL
Fluoranthene 0.000013 0.006 ESL
Fluorene 0.000081 0.1 ESL
Formaldehyde 4.34 2.7 ESL
Heptane, n- 1.79 85 ESL
Hexachloro-1,3-butadiene 0.00032 0.02 ESL
Hexane, n- 2.19 57 ESL
Isobutane 0.15 800 ESL
Isobutyraldehyde 0.014 25 ESL
Isopentane 4.47 120 ESL
Isopropylbenzene 0.0036 50 ESL
Isopropyltoluene, 4- 0.0017 50 ESL
Methane 3,660 No screening level
Methanol 0.23 200 ESL
Methyl ethyl ketone 0.00090 900 ESL
Methyl naphthalene, 2- 0.00055 0.5 ESL
Methyl-2-pentanone, 4- 0.00094 20 ESL
Methylcyclohexane 0.030 400 ESL
Methylene chloride 0.40 7.5 ESL
Naphthalene 0.0021 10 ESL
Nonane, n- 1.19 200 ESL
Octane, n- 1.43 75 ESL
Pentane, n- 3.48 120 ESL
Phenanthrene 0.00014 0.007 ESL
Phenol 0.0011 5 ESL
Propane 2.24 No screening level
Propylbenzene, n- 0.0099 25 ESL
Propylene 0.00073 No screening level
Pyrene 0.000016 0.006 ESL
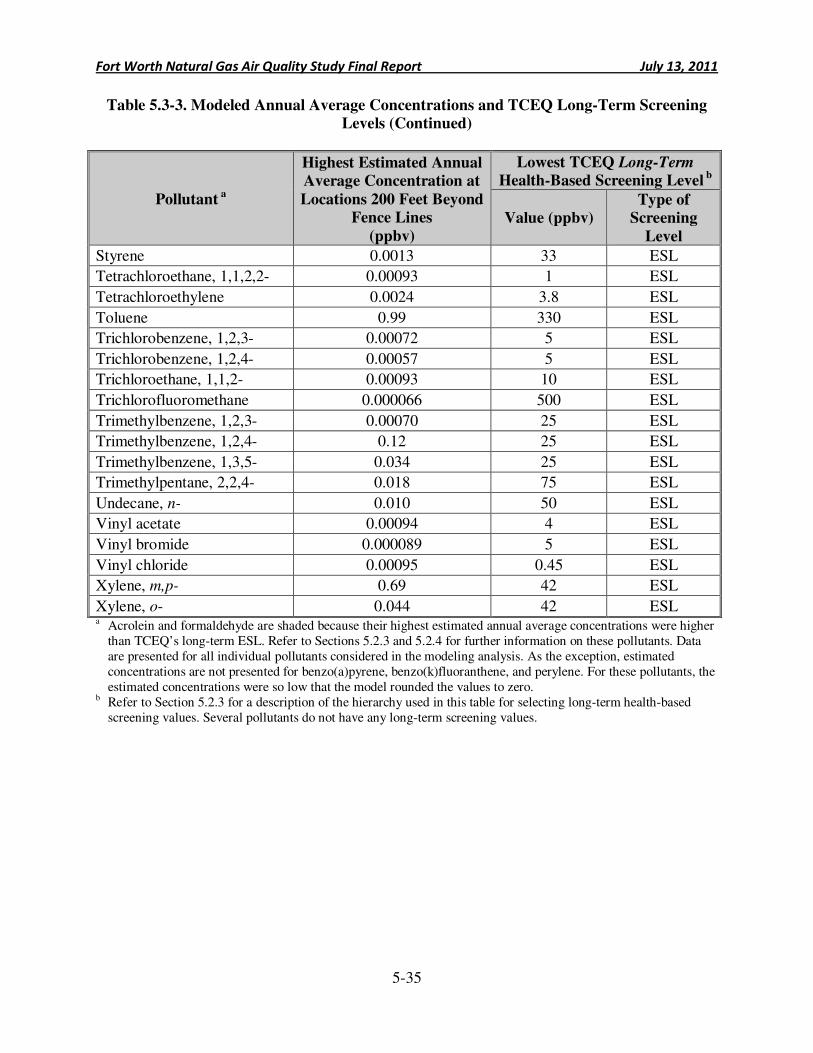
Fort Worth Natural Gas Air Quality Study Final Report July 13, 2011
5-35
Table 5.3-3. Modeled Annual Average Concentrations and TCEQ Long-Term Screening
Levels (Continued)
Pollutant a
Highest Estimated Annual
Average Concentration at
Locations 200 Feet Beyond
Fence Lines
(ppbv)
Lowest TCEQ Long-Term
Health-Based Screening Level b
Value (ppbv)
Type of
Screening
Level
Styrene 0.0013 33 ESL
Tetrachloroethane, 1,1,2,2- 0.00093 1 ESL
Tetrachloroethylene 0.0024 3.8 ESL
Toluene 0.99 330 ESL
Trichlorobenzene, 1,2,3- 0.00072 5 ESL
Trichlorobenzene, 1,2,4- 0.00057 5 ESL
Trichloroethane, 1,1,2- 0.00093 10 ESL
Trichlorofluoromethane 0.000066 500 ESL
Trimethylbenzene, 1,2,3- 0.00070 25 ESL
Trimethylbenzene, 1,2,4- 0.12 25 ESL
Trimethylbenzene, 1,3,5- 0.034 25 ESL
Trimethylpentane, 2,2,4- 0.018 75 ESL
Undecane, n- 0.010 50 ESL
Vinyl acetate 0.00094 4 ESL
Vinyl bromide 0.000089 5 ESL
Vinyl chloride 0.00095 0.45 ESL
Xylene, m,p- 0.69 42 ESL
Xylene, o- 0.044 42 ESL a Acrolein and formaldehyde are shaded because their highest estimated annual average concentrations were higher
than TCEQ’s long-term ESL. Refer to Sections 5.2.3 and 5.2.4 for further information on these pollutants. Data are presented for all individual pollutants considered in the modeling analysis. As the exception, estimated concentrations are not presented for benzo(a)pyrene, benzo(k)fluoranthene, and perylene. For these pollutants, the estimated concentrations were so low that the model rounded the values to zero.
b Refer to Section 5.2.3 for a description of the hierarchy used in this table for selecting long-term health-based screening values. Several pollutants do not have any long-term screening values.
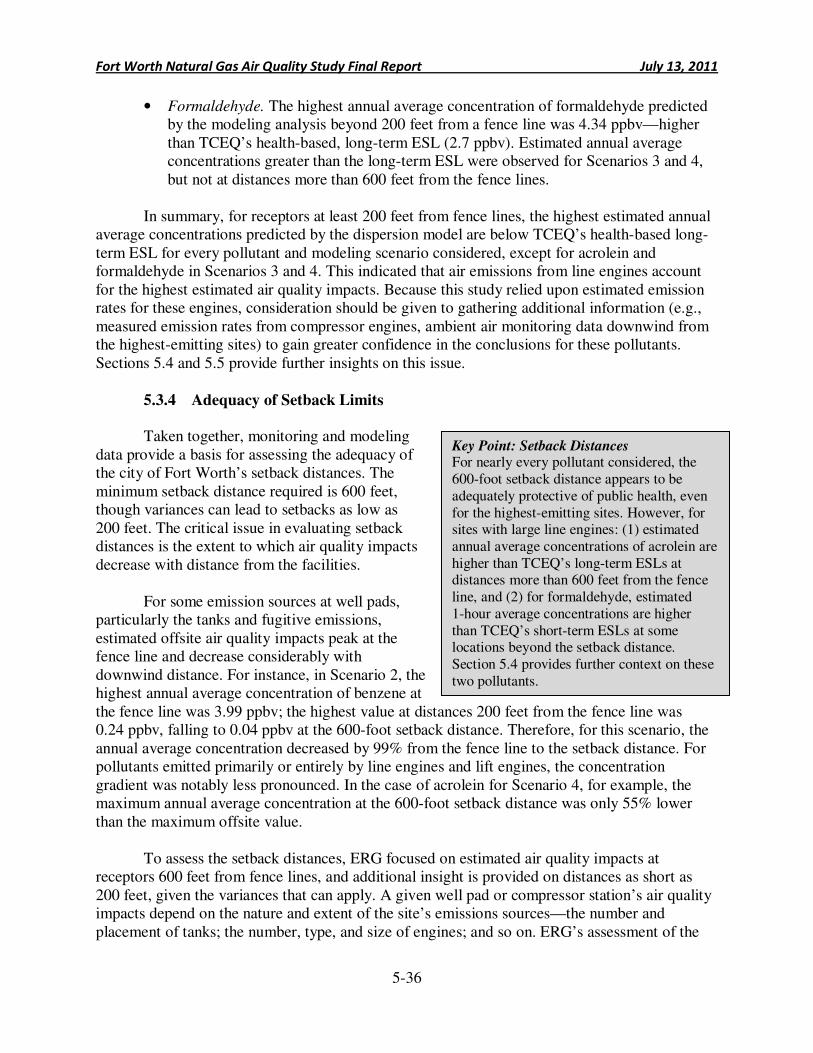
Fort Worth Natural Gas Air Quality Study Final Report July 13, 2011
5-36
Key Point: Setback Distances For nearly every pollutant considered, the 600-foot setback distance appears to be adequately protective of public health, even for the highest-emitting sites. However, for sites with large line engines: (1) estimated annual average concentrations of acrolein are higher than TCEQ’s long-term ESLs at distances more than 600 feet from the fence line, and (2) for formaldehyde, estimated 1-hour average concentrations are higher than TCEQ’s short-term ESLs at some locations beyond the setback distance. Section 5.4 provides further context on these two pollutants.
• Formaldehyde. The highest annual average concentration of formaldehyde predicted by the modeling analysis beyond 200 feet from a fence line was 4.34 ppbv—higher than TCEQ’s health-based, long-term ESL (2.7 ppbv). Estimated annual average concentrations greater than the long-term ESL were observed for Scenarios 3 and 4, but not at distances more than 600 feet from the fence lines.
In summary, for receptors at least 200 feet from fence lines, the highest estimated annual
average concentrations predicted by the dispersion model are below TCEQ’s health-based long-term ESL for every pollutant and modeling scenario considered, except for acrolein and formaldehyde in Scenarios 3 and 4. This indicated that air emissions from line engines account for the highest estimated air quality impacts. Because this study relied upon estimated emission rates for these engines, consideration should be given to gathering additional information (e.g., measured emission rates from compressor engines, ambient air monitoring data downwind from the highest-emitting sites) to gain greater confidence in the conclusions for these pollutants. Sections 5.4 and 5.5 provide further insights on this issue.
5.3.4 Adequacy of Setback Limits
Taken together, monitoring and modeling data provide a basis for assessing the adequacy of the city of Fort Worth’s setback distances. The minimum setback distance required is 600 feet, though variances can lead to setbacks as low as 200 feet. The critical issue in evaluating setback distances is the extent to which air quality impacts decrease with distance from the facilities.
For some emission sources at well pads,
particularly the tanks and fugitive emissions, estimated offsite air quality impacts peak at the fence line and decrease considerably with downwind distance. For instance, in Scenario 2, the highest annual average concentration of benzene at the fence line was 3.99 ppbv; the highest value at distances 200 feet from the fence line was 0.24 ppbv, falling to 0.04 ppbv at the 600-foot setback distance. Therefore, for this scenario, the annual average concentration decreased by 99% from the fence line to the setback distance. For pollutants emitted primarily or entirely by line engines and lift engines, the concentration gradient was notably less pronounced. In the case of acrolein for Scenario 4, for example, the maximum annual average concentration at the 600-foot setback distance was only 55% lower than the maximum offsite value.
To assess the setback distances, ERG focused on estimated air quality impacts at
receptors 600 feet from fence lines, and additional insight is provided on distances as short as 200 feet, given the variances that can apply. A given well pad or compressor station’s air quality impacts depend on the nature and extent of the site’s emissions sources—the number and placement of tanks; the number, type, and size of engines; and so on. ERG’s assessment of the
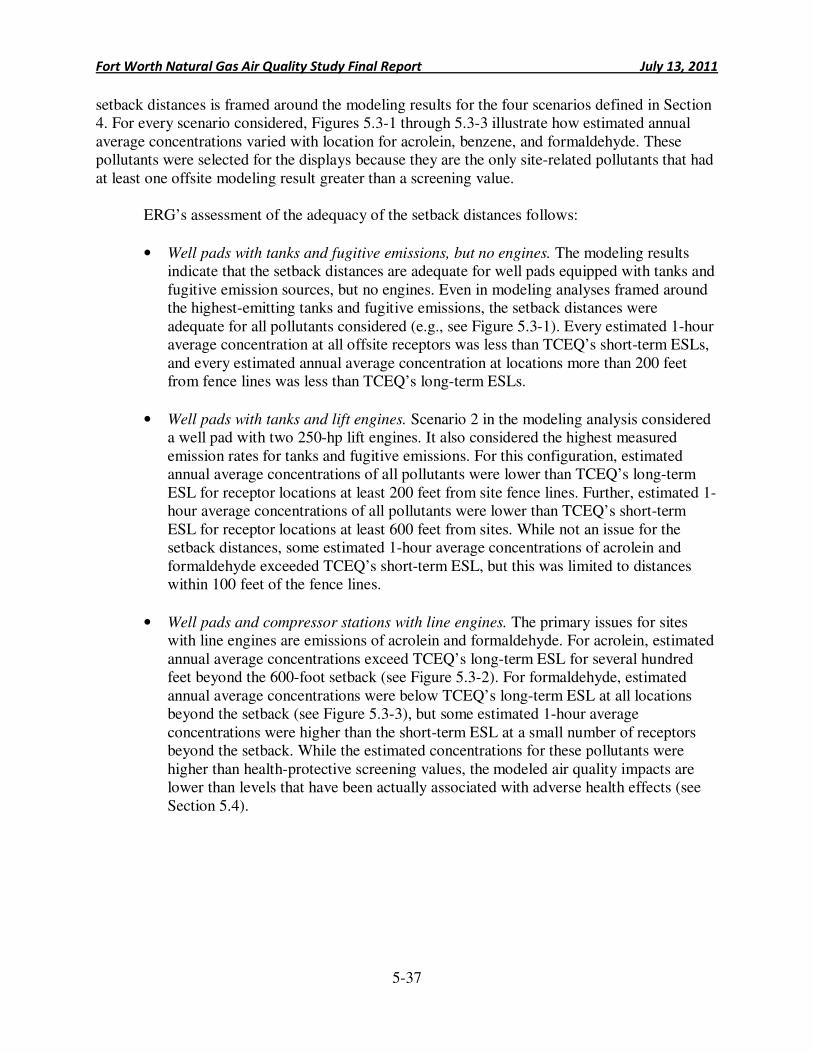
Fort Worth Natural Gas Air Quality Study Final Report July 13, 2011
5-37
setback distances is framed around the modeling results for the four scenarios defined in Section 4. For every scenario considered, Figures 5.3-1 through 5.3-3 illustrate how estimated annual average concentrations varied with location for acrolein, benzene, and formaldehyde. These pollutants were selected for the displays because they are the only site-related pollutants that had at least one offsite modeling result greater than a screening value.
ERG’s assessment of the adequacy of the setback distances follows:
• Well pads with tanks and fugitive emissions, but no engines. The modeling results indicate that the setback distances are adequate for well pads equipped with tanks and fugitive emission sources, but no engines. Even in modeling analyses framed around the highest-emitting tanks and fugitive emissions, the setback distances were adequate for all pollutants considered (e.g., see Figure 5.3-1). Every estimated 1-hour average concentration at all offsite receptors was less than TCEQ’s short-term ESLs, and every estimated annual average concentration at locations more than 200 feet from fence lines was less than TCEQ’s long-term ESLs.
• Well pads with tanks and lift engines. Scenario 2 in the modeling analysis considered a well pad with two 250-hp lift engines. It also considered the highest measured emission rates for tanks and fugitive emissions. For this configuration, estimated annual average concentrations of all pollutants were lower than TCEQ’s long-term ESL for receptor locations at least 200 feet from site fence lines. Further, estimated 1-hour average concentrations of all pollutants were lower than TCEQ’s short-term ESL for receptor locations at least 600 feet from sites. While not an issue for the setback distances, some estimated 1-hour average concentrations of acrolein and formaldehyde exceeded TCEQ’s short-term ESL, but this was limited to distances within 100 feet of the fence lines.
• Well pads and compressor stations with line engines. The primary issues for sites with line engines are emissions of acrolein and formaldehyde. For acrolein, estimated annual average concentrations exceed TCEQ’s long-term ESL for several hundred feet beyond the 600-foot setback (see Figure 5.3-2). For formaldehyde, estimated annual average concentrations were below TCEQ’s long-term ESL at all locations beyond the setback (see Figure 5.3-3), but some estimated 1-hour average concentrations were higher than the short-term ESL at a small number of receptors beyond the setback. While the estimated concentrations for these pollutants were higher than health-protective screening values, the modeled air quality impacts are lower than levels that have been actually associated with adverse health effects (see Section 5.4).
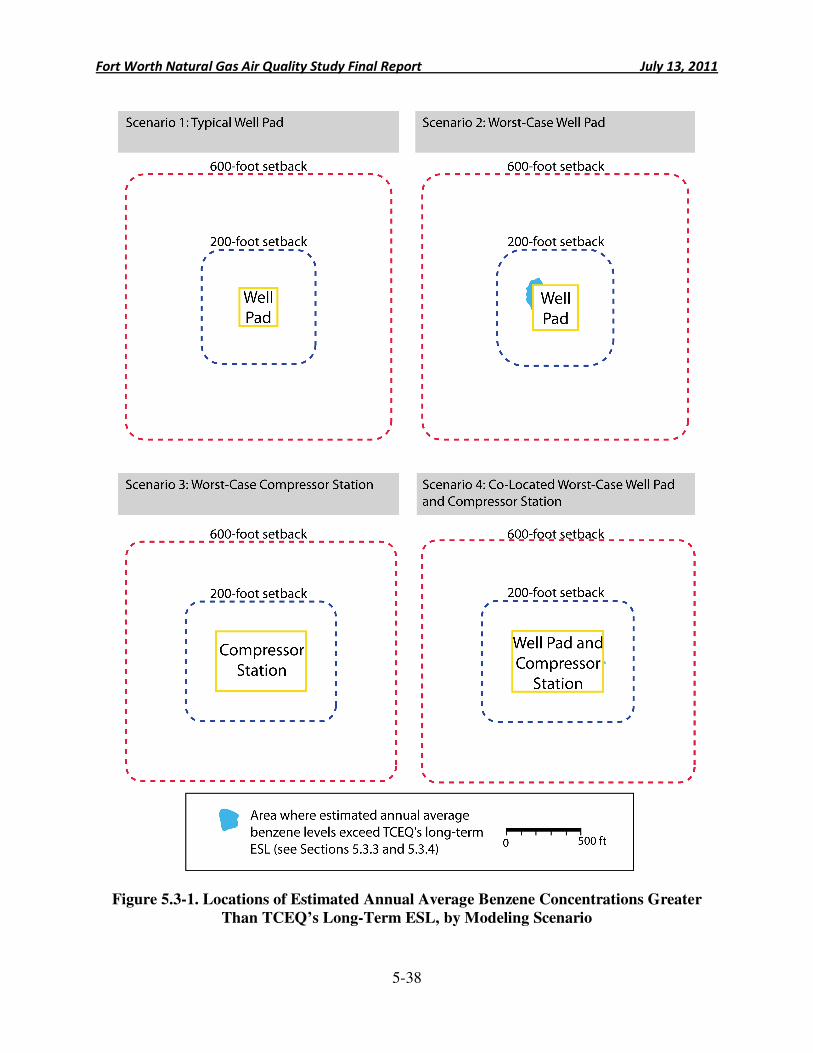
Fort Worth Natural Gas Air Quality Study Final Report July 13, 2011
5-38
Figure 5.3-1. Locations of Estimated Annual Average Benzene Concentrations Greater
Than TCEQ’s Long-Term ESL, by Modeling Scenario
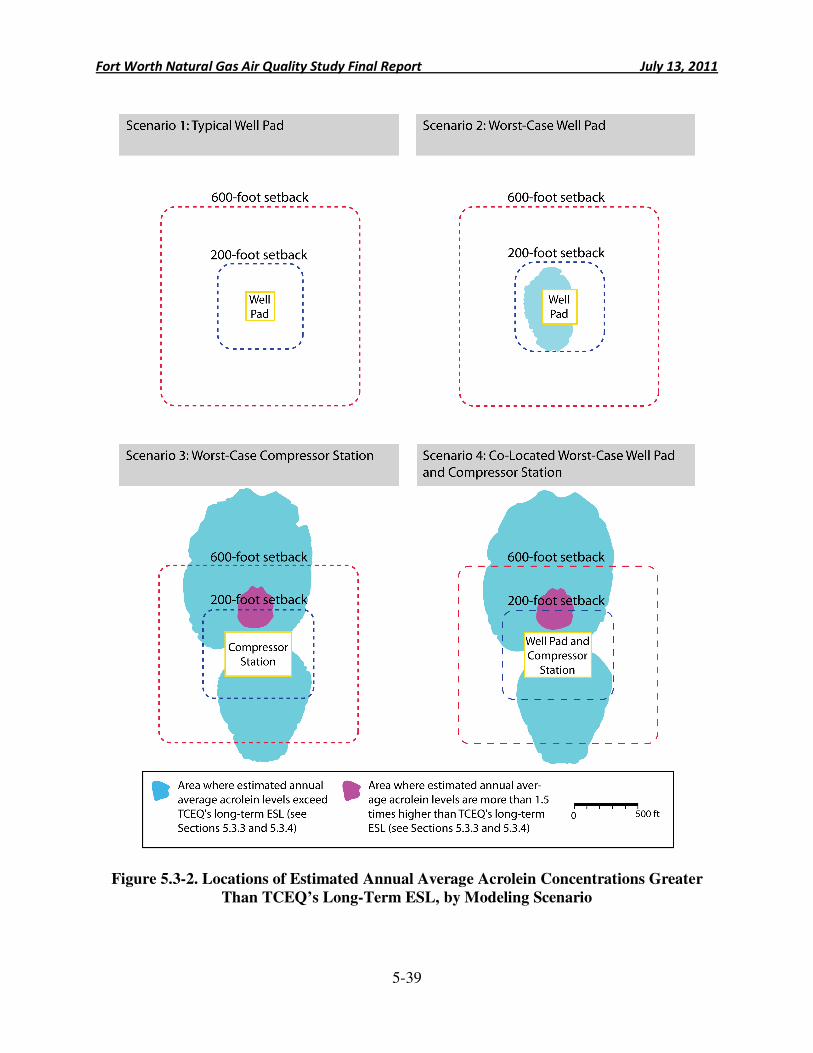
Fort Worth Natural Gas Air Quality Study Final Report July 13, 2011
5-39
Figure 5.3-2. Locations of Estimated Annual Average Acrolein Concentrations Greater
Than TCEQ’s Long-Term ESL, by Modeling Scenario
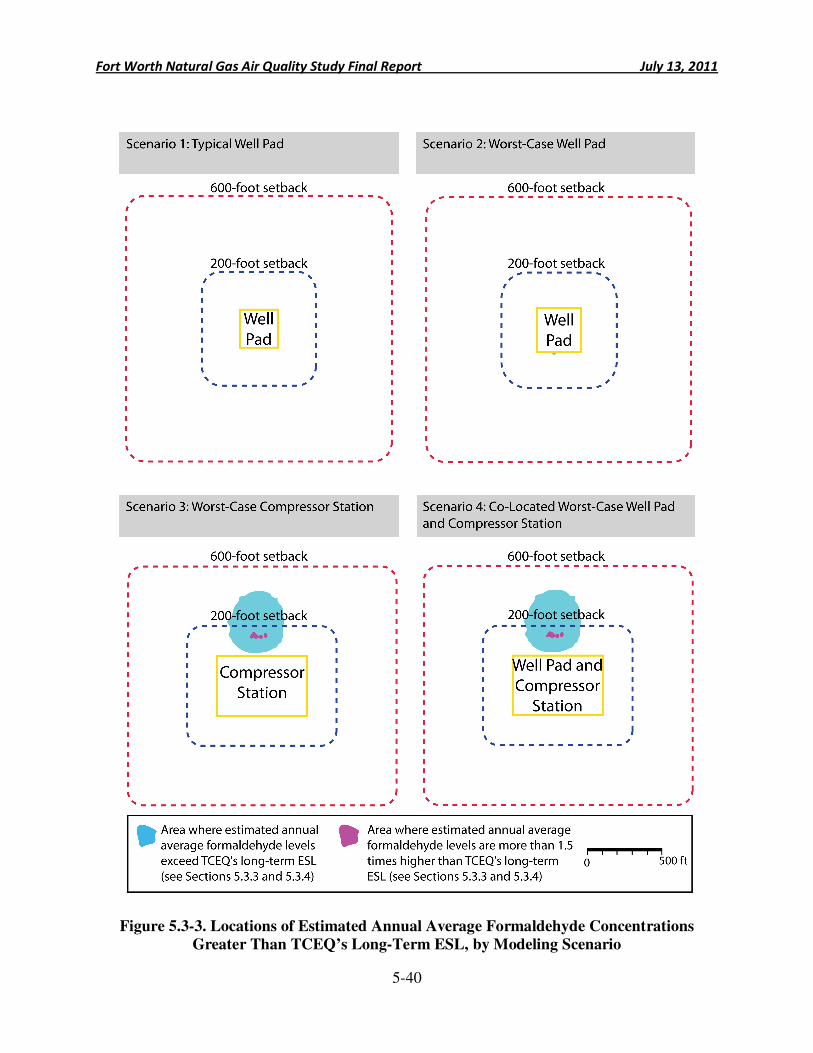
Fort Worth Natural Gas Air Quality Study Final Report July 13, 2011
5-40
Figure 5.3-3. Locations of Estimated Annual Average Formaldehyde Concentrations
Greater Than TCEQ’s Long-Term ESL, by Modeling Scenario
Fort Worth Natural Gas Air Quality Study Final Report July 13, 2011
5-41
In summary, for the overwhelming majority of sites considered in this study, the modeling analysis indicates that Fort Worth’s 600-foot setback distance is adequate. For the relatively few sites with multiple, large line engines, the modeling analysis found some areas beyond the setbacks to have estimated acrolein and formaldehyde concentrations greater than TCEQ’s ESLs. For both pollutants, ERG’s modeling is based entirely on estimated emission rates, and not measured values. This underscores the value of obtaining more detailed acrolein and formaldehyde emissions data for line engines and focused ambient air monitoring to validate these findings. Such studies would provide greater confidence in the adequacy and protectiveness of the city’s setbacks.
5.3.5 Modeled Concentrations: Main Findings, Limitations, and Uncertainties
The information presented throughout Section 5.3 is based entirely on the dispersion modeling analysis. Unlike ambient air monitoring data, which are direct measurements of air pollution levels, models provide estimates of ambient air concentrations. The accuracy of the modeling outputs depends on many factors, but especially on the representativeness of the emissions data input to the model. Emission rates for this study were based on measured and estimated data: emissions from tanks and fugitive sources were directly measured during the point source testing program, and emissions from lift engines and line engines were estimated using standard computational algorithms and EPA-published emission factors. For some pollutants, most notably acrolein and formaldehyde, the estimated offsite ambient air concentrations from the model are based entirely on the estimated emissions from lift engines and line engines. While these estimates were generated using the best information available to ERG, the methodologies may not adequately represent the types of engines typically used at well pads and compressor stations in Fort Worth. Because acrolein and formaldehyde are two pollutants of concern for this study, consideration should be given to reducing uncertainties associated with the estimated concentrations. This could be achieved by either additional point source testing at sites with line engines or air monitoring for these compounds downwind from a line engine site known to burn the largest quantities of natural gas.
Additionally, the modeling conducted for this study only evaluated dispersion, or the
movement of the pollutants through the air from their sources to offsite receptors. Many of the pollutants emitted at the well pads and compressor stations are known to react in the air and form other pollutants, and this was not considered in the modeling analysis. Supplemental analyses using photochemical models might be warranted to more fully investigate the full range of air quality impacts on local air quality (e.g., consideration of contributions to ozone formation and other processes). 5.4 Additional Context for Selected Pollutants
The earlier analyses in this section identified acrolein and formaldehyde as the pollutants that are most likely to have site-related air quality impacts greater than TCEQ health-based screening levels at locations beyond the 600-foot setbacks. Additionally, estimated ambient air concentrations of benzene were found to exceed short-term screening levels in the immediate vicinity of the highest-emitting tanks. This section presents additional context for these pollutants, which includes comparisons to air pollution levels measured elsewhere in Texas and
Fort Worth Natural Gas Air Quality Study Final Report July 13, 2011
5-42
further insights into toxicity. Finally, this section presents information on two pollutants that had estimated 1-hour average concentrations greater than odor-based short-term screening levels.
• Benzene. For additional perspective on benzene, ERG compared program-average concentrations calculated for all eight monitoring stations to 2010 annual average levels measured by TCEQ at 45 other locations statewide (see Figure 5.4-1). For the other statewide monitoring stations, 2010 statistical data summaries were downloaded from TCEQ’s Texas Air Monitoring Information System.12 ERG only considered sites that employed 24-hour average canister sampling technology—the same sampling approach used in the ambient air monitoring program. Further, ERG excluded any sites that had fewer than 40 valid 24-hour air samples over the calendar year, due to the large number of missing or invalid measurements for these sites. In the few cases where more than one monitor was placed at a given site, data from the monitor with the higher number of valid samples were used in this analysis.
Figure 5.4-1 shows how program-average concentrations of benzene from this study compared to annual average concentrations measured elsewhere in Texas. The figure lists the names of the cities where the other monitoring occurred. While some comparison stations are located near large petrochemical refineries and industrial complexes, several other comparison stations were located in residential and commercial settings away from such larger sources. For seven out of eight monitoring stations in this study, the program-average benzene concentrations ranked relatively low when compared to 2010 annual averages for other monitors in Texas. However, program-average benzene levels at site S-4 ranked 11th out of the 53 sites shown in the figure. The relatively high ranking for this site likely reflects contributions from a nearby compressor station and well pad, and mobile source activity near the monitor. Overall, Figure 5.4-1 provides no evidence that benzene levels measured during this study were unusually elevated when compared to other monitoring stations in Texas. More importantly, the program-average concentrations for the Fort Worth monitoring stations are all lower than TCEQ’s long-term health-based AMCV.
• Acrolein. As noted previously, acrolein was not a target analyte for the ambient air monitoring program. Even though many parties have previously measured airborne levels of acrolein at other locations in Texas and nationwide, recent studies have identified important data quality concerns associated with the ambient air monitoring methods that had been widely used for this pollutant. In December 2010, EPA summarized these concerns and began flagging past air measurements of acrolein as “unverified” if certain canister cleaning practices, calibration standards, and timely analysis were not applied.13
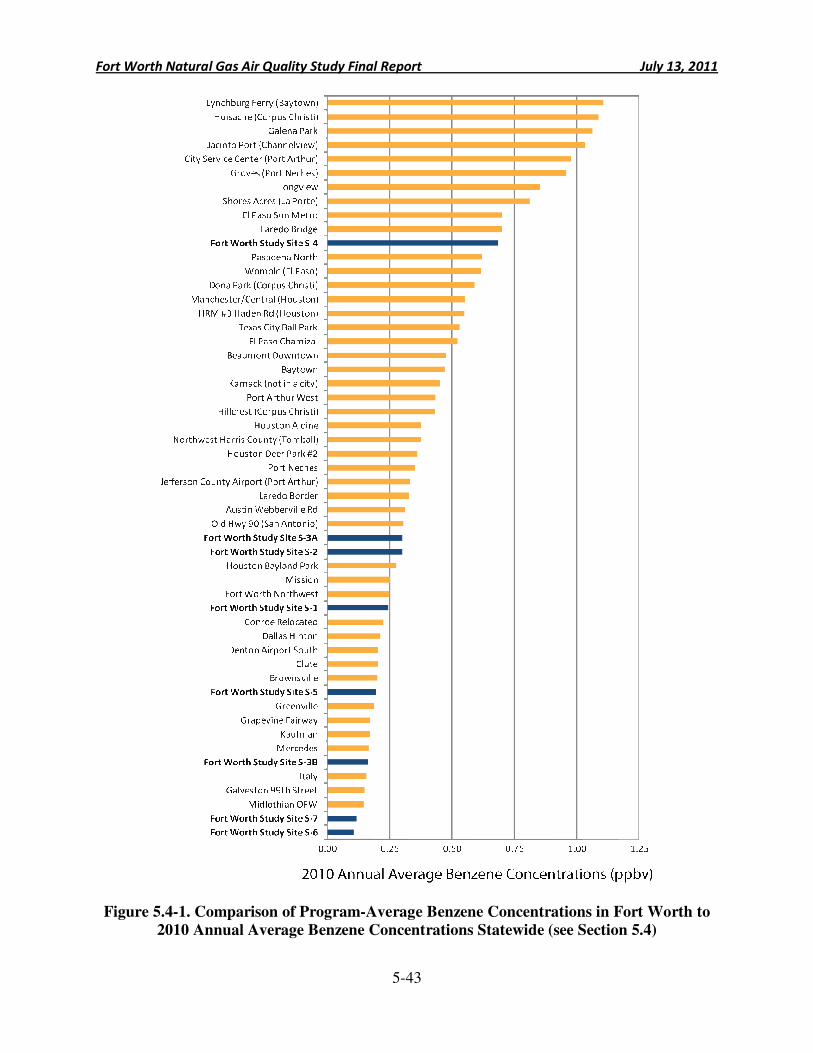
Fort Worth Natural Gas Air Quality Study Final Report July 13, 2011
5-43
Figure 5.4-1. Comparison of Program-Average Benzene Concentrations in Fort Worth to
2010 Annual Average Benzene Concentrations Statewide (see Section 5.4)
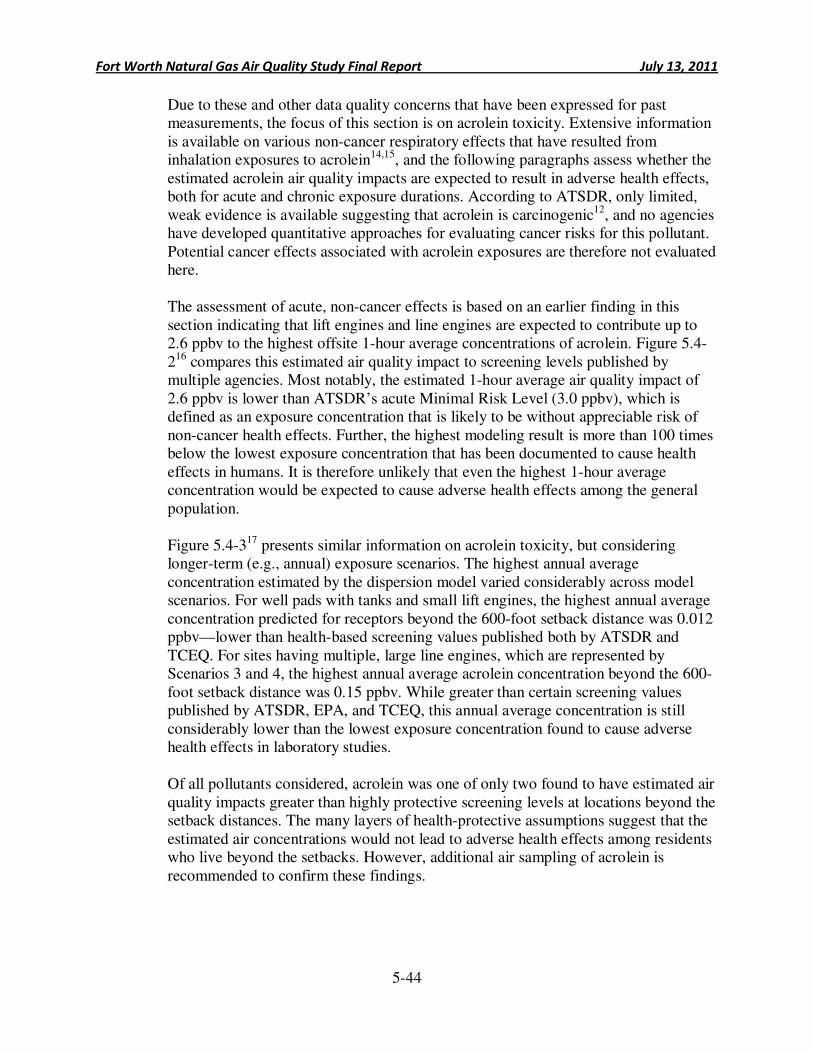
Fort Worth Natural Gas Air Quality Study Final Report July 13, 2011
5-44
Due to these and other data quality concerns that have been expressed for past measurements, the focus of this section is on acrolein toxicity. Extensive information is available on various non-cancer respiratory effects that have resulted from inhalation exposures to acrolein14,15, and the following paragraphs assess whether the estimated acrolein air quality impacts are expected to result in adverse health effects, both for acute and chronic exposure durations. According to ATSDR, only limited, weak evidence is available suggesting that acrolein is carcinogenic12, and no agencies have developed quantitative approaches for evaluating cancer risks for this pollutant. Potential cancer effects associated with acrolein exposures are therefore not evaluated here.
The assessment of acute, non-cancer effects is based on an earlier finding in this section indicating that lift engines and line engines are expected to contribute up to 2.6 ppbv to the highest offsite 1-hour average concentrations of acrolein. Figure 5.4-216 compares this estimated air quality impact to screening levels published by multiple agencies. Most notably, the estimated 1-hour average air quality impact of 2.6 ppbv is lower than ATSDR’s acute Minimal Risk Level (3.0 ppbv), which is defined as an exposure concentration that is likely to be without appreciable risk of non-cancer health effects. Further, the highest modeling result is more than 100 times below the lowest exposure concentration that has been documented to cause health effects in humans. It is therefore unlikely that even the highest 1-hour average concentration would be expected to cause adverse health effects among the general population.
Figure 5.4-317 presents similar information on acrolein toxicity, but considering longer-term (e.g., annual) exposure scenarios. The highest annual average concentration estimated by the dispersion model varied considerably across model scenarios. For well pads with tanks and small lift engines, the highest annual average concentration predicted for receptors beyond the 600-foot setback distance was 0.012 ppbv—lower than health-based screening values published both by ATSDR and TCEQ. For sites having multiple, large line engines, which are represented by Scenarios 3 and 4, the highest annual average acrolein concentration beyond the 600-foot setback distance was 0.15 ppbv. While greater than certain screening values published by ATSDR, EPA, and TCEQ, this annual average concentration is still considerably lower than the lowest exposure concentration found to cause adverse health effects in laboratory studies.
Of all pollutants considered, acrolein was one of only two found to have estimated air quality impacts greater than highly protective screening levels at locations beyond the setback distances. The many layers of health-protective assumptions suggest that the estimated air concentrations would not lead to adverse health effects among residents who live beyond the setbacks. However, additional air sampling of acrolein is recommended to confirm these findings.
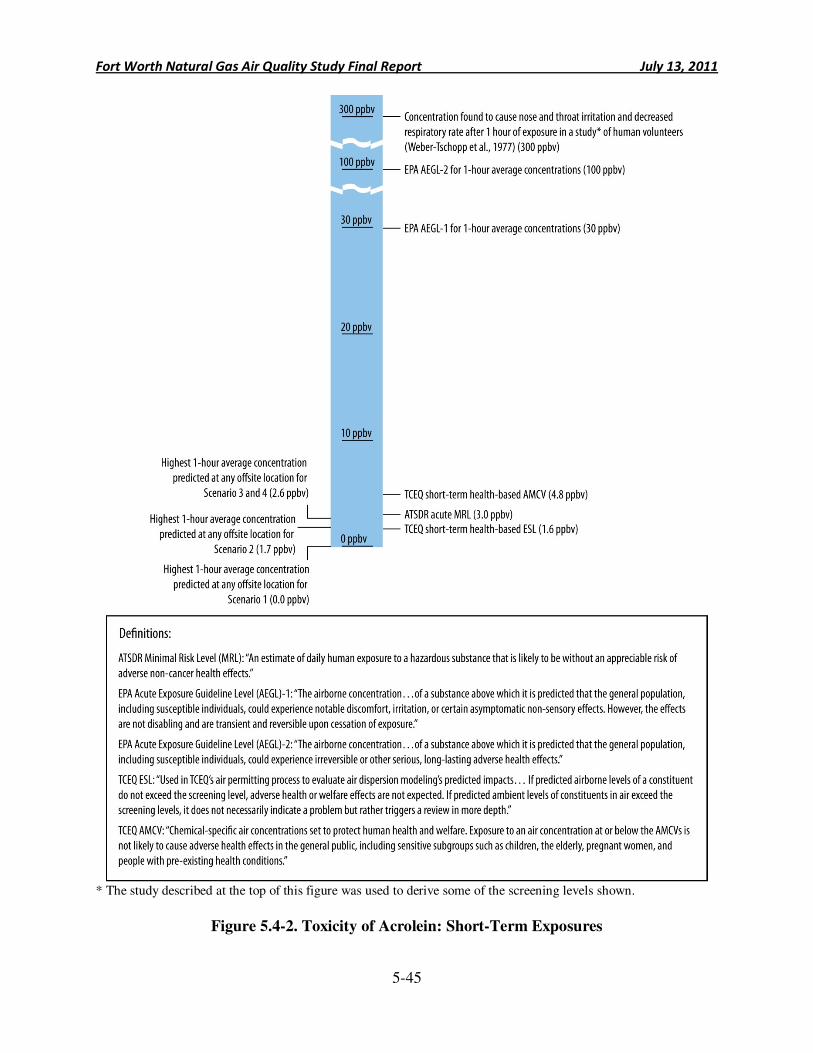
Fort Worth Natural Gas Air Quality Study Final Report July 13, 2011
5-45
* The study described at the top of this figure was used to derive some of the screening levels shown.
Figure 5.4-2. Toxicity of Acrolein: Short-Term Exposures
Fort Worth Natural Gas Air Quality Study Final Report July 13, 2011
5-46
* The study described at the top of this figure was used to derive some of the screening levels shown.
Figure 5.4-3. Toxicity of Acrolein: Long-Term Exposures
Fort Worth Natural Gas Air Quality Study Final Report July 13, 2011
5-47
• Formaldehyde. For additional context on measured and estimated formaldehyde levels, ERG compared program-average concentrations calculated for the two monitoring stations with available sampling data to 2010 annual average levels measured by TCEQ at six other locations statewide (see Figure 5.4-4). Data for the other monitoring stations were accessed from TCEQ’s Texas Air Monitoring Information System12 and processed following the same methodology that is documented for the benzene analysis. As Figure 5.4-4 shows, formaldehyde is routinely monitored at far fewer stations in comparison to benzene. However, at every other TCEQ station that met the site selection criteria, annual average concentrations of formaldehyde in 2010 were higher than the program-average concentrations calculated for monitoring sites S-4 and S-5. This suggests that the formaldehyde levels measured during the Fort Worth Natural Gas Air Quality Study were not elevated in comparison to other monitoring locations in Texas.
ERG also considered the health implications of the measured and modeled air quality impacts. This was done for both non-cancer health effects (for acute and chronic exposure durations) and for potential cancer effects (chronic exposures only). Figure 5.4-518 provides additional context on the health implications of short-term inhalation exposures to formaldehyde. All measured 24-hour average concentrations during the ambient air monitoring program were considerably lower than the most health-protective screening levels. Further, the highest 1-hour average concentration predicted by the model for the highest-emitting site (34 ppbv) was not only lower than ATSDR’s Minimal Risk Level, but substantially below the lowest concentration that has been shown to cause adverse acute health effects in humans. Accordingly, the peak formaldehyde air quality impacts identified in this study are not expected to cause acute health effects among city residents. For chronic exposure durations, the highest program-average formaldehyde concentration calculated from the monitoring data and the highest annual average formaldehyde concentration estimated by the dispersion model were both lower than every applicable non-cancer screening level published by ATSDR and TCEQ. Therefore, even when considering the highest-emitting sites, the long-term air quality impacts of formaldehyde are not expected to cause adverse non-cancer effects. Figure 5.4-619 provided additional context on the health implications of long term inhalation exposures to formaldehyde. ERG also considered cancer endpoints, given that formaldehyde has been classified as a human carcinogen. According to risk levels currently published on EPA’s Integrated Risk Information System (IRIS),1 formaldehyde concentrations between 0.06 ppbv and 6 ppbv are expected to have theoretical lifetime cancer risks between 1 in 1,000,000 and 1 in 10,000. This risk range is common for urban settings, and the theoretical cancer risks for Fort Worth are lower than those for every other monitoring site shown in Figure 5.4-4.
1 New scientific information is continually becoming available on the links between certain air pollutants and adverse health effects. This is particularly true for formaldehyde, for which EPA, the National Academy of Sciences, and other entities have very recently published updates and reviews of the chemical’s toxicity and carcinogenicity. However, EPA’s final formaldehyde inhalation assessment was not available at the time this report was completed.
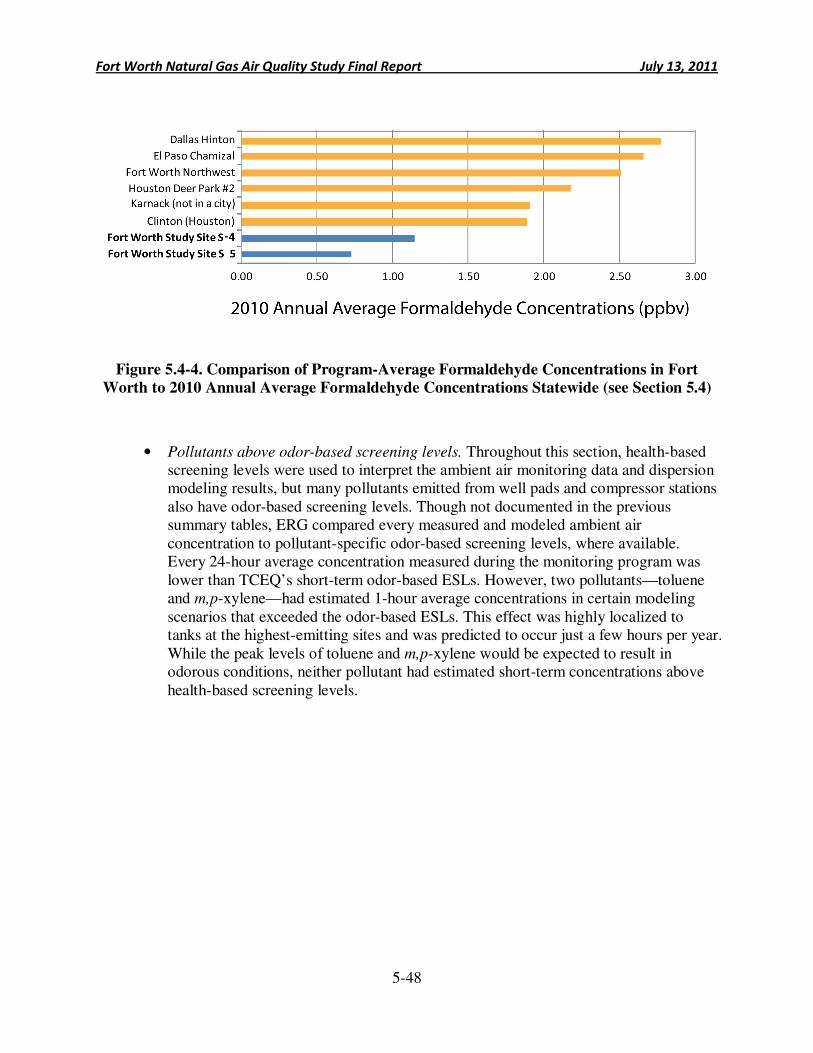
Fort Worth Natural Gas Air Quality Study Final Report July 13, 2011
5-48
Figure 5.4-4. Comparison of Program-Average Formaldehyde Concentrations in Fort
Worth to 2010 Annual Average Formaldehyde Concentrations Statewide (see Section 5.4)
• Pollutants above odor-based screening levels. Throughout this section, health-based screening levels were used to interpret the ambient air monitoring data and dispersion modeling results, but many pollutants emitted from well pads and compressor stations also have odor-based screening levels. Though not documented in the previous summary tables, ERG compared every measured and modeled ambient air concentration to pollutant-specific odor-based screening levels, where available. Every 24-hour average concentration measured during the monitoring program was lower than TCEQ’s short-term odor-based ESLs. However, two pollutants—toluene and m,p-xylene—had estimated 1-hour average concentrations in certain modeling scenarios that exceeded the odor-based ESLs. This effect was highly localized to tanks at the highest-emitting sites and was predicted to occur just a few hours per year. While the peak levels of toluene and m,p-xylene would be expected to result in odorous conditions, neither pollutant had estimated short-term concentrations above health-based screening levels.
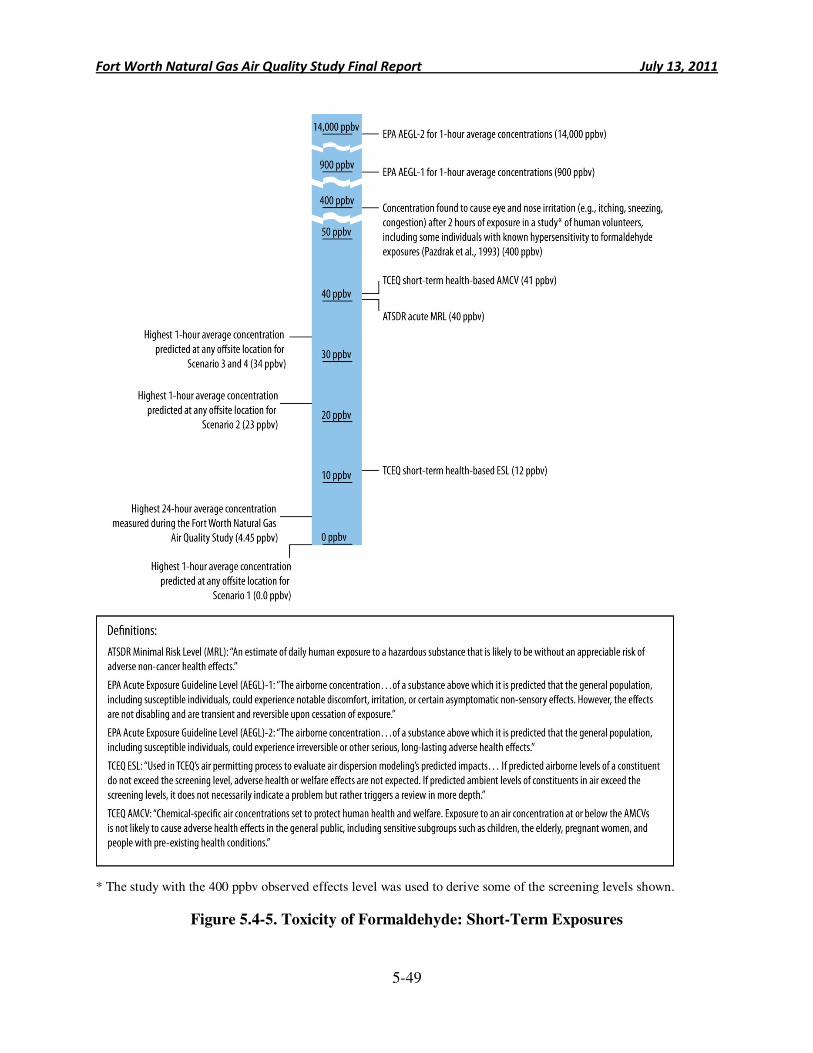
Fort Worth Natural Gas Air Quality Study Final Report July 13, 2011
5-49
* The study with the 400 ppbv observed effects level was used to derive some of the screening levels shown.
Figure 5.4-5. Toxicity of Formaldehyde: Short-Term Exposures
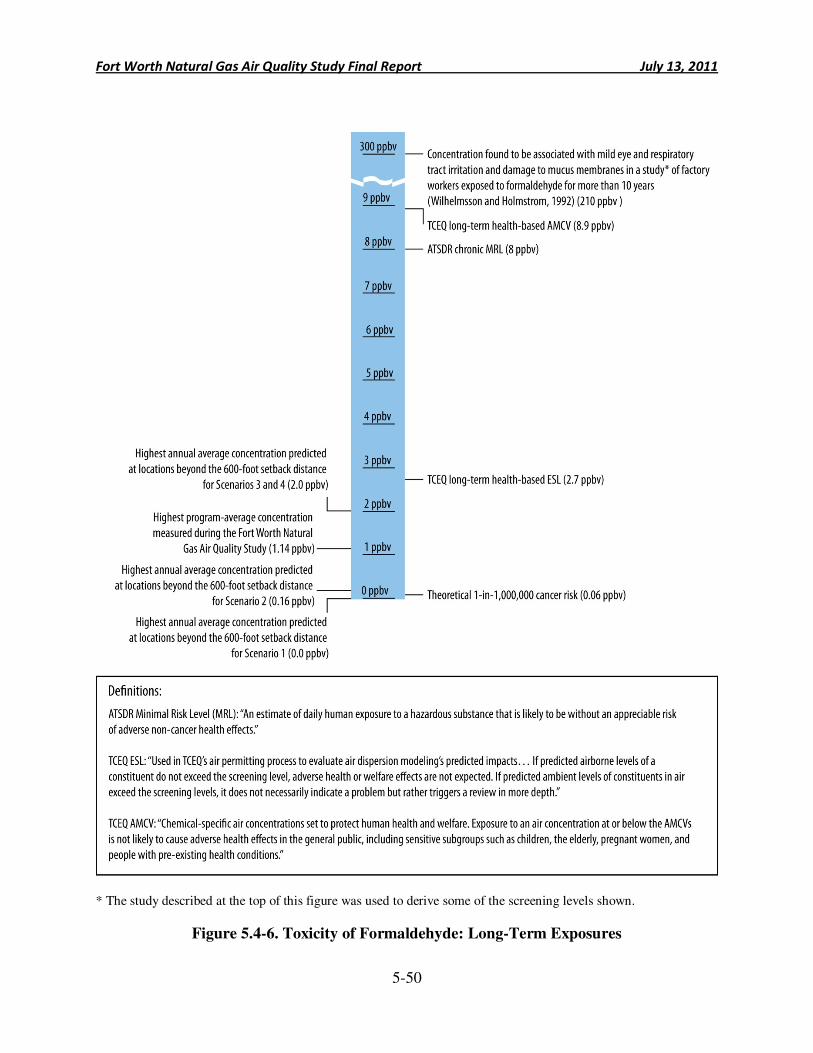
Fort Worth Natural Gas Air Quality Study Final Report July 13, 2011
5-50
* The study described at the top of this figure was used to derive some of the screening levels shown.
Figure 5.4-6. Toxicity of Formaldehyde: Long-Term Exposures
Fort Worth Natural Gas Air Quality Study Final Report July 13, 2011
5-51
5.5 Public Health Evaluation Conclusions
The ambient air monitoring conducted in Fort Worth found dozens of air pollutants above
detection limits. However, this is not uncommon for urban air quality, due to the complex mixture of emissions sources found in our country’s metropolitan areas. The presence of a pollutant in Fort Worth’s air likely reflects contributions from many different sources. Quantifying the extent to which natural gas exploration and production activity contributes to air quality is a complicated task, due to the confounding effect of other emission sources, such as motor vehicles, gasoline stations, and industrial sources. It is for this reason that the Fort Worth Natural Gas Air Quality Study considered two different approaches to evaluate air quality impacts from natural gas exploration and production activity.
First, ERG considered findings from the ambient air monitoring program, which directly measured air pollution levels at eight locations throughout Fort Worth. The ambient air monitoring data did not reveal any evidence of pollutants associated with natural gas exploration and production activity reaching concentrations above applicable screening levels: The highest 24-hour average concentrations of all site-related pollutants were lower than TCEQ’s health-based short-term screening levels, and the program-average concentrations of all site-related pollutants were lower than TCEQ’s health-based long-term screening levels. Even though the ambient air monitoring data provided useful insights into local air quality, review of modeling data was needed to consider potential air quality impacts at locations where and times when monitoring did not occur.
Next, ERG conducted a dispersion modeling analysis, which estimated air quality impacts that can be attributed specifically to emissions from well pads and compressor stations. These estimates were derived from measured emissions for tanks and fugitive sources and estimated emissions from compressor engines. The model was run for four different equipment configurations at well pads and compressor stations, and some modeling scenarios were based on the highest emission rates measured during the point source testing program. Most notably, the worst-case scenario assumed that the highest measured emission rates of all pollutants occurred at a single hypothetical site. The modeling analysis confirmed that benzene emissions from tanks could lead to air pollution levels slightly higher than TCEQ’s short-term ESL, but this occurred infrequently and only in very close proximity to the highest-emitting tanks. The modeling also indicated that sites containing multiple, large line engines can emit acrolein and formaldehyde at levels that would cause offsite ambient air concentrations to exceed TCEQ’s short-term and long-term screening levels over various distances. For all remaining pollutants considered, the modeling found no evidence of short-term or long-term air quality impacts at levels of health concern.
ERG considered both the modeling and monitoring results when assessing the adequacy of Fort Worth’s setback limits. The details of this analysis depend on multiple factors, including the pollutant, exposure duration, and well pad equipment configuration. Table 5.5-1 documents ERG’s main findings for different combinations of these factors. Overall, ERG concluded that the 600-foot setback distances are adequately protective of public health. Greater confidence in this finding can be gained through further study of acrolein and formaldehyde air quality impacts

Fort Worth Natural Gas Air Quality Study Final Report July 13, 2011
5-52
near sites with multiple, large line engines, especially when variances to the 600-foot setbacks are being considered for these higher-emitting facilities. TCEQ has recently completed an ambient air monitoring study that considered acrolein and formaldehyde levels in Fort Worth.20 The week-long monitoring effort found no evidence of acrolein and formaldehyde exceeding short-term health-based screening levels, but that study was limited in scope and duration. Routine monitoring over a longer duration near a site with multiple, large lift engines is encouraged.
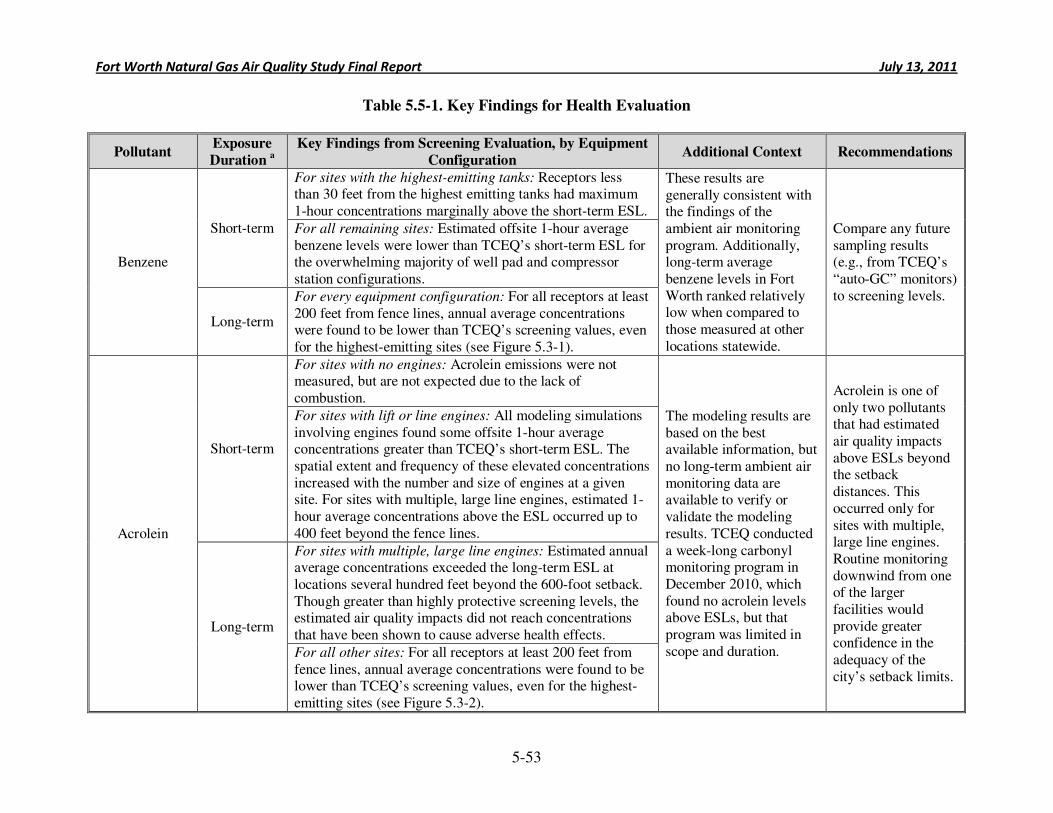
Fort Worth Natural Gas Air Quality Study Final Report July 13, 2011
5-53
Table 5.5-1. Key Findings for Health Evaluation
Pollutant Exposure
Duration a
Key Findings from Screening Evaluation, by Equipment
Configuration Additional Context Recommendations
Benzene
Short-term
For sites with the highest-emitting tanks: Receptors less than 30 feet from the highest emitting tanks had maximum 1-hour concentrations marginally above the short-term ESL.
These results are generally consistent with the findings of the ambient air monitoring program. Additionally, long-term average benzene levels in Fort Worth ranked relatively low when compared to those measured at other locations statewide.
Compare any future sampling results (e.g., from TCEQ’s “auto-GC” monitors) to screening levels.
For all remaining sites: Estimated offsite 1-hour average benzene levels were lower than TCEQ’s short-term ESL for the overwhelming majority of well pad and compressor station configurations.
Long-term
For every equipment configuration: For all receptors at least 200 feet from fence lines, annual average concentrations were found to be lower than TCEQ’s screening values, even for the highest-emitting sites (see Figure 5.3-1).
Acrolein
Short-term
For sites with no engines: Acrolein emissions were not measured, but are not expected due to the lack of combustion.
The modeling results are based on the best available information, but no long-term ambient air monitoring data are available to verify or validate the modeling results. TCEQ conducted a week-long carbonyl monitoring program in December 2010, which found no acrolein levels above ESLs, but that program was limited in scope and duration.
Acrolein is one of only two pollutants that had estimated air quality impacts above ESLs beyond the setback distances. This occurred only for sites with multiple, large line engines. Routine monitoring downwind from one of the larger facilities would provide greater confidence in the adequacy of the city’s setback limits.
For sites with lift or line engines: All modeling simulations involving engines found some offsite 1-hour average concentrations greater than TCEQ’s short-term ESL. The spatial extent and frequency of these elevated concentrations increased with the number and size of engines at a given site. For sites with multiple, large line engines, estimated 1-hour average concentrations above the ESL occurred up to 400 feet beyond the fence lines.
Long-term
For sites with multiple, large line engines: Estimated annual average concentrations exceeded the long-term ESL at locations several hundred feet beyond the 600-foot setback. Though greater than highly protective screening levels, the estimated air quality impacts did not reach concentrations that have been shown to cause adverse health effects.
For all other sites: For all receptors at least 200 feet from fence lines, annual average concentrations were found to be lower than TCEQ’s screening values, even for the highest-emitting sites (see Figure 5.3-2).
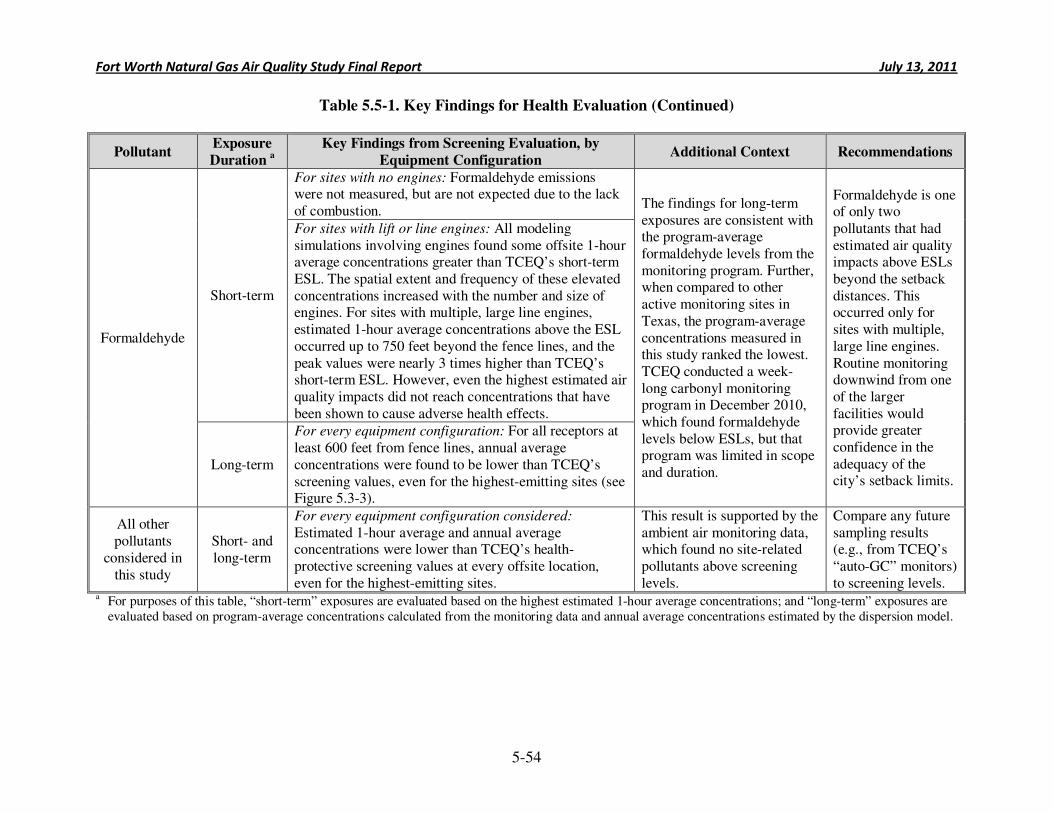
Fort Worth Natural Gas Air Quality Study Final Report July 13, 2011
5-54
Table 5.5-1. Key Findings for Health Evaluation (Continued)
Pollutant Exposure
Duration a
Key Findings from Screening Evaluation, by
Equipment Configuration Additional Context Recommendations
Formaldehyde
Short-term
For sites with no engines: Formaldehyde emissions were not measured, but are not expected due to the lack of combustion.
The findings for long-term exposures are consistent with the program-average formaldehyde levels from the monitoring program. Further, when compared to other active monitoring sites in Texas, the program-average concentrations measured in this study ranked the lowest. TCEQ conducted a week-long carbonyl monitoring program in December 2010, which found formaldehyde levels below ESLs, but that program was limited in scope and duration.
Formaldehyde is one of only two pollutants that had estimated air quality impacts above ESLs beyond the setback distances. This occurred only for sites with multiple, large line engines. Routine monitoring downwind from one of the larger facilities would provide greater confidence in the adequacy of the city’s setback limits.
For sites with lift or line engines: All modeling simulations involving engines found some offsite 1-hour average concentrations greater than TCEQ’s short-term ESL. The spatial extent and frequency of these elevated concentrations increased with the number and size of engines. For sites with multiple, large line engines, estimated 1-hour average concentrations above the ESL occurred up to 750 feet beyond the fence lines, and the peak values were nearly 3 times higher than TCEQ’s short-term ESL. However, even the highest estimated air quality impacts did not reach concentrations that have been shown to cause adverse health effects.
Long-term
For every equipment configuration: For all receptors at least 600 feet from fence lines, annual average concentrations were found to be lower than TCEQ’s screening values, even for the highest-emitting sites (see Figure 5.3-3).
All other pollutants
considered in this study
Short- and long-term
For every equipment configuration considered: Estimated 1-hour average and annual average concentrations were lower than TCEQ’s health-protective screening values at every offsite location, even for the highest-emitting sites.
This result is supported by the ambient air monitoring data, which found no site-related pollutants above screening levels.
Compare any future sampling results (e.g., from TCEQ’s “auto-GC” monitors) to screening levels.
a For purposes of this table, “short-term” exposures are evaluated based on the highest estimated 1-hour average concentrations; and “long-term” exposures are evaluated based on program-average concentrations calculated from the monitoring data and annual average concentrations estimated by the dispersion model.
Fort Worth Natural Gas Air Quality Study Final Report July 13, 2011
6-1
6.0 Regulatory Assessment
Under this task, facility-level emission estimates developed under Task 3 (point source testing) for well pads, compressor stations, and natural gas processing and treatment plants were evaluated against various federal and state air quality regulatory thresholds and standards applicable to these types of facilities. Regulatory standards considered include EPA’s operating and construction permit rules, National Emissions Standard for Hazardous Air Pollutants (NESHAPs), and New Source Performance Standards (NSPS); TCEQ’s permit-by-rule, standard permit, and other regulations applicable to upstream oil and gas facilities; and the city of Fort Worth’s Gas Well Drilling Ordinance.
This section has four sub-sections:
• 6.1 Federal Air Quality Rules – A description of potentially applicable U.S. EPA air quality rules are provided here.
• 6.2 Texas Commission on Environmental Quality Air Quality Rules – This section provides a discussion of potentially applicable TCEQ air quality rules.
• 6.3 City of Fort Worth Air Quality Rules – The city of Fort Worth’s Gas Well Drilling Ordinance (Ordinance No. 18449-02-2009) is discussed in this section.
• 6.4 Regulatory Assessment Conclusions – Provides a summary of the results of the regulatory assessment.
6.1 Federal Air Quality Rules
EPA regulates air emissions from stationary sources such as well pads and compressor
stations through a variety of regulatory mechanisms. In brief, these are:
• Operating permit rules
• Construction permit rules
• NSPS
• NESHAPs
• The Greenhouse Gas Reporting Program
These air quality regulations are discussed individually in Sections 6.1.1 through 6.1.5.
6.1.1 Operating Permits
Operating permits are legally enforceable documents that permitting authorities issue to
air pollution sources after the sources begin to operate. Depending on the magnitude of emissions from a facility, there are different types of operating permits available, with the largest sources (typically those emitting over 100 tons per year (tpy) of a regulated pollutant such as VOCs) required to obtain a Title V Operating permit. In Texas, these permits are issued by TCEQ as discussed below in Section 6.2.
Fort Worth Natural Gas Air Quality Study Final Report July 13, 2011
6-2
6.1.2 Construction Permits
Construction permits are legally enforceable documents that permitting authorities issue
to air pollution sources before construction. EPA regulations applicable to all new sources are included under the New Source Review (NSR) provisions, which are broken down into regulations for attainment areas and regulations for nonattainment areas. Tarrant County is considered a nonattainment area for ozone, which requires more stringent control of VOC and NOx emissions.
The state of Texas implements the federal NSR rules through its construction permit program. Under Title 30 of the Texas Administrative Code (TAC), Chapter 116, Subchapter B, oil and gas exploration and production facilities may be authorized to construct through TCEQ’s Permit-by-Rule (PBR), Standard Permit, or NSR permitting process. These types of permits are discussed in more detail below in Section 6.2.
6.1.3 New Source Performance Standards
NSPS regulations apply to new, modified, or reconstructed emission sources categorized by source type. For the oil and gas industry, the potentially applicable NSPS include the following:
• Subpart A—General Requirements (including flares)
• Subparts K and Ka—Storage Vessels for Petroleum Liquids
• Subpart Kb—Volatile Organic Liquid Storage Vessels (including Liquid Storage)
• Subpart GG—Stationary Gas Turbines
• Subpart KKK—Equipment Leaks of VOC from Onshore Natural Gas Processing Plants
• Subpart LLL—Onshore Natural Gas Processing: SO2 Emissions
• Subpart IIII—Stationary Compression Ignition Internal Combustion Engines
• Subpart JJJJ—Stationary Spark Ignition Internal Combustion Engines
• Subpart KKKK—Stationary Combustion Engines
A brief discussion of each of these regulations follows. Where possible, a preliminary determination of compliance and applicability status with respect to the sites visited under the point source task has been made. However, a formal and comprehensive compliance and applicability assessment is not possible for each facility without a complete record of construction, monitoring, and recordkeeping activities.
Subparts K and Ka—Storage Vessels for Petroleum Liquids. These regulations apply to storage vessels for volatile organic liquids (including petroleum) built or modified after June 11, 1973 (Subpart K), or after May 18, 1978 (Subpart Ka). These rules apply to storage tanks with a design capacity greater than 40,000 gallons. None of the tanks visited under Task 3 have
Fort Worth Natural Gas Air Quality Study Final Report July 13, 2011
6-3
capacities greater than 40,000 gallons, so it appears that none of the visited tanks are subject to these rules.
Subpart Kb—Volatile Organic Liquid Storage Vessels (Including Liquid Storage). This regulation applies to storage vessels for volatile organic liquids (including petroleum) built or modified after July 23, 1984 (Subpart Kb) and with a capacity greater than 19,800 gallons. Six tanks that were visited under Task 3 appear to have capacities greater than 19,800 gallons. However, the rule does not apply to “Vessels with a design capacity less than or equal to 1,589.874 m3 (~420,000 gallons) used for petroleum or condensate stored, processed, or treated prior to custody transfer.” Therefore, this rule does not appear to apply to any storage tanks visited under Task 3.
Subpart GG—Stationary Gas Turbines. This regulation applies to stationary gas turbines
with a heat input at peak load greater than 10 million British thermal units (Btu) per hour. This rule limits NOx and SO2 emissions from subject facilities. ERG did not identify any gas turbines under Task 3.
Subpart KKK—Equipment Leaks of VOC from Onshore Natural Gas Processing Plants.
This regulation applies to onshore natural gas processing plants as defined as “any processing site engaged in the extraction of natural gas liquids from field gas, fractionation of mixed natural gas liquids to natural gas products, or both.” This rule requires VOC leak detection and repair at facilities that remove natural gas liquids from field gas. Site PS-159 (the Crosstex Amine Treatment Center) could be subject to this rule. However, status of compliance with the monitoring requirements under this rule cannot be determined using the data obtained at the time of the survey.
Subpart LLL—Onshore Natural Gas Processing: SO2 Emissions. This regulation applies
to sweetening units (process devices that remove hydrogen sulfide (H2S) and CO2 contents from sour natural gas) and sulfur recovery units at facilities that process natural gas. Sour natural gas is natural gas with an H2S concentration greater than 0.25 grains per 100 standard cubic feet. The natural gas in the Barnett Shale is not considered to be sour natural gas, so this rule does not appear to apply to any facilities in Fort Worth.
Subpart IIII—Stationary Compression Ignition Internal Combustion Engines. This
regulation applies to compression ignition internal combustion engines of various sizes, dependent upon date of construction. Much of this regulation is applicable to engine manufacturers themselves, not the engine users. This rule limits combustion emissions (hydrocarbons, NOx, CO, and PM) from subject engines, which were not tested as part of this project. While this rule may apply to engines used at natural gas well pads and compressor stations in Fort Worth, no applicability or compliance determination can be made at this time.
Subpart JJJJ—Stationary Spark Ignition Internal Combustion Engines. This regulation,
similar to Subpart IIII, applies to stationary spark ignition internal combustion engines of various sizes, dependent upon date of construction. Much of this regulation is applicable to engine manufacturers themselves, not the engine users. This rule limits combustion emissions (VOC, NOx, and CO) from subject engines, which were not tested as part of this project. While this rule
Fort Worth Natural Gas Air Quality Study Final Report July 13, 2011
6-4
may apply to engines used at natural gas well pads and compressor stations in Fort Worth, no applicability or compliance determination can be made at this time.
Subpart KKKK—Stationary Combustion Turbines. This regulation applies to stationary
combustion turbines constructed, modified, or reconstructed after February 18, 2005. This rule limits NOx and SO2 emissions from subject facilities. ERG did not identify any gas turbines under Task 3.
6.1.4 National Emission Standards for Hazardous Air Pollutants
NESHAPs regulate HAPs from new and existing stationary sources. For the oil and gas industry, the potentially applicable NESHAPs include the following:
• Subpart H—Organic Hazardous Air Pollutants for Equipment Leaks
• Subpart V—Equipment Leaks (Fugitive Emission Sources)
• Subpart HH—Oil and Natural Gas Production Facilities
• Subpart VV—Oil-Water Separators and Organic-Water Separators
• Subpart HHH—Natural Gas Transmission and Storage Facilities
• Subpart YYYY—Stationary Combustion Turbines
• Subpart ZZZZ—Stationary Reciprocating Internal Combustion Engines
A brief discussion of each of these rules follows. Where possible, a preliminary determination of compliance and applicability status with respect to the sites visited under the point source task has been made. However, a formal and comprehensive compliance and applicability assessment is not possible for each facility without a complete record of construction, monitoring, and recordkeeping activities.
Many of the NESHAP regulations apply only to major HAP sources, those defined as emitting greater than 10 tpy of any single HAP, or 25 tpy of all HAPs combined. As a result of the point source testing task, three potential major HAP sources were identified, including two compressor stations (Site IDs PS-118 and PS-119) and the gas processing plant (Site ID PS-159). All of these facilities were determined to be major HAP sources due to formaldehyde emissions from their compressor engines. Due to the conservative nature of the emissions estimation approach used for these engines (24-hour-per-day, 365-day-per-year operation of all the engines at the facility without controls), a full compliance evaluation would need to be made to definitively conclude whether or not these facilities are major sources of HAP.
Subpart H—Organic Hazardous Air Pollutants for Equipment Leaks. This regulation applies to sources subject to other NESHAP rules under 40 CFR Part 63 that specifically point back to this rule. As such, any applicability under Subpart H would be referenced in the rules discussed below.
Subpart V—Equipment Leaks (Fugitive Emission Sources). This regulation applies to pumps, compressors, pressure relief devices, sampling connection systems, open-ended valves or
Fort Worth Natural Gas Air Quality Study Final Report July 13, 2011
6-5
lines, valves, connectors, surge control vessels, bottoms receivers, and control devices or systems that are intended to operate in volatile HAP service. However, this rule is only triggered when the fluid or gas flowing through the equipment contains at least 10% by weight of a volatile HAP. No sources visited under Task 3 have volatile HAP concentrations of 10% or greater.
Subpart HH—Oil and Natural Gas Production Facilities. This regulation applies to oil and gas production facilities. There are different requirements for major and minor HAP sources, based on the magnitude of emissions. Requirements for major HAP sources include controlling HAP from tanks with flash emissions, controlling equipment leaks, and controlling glycol dehydrators. As discussed above, there are three potential major HAP sources that were visited that may be subject to the major source provisions of this regulation.
For minor HAP sources, there are limited requirements under this rule for triethylene
glycol dehydration units, and those requirements are dependent upon the throughput or benzene emissions. For sources with benzene emissions less than 1 tpy, the only requirement is to maintain records verifying the benzene emission rate. There was one source visited under Task 3 that was estimated to emit over one tpy of benzene, the gas processing plant (PS-159). The remainder of the sites emitted less than one tpy of benzene. The only requirement applicable to these sources would be to keep records (as defined under the rule) of benzene emissions.
Subpart VV—Oil-Water Separators and Organic-Water Separators. This regulation applies to facilities that control air emissions from oil-water and organic-water separators. However, it only applies when another NESHAP subpart references it. No such facilities have been identified under this project.
Subpart HHH—Natural Gas Transmission and Storage Facilities. This regulation applies to owners and operators of natural gas transmission and storage facilities that transport or store natural gas before it enters the pipeline to a local distribution company or a final end user, and that are major sources of HAPs. A compressor station that transports natural gas prior to the point of custody transfer or to a natural gas processing plant (if present) is not considered a part of the natural gas transmission and storage source category. If applicable, this rule would require control of emissions from any glycol dehydration unit that emits more than 1 tpy of benzene. As mentioned above, the gas processing plant (PS-159) was the only facility estimated to emit over one tpy of benzene, with estimated benzene emissions at 1.2 tpy.
Subpart YYYY—Stationary Combustion Turbines. This regulation applies to stationary combustion turbines located at major sources of HAPs. ERG did not identify any stationary combustion turbines under Task 3.
Subpart ZZZZ—Stationary Reciprocating Internal Combustion Engines. This regulation applies to stationary reciprocating internal combustion engines located at major and area sources of HAPs. The applicability of this rule depends on both the construction date and the size of the engine. For many of the engines subject to this rule in Fort Worth, the only requirements are to comply with 40 CFR part 60 subpart IIII for compression ignition engines, or 40 CFR part 60 subpart JJJJ for spark ignition engines, as discussed in Section 6.1.3. Certain engines may also be required to specifically control formaldehyde emissions.
Fort Worth Natural Gas Air Quality Study Final Report July 13, 2011
6-6
6.1.5 Greenhouse Gas Reporting Program
On November 8, 2010, EPA signed a rule that finalizes reporting requirements for the petroleum and natural gas industry under 40 CFR Part 98, the regulatory framework for the Greenhouse Gas Reporting Program. In short, Subpart W of Part 98 requires petroleum and natural gas facilities that emit 25,000 metric tons or more of CO2 equivalent per year to report annual methane and CO2 emissions from equipment leaks and venting, and emissions of CO2, methane, and nitrous oxide from gas flaring and from onshore petroleum and natural gas production stationary and portable combustion emissions and combustion emissions from stationary equipment involved in natural gas distribution. However, this rule does not require facilities to report their emissions until March 31, 2012, at which time emissions for the 2011 calendar year will need to be reported for subject facilities.
Based on the results of the point source testing, there are several facilities with methane emissions from equipment leaks and venting that emit over 8,000 metric tons of CO2 equivalents per year. In addition, emissions from compressor engine exhausts are likely to account for a significant amount of CO2 (a single 2,000 hp engine may emit over 7,000 metric tons of CO2 equivalents per year), which would result in many of the larger compressor stations exceeding the annual threshold of 25,000 metric tons of CO2 equivalent emissions. As such, it appears that several facilities in the city of Fort Worth will be required to report their greenhouse gas emissions to EPA under this rule beginning in 2012.
However, it should be noted that there is some uncertainty as to the applicability of this rule, and EPA is currently actively providing guidance and rule interpretation to the oil and gas industry as they prepare to begin reporting emissions next year. 6.2 Texas Commission on Environmental Quality Air Quality Rules
Like EPA, TCEQ regulates air emissions from stationary sources related to upstream oil and gas facilities through a variety of regulatory mechanisms:
• PBRs
• Standard permits
• NSR permits
• Control of Air Pollution from Visible Emissions and Particulate Matter
• Control of Air Pollution from Sulfur Compounds
• Standards of Performance for Hazardous Air Pollutants and for Designated Facilities and Pollutants
• Control of Air Pollution from Volatile Organic Compounds
• Control of Air Pollution from Nitrogen Compounds
• Federal operating permits
These air quality regulations are discussed individually in Sections 6.2.1 through 6.2.9. Where possible, a preliminary determination of compliance and applicability status with respect
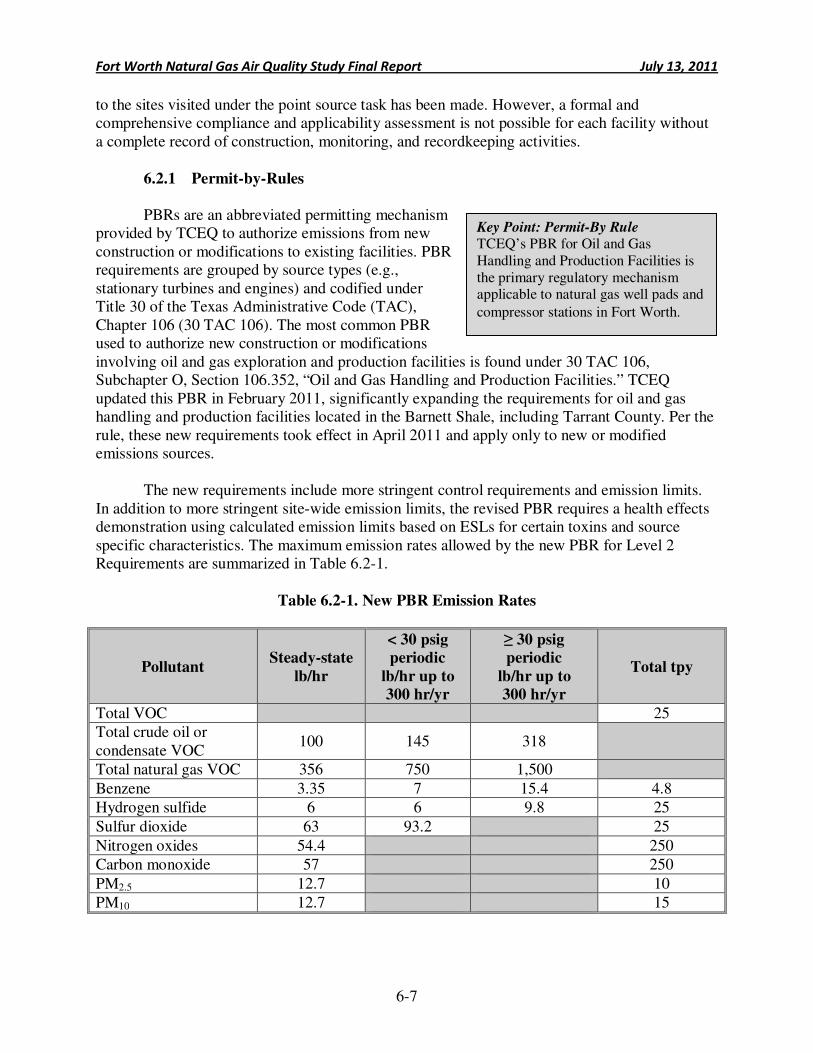
Fort Worth Natural Gas Air Quality Study Final Report July 13, 2011
6-7
Key Point: Permit-By Rule TCEQ’s PBR for Oil and Gas Handling and Production Facilities is the primary regulatory mechanism applicable to natural gas well pads and
compressor stations in Fort Worth.
to the sites visited under the point source task has been made. However, a formal and comprehensive compliance and applicability assessment is not possible for each facility without a complete record of construction, monitoring, and recordkeeping activities.
6.2.1 Permit-by-Rules
PBRs are an abbreviated permitting mechanism provided by TCEQ to authorize emissions from new construction or modifications to existing facilities. PBR requirements are grouped by source types (e.g., stationary turbines and engines) and codified under Title 30 of the Texas Administrative Code (TAC), Chapter 106 (30 TAC 106). The most common PBR used to authorize new construction or modifications involving oil and gas exploration and production facilities is found under 30 TAC 106, Subchapter O, Section 106.352, “Oil and Gas Handling and Production Facilities.” TCEQ updated this PBR in February 2011, significantly expanding the requirements for oil and gas handling and production facilities located in the Barnett Shale, including Tarrant County. Per the rule, these new requirements took effect in April 2011 and apply only to new or modified emissions sources.
The new requirements include more stringent control requirements and emission limits. In addition to more stringent site-wide emission limits, the revised PBR requires a health effects demonstration using calculated emission limits based on ESLs for certain toxins and source specific characteristics. The maximum emission rates allowed by the new PBR for Level 2 Requirements are summarized in Table 6.2-1.
Table 6.2-1. New PBR Emission Rates
Pollutant Steady-state
lb/hr
< 30 psig
periodic
lb/hr up to
300 hr/yr
≥ 30 psig
periodic
lb/hr up to
300 hr/yr
Total tpy
Total VOC 25 Total crude oil or condensate VOC
100 145 318
Total natural gas VOC 356 750 1,500
Benzene 3.35 7 15.4 4.8 Hydrogen sulfide 6 6 9.8 25
Sulfur dioxide 63 93.2 25
Nitrogen oxides 54.4 250 Carbon monoxide 57 250
PM2.5 12.7 10 PM10 12.7 15
Fort Worth Natural Gas Air Quality Study Final Report July 13, 2011
6-8
The ESL based emission limits are site and source specific based on the source characteristics and the distance of the source relative to the nearest off-site receptor.
Based on the emission estimates developed under Task 3, most of the facilities surveyed
would likely meet the new site-wide emissions limits if they were applicable, except for two compressor stations (Site IDs PS-118 and PS-127) and the gas processing facility (Site ID PS-159). The emissions estimates for CO from these three sites are above the CO lb/hr emission limits. A complete comparison to the new ESL based emission limits cannot be determined using the data collected during the point source testing.
As the new PBR rule was not in effect at the time of the point source testing, it is likely
that most of the emissions sources located at the sites tested in Task 3 were previously authorized and were operating under the old PBR requirements outlined in 30 TAC Section 106.352(l). Under the old PBR requirements, total emissions could not exceed 25 tpy each of SO2, all other sulfur compounds combined, or all VOCs combined or 250 tpy each of NOx and CO. Total emissions of sulfur compounds, excluding sulfur oxides, from all vents could not exceed 4.0 pounds per hour. Through the point source testing task, three potential sources were identified, including two compressor stations (Site IDs PS-118 and PS-119) and the gas processing plant (Site ID PS-159), with site-wide emissions exceeding the 25 tpy VOC limit. Additionally, estimated CO emissions from two compressor stations (Site IDs PS-118 and PS-127) and the gas processing plant (Site ID PS-159) exceed the 250 tpy threshold. For each of these facilities, it appears that emissions from the natural gas compressor engines cause them to exceed PBR thresholds.
30 TAC Section 106.352(l) also requires compressors and flares to meet the requirements of §106.492 and §106.512 of 30 TAC (relating to flares and stationary engines and turbines, respectively). 30 TAC §106.512 limits NOx emissions, depending on engine type (rich-burn or lean-burn), fuel type (gas-fired, dual fuel-fired, liquid fuel-fired) and manufacturing date.
Compliance with the emission specification requirements under the PBR rules cannot be determined using the data obtained at the time of the survey. Records of manufacturing dates and the dates in which existing sources were last modified would be required to complete a full compliance assessment for any individual facility.
6.2.2 Standard Permit
Similar to PBRs, standard permits are an abbreviated permitting mechanism provided by TCEQ to authorize emissions from new construction or modifications. However, standard permits generally require more stringent emission controls meeting what is considered the best available control technology (BACT). New construction or modifications involving oil and gas exploration and production facilities permitted by standard permit must meet the requirements provided under 30 TAC Chapter 116, Subchapter F, Section 116.620, “Installation and/or Modification of Oil and Gas Facilities.” The standard permit issued by TCEQ often includes site-specific requirements including, but not limited to, site-wide and/or source-specific emission limits. While some of the facilities visited in Task 3 may have been authorized under a standard permit, no information on these was available during this review.
Fort Worth Natural Gas Air Quality Study Final Report July 13, 2011
6-9
6.2.3 New Source Review Permits
New construction or projects involving modifications to existing facilities that cannot meet the requirements of an applicable PBR or standard permit must be authorized prior to start of construction under 30 TAC Chapter 116, Subchapter B, “New Source Review Permits.” This permitting mechanism requires installation of either BACT or lowest achievable emission reductions, depending on whether the source is located in an attainment or a non-attainment area. Tarrant County is located in a non-attainment area for ozone, so the latter would be required for project sources emitting VOCs and NOx; BACT would be required for all other project-related criteria pollutants. NSR permits also require two public notice periods and a health impacts review to evaluate to potential health impacts from certain toxins associated with the project-related emissions. The NSR permit issued by TCEQ often includes site-specific requirements including, but not limited to, site-wide and/or source-specific emission limits. NSR permits issued for the sites visited under Task 3 were considered outside the scope of this study, and were therefore not reviewed.
6.2.4 Control of Air Pollution from Visible Emissions and Particulate Matter
This rule regulates the amount of visible emissions and particulate matter that are permissible from any source operated in Texas. Visible emissions from stationary vents are not allowed to exceed opacities greater than 30% averaged over a six-minute period, 20% averaged over a six-minute period for any source on which construction was begun after January 31, 1972, or 15% averaged over a six-minute period for any source having a total flowrate greater than or equal to 100,000 actual cubic feet per minute, unless an optical instrument capable of measuring the opacity of emissions is installed in the vent. No visible emissions were observed from stationary vents located at the sites visited under Task 3. Visible emissions from a process gas flare used in routine or scheduled facility operations are not allowed for more than five minutes in any two-hour period. Two sites visited during Task 3 operated flares; however, compliance status with the requirements under this rule cannot be determined using the data obtained at the time of the survey. Compliance status with this requirement cannot be determined for the vents visited using the data obtained at the time of the survey. However, considering the nature of material (i.e., natural gas) being managed at the sites studied, the particulate matter emission rate limits specified are not expected to be exceeded.
6.2.5 Control of Air Pollution from Sulfur Compounds
This rule regulates the amount of sulfur compound emissions, particularly SO2, H2S, sulfuric acid, and total reduced sulfur, that are permissible from certain sources operated in Texas. Those sulfur compounds applicable to the operation of oil and gas facilities are SO2 and H2S. SO2 emissions from a source or sources operated on a property or multiple sources operated on contiguous properties cannot cause an exceedance of a net ground level concentration of 0.4 parts per million by volume (ppmv) averaged over any 30-minute period. H2S from a source or sources operated on a property or multiple sources operated on contiguous properties are also limited; the specific limit depends on the affected downwind sources.
Fort Worth Natural Gas Air Quality Study Final Report July 13, 2011
6-10
Compliance with the ground-level concentration requirements under this rule cannot be determined using the data obtained at the time of the survey. As mentioned previously, the natural gas in the Barnett Shale is not considered to be sour natural gas, so this rule does not appear to apply to any facilities in Fort Worth.
6.2.6 Standards of Performance for Hazardous Air Pollutants and for Designated
Facilities and Pollutants
This rule simply incorporates, by reference, all of the federal NESHAPs that regulate HAPs from new and existing stationary sources. Section 6.1.4 lists and briefly describes the potentially applicable NESHAPs for the oil and gas industry.
6.2.7 Control of Air Pollution from Volatile Organic Compounds
This rule regulates the amount of VOCs that are permissible from sources operated in Texas. The rule requirements are organized by source type under 30 TAC Chapter 115 and only apply to sources located in non-attainment areas specified in the rule. Those parts of the rule that are potentially subject to upstream oil and gas facilities are Subchapter B, Division 1, “Storage of VOCs”; Subchapter C, Division 1, “Loading and Unloading of VOCs”; and Subchapter D, Division 3, “Fugitive Emission Control in Petroleum Refining, Natural Gas/Gasoline Processing, and Petrochemical Processes in Ozone Non-attainment Areas.” Storage tanks containing VOCs including, but not limited to, crude or condensate must control emissions using control technologies specified in the rule. Control options vary depending on the size of the tank and its configuration. Loading of certain VOC materials must be controlled by a vapor control system that maintains a control efficiency of at least 90%, a vapor balance system, or pressurized loading. This rule also requires VOC leak detection and repair at natural gas/gasoline processing operations. Site PS-159 (the Crosstex Amine Treatment Center) could be subject to this rule.
Compliance status with the control and monitoring requirements under this rule cannot be determined using the data obtained at the time of the survey.
6.2.8 Control of Air Pollution from Nitrogen Compounds
This rule regulates the amount of nitrogen compounds that are permissible from sources
operated in Texas. Similar to 30 TAC Chapter 115, the rule requirements for this chapter are organized by source type under 30 TAC Chapter 117 and only apply to sources located in non-attainment areas specified in the rule. Those parts of the rule that are most commonly subject to upstream oil and gas facilities are found under Subchapter D, “Combustion Control at Minor Sources in Ozone Non-attainment Areas.” For the Dallas–Fort Worth area, including Tarrant County, NOx emissions from stationary internal combustion engines at any minor stationary source of NOx (a source that emits less than 250 tpy) are limited, depending on engine type and construction date. Most engines at sites visited under Task 3 would be subject to a limit of 0.50 grams of NOx per hp per hour.
Compliance with the emission specification requirements under this rule cannot be determined using the data obtained at the time of the survey. Records of manufacturing dates and
Fort Worth Natural Gas Air Quality Study Final Report July 13, 2011
6-11
the dates in which existing sources were last modified would be required to complete a full compliance assessment for any individual engine.
6.2.9 Federal Operating Permits
The Title V Federal Operating Permit Program is regulated under 30 TAC Chapter 122.
Title V operating permits are required for any site that is a major source. A major source is a site which that emits, or has the potential to emit, 100 tpy or more of any air pollutant. A site is also considered a major source if it emits or has the potential to emit, in the aggregate, 10 tpy or more of any single hazardous air pollutant listed under the federal Clean Air Act or 25 tpy or more of any combination of hazardous air pollutants listed under the Act. One of the primary objectives of the Title V operating program is to assimilate in one document all of the requirements to which a facility is subject. The Title V permit serves as the key verification and documentation of a facility’s compliance with all applicable requirements of the Texas and federal Clean Air Acts. Permit holders must annually certify compliance with the permit terms and conditions and submit semi-annual deviation reports in which they self-disclose known non-compliance activities during the reporting period.
Five potential major sources were identified, including three compressor stations (Site IDs PS-118, PS-119, PS-127), the gas processing plant (Site ID PS-159), and one well pad (Site ID 238). All of these facilities were determined to be major sources due to formaldehyde and/or CO emissions from their compressor engines. However, due to the conservative nature of the emissions estimation approach used for these engines (24-hour-per-day, 365-day-per-year operation of all the engines at the facility without controls), a full compliance evaluation would need to be made to definitively conclude whether or not these facilities are major sources and subject to the Title V Federal Operating Program. 6.3 City of Fort Worth Air Quality Rules
The city of Fort Worth’s Gas Well Drilling Ordinance (Ordinance No. 18449-02-2009)
has one provision that requires air emissions control. Under Section 15-42 of this ordinance, tank batteries with a rolling annual aggregate emissions rate of 25 tpy or more of VOC must use vapor recovery equipment with a 95% recovery efficiency. Based on the results of the point source testing under Task 3, two compressor stations (Site IDs PS-118 and PS-119) and the gas processing plant (Site ID PS-159) have facility-wide VOC emissions greater than 25 tpy. However, the majority of the VOC emissions at these sites come from non-tank emission points and the natural-gas-fired compression engines, and none of these facilities have VOC emissions from their storage tank batteries exceeding 25 tpy. Therefore, based on the results of Task 3, this rule does not appear to apply to any of the tested facilities. 6.4 Regulatory Assessment Conclusions
A regulatory assessment was conducted based on the results of the point source testing to determine if any facilities exceeded regulatory thresholds. For many of the rules potentially applicable to oil and gas sources in Fort Worth, we were unable to make a definitive determination on whether the source was subject to the rule, and/or whether the source was in
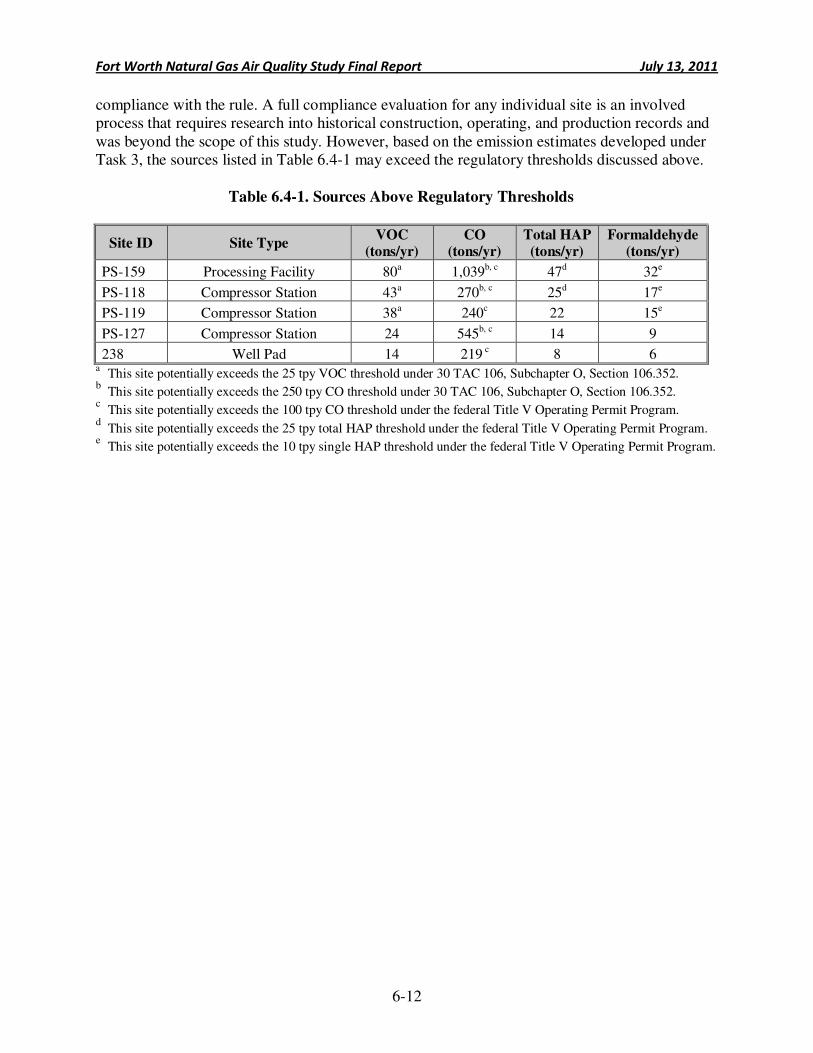
Fort Worth Natural Gas Air Quality Study Final Report July 13, 2011
6-12
compliance with the rule. A full compliance evaluation for any individual site is an involved process that requires research into historical construction, operating, and production records and was beyond the scope of this study. However, based on the emission estimates developed under Task 3, the sources listed in Table 6.4-1 may exceed the regulatory thresholds discussed above.
Table 6.4-1. Sources Above Regulatory Thresholds
Site ID Site Type VOC
(tons/yr) CO
(tons/yr) Total HAP (tons/yr)
Formaldehyde (tons/yr)
PS-159 Processing Facility 80a 1,039b, c 47d 32e
PS-118 Compressor Station 43a 270b, c 25d 17e
PS-119 Compressor Station 38a 240c 22 15e
PS-127 Compressor Station 24 545b, c 14 9
238 Well Pad 14 219 c 8 6 a
This site potentially exceeds the 25 tpy VOC threshold under 30 TAC 106, Subchapter O, Section 106.352. b
This site potentially exceeds the 250 tpy CO threshold under 30 TAC 106, Subchapter O, Section 106.352. c
This site potentially exceeds the 100 tpy CO threshold under the federal Title V Operating Permit Program. d
This site potentially exceeds the 25 tpy total HAP threshold under the federal Title V Operating Permit Program. e
This site potentially exceeds the 10 tpy single HAP threshold under the federal Title V Operating Permit Program.
Fort Worth Natural Gas Air Quality Study Final Report July 13, 2011
7-1
Key Point: Full Build-Out Estimates ERG projects that emissions from natural gas production operations in Fort Worth will peak in 2012 and
2013 before beginning to decline.
7.0 Full Build-Out Estimates
Over the last five years, there has been a dramatic increase in natural gas production in the Barnett Shale, and in the city of Fort Worth itself. The expansion of the natural gas industry within the city is expected to continue into the future, and emissions from these activities are also expected to increase. ERG has developed estimates of total emissions from natural gas production from 2010 to 2018, based on the results of the point source testing task. As described below, ERG projects that emissions from natural gas production will peak in 2012 and 2013, and will slowly decline over time as the known natural gas reserves in the Barnett Shale are depleted. In this context, “full build-out” means the point at which natural production will result in the maximum annual emissions. For purposes of this evaluation, total emissions from natural gas production activity are assumed to correlate to total natural gas production levels.
This evaluation includes emissions from production activities (all emission sources found at producing well pads, compressor stations, and the gas processing plant), but does not include emissions from pre-production activities such as site construction, exploration (drilling), stimulation (fracking), or well completion.
One drilling operation, one fracking operation, and one well completion operation were
visited under the point source testing task, and emissions estimates were developed for each of these operations. However, this information was insufficient to extrapolate to all drilling, fracking, and completion operations occuring in 2010 due to the variability in how these operations are conducted from well to well, and from operator to operator. Additionally, the single saltwater treatment facility located in Fort Worth was also visited. However, emissions at the time of the visit were determined to be very small (less than half a pound of VOC per year).
This section has five sub-sections:
• 7.1 Factors Affecting Natural Gas Production – This section describes the various factors that must be considered when predicting future natural gas production.
• 7.2 Methodology for Forecasting Natural Gas Production – A description of the methodology used to estimate future natural gas production is provided in this section.
• 7.3 2010 Base Year Emissions Inventory – Describes how the current (2010) emissions inventory was compiled.
• 7.4 2010 through 2018 Projected Emissions Inventories – This section describes how the emissions estimates for 2011 – 2018 were calculated.
• 7.5 Full Build-Out Estimates Conclusions – This section presents the conclusions of the full build-out component of this study.
Fort Worth Natural Gas Air Quality Study Final Report July 13, 2011
7-2
Key Point: Drilling and Permit Activity By 2010, the number of active drill rigs and the number of well pad permits issued by the City of Fort Worth were down nearly 60% from their 2008 highs.
7.1 Factors Affecting Natural Gas Production
Estimating the future production of natural
gas depends upon several factors. The primary factors include the amount of recoverable natural gas in the Barnett Shale formation, the ability of operators to access the gas with available drilling and fracturing methods (amounts technically recoverable), and the economics of the extraction process (amounts economically recoverable). Other operational factors include the number of existing producing wells, the depletion rate of existing wells, the number of new wells drilled, and the initial production from new wells, all of which contribute to the amounts of gas technically recoverable. These operational factors depend on the wellhead price of natural gas (price received by producers) and the costs of extracting the gas.
While the amount of recoverable gas in the Barnett Shale is finite, there will still be technically recoverable natural gas decades from now. However, the rate at which this gas is extracted will depend on the price received and the costs of drilling wells, installing production infrastructure such as pipelines and compressor stations, and the costs of operating these facilities.
The amount of recoverable gas in the Barnett Shale area is unknown. Current estimates of gas reserves in the Barnett Shale vary from 25 to 30 trillion cubic feet. This is not an absolute figure, as estimates of proven reserves and recoverable reserves change year by year. Reserve estimates increase as new data is obtained from exploration and drilling activities, while gas reserves are depleted as gas is extracted from existing wells. The Barnett Shale is unique in that it is the first domestic shale gas play to be extensively drilled and developed. Therefore, there is a wealth of information available about the size of the resource. In 2007, the Perryman Group estimated economically recoverable reserves of gas in the Barnett Shale at 2 trillion cubic feet and technically recoverable reserves at 30 trillion cubic feet.21 The U.S. Energy Information Administration’s most recent estimate of shale gas reserves for the three Texas Districts (Districts 5, 7B, and 9) that include Barnett Shale acreage is 26.47 trillion cubic feet.22
Figure 7.1-1 shows natural gas production in the entire Barnett Shale and in Tarrant County since 1993.23 Notice that, over time, production of shale gas in Tarrant County has mirrored the larger trend in the entire Barnett Shale region. Due to the availability of county-level data from the Railroad Commission of Texas, this analysis uses current and projected production data for Tarrant County as a surrogate to reflect current and projected production data for the city of Fort Worth.
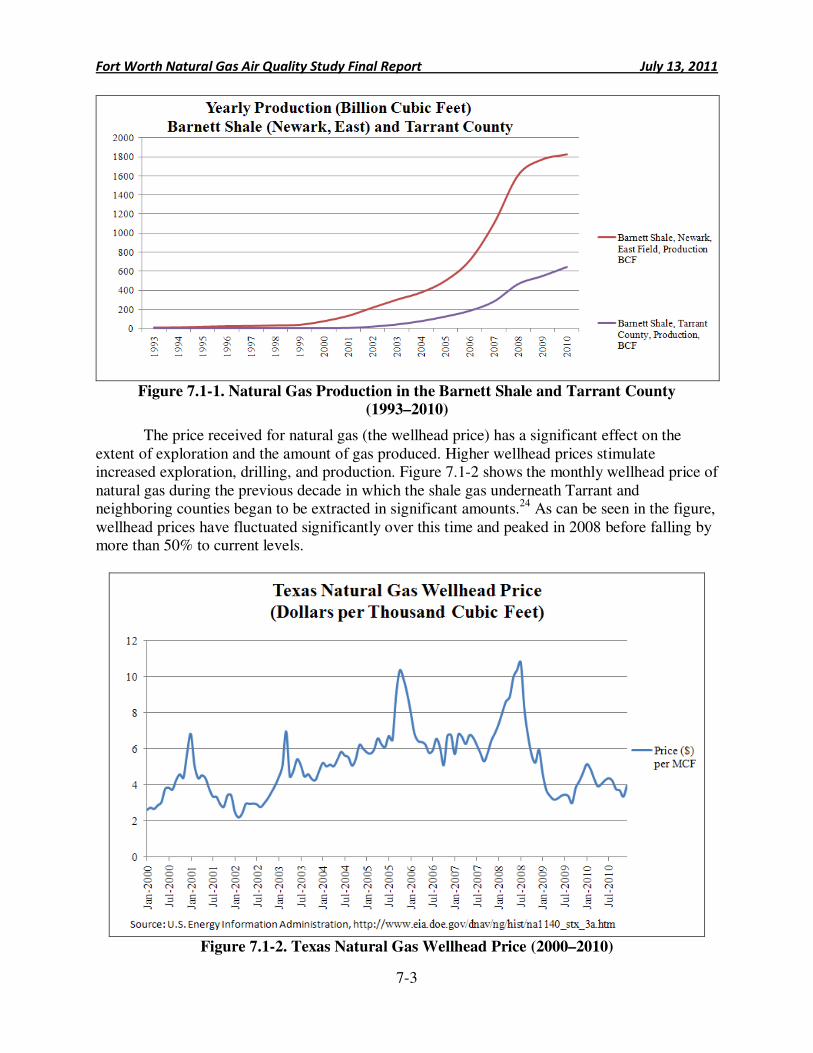
Fort Worth Natural Gas Air Quality Study Final Report July 13, 2011
7-3
Figure 7.1-1. Natural Gas Production in the Barnett Shale and Tarrant County
(1993–2010)
The price received for natural gas (the wellhead price) has a significant effect on the extent of exploration and the amount of gas produced. Higher wellhead prices stimulate increased exploration, drilling, and production. Figure 7.1-2 shows the monthly wellhead price of natural gas during the previous decade in which the shale gas underneath Tarrant and neighboring counties began to be extracted in significant amounts.24 As can be seen in the figure, wellhead prices have fluctuated significantly over this time and peaked in 2008 before falling by more than 50% to current levels.
Figure 7.1-2. Texas Natural Gas Wellhead Price (2000–2010)
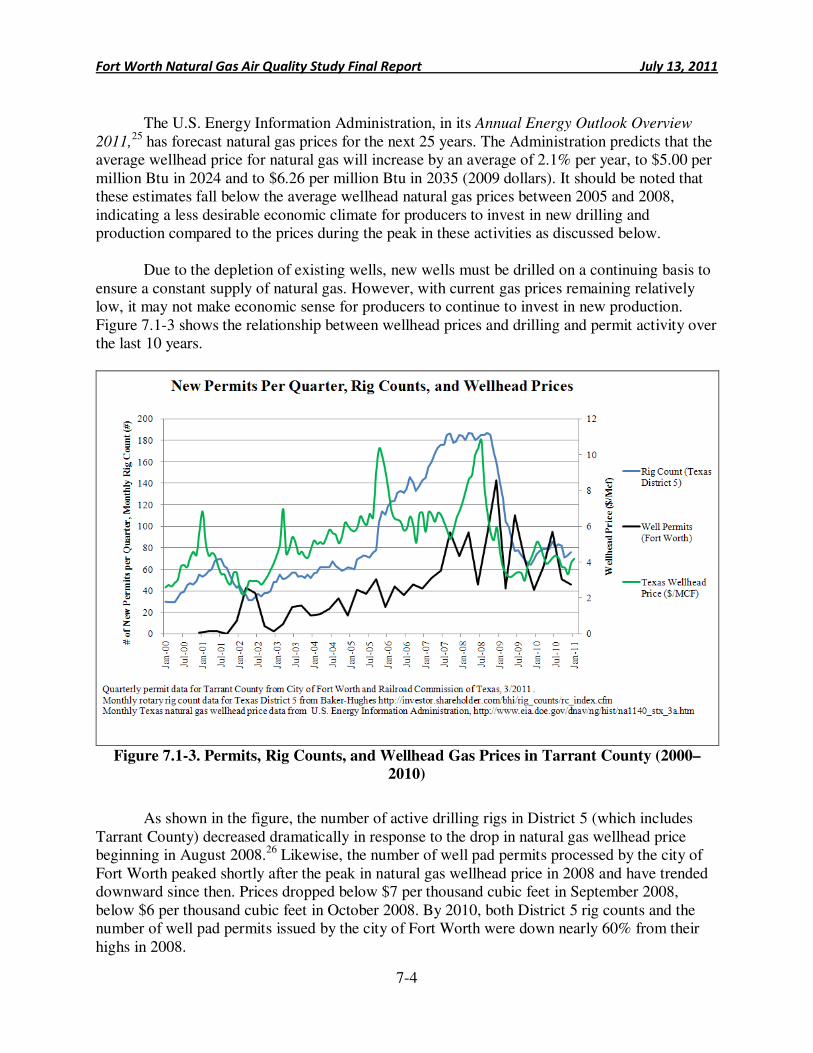
Fort Worth Natural Gas Air Quality Study Final Report July 13, 2011
7-4
The U.S. Energy Information Administration, in its Annual Energy Outlook Overview
2011,25 has forecast natural gas prices for the next 25 years. The Administration predicts that the
average wellhead price for natural gas will increase by an average of 2.1% per year, to $5.00 per million Btu in 2024 and to $6.26 per million Btu in 2035 (2009 dollars). It should be noted that these estimates fall below the average wellhead natural gas prices between 2005 and 2008, indicating a less desirable economic climate for producers to invest in new drilling and production compared to the prices during the peak in these activities as discussed below.
Due to the depletion of existing wells, new wells must be drilled on a continuing basis to ensure a constant supply of natural gas. However, with current gas prices remaining relatively low, it may not make economic sense for producers to continue to invest in new production. Figure 7.1-3 shows the relationship between wellhead prices and drilling and permit activity over the last 10 years.
Figure 7.1-3. Permits, Rig Counts, and Wellhead Gas Prices in Tarrant County (2000–
2010)
As shown in the figure, the number of active drilling rigs in District 5 (which includes
Tarrant County) decreased dramatically in response to the drop in natural gas wellhead price beginning in August 2008.26 Likewise, the number of well pad permits processed by the city of Fort Worth peaked shortly after the peak in natural gas wellhead price in 2008 and have trended downward since then. Prices dropped below $7 per thousand cubic feet in September 2008, below $6 per thousand cubic feet in October 2008. By 2010, both District 5 rig counts and the number of well pad permits issued by the city of Fort Worth were down nearly 60% from their highs in 2008.
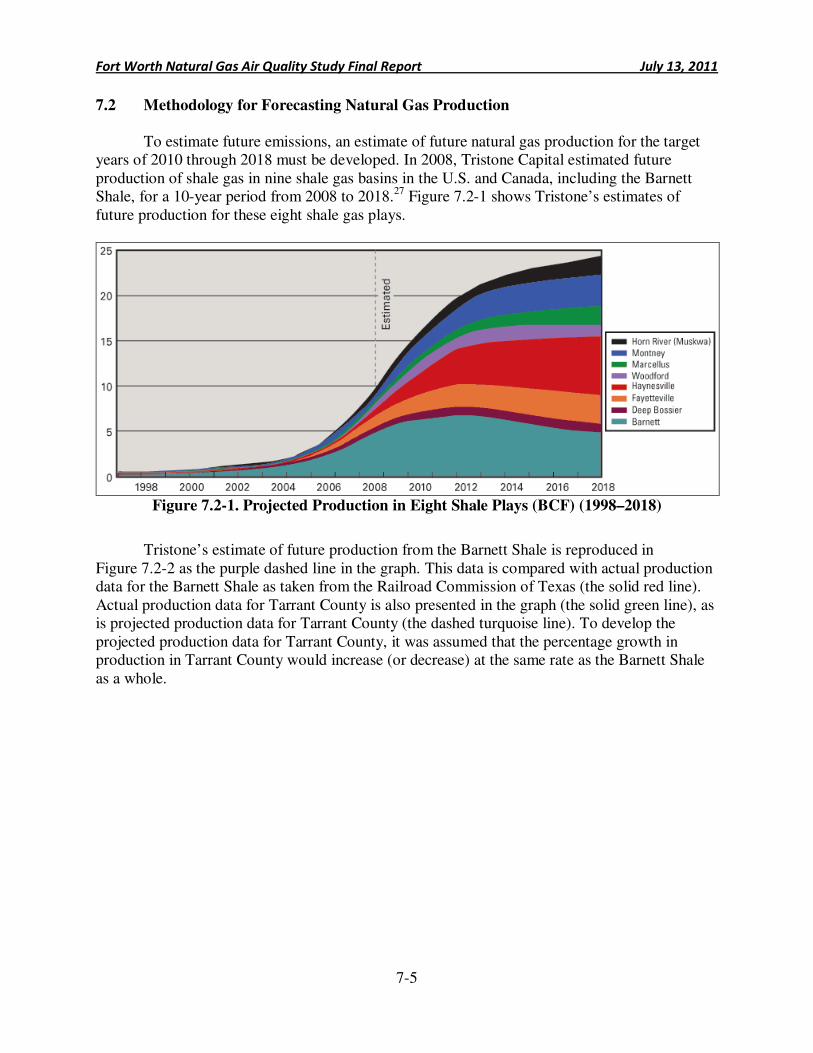
Fort Worth Natural Gas Air Quality Study Final Report July 13, 2011
7-5
7.2 Methodology for Forecasting Natural Gas Production
To estimate future emissions, an estimate of future natural gas production for the target years of 2010 through 2018 must be developed. In 2008, Tristone Capital estimated future production of shale gas in nine shale gas basins in the U.S. and Canada, including the Barnett Shale, for a 10-year period from 2008 to 2018.27 Figure 7.2-1 shows Tristone’s estimates of future production for these eight shale gas plays.
Figure 7.2-1. Projected Production in Eight Shale Plays (BCF) (1998–2018)
Tristone’s estimate of future production from the Barnett Shale is reproduced in
Figure 7.2-2 as the purple dashed line in the graph. This data is compared with actual production data for the Barnett Shale as taken from the Railroad Commission of Texas (the solid red line). Actual production data for Tarrant County is also presented in the graph (the solid green line), as is projected production data for Tarrant County (the dashed turquoise line). To develop the projected production data for Tarrant County, it was assumed that the percentage growth in production in Tarrant County would increase (or decrease) at the same rate as the Barnett Shale as a whole.
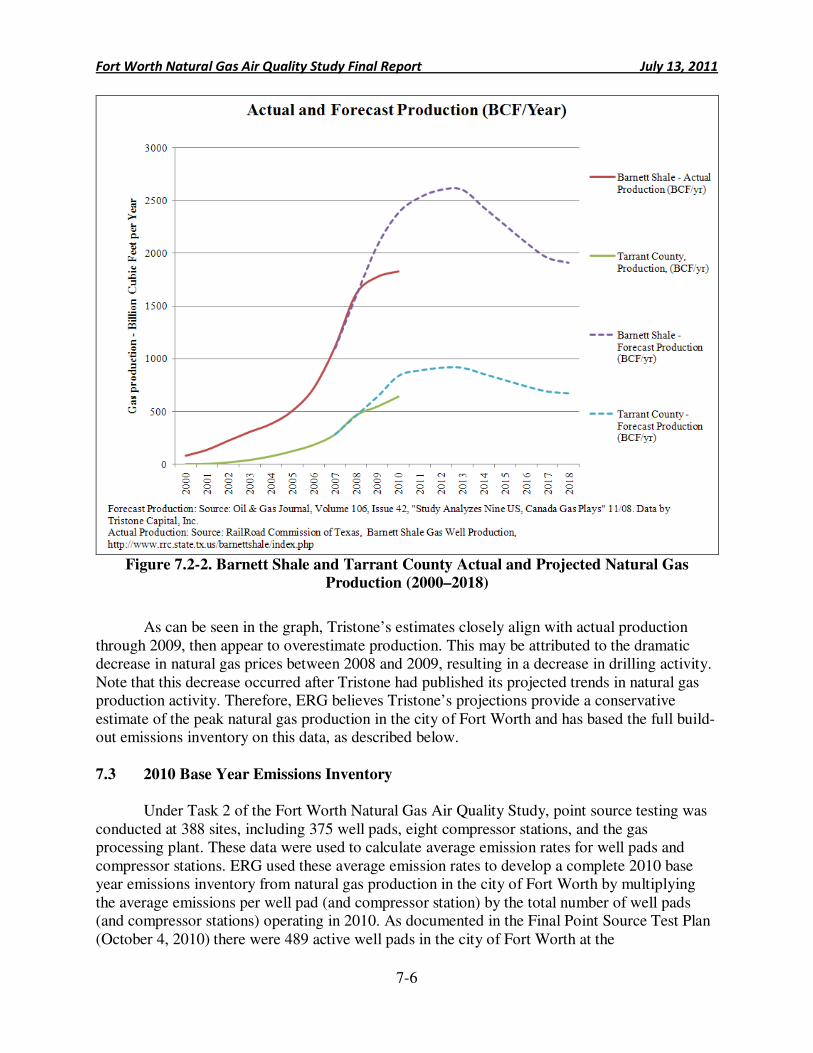
Fort Worth Natural Gas Air Quality Study Final Report July 13, 2011
7-6
Figure 7.2-2. Barnett Shale and Tarrant County Actual and Projected Natural Gas
Production (2000–2018)
As can be seen in the graph, Tristone’s estimates closely align with actual production
through 2009, then appear to overestimate production. This may be attributed to the dramatic decrease in natural gas prices between 2008 and 2009, resulting in a decrease in drilling activity. Note that this decrease occurred after Tristone had published its projected trends in natural gas production activity. Therefore, ERG believes Tristone’s projections provide a conservative estimate of the peak natural gas production in the city of Fort Worth and has based the full build-out emissions inventory on this data, as described below.
7.3 2010 Base Year Emissions Inventory
Under Task 2 of the Fort Worth Natural Gas Air Quality Study, point source testing was
conducted at 388 sites, including 375 well pads, eight compressor stations, and the gas processing plant. These data were used to calculate average emission rates for well pads and compressor stations. ERG used these average emission rates to develop a complete 2010 base year emissions inventory from natural gas production in the city of Fort Worth by multiplying the average emissions per well pad (and compressor station) by the total number of well pads (and compressor stations) operating in 2010. As documented in the Final Point Source Test Plan (October 4, 2010) there were 489 active well pads in the city of Fort Worth at the
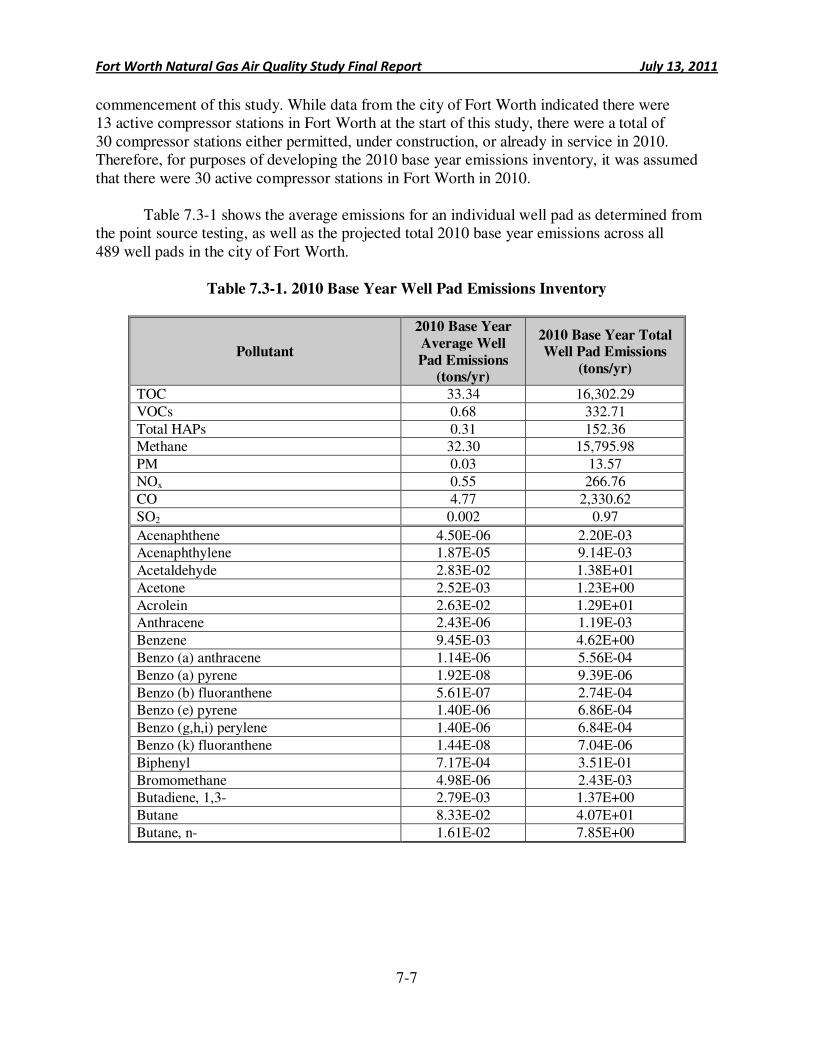
Fort Worth Natural Gas Air Quality Study Final Report July 13, 2011
7-7
commencement of this study. While data from the city of Fort Worth indicated there were 13 active compressor stations in Fort Worth at the start of this study, there were a total of 30 compressor stations either permitted, under construction, or already in service in 2010. Therefore, for purposes of developing the 2010 base year emissions inventory, it was assumed that there were 30 active compressor stations in Fort Worth in 2010.
Table 7.3-1 shows the average emissions for an individual well pad as determined from the point source testing, as well as the projected total 2010 base year emissions across all 489 well pads in the city of Fort Worth.
Table 7.3-1. 2010 Base Year Well Pad Emissions Inventory
Pollutant
2010 Base Year
Average Well
Pad Emissions (tons/yr)
2010 Base Year Total Well Pad Emissions
(tons/yr)
TOC 33.34 16,302.29
VOCs 0.68 332.71
Total HAPs 0.31 152.36 Methane 32.30 15,795.98
PM 0.03 13.57
NOx 0.55 266.76
CO 4.77 2,330.62
SO2 0.002 0.97
Acenaphthene 4.50E-06 2.20E-03 Acenaphthylene 1.87E-05 9.14E-03
Acetaldehyde 2.83E-02 1.38E+01
Acetone 2.52E-03 1.23E+00
Acrolein 2.63E-02 1.29E+01 Anthracene 2.43E-06 1.19E-03
Benzene 9.45E-03 4.62E+00
Benzo (a) anthracene 1.14E-06 5.56E-04
Benzo (a) pyrene 1.92E-08 9.39E-06
Benzo (b) fluoranthene 5.61E-07 2.74E-04 Benzo (e) pyrene 1.40E-06 6.86E-04
Benzo (g,h,i) perylene 1.40E-06 6.84E-04
Benzo (k) fluoranthene 1.44E-08 7.04E-06
Biphenyl 7.17E-04 3.51E-01
Bromomethane 4.98E-06 2.43E-03 Butadiene, 1,3- 2.79E-03 1.37E+00
Butane 8.33E-02 4.07E+01
Butane, n- 1.61E-02 7.85E+00
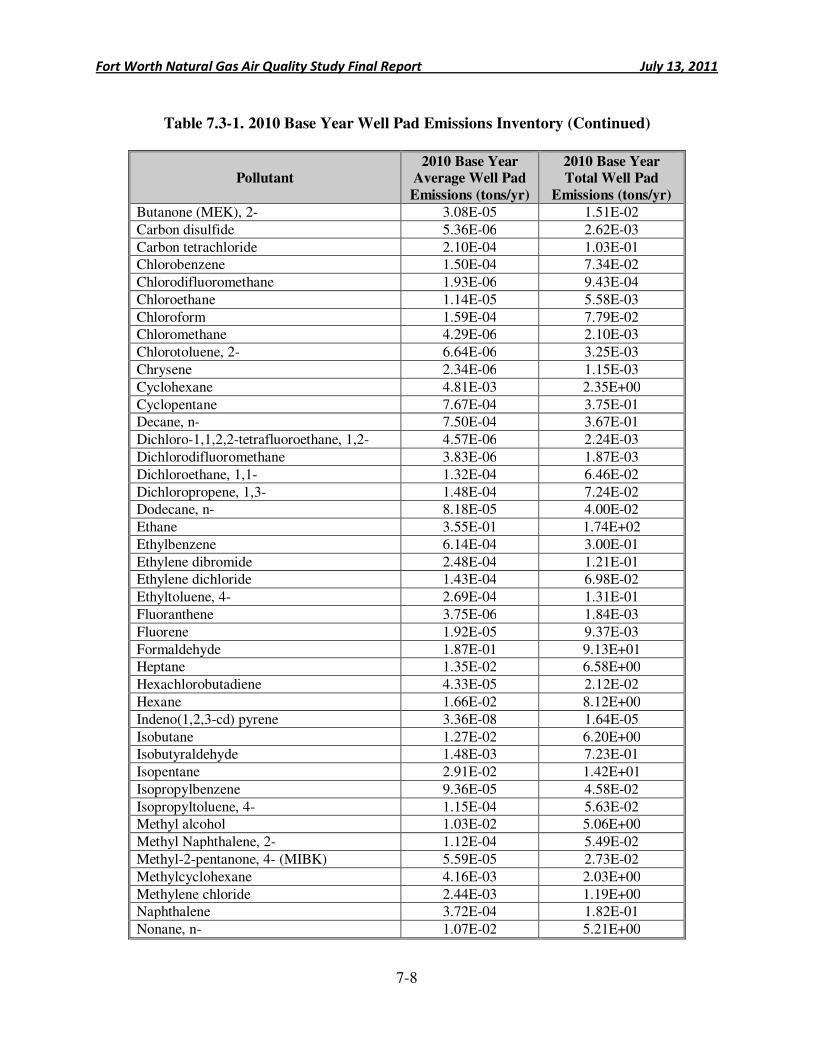
Fort Worth Natural Gas Air Quality Study Final Report July 13, 2011
7-8
Table 7.3-1. 2010 Base Year Well Pad Emissions Inventory (Continued)
Pollutant 2010 Base Year
Average Well Pad
Emissions (tons/yr)
2010 Base Year Total Well Pad
Emissions (tons/yr)
Butanone (MEK), 2- 3.08E-05 1.51E-02
Carbon disulfide 5.36E-06 2.62E-03
Carbon tetrachloride 2.10E-04 1.03E-01 Chlorobenzene 1.50E-04 7.34E-02
Chlorodifluoromethane 1.93E-06 9.43E-04
Chloroethane 1.14E-05 5.58E-03
Chloroform 1.59E-04 7.79E-02 Chloromethane 4.29E-06 2.10E-03
Chlorotoluene, 2- 6.64E-06 3.25E-03
Chrysene 2.34E-06 1.15E-03
Cyclohexane 4.81E-03 2.35E+00
Cyclopentane 7.67E-04 3.75E-01 Decane, n- 7.50E-04 3.67E-01
Dichloro-1,1,2,2-tetrafluoroethane, 1,2- 4.57E-06 2.24E-03
Dichlorodifluoromethane 3.83E-06 1.87E-03
Dichloroethane, 1,1- 1.32E-04 6.46E-02
Dichloropropene, 1,3- 1.48E-04 7.24E-02 Dodecane, n- 8.18E-05 4.00E-02
Ethane 3.55E-01 1.74E+02
Ethylbenzene 6.14E-04 3.00E-01
Ethylene dibromide 2.48E-04 1.21E-01 Ethylene dichloride 1.43E-04 6.98E-02
Ethyltoluene, 4- 2.69E-04 1.31E-01
Fluoranthene 3.75E-06 1.84E-03
Fluorene 1.92E-05 9.37E-03
Formaldehyde 1.87E-01 9.13E+01 Heptane 1.35E-02 6.58E+00
Hexachlorobutadiene 4.33E-05 2.12E-02
Hexane 1.66E-02 8.12E+00
Indeno(1,2,3-cd) pyrene 3.36E-08 1.64E-05
Isobutane 1.27E-02 6.20E+00 Isobutyraldehyde 1.48E-03 7.23E-01
Isopentane 2.91E-02 1.42E+01
Isopropylbenzene 9.36E-05 4.58E-02
Isopropyltoluene, 4- 1.15E-04 5.63E-02 Methyl alcohol 1.03E-02 5.06E+00
Methyl Naphthalene, 2- 1.12E-04 5.49E-02
Methyl-2-pentanone, 4- (MIBK) 5.59E-05 2.73E-02
Methylcyclohexane 4.16E-03 2.03E+00
Methylene chloride 2.44E-03 1.19E+00 Naphthalene 3.72E-04 1.82E-01
Nonane, n- 1.07E-02 5.21E+00
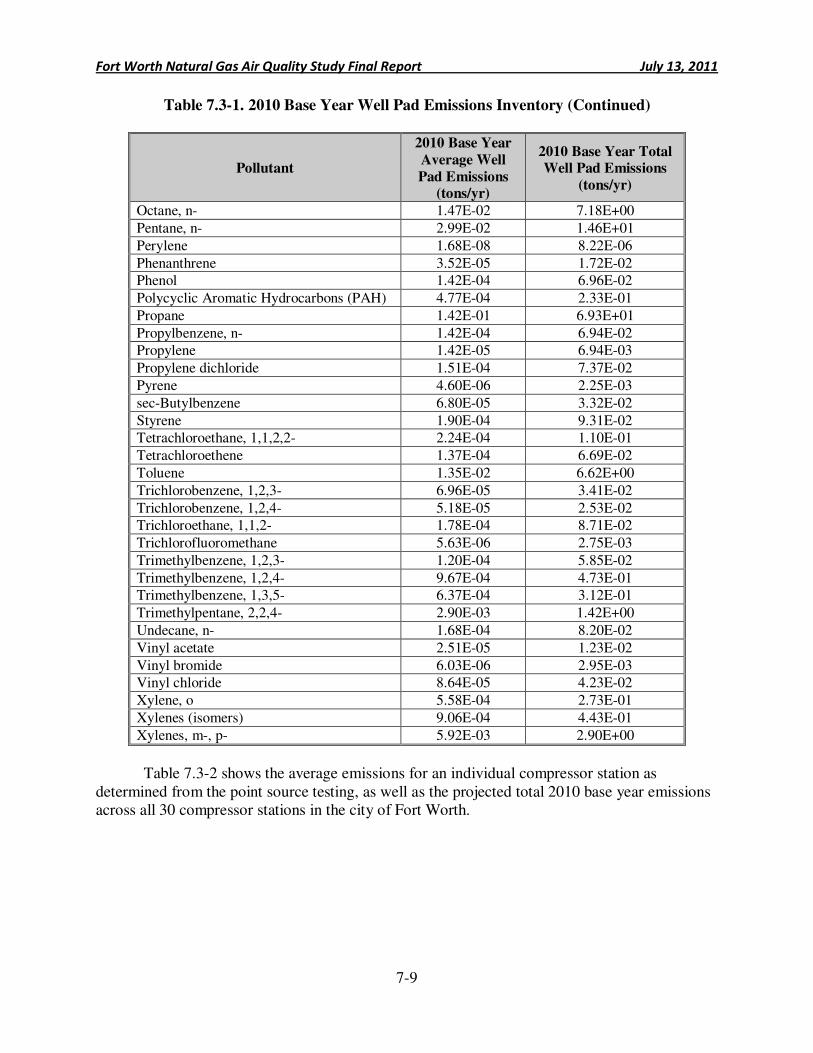
Fort Worth Natural Gas Air Quality Study Final Report July 13, 2011
7-9
Table 7.3-1. 2010 Base Year Well Pad Emissions Inventory (Continued)
Pollutant
2010 Base Year
Average Well
Pad Emissions (tons/yr)
2010 Base Year Total Well Pad Emissions
(tons/yr)
Octane, n- 1.47E-02 7.18E+00
Pentane, n- 2.99E-02 1.46E+01
Perylene 1.68E-08 8.22E-06
Phenanthrene 3.52E-05 1.72E-02 Phenol 1.42E-04 6.96E-02
Polycyclic Aromatic Hydrocarbons (PAH) 4.77E-04 2.33E-01
Propane 1.42E-01 6.93E+01
Propylbenzene, n- 1.42E-04 6.94E-02 Propylene 1.42E-05 6.94E-03
Propylene dichloride 1.51E-04 7.37E-02
Pyrene 4.60E-06 2.25E-03
sec-Butylbenzene 6.80E-05 3.32E-02
Styrene 1.90E-04 9.31E-02 Tetrachloroethane, 1,1,2,2- 2.24E-04 1.10E-01
Tetrachloroethene 1.37E-04 6.69E-02
Toluene 1.35E-02 6.62E+00
Trichlorobenzene, 1,2,3- 6.96E-05 3.41E-02
Trichlorobenzene, 1,2,4- 5.18E-05 2.53E-02 Trichloroethane, 1,1,2- 1.78E-04 8.71E-02
Trichlorofluoromethane 5.63E-06 2.75E-03
Trimethylbenzene, 1,2,3- 1.20E-04 5.85E-02
Trimethylbenzene, 1,2,4- 9.67E-04 4.73E-01 Trimethylbenzene, 1,3,5- 6.37E-04 3.12E-01
Trimethylpentane, 2,2,4- 2.90E-03 1.42E+00
Undecane, n- 1.68E-04 8.20E-02
Vinyl acetate 2.51E-05 1.23E-02
Vinyl bromide 6.03E-06 2.95E-03 Vinyl chloride 8.64E-05 4.23E-02
Xylene, o 5.58E-04 2.73E-01
Xylenes (isomers) 9.06E-04 4.43E-01
Xylenes, m-, p- 5.92E-03 2.90E+00
Table 7.3-2 shows the average emissions for an individual compressor station as
determined from the point source testing, as well as the projected total 2010 base year emissions across all 30 compressor stations in the city of Fort Worth.
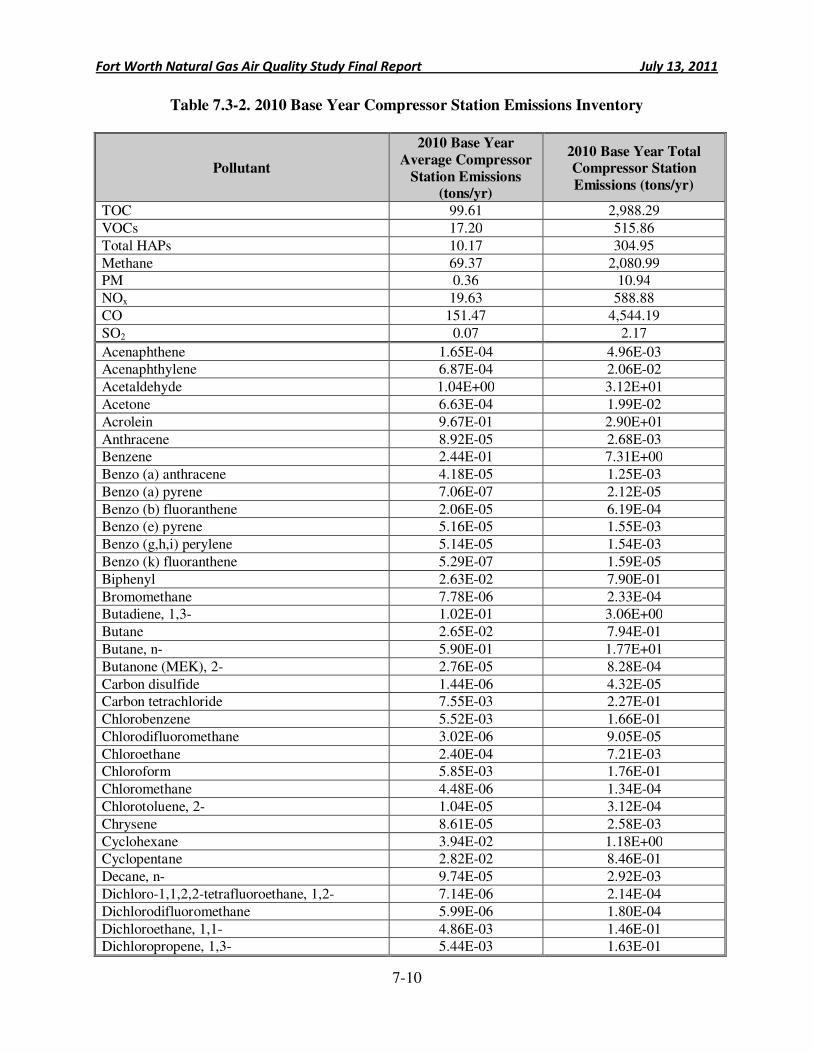
Fort Worth Natural Gas Air Quality Study Final Report July 13, 2011
7-10
Table 7.3-2. 2010 Base Year Compressor Station Emissions Inventory
Pollutant
2010 Base Year
Average Compressor
Station Emissions (tons/yr)
2010 Base Year Total Compressor Station
Emissions (tons/yr)
TOC 99.61 2,988.29
VOCs 17.20 515.86
Total HAPs 10.17 304.95
Methane 69.37 2,080.99 PM 0.36 10.94
NOx 19.63 588.88
CO 151.47 4,544.19
SO2 0.07 2.17
Acenaphthene 1.65E-04 4.96E-03 Acenaphthylene 6.87E-04 2.06E-02
Acetaldehyde 1.04E+00 3.12E+01
Acetone 6.63E-04 1.99E-02
Acrolein 9.67E-01 2.90E+01
Anthracene 8.92E-05 2.68E-03 Benzene 2.44E-01 7.31E+00
Benzo (a) anthracene 4.18E-05 1.25E-03
Benzo (a) pyrene 7.06E-07 2.12E-05
Benzo (b) fluoranthene 2.06E-05 6.19E-04 Benzo (e) pyrene 5.16E-05 1.55E-03
Benzo (g,h,i) perylene 5.14E-05 1.54E-03
Benzo (k) fluoranthene 5.29E-07 1.59E-05
Biphenyl 2.63E-02 7.90E-01
Bromomethane 7.78E-06 2.33E-04 Butadiene, 1,3- 1.02E-01 3.06E+00
Butane 2.65E-02 7.94E-01
Butane, n- 5.90E-01 1.77E+01
Butanone (MEK), 2- 2.76E-05 8.28E-04
Carbon disulfide 1.44E-06 4.32E-05 Carbon tetrachloride 7.55E-03 2.27E-01
Chlorobenzene 5.52E-03 1.66E-01
Chlorodifluoromethane 3.02E-06 9.05E-05
Chloroethane 2.40E-04 7.21E-03 Chloroform 5.85E-03 1.76E-01
Chloromethane 4.48E-06 1.34E-04
Chlorotoluene, 2- 1.04E-05 3.12E-04
Chrysene 8.61E-05 2.58E-03
Cyclohexane 3.94E-02 1.18E+00 Cyclopentane 2.82E-02 8.46E-01
Decane, n- 9.74E-05 2.92E-03
Dichloro-1,1,2,2-tetrafluoroethane, 1,2- 7.14E-06 2.14E-04
Dichlorodifluoromethane 5.99E-06 1.80E-04
Dichloroethane, 1,1- 4.86E-03 1.46E-01 Dichloropropene, 1,3- 5.44E-03 1.63E-01
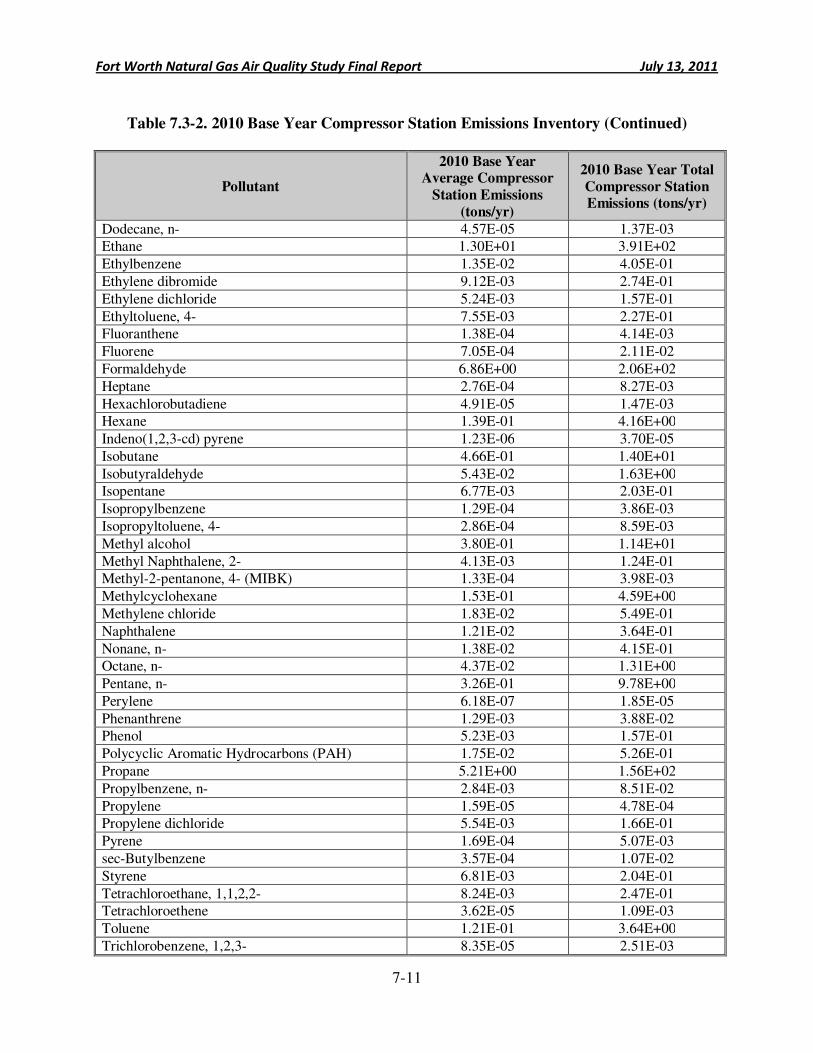
Fort Worth Natural Gas Air Quality Study Final Report July 13, 2011
7-11
Table 7.3-2. 2010 Base Year Compressor Station Emissions Inventory (Continued)
Pollutant
2010 Base Year Average Compressor
Station Emissions
(tons/yr)
2010 Base Year Total
Compressor Station Emissions (tons/yr)
Dodecane, n- 4.57E-05 1.37E-03 Ethane 1.30E+01 3.91E+02
Ethylbenzene 1.35E-02 4.05E-01
Ethylene dibromide 9.12E-03 2.74E-01
Ethylene dichloride 5.24E-03 1.57E-01
Ethyltoluene, 4- 7.55E-03 2.27E-01 Fluoranthene 1.38E-04 4.14E-03
Fluorene 7.05E-04 2.11E-02
Formaldehyde 6.86E+00 2.06E+02
Heptane 2.76E-04 8.27E-03
Hexachlorobutadiene 4.91E-05 1.47E-03 Hexane 1.39E-01 4.16E+00
Indeno(1,2,3-cd) pyrene 1.23E-06 3.70E-05
Isobutane 4.66E-01 1.40E+01
Isobutyraldehyde 5.43E-02 1.63E+00 Isopentane 6.77E-03 2.03E-01
Isopropylbenzene 1.29E-04 3.86E-03
Isopropyltoluene, 4- 2.86E-04 8.59E-03
Methyl alcohol 3.80E-01 1.14E+01
Methyl Naphthalene, 2- 4.13E-03 1.24E-01 Methyl-2-pentanone, 4- (MIBK) 1.33E-04 3.98E-03
Methylcyclohexane 1.53E-01 4.59E+00
Methylene chloride 1.83E-02 5.49E-01
Naphthalene 1.21E-02 3.64E-01
Nonane, n- 1.38E-02 4.15E-01 Octane, n- 4.37E-02 1.31E+00
Pentane, n- 3.26E-01 9.78E+00
Perylene 6.18E-07 1.85E-05
Phenanthrene 1.29E-03 3.88E-02 Phenol 5.23E-03 1.57E-01
Polycyclic Aromatic Hydrocarbons (PAH) 1.75E-02 5.26E-01
Propane 5.21E+00 1.56E+02
Propylbenzene, n- 2.84E-03 8.51E-02
Propylene 1.59E-05 4.78E-04 Propylene dichloride 5.54E-03 1.66E-01
Pyrene 1.69E-04 5.07E-03
sec-Butylbenzene 3.57E-04 1.07E-02
Styrene 6.81E-03 2.04E-01
Tetrachloroethane, 1,1,2,2- 8.24E-03 2.47E-01 Tetrachloroethene 3.62E-05 1.09E-03
Toluene 1.21E-01 3.64E+00
Trichlorobenzene, 1,2,3- 8.35E-05 2.51E-03
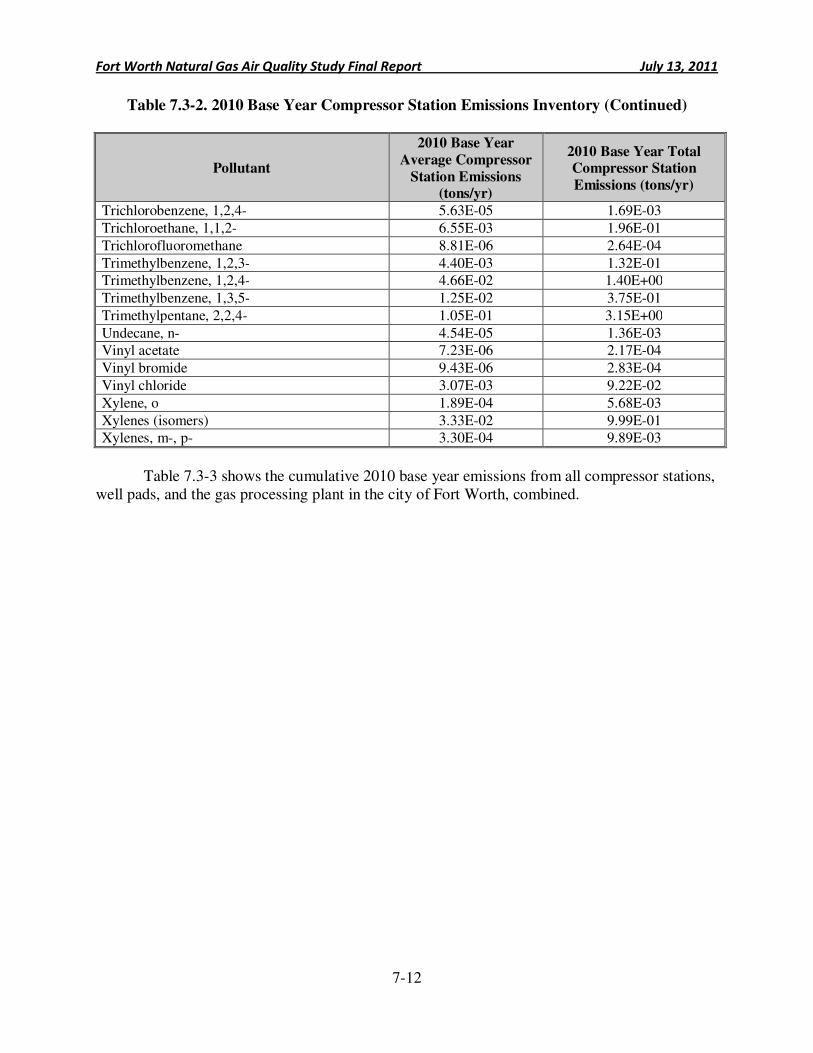
Fort Worth Natural Gas Air Quality Study Final Report July 13, 2011
7-12
Table 7.3-2. 2010 Base Year Compressor Station Emissions Inventory (Continued)
Pollutant
2010 Base Year
Average Compressor
Station Emissions (tons/yr)
2010 Base Year Total Compressor Station
Emissions (tons/yr)
Trichlorobenzene, 1,2,4- 5.63E-05 1.69E-03
Trichloroethane, 1,1,2- 6.55E-03 1.96E-01
Trichlorofluoromethane 8.81E-06 2.64E-04
Trimethylbenzene, 1,2,3- 4.40E-03 1.32E-01 Trimethylbenzene, 1,2,4- 4.66E-02 1.40E+00
Trimethylbenzene, 1,3,5- 1.25E-02 3.75E-01
Trimethylpentane, 2,2,4- 1.05E-01 3.15E+00
Undecane, n- 4.54E-05 1.36E-03 Vinyl acetate 7.23E-06 2.17E-04
Vinyl bromide 9.43E-06 2.83E-04
Vinyl chloride 3.07E-03 9.22E-02
Xylene, o 1.89E-04 5.68E-03
Xylenes (isomers) 3.33E-02 9.99E-01 Xylenes, m-, p- 3.30E-04 9.89E-03
Table 7.3-3 shows the cumulative 2010 base year emissions from all compressor stations,
well pads, and the gas processing plant in the city of Fort Worth, combined.
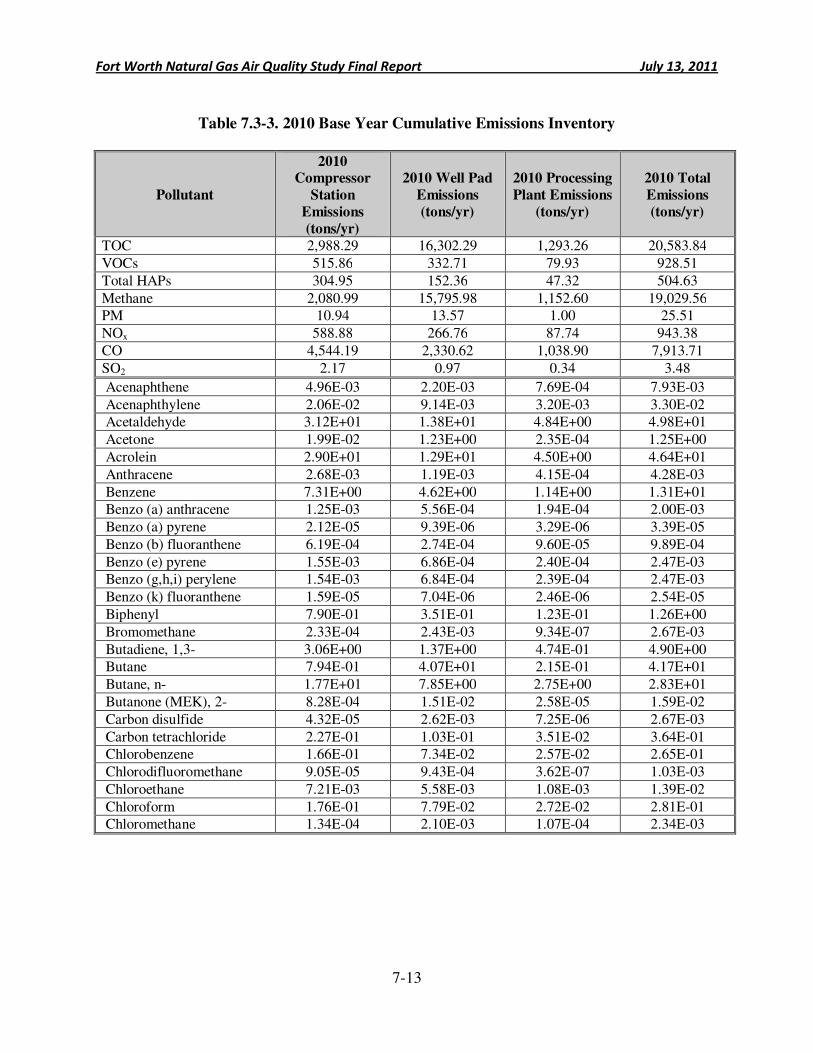
Fort Worth Natural Gas Air Quality Study Final Report July 13, 2011
7-13
Table 7.3-3. 2010 Base Year Cumulative Emissions Inventory
Pollutant
2010 Compressor
Station
Emissions
(tons/yr)
2010 Well Pad
Emissions
(tons/yr)
2010 Processing
Plant Emissions
(tons/yr)
2010 Total
Emissions
(tons/yr)
TOC 2,988.29 16,302.29 1,293.26 20,583.84
VOCs 515.86 332.71 79.93 928.51
Total HAPs 304.95 152.36 47.32 504.63
Methane 2,080.99 15,795.98 1,152.60 19,029.56 PM 10.94 13.57 1.00 25.51
NOx 588.88 266.76 87.74 943.38
CO 4,544.19 2,330.62 1,038.90 7,913.71
SO2 2.17 0.97 0.34 3.48
Acenaphthene 4.96E-03 2.20E-03 7.69E-04 7.93E-03
Acenaphthylene 2.06E-02 9.14E-03 3.20E-03 3.30E-02 Acetaldehyde 3.12E+01 1.38E+01 4.84E+00 4.98E+01
Acetone 1.99E-02 1.23E+00 2.35E-04 1.25E+00
Acrolein 2.90E+01 1.29E+01 4.50E+00 4.64E+01
Anthracene 2.68E-03 1.19E-03 4.15E-04 4.28E-03
Benzene 7.31E+00 4.62E+00 1.14E+00 1.31E+01 Benzo (a) anthracene 1.25E-03 5.56E-04 1.94E-04 2.00E-03
Benzo (a) pyrene 2.12E-05 9.39E-06 3.29E-06 3.39E-05
Benzo (b) fluoranthene 6.19E-04 2.74E-04 9.60E-05 9.89E-04
Benzo (e) pyrene 1.55E-03 6.86E-04 2.40E-04 2.47E-03 Benzo (g,h,i) perylene 1.54E-03 6.84E-04 2.39E-04 2.47E-03
Benzo (k) fluoranthene 1.59E-05 7.04E-06 2.46E-06 2.54E-05
Biphenyl 7.90E-01 3.51E-01 1.23E-01 1.26E+00
Bromomethane 2.33E-04 2.43E-03 9.34E-07 2.67E-03
Butadiene, 1,3- 3.06E+00 1.37E+00 4.74E-01 4.90E+00 Butane 7.94E-01 4.07E+01 2.15E-01 4.17E+01
Butane, n- 1.77E+01 7.85E+00 2.75E+00 2.83E+01
Butanone (MEK), 2- 8.28E-04 1.51E-02 2.58E-05 1.59E-02
Carbon disulfide 4.32E-05 2.62E-03 7.25E-06 2.67E-03
Carbon tetrachloride 2.27E-01 1.03E-01 3.51E-02 3.64E-01 Chlorobenzene 1.66E-01 7.34E-02 2.57E-02 2.65E-01
Chlorodifluoromethane 9.05E-05 9.43E-04 3.62E-07 1.03E-03
Chloroethane 7.21E-03 5.58E-03 1.08E-03 1.39E-02
Chloroform 1.76E-01 7.79E-02 2.72E-02 2.81E-01 Chloromethane 1.34E-04 2.10E-03 1.07E-04 2.34E-03
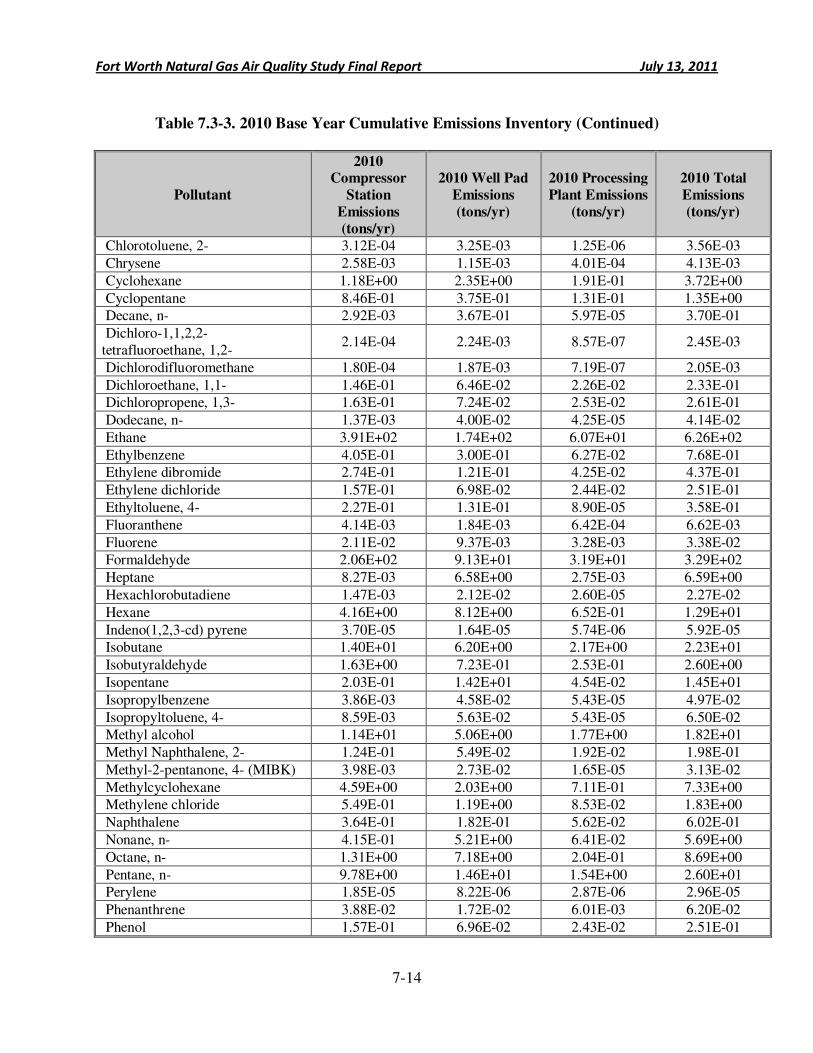
Fort Worth Natural Gas Air Quality Study Final Report July 13, 2011
7-14
Table 7.3-3. 2010 Base Year Cumulative Emissions Inventory (Continued)
Pollutant
2010 Compressor
Station
Emissions
(tons/yr)
2010 Well Pad
Emissions
(tons/yr)
2010 Processing
Plant Emissions
(tons/yr)
2010 Total
Emissions
(tons/yr)
Chlorotoluene, 2- 3.12E-04 3.25E-03 1.25E-06 3.56E-03
Chrysene 2.58E-03 1.15E-03 4.01E-04 4.13E-03
Cyclohexane 1.18E+00 2.35E+00 1.91E-01 3.72E+00
Cyclopentane 8.46E-01 3.75E-01 1.31E-01 1.35E+00 Decane, n- 2.92E-03 3.67E-01 5.97E-05 3.70E-01
Dichloro-1,1,2,2-tetrafluoroethane, 1,2-
2.14E-04 2.24E-03 8.57E-07 2.45E-03
Dichlorodifluoromethane 1.80E-04 1.87E-03 7.19E-07 2.05E-03
Dichloroethane, 1,1- 1.46E-01 6.46E-02 2.26E-02 2.33E-01 Dichloropropene, 1,3- 1.63E-01 7.24E-02 2.53E-02 2.61E-01
Dodecane, n- 1.37E-03 4.00E-02 4.25E-05 4.14E-02
Ethane 3.91E+02 1.74E+02 6.07E+01 6.26E+02
Ethylbenzene 4.05E-01 3.00E-01 6.27E-02 7.68E-01 Ethylene dibromide 2.74E-01 1.21E-01 4.25E-02 4.37E-01
Ethylene dichloride 1.57E-01 6.98E-02 2.44E-02 2.51E-01
Ethyltoluene, 4- 2.27E-01 1.31E-01 8.90E-05 3.58E-01
Fluoranthene 4.14E-03 1.84E-03 6.42E-04 6.62E-03
Fluorene 2.11E-02 9.37E-03 3.28E-03 3.38E-02 Formaldehyde 2.06E+02 9.13E+01 3.19E+01 3.29E+02
Heptane 8.27E-03 6.58E+00 2.75E-03 6.59E+00
Hexachlorobutadiene 1.47E-03 2.12E-02 2.60E-05 2.27E-02
Hexane 4.16E+00 8.12E+00 6.52E-01 1.29E+01
Indeno(1,2,3-cd) pyrene 3.70E-05 1.64E-05 5.74E-06 5.92E-05 Isobutane 1.40E+01 6.20E+00 2.17E+00 2.23E+01
Isobutyraldehyde 1.63E+00 7.23E-01 2.53E-01 2.60E+00
Isopentane 2.03E-01 1.42E+01 4.54E-02 1.45E+01
Isopropylbenzene 3.86E-03 4.58E-02 5.43E-05 4.97E-02
Isopropyltoluene, 4- 8.59E-03 5.63E-02 5.43E-05 6.50E-02 Methyl alcohol 1.14E+01 5.06E+00 1.77E+00 1.82E+01
Methyl Naphthalene, 2- 1.24E-01 5.49E-02 1.92E-02 1.98E-01
Methyl-2-pentanone, 4- (MIBK) 3.98E-03 2.73E-02 1.65E-05 3.13E-02
Methylcyclohexane 4.59E+00 2.03E+00 7.11E-01 7.33E+00 Methylene chloride 5.49E-01 1.19E+00 8.53E-02 1.83E+00
Naphthalene 3.64E-01 1.82E-01 5.62E-02 6.02E-01
Nonane, n- 4.15E-01 5.21E+00 6.41E-02 5.69E+00
Octane, n- 1.31E+00 7.18E+00 2.04E-01 8.69E+00
Pentane, n- 9.78E+00 1.46E+01 1.54E+00 2.60E+01 Perylene 1.85E-05 8.22E-06 2.87E-06 2.96E-05
Phenanthrene 3.88E-02 1.72E-02 6.01E-03 6.20E-02
Phenol 1.57E-01 6.96E-02 2.43E-02 2.51E-01
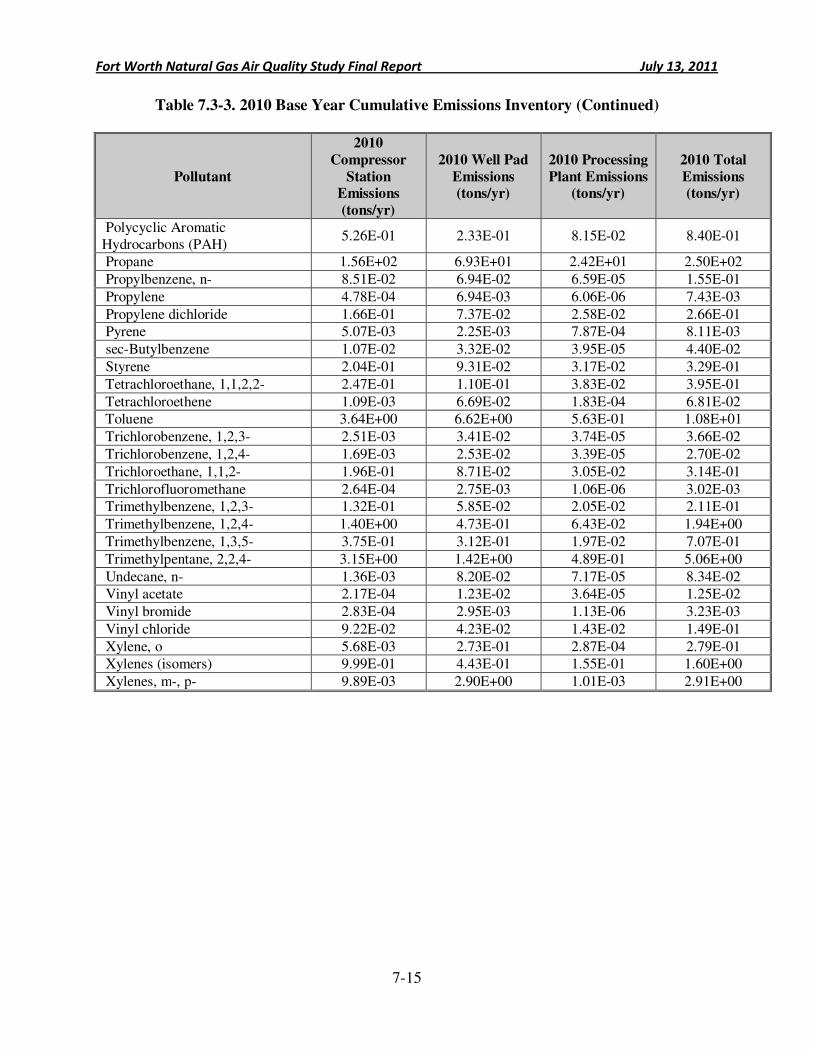
Fort Worth Natural Gas Air Quality Study Final Report July 13, 2011
7-15
Table 7.3-3. 2010 Base Year Cumulative Emissions Inventory (Continued)
Pollutant
2010
Compressor
Station Emissions
(tons/yr)
2010 Well Pad
Emissions (tons/yr)
2010 Processing
Plant Emissions (tons/yr)
2010 Total
Emissions (tons/yr)
Polycyclic Aromatic Hydrocarbons (PAH)
5.26E-01 2.33E-01 8.15E-02 8.40E-01
Propane 1.56E+02 6.93E+01 2.42E+01 2.50E+02
Propylbenzene, n- 8.51E-02 6.94E-02 6.59E-05 1.55E-01
Propylene 4.78E-04 6.94E-03 6.06E-06 7.43E-03
Propylene dichloride 1.66E-01 7.37E-02 2.58E-02 2.66E-01 Pyrene 5.07E-03 2.25E-03 7.87E-04 8.11E-03
sec-Butylbenzene 1.07E-02 3.32E-02 3.95E-05 4.40E-02
Styrene 2.04E-01 9.31E-02 3.17E-02 3.29E-01
Tetrachloroethane, 1,1,2,2- 2.47E-01 1.10E-01 3.83E-02 3.95E-01
Tetrachloroethene 1.09E-03 6.69E-02 1.83E-04 6.81E-02 Toluene 3.64E+00 6.62E+00 5.63E-01 1.08E+01
Trichlorobenzene, 1,2,3- 2.51E-03 3.41E-02 3.74E-05 3.66E-02
Trichlorobenzene, 1,2,4- 1.69E-03 2.53E-02 3.39E-05 2.70E-02
Trichloroethane, 1,1,2- 1.96E-01 8.71E-02 3.05E-02 3.14E-01
Trichlorofluoromethane 2.64E-04 2.75E-03 1.06E-06 3.02E-03 Trimethylbenzene, 1,2,3- 1.32E-01 5.85E-02 2.05E-02 2.11E-01
Trimethylbenzene, 1,2,4- 1.40E+00 4.73E-01 6.43E-02 1.94E+00
Trimethylbenzene, 1,3,5- 3.75E-01 3.12E-01 1.97E-02 7.07E-01
Trimethylpentane, 2,2,4- 3.15E+00 1.42E+00 4.89E-01 5.06E+00
Undecane, n- 1.36E-03 8.20E-02 7.17E-05 8.34E-02 Vinyl acetate 2.17E-04 1.23E-02 3.64E-05 1.25E-02
Vinyl bromide 2.83E-04 2.95E-03 1.13E-06 3.23E-03
Vinyl chloride 9.22E-02 4.23E-02 1.43E-02 1.49E-01
Xylene, o 5.68E-03 2.73E-01 2.87E-04 2.79E-01 Xylenes (isomers) 9.99E-01 4.43E-01 1.55E-01 1.60E+00
Xylenes, m-, p- 9.89E-03 2.90E+00 1.01E-03 2.91E+00
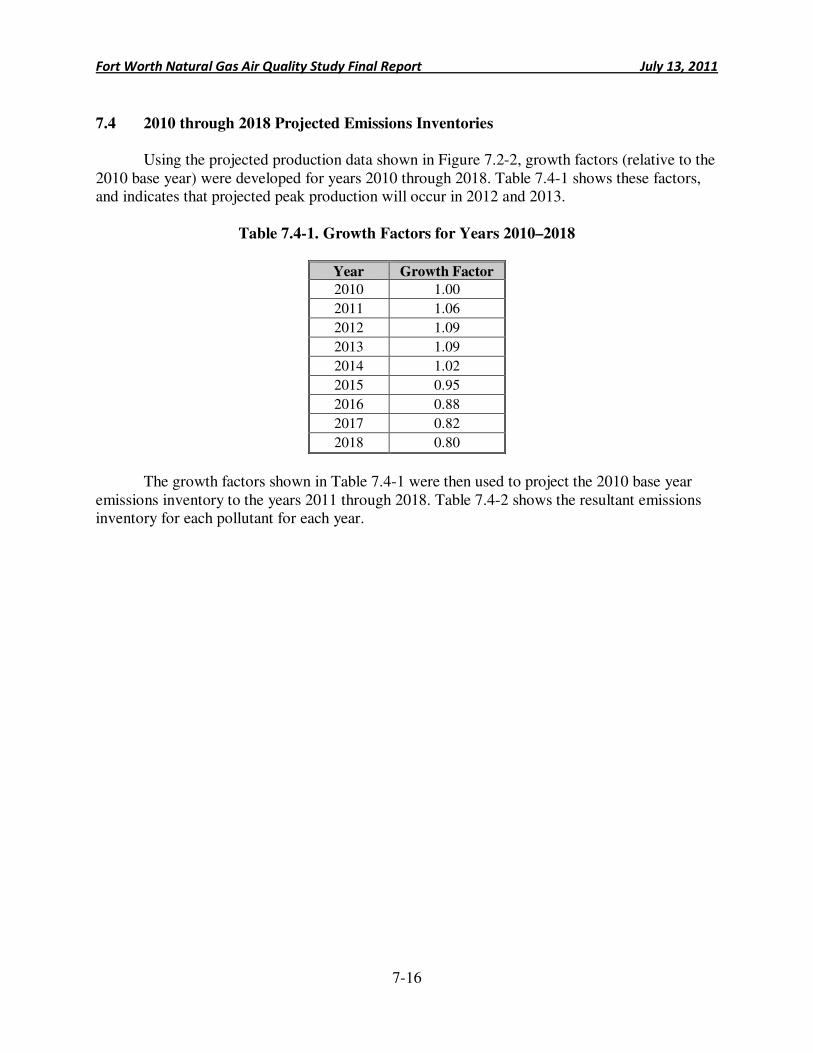
Fort Worth Natural Gas Air Quality Study Final Report July 13, 2011
7-16
7.4 2010 through 2018 Projected Emissions Inventories
Using the projected production data shown in Figure 7.2-2, growth factors (relative to the
2010 base year) were developed for years 2010 through 2018. Table 7.4-1 shows these factors, and indicates that projected peak production will occur in 2012 and 2013.
Table 7.4-1. Growth Factors for Years 2010–2018
Year Growth Factor
2010 1.00
2011 1.06
2012 1.09
2013 1.09
2014 1.02
2015 0.95
2016 0.88
2017 0.82
2018 0.80
The growth factors shown in Table 7.4-1 were then used to project the 2010 base year
emissions inventory to the years 2011 through 2018. Table 7.4-2 shows the resultant emissions inventory for each pollutant for each year.
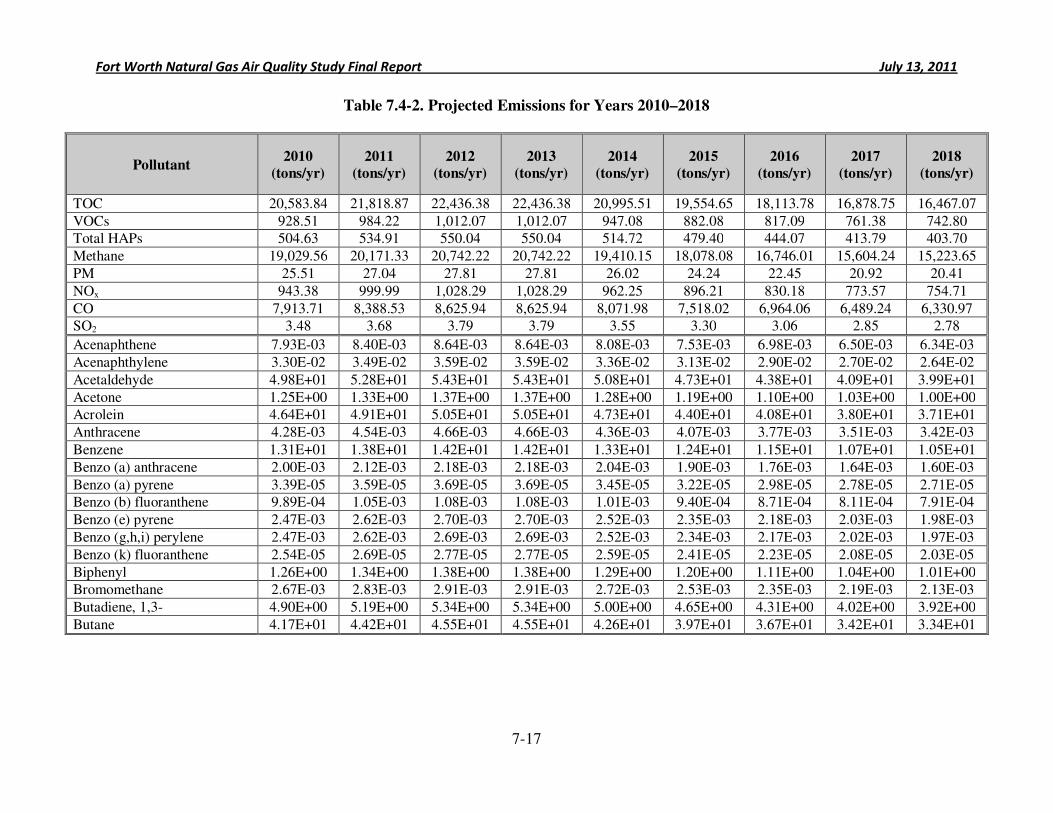
Fort Worth Natural Gas Air Quality Study Final Report July 13, 2011
7-17
Table 7.4-2. Projected Emissions for Years 2010–2018
Pollutant 2010
(tons/yr)
2011
(tons/yr)
2012
(tons/yr)
2013
(tons/yr)
2014
(tons/yr)
2015
(tons/yr)
2016
(tons/yr)
2017
(tons/yr)
2018
(tons/yr)
TOC 20,583.84 21,818.87 22,436.38 22,436.38 20,995.51 19,554.65 18,113.78 16,878.75 16,467.07
VOCs 928.51 984.22 1,012.07 1,012.07 947.08 882.08 817.09 761.38 742.80 Total HAPs 504.63 534.91 550.04 550.04 514.72 479.40 444.07 413.79 403.70
Methane 19,029.56 20,171.33 20,742.22 20,742.22 19,410.15 18,078.08 16,746.01 15,604.24 15,223.65
PM 25.51 27.04 27.81 27.81 26.02 24.24 22.45 20.92 20.41
NOx 943.38 999.99 1,028.29 1,028.29 962.25 896.21 830.18 773.57 754.71
CO 7,913.71 8,388.53 8,625.94 8,625.94 8,071.98 7,518.02 6,964.06 6,489.24 6,330.97 SO2 3.48 3.68 3.79 3.79 3.55 3.30 3.06 2.85 2.78
Acenaphthene 7.93E-03 8.40E-03 8.64E-03 8.64E-03 8.08E-03 7.53E-03 6.98E-03 6.50E-03 6.34E-03
Acenaphthylene 3.30E-02 3.49E-02 3.59E-02 3.59E-02 3.36E-02 3.13E-02 2.90E-02 2.70E-02 2.64E-02
Acetaldehyde 4.98E+01 5.28E+01 5.43E+01 5.43E+01 5.08E+01 4.73E+01 4.38E+01 4.09E+01 3.99E+01
Acetone 1.25E+00 1.33E+00 1.37E+00 1.37E+00 1.28E+00 1.19E+00 1.10E+00 1.03E+00 1.00E+00 Acrolein 4.64E+01 4.91E+01 5.05E+01 5.05E+01 4.73E+01 4.40E+01 4.08E+01 3.80E+01 3.71E+01
Anthracene 4.28E-03 4.54E-03 4.66E-03 4.66E-03 4.36E-03 4.07E-03 3.77E-03 3.51E-03 3.42E-03
Benzene 1.31E+01 1.38E+01 1.42E+01 1.42E+01 1.33E+01 1.24E+01 1.15E+01 1.07E+01 1.05E+01
Benzo (a) anthracene 2.00E-03 2.12E-03 2.18E-03 2.18E-03 2.04E-03 1.90E-03 1.76E-03 1.64E-03 1.60E-03
Benzo (a) pyrene 3.39E-05 3.59E-05 3.69E-05 3.69E-05 3.45E-05 3.22E-05 2.98E-05 2.78E-05 2.71E-05 Benzo (b) fluoranthene 9.89E-04 1.05E-03 1.08E-03 1.08E-03 1.01E-03 9.40E-04 8.71E-04 8.11E-04 7.91E-04
Benzo (e) pyrene 2.47E-03 2.62E-03 2.70E-03 2.70E-03 2.52E-03 2.35E-03 2.18E-03 2.03E-03 1.98E-03
Benzo (g,h,i) perylene 2.47E-03 2.62E-03 2.69E-03 2.69E-03 2.52E-03 2.34E-03 2.17E-03 2.02E-03 1.97E-03
Benzo (k) fluoranthene 2.54E-05 2.69E-05 2.77E-05 2.77E-05 2.59E-05 2.41E-05 2.23E-05 2.08E-05 2.03E-05
Biphenyl 1.26E+00 1.34E+00 1.38E+00 1.38E+00 1.29E+00 1.20E+00 1.11E+00 1.04E+00 1.01E+00 Bromomethane 2.67E-03 2.83E-03 2.91E-03 2.91E-03 2.72E-03 2.53E-03 2.35E-03 2.19E-03 2.13E-03
Butadiene, 1,3- 4.90E+00 5.19E+00 5.34E+00 5.34E+00 5.00E+00 4.65E+00 4.31E+00 4.02E+00 3.92E+00
Butane 4.17E+01 4.42E+01 4.55E+01 4.55E+01 4.26E+01 3.97E+01 3.67E+01 3.42E+01 3.34E+01
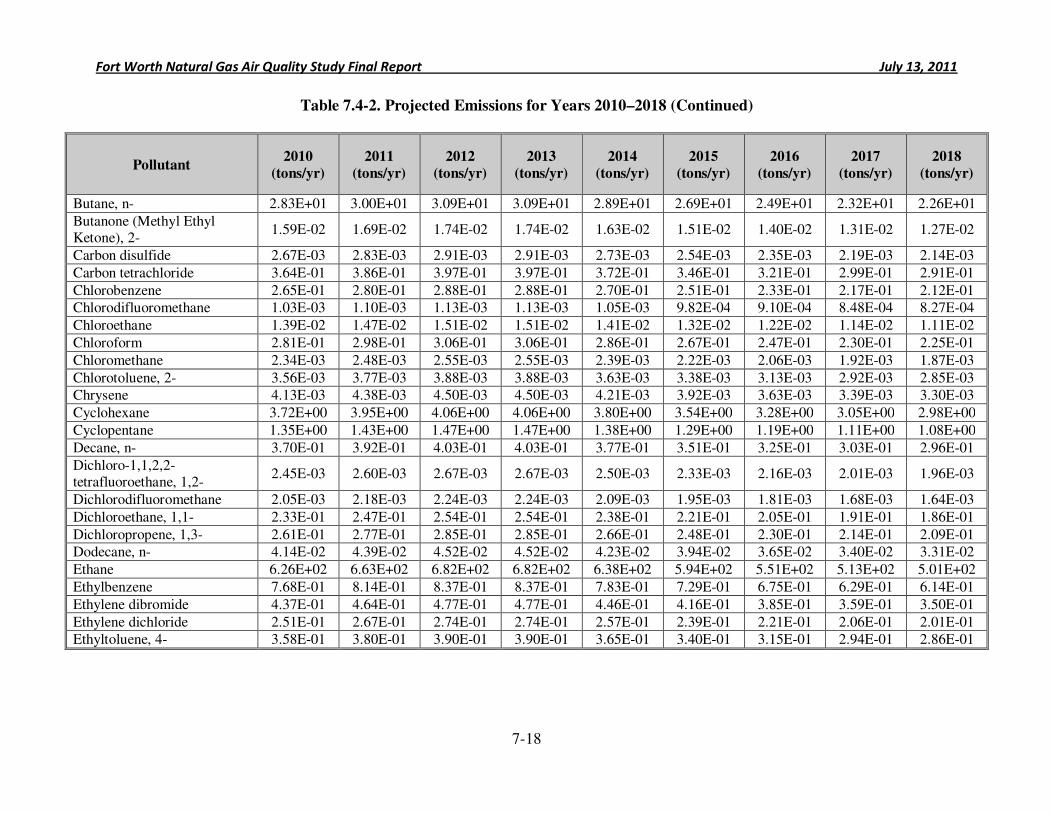
Fort Worth Natural Gas Air Quality Study Final Report July 13, 2011
7-18
Table 7.4-2. Projected Emissions for Years 2010–2018 (Continued)
Pollutant 2010
(tons/yr)
2011
(tons/yr)
2012
(tons/yr)
2013
(tons/yr)
2014
(tons/yr)
2015
(tons/yr)
2016
(tons/yr)
2017
(tons/yr)
2018
(tons/yr)
Butane, n- 2.83E+01 3.00E+01 3.09E+01 3.09E+01 2.89E+01 2.69E+01 2.49E+01 2.32E+01 2.26E+01
Butanone (Methyl Ethyl Ketone), 2-
1.59E-02 1.69E-02 1.74E-02 1.74E-02 1.63E-02 1.51E-02 1.40E-02 1.31E-02 1.27E-02
Carbon disulfide 2.67E-03 2.83E-03 2.91E-03 2.91E-03 2.73E-03 2.54E-03 2.35E-03 2.19E-03 2.14E-03
Carbon tetrachloride 3.64E-01 3.86E-01 3.97E-01 3.97E-01 3.72E-01 3.46E-01 3.21E-01 2.99E-01 2.91E-01
Chlorobenzene 2.65E-01 2.80E-01 2.88E-01 2.88E-01 2.70E-01 2.51E-01 2.33E-01 2.17E-01 2.12E-01 Chlorodifluoromethane 1.03E-03 1.10E-03 1.13E-03 1.13E-03 1.05E-03 9.82E-04 9.10E-04 8.48E-04 8.27E-04
Chloroethane 1.39E-02 1.47E-02 1.51E-02 1.51E-02 1.41E-02 1.32E-02 1.22E-02 1.14E-02 1.11E-02
Chloroform 2.81E-01 2.98E-01 3.06E-01 3.06E-01 2.86E-01 2.67E-01 2.47E-01 2.30E-01 2.25E-01
Chloromethane 2.34E-03 2.48E-03 2.55E-03 2.55E-03 2.39E-03 2.22E-03 2.06E-03 1.92E-03 1.87E-03
Chlorotoluene, 2- 3.56E-03 3.77E-03 3.88E-03 3.88E-03 3.63E-03 3.38E-03 3.13E-03 2.92E-03 2.85E-03 Chrysene 4.13E-03 4.38E-03 4.50E-03 4.50E-03 4.21E-03 3.92E-03 3.63E-03 3.39E-03 3.30E-03
Cyclohexane 3.72E+00 3.95E+00 4.06E+00 4.06E+00 3.80E+00 3.54E+00 3.28E+00 3.05E+00 2.98E+00
Cyclopentane 1.35E+00 1.43E+00 1.47E+00 1.47E+00 1.38E+00 1.29E+00 1.19E+00 1.11E+00 1.08E+00
Decane, n- 3.70E-01 3.92E-01 4.03E-01 4.03E-01 3.77E-01 3.51E-01 3.25E-01 3.03E-01 2.96E-01
Dichloro-1,1,2,2-tetrafluoroethane, 1,2-
2.45E-03 2.60E-03 2.67E-03 2.67E-03 2.50E-03 2.33E-03 2.16E-03 2.01E-03 1.96E-03
Dichlorodifluoromethane 2.05E-03 2.18E-03 2.24E-03 2.24E-03 2.09E-03 1.95E-03 1.81E-03 1.68E-03 1.64E-03
Dichloroethane, 1,1- 2.33E-01 2.47E-01 2.54E-01 2.54E-01 2.38E-01 2.21E-01 2.05E-01 1.91E-01 1.86E-01
Dichloropropene, 1,3- 2.61E-01 2.77E-01 2.85E-01 2.85E-01 2.66E-01 2.48E-01 2.30E-01 2.14E-01 2.09E-01 Dodecane, n- 4.14E-02 4.39E-02 4.52E-02 4.52E-02 4.23E-02 3.94E-02 3.65E-02 3.40E-02 3.31E-02
Ethane 6.26E+02 6.63E+02 6.82E+02 6.82E+02 6.38E+02 5.94E+02 5.51E+02 5.13E+02 5.01E+02
Ethylbenzene 7.68E-01 8.14E-01 8.37E-01 8.37E-01 7.83E-01 7.29E-01 6.75E-01 6.29E-01 6.14E-01
Ethylene dibromide 4.37E-01 4.64E-01 4.77E-01 4.77E-01 4.46E-01 4.16E-01 3.85E-01 3.59E-01 3.50E-01
Ethylene dichloride 2.51E-01 2.67E-01 2.74E-01 2.74E-01 2.57E-01 2.39E-01 2.21E-01 2.06E-01 2.01E-01 Ethyltoluene, 4- 3.58E-01 3.80E-01 3.90E-01 3.90E-01 3.65E-01 3.40E-01 3.15E-01 2.94E-01 2.86E-01
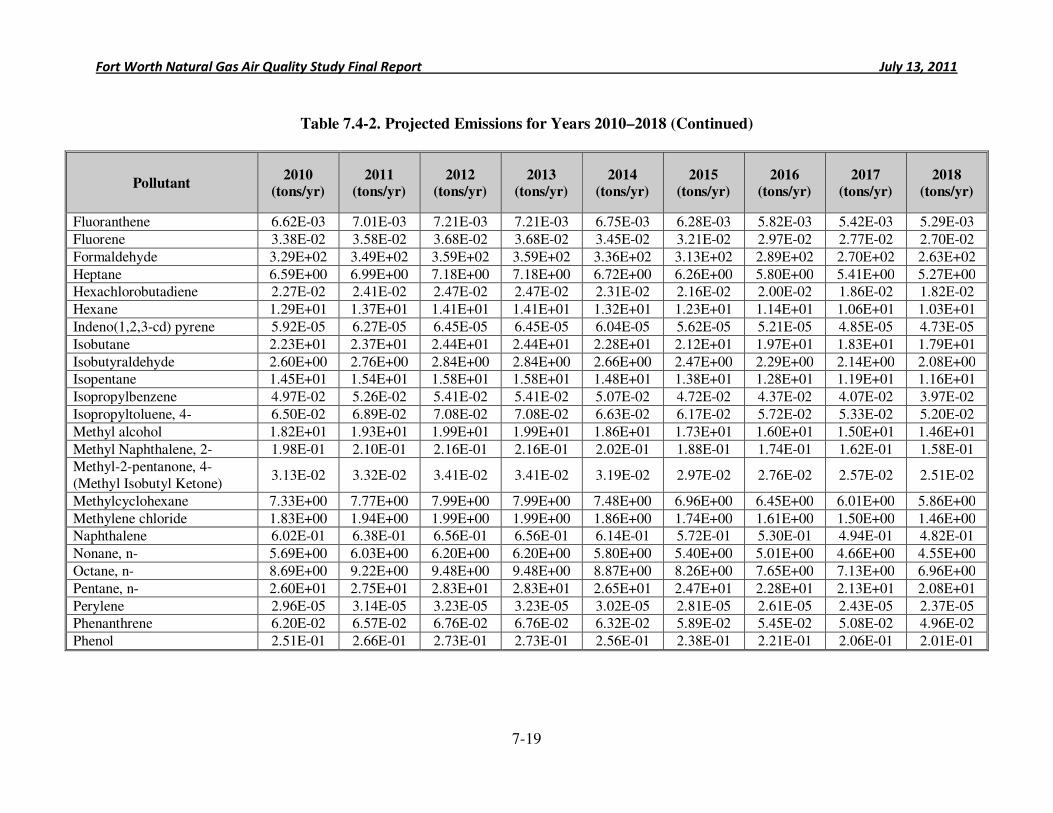
Fort Worth Natural Gas Air Quality Study Final Report July 13, 2011
7-19
Table 7.4-2. Projected Emissions for Years 2010–2018 (Continued)
Pollutant 2010
(tons/yr) 2011
(tons/yr) 2012
(tons/yr) 2013
(tons/yr) 2014
(tons/yr) 2015
(tons/yr) 2016
(tons/yr) 2017
(tons/yr) 2018
(tons/yr)
Fluoranthene 6.62E-03 7.01E-03 7.21E-03 7.21E-03 6.75E-03 6.28E-03 5.82E-03 5.42E-03 5.29E-03
Fluorene 3.38E-02 3.58E-02 3.68E-02 3.68E-02 3.45E-02 3.21E-02 2.97E-02 2.77E-02 2.70E-02
Formaldehyde 3.29E+02 3.49E+02 3.59E+02 3.59E+02 3.36E+02 3.13E+02 2.89E+02 2.70E+02 2.63E+02
Heptane 6.59E+00 6.99E+00 7.18E+00 7.18E+00 6.72E+00 6.26E+00 5.80E+00 5.41E+00 5.27E+00 Hexachlorobutadiene 2.27E-02 2.41E-02 2.47E-02 2.47E-02 2.31E-02 2.16E-02 2.00E-02 1.86E-02 1.82E-02
Hexane 1.29E+01 1.37E+01 1.41E+01 1.41E+01 1.32E+01 1.23E+01 1.14E+01 1.06E+01 1.03E+01
Indeno(1,2,3-cd) pyrene 5.92E-05 6.27E-05 6.45E-05 6.45E-05 6.04E-05 5.62E-05 5.21E-05 4.85E-05 4.73E-05
Isobutane 2.23E+01 2.37E+01 2.44E+01 2.44E+01 2.28E+01 2.12E+01 1.97E+01 1.83E+01 1.79E+01
Isobutyraldehyde 2.60E+00 2.76E+00 2.84E+00 2.84E+00 2.66E+00 2.47E+00 2.29E+00 2.14E+00 2.08E+00 Isopentane 1.45E+01 1.54E+01 1.58E+01 1.58E+01 1.48E+01 1.38E+01 1.28E+01 1.19E+01 1.16E+01
Isopropylbenzene 4.97E-02 5.26E-02 5.41E-02 5.41E-02 5.07E-02 4.72E-02 4.37E-02 4.07E-02 3.97E-02
Isopropyltoluene, 4- 6.50E-02 6.89E-02 7.08E-02 7.08E-02 6.63E-02 6.17E-02 5.72E-02 5.33E-02 5.20E-02
Methyl alcohol 1.82E+01 1.93E+01 1.99E+01 1.99E+01 1.86E+01 1.73E+01 1.60E+01 1.50E+01 1.46E+01
Methyl Naphthalene, 2- 1.98E-01 2.10E-01 2.16E-01 2.16E-01 2.02E-01 1.88E-01 1.74E-01 1.62E-01 1.58E-01 Methyl-2-pentanone, 4- (Methyl Isobutyl Ketone)
3.13E-02 3.32E-02 3.41E-02 3.41E-02 3.19E-02 2.97E-02 2.76E-02 2.57E-02 2.51E-02
Methylcyclohexane 7.33E+00 7.77E+00 7.99E+00 7.99E+00 7.48E+00 6.96E+00 6.45E+00 6.01E+00 5.86E+00
Methylene chloride 1.83E+00 1.94E+00 1.99E+00 1.99E+00 1.86E+00 1.74E+00 1.61E+00 1.50E+00 1.46E+00 Naphthalene 6.02E-01 6.38E-01 6.56E-01 6.56E-01 6.14E-01 5.72E-01 5.30E-01 4.94E-01 4.82E-01
Nonane, n- 5.69E+00 6.03E+00 6.20E+00 6.20E+00 5.80E+00 5.40E+00 5.01E+00 4.66E+00 4.55E+00
Octane, n- 8.69E+00 9.22E+00 9.48E+00 9.48E+00 8.87E+00 8.26E+00 7.65E+00 7.13E+00 6.96E+00
Pentane, n- 2.60E+01 2.75E+01 2.83E+01 2.83E+01 2.65E+01 2.47E+01 2.28E+01 2.13E+01 2.08E+01
Perylene 2.96E-05 3.14E-05 3.23E-05 3.23E-05 3.02E-05 2.81E-05 2.61E-05 2.43E-05 2.37E-05 Phenanthrene 6.20E-02 6.57E-02 6.76E-02 6.76E-02 6.32E-02 5.89E-02 5.45E-02 5.08E-02 4.96E-02
Phenol 2.51E-01 2.66E-01 2.73E-01 2.73E-01 2.56E-01 2.38E-01 2.21E-01 2.06E-01 2.01E-01
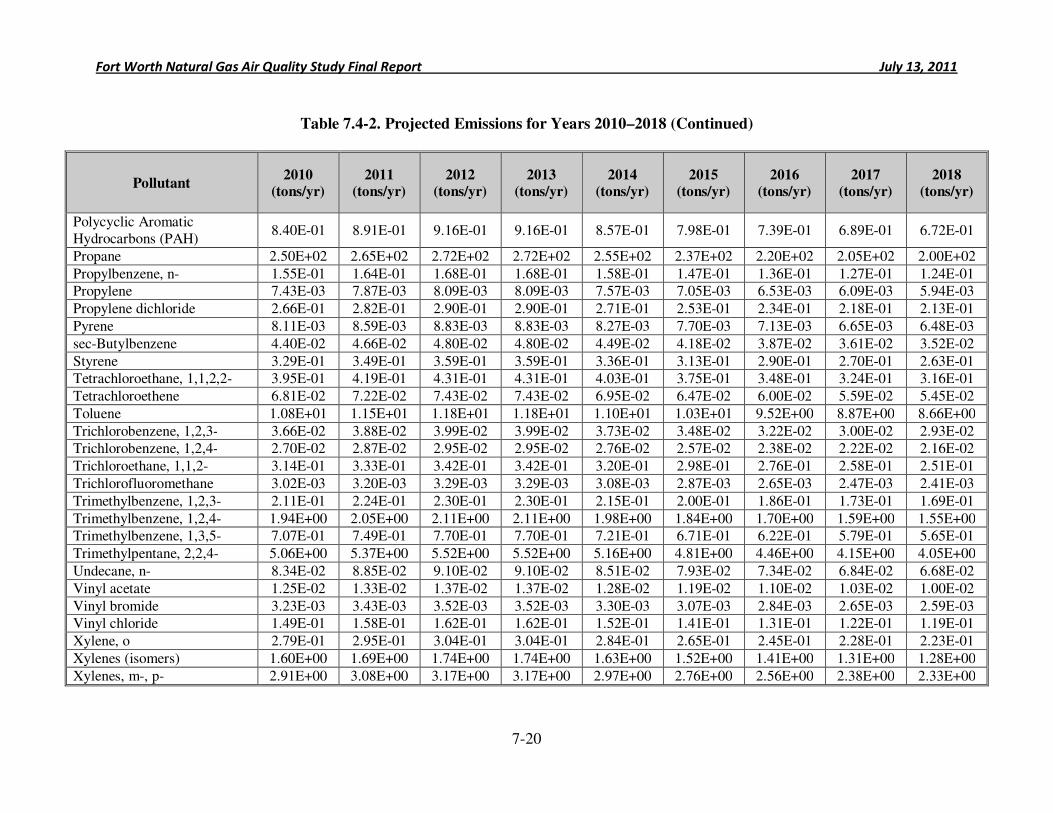
Fort Worth Natural Gas Air Quality Study Final Report July 13, 2011
7-20
Table 7.4-2. Projected Emissions for Years 2010–2018 (Continued)
Pollutant 2010
(tons/yr) 2011
(tons/yr) 2012
(tons/yr) 2013
(tons/yr) 2014
(tons/yr) 2015
(tons/yr) 2016
(tons/yr) 2017
(tons/yr) 2018
(tons/yr)
Polycyclic Aromatic Hydrocarbons (PAH)
8.40E-01 8.91E-01 9.16E-01 9.16E-01 8.57E-01 7.98E-01 7.39E-01 6.89E-01 6.72E-01
Propane 2.50E+02 2.65E+02 2.72E+02 2.72E+02 2.55E+02 2.37E+02 2.20E+02 2.05E+02 2.00E+02
Propylbenzene, n- 1.55E-01 1.64E-01 1.68E-01 1.68E-01 1.58E-01 1.47E-01 1.36E-01 1.27E-01 1.24E-01 Propylene 7.43E-03 7.87E-03 8.09E-03 8.09E-03 7.57E-03 7.05E-03 6.53E-03 6.09E-03 5.94E-03
Propylene dichloride 2.66E-01 2.82E-01 2.90E-01 2.90E-01 2.71E-01 2.53E-01 2.34E-01 2.18E-01 2.13E-01
Pyrene 8.11E-03 8.59E-03 8.83E-03 8.83E-03 8.27E-03 7.70E-03 7.13E-03 6.65E-03 6.48E-03
sec-Butylbenzene 4.40E-02 4.66E-02 4.80E-02 4.80E-02 4.49E-02 4.18E-02 3.87E-02 3.61E-02 3.52E-02
Styrene 3.29E-01 3.49E-01 3.59E-01 3.59E-01 3.36E-01 3.13E-01 2.90E-01 2.70E-01 2.63E-01 Tetrachloroethane, 1,1,2,2- 3.95E-01 4.19E-01 4.31E-01 4.31E-01 4.03E-01 3.75E-01 3.48E-01 3.24E-01 3.16E-01
Tetrachloroethene 6.81E-02 7.22E-02 7.43E-02 7.43E-02 6.95E-02 6.47E-02 6.00E-02 5.59E-02 5.45E-02
Toluene 1.08E+01 1.15E+01 1.18E+01 1.18E+01 1.10E+01 1.03E+01 9.52E+00 8.87E+00 8.66E+00
Trichlorobenzene, 1,2,3- 3.66E-02 3.88E-02 3.99E-02 3.99E-02 3.73E-02 3.48E-02 3.22E-02 3.00E-02 2.93E-02 Trichlorobenzene, 1,2,4- 2.70E-02 2.87E-02 2.95E-02 2.95E-02 2.76E-02 2.57E-02 2.38E-02 2.22E-02 2.16E-02
Trichloroethane, 1,1,2- 3.14E-01 3.33E-01 3.42E-01 3.42E-01 3.20E-01 2.98E-01 2.76E-01 2.58E-01 2.51E-01
Trichlorofluoromethane 3.02E-03 3.20E-03 3.29E-03 3.29E-03 3.08E-03 2.87E-03 2.65E-03 2.47E-03 2.41E-03
Trimethylbenzene, 1,2,3- 2.11E-01 2.24E-01 2.30E-01 2.30E-01 2.15E-01 2.00E-01 1.86E-01 1.73E-01 1.69E-01
Trimethylbenzene, 1,2,4- 1.94E+00 2.05E+00 2.11E+00 2.11E+00 1.98E+00 1.84E+00 1.70E+00 1.59E+00 1.55E+00 Trimethylbenzene, 1,3,5- 7.07E-01 7.49E-01 7.70E-01 7.70E-01 7.21E-01 6.71E-01 6.22E-01 5.79E-01 5.65E-01
Trimethylpentane, 2,2,4- 5.06E+00 5.37E+00 5.52E+00 5.52E+00 5.16E+00 4.81E+00 4.46E+00 4.15E+00 4.05E+00
Undecane, n- 8.34E-02 8.85E-02 9.10E-02 9.10E-02 8.51E-02 7.93E-02 7.34E-02 6.84E-02 6.68E-02
Vinyl acetate 1.25E-02 1.33E-02 1.37E-02 1.37E-02 1.28E-02 1.19E-02 1.10E-02 1.03E-02 1.00E-02
Vinyl bromide 3.23E-03 3.43E-03 3.52E-03 3.52E-03 3.30E-03 3.07E-03 2.84E-03 2.65E-03 2.59E-03 Vinyl chloride 1.49E-01 1.58E-01 1.62E-01 1.62E-01 1.52E-01 1.41E-01 1.31E-01 1.22E-01 1.19E-01
Xylene, o 2.79E-01 2.95E-01 3.04E-01 3.04E-01 2.84E-01 2.65E-01 2.45E-01 2.28E-01 2.23E-01
Xylenes (isomers) 1.60E+00 1.69E+00 1.74E+00 1.74E+00 1.63E+00 1.52E+00 1.41E+00 1.31E+00 1.28E+00
Xylenes, m-, p- 2.91E+00 3.08E+00 3.17E+00 3.17E+00 2.97E+00 2.76E+00 2.56E+00 2.38E+00 2.33E+00
Fort Worth Natural Gas Air Quality Study Final Report July 13, 2011
7-21
Key Point: Barnett Shale Based on a reserve estimate of 30 trillion cubic feet of natural gas, over 75% of the available natural gas in the Barnett Shale is projected to be
recovered by the end of 2018.
7.5 Full Build-Out Estimates Conclusions
Emissions from the production of natural gas in the city of Fort Worth are projected to peak in 2012 and 2013, and in 2015 are projected to decrease to below 2010 levels. The projected peak emission levels occurring in 2012 and 2013 are expected to be 9% higher than emissions during the 2010 baseline year.
As discussed above, natural gas production is primarily dependent on the price that producers will receive. This concept is reflected in the demonstrated relationship between drilling rig and permit activity and natural gas prices. If the wellhead price for natural gas remains relatively low, as it is now, producers do not have economic incentive to invest in new exploration and drilling. Under this scenario, it is expected that total production from currently producing wells and leased wells not yet in production (but currently in development) will increase in the short term, followed by a slow decline.
Should wellhead prices for natural gas unexpectedly increase in future years, natural gas production and associated air emissions may be greater than projected. However, it is important to note that the longer natural gas prices remain flat, the lower the peak production rate will be, even with a spike in the price of natural gas. This is because the overall size of the resource, or the reserves, is finite, and the reserve decreases in size as each year passes. The data used in this analysis shows that, based on a reserve estimate of 30 trillion cubic feet of natural gas in the Barnett Shale, approximately one-third has already been depleted, and over 75% will have been recovered by the end of 2018.
Fort Worth Natural Gas Air Quality Study Final Report July 13, 2011
8-1
8.0 Conclusions and Recommendations
Commencing with planning activities in July 2010 and field activities in August 2010, the Fort Worth Natural Gas Air Quality Study was a multi-phase project aimed at characterizing the air quality impacts of natural gas exploration and production, determining any potential health risks associated with those impacts, quantifying the total amount of pollutants being emitted, and determining if natural gas sites were in compliance with air quality regulations.
Two primary raw data collection activities were used: 1) an ambient air monitoring network, and 2) a systematic point source testing program. Point source testing data were then used to perform air dispersion modeling, and measured and modeled air concentrations were used in the public health evaluation. Each of these tasks was designed to help city officials answer the following questions:
• How much air pollution is being released by natural gas exploration in Fort Worth?
• Do sites comply with environmental regulation?
• How do releases from these sites affect off-site air pollution levels?
• Are the city’s required setbacks for these sites adequate to protect public health?
Section 8.1 provides a summary of the conclusions for each task of this study, Section 8.2
includes answers to the four primary study questions, and Section 8.3 provides specific recommendations for ensuring that emissions from natural gas sites do not cause unhealthy air pollution levels. 8.1 Task Level Conclusions
As discussed previously, the Fort Worth Natural Gas Air Quality Study was multi-faceted
and included Ambient Air Monitoring, Point Source Testing, Air Dispersion Modeling, a Public Health Evaluation, a Regulatory Assessment, and Full Build-Out Estimates. The key findings for each of these tasks are provided below.
Key findings of the Ambient Air Monitoring task include:
• 169 ambient air samples from 8 locations in Fort Worth were collected and analyzed, resulting in over 15,000 ambient air data points generated for this study.
• Methane, ethane, propane, and butane were the pollutants found at highest concentrations. However, more toxic pollutants (e.g., benzene) were also found, but generally at much lower levels.
• Concentrations measured at Site S-4 (located in a high-level activity area near compressor stations, well pads, and mobile sources) were generally higher than at the other sites.
• Concentrations measured at Sites S-6 and S-7 (both located within 350 of active well pads) were surprisingly low relative to the other sites.
Fort Worth Natural Gas Air Quality Study Final Report July 13, 2011
8-2
• Wind patterns observed during the sampling period were consistent with historical wind patterns, indicating proper placement of the ambient air monitors.
Key findings of the Point Source Testing task include:
• At 96 sites, no emissions were detected by the IR camera. Most of these sites contained 3 wells or less.
• The largest source of fugitive emissions detected with the IR camera was leaking tank thief hatches.
• Pneumatic Valve Controllers were the most frequent emission sources encountered at well pads and compressor stations.
• Compressor engines have a significant impact on emissions, especially the large line compressors found at compressor stations.
• There was little difference in average TOC emissions between dry and wet gas sites, but average VOC and HAP emissions from wet gas sites proved to be considerably higher.
Key findings of the Public Health Evaluation task (including analysis of the emissions
concentrations predicted under the Air Dispersion Modeling task) include:
• Benzene emissions from tanks could lead to air pollution levels slightly higher than TCEQ’s short-term ESL, but only in very close proximity to the highest-emitting tanks.
• Large line engines can emit acrolein and formaldehyde at levels that would cause offsite ambient air concentrations to exceed TCEQ’s short-term and long-term screening levels over various distances. This finding is based entirely on estimated emission rates.
• Trace levels of halogenated hydrocarbons detected during the ambient air monitoring program are not likely to be attributable to emissions from natural gas exploration and production activity.
Key findings of the Regulatory Assessment task include:
• Five sites had cumulative VOC emissions greater than the PBR trigger level of 25 tons/yr and/or CO emissions greater than the major source threshold of 100 tons/yr.
Key findings of the Full Build-Out Estimates task include:
• Emissions from the production of natural gas in the city of Fort Worth are projected to peak in 2012 and 2013 at 9% above 2010 levels.
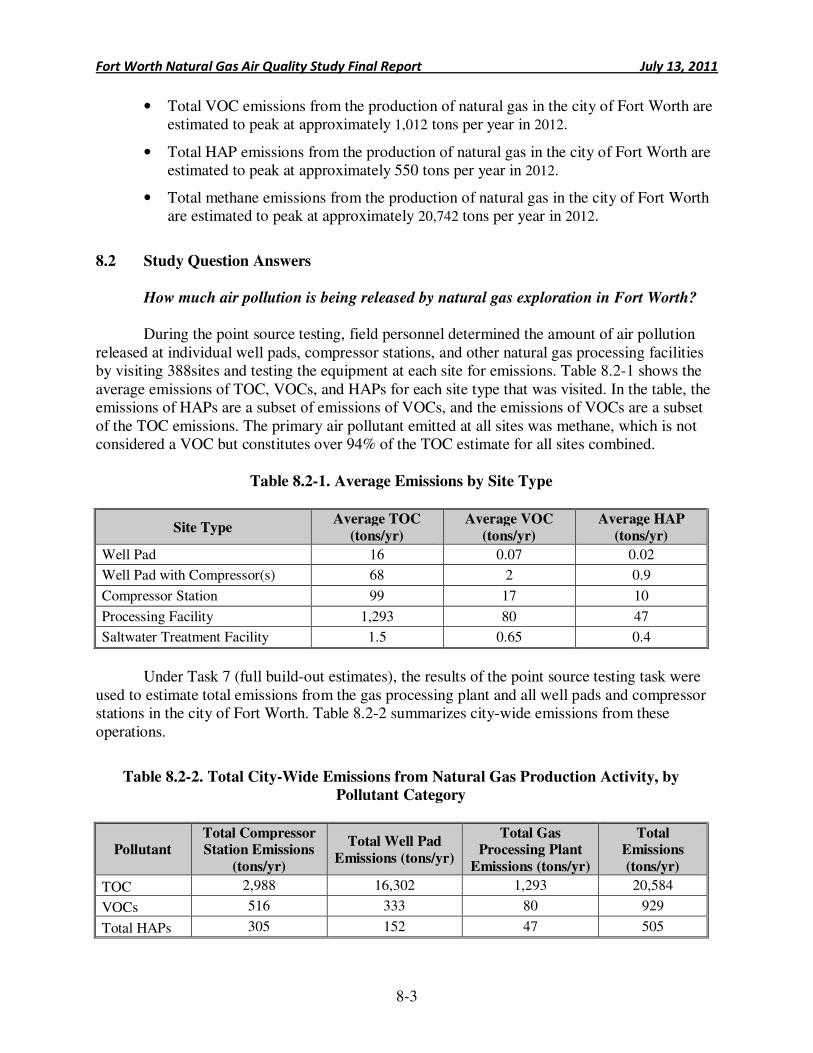
Fort Worth Natural Gas Air Quality Study Final Report July 13, 2011
8-3
• Total VOC emissions from the production of natural gas in the city of Fort Worth are estimated to peak at approximately 1,012 tons per year in 2012.
• Total HAP emissions from the production of natural gas in the city of Fort Worth are estimated to peak at approximately 550 tons per year in 2012.
• Total methane emissions from the production of natural gas in the city of Fort Worth are estimated to peak at approximately 20,742 tons per year in 2012.
8.2 Study Question Answers
How much air pollution is being released by natural gas exploration in Fort Worth?
During the point source testing, field personnel determined the amount of air pollution
released at individual well pads, compressor stations, and other natural gas processing facilities by visiting 388sites and testing the equipment at each site for emissions. Table 8.2-1 shows the average emissions of TOC, VOCs, and HAPs for each site type that was visited. In the table, the emissions of HAPs are a subset of emissions of VOCs, and the emissions of VOCs are a subset of the TOC emissions. The primary air pollutant emitted at all sites was methane, which is not considered a VOC but constitutes over 94% of the TOC estimate for all sites combined.
Table 8.2-1. Average Emissions by Site Type
Site Type Average TOC
(tons/yr)
Average VOC
(tons/yr)
Average HAP
(tons/yr)
Well Pad 16 0.07 0.02
Well Pad with Compressor(s) 68 2 0.9
Compressor Station 99 17 10
Processing Facility 1,293 80 47
Saltwater Treatment Facility 1.5 0.65 0.4
Under Task 7 (full build-out estimates), the results of the point source testing task were
used to estimate total emissions from the gas processing plant and all well pads and compressor stations in the city of Fort Worth. Table 8.2-2 summarizes city-wide emissions from these operations.
Table 8.2-2. Total City-Wide Emissions from Natural Gas Production Activity, by
Pollutant Category
Pollutant Total Compressor Station Emissions
(tons/yr)
Total Well Pad
Emissions (tons/yr)
Total Gas Processing Plant
Emissions (tons/yr)
Total Emissions
(tons/yr)
TOC 2,988 16,302 1,293 20,584
VOCs 516 333 80 929
Total HAPs 305 152 47 505
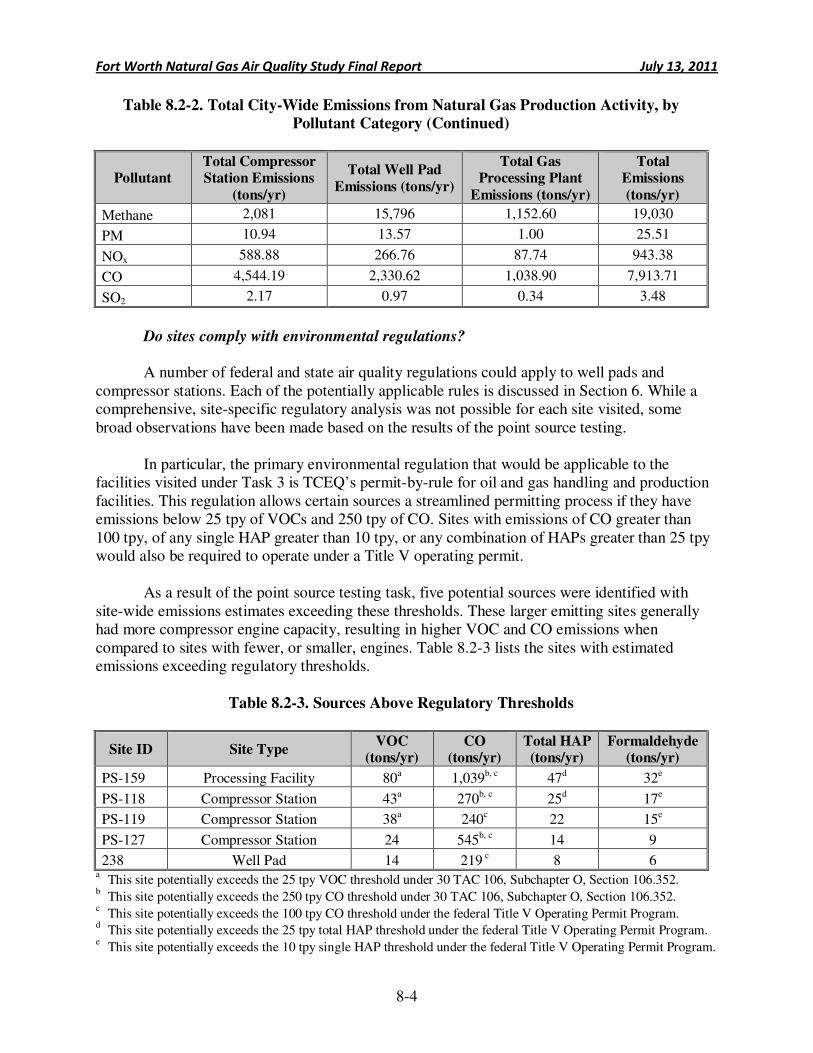
Fort Worth Natural Gas Air Quality Study Final Report July 13, 2011
8-4
Table 8.2-2. Total City-Wide Emissions from Natural Gas Production Activity, by
Pollutant Category (Continued)
Pollutant Total Compressor Station Emissions
(tons/yr)
Total Well Pad
Emissions (tons/yr)
Total Gas Processing Plant
Emissions (tons/yr)
Total Emissions
(tons/yr)
Methane 2,081 15,796 1,152.60 19,030
PM 10.94 13.57 1.00 25.51
NOx 588.88 266.76 87.74 943.38
CO 4,544.19 2,330.62 1,038.90 7,913.71
SO2 2.17 0.97 0.34 3.48
Do sites comply with environmental regulations?
A number of federal and state air quality regulations could apply to well pads and compressor stations. Each of the potentially applicable rules is discussed in Section 6. While a comprehensive, site-specific regulatory analysis was not possible for each site visited, some broad observations have been made based on the results of the point source testing.
In particular, the primary environmental regulation that would be applicable to the facilities visited under Task 3 is TCEQ’s permit-by-rule for oil and gas handling and production facilities. This regulation allows certain sources a streamlined permitting process if they have emissions below 25 tpy of VOCs and 250 tpy of CO. Sites with emissions of CO greater than 100 tpy, of any single HAP greater than 10 tpy, or any combination of HAPs greater than 25 tpy would also be required to operate under a Title V operating permit.
As a result of the point source testing task, five potential sources were identified with site-wide emissions estimates exceeding these thresholds. These larger emitting sites generally had more compressor engine capacity, resulting in higher VOC and CO emissions when compared to sites with fewer, or smaller, engines. Table 8.2-3 lists the sites with estimated emissions exceeding regulatory thresholds.
Table 8.2-3. Sources Above Regulatory Thresholds
Site ID Site Type VOC
(tons/yr) CO
(tons/yr) Total HAP (tons/yr)
Formaldehyde (tons/yr)
PS-159 Processing Facility 80a 1,039b, c 47d 32e
PS-118 Compressor Station 43a 270b, c 25d 17e
PS-119 Compressor Station 38a 240c 22 15e
PS-127 Compressor Station 24 545b, c 14 9
238 Well Pad 14 219 c 8 6 a
This site potentially exceeds the 25 tpy VOC threshold under 30 TAC 106, Subchapter O, Section 106.352. b
This site potentially exceeds the 250 tpy CO threshold under 30 TAC 106, Subchapter O, Section 106.352. c
This site potentially exceeds the 100 tpy CO threshold under the federal Title V Operating Permit Program. d
This site potentially exceeds the 25 tpy total HAP threshold under the federal Title V Operating Permit Program. e
This site potentially exceeds the 10 tpy single HAP threshold under the federal Title V Operating Permit Program.
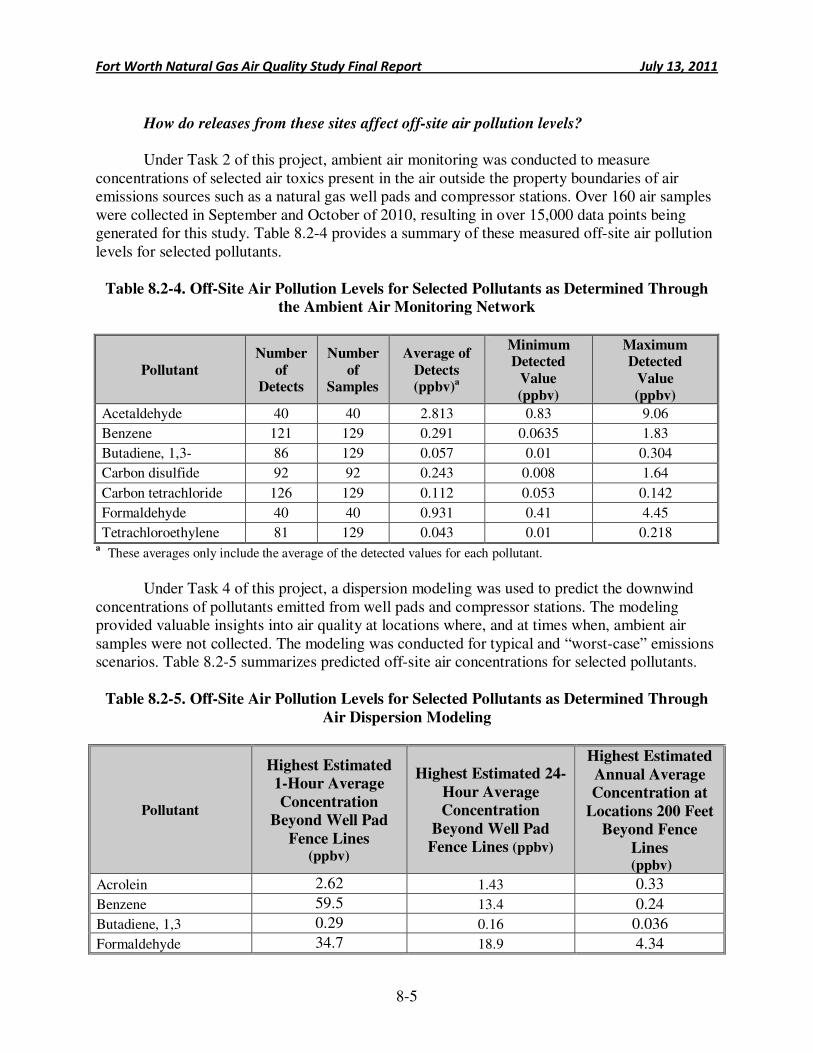
Fort Worth Natural Gas Air Quality Study Final Report July 13, 2011
8-5
How do releases from these sites affect off-site air pollution levels?
Under Task 2 of this project, ambient air monitoring was conducted to measure
concentrations of selected air toxics present in the air outside the property boundaries of air emissions sources such as a natural gas well pads and compressor stations. Over 160 air samples were collected in September and October of 2010, resulting in over 15,000 data points being generated for this study. Table 8.2-4 provides a summary of these measured off-site air pollution levels for selected pollutants.
Table 8.2-4. Off-Site Air Pollution Levels for Selected Pollutants as Determined Through
the Ambient Air Monitoring Network
Pollutant
Number
of Detects
Number
of Samples
Average of
Detects (ppbv)
a
Minimum Detected
Value
(ppbv)
Maximum Detected
Value
(ppbv)
Acetaldehyde 40 40 2.813 0.83 9.06
Benzene 121 129 0.291 0.0635 1.83
Butadiene, 1,3- 86 129 0.057 0.01 0.304
Carbon disulfide 92 92 0.243 0.008 1.64
Carbon tetrachloride 126 129 0.112 0.053 0.142
Formaldehyde 40 40 0.931 0.41 4.45
Tetrachloroethylene 81 129 0.043 0.01 0.218 a
These averages only include the average of the detected values for each pollutant.
Under Task 4 of this project, a dispersion modeling was used to predict the downwind
concentrations of pollutants emitted from well pads and compressor stations. The modeling provided valuable insights into air quality at locations where, and at times when, ambient air samples were not collected. The modeling was conducted for typical and “worst-case” emissions scenarios. Table 8.2-5 summarizes predicted off-site air concentrations for selected pollutants.
Table 8.2-5. Off-Site Air Pollution Levels for Selected Pollutants as Determined Through
Air Dispersion Modeling
Pollutant
Highest Estimated
1-Hour Average
Concentration
Beyond Well Pad
Fence Lines (ppbv)
Highest Estimated 24-
Hour Average
Concentration
Beyond Well Pad
Fence Lines (ppbv)
Highest Estimated
Annual Average
Concentration at
Locations 200 Feet
Beyond Fence
Lines (ppbv)
Acrolein 2.62 1.43 0.33
Benzene 59.5 13.4 0.24
Butadiene, 1,3 0.29 0.16 0.036
Formaldehyde 34.7 18.9 4.34
Fort Worth Natural Gas Air Quality Study Final Report July 13, 2011
8-6
Are the city’s required setbacks for these sites adequate to protect public health?
ERG conducted a health screening evaluation to evaluate the health implications of air emissions from natural gas exploration and production activity. This evaluation was based on protective health-based screening values, primarily those published by TCEQ, though consideration was also given to EPA and ATSDR values for the pollutants of greatest concern. The ambient air monitoring data revealed no site-related pollutants with 24-hour average concentrations or program-average concentrations above TCEQ’s health-based screening levels. The modeling analysis identified three pollutants—acrolein, benzene, and formaldehyde—with estimated 1-hour average or annual average concentrations above screening levels at some offsite locations. This was most prevalent for sites with multiple, large line compressor engines. However, due to the highly protective nature of the health-based screening values, none of the estimated concentrations reached levels expected to be associated with adverse health effects.
The modeling analysis served as the basis for evaluating the adequacy of setback
distances. For the overwhelming majority of sites considered in this study, the modeling results indicate that Fort Worth’s 600-foot setback distance is adequate. More specifically, for sites with no engines and for sites with smaller lift engines, no pollutants were found to have estimated 1-hour maximum or annual average concentrations above TCEQ’s applicable health-based screening levels beyond the setback distances. For the relatively few sites with multiple, large line engines, the modeling analysis found some areas beyond the setbacks to have estimated acrolein and formaldehyde concentrations greater than TCEQ’s ESLs, though not reaching concentrations expected to cause adverse health effects. For both pollutants, ERG’s modeling is based entirely on estimated emission rates, and not measured values. This underscores the value of obtaining more detailed acrolein and formaldehyde emissions data for line engines and focused ambient air monitoring to validate these findings. Such studies would provide greater confidence in the adequacy and protectiveness of the city’s setbacks. 8.3 Recommendations
Although this study did not reveal any significant health threats beyond setback distances, it is important to remember that the sources of concern for this project—natural gas exploration and production activity—are located in residential settings throughout a metropolitan area. Though the most toxic pollutants these sources emit are released in relatively low quantities, all reasonable precautions to reduce emissions from the well pads and compressor stations should be made. This is particularly important for tanks and line compressor engines, because these two sources accounted for the greatest portion of the risks observed for the pollutants selected for further evaluation. Such precautions would include the installation and operation of the following air pollution control equipment:
Vapor Recovery Units on storage tanks – storage tanks are the highest source of benzene
emissions, and vapor recovery units could reduce these emissions by 90% or more. This would be most beneficial at wet gas sites with higher condensate production.
3-way catalysts and/or catalytic oxidizers on compressor station compressor engines –
the large compressor engines located at compressor stations are the main source of acrolein and
Fort Worth Natural Gas Air Quality Study Final Report July 13, 2011
8-7
formaldehyde, the two pollutants of greatest concern from a public health perspective. 3-way catalysts are primarily NOx control technologies, but have a co-benefit of reducing CO and VOC emissions. Catalytic oxidizers are used to control CO and VOC emissions.
Electric compressor engines – As many of the compressor stations in Fort Worth are
located in an urban setting, easy access to the electric grid also provides an opportunity to eliminate emissions from compressor engines completely through the use of electric motors.
Low bleed or no bleed pneumatic valve controllers – Pneumatic valve controllers were
the most frequent fugitive emission source found during the point source testing task. Under EPA’s voluntary Natural Gas STAR Program, the use of low bleed valve controllers and electric valve controllers is encouraged and has proven effective in reducing VOC (and methane) emissions from natural gas operations.
In addition to these air pollution control equipment recommendations, enhanced
inspection and maintenance of equipment at natural gas sites can help ensure that preventable emissions are greatly reduced or eliminated. At a small subset of sites, the point source testing team noted signs of malfunctioning equipment that likely caused increased emissions. For example, some hatches atop tanks were ajar and not closed, and corrosion had apparently caused a hole to form on the roof of at least one tank.
The emission estimates used in this study for acrolein and formaldehyde are based on the
best emissions information currently available for compressor engines – emission factors from U.S. EPA’s Compilation of Air Pollutant Emission Factors (AP-42).28 As control of acrolein and formaldehyde emissions from compressor engines is not explicitly required under any current regulation, no control efficiency was assumed in our estimates. Options available to confirm our assumptions and findings with regards to these pollutants include:
• Contact compressor station owners and operators to establish the frequency at which their engines have installed controls, and to obtain any existing stack testing results
• Analyze the findings of TCEQ’s Phase II Barnett Shale Area Special Inventory efforts to establish the frequency at which compressor engines have installed controls
• Conduct point source stack testing at the exhaust of compressor engines to characterize acrolein and formaldehdye emissions
• Conduct focused ambient air monitoring of acrolein and formaldehdye emissions in close proximity to the larger compressor stations
Finally, ERG fully supports continued ambient air monitoring in and around the city of
Fort Worth in order to confirm the key findings of this report. In particular, the results of TCEQ’s ongoing monitoring efforts in the Barnett Shale should be monitored for any changes in air quality in Fort Worth as worsening air quality may require additional response such as additional controls or site maintenance requirements.
Fort Worth Natural Gas Air Quality Study Final Report July 13, 2011
9-1
9.0 References
1. U.S. Environmental Protection Agency. 1999. Compendium Method TO-15: Determination of Volatile Organic Compounds (VOCs) in Air Collected in Specially-Prepared Canisters and Analyzed by Gas Chromatography/Mass Spectrometry (GC/MS). Can be found at http://www.epa.gov/ttn/amtic/airtox.html.
2. U.S. Environmental Protection Agency. 1999. Compendium Method TO-11A: Determination
of Formaldehyde in Ambient Air Using Adsorbent Cartridge Followed by High Performance Liquid Chromatography (HPLC). Can be found at http://www.epa.gov/ttn/amtic/airtox.html.
3. U.S. Environmental Protection Agency. 1999. Compendium Method TO-14A: Determination
of Volatile Organic Compounds (VOCs) in Ambient Air Using Specially Prepared Canisters with Subsequent Analysis by Gas Chromatography. Can be found at http://www.epa.gov/ttnamti1/files/ambient/airtox/to-14ar.pdf.
4. 101st Congress (1989-1990). Title III—Hazardous Air Pollutants. S.1630.ENR. THOMAS
(Library of Congress). 5. U.S. Environmental Protection Agency. 2010. SAT Initiative: Lamkin Elementary School
(Cypress Texas). Can be found at http://www.epa.gov/schoolair/pdfs/LamkinTechReport.pdf. 6. U.S. Environmental Protection Agency. 2010. Results of the 2005 NATA Model-to-Monitor
Comparison, Final Report. Can be found at http://www.epa.gov/ttn/atw/nata2005/05pdf/nata2005_model2monitor.pdf.
7. United States Environmental Protection Agency. Protocol for Equipment Leak Emission
Estimates. EPA-453/R-95-017. November 1995 8. Schulman et al., Addendum to ISC3 User’s Guide: The PRIME Plume Rise and Building
Downwash Model. Earth Tech, Inc, November 1997. Can be found at http://www.epa.gov/ttn/scram/7thconf/iscprime/useguide.pdf.
9. S Prasad, L Zhao, J Gomes. 2011. Methane and Natural Gas Exposure Limits. Presented at the 2010 Joint Conference of International Society of Exposure Science and International Society for Environmental Epidemiology. Epidemiology 22(1):S251. January, 2011.
10. CCOHS. 2006. Health Effects of Methane. Canadian Centre for Occupational Health and
Safety (CCOHS). http://www.ccohs.ca/oshanswers/chemicals/chem_profiles/methane/health_met.html. Last updated December 11, 2006.
11. Agency for Toxic Substances and Disease Registry, 1994. Toxicological Profile for Hexachlorobutadiene. U.S. Department of Health and Human Services: Agency for Toxic Substances and Disease Registry. May, 1994.
Fort Worth Natural Gas Air Quality Study Final Report July 13, 2011
9-2
12. Texas Commission on Environmental Quality, 2011a. Texas Air Monitoring Information Systems. Site last accessed June 30, 2011. http://www5.tceq.state.tx.us/tamis/index.cfm?fuseaction=home.welcome
13. U.S. Environmental Protection Agency, 2010. Data Quality Evaluation Guidelines for
Ambient Air Acrolein Measurements. December 17, 2010. 14. Agency for Toxic Substances and Disease Registry, 2007. Toxicological Profile for Acrolein.
U.S. Department of Health and Human Services: Agency for Toxic Substances and Disease Registry. August, 2007.
15. Texas Commission on Environmental Quality, 2010. Development Support Document:
Acrolein. Prepared by Allison Jenkins. November 19, 2010. 16. Weber-Tschopp A, Fischer T, Gierr R , et al. 1977. Experimental irritating effects of acrolein
on man. Int Arch Occup Environ Health 40:117-130. (German) 17. Feron VJ, Kruysse A, Til HP, et al. 1978. Repeated exposure to acrolein vapour: Subacute
studies in hamsters, rats, and rabbits. Toxicology 9:47-58. 18. Pazdrak K, Gorski P, Krakowiak A, et al. 1993. Changes in nasal lavage fluid due to
formaldehyde inhalation. In Arch Occup Environ Health 64:515-519. 19. Wilhelmsson B, Holmstrom M. 1992. Possible mechanisms of formaldehyde-induced
discomfort in the upper airways. Scand J Work Environ Health 18:403-407. 20. Texas Commission on Environmental Quality, 2011b. Health Effects Evaluation of Region 4
Carbonyl Monitoring Project, November 6-10, 2010: Sampling for Carbonyl Compounds in Dish and Fort Worth, Texas. Memorandum from Shannon Ethridge, TCEQ Toxicology Division, to John Sadlier, TCEQ Office of Compliance and Enforcement. February 24, 2011.
21. The Perryman Group. 2007. Bounty from Below: The Impact of Developing Natural Gas
Resources Associated with the Barnett Shale on Business Activity in Fort Worth and the Surrounding 14-County Area. Can be found at http://www.barnettshaleexpo.com/docs/Barnett_Shale_Impact_Study.pdf.
22. U.S. Energy Information Administration. 2010. U.S. Crude Oil, Natural Gas, and Natural
Gas Liquids Proved Reserves, 2009. Can be found at http://www.eia.doe.gov/oil_gas/natural_gas/data_publications/crude_oil_natural_gas_reserves/cr.html.
23. Railroad Commission of Texas. 2011. Barnett Shale Information. Can be found at
http://www.rrc.state.tx.us/barnettshale/index.php. 24. U.S. Energy Information Administration. 2011. Annual Texas Natural Gas Wellhead Price.
Can be found at http://www.eia.doe.gov/dnav/ng/hist/na1140_stx_3a.htm.
Fort Worth Natural Gas Air Quality Study Final Report July 13, 2011
9-3
25. U.S. Energy Information Administration. 2011. Annual Energy Outlook 2011. Can be found
at http://www.eia.gov/forecasts/aeo/MT_naturalgas.cfm. 26. Baker-Hughes Incorporated. 2011. Rig Count: Overview & FAQ. Can be found at
http://investor.shareholder.com/bhi/rig_counts/rc_index.cfm. 27. Oil and Gas Journal. 2008. Study Analyzes Nine US, Canada Shale Gas Plays. Vol. 106,
Issue 42.
28. U.S. Environmental Protection Agency. 1995. AP 42, Fifth Edition, Compilation of Air Pollutant Emission Factor Volume 1: Stationary Point and Area Sources. January, 1995.