Embed Size (px)
Citation preview
CITY OF FORT WAYNE
BUDGET IN BRIEF
2009
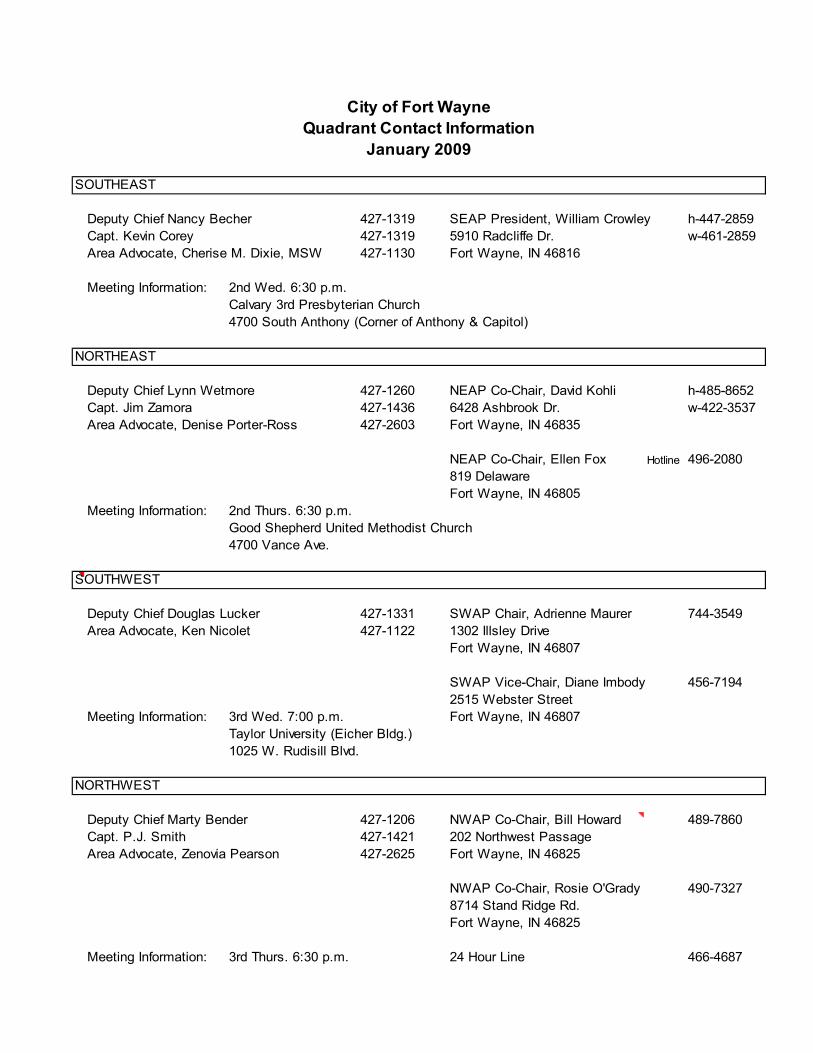
SOUTHEAST
Deputy Chief Nancy Becher 427-1319 SEAP President, William Crowley h-447-2859
Capt. Kevin Corey 427-1319 5910 Radcliffe Dr. w-461-2859
Area Advocate, Cherise M. Dixie, MSW 427-1130 Fort Wayne, IN 46816
Meeting Information: 2nd Wed. 6:30 p.m.
Calvary 3rd Presbyterian Church
4700 South Anthony (Corner of Anthony & Capitol)
NORTHEAST
Deputy Chief Lynn Wetmore 427-1260 NEAP Co-Chair, David Kohli h-485-8652
Capt. Jim Zamora 427-1436 6428 Ashbrook Dr. w-422-3537
Area Advocate, Denise Porter-Ross 427-2603 Fort Wayne, IN 46835
NEAP Co-Chair, Ellen Fox Hotline 496-2080
819 Delaware
Fort Wayne, IN 46805
Meeting Information: 2nd Thurs. 6:30 p.m.
Good Shepherd United Methodist Church
4700 Vance Ave.
SOUTHWEST
Deputy Chief Douglas Lucker 427-1331 SWAP Chair, Adrienne Maurer 744-3549
Area Advocate, Ken Nicolet 427-1122 1302 Illsley Drive
Fort Wayne, IN 46807
SWAP Vice-Chair, Diane Imbody 456-7194
2515 Webster Street
Meeting Information: 3rd Wed. 7:00 p.m. Fort Wayne, IN 46807
Taylor University (Eicher Bldg.)
1025 W. Rudisill Blvd.
NORTHWEST
Deputy Chief Marty Bender 427-1206 NWAP Co-Chair, Bill Howard 489-7860
Capt. P.J. Smith 427-1421 202 Northwest Passage
Area Advocate, Zenovia Pearson 427-2625 Fort Wayne, IN 46825
NWAP Co-Chair, Rosie O'Grady 490-7327
8714 Stand Ridge Rd.
Fort Wayne, IN 46825
Meeting Information: 3rd Thurs. 6:30 p.m. 24 Hour Line 466-4687
City of Fort Wayne
Quadrant Contact Information
January 2009
CITY OF FORT WAYNE THOMAS C. HENRY, MAYOR
December 9, 2008
Dear Citizen: As you’ve no doubt heard and seen in the news this year, the economy is suffering. Our City is no different from many others: we’re challenged to try to bring the highest level of services to our citizens while using as few resources as possible. It is always our goal to be fiscally re-sponsible and to use your tax money wisely. The 2009 City Budget reflects this commitment. Fort Wayne city employees have had plenty of practice learning to do more with less. Since 1999, the City has added no staff to its total headcount outside of public safety positions. While we now have over 1,200 miles of roads and streets to maintain, funding sources con-tinue to dwindle. Although times are challenging, we want to continue to provide the quality of services our residents expect from City government. To help guide us during these times, the leadership team invested a lot of time and effort into crafting a strategic plan for the city, to give us a sense of direction and provide priorities and goals. As we begin the implementation phase of our strategic plan, we look to our mission statement: The City of Fort Wayne is committed to being responsive, open and resourceful in providing its citizens with profssional and creative services focusing on continuous improve-ment and high performance. I encourage each citizen to be involved with our efforts, to share your talents and observations with local government, and to let us know how we’re doing in our commitment to being re-sponsive, open and resourceful. Sincerely,
Thomas C. Henry Mayor
SAFE CITY l QUALITY JOBS l B.E.S.T. 1 E. MAIN ST. I FORT WAYNE, INDIANA l 46802-1804 l www.cityoffortwayne.org
Table of Contents
Introduction .............................................. … 2 Divisions of the City ....................................3-5 Citizens of Fort Wayne Tax Rates ................. 6 The Budget Process ...................................... 7 Budget by Classification..............................8-9 Organizational Chart ............................... 10-11 Budget by Department ................................. 12 Revenues................................................13-14 City Utilities Budget and Revenue ..........15-20 Departmental Telephone Directory .............. 21 Fort Wayne at a Glance ..........................22-23
1
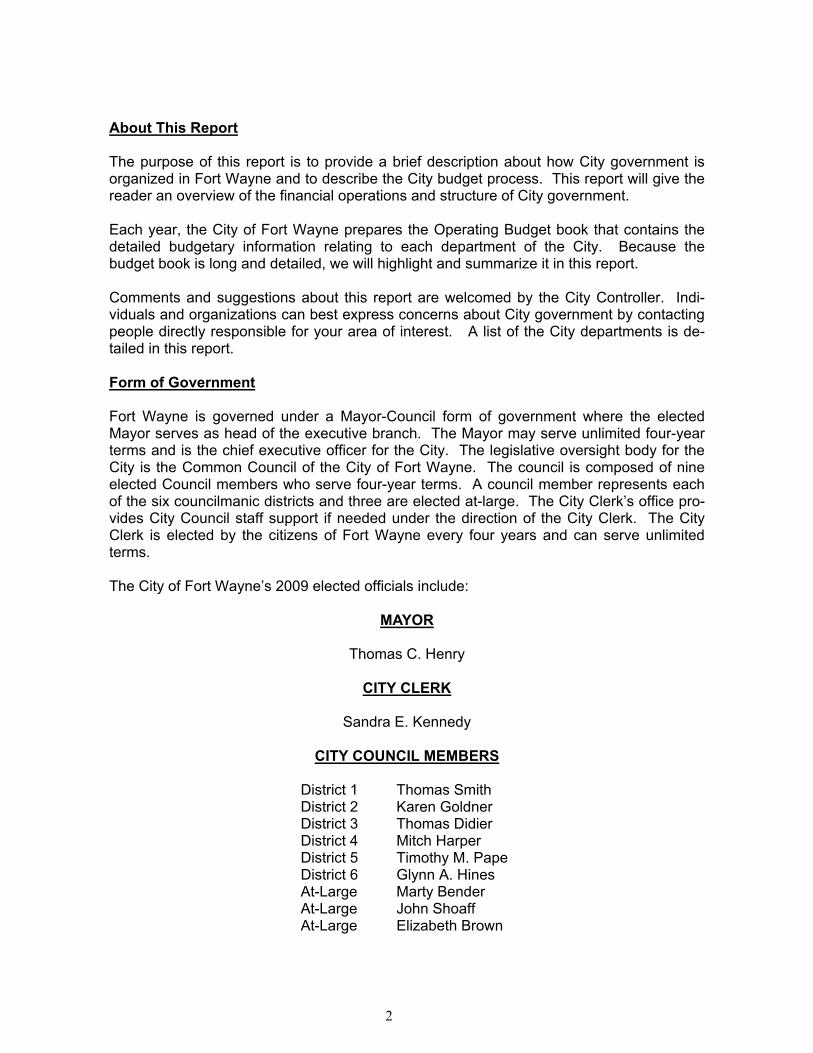
About This Report
The purpose of this report is to provide a brief description about how City government is organized in Fort Wayne and to describe the City budget process. This report will give the reader an overview of the financial operations and structure of City government. Each year, the City of Fort Wayne prepares the Operating Budget book that contains the detailed budgetary information relating to each department of the City. Because the budget book is long and detailed, we will highlight and summarize it in this report. Comments and suggestions about this report are welcomed by the City Controller. Indi-viduals and organizations can best express concerns about City government by contacting people directly responsible for your area of interest. A list of the City departments is de-tailed in this report. Form of Government Fort Wayne is governed under a Mayor-Council form of government where the elected Mayor serves as head of the executive branch. The Mayor may serve unlimited four-year terms and is the chief executive officer for the City. The legislative oversight body for the City is the Common Council of the City of Fort Wayne. The council is composed of nine elected Council members who serve four-year terms. A council member represents each of the six councilmanic districts and three are elected at-large. The City Clerk’s office pro-vides City Council staff support if needed under the direction of the City Clerk. The City Clerk is elected by the citizens of Fort Wayne every four years and can serve unlimited terms. The City of Fort Wayne’s 2009 elected officials include:
MAYOR
Thomas C. Henry
CITY CLERK
Sandra E. Kennedy
CITY COUNCIL MEMBERS
District 1 Thomas Smith District 2 Karen Goldner District 3 Thomas Didier District 4 Mitch Harper District 5 Timothy M. Pape District 6 Glynn A. Hines At-Large Marty Bender At-Large John Shoaff At-Large Elizabeth Brown
2
DIVISIONS OF THE CITY GOVERNMENT Office of the Mayor The Mayor oversees the implementation of policies and the efficient flow of ongoing services through wide appointive powers. This includes the capability to appoint the heads of seven major administrative divisions of the city and many board and commission members. Specific departments under the Office of the Mayor include the Public Information Office, the Neighborhood and Citizen’s Advocate Office, the Law Department, Human Resources, and the Internal Audit Department. City Clerk The office of the City Clerk is crucial as a liaison between the citizens of Fort Wayne and the Common Council. The City Clerk also acts as a liaison between the Administration and the Common Council. The office includes a number of Indiana Statutory responsibilities and also serves as the administrator of the City of Fort Wayne Violations Bureau. Finance & Administration The mission of the Finance & Administration Division is to ensure fiscal responsibility and ef-fective administrative services for the City of Fort Wayne. The departments within the division are the Controller’s Office, Risk Management, Payroll, Purchasing, Property Management, Cable, and Information Systems. Public Safety The Division provides safety, maintains order and protects the rights of the Citizens of Fort Wayne. The Fire Chief and Chief of Police retain the responsibility for major policy decisions, budgeting, long-range planning and the day-to-day coordination of seven departments: Police, Fire, Animal Control, Weights and Measures, Police Merit Commission, and Communications. Community Development The overall purpose of the Division is to improve Fort Wayne’s physical and economic envi-ronment. The Division includes the following departments: Administration, Fiscal, Redevelop-ment, Land Use and Development Permits, Community Development Corporation, Neighbor-hood Code, Planning, Special Projects/GIS and the Office of Housing and Neighborhood Ser-vices. The mission of the Division is to develop and implement creative community-based strategies to enhance economic opportunity, build strong neighborhoods, and ensure a dynamic frame-work for quality growth and development. Economic development, urban revitalization, hous-ing and comprehensive planning continue to be high priorities of the City of Fort Wayne. Growth in the City’s assessed value is essential to holding its property tax rate flat and ensur-ing that the cost of City services is shared by those who use the services.
3
The City’s Community Development Division is primarily responsible for these efforts, both through its various departments’ activities and those of contractors. The City contracts with the Fort Wayne-Allen County Economic Development Alliance (“The Alliance”) to coordinate economic development marketing services and project management. City Utilities and Public Works The City Utilities Administration Department represents the office of the Director of Utilities and is responsible for enforcement and interpreting City Utilities rules and regulations. City Utilities encompasses the departments of Accounting, Customer Relations, Data Control, Meter Reading, New Water and Sewer Permits, Water Resources (Development Services, Planning and Design, Engineering Support Services, Geographical Information Systems), Water Maintenance and Service, Water Filtration Plant, Water Pollution Control Mainte-nance, Storm Water Maintenance, and Water Pollution Control Plant. The Division of Public Works is the administrator for much of Fort Wayne’s infrastructure. Its departments maintain and improve the City’s system for transportation and solid waste. From engineering and intersection improvement to battling floods, the Division of Public Works provides a vital support to neighborhoods, businesses, and economic development projects. The Division encompasses the Office of the Director, Barrett Law, Energy and En-vironmental Services, Traffic Engineering, Transportation Administration & Support, Street Light Engineering, Street Department, Street Project Management, Flood Control, and City Garage.
Fort Wayne Parks and Recreation The Parks and Recreation Department maintains more than 2,800 acres of public park lands and provides numerous recreation facilities, programs and services for the Fort Wayne com-munity. Created in 1905, the Parks and Recreation Department is administered by a four-member bipartisan Board of Park Commissioners. Authorized by state statute, the Board of Park Commissioners reviews and approves the annual budget, expenditures and contracts. In addition, they oversee 85 parks, including the Children’s Zoo, Headwaters Park, the Bo-tanical Conservatory, McMillen Ice Arena and three community centers. The Fort Wayne park system was largely developed over the last 100 years through the generous support of local citizens. This support continues to build on that legacy as the De-partment received a special $1 million gift in 2008 from the Foellinger Foundation. In 2008,
4
visitor attraction received a $900,000 HVAC upgrade which enhances the experience of the customers. Successful programming, both old and new, is also a tenet of the Parks and Recreation De-partment. The Franke Day Camp operated its 62nd consecutive summer in 2008, serving nearly 2000 youth ranging in ages 4-18. The Lifetime Sports Academy enjoyed it 11th year as full scholarships to St. Francis were awarded to former attendees. The Botanical Conserva-tory continued its successful Friday evening concert series called “Botanical Roots” as citi-zens and sponsors reflect solid community support. The Foellinger Theatre expanded the summer concert series to sell out crowds in June, July and August. The Fort Wayne Children’s Zoo and Headwater’s Park are operated through cooperative agreements with the Parks and Recreation Division. These agreements strengthen the or-ganizational effectiveness of all the parties involved and provide outside funding resources to offset a burden to the Park General Fund.
5
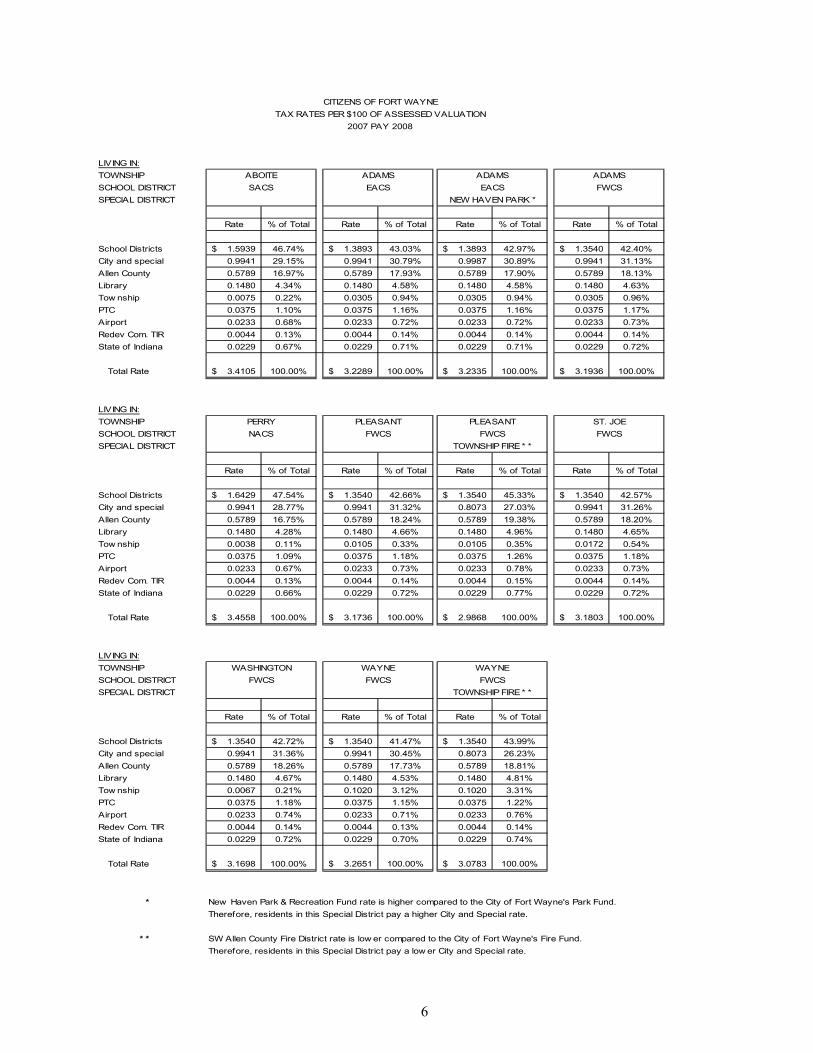
6
LIVING IN:
TOWNSHIP
SCHOOL DISTRICT
SPECIAL DISTRICT
Rate % of Total Rate % of Total Rate % of Total Rate % of Total
School Districts 1.5939$ 46.74% 1.3893$ 43.03% 1.3893$ 42.97% 1.3540$ 42.40%
City and special 0.9941 29.15% 0.9941 30.79% 0.9987 30.89% 0.9941 31.13%
Allen County 0.5789 16.97% 0.5789 17.93% 0.5789 17.90% 0.5789 18.13%
Library 0.1480 4.34% 0.1480 4.58% 0.1480 4.58% 0.1480 4.63%
Tow nship 0.0075 0.22% 0.0305 0.94% 0.0305 0.94% 0.0305 0.96%
PTC 0.0375 1.10% 0.0375 1.16% 0.0375 1.16% 0.0375 1.17%
Airport 0.0233 0.68% 0.0233 0.72% 0.0233 0.72% 0.0233 0.73%
Redev Com. TIR 0.0044 0.13% 0.0044 0.14% 0.0044 0.14% 0.0044 0.14%
State of Indiana 0.0229 0.67% 0.0229 0.71% 0.0229 0.71% 0.0229 0.72%
Total Rate 3.4105$ 100.00% 3.2289$ 100.00% 3.2335$ 100.00% 3.1936$ 100.00%
LIVING IN:
TOWNSHIP
SCHOOL DISTRICT
SPECIAL DISTRICT
Rate % of Total Rate % of Total Rate % of Total Rate % of Total
School Districts 1.6429$ 47.54% 1.3540$ 42.66% 1.3540$ 45.33% 1.3540$ 42.57%
City and special 0.9941 28.77% 0.9941 31.32% 0.8073 27.03% 0.9941 31.26%
Allen County 0.5789 16.75% 0.5789 18.24% 0.5789 19.38% 0.5789 18.20%
Library 0.1480 4.28% 0.1480 4.66% 0.1480 4.96% 0.1480 4.65%
Tow nship 0.0038 0.11% 0.0105 0.33% 0.0105 0.35% 0.0172 0.54%
PTC 0.0375 1.09% 0.0375 1.18% 0.0375 1.26% 0.0375 1.18%
Airport 0.0233 0.67% 0.0233 0.73% 0.0233 0.78% 0.0233 0.73%
Redev Com. TIR 0.0044 0.13% 0.0044 0.14% 0.0044 0.15% 0.0044 0.14%
State of Indiana 0.0229 0.66% 0.0229 0.72% 0.0229 0.77% 0.0229 0.72%
Total Rate 3.4558$ 100.00% 3.1736$ 100.00% 2.9868$ 100.00% 3.1803$ 100.00%
LIVING IN:
TOWNSHIP
SCHOOL DISTRICT
SPECIAL DISTRICT
Rate % of Total Rate % of Total Rate % of Total
School Districts 1.3540$ 42.72% 1.3540$ 41.47% 1.3540$ 43.99%
City and special 0.9941 31.36% 0.9941 30.45% 0.8073 26.23%
Allen County 0.5789 18.26% 0.5789 17.73% 0.5789 18.81%
Library 0.1480 4.67% 0.1480 4.53% 0.1480 4.81%
Tow nship 0.0067 0.21% 0.1020 3.12% 0.1020 3.31%
PTC 0.0375 1.18% 0.0375 1.15% 0.0375 1.22%
Airport 0.0233 0.74% 0.0233 0.71% 0.0233 0.76%
Redev Com. TIR 0.0044 0.14% 0.0044 0.13% 0.0044 0.14%
State of Indiana 0.0229 0.72% 0.0229 0.70% 0.0229 0.74%
Total Rate 3.1698$ 100.00% 3.2651$ 100.00% 3.0783$ 100.00%
* New Haven Park & Recreation Fund rate is higher compared to the City of Fort Wayne's Park Fund.
Therefore, residents in this Special District pay a higher City and Special rate.
* * SW Allen County Fire District rate is low er compared to the City of Fort Wayne's Fire Fund.
Therefore, residents in this Special District pay a low er City and Special rate.
FWCS FWCS FWCS
TOWNSHIP FIRE * *
TOWNSHIP FIRE * *
WASHINGTON WAYNE WAYNE
ST. JOE
NACS FWCS FWCS FWCS
NEW HAVEN PARK *
PERRY PLEASANT PLEASANT
SACS EACS EACS FWCS
CITIZENS OF FORT WAYNE
TAX RATES PER $100 OF ASSESSED VALUATION
2007 PAY 2008
ABOITE ADAMS ADAMS ADAMS
THE BUDGET PROCESS The Civil City budget process begins with individual departments preparing draft budgets each May for the next calendar/fiscal year. The division of Finance and Administration pro-vides the departments with a set of assumptions. These budget requests are then sub-jected to internal review and modification. The Common Council actively participates in the examination of the budgets. With the Mayor’s approval, a budget ordinance is then pre-pared for introduction to the Common Council in early September. Beyond the public and televised Common Council sessions, there is a legal public hearing held as part of the budget process at which citizens may provide the administration and Common Council with their comments concerning the budget. By state law, the Common Council must pass the budget by the end of September each year. The Common Council has the power to de-crease any major category proposed by the Administration, but may not increase any major category in the budget. The next step is the final budget hearing of the Department of Local Government Finance in December. This is the time for estimates to be verified and a final property tax rate set. The Indiana Department of Local Government Finance must certify the rate by February 15th. The 2009 budget was prepared on a monthly basis. All departments distributed their yearly estimated expenditures into the months they expected each to occur. During 2009, actual expenditures will be compared to the budget each month. Variances of +/- 3% and $1,000 for budgets less than $100,000 or variances of +/-3% and $2,500 for budgets over $100,000 will be explained. Throughout the year the City may find the budget needs to be amended to account for new funds that have become available, or to provide for a revision of objectives. Such revisions are accomplished through quarterly fiscal ordinances in a process that is similar to the one described above. At every appropriate point in the process, the public is notified of the an-ticipated amounts of the budget revisions. The schedule of major budget events is as follows:
The City Utilities internal budget process is similar to the Civil City; however, the Board of Public Works approves the City Utilities budget. City Utilities budget and revenue sources are included later in this report.
May Budget instructions issued by the City Controller
June Budget requests submitted - Revenue estimates prepared
August Internal reviews and modification of budget submissions
September Budget submitted to Common Council, hearings and adoption
December Department of Local Government Finance review and approval
January Budget implementation
7
Budget by Classification The budgets of all governmental units in Indiana are prepared according to a form prescribed by the Indiana State Board of Accounts. The legal level of budgetary control is by object clas-sifications. Objects are called expense accounts or line items by the private sector. Major classifications of expenditures are as follows: Personal Services – Expenditures for salaries, wages and related employee benefits. An-nual salary increases of approximately 3% have been suspended for 2009. Supplies – Office supplies, operating supplies, repair and maintenance supplies. The 2009 budget shows a 1.9% increase for this classification, due to fuel, natural gas, and water costs. Other Services and Charges – Professional services, communication and transportation, printing and advertising, insurance, utility services, repairs and maintenance, rentals, and debt service. The cost of professional services, contract services, lease, loan and bond payments, primarily related to infrastructure projects, will vary significantly from year to year. Capital Outlay – All lands, buildings, improvements, machinery and equipment purchases that are not financed through leases or bond issues. The capital outlay for 2009 increased for this classification to support infrastructure maintenance, as well as economic development.
8
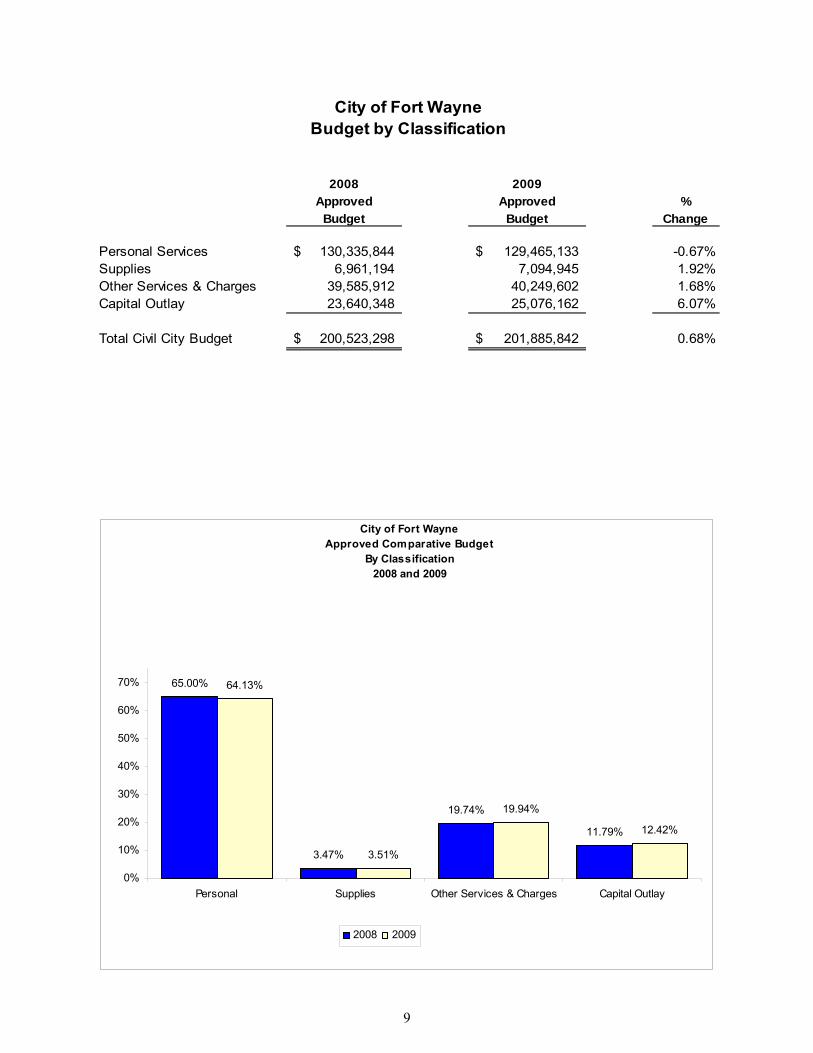
2008 2009Approved Approved %
Budget Budget Change
Personal Services 130,335,844$ 129,465,133$ -0.67%
Supplies 6,961,194 7,094,945 1.92%
Other Services & Charges 39,585,912 40,249,602 1.68%
Capital Outlay 23,640,348 25,076,162 6.07%
Total Civil City Budget 200,523,298$ 201,885,842$ 0.68%
City of Fort Wayne
Budget by Classification
9
City of Fort Wayne
Approved Comparative Budget
By Classification
2008 and 2009
65.00%
3.47%
19.74%
11.79%
64.13%
3.51%
19.94%
12.42%
0%
10%
20%
30%
40%
50%
60%
70%
Personal Supplies Other Services & Charges Capital Outlay
2008 2009
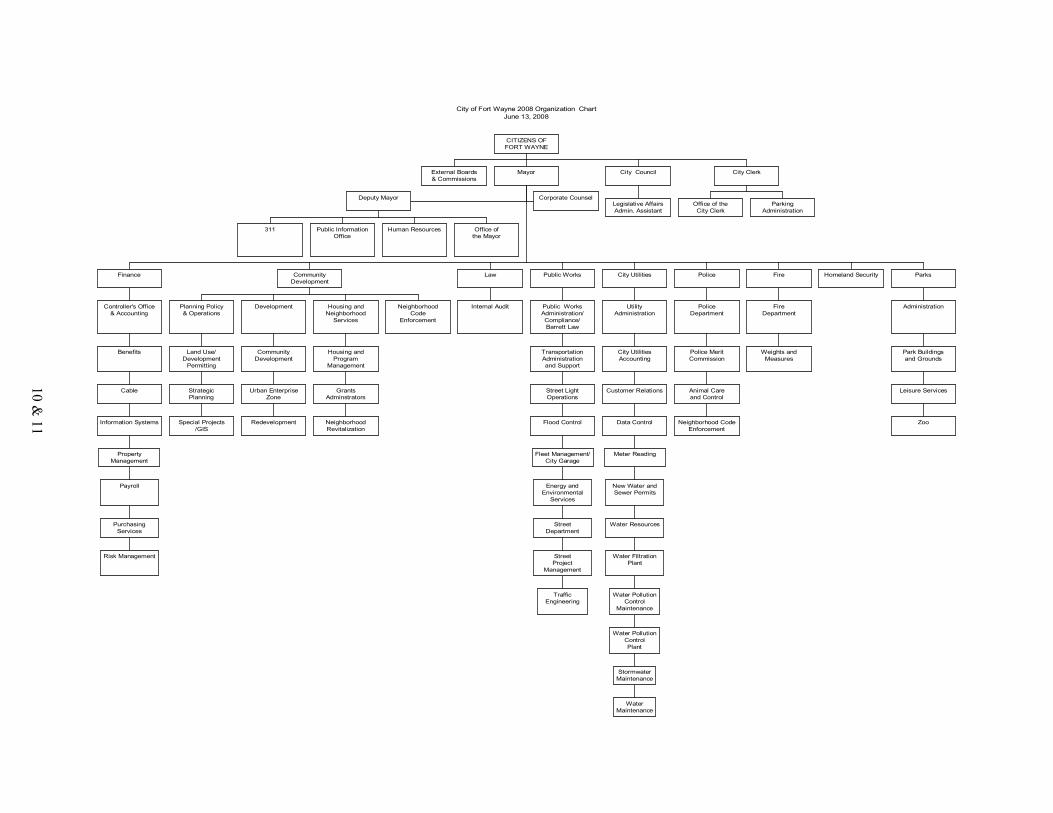
City of Fort Wayne 2008 Organization ChartJune 13, 2008
External Boards& Commissions
311 Public InformationOffice
Human Resources Office ofthe Mayor
Deputy Mayor Corporate Counsel
Risk Management
PurchasingServices
Payroll
PropertyManagement
Information Systems
Cable
Benefits
Controller's Office& Accounting
Finance
Special Projects/GIS
StrategicPlanning
Land Use/DevelopmentPermitting
Planning Policy& Operations
Redevelopment
Urban EnterpriseZone
CommunityDevelopment
Development
NeighborhoodRevitalization
GrantsAdminstrators
Housing andProgram
Management
Housing andNeighborhoodServices
NeighborhoodCode
Enforcement
CommunityDevelopment
Internal Audit
Law
TrafficEngineering
StreetProject
Management
StreetDepartment
Energy andEnvironmentalServices
Fleet Management/City Garage
Flood Control
Street LightOperations
TransportationAdministrationand Support
Public WorksAdministration/Compliance/Barrett Law
Public Works
WaterMaintenance
StormwaterMaintenance
Water PollutionControlPlant
Water PollutionControl
Maintenance
Water FiltrationPlant
Water Resources
New Water andSewer Permits
Meter Reading
Data Control
Customer Relations
City UtilitiesAccounting
UtilityAdministration
City Utilities
Neighborhood CodeEnforcement
Animal Careand Control
Police MeritCommission
PoliceDepartment
Police
Weights andMeasures
FireDepartment
Fire Homeland Security
Zoo
Leisure Services
Park Buildingsand Grounds
Administration
Parks
Mayor
Legislative AffairsAdmin. Assistant
City Council
Office of theCity Clerk
ParkingAdministration
City Clerk
CITIZENS OFFORT WAYNE
10 & 11
12
City Government Revenues
As shown in the Revenues by Source schedule, the City has many sources of revenue to pay for the cost of operations and services. The majority of City revenues are generated from taxes. The largest three tax revenues are: Property Taxes, County Option Income Tax (COIT) and County Economic Development Income Tax (CEDIT). State statutes, and/or local ordinances, define how each type of revenue may be used. Fol-lowing is a brief explanation of the use of the City’s larger revenue streams. Taxes Property Tax, Commercial Vehicle Excise Tax (CVET), Financial Institution Tax, COIT (County Option Income Tax .6%), and Auto/Aircraft (license) Excise taxes are used exclu-sively to fund operations of certain City departments. These departments perform executive/finance, public safety, parks and community development work, and include administrative/engineering departments in the Public Works Division. Most of these funds go into the City’s property tax supported funds. CEDIT (Community Economic Development Income Tax .4%) - In July 2005, SEA (Senate Enrolled Act) 100 was passed which provides that a county, city, or town may use county eco-nomic development income tax revenue for any lawful purpose. The Excise Surtax and Wheel Tax revenue is derived from Allen County vehicle owners who pay annual motor license excise tax. A distribution to county, cities and towns within the county is based on the same formula as used for Local Road & Street fund distributions. These funds must be used to construct, reconstruct, repair and maintain streets and roads. These funds are used in the City’s Motor Vehicle Highway fund. The Gas Tax revenue is generated from the sale of gasoline & other fuels. A distribution to county, cities and towns within the county is based on the same formula as used for Motor Vehicle Highway fund distributions. These funds are used to support the Motor Vehicle High-way and Local Road & Street funds. License & Permits The largest revenue in the License & Permit category is the Cable Franchise Fees. These fees are added to cable subscribers’ bills. Forty percent of this revenue is used to pay for the operation of the government access channel with the remainder going into the City’s General Fund for operating costs. All other fees listed go into the General Fund. Intergovernmental Revenues Governmental revenues are primarily provided by the State to pay the annual costs of the Pre’77 “pay-as-you-go” public safety pension plan ($16.2M) and to pay for the Street Depart-ment operating costs and projects ($10.6M).
13
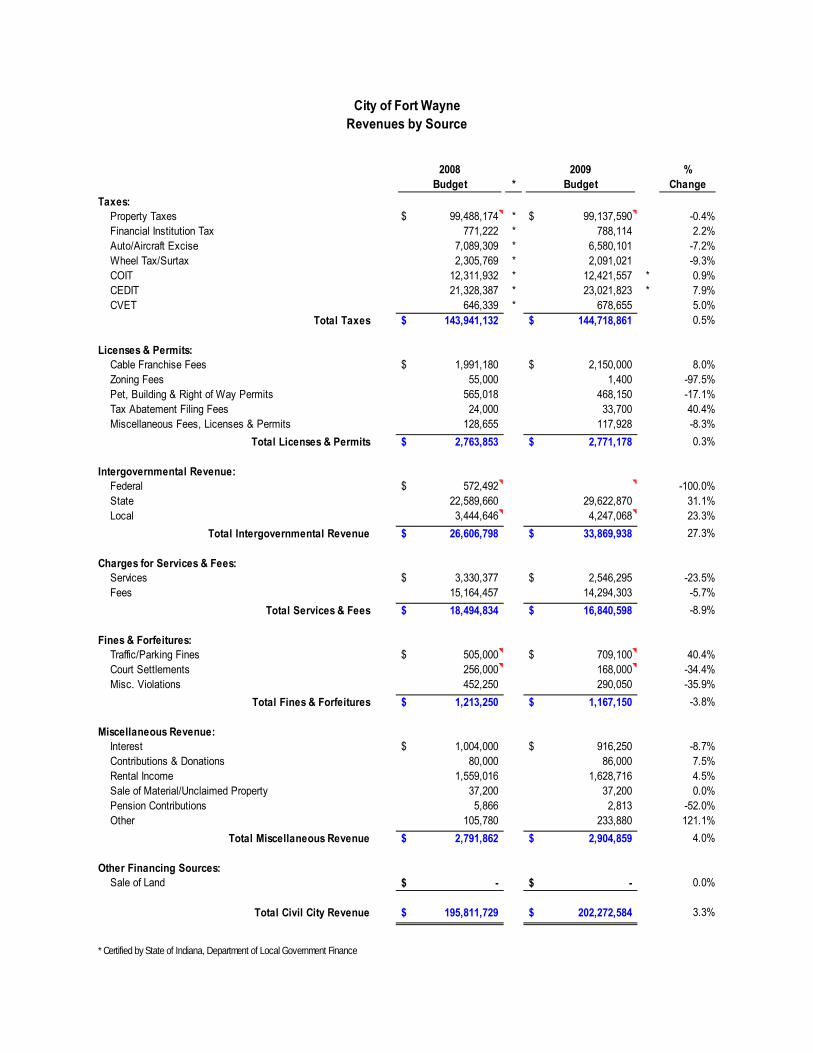
2008 2009 %
Budget * Budget Change
Taxes:
Property Taxes 99,488,174$ * 99,137,590$ -0.4%
Financial Institution Tax 771,222 * 788,114 2.2%
Auto/Aircraft Excise 7,089,309 * 6,580,101 -7.2%
Wheel Tax/Surtax 2,305,769 * 2,091,021 -9.3%
COIT 12,311,932 * 12,421,557 * 0.9%
CEDIT 21,328,387 * 23,021,823 * 7.9%
CVET 646,339 * 678,655 5.0%
Total Taxes 143,941,132$ 144,718,861$ 0.5%
Licenses & Permits:
Cable Franchise Fees 1,991,180$ 2,150,000$ 8.0%
Zoning Fees 55,000 1,400 -97.5%
Pet, Building & Right of Way Permits 565,018 468,150 -17.1%
Tax Abatement Filing Fees 24,000 33,700 40.4%
Miscellaneous Fees, Licenses & Permits 128,655 117,928 -8.3%
Total Licenses & Permits 2,763,853$ 2,771,178$ 0.3%
Intergovernmental Revenue:
Federal 572,492$ -100.0%
State 22,589,660 29,622,870 31.1%
Local 3,444,646 4,247,068 23.3%
Total Intergovernmental Revenue 26,606,798$ 33,869,938$ 27.3%
Charges for Services & Fees:
Services 3,330,377$ 2,546,295$ -23.5%
Fees 15,164,457 14,294,303 -5.7%
Total Services & Fees 18,494,834$ 16,840,598$ -8.9%
Fines & Forfeitures:
Traffic/Parking Fines 505,000$ 709,100$ 40.4%
Court Settlements 256,000 168,000 -34.4%
Misc. Violations 452,250 290,050 -35.9%
Total Fines & Forfeitures 1,213,250$ 1,167,150$ -3.8%
Miscellaneous Revenue:
Interest 1,004,000$ 916,250$ -8.7%
Contributions & Donations 80,000 86,000 7.5%
Rental Income 1,559,016 1,628,716 4.5%
Sale of Material/Unclaimed Property 37,200 37,200 0.0%
Pension Contributions 5,866 2,813 -52.0%
Other 105,780 233,880 121.1%
Total Miscellaneous Revenue 2,791,862$ 2,904,859$ 4.0%
Other Financing Sources:
Sale of Land -$ -$ 0.0%
Total Civil City Revenue 195,811,729$ 202,272,584$ 3.3%
* Certified by State of Indiana, Department of Local Government Finance
City of Fort Wayne
Revenues by Source
15
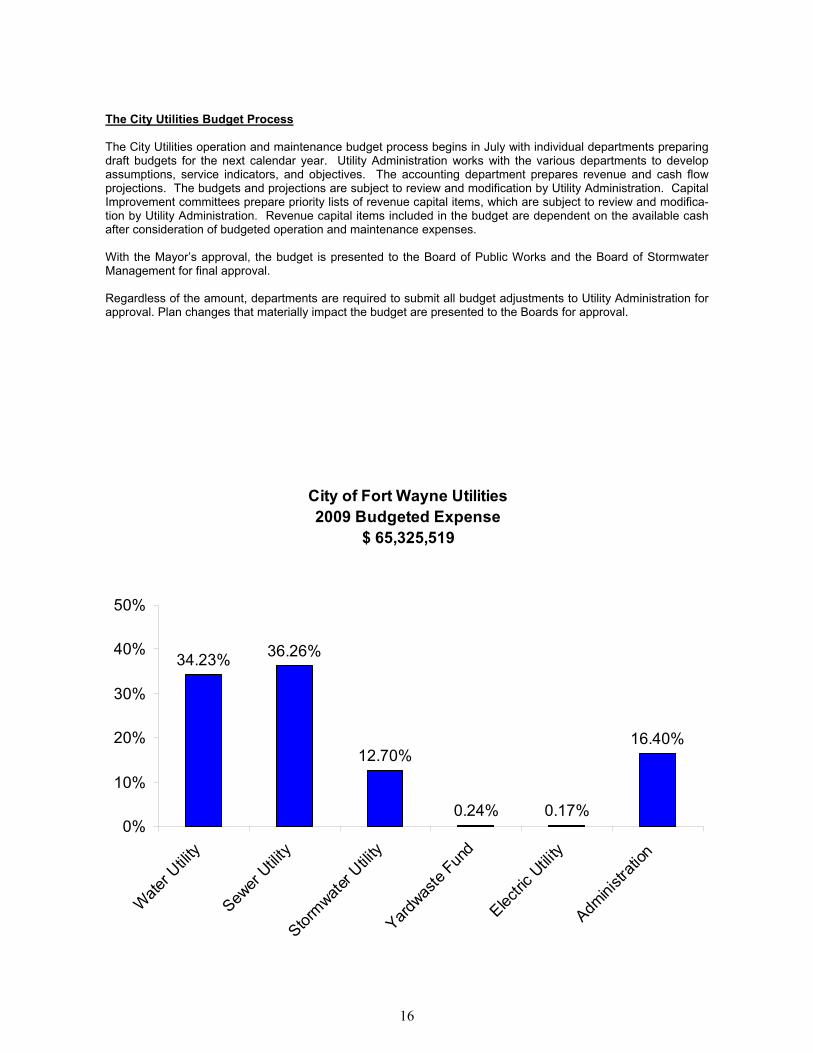
The City Utilities Budget Process The City Utilities operation and maintenance budget process begins in July with individual departments preparing draft budgets for the next calendar year. Utility Administration works with the various departments to develop assumptions, service indicators, and objectives. The accounting department prepares revenue and cash flow projections. The budgets and projections are subject to review and modification by Utility Administration. Capital Improvement committees prepare priority lists of revenue capital items, which are subject to review and modifica-tion by Utility Administration. Revenue capital items included in the budget are dependent on the available cash after consideration of budgeted operation and maintenance expenses. With the Mayor’s approval, the budget is presented to the Board of Public Works and the Board of Stormwater Management for final approval. Regardless of the amount, departments are required to submit all budget adjustments to Utility Administration for approval. Plan changes that materially impact the budget are presented to the Boards for approval.
City of Fort Wayne Utilities
2009 Budgeted Expense
$ 65,325,519
34.23%36.26%
12.70%
0.24% 0.17%
16.40%
0%
10%
20%
30%
40%
50%
Water Utility
Sewer Utility
Stormwater Utility
Yardwaste Fund
Electric Utility
Administration
16
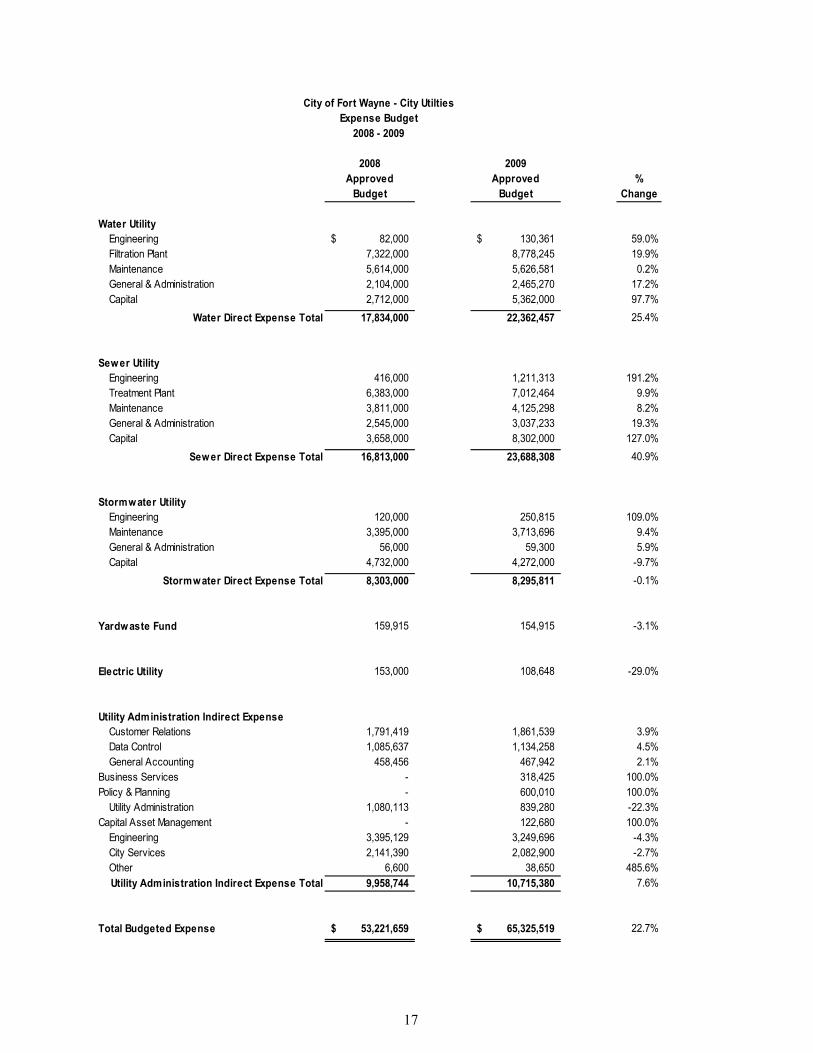
City of Fort Wayne - City Utilties
Expense Budget
2008 2009
Approved Approved %
Budget Budget Change
Water Utility
Engineering 82,000$ 130,361$ 59.0%
Filtration Plant 7,322,000 8,778,245 19.9%
Maintenance 5,614,000 5,626,581 0.2%
General & Administration 2,104,000 2,465,270 17.2%
Capital 2,712,000 5,362,000 97.7%
Water Direct Expense Total 17,834,000 22,362,457 25.4%
Sewer Utility
Engineering 416,000 1,211,313 191.2%
Treatment Plant 6,383,000 7,012,464 9.9%
Maintenance 3,811,000 4,125,298 8.2%
General & Administration 2,545,000 3,037,233 19.3%
Capital 3,658,000 8,302,000 127.0%
Sewer Direct Expense Total 16,813,000 23,688,308 40.9%
Stormwater Utility
Engineering 120,000 250,815 109.0%
Maintenance 3,395,000 3,713,696 9.4%
General & Administration 56,000 59,300 5.9%
Capital 4,732,000 4,272,000 -9.7%
Stormwater Direct Expense Total 8,303,000 8,295,811 -0.1%
Yardwaste Fund 159,915 154,915 -3.1%
Electric Utility 153,000 108,648 -29.0%
Utility Administration Indirect Expense
Customer Relations 1,791,419 1,861,539 3.9%
Data Control 1,085,637 1,134,258 4.5%
General Accounting 458,456 467,942 2.1%
Business Services - 318,425 100.0%
Policy & Planning - 600,010 100.0%
Utility Administration 1,080,113 839,280 -22.3%
Capital Asset Management - 122,680 100.0%
Engineering 3,395,129 3,249,696 -4.3%
City Services 2,141,390 2,082,900 -2.7%
Other 6,600 38,650 485.6%
Utility Administration Indirect Expense Total 9,958,744 10,715,380 7.6%
Total Budgeted Expense 53,221,659$ 65,325,519$ 22.7%
2008 - 2009
17
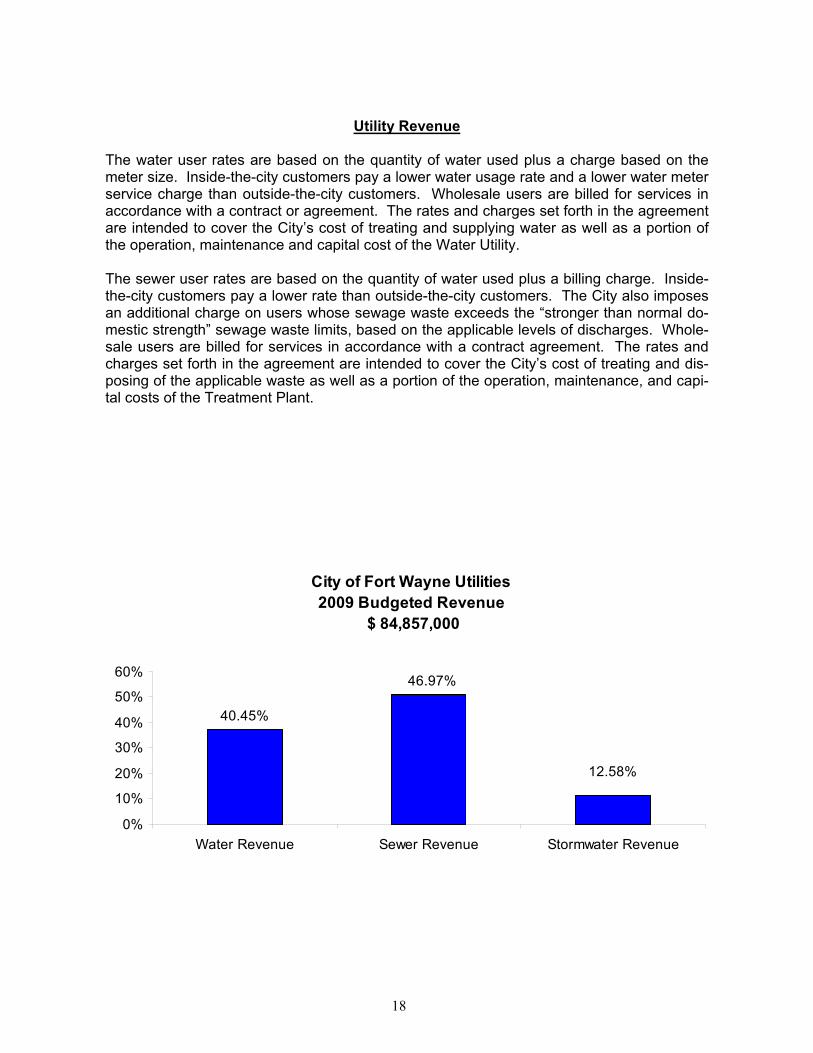
Utility Revenue The water user rates are based on the quantity of water used plus a charge based on the meter size. Inside-the-city customers pay a lower water usage rate and a lower water meter service charge than outside-the-city customers. Wholesale users are billed for services in accordance with a contract or agreement. The rates and charges set forth in the agreement are intended to cover the City’s cost of treating and supplying water as well as a portion of the operation, maintenance and capital cost of the Water Utility. The sewer user rates are based on the quantity of water used plus a billing charge. Inside-the-city customers pay a lower rate than outside-the-city customers. The City also imposes an additional charge on users whose sewage waste exceeds the “stronger than normal do-mestic strength” sewage waste limits, based on the applicable levels of discharges. Whole-sale users are billed for services in accordance with a contract agreement. The rates and charges set forth in the agreement are intended to cover the City’s cost of treating and dis-posing of the applicable waste as well as a portion of the operation, maintenance, and capi-tal costs of the Treatment Plant.
City of Fort Wayne Utilities
2009 Budgeted Revenue
$ 84,857,000
40.45%
46.97%
12.58%
0%
10%
20%
30%
40%
50%
60%
Water Revenue Sewer Revenue Stormwater Revenue
18
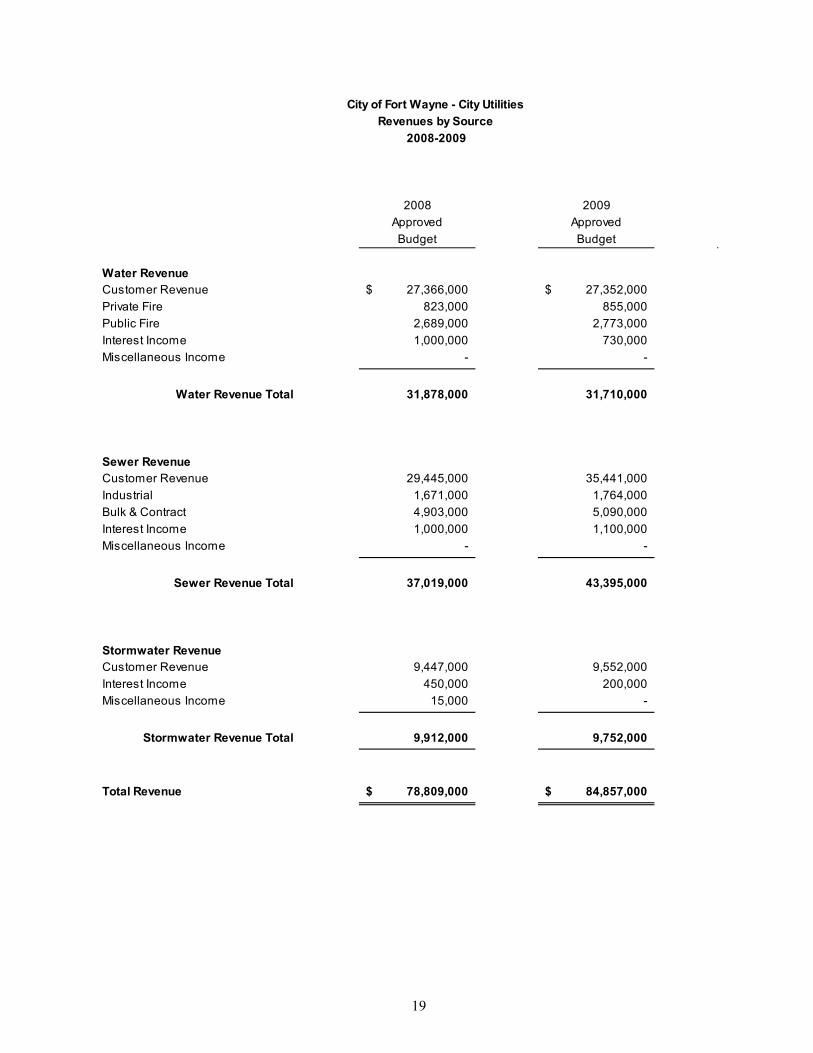
City of Fort Wayne - City Utilities
Revenues by Source
2008 2009
Approved Approved
Budget Budget
Water Revenue
Customer Revenue 27,366,000$ 27,352,000$
Private Fire 823,000 855,000
Public Fire 2,689,000 2,773,000
Interest Income 1,000,000 730,000
Miscellaneous Income - -
Water Revenue Total 31,878,000 31,710,000
Sewer Revenue
Customer Revenue 29,445,000 35,441,000
Industrial 1,671,000 1,764,000
Bulk & Contract 4,903,000 5,090,000
Interest Income 1,000,000 1,100,000
Miscellaneous Income - -
Sewer Revenue Total 37,019,000 43,395,000
Stormwater Revenue
Customer Revenue 9,447,000 9,552,000
Interest Income 450,000 200,000
Miscellaneous Income 15,000 -
Stormwater Revenue Total 9,912,000 9,752,000
Total Revenue 78,809,000$ 84,857,000$
2008-2009
19
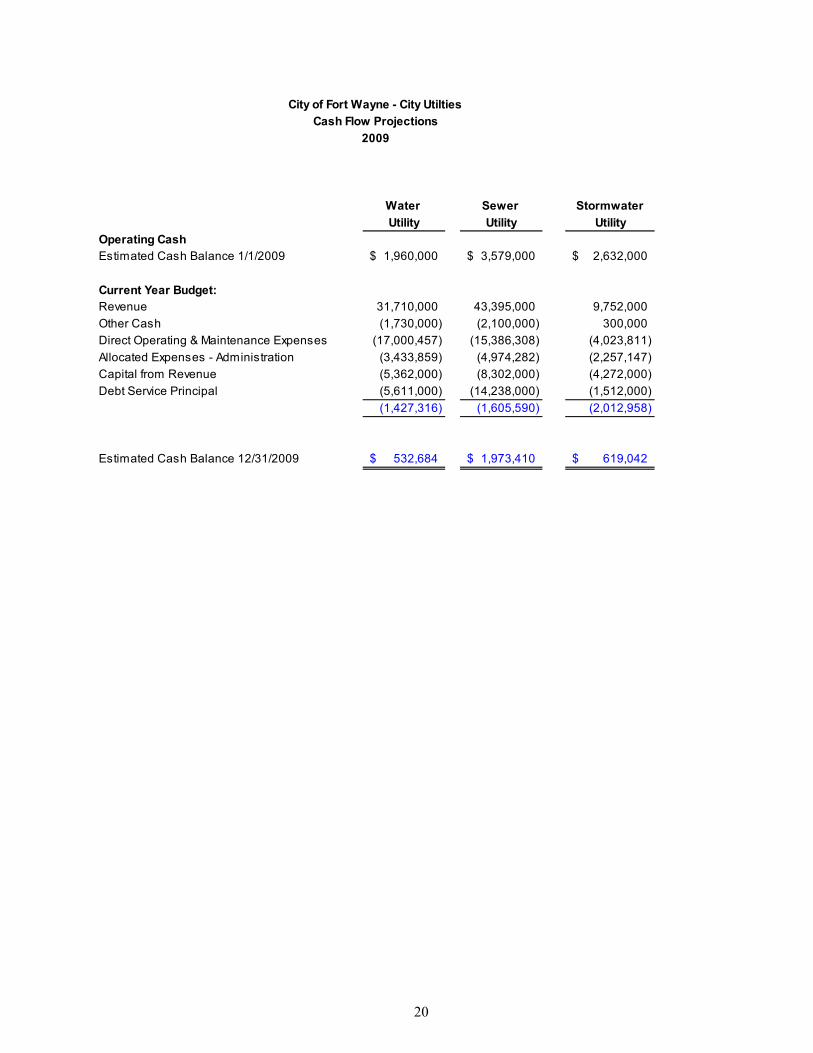
City of Fort Wayne - City Utilties
Water Sewer Stormwater
Utility Utility Utility
Operating Cash
Estimated Cash Balance 1/1/2009 1,960,000$ 3,579,000$ 2,632,000$
Current Year Budget:
Revenue 31,710,000 43,395,000 9,752,000
Other Cash (1,730,000) (2,100,000) 300,000
Direct Operating & Maintenance Expenses (17,000,457) (15,386,308) (4,023,811)
Allocated Expenses - Administration (3,433,859) (4,974,282) (2,257,147)
Capital from Revenue (5,362,000) (8,302,000) (4,272,000)
Debt Service Principal (5,611,000) (14,238,000) (1,512,000)
(1,427,316) (1,605,590) (2,012,958)
Estimated Cash Balance 12/31/2009 532,684$ 1,973,410$ 619,042$
Cash Flow Projections
2009
20
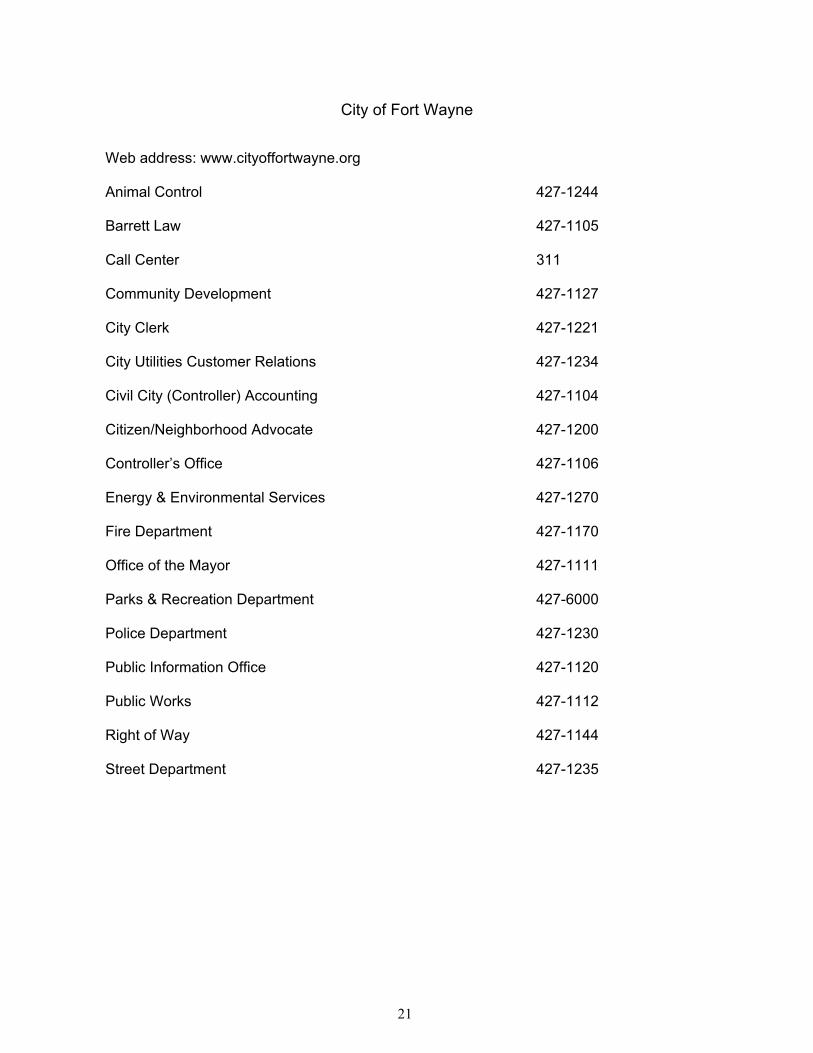
City of Fort Wayne
Web address: www.cityoffortwayne.org Animal Control 427-1244 Barrett Law 427-1105 Call Center 311 Community Development 427-1127 City Clerk 427-1221 City Utilities Customer Relations 427-1234 Civil City (Controller) Accounting 427-1104 Citizen/Neighborhood Advocate 427-1200 Controller’s Office 427-1106 Energy & Environmental Services 427-1270 Fire Department 427-1170 Office of the Mayor 427-1111 Parks & Recreation Department 427-6000 Police Department 427-1230 Public Information Office 427-1120 Public Works 427-1112 Right of Way 427-1144 Street Department 427-1235
21
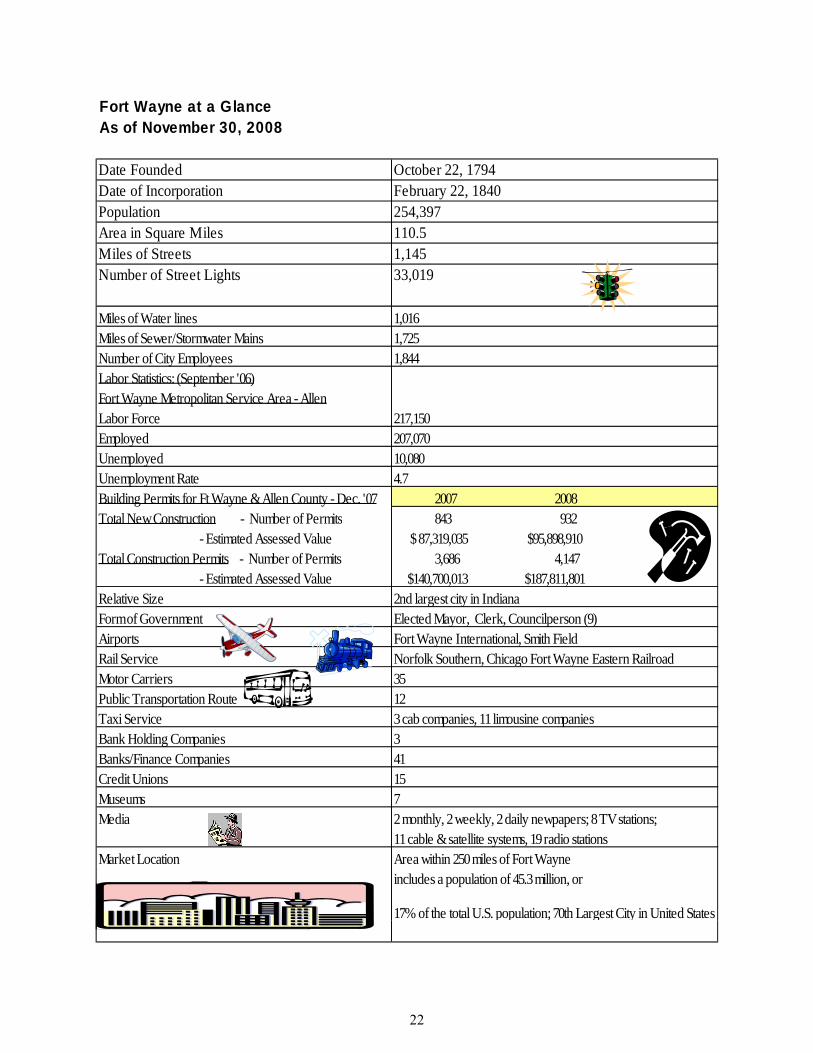
Fort Wayne at a GlanceAs of November 30, 2008
Date Founded October 22, 1794Date of Incorporation February 22, 1840Population 254,397Area in Square Miles 110.5Miles of Streets 1,145Number of Street Lights 33,019
Miles of Water lines 1,016Miles of Sewer/Stormwater Mains 1,725Number of City Employees 1,844Labor Statistics: (September '06)Fort Wayne Metropolitan Service Area - AllenLabor Force 217,150Employed 207,070Unemployed 10,080Unemployment Rate 4.7Building Permits for Ft Wayne & Allen County - Dec. '07 2007 2008 Total New Construction - Number of Permits 843 932 - Estimated Assessed Value $ 87,319,035 $95,898,910Total Construction Permits - Number of Permits 3,686 4,147 - Estimated Assessed Value $140,700,013 $187,811,801Relative Size 2nd largest city in Indiana Form of Government Elected Mayor, Clerk, Councilperson (9)Airports Fort Wayne International, Smith FieldRail Service Norfolk Southern, Chicago Fort Wayne Eastern RailroadMotor Carriers 35Public Transportation Route 12Taxi Service 3 cab companies, 11 limousine companiesBank Holding Companies 3Banks/Finance Companies 41Credit Unions 15Museums 7Media 2 monthly, 2 weekly, 2 daily newpapers; 8 TV stations;
11 cable & satellite systems, 19 radio stationsMarket Location Area within 250 miles of Fort Wayne
includes a population of 45.3 million, or
17% of the total U.S. population; 70th Largest City in United States
22
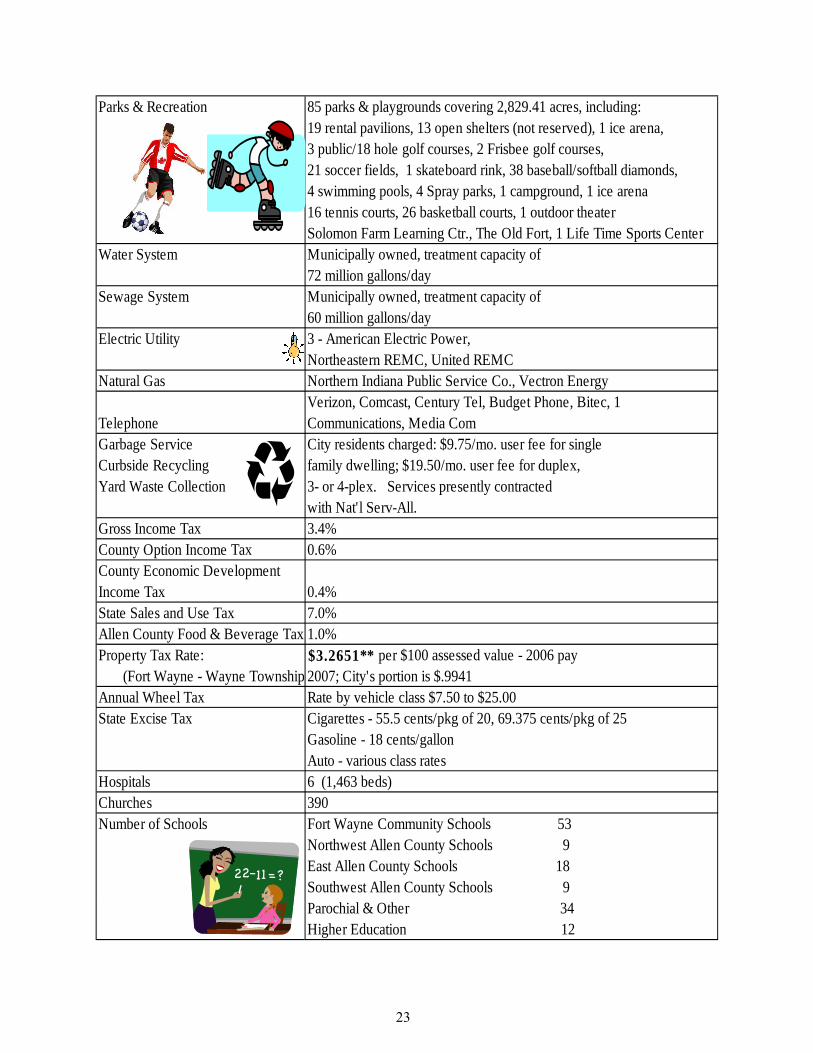
Parks & Recreation 85 parks & playgrounds covering 2,829.41 acres, including:19 rental pavilions, 13 open shelters (not reserved), 1 ice arena, 3 public/18 hole golf courses, 2 Frisbee golf courses, 21 soccer fields, 1 skateboard rink, 38 baseball/softball diamonds,4 swimming pools, 4 Spray parks, 1 campground, 1 ice arena 16 tennis courts, 26 basketball courts, 1 outdoor theaterSolomon Farm Learning Ctr., The Old Fort, 1 Life Time Sports Center
Water System Municipally owned, treatment capacity of72 million gallons/day
Sewage System Municipally owned, treatment capacity of60 million gallons/day
Electric Utility 3 - American Electric Power,Northeastern REMC, United REMC
Natural Gas Northern Indiana Public Service Co., Vectron Energy
TelephoneVerizon, Comcast, Century Tel, Budget Phone, Bitec, 1 Communications, Media Com
Garbage Service City residents charged: $9.75/mo. user fee for singleCurbside Recycling family dwelling; $19.50/mo. user fee for duplex, Yard Waste Collection 3- or 4-plex. Services presently contracted
with Nat'l Serv-All. Gross Income Tax 3.4%County Option Income Tax 0.6%County Economic Development Income Tax 0.4%State Sales and Use Tax 7.0%Allen County Food & Beverage Tax 1.0%Property Tax Rate: $3.2651** per $100 assessed value - 2006 pay (Fort Wayne - Wayne Township)2007; City's portion is $.9941Annual Wheel Tax Rate by vehicle class $7.50 to $25.00State Excise Tax Cigarettes - 55.5 cents/pkg of 20, 69.375 cents/pkg of 25
Gasoline - 18 cents/gallonAuto - various class rates
Hospitals 6 (1,463 beds)Churches 390Number of Schools Fort Wayne Community Schools 53
Northwest Allen County Schools 9East Allen County Schools 18Southwest Allen County Schools 9Parochial & Other 34Higher Education 12
23
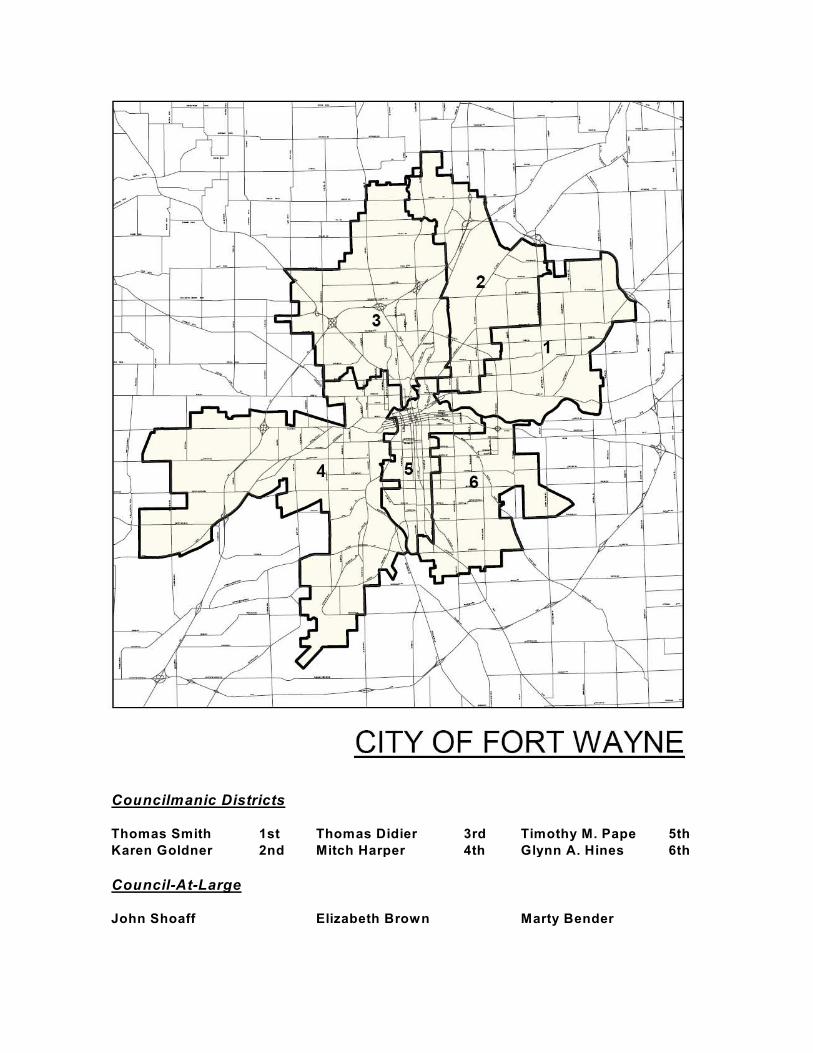
Councilmanic Districts
Thomas Smith 1st Thomas Didier 3rd Timothy M. Pape 5th
Karen Goldner 2nd Mitch Harper 4th Glynn A. Hines 6th
Council-At-Large
John Shoaff Elizabeth Brown Marty Bender