Embed Size (px)
Citation preview

CITY OF EL PASO, TEXAS AGENDA ITEM DEPARTMENT HEAD’S SUMMARY FORM
DEPARTMENT: Development and Infrastructure Services AGENDA DATE: October 14, 2008 CONTACT PERSON/PHONE: John Neal, Office of City Manager 541-4285, 621-6822 DISTRICT(S) AFFECTED: All
SUBJECT: Presentation, discussion and action on consideration of the following: a) Annexation Assessment and Impact Fee Report by Halff Associates b) Creation of an Advisory Committee for impact fees consideration c) Roadway impact fees d) Water and Wastewater impact fees e) Texas statutory requirements for impact fess and timeline f) Other action related to said report
BACKGROUND / DISCUSSION:Halff Associates has submitted the Annexation Assessment and Impact Fee Report. The Planning Legislative Review Committee has received a briefing on the report and the above referenced items, and has a set of recommendations. Staff will provide a briefing to the full City Council and is seeking policy direction on these items.
PRIOR COUNCIL ACTION:
Awarded consulting services contract to Hall Associates for this report in June 2007. AMOUNT AND SOURCE OF FUNDING:N/A BOARD / COMMISSION ACTION:Recommendations of Planning LRC: 1. Accept staff recommendation to move no further on roadway impact fees 2. Continue water and wastewater impact fees evaluation 3. Have CPC review effect of impact fees on home prices and affordability 4. Appoint City Plan Commission as Advisory Committee 5. Advisory Committee to:
a) Review Service Areas for creation of multiple service areas for water and wastewater b) Review issue of using existing capacity for calculation of impact fees c) Review options for possible reduction of impact fees for affordable housing
*******************REQUIRED AUTHORIZATION******************** LEGAL: (if required) _____________________________ FINANCE: (if required)______________________ DEPARTMENT HEAD: Patricia D. Adauto ______________________________________________________ ************************************************************************************* APPROVED FOR AGENDA: CITY MANAGER: ______________________________________________DATE: _______________

ANNEXATION AND IMPACT FEESANNEXATION AND IMPACT FEES

Annexation and Impact Fee StudyAnnexation and Impact Fee Study
March 2006 Wilbur SmithMarch 2006 Wilbur Smith
June 2007 Halff AssociatesJune 2007 Halff Associates
Red OakRed Oak-- EPWUEPWU
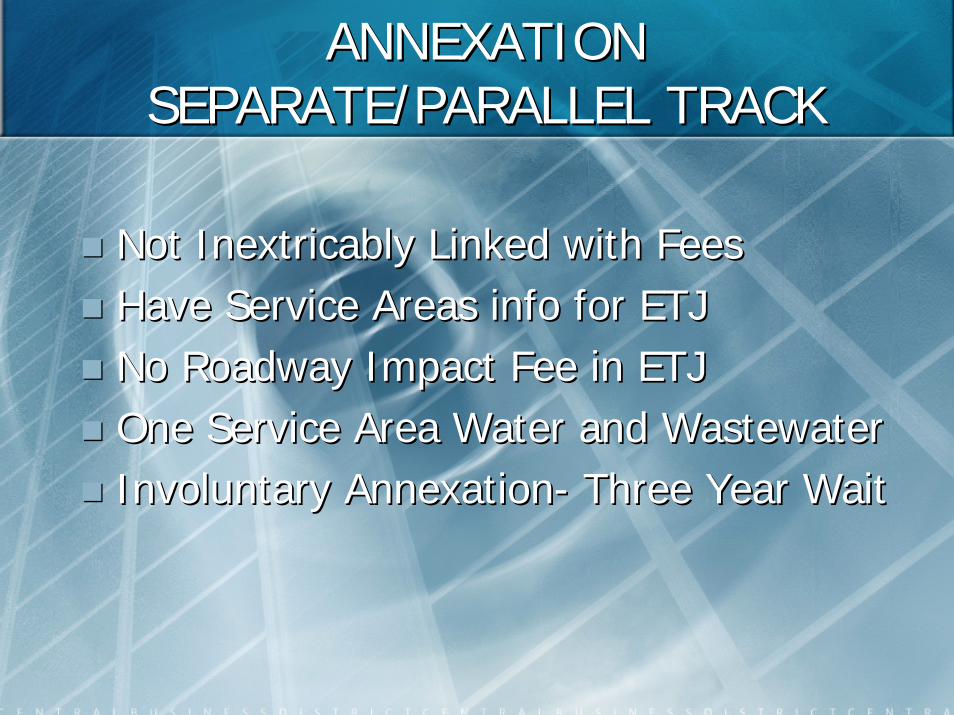
ANNEXATION ANNEXATION SEPARATE/PARALLEL TRACKSEPARATE/PARALLEL TRACK
Not Inextricably Linked with FeesNot Inextricably Linked with FeesHave Service Areas info for ETJHave Service Areas info for ETJNo Roadway Impact Fee in ETJNo Roadway Impact Fee in ETJOne Service Area Water and WastewaterOne Service Area Water and WastewaterInvoluntary AnnexationInvoluntary Annexation-- Three Year WaitThree Year Wait

IMPACT FEESIMPACT FEES
““means a charge or assessment imposed means a charge or assessment imposed by a political subdivision against new by a political subdivision against new development in order to generate development in order to generate revenue for funding or recouping the revenue for funding or recouping the costs of capital improvements or costs of capital improvements or facilities expansion necessitated by and facilities expansion necessitated by and attributable to the new development.attributable to the new development.””Texas Local Government Code Chapter Texas Local Government Code Chapter 395.395.
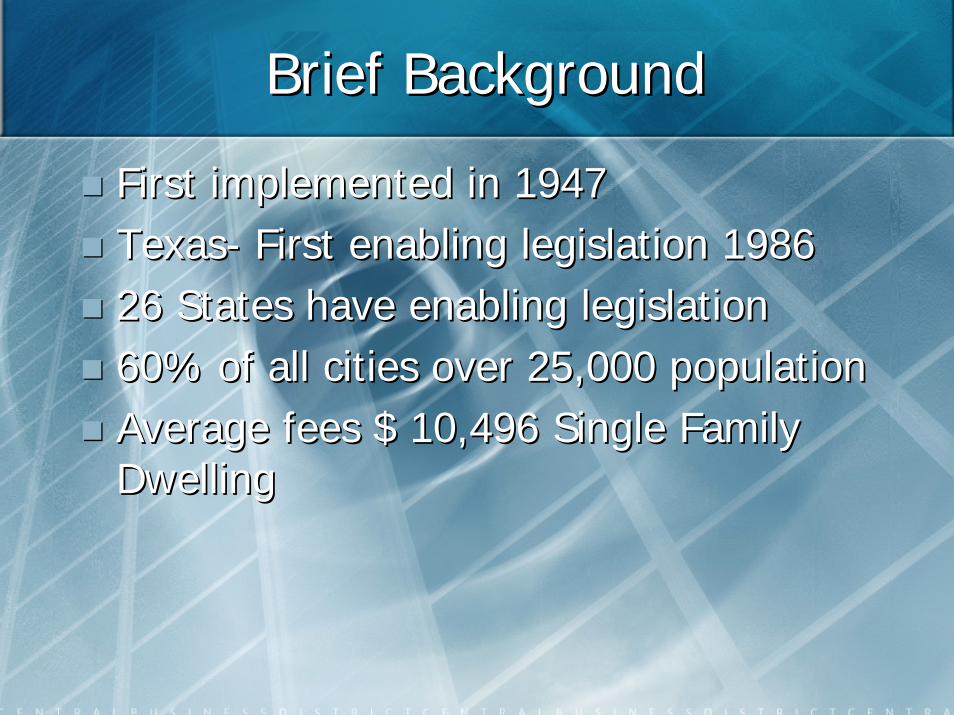
Brief Background Brief Background
First implemented in 1947First implemented in 1947TexasTexas-- First enabling legislation 1986First enabling legislation 198626 States have enabling legislation26 States have enabling legislation60% of all cities over 25,000 population60% of all cities over 25,000 populationAverage fees $ 10,496 Single Family Average fees $ 10,496 Single Family DwellingDwelling

Types of Impact FeesTypes of Impact Fees
Texas: Texas: Water and WastewaterWater and WastewaterRoadwaysRoadwaysDrainageDrainage
Other States:Other States:ParksParksLibrariesLibrariesFire StationsFire StationsPolice StationsPolice StationsSchools Schools
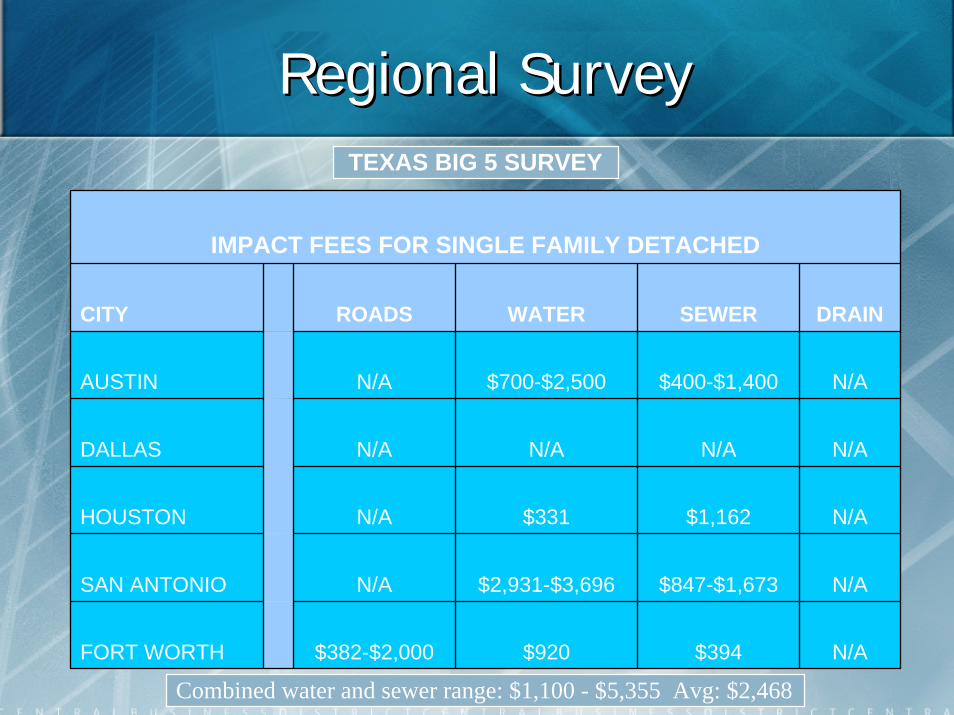
Regional SurveyRegional SurveyTEXAS BIG 5 SURVEY
IMPACT FEES FOR SINGLE FAMILY DETACHED
CITY ROADS WATER SEWER DRAIN
AUSTIN N/A $700-$2,500 $400-$1,400 N/A
DALLAS N/A N/A N/A N/A
HOUSTON N/A $331 $1,162 N/A
SAN ANTONIO N/A $2,931-$3,696 $847-$1,673 N/A
FORT WORTH $382-$2,000 $920 $394 N/A
Combined water and sewer range: $1,100 - $5,355 Avg: $2,468
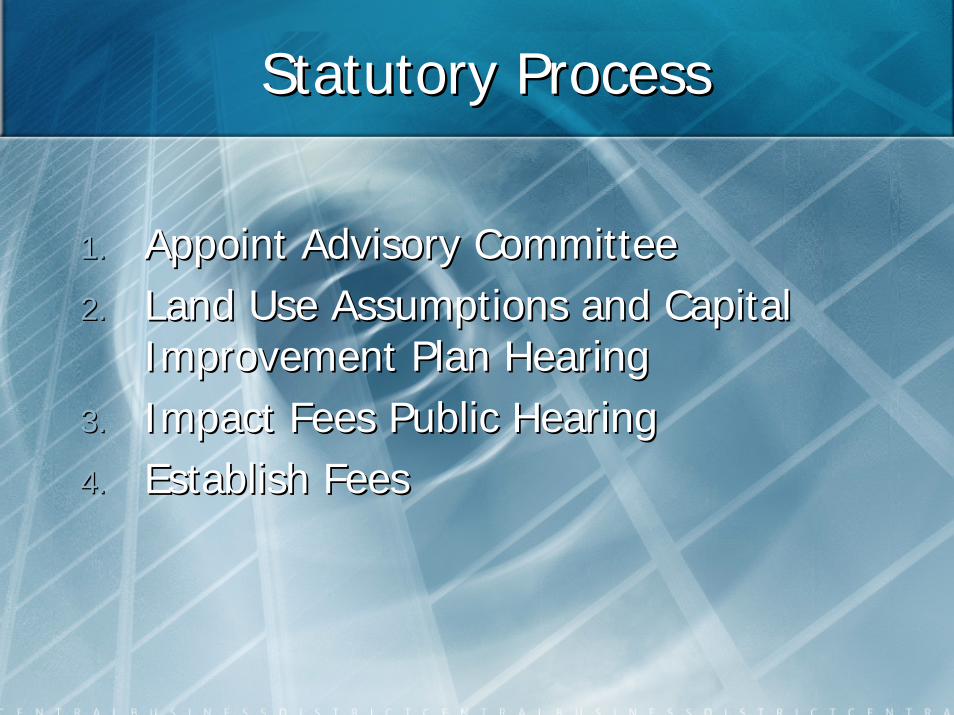
Statutory ProcessStatutory Process
1.1. Appoint Advisory CommitteeAppoint Advisory Committee2.2. Land Use Assumptions and Capital Land Use Assumptions and Capital
Improvement Plan HearingImprovement Plan Hearing3.3. Impact Fees Public HearingImpact Fees Public Hearing4.4. Establish Fees Establish Fees

ScheduleSchedule
IMPACT FEE ABBRIEVIATED SCHEDULEIMPACT FEE ABBRIEVIATED SCHEDULE
FAST MEDIUM SLOWFAST MEDIUM SLOW1.1. LRC Briefing 10/LRC Briefing 10/2 10/16 10/302 10/16 10/30
Advisory Committee recommendedAdvisory Committee recommended
2.2. Council briefing 10/7 Council briefing 10/7 10/28 11/410/28 11/4
3.3. Council appoints Advisory Council appoints Advisory CommComm 10/21 11/18 11/2510/21 11/18 11/25
4.4. Council sets Public Hearing 11/4 Council sets Public Hearing 11/4 12/2 12/912/2 12/9Land Use Assumptions (LUA)Land Use Assumptions (LUA)Capital Improvement Plan (CIP)Capital Improvement Plan (CIP)
ScheduleSchedule
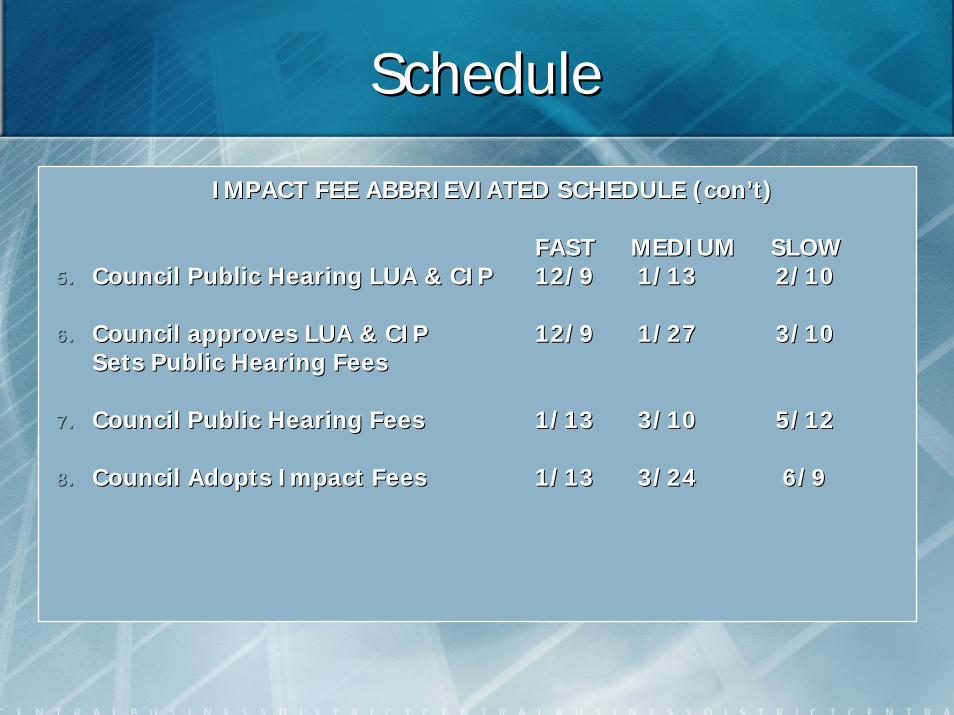
IMPACT FEE ABBRIEVIATED SCHEDULE (IMPACT FEE ABBRIEVIATED SCHEDULE (concon’’tt))
FASTFAST MEDIUM SLOWMEDIUM SLOW5.5. Council Public Hearing LUA & CIPCouncil Public Hearing LUA & CIP 12/912/9 1/131/13 2/102/10
6.6. Council approves LUA & CIPCouncil approves LUA & CIP 12/912/9 1/271/27 3/103/10Sets Public Hearing FeesSets Public Hearing Fees
7.7. Council Public Hearing FeesCouncil Public Hearing Fees 1/131/13 3/103/10 5/125/12
8.8. Council Adopts Impact FeesCouncil Adopts Impact Fees 1/131/13 3/243/24 6/9 6/9

Advisory Committee DutiesAdvisory Committee Duties
1.1. Advise and assist with Land Use Advise and assist with Land Use AssumptionsAssumptions
2.2. Review Capital Improvement PlanReview Capital Improvement Plan3.3. Monitor and evaluate implementationMonitor and evaluate implementation4.4. File semiFile semi--annual reportsannual reports5.5. Advise on updates and revisionsAdvise on updates and revisions
File comments before public hearings File comments before public hearings

Advisory Committee membershipAdvisory Committee membership
Option 1: Appointed by Council. At least 5Option 1: Appointed by Council. At least 5members. 40% from real estate,members. 40% from real estate,development or building industries.development or building industries.
Option 2: CPC with at least one member from oneOption 2: CPC with at least one member from oneof the above industries. If not, add one.of the above industries. If not, add one.
And: One member from ETJ.And: One member from ETJ.
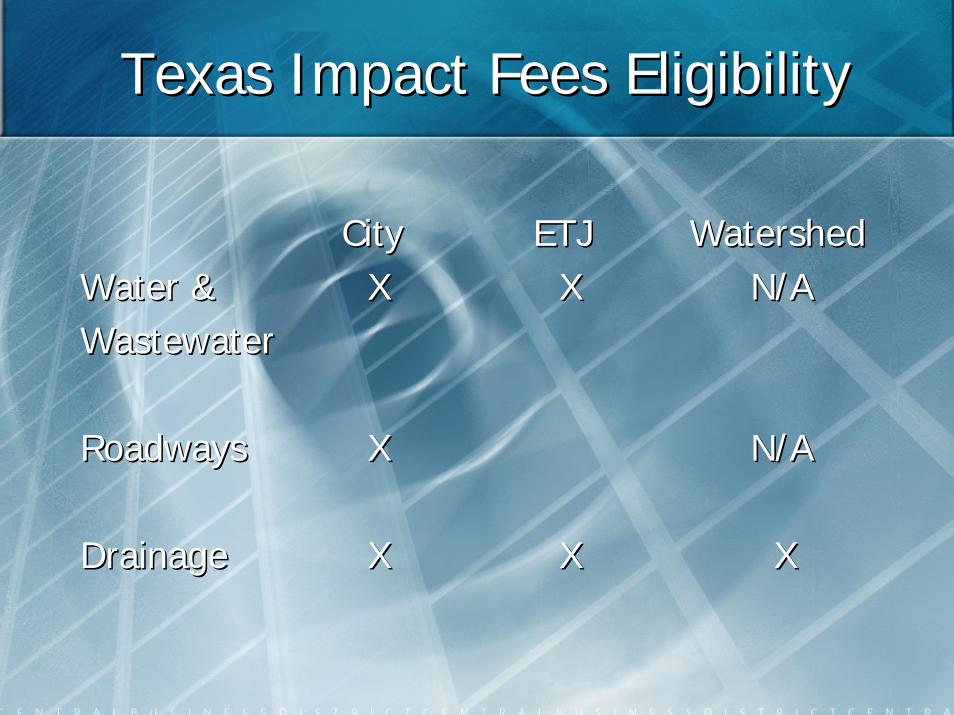
Texas Impact Fees EligibilityTexas Impact Fees Eligibility
CityCity ETJETJ WatershedWatershedWater &Water & XX XX N/AN/AWastewaterWastewater
RoadwaysRoadways XX N/AN/A
DrainageDrainage XX XX XX
RoadwaysRoadways
Collectors and Arterials, Highway matchCollectors and Arterials, Highway match
Not in ETJNot in ETJ
Service Areas not greater than 6 milesService Areas not greater than 6 miles
CIPCIP
Credit discount 50%Credit discount 50%

El Paso RoadwaysEl Paso Roadways
Developer Built RoadsDeveloper Built Roads
Collectors and Arterials on City MTPCollectors and Arterials on City MTP
OverwidthsOverwidths
Proportionality Proportionality

Impact Fee Alternative ApproachImpact Fee Alternative Approach
Easier applicability to City built road Easier applicability to City built road schemescheme
Basically only a different way to pay for Basically only a different way to pay for and collect costsand collect costs
Proportionality still prevails !Proportionality still prevails !
Outlook Using Current ApproachOutlook Using Current Approach
Divide Eligible Roads in 3 CategoriesDivide Eligible Roads in 3 Categories
1.1. Areas likely to be annexedAreas likely to be annexed2.2. PSB LandPSB Land3.3. Balance of roads Balance of roads

MapsMaps
Eastside Service Areas and MTP

MapsMaps
MapsMaps
1.1. Annexation roads 48 linear Annexation roads 48 linear milesmiles
2.2. PSB 60 linear milesPSB 60 linear miles3.3. Other less than 30, probably Other less than 30, probably
no more than 20 linear milesno more than 20 linear miles
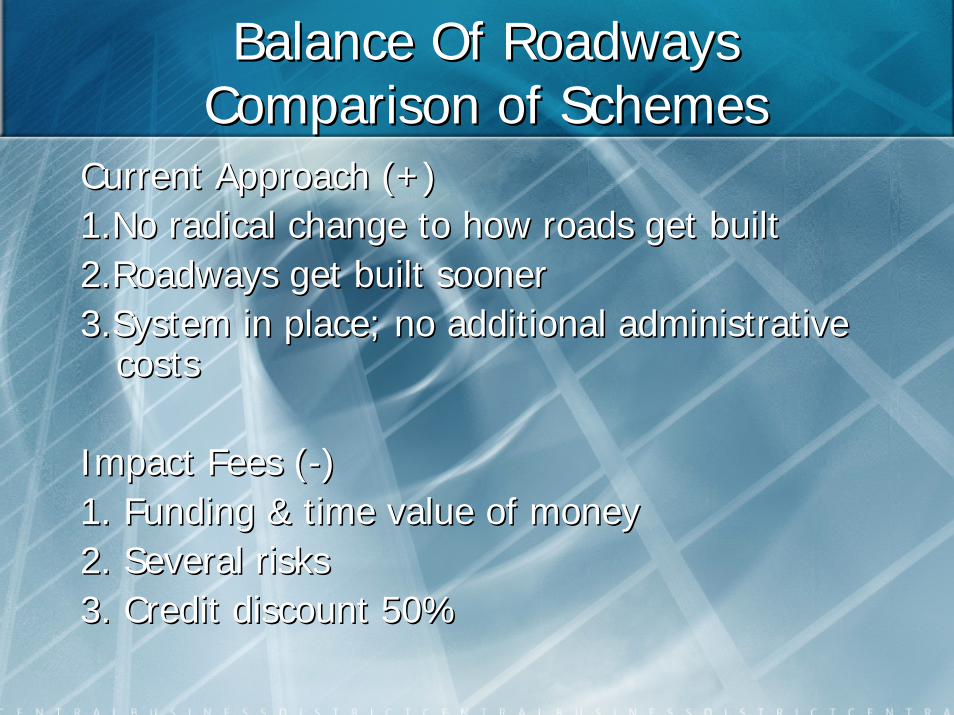
Balance Of RoadwaysBalance Of RoadwaysComparison of SchemesComparison of Schemes
Current Approach (+)Current Approach (+)1.No radical change to how roads get built1.No radical change to how roads get built2.Roadways get built sooner2.Roadways get built sooner3.System in place; no additional administrative 3.System in place; no additional administrative
costscosts
Impact Fees (Impact Fees (--))1. Funding & time value of money1. Funding & time value of money2. Several risks2. Several risks3. Credit discount 50% 3. Credit discount 50%
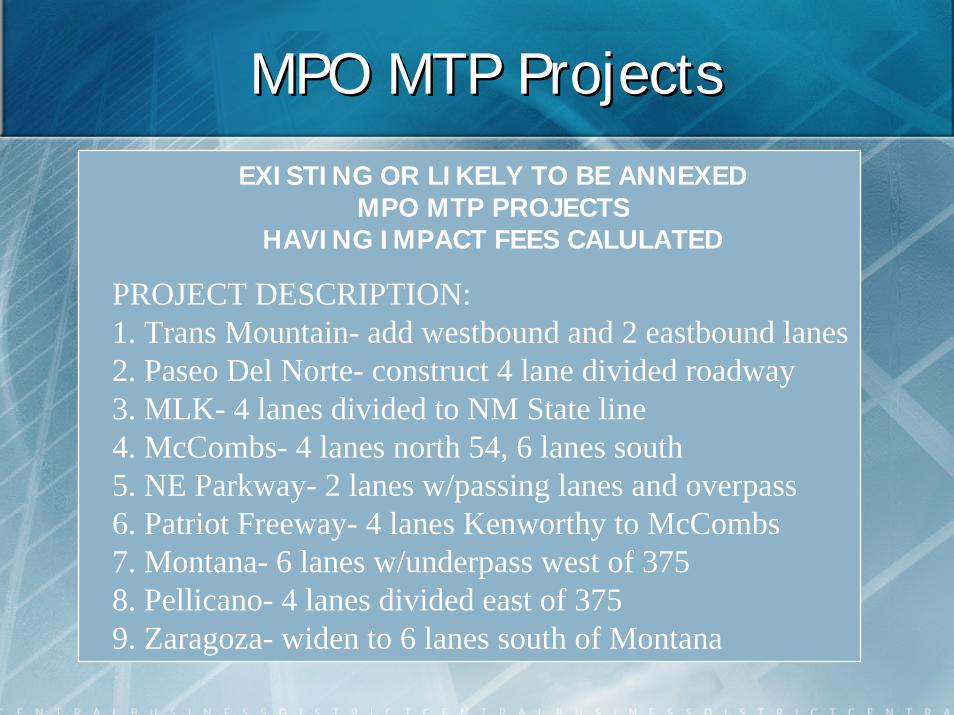
MPO MTP ProjectsMPO MTP Projects
EXISTING OR LIKELY TO BE ANNEXEDMPO MTP PROJECTS
HAVING IMPACT FEES CALULATED
PROJECT DESCRIPTION:1. Trans Mountain- add westbound and 2 eastbound lanes2. Paseo Del Norte- construct 4 lane divided roadway3. MLK- 4 lanes divided to NM State line4. McCombs- 4 lanes north 54, 6 lanes south5. NE Parkway- 2 lanes w/passing lanes and overpass6. Patriot Freeway- 4 lanes Kenworthy to McCombs7. Montana- 6 lanes w/underpass west of 3758. Pellicano- 4 lanes divided east of 3759. Zaragoza- widen to 6 lanes south of Montana

Impact Fee Cost and Service Impact Fee Cost and Service SharingSharing
PROJECT COST AND SERVICE AREASSHARE THROUGH IMPACT FEES:
In $ Millions
Total Share Percent1. Trans Mountain 38.5 1.2 3% 2. Paseo Del Norte 25.3 4.8 19% 3. MLK* 7.3 .09 ---4. McCombs* 16.4 .2 ---5. NE Parkway 209.7 17.1 9%6. Patriot Freeway 41.3 5.2 13%7. Montana 49.3 5.5 12%8. Pellicano 7.4 1.8 25%9. Zaragoza 15.2 1.3 9%
TOTALS 410 37.2 9% * Total costs include NE Master Plan share.

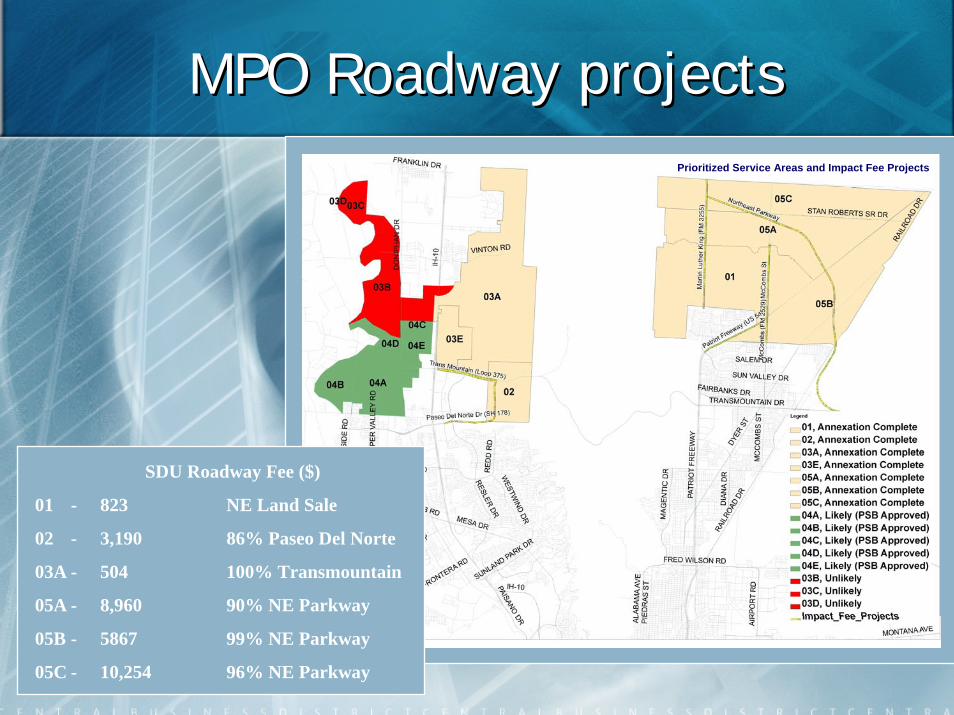
MPO Roadway projectsMPO Roadway projects
Prioritized Service Areas and Impact Fee Projects
SDU Roadway Fee ($)
06 - 536 100% Montana
08B - 404 Pellicano
08ANX - 1,697 Zaragoza – 6 lanes
MPO Roadway projectsMPO Roadway projects
SDU Roadway Fee ($)
01 - 823 NE Land Sale
02 - 3,190 86% Paseo Del Norte
03A - 504 100% Transmountain
05A - 8,960 90% NE Parkway
05B - 5867 99% NE Parkway
05C - 10,254 96% NE Parkway
Prioritized Service Areas and Impact Fee Projects

MPO PROJECTS MPO PROJECTS
Highway CMP PSB TRZ Toll Highway CMP PSB TRZ Toll OverwidthOverwidth1. Transmountain1. Transmountain XX XX XX2. 2. PaseoPaseo Del NorteDel Norte X ($6M)X ($6M)3. MLK3. MLK XX4. McCombs 4. McCombs XX X (part)X (part)5. NE Parkway5. NE Parkway XX XX XX XX6. Patriot Freeway6. Patriot Freeway XX7. Montana7. Montana XX XX8. 8. PellicanoPellicano9. Zaragoza9. Zaragoza XX XX XX

Staff RecommendationStaff Recommendation
Retain Current Scheme to build and fund roads.Retain Current Scheme to build and fund roads.
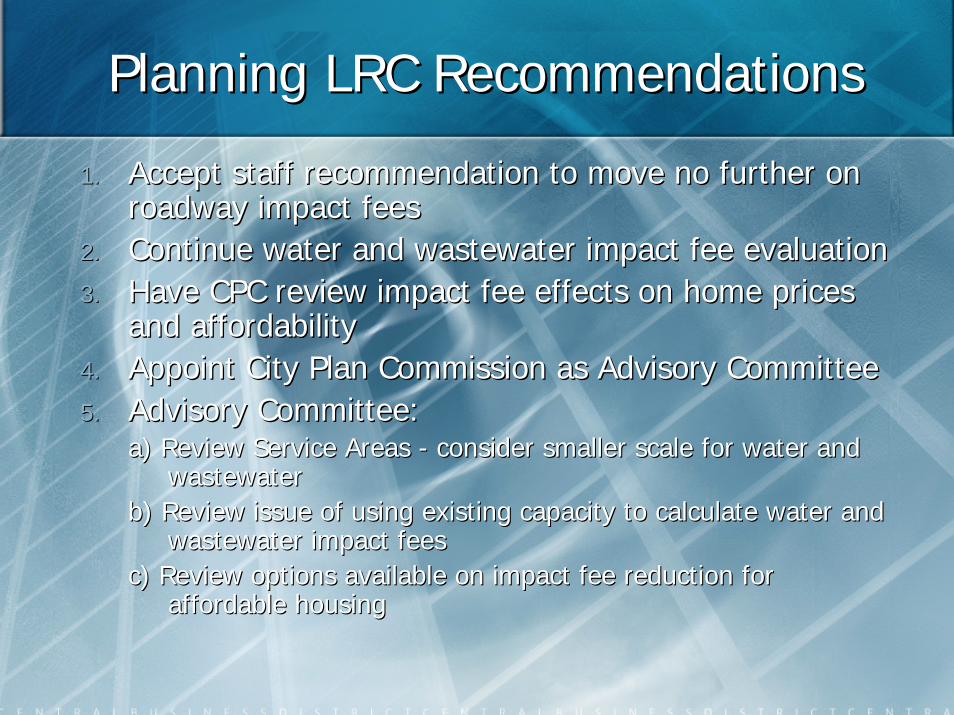
Planning LRC Recommendations Planning LRC Recommendations
1.1. Accept staff recommendation to move no further on Accept staff recommendation to move no further on roadway impact feesroadway impact fees
2.2. Continue water and wastewater impact fee evaluationContinue water and wastewater impact fee evaluation3.3. Have CPC review impact fee effects on home prices Have CPC review impact fee effects on home prices
and affordabilityand affordability4.4. Appoint City Plan Commission as Advisory Committee Appoint City Plan Commission as Advisory Committee 5.5. Advisory Committee:Advisory Committee:
a) Review Service Areas a) Review Service Areas -- consider smaller scale for water and consider smaller scale for water and wastewaterwastewater
b) Review issue of using existing capacity to calculate water anb) Review issue of using existing capacity to calculate water and d wastewater impact feeswastewater impact fees
c) Review options available on impact fee reduction for c) Review options available on impact fee reduction for affordable housingaffordable housing

10/14/2008
1
Water and Wastewater Impact FeesWater and Wastewater Impact Fees
Presentation to City CouncilPresentation to City CouncilOctober 14, 2008October 14, 2008
Water and Wastewater Impact FeesWater and Wastewater Impact Fees
Currently existing ratepayers subsidize Currently existing ratepayers subsidize growth and new developmentsgrowth and new developments
Impact fees are a way to charge the cost of Impact fees are a way to charge the cost of new developments to new developmentsnew developments to new developments
In July 1996, impact fees were considered by In July 1996, impact fees were considered by City Council and defeatedCity Council and defeated
Since 1995, the Utility estimates it has spent Since 1995, the Utility estimates it has spent over $200 million in growth related projects over $200 million in growth related projects that could have been funded, in whole or that could have been funded, in whole or part, with impact fees part, with impact fees
Having impact fees would have mitigated Having impact fees would have mitigated rate increases and/or allowed for more rehab rate increases and/or allowed for more rehab projects over the past decadeprojects over the past decade
10/14/2008
2
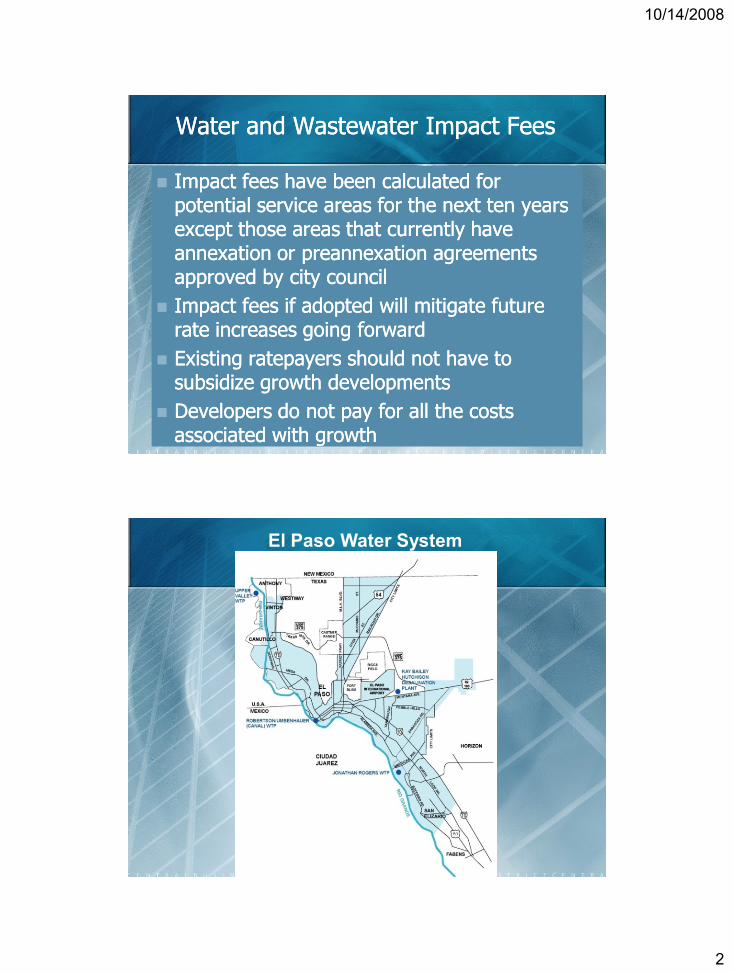
Water and Wastewater Impact FeesWater and Wastewater Impact Fees
Impact fees have been calculated for Impact fees have been calculated for potential service areas for the next ten years potential service areas for the next ten years except those areas that currently have except those areas that currently have annexation or annexation or preannexationpreannexation agreements agreements approved by city councilapproved by city council
Impact fees if adopted will mitigate future Impact fees if adopted will mitigate future rate increases going forwardrate increases going forward
Existing ratepayers should not have to Existing ratepayers should not have to subsidize growth developmentssubsidize growth developments
Developers do not pay for all the costs Developers do not pay for all the costs associated with growthassociated with growth
El Paso Water System
10/14/2008
3
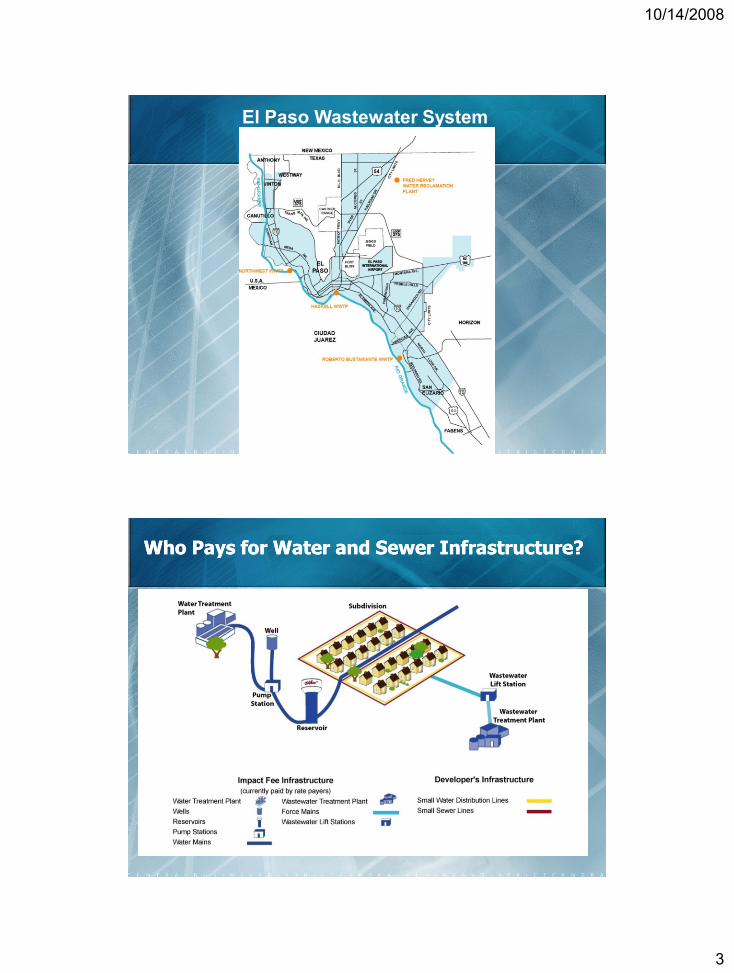
El Paso Wastewater System
Who Pays for Water and Sewer Infrastructure?Who Pays for Water and Sewer Infrastructure?

10/14/2008
4
Who Pays for What?Who Pays for What?
Water and Sewer FacilitiesWater and Sewer Facilities
Who Pays?Who Pays?
Included in Included in
Impact Fee Impact Fee
calculation?calculation?
Developer Developer
pays or pays or
constructsconstructs
Utility is Utility is
responsible responsible
for for
constructionconstruction
Design and Engineering Design and Engineering –– lines w/in subdivisionlines w/in subdivision $$ NONO
Service connections to lotsService connections to lots $$ NONO
Supply / Collection lines within subdivisionSupply / Collection lines within subdivision $$ NONO
Oversized Supply / Collection lines Oversized Supply / Collection lines $$(1)(1) NONO
Major Transmission LinesMajor Transmission Lines $$ YESYES
Design and Engineering Design and Engineering –– offoff--site / backbone site / backbone
facilitiesfacilities$$ YESYES
Water Pumping / Sewer Lift StationsWater Pumping / Sewer Lift Stations $ $ (2)(2) YESYES
Sewer Interceptor linesSewer Interceptor lines $ $ (2)(2) YESYES
Water Storage FacilitiesWater Storage Facilities $ $ (2)(2) YESYES
Water and Wastewater Treatment FacilitiesWater and Wastewater Treatment Facilities $$ YESYES
Water Supply WellsWater Supply Wells $$ YESYES
Water Supply SourceWater Supply Source $$ YESYES
(1)(1) Cost sharing between Developer and Utility per line extension as per Rules and Regulations. Cost sharing between Developer and Utility per line extension as per Rules and Regulations.
(2)(2) Developer pays if service is needed ahead of EPWU’s schedule. Cost is partially offset as future connections Developer pays if service is needed ahead of EPWU’s schedule. Cost is partially offset as future connections
take place. take place.
Vista del Sol - 2.5 MG
Elevated Reservoir
Vista Del Sol Elevated
Tank = $3.5 M total
Landmark Construction
Moreno Cardenas Inc.

10/14/2008
5
Easyway Lift Station &
Easy Way II Dual Force Mains
$20.3 M
Wright Construction (L.S.)
S.J. Louis (Force Mains)
Parkhill Smith & Cooper
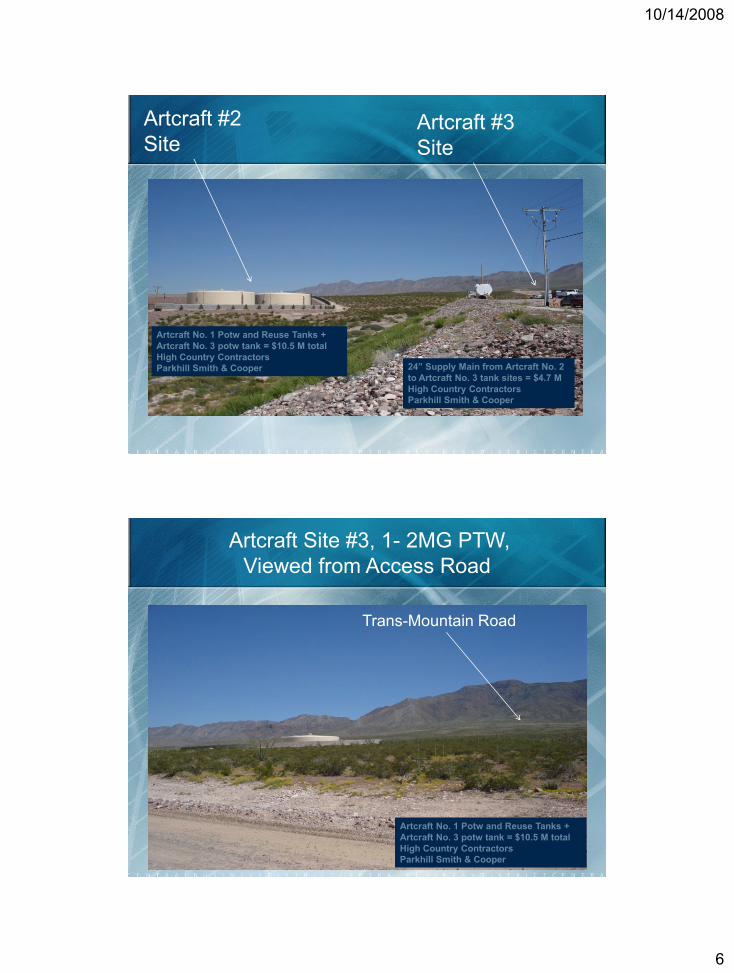
Artcraft Site #2
1-2MG PTW, 1-2MG Reuse
Artcraft No. 1 Potw and Reuse Tanks +
Artcraft No. 3 potw tank = $10.5 M total
High Country Contractors
Parkhill Smith & Cooper
10/14/2008
6
Artcraft #2
SiteArtcraft #3
Site
Artcraft No. 1 Potw and Reuse Tanks +
Artcraft No. 3 potw tank = $10.5 M total
High Country Contractors
Parkhill Smith & Cooper 24” Supply Main from Artcraft No. 2
to Artcraft No. 3 tank sites = $4.7 M
High Country Contractors
Parkhill Smith & Cooper
Artcraft Site #3, 1- 2MG PTW,
Viewed from Access Road
Trans-Mountain Road
Artcraft No. 1 Potw and Reuse Tanks +
Artcraft No. 3 potw tank = $10.5 M total
High Country Contractors
Parkhill Smith & Cooper
10/14/2008
7
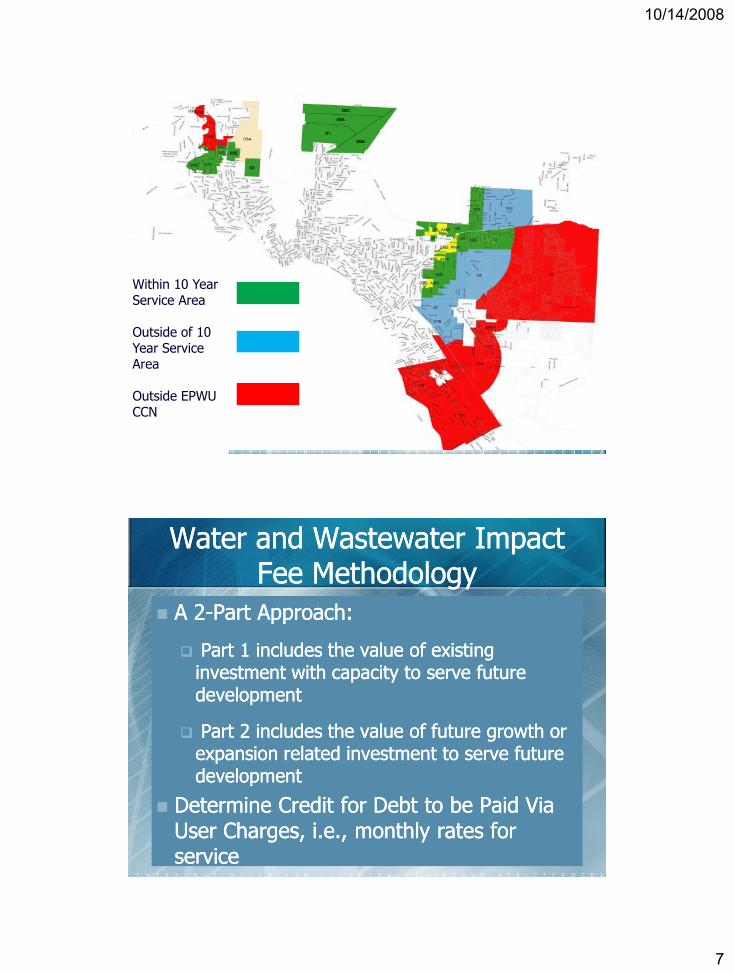
Within 10 Year Service Area
Outside of 10 Year Service Area
Outside EPWU CCN
Water and Wastewater Impact Water and Wastewater Impact Fee MethodologyFee Methodology
A 2A 2--Part Approach:Part Approach:
Part 1 includes the value of existing Part 1 includes the value of existing investment with capacity to serve future investment with capacity to serve future developmentdevelopment
Part 2 includes the value of future growth or Part 2 includes the value of future growth or expansion related investment to serve future expansion related investment to serve future developmentdevelopment
Determine Credit for Debt to be Paid Via Determine Credit for Debt to be Paid Via User Charges, i.e., monthly rates for User Charges, i.e., monthly rates for serviceservice

10/14/2008
8
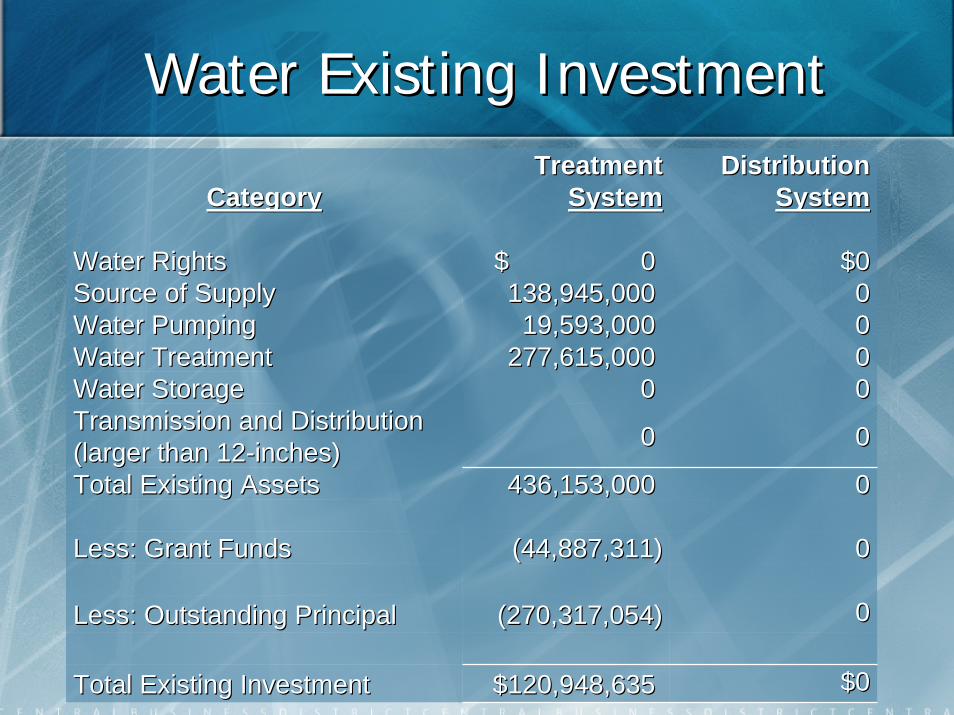
Water Existing InvestmentWater Existing Investment
CategoryCategory
TreatmentTreatment
SystemSystem
DistributionDistribution
SystemSystem
Water RightsWater Rights $ 0$ 0 $0$0
Source of SupplySource of Supply 138,945,000138,945,000 00
Water PumpingWater Pumping 19,593,00019,593,000 00
Water TreatmentWater Treatment 277,615,000277,615,000 00
Water StorageWater Storage 00 00
Transmission and Distribution Transmission and Distribution
(larger than 12(larger than 12--inches)inches)00 00
Total Existing AssetsTotal Existing Assets 436,153,000436,153,000 00
Less: Grant FundsLess: Grant Funds (44,887,311)(44,887,311) 00
Less: Outstanding PrincipalLess: Outstanding Principal (270,317,054) (270,317,054) 00
Total Existing InvestmentTotal Existing Investment $120,948,635$120,948,635 $0$0
CategoryCategory
Treatment Treatment
SystemSystem
Collection Collection
SystemSystem
Wastewater TreatmentWastewater Treatment $214,803,000$214,803,000 $0$0
Interceptors & Collection Interceptors & Collection
(larger than 12(larger than 12--inches)inches)
00 00
Total Existing AssetsTotal Existing Assets 214,803,000214,803,000 00
Less: Grant FundsLess: Grant Funds (7,904,904)(7,904,904) 00
Less: Outstanding Less: Outstanding
PrincipalPrincipal
(106,768,799) (106,768,799) 00
Total Existing InvestmentTotal Existing Investment $100,129,297$100,129,297 $0$0
Wastewater Existing Wastewater Existing InvestmentInvestment
10/14/2008
9
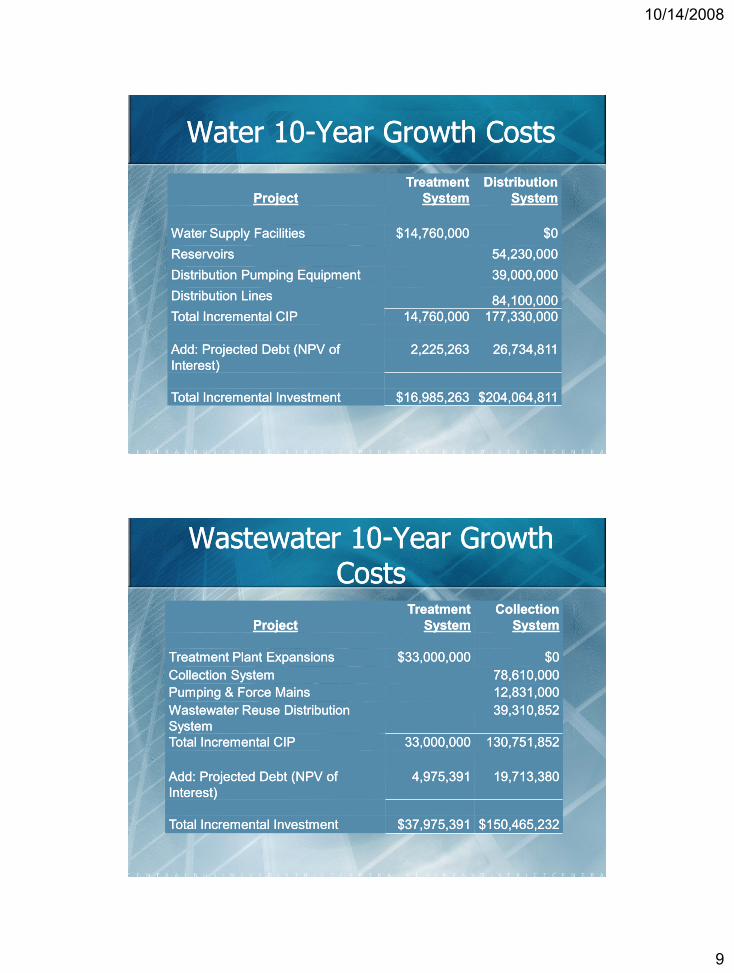
Water 10Water 10--Year Growth CostsYear Growth Costs
ProjectProject
TreatmentTreatment
SystemSystem
DistributionDistribution
SystemSystem
Water Supply FacilitiesWater Supply Facilities $14,760,000$14,760,000 $0$0
ReservoirsReservoirs 54,230,00054,230,000
Distribution Pumping EquipmentDistribution Pumping Equipment 39,000,00039,000,000
Distribution LinesDistribution Lines 84,100,00084,100,000
Total Incremental CIPTotal Incremental CIP 14,760,000 14,760,000 177,330,000177,330,000
Add: Projected Debt (NPV of Add: Projected Debt (NPV of
Interest)Interest)
2,225,2632,225,263 26,734,81126,734,811
Total Incremental InvestmentTotal Incremental Investment $16,985,263$16,985,263 $204,064,811$204,064,811
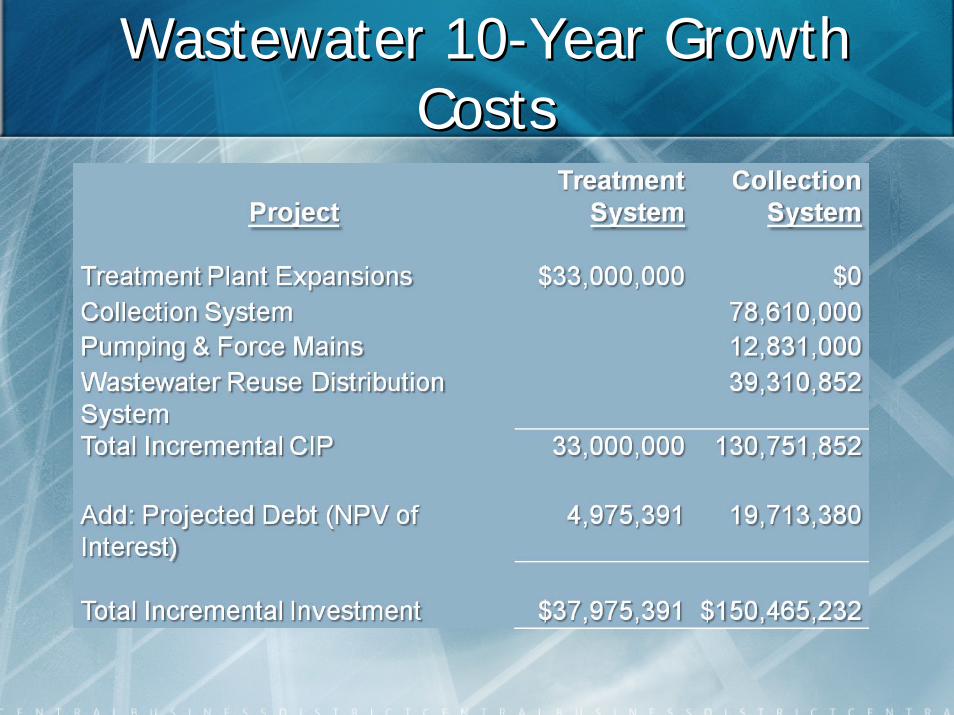
Wastewater 10Wastewater 10--Year Growth Year Growth CostsCosts
ProjectProject
TreatmentTreatment
SystemSystem
CollectionCollection
SystemSystem
Treatment Plant ExpansionsTreatment Plant Expansions $33,000,000$33,000,000 $0$0
CollectionCollection SystemSystem 78,610,00078,610,000
Pumping & Force MainsPumping & Force Mains 12,831,00012,831,000
Wastewater Reuse Distribution Wastewater Reuse Distribution
SystemSystem
39,310,85239,310,852
Total Incremental CIPTotal Incremental CIP 33,000,000 33,000,000 130,751,852130,751,852
Add: Projected Debt (NPV of Add: Projected Debt (NPV of
Interest)Interest)
4,975,3914,975,391 19,713,38019,713,380
Total Incremental InvestmentTotal Incremental Investment $37,975,391$37,975,391 $150,465,232$150,465,232

10/14/2008
10
Water Impact FeeWater Impact Fee
Treatment Treatment
SystemSystem
Distribution Distribution
SystemSystem
Existing InvestmentExisting Investment $120,948,635$120,948,635 $$ 00
Incremental InvestmentIncremental Investment 16,985,26316,985,263 204,064,811204,064,811
Total InvestmentTotal Investment 137,933,898137,933,898 204,064,811204,064,811
Existing System Existing System
Service Unit CapacityService Unit Capacity
419,164419,164 00
Proposed Additional Proposed Additional
Service Unit Capacity Service Unit Capacity
29,29129,291 115,231115,231
Total Service Units Total Service Units 448,454448,454 115,231115,231
Fee per Service UnitFee per Service Unit $308$308 $1,771$1,771
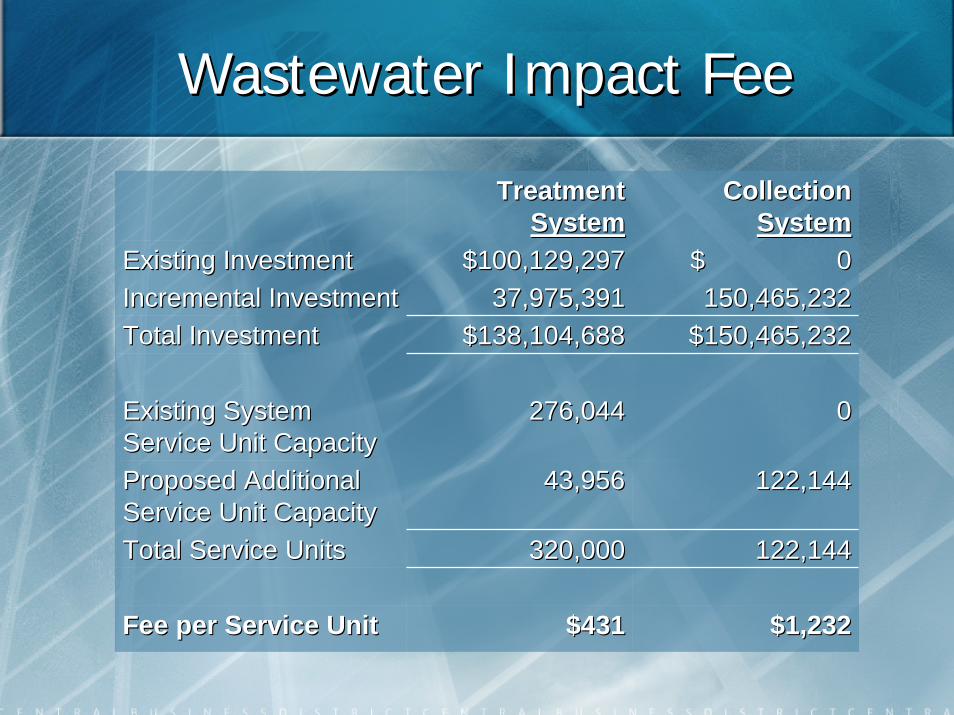
Wastewater Impact FeeWastewater Impact Fee
TreatmentTreatment
SystemSystem
CollectionCollection
SystemSystem
Existing InvestmentExisting Investment $100,129,297$100,129,297 $$ 00
Incremental InvestmentIncremental Investment 37,975,39137,975,391 150,465,232150,465,232
Total InvestmentTotal Investment $138,104,688$138,104,688 $150,465,232$150,465,232
Existing System Existing System
Service Unit CapacityService Unit Capacity
276,044276,044 00
Proposed Additional Proposed Additional
Service Unit CapacityService Unit Capacity
43,95643,956 122,144122,144
Total Service UnitsTotal Service Units 320,000320,000 122,144122,144
Fee per Service UnitFee per Service Unit $431$431 $1,232$1,232

10/14/2008
11
Impact Fees Impact Fees –– LUE ValuesLUE Values
TreatmentTreatment
DistributionDistribution
/Collection/Collection TotalTotal
WaterWater(1)(1) $308$308 $1,771$1,771 $2,079$2,079
WastewaterWastewater(1)(1) 431431 1,2321,232 1,6631,663
TotalTotal $739$739 $3,003$3,003 $3,742$3,742
(1) Less than 1” meter(1) Less than 1” meter
Proposed Water Impact FeesProposed Water Impact Fees
Meter SizeMeter Size MaximumMaximum CreditCredit Net FeeNet Fee
Less than 1Less than 1--inchinch $2,079$2,079 ($378)($378) $1,701$1,701
11--inchinch 3,4723,472 (631)(631) 2,8412,841
1 ½1 ½--inchinch 6,9236,923 (1,258)(1,258) 5,6655,665
22--inchinch 11,08111,081 (2,013)(2,013) 9,0689,068
33--inchinch 20,79020,790 (3,778)(3,778) 17,01217,012
44--inchinch 34,65734,657 (6,297)(6,297) 28,36028,360
66--inchinch 69,29369,293 (12,591)(12,591) 56,70256,702
88--inchinch 110,873110,873 (20,146)(20,146) 90,72790,727
10/14/2008
12
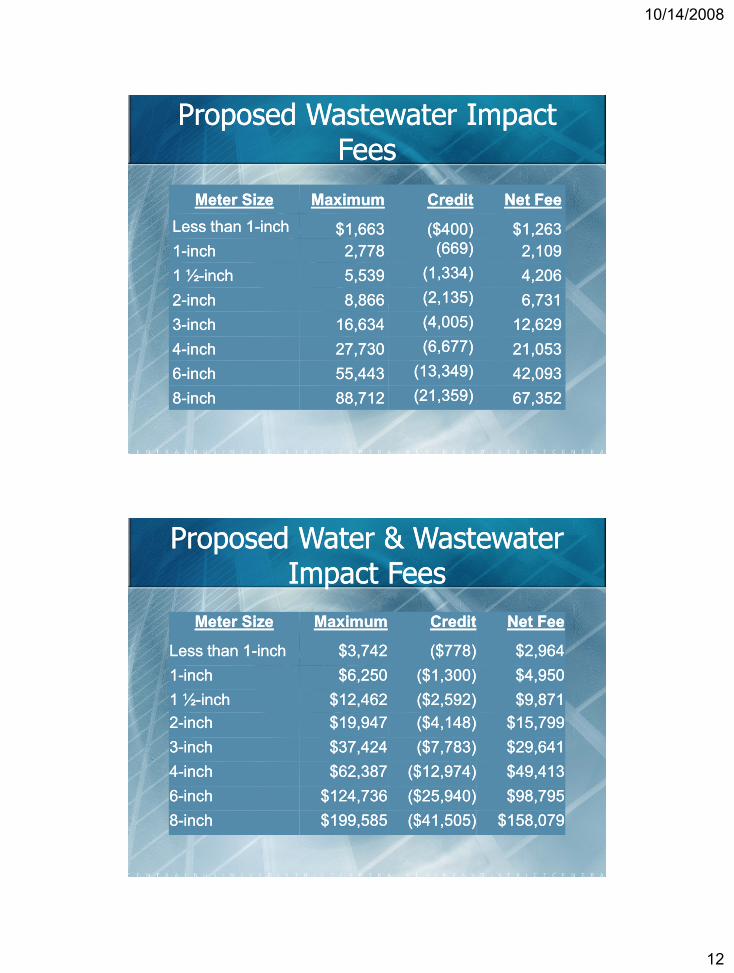
Proposed Wastewater Impact Proposed Wastewater Impact FeesFees
Meter SizeMeter Size MaximumMaximum CreditCredit Net FeeNet Fee
Less than 1Less than 1--inchinch $1,663$1,663 ($400)($400) $1,263$1,263
11--inchinch 2,7782,778 (669)(669) 2,1092,109
1 ½1 ½--inchinch 5,5395,539 (1,334)(1,334) 4,2064,206
22--inchinch 8,8668,866 (2,135)(2,135) 6,7316,731
33--inchinch 16,63416,634 (4,005)(4,005) 12,62912,629
44--inchinch 27,73027,730 (6,677)(6,677) 21,05321,053
66--inchinch 55,44355,443 (13,349)(13,349) 42,09342,093
88--inchinch 88,71288,712 (21,359)(21,359) 67,35267,352
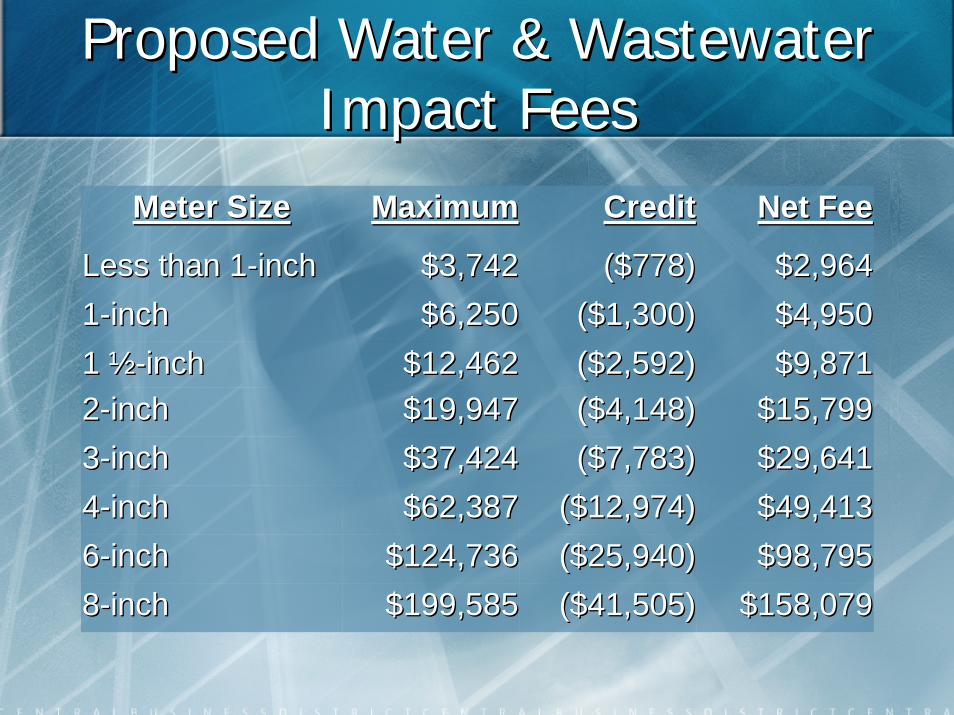
Proposed Water & Wastewater Proposed Water & Wastewater Impact FeesImpact Fees
Meter Size Meter Size Maximum Maximum Credit Credit Net Fee Net Fee
Less than 1Less than 1--inch inch $3,742 $3,742 ($778)($778) $2,964 $2,964
11--inch inch $6,250 $6,250 ($1,300)($1,300) $4,950 $4,950
1 ½1 ½--inch inch $12,462 $12,462 ($2,592)($2,592) $9,871 $9,871
22--inch inch $19,947 $19,947 ($4,148)($4,148) $15,799 $15,799
33--inch inch $37,424 $37,424 ($7,783)($7,783) $29,641 $29,641
44--inch inch $62,387 $62,387 ($12,974)($12,974) $49,413 $49,413
66--inch inch $124,736 $124,736 ($25,940)($25,940) $98,795 $98,795
88--inch inch $199,585 $199,585 ($41,505)($41,505) $158,079 $158,079

10/14/2008
13
Impact Fee Impact Fee –– Incremental OnlyIncremental Only
WaterWater WastewaterWastewater
TreatmentTreatment $ 16,985,263$ 16,985,263 $ 37,975,391$ 37,975,391
Distribution / CollectionDistribution / Collection 204,064,811204,064,811 150,465,302150,465,302
Incremental InvestmentIncremental Investment $ $ 221,050,074221,050,074 $ 188,440,693$ 188,440,693
Additional Service Unit Additional Service Unit
Capacity Capacity 144,522144,522 166,100166,100
Incremental FeeIncremental Fee $2,351$2,351 $2,096$2,096
Hybrid FeeHybrid Fee $2,079$2,079 $1,664$1,664
DifferenceDifference $ 272$ 272 $ 432$ 432
Affordable Housing CreditAffordable Housing Credit
Section 395.016 Time for Assessment Section 395.016 Time for Assessment and Collection of Fee, subsection (g)and Collection of Fee, subsection (g)
City Council may Reduce or Waive an City Council may Reduce or Waive an Impact Fee for Affordable HousingImpact Fee for Affordable Housing
May be a Full or Partial Credit Based on May be a Full or Partial Credit Based on Council Policy Council Policy –– Existing Credit Programs Existing Credit Programs in Austin and San Antonioin Austin and San Antonio
10/14/2008
14
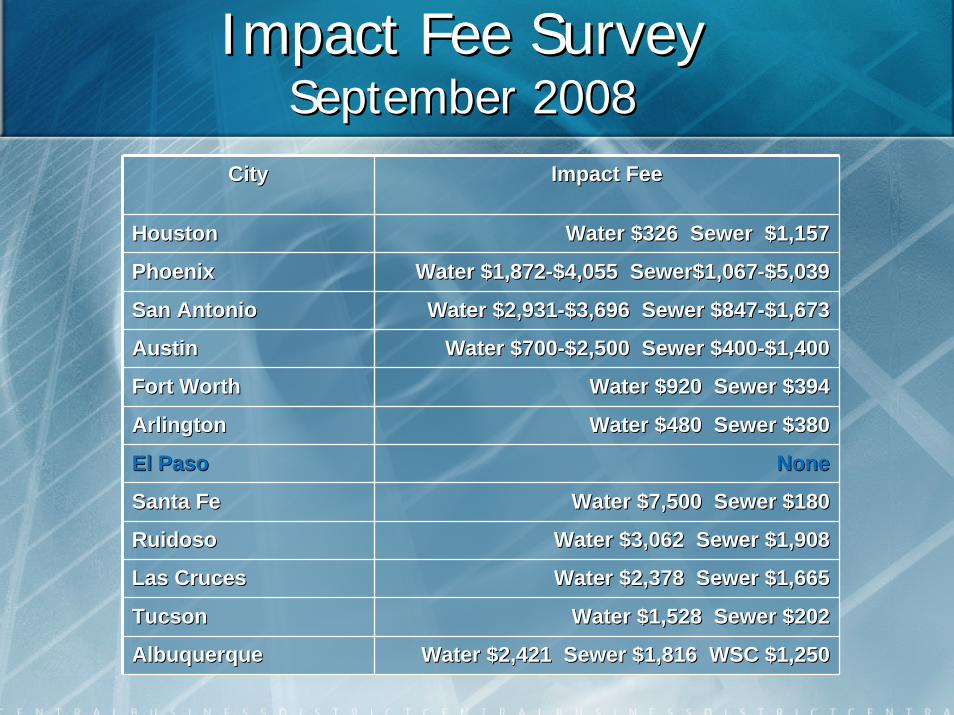
CityCity Impact FeeImpact Fee
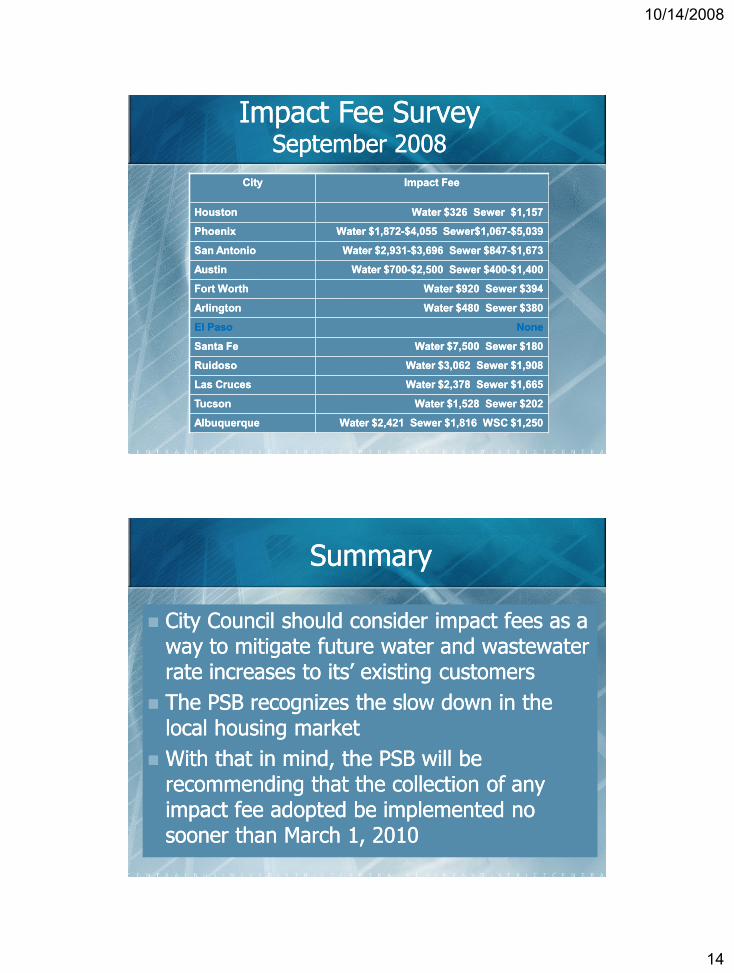
HoustonHouston Water $326 Sewer $1,157Water $326 Sewer $1,157
PhoenixPhoenix Water $1,872Water $1,872--$4,055 Sewer$1,067$4,055 Sewer$1,067--$5,039$5,039
San AntonioSan Antonio Water $2,931Water $2,931--$3,696 Sewer $847$3,696 Sewer $847--$1,673$1,673
AustinAustin Water $700Water $700--$2,500 Sewer $400$2,500 Sewer $400--$1,400$1,400
Fort WorthFort Worth Water $920 Sewer $394Water $920 Sewer $394
ArlingtonArlington Water $480 Sewer $380Water $480 Sewer $380
El PasoEl Paso NoneNone
Santa FeSanta Fe Water $7,500 Sewer $180Water $7,500 Sewer $180
RuidosoRuidoso Water $3,062 Sewer $1,908Water $3,062 Sewer $1,908
Las CrucesLas Cruces Water $2,378 Sewer $1,665Water $2,378 Sewer $1,665
TucsonTucson Water $1,528 Sewer $202Water $1,528 Sewer $202
AlbuquerqueAlbuquerque Water $2,421 Sewer $1,816 WSC $1,250Water $2,421 Sewer $1,816 WSC $1,250
Impact Fee SurveyImpact Fee SurveySeptember 2008September 2008
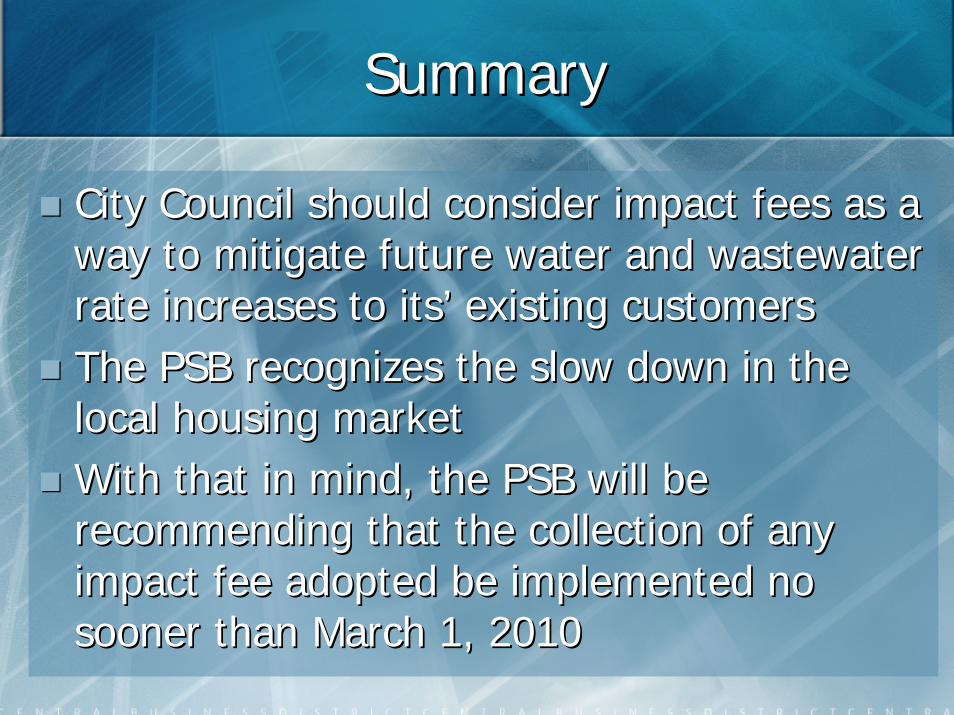
SummarySummary
City Council should consider impact fees as a City Council should consider impact fees as a way to mitigate future water and wastewater way to mitigate future water and wastewater rate increases to its’ existing customersrate increases to its’ existing customers
The PSB recognizes the slow down in the The PSB recognizes the slow down in the local housing marketlocal housing market
With that in mind, the PSB will be With that in mind, the PSB will be recommending that the collection of any recommending that the collection of any impact fee adopted be implemented no impact fee adopted be implemented no sooner than March 1, 2010sooner than March 1, 2010
Water Existing InvestmentWater Existing Investment
CategoryCategoryTreatmentTreatment
SystemSystemDistributionDistribution
SystemSystem
Water RightsWater Rights $ 0$ 0 $0$0Source of SupplySource of Supply 138,945,000138,945,000 00Water PumpingWater Pumping 19,593,00019,593,000 00Water TreatmentWater Treatment 277,615,000277,615,000 00Water StorageWater Storage 00 00Transmission and Distribution Transmission and Distribution (larger than 12(larger than 12--inches)inches) 00 00
Total Existing AssetsTotal Existing Assets 436,153,000436,153,000 00
Less: Grant FundsLess: Grant Funds (44,887,311)(44,887,311) 00
Less: Outstanding PrincipalLess: Outstanding Principal (270,317,054) (270,317,054) 00
Total Existing InvestmentTotal Existing Investment $120,948,635$120,948,635 $0$0

Wastewater Existing Wastewater Existing InvestmentInvestment
CategoryCategoryTreatment Treatment
SystemSystemCollection Collection
SystemSystemWastewater TreatmentWastewater Treatment $214,803,000$214,803,000 $0$0Interceptors & Collection Interceptors & Collection (larger than 12(larger than 12--inches)inches)
00 00
Total Existing AssetsTotal Existing Assets 214,803,000214,803,000 00
Less: Grant FundsLess: Grant Funds (7,904,904)(7,904,904) 00
Less: Outstanding Less: Outstanding PrincipalPrincipal
(106,768,799) (106,768,799) 00
Total Existing InvestmentTotal Existing Investment $100,129,297$100,129,297 $0$0

Water 10Water 10--Year Growth CostsYear Growth Costs
Wastewater 10Wastewater 10--Year Growth Year Growth CostsCosts

Water Impact FeeWater Impact Fee
Treatment Treatment SystemSystem
Distribution Distribution SystemSystem
Existing InvestmentExisting Investment $120,948,635$120,948,635 $$ 00Incremental InvestmentIncremental Investment 16,985,26316,985,263 204,064,811204,064,811Total InvestmentTotal Investment 137,933,898137,933,898 204,064,811204,064,811
Existing System Existing System Service Unit CapacityService Unit Capacity
419,164419,164 00
Proposed Additional Proposed Additional Service Unit Capacity Service Unit Capacity
29,29129,291 115,231115,231
Total Service Units Total Service Units 448,454448,454 115,231115,231
Fee per Service UnitFee per Service Unit $308$308 $1,771$1,771
Wastewater Impact FeeWastewater Impact Fee
TreatmentTreatmentSystemSystem
CollectionCollectionSystemSystem
Existing InvestmentExisting Investment $100,129,297$100,129,297 $$ 00Incremental InvestmentIncremental Investment 37,975,39137,975,391 150,465,232150,465,232Total InvestmentTotal Investment $138,104,688$138,104,688 $150,465,232$150,465,232
Existing System Existing System Service Unit CapacityService Unit Capacity
276,044276,044 00
Proposed Additional Proposed Additional Service Unit CapacityService Unit Capacity
43,95643,956 122,144122,144
Total Service UnitsTotal Service Units 320,000320,000 122,144122,144
Fee per Service UnitFee per Service Unit $431$431 $1,232$1,232

Impact Fees Impact Fees –– LUE ValuesLUE Values
TreatmentTreatmentDistributionDistribution/Collection/Collection TotalTotal
WaterWater(1)(1) $308$308 $1,771$1,771 $2,079$2,079
WastewaterWastewater(1)(1) 431431 1,2321,232 1,6631,663
TotalTotal $739$739 $3,003$3,003 $3,742$3,742
(1) Less than 1(1) Less than 1”” metermeter

Proposed Water Impact FeesProposed Water Impact Fees
Meter SizeMeter Size MaximumMaximum CreditCredit Net FeeNet FeeLess than 1Less than 1--inchinch $2,079$2,079 ($378)($378) $1,701$1,70111--inchinch 3,4723,472 (631)(631) 2,8412,8411 1 ½½--inchinch 6,9236,923 (1,258)(1,258) 5,6655,66522--inchinch 11,08111,081 (2,013)(2,013) 9,0689,06833--inchinch 20,79020,790 (3,778)(3,778) 17,01217,01244--inchinch 34,65734,657 (6,297)(6,297) 28,36028,36066--inchinch 69,29369,293 (12,591)(12,591) 56,70256,70288--inchinch 110,873110,873 (20,146)(20,146) 90,72790,727

Proposed Wastewater Impact Proposed Wastewater Impact FeesFees
Meter SizeMeter Size MaximumMaximum CreditCredit Net FeeNet FeeLess than 1Less than 1--inchinch $1,663$1,663 ($400)($400) $1,263$1,26311--inchinch 2,7782,778 (669)(669) 2,1092,1091 1 ½½--inchinch 5,5395,539 (1,334)(1,334) 4,2064,20622--inchinch 8,8668,866 (2,135)(2,135) 6,7316,73133--inchinch 16,63416,634 (4,005)(4,005) 12,62912,62944--inchinch 27,73027,730 (6,677)(6,677) 21,05321,05366--inchinch 55,44355,443 (13,349)(13,349) 42,09342,09388--inchinch 88,71288,712 (21,359)(21,359) 67,35267,352
Proposed Water & Wastewater Proposed Water & Wastewater Impact FeesImpact Fees
Meter Size Meter Size Maximum Maximum Credit Credit Net Fee Net Fee
Less than 1Less than 1--inch inch $3,742 $3,742 ($778)($778) $2,964 $2,964 11--inch inch $6,250 $6,250 ($1,300)($1,300) $4,950 $4,950 1 1 ½½--inch inch $12,462 $12,462 ($2,592)($2,592) $9,871 $9,871 22--inch inch $19,947 $19,947 ($4,148)($4,148) $15,799 $15,799 33--inch inch $37,424 $37,424 ($7,783)($7,783) $29,641 $29,641 44--inch inch $62,387 $62,387 ($12,974)($12,974) $49,413 $49,413 66--inch inch $124,736 $124,736 ($25,940)($25,940) $98,795 $98,795 88--inch inch $199,585 $199,585 ($41,505)($41,505) $158,079 $158,079

Affordable Housing CreditAffordable Housing Credit
Section 395.016 Time for Assessment Section 395.016 Time for Assessment and Collection of Fee, subsection (g)and Collection of Fee, subsection (g)
City Council may Reduce or Waive an City Council may Reduce or Waive an Impact Fee for Affordable HousingImpact Fee for Affordable Housing
May be a Full or Partial Credit Based on May be a Full or Partial Credit Based on Council Policy Council Policy –– Existing Credit Programs Existing Credit Programs in Austin and San Antonioin Austin and San Antonio
CityCity Impact FeeImpact Fee
HoustonHouston Water $326 Sewer $1,157Water $326 Sewer $1,157
PhoenixPhoenix Water $1,872Water $1,872--$4,055 Sewer$1,067$4,055 Sewer$1,067--$5,039$5,039
San AntonioSan Antonio Water $2,931Water $2,931--$3,696 Sewer $847$3,696 Sewer $847--$1,673$1,673
AustinAustin Water $700Water $700--$2,500 Sewer $400$2,500 Sewer $400--$1,400$1,400
Fort WorthFort Worth Water $920 Sewer $394Water $920 Sewer $394
ArlingtonArlington Water $480 Sewer $380Water $480 Sewer $380
El PasoEl Paso NoneNone
Santa FeSanta Fe Water $7,500 Sewer $180Water $7,500 Sewer $180
RuidosoRuidoso Water $3,062 Sewer $1,908Water $3,062 Sewer $1,908
Las CrucesLas Cruces Water $2,378 Sewer $1,665Water $2,378 Sewer $1,665
TucsonTucson Water $1,528 Sewer $202Water $1,528 Sewer $202
AlbuquerqueAlbuquerque Water $2,421 Sewer $1,816 WSC $1,250Water $2,421 Sewer $1,816 WSC $1,250
Impact Fee SurveyImpact Fee SurveySeptember 2008September 2008
SummarySummary
City Council should consider impact fees as a City Council should consider impact fees as a way to mitigate future water and wastewater way to mitigate future water and wastewater rate increases to itsrate increases to its’’ existing customersexisting customersThe PSB recognizes the slow down in the The PSB recognizes the slow down in the local housing marketlocal housing marketWith that in mind, the PSB will be With that in mind, the PSB will be recommending that the collection of any recommending that the collection of any impact fee adopted be implemented no impact fee adopted be implemented no sooner than March 1, 2010sooner than March 1, 2010