Embed Size (px)
Citation preview

City of Edmonton 2016 EPCOR Proposal for Drainage Transfer Analysis FINAL REPORT October 5, 2016

City of Edmonton 2016 EPCOR Proposal for Drainage Transfer Analysis October 5, 2016
2
Audit • Tax • Advisory © Grant Thornton LLP. A Canadian Member of Grant Thornton International Ltd. All rights reserved.
Contents
1 Executive Summary ........................................................................................................................... 6
1.1 Project Overview ...................................................................................................................... 6 1.2 Summary of Analysis & Results................................................................................................ 6
1.2.1 Quantitative Analysis Summary .......................................................................................... 6 1.2.2 Qualitative Analysis Summary .......................................................................................... 11
1.3 Next Steps .............................................................................................................................. 14
2 Introduction ...................................................................................................................................... 15
2.1 Project Background ................................................................................................................ 15 2.2 Organizational Background .................................................................................................... 15
2.2.1 City Drainage Utility .......................................................................................................... 15 2.2.2 EPCOR Utilities Inc. ......................................................................................................... 17
2.3 EPCOR in Edmonton .............................................................................................................. 19 2.4 Drainage and EPCOR Relative Sizes ..................................................................................... 20 2.5 Project Objective .................................................................................................................... 21 2.6 Scope of Work ........................................................................................................................ 22
2.6.1 Quantitative Scope ........................................................................................................... 22 2.6.2 Qualitative Scope ............................................................................................................. 22
2.7 Project Approach .................................................................................................................... 22 2.8 Acknowledgements ................................................................................................................ 24
3 Quantitative Analysis ...................................................................................................................... 25
3.1 Financial Models Review ........................................................................................................ 25 3.1.1 Input Assumptions: City Model ......................................................................................... 25 3.1.2 Input Assumptions: EPCOR Model ................................................................................... 28
3.2 Current State of Drainage ....................................................................................................... 30 3.3 Future State of Drainage ........................................................................................................ 31
3.3.1 Capital Expenditure Forecasts.......................................................................................... 32 3.3.2 Income Statement Impacts ............................................................................................... 33 3.3.3 Drainage Financial Indicators ........................................................................................... 34 3.3.4 Future State of Drainage Summary .................................................................................. 35
3.4 EPCOR Proposal .................................................................................................................... 35 3.4.1 Operational Efficiency ....................................................................................................... 36 3.4.2 Capital Efficiency .............................................................................................................. 41

City of Edmonton 2016 EPCOR Proposal for Drainage Transfer Analysis October 5, 2016
3
Audit • Tax • Advisory © Grant Thornton LLP. A Canadian Member of Grant Thornton International Ltd. All rights reserved.
3.5 Future State of Drainage after Proposal ................................................................................. 42 3.5.1 EPCOR Sources and Uses of Funds ................................................................................ 43 3.5.2 EPCOR Financial Indicators ............................................................................................. 44 3.5.3 Future State of Drainage After Proposal Summary .......................................................... 45 3.5.4 Dividend & Dividend Sustainability ................................................................................... 46 3.5.5 Other Revenue Sources ................................................................................................... 48
3.6 Organizational Financial Analysis ........................................................................................... 48 3.6.1 EPCOR Financial Capacity and Impacts .......................................................................... 48 3.6.2 City Debt Limits and Credit Rating Impacts ...................................................................... 50 3.6.3 Tax Consequences ........................................................................................................... 54
3.7 Valuation Analysis and Economic Comparison ...................................................................... 57 3.7.1 Valuation Overview ........................................................................................................... 58 3.7.2 Valuation Methodologies .................................................................................................. 58 3.7.3 Selected Valuation Approach ........................................................................................... 58 3.7.4 Financial Forecast ............................................................................................................ 60 3.7.5 Valuation Scenarios .......................................................................................................... 61 3.7.6 Valuation .......................................................................................................................... 62 3.7.7 Public Company Comparables and Precedent Transactions ........................................... 66 3.7.8 Economic Comparison: City and Taxpayers ..................................................................... 68 3.7.9 Economic Comparison: Ratepayers ................................................................................. 69 3.7.10 Economic Comparison Summary ..................................................................................... 71
3.8 Quantitative Analysis Summary .............................................................................................. 71
4 Qualitative Analysis ......................................................................................................................... 72
4.1 Regulatory and Governance ................................................................................................... 72 4.1.1 City’s Current State .......................................................................................................... 72 4.1.2 EPCOR’s Proposal ........................................................................................................... 74 4.1.3 Proposed Operational Structure ....................................................................................... 75 4.1.4 Proposed Oversight .......................................................................................................... 79 4.1.5 Benefits and Risks ............................................................................................................ 82
4.2 Planning ................................................................................................................................. 82 4.2.1 Capital Approvals Process ............................................................................................... 82 4.2.2 Drainage Planning ............................................................................................................ 85
4.3 Operations .............................................................................................................................. 87 4.3.1 Differences between Drainage and Water ........................................................................ 87 4.3.2 Synergies Gained ............................................................................................................. 87 4.3.3 Synergies Lost .................................................................................................................. 88
4.4 Legal Implications ................................................................................................................... 89 4.4.1 Liability Impacts ................................................................................................................ 89 4.4.2 Existing Contracts and Approvals ..................................................................................... 90 4.4.3 Legal Impacts on Partners ................................................................................................ 90 4.4.4 Grants ............................................................................................................................... 90 4.4.5 Health and Safety ............................................................................................................. 92
4.5 Stakeholder Impacts ............................................................................................................... 92 4.5.1 ACRWC ............................................................................................................................ 92

City of Edmonton 2016 EPCOR Proposal for Drainage Transfer Analysis October 5, 2016
4
Audit • Tax • Advisory © Grant Thornton LLP. A Canadian Member of Grant Thornton International Ltd. All rights reserved.
4.5.2 Customers ........................................................................................................................ 92 4.5.3 Employees ........................................................................................................................ 93
4.6 Qualitative Analysis Summary ................................................................................................ 94
5 Industry Overview ............................................................................................................................ 95
5.1 Water and Wastewater Industry Overview ............................................................................. 95 5.1.1 Wastewater System .......................................................................................................... 95 5.1.2 Size of the Market ............................................................................................................. 96 5.1.3 Competitive Landscape .................................................................................................... 97
5.2 Benchmarking ......................................................................................................................... 99 5.2.1 Operational and Ownership Structures ............................................................................. 99
6 Observations and Recommendations .......................................................................................... 103
Authorship and Limitations ................................................................................................................... 107
Acronyms and Abbreviations ................................................................................................................ 108
Appendices ............................................................................................................................................. 110
City of Edmonton 2016 EPCOR Proposal for Drainage Transfer Analysis October 5, 2016
5
Audit • Tax • Advisory © Grant Thornton LLP. A Canadian Member of Grant Thornton International Ltd. All rights reserved.
Appendices Appendix A EPCOR Proposal for Drainage Transfer (April, 2016) Appendix B Project Scope and Work Plan Appendix C Reconsolidation of City Drainage Model and EPCOR Stand-alone Drainage Model Appendix D GST Impact Details Appendix E GST Transfer Tax reference clause from Gold Bar Wastewater Treatment Plant Agreement Appendix F Valuation Restrictions and Financial Appendices Appendix G EPCOR IRs
City of Edmonton 2016 EPCOR Proposal for Drainage Transfer Analysis October 5, 2016
6
Audit • Tax • Advisory © Grant Thornton LLP. A Canadian Member of Grant Thornton International Ltd. All rights reserved.
1 Executive Summary
1.1 Project Overview
On June 14, 2016 EPCOR Utilities Inc. (EPCOR) presented to Edmonton City Council its Proposal (the Proposal) to transfer the City of Edmonton’s (the City) Drainage Utility (Drainage). Council moved to pursue considering the EPCOR Proposal, and recommended City Administration retain a third-party to provide an independent assessment of key financial and non-financial aspects of the Proposal. Key project principles and a comprehensive scope of review were developed to support the assessment of EPCOR’s Proposal.
In July 2016, the City retained the accounting and consulting firm Grant Thornton LLP (Grant Thornton) to provide an independent assessment of EPCOR’s Proposal. In response to the scope of review, Grant Thornton evaluated the EPCOR Proposal from quantitative and qualitative perspectives. Specifically, we have assessed quantitative impacts to the City, ratepayers, and taxpayers if Drainage remains with the City, if it is transferred to EPCOR, as well as the notional value if it was to be sold to a third party. Governance, regulatory, operational, and potential legal implications were analyzed as part of our qualitative review. The basis for this Study’s review included 10 year financial forecast models prepared by the City and EPCOR, written Information Request (IRs) responses provided by EPCOR, as well as a comprehensive consultation program with City and EPCOR subject-matter-experts and management.
1.2 Summary of Analysis & Results
The following sections summarize the results of the quantitative and qualitative analysis performed.
1.2.1 Quantitative Analysis Summary
By using the City and EPCOR’s 10 year financial forecast models, we conducted a current and future state review of Drainage, an evaluation of the potential financial impacts of a proposed transfer, as well as an economic comparison of Drainage under different ownership models from the perspectives of the City, taxpayers, and ratepayers. Note that both the City and EPCOR base case models assume that the average monthly drainage rates increase by 3% annually over the 10 year forecast period. As further described, this rate increase assumption places significant pressure on Drainage’s financial performance (for both the City and EPCOR), largely due to the significant capital program forecast over the next 10 years. A rate increase beyond this level would likely be required to support operational and capital expenditures.

City of Edmonton 2016 EPCOR Proposal for Drainage Transfer Analysis October 5, 2016
7
Audit • Tax • Advisory © Grant Thornton LLP. A Canadian Member of Grant Thornton International Ltd. All rights reserved.
1.2.1.1 Current and Future State of Drainage
By the end of 2016, Drainage is forecast to have approximately $1.1B in non-contributed assets, $609.3M in long-term debt, and $530.0M in equity. The current state of the Drainage Utility, based on City projections for year-end 2016 (2016F), appears to be moderately healthy with the following consolidated (combined Sanitary and Stormwater Utilities, and the Drainage Design and Construction group) metrics calculated from the City Drainage Model:
• Accounting Return on Equity (ROE; 2016F net income / 2016F mid-year retained earnings): 7.97%
• Return on Rate Base (2016F net income plus interest / 2016F mid-year rate base): 6.00% • Debt to Capitalization (2016F total debt / 2016F debt plus retained earnings): 51.6% • Funds From Operations to Debt (2016F net income plus depreciation / 2016F long term
debt – cash balance): 11.4% However, due to the large forecast capital program over the next 10 years ($1.93B in utility-financed capital), as well as the constraint of 3.0% annual increases in monthly Drainage utility rates over the forecast period, there will be significant pressure on the Utility’s financial performance. Under these assumptions, financial metrics of Drainage deteriorate, and the Utility is unable to generate fair and reasonable returns over the 10 year projection period as shown below:
• Accounting ROE (2026F net income / 2026F mid-year retained earnings): 2.98% • Return on Rate Base (2026F net income plus interest / 2026F mid-year rate base): 1.00% • Debt to Capitalization (2026F total debt / 2026F debt plus retained earnings): 68.4% • Funds From Operations to Debt (2026F net income plus depreciation / 2026F long term
debt – cash balance): 4.5%
1.2.1.2 EPCOR Proposal
EPCOR has taken the City Drainage Model, and has made adjustments to the forecasts based on how EPCOR would operate Drainage. As such, the following items have been contemplated within EPCOR’s Stand-alone Drainage Model and its Proposal for the Drainage transfer:
Assumption of Drainage Balance Sheet: EPCOR assumes Drainage’s current balance sheet, including $609.3M in long-term debt, as well as $44.3M in cash.
Rate Revenues: For the purposes of its forecast, EPCOR has used Drainage’s 10 year revenue forecast that assumes the 3.0% annual increase in monthly rates. As part of its Proposal, EPCOR has committed to hold this rate increase between 2017 to 2021, and then proposes to submit a Performance Based Regulation (PBR) application for new rates over the 2022 to 2026 period.
Cost Efficiencies: EPCOR projects it can achieve at least a 10% efficiency factor on Drainage capital (resulting in a savings of $193.4M over forecast period), as well as 5.0% in operating efficiencies (increasing 1.0% per year in each of the first five years for a total of 5.0% by 2021, which results in $43.6M of savings over the forecast period). Based on our analysis of EPCOR’s evidence base for these assumptions, we believe these efficiency factors are reasonable.
City of Edmonton 2016 EPCOR Proposal for Drainage Transfer Analysis October 5, 2016
8
Audit • Tax • Advisory © Grant Thornton LLP. A Canadian Member of Grant Thornton International Ltd. All rights reserved.
Incremental Dividend: As a result of the addition of Drainage’s Funds From Operation (FFO) into the EPCOR organization, EPCOR forecasts an immediate increase of least $20M to its dividend to the City in the first year following the proposed transfer. EPCOR produced sensitivity ranges based on varying levels of operating and capital efficiencies, and has demonstrated that there would be increases to the dividend to the City over the forecast period. As total dividends are also forecast to increase from EPCOR to the City irrespective of the proposed transfer, EPCOR anticipates that total dividends will converge over the long-term (likely well beyond the 10 year forecast horizon) for scenarios with and without the Drainage transfer. However, with the proposed Drainage transfer, EPCOR projects to have a faster pace at which its earnings and dividends will grow. As such, the proposed immediate increase of at least $20M to EPCOR’s dividend to the City appears to be reasonable. Under the EPCOR Unanimous Shareholder Agreement, Council (as EPCOR’s sole shareholder) has reserved the right to determine the EPCOR dividend policy, which it reviews on an annual basis. Therefore, Council has the ability to validate EPCOR’s dividend by using EPCOR’s dividend payout ratio (dividend as a % of net income) as an indicator1.
Transition Payment: For its forecast EPCOR utilizes the City’s operating expenses (before applying an efficiency factor), which includes Drainage’s costs for shared services. Realizing that there may be stranded costs as a result of the transfer, EPCOR has included a provision of up to $75M for any stranded costs the City may incur as a result of the proposed transfer of Drainage2.
Equity Injections: By leveraging the health of its corporate balance sheet, EPCOR would be able to inject equity into Drainage. This would come from other EPCOR business lines or EPCOR corporate borrowings upon corporate-wide financial consolidation. This is a reasonable assumption and points to a major difference from the City Model, in which there are no external equity injections provided to Drainage (i.e. Drainage operates as a self-funded utility through rate and program revenues).
Other Revenue Sources: While EPCOR anticipates that the inclusion of Drainage would provide EPCOR with improved qualifications to pursue wastewater and stormwater infrastructure projects in other jurisdictions, its Proposal is not based on additional revenues sources as a result of the proposed transfer. EPCOR has however, prepared a scenario of its corporate plan in which it replaced two utility acquisitions with drainage-related business development projects that have a higher probability of success and are expected to yield better margins. Given the subjectivity involved in forecasting additional business development as a result of the proposed transfer, we agree with EPCOR’s conservative approach of not relying on additional revenue sources as a major consideration as it relates to the quantitative benefits of its proposal.
1.2.1.3 Organizational Financial Analysis
Based on the review of EPCOR’s financial capacity, it appears that EPCOR is financially capable of absorbing Drainage’s current and future financial outlook as forecast in the EPCOR Stand-
1 Most EPCOR utility peers use a dividend payout ratio between 40% to 60% (IR 3). 2 Information provided by the City as per their preliminary analysis of shared service costs indicates that the net present value of potential stranded costs is approximately $29M following a potential transfer. EPCOR did not alter the $75M provision in its corporate Long Term Planning model.

City of Edmonton 2016 EPCOR Proposal for Drainage Transfer Analysis October 5, 2016
9
Audit • Tax • Advisory © Grant Thornton LLP. A Canadian Member of Grant Thornton International Ltd. All rights reserved.
alone Drainage Model. Additionally, EPCOR can access an additional $900M of unallocated investment capacity after the addition of Drainage, and has the financial capacity to raise an additional $900M if required (e.g. to accelerate capital spending on flood mitigation).
A transfer of Drainage would give the City a long-term increase in the amount of total debt servicing capacity available. However, this debt is restricted to “self-liquidating debt”, which according to City policy, is used for utility borrowing or local improvement financing, rather than tax-supported infrastructure spending. Irrespective of the proposed transfer, the City appears to have capacity for additional borrowing for “tax supported debt”. What’s more, including Drainage’s debt servicing requirements, the City has a moderate amount of additional capacity to borrow self-liquidating debt. As a result, the proposed transfer will not have significant impacts on the City’s ability to borrow for tax-supported projects and/or programs. Nonetheless, should the City desire to increase its borrowing capacity, a change to its Debt Management Fiscal Policy (DMFP) as it relates to its current debt servicing limits (which are currently below debt servicing limits of the Municipal Government Act [MGA]) would be required.
1.2.1.4 Tax Consequences
EPCOR has represented that it meets the requirements, such that EPCOR would not have income tax payable in relation to taxable income generated from Drainage activities.
A change in ownership of the drainage system from the City to EPCOR creates a risk of the system becoming assessable and subject to municipal property tax due to wording in the MGA. However, a provision can be requested from the Province to be added to the MGA similar to the assessment exemption for EPCOR’s water supply and distribution utility.
While EPCOR’s proposed plan of action for GST on the proposed transfer and during operations is reasonable, it is suggested that more detail regarding its status as a designated para-municipal organization at the time of transfer and the timing of the application for a “municipal designation” be reviewed. Nonetheless, based on the information provided, as well as the historical precedents of previous asset transfers from the City to EPCOR, there do not appear to be any major tax consequences that would impede EPCOR’s Proposal.
1.2.1.5 Valuation Analysis and Economic Comparison
We prepared an independent calculation of the fair market value of Drainage as of January 1, 2017. Our economic comparison comprised of six comparison scenarios, including Drainage remaining under City ownership and operation, being transferred to EPCOR, as well as the notional fair market value of Drainage to an arm’s length third party. The comparative scenario for these three ownership alternatives used the assumption in the City Drainage Model of increasing monthly drainage rates by 3.0% annually from 2017 to 2021. However, beginning in 2022 until the end of the forecast period in 2026, drainage rates are assumed to increase to a level to obtain a return on the equity portion of the rate base of 10.5%3.
3 Note that the 10.5% ROE used on the equity component of the rate base is arbitrary, and is incorporated into each scenario for comparison purposes only. Grant Thornton relied on the financial outputs of the financial models prepared by the City and EPCOR.
City of Edmonton 2016 EPCOR Proposal for Drainage Transfer Analysis October 5, 2016
10
Audit • Tax • Advisory © Grant Thornton LLP. A Canadian Member of Grant Thornton International Ltd. All rights reserved.
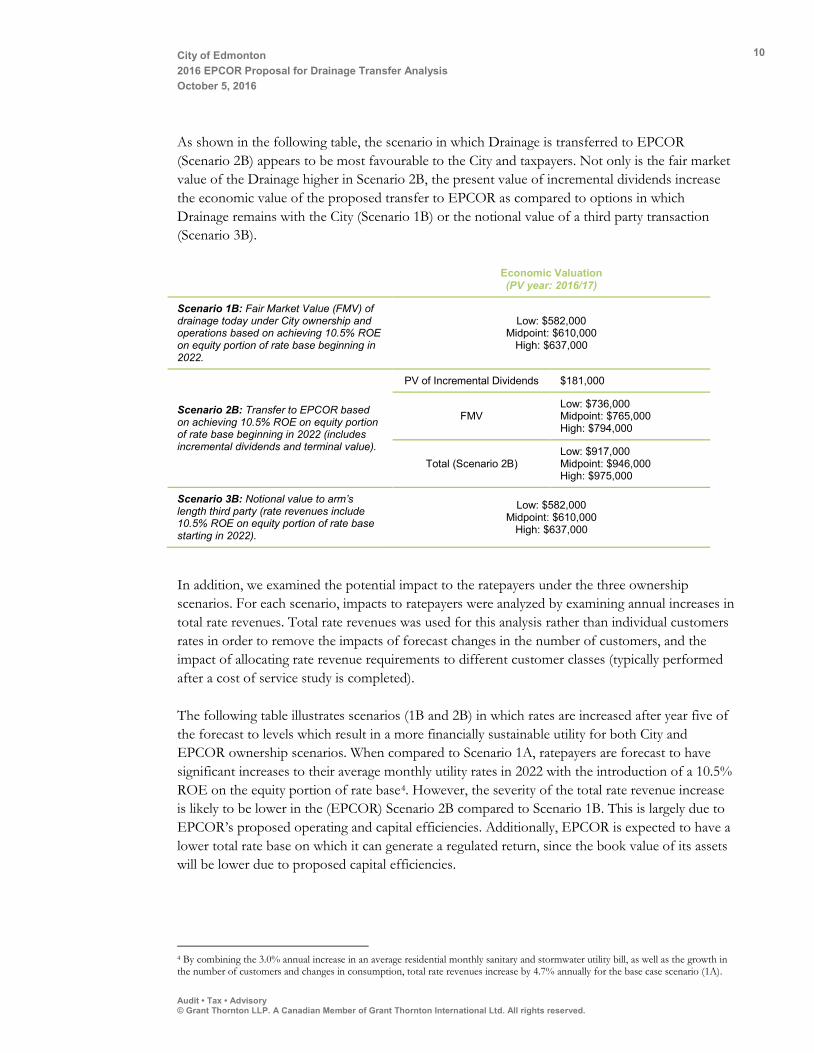
As shown in the following table, the scenario in which Drainage is transferred to EPCOR (Scenario 2B) appears to be most favourable to the City and taxpayers. Not only is the fair market value of the Drainage higher in Scenario 2B, the present value of incremental dividends increase the economic value of the proposed transfer to EPCOR as compared to options in which Drainage remains with the City (Scenario 1B) or the notional value of a third party transaction (Scenario 3B).
Economic Valuation (PV year: 2016/17)
Scenario 1B: Fair Market Value (FMV) of drainage today under City ownership and operations based on achieving 10.5% ROE on equity portion of rate base beginning in 2022.
Low: $582,000
Midpoint: $610,000 High: $637,000
Scenario 2B: Transfer to EPCOR based on achieving 10.5% ROE on equity portion of rate base beginning in 2022 (includes incremental dividends and terminal value).
PV of Incremental Dividends $181,000
FMV Low: $736,000 Midpoint: $765,000 High: $794,000
Total (Scenario 2B)
Low: $917,000 Midpoint: $946,000 High: $975,000
Scenario 3B: Notional value to arm’s length third party (rate revenues include 10.5% ROE on equity portion of rate base starting in 2022).
Low: $582,000 Midpoint: $610,000
High: $637,000
In addition, we examined the potential impact to the ratepayers under the three ownership scenarios. For each scenario, impacts to ratepayers were analyzed by examining annual increases in total rate revenues. Total rate revenues was used for this analysis rather than individual customers rates in order to remove the impacts of forecast changes in the number of customers, and the impact of allocating rate revenue requirements to different customer classes (typically performed after a cost of service study is completed).
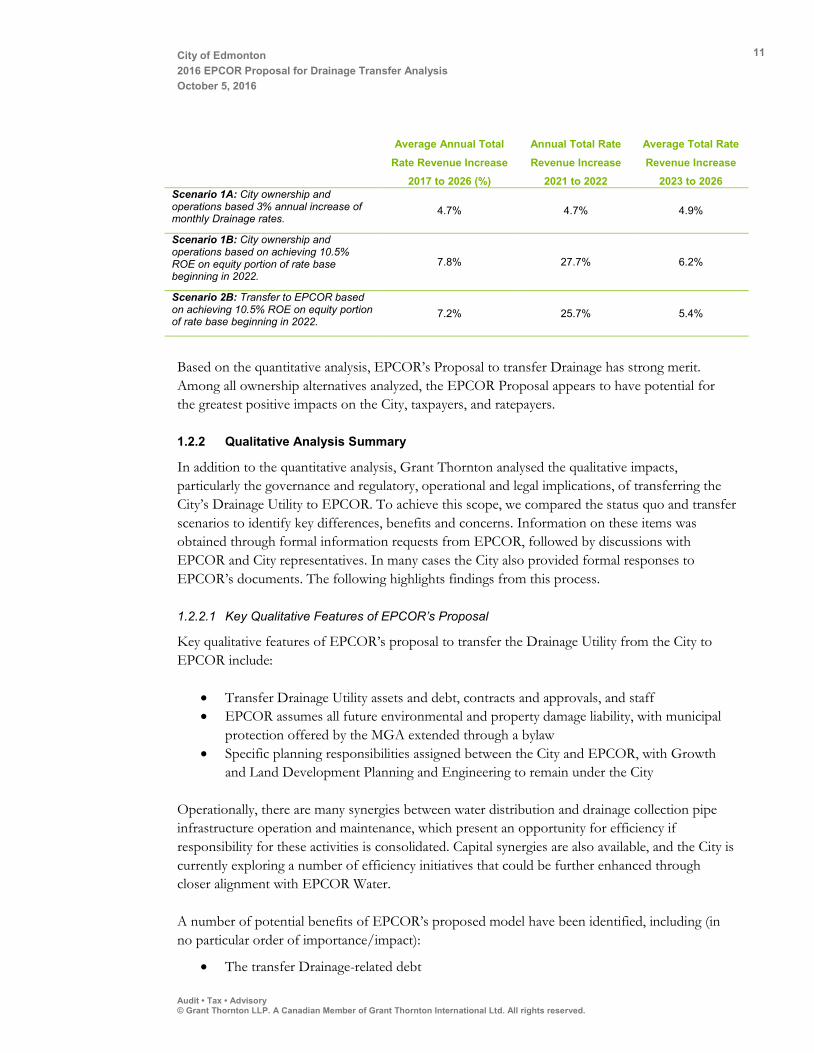
The following table illustrates scenarios (1B and 2B) in which rates are increased after year five of the forecast to levels which result in a more financially sustainable utility for both City and EPCOR ownership scenarios. When compared to Scenario 1A, ratepayers are forecast to have significant increases to their average monthly utility rates in 2022 with the introduction of a 10.5% ROE on the equity portion of rate base4. However, the severity of the total rate revenue increase is likely to be lower in the (EPCOR) Scenario 2B compared to Scenario 1B. This is largely due to EPCOR’s proposed operating and capital efficiencies. Additionally, EPCOR is expected to have a lower total rate base on which it can generate a regulated return, since the book value of its assets will be lower due to proposed capital efficiencies.
4 By combining the 3.0% annual increase in an average residential monthly sanitary and stormwater utility bill, as well as the growth in the number of customers and changes in consumption, total rate revenues increase by 4.7% annually for the base case scenario (1A).
City of Edmonton 2016 EPCOR Proposal for Drainage Transfer Analysis October 5, 2016
11
Audit • Tax • Advisory © Grant Thornton LLP. A Canadian Member of Grant Thornton International Ltd. All rights reserved.
Average Annual Total
Rate Revenue Increase 2017 to 2026 (%)
Annual Total Rate
Revenue Increase 2021 to 2022
Average Total Rate
Revenue Increase 2023 to 2026
Scenario 1A: City ownership and operations based 3% annual increase of monthly Drainage rates.
4.7% 4.7% 4.9%
Scenario 1B: City ownership and operations based on achieving 10.5% ROE on equity portion of rate base beginning in 2022.
7.8% 27.7% 6.2%
Scenario 2B: Transfer to EPCOR based on achieving 10.5% ROE on equity portion of rate base beginning in 2022.
7.2% 25.7% 5.4%
Based on the quantitative analysis, EPCOR’s Proposal to transfer Drainage has strong merit. Among all ownership alternatives analyzed, the EPCOR Proposal appears to have potential for the greatest positive impacts on the City, taxpayers, and ratepayers.
1.2.2 Qualitative Analysis Summary
In addition to the quantitative analysis, Grant Thornton analysed the qualitative impacts, particularly the governance and regulatory, operational and legal implications, of transferring the City’s Drainage Utility to EPCOR. To achieve this scope, we compared the status quo and transfer scenarios to identify key differences, benefits and concerns. Information on these items was obtained through formal information requests from EPCOR, followed by discussions with EPCOR and City representatives. In many cases the City also provided formal responses to EPCOR’s documents. The following highlights findings from this process.
1.2.2.1 Key Qualitative Features of EPCOR’s Proposal
Key qualitative features of EPCOR’s proposal to transfer the Drainage Utility from the City to EPCOR include:
• Transfer Drainage Utility assets and debt, contracts and approvals, and staff • EPCOR assumes all future environmental and property damage liability, with municipal
protection offered by the MGA extended through a bylaw • Specific planning responsibilities assigned between the City and EPCOR, with Growth
and Land Development Planning and Engineering to remain under the City
Operationally, there are many synergies between water distribution and drainage collection pipe infrastructure operation and maintenance, which present an opportunity for efficiency if responsibility for these activities is consolidated. Capital synergies are also available, and the City is currently exploring a number of efficiency initiatives that could be further enhanced through closer alignment with EPCOR Water.
A number of potential benefits of EPCOR’s proposed model have been identified, including (in no particular order of importance/impact):
• The transfer Drainage-related debt

City of Edmonton 2016 EPCOR Proposal for Drainage Transfer Analysis October 5, 2016
12
Audit • Tax • Advisory © Grant Thornton LLP. A Canadian Member of Grant Thornton International Ltd. All rights reserved.
• Additional $20+ M added to the EPCOR dividend annually• Ability for EPCOR to leverage experience and expertise in Drainage to qualify for new
drainage related business development opportunities• Consolidate the four major components of the water system to achieve capital and
operational synergies• Rate stability for ratepayers until the end of 2021
Potential risks, concerns and gaps explored throughout the qualitative review included (in no particular order of importance/impact):
• Limited ability to mitigate rate increases by adjusting returns on equity downward• Decreased involvement of Utility Committee (UC) in decision-making• While rates would be maintained at 3% through 2021 the impact in 2022 and onward is
unknown• Loss of embedded expertise within the City• Loss of efficiency in Drainage planning process• Key Drainage staff attrition• Loss of transparency in reporting and decision-making• Eligibility for grant funding to mitigate rate increases, particularly for flood mitigation
capital improvements
These risks and concerns have been discussed with EPCOR and the City, and EPCOR has affirmed that these would be mitigated to the extent possible. In some cases, additional discussion would be required to resolve minor outstanding decisions, which would be undertaken only if the transfer is approved.
In addition to the proposed approach, other operational structures were considered, including:
• Transfer of operating responsibility to EPCOR with asset ownership remaining with theCity. This is a viable option but offers less in the form of dividends to the City andoperational and capital efficiencies, and leaves asset-related liability and responsibility fordebt issuance with the City. Further, this is a more viable approach for a municipality withlittle in the way of operational expertise, which is not the case for the City.
• Transfer wastewater to EPCOR and leave stormwater with the City. This is not a viableoption. Edmonton’s combined sewer system and interconnected operational structurewould be too difficult to manage as separate utilities and many existing efficiencies wouldbe lost.
1.2.2.2 Regulatory and Governance
City Council serves three roles in its relationship with EPCOR: regulator, shareholder, and policy maker. As regulator, Council regulates EWSI through its approval of the PBR application that sets water and wastewater treatment rates as well as performance measures over a five year period. Additionally, non-routine adjustments outside of the approved PBR are reviewed and recommended by Administration and approved by the Utility Committee (UC; a committee comprised of Council members). As sole shareholder, Council’s duties and powers are set in
City of Edmonton 2016 EPCOR Proposal for Drainage Transfer Analysis October 5, 2016
13
Audit • Tax • Advisory © Grant Thornton LLP. A Canadian Member of Grant Thornton International Ltd. All rights reserved.
accordance with the Unanimous Shareholder Agreement and governed by the Alberta Business Corporations Act. Shareholder meetings are held between EPCOR and City Council, and EPCOR’s 10 year Long Term Plan is reviewed annually by Council. Finally, Council, as policy maker, represents the interest of citizens by approving priority areas and policies to be followed by EPCOR.
The regulatory and governance structure for the proposed Drainage transfer would mirror that used for Water Services and Wastewater Treatment, with extra provision for development and monitoring through the Stormwater Integrated Resource Plan (SIRP). This means EPCOR would utilize the same PBR-like approach to rate setting and performance management, with enhanced involvement and reporting to the Utility Committee in the short-term.
Based off Integrated Resource Plans (IRPs) in the utility industry, the SIRP is a long term road map that sets stormwater capital investment strategies and priorities over long time horizons. The SIRP would be developed through a public consultation process to support understanding of sensibilities around what citizens want and how much they are willing to pay. Development of the SIRP would be overseen by the UC and would be reviewed annually and updated every three years, which is consistent with the Water and Gold Bar Wastewater Treatment Plant (GBWWTP) IRPs. Accountability metrics would be largely driven by the City. EPCOR has agreed to be adaptable to meet City’s needs should Council or the UC desire to have a different type of or level of reporting with respect to the SIRP and its implementation.
Other regulatory options were analysed, including the use of a cost of service methodology for the first few years following a transfer. However, it has been determined that a PBR is an appropriate regulatory approach for EPCOR for two primary reasons:
• EPCOR has committed to a 3.0% annual monthly rate increase per year until the end of 2021, regardless of its cost of service, and
• A PBR reduces the regulatory burden for both the City and EPCOR, allowing additional cost savings.
The City, as regulator of rates, performance measures, and terms and conditions of service, would retain formal regulatory oversight and approval of all aspects of the Utility.
1.2.2.3 Planning
Planning would remain with the City through development planning and engineering for new developments. Additional, formalized communication and coordination processes would be required to involve EPCOR as the owner and operator of the system, but this approach enables the City to ensure development aligns with its strategic vision. For other development, such as mature neighbourhoods, the process would mirror that of Water.
1.2.2.4 Legal
From a legal standpoint, liability protection could be extended to EPCOR in the same manner used for Water Services and Wastewater Treatment. The result would be similar exposure to
City of Edmonton 2016 EPCOR Proposal for Drainage Transfer Analysis October 5, 2016
14
Audit • Tax • Advisory © Grant Thornton LLP. A Canadian Member of Grant Thornton International Ltd. All rights reserved.
liability for EPCOR as the City, with all liability for post-transfer environmental and property damage falling to EPCOR rather than the City.
There is precedence for transferring a municipal Approval to Operate, and this is not expected to be an impediment. The process is slightly more complex than simply assigning the Approval to another organization, but the City has recent experience with interim management of the Approval between renewals as demonstrated following the transfer of the GBWWTP. Other contracts would be reviewed in detail and addressed on a case-by-case basis, but precedence again suggests a low likelihood of significant issues in this area.
Grant funding is identified as an area where the potential for negative impact is slightly higher. Many federal and provincial grant funding agencies are vague or silent regarding municipal corporations receiving either grant funding or ownership of municipal infrastructure constructed using grant funds. Information about some grant programs indicates that funding is directed at municipalities only. Federal and Provincial grants are often interconnected and may affect whether or not funding will be available or assets paid by this funding can be transferred. Additional exploration and verification with grant funders would be required if the transfer was approved. That said, the Drainage Utility does not receive a significant amount of grant funding, and City grant funding is typically used for tax-funded programs and services rather than rate-funded utility requirements.
1.2.2.5 Stakeholder Impacts
Impacts to partners, such as the Alberta Capital Region Wastewater Commission (ACRWC), are expected to be minimal, as are impacts to customers. EPCOR has established positive relationships with these stakeholders and would be able to leverage this experience to ensure a seamless transition. Council priorities around citizen engagement and advocacy have been identified and EPCOR also has strong experience in these activities through its other business lines.
The area of health and safety is extremely important, and it is noted that EPCOR has a strong health and safety record that compares favourably to Drainage. No issues have been identified suggesting that this area would be compromised in a transfer. Regarding employee retention, EPCOR has committed to retain all Drainage Services employees and identified shared services staff transferred with the Utility, with comparable pay and seniority. It is important to note that obtaining a union perspective on the transfer was beyond the scope of this review.
1.3 Next Steps
Based on the quantitative and qualitative analysis presented in this Study, EPCOR’s Proposal to transfer Drainage has potential to yield net benefits to the City, taxpayers, and ratepayers. While a number of next steps are included in this Study for consideration, it is recommended that the City further consider the merits of the EPCOR Proposal based on its own risk/reward parameters and the information presented in this Study.

City of Edmonton 2016 EPCOR Proposal for Drainage Transfer Analysis October 5, 2016
15
Audit • Tax • Advisory © Grant Thornton LLP. A Canadian Member of Grant Thornton International Ltd. All rights reserved.
2 Introduction
2.1 Project Background
In the fall of 2015, EPCOR Utilities Inc. (EPCOR) approached the City of Edmonton (City) Administration with the intent to develop a business case for the transfer of drainage assets and operations (referred to as the City’s Drainage Utility, herein referred to as Drainage) to EPCOR (excluding certain components of Drainage Planning). In April 2016, EPCOR forwarded its Proposal to Administration (see Appendix A).
On June 14, 2016 EPCOR presented its Proposal to transfer Drainage to City Council. EPCOR suggested that this transfer would complete its ownership of Edmonton’s water utility cycle and move water utility operations strategically under one roof. Council moved to pursue considering the EPCOR proposal, and it recommend that Administration work with EPCOR to complete an independent assessment of the EPCOR Proposal and return to the October 25, 2016, City Council meeting with the final report.
In July, 2016 Grant Thornton LLP (Grant Thornton) was retained to provide an independent assessment of key financial and non-financial aspects of EPCOR’s Proposal.
2.2 Organizational Background
The following section provides a high-level background of Drainage and EPCOR.
2.2.1 City Drainage Utility
Drainage is comprised of the Sanitary Drainage Utility and the Stormwater Drainage Utility owned and operated by the City under the authority of the Drainage Bylaw (No. 16200). Drainage plans for and operates a total of nearly 6,000 km of storm, sanitary and combined drainage pipes; 240 stormwater management facilities; and 85 pump stations. As part of the Utility, the Design and Construction section designs and constructs sanitary and stormwater drainage infrastructure. The book value of the non-financial assets related to Drainage are $3.2B (as of forecast year 2016) with a regulated rate base of approximately $1.1B (the $2.1B difference from net book value are contributed assets that the Utility is not entitled to earn on). Total Drainage debt is approximately $609M or approximately 60% of rate base.
Drainage is mandated to provide all planning, operations, maintenance, rehabilitation and environmental protection services related to the Sanitary Drainage Utility and the Stormwater

City of Edmonton 2016 EPCOR Proposal for Drainage Transfer Analysis October 5, 2016
16
Audit • Tax • Advisory © Grant Thornton LLP. A Canadian Member of Grant Thornton International Ltd. All rights reserved.
Drainage Utility infrastructure and systems within the City of Edmonton. Specifically, its scope of responsibilities for these utilities include planning, building, operating, and maintaining a network of pipes, tunnels, pump stations, outfalls and other miscellaneous drainage facilities that make up Edmonton’s sanitary and stormwater systems. These services are provided to the City’s residential sector (both single-family and multi-family households), the commercial sector, large wholesale customers, and the Alberta Capital Region Wastewater Commission (ACRWC). However, Drainage also supports a variety of additional activities, including lot grading program services, support for private development, industrial wastewater control, water service connections, etc.
As part of a broader corporate reorganization at the City, effective March 1, 2016, the Drainage Services Branch (which included drainage planning, design, construction and operations functions) now resides in three City Departments: City Operations (Utility Services Branch), Integrated Infrastructure Services, and Sustainable Development Departments. Drainage is implementing goals set forth in the 2016-18 Utility Services Branch Business Plan, as well as the 2015-24 Aspirational Drainage Master Plan, which links to the City’s 10 year goals. The Drainage Utility Policy C304D adopted on September 23, 2014, reflects Council’s directions on the financial objectives and management for Drainage.
2.2.1.1 Governance of Drainage
As a municipal organization, the City ensures utility rates are set based on the underlying principles that rates are to be fair and equitable to all customers. Elected officials and Administration need to ensure that utility services respond to the growth of the City, are affordable for the ratepayer, are efficient in their service delivery, and meet the expectations of the public. As such, City Council established a Utility Committee that consists of four members of Council as permanent members of this committee during Council’s term. In addition, Council appointed a nonelected independent Utility Advisor to provide advice to Council and the Utility Committee. This structure provides the Committee with expert nonoperational advice that is independent of Administration, and allows the members to focus on the wellbeing of the Utilities to ensure its operational and financial sustainability.
The Utility Committee reviews and makes recommendations to Council about:
1. Reports on the governance, policy, budget, and rate regulation of the City Regulated Utilities (Drainage Utility, Waste Management Utility, EPCOR Water Services Inc.), as applicable;
2. Utility Advisor reports;
3. Utilities Consumer Advocate Advisory Board reports.
The Utility Committee may direct the Utility Advisor to provide information to the Committee in relation to matters falling within its mandate.
City of Edmonton 2016 EPCOR Proposal for Drainage Transfer Analysis October 5, 2016
17
Audit • Tax • Advisory © Grant Thornton LLP. A Canadian Member of Grant Thornton International Ltd. All rights reserved.
2.2.2 EPCOR Utilities Inc.
EPCOR builds, owns and operates water and wastewater treatment facilities, electrical transmission and distribution networks and infrastructure across Canada and the United States. EPCOR was created in 1996 and conducts its operations through various wholly owned subsidiaries. A current list of the subsidiaries is noted below:
• EPCOR Distribution and Transmission Inc. • EPCOR Water Services Inc. • EPCOR Water USA Inc. • EPCOR Energy Alberta Limited Partnership • EPCOR Technologies Inc. • EPCOR Power Development Corporation
EPCOR, inclusive of the entities above, has approximately 2,800 employees.
EPCOR had $260 million in net income for the year ended December 31, 2015 with net income of $191 million for 2014. This net income was generated on combined revenue of $1,996 million for 2015 and $1,904 million for 20145. EPCOR provides water, wastewater and distribution services to more than 1.0 million people in more than 75 communities across Western Canada and the United States through its more than 50 facilities6.
2.2.2.1 Governance of EPCOR
EPCOR is a business corporation wholly owned by the City. As a separate legal entity, EPCOR is governed by an independent board of directors that make decisions with respect to the EPCOR business. The Board of Directors owes a fiduciary duty to EPCOR to make decisions that benefit the corporation.
The City as shareholder sets the tone and boundaries through a unanimous shareholder agreement, and the Board has the authority to manage the business and the affairs of EPCOR. The City as shareholder cannot run the day to day business of EPCOR. The shareholder, which is represented by Council, is kept current on EPCOR's financial standing and progress on business plans and operations through quarterly meetings with the EPCOR board and senior management.
2.2.2.2 EPCOR History
The following table details the evolution of EPCOR.
1891 The Edmonton Electric Lighting and Power Company begins operations.
1902 Edmonton Electric Lighting and Power becomes the first municipally owned electric utility in the country.
1903 Edmonton Electric Lighting and Power builds the City’s first water treatment plant at Rossdale and a
distribution system. A new electricity plant is also built at Rossdale.
1913 A high lift, low lift pump house is built and two water intakes with 900m pipes are constructed.
5 EPCOR 2015 MD&A 6 IBISWorld, Water Supply and Irrigation Systems in Canada, February, 2016.

City of Edmonton 2016 EPCOR Proposal for Drainage Transfer Analysis October 5, 2016
18
Audit • Tax • Advisory © Grant Thornton LLP. A Canadian Member of Grant Thornton International Ltd. All rights reserved.
1933 Edmonton’s first traffic light is installed.
1947 The Rossdale #1 Water Treatment Plan is commissioned. Underground electricity lines are installed in
downtown Edmonton to form the Network Distribution System.
1955 The Rossdale electricity plant switches from coal-fired to gas-fired boilers.
1956 The Rossdale #2 Water Treatment Plant is commissioned.
1967 The Rossdale #3 Water Treatment Plant is commissioned and fluoridation begins.
1970 Edmonton Power is formed by combining the electrical distribution and power plan departments of the City.
1976 Another water treatment plant (E.L. Smith) is opened. The Clover Bar Generating Station is commissioned.
1989 The Genesee Unit 1 electricity generating station becomes operational.
1994 The Genesee Unit 2 electricity generating station becomes operational.
1996 Edmonton Water is incorporated as a separate legal entity, renamed Aqualta Inc., and begins managing the
City's Water Branch assets. EPCOR Utilities Inc. is formed by combining the operations of Edmonton
Power, Aqualta and Eltec (a commercial electrical service operation). This is the first merger of power and
water utilities in Canada.
2001 A universal brand name, EPCOR, is introduced.
2003 UV disinfection is added to the Rossdale Water Treatment Plant.
2005 EPCOR acquires privately-owned White Rock water utility in British Columbia. The Genesee Unit 3
electricity generating station becomes operational. EPCOR Power L.P. launches.
2006 The Britannia Mine Water Treatment Plant begins operations. The Genesee Unit 3 electricity generating
station becomes operational (in partnership with TransAlta Corporation). EPCOR completes and begins
operating a wastewater and collection treatment system for the District of Sooke on Vancouver Island.
2007 Construction begins on Keephills 3, a supercritical coal-fired electricity generating unit west of Edmonton (in
partnership with TransAlta Corporation).
2008 The upgrade to the E.L. Smith Water Treatment Plant in Edmonton completed.
2009 Purchased Suncor Potable Water & Wastewater Facilities for $100 Million with a 20 year leaseback
agreement. Capital Power Corporation was established on July 9th (a spin off of EPCOR’s power generation
business). Transfer of Gold Bar Wastewater Treatment Plant from the City of Edmonton to EPCOR.
2011 EPCOR entered the US water market under the subsidiary company EPCOR Water (USA) by acquiring
Chaparral City Water Company (Chaparral) of Fountain Hills, Arizona.
2012 EPCOR Water (USA) acquires America Water Works Company’s Arizona and New Mexico water
businesses which made them the largest privately regulated water provider in the two states.
2013 The Heartland Transmission Project, partnered by EPCOR and AltaLink, begins service. This 66KM double
circuit 500kV line links power generation between the west of Edmonton and northeast Heartland region.
2014 EPCOR wins the bid to design, build, finance, and operate the new wastewater treatment plant in Regina.
EPCOR finishes constructing a new water treatment plant in Kananaskis, which was done in partnership
with the Alberta government.
2015 EPCOR Water (USA) enters agreement to acquire Willow Valley Water Company. EPCOR partners with
Ontario communities to create natural gas distribution utility.
2016 EPCOR proposes transfer of the City's Drainage Utility. EPCOR USA enters Texas market with acquisition
of 130 Pipeline Project (53-mile wholesale water supply pipeline that delivers groundwater in the
northeastern Austin, Texas metropolitan area).
City of Edmonton 2016 EPCOR Proposal for Drainage Transfer Analysis October 5, 2016
19
Audit • Tax • Advisory © Grant Thornton LLP. A Canadian Member of Grant Thornton International Ltd. All rights reserved.
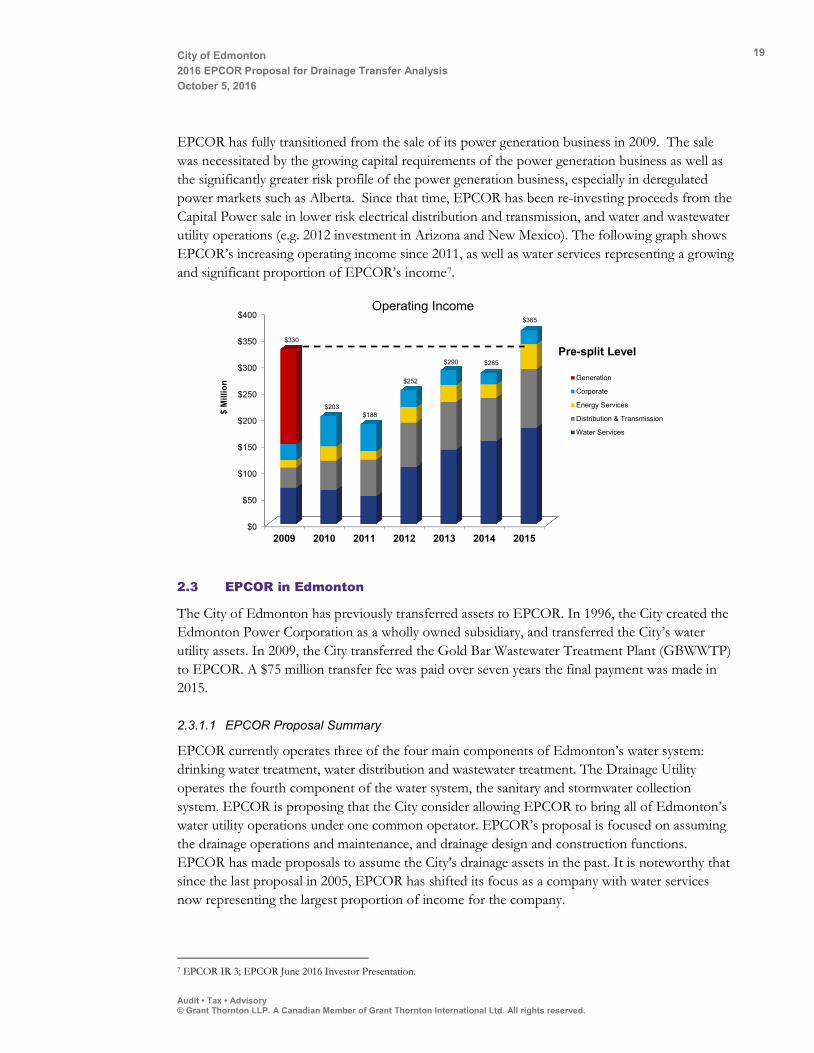
EPCOR has fully transitioned from the sale of its power generation business in 2009. The sale was necessitated by the growing capital requirements of the power generation business as well as the significantly greater risk profile of the power generation business, especially in deregulated power markets such as Alberta. Since that time, EPCOR has been re-investing proceeds from the Capital Power sale in lower risk electrical distribution and transmission, and water and wastewater utility operations (e.g. 2012 investment in Arizona and New Mexico). The following graph shows EPCOR’s increasing operating income since 2011, as well as water services representing a growing and significant proportion of EPCOR’s income7.
2.3 EPCOR in Edmonton
The City of Edmonton has previously transferred assets to EPCOR. In 1996, the City created the Edmonton Power Corporation as a wholly owned subsidiary, and transferred the City’s water utility assets. In 2009, the City transferred the Gold Bar Wastewater Treatment Plant (GBWWTP) to EPCOR. A $75 million transfer fee was paid over seven years the final payment was made in 2015.
2.3.1.1 EPCOR Proposal Summary
EPCOR currently operates three of the four main components of Edmonton’s water system: drinking water treatment, water distribution and wastewater treatment. The Drainage Utility operates the fourth component of the water system, the sanitary and stormwater collection system. EPCOR is proposing that the City consider allowing EPCOR to bring all of Edmonton’s water utility operations under one common operator. EPCOR’s proposal is focused on assuming the drainage operations and maintenance, and drainage design and construction functions. EPCOR has made proposals to assume the City’s drainage assets in the past. It is noteworthy that since the last proposal in 2005, EPCOR has shifted its focus as a company with water services now representing the largest proportion of income for the company.
7 EPCOR IR 3; EPCOR June 2016 Investor Presentation.
$0
$50
$100
$150
$200
$250
$300
$350
$400
2009 2010 2011 2012 2013 2014 2015
Generation
Corporate
Energy Services
Distribution & Transmission
Water Services
Pre-split Level
$ M
illio
n
$330
$203$188
$252
$290
$365
$285
Operating Income
City of Edmonton 2016 EPCOR Proposal for Drainage Transfer Analysis October 5, 2016
20
Audit • Tax • Advisory © Grant Thornton LLP. A Canadian Member of Grant Thornton International Ltd. All rights reserved.
2.4 Drainage and EPCOR Relative Sizes
EPCOR’s Edmonton area water services and wasterwater treatment operations are anticipated to have 601 permanent and 19 temporary staff by end of year 20168, while Drainage is forecast to have approximately 761 Full Time Equivalent (FTE) in 20169.
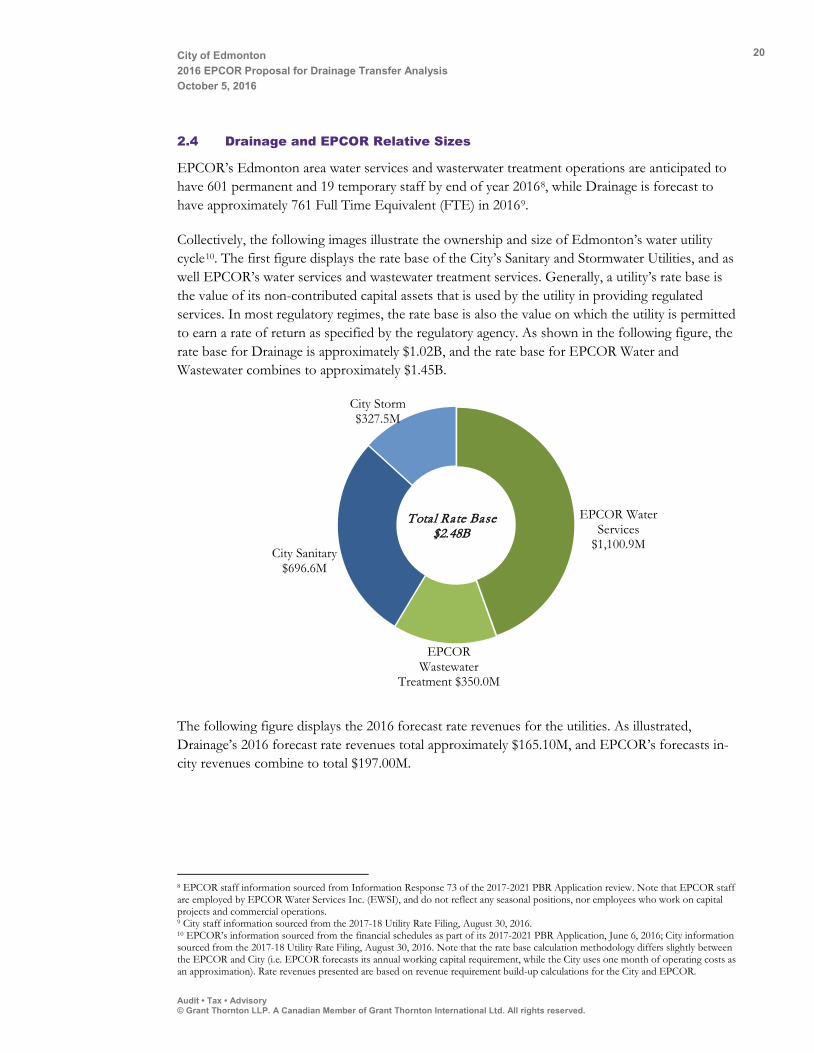
Collectively, the following images illustrate the ownership and size of Edmonton’s water utility cycle10. The first figure displays the rate base of the City’s Sanitary and Stormwater Utilities, and as well EPCOR’s water services and wastewater treatment services. Generally, a utility’s rate base is the value of its non-contributed capital assets that is used by the utility in providing regulated services. In most regulatory regimes, the rate base is also the value on which the utility is permitted to earn a rate of return as specified by the regulatory agency. As shown in the following figure, the rate base for Drainage is approximately $1.02B, and the rate base for EPCOR Water and Wastewater combines to approximately $1.45B.
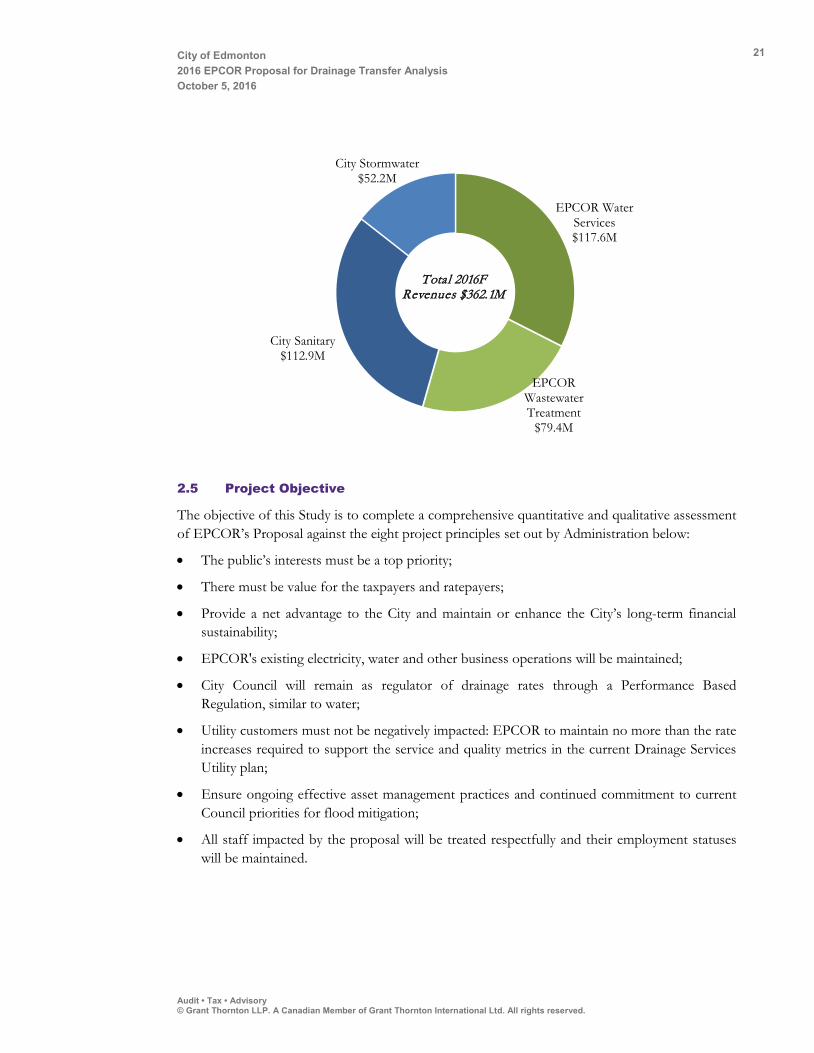
The following figure displays the 2016 forecast rate revenues for the utilities. As illustrated, Drainage’s 2016 forecast rate revenues total approximately $165.10M, and EPCOR’s forecasts in-city revenues combine to total $197.00M.
8 EPCOR staff information sourced from Information Response 73 of the 2017-2021 PBR Application review. Note that EPCOR staff are employed by EPCOR Water Services Inc. (EWSI), and do not reflect any seasonal positions, nor employees who work on capital projects and commercial operations. 9 City staff information sourced from the 2017-18 Utility Rate Filing, August 30, 2016. 10 EPCOR’s information sourced from the financial schedules as part of its 2017-2021 PBR Application, June 6, 2016; City information sourced from the 2017-18 Utility Rate Filing, August 30, 2016. Note that the rate base calculation methodology differs slightly between the EPCOR and City (i.e. EPCOR forecasts its annual working capital requirement, while the City uses one month of operating costs as an approximation). Rate revenues presented are based on revenue requirement build-up calculations for the City and EPCOR.
EPCOR Water Services
$1,100.9M
EPCOR Wastewater
Treatment $350.0M
City Sanitary $696.6M
City Storm $327.5M
Total Rate Base $2.48B
City of Edmonton 2016 EPCOR Proposal for Drainage Transfer Analysis October 5, 2016
21
Audit • Tax • Advisory © Grant Thornton LLP. A Canadian Member of Grant Thornton International Ltd. All rights reserved.
2.5 Project Objective
The objective of this Study is to complete a comprehensive quantitative and qualitative assessment of EPCOR’s Proposal against the eight project principles set out by Administration below:
• The public’s interests must be a top priority;
• There must be value for the taxpayers and ratepayers;
• Provide a net advantage to the City and maintain or enhance the City’s long-term financial sustainability;
• EPCOR's existing electricity, water and other business operations will be maintained;
• City Council will remain as regulator of drainage rates through a Performance Based Regulation, similar to water;
• Utility customers must not be negatively impacted: EPCOR to maintain no more than the rate increases required to support the service and quality metrics in the current Drainage Services Utility plan;
• Ensure ongoing effective asset management practices and continued commitment to current Council priorities for flood mitigation;
• All staff impacted by the proposal will be treated respectfully and their employment statuses will be maintained.
EPCOR Water Services $117.6M
EPCOR Wastewater Treatment
$79.4M
City Sanitary $112.9M
City Stormwater $52.2M
Total 2016F Revenues $362.1M
City of Edmonton 2016 EPCOR Proposal for Drainage Transfer Analysis October 5, 2016
22
Audit • Tax • Advisory © Grant Thornton LLP. A Canadian Member of Grant Thornton International Ltd. All rights reserved.
2.6 Scope of Work
Related to the broad Study objective, detailed scope questions were included as part of the Request for Proposal (RFP) documents. These scope questions were grouped in quantitative and qualitative categories. This subsection describes the scope of work from a high-level perspective. The detailed project scope as well as Grant Thornton’s tailored work plan may be found in Appendix B.
2.6.1 Quantitative Scope
Broadly, the quantitative scope focused on evaluating the financial implications of transferring Drainage to EPCOR. Relating to the project principles, this involved considering the impacts to the City, ratepayers, and taxpayers, if EPCOR assumes Drainage. To achieve this scope, we have compared the quantitative impacts to these parties if (1) Drainage remains with the City, (2) if it is transferred to EPCOR, as well as (3) the notional value if sold to a third party.
2.6.2 Qualitative Scope
The qualitative scope of work called to evaluate governance and regulatory, operational, and legal implications of transferring the Drainage Utility to EPCOR. To achieve this scope, we have compared the qualitative impacts of Drainage being transferred to EPCOR, including key differences, benefits and concerns.
2.7 Project Approach
This Study was undertaken in a phased approach over an eight week period. To augment EPCOR’s written Proposal (provided in Appendix A), our team prepared a detailed project plan with specific inquires for EPCOR and the City (provided in Appendix B). These inquiries were designed to provide the necessary information to answer specific quantitative and qualitative questions identified as part of this Study’s scope of work. Answers to these inquiries were provided in the form of existing documents, analysis conducted by the City and EPCOR, numerous meetings with City and EPCOR staff, as well as written Information Requests (IRs) responses provided by EPCOR. Where required, EPCOR gathered background and comparative information from City staff, and produced written IRs for Grant Thornton and the City. Once IRs were distributed by EPCOR, City staff provided specific feedback and original IRs were adjusted, and in some cases elaborated. These IRs formed the primary information basis for this Study (all finalized EPCOR IRs are provided in Appendix G)11.
A current state review of the City’s Sanitary and Storm Utilities (i.e. Drainage), was performed with an aim of establishing how Drainage would perform if it remained with the City under a number of scenarios. Relevant financial and operational background information was reviewed and Drainage financial and operational subject-matter-experts were consulted to clarify and confirm information received. We worked closely with City staff to review the existing Drainage 10 year forecast and rate model (referred to as the City Drainage Model). This formed the quantitative basis of the future state review of Drainage if it were continued to be owned and operated by the City.
11 EPCOR created additional analysis documents referred to Information Briefs which are outside of this Study’s scope of review.

City of Edmonton 2016 EPCOR Proposal for Drainage Transfer Analysis October 5, 2016
23
Audit • Tax • Advisory © Grant Thornton LLP. A Canadian Member of Grant Thornton International Ltd. All rights reserved.
The City Drainage Model was compared against our review of EPCOR’s Stand-alone 10 year Drainage forecast Model (referred to as EPCOR Stand-alone Drainage Model). A number of scenarios were examined to stress test EPCOR’s Stand-alone Drainage Model and determine the broader financial consequences to EPCOR’s debt capacity and credit ratings. This was done by reviewing outputs from EPCOR’s Long-Term Plan Model (EPCOR LTP Model), EPCOR’s consolidated corporate forecast model12. This includes the impacts to the EPCOR LTP Model with the proposed Drainage transfer. In addition, we met with EPCOR management to discuss other future business development opportunities for which EPCOR may have greater probabilities of securing following the potential Drainage transfer. These were also included in EPCOR’s LTP Model to demonstrate the broader financial impacts with and without the proposed Drainage transfer.
To complete the quantitative analysis, our team compared the economic values of Drainage if it was remained with the City, transferred to EPCOR, or sold to an arms-length third party. This analysis used quantitative outputs from the City Drainage Model and EPCOR Stand-alone Drainage Model, as well as a comparative iteration of both Models using similar rate increases and return thresholds. The results of this analysis were compared under the perspectives of the City, taxpayers, and Drainage Utility ratepayers.
In parallel to the quantitative analysis, our team undertook a qualitative review program to address the qualitative scope of review. As with the quantitative review, specific inquiry questions were posed to the City and EPCOR. The City conducted analysis and provided information to us, while IR responses were provided by EPCOR. To supplement this written information, our team facilitated interviews with City and EPCOR staff to discuss details on the following topics: operations, planning, legal, regulatory and governance, and external industry and stakeholders. While broader external consultation was out of scope of this engagement, we also interviewed staff of the Alberta Capital Region Wastewater Commission (ACRWC) to gauge their perspective on a potential transfer of Drainage, particularly after the transfer of the GBWWTP to EPCOR in 2009. Collectively, this information was reviewed and analysed to provide responses to questions identified in the qualitative scope of work.
In addition, a brief external scan was performed. This phase of work was focused on the ownership and operation of stormwater and sanitary conveyance systems in other municipalities. A high-level economic and industry review was also conducted based on secondary research and analysis. Insights from this external review revealed trend and drivers in the sanitary and stormwater conveyance industry.
In the next phase of our work plan, we held quantitative and qualitative workshops with broad participation from both City and EPCOR. The purpose of these workshops was to confirm the accuracy of our understanding of information received, review assumptions and our draft analysis, engage in broad discussion, identify additional information requirements, and gather consensus on next steps for the Study. It was noted that there were items that required further review and analysis to confirm certain details in a transfer scenario. While these are documented in this Study
12 Due to confidentiality requirements, Grant Thornton did not receive EPCOR’s LTP Model, nor did we verify the integrity of LTP Model outputs.
City of Edmonton 2016 EPCOR Proposal for Drainage Transfer Analysis October 5, 2016
24
Audit • Tax • Advisory © Grant Thornton LLP. A Canadian Member of Grant Thornton International Ltd. All rights reserved.
as next steps, we believe that they are not major factors for the determination of the potential transfer of Drainage.
2.8 Acknowledgements
This Study involved significant effort from many staff from the City and EPCOR. We would like to acknowledge the following individuals who contributed their time, expertise, and support for the Study:
City Staff:
• Todd Burge, Deputy City Manager and Chief Financial Officer, Financial and Corporate Services
• Cheryl Hagen, Finance Director, Utility Services • Romana Kabalin, Corporate Funding Manager, Financial Strategies and Budget • Stacey Padbury, Branch Manager, Financial Services • Dallas Raudebaugh, Finance Manager, Utility Services • Barry McNabb, Branch Manager, Financial Strategies and Budget • Janice Wan, Strategic Coordinator, Financial and Corporate Services • Mikaela Hanley, Acting Director of Drainage Planning, City Planning • Michelle Poh, Utilities Business Advisor • Peter Ohm, Branch Manager, City Planning • Fernando Sacluti, Acting Director of Drainage Planning and Engineering, City Planning • Chris Ward, Branch Manager, Utility Services • Todd Wyman, Acting Executive Director, Utilities Infrastructure Services • Cameron Ashmore, Barrister and Solicitor, Law Branch • Ingrid Johnson, Director, Law Branch • Claudia Pooli, Barrister and Solicitor, Law Branch • Jeff MacPherson, Branch Manager, Human Resources • Norman Sampson, Director of Corporate Safety and Disability Management, Human
Resources EPCOR Staff:
• Amanda Rosychuk, SVP Corporate Services • Guy Bridgeman, SVP and CFO • Stephen Stanley, SVP Commercial Services • Jamie Pytel, General Counsel & Corporate Secretary • Susan Ancel, Director, Edmonton Water D&T • Kelly O’Byrne, Senior Specialist, Project Analysis • Deborah Samagalski, Senior Specialist, HR Integration • Lianne Redmond, Senior Manager, Operational Communications • Al Stempfle, Project Manager (Contract)
City of Edmonton 2016 EPCOR Proposal for Drainage Transfer Analysis October 5, 2016
25
Audit • Tax • Advisory © Grant Thornton LLP. A Canadian Member of Grant Thornton International Ltd. All rights reserved.
3 Quantitative Analysis
This section provides detail on the quantitative analysis performed including a review and comparison of the City and EPCOR Drainage Models, the financial impacts of a proposed transfer to both the City and EPCOR, as well as an economic comparison of Drainage under different ownership models.
3.1 Financial Models Review
This section focuses on the current and future state of Drainage as forecast in the City Drainage Model. It also compares the future state of Drainage if transferred to EPCOR as projected in the EPCOR Stand-alone Drainage Model. Note that both the City and EPCOR Drainage Models have 10-year forecast horizons between January 1, 2017 to December 31, 2026. The EPCOR Stand-alone Drainage Model assumes that Drainage is transferred to EPCOR on January 1, 201713. Note that a detailed reconciliation of both Models is provided in Appendix C.
3.1.1 Input Assumptions: City Model
Our analysis is based on the review of the City Drainage Rate Model, provided August 18, 2016, which includes forecast results for years 2017 to 2026. Assumptions were analysed individually for the Sanitary and Stormwater Utilities (assumptions and outputs for the Drainage Design and Construction (DDC) are combined with the Sanitary Utility for evaluation purposes). The City Drainage Model includes the following input assumptions:
3.1.1.1 Revenue Assumptions
Forecast revenues are typically calculated based on a cost recovery basis with the intent of earning a return on rate base. However, the City Drainage Model is constrained to a fixed annual rate increase over the forecast period.
Utility Rates14: Monthly Drainage rates increase by approximately 3.0% annually, resulting in a $1.00 increase in 2017 to a $1.30 increase in 2026 for a typical residential monthly bill. This was achieved by adjusting the Return on Equity (ROE) on the equity component of the rate base, and the capital structure for utility-financed capital for the Sanitary and Stormwater Utilities (i.e.
13 Upon consulting with EPCOR and City staff, a potential transfer of Drainage to EPCOR would likely not be possible until Q2/Q3, 2017. A January 1, 2017 proposed transfer date is used solely for modeling purposes. 14 Sanitary Utility ratepayers are charged a fixed fee based on connection meter sizes and a variable charge based on water consumption, and Storm Utility ratepayers are charged a based on their property size, development intensity, run-off coefficient. The “3.0% rate annual rate increase” represents the annual billing increase for a typical residential monthly bill.

City of Edmonton 2016 EPCOR Proposal for Drainage Transfer Analysis October 5, 2016
26
Audit • Tax • Advisory © Grant Thornton LLP. A Canadian Member of Grant Thornton International Ltd. All rights reserved.
additional borrowing). With a 3.0% rate increase hold, equity returns are held low, and turn negative in forecast year 2025 and 2022 for the Sanitary and Stormwater Utilities, respectively. This suggests that rate revenues do not cover a ROE portion of financing, which erodes into the Utilities’ equity balances.
Customer Growth: Over the forecast period, the number of residential customers are anticipated to grow by 1.5% annually, while multi-family and commercial customers grow by 1% annually. For normal rate setting in the City Drainage Model, the sanitary utility recovers approximately 30% of its required revenues through a fixed charge to these customers based on water meter size.
Consumption: Among residential customers, consumption is forecast to move from 15.3m3 to 15.1m3 per month. Multi-family and commercial customers’ consumption remains constant at 416.3m3, and 119.0m3 per month. For normal rate setting in the City Drainage Model, 70% of required revenue rate charges for the sanitary utility are recovered on variable water consumption basis.
Rate Revenues: By combining the 3.0% annual increase in an average monthly sanitary and stormwater utility bill, as well as the growth in the number of customers and changes in consumption, total rate revenue increase by 4.7% annually on average as shown in the following table.
($000's) Total 2017 2018 2019 2020 2021 2022 2023 2024 2025 2026 Sanitary Rate Revenue 1,373,945 114,486 118,564 122,581 127,700 132,891 138,565 144,267 151,589 157,900 165,403
Storm Rate Revenue 742,579 57,391 60,744 64,360 67,895 71,766 75,675 79,559 83,459 87,628 94,102
Total Rate Revenue 2,116,525 171,877 179,309 186,941 195,595 204,657 214,240 223,826 235,047 245,528 259,505
Total Rate Revenue % Increase
Average Annual Increase: 4.7% 4.3% 4.3% 4.6% 4.6% 4.7% 4.5% 5.0% 4.5% 5.7%
Typical Residential Bill % Increase
Average Annual Increase: 3.0% 3.0% 3.0% 3.0% 3.0% 3.0% 3.0% 3.0% 3.0% 3.0%
Non-Rate Program Revenues: Revenues associated non-rate programs, DDC, suburban customers, and late payments were manually forecast for projection years 2016 to 2018. For years 2019 to 2026 an annual 2.17% annual inflationary growth percentages were used to forecast these revenues. Note that these program revenues make up 4.4% to 6.0% of total revenues for the Sanitary and Stormwater Utilities on a combined basis over the forecast period.
Interest Income: Income generated from cash balances is based on a 2.0% annual interest rate. On a combined basis, this accounts for 0.1% to 0.6% of total revenues over the forecast period.

City of Edmonton 2016 EPCOR Proposal for Drainage Transfer Analysis October 5, 2016
27
Audit • Tax • Advisory © Grant Thornton LLP. A Canadian Member of Grant Thornton International Ltd. All rights reserved.
3.1.1.2 Operating Cost Assumptions
The following tables summarises the 2017 forecast year’s operating costs for the Sanitary and Stormwater Utilities as detailed in the City Drainage Model.
($000's) 2017($) 2017% Sanitary Utility (includes DDC) Operations and Maintenance 30,816 40% Customer Billings Services 5,016 6% Shared Services 13,902 18% Biosolids Disposal 17,412 22% Local Access Fee 9,159 12% SSSF Payment 1,300 2% Total 77,605 100%
($000's) 2017($) 2017% Stormwater Utility Operations and Maintenance 14,502 78% Customer Billings Services 1,169 6% Shared Services 3,003 16% Total 18,674 100%
Operating and Maintenance Costs: The City forecasts operating and maintenance costs for projection years 2016 to 2018 using a budgetary approach in which figures are forecast independently and manually entered (e.g. based on the information available during the model’s development, insurance premiums were individually projected to increase from 2016 to 2017). For forecast years 2019 to 2026, annual inflationary growth percentages were used to forecast costs ranging from 1.5% to 2.17%. Shared services (which include costs for the Utilities’ use of human resources, legal services, information technology, financial services, space rent, etc.) as well as customer billing services are also forecast using the same approach.
Biosolids Disposal (Sanitary Utility only): Biosolids disposal costs are forecast based on predicted disposal quantities through internal (e.g. composting) and external contractor costs.
Local Access Fee (Sanitary Utility only): A Local Access Fee (also referred to as a franchise fee) is charged by the City to the Sanitary Utility for the use of public rights of way and in lieu of property taxes. It is forecast based on 8.0% of the Sanitary Utility’s rate revenues annually.
Sanitary Servicing Strategy Fund (SSSF) Contribution (Sanitary Utility only): The Sanitary Utility contributes $1.3 million annually to fund the construction of large (transmission) sewers as part of the SSSF. This is a cost item included over the entire forecast period in the Model15.
15 The SSSF contribution is currently planned up to 2024, however it is included in years 2025 and 2026 in the City and EPCOR Model.
City of Edmonton 2016 EPCOR Proposal for Drainage Transfer Analysis October 5, 2016
28
Audit • Tax • Advisory © Grant Thornton LLP. A Canadian Member of Grant Thornton International Ltd. All rights reserved.
3.1.1.3 Capital Cost Assumptions
Capital expenses include depreciation of City-financed assets, financing charges (interest), and the ROE.
Depreciation Costs: Depreciation is calculated for each asset category and is based on the City’s asset schedules. It includes depreciation on non-contributed, city-financed assets (excludes depreciation on contributed capital assets). In the 2017 forecast year, depreciation is expected to be $15.7M and $10.1M for the Sanitary and Stormwater Utility, respectively. This accounts for 14.8% of the Sanitary Utility total expenses and 27.1% of total Stormwater expenses.
Interest Costs: The City’s interest rates on long-term debt are 3.42% in 2017 and grow to 5.67% by 2026. These inputs are provided by the City’s corporate capital planning area, and reflect that the City’s interest rates are forecast to increase by 25 basis points per year starting in 2021 to the end of the forecast period.
Return on Equity: As noted earlier, the City Drainage Model is constrained by an annual 3.0% rate increase. As a result, the return on rate base (which is a combination of the ROE on the equity component of the rate base and the return on debt on the rate base that is financed by debt) can be perceived as a resulting output, rather an input assumption. Specifically, the City Model adjusts and lowers its ROE over the forecast period to compensate for growing operational and capital costs with a fixed 3.0% annual rate increase.
3.1.2 Input Assumptions: EPCOR Model
Our analysis is based on the review of the EPCOR Stand-alone Drainage Rate Model, provided August 25, 2016, which includes forecast results for years 2017 to 2026. Our team worked closely with EPCOR and City staff to reconcile key differences of the EPCOR model (see Appendix C). The EPCOR Drainage Model includes the following input assumptions:
3.1.2.1 Revenue Assumptions
EPCOR has elected to use all rate and program revenue outputs from the City Model as inputs into its model. As such, revenues are identical for both the City and EPCOR model. As part of its Proposal, EPCOR has committed to hold rate increases at 3.0% for the five years from 2017 to 2021 (as stated in IR 6). After this period, subsequent rate changes are proposed to be examined through a Performance Based Review (PBR) regulatory framework. However, for the purposes of its model, EPCOR has used the City’s rate revenues, which reflect the 3.0% annual rate increase over the entire 10 year forecast period. This is a reasonable assumption to support the comparison of the City and EPCOR Models16.
Equity Injections: To balance the EPCOR Stand-alone Drainage Model’s Debt-to-Capitalization ratio17 (to a target of 55% to 65%) as well as stabilize the FFO/Debt metric18 (to a target of 10% 16 Both the City and EPCOR recognize the need to increase Drainage utility rates. The City proposed consolidated rate increases of 3.7% in 2018 and 4.0% in 2019 as per the 2017-18 Utility Rate Filing, August 30, 2016. As described later in this Study, EPCOR proposes to submit a Performance Based Review (PBR) Application that will identify new rates for 2022-26. 17 The Debt-to-Capitalization (also referred to as Debt-to-Cap) ratio calculates the proportion of total retained earnings represented by total debt (after adjusting for cash and back-to-back debt receivables).
City of Edmonton 2016 EPCOR Proposal for Drainage Transfer Analysis October 5, 2016
29
Audit • Tax • Advisory © Grant Thornton LLP. A Canadian Member of Grant Thornton International Ltd. All rights reserved.
to 15%), EPCOR is able to inject equity into Drainage from other EPCOR business lines or EPCOR corporate borrowings upon corporate-wide financial consolidation outside of EPCOR’s Stand-alone Drainage Model. Note that the corporate impact analysis of total debt and equity injections in the EPCOR Stand-alone Drainage Model is presented in Section 3.6. Forecast equity injections begin in year 2020 at $20M, and grow to $68M by the end of the forecast period. This is a reasonable assumption and points to a major difference to the City Model, in which there are no external equity injections are provided to Drainage (i.e. Drainage operates as a self-funded utility through rate and program revenues).
3.1.2.2 Operating Cost Assumptions
Generally, EPCOR has used City operating cost outputs, with a number of differences described below.
Operating Cost Efficiencies: EPCOR assumes that it will be able to generate operating cost efficiencies: 1% reduction in 2017, growing by 1% annually to a maximum of 5% for the duration of the forecast year. The reasonableness for this input assumption is discussed in detail in Section 3.4.1. This results in a higher net income in the EPCOR Drainage Model.
Stranded Cost Payment to City: EPCOR has used Drainage’s allocation of shared services (i.e. overhead allocations) in their projections in their Stand-alone Drainage Model. EPCOR has also proposed a transition payment of up to $75M as a provision to cover the potential for stranded costs that may remain in the City and would no longer be recovered through Drainage utility rates. This transition payment to the City is not included in EPCOR’s Stand-alone Drainage Model, but is factored in during the roll up of the EPCOR Stand-alone Drainage Model into EPCOR’s LTP Model19.
Return on Equity: Similar to the City Drainage Model, the ROE is an output due to the annual 3.0% annual rate increase. However, EPCOR’s equity returns in its Stand-alone Drainage Model also are impacted through its equity injections. As its equity injections into the utility increase, its equity grows, thereby reducing the ROE at the same earning levels.
3.1.2.3 Capital Cost Assumptions
Generally, EPCOR has used City capital cost outputs, with a number of differences described below.
Capital Cost Efficiencies: EPCOR assumes that it will be able to generate at least a 10% cost efficiency on new, utility-financed capital beginning immediately in 2017. The reasonableness for this input assumption in discussed in detail in Section 3.4.2. This has an effect on both
18 The FFO/Debt (also referred to as Funds from Operations to Debt) metric calculates the proportion of total debt (after adjusting for cash and back-to-back debt receivables) that is represented from earnings after interest (not including accounting accruals such as depreciation). 19 EPCOR has used Drainage’s shared services cost forecasts in its Stand-alone Model, and has factored in a transition payment to the City in its LTP Model. Information provided by the City as per their preliminary analysis of shared service costs indicates that the net present value of potential stranded costs is approximately $29M following a potential transfer. EPCOR did not alter the $75M provision in its corporate Long Term Planning model.

City of Edmonton 2016 EPCOR Proposal for Drainage Transfer Analysis October 5, 2016
30
Audit • Tax • Advisory © Grant Thornton LLP. A Canadian Member of Grant Thornton International Ltd. All rights reserved.
depreciation (due to lower forecast asset book values) and interest expense (due to less borrowing requirements to fund capital expenditures).
Interest Costs: EPCOR capitalizes interest costs on construction, whereas the City’s Model does not. In addition, EPCOR’s interest rates on long-term debt are 3.41% in 2017 and grow to 4.41% by 2021, and remain constant over the forecast period. EPCOR interest rates are based on estimate quotes provided by the Royal Bank of Canada (RBC) for EPCOR’s corporate borrowing. EPCOR also adds an additional 25 basis point increase for specific Drainage related borrowing. EPCOR’s interest rate is lower than the rate used in the City model (with slight differences in earlier forecast years (0.010%) with a maximum difference of 1.3% in year 2026).
While EPCOR’s ability to raise debt at lower financing rates as compared to the City may seem counter intuitive (given historically low public sector borrowing rates), this difference is due to EPCOR’s use of different debt instruments and maturities, such as longer term bullet debentures, compared to the City’s use of 20 year amortizing bonds. In addition, this is also due to the 25 basis point annual increase in City interest rates to the end of the forecast period, while EPCOR holds its interest rate constant from years 2021 to 2026. This results in lower interest costs for EPCOR over the entire forecast period. Given the justification provided and Drainage’s use of City corporate forecast for interest costs, EPCOR interest rate assumption appears to be reasonable.
Depreciation Costs: Because EPCOR capitalizes interest during construction, EPCOR’s book value of its new, utility-financed assets are higher, compared to if interest costs during construction were expensed. However, overall EPCOR has lower total depreciation expenses due to its proposed capital efficiencies on new asset construction, which lowers asset book values.
3.1.2.4 Balance Sheet Assumptions
The EPCOR Stand-alone Drainage Rate Model includes all existing drainage debt as of the transfer ($609.3M of long-term debt and $34.5M of current liabilities as of forecast year 2016), as well as all assets, including $44.3M of cash. Broadly, EPCOR proposes to adopt the Drainage Utility’s balance sheet as of the December 31, 2016 projection. Any new debt procured by EPCOR is assumed to be procured in the first month of each forecast year.
3.2 Current State of Drainage
According to the City Drainage Model, in forecast year 2016, Drainage is anticipated to have approximately $1.1B in non-contributed assets, $609.3M in long-term debt, and $530.0M in equity as shown in the following table.
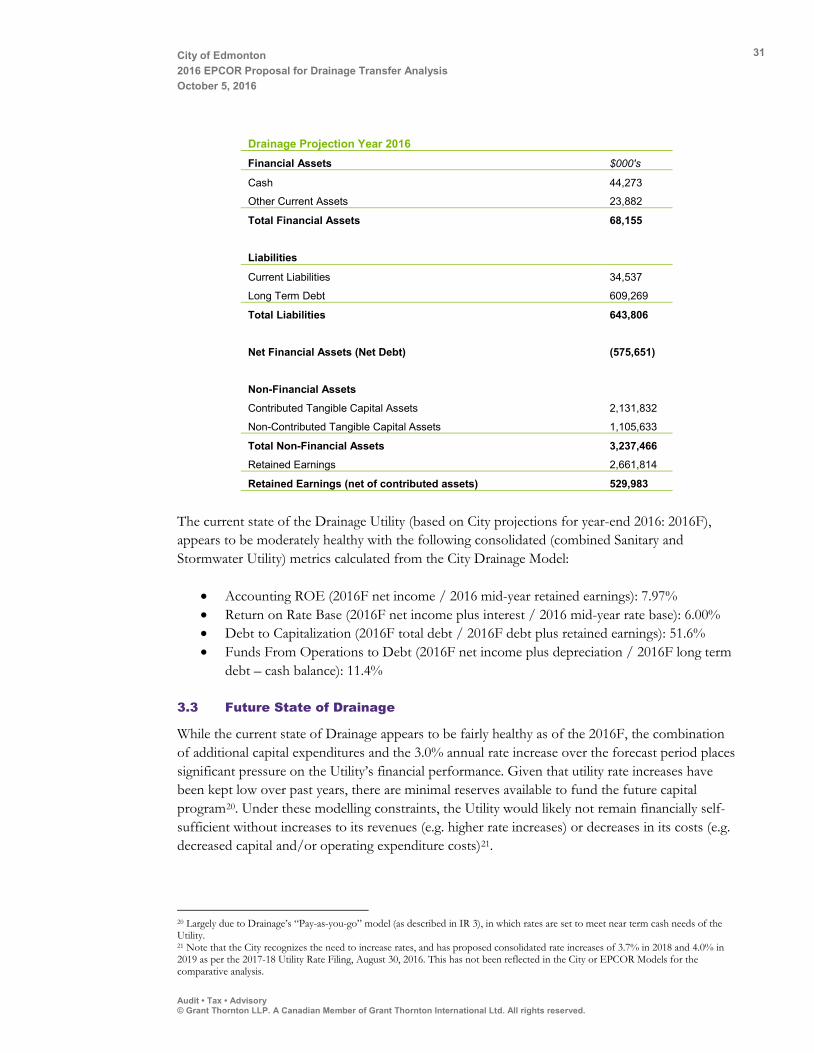
City of Edmonton 2016 EPCOR Proposal for Drainage Transfer Analysis October 5, 2016
31
Audit • Tax • Advisory © Grant Thornton LLP. A Canadian Member of Grant Thornton International Ltd. All rights reserved.
Drainage Projection Year 2016
Financial Assets $000's
Cash 44,273
Other Current Assets 23,882
Total Financial Assets 68,155
Liabilities
Current Liabilities 34,537
Long Term Debt 609,269
Total Liabilities 643,806
Net Financial Assets (Net Debt) (575,651)
Non-Financial Assets
Contributed Tangible Capital Assets 2,131,832
Non-Contributed Tangible Capital Assets 1,105,633
Total Non-Financial Assets 3,237,466
Retained Earnings 2,661,814
Retained Earnings (net of contributed assets) 529,983
The current state of the Drainage Utility (based on City projections for year-end 2016: 2016F), appears to be moderately healthy with the following consolidated (combined Sanitary and Stormwater Utility) metrics calculated from the City Drainage Model:
• Accounting ROE (2016F net income / 2016 mid-year retained earnings): 7.97% • Return on Rate Base (2016F net income plus interest / 2016 mid-year rate base): 6.00% • Debt to Capitalization (2016F total debt / 2016F debt plus retained earnings): 51.6% • Funds From Operations to Debt (2016F net income plus depreciation / 2016F long term
debt – cash balance): 11.4%
3.3 Future State of Drainage
While the current state of Drainage appears to be fairly healthy as of the 2016F, the combination of additional capital expenditures and the 3.0% annual rate increase over the forecast period places significant pressure on the Utility’s financial performance. Given that utility rate increases have been kept low over past years, there are minimal reserves available to fund the future capital program20. Under these modelling constraints, the Utility would likely not remain financially self-sufficient without increases to its revenues (e.g. higher rate increases) or decreases in its costs (e.g. decreased capital and/or operating expenditure costs)21.
20 Largely due to Drainage’s “Pay-as-you-go” model (as described in IR 3), in which rates are set to meet near term cash needs of the Utility. 21 Note that the City recognizes the need to increase rates, and has proposed consolidated rate increases of 3.7% in 2018 and 4.0% in 2019 as per the 2017-18 Utility Rate Filing, August 30, 2016. This has not been reflected in the City or EPCOR Models for the comparative analysis.

City of Edmonton 2016 EPCOR Proposal for Drainage Transfer Analysis October 5, 2016
32
Audit • Tax • Advisory © Grant Thornton LLP. A Canadian Member of Grant Thornton International Ltd. All rights reserved.
3.3.1 Capital Expenditure Forecasts
As shown in the graph below, the current Drainage capital plan totals $1.93B over the next ten years (approximately $200M per year). Of this amount, $530M has been earmarked for flood mitigation (approximately $53M per year).
3.3.1.1 Flood Mitigation
The following background regarding the flood mitigation program was provided by City staff (September 2, 2016):
The City-Wide Flood Mitigation Program is a proactive, long-term strategy intended to provide up to 1:100-year protection for existing at risk neighbourhoods in Edmonton. In 2004 and 2012, the City experienced severe storms causing widespread damage to both City-owned and private property. In both instances, the City implemented capital programs to deal with these affected areas. Severe events in 2013 further prompted the City to develop a city-wide approach for all at risk neighbourhoods (an additional 160 residential neighbourhoods and 33 industrial parks), giving all neighbourhoods across the City similar protection against the increasingly severe weather.
Based on preliminary information, the initial estimate to implement a city-wide strategy was estimated at approximately $2.4 billion (2013 dollars), implemented over 50-100 years. Subsequent detailed analysis of the drainage system indicates that over 40 kilometres of large storm tunnels and other widespread sewer improvements are needed, in addition to roughly 50 new dry ponds. The cost of this new infrastructure will continue to be refined to account for construction risks and optimized designs. In order to deal with concerns about affordability of this program, the City also continues to look at alternate levels of service which still provide significant improvements that protect residents. This will give City Council an opportunity to make a more informed decision regarding the future capital program. Administration plans to present these to Council for approval in Q2 2017, with interim information provided in early Q4 2016.
As stated in EPCOR IR 3, Drainage staff estimate that the current amount of capital expenditures earmarked for flood mitigation projects (approximately $53M per year) may be accelerated over a
$528M
$1.934B
$-
$200,000
$400,000
$600,000
$800,000
$1,000,000
$1,200,000
$1,400,000
$1,600,000
$1,800,000
$2,000,000
2017 2018 2019 2020 2021 2022 2023 2024 2025 2026
Cum
ulat
ive
Cap
ital E
xpen
ditu
res
($00
0's)
Flood Mitigation Cumulative Capex Cumulative
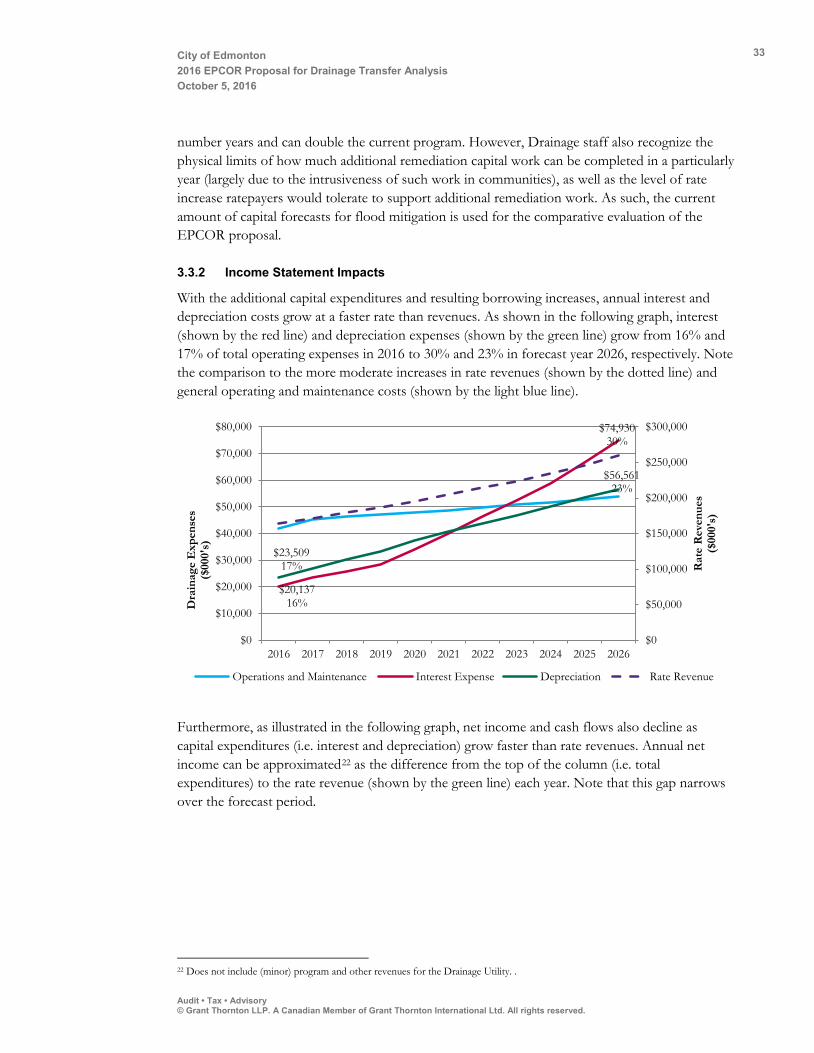
City of Edmonton 2016 EPCOR Proposal for Drainage Transfer Analysis October 5, 2016
33
Audit • Tax • Advisory © Grant Thornton LLP. A Canadian Member of Grant Thornton International Ltd. All rights reserved.
number years and can double the current program. However, Drainage staff also recognize the physical limits of how much additional remediation capital work can be completed in a particularly year (largely due to the intrusiveness of such work in communities), as well as the level of rate increase ratepayers would tolerate to support additional remediation work. As such, the current amount of capital forecasts for flood mitigation is used for the comparative evaluation of the EPCOR proposal.
3.3.2 Income Statement Impacts
With the additional capital expenditures and resulting borrowing increases, annual interest and depreciation costs grow at a faster rate than revenues. As shown in the following graph, interest (shown by the red line) and depreciation expenses (shown by the green line) grow from 16% and 17% of total operating expenses in 2016 to 30% and 23% in forecast year 2026, respectively. Note the comparison to the more moderate increases in rate revenues (shown by the dotted line) and general operating and maintenance costs (shown by the light blue line).
Furthermore, as illustrated in the following graph, net income and cash flows also decline as capital expenditures (i.e. interest and depreciation) grow faster than rate revenues. Annual net income can be approximated22 as the difference from the top of the column (i.e. total expenditures) to the rate revenue (shown by the green line) each year. Note that this gap narrows over the forecast period.
22 Does not include (minor) program and other revenues for the Drainage Utility. .
$20,137 16%
$74,930 30%
$23,509 17%
$56,561 23%
$0
$50,000
$100,000
$150,000
$200,000
$250,000
$300,000
$0
$10,000
$20,000
$30,000
$40,000
$50,000
$60,000
$70,000
$80,000
2016 2017 2018 2019 2020 2021 2022 2023 2024 2025 2026
Rat
e R
even
ues
($
000'
s)
Dra
inag
e E
xpen
ses
($
000'
s)
Operations and Maintenance Interest Expense Depreciation Rate Revenue
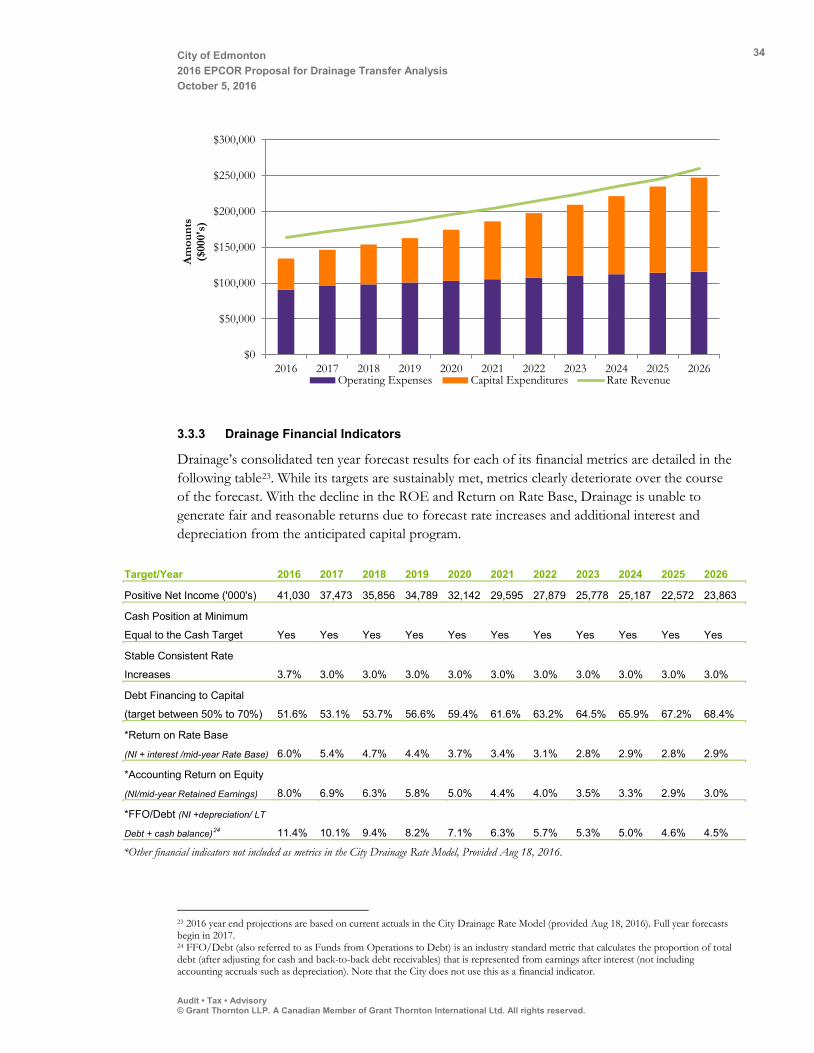
City of Edmonton 2016 EPCOR Proposal for Drainage Transfer Analysis October 5, 2016
34
Audit • Tax • Advisory © Grant Thornton LLP. A Canadian Member of Grant Thornton International Ltd. All rights reserved.
3.3.3 Drainage Financial Indicators
Drainage’s consolidated ten year forecast results for each of its financial metrics are detailed in the following table23. While its targets are sustainably met, metrics clearly deteriorate over the course of the forecast. With the decline in the ROE and Return on Rate Base, Drainage is unable to generate fair and reasonable returns due to forecast rate increases and additional interest and depreciation from the anticipated capital program.
Target/Year 2016 2017 2018 2019 2020 2021 2022 2023 2024 2025 2026
Positive Net Income ('000's) 41,030 37,473 35,856 34,789 32,142 29,595 27,879 25,778 25,187 22,572 23,863
Cash Position at Minimum
Equal to the Cash Target Yes Yes Yes Yes Yes Yes Yes Yes Yes Yes Yes
Stable Consistent Rate
Increases 3.7% 3.0% 3.0% 3.0% 3.0% 3.0% 3.0% 3.0% 3.0% 3.0% 3.0%
Debt Financing to Capital
(target between 50% to 70%) 51.6% 53.1% 53.7% 56.6% 59.4% 61.6% 63.2% 64.5% 65.9% 67.2% 68.4%
*Return on Rate Base
(NI + interest /mid-year Rate Base) 6.0% 5.4% 4.7% 4.4% 3.7% 3.4% 3.1% 2.8% 2.9% 2.8% 2.9%
*Accounting Return on Equity
(NI/mid-year Retained Earnings) 8.0% 6.9% 6.3% 5.8% 5.0% 4.4% 4.0% 3.5% 3.3% 2.9% 3.0%
*FFO/Debt (NI +depreciation/ LT
Debt + cash balance)24 11.4% 10.1% 9.4% 8.2% 7.1% 6.3% 5.7% 5.3% 5.0% 4.6% 4.5%
*Other financial indicators not included as metrics in the City Drainage Rate Model, Provided Aug 18, 2016.
23 2016 year end projections are based on current actuals in the City Drainage Rate Model (provided Aug 18, 2016). Full year forecasts begin in 2017. 24 FFO/Debt (also referred to as Funds from Operations to Debt) is an industry standard metric that calculates the proportion of total debt (after adjusting for cash and back-to-back debt receivables) that is represented from earnings after interest (not including accounting accruals such as depreciation). Note that the City does not use this as a financial indicator.
$0
$50,000
$100,000
$150,000
$200,000
$250,000
$300,000
2016 2017 2018 2019 2020 2021 2022 2023 2024 2025 2026
Am
ount
s ($
000'
s)
Operating Expenses Capital Expenditures Rate Revenue
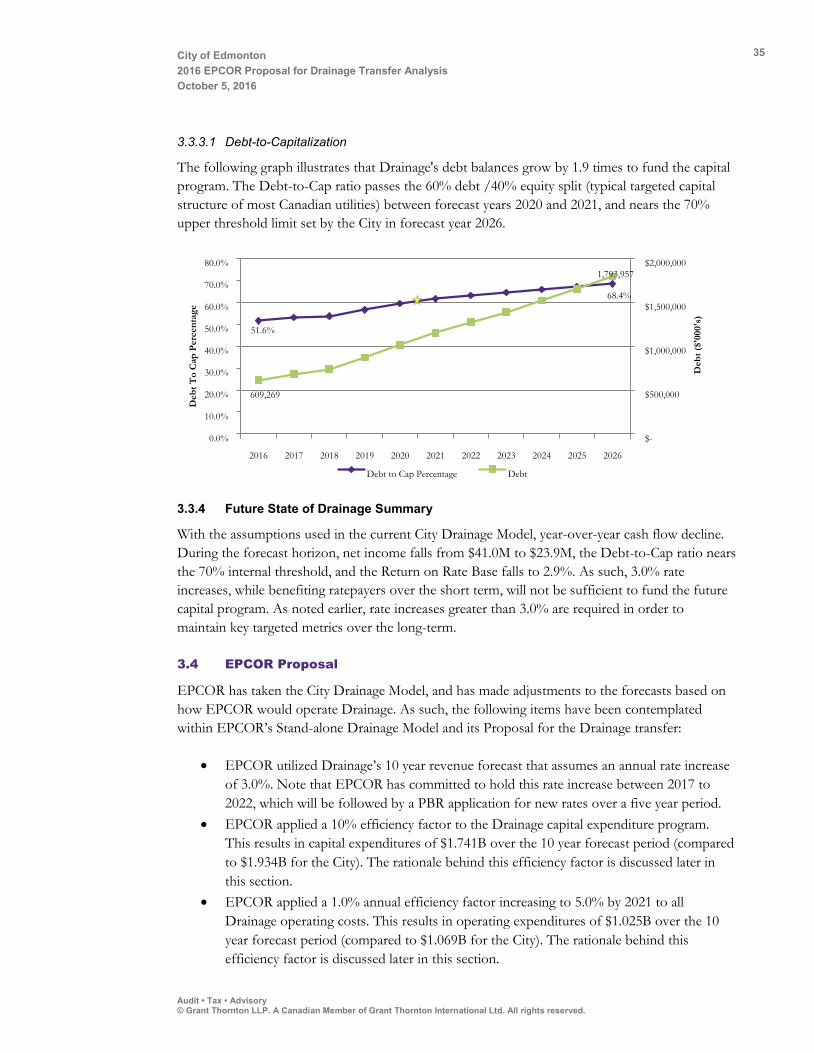
City of Edmonton 2016 EPCOR Proposal for Drainage Transfer Analysis October 5, 2016
35
Audit • Tax • Advisory © Grant Thornton LLP. A Canadian Member of Grant Thornton International Ltd. All rights reserved.
3.3.3.1 Debt-to-Capitalization
The following graph illustrates that Drainage's debt balances grow by 1.9 times to fund the capital program. The Debt-to-Cap ratio passes the 60% debt /40% equity split (typical targeted capital structure of most Canadian utilities) between forecast years 2020 and 2021, and nears the 70% upper threshold limit set by the City in forecast year 2026.
3.3.4 Future State of Drainage Summary
With the assumptions used in the current City Drainage Model, year-over-year cash flow decline. During the forecast horizon, net income falls from $41.0M to $23.9M, the Debt-to-Cap ratio nears the 70% internal threshold, and the Return on Rate Base falls to 2.9%. As such, 3.0% rate increases, while benefiting ratepayers over the short term, will not be sufficient to fund the future capital program. As noted earlier, rate increases greater than 3.0% are required in order to maintain key targeted metrics over the long-term.
3.4 EPCOR Proposal
EPCOR has taken the City Drainage Model, and has made adjustments to the forecasts based on how EPCOR would operate Drainage. As such, the following items have been contemplated within EPCOR’s Stand-alone Drainage Model and its Proposal for the Drainage transfer:
• EPCOR utilized Drainage’s 10 year revenue forecast that assumes an annual rate increase of 3.0%. Note that EPCOR has committed to hold this rate increase between 2017 to 2022, which will be followed by a PBR application for new rates over a five year period.
• EPCOR applied a 10% efficiency factor to the Drainage capital expenditure program. This results in capital expenditures of $1.741B over the 10 year forecast period (compared to $1.934B for the City). The rationale behind this efficiency factor is discussed later in this section.
• EPCOR applied a 1.0% annual efficiency factor increasing to 5.0% by 2021 to all Drainage operating costs. This results in operating expenditures of $1.025B over the 10 year forecast period (compared to $1.069B for the City). The rationale behind this efficiency factor is discussed later in this section.
51.6%
68.4%
609,269
1,793,957
$-
$500,000
$1,000,000
$1,500,000
$2,000,000
0.0%
10.0%
20.0%
30.0%
40.0%
50.0%
60.0%
70.0%
80.0%
2016 2017 2018 2019 2020 2021 2022 2023 2024 2025 2026
Deb
t ($'
000'
s)
Deb
t To
Cap
Per
cent
age
Debt to Cap Percentage Debt

City of Edmonton 2016 EPCOR Proposal for Drainage Transfer Analysis October 5, 2016
36
Audit • Tax • Advisory © Grant Thornton LLP. A Canadian Member of Grant Thornton International Ltd. All rights reserved.
• EPCOR applied the same metrics around the capitalization of Drainage as it would any of its other subsidiaries. In particular, EPCOR notionally issued intercompany debt to Drainage and injected equity as necessary to maintain its capital structure within a reasonable range. As discussed later in this section, the injection of equity allows Drainage to stabilize their FFO/Debt credit metric.
• EPCOR has projected an immediate increase of at least $20M to its dividend to the City in the first year following the proposed transfer.
• EPCOR has added up to $75M as a provision to include any stranded costs the City may encounter as part of the transfer. This is captured in EPCOR’s LTP Model, rather than shown as a cost item in the EPCOR’s Stand-alone Drainage Model25.
• Existing Drainage debt of approximately $609M would be assumed by EPCOR through a back to back arrangement with the City (a similar approach as taken for the Power and Water related debt in 1996 and for GBWWTP debt post its transfer to EPCOR in 2009).
• No changes are anticipated Drainage’s contribution to the Local Access Fee (8% of Sanitary Utility’s rate revenues) and the SSSF contribution ($1.3M annually).
3.4.1 Operational Efficiency
As described in EPCOR’s IR 8, EPCOR’s Proposal includes an assumption that total operating costs within Drainage can be reduced by 1.0% per year in each of the first five years (2017-21) for a total of 5.0% or approximately $5M by 2021. Cost savings resulting from these efficiencies total to $43.59M over the 10 year forecast period. Incremental operational cost savings for Drainage are reflected in the table below.
$000’s Total 2017 2018 2019 2020 2021 2022 2023 2024 2025 2026 City OPEX26 1,069,059 96,279 98,500 101,143 103,433 105,697 108,132 110,649 112,909 115,271 117,046
EPCOR OPEX 1,025,470 95,316 96,530 98,109 99,296 100,412 102,726 105,117 107,263 109,508 111,194 Efficiency ($) 43,590 963 1,970 3,034 4,137 5,285 5,407 5,532 5,645 5,764 5,852 Efficiency (%) 1% 2% 3% 4% 5% 5% 5% 5% 5% 5%
It is important to view EPCOR’s operational cost savings on an incremental basis to cost saving initiatives currently underway in the City, as well as potential lost synergies. The City for example, has a current 2% cost savings initiative (2% savings per year over the past three years to find 8% in total savings over four years). Additionally, there may be potential lost synergies and cost savings opportunities if Drainage was to be transferred to EPCOR out of the newly formed Utility Services Branch (e.g. Drainage and Waste utility engineering group). However, upon full consultation with City and EPCOR staff, it was agreed that EPCOR would have incremental operating efficiencies, partially with inherit synergies between water and wastewater.
25 Information provided by the City as per their preliminary analysis of shared service costs indicates that the net present value of potential stranded costs is approximately $29M following a potential transfer. EPCOR did not alter the $75M provision in its corporate Long Term Planning model. 26 Operational expenditures in the City and EPCOR Drainage Models include operational and maintenance costs, customer billing services, shared services, biosolids disposal, Local Access Fee, and SSSF payment.
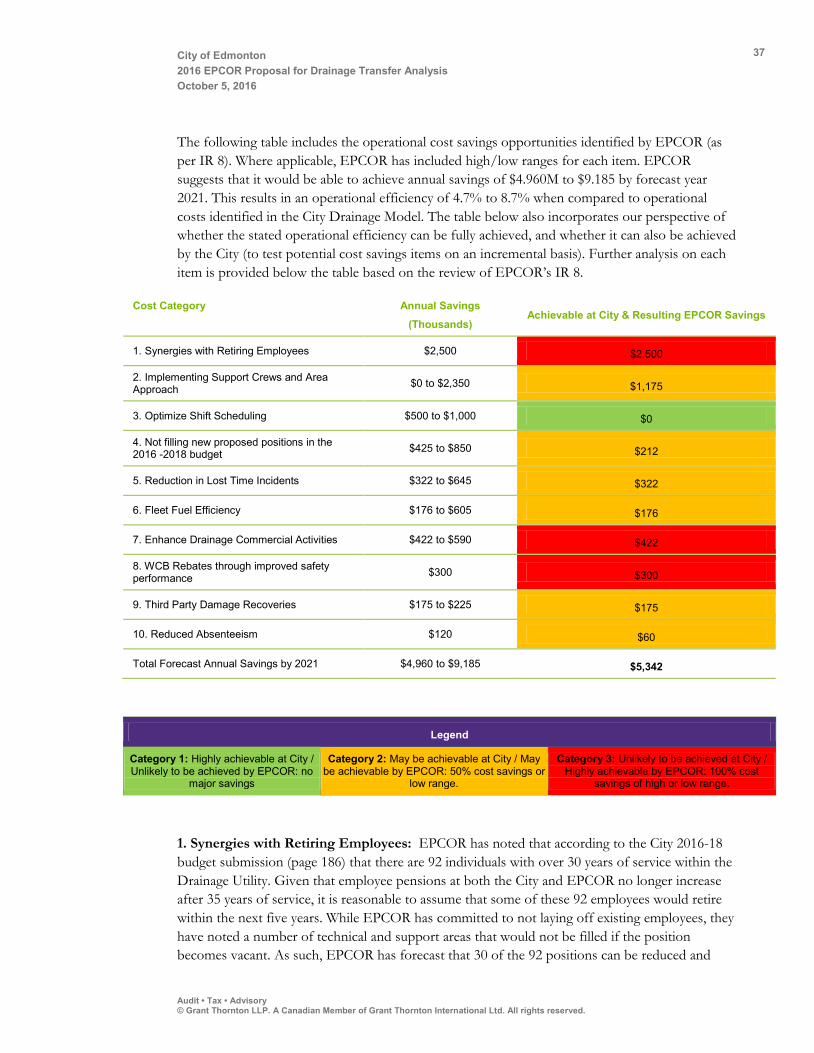
City of Edmonton 2016 EPCOR Proposal for Drainage Transfer Analysis October 5, 2016
37
Audit • Tax • Advisory © Grant Thornton LLP. A Canadian Member of Grant Thornton International Ltd. All rights reserved.
The following table includes the operational cost savings opportunities identified by EPCOR (as per IR 8). Where applicable, EPCOR has included high/low ranges for each item. EPCOR suggests that it would be able to achieve annual savings of $4.960M to $9.185 by forecast year 2021. This results in an operational efficiency of 4.7% to 8.7% when compared to operational costs identified in the City Drainage Model. The table below also incorporates our perspective of whether the stated operational efficiency can be fully achieved, and whether it can also be achieved by the City (to test potential cost savings items on an incremental basis). Further analysis on each item is provided below the table based on the review of EPCOR’s IR 8.
Cost Category Annual Savings
(Thousands) Achievable at City & Resulting EPCOR Savings
1. Synergies with Retiring Employees $2,500 $2,500
2. Implementing Support Crews and Area Approach $0 to $2,350 $1,175
3. Optimize Shift Scheduling $500 to $1,000 $0
4. Not filling new proposed positions in the 2016 -2018 budget $425 to $850 $212
5. Reduction in Lost Time Incidents $322 to $645 $322
6. Fleet Fuel Efficiency $176 to $605 $176
7. Enhance Drainage Commercial Activities $422 to $590 $422
8. WCB Rebates through improved safety performance $300 $300
9. Third Party Damage Recoveries $175 to $225 $175
10. Reduced Absenteeism $120 $60
Total Forecast Annual Savings by 2021 $4,960 to $9,185 $5,342
Legend
Category 1: Highly achievable at City / Unlikely to be achieved by EPCOR: no
major savings
Category 2: May be achievable at City / May be achievable by EPCOR: 50% cost savings or
low range.
Category 3: Unlikely to be achieved at City / Highly achievable by EPCOR: 100% cost
savings of high or low range.
1. Synergies with Retiring Employees: EPCOR has noted that according to the City 2016-18 budget submission (page 186) that there are 92 individuals with over 30 years of service within the Drainage Utility. Given that employee pensions at both the City and EPCOR no longer increase after 35 years of service, it is reasonable to assume that some of these 92 employees would retire within the next five years. While EPCOR has committed to not laying off existing employees, they have noted a number of technical and support areas that would not be filled if the position becomes vacant. As such, EPCOR has forecast that 30 of the 92 positions can be reduced and
City of Edmonton 2016 EPCOR Proposal for Drainage Transfer Analysis October 5, 2016
38
Audit • Tax • Advisory © Grant Thornton LLP. A Canadian Member of Grant Thornton International Ltd. All rights reserved.
covered through operational synergies following employee retirements. At an approximate annual cost of $85k per position, this would yield a savings of approximately $2.5M by 2021. Given that the City would likely backfill most positions for retiring employees, the entirety of this proposed operational saving is reasonable to include.
2. Implementing Support Crews and Area Approach: EPCOR has noted that it has enhanced tools and support structures for its operations and maintenance team completing both operational and capital repairs to the water network. Given the information available, EPCOR has made assumptions on the number of excavations made by Drainage crews which are operational and not charged back to capital accounts. Based on consultation with City staff, it was noted that Drainage and EPCOR field staff cross into each other when dealing with infrastructure operations and maintenance. As such, there is the potential for operational cost savings through the collaborative planning through the area approach and field support teams proposed by EPCOR. However, based on the information available at this time, and the $0 savings as the low range proposed by EPCOR, it is reasonable to assume 50% of the high range’s cost savings may be achievable by EPCOR by 2021.
3. Optimize Shift Scheduling: The Drainage budget indicated that the Utility currently incurs approximately $7 M per year in overtime ($5M capital and $2M operating). EPCOR noted that it would be able to reduce the operating overtime by $500k to $1M by 2021. While it is reasonable to assume that EPCOR can achieve this target, Drainage staff has also indicated that operational overtime has been and continues to be reduced. Specifically, overtime controls in Drainage Operations are already being implemented in Q1 and Q2 of 2016. Thus, on an incremental basis, it can be assumed that by 2021, Drainage’s overtime can be fully addressed at the City. As such, we believe that it is not reasonable to include this operational cost savings from an incremental perspective.
4. Not Filling New Proposed Positions in the 2016 -2018 Budget: EPCOR has estimated $425k to $850k in annual cost savings from not filling proposed positions in 2016-18 budget since it is able to use its existing support teams and technologies/systems to meet service requirements. EPCOR notes that the City has indicated that some of the positions noted will be filled by the time a decision is made related to the transfer of Drainage. Thus, EPCOR provides a range to account for the positions that will be filled. Upon feedback from Drainage staff, it was also noted that some positions (e.g. project engineers) are funded through capital, and thus would not result in an operational cost savings. However, it is reasonable to assume that there may be opportunities for EPCOR not to fill some of these positions depending on proposed timelines for the hiring of the position. As such, we believe it is reasonable to assume 50% of the low range’s cost savings proposed by EPCOR may be achievable.
5. Reduction in Lost Time Incidents: EPCOR has estimated annual cost savings between $322k to $645k by 2021 to account for direct and indirect costs for lost time incidents. It is noted that from 2012 to 2015 Drainage experienced 42 lost time injuries, while EPCOR experienced 12 lost time injuries (30 less than Drainage or six per year). EPCOR estimates the direct wage cost of lost time incidents to be $45k. Based on third party research, EPCOR estimated that the indirect cost (e.g. re-training of replacement employees, insurance costs, lost productivity, etc.) to be
City of Edmonton 2016 EPCOR Proposal for Drainage Transfer Analysis October 5, 2016
39
Audit • Tax • Advisory © Grant Thornton LLP. A Canadian Member of Grant Thornton International Ltd. All rights reserved.
approximately $100k per lost time incident. As such, EPCOR estimates the cost savings can be as high as $645k (i.e. $45k for direct costs and $600k of indirect costs). Based on the high-level of uncertainty involved with indirect costs associated with lost time incidents, it is reasonable to assume the EPCOR’s low range of cost savings for this item.
6. Fleet Fuel Efficiency: Based on the current data available, EPCOR has estimated an annual savings between $176k to $605k for incremental fleet fuel efficiency. The premise of this estimate is based on the EPCOR’s average fuel efficiency of 26L/100km to Drainage’s estimate average fuel efficiency of 31L/100km. EPCOR suggests that this 16% decrease would result in a savings of $176k per year, with additional fleet fuel efficiencies that may be found by 2021 to increase this figure to its higher savings range estimate. However, at this time, this is a high-level estimate based on the annual budgeted fuel costs for the drainage fleet of $1.1M, and does not include the types and mix of fleet vehicles being compared, an absolute volume reduction, and the impact of changing fuel prices. As such, it is reasonable to assume the EPCOR’s low range of cost savings for this item.
7. Enhance Drainage Commercial Activities: In 2015, EPCOR Water generated an additional $950k in profit from providing non-regulated services to Multifamily and Commercial properties in the Edmonton area (e.g. such as main break repair, system expansion, valve and hydrant repairs and hydrant inspections). EPCOR proposes that Drainage can provide similar non-regulated fee for service work such as scoping lines, camera work on private property, flushing catch basins, hydrovac work, and cleaning out of drainage lines to similar customers. EPCOR assumes that Drainage would be able to generate additional revenues of $750k to $1M and approximately $422k to $590k in profits to offset its operational costs. According to the 2013 Cost of Service Study, Drainage Operations currently provides a number of non-rate programs such as residential sewer clearing, liquid waste disposal, etc. Some of these programs did not appear to be 100% cost recovered. Moreover, given EPCOR’s experience in providing commercial services through EPCOR Water to generate profits, it is likely to achieve greater results than compared to non-regulated services provided by the City. As such, it is reasonable to assume that EPCOR may be able to generate additional profits to offset operational costs in the low range of cost savings for this item.
8. WCB Rebates Through Improved Safety Performance: Both the City and EPCOR receive the Certificate of Recognition (COR) rebate (approximately $200k) for their Workers Compensation Board (WCB) premiums. EPCOR received an additional rebate ($300k) over this base rebate given its safety performance, and EPCOR believe that this can be achieved for Drainage by 2021. While the City receives WCB rebates at a corporate level based on the City's overall safety performance, of which Drainage is a part of, there is merit in cost savings that may be passed to Drainage should the rebate increase. In addition, the City as a whole, may benefit from improved safety performance should EPCOR assume Drainage activities (given the complexity and risk levels involved for Drainage field work). Although more information is required regarding additional WCB rebates, as well as the proportion of an additional rebate that would be provided back to Drainage from the City, it is plausible to assume that the $300k in additional rebate savings can be generated for Drainage based on EPCOR Water’s experience.

City of Edmonton 2016 EPCOR Proposal for Drainage Transfer Analysis October 5, 2016
40
Audit • Tax • Advisory © Grant Thornton LLP. A Canadian Member of Grant Thornton International Ltd. All rights reserved.
9. Third Party Damage Recoveries: EPCOR suggests there is an opportunity to save between $175k to $225k through full recovery of third party damages to Drainage infrastructure. EPCOR Water has enhanced its process to ensure that third party damages are invoiced and recovered in a timely manner from individuals that damage the water infrastructure. While the specific number of third party damage incidents and cost recovery are currently unknown for Drainage at this time, Drainage staff estimate that they recover $100K annually in damage from third parties. It is acknowledged that EPCOR Water has a proven track record to recover these damage costs. However, by 2021, the City may also be able to improve its recovery of these costs through adopting similar processes. As such, it is reasonable to include the low range of the EPCOR estimate to represent the possible incremental cost savings given its experiences with EPCOR Water.
10. Reduced Absenteeism: Based on information provided noted by EPCOR and provided by the City, the number of average annual hours of sick time per employee in Drainage is 58.38, and EPCOR Water Canada has an a average of 52.83. The City estimated the total cost of absences across Drainage to be $1.3 million. EPCOR suggests it can lower absence rates of Drainage to its average level and thus achieve an annual $120k in savings. The City is currently reviewing the sick leave program with the expressed intent of implementing changes to lower sick leave. As such, by 2021, it may be possible for both EPCOR and City to lower its sick time averages, and both organizations may also have other initiatives to reduce absenteeism that may continue to provide incremental cost savings. Given the current initiatives at the City to reduce absenteeism, sick time averages in Drainage may decline by 2021. However, given EPCOR’s sick time averages are currently lower, we believe it is reasonable to assume 50% of the cost savings proposed by EPCOR are achievable.
3.4.1.1 Operational Efficiency Summary
After analysing each quantified operational cost saving items proposed, EPCOR is forecast to achieve a high-level estimate of incremental cost savings of approximately $5.3M, which is approximately 5.1% of total operational costs identified in the City Drainage Model. In addition, EPCOR has identified other potential synergies that have not been quantified at this time. These include the following:
• Customer escalations and dispatch • SCADA management • Fleet coordination • GIS and work management • Customer analytics for revenue forecasting and system planning • Plants maintenance to support lift stations and control gates • Tandem trucks supporting excavation crews • Inspections of new and infill development • Watershed protection and regulatory activities • Workforce training • Procurement of power and materials
City of Edmonton 2016 EPCOR Proposal for Drainage Transfer Analysis October 5, 2016
41
Audit • Tax • Advisory © Grant Thornton LLP. A Canadian Member of Grant Thornton International Ltd. All rights reserved.
In addition to the above analysis, research provided by the Ontario Distribution Sector Review Panel27, suggests that operational efficiency savings following the merger of several Local Distribution Companies (LDCs) were in the range of 11% to 13%.
While it has been noted that some of the above cost savings initiatives could be implemented in the City, it is reasonable to assume that EPCOR would be able to make changes at a faster pace given its experiences in EPCOR Water, existing systems and utility focus. Additionally, EPCOR noted that it would continue to find opportunities not captured in its IR following the proposed transfer. While it was acknowledged that there may be potential lost synergies in the City should the Drainage transfer occur, it was agreed that EPCOR would be able to leverage its existing relationships with other City departments and external stakeholders to maintain open communication and operational collaboration.
Given the above analysis, additional synergies which have not been quantified, as well as external research, EPCOR’s use of a maximum 5% operating efficiency factor by year five of the forecast is reasonable. The possibility also exists for greater operational efficiency gains.
3.4.2 Capital Efficiency
As described in EPCOR’s IR 7, EPCOR’s Proposal includes an assumption it can deliver the 10 year forecast Drainage capital program at a 10% lower cost. Cost savings resulting from these efficiencies total to $193.4M over the 10 year forecast period. This capital efficiency is explained by factors described in detail in its IR 7, and summarized below:
1. Very Low Cost Internal Engineering Design for Routine Projects: EPCOR suggests that it can reduce the cost of engineering design as a percentage of construction costs for recurring projects. Drainage staff noted that most drainage projects are not as routine compared to water projects due to broader planning implications (e.g. storm ponds), primary gravity driven flows (in comparison to water as a pressurized system), and often greater pipe depths as compared to most underground water infrastructure. Drainage also uses internal engineering for small routine projects, however these are far fewer compared to routine water projects. While there will likely be cost savings with greater use of internal engineering by EPCOR, these may not be as large as projected.
2. Master Service Agreements with a Limited Number of Highly Qualified Engineering and Construction Firms Result in Lower Unit Costs: EPCOR estimates that placing a large volume of work with a small number of highly qualified engineering and construction contractors reduces costs overall and unit cost for projects where they are utilized. Drainage currently completes a high volume of its construction work with in-house crews. When tendering for work, Drainage currently uses a prequalification process, and may be able to adapt its procurement process to accomplish a similar strategy to EPCOR. However, it was noted that this may take time to implement at the City.
27 Ontario Distribution Sector Review Panel, Renewing Ontario’s Electricity Distribution Sector: Putting the Consumer First, December 2012.
City of Edmonton 2016 EPCOR Proposal for Drainage Transfer Analysis October 5, 2016
42
Audit • Tax • Advisory © Grant Thornton LLP. A Canadian Member of Grant Thornton International Ltd. All rights reserved.
3. Master Service Agreements with No Contractor Contingency Results in Lower Realized Contractor Costs: EPCOR believes that fixed price construction projects determined under a conventional Design Bid Build model include a 23% premium to cover risk (contractor contingency). By accepting this risk and managing change orders (force accounts) very closely EPCOR experiences a 9% increase in costs through force accounts, resulting in an 11.3% savings. While Drainage is able to use force accounts as well, EPCOR appears to have a robust process in risk sharing with its contractors.
4. Master Service Agreements Results in Lower Procurement and Project Administration Costs (Lower Capital Overhead Rate): By using the master agreement approach with pre-agreed competitive unit pricing, EPCOR indicates it can materially reduce procurement and project administration to 5.5% of capital overhead costs. This is materially lower than the City’s 11% capital overhead rate. It was mutually agreed by EPCOR and Drainage staff that this would have a direct efficiency savings on capital.
5. Value Engineering/ Construction Reviews for Large Projects: EPCOR spends considerable time with its design consultant and contractor in “value engineering” sessions looking for ways to reduce capital costs as well as ongoing operating costs. EPCOR points to its selected bid for the City of Regina’s Wastewater Treatment Plant Public Private Partnership (P3), which was 10% below the public sector comparator. It was noted that the City’s Utility Infrastructure Branch uses a similar approach for its significant projects (i.e. value engineering, constructability reviews, risk assessments, etc.).
3.4.2.1 Capital Efficiency Summary
As a follow-up to its IR, EPCOR recognized that some of the procurement, project delivery and project management strategies are currently utilized (or can be utilized) by Drainage and the City to varying degrees. EPCOR has estimated that if none of these strategies were currently used by the City, the capital savings would be 18.5%. As such, EPCOR’s 10% capital efficiency is incremental to that what is being achieved or can be achieved by Drainage.
EPCOR’s use of a 10% capital efficiency factor used in its 10 year forecast Model is reasonable. However, EPCOR’s statement of an 18.5% capital efficiency in IR 7 may be higher than a reasonable range given similar procurement, project delivery and project management strategies used by Drainage and the City. Given the magnitude of the capital program forecast for Drainage over the next 10 years, significant effort and focus will be required to achieve these goals.
3.5 Future State of Drainage after Proposal
This section discusses the future state of Drainage if it is transferred to EPCOR as forecast in the EPCOR Stand-alone Drainage Model. Similar to the City Drainage Model, EPCOR would also face pressure to continue to operate the Utility with 3.0% annual rate increases. However, with its operating and capital efficiencies, and equity injections from its corporate level, EPCOR is able to financially sustain the Utility (albeit with low returns) over the forecast period.

City of Edmonton 2016 EPCOR Proposal for Drainage Transfer Analysis October 5, 2016
43
Audit • Tax • Advisory © Grant Thornton LLP. A Canadian Member of Grant Thornton International Ltd. All rights reserved.
3.5.1 EPCOR Sources and Uses of Funds
The following graphs illustrate EPCOR’s sources and uses of funds in its Drainage Stand-alone Model. The first graph below displays the construction costs in orange (i.e. capital expenditures), total debt service in green (i.e. annual principal and interest costs), forecast incremental dividends paid to the City in blue, and operating cash flow on the purple line (i.e. revenues less operating expenditures and work capital adjustments). Throughout the forecast period, it is clear that operating cash flows generated from the Drainage Utility are not sufficient to cover capital expenditures, annual debt service, as well as dividends paid to the City. As such, additional sources of funding through borrowing and equity injections are required.
Given that operating cash flows are not sufficient to fund construction costs, debt servicing and the annual incremental dividends paid to the City, the following graph illustrates the sources of funds to cover the additional funding amounts required. In the first forecast year, the EPCOR Model uses the entire cash balance of Drainage assumed to be transferred as a source of funding. Additional borrowing each forecast year forms a large component of funding, while equity injections (shown in red) beginning in year 2020 help to stabilize the stand-alone capital structure of Drainage. Due to the 3.0% annual rate increase assumption, as well as the large capital program, a large amount of borrowing required (albeit less than what is forecast in the City Drainage Model)28.
28 While the 3.0% rate increases are used for modelling purpose, the large borrowing increase are likely to be reduced with rate increases given that EPCOR proposes to submit a Performance Based Review (PBR) Application that will identify new rates for 2022-26.
$0
$50,000
$100,000
$150,000
$200,000
$250,000
$300,000
$350,000
$400,000
2016 2017 2018 2019 2020 2021 2022 2023 2024 2025
Am
ount
($'0
00,s
')
Construction Costs Total Debt Service Dividends Operating Cash Flow

City of Edmonton 2016 EPCOR Proposal for Drainage Transfer Analysis October 5, 2016
44
Audit • Tax • Advisory © Grant Thornton LLP. A Canadian Member of Grant Thornton International Ltd. All rights reserved.
3.5.2 EPCOR Financial Indicators
The following table details the consolidated ten year forecast results for Drainage as per the EPCOR Stand-alone Drainage Model. While these results are improved over the City’s results shown earlier, there continues to be a decline in most financial metrics as borrowing increases and returns decrease as a result of the large capital program and fixed 3.0% annual rate increase.
Target/Year 2017 2018 2019 2020 2021 2022 2023 2024 2025 2026
Net Income ('000's) 41,920 42,411 41,112 38,813 38,206 38,138 37,804 39,787 41,228 46,097
Rate increases 3.0% 3.0% 3.0% 3.0% 3.0% 3.0% 3.0% 3.0% 3.0% 3.0%
Debt-to-Capitalization
(target: 55% to 65%) 54.6% 55.9% 59.1% 60.8% 62.1% 62.9% 63.5% 64.1% 63.7% 62.4%
*Accounting Return on Equity 7.7% 7.5% 7.0% 6.3% 5.8% 5.5% 5.2% 5.2% 5.0% 5.2%
*FFO/Debt
(target: 10% to 15%) 9.8% 9.5% 8.2% 7.3% 6.7% 6.4% 6.1% 6.0% 5.9% 6.2%
3.5.2.1 Debt-to-Capitalization
The following graph and table illustrate that EPCOR’s ability to inject equity helps lower their Debt-to-Cap ratio over the forecast. Although this is improved over the City’s forecast, the Debt-to-Cap ratio still remains high due to the amount of borrowing and fixed rate increases that do not support equity reserve building.
$0
$20,000
$40,000
$60,000
$80,000
$100,000
$120,000
$140,000
$160,000
$180,000
$200,000
2017 2018 2019 2020 2021 2022 2023 2024 2025 2026
Am
ount
($'0
00,s
')
Total Borrowing Total Equity Total Cash

City of Edmonton 2016 EPCOR Proposal for Drainage Transfer Analysis October 5, 2016
45
Audit • Tax • Advisory © Grant Thornton LLP. A Canadian Member of Grant Thornton International Ltd. All rights reserved.
Target/Year 2017 2018 2019 2020 2021 2022 2023 2024 2025 2026 EPCOR Capex
$127M
$112M
$181M
$195M
$190M
$177M
$173M
$189M
$194M
$201M
Equity Injections $0 $0 $0 $20M $20M $20M $20M $24M $45M $68M
3.5.2.2 FFO/Debt
As illustrated in the graph below, EPCOR is able to stabilize the standalone FFO/Debt metric with its ability to inject equity as well as lower costs generated from its proposed efficiencies. There is a slight increase in this metric as well as the ROE from forecast years 2025 to 2026. Nonetheless, the FFO/Debt levels remain lower than targeted levels on a stand-alone basis (i.e. before consolidating results in EPCOR’s LTP Model).
3.5.3 Future State of Drainage After Proposal Summary
Given that EPCOR has used many of the assumptions of the City Drainage Model, it is also forecast to have deteriorating credit metrics over the 10 year time horizon.
54.6%
62.4%
$723,272
$1,571,659
$-
$200,000
$400,000
$600,000
$800,000
$1,000,000
$1,200,000
$1,400,000
$1,600,000
$1,800,000
48.0%
50.0%
52.0%
54.0%
56.0%
58.0%
60.0%
62.0%
64.0%
66.0%
2017 2018 2019 2020 2021 2022 2023 2024 2025 2026
Deb
t ('0
00's
)
Deb
t To
Cap
Per
cent
age
Debt to Cap Percentage Debt
9.8% 9.5%
8.2%
7.3% 6.7% 6.4% 6.1% 6.0% 5.9% 6.2%
7.7%
7.5% 7.0%
6.3% 5.8% 5.5% 5.2% 5.2% 5.0% 5.2%
0.0%
2.0%
4.0%
6.0%
8.0%
10.0%
12.0%
2017 2018 2019 2020 2021 2022 2023 2024 2025 2026
Prec
enta
ge
FFO/Debt Accounting ROE

City of Edmonton 2016 EPCOR Proposal for Drainage Transfer Analysis October 5, 2016
46
Audit • Tax • Advisory © Grant Thornton LLP. A Canadian Member of Grant Thornton International Ltd. All rights reserved.
Unlike the Drainage Model however, there appears to be a stabilization in forecast year 2024 as net income begins to increase, followed by improved Debt-to-Cap and FFO/Debt metrics in 2025 and 2026. This is largely due to operating efficiencies, capital efficiencies (resulting in lower borrowing, interest expense, and amortization), as well as EPCOR’s ability to inject equity funding into Drainage. As such, Drainage has a more favourable outlook in the EPCOR Stand-alone Model compared to the City Model under similar rate increase constraints. Additionally, following EPCOR’s commitment to hold the 3.0% rate increase between 2017 to 2021, it is presumed to have rate increases which will improve the financial outlook of Drainage on a stand-alone basis within EPCOR further.
3.5.4 Dividend & Dividend Sustainability
As stated in EPCOR IR 3, EPCOR is committed to increase the EPCOR dividend to the City by at least $20M in the first year following a transfer of Drainage to EPCOR (absent to any changes in the 3.0% annual rate increase). This is largely due to the EPCOR’s strong corporate balance sheet, EPCOR’s earnings outlook with the addition of Drainage, and operating and capital efficiencies proposed by EPCOR.
EPCOR provided Grant Thornton with dividend forecasts over the 10 year forecast horizon after consolidating EPCOR’s Drainage Stand-alone Model into EPCOR’s LTP Model. Upon request of Grant Thornton, EPCOR produced sensitivity ranges to test the impacts to its LTP Model with varying levels of operating and capital efficiencies to stress-test the LTP Model under different scenarios. The following table details the incremental dividend forecast to the City under each of these scenarios. When combined with EPCOR's LTP model, EPCOR forecasts an additional $202M in dividends to the City over the 10 year period in the base case model. Based on the sensitivity outputs provided by EPCOR, we believe that the $20M additional incremental dividend is reasonable in the first year following the proposed transfer.
Millions ($)
Capex Efficiency
OPEX Efficiency Scenario 2017 2018 2019 2020 2021 2022 2023 2024 2025 2026 Total
0% 0.0% 1 26 21 18 15 14 13 8 8 7 7 137
0% 2.5% 2 26 22 20 17 16 15 10 10 9 9 154
0% 5.0% 3 26 23 20 17 18 17 12 12 10 11 166
0% 7.5% 4 26 22 20 17 18 17 14 13 12 13 172
5% 0.0% 5 26 21 19 16 16 15 11 11 10 11 156
5% 2.5% 6 26 23 21 18 18 17 13 13 12 13 174
5% 5.0% 7 26 23 21 18 19 18 15 14 14 15 183
5% 7.5% 8 26 23 21 19 19 18 16 16 16 17 191
10% 0.0% 9 26 22 20 17 18 17 13 13 13 14 173
10% 2.5% 10 26 23 22 19 19 18 15 15 15 16 188
10% 5.0% Base Case 26 23 22 20 21 20 17 17 17 19 202
10% 7.5% 12 26 23 22 20 21 20 18 19 19 20 208
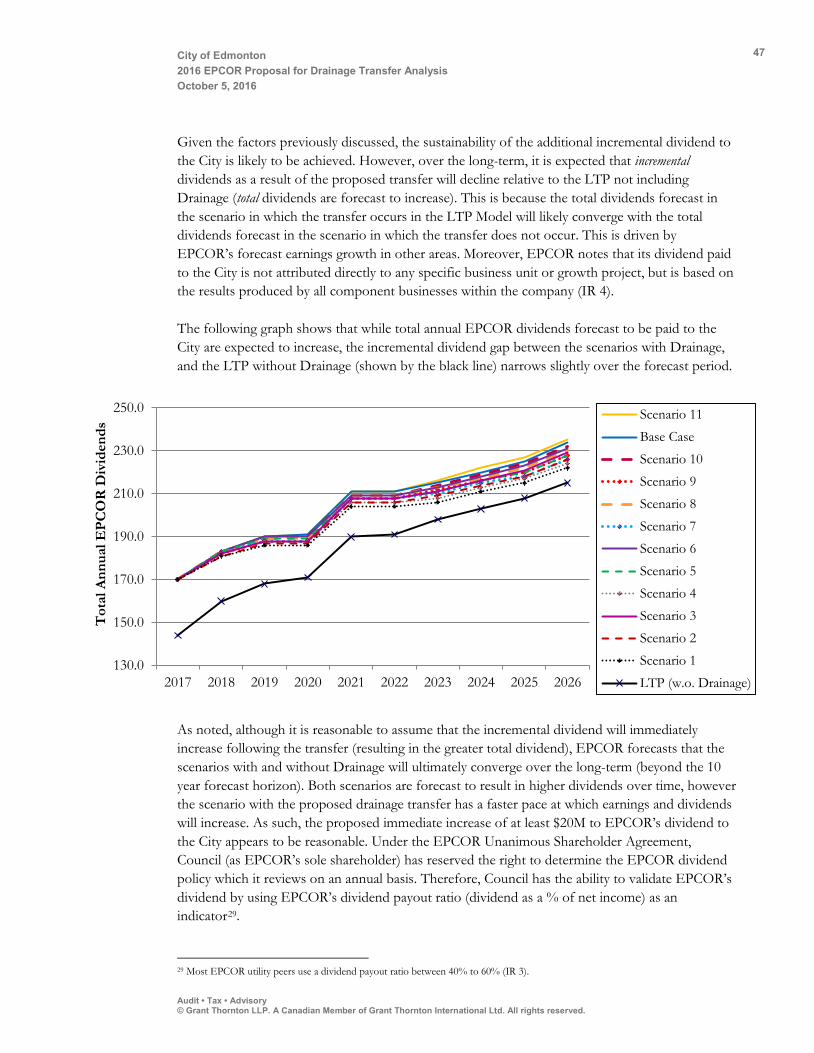
City of Edmonton 2016 EPCOR Proposal for Drainage Transfer Analysis October 5, 2016
47
Audit • Tax • Advisory © Grant Thornton LLP. A Canadian Member of Grant Thornton International Ltd. All rights reserved.
Given the factors previously discussed, the sustainability of the additional incremental dividend to the City is likely to be achieved. However, over the long-term, it is expected that incremental dividends as a result of the proposed transfer will decline relative to the LTP not including Drainage (total dividends are forecast to increase). This is because the total dividends forecast in the scenario in which the transfer occurs in the LTP Model will likely converge with the total dividends forecast in the scenario in which the transfer does not occur. This is driven by EPCOR’s forecast earnings growth in other areas. Moreover, EPCOR notes that its dividend paid to the City is not attributed directly to any specific business unit or growth project, but is based on the results produced by all component businesses within the company (IR 4).
The following graph shows that while total annual EPCOR dividends forecast to be paid to the City are expected to increase, the incremental dividend gap between the scenarios with Drainage, and the LTP without Drainage (shown by the black line) narrows slightly over the forecast period.
As noted, although it is reasonable to assume that the incremental dividend will immediately increase following the transfer (resulting in the greater total dividend), EPCOR forecasts that the scenarios with and without Drainage will ultimately converge over the long-term (beyond the 10 year forecast horizon). Both scenarios are forecast to result in higher dividends over time, however the scenario with the proposed drainage transfer has a faster pace at which earnings and dividends will increase. As such, the proposed immediate increase of at least $20M to EPCOR’s dividend to the City appears to be reasonable. Under the EPCOR Unanimous Shareholder Agreement, Council (as EPCOR’s sole shareholder) has reserved the right to determine the EPCOR dividend policy which it reviews on an annual basis. Therefore, Council has the ability to validate EPCOR’s dividend by using EPCOR’s dividend payout ratio (dividend as a % of net income) as an indicator29.
29 Most EPCOR utility peers use a dividend payout ratio between 40% to 60% (IR 3).
130.0
150.0
170.0
190.0
210.0
230.0
250.0
2017 2018 2019 2020 2021 2022 2023 2024 2025 2026
Tot
al A
nnua
l EPC
OR
Div
iden
ds Scenario 11
Base Case
Scenario 10
Scenario 9
Scenario 8
Scenario 7
Scenario 6
Scenario 5
Scenario 4
Scenario 3
Scenario 2
Scenario 1
LTP (w.o. Drainage)

City of Edmonton 2016 EPCOR Proposal for Drainage Transfer Analysis October 5, 2016
48
Audit • Tax • Advisory © Grant Thornton LLP. A Canadian Member of Grant Thornton International Ltd. All rights reserved.
3.5.5 Other Revenue Sources
As noted in EPCOR IR 4, the transfer of Drainage would provide EPCOR with significant additional expertise in managing linear wastewater and stormwater infrastructure. Gaining Drainage experience and expertise will allow EPCOR to pursue large linear wastewater and stormwater infrastructure opportunities with better margins and a higher probability of success compared to other opportunities EPCOR would otherwise be pursuing. However, EPCOR also notes that incremental dividends forecast in its LTP are based directly on the increased in consolidated net income as a result of the proposed transfer of Drainage, rather than additional business development growth as a result of the transfer of Drainage. Nonetheless, a number of upcoming projects to which the transfer of drainage may provide EPCOR with a higher probability of success are listed in IR 4. These specific opportunities total approximately $1.8B of capital. Without the transfer of Drainage, EPCOR believes that it may be challenged to qualify, or be short-listed, for some of these opportunities. EPCOR has also identified certain challenges of partnering with larger international organizations that bring drainage related expertise in the past.
EPCOR has prepared a version of its LTP Model that includes Drainage which supports the increase in the EPCOR dividend by at least $20M immediately following a transfer of Drainage to EPCOR. In this version, EPCOR has replaced two utility acquisitions with approximately $300M of drainage related business development projects that have a higher probability of success and are expected to yield better margins.
3.6 Organizational Financial Analysis
The followings section details the organizational financial capacity of EPCOR and resulting impacts to EPCOR’s debt limits and credit ratings following the proposed transfer. It also details the impacts to the City’s debt availability and credit rating following a potential transfer of Drainage.
3.6.1 EPCOR Financial Capacity and Impacts
As noted in IR 3, EPCOR raises all of its debt from the public markets in Canada and the United States and manages all of its cash at the consolidated level. The consolidated structure allows the company to scale services and create savings for certain activities among its operating entities. In particular, some of the central savings that are achieved are:
Cash management: cash requirements of the various subsidiaries depends upon their capital cycle and as a result, the consolidated entity can reallocate cash among these operating entities as required. Furthermore, consolidating cash management requires fewer bank accounts and consolidated credit facilities, leading to additional savings.
Consolidated Debt Issuance: EPCOR currently maintains a $350M syndicated credit facility and a $200M syndicate credit facility that is restricted to letters of credit only. Furthermore, EPCOR maintains a Canadian base shelf prospectus under which it can raise up to $1B of debt that have maturities 1 year and over. These facilities allow EPCOR to go to the public markets less frequently and for larger issuances thereby reducing the debt issuance costs.
City of Edmonton 2016 EPCOR Proposal for Drainage Transfer Analysis October 5, 2016
49
Audit • Tax • Advisory © Grant Thornton LLP. A Canadian Member of Grant Thornton International Ltd. All rights reserved.
EPCOR currently does not have a debt limit. EPCOR manages its leverage capabilities to maintain credit ratings of A- and A low with Standard and Poor’s (S&P) and DBRS, respectively (EPCOR was upgraded by S&P from BBB+ to A- in 2014). The key criteria that are considered as part of these ratings include:
Adjusted Funds from Operations (FFO) / Debt: minimum of 13% to maintain an A- credit rating from S&P. EPCOR’s current ratio is 19.5% with it expected to be between 15% and 19% for 201630.
Unregulated EBITDA: maximum of 15% in order to maintain A- credit rating from Standard & Poor’s. According to S&P, about 10% of EPCOR EBITDA is currently unregulated.
Debt-to-Cap Ratio: Although EPCOR’s covenant allows a Debt-to-Cap Ratio up to 70%, EPCOR targets not to exceed 55%. At the end of 2015, this ratio was at approximately 45%, which represents the ability to assume additional debt.
3.6.1.1 Impact of Transfer to EPCOR’s Credit Rating
EPCOR incorporated the outputs of its Stand-alone Drainage Model into its LTP model. This included the following incremental impacts (EPCOR IR 3):
• Add Drainage capital expenditures of $1.741B over the 10 year period (after the 10% annual capital efficiency reduction);
• Add a transition payment of up to $75M as a provision to cover the potential for stranded costs that may remain in the City and would no longer be recovered through Drainage rates;
• Add $609M of existing Debt that EPCOR would take on responsibility for (through a back-to-back arrangement);
• Add FFO realized from Drainage $777 M over the 10 year period.
This resulted in the following immediate and long term observations:
• Given EPCOR’s current strong balance sheet the FFO/Debt metric, EPCOR’s main credit indicator, moves in the 14% range which is higher than the 13% minimum required to maintain its current credit rating.
• EPCOR’s net income increases by $42 million in 2017 and grows by a compound annual growth rate of 4.4% over the 10 year forecast.
• EPCOR’s dividend to the City increases by a minimum $20 million in the first year following the transfer, and the increase is sustained given all of EPCOR’s consolidated earnings growth forecasts.
At the request of Grant Thornton, EPCOR produced sensitivity ranges to test the impacts to its LTP Model with varying levels of operating and capital efficiencies to stress-test the LTP Model under different scenarios. Under a scenario where no efficiencies were being achieved in Drainage,
30 S&P EPCOR credit research report dated August 11, 2016.

City of Edmonton 2016 EPCOR Proposal for Drainage Transfer Analysis October 5, 2016
50
Audit • Tax • Advisory © Grant Thornton LLP. A Canadian Member of Grant Thornton International Ltd. All rights reserved.
EPCOR was still able to maintain an FFO/Debt ratio of 13.5%. In addition, EPCOR has also had informal discussions with S&P about Drainage and they have suggested, assuming no change to business risk, that a negative rating action could occur if the FFO/Debt ratio goes below 11% to as low as 9% (S&P Report, September 17, 2015). DBRS also discusses the potential of the transfer of Drainage but doesn’t comment specifically around parameters on which a downgrade could occur. Nonetheless, the above factors indicate that EPCOR is financially capable of absorbing Drainage’s current and future financial outlook as forecast in the EPCOR Stand-alone Drainage Model.
3.6.1.2 Financial Impact of Accelerated Flood Mitigation
EPCOR has assessed its borrowing capacity to accelerate flood mitigation remedial work beyond what is forecast in the City’s 10 year capital forecast (i.e. approximately $53M per year). At current estimates, EPCOR believes it has access to an additional $900M of unallocated investment capacity after the addition of Drainage (making an assumption that it would be able to generate a fair return on capital investment). If EPCOR were to issue preferred shares, as it has done in the past, it could raise an additional $900M bring the total up to $1.8B for additional investment opportunities (EPCOR IR 3). Compared to peers, EPCOR appears to have a lower Debt-to-Cap ratio, meaning that it has financing capacity to take on the substantial on-going capital investment requirements of Drainage. Based on the above and the IRs provided by EPCOR, EPCOR is in a position to financially absorb Drainage as part of the proposed transfer while having additional capacity to fund an accelerating flood mitigation program if required. 3.6.2 City Debt Limits and Credit Rating Impacts
Debt borrowed by the City is classified into two major categories based on the source of funding used to repay debt: tax supported and self-liquidating31. Tax-supported debt is used for capital expenditures related to tax-supported operations and is repaid using tax levy revenues. Within the tax-supported debt category, is “self-supporting tax guaranteed debt”, which is used to finance capital expenditures by non-utility operations that generate sufficient cash to fund all obligations or have dedicated sources of revenues (e.g. South LRT project that was predominately funded with Federal Gas Tax grants). Shortfalls in funding from this stream are funded through tax levy revenues. Self-liquidating debt is assumed to fund capital expenditures by activities or programs that are self-funded including utilities and local improvements (i.e. projects that are of greater benefit to an area of the City than to the whole City and as such, are paid for by the property owners who are the recipients of that benefit).
The Municipal Government Act (MGA) is the City’s external authority on borrowing, and the Debt Management Fiscal Policy (DMFP) is the City’s internal policy that establishes guidelines for the issuance and use of new debt. The MGA includes a debt limit of two times the City revenue and a debt servicing (i.e. annual required debt repayments including interest and principal) limit of 35% of consolidated revenues. Revenues for this calculation are net of capital government
31 City’s Debt Management Fiscal Policy C203C, 2008.
City of Edmonton 2016 EPCOR Proposal for Drainage Transfer Analysis October 5, 2016
51
Audit • Tax • Advisory © Grant Thornton LLP. A Canadian Member of Grant Thornton International Ltd. All rights reserved.
transfers and contributed tangible assets. As per the City’s Debt Update (June 2016)32, the forecast debt service limit (i.e. the maximum amount of annual debt principal and interest that can be paid within the limits identified in the DMFP) in 2017 is $645M with the inclusion of the Drainage Utility.
The City’s DMFP prescribes a Total Debt Service Limit (TDSL) of 22% of total City revenues, and a lower debt service limit of 15% of tax supported operating revenues for Tax Supported Debt (TSD). These limits are lower (i.e. more risk-averse and conservative) than MGA debt servicing limit described earlier.
Debt associated with Drainage is classified as self-liquidating debt, and as such, does not impact the City’s 15% debt service limit for TSD. Thus, while the City would gain additional self-liquidating debt borrowing capacity by transferring Drainage’s debt to EPCOR, the transfer would not have an impact on the City’s TSD service limits. As stated earlier, the City’s self-liquidating debt is typically only used for utilities or local improvements.
3.6.2.1 MGA Debt Service Limit Impacts
The following table represents the net gain/(loss) of the City’s debt capacity according to the MGA limits following the proposed transfer of drainage. The debt room lost takes into account lost revenues of drainage, while the debt room gained takes into account the annual debt servicing of Drainage. According to MGA limits, the transfer of Drainage would provide a net gain in the amount of total debt available to be borrowed. More specifically, it would result in an additional $312M in debt room gained in 2017, growing to $1.25B in 2026 as a result of the increased borrowing forecast by Drainage. While this appears favourable, it is not impactful as the City is bound by lower debt serving limits in its DMFP.
(in $000's) 2017 2018 2019 2020 2021 2022 2023 2024 2025 2026 MGA Debt Limit Debt Room Lost (2x revenue) (368,194) (380,134) (395,758) (413,448) (431,890) (451,438) (470,928) (493,592) (514,964) (542,866) Debt Room Gained 680,638 738,719 870,192 1,014,369 1,150,995 1,272,384 1,388,025 1,519,208 1,654,064 1,793,957 Net (Loss)/ Gain 312,444 358,585 474,434 600,921 719,105 820,946 917,097 1,025,616 1,139,100 1,251,091
Source: City Drainage Rate Model, Provided Aug 18, 201633.
3.6.2.2 DMFP: Total Debt Service Limit (TDSL)
As at June 2016, the City had 57.3% ($352M) of its TDSL available and 48.4% ($160M) of its TSD service limit available as per the DMFP internal policy. The City budgets capital expenditures over a four year period (currently the 2015 – 2018 capital budget cycle), and thus future forecasts for debt availability do not include unapproved capital projects beyond this time horizon. The City has additional debt capacity available during this period, as debt service availability ranges from 43.3% to 57.3% for total debt and 22.6% to 48.4% available for TSD.
32 Financial and Corporate Services Report CR_3333 Projected Year-End Financial Results, June 30, 2016. 33 The City Drainage Rate Model (Aug 18, 2016) was completed after the City Debt Update – June 2016, and as such, there may be different assumptions in these models.

City of Edmonton 2016 EPCOR Proposal for Drainage Transfer Analysis October 5, 2016
52
Audit • Tax • Advisory © Grant Thornton LLP. A Canadian Member of Grant Thornton International Ltd. All rights reserved.
(in $000's) 2016 2017 2018 2019 2020 2021 2022 2023 2024 2025 2026 DMFP Total Debt Servicing Limit (TDSL - 22%) 613,963 644,661 676,894 710,739 746,276 783,590 807,097 831,310 856,250 881,937 908,395
% Used 43% 57% 51% 50% 51% 50% 50% 50% 50% 49% 49% % Available 57% 43% 49% 50% 49% 50% 50% 50% 50% 51% 51%
TDSL Amount Used 261,945 365,738 347,715 352,610 381,964 392,699 402,876 413,004 424,265 433,502 444,462 TDSL Amount Available 352,018 278,923 329,179 358,129 364,312 390,891 404,221 418,306 431,985 448,435 463,933
DMFP Tax Supported Debt Serving Limit (15%) 330,991 347,541 364,918 383,163 402,322 414,391 426,823 439,628 452,817 466,401 471,065
% Used 52% 77% 67% 65% 66% 64% 62% 60% 58% 55% 54% % Available 48% 23% 33% 35% 34% 36% 38% 40% 42% 45% 46%
TSD Servicing Limit - Amount Used 170,786 269,008 244,258 247,876 267,405 266,852 266,549 263,895 262,403 258,473 255,719 TSD Servicing Limit - Amount Available 160,205 78,533 120,660 135,287 134,917 147,540 160,274 175,732 190,414 207,928 215,346
Source: City of Edmonton Q2 Debt Update, Q2 2016 Performance Report
Similar to the MGA, the City’s TDSL of 22% includes the two perspectives: debt room lost (i.e. reduced based on Drainage revenue no longer available for debt serving), and debt room gained (i.e. annual principal and interest from Drainage no longer being applied to total debt limits). The following table details the results of a proposed transfer of Drainage. It shows that there is a favourable impact to the City’s TDSL, with additional debt service capacity growing to $64M in 2026. While this also appears favourable, it is not impactful to the City’s ability to borrow TSD.
(in $000's) 2017 2018 2019 2020 2021 2022 2023 2024 2025 2026 DMFP Total Debt Service Limit Debt Room Lost (22% of revenue) (40,501) (41,815) (43,533) (45,479) (47,508) (49,658) (51,802) (54,295) (56,646) (59,715)
Debt Room Gained 43,047 45,379 47,391 56,334 65,835 76,468 87,380 98,837 110,931 123,456
Net (Loss)/ Gain 2,546 3,565 3,857 10,854 18,327 26,810 35,578 44,542 54,285 63,741 Source: City Drainage Rate Model, Provided Aug 18, 2016; City of Edmonton Q2 Debt Update, Q2 2016 Performance Report
3.6.2.3 DMFP: Self-liquidating Debt Servicing Capacity
Below we have also detailed, how much of the 22% TDSL is available under the scenario in which:
1. The City utilizes 100% of the TSD service room under the debt service limit of 15%stated in the DMFP policy; and
2. The amount debt servicing costs for Drainage is also included.

City of Edmonton 2016 EPCOR Proposal for Drainage Transfer Analysis October 5, 2016
53
Audit • Tax • Advisory © Grant Thornton LLP. A Canadian Member of Grant Thornton International Ltd. All rights reserved.
(in $000's) 2017 2018 2019 2020 2021 2022 2023 2024 2025 2026 DMFP Total Debt Servicing Limit (TDSL - 22%) 644,661 676,894 710,739 746,276 783,590 807,097 831,310 856,250 881,937 908,395 Less: Max DMFP Tax Supported Debt Serving Limit (15%) (347,541) (364,918) (383,163) (402,322) (414,391) (426,823) (439,628) (452,817) (466,401) (471,065) Remaining Debt Servicing Capacity for Self-Liquidating Debt 297,121 311,977 327,575 343,954 369,198 380,274 391,683 403,433 415,536 437,330 Less: Projected Other Self Liquidating Debt Servicing (53,683) (58,078) (57,343) (58,225) (60,012) (59,859) (61,729) (63,025) (64,098) (65,287) Remaining Debt Servicing Capacity for Self-Liquidating Debt (without Drainage)
243,438 253,899 270,232 285,729 309,186 320,415 329,954 340,408 351,438 372,043
Less: Projected Drainage Debt Servicing (43,047) (45,379) (47,391) (56,334) (65,835) (76,468) (87,380) (98,837) (110,931) (123,456) Self-liquidating Debt Servicing Capacity Available 200,391 208,520 222,841 229,395 243,351 243,947 242,574 241,571 240,507 248,587
Source: City of Edmonton Q2 Debt Update, Q2 2016 Performance Report
As shown in the table, the City is forecast to have between $200M in 2017 to $249M in 2026 in self-liquidating debt servicing capacity available even after incorporating the maximum amount of TSD servicing and all forecast self-liquidating debt servicing (including Drainage’s debt servicing costs). While the amounts of self-liquidating debt servicing capacity available can increase with transferring Drainage’s debt serving costs (i.e. $249M in 2017 to $372 in 2026), this may only be used to fund other self-liquidating debt, rather than TSD.
3.6.2.4 Debt Conclusion
In summary, a transfer of the Drainage would give the City a long-term increase in the amount of total debt servicing capacity available. However, this debt is restricted to self-liquidating debt. Based on the City of Edmonton’s Debt Update (June 2016), the City has not reached its maximum debt limits for TDSL or TSD debt service limit. As detailed in the table above, under the scenario that the City exhausts its TSD servicing limit, and maintains the Drainage debt servicing costs, an estimated $200M in 2017 in debt servicing capacity is still available for self-liquidating debt under the TDSL.
In order for the City to utilize the additional debt servicing capacity gained from the transfer of Drainage it would need to:
1. Identify other expenditures that are classified as self-liquidating debt to utilize theadditional capacity (beyond the existing excess capacity even after including Drainage’sdebt servicing costs); and/or
2. Propose changes to the DMFP as it relates to the 15% TSD service limit, which wouldrequire Council approval. Given the City’s debt servicing limits are below the thresholdsidentified in the MGA, it has the ability to increase its debt servicing limits whileremaining below the debt servicing limit of 35% of consolidated revenues as prescribed inthe MGA.

City of Edmonton 2016 EPCOR Proposal for Drainage Transfer Analysis October 5, 2016
54
Audit • Tax • Advisory © Grant Thornton LLP. A Canadian Member of Grant Thornton International Ltd. All rights reserved.
3.6.2.5 S&P Ratings Summary
Historically, when calculating the debt and credit ratings for the City, S&P includes all debt borne by the City, including debt in the City’s name that is secured and paid for by EPCOR (e.g. debt relating to the GBWWTP transfer)34. The S&P credit rating analysis of the City will include dividends paid from EPCOR, but exclude net income or revenues earned by EPCOR. Thus, in the event of a proposed Drainage transfer, the City’s S&P credit rating will likely be impacted in the following ways:
1. Lost drainage revenues will have a negative impact, which will be slightly offset byadditional incremental dividends provided by EPCOR.
2. Given that there is a strong possibility that existing Drainage debt will remain in the City’sname, there may be a negative effect on the City’s credit rating in the short term given theloss of Drainage revenue. This could be mitigated if existing Drainage debt is transferreddirectly into EPCOR’s name.
3. Over the longer term, the City’s rating position could potentially deteriorate if it issuesadditional (non-Drainage related) debt after the proposed transfer (given the loss ofDrainage revenues, the continued assignment of Drainage’s existing debt, and any newnon-Drainage debt required). Note that any new debt issuance by EPCOR to support itsbusinesses including Drainage would not be attributed back to the City.
3.6.2.6 Alberta Capital Finance Authority
The City’s current funding for capital projects is facilitated through the Alberta Capital Finance Authority (ACFA). The ACFA is able to borrow in capital markets at interest rates which would not be available to local authorities acting independently. As such, the City’s S&P credit rating, while important, has little/no effect on its borrowing rates. The ability for the City to obtain necessary loans is ultimately contingent on the fact that the City is in compliance with the debt and debt servicing limits regulated by the MGA.
3.6.3 Tax Consequences
Grant Thornton worked with the City and EPCOR to identify material tax implications if Drainage were to be transferred to EPCOR35. The comments are based on the facts and assumptions stated below. Any variation or differences in these facts and assumptions may materially affect the analysis and conclusions. In providing our comments, Grant Thornton has relied upon our understanding of the Act, the Income Tax Regulations (“Regulations”), relevant decisions of Canadian courts of law and our understanding of the current administrative policies and assessing practices as published by the Canada Revenue Agency (the “CRA”) as of August 19, 2016. Comments also reflect our understanding of any proposed legislation (“Proposed Legislation”) or 34 It was noted in consultations with City staff that S&P excludes the debt transferred to ENMAX that remained in the City of Calgary’s name. As such, the City may wish to have further discussions with S&P regarding debt that is transferred and secured be a third party. 35 Note that this section is based on information provided to Grant Thornton by the City and EPCOR, and as result does not constitute an opinion, but rather are for discussion purposes.

City of Edmonton 2016 EPCOR Proposal for Drainage Transfer Analysis October 5, 2016
55
Audit • Tax • Advisory © Grant Thornton LLP. A Canadian Member of Grant Thornton International Ltd. All rights reserved.
regulations released by the Canadian Federal Department of Finance (“Finance”) prior to August 19, 2016. These laws, proposals and policies are subject to change and any changes thereto may also affect the analysis and conclusions. Please be advised that unless otherwise agreed to, we shall be under no obligation to update our analysis or conclusions in the event that such changes as discussed herein occur.
3.6.3.1 Facts and Material Assumptions
• We understand that the Proposed Transfer will be undertaken by way of a transfer ofcertain assets and the assumption of certain liabilities of the City (the “Target Assets”) toa wholly-owned subsidiary of EPCOR36.
• We further understand that EPCOR is proposing to have the City continue to regulatedrainage utility rates, and that EPCOR is also proposing to retain those Employeesaffected by the Proposed Transfer.
• Our understanding is that EPCOR and the subsidiary corporation they intend ontransferring the Target Assets to (the “Transferee”) are similarly not subject to provincialincome tax by sections 2 and 4 of the Alberta Corporate Tax Act.
• Each of the City, EPCOR and the Transferee are registered for GST.• For GST, the Target Assets would be considered real property as the Target Assets are
permanently attached to real property and the provision of the Drainage Utility toCustomers would be considered the provision of sewer services.
• It is our understanding that the City is also similarly except from income tax by virtue ofparagraph 149(1)(c).
• The activities of Drainage, and the profits derived therefrom, are not subject to Alberta’sPayment in Lieu of Income Tax regime as set out in subsection 147(1) of the ElectricUtilities Act (Alberta).
3.6.3.2 Income Tax Impacts
As per EPCOR’s IR 21, income earned from Drainage after the proposed transfer will not be subject to income tax because the Drainage assets will be owned by a corporation that is 100% owned (indirectly) by the City of Edmonton and this corporation will earn at least 90% of its income from activities carried on within the geographical boundaries of the City of Edmonton. As such, EPCOR has represented that it meets the requirements set forth in paragraph 149(1)(d.5), such that EPCOR does not have income tax payable in relation to taxable income generated in a taxation period. EPCOR has also represented that the subsidiary corporation they intend on transferring the Target Assets to (the “Transferee”) would meet the requirements set forth in paragraph 149(1)(d.6) such that the Transferee would also be exempt from federal income tax.
3.6.3.3 Property Tax Impacts
A change in ownership of the drainage system from the City to EPCOR creates a risk of the system becoming assessable and subject to property tax. This is due the wording in section 298(1)(a) of the Municipal Government Act (MGA). Section 298 of the MGA outlines property in a municipality that is not to be assessed for municipal property tax purposes. Clause (1)(a) of
36 We note that our understanding is that the final determination as to which EPCOR subsidiary will own the Target Assets is yet to be determined.
City of Edmonton 2016 EPCOR Proposal for Drainage Transfer Analysis October 5, 2016
56
Audit • Tax • Advisory © Grant Thornton LLP. A Canadian Member of Grant Thornton International Ltd. All rights reserved.
this section states that a sewage and drainage system is not to be assessed, but only if it is owned by the Crown, a municipality or a regional services commission. As such, if the property is transferred to EPCOR there is a risk that it would become assessable. Since there is no exemption from taxation for this property provided in the MGA, the risk is that it would become taxable and also be subject to the education property tax portion which is collected by the City and transferred to the Province. While the current wording in the MGA does not specifically include municipally-controlled corporations, EPCOR views this risk to be relatively small given its 100% ownership by the City. However, at this time there remains a small risk. This can be mitigated if the City requests that the Province add a clause that is similar to the current EPCOR water supply and distribution exemption that includes private corporations.
In addition, the proposed transfer will include certain properties that support Drainage operations (e.g. service centres), which will likely be subject to property taxation under EPCOR ownership. Currently, drainage facilities and systems are not assessable (and if they are not assessable they are not taxable). While the value of these assessable properties is small relative to the sewage and drainage system identified in Section 298 of the MGA, a similar mechanism in place for EPCOR Water can be adopted whereby property municipal taxes (excluding school taxes) payable to the City are deducted from the 8% Local Access Fee payable to the City. Further analysis is required to understand the extent of current Drainage assets that may become assessable for municipal property for taxes, as well as any impacts to the Local Access Fee and revenues losses to the City due to a component of taxes being transferred to the Province.
3.6.3.4 GST Impacts
From a GST perspective, the provision of drainage services may either be exempt or taxable depending on the status of the service provider. If the service is provided by a “municipality” or “designated municipality” as defined in the Excise Tax Act (Canada), the service to the Customer would be exempt. If the service is provided by any other entity, it is taxable and subject to GST.
If the Transferee is not designated as a municipality at the time of the transfer, the Transferee’s supplies could be taxable (i.e. bill for services would be subject to GST). A position can be taken that the supplies will be exempt if the application for the municipal designation is made at or prior to the date of transfer; however, this would be relying upon the CRA to concur the designation applies. Until such time as the designation is acquired, there is a concern that the Transferee could be liable for the uncollected GST on its provision of services.
In order to assess the GST impact of the transfer of the Target Assets and provision of the Drainage Service Utility, is it suggested that the City consider in more detail the Transferee’s status as a designated para-municipal organization at the time of transfer and the timing of the application for a “municipal designation”. Further details regarding EPCOR’s proposed plan of action for GST on the proposed transfer and during operations is provided in Appendix D. Based on the information provided, as well as the historical precedents of previous asset transfers from the City to EPCOR, there do not appear to be any major GST tax consequences that would impede EPCOR’s Proposal. In addition, the City can consider including similar provisions used for the GBWWTP transfer to protect against GST transfer taxes (provided in Appendix E).
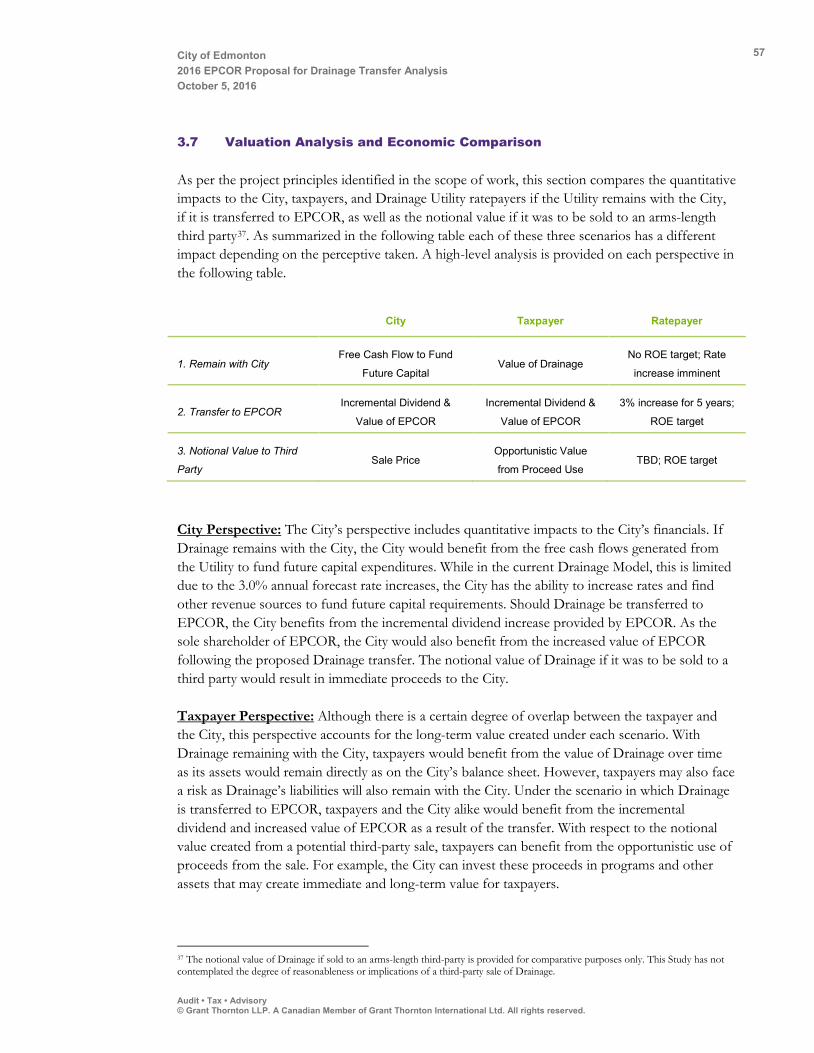
City of Edmonton 2016 EPCOR Proposal for Drainage Transfer Analysis October 5, 2016
57
Audit • Tax • Advisory © Grant Thornton LLP. A Canadian Member of Grant Thornton International Ltd. All rights reserved.
3.7 Valuation Analysis and Economic Comparison
As per the project principles identified in the scope of work, this section compares the quantitative impacts to the City, taxpayers, and Drainage Utility ratepayers if the Utility remains with the City, if it is transferred to EPCOR, as well as the notional value if it was to be sold to an arms-length third party37. As summarized in the following table each of these three scenarios has a different impact depending on the perceptive taken. A high-level analysis is provided on each perspective in the following table.
City Taxpayer Ratepayer
1. Remain with CityFree Cash Flow to Fund
Future Capital Value of Drainage
No ROE target; Rate
increase imminent
2. Transfer to EPCORIncremental Dividend &
Value of EPCOR
Incremental Dividend &
Value of EPCOR
3% increase for 5 years;
ROE target
3. Notional Value to Third
Party Sale Price
Opportunistic Value
from Proceed Use TBD; ROE target
City Perspective: The City’s perspective includes quantitative impacts to the City’s financials. If Drainage remains with the City, the City would benefit from the free cash flows generated from the Utility to fund future capital expenditures. While in the current Drainage Model, this is limited due to the 3.0% annual forecast rate increases, the City has the ability to increase rates and find other revenue sources to fund future capital requirements. Should Drainage be transferred to EPCOR, the City benefits from the incremental dividend increase provided by EPCOR. As the sole shareholder of EPCOR, the City would also benefit from the increased value of EPCOR following the proposed Drainage transfer. The notional value of Drainage if it was to be sold to a third party would result in immediate proceeds to the City.
Taxpayer Perspective: Although there is a certain degree of overlap between the taxpayer and the City, this perspective accounts for the long-term value created under each scenario. With Drainage remaining with the City, taxpayers would benefit from the value of Drainage over time as its assets would remain directly as on the City’s balance sheet. However, taxpayers may also face a risk as Drainage’s liabilities will also remain with the City. Under the scenario in which Drainage is transferred to EPCOR, taxpayers and the City alike would benefit from the incremental dividend and increased value of EPCOR as a result of the transfer. With respect to the notional value created from a potential third-party sale, taxpayers can benefit from the opportunistic use of proceeds from the sale. For example, the City can invest these proceeds in programs and other assets that may create immediate and long-term value for taxpayers.
37 The notional value of Drainage if sold to an arms-length third-party is provided for comparative purposes only. This Study has not contemplated the degree of reasonableness or implications of a third-party sale of Drainage.

City of Edmonton 2016 EPCOR Proposal for Drainage Transfer Analysis October 5, 2016
58
Audit • Tax • Advisory © Grant Thornton LLP. A Canadian Member of Grant Thornton International Ltd. All rights reserved.
Ratepayer Perspective: This is a unique viewpoint as compared to the City and taxpayer perspectives. The ratepayer perspective accounts for the potential and magnitude of rate increases given the different ownership structures. Currently, the Drainage Services Utility Fiscal Policy (C304D), does not include a specific return target for the Utility38. As such, Drainage has the ability to adjust its ROE for a period of time to limit large increases in utility rates. EPCOR has committed to hold the 3.0% annual rate increase between 2017 to 2022, followed by a PBR application for new rates over the 2022 to 2026 period. While this initial five years of 3.0% rate increase will benefit ratepayers, after five years EPCOR’s PBR application will include a regulated ROE that will be included in its revenue requirement. This will have an impact to Drainage utility rates. Unlike EPCOR’s commitment to hold rate increases to 3.0% annually, it is assumed that a notional third-party acquirer would require an immediate rate increase to generate the regulated ROE in 2017.
3.7.1 Valuation Overview
In order to evaluate the EPCOR Proposal from a quantitative perspective, we have prepared an independent calculation of the fair market value of Drainage as at January 1, 2017 (the “Valuation Date”).
We reserve the right, but are under no obligation, to review all calculations included in or referred to in this report and, if we consider it necessary, to revise our calculation of fair market value in light of any information existing at the Valuation Date that subsequently becomes known to us following the date of our report. Furthermore, our valuation analysis has been prepared solely for the evaluation of EPCOR’s Proposal to transfer Drainage. No other use is intended or permitted without the prior written consent of Grant Thornton LLP.
The conclusions set out in this section are based on the scope of our review, and is subject to the assumptions, restrictions and qualification set out in Appendix F.
3.7.2 Valuation Methodologies
Valuations are generally prepared using an asset based approach, an earnings/cash flow approach, or a market-based approach. Asset based approaches are typically used for businesses where the going concern outlook may be uncertain or for real estate or investment holding companies where their worth is solely the tangible assets they hold. Earnings/cash flow approaches are appropriate when the business is considered a viable going concern, provides investors with a reasonable rate of return on investment and where purchasers would value it on the basis of its stream of earnings/cash flows. The market-based approach is based on the implied valuation metrics of comparable public companies and precedent transactions.
3.7.3 Selected Valuation Approach
The following is a synopsis of the principal and secondary technique we employed in our valuation analysis of Drainage. As a primary valuation approach, we have used an earnings based approach, specifically, the Discounted Cash Flow (DCF) methodology. To assess the reasonability of the
38 Drainage Services Utility Fiscal Policy (C304D), July 2014.
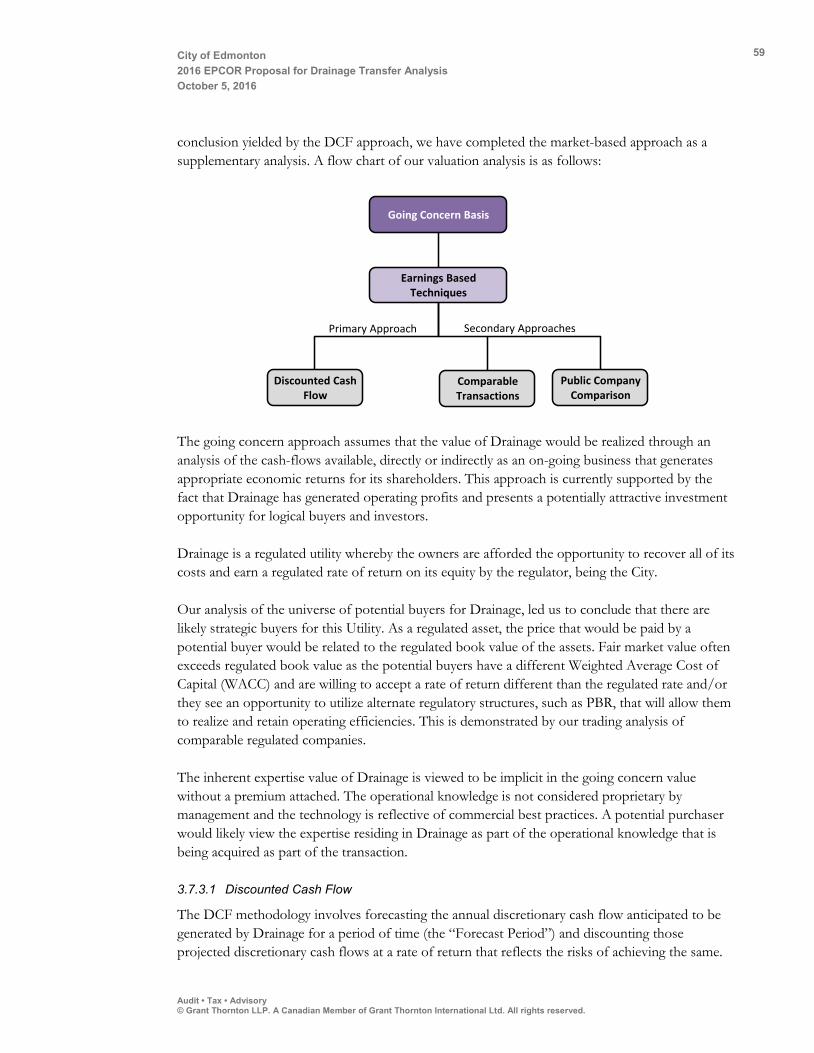
City of Edmonton 2016 EPCOR Proposal for Drainage Transfer Analysis October 5, 2016
59
Audit • Tax • Advisory © Grant Thornton LLP. A Canadian Member of Grant Thornton International Ltd. All rights reserved.
conclusion yielded by the DCF approach, we have completed the market-based approach as a supplementary analysis. A flow chart of our valuation analysis is as follows:
The going concern approach assumes that the value of Drainage would be realized through an analysis of the cash-flows available, directly or indirectly as an on-going business that generates appropriate economic returns for its shareholders. This approach is currently supported by the fact that Drainage has generated operating profits and presents a potentially attractive investment opportunity for logical buyers and investors.
Drainage is a regulated utility whereby the owners are afforded the opportunity to recover all of its costs and earn a regulated rate of return on its equity by the regulator, being the City.
Our analysis of the universe of potential buyers for Drainage, led us to conclude that there are likely strategic buyers for this Utility. As a regulated asset, the price that would be paid by a potential buyer would be related to the regulated book value of the assets. Fair market value often exceeds regulated book value as the potential buyers have a different Weighted Average Cost of Capital (WACC) and are willing to accept a rate of return different than the regulated rate and/or they see an opportunity to utilize alternate regulatory structures, such as PBR, that will allow them to realize and retain operating efficiencies. This is demonstrated by our trading analysis of comparable regulated companies.
The inherent expertise value of Drainage is viewed to be implicit in the going concern value without a premium attached. The operational knowledge is not considered proprietary by management and the technology is reflective of commercial best practices. A potential purchaser would likely view the expertise residing in Drainage as part of the operational knowledge that is being acquired as part of the transaction.
3.7.3.1 Discounted Cash Flow
The DCF methodology involves forecasting the annual discretionary cash flow anticipated to be generated by Drainage for a period of time (the “Forecast Period”) and discounting those projected discretionary cash flows at a rate of return that reflects the risks of achieving the same.
Secondary Approaches
100%
Earnings Based Techniques
Discounted Cash Flow
Public Company Comparison
Going Concern Basis
Comparable Transactions
Primary Approach
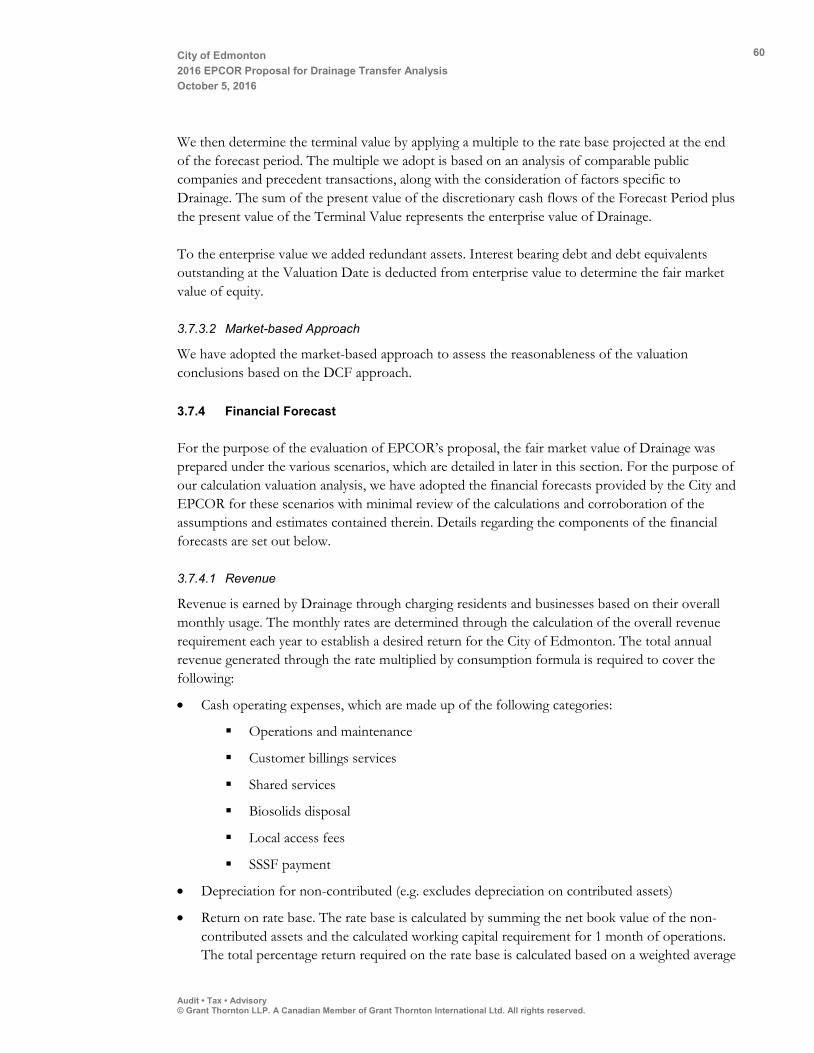
City of Edmonton 2016 EPCOR Proposal for Drainage Transfer Analysis October 5, 2016
60
Audit • Tax • Advisory © Grant Thornton LLP. A Canadian Member of Grant Thornton International Ltd. All rights reserved.
We then determine the terminal value by applying a multiple to the rate base projected at the end of the forecast period. The multiple we adopt is based on an analysis of comparable public companies and precedent transactions, along with the consideration of factors specific to Drainage. The sum of the present value of the discretionary cash flows of the Forecast Period plus the present value of the Terminal Value represents the enterprise value of Drainage.
To the enterprise value we added redundant assets. Interest bearing debt and debt equivalents outstanding at the Valuation Date is deducted from enterprise value to determine the fair market value of equity.
3.7.3.2 Market-based Approach
We have adopted the market-based approach to assess the reasonableness of the valuation conclusions based on the DCF approach.
3.7.4 Financial Forecast
For the purpose of the evaluation of EPCOR’s proposal, the fair market value of Drainage was prepared under the various scenarios, which are detailed in later in this section. For the purpose of our calculation valuation analysis, we have adopted the financial forecasts provided by the City and EPCOR for these scenarios with minimal review of the calculations and corroboration of the assumptions and estimates contained therein. Details regarding the components of the financial forecasts are set out below.
3.7.4.1 Revenue
Revenue is earned by Drainage through charging residents and businesses based on their overall monthly usage. The monthly rates are determined through the calculation of the overall revenue requirement each year to establish a desired return for the City of Edmonton. The total annual revenue generated through the rate multiplied by consumption formula is required to cover the following:
• Cash operating expenses, which are made up of the following categories:
Operations and maintenance
Customer billings services
Shared services
Biosolids disposal
Local access fees
SSSF payment
• Depreciation for non-contributed (e.g. excludes depreciation on contributed assets)
• Return on rate base. The rate base is calculated by summing the net book value of the non-contributed assets and the calculated working capital requirement for 1 month of operations. The total percentage return required on the rate base is calculated based on a weighted average
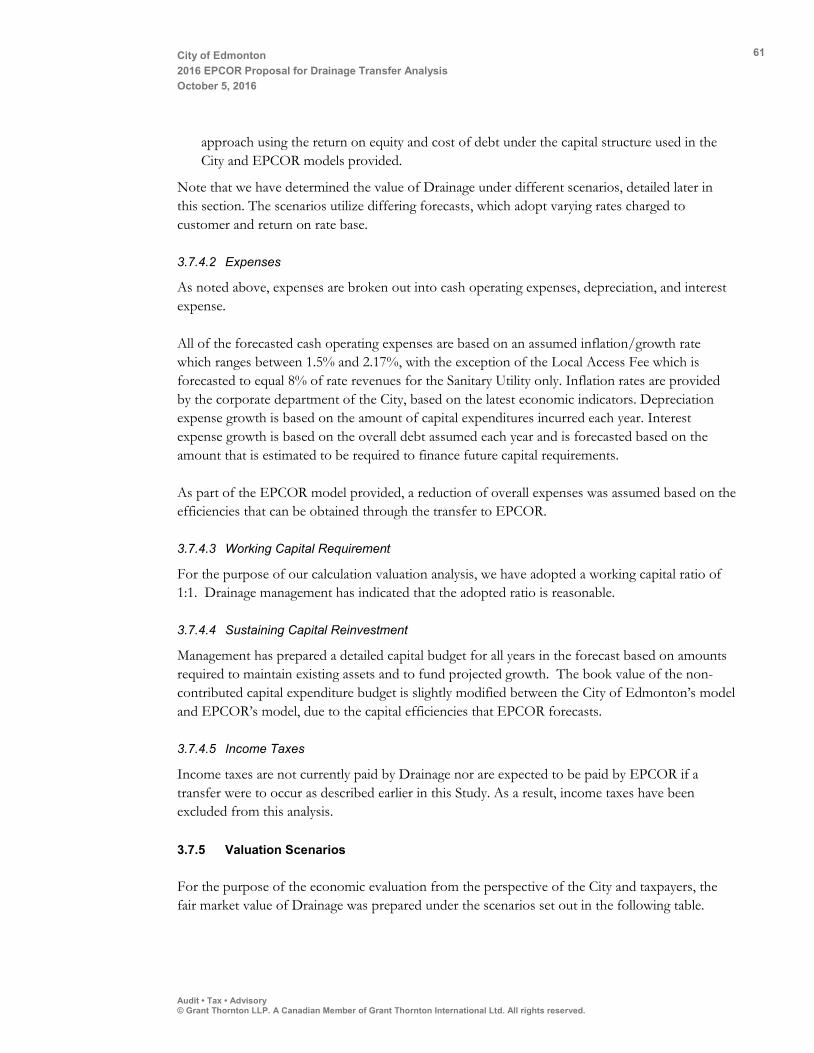
City of Edmonton 2016 EPCOR Proposal for Drainage Transfer Analysis October 5, 2016
61
Audit • Tax • Advisory © Grant Thornton LLP. A Canadian Member of Grant Thornton International Ltd. All rights reserved.
approach using the return on equity and cost of debt under the capital structure used in the City and EPCOR models provided.
Note that we have determined the value of Drainage under different scenarios, detailed later in this section. The scenarios utilize differing forecasts, which adopt varying rates charged to customer and return on rate base.
3.7.4.2 Expenses
As noted above, expenses are broken out into cash operating expenses, depreciation, and interest expense.
All of the forecasted cash operating expenses are based on an assumed inflation/growth rate which ranges between 1.5% and 2.17%, with the exception of the Local Access Fee which is forecasted to equal 8% of rate revenues for the Sanitary Utility only. Inflation rates are provided by the corporate department of the City, based on the latest economic indicators. Depreciation expense growth is based on the amount of capital expenditures incurred each year. Interest expense growth is based on the overall debt assumed each year and is forecasted based on the amount that is estimated to be required to finance future capital requirements.
As part of the EPCOR model provided, a reduction of overall expenses was assumed based on the efficiencies that can be obtained through the transfer to EPCOR.
3.7.4.3 Working Capital Requirement
For the purpose of our calculation valuation analysis, we have adopted a working capital ratio of 1:1. Drainage management has indicated that the adopted ratio is reasonable.
3.7.4.4 Sustaining Capital Reinvestment
Management has prepared a detailed capital budget for all years in the forecast based on amounts required to maintain existing assets and to fund projected growth. The book value of the non-contributed capital expenditure budget is slightly modified between the City of Edmonton’s model and EPCOR’s model, due to the capital efficiencies that EPCOR forecasts.
3.7.4.5 Income Taxes
Income taxes are not currently paid by Drainage nor are expected to be paid by EPCOR if a transfer were to occur as described earlier in this Study. As a result, income taxes have been excluded from this analysis.
3.7.5 Valuation Scenarios
For the purpose of the economic evaluation from the perspective of the City and taxpayers, the fair market value of Drainage was prepared under the scenarios set out in the following table.

City of Edmonton 2016 EPCOR Proposal for Drainage Transfer Analysis October 5, 2016
62
Audit • Tax • Advisory © Grant Thornton LLP. A Canadian Member of Grant Thornton International Ltd. All rights reserved.
Model 2017 – 2021 2022 – 2026 and Terminal Period
Scenario 1A City of
Edmonton
3% annual increase of monthly
Drainage rates
3% annual increase of monthly
Drainage rates
Scenario 1B City of
Edmonton
3% annual increase of monthly
Drainage rates
Return of equity portion of rate base
of 10.5%
Scenario 2A EPCOR 3% annual increase of monthly
Drainage rates
3% annual increase of monthly
Drainage rates
Scenario 2B EPCOR 3% annual increase of Drainage
rates
Return of equity portion of rate base
of 10.5%
Scenario 3A Notional Buyer Return of equity portion of rate base
of 10.5%
Return of equity portion of rate base
of 10.5%
Scenario 3B Notional Buyer 3% annual increase of monthly
Drainage rates
Return of equity portion of rate base
of 10.5%
While the fair market value was determined under various scenarios, it is our view that the fair market value under Scenario 3A best reflects the fair market value of Drainage from the perspective of an arm’s length acquirer. Note that 1, 2 and 3 “B” scenarios are used to equivalently compare the alternative ownership options39. 3.7.6 Valuation
3.7.6.1 Weighted Average Cost of Capital
The selection of a capitalization rate (also known as a cash-flow multiple) is based on consideration of a wide variety of factors, which can be expected to influence the trend of the Drainage’s earnings in the future, as well as the present economic and competitive conditions. We utilized the WACC – capital asset pricing model to determine the appropriate discount rate range for Drainage. The WACC, or discount rate, represents a weighted average of the cost of debt and the cost of equity. The weighting is based on the underlying company’s or asset’s target debt to equity ratio based on market values. In determining the WACC for Drainage we examined the capital structures and betas for comparable companies. From this calculation we selected a range of discount rates from 6.5% – 6.9%. The table below summarizes the key assumptions used to determine the WACC.
Parameters Low High Corporate Interest Rate 4.2% 4.2% Corporate Income Tax Rate - - Debt/Business Enterprise 60% 60% Equity/Business Enterprise 40% 40% Weighted After-tax Cost of Debt 2.5% 2.5% Weighted Cost of Equity 4.0% 4.4% WACC 6.5% 6.9%
39 Note that the 10.5% ROE used on the equity component of the rate base is arbitrary, and is incorporated into each scenario for comparison purposes only.

City of Edmonton 2016 EPCOR Proposal for Drainage Transfer Analysis October 5, 2016
63
Audit • Tax • Advisory © Grant Thornton LLP. A Canadian Member of Grant Thornton International Ltd. All rights reserved.
The noted inputs for WACC are used for all Scenarios except for Scenario 3A. An additional 1.5% risk premium was added to the cost of equity to account for the additional risk of achieving a rate of return on the equity portion of rate base of 10.5% beginning in 2017 (the financial forecast in all other scenarios assumes a 3.0% annual increase of monthly Drainage rates from 2017 to 2021, which results in lower revenue levels during this time period, relative to Scenario 3A). Due to the regulatory environment, an added risk premium is reasonable when determining whether this return on rate base can be implemented immediately in 2017. This added premium resulted in an increased WACC of 7.1% to 7.5% for Scenario 3A.
3.7.6.2 Scenario 1A: 3% annual rate increases, city ownership
Scenario 1A is based on the Drainage Model provided by the City with the assumption of increasing monthly drainage rates by 3.0% annually from 2017 through to 2026. The terminal period net present value is based on a multiple of rate base at the end of the forecast period. The adopted multiple of 1.2x, is based on our analysis of comparable public companies and precedent transactions, along with the consideration of factors specific to Drainage. The valuation summary is outlined below, with full financial schedules (for all scenarios) provided in Appendix F.
Scenario 1A Summary
3.7.6.3 Scenario 1B: 3% annual rate increases to 2021, 10.5% ROE in 2022, city ownership
Scenario 1B is based on an iteration of the Drainage Model provided by the City with the assumption of increasing monthly drainage rates by 3% annually from 2017 to 2021. Beginning in 2022 until the end of the forecast period in 2026, drainage rates are assumed to increase to a level to obtain a return on the equity portion of rate base of 10.5%. The terminal period net present value is based on a multiple of rate base at the end of the forecast period. The adopted multiple is 1.2x, which is similar to the rate adopted in Scenario 1A. The valuation summary follows.
LOW MIDPOINT HIGH
Present v alue of discretionary cash flow s:Fiscal 2017 through 2026 (560,248) (565,135) (570,022)Terminal v alue 1,569,657 1,599,628 1,629,598
Enterprise v alue 1,009,409 1,034,493 1,059,576
Enterprise Value/Forecast FY17 EBITDA 11.6x 11.9x 12.2xEnterprise Value/Rate Base 0.98x 1.00x 1.03x
Less: Long term debt (609,269) (609,269) (609,269)Fair market value of City of Edmonton, Drainage Utility 400,140 425,223 450,306
Rounded 400,000 425,000 450,000

City of Edmonton 2016 EPCOR Proposal for Drainage Transfer Analysis October 5, 2016
64
Audit • Tax • Advisory © Grant Thornton LLP. A Canadian Member of Grant Thornton International Ltd. All rights reserved.
Scenario 1B Summary
3.7.6.4 Scenario 2A: 3% annual rate increases, EPCOR ownership
Scenario 2A is based on the Stand-alone Drainage Model provided by EPCOR with the assumption of increasing monthly drainage rates by 3% annually from 2017 through to the end of the forecast period in 2026. The terminal period net present value is based on a multiple of rate base at the end of the forecast period. The adopted multiple of 1.3x is higher than the multiple adopted in Scenario 1A and 1B, which in our view is reasonable having consideration of the expected efficiencies adopted in the EPCOR model, specifically, savings related to operation expenses and capital expenditures. The valuation summary is outlined below.
Scenario 2A Summary
3.7.6.5 Scenario 2B: 3% annual rate increases to 2021, 10.5% ROE in 2022, EPCOR ownership
Scenario 2B is based on an iteration of EPCOR’s Stand-alone Drainage Model (provided by EPCOR), with the assumption of increasing monthly drainage rates by 3% annually from 2017 to 2021. Beginning in 2022 until the end of the forecast period in 2026, drainage rates are assumed to increase to a level required to obtain a return on the equity portion of rate base of 10.5%. The terminal period net present value is based on a multiple of rate base at the end of the forecast period. The adopted multiple of 1.3x, is similar to the rate adopted in 2A. The valuation summary follows.
LOW MIDPOINT HIGH
Present v alue of discretionary cash flow s:Fiscal 2017 through 2026 (378,178) (380,440) (382,703)Terminal v alue 1,569,467 1,599,434 1,629,401
Enterprise v alue 1,191,290 1,218,994 1,246,698
Enterprise Value/Forecast FY17 EBITDA 13.7x 14.1x 14.4xEnterprise Value/Rate Base 1.15x 1.18x 1.21x
Less: Long term debt (609,269) (609,269) (609,269)Fair market value of City of Edmonton, Drainage Utility 582,020 609,725 637,429
Rounded 582,000 610,000 637,000
LOW MIDPOINT HIGH
Present v alue of discretionary cash flow s:Fiscal 2017 through 2026 (390,263) (393,572) (396,880)Terminal v alue 1,583,709 1,613,948 1,644,187
Enterprise v alue 1,193,446 1,220,376 1,247,307
Enterprise Value/Forecast FY17 EBITDA 13.4x 13.7x 14.0xEnterprise Value/Rate Base 1.17x 1.20x 1.23x
Less: Long term debt (609,269) (609,269) (609,269)Fair market value of City of Edmonton, Drainage Utility 584,177 611,107 638,037
Rounded 584,000 611,000 638,000

City of Edmonton 2016 EPCOR Proposal for Drainage Transfer Analysis October 5, 2016
65
Audit • Tax • Advisory © Grant Thornton LLP. A Canadian Member of Grant Thornton International Ltd. All rights reserved.
Scenario 2B Summary
3.7.6.6 Scenario 3A: immediate 10.5% ROE, notional value
Scenario 3A is based on a notional buyer scenario, using an iteration of the Drainage Model created by the City, with the assumption of drainage rates increasing to a level required to obtain a return on the equity portion of rate base of 10.5% beginning in 2017 through to end of the forecast period in 2026. The terminal period net present value is based on a multiple of rate base at the end of the forecast period. We adopted a multiple of 1.2x, as this model is based on the City forecast, which does not consider any operational efficiencies. This is similar to the rate adopted in Scenario 1A and 1B. The valuation summary is outlined below.
Scenario 3A Summary
3.7.6.7 Scenario 3B: 3% annual rate increases to 2021, 10.5% ROE in 2022, notional value
Scenario 3B is based on a notional buyer scenario, using an iteration of the Drainage Model created by the City, with the assumption of increasing monthly drainage rates by 3% annually from 2017 to 2021. Beginning in 2022 until the end of the forecast period in 2026, drainage rates are assumed to increase to a level required to obtain a return on the equity portion of rate base of 10.5%. The terminal period net present value is based on a multiple of rate base at the end of the forecast period. The multiple adopted was 1.2x, which is similar to the rate adopted in Scenario 3A. The valuation summary follows.
LOW MIDPOINT HIGH
Present v alue of discretionary cash flow s:Fiscal 2017 through 2026 (242,533) (243,730) (244,928)Terminal v alue 1,587,412 1,617,722 1,648,032
Enterprise v alue 1,344,879 1,373,991 1,403,104
Enterprise Value/Forecast FY17 EBITDA 15.1x 15.5x 15.8xEnterprise Value/Rate Base 1.32x 1.35x 1.38x
Less: Long term debt (609,269) (609,269) (609,269)Fair market value of City of Edmonton, Drainage Utility 735,610 764,722 793,834
Rounded 736,000 765,000 794,000
LOW MIDPOINT HIGH
Present v alue of discretionary cash flow s:Fiscal 2017 through 2026 (266,862) (268,447) (270,032)Terminal v alue 1,484,335 1,512,515 1,540,695
Enterprise v alue 1,217,473 1,244,068 1,270,663
Enterprise Value/Forecast FY17 EBITDA 12.6x 12.9x 13.2xEnterprise Value/Rate Base 1.18x 1.21x 1.23x
Less: Long term debt (609,269) (609,269) (609,269)Fair market value of City of Edmonton, Drainage Utility 608,203 634,799 661,394
Rounded 608,000 635,000 661,000

City of Edmonton 2016 EPCOR Proposal for Drainage Transfer Analysis October 5, 2016
66
Audit • Tax • Advisory © Grant Thornton LLP. A Canadian Member of Grant Thornton International Ltd. All rights reserved.
Scenario 3B Summary
3.7.6.8 Summary table
The following table summarizes the key valuation balances and multiples from the six scenarios outlined above.
3.7.7 Public Company Comparables and Precedent Transactions
The following comparable public company and precedent Ontario LDC transaction comparison was performed based on the notional buyer Scenario 3A.
LOW MIDPOINT HIGH
Present v alue of discretionary cash flow s:Fiscal 2017 through 2026 (378,178) (380,440) (382,703)Terminal v alue 1,569,467 1,599,434 1,629,401
Enterprise v alue 1,191,290 1,218,994 1,246,698
Enterprise Value/Forecast FY17 EBITDA 13.7x 14.1x 14.4xEnterprise Value/Rate Base 1.15x 1.18x 1.21x
Less: Long term debt (609,269) (609,269) (609,269)Fair market value of City of Edmonton, Drainage Utility 582,020 609,725 637,429
Rounded 582,000 610,000 637,000
($000s) Scenario 1A Scenario 1B Scenario 2A Scenario 2B Scenario 3A Scenario 3BEnterprise v alue
Low 1,009,409 1,191,290 1,193,446 1,344,879 1,217,473 1,191,290High 1,059,576 1,246,698 1,247,307 1,403,104 1,270,663 1,246,698
Fair Market ValueLow 400,000 582,000 584,000 736,000 608,000 582,000High 450,000 637,000 638,000 794,000 661,000 637,000
Enterprise Value/Forecast FY17 EBITDALow 11.6x 13.7x 13.4x 15.1x 12.6x 13.7xHigh 12.2x 14.4x 14.0x 15.8x 13.2x 14.4x
Enterprise Value/Rate BaseLow 0.98x 1.15x 1.17x 1.32x 1.18x 1.15xHigh 1.03x 1.21x 1.23x 1.38x 1.23x 1.21x
NorthAmerican Comparable Public Companies ($000 CAD millions)
Ticker Enterprise Market Levered Market Cap/ Current EV/Revenue Gross EBITDA EV/EBITDA Debt /
Company Name1 Symbol Value Cap Beta Book Value Ratio LTM Margin Margin LTM EV Rate Base
1 American Water Works Company, Inc. NYSE:AWK 23,594 14,878 0.2 2.9x 0.4x 5.4x 56% 48% 11.2x 39% 13,353 1.82 Aqua America Inc. NYSE:WTR 9,727 7,295 0.4 3.1x 0.7x 8.6x 62% 55% 15.5x 26% 4,371 2.23 Artesian Resources Corp. NasdaqGS:ARTN. 505 342 0.2 1.9x 0.6x 4.7x 50% 44% 10.6x 32% 322 1.64 California Water Service Group NYSE:CWT 2,252 1,546 0.6 1.8x 0.9x 2.8x 52% 27% 10.2x 34% 1,661 1.45 Connecticut Water Service Inc. NasdaqGS:CTWS 852 590 0.2 2.2x 0.7x 6.4x 50% 40% 15.9x 32% 491 1.76 Middlesex Water Co. NasdaqGS:MSEX 814 597 0.5 2.1x 0.9x 4.7x 48% 39% 12.0x 25% 442 1.87 SJW Corp. NYSE:SJW 1,393 838 0.4 1.6x 0.9x 3.3x 59% 40% 8.2x 42% 1,023 1.48 The York Water Company NasdaqGS:YORW 566 443 0.6 2.9x 1.9x 8.7x 83% 61% 14.2x 22% 232 2.4
6 Average 4,963$ 3,316$ 0.4 2.3x 0.9x 5.6x 57% 44% 12.2x 31% 1.8 7 Median 1,123$ 718$ 0.4 2.1x 0.8x 5.1x 54% 42% 11.6x 32% 1.8 8 Min 505$ 342$ 0.2 1.6x 0.4x 2.8x 48% 27% 8.2x 22% 1.4 9 Max 23,594$ 14,878$ 0.6 3.1x 1.9x 8.7x 83% 61% 15.9x 42% 2.4
1 As per CapitalIQ at December 31, 2015
EV/Rate Base

City of Edmonton 2016 EPCOR Proposal for Drainage Transfer Analysis October 5, 2016
67
Audit • Tax • Advisory © Grant Thornton LLP. A Canadian Member of Grant Thornton International Ltd. All rights reserved.
While we have considered public equity market multiples, we have recognized the limitations of any comparison between these multiples, and those implied by our valuation due to:
a) Differences between the size of the comparable companies and Drainage;
b) Differences in geographic coverage, service offering, client base as well as other operating features of the public equity market comparables versus that of Drainage; and
c) Differences in different regulatory environments.
The average EV/EBITDA and EV/Rate Base of Drainage is on the low end of the range of comparable North American public companies and precedent Ontario LDC transactions, which is reasonable given the current level of the return on the equity portion of the rate base, which at the Valuation Date was well below the target of 10.5%, and the risk of achieving this targeted rate of return over the forecast period, having consideration of the regulated environment Drainage operates.
Ontario LDC Precedent Transactions ($CDN millions)
Date Target/Issuer Buyers
Total Enterprise
ValueRate Base
Total Revenue
Distribution revenue EBITDA
Implied TEV / Total
Revenue
Implied TEV / Distribution
Revenue
Implied TEV /
EBITDAImplied TEV / Rate Base
1 15-Aug-2016 Orillia Power Corporation Hydro One Limited (TSX:H) 41 28 44 9 3.18 0.9x 4.8x 13.0x 1.46x2 10-Jun-2016 Haldimand County Utilities Inc. Hydro One Limited (TSX:H) 75 50 62 13 5.48 1.2x 5.9x 13.7x 1.49x
3 01-Dec-2014 SNC-Lavalin Energy Alberta Ltd. and AltaLink Holdings, L.P.
Berkshire Hathaway Energy Company - - - - - - - - -
4 21-May-2014 Woodstock Hydro Holdings Inc. Hydro One Limited (TSX:H) 46 33 52 9 4.23 0.9x 5.4x 10.9x 1.42x
5 13-May-2014 Brant County Power Inc. Cambridge and North Dumfries Hydro Inc. (nka: Energy+ Inc.) 40 28 37 6 2.45 1.1x 6.4x 16.4x 1.43x
6 02-Apr-2013 Norfolk Power Inc. Hydro One Limited (TSX:H) 93 60 49 12 6.40 1.9x 7.6x 14.5x 1.54x
Average 59$ 40$ 49$ 10$ 4$ 1.2x 6.0x 13.7x 1.47xMedian 46$ 33$ 49$ 9$ 4$ 1.1x 5.9x 13.7x 1.46x
Min 40$ 28$ 37$ 6$ 2$ 0.9x 4.8x 10.9x 1.42xMax 93$ 60$ 62$ 13$ 6$ 1.9x 7.6x 16.4x 1.54x
Sources: Capital IQ, a division of Standard and Poor's, as at August 30, 2016. OEB Yearbook of Electricity Distributors, 2013 - 2015Note: Information regarding the Berkshire transaction noted above (transaction #3) was not publicly disclosed and not included in the averages.
Company Name Min Average Max
North American Comparable Companies 8.2x 12.2x 15.9xOntario LDC Transactions 10.9x 13.7x 16.4xCity of Edmonton, Drainage Services - FY17 EBITDA 12.6x 12.9x 13.2x
Company Name Min Average Max
North American Comparable Companies 1.36x 1.79x 2.44xOntario LDC Transactions 1.42x 1.47x 1.54xCity of Edmonton, Drainage Services 1.18x 1.21x 1.23x
EV/EBITDA
EV/Rate Base
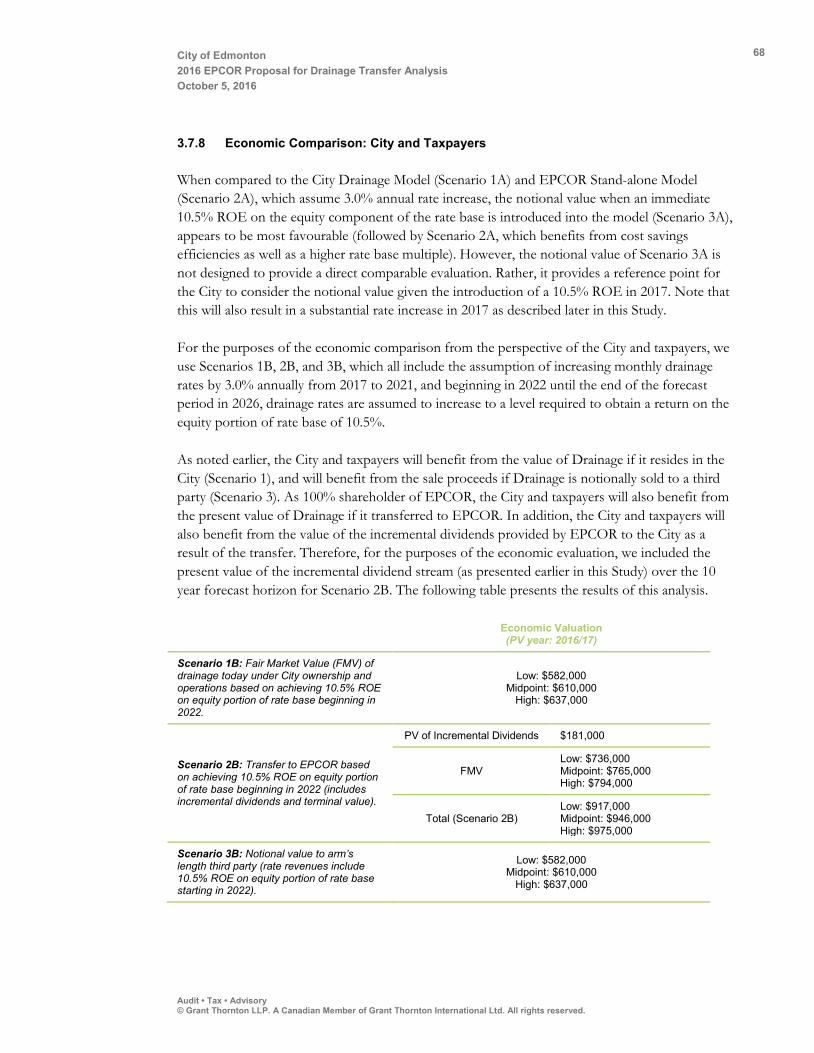
City of Edmonton 2016 EPCOR Proposal for Drainage Transfer Analysis October 5, 2016
68
Audit • Tax • Advisory © Grant Thornton LLP. A Canadian Member of Grant Thornton International Ltd. All rights reserved.
3.7.8 Economic Comparison: City and Taxpayers
When compared to the City Drainage Model (Scenario 1A) and EPCOR Stand-alone Model (Scenario 2A), which assume 3.0% annual rate increase, the notional value when an immediate 10.5% ROE on the equity component of the rate base is introduced into the model (Scenario 3A), appears to be most favourable (followed by Scenario 2A, which benefits from cost savings efficiencies as well as a higher rate base multiple). However, the notional value of Scenario 3A is not designed to provide a direct comparable evaluation. Rather, it provides a reference point for the City to consider the notional value given the introduction of a 10.5% ROE in 2017. Note that this will also result in a substantial rate increase in 2017 as described later in this Study.
For the purposes of the economic comparison from the perspective of the City and taxpayers, we use Scenarios 1B, 2B, and 3B, which all include the assumption of increasing monthly drainage rates by 3.0% annually from 2017 to 2021, and beginning in 2022 until the end of the forecast period in 2026, drainage rates are assumed to increase to a level required to obtain a return on the equity portion of rate base of 10.5%.
As noted earlier, the City and taxpayers will benefit from the value of Drainage if it resides in the City (Scenario 1), and will benefit from the sale proceeds if Drainage is notionally sold to a third party (Scenario 3). As 100% shareholder of EPCOR, the City and taxpayers will also benefit from the present value of Drainage if it transferred to EPCOR. In addition, the City and taxpayers will also benefit from the value of the incremental dividends provided by EPCOR to the City as a result of the transfer. Therefore, for the purposes of the economic evaluation, we included the present value of the incremental dividend stream (as presented earlier in this Study) over the 10 year forecast horizon for Scenario 2B. The following table presents the results of this analysis.
Economic Valuation (PV year: 2016/17)
Scenario 1B: Fair Market Value (FMV) of drainage today under City ownership and operations based on achieving 10.5% ROE on equity portion of rate base beginning in 2022.
Low: $582,000 Midpoint: $610,000
High: $637,000
Scenario 2B: Transfer to EPCOR based on achieving 10.5% ROE on equity portion of rate base beginning in 2022 (includes incremental dividends and terminal value).
PV of Incremental Dividends $181,000
FMV Low: $736,000 Midpoint: $765,000 High: $794,000
Total (Scenario 2B) Low: $917,000 Midpoint: $946,000 High: $975,000
Scenario 3B: Notional value to arm’s length third party (rate revenues include 10.5% ROE on equity portion of rate base starting in 2022).
Low: $582,000 Midpoint: $610,000
High: $637,000
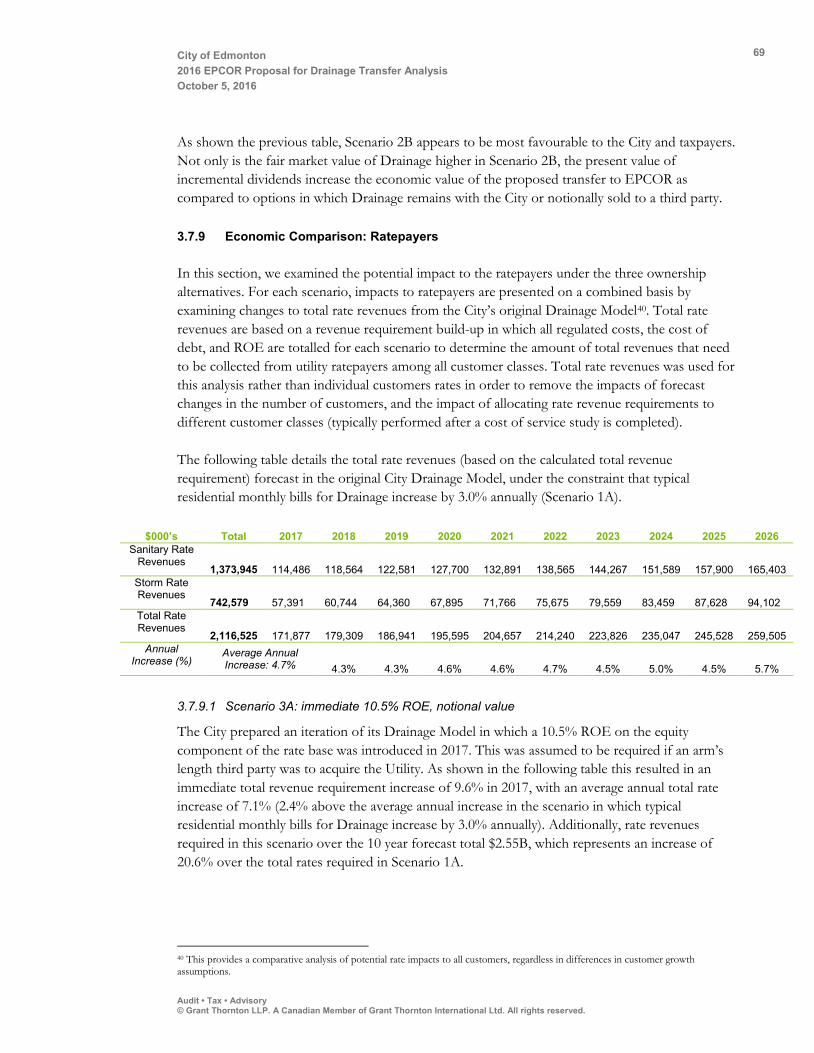
City of Edmonton 2016 EPCOR Proposal for Drainage Transfer Analysis October 5, 2016
69
Audit • Tax • Advisory © Grant Thornton LLP. A Canadian Member of Grant Thornton International Ltd. All rights reserved.
As shown the previous table, Scenario 2B appears to be most favourable to the City and taxpayers. Not only is the fair market value of Drainage higher in Scenario 2B, the present value of incremental dividends increase the economic value of the proposed transfer to EPCOR as compared to options in which Drainage remains with the City or notionally sold to a third party.
3.7.9 Economic Comparison: Ratepayers
In this section, we examined the potential impact to the ratepayers under the three ownership alternatives. For each scenario, impacts to ratepayers are presented on a combined basis by examining changes to total rate revenues from the City’s original Drainage Model40. Total rate revenues are based on a revenue requirement build-up in which all regulated costs, the cost of debt, and ROE are totalled for each scenario to determine the amount of total revenues that need to be collected from utility ratepayers among all customer classes. Total rate revenues was used for this analysis rather than individual customers rates in order to remove the impacts of forecast changes in the number of customers, and the impact of allocating rate revenue requirements to different customer classes (typically performed after a cost of service study is completed).
The following table details the total rate revenues (based on the calculated total revenue requirement) forecast in the original City Drainage Model, under the constraint that typical residential monthly bills for Drainage increase by 3.0% annually (Scenario 1A).
$000’s Total 2017 2018 2019 2020 2021 2022 2023 2024 2025 2026 Sanitary Rate
Revenues 1,373,945
114,486
118,564
122,581
127,700
132,891
138,565
144,267
151,589
157,900
165,403
Storm Rate Revenues
742,579 57,391
60,744
64,360
67,895
71,766
75,675
79,559
83,459
87,628
94,102
Total Rate Revenues
2,116,525 171,877
179,309
186,941
195,595
204,657
214,240
223,826
235,047
245,528
259,505
Annual Increase (%)
Average Annual Increase: 4.7% 4.3% 4.3% 4.6% 4.6% 4.7% 4.5% 5.0% 4.5% 5.7%
3.7.9.1 Scenario 3A: immediate 10.5% ROE, notional value
The City prepared an iteration of its Drainage Model in which a 10.5% ROE on the equity component of the rate base was introduced in 2017. This was assumed to be required if an arm’s length third party was to acquire the Utility. As shown in the following table this resulted in an immediate total revenue requirement increase of 9.6% in 2017, with an average annual total rate increase of 7.1% (2.4% above the average annual increase in the scenario in which typical residential monthly bills for Drainage increase by 3.0% annually). Additionally, rate revenues required in this scenario over the 10 year forecast total $2.55B, which represents an increase of 20.6% over the total rates required in Scenario 1A.
40 This provides a comparative analysis of potential rate impacts to all customers, regardless in differences in customer growth assumptions.

City of Edmonton 2016 EPCOR Proposal for Drainage Transfer Analysis October 5, 2016
70
Audit • Tax • Advisory © Grant Thornton LLP. A Canadian Member of Grant Thornton International Ltd. All rights reserved.
$000’s Total 2017 2018 2019 2020 2021 2022 2023 2024 2025 2026 Total Rate
Revenues 2,552,809
181,592
199,029
208,905
230,928
243,292
265,244
276,640
299,130
312,328
335,722
Annual Increase
(%)
Average Annual Increase: 7.1% 9.6% 5.0% 10.5% 5.4% 9.0% 4.3% 8.1% 4.4% 7.5%
3.7.9.2 Scenario 1B & 3B: 3% annual rate increases to 2021, 10.5% ROE in 2022
Rate impacts for Scenarios 1B and 3B are identical. These scenarios are based on an iteration of the Drainage Model that the City prepared in which monthly drainage rates increase by 3% annually from 2017 to 2021, followed by the introduction of a 10.5% ROE on the equity component of the rate base in 2022 to the end of the forecast period.
As shown in the table below, total rate revenues track very closely to Scenario 1A from 2017 to 202141. However, in forecast year 2022, when the 10.5% ROE is introduced, total rate revenues increase 27.7% over the previous year. Moreover, to sustain this increased ROE, the average annual total rate revenue increase over the last four years of the forecast is 6.2%. This suggests that ratepayers will have a significant increase to their average monthly utility rates particularly in 2022, as well as to the end of the forecast period. Specifically, this iteration of the City Model estimates that the typical residential monthly bill for Drainage services will increase by 20.2% from 2021 to 2022, going from an annual monthly bill increase of approximately $1.13 in 2020 to 2021, to an increase of $7.75 in 2022.
$000’s Total 2017 2018 2019 2020 2021 2022 2023 2024 2025 2026 Total Rate Revenues
2,413,238 171,878
179,309
186,939
195,588
204,666
261,330
277,588
298,474
312,903
331,841
Annual Increase (%)
Average Annual Increase: 7.8% 4.3% 4.3% 4.6% 4.6% 27.7% 6.2% 7.5% 4.8% 6.1%
3.7.9.3 Scenario 2B: 3% annual rate increases to 2021, 10.5% ROE in 2022, EPCOR ownership
Scenario 2B is based on an iteration of EPCOR’s Stand-alone Drainage Model (provided by EPCOR)42, with the assumption of increasing monthly drainage rates by 3% annually from 2017 to 2021, followed by the introduction of a 10.5% ROE on the equity component of the rate base in 2022 to the end of the forecast period. EPCOR prepared estimated total required revenue impacts starting in 2022 following the use of rate revenues taken from the City Drainage Model for the first five years.
As shown in the table below, in forecast year 2022, when the 10.5% ROE is introduced, total rate revenues increase 25.1% over the previous year (compared to 27.7% for Scenarios 1B and 3B). To sustain this increase ROE, the average annual total rate revenue increase over the last four years of the forecast is 5.4% (1.1% lower than Scenarios 1B and 3B).
41 Slight differences from total rate revenues to Scenario 1A are due to small model calculation differences and adjustments made by the City in this iteration of the Drainage Model. 42 EPCOR Stand-alone Drainage Model with Rate Increase in 2022, provided September 1, 2016. Note to support the consistency of the evaluation to the City Drainage Model, total rate revenues are used in this iteration in the EPCOR Stand-alone Drainage Model, rather than revenue requirements which include “other revenues”.

City of Edmonton 2016 EPCOR Proposal for Drainage Transfer Analysis October 5, 2016
71
Audit • Tax • Advisory © Grant Thornton LLP. A Canadian Member of Grant Thornton International Ltd. All rights reserved.
$000’s Total 2017 2018 2019 2020 2021 2022 2023 2024 2025 2026 Total Rate Revenues
2,373,064 171,877 179,309 186,941 195,595 204,657 257,261 272,449 286,542 301,069 317,364 Annual
Increase (%) Average Annual Increase: 7.2% 4.3% 4.3% 4.6% 4.6% 25.7% 5.9% 5.2% 5.1% 5.4%
Similar to Scenarios 1B and 3B, ratepayers are forecast to have significant increases to their average monthly utility rates in 2022, however the severity of the rate increase is likely to be lower in the Scenario 2B compared to Scenarios 1B and 3B. This is largely due to EPCOR’s proposed operating and capital and operating efficiencies. Additionally, EPCOR is expected to have a lower total rate base on which it can generate a regulated return, since the book value of its assets may be lower due to proposed capital efficiencies43. Moreover, should EPCOR realize additional cost savings (e.g. lower shared services costs44), further benefits to ratepayers could be achieved.
3.7.10 Economic Comparison Summary
Given the following reasons, Scenario 2B appears to be preferred alternative for the City, taxpayers and ratepayers:
• The fair market value of Drainage is higher in Scenario 2B.• Scenario 2B provides added advantage of an incremental dividend.• While the introduction of the 10.5% ROE on the equity component of the rate base will
lead to forecasted rate increases under all ownership alternatives, Scenario 2B has a lowerannual total revenue increase than other scenarios, as well as lower annual total revenueincreases thereafter to the forecast horizon.
3.8 Quantitative Analysis Summary
Based on the quantitative analysis, EPCOR’s Proposal to transfer Drainage has strong merit. Among all ownership alternative analyzed, the EPCOR Proposal appears to have the potential for greatest positive impacts on the City, taxpayers, and ratepayers45.
43 Note that EPCOR capitalizes interest costs on capital which has an impact to increase the book value of assets. 44 Information provided by the City as per their preliminary analysis of shared service costs indicates that the net present value of potential stranded costs is approximately $29M following a potential transfer. EPCOR did not alter the $75M provision in its corporate Long Term Planning model. 45 At similar ROE levels to prudently fund the Utility over the long-term.

City of Edmonton 2016 EPCOR Proposal for Drainage Transfer Analysis October 5, 2016
72
Audit • Tax • Advisory © Grant Thornton LLP. A Canadian Member of Grant Thornton International Ltd. All rights reserved.
4 Qualitative Analysis
In addition to a quantitative analysis, Grant Thornton completed a qualitative analysis to identify the impacts, particularly the governance and regulatory, operational and legal implications, of transferring the City’s Drainage Utility to EPCOR. Within this scope we compared the status quo and transfer scenarios to identify key differences, benefits and concerns.
EPCOR’s position on these qualitative impacts was first acquired through a number of information requests. EPCOR’s responses to these information requests are referenced in the following discussion and can be found in full in Appendix G. The information requests were further discussed with EPCOR and City representatives, and many were supplemented by written responses from the City. In some cases further analysis would be required should Council vote to approve the transfer. Areas for additional assessment have been identified throughout the following sections and are summarized in the findings and recommendations section of this report.
4.1 Regulatory and Governance
4.1.1 City’s Current State
City Council serves three roles in its relationship with EPCOR: regulator, shareholder, and policy maker. As regulator, Council regulates EWSI through its approval of the PBR application that sets water and wastewater treatment rates as well as regulated performance measures over a five year period. Additionally, non-routine adjustments outside of the approved PBR are reviewed and recommended by Administration and approved by the Utility Committee (UC; a committee comprised of Council members). EPCOR also provides an annual PBR report to the UC for information.
As sold shareholder, Council’s duties and powers set in accordance with the Unanimous Shareholder Agreement (USA) and governed by the Alberta Business Corporations Act. EPCOR’s Board of Directors hires the management to run the day-to-day business of the corporation, while Council (as shareholder) approves the members of the Board of Directors and guides policy decisions. Shareholder meetings are held between EPCOR and City Council, and EPCOR’s 10 year Long Term Plan is reviewed annually by Council. As the sole shareholder, Council does have the ability to dictate all actions of EPCOR, including the extreme measure of replacing EPCOR’s Board of Directors (IR 30).

City of Edmonton 2016 EPCOR Proposal for Drainage Transfer Analysis October 5, 2016
73
Audit • Tax • Advisory © Grant Thornton LLP. A Canadian Member of Grant Thornton International Ltd. All rights reserved.
Finally, Council, as policy maker, represents the interest of citizens by approving priority areas and policies to be followed by EPCOR.
To understand the impact of the regulatory and governance structure proposed by EPCOR it is important to consider the City’s current state. Organizationally, Drainage Services is in flux as its activities have transitioned from one Branch to three. As a result, three Branch Managers now oversee all Drainage operations, capital, and planning. As the structure is new, the historical processes for business planning and budgeting will require revision, and the new approach will be implemented during the upcoming budget preparation process.
Given the unknown impact of the organizational changes on the 2016 process, the following describes the City’s operational budgeting process as of 2015.
• An annual report is developed and presented to Utility Committee in April/May. • A three-year (revolving) business plan is then delivered by end of June, which establishes the
annual operating budget and rates at a high level. This plan forms the basis for the fall budget submission. Any changes to this budget and rates between June and the fall must be rationalized, defensible, and significant (e.g., the utility received a grant for a capital project that will no longer be funded through rates). Changes due to information not considered during the development of the business plan are not considered justifiable.
• The budget is presented to the Utility Committee (UC) in the fall, and goes through a written and oral question and answer process. The Utility Advisor (UA) is a critical component of the UC, which depends on the UA’s expertise and advice. The annual budget process may involve a back-and-forth with Drainage Services if changes are required, or may result in a simple recommendation by the UA to Council to accept the budget as proposed. Alternatively, given timing constraints, the UA may recommend the budget subject to specific changes that have been discussed with Drainage and are in-progress. Following the discussion process the UA writes a formal response to the Clerk’s Office, which is attached to the budget submission to Council. This has been identified as an area where a procedural change may be required on EPCOR’s part should the transfer proceed.
• A high level presentation of the budget is made to Council in the early days of budget presentations. This timing is important because rate approvals must take place both in the budget and to the Drainage Services Bylaw, and sufficient lead-time is required to process and approve the bylaw for a January 1 rate change. Approval of the budget and bylaw by Council is heavily influenced by the written response provided by the UA.
The 2016 budget development and presentation process is expected to be somewhat different due to the involvement of three Branch Managers, but the requirement for the Drainage Services bylaw, which contains the rates for the upcoming year, to be approved and in place by January 1st, is not expected to change.
Benefits of this structure are the availability of in-house experts to advice and collaborate with the UC and UA, as well as the direct link between Council and City operations.

City of Edmonton 2016 EPCOR Proposal for Drainage Transfer Analysis October 5, 2016
74
Audit • Tax • Advisory © Grant Thornton LLP. A Canadian Member of Grant Thornton International Ltd. All rights reserved.
Risks of this approach include delays in the process that would impact bylaw approval and EPCOR billing, and the recent changes that introduce the involvement of three Branch Managers, which reside under three different Deputy City Managers. Another concern associated with the current Drainage Services structure is the limitation on debt associated with the municipal debt limit policy (as discussed in the quantitative section earlier).
4.1.2 EPCOR’s Proposal
EPCOR’s proposed governance and regulatory structure is equivalent to that used for its water treatment, water distribution, and wastewater treatment lines of business. As detailed in EPCOR IR 25:
• EPCOR would propose that Drainage be regulated in the same manner as EPCOR’s Edmonton water and wastewater treatment operations: − Extend the existing EPCOR water (and wastewater treatment) franchise to
include collection of Sewage and Stormwater within the municipal boundaries of the City of Edmonton.
− The City would continue to regulate rates, performance measures and terms and conditions of service through the same Utility Committee Rates Setting Process used today to review and approve both the Water and Wastewater treatment rates and the Drainage rates.
− The City would continue to have formal regulatory oversight and approval of all aspects of the drainage utility including design and planning criteria.
Given the current positive relationship between EPCOR and City management, this approach appears to be reasonable.
Structurally, Drainage could either fall under EWSI or be established as a standalone business unit. From a legal standpoint, the following excerpt from the MGA is relevant:
With respect to Council’s authority to regulate a public utility that is not owned and operated by the City, this is possible only if “EPCOR Water Services Inc.” is the “owner or operator” of the public utility. Specifically, s. 47.1 of the MGA provides:
“(2) Part 2 of the Public Utilities Act does not apply in respect of a public utility that (a) is owned or operated by EPCOR Water Services Inc., and (b) provides a utility service with the boundaries of the City of Edmonton.”
If the utility is owned and operated by a different EPCOR entity, it is arguable that the City would not have authority to regulate that utility and authority would fall to the Alberta Utilities Commission.
The options available to address would be to either merge Drainage with EWSI or amend the MGA. EPCOR has indicated a preference, given the number of FTEs, assets and revenue to establish a new business unit. However, EPCOR has suggested that it would adopt the approach that would facilitate a smooth transition. Further exploration of this option would require involvement at the Provincial level.

City of Edmonton 2016 EPCOR Proposal for Drainage Transfer Analysis October 5, 2016
75
Audit • Tax • Advisory © Grant Thornton LLP. A Canadian Member of Grant Thornton International Ltd. All rights reserved.
Some concern was initially expressed noting that the water and drainage businesses, although similar in nature, have operational and capital differences that may not be fully appreciated by EPCOR. However, EPCOR has noted two items that help to mitigate this concern. First is its experience operating drainage infrastructure in a number of jurisdictions, as well as it’s more recent role as owner-operator of drainage services in Arizona. Second is the fact that a transfer of assets would be accompanied by a transfer of staff, who would provide the same level of expertise the City currently enjoys.
4.1.3 Proposed Operational Structure
4.1.3.1 Common Delivery Structures
Delivery of wastewater and stormwater collection services can fall along a spectrum from a standard municipal department to a fully external corporation. The four general categories are:
• Municipal department with planning and rate setting done as part of the annual budget process; • Municipal utility delivered by a municipal department with a rate-setting process outside the
standard budget process; • Municipal Utility Corporation (MUC), of which EPCOR is an example, where the Municipality
is the sole owner and regulator of an arms-length corporation; • Third-party service provider that is awarded a franchise agreement with a municipality (typically
with the Municipality or Province as the regulator, depending on the utility).
EPCOR’s proposed approach aligns with its current structure as an MUC.
4.1.3.2 EPCOR’s Proposed Delivery Structure
EPCOR details three alternative delivery models that have been considered (EPCOR IR 3). The first is the transfer of all Drainage related assets and obligations as well as full operating responsibility for Drainage operations, including the Sanitary Utility, Stormwater Utility, and Design and Construction.
Key aspects of this proposed model include:
• All Drainage owned assets transfer to EPCOR. − All below ground pipe and all pumping infrastructure for the Sanitary and Stormwater
Utility. − Service Centres, inventory, mobile equipment etc. − One exception, related to above ground dry and wet ponds, is detailed below
• All Approvals to Operate and key Licenses are transferred • Assignment of major contracts. • EPCOR takes responsibility for all existing debt (through a back-to back arrangement) and
responsibility for all new debt without recourse or credit support from the City. • EPCOR commits to increase the EPCOR Dividend by $20+ M in the year immediately
following the transfer of Drainage to EPCOR.
City of Edmonton 2016 EPCOR Proposal for Drainage Transfer Analysis October 5, 2016
76
Audit • Tax • Advisory © Grant Thornton LLP. A Canadian Member of Grant Thornton International Ltd. All rights reserved.
• EPCOR commits to the same annual rate increase that Drainage would have received (3%)through the end of 2021. EPCOR will commit to performance standards that will ensureservice levels will be maintained.
• EPCOR commits to make transition payments (up to $75M) to compensate the City for coststhat the City continues to incur that it was previously recovering through the Drainage utilityrates46.
• EPCOR will make offers of employment to all current Drainage employees on comparableterms to what they have now and will respect all existing collective agreements and negotiatenew collective agreements in good faith. EPCOR commits to not lay off any existing Drainageemployee and to manage any position reductions realized through efficiencies over timethrough attrition.
• The City would continue to be responsible for environmental liabilities and litigation arisingprior to a transfer and EPCOR would be responsible for environmental liabilities and litigationarising after the transfer.
EPCOR has proposed that all above ground dry and wet ponds (including the Stormwater ponds and the Clover Bar lagoons) remain with the City. However, on further examination and discussion it was determined that the majority of the City’s above ground ponds are on Public Utility Lots (PULs) and are owned and operated by Drainage, with Parks and Roads maintaining vegetation and trails. As a result, it was agreed that it would most likely make sense for the ponds on the Drainage-specific PULs to be transferred. Ponds on school grounds as well as the Bremner Lagoons and the Queen Elizabeth WWTP (both closed but not decommissioned) were determined to be specific items that would need addressing in the transition period rather than a final determination at this point in the proposal stage.
Discussion around the Clover Bar lagoons is closely tied to discussion around biosolids more generally. At this point ownership of this area has also been identified as a subject that would be further explored in transition discussions, and would involve Drainage Services, EPCOR, and also Waste Management. The benefit of transferring the Clover Bar lagoons to EPCOR is the creation and management of biosolids as a key step in the wastewater treatment process, and with EPCOR taking responsibility, completes their involvement in the entire cycle.
The main factor contributing to the case for transferring pond assets is as follows: if all the design, construction, and operations expertise of ponds, lagoons, and lakes was transferred to EPCOR there is little reason for the City to maintain ownership of assets for which it does not have the expertise to manage.
There is also a matter of environmental risk, especially for the lagoons. Tying the risk of ownership to the operator may be in both the City’s and EPCOR’s best interests. For the Bremner Lagoons and former Queen Elizabeth Waste Water Treatment Plant the question is around how decommissioning will be funded (through rates or taxes). This requires further discussion internally as accounting rules prohibit debt financing for decommissioning.
46 Information provided by the City as per their preliminary analysis of shared service costs indicates that the net present value of potential stranded costs is approximately $29M following a potential transfer. EPCOR did not alter the $75M provision in its corporate Long Term Planning model.

City of Edmonton 2016 EPCOR Proposal for Drainage Transfer Analysis October 5, 2016
77
Audit • Tax • Advisory © Grant Thornton LLP. A Canadian Member of Grant Thornton International Ltd. All rights reserved.
Potential benefits of EPCOR’s proposed model include (in no particular order of importance/impact):
• The transfer Drainage-related debt • Additional $20+ M added to the EPCOR dividend annually • Ability for EPCOR to leverage experience and expertise in Drainage to qualify for new drainage
related business development opportunities • Consolidate the four major components of the water system to achieve capital and operational
synergies • Rate stability for ratepayers until the end of 2021
A number of risks associated with EPCOR’s proposed model and EPCOR’s mitigation tactics have been detailed in EPCOR IR 34. Additional risks identified during the course of this review are described below (in no particular order of importance/impact):
• Decreased involvement of UC in decision-making − Response: The UC and Council, as regulator, can set the process used for planning and
reporting to satisfy their risk tolerance and level of interest in active participation in the decision-making process.
• While rates would be maintained at 3% through 2021 the impact in 2022 and onward is unknown − Response: This risk is not inherent to EPCOR’s model, and is an issue the City would face
as well. The regulator has the ability to influence decisions around capital planning and rate increases, with full understanding of the risk associated with those decisions.
• Loss of embedded expertise within the City − Response: EPCOR works closely with the City to offer expert advice in other areas, and
would continue to do so. In the matter of reviewing EPCOR’s capital plans, budget, and/or PBR, the City is at liberty to bring in external consultants as it does now to provide technical advice and opinions.
• Key Drainage staff attrition − Response: EPCOR has a demonstrated change management process to support retention
throughout the process. In addition, during the transfer of the GBWWTP any key staff member departures were addressed by drawing on other internal experts as well as third party consultants to ease the transition and keep operations running smoothly.
• Loss of transparency in reporting and decision-making − Response: EPCOR works with open data, with some restrictions imposed by requirements
for privacy and terrorism concerns. Data around operational matters such as power outages and water main breaks are reported on EPCOR’s website. Financial reporting is also very open with respect to Edmonton operations, and the PBR submission is a publically available document.

City of Edmonton 2016 EPCOR Proposal for Drainage Transfer Analysis October 5, 2016
78
Audit • Tax • Advisory © Grant Thornton LLP. A Canadian Member of Grant Thornton International Ltd. All rights reserved.
4.1.3.3 Alternative Delivery Structures Considered
Alternative 1: EPCOR assumes operational responsibility for Drainage Services and asset ownership is retained by the City
Under this alternative, EPCOR would take over responsibility for all operations of the Sanitary Utility, the Stormwater Utility and Design and Construction. This would include a transfer of all existing staff and an assignment of all material contracts.
All Drainage assets would remain with the City. Planning for new drainage infrastructure and capital budgeting would remain with the City through the City’s annual budgeting process. The City would continue to be responsible for tariff approval. Depending on the type of capital EPCOR would play a role in planning, designing, project managing and constructing.
EPCOR would be paid a management fee that fairly compensates it for its time and effort in managing Drainage. This would be a long term contractual arrangement based in market rates.
EPCOR has demonstrated experience in this approach through its agreements with a number of municipal and industrial customers as well as the EPCOR Technologies group, which operates the City’s electrical transportation infrastructure. The advantage of this option is primarily around the optics of ownership. The City would retain control over assets and planning and EPCOR would be able to achieve some operating and capital efficiencies (though to a much smaller extent than that seen under the preferred approach).
Disadvantages include: a lower dividend increase (estimated at approximately $2 M rather than $20+ M); City retains the risk associated with asset ownership; no transfer of debt; limitations on business development opportunities for EPCOR; and EPCOR’s limited role in capital planning would impair its asset management ability. Further, this type of model is typically implemented when an organization has limited internal operational capacity. As the City has robust operational capacity at this time, there is less incentive to pursue this approach.
Alternative 2: The Sanitary Utility is transferred to EPCOR while the Stormwater Utility remains with the City
The rationale for this approach is that the Sanitary Utility shares many characteristics and potential efficiencies with the Water distribution network and there are fewer efficiencies available for the Stormwater Utility, which also carries a greater risk due to flood challenges.
Benefits of this approach would be the strong alignment between water and sanitary systems, and that the City would retain control over the development of the Stormwater Integrated Resource Plan.
However, the areas of the City still served by combined sanitary and stormwater sewer systems would be challenging to manage in a split scenario, and splitting the utilities could result in a loss of efficiency. Further, the City does not currently operate the two systems separately. It would be difficult to identify existing crews or equipment that are dedicated to one system over the other.
City of Edmonton 2016 EPCOR Proposal for Drainage Transfer Analysis October 5, 2016
79
Audit • Tax • Advisory © Grant Thornton LLP. A Canadian Member of Grant Thornton International Ltd. All rights reserved.
If Council chose to pursue the option of the City maintaining ownership of the stormwater system and transferring the sanitary system because of the need to develop a flood mitigation strategy, at a minimum it may be wise to contract the operations of the stormwater system to EPCOR to ensure continued operational effectiveness (i.e., a blend of options 2 and 3). However it would be easier to manage if the ownership of both sanitary and storm be with one party - either the City or EPCOR.
In general, this is not seen to be a viable option.
4.1.4 Proposed Oversight
4.1.4.1 Rate Setting
There are four main method municipalities and utilities typically use when calculating utility rates. These include:
• Municipal pay-as-you-go, which sets rates on a cash basis (O&M plus cash cost of current capital, and interest and debt repayment if applicable). Excludes other items seen in a full cost of service analysis, such as shared services costs.
• Utility cost of service models are used by stand-alone utilities on either a forecast or actual basis. Rates must support O&M, indirect costs, depreciation expense, interest expense, and cost of equity, and the utility must have a capital structure that enables borrowing and sustainable operations.
• Actual/Forecast cost of service models differ in the way rates are adjusted and who bears the risk. Utilities using actual cost of service adjust future rates up or down based on a comparison of actual and allowed equity return. Utilities using forecast cost of service set rates on a prospective basis and bear the risk for differences in actual cost and revenue (and thus are allowed to earn a higher return).
• Performance base rate (PBR) making sets rates for the first year of a set term and then applies a formula to determine rates for each subsequent year of that term. First year rates are typically calculated using a full forecast cost of service analysis.
The City currently uses an annual forecast cost of service approach based on a cost of service study conducted every three to four years but uses a pay-as-you-go approach to fund short-term capital (by adjusting ROE). EPCOR currently uses the PBR approach for its municipal services, but used the forecast cost of service approach for water services from the period of 1996 to 2001 and for wastewater treatment for 2010 and 2011.
EPCOR has proposed that it would employ a Performance-Based Rates (PBR) approach for Drainage as it does for its other regulated businesses. The different approaches used following transfer of assets from the City to EPCOR in the past are described below:
• For the years 1996 (when EPCOR was formed) to 2001, EPCOR used a traditional cost of service method to determine rates and submit a rate application to its regulator (the City).
• The current five-year PBR methodology was introduced in 2002.

City of Edmonton 2016 EPCOR Proposal for Drainage Transfer Analysis October 5, 2016
80
Audit • Tax • Advisory © Grant Thornton LLP. A Canadian Member of Grant Thornton International Ltd. All rights reserved.
• When the GBWWTP was transferred to EPCOR in 2009 a COSS methodology was used for both 2010 and 2011 rates. Rates for treatment were subsequently included in the 2012-2017 PBR along with water services.
The primary reason a similar use of the cost of service approach is not being proposed for the Drainage transfer is EPCOR’s commitment to a 3% rate increase until the end of 2021. Cost of service and rate studies are typically conducted to help a utility and its regulator determine appropriate rates. If the rates are to be held at a set increase, there is little need to impose the administrative burden involved in conducting and reviewing a complex rate study.
The PBR combines the value inherent in rebasing every five years with the efficiency of using a factor to increase costs and rates in the interim. This is especially effective if there are no significant changes to the system during the period. Given that EPCOR has committed to the rate increases identified by the City’s model a PBR approach would be appropriate as long as it aligns with this plan.
While it is a longer term plan, the PBR does not impair EPCOR’s ability to address emerging capital and maintenance needs, which are identified as part of ongoing operations or during the annual planning process. Emerging needs for water services and wastewater treatment are currently addressed through non-routine rate adjustments, which are provided for in the PBR. The Drainage Utility would follow the same approach, allowing the UC to review and approve any material changes in capital expenditures between PBR renewals.
4.1.4.2 Reporting
Under the PBR method, the regulator has the ability to influence its level of oversight by establishing requirements around items such as frequency and level of detail in reporting, level of regulator involvement, technical expert involvement, etc. In its proposal, EPCOR has committed to:
• Quarterly performance review meetings with UC • Annual reporting to UC • Annual planning meeting with UC • Annual progress update on the Stormwater Integrated Resource Plan (SIRP) (to be developed)
Should the UC require a different type or level of reporting, EPCOR has agreed to be adaptable to the City’s needs. This represents a higher level of reporting than currently employed for EPCOR’s water services and wastewater treatment businesses, for which EPCOR provides an annual report to the UC (as is typical of a traditional PBR approach). This is a result of the sensitivity around stormwater management in particular and the greater role the UC may wish to play in ensuring it is structured in an amenable way.
Based off Integrated Resource Plans (IRPs) in the utility industry, the SIRP is a long term road map that sets stormwater capital investment strategies and priorities over long time horizons. The SIRP would be developed through a public consultation process to support understanding of
City of Edmonton 2016 EPCOR Proposal for Drainage Transfer Analysis October 5, 2016
81
Audit • Tax • Advisory © Grant Thornton LLP. A Canadian Member of Grant Thornton International Ltd. All rights reserved.
sensibilities around what citizens want and how much they are willing to pay. Development of the SIRP would be overseen by the UC and would be reviewed annually and updated every three years, which is consistent with the Water and GWWTP IRPs. Accountability metrics would be largely driven by the City, as stormwater design standards are not provincially or federally mandated by Health Canada or Alberta Environment. EPCOR has agreed to be adaptable to meet City’s needs should a Council or the UC desire to have a different type of or level of reporting with respect to the SIRP and its implementation.
Monitoring Performance The PBR reporting process embeds a performance measurement and reporting component, which are detailed in EPCOR IR 29. The mechanisms that would be used to define and monitor Drainage service levels would be equivalent to the regulatory process currently used for Water Services and Wastewater Treatment.
EPCOR would use the service levels currently established for Drainage, with some adaptation to fit within the PBR reporting process. Both the City and EPCOR recognize that Drainage Services is not currently in a position to achieve the established stretch targets.
Consideration was given to including EPCOR’s operational and capital efficiency targets as performance targets within the PBR. EPCOR noted that these targets are effectively embedded in the proposed model due to the limitations imposed on rate increases. This means that failure to achieve the efficiency gains hurts EPCOR, not the ratepayers. However, EPCOR is not opposed to formalizing the targets if Council feels this is important. It would be reasonable to integrate the operational and capital efficiency targets within the rebasing process for the PBR in 2021.
Once measures have been defined and integrated into the PBR, performance on these measures is monitored and reported to the regulator on an annual basis. EPCOR currently conducts internal and external audits to verify that measurement and reporting for its various business lines is accurate, and it would be expected to undertake the same processes for measures related to the Drainage Utility.
Further, during the PBR renewal process EPCOR looks at other water utilities and benchmarking studies to assess appropriateness of its measures and targets. Measures are also aligned with the City’s The Way Ahead and The Way We Green goals and Council priorities. This is another area where it would be appropriate to undertake these activities for the Drainage Utility as well.
Escalation As its sole shareholder, the City technically has the ability to dictate all of EPCOR’s actions. Should EPCOR fail to meet its financial performance expectations, City Council, as shareholder has the ability to escalate matters as it sees fit. Additionally, City Council, as the utility regulator, has the ability to set performance measures for EPCOR’s utility performance. At this time, failure to meet service level targets (as prescribed in the approved PBR) results in a financial penalty.
Extreme actions, such as requesting a transfer back of Drainage, could be approached through a negotiated financial transaction or through more forceful action such as replacing any or all of
City of Edmonton 2016 EPCOR Proposal for Drainage Transfer Analysis October 5, 2016
82
Audit • Tax • Advisory © Grant Thornton LLP. A Canadian Member of Grant Thornton International Ltd. All rights reserved.
EPCOR’s Board members. It is important that Council is aware of the significance of such an act, as this would severely damage EPCOR’s business and credibility in the marketplace. Therefore, while this is technically an option it is not a particularly viable or desirable one and should be considered only for the extreme, last resort measure it would be.
4.1.5 Benefits and Risks
Two major benefits have been identified regarding EPCOR’s proposal. The first is that EPCOR has experience managing utility operations and infrastructure under the proposed approach, and has a highly focused business portfolio. Second, the City would retain control over the assets, operations, and planning through its roles as regulator and shareholder, and through Council’s position as elected officials representing citizens.
Risks identified with this approach would be mitigated using the same approaches developed for water services and wastewater treatment. These risks include (in no particular order of importance/impact):
• The potential loss of in-house expertise in drainage construction and operations, which EPCOR has suggested would be addressed through either internal resources or the use of third-party engineering consultants on a short term basis;
• Alignment of EPCOR Board’s fiduciary responsibility with EPCOR and not the City. EPCOR has noted that the Board is also accountable to other regulators for other lines of business and in other jurisdictions, and while it does not always agree with regulatory decisions, it respects and complies with them as it would with any decisions handed down from the City.
• Additional level of separation between the UC and drainage services means that decisions and changes could potentially take longer to implement.
4.2 Planning
4.2.1 Capital Approvals Process
EPCOR IR 39 describes EPCOR’s capital planning and approval process and the following is a side-by-side comparison of the City’s and EPCOR’s capital planning, approvals, and reporting processes.
Item The City EPCOR Long Term Planning
Ten year Capital Investment Agenda (CIA) • Profiles are created within each
Department, and the Capital Budget Office (CBO) develops CIA
• This is reviewed by the Capital Projects Planning Committee (CPPC) through a strategic lens
• CIA then endorsed by the Corporate Leadership Team (CLT)
20-50 year Integrated Resource Plan (IRP) – Vision document • From EPCOR’s side, it is refreshed
every three years within each Business Unit, reviewed by a Steering Committee, and approved by a Senior VP
• From the City’s side, this is reviewed and recommended (if requested) by City Administration

City of Edmonton 2016 EPCOR Proposal for Drainage Transfer Analysis October 5, 2016
83
Audit • Tax • Advisory © Grant Thornton LLP. A Canadian Member of Grant Thornton International Ltd. All rights reserved.
and used by Council to set direction on the four year budget
• Plan is refreshed annually with a deeper review aligned with the four years budget cycle
and approved by the Utility Committee
Ten year Long Term Plan • Used to prepare the annual budget • From EPCOR’s side, this is
refreshed annually and follows the same development and approvals process as the IRP with the additional steps of review and approval by the CEO and the Board
• From the City’s side, the Long Term Plan is reviewed annually at the annual Shareholder Meeting with City Council
Medium-Term Budget Proposal
Four year proposed budget • Council sets the direction on this
budget based on the ten year CIA47 • Utilities prepares a ten year capital
forecast, which aligns to the City’s four year capital budget
• Finalized budget is presented the UC, which recommends to Council
• Council holds a Public Release and Public Hearing, and the budget is approved.
• Any required updates from the UC and Council are incorporated by the CBO and then approved budgets are uploaded by each Department
Performance Based Rates (PBR) • Five year refresh cycle • From EPCOR’s side this is
prepared by BUs, driven from the IRP, Long Term Plan, and Annual budget. Review and approval process includes the Steering Committee and SVP, and it is provided to the CEO for information
• From the City’s side, City Administration followed by the UC reviews and recommends approval of the PBR and Council approves the water PBR Bylaw
Annual Budget
The four-year budget is intended to be refreshed annually
BUs prepare an annual budget which is reviewed and approved by the Steering Committee, SVP, CEO, and Board
Changes to the Capital Budget
Supplemental Capital Budget Adjustments (SCBA) • Prepared by Departments based on
instruction from the CBO • Reviewed by each level (CBO,
CPPC, CLT, and UC)
Non-Routine Adjustments (NRA) • From EPCOR’s side, BUs prepare
an application for an NRA which, depending on the dollar value, will be approved by the SVP, CEO, or Board.
47 In practice, City Utilities has been outside of this process, but will start to follow more closely in 2019 to 2028 CIA.

City of Edmonton 2016 EPCOR Proposal for Drainage Transfer Analysis October 5, 2016
84
Audit • Tax • Advisory © Grant Thornton LLP. A Canadian Member of Grant Thornton International Ltd. All rights reserved.
• CLT and the UC recommend the SCBA to Council, where it is deliberated and approved
• From the City’s side, the NRA is reviewed and recommended by Administration and approved by the UC
Reporting Annual reporting
• Departments compare budget to actuals and explain variances
• CBO reviews and drafts a capital performance report.
• Reviewed by each level (CBO, CPPC, CLT, and UC) and provided to Council for discussion and approval
Carry Forwards • At the end of the year a peer review
of carry forwards is conducted by the CPPC with participation from all levels and sign-off by CLT
Quarterly reporting • From EPCOR’s side, monthly
reports are prepared by the BUs with explanations for variances from the budget. These variance reports are approved by the CEO and Board
• From the City’s side, Council receives EPCOR’s quarterly and year end external financial reporting at quarterly Shareholder meetings
Annual PBR reporting • From EPCOR’s side, the PBR
report is prepared, including audit of performance, by the BUs, reviewed and approved by the SVP and provided to the CEO for information
• From the City’s side, the PBR report is received by Administration and the UC for information
Similarities • Four-year/annual budgets are driven by ten-year capital plans • Council receives long term capital plans for information • Ten-year plans are refreshed annually • Supplemental / non-routine rate adjustments goes through a separate process and is approved
by the UC and/or Council • Consolidated financial results are provided to Council quarterly • Annual reports are prepared including financial and operational information and provided (as
an agenda item) to the UC
Major Differences • EPCOR prepares a 20-50 year “vision” document and the City has longer term rate modelling • The City drafts a capital budget, which is approved by Council, every four years and refreshes
this plan annually; EPCOR prepares an annual budget, which is not approved by Council, as well as a refreshed PBR every five years (Council approves changes to the Water Bylaw)

City of Edmonton 2016 EPCOR Proposal for Drainage Transfer Analysis October 5, 2016
85
Audit • Tax • Advisory © Grant Thornton LLP. A Canadian Member of Grant Thornton International Ltd. All rights reserved.
Comparison of the City and EPCOR’s capital planning processes reveal some differences; however, the foundation of both is very similar in that both organizations prepare ten-year capital plans that are further detailed in shorter term plans (four-year budget or five-year PBR). These shorter term plans are reviewed by Council (through the UC) and are open to discussion and negotiation before finalization. Reporting contains similar information to inform Council of financial status and operational performance.
As EPCOR has proposed utilizing the same PBR-like approach for Drainage as used for its Water Services and Wastewater Treatment businesses, Council and the UC could expect to see the same processes resulting in equivalent information presented in a similar manner, as discussed in more detail in the Regulatory and Governance section of this Qualitative Analysis.
4.2.2 Drainage Planning
In relation to its water business, EPCOR currently interfaces with the City and stakeholders for a number of development planning programs and initiatives, including:
• Large scale City planning such as the Way we Green, the Way we Grow, the Stewarding GreatNeighbourhoods program, the Blatchford redevelopment project, and annexation efforts
• Ongoing City developing planning involving Area Structure Plans, Neighbourhood StructurePlans, and Subdivision planning
• Coordinating with the Urban Development Institute (UDI) through the General Subcommitteeand Water Subcommittee
• Coordinating with other developers for infill development
EPCOR has suggested there is opportunity to streamline the planning function through workflow improvements and reduced number of interfaces, with the result of reduced cost and cycle time for internal and external customers. Should the transfer take place, EPCOR has proposed that a Utility specific planning committee be created to include EPCOR, the City’s Sustainable Development group, UDI, and potentially ATCO.
EPCOR has laid out its proposal for Drainage Planning in EPCOR IR 31. The division of responsibilities is part of an ongoing conversation between the City and EPCOR, and full resolution on the structure and interfaces would be determined should Council approve the transfer.
The following table is a high level summary of the components that will transfer to EPCOR and the components that will remain with the City as of the date of this report:

City of Edmonton 2016 EPCOR Proposal for Drainage Transfer Analysis October 5, 2016
86
Audit • Tax • Advisory © Grant Thornton LLP. A Canadian Member of Grant Thornton International Ltd. All rights reserved.
Function Current City Department Transfer to EPCOR Remain with COE
Systems Management Utility Services Yes None
Priority Assets Utilities Infrastructure Yes None
Infrastructure Planning Sustainable Development Partial transfer Partial Remain
Growth and Land Development Sustainable Development Partial transfer Partial Remain
Public Services Sustainable Development Partial transfer Partial Remain
EPCOR and the City engaged in extensive discussion around the components of Drainage Planning that would remain with the City and the components that would transfer. Of particular importance was the area of development planning approvals in the Growth and Land Development (GLD) function. It was decided that the Planning and Engineering groups should remain with the City, which would ensure the City has direct control over the direction of municipal development.
This also means that the City’s internal Service Level Agreements would continue to oversee the effective and efficient delivery of review and approvals for all Drainage infrastructure in new developments. Planning-specific service levels (e.g. turnaround time, inspection approvals, etc.) are in place for all asset owners involved in the development approvals process. These service levels are developed by the City in collaboration with EPCOR and other partners. Accountability is managed by the City’s Development Coordination branch through its relationships with UDI and engineering consultants.
While responsibility for area plan and engineering drawing review would remain with the City, EPCOR has proposed that the inspection function be transferred. The result would be a change to the process of transferring engineering drawings from the reviewer to the inspector. As this is already a requirement within the City, a similar process could be used with accommodation for transfer between City and EPCOR staff. As the staff would remain the same on both ends, this is unlikely to cause disruption to industry stakeholders.
For the SSSF and PACs, EPCOR has proposed that the funds and management of the SSSF and PAC programs will continue to reside within the City and Drainage contributions will remain the same. SSSF Management and SSSF Operational Committees would also remain in place and include representation from the City, UDI, and EPCOR. The SSSF Program is currently under review, with a draft report expected early September. EPCOR has indicated that it would support and assist with implementation of recommendations arising from this review.
An additional item of note is the Planning function in the Water and Sewer Servicing group within the Public Services area. Discussion on this area is ongoing and its final placement would be further reviewed should the transfer be approved. However, both the City and EPCOR identified significant overlap in this area, and agreed that there is an opportunity to increase efficiency in this area regardless of Council’s decision on this matter.

City of Edmonton 2016 EPCOR Proposal for Drainage Transfer Analysis October 5, 2016
87
Audit • Tax • Advisory © Grant Thornton LLP. A Canadian Member of Grant Thornton International Ltd. All rights reserved.
Any concerns raised generally centred on relationships and communication. For example, the transfer of drainage inspectors (currently housed within GLD) would require strong communication and coordination between the City’s Engineering group and EPCOR’s inspectors. However, it is noted that effective communication between these groups is a current requirement, and the transfer would have little functional impact on the people and processes involved. It is noted that a number of committees are already in place to support coordination between City functions and developers. Formalizing EPCOR’s involvement in these meetings would be beneficial to ensure alignment at a planning level.
4.3 Operations
4.3.1 Differences between Drainage and Water
While there are fundamental differences in the design, construction, and operation of drainage systems compared to water systems, such as the use of gravity-based vs. pressurized systems, the depth of pipes, construction methodologies, and the integration of ponds, there is general consensus that this would not present an issue for EPCOR for two main reasons. Firstly, along with the transfer of assets and debts would be the transfer of almost all staff involved in the Drainage function. This would result in the transference of the necessary expertise to build and manage the drainage system to the same standard as would otherwise occur. Second, EPCOR’s experience in other jurisdictions, although at a smaller scale and with various differences, would be leveraged to further enhance the expertise of current Drainage Services staff.
Further, the same concern was raised during the decision to transfer the GBWWTP in 2009 and EPCOR was able to manage the transition in a manner that resulted in little to no impact to stakeholders.
4.3.2 Synergies Gained
EPCOR has provided estimates quantifying potential operational and capital synergies in information responses EPCOR IR 8 and EPCOR IR 7. EPCOR has indicated a high level of confidence that the 5% operational and 10% capital efficiencies described in the Quantitative Analysis section of this report can be achieved by year five following a transfer. Further, EPCOR has noted the internal pressure to maximize efficiencies given the commitments made to a 3% annual rate increase and no staff lay-offs during that period.
During the consultation process undertaken as part of this qualitative analysis, it was noted that the City has embarked on a number of initiatives to increase operating and capital efficiencies independent of the EPCOR proposal, which could impact the relative benefit to the City but would likely be integrated into the optimization work done within EPCOR should the transfer be approved.
Additional operational and capital efficiencies are described in EPCOR IR 33 that have not been quantified at this time. This list was not intended to be exhaustive, and it is noted that a temporary period of lowered efficiency would likely result during the transition period. The operational opportunities include:

City of Edmonton 2016 EPCOR Proposal for Drainage Transfer Analysis October 5, 2016
88
Audit • Tax • Advisory © Grant Thornton LLP. A Canadian Member of Grant Thornton International Ltd. All rights reserved.
• Issue escalation and dispatch (customer responsiveness) though integration of Drainageemergency response with EPCOR’s Water and Power trouble response functions
• Integration of the City’s GIS and Work Management tools with EPCOR’s real time interface toalert the public of planned and unplanned outages and road closures
• Commercial opportunities to leverage drainage expertise to include third party storm andsanitary pipes, lift stations, and services
• Crossover of mechanical, electrical and labour skills sets between GBWWTP and liftstation/control gate repair and maintenance activities
• Crossover of skills in construction groups, particularly in the open-cut operations• Integration of fleet services contracts and technology to improve safety and lower costs• Alignment of goals for watershed management and regulatory activities• In-house training developed for water staff certification could be applied to support new and
ongoing certification for drainage staff
Shared services has also been identified as an area for synergies within EPCOR. It is recognized that the transfer of Drainage Services would likely result in some level of loss in efficiency within the City, which would be addressed through the transition fee EPCOR has proposed. Quantification of this fee would be completed in the event the transfer is approved by Council.
Additional areas subject to further exploration have also been identified, and include:
• SCADA Management• Customer analytics for revenue forecasting and system planning• Inspections of new and infill development• Engineering drawing reviews for new subdivisions
On the capital side, potential opportunities for synergies have been identified in the following areas:
• Project management• Construction detours and surface restoration• Coordination of the cast iron renewal and combined sewer separation programs• EPCOR’s Master Agreement approach to long term contracts
4.3.3 Synergies Lost
It is important to note that any synergies lost as a result of transferring Drainage Services to EPCOR would be mitigated for the most part through the transition fee paid by EPCOR toward stranded costs such as IT and staff and formalized relationships and communication processes48. Within Drainage, formalized processes would be introduced to ensure continued coordination between EPCOR and City staff responsible for specific aspects of the planning function. More broadly, any existing relationships between Drainage Services and other City departments and programs, such as Engineering, the Neighbourhood Renewal program, Roadways Operations, and
48Information provided by the City as per their preliminary analysis of shared service costs indicates that the net present value of potential stranded costs is approximately $29M following a potential transfer. EPCOR did not alter the $75M provision in its corporate Long Term Planning model.
City of Edmonton 2016 EPCOR Proposal for Drainage Transfer Analysis October 5, 2016
89
Audit • Tax • Advisory © Grant Thornton LLP. A Canadian Member of Grant Thornton International Ltd. All rights reserved.
Inspections would require formalization. It is noted that EPCOR has existing relationships with these areas for its Water business and is supportive of formalized relationships to ensure effective communication and coordination.
4.4 Legal Implications
4.4.1 Liability Impacts
A legal review by EPCOR’s legal team, described in EPCOR IR 38 indicates that liability impacts would remain essentially the same under EPCOR as they are under the City as long as they are managed appropriately and the City were to pass bylaw amendments to include the same liability protections as found in the MGA. For example, section 528 of the MGA protects municipalities from liability for claims based on nuisance (or any other tort not requiring a finding of intention or negligence) if the damages arises from the operation of a public utility.
EPCOR suggests extension of these protections through amendment of the Drainage Bylaw or some other appropriate bylaw. The decision to pass bylaws is solely within the unfettered discretion of City Council based on legal considerations. The exact approach would be decided following a Council decision. Accordingly, whether or not such provisions would be included in a bylaw has not been determined.
The City has suggested that the following authorities from the MGA should be considered for inclusion in a revised bylaw. These are the provisions in sub-sections 34 through 42 and include:
• 34 – Duty to supply utility services• 35 – Parcels adjacent to roads and easements• 36 – Right of entry – main lines• 37 – Service Connections – owner• 38 – Service Connections – municipality• 39 – Restoration and costs• 40 – Buildings• 41 – Discontinue providing public utility• 42 – Liability for public utilities charges
Should a transfer occur, the City would continue to be responsible for liabilities arising prior to the transfer and EPCOR would assume responsibility for liabilities occurring post-transfer. While both parties would likely be included in any legal action resulting from issues with the water or drainage system, the indemnification process would mean any such action relating to the responsibilities taken over by EPCOR would primarily be a reputational risk to the City rather than a financial risk. This risk cannot be entirely eliminated, but is similar to that seen for the water services and wastewater treatment businesses and is a risk the City faces currently with its drainage business.
For environmental damage, liability transfers with ownership, but pre-transfer liability would remain with the City regardless as noted above.
City of Edmonton 2016 EPCOR Proposal for Drainage Transfer Analysis October 5, 2016
90
Audit • Tax • Advisory © Grant Thornton LLP. A Canadian Member of Grant Thornton International Ltd. All rights reserved.
The City maintains insurance for any claims, and EPCOR need similar coverage as it currently holds for its other lines of business. Any such claims would be handled in a manner similar to the City’s current approach and overseen by EPCOR’s legal team. EPCOR currently manages claims through an independent insurance adjuster overseen by EPCOR’s legal department and supported by operations staff.
4.4.2 Existing Contracts and Approvals
The Province grants the City with Approval to Operate the Drainage Services utility, and this Approval is renewed every ten years with the most recent approval granted in 2015. When the GBWWTP was transferred in 2009 the Approval remained with the City, where it was administered, and operating responsibility was transferred to EPCOR. During the renewal in 2015 EPCOR was formally added to the Approval. It is expected that a similar process would be used to bridge the time between the current Approval and the next renewal in 2025 and that the Province would be unlikely to object.
The proposed manner in which Drainage Planning would be split could impact this. It has been identified that the Province might take issue with the City holding the planning function and EPCOR holding the assets and operations. This is an item for which follow-up discussion with the Province would be required to identify any potential concerns at an early stage.
Other contracts, including vendor and partnership agreements, would need to be reviewed in detail for provisions should Council choose to proceed with exploring the transfer. As contracts typically have a transfer clause this was not identified as an area of concern. The only exception would be if the other contract party refused to consent to the transfer, in which case the City would retain the contract and work as an interface while termination rights were explored. However, this was assessed as having a low likelihood of occurrence.
4.4.3 Legal Impacts on Partners
Local improvement financing was identified as a potential issue for developers during the review of EPCOR’s 2005 Drainage Services transfer proposal. The concern was raised that developers would not be able to access local improvement financing for drainage projects if the utility was transferred to EPCOR. In Issue Brief 35, EPCOR has detailed its analysis of this issue. The conclusion, which the City has reviewed and stated their agreement, is that the transfer would not impact access by developers to this financing source. A review of the MGA indicated that no restrictions are presently in place to prevent the City from borrowing and lending in the same manner as currently used, regardless of the ultimate ownership of the infrastructure constructed under this financing mechanism. This opinion has not been tested in a court and if a legal challenge was successful this could result in a risk for the City. Further, this mechanism has been used within the last ten years for both Drainage and Water assets without issue.
4.4.4 Grants
Grant funding is identified as an area where the potential for negative impact is slightly higher. Many federal and provincial grant funding agencies are unclear, vague or silent regarding municipal corporations receiving either grant funding or ownership of municipal infrastructure
City of Edmonton 2016 EPCOR Proposal for Drainage Transfer Analysis October 5, 2016
91
Audit • Tax • Advisory © Grant Thornton LLP. A Canadian Member of Grant Thornton International Ltd. All rights reserved.
constructed using grant funds. Additional exploration and verification with grant funders would be required if the transfer was approved.
Drainage Services recently received $16.4 M for flood prevention from the Alberta Community Resilience Program (ACRP). The provisions surrounding this grant include the following:
The ACRP Program guidelines indicate that funding is directed at municipalities only. The document also states that “any works funded under this Program must be owned and operated /maintained by the municipality.” Neither the program guidelines nor the memorandum of agreement explicitly address assignment by the City upon project completion.
With the above in mind, it is questionable whether EPCOR would be eligible to apply for new grant funding on its own based on the Program document’s reference to municipalities and infrastructure owned and operated by municipalities. Moreover, further interpretation would be required to assess whether the City could transfer ownership of the completed Project to EPCOR and whether there would be any consequences in doing so.
Under the Alberta Community Resilience Program given that Program parameters require more clarity, it would be important to engage in open dialogue with the Province to determine the impact of a transfer on past, present and future ACRP grant funding..
The Drainage Utility has also applied for federal grant funding from the Building Canada Fund – Provincial-Territorial Component for storm relief and conveyance improvement at the Sister Mary Ann Casey (Tawa) Park and Edith Rogers / Malcolm Tweddle dry pond. Grant funding for these projects is currently under consideration. If approved, a federal contribution of approximately $30.32 M would supplement provincial funding already committed under the ACRP program. Should the City secure this funding, the impact of a Drainage transfer to EPCOR would also need to be assessed with regard to the Building Canada Fund.
As accessibility differs for different funding providers and specific grants, eligibility would need to be assessed on a case-by-case basis. Further discussion with individual granting agencies and for specific grant funding (to be undertaken should the transfer proceed) by the City and EPCOR would be advisable.
EPCOR has not received any grant funding for its current operations. However, Regina has been identified as a Canadian municipality that has received funding through P3 Canada for the construction of a wastewater treatment plant, the operation of which is contracted out to EPCOR49.
Aside from Drainage specific grants like the ACRP grant noted above, when the City receives grant funding it is directed to tax-funded programs rather than the utilities. As such, it is expected 49 Regina’s Wastewater Treatment Plant P3, includes approximately $48M in funding from the P3 Canada Fund (City of Regina, June 14, 2016).

City of Edmonton 2016 EPCOR Proposal for Drainage Transfer Analysis October 5, 2016
92
Audit • Tax • Advisory © Grant Thornton LLP. A Canadian Member of Grant Thornton International Ltd. All rights reserved.
that the availability of grant funding would not significantly impact utility rates regardless of EPCOR’s eligibility. This also suggests that it would be appropriate for the City’s position on the use and application of grants to utility infrastructure versus other City projects or programs to be solidified and written into the EPCOR agreement. Addressing this matter into an agreement would also give clarity to the treatment of future grants that may be applicable to drainage infrastructure.
4.4.5 Health and Safety
In EPCOR IR 35, EPCOR has provided a description of its Health and Safety practices, policies, and systems including comparison to some Drainage statistics such as lost time incidents, long term injury frequency, and lost days. According to reported statistics, EPCOR has a strong health and safety record and compares favourably to Drainage in terms of lost time incidents.
A supplemental document provided by EPCOR shows both the WCB and the EPCOR Incident Management System (IMS) information on lost time, and explains the differences in the way incidents are tracked and reported due to differences in reporting and categorization methodologies. While lost time incidents reported to WCB are slightly higher than the data provided in the information request (16 for WCB compared to 12 in IMS), lost time injuries on a per-FTE basis remain lower than Drainage Services. The question was raised as to whether Drainage construction work contributed more significantly to the lost time injury incidence rate, and whether this made the comparison unbalanced. However, EPCOR’s statistics also include its construction group, making the comparison appropriate.
Health and safety practices would likely change for Drainage Services personnel as it would be expected for EPCOR to train all new staff on its corporate health and safety programs and expect adherence to its policies. There would be no impact to health and safety practices for the City.
4.5 Stakeholder Impacts
4.5.1 ACRWC
While some issues were identified in the relationship between ACRWC and EPCOR following the transfer of the GBWWTP, representatives from the ACRWC noted that relationships have improved significantly and they would not have any objection to the transfer or concerns about negative impacts to their operations.
It was noted that if the transfer were approved by City Council, the ACRWC would consult with its Board of Directors. Should the transfer proceed, it would be recommended that EPCOR maintain a close relationship with the ACRWC to maintain this positive relationship and support effective operations.
4.5.2 Customers
From an operational perspective, there would likely be little to no change for customers following a transfer. Customer-facing items such as billing, which is currently done by EPCOR, and issue reporting and response would remain essentially the same.

City of Edmonton 2016 EPCOR Proposal for Drainage Transfer Analysis October 5, 2016
93
Audit • Tax • Advisory © Grant Thornton LLP. A Canadian Member of Grant Thornton International Ltd. All rights reserved.
EPCOR IR 25 describes EPCOR’s standards around response to trouble calls, customer escalation process, and customer claims and compensation. EPCOR currently has an escalation process for managing power and water concerns and claims directed to City Councillors, and would use the same process for concerns related to drainage. EPCOR attempts to respond to issues within 24 hours, whether they are initiated by a customer, citizen, the City, or a Councillor.
Two items relating to customer relationship management would need to be maintained if Drainage were transferred to EPCOR. The first pertains to citizen engagement, which has been identified as a Council priority. It is important to the City that EPCOR follow the City’s lead in greater engagement with citizens. This means involving people earlier in the process and incorporating their feedback into the final decision. EPCOR has noted that engagement at the initial planning stage is standard practice, and feedback is incorporated and changes are made based on the results of the engagement process. This appears to align with Council’s expectations around engagement.
Customer advocacy is another area where Council has expressed interest in the past, specifically around insurance and environmental concerns. EPCOR has also supported customer advocacy by working with the Fire Department to help improve insurance ratings for businesses as well as for greenfield and infill developments.
With respect to commercial customers, EPCOR has proposed to transfer the Drainage Bylaw enforcement function and assume the bylaw enforcement role. Under this arrangement, EPCOR would set the fines and the regulator (the City) would approve them. This would allow the fees received from fines issued by Bylaw Officers to be collected by EPCOR directly rather than being transferred through the City. From a legal standpoint there does not appear to be any impediment to this transfer, and the ability to manage fines under City bylaws has been granted to not-for-profits in the past. However, such a transfer would require approval from the Solicitor General. This is an area that remains under evaluation, and more analysis would be required during a transition phase should the transfer proceed.
4.5.3 Employees
EPCOR has committed to transferring all included City employees (including identified shared services staff) with comparable pay, benefits and seniority. Further, EPCOR has committed to honouring the existing union agreements which are up for renewal in 2018. EPCOR would negotiate new collective agreements with each of the unions so that all employees within each union would be covered by the same agreement. EPCOR suggests that a reasonable time frame for harmonization of collective agreement terms and conditions would be addressed through the bargaining process.
Efficiencies in staffing would not come as a result of layoffs, though specific unfilled positions would likely be eliminated as well as other positions that become vacant through natural attrition and retirement.
It is important to note obtaining a union perspective on the transfer was beyond the scope of this review. However, response to EPCOR’s 2005 proposal to transfer Drainage Services was one of

City of Edmonton 2016 EPCOR Proposal for Drainage Transfer Analysis October 5, 2016
94
Audit • Tax • Advisory © Grant Thornton LLP. A Canadian Member of Grant Thornton International Ltd. All rights reserved.
opposition. As a result, it is recommended that greater engagement with union representatives from CUPE 30, CSU 52 and IBEW by both the City and EPCOR take place should Council choose to proceed.
Staff engagement, which was also beyond the scope of this review, would also be recommended to help assuage concerns and begin the change management process in a positive manner.
4.6 Qualitative Analysis Summary
Based on the qualitative analysis, EPCOR’s Proposal to transfer Drainage has strong merit. While a number of next steps are identified in Section 6 of this Study, based on the information provided, we have not identified any major qualitative impediments to the proposed transfer.

City of Edmonton 2016 EPCOR Proposal for Drainage Transfer Analysis October 5, 2016
95
Audit • Tax • Advisory © Grant Thornton LLP. A Canadian Member of Grant Thornton International Ltd. All rights reserved.
5 Industry Overview
5.1 Water and Wastewater Industry Overview
Analysis of sanitary and storm water conveyance and treatment is appropriately viewed within the context of the broader water and wastewater industry. This includes the sourcing, transportation, purification and distribution of potable water; the collection, treatment and disposal of wastewater; and incidental services such as design, construction, maintenance, repair, testing, metering and billing, facilities management, and consulting.
The water and wastewater industry is distinguished from other industries by its capital intensity, its characteristic as a local natural monopoly, and its importance in terms of public and environmental health.
Water and wastewater utilities can be split by their two primary operations: treatment and conveyance. Treatment can be further divided into potable water and wastewater, and conveyance into distribution of drinking water and collection of wastewater and storm water.
5.1.1 Wastewater System
The major components of a wastewater system are service connections to networks on both private and public property, local sewers, trunk lines, pumping stations, treatment plants, and effluent disposal facilities.
Although water and wastewater infrastructure has many similarities and often involve the same key functions, they also have important differences. From an infrastructure perspective, wastewater and stormwater systems are typically designed to utilize gravity as a means of conveyance, while water systems use pressure from the treatment plant to move flows through the system. This
Water & Wastewater Industry
Reuse
Storm Water
Sanitary Water
Collection and TransmissionDistribution of drinking waterDrinking Water TreatmentWastewater Treatment and
Disposal (sanitary and storm)
Conveyence Treatment

City of Edmonton 2016 EPCOR Proposal for Drainage Transfer Analysis October 5, 2016
96
Audit • Tax • Advisory © Grant Thornton LLP. A Canadian Member of Grant Thornton International Ltd. All rights reserved.
means that wastewater and stormwater pipes tend to be much deeper in the ground, which impacts construction and maintenance of the assets. Stormwater systems also incorporate overland drainage (e.g. roadways) as well as dry and wet ponds to help manage significant storm events. On the rate side, wastewater services are typically not directly metered, meaning that rate design usually does not influence users’ behaviour with respect to generating wastewater (except in the case of over-strength surcharges for some industrial and commercial users). As the benefits of having a strong wastewater system are not always tangible to consumers there can be more resistance to rate increases for wastewater than for water.
Storm water collection is typically managed either in the waste department of a municipality or with the wastewater utility. Major conveyance infrastructure can consist of separated broad and trunk sewers, combined storm and sanitary sewers, or a combination. In most cases if the wastewater and storm water flow through a combined sewer system they are managed together as one utility.
While an essential component of the wastewater and storm water cycle, wastewater treatment is generally not a highly visible service to customers. This component of the cycle is generally highly regulated and treatment plant operators are required to monitor outflows and report performance to a regulator.
5.1.2 Size of the Market
The revenues for the Water Supply and Conveyance Systems in Canada were $6.7B in 2015 and expected to be $6.8B in 2016. In Canada, just under than 40 billion cubic metric tonnes of water are used each year50.
Based on the Canadian Infrastructure Report Card51, it is estimated that water, wastewater, and storm water infrastructure account for $574B of the infrastructure in Canada. Of this, $367B is related to wastewater and storm water.
Target annual reinvestment for wastewater and storm water is $4.22B for linear assets and $7.37B for non-linear assets, for a total of $11.59B per year.
50 IBISWorld Industry Report 22131CA, IBISWorld Inc., February 2016 51 Infrastructure Report Card, 2016
Industry Very Poor Poor Fair Good Very Good Total Potable Water (Billions) $7 $18 $35 $72 $75 $207Wastewater (Billions) $6 $20 $56 $60 $91 $233Storm Water (Billions) $3 $7 $21 $44 $59 $134Total (Billions) $16 $45 $112 $176 $225 $574
Total Wastewater and Storm Water (Billions)
$9 $27 $77 $104 $150 $367
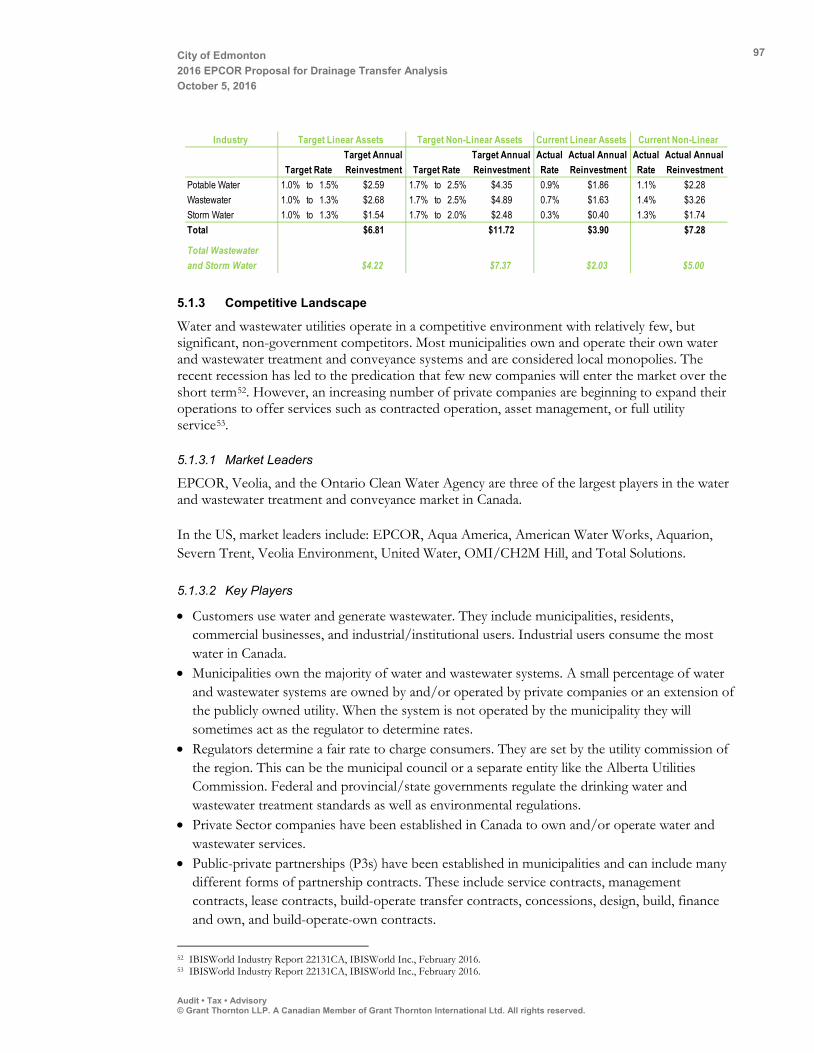
City of Edmonton 2016 EPCOR Proposal for Drainage Transfer Analysis October 5, 2016
97
Audit • Tax • Advisory © Grant Thornton LLP. A Canadian Member of Grant Thornton International Ltd. All rights reserved.
5.1.3 Competitive Landscape
Water and wastewater utilities operate in a competitive environment with relatively few, but significant, non-government competitors. Most municipalities own and operate their own water and wastewater treatment and conveyance systems and are considered local monopolies. The recent recession has led to the predication that few new companies will enter the market over the short term52. However, an increasing number of private companies are beginning to expand their operations to offer services such as contracted operation, asset management, or full utility service53. 5.1.3.1 Market Leaders
EPCOR, Veolia, and the Ontario Clean Water Agency are three of the largest players in the water and wastewater treatment and conveyance market in Canada. In the US, market leaders include: EPCOR, Aqua America, American Water Works, Aquarion, Severn Trent, Veolia Environment, United Water, OMI/CH2M Hill, and Total Solutions.
5.1.3.2 Key Players
• Customers use water and generate wastewater. They include municipalities, residents, commercial businesses, and industrial/institutional users. Industrial users consume the most water in Canada.
• Municipalities own the majority of water and wastewater systems. A small percentage of water and wastewater systems are owned by and/or operated by private companies or an extension of the publicly owned utility. When the system is not operated by the municipality they will sometimes act as the regulator to determine rates.
• Regulators determine a fair rate to charge consumers. They are set by the utility commission of the region. This can be the municipal council or a separate entity like the Alberta Utilities Commission. Federal and provincial/state governments regulate the drinking water and wastewater treatment standards as well as environmental regulations.
• Private Sector companies have been established in Canada to own and/or operate water and wastewater services.
• Public-private partnerships (P3s) have been established in municipalities and can include many different forms of partnership contracts. These include service contracts, management contracts, lease contracts, build-operate transfer contracts, concessions, design, build, finance and own, and build-operate-own contracts.
52 IBISWorld Industry Report 22131CA, IBISWorld Inc., February 2016. 53 IBISWorld Industry Report 22131CA, IBISWorld Inc., February 2016.
Industry Target Annual Reinvestment
Target Annual Reinvestment
Actual Rate
Actual Annual Reinvestment
Actual Rate
Actual Annual Reinvestment
Potable Water 1.0% to 1.5% $2.59 1.7% to 2.5% $4.35 0.9% $1.86 1.1% $2.28Wastewater 1.0% to 1.3% $2.68 1.7% to 2.5% $4.89 0.7% $1.63 1.4% $3.26Storm Water 1.0% to 1.3% $1.54 1.7% to 2.0% $2.48 0.3% $0.40 1.3% $1.74Total $6.81 $11.72 $3.90 $7.28
Total Wastewater and Storm Water $4.22 $7.37 $2.03 $5.00
Target Rate Target Rate
Current Linear Assets Current Non-Linear Target Non-Linear AssetsTarget Linear Assets

City of Edmonton 2016 EPCOR Proposal for Drainage Transfer Analysis October 5, 2016
98
Audit • Tax • Advisory © Grant Thornton LLP. A Canadian Member of Grant Thornton International Ltd. All rights reserved.
5.1.3.3 Structure
Municipal governments own most water and wastewater operations in Canada. Globally it is more common for private sector firms to provide these services. The U.K. and France have the highest number of water and wastewater utilities owned and operated by private companies. Large players include Vivendi, Ondeo, Saur, Thames Water, United Utilities, and Kelda. Engineering and construction companies have started to assume risk sharing roles when designing and constructing components for the utilities. It has also become common for water and wastewater companies to become full service water companies by acquiring engineering and construction firms. 5.1.3.4 Trends
Trend Driver Pressure on water and wastewater utilities to take on green initiatives
• Increasing recognition of water as a precious resource • Municipalities require utilities to uphold environmental standards
Increasing interest in water reuse • Increasing recognition of water as a precious resource Increasing need for investment in water and wastewater infrastructure and technology
• Rising global demand for water • Scarcity of water supply in many areas • Deteriorating quality of water resources • Age and inefficiency of existing water and wastewater infrastructure • Increasing stringency of water and wastewater standards and
environmental regulations Increasing role of the private sector in the provision of water and wastewater services
• Municipalities are having difficulty funding water services due to decreased tax revenue
Mergers and acquisition activities within the water and wastewater industry
• Ageing and failing infrastructure • Environmental regulations are difficult to achieve without economies of
scale Consolidation of investors and suppliers in the water and wastewater sector
• Consolidation of small utilities within geographical markets (especially in the US)
• International expansion of large investor-owned water and wastewater utilities
• Consolidation of system management services through municipal outsourcing contracts
• Vertical integration between water and wastewater utilities and related parties such as suppliers and engineering and construction firms
• Convergence of water and wastewater utilities with power utilities • Foreign companies (example Veolia) are starting to operate in Canada
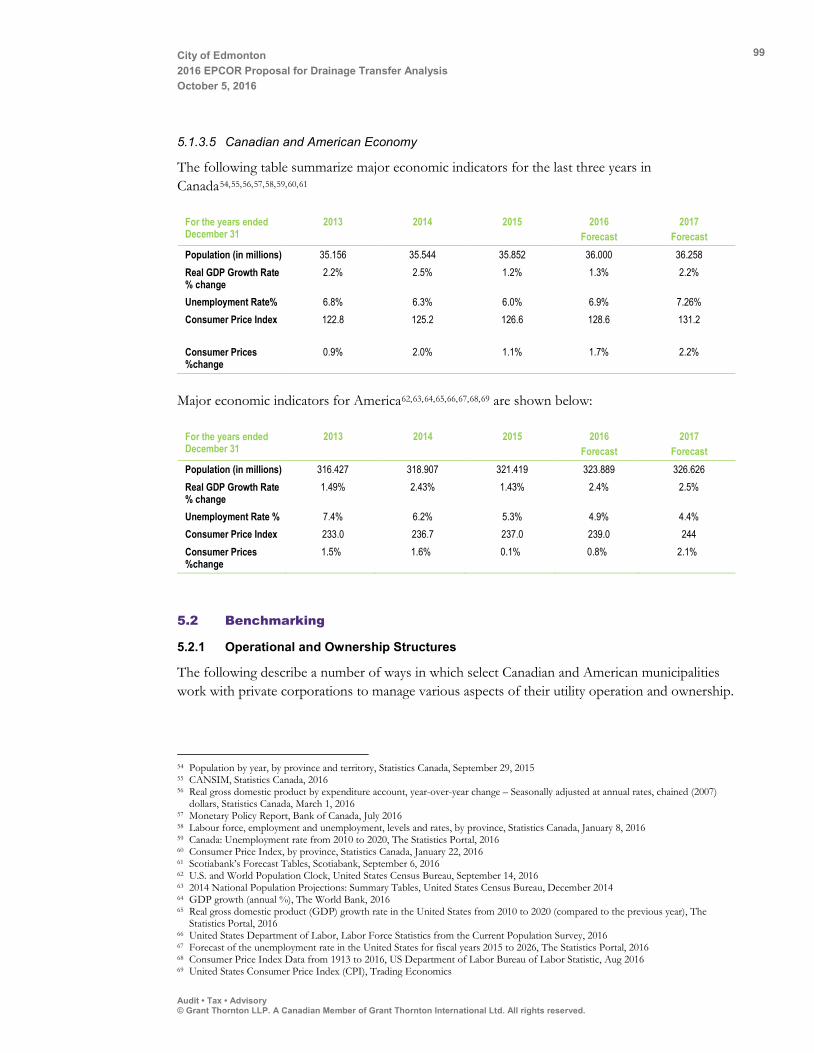
City of Edmonton 2016 EPCOR Proposal for Drainage Transfer Analysis October 5, 2016
99
Audit • Tax • Advisory © Grant Thornton LLP. A Canadian Member of Grant Thornton International Ltd. All rights reserved.
5.1.3.5 Canadian and American Economy
The following table summarize major economic indicators for the last three years in Canada54,55,56,57,58,59,60,61
For the years ended December 31
2013 2014 2015 2016 Forecast
2017 Forecast
Population (in millions) 35.156 35.544 35.852 36.000 36.258 Real GDP Growth Rate % change
2.2% 2.5% 1.2% 1.3% 2.2%
Unemployment Rate% 6.8% 6.3% 6.0% 6.9% 7.26% Consumer Price Index 122.8
125.2
126.6 128.6 131.2
Consumer Prices %change
0.9% 2.0% 1.1% 1.7% 2.2%
Major economic indicators for America62,63,64,65,66,67,68,69 are shown below:
For the years ended December 31
2013 2014 2015 2016 Forecast
2017 Forecast
Population (in millions) 316.427 318.907 321.419 323.889 326.626 Real GDP Growth Rate % change
1.49% 2.43% 1.43% 2.4% 2.5%
Unemployment Rate % 7.4% 6.2% 5.3% 4.9% 4.4% Consumer Price Index 233.0 236.7 237.0 239.0 244 Consumer Prices %change
1.5% 1.6% 0.1% 0.8% 2.1%
5.2 Benchmarking
5.2.1 Operational and Ownership Structures
The following describe a number of ways in which select Canadian and American municipalities work with private corporations to manage various aspects of their utility operation and ownership.
54 Population by year, by province and territory, Statistics Canada, September 29, 2015 55 CANSIM, Statistics Canada, 2016 56 Real gross domestic product by expenditure account, year-over-year change – Seasonally adjusted at annual rates, chained (2007)
dollars, Statistics Canada, March 1, 2016 57 Monetary Policy Report, Bank of Canada, July 2016 58 Labour force, employment and unemployment, levels and rates, by province, Statistics Canada, January 8, 2016 59 Canada: Unemployment rate from 2010 to 2020, The Statistics Portal, 2016 60 Consumer Price Index, by province, Statistics Canada, January 22, 2016 61 Scotiabank’s Forecast Tables, Scotiabank, September 6, 2016 62 U.S. and World Population Clock, United States Census Bureau, September 14, 2016 63 2014 National Population Projections: Summary Tables, United States Census Bureau, December 2014 64 GDP growth (annual %), The World Bank, 2016 65 Real gross domestic product (GDP) growth rate in the United States from 2010 to 2020 (compared to the previous year), The
Statistics Portal, 2016 66 United States Department of Labor, Labor Force Statistics from the Current Population Survey, 2016 67 Forecast of the unemployment rate in the United States for fiscal years 2015 to 2026, The Statistics Portal, 2016 68 Consumer Price Index Data from 1913 to 2016, US Department of Labor Bureau of Labor Statistic, Aug 2016 69 United States Consumer Price Index (CPI), Trading Economics
City of Edmonton 2016 EPCOR Proposal for Drainage Transfer Analysis October 5, 2016
100
Audit • Tax • Advisory © Grant Thornton LLP. A Canadian Member of Grant Thornton International Ltd. All rights reserved.
5.2.1.1 Privatization of drainage in other jurisdictions
Few municipalities have privatized drainage operations. This is likely because large capital expenditures, such as those required to build or upgrade treatment plants, are not yet required for conveyance systems, which are typically replaced incrementally. Different structures for operating various aspects of the water-wastewater cycle, as well as municipalities utilizing these different structures are described below.
5.2.1.2 Privatization of water, wastewater, and/or storm water
• Sooke, BC: EPCOR manages water and wastewater operations and expansion of the collections systems. EPCOR’s contract is a Design/Build/Operate agreement and began in 2006
• Grande Prairie, AB: wastewater collection is run by the private company Aquaterra. Storm water is managed by the municipality
• Chestermere, AB: EPCOR maintains the water and waste water infrastructure and Chestermere Utilities Inc. manages operations
• Washington, DC: wastewater and storm water collection is managed by the crown corporation, DC Water
5.2.1.3 Separation of water and wastewater
• Halifax, NS: Halifax Regional Water Commission manages water and resembles a crown corporation, Halifax regional municipality manages wastewater/drainage
• London, ON: water is jointly managed with Azurix, wastewater and drainage are a part of the environmental services department
• Peterborough, ON: water is supplied by Peterborough Utilities Inc. and drainage services by the utility department
• Indianapolis, IN: O&M contract with Veolia Water for Water, O&M contract with United Water for drainage (United Water and Veolia are the same company)
• San Jose, CA: water is provided by the San Jose water company and drainage is provided by the municipal Environmental Services department
• Seattle, WA: separate municipal utilities
5.2.1.4 Separation of wastewater conveyance and treatment
• Regina, SK: municipality owns and operates the drainage assets, EPCOR has a P3 contract with the City to build and operate the treatment plant
• Metro Vancouver, BC: region owns the wastewater treatment plants for the entire region, the City manages the conveyance system
5.2.1.5 Reintegration of utility following privatization
• White Rock, BC: repurchased its water assets from EPCOR in 2015 after having entered into an own/operate agreement in 2005. Representatives from White Rock indicated a positive relationship but noted: “the City’s desire to purchase the utility assets arose out of an interest by the City Council and Administration to own its water assets and have the economic benefits go to White Rock and its residents.” White Rock proposed that the rates would go down for both multi-family properties and single family homes under the new structure.

City of Edmonton 2016 EPCOR Proposal for Drainage Transfer Analysis October 5, 2016
101
Audit • Tax • Advisory © Grant Thornton LLP. A Canadian Member of Grant Thornton International Ltd. All rights reserved.
The following table summarizes the structure used by these municipalities in terms of ownership and operation of storm water and wastewater conveyance and wastewater treatment.
City Drainage Ownership Framework
Storm water collection
management Storm Water
Collection Revenue Wastewater collection
management
Wastewater collection Revenue
Wastewater treatment
management Other Findings
Vancouver, BC Municipal Utility Municipality Flat rate included as a separate item on property tax notice
Municipality Flat rate included as a separate item on property tax notice
Metro Vancouver
Municipality is two tier, metro Vancouver has large pipes to connect the municipal sewers to the regional plant
Sooke, B.C. EPCOR is in charge of the operations per a Design/Build/Operate agreement but the city retains ownership.
EPCOR Rate based EPCOR Rate based EPCOR
Calgary, AB Wastewater department Water Resources and Water Services (Utilities) business unit – Infrastructure planning department
Cost of Service Study (COSS) - rates are set for a 4 year period
Water Resources and Water Services (Utilities) business unit – wastewater treatment department
COSS - rates are set for a 4 year period
Water Resources and Water Services (Utilities) business unit – wastewater treatment department
Grande Prairie, AB
City of Grande Prairie City of Grande Prairie Public Works
Property taxes Aquatera Rates based on consumption outlined in Bylaw C-1139M
Aquatera Aquatera is an MUC and returns a dividend to its shareholders
Chestermere, AB
City of Chestermere EPCOR manages infrastructure, Chestermere Utilities Inc. (CUI) manages operations
Flat monthly fee EPCOR manages infrastructure, CUI manages operations
Based on usage, rates determined by Calgary treatment plant
EPCOR manages infrastructure, CUI manages operations
CUI operates as a MUC and is wholly owned by the City of Chestermere
Regina, SK City of Regina City of Regina Rate based on the size of the property.
City of Regina Pay based on a percentage of total water consumption Rates are approved every 3 years by council
EPCOR EPCOR cites Gold Bar as one of the reasons this project was won
Saskatoon, SK City of Saskatoon Municipal utility Users are charged a number of Equivalent Runoff Unit (ERUs) every month
Municipal utility Volumetric charges based on water meter size and usage
Municipal utility Sewers and wastewater treatment are separate municipal departments
Ottawa, ON City of Ottawa Municipality Included with the water usage bill, customers are charged consumption plus surcharge for wastewater and storm water
Municipality Included with the water usage bill, customers are charged consumption plus surcharge for wastewater and storm water
City of Ottawa Ottawa is looking to change the payment system
Halifax, NS Halifax regional municipality Halifax Water, the municipal water, wastewater and
Charged per property connected to storm water
Halifax regional municipality
Rates based on expected consumption and
Halifax Water Halifax implemented a separate cost for storm water in
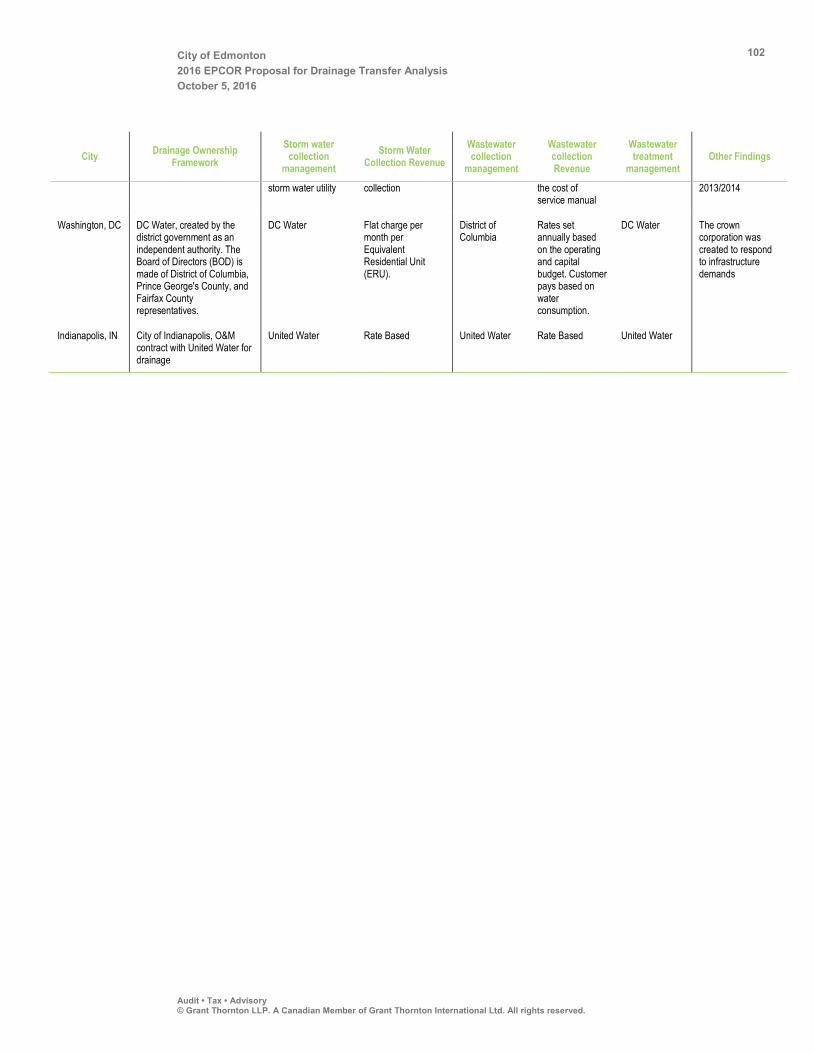
City of Edmonton 2016 EPCOR Proposal for Drainage Transfer Analysis October 5, 2016
102
Audit • Tax • Advisory © Grant Thornton LLP. A Canadian Member of Grant Thornton International Ltd. All rights reserved.
City Drainage Ownership Framework
Storm water collection
management Storm Water
Collection Revenue Wastewater collection
management
Wastewater collection Revenue
Wastewater treatment
management Other Findings
storm water utility collection the cost of service manual
2013/2014
Washington, DC DC Water, created by the district government as an independent authority. The Board of Directors (BOD) is made of District of Columbia, Prince George's County, and Fairfax County representatives.
DC Water Flat charge per month per Equivalent Residential Unit (ERU).
District of Columbia
Rates set annually based on the operating and capital budget. Customer pays based on water consumption.
DC Water The crown corporation was created to respond to infrastructure demands
Indianapolis, IN City of Indianapolis, O&M contract with United Water for drainage
United Water Rate Based United Water Rate Based United Water

City of Edmonton 2016 EPCOR Proposal for Drainage Transfer Analysis October 5, 2016
103
Audit • Tax • Advisory © Grant Thornton LLP. A Canadian Member of Grant Thornton International Ltd. All rights reserved.
6 Observations and Recommendations
Based on the quantitative and qualitative analysis presented in this Study, EPCOR’s Proposal to transfer Drainage has potential to yield net benefits to the City, taxpayers, and ratepayers. Thus, it is recommended that the City further consider the merits of the EPCOR Proposal based on its own risk/reward parameters and the information presented in this Study. We have summarized the net benefits of the EPCOR’s Proposal to aid in this consideration:
Capital Savings: Drainage is forecast to have large $1.9B capital program over the next 10 years (which can potential increase further with additional flood mitigation investment). EPCOR’s 10% capital efficiency appears to be reasonable, and can result in $193M in savings over the 10 year forecast period. This is a significant factor, and one which would also benefit ratepayers since EPCOR would have a lower rate base on which it would be able to generate a regulated ROE compared to other ownership alternatives.
Operational Savings: EPCOR meets the mandatory criteria of not proposing any Drainage staff layoffs. Rather it poses a number of incremental cost savings opportunities which appear reasonable. It was agreed that EPCOR would be able to introduce cost saving measures, while minimizing the impact of lost synergies, where possible.
Organizational Focus: EPCOR has matured as an organization, and has fully transitioned from the sale of its power generation business in 2009. It has shifted much of its focus on water utilities since that time. This is a fundamental change since its last Proposal to transfer Drainage in 2005.
Incremental Dividend: EPCOR proposes to use the health of its strong balance sheet to provide the City with at least a $20M additional dividend the first year following the transfer. We find this to be advantageous to the City and taxpayers since Drainage currently does not pay a dividend to the City, and the future state of the Drainage utility appears to require a significant amount of investment.
Commitment to Hold Rate Increase: Our quantitative analysis revealed that any owner (i.e. City, EPCOR, notional third-party) of Drainage will need to increase utility rates to fund the forecast capital program. The Utility does not appear to be financially self-sufficient over the long-term with a 3.0% annual increase of monthly Drainage rates. However, EPCOR has committed to hold these rate increases in spite of earning a low ROE between forecast years 2017 to 2021. In

City of Edmonton 2016 EPCOR Proposal for Drainage Transfer Analysis October 5, 2016
104
Audit • Tax • Advisory © Grant Thornton LLP. A Canadian Member of Grant Thornton International Ltd. All rights reserved.
addition, it is forecast to have the lowest total rate revenue increase of the scenarios analysed when a 10.5% ROE on the equity component of the rate base is introduced in 2022.
Proven Regulatory Regime: EPCOR proposes to use a PBR for Drainage as it does for EPCOR Water and Wastewater. Given that both EPCOR and the City (in its regulator capacity) are familiar with this regime for Water, it is reasonable to assume that similar regulatory regime can be adopted for Drainage.
Transfer of Liability: A transfer of the Drainage Utility would result in a transfer of associated environmental and property damage liabilities. EPCOR would be eligible for municipal protection offered by the MGA through a bylaw in the same manner those protections have been extended to EPCOR’s Water Services and Wastewater Treatment businesses.
Control over Municipal Development: The proposed division of Drainage Planning responsibilities means that the two areas responsible for area and detailed engineering drawing review would remain with the City. This ensures the City would have direct control over the direction of municipal development.
Expansion of EPCOR’s Business: In-house expertise in the full water-wastewater cycle could be leveraged by EPCOR to qualify for new full-cycle or drainage related business development opportunities. This could have a direct financial benefit for the City through further increases in EPCOR’s dividend.
Retained Control: The City would retain control over the Drainage Utility assets, operations, and planning through its roles as regulator and shareholder, and through Council’s position as elected officials representing citizens.
Based on the information collected during the course of this engagement, we have not identified any major impediments to the proposed transfer. Additionally, there are historical precedents of the City transferring assets to EPCOR (e.g. 1996 transfer of City water utility assets, and transfer of the Gold Bar Wastewater Treatment Plant in 2009). However, we recommend the following next steps should City Council vote to approve the EPCOR proposal (in no particular order):
• Engage S&P to determine the reasonableness of removing back-to-back debt secured by EPCOR as part of their credit analysis on the City.
• Identify how short-term assets, including $44.3M in cash in forecast year 2016 should be handled in a transfer scenario.
• Gauge if the incremental dividend increase in the first year following the transfer should be higher than $20M.
• Consider the inclusion of operational and capital efficiency factors as performance measures as part of the proposed PBR regulatory regime particularly in the rebasing process in 2021.
City of Edmonton 2016 EPCOR Proposal for Drainage Transfer Analysis October 5, 2016
105
Audit • Tax • Advisory © Grant Thornton LLP. A Canadian Member of Grant Thornton International Ltd. All rights reserved.
• Requests that the Province add a clause that is similar to the water supply and distribution exemption that includes private corporations in section 298(1)(a), Clause (1)(a) of the MGA. This would mitigate the slight risk of the Drainage system becoming assessable and subject to property tax if a transfer were to occur.
• Further analyse the extent of current Drainage assets that may become assessable for property taxes, as well as any impacts to the Local Access Fee and revenues lost to the City due to a component of taxes being transferred to the Province.
• In order to assess the GST impact of the transfer of the Target Assets and provision of Drainage, we recommend the City consider in more detail the Transferee’s status as a designated para-municipal organization at the time of transfer and the timing of the application for a “municipal designation”.
• Conduct broader engagement with internal and external stakeholders, such as staff, unions, the Urban Development Institute (UDI), etc.
• Review and quantify potential stranded costs to determine the appropriate transition fee payable by EPCOR to the City to accommodate the impacts on shared services such as IT and HR (currently, a placeholder of $75M is used by EPCOR)70.
• Review legal avenues for structure of Drainage under EPCOR relating to structuring as a separate business unit or amending the MGA to include the new BU to the exemption from Part 2 of the Public Utility Act.
• Assess UC appetite for including a method of tracking and reporting progress on capital and operational efficiency targets in the initial PBR.
• Assess UC appetite for suggested regulatory and planning meeting and reporting schedule outlined in EPCOR’s proposal.
• Further explore ownership and operational responsibility of
o Above-ground dry and wet ponds not located on Public Utility Lots (e.g., ponds located on school grounds).
o Clover Bar Lagoons and biosolids inventory.
• Further explore ownership and decommissioning responsibility of Bremner Lagoons and Queen Elizabeth WWTP.
70 Information provided by the City as per their preliminary analysis of shared service costs indicates that the net present value of potential stranded costs is approximately $29M following a potential transfer. EPCOR did not alter the $75M provision in its corporate Long Term Planning model.

City of Edmonton 2016 EPCOR Proposal for Drainage Transfer Analysis October 5, 2016
106
Audit • Tax • Advisory © Grant Thornton LLP. A Canadian Member of Grant Thornton International Ltd. All rights reserved.
• Assess current Drainage Services performance measures and targets and determine whether they are appropriate and how they would be adapted to fit under the PBR regulatory framework.
• Confirm allocation of Drainage Services’ Planning function responsibilities between the City and EPCOR.
• Assess options and put in place a bylaw extending municipal indemnity and additional MGA provisions 34 through 42 to Drainage under EPCOR.
• Engage with Alberta Environment and Parks to obtain approval to transfer operating responsibility for Drainage Services to EPCOR under the Approval to Operate, and determine impact of dividing Planning responsibilities between the two organizations.
• Review all existing contracts held by Drainage Services for transfer clauses and engage contract holders to inform them of the transition.
• Review existing grant agreements for possible consequences of a transfer (e.g., potential requirement to repay grant if assets are transferred).
• Contact granting agencies to determine if EPCOR would be eligible for grants, where they are silent on municipally owned corporations or where the definition of eligible applicant is unclear and requires further interpretation.
• Solidify the City’s position on the use and application of grants to utility infrastructure versus other City projects and include language specifying this within the EPCOR agreement.
The following recommendation applies whether or not Edmonton City Council votes to approve the transfer of Drainage Services to EPCOR:
• Conduct an overall analysis of the City’s Debt Management Fiscal Policy (DMFP).
• The City and EPCOR should work together to identify opportunities for efficiency in the Water and Sewer Servicing group within the Public Services function.

City of Edmonton 2016 EPCOR Proposal for Drainage Transfer Analysis October 5, 2016
107
Audit • Tax • Advisory © Grant Thornton LLP. A Canadian Member of Grant Thornton International Ltd. All rights reserved.
Authorship and Limitations
This report is prepared by Grant Thornton LLP for the City of Edmonton, Drainage Service Branch. This report is not intended for general circulation or publication, nor is it to be reproduced or used for any purpose other than previously outlined without our prior written permission in each specific instance.
This report is based on information and documentation that was made available to Grant Thornton. As such, Grant Thornton assumes no responsibility and makes no representations with respect to the accuracy or completeness of any information provided to us. We are not guarantors of the information which we have relied upon in preparing our report, and except as stated, we have not audited or otherwise attempted to verify any of the underlying information or data contained in this report. We reserve the right, but are under no obligation, to review all calculations included in or referred to in this report and, if we consider it necessary, to revise the report at a later date. It is understood and agreed that all decisions in connection with the implementation of recommendations provided by Grant Thornton shall be the responsibility of, and be made by the City of Edmonton.

City of Edmonton 2016 EPCOR Proposal for Drainage Transfer Analysis October 5, 2016
108
Audit • Tax • Advisory © Grant Thornton LLP. A Canadian Member of Grant Thornton International Ltd. All rights reserved.
Acronyms and Abbreviations
ACFA Alberta Capital Finance Authority ACRWC Alberta Capital Region Wastewater Commission ACRP Alberta Community Resilience Program B Billion/Billions BOD Board of Directors BU Business Unit Cap Capitalization CRA Canada Revenue Agency CBO Capital Budget Office CIA Capital Investment Agenda CPPC Capital Projects Planning Committee CEO Chief Executive Officer COR Certificate of Recognition CLT Corporate Leadership Team COSS Cost of Service Study Drainage City of Edmonton Drainage Utility DMFP Debt Management Fiscal Policy DCF Discounted Cash Flow EBITDA Earnings before Interest, Tax, Depreciation and Amortization EPCOR EPCOR Utilities Inc. ERU Equivalent Residential Unit EV Enterprise Value EWSI EPCOR Water Services Inc. F Forecast FY Forecast Year FFO Funds From Operation GBWWTP Gold Bar Wastewater Treatment Plant GLD Growth and Land Development GT Grant Thornton LLP IMS Incident Management System IRP Integrated Resource Plan IR Information Request (responses from EPCOR to GT information request) k Thousands km Kilometres
City of Edmonton 2016 EPCOR Proposal for Drainage Transfer Analysis October 5, 2016
109
Audit • Tax • Advisory © Grant Thornton LLP. A Canadian Member of Grant Thornton International Ltd. All rights reserved.
L Litres LDCs Local Distribution Companies LTP Long-Term Plan (EPCOR LTP Model) M Million/Millions MGA Municipal Government Act MUC Municipal Utility Corporation NRA Non-Routine Adjustment O&M Operating and Maintenance PBR Performance Based Regulation Proposal EPCOR’s proposal to transfer Drainage (presented June 14, 2016 to Council) P3 Public Private Partnership Q Quarter ROE Return on Equity RBC Royal Bank of Canada SSSF Sanitary Servicing Strategy Fund SVP Senior Vice President S&P Standard and Poor’s SIRP Stormwater Integrated Resource Plan SCBA Supplemental Capital Budget Adjustments TSD Tax Supported Debt TSX Toronto Stock Exchange TDSL Total Debt Service Limit UDI Urban Development Institute UA Utility Advisor UC Utility Committee WACC Weighted Average Cost of Capital WCB Workers Compensation Board