Embed Size (px)
Citation preview
CITY OF DAVIS & UC DAVIS FIRE DEPARTMENTS
SHARED FIRE MANAGEMENT
Monthly Performance Report April 2014

Davis & UC Davis Fire Crews respond to an emergency in downtown Davis. This type of daily cooperation and cohesiveness of operation is
further bolstered through shared management.
Chief’s Message Community Members,
I am pleased to present the first monthly performance report for the Shared Fire Management of the City of Davis (DFD) and UC Davis Fire Departments (UCDFD). Through the collective efforts of talented employees in both organizations, we are able to provide not only data about how we are performing, but also hope to paint the picture of work that is done by these two outstanding fire and emergency services agencies every day.
Just like our communities and our greater society, the fire service is changing. Change doesn’t come easy to many; in fact most people can relate one of the most personally challenging experiences in their life to a significant change. One of my personal goals as the shared Fire Chief is to help both departments, their respective communities and staff, through what are very challenging times in our industry today and into the future.
I see the road blocks that are ahead of us as a glass half full. It’s an opportunity for us to collaborate, innovate, re-imagine, and create a sustainable path for our operations moving forward. We have completed a Standard of Cover document and Strategic Plan for UCDFD, and we will begin work on DFD’s in July to help revitalize the department’s mission, vision, and values along with plotting a course that will help guide our service delivery as the community grows.
These monthly reports are designed to be a high-level overview of key activities and functions of the organizations. They should generate discussion, both draw and answer questions, and provide insight into the operations of modern day fire and emergency services delivery. This data alone should not inform policy decisions, but instead provide the framework to pose policy questions which, provided context and a comprehensive data set, can aid us in developing programs, services, and deployment strategies that best suit the needs of our unique communites.
Your new fire management team is eager to see the Shared Fire Management agreement renew and continue the great work that has been accomplished to date. Simply put, together we can do more!
Looking forward,
Nathan J. Trauernicht, MPA, CFO, CTO, MIFireE Fire Chief City of Davis & UC Davis Fire Departments
Fire Chief Nathan Trauernicht
Our Performance At A Glance
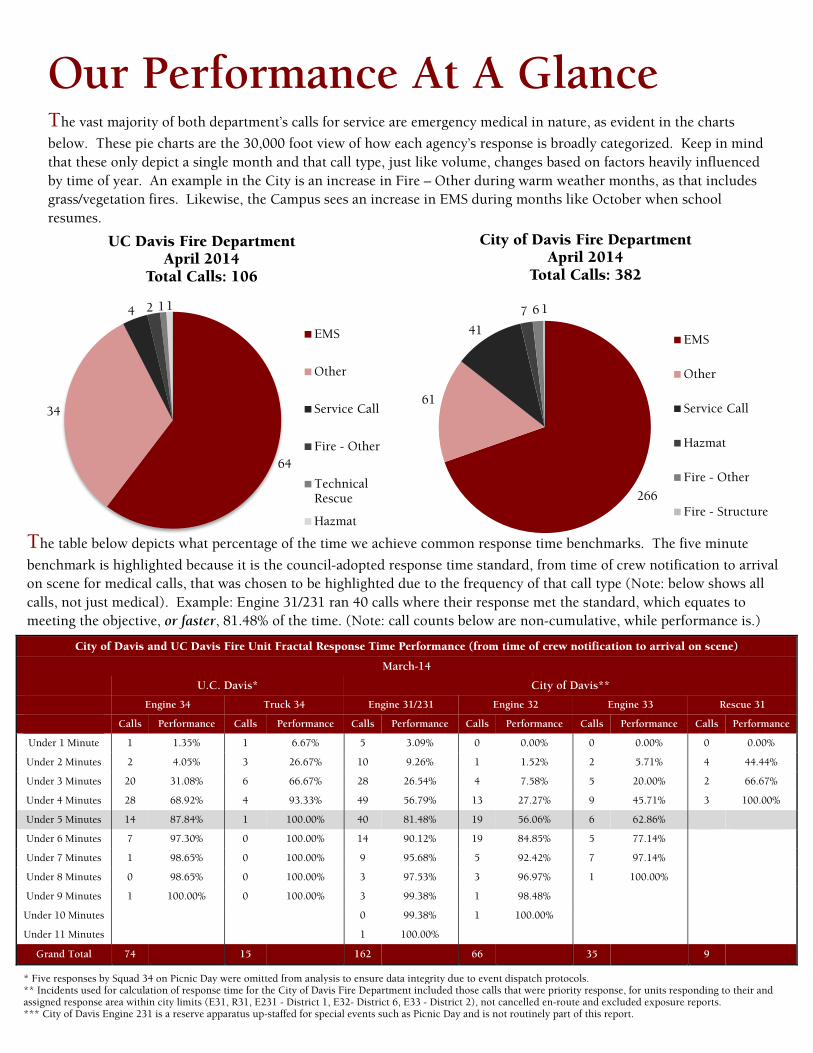
The vast majority of both department’s calls for service are emergency medical in nature, as evident in the charts below. These pie charts are the 30,000 foot view of how each agency’s response is broadly categorized. Keep in mind that these only depict a single month and that call type, just like volume, changes based on factors heavily influenced by time of year. An example in the City is an increase in Fire – Other during warm weather months, as that includes grass/vegetation fires. Likewise, the Campus sees an increase in EMS during months like October when school resumes.
64
34
4 2 1 1
UC Davis Fire Department April 2014
Total Calls: 106
EMS
Other
Service Call
Fire - Other
TechnicalRescue
Hazmat
266
61
41 7 6 1
City of Davis Fire Department April 2014
Total Calls: 382
EMS
Other
Service Call
Hazmat
Fire - Other
Fire - Structure
City of Davis and UC Davis Fire Unit Fractal Response Time Performance (from time of crew notification to arrival on scene)
March-14
U.C. Davis* City of Davis**
Engine 34 Truck 34 Engine 31/231 Engine 32 Engine 33 Rescue 31
Calls Performance Calls Performance Calls Performance Calls Performance Calls Performance Calls Performance
Under 1 Minute 1 1.35% 1 6.67% 5 3.09% 0 0.00% 0 0.00% 0 0.00%
Under 2 Minutes 2 4.05% 3 26.67% 10 9.26% 1 1.52% 2 5.71% 4 44.44%
Under 3 Minutes 20 31.08% 6 66.67% 28 26.54% 4 7.58% 5 20.00% 2 66.67%
Under 4 Minutes 28 68.92% 4 93.33% 49 56.79% 13 27.27% 9 45.71% 3 100.00%
Under 5 Minutes 14 87.84% 1 100.00% 40 81.48% 19 56.06% 6 62.86% Under 6 Minutes 7 97.30% 0 100.00% 14 90.12% 19 84.85% 5 77.14% Under 7 Minutes 1 98.65% 0 100.00% 9 95.68% 5 92.42% 7 97.14% Under 8 Minutes 0 98.65% 0 100.00% 3 97.53% 3 96.97% 1 100.00% Under 9 Minutes 1 100.00% 0 100.00% 3 99.38% 1 98.48% Under 10 Minutes 0 99.38% 1 100.00% Under 11 Minutes 1 100.00%
Grand Total 74 15 162 66 35 9
* Five responses by Squad 34 on Picnic Day were omitted from analysis to ensure data integrity due to event dispatch protocols. ** Incidents used for calculation of response time for the City of Davis Fire Department included those calls that were priority response, for units responding to their and
assigned response area within city limits (E31, R31, E231 - District 1, E32- District 6, E33 - District 2), not cancelled en-route and excluded exposure reports. *** City of Davis Engine 231 is a reserve apparatus up-staffed for special events such as Picnic Day and is not routinely part of this report.
The table below depicts what percentage of the time we achieve common response time benchmarks. The five minute
benchmark is highlighted because it is the council-adopted response time standard, from time of crew notification to arrival on scene for medical calls, that was chosen to be highlighted due to the frequency of that call type (Note: below shows all calls, not just medical). Example: Engine 31/231 ran 40 calls where their response met the standard, which equates to meeting the objective, or faster, 81.48% of the time. (Note: call counts below are non-cumulative, while performance is.)
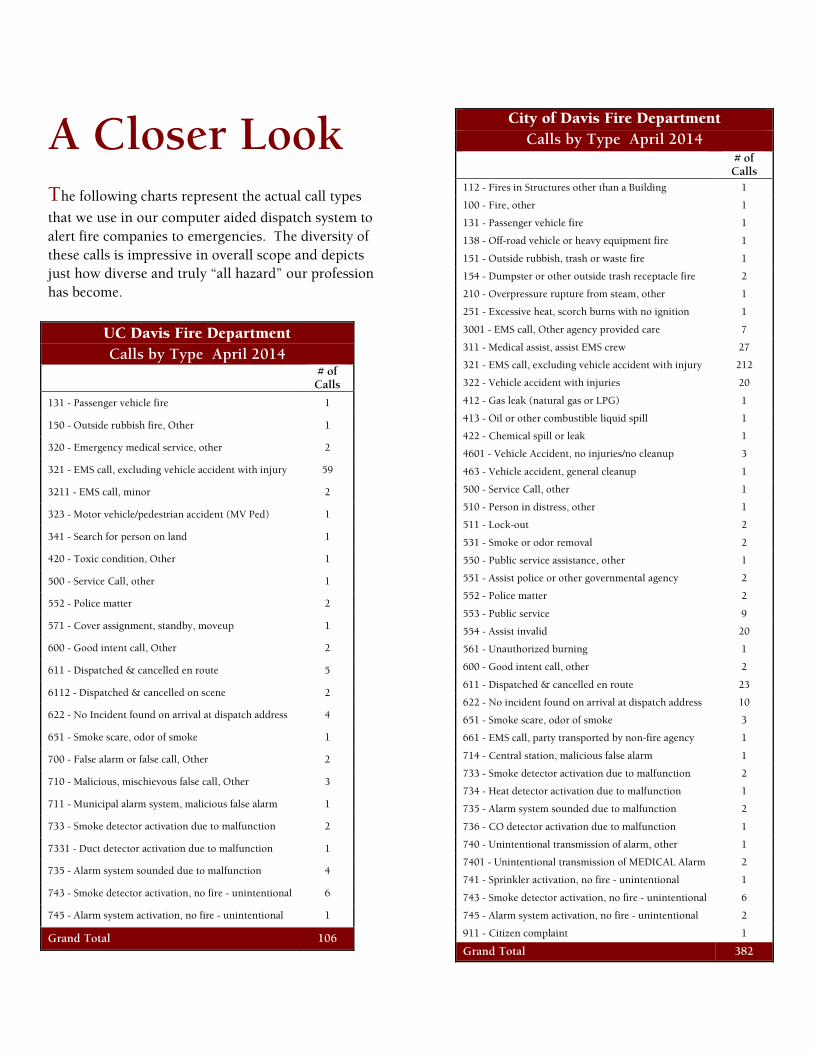
A Closer Look The following charts represent the actual call types that we use in our computer aided dispatch system to alert fire companies to emergencies. The diversity of these calls is impressive in overall scope and depicts just how diverse and truly “all hazard” our profession has become.
City of Davis Fire Department Calls by Type April 2014
# of Calls
112 - Fires in Structures other than a Building 1
100 - Fire, other 1
131 - Passenger vehicle fire 1
138 - Off-road vehicle or heavy equipment fire 1
151 - Outside rubbish, trash or waste fire 1
154 - Dumpster or other outside trash receptacle fire 2
210 - Overpressure rupture from steam, other 1
251 - Excessive heat, scorch burns with no ignition 1
3001 - EMS call, Other agency provided care 7
311 - Medical assist, assist EMS crew 27
321 - EMS call, excluding vehicle accident with injury 212
322 - Vehicle accident with injuries 20
412 - Gas leak (natural gas or LPG) 1
413 - Oil or other combustible liquid spill 1
422 - Chemical spill or leak 1
4601 - Vehicle Accident, no injuries/no cleanup 3
463 - Vehicle accident, general cleanup 1
500 - Service Call, other 1
510 - Person in distress, other 1
511 - Lock-out 2
531 - Smoke or odor removal 2
550 - Public service assistance, other 1
551 - Assist police or other governmental agency 2
552 - Police matter 2
553 - Public service 9
554 - Assist invalid 20
561 - Unauthorized burning 1
600 - Good intent call, other 2
611 - Dispatched & cancelled en route 23
622 - No incident found on arrival at dispatch address 10
651 - Smoke scare, odor of smoke 3
661 - EMS call, party transported by non-fire agency 1
714 - Central station, malicious false alarm 1
733 - Smoke detector activation due to malfunction 2
734 - Heat detector activation due to malfunction 1
735 - Alarm system sounded due to malfunction 2
736 - CO detector activation due to malfunction 1
740 - Unintentional transmission of alarm, other 1
7401 - Unintentional transmission of MEDICAL Alarm 2
741 - Sprinkler activation, no fire - unintentional 1
743 - Smoke detector activation, no fire - unintentional 6
745 - Alarm system activation, no fire - unintentional 2
911 - Citizen complaint 1
Grand Total 382
UC Davis Fire Department Calls by Type April 2014
# of
Calls
131 - Passenger vehicle fire 1
150 - Outside rubbish fire, Other 1
320 - Emergency medical service, other 2
321 - EMS call, excluding vehicle accident with injury 59
3211 - EMS call, minor 2
323 - Motor vehicle/pedestrian accident (MV Ped) 1
341 - Search for person on land 1
420 - Toxic condition, Other 1
500 - Service Call, other 1
552 - Police matter 2
571 - Cover assignment, standby, moveup 1
600 - Good intent call, Other 2
611 - Dispatched & cancelled en route 5
6112 - Dispatched & cancelled on scene 2
622 - No Incident found on arrival at dispatch address 4
651 - Smoke scare, odor of smoke 1
700 - False alarm or false call, Other 2
710 - Malicious, mischievous false call, Other 3
711 - Municipal alarm system, malicious false alarm 1
733 - Smoke detector activation due to malfunction 2
7331 - Duct detector activation due to malfunction 1
735 - Alarm system sounded due to malfunction 4
743 - Smoke detector activation, no fire - unintentional 6
745 - Alarm system activation, no fire - unintentional 1
Grand Total 106
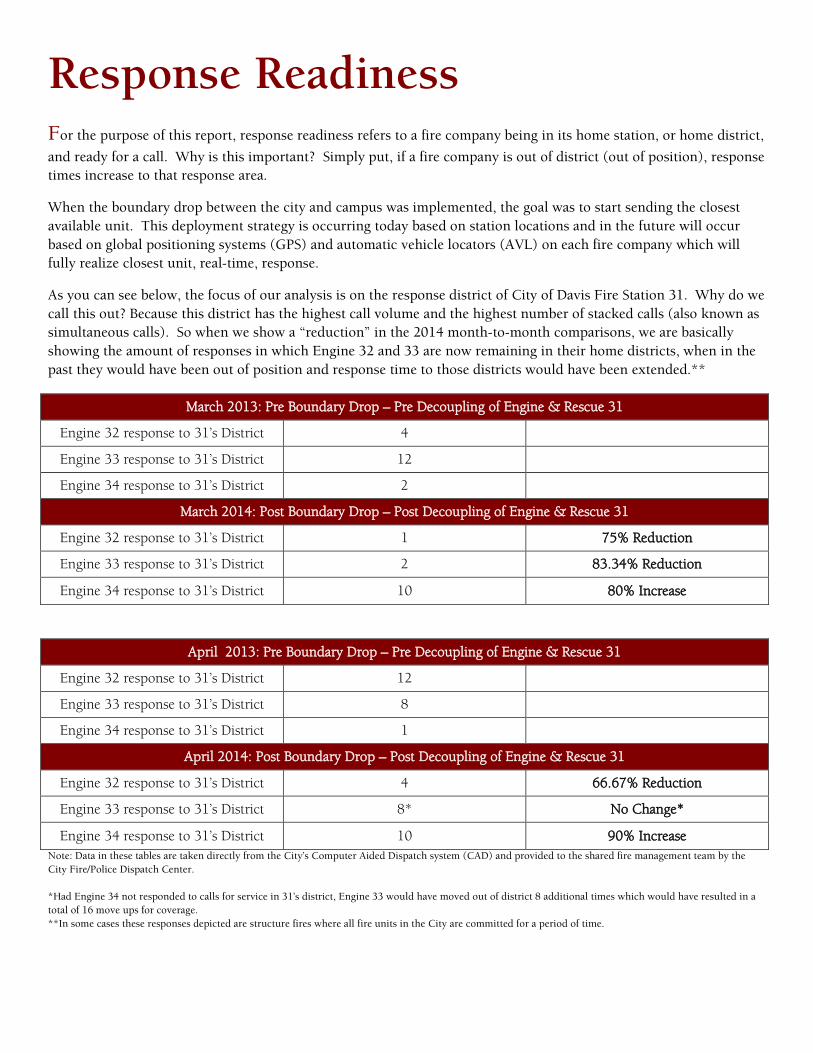
Response Readiness For the purpose of this report, response readiness refers to a fire company being in its home station, or home district,
and ready for a call. Why is this important? Simply put, if a fire company is out of district (out of position), response times increase to that response area.
When the boundary drop between the city and campus was implemented, the goal was to start sending the closest available unit. This deployment strategy is occurring today based on station locations and in the future will occur based on global positioning systems (GPS) and automatic vehicle locators (AVL) on each fire company which will fully realize closest unit, real-time, response.
As you can see below, the focus of our analysis is on the response district of City of Davis Fire Station 31. Why do we call this out? Because this district has the highest call volume and the highest number of stacked calls (also known as simultaneous calls). So when we show a “reduction” in the 2014 month-to-month comparisons, we are basically showing the amount of responses in which Engine 32 and 33 are now remaining in their home districts, when in the past they would have been out of position and response time to those districts would have been extended.**
March 2013: Pre Boundary Drop – Pre Decoupling of Engine & Rescue 31
Engine 32 response to 31’s District 4
Engine 33 response to 31’s District 12
Engine 34 response to 31’s District 2
March 2014: Post Boundary Drop – Post Decoupling of Engine & Rescue 31
Engine 32 response to 31’s District 1 75% Reduction
Engine 33 response to 31’s District 2 83.34% Reduction
Engine 34 response to 31’s District 10 80% Increase
April 2013: Pre Boundary Drop – Pre Decoupling of Engine & Rescue 31
Engine 32 response to 31’s District 12
Engine 33 response to 31’s District 8
Engine 34 response to 31’s District 1
April 2014: Post Boundary Drop – Post Decoupling of Engine & Rescue 31
Engine 32 response to 31’s District 4 66.67% Reduction
Engine 33 response to 31’s District 8* No Change*
Engine 34 response to 31’s District 10 90% Increase Note: Data in these tables are taken directly from the City’s Computer Aided Dispatch system (CAD) and provided to the shared fire management team by the City Fire/Police Dispatch Center. *Had Engine 34 not responded to calls for service in 31’s district, Engine 33 would have moved out of district 8 additional times which would have resulted in a total of 16 move ups for coverage. **In some cases these responses depicted are structure fires where all fire units in the City are committed for a period of time.
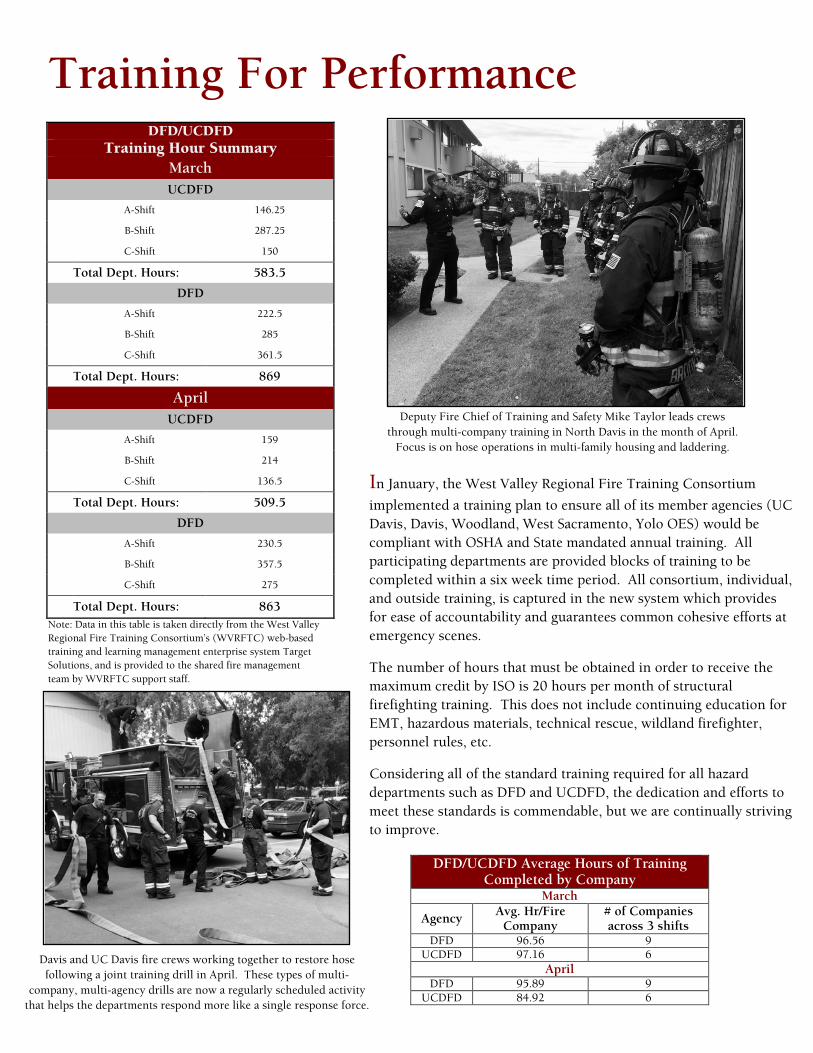
Training For Performance DFD/UCDFD
Training Hour Summary March UCDFD
A-Shift 146.25
B-Shift 287.25
C-Shift 150
Total Dept. Hours: 583.5
DFD
A-Shift 222.5
B-Shift 285
C-Shift 361.5
Total Dept. Hours: 869
April UCDFD
A-Shift 159
B-Shift 214
C-Shift 136.5
Total Dept. Hours: 509.5
DFD
A-Shift 230.5
B-Shift 357.5
C-Shift 275
Total Dept. Hours: 863 Note: Data in this table is taken directly from the West Valley Regional Fire Training Consortium’s (WVRFTC) web-based training and learning management enterprise system Target Solutions, and is provided to the shared fire management team by WVRFTC support staff.
In January, the West Valley Regional Fire Training Consortium implemented a training plan to ensure all of its member agencies (UC Davis, Davis, Woodland, West Sacramento, Yolo OES) would be compliant with OSHA and State mandated annual training. All participating departments are provided blocks of training to be completed within a six week time period. All consortium, individual, and outside training, is captured in the new system which provides for ease of accountability and guarantees common cohesive efforts at emergency scenes.
The number of hours that must be obtained in order to receive the maximum credit by ISO is 20 hours per month of structural firefighting training. This does not include continuing education for EMT, hazardous materials, technical rescue, wildland firefighter, personnel rules, etc.
Considering all of the standard training required for all hazard departments such as DFD and UCDFD, the dedication and efforts to meet these standards is commendable, but we are continually striving to improve.
DFD/UCDFD Average Hours of Training Completed by Company
March
Agency Avg. Hr/Fire Company
# of Companies across 3 shifts
DFD 96.56 9 UCDFD 97.16 6
April DFD 95.89 9
UCDFD 84.92 6
Deputy Fire Chief of Training and Safety Mike Taylor leads crews through multi-company training in North Davis in the month of April.
Focus is on hose operations in multi-family housing and laddering.
Davis and UC Davis fire crews working together to restore hose following a joint training drill in April. These types of multi-
company, multi-agency drills are now a regularly scheduled activity that helps the departments respond more like a single response force.
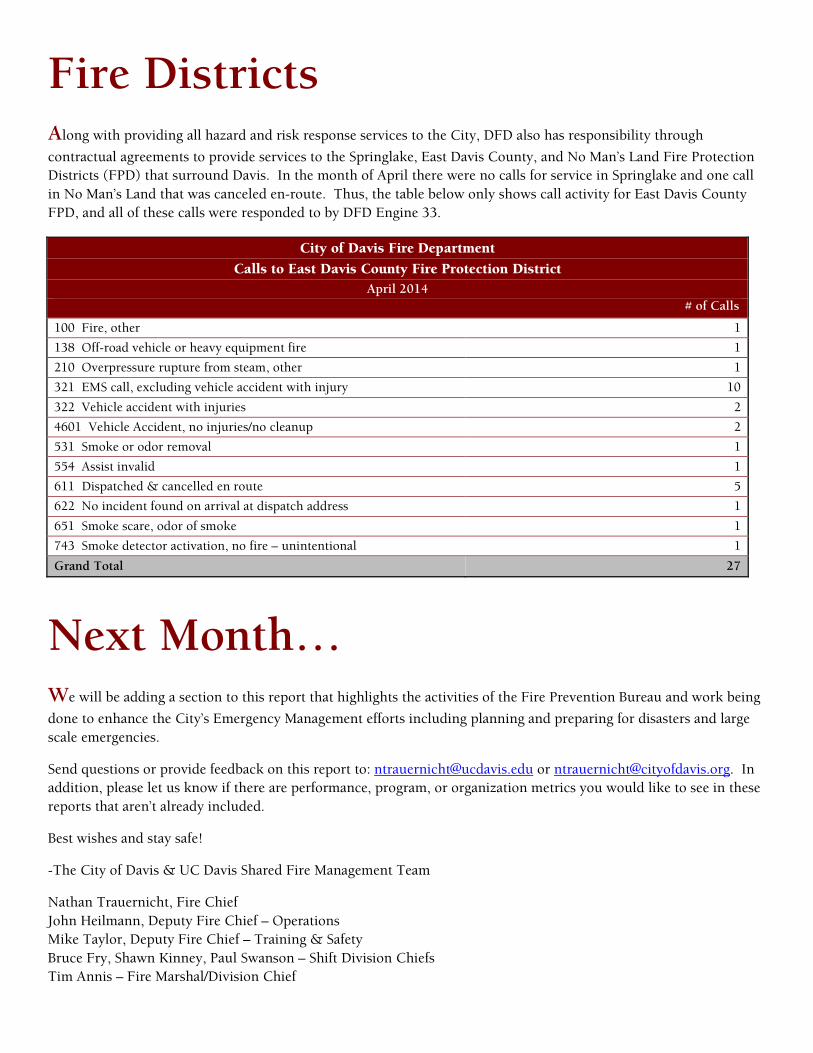
Fire Districts Along with providing all hazard and risk response services to the City, DFD also has responsibility through
contractual agreements to provide services to the Springlake, East Davis County, and No Man’s Land Fire Protection Districts (FPD) that surround Davis. In the month of April there were no calls for service in Springlake and one call in No Man’s Land that was canceled en-route. Thus, the table below only shows call activity for East Davis County FPD, and all of these calls were responded to by DFD Engine 33.
City of Davis Fire Department Calls to East Davis County Fire Protection District
April 2014 # of Calls
100 Fire, other 1
138 Off-road vehicle or heavy equipment fire 1
210 Overpressure rupture from steam, other 1
321 EMS call, excluding vehicle accident with injury 10
322 Vehicle accident with injuries 2
4601 Vehicle Accident, no injuries/no cleanup 2
531 Smoke or odor removal 1
554 Assist invalid 1
611 Dispatched & cancelled en route 5
622 No incident found on arrival at dispatch address 1
651 Smoke scare, odor of smoke 1
743 Smoke detector activation, no fire – unintentional 1
Grand Total 27
Next Month… We will be adding a section to this report that highlights the activities of the Fire Prevention Bureau and work being
done to enhance the City’s Emergency Management efforts including planning and preparing for disasters and large scale emergencies.
Send questions or provide feedback on this report to: [email protected] or [email protected]. In addition, please let us know if there are performance, program, or organization metrics you would like to see in these reports that aren’t already included.
Best wishes and stay safe!
-The City of Davis & UC Davis Shared Fire Management Team
Nathan Trauernicht, Fire Chief John Heilmann, Deputy Fire Chief – Operations Mike Taylor, Deputy Fire Chief – Training & Safety Bruce Fry, Shawn Kinney, Paul Swanson – Shift Division Chiefs Tim Annis – Fire Marshal/Division Chief