Embed Size (px)
Citation preview

City of Chicago Chicago Midway International Airport
An Enterprise Fund of the City of Chicago
Comprehensive Annual Financial Report For the Years Ended December 31, 2018 and 2017
Lori E. Lightfoot, Mayor Jennie Huang Bennett, Chief Financial Officer
Erin Keane, City Comptroller Jamie L. Rhee, Commissioner

2018 COMPREHENSIVE ANNUAL FINANCIAL REPORT OF THE CHICAGO MIDWAY INTERNATIONAL AIRPORT
TABLE OF CONTENTS
PART I ؘ– INTRODUCTORY SECTION
Letter of Transmittal ...................................................................................................................................................... 2 Certificate of Achievement for Excellence in Financial Reporting ............................................................................... 6 Organization Chart/List of Principal Officials ............................................................................................................... 7
PART II ؘ– FINANCIAL SECTION
Independent Auditors Report and Financial Statements
Independent Auditors’ Report ....................................................................................................................................... 8 Management’s Discussion and Analysis ..................................................................................................................... 11
Basic Financial Statements
Statements of Net Position........................................................................................................................................... 21 Statements of Revenues, Expenses and Changes in Net Position ................................................................................ 22 Statements of Cash Flows ............................................................................................................................................ 23 Notes to Basic Financial Statements ............................................................................................................................ 25
REQUIRED SUPPLEMENTAL INFORMATION
Schedule of Changes in the Net Pension Liability and Related Ratios ........................................................................ 57 Schedule of Contributions ........................................................................................................................................... 61
ADDITIONAL INFORMATION Calculations of Coverage
Chicago Midway Airport Revenue Bonds ................................................................................................................... 64 Chicago Midway Airport Second Lien Revenue Bonds .............................................................................................. 66
PART III ؘ– STATISTICAL SECTION (Unaudited)
Historical Operating Results, Each of the Ten Years Ended December 31, 2009-2018 .............................................. 70 Debt Service Schedule ................................................................................................................................................. 71 Midway Airport Revenue Bonds, Series 1996, Estimated Bond-Funded Costs as of December 31, 2018 .......................................................................................................................................... 72 Capital Improvement Program 2019-2025, Estimated Source and Uses of Funds as of December 31, 2018, ......................................................................................................................................... 73 Terminal Development Program, Estimated Sources and Uses of Funds as of December 31, 2018 ........................... 74 Historical Enplaned Passengers, Each of the Ten Years Ended December 31, 2009-2018 ......................................... 75 Enplaned Commercial Passengers by Airline, Each of the Ten Years Ended December 31, 2009-2018 .................... 76 Historical Enplaned Passengers, Chicago Region Airports, Each of the Ten Years Ended December 31, 2009-2018 ......................................................................................................................................... 77 Historical Total Origin and Destination (O&D) Enplanements, Chicago Region Airports Each of the Ten Years Ended December 31, 2009-2018 ......................................................................................... 78 Aircraft Operations, Each of the Ten Years Ended December 31, 2009-2018 ............................................................ 79
Net Position by Component, Each of the Ten Years Ended December 31, 2009-2018 ............................................... 80 Change in Net Position, Each of the Ten Years Ended December 31, 2009-2018 ...................................................... 81 Long Term Debt, Each of the Ten Years Ended December 31, 2009-2018 ............................................................... 82 Full Time Equivalent Chicago Midway Airport Employees by Function, Each of the Ten Years Ended December 31, 2009-2018 ......................................................................................................................................... 83 Principal Employers (Non-Government), Current Year and Nine Years Ago............................................................. 84 Population and Income Statistics, Each of the Ten Years Ended December 31, 2009-2018 ....................................... 85 Landing Fees and Terminal Area Use Charges ........................................................................................................... 86

PART I
INTRODUCTORY SECTION
2

3

4

5

Certificate of
Presented to
Chicago Midway International Airport
For its Comprehensive Annual
December 31, 2017
Executive Director/CEO
Financial Reportfor the Fiscal Year Ended
Reportingin Financial
for ExcellenceAchievement
Text38: IllinoisText53:
Government Finance Officers Association

CITY OF CHICAGO
CHICAGO MIDWAY INTERNATIONAL AIRPORT
ORGANIZATION CHART
AS OF 12/31/2018
CITIZENS
CHICAGO MIDWAY AIRPORT
OPERATIONS
MAYOR
CITY
TREASURER
CITY
CLERK
CITY
COUNCIL
OTHER CITY
DEPARTMENTS
AVIATION
DEPARTMENT
COUNCIL
COMMITTEES

PART II
FINANCIAL SECTION

INDEPENDENT AUDITORS’ REPORT
To the Honorable Lori E. Lightfoot, Mayor And Members of the City Council City of Chicago, Illinois
Report on the Financial Statements
We have audited the accompanying financial statements of Chicago Midway International Airport (“Midway”), an enterprise fund of the City of Chicago, Illinois (the “City”), as of and for the years ended December 31, 2018 and 2017, and the related notes to the financial statements, which collectively comprise Midway’s basic financial statements as listed in the table of contents.
Management’s Responsibility for the Financial Statements
Management is responsible for the preparation and fair presentation of these financial statements in accordance with accounting principles generally accepted in the United States of America; this includes the design, implementation, and maintenance of internal control relevant to the preparation and fair presentation of financial statements that are free from material misstatement, whether due to fraud or error.
Auditors’ Responsibility
Our responsibility is to express an opinion on these financial statements based on our audits. We conducted our audits in accordance with auditing standards generally accepted in the United States of America. Those standards require that we plan and perform the audit to obtain reasonable assurance about whether the financial statements are free from material misstatement.
An audit involves performing procedures to obtain audit evidence about the amounts and disclosures in the financial statements. The procedures selected depend on the auditor’s judgment, including the assessment of the risks of material misstatement of the financial statements, whether due to fraud or error. In making those risk assessments, the auditor considers internal control relevant to the entity’s preparation and fair presentation of the financial statements in order to design audit procedures that are appropriate in the circumstances, but not for the purpose of expressing an opinion on the effectiveness of the entity’s internal control. Accordingly, we express no such opinion. An audit also includes evaluating the appropriateness of accounting policies used and the reasonableness of significant accounting estimates made by management, as well as evaluating the overall presentation of the financial statements.
We believe that the audit evidence we have obtained is sufficient and appropriate to provide a basis for our audit opinion.

- 9 -
Opinion
In our opinion, the financial statements referred to above present fairly, in all material respects, the financial position of Chicago Midway International Airport, as of December 31, 2018 and 2017, and the changes in its financial position, and its cash flows for the years then ended in accordance with accounting principles generally accepted in the United States of America.
Emphasis of Matter
As discussed in Note 1 to the basic financial statements, the basic financial statements referred to above present only Chicago Midway International Airport, an enterprise fund of the City, and do not purport to, and do not, present the financial position of the City as of December 31, 2018 and 2017, changes in its financial position, or, where applicable, its cash flows, thereof, in conformity with accounting principles generally accepted in the United States of America. Our opinion is not modified with respect to this matter.
Other Matters
Required Supplementary Information
Accounting principles generally accepted in the United States of America require that Management’s Discussion and Analysis, the Schedule of Changes in the Net Pension Liability and Related Ratios, and the Schedule of Contributions as listed in the table of contents, be presented to supplement the basic financial statements. Such information, although not a part of the basic financial statements, is required by the Governmental Accounting Standards Board who considers it to be an essential part of financial reporting for placing the basic financial statements in an appropriate operational, economic, or historical context. We have applied certain limited procedures to the required supplementary information in accordance with auditing standards generally accepted in the United States of America, which consisted of inquiries of management about the methods of preparing the information and comparing the information for consistency with management’s responses to our inquiries, the basic financial statements, and other knowledge we obtained during our audit of the basic financial statements. We do not express an opinion or provide any assurance on the information because the limited procedures do not provide us with sufficient evidence to express an opinion or provide any assurance.
Other Information
Our audit was conducted for the purpose of forming an opinion on the financial statements that collectively comprise Midway’s basic financial statements. The introductory section, additional supplementary information, and statistical section are presented for purposes of additional analysis and are not a required part of the basic financial statements.
The additional supplementary information is the responsibility of management and was derived from and relates directly to the underlying accounting and other records used to prepare the basic financial statements. Such information has been subjected to the auditing procedures applied in the audit of the basic financial statements and certain additional procedures, including comparing and reconciling such information directly to the underlying accounting and other records used to prepare the basic financial statements or to the basic financial statements themselves, and other additional procedures in accordance with auditing standards generally accepted in the United States of America. In our opinion, the

- 10 -
additional supplementary information is fairly stated, in all material respects, in relation to the basic financial statements as a whole.
The introductory section and statistical section have not been subjected to the auditing procedures applied in the audit of the basic financial statements, and accordingly, we do not express an opinion or provide any assurance on them.
June 25, 2019
- 11 -
CITY OF CHICAGO, ILLINOIS CHICAGO MIDWAY INTERNATIONAL AIRPORT
MANAGEMENT’S DISCUSSION AND ANALYSIS (Dollars in thousands)
This following discussion and analysis of the Chicago Midway International Airport’s (the “Airport” or “Midway”) performance provides an introduction and overview of the Airport’s financial activities for the years ended December 31, 2018 and 2017. Please read this discussion in conjunction with the Airport’s basic financial statements and the notes to basic financial statements following this section.
FINANCIAL HIGHLIGHTS
2018
• Operating revenues for 2018 increased by $11,508 compared to 2017 operating revenue primarily due to increases in the landing fees and terminal rental rates to pay for capital development of the airport and operational infrastructure reliability.
• Operating expenses before depreciation and amortization increased by $10,445 compared to 2017 due to increases in salaries and wages of $3,223 due to increased public safety presence, pension expense of $2,632 primarily as a result of composition of amounts being amortized from deferred inflows and outflows related to prior assumptions changes and differences between projected and actual earnings on pension plan investments, and repairs and maintenance of $2,820 due to increased equipment and fuel maintenance.
• The Airport’s total net deficit at December 31, 2018, was $332,824. This is a decrease of $25,823 compared to total net deficit at December 31, 2017, primarily due to the reduction of capital grant revenues earned during 2018 for Airport Improvement Grants (AIP) that were awarded but not expended during 2018. These grant awards will be expended during 2019-2020.
• Capital asset additions for 2018 were $80,927, which is an increase of $45,038 compared to 2017, principally due to runway rehabilitation and parking and security improvements related to the terminal checkpoint expansion as part of the Midway Modernization Program. Completed projects totaling, $18,008 were transferred from construction in progress to applicable buildings and other facilities capital account.
2017
• Operating revenues for 2017 increased by $12,832 compared to 2016 operating revenue primarily due to increases in the landing fees and terminal rental rates to pay for capital development of the airport, increases in concessions revenues (primarily food & beverage and retail) due to a new concessions management contract which the Airport entered into in May 2017 with Midway Partnership LLC, and parking revenues due to a new rate structure implemented in January 2017.
• Operating expenses before depreciation and amortization decreased by $11,640 compared to 2016 primarily due to a decrease in pension expenses as a result of the changes under Public Act 100-0023 (P.A. 100-0023), which requires increased future contributions to the

- 12 -
Municipal Employees’ Annuity and Benefit Fund of Chicago (Municipal Employees’) and the Laborers’ and Retirement Board Employees’ Annuity and Benefit Fund of Chicago (Laborers’) Plans. The increase in future required contributions increased the discount rate used to determine the total pension liability and decreased the current year pension expense. This was offset by an increase in professional and engineering services for pre-construction (planning) related services associated with the Midway Modernization Program.
• The Airport’s total net deficit at December 31, 2017, was $(307,001). This is a decrease of $3,148 compared to total net deficit at December 31, 2016, primarily due to the non cash portion of pension expense (recorded as an operating expense) that is not collected in rates and charges.
• Capital asset additions for 2017 were $35,889, principally due to land acquisition, runway rehabilitation and parking and security improvements. Completed projects totaling, $14,174 were transferred from construction in progress to applicable buildings and other facilities capital account.
OVERVIEW OF THE BASIC FINANCIAL STATEMENTS
This discussion and analysis is intended to serve as an introduction to the Airport’s basic financial statements. The Airport is included in the City of Chicago, Illinois’ (the “City”) reporting entity as an enterprise fund. The Airport’s basic financial statements are composed of the basic financial statements and the notes to basic financial statements. In addition to the basic financial statements, this report also presents additional and statistical information after the notes to basic financial statements.
The Statements of Net Position present all of the Airport’s assets and liabilities using the accrual basis of accounting. The difference between assets and deferred outflows and liabilities and deferred inflows is reported as net position. The increase or decrease in net position may serve as an indicator, over time, whether the Airport’s financial position is improving or deteriorating. However, the consideration of other non-financial factors, such as changes within the airline industry, may be necessary in the assessment of the overall financial position and health of the Airport.
The Statements of Revenues, Expenses, and Changes in Net Position present all current fiscal year revenues and expenses, regardless of when cash is received or paid, and the ensuing change in net position.
The Statements of Cash Flows report how cash and cash equivalents are provided and used by the Airport’s operating, capital financing, noncapital financing and investing activities. These statements present the cash received and disbursed, the net increase or decrease in cash and cash equivalents for the year and the cash and cash equivalents balance at year-end.
The Notes to Basic Financial Statements are an integral part of the basic financial statements; accordingly, such disclosures are essential to a full understanding of the information provided in the basic financial statements.
The Required Supplementary Information section presents the schedule of changes in the net pension liability and related ratios and the schedule of contributions.
In addition to the basic financial statements, this report includes the Additional Supplementary and Statistical Information. The Additional Supplementary Information section presents debt

- 13 -
service coverage calculations and the Statistical Information section includes certain unaudited information related to the Airport’s historical financial and non-financial operating results and capital activities.
FINANCIAL ANALYSIS
Landing fees and terminal area use charges and fueling system charges are assessed to the various airlines throughout each year based on estimated rates. Such rates are designed to yield collections from airlines adequate to cover certain operating expenses and required debt service and fund deposits as determined under provisions of the Airport Use Agreement and Facilities Lease (“Use Agreement”). Incremental amounts due from the airlines arise when amounts assessed, based on the estimated rates used during the year, are less than actual expenses and required deposits for the year. Such incremental amounts due from airlines are included in amounts to be billed. Incremental amounts due to the airlines arise when amounts assessed, based on the estimated rates used during the year, exceed actual expenses and required deposits for the year. Such incremental amounts due to airlines are included in billings over amounts earned. The termination date of the Use Agreement is December 31, 2027.

- 14 -
At December 31, 2018, the Airport’s financial position included total assets and deferred outflows of $2,041,271 total liabilities and deferred inflows of $2,374,095 and net deficit of $332,824. A comparative condensed summary of the Airport’s net position at December 31, 2018, 2017, and 2016, is as follows:
2018 2017 2016
Current unrestricted assets 88,052$ 72,095$ 61,717$ Restricted and other assets—noncurrent 622,339 692,585 705,534 Capital assets—net 1,196,678 1,167,134 1,182,688
Total assets 1,907,069 1,931,814 1,949,939
Deferred outflows 134,202 154,462 114,005
Total assets and deferred outflows 2,041,271$ 2,086,276$ 2,063,944$
Current unrestricted liabilities 51,908$ 39,668$ 34,711$ Liabilities payable from restricted assets and noncurrent liabilities 2,239,346 2,244,835 2,324,682
Total liabilities 2,291,254 2,284,503 2,359,393
Deferred inflows 82,841 108,774 8,404
Total liabilities and deferred inflows 2,374,095$ 2,393,277$ 2,367,797$
Net position: Net investment in capital assets (172,197)$ (180,803)$ (152,026)$ Restricted 120,685 127,476 83,048 Unrestricted (281,312) (253,674) (234,875)
Total net deficit (332,824)$ (307,001)$ (303,853)$
Net Position

- 15 -
2018
Current unrestricted assets increased by $15,957 (22.1%) primarily due to an increase in cash and cash equivalents from increased landing fee and terminal rental revenues. The Airport’s current ratio (current unrestricted assets/current unrestricted liabilities) at December 31, 2018 and 2017, was 1.70:1 and 1.82:1, respectively. Noncurrent restricted and other assets decreased by $70,246 (10.1%) mainly due to decreases in construction funds of $53,291 (14.7%) related to increased activity in the Midway Modernization Program capital development during 2018. Net capital assets increased by $29,544 (2.5%) due primarily to projects continually being completed.
The increase in current liabilities of $12,240 (30.9%) is mainly related to the increase in billings over amounts earned for terminal rent of $12,802.
Liabilities payable from restricted assets and noncurrent liabilities decreased by $5,488 (0.2%) in 2018 mainly due to a decrease in revenue bonds payable from restricted funds of $59,607 (3.2%), which was offset by an increase in pension liability of $39,092 (13.4%) compared to 2017 primarily as a result of a decrease in pension plan assets associated with investment losses caused by market results. At December 31, 2018, total net deficit was $(332,824), a decrease of $25,823 (8.4%).
Deferred outflows decreased by $20,260 (13.1%) and deferred inflows decreased by $25,933 (23.8%) during 2018 due to the difference between 2018 projected and actual earnings on pension plan investments.
2017
Current unrestricted assets increased by $10,378 (16.8%) primarily due to an increase in cash and cash equivalents from increased revenues. The Airport’s current ratio (current unrestricted assets/current unrestricted liabilities) at December 31, 2017 and 2016, was 1.82:1 and 1.78:1, respectively. Noncurrent restricted and other assets decreased by $12,949 (1.8%) mainly due to decreases in construction funds of $32,119 related to increased activity in the Midway Modernization capital improvement plan during 2017. Net capital assets decreased by $15,554 (1.3%) due principally to projects continually being completed, therefore an overall increase in depreciation.
The increase in current liabilities of $4,957 (14.3%) is mainly related to the increase in advances for terminal rent of $2,013. Pension liability in the amount of $290,610 decreased $26,137 (8.25%) compared to 2016 as a result of the changes under P.A. 100-0023 which requires increased future contributions to the Municipal Employees’ and Laborers’ plans. The increase in future required contributions increased the discount rate used to determine the total pension liability and therefore decreased the net pension liability.
Liabilities payable from restricted assets and noncurrent liabilities decreased by $79,847 (3.4%) in 2017 mainly due to a decrease in revenue bonds payable from restricted funds of $36,793, which was offset by a decrease in net pension liability as a result of the changes under P.A. 100-0023, which impacted the Municipal Employees’ and Laborers’ plans. At December 31, 2017, total net deficit was $(307,001), a decrease of $3,148 (1.0%).
Deferred outflows increased by $40,457 (35.5%) and deferred inflows increased by $100.4 (1,194.3%) during 2017 due to changes in the required future pension contributions as discussed above in the financial highlights.

- 16 -
A comparative condensed summary of the Airport’s changes in net position for the years ended December 31, 2018, 2017, and 2016 is as follows (dollars in thousands):
2018 2017 2016
Operating revenues: Landing fees and terminal area use charges 106,125$ 95,416$ 87,425$ Rents, concessions and other 100,408 99,609 94,768
Total operating revenues 206,533 195,025 182,193
Operating expenses: Salaries and wages 51,408 48,185 48,548 Pension expense 42,843 40,211 47,879 Repairs and maintenance 47,326 44,506 48,277 Professional and engineering 24,144 24,344 20,851 Other operating expenses 15,689 13,719 17,050 Depreciation and amortization 51,383 51,443 49,118
Total operating expenses 232,793 222,408 231,723
Operating (loss) (26,260) (27,383) (49,530)
Nonoperating revenue (expenses): Nonoperating revenues 54,462 55,245 49,560 Nonoperating expenses (60,801) (62,566) (88,310)
Total nonoperating revenues (expenses) (6,339) (7,321) (38,750)
(Loss) before capital grants (32,599) (34,704) (88,280)
Capital grants 6,776 31,556 27,903
Change in net position (25,823) (3,148) (60,377)
Net deficit beginning of year (307,001) (303,853) (243,476)
Net deficit end of year (332,824)$ (307,001)$ (303,853)$
Changes in Net Position
2018
Landing fees and terminal area use charges for the years 2018 and 2017 were $106,125 and $95,416, respectively. Rents, concessions, and other revenues were $100,408 and $99,609 for 2018 and 2017, respectively. The increase in 2018 operating revenues of $11,508 (5.9%) from 2017 was due to increased landing fees and terminal area use charges of $10,709 to pay for capital development of the airport and operational infrastructure reliability and rents and other

- 17 -
concession revenue of $799 based on steady revenues earned under the Midway concessions program.
Salaries and wages increased by $3,223 (6.7%) in 2018 compared to 2017 due to an increase in public safety presence and additional traffic management support as the construction of the terminal security checkpoint expansion is over a major roadway and affects traffic flow. Repairs and maintenance increased by $2,820 (6.3%) due to increased equipment and fuel maintenance.
Pension expense increased $2,632 (6.5%) from $40,211 in 2017 to $42,843 in 2018, as a result of composition of amounts being amortized from deferred inflows and outflows related to prior assumptions changes and differences between projected and actual earnings on pension plan investments. During 2018, the Airport made contributions of $11,490 toward the pension plans.
The 2018 nonoperating revenues of $54,462 are comprised of Passenger Facility Charges (PFC) revenue of $39,469, Customer Facility Charges (CFC) revenue of $7,502, investment income of $6,408 and other nonoperating revenues of $1,083. During 2018, nonoperating revenues decreased by $783 primarily due to fair value changes in investment income resulting from better long-term investment management.
Nonoperating expenses of $60,801 and $62,566 for the years 2018 and 2017, respectively, were primarily comprised of bond interest expense.
Capital grants decreased $24,780 in 2018, primarily due to the reduction of capital grant revenues earned during 2018 for Airport Improvement Grants (AIP) grants that were awarded but not expended during 2018. These grant awards will be expended during 2019-2020.
2017
Landing fees and terminal area use charges for the years 2017 and 2016 were $95,416 and $87,425, respectively. Rents, concessions, and other revenues were $99,609 and $94,768 for 2017 and 2016, respectively. The increase in 2017 operating revenues of $12,832 (7.0%) from 2016 was due to increased landing fees and terminal area use charges of $7,991 and rents and other concession revenue of $4,841 due to a new concessions management contract which the Airport entered into in May 2017 with Midway Partnership LLC, and due to a new parking rate structure implemented in January 2017.
Salaries and wages decreased by $363 (0.7%) in 2017 compared to 2016 due to a decrease in the payment of overtime and medical care premiums as well as a retroactive salary adjustment in 2016 that was not applicable in 2017. Professional and engineering expenses increased $3,493 (16.8%) compared to 2017 primarily due to increases in contractor costs associated with public parking facilities and pre-construction planning related to Midway Modernization.
Pension expense decreased $7,668 (16%) from $47,879 in 2016 to $40,211 in 2017 as a result of the changes under P.A. 100-0023, which requires increased future contributions to the Municipal Employees’ and Laborers’ plans. The increase in future required contributions increased the discount rate used to determine the total pension liability and decreased the current year pension expense. During 2017, $9,548 of the $40,211 was paid under statutory requirements.
The 2017 nonoperating revenues of $55,245 are comprised of Passenger Facility Charges (PFC) revenue of $40,918, Customer Facility Charges (CFC) revenue of $8,130, investment income of

- 18 -
$5,722 and other nonoperating revenues of $475. During 2017, nonoperating revenues increased by $5,685 primarily due to fair value changes in investment income resulting from better long-term investment management.
Nonoperating expenses of $62,566 and $88,310 for the years 2017 and 2016, respectively, were primarily comprised of bond interest expense and noise mitigation costs.
Capital grants increased $3,653 in 2017, mainly as a result of when associated capital expenditures became eligible for grant reimbursement from the federal government and increase in the allotment of Airport Improvement Program grant funding from the FAA.
A comparative summary of the Airport’s cash flows for the years ended December 31, 2018, 2017, and 2016, is as follows:
2018 2017 2016
Cash provided by (used in) activities: Operating 69,048$ 56,535$ 41,960$ Capital and related financing (135,794) (98,141) 287,614 Noncapital financing (477) (814) (26,725) Investing 157,177 74,775 (243,563)
Net change in cash and cash equivalents 89,954 32,355 59,286
Cash and cash equivalents: Beginning of year 260,393 228,038 168,752
End of year 350,347$ 260,393$ 228,038$
Cash Flows
2018
As of December 31, 2018, the Airport’s cash and cash equivalents of $350,347 increased by $89,954 compared to $260,393 at December 31, 2017, due to operating activities of $69,048, and investing activities of $157,177 offset by noncapital financing of $477 and capital and related financing of $135,794, due to excess CFC funds used to pay off CFC bonds through restructuring and additional capital asset construction. Total cash and cash equivalents at December 31, 2018, were comprised of unrestricted and restricted cash and cash equivalents of $62,153 and $288,194, respectively.
2017
As of December 31, 2017, the Airport’s available cash and cash equivalents of $260,393 increased by $32,355 compared to $228,038 at December 31, 2016, due to operating activities of $56,535 and investing activities of $74,775 offset by capital and related financing of $98,141 and noncapital financing of $814. Total cash and cash equivalents at December 31, 2017, were comprised of unrestricted and restricted cash and cash equivalents of $46,037 and $214,356, respectively.

- 19 -
CAPITAL ASSET AND DEBT ADMINISTRATION
At the end of 2018 and 2017, the Airport had $1,196,678 and $1,167,134, respectively, invested in net capital assets. During 2018, the Airport had additions of $80,927 related to capital activities. Construction projects include runway rehabilitation, passenger security checkpoint and terminal garage enhancements.
During 2018, completed projects totaling $18,008 were transferred from construction in progress to applicable buildings and other facilities capital account. These major completed projects were related to building security, runway and taxi improvements and parking enhancements.
The Airport’s capital assets at December 31, 2018, 2017, and 2016, are summarized as follows:
2018 2017 2016
Capital assets not depreciated: Land 116,250$ 116,475$ 115,637$ Construction in progress 95,571 32,427 11,550
Total capital assets not depreciated 211,821 148,902 127,187
Capital assets depreciated: Buildings and other facilities 1,703,964 1,685,956 1,671,782 Less accumulated depreciation for: Buildings and other facilities (719,107) (667,724) (616,281)
Total capital assets depreciated—net 984,857 1,018,232 1,055,501
Total property and facilities—net 1,196,678$ 1,167,134$ 1,182,688$
Capital Assets at Year-End
The Airport’s capital activities are funded through Airport revenue bonds, federal and state grants, PFC and CFC revenue. Additional information on the Airport’s capital assets is presented in Note 5 of the notes to the basic financial statements.
During 2018, the Airport sold $45,670 of Chicago Midway International Airport Second Lien Revenue Refunding Bonds, Series 2018 A, having interest rates ranging from 2.9% to 3.9% and maturity dates ranging from January 1, 2019 to January 1, 2029. Certain net proceeds used to refund certain maturities of outstanding bonds and to pay the cost of issuance of bonds.

- 20 -
The Airport’s outstanding debt at December 31, 2018, 2017, and 2016, is summarized as follows (dollars in thousands):
2018 2017 2016
Revenue bonds and notes 1,713,485$ 1,755,835$ 1,781,605$ Unamortized: Bond premium (discount) 105,563 114,270 123,133
Total revenue bonds payable—net of unamortized premium discount 1,819,048 1,870,105 1,904,738
Current bonds payable (36,480) (27,930) (25,770)
Total long-term revenue bonds and notes payable—net 1,782,568$ 1,842,175$ 1,878,968$
Outstanding Debt at Year-End
Additional information on the Airport’s long-term debt is presented in Note 4 of the notes to basic financial statements and in the Statistical Information section of this report.
The Airport’s revenue bonds at December 31, 2018, had credit ratings with each of the four major rating agencies as follows:
Moody’sInvestor Standard Fitch KrollServices & Poor’s Ratings Ratings
First Lien Chicago Midway Revenue Bonds A2 A NR NRSecond Lien Chicago Midway Revenue Bonds A3 A A A
At December 31, 2018 and 2017, the Airport believes it was in compliance with the debt covenants as stated within the Master Trust Indentures.
ECONOMIC FACTORS AND NEXT YEAR RATES AND CHARGES
The airlines using the Airport generally provide low fare, point-to-point origination and destination passenger service. During 2018 and 2017, Southwest Airlines accounted for 92.9% and 92.7%, respectively, of total enplanements at the Airport.
Based on the Airport’s rates and charges for 2019, total budgeted operating and maintenance expenses are projected at $173,031 and total net debt service and fund deposit requirements are projected at $82,509. Additionally, 2019 nonairline and nonsignatory revenues are budgeted for $86,510, resulting in a net airline requirement of $169,029 that will be funded through landing fees, terminal area use charges, and fueling system charges.
REQUESTS FOR INFORMATION
This financial report is designed to provide the reader with a general overview of the Airport’s finances. Questions concerning any of the information provided in this report or requests for additional financial information should be addressed to the City of Chicago Department of Finance.

BASIC FINANCIAL STATEMENTS

- 21 -
CITY OF CHICAGO, ILLINOISCHICAGO MIDWAY INTERNATIONAL AIRPORT
STATEMENTS OF NET POSITIONAS OF DECEMBER 31, 2018 AND 2017($ in thousands)
2018 2017 2018 2017ASSETS LIABILITIES, DEFERRED INFLOWS AND NET POSITION
CURRENT ASSETS: CURRENT LIABILITIES: Cash and cash equivalents (Note 2) 62,153$ 46,037$ Accounts payable and accrued liabilities 23,388$ 23,867$ Cash and cash equivalents—restricted (Note 2) 104,883 85,740 Due to other City funds 10,302 9,185 Investments (Note 2) 5,081 5,009 Advances for terminal and hangar rent 1,542 2,743 Accounts receivable—net of allowance for doubtful accounts Billings over amounts earned 16,676 3,874 of approximately $130 in 2018 and $178 in 2017 9,004 11,232 Liabilities payable from restricted assets: Amounts to be billed 9,205 7,747 Accounts payable 31,503 19,289 Due from other City funds 2,022 1,583 Due to other City funds 442 352 Prepaid expenses 442 390 Interest payable 36,458 38,168 Interest receivable 145 97 Current portion of revenue bond payable (Note 4) 36,480 27,930
Total current assets 192,935 157,835 Total current liabilities 156,791 125,408
NONCURRENT ASSETS: NONCURRENT LIABILITIES: Cash and cash equivalents (Note 2)—restricted 183,311 128,616 Revenue bonds payable—net of current maturities (Note 4) 1,782,568 1,842,175 Investments (Note 2)—restricted 296,144 442,809 Net pension liability (Note 7) 329,702 290,610 Due from other governments—restricted 32,416 29,707 Derivative instrument (Note 4) 20,239 24,319 Passenger facility charges and other receivables—restricted 3,306 3,068 Performance deposits 1,954 1,991 Interest receivable—restricted 1,706 2,033
Total noncurrent liabilities 2,134,463 2,159,095 Other assets 573 612
Total liabilities 2,291,254 2,284,503 Property and facilities (Note 5): Land 116,250 116,475 DEFERRED INFLOWS (Note 10) 82,841 108,774 Buildings and other facilities 1,703,964 1,685,956 Construction in progress 95,571 32,427 NET POSITION (Note 1):
Net investment in capital assets (deficit) (172,197) (180,803) Total property and facilities 1,915,785 1,834,858
Restricted net position: Less accumulated depreciation (719,107) (667,724) Debt service 5,381 8,750
Capital projects 49,213 41,292 Property and facilities—net 1,196,678 1,167,134 Passenger facility charges 3,854 4,035
Airport use agreement 35,978 34,541 Total noncurrent assets 1,714,134 1,773,979 Customer facility charges 13,798 31,573
Other assets 12,461 7,285 Total assets 1,907,069 1,931,814
Total restricted net position 120,685 127,476 DEFERRED OUTFLOWS (Note 10) 134,202 154,462
Unrestricted net (deficit) position (281,312) (253,674)
Total net (deficit) position (332,824) (307,001)
TOTAL ASSETS AND DEFERRED OUTFLOWS 2,041,271$ 2,086,276$ TOTAL 2,041,271$ 2,086,276$
See notes to basic financial statements.

- 22 -
CITY OF CHICAGO, ILLINOISCHICAGO MIDWAY INTERNATIONAL AIRPORT
STATEMENTS OF REVENUES, EXPENSES, AND CHANGES IN NET POSITIONFOR THE YEARS ENDED DECEMBER 31, 2018 AND 2017($ in thousands)
2018 2017OPERATING REVENUES: Landing fees and terminal area use charges 106,125$ 95,416$ Rents, concessions and other (Note 6) 100,408 99,609
Total operating revenues 206,533 195,025
OPERATING EXPENSES: Salaries and wages 51,408 48,185 Pension expense (Note 7) 42,843 40,211 Repairs and maintenance 47,326 44,506 Professional and engineering services 24,144 24,344 Other operating expenses 15,689 13,719
Total operating expenses before depreciation and amortization 181,410 170,965 Depreciation and amortization 51,383 51,443
Total operating expenses 232,793 222,408
OPERATING LOSS (26,260) (27,383)
NONOPERATING REVENUES (EXPENSES): Passenger facility charges revenues 39,469 40,918 Customer facility charges revenues 7,502 8,130 Investment income 6,408 5,722 Interest expense (Note 4) (59,598) (61,277) Noise mitigation costs (648) (1,289) Costs of issuance (555) - Other nonoperating revenues 1,083 475
Total nonoperating revenues (expenses) (6,339) (7,321)
CHANGE IN NET POSITION BEFORE CAPITAL GRANTS (32,599) (34,704) CAPITAL GRANTS 6,776 31,556
CHANGE IN NET POSITION (25,823) (3,148) TOTAL NET DEFICIT—Beginning of year (307,001) (303,853)
TOTAL NET DEFICIT—End of year (332,824)$ (307,001)$
See notes to basic financial statements.

- 23 -
CITY OF CHICAGO, ILLINOISCHICAGO MIDWAY INTERNATIONAL AIRPORT
STATEMENTS OF CASH FLOWSFOR THE YEARS ENDED DECEMBER 31, 2018 AND 2017($ in thousands)
2018 2017CASH FLOWS FROM OPERATING ACTIVITIES: Landing fees and terminal area use charges 113,103$ 95,565$ Rents, concessions and other 105,810 101,778 Payments to vendors (99,379) (83,615) Payments to employees (45,367) (44,479) Transactions with other City funds (used in) (4,680) (13,157) Transactions with other City funds (used in) provided by (439) 443
Cash flows provided by operating activities 69,048 56,535
CASH FLOWS FROM CAPITAL AND RELATED FINANCING ACTIVITIES: Proceeds from issuance of bonds 45,670 - Principal paid on bonds (27,930) (25,770) Cash paid to refund bonds (62,720) - Bond issuance and other related costs (3,332) (4,061) Interest paid (82,596) (82,336) Acquisition and construction of capital assets (55,685) (39,634) Grant receipts 4,067 3,147 Passenger Facility Charges revenues 39,458 40,700 Customer Facility Charges revenues 7,274 9,813
Cash flows used in capital and related financing activities (135,794) (98,141)
CASH FLOWS FROM NONCAPITAL FINANCING ACTIVITIES: Proceeds from settlement agreement 171 475 Cash paid for noise mitigation program (648) (1,289)
Cash flows used in noncapital financing activities (477) (814)
CASH FLOWS FROM INVESTING ACTIVITIES: Sale (purchases) of investments—net 146,856 66,305 Investment interest 10,321 8,470
Cash flows provided by investing activities 157,177 74,775
NET CHANGE IN CASH AND CASH EQUIVALENTS 89,954 32,355 CASH AND CASH EQUIVALENTS—Beginning of year 260,393 228,038
CASH AND CASH EQUIVALENTS—End of year 350,347$ 260,393$
(Continued)

- 24 -
CITY OF CHICAGO, ILLINOISCHICAGO MIDWAY INTERNATIONAL AIRPORT
STATEMENTS OF CASH FLOWSFOR THE YEARS ENDED DECEMBER 31, 2018 AND 2017($ in thousands)
2018 2017
RECONCILIATION OF CASH AND CASH EQUIVALENTS REPORTED ON THE STATEMENTS OF NET POSITION: Unrestricted 62,153$ 46,037$ Restricted: Current 104,883 85,740 Noncurrent 183,311 128,616
TOTAL 350,347$ 260,393$
RECONCILIATION OF OPERATING LOSS TO CASH PROVIDED BY OPERATING ACTIVITIES: Operating loss (26,260)$ (27,383)$ Adjustments to reconcile operating loss to cash flows from operating activities: Depreciation and amortization 51,383 51,443 Pension expense other than contributions 31,353 30,663 Provision for uncollectible accounts 8 41 Changes in assets and liabilities: Decrease (increase) in accounts receivable 2,220 (3,324) Decrease in due from other City funds (439) 443 Increase in prepaid expenses (52) (171) Increase (decrease) in due to other City funds 1,207 1,320 Decrease in amounts to be billed 7,747 (327) Increase (decrease) in billings over amounts earned 3,597 3,874 Increase (decrease) in advances for terminal and hangar rent (1,201) 2,013 (Decrease) increase in accounts payable and accrued liabilities (515) (2,057)
CASH FLOWS FROM OPERATING ACTIVITIES 69,048$ 56,535$
SUPPLEMENTAL DISCLOSURE OF NONCASH ITEMS—Property additions in 2018 and 2017 of $30,041 and $18,330, respectively, are included in accounts payable
The fair value adjustments (loss) to investments for2018 and 2017 were $(3,809) and $(4,072), respectively.
See notes to basic financial statements. (Concluded)

- 25 -
CITY OF CHICAGO, ILLINOIS CHICAGO MIDWAY INTERNATIONAL AIRPORT
NOTES TO BASIC FINANCIAL STATEMENTS AS OF AND FOR THE YEARS ENDED DECEMBER 31, 2018 AND 2017
1. ORGANIZATION AND SUMMARY OF SIGNIFICANT ACCOUNTING POLICIES
Organization—Chicago Midway International Airport (the “Airport” or “Midway) is operated by the City of Chicago, Illinois (the “City”) Department of Aviation. The Airport is included in the City’s reporting entity as an enterprise fund. The City is a member of the Chicago-Gary Regional Airport Authority, which was created in 1995 to address the air transportation needs of the Chicago-Northwest Indiana Region. The Airport operated subject to the provisions of the Airport Use Agreement and Facilities Lease (“Use Agreement”) commencing January 1, 2013, which is a residual Use Agreement that is scheduled to terminate on December 31, 2027.
Basis of Accounting and Measurement Focus—The accounting policies of the Airport are based upon accounting principles generally accepted in the United States of America, as prescribed by the Governmental Accounting Standards Board (GASB). The accounting and financial reporting treatment applied to a fund is determined by its measurement focus. The accounts of the Airport are reported using the flow of economic resources measurement focus.
The Airport uses the accrual basis of accounting, under which revenues are recognized when earned and expenses are recognized when incurred.
Annual Appropriated Budget—The Airport has a legally adopted annual budget, which is not required to be reported.
Management’s Use of Estimates—The preparation of basic financial statements in conformity with accounting principles generally accepted in the United States of America requires management to make estimates and assumptions that affect the reported amounts of assets and liabilities and the disclosure of contingent assets and liabilities at the date of the basic financial statements, and the reported amounts of revenues and expenses during the reporting period. Actual results could differ from the estimates.
Cash, Cash equivalents and Investments—Cash, cash equivalents, and investments generally are held with the City treasurer as required by the Municipal Code of Chicago (the “Code”). Interest earned on pooled investments is allocated to participating funds based upon their average combined cash and investment balances. Due to contractual agreements or legal restrictions, the cash and investments of certain funds are segregated and earn and receive interest directly.
The Code permits deposits only to City Council-approved depositories, which must be regularly organized state or national banks and federal and state savings and loan associations, located within the City, whose deposits are federally insured.
Investments are limited to those authorized by the Code. Investments authorized by the Code include, but are not limited to, interest-bearing general obligations of the City, the State of Illinois (the “State”), and the U.S. government; U.S. Treasury bills and other

- 26 -
non-interest-bearing general obligations of the U.S. government purchased in the open market below face value; domestic money market mutual funds regulated by, and in good standing with, the Securities and Exchange Commission; and tax anticipation warrants issued by the City (see Note 2). The City is prohibited by ordinance from investing in derivatives, as defined, without City Council approval.
The Airport values its investments at fair value or amortized cost as applicable. U.S. government securities purchased at a price other than par with a maturity of less than one year are reported at amortized cost.
Repurchase agreements can be purchased only from banks and certain other institutions authorized to do business in the State. The City Treasurer requires that securities pledged to secure these agreements have a fair value equal to the cost of the repurchase agreements plus accrued interest.
Investments generally may not have a maturity in excess of 30 years from the date of purchase. Certain other investment balances are held in accordance with the specific provisions of applicable bond ordinances.
Cash equivalents include certificates of deposit and other investments with maturities of three months or less when purchased.
Accounts Receivable Allowance—Management has provided an allowance based on amounts recorded at year-end, which may be uncollectible.
Transactions with the City—The City’s general fund provides services to the Airport. The amounts allocated to the Airport for these services are treated as operating expenses and consist mainly of employee benefits, self-insured risks, and administrative expenses.
Property and Facilities—Property and facilities are recorded at cost or, for donated assets, donated works of art and similar items, and capital assets received in a consortium arrangement at acquisition value. Expenditures greater than $5,000 for the acquisition, construction, or equipping of capital projects, together with related design, architectural, and engineering fees, are capitalized. Expenditures for vehicles and other movable equipment are expensed as incurred.
Depreciation and amortization are provided using the straight-line method and begin in the year following the year of acquisition or completion. Estimated useful lives are as follows:
Facilities and structures 40 yearsRunways, aprons, tunnels, taxiways, and paved roads 30 yearsOther 10–30 years
Deferred Outflows—Deferred outflows represent the unamortized loss on bond refundings, fair value of derivative instruments that are deemed to be effective hedges and differences between estimated and actual investment earnings related to pensions, and changes in actuarial assumptions related to pensions.
Deferred Inflows—Deferred inflows represent the differences between projected and actual actuarial experience related to pensions.
Net Position—Net position comprises the net earnings from operating and nonoperating revenues, expenses, and capital grants. Net position is displayed in three components—net

- 27 -
investment in capital assets; restricted for debt service, capital projects, PFC, Airport Use Agreement requirements, CFC, and other assets; and unrestricted. Net investment in capital assets consists of all capital assets, net of accumulated depreciation, reduced by outstanding debt net of debt service reserve, and unspent construction funds. Restricted net position consists of net position for which constraints are placed thereon by external parties (such as lenders and grantors) and laws, regulations, and enabling legislation. Unrestricted net position consists of all other net position not categorized as either of the above.
Employee Benefits—Employee benefits are granted for vacation and sick leave, workers’ compensation, and health care. Unused vacation leave is accrued and may be carried over for up to one year. Sick leave is accumulated at the rate of one day for each month worked, up to a maximum of 200 days. Severance of employment terminates all rights to receive compensation for any unused sick leave. Sick leave pay is not accrued. Employee benefit claims outstanding, including claims incurred but not reported, are estimated and recorded as liabilities. The Airport maintains insurance from a commercial carrier for workers’ compensation claims. Settlements in each of the past three years have been less than insurance coverage maintained.
Employees are eligible to defer a portion of their salaries until future years under the City’s deferred compensation plan created in accordance with Internal Revenue Code Section 457. The deferred compensation is not available to employees until termination, retirement, death, or unforeseeable emergency. The plan is administered by third-party administrators who maintain the investment portfolio. The plan’s assets have been placed in trust accounts with the plan administrators for the exclusive benefit of participants and their beneficiaries and are not considered assets of the City.
The City is subject to the State of Illinois Unemployment Compensation Act and has elected the reimbursing employer option for providing unemployment insurance benefits for eligible former employees. Under this option, the City reimburses the State for claims paid by the State.
Bond Insurance Costs, and Bond Premiums, and Discounts—Bond insurance costs and bond premiums and discounts are deferred and amortized over the term of the related debt. Other debt issuance costs are expensed in the period incurred.
Capitalized Interest—Interest expense on construction bond proceeds are capitalized during construction on those capital projects paid from the bond proceeds and are being amortized over the depreciable lives of the related assets on a straight-line basis.
Capital Grants—The Airport reports capital grants as revenue on the statements of revenues, expenses, and changes in net position. Capital grants are on a reimbursement basis and revenues are recognized when associated capital expenditures become eligible and are spent for grant reimbursement.
Noise Mitigation Costs—Funds expended for the Noise Mitigation Program are recorded as nonoperating expenses in the period they are incurred.
Revenue Recognition—Revenues from landing fees, terminal area use charges, fueling system charges, parking revenue, and concessions are reported as operating revenues. The Airport adheres to the guidelines outlined in the Federal Aviation Administration (FAA) revenue use policy. Landing fees and terminal area use charges and fueling system charges are assessed to the various airlines throughout each year based on estimated

- 28 -
rates. Such rates are designed to yield collections from airlines adequate to cover certain expenses and required debt service and fund deposits as determined under provisions of the previously defined Use Agreement. Incremental amounts due from the airlines arise when amounts assessed, based on the estimated rates used during the year, are less than actual expenses and required deposits for the year. Such incremental amounts due from airlines are included in amounts to be billed. Incremental amounts due to the airlines arise when amounts assessed, based on the estimated rates used during the year, exceed actual expenses and required deposits for the year. Such incremental amounts due to airlines are included in billings over amounts earned.
Passenger Facility Charge (PFC) Revenue—The Airport imposed PFCs of $4.50 per eligible enplaned passenger for the years ended December 31, 2018 and 2017, respectively. PFCs are available, subject to Federal Aviation Administration regulation and approval, to finance specific eligible capital projects. The City reports PFC revenue as nonoperating revenue and related noncapital expenses as nonoperating expenses in conformity with industry practice.
Customer Facility Charge (CFC) Revenue—The Airport imposed a CFC of $4.75 per contract day on each customer for motor vehicle rentals at the Airport for the years ended December 31, 2018 and 2017, respectively. CFCs are available to finance-specific eligible capital projects. The City reports CFC revenue as nonoperating revenue and related noncapital expenses as nonoperating expenses in conformity with industry practice.
Expenses—Salaries and wages, repair and maintenance, pension expense, professional and engineering services, and other expenses that relate to Airport operations are reported as operating expenses. Interest expense, financing costs, and noise mitigation costs are reported as nonoperating expenses.
Adopted Accounting Standards—GASB Statement No. 85, Omnibus (“GASB 85”) addresses practice issues that have been identified during implementation and application of certain GASB Statements. GASB 85 addresses various miscellaneous issues related to blending component units, goodwill, fair value measurement and application, and postemployment benefits (OPEB). Adoption of GASB 85 had no impact to the Airport.
GASB Statement No. 75, Accounting and Financial Reporting for Postemployment Benefits Other Than Pensions (“GASB 75”), replaces the requirements of Statements No. 45, Accounting and Financial Reporting by Employers for Postemployment Benefits Other Than Pensions, as amended, and No. 57, OPEB Measurements by Agent Employers and Agent Multiple-Employer Plans, for OPEB. GASB 75 details the recognition and disclosure requirements for employers with payables to defined benefit OPEB plans that are administered through trusts that meet the specified criteria and for employers whose employees are provided with defined contribution OPEB. GASB 75 states that the provisions of the standard need not be applied to immaterial amounts. The OPEB benefit information pertaining expressly to the Airport employees was deemed to be immaterial to the Airport basic financial statements. As such, no liability has been recorded in the accompanying basic financial statements. OPEB liabilities for the City are recorded within the City’s government-wide basic financial statements. The City’s actuarial valuation of certain OPEB benefits provided under collective bargaining agreements (CBAs) assumes the expiration of these benefits as of the conclusion of negotiations on new CBAs. Based on prior history, the negotiations are assumed to be concluded by December 31, 2019. It is not known whether the OPEB benefits provided under these CBAs will be specifically eliminated, modified, or extended at this time.

- 29 -
GASB Statement No. 86, Certain Debt Extinguishment Issues (“GASB 86”) establishes accounting and financial reporting for in-substance defeasance of debt by providing guidance for transactions in which cash and other monetary assets acquired with only existing resources (resources other than the proceeds of refunding debt) are placed in an irrevocable trust for the sole purpose of extinguishing debt. Adoption of GASB 86 had no impact to the Airport as historical defeasances of debt have not been from existing resources.
Upcoming Accounting Standards—Other accounting standards that the Airport is currently reviewing for applicability and potential impact on the financial statements include:
GASB Statement No. 83, Certain Asset Retirement Obligations (“GASB 83”) addresses accounting and financial reporting for certain asset retirement obligations (AROs). A government that has legal obligations to perform future asset retirement activities related to its tangible capital assets will have to recognize a liability based on the guidance in this statement. GASB 83 also requires disclosure of information about the nature of a government’s AROs, the methods and assumptions used for the estimates of the liabilities, and the estimated remaining useful life of the associated tangible capital assets. GASB 83 will be effective for the Airport beginning with its year ending December 31, 2019.
GASB Statement No. 84, Fiduciary Activities (“GASB 84”) improves the guidance regarding the identification of fiduciary activities for accounting and financial reporting purposes and how those activities should be reported. GASB 84 will be effective for the Airport beginning with its year ending December 31, 2019.
GASB Statement No. 87, Leases (“GASB 87”) requires recognition of certain lease assets and liabilities for leases that previously were classified as operating leases and recognized as inflows of resources or outflows of resources based on the payment provisions of the contract. GASB 87 will establish a single model for lease accounting based on the foundational principle that leases are financings of the right to use an underlying asset. Under GASB 87, a lessee is required to recognize a lease liability and an intangible right-to-use lease asset, and a lessor is required to recognize a lease receivable and a deferred inflow of resources. GASB 87 will increase the usefulness of governments’ financial statements by requiring reporting of certain lease liabilities that are currently not reported. GASB 87 will be effective for the Airport beginning with its year ending December 31, 2020.
GASB Statement No. 88, Certain Disclosures Related to Debt, Including Direct Borrowings and Direct Placements (“GASB 88”) will improve the information that is disclosed in notes to government financial statements related to debt, including direct borrowings and direct placements. It also clarifies which liabilities governments should include when disclosing information related to debt. GASB 88 will be effective for the Airport beginning with its year ending December 31, 2019.
GASB Statement No. 89, Accounting for Interest Cost Incurred before the End of a Construction Period (“GASB 89”) will enhance the relevance and comparability of information about capital assets and the cost of borrowing for a reporting period. GASB 89 requires that interest cost incurred before the end of a construction period be recognized as an expense in the period in which the cost is incurred for financial statements prepared using the economic resources measurement focus. As a result, interest cost incurred before the end of a construction period will not be included in the historical cost of a capital

- 30 -
asset reported in a business-type activity or enterprise fund. GASB 89 will be effective for the Airport beginning with its year ending December 31, 2020.
GASB Statement No. 90, Majority Equity Interests an amendment of GASB Statements No. 14 and No. 61 (“GASB 90”) aims to improve the consistency and comparability of reporting a government’s majority equity interest in a legally separate organization and the relevance of financial statement information for certain component units. GASB 90 will be effective for the Airport beginning with its year ending December 31, 2019.
GASB Statement No. 91, Conduit Debt Obligations (“GASB 91”) provides a single method of reporting conduit debt obligations by issuers and aims to eliminate diversity in practice associated with (1) commitments extended by issuers, (2) arrangements associated with conduit debt obligations, and (3) related note disclosures. GASB 91 will be effective for the Airport beginning with its year ending December 31, 2021.
2. RESTRICTED AND UNRESTRICTED CASH, CASH EQUIVALENTS, AND INVESTMENTS
Cash Equivalents and Investments—As of December 31, 2018, the Airport had the following investments (dollars in thousands):
More thanInvestment Type Less than 1 1–5 6–10 10 Fair Value
U.S. agencies 152,199$ 74,094$ - $ - $ 226,293$ U.S. treasuries 29,931 - - - 29,931 Municipal bonds 10,849 61,784 9,495 4,528 86,656 Corporate bonds - - - - - Certificates of deposits and other short-term 213,281 - - - 213,281
Subtotal 406,260$ 135,878$ 9,495$ 4,528$ 556,161$
Maturities (in Years)
As of December 31, 2017, the Airport had the following investments (dollars in thousands):
More thanInvestment Type Less than 1 1–5 6–10 10 Fair Value
U.S. agencies 219,922$ 135,621$ - $ - $ 355,543$ U.S. treasuries 11,970 - - - 11,970 Municipal bonds 17,507 77,640 9,616 11,474 116,237 Corporate bonds - - - - - Certificates of deposits and other short-term 225,997 - - - 225,997
Subtotal 475,396$ 213,261$ 9,616$ 11,474$ 709,747$
Maturities (in Years)

- 31 -
U.S. agencies include investments in government-sponsored enterprises such as Federal National Mortgage Association, Federal Home Loan Banks, and Federal Home Loan Mortgage Corp.
Investments Fair Value Measurements—The City categorizes the fair value measurements of its investments based the hierarchy established by generally accepted accounting principles. The hierarchy is based on the valuation techniques used to measure fair value.
Level 1—Inputs are unadjusted quoted prices in active markets for identical assets
Level 2—Observable inputs other than quoted market prices, and
Level 3—Unobservable Inputs
The investments measured at fair value as of December 31, 2018 and 2017 were (dollars in thousands):
Level 1 Level 2 Level 3 Level 1 Level 2 Level 3
U.S. agencies - $ 185,777$ - $ - $ 292,530$ - $ U.S. treasuries - 4,996 - - 5,985 - Municipal bonds - 84,521 - - 112,237 -
Total investments at fair value - $ 275,294$ - $ - $ 410,752$ - $
2018 2017
Investments that are valued through other observable inputs (Level 2), are valued using methods that include, but are not limited to, model processes, benchmark curves, benchmarking of like securities, sector groupings, and matrix pricing.
Money market investments and participating interest-earning investment contracts that have a remaining maturity at the time of purchase of one year or less and are held by governments other than the external investment pools are measured at amortized cost and are not reflected in the table above. The total of these investments at amortized cost for Midway are $280.9 million and $298.9 million at December 31, 2018 and 2017, respectively.
Interest Rate Risk—As a means of limiting its exposure to fair value losses arising from rising interest rates, the City’s investment policy requires that investments generally may not have a maturity date in excess of 30 years from the date of purchase. Certain other investments are held in accordance with the specific provisions of applicable ordinances.
Credit Risk—With regard to credit risk, the Code limits the investments in securities to:
(1) Interest-bearing general obligations of the United States and the State of Illinois;
(2) United States treasury bills and other non-interest bearing general obligations of the United States or United States government agencies when offered for sale at a price below the face value of same, so as to afford the City a return on such investment in lieu of interest;

- 32 -
(3) Tax anticipation warrants, municipal bonds, notes, commercial paper or other instruments representing a debt obligation issued by the City of Chicago;
(4) Commercial paper which: (1) at the time of purchase, is rated in the two highest classifications by at least two accredited ratings agencies; and (2) matures not more than 270 days after the date of purchase;
(5) Reverse repurchase agreement if: (1) the term does not exceed 90 days; and (2) the maturity of the investment acquired with the proceeds of the reverse repurchase agreement does not exceed the expiration date of the reverse repurchase agreement; Reverse repurchase agreements may be transacted with primary dealers and financial institutions, provided that the City has on file a master repurchase agreement;
(6) Certificates of deposit of banks or savings and loan associations designated as municipal depositories which are insured by federal deposit insurance; provided that any amount of the deposit in excess of the federal deposit insurance shall be collateralized as noted in Custodial Credit Risk—Cash and Certificates of Deposit below;
(7) Bankers acceptance of banks whose senior obligations, at the time of purchase, are rated in either the AAA or AA rating categories by at least two accredited ratings agencies;
(8) Tax-exempt securities exempt from federal arbitrage provisions applicable to investments of proceeds of the City’s tax-exempt debt obligations;
(9) Domestic money market mutual funds regulated by and in good standing with the Securities and Exchange Commission; provided that such money market mutual funds’ portfolios are limited to investments authorized by this section;
(10) Any other suitable investment instrument permitted by state laws governing municipal investments generally, subject to the reasonable exercise of prudence in making investments of public funds;
(11) Except where otherwise restricted or prohibited, a non-interest-bearing savings account, non-interest-bearing checking account or other non-interest bearing demand account established in a national or state bank, or a federal or state savings and loan association, when, in the determination of the treasurer, the placement of such funds in the non-interest bearing account is used as compensating balances to offset fees associated with that account that will result in cost savings to the City;
(12) Bonds of companies organized in the United States with assets exceeding $1 billion that, at the time of purchase, are rated not less than two ratings above investment grade, or equivalent rating, by at least two accredited ratings agencies;
(13) Debt instruments of international financial institutions, including but not limited to the World Bank and the International Monetary Fund, that, at the time of purchase, are rated within 4 intermediate credit ratings of the United States sovereign credit rating by at least two accredited ratings agencies, but not less than an A-rating, or equivalent rating. For purposes of this subsection, an “international financial institution” means a financial institution that has been established or chartered by more than one country and the owners or shareholders are generally national governments or other international institutions such as the United Nations;
- 33 -
(14) United States dollar denominated debt instruments of foreign sovereignties that, at the time of purchase, are rated within 4 intermediate credit ratings of the United States sovereign credit rating by at least two accredited ratings agencies, but not less than an A-rating or equivalent rating;
(15) Interest-bearing bonds of any county, township, city, village, incorporated town, municipal corporation, or school district, of the State of Illinois, of any other state, or of any political subdivision or agency of the State of Illinois or of any other state, whether the interest earned thereon is taxable or tax-exempt under federal law. The bonds shall be registered in the name of the city or held under a custodial agreement at a bank. The bonds shall be rated, at the time of purchase, not less than A-, or equivalent rating, by at least two accredited rating agencies with nationally recognized expertise in rating bonds of states and their political subdivisions;
(16) Bonds registered and regulated by the Securities and Exchange Commission and for which the full faith and credit of the State of Israel is pledged for payment; provided that the bonds have an A-rating or above or equivalent rating by at least two accredited ratings agencies;
(17) Bonds, notes, debentures, or other similar obligations of agencies of the United States rated, at the time of purchase, no less than AAA by at least two accredited rating agencies.
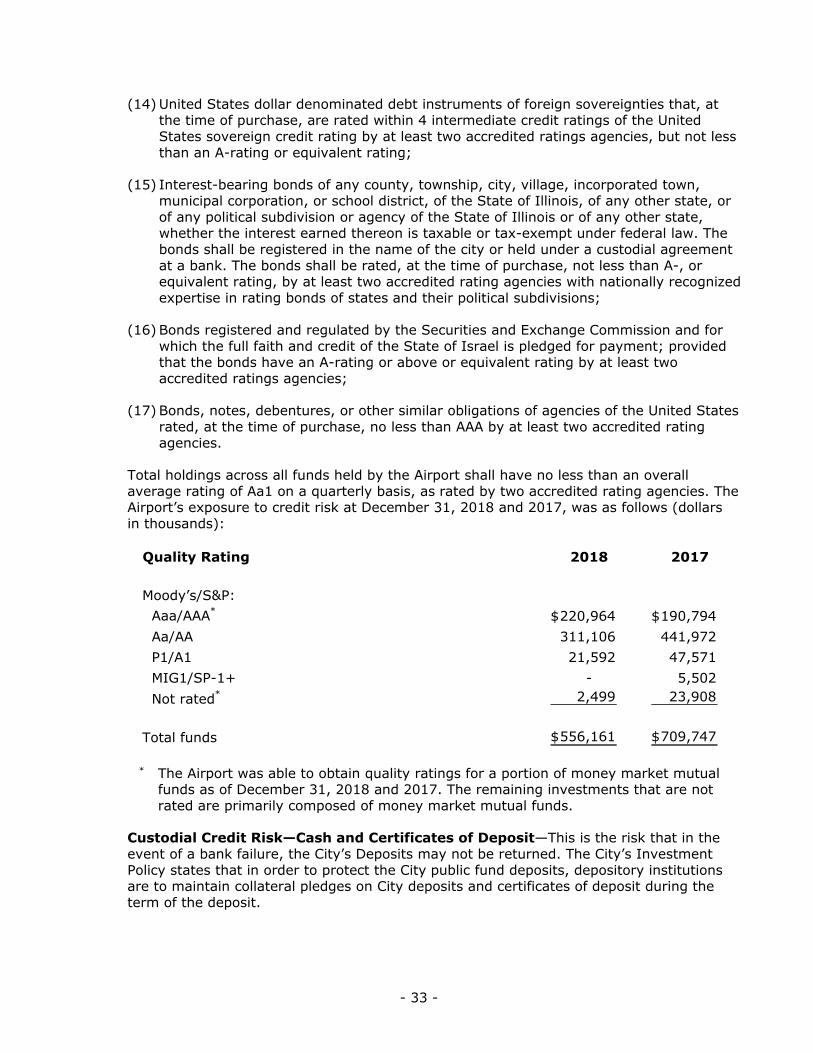
Total holdings across all funds held by the Airport shall have no less than an overall average rating of Aa1 on a quarterly basis, as rated by two accredited rating agencies. The Airport’s exposure to credit risk at December 31, 2018 and 2017, was as follows (dollars in thousands):
Quality Rating 2018 2017
Moody’s/S&P: Aaa/AAA* 220,964$ 190,794$ Aa/AA 311,106 441,972 P1/A1 21,592 47,571 MIG1/SP-1+ - 5,502 Not rated* 2,499 23,908
Total funds 556,161$ 709,747$
* The Airport was able to obtain quality ratings for a portion of money market mutual funds as of December 31, 2018 and 2017. The remaining investments that are not rated are primarily composed of money market mutual funds.
Custodial Credit Risk—Cash and Certificates of Deposit—This is the risk that in the event of a bank failure, the City’s Deposits may not be returned. The City’s Investment Policy states that in order to protect the City public fund deposits, depository institutions are to maintain collateral pledges on City deposits and certificates of deposit during the term of the deposit.

- 34 -
For certificates of deposit of banks or savings and loan associations designated as municipal depositories which are insured by federal deposit insurance, any amount of the deposit in excess of the federal deposit insurance shall be either: (1) fully collateralized at least 102% by: (i) marketable U.S. government securities marked to market at least monthly; (ii) bonds, notes, or other securities constituting the direct and general obligation of any agency or instrumentality of the United States; or (iii) bonds, notes or other securities constituting a direct and general obligation of any county, township, city, village, incorporated town, municipal corporation, or school district, of the State of Illinois or of any other state, or of any political subdivision or agency of the State of Illinois or any other state which are rated in either the AAA or AA rating categories by at least two accredited ratings agencies and maintaining such rating during the term of such investments; (2) secured by a corporate surety bond issued by an insurance company licensed to do business in Illinois and having a claims-paying rating in the top rating category as rated by a nationally recognized statistical rating organization and maintaining such rating during the term of such investment; or (3) fully collateralized at least 102% by an irrevocable letter of credit issued in favor of the City of Chicago by the Federal Home Loan Bank, provided that the Federal Home Loan Bank’s short-term debt obligations are rated in the highest rating category by at least one accredited ratings agency throughout the term of the certificate of deposit.
The collateral required to secure City funds must be held in safekeeping and pursuant to collateral agreements which would prohibit release or substitution of pledged assets without proper written notification and authorization of the City Treasurer. The final maturity of acceptable collateral pledged shall not exceed 120 months.
The bank balance of cash and certificates of deposit with the City’s various municipal depositories was $1,035.1 million. 97.7 percent of the bank balance was either insured or collateralized with securities held by City agents in the City’s name. $23.7 million was uncollateralized at December 31, 2018, and thus was subject to custodial credit risk.
Custodial Credit Risk—Investments—For an investment, this is the risk that, in the event of the failure of the counterparty, the City will not be able to recover the value of its investments or collateral securities that are in possession of an outside party. The City has no custodial credit risk exposure because investment securities are insured, registered and held by the City.
The investments reported in the basic financial statements at December 31, 2018 and 2017, are summarized as follows (dollars in thousands):
2018 2017
Per Note 2: Investments—airport 556,161$ 709,747$
Per basic financial statements: Restricted investments 296,144$ 442,809$ Unrestricted investments 5,081 5,009 Investments classified as cash and cash equivalents on the statements of net position 254,936 261,929
556,161$ 709,747$

- 35 -
3. RESTRICTED ASSETS
There are various limitations and restrictions contained in the Master Indenture of Trust securing the Chicago Midway Airport Revenue Bonds (“First Lien Master Indenture”) and the Master Indenture of Trust securing the Chicago Midway Airport Second Lien Obligation (“Second Lien Master Indenture”) and together with the First Lien Master Indenture (“Master Indentures”), the Use Agreement and federal regulations contain various limitations and restrictions, which, among other things, require the creation and maintenance of separate accounts, certain of which must be held by a trustee and into which required deposits are made by the Airport on a periodic basis to fund construction, debt retirement, operation and maintenance, and contingencies.
Restricted cash, cash equivalents, and investment balances in accordance with the Master Indenture requirements at December 31, 2018 and 2017, were as follows (dollars in thousands):
Account 2018 2017
Construction 309,972$ 363,263$ Capitalized interest 3,733 14,941 Debt service 77,748 74,387 Debt service reserve 127,460 128,237 Operation and maintenance reserve 26,699 25,812 Repair and replacement 9,261 8,086 Emergency reserve 426 416 Customer Facility Charge (CFC) 14,052 31,796 Other 14,440 9,265
Subtotal—master indentures and use agreement accounts 583,791 656,203
Passenger Facility Charges (PFC) 548 965
Total 584,339$ 657,168$
Construction and capitalized interest accounts, which are funded with bond proceeds, are restricted to pay authorized capital improvements and related interest costs during construction.
Required deposits are made by the Airport from revenues collected after funding deposits to an operation and maintenance account in the following priority on a monthly basis:
• The debt service account, which is restricted for the payment of debt service.
• The operation and maintenance reserve account, which is restricted to make loans to the operation and maintenance account, as needed, and are to be repaid as the funds become available.
The debt service reserve account requirement was funded upon issuance of, the Series 2004 second lien bonds, the Series 2010 second lien bonds, the Series 2013 second lien bonds, the Series 2016 second lien bonds and the Series 2014 second lien bonds with

- 36 -
a cash deposit. The debt service reserve account is restricted to the payment of debt service in the event that the balance in the debt service account is insufficient.
The repair and replacement account must be used for paying the cost of maintenance expenditures, such as costs incurred for major repairs, renewals, and replacements at the Airport whether caused by normal wear and tear or by unusual and extraordinary occurrences.
The emergency reserve account is restricted to make payments for certain purposes, including terminal area use charges, landing fees, and certain other charges that are deemed uncollectible and also for any judgments or settlements against the Airport.
The CFC funds are restricted for permitted costs and purposes related to the consolidated rental car facility. The PFC account is restricted to fund eligible and approved PFC projects.
Other funds include the federal and state grant funds, the security for payment fund, and the Airport development fund.
At December 31, 2018 and 2017, the Airport believes it was in compliance with the funding requirements and restrictions as stated in the Master Indentures.

- 37 -
4. LONG-TERM DEBT
Long-term debt at December 31, 2018 and 2017, consisted of the following (dollars in thousands):
2018 2017
First lien bonds: $54,210 Series 1998 C Chicago Midway Airport Revenue Bonds, issued September 10, 1998, due through 2024, interest at 5.25%–5.50% 22,660$ 25,775$
Subtotal—first lien bonds 22,660 25,775
Second lien bonds: $152,150 Series 2004 C and D Chicago Midway Airport Second Lien Revenue Bonds, issued December 14, 2004, due through 2035, interest rate Swap at 4.174% and 4.247% at December 31, 2018, respectively) 122,850 127,625 $63,470 Series 2010 C Chicago Midway Airport Second Lien Revenue Bonds, issued October 26, 2010, due through 2041, interest rate at 3.782%–7.168% - 61,260 $118,600 Series 2013 A Chicago Midway Airport Second Lien Revenue Bonds, issued December 5, 2013, due through 2033, interest rate at 5.375%–5.500% 118,600 118,600 $150,365 Series 2013 B Chicago Midway Airport Second Lien Revenue Bonds, issued December 5, 2013, due through 2035, interest rate at 4.125%–5.250% 150,365 150,365 $64,995 Series 2013 C Chicago Midway Airport Second Lien Revenue Bonds, issued December 5, 2013, due through 2020, interest rate at 0.740%–3.655% 25,365 39,420 $484,200 Series 2014 A Chicago Midway Airport Second Lien Revenue Bonds, issued June 11, 2014, due through 2041, interest rate at 5.000% 484,200 484,200 $287,610 Series 2014 B Chicago Midway Airport Second Lien Revenue Bonds, issued June 11, 2014, due through 2036, interest rate at 4.000%–5.000% 287,610 287,610 $124,710 Series 2014 C Chicago Midway Airport Second Lien Revenue Bonds, issued June 11, 2014, due through 2044 variable floating interest rate (1.85% at December 31, 2018) 124,710 124,710 $121,265 Series 2016 A Chicago Midway Airport Second Lien Revenue Bonds, issued June 1, 2016, due through 2033, interest rate at 2.000%–5.000% 119,145 120,070 $221,130 Series 2016 B Chicago Midway Airport Second Lien Revenue Bonds, issued June 1, 2016, due through 2046, interest rate at 2.000%–5.000% 212,310 216,200 $45,670 Series 2018 A Chicago Midway Airport Second Lien Revenue Bonds, issued August 1, 2018, due through 2029, interest rate at 2.937%–3.897% 45,670 -
Subtotal—second lien bonds 1,690,825 1,730,060
Total revenue bonds and notes 1,713,485 1,755,835
Unamortized premium (discount) 105,563 114,270
Total revenue bonds payable—net of unamortized premium (discount) 1,819,048 1,870,105
Current portion (36,480) (27,930)
Total long-term revenue bonds payable 1,782,568$ 1,842,175$
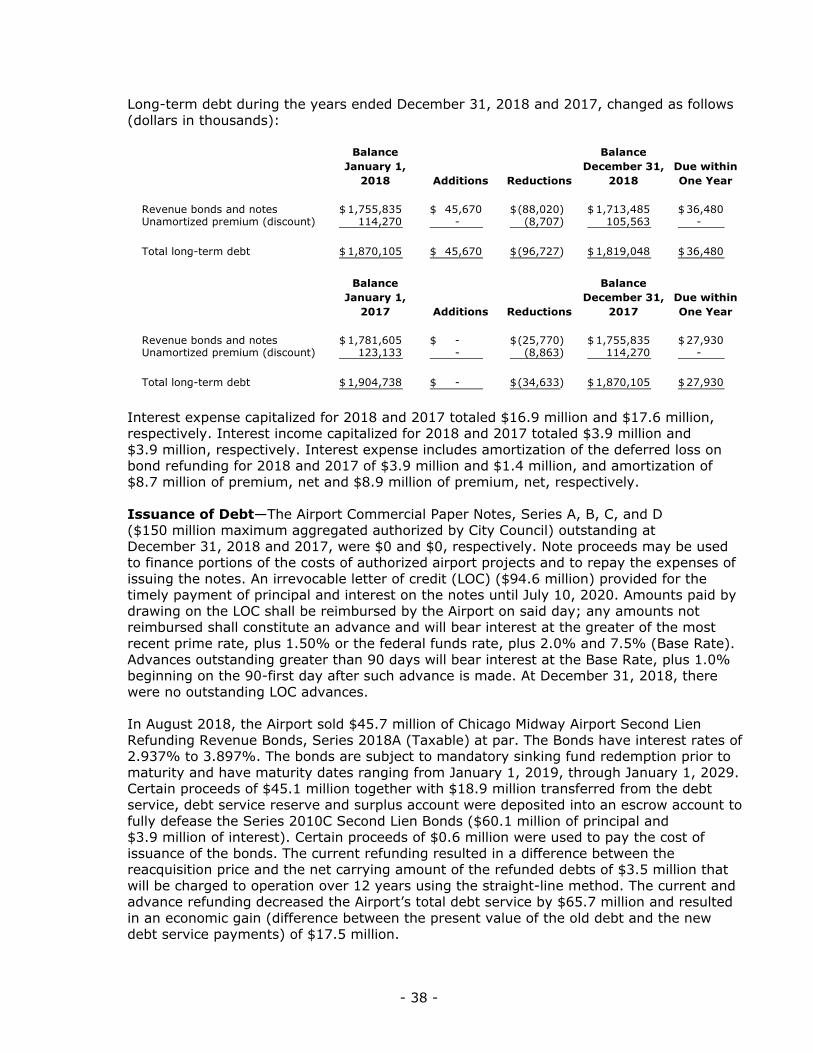
- 38 -
Long-term debt during the years ended December 31, 2018 and 2017, changed as follows (dollars in thousands):
Balance BalanceJanuary 1, December 31, Due within
2018 Additions Reductions 2018 One Year
Revenue bonds and notes 1,755,835$ 45,670$ (88,020)$ 1,713,485$ 36,480$ Unamortized premium (discount) 114,270 - (8,707) 105,563 -
Total long-term debt 1,870,105$ 45,670$ (96,727)$ 1,819,048$ 36,480$
Balance BalanceJanuary 1, December 31, Due within
2017 Additions Reductions 2017 One Year
Revenue bonds and notes 1,781,605$ - $ (25,770)$ 1,755,835$ 27,930$ Unamortized premium (discount) 123,133 - (8,863) 114,270 -
Total long-term debt 1,904,738$ - $ (34,633)$ 1,870,105$ 27,930$
Interest expense capitalized for 2018 and 2017 totaled $16.9 million and $17.6 million, respectively. Interest income capitalized for 2018 and 2017 totaled $3.9 million and $3.9 million, respectively. Interest expense includes amortization of the deferred loss on bond refunding for 2018 and 2017 of $3.9 million and $1.4 million, and amortization of $8.7 million of premium, net and $8.9 million of premium, net, respectively.
Issuance of Debt—The Airport Commercial Paper Notes, Series A, B, C, and D ($150 million maximum aggregated authorized by City Council) outstanding at December 31, 2018 and 2017, were $0 and $0, respectively. Note proceeds may be used to finance portions of the costs of authorized airport projects and to repay the expenses of issuing the notes. An irrevocable letter of credit (LOC) ($94.6 million) provided for the timely payment of principal and interest on the notes until July 10, 2020. Amounts paid by drawing on the LOC shall be reimbursed by the Airport on said day; any amounts not reimbursed shall constitute an advance and will bear interest at the greater of the most recent prime rate, plus 1.50% or the federal funds rate, plus 2.0% and 7.5% (Base Rate). Advances outstanding greater than 90 days will bear interest at the Base Rate, plus 1.0% beginning on the 90-first day after such advance is made. At December 31, 2018, there were no outstanding LOC advances.
In August 2018, the Airport sold $45.7 million of Chicago Midway Airport Second Lien Refunding Revenue Bonds, Series 2018A (Taxable) at par. The Bonds have interest rates of 2.937% to 3.897%. The bonds are subject to mandatory sinking fund redemption prior to maturity and have maturity dates ranging from January 1, 2019, through January 1, 2029. Certain proceeds of $45.1 million together with $18.9 million transferred from the debt service, debt service reserve and surplus account were deposited into an escrow account to fully defease the Series 2010C Second Lien Bonds ($60.1 million of principal and $3.9 million of interest). Certain proceeds of $0.6 million were used to pay the cost of issuance of the bonds. The current refunding resulted in a difference between the reacquisition price and the net carrying amount of the refunded debts of $3.5 million that will be charged to operation over 12 years using the straight-line method. The current and advance refunding decreased the Airport’s total debt service by $65.7 million and resulted in an economic gain (difference between the present value of the old debt and the new debt service payments) of $17.5 million.

- 39 -
Defeased Bonds—Defeased bonds have been removed from the balance sheet because the related assets have been placed in irrevocable trusts, together with interest earned thereon, will provide amount sufficient for payment of all principal and interest. Defeased bonds at December 31, 2018 are as follows (dollars in thousands):
Defeased Outstanding
Chicago Midway Airport 2010C Second Lien Revenue Bonds 60,090$ 57,580$
Total 60,090$ 57,580$
Debt Redemption—Following is a schedule of debt service requirements to maturity of the first lien bonds (dollars in thousands):
Years EndingDecember 31 Principal Interest Total
2019 3,290$ 1,156$ 4,446$ 2020 3,470 970 4,440 2021 3,660 774 4,434 2022 3,860 567 4,427 2023 4,080 349 4,429 2024 4,300 118 4,418
Total 22,660$ 3,934$ 26,594$
Following is a schedule of debt service requirements to maturity of the second lien bonds. For issues with variable rates, interest is imputed at the percent rate effective at December 31, 2018 (dollars in thousands):
Years EndingDecember 31 Principal Interest Total
2019 33,190$ 77,831$ 111,021$ 2020 44,715 76,365 121,080 2021 50,235 74,169 124,404 2022 56,280 71,615 127,895 2023 64,380 68,706 133,086 2024–2028 380,560 291,283 671,843 2029–2033 436,010 189,572 625,582 2034–2038 300,825 89,351 390,176 2039–2043 229,925 37,387 267,312 2044–2046 94,705 4,381 99,086
Total 1,690,825$ 980,660$ 2,671,485$
The Airport’s second lien variable rate bonds may bear interest from time to time at a flexible rate, a daily rate, a weekly rate, an adjustable long rate or the fixed rate as determined from time to time by the remarketing agent, in consultation with the City. At December 31, 2018, the Series 2004 C&D bonds and the Series 2014C bonds were in a
- 40 -
weekly rate interest mode. Irrevocable LOC ($124.3 million) provides for the timely payment of principal and interest on the Series 2004 C&D bonds until November 25, 2019.
Irrevocable LOC ($126.1 million) provides for the timely payment of principal and interest on the Series 2014C bonds until July 17, 2020.
In the event the bonds are put back to the bank and not successfully remarketed, or if the LOC expires without an extension or substitution, the bank bonds will convert to a term loan. There is no principal due on potential term loans within the next fiscal year.
Debt Covenants—The Master Indenture of Trust securing Chicago Midway Airport Revenue Bonds requires in each year that the City fix and establish and revise from time to time whenever necessary, such rates and other charges for the use and operation of Midway and for services rendered by the City in the operation of Midway in order that, in each Fiscal year, Revenues, together with any Other Available Monies deposited with the Trustee with respect to such Fiscal Year and any cash balance held in the Revenue Fund on the first day of such Fiscal Year not then required to be deposited in any Fund or Account, will be at least sufficient (a) to provide for the Operation and Maintenance Expenses for the Fiscal Year and (b) to provide for the greater of (i) the amounts needed to make the Deposits required during such Fiscal Year into the Debt Service Funds, the Operations & Maintenance Reserve Account, the Working Capital Account, the Debt Service Reserve Fund, the Junior Lien Obligation Debt Service Fund, the Repair and Replacement Fund, and the Special Project Fund and (ii) an amount not less than 125% of the Aggregate Debt Service for the Bond Year commencing during such Fiscal Year reduced by an amount equal to the sum of any amount held in any Capitalized Interest Account for disbursement during such Fiscal Year to pay interest on First Lien Bonds. These requirements were met at December 31, 2018.
The Master Indenture of Trust Securing Chicago Midway Airport Second Lien Obligations requires that the City fix and establish and revise from time to time whenever necessary, such rentals, rates and other charges for the use and operation of Midway and for certain services rendered by the City in the operation of Midway in order that in each Fiscal Year, Revenues, together with Other Available Moneys deposited with the First Lien Trustee or the Second Lien Trustee with respect to such Fiscal Year and any cash balance held in the First Lien Revenue Fund or the Second Lien Revenue Fund on the first day of such Fiscal Year not then required to be deposited in any Fund or Account under the First Lien Indenture for the Second Lien Indenture, will be at least sufficient (1) to provide for the payment of Operation and Maintenance Expenses for the Fiscal Year and (2) to provide for the greater of (A) or (B) as follows: (A) the greater of the amounts needed to make the deposits required under the First Lien Indenture described in the immediately preceding paragraph above; or (B) the greater of the amounts needed to make the deposits required under the First Lien Indenture described in the immediately preceding paragraph above or an amount not less than 110% of the Aggregate First Lien Debt Service and Aggregate Second Lien Debt Service for the Bond Year commencing during such Fiscal Year, reduced by (X) any amount held in any Capitalized Interest Account for disbursement during such Bond Year to pay interest on First Lien Bonds, and (Y) any amount held in any capitalized interest account established pursuant to a Supplemental Indenture under the Second Lien Indenture for disbursement during such Bond Year to pay interest on Second Lien Obligations. These requirements were met at December 31, 2018.
Hedging Derivatives—In April 2011, the Airport novated its $60.9 million notional amount swap associated with the Midway Airport Series 2004 C&D variable rate bonds with J.P. Morgan to Wells Fargo Bank, N.A. The fixed rate the Airport pays increased from

- 41 -
4.174% to 4.247%, and the Airport signed a one-way credit support agreement (CSA) that no longer requires the Airport to post collateral if the mark-to-market exceeds the threshold, previously defined in the J.P. Morgan agreement. A Goldman Sachs swap covers the 60% balance of the bonds, with a current notional amount of $73.7 million, which does not have a two-way CSA and remains unchanged.
Objective of the Swaps—In order to protect against the potential of rising interest rates, the Airport has entered into a separate pay-fixed, receive-variable interest rate swap at a cost less than what the Airport would have paid to issue fixed-rate debt (dollars in thousands).
Classification Amount Classification Amount Notional
Cash flow hedges—pay-fixed interest rate swaps Deferred outflow of Deferred outflow of
resources 4,080$ resources (20,239)$ 122,850$
Changes in Fair Value December 31, 2018Fair Value at
Classification Amount Classification Amount Notional
Cash flow hedges—pay-fixed interest rate swaps Deferred outflow of Deferred outflow of
resources 1,715$ resources (24,319)$ 127,625$
Changes in Fair Value December 31, 2017Fair Value at
Pay-Fixed, Receive-Variable Interest Rate Swaps—The swap counterparties are Goldman Sachs and Wells Fargo, with notional amounts as of December 31, 2018, of $73.7 million and $49.1 million, respectively, and as of December 31, 2017, of $76.6 million and $51.1 million, respectively.
Terms, Fair Values, and Credit Risk—The terms, including the fair value and credit ratings of the outstanding swaps as of December 31, 2018 and 2017, are as follows. The notional amounts of the swaps match the principal amounts of the associated debt. The Airport’s swap agreements contained scheduled reductions to outstanding notional amounts that are expected to approximately follow scheduled or anticipated reductions in the associated “bonds payable” category (dollars in thousands).
2018 Fixed Variable Fair Swap CounterpartyAssociated Notional Effective Rate Rate Value Termination CreditBond Issue Amounts Date Paid Received 2018 Date Rating
Series 2004 C&D Bonds 73,710$ December 14, 2004 4.174 % SIFMA +.05% (11,928)$ January 1, 2035 A1/A+Series 2004 C&D Bonds 49,140 April 21, 2011 4.247 SIFMA +.05% (8,311) January 1, 2035 Aa2/A+
Total 122,850$ (20,239)$
2017 Fixed Variable Fair Swap CounterpartyAssociated Notional Effective Rate Rate Value Termination CreditBond Issue Amounts Date Paid Received 2017 Date Rating
Series 2004 C&D Bonds 76,575$ December 14, 2004 4.174 % SIFMA +.05% (14,256)$ January 1, 2035 A1/A+Series 2004 C&D Bonds 51,050 April 21, 2011 4.247 SIFMA +.05% (10,063) January 1, 2035 Aa2/AA-
Total 127,625$ (24,319)$

- 42 -
Fair Value—As per industry convention, the fair value of the Airport’s outstanding swaps was estimated using the zero-coupon method. This method calculates the future net settlement payment required by the swap, assuming that the forward rates implied the yield curve correctly anticipates future spot rates. These payments are then discounted using the spot rates implied by the current yield curve for hypothetical zero-coupon bonds due on the date of each future net settlement of the swap. Because interest rates declined subsequent to the date of execution, the Airport’s swaps had negative values. Derivative instruments are valued in the market using regression analysis. Significant inputs to the derivative valuation for interest rate swaps are observable in active markets and are classified as Level 2 in the fair value hierarchy.
Credit Risk—The Airport is exposed to credit risk (counterparty risk) through the counterparties with which it enters into agreements. If minimum credit rating requirements are not maintained, the counterparty is required to post collateral to a third party. This protects the Airport by mitigating the credit risk, and therefore the ability to pay a termination payment, inherent in a swap. Collateral on all swaps is to be in the form of cash or eligible collateral held by a third-party custodian. Upon credit events, the swaps also allow transfers, credit support, and termination, if the counterparty is unable to meet the said credit requirements.
Basis Risk—Basis risk refers to the mismatch between the variable rate payments received on a swap contract and the interest payment actually owed on the bonds. The two significant components driving this risk are credit and Securities Industry and Financial Markets Associations (SIFMA) ratios. Credit may create basis risk because the Airport’s bonds may trade differently than the swap index as a result of a credit change in the Airport. SIFMA ratios (or spreads) may create basis risk if SIFMA swaps of the Airport’s bonds trade higher than the SIFMA received on the swap. This can occur due to many factors including, without limitations, changes in marginal tax rates, tax-exempt status of bonds, and supply and demand for variable rate bonds. The Airport is exposed to basis risk on the swaps if the rate paid on the bonds is higher than the rate received. The Airport is liable for the difference. The difference would need to be available on the debt service payment date and would add additional underlying cost to the transaction.
Tax Risk—The swap exposes the Airport to tax risk or a permanent mismatch (shortfall) between the floating rate received on the swap and the variable rate paid on the underlying variable-rate bonds due to tax law changes such that the Federal or State tax exception of municipal debt is eliminated or its value reduced. There have been no tax law changes since the execution of this swap agreement.
Termination Risk—The risk that the swap could be terminated as a result of certain events, including a ratings downgrade for the issuer or swap counterparty, covenant violation, bankruptcy, payment default, or other defined events of default. Termination of a swap may result in a payment made by the issuer or to the issuer depending upon the market at the time of termination.

- 43 -
Swap Payments and Associated Debt—As of December 31, 2018, debt service requirements for the Airport’s outstanding variable-rate debt and net swap payments, assuming current interest rates remain the same, for their term are as follows (dollars in thousands):
InterestYears Ending RateDecember 31 Principal Interest Swaps—Net Total
2019 5,000$ 2,054$ 2,917$ 9,971$ 2020 5,225 1,964 2,788 9,977 2021 5,350 1,871 2,657 9,878 2022 5,675 1,773 2,517 9,965 2023 5,925 1,670 2,372 9,967 2024–2028 33,850 6,645 9,434 49,929 2029–2033 42,175 3,297 4,681 50,153 2034–2035 19,650 203 288 20,141
Total 122,850$ 19,477$ 27,654$ 169,981$
Variable-Rate Bondswith Swaps
5. CHANGES IN CAPITAL ASSETS
During the years ended December 31, 2018 and 2017, capital assets changed as follows (dollars in thousands):
Balance Disposals BalanceJanuary 1, and December 31,
2018 Additions Transfers 2018
Capital assets not depreciated: Land 116,475$ - $ (225)$ 116,250$ Construction in progress(1) 32,427 80,927 (17,783) 95,571
Total capital assets not depreciated 148,902 80,927 (18,008) 211,821
Capital assets depreciated—buildings and other facilities 1,685,956 18,008 - 1,703,964 Less accumulated depreciation for—buildings and other facilities (667,724) (51,383) - (719,107)
Total capital assets depreciated—net 1,018,232 (33,375) - 984,857
Total property and facilities—net 1,167,134$ 47,552$ (18,008)$ 1,196,678$
(1) Includes net capitalized interest of $19,423
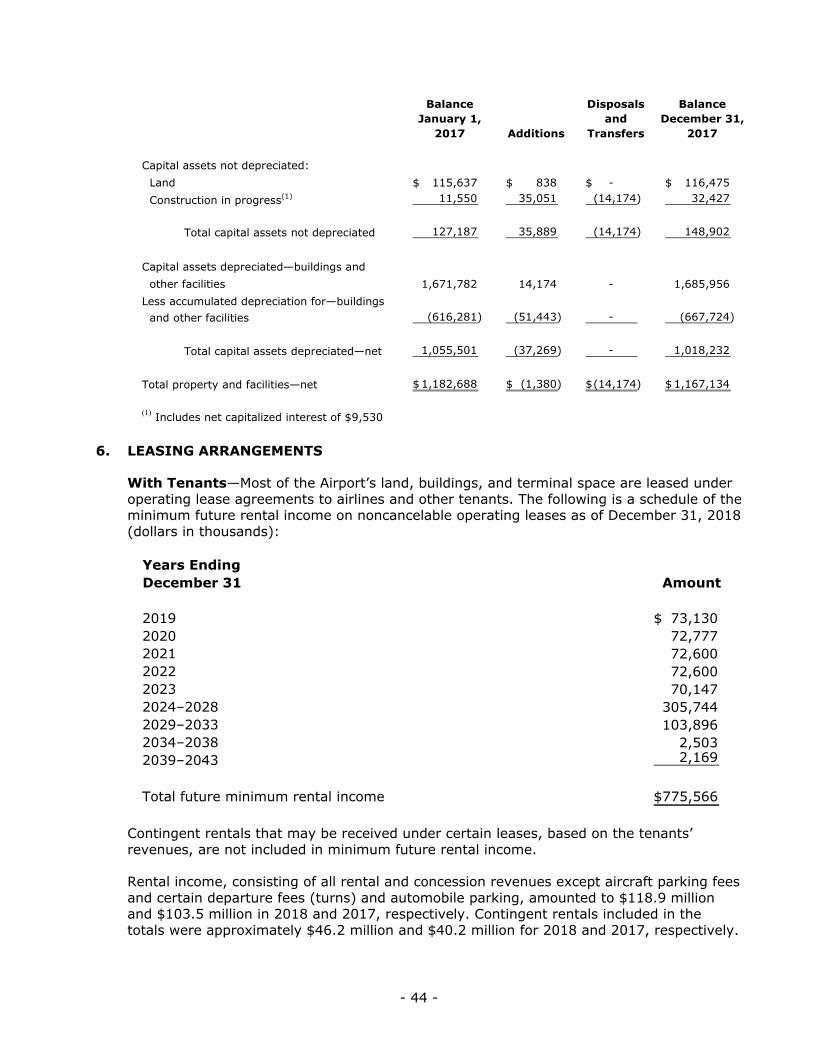
- 44 -
Balance Disposals BalanceJanuary 1, and December 31,
2017 Additions Transfers 2017
Capital assets not depreciated: Land 115,637$ 838$ - $ 116,475$ Construction in progress(1) 11,550 35,051 (14,174) 32,427
Total capital assets not depreciated 127,187 35,889 (14,174) 148,902
Capital assets depreciated—buildings and other facilities 1,671,782 14,174 - 1,685,956 Less accumulated depreciation for—buildings and other facilities (616,281) (51,443) - (667,724)
Total capital assets depreciated—net 1,055,501 (37,269) - 1,018,232
Total property and facilities—net 1,182,688$ (1,380)$ (14,174)$ 1,167,134$
(1) Includes net capitalized interest of $9,530
6. LEASING ARRANGEMENTS
With Tenants—Most of the Airport’s land, buildings, and terminal space are leased under operating lease agreements to airlines and other tenants. The following is a schedule of the minimum future rental income on noncancelable operating leases as of December 31, 2018 (dollars in thousands):
Years EndingDecember 31 Amount
2019 73,130$ 2020 72,777 2021 72,600 2022 72,600 2023 70,147 2024–2028 305,744 2029–2033 103,896 2034–2038 2,503 2039–2043 2,169
Total future minimum rental income 775,566$
Contingent rentals that may be received under certain leases, based on the tenants’ revenues, are not included in minimum future rental income.
Rental income, consisting of all rental and concession revenues except aircraft parking fees and certain departure fees (turns) and automobile parking, amounted to $118.9 million and $103.5 million in 2018 and 2017, respectively. Contingent rentals included in the totals were approximately $46.2 million and $40.2 million for 2018 and 2017, respectively.

- 45 -
7. PENSION PLANS
General Information about the Pension Plan
Plan Description—Eligible Midway Fund employees participate in one of four single-employer defined benefit pension plans (Plans). These Plans are: the Municipal Employees’ Annuity and Benefit Fund of Chicago (Municipal Employees’); the Laborers’ and Retirement Board Employees’ Annuity and Benefit Fund of Chicago (Laborers’); the Policemen’s Annuity and Benefit Fund of Chicago (Policemen’s); and the Firemen’s Annuity and Benefit Fund of Chicago (Firemen’s). The plans are administered by individual retirement boards of trustees comprised of City officials or their designees and of trustees elected by Plan members. Certain employees of the Chicago Board of Education participate in Municipal Employees’ or Laborers’. Each Plan issues a publicly available financial report that includes financial statements and required supplementary information that can be obtained at www.meabf.org, www.labfchicago.org, www.chipabf.org, and www.fabf.org.
Benefits provided—The Plans provide retirement, disability, and death benefits as established by State law. Benefits generally vest after 10 years of credited service. Employees qualify for an unreduced retirement age minimum formula annuity based on a combination of years of service and age of retirement. Employees may also receive a reduced retirement age minimum formula annuity if they do not meet the age and service requirements for the unreduced retirement age annuity. The requirements of age and service are different for employees depending on when they first became members of their respective Plans. For all four Plans, employees who became members before January 1, 2011 are considered Tier 1 Employees. For Policemen’s and Firemen’s, those employees who became members on or after January 1, 2011 are considered Tier 2 Employees. For Municipal Employees’ and Laborers’, those employees who became members on or after January 1, 2011 but before July 6, 2017 are considered Tier 2 Employees. For Municipal Employees’ and Laborers’, those employees who became members on or after July 6, 2017 are considered Tier 3 Employees. Public Act 100-0023 (P.A. 100-0023), which established the requirements for Tier 3 employees, includes a provision for Tier 2 employees to elect to be considered as Tier 3 employees. The annuity is computed by multiplying the final average salary by a percentage ranging from 2.2% to 2.5% per year of credited service. The final average salary is the employee’s highest average annual salary for any four consecutive years within the last 10 years of credited service for participants who are Tier 1 Employees and any eight consecutive years within the last 10 years of credited service for participants who are Tier 2 Employees or Tier 3 Employees.
Benefit terms provide for annual adjustments to each employee’s retirement allowance subsequent to the employees’ retirement date. For Tier 1 Employees, the annual adjustments for Municipal Employees’ and Laborers’ are 3.0%, compounded, and for Policemen’s and the majority of participants in Firemen’s 3.0%, simple, for annuitants born before January 1, 1966 and 1.5%, simple, born after January 1, 1966 or later. For Tier 2 Employees and Tier 3 Employees, the annual adjustments are equal to the lesser of 3.0% and 50% of CPI-U of the original benefit.

- 46 -
Employees Covered by Benefit Terms—At December 31, 2018, the following City employees were covered by the benefit terms:
MunicipalEmployees’ Laborers’ Policemen’s Firemen’s Total
Inactive employees or beneficiaries currently receiving benefits 25,577 3,688 13,631 5,022 47,918 Inactive employees entitled to but not yet receiving benefits 17,575 1,489 721 92 19,877 Active employees 31,285 2,715 13,438 4,487 51,925
74,437 7,892 27,790 9,601 119,720
Contributions—For the Municipal Employees’ and Laborers’ Plans, P.A. 100-0023 was enacted on July 6, 2017. P.A. 100-0023 requires the City to contribute specific amounts to the Municipal Employees’ and the Laborers’ Plans in the aggregate amounts as follows: in payment year 2018, $302.0 million; in payment year 2019, $392.0 million; in payment year 2020, $481.0 million; in payment year 2021, $571.0 million; and in payment year 2022, $660.0 million. Additionally, P.A. 100-0023 requires that the City’s contributions are at actuarially determined rates beginning in payment year 2023 and future funding be sufficient to produce a funding level of 90% by the year end of 2058.
For Policemen’s and Firemen’s, Public Act 99-0506 (P.A. 99-0506) was enacted on May 31, 2016. P.A. 99- 0506 requires the City to contribute specific amounts to Policemen’s and Firemen’s Plans in the aggregate amounts as follows: in payment year 2018, $727.0 million; in payment year 2019, $792.0 million; and in payment year 2020, $824.0 million. Additionally, P.A. 99-0506 requires that the City’s contributions are at actuarially determined rates beginning in payment year 2021 and future funding be sufficient to produce a funding level of 90% by the year end of 2055.
The City’s contributions are budgeted in the same year as the applicable levy year for the property taxes funding the contributions. The City’s contributions are then paid to the pension funds in the following year (which is when the levied property taxes are collected and paid to the City by the Cook County Treasurer).
The contribution to all four pension plans from the Airport was $11.5 million and $9.5 million for the years ended December 31, 2018 and 2017, respectively.
Net Pension Liability, Pension Expense, and Deferred Outflows of Resources and Deferred Inflows of Resources Related to Pensions—At December 31, 2018 and 2017, the Airport reported a liability of $329.7 million and $290.6 million, respectively, for its proportionate share of the net pension liability. The net pension liability was measured as of December 31, 2018 and 2017, and the total pension liability used to calculate the net pension liability was determined by an actuarial valuation as of that date.
Changes in Actuarial Assumptions—Changes in the municipal bond rate resulted in an increase in the single discount rate for Laborers, Policemen, and Firemen. In addition, the investment return assumption for Firemen decreased from 7.50% to 6.75% resulting in a decrease in the single discount rate for Firemen, which offset the increase from the change in the municipal bond rate. See discount rate section below.
The change in the single discount rate and other assumptions decreased the net pension liability by $0.2 million for Laborers’ and $1.2 million for Policemen and increased the net

- 47 -
pension liability by $5.2 million for Firemen. These changes are being amortized into expense over a 4 year period for Laborers’ and a 6 year period for Policemen and Firemen.
The Airport’s proportion of the net pension liability was determined based on the rates of the Airport’s salaries within each corresponding pension plan to the total budgeted salaries for 2018 and 2017. At December 31, 2018 and 2017, the Airport’s proportion was 1.5% and 1.4%, respectively, of the Municipal Employees’ Plan, 1.5% and 1.5% of the Laborer’s Plan, 0.5% and 0.5% of the Policemen’s Plan and 1.4% and 1.3%, respectively, of the Firemen’s Plan.
For the years ended December 31, 2018 and 2017, the Airport recognized pension expense of $42.8 million and $40.2 million, respectively.
At December 31, 2018 and 2017, the reported deferred outflows of resources of $44.9 million and $59.6 million, respectively, and deferred inflows of resources of $82.8 million and $108.8 million, respectively, related to pensions from the following sources:
Municipal Employees’ (dollars in thousands):
Deferred Deferred Deferred DeferredOutflows of Inflows of Outflows of Inflows ofResources Resources Resources Resources
Differences between expected and actual experience 1,117$ 2,623$ - $ 3,582$ Changes of assumptions 25,467 68,555 47,561 85,881 Net difference between projected and actual earnings on pension plan investments 4,203 - - 1,499
Total 30,787$ 71,178$ 47,561$ 90,962$
2018 2017
Amounts reported as deferred outflows of resources and deferred inflows of resources related to Municipal Employees’ pensions will be recognized in pension expense/(benefit) as follows:
Years EndingDecember 31
2019 2,564$ 2020 (23,307) 2021 (21,379) 2022 1,731
Total (40,391)$
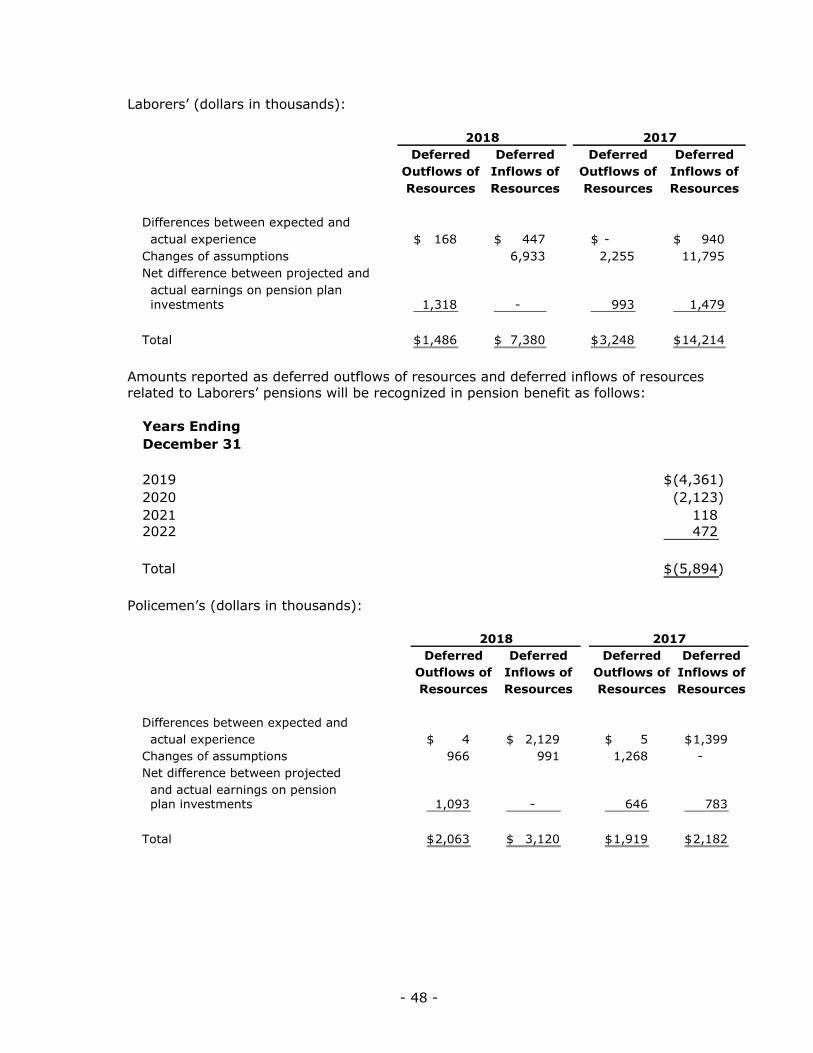
- 48 -
Laborers’ (dollars in thousands):
Deferred Deferred Deferred DeferredOutflows of Inflows of Outflows of Inflows ofResources Resources Resources Resources
Differences between expected and actual experience 168$ 447$ - $ 940$ Changes of assumptions 6,933 2,255 11,795 Net difference between projected and actual earnings on pension plan investments 1,318 - 993 1,479
Total 1,486$ 7,380$ 3,248$ 14,214$
2018 2017
Amounts reported as deferred outflows of resources and deferred inflows of resources related to Laborers’ pensions will be recognized in pension benefit as follows:
Years EndingDecember 31
2019 (4,361)$ 2020 (2,123) 2021 118 2022 472
Total (5,894)$
Policemen’s (dollars in thousands):
Deferred Deferred Deferred DeferredOutflows of Inflows of Outflows of Inflows ofResources Resources Resources Resources
Differences between expected and actual experience 4$ 2,129$ 5$ 1,399$ Changes of assumptions 966 991 1,268 - Net difference between projected and actual earnings on pension plan investments 1,093 - 646 783
Total 2,063$ 3,120$ 1,919$ 2,182$
2018 2017
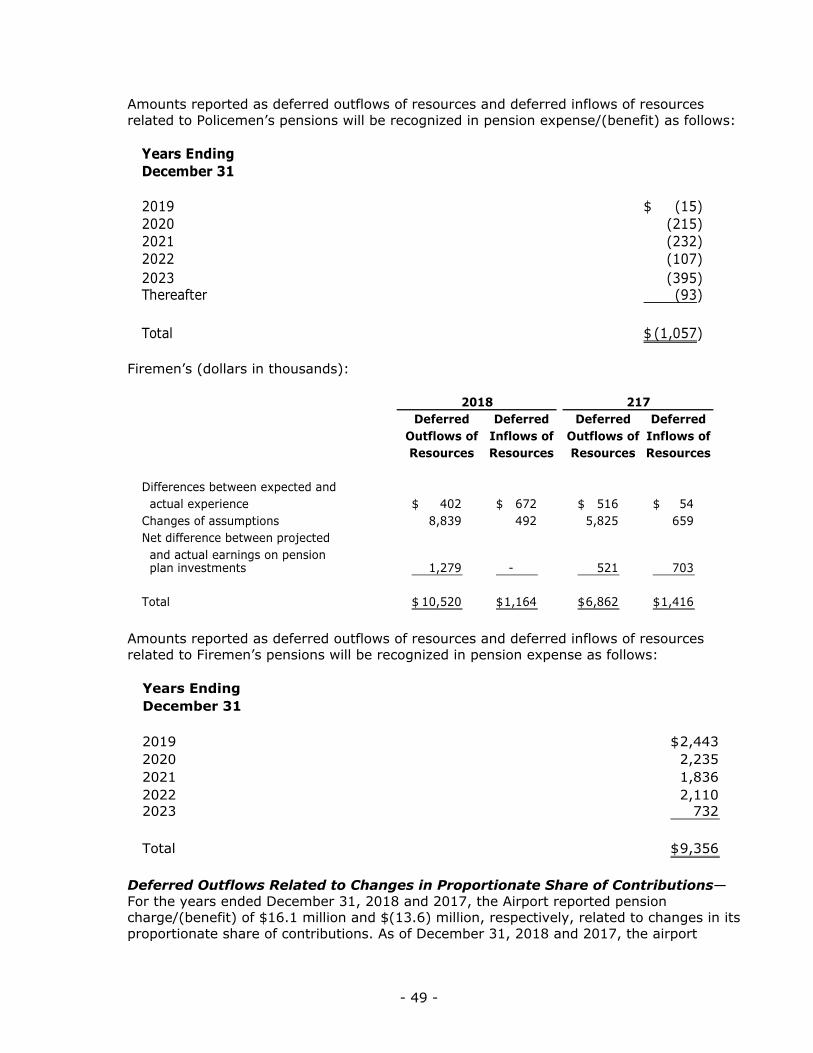
- 49 -
Amounts reported as deferred outflows of resources and deferred inflows of resources related to Policemen’s pensions will be recognized in pension expense/(benefit) as follows:
Years EndingDecember 31
2019 (15)$ 2020 (215) 2021 (232) 2022 (107) 2023 (395) Thereafter (93)
Total (1,057)$
Firemen’s (dollars in thousands):
Deferred Deferred Deferred DeferredOutflows of Inflows of Outflows of Inflows ofResources Resources Resources Resources
Differences between expected and actual experience 402$ 672$ 516$ 54$ Changes of assumptions 8,839 492 5,825 659 Net difference between projected and actual earnings on pension plan investments 1,279 - 521 703
Total 10,520$ 1,164$ 6,862$ 1,416$
2018 217
Amounts reported as deferred outflows of resources and deferred inflows of resources related to Firemen’s pensions will be recognized in pension expense as follows:
Years EndingDecember 31
2019 2,443$ 2020 2,235 2021 1,836 2022 2,110 2023 732
Total 9,356$
Deferred Outflows Related to Changes in Proportionate Share of Contributions—For the years ended December 31, 2018 and 2017, the Airport reported pension charge/(benefit) of $16.1 million and $(13.6) million, respectively, related to changes in its proportionate share of contributions. As of December 31, 2018 and 2017, the airport
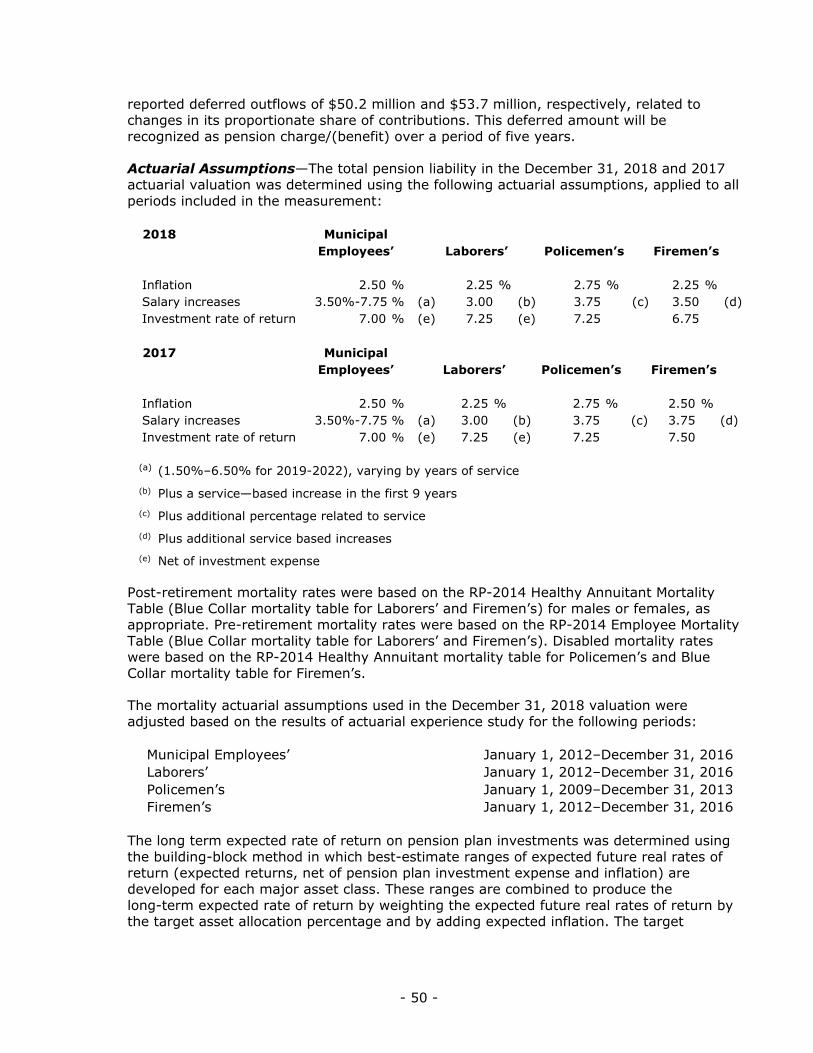
- 50 -
reported deferred outflows of $50.2 million and $53.7 million, respectively, related to changes in its proportionate share of contributions. This deferred amount will be recognized as pension charge/(benefit) over a period of five years.
Actuarial Assumptions—The total pension liability in the December 31, 2018 and 2017 actuarial valuation was determined using the following actuarial assumptions, applied to all periods included in the measurement:
2018 MunicipalEmployees’ Laborers’ Policemen’s Firemen’s
Inflation 2.50 % 2.25 % 2.75 % 2.25 % Salary increases 3.50%-7.75 % (a) 3.00 (b) 3.75 (c) 3.50 (d)Investment rate of return 7.00 % (e) 7.25 (e) 7.25 6.75
2017 MunicipalEmployees’ Laborers’ Policemen’s Firemen’s
Inflation 2.50 % 2.25 % 2.75 % 2.50 % Salary increases 3.50%-7.75 % (a) 3.00 (b) 3.75 (c) 3.75 (d)Investment rate of return 7.00 % (e) 7.25 (e) 7.25 7.50
(a) (1.50%–6.50% for 2019-2022), varying by years of service (b) Plus a service—based increase in the first 9 years (c) Plus additional percentage related to service (d) Plus additional service based increases (e) Net of investment expense
Post-retirement mortality rates were based on the RP-2014 Healthy Annuitant Mortality Table (Blue Collar mortality table for Laborers’ and Firemen’s) for males or females, as appropriate. Pre-retirement mortality rates were based on the RP-2014 Employee Mortality Table (Blue Collar mortality table for Laborers’ and Firemen’s). Disabled mortality rates were based on the RP-2014 Healthy Annuitant mortality table for Policemen’s and Blue Collar mortality table for Firemen’s.
The mortality actuarial assumptions used in the December 31, 2018 valuation were adjusted based on the results of actuarial experience study for the following periods:
Municipal Employees’ January 1, 2012–December 31, 2016Laborers’ January 1, 2012–December 31, 2016Policemen’s January 1, 2009–December 31, 2013Firemen’s January 1, 2012–December 31, 2016
The long term expected rate of return on pension plan investments was determined using the building-block method in which best-estimate ranges of expected future real rates of return (expected returns, net of pension plan investment expense and inflation) are developed for each major asset class. These ranges are combined to produce the long-term expected rate of return by weighting the expected future real rates of return by the target asset allocation percentage and by adding expected inflation. The target

- 51 -
allocation and best estimates of arithmetic real rates of return for each major asset class as of December 31, 2018 and 2017 are summarized in the following tables:
Municipal Municipal2018 Employees’ Laborers’ Policemen’s Firemen’s Employees’ Laborers’ Policemen’s Firemen’s
Asset Class: Equity - % - % - % 60.0 % - % - % - % 7.20 % Domestic equity 26.0 - - - 5.10 - - - U.S. equity - 25.0 21.0 - - 5.70 6.00 - Non U.S. equity - 20.0 21.0 - - 5.20 7.40 - Global low volatility equity - 5.0 - - - 4.70 - - International equity 22.0 - - - 5.30 - - Fixed income 25.0 20.0 22.0 20.0 0.80 (0.10) 2.20 3.75 Hedge funds 10.0 10.0 7.0 - 3.40 3.50 4.20 - Infrastructure 2.0 - - - 5.00 - - - Private debt - 3.0 - - - 7.60 - - Private equity 5.0 4.0 - - 8.30 8.70 - - Private markets - - 17.0 - - - 6.70 - Global asset allocation - - 5.0 - - - 4.40 - Real estate 10.0 10.0 7.0 8.0 4.70 4.90 4.10 6.25 Private real assets - 3.0 - - - 5.30 - - Other investments - - - 12.0 - - - 5.82
Total 100.0 % 100.0 % 100.0 % 100.0 %
Long-Term Expected Real Rate of ReturnTarget Allocation
Municipal Municipal2017 Employees’ Laborers’ Policemen’s Firemen’s Employees’ Laborers’ Policemen’s Firemen’s
Asset Class: Equity - % - % - % 60.0 % - % - % - % 7.25 % Domestic equity 26.0 - - - 5.6 - - - U.S. equity - 25.0 21.0 - - 5.8 6.1 - Non U.S. equity - 20.0 21.0 - - 5.7 7.7 - Global low volatility equity - 5.0 - - - 5.0 - - International equity 22.0 - - - 5.7 - - - Fixed income 27.0 20.0 22.0 20.0 1.0 (0.2) 1.9 7.34 Hedge funds 10.0 10.0 5.0 - 3.6 3.6 4.0 - Private debt - 3.0 - - - 8.2 - - Private equity 5.0 4.0 - - 9.4 9.4 - - Private markets - - 17.0 - - - 7.4 - Global asset allocation - - 5.0 - - - 4.4 - Real estate 10.0 10.0 5.0 8.0 5.4 5.4 4.6 7.62 Real assets - - 4.0 - - - 4.4 - Private real assets - 3.0 - - - 5.8 - - Other investments - - - 12.0 - - - 7.70
Total 100.0 % 100.0 % 100.0 % 100.0 %
Long-Term Expected Real Rate of ReturnTarget Allocation
Discount Rate
Municipal Employees’—The discount rate used to measure the total pension liability as of December 31, 2018 and 2017 was 7.0%. The projection of cash flows used to determine the discount rate assumed plan member contributions will be made according to the contribution rate applicable for each member’s tier and that employer contributions will be made as specified by Public Act 100-0023. For this purpose, only employer contributions that are intended to fund benefits of current plan members and their beneficiaries are included. Projected employer contributions and contributions from future plan members that are intended to fund the service costs of future plan members and their beneficiaries are not included. Based on those assumptions, the pension plan’s fiduciary net position was projected to be available to make all projected future benefit payments of current plan members. Therefore, the long term expected rate of return on pension plan investments

- 52 -
was applied to all periods of projected benefit payments to determine the total pension liability
Laborers’—A Single Discount Rate of 7.11% and 7.07% was used to measure the total pension liability as of December 31, 2018 and 2017, respectively. This Single Discount Rate was based on an expected rate of return on pension plan investments of 7.25% as of December 31, 2018 and 2017, and a municipal bond rate of 3.71% and 3.31% as of December 31, 2018 and 2017, respectively (based on the rate closest to but not later than the measurement date of the “20-Year Municipal GO AA Index” rate from Fidelity Index). The projection of cash flows used to determine this Single Discount Rate assumed that plan member contributions will be made at the current contribution rate and that employer contributions will be made at under the statutory funding policy. Based on these assumptions, the pension plan’s fiduciary net position and future contributions were sufficient to finance the benefit payments only through the year 2072. As a result, the long-term expected rate of return on pension plan investments was applied to projected benefit payments through the year 2072, and the municipal bond rate was applied to all benefit payments after that date.
Policemen’s—A Single Discount Rate of 7.18% and 7.0% was used to measure the total pension liability as of December 31, 2018 and 2017, respectively. This Single Discount Rate was based on an expected rate of return on pension plan investments of 7.25% for December 31, 2018 and 2017, respectively, and a municipal bond rate of 3.71% and 3.31% as of December 31, 2018 and 2017, respectively (based on the rate closest to but not later than the measurement date of the “20-Year Municipal GO AA Index” rate from Fidelity Index). The projection of cash flows used to determine this Single Discount Rate assumed that plan member contributions will be made at the current contribution rate and employer contributions are made in accordance with the statutory requirements. Based on these assumptions, the pension plan’s fiduciary net position and future contributions were sufficient to finance the benefit payments through the year 2079 (for the 2018 valuation) and the year 2070 (for the 2017 valuation). As a result, the long-term expected rate of return on pension plan investments was applied to projected benefit payments through the year 2079 (for the 2018 valuation) and the year 2070 (for the 2017 valuation), and the respective municipal bond rate was applied to all benefit payments after that date.
Firemen’s—A Single Discount Rate of 6.61% and 7.23% was used to measure the total pension liability as of December 31, 2018 and 2017, respectively. This Single Discount Rate was based on an expected rate of return on pension plan investments of 6.75% and 7.5% for December 31, 2018 and 2017, respectively, and a municipal bond rate of 3.71% and 3.31% as of December 31, 2018 and 2017, respectively (based on the rate closest to but not later than the measurement date of the “20-Year Municipal GO AA Index” rate from Fidelity Index). The projection of cash flows used to determine the discount rate assumed that plan member contributions will be made in accordance with the statutory requirements. Based on these assumptions, the pension plan’s fiduciary net position and future contributions were sufficient to finance the benefit payments through the year 2072 (for the 2018 valuation) and 2070 (for the 2017 valuation). As a result, the long-term expected rate of return on pension plan investments was applied to projected benefit payments through the year 2072 (for the 2018 valuation) and 2070 (for the 2017 valuation), and the respective municipal bond rate was applied to all benefit payments after that date.

- 53 -
Sensitivity of the Airport’s Net Pension Liability to Changes in the Discount Rate
Municipal Employees’—The following presents the allocated share of the net pension liability to the Airport as of December 31, 2018 and 2017, calculated using the discount rate of 7.00%, as well as what the net pension liability would be if it were calculated using a discount rate that is 1% point lower (6.00%) or 1% (8.00%) point higher than the current rate (dollars in thousands):
Net Pension Liability December 31, 2018 1% Decrease Discount Rate 1% Increase
Municipal Employees’ discount rate 6.00 % 7.00 % 8.00 % Municipal Employees’ net pension liability 219,518$ 188,469$ 162,720$
Current
Net Pension Liability December 31, 2017 1% Decrease Discount Rate 1% Increase
Municipal Employees’ discount rate 6.00 % 7.00 % 8.00 % Municipal Employees’ net pension liability 188,457$ 160,076$ 136,569$
Current
Laborers’—The following presents the allocated share of the net pension liability to the Airport as of December 31, 2018 and 2017, calculated using the discount rate of 7.11% and 7.07%, respectively, as well as what the net pension liability would be if it were calculated using a discount rate that is 1% point lower (6.11%) or 1% point higher (8.11%) than the current rate (dollars in thousands):
Net Pension Liability December 31, 2018 1% Decrease Discount Rate 1% Increase
Laborers’ discount rate 6.11 % 7.11 % 8.11 % Laborers’ net pension liability 27,927$ 23,248$ 19,330$
Current
Net Pension Liability December 31, 2017 1% Decrease Discount Rate 1% Increase
Laborers’ discount rate 6.07 % 7.07 % 8.07 % Laborers’ net pension liability 24,973$ 20,249$ 16,298$
Current
Policemen’s—The following presents the allocated share of the net pension liability to the Airport as of December 31, 2018 and 2017, calculated using the discount rate of 7.18% and 7.0%, respectively, as well as what the net pension liability would be if it were calculated using a discount rate that is 1% point lower (6.18%) or 1% point higher (8.18%) than the current rate (dollars in thousands):
Net Pension Liability December 31, 2018 1% Decrease Discount Rate 1% Increase
Policemen’s discount rate 6.18 % 7.18 % 8.18 % Policemen’s net pension liability 54,477$ 47,425$ 41,483$
Current

- 54 -
Net Pension Liability December 31, 2017 1% Decrease Discount Rate 1% Increase
Policemen’s discount rate 6.00 % 7.00 % 8.00 % Policemen’s net pension liability 55,663$ 48,149$ 41,838$
Current
Firemen’s—The following presents the allocated share of the net pension liability to the Airport as of December 31, 2018 and 2017, calculated using the discount rate of 6.61% and 7.23%, respectively, as well as what the net pension liability would be if it were calculated using a discount rate that is 1% point lower (5.61%) or 1% point higher (7.61%) than the current rate (dollars in thousands):
Net Pension Liability December 31, 2018 1% Decrease Discount Rate 1% Increase
Firemen’s discount rate 5.61 % 6.61 % 7.61 % Firemen’s net pension liability 80,915$ 70,560$ 61,914$
Current
Net Pension Liability December 31, 2017 1% Decrease Discount Rate 1% Increase
Firemen’s discount rate 6.23 % 7.23 % 8.23 % Firemen’s net pension liability 71,334$ 62,136$ 54,423$
Current
Pension Plan Fiduciary Net Position—Detailed information about the pension plan’s fiduciary net position is available in the separately issued Pension Plans financial report.
8. RELATED-PARTY TRANSACTIONS
Included in operating expenses are reimbursements to the general fund of the City for services provided by other City departments, employee fringe benefits, and self-insured risks. Such reimbursements were $24.5 million in 2018 and $22.0 million in 2017.
9. COMMITMENTS AND CONTINGENCIES
The Airport has certain contingent liabilities resulting from litigation, claims, and commitments incident to the ordinary course of business. Management expects that the final resolution of these contingencies will not have a material adverse effect on the financial position or results of operations of the Airport.
The Airport provides employee health benefits under a self-insurance program, administered by the City. Such claims outstanding, including claims incurred but not reported, are estimated and recorded as liabilities in the financial statements.

- 55 -
Uninsured claim expenditures and liabilities are reported when it is probable that a loss has occurred and the amount of that loss can be reasonably estimated. These losses include an estimate of claims that have been incurred but not reported. Changes in the claims liability amount for the years ended December 31, 2018 and 2017, are as follows (dollars in thousands):
2018 2017
Beginning balance—January 1 511$ 620$ Total claims incurred 5,102 4,141 Claims paid (5,136) (4,250)
Claims liability—December 31 477$ 511$
The City’s property and liability insurance premiums are approximately $11.1 million per year. The City maintains property and liability insurance coverage for both O’Hare and Midway and allocates the cost of the premiums between the two airports. The property coverage was renewed on December 31, 2018 with a limit of $3.5 billion and includes $3.5 billion in terrorism coverage, and the liability coverage was renewed May 15, 2018 with a limit of $1 billion and includes $1 billion in war and terrorism liability coverage.
At December 31, 2018 and 2017, the Airport had commitments in the amount of approximately $234.2 million and $116.3 million, respectively, in connection with contracts entered into for construction projects.
10. DEFERRED OUTFLOWS/INFLOWS OF RESOURCES
2018 2017
Deferred outflows of resources: Deferred outflows from pension activities accumulated 44,856$ 59,589$ Changes in proportionate share of pension contribution 50,233 53,694 Unamortized deferred bond refunding costs 18,874 16,860 Derivatives 20,239 24,319
Total deferred outflows of resources 134,202$ 154,462$
Deferred inflows of resources deferred inflows from pension activities (82,841)$ (108,774)$

- 56 -
11. SUBSEQUENT EVENTS
Midway has evaluated subsequent events through June 25, 2019, the date the financial statements were available to be issued and concluded no subsequent events have occurred that would require recognition that have not already been recognized or that require disclosure that have not already been disclosed.
* * * * * *

REQUIRED SUPPLEMENTARY INFORMATION

- 57 -
CITY OF CHICAGO, ILLINOISCHICAGO MIDWAY INTERNATIONAL AIRPORT
SCHEDULE OF CHANGES IN THE NET PENSION LIABILITY AND RELATED RATIOSLAST FOUR FISCAL YEARS(Dollars are in thousands)
2018 2017 2016 2015
MUNICIPAL EMPLOYEES’: Total pension liability: Service cost* 223,528$ 572,534$ 619,743$ 226,816$ Interest 1,123,348 915,711 878,369 909,067 Benefit changes - - - 2,140,009 Differences between expected and actual experience 95,540 (177,755) (127,119) (109,865) Assumption changes - (7,431,191) (578,920) 8,711,755 Benefit payments including refunds (916,198) (888,174) (859,672) (826,036)
Net change in total pension liability 526,218 (7,008,875) (67,599) 11,051,746
Total pension liability—beginning 16,282,396 23,291,271 23,358,870 12,307,094
Total pension liability—ending (a) 16,808,614 16,282,396 23,291,271 23,358,840
Plan fiduciary net position: Contributions—employer 349,574 261,764 149,718 149,225 Contributions—employee 138,400 134,765 130,391 131,428 Net investment income (204,975) 610,515 281,419 114,025 Benefit payments including refunds of - - - - employee contribution (916,198) (888,174) (859,672) (826,036) Administrative expenses (6,639) (6,473) (7,056) (6,701) Other - 5,394 - -
Net change in plan fiduciary net position (639,838) 117,791 (305,200) (438,059)
Plan fiduciary net position—beginning 4,554,018 4,436,227 4,741,427 5,179,486
Plan fiduciary net position—ending (b) 3,914,180 4,554,018 4,436,227 4,741,427
NET PENSION LIABILITY—Ending (a)-(b) 12,894,434$ 11,728,378$ 18,855,044$ 18,617,413$
PLAN FIDUCIARY NET POSITION AS A PERCENTAGE OF THE TOTAL PENSION LIABILITY 23.29 % 27.97 % 19.05 % 20.30 %
COVERED PAYROLL** 1,734,596$ 1,686,533$ 1,646,939$ 1,643,481$
EMPLOYER’S NET PENSION LIABILITY AS A PERCENTAGE OF COVERED PAYROLL 743.37 % 695.41 % 1,144.85 % 1,132.81 %
ALLOCATED NET PENSION LIABILITY 188,469$ 160,076$ 175,069$ 171,485$
ALLOCATED PERCENTAGE 1.46 % 1.36 % 0.93 % 0.92 %
* Includes pension plan administrative expense.** Covered payroll is the amount in force as of the actuarial valuation date and likely differs from actual payroll paid during fiscal year.
Ten year information will be provided prospectively starting with year 2015. (Continued)

- 58 -
CITY OF CHICAGO, ILLINOISCHICAGO MIDWAY INTERNATIONAL AIRPORT
SCHEDULE OF CHANGES IN THE NET PENSION LIABILITY AND RELATED RATIOSLAST FOUR FISCAL YEARS(Dollars are in thousands)
2018 2017 2016 2015
LABORERS’: Total pension liability: Service cost* 40,801$ 80,232$ 82,960$ 38,389$ Interest 183,135 154,047 150,166 153,812 Benefit changes - 150 - 384,033 Differences between expected and actual experience 15,143 (62,178) (30,428) (46,085) Assumption changes (11,788) (1,074,754) (62,905) 1,175,935 Benefit payments including refunds (160,061) (157,050) (154,683) (152,530) Pension plan administrative expense (3,933) (3,985) (4,080) (3,844)
Net change in total pension liability 63,297 (1,063,538) (18,970) 1,549,710
Total pension liability—beginning 2,630,107 3,693,645 3,712,615 2,162,905
Total pension liability—ending (a) 2,693,404 2,630,107 3,693,645 3,712,615
Plan fiduciary net position: Contributions—employer 47,844 35,457 12,603 12,412 Contributions—employee 17,837 17,411 17,246 16,844 Net investment income (75,219) 207,981 57,997 (22,318) Benefit payments including refunds of employee contribution (160,061) (157,050) (154,683) (152,530)
Administrative expenses (3,933) (3,985) (4,080) (3,844) Other 661 - - -
Net change in plan fiduciary net position (172,871) 99,814 (70,917) (149,436)
Plan fiduciary net position—beginning 1,267,554 1,167,740 1,238,657 1,388,093
Plan fiduciary net position—ending (b) 1,094,683 1,267,554 1,167,740 1,238,657
NET PENSION LIABILITY—Ending (a)-(b) 1,598,721$ 1,362,553$ 2,525,905$ 2,473,958$
PLAN FIDUCIARY NET POSITION AS A PERCENTAGE OF THE TOTAL PENSION LIABILITY 40.64 % 48.19 % 31.61 % 33.36 %
COVERED PAYROLL** 211,482$ 208,442$ 208,155$ 204,773$
EMPLOYER’S NET PENSION LIABILITY AS A PERCENTAGE OF COVERED PAYROLL 755.96 % 653.68 % 1,213.47 % 1,208.15 %
ALLOCATED NET PENSION LIABILITY 23,248$ 20,249$ 38,495$ 36,973$
ALLOCATED PERCENTAGE 1.45 % 1.49 % 1.52 % 1.50 %
* Includes pension plan administrative expense.** Covered payroll is the amount in force as of the actuarial valuation date and likely differs from actual payroll paid during fiscal year.
Ten year information will be provided prospectively starting with year 2015. (Continued)

- 59 -
CITY OF CHICAGO, ILLINOISCHICAGO MIDWAY INTERNATIONAL AIRPORT
SCHEDULE OF CHANGES IN THE NET PENSION LIABILITY AND RELATED RATIOSLAST FOUR FISCAL YEARS(Dollars are in thousands)
2018 2017 2016 2015
POLICEMEN’S: Total pension liability: Service cost* 242,998$ 237,333$ 220,570$ 213,585$ Interest 931,731 917,720 851,098 832,972 Benefit changes - - 606,250 - Differences between expected and actual experience (281,151) (299,923) 1,801 (105,969) Assumption changes (259,052) 238,975 112,585 - Benefit payments including refunds (771,104) (747,891) (707,196) (676,777) Pension plan administrative expense (4,626) (4,843) (4,750) (4,508)
Net change in total pension liability (141,204) 341,371 1,080,358 259,303
Total pension liability—beginning 13,454,462 13,113,091 12,032,733 11,773,430
Total pension liability—ending (a) 13,313,258 13,454,462 13,113,091 12,032,733
Plan fiduciary net position: Contributions—employer 588,035 494,483 272,428 572,836 Contributions—employee 107,186 103,011 101,476 107,626 Net investment income (137,977) 412,190 142,699 (5,334) Benefit payments including refunds of employee contribution (771,104) (747,891) (707,196) (676,777) Administrative expenses (4,626) (4,843) (4,750) (4,508) Other 1,600 97 1,413 3,092
Net change in plan fiduciary net position (216,886) 257,047 (193,930) (3,065)
Plan fiduciary net position—beginning 3,122,066 2,865,019 3,058,949 3,062,014
Plan fiduciary net position—ending (b) 2,905,180 3,122,066 2,865,019 3,058,949
NET PENSION LIABILITY—Ending (a)-(b) 10,408,078$ 10,332,396$ 10,248,072$ 8,973,784$
PLAN FIDUCIARY NET POSITION AS A PERCENTAGE OF THE TOTAL PENSION LIABILITY 21.82 % 23.20 % 21.85 % 25.42 %
COVERED PAYROLL**1,205,324$ 1,150,406$ 1,119,527$ 1,086,608$
EMPLOYER’S NET PENSION LIABILITY AS A PERCENTAGE OF COVERED PAYROLL 863.51 % 898.15 % 915.39 % 825.85 %
ALLOCATED NET PENSION LIABILITY 47,425$ 48,149$ 45,971$ 36,344$
ALLOCATED PERCENTAGE 0.46 % 0.47 % 0.45 % 0.41 %
* Includes pension plan administrative expense** Covered payroll is the amount in force as of the actuarial valuation date and
likely differs from actual payroll paid during fiscal year.
Ten year information will be provided prospectively starting with year 2015. (Continued)

- 60 -
CITY OF CHICAGO, ILLINOISCHICAGO MIDWAY INTERNATIONAL AIRPORT
SCHEDULE OF CHANGES IN THE NET PENSION LIABILITY AND RELATED RATIOSLAST FOUR FISCAL YEARS(Dollars are in thousands)
2018 2017 2016 2015
FIREMEN’S: Total pension liability: Service cost* 97,143$ 93,367$ 94,115$ 87,203$ Interest 410,821 371,622 342,085 338,986 Benefit changes - - 227,213 - Differences between expected and actual experience (56,418) 26,954 24,110 (7,981) Assumption changes 382,611 414,219 (74,373) 176,282 Benefit payments including refunds (324,662) (306,098) (286,759) (278,017) Pension plan administrative expense (3,285) (3,172) (3,217) (3,149)
Net change in total pension liability 506,210 596,892 323,174 313,324
Total pension liability—beginning 5,746,150 5,149,258 4,826,084 4,512,760
Total pension liability—ending (a) 6,252,360 5,746,150 5,149,258 4,826,084
Plan fiduciary net position: Contributions—employer 249,684 228,453 154,101 236,104 Contributions—employee 45,894 47,364 48,960 46,552 Net investment income (58,000) 140,570 60,881 7,596 Benefit payments including refunds of employee contribution (324,662) (306,098) (286,759) (278,017) Administrative expenses (3,285) (3,172) (3,217) (3,149) Other 6 22 (53) 7
Net change in plan fiduciary net position (90,363) 107,139 (26,087) 9,093
Plan fiduciary net position—beginning 1,126,153 1,019,014 1,045,101 1,036,008
Plan fiduciary net position—ending (b) 1,035,790 1,126,153 1,019,014 1,045,101
NET PENSION LIABILITY—Ending (a)-(b) 5,216,570$ 4,619,997$ 4,130,244$ 3,780,983$
PLAN FIDUCIARY NET POSITION AS A PERCENTAGE OF THE TOTAL PENSION LIABILITY 16.57 % 19.60 % 19.79 % 21.66 %
COVERED PAYROLL** 456,969$ 469,407$ 478,471$ 465,232$
EMPLOYER’S NET PENSION LIABILITY AS A PERCENTAGE OF COVERED PAYROLL 1,141.56 % 984.22 % 863.22 % 812.71 %
ALLOCATED NET PENSION LIABILITY 70,560$ 62,136$ 57,212$ 51,224$
ALLOCATED PERCENTAGE 1.35 % 1.34 % 1.39 % 1.36 %
* Includes pension plan administrative expense.** Covered payroll is the amount in force as of the actuarial valuation date and likely differs from actual payroll paid during fiscal year.
Ten year information will be provided prospectively starting with year 2015. (Concluded)

- 61 -
CITY OF CHICAGO, ILLINOISCHICAGO MIDWAY INTERNATIONAL AIRPORT
SCHEDULE OF CONTRIBUTIONSLAST TEN YEARS(Dollars are in thousands)
Municipal Employees’Contributions inRelation to the Contributions as
Actuarially Actuarially a Percentage ofYears Ended Determined Determined Contribution Covered CoveredDecember 31 Contributions Contribution Deficiency Payroll* Payroll
2009 413,509$ 148,047$ 265,462$ 1,551,973$ 9.54 % 2010 483,948 154,752 329,196 1,541,388 10.04 2011 611,756 147,009 464,747 1,605,993 9.15 2012 690,823 148,859 541,964 1,590,794 9.36 2013 820,023 148,197 671,826 1,580,289 9.38 2014 839,039 149,747 689,292 1,602,978 9.34 2015 677,200 149,225 527,975 1,643,481 9.08 2016 961,770 149,718 812,052 1,646,939 9.09 2017 1,005,457 261,764 743,693 1,686,533 15.52 2018 1,049,916 349,574 700,342 1,734,596 20.15
* Covered payroll is the amount in force as of the actuarial valuation date and likely differs from actual payroll paid during fiscal year.
Laborers’Contributions inRelation to the Contributions as
Actuarially Actuarially a Percentage ofYears Ended Determined Determined Contribution Covered CoveredDecember 31 Contributions* Contribution Deficiency Payroll** Payroll
2009 33,518$ 14,627$ 18,891$ 208,626$ 7.01 % 2010 46,665 15,352 31,313 199,863 7.68 2011 57,259 12,779 44,480 195,238 6.55 2012 77,566 11,853 65,713 198,790 5.96 2013 106,199 11,583 94,616 200,352 5.78 2014 106,019 12,161 93,858 202,673 6.00 2015 79,851 12,412 67,439 204,773 6.06 2016 117,033 12,603 104,430 208,155 6.05 2017 124,226 35,457 88,769 208,442 17.01 2018 129,247 47,844 81,403 211,482 22.62
* The LABF Statutory Funding does not conform to Actuarial Standards of Practice, therefore, the actuarially determined contribution is equal to the normal cost plus an amount to amortize the unfunded liability using dollar payments and a 30 year open amortization period.
** Covered payroll is the amount in force as of the actuarial valuation date and likely differs from actual payroll paid during fiscal year. (Continued)
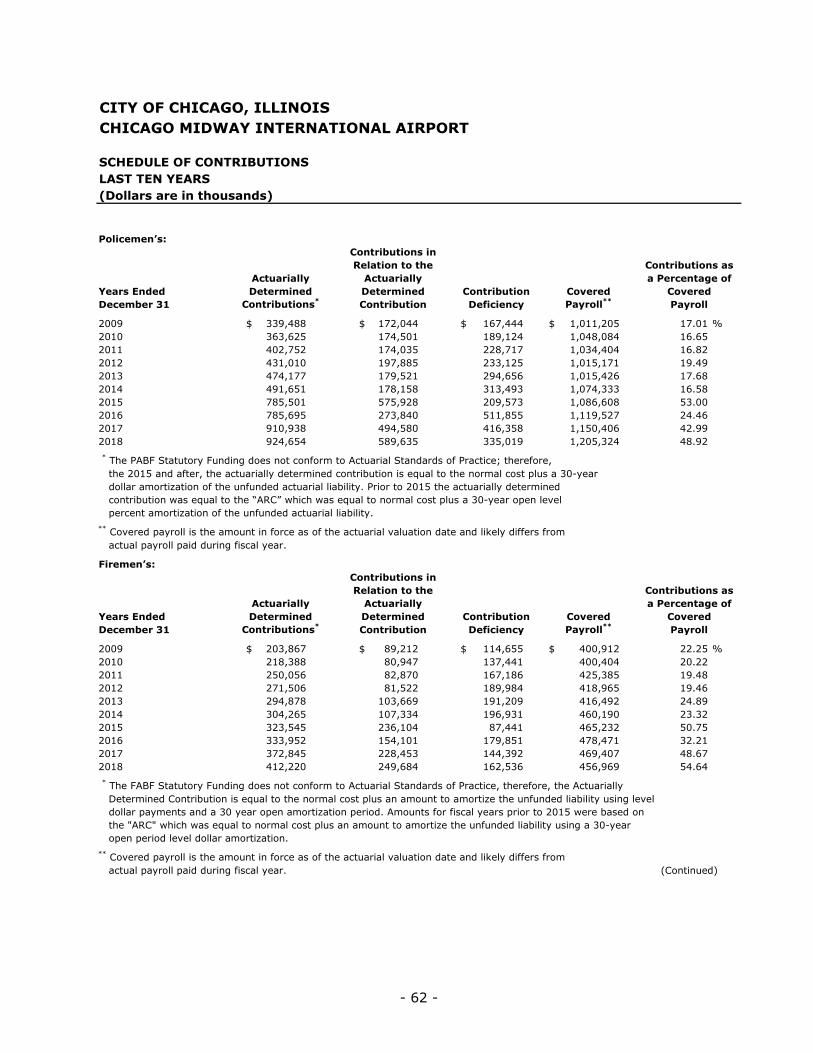
- 62 -
CITY OF CHICAGO, ILLINOISCHICAGO MIDWAY INTERNATIONAL AIRPORT
SCHEDULE OF CONTRIBUTIONSLAST TEN YEARS(Dollars are in thousands)
Policemen’s:Contributions inRelation to the Contributions as
Actuarially Actuarially a Percentage ofYears Ended Determined Determined Contribution Covered CoveredDecember 31 Contributions* Contribution Deficiency Payroll** Payroll
2009 339,488$ 172,044$ 167,444$ 1,011,205$ 17.01 % 2010 363,625 174,501 189,124 1,048,084 16.65 2011 402,752 174,035 228,717 1,034,404 16.82 2012 431,010 197,885 233,125 1,015,171 19.49 2013 474,177 179,521 294,656 1,015,426 17.68 2014 491,651 178,158 313,493 1,074,333 16.58 2015 785,501 575,928 209,573 1,086,608 53.00 2016 785,695 273,840 511,855 1,119,527 24.46 2017 910,938 494,580 416,358 1,150,406 42.99 2018 924,654 589,635 335,019 1,205,324 48.92
* The PABF Statutory Funding does not conform to Actuarial Standards of Practice; therefore, the 2015 and after, the actuarially determined contribution is equal to the normal cost plus a 30-year dollar amortization of the unfunded actuarial liability. Prior to 2015 the actuarially determined contribution was equal to the “ARC” which was equal to normal cost plus a 30-year open level percent amortization of the unfunded actuarial liability.** Covered payroll is the amount in force as of the actuarial valuation date and likely differs from actual payroll paid during fiscal year.
Firemen’s:Contributions inRelation to the Contributions as
Actuarially Actuarially a Percentage ofYears Ended Determined Determined Contribution Covered CoveredDecember 31 Contributions* Contribution Deficiency Payroll** Payroll
2009 203,867$ 89,212$ 114,655$ 400,912$ 22.25 % 2010 218,388 80,947 137,441 400,404 20.22 2011 250,056 82,870 167,186 425,385 19.48 2012 271,506 81,522 189,984 418,965 19.46 2013 294,878 103,669 191,209 416,492 24.89 2014 304,265 107,334 196,931 460,190 23.32 2015 323,545 236,104 87,441 465,232 50.75 2016 333,952 154,101 179,851 478,471 32.21 2017 372,845 228,453 144,392 469,407 48.67 2018 412,220 249,684 162,536 456,969 54.64
* The FABF Statutory Funding does not conform to Actuarial Standards of Practice, therefore, the Actuarially Determined Contribution is equal to the normal cost plus an amount to amortize the unfunded liability using level dollar payments and a 30 year open amortization period. Amounts for fiscal years prior to 2015 were based on the "ARC" which was equal to normal cost plus an amount to amortize the unfunded liability using a 30-year open period level dollar amortization.** Covered payroll is the amount in force as of the actuarial valuation date and likely differs from actual payroll paid during fiscal year. (Continued)

- 63 -
CITY OF CHICAGO, ILLINOISCHICAGO MIDWAY INTERNATIONAL AIRPORT
SCHEDULE OF CONTRIBUTIONS
Actuarial Methods Municipaland Assumptions Employees’ Laborers’ Policemen’s Firemen’s
Actuarial valuation date 12/31/2018 (a) 12/31/2018 (q) 12/31/2018 12/31/2018Actuarial cost method Entry age normal Entry age normal Entry age normal Entry age normalAsset valuation method 5-yr. Smoothed 5-yr. Smoothed 5-yr. Smoothed 5-yr. Smoothed
Market Market Market MarketActuarial assumptions: Inflation 2.50 % 2.25 % 2.75 % 2.25 % Salary increases 3.50 %–7.75 % (b) 3.00 % (c) 3.75 % (d) 3.50 % (e) Investment rate of return 7.00 % (f) 7.25 % (g) 7.25 % 6.75 % Retirement age (h) (i) (j) (i) Mortality (k) (l) (m) (n) Other information (o) (p) (p) (p)
(a) Actuarially determined contribution amount is determined as of December 31, with appropriate interest to the end of the year.(b) (1.50%–6.50% for 2019-2022), varying by years of service.
(c) Plus a service-based increase in the first 9 years.(d) Plus a service-based increases consistent with bargain contracts..(e) Salary increase rates based on age-related productivity and merit rates plus inflation.(f) Net of investment expense.(g) Net of investment expense, including inflation.(h) For employees first hired prior to January 1, 2011, rates of retirement are based on the recent experience of the Fund (effective
December 31, 2017).For employees first hired on or after January 1, 2011 and before July 6, 2017, rates of retirement for each age from 62 to 80were used (effective December 31, 2011).For employees first hired on or after July 6, 2017, rates of retirement for each age from 62 to 80 were used (effectiveDecember 31, 2017).
(i) Experience-based table of rates that are specific to the type of eligibility condition. Last updated for the December 31, 2017,valuation pursuant to an experience study of the period January 1, 2012, through December 31, 2016.
(j) Experience-based table of rates that are specific to the type of eligibility condition. Last updated for the December 31, 2014,actuarial valuation pursuant to an experience study of the period January 1, 2009, through December 31, 2013.
(k) Post-retirement mortality rates were based on the RP-2014 Healthy Annuitant Mortality Tables, set forward two years for males andone year for females, and projected generationally using scale MP-2016. Pre-retirement mortality rates were based on 120% of theRP-2014 Employee Mortality Tables projected generationally using scale MP-2016.
(l) Post Retirement Mortality: Scaling factors of 117% for males, and 102% for females of the RP-2014 Blue Collar Healthy Annuitantmortality table, sex distinct, with generational mortality improvement using MP-2017 2-dimensional mortality improvement scales.No adjustment is made for post-disabled mortality.Pre Retirement Mortality: Scaling factors of 109% for males, and 103% for females of the RP-2014 Blue Collar Employee mortalitytable, sex distinct, with generational mortality improvement using MP-2017 2-dimensional mortality improvement scales.
(m) Post-Retirement Healthy mortality rates: Sex distinct Retirement Plans 2014 Healthy Annuitant mortality table weighted 108% formales and 97% for females.Pre-Retirement mortality rates: Sex distinct Retirement Plans 2014 Total Employee mortality table weighted 85% for males and115% for females. Disabled Mortality: Sex distinct Retirement Plans 2014 Healthy Annuitant mortality table weighted 115% formales and 115% for females
(n) Post Retirement Mortality: Scaling factors of 106% for males, and 98% for females of the RP-2014 Blue Collar Healthy Annuitantmortality table, sex distinct, with generational mortality improvement using MP-2017 2-dimensional mortality improvement scales.Disabled Mortality: Scaling factors of 107% for males, and 99% for females of the RP-2014 Blue Collar Healthy Annuitant mortalitytable, sex distinct, with generational mortality improvement using MP-2017 2-dimensional mortality improvement scales.Pre-Retirement Mortality: Scaling factors of 92% for males, and 100% for females of the RP-2014 Blue Collar Employee mortalitytable, sex distinct, with generational mortality improvement using MP-2017 2-dimensional mortality improvement scales.Future mortality improvements in pre- and post-retirement mortality are reflected by projecting the base mortality tables back fromthe year 2014 to the year 2006 using the MP-2014 projection scale and projecting from 2006 using the MP-2017 projection scale.
(o) Other assumptions: Same as those used in the December 31, 2018, actuarial funding valuations.(p) The actuarial valuation is based on the statutes in effect as of December 31, 2018.
(Concluded)

ADDITIONAL INFORMATION
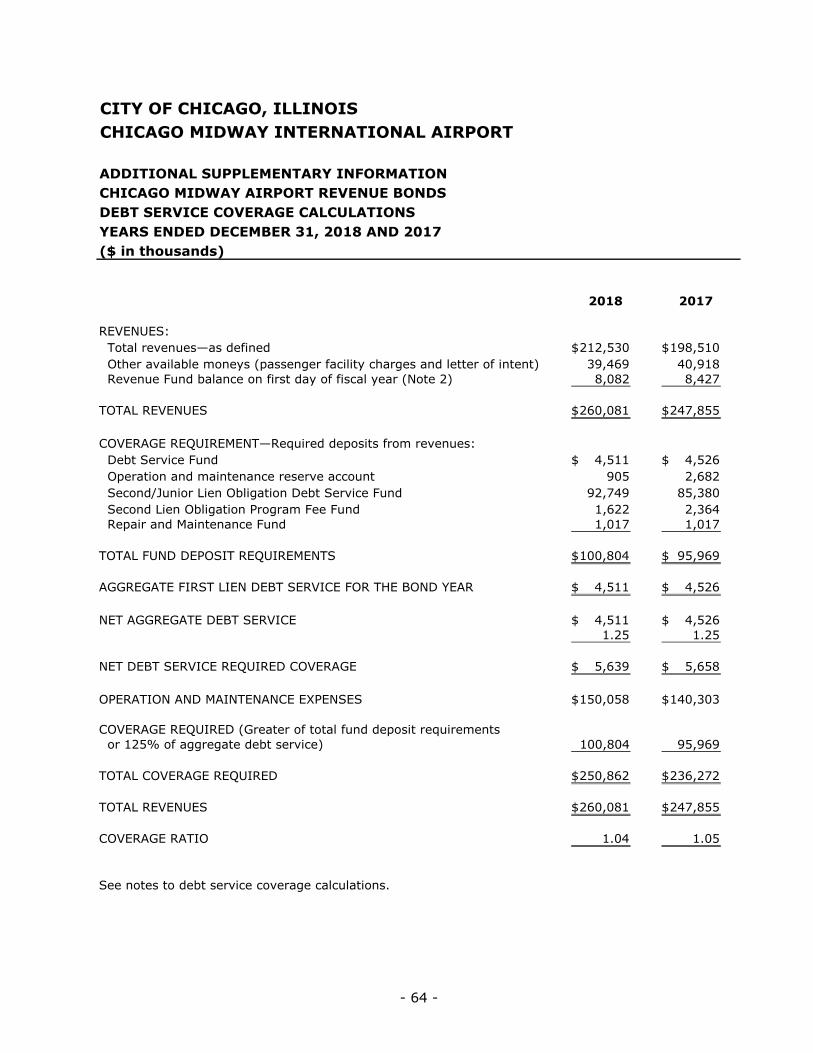
- 64 -
CITY OF CHICAGO, ILLINOISCHICAGO MIDWAY INTERNATIONAL AIRPORT
ADDITIONAL SUPPLEMENTARY INFORMATIONCHICAGO MIDWAY AIRPORT REVENUE BONDSDEBT SERVICE COVERAGE CALCULATIONSYEARS ENDED DECEMBER 31, 2018 AND 2017($ in thousands)
2018 2017
REVENUES: Total revenues—as defined 212,530$ 198,510$ Other available moneys (passenger facility charges and letter of intent) 39,469 40,918 Revenue Fund balance on first day of fiscal year (Note 2) 8,082 8,427
TOTAL REVENUES 260,081$ 247,855$
COVERAGE REQUIREMENT—Required deposits from revenues: Debt Service Fund 4,511$ 4,526$ Operation and maintenance reserve account 905 2,682 Second/Junior Lien Obligation Debt Service Fund 92,749 85,380 Second Lien Obligation Program Fee Fund 1,622 2,364 Repair and Maintenance Fund 1,017 1,017
TOTAL FUND DEPOSIT REQUIREMENTS 100,804$ 95,969$
AGGREGATE FIRST LIEN DEBT SERVICE FOR THE BOND YEAR 4,511$ 4,526$
NET AGGREGATE DEBT SERVICE 4,511$ 4,526$ 1.25 1.25
NET DEBT SERVICE REQUIRED COVERAGE 5,639$ 5,658$
OPERATION AND MAINTENANCE EXPENSES 150,058$ 140,303$
COVERAGE REQUIRED (Greater of total fund deposit requirements or 125% of aggregate debt service) 100,804 95,969
TOTAL COVERAGE REQUIRED 250,862$ 236,272$
TOTAL REVENUES 260,081$ 247,855$
COVERAGE RATIO 1.04 1.05
See notes to debt service coverage calculations.

- 65 -
CITY OF CHICAGO, ILLINOIS CHICAGO MIDWAY INTERNATIONAL AIRPORT
ADDITIONAL SUPPLEMENTARY INFORMATION CHICAGO MIDWAY AIRPORT REVENUE BONDS NOTES TO DEBT SERVICE COVERAGE CALCULATIONS YEARS ENDED DECEMBER 31, 2018 AND 2017
1. RATE COVENANT
The Master Indenture of Trust (“Master Indenture”) securing the Chicago Midway Airport Revenue Bonds (“Bonds”) requires that revenues, together with other available moneys deposited with the trustee and any balance held in the revenue fund on the first day of the calendar year not then required to be deposited in any fund or account, will be at least sufficient (i) to provide for the payment of operation and maintenance expenses for the year and (ii) to provide for the greater of (a) the amounts, if any, needed to make required deposits into the Debt Service Fund, the Operating and Maintenance Reserve Account, the Working Capital Account, the Debt Service Reserve Fund, the Junior Lien Obligation Debt Service Fund, the Repair and Replacement Fund, and the Special Project Fund; and (b) an amount not less than 125% of the aggregate debt service for the Bond year commencing during such fiscal year.
Of the $42.8 million of pension expense for 2018, $11.5 million is the portion of the City’s pension contribution payable in 2018 to the pension funds and allocable to Midway Airport. The remaining portion of the pension expense for 2018, $31.3 million, is recognized on the income statement of Midway Airport for 2018 but is not due and payable by the City during 2018; accordingly, that portion is not included in Operating Expenses for purposes of calculation of the debt service coverage ratios.
2. REVENUE FUND BALANCE
The revenue fund balance includes all cash, cash equivalents, and investments, which were available to the revenue fund to satisfy the coverage requirement under the terms of the Master Indenture.
3. FUND DEPOSIT REQUIREMENTS
The Airport excludes the Airport Development Fund in the Debt Service Coverage calculation. This fund can be used by the City for any lawful Airport purpose and therefore can be used to fulfill any debt service obligations. The balance as of December 31,2018 was $14.5 million.
* * * * * *

- 66 -
CITY OF CHICAGO, ILLINOISCHICAGO MIDWAY INTERNATIONAL AIRPORT
ADDITIONAL SUPPLEMENTARY INFORMATIONCHICAGO MIDWAY AIRPORT SECOND LIEN REVENUE BONDSDEBT SERVICE COVERAGE CALCULATIONSYEARS ENDED DECEMBER 31, 2018 AND 2017($ in thousands)
2018 2017
REVENUES: Total revenues—as defined 212,530$ 198,510$ Other available moneys (passenger facility charges and letter of intent) 39,469 40,918 Revenue fund balance on first day of fiscal year (Note 2) 8,082 8,427
TOTAL REVENUES FOR CALCULATION OF COVERAGE 260,081$ 247,855$
COVERAGE REQUIREMENT—Required deposits from revenues: First Lien Debt Service Fund 4,511$ 4,526$ Operation and maintenance reserve account 905 2,682 Second Lien Obligation Debt Service Fund 92,749 85,380 Second Lien Obligation Program Fee Fund 1,622 2,364 Repair and Replacement Fund 1,017 1,017
TOTAL FUND DEPOSIT REQUIREMENTS 100,804$ 95,969$
125% OF AGGREGATE FIRST LIEN DEBT SERVICE FOR THE BOND YEAR: Aggregate First Lien Debt Service 4,511$ 4,526$
Net aggregate First Lien Debt Service 4,511 4,526
1.25 1.25
125% OF AGGREGATE FIRST LIEN DEBT SERVICE 5,639$ 5,658$
GREATER OF FUND DEPOSIT REQUIREMENTS OR 125% OF AGGREGATE FIRST LIEN DEBT SERVICE 100,804$ 95,969$
110% OF AGGREGATE FIRST AND SECOND LIEN DEBT SERVICE FOR THE BOND YEAR: Aggregate First Lien Debt Service 4,511$ 4,526$ Aggregate Second Lien Debt Service 105,352 98,930 Less amounts transferred from Junior Lien Capitalized Interest Accounts (11,301) (13,495)
Net aggregate First and Second Lien Debt Service 98,562 89,961
1.10 1.10
110% OF AGGREGATE FIRST AND SECOND LIEN DEBT SERVICE 108,418$ 98,957$
GREATER OF FUND DEPOSIT REQUIREMENTS OR 110% OF AGGREGATE FIRST AND SECOND LIEN DEBT SERVICE 108,418$ 98,957$
GREATER OF FUND DEPOSIT REQUIREMENTS OR 125% OF FIRST LIEN DEBT OR 110% OF AGGREGATE DEBT SERVICE 108,418$ 98,957$
COVERAGE CALCULATION: Operation and maintenance expenses 150,058$ 140,303$ 110% of aggregate First and Second Lien Debt Service 108,418 98,957
TOTAL COVERAGE REQUIRED 258,476$ 239,260$
TOTAL REVENUES 260,081$ 247,855$
REVENUES IN EXCESS OF COVERAGE REQUIREMENT 1,605$ 8,595$
COVERAGE RATIO 1.01 1.04
See notes to debt service coverage calculations.

- 67 -
CITY OF CHICAGO, ILLINOIS CHICAGO MIDWAY INTERNATIONAL AIRPORT
ADDITIONAL SUPPLEMENTARY INFORMATION CHICAGO MIDWAY AIRPORT SECOND LIEN REVENUE BONDS NOTES TO DEBT SERVICE COVERAGE CALCULATIONS YEARS ENDED DECEMBER 31, 2018 AND 2017
1. RATE COVENANT
The Master Indenture of Trust (“Master Indenture”) securing the Chicago Midway Airport Second Lien Revenue Bonds (“Bonds”) requires that revenues, together with other available moneys deposited with the first lien trustee or the second lien trustee and any balance held in the first lien revenue fund or the second lien revenue fund on the first day of the year not then required to be deposited in any fund or account under the first lien indenture or the second lien indenture, will be at least sufficient (a) to provide for the payment of operation and maintenance expenses for the year and (b) to provide for: (i) the greater of the amounts needed to make the deposits required under the first lien indenture during such calendar year into the first lien debt service fund, the Operating and Maintenance (O&M) Reserve Account, the Working Capital Account, the First Lien Debt Service Reserve Fund, the Junior Lien Obligation Debt Service Fund, the Repair and Replacement Fund and the Special Project Fund, or an amount not less than 125% of the Aggregate First Lien Debt Service for the Bond year commencing during such year, reduced by any amount held in any capitalized interest account for disbursement during such Bond year to pay interest on first lien bonds; or (ii) the greater of the amounts needed to make the deposits required under the first lien indenture during such year into the First Lien Debt Service Fund, the O&M Reserve Account, the Working Capital Account, the First Lien Debt Service Reserve Fund, the Junior Lien Obligation Debt Service Fund, the Repair and Replacement Fund and the Special Project Fund, or an amount not less than 110% of the sum of Aggregate First Lien Debt Service and Aggregate Second Lien Debt Service for the Bond year commencing during such year, reduced by (a) any amount held in any capitalized interest account for disbursement during such Bond year to pay interest on any first lien bonds, and (b) any amount held in any capitalized interest account established pursuant to a supplemental indenture for disbursement during such Bond year to pay interest on second lien obligations.
Of the $42.8 million of pension expense for 2018, $11.5 million is the portion of the City’s pension contribution payable in 2018 to the pension funds and allocable to Midway Airport. The remaining portion of the pension expense for 2018, $31.3 million, is recognized on the income statement of Midway Airport for 2018 but is not due and payable by the City during 2018; accordingly, that portion is not included in Operating Expenses for purposes of calculation of the debt service coverage ratios.
2. REVENUE FUND BALANCE
The revenue fund balance includes all cash, cash equivalents, and investments, which were available to the revenue fund to satisfy the coverage requirement under the terms of the Master Indenture.

- 68 -
3. FUND DEPOSIT REQUIREMENTS
The Airport excludes the Airport Development Fund in the Debt Service Coverage calculation. This fund can be used by the City for any lawful Airport purpose and therefore can be used to fulfill any debt service obligations. The balance as of December 31,2018 was $14.5 million.
* * * * * *

PART III
STATISTICAL SECTION (UNAUDITED)

- 69 -
STATISTICAL INFORMATION
(UNAUDITED)
This part of the City’s comprehensive annual financial report presents detailed information as a context for understanding what the information in the financial statements, notes disclosures and required supplementary information says about the Airport’s overall financial health.
Contents
Financial Trends
These schedules contain trend information to help the reader understand how the Airport’s financial performance and well-being have changed over time.
Revenue Capacity
These schedules contain information to help the reader assess the Airport’s most significant revenue sources.
Debt Capacity
These schedules present information to help the reader assess the affordability of the Airport’s current levels of outstanding debt and the Airport’s ability to issue additional debt in the future.
Demographic and Economic Information
These schedules offer demographic and economic indicators to help the reader understand the Environment within which the Airport’s financial activities takes place.
Operating Information
These schedules contains data to help the reader understand how the information in the Airport’s financial report relates to the services the Airport provides and the activities it performs.

- 70 -
CITY OF CHICAGO, ILLINOISCHICAGO MIDWAY INTERNATIONAL AIRPORT
HISTORICAL OPERATING RESULTSEACH OF THE TEN YEARS ENDED DECEMBER 31, 2009–2018 (UNAUDITED)($ in thousands)
2009 2010 2011 2012 2013 2014 2015 2016 2017 2018
OPERATING REVENUES: Landing fees 21,939$ 35,299$ 38,583$ 32,143$ 42,516$ 42,539$ 48,350$ 49,186$ 54,165$ 58,304$
Rental revenues: Terminal area use charges 30,701 42,895 40,862 38,769 47,486 40,916 36,273 38,239 41,251 47,821 Other rentals and fueling system fees 20,367 21,488 24,978 32,202 26,004 24,197 25,945 26,396 27,912 28,755
Subtotal rental revenues 51,068 64,383 65,840 70,971 73,490 65,113 62,218 64,635 69,163 76,576
Concessions: Auto parking 27,902 27,849 29,112 30,830 32,721 34,226 35,772 36,665 38,317 36,602 Auto rentals 8,505 8,182 8,776 9,021 10,255 10,743 11,104 11,390 11,287 11,022 Restaurant 7,396 8,151 8,875 9,686 10,179 11,090 12,150 13,019 14,912 16,167 News and gifts 3,437 3,488 3,551 3,486 3,619 3,761 4,128 4,471 4,729 5,379 Other 2,054 1,704 2,634 1,696 2,409 2,787 2,397 2,827 2,452 2,483
Subtotal concessions 49,294 49,374 52,948 54,719 59,183 62,607 65,551 68,372 71,697 71,653
Reimbursements - - - - - - - - -
Total operating revenues(1) 122,301 149,056 157,371 157,833 175,189 170,259 176,119 182,193 195,025 206,533
OPERATING AND MAINTENANCE EXPENSES: Salaries and wages(2) 39,521 42,105 43,554 44,463 43,998 47,836 43,343 48,548 48,185 51,408 Pension expense - - - - - - 60,767 47,879 40,211 42,843 Repairs and maintenance 37,967 31,942 40,732 37,990 39,606 44,160 44,095 48,277 44,506 47,326 Energy 8,245 6,724 6,415 7,258 7,205 7,060 6,868 7,221 6,984 7,104 Materials and supplies 1,252 1,522 1,418 1,318 1,927 1,971 2,522 2,016 1,932 2,397 Professional and engineering services 6,727 15,832 15,650 15,011 19,144 23,255 20,954 20,851 24,344 24,144 Other operating expenses 5,929 10,211 2,320 8,257 9,236 5,314 5,327 7,813 4,803 6,188
Total operating and maintenance expenses before depreciation and amortization(3) 99,641 108,336 110,089 114,297 121,116 129,596 183,876 182,605 170,965 181,410
NET OPERATING INCOME BEFORE DEPRECIATION AND AMORTIZATION(4) 22,660$ 40,720$ 47,282$ 43,536$ 54,073$ 40,663$ (7,757)$ (412)$ 24,060$ 25,123$
DEBT SERVICE COVERAGE RATIO(5) 1.08 1.10 1.07 1.07 1.06 1.09 1.11 1.04 1.05 1.04
(1) Average annual compound growth rate for 2009–2018 for total operating revenues is 6.0%.(2) Salaries and wages includes charges for pension, health care and other employee benefits for years 2009–2018.(3) Average annual compound growth rate for 2009–2018 for total operating and maintenance expenses before depreciation and amortization is 6.9%.(4) Amount for 2018 may be reconciled to operating loss of $26,260 reported in the 2018 Statement of Revenues, Expenses and Changes in Net Position by deducting depreciation and amortization of $51,383. Amount for prior years may be reconciled through similar calculations.(5) Represents debt service coverage ratio on first and second lien bonds.
Of the $42.8 million of pension expense for 2018, $11.5 million is the portion of the City’s pension contribution payable in 2018 to the pension funds and allocable to Midway Airport. The remaining portion of the pension expense for 2018 $31.3 million is recognized on the income statement of Midway Airport for 2018 pursuant to GASB 68 but is not due and payable by the City during 2018; accordingly, that portion is not included in Operating Expenses for purposes of calculation of the debt service coverage ratios.
Source: Chicago Midway Airport Audited Financial Statements and City of Chicago Comptroller’s Office.

- 71 -
CITY OF CHICAGO, ILLINOISCHICAGO MIDWAY INTERNATIONAL AIRPORT
DEBT SERVICE SCHEDULE (UNAUDITED)($ in thousands)
The following table sets forth aggregate annual debt service of principal and interest for outstanding Midway Airport Revenue Bonds:
Debt Service (First Lien) Debt Service Debt Service Debt Service Debt Service Debt Service (Second Lien)Series 1998 Total Series 2004 Series 2013 Series 2014 Series 2016 Series 2018 Total
Year Ending First Lien Debt Second Lien Second Lien Second Lien Second Lien Second Lien Debt TotalDecember 31 Bonds Service Bonds Bonds Bonds Bonds Bonds Service(1) Debt Service
2019 4,446$ 4,446$ 9,971$ 30,321$ 45,698$ 20,981$ 4,050$ 111,021$ 115,467$ 2020 4,440 4,440 9,977 33,611 45,636 26,568 5,288 121,080 125,520 2021 4,434 4,434 9,878 24,463 58,227 26,554 5,282 124,404 128,838 2022 4,427 4,427 9,965 24,812 61,290 26,551 5,277 127,895 132,322 2023 4,429 4,429 9,968 28,030 68,039 21,778 5,271 133,086 137,515 2024 4,418 4,418 9,982 27,562 67,907 21,773 5,267 132,491 136,909 2025 - - 9,986 27,218 73,659 20,521 5,266 136,650 136,650 2026 - - 10,003 26,110 73,552 20,515 5,263 135,443 135,443 2027 - - 9,958 25,230 73,284 20,505 5,256 134,233 134,233 2028 - - 10,000 23,775 73,506 20,494 5,251 133,026 133,026 2029 - - 10,003 22,759 73,365 20,484 3,808 130,419 130,419 2030 - - 10,039 24,479 70,464 20,475 - 125,457 125,457 2031 - - 10,036 27,944 65,870 20,464 - 124,314 124,314 2032 - - 10,042 24,260 68,441 20,499 - 123,242 123,242 2033 - - 10,032 23,330 68,290 20,498 - 122,150 122,150 2034 - - 10,056 22,384 68,140 20,485 - 121,065 121,065 2035 - - 10,085 18,825 70,620 20,473 - 120,003 120,003 2036 - - - - 26,669 20,403 - 47,072 47,072 2037 - - - - 30,647 20,391 - 51,038 51,038 2038 - - - - 30,621 20,377 - 50,998 50,998 2039 - - - - 30,591 20,355 - 50,946 50,946 2040 - - - - 30,563 20,337 - 50,900 50,900 2041 - - - - 30,712 20,319 - 51,031 51,031 2042 - - - - 36,456 20,302 - 56,758 56,758 2043 - - - - 37,396 20,281 - 57,677 57,677 2044 - - - - 38,370 20,262 - 58,632 58,632 2045 - - - - - 20,241 - 20,241 20,241 2046 - - - - - 20,213 - 20,213 20,213
26,594$ 26,594$ 169,981$ 435,113$ 1,418,013$ 593,099$ 55,279$ 2,671,485$ 2,698,079$
(1) Assumes an interest rate effective at December 31, 2018, on $247,560 of Second Lien Bonds that are variable-rate demand obligations.
Note: The annual debt service tables in the Official Statements for the above debt were presented with a year ended January 1. The information above is presented with a year ended December 31. The change has been made to facilitate reconciliation to revenue bonds payable at December 31, 2017.

- 72 -
CITY OF CHICAGO, ILLINOISCHICAGO MIDWAY INTERNATIONAL AIRPORT
MIDWAY AIRPORT REVENUE BONDSSERIES 1996 ESTIMATED BOND-FUNDED COSTSAS OF DECEMBER 31, 2018 (UNAUDITED)($ in thousands)
EstimatedBond-Funded
Costs(1)
Airfield 20,808$ Terminal 36,173 Terminal ramp 2,374 Parking and roadways 90,551 Noise 28,984 Land acquisition 23,563 Fuel storage facilities 17,392
Total 219,845$
(1) Includes estimated costs to be funded from investment earnings.
Source: City of Chicago Department of Aviation.

- 73 -
CITY OF CHICAGO, ILLINOISCHICAGO MIDWAY INTERNATIONAL AIRPORT
CAPITAL IMPROVEMENT PROGRAM 2019–2025ESTIMATED SOURCES AND USES OF FUNDSAS OF DECEMBER 31, 2018 (UNAUDITED)($ in thousands)
ESTIMATED SOURCES: AIP—entitlements 40,760$ Other Airport Funds 777 Series 2010 Bonds 12,146 Series 2014 Bonds 41,531 Series 2016 Bonds 218,912 Future Bonds 169,465
TOTAL ESTIMATED SOURCES 483,591$
ESTIMATED USES: Terminal area projects 111,716$ Land acquisition 7,000 Airfield projects 117,596 Parking/roadway projects 165,754 Noise projects 44,641 Safety and security 6,723 Implementation 30,161
TOTAL ESTIMATED USES 483,591$
Source: City of Chicago Department of Aviation.
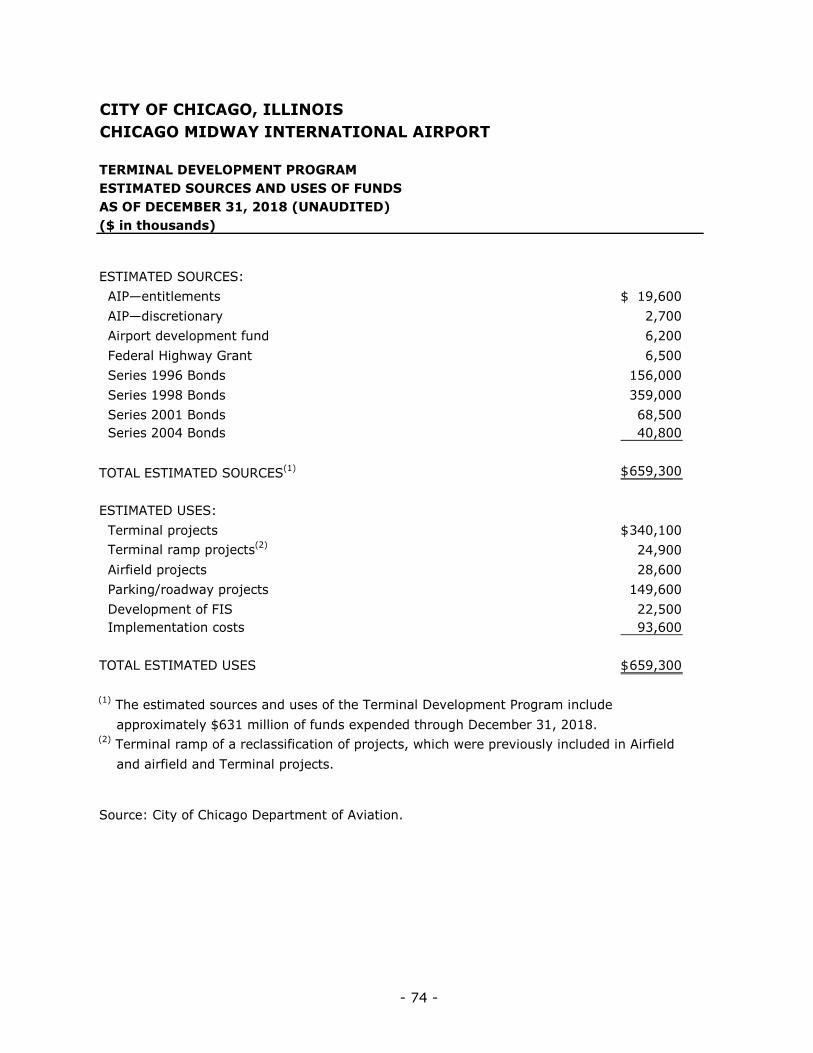
- 74 -
CITY OF CHICAGO, ILLINOISCHICAGO MIDWAY INTERNATIONAL AIRPORT
TERMINAL DEVELOPMENT PROGRAMESTIMATED SOURCES AND USES OF FUNDSAS OF DECEMBER 31, 2018 (UNAUDITED)($ in thousands)
ESTIMATED SOURCES: AIP—entitlements 19,600$ AIP—discretionary 2,700 Airport development fund 6,200 Federal Highway Grant 6,500 Series 1996 Bonds 156,000 Series 1998 Bonds 359,000 Series 2001 Bonds 68,500 Series 2004 Bonds 40,800
TOTAL ESTIMATED SOURCES(1) 659,300$
ESTIMATED USES: Terminal projects 340,100$ Terminal ramp projects(2) 24,900 Airfield projects 28,600 Parking/roadway projects 149,600 Development of FIS 22,500 Implementation costs 93,600
TOTAL ESTIMATED USES 659,300$
(1) The estimated sources and uses of the Terminal Development Program include approximately $631 million of funds expended through December 31, 2018.(2) Terminal ramp of a reclassification of projects, which were previously included in Airfield and airfield and Terminal projects.
Source: City of Chicago Department of Aviation.

- 75 -
CITY OF CHICAGO, ILLINOISCHICAGO MIDWAY INTERNATIONAL AIRPORT
HISTORICAL ENPLANED PASSENGERSEACH OF THE TEN YEARS ENDED DECEMBER 31, 2009–2018 (UNAUDITED)
Domestic Domestic Total International Total PercentYears Air Carrier Commuter(1) Domestic Enplanements Enplanements Change
2009 8,541,786 158 8,541,944 29,903 8,571,847 2.6 2010 8,792,557 14,156 8,806,713 49,312 8,856,025 3.3 2011 9,288,332 50,489 9,338,821 119,989 9,458,810 6.8 2012 9,573,226 36,968 9,610,194 169,415 9,779,609 3.4 2013 10,003,167 - 10,003,167 264,314 10,267,481 5.0 2014 10,315,089 - 10,315,089 292,907 10,607,996 3.3 2015 10,731,246 - 10,731,246 386,977 11,118,223 4.8 2016 10,953,566 - 10,953,566 392,182 11,345,748 2.0 2017 10,825,564 - 10,825,564 406,708 11,232,272 (1.0) 2018 10,625,852 10,625,852 396,372 11,022,224 (1.9)
2009–2018 2.5 % (100.0)% 2.5 % 33.3 % 2.8 %
(1) “Domestic Air Carrier” includes General Aviation.
Source: City of Chicago Department of Aviation.
Average Annual Compound Growth Rates

- 76 -
CITY OF CHICAGO, ILLINOISCHICAGO MIDWAY INTERNATIONAL AIRPORT
ENPLANED COMMERCIAL PASSENGERS BY AIRLINEEACH OF THE TEN YEARS ENDED DECEMBER 31, 2009–2018 (UNAUDITED)
% of % of % of % of % of % of % of % of % of % ofEnplanements Total Enplanements Total Enplanements Total Enplanements Total Enplanements Total Enplanements Total Enplanements Total Enplanements Total Enplanements Total Enplanements Total
Southwest Airlines 7,188,750 83.9 % 7,561,053 85.4 % 8,196,402 86.7 % 8,515,527 87.1 % 8,885,118 86.5 % 9,262,733 87.3 % 10,281,189 92.5 % 10,520,571 92.7 % 10,415,087 92.7 % 10,240,801 92.9 %
AirTran 487,087 5.7 465,237 5.3 413,717 4.4 387,114 4.0 462,680 4.5 383,443 3.6 - - - - - - - -
Northwest Airlines 267,433 3.1 14,726 0.2 - - - - - - - - - - - - - - - -
Frontier 164,749 1.9 151,440 1.7 158,405 1.7 144,496 1.5 161,456 1.6 157,835 1.5 8,658 0.1 - - - - - -
Shuttle America (Delta Express) 181,356 2.0 90,544 1.0 8,874 0.1 6,085 - 4,281 0.1 7,830 0.1 640 - 3,535 0.0 - - - -
Atlantic Southeast 3,715 0.1 29,314 0.3 - - - 0.1 - - - - - - - - - - - -
Comair - - 14,156 - - - 36,968 - - - - - - - - - - - - -
Delta 144,037 1.7 176,231 2.0 239,357 2.5 231,644 2.5 239,361 2.3 265,134 2.5 278,356 2.5 266,281 2.3 247,076 2.2 227,967 2.1
All other airlines 134,720 1.6 353,324 3.9 442,055 4.6 457,775 4.8 514,585 5.0 531,021 5.0 549,380 4.9 555,361 4.9 570,109 5.1 553,456 5.0
Total 8,571,847 100.0 % 8,856,025 100.0 % 9,458,810 100.0 % 9,779,609 100.0 % 10,267,481 100.0 % 10,607,996 100.0 % 11,118,223 100.0 % 11,345,748 100.0 % 11,232,272 100.0 % 11,022,224 100.0 %
20182009 2010 2011 20172012 2013 2014 2015 2016

- 77 -
CITY OF CHICAGO, ILLINOISCHICAGO MIDWAY INTERNATIONAL AIRPORT
HISTORICAL ENPLANED PASSENGERSCHICAGO REGION AIRPORTSEACH OF THE TEN YEARS ENDED DECEMBER 31, 2009–2018 (UNAUDITED)
Percent PercentTotal of Total Total of Total Total
Years Enplanements Chicago Enplanements Chicago Enplanements
2009 8,571,847 21.1 % 32,047,097 78.9 % 40,618,944 2010 8,856,025 21.0 33,232,412 79.0 42,088,437 2011 9,458,810 22.2 33,207,302 77.8 42,666,112 2012 9,779,609 22.7 33,244,515 77.3 43,024,124 2013 10,267,481 23.6 33,297,578 76.4 43,565,059 2014 10,607,996 23.4 34,646,832 76.6 45,254,828 2015 11,118,223 22.5 38,395,905 77.5 49,514,128 2016 11,345,748 22.6 38,872,669 77.4 50,218,417 2017 11,232,272 22.0 39,815,888 78.0 51,048,160 2018 11,022,224 21.0 41,563,343 79.0 52,585,567
2009–2018 2.8 % 2.9 % 2.9 %
Source: City of Chicago Department of Aviation.
Chicago MidwayInternational Airport
Chicago O’HareInternational Airport
Average Annual Compound Growth Rates

- 78 -
CITY OF CHICAGO, ILLINOISCHICAGO MIDWAY INTERNATIONAL AIRPORT
HISTORICAL TOTAL ORIGIN AND DESTINATION (O&D) ENPLANEMENTSCHICAGO REGION AIRPORTSEACH OF THE TEN YEARS ENDED DECEMBER 31, 2009–2018 (UNAUDITED)
Total Percent Total Percent TotalO&D of Total O&D of Total O&D
Years Enplanements Chicago Enplanements Chicago Enplanements
2009 5,647,591 26.4 % 15,708,291 73.6 % 21,355,882 2010 5,485,191 23.9 17,419,794 76.1 22,904,985 2011 5,693,938 26.3 15,972,745 73.7 21,666,683 2012 6,308,718 27.2 16,867,283 72.8 23,176,001 2013 6,505,206 27.6 17,044,643 72.4 23,549,849 2014 6,446,497 27.4 17,115,535 72.6 23,562,032 2015 6,890,633 25.5 20,096,191 74.5 26,986,824 2016 7,181,858 25.5 20,991,241 74.5 28,173,099 2017 7,446,996 24.9 22,429,433 75.1 29,876,429 2018 7,197,512 23.5 23,483,289 76.5 30,680,801
2009–2018 2.7 % 4.6 % 4.1 %
(1) Originating enplanements, resulting connecting enplanements and percentages have been recalculated based on updated information.
Source: City of Chicago Department of Aviation.
Chicago MidwayInternational Airport
Chicago O’HareInternational Airport
Average Annual Compound Growth Rates

- 79 -
CITY OF CHICAGO, ILLINOISCHICAGO MIDWAY INTERNATIONAL AIRPORT
AIRCRAFT OPERATIONSEACH OF THE TEN YEARS ENDED DECEMBER 31, 2009–2018 (UNAUDITED)
AircraftOperationsDomestic International Total Domestic General
Years Air Carrier Air Carrier Air Carrier Commuter Aviation Total
2009 180,391 3,354 183,745 7 61,057 244,809 2010 175,812 3,403 179,215 572 65,746 245,533 2011 178,640 4,332 182,972 2,622 69,633 255,227 2012 188,628 5,250 193,878 1,890 54,145 249,913 2013 182,643 7,046 189,689 8,401 54,036 252,126 2014 178,518 7,299 185,817 10,013 53,422 249,252 2015 177,658 8,474 186,132 11,857 55,530 253,519 2016 178,346 8,220 186,566 9,822 56,658 253,046 2017 185,471 8,374 193,845 - 57,496 251,341 2018 178,791 8,491 187,282 - 56,040 243,322
2009–2018 (0.1)% 10.9 % 0.2 % (100.0)% (0.9)%
Source: City of Chicago Department of Aviation.
Average Annual Compound Growth Rates

- 80 -
CITY OF CHICAGO, ILLINOISCHICAGO MIDWAY INTERNATIONAL AIRPORT
NET POSITION BY COMPONENTEACH OF THE TEN YEARS ENDED DECEMBER 31, 2009–2018 (UNAUDITED)($ in thousands)
2009 2010 2011 2012 2013 2014 2015 2016 2017 2018
NET POSITION: Net investment in capital assets (1,936)$ (39,755)$ (70,876)$ (87,279)$ (131,057)$ (115,080)$ (150,431)$ (152,026)$ (180,803)$ (172,197)$ Restricted 201,158 190,641 208,100 80,507 99,427 86,526 97,980 83,048 127,476 120,685 Unrestricted 5,792 20,040 37,224 36,572 46,613 21,856 (191,025) (234,875) (253,674) (281,312)
TOTAL NET POSITION 205,014$ 170,926$ 174,448$ 29,800$ 14,983$ (6,698)$ (243,476)$ (303,853)$ (307,001)$ (332,824)$ * **
* Amounts were restated due to the implementation of GASB 65.** Amounts were restated due to the implementation of GASB 68.

- 81 -
CITY OF CHICAGO, ILLINOISCHICAGO MIDWAY INTERNATIONAL AIRPORT
CHANGE IN NET POSITIONEACH OF THE TEN YEARS ENDED DECEMBER 31, 2009–2018 (UNAUDITED)($ in thousands)
2009 2010 2011 2012 2013 2014 2015 2016 2017 2018
OPERATING REVENUES 122,301$ 149,056$ 157,371$ 157,833$ 175,189$ 170,259$ 176,119$ 182,193$ 195,025$ 206,533$
OPERATING EXPENSES 147,308 161,103 161,156 159,530 162,654 175,759 231,595 231,723 222,408 232,793
OPERATING (LOSS) GAIN (25,007) (12,047) (3,785) (1,697) 12,535 (5,500) (55,476) (49,530) (27,383) (26,260)
NONOPERATING (EXPENSES) REVENUES (13,964) (24,502) 4,246 (31,708) (32,327) (21,007) (30,966) (38,750) (7,321) (6,339)
(LOSS) GAIN BEFORE CAPITAL GRANTS (38,971) (36,549) 461 (33,405) (19,792) (26,507) (86,442) (88,280) (34,704) (32,599)
CAPITAL GRANTS - 2,461 3,061 4,681 4,975 4,826 9,279 27,903 31,556 6,776
CHANGE IN NET POSITION (38,971)$ (34,088)$ 3,522$ (28,724)$ (14,817)$ (21,681)$ (77,163)$ (60,377)$ (3,148)$ (25,823)$
* ** * Amounts were restated due to the implementation of GASB 65.** Amounts were restated due to the implementation of GASB 68.

- 82 -
CITY OF CHICAGO, ILLINOISCHICAGO MIDWAY INTERNATIONAL AIRPORT
LONG-TERM DEBTEACH OF THE TEN YEARS ENDED DECEMBER 31, 2009–2018 (UNAUDITED)($ in thousands)
2009 2010 2011 2012 2013 2014 2015 2016 2017 2018
First lien bonds 806,015$ 783,595$ 780,205$ 758,560$ 624,545$ 34,180$ 31,530$ 28,730$ 25,775$ 22,660$
Second lien bonds 399,140 685,780 681,285 648,130 812,750 1,489,410 1,474,795 1,752,875 1,730,060 1,690,825
Commercial paper notes 61,360 4,005 - 34,639 57,713 - - - - -
Total revenue bonds and notes 1,266,515 1,473,380 1,461,490 1,441,329 1,495,008 1,523,590 1,506,325 1,781,605 1,755,835 1,713,485
Unamortized premium (8,812) 8 (281) 160 4,325 84,609 79,093 123,133 114,270 105,563
Total revenue bonds payable,
net of unamortized premium (discount) 1,257,703 1,473,388 1,461,209 1,441,489 1,499,333 1,608,199 1,585,418 1,904,738 1,870,105 1,819,048
Enplanements(1) 8,571,847 8,856,025 9,458,810 9,779,609 10,267,481 10,607,996 11,118,223 11,345,748 11,232,272 11,022,224
Total debt per enplanements 148$ 166$ 155$ 147$ 146$ 144$ 135$ 157$ 156$ 155$
(1) Enplaned Commercial Passengers by Airline Schedule as shown on page 76.

- 83 -
CITY OF CHICAGO, ILLINOISCHICAGO MIDWAY INTERNATIONAL AIRPORT
FULL-TIME EQUIVALENT CHICAGO MIDWAY AIRPORT EMPLOYEES BY FUNCTIONEACH OF THE TEN YEARS ENDED DECEMBER 31, 2009–2018 (UNAUDITED)
Function 2009 2010 2011 2012 2013 2014 2015 2016 2017 2018
Airfield operations 75 75 75 70 70 85 88 94 127 128 Landside operations - - - - - 21 20 21 21 21 Security management 60 60 60 60 60 69 62 62 63 64 Facility management 28 32 35 33 35 14 15 15 15 15 Midway administration 11 10 10 10 10 10 10 10 12 12 Safety management 2 2 2 2 2 - - - - -
Total 176 179 182 175 177 199 195 202 238 240
Source: City of Chicago’s Program and Budget Summary.
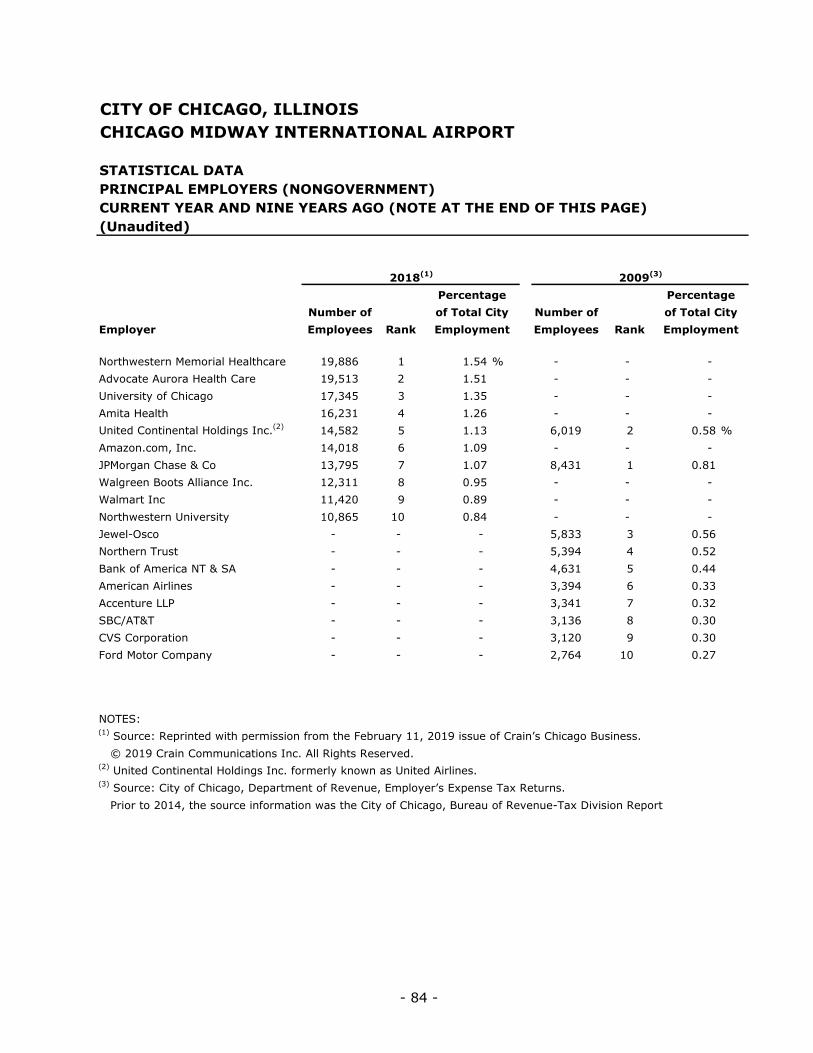
- 84 -
CITY OF CHICAGO, ILLINOISCHICAGO MIDWAY INTERNATIONAL AIRPORT
STATISTICAL DATAPRINCIPAL EMPLOYERS (NONGOVERNMENT)CURRENT YEAR AND NINE YEARS AGO (NOTE AT THE END OF THIS PAGE)(Unaudited)
Percentage PercentageNumber of of Total City Number of of Total City
Employer Employees Rank Employment Employees Rank Employment
Northwestern Memorial Healthcare 19,886 1 1.54 % - - - Advocate Aurora Health Care 19,513 2 1.51 - - - University of Chicago 17,345 3 1.35 - - - Amita Health 16,231 4 1.26 - - - United Continental Holdings Inc.(2) 14,582 5 1.13 6,019 2 0.58 % Amazon.com, Inc. 14,018 6 1.09 - - - JPMorgan Chase & Co 13,795 7 1.07 8,431 1 0.81 Walgreen Boots Alliance Inc. 12,311 8 0.95 - - - Walmart Inc 11,420 9 0.89 - - - Northwestern University 10,865 10 0.84 - - - Jewel-Osco - - - 5,833 3 0.56 Northern Trust - - - 5,394 4 0.52 Bank of America NT & SA - - - 4,631 5 0.44 American Airlines - - - 3,394 6 0.33 Accenture LLP - - - 3,341 7 0.32 SBC/AT&T - - - 3,136 8 0.30 CVS Corporation - - - 3,120 9 0.30 Ford Motor Company - - - 2,764 10 0.27
NOTES:(1) Source: Reprinted with permission from the February 11, 2019 issue of Crain’s Chicago Business. © 2019 Crain Communications Inc. All Rights Reserved.(2) United Continental Holdings Inc. formerly known as United Airlines.(3) Source: City of Chicago, Department of Revenue, Employer’s Expense Tax Returns. Prior to 2014, the source information was the City of Chicago, Bureau of Revenue-Tax Division Report
2018(1) 2009(3)

- 85 -
CITY OF CHICAGO, ILLINOISCHICAGO MIDWAY INTERNATIONAL AIRPORT
STATISTICAL DATAPOPULATION AND INCOME STATISTICSEACH OF THE TEN YEARS ENDED DECEMBER 31, 2009–2018(Unaudited)
Median Number of City Unemployment Per Capita TotalYear Population(1) Age(2) Households(2) Employment Rate(3) Income(4) Income
2009 2,896,016 34.5 1,037,069 1,171,841 10.0 43,727 126,634,091,632 2010 2,695,598 34.8 1,045,666 1,116,830 10.1 45,957 123,881,597,286 2011 2,695,598 33.2 1,048,222 1,120,402 9.3 45,977 123,935,509,246 2012 2,695,598 33.0 1,054,488 1,144,896 8.9 48,305 130,210,861,390 2013 2,695,598 33.5 1,062,029 1,153,725 8.3 49,071 132,275,689,458 2014 2,695,598 33.9 1,031,672 1,264,234 5.7 50,690 136,639,862,620 2015 2,695,598 34.2 1,053,229 1,273,733 5.7 53,886 145,254,993,828 2016 2,695,598 34.4 1,053,986 1,282,117 5.4 55,621 149,931,856,358 2017 2,695,598 34.6 1,047,695 1,289,325 4.7 N/A (5) N/A (5)
2018 2,695,598 N/A (5) N/A (5) 1,288,755 4.0 N/A (5) N/A (5)
Notes:(1) Source: U.S. Census Bureau.(2) Source: American Fact Finder—United States Census Bureau data estimates. Data not available for 2018.(3) Source: Bureau of Labor Statistics 2018, Unemployment rate for Chicago-Naperville-Illinois Metropolitan Area.(4) Source: U.S. Department of Commerce, Bureau of Economic Analysis, Per Capita Personal Income for Chicago-Naperville-Illinois Metropolitan Area.(5) N/A means not available at time of publication.
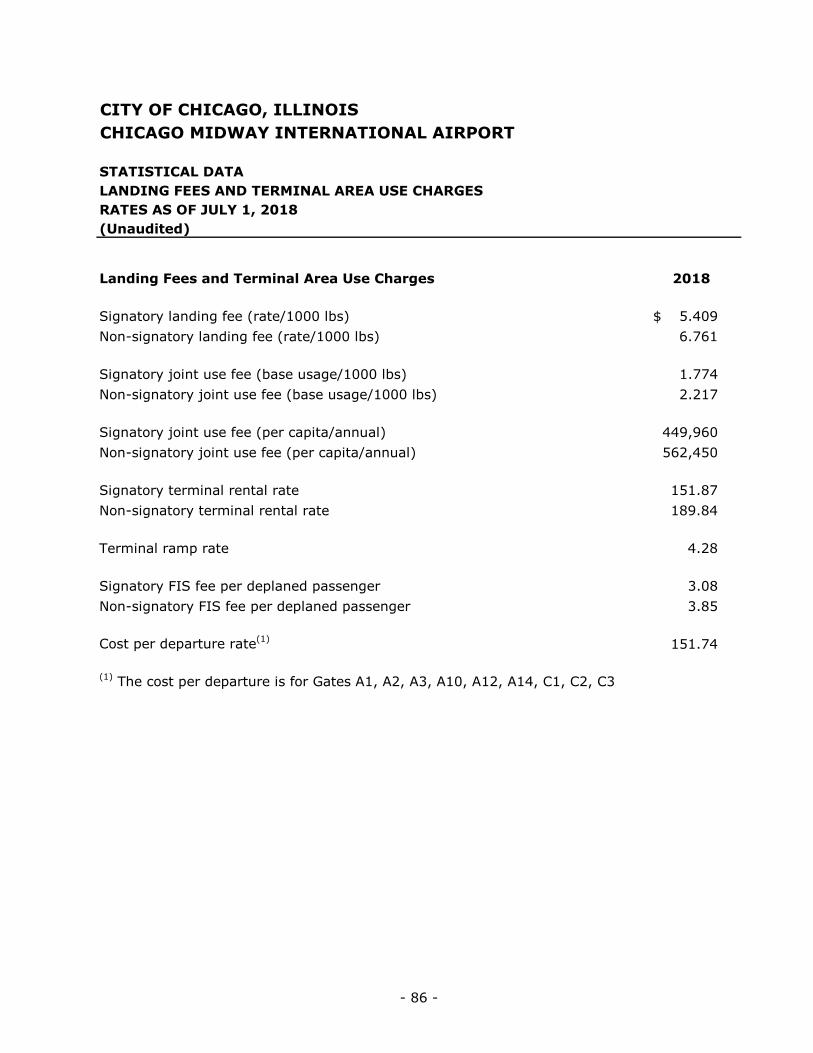
- 86 -
CITY OF CHICAGO, ILLINOISCHICAGO MIDWAY INTERNATIONAL AIRPORT
STATISTICAL DATALANDING FEES AND TERMINAL AREA USE CHARGESRATES AS OF JULY 1, 2018(Unaudited)
Landing Fees and Terminal Area Use Charges 2018
Signatory landing fee (rate/1000 lbs) 5.409$ Non-signatory landing fee (rate/1000 lbs) 6.761
Signatory joint use fee (base usage/1000 lbs) 1.774 Non-signatory joint use fee (base usage/1000 lbs) 2.217
Signatory joint use fee (per capita/annual) 449,960 Non-signatory joint use fee (per capita/annual) 562,450
Signatory terminal rental rate 151.87 Non-signatory terminal rental rate 189.84
Terminal ramp rate 4.28
Signatory FIS fee per deplaned passenger 3.08 Non-signatory FIS fee per deplaned passenger 3.85
Cost per departure rate(1) 151.74
(1) The cost per departure is for Gates A1, A2, A3, A10, A12, A14, C1, C2, C3