Embed Size (px)
Citation preview

1 | P a g e
CITY OF CAPE TOWN
WATER & SANITATION DEPARTMENT
ANNUAL REPORT 2012/13

2 | P a g e
TABLE OF CONTENTS PAGES
LIST OF TABLES .............................................................................................................. 3 LIST OF FIGURES ............................................................................................................ 5 ABBREVIATIONS AND DEFINITIONS ......................................................................... 6
1. EXECUTIVE SUMMARY ............................................................................................ 7 2. POLICY AND REGULATION ..................................................................................... 8 3. ANNUAL REPORT ....................................................................................................... 9 4. DEMOGRAPHICS AND SOCIO–ECONOMIC ......................................................... 11 5. SERVICE LEVELS ...................................................................................................... 31
6. INFRASTRUCTURE ................................................................................................... 39 7. OPERATION AND MAINTENANCE ........................................................................ 43 8. ASSOCIATED SERVICES .......................................................................................... 57 9. WATER CONSERVATION AND DEMAND MANAGEMENT .............................. 59 10. WATER RESOURCES .............................................................................................. 62
11. FINANCIAL PERFORMANCE/MANAGEMENT .................................................. 63 12. WATER SERVICES INSTITUTIONAL ARRANGEMENTS ................................. 64
13. SOCIAL AND CUSTOMER REQUIREMENTS ...................................................... 72 13.1 SITUATION ASSESSMENT ................................................................................... 72
14. PROJECTS COMPLETED ........................................................................................ 82 15. NON-FINANCIAL PERFORMANCE ...................................................................... 97

3 | P a g e
LIST OF TABLES Table 1: Performance statistics (SDBIP Statistics) actuals .................................................... 9
Table 2: Municipal Blue Drop Score ...................................................................................... 9
Table 3: Estimated households living in dwelling types for 2011 Census ............................ 25
Table 4: Informal Dwelling per District (informal settlements) as December 2012 ............... 26
Table 5: Cape Town 2011 household and population growth .............................................. 29
Table 6:National minimum basic service standards ............................................................. 33
Table 7: Service Level Profile (as at June 2013) ................................................................. 33
Table 8: Residential consumer units as at September (Formal & Informal) ......................... 34
Table 9: Categorization of Services Standards.................................................................... 34
Table 10: Water: Profile of consumers as at June 2013 ...................................................... 35
Table 11: Basic Sanitation Technologies Installed and Households Serviced (June 2013) . 35
Table 12: Capital spend during the last 3 years as January 2013 ....................................... 40
Table 13: Chamber Covers Replacement ........................................................................... 41
Table 14: Sewer Blockage Incidents ................................................................................... 41
Table 15: Sewer Networks Repairs and Maintenance ......................................................... 42
Table 16: Water Pipework Replaced in as at June 2013 ..................................................... 44
Table 17: Estimated Sewer Rehabilitation Lengths as at January 2013 .............................. 45
Table 18: Potable Water Quality for the month of July 2013 ................................................ 46
Table 19: Wastewater Treatment non compliance from July-June 2012/13 financial year ... 48
Table 20: Final Effluent Quality for all the Wastewater Works ............................................. 53
Table 21: Total Quantity of Effluent Received at Waste Water Treatment Plants .......... 54
Table 22: Status of Equipment and Plant at Bulk Water Installations .................................. 54
Table 23: Pump Stations Sewer Spillage ............................................................................ 56
Table 24: Education plan for Water Services ...................................................................... 57
Table 25: Health plan for Water Services ............................................................................ 57
Table 26: Education plan for Sanitation Services ................................................................ 58
Table 27: Sanitation Service levels at schools and Tertiary Education Facilities ................. 58

4 | P a g e
Table 28: Health Plan for Sanitation .................................................................................... 58
Table 29: Pressure Management Initiatives within the last three years (2010/11 – 2012/13)60
Table 30: Storage in the major dams of the WCWSS at 26 August 2013 ............................ 62
Table 31: Shows the capacities of the minor dams supplying water to Cape Town. ............ 62
Table 32: Potable Water Production and Supply ................................................................. 63
Table 33: WSA capacity development currently in process ................................................. 65
Table 34: The bylaws affecting water services are listed in the table below ........................ 65
Table 35: The bylaws affecting water services are listed in the table below ........................ 68
Table 36: The institutional objectives of the IDP .................................................................. 70
Table 37: Water Distribution Networks ................................................................................ 74
Table 38: Water Meter Connections (Performed by Depot) ................................................. 75
Table 39: Sewerage Blockages per areas of Metro for August 2013 ................................... 77
Table 40: Quality of Services Provided ............................................................................... 81
Table 41: Cumulative Notification Statistics July 2012 - June 2013 ..................................... 81
Table 42: Capital Budget of the CCT for 2012/13 as at June 2013 ...................................... 83
Table 43: 2012/2013 Water and Sanitation Department SDBIP – 4th Quarter performance . 97

5 | P a g e
LIST OF FIGURES
Figure 1: Locality Map of CCT ............................................................................................. 12
Figure 2: Structure of Water and Sanitation department ...................................................... 14
Figure 3: Reticulation Districts ............................................................................................. 14
Figure 4: Topography .......................................................................................................... 16
Figure 5: Biodiversity Network: Source: Cape Town Spatial Development Framework: ...... 18
Figure 6: Location of Urban Growth (Source: Expansion of Urban CT, 2009) ..................... 19
Figure 7: Existing Land Use and Potential Future Development Areas (Source: Cape Town Spatial Development Framework: Technical Report 2012) .................................................. 20
Figure 8: Areas Potentially Suited to Urban and Industrial Development (Source: Cape Town Spatial Development Framework: Technical Report 2012) .................................................. 21
Figure 9: Socio-Economic Index for Cape Town – Census Suburbs (based on 2011 Census data) ................................................................................................................................... 24
Figure 10: Compiled by Strategic Development Information and GIS Department, City of Cape Town1996, 2001 and 2011 Census data supplied by Statistics South Africa (Based on Census 2011 information available at the time of compilation, as released by Statistics South Africa) ................................................................................................................................. 25
Figure 11: Households earning below Household Subsistence Level (household income below R3500) Source: Statistics South Africa, 1996, 2001, and 2005 and Strategic Development information and GIS ...................................................................................... 26
Figure 12: Household vs population growth ....................................................................... 30
Figure 13: Cape Town Census 2011 categorise by age. ..................................................... 31
Figure 14: Location of Informal Areas within the City........................................................... 36
Figure 15: Breakdown of residential consumer units as at end of June 2013 ...................... 38
Figure 16: Water Network Performance as at end of August 2013 ...................................... 43
Figure 17: Sewer Network Performance as at end of August 2013 ..................................... 44
Figure 18: Final Effluent Quality for all the Wastewater Works ............................................ 53
Figure 19: Water Demand Projection .................................................................................. 61
Figure 20: Three year overview of successful impact of WCWDM Interventions ................. 61
Figure 21: Water Service Institutional Arrangements (Source: Water Demand Management Strategy) ............................................................................................................................. 64
Figure 22: Customer satisfaction levels over time .............................................................. 72

6 | P a g e
ABBREVIATIONS AND DEFINITIONS WSDP ................................................................... Water Services Development plan
WDM & S .................................................... Water Demand Management & Strategy
WSA ........................................................................................ Water Service Authority
SDBIP ............................................... Service Delivery Business Implementation Plan
USPC ........................................................ Utility Services Portfolio Committee Report
EAM .......................................................................... Engineering Asset Management
RPMS ................................................ Regulatory Performance Measurement System
CMA ...................................................................................... Cape Metropolitan Area
MLC .................................................................................. Metropolitan Local Councils
CMC ................................................................................... Cape Metropolitan Council
QMS ............................................................................. Quality Management Systems
WSP ........................................................................................ Water Service Provider
WWTW ........................................................................ Waste Water Treatment Works

7 | P a g e
1. EXECUTIVE SUMMARY 1.1 THE PURPOSE OF AN ANNUAL REPORT:
to provide a record of the activities of the municipality during the financial year to which the report relates;
to provide a report on performance against the budget and Integrated Development Plan (IDP) of the municipality for that financial year; and
to promote accountability to the community for the decisions made during the year by the municipality.
1.2 METHODOLOGY FOLLOWED
The Branch Managers, within the department, were consulted for input covering their areas of responsibility namely:
Reticulation
Water Demand Management and Strategy (WDM&S)
Scientific services
Bulk water
Wastewater Treatment
Finance (Water and Sanitation)
Engineering Asset Management (EAM)
Utility Services Portfolio Committee Report (USPC) and WSDP were used as a source of information for input and verification. Lastly the draft report was circulated for comment to Branch Managers and finally revised to incorporate comments.
1.3 WSA’S AREA OF JURISDICTION
The City (WSA/WSP) provides water and sanitation services to the City Metro and some local municipality. The WSA also supplies water to Stellenbosch and Drakenstein municipalities.
1.4 AVAILABILITY OF THE WATER SERVICES AUDIT REPORT
The audit report is made available on annually and is accessible on the City’s website.

8 | P a g e
2. POLICY AND REGULATION 2.1 POLICY AND BY-LAWS
In the interest of encouraging compliance, an incentive-based provision was introduced in the Tariff policy, pertaining to rebates for dischargers who invest on infrastructure that serve to improve the quality of effluent discharged.
The Wastewater & Industrial effluent by-law is near finalisation/promulgation after a comprehensive amendment process. The amendment of the water by-law has been initiated, whilst the treated effluent by-law review has been put on hold until the promulgation of the Department of Water Affairs (DWA)’s general authorisations. National legislation changes and other challenges experienced on the ground have been the basis for the review of these by-laws. 2.2 REGULATION
The Water and Sanitation department continues to participate in the Department of Water Affairs’ annual Regulatory Performance Management System audits. The key focus areas were financial sustainability, contract management and risk management. The City received an Appreciation Award for significant contribution to the enhancement of the Regulatory Performance Management System (RPMS). The results of the 2013 audit performance which took place from November 2012 and February 2013, confirmed that the municipality generally demonstrated strong financial sustainability and risk management, with minor improvements needed on contract management. 2.4 EDUCATION & AWARENESS
Awareness on water by-laws in the commercial/industrial sector is on-going, done on a daily basis as part of compliance monitoring. The approach used on the residential sector is in accordance to the Expanded Public Works Programme, wherein fieldworkers are sourced from the sub-councils, trained and employed to conduct door to door education and awareness on a specific subject matter. The sewer blockages awareness campaign continues to be rolled out in phases in other parts of the City of Cape Town. In the 2012/13 year, the areas included Gugulethu, Bonteheuwel, Macassar and Delft. 2.5 ENFORCEMENT
A total of 61 fines were issued in the 2012/13 year. Law enforcement training is on-going for all new inspectors followed by their appointments as Peace Officers. About R50 000 income was made from the resampling miscellaneous tariff and just over R19 million revenue on Industrial effluent treatment.
9 | P a g e
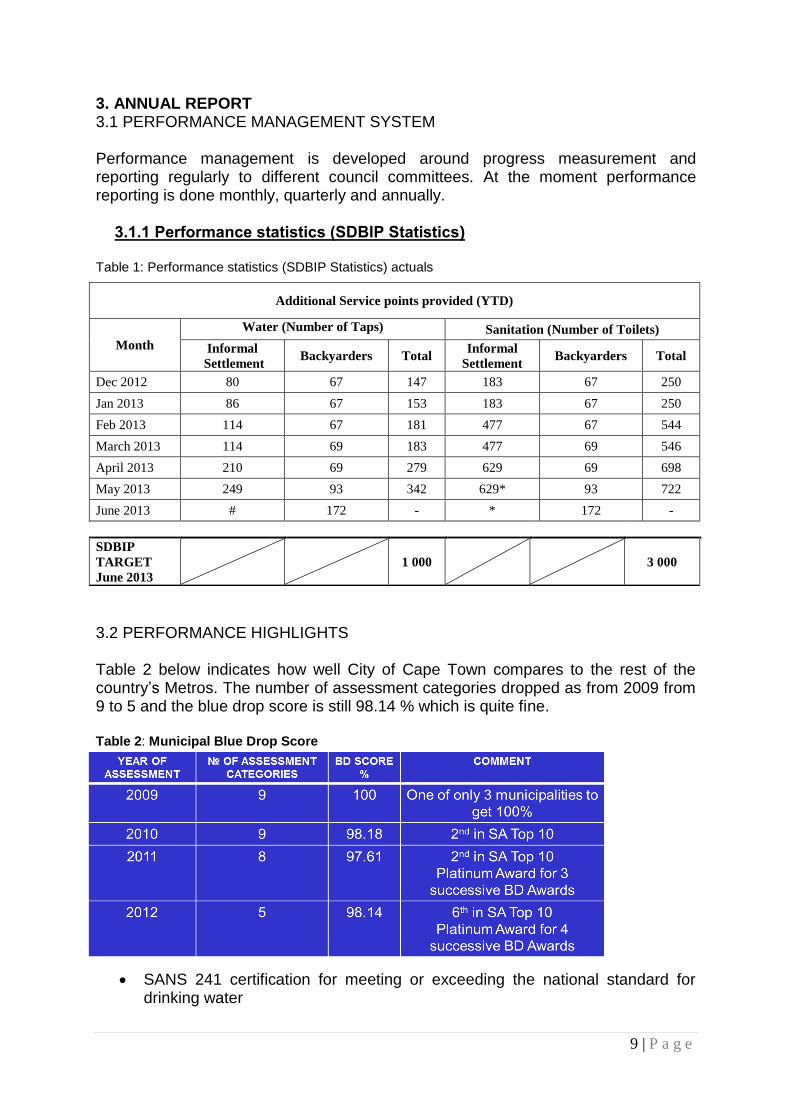
3. ANNUAL REPORT 3.1 PERFORMANCE MANAGEMENT SYSTEM Performance management is developed around progress measurement and reporting regularly to different council committees. At the moment performance reporting is done monthly, quarterly and annually.
3.1.1 Performance statistics (SDBIP Statistics) Table 1: Performance statistics (SDBIP Statistics) actuals
3.2 PERFORMANCE HIGHLIGHTS Table 2 below indicates how well City of Cape Town compares to the rest of the country’s Metros. The number of assessment categories dropped as from 2009 from 9 to 5 and the blue drop score is still 98.14 % which is quite fine. Table 2: Municipal Blue Drop Score
SANS 241 certification for meeting or exceeding the national standard for drinking water
Additional Service points provided (YTD)
Month
Water (Number of Taps) Sanitation (Number of Toilets)
Informal
Settlement Backyarders Total
Informal
Settlement Backyarders Total
Dec 2012 80 67 147 183 67 250
Jan 2013 86 67 153 183 67 250
Feb 2013 114 67 181 477 67 544
March 2013 114 69 183 477 69 546
April 2013 210 69 279 629 69 698
May 2013 249 93 342 629* 93 722
June 2013 # 172 - * 172 -
SDBIP
TARGET
June 2013 1 000 3 000

10 | P a g e
The technical operations centre (TOC) is the first and only call centre in Africa to have received SANS 990 certification and is the first contact centre in Africa officially complying with the requirements of SANS 990-2.
Laboratories have 17025 SANS 025 national accreditation.
Bulk Water supply has ISO certification.
In 2011 was chosen as best water demand manager of all the Southern African Development Community (SADC) countries by the Development Bank of Southern Africa.
City of Cape Town was ranked amongst the top 10 municipalities in the country for the fourth consecutive year for drinking water quality. In addition, seven of the City’s Wastewater Treatment Works received Certificates of Excellence from WISA.
According to the last Green Drop report by DWA, the average Green Drop score – which is a measure of the City’s wastewater treatment works (WWTWs) facilities – was 86.8%. Eleven of the WWTWs scored higher than 90%, including Gordon’s Bay, Klipheuwel, Llandudno, Macassar, Melkbosstrand, Wesfleur, Wildevoëlvlei and Zandvliet WWTWs – thereby qualifying for Green Drop status. Athlone and Cape Flats WWTWs, however, struggled with compliance and therefore lost their Green Drop status. The results of the 2013 Green Drop report have not yet been released by DWA at the time this annual report has been compiled.
3.3 NATIONAL WATER SERVICES REGULATION STRATEGY The City takes guidance from the National Water Services Regulation Strategy drafted on the Draft 8.1, May 2007.
The core of regulation is to protect the consumer and the public interest by ensuring the following:
Compliance with minimum national norms and standards.
Good performance and efficient use of resources.
Good contracting practice. The National Strategy calls for a developmental approach that has the following key components:
Implementing priority programmes
Building foundation for effective regulation
Implement the full scope of regulation The city endorses this approach and is committed to playing a lead role in implementing and maintaining the full scope of regulation taking into account the protection of the customer while ensuring the public interest.

11 | P a g e
4. DEMOGRAPHICS AND SOCIO–ECONOMIC
Demographics are the most recent statistical characteristics of a population. Commonly examined demographics include gender, race, age, disabilities, mobility, home ownership, employment status, and even location. Demographic trends describe the historical changes in demographics in a population over time (for example, the average age of a population may increase or decrease over time). Both distributions and trends of values within a demographic variable are of interest. Demographics are about the population of a region and the culture of the people there. 4.1 LOCATION
The City of Cape Town (CCT) is located in the Western Cape Province on the south-eastern corner of South Africa as indicated on Figure 1. The total area is approximately 2 461 km2 and its coastline is 294 km long (Annual Report).
Description of settlement types within the City of Cape Town:
Urban – Formal towns within vicinity of urban cores
Dense – Dense rural settlements with population > 5000
Village – Rural village with population between 500 and 5000
Scattered – Scattered rural village with population less than 500
Farmlands – Farming.

12 | P a g e
Figure 1: Locality Map of CCT
13 | P a g e
WSA Perspective 4.1.1 Brief History
As the City’s population increased, many surrounding suburbs and villages grew into municipalities. Fish Hoek was incorporated in 1940, and by 1945, the end of World War II, four new municipalities – Bellville, Durbanville, Goodwood and Parow – were formed. Pinelands became a municipality in 1948, and Milnerton one in 1955. Eventually, greater Cape Town had 39 local authorities and 19 administrations. After the 1994 elections, municipal government underwent a complete overhaul. This was driven by the desire to do away with racially based entities, and also because many of the thousands of local authorities around the country were too small to be effective. On the eve of the 1996 local government elections, the 58 entities that made up metropolitan Cape Town were combined into seven – the municipalities of Blaauwberg, Cape Town, Helderberg, Oostenberg, South Peninsula, Tygerberg and the umbrella Cape Metropolitan Council. The City of Cape Town itself came into being at midnight on 4 December 2000, when these seven entities were merged into the Cape Town ‘Unicity’. At the same time across the country, 283 other municipal councils (another five metropolitan councils, 231 local councils and 47 district councils) were also established. The new Unicity had more than 27 000 staff and a budget of R8,9 billion (a capital budget of R2,1 billion and an operating budget of R6,8 billion). At a practical level, there was the huge challenge of merging staff, functions, systems, infrastructure and equipment from the seven administrations into one entity. Just over a decade later, the City now has a staff complement of just over 25 000 employees, and a budget of R27, 1 billion (a capital budget of R5, 070 billion and an operating budget of R22, 1 billion).
4.1.2 Situation Assessment
Currently, the CCT carries both the constitutional responsibility for water services provision, as the Water Services Authority, and the operational responsibility, as the Water Services Provider, through the Water and Sanitation Services Department.

14 | P a g e
Water and Sanitation
Service Provider
Support ServicesFinancial &
Commercial
Engineering & Asset
ManagementScientific Services
Water Demand
Management &
Strategy
ReticulationWaste Water TreatmentBulk Water
Water and Sanitation
Service Authority
Department of Water
Affairs (Regulator)
SewerageWater
City of Cape Town
Utility Services
Directorate
Operational responsibility
for water services provision
Consitutional responsibility for
water services provision
Service delivery agreement
Consumer
Consumer contracts Consumer Charter
By-laws
By-laws
City Manager
Figure 2: Structure of Water and Sanitation department
The Bulk Water Branch of the CCT operates the bulk water supply system. It supplies bulk water to the eight reticulation districts of the Reticulation Branch – the reticulation districts distribute the water to the end users. Please see figure 3 below of 8 reticulation districts:
Figure 3: Reticulation Districts
15 | P a g e
From a value-chain perspective, catchment areas above the dams are managed, raw water is empounded in the dams then conveyed to and treated at water treatment plants.The bulk treated water is then strategically conveyed via a network of large diameter pipelines and bulk reservoirs to the bulk meters of the various districts of the City and the neighbouring Local Municipalities. The Bulk Water Branch allocates demand load to the various bulk supply sub-systems in order to maximise the yield of the dams of the Western Cape Water Supply System, which incorporates both City-owned and DWA-owned dams and the branch is responsible for the value chain to this point. The districts of the Reticulation Branch, thereafter, distribute the water through the secondary distribution network to the end-users. Wastewater collection and treatment is also carried out by the Water and Sanitation Department. The wastewater collection function falls under the Reticulation Branch, whereas treatment is undertaken by the Wastewater Treatment Branch.
4.1.3 Physical Perspective
Information on the physical attributes of the area, the history, main features and attractions are presented on the CCT’s website (http://www.capetown.gov.za ).
4.1.4 Topography
The area consists of varying topography which includes flat plains, hills and mountains. High mountains are located fairly close to the sea; e.g. Table Mountain which exceeds 1 000 m in elevation. Other high mountains on the perimeter include the Hottentots-Holland, Helderberg, Stellenbosch, Jonkershoek, Franschhoek, Wemmershoek, Du Toits, Paarl, Slanghoek, Limiet and Elandskloof mountains. These mountains form an eastern perimeter of mountains around the CCT, as shown on Figure 4.

16 | P a g e
Figure 4: Topography
17 | P a g e
A major portion of the CCT consists of the area known as the Cape Flats, which has an elevation of between 20 and 45 m above sea level. This area is relatively low-lying and can be supplied via the bulk supply network from large reservoirs with top water levels at 110 m above sea level (ASL). The mountainside developments in Somerset-West, along Table Mountain and the Peninsula mountain range, as well as the hilly development in Durbanville, Brackenfell-north, and the Atlantis area are at elevations, which are too high to be supplied from the 110 m ASL reservoirs. Very few areas with water demand are located at elevations higher than 200 m ASL. The rivers in the CCT are relatively small. Some rivers worth mentioning are the Salt-, the Dieppe-, the Black-, the East-, Quills-, Moderate- and Lorenz rivers. The rivers which are utilised as water sources lie mostly outside of the CCT. These are the tributaries to the Berg River namely the Wolwekloof and Banhoek tributaries, Sonderend-, Palmiet-, Klein Berg- and Leeu rivers. Of these, the Berg River that flows in a northerly and later westerly direction is by far the largest.
4.1.5 Climate
Cape Town has a Mediterranean-type climate with well-defined seasons. Cape Town has a mean annual rainfall of 515mm/annum and an average temperature of 16.7ºC. The CMA is a winter rainfall area. In the winter months, May through August, cold fronts sweep across the Atlantic and bombard Cape Town with rain and the north-west gales. The winters are cool with an average minimum temperature of about 7° C. Most of the rainfall occurs in winter, but due to the topography the rainfall varies quite dramatically. In the valleys and coastal plains it averages 500mm per year, while in the mountainous areas it can average as much as 1500mm a year. The meteorological depressions that typically bring rain to this area during winter move past to the south of the area (and the land mass) during summer; resulting in long dry spells. It is during the dry summer, November through to February, that the water demands are highest, due to the higher temperatures and the fact that watering of gardens is the norm in almost all the residential areas. Summer temperatures average at maximum around 26°C. The contrast between the winter and summer season complicates the management of a bulk water supply system, as sufficient run-off needs to be stored during winter in order to meet the increased water demand in the hot and dry summer months.
4.1.6 Natural Environment
Cape Town is one of the most beautiful and diverse cities in the world. The city is located in a highly sensitive and vulnerable ecosystem and is recognised as a global biodiversity hotspot, meaning that it is highly threatened. The City is also fortunate to have the Table Mountain National park within its boundary. The City’s environment is one of its strongest assets - driving tourism and attracting people and investment into the city’s economy. Finding the balance for sustainable development and improving quality of life remains a challenge. Growing resource consumption, pollution (air,
18 | P a g e
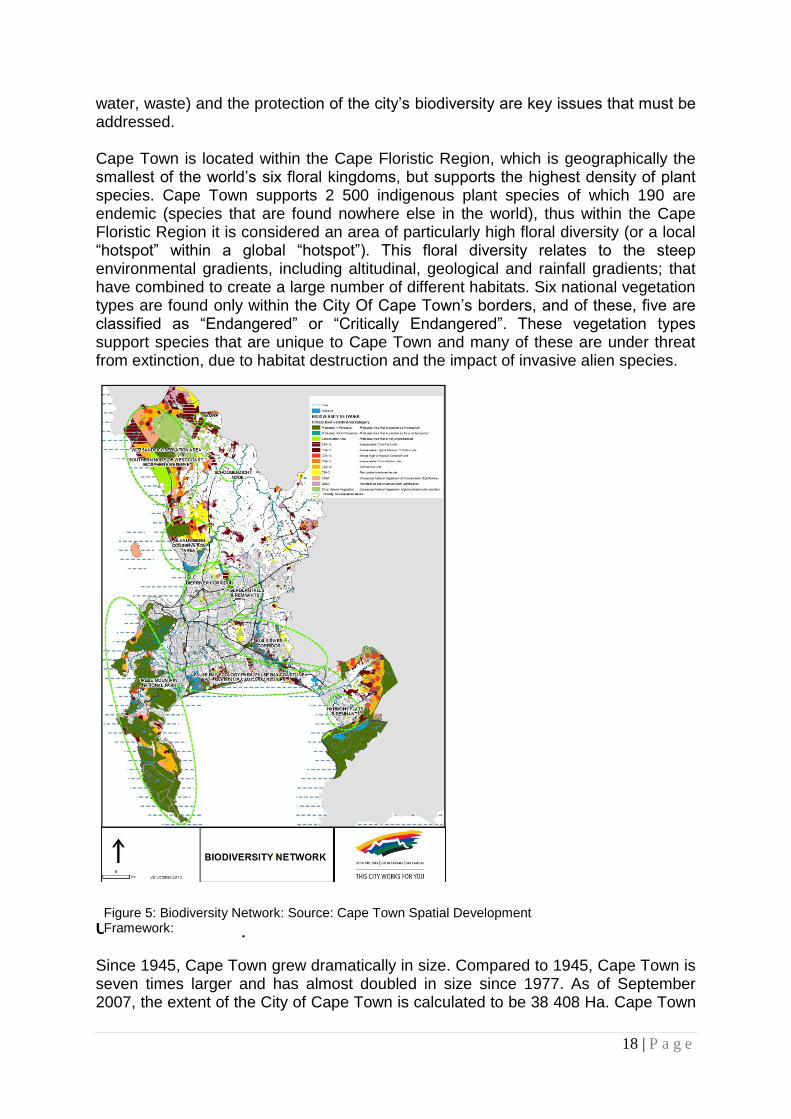
water, waste) and the protection of the city’s biodiversity are key issues that must be addressed. Cape Town is located within the Cape Floristic Region, which is geographically the smallest of the world’s six floral kingdoms, but supports the highest density of plant species. Cape Town supports 2 500 indigenous plant species of which 190 are endemic (species that are found nowhere else in the world), thus within the Cape Floristic Region it is considered an area of particularly high floral diversity (or a local “hotspot” within a global “hotspot”). This floral diversity relates to the steep environmental gradients, including altitudinal, geological and rainfall gradients; that have combined to create a large number of different habitats. Six national vegetation types are found only within the City Of Cape Town’s borders, and of these, five are classified as “Endangered” or “Critically Endangered”. These vegetation types support species that are unique to Cape Town and many of these are under threat from extinction, due to habitat destruction and the impact of invasive alien species.
Urban Growth Perspective Since 1945, Cape Town grew dramatically in size. Compared to 1945, Cape Town is seven times larger and has almost doubled in size since 1977. As of September 2007, the extent of the City of Cape Town is calculated to be 38 408 Ha. Cape Town
Figure 5: Biodiversity Network: Source: Cape Town Spatial Development Framework:

19 | P a g e
is growing at a rate of 650 Ha per year. Refer to Figure 6 for location of Urban Growth (Expansion of Urban CT, 2009).
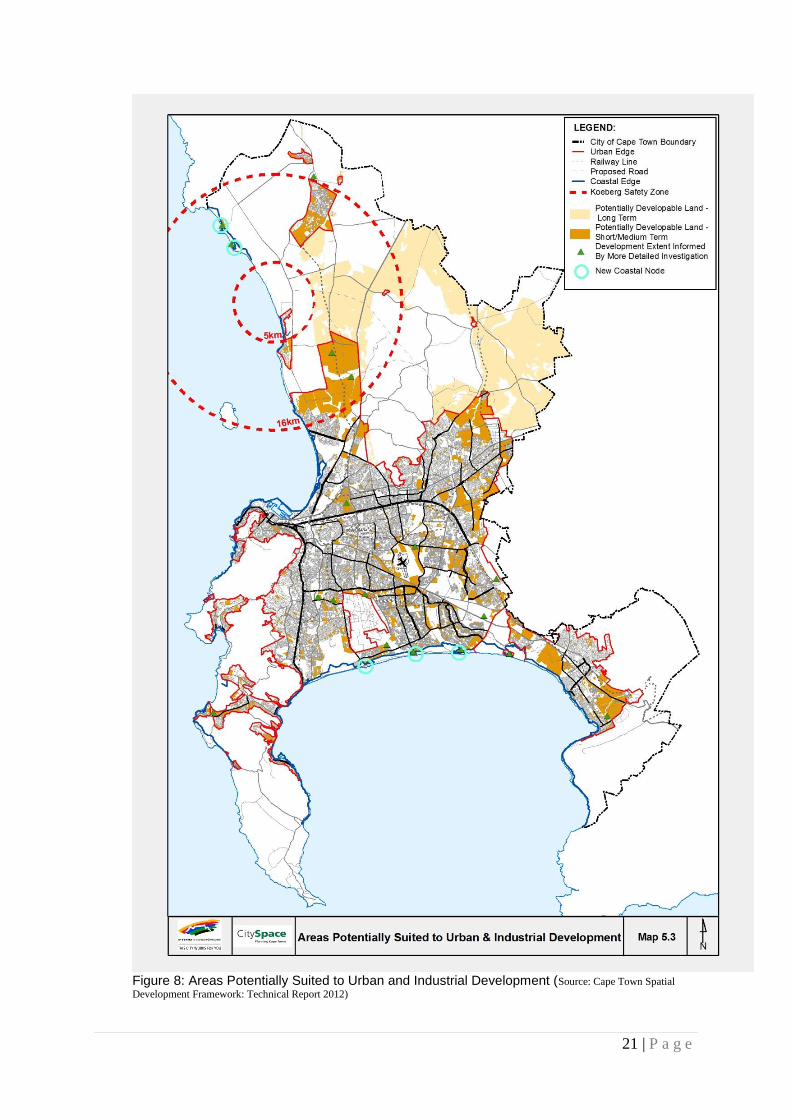
Sprawl contributes to increasing commuting times as well as the loss of valuable agricultural land and areas with high biodiversity conservation potential (City of Cape Town, 2006). Much of the recent growth has contributed to sprawl with relatively low density suburban residential development driving this process, although higher density, higher income residential development in the CBD has accelerated in the past few years. Concentration of populations in urban areas greatly reduces the unit cost of piped water, sewers, drains and roads. The use of environmentally friendly energy sources and transport can reduce these costs even further. The existing land use and potential future development areas are shown in Figure 7 and Figure 8 below.
Figure 6: Location of Urban Growth (Source: Expansion of Urban CT, 2009)

20 | P a g e
Figure 7: Existing Land Use and Potential Future Development Areas (Source: Cape Town Spatial Development Framework: Technical Report 2012)
21 | P a g e
Figure 8: Areas Potentially Suited to Urban and Industrial Development (Source: Cape Town Spatial
Development Framework: Technical Report 2012)

22 | P a g e
The major dams from which the CCT is supplied are situated outside (except for the Steenbras Upper and the Steenbras Lower Dams) the mountainous eastern perimeter of the area: o The Theewaterskloof dam near Villiersdorp is the major water source of the
COCT and forms part of a large inter-basin water transfer scheme that regulates the flow from the Sonderend-, Berg- and Eerste rivers.
o The Voëlvlei dam is the furthest north near Gouda and relies on diversion works in the Klein Berg, Leeu and 24 Rivers for its water supply.
o The Wemmershoek dam is situated in the mountains near Franschhoek and is supplied from various small rivers in the Wemmershoek Mountains (e.g. Tierkloof- and Olifants rivers).
o The Steenbras Upper dam and Steenbras Lower dam are situated in the Hottentots-Holland mountain range near Gordon’s Bay, and serve a dual purpose of providing an upper reservoir for the Steenbras Pumped Storage Scheme and for supplying water for domestic/industrial use to the CMA.
o The Berg River Dam is located in the upper reaches of the Berg River near Franschhoek.
o Other smaller dams include the dams on Table Mountain (Woodhead, Hely Hutchinson, De Villiers, Victoria and Alexandra) which are used to supply water to the southern suburbs and the Peninsula, and the dams at Simons Town ( Kleinplaats and Lewis Gay) which provide water to the Peninsula.
4.1.7 Economics
During the past decade, Cape Town has remained the second largest metro contributor to South Africa’s Gross Domestic Product (GDP). In line with the national trend of comparatively faster economic growth in metro versus non-metro areas, Cape Town’s contribution to national GDP rose from 10.7% in 2002 to 11.3% in 2012. (Global Insight, 2013) Cape Town’s economy grew at an average annual rate of 3.9%, 0.4% higher than the country as a whole in this period. (Global Insight, 2013) Growth peaked at 6.0% in 2007, but then dropped to -1.3% in the global recession in 2009. Post-recession economic growth for the city has tended to be more subdued than pre-recession growth. While Cape Town has retained its position as the second largest metro economy in South Africa, it still remains some distance behind the City of Johannesburg which contributed 16.6% of the nation’s GDP in 2012. EThekwini follows closely behind Cape Town with a contribution of 10.8% and recorded the same (3.9%) annual growth rate as Cape Town. However, strong annual growth rates for Tshwane (4.5%) and Ekhurhuleni (4.0%) as a result of their location in the Gauteng economic hub alongside City of Johannesburg, could threaten Cape Town’s position as South Africa’s second most economically powerful metro area in the future. A city’s ability to transform economic growth into benefits for its residents is normally measured in the number of jobs that are created. In this respect, the number of
employed individuals in Cape Town increased by 169,525 between [2008 and 2012]. (StatsSA,2013) Unfortunately, this level of employment creation has not been able to absorb all the new entrants to the labour market during this period resulting in the city’s unemployment rate rising from 19.7% in 2008 to 25.4% in 2012. The

23 | P a g e
insufficient growth in employment must, however, be seen in the context of a recessionary global economic environment in 2009, and large employment losses in South Africa as a whole during this period. GDP per capita, by weighting economic output by the number of residents, provides a reflection of the relative prosperity of a city’s residents. Cape Town’s GDP per capita, at R58 845 is significantly higher than South Africa’s (R37 404). (Global Insight, 2013) It does, however, lag a long way behind Johannesburg which has a GDP per capita of R72 437. The City’s EPWP continues to contribute to the reduction of poverty and unemployment and generated 5206 temporary jobs, within Water and Sanitation, for Cape Town citizens and residents. As at 2011, the population of Cape Town was estimated at 3 740 000 people. HIV and Aids also influence population growth, and current trends indicate a lower mortality rate than that originally predicted. In the period 2001 – 2011, the population of Cape Town has increased by 29% and in the 15 year period 1996 – 2011 by 46%. The overall trend is that Cape Town’s population will continue to grow each year although at a slower rate than previous years. The number of people living in informal settlements has been growing at an increasing rate and the current housing backlog is estimated at approximately 363 000 units (Housing Information Branch, Strategy Support and Co-ordination, as at June 2012).

24 | P a g e
Figure 9: Socio-Economic Index for Cape Town – Census Suburbs (based on 2011 Census data)
The map indicates the areas in Cape Town which are very needy, needy and average. The index which can be used as a broad proxy for poverty uses a weighted index of household information as follows:
Household Services (energy for lighting,water , refuse toilet facilities) 30%;
Education (literacy, no schooling, adults with less than Grade 12 or no tertiary education) 20%;
Housing (Dwelling type and room density) 20%;
Economic (employment, income and economic dependency) 30%.
4.2 SOCIAL ECONOMIC PROFILE 4.2.1 Dwellings
A formal dwelling is defined as a structure built according to approved plans, i.e. house on a separate stand, flat or apartment, townhouse, room in backyard, rooms or flat-let elsewhere. An informal dwelling is defined as a makeshift structure not

25 | P a g e
erected according to approved architectural plans, for example shacks or shanties in informal settlements or in backyards. Table 3: Estimated households living in dwelling types for 2011 Census
Cape Town Type of Dwelling
Black African Coloured Asian White Other Total
Num % Num % Num % Num % Num % Num %
Formal Dwelling 250 762 56.4% 327 383
91.3% 13
852 97.1%
230 575
99.0% 14
961 82.8% 837 533 78.4%
Informal dwelling / shack in backyard
54 500 12.3% 18
082 5.0% 150 1.1% 337 0.1% 1 889 10.5% 74 958 7.0%
Informal dwelling / shack NOT in backyard
134 914 30.3% 7 531 2.1% 141 1.0% 387 0.2% 850 4.7% 143 823 13.5%
Other 4 607 1.0% 5 634 1.6% 123 0.9% 1 528 0.7% 369 2.0% 12 261 1.1%
Total 444 783 100.0
% 358 630
100.0%
14 266
100.0%
232 827
100.0%
18 069
100.0%
1 068 575
100.0%
79.3%
3.3%
15.9%
0.7%
78.9%
4.3%
14.5%
2.2%
78.4%
7.0%13.5%
1.1%
0%
10%
20%
30%
40%
50%
60%
70%
80%
90%
Formal dwelling Informal dwellingin backyard
Informal dwellingin settlement
Other
1996 2001 2011
Percentage Cape Town Households Living in Dwellings
Figure 10: Compiled by Strategic Development Information and GIS Department, City of Cape Town1996, 2001 and 2011 Census data supplied by Statistics South Africa (Based on Census 2011 information available at the time of compilation, as released by Statistics South Africa)
In the period 2001 – 2011 (10 years):
The percentage of households in Cape Town in formal, informal and other types of dwellings has largely remained the same.
In 2011, 78% of households in Cape Town live in formal dwellings (similar to 2001 79%); 14% of households (144 000 households) live in informal dwellings in informal settlements (15% in 2001).
However there has been a large growth in the number of households living in informal dwellings in backyards, with 7% of households (75 000 households) in 2011, an increase of more than 3% from 4.3% in 2001.
In 2011, 43% of Black African households in Cape Town were living in informal settlements and informal dwellings in backyards. This is a decrease from 2001 where the percentage was 52% of Black African households.
Both in 2001 and 2011, 87% of households living in either informal settlements or informal dwellings in backyards are Black African.

26 | P a g e
In 2011, 25 613 (7%) Coloured households in Cape Town are living in informal settlements and informal dwellings in backyards, an increase from 2001 with 17 083 (5.5%) Coloured households.
Table 4: Informal Dwelling per District (informal settlements) as December 2012
DISTRICT Informal Settlements: No. Dwellings
D1 – South Peninsula 7 992
D2 - Tygerberg 4 105
D3 – Khayelitsha 38 700
D4 - Helderberg 12 371
D5 – Mitchells Plain 26 019
D6A – North East 3 645
D6B – Blaauberg 10 108
Total 102 940
There are many areas that are characterised by severe social and economic conditions, high levels of poverty, unemployment, illiteracy, alcoholism, low health status and other deviant behaviour such as crime and delinquency. The health status of residents in informal settlements is low; this is partly due to poor living conditions. There exists a need for Water and Sanitation to intervene by providing suitable access to suitable sanitation facilities.
4.2.2. Poverty
Figure 11: Households earning below Household Subsistence Level (household income below R3500) Source: Statistics South Africa, 1996, 2001, and 2005 and Strategic Development information and GIS

27 | P a g e
4.2.3. Health Status: HIV/AIDS
The antenatal prevalence of HIV in Cape Town has increased slightly over the last number of years; from 18.2% in 2006 to 20.9% in 2011 (the latest released data from the annual survey). This is higher than that for the Western Cape which was at 18.4% in 2011 but significantly lower than that for South Africa which has plateaued at about 30% over the last number of years. However, some areas within Cape Town have an antenatal HIV seroprevalence as high as, or higher than, the National average, including Khayelitsha at 37.1% in 2011. It is not clear what effect longevity of clients on antiretroviral treatment (ART) is having on prevalence, but it is probably a contributing factor, meaning that the increased prevalence is not necessarily all bad news. The number of people with HIV registered for ART in Cape Town has increased to 101,820 in June 2013. The number of facilities dispensing ART has increased to 65: of these, most are at primary health care level. These figures do not include treatment at private facilities.
4.2.4. Regional Perspective The City of Cape Town is the major economic hub of the Western Cape contributing 76% of the province’s GDP. It is bordered by the West Coast DM to the north, the Cape Winelands District Council to the North East and Overberg DM to the South East. Cities do not function in isolation, but form part of particular regions with a range of different stakeholders that influence their management. The key challenges for developing successful city-regions include securing balanced economic growth, appropriate governance systems to ensure effective cooperative decision-making, an entrepreneurial approach to facilitating investment, and the avoidance of competition between the cities and towns in the city-region system. This acknowledges that major development projects have to be coordinated effectively for the benefit of the city-region as a whole. An important aspect of this is ‘spatial coalitions’, which are meaningful partnerships with business, civil society and spheres of government, as valuable assets in fostering a competitive regionalism (South African Cities Network, 2006). Two key strategies impact on the broader Cape Town context; namely, the National Accelerated and Shared Growth Initiative for South Africa (ASGISA), and the Western Cape Growth and Development Strategy (PGDS). ASGISA is a national framework to support a range of key policy thrusts, including macro-economic policy refinement, strategic infrastructure provision, sector investment strategy, labour market skills, small business and governance. Provincially, the PGDS is a strategy for the Province to achieve shared growth and integrated development. It is the core alignment mechanism for the province and a coordination and implementation strategy driven by the Provincial Government Western Cape. The objectives of the PGDS are:
Identify appropriate levers to shift developmental path

28 | P a g e
Identify location of regional development motors of shared growth
Commit the Provincial Government to strengthen its contribution to shared growth and development
Design institutional architecture and reforms necessary for achieving shared growth and development
Focus, align and harmonise the Provincial Government planning, budgeting and implementation
Provide a framework for improved collaboration and coordination of all stakeholders in the Province around a shared growth and the development agenda.
Strategies at a metropolitan level should take cognisance of and be aligned to these higher level strategies such as ASGISA and the PGDS, whilst focusing on the particular local challenges (City of Cape Town, 2006). 4.3. TOTAL POPULATION 3 740 000 people in Cape Town; 29.3 % increase since Census 2001 (10 years); 46% increase in 15 years (1996- 2011). Cape Town’s population has grown and will continue to grow, both from natural births (although at a slower rate, with fertility levels declining) as well as in-migration. Average household sizes have been slowly decreasing from 3.92 in 1996 to 3.72 in 2001, with the 2011 average 3.50 likely to continue to decline into the future. The population is starting to show aging trends – especially the White population group. There is a need to analyse the impact of aging population on affordability of rates and services. Large cohort in the 15-64 year age group – “window of opportunity.” The following demographical analysis is the most recent available and reflects information and estimates as at 2011" In 10 year period 2001 – 2011:
number of households in Cape Town increased 38% (Population increase 29%)
number of Black African households increased 77% (Population increase 58%)
number of Coloured households increased 16% (Population increase 14%).
In 15 year period 1996 – 2011:
number of households in Cape Town increased 64% (Population increase 46%)
number of Black African households increased 165% (Population increase 124%)
number of Coloured households increased 38% (Population increase 28%).

29 | P a g e
Table 5: Cape Town 2011 household and population growth
4.4. TOTAL NUMBER OF HOUSEHOLDS AND AVERAGE HOUSEHOLD SIZE The estimated number of households in Cape Town in 2012 was 1 106 000, having risen from 1 144 700 in 2013. The number of households is expected to increase to about 1.45 million by 2019 (Demographic and Socio-economic Characteristics of Cape Town report of April 2011). 4.5. CAPE TOWN CENSUS

30 | P a g e
-10%
0%
10%
20%
30%
40%
50%
60%
70%
80%
90%
100%
110%
120%
130%
140%
150%
160%
170%
5years
10years
15years
5years
10years
15years
5years
10years
15years
5years
10years
15years
5years
10years
15years
Black African Coloured Asian White Total
Households Population
Figure 12: Household vs population growth

31 | P a g e
4.6. AGE AND GENDER PROFILE
57% of Cape Town’s population is over 25 years
2011 Median age (when data available) will be over 26 years
Trend of reducing overall proportion in 5 - 24 years age groups
Population is starting to age, in particular White population group
9.4%
18.8% 19.0%
46.7%
5.0%
8.7%
17.9%20.0%
48.4%
5.0%
9.9%
14.9%
18.4%
51.3%
5.5%
0%
10%
20%
30%
40%
50%
60%
0 to 4 years 5 to 14 years 15 to 24 years 25 to 64 years 65 years andolder
1996 2001 2011
Figure 13: Cape Town Census 2011 categorise by age.
5. SERVICE LEVELS
Having an understanding of the current situation allows the most important aspect of the plan to be addressed, which are the service level targets. This section sets out what services will be provided to consumers, both in terms of level of service and quality of service. The concept of service levels relates to the options which consumers can be given with regard to the convenience of the service and hence the amount of water which they will consume and the associated wastewater they will generate. There are a range of different service types which can be provided. These are clarified below according to the types reported in the tables.
5.1.1. None or inadequate
This refers to the number of consumer units (or households) that do not have access to basic water supply or sanitation.

32 | P a g e
5.1.2. Basic water supply comprises
The Strategic Framework for Water Services (2003), Basic Water Supply is defined as follows:
a minimum quantity of potable water of 25 litres per person per day;
at a minimum flow rate of not less than 10 litres per minutes (in the case of communal water points)
within 200 metres of a household, and
6 000 litres of potable water supplied per formal connection per month (in the case of yard or house connections).
The City of Cape Town added the following minimum standards for communal taps/standpipes:
within 100 metres of a household;
at a ratio of not more than 25 households per tap (based on 25 litres per person per day at a flow rate of 10 litres per minute).
5.1.3. Basic sanitation comprises
The Strategic Framework further defines basic Sanitation Facilities as follows:
to provide a sanitation facility which is safe, reliable, private, protected from the weather and ventilated, keeps smells to the minimum, is easy to keep clean, minimises the risk of the spread of sanitation-related diseases by facilitating the appropriate control of disease carrying flies and pests;
enables safe and appropriate treatment and/or removal of human waste and wastewater in an environmentally sound manner.
The City of Cape Town added the following minimum standards for the number of toilets per household:
the provision of a shared toilet (at a ratio of not more than 5 families per toilet) which is safe, reliable, environmentally sound, easy to keep clean, provides privacy and protection against the weather, well ventilated, keeps smells to a minimum;
to prevent the entry and exit of flies and other disease-carrying pests.
The City of Cape Town’s Basic Service Level Targets which included the National Norms and Standard and the City’s additional minimum standards as described above is summarized in Table 6 below:
33 | P a g e
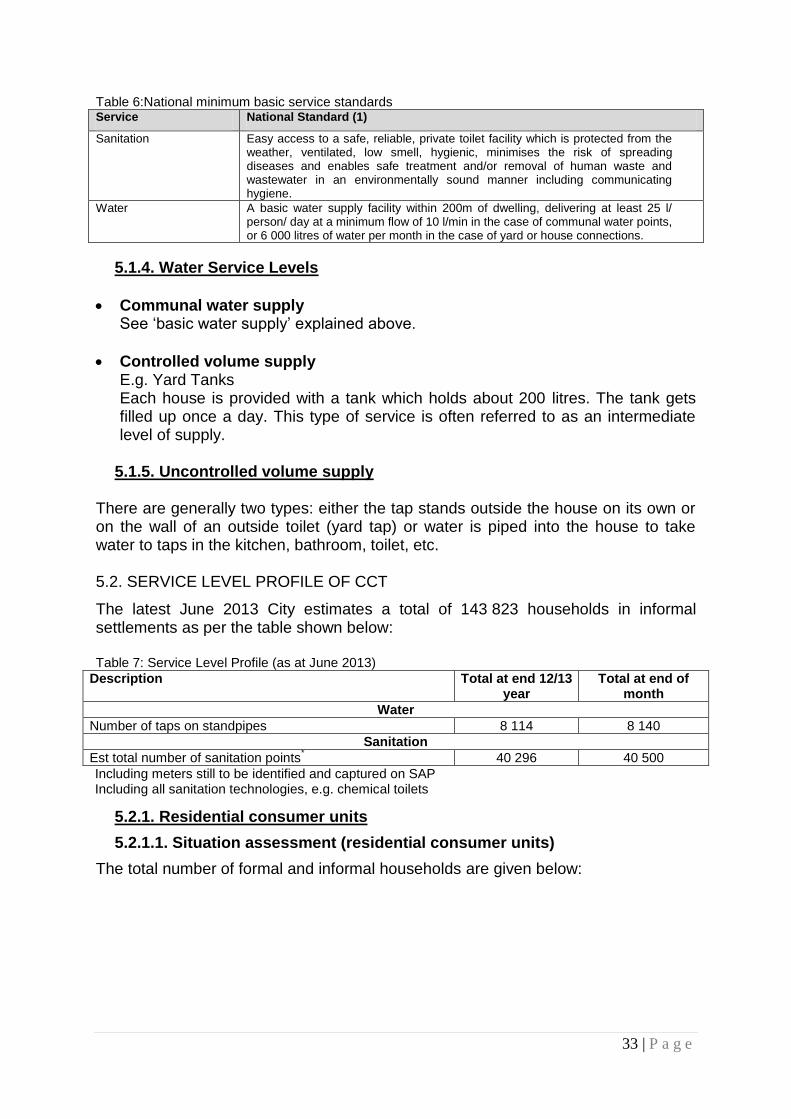
Table 6:National minimum basic service standards Service National Standard (1)
Sanitation Easy access to a safe, reliable, private toilet facility which is protected from the weather, ventilated, low smell, hygienic, minimises the risk of spreading diseases and enables safe treatment and/or removal of human waste and wastewater in an environmentally sound manner including communicating hygiene.
Water A basic water supply facility within 200m of dwelling, delivering at least 25 l/ person/ day at a minimum flow of 10 l/min in the case of communal water points, or 6 000 litres of water per month in the case of yard or house connections.
5.1.4. Water Service Levels
Communal water supply See ‘basic water supply’ explained above.
Controlled volume supply E.g. Yard Tanks Each house is provided with a tank which holds about 200 litres. The tank gets filled up once a day. This type of service is often referred to as an intermediate level of supply.
5.1.5. Uncontrolled volume supply
There are generally two types: either the tap stands outside the house on its own or on the wall of an outside toilet (yard tap) or water is piped into the house to take water to taps in the kitchen, bathroom, toilet, etc.
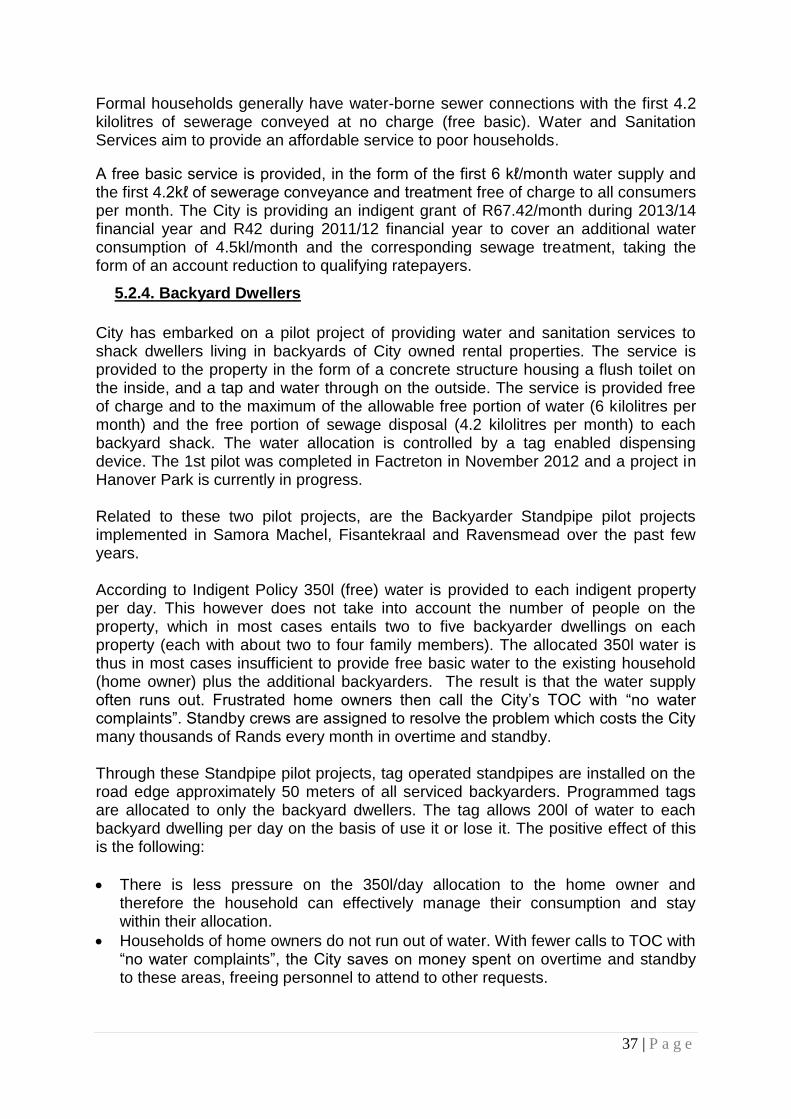
5.2. SERVICE LEVEL PROFILE OF CCT
The latest June 2013 City estimates a total of 143 823 households in informal settlements as per the table shown below: Table 7: Service Level Profile (as at June 2013)
Description Total at end 12/13 year
Total at end of month
Water
Number of taps on standpipes 8 114 8 140
Sanitation
Est total number of sanitation points* 40 296 40 500
Including meters still to be identified and captured on SAP Including all sanitation technologies, e.g. chemical toilets
5.2.1. Residential consumer units
5.2.1.1. Situation assessment (residential consumer units)
The total number of formal and informal households are given below:

34 | P a g e
Table 8: Residential consumer units as at September (Formal & Informal)
2011/12
Population 3 848 500
Households 1 106 000
Household categories
Formal 887 219
Informal 143 823
Total 1 031 042
Backyard dweller 74 958 Source: Water Services and Sanitation; Strategic Information
Table 9: Categorization of Services Standards
Cat. Land Type Bulk
Infrastructure
Distributed space
available within
settlement
Recommended Level of Service
A1
Government land,
occupation permitted
Available within economical
distance
Adequate 1
Inadequate 2
Not available within economical
distance
Adequate 3
Inadequate 4
5
A2 Private land, occupation permitted
Not applicable (no capital
investment on private land)
Adequate 3
Inadequate 4
5
B
Adverse physical
conditions, occupation permitted
Not applicable
Adequate 3
Inadequate
4
5
C Occupation prohibited
Not applicable
Adequate 3
Inadequate 4
5
5.2.2. Residential consumer units for water
Service levels of existing formal developed and informal areas (excluding rural areas) generally meet the minimum standards as required by the Water Services Act 108 of 1997. Formal households have either a metered water connection to the house or to a yard toilet with water tap (uncontrolled volume supply). The first 6 kilolitres per month are supplied at no charge (free basic). Informal areas have communal standpipes and water is provided free.

35 | P a g e
Table 10: Water: Profile of consumers as at June 2013
Consumers with: 2012/13 (as at June
2013) 1 None or inadequate (Target) 0
2 Communal water supply 143 823
3 Controlled volume supply -
4 Uncontrolled volume supply 924 752
5 Total served (2+3+4) 1 068 575
6 Total (1+5) 1 068 575 Source: Water and Sanitation Services 2011 census figures
5.2.3. Residential consumer units for sanitation
The general percentage distribution of households with inadequate sanitation services correlate to a large extent with the location of informal settlements as determined through aerial and on-site surveys and depicted in Figure 14. Table 11: Basic Sanitation Technologies Installed and Households Serviced (June 2013)
Type No of toilets
% of Total
Service Ration (HH)
HH Serviced
Chemical 5 129 12.73% 5 25 645
Container 4 223 10.48% 5 21 115
Bucket 958 2.38% 1 958
Portapotti 17 834 44.26% 1 17 834
Pitliner 312 0.77% 5 1 560
Dry Sanitation 187 0.46% 5 935
Conservancy tanks 370 0.92% 5 1 850
Dehydration (Enviroloo)
165 0.41% 4 660
Dehydration (Afrisan)
450 1.12% 1 450
Anaerobic 48 0.12% 2 96
Full Flush 10 620 26.35% 5 53 100
TOTAL 40 296 124 203 Source: Water and Sanitation Services (informal Settlements – as at June 2013)

36 | P a g e
Figure 14: Location of Informal Areas within the City
37 | P a g e
Formal households generally have water-borne sewer connections with the first 4.2 kilolitres of sewerage conveyed at no charge (free basic). Water and Sanitation Services aim to provide an affordable service to poor households.
A free basic service is provided, in the form of the first 6 kℓ/month water supply and the first 4.2kℓ of sewerage conveyance and treatment free of charge to all consumers per month. The City is providing an indigent grant of R67.42/month during 2013/14 financial year and R42 during 2011/12 financial year to cover an additional water consumption of 4.5kl/month and the corresponding sewage treatment, taking the form of an account reduction to qualifying ratepayers.
5.2.4. Backyard Dwellers
City has embarked on a pilot project of providing water and sanitation services to shack dwellers living in backyards of City owned rental properties. The service is provided to the property in the form of a concrete structure housing a flush toilet on the inside, and a tap and water through on the outside. The service is provided free of charge and to the maximum of the allowable free portion of water (6 kilolitres per month) and the free portion of sewage disposal (4.2 kilolitres per month) to each backyard shack. The water allocation is controlled by a tag enabled dispensing device. The 1st pilot was completed in Factreton in November 2012 and a project in Hanover Park is currently in progress. Related to these two pilot projects, are the Backyarder Standpipe pilot projects implemented in Samora Machel, Fisantekraal and Ravensmead over the past few years. According to Indigent Policy 350l (free) water is provided to each indigent property per day. This however does not take into account the number of people on the property, which in most cases entails two to five backyarder dwellings on each property (each with about two to four family members). The allocated 350l water is thus in most cases insufficient to provide free basic water to the existing household (home owner) plus the additional backyarders. The result is that the water supply often runs out. Frustrated home owners then call the City’s TOC with “no water complaints”. Standby crews are assigned to resolve the problem which costs the City many thousands of Rands every month in overtime and standby. Through these Standpipe pilot projects, tag operated standpipes are installed on the road edge approximately 50 meters of all serviced backyarders. Programmed tags are allocated to only the backyard dwellers. The tag allows 200l of water to each backyard dwelling per day on the basis of use it or lose it. The positive effect of this is the following:
There is less pressure on the 350l/day allocation to the home owner and therefore the household can effectively manage their consumption and stay within their allocation.
Households of home owners do not run out of water. With fewer calls to TOC with “no water complaints”, the City saves on money spent on overtime and standby to these areas, freeing personnel to attend to other requests.

38 | P a g e
The cost of water in one of these areas serviced by the standpipes is approximately R1200 per month - a fraction of the costs incurred by the City addressing “no water complaints” in the same area.
City is building a relationship with its citizens, creating a sense of trust and caring. There is an outcry from neighbouring areas of the Standpipe pilot projects to implement similar projects as the benefits to residents are becoming clearer. A survey has recently been conducted to measure the real success of these Standpipe pilot projects to determine future roll-out possibilities.
5.2.5. Grey Water Management
Space constraints, geological conditions and the lack of a gravity sewer connection points are major limiting factors for consistently reducing grey water problems within informal settlements.
5.2.6. Residential consumer units for water and sanitation
Figure 15: Breakdown of residential consumer units as at end of June 2013
This break down in residential consumers emphasises the need to focus on improved water and sanitation services onto informal household consumers and backyarders. The break down includes the back yarders.
5.2.7 Pit emptying and sludge disposal
Pit emptying is not applicable, while the disposal of container toilets is taken into the waste stream.
5.2.8. Types of sanitation technology options
Refer to Table 11.

39 | P a g e
5.2.9. Informal Settlements Targeted Eradication
To eradicate the sanitation service target and service the influx of people in informal settlements, the Water and Sanitation department is implementing a service provision programme that is integral to the 10-year Housing Plan. The replacement of buckets (an estimated additional R58 million) is not included within these projections, due a lack of basic sanitation norms and standards from National level to specifically cater for the unique sandy conditions and high water table within the City of Cape Town. The medium term goal will therefore be to target eradication and to maintain the cleaning service quality of all the existing buckets in use. The City’s Housing programme is funded through National grants. Servicing of the informal settlements is funded by the Water and Sanitation department with partial recovery of cost from the national Equitable Share. Depending on the speed of implementing this programme, as for in-situ upgrading or the “decanting” of such settlements to developed formal areas, the informal settlement programme needs to adapt. 6. INFRASTRUCTURE
The City has undertaken an accelerated programme to improve the replacement of water distribution network mains, especially in areas that experience a high incidence of bursts, such as the Tygerberg district. More importantly, Water and Sanitation Services is implementing an Asset Management Programme (AMP).
West Coast / Parklands development corridor
De Grendel / N7 development node
Northern development/Fisantekraal corridor
Bottelary development corridor
Fast-track housing projects (e.g. N2 Gateway)
Maccassar / AECI development node The timing of the development of the required bulk water infrastructure is dependent on the growth in water demand compared to the effectiveness of the Water Demand Management (WDM) Strategy. To ensure security of supply, the City of Cape Town, in consultation with the Department of Water Affairs (DWA), is exploring the next water resource scheme to be developed by 2019. The most probable scheme in the order of economic priority is the raising of Voelvlei dam (DWA), wastewater reclamation, groundwater (TMG Aquifer) and desalination. The desalination study is currently underway, the water reclamation study will commence soon and the pilot for the groundwater (TMG) extraction will also be commencing soon. In addition, the City of Cape Town will increase the treatment and conveyance capacity of the bulk water supply to enable optimum utilization of the existing water resource capacity created by the construction of the Berg River Dam. To this end, the Bulk Water Augmentation Scheme (BWAS), which entails the construction of Muldersvlei Treatment Plant (500 Ml/day), reservoirs (600Ml) and conveyance bulk pipelines (56km), is under planning and design.

40 | P a g e
The capital expenditure on the development and maintenance of this extensive infrastructure is outlined in the table below. Table 12: Capital spend during the last 3 years as January 2013
The statistics below highlight the problems or challenges faced by the department, which ultimately hinder service delivery. Some of the challenges have increased over the past three years, others remained the same without any improvement, mostly due to budget constraints, socio-economic pressure and lack of knowledge (in particular the sewer blockages caused by foreign objects).
2012/13 2011/12 *2010/11
WWTW 166 613 750 223 192 549 121 505 353
Reticulation 355 229 929 260 063 202 186 370 128
BW 28 664 004 17 037 756 19 160 383
EAM 74 823 457 62 713 466 36 881 170
WDM & Strategy 38 399 362 24 639 078 14 959 342
Other (SPT, SS) 18 448 000 17 510 474 11 869 133
682 178 502 605 156 524 390 745 508
*Value as at June 2013

41 | P a g e
Table 13: Chamber Covers Replacement
2013/14 YEAR STATS AS AT END AUGUST 2013 YTD - ANNUAL COMPARISON
CHAMBER COVER
REPLACEMENT
BLAAUW- BERG
CAPE TOWN
HELDER- BERG
KHAYE- LITSHA
SOUTH PEN.
TYGER- BERG
YTD-
2013/14 YTD-
2012/13 YTD-
2011/12
Meter Box Cover 3 30 86 0 45 61 225 121 86
Hydrant Cover 10 6 47 0 4 48 115 112 98
Valve Cover 4 0 34 0 0 38 76 33 44
Sewer 37 125 143 0 4 52 361 206 259
TOTAL 54 161 310 0 53 199 777 472 487
Table 14: Sewer Blockage Incidents
2013/14 YEAR STATS AS AT END AUGUST 2013 YTD – ANNUAL COMPARISON
SEWER BLOCKAGES
INCIDENTS
BLAAUW- BERG
CAPE TOWN
HELDER- BERG
KHAYE- LITSHA
SOUTH PEN.
TYGER- BERG
YTD- 2013/14
YTD- 2012/13
YTD- 2011/12
Building Material 31 0 304 170 12 441 958 1 214 842
Collapses 6 2 110 0 11 48 177 140 107
Fats 685 1 037 902 200 482 857 4 163 4 188 3 755
Other foreign objects 676 3 283 980 86 1 093 1 667 7 785 7 368 7 254
Roots 841 494 629 4 480 660 3 108 3 572 2 949
Sand 28 976 646 227 69 312 2 258 2 206 1 915
TOTAL 2 267 5 792 3 571 687 2 147 3 985 18 449 18 688 16 822

42 | P a g e
Table 15: Sewer Networks Repairs and Maintenance
2013/14 YEAR STATS AS AT END AUGUST 2013 YTD - ANNUAL COMPARISON
SEWER NETWORK REPAIRS AND MAINTENANCE
BLAAUW- BERG
CAPE TOWN
HELDER- BERG
KHAYE- LITSHA
SOUTH PEN.
TYGER- BERG
YTD- 2013/14
YTD- 2012/13
YTD- 2011/12
Sewer Pipe Breakage Repair (No.)
14 84 93 3 1 6 201 159 115
Sewer Manhole Repair (No.)
13 34 84 0 13 0 144 115 94
New Sewer Mains Installed (m) Total
1 508 2 255 4 321 0 1 0 8 085 5 018 2 852
Sewer Mains - Replacement (m)
90 0 825 0 0 167 1 082 6 336 674
New connections to sewer network (No.)
7 5 20 0 1 3 36 43 50
Pest Control (No.) 3 144 54 0 1 2 204 105 526

43 | P a g e
7. OPERATION AND MAINTENANCE
The focus on improvement of levels of service through creating new infrastructure at great cost results often in overlooking the importance of the development and implementation of sound asset management practices. Through the assessment of this important function WSAs are enabled to identify areas of concern and it should form the base for the development of an Asset Management Plan. Neglecting the implementation of best practice operational and maintenance procedures would result in ineffective service delivery and shortened life span expectancy of assets. Additional capital expenditure for refurbishment or replacement will eventually be unavoidable. The two important aspects of asset management under consideration are:
Operations
Maintenance
7.1. OPERATION AND MAINTENANCE 7.1.1. Water Network Performance
Figure 16: Water Network Performance as at end of August 2013

44 | P a g e
There is a general downward trend in burst water mains. This is a result:
Primarily of increased water mains relays.
Pressure management (this only ameliorates the symptoms of ageing infrastructure; it does not arrest the aging process).
Improved management of network operations. Table 16: Water Pipework Replaced in as at June 2013
Regions Sewer (Km) Water (Km)
Northern Panorama(BLA) 762.06 1012.51
Northern Panorama (KRF) 1308.44 1402.84
Tygerberg 1503.69 1710.05
Ebenezer 601.31 742.86
SPM 1375.31 1579.91
Helderberg 1448.44 1599.79
Hillstar 948.52 1165.11
Mitchells Plain 562.74 637.25
Khayelitsha 362.14 412.93
Total 8872.65 10263.25 Source: TOC GIS as at June 2013
7.1.2. Sewer Network Performance
Figure 17: Sewer Network Performance as at end of August 2013
The causes of blockages are elaborated on in other sections of this report.

45 | P a g e
The sharp increase in spillages is due to the higher than average rainfall and the resultant storm water ingress.
Increased management of blockages, sewer mains cleaning and sewer inspections is urgently required. The following actions have been taken:
- Consultants investigating storm water ingress in worst affected
catchments (Kuils River area). - Increased enforcement of By-laws (Certificate of Compliance of Water
Installation on Transfer of Ownership in accordance with Water By-law). - Sewer Blockage awareness campaign. - Capital projects to clean major collector sewers, i.e. Cape Flats 1 and 2.
GIS records indicate the following: Table 17: Estimated Sewer Rehabilitation Lengths as at January 2013
Material Length (m) Pitch fibre 142 384m
Clay sewers 258 560m Source: Budget Plan (Vol 4), Reticulation, Five year replacement programme
7.1.3. Water Process Control, Maintenance and Management Skill
The current classification of the WTW’s, is according to Section 26 of the National Water Act (Act No.36 of 1998). Monitoring Process The quality of water produced at the CCT’s water treatment plants is strictly monitored on a continual basis to ensure compliance with the South African National Standard 241:2011 on drinking water quality. The Scientific Services Branch conducts routine sampling and analysis of potable water produced at all water treatment plants, distribution as well as inspection of treatment processes. Scientific services have acquired SANS 17025 certification for laboratory quality testing. Expansion of the laboratory is a necessity for improving its capability to undertake a wide spectrum of tests. To comply with the requirements of SANS 241:2011 Scientific Services has expanded the list of determinants analysed and increased the amount of monitoring points to comply with the population within the Cape Metropolitan distribution area. The water quality report below indicates the analytical data and approximate distribution for Cape Town drinking water. The 12 month rolling average is for the period August 2012 to July 2013. The South African National Standards (SANS 241:2011) Specification for Class I water is also stipulated on this report. This report indicates the quality of the drinking water leaving each of the major water treatment plants and the approximate distribution areas they service.

46 | P a g e
Table 18: Potable Water Quality for the month of July 2013
Water Supply Outlets
Sample Points Per
Water Supply Outlet
Sample Points
Sampled
Number of Samples taken for July
% Compliance SANS 241
Chemical Micro-
biological
July Month 12 Month Rolling Average
Chemical Micro-
biological Chemical
Micro-biological
Water Treatment
Plants 10 10 45 45 99 98 99 100
Reservoir 24 23 104 114 100 100 100 99
Distribution 126 116 562 576 100 100 100 100
Informal Settlements
43 37 76 82 100 93 100 95
Total 203 186 787 817 99.8 97.8 99.8 98.5
Information for August was not available at the time of reporting due to the processing time required to produce the necessary statistics for the above.
Chemical Results:
Sample points BBW 07 (Milnerton Library) fails due to a high Turbidity value. Sample point SPW 01 (Noordhoek Environmental Health, Main Road) fails due to high pH values. Sample point GPW 03 (Oranjezicht Reservoir Outlet) fails due to high Turbidity, Iron, Aluminium and Manganese values. Sample point GPW 09 (Camps Bay Drive) fails due to high Iron and Turbidity values. Overall the water is safe to drink.
The analyses that fail SANS 241:2011 at the WTP’s for July are Aluminium and Turbidity.
Microbiology Results:
The following samples did not comply with SANS 241 bacteriological requirements ( <1 E. coli per 100ml) in the month of July 2013: On 2013-07-08 Somerset West Treated had an E. coli count of 10 Colony Forming Units (CFU’s) per 100ml and on 2013-07-22 Mamre Library had an E. coli count of 3 CFU’s per 100ml. Please see the comments below regarding the informal settlements sample sites.
Chemical analyses notes: 1) PH, Conductivity, Turbidity & Alkalinity are done weekly. 2) Aluminium, Chloride, Calcium, Iron, Manganese, Potassium, Sodium, Sulphate, Nitrate, Nitrite, TDS, Total Hardness, Chromium, Cadmium, Cobalt, Copper, Nickel, Lead, Vanadium, Zinc, Antimony, Arsenic, Selenium, TOC & Fluoride are done every 8 to 9 weeks.
Microbiological monitoring in informal settlements:
The following operational challenges may lead to contamination of samples and ‘false’ non-compliance results in informal settlements:
Plastic communal taps are being used for sampling. These taps cannot be flamed prior to sample collection, as required by the sampling procedure,

47 | P a g e
because of the plastic material.
Taps are not dedicated for sampling, as required by sampling procedure, and are used by the community.
Location of sample taps in close proximity to or just behind the communal toilets can introduce cross contamination to the tap as users wash, touch and drink directly from the taps.
Taps are often dirty and leaking.
7.1.4. Waste Water Operations (Process Control), Maintenance and Management Skill
An Operational and Compliance Monitoring Programme that meets the requirements of DWA as stipulated in the Green Drop Criteria was drawn up by CCT and is implemented by the Municipality. Operational samples are taken on a daily basis at all the WWTWs. The compliance samples that are taken on a monthly basis at all the WWTWs are analysed at CCT accredited Scientific Services laboratories and monthly monitoring and inspection reports are compiled.

48 | P a g e
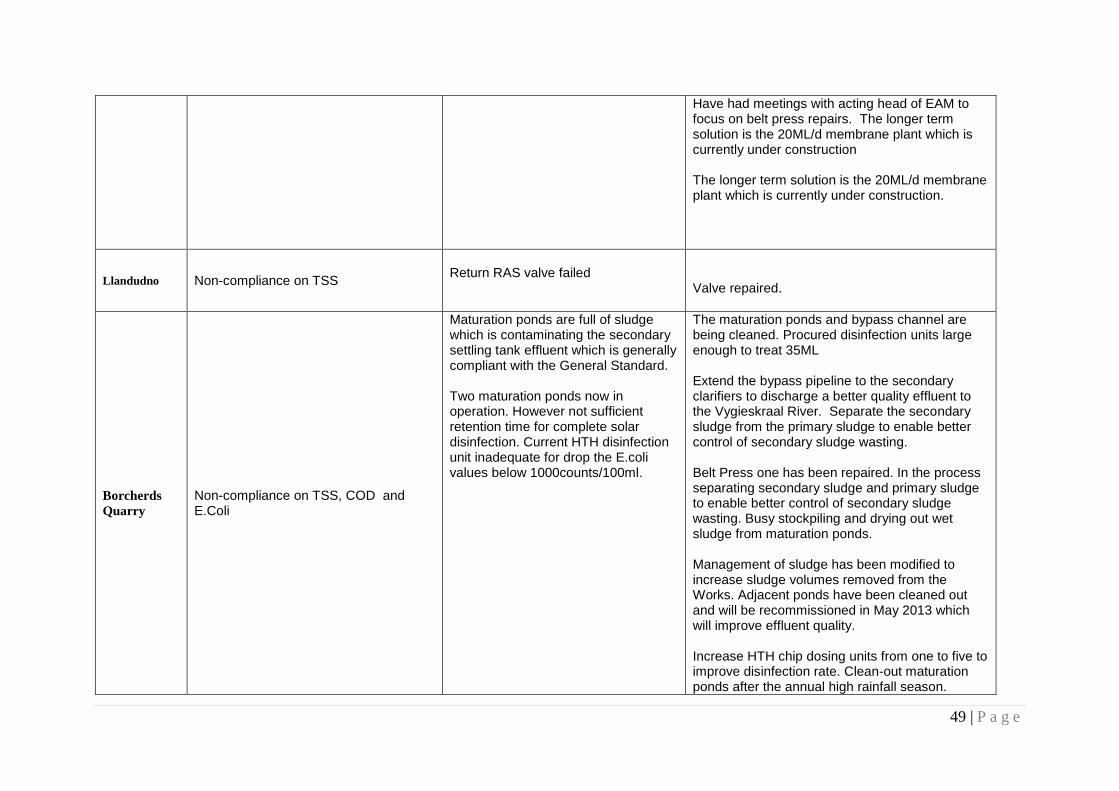
7.1.5 Wastewater Treatment non-compliance Table 19: Wastewater Treatment non compliance from July-June 2012/13 financial year
WWTW PROBLEM DEFINITION CAUSES REMEDIAL ACTIONS
Bellville
No sample complying on COD, Ammonia and E.Coli. One sample complying on TSS
Broken diffusers in North and Centre biological reactors are causing poor aeration of the biomass. Experienced belt press mechanical breakdowns which have reduced the mass of sludge to be wasted per day. The plant was affected by industrial discharges. The UV disinfection system is not in operation due to the poor settling pond effluent. The biomass suffered further oxygen deprivation when Aeration Blower 3 gearbox non-drive end bearing failed due to high temperature on 29th October 2012 at 12:00. EAM were able to restart Blower 4 on 31st October at 09:00. The biomass dissolved oxygen concentration continues to be low due to broken aeration diffusers. Frequent belt press mechanical breakdowns reduces the mass of sludge to be wasted per day and causes sludge to be returned to the reactor via the thickener effluent thus adding extra organic loading on the works.
Some diffusers were replaced. Construction on the new Membrane Works is in progress (long-term plan). A task group comprising Operations and EAM electrical and mechanical sections has been formed to focus on improving the reliability of the dewatering equipment. The settlement ponds are in the process if being cleaned out. The by-pass pipeline to the UV lights is in progress – this will allow the SST effluent to flow directly to the UV disinfection unit. In the process of installing surface aerators, which is envisaged to be completed in about 3weeks time, in order to increase residual oxygen levels in the biological reactors Two surface aerators were installed in North reactor on 13th December 2012. This has increased the dissolved oxygen concentration of the biomass from below 0.1 to 1.0 mg. Ferric chloride dosed into the effluent from the bioreactors helped to reduce suspended carryover into the final effluent. The effluent leaving the Plant, while still non-compliant is improving. The longer term solution is the 20ML/d membrane plant (MBR) which is currently under construction. In addition, the aeration system (blowers and diffusers) in the existing bioreactors needs to be replaced once the MBR is commissioned.
49 | P a g e
Have had meetings with acting head of EAM to focus on belt press repairs. The longer term solution is the 20ML/d membrane plant which is currently under construction The longer term solution is the 20ML/d membrane plant which is currently under construction.
Llandudno Non-compliance on TSS
Return RAS valve failed
Valve repaired.
Borcherds
Quarry
Non-compliance on TSS, COD and E.Coli
Maturation ponds are full of sludge which is contaminating the secondary settling tank effluent which is generally compliant with the General Standard. Two maturation ponds now in operation. However not sufficient retention time for complete solar disinfection. Current HTH disinfection unit inadequate for drop the E.coli values below 1000counts/100ml.
The maturation ponds and bypass channel are being cleaned. Procured disinfection units large enough to treat 35ML Extend the bypass pipeline to the secondary clarifiers to discharge a better quality effluent to the Vygieskraal River. Separate the secondary sludge from the primary sludge to enable better control of secondary sludge wasting. Belt Press one has been repaired. In the process separating secondary sludge and primary sludge to enable better control of secondary sludge wasting. Busy stockpiling and drying out wet sludge from maturation ponds. Management of sludge has been modified to increase sludge volumes removed from the Works. Adjacent ponds have been cleaned out and will be recommissioned in May 2013 which will improve effluent quality. Increase HTH chip dosing units from one to five to improve disinfection rate. Clean-out maturation ponds after the annual high rainfall season.

50 | P a g e
Klipheuwel
Non-complying Ammonia, COD and E Coli
Septic tank being cleaned out. RBC shaft and disk failure. RBC installed 28/06/2013 and hoping to see effluent compliance improvement. Rotating Biological Contactor No.3 tripped due to damaged disks. Supplementary aeration blower motor burnt out. Influent Ammonia and COD to the works is three times higher than design (COD and ammonia), so the works is organically overloaded.
RBC shaft and disc repaired on emergency basis. Septic tank to be cleaned out and in the medium term to construct a 2
nd septic tank.
RBC disks were removed. RBC returned from repairs on the 18th of June 2013 and installed on the 28th of June 2013. One new RBC to be purchased as a spare unit. 3. New blower to be fitted. Wastewater and Reticulation are monitoring and prevent illegal dumping of septic tanks and bucket disposal into the system. Building of the second septic tank to handle the increased organic loading is proposed for 2013
Simons Town
Non-Compliance on COD Influent contains non-biodegradable COD which cannot be removed by treatment process. High concentration of non-biodegradable COD in influent sewage
DWA informed and Permit deviation requested. Requested relaxation of COD discharge permit. Requires an amendment to the Works permit from the Department of Water Affairs
Parow E.coli
The chlorine contact channel was taken out of commission to remove accumulated sludge. Disinfection unit was faulty. No 3 Rotating disc shaft snapped on 3rd December 2012 reducing oxygen supply by one third.
The tank was cleaned out and put back into
operation.
Unit to be repaired. Temporary shaft was fitted by
16th December 2012 and two weeks later, the
Plant had return to normal.
Mitchells
Plain
Non-compliance on all parameters; ammonia, TSS, COD and E.Coli
Maturation Ponds contaminated with sludge due to failure of Archimedean Screw Pumps at Intermediate Pumpstation. Cleaning/refurbishing of maturation ponds. Ponds full of sludge
Removing sludge from maturation ponds. The plant effluent compliant before entering maturation ponds. Works will comply when ponds refurbishment is completed. Cleaning of ponds in progress

51 | P a g e
Zandvliet Non-compliance Ammonia Plant currently operating at its maximum design capacity
Extension to works is being planned and the diversion of flow away from the Plant to Macassar is part of that extension and will be prioritised. The appointment of design consultants will take place this FY.
Westfleur
Industrial Non-compliance ammonia and COD
Domestic Blower No.1 DE bearing failed during the first week of January 2013. Domestic raw inlet screw No.1 bottom bearing failed during week 4. Industrial blowers have been non-operational for the whole February month, blowers faulty up and undergoing repairs.
1. Diverted some domestic flow to industrial works. Industrial non-compliant with ammonia. Resolved by replacing DE bearing. 2. Diverted domestic raw sewage to the Industrial works because standby screw was also out of commission. Industrial works was overloaded causing COD and ammonia failures. Temporarily resolved by fitting screw 1 motor and gearbox to screw 2.
Cape Flats Non-compliance on COD and E.Coli
The retention time on the ponds was not sufficient. Secondary Pond No 2 bridge in embankment causing short circuiting of effluent.
Increased retention time by diverting the flow. Repair embankment
Kraaifontein Non-compliance on COD
Effluent from the SST is of good quality and it meets compliance requirement but it gets contaminated on the ponds as ponds accumulated significant amount of sludge over the years.
Ponds by-pass line is built and will be in operation end of March 2013. Effluent from SST will go straight to chlorine contact chamber.
Melkbosstrand Non-compliance on TSS and E.Coli
There is insufficient amount of sand in the sludge drying beds which resulted to poor dewaterability of sludge and extended long hours of dryness. This resulted in sludge build-up in the reactor which eventually resulted in solids carryovers in the SST’s, hence TSS and E.coli failure.
Sand purchased and sludge drying beds filled up, solids wasting from the reactor increased. The installation of a mechanical sludge dewatering is part of a capital project for 2013/14.
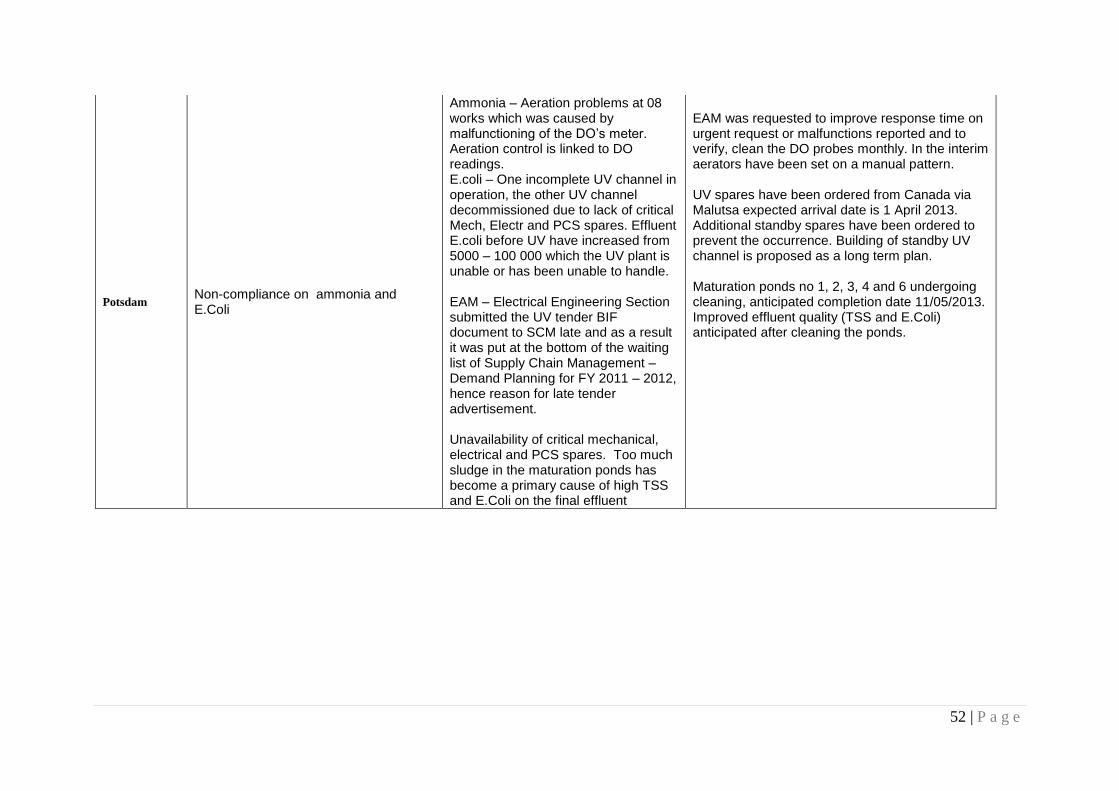
52 | P a g e
Potsdam Non-compliance on ammonia and E.Coli
Ammonia – Aeration problems at 08 works which was caused by malfunctioning of the DO’s meter. Aeration control is linked to DO readings. E.coli – One incomplete UV channel in operation, the other UV channel decommissioned due to lack of critical Mech, Electr and PCS spares. Effluent E.coli before UV have increased from 5000 – 100 000 which the UV plant is unable or has been unable to handle. EAM – Electrical Engineering Section submitted the UV tender BIF document to SCM late and as a result it was put at the bottom of the waiting list of Supply Chain Management – Demand Planning for FY 2011 – 2012, hence reason for late tender advertisement. Unavailability of critical mechanical, electrical and PCS spares. Too much sludge in the maturation ponds has become a primary cause of high TSS and E.Coli on the final effluent
EAM was requested to improve response time on urgent request or malfunctions reported and to verify, clean the DO probes monthly. In the interim aerators have been set on a manual pattern. UV spares have been ordered from Canada via Malutsa expected arrival date is 1 April 2013. Additional standby spares have been ordered to prevent the occurrence. Building of standby UV channel is proposed as a long term plan. Maturation ponds no 1, 2, 3, 4 and 6 undergoing cleaning, anticipated completion date 11/05/2013. Improved effluent quality (TSS and E.Coli) anticipated after cleaning the ponds.

53 | P a g e
7.1.6 Wastewater Final Effluent Quality Table 20: Final Effluent Quality for all the Wastewater Works
Months TSS 25mg/l
COD 75mg/l @
NH3 10mg/l
E.Coli 1000/100ml
Jun-13 95.2 96.4 86.9 79
May-13 95.2 86.4 83 80.5
Apr-13 83.7 73.5 85.7 81.3
Mar-13 79.5 77.1 78.3 75.6
Feb-13 80.2 76.7 81.4 75.3
Jan-13 84.4 81.7 72.5 84.3
Dec-12 86.9 83.3 76.2 85.2
Nov-12 88.9 80 85.6 83.1
Oct-12 96.3 88.8 86.9 85.4
Sep-12 92 84.1 88.6 86.1
Aug-12 90.2 88 89.1 83.3
Jul-12 91.2 90.2 87.3 80.2
Figure 18: Final Effluent Quality for all the Wastewater Works

54 | P a g e
Table 21: Total Quantity of Effluent Received at Waste Water Treatment Plants
7.1.7 Status of Equipment and Plant at Bulk Water Installations (October 2013) Table 22: Status of Equipment and Plant at Bulk Water Installations
Item no WTP Description Intervention Required Estimated Cost
1 Faure WTP (BW) Obsolete and aging SCADA equipment
Replacement of all PLCs. Tender for consultants cancelled (advertised 80/20, both tenders received >R1 000 0000). Tender to be re-advertised.
R 6 million
2 Blackheath WTP (BW) PAC Dosing System Complete Part B of works. Commissioning and operational acceptance period for Part A completed, but Contract terminated due to non-performance of contractor on Part B. Tender for completion of Part B to be advertised.
R 700 000
3 Blackheath WTP (BW) Treatment Residue Water Recovery PS
Replace pump motor and associated equipment – Works completed, Contract in Defects Notification Period
R 902 572 [Completed]
4 Steenbras WTP (BW) Lime Storage and Transfer system
Complete existing contract – Contractor to address items as per snag list [Completed]
[Completed]
5 Voёlvlei WTP (BW) Pump System Surge Vessels Phased refurbishment of 4 large pressure vessels. Inspection by Competent Person completed, and only minor refurbishment required.
R 500 000
6 Voёlvlei WTP (BW) Air-scour Blowers Phased replacement of 2 blowers. One blower replaced during 2010/11, and the second during 2012/13.[Completed].
R 250 000
7 Witzands WTP (BW) Acid Regeneration System Refurbish Acid System R 2 million
8 Firlands PS (BW) Obsolete and aging Variable Frequency Drives (VFD)
Replacement of 4 off VSD’s. Phase 1 (replacement of 2 VSD’s): contract in progress.
R 15 million
With Reference to: DWAF WSDP Guideline
Aug 2010 Description
WSDP Implementation Report
Comparative Figures for the Preceding 3 Financial Years
Previous Financial Year
Chapter & Table No. 2012/13 2011/12 2010/11 2009/10
8.2 (11) ToT. Total Quantity of Effluent Received at Waste Water Treatment Plants(Inflow)
238 985.2 218 149.4 226 750.3 257 354.2

55 | P a g e
9 Kildare PS (BW) Obsolete motors and electrical control equipment
Replace pump motors and control equipment – Contract complete.
R 1 968 000 [Completed]
10 Molteno Reservoir PS No. 2 (BW)
Obsolete and aging pump starter panel
Replace pump starter panel – Contract complete.
R 406 200 [Completed]
11 Voёlvlei WTP (BW) Electrical protection of Low Lift Pump Station Variable Frequency Drives (VFD)
Install UPS’s to Low Lift Pump Station VFDs – Tender advertised 12 July 2013, closed 2 August 2013; BAC report being finalised.
R 450 000

56 | P a g e
7.1.7 Status of Equipment and Plant on Pump Stations (as at August 2013) Table 23: Pump Stations Sewer Spillage
ITEM
NR
REPORTED PUMP STATION AND RISING SEWER INCIDENTS: AUGUST 2013
PUMP STATION
LOCATION DATE CAUSE POINT OF
OVERFLOW ACTION TAKEN
IMPACT*
1 Helderberg Strand 06/08/2013
PLC fault Onto the field from manhole
PLC reset Medium
2 Rugby Brooklyn 06/08/2013
Power failure Zoar Vlei
Jet Vac organised to managed sump level till power came back
Medium
3 River Rd Brooklyn 08/08/2013
Broken rising main
Zoar Vlei
Jet Vac organised to managed sump level assisting Waterworks
Medium
4 Sarepta #2 Sacks Circle Bellville
13/08/2013
Stormwater ingress
Kuils River Monitored the situation
Medium
5 Bridgetown Kewtown 13/08/2013
Stormwater ingress
Into canal behind the station
Monitored the situation
Severe
6 Helderberg Strand 13/08/2013
Stormwater ingress
Onto the field from manhole
Monitored the situation
Severe
7 Mosselbank Kraaifontein 13/08/2013
Stormwater ingress
Into canal behind the station
Monitored the situation
Severe
8 Raapenberg Mowbray 13/08/2013
Stormwater ingress
Into Black River Monitored the situation
Medium
9 Khayelitsha Khayelitsha 13/08/2013
Stormwater ingress
From various manholes in the area
Monitored the situation
Medium
10 Muller Street Kraaifontein 13/08/2013
Stormwater ingress
Into stormwater Monitored the situation
Medium
11 Macassar Macassar 13/08/2013
Stormwater ingress
Into river behind the station
Monitored the situation
Severe
12 Sarepta #2 Sacks Circle Bellville
15/08/2013
Stormwater ingress
Kuils River Monitored the situation
Medium
13 Dalebrook Muizenberg 19/08/2013
Stormwater ingress
Into the sea Monitored the situation
Medium
14 Flintdale Southfield 19/08/2013
Stormwater ingress
Into Southfield canal
Monitored the situation
Medium
15 Victoria Road Southfield 19/08/2013
Stormwater ingress
Into Southfield canal
Monitored the situation
Medium
16 Uxbridge Lakeside 19/08/2013
Stormwater ingress
Into stormwater Monitored the situation
Medium
17 Silvermine Silvermine Village
21/08/2013
Pump #1 tripped and Stormwater
Into pond Reset the pump Minor

57 | P a g e
8. ASSOCIATED SERVICES
8.1. WATER SERVICES 8.1.1. Education Plan
Table 24: Education plan for Water Services
Associated Services Facility
Number of Facilities
Facilities with Adequate Services
Facilities with no Services
Facilities with inadequate Services
Total Potential Cost (Basic Level) RM
Schools
1 238
100 % 0 0 -
Tertiary Education Facility
Unknown 100 % 0 0 -
8.1.2 Health Plan
Table 25: Health plan for Water Services
Associated Services Facility
Number of Facilities
Facilities with Adequate Services
Facilities with no Services
Facilities with inadequate Services
Total Potential Cost (Basic Level) RM
Hospitals
38 100% 0 0 -
Health Centres
100% 0 0 -
Clinics (Mobile Incl.)
100% 0 0 -
Hospitals
Health Centres
Clinics
Mobile Centres
38 Unknown Unknown Unknown
ingress
18 Cayman Beach
Gordon's Bay
21/09/2013
Stormwater ingress
Manholes in Cayman Beach development
Monitored Minor
19 Pumping Station 4
Gordon's Bay
21/09/2013
Stormwater ingress
At pumping station
Monitored Minor
20 Sarepta #2 Sacks Circle Bellville
28/08/2013
Stormwater ingress
Kuils River Monitored the situation
Medium
21 Sarepta #2 Sacks Circle Bellville
29/08/2013
Stormwater ingress
Kuils River Monitored the situation
Medium

58 | P a g e
Number of Medical Facilities
Unknown Nurse patient ratio (National target 34)
Unknown
Percentage births under 2.5kg (National Target < 10%)
Unknown Proportion under 1 with 1st measles immunisation (National Target 90%)
Unknown
TB prevalence rate (2005)
Unknown TB Cure rate % (National target 85%)
Unknown
HIV/AIDS prevalence rate (2005)
Unknown HIV/AIDS prevalence rate (2010)
Unknown
Number of HIV/AIDS deaths (2005)
Unknown Number of HIV/AIDS deaths (2010)
Unknown
8.2 SANITATION SERVICES
8.2.1 Education Plan Table 26: Education plan for Sanitation Services
Associated Services Facility
Number of Facilities
Facilities with Adequate Services
Facilities with no Services
Facilities with inadequate Services
Total Potential Cost (Basic Level) RM
Schools
1 238
100 % 0 0 -
Tertiary Education Facility
Unknown 100 % 0 0 -
Table 27: Sanitation Service levels at schools and Tertiary Education Facilities School/Tertiary Education Facility
Type
Water Service Level
_ Primary; Secondary and Tertiary (list as above)
Full Flush to sewer
8.2.2 Health Plan Table 28: Health Plan for Sanitation
Associated Services Facility
Number of Facilities
Facilities with Adequate Services
Facilities with no Services
Facilities with inadequate Services
Total Potential Cost (Basic Level) RM
Hospitals 38 100 0 0 -

59 | P a g e
Health Centres
Unknown 100 0 0 -
Clinics (Mobile Incl.)
Unknown 100 0 0 -
9. WATER CONSERVATION AND DEMAND MANAGEMENT
The purpose of the Water Demand Management and Water Conservation Strategy is to provide a long-term balance between available water resources and demand for these resources, minimise water losses from the system and postpone the need for expensive capital infrastructure projects for as long as economically viable. The City of Cape Town has a responsibility to provide and manage services (including water and sanitation services) to a constantly growing population. Added to this, the fact that Cape Town lies in a water scarce region and the options for further water augmentation schemes to supply the Cape Town area are extremely limited since the completion of the Berg Water Project. Good water conservation and water demand management principals therefore play a crucial role in ensuring we are equipped to manage the growth and development which is taking place within our boundaries. Growth is vital for the economy, but the management of the provision of water and sanitation services in this growing economy can bring with it some challenges. The City’s response to these challenges has been to grow and develop the Water Demand Management (WDM) Department to manage a full range of projects/activities in respect of water conservation and water demand management, a few of which are mentioned below. The Water Demand Management Department and Strategy Branch cannot single out one project for this award as each project undertaken has an innovative and different approach. The projects are summarised below: 9.1 PRESSURE MANAGEMENT (MAJOR AND MINOR PROJECTS)
Pressure management is sustainable as it reduces losses in the system, reduces bursts, reduces internal leaks, prolongs the life of the reticulation system, saves the City water and money and has a 6-12 month payback period. The City has continued to roll out Pressure Management installations across the City with 6 more installations added during 2011, refer to Table 28. The total annual water savings for all existing projects combined is 3.73 million m³ (R31 Million/year).

60 | P a g e
Table 29: Pressure Management Initiatives within the last three years (2010/11 – 2012/13)
Area Year Implemented
Water Savings (million m
3/yr.)
Implementation Cost (million/yr.)
Cost Savings @ R9.40/m
3 (million/yr.)
Crossroads 2010/11 0.18 R 1.24 R 1.7
Plumstead/ Retreat
2011 0.96 R 3.52 R 9.1
Marina Da Gama
2011/12 0.33 R 3.29 R 3.1
Grassy Park 2011/12 1.07 R 2.45 R 10.23
Bishop Lavis 2011/2012 0.55 R 3.06 R 5.45
Thornton 2012 0.53 R 2.25 R 0.5
Kalkfontein 2012/13 0.11 R 1.45 R 1.0
3.73 R 17.26 R 31.08
By looking at the table above the total estimated savings from the system alone around the areas is R3.73 million m3 per year as from 2010/11-2012/13. With the implementation of a policy to install water management devices on a prioritised basis, residences defined as indigent now have the means by which to prevent their water consumption from reaching unaffordable levels. It is critical for the City to ensure efficient use of scarce water resources to meet the growing needs of the population. To this end, the City strives to maximise the use of existing infrastructure to drive the achievement of the objectives set out in its Water Demand Management and Water Conservation Strategy.
Effective water demand management is a core requirement for the sustainability of water supply to the city. If water consumption is controlled at the levels expected in the Water Demand Management and Water Conservation Strategy, it may allow the next water resource scheme to be deferred to approximately 2029. 9.2 RETROFITTING AND LEAK FIXING
The Retrofitting programme was undertaken in Samora Machel, Ravensmead and Fisantekraal. The community generally welcomed the project and were particularly pleased with having their responsibilities clearly spelt out, being shown how to read their meters so that they could detect underground leaks and correlate the reading with their bill, and seeing that they are actually getting 6kl/month free. The average water savings achieved with this project was approximately 10Kl/month per targeted area and a financial saving of between R1.2 – R1.7 Million/year per targeted area.
9.3 WATER EDUCATION CONSUMER PERCEPTION ASSESSMENT PROJECT The Water Conservation Awareness and Education projects (most of which are on-going) included the comprehensive Water Conservation Consumer Perception Assessment (report attached to this document) which included the implementation of the City’s Mayoral Expanded Public Works Programme (EPWP). The results obtained from this project will serve as a valuable guide from where planning,

61 | P a g e
financial resources and human resources, educational resources and time management can most effectively be applied by the Water Conservation Section, thereby ensuring that the most efficient education and awareness strategy is implemented where it is most needed in order to achieve the maximum water savings for the City.
Figure 19: Water Demand Projection
Figure 20: Three year overview of successful impact of WCWDM Interventions

62 | P a g e
10. WATER RESOURCES 10.1 Major Dam Levels
The table below compares the storage in the six major dams of the Western Cape Water Supply System over the past five years. Table 30: Storage in the major dams of the WCWSS at 26 August 2013
MAJOR DAMS (99.6% of total
capacity)
BULK STORAGE ON 26 AUGUST 2009 – 2013
CAPACITY
CAP. LESS DEAD % % % % %
Ml STORAGE 2009 2010 2011 2012 2013
Wemmershoek 58 644 58 544 99.8 77.3 76.0 94.4 99.8
Steenbras Lower 33 517 33 517 100.4 57.9 80.8 100.1 100.7
Steenbras Upper 31 767 29 267 100.3 85.4 100.8 99.9 101.3
Voëlvlei 164 122 156 022 99.2 98.0 84.2 86.2 98.7
Theewaterskloof 480 250 432 250 103.0 93.9 82.1 91.1 104.3
Berg River 130 000 125 800 100.5 100.7 89.2 100.1 100.7
TOTAL STORED
911 881 834 385 752 005 829 852 918 119
TOTAL STORAGE 898 300 835 400 768 300 898 300 898 300 898 300 898 300
% STORAGE
101.5 92.9 83.7 92.4 102.2
The six major dams comprise 99.6% of the total system capacity. The percentages in the above table include “dead storage” (water that is not available for use). The approximate dead storage for each dam is indicated in the table.
10.2 Minor Dam Levels Table 31: Shows the capacities of the minor dams supplying water to Cape Town.
MINOR DAMS CAPACITY % on
(0.4% of Total System Capacity) Ml 26 AUGUST
2013 Dams supplying Kloof Nek WTW:
Hely Hutchinson 925 100.8 Woodhead 954 100.9
Dams supplying Constantia Nek WTW: Victoria 128 101.2 Alexandra 126 98.3 De Villiers 243 100.7
Dams supplying Brooklands WTW: Kleinplaats 1 368 102.5 Lewis Gay 182 94.5
The minor dams owned and operated by the City of Cape Town comprise 0.4% of the total system capacity.
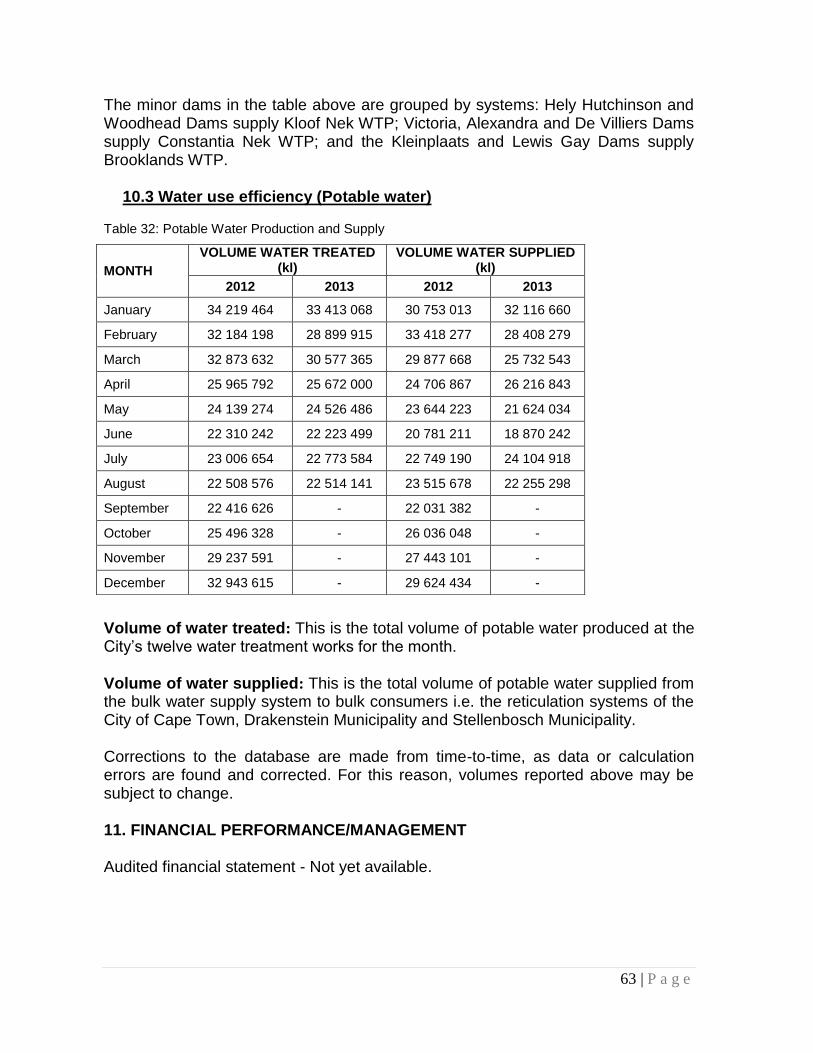
63 | P a g e
The minor dams in the table above are grouped by systems: Hely Hutchinson and Woodhead Dams supply Kloof Nek WTP; Victoria, Alexandra and De Villiers Dams supply Constantia Nek WTP; and the Kleinplaats and Lewis Gay Dams supply Brooklands WTP.
10.3 Water use efficiency (Potable water)
Table 32: Potable Water Production and Supply
Volume of water treated: This is the total volume of potable water produced at the City’s twelve water treatment works for the month.
Volume of water supplied: This is the total volume of potable water supplied from the bulk water supply system to bulk consumers i.e. the reticulation systems of the City of Cape Town, Drakenstein Municipality and Stellenbosch Municipality. Corrections to the database are made from time-to-time, as data or calculation errors are found and corrected. For this reason, volumes reported above may be subject to change. 11. FINANCIAL PERFORMANCE/MANAGEMENT
Audited financial statement - Not yet available.
MONTH
VOLUME WATER TREATED (kl)
VOLUME WATER SUPPLIED (kl)
2012 2013 2012 2013
January 34 219 464 33 413 068 30 753 013 32 116 660
February 32 184 198 28 899 915 33 418 277 28 408 279
March 32 873 632 30 577 365 29 877 668 25 732 543
April 25 965 792 25 672 000 24 706 867 26 216 843
May 24 139 274 24 526 486 23 644 223 21 624 034
June 22 310 242 22 223 499 20 781 211 18 870 242
July 23 006 654 22 773 584 22 749 190 24 104 918
August 22 508 576 22 514 141 23 515 678 22 255 298
September 22 416 626 - 22 031 382 -
October 25 496 328 - 26 036 048 -
November 29 237 591 - 27 443 101 -
December 32 943 615 - 29 624 434 -

64 | P a g e
12. WATER SERVICES INSTITUTIONAL ARRANGEMENTS 12.1 Situation assessment (water services institutional arrangements profile)
The new City of Cape Town and the Water and Sanitation Services entity was formed with the amalgamation of the Cape Metropolitan Council and the 6 metropolitan local councils in December 2000.
Water and Sanitation
Service Provider
Support ServicesFinancial &
Commercial
Engineering & Asset
ManagementScientific Services
Water Demand
Management &
Strategy
ReticulationWaste Water TreatmentBulk Water
Water and Sanitation
Service Authority
Department of Water
Affairs (Regulator)
SewerageWater
City of Cape Town
Utility Services
Directorate
Operational responsibility
for water services provision
Consitutional responsibility for
water services provision
Service delivery agreement
Consumer
Consumer contracts Consumer Charter
By-laws
By-laws
City Manager
Figure 21: Water Service Institutional Arrangements (Source: Water Demand Management Strategy)
On 28 November 2001, Council authorized Water and Sanitation Services as it was called then to operate as fully-fledged and functional internal business unit in order to ensure maximum independence and minimum constraints. In practice this has not been implemented further and the service is now housed in the Utility Services Directorate as the Water and Sanitation Department.
12.2 Future Trends and Goals
The appointment and retention of technical staff (engineers, scientists and IT personnel) remains a high priority.
12.2.1. Strategic gap analysis The City of Cape Town is currently undertaking the constitutional responsibility for water service provision (as the Water Services Authority (WSA)) as well as the

65 | P a g e
operational responsibility (as the Water Service Provider (WSP)). The City has not separated the service authority and service provision function to establish a municipal entity, preferring to operate the service as an internal ring-fenced department. At the moment, there is no service delivery agreement between WSA and WSP in place.
12.2.2. Implementation strategies
Institutional reform: The City’s strategic intent, aligned with the national agenda and as stated in the IDP is:
Sustainable use of scarce resources such as water
Achieving operational, financial and other efficiencies which will enhance equitable, affordable and effective service delivery and sustainable development;
Increase service provision (taps and toilets in formal settlements)
Human resources: It is the City’s strategic intent to develop and retain a skilled and motivated staff according to the Staffing Strategy and the Workplace Skills Plan. A strategy to hold onto staff is a talent management programme currently underway which intends to hold onto qualified and experience staff through a career development and succession plan. This effort will help to hold onto institutional knowledge.
Table 33: WSA capacity development currently in process
WSA Priorities for capacity development
Capacity needs assessments conducted(Yes/No)
Formal Skills training required (Yes/ No)
Proposed timeframe for capacity development
Total Estimated Cost in rates only (exclu VAT)
Strategic and Master Planning
Yes Yes
From date of commencement of contract until 30 June 2013.
R 565 421
An automation, monitoring and technology programme is being driven in the department towards achieving maximum efficiency and optimum utilisation of staff resources in a “smart” way. To this end, cooperation has been pursued with leaders in the field such as the Norwegian Oslo Waterworks and the Danish Hydraulic Institute. Table 34: The bylaws affecting water services are listed in the table below
ACTION PROGRESS TIMEFRAME IMPLEMENTATION COST
Plant SCADA upgrades. (Bulk, Wastewater, Pump stations).
SCADA upgrades completed at Atlantis, Blackheath and Steenbras WTP. Visnet implemented Software and partial commissioning at
5 years (2014)
R10M for current Reticulation system phase. Full system scope being

66 | P a g e
Wildevoelvlei WWTW Additional license required and connection to corporate network. And Wemmershoek Dam WTW. Complete
developed.
Bulk & Zone meter automation
Further zones delineated (201) and zone meters installed.
All Water Zone meters logged by 2014.
Customer meter automation
AMR pilot installation completed May 2010. Extensive evaluation undertaken in N2 Gateway, SunsetBeach and Epping Industria. Various technical, meter supply and process issuesaddressed. Prepayment meters to be investigated and piloted.
AMR Phased rollout planned in priority industrial or commercial areas over a multi-year timeframe (2020) for entire City. Prepayment pilot 2011.
R1.5M pilot phase. R50M excluding meter replacement.
Integrated Information System
DIMS development (Danish Hydraulic Institute) with major DWA grant completed. Integrates key major Water and Sanitation information systems in browser map-based dashboards.
Completed and handover October 2010
R7M (R5M DWA grant)
Integrated Master Planning: A tender evaluation is currently underway to appoint a service provider who transfer skills to City of Cape Town staff. An appointment is expected to be made within the next 4 weeks and the appointment is intended to cover 3 financial years
Training and skills transfer in the practical updating of the IMP is expected to be completed by June 2015
The tender was designed as a rates only tender but the estimated cost for the project is between 10 and 13 million over the 3year period
A tender evaluation is currently underway to appoint a service provider who transfers skills to City of Cape Town staff. An appointment is expected to be made within the next 4 weeks and the appointment is intended to cover 3 financial years
Technical Operating Centre process improvements
SAP-GIS Integration being implemented under control of SAP. Includes: GIS & SCADA integration in SAP, C3 Notifications, Tetra Radio comms and spatial tracking, Mobile Asset Management.
2012 R10M.

67 | P a g e
SCADA/Telemetry master plan
Contract has been awarded to develop a new master station for all reservoirs and pump stations, including the supply of RTU’s. Also included is the development of data from the new telemetry system to the database that DIMS will harvest. Tender in place for the procurement of RTUs Factory Acceptance Test complete snag list being resolved. Test RTU in field trials.
Central SCADA system installed
500 RTUs procured under a tender
80 Installed, 26 commissioned and handed over
2012
Automated Water Analysis
Process lab Units already installed at 9 Bulk Water Depots. Installation of 8 computers and Connectivity testing to be in March 2010.
Completion end March 2010.
R693 000
Air Quality Monitoring System (Service provider to Health Dept.)
Tender awarded April 2010. Completed 2010
R1.3 Million

68 | P a g e
12.2.3. Bylaws affecting water services
Table 35: The bylaws affecting water services are listed in the table below
By-law Date promulgated
Short Description Effect on Water Services
Water
18 February 2011
To control and regulate water supply and use in the City of Cape Town and strive for continued availability and access of the resource to all.
Increased awareness on the need to save water, renders a more sustainable provision of the service where supply meets demand. Punitive measures serve to deter non-compliance.
Wastewater and Industrial Effluent
1 September 2006
To control and regulate sewerage and industrial effluent discharges for the protection of infrastructure and the environment.
Increased awareness amongst the target market continues to trigger behavioural change in terms of a better understanding of the principle of environmental protection Punitive measures serve to deter non-compliance
Credit Control and Debt Collection
Latest as Approved by Special Council on 28 May 2012
To give effect to the Council’s credit control and debt collection policy, its implementation and enforcement, as required by Section 98 of the Municipal Systems Act, 32 of 2000, and to give effect to the duty imposed by Section 96 of the Municipal Systems Act to collect all money that is due and payable to the Council.
Renders the service financially sustainable for current and future generations.
By-law relating to Stormwater Management
23 September 2005
To provide for the regulation of stormwater management and to regulate activities which may have a detrimental effect on the development, operation or maintenance of the stormwater system
Greater public awareness on the need to prevent environmental damage Punitive measures serve to deter non-compliance.
Treated Effluent
28 October 2009
To control and regulate the supply and use of treated effluent in the City of Cape Town in line with the Integrated Water Resource
Treated effluent users make available more potable water to other consumers in need and hence

69 | P a g e
By-law Date promulgated
Short Description Effect on Water Services
Management and Water Conservation Water Demand Management goals.
prolong local water security.

70 | P a g e
Table 36: The institutional objectives of the IDP
Strategic Focus Area
Objective Programme Water Services Business Elements
1. S
ocio
- E
co
no
mic
Pro
file
2. S
erv
ice L
evel
Pro
file
3. W
ate
r
Reso
urc
e P
rofile
4. W
ate
r
Co
nserv
atio
n /
Dem
an
d
Man
ag
em
en
t
5. W
ate
r
Serv
ices
Infra
stru
ctu
re
Pro
file
6. W
ate
r bala
nc
e
7. W
ate
r
Serv
ices
institu
tion
al
arra
ng
em
en
ts
Pro
file
8. C
usto
me
r S
erv
ice P
rofile
9. F
inan
cia
l
pro
file
10. L
ist o
f P
roje
cts
Page Numbers
1.THE OPPORTUNITY CITY
Objective 1.1 - Create an enabling environment to attract investment to generate economic growth and job creation
P1.1(c) Identify and promote catalytic sectors, such as oil and gas
x
Objective1.2 - Provision and maintenance of economic and social infrastructure to ensure infrastructure-led growth and development
P1.2(b) Maintenance of infrastructure
x
P1.2(c) Investing in Infrastructure
x
Objective 1.3 – Promote a sustainable environment through efficient utilization of resources
P1.3(a) Sustainable utilization of scarce resources
x x x x
1.3(b) Water Conservation and Water Demand Management Strategy
x x x x x x
2.THE SAFE CITY
No direct link to Water Services objectives
3. THE CARING CITY
Objective 3.4 Provide for the needs of informal settlements and backyard residences through improved services
P3.4(b) Service delivery programme in informal settlements
x
P3.4(c) Backyarder service programme
x x
Objective 3.7 Provision of effective Environmental Health services.
P 3.5(a) Environmental Health Care Programme
x x x

71 | P a g e
Strategic Focus Area
Objective Programme Water Services Business Elements
1. S
ocio
- E
co
no
mic
Pro
file
2. S
erv
ice L
evel
Pro
file
3. W
ate
r
Reso
urc
e P
rofile
4. W
ate
r
Co
nserv
atio
n /
Dem
an
d
Man
ag
em
en
t
5. W
ate
r
Serv
ices
Infra
stru
ctu
re
Pro
file
6. W
ate
r bala
nc
e
7. W
ate
r
Serv
ices
institu
tion
al
arra
ng
em
en
ts
Pro
file
8. C
usto
me
r S
erv
ice P
rofile
9. F
inan
cia
l
pro
file
10. L
ist o
f P
roje
cts
Page Numbers
4.THE INCLUSIVE CITY
Objective 4.1 Ensure responsiveness by creating an environment where citizens can communicate with and be responded to.
P4.1(a) Managing service delivery through the service management process (C3 notification responsiveness)
x x x
P4.1(b) Building strategic partnerships
x x
5.THE WELL-RUN CITY
No direct link to Water Services objectives
x

72 | P a g e
13. SOCIAL AND CUSTOMER REQUIREMENTS
13.1 SITUATION ASSESSMENT
Although under stress in certain regions, necessary infrastructure is in place to ensure an adequate quality of service to all households. All customers receive water that is fully treated. There are mechanisms in place to attend to customer complaints and queries. A survey is undertaken on an annual basis to gauge the customer satisfaction in formal domestic, informal domestic and business sectors and to identify specific issues of concern.
Figure 22: Customer satisfaction levels over time
The general conclusions are:
The increasing satisfaction level for respondents living in formal residential areas has shown a downturn.
Respondents living in informal residential areas are generally dissatisfied.
82% of business respondents are satisfied.
This could be an indication that residents do not understand the reasons for a basic level of service as opposed to a full level of service. An alternative argument could be that people, whether in a formal or informal settlement, will only be satisfied with a full level of service and that the level of satisfaction in

73 | P a g e
informal settlements will always remain low due to problems related to communal toilets. 13.2 FUTURE TRENDS AND GOALS The goal is to ensure that the percentage of customers satisfied with the service continues to increase and reaches 95% within the next 5 years. 13.3 STRATEGIC GAP ANALYSIS
There is no consolidated information on response times to complaints and queries and to repairing water and sewer mains. An integrated information system dealing with these matters is under development by the Technical Operating Centre. 13.4. IMPLEMENTATION STRATEGIES
Ensuring water pressure standards are maintained to improve areas of extreme high or low pressures.
The Education and Awareness Campaign will be extended to affect behaviour change in residential customers towards reducing water consumption, and that all customers have a better knowledge of water efficient fittings.
Establishment of a system at the Technical Operating Centre to ensure that customer complaints are measured and followed up.
The AMR project promises to bring improved customer satisfaction around metering and billing.
Appointment of staff for critical vacancies.
Have a public awareness on level of service and affordability.
The survey question in informal settlements should be structured differently.
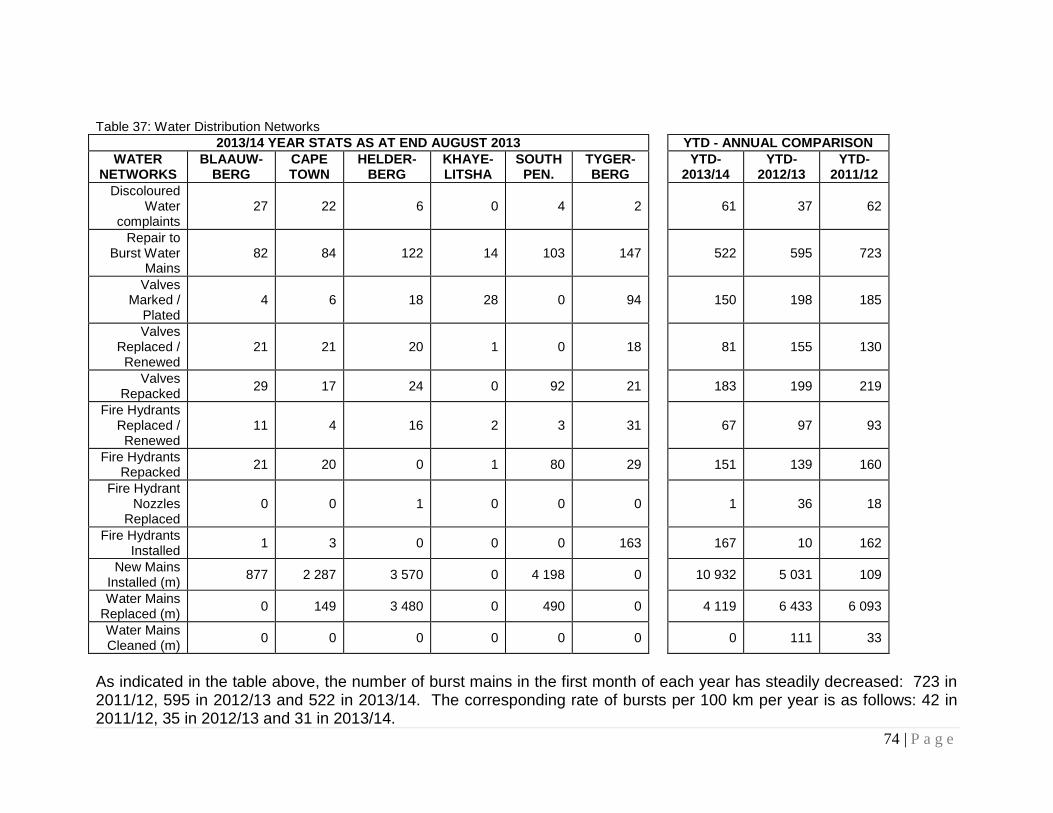
74 | P a g e
Table 37: Water Distribution Networks
2013/14 YEAR STATS AS AT END AUGUST 2013 YTD - ANNUAL COMPARISON
WATER NETWORKS
BLAAUW- BERG
CAPE TOWN
HELDER- BERG
KHAYE-LITSHA
SOUTH PEN.
TYGER- BERG
YTD-
2013/14 YTD-
2012/13 YTD-
2011/12
Discoloured Water
complaints 27 22 6 0 4 2 61 37 62
Repair to Burst Water
Mains 82 84 122 14 103 147 522 595 723
Valves Marked /
Plated 4 6 18 28 0 94 150 198 185
Valves Replaced / Renewed
21 21 20 1 0 18 81 155 130
Valves Repacked
29 17 24 0 92 21 183 199 219
Fire Hydrants Replaced / Renewed
11 4 16 2 3 31 67 97 93
Fire Hydrants Repacked
21 20 0 1 80 29 151 139 160
Fire Hydrant Nozzles
Replaced 0 0 1 0 0 0 1 36 18
Fire Hydrants Installed
1 3 0 0 0 163 167 10 162
New Mains Installed (m)
877 2 287 3 570 0 4 198 0 10 932 5 031 109
Water Mains Replaced (m)
0 149 3 480 0 490 0 4 119 6 433 6 093
Water Mains Cleaned (m)
0 0 0 0 0 0 0 111 33
As indicated in the table above, the number of burst mains in the first month of each year has steadily decreased: 723 in 2011/12, 595 in 2012/13 and 522 in 2013/14. The corresponding rate of bursts per 100 km per year is as follows: 42 in 2011/12, 35 in 2012/13 and 31 in 2013/14.

75 | P a g e
Table 38: Water Meter Connections (Performed by Depot)
2013/14 YEAR STATS AS AT END AUGUST 2013 YTD – ANNUAL COMPARISON BLAAUW-
BERG CAPE TOWN
HELDER- BERG
KHAYE-LITSHA
SOUTH PEN.
TYGER- BERG
YTD-
2013/14 YTD-
2012/13 YTD-
2011/12 Installed Meter
Connections 15 mm
47 0 0 0 0 0 47 132 47
Installed Meter Connections
20 mm 175 255 1 2 9 7 449 355 328
Installed Meter Connections
25 mm 7 57 0 1 4 1 70 35 43
Installed Meter Connections
32 mm 1 0 1 0 0 0 2 0 0
Installed Meter Connections
40 mm 7 3 0 0 1 1 12 14 42
Installed Meter Connections 50 mm
1 11 0 0 2 0 14 8 11
Installed Meter Connections
80 mm 2 3 0 0 0 0 5 2 2
Installed Meter Connections
100 mm 0 16 0 0 0 0 16 9 7
Installed Meter Connections
150 mm 0 2 0 0 0 0 2 4 2
Water Meters Replaced
132 155 198 75 0 144 704 572 850
Relocate / Re-fix Meters
107 20 3 136 47 91 404 769 760
Water Meters 10 72 123 0 21 42 268 233 225

76 | P a g e
Stolen
Remove Water Meter Connections
52 0 3 76 0 4 135 188 97
Repair Leaks on Water Connections
783 2 265 844 403 1 062 518 5 875 6 120 5 693
Locate Water Meters
44 0 1 3 0 11 59 277 146
TOTAL 1 368 2 859 1 174 696 1 146 819 8 062 8 718 8 253
A Project Initiation document (PID) was submitted to acquire funds for the new financial year in order to roll-out the Sewer Blockages Education campaign to other areas, but unfortunately the request was unsuccessful due to insufficient funds compared to the number of PIDs received, so the household door to door campaign has been put on hold until further notice.

77 | P a g e
Table 39: Sewerage Blockages per areas of Metro for August 2013
BUILDING COLLAPSES FATS
FOREIGN ROOTS SAND TOTAL
MATERIAL OBJECTS
South Peninsula Area 0 0 254 519 317 1 1091
Blaauwberg Area 0 3 46 74 83 7 213
Durbanville 0 0 110 0 108 0 218
Kraaifontein/Brackenfell 0 0 177 156 186 0 519
Atlantis 12 1 40 108 92 1 254
Bellville Area 3 0 71 183 169 30 456
Goodwood Area 7 15 60 530 65 40 717
Parow Area 209 13 328 309 24 35 918
Khayelitsha 126 0 124 46 2 144 442
CBD & Atlantic Seaboard 0 0 8 371 39 5 423
Mitchells Plain/Philippi 0 2 251 376 1 77 707
Maitland/Pinelands 0 0 15 262 30 23 330
Rosebank/Claremont 0 0 57 159 85 6 307
Athlone/Hanover Park 0 0 189 390 49 66 694
Ikapa 0 0 43 264 17 306 630
Delft/Eerste River/Kuils River 31 37 270 316 206 165 1025
Somerset West/Strand 110 19 174 160 92 152 707
TOTAL 498 90 2217 4223 1565 1058 9651

78 | P a g e
13.5. CUSTOMER SERVICES
Infrastructure and personnel is in place for this function and there are also projects to improve the performance.
13.6. CUSTOMER/CONSUMER CHARTER
This service charter provides our customers with a clear understanding of our commitment to service and product quality and of the standards we strive to meet. It also explains the City of Cape Town’s obligations and the obligations of the consumers. The charter includes a list of our service standards and we encourage all users and other stakeholders to measure our performance against these standards, and to communicate any deviations to our hotline number on 0860 10 30 54 or/and 0860 10 30 89. (Water option) Customer right to access The water service act (Act no. 108 of 1997) compels the City of Cape Town to provide water and sanitation services that are efficient, affordable, and sustainable. The City of Cape Town water quality complies with world class standards (WHO & SANS 241). The City of Cape Town wastewater complies with the DWA: Wastewater General Standards (1984), DWA: Wastewater special standards (1984), National Standards and by laws The ISO 9001 Quality Management System will:
Assist integration of previous administrations
Improve customer satisfaction
Ensure compliance to OHS and Environmental Standards
Improve service delivery
Improving the processes on a continual basis
Improve efficiency/production- lower costs
Facilitate performance management
Boost staff morale
Ensure documentation of best practices. The Consumer (previously Customer) Charter was introduced as part of this process during 2001.

79 | P a g e
13.7. CUSTOMER SURVEYS
Since 2002, Water and Sanitation Services has been conducting research on annual basis to measure consumer satisfaction, needs and perceptions. Water and Sanitation Objectives for Customer Surveys The objectives of conducting a customer survey for Water and Sanitation Department are as follows:
To enable Water and Sanitation to gain great insights about customer requirements
To generate feedback about Water and Sanitation’s products and services as well as customer service.
To attune Water and Sanitation towards more focused customer service
To develop better relationships with customers to achieve brand success
To assist with quick measures to bring about the desired improvements or address grievances and placate relevant customers
To drive innovative efforts and initiatives at Water and Sanitation branches
To consistently and better address customer needs and expectations, maintain brand reputation and facilitate long-term relationships with Water and Sanitation Customers
The findings from the research are, among other things, used:
As an input to ISO 9001:2008 certification
to ensure that an acceptable level of service satisfaction is achieved and maintained
to identify areas needing improvement
to develop continual improvement initiatives
to uncover needs not currently being addressed, especially in informal areas or in commercial arena
to ensure relevance of the Water Service Customer Charter.
The following issues are mainly addressed:
Perception of services received: drinking water, effluent water or sewer(sanitation) drainage
Evaluation of services rendered when reporting problems or enquiring about water services
Awareness of environmental initiatives, including water conservation or restrictions
Awareness of regulation in the sector
Effectiveness of marketing drives such as around Water Week

80 | P a g e
Issues relating to payment and billing procedures for services
Importance rating and evaluation of services supplied. Improved Metering of Informal Settlements Consumption
The Reticulation Branch has been busy since June 2010 with a process to more accurately account for the water consumption within Informal Settlements. During this process the numbers of dwelling units had to be estimated as being supplied by a particular meter. This was a lengthy process, as within a settlement, one has to establish which standpipes are fed by which meters before one can attribute estimates of dwelling units served by particular meters. This process was extended into numerous settlements and currently totals 291 meters loaded, read and reported on SAP. These meters serve an estimated 87 269 households. The Water & Sanitation Services Finance and Commerce Branch, has taken ownership for the monthly reading and reporting of the 291 meters loaded on SAP. A procedure has also been implemented for recording newly installed informal settlement meters on the SAP system for regular reading and reporting.
The strategic issues, policies, objectives and initiatives of the Customer and Meter Management Section are herewith briefly discussed:
Key Strategic Issues There are seven key strategic issues on which CCT is basing its customer and meter management strategy:
An Effective Debt Management Process
Meter Verification and Meter Accuracy
Meter Management and Billing
Meter Reading
24/7 Technical Operation Centre
Corporate Call Centre
Customer Interaction
13.8 QUALITY OF SERVICE FOR WATER: URBAN
The overview of the quality of service provided is given in the table below:
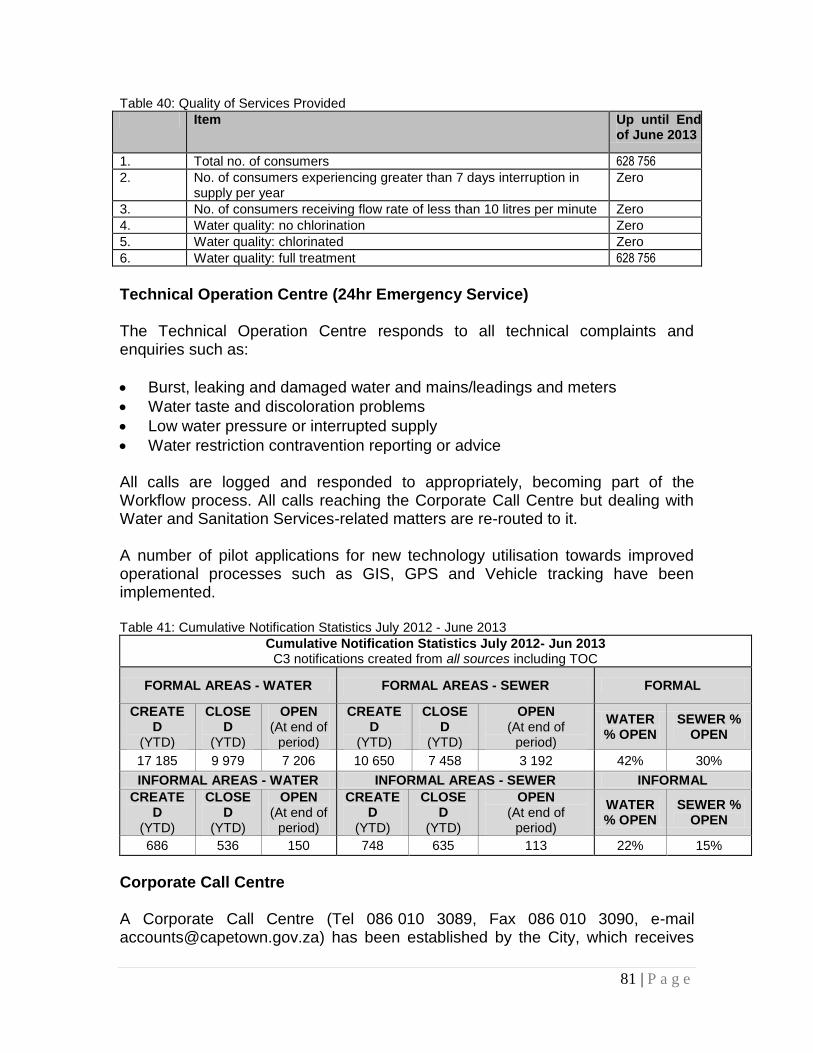
81 | P a g e
Table 40: Quality of Services Provided
Item Up until End of June 2013
1. Total no. of consumers 628 756
2. No. of consumers experiencing greater than 7 days interruption in supply per year
Zero
3. No. of consumers receiving flow rate of less than 10 litres per minute Zero
4. Water quality: no chlorination Zero
5. Water quality: chlorinated Zero
6. Water quality: full treatment 628 756
Technical Operation Centre (24hr Emergency Service) The Technical Operation Centre responds to all technical complaints and enquiries such as:
Burst, leaking and damaged water and mains/leadings and meters
Water taste and discoloration problems
Low water pressure or interrupted supply
Water restriction contravention reporting or advice
All calls are logged and responded to appropriately, becoming part of the Workflow process. All calls reaching the Corporate Call Centre but dealing with Water and Sanitation Services-related matters are re-routed to it. A number of pilot applications for new technology utilisation towards improved operational processes such as GIS, GPS and Vehicle tracking have been implemented. Table 41: Cumulative Notification Statistics July 2012 - June 2013
Cumulative Notification Statistics July 2012- Jun 2013 C3 notifications created from all sources including TOC
FORMAL AREAS - WATER FORMAL AREAS - SEWER FORMAL
CREATED
(YTD)
CLOSED
(YTD)
OPEN (At end of
period)
CREATED
(YTD)
CLOSED
(YTD)
OPEN (At end of
period)
WATER % OPEN
SEWER % OPEN
17 185 9 979 7 206 10 650 7 458 3 192 42% 30%
INFORMAL AREAS - WATER INFORMAL AREAS - SEWER INFORMAL
CREATED
(YTD)
CLOSED
(YTD)
OPEN (At end of
period)
CREATED
(YTD)
CLOSED
(YTD)
OPEN (At end of
period)
WATER % OPEN
SEWER % OPEN
686 536 150 748 635 113 22% 15%
Corporate Call Centre A Corporate Call Centre (Tel 086 010 3089, Fax 086 010 3090, e-mail [email protected]) has been established by the City, which receives

82 | P a g e
most complaints and requests, also those in respect of water account queries. Any technical complaints or others related to water that cannot be dealt with by the Corporate Call Centre, is forwarded via an electronic notification to the Technical Operation Centre for action.
13.9 EDUCATION FOR BASIC WATER SERVICES
Customer Interaction This function includes engaging the public and educating them in the awareness of Water Conservation, Water Pollution and Water Demand Management. It also deals with broad-impact citizen queries and correspondence as well as matters that are logged at the Corporate Call Centre but which require specialist investigations. Customer education, communication and liaison are accepted as key strategic issues and are being afforded a high priority in the new structure of Water and Sanitation Services. Water conservation, water pollution, water ingress and payment habits, among others, are all being addressed in a comprehensive and sustainable fashion.
14. PROJECTS COMPLETED
The project list as provided from the department is given in the table below: (Source: 10 Year Capital Prioritisation spread sheet: Finance). This is a comprehensive list of Projects which includes the sustainability list. The table lists the total cost of each project. All the projects are for inclusion in the IDP. The infrastructure projects are listed in group in accordance with their investment reason i.e. new asset, enhancement asset and replacement of asset. Support Services projects are grouped together.

83 | P a g e
Table 42: Capital Budget of the CCT for 2012/13 as at June 2013
WBS Element
WBS Element Description
Source
Fund Source Desc
Current Budget
Planned Monthly Spend
Actual
Monthly Spend
Monthly Variance
YTD Planned Spend
YTD Actu
al Spend
% Spent of Current Budget
YTD Variance
YTD %
Variance
Anticipat
ed Exp to 30 Jun '13
Reason for
underspend
Responsible Person
Major
Fund
Commitme
nts
Branch
C05.01333-F2
Durbanville Collectors Sewers
Internal
3 BICL Sewer:Tyg N
269 237
69 237
0 -69 237
269 237
247 695
92%
-21 542
-8% 247 695
Other - Please specify
Eduaan Albertyn
CRR 0 Retic
C05.01333-F3
Durbanville Collectors Sewers
Internal
1 EFF 2 429 233
293 601
0 -293 601
2 429 233
1 860 026
77%
-569 207
-23%
1 860 026
Other - Please specify
Eduaan Albertyn
EFF 569 207
Retic
C06.01457-F1
Bellvile North Water Supply system
Internal
1 EFF 8 755 700
3 755 700
736 019
-3 019 681
8 755 700
3 052 897
35%
-5 702 803
-65%
4 468 000
Other - Please specify
Eduaan Albertyn
EFF 5 011 488
Retic
C06.01639-F2
Retreat Rising Main - Rehab
Internal
1 EFF 1 348 518
345 203
198 883
-146 320
1 348 518
1 202 199
89%
-146 319
-11%
1 202 199
Project completed - Savings identified
Andrew Taylor
EFF 146 318
Retic
C06.01639-F3
Retreat Rising Main - Rehab
External
4 NT USDG 4 175 439
263 937
0 -263 937
4 175 439
4 100 000
98%
-75 439
-2% 4 100 000
Project completed - Savings identified
Andrew Taylor
CGD
0 Retic
C06.30147-F1
Kraaifontein WWTW
Internal
1 EFF 446 599
0 166 115
166 115
446 599
446 599
100%
0 0% 446 599
Project completed - Savings identified
Kevin Allan Samson
EFF 0 WWTW
C06.30170-F1
Bellville WWTW - EFF
Internal
1 EFF 45 741 258
8 241 258
11 999 749
3 758 491
45 741 258
45 734 753
100%
-6 505
0% 45 734 753
Project completed - Savings identified
Kevin Allan Samson
EFF 2 360 WWTW

84 | P a g e
C06.30170-F3
Bellville WWTW-USDG
External
4 NT USDG 70 066 500
18 122 303
16 290 603
-1 831 700
70 066 500
69 861 143
100%
-205 357
0% 69 861 143
Project completed - Savings identified
Kevin Allan Samson
CGD
105 357
WWTW
C06.30201-F1
Athlone WWTW - EFF
Internal
1 EFF 98 000
58 000
0 -58 000
98 000
83 241
85%
-14 759
-15%
83 241
Project completed - Savings identified
Kevin Allan Samson
EFF 14 759
WWTW
C06.30201-F3
Athlone WWTW (USDG)
External
4 NT USDG 2 637 002
439 134
50 810
-388 324
2 637 002
1 794 006
68%
-842 996
-32%
1 794 006
Project completed - Savings identified
Kevin Allan Samson
CGD
842 988
WWTW
C06.42179-F2
Protea Heights Water Sup
Internal
1 EFF 47 141
0 0 0 47 141
47 140
100%
-1 0% 47 140
Project completed - Savings identified
Eduaan Albertyn
EFF 0 Retic
C07.00047-F2
Fish Hoek Outfall Sewer
Internal
1 EFF 1 000 000
524 221
0 -524 221
1 000 000
1 000 000
100%
0 0% 1 000 000
Project completed - Savings identified
Yusuf Ebrahim
EFF 0 Retic
C07.00048-F2
Blue Route Interceptor Sewer
Internal
1 EFF 999 779
524 221
0 -524 221
999 779
149 000
15%
-850 779
-85%
999 779
Project completed - Savings identified
Yusuf Ebrahim
EFF 850 779
Retic
C07.00407-F1
Northern Area Sewer Thornton
Internal
1 EFF 10 000 000
3 857 226
143 980
-3 713 246
10 000 000
2 421 255
24%
-7 578 745
-76%
7 074 487
Project delayed due to tender appeals
Zamokuhle Chauke
EFF 7 578 745
Retic

85 | P a g e
C08.00214-F1
De Grendel Reservoir
Internal
1 EFF 16 000 000
4 000 000
4 518 751
518 751
16 000 000
12 103 879
76%
-3 896 121
-24%
16 000 000
Project delayed due to contractor/vendor underperformance / supply constraints
Eduaan Albertyn
EFF 3 896 120
Retic
C08.86023-F1
De Gendel Reservoir Link
Internal
1 EFF 1 559 731
359 931
47 938
-311 993
1 559 731
297 633
19%
-1 262 098
-81%
1 559 731
Project completed - Savings identified
Eduaan Albertyn
EFF 381 696
Retic
C08.86023-F2
De Gendel Reservoir Link
Internal
3 BICL Water:Tyg N
9 100 000
0 0 0 9 100 000
9 100 000
100%
0 0% 9 100 000
Project completed - Savings identified
Eduaan Albertyn
CRR 0 Retic
C08.86024-F1
Contermans Kloof Water Mains
Internal
1 EFF 8 627 164
696 782
0 -696 782
8 627 164
8 592 475
100%
-34 689
0% 8 592 476
Project completed - Savings identified
Eduaan Albertyn
EFF 0 Retic
C08.86027-F1
SWest Bus Park Main Sewer (lower leg)
Internal
1 EFF 78 350
0 0 0 78 350
78 350
100%
0 0% 78 350
Project completed - Savings identified
Charl Moller
EFF 0 Retic
C08.86031-F1
Provision of Sewerage to Croydon
Internal
1 EFF 4 675 824
2 280 000
1 238 245
-1 041 755
4 675 824
3 167 030
68%
-1 508 794
-32%
4 675 016
Other - Please specify
Charl Moller
EFF 1 507 986
Retic
C08.86038-F1
Main Rd Upgrade M/Berg to Clovelly Rehab
Internal
1 EFF 12 588 000
556 320
0 -556 320
12 588 000
12 588 000
100%
0 0% 12 588 000
Project completed - Savings identified
Yusuf Ebrahim
EFF 0 Retic

86 | P a g e
C09.86008-F1
Ruyterwacht Midblock Water Pipes
Internal
1 EFF 3 000 000
219 458
0 -219 458
3 000 000
3 000 000
100%
0 0% 3 000 000
Project completed - Savings identified
Zamokuhle Chauke
EFF 0 Retic
C09.86014-F1
Pump Station & Rising Main Du Noon
Internal
1 EFF 1 075 000
400 000
0 -400 000
1 075 000
392 715
37%
-682 285
-63%
1 075 000
Project completed - Savings identified
Eduaan Albertyn
EFF 682 285
Retic
C09.86014-F2
Pump Station & Rising Main Du Noon
External
4 NT USDG 7 925 000
2 925 000
1 205 691
-1 719 309
7 925 000
2 876 771
36%
-5 048 229
-64%
7 925 000
Project completed - Savings identified
Eduaan Albertyn
CGD
5 048 229
Retic
C09.86015-F1
Rehab Outfall Sewers Pentz Sandrift m/qu
Internal
1 EFF 1 200 000
800 000
0 -800 000
1 200 000
0 0% -1 200 000
-100
%
318 123
Other - Please specify
Eduaan Albertyn
EFF 1 200 000
Retic
C10.82001-F1
Cape Flats #1 Rehabilitation
Internal
1 EFF 500 000
0 60 000
60 000
500 000
497 392
99%
-2 608
-1% 497 392
Project completed - Savings identified
Yusuf Ebrahim
EFF 0 Retic
C10.82002-F1
Cape Flats #2 Rehabilitation
Internal
1 EFF 433 101
0 0 0 433 101
433 101
100%
0 0% 433 101
Project completed - Savings identified
Yusuf Ebrahim
EFF 0 Retic
C10.86066-F2
Khayelitsha Driftsands Site C
External
4 NT USDG 10 127 665
1 360 014
116 978
-1 243 036
10 127 665
6 814 096
67%
-3 313 569
-33%
6 814 096
Project delayed due to contractor/vendor underperformance / supply constraints
Tertius De Jager
CGD
3 313 568
Retic

87 | P a g e
C10.86118-F2
Treated Effluent Re-use
External
4 STATE DEPT: DWAF
0 0 0 0 0 -43 883
0% -43 883
0% 0 Other - Please specify
Collin Mubadiro
CGD
0 WDM
C10.86130-F1
Regional resources development
Internal
1 EFF 5 355 584
1 321 879
347 713
-974 166
5 355 584
4 381 419
82%
-974 165
-18%
5 261 247
Project completed - Savings identified
Nigel Ireland
EFF 400 613
Retic
C10.86132-F1
Remove midblock water network-Bishop Lav
Internal
1 EFF 1 908 951
425 651
0 -425 651
1 908 951
762 604
40%
-1 146 347
-60%
1 152 493
Project delayed due to departmental capacity constraints
Zamokuhle Chauke
EFF 389 888
Retic
C11.86059-F3
Sandtrap Bridgetown Sewer Pump Station
External
4 NT USDG 14 600 000
3 058 572
1 778 912
-1 279 660
14 600 000
10 719 549
73%
-3 880 451
-27%
14 484 075
Project completed - Savings identified
Zamokuhle Chauke
CGD
3 764 526
Retic
C11.86063-F3
Potsdam WWTW - Extension (USDG)
External
4 NT USDG 1 720 171
46 434
0 -46 434
1 720 171
1 720 171
100%
0 0% 1 720 171
Project completed - Savings identified
Kevin Allan Samson
CGD
0 WWTW
C11.86077-F2
Bulk Water Augmentation Scheme (CRR)
Internal
3 AFF: Water
1 700 000
935 076
0 -935 076
1 700 000
65 124
4% -1 634 876
-96%
65 124
Other - Please specify
Kevin Balfour
CRR 934 876
BW
C12.86002-F2
Repl&Upgr Sew Pumps Citywide
Internal
1 EFF 729 208
160 000
32 582
-127 419
729 208
632 276
87%
-96 932
-13%
705 788
Project completed - Savings identified
Brian Andrew Thomson
EFF 73 511
Retic
C12.86004-F2
Replace & Upgrade Water Network
Internal
1 EFF 0 0 0 0 0 -2 832
0% -2 832
0% 0 Other - Please specify
Albertus Johannes Louw
EFF 0 Retic
C12.86008-F2
Infrastructure Replace/Refurbish - WWT
External
4 NT USDG 7 285 100
1 243 875
1 524 419
280 544
7 285 100
6 328 567
87%
-956 533
-13%
6 328 567
Project completed - Savings identifie
Kevin Allan Samson
CGD
222 444
WWTW

88 | P a g e
d
C12.86019-F2
TMS Aquifer Deep Borehole
Internal
1 EFF 3 550 000
754 091
761 289
7 198
3 550 000
3 275 900
92%
-274 100
-8% 3 550 000
Other - Please specify
Paul Rhode EFF 274 100
BW
C12.86033-F1
Tools & Equipment (Mech)
Internal
1 EFF 0 0 0 0 0 -1 694
0% -1 694
0% -1 694
Bert Correia
EFF 0 EAM
C12.86046-F1
Water Meters External
4 PRIVATE SECTOR FIN
0 0 0 0 0 -7 0% -7 0% 0 Other - Please specify
Mogamat Nazeem Marlie
CGD
0 Retic
C12.86046-F2
Water Meters (EFF) Internal
1 EFF 0 0 0 0 0 -85 0% -85 0% 0 Other - Please specify
Mogamat Nazeem Marlie
EFF 0 Retic
C12.86075-F1
Northern Regional Sludge Facility
Internal
1 EFF 1 000 000
500 000
15 000
-485 000
1 000 000
973 148
97%
-26 852
-3% 973 148
Project completed - Savings identified
Kevin Allan Samson
EFF 26 852
WWTW
C12.86079-F1
EAM Depot Realignment - 5 Nodal System
Internal
1 EFF 41 449 457
15 994 728
2 665 667
-13 329 061
41 449 457
13 509 093
33%
-27 940 364
-67%
23 000 000
Project delayed due to contractor/vendor underperformance / supply constraints
Bert Correia
EFF 27 937 992
EAM
C12.86082-F1
Water Supply at Baden Powell Dr to Khaye
External
4 NT USDG 400 000
0 0 0 400 000
0 0% -400 000
-100
%
0 Other - Please specify
Tertius De Jager
CGD
0 Retic
C12.86083-F1
New Rest Reticulation Rectification
External
4 NT USDG 1 500 000
0 0 0 1 500 000
120 573
8% -1 379 427
-92%
1 500 000
Project delayed due to way leave approvals
Albertus Johannes Louw
CGD
1 379 427
Retic

89 | P a g e
C12.86084-F1
Completion of Langa Collector Sewer
External
4 NT USDG 500 000
0 228 254
228 254
500 000
499 907
100%
-93 0% 499 907
Project completed - Savings identified
Albertus Johannes Louw
CGD
93 Retic
C12.86090-F1
BlacMac Sewer: Upgrade sewer diversion
External
4 PROV HOUSE DEV BRD
3 000 000
1 500 000
0 -1 500 000
3 000 000
0 0% -3 000 000
-100
%
0 Project delayed due to tender appeals
Rajan Moodley
CGD
0 WWTW
C12.86091-F1
Borchards Quarry WWTW
External
4 NT USDG 1 150 000
0 109 375
109 375
1 150 000
840 732
73%
-309 268
-27%
840 732
Project completed - Savings identified
Kevin Allan Samson
CGD
283 127
WWTW
C12.86092-F1
Cape Flats WWTW External
4 NT USDG 995 865
300 000
320 408
20 408
995 865
995 770
100%
-95 0% 995 865
Project completed - Savings identified
Kevin Allan Samson
CGD
95 WWTW
C12.86096-F1
Macassar WWTW Extension (USDG)
External
4 NT USDG 9 328 500
2 966 701
3 160 392
193 691
9 328 500
9 256 510
99%
-71 990
-1% 9 256 510
Project completed - Savings identified
Kevin Allan Samson
CGD
71 990
WWTW
C12.86100-F1
Water Meter Reading equipment
Internal
1 EFF 6 000 000
508 530
0 -508 530
6 000 000
5 899 010
98%
-100 990
-2% 5 899 010
Project completed - Savings identified
Albertus Van Zyl Saayman
EFF 0 Fin
C12.86103-F1
Scottsdene : Reticulation Network
External
4 NT USDG 15 832 849
3 250 850
0 -3 250 850
15 832 849
15 832 849
100%
0 0% 15 832 849
Project completed - Savings identified
Robert Vere Johnston
CGD
0 Retic
C12.86141-F1
Bulk Water Infrastructure Replacement
Internal
1 EFF 79 004
0 0 0 79 004
79 004
100%
0 0% 79 004
Kevin Balfour
EFF 0 BW

90 | P a g e
C12.95018-F1
Treated Effluent: Reuse & Inf Upgrades
Internal
1 EFF 4 747 109
998 021
1 887 590
889 569
4 747 109
3 133 798
66%
-1 613 311
-34%
4 585 707
Project completed - Savings identified
Collin Mubadiro
EFF 1 613 311
WDM
C12.96004-F1
Pressure Management: COCT
Internal
1 EFF 57 253
0 0 0 57 253
57 253
100%
0 0% 57 253
Project completed - Savings identified
Collin Mubadiro
EFF 0 WDM
C13.00021-F1
Zone Metering Internal
1 EFF 1 240 000
280 451
287 125
6 674
1 240 000
317 674
26%
-922 326
-74%
887 970
Project completed - Savings identified
Jacobus De Bruyn
EFF 887 970
WDM
C13.00023-F1
Logger Installations Internal
1 EFF 1 500 000
500 000
846 716
346 716
1 500 000
1 036 336
69%
-463 664
-31%
1 036 336
Project completed - Savings identified
Jacobus De Bruyn
EFF 175 439
WDM
C13.00024-F1
Information System Server
Internal
1 EFF 125 000
25 000
60 523
35 523
125 000
60 523
48%
-64 477
-52%
60 523
Project delayed due to contractor/vendor underperformance / supply constraints
Jacobus De Bruyn
EFF 16 055
WDM
C13.00025-F1
Electronic Drawing Equipment: Additional
Internal
1 EFF 300 000
80 000
0 -80 000
300 000
0 0% -300 000
-100
%
264 670
Project completed - Savings identified
Jacobus De Bruyn
EFF 264 670
WDM
C13.86000-F1
Replacement of Plant & Equipment (EAMS)
Internal
1 EFF 5 060 000
1 110 000
2 792 800
1 682 800
5 060 000
4 985 447
99%
-74 553
-1% 4 985 447
Project completed - Savings
Bert Correia
EFF 73 084
EAM

91 | P a g e
identified
C13.86011-F1
Replacement of Vehicles (EAMS)
Internal
1 EFF 25 000 000
6 769 429
3 787 271
-2 982 158
25 000 000
24 595 838
98%
-404 162
-2% 24 595 838
Project completed - Savings identified
Bert Correia
EFF 0 EAM
C13.86014-F1
Furniture, Tools, Equip: Additional EAMS
Internal
1 EFF 196 000
0 31 616
31 616
196 000
148 432
76%
-47 568
-24%
158 200
Project completed - Savings identified
Bert Correia
EFF 8 084 EAM
C13.86022-F1
Refurbishment of Labs
Internal
1 EFF 500 000
100 000
64 884
-35 116
500 000
477 726
96%
-22 274
-4% 477 726
Project completed - Savings identified
David Epstein
EFF 21 425
SS
C13.86036-F1
Furniture & Equipment (IT): Additional
Internal
1 EFF 1 000 000
233 386
202 700
-30 686
1 000 000
751 245
75%
-248 755
-25%
751 245
Project delayed due to contractor/vendor underperformance / supply constraints
Ashraf Arendse
EFF 185 182
SPT
C13.86037-F1
Furniture,Tools, Equipme: Additional WDM
Internal
1 EFF 110 000
20 000
22 209
2 209
110 000
22 209
20%
-87 791
-80%
22 209
Other - Please specify
Collin Mubadiro
EFF 39 080
WDM
C13.86040-F1
Informal Incremental Areas Upgrade
Internal
1 EFF 20 160 840
4 951 471
1 830 638
-3 120 833
20 160 840
9 907 425
49%
-10 253 415
-51%
19 339 878
Project delayed due to labour problems
Tertius De Jager
EFF 9 146 793
Retic
C13.86041-F1
Bulk Water Infrastructure Replacement
Internal
1 EFF 15 000 000
4 305 975
2 244 677
-2 061 298
15 000 000
12 495 820
83%
-2 504 180
-17%
15 000 000
Other - Please specify
Kevin Balfour
EFF 2 437 613
BW

92 | P a g e
C13.86043-F1
Laboratory Equipment: Additional
Internal
1 EFF 3 195 700
399 791
2 170 632
1 770 841
3 195 700
2 672 555
84%
-523 145
-16%
3 195 700
Project completed - Savings identified
David Epstein
EFF 523 145
SS
C13.86046-F1
Replace &Upgr Sew Pumpstns (citywide)
Internal
1 EFF 7 500 000
1 628 578
267 886
-1 360 692
7 500 000
4 092 093
55%
-3 407 907
-45%
7 469 542
Project completed - Savings identified
Brian Andrew Thomson
EFF 3 377 449
Retic
C13.86047-F1
Replace & Upgr Sewer Network (Citywide)
Internal
1 EFF 37 923 547
18 904 238
6 426 731
-12 477 507
37 923 547
25 446 040
67%
-12 477 507
-33%
37 258 111
Project completed - Savings identified
Nigel Ireland
EFF 11 356 044
Retic
C13.86048-F1
Replace & Upgr Water Network (citywide)
Internal
1 EFF 71 511 946
12 859 811
8 199 406
-4 660 405
71 511 946
62 303 592
87%
-9 208 354
-13%
69 934 696
Project completed - Savings identified
Albertus Johannes Louw
EFF 6 270 339
Retic
C13.86048-F2
Replace & Upgrade Water Network (USDG)
External
4 NT USDG 4 000 000
813 956
0 -813 956
4 000 000
3 580 646
90%
-419 354
-10%
3 580 646
Project completed - Savings identified
Tertius De Jager
CGD
418 303
Retic
C13.86050-F1
TOC Infrastructure Development
Internal
1 EFF 4 500 000
4 484 498
16 995
-4 467 503
4 500 000
32 497
1% -4 467 503
-99%
32 497
Project delayed due to contractor/vendor underperformance / supply constraints
John Potgieter
EFF 4 393 514
Retic
C13.86053-F1
Completion of Cape Flats III Bulk Sewer
External
4 NT USDG 3 370 879
2 570 879
163 747
-2 407 132
3 370 879
728 092
22%
-2 642 787
-78%
728 092
Other - Please specify
Nigel Ireland
CGD
2 642 787
Retic

93 | P a g e
C13.86053-F2
Completion of Cape Flats III Bulk Sewer
Internal
1 EFF 1 000 000
0 0 0 1 000 000
1 000 000
100%
0 0% 1 000 000
Project completed - Savings identified
Nigel Ireland
EFF 0 Retic
C13.86055-F1
Replacement Of Plant and Equipment BW
Internal
1 EFF 150 000
6 858
2 099
-4 759
150 000
132 287
88%
-17 713
-12%
132 287
Project completed - Savings identified
Vernon Marinus
EFF 0 BW
C13.86056-F1
Plant and Equipment Additional
Internal
1 EFF 500 000
20 648
0 -20 648
500 000
499 252
100%
-748 0% 499 252
Project completed - Savings identified
Vernon Marinus
EFF 0 BW
C13.86058-F1
Tools and Equipment: Additional
Internal
1 EFF 800 000
0 174 500
174 500
800 000
479 299
60%
-320 701
-40%
479 299
Project delayed due to tender appeals
Bert Correia
EFF 0 EAM
C13.86065-F1
Tools & Equipment: Additional (Mech)
Internal
1 EFF 2 325 000
1 174 342
317 869
-856 473
2 325 000
1 526 925
66%
-798 075
-34%
2 289 079
Project completed - Savings identified
Bert Correia
EFF 140 975
EAM
C13.86067-F1
Tools & Equipment: Additional (PCS)
Internal
1 EFF 253 000
0 0 0 253 000
37 842
15%
-215 158
-85%
43 635
Project delayed due to tender appeals
Bert Correia
EFF 5 794 EAM
C13.86069-F1
Pressure Management: COCT
Internal
1 EFF 16 000 000
4 500 000
3 116 477
-1 383 523
16 000 000
11 751 094
73%
-4 248 906
-27%
15 680 000
Project completed - Savings identified
Collin Mubadiro
EFF 4 016 987
WDM
C13.86072-F1
Infrastructure Replace/Refurbish - WWT
Internal
1 EFF 26 144 755
8 360 954
3 000 244
-5 360 710
26 144 755
22 551 842
86%
-3 592 913
-14%
22 551 842
Project completed - Savings identified
Kevin Allan Samson
EFF 1 052 072
WWTW
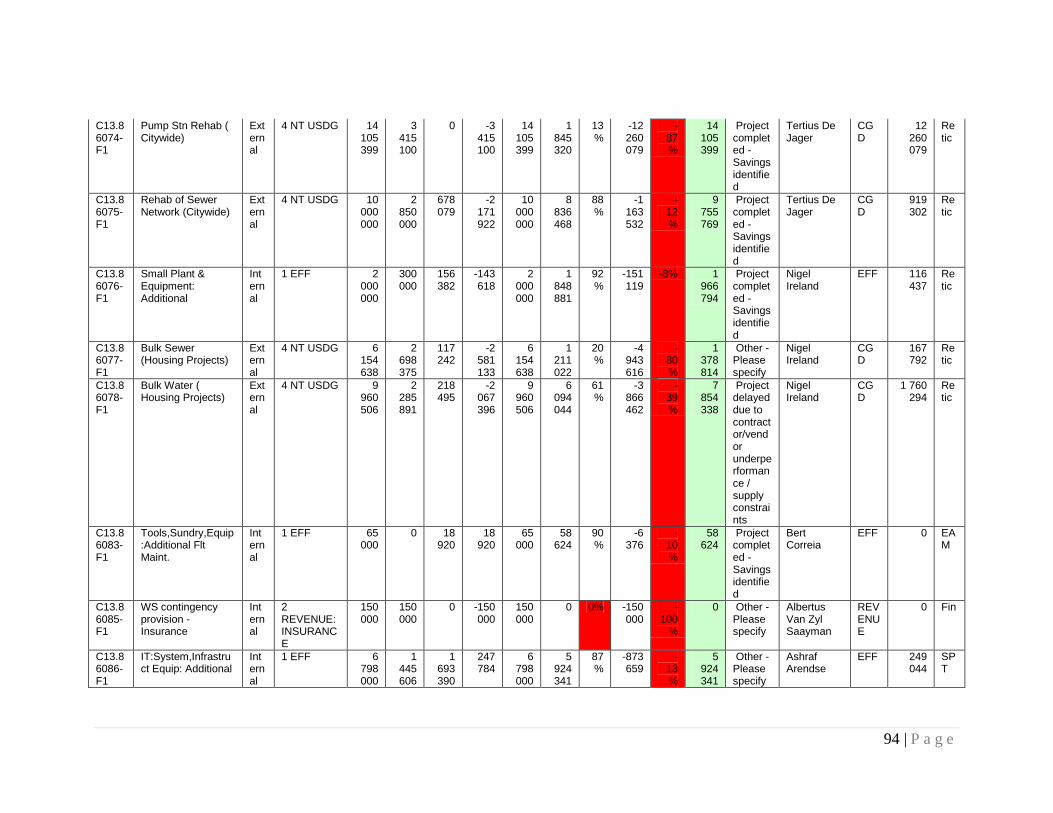
94 | P a g e
C13.86074-F1
Pump Stn Rehab ( Citywide)
External
4 NT USDG 14 105 399
3 415 100
0 -3 415 100
14 105 399
1 845 320
13%
-12 260 079
-87%
14 105 399
Project completed - Savings identified
Tertius De Jager
CGD
12 260 079
Retic
C13.86075-F1
Rehab of Sewer Network (Citywide)
External
4 NT USDG 10 000 000
2 850 000
678 079
-2 171 922
10 000 000
8 836 468
88%
-1 163 532
-12%
9 755 769
Project completed - Savings identified
Tertius De Jager
CGD
919 302
Retic
C13.86076-F1
Small Plant & Equipment: Additional
Internal
1 EFF 2 000 000
300 000
156 382
-143 618
2 000 000
1 848 881
92%
-151 119
-8% 1 966 794
Project completed - Savings identified
Nigel Ireland
EFF 116 437
Retic
C13.86077-F1
Bulk Sewer (Housing Projects)
External
4 NT USDG 6 154 638
2 698 375
117 242
-2 581 133
6 154 638
1 211 022
20%
-4 943 616
-80%
1 378 814
Other - Please specify
Nigel Ireland
CGD
167 792
Retic
C13.86078-F1
Bulk Water ( Housing Projects)
External
4 NT USDG 9 960 506
2 285 891
218 495
-2 067 396
9 960 506
6 094 044
61%
-3 866 462
-39%
7 854 338
Project delayed due to contractor/vendor underperformance / supply constraints
Nigel Ireland
CGD
1 760 294
Retic
C13.86083-F1
Tools,Sundry,Equip:Additional Flt Maint.
Internal
1 EFF 65 000
0 18 920
18 920
65 000
58 624
90%
-6 376
-10%
58 624
Project completed - Savings identified
Bert Correia
EFF 0 EAM
C13.86085-F1
WS contingency provision - Insurance
Internal
2 REVENUE: INSURANCE
150 000
150 000
0 -150 000
150 000
0 0% -150 000
-100
%
0 Other - Please specify
Albertus Van Zyl Saayman
REVENUE
0 Fin
C13.86086-F1
IT:System,Infrastruct Equip: Additional
Internal
1 EFF 6 798 000
1 445 606
1 693 390
247 784
6 798 000
5 924 341
87%
-873 659
-13%
5 924 341
Other - Please specify
Ashraf Arendse
EFF 249 044
SPT

95 | P a g e
C13.86088-F1
Stormwater Ingress Systems (WDM)
Internal
1 EFF 470 000
100 000
338 237
238 237
470 000
464 857
99%
-5 143
-1% 464 857
Project completed - Savings identified
Collin Mubadiro
EFF 0 WDM
C13.86090-F1
Informal settlements water installations
Internal
1 EFF 2 000 000
500 000
62 964
-437 036
2 000 000
719 131
36%
-1 280 869
-64%
2 000 000
Project completed - Savings identified
Tertius De Jager
EFF 1 270 188
Retic
C13.86091-F1
Water Meters (Retic)
Internal
1 EFF 1 200 000
700 000
692 041
-7 959
1 200 000
1 091 169
91%
-108 831
-9% 1 200 000
Project completed - Savings identified
Mogamat Nazeem Marlie
EFF 0 Retic
C13.86091-F2
Water Meters (Retic)
External
4 PRIVATE SECTOR FIN
10 000 000
822 461
150 069
-672 392
10 000 000
9 856 201
99%
-143 799
-1% 10 000 000
Project completed - Savings identified
Mogamat Nazeem Marlie
CGD
44 218
Retic
C13.86092-F2
Development of Additional Infrastructure
Internal
3 AFF: Water
9 235 000
2 784 073
2 447 164
-336 909
9 235 000
7 116 619
77%
-2 118 381
-23%
7 900 000
Other - Please specify
Kevin Balfour
CRR 1 445 345
BW
C13.86094-F1
Upgrading of Sewer Connection Erf 267
Internal
3 AFF:WardAllocation
130 000
0 0 0 130 000
130 000
100%
0 0% 130 000
Project completed - Savings identified
Randall John Josephs
CRR 0 Retic
C13.86096-F1
Water Projects as per Master Plan
Internal
1 EFF 6 000 000
823 992
440 995
-382 997
6 000 000
5 792 884
97%
-207 116
-3% 5 797 686
Project completed - Savings identified
Nigel Ireland
EFF 0 Retic
C13.86097-F1
Replacement of Radio
Internal
2 REVENUE: INSURANCE
7 139
0 0 0 7 139
0 0% -7 139
-100
%
0 Project completed - Savings identified
Eduaan Albertyn
REVENUE
0 Retic

96 | P a g e
C13.86098-F1
Completion of Market Facility (Ward 97)
Internal
3 AFF:WardAllocation
61 630
30 630
0 -30 630
61 630
0 0% -61 630
-100
%
61 630
Project completed - Savings identified
Tertius De Jager
CRR 61 553
Retic
C13.95014-F1
Treated Effluent: Infrastructure Upgrade
Internal
1 EFF 13 850 000
5 286 788
3 541 690
-1 745 098
13 850 000
10 006 326
72%
-3 843 674
-28%
13 503 750
Project completed - Savings identified
Collin Mubadiro
EFF 3 843 674
WDM
68934727
1
62291783
5

97 | P a g e
15. NON-FINANCIAL PERFORMANCE Table 43: 2012/2013 Water and Sanitation Department SDBIP – 4
th Quarter performance