Embed Size (px)
Citation preview

February 21, 2013
(Revised June 10, 2013)
Phase1:CommercialMarketSupplyandDemandAnalysis
CityofBurlingtonOfficialPlanReview– CommercialStrategyStudy
February21,2013
Ms.AndreaSmith,MCIP,RPPSeniorPlanner–Policy,PlanningandBuildingDepartmentCityofBurlington426BrantStreetBurlington,OntarioL7R3Z6
DearMs.Smith:
Re:CommercialStrategyStudy(Phase1:CommercialMarketSupplyandDemandAnalysis)
urbanMetricsinc.ispleasedtosubmitourCommercialMarketSupplyandDemandAnalysisreporttotheCityofBurlington,whichprovidesasummaryofourfindingsastheyrelatetothesupplyofandfuturedemandforcommercialfacilitiesthroughouttheCityto2031.ThisbackgroundreporthasbeenpreparedaspartoftheCityofBurlington’sbroaderOfficialPlanReviewCommercialStrategyStudy,whichisbeingundertakenjointlybyurbanMetricsinc.andThePlanningPartnership,plusstafffromtheCityofBurlington’sPlanningandBuildingDepartment.
TheprimarypurposeofthisreportistoprovidecommercialmarketanalysistotheCityofBurlingtontoguidetheformationoffuturecommerciallandusepolicyrecommendations.Inparticular,thisreportquantifiesthefutureretailandservicecommercialspacerequirementsintheCityofBurlingtonto2031,andprovidesrecommendationsastohowfuturespacecanbeaccommodatedwithintheurbansystem.

Theanalysesandappendicesintheattachedreportprovideourdetailedstudyfindingsandconclusions.Thesefindingsandconclusionsrepresentourbestjudgement,basedontheinformationthatwasavailabletousatthetimeofourresearch.Accordingly,thefindings,conclusions,projections,andrecommendationspresentedhereinshouldbereviewedandinterpretedwithreferencetoevolvingcircumstancesandeconomicconditions.
IthasbeenapleasureconductingthispartoftheassignmentonbehalfoftheCityofBurlington,andwelookforwardtodiscussingourresults.
Yourstruly,urbanMetrics inc. RowanF.J.Faludi,CMC,MCIP,RPP,PLEPartner416‐351‐[email protected]
CityofBurlington–OfficialPlanReviewCommercialStrategyStudy(Phase1:CommercialMarketSupplyandDemandAnalysis)
TABLE OF CONTENTS
EXECUTIVESUMMARY................................................................................................................................................................................................I
1 INTRODUCTION....................................................................................................................................................................................................1 1.1 BACKGROUND...................................................................................................................................................................................................................................................1 1.2 STUDYOBJECTIVES.........................................................................................................................................................................................................................................2 1.3 2003OFFICIALPLANREVIEWRETAILCOMMERCIALSTUDY................................................................................................................................................................3 1.4 APPROACH........................................................................................................................................................................................................................................................4 1.5 ASSUMPTIONS..................................................................................................................................................................................................................................................7
2 CITYOFBURLINGTON–GEOGRAPHYANDDEMOGRAPHICCHARACTERISTICS...........................................................................9 2.1 LOCATIONALCHARACTERISTICS...................................................................................................................................................................................................................9 2.1.1 Regionalcontext...............................................................................................................................................................................................................................................9 2.1.2 InternalTransportation............................................................................................................................................................................................................................10
2.2 DEMOGRAPHICCHARACTERISTICS............................................................................................................................................................................................................11 2.2.1 HistoricandForecastPopulationGrowth.........................................................................................................................................................................................11 2.2.2 AgeStructure..................................................................................................................................................................................................................................................13 2.2.3 IncomeStructure..........................................................................................................................................................................................................................................14 2.2.4 Ethnicity............................................................................................................................................................................................................................................................16 2.2.5 FamilyStructure...........................................................................................................................................................................................................................................17 2.2.6 HistoricandForecastEmploymentGrowth.....................................................................................................................................................................................18
3 RETAILSTRUCTURE.........................................................................................................................................................................................19 3.1 INVENTORY....................................................................................................................................................................................................................................................19 3.2 INVENTORYOFVACANTSPACE..................................................................................................................................................................................................................27 3.3 CHANGEINCOMMERCIALSPACESINCE2002........................................................................................................................................................................................29 3.4 COMMERCIALSPACEPERCAPITA.............................................................................................................................................................................................................32 3.5 INVENTORYINRELATIONTOTHEACTIVETRANSPORTATIONNETWORK.........................................................................................................................................37 3.5.1 TransitAccessibility.....................................................................................................................................................................................................................................37 3.5.2 Walkability.......................................................................................................................................................................................................................................................37 3.5.3 CyclingandRecreationTrailNetwork...............................................................................................................................................................................................37
3.6 POTENTIALFUTURECOMMERCIALDEVELOPMENTS.............................................................................................................................................................................42

CityofBurlington–OfficialPlanReviewCommercialStrategyStudy(Phase1:CommercialMarketSupplyandDemandAnalysis)
3.7 COMPETITIVERETAILFACILITIESOUTSIDEBURLINGTON....................................................................................................................................................................47
4 THECITYOFBURLINGTON’STRADEAREA..............................................................................................................................................49 4.1 TRADEAREADEFINED................................................................................................................................................................................................................................49 4.1.1 LicencePlateSurveys..................................................................................................................................................................................................................................49 4.1.2 DowntownSurveyOrigins........................................................................................................................................................................................................................53
4.2 BURLINGTONTRADEAREA........................................................................................................................................................................................................................55 4.3 TRADEAREAPOPULATIONPROJECTIONS................................................................................................................................................................................................59 4.4 TRADEAREAINCOMELEVELS...................................................................................................................................................................................................................61 4.5 TRADEAREAEXPENDITURES.....................................................................................................................................................................................................................61 4.5.1 PerCapitaNon‐FoodStoreRetail(NFSR)Expenditures............................................................................................................................................................62 4.5.2 PerCapitaFoodStoreRetail(FSR)Expenditures.........................................................................................................................................................................64
5 BURLINGTONRESIDENTSSHOPPINGPATTERNS..................................................................................................................................66 5.1 DISTRIBUTIONOFBURLINGTONRESIDENTS’EXPENDITURES(2012)..............................................................................................................................................66 5.2 ONLINESHOPPING.......................................................................................................................................................................................................................................70
6 COMMERCIALTRENDS....................................................................................................................................................................................72 6.1 POWERCENTRESANDLARGEFORMATRETAILERS...............................................................................................................................................................................73 6.2 THEBROADENINGOFSHOPPINGCENTREMERCHANDISING...............................................................................................................................................................75 6.3 NEWDEVELOPMENTCONCEPTS...............................................................................................................................................................................................................75 6.3.1 LifestyleandHybridCentres....................................................................................................................................................................................................................75 6.3.2 NewUrbanism................................................................................................................................................................................................................................................78 6.3.3 OutletCentres.................................................................................................................................................................................................................................................80
6.4 FOREIGNRETAILERS–THEUSINVASION................................................................................................................................................................................................82 6.5 BLURRINGOFTHERETAILHIERARCHY....................................................................................................................................................................................................83 6.6 NON‐STORERETAILING..............................................................................................................................................................................................................................84 6.7 ACTIVE/TRANSITORIENTEDCOMMERCIALDEVELOPMENT...............................................................................................................................................................85 6.8 SUMMARY......................................................................................................................................................................................................................................................86
7 BURLINGTONRESIDENTSRETAILDESIRESANDPREFERENCES.....................................................................................................88 7.1 BURLINGTONRESIDENTS’PERCEPTIONSOFBURLINGTONSHOPPINGFACILITIES..........................................................................................................................88 7.2 BURLINGTONRESIDENTS’PERCEPTIONSOFDOWNTOWNBURLINGTON..........................................................................................................................................89
CityofBurlington–OfficialPlanReviewCommercialStrategyStudy(Phase1:CommercialMarketSupplyandDemandAnalysis)
8 ROLEOFDOWNTOWNBURLINGTON.........................................................................................................................................................94 8.1 DOWNTOWNTRADEAREA..........................................................................................................................................................................................................................98
9 FUTUREWARRANTEDSPACEANALYSIS.................................................................................................................................................101 9.1 FOODSTORERETAILEXPENDITUREANALYSIS....................................................................................................................................................................................102 9.1.1 CItyofBurlingtonShare.........................................................................................................................................................................................................................102 9.1.2 ResidualExpenditurePotentialfromBurlingtonResidents..................................................................................................................................................102 9.1.3 MarketOpportunityforFSRSpace....................................................................................................................................................................................................102
9.2 NON‐FOODSTORERETAILEXPENDITUREANALYSIS..........................................................................................................................................................................103 9.2.1 CItyofBurlingtonandSecondaryTradeAreaShares..............................................................................................................................................................104 9.2.2 ResidualExpenditurePotentialfromTradeAreaResidents.................................................................................................................................................104 9.2.3 MarketOpportunityforNFSRSpace................................................................................................................................................................................................106
9.3 OTHERSELECTEDRETAILANDSERVICESPACEPOTENTIAL.............................................................................................................................................................106 9.4 SUMMARYOFADDITIONALWARRANTEDCOMMERCIALSPACE........................................................................................................................................................108
10 DOWNTOWNMARKETANALYSIS..............................................................................................................................................................110 10.1 DOWNTOWNPRIMARYTRADEAREAPOPULATIONGROWTH...............................................................................................................................................................110 10.2 PROJECTEDFUTUREWARRANTEDSPACEINTHEDOWNTOWN........................................................................................................................................................111 10.2.1 Non‐FoodStoreRetailAnalysis...........................................................................................................................................................................................................111 10.2.2 FoodStoreRetailAnalysis.....................................................................................................................................................................................................................113 10.2.3 ServicesandSelectedretailSpaceAnalysis...................................................................................................................................................................................115 10.2.4 DowntownWarrantedSpaceSummary.........................................................................................................................................................................................116
11 SUPPLYANDDEMANDRECONCILIATION...............................................................................................................................................117
12 CONCLUSIONS...................................................................................................................................................................................................119
APPENDIXA–LICENCEPLATESURVEYRESULTS.......................................................................................................................................123
APPENDIXB–ONLINE/TELEPHONECONSUMERSURVEYRESULTS....................................................................................................132
APPENDIXC–INVENTORYOFCOMMERCIALSPACE.................................................................................................................................159
APPENDIXD–BACKGROUNDDATAANDDEFINITIONOFTERMS........................................................................................................161

CityofBurlington–OfficialPlanReviewCommercialStrategyStudy(Phase1:CommercialMarketSupplyandDemandAnalysis)
L I ST OF F IGURES FigureES‐1:SummaryofFutureWarrantedSpaceinBurlington(2012‐2031)..............................................................................................................................vi FigureES‐2:SummaryofSupplyandDemandReconciliation...............................................................................................................................................................vii Figure2‐1:CityofBurlingtonRegionalContext.............................................................................................................................................................................................9 Figure2‐2BurlingtonStreetNetwork.............................................................................................................................................................................................................10 Figure2‐3:HistoricPopulation,CityofBurlington(2006‐2011).........................................................................................................................................................12 Figure2‐4:ForecastPopulation,HaltonRegionMunicipalities(2011‐2031)................................................................................................................................12 Figure2‐5:CityofBurlingtonAgeDistribution(2006–2011).............................................................................................................................................................13 Figure2‐6:PerCapitaIncome,HaltonRegionMunicipalities(2006)................................................................................................................................................14 Figure2‐7:PerCapitaIncomeIndextoProvincebyDisseminationArea,CItyofBurlington(2006)..................................................................................15 Figure2‐8:Top5EthnicOrigins,CityofBurlington(2006)...................................................................................................................................................................16 Figure2‐9:FamilyStructure,CItyofBurlington(2011)..........................................................................................................................................................................17 Figure2‐10:PersonsandChildrenperFamily,HaltonRegion(2011)..............................................................................................................................................17 Figure2‐11:HistoricandForecastEmployment,HaltonRegionMunicipalities(2011‐2031)...............................................................................................18 Figure3‐1:BurlingtonCommercialSpaceInventory(squarefeet).....................................................................................................................................................20 Figure3‐2:BurlingtonCommercialSpaceInventoryLocations...........................................................................................................................................................21 Figure3‐3:BurlingtonMajorCommercialStructure.................................................................................................................................................................................22 Figure3‐4:SupermarketChainRepresentationinBurlington..............................................................................................................................................................23 Figure3‐5:SupermarketsinBurlington.........................................................................................................................................................................................................25 Figure3‐6:TwoKilometreDistanceAroundSupermarkets..................................................................................................................................................................26 Figure3‐7:VacantSpaceSummary...................................................................................................................................................................................................................28 Figure3‐8:CityofBurlingtonChangeinCommercialSpace2002‐2012(squarefeet)...............................................................................................................31 Figure3‐9:CityofBurlingtonPerCapitaCommercialSpace.................................................................................................................................................................34 Figure3‐10:PerCapitaRetailSpaceinSelectedGTAMunicipalities.................................................................................................................................................35 Figure3‐11:PerCapitaFoodServicesandDrinkingSpaceinSelectedGTAMunicipalities.....................................................................................................36 Figure3‐12:BurlingtonTransitRouteMap...................................................................................................................................................................................................39 Figure3‐13:400MetreRadiusAroundSupermarkets.............................................................................................................................................................................40 Figure3‐14:MajorretailnodesandBurlington’sCycle/Trailnetwork............................................................................................................................................41 Figure3‐15:PotentialFutureCommercialDevelopments......................................................................................................................................................................44 Figure3‐16:LocationofPotentialFutureCommercialDevelopments..............................................................................................................................................46 Figure4‐1:CityofBurlingtonLicencePlateSurveyResults,MapofCustomerOrigins..............................................................................................................51 Figure4‐2:CityofBurlingtonLicencePlateSurveyResults,CustomerOriginDistribution.....................................................................................................52 Figure4‐3:DowntownBurlingtonOn‐StreetInterceptSurveyResults,RespondentOriginDistribution.........................................................................53

CityofBurlington–OfficialPlanReviewCommercialStrategyStudy(Phase1:CommercialMarketSupplyandDemandAnalysis)
Figure4‐4:DowntownBurlingtonOn‐StreetInterceptSurveyResults,MapofRespondentOrigins..................................................................................54 Figure4‐5:CityofBurlingtonTradeArea......................................................................................................................................................................................................56 Figure4‐6:2003and2012BurlingtonTradeareas...................................................................................................................................................................................58 Figure4‐7:CityofBurlingtonTradeArea,HistoricandForecastPopulation(2006‐2031).....................................................................................................60 Figure4‐8:CityofBurlingtonTradeArea,PerCapitaIncomeLevels(2006).................................................................................................................................61 Figure4‐9:CityofBurlingtonTradeArea,PerCapitaNFSRExpenditurePotential....................................................................................................................63 Figure4‐10:CityofBurlingtonTradeArea,PerCapitaFSRExpenditurePotential.....................................................................................................................65 Figure5‐1:Online/TelephoneConsumerSurvey,MajorRetailNodes..............................................................................................................................................68 Figure5‐2:DistributionofBurlingtonResidents’ExpendituresbyREtailArea&StoreCategory(NFSR)........................................................................69 Figure5‐3:DistributionofBurlingtonResidents’ExpendituresbyREtailArea&StoreCategory(FSR+Restaurants)..............................................70 Figure5‐5:DistributionofOnlineExpendituresbyCategory(ValueofExpenditures)..............................................................................................................71 Figure5‐4:PrevalanceofOnlineShoppingAmongSurveyRespondents(MadeOn‐LinePurchaseinpastmonth)......................................................71 Figure7‐1:AvailabilityofExistingRetailFacilitiesbyStoreFormat,CityofBurlington...........................................................................................................88 Figure7‐2:AvailabilityofExistingRetailFacilitiesbyStoreType,CityofBurlington................................................................................................................89 Figure7‐3:FrequencyofVisitstoDowntownBurlington,Day&Evening.......................................................................................................................................89 Figure7‐4:MethodofTraveltoDowntownBurlington...........................................................................................................................................................................90 Figure7‐5:SatisfactionwithDowntownParking(Adequacy,Convience&Affordability)........................................................................................................91 Figure7‐6:AvailabilityofExistingRetailFacilitiesbyStoreType,DowntownBurlington......................................................................................................92 Figure7‐7:ImportanceofVariousDowntownFunctionstoBurlingtonResidents(Outof10)..............................................................................................92 Figure8‐1:ReasonsforVisitingDowntownBurlington,On‐StreetInterceptSurveys...............................................................................................................95 Figure8‐2:MapofDowntownBurlington......................................................................................................................................................................................................97 Figure8‐3:distributionofdowntownburlingtonvisitors.....................................................................................................................................................................98 Figure8‐4:downtownburlingtontradearea............................................................................................................................................................................................100 Figure9‐1:FoodStoreRetail(FSR)Analysis.............................................................................................................................................................................................103 Figure9‐2:Non‐FoodStoreRetail(FSR)Analysis...................................................................................................................................................................................105 Figure9‐3:WarrantedAdditionalRetailandServiceSpaceinBurlington(2012‐2031)......................................................................................................108 Figure9‐4:SummaryofFutureWarrantedSpaceinBurlington(2012–2031)........................................................................................................................109 Figure10‐1:DowntownWarrantedNFSRSpaceProjection...............................................................................................................................................................112 Figure10‐2:DowntownWarrantedFSRSpaceProjection..................................................................................................................................................................114 Figure10‐3:ServicesandSelectedRetailWarrantedSpaceAnalysis.............................................................................................................................................115 Figure10‐4:2031FutureWarrantedDowntownSpaceSummary..................................................................................................................................................116 Figure11‐1:SupplyandDemandReconciliation.....................................................................................................................................................................................118 FigureA‐1:CustomerOriginSurveyResults,2012(NumberofLicencePlates)........................................................................................................................124 FigureA‐2:CustomerOriginSurveyResults,2012(PercentageofLicencePlates)..................................................................................................................125
CityofBurlington–OfficialPlanReviewCommercialStrategyStudy(Phase1:CommercialMarketSupplyandDemandAnalysis)
FigureA‐3:MapofCustomerOriginLicencePlateSurveyResults(MapleviewCentre).........................................................................................................126 FigureA‐4:MapofCustomerOriginLicencePlateSurveyResults(MapleviewCentre).........................................................................................................127 FigureA‐5:MapofCustomerOriginLicencePlateSurveyResults(BurlingtonPowerCentre)...........................................................................................128 FigureA‐6:MapofCustomerOriginLicencePlateSurveyResults(MillcroftCentre)..............................................................................................................129 FigureA‐7:MapofCustomerOriginLicencePlateSurveyResults(Appleby‐DundasPowerNode).................................................................................130 FigureA‐8:MapofCustomerOriginLicencePlateSurveyResults(BurloakCentre)...............................................................................................................131 FigureB‐1:Online/TelephoneConsumerSurveys,DemographicCharacteristics.....................................................................................................................133 FigureB‐2:Online/TelephoneConsumerSurveys,NFSRExpenditursbyBurlingtonResidents(WEIGHTED)...........................................................134 FigureB‐3:Online/TelephoneConsumerSurveys,FSR&RestaurantExpenditursbyBurlingtonResidents(WEIGHTED)...................................135 FigureB‐4:Online/TelephoneConsumerSurveys,SurveyQuestionnaire....................................................................................................................................136 FigureC‐1:InventoryofBurlingtonCommercialSpacebyRetailCategoryandMajorRetailNode...................................................................................159 FigureD‐1:OntarioRetailTrade–AveragePerCapitaExpendituresbyRetailCategory(2012).......................................................................................163 FigureD‐2:ProvinceofOntarioIncome/ExpenditureRegressionEquations,2010.................................................................................................................164 FigureD‐3:ProvinceofOntario,HistoricRealGrowthinFoodStoreRetail(FSR)Expenditures.......................................................................................165 FigureD‐4:ProvinceofOntario,HistoricRealGrowthinNon‐FoodStoreRetail(NFSR)Expenditures..........................................................................166 FigureD‐5:Retail/ServiceStoreClassification,BasedonNorthAmericanIndustryClassificationSystem(NAICS)..................................................167

CityofBurlington–OfficialPlanReviewCommercialStrategyStudy(Phase1:CommercialMarketSupplyandDemandAnalysis)
i
EXECUTIVESUMMARY
urbanMetricsinc.andThePlanningPartnershiphavebeenretainedbytheCityofBurlingtontoundertakeaCommercialStrategyStudy,whichisbeingpreparedaspartoftheCity’songoingOfficialPlanReviewprocess.TheCommercialStrategyStudyisintendedtore‐evaluatethecommercialpoliciesoftheCityofBurlingtonOfficialPlaninordertoaddressStrategicPlandirections,andtoensurethat:
TheCity’spoliciesaddresscurrentandfuturecommerciallanduseneeds;
Commercialareascanbeeffectivelyandefficientlyplanned;
Policiesarereflectiveofrecentchangestocommerciallanduseplanningandothertrends;and,
Policiescanbeeffectivelyimplemented.
AspartofPhase1ofthisbroaderCommercialStrategyStudy,urbanMetricshaspreparedthefollowingCommercialMarketSupplyandDemandAnalysisbackgroundreport,whichisintendedtoprovidetherequiredcommercialmarketanalysistoguidetheformationoffuturecommerciallandusepolicyrecommendations.Inparticular,thisreportquantifiesthefutureretailandservicecommercialspacerequirementsintheCityofBurlingtonto2031,andprovidesrecommendationsastohowfuturespacecanbeaccommodatedwithintheurbansystemduringthistimeperiod.
Thefollowingprovidesabriefoverviewofourkeyresearchfindingsandconclusions.
REPORTFINDINGS
BURLINGTON’SCOMMERCIALMARKETCHARACTERISTICS
Basedon2011CensusdataandpopulationestimatespreparedbytheRegionalMunicipalityofHalton,thecurrentpopulationofBurlingtonisapproximately183,1001.Thislevelofpopulationprovidesthecriticalmasstomaintainthefullrangeofretailandservicefacilitiesinthecommercialhierarchy.
1Includesadjustmentsforcensusundercount,asdetailedinSection4.3ofthisreport.

CityofBurlington–OfficialPlanReviewCommercialStrategyStudy(Phase1:CommercialMarketSupplyandDemandAnalysis)
ii
Inrecentyears,theCityofBurlingtonhasexperiencedmoderatepopulationgrowth;increasingbyanestimated2,520individualsduringthepreviousinter‐censusperiod(i.e.,2006to2011).Thisrepresentsanaverageannualgrowthrateof1.3%.
By2031,Burlington’spopulationisforecasttoreachatotalofapproximately195,700persons,representingtotalmarketgrowthof12,600residentsbetween2012and2031.ThisadditionalmarketgrowthwillultimatelyincreasethedemandfornewretailandservicecommercialfacilitiesintheCity.
AstheCityisquicklyapproachingitsGreenfieldcapacity,thelargestshareofresidentialgrowthwillbeattractedtointensificationsites:includingthedowntownUrbanGrowthCentre;UrbanGrowthCorridorsalongPlainsRoadandFairviewStreet;andmixeduseareasaroundtheexistingmallsandGOrailstations.
IncomelevelsinBurlington,andinthebalanceofHaltonRegion,arewellabovetheaveragefortheProvinceofOntarioasawhole.Basedon2006Censusdata,forexample,percapitaincomelevelsintheCityofBurlingtonwereapproximately23%higherthantheProvincialaveragein2005.ThisindicatesthatthereissignificantindividualspendingpoweramongBurlingtonresidents.
BURLINGTON’SEXISTINGCOMMERCIALSTRUCTURE
BasedonarecentinventoryofretailandservicecommercialusesintheCity,thereiscurrentlysome10.6millionsquarefeetofcommercialspacelocatedinBurlington.Ofthistotal,approximately45%iscomprisedofNon‐FoodStoreRetail(NFSR)facilities,39%iscomprisedofservices,9%ismadeupoffoodandbeveragefacilities,and5%isvacant.
Burlingtonhasatraditionalcommercialstructure,withthesinglelargestconcentrationofoverallcommercialspacewithinthedowntowncore.Italsohastwoenclosedregionalshoppingcentres(BurlingtonMallandMapleviewShoppingCentre)andfourmajorpowercentrenodes,whicharesituatedatBrantStreetandtheQueenElizabethWay(QEW);PlainsRoadandtheQueenElizabethWay(QEW);ApplebyandUpperMiddleRoad;andDundasandAppleby.
Together,thesemajorretailnodescontainsome4.3millionsquarefeetofcommercialspaceandaccountforapproximately41%ofthetotalsupplyinBurlington.
ThecommercialvacancyrateinBurlingtoniscurrently5.0%,whichisindicativeofabalancedandhealthymarket.Althoughthereareseveralnodeswithrelativelyhighvacancyrates,theytendtobeduetospacetransitionsanduniquecircumstancesratherthansignifyingstructuralissueswiththeCity’s’commercialsupply.
SincetheCity’spreviouscommercialstudywaspreparedin2003,thegrowthincommercialspaceinBurlingtongenerallyoutpacedpopulationgrowth.Accordingly,Burlingtonhasexperiencedasignificantgrowthinspaceonapercapitabasisoverthepasttenyears.
CityofBurlington–OfficialPlanReviewCommercialStrategyStudy(Phase1:CommercialMarketSupplyandDemandAnalysis)
iii
Overall,percapitaspaceratiosarecurrentlyabovetheaverageofcomparablemunicipalities,whichtosomeextentcanbeexplainedbyitsincomecharacteristicsanditsaccessibilitytothehighwaynetworkwithinthewesternGreaterGoldenHorseshoe.Itisimportanttonote,however,thatthehealthyvacancyratesinthecommunitysuggestthatBurlingtonisgenerallynotoverstored.
FUTURECOMMERCIALDEVELOPMENTINBURLINGTON
BasedoninformationprovidedbytheCityofBurlington,anumberofpotentialfuturecommercialdevelopmentshavebeenidentified,whichareexpectedtogenerateasignificantamountofnewcommercialspaceinBurlingtonthroughoutthestudyperiodto2031:
ImmediateDevelopmentProspects,whichincludethoseapplicationsthathaverecentlyreceivedapproval,orareclosetoreceivingfullplanningapproval,areexpectedtoaddsome125,000squarefeetofcommercialspace.
OtherProposedDevelopments,whichincludeallotherformaldevelopmentapplicationsatvariousstagesoftheCity’sapprovalprocess,wouldpotentiallyyieldsome721,000squarefeetofnewretailandservicedevelopmentspace.
SignificantUndevelopedDesignatedandZonedSites,whichincludeavarietyofvacantlandparcelslocatedintheCity’sexistingcommercialnodes.Thesesitesaregenerallyzonedforcommercialusesbutarenotyetsubjecttoformalplanningorbuildingpermitapplications.Ifdeveloped,thesesiteswouldaddsome347,000squarefeetofcommercialspacetotheexistingsupply.
Ifallofthesedevelopmentsproceedasplanned,theywouldaddatotalofsome1.194millionsquarefeettotheexistingsupplyofcommercialspaceinBurlington.OverhalfofthisspacewouldcomprisetheexpansionoftheexistingregionalcommercialnodeatDundasandApplebyLineinnorth‐westBurlington.
TheCityofBurlington’sPlanningDepartmenthasalsoidentifiedanumberofsitesashavingpotentialforfuturecommercialdevelopment,whichincludebothservicedandun‐servicedsitesthataregenerallyzonedformixedcommercial‐residentialorcommercial‐employmentuses.TheseOtherPotentialCommercialDevelopmentSitesincludethe225,000squarefootIKEAoutlet,whichwouldbevacatediftheplanningapplicationfacilitatingtherelocationoftheexistingIKEAstoreisapproved.
BasedonareviewofrecentdevelopmenttrendsintheGreaterTorontoArea,andacrossCanada,futurecommercialdevelopmentintheCityofBurlingtonwilllikelybeinfluencedbythefollowing:
TheEvolutionofPowerCentreandLargeFormatRetailDevelopment;
TheBroadeningofShoppingCentreMerchandise;

CityofBurlington–OfficialPlanReviewCommercialStrategyStudy(Phase1:CommercialMarketSupplyandDemandAnalysis)
iv
TheIntroductionofLifestyleCentresandHybridMixed‐UseCentres;
ThePrinciplesofNewUrbanism;
OutletCentreDevelopment;
TheInfluxofU.S.RetailerstoCanada;
TheBlurringoftheRetailHierarchy;
Non‐StoreShopping;and,
Transit/ActiveTransportationSupportiveCommercialDevelopment.
CITYOFBURLINGTONANDDOWNTOWNTRADEAREAS
BasedontheresultsoflicenceplatessurveysconductedatfiveofBurlington’smajorshoppingdestinations,aswellason‐streetinterceptsurveysundertakeninthedowntown,BurlingtoncommercialfacilitiesderivethemajorityoftheirsalesvolumefromresidentsoftheCity.Inaddition,however,BurlingtonretailersalsoattractasignificantportionoftheircustomersfromnearbycommunitiesinneighbouringmunicipalitiessuchasOakvilleandHamilton.
Accordingly,aTradeAreafortheCityofBurlingtonhasbeendelineatedthatincludesthreeseparatezones,asfollows:PrimaryZone(CityofBurlington);SecondaryZoneEast(WesternOakville);andSecondaryZoneWest(LowerHamiltonandDundas).
BasedonrecentCensusdataandpopulationestimatespreparedbytheRegionalMunicipalityofHaltonandCityofHamilton,atotalofsome497,700individualscurrentlyresideintheBurlingtonTradeArea.Thepopulationofthisareaisforecasttoincreasebysome45,900personsoverthestudyperiod;reachingatotalof543,600by2031.
DowntownBurlingtonservestheentireCityofBurlington,withacommercialPrimaryZonethatextendseastofKingRoad;southofHighway403andtheQueenElizabethWay(QEW);westofWalkersLine;andnorthofLakeOntario.Basedontheresultsofon‐streetinterceptsurveysundertakenintheCity’score,approximately63%ofvisitorstothedowntownoriginatefromthisPrimaryTradeArea.
The2011populationofthePrimaryTradeAreaforDowntownBurlingtonhasbeenestimatedat46,000persons,includingadjustmentsforcensusundercount.BasedonHaltonRegion’sBestPlanningestimates,thepopulationofthisareaisexpectedtoreach53,000by2031;largelythroughinfillandintensificationintheCity’sUrbanGrowthCentre.
CityofBurlington–OfficialPlanReviewCommercialStrategyStudy(Phase1:CommercialMarketSupplyandDemandAnalysis)
v
BURLINGTONRESIDENTS’SHOPPINGPATTERNS,PREFERENCES&PERCEPTIONS
Basedontheresultsoftheonline/telephoneconsumersurveys,BurlingtonresidentsundertakethemajorityoftheirshoppingwithintheCityofBurlington.Infact,BurlingtonNon‐FoodStoreRetail(NFSR),FoodStoreRetail(FSR)andRestaurantfacilitiescurrentlycaptureapproximately93.4%,85.1%and83.4%ofthetotalvalueofexpendituresmadeinthesestorecategories,respectively.
Approximately15%ofBurlingtonresidents’NFSRexpendituresin2012weremadeoutsidetheCityofBurlington.Althoughrelativelylimited,mostofthisexpenditureoutflowfromtheCitycanbeaccountedforbyretailfacilitiessituatedintheneighbouringmunicipalitiesofOakville,andHamiltontoaslightlylesserextent.
ThemajorityofBurlingtonresidents’NFSRexpendituresaremadeatBurlingtonMall,MapleviewCentreorBurlingtonPowerCentre.Collectively,thesethreecentrescaptureapproximately40%ofthetotalvalueofresidents’NFSRexpenditures.
Approximatelyonethird(31%)ofBurlingtonresidentsarecurrentlyengagedinsomeformofnon‐store,oronlineshopping.Intotal,Burlingtonresidents’onlineexpendituresaccountedforlessthanonetenthofthetotalvaluetheyspentatactualbrickandmortarFSR,NFSRandRestaurantfacilities.
Themajorityoflocalresidents’onlineexpendituresrelatedtoservice‐baseditems,includingmorethanhalfofwhichthatrelatedtothepurchaseofvariousticketsandtravel‐relatedservices(53.7%).Anadditional32.9%and13.4%ofonlineexpendituresweremadeonretailmerchandise(includingdownloadedmaterials)andotherservices,respectively.
Overall,themajorityofBurlingtonresidentsarecurrentlysatisfiedwithboththetypeandformatofretailandserviceofferingsavailabletothemintheCity.Alargeportionofresidents,however,feelthattherearecurrentlytoomanyFastFoodRestaurantsandBigBoxretailersintheCity.Similarly,manybelievethattheCitywouldbenefitfromanincreaseinthequantity/qualityofpedestrianretailareas,retailaccessiblebytransitandconvenience/neighbourhoodscaleretailers.
Basedontheresultsoftheonline/telephoneconsumerandon‐streetinterceptsurveys,aswellasfeedbackobtainedduringpublicconsultationevents,thereisastrongdemandforadditionalfood‐storeretailofferingsinDowntownBurlington.Inparticular,thereisastrongdesireforadditionalspecialtyfoodstores,asecondsupermarket/grocerystore,andaregularfamer’smarketinthedowntown.
CityofBurlington–OfficialPlanReviewCommercialStrategyStudy(Phase1:CommercialMarketSupplyandDemandAnalysis)
vi
FUTURECOMMERCIALSPACEWARRANTEDINBURLINGTON
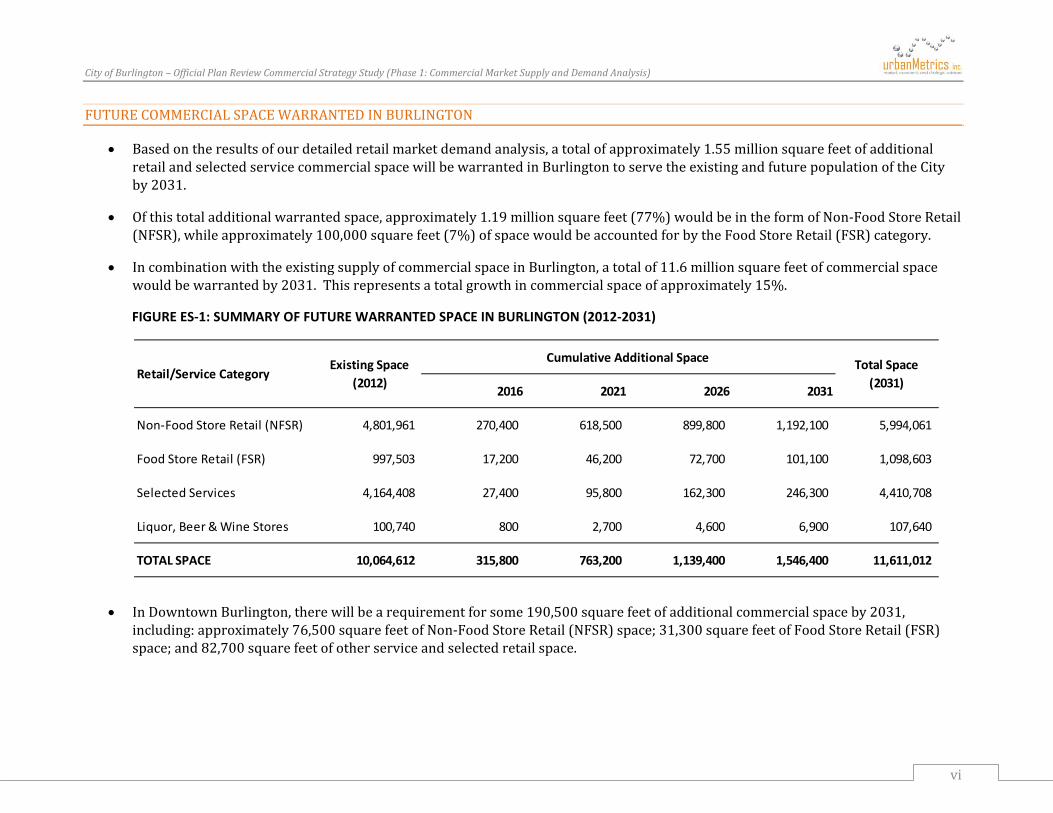
Basedontheresultsofourdetailedretailmarketdemandanalysis,atotalofapproximately1.55millionsquarefeetofadditionalretailandselectedservicecommercialspacewillbewarrantedinBurlingtontoservetheexistingandfuturepopulationoftheCityby2031.
Ofthistotaladditionalwarrantedspace,approximately1.19millionsquarefeet(77%)wouldbeintheformofNon‐FoodStoreRetail(NFSR),whileapproximately100,000squarefeet(7%)ofspacewouldbeaccountedforbytheFoodStoreRetail(FSR)category.
IncombinationwiththeexistingsupplyofcommercialspaceinBurlington,atotalof11.6millionsquarefeetofcommercialspacewouldbewarrantedby2031.Thisrepresentsatotalgrowthincommercialspaceofapproximately15%.
FIGURE ES‐1: SUMMARY OF FUTURE WARRANTED SPACE IN BURLINGTON (2012‐2031)
InDowntownBurlington,therewillbearequirementforsome190,500squarefeetofadditionalcommercialspaceby2031,including:approximately76,500squarefeetofNon‐FoodStoreRetail(NFSR)space;31,300squarefeetofFoodStoreRetail(FSR)space;and82,700squarefeetofotherserviceandselectedretailspace.
2016 2021 2026 2031
Non‐Food Store Retail (NFSR) 4,801,961 270,400 618,500 899,800 1,192,100 5,994,061
Food Store Retail (FSR) 997,503 17,200 46,200 72,700 101,100 1,098,603
Selected Services 4,164,408 27,400 95,800 162,300 246,300 4,410,708
Liquor, Beer & Wine Stores 100,740 800 2,700 4,600 6,900 107,640
TOTAL SPACE 10,064,612 315,800 763,200 1,139,400 1,546,400 11,611,012
Cumulative Additional SpaceExisting Space (2012)
Retail/Service CategoryTotal Space
(2031)
CityofBurlington–OfficialPlanReviewCommercialStrategyStudy(Phase1:CommercialMarketSupplyandDemandAnalysis)
vii
SUMMARY&CONCLUSIONS
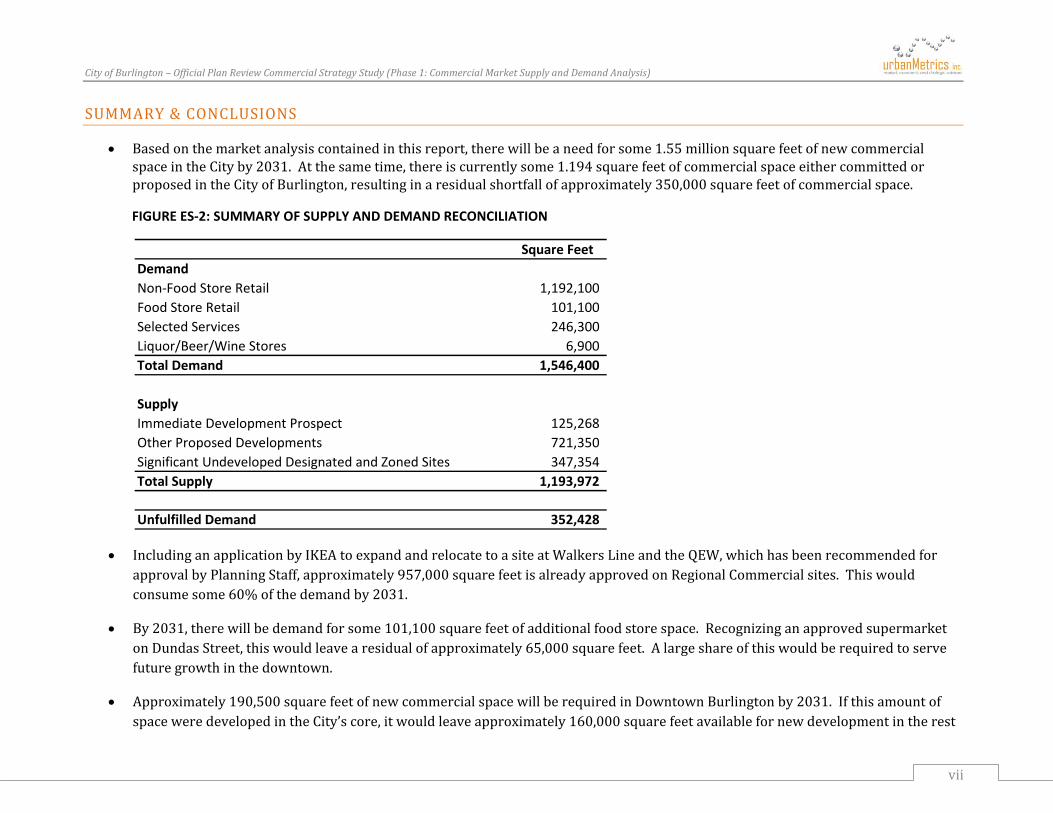
Basedonthemarketanalysiscontainedinthisreport,therewillbeaneedforsome1.55millionsquarefeetofnewcommercialspaceintheCityby2031.Atthesametime,thereiscurrentlysome1.194squarefeetofcommercialspaceeithercommittedorproposedintheCityofBurlington,resultinginaresidualshortfallofapproximately350,000squarefeetofcommercialspace.
FIGURE ES‐2: SUMMARY OF SUPPLY AND DEMAND RECONCILIATION
IncludinganapplicationbyIKEAtoexpandandrelocatetoasiteatWalkersLineandtheQEW,whichhasbeenrecommendedforapprovalbyPlanningStaff,approximately957,000squarefeetisalreadyapprovedonRegionalCommercialsites.Thiswouldconsumesome60%ofthedemandby2031.
By2031,therewillbedemandforsome101,100squarefeetofadditionalfoodstorespace.RecognizinganapprovedsupermarketonDundasStreet,thiswouldleavearesidualofapproximately65,000squarefeet.Alargeshareofthiswouldberequiredtoservefuturegrowthinthedowntown.
Approximately190,500squarefeetofnewcommercialspacewillberequiredinDowntownBurlingtonby2031.IfthisamountofspaceweredevelopedintheCity’score,itwouldleaveapproximately160,000squarefeetavailablefornewdevelopmentintherest
Square FeetDemandNon‐Food Store Retail 1,192,100 Food Store Retail 101,100 Selected Services 246,300 Liquor/Beer/Wine Stores 6,900 Total Demand 1,546,400
SupplyImmediate Development Prospect 125,268 Other Proposed Developments 721,350 Significant Undeveloped Designated and Zoned Sites 347,354 Total Supply 1,193,972
Unfulfilled Demand 352,428
CityofBurlington–OfficialPlanReviewCommercialStrategyStudy(Phase1:CommercialMarketSupplyandDemandAnalysis)
viii
oftheCity.ThisisarelativelysmallamountandshouldsupportnewpopulationalongtheUrbanGrowthCorridorandmixedusedevelopmentinproximitytotheGOTransitstationsandRegionalMallsites,aswellas,providinglocalservingcommercialspaceinareassuchaswestAldershotwhichmaylackcertainretailfacilities.
Therearealreadyanumberofvacantsitesintheseareaswithapprovalforcommercialspace,oftenaspartofamixed‐usezoningcategory.Whereapplicationsfornewcommercialspacearemade,approvalshouldgiveprioritytothosedevelopmentssupportingpopulationintensificationareasandinexistingareaslackinglocalservingretailfacilities.
Theresultsofthemarketanalysisclearlyindicatethattheavailablesupplyofcommerciallydesignatedlandswillbesufficienttomeetfuturedemandto2031.Assuch,therewillbenoneedtodesignateadditionalcommerciallandstosupportgrowthto2031.TheonlyexceptionstothiswouldbetomeetlocalservingneedsinexistingundersuppliedportionsoftheCity,suchaswestAldershot,ortoprovideforlocalservingretailtosupportfutureresidentialdevelopmentinintensificationareas.Similarly,theconversionofemploymentlandstocommercialisnotrequiredtosupportfuturegrowthinBurlingtonandshouldbeavoided.
CityofBurlington–OfficialPlanReviewCommercialStrategyStudy(Phase1:CommercialMarketSupplyandDemandAnalysis)
1
1 INTRODUCTION
1.1 BACKGROUND
ThisCommercialMarketreportrepresentsthefirstphaseofathreephaseprocesstocompleteacommercialstrategystudyaspartoftheCity’s2012OfficialPlanReview.ItcontainsanextensiveanalysisofthesupplyofanddemandforcommercialusesintheCityofBurlington.Areviewoflandusepoliciesregulatingthedevelopmentofcommerciallands,isalsopartofthisfirstphaseandcontainedinaseparatereport.
Theremainingtwophasesinclude:theformulationofpolicydirectionsanddesignrecommendations(Phase2),andthepreparationofurbandesignguidelines(Phase3).Inadditiontothesethreephases,thestudyprocesshasincludedadowntownstrategydiscussionpaper,whichhasbeenfinalizedandconsideredinaspartofthisreport.
AstheCityapproachesitsgreenfielddevelopmentcapacity,theemphasisofthecurrentOfficialPlanReviewistodeveloppolicythatguideslanduseplanningdecisionsinaplanningcontextwhereintensificationandinfillistheprimaryformofdevelopment.Ratherthanfocusonthecreationofnewneighbourhoods,theemphasiswillbeonrefiningexistingones.ItisthroughthislensthattheCommercialStrategyStudyhasbeenconducted.
Anadditionalareaoffocushasbeenthedowntownasthisareaisanintegralcomponentofthecurrentcommercialsysteminthecity.ItisalsoanareathathasbeenidentifiedasanUrbanGrowthCentretomeetintensificationtargets,andbecauseofthis,itscommercialrolewithinthecityhasthepotentialtoredefineitselfandevolve.
TheCommercialStrategyStudyalsoservestoaddresstheCity’sStrategicPlandirectionsregardingvibrantneighbourhoodsandprosperitydirections.Assuch,afocusofthestudyistocreateastrategytoredevelopagingretailareasintomixed‐use“peopleplaces”;encourageavibrantandhealthymixed‐usedowntown;andcreatemoremixedresidential/commercialplaceswithinexistingneighbourhoods.
Solutionsforintegratingretailareaswiththepublicandactivetransportationnetworksisalsoadirectiveforthisstudy.Tothisend,theimpactofthedesignatedProvinciallyidentifiedmobilityhubinthedowntownoncommercialopportunitieshasalsobeenconsidered.

CityofBurlington–OfficialPlanReviewCommercialStrategyStudy(Phase1:CommercialMarketSupplyandDemandAnalysis)
2
1.2 STUDYOBJECTIVES
ThepurposeoftheoverallCommercialStrategyStudyistoobtainpolicydirectionthatincorporatescommerciallanduseplanningwithneighbourhoodplanningandurbandesign.Thefocusisnotonlytoensureadequacyofcommercialspace,butalsoitsintegrationwithinneighbourhoodsandcommunityfacilities/infrastructure.Thereviewincludesbothretailandservicecommercialuses.
Specifically,thefundamentalinquiriesofthePhase1MarketandPolicyreportare:
1. Whatarethenational,provincial,regionalandlocalmarketconditionsandlifestyletrendsthatarelikelytoinfluencetheamount,location,design,formandfunctionofcommercialdevelopmentto2031,withinthecityandwithinthedowntown?
2. Howistheexistingsupplyofcommerciallandsandfloorareastoaccommodatecurrentandfutureretailandservicecommercialneedsto2031,withinthecityandthedowntown?
3. WhatisthegrowthpotentialofcommercialactivityinthedowntowngiventhataportionofthedowntownmixedusecentreisdesignatedasanUrbanGrowthCentre?
4. Howadequateistheexistingcommercialpolicyframeworkpositionedtoaddresscurrentandprojecteddemandinthecontextofexpectedtrends,inthecityandthedowntown?
Inadditiontothesebasicquestions,thefirstphaseofthestudyhasincludedextensiveinputfromBurlingtonresidents,businessesandotherstakeholders,intermsoftheirpreferencesforthefuturedevelopmentofthedowntownandtheurbanstructure.
Theprincipalareasofinquiryfortheremainingstudyphasesare:
5. Howshouldthecurrentpolicyframeworkbemodifiedtoservethecity’sanddowntown’slandneedsovertheplanningperiodto2031?
6. Givendowntown’ssize,locationandcompetitiveenvironment,whatroleshoulditplayinthecommercialhierarchy?Isitshighestpotentialasaregional,city‐wide,orneighbourhooddestination,orsomecombinationthereof?
7. WhatstepscanthecitytaketofacilitatethesuccessfulintegrationofcommercialareaswithinneighbourhoodstoimplementtheStrategicPlanwithrespecttoVibrantNeighbourhoodsandProsperitydirections?
8. Whatstepscanthecitytaketofacilitatethedevelopment,redevelopment,revitalizationandintensificationofcommerciallandswithinnodesandcorridors,andwithinmobilityhubareas,soasto:

CityofBurlington–OfficialPlanReviewCommercialStrategyStudy(Phase1:CommercialMarketSupplyandDemandAnalysis)
3
a. incorporategoodprinciplesofurbandesignandsustainability;b. makeefficientuseofhardinfrastructure;c. accommodateco‐locationwithcommunityfacilities/infrastructure;andd. integratecommerciallandswithinaneighbourhood.
9. Howshouldthepolicyframeworkbemodifiedtoalignwithuppertierpolicy(e.g.ProvincialPolicyStatementandPlacestoGrow)?
10. Whatinformationdoesthecityneedtotrackinordertomonitorcommercialactivityinthecityandthedowntown?
11. Whatmechanismscanbeusedtoassistintheimplementationofthecommerciallanduseobjectives(e.g.programsandpartnerships)?
1.3 2003OFFICIALPLANREVIEWRETAILCOMMERCIALSTUDY
ThisMarketStudybuildsontheworkundertakeninthepreviousretailcommercialstudyforBurlingtonundertakenin2003byRobinDee&AssociatesandSorensonGravelyLowesPlanningAssociatesInc.
Inthe2003study,theconsultantsidentifiedademandforapproximatelytwomillionsquarefeetofadditionalcommercialspacebetween2003and2021inthePrimaryZonecomprisingtheCityofBurlingtonandtheHamiltoncommunityofWaterdown.Allofthiswarrantedspacehadbeenaccountedforbywayofexpansionpotentialatexistingcommercialprojects;vacantanddesignatedsites;andapprovedproposals.
BasedontheresultsofthiscurrentMarketStudy,theactualgrowthincommercialspaceinjusttheCityofBurlingtonto2012hasexceededthatamount.Atthesametime,however,theaveragevacancyratefortheCityhasdeclinedfrom6.4%to5.0%suggestingthateventhoughtheCityhasseenasizeableincreaseinitscommercialinventory,themarkethadthecapacitytoabsorbit.
The2003studyalsoconcludedthatthecurrentretailhierarchyintheOfficialPlan“provides,ingeneral,foranappropriatedistributionofretailspaceacrosstheCitywhileprovidingahighlevelofservice”.Withconsiderablegrowthinthecommercialstructuresince2003,thesameconclusioncanbereachedwithregardstothedistributionofcommercialspaceasitexiststoday.Sincethe2003study,theCityhasseentheadditionofanewregionalpowercentrenodeatApplebyLineandDundasandthestrengtheningofmostofitsothermajorcommercialnodes,includingthedowntown.Atthesametime,newcompetitionbywayofpowercentredevelopmentatBurloakandtheQEWinOakvilleandatDundasandHighway6inWaterdownhasmaintainedthecompetitivebalancebetweenBurlingtonanditsneighbouringmunicipalities.
CityofBurlington–OfficialPlanReviewCommercialStrategyStudy(Phase1:CommercialMarketSupplyandDemandAnalysis)
4
Itisalsoimportanttorecognizethatsincethe2003study,theGovernmentofOntariointroduceditsProvincialPolicyStatementandGrowthPlanfortheGreaterGoldenHorseshoe.Whileoverall,thepopulationgrowthratesassumedintheDee/SGLstudyareinlinewiththemorecurrentGrowthPlaninfluencedprojections,thereisnowagreateremphasisplacedonintensification.Asaresult,thiscurrentstudyisbasedonalargeshareoffuturepopulationgrowthwillinexistingareas,withthelargestshareinthedowntown.Thiswillultimatelyinfluencewherefuturecommercialdevelopmentshouldbefocused.
1.4 APPROACH
ThefollowingprovidesanoverviewofthevariousworkstepsthathavebeenundertakenurbanMetricsinpreparingthisCommercialMarketSupplyandDemandAnalysis:
Collection,ReviewandAnalysisofRelevantBackgroundMaterials
WehavecollectedandreviewedavarietyofrelevantbackgroundinformationthatwasobtaineddirectlyfromtheCityofBurlington,aswellasthroughourownindependentresearch.ThisincludesareviewoftheCity’sexistingOfficialPlancommercialpolicies;relevantpolicyandstrategicdocumentspreparedby–oronbehalfof–theCity;recentmarketdemandandimpactanalysesundertakeninandaroundtheCityofBurlington;Burlingtondevelopmentapplicationstatistics;aswellaspopulationandemploymentforecastspreparedbytheCityofBurlington,HaltonRegionandothernearbymunicipalities.
CommercialMarketandTrendsAnalysis
BasedonrecentworkundertakenbyurbanMetrics,wehaveprovidedasummaryofprevailingnational,regionalandlocaltrendsinretaildevelopmentandconsumershoppingbehavior,whichwilllikelyinfluencethefuturecommercialstructureandcompetitivenessofretail/servicefacilitieslocatedintheCityofBurlington.Inparticular,wehaveconsideredsuchfactorsandtrendsas:theentryofnewdepartmentstoresandothermajorretailersintoCanada;retailingandurbanintensification;theagingpopulation;transitsupportiveretaildevelopment;thefutureofpoweror“big‐box”retailing;andactivetransportationstrategiesaroundretailing.
DeterminationofBurlingtonMarketCharacteristics
WehaveundertakenadetaileddemographicandtrendanalysisfortheCityasawhole,includingareviewoftheCityandRegionalMunicipalityofHalton’spopulationprojections,economiccharacteristicsandagestructure.

CityofBurlington–OfficialPlanReviewCommercialStrategyStudy(Phase1:CommercialMarketSupplyandDemandAnalysis)
5
InventoryofCommercialSpaceinBurlington
AninventoryofallretailandservicecommercialspacelocatedintheCityofBurlingtonhasbeenundertakenandsubsequentlyclassifiedbystoretype,basedontheNorthAmericanIndustrialClassificationSystem(NAICS).Basedonthisinformation,wehavecalculatedkeyperformancemeasuresfortheCityasawholeandforspecificsub‐areas(e.g.,DowntownBurlington),including:vacancyratesandpercapitaspaceratios.
Wehavealsocomparedtheresultsofour2012inventorywiththatundertakenbyRobinDee&AssociatesaspartofthepreviousOfficialPlanReviewRetailCommercialStudypreparedfortheCityin2003.ThiscomparisonhasprovidedthecontexttodeterminehowthecurrentsupplyofcommercialspaceinBurlingtonshouldbetakenintoconsiderationwithregardstodeterminingfuturespacerequirements.
IdentificationofFutureRetailOpportunities
BasedprimarilyoninformationprovidedbytheCityofBurlington,areviewofOfficialPlanandZoninginformation,andourownfieldwork,wehaveidentifiedlocationsforpotentialfuturecommercialdevelopment,redevelopmentand/orintensification.
EmpiricalResearch(LicencePlate,On‐StreetInterceptandOnline/TelephoneConsumerSurveys)
WehaveundertakenavarietyofbackgroundconsumersurveyresearchtodeterminethecurrentshoppingpatternsandbehaviorofBurlingtonresidents.Thisbackgroundmarketresearchhasincludedlicenceplatesurveys,on‐streetinterceptsurveys,aswellasanonline/telephoneconsumersurveyofBurlingtonresidents,asdescribedbelow.
LicencePlateSurveys–atotalofsome1,849uniquelicenceplaterecordswerecollectedoverathreeweekperiodintheFallof2012(i.e.SeptemberandOctober)atsixmajorshoppingdestinationslocatedinorneartheedgesoftheCityofBurlington.(i.e.,BurlingtonMall,MapleviewCentre,BurlingtonPowerCentre(BrantStreet&theQueenElizabethWay),MillcroftCentre,theAppleby‐DundasPowerNodeandBurloakCentreinOakville).Theresultsofthesesurveyshavebeenusedtodeterminethegeographicdraw–orTradeArea–ofcommercialfacilitieslocatedintheCityofBurlington.
On‐StreetInterceptSurveys–approximately300on‐streetinterceptsurveyswerecompletedwithlocalresidents,employees,visitorsandotherpatronsofDowntownBurlingtonbetweenSeptemberandOctober2012.Theresultsofthesesurveyshavebeenusedtoidentifyshoppingpatterns,modesoftransportationandcustomeroriginsforthedowntown.
CityofBurlington–OfficialPlanReviewCommercialStrategyStudy(Phase1:CommercialMarketSupplyandDemandAnalysis)
6
Online/TelephoneConsumerSurveys–atotalof885onlineandtelephoneconsumersurveyshavebeencompleted2todetermineBurlingtonresidents’shoppingpatterns,aswellastheirperceptionsofandsatisfactionlevelswiththevarioustypeandformatofcommercialfacilitiesinBurlington.
Public/StakeholderConsultation
Inadditiontothevariousempiricalresearchthathasbeenundertakenasinputtoourcommercialmarketanalysis,urbanMetricsandThePlanningPartnershiphavealsoengagedlocalresidents,businessownersandothermembersofthepublictoobtainfeedbackastotheiropinionsregardingthecurrentandfuturestateofDowntownBurlington.Forexample,aDowntownPublicWorkshoppublicconsultationeventwasheldonNovember7,2012,attheBurlingtonArtsCentrewithmorethan130membersofthepublic.Thiseventincludedaninteractive“visioning”exercisethatpolledparticipantsbasedonanumberofquestionsrelatingtotheirsatisfactionwithdowntownandthespecificimprovementsthattheythoughtcouldbemade,aswellassmallerbreak‐outsessionsthatdealtwithspecific“tabletopics”intendedtofurtherdeveloptheideasandissuespresentedearlierintheevent.
TheresultsofthistypeofpublicconsultationhavebeenusedtoassessthecurrentstateofDowntownBurlington,thevariousfunctionsitserves,howwellitiscurrentlymeetingtheneedsoftheCity,andhowwellcurrentlanduseplanningpoliciesaresupportingitsvibrancy,asdetailedintheaccompanyingInterimCommercialStrategyDiscussionPaperonDowntownBurlington,whichwaspreparedbyurbanMetricsinc.andThePlanningPartnershipearlier.
AnalysisofBurlingtonMarketDimensionsandConditions
Relyingonthelicenseplate,on‐street,telephoneandon‐linesurveys;theinventoryofcompetition;andthepopulationanalysis,aTradeAreahasbeenfortheCityofBurlingtonasawhole,andthedowntowncore.Thesegeographicareashaveservedasthebasisforourmarketsupplyanddemandanalysis.
Withintheseareas,wehavealsoestimatedfuturepopulationgrowthanddeterminedtheuniqueincomeandexpenditurecharacteristicsofTradeArearesidents;whichhaveservedasimportantinputstoourmarketanalysis.
CommercialNeedsAssessment
Usingtheresultsofthepreviousworksteps,wehaveundertakenadetailedmarketdemandanalysisbymajorstoretype;includingFoodStoreRetail(FSR)andNon‐FoodStoreRetail(NFSR).Inparticular,thisanalysishasreliedonTradeAreapopulationestimates,incomeandexpenditurecharacteristicsofTradeArearesidents,commercialinventoryinformation,aswellastheresultsofthe
2Includes364completedtelephonesurveys,261fullycompleteon‐linesurveys,and260partiallycompletedon‐linesurveys.
CityofBurlington–OfficialPlanReviewCommercialStrategyStudy(Phase1:CommercialMarketSupplyandDemandAnalysis)
7
online/telephoneconsumersurveysandlicenseplatesurveys,whichhavebeenusedtodevelopmarketsharesandinflowratiosforourexpenditureanalysis.WhereStatisticsCanadaexpendituredataisnotavailable,wehavereliedonapercapitaspacemethodologyforselectedotherretailandservicecategories.
ThisanalysishasbeenusedtoprojectcommercialspaceneedsintheCityofBurlingtonto2031.Similarly,thisanalysishasalsobeenusedtodeterminehowwelltheexistingsupplyofcommerciallandandspacewillbeabletoaccommodateexistingandfutureretailandservicecommercialneedsthroughoutthisperiod.
DevelopmentofConclusionsandRecommendations
Basedontheresultsofthevariousresearchandanalysisdescribedinthepreviousworksteps,wehaveprovidedasummaryofourkeyresearchfindingsandconclusions.WehavealsodevelopedanumberofrecommendationsastohowtheCity’sfuturespacerequirementscanbeaccommodatedwithintheexistingurbansystemofBurlington.
1.5 ASSUMPTIONS
Inanyanalysisrequiringestimatesoffutureconditions,itisnecessarytomakecertainbasicassumptions,asfollows:
Overtheforecastperiod,totheyear2031,areasonabledegreeofeconomicgrowthandstabilitywillprevailinCanada,OntarioandspecificallyinHaltonRegion.Itisexpectedthatoverthisperiodcyclicaldownturnandupturnwilloccur.
Thepopulationforecasts,whicharebasedonHaltonRegion’sBestPlanningEstimatesareassumedreasonableandwillnotvarysignificantlyfromactualcountsinthefuture.
Thevarioussourcesemployedinouranalysistocalculateretailexpenditures,baseyearBurlingtonsharesorcapturerates,andsalespersquaremetre/footperformancelevelsforthevariousretailstoretypesanalyzedareconsideredsufficientlyreliable.
Commercialusesexaminedinthisreportincluderetail,servicecommercial,andlocalserving/streetfrontofficeuses.Forthepurposesofourmarketanalysis,certaincommercialuseshavenotbeenevaluated,includingautomotivesales,carrentalfirms,servicestations,funeralservicesandhotel/motelaccommodationuses.
Alldollarreferencesarein2012dollars,whichexcludeinflation,unlessnotedotherwise.Ourresearchandanalysishasbeenconductedinaccordancewiththetermsofreferenceforthisassignmentandourauthorizedscopeofwork.Thefindingsandrecommendationspresentedinthisreportrepresentourbestjudgmentbasedupontheinformationavailabletousasofthedateofourresearch.

CityofBurlington–OfficialPlanReviewCommercialStrategyStudy(Phase1:CommercialMarketSupplyandDemandAnalysis)
8
Accordingly,thefindingsandrecommendationspresentedhereinshouldbereviewedandinterpretedwithreferencetoevolvingcircumstancesandeconomicconditions.If,foranyreason,therearesignificantdeviationsfromanyoftheseassumptions,thereportanditsconclusionsshouldbereviewedorre‐examined.
CityofBurlington–OfficialPlanReviewCommercialStrategyStudy(Phase1:CommercialMarketSupplyandDemandAnalysis)
9
2 CITYOFBURLINGTON–GEOGRAPHYANDDEMOGRAPHICCHARACTERISTICS
2.1 LOCATIONALCHARACTERISTICS
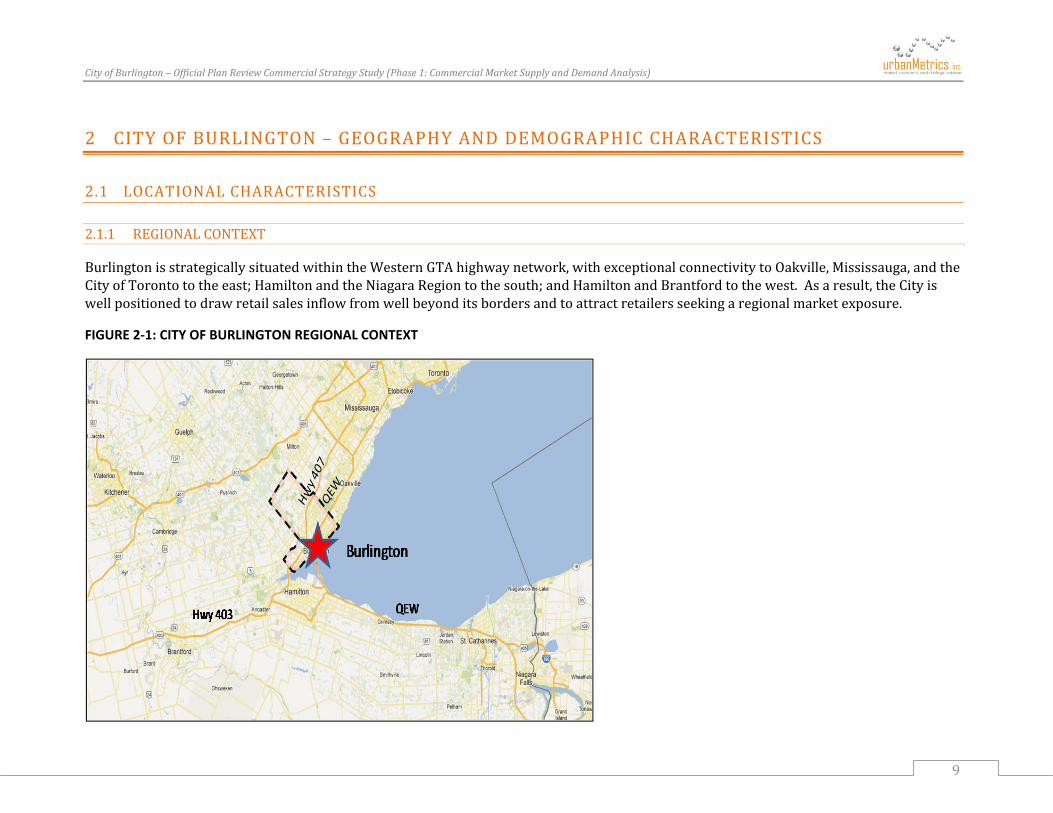
2.1.1 REGIONALCONTEXT
BurlingtonisstrategicallysituatedwithintheWesternGTAhighwaynetwork,withexceptionalconnectivitytoOakville,Mississauga,andtheCityofTorontototheeast;HamiltonandtheNiagaraRegiontothesouth;andHamiltonandBrantfordtothewest.Asaresult,theCityiswellpositionedtodrawretailsalesinflowfromwellbeyonditsbordersandtoattractretailersseekingaregionalmarketexposure.
FIGURE 2‐1: CITY OF BURLINGTON REGIONAL CONTEXT
CityofBurlington–OfficialPlanReviewCommercialStrategyStudy(Phase1:CommercialMarketSupplyandDemandAnalysis)
10
Basedon2006StatisticsCanadaPlaceofWorkdata,Burlingtoniswellbalancedintermsofcommuterflows,withsome41,300BurlingtonresidentsworkingoutsidetheCityand39,805non‐BurlingtonresidentsworkingintheCity.Approximately60%ofnon‐residentsworkinginBurlingtonliveinHamilton.Toamuchlessextent,BurlingtondrawsemploymentfromOakville,MississaugaandtheCityofToronto.
CommutingtripsbyBurlingtonresidentsoutsidetheCityaremuchmoreevenlydistributedamongthesesamemunicipalities,withabout24%ofcommutingoutflowdestinedforOakville;and21%destinedforeachMississaugaandTorontorespectively.
ThesecommutingflowpatternsprovideaguidetotheretailinflowsandoutflowstoandfromtheCity.
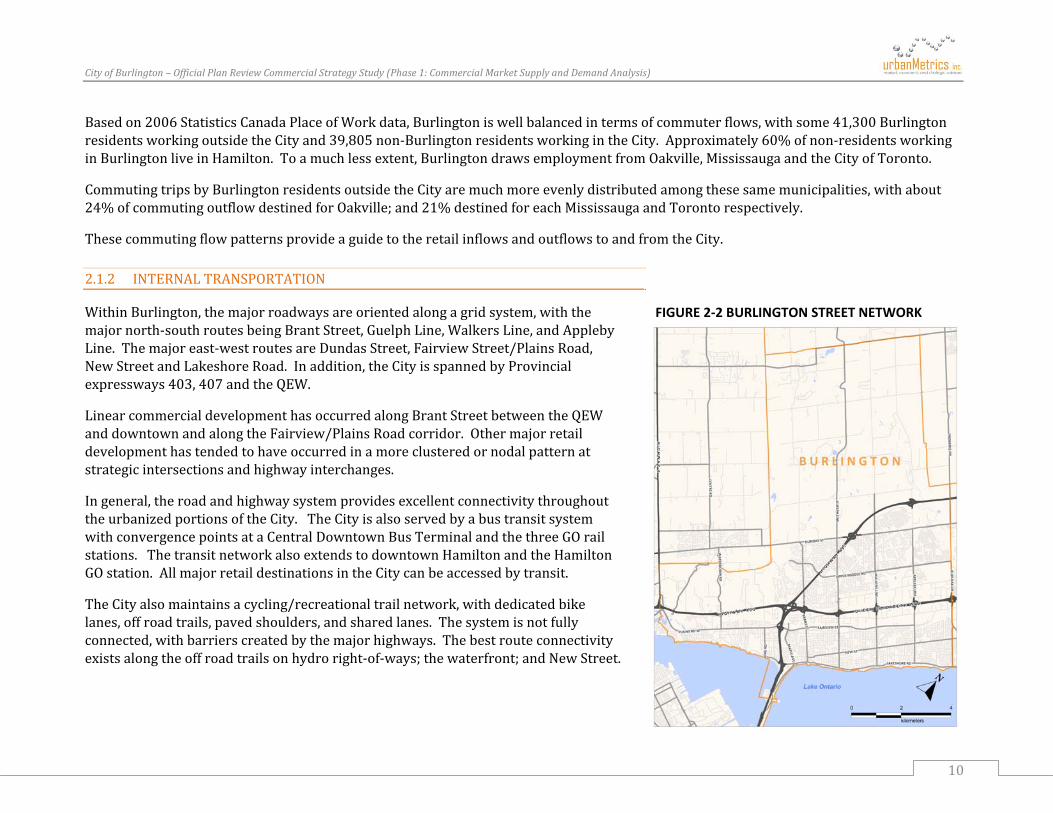
2.1.2 INTERNALTRANSPORTATION
WithinBurlington,themajorroadwaysareorientedalongagridsystem,withthemajornorth‐southroutesbeingBrantStreet,GuelphLine,WalkersLine,andApplebyLine.Themajoreast‐westroutesareDundasStreet,FairviewStreet/PlainsRoad,NewStreetandLakeshoreRoad.Inaddition,theCityisspannedbyProvincialexpressways403,407andtheQEW.
LinearcommercialdevelopmenthasoccurredalongBrantStreetbetweentheQEWanddowntownandalongtheFairview/PlainsRoadcorridor.Othermajorretaildevelopmenthastendedtohaveoccurredinamoreclusteredornodalpatternatstrategicintersectionsandhighwayinterchanges.
Ingeneral,theroadandhighwaysystemprovidesexcellentconnectivitythroughouttheurbanizedportionsoftheCity.TheCityisalsoservedbyabustransitsystemwithconvergencepointsataCentralDowntownBusTerminalandthethreeGOrailstations.ThetransitnetworkalsoextendstodowntownHamiltonandtheHamiltonGOstation.AllmajorretaildestinationsintheCitycanbeaccessedbytransit.
TheCityalsomaintainsacycling/recreationaltrailnetwork,withdedicatedbikelanes,offroadtrails,pavedshoulders,andsharedlanes.Thesystemisnotfullyconnected,withbarrierscreatedbythemajorhighways.Thebestrouteconnectivityexistsalongtheoffroadtrailsonhydroright‐of‐ways;thewaterfront;andNewStreet.
FIGURE 2‐2 BURLINGTON STREET NETWORK

CityofBurlington–OfficialPlanReviewCommercialStrategyStudy(Phase1:CommercialMarketSupplyandDemandAnalysis)
11
2.2 DEMOGRAPHICCHARACTERISTICS
Thesocio‐demographiccharacteristicsofacommunitycaninfluencethemarketdemandforretailspace,includingconsumers’preferencesforcertaintypesofretailfacilitiesandtheattractionofretailbusinessestoacommunity.Changesinthedemographicsofacommunityandlifestylepatternscanalterthedemandfordifferenttypesofretailandservicecommercialfacilities,withpopulationgrowthandincomelevelstheultimateinfluencersofdemand.Someofthekeydriversofchangeincludethecompositionalvariationsinapopulation(i.e.,aginganddeclininghouseholdsizes),percapitaincomelevelsandlifestylechangesassociatedwithanagingpopulation.
ThefollowingsectionofthereportprovidesanevaluationofthefollowingcharacteristicsoftheCityofBurlington’spopulation:
Currentandhistoricpopulation;
Forecastpopulationgrowth;
Agestructure;
Incomelevels;
Ethnicity;
Familystructure;
Currentandhistoricemploymentlevels;and,
Forecastemploymentgrowth.
Section4.5ofthisreportfurtherexaminesthepopulationprojectionsfortheCityofBurlingtonanditsTradeAreatoassistindeterminingfutureretailspaceneeds.
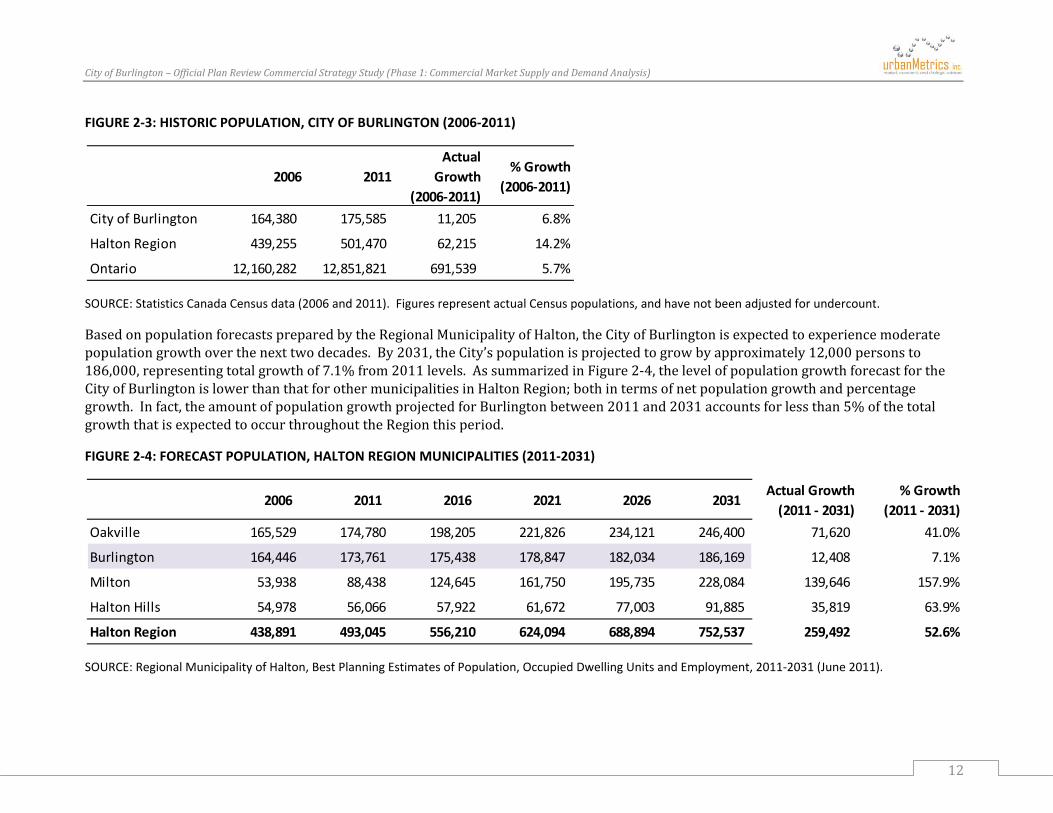
2.2.1 HISTORICANDFORECASTPOPULATIONGROWTH
BasedonStatisticsCanadaCensusdata,thepopulationoftheCityofBurlingtonreachedanestimated175,585personsin2011.Thisrepresentsagrowthrateofapproximately6.8%from2006,oranaverageannualgrowthrateof1.4%.Thisisslightlyhigherthantheprovincialpopulationgrowthrateduringthisperiod(i.e.,2006to2011)andbelowthatfortheentireRegionalMunicipalityofHalton(i.e.,CityofBurlington,TownofOakville,TownofMiltonandTownofHaltonHills).
Figure2‐3illustratesthehistoricchangeinpopulationbetween2006and2011fortheCityofBurlington,aswellasfortheRegionalMunicipalityofHaltonandtheProvinceofOntarioasawhole.
CityofBurlington–OfficialPlanReviewCommercialStrategyStudy(Phase1:CommercialMarketSupplyandDemandAnalysis)
12
FIGURE 2‐3: HISTORIC POPULATION, CITY OF BURLINGTON (2006‐2011)
SOURCE: Statistics Canada Census data (2006 and 2011). Figures represent actual Census populations, and have not been adjusted for undercount.
BasedonpopulationforecastspreparedbytheRegionalMunicipalityofHalton,theCityofBurlingtonisexpectedtoexperiencemoderatepopulationgrowthoverthenexttwodecades.By2031,theCity’spopulationisprojectedtogrowbyapproximately12,000personsto186,000,representingtotalgrowthof7.1%from2011levels.AssummarizedinFigure2‐4,thelevelofpopulationgrowthforecastfortheCityofBurlingtonislowerthanthatforothermunicipalitiesinHaltonRegion;bothintermsofnetpopulationgrowthandpercentagegrowth.Infact,theamountofpopulationgrowthprojectedforBurlingtonbetween2011and2031accountsforlessthan5%ofthetotalgrowththatisexpectedtooccurthroughouttheRegionthisperiod.
FIGURE 2‐4: FORECAST POPULATION, HALTON REGION MUNICIPALITIES (2011‐2031)
SOURCE: Regional Municipality of Halton, Best Planning Estimates of Population, Occupied Dwelling Units and Employment, 2011‐2031 (June 2011).
2006 2011Actual
Growth (2006‐2011)
% Growth (2006‐2011)
City of Burlington 164,380 175,585 11,205 6.8%
Halton Region 439,255 501,470 62,215 14.2%
Ontario 12,160,282 12,851,821 691,539 5.7%
2006 2011 2016 2021 2026 2031Actual Growth (2011 ‐ 2031)
% Growth (2011 ‐ 2031)
Oakville 165,529 174,780 198,205 221,826 234,121 246,400 71,620 41.0%
Burlington 164,446 173,761 175,438 178,847 182,034 186,169 12,408 7.1%
Milton 53,938 88,438 124,645 161,750 195,735 228,084 139,646 157.9%
Halton Hills 54,978 56,066 57,922 61,672 77,003 91,885 35,819 63.9%
Halton Region 438,891 493,045 556,210 624,094 688,894 752,537 259,492 52.6%

CityofBurlington–OfficialPlanReviewCommercialStrategyStudy(Phase1:CommercialMarketSupplyandDemandAnalysis)
13
2.2.2 AGESTRUCTURE
Ashouseholdsage,theirneedsandspendinghabitsshift.Inverybroadterms,youngadultstendtospendahigherproportionoftheirincomeonfashion,entertainmentandrecreationmerchandise.Astheseindividualsgetmarriedandhavechildren,spendingpatternstendtoshifttowardsitemsandservicesrelatedtohousingandchildrearing.Similarly,whenfamilysizesincreaseandchildrenage,housing,homefurnishingsandhomedécoritemsoccupyamuchgreatershareinhouseholdexpenditures.Followingretirement,housingandfurnishingsneedsaretypicallyreduced,althoughinmanycasesthequantityisreplacedbyhigherquality.Inaddition,asconsumersage,thereisagreateremphasisonservice‐relatedexpenditures.
Basedon2011Censusdata,themedianageoftheBurlingtonpopulationwas41.8,whichrepresentsaslightincreasefromtheCity’s2006medianageof40.3.Itisalsointerestingtonotethatthe2011medianageofBurlingtonresidentsissomewhathigherthanthatoftheOntariopopulation(40.4)andneighbouringcommunitiessuchasOakville(40.2).Overall,therefore,itisevidentthatBurlingtonhasarelativelymaturepopulationincomparisontootherareasoftheProvinceandGreaterTorontoArea.
ThechartinFigure2‐5providesasummaryofthecurrentandhistoricagedistributionoftheBurlingtonpopulationbyfive‐yearagegroup.Asshown,theCity’spopulationiswellrepresentedinallagegroups,withthelargestshareconcentratedinthe35to59agerange.ItisalsoimportanttonotethatBurlington’smiddle‐ageandseniorpopulationshavecontinuedtoincreaseoverthe2006to2011period,withgrowthrecordedinallagecategoriesforpersons45yearsandover.
AlthoughtheBurlingtonpopulationhascontinuedtoage,therehasalsobeensomegrowthintheyoungermarketpopulationaswell;withincreasesofmorethan5%ineachofthe15‐19,20‐24and25‐29agecategories.
FIGURE 2‐5: CITY OF BURLINGTON AGE DISTRIBUTION (2006 – 2011)
SOURCE: urbanMetrics inc., based on Statistics Canada Census data (2006 and 2011).
0 2,000 4,000 6,000 8,000 10,000 12,000 14,000 16,000
0 to 4 years5 to 9 years
10 to 14 years15 to 19 years20 to 24 years25 to 29 years30 to 34 years35 to 39 years40 to 44 years45 to 49 years50 to 54 years55 to 59 years60 to 64 years65 to 69 years70 to 74 years75 to 79 years80 to 84 years
85 years and over
Burlington (2011) Burlington (2006)

CityofBurlington–OfficialPlanReviewCommercialStrategyStudy(Phase1:CommercialMarketSupplyandDemandAnalysis)
14
2.2.3 INCOMESTRUCTURE
Incombinationwithfuturepopulationlevels,percapitaincomeisanimportantelementindeterminingthecurrentandfutureretailexpenditurepotentialofBurlingtonresidents.AssummarizedinFigure2‐6,incomelevelsaregenerallyquitehighthroughouttheentireRegionalMunicipalityofHalton,andparticularlysointheTownofOakvilleandCityofBurlington.Basedon2006Censusdata,percapitaincomelevelsintheCityofBurlingtonareapproximately5%belowtheRegionalaverage;howevertheyaremorethan23%abovetheProvincialaverage.
FIGURE 2‐6: PER CAPITA INCOME, HALTON REGION MUNICIPALITIES (2006)
SOURCE: Statistics Canada Census data (2006). Figures represent 2005 income levels.
ThemapinFigure2‐7onthefollowingpageprovidesanillustrationofpercapitaincomelevelsindexedtotheProvincialaveragefortheentireCityofBurlington,aswellaspartsofneighbouringmunicipalitiessuchasOakville,Milton,andHamilton.Asshown,percapitaincomelevelsaregenerallygreaterthanorequaltotheProvincialaverageforthevastmajorityofdisseminationareasidentifiedinBurlington,OakvilleandsouthernMilton.Moreover,therelativelylimitednumbersoflowincomepocketsinthesemunicipalitiesareconcentratedalongtheQueenElizabethWayhighwaycorridor,whichconsistsprimarilyofnon‐residentiallanduses.
Overall,thereissignificantindividualspendingpowerintheCityofBurlington,aswellasmanyofthesurroundingmunicipalitiesintheRegion.AlthoughthevariousretailandservicecommercialfacilitieslocatedintheCityprimarilyservelocalresidents,manyofBurlington’sregionalshoppingcentreswillbeabletodrawonthespendingpowerofadjacentmunicipalitiesaswell.
Index to Halton Region
Index to Province
Oakville 45,268$ 1.14 1.47
Burlington 37,736$ 0.95 1.23
Milton 34,480$ 0.86 1.12
Halton Hills 35,277$ 0.88 1.15
Halton Region 39,867$ 1.00 1.30
Ontario 30,723$ 0.77 1.00
Income IndicesPer Capita Income
(2005)Municipality/Region
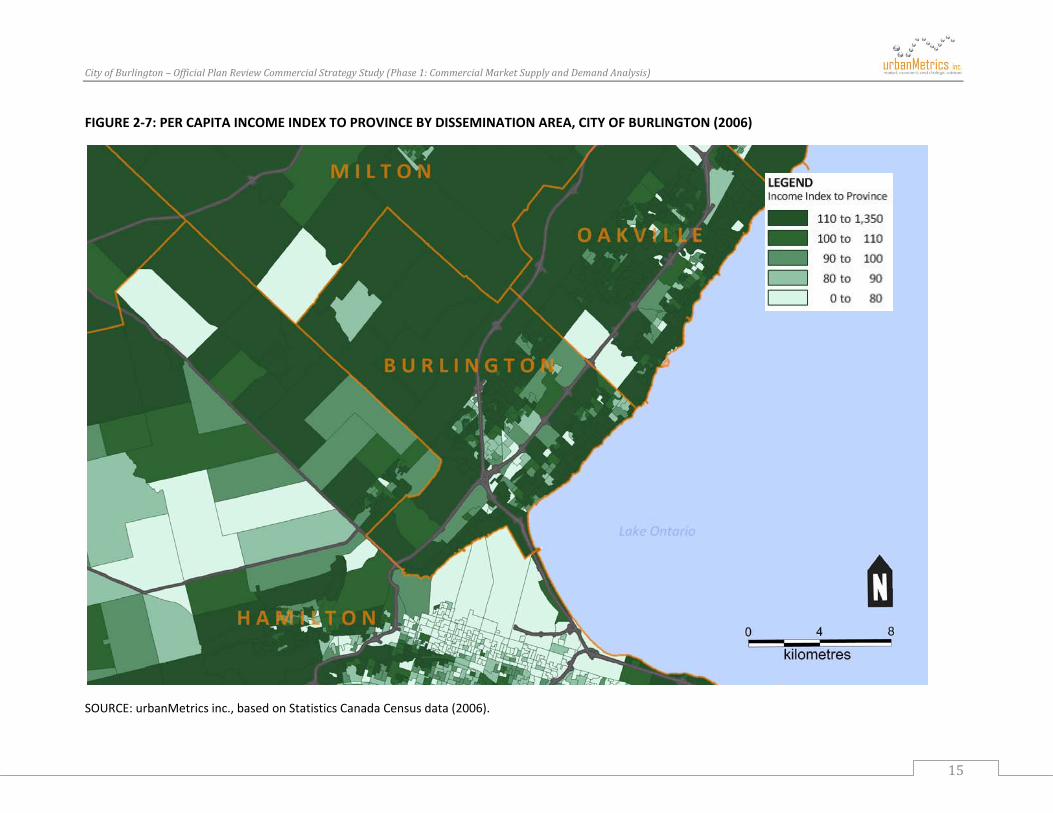
CityofBurlington–OfficialPlanReviewCommercialStrategyStudy(Phase1:CommercialMarketSupplyandDemandAnalysis)
15
FIGURE 2‐7: PER CAPITA INCOME INDEX TO PROVINCE BY DISSEMINATION AREA, CITY OF BURLINGTON (2006)
SOURCE: urbanMetrics inc., based on Statistics Canada Census data (2006).

CityofBurlington–OfficialPlanReviewCommercialStrategyStudy(Phase1:CommercialMarketSupplyandDemandAnalysis)
16
2.2.4 ETHNICITY
Ingeneral,ethnicityhasthegreatestinfluenceonfoodretailingandfoodservicesandmuchlesssowithrespecttonon‐foodretailing.Inrecentyears,however,largeethnicmarketshaveinfluencedthetypeofretailersandformatsattractedtosomepartsoftheGreaterTorontoArea(GTA).Forexample,theChineseandEastAsianpopulationincommunitiessuchasMarkhamandScarboroughhavespawnedthedevelopmentof“AsianRetailFormats”,whicharecharacterizedbyverysmallretailunits,fewretailanchors,andahighproportionofrestaurantspace.Similarly,theEastIndianCommunityhasattractedmanyretailersuniquetothispopulationbaseinmunicipalitieswheretheyareheavilyconcentrated.
In2006–themostrecentcensusperiodforwhichthistypeofdataisavailable–themajorityofBurlingtonresidentsidentifiedthemselvesasCanadianorofWesternEuropeandescent.Infact,nearlyonequarteridentifiedthemselvesasCanadian(23.7%),whilemorethanfourineveryfiveresidentsindicatedthattheirethnicoriginwaseitherEnglish,ScottishorIrish.Figure2‐8providesasummaryofthetopfiveethnicoriginsintheCityofBurlington,basedon2006Censusdata.
FIGURE 2‐8: TOP 5 ETHNIC ORIGINS, CITY OF BURLINGTON (2006)
SOURCE: Statistics Canada Census data (2006). Population totals represent the sum of single and multiple responses for each ethnic origin category. All figures based on the Census population and do not include undercount adjustments.
GiventhatBurlingtonandothernearbycommunitiesintheWesternGTAhavenotexperiencedthesamelevelofethnicdiversificationasinotherpartsoftheprovince(e.g.,CityofToronto,YorkRegion),nomajorchangesareanticipatedintermsofthetypesofgoodsbeingdemandedintheCityofBurlington,northetypeofretailformatsbeingdeveloped(i.e.,basedonethnicityalone).Amoredetailedreviewofthetrendsthatarelikelytoaffectthetypeandformatofretail/servicecommercialfacilitieslocatedintheCityofBurlingtonisprovidedinSection6ofthisreport.
Ethnic Origin Population (2006) % of TotalEnglish 59,275 36.1%Scottish 39,470 24.0%Canadian 38,985 23.7%Irish 33,730 20.5%German 16,565 10.1%Total Population 164,380 100.0%
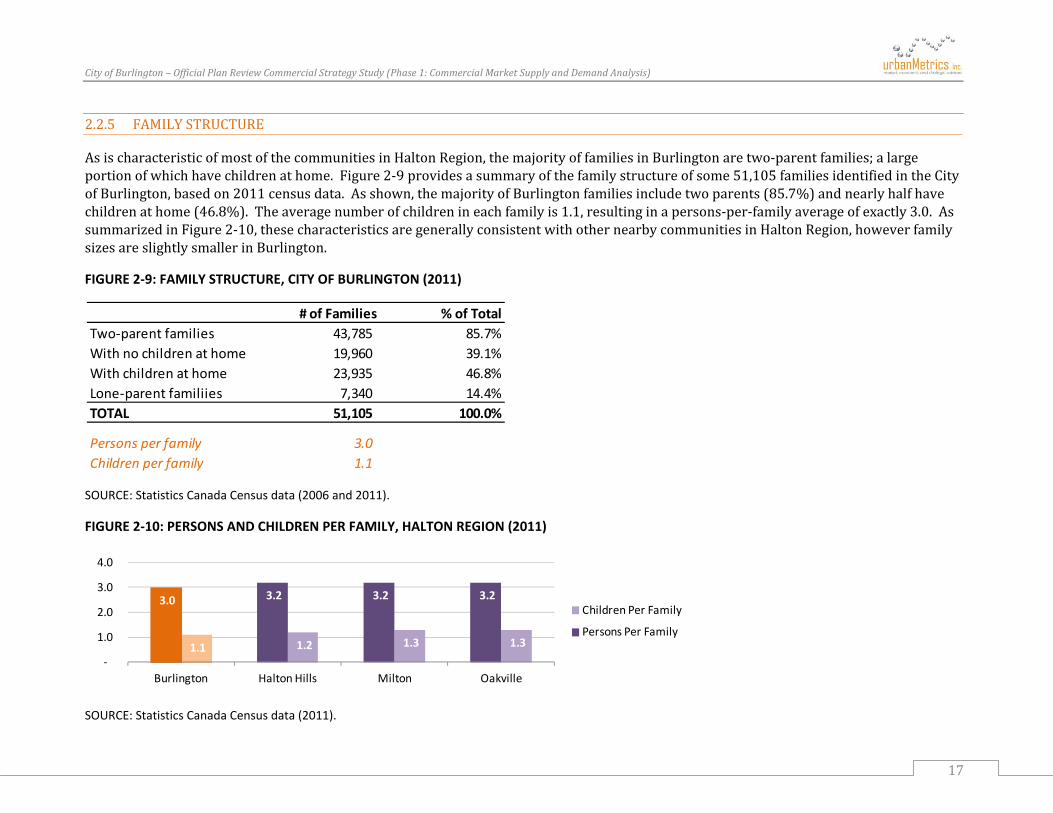
CityofBurlington–OfficialPlanReviewCommercialStrategyStudy(Phase1:CommercialMarketSupplyandDemandAnalysis)
17
2.2.5 FAMILYSTRUCTURE
AsischaracteristicofmostofthecommunitiesinHaltonRegion,themajorityoffamiliesinBurlingtonaretwo‐parentfamilies;alargeportionofwhichhavechildrenathome.Figure2‐9providesasummaryofthefamilystructureofsome51,105familiesidentifiedintheCityofBurlington,basedon2011censusdata.Asshown,themajorityofBurlingtonfamiliesincludetwoparents(85.7%)andnearlyhalfhavechildrenathome(46.8%).Theaveragenumberofchildrenineachfamilyis1.1,resultinginapersons‐per‐familyaverageofexactly3.0.AssummarizedinFigure2‐10,thesecharacteristicsaregenerallyconsistentwithothernearbycommunitiesinHaltonRegion,howeverfamilysizesareslightlysmallerinBurlington.
FIGURE 2‐9: FAMILY STRUCTURE, CITY OF BURLINGTON (2011)
SOURCE: Statistics Canada Census data (2006 and 2011).
FIGURE 2‐10: PERSONS AND CHILDREN PER FAMILY, HALTON REGION (2011)
SOURCE: Statistics Canada Census data (2011).
# of Families % of TotalTwo‐parent families 43,785 85.7%With no children at home 19,960 39.1%With children at home 23,935 46.8%Lone‐parent familiies 7,340 14.4%TOTAL 51,105 100.0%
Persons per family 3.0 Children per family 1.1
1.3 1.3 1.2 1.1
3.2 3.2 3.2 3.0
‐
1.0
2.0
3.0
4.0
OakvilleMiltonHalton HillsBurlington
Children Per Family
Persons Per Family
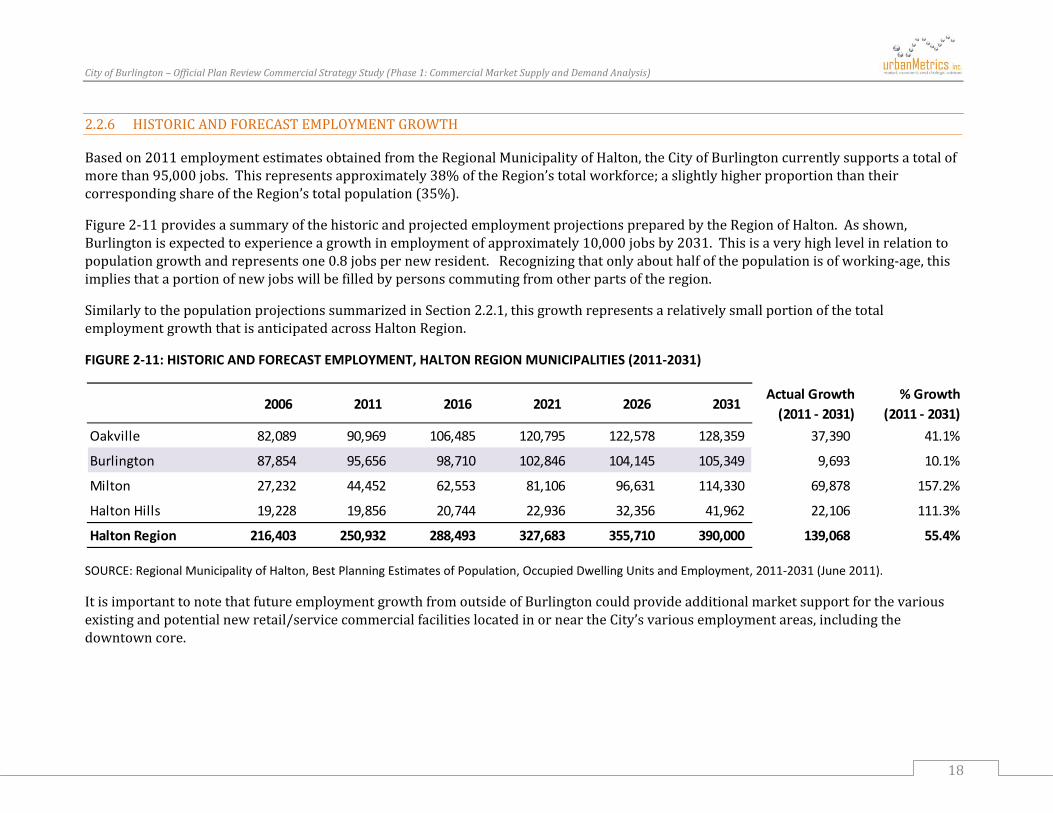
CityofBurlington–OfficialPlanReviewCommercialStrategyStudy(Phase1:CommercialMarketSupplyandDemandAnalysis)
18
2.2.6 HISTORICANDFORECASTEMPLOYMENTGROWTH
Basedon2011employmentestimatesobtainedfromtheRegionalMunicipalityofHalton,theCityofBurlingtoncurrentlysupportsatotalofmorethan95,000jobs.Thisrepresentsapproximately38%oftheRegion’stotalworkforce;aslightlyhigherproportionthantheircorrespondingshareoftheRegion’stotalpopulation(35%).
Figure2‐11providesasummaryofthehistoricandprojectedemploymentprojectionspreparedbytheRegionofHalton.Asshown,Burlingtonisexpectedtoexperienceagrowthinemploymentofapproximately10,000jobsby2031.Thisisaveryhighlevelinrelationtopopulationgrowthandrepresentsone0.8jobspernewresident.Recognizingthatonlyabouthalfofthepopulationisofworking‐age,thisimpliesthataportionofnewjobswillbefilledbypersonscommutingfromotherpartsoftheregion.
SimilarlytothepopulationprojectionssummarizedinSection2.2.1,thisgrowthrepresentsarelativelysmallportionofthetotalemploymentgrowththatisanticipatedacrossHaltonRegion.
FIGURE 2‐11: HISTORIC AND FORECAST EMPLOYMENT, HALTON REGION MUNICIPALITIES (2011‐2031)
SOURCE: Regional Municipality of Halton, Best Planning Estimates of Population, Occupied Dwelling Units and Employment, 2011‐2031 (June 2011).
ItisimportanttonotethatfutureemploymentgrowthfromoutsideofBurlingtoncouldprovideadditionalmarketsupportforthevariousexistingandpotentialnewretail/servicecommercialfacilitieslocatedinorneartheCity’svariousemploymentareas,includingthedowntowncore.
2006 2011 2016 2021 2026 2031Actual Growth (2011 ‐ 2031)
% Growth (2011 ‐ 2031)
Oakville 82,089 90,969 106,485 120,795 122,578 128,359 37,390 41.1%
Burlington 87,854 95,656 98,710 102,846 104,145 105,349 9,693 10.1%
Milton 27,232 44,452 62,553 81,106 96,631 114,330 69,878 157.2%
Halton Hills 19,228 19,856 20,744 22,936 32,356 41,962 22,106 111.3%
Halton Region 216,403 250,932 288,493 327,683 355,710 390,000 139,068 55.4%

CityofBurlington–OfficialPlanReviewCommercialStrategyStudy(Phase1:CommercialMarketSupplyandDemandAnalysis)
19
3 RETAILSTRUCTURE
3.1 INVENTORY
Figure3‐1summarizestheBurlingtonCommercialInventorybymajornode.ThelocationofeachnodeisindicatedonFigure3‐2.TheinventoryfollowsStatisticsCanadaandNAICSclassificationpracticesandisbasedonstoretypesratherthanmerchandise3.
Intotaltherearesome10.6millionsquarefeetofcommercialspaceintheCity,ofwhichapproximately45%iscomprisedofnon‐foodretailstores;39%iscomprisedofservices;9%ismadeupoffoodandbeveragestores;and5%isvacant.
Burlingtonhasatraditionalcommercialstructure,withthesinglelargestconcentrationofcommercialspacebeingwithinthedowntowncore.TheCityhastwoenclosedregionalshoppingcentres(BurlingtonMallandMapleviewShoppingCentre)ranked20thand32ndintermsofsizeofallenclosedmallsinOntario.Italsocontainsfourmajorpowercentrenodes:atBrantStreetandtheQEW;PlainsRoadandtheQEW;atApplebyandUpperMiddleRoad;and:atDundasandAppleby.
Togetherthesemajornodescontainsome4.3millionsquarefeetorabout41%ofthetotalinventory.Thelargestshareofspaceiscomprisedoflocalserving(i.e.convenience,neighbourhoodanddistrictretail)andarterialcommercialfacilitiesnotpartofamajorshoppingcentreornode.Thisstructureispreferablefromasmartgrowthperspectivebecauseitprovidesforamorebalanceddistributionofcommercialspaceinrelationtoresidentialcommunities.Conversely,commercialstructureswhicharemorefocusedonregionalretailnodestypicallyrequirelongershoppingtrips.
Burlingtoncontainsallofthemajornon‐foodretailersandstoretypesfoundinmosturbanGTAmunicipalities,including:
TwoBayDepartmentStores; ASearsDepartmentStore; TwoWalmartDepartmentStores; TwoZellersStores,whicharebeingtakenoverbyTarget; HomeDepotandRonabuildingcentres; ACostcoWarehouseMembershipClub;and,
3Forexample,departmentandwarehousemembershipclubsalesareclassifiedbyStatisticsCanadaas“GeneralMerchandise”,regardlessofmerchandisetype.Forthisreason,foodstorespaceinWalmartandCostcowouldbelistedunderthegeneralmerchandisecategory.
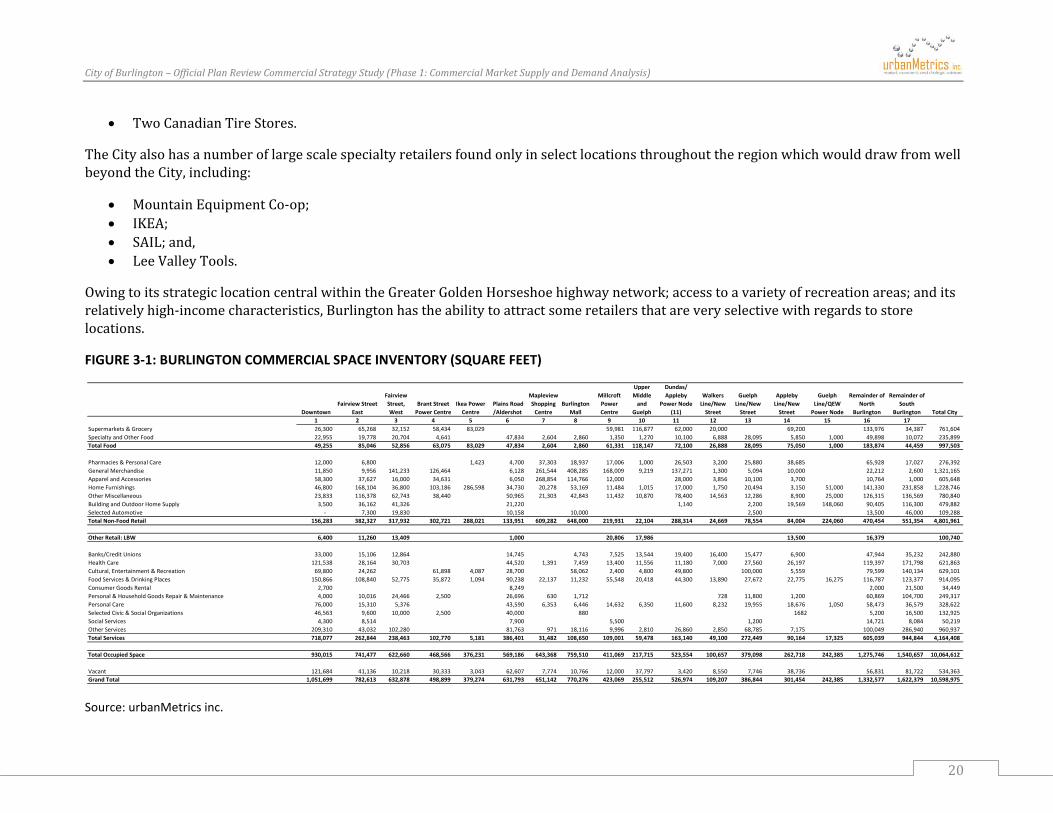
CityofBurlington–OfficialPlanReviewCommercialStrategyStudy(Phase1:CommercialMarketSupplyandDemandAnalysis)
20
TwoCanadianTireStores.
TheCityalsohasanumberoflargescalespecialtyretailersfoundonlyinselectlocationsthroughouttheregionwhichwoulddrawfromwellbeyondtheCity,including:
MountainEquipmentCo‐op; IKEA; SAIL;and, LeeValleyTools.
OwingtoitsstrategiclocationcentralwithintheGreaterGoldenHorseshoehighwaynetwork;accesstoavarietyofrecreationareas;anditsrelativelyhigh‐incomecharacteristics,Burlingtonhastheabilitytoattractsomeretailersthatareveryselectivewithregardstostorelocations.
FIGURE 3‐1: BURLINGTON COMMERCIAL SPACE INVENTORY (SQUARE FEET)
Source: urbanMetrics inc.
DowntownFairview Street
East
Fairview Street, West
Brant Street Power Centre
Ikea Power Centre
Plains Road /Aldershot
Mapleview Shopping Centre
Burlington Mall
Millcroft Power Centre
Upper Middle and
Guelph
Dundas/ Appleby
Power Node (11)
Walkers Line/New Street
Guelph Line/New Street
Appleby Line/New Street
Guelph Line/QEW Power Node
Remainder of North
Burlington
Remainder of South
Burlington Total City1 2 3 4 5 6 7 8 9 10 11 12 13 14 15 16 17
Supermarkets & Grocery 26,300 65,268 32,152 58,434 83,029 59,981 116,877 62,000 20,000 69,200 133,976 34,387 761,604 Specialty and Other Food 22,955 19,778 20,704 4,641 47,834 2,604 2,860 1,350 1,270 10,100 6,888 28,095 5,850 1,000 49,898 10,072 235,899 Total Food 49,255 85,046 52,856 63,075 83,029 47,834 2,604 2,860 61,331 118,147 72,100 26,888 28,095 75,050 1,000 183,874 44,459 997,503
Pharmacies & Personal Care 12,000 6,800 1,423 4,700 37,303 18,937 17,006 1,000 26,503 3,200 25,880 38,685 65,928 17,027 276,392 General Merchandise 11,850 9,956 141,233 126,464 6,128 261,544 408,285 168,009 9,219 137,271 1,300 5,094 10,000 22,212 2,600 1,321,165 Apparel and Accessories 58,300 37,627 16,000 34,631 6,050 268,854 114,766 12,000 28,000 3,856 10,100 3,700 10,764 1,000 605,648 Home Furnishings 46,800 168,104 36,800 103,186 286,598 34,730 20,278 53,169 11,484 1,015 17,000 1,750 20,494 3,150 51,000 141,330 231,858 1,228,746 Other Miscellaneous 23,833 116,378 62,743 38,440 50,965 21,303 42,843 11,432 10,870 78,400 14,563 12,286 8,900 25,000 126,315 136,569 780,840 Building and Outdoor Home Supply 3,500 36,162 41,326 21,220 1,140 2,200 19,569 148,060 90,405 116,300 479,882 Selected Automotive ‐ 7,300 19,830 10,158 10,000 2,500 13,500 46,000 109,288 Total Non‐Food Retail 156,283 382,327 317,932 302,721 288,021 133,951 609,282 648,000 219,931 22,104 288,314 24,669 78,554 84,004 224,060 470,454 551,354 4,801,961
Other Retail: LBW 6,400 11,260 13,409 1,000 20,806 17,986 13,500 16,379 100,740
Banks/Credit Unions 33,000 15,106 12,864 14,745 4,743 7,525 13,544 19,400 16,400 15,477 6,900 47,944 35,232 242,880 Health Care 121,538 28,164 30,703 44,520 1,391 7,459 13,400 11,556 11,180 7,000 27,560 26,197 119,397 171,798 621,863 Cultural, Entertainment & Recreation 69,800 24,262 61,898 4,087 28,700 58,062 2,400 4,800 49,800 100,000 5,559 79,599 140,134 629,101 Food Services & Drinking Places 150,866 108,840 52,775 35,872 1,094 90,238 22,137 11,232 55,548 20,418 44,300 13,890 27,672 22,775 16,275 116,787 123,377 914,095 Consumer Goods Rental 2,700 8,249 2,000 21,500 34,449 Personal & Household Goods Repair & Maintenance 4,000 10,016 24,466 2,500 26,696 630 1,712 728 11,800 1,200 60,869 104,700 249,317 Personal Care 76,000 15,310 5,376 43,590 6,353 6,446 14,632 6,350 11,600 8,232 19,955 18,676 1,050 58,473 36,579 328,622 Selected Civic & Social Organizations 46,563 9,600 10,000 2,500 40,000 880 1682 5,200 16,500 132,925 Social Services 4,300 8,514 7,900 5,500 1,200 14,721 8,084 50,219 Other Services 209,310 43,032 102,280 81,763 971 18,116 9,996 2,810 26,860 2,850 68,785 7,175 100,049 286,940 960,937 Total Services 718,077 262,844 238,463 102,770 5,181 386,401 31,482 108,650 109,001 59,478 163,140 49,100 272,449 90,164 17,325 605,039 944,844 4,164,408
Total Occupied Space 930,015 741,477 622,660 468,566 376,231 569,186 643,368 759,510 411,069 217,715 523,554 100,657 379,098 262,718 242,385 1,275,746 1,540,657 10,064,612
Vacant 121,684 41,136 10,218 30,333 3,043 62,607 7,774 10,766 12,000 37,797 3,420 8,550 7,746 38,736 56,831 81,722 534,363 Grand Total 1,051,699 782,613 632,878 498,899 379,274 631,793 651,142 770,276 423,069 255,512 526,974 109,207 386,844 301,454 242,385 1,332,577 1,622,379 10,598,975
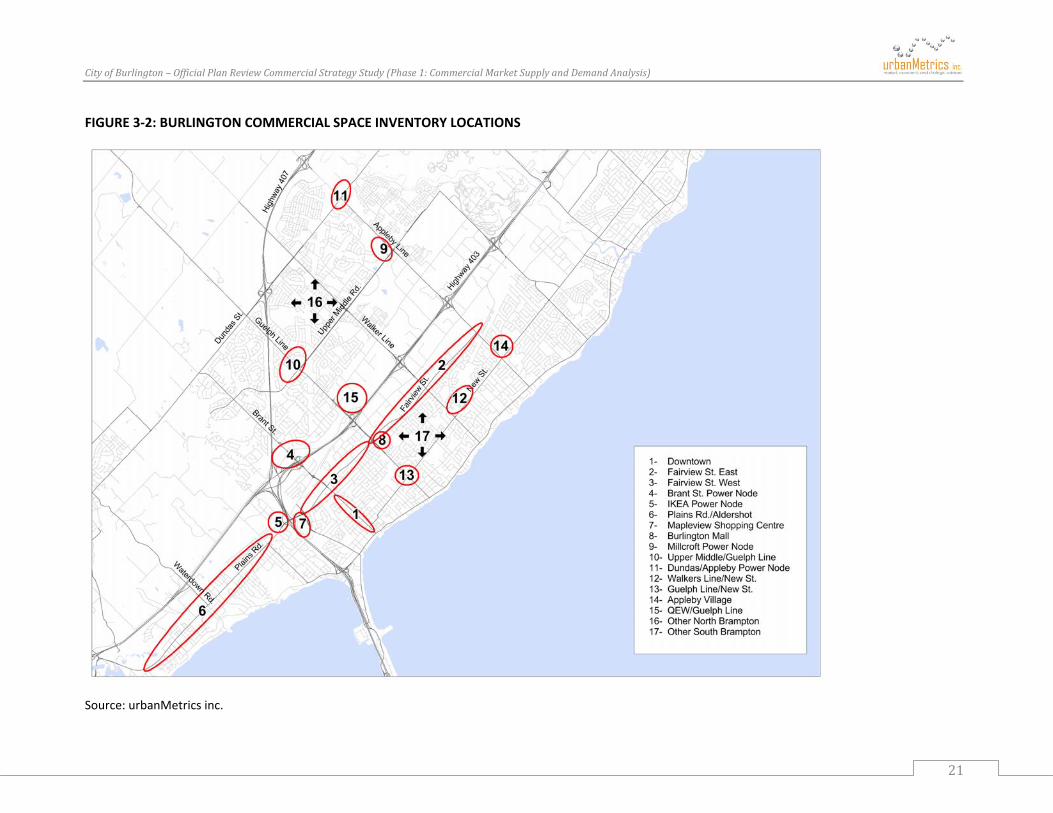
CityofBurlington–OfficialPlanReviewCommercialStrategyStudy(Phase1:CommercialMarketSupplyandDemandAnalysis)
21
FIGURE 3‐2: BURLINGTON COMMERCIAL SPACE INVENTORY LOCATIONS
Source: urbanMetrics inc.
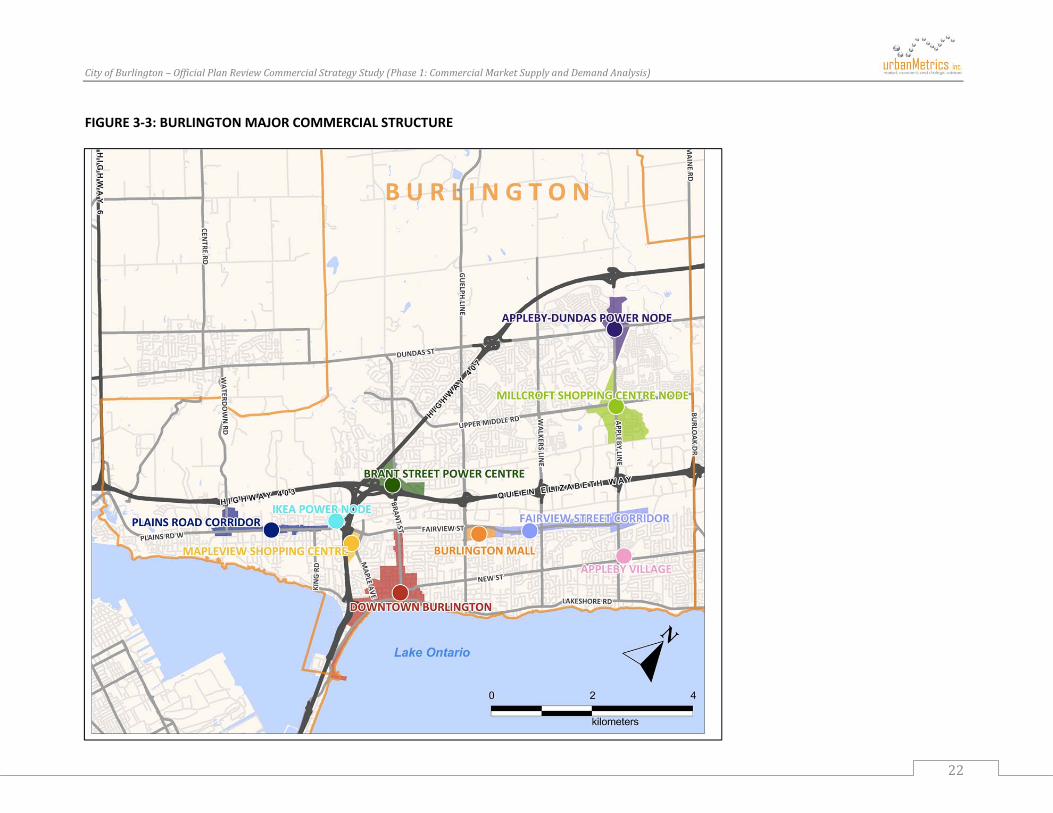
CityofBurlington–OfficialPlanReviewCommercialStrategyStudy(Phase1:CommercialMarketSupplyandDemandAnalysis)
22
FIGURE 3‐3: BURLINGTON MAJOR COMMERCIAL STRUCTURE
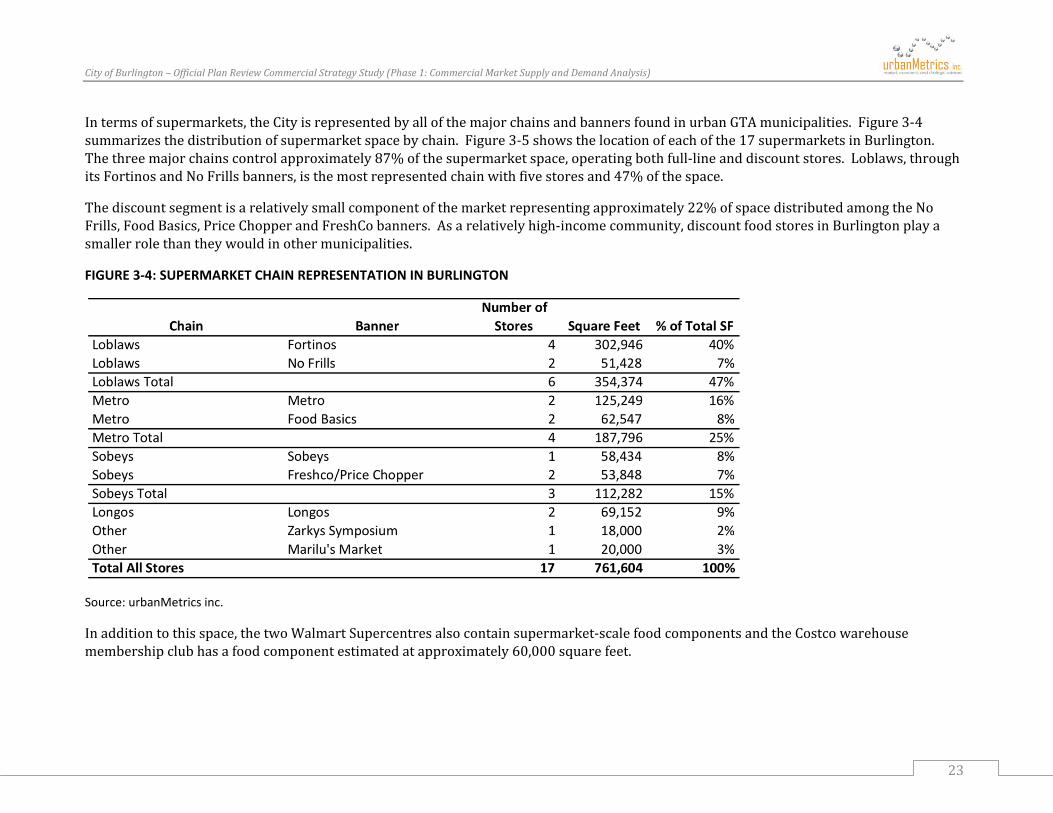
CityofBurlington–OfficialPlanReviewCommercialStrategyStudy(Phase1:CommercialMarketSupplyandDemandAnalysis)
23
Intermsofsupermarkets,theCityisrepresentedbyallofthemajorchainsandbannersfoundinurbanGTAmunicipalities.Figure3‐4summarizesthedistributionofsupermarketspacebychain.Figure3‐5showsthelocationofeachofthe17supermarketsinBurlington.Thethreemajorchainscontrolapproximately87%ofthesupermarketspace,operatingbothfull‐lineanddiscountstores.Loblaws,throughitsFortinosandNoFrillsbanners,isthemostrepresentedchainwithfivestoresand47%ofthespace.
Thediscountsegmentisarelativelysmallcomponentofthemarketrepresentingapproximately22%ofspacedistributedamongtheNoFrills,FoodBasics,PriceChopperandFreshCobanners.Asarelativelyhigh‐incomecommunity,discountfoodstoresinBurlingtonplayasmallerrolethantheywouldinothermunicipalities.
FIGURE 3‐4: SUPERMARKET CHAIN REPRESENTATION IN BURLINGTON
Source: urbanMetrics inc.
Inadditiontothisspace,thetwoWalmartSupercentresalsocontainsupermarket‐scalefoodcomponentsandtheCostcowarehousemembershipclubhasafoodcomponentestimatedatapproximately60,000squarefeet.
CityofBurlington–OfficialPlanReviewCommercialStrategyStudy(Phase1:CommercialMarketSupplyandDemandAnalysis)
24
Figure3‐6providesananalysisofthegeographicrepresentationofSupermarketswithintheCity.Ingeneral,atypicaltradeareaforasupermarketinanurbanareaisapproximatelytwokilometres.OnFigure3‐6,twokilometreradiiaroundeachsupermarkethavebeendelineatedasaguidetohowwelldifferentpartsoftheCityareservedbyfoodstores.Ingeneral,theurbanportionsoftheCityarewellservedbytheexistingsupplyofsupermarketswiththeexceptionofAldershot,wherethecloseststoreistheFortinossuperstoreattheQEWandPlainsRoad.Muchofthiscommunityisoutsideofatwo‐kilometreradius.Thereis,however,alargeconcentrationofsmallerfoodstoresalongPlainsRoadwhichservestheAldershotcommunity.

CityofBurlington–OfficialPlanReviewCommercialStrategyStudy(Phase1:CommercialMarketSupplyandDemandAnalysis)
25
FIGURE 3‐5: SUPERMARKETS IN BURLINGTON
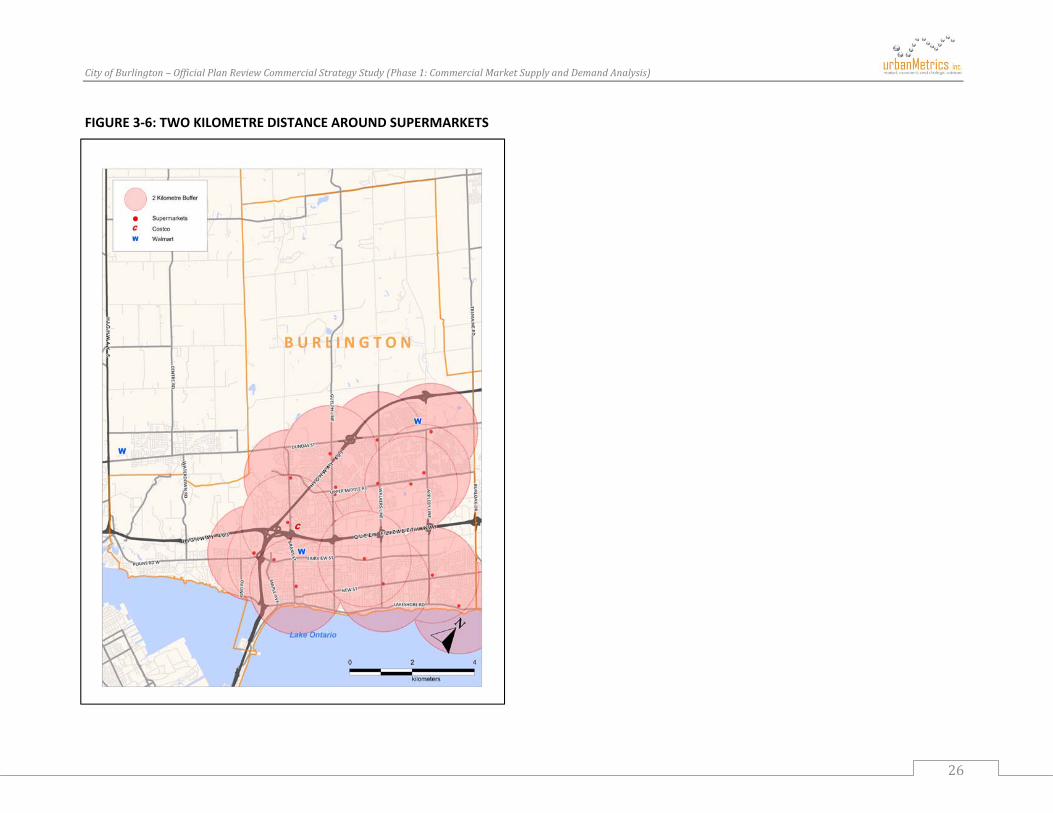
CityofBurlington–OfficialPlanReviewCommercialStrategyStudy(Phase1:CommercialMarketSupplyandDemandAnalysis)
26
FIGURE 3‐6: TWO KILOMETRE DISTANCE AROUND SUPERMARKETS

CityofBurlington–OfficialPlanReviewCommercialStrategyStudy(Phase1:CommercialMarketSupplyandDemandAnalysis)
27
Inconclusion,withtheexceptionofAldershot,theurbanportionsoftheCityareadequatelyservedbythedistributionofsupermarketsandothermajorfoodretailersacrosstheCity.
3.2 INVENTORYOFVACANTSPACE
Figure3‐7summarizesthevacantspaceinventoryfortheCity.Overallthevacancyrateis5.0%,whichisindicativeofabalancedmarket.Whilethereareseveralnodeswithrelativelyhighvacancyrates,thesetendtobeduetospacetransitionsanduniquecircumstancesratherthansignifyingstructuralissueswiththeCity’scommercialsupply.
Forexample,thevacantspaceinthedowntownareaincludes,internalspaceinBurlingtonSquare–aprojectwhichhasalwaysstruggledtoleasetoretailtenantsandhastendedtoattractinstitutionalusers;ablockwhichisbeingredeveloped;andaspecialtyretailcenter(“VillageSquare”)whichhashaddifficultyattractingretailtenantsduetoitsconfiguration.Excludingtheseprojects,thedowntownvacancyratewouldbeapproximately5.0%orin‐linewiththeCityaverage.
ApplebyVillageatApplebyLineandNewStreetwasaformerenclosedcommunityscaleshoppingcentre,whichhasrecentlyde‐malledtoanewformatopenconceptcentreandisstillhassomevacantunitsforlease.Similarly,thevacantspacewithintheUpperMiddleRoad/GuelphLineNodeisconcentratedprimarilyintheFortinosPlaza,whichhasrecentlyundergonearenovation/expansionandisstillintheprocessofleasingspace.
Insummary,thevacantspaceinventoryisindicativeofahealthyandbalancedmarketwithintheCityandtheindividualcommercialnodes.
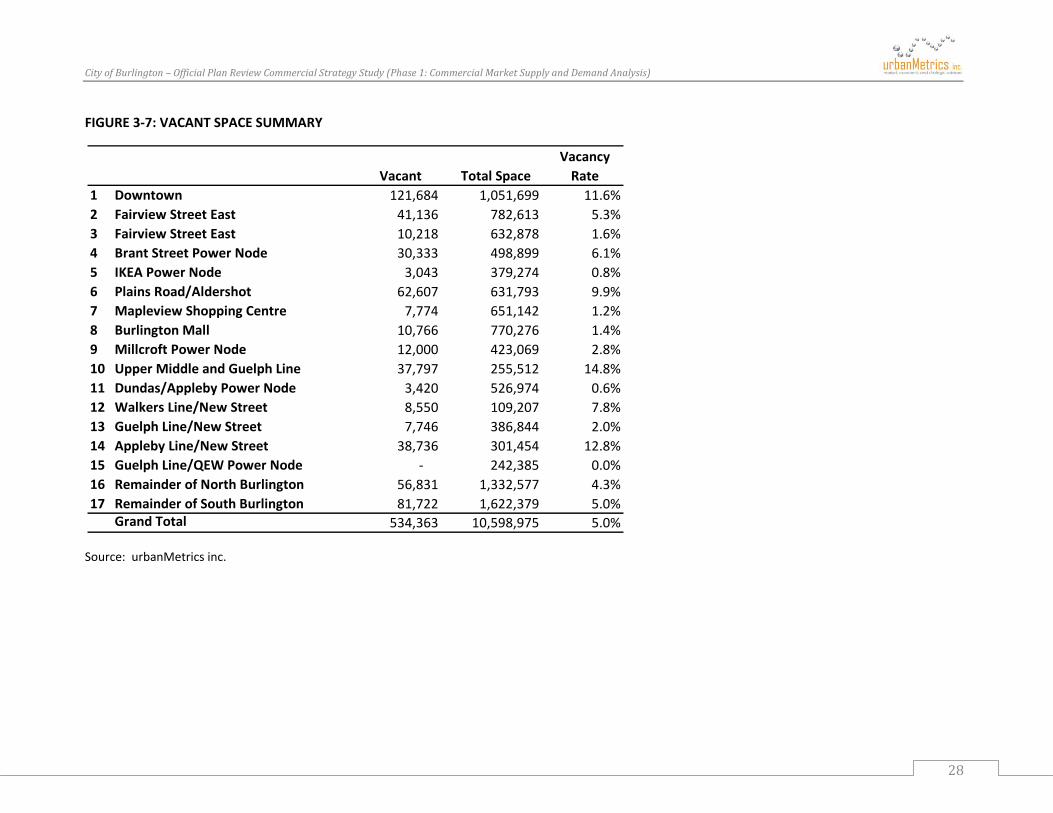
CityofBurlington–OfficialPlanReviewCommercialStrategyStudy(Phase1:CommercialMarketSupplyandDemandAnalysis)
28
FIGURE 3‐7: VACANT SPACE SUMMARY
Source: urbanMetrics inc.
Vacant Total SpaceVacancy Rate
1 Downtown 121,684 1,051,699 11.6%2 Fairview Street East 41,136 782,613 5.3%3 Fairview Street East 10,218 632,878 1.6%4 Brant Street Power Node 30,333 498,899 6.1%5 IKEA Power Node 3,043 379,274 0.8%6 Plains Road/Aldershot 62,607 631,793 9.9%7 Mapleview Shopping Centre 7,774 651,142 1.2%8 Burlington Mall 10,766 770,276 1.4%9 Millcroft Power Node 12,000 423,069 2.8%10 Upper Middle and Guelph Line 37,797 255,512 14.8%11 Dundas/Appleby Power Node 3,420 526,974 0.6%12 Walkers Line/New Street 8,550 109,207 7.8%13 Guelph Line/New Street 7,746 386,844 2.0%14 Appleby Line/New Street 38,736 301,454 12.8%15 Guelph Line/QEW Power Node ‐ 242,385 0.0%16 Remainder of North Burlington 56,831 1,332,577 4.3%17 Remainder of South Burlington 81,722 1,622,379 5.0%
Grand Total 534,363 10,598,975 5.0%
CityofBurlington–OfficialPlanReviewCommercialStrategyStudy(Phase1:CommercialMarketSupplyandDemandAnalysis)
29
3.3 CHANGEINCOMMERCIALSPACESINCE2002
Figure3‐8summarizesthechangeincommercialspacebynodeandbycategorysincetheCity’spreviouscommercialstudywaspreparedin2003.Wewouldnotethattheinventoryforthisstudywasconductedinthefallof2002,whereasinthiscurrentstudy,theinventorywasconductedinthefallof2012.
Thetwoinventorieswereconductedbythesamefirm,withthe2002storeinventoryactingasthebaseforthe2012inventory.Thisfacilitatescomparisonbetweenthetwoinventoriesasitavoidstheissueofdifferingsizeestimatesbydifferentconsultants.However,animportantdifferenceisthatin2005,StatisticsCanadachangeditsretailclassificationsystemwhichhasresultedinsomevariancesinthespaceinclusionsbetweenthetwoperiods.Themostsignificantdifferencesareasfollows:
Thefoodcategoriesarerelativelyunchanged,withtheminorexceptionthatvitamin/foodsupplementstoreshadbeenmovedfromotherfoodtopharmaciesandpersonalcare;
Withinthenon‐foodcategories,thepharmacyandpersonalcarecategorynowincludesanumberofstoretypespreviouslyincludedinothercategories,suchasoptical;hearingaids;andnutritionalsupplements.Theapparelaccessoriescategorynowincludesjewelleryandluggage/leather,whichwerepreviouslycategorizedundertheothermiscellaneouscategory.Thebuildingandoutdoorhomesupplycategoryhasbeenbolsteredthroughtheinclusionofarangeofhomerenovationsupplyfirms(e.g.kitchencabinets;plumbing;electrical;spas;poolsupplies;etc.thathadpreviouslybeencategorizedaswholesale.Inaddition,hardwarestoreshadbeenclassifiedasothermiscellaneousretail.Theothermiscellaneouscategory,inadditiontotheabovenotedchanges,nowincludesusedgoods(previouslynotconsideredretail)andexcludesanumberofminorcategories.
Theservicescategorieshavechangedsignificantlyandwiththeexceptionofbanks/creditunions;healthcare;andfoodservicesanddrinkingplaces,itisnotpossibletocomparetheindividualcategoriesbetweenthetwoinventories.
Forthesereasons,thecomparisonbetweenthetwoyearsshouldbeviewedgenerally,withmorecredencegiventothosecategoriesexperiencingminimalchangesandthemoregeneralspacetotals.Overall,thesizeofthetwoinventorieshasgrownbyapproximately3.4millionorbyjustunder50%.Recognizingthatsomecategorieshavebeenbolsteredbyspacenotpreviouslyincludedintheinventory,theactualcommercialspacegrowthisapproximately40%.Thisisstillconsiderablymorethanthepopulationgrowthoverthisperiod,whichwasapproximately16%.Itisalsoimportanttonotethattheamountofvacantspaceincreasedbyonly12%(i.e.belowtherateofpopulationgrowth),indicatingthatdespitetheverylargegrowthincommercialspace,markettake‐uporabsorptionwasnotanissue.

CityofBurlington–OfficialPlanReviewCommercialStrategyStudy(Phase1:CommercialMarketSupplyandDemandAnalysis)
30
Inparticular,thedowntowndidnotappeartobeaffectedbythegrowthincommercialspaceelsewhereintheCity,asthetotalamountofvacantspacewasvirtuallyunchanged(117,504squarefeetin2002vs.121,684squarefeetin2012).Excludingtheredevelopmentblock,thevacantspaceinthedowntownlikelydeclinedoverthisperiod.
Intermsofcategories,thefoodstorecategorygrewbyarelativelymodestamountinkeepingwithpopulationgrowth.Thisisconsistentwithbroadereconomictrends,whichhaveseenminimalgrowthinthiscategoryowingtotheriseoffoodretailingbynon‐foodretailers(e.g.Walmart,Costco,andShoppersDrugMart)andanincreaseinfoodservice(restaurantsandfastfoodoutlets)consumption.Thenon‐foodcategorygrewbyapproximately49%.Excludingthebuildingsupplyandautomotivesupplycategories,whichwouldhavemostaffectedbytheadditionofpreviouslynon‐classifiedretailspace,thegrowthinnon‐foodspacewouldhavebeenapproximately42%.
Insummary,overthegrowthincommercialspaceinBurlingtonoverthepasttenyearshasoutpacedpopulationgrowth.Atthesametime,however,thespacehasgenerallybeenabsorbedwithinthemarketandhasnotappearedtonegativelyimpactthedowntown.

CityofBurlington–OfficialPlanReviewCommercialStrategyStudy(Phase1:CommercialMarketSupplyandDemandAnalysis)
31
FIGURE 3‐8: CITY OF BURLINGTON CHANGE IN COMMERCIAL SPACE 2002‐2012 (SQUARE FEET)
Source: urbanMetrics inc.
2002 2012 Difference%
DifferenceSupermarkets & Grocery 689,789 763,404 73,615 11%Specialty and Other Food 163,825 234,099 70,274 43%Total Food 853,614 997,503 143,889 17%
Pharmacies & Personal Care 116,148 276,392 160,244 138%Department Stores 699,236 773,567 74,331 11%Canadian Tire Stores 160,539 183,407 22,868 14%Costco 118,277 118,277 ‐ 0%General Merchandise 73,997 245,914 171,917 232%Apparel and Accessories 416,864 605,648 188,784 45%Home Furnishings 771,568 1,228,746 457,178 59%Other Miscellaneous 607,725 780,840 173,115 28%Building and Outdoor Home Supply 211,851 479,882 268,031 127%Selected Automotive 41,642 109,288 67,646 162%Total Non‐Food Retail 3,217,847 4,801,961 1,584,114 49%
Other Retail: LBW 68,415 100,740 32,325 47%
Banks/Credit Unions 137,313 242,880 105,567 77%Health Care 315,713 621,863 306,150 97%Cultural, Entertainment & Recreation 629,101 629,101 n/aFood Services & Drinking Places 678,806 914,095 235,289 35%Consumer Goods Rental 34,449 34,449 n/aPersonal & Household Goods Repair/Main. 249,317 249,317 n/aPersonal Care 370,556 328,622 41,934‐ ‐11%Selected Civic & Social Organizations 132,925 132,925 n/aSocial Services 50,219 50,219 n/aOther Services 1,033,033 960,937 72,096‐ n/aTotal Services 2,535,421 4,164,408 1,628,987 64%
Total Occupied Space 6,675,297 10,064,612 3,389,315 51%
Vacant 478,788 534,363 55,575 12%Grand Total 7,154,085 10,598,975 3,444,890 48%

CityofBurlington–OfficialPlanReviewCommercialStrategyStudy(Phase1:CommercialMarketSupplyandDemandAnalysis)
32
3.4 COMMERCIALSPACEPERCAPITA
Figure3‐9summarizesthesquarefeetperresidentintheCityasperthe2012inventorybycommercialcategory.Overallthereisapproximately58squarefeetpercapitaintheCity.ThisisarelativelyhighratiocomparedwithmostotherGTAmunicipalities.Whiletheservicescategoryisoftendifficulttocomparebetweendifferentinventoriesduetodifferencesinmethodologiesandstudypurpose,wehaveprovidedacomparisonbetweenBurlingtonandarangeofotherGTAmunicipalitiesforthefood;non‐foodandfoodservicecategories.ThemunicipalitieschosenaretheurbanmunicipalitiesintheGTAforwhichrecentinventoriesareavailable.Thecomparablemunicipalitiesinclude4:
HaltonRegion
Burlington Oakville
PeelRegion
Brampton
YorkRegion
Markham RichmondHill Vaughan Newmarket
DurhamRegion
Pickering Ajax
WaterlooRegion
CityofWaterloo
4InventorydatawasnotavailablefortheCityofMississauga,theCityofOshawa,andtheTownofAurora,TheCityofTorontowasnotconsideredareasonablecomparable.

CityofBurlington–OfficialPlanReviewCommercialStrategyStudy(Phase1:CommercialMarketSupplyandDemandAnalysis)
33
Between2002and2012thepercapitanon‐foodstorespaceinBurlingtonhaseffectivelyremainedconstant.Thecurrentrateof5.4squarefeetpercapitaisaboveaverageandbetweenthelevelsfoundinMarkhamandWaterloo.GiventheaboveaverageincomecharacteristicsoftheCityandtheminimalchangeinsupplyoverthepast10years,ahigherthannormalratioofspaceperpopulationinthefoodcategoryisnotremarkable.
Ontheotherhand,boththenon‐foodandfoodservices/drinkingcategorieshavegrownsignificantlyonapercapitabasisoverthepast10years.Thecurrentnon‐foodspacepercapitaratioishigherthanalloftheurbancomparableswiththeexceptionofNewmarket.Intermsofnon‐foodstores,thepercapitaspaceinthegeneralmerchandisecategory(whichincludesdepartmentstores,Costco,CanadianTire,dollarstores,andarangeofothergeneralretailers),aswellasthehomefurnishingscategory,areparticularlyabovethenormforurbanGTAmunicipalities.
Thefoodservices/drinkingspacepercapitaratioinBurlingtonisalsoabovethegroupaverage5,butwithinthemiddleoftheselectedmunicipalities.
Insummary,theBurlingtonhasexperiencedasignificantgrowthinspaceonapercapitabasisoverthepasttenyears.Onaperresidentbasis,itscommercialspaceisabovetheaverageofcomparablemunicipalities,whichtosomeextentcanbeexplainedbyitsincomecharacteristicsanditsaccessibilitytothehighwaynetworkwithinthewesternGoldenHorseshoeregion.Vacancyrateswithinthecommunity,however,suggestthatBurlingtonisgenerallynotoverstored.
5Dataforfoodservices/drinkingspacewasnotavailableforthefullsetofcomparablemunicipalities.
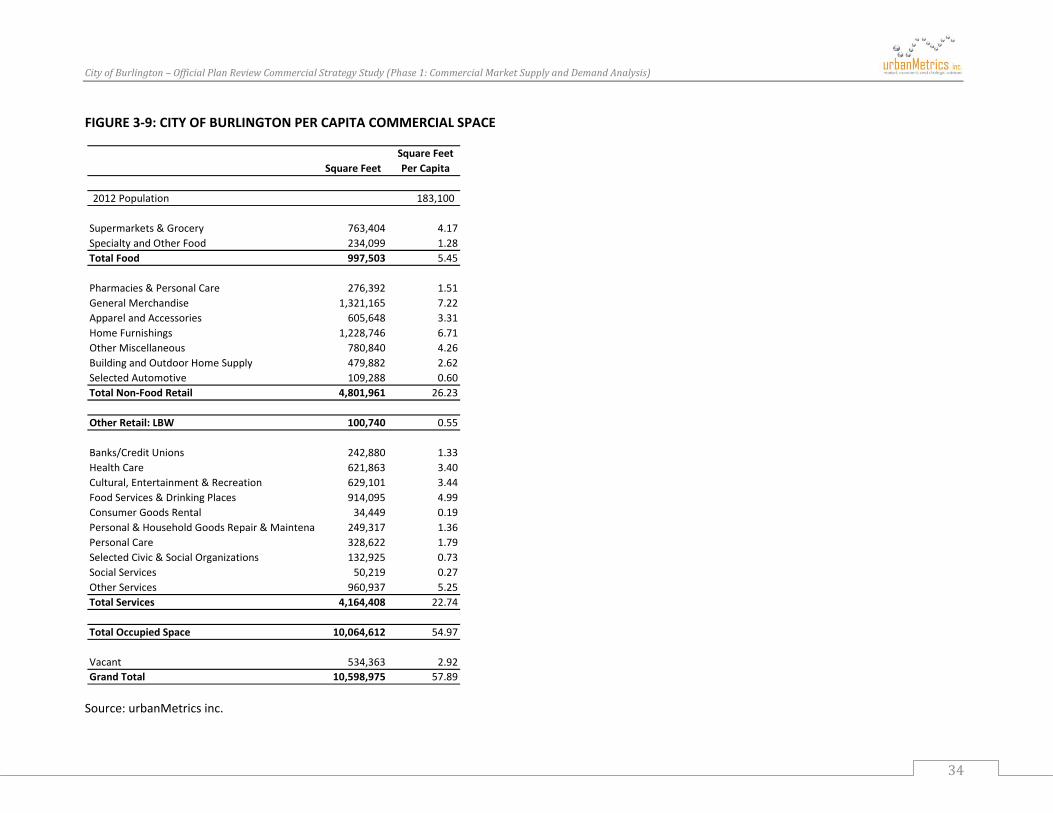
CityofBurlington–OfficialPlanReviewCommercialStrategyStudy(Phase1:CommercialMarketSupplyandDemandAnalysis)
34
FIGURE 3‐9: CITY OF BURLINGTON PER CAPITA COMMERCIAL SPACE
Source: urbanMetrics inc.
Square FeetSquare Feet Per Capita
2012 Population 183,100
Supermarkets & Grocery 763,404 4.17Specialty and Other Food 234,099 1.28Total Food 997,503 5.45
Pharmacies & Personal Care 276,392 1.51General Merchandise 1,321,165 7.22Apparel and Accessories 605,648 3.31Home Furnishings 1,228,746 6.71Other Miscellaneous 780,840 4.26Building and Outdoor Home Supply 479,882 2.62Selected Automotive 109,288 0.60Total Non‐Food Retail 4,801,961 26.23
Other Retail: LBW 100,740 0.55
Banks/Credit Unions 242,880 1.33Health Care 621,863 3.40Cultural, Entertainment & Recreation 629,101 3.44Food Services & Drinking Places 914,095 4.99Consumer Goods Rental 34,449 0.19Personal & Household Goods Repair & Maintena 249,317 1.36Personal Care 328,622 1.79Selected Civic & Social Organizations 132,925 0.73Social Services 50,219 0.27Other Services 960,937 5.25Total Services 4,164,408 22.74
Total Occupied Space 10,064,612 54.97
Vacant 534,363 2.92Grand Total 10,598,975 57.89

CityofBurlington–OfficialPlanReviewCommercialStrategyStudy(Phase1:CommercialMarketSupplyandDemandAnalysis)
35
FIGURE 3‐10: PER CAPITA RETAIL SPACE IN SELECTED GTA MUNICIPALITIES6
NON‐FOOD STORE RETAIL (NFSR) FOOD STORE RETAIL (FSR)
Source: urbanMetrics inc.
6urbanMetricsCommercialInventoriesforBurlington(2012),Vaughan,Pickering,Newmarket,Ajax,Waterloo,andOakville.JohnWinterandAssociatesLimitedInventoryofCommercialSpaceforMarkham.RealtyResearchGroup,2006RetailMarketAnalysisUpdateforWhitby.2005MaloneGivenParsons:RetailPolicyReviewStudyforBrampton
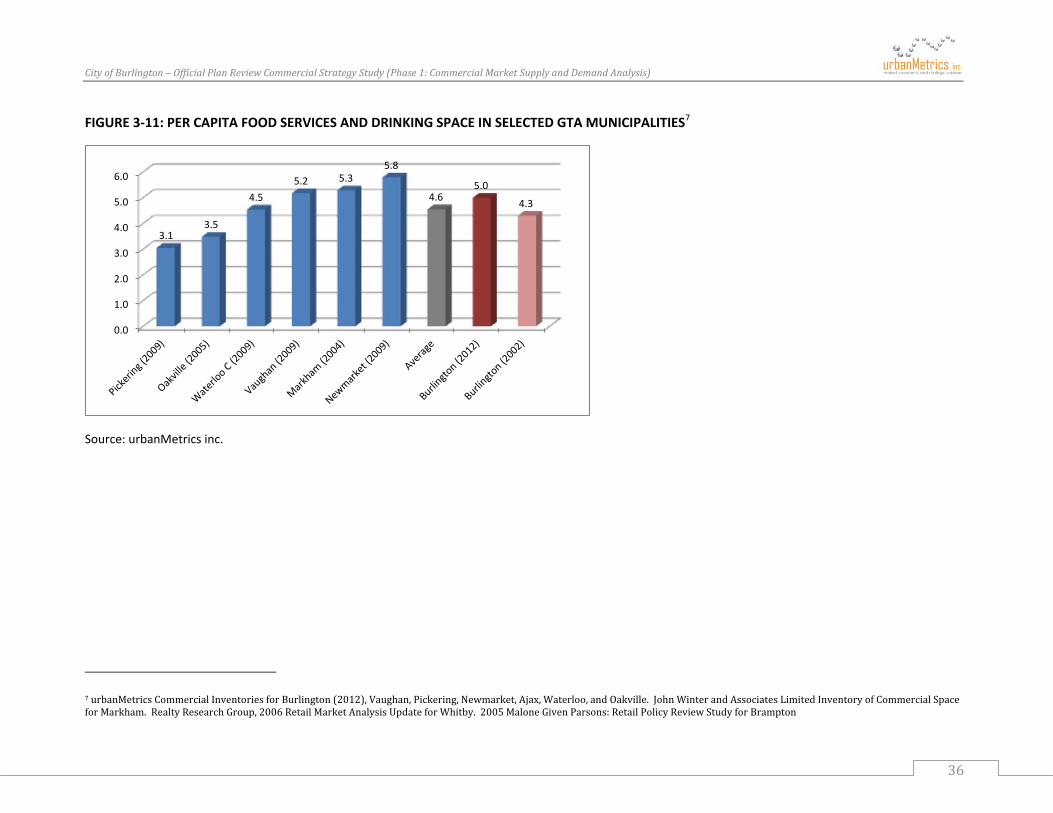
CityofBurlington–OfficialPlanReviewCommercialStrategyStudy(Phase1:CommercialMarketSupplyandDemandAnalysis)
36
FIGURE 3‐11: PER CAPITA FOOD SERVICES AND DRINKING SPACE IN SELECTED GTA MUNICIPALITIES7
Source: urbanMetrics inc.
7urbanMetricsCommercialInventoriesforBurlington(2012),Vaughan,Pickering,Newmarket,Ajax,Waterloo,andOakville.JohnWinterandAssociatesLimitedInventoryofCommercialSpaceforMarkham.RealtyResearchGroup,2006RetailMarketAnalysisUpdateforWhitby.2005MaloneGivenParsons:RetailPolicyReviewStudyforBrampton
0.0
1.0
2.0
3.0
4.0
5.0
6.0
Picke
ring (
2009
) Oa
kville
(200
5) W
aterlo
o C (2
009)
Vaug
han (
2009
) Ma
rkham
(200
4) Ne
wmark
et (20
09)
Avera
ge
Burlin
gton (
2012
) Bu
rlingto
n (20
02)
3.1 3.5
4.5 5.2 5.3
5.8
4.6 5.0
4.3
CityofBurlington–OfficialPlanReviewCommercialStrategyStudy(Phase1:CommercialMarketSupplyandDemandAnalysis)
37
3.5 INVENTORYINRELATIONTOTHEACTIVETRANSPORTATIONNETWORK
3.5.1 TRANSITACCESSIBILITY
Figure3‐12illustratestheBurlingtonTransitRouteMapandmajorshoppingdestinations.Intermsofaccessibility,everymajorshoppingnodeandlargefoodstoreanchoredshoppingcentreisonatleastonetransitline.DowntownBurlingtonistheconvergencepointforfiveBurlingtonTransitLinesandoneHamiltontransitline.
Whileallofthemajorshoppingdestinationscanbeaccessedbytransit,theeaseofaccessandtransfersrequiredwillultimatelydependontheoriginoftheshopperandtheirultimatedestination.
Fromapracticalstandpoint,shoppingbybustransitistypicallyonlyundertakenasanalternativetoautomobiletravel,duetoage,affordabilityormobilityissues.Inanaffluentcommunity,suchasBurlington,busorientedshoppingforthevastmajorityofresidentswouldnotbealifestylechoice,butratheranecessityforyoungpersonswithoutadriverslicense;seniorsnolongerabletodrive;andlowincomepersons.
Inadditiontothebustransitsystem,theCityisservedbyall‐dayGOtrainservicealongtheLakeshoreLine,withstationsatAldershot,BrantStreet(BurlingtonStation)andAppleby.ThereisadevelopingcommercialnodeinproximitytotheBrantStreetStation,withplanningpoliciessupportiveofmixedusedevelopmentinproximitytothesestations.
3.5.2 WALKABILITY
Figure3‐13illustrates400metreradiiaroundtheCity’ssupermarkets.Thisillustratesthepedestrianproximityofweeklyshoppingopportunities.WewouldnotethatthereareavarietyofspecialtyfoodandconveniencestoresalsoservingtheCity,butforthemostpart,thevastmajorityoftheCityisoutsideareasonablewalkingdistancetoaweeklyfooddestination.
3.5.3 CYCLINGANDRECREATIONTRAILNETWORK
Figure3‐14illustratesthelocationBurlington’ssupermarketsandmajorshoppingdestinationsinrelationtotheCity’scyclingandrecreationtrailnetwork.Asindicatedbythismap,thedowntownisrelativelywellconnectedviaoff‐roadtrailsandbikelanes.AlthoughnotshownontheMap,theWaterfrontTrailextendsalongLakeshoreRoadinBurlingtonextendingeastthroughtheGTAandsouthtotheNiagaraRegion.Thetwoenclosedregionalshoppingcentresarealsoconnectedtothenetworkviabikelanes,asarethreeofthefourpowernodes.Elevenoftheseventeensupermarketscanalsobeaccessedfromthecyclingnetwork.Itisimportanttorecognize,however,that
CityofBurlington–OfficialPlanReviewCommercialStrategyStudy(Phase1:CommercialMarketSupplyandDemandAnalysis)
38
regardlessoftheoverallconnectivitytothenetwork,barrierstocyclingsafetycanstillexistintermsofenteringandexitingshoppingcentresandintermsofon‐sitemovement.ThisisbeingaddressedaspartoftheurbandesigncomponentsoftheCommercialStrategy.
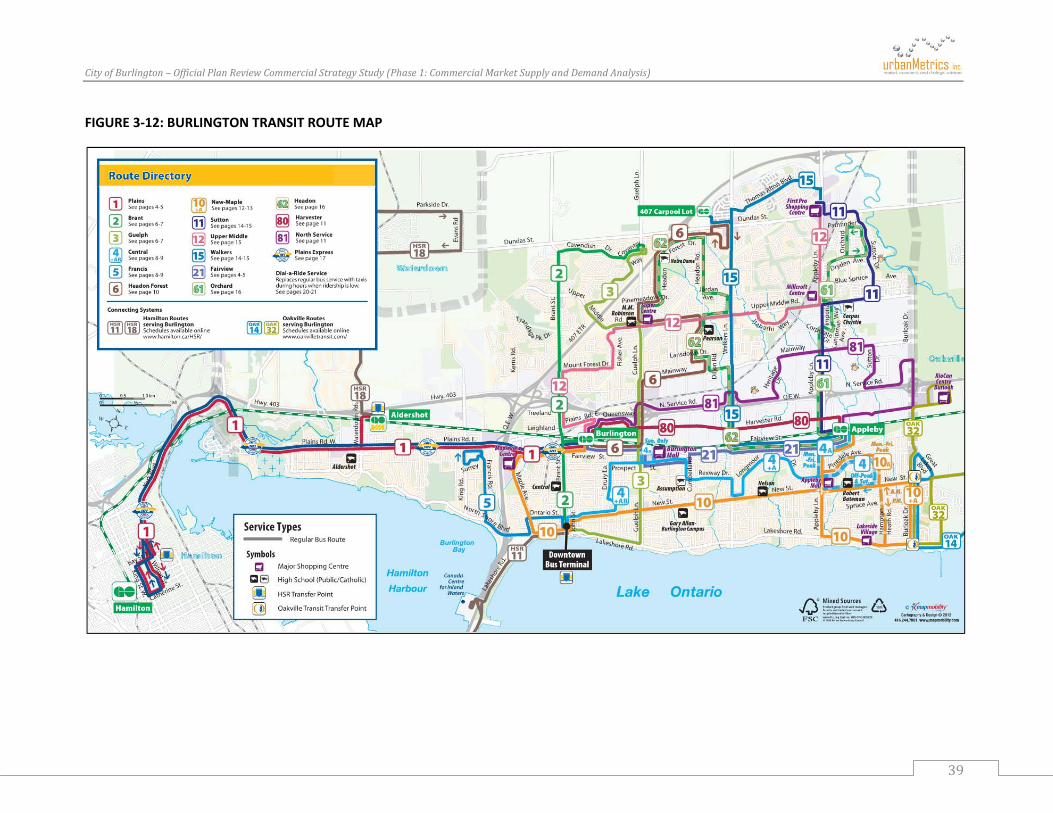
CityofBurlington–OfficialPlanReviewCommercialStrategyStudy(Phase1:CommercialMarketSupplyandDemandAnalysis)
39
FIGURE 3‐12: BURLINGTON TRANSIT ROUTE MAP

CityofBurlington–OfficialPlanReviewCommercialStrategyStudy(Phase1:CommercialMarketSupplyandDemandAnalysis)
40
FIGURE 3‐13: 400 METRE RADIUS AROUND SUPERMARKETS

CityofBurlington–OfficialPlanReviewCommercialStrategyStudy(Phase1:CommercialMarketSupplyandDemandAnalysis)
41
FIGURE 3‐14: MAJOR RETAIL NODES AND BURLINGTON’S CYCLE/TRAIL NETWORK

CityofBurlington–OfficialPlanReviewCommercialStrategyStudy(Phase1:CommercialMarketSupplyandDemandAnalysis)
42
Insummary,Burlington’smajorretailcentresarewellconnectedviathetransitsystem,butaremuchlessaccessibleforpedestriansandcyclists.
3.6 POTENTIALFUTURECOMMERCIALDEVELOPMENTS
Figure3‐15summarizesthepotentialfuturecommercialdevelopmentsbasedoninformationprovidedbyCityofBurlingtonplanningstaff.Figure3‐16identifiesthelocationoftheseopportunities.Thepotentialdevelopmentshavebeensubdividedintofourgroups:
ImmediateDevelopmentProspects–Theseareactiveapplicationsthathaverecentlybeenorareclosetoreceivingfullplanningapprovals.
OtherProposedDevelopments–OtherapplicationsreceivedbythePlanningDepartmentinvariousstagesoftheapprovalprocess.
SignificantUndevelopedDesignatedandZonedSites–Thesearevacantlandswithinexistingcommercialnodes,whicharezonedforretailcommercialuses,butarenotyetsubjecttoplanningand/orbuildingpermitapplications.
OtherPotentialCommercialDevelopmentSites–ThesearesitesidentifiedbytheCityofBurlingtonPlanningDepartmentashavingpotentialforfuturecommercialdevelopment.Theyareavarietyofsites,bothservicedandun‐serviced.Mostoftheservicedpropertiesarezonedformixedcommercial‐residentialorcommercial‐employmentusesandarerestrictedintheamountofcommercialspacethatcanbedeveloped.Thiscategoryalsoincludesthe225,000squarefootIKEAoutlet,whichwouldbevacated,iftheplanningapplicationfacilitatingtherelocationofthestoretoasiteatWalkersLineandtheQEWisapproved.
Inadditiontothesefuturedevelopments,theZellersstoresatBurlingtonMallandMillcroftCentrearebeingconvertedtoTargetdepartmentstores.ItisassumedthattheTargetstoreswillgeneratehighersalesvolumesandbegenerallymorecompetitivethantheformerZellersoutlets.TargethasalsopartneredwithSobeystoprovideaselectionofgroceryitems,buttheirfirstCanadianstoresdonottocontainsupermarket‐scalefoodcomponents.
AlargescaleproposalofnotewouldbeanapplicationbyIKEAtorelocateandexpanditscurrentoperationsatPlainsRoadandtheQEWtoWalkersLineandtheQEW.Theproposalwouldincludearetailoutlet,warehouse,andheadoffice.Thecommercialcomponentwouldcomprisejustover300,000squarefeet.TheintendedpropertyisinadesignatedBusinessCorridor,whichwouldpermitonlyalimitedrangeofcommercialuses.ConsequentlyanOfficialPlanAmendmentandrezoningwouldberequiredtofacilitatethisdevelopment.Asweunderstand,planningstaffisrecommendingapprovalofthisapplication,whichhasnotyetbeenapprovedbyCouncil.
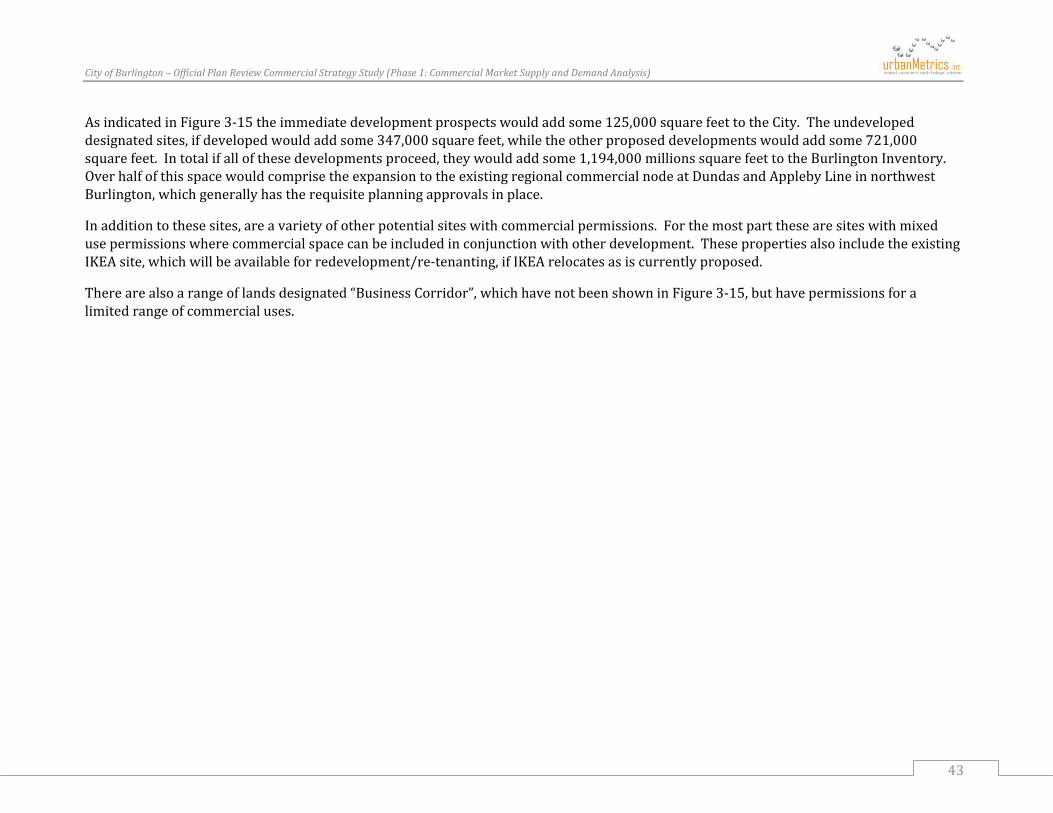
CityofBurlington–OfficialPlanReviewCommercialStrategyStudy(Phase1:CommercialMarketSupplyandDemandAnalysis)
43
AsindicatedinFigure3‐15theimmediatedevelopmentprospectswouldaddsome125,000squarefeettotheCity.Theundevelopeddesignatedsites,ifdevelopedwouldaddsome347,000squarefeet,whiletheotherproposeddevelopmentswouldaddsome721,000squarefeet.Intotalifallofthesedevelopmentsproceed,theywouldaddsome1,194,000millionssquarefeettotheBurlingtonInventory.OverhalfofthisspacewouldcomprisetheexpansiontotheexistingregionalcommercialnodeatDundasandApplebyLineinnorthwestBurlington,whichgenerallyhastherequisiteplanningapprovalsinplace.
Inadditiontothesesites,areavarietyofotherpotentialsiteswithcommercialpermissions.Forthemostpartthesearesiteswithmixedusepermissionswherecommercialspacecanbeincludedinconjunctionwithotherdevelopment.ThesepropertiesalsoincludetheexistingIKEAsite,whichwillbeavailableforredevelopment/re‐tenanting,ifIKEArelocatesasiscurrentlyproposed.
Therearealsoarangeoflandsdesignated“BusinessCorridor”,whichhavenotbeenshowninFigure3‐15,buthavepermissionsforalimitedrangeofcommercialuses.
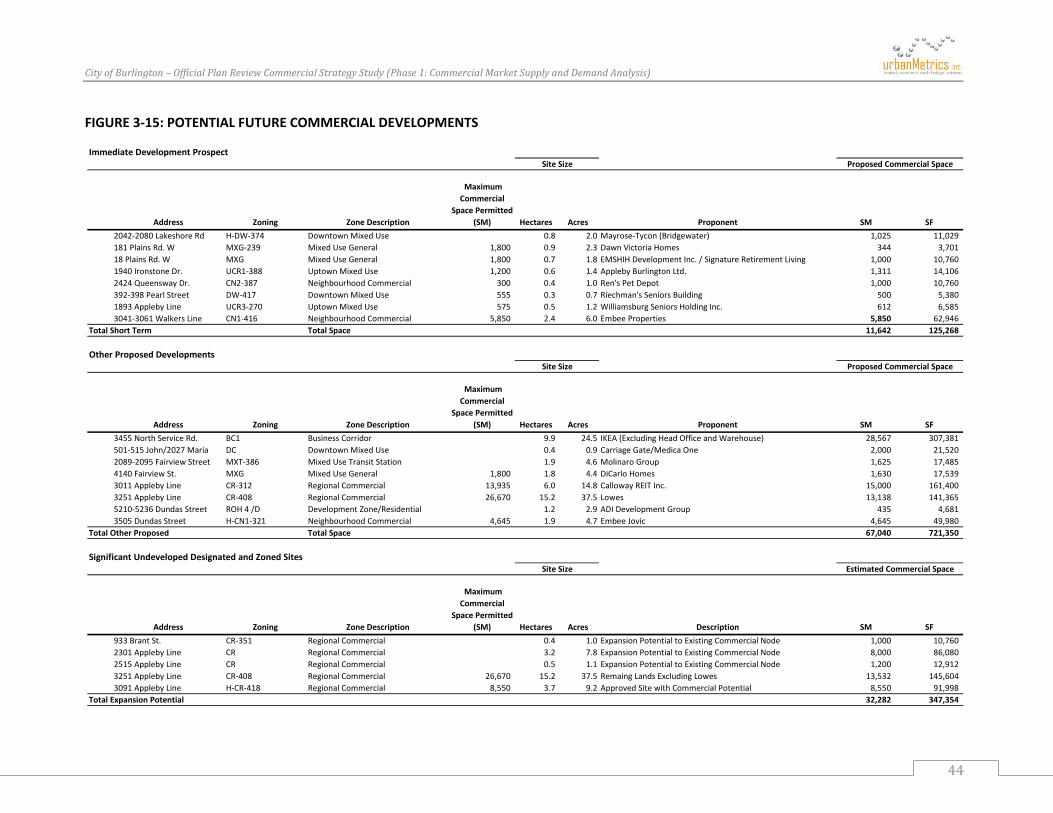
CityofBurlington–OfficialPlanReviewCommercialStrategyStudy(Phase1:CommercialMarketSupplyandDemandAnalysis)
44
FIGURE 3‐15: POTENTIAL FUTURE COMMERCIAL DEVELOPMENTS
Immediate Development Prospect
Address Zoning Zone Description
Maximum Commercial
Space Permitted (SM) Hectares Acres Proponent SM SF
2042‐2080 Lakeshore Rd H‐DW‐374 Downtown Mixed Use 0.8 2.0 Mayrose‐Tycon (Bridgewater) 1,025 11,029 181 Plains Rd. W MXG‐239 Mixed Use General 1,800 0.9 2.3 Dawn Victoria Homes 344 3,701 18 Plains Rd. W MXG Mixed Use General 1,800 0.7 1.8 EMSHIH Development Inc. / Signature Retirement Living 1,000 10,760 1940 Ironstone Dr. UCR1‐388 Uptown Mixed Use 1,200 0.6 1.4 Appleby Burlington Ltd. 1,311 14,106 2424 Queensway Dr. CN2‐387 Neighbourhood Commercial 300 0.4 1.0 Ren's Pet Depot 1,000 10,760 392‐398 Pearl Street DW‐417 Downtown Mixed Use 555 0.3 0.7 Riechman's Seniors Building 500 5,380 1893 Appleby Line UCR3‐270 Uptown Mixed Use 575 0.5 1.2 Williamsburg Seniors Holding Inc. 612 6,585 3041‐3061 Walkers Line CN1‐416 Neighbourhood Commercial 5,850 2.4 6.0 Embee Properties 5,850 62,946
Total Short Term Total Space 11,642 125,268
Other Proposed Developments
Address Zoning Zone Description
Maximum Commercial
Space Permitted (SM) Hectares Acres Proponent SM SF
3455 North Service Rd. BC1 Business Corridor 9.9 24.5 IKEA (Excluding Head Office and Warehouse) 28,567 307,381 501‐515 John/2027 Maria DC Downtown Mixed Use 0.4 0.9 Carriage Gate/Medica One 2,000 21,520 2089‐2095 Fairview Street MXT‐386 Mixed Use Transit Station 1.9 4.6 Molinaro Group 1,625 17,485 4140 Fairview St. MXG Mixed Use General 1,800 1.8 4.4 DiCarlo Homes 1,630 17,539 3011 Appleby Line CR‐312 Regional Commercial 13,935 6.0 14.8 Calloway REIT Inc. 15,000 161,400 3251 Appleby Line CR‐408 Regional Commercial 26,670 15.2 37.5 Lowes 13,138 141,365 5210‐5236 Dundas Street ROH 4 /D Development Zone/Residential 1.2 2.9 ADI Development Group 435 4,681 3505 Dundas Street H‐CN1‐321 Neighbourhood Commercial 4,645 1.9 4.7 Embee Jovic 4,645 49,980
Total Other Proposed Total Space 67,040 721,350
Significant Undeveloped Designated and Zoned Sites
Address Zoning Zone Description
Maximum Commercial
Space Permitted (SM) Hectares Acres Description SM SF
933 Brant St. CR‐351 Regional Commercial 0.4 1.0 Expansion Potential to Existing Commercial Node 1,000 10,760 2301 Appleby Line CR Regional Commercial 3.2 7.8 Expansion Potential to Existing Commercial Node 8,000 86,080 2515 Appleby Line CR Regional Commercial 0.5 1.1 Expansion Potential to Existing Commercial Node 1,200 12,912 3251 Appleby Line CR‐408 Regional Commercial 26,670 15.2 37.5 Remaing Lands Excluding Lowes 13,532 145,604 3091 Appleby Line H‐CR‐418 Regional Commercial 8,550 3.7 9.2 Approved Site with Commercial Potential 8,550 91,998
Total Expansion Potential 32,282 347,354
Site Size Proposed Commercial Space
Site Size Proposed Commercial Space
Site Size Estimated Commercial Space

CityofBurlington–OfficialPlanReviewCommercialStrategyStudy(Phase1:CommercialMarketSupplyandDemandAnalysis)
45
Source: urbanMetrics inc. based on information provided by the City of Burlington.
Other Potential Commercial Development Sites
Address Zoning Zone Description
Maximum Commercial
Space Permitted (SM) Hectares Acres
1065 Plains Rd. E CR Regional Commercial 5.1 12.63232 Tremaine Rd. D Development Zone 0.8 2.03278 Tremaine Rd. D Development Zone 0.4 1.05463 Dundas St. D Development Zone 48.8 120.65421 Dundas St. D Development Zone 17.7 43.85401 Dundas St. D Development Zone 2.2 5.61309 Appleby Line D Development Zone 7.4 18.2421 John St. DC Downtown Mixed Use 0.4 1.0391 Brant St. DC Downtown Mixed Use 0.3 0.73119 North Service Rd. CE‐37 Employment Commercial 11.1 27.53119 North Service Rd. CE‐37 Employment Commercial 1.4 3.42200 Industrial St. CE‐34 Employment Commercial 15,800 1.4 3.52210 Industrial St. CE‐34 Employment Commercial 15,800 1.2 2.91070 Waterdown Rd. H‐GE1‐57 General Employoment (1 3.7 9.14495 North Service Rd. GE1 General Employoment (1 10.5 26.01021 Emery Ave. GE2 General Employoment (1 1.7 4.1101 Masonry Crt. MXC‐26 Mixed Commercial Corridor 5,600 5.1 12.64415 Fairview St. H‐MXC‐414 Mixed Commercial Corridor 5,600 6.5 16.01167 Plains Rd. E MXE Mixed Use Employment 500 0.8 2.01178 Plains Rd. E MXE Mixed Use Employment 500 0.5 1.41215 Appleby Line MXE Mixed Use Employment 500 1.2 3.05091 Fairview St. MXE Mixed use Employment 500 1.3 3.2277 Plains Rd. E MXG Mixed Use General 1,800 2.5 6.2457 Plains Rd. E MXG Mixed Use General 1,800 0.7 1.871 Plains Rd. E MXG Mixed Use General 1,800 0.4 0.9769 Brant St. MXG‐8 Mixed Use General 1,800 0.3 0.7779 Brant St. MXG Mixed Use General 1,800 0.1 0.21200 King Rd. See 4000‐3 Mixed Use/Gen Employment 49.1 121.4561 Wedgewood Dr. CN2 Neighbourhood Commercial 0.5 1.21150 Plains Rd. W CN2 Neighbourhood Commercial 0.6 1.45001 Corporate Dr. UCR3‐273 Uptown Mixed Use 0.2 0.40000 Burlington‐Spcls See 1642 9.4 23.2
1) Lands designated General Employment on this table are overlain with a Mixed Commercial Corridor designation on themajor street front.
Split Zoned 3.4 HA vacant
Partly Occupied ‐ 1,289 M of site area undeveloped
Parking Lot ‐ Potential RedevelopmentParking Lot ‐ Potential Redevelopment
Fill On Property and Environmental ConstraintsPinedale Plaza 4,823 M
Portion Near Road Designated Mixed Use Employment
Approx 3.4 Hectares Developed with Leons Store
NotesExisting IKEA (225,694 SF)
CityofBurlington–OfficialPlanReviewCommercialStrategyStudy(Phase1:CommercialMarketSupplyandDemandAnalysis)
46
FIGURE 3‐16: LOCATION OF POTENTIAL FUTURE COMMERCIAL DEVELOPMENTS
Source: urbanMetrics inc. based on information provided by the City of Burlington
CityofBurlington–OfficialPlanReviewCommercialStrategyStudy(Phase1:CommercialMarketSupplyandDemandAnalysis)
47
3.7 COMPETITIVERETAILFACILITIESOUTSIDEBURLINGTON
TheCityofBurlingtonispartofabroaderregionalcommercialstructurewhichspanstheGreaterTorontoArea.TheCityismostinfluencedbythecommercialnodesinOakvilleandHamilton.Oakvillehastraditionallybeenunderservedintermsofregionalretailfacilitiesandhastendedtorelyonfacilitiesinitsneighbouringmunicipalities,includingBurlington.In2007,amajorretailpowercentredevelopmentopenedinOakvilleatBurloakDriveandtheQEWontheOakville/Burlingtonborder.At530,000squarefeet,theRioCanBurloakCentreisanchoredbyaHomeDepot,aCineplexOdeonandaLongossupermarketandcontainsarangeofmostlynon‐foodretailtenants.
Whilethisdevelopmentcouldserveasaninterveningopportunity,reducinginflowintoBurlingtonfromOakville,thelicense–platesurveysconductedatthemajorBurlingtonretailnodesindicatethattheretailsalesvolumesfromOakvillehavepersisted.Potentially,thelackofadepartmentstoreanchorhasreducedtheeffectivenessoftheBurloakpowercentreintermsofdivertingOakvilleshoppers.In2013,theZellersatHopedaleMallinsouthcentralOakvillewillbeconvertedtoaTargetdepartmentstore,whichmayservetoinfluencenon‐foodsalesinsoutheastBurlingtonandsouthOakville.
InHamilton,theclosestcommercialcompetitiontoBurlingtonwouldbeEastgateSquaretothesouth,andthecommunityofWaterdowntothenorthwest.EastgateSquareisa550,000squarefootregionalshoppingcentreonCentennialParkwayanchoredbyaSearsdepartmentstoreandaFortinosSupermarket.Itiscurrentlyundergoingamajorrenovationtore‐tenanttheformerWalmart,whichrecentlyvacatedtheshoppingcentre.TheexpansionwilladdSportChek,Winners,UrbanPlanet,aswellasarangeofotherancillarytenants.
TheWalmartstorehasrelocatedandexpandedonanewSmartCentrespowercentreatCentennialParkwayandtheQEW,adjacenttotheSkywayBridgeconnectingtoBurlington.ThisdevelopmentmayservetoconstrainsomeinflowintoBurlingtoninthefuture.
Sincethe2003BurlingtonCommercialStudy,significantcommercialexpansionhasoccurredwithintheHamiltoncommunityofWaterdownadjacenttotheCityofBurlington,includingthedevelopmentofamajorpowercenternodeattheintersectionofHighway6andDundasStreet(Highway5).Thisnodenowcontainsapproximately600,000squarefeetofpowercentreretailspace,includingWalmart,CanadianTire,Rona,andZellers(UnderConversiontoTarget).Thisnodecurrentlyrepresentsapproximatelyhalfofthe1.2millionsquarefeetexistingwithintheformercommunityofWaterdown8,withvacantlandsavailableforfurtherexpansion.Inaddition,theWaterdownSecondaryPlan,whichwouldexpandtheWaterdownurbanareatotheeast,wouldaddadditionaldistrictandlocalservingretailsitesonDundasStreet.
ThisdevelopmenthaslikelycurtailedinflowfromtheWaterdowncommunity,asithasaddedanchortenantsthatwerenotpreviouslyavailabletolocalresidents.
8BasedonaninventoryconductedbyMaloneGivenParsons,WaterdownBayLandownersMarketImpactStudy,August2011.

CityofBurlington–OfficialPlanReviewCommercialStrategyStudy(Phase1:CommercialMarketSupplyandDemandAnalysis)
48
Insummary,Burlingtonhasseenconsiderableexpansioninitscommercialinventoryoverthepasttenyears,withgrowthoutpacingpopulationincreases.ItcurrentlyhasacommercialsupplyonaperresidentbasisthatexceedsthatinmosturbanGTAmunicipalities.However,itsoverallvacancyratesuggeststhatthecurrentretailspacesupplyisinbalancewithmarketrequirements,whichhasbeenbolsteredbyaboveaverageincomesandastrategiclocationwithrespecttothewesternGTAhighwaynetwork.Thereisjustovermillionsquarefeetofadditionalcommercialspace(representingapproximately10%ofthecurrentinventory)proposedorapprovedwithintheCity,withthepotentialforsmallerscalecommercialdevelopmentonanumberofothermixeduseandmixedemploymentsites.
Inthefuture,theremaybesomereductionininflowfromHamiltonduetonewdevelopmentinWaterdownandneartheCentennialParkway/QEWinterchange,althoughthisisnotexpectedtosignificantlyaffectoveralldemandforcommercialspacewithinBurlington.

CityofBurlington–OfficialPlanReviewCommercialStrategyStudy(Phase1:CommercialMarketSupplyandDemandAnalysis)
49
4 THECITYOFBURLINGTON’STRADEAREA
AnevaluationoftheretailmarketinBurlingtonrequiresanunderstandingofthedemandandsupplyfactorsthatinfluencetheneedfornewretailandservicefacilities.Essentialtothisevaluationisthedelineationofthetradearea–ormarketarea–servedbytheCityandthedeterminationofpopulationandpercapitaincomelevelswithinthisarea.
4.1 TRADEAREADEFINED
Atradeareatypicallyrepresentsthegeographicareafromwhicharetaildevelopment(orretailarea)wouldnormallyexpecttoderivethemajorityofitssalesvolume.Thephysicalsizeofatradeareatypicallyvariesduetooutsidefactorssuchasthelocalroadnetwork,naturalphysicalbarriers(e.g.,rivers,bridges,etc.)andtheproximityofcompetingshoppingdestinations.Theseinfluencescanallservetolimitandotherwisedefinethegeographicdrawingpowerofaretailarea.Furthermore,retailgravity,orthenumberandconcentrationofstoresatashoppingnodeorvenue,candefinetheattractivenessofaretaildestination.Anareawheremanyretailalternativesandstoresareconcentratedenhancestheconsumerdrawingpowerandincreasesthedistanceconsumersarewillingtotraveltoshopthere.
FortheCityofBurlington,competitiveretailcentresthatexistinHamilton,OakvilleandotherneighbouringcommunitieswillcontinuetoinfluencethescopeofretailopportunitiesinBurlington.TheseexistingshoppingopportunitiesandotherproposedretaildevelopmentsinandaroundthesecommunitieswillcontinuetodefineandlimitthetradeareafortheCityofBurlington.
ToestimatetheextentofBurlington’sTradeArea,wehavereliedonlicenceplatesurveysconductedatselectedshoppingdestinationslocatedinandaroundtheCityofBurlington;theresultsofon‐streetinterceptsurveysconductedintheCity’sdowntown;ourunderstandingoftheinventoryofcommercialspaceinBurlington;andthemajorretailopportunitiesinneighbouringmunicipalities.ThefollowingsubsectionsprovideanoverviewofthevariousresearchandanalysisthatwasundertakenasinputtothedelineationoftheCity’sTradeArea.
4.1.1 LICENCEPLATESURVEYS
ThelicenceplatesurveyswereconductedoverathreeweekperiodintheFallof2012,includingthelasttwoweeksofSeptemberandthefirstofOctober.Atotalof1,849licenceplateswerecollectedatsixdifferentshoppingdestinationslocatedinorneartheedgesoftheCityofBurlington,including:BurlingtonMall,MapleviewCentre,BurlingtonPowerCentre(Brant/QEW),MillcroftCentre,Appleby‐DundasPowerNode,andBurloakCentre(Oakville).ThedetailedresultsofthesesurveyshavebeenprovidedinAppendixA.
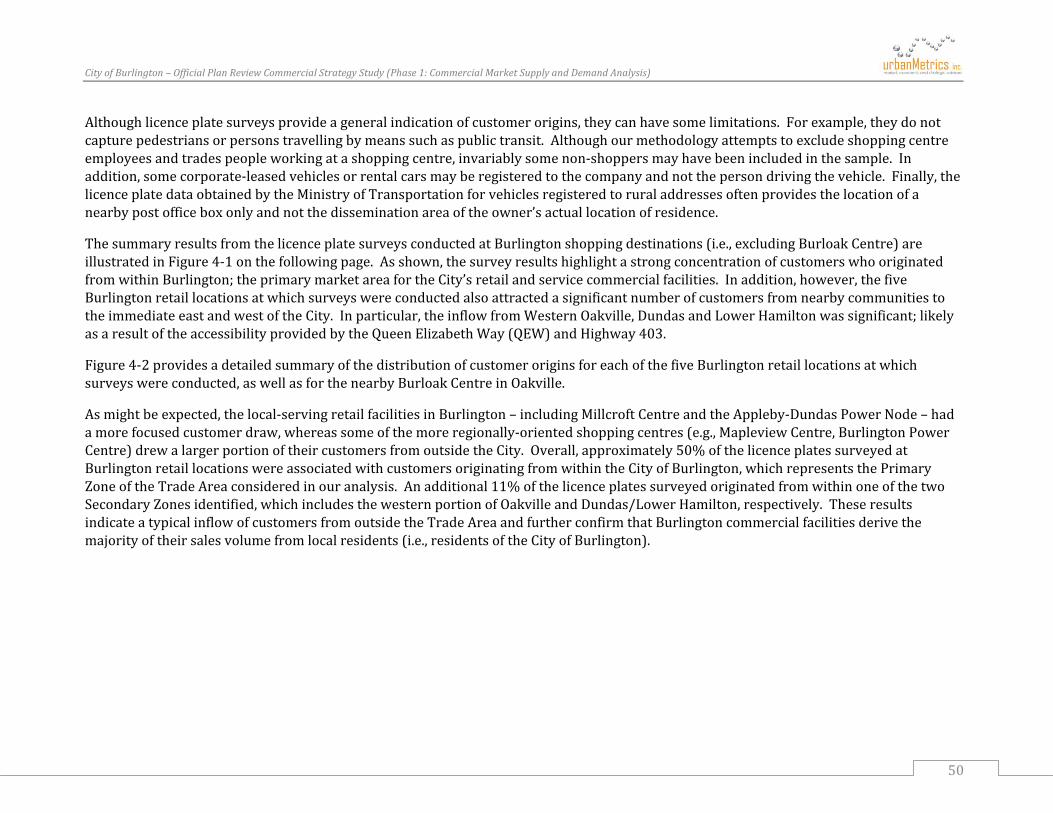
CityofBurlington–OfficialPlanReviewCommercialStrategyStudy(Phase1:CommercialMarketSupplyandDemandAnalysis)
50
Althoughlicenceplatesurveysprovideageneralindicationofcustomerorigins,theycanhavesomelimitations.Forexample,theydonotcapturepedestriansorpersonstravellingbymeanssuchaspublictransit.Althoughourmethodologyattemptstoexcludeshoppingcentreemployeesandtradespeopleworkingatashoppingcentre,invariablysomenon‐shoppersmayhavebeenincludedinthesample.Inaddition,somecorporate‐leasedvehiclesorrentalcarsmayberegisteredtothecompanyandnotthepersondrivingthevehicle.Finally,thelicenceplatedataobtainedbytheMinistryofTransportationforvehiclesregisteredtoruraladdressesoftenprovidesthelocationofanearbypostofficeboxonlyandnotthedisseminationareaoftheowner’sactuallocationofresidence.
ThesummaryresultsfromthelicenceplatesurveysconductedatBurlingtonshoppingdestinations(i.e.,excludingBurloakCentre)areillustratedinFigure4‐1onthefollowingpage.Asshown,thesurveyresultshighlightastrongconcentrationofcustomerswhooriginatedfromwithinBurlington;theprimarymarketareafortheCity’sretailandservicecommercialfacilities.Inaddition,however,thefiveBurlingtonretaillocationsatwhichsurveyswereconductedalsoattractedasignificantnumberofcustomersfromnearbycommunitiestotheimmediateeastandwestoftheCity.Inparticular,theinflowfromWesternOakville,DundasandLowerHamiltonwassignificant;likelyasaresultoftheaccessibilityprovidedbytheQueenElizabethWay(QEW)andHighway403.
Figure4‐2providesadetailedsummaryofthedistributionofcustomeroriginsforeachofthefiveBurlingtonretaillocationsatwhichsurveyswereconducted,aswellasforthenearbyBurloakCentreinOakville.
Asmightbeexpected,thelocal‐servingretailfacilitiesinBurlington–includingMillcroftCentreandtheAppleby‐DundasPowerNode–hadamorefocusedcustomerdraw,whereassomeofthemoreregionally‐orientedshoppingcentres(e.g.,MapleviewCentre,BurlingtonPowerCentre)drewalargerportionoftheircustomersfromoutsidetheCity.Overall,approximately50%ofthelicenceplatessurveyedatBurlingtonretaillocationswereassociatedwithcustomersoriginatingfromwithintheCityofBurlington,whichrepresentsthePrimaryZoneoftheTradeAreaconsideredinouranalysis.Anadditional11%ofthelicenceplatessurveyedoriginatedfromwithinoneofthetwoSecondaryZonesidentified,whichincludesthewesternportionofOakvilleandDundas/LowerHamilton,respectively.TheseresultsindicateatypicalinflowofcustomersfromoutsidetheTradeAreaandfurtherconfirmthatBurlingtoncommercialfacilitiesderivethemajorityoftheirsalesvolumefromlocalresidents(i.e.,residentsoftheCityofBurlington).

CityofBurlington–OfficialPlanReviewCommercialStrategyStudy(Phase1:CommercialMarketSupplyandDemandAnalysis)
51
FIGURE 4‐1: CITY OF BURLINGTON LICENCE PLATE SURVEY RESULTS, MAP OF CUSTOMER ORIGINS
SOURCE: urbanMetrics inc., based on licence plate survey results undertaken in September and October, 2012.
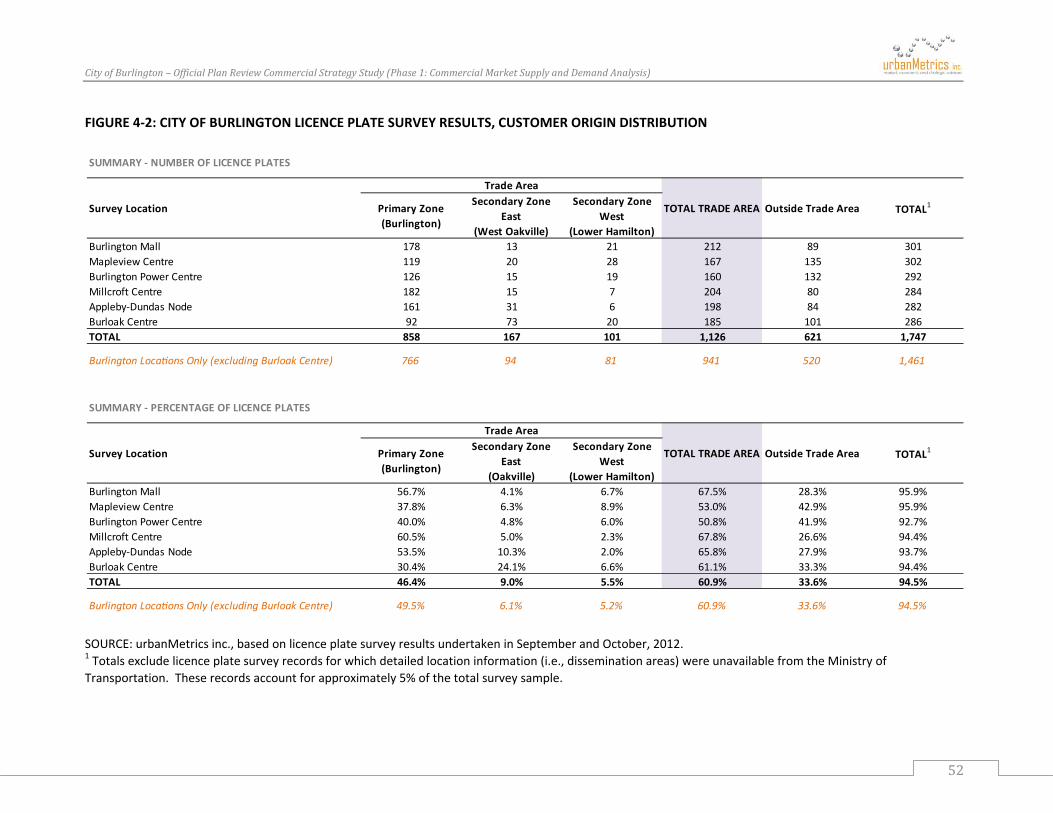
CityofBurlington–OfficialPlanReviewCommercialStrategyStudy(Phase1:CommercialMarketSupplyandDemandAnalysis)
52
FIGURE 4‐2: CITY OF BURLINGTON LICENCE PLATE SURVEY RESULTS, CUSTOMER ORIGIN DISTRIBUTION
SOURCE: urbanMetrics inc., based on licence plate survey results undertaken in September and October, 2012. 1 Totals exclude licence plate survey records for which detailed location information (i.e., dissemination areas) were unavailable from the Ministry of Transportation. These records account for approximately 5% of the total survey sample.
SUMMARY ‐ NUMBER OF LICENCE PLATES
Primary Zone(Burlington)
Secondary Zone East
(West Oakville)
Secondary Zone West
(Lower Hamilton)Burlington Mall 178 13 21 212 89 301Mapleview Centre 119 20 28 167 135 302Burlington Power Centre 126 15 19 160 132 292Millcroft Centre 182 15 7 204 80 284Appleby‐Dundas Node 161 31 6 198 84 282Burloak Centre 92 73 20 185 101 286TOTAL 858 167 101 1,126 621 1,747
Burlington Loca ons Only (excluding Burloak Centre) 766 94 81 941 520 1,461
Survey Location TOTAL1TOTAL TRADE AREA
Trade Area
Outside Trade Area
SUMMARY ‐ PERCENTAGE OF LICENCE PLATES
Primary Zone(Burlington)
Secondary Zone East
(Oakville)
Secondary Zone West
(Lower Hamilton)Burlington Mall 56.7% 4.1% 6.7% 67.5% 28.3% 95.9%Mapleview Centre 37.8% 6.3% 8.9% 53.0% 42.9% 95.9%Burlington Power Centre 40.0% 4.8% 6.0% 50.8% 41.9% 92.7%Millcroft Centre 60.5% 5.0% 2.3% 67.8% 26.6% 94.4%Appleby‐Dundas Node 53.5% 10.3% 2.0% 65.8% 27.9% 93.7%Burloak Centre 30.4% 24.1% 6.6% 61.1% 33.3% 94.4%TOTAL 46.4% 9.0% 5.5% 60.9% 33.6% 94.5%
Burlington Loca ons Only (excluding Burloak Centre) 49.5% 6.1% 5.2% 60.9% 33.6% 94.5%
Survey Location
Trade Area
Outside Trade Area TOTAL1TOTAL TRADE AREA

CityofBurlington–OfficialPlanReviewCommercialStrategyStudy(Phase1:CommercialMarketSupplyandDemandAnalysis)
53
4.1.2 DOWNTOWNSURVEYORIGINS
Similarlytothelicenceplatesurveyresearchpresentedintheprevioussection,wehavealsoreliedontheresultsofon‐streetinterceptsurveysundertakenbyurbanMetricsinDowntownBurlingtoninordertodelineatetheTradeAreafortheCity.AsdetailedinSection2ofourearlierInterimCommercialStrategyDiscussionPaperonthedowntown,atotalofapproximately300interceptsurveyswerecompletedwithlocalresidents,employees,visitorsandotherpatronsofDowntownBurlingtonbetweenSeptemberandOctoberof2012.
Figures4‐3and4‐4provideasummaryofthegeographicdistributionofpatronsofDowntownBurlington,basedonpostalcodeinformationthatwasobtaineddirectlyfromrespondentswhoparticipatedintheon‐streetinterceptsurveys.Asshown,approximately80%oftherespondentssurveyedoriginatedfromwithintheCityofBurlington(i.e.,thePrimaryZoneoftheTradeArea).Moreover,thevastmajorityoftheindividualssurveyedcurrentlyresideinthesouthernportionofBurlington(i.e.,southoftheQueenElizabethWayandHighway403).Inaddition,some14%ofrespondentsoriginatedfromtheneighbouringcommunitiesofOakvilleandHamilton.
Althoughonlyaportionoftherespondentswhocompletedthissurveywerespecificallyvisitingthedowntowntoshop,theresultsofthesesurveysprovideadditionalinsightastotheextenttowhichthevariousretailandservicecommercialfacilitieslocatedinDowntownBurlingtonattractcustomersfromoutsidetheCity’score,aswellasbeyond.Basedontheresultsofourresearch,itisevidentthat–fromacommercialperspective–DowntownBurlingtoncurrentlyservesprimarilyasalocal‐servingretailnodeanddoesnotattractasignificantportionofitscustomersfromoutsidetheCity.
FIGURE 4‐3: DOWNTOWN BURLINGTON ON‐STREET INTERCEPT SURVEY RESULTS, RESPONDENT ORIGIN DISTRIBUTION
SOURCE: urbanMetrics inc., based on the results of on‐street intercept surveys undertaken in Downtown Burlington between September and October, 2012.
Location/Community # of Survey Respondents % of Total
City of Burlington 232 79.5%Burlington South (south of Queen Elizabeth Way and Highway 403) 201 68.8%Burlington North (north of Queen Elizabeth Way and Highway 403) 31 10.6%
Other Nearby Communities 40 13.7%Town of Oakville 9 3.1%City of Hamilton 31 10.6%
All Other Locations 20 6.8%
Grand Total 292 100.0%

CityofBurlington–OfficialPlanReviewCommercialStrategyStudy(Phase1:CommercialMarketSupplyandDemandAnalysis)
54
FIGURE 4‐4: DOWNTOWN BURLINGTON ON‐STREET INTERCEPT SURVEY RESULTS, MAP OF RESPONDENT ORIGINS
SOURCE: urbanMetrics inc., based on the results of on‐street intercept surveys undertaken in Downtown Burlington between September and October, 2012.

CityofBurlington–OfficialPlanReviewCommercialStrategyStudy(Phase1:CommercialMarketSupplyandDemandAnalysis)
55
4.2 BURLINGTONTRADEAREA
Basedprimarilyontheresultsofthevarioussurveyresearchpresentedintheprevioussections,aswellasourdetailedunderstandingoftheinventoryofcommercialspaceinBurlingtonplusthemajorretailopportunitiesinneighbouringmunicipalities,wehavedelineatedaTradeAreafortheCityofBurlington.Thisgeographicareahasservedasthebasisforourmarketsupplyanddemandanalysis,assummarizedthroughoutthebalanceofthisreport.
TheCityofBurlingtonisrecognizedasthe“PrimaryZone”oftheTradeArea,fromwhichthevastmajorityofexpendituresattheCity’scommercialfacilitieswillbederived.Wehavealsorecognizedtheexpendituresexpectedtobederivedfromthesurroundingareaaswell.Forthisreason,twosecondaryzoneshavebeendelineated,includingthe“SecondaryZoneEast”,whichincludespartofwesternOakvilleandthe“SecondaryZoneWest”,whichincludesallofLowerHamiltonandthecommunityofDundas.Thefollowingprovidesabriefoverviewofthegeographicextentandthegeneralcharacteristicsofeachofthesethreetradeareazones.
PrimaryZone(CityofBurlington)–ThiszonecomprisestheCityofBurlingtoninitsentirety,generallyextendingnorthofLakeOntario;southofDerryRoad;andbetweenHighway6/MilburoughLineandBurloakDriveinthewestandeast,respectively.
SecondaryZoneEast(WesternOakville)–ThiszonecomprisesthewesternportionoftheTownofOakville,whichissituatedtotheimmediateeastoftheCityofBurlington.ThiszoneisgenerallyboundbyBurloakDriveinthewest(i.e.,thesharedmunicipalboundarywiththeCityofBurlington);Highway407andLowerBaseLineinthenorth;SixteenMileCreekintheeast,andLakeOntariointhesouth.SeveraloftheCityofBurlington’smajorretailcentresareeasilyaccessibletoWesternOakvilleresidentsviatheQueenElizabethWay(QEW)andothermajoreast‐westtrafficcorridorsthatextendbetweenBurlingtonandOakville(e.g.,DundasStreet,NewStreet/RebeccaStreet,andLakeshoreRoad).
SecondaryZoneWest(LowerHamilton&Dundas)–ThiszonecomprisesalargeportionofurbanHamilton,includingtheentireLowerHamiltonarea,aswellasthecommunityofDundas.ItgenerallyextendswestofStoneyCreek(i.e.,GrayRoad/QueenstonRoad/CentennialParkwaySouth);north‐eastoftheNiagaraEscarpment;andsouthofHamiltonHarbour/BurlingtonBay(i.e.,thesharedmunicipalboundarywiththeCityofBurlington).TheCityofBurlingtonisimmediatelyaccessiblefromLowerHamiltonviatheQueenElizabethWay(SkywayBridge),whileresidentsofDundascaneasilytraveltoBurlingtonviaHighway403.
Figure4‐5onthefollowingpageprovidesamapofthethreemajorBurlingtonTradeAreazonesidentifiedabove.
Forthepurposesofouranalysis,recognizingthelimitationsofthelicenceplatesurveyssummarizedearlier,plusthesize,scaleanddrawingpowerofthecentressurveyed,urbanMetricsestimatestheannualaverageNon‐FoodStoreRetail(NFSR)inflowsalesfromoutsidetheTradeAreaat15%.ThisaccountsformorelocaldrawingpoweroflowerorderretailspacewithintheCityofBurlington.Asaresultofthelocalnatureoffoodstoreshoppingpatterns,theinflowrateusedfortheFoodStoreRetail(FSR)categoryisbasedontheCityofBurlington’s
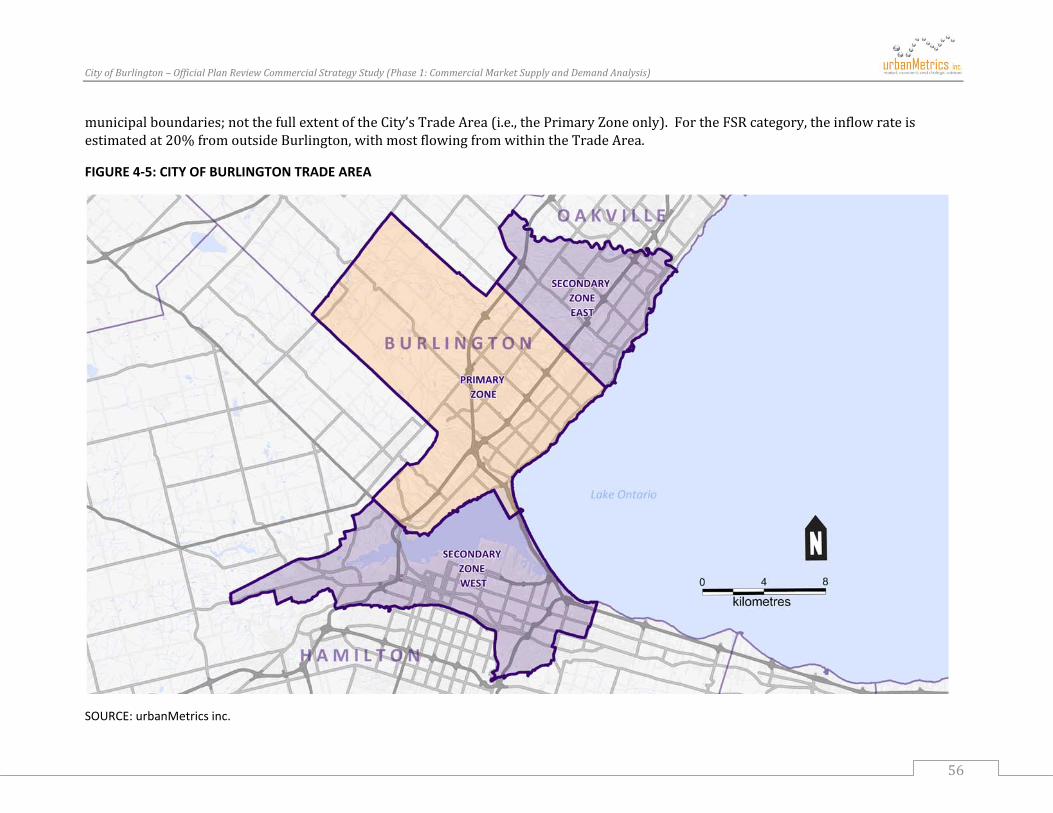
CityofBurlington–OfficialPlanReviewCommercialStrategyStudy(Phase1:CommercialMarketSupplyandDemandAnalysis)
56
municipalboundaries;notthefullextentoftheCity’sTradeArea(i.e.,thePrimaryZoneonly).FortheFSRcategory,theinflowrateisestimatedat20%fromoutsideBurlington,withmostflowingfromwithintheTradeArea.
FIGURE 4‐5: CITY OF BURLINGTON TRADE AREA
SOURCE: urbanMetrics inc.

CityofBurlington–OfficialPlanReviewCommercialStrategyStudy(Phase1:CommercialMarketSupplyandDemandAnalysis)
57
Figure4‐6illustratestheprincipaldifferencesbetweenthe2003and2012TradeAreas.Asillustratedinthisfigure,theprimarydifferencesarethat:
The2003TradeAreadidnotincludeanyportionoftheTownofOakville,whichnowcontributesmoretoBurlington’sretailsalesthantheHamiltonportionoftheTradeArea.
The2003PrimaryZoneincludedthecommunityofWaterdown,whichnowcontributesminimaltoBurlington’sretailsales.ThiscommunitywasalsoomittedfromthePrimaryzoneforadministrativereasonsinthatitisoutsideoftheCityofBurlington.
The2003SecondaryZoneincludedtheruralportionsofBurlingtonandFlamborough.ThecurrentTradeAreaincorporatesallofBurlingtonintothePrimaryZone.TheruralportionsoftheformermunicipalityofFlamboroughhavebeenanalyzedasinflowfromoutsidetheTradeArea.
TherearealsosomeminorvariancesintheportionoflowerHamiltonincludedinthe2003and2012TradeAreas.
Ingeneral,the2003studyassumedlowerlevelsofinflowthanthecurrentstudy.Asnotedabove,theinflowin2012iscalculatedat15%,whereasin2003formostcategories,inflowwasestimatedatbetween7.5%and8.5%,withtheexceptionofhomefurnishingsandwarehousemembershipclub,whereinflowwasestimatedat30%.
Insummary,basedontheempiricalevidenceconductedaspartofthe2012study,thestrengtheningofBurlington’scommercialsectorhasresultedinanincreaseddrawfromOakville,whileatthesametimethenewpowerretaildevelopmentwhichhasoccurredatHighway5and6,hasreducedthespendinginfluenceofWaterdownresidentswithintheBurlingtonmarket.

CityofBurlington–OfficialPlanReviewCommercialStrategyStudy(Phase1:CommercialMarketSupplyandDemandAnalysis)
58
FIGURE 4‐6: 2003 AND 2012 BURLINGTON TRADE AREAS

CityofBurlington–OfficialPlanReviewCommercialStrategyStudy(Phase1:CommercialMarketSupplyandDemandAnalysis)
59
4.3 TRADEAREAPOPULATIONPROJECTIONS
InordertoprojectthefutureretailmarketdemandinBurlingtonto2031,itisnecessarytoestimatethefuturepopulationintheCityandthedefinedTradeArea.Populationchange,inadditiontoincomeandexpenditurelevels,isamajorfactorinfluencingthelevelofretailsalesandspacewarrantedinagivenarea.
ForecastpopulationlevelsforeachTradeAreazoneareurbanMetricsestimatesbasedonStatisticsCanadaCensusdata,populationprojectionsobtainedfromthevariousmunicipalitiesintheTradeArea,andthepopulationforecastsinSchedule3oftheMinistryofInfrastructure’sPlacestoGrow,GrowthPlanfortheGreaterGoldenHorseshoe(2006).
AssummarizedinFigure4‐7,thepopulationoftheTradeAreaisexpectedtoincreasefromatotalof497,700personsin2012toanestimated543,600personsin2031.Thisrepresentsatotalmarketgrowthofapproximately46,000individualsduringthisperiod.AsindicatedinFigure4‐7,itisimportanttonotethatthemajorityofthisgrowthisanticipatedtooccurintheSecondaryZoneEastandSecondaryZoneWestportionsoftheTradeArea;whicharecontainedwithintheneighbouringmunicipalitiesofHamiltonandOakville.TheCityofBurlingtonportionoftheTradeAreaaccountsforapproximately27%ofthegrowththatisforecasttooccurby2031.
GiventhatthemajorityofBurlington’savailableGreenfieldlandswillbefullydevelopedinthenearfuture(2015),itisexpectedthatmostofthegrowthforecasttotakeplaceintheCityoverthenexttwodecadeswilloccurinintensificationareas.Infact,asperthefindingsoftheCityofBurlington’s2008IntensificationStudy,anestimated33%offuturepopulationgrowthisprojectedtooccurintheCity’sUrbanGrowthCentre(i.e.,DowntownBurlington)orUrbanGrowthCorridors(i.e.,PlainsRoadandFairviewStreet).Moreover,itisestimatedthatapproximately60%ofthetotalresidentialunitscreatedinBurlingtonbetween2006and2031willbethroughintensification9.
ThemajorrolethatintensificationisexpectedtoplayintermsofaccommodatingfuturegrowthinBurlingtonwillhaveasignificantimpactonhowthecommercialstructureisplanned.Forexample,inadditiontotheGreenfieldretaildevelopmentthathasoccurredintheCityinrecentyears,significantemphasiswillneedtobeplacedonexpandingtheexistingcommercialinfrastructureinareastargetedforresidentialintensification.ThisrepresentsasubstantialdeparturefromhowcommercialdevelopmenthastakenplaceacrosstheGreaterTorontoAreainthepast;requiringafocusonredevelopmentinsteadofnewdevelopmentinordertomeettheexpecteddemandfornewcommercialuses.
9CityofBurlington,DevelopmentandInfrastructureDivision,PlanningDepartmentreporttotheChairandMembersoftheCommunityDevelopmentCommittee,RE:BurlingtonIntensificationStudy,Preliminary2031ResidentialandEmploymentIntensificationEstimates(2008).

CityofBurlington–OfficialPlanReviewCommercialStrategyStudy(Phase1:CommercialMarketSupplyandDemandAnalysis)
60
FIGURE 4‐7: CITY OF BURLINGTON TRADE AREA, HISTORIC AND FORECAST POPULATION (2006‐2031)
SOURCE: urbanMetrics inc. All population figures rounded to the nearest 100 persons. 1 Based on Statistics Canada Census data, adjusted for net under coverage. 2 Population for forecast years based on urbanMetrics projections, which were derived from population projections obtained from the various municipalities in the Trade Area:
Regional Municipality of Halton – Best Planning Estimates of Population, Occupied Dwelling Units and Employment, 2011‐2031 (June 2011); City of Hamilton – Estimate of Unit and Population Growth for City of Hamilton, 2006‐2031, based on 2006 GRIDS Traffic Zone analysis (April 2008); Ministry of Infrastructure – The Growth Plan for the Greater Golden Horseshoe, Schedule 3 (2006).
Trade Area Zone 2006 2011 2012 2016 2021 2026 2031
Primary Zone 171,300 182,700 183,100 184,500 188,000 191,400 195,700 12,600
Average Annual Growth Rate 1.3% 0.2% 0.2% 0.4% 0.4% 0.4%
Average Annual Growth 2,280 400 350 700 680 860
Secondary Zone East 88,900 101,500 102,600 106,800 112,100 114,600 118,200 15,600
Average Annual Growth Rate 2.8% 1.1% 1.0% 1.0% 0.4% 0.6%
Average Annual Growth 2,520 1,100 1,050 1,060 500 720
Secondary Zone West 214,500 212,600 212,000 209,600 217,600 217,100 229,700 17,700
Average Annual Growth Rate ‐0.2% ‐0.3% ‐0.3% 0.8% 0.0% 1.2%
Average Annual Growth ‐380 ‐600 ‐600 1,600 ‐100 2,520
TOTAL TRADE AREA 474,700 496,800 497,700 500,900 517,700 523,100 543,600 45,900
Average Annual Growth Rate 0.9% 0.2% 0.2% 0.7% 0.2% 0.8%
Average Annual Growth 4,420 900 800 3,360 1,080 4,100
Total Growth(2012‐2031)
FORECAST2HISTORIC1
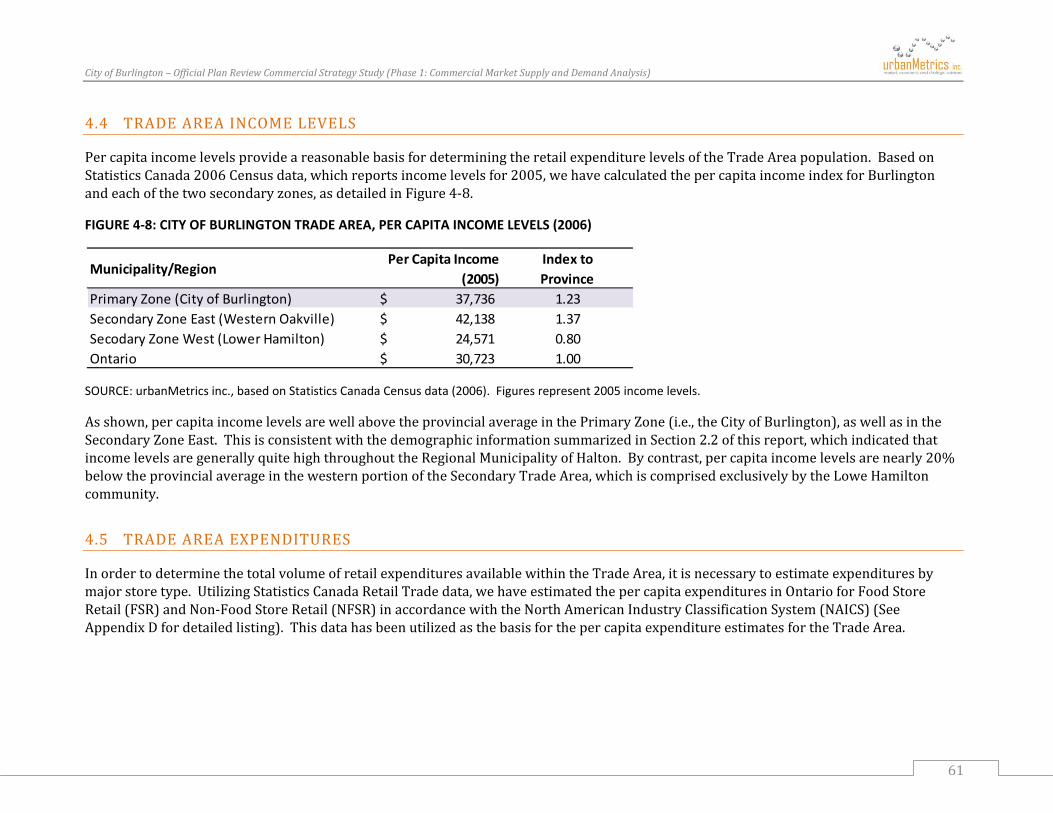
CityofBurlington–OfficialPlanReviewCommercialStrategyStudy(Phase1:CommercialMarketSupplyandDemandAnalysis)
61
4.4 TRADEAREAINCOMELEVELS
PercapitaincomelevelsprovideareasonablebasisfordeterminingtheretailexpenditurelevelsoftheTradeAreapopulation.BasedonStatisticsCanada2006Censusdata,whichreportsincomelevelsfor2005,wehavecalculatedthepercapitaincomeindexforBurlingtonandeachofthetwosecondaryzones,asdetailedinFigure4‐8.
FIGURE 4‐8: CITY OF BURLINGTON TRADE AREA, PER CAPITA INCOME LEVELS (2006)
SOURCE: urbanMetrics inc., based on Statistics Canada Census data (2006). Figures represent 2005 income levels.
Asshown,percapitaincomelevelsarewellabovetheprovincialaverageinthePrimaryZone(i.e.,theCityofBurlington),aswellasintheSecondaryZoneEast.ThisisconsistentwiththedemographicinformationsummarizedinSection2.2ofthisreport,whichindicatedthatincomelevelsaregenerallyquitehighthroughouttheRegionalMunicipalityofHalton.Bycontrast,percapitaincomelevelsarenearly20%belowtheprovincialaverageinthewesternportionoftheSecondaryTradeArea,whichiscomprisedexclusivelybytheLoweHamiltoncommunity.
4.5 TRADEAREAEXPENDITURES
InordertodeterminethetotalvolumeofretailexpendituresavailablewithintheTradeArea,itisnecessarytoestimateexpendituresbymajorstoretype.UtilizingStatisticsCanadaRetailTradedata,wehaveestimatedthepercapitaexpendituresinOntarioforFoodStoreRetail(FSR)andNon‐FoodStoreRetail(NFSR)inaccordancewiththeNorthAmericanIndustryClassificationSystem(NAICS)(SeeAppendixDfordetailedlisting).ThisdatahasbeenutilizedasthebasisforthepercapitaexpenditureestimatesfortheTradeArea.
Municipality/RegionPer Capita Income
(2005)Index to Province
Primary Zone (City of Burlington) 37,736$ 1.23Secondary Zone East (Western Oakville) 42,138$ 1.37Secodary Zone West (Lower Hamilton) 24,571$ 0.80Ontario 30,723$ 1.00
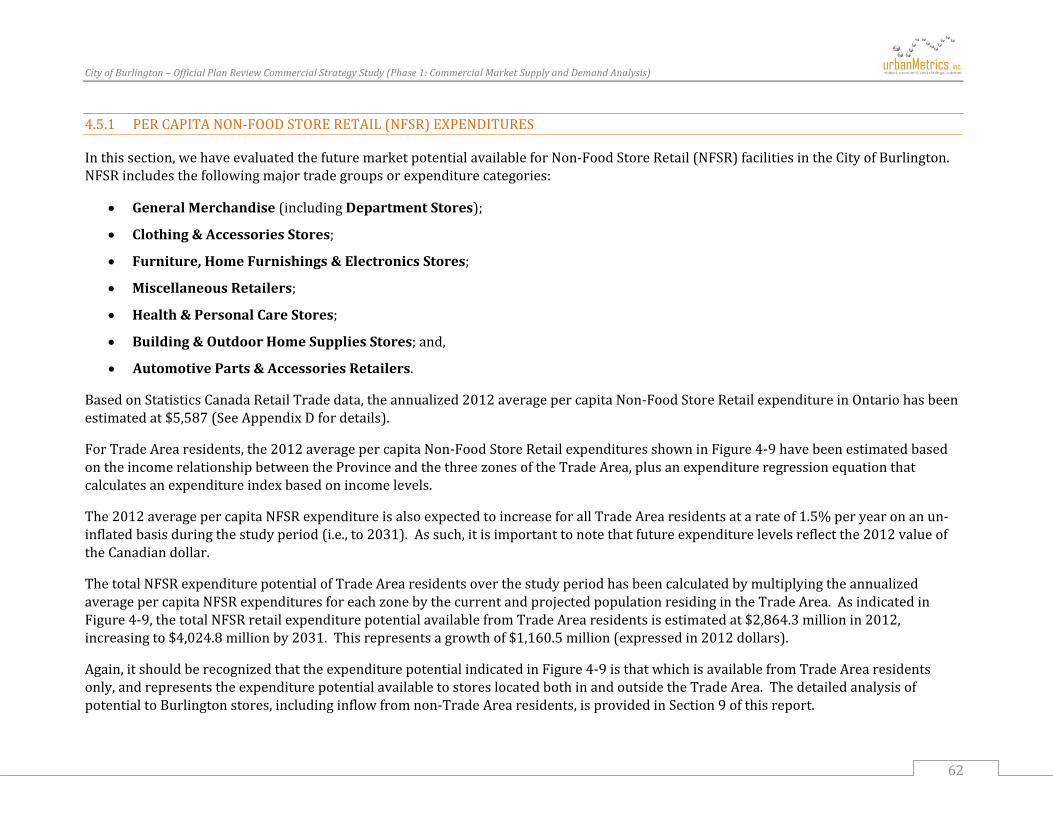
CityofBurlington–OfficialPlanReviewCommercialStrategyStudy(Phase1:CommercialMarketSupplyandDemandAnalysis)
62
4.5.1 PERCAPITANON‐FOODSTORERETAIL(NFSR)EXPENDITURES
Inthissection,wehaveevaluatedthefuturemarketpotentialavailableforNon‐FoodStoreRetail(NFSR)facilitiesintheCityofBurlington.NFSRincludesthefollowingmajortradegroupsorexpenditurecategories:
GeneralMerchandise(includingDepartmentStores);
Clothing&AccessoriesStores;
Furniture,HomeFurnishings&ElectronicsStores;
MiscellaneousRetailers;
Health&PersonalCareStores;
Building&OutdoorHomeSuppliesStores;and,
AutomotiveParts&AccessoriesRetailers.
BasedonStatisticsCanadaRetailTradedata,theannualized2012averagepercapitaNon‐FoodStoreRetailexpenditureinOntariohasbeenestimatedat$5,587(SeeAppendixDfordetails).
ForTradeArearesidents,the2012averagepercapitaNon‐FoodStoreRetailexpendituresshowninFigure4‐9havebeenestimatedbasedontheincomerelationshipbetweentheProvinceandthethreezonesoftheTradeArea,plusanexpenditureregressionequationthatcalculatesanexpenditureindexbasedonincomelevels.
The2012averagepercapitaNFSRexpenditureisalsoexpectedtoincreaseforallTradeArearesidentsatarateof1.5%peryearonanun‐inflatedbasisduringthestudyperiod(i.e.,to2031).Assuch,itisimportanttonotethatfutureexpenditurelevelsreflectthe2012valueoftheCanadiandollar.
ThetotalNFSRexpenditurepotentialofTradeArearesidentsoverthestudyperiodhasbeencalculatedbymultiplyingtheannualizedaveragepercapitaNFSRexpendituresforeachzonebythecurrentandprojectedpopulationresidingintheTradeArea.AsindicatedinFigure4‐9,thetotalNFSRretailexpenditurepotentialavailablefromTradeArearesidentsisestimatedat$2,864.3millionin2012,increasingto$4,024.8millionby2031.Thisrepresentsagrowthof$1,160.5million(expressedin2012dollars).
Again,itshouldberecognizedthattheexpenditurepotentialindicatedinFigure4‐9isthatwhichisavailablefromTradeArearesidentsonly,andrepresentstheexpenditurepotentialavailabletostoreslocatedbothinandoutsidetheTradeArea.ThedetailedanalysisofpotentialtoBurlingtonstores,includinginflowfromnon‐TradeArearesidents,isprovidedinSection9ofthisreport.

CityofBurlington–OfficialPlanReviewCommercialStrategyStudy(Phase1:CommercialMarketSupplyandDemandAnalysis)
63
FIGURE 4‐9: CITY OF BURLINGTON TRADE AREA, PER CAPITA NFSR EXPENDITURE POTENTIAL
SOURCE: urbanMetrics inc. 1 Based on Statistics Canada Retail Trade data.
2012 Dollars 2012
Province of OntarioPer Capita NFSR Expenditure $ 5,587 1
2012 Dollars 2012 2016 2021 2026 2031
Primary Zone (Burlington)Income Index to Province 122.80 NFSR Expenditure Index to Province 109.10 Per Capita NFSR Expenditure $ 6,095 $ 6,461 $ 6,918 $ 7,375 $ 7,832Population 183,100 184,500 188,000 191,400 195,700 TOTAL NFSR POTENTIAL ($Millions) $ 1,116.0 $ 1,192.1 $ 1,300.6 $ 1,411.6 $ 1,532.7
Secondary Zone EastIncome Index to Province 137.20 NFSR Expenditure Index to Province 114.90 Per Capita NFSR Expenditure $ 6,419 $ 6,804 $ 7,286 $ 7,767 $ 8,248Population 102,600 106,800 112,100 114,600 118,200 TOTAL NFSR POTENTIAL ($Millions) $ 658.6 $ 726.7 $ 816.8 $ 890.1 $ 974.9 Secondary Zone WestIncome Index to Province 80.00 NFSR Expenditure Index to Province 92.00 Per Capita NFSR Expenditure $ 5,140 $ 5,448 $ 5,834 $ 6,219 $ 6,605Population 212,000 209,600 217,600 217,100 229,700 TOTAL NFSR POTENTIAL ($Millions) $ 1,089.7 $ 1,141.9 $ 1,269.5 $ 1,350.1 $ 1,517.2
TOTAL TRADE AREATOTAL NFSR POTENTIAL ($Millions) $ 2,864.3 $ 3,060.7 $ 3,386.9 $ 3,651.8 $ 4,024.8
Cumulative Growth $ 196.4 $ 522.6 $ 787.5 $ 1,160.5

CityofBurlington–OfficialPlanReviewCommercialStrategyStudy(Phase1:CommercialMarketSupplyandDemandAnalysis)
64
4.5.2 PERCAPITAFOODSTORERETAIL(FSR)EXPENDITURES
Foodretailingistypicallyundertakenclosetohome,withmuchshortershoppingtripsthanfornon‐foodshopping.Asaresult,tradeareasforFood‐StoreRetail(FSR)facilitiestendtobesmaller.ForthepurposesofourFSRanalysis,therefore,wehaveassumedthatthevastmajorityofspendingatBurlingtonsupermarketsandotherconvenienceandspecialtyfoodstoreswillbederivedfromBurlingtonresidents.Accordingly,wehavefocusedourFSRanalysisontheCityofBurlingtonratherthantheentireTradeArea,aswasdonewithrespecttotheNon‐FoodStoreRetail(NFSR)category.InflowfromoutsidetheCityisstillrecognized,butatmuchlowerlevelsthanestimatedforNFSRstores.
BasedonStatisticsCanadaRetailTradedata,theannualized2012percapitaFoodStoreRetailexpenditureinOntariohasbeenestimatedat$2,230(SeeAppendixDfordetails).FoodStoreRetailexpendituresincludethosemadeinsupermarkets,grocerystores,andconvenienceandspecialtyfoodstores.ForBurlingtonresidents,the2012averagepercapitaFSRexpenditureshowninFigure4‐10hasbeenestimatedbasedontheincomerelationshipbetweentheProvinceandtheCityofBurlington,plusanexpenditureregressionequationthatcalculatesanexpenditureindexrelativetoincomelevels.
The2012annualizedaveragepercapitaFSRexpendituresforBurlingtonresidentsareexpectedtoincreaseatarateof0.25%peryearonanun‐inflatedbasisbetween2012and2031.Asdiscussedintheunderlyingassumptionsofthisreport,aswellasintheprevioussection,futurechangesinexpenditurepatternssolelyduetoinflationhavenotbeenrecognized.Therefore,thefutureexpenditurelevelsindicatedinFigure4‐10reflectthe2012valueoftheCanadiandollar.
BymultiplyingtheannualizedaveragepercapitaFSRexpenditurebythecurrentandprojectedpopulationoftheCityofBurlington,thetotalfoodstorepotentialfromCityresidentshasbeencalculatedoverthestudyperiod.Intotal,thefoodstorepotentialavailablefromBurlingtonresidentshasbeenestimatedat$417.7millionin2012.By2031,thispotentialisexpectedtoreach$467.5million;agrowthofapproximately$49.8millionovertheindicatedtwenty‐yearperiod(expressedin2012dollars).
CityofBurlington–OfficialPlanReviewCommercialStrategyStudy(Phase1:CommercialMarketSupplyandDemandAnalysis)
65
FIGURE 4‐10: CITY OF BURLINGTON TRADE AREA, PER CAPITA FSR EXPENDITURE POTENTIAL
SOURCE: urbanMetrics inc. 1 Based on Statistics Canada Retail Trade data.
2012 Dollars 2012Province of OntarioPer Capita FSR Expenditure $ 2,230 1
2012 Dollars 2012 2016 2021 2026 2031
Primary Zone (Burlington)Income Index to Province 122.80 FSR Expenditure Index to Province 102.30 Per Capita FSR Expenditure $ 2,281 $ 2,304 $ 2,332 $ 2,361 $ 2,389Population 183,100 184,500 188,000 191,400 195,700 TOTAL FSR POTENTIAL ($Millions) $ 417.7 $ 425.1 $ 438.4 $ 451.9 $ 467.5
Cumulative Growth $ 7.4 $ 20.7 $ 34.2 $ 49.8

CityofBurlington–OfficialPlanReviewCommercialStrategyStudy(Phase1:CommercialMarketSupplyandDemandAnalysis)
66
5 BURLINGTONRESIDENTSSHOPPINGPATTERNS
Surveyresearchisanintegralcomponentofundertakingaretailmarketanalysis,suchasthatpresentedinthisreport.Ourresearchhasincludedlicenceplatesurveys,on‐streetinterceptsurveys,aswellasonlineandtelephonesurveysofBurlingtonconsumers.Theonline/telephonesurveysprovideinformationonBurlingtonresidents’shoppingpatternsbystoretype,aswellasthecorrespondingcaptureratesforretailandservicefacilitieslocatedintheCity.ThefollowingsectionsummarizesthekeyfindingsofourconsumerresearchrelatingtotheshoppingandexpenditurepatternsofBurlingtonresidents.Thedetailedstatisticaltablesgeneratedbythesesurveys,aswellasotherrelevantbackgroundinformation,canbefoundinAppendixB.
Atotalofsome885consumersurveys(364fully‐completedtelephonesurveys,261fully‐completedon‐linesurveysand260partiallycompleteon‐linesurveys10)withBurlingtonresidentswerecompletedtodeterminetheexistingexpenditurepatternsofmunicipalresidents;establishtheexistingmarketsharesbeingcapturedbyCityofBurlingtonretailfacilities;andtheoutflowofsalestostoreslocatedoutsidetheCity.AsillustratedonthemapinFigure5‐1,retailexpendituresforeachstorecategoryhavegenerallybeencategorizedintooneoftenmajorretailareaslocatedinBurlington,including:DowntownBurlington,BurlingtonMall,MapleviewShoppingCentre,BurlingtonPowerCentre(QEW/Brant),PlainsRoadCorridor,FairviewStreetCorridor,Appleby‐DundasPowerNode,MillcroftShoppingCentre,ApplebyMall,andAllOtherBurlington.Similarly,expendituresmadeoutsidetheCityofBurlingtonhavebeencategorizedasfollows:BurloakCentre(Oakville),AllOtherOakville,FlamboroughPowerCentre(Waterdown),AllOtherHamilton,andAllOtherOutsideofBurlington.
5.1 DISTRIBUTIONOFBURLINGTONRESIDENTS’EXPENDITURES(2012)
Figures5‐2and5‐3summarizeBurlingtonresidents’2012expenditurepatternsbymajorstorecategory,includingallrelevantNon‐FoodStoreRetail(NFSR)andFoodStoreRetail(FSR)subcategories,respectively.Basedonouranalysisoftheonlineandtelephoneconsumersurveys,wenotethefollowing:
Inallretailcategories,BurlingtonresidentsundertookthemajorityoftheirshoppingwithintheCityofBurlington.Infact,approximately93.4%ofthetotalvalueofFSRexpenditures,85.1%ofNFSRexpenditures,and83.4%ofRestaurantexpendituresmadebyBurlingtonresidentswereattributabletoretailfacilitieslocatedinBurlington.
10Partiallycompletesurveyswereterminatedbytherespondentspriortoreachingtheendofthesurveydocument.Wheresufficientinformationtocategorizetherespondentwasavailable,someresultsfrompartiallycompletedsurveyswereincorporated.

CityofBurlington–OfficialPlanReviewCommercialStrategyStudy(Phase1:CommercialMarketSupplyandDemandAnalysis)
67
Insomestorecategories,however,Burlingtonresidentsmadeupto42.4%oftheirexpendituresatretailfacilitieslocatedinothermunicipalities.Forexample,thegreatestamountofoutflowiscurrentlytakingplaceintheBuilding&OutdoorHomeSuppliescategory,whereasmuchlowerlevelsofoutflowareoccurringintheHealth&PersonalCareStoreandSupermarketcategories.Thisistypicalofpharmacies,drugstoresandfood‐storeretailers,whichtendtobemoreneighbourhood‐orientedandlocal‐servinginnature.
Similarly,morethanthreequartersofBurlingtonresidents’expendituresatGeneralMerchandise;Clothing&Accessories;Furniture,HomeFurnishings&Electronics;MiscellaneousRetailandSpecialtyFoodretailersweremadelocally(i.e.,atBurlingtonshoppingdestinations).
Approximately14%ofBurlingtonresidents’NFSRexpendituresin2012weremadeoutsidetheCityofBurlington.Ofthistotal,approximatelyhalfweremadeatretailfacilitieslocatedineitherOakvilleorHamilton.Assuch,arelativelysmallportionofBurlingtonresidents’expendituresweremadebeyondthemunicipalitiesthatarelocatedimmediatelyadjacenttotheCity.
BurlingtonMall,MapleviewCentreandBurlingtonPowerCentrewerethethreeindividualretailareasthatcapturedthegreatestportionofBurlingtonresidents’NFSRexpenditures.Collectively,thesethreecentrescapturedapproximately40%ofresidents’totalNFSRexpenditures.CaptureratesforthesethreecentreswereparticularlystrongintheGeneralMerchandise(67.8%)andClothing&Accessories(51.1%)storecategories.
DowntownBurlingtonaccountedfornearlyonequarterofthetotalRestaurantexpendituresmadebyBurlingtonresidents.Italsoaccountedformorethanonetenthofresidents’Clothing&Accessories,MiscellaneousRetailandConvenience&SpecialtyFoodStoreexpenditures.
Insummary,themajorityofBurlingtonresidents’expendituresaremadeatBurlingtonshoppingdestinations.Althoughrelativelylimited,mostoftheexpenditureoutflowfromtheCitycanbeaccountedforbyretailfacilitiessituatedintheneighbouringmunicipalitiesofOakville,andtoaslightlylesserextent,Hamilton.
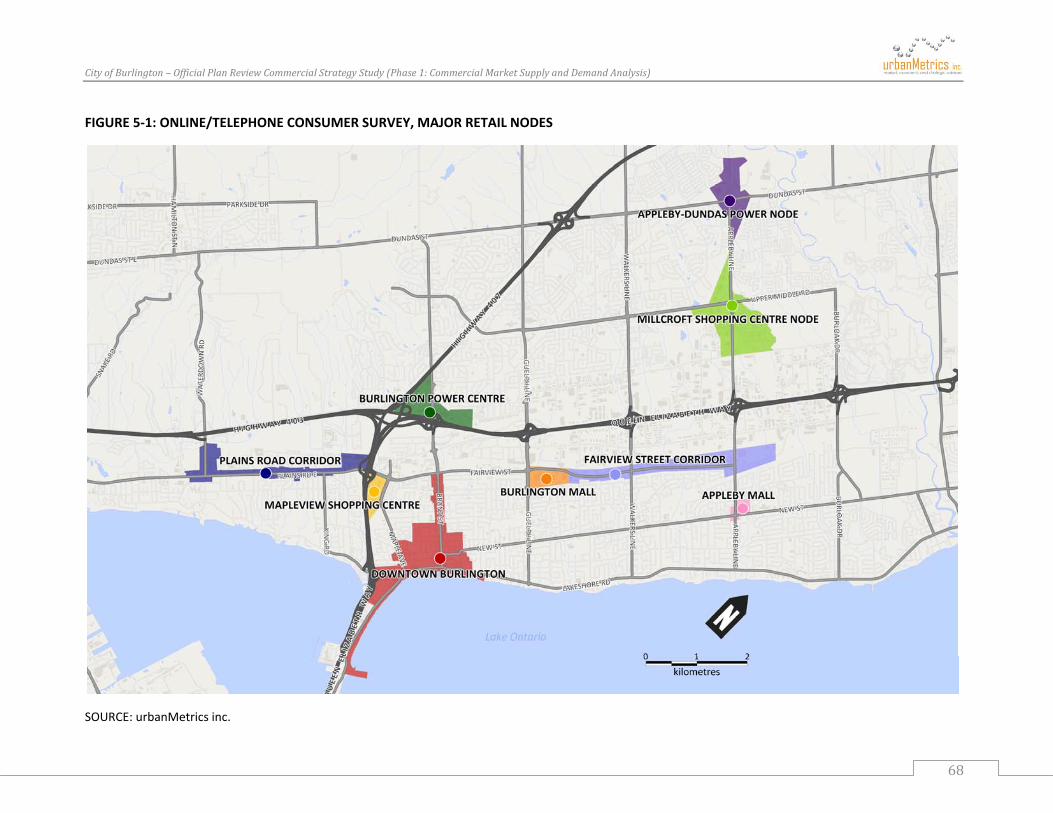
CityofBurlington–OfficialPlanReviewCommercialStrategyStudy(Phase1:CommercialMarketSupplyandDemandAnalysis)
68
FIGURE 5‐1: ONLINE/TELEPHONE CONSUMER SURVEY, MAJOR RETAIL NODES
SOURCE: urbanMetrics inc.
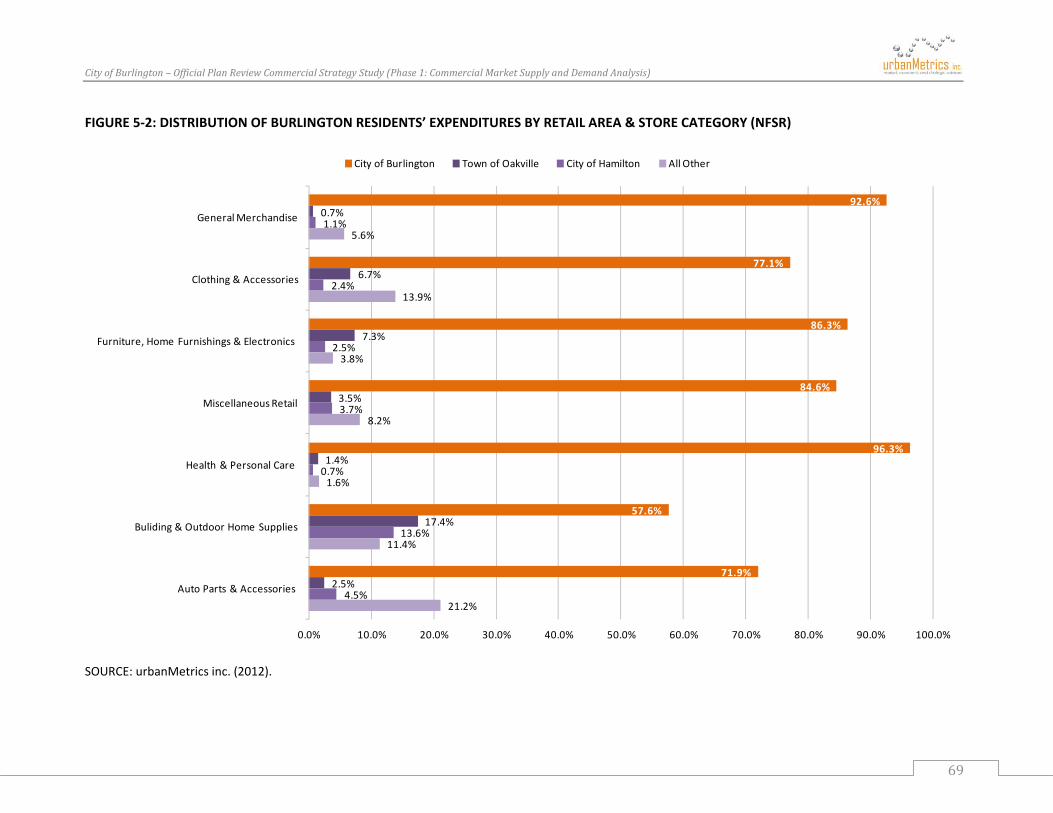
CityofBurlington–OfficialPlanReviewCommercialStrategyStudy(Phase1:CommercialMarketSupplyandDemandAnalysis)
69
FIGURE 5‐2: DISTRIBUTION OF BURLINGTON RESIDENTS’ EXPENDITURES BY RETAIL AREA & STORE CATEGORY (NFSR)
SOURCE: urbanMetrics inc. (2012).
92.6%
77.1%
86.3%
84.6%
96.3%
57.6%
71.9%
0.7%
6.7%
7.3%
3.5%
1.4%
17.4%
2.5%
1.1%
2.4%
2.5%
3.7%
0.7%
13.6%
4.5%
5.6%
13.9%
3.8%
8.2%
1.6%
11.4%
21.2%
0.0% 10.0% 20.0% 30.0% 40.0% 50.0% 60.0% 70.0% 80.0% 90.0% 100.0%
General Merchandise
Clothing & Accessories
Furniture, Home Furnishings & Electronics
Miscellaneous Retail
Health & Personal Care
Buliding & Outdoor Home Supplies
Auto Parts & Accessories
City of Burlington Town of Oakville City of Hamilton All Other

CityofBurlington–OfficialPlanReviewCommercialStrategyStudy(Phase1:CommercialMarketSupplyandDemandAnalysis)
70
FIGURE 5‐3: DISTRIBUTION OF BURLINGTON RESIDENTS’ EXPENDITURES BY RETAIL AREA & STORE CATEGORY (FSR + RESTAURANTS)
SOURCE: urbanMetrics inc. (2012).
5.2 ONLINESHOPPING
InadditiontoquestionsregardingtherecentretailexpendituresmadebyPrimaryZoneshoppersatretailfacilitieslocatedinBurlingtonandothernearbycommunities,theonline/telephonesurveyincludedanumberofquestionsrelatedtorespondents’onlineshoppinghabits.AssummarizedinFigure5‐4,approximatelyonethird(31%)ofallrespondentsindicatedthattheyhaddonesomeformofonlineshoppingduringthepastmonth.Theserespondentscollectivelyspentatotalofapproximately$87,500online,whichrepresentslessthanonetenthofthetotalamountspentbysurveyrespondentsatFSR,NFSRandRestaurantfacilitiesduringthesameperiod.
Figure5‐5furthersummarizesthespecifictypeofretailandserviceproductsthatsurveyrespondentspurchasedonline.Asshown,themajorityofrespondents’onlineexpendituresrelatedtoservice‐baseditems,includingmorethanhalfofwhichthatrelatedtothepurchaseofvariousticketsandtravel‐relatedservices(e.g.,entertainmentevents,airlinetickets,hotelbookings).Bycontrast,retailmerchandise–includingmusic,movieande‐bookdownloads–accountedforonlyonethirdofthetotalvalueofexpendituresmadebysurveyrespondents.
94.7%
83.7%
83.4%
3.2%
4.7%
5.0%
0.5%
4.8%
1.6%
1.6%
6.8%
9.9%
0.0% 10.0% 20.0% 30.0% 40.0% 50.0% 60.0% 70.0% 80.0% 90.0% 100.0%
Supermarkets
Convenience & Specialty Food
Restaurants
City of Burlington Town of Oakville City of Hamilton All Other

CityofBurlington–OfficialPlanReviewCommercialStrategyStudy(Phase1:CommercialMarketSupplyandDemandAnalysis)
71
Yes193 31%
No426 68%
Yes
No
No Response
Althoughnotconsideredspecificallyinourretailmarketanalysis–asitisbasedexclusivelyonStatisticsCanadaRetailTradedatathatmeasuresretailspendingatactualbrickandmortarstorelocations–itisimportanttonotethattheextenttowhichBurlingtonresidentsultimatelyadoptonlineshoppingovertraditionalstoreformatscouldpotentiallyinfluencetheamountofretailandservicecommercialspacethatisrequiredtomeetthedemandsofCityresidentslong‐term.
Basedontheresultsofourconsumersurveys,however,itisevidentthatonlineshoppingcurrentlyaccountsforonlyasmallproportionofBurlingtonresidents’expenditures.Furthermore,somestoretypes–suchassupermarketsandhealthandpersonalcarestores(e.g.,pharmaciesanddrugstores)–arelesslikelytobeinfluencedbychangesinonlineshoppingbehavior,asthereisexpectedtobeacontinueddemandforstoresthatsupplyvariousneighbourhood‐orientedandconveniencerelatedgoodsandservices.
FIGURE 5‐5: DISTRIBUTION OF ONLINE EXPENDITURES BY CATEGORY (VALUE OF EXPENDITURES)
SOURCE: urbanMetrics inc. (2012).
32.9%
53.7%
13.4%
0.0% 10.0% 20.0% 30.0% 40.0% 50.0% 60.0%
Retail Merchandise (including music, movie and e‐book downloads)
Tickets and Travel‐Related Services (including event, airline and hotel tickets)
All Other Services
FIGURE 5‐4: PREVALANCE OF ONLINE SHOPPING AMONG SURVEY RESPONDENTS (MADE ON‐LINE PURCHASE IN PAST MONTH)
SOURCE: urbanMetrics inc. (2012).

CityofBurlington–OfficialPlanReviewCommercialStrategyStudy(Phase1:CommercialMarketSupplyandDemandAnalysis)
72
6 COMMERCIALTRENDS
Howweplan,structureandregulateretailtrade...haslargeeffectsnotonlyoneconomicefficiencyandconsumersatisfactionbutonthequalityoflifeandthemaintenanceofavitalpublicsphere.11
TheretailindustryandretaildevelopmentinNorthAmericaiscontinuallyevolving,adaptingandfindingnewwaystoattractandexcitethecustomer.Thereisan“outwiththeold”movementtocreatebettersettings(i.e.imageandstyle)forpeopleactivitybycreatingmixed‐usenodesthatembracecommunityconnections,streetlifeandprovideintegratedactivity.
AlthoughbigboxretailerscontinuetodominatecommercialdevelopmentinCanada,theyareevolvingtomeettheneedsofconsumersandemergingplanningandurbandesignpolicies.Acyclecanalsobeobservedinwhichformatsthatarefillingamarketnichethrive,reachthepeakoftheirpopularityandsuccessandthenlosetheirpositionandaresupersededandreplacedbyothers.OutletcentresandawaveofretailerslookingtosetupshopinCanadaarehottopicsintheretailindustrytoday.
Powercentres,thenewformattrendthatemergedintheearly1990’sinCanada,continuetoenhancetheirtenantselectionsanddesignstandards,whiletraditionalenclosedmallsarebeingchallengedtoremainrelevantbyexpanding,re‐tenantingandrepositioningtheirpropertiestomaintaintheircompetitiveness.WiththearrivalofmoreretailersfromtheUSandabroad,aswellasnewcentreformats,includingoutletcentres,theevolutioncontinues.Developersarealsostartingtobuildmoreinnovativeretailandmixeduseprojectsthatprovideforbetterpedestrianandtransitconnectivityandimproveddesignstandardsthathavebeenmissinginthefirstgenerationofpowercentres.
Inthissectionwediscusssomeofthemoreprevalenttrendsintheretailindustryandbuiltform,including:
PowerCentresandLargeFormatRetailers
TheBroadeningofShoppingCentreMerchandising
LifestyleCentresandHybridMixed‐UseCentres
NewUrbanism
OutletCentres
11GraemeDavison,FromtheMarkettotheMall,p.1.
CityofBurlington–OfficialPlanReviewCommercialStrategyStudy(Phase1:CommercialMarketSupplyandDemandAnalysis)
73
InfluxofU.S.RetailerstoCanada
BlurringoftheRetailHierarchy
Non‐storeshopping
Transit/ActiveTransportationSupportiveCommercialDevelopment
6.1 POWERCENTRESANDLARGEFORMATRETAILERS
Someofthemostsweepingchangesoverthepasttwodecadeshavebeenthetransitionoftheshoppingcentreindustrywiththeevolutionofthe“powercentre”andtheadditionofnewformatretailers.AlthoughBurlingtonwasthelocationofthelastdepartmentstoreanchoredenclosedregionalshoppingcentreinCanada(MapleviewShoppingCentre1990),allnewregionalscaleretailfacilitiesconstructedintheCitysincethenhavebeenlargeformatandpowercentredevelopments.Infact,eventhetraditionalenclosedApplebyMall,whichwasoriginallyconstructedin1971,hasrecentlyundergoneatransformationtoanopenairformat.
NewformatretailersandpowercentreshaveaccountedforthegreatestportionofnewretailfloorspaceconstructedinCanadasincetheearly1990s.Theyhavenotonlyabsorbedmostnewmarketgrowth,butinsomecommunitiestheyarecuttingintothemarketsofexistingtraditionalregionalcentres,particularlywiththeinclusionofmorefashionretailers,aswellasdowntowns.Insomemarkets,theyarealsofulfillingtheroleofatraditionalregionalcentrewherenoneexist.
Largeformatretailershavetypicallyfollowedthreelocationalmodels:
Lowcostlocationsonindustrialdesignatedlandsorcommercialdesignatedgreenfieldsitesthatprovideforexpansiveparkingareasandregionalaccessibility;
Brownfieldindustriallandconversions,wherebyolderindustrialsitesaretransformedintoretailpowercentres,hybridsandmixed‐usedevelopments;and
Clusteringaroundexistingshoppingcentresand/orexistingpowercentres,whichistypicallyaccomplishedthroughbothredevelopmentandgreenfielddevelopmentandresultsinregionalorsuperregionalretailclusters(e.g.Highway407/400“supercluster”inVaughanorYongeStreetCorridornearUpperCanadaMallinNewmarket).
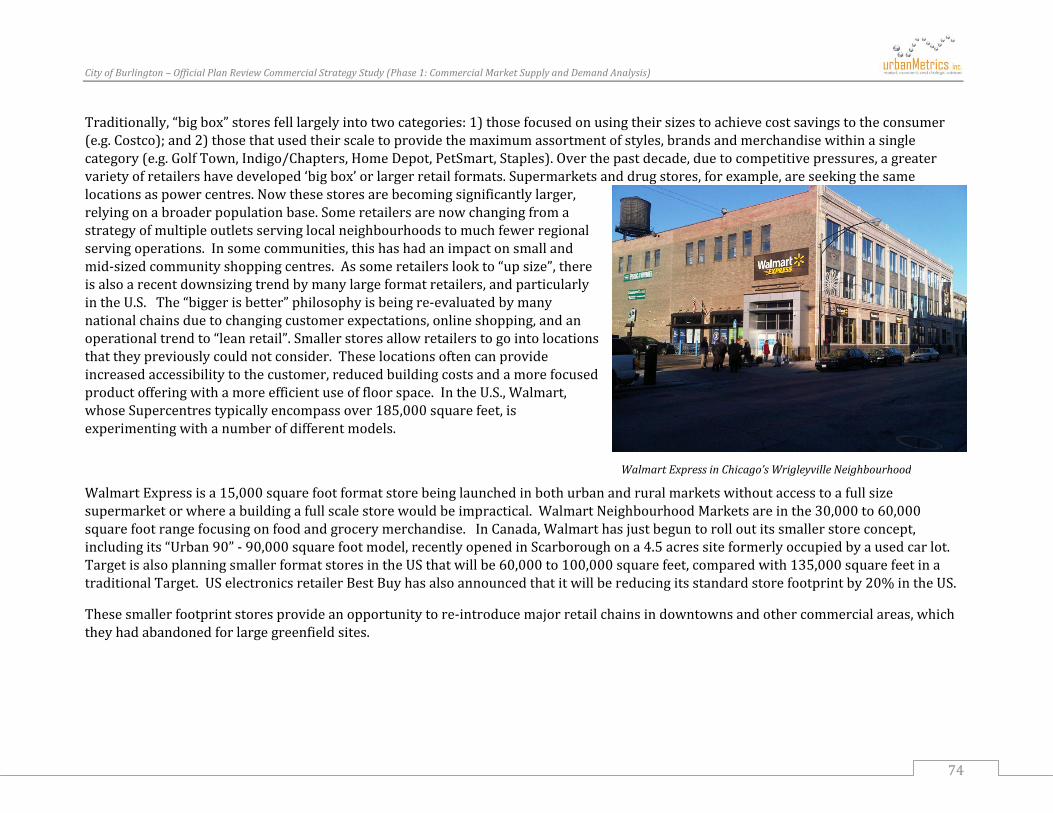
CityofBurlington–OfficialPlanReviewCommercialStrategyStudy(Phase1:CommercialMarketSupplyandDemandAnalysis)
74
Traditionally,“bigbox”storesfelllargelyintotwocategories:1)thosefocusedonusingtheirsizestoachievecostsavingstotheconsumer(e.g.Costco);and2)thosethatusedtheirscaletoprovidethemaximumassortmentofstyles,brandsandmerchandisewithinasinglecategory(e.g.GolfTown,Indigo/Chapters,HomeDepot,PetSmart,Staples).Overthepastdecade,duetocompetitivepressures,agreatervarietyofretailershavedeveloped‘bigbox’orlargerretailformats.Supermarketsanddrugstores,forexample,areseekingthesamelocationsaspowercentres.Nowthesestoresarebecomingsignificantlylarger,relyingonabroaderpopulationbase.Someretailersarenowchangingfromastrategyofmultipleoutletsservinglocalneighbourhoodstomuchfewerregionalservingoperations.Insomecommunities,thishashadanimpactonsmallandmid‐sizedcommunityshoppingcentres.Assomeretailerslookto“upsize”,thereisalsoarecentdownsizingtrendbymanylargeformatretailers,andparticularlyintheU.S.The“biggerisbetter”philosophyisbeingre‐evaluatedbymanynationalchainsduetochangingcustomerexpectations,onlineshopping,andanoperationaltrendto“leanretail”.Smallerstoresallowretailerstogointolocationsthattheypreviouslycouldnotconsider.Theselocationsoftencanprovideincreasedaccessibilitytothecustomer,reducedbuildingcostsandamorefocusedproductofferingwithamoreefficientuseoffloorspace.IntheU.S.,Walmart,whoseSupercentrestypicallyencompassover185,000squarefeet,isexperimentingwithanumberofdifferentmodels.
WalmartExpressisa15,000squarefootformatstorebeinglaunchedinbothurbanandruralmarketswithoutaccesstoafullsizesupermarketorwhereabuildingafullscalestorewouldbeimpractical.WalmartNeighbourhoodMarketsareinthe30,000to60,000squarefootrangefocusingonfoodandgrocerymerchandise.InCanada,Walmarthasjustbeguntorolloutitssmallerstoreconcept,includingits“Urban90”‐90,000squarefootmodel,recentlyopenedinScarboroughona4.5acressiteformerlyoccupiedbyausedcarlot.TargetisalsoplanningsmallerformatstoresintheUSthatwillbe60,000to100,000squarefeet,comparedwith135,000squarefeetinatraditionalTarget.USelectronicsretailerBestBuyhasalsoannouncedthatitwillbereducingitsstandardstorefootprintby20%intheUS.
Thesesmallerfootprintstoresprovideanopportunitytore‐introducemajorretailchainsindowntownsandothercommercialareas,whichtheyhadabandonedforlargegreenfieldsites.
WalmartExpressinChicago’sWrigleyvilleNeighbourhood

CityofBurlington–OfficialPlanReviewCommercialStrategyStudy(Phase1:CommercialMarketSupplyandDemandAnalysis)
75
6.2 THEBROADENINGOFSHOPPINGCENTREMERCHANDISING
Thewaveofpowercentredevelopmentishavingaprofoundimpactontheshoppingcentreindustry,bothindirectlyanddirectly.Indirectly,thearrivalinCanadaofWalmart(in1994)andthebigboxspecialtysectorhavebeenrapidlyerodingthemarketsharesonceattributabletothetraditionaldepartmentstoresector.ThenewlyintroducedWalmartSupercentre,withitssupermarket‐scalefoodcomponent,isalsohavinganimpactonsupermarketretailers.TheTargetdepartmentstorechain,whichwillbeginopeningitsfirstCanadianstoresin2013(includingtwoinBurlingtonandoneinWaterdownandoneinOakville),willbepartneringwithSobeystoprovideanarrayoffreshgroceryandfoodmerchandise,althoughitwillbeonsmallerscalethanWalmart.Similarly,othernon‐foodstores,suchasShoppersDrugMarthavegreatlyexpandedtheirselectionoffoodandgroceryitems.TheimpactofWalmartandothertraditionalnon‐foodretailershasstuntedgrowthinthetraditionalsupermarketsectorinrecentyears.
Inaddition,withtheincreasingmovementofapparelretailerstopowercentresandtheattractionofbigboxtenantstotraditionalshoppingcentres,thereisagrowingcompetitiveoverlapbetweenthesetworetailforms,notonlyfornewshoppersbutalsoforthesametenants.
6.3 NEWDEVELOPMENTCONCEPTS
Asanalternativetothepowercentre,whichhasbeencriticizedfornotadaptingtonon‐automobiletripsandlackingtheaestheticformandappealrequiredtoattractthemoreupscalemarketsegment,somedevelopmentcompaniesareturningtoso‐called“lifestylecentres”,andmixed‐usehybrids,including“main‐street”retailing,tocreatecommunityplaces.Open‐airandenclosedoutlettypecentresarealsoemergingandplannedinCanada,marketedasdestinationlocationsforvalueseekingcustomers.
6.3.1 LIFESTYLEANDHYBRIDCENTRES
“Lifestylecentres”havebeenoperatingintheUnitedStatesforaboutthreedecades,however,whatconstitutesalifestylecentreisoftenconsideredadifficultquestiontoanswerasmorearebuiltandtheformatevolvestofitdifferentmarketneeds.Notonlyhasthesizeof“lifestylecentres”changedovertheyears,butalsotheirdesignandtenantmix.Theterm“lifestylecentre”isnowbeingreferredtoasa“catchallterm”foranumberofdiversemixed‐useprojectsacrossNorthAmerica.
CityofBurlington–OfficialPlanReviewCommercialStrategyStudy(Phase1:CommercialMarketSupplyandDemandAnalysis)
76
TheInternationalCouncilofShoppingCenters(ICSC)definesalifestylecentreasfollows:
Mostoftenlocatednearaffluentresidentialneighborhoods,thiscentretypecaterstotheretailneedsand“lifestyle”pursuitsofconsumersinitstradingarea.Ithasanopenairconfigurationandtypicallyincludesatleast50,000squarefeetofretailspace(GLA)occupiedbychainspecialtystores.(Thewholecentremayrangefrom150,000to500,000squarefeet.)Otherelementsdifferentiatethelifestylecentreroleasamulti‐purposeleisure‐timedestination,includingrestaurants,specialtyfoodstores,entertainment,anddesignambienceandamenitiessuchasfountainsandstreetfurniturethatareconducivetocasualbrowsing.Itmaybeanchoredbyalarge‐formatspecialtystore,asmallerversionofa“bigbox”storeand/orentertainmentvenuessuchascinemas.Theprimarytradeareaistentotwentykilometers.
Lifestylecentresareaimingtostrikeabalancebetweenthemallshoppingexperienceandtheneedforbigboxspecialtytenantstocreatearegionaldraw.Todifferentiatelifestylecentresfromtypicalpowercentres,developershaveusedtheming,internalpedestrianconnections,highqualitydesign,andentertainment.Often,thelifestylecentretriestomimica“MainStreet”tocreatea“streetculture”andtheprovisionofpublicspace.
IndustryexpertshaveoftenquestionedwhythelifestylecentreconcepthasbeenslowtoemergeinCanada.AsindicatedinapublicationbytheCentrefortheStudyofCommercialActivity(CSCA)12lifestyledevelopmentsinCanadahavebeenminimalduetoafewsignificantdifferencesbetweentheCanadianandAmericanmarketplace,including:
Thecoldclimatethroughthelong‐wintermeansshopperswillnotwanttowalkaroundalifestylestreetscapewithanopen‐airconfiguration;
Thelackofupscalesuburbanneighbourhoods,andthereforethelackofinterestonthepartofupscaleretailerstoenterorexpandwithintheCanadianmarketplace;and,
ThecomparativeconservatismofCanadianretaildevelopmentcomparedtosouthoftheborder,whichhascreatedreluctancetoenterintoaperceivedhigherriskdevelopment.
TheCSCAindicates,however,thatopen‐aircentresintheformofpowercentreshavebeensuccessfulinCanadabasedontheirwidespreadgrowth,indicatingthatCanadiansaremore“hardy”whenitcomestodealingwithcoldtemperatures.IntheU.S.,thecoldclimatehasnothadanimpactastherearenumerousopen‐airlifestylecentresthathavebeendevelopedinthenorthernsnowbeltregionwithdesignandtechnologytooffershelterfromtheelements.Inresponsetotheissueofthelackof“upscale”neighbourhoodsinCanada,theCSCAindicates
12T.Hernandez,LifestyleCentresinCanada,2007,CSCA(Ryerson)

CityofBurlington–OfficialPlanReviewCommercialStrategyStudy(Phase1:CommercialMarketSupplyandDemandAnalysis)
77
that,“unliketheUS,Canadahasnotwitnessedthesamedegreeofsuburbanizationofaffluence;insteadCanadiansuburbsareimmersedinthe“middle‐ground”,makingithardertoidentifymarketsforlifestyletypedevelopments.
DespitethefactthatlifestyletypecentreshavebeenslowtoemergeinCanada,thereisincreasedimpetustodevelopnewalternativetypesofretailspaceornewformats,includingshoppingcentrehybridsthatcombinepredominantelementsfromtwoormoredistincttraditionaland/orspecialtyshoppingcentretypes,e.g.powercentre,regionalmallandlifestylecentres.TheCSCAindicatesthatthetraditionalpowercentrehasenteredthematurestageofitslifecycleandthatconsumersarefatiguedwiththeconcept.
InCanada,mixed‐usehybridformsofretaildevelopmentwithso‐called“lifestyle”componentsincludeQuartierDIX30,oneofthelargest“lifestyle”centresinCanadalocatedinBrossard,Québec.Atfullbuild‐out,theprojectisexpectedtoinclude2.4millionsquarefeetandattract21.7millionvisitorsannually.OtherexamplesoflifestylecentresincludeTheShopsatMorganCrossinginSurrey,BritishColumbia.
Lifestyle Centre ‐ The Shops at Morgan Crossing, Surrey, BC
Inadditiontonewcentres,existingshoppingcentresarere‐inventingthemselveswiththeadditionofnew“lifestyle‐focused”space.AsindicatedbytheCSCA,insomecases,thenewformatcentrescanbeconsideredas“moresophisticatedpowercentreswithdesignfeaturestosoftenthefunctionandformofthecentres”.
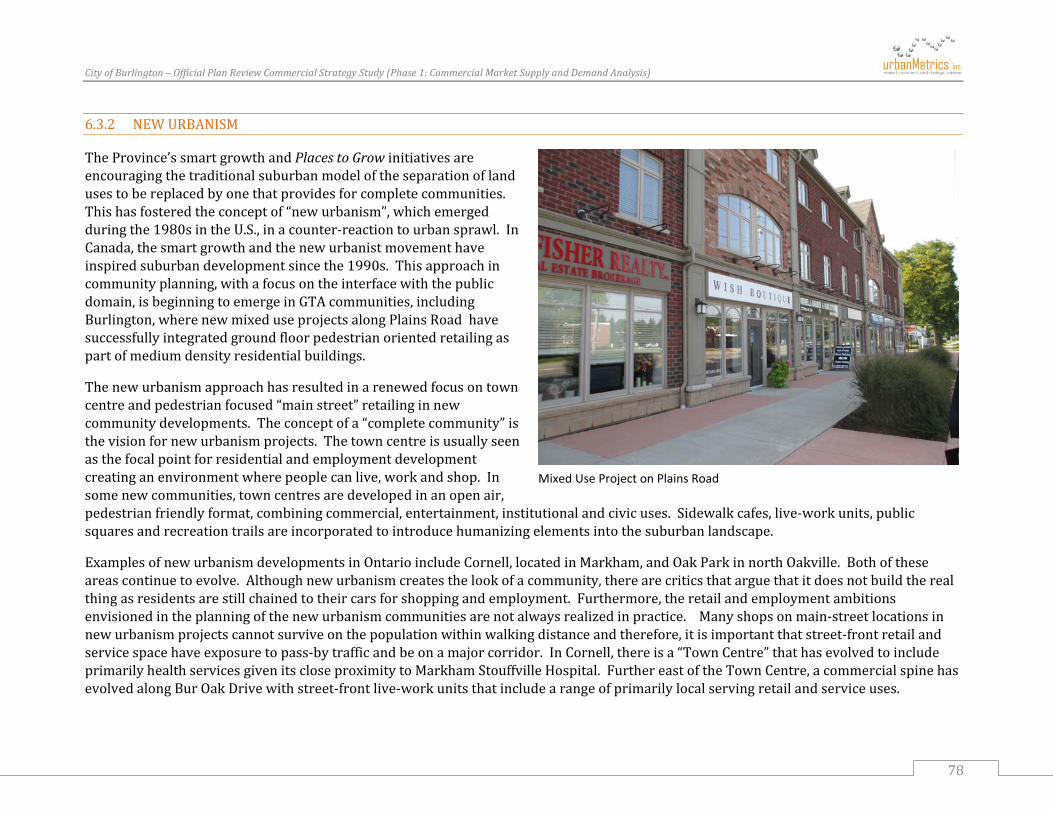
CityofBurlington–OfficialPlanReviewCommercialStrategyStudy(Phase1:CommercialMarketSupplyandDemandAnalysis)
78
6.3.2 NEWURBANISM
TheProvince’ssmartgrowthandPlacestoGrowinitiativesareencouragingthetraditionalsuburbanmodeloftheseparationoflandusestobereplacedbyonethatprovidesforcompletecommunities.Thishasfosteredtheconceptof“newurbanism”,whichemergedduringthe1980sintheU.S.,inacounter‐reactiontourbansprawl.InCanada,thesmartgrowthandthenewurbanistmovementhaveinspiredsuburbandevelopmentsincethe1990s.Thisapproachincommunityplanning,withafocusontheinterfacewiththepublicdomain,isbeginningtoemergeinGTAcommunities,includingBurlington,wherenewmixeduseprojectsalongPlainsRoadhavesuccessfullyintegratedgroundfloorpedestrianorientedretailingaspartofmediumdensityresidentialbuildings.
Thenewurbanismapproachhasresultedinarenewedfocusontowncentreandpedestrianfocused“mainstreet”retailinginnewcommunitydevelopments.Theconceptofa“completecommunity”isthevisionfornewurbanismprojects.Thetowncentreisusuallyseenasthefocalpointforresidentialandemploymentdevelopmentcreatinganenvironmentwherepeoplecanlive,workandshop.Insomenewcommunities,towncentresaredevelopedinanopenair,pedestrianfriendlyformat,combiningcommercial,entertainment,institutionalandcivicuses.Sidewalkcafes,live‐workunits,publicsquaresandrecreationtrailsareincorporatedtointroducehumanizingelementsintothesuburbanlandscape.
ExamplesofnewurbanismdevelopmentsinOntarioincludeCornell,locatedinMarkham,andOakParkinnorthOakville.Bothoftheseareascontinuetoevolve.Althoughnewurbanismcreatesthelookofacommunity,therearecriticsthatarguethatitdoesnotbuildtherealthingasresidentsarestillchainedtotheircarsforshoppingandemployment.Furthermore,theretailandemploymentambitionsenvisionedintheplanningofthenewurbanismcommunitiesarenotalwaysrealizedinpractice.Manyshopsonmain‐streetlocationsinnewurbanismprojectscannotsurviveonthepopulationwithinwalkingdistanceandtherefore,itisimportantthatstreet‐frontretailandservicespacehaveexposuretopass‐bytrafficandbeonamajorcorridor.InCornell,thereisa“TownCentre”thathasevolvedtoincludeprimarilyhealthservicesgivenitscloseproximitytoMarkhamStouffvilleHospital.FurthereastoftheTownCentre,acommercialspinehasevolvedalongBurOakDrivewithstreet‐frontlive‐workunitsthatincludearangeofprimarilylocalservingretailandserviceuses.
Mixed Use Project on Plains Road
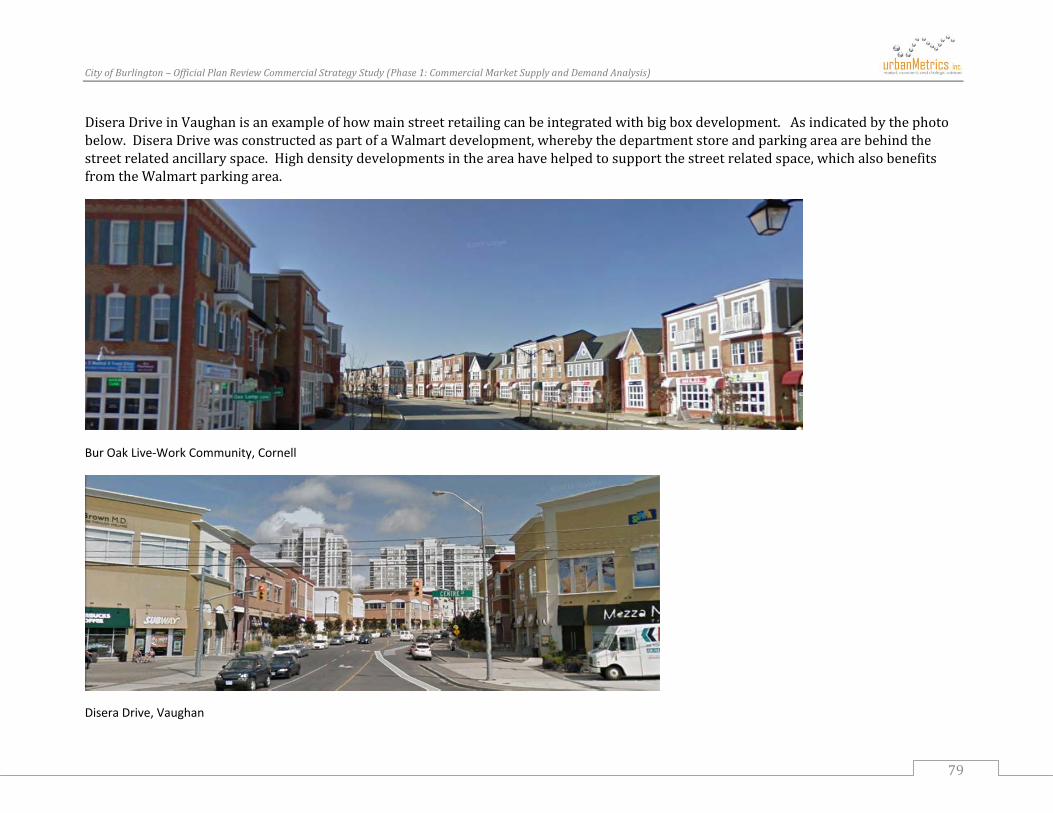
CityofBurlington–OfficialPlanReviewCommercialStrategyStudy(Phase1:CommercialMarketSupplyandDemandAnalysis)
79
DiseraDriveinVaughanisanexampleofhowmainstreetretailingcanbeintegratedwithbigboxdevelopment.Asindicatedbythephotobelow.DiseraDrivewasconstructedaspartofaWalmartdevelopment,wherebythedepartmentstoreandparkingareaarebehindthestreetrelatedancillaryspace.Highdensitydevelopmentsintheareahavehelpedtosupportthestreetrelatedspace,whichalsobenefitsfromtheWalmartparkingarea.
Bur Oak Live‐Work Community, Cornell
Disera Drive, Vaughan
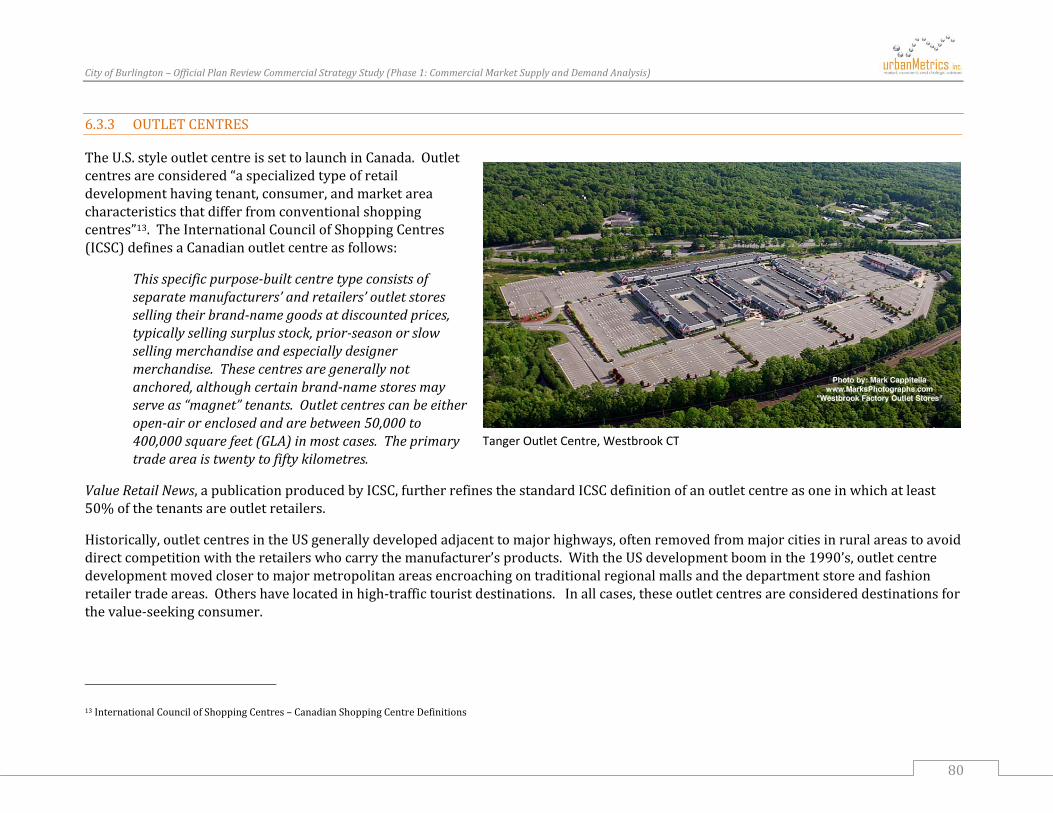
CityofBurlington–OfficialPlanReviewCommercialStrategyStudy(Phase1:CommercialMarketSupplyandDemandAnalysis)
80
6.3.3 OUTLETCENTRES
TheU.S.styleoutletcentreissettolaunchinCanada.Outletcentresareconsidered“aspecializedtypeofretaildevelopmenthavingtenant,consumer,andmarketareacharacteristicsthatdifferfromconventionalshoppingcentres”13.TheInternationalCouncilofShoppingCentres(ICSC)definesaCanadianoutletcentreasfollows:
Thisspecificpurpose‐builtcentretypeconsistsofseparatemanufacturers’andretailers’outletstoressellingtheirbrand‐namegoodsatdiscountedprices,typicallysellingsurplusstock,prior‐seasonorslowsellingmerchandiseandespeciallydesignermerchandise.Thesecentresaregenerallynotanchored,althoughcertainbrand‐namestoresmayserveas“magnet”tenants.Outletcentrescanbeeitheropen‐airorenclosedandarebetween50,000to400,000squarefeet(GLA)inmostcases.Theprimarytradeareaistwentytofiftykilometres.
ValueRetailNews,apublicationproducedbyICSC,furtherrefinesthestandardICSCdefinitionofanoutletcentreasoneinwhichatleast50%ofthetenantsareoutletretailers.
Historically,outletcentresintheUSgenerallydevelopedadjacenttomajorhighways,oftenremovedfrommajorcitiesinruralareastoavoiddirectcompetitionwiththeretailerswhocarrythemanufacturer’sproducts.WiththeUSdevelopmentboominthe1990’s,outletcentredevelopmentmovedclosertomajormetropolitanareasencroachingontraditionalregionalmallsandthedepartmentstoreandfashionretailertradeareas.Othershavelocatedinhigh‐traffictouristdestinations.Inallcases,theseoutletcentresareconsidereddestinationsforthevalue‐seekingconsumer.
13InternationalCouncilofShoppingCentres–CanadianShoppingCentreDefinitions
Tanger Outlet Centre, Westbrook CT

CityofBurlington–OfficialPlanReviewCommercialStrategyStudy(Phase1:CommercialMarketSupplyandDemandAnalysis)
81
Tanger,whohasbeendevelopingoutletcentresforsome30yearsintheUS,hasasetofguidelinestheyfollowinevaluatingopportunitiesforthedevelopmentofnewoutletcentres(typically90storeswithabout350,000squarefeet).Theseguidelines,asindicatedinTanger’s2010Form10‐Kreport,typicallyincludeseekinglocationswithinmarketsthathaveatleast1millionpeopleresidingwithina50to60kilometreradiuswithanaveragehouseholdincomeofatleast$65,000peryear,frontageonamajorinterstateorroadwaythathasexcellentvisibility,andatrafficcountofatleast55,000carsperday.Leadingtourist,vacationandresortmarketsthatmaynothavethelocalpopulationbaseandthatreceiveatleast5millionvisitorsannuallyarealsocloselyevaluated.
InOntario,smalloutletcentres(i.e.lessthan250,000squarefeet)havedevelopedprimarilyinhigh‐traffictouristdestinations(e.g.St.Jacobs,NiagaraFalls)orinlocationswithgoodhighwayaccessonawelltravelledroute(e.g.Cookstown).InOntario,thefirstoutletcentreinSt.Jacobsopenedin1994.Onlyonenewoutlet
centrehasbeendevelopedoverthepast10years.Intotal,therearecurrentlysevenoutletcentres,includingDixieOutletMallwhichincludesamixofoutletretailers,off‐priceretailers,andlargeformatstores.
InCanada,unlikeintheUS,theoutletcentreconcepthasbeenslowtoemergeandhasfocusedontheOntarioandQuebecmarkets.InOntario,anumberofnewoutletcentresareplanned,includingtheexpansionofexistingoutletcentres(e.g.CookstownOutletMall).MostoftheexistingnewretaildevelopmentformatsinCanada,suchaspowercentres,havebeenmodeledaftertheUSexperience.ThenewoutletcentresplannedinCanadaareexpectedtofollowtheUStrendsandbesimilarinformattothenewopen‐airUScentres.ThemajorityofthetenantsinthenewCanadianoutletcentresarealsoexpectedtobeU.S.basedtenantsnewtotheCanadianmarket.
InMarch2011,RioCanRealEstateInvestmentTrust("RioCan")andTangerFactoryOutletCenters,Inc.("Tanger"),throughtheirexclusivejointventure,enteredintoapurchaseandsaleagreementtoacquirea35acreparceloflandtobuildthefirstTangerOutletCenterintheGreaterTorontoArea("GTA").ThesiteforTanger’sfirstfactoryoutletwillbeHaltonHills,onHighway401attheJamesSnowParkwayinterchange.Theprojectisscheduledtostartinthefourthquarterof2011andbereadyforanApril2013opening.AnotherTanger/RioCanoutletisalsoplannedforKanataandCookstown(expansionofanexistingoutletcentre).AccordingtoICSCinformation,thetenantmixfortheTangercentreswillbefocusedonleadingdesignerandbrand‐namemanufacturers. Americanbrandswillmakeupabout80%ofthetenantsatthecentre,andthebalancewillbeCanadian.
Theconcept,designandmerchandisingoftheTanger’sOntariooutletcentreswillbesimilartothosewithintheTangerportfolioofoutletcentresintheU.S.Thecentresareexpectedtoincludeabout350,000squarefeetofbrandedfactoryoutletretailersfromtheU.S.andCanadaofferingconsumersauniqueopportunitytopurchasemerchandisedirectlyfromleadingdesignerandbrandnamemanufacturersat
Cookstown Outlet Mall

CityofBurlington–OfficialPlanReviewCommercialStrategyStudy(Phase1:CommercialMarketSupplyandDemandAnalysis)
82
asubstantialsavings.Itisalsotheintentionofthejointventuretodevelopasmanyas10to15outletcentresinlargerurbanmarketsandtouristareasacrossCanada,overafivetosevenyearperiod.
FollowingtheRioCan/Tangerannouncement,inMay2011,Simon’sPropertyGroupandCallowayRealEstateInvestmentTrustannouncedthesigningofaletterofintenttodevelopthefirstPremiumOutletCenter®inCanada.ThecentrewillalsobelocatedintheTownofHaltonHills,Ontario,just15minutesoutsideofToronto.TheHaltonHillssite,locatedatHighway401andTrafalgarRoad,isjust5kilometreseastoftheTangersite.Constructionisexpectedtobegininthespringof2012.
Otheroutletcentresplannedincludea700,000squarefootcentreinNiagara‐on‐the‐LaketobedevelopedbyIvanhoeCambridge.
6.4 FOREIGNRETAILERS–THEUSINVASION
TheAmericanretailinvasioncontinues.CanadaisinthemidstofalargewaveofU.S.retailerslookingtosetupshophere,joiningrecentarrivalssuchasCrate&Barrel,Marshalls,J.CrewandVictoriaSecret.WiththerecentannouncementofTarget’sarrivalinCanada,settoopen135storesby2013throughtheacquisitionofZellersleases,thetrendisexpectedtoaccelerate.
Withtheirowneconomystagnant,severalotherUSretailersarealsoevaluatingopportunitiesinCanada.AnalystsarepredictingthatanumberofU.S.retailers,includingDick’sSportingGoods,Macy’s,Nordstrom,Kohl’sandJCPenny,arealsoontheirway. ForU.S.retailers,CanadaisconsideredtheperfecttestmarketandrepresentsalogicalnextmovenowthattheeconomicconditionsinCanadianarefavourable.Canada’smainlyEnglish–speakingpopulation,itscloseproximitytoexistingsupplychains,andthefactthatconsumersalreadyknowU.Sbrands,haveluredU.S.interests.SomeU.S.retailersarelookingforopportunitiestoentertheCanadianmarketquicklyandeasilythroughacquisition(ashasbeenthecasewithTarget,Walmart)ratherthanastore‐by‐storeexpansion.AlthoughmostU.S.retailersenteringCanadahavebeensuccessful(e.g.Costco,HomeDepot),themostnotablecasualtywasSam’sClub,whichhadafiveyearruninCanadabutcouldnotcompetewithCostcowhorampeduptheirexpansionplans.
ThearrivalofU.S.retailerswillresultinmorechoicesforCanadianconsumersandforshoppingcentredevelopers,however,theincreasedcompetitioncouldimpactsomeCanadianretailerswhonodoubtwillneedtore‐examinetheirbusinessstrategiestosurviveandthrive.CanadianretailersarealreadypreparingforthearrivalofTarget.CanadianTireisrampinguptheirmarketingcampaignwiththeir“BringitOn”sloganandlikeotherretailers,includingWalmart,areinvestinginnewlocationsandrenovatingexistingstorestoestablishmarketposition.
TheimpactofTargetmaynotcauseasignificantgeographicshiftinexpendituresintheurbanportionsoftheGTAbecausethechainwillberolledoutatexistingretaillocationsinmostcommunities.Forexample,therewillbetwoTargetstoresopeninginBurlington,whileatthe

CityofBurlington–OfficialPlanReviewCommercialStrategyStudy(Phase1:CommercialMarketSupplyandDemandAnalysis)
83
sametime,Targetwillbeopeningstoresinneighbouringcommunities,includingOakvilleandWaterdown.However,inthatTargetstoresareexpectedtogeneratemultipletimesthesalesgeneratedbytheformerZellerstenants,therewilllikelybesometransfersfromotherdepartmentstores,supermarkets,andspecialtyretailers.
ItshouldalsobenotedthatinadditiontotheinfluxofUSandotherforeignretailerstoCanada,thereareanumberofmajorCanadianownedstoresthatalsohaveexpansionplansthatwillincreasecompetition.Examplesinclude:
LaMaisonSimons,amajorQuebec‐basedfashionretailerwhoisplanningonopening12storesinEnglishCanadainthefuture,includinglocationsintheTorontomarketinthe100,000squarefoot+/‐range.
SAIL,anotherQuebec‐basedoutdoorssuperstorewithstoresinthe70,000squarefootrange,whichrecentlyopenedinBurlington.
6.5 BLURRINGOFTHERETAILHIERARCHY
ThetraditionalretailhierarchyevolvedfromWalterChristaller’s“centralplacetheory”in1930whichreliedontheconceptsofthresholdandrange.Theresultwasasystemofcentresofvarioussizesthatemergedwitheachcentresupplyingparticulartypesofgoodsforminglevelsofahierarchy.ThishierarchyisevidentinBurlington.InmunicipalitiesacrossCanada,however,thereisablurringofthetraditionalretailhierarchy.Theretailhierarchyisbeingunderminedbyanumberoffactors,includingchangesinconsumerwants/needs,andthefactthatpeoplearelessconstrainedtoshopneartheirhome.Thegradualprogressionofchangesinretailformatshasalsoalteredtheroleandfunctionofexistingandplannedcommercialareasandtheretailhierarchy.
Althoughdistancetravelledisstillanimportantfactorinaperson’sdecisionofwheretoshop,peoplewilltravelfurthertoshopatacentrewhichfulfilstheirneedsandentertainsthem.Consumersdonotnecessarilyhaveanunbridledloyaltytoalocalcentreorspecificstorewheretheyshop.Intoday’smobilesociety,peoplecanandwilldrivetomoredistantlocationsiftheyperceivethattheywillbenefitfromlowerprices,betterproductselectionandagreatchoiceofmerchandise.Thisresultsinabreakdownofthetraditionalretailhierarchywherepeoplewouldgototheirneareststore.Thefactthatshoppingisalsomoreofaleisureactivityandnotanecessityalsounderminestheretailhierarchy.

CityofBurlington–OfficialPlanReviewCommercialStrategyStudy(Phase1:CommercialMarketSupplyandDemandAnalysis)
84
Shoppingcentres,particularlyinthemiddlerangesofthehierarchy(i.e.communityandneighbourhoodscaleshoppingareas)arealsofindingitincreasinglydifficulttocompetewithpowercentresandbigboxretailers.AlocalexampleisApplebyMall,aformersmallscaleenclosedcentre,which“de‐malled”tomoreeffectivelycompetewithitsbigboxcompetition.
6.6 NON‐STORERETAILING
WiththebirthoftheInternetin1993cameE‐commerceoron‐lineshoppingfromthecomfortofyourhome.ForCanadianconsumers,thevalueofinternetshoppingcomprised$15billionin2009,comparedtoalmost$8billionin2005.AlthoughE‐commercecontinuestogrow,itstillrepresentsonlyasmallportionoftotalretailtrade($415millionin2009inCanada).Itisexpectedthatasyounger,Internet‐savvycustomersmatureandInternet‐usagebecomesmorewidespreadovertimeamongconsumersofallages,E‐commercewillbecomeincreasinglyrelevant.However,itwillnotreplaceshoppinginallstores–peoplewillcontinuetoseeshoppinginstoresasanenjoyablesocialevent.AccordingtoaStatisticsCanadasurvey,themostcommontypesofonlineshoppingcontinuetobetravelservices;entertainmentproductssuchasconcerttickets;booksandmagazines;andclothing,jewelleryandaccessories.
StatisticsCanadaindicatesthattheInternethasbecomeasupplementtotraditionalretailshoppingmorethanasubstituteformanyCanadians.Many“brickandmortar”storesalsonowprovideon‐lineshopping.
BasedonthesurveysconductedbyurbanMetricsinBurlington,some22%oftelephonesurveyrespondentsand43%ofon‐linesurveyrespondentsmadeinternetpurchasesoverthepastmonth.Themostpopularpurchaserswereretailitemsincludingbooks,movies,musicandothermerchandise,whereasticketsandothertravelrelatedservicesaccountedforthegreatestvalueofonlineexpenditures.
In2009,StatisticsCanadadataindicatesthat52%ofCanadianswentonlineto"windowshop,"thatis,toresearchorbrowseproducts,upfrom43%in2007.Amongallwindowshoppersin2009,69%reportedsubsequentlymakingapurchasedirectlyfromastore,upfrom64%in2007.TheInternetcomplementstraditionalretailforcertaincategoriessuchasconsumerelectronics(camerasandDVDplayers),appliancesandfurniture,aswellasclothing,jewelleryandaccessories.The“window”shoppersaretypicallythosethatalsorefrainfrombuyingonlineduetosecurityandprivacyconcernsortheinabilitytotouchandfeelproducts.
InadditiontoInternetshopping,homeshoppingthroughcataloguescontinuestoexpand.Therearehundredsofcompanies,manyofwhichareUSAbased,whichprovidecataloguesfortelephoneoron‐lineshopping(e.g.LLBean,LandsEnd,Avon,Sears).CanadaPostispromotingBorderfree™forbarrier‐freeandhasslefreeshoppingbypartneringwithinternationalcompaniesinanefforttosimplifyshippingprocedures.Mostofthesecompanieshavecatalogues.
Furthermore,itislikelythatincreasedaccesstodigitaltelevisionwillleadtomorepurchasesbeingmadethroughinteractivesystems.
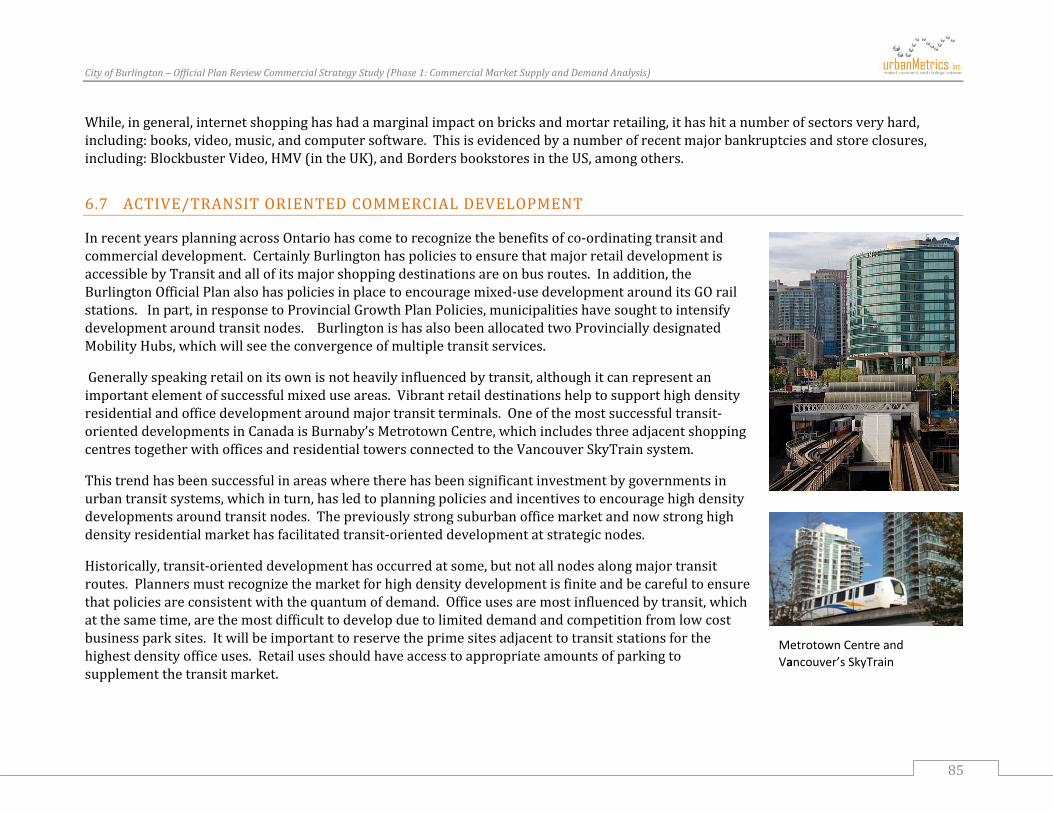
CityofBurlington–OfficialPlanReviewCommercialStrategyStudy(Phase1:CommercialMarketSupplyandDemandAnalysis)
85
While,ingeneral,internetshoppinghashadamarginalimpactonbricksandmortarretailing,ithashitanumberofsectorsveryhard,including:books,video,music,andcomputersoftware.Thisisevidencedbyanumberofrecentmajorbankruptciesandstoreclosures,including:BlockbusterVideo,HMV(intheUK),andBordersbookstoresintheUS,amongothers.
6.7 ACTIVE/TRANSITORIENTEDCOMMERCIALDEVELOPMENT
InrecentyearsplanningacrossOntariohascometorecognizethebenefitsofco‐ordinatingtransitandcommercialdevelopment.CertainlyBurlingtonhaspoliciestoensurethatmajorretaildevelopmentisaccessiblebyTransitandallofitsmajorshoppingdestinationsareonbusroutes.Inaddition,theBurlingtonOfficialPlanalsohaspoliciesinplacetoencouragemixed‐usedevelopmentarounditsGOrailstations.Inpart,inresponsetoProvincialGrowthPlanPolicies,municipalitieshavesoughttointensifydevelopmentaroundtransitnodes.BurlingtonishasalsobeenallocatedtwoProvinciallydesignatedMobilityHubs,whichwillseetheconvergenceofmultipletransitservices.
Generallyspeakingretailonitsownisnotheavilyinfluencedbytransit,althoughitcanrepresentanimportantelementofsuccessfulmixeduseareas.Vibrantretaildestinationshelptosupporthighdensityresidentialandofficedevelopmentaroundmajortransitterminals.Oneofthemostsuccessfultransit‐orienteddevelopmentsinCanadaisBurnaby’sMetrotownCentre,whichincludesthreeadjacentshoppingcentrestogetherwithofficesandresidentialtowersconnectedtotheVancouverSkyTrainsystem.
Thistrendhasbeensuccessfulinareaswheretherehasbeensignificantinvestmentbygovernmentsinurbantransitsystems,whichinturn,hasledtoplanningpoliciesandincentivestoencouragehighdensitydevelopmentsaroundtransitnodes.Thepreviouslystrongsuburbanofficemarketandnowstronghighdensityresidentialmarkethasfacilitatedtransit‐orienteddevelopmentatstrategicnodes.
Historically,transit‐orienteddevelopmenthasoccurredatsome,butnotallnodesalongmajortransitroutes.Plannersmustrecognizethemarketforhighdensitydevelopmentisfiniteandbecarefultoensurethatpoliciesareconsistentwiththequantumofdemand.Officeusesaremostinfluencedbytransit,whichatthesametime,arethemostdifficulttodevelopduetolimiteddemandandcompetitionfromlowcostbusinessparksites.Itwillbeimportanttoreservetheprimesitesadjacenttotransitstationsforthehighestdensityofficeuses.Retailusesshouldhaveaccesstoappropriateamountsofparkingtosupplementthetransitmarket.
Metrotown Centre and Vancouver’s SkyTrain

CityofBurlington–OfficialPlanReviewCommercialStrategyStudy(Phase1:CommercialMarketSupplyandDemandAnalysis)
86
Inaddition,totransitorienteddevelopment,morerecentlyjurisdictionsacrosstheProvincehavefocusedonactivetransportationalternativesasameansofencouraginghealthiercommunities.Thisinvolvesthedesignof“completestreets”toensurethatplannersandengineersdesignstreetsforallmannerofroadusers,includingpedestrians,cyclistsandtransitusers,inadditiontodrivers.Keytothisstrategyisthedevelopmentofintegratedpedestrianandcyclingnetworks.
Theintegrationofcommercialdevelopmentaspartofanactivetransportationstrategyisstillinitsinfancy.Whilemanymunicipalitieshavedevelopedpolicieswhichrequireorencouragestreetrelatedretailingatstrategiclocationsandrequirecertainbusinessestoincorporatebikelockingracksintotheirproperties,mostmunicipalitieshaveyettoaddressissuessuchasthedesignofbike/trailnetworkstointegrateretaildestinationsandthecreationofpoliciestoencouragesafeandfriendlycycling/pedestrianaccesstoandwithinretaildevelopments.
6.8 SUMMARY
Theretailindustryanditsbuiltformaredynamic–evolvingandchangingtoconsumerpreferences,lifestylesandnewinnovations.Basedonourresearch,theretaillandscapeisexpectedtocontinuetoevolvewiththeadditionofoutletcentresandtheintegrationofpowercentres,mallsandlifestylecentresintohybridmixed‐usedevelopmentsthatwillbedifferentiatedfromeachothertosomeextentthroughstyle,architectureandtheneedsofthecommunity.
Theprinciplesofnewurbanism,sustainabilityandthefocusonpublicspaceswillalsocontinuetoinfluenceretaildevelopmentinthefuture,whilebetteraccommodatingchangingmarketconditions.Thearchitectureanddesignofretailspacewillnodoubtcontinuetoevolvewiththecreationofmoremeaningfulandmemorablespacesthathaveafeelingofcommunityorsenseofplace.
AlthoughthepotentialforwidespreaddevelopmentofthemoretraditionallifestylecentresfoundintheUSisunlikelytooccurinCanada,therewillbemoredevelopmentswhichincorporatelifestylecomponents,includingredevelopmentofexistingshoppingcentres/powercentres,theadditionofmoredesignelements,including“main‐street”andtowncentreinitiatives,andthecombinationofmixed‐uses(i.e.retail,office,residential)recognizingtrendsfornewurbanismandsmartgrowthinitiatives.Largeroutletcentres,forthevalueseekingconsumer,arealsoexpectedtoemergeinCanada,includingtheTorontoarea.
Theshiftingagecohortsareexpectedtofuelfuturechangesintheretaillandscape.Asthelarge“BabyBoom”generationages,itisexpectedthatopportunitiesformorenichelifestyledevelopmentswillemerge.AsindicatedbytheCSCA,themassmiddle‐groundconsumermaystarttoexpectmorefrom
LIVE WORK
SHOP
LIVE WORK
SHOP
Traditional Suburban Model
Smart Growth/Complete Community Model

CityofBurlington–OfficialPlanReviewCommercialStrategyStudy(Phase1:CommercialMarketSupplyandDemandAnalysis)
87
theirtraditionalpowercentreshoppingexperience,whichisalreadyevidentintheincreasedadditionoffashionandrestauranttenantsinpowercentresandhybridlifestylecentres.
Thedemandfordeveloperstocreateuniqueformatsandtosatisfytheneedsofconsumerswithuniquetenantsishavingapositiveimpactontheretaillandscape.Retailersareintroducingadditionalconceptsinordertoremaincompetitiveinthemarketplace.WithawaveofU.S.retailersexpectedtolaunchinCanada,theretaillandscapewillcontinuetoevolve.
Whetheritismixed‐uselifestyleortowncentredevelopmentswithwalkableenvironments,reintegratingretailspaceintodowntowns(i.e.theevolutionfromsuburbantourban),orredevelopingobsoleteprojectsasmoreinnovativeonesemerge,densificationandmixed‐usedevelopmentisdefinitelythenextwaveofretaildevelopmentthatsupportsthesmartgrowth/completecommunitymodelunderlyingcommunityplanningtoday.
TheGrowthPlanfortheGreaterGoldenHorseshoeembracestheneedformixed‐usedevelopmentandstrengtheningcoreareas.TheGrowthPlanaimsto,amongotherthings,revitalizedowntownstobecomevibrantandconvenientcentres,andtocreatecompletecommunitiesthatoffermoreoptionsforliving,working,shoppingandplaying.
GiventhetrendsandprovincialGrowthPlanpolicies,thereisthepotentialorfutureopportunityforcommercialcentres/nodesinClaringtontocombineretailwithoffice,residential,andcommunityusestothebenefitoftheneighbourhoodandcommunity.Neighbourhoodretailing,inparticular,isconsideredimportantforprovidingeverydaygoodsandservicestoresidentsaswellasforprovidingasenseofplaceandcontributingtocompletecommunities.
Thetraditionalsuburbanmodelcreatedaseparationbetweenwherepeoplelivefromwheretheyworkandshop.Thispatternofgrowthisseenasresultinginanincreasedneedforautomobiletravelandcontributestohigherenergyconsumption,decliningairqualityandpublichealth.Assuchitwillbeimportantthatthereareappropriatestrategiestoprovidefornewmulti‐purposeretailcentresandforredevelopingorreinventingexistingcommercialcentresanddistrictsintomixed‐usenodeswithalternativetransportationinmind,includingcreatingpublicgatheringplaces,andintegratinghousingandemploymentuses,whereappropriate,tocreatecompletecommunitiesandachieveamorebalancedapproachtogrowth.
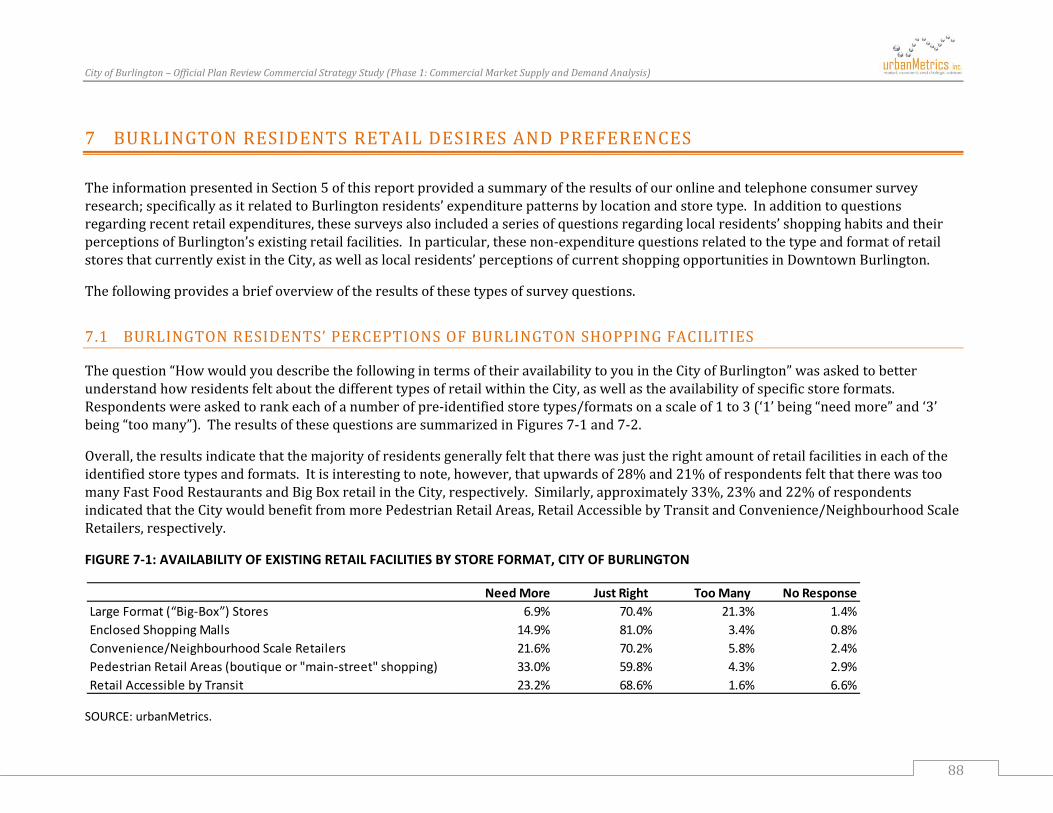
CityofBurlington–OfficialPlanReviewCommercialStrategyStudy(Phase1:CommercialMarketSupplyandDemandAnalysis)
88
7 BURLINGTONRESIDENTSRETAILDESIRESANDPREFERENCES
TheinformationpresentedinSection5ofthisreportprovidedasummaryoftheresultsofouronlineandtelephoneconsumersurveyresearch;specificallyasitrelatedtoBurlingtonresidents’expenditurepatternsbylocationandstoretype.Inadditiontoquestionsregardingrecentretailexpenditures,thesesurveysalsoincludedaseriesofquestionsregardinglocalresidents’shoppinghabitsandtheirperceptionsofBurlington’sexistingretailfacilities.Inparticular,thesenon‐expenditurequestionsrelatedtothetypeandformatofretailstoresthatcurrentlyexistintheCity,aswellaslocalresidents’perceptionsofcurrentshoppingopportunitiesinDowntownBurlington.
Thefollowingprovidesabriefoverviewoftheresultsofthesetypesofsurveyquestions.
7.1 BURLINGTONRESIDENTS’PERCEPTIONSOFBURLINGTONSHOPPINGFACILITIES
Thequestion“HowwouldyoudescribethefollowingintermsoftheiravailabilitytoyouintheCityofBurlington”wasaskedtobetterunderstandhowresidentsfeltaboutthedifferenttypesofretailwithintheCity,aswellastheavailabilityofspecificstoreformats.Respondentswereaskedtorankeachofanumberofpre‐identifiedstoretypes/formatsonascaleof1to3(‘1’being“needmore”and‘3’being“toomany”).TheresultsofthesequestionsaresummarizedinFigures7‐1and7‐2.
Overall,theresultsindicatethatthemajorityofresidentsgenerallyfeltthattherewasjusttherightamountofretailfacilitiesineachoftheidentifiedstoretypesandformats.Itisinterestingtonote,however,thatupwardsof28%and21%ofrespondentsfeltthattherewastoomanyFastFoodRestaurantsandBigBoxretailintheCity,respectively.Similarly,approximately33%,23%and22%ofrespondentsindicatedthattheCitywouldbenefitfrommorePedestrianRetailAreas,RetailAccessiblebyTransitandConvenience/NeighbourhoodScaleRetailers,respectively.
FIGURE 7‐1: AVAILABILITY OF EXISTING RETAIL FACILITIES BY STORE FORMAT, CITY OF BURLINGTON
SOURCE: urbanMetrics.
Need More Just Right Too Many No ResponseLarge Format (“Big‐Box”) Stores 6.9% 70.4% 21.3% 1.4%Enclosed Shopping Malls 14.9% 81.0% 3.4% 0.8%Convenience/Neighbourhood Scale Retailers 21.6% 70.2% 5.8% 2.4%Pedestrian Retail Areas (boutique or "main‐street" shopping) 33.0% 59.8% 4.3% 2.9%Retail Accessible by Transit 23.2% 68.6% 1.6% 6.6%
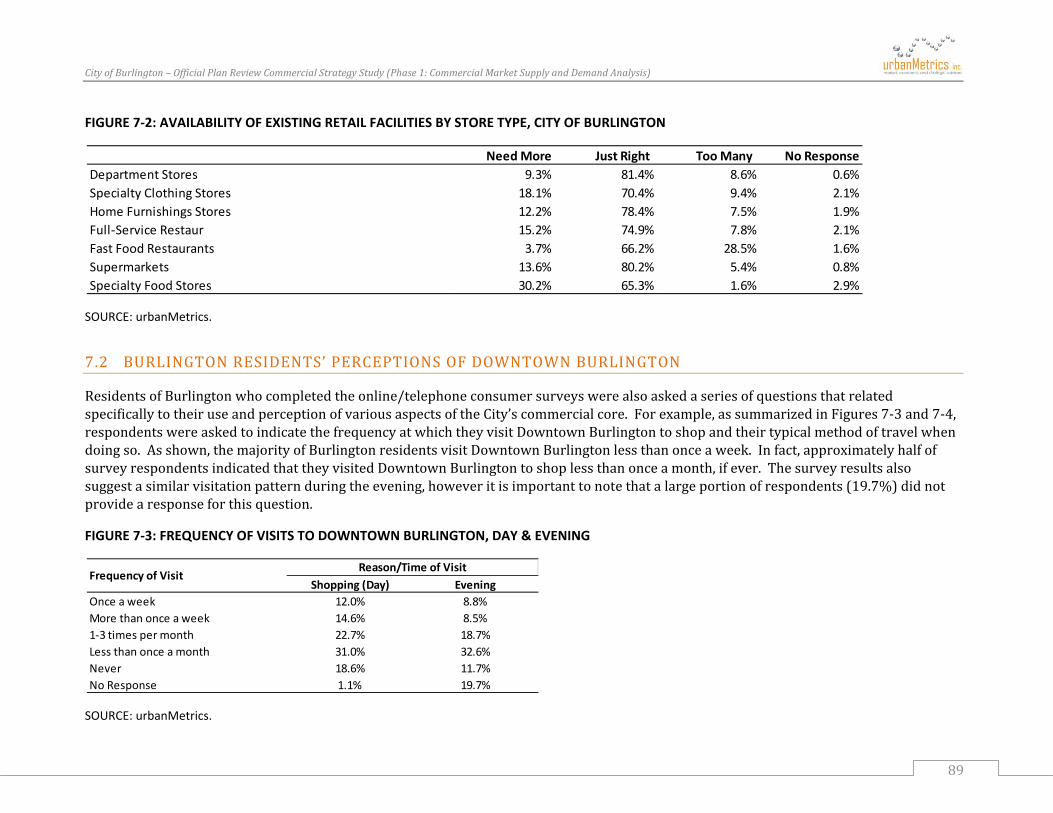
CityofBurlington–OfficialPlanReviewCommercialStrategyStudy(Phase1:CommercialMarketSupplyandDemandAnalysis)
89
FIGURE 7‐2: AVAILABILITY OF EXISTING RETAIL FACILITIES BY STORE TYPE, CITY OF BURLINGTON
SOURCE: urbanMetrics.
7.2 BURLINGTONRESIDENTS’PERCEPTIONSOFDOWNTOWNBURLINGTON
ResidentsofBurlingtonwhocompletedtheonline/telephoneconsumersurveyswerealsoaskedaseriesofquestionsthatrelatedspecificallytotheiruseandperceptionofvariousaspectsoftheCity’scommercialcore.Forexample,assummarizedinFigures7‐3and7‐4,respondentswereaskedtoindicatethefrequencyatwhichtheyvisitDowntownBurlingtontoshopandtheirtypicalmethodoftravelwhendoingso.Asshown,themajorityofBurlingtonresidentsvisitDowntownBurlingtonlessthanonceaweek.Infact,approximatelyhalfofsurveyrespondentsindicatedthattheyvisitedDowntownBurlingtontoshoplessthanonceamonth,ifever.Thesurveyresultsalsosuggestasimilarvisitationpatternduringtheevening,howeveritisimportanttonotethatalargeportionofrespondents(19.7%)didnotprovidearesponseforthisquestion.
FIGURE 7‐3: FREQUENCY OF VISITS TO DOWNTOWN BURLINGTON, DAY & EVENING
SOURCE: urbanMetrics.
Need More Just Right Too Many No ResponseDepartment Stores 9.3% 81.4% 8.6% 0.6%Specialty Clothing Stores 18.1% 70.4% 9.4% 2.1%Home Furnishings Stores 12.2% 78.4% 7.5% 1.9%Full‐Service Restaur 15.2% 74.9% 7.8% 2.1%Fast Food Restaurants 3.7% 66.2% 28.5% 1.6%Supermarkets 13.6% 80.2% 5.4% 0.8%Specialty Food Stores 30.2% 65.3% 1.6% 2.9%
Shopping (Day) EveningOnce a week 12.0% 8.8%More than once a week 14.6% 8.5%1‐3 times per month 22.7% 18.7%Less than once a month 31.0% 32.6%Never 18.6% 11.7%No Response 1.1% 19.7%
Reason/Time of VisitFrequency of Visit
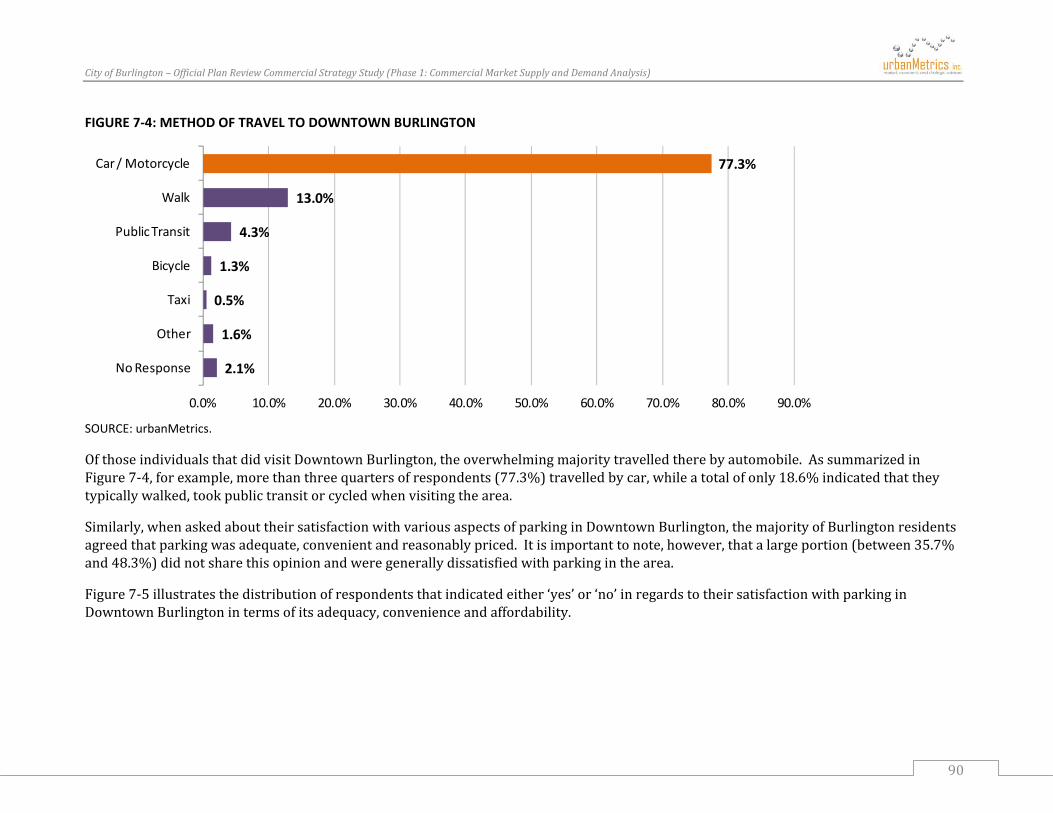
CityofBurlington–OfficialPlanReviewCommercialStrategyStudy(Phase1:CommercialMarketSupplyandDemandAnalysis)
90
FIGURE 7‐4: METHOD OF TRAVEL TO DOWNTOWN BURLINGTON
SOURCE: urbanMetrics.
OfthoseindividualsthatdidvisitDowntownBurlington,theoverwhelmingmajoritytravelledtherebyautomobile.AssummarizedinFigure7‐4,forexample,morethanthreequartersofrespondents(77.3%)travelledbycar,whileatotalofonly18.6%indicatedthattheytypicallywalked,tookpublictransitorcycledwhenvisitingthearea.
Similarly,whenaskedabouttheirsatisfactionwithvariousaspectsofparkinginDowntownBurlington,themajorityofBurlingtonresidentsagreedthatparkingwasadequate,convenientandreasonablypriced.Itisimportanttonote,however,thatalargeportion(between35.7%and48.3%)didnotsharethisopinionandweregenerallydissatisfiedwithparkinginthearea.
Figure7‐5illustratesthedistributionofrespondentsthatindicatedeither‘yes’or‘no’inregardstotheirsatisfactionwithparkinginDowntownBurlingtonintermsofitsadequacy,convenienceandaffordability.
77.3%
13.0%
4.3%
1.3%
0.5%
1.6%
2.1%
0.0% 10.0% 20.0% 30.0% 40.0% 50.0% 60.0% 70.0% 80.0% 90.0%
Car / Motorcycle
Walk
Public Transit
Bicycle
Taxi
Other
No Response
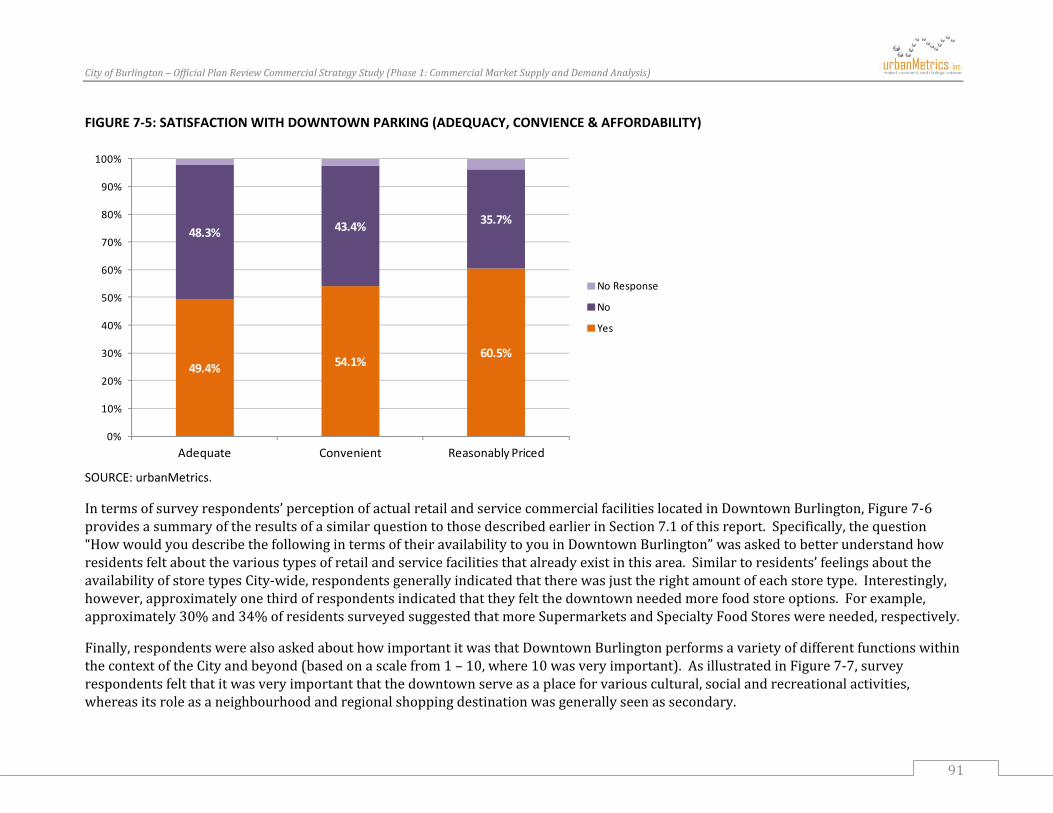
CityofBurlington–OfficialPlanReviewCommercialStrategyStudy(Phase1:CommercialMarketSupplyandDemandAnalysis)
91
FIGURE 7‐5: SATISFACTION WITH DOWNTOWN PARKING (ADEQUACY, CONVIENCE & AFFORDABILITY)
SOURCE: urbanMetrics.
Intermsofsurveyrespondents’perceptionofactualretailandservicecommercialfacilitieslocatedinDowntownBurlington,Figure7‐6providesasummaryoftheresultsofasimilarquestiontothosedescribedearlierinSection7.1ofthisreport.Specifically,thequestion“HowwouldyoudescribethefollowingintermsoftheiravailabilitytoyouinDowntownBurlington”wasaskedtobetterunderstandhowresidentsfeltaboutthevarioustypesofretailandservicefacilitiesthatalreadyexistinthisarea.Similartoresidents’feelingsabouttheavailabilityofstoretypesCity‐wide,respondentsgenerallyindicatedthattherewasjusttherightamountofeachstoretype.Interestingly,however,approximatelyonethirdofrespondentsindicatedthattheyfeltthedowntownneededmorefoodstoreoptions.Forexample,approximately30%and34%ofresidentssurveyedsuggestedthatmoreSupermarketsandSpecialtyFoodStoreswereneeded,respectively.
Finally,respondentswerealsoaskedabouthowimportantitwasthatDowntownBurlingtonperformsavarietyofdifferentfunctionswithinthecontextoftheCityandbeyond(basedonascalefrom1–10,where10wasveryimportant).AsillustratedinFigure7‐7,surveyrespondentsfeltthatitwasveryimportantthatthedowntownserveasaplaceforvariouscultural,socialandrecreationalactivities,whereasitsroleasaneighbourhoodandregionalshoppingdestinationwasgenerallyseenassecondary.
49.4% 54.1%60.5%
48.3% 43.4% 35.7%
0%
10%
20%
30%
40%
50%
60%
70%
80%
90%
100%
Adequate Convenient Reasonably Priced
No Response
No
Yes
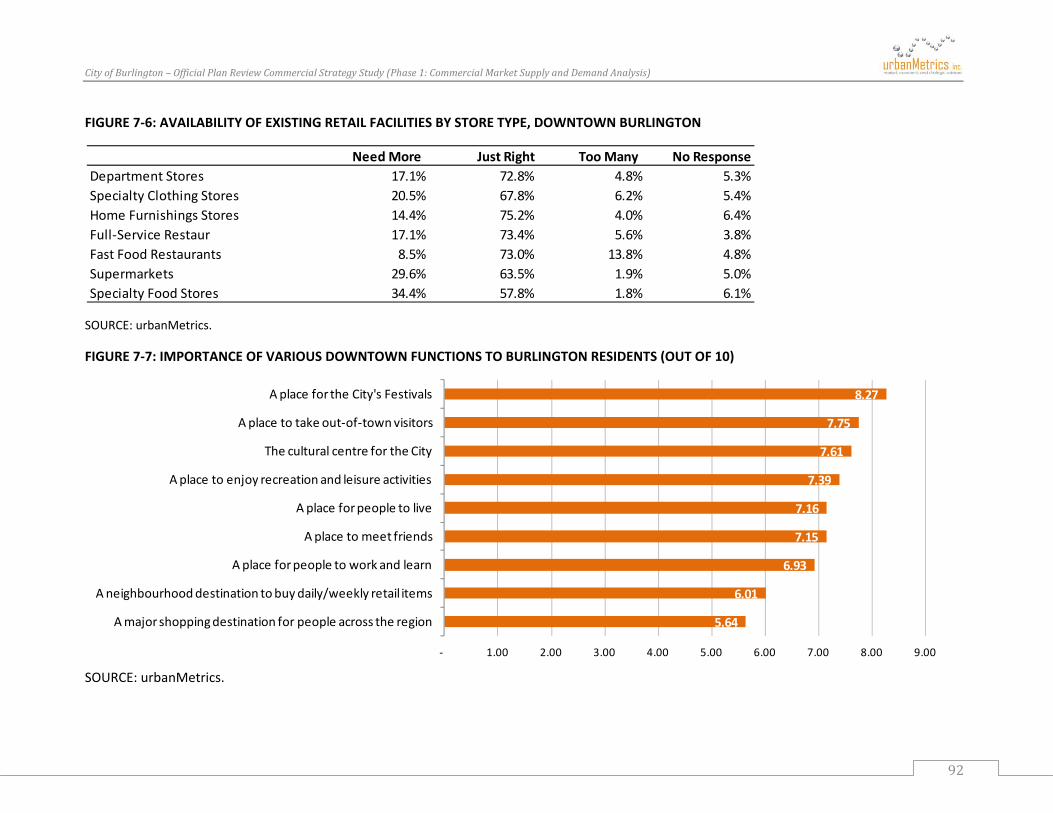
CityofBurlington–OfficialPlanReviewCommercialStrategyStudy(Phase1:CommercialMarketSupplyandDemandAnalysis)
92
FIGURE 7‐6: AVAILABILITY OF EXISTING RETAIL FACILITIES BY STORE TYPE, DOWNTOWN BURLINGTON
SOURCE: urbanMetrics.
FIGURE 7‐7: IMPORTANCE OF VARIOUS DOWNTOWN FUNCTIONS TO BURLINGTON RESIDENTS (OUT OF 10)
SOURCE: urbanMetrics.
Need More Just Right Too Many No ResponseDepartment Stores 17.1% 72.8% 4.8% 5.3%Specialty Clothing Stores 20.5% 67.8% 6.2% 5.4%Home Furnishings Stores 14.4% 75.2% 4.0% 6.4%Full‐Service Restaur 17.1% 73.4% 5.6% 3.8%Fast Food Restaurants 8.5% 73.0% 13.8% 4.8%Supermarkets 29.6% 63.5% 1.9% 5.0%Specialty Food Stores 34.4% 57.8% 1.8% 6.1%
8.27
7.75
7.61
7.39
7.16
7.15
6.93
6.01
5.64
‐ 1.00 2.00 3.00 4.00 5.00 6.00 7.00 8.00 9.00
A place for the City's Festivals
A place to take out‐of‐town visitors
The cultural centre for the City
A place to enjoy recreation and leisure activities
A place for people to live
A place to meet friends
A place for people to work and learn
A neighbourhood destination to buy daily/weekly retail items
A major shopping destination for people across the region
CityofBurlington–OfficialPlanReviewCommercialStrategyStudy(Phase1:CommercialMarketSupplyandDemandAnalysis)
93
Overall,theresultsoftheonline/telephoneconsumersurveysthatrelatetoDowntownBurlingtonrepresentonlyaslightdeparturefromtheresultsofsimilarquestionsthatwereaskedduringtheon‐streetinterceptsurveysundertakenwithexistingpatronsofDowntownBurlington.Forexample,althoughvisitationlevelsandsatisfactionwithvariousaspectsofparkingweregenerallyloweramongresidentsfromacrosstheCity,therewerestrongsimilaritiesinthefeedbackobtainedfrombothsampleswithregardstotheirsatisfactionwiththetypeofretailfacilitiesavailableindowntownandthevariousrolesthattheyfeltitshouldserve.Inparticular,itisinterestingtonotethatrespondentsfromboththeonline/telephonesurveysandon‐streetinterceptsurveysidentifiedfood‐storeretailingassomethingthatthedowntownneededmoreof.Similarly,respondentsfrombothsurveyssharedtheopinionthatDowntownBurlingtonservesasanimportantcultural,socialandentertainmentcentre,whereasitsroleasaneighbourhoodandregionalshoppingdestinationwasofsecondaryimportance.
Thedetailedresultsoftheon‐streetinterceptsurveys–aswellasvariousotherresearchandanalysesrelatingtothedowntown–havebeensummarizedinaseparatereportpreparedbyurbanMetricsaspartoftheCity’sbroaderOfficialPlanReviewCommercialStrategyStudy.ThefollowingsectionofthisreportprovidesasummaryofthekeyfindingsandconclusionsfromthisearlierInterimCommercialStrategyDiscussionPaperonDowntownBurlington.
CityofBurlington–OfficialPlanReviewCommercialStrategyStudy(Phase1:CommercialMarketSupplyandDemandAnalysis)
94
8 ROLEOFDOWNTOWNBURLINGTON
Priortothecompletionofthiscommercialmarketstudy,urbanMetricspreparedanInterimCommercialStrategyDiscussionPaper,whichsummarizedtheresultsofvariouspreliminaryresearchthatrelatedspecificallytoDowntownBurlington.TheresearchandanalysispresentedinthisdiscussionpaperrepresentedaseparatecomponentoftheCityofBurlington’sbroaderOfficialPlanReviewCommercialStrategyStudy,whichwasspecificallyintendedtoinformtheCity’sDowntownTaskGroupastothecurrentstateofDowntownBurlington;thevariousfunctionsitserves;andhowwellitiscurrentlymeetingtheneedsofCityresidents,amongotherthings.
TheInterimCommercialStrategyDiscussionPaperprovidedadetailedsummaryofourresearchfindingsonthedowntown,includingtheresultsofadetailedcommercialinventoryofretail/servicecommercialspace;areviewofrelevantofficecommercialspace;identificationofpotentialfuturedevelopmentsites;ananalysisofforecastpopulationandemploymentgrowth;aswellastheresultsofon‐streetinterceptsurveysconductedwithpatronsofthedowntown,plusapublicworkshopheldwithsome130localresidents,businessownersandstakeholdersonNovember7,2012attheBurlingtonArtsCentre.
Forthepurposesofthisproject,“DowntownBurlington”hasbeendefinedastheareacenteredonBrantStreet,generallyextendingfromLakeOntariointhesouthtoFairviewStreetinthenorth;betweentheQueenElizabethWay(QEW)andSmithAvenueinthewestandeast,respectively.Figure8‐2providesanillustrationofthegeographicextentofthedowntownarea.
BasedontheinformationpresentedintheInterimCommercialStrategyDiscussionPaper,thefollowingprovidesabriefoverviewofourkeyresearchfindingsandconclusionsrelatingtothecurrentroleandstateofDowntownBurlington,whichservesasanintegralcomponentofthecurrentcommercialsysteminBurlington:
BasedontheresultsofadetailedinventoryoftheretailandservicecommercialspacelocatedinDowntownBurlingtoninOctober2012,theCity’scorecurrentlycontainsoveronemillionsquarefeetofretail/servicecommercialspace.BasedontheinventoryinformationpresentedinSection3ofthisreport,thisrepresentsapproximatelyonetenthofthetotalcommercialspacelocatedintheentireCityofBurlington.
Morethantwothirds(69.3%)ofthecommercialspaceinDowntownBurlingtoniscurrentlytenantedbyservice‐basedcommercialfacilities,suchasBanks,FoodServices&DrinkingPlaces,PersonalCareServicesandHealthCareservicefacilities.Oftheremainingretailcommercialspacelocatedinthedowntown,themajorityiscomprisedbyClothing&AccessoriesandFurniture,HomeFurnishings&Electronicsstores,asistypicalofmostcomparabledowntownshoppingdistricts.

CityofBurlington–OfficialPlanReviewCommercialStrategyStudy(Phase1:CommercialMarketSupplyandDemandAnalysis)
95
ThecurrentcommercialvacancyrateinDowntownBurlingtonis11.2%.Althoughthisisarelativelyhighrate–with“typical”or“normal”ratesrangingbetween5.0%and8.0%‐itisimportanttonotethatmostoftheincludedvacantspaceisconcentratedinanumberofagingcommercialplazas,someofwhichareslatedforredevelopment(e.g.,VillageSquare,TudorSquareandBurlingtonSquarePlaza).Overall,DowntownBurlingtonhasveryhealthyvacancyratesinprimeareas.
DowntownBurlingtoncurrentlycontainsawiderangeoflandusesandservesavarietyofdifferentfunctions;bothlocallyandwithinthecontextoftheCityasawhole.Forexample,inadditiontoservingasakeyneighbourhoodandtouristshoppingdestination,thedowntownservesasanimportantplaceforWorking&Learning,Living,Playing,CommunityActivitiesandTransportation.Infact,basedontheresultsofon‐streetinterceptsurveysundertakenwithpatronsoftheDowntown,themajorityofrespondentsindicatedthattheyvisitedthecoreforreasonsotherthantoshop.Figure8‐1providesasummaryofthetopreasonsforvisitingamongsurveyrespondents.
Burlington’sUrbanGrowthCentre–whichgenerallycorrespondstotheDowntownBurlingtonareaidentifiedinFigure8‐2–containedatotalofsome8,400residentsin2006.Thisareaalsosupportedatotalofsome5,600employeesatthistime.BasedontheintensificationtargetssetoutintheProvince’sGrowthPlan,thedowntownisexpectedtoexperiencepopulationandemploymentgrowthofapproximately9,400by2031.
AssummarizedinSection4.1ofthisreport,themajorityofpatronsofDowntownBurlingtonoriginatefromwithintheCityofBurlington;andparticularlyfromwithinarelativelyshortdistanceofthecore.Basedontheresultsoftheon‐streetinterceptsurveys,forexample,approximately69%ofrespondentscurrentlyresideinthesouthernportionofBurlington(i.e.,southoftheQueenElizabethWayandHighway403).
Basedonthefeedbackobtainedfromlocalresidents,employees,andothervisitorstothedowntownduringthepublicconsultationevent,aswellastheresultsoftheon‐streetinterceptsurveys,itisevidentthatthereisdemandforadditionalneighbourhood‐
Live Downtown
7526%
Work Downtown
4515%
Shopping3813%
Appointment3612%
Dining269%
All Other7225%
FIGURE 8‐1: REASONS FOR VISITING DOWNTOWN BURLINGTON, ON‐STREET INTERCEPT SURVEYS
SOURCE: urbanMetrics inc., based on the results of on‐street intercept surveys with patrons of Downtown Burlington.

CityofBurlington–OfficialPlanReviewCommercialStrategyStudy(Phase1:CommercialMarketSupplyandDemandAnalysis)
96
servingretailandservicefacilitiesinDowntownBurlington.Inparticular,anoverwhelmingnumberofsurveyrespondentsandworkshopparticipantsindicatedthattheywouldliketoseemorefood‐storeretailersinthedowntown,includingspecialtyfoodstores(e.g.,butchers,fishmarkets,bakeries,gourmetfoodshops,freshproduce/fruitstores,organic/healthfoodstoresandoptionsforvegans/vegetarians/gluten‐freeshoppers);asecondsupermarket/grocerystore;andaregularfarmer’smarket.Similarly,otherneighbourhood‐orientedretailestablishmentsthatweredesiredamongrespondentsandparticipantsincludedalocalhardwarestoreandnewpharmacies/drugstores.
Overall,theresultsofourresearchindicatethatDowntownBurlingtoniscurrentlyoperatingasamulti‐functionalcorewithstrengthinanumberofdifferentareas.Allofthesestrengths–includingthescaleofthecommercialcore;lowvacancyratesinprimeareas;recentresidentialdevelopmentactivityandinterest;publicsectorinvestmentinthedowntownandwaterfront;andthecontinuedfocusoncivicevents–allsupportthearea’svibrancy.

CityofBurlington–OfficialPlanReviewCommercialStrategyStudy(Phase1:CommercialMarketSupplyandDemandAnalysis)
97
FIGURE 8‐2: MAP OF DOWNTOWN BURLINGTON
SOURCE: urbanMetrics inc.

CityofBurlington–OfficialPlanReviewCommercialStrategyStudy(Phase1:CommercialMarketSupplyandDemandAnalysis)
98
8.1 DOWNTOWNTRADEAREA
ThefollowingprovidesanoverviewofthegeographicdistributionofpatronsofDowntownBurlington,basedonpostalcodeinformationobtaineddirectlyfromrespondentswhoparticipatedintheon‐streetinterceptsurveys14.
AssummarizedinFigure8‐3,approximately80%oftherespondentssurveyedoriginatedfromwithintheCityofBurlington.Infact,themajorityoftheindividualssurveyed(69%)currentlyresideinthesouthernportionofBurlington(i.e.,southoftheQueenElizabethWay(QEW)andHighway403).
FIGURE 8‐3: DISTRIBUTION OF DOWNTOWN BURLINGTON VISITORS
Location/Community Number of Survey
Respondents % of Total
City of Burlington (South of QEW/403) 201 68.8%
City of Burlington (North of QEW 403) 31 10.6%
TOTAL CITY OF BURLINGTON 232 79.5%
Town of Oakville 9 3.1%
City of Hamilton 31 10.6%
All Other Locations 20 6.8%
TOTAL OTHER LOCATIONS 60 20.5%
TOTAL ALL RESPONDENTS 292 100.0%
14Thistypeofsurveymyslightlyoverestimatethewalk‐inpopulationasitmaynotcapturepersonswhodrivedirectlytoapointoforigindowntownanddonottaketypicalpedestrianrouteswherethesurveyswereconducted.

CityofBurlington–OfficialPlanReviewCommercialStrategyStudy(Phase1:CommercialMarketSupplyandDemandAnalysis)
99
Asareference,in2002asimilarsurveyofdowntownshoppersindicatedthat70%livedindowntownBurlington,suggestingaslightcontractionofthetradearea.
Anadditional14%ofrespondentsoriginatedfromothernearbycommunities,including11%and3%fromvariouspartsofHamiltonandOakville,respectively
Figure8‐4illustratesthegeographicdistributionofpatronsofDowntownBurlington,basedontheresultsoftheon‐streetinterceptsurveys.ThisfigurehasbeenoverlaidwiththedowntownTradeAreaasdelineatedbyurbanMetricsbasedonthesurveysandcommercialinventory.WhilethemajorityofDowntownBurlingtonpatronsoriginatefromwithinarelativelyshortdistanceofthecore,itisalsoimportanttonotethatthedowntownattractsindividualsfromacrosstheCity;fromneighbouringcommunitiessuchasHamiltonandOakville,andfromasfarawayascommunitieslikeGuelphandMississauga.AsillustratedbyFigure8‐4,thePrimaryTradeAreaforthedowntown,whichwouldrepresentthesourceofthemostcustomersonconsistentandongoingbasis,hasbeendefinedastheareaeastofKingRoad,southof403/QEW,westofWalkersLineandnorthofthelake.TheSecondaryTradeAreahasbeendefinedasthebalanceoftheCityofBurlington.Asnotedpreviously,theCityortheentireTradeArearepresentssome80%ofcustomerorigins,whilethePrimaryTradeArearepresentssome63%ofdowntownvisitorswithapopulationof46,000.BasedonHaltonRegion’sBestPlanningestimates,thisisexpectedtoreach53,000by2031,largelythroughinfillandintensification.ThelargestshareofthisgrowthwouldoccurwithintheUrbanGrowthCentre.
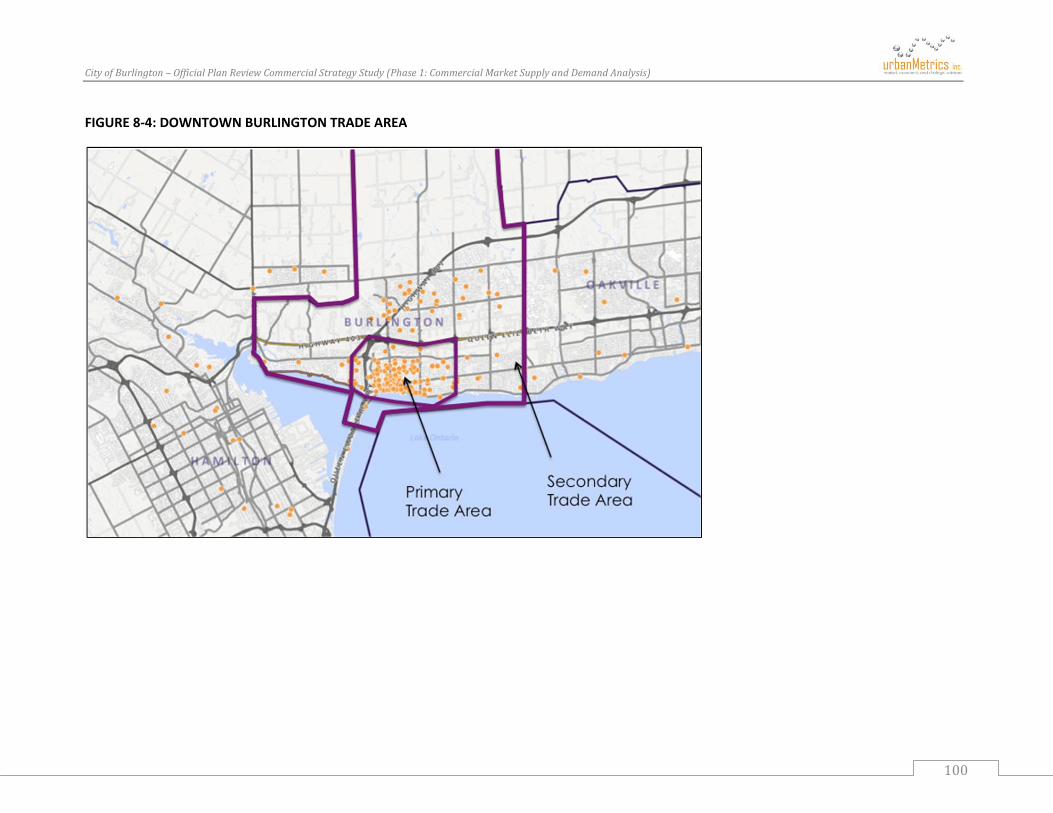
CityofBurlington–OfficialPlanReviewCommercialStrategyStudy(Phase1:CommercialMarketSupplyandDemandAnalysis)
100
FIGURE 8‐4: DOWNTOWN BURLINGTON TRADE AREA
CityofBurlington–OfficialPlanReviewCommercialStrategyStudy(Phase1:CommercialMarketSupplyandDemandAnalysis)
101
9 FUTUREWARRANTEDSPACEANALYSIS
Inthissection,wehaveevaluatedthemarketopportunityforFoodStoreRetail(FSR),Non‐FoodStoreRetail(NFSR)andselectedotherretailandservicespaceintheCityofBurlington.OurestimatesofwarrantedspaceforFSRandNFSRhavebeenbasedonaresidualanalysisapproach.Thisapproachisconsideredappropriateforlong‐termlanduseplanningasitdoesnotencroachonthesalesofexistingstoresinBurlingtontosupportadditionalspace.
ThefollowingsummarizesthemethodologyusedtocalculatethewarrantedFSRandNFSRspaceintheCity:
TheexistingexpendituresmadebyBurlingtonresidentsintheCityof“BurlingtonShare”wereestimatedbasedontheresultsofouronlineandtelephoneconsumersurveys.
ThefutureBurlingtonmarketshareswereforecastedoverthestudyperiod(2012to2031)basedonanestimateoftheopportunityforrecaptureofexpenditurescurrentlyleavingthecommunityandourknowledgeofexistingcommercialdevelopmentapplications.
ByapplyingtheBurlingtonmarketsharestotheavailableexpenditurepotentialdeterminedinSection4.5ofthisreport,theBurlingtonexpenditurepotentialfromBurlingtonresidentswascalculated.
Theresidualpotentialavailableorthenetadditionalexpendituregrowthoverthestudyperiodwascalculated.
Inflowsalesfromnon‐TradeArearesidentswereaddedtotheresidualpotentialtocalculatethetotaladditionalsalesvolumeavailabletonewBurlingtonretailfacilities.Inflowhasbeenestimatedbasedonourassumptionofhowmuchoftheexistingandproposedcommercialspaceisandwillbesupportedbynon‐TradeArearesidents.
ThewarrantedFSRandNFSRspacehasbeencalculatedbasedonexpectedsalesperformancelevelsappliedtothetotalsalesvolumeavailable.
Thefollowingsectionssummarizetheresultsofourwarrantedspaceanalyses,whichcanbeconsideredasageneralguidelineindeterminingfuturespaceneedsintheCityofBurlington.
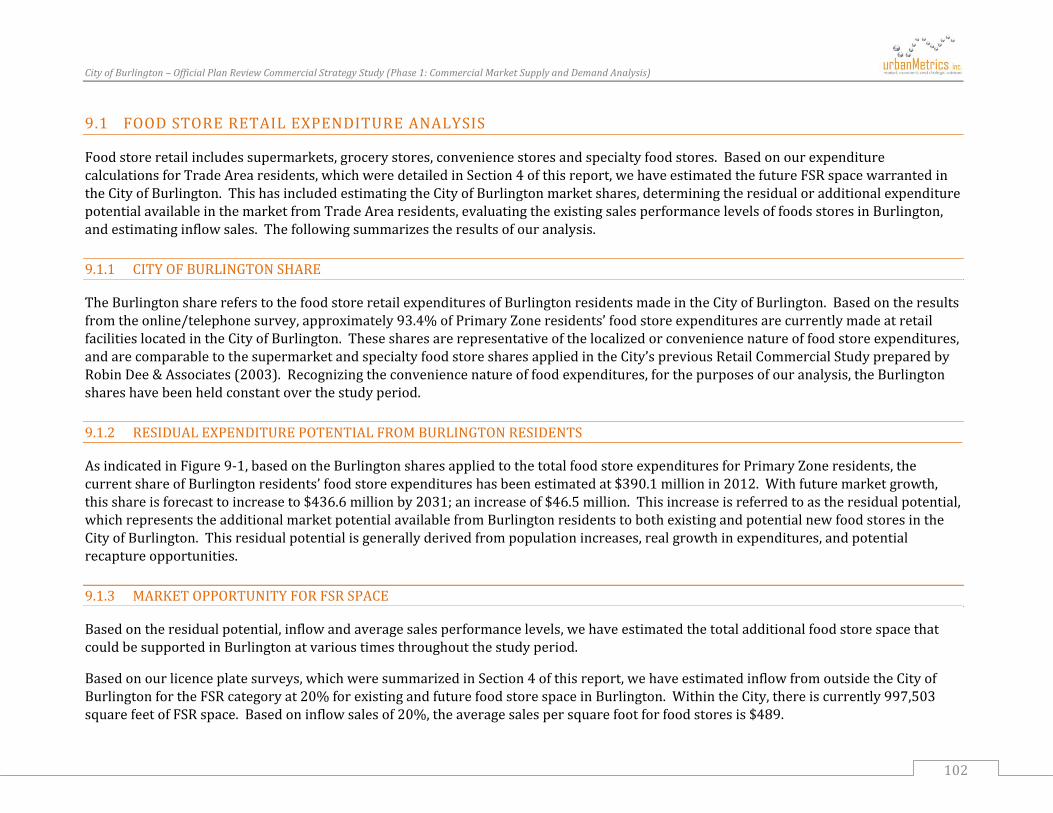
CityofBurlington–OfficialPlanReviewCommercialStrategyStudy(Phase1:CommercialMarketSupplyandDemandAnalysis)
102
9.1 FOODSTORERETAILEXPENDITUREANALYSIS
Foodstoreretailincludessupermarkets,grocerystores,conveniencestoresandspecialtyfoodstores.BasedonourexpenditurecalculationsforTradeArearesidents,whichweredetailedinSection4ofthisreport,wehaveestimatedthefutureFSRspacewarrantedintheCityofBurlington.ThishasincludedestimatingtheCityofBurlingtonmarketshares,determiningtheresidualoradditionalexpenditurepotentialavailableinthemarketfromTradeArearesidents,evaluatingtheexistingsalesperformancelevelsoffoodsstoresinBurlington,andestimatinginflowsales.Thefollowingsummarizestheresultsofouranalysis.
9.1.1 CITYOFBURLINGTONSHARE
TheBurlingtonsharereferstothefoodstoreretailexpendituresofBurlingtonresidentsmadeintheCityofBurlington.Basedontheresultsfromtheonline/telephonesurvey,approximately93.4%ofPrimaryZoneresidents’foodstoreexpendituresarecurrentlymadeatretailfacilitieslocatedintheCityofBurlington.Thesesharesarerepresentativeofthelocalizedorconveniencenatureoffoodstoreexpenditures,andarecomparabletothesupermarketandspecialtyfoodstoresharesappliedintheCity’spreviousRetailCommercialStudypreparedbyRobinDee&Associates(2003).Recognizingtheconveniencenatureoffoodexpenditures,forthepurposesofouranalysis,theBurlingtonshareshavebeenheldconstantoverthestudyperiod.
9.1.2 RESIDUALEXPENDITUREPOTENTIALFROMBURLINGTONRESIDENTS
AsindicatedinFigure9‐1,basedontheBurlingtonsharesappliedtothetotalfoodstoreexpendituresforPrimaryZoneresidents,thecurrentshareofBurlingtonresidents’foodstoreexpenditureshasbeenestimatedat$390.1millionin2012.Withfuturemarketgrowth,thisshareisforecasttoincreaseto$436.6millionby2031;anincreaseof$46.5million.Thisincreaseisreferredtoastheresidualpotential,whichrepresentstheadditionalmarketpotentialavailablefromBurlingtonresidentstobothexistingandpotentialnewfoodstoresintheCityofBurlington.Thisresidualpotentialisgenerallyderivedfrompopulationincreases,realgrowthinexpenditures,andpotentialrecaptureopportunities.
9.1.3 MARKETOPPORTUNITYFORFSRSPACE
Basedontheresidualpotential,inflowandaveragesalesperformancelevels,wehaveestimatedthetotaladditionalfoodstorespacethatcouldbesupportedinBurlingtonatvarioustimesthroughoutthestudyperiod.
Basedonourlicenceplatesurveys,whichweresummarizedinSection4ofthisreport,wehaveestimatedinflowfromoutsidetheCityofBurlingtonfortheFSRcategoryat20%forexistingandfuturefoodstorespaceinBurlington.WithintheCity,thereiscurrently997,503squarefeetofFSRspace.Basedoninflowsalesof20%,theaveragesalespersquarefootforfoodstoresis$489.
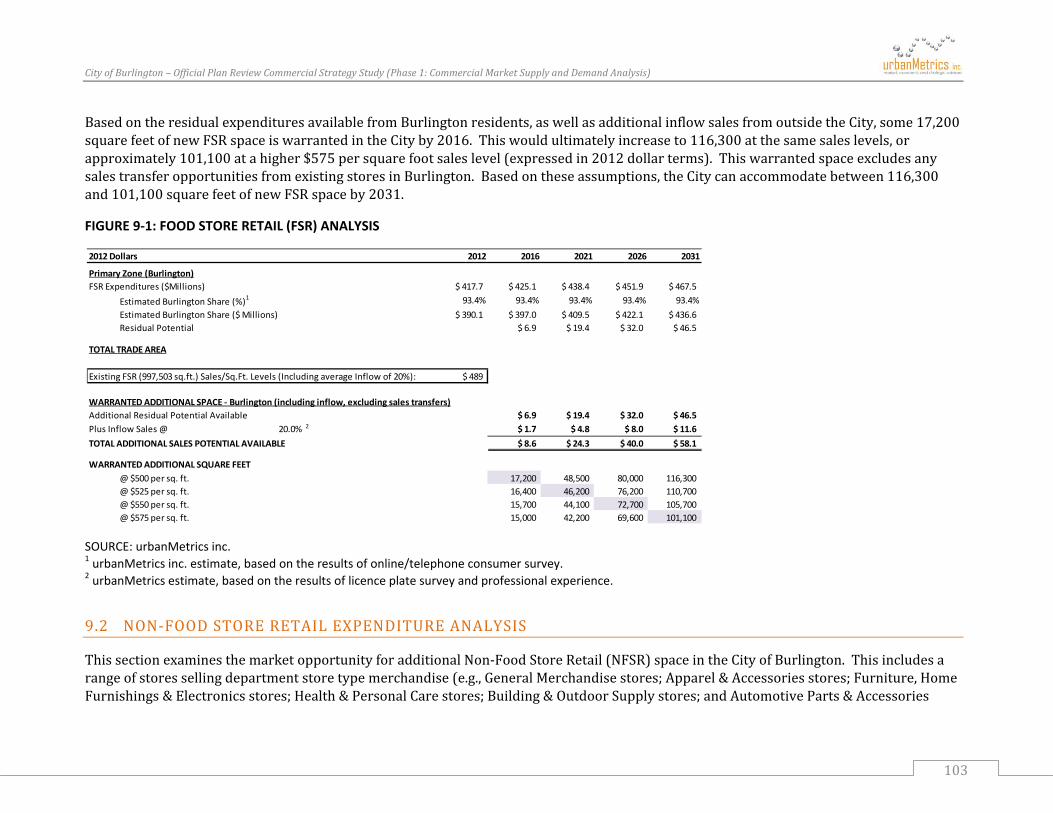
CityofBurlington–OfficialPlanReviewCommercialStrategyStudy(Phase1:CommercialMarketSupplyandDemandAnalysis)
103
BasedontheresidualexpendituresavailablefromBurlingtonresidents,aswellasadditionalinflowsalesfromoutsidetheCity,some17,200squarefeetofnewFSRspaceiswarrantedintheCityby2016.Thiswouldultimatelyincreaseto116,300atthesamesaleslevels,orapproximately101,100atahigher$575persquarefootsaleslevel(expressedin2012dollarterms).ThiswarrantedspaceexcludesanysalestransferopportunitiesfromexistingstoresinBurlington.Basedontheseassumptions,theCitycanaccommodatebetween116,300and101,100squarefeetofnewFSRspaceby2031.
FIGURE 9‐1: FOOD STORE RETAIL (FSR) ANALYSIS
SOURCE: urbanMetrics inc. 1 urbanMetrics inc. estimate, based on the results of online/telephone consumer survey. 2 urbanMetrics estimate, based on the results of licence plate survey and professional experience.
9.2 NON‐FOODSTORERETAILEXPENDITUREANALYSIS
ThissectionexaminesthemarketopportunityforadditionalNon‐FoodStoreRetail(NFSR)spaceintheCityofBurlington.Thisincludesarangeofstoressellingdepartmentstoretypemerchandise(e.g.,GeneralMerchandisestores;Apparel&Accessoriesstores;Furniture,HomeFurnishings&Electronicsstores;Health&PersonalCarestores;Building&OutdoorSupplystores;andAutomotiveParts&Accessories
2012 Dollars 2012 2016 2021 2026 2031
Primary Zone (Burlington)FSR Expenditures ($Millions) $ 417.7 $ 425.1 $ 438.4 $ 451.9 $ 467.5
Estimated Burlington Share (%)1 93.4% 93.4% 93.4% 93.4% 93.4%Estimated Burlington Share ($ Millions) $ 390.1 $ 397.0 $ 409.5 $ 422.1 $ 436.6Residual Potential $ 6.9 $ 19.4 $ 32.0 $ 46.5
TOTAL TRADE AREA
$ 489
WARRANTED ADDITIONAL SPACE ‐ Burlington (including inflow, excluding sales transfers)Additional Residual Potential Available $ 6.9 $ 19.4 $ 32.0 $ 46.5Plus Inflow Sales @ 20.0% 2 $ 1.7 $ 4.8 $ 8.0 $ 11.6TOTAL ADDITIONAL SALES POTENTIAL AVAILABLE $ 8.6 $ 24.3 $ 40.0 $ 58.1
WARRANTED ADDITIONAL SQUARE FEET@ $500 per sq. ft. 17,200 48,500 80,000 116,300 @ $525 per sq. ft. 16,400 46,200 76,200 110,700 @ $550 per sq. ft. 15,700 44,100 72,700 105,700 @ $575 per sq. ft. 15,000 42,200 69,600 101,100
Existing FSR (997,503 sq.ft.) Sales/Sq.Ft. Levels (Including average Inflow of 20%):

CityofBurlington–OfficialPlanReviewCommercialStrategyStudy(Phase1:CommercialMarketSupplyandDemandAnalysis)
104
stores).ThefollowingprovidesanoverviewofourdetailedNFSRanalysis,whichfollowsasimilarmethodologytothatappliedfortheFSRcategory,asoutlinedintheprevioussection.
9.2.1 CITYOFBURLINGTONANDSECONDARYTRADEAREASHARES
Basedontheresultsoftheonline/telephoneconsumersurvey,andasindicatedinFigure9‐2,wehaveestimatedthatapproximately85.1%ofCityofBurlingtonresidents’NFSRexpendituresarecurrentlymadeintheCityofBurlington.IntheSecondaryTradeAreas(i.e.,SecondaryZoneEastandSecondaryZoneWest),theCityofBurlingtonshareshavebeenestimatedat17.7%and9.2%inthebaseyearof2012,respectively.Sharesforthetwosecondaryzoneshavebeenestimatedbasedontheresultsofthelicenceplatesurveys,aswellastheexistingsalessupportderivedfromBurlingtonresidentsandestimatedinflowsaleslevels.
GiventhatBurlingtonretailfacilitiesarealreadycapturingalargeshareofBurlingtonresidents’NFSRexpenditures(85.1%),theseshareshavebeenheldconstantthroughoutthebalanceofthestudyperiodto2031.Bycontrast,captureratesforthetwosecondaryzoneshavebeendecreasedslightlyoverthestudyperiodtoreflectthepotentialintroductionofnewretaildevelopmentsinneighbouringmunicipalities.Inparticular,wenotethattheexistingWalmartstoreatEastgateSquareinHamiltonisrelocatingtoanewSmartCentresdevelopmentonCentennialParkwaynearthefootoftheBurlingtonSkywaybridge.Similarly,EastgateMalliscurrentlyintheprocessofremerchandisingthisformerWalmartspacewithamixofnewretailers,includingWinnersandSportCheck.TheseandotheranticipatednewretailopportunitiesincloserproximitytoSecondaryZoneEastandSecondaryZoneWestresidentswilllikelytempertheabilityofnewandexistingretailfacilitiesBurlingtontocaptureadditionalsalesopportunitiesfromtheseareas.
BasedonourestimatesofcurrentandfutureBurlingtonshares,theBurlingtonshareoftotalNFSRexpenditureshasbeenestimatedat$1,166.6millionin2012,representinganaverageof40.7%ofthetotalNFSRexpenditurepotentialofTradeArearesidentsoverall.Thisshareisforecasttoincreaseto$1,571.9millionby2031.
9.2.2 RESIDUALEXPENDITUREPOTENTIALFROMTRADEAREARESIDENTS
AsindicatedinFigure9‐2,theresidualpotentialavailablefromBurlingtonandSecondaryZoneresidentsforexistingandnewNFSRspaceinBurlingtonhasbeenestimatedat$74.7millionby2016,increasingto$405.3millionby2031(expressedin2012dollarsandexcludinginflow).

CityofBurlington–OfficialPlanReviewCommercialStrategyStudy(Phase1:CommercialMarketSupplyandDemandAnalysis)
105
FIGURE 9‐2: NON‐FOOD STORE RETAIL (FSR) ANALYSIS
SOURCE: urbanMetrics inc. 1 urbanMetrics inc. estimate, based on the results of online/telephone consumer survey. 2 urbanMetrics estimate, based on the results of licence plate survey and professional experience.
2012 Dollars 2012 2016 2021 2026 2031
Primary Zone (Burlington)Non‐Food Store Retail (NFSR) ($Millions) $ 1,116.0 $ 1,192.1 $ 1,300.6 $ 1,411.6 $ 1,532.7
Estimated Burlington Share (%)1 85.1% 85.1% 85.1% 85.1% 85.1%Estimated Burlington Share ($ Millions) $ 949.7 $ 1,014.5 $ 1,106.8 $ 1,201.3 $ 1,304.3Residual Potential $ 64.8 $ 157.1 $ 251.6 $ 354.6
Secondary Zone EastNon‐Food Store Retail (NFSR) ($Millions) $ 658.6 $ 726.7 $ 816.8 $ 890.1 $ 974.9
Estimated Burlington Share (%)1 17.7% 17.1% 16.4% 15.7% 15.0%Estimated Burlington Share ($ Millions) $ 116.5 $ 124.5 $ 134.1 $ 139.8 $ 146.2Residual Potential $ 8.0 $ 17.6 $ 23.3 $ 29.7
Secondary Zone WestNon‐Food Store Retail (NFSR) ($Millions) $ 1,089.7 $ 1,141.9 $ 1,269.5 $ 1,350.1 $ 1,517.2
Estimated Burlington Share (%)1 9.2% 9.0% 8.6% 8.3% 8.0%Estimated Burlington Share ($ Millions) $ 100.4 $ 102.3 $ 109.7 $ 112.3 $ 121.4Residual Potential $ 1.9 $ 9.3 $ 11.9 $ 21.0
TOTAL TRADE AREATotal Non‐Food Store Retail (NFSR) Expenditures ($Millions) $ 2,864.3 $ 3,060.7 $ 3,386.9 $ 3,651.8 $ 4,024.8Total Estimated Burlington Share ($Millions) $ 1,166.6 $ 1,241.3 $ 1,350.6 $ 1,453.4 $ 1,571.9Estimated Burlngton Share (%) 40.7% 40.6% 39.9% 39.8% 39.1%
Existing Sales from Trade Area Residents ($Millions) $ 1,166.6 $ 1,166.6 $ 1,166.6 $ 1,166.6 $ 1,166.6Residual Potential ($Millions) $ 74.7 $ 184.0 $ 286.8 $ 405.3
$ 286
WARRANTED ADDITIONAL Non‐Food Store Retail (NFSR) SPACE ‐ Burlington (including inflow, excluding sales transfers)Additional Residual Potential Available $ 74.7 $ 184.0 $ 286.8 $ 405.3Plus Inflow Sales @ 15.0% 2 $ 13.2 $ 32.5 $ 50.6 $ 71.5TOTAL ADDITIONAL SALES POTENTIAL AVAILABLE $ 87.9 $ 216.5 $ 337.4 $ 476.8
WARRANTED ADDITIONAL SQUARE FEET (3@ $325 per sq. ft. 270,400 666,100 1,038,200 1,467,100 @ $350 per sq. ft. 251,100 618,500 964,000 1,362,400 @ $375 per sq. ft. 234,400 577,300 899,800 1,271,500 @ $400 per sq. ft. 219,700 541,200 843,500 1,192,100
Existing NFSR (4,801,961 sq.ft.) Sales/Sq.Ft. Levels (Including average Inflow of 15%):

CityofBurlington–OfficialPlanReviewCommercialStrategyStudy(Phase1:CommercialMarketSupplyandDemandAnalysis)
106
9.2.3 MARKETOPPORTUNITYFORNFSRSPACE
BasedontheresidualsalesavailablefromTradeArearesidentsaswellasinflowsalesestimatedat15%,wehavedeterminedthemarketopportunityforadditionalNFSRspaceinBurlington.
Thereiscurrentlysome4,801,961squarefeetofNFSRspaceinBurlington,achievinganaveragesalesperformancelevelof$286persquarefoot(assuminginflowsalesof15%fromoutsidetheTradeArea).Itisimportanttorecognize,however,thatsalesperformancelevelscanvarysignificantlybystoretype.Forexample,smallerstoresthatsellrelativelyexpensivemerchandise(e.g.,jewellerystores,electronicsstores)tendtoyieldsubstantiallyhighersalespersquarefootperformancelevelsthanmuchlargerstoresthatofferawiderrangeofgoodsandservices,includingdepartmentstores,sportinggoodsstoresandhomeimprovementcentres.
Basedonouranalysis,thetotalamountofwarrantedadditionalNFSRspaceinBurlingtonby2031hasbeenestimatedatbetween1.47millionsquarefeet(atanaverageof$325persquarefoot)and1.19millionsquarefeet(atanaverageof$400persquarefoot).
9.3 OTHERSELECTEDRETAILANDSERVICESPACEPOTENTIAL
ThefollowingsectionexaminesthefuturedemandforotherselectedretailandservicespaceintheCityofBurlingtonbasedonapercapitaspaceratioanalysis.ThecommercialcategoriesanalyzedinthismannergenerallydonotlendthemselvestoanexpenditureanalysissimilartothoseundertakenfortheFSRandNFSRcategories.Moreover,insomecasesdataisnotavailableorreliableforthesecategories.Itshouldberecognized,however,thatthisapproachimposesa“generic”or“typical”setofmarketdemandconditionsonthecurrentandfuturepopulationofBurlington.TheseconditionsarebasedonexistingservicelevelsintheCityandobservationsmadeinavarietyofothermarketareas.Assuch,theycannotdirectlyreflectspecialcircumstancesoruniquecharacteristicsoftheBurlingtonpopulation,suchasincomelevelsandregionalorlocalshoppingpreferences.Forthepurposeofouranalysis,wehaveassumedthatoutflowwouldequatetoinflow.
Thefollowingtypesofretailandservicefacilitiesareincludedinouranalysis:
Liquor,Beer&WineStores; Banks/CreditUnions; HealthCare; Cultural,Entertainment&Recreation; FoodServices&DrinkingPlaces; ConsumerGoodsRental; Personal&HouseholdGoodsRepair&Maintenance;

CityofBurlington–OfficialPlanReviewCommercialStrategyStudy(Phase1:CommercialMarketSupplyandDemandAnalysis)
107
PersonalCare; SelectedCivic&SocialOrganizations; SocialServices;and OtherServices.
BasedontheresultsofourcommercialinventoryoftheCityofBurlington,whichhavebeensummarizedindetailinSection3ofthisreport,thereiscurrentlysome4,265,148squarefeetofselectedretailandservicespacelocatedinBurlington.BasedoncurrentpopulationestimatesfortheCity,thisrepresentsatotalof23.29squarefeetpercapitain2012.GiventhatthisisslightlyhigherthantheamountofspacethatistypicallyobservedincomparablecommunitiesacrosstheProvinceonapercapitabasis,thissuggeststhatthereisapotentialover‐supplyofexistingservicespaceinBurlington.InestimatingthetotalamountofspacethatwillberequiredtoservefutureresidentsoftheCity,therefore,wehaveappliedsomewhatlower“target”percapitaspaceratiostotheforecastpopulation,basedonresidualgrowth.
Itisimportanttorememberthatourforecastscannotfullycapturehowtheemergenceofnewretailtrendsorstoreformatswillalterfuturepercapitaspaceratios.Therefore,flexibilityandarealisticinterpretationofthesefindingsarerequiredfortheapplicationofthisapproach.Basedonouranalysis,whichhasbeensummarizedinFigure9‐3,anadditional253,260squarefeetofselectedretailandservicespacewillberequiredinBurlingtonby2031.IncombinationwiththeexistingselectedretailandservicespacelocatedinBurlington,thisresultsinatotalof4,518,408squarefeetby2031.

CityofBurlington–OfficialPlanReviewCommercialStrategyStudy(Phase1:CommercialMarketSupplyandDemandAnalysis)
108
FIGURE 9‐3: WARRANTED ADDITIONAL RETAIL AND SERVICE SPACE IN BURLINGTON (2012 ‐ 2031)
SOURCE: urbanMetrics inc. 1 Based on population estimates summarized in Section 4.3 of this report. 2 Represents sum of existing space in 2012 and the amount of additional space that is warranted by 2031, based on residual population growth and target per capita space ratios.
9.4 SUMMARYOFADDITIONALWARRANTEDCOMMERCIALSPACE
AsummaryoftheamountofwarrantedadditionalretailspaceinBurlingtonbymajorstoretypeoverthe2012to2031periodispresentedinFigure9‐4.FortheFSRandNFSRcategories,wehaveusedincreasingsalespersquarefootperformancelevels(from$500to$575persquarefootforFSRandfrom$325to$400persquarefootforNFSR)toestimatedemandforfuturespace.Thisisconsideredappropriatebecausecompetitionintheretailsectorhashistoricallypushedupwardthelevelofstoreproductivity.
2016 2021 2026 2031POPULATION 1 184,500 188,000 191,400 195,700Cumulative Growth ‐ 1,400 4,900 8,300 12,600
RETAIL/SERVICE CATEGORYExisting Space
(sq ft)Space Per Capita (sq ft/capita)
Target Space Per Capita
(sq ft/capita)
Warranted Additional Space
(sq ft)
Warranted Additional Space
(sq ft)
Warranted Additional Space
(sq ft)
Warranted Additional Space
(sq ft)
Liquor, Beer & Wine Stores 100,740 0.55 0.55 770 2,695 4,565 6,930 107,670SUBTOTAL ‐ Selected Retail 100,740 0.55 0.55 770 2,695 4,565 6,930 107,670
Banks/Credit Unions 242,880 1.33 1.30 1,820 6,370 10,790 16,380 259,260Health Care 621,863 3.40 2.00 2,800 9,800 16,600 25,200 647,063Cultural, Entertainment & Recreation 629,101 3.44 3.00 4,200 14,700 24,900 37,800 666,901Food Services & Drinking Places 914,095 4.99 4.50 6,300 22,050 37,350 56,700 970,795Consumer Goods Rental 34,449 0.19 0.20 280 980 1,660 2,520 36,969Personal & Household Goods Repair & Maintenance 249,317 1.36 1.30 1,820 6,370 10,790 16,380 265,697Personal Care 328,622 1.79 1.80 2,520 8,820 14,940 22,680 351,302Selected Civic & Social Organizations 132,925 0.73 0.70 980 3,430 5,810 8,820 141,745Social Services 50,219 0.27 0.25 350 1,225 2,075 3,150 53,369Other Services 960,937 5.25 4.50 6,300 22,050 37,350 56,700 1,017,637
SUBTOTAL ‐ Selected Services 4,164,408 22.74 19.55 27,370 95,795 162,265 246,330 4,410,738
GRAND TOTAL ‐ Selected Retail and Service Categories 4,265,148 23.29 20.10 28,140 98,490 166,830 253,260 4,518,408
TOTAL SPACE2031
(sq ft) 2
2012183,100

CityofBurlington–OfficialPlanReviewCommercialStrategyStudy(Phase1:CommercialMarketSupplyandDemandAnalysis)
109
By2031,atotalofapproximately11.6millionsquarefeetofretailandselectedservicespacewouldbewarrantedinBurlingtontoservetheexistingandfuturepopulationofmorethan195,000residents.Itshouldbenoted,however,thatnotallservicecategorieswereconsideredinthismodel.Ouranalysisofwarrantedspaceisconsideredaguidelineonly,andmustbeevaluatedinthecontextoftheassumptionsutilized,includinganticipatedpopulationgrowth,inflowsaleslevels,andaveragesalespersquarefootperformancelevels.
FIGURE 9‐4: SUMMARY OF FUTURE WARRANTED SPACE IN BURLINGTON (2012 – 2031)
SOURCE: urbanMetrics inc.
2016 2021 2026 2031
Non‐Food Store Retail (NFSR) 4,801,961 270,400 618,500 899,800 1,192,100 5,994,061
Food Store Retail (FSR) 997,503 17,200 46,200 72,700 101,100 1,098,603
Selected Services 4,164,408 27,400 95,800 162,300 246,300 4,410,708
Liquor, Beer & Wine Stores 100,740 800 2,700 4,600 6,900 107,640
TOTAL SPACE 10,064,612 315,800 763,200 1,139,400 1,546,400 11,611,012
Cumulative Additional SpaceExisting Space (2012)
Retail/Service CategoryTotal Space
(2031)

CityofBurlington–OfficialPlanReviewCommercialStrategyStudy(Phase1:CommercialMarketSupplyandDemandAnalysis)
110
10 DOWNTOWNMARKETANALYSIS
Inthissection,wehaveidentifiedtheadditionalspacethatwouldbewarrantedinthedowntown(asdefinedinFigure8‐2).ThemajorityoffuturepopulationgrowthintheCitywillbeaccommodatedthroughintensification,withthedowntownaccommodatingthelargestshareofthisgrowth.
10.1 DOWNTOWNPRIMARYTRADEAREAPOPULATIONGROWTH
AsdiscussedinSection8,DowntownBurlingtonservestheentireCity,withacommercialPrimaryZoneboundedbyKingRoad,Highway403/QEW,WalkersLineandLakeOntario.BasedontheDowntowninterceptsurvey,approximately63%ofvisitorstothedowntownoriginatefromthisarea.Thisareaalsoaccountsfor81.5%ofdowntownGroceryandFoodsales;39%ofretailsales;and64%ofrestaurantandfastfoodsales,basedonthedowntowninterceptsurvey.AspertheCensus,thepopulationofthePrimaryZonein2011isestimatedat46,000.BasedontheJanuary31,2008BurlingtonIntensificationStudy,approximately52%offutureresidentialunitsto2031wouldbeintheformofintensificationwithin:theUrbanGrowthCentre;withintheUrbanGrowthCorridoralongFairviewStreetandPlainsRoad;onthetwoRegionalMallsites;aswellas,bywayoflowdensityinfillandaccessoryunits.ThePrimaryZoneoftheDowntownTradeArea,whichincludestheUrbanGrowthCentre;largeportionsoftheUrbanGrowthCorridor;andthetwoRegionalMalls,willbetherecipientofalargeshareoffutureintensificationgrowth.BasedonHaltonRegion’sBestPlanningEstimatesprojections,the2031populationforthePrimaryZoneisestimatedat53,000representingagrowthofsome7,000persons.AlargeshareofthisgrowthcouldoccurintheUrbanGrowthCentre15
15The2008Intensificationreport,basedonasite‐by‐sitereviewestimatesthatsome2,200unitswithapopulationof3,750couldbedevelopedintheUrbanGrowthCentre(UGC).ThisfiguremaybelowinrelationtotheProvincialGrowthPlantarget.AspertheGrowthPlan,between2012and2031,theUrbanGrowthCentreitselfistargetedtoincreasefromatotalof14,000residentsandjobsin2006to23,400personsandjobsby2031,basedonadensitytargetof200personsandjobsperhectarein2031.Thisrepresentsgrowthofsome9,400personsandjobsoverthisperiod.BasedonCensuspopulationdata,itisestimatedthattheUrbanGrowthCentrepopulationin2006was7,600personsandtheworkforceisapproximately7,400.Thisrepresentsapopulation/employmentratioof54%/46%.Futuregrowthwilllikelybemoreheavilyorientedtoresidentialdevelopment.Thisisbecausethecurrentratioisheavilyinfluencedbyanumberoflargescaleemployers,includingJosephBrantHospitalandBurlingtonCivicOffices,whichhavelimitedgrowthpotential.If75%ofUGCgrowthwillbecomprisedofnewresidents,thiswouldresultinanincreaseofapproximately7,000newresidentsoragrowthof88%between2006and2031.BasedonCensusdata,between2006and2011,theUGCpopulationgrewbysome800persons.Thiswouldresultinafuturegrowthbetween2011and2031ofapproximately6,200personsintheUrbanGrowthCentrealone.

CityofBurlington–OfficialPlanReviewCommercialStrategyStudy(Phase1:CommercialMarketSupplyandDemandAnalysis)
111
10.2 PROJECTEDFUTUREWARRANTEDSPACEINTHEDOWNTOWN
OnFigures10‐1to10‐3,thefuturenon‐foodstoreretail,foodstoreretailandservicesspaceneedsfortheDowntownhavebeenprojectedto2031.
10.2.1 NON‐FOODSTORERETAILANALYSIS
Figure10‐1providesouranalysisofnon‐foodstoreretailrequirementsinthedowntownto2031.ThisanalysisiscomparabletotheanalysescontainedinSection9.Inthiscase,however,thePrimaryZonerepresentstheprimaryzonefortheDowntown,whiletheSecondaryZoneistheRestofBurlington.ExpendituresfromoutsidetheCityareanalyzedas“inflow”whichhasbeenestimatedbasedontheDowntownInterceptSurveyresults.AsinSection9,localexpenditureshavebeenestimatedbasedonthepercapitaincomeindextotheProvince.Thetotalpotentialiscalculatedbymultiplyingthepercapitaexpendituresbythepopulationineachzone.TheDowntownShareofexpendituresforeachzoneisbasedontheconsumertelephone/on‐linesurveysandthedowntowninterceptsurvey.Basedonthe2012DowntownShareassumptions,anestimateofinflowfromoutsidetheCityof20%andtheinventoryofspace,itiscalculatedthatthecurrentsalespersquarefootgeneratedbyDowntownnon‐foodretailstoresis$366,whichisabovetheCity‐wideaverageof$286.Infutureyears,wehaveassumedminorincreasesinthedowntownmarketsharerecognizingtheincreasedcommercialandresidentialdevelopmentplannedforthedowntownanditsabilitytogenerateagreatercriticalmassofretailspace.Asthedowntownincreasesinscale,itwillgrowitsattractivenessasavisitordestination.Basedontheanticipatedgrowthto2031,includingpopulationincreases,realgrowthinexpendituresandanincreaseinmarketattraction,itiscalculatedthattherewillbearequirementforsome76,500squarefeetofadditionalnon‐foodstorespaceby2031,assumingasalespersquarefootplanningratioof$400persquarefoot.

CityofBurlington–OfficialPlanReviewCommercialStrategyStudy(Phase1:CommercialMarketSupplyandDemandAnalysis)
112
FIGURE 10‐1: DOWNTOWN WARRANTED NFSR SPACE PROJECTION
2012 Dollars 2012 2031
Primary ZoneIncome Index to Province 1.18NFSR Expenditure Index to Province(1 1.07Per Capita NFSR Expenditure(1 5,989$ 7,696$ Population 46,000 53,000 TOTAL NFSR POTENTIAL 275.5$ 407.9$
Secondary Zone (Rest of Burlington)Income Index to Province 1.24NFSR Expenditure Index to Province(1 1.10Per Capita NFSR Expenditure(1 6,131$ 7,882$ Population 137,100 142,700 TOTAL NFSR POTENTIAL 840.5$ 1,124.8$
Total Trade AreaTOTAL NFSR POTENTIAL 1,116.0$ 1,532.7$
Primary ZoneNFSR Expenditure Potential 275.5$ 407.9$ Downtown Share (%)(2 10.00% 11.00%Estimated Downtown Share ($ Millions) 27.6$ 44.9$ Residual Potential 17.3$
Secondary Zone (Rest of Burlington)NFSR Expenditure Potential 840.5$ 1,124.8$ Downtown Share (%)(2 2.15% 2.25%Estimated Downtown Share ($ Millions) 18.1$ 25.3$ Residual Potential
TOTAL TRADE AREANFSR Expenditure Potential 1,116.0$ 1,532.7$ Estimated Downtown Share (%) 4.1% 4.6%Estimated Downtown Share ($ Millions) 45.7$ 70.2$ Residual Potential 24.50$
Existing NFSR (156,283 sf) Sales/SF Levels (Including average level of inflow of 20%) 366$
WARRANTED ADDITIONAL NON‐FOOD STORE RETAIL (NFSR) SPACE
Additional Residual Potential AvailablePlus Inflow Sales @20%(3
ADDITIONAL SALES POTENTIAL AVAILABLE 30.6$
WARRANTED ADDITIONAL SQUARE FEET @ $325 per square foot 94,200 @ $350 per square foot 87,400 @ $375 per square foot 81,600 @ $400 per square foot 76,500
Source: urbanMetrics inc.
1) Local expenditures are based on relationship to income.
(See Appendix D for regression equation)
2) 2012 Downtown Share base on the telephone, on‐l ine
and downtown intercept surveys.
3) Estiamted based on the downtown intercept survey.

CityofBurlington–OfficialPlanReviewCommercialStrategyStudy(Phase1:CommercialMarketSupplyandDemandAnalysis)
113
10.2.2 FOODSTORERETAILANALYSIS
Asimilaranalysishasbeenundertakenforfoodstores,includingsupermarketsandspecialtystores.Basedonthetelephonesurvey,on‐lineanddowntowninterceptsurveys,alargeshareofdowntownfoodpurchasesaremadebyresidentsofthePrimaryZone.AswiththeNFSRcategory,increasesintheDowntownsharehasbeenestimatedreflectingoverallgrowthintheGrowthCentre.Basedontheanticipatedgrowthto2031,includingpopulationincreases,realgrowthinexpendituresandanincreaseinmarketattraction,itiscalculatedthattherewillbearequirementforsome31,300squarefeetofadditionalfoodstorespaceby2031,assumingasalespersquarefootplanningratioof$600persquarefoot.

CityofBurlington–OfficialPlanReviewCommercialStrategyStudy(Phase1:CommercialMarketSupplyandDemandAnalysis)
114
FIGURE 10‐2: DOWNTOWN WARRANTED FSR SPACE PROJECTION
2012 Dollars 2012 2031
Primary Zone Income Index to Province 1.18FSR Expenditure Index to Province(1 1.02Per Capita FSR Expenditure(1 2,270$ 2,378$ Population 46,000 53,000 TOTAL NFSR POTENTIAL 104.4$ 126.0$
Secondary Zone (Rest of Burlington)Income Index to Province 1.24FSR Expenditure Index to Province(1 1.02Per Capita FSR Expenditure(1 2,284$ 2,393$ Population 137,100 142,700 TOTAL NFSR POTENTIAL 313.2$ 341.5$
Total Trade AreaTOTAL NFSR POTENTIAL 417.6$ 467.5$
Primary ZoneNFSR Expenditure Potential 104.4$ 126.0$ Estimated Downtown Share (%)(2 26.50% 35.00%Estimated Downtown Share ($ Millions) 27.7$ 44.1$ Residual Potential 16.4$
Secondary Zone (Rest of Burlington)NFSR Expenditure Potential 313.2$ 341.5$ Estimated Downtown Share (%)(2 0.70% 0.80%Estimated Downtown Share ($ Millions) 2.2$ 2.7$ Residual Potential
TOTAL TRADE AREANFSR Expenditure Potential 417.6$ 467.5$ Estimated Downtown Share (%) 7.2% 10.0%Estimated Downtown Share ($ Millions) 29.9$ 46.8$ Residual Potential 16.90$
Existing NFSR (49,255 sf) Sales/SF Levels (Including average level of inflow of 10%) 674$
WARRANTED ADDITIONAL NON‐FOOD STORE RETAIL (NFSR) SPACE
Additional Residual Potential AvailablePlus Inflow Sales @ 10.0%(3 1.90$ ADDITIONAL SALES POTENTIAL AVAILABLE 18.8$
WARRANTED ADDITIONAL SQUARE FEET @ $500per square foot 37,600 @ $525 per square foot 35,800 @ $575 per square foot 32,700 @ $600 per square foot 31,300
Source: urbanMetrics inc.
1) Local expenditures are based on relationship to income.(See Appendix D for regression equation)
2) 2012 Downtown Share base on the telephone, on‐line
and downtown intercept surveys.
3) Estiamted based on the downtown intercept survey.
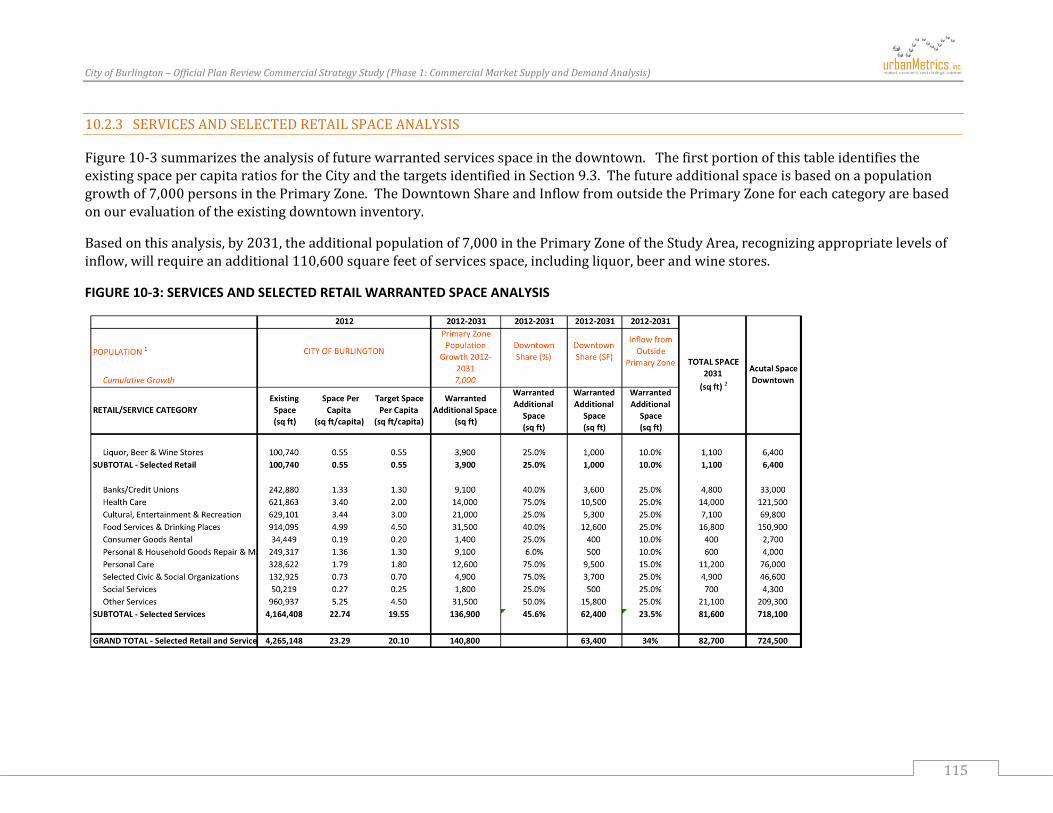
CityofBurlington–OfficialPlanReviewCommercialStrategyStudy(Phase1:CommercialMarketSupplyandDemandAnalysis)
115
10.2.3 SERVICESANDSELECTEDRETAILSPACEANALYSIS
Figure10‐3summarizestheanalysisoffuturewarrantedservicesspaceinthedowntown.ThefirstportionofthistableidentifiestheexistingspacepercapitaratiosfortheCityandthetargetsidentifiedinSection9.3.Thefutureadditionalspaceisbasedonapopulationgrowthof7,000personsinthePrimaryZone.TheDowntownShareandInflowfromoutsidethePrimaryZoneforeachcategoryarebasedonourevaluationoftheexistingdowntowninventory.
Basedonthisanalysis,by2031,theadditionalpopulationof7,000inthePrimaryZoneoftheStudyArea,recognizingappropriatelevelsofinflow,willrequireanadditional110,600squarefeetofservicesspace,includingliquor,beerandwinestores.
FIGURE 10‐3: SERVICES AND SELECTED RETAIL WARRANTED SPACE ANALYSIS
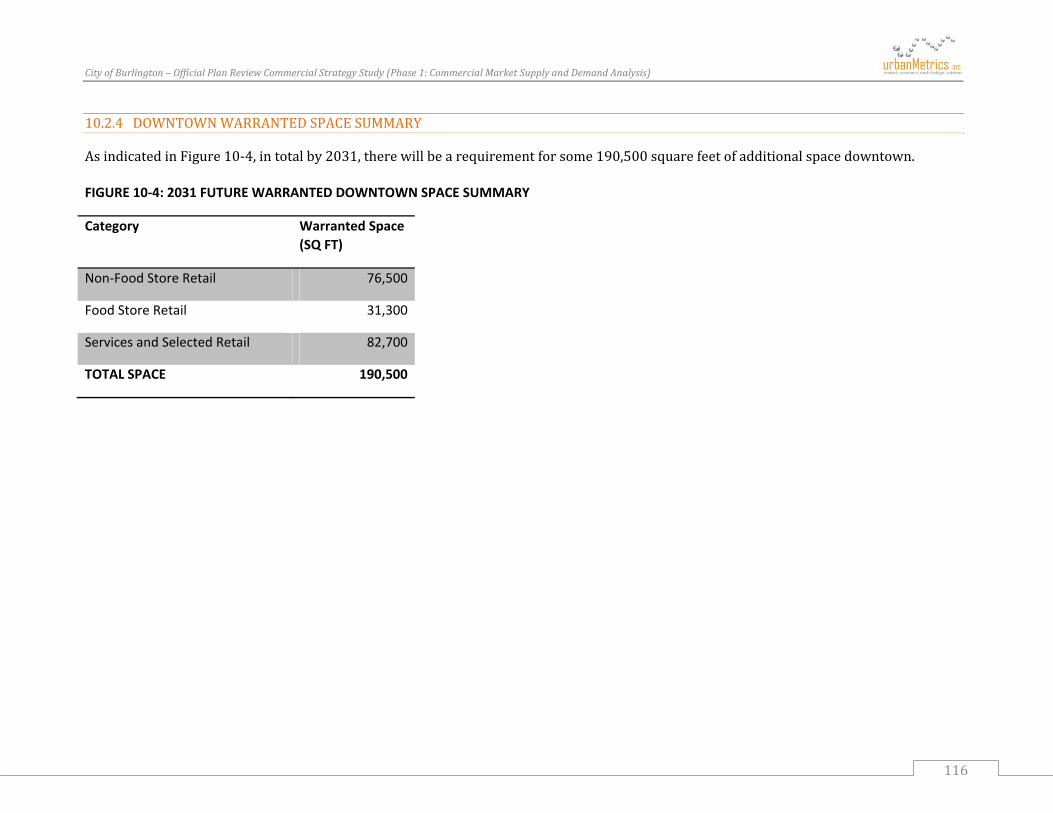
CityofBurlington–OfficialPlanReviewCommercialStrategyStudy(Phase1:CommercialMarketSupplyandDemandAnalysis)
116
10.2.4 DOWNTOWNWARRANTEDSPACESUMMARY
AsindicatedinFigure10‐4,intotalby2031,therewillbearequirementforsome190,500squarefeetofadditionalspacedowntown.FIGURE 10‐4: 2031 FUTURE WARRANTED DOWNTOWN SPACE SUMMARY
Category Warranted Space (SQ FT)
Non‐Food Store Retail 76,500
Food Store Retail 31,300
Services and Selected Retail 82,700
TOTAL SPACE 190,500

CityofBurlington–OfficialPlanReviewCommercialStrategyStudy(Phase1:CommercialMarketSupplyandDemandAnalysis)
117
11 SUPPLYANDDEMANDRECONCILIATION
Figure11‐1summarizesthereconciliationofcommercialspacesupplyanddemand.Asindicatedbythisfigure,basedonourmarketanalysis,by2031,therewillbeaneedforsome1.55millionsquarefeetofnewcommercialspace.
Atthesametime,thereiscurrentlysome1,194,000squarefeeteithercommittedorproposed,foraresidualshortfallofapproximately350,000squarefeet.
Severalpointsneedtobeunderstoodwithregardstothisanalysis:
First,includingtheIKEAapplication,whichhasbeenrecommendedforapprovalbyPlanningStaff,approximately957,000squarefeetisapprovedonRegionalCommercialsites.Thiswouldconsumesome60%ofthedemandby2031.Excludingtheapprovedsupermarketat3505Dundasandrecognizingthattypicallyonlyabout10%ofspaceinpowercentrescomprisesservices,itisestimatedthatapproximately860,000squarefeetalreadyapprovedwillcompriseregionalnon‐foodretailspace.Thiswouldleaveapproximately335,000squarefeetofnon‐foodretailspaceavailablefortheremainderoftheCity.
Secondly,by2031therewillbedemandforsome101,100squarefeetofadditionalfoodstorespace.Recognizingtheproposedsupermarketat3505DundasStreet,thiswouldleavearesidualofapproximately65,000squarefeet.Thiswouldprovideanopportunityforoneortwomid‐sizedsupermarketsand/oracollectionofsmallerfoodstores.Aportionofthiswouldberequiredtoservefuturegrowthinthedowntown.
Ascalculatedintheprevioussection,thewarrantedspaceto2031intheDowntownwouldamounttosome190,500.Thiswouldleaveonly160,000squarefeetavailablefornewdevelopmentintherestoftheCity.ThisisarelativelysmallamountandshouldsupportnewpopulationalongtheUrbanGrowthCorridorandmixedusedevelopmentinproximitytotheGOTransitstationsandRegionalMallsites,aswellas,providinglocalservingcommercialspaceinareassuchasWestAldershotwhichmaylackcertainretailfacilities.
Asnoted,therearealreadyanumberofvacantsitesintheseareaswithapprovalforcommercialspace,oftenaspartofmixed‐usezoningcategory.Whereapplicationsfornewcommercialspacearemade,approvalshouldgiveprioritytothosedevelopmentssupportingpopulationintensificationareasandinexistingareaslackinglocalservingretailfacilities.

CityofBurlington–OfficialPlanReviewCommercialStrategyStudy(Phase1:CommercialMarketSupplyandDemandAnalysis)
118
FIGURE 11‐1: SUPPLY AND DEMAND RECONCILIATION
Itisimportanttonotethattheanalysiscontainedinthisreportshouldbeviewedwithsomeflexibilityand,specificallyshouldnotbeusedtoregulatelandusesonacategorybycategorybasis.
FIGURE 1‐11: SUPPLY AND DEMAND RECONCILIATION
Square FeetDemandNon‐Food Store Retail 1,192,100 Food Store Retail 101,100 Selected Services 246,300 Liquor/Beer/Wine Stores 6,900 Total Demand 1,546,400
SupplyImmediate Development Prospect 125,268 Other Proposed Developments 721,350 Significant Undeveloped Designated and Zoned Sites 347,354 Total Supply 1,193,972
Unfulfilled Demand 352,428

CityofBurlington–OfficialPlanReviewCommercialStrategyStudy(Phase1:CommercialMarketSupplyandDemandAnalysis)
119
12 CONCLUSIONS
BurlingtonisstrategicallysituatedwithintheWesternGTAhighwaynetworkwhichallowsittodrawretailsalesfromwellbeyonditsboundaries.Aboveaverageincomesinthecommunityalsoprovideanopportunityforincreasedretailsales.
Overthepast10years,thegrowthincommercialspacehasoutpacedpopulationgrowth.ThecurrentsupplyofcommercialspaceisaboveaverageforsuburbanGTAmunicipalities.However,vacancyratesandsalesperformancelevelsintheCityindicatethattheretailmarketisstillinbalance.
The2003BurlingtonCommercialMarketStudyconductedbyRobinDee&AssociatesandSorensonGravelyLowesPlanningAssociatesInc.concludedthat“theretailhierarchyintheOfficialPlanprovides,ingeneral,foranappropriatedistributionofretailspaceacrosstheCitywhileprovidingforahighlevelofservice”.Withconsiderablegrowthinthecommercialstructure,thesameconclusioncanbereachedwithregardstothedistributionofcommercialspaceasitexiststoday.
AstheCityisquicklyapproachingitsgreenfieldcapacity,thelargestshareofresidentialgrowthwillbeattractedtointensificationsites:includingthedowntownUrbanGrowthCentre;UrbanGrowthCorridorsalongPlainsRoadandFairviewStreet;andmixeduseareasaroundtheexistingmallsandGOrailstations.
Between2012and2031,theCity’spopulationisprojectedtogrowbysome12,600personstoalevelof195,700.ThispopulationallowstheCitytomaintainthefullrangeofretailformatsandmajorretailstorestypicallyfoundinmostsuburbanGTAmarkets.Inaddition,itsstrategiclocationandaboveaverageincomeshaveenabledBurlingtontoattractanumberoflargeformatspecialtyretailers,suchas:IKEA,MountainEquipmentCo‐Op,SailandLeeValleyTools,foundonlyinselectmarkets.
Thecurrentcommercialinventoryaccountsforsome10.6millionsquarefeet.Burlingtonhasatraditionalcommercialstructure,withthesinglelargestconcentrationofspacefoundintheDowntowncore.TheCityhastwoenclosedregionalshoppingcentres,fourmajorpowercentrenodes,andanarterialcommercialcorridorsextendingalongFairviewStreetandPlainsRoad.Togetherthesenodescomprisesome41%ofthetotalinventory.Thelargestshareofspaceiscomprisedoflocalservingandarterialcommercialfacilitiesnotpartofamajornode.Thisstructureprovidesforabalanceddistributionofcommercialspaceinrelationtoresidentialneighbourhoods.

CityofBurlington–OfficialPlanReviewCommercialStrategyStudy(Phase1:CommercialMarketSupplyandDemandAnalysis)
120
Thereare17supermarketsintheCity.WiththeexceptionofWestAldershotallresidentsarewithintwokilometresofasupermarket.Thisisthetypicalmarketareaservedbyasupermarketinanurbanarea.
Intermsofactivetransportation,everymajorretailnodecanbeaccessedbytransit.Supermarkets,however,areoutsideofwalkingdistanceforthemajorityofthepopulation.Mostmajorretaildestinationsareconnectedtothebikeandrecreationaltrailnetwork.Thenetworkitselfissomewhatdisjointed,withthemajorexpresswaysactingasbarriers.Thebestconnectivityisfoundalongthehydroright‐of‐ways,NewStreetandLakeshoreRoad.Regardlessoftheoverallconnectivitytothenetwork,barrierstocyclingsafetycanstillexistintermsofenteringandexitingshoppingcentresandintermsofon‐sitemovement.
Burlington’sTradeAreahaschangedsomewhatoverthepast10years.NewcommercialdevelopmentinBurlingtonhasenabledittopenetratemoreheavilyintoOakville,despitethemorerecentopeningoftheBurloakPowerCentreontheOakville‐Burlingtonboundary.Atthesametime,however,newmajorretaildevelopmentatDundasandHighway6inWaterdownhasreducedinflowbyresidentsofthisHamiltoncommunity,aswellasbyresidentsofruralFlamborough.Burlington’scurrenttradeareahasbeendelineatedtoincludetheentireCity;westernOakville;DundasandaportionofupperHamilton.
Basedontheconsumerresearchconductedaspartofthisstudy,themajorityofBurlingtonResidentsaregenerallysatisfiedwiththetypeandformatofretailandserviceofferingsavailabletothem.Approximately21%oftherespondentstothetelephoneandon‐linesurveysfeltthereweretoomanybigboxretaildevelopmentsand29%feltthereweretoomanyfastfoodoutlets.
Basedontheon‐line/telephonesurveys,theon‐streetinterceptsurveys,andthedowntownworkshop,therewasastrongdesireforadditionalfoodstoreofferingsdowntownandmoreentertainmentopportunities.
Anumberoftrendsareandwillcontinuetoinfluencecommercialdevelopmentinthefuture: Owingtocompetitivepressuresfrombigboxretailersmanyshoppingcentresatthemid‐rangeofthecommercialhierarchy
havede‐malled.Somehavetransformedintomixedresidential‐retailprojects,andotherssuchasApplebyMallhavere‐inventedthemselvesasopen‐conceptnewformatcentres.
Anumberofmajorretailerchains(e.g.Walmart,Sobeys,HomeDepot,BestBuy)aredevelopingsmallerconceptstoresthatallowthemtoenterurbanmarketsandmarketstoosmalltosupporttraditionalformats.

CityofBurlington–OfficialPlanReviewCommercialStrategyStudy(Phase1:CommercialMarketSupplyandDemandAnalysis)
121
Inpartduetopressurefromnewplanningpolicies,mixed‐useandstreetrelatedretailformatsarebeingintroducedinanumberofmarkets.BurOakdriveinCornellandDiseraDriveinVaughanareexamplesintraditionalsuburbancommunities.InBurlington,anumberofmixeduseprojectswithstreetrelatedretailhavebeendevelopedalongPlainsRoad.Thesetypesofprojectshavehadvaryingdegreesofsuccess,withthemostsuccessfulbeingsituatedneartohighdensityresidentialdevelopment;onmajorroadways;andinareasofexistingpedestrianactivity.
USandforeignretailersarecontinuingtofindtheCanadianmarketattractive.Overthenextyear,Targetwillbeopeningtwo
storesinBurlingtoninformerZellersoutlets.Inaddition,theywillbeopeningstoresatHopedaleMallinOakvilleandinWaterdown.AsTargetwilllikelygeneratemuchhighersalesthantheformerZellerstenants,itwilllikelyattractaportionoffuturesalesgrowththatmighthaveotherwisegonetonewretailers,aswellas,attractingsomesalesfromexistingretailers.Wedonot,however,anticipatethatthetwonewTargetsinBurlington,willhaveanimpactonthecommercialhierarchy,butratherrepresentnormalcompetitivebehaviourwithinthemarketplace.
Anumberofretailchainshavebroadenedtheirmerchandiselines,whichhasinsomecasescausedablurringoftraditional
anchorroles.WalmartSuperstores,forexamplecontainasupermarket‐scalefoodcomponent;LoblawscarriestheJoeFreshapparelline;andthenewformatShoppersDrugMartstorescontainaselectionofgroceryitems.Thesestorescanserveavarietyofcommercialfunctionsatmultiplelevelsofthehierarchy.
Internetshoppinghasbecomecommonplace.Some22%ofBurlingtontelephonesurveyrespondentsand43%ofon‐line
respondentsreportedmakinganinternetpurchaseoverthepastmonth.Althoughthetotalvolumeofon‐linesalesissmallincomparisontothetotalretailmarket,ithashadasignificantimpactoncertainretailcategories,including:books,recordedmusic,software,videosalesandrental,andtravelbookings.
TheagingNorthAmericanconsumerbasehasresultedinchangingshoppingpatterns.Asthebabyboomgenerationmoves
throughretirementoverthenexttwodecades,therewilllikelybeincreaseddemandforservicesattheexpenseofretailmerchandiseandagrowingmovementtowardsqualityandvalueformoney.
Basedonthemarketanalysiscontainedinthisreport,by2031,therewillbeaneedforsome1.55millionsquarefeetofnew
commercialspaceintheCity.Atthesametime,thereiscurrentlysome1,194,000squarefeeteithercommittedorproposed,foraresidualshortfallofapproximately350,000squarefeet.

CityofBurlington–OfficialPlanReviewCommercialStrategyStudy(Phase1:CommercialMarketSupplyandDemandAnalysis)
122
IncludinganapplicationbyIKEAtoexpandandrelocatetoasiteatWalkersLineandtheQEW,whichhasbeenrecommendedforapprovalbyPlanningStaff,approximately927,000squarefeetisalreadyapprovedonRegionalCommercialsites.Thiswouldconsumesome60%ofthedemandby2031.
Secondly,by2031therewillbedemandforsome101,100squarefeetofadditionalfoodstorespace.RecognizingtheproposedanapprovedsupermarketonDundasStreet,thiswouldleavearesidualofapproximately65,000squarefeet.Alargeshareofthiswouldberequiredtoservefuturegrowthinthedowntown.
Basedonthedowntowninterceptsurvey,DowntownBurlingtonservesaprimarymarketboundedbyKingRoad,WalkersLine,theQEW/Hwy403andLakeOntario.Thisareacontainsanumberofkeyintensificationareasincluding:theUrbanGrowthCentre,thetwoRegionalMalls,theBurlingtonGOstation,andportionsoftheFairviewStreet/PlainsRoadUrbanCorridor.BasedonHaltonRegion’sBestPlanningestimates,itisestimatedthatthisareawillgrowbyapproximately7,000residentsbetween2012and2031.
ThiswouldresultinadditionalwarrantedspaceintheDowntownUrbanGrowthCentreofapproximately190,500squarefeetby2031.
Ifthisamountofspaceweredevelopedinthedowntown,itwouldleaveonlyapproximately160,000squarefeetavailablefornewdevelopmentintherestoftheCity.ThisisarelativelysmallamountandshouldsupportnewpopulationalongtheUrbanGrowthCorridorandmixedusedevelopmentinproximitytotheGOTransitstationsandRegionalMallsites,aswellas,providinglocalservingcommercialspaceinareassuchaswestAldershotwhichmaylackcertainretailfacilities.
Asnoted,therearealreadyanumberofvacantsitesintheseareaswithapprovalforcommercialspace,oftenaspartofamixed‐usezoningcategory.Whereapplicationsfornewcommercialspacearemade,approvalshouldgiveprioritytothosedevelopmentssupportingpopulationintensificationareasandinexistingareaslackinglocalservingretailfacilities.
Theresultsofthemarketanalysisclearlyindicatethattheavailablesupplyofcommerciallydesignatedlandswillbesufficienttomeetfuturedemandto2031.Assuch,therewillbenoneedtodesignateadditionalcommerciallandstosupportgrowthto2031.TheonlyexceptionstothiswouldbetomeetlocalservingneedsinexistingundersuppliedportionsoftheCity,suchaswestAldershot,ortoprovideforlocalservingretailtosupportfutureresidentialdevelopmentinintensificationareas.Similarly,theconversionofemploymentlandstocommercialisnotrequiredtosupportfuturegrowthinBurlingtonandshouldbeavoided.
CityofBurlington–OfficialPlanReviewCommercialStrategyStudy(Phase1:CommercialMarketSupplyandDemandAnalysis)
123
APPENDIXA–LICENCEPLATESURVEYRESULTS
LicenceplatesurveysareusedtodeterminethegeographicdraworTradeAreaofretailcentres,nodesorindividuallocationsatacertainpointintime.FortheCityofBurlington,licenceplatenumberswerecollectedoverathreeweekperiodintheFallof2012,includingthelasttwoweeksofSeptemberandthefirstofOctober.
ThelicenceplatesurveyswereconductedatBurlingtonMall,MapleviewCentre,BurlingtonPowerCentre(BrantStreet&theQueenElizabethWay),MillcroftCentre,theAppleby‐DundasPowerNodeandtheBurloakCentreinOakville.Oncecollected,licenceplatenumbersweresubmittedtotheMinistryofTransportationtoobtaintheDisseminationArea(DA)correspondingtothelicenceplateregistrant.Approximately1,849uniquelicenceplaterecordswerecollectedduringtheresearchperiod.TheMinistryofTransportationreturned1,747locationrecordsforshoppers,ofwhich1,461relatedtothefiveidentifiedshoppingdestinationslocatedwithintheCityofBurlington(i.e.,excludingBurloakCentre).
ItshouldbenotedthatalthoughlicenceplatesurveysprovideanindicationoftheTradeAreofaretailcentre,theydohavecertainlimitations.Licenceplatesurveysdonotcapturethepedestriantrafficorshoppersusingtransitandthereforetheresultstendtooverrepresentthedrawfromoutlyingareas.Furthermore,itshouldalsobenotedthatinsomeinstances,theaddressontheregistrationofacarisnotthesameaddressasthepersondrivingthecar.Forexample,thismayoccurwhenthecarisrentedorleasedtoabusinessaddress.
ThedetailedresultsofthelicenceplatesurveysforeachlocationarepresentedinFigureA‐1andFigureA‐2,whichindicatethetotalnumberandpercentageofvehiclesoriginatingfromeachoftheidentifiedCustomerOriginlocations,respectively.Inaddition,themapsinFiguresA‐3toA‐8provideanillustrationofthegeographicdistributionofcustomeroriginsthroughoutthevariousTradeAreazonesandbeyond.
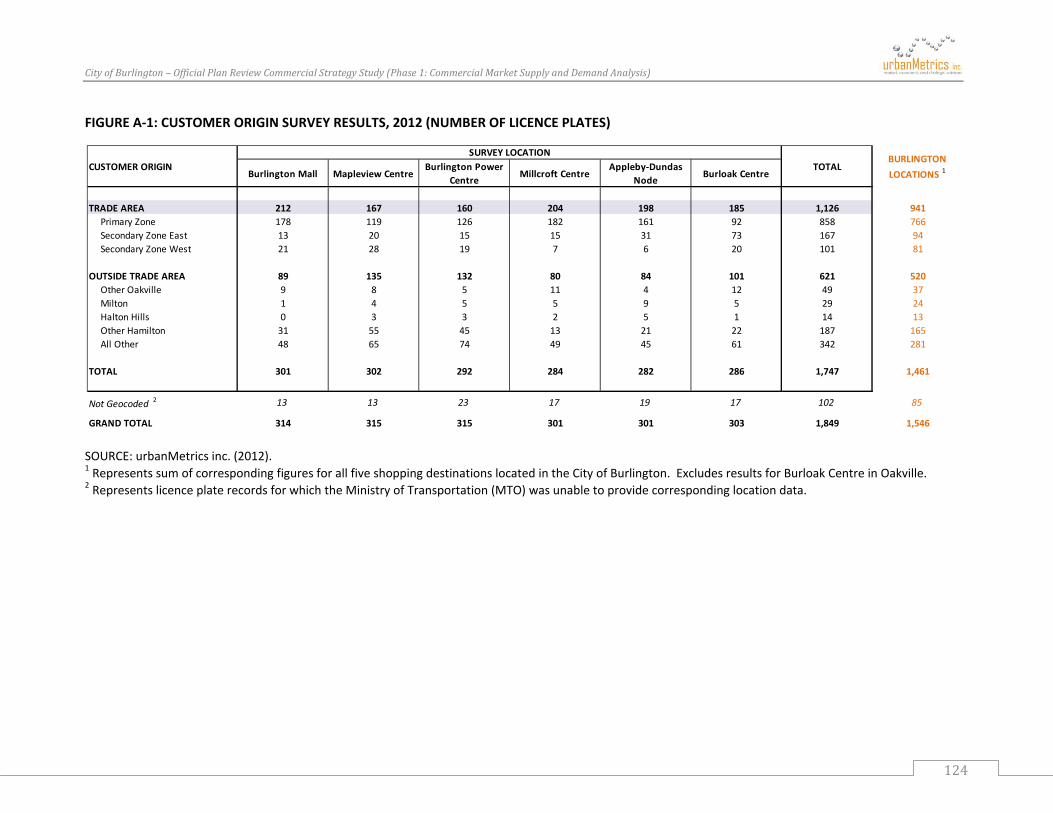
CityofBurlington–OfficialPlanReviewCommercialStrategyStudy(Phase1:CommercialMarketSupplyandDemandAnalysis)
124
FIGURE A‐1: CUSTOMER ORIGIN SURVEY RESULTS, 2012 (NUMBER OF LICENCE PLATES)
SOURCE: urbanMetrics inc. (2012). 1 Represents sum of corresponding figures for all five shopping destinations located in the City of Burlington. Excludes results for Burloak Centre in Oakville. 2 Represents licence plate records for which the Ministry of Transportation (MTO) was unable to provide corresponding location data.
Burlington Mall Mapleview CentreBurlington Power
Centre Millcroft CentreAppleby‐Dundas
Node Burloak Centre
TRADE AREA 212 167 160 204 198 185 1,126 941Primary Zone 178 119 126 182 161 92 858 766Secondary Zone East 13 20 15 15 31 73 167 94Secondary Zone West 21 28 19 7 6 20 101 81
OUTSIDE TRADE AREA 89 135 132 80 84 101 621 520Other Oakville 9 8 5 11 4 12 49 37Milton 1 4 5 5 9 5 29 24Halton Hills 0 3 3 2 5 1 14 13Other Hamilton 31 55 45 13 21 22 187 165All Other 48 65 74 49 45 61 342 281
TOTAL 301 302 292 284 282 286 1,747 1,461
Not Geocoded 2 13 13 23 17 19 17 102 85
GRAND TOTAL 314 315 315 301 301 303 1,849 1,546
SURVEY LOCATIONCUSTOMER ORIGIN TOTAL
BURLINGTON LOCATIONS 1

CityofBurlington–OfficialPlanReviewCommercialStrategyStudy(Phase1:CommercialMarketSupplyandDemandAnalysis)
125
FIGURE A‐2: CUSTOMER ORIGIN SURVEY RESULTS, 2012 (PERCENTAGE OF LICENCE PLATES)
SOURCE: urbanMetrics inc. (2012). 1 Represents sum of corresponding figures for all five shopping destinations located in the City of Burlington. Excludes results for Burloak Centre in Oakville. 2 Represents licence plate records for which the Ministry of Transportation (MTO) was unable to provide corresponding location data.
Burlington Mall Mapleview CentreBurlington Power
Centre Millcroft CentreAppleby‐Dundas
Node Burloak Centre
TRADE AREA 67.5% 53.0% 50.8% 67.8% 65.8% 61.1% 60.9% 60.9%Primary Zone 56.7% 37.8% 40.0% 60.5% 53.5% 30.4% 46.4% 49.5%Secondary Zone East 4.1% 6.3% 4.8% 5.0% 10.3% 24.1% 9.0% 6.1%Secondary Zone West 6.7% 8.9% 6.0% 2.3% 2.0% 6.6% 5.5% 5.2%
OUTSIDE TRADE AREA 28.3% 42.9% 41.9% 26.6% 27.9% 33.3% 33.6% 33.6%Other Oakville 2.9% 2.5% 1.6% 3.7% 1.3% 4.0% 2.7% 2.4%Milton 0.3% 1.3% 1.6% 1.7% 3.0% 1.7% 1.6% 1.6%Halton Hills 0.0% 1.0% 1.0% 0.7% 1.7% 0.3% 0.8% 0.8%Other Hamilton 9.9% 17.5% 14.3% 4.3% 7.0% 7.3% 10.1% 10.7%All Other 15.3% 20.6% 23.5% 16.3% 15.0% 20.1% 18.5% 18.2%
TOTAL 95.9% 95.9% 92.7% 94.4% 93.7% 94.4% 94.5% 94.5%
Not Geocoded 2 4.1% 4.1% 7.3% 5.6% 6.3% 5.6% 5.5% 5.5%
GRAND TOTAL 100.0% 100.0% 100.0% 100.0% 100.0% 100.0% 100.0% 100.0%
CUSTOMER ORIGINSURVEY LOCATION
TOTALBURLINGTON LOCATIONS 1
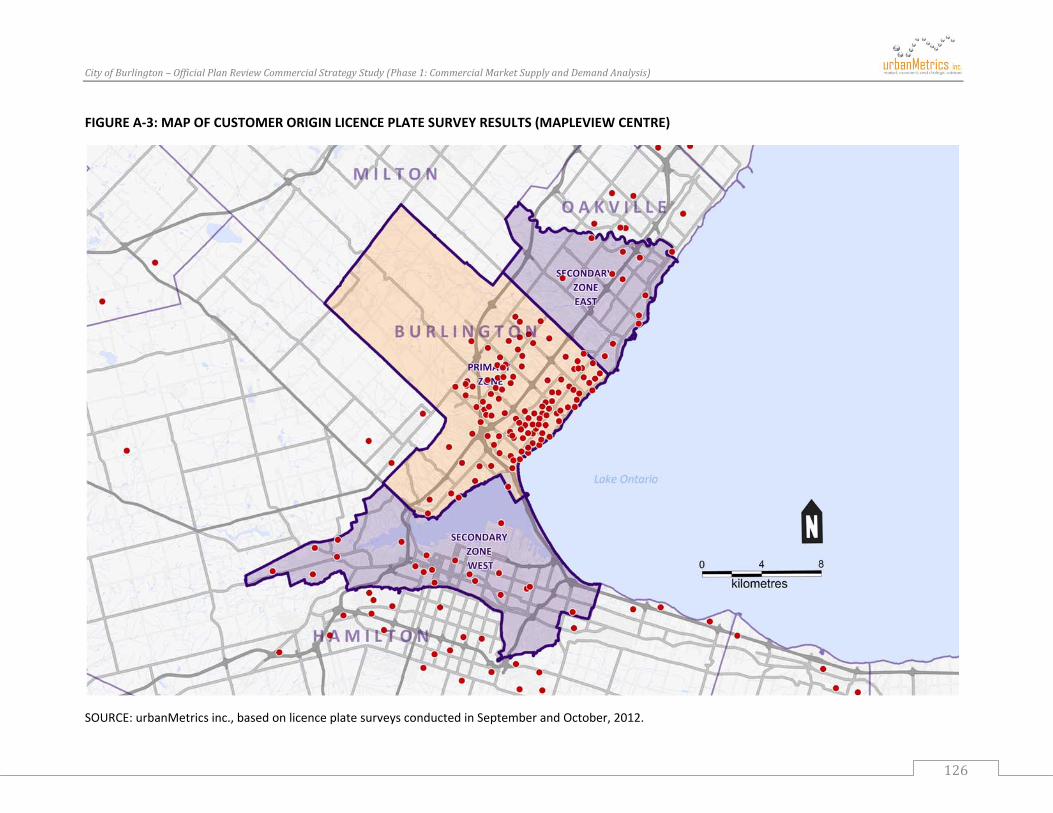
CityofBurlington–OfficialPlanReviewCommercialStrategyStudy(Phase1:CommercialMarketSupplyandDemandAnalysis)
126
FIGURE A‐3: MAP OF CUSTOMER ORIGIN LICENCE PLATE SURVEY RESULTS (MAPLEVIEW CENTRE)
SOURCE: urbanMetrics inc., based on licence plate surveys conducted in September and October, 2012.

CityofBurlington–OfficialPlanReviewCommercialStrategyStudy(Phase1:CommercialMarketSupplyandDemandAnalysis)
127
FIGURE A‐4: MAP OF CUSTOMER ORIGIN LICENCE PLATE SURVEY RESULTS (MAPLEVIEW CENTRE)
SOURCE: urbanMetrics inc., based on licence plate surveys conducted in September and October, 2012.

CityofBurlington–OfficialPlanReviewCommercialStrategyStudy(Phase1:CommercialMarketSupplyandDemandAnalysis)
128
FIGURE A‐5: MAP OF CUSTOMER ORIGIN LICENCE PLATE SURVEY RESULTS (BURLINGTON POWER CENTRE)
SOURCE: urbanMetrics inc., based on licence plate surveys conducted in September and October, 2012.

CityofBurlington–OfficialPlanReviewCommercialStrategyStudy(Phase1:CommercialMarketSupplyandDemandAnalysis)
129
FIGURE A‐6: MAP OF CUSTOMER ORIGIN LICENCE PLATE SURVEY RESULTS (MILLCROFT CENTRE)
SOURCE: urbanMetrics inc., based on licence plate surveys conducted in September and October, 2012.

CityofBurlington–OfficialPlanReviewCommercialStrategyStudy(Phase1:CommercialMarketSupplyandDemandAnalysis)
130
FIGURE A‐7: MAP OF CUSTOMER ORIGIN LICENCE PLATE SURVEY RESULTS (APPLEBY‐DUNDAS POWER NODE)
SOURCE: urbanMetrics inc., based on licence plate surveys conducted in September and October, 2012.
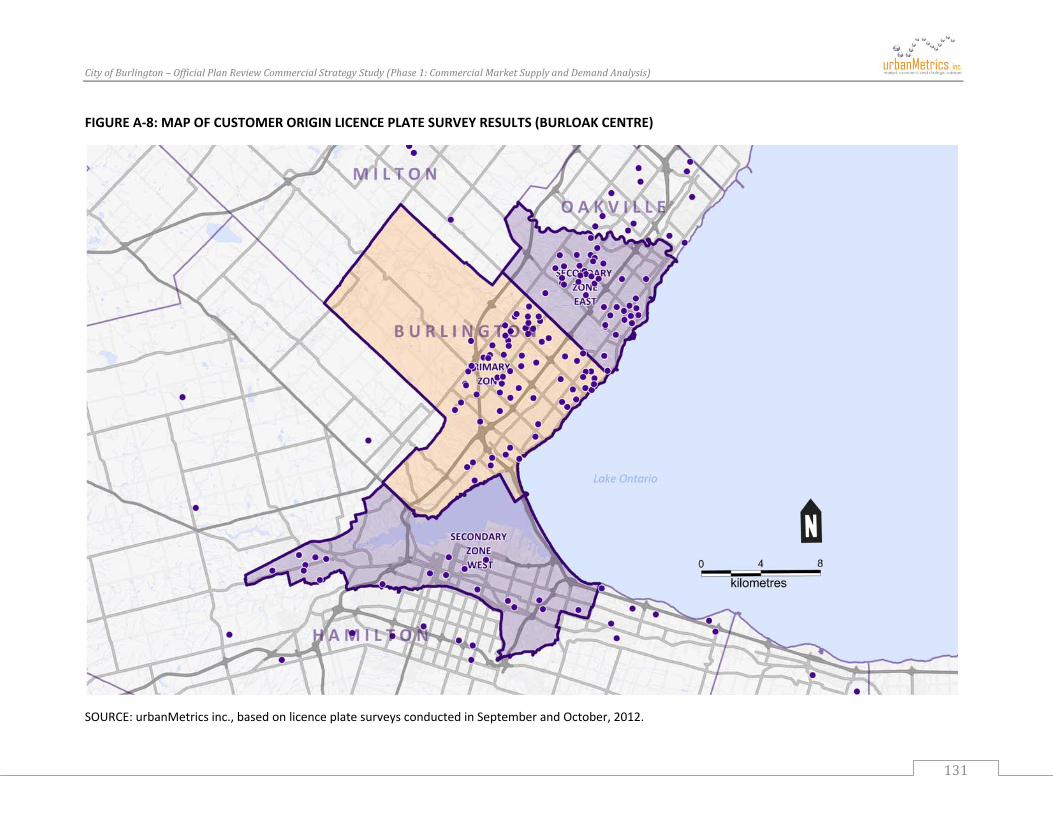
CityofBurlington–OfficialPlanReviewCommercialStrategyStudy(Phase1:CommercialMarketSupplyandDemandAnalysis)
131
FIGURE A‐8: MAP OF CUSTOMER ORIGIN LICENCE PLATE SURVEY RESULTS (BURLOAK CENTRE)
SOURCE: urbanMetrics inc., based on licence plate surveys conducted in September and October, 2012.
CityofBurlington–OfficialPlanReviewCommercialStrategyStudy(Phase1:CommercialMarketSupplyandDemandAnalysis)
132
APPENDIXB–ONLINE/TELEPHONECONSUMERSURVEYRESULTS
AspartofconsumersurveysconductedintheCityofBurlingtonandothernearbycommunities,questionsabouttheCitywereaskedtodetermineexistingshoppinghabits,aswellasperceptionsandsatisfactionlevelsofTradeArearesidents;particularlythoseresidinginthePrimaryZone(Burlington).Twoseparatesurveyswereconductedwithidenticalquestionnaires,asfollows:
OnlineSurvey(n=521)–anonlineconsumersurveywasdesignedandconductedbyurbanMetricsbetweenNovemberandearlyDecember2012.Atotalofsome521surveyresponseswerecollectedfromBurlingtonresidents,including261fully‐completedresponsesthatwereincludedinouranalysisandanadditional260partiallycompletedresponsesthatwereincorporatedwherepossible16.
TelephoneSurvey(n=364)–anidenticalin‐hometelephoneconsumersurveywassub‐contractedtoaresearchcompanywhointerviewedatotalofsome364personsinearlyDecember2012.
Intotal,885onlineandtelephoneconsumersurveyswereundertakenwithBurlingtonresidents.Approximately625ofthesesurveyswerefully‐completedandincludedinourdetailedretailmarketanalysis.
FigureB‐1providesasummaryofthedemographiccharacteristicsoftheBurlingtonsample,whileFiguresB‐2andB‐3presentbreakdownsofNon‐FoodStoreRetail(NFSR),FoodStoreRetail(FSR)andRestaurantexpendituresbytypeandlocationofpurchase,basedontheresultsoftheconsumersurveys.Giventhatalargeportionofthesurveysamplewasself‐selected(i.e.,theonlinesurveyportion),wehaveweightedtheresultsoftheexpenditure‐typesurveyquestions,basedontheactualCensuspopulationandachievedsampleineachofanumberofpre‐determinedsamplingareas.ThesesamplingareaswerederivedfromthesevenForwardSortationAreas(FSA’s)thatcomprisetheCityofBurlington(i.e.,L7T,L7S,L7R,L7N,L7L,L7PandL7M).ThisweightingofexpenditureshasbeenperformedinordertomoreaccuratelyreflecttheuniqueshoppinganddemographiccharacteristicsofresidentsfromeachoftheseareasofBurlington.
AcopyofthesurveyquestionnaireusedforboththeonlineandtelephonesurveyshasbeenincludedinFigureB‐4.
16Partiallycompletesurveyswereterminatedbytherespondentspriortoreachingtheendofthesurveydocument.Wheresufficientinformationtocategorizetherespondentwasavailable,someresultsfrompartiallycompletedsurveyswereincorporated.
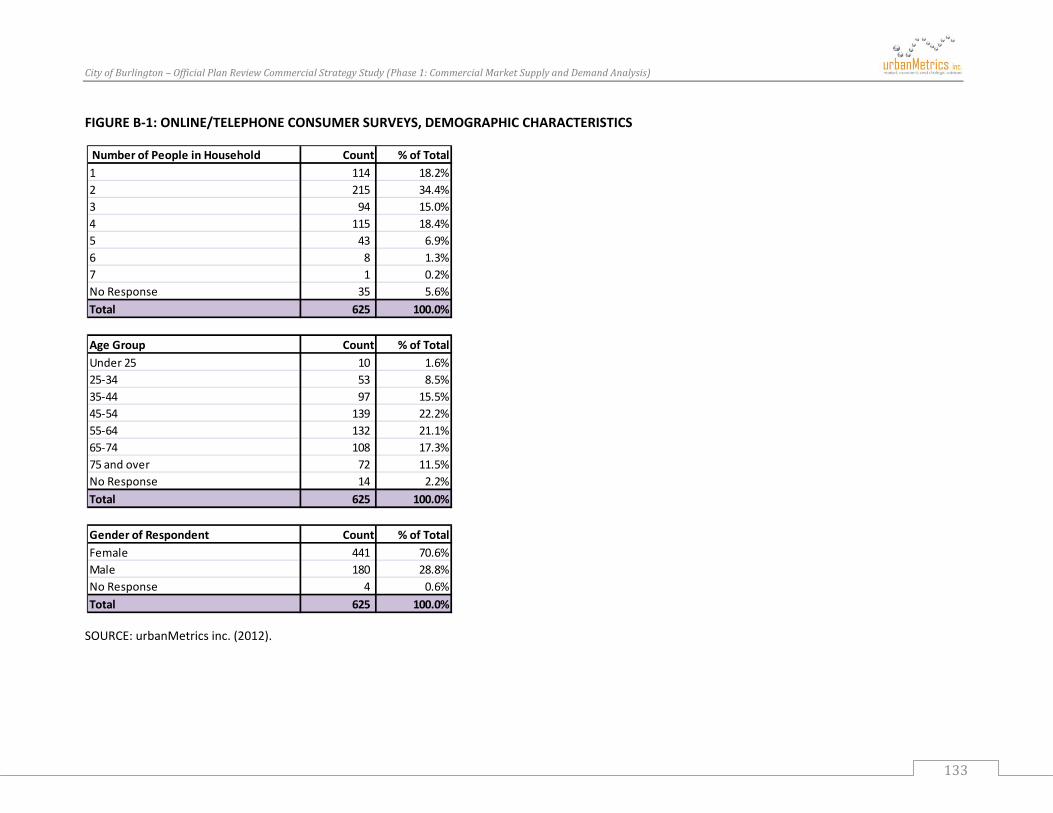
CityofBurlington–OfficialPlanReviewCommercialStrategyStudy(Phase1:CommercialMarketSupplyandDemandAnalysis)
133
FIGURE B‐1: ONLINE/TELEPHONE CONSUMER SURVEYS, DEMOGRAPHIC CHARACTERISTICS
SOURCE: urbanMetrics inc. (2012).
Number of People in Household Count % of Total1 114 18.2%2 215 34.4%3 94 15.0%4 115 18.4%5 43 6.9%6 8 1.3%7 1 0.2%No Response 35 5.6%Total 625 100.0%
Age Group Count % of TotalUnder 25 10 1.6%25‐34 53 8.5%35‐44 97 15.5%45‐54 139 22.2%55‐64 132 21.1%65‐74 108 17.3%75 and over 72 11.5%No Response 14 2.2%Total 625 100.0%
Gender of Respondent Count % of TotalFemale 441 70.6%Male 180 28.8%No Response 4 0.6%Total 625 100.0%

CityofBurlington–OfficialPlanReviewCommercialStrategyStudy(Phase1:CommercialMarketSupplyandDemandAnalysis)
134
FIGURE B‐2: ONLINE/TELEPHONE CONSUMER SURVEYS, NFSR EXPENDITURS BY BURLINGTON RESIDENTS (WEIGHTED)
SOURCE: urbanMetrics inc., based on the results of the online/telephone consumer surveys. Expenditures have been weighted based on the actual 2011 Census population and achieved sample in each of a number of pre‐identified sampling areas.
$ % $ % $ % $ % $ % $ % $ % $ %Downtown Burlington 2.3$ 0.5% 15.4$ 10.9% 8.1$ 4.3% 9.4$ 11.3% 8.3$ 6.5% 0.4$ 0.3% 1.7$ 4.2% 45.5$ 4.1%
Burlington Mall (Fairview Street & Guelph Line) 88.1$ 20.9% 24.6$ 17.4% 4.9$ 2.6% 7.3$ 8.8% 5.2$ 4.1% 6.4$ 5.5% 6.9$ 16.9% 143.4$ 12.8%
Mapleview Shopping Centre (Fairview Street & Queen Elizabeth Way) 73.6$ 17.5% 46.4$ 32.9% 11.1$ 5.9% 5.0$ 6.0% 5.7$ 4.5% 0.2$ 0.2% ‐$ 0.0% 142.0$ 12.7%
Burlington Power Centre (Brant Street & Queen Elizabeth Way) 124.1$ 29.5% 1.1$ 0.8% 23.8$ 12.6% 6.4$ 7.8% 0.9$ 0.7% 3.5$ 3.0% 0.0$ 0.1% 159.8$ 14.3%
Plains Road Corridor (Waterdown Road to Queen Elizabeth Way) 0.7$ 0.2% 0.6$ 0.5% 2.4$ 1.3% 3.1$ 3.7% 6.2$ 4.9% 1.0$ 0.9% 1.4$ 3.5% 15.3$ 1.4%
Fairview Street Corridor (Guelph Line to Appleby Line) 1.7$ 0.4% 2.6$ 1.9% 23.3$ 12.3% 7.3$ 8.8% 1.2$ 0.9% 2.7$ 2.3% 2.2$ 5.4% 40.9$ 3.7%
Appleby‐Dundas Power Node (Dundas Street & Appleby Line) 36.0$ 8.5% 10.3$ 7.3% 1.8$ 0.9% 1.7$ 2.0% 9.6$ 7.6% 0.5$ 0.5% ‐$ 0.0% 59.9$ 5.4%
Millcroft Shopping Centre Node (Upper Middle Road & Appleby Line) 15.4$ 3.6% 1.3$ 0.9% 1.4$ 0.7% 0.5$ 0.6% 6.6$ 5.2% 3.2$ 2.8% ‐$ 0.0% 28.3$ 2.5%
Appleby Mall (New Street & Appleby Line) 2.9$ 0.7% 0.9$ 0.6% 0.8$ 0.4% 1.1$ 1.4% 19.9$ 15.7% 3.0$ 2.6% ‐$ 0.0% 28.6$ 2.6%
All Other Burlington 45.4$ 10.8% 5.5$ 3.9% 85.5$ 45.3% 28.2$ 34.1% 58.6$ 46.2% 45.3$ 39.5% 16.9$ 41.9% 285.5$ 25.6%
TOTAL ‐ City of Burlington 390.1$ 92.6% 108.9$ 77.1% 163.0$ 86.3% 69.9$ 84.6% 122.1$ 96.3% 66.0$ 57.6% 29.1$ 71.9% 949.2$ 85.1%Burloak Centre (Burloak Drive & Queen Elizabeth Way, Oakville) 2.1$ 0.5% 7.1$ 5.0% 11.2$ 5.9% 0.2$ 0.2% 0.6$ 0.5% 11.3$ 9.8% ‐$ 0.0% 32.4$ 2.9%All Other Oakville 0.8$ 0.2% 2.3$ 1.7% 2.6$ 1.4% 2.8$ 3.3% 1.2$ 1.0% 8.7$ 7.6% 1.0$ 2.5% 19.4$ 1.7%
SUBTOTAL ‐ Town of Oakville 2.9$ 0.7% 9.4$ 6.7% 13.8$ 7.3% 2.9$ 3.5% 1.8$ 1.4% 20.0$ 17.4% 1.0$ 2.5% 51.8$ 4.6%Flamborough Power Centre (Waterdown) 3.0$ 0.7% ‐$ 0.0% ‐$ 0.0% 1.1$ 1.3% ‐$ 0.0% 4.3$ 3.7% ‐$ 0.0% 8.3$ 0.7%All Other Hamilton 1.7$ 0.4% 3.4$ 2.4% 4.8$ 2.5% 2.0$ 2.4% 0.9$ 0.7% 11.3$ 9.8% 1.8$ 4.5% 25.8$ 2.3%
SUBTOTAL ‐ City of Hamilton 4.7$ 1.1% 3.4$ 2.4% 4.8$ 2.5% 3.1$ 3.7% 0.9$ 0.7% 15.5$ 13.6% 1.8$ 4.5% 34.1$ 3.1%All Other Outside of Burlington 23.6$ 5.6% 19.6$ 13.9% 7.2$ 3.8% 6.8$ 8.2% 2.0$ 1.6% 13.1$ 11.4% 8.6$ 21.2% 80.9$ 7.3%
TOTAL ‐ Outside City of Burlington 31.1$ 7.4% 32.4$ 22.9% 25.9$ 13.7% 12.8$ 15.4% 4.7$ 3.7% 48.6$ 42.4% 11.4$ 28.1% 166.8$ 14.9%GRAND TOTAL 421.2$ 100.0% 141.3$ 100.0% 188.9$ 100.0% 82.6$ 100.0% 126.8$ 100.0% 114.6$ 100.0% 40.5$ 100.0% 1,116.0$ 100.0%2012 Expenditure Potential 421.2$ 141.3$ 188.9$ 82.6$ 126.8$ 114.6$ 40.5$ 1,116.0$
Buliding & Outdoor Home Supplies
Auto Parts & Accessories
TOTAL NFSR EXPENDITURESRETAIL NODE
General Merchandise
Clothing & Accessories
Furniture, Home Furnishings & Electronics
Miscellaneous Retail
Health & Personal Care
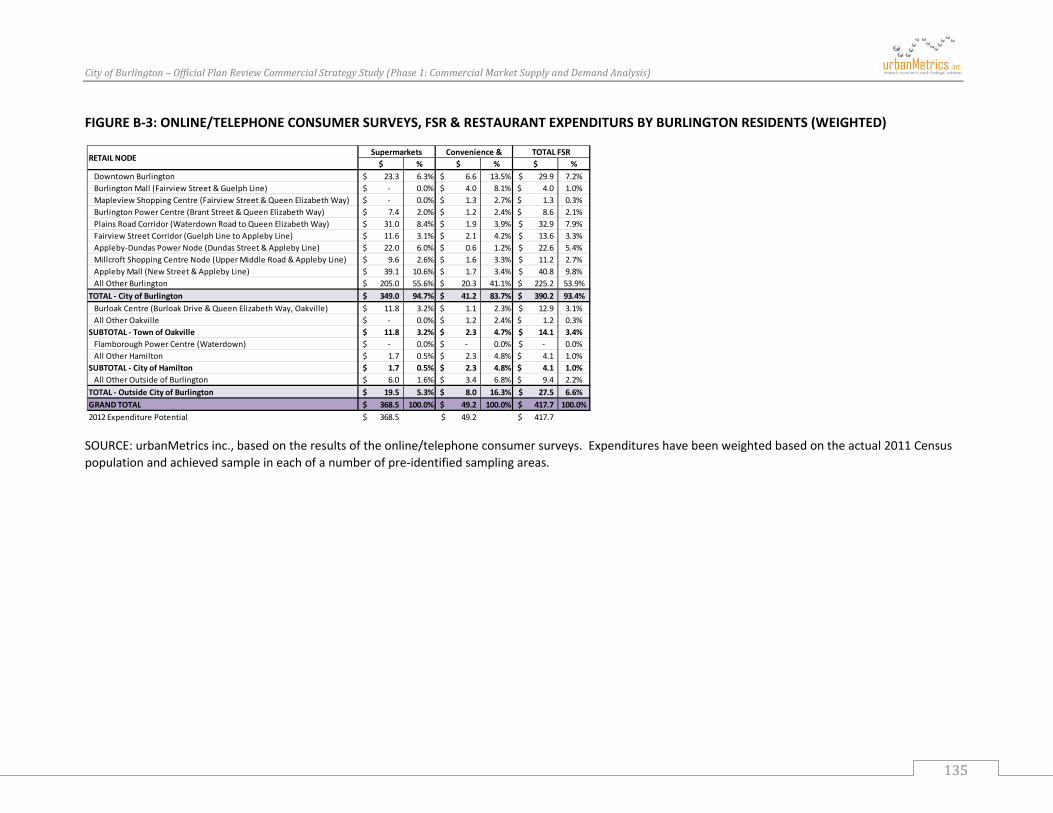
CityofBurlington–OfficialPlanReviewCommercialStrategyStudy(Phase1:CommercialMarketSupplyandDemandAnalysis)
135
FIGURE B‐3: ONLINE/TELEPHONE CONSUMER SURVEYS, FSR & RESTAURANT EXPENDITURS BY BURLINGTON RESIDENTS (WEIGHTED)
SOURCE: urbanMetrics inc., based on the results of the online/telephone consumer surveys. Expenditures have been weighted based on the actual 2011 Census population and achieved sample in each of a number of pre‐identified sampling areas.
$ % $ % $ %Downtown Burlington 23.3$ 6.3% 6.6$ 13.5% 29.9$ 7.2%Burlington Mall (Fairview Street & Guelph Line) ‐$ 0.0% 4.0$ 8.1% 4.0$ 1.0%Mapleview Shopping Centre (Fairview Street & Queen Elizabeth Way) ‐$ 0.0% 1.3$ 2.7% 1.3$ 0.3%Burlington Power Centre (Brant Street & Queen Elizabeth Way) 7.4$ 2.0% 1.2$ 2.4% 8.6$ 2.1%Plains Road Corridor (Waterdown Road to Queen Elizabeth Way) 31.0$ 8.4% 1.9$ 3.9% 32.9$ 7.9%Fairview Street Corridor (Guelph Line to Appleby Line) 11.6$ 3.1% 2.1$ 4.2% 13.6$ 3.3%Appleby‐Dundas Power Node (Dundas Street & Appleby Line) 22.0$ 6.0% 0.6$ 1.2% 22.6$ 5.4%Millcroft Shopping Centre Node (Upper Middle Road & Appleby Line) 9.6$ 2.6% 1.6$ 3.3% 11.2$ 2.7%Appleby Mall (New Street & Appleby Line) 39.1$ 10.6% 1.7$ 3.4% 40.8$ 9.8%All Other Burlington 205.0$ 55.6% 20.3$ 41.1% 225.2$ 53.9%
TOTAL ‐ City of Burlington 349.0$ 94.7% 41.2$ 83.7% 390.2$ 93.4%Burloak Centre (Burloak Drive & Queen Elizabeth Way, Oakville) 11.8$ 3.2% 1.1$ 2.3% 12.9$ 3.1%All Other Oakville ‐$ 0.0% 1.2$ 2.4% 1.2$ 0.3%
SUBTOTAL ‐ Town of Oakville 11.8$ 3.2% 2.3$ 4.7% 14.1$ 3.4%Flamborough Power Centre (Waterdown) ‐$ 0.0% ‐$ 0.0% ‐$ 0.0%All Other Hamilton 1.7$ 0.5% 2.3$ 4.8% 4.1$ 1.0%
SUBTOTAL ‐ City of Hamilton 1.7$ 0.5% 2.3$ 4.8% 4.1$ 1.0%All Other Outside of Burlington 6.0$ 1.6% 3.4$ 6.8% 9.4$ 2.2%
TOTAL ‐ Outside City of Burlington 19.5$ 5.3% 8.0$ 16.3% 27.5$ 6.6%GRAND TOTAL 368.5$ 100.0% 49.2$ 100.0% 417.7$ 100.0%2012 Expenditure Potential 368.5$ 49.2$ 417.7$
RETAIL NODESupermarkets Convenience & TOTAL FSR
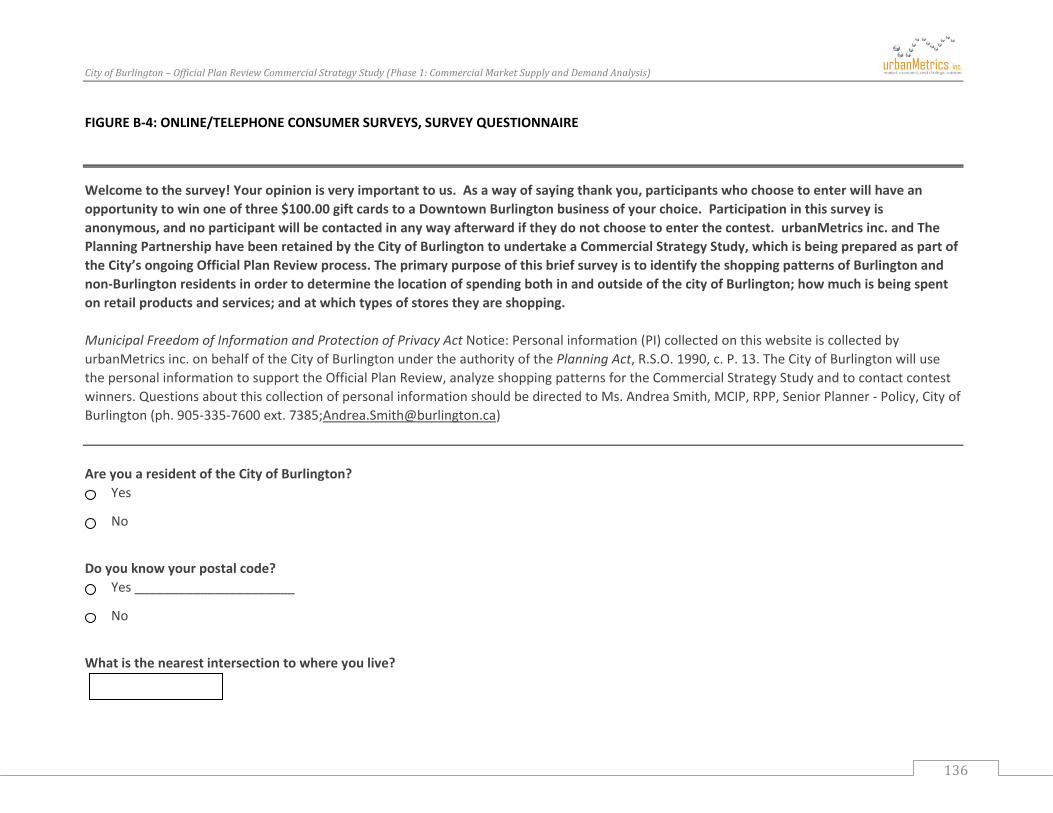
CityofBurlington–OfficialPlanReviewCommercialStrategyStudy(Phase1:CommercialMarketSupplyandDemandAnalysis)
136
FIGURE B‐4: ONLINE/TELEPHONE CONSUMER SURVEYS, SURVEY QUESTIONNAIRE
Welcome to the survey! Your opinion is very important to us. As a way of saying thank you, participants who choose to enter will have an opportunity to win one of three $100.00 gift cards to a Downtown Burlington business of your choice. Participation in this survey is anonymous, and no participant will be contacted in any way afterward if they do not choose to enter the contest. urbanMetrics inc. and The Planning Partnership have been retained by the City of Burlington to undertake a Commercial Strategy Study, which is being prepared as part of the City’s ongoing Official Plan Review process. The primary purpose of this brief survey is to identify the shopping patterns of Burlington and non‐Burlington residents in order to determine the location of spending both in and outside of the city of Burlington; how much is being spent on retail products and services; and at which types of stores they are shopping. Municipal Freedom of Information and Protection of Privacy Act Notice: Personal information (PI) collected on this website is collected by urbanMetrics inc. on behalf of the City of Burlington under the authority of the Planning Act, R.S.O. 1990, c. P. 13. The City of Burlington will use the personal information to support the Official Plan Review, analyze shopping patterns for the Commercial Strategy Study and to contact contest winners. Questions about this collection of personal information should be directed to Ms. Andrea Smith, MCIP, RPP, Senior Planner ‐ Policy, City of Burlington (ph. 905‐335‐7600 ext. 7385;[email protected]) Are you a resident of the City of Burlington? Yes
No
Do you know your postal code? Yes ______________________
No
What is the nearest intersection to where you live?

CityofBurlington–OfficialPlanReviewCommercialStrategyStudy(Phase1:CommercialMarketSupplyandDemandAnalysis)
137
Are you over the age of 18? and the primary shopper in your household? Yes
No
Are you the primary shopper in your household? Yes
No
In the last MONTH, have you done any shopping whatsoever? Yes
No
In the past MONTH, which types of stores have you shopped at: Yes No
Department Stores (such as Walmart, Zellers & the Bay)
Warehouse membership clubs (such as Costco)
Canadian Tire
Auto Parts, Tires & Accessories (Napa Auto, XYZ Tire Shop) ‐ excluding automobile dealerships
General Merchandise & Dollar Stores (Giant Tiger, Dollarama, Liquidation World)
Supermarkets (Fortinos, FreshCo., Longos, No Frills etc)
Specialty Food Stores (meats, breads, small grocery & convenience stores)
Health & Personal (Drug, optical, nutrition)
Clothes, Shoes, Accessories & Jewellery stores
CityofBurlington–OfficialPlanReviewCommercialStrategyStudy(Phase1:CommercialMarketSupplyandDemandAnalysis)
138
Furniture, Appliances & Home Fashions
Electronics, Computers, Cameras & Mobile Devices
Building & Outdoor Supply Stores (home improvement, hardware, paint & garden centres)
Specialty Stores (office supplies, sporting goods, hobby, art , book, music, florists & pet supplies)
Second Hand Merchandise Stores (charity shops, antique & consignment stores)
Restaurants (full‐service & fast‐food)
You indicated that you shopped at a DEPARTMENT STORE in the past MONTH. Excluding online shopping, which stores did you shop at specifically and approximately how much did you spend? The Bay – Mapleview Centre (Fairview Street & Queen Elizabeth Way)
The Bay – Burlington Mall (Fairview Street & Guelph Line)
Sears – Mapleview Centre (Fairview Street & Queen Elizabeth Way)
Walmart Supercentre (Fairview Street & Brant Street)
Walmart Supercentre (Dundas Street West & Appleby Line)
Walmart Supercentre – Waterdown (Dundas Street East & Hollybush Drive)
All Other Outside Burlington
You indicated that you spent $(SUM BASED ON RESPONSES) at Department Stores, what percentage (%) was made on food and supermarket items?
CityofBurlington–OfficialPlanReviewCommercialStrategyStudy(Phase1:CommercialMarketSupplyandDemandAnalysis)
139
You indicated that you shopped at a WAREHOUSE MEMBERSHIP CLUB such as Costco in the past MONTH. Excluding online shopping, which stores did you shop at specifically, and approximately how much did you spend? Costco – Burlington (Queen Elizabeth Way & Brant Street)
Costco – Ancaster (Lincoln Alexander Parkway & Highway 403)
Costco – Mississauga (Dundas Street West & Winston Churchill Boulevard)
All Other Outside Burlington
If other, please give the name and location of the store Store name
Location
You indicated that you spent $(SUM BASED ON RESPONSES) at Warehouse Membership Clubs, what percentage (%) was made on food and supermarket items?
You indicated that you shopped at a Canadian Tire in the past MONTH. Excluding online shopping, which stores did you shop at specifically, and approximately how much did you spend? Canadian Tire – Burlington Mall (Fairview Street & Guelph Line)
Canadian Tire – Millcroft Shopping Centre (Upper Middle Road & Appleby Line)
CityofBurlington–OfficialPlanReviewCommercialStrategyStudy(Phase1:CommercialMarketSupplyandDemandAnalysis)
140
Canadian Tire – Waterdown (Dundas Street East & Highway 6)
All Other Outside Burlington
You indicated another location for Canadian Tire, please specify the location below:
You indicated that you shopped at an AUTO PARTS, TIRES & ACCESSORY STORE ‐ excluding automobile dealerships ‐ in the past MONTH. Excluding online shopping, in which of the following retail/service commercial areas was this store located; and approximately how much did you spend? Downtown Burlington
Burlington Mall (Fairview Street & Guelph Line)
Mapleview Shopping Centre (Fairview Street & Queen Elizabeth Way)
Burlington Power Centre (Brant Street & Queen Elizabeth Way)
Plains Road Corridor (Waterdown Road to Queen Elizabeth Way)
Fairview Street Corridor (Guelph Line to Appleby Line)
Appleby‐Dundas Power Node (Dundas Street & Appleby Line)
Millcroft Shopping Centre Node (Upper Middle Road & Appleby Line)
Appleby Mall (New Street & Appleby Line)
All Other Burlington
CityofBurlington–OfficialPlanReviewCommercialStrategyStudy(Phase1:CommercialMarketSupplyandDemandAnalysis)
141
Burloak Centre (Burloak Drive & Queen Elizabeth Way, Oakville)
All Other Oakville
Flamborough Power Centre (Waterdown)
All Other Hamilton
All Other Outside of Burlington
You indicated that you shopped at a GENERAL MERCHANDISE & DOLLAR STORE ‐ such as Giant Tiger, Dollarama & Liquidation World ‐ in the past MONTH. Excluding online shopping, in which of the following retail/service commercial areas was this store located; and approximately how much did you spend? Downtown Burlington
Burlington Mall (Fairview Street & Guelph Line)
Mapleview Shopping Centre (Fairview Street & Queen Elizabeth Way)
Burlington Power Centre (Brant Street & Queen Elizabeth Way)
Plains Road Corridor (Waterdown Road to Queen Elizabeth Way)
Fairview Street Corridor (Guelph Line to Appleby Line)
Appleby‐Dundas Power Node (Dundas Street & Appleby Line)
Millcroft Shopping Centre Node (Upper Middle Road & Appleby Line)
Appleby Mall (New Street & Appleby Line)

CityofBurlington–OfficialPlanReviewCommercialStrategyStudy(Phase1:CommercialMarketSupplyandDemandAnalysis)
142
All Other Burlington
Burloak Centre (Burloak Drive & Queen Elizabeth Way, Oakville)
All Other Oakville
Flamborough Power Centre (Waterdown)
All Other Hamilton
All Other Outside of Burlington
You indicated that you shopped at a SUPERMARKET in the past MONTH. Excluding online shopping, which stores did you shop at specifically, and approximately how much did you spend? Food Basics (Lakeshore Road & Hampton Heath Road)
Food Basics (Upper Middle Road & Guelph Line)
Fortinos (Plains Road East & Queen Elizabeth Way)
Fortinos (Upper Middle Road & Guelph Line)
Fortinos (New Street & Appleby Line)
Fortinos (Dundas Street & Appleby Line)
Fortinos (Parkside Drive & Hamilton Street North, Waterdown)
FreshCo. (Upper Middle Road & Brant Street)
FreshCo. (Upper Middle Road & Walkers Line)

CityofBurlington–OfficialPlanReviewCommercialStrategyStudy(Phase1:CommercialMarketSupplyandDemandAnalysis)
143
Longos (Fairview Street & Maple Avenue)
Longos (Dundas Street & Walkers Line)
Longos – Burloak Centre (Queen Elizabeth Way & Burloak Drive, Oakville)
Metro (Upper Middle Road & Appleby Line)
Metro (Fairview Street & Cumberland Avenue)
No Frills – Downtown Burlington (Brant Street & Victoria Avenue)
No Frills (Coventry Way & Guelph Line)
Sobeys (North Service Road & Brant Street)
Other in Burlington
All Other Outside of Burlington
If you selected other, please specify the name and location of the store in the fields below: Store Name
Store Location
You indicated that you shopped at an OTHER/SPECIALTY FOOD STORE ‐ such as a jug milk store, bakery, deli, meat shop, frozen food store, convenience food store, candy shop or fruit market ‐ in the past MONTH. Excluding online shopping, in which of the following retail/service commercial areas was this store located; and approximately how much did you spend there? Downtown Burlington

CityofBurlington–OfficialPlanReviewCommercialStrategyStudy(Phase1:CommercialMarketSupplyandDemandAnalysis)
144
Burlington Mall (Fairview Street & Guelph Line)
Mapleview Shopping Centre (Fairview Street & Queen Elizabeth Way)
Burlington Power Centre (Brant Street & Queen Elizabeth Way)
Plains Road Corridor (Waterdown Road to Queen Elizabeth Way)
Fairview Street Corridor (Guelph Line to Appleby Line)
Appleby‐Dundas Power Node (Dundas Street & Appleby Line)
Millcroft Shopping Centre Node (Upper Middle Road & Appleby Line)
Appleby Mall (New Street & Appleby Line)
All Other Burlington
Burloak Centre (Burloak Drive & Queen Elizabeth Way, Oakville)
All Other Oakville
Flamborough Power Centre (Waterdown)
All Other Hamilton
All Other Outside of Burlington
You indicated that you shopped at a HEALTH & PERSONAL CARE STORE ‐ such as a drug store, pharmacy, optical, nutrition or health equipment supply store ‐ in the past MONTH. Excluding online shopping, in which of the following retail/service commercial areas was this store located; and approximately how much did you spend there?

CityofBurlington–OfficialPlanReviewCommercialStrategyStudy(Phase1:CommercialMarketSupplyandDemandAnalysis)
145
Downtown Burlington
Burlington Mall (Fairview Street & Guelph Line)
Mapleview Shopping Centre (Fairview Street & Queen Elizabeth Way)
Burlington Power Centre (Brant Street & Queen Elizabeth Way)
Plains Road Corridor (Waterdown Road to Queen Elizabeth Way)
Fairview Street Corridor (Guelph Line to Appleby Line)
Appleby‐Dundas Power Node (Dundas Street & Appleby Line)
Millcroft Shopping Centre Node (Upper Middle Road & Appleby Line)
Appleby Mall (New Street & Appleby Line)
All Other Burlington
Burloak Centre (Burloak Drive & Queen Elizabeth Way, Oakville)
All Other Oakville
Flamborough Power Centre (Waterdown)
All Other Hamilton
All Other Outside of Burlington
You indicated that you shopped at an APPAREL & ACCESSORIES STORE ‐ such as clothing, shoes, luggage, leather goods, clothing accessories or jewellery stores ‐ in the past MONTH. Excluding online shopping, in which of the following retail/service commercial areas was this store located; and approximately how much did you spend there?
CityofBurlington–OfficialPlanReviewCommercialStrategyStudy(Phase1:CommercialMarketSupplyandDemandAnalysis)
146
Downtown Burlington
Burlington Mall (Fairview Street & Guelph Line)
Mapleview Shopping Centre (Fairview Street & Queen Elizabeth Way)
Burlington Power Centre (Brant Street & Queen Elizabeth Way)
Plains Road Corridor (Waterdown Road to Queen Elizabeth Way)
Fairview Street Corridor (Guelph Line to Appleby Line)
Appleby‐Dundas Power Node (Dundas Street & Appleby Line)
Millcroft Shopping Centre Node (Upper Middle Road & Appleby Line)
Appleby Mall (New Street & Appleby Line)
All Other Burlington
Burloak Centre (Burloak Drive & Queen Elizabeth Way, Oakville)
All Other Oakville
Flamborough Power Centre (Waterdown)
All Other Hamilton
All Other Outside of Burlington
You indicated that you shopped at a FURNITURE, HOME FURNISHINGS, APPLIANCE STORE in the past MONTH. Excluding online shopping, in which of the following retail/service commercial areas was this store located; and approximately how much did you spend?
CityofBurlington–OfficialPlanReviewCommercialStrategyStudy(Phase1:CommercialMarketSupplyandDemandAnalysis)
147
Downtown Burlington
Burlington Mall (Fairview Street & Guelph Line)
Mapleview Shopping Centre (Fairview Street & Queen Elizabeth Way)
Burlington Power Centre (Brant Street & Queen Elizabeth Way)
Plains Road Corridor (Waterdown Road to Queen Elizabeth Way)
Fairview Street Corridor (Guelph Line to Appleby Line)
Appleby‐Dundas Power Node (Dundas Street & Appleby Line)
Millcroft Shopping Centre Node (Upper Middle Road & Appleby Line)
Appleby Mall (New Street & Appleby Line)
All Other Burlington
Burloak Centre (Burloak Drive & Queen Elizabeth Way, Oakville)
All Other Oakville
Flamborough Power Centre (Waterdown)
All Other Hamilton
All Other Outside of Burlington
You indicated that you shopped at an ELECTRONIC, COMPUTER, CAMERA OR TELEPHONE STORE in the past MONTH. Excluding online shopping, in which of the following retail/service commercial areas was this store located; and approximately how much did you spend?
CityofBurlington–OfficialPlanReviewCommercialStrategyStudy(Phase1:CommercialMarketSupplyandDemandAnalysis)
148
Downtown Burlington
Burlington Mall (Fairview Street & Guelph Line)
Mapleview Shopping Centre (Fairview Street & Queen Elizabeth Way)
Burlington Power Centre (Brant Street & Queen Elizabeth Way)
Plains Road Corridor (Waterdown Road to Queen Elizabeth Way)
Fairview Street Corridor (Guelph Line to Appleby Line)
Appleby‐Dundas Power Node (Dundas Street & Appleby Line)
Millcroft Shopping Centre Node (Upper Middle Road & Appleby Line)
Appleby Mall (New Street & Appleby Line)
All Other Burlington
Burloak Centre (Burloak Drive & Queen Elizabeth Way, Oakville)
All Other Oakville
Flamborough Power Centre (Waterdown)
All Other Hamilton
All Other Outside of Burlington

CityofBurlington–OfficialPlanReviewCommercialStrategyStudy(Phase1:CommercialMarketSupplyandDemandAnalysis)
149
You indicated that you shopped at a BUILDING & OUTDOOR HOME SUPPLY STORE ‐ such as a home improvement centre or hardware store; paint and wallpaper store; plumbing and electrical supply store; nursery or garden centre ‐ in the past MONTH. Excluding online shopping, in which of the following retail/service commercial areas was this store located; and approximately how much did you spend there? Downtown Burlington
Burlington Mall (Fairview Street & Guelph Line)
Mapleview Shopping Centre (Fairview Street & Queen Elizabeth Way)
Burlington Power Centre (Brant Street & Queen Elizabeth Way)
Plains Road Corridor (Waterdown Road to Queen Elizabeth Way)
Fairview Street Corridor (Guelph Line to Appleby Line)
Appleby‐Dundas Power Node (Dundas Street & Appleby Line)
Millcroft Shopping Centre Node (Upper Middle Road & Appleby Line)
Appleby Mall (New Street & Appleby Line)
All Other Burlington
Burloak Centre (Burloak Drive & Queen Elizabeth Way, Oakville)
All Other Oakville
Flamborough Power Centre (Waterdown)
All Other Hamilton
All Other Outside of Burlington

CityofBurlington–OfficialPlanReviewCommercialStrategyStudy(Phase1:CommercialMarketSupplyandDemandAnalysis)
150
You indicated that you shopped at a SPECIALTY STORE ‐ such as office supply, sporting goods, hobby, art, books, music, florist & pet supply stores ‐ in the past MONTH. Excluding online shopping, in which of the following retail/service commercial areas was this store located; and approximately how much did you spend there? Downtown Burlington
Burlington Mall (Fairview Street & Guelph Line)
Mapleview Shopping Centre (Fairview Street & Queen Elizabeth Way)
Burlington Power Centre (Brant Street & Queen Elizabeth Way)
Plains Road Corridor (Waterdown Road to Queen Elizabeth Way)
Fairview Street Corridor (Guelph Line to Appleby Line)
Appleby‐Dundas Power Node (Dundas Street & Appleby Line)
Millcroft Shopping Centre Node (Upper Middle Road & Appleby Line)
Appleby Mall (New Street & Appleby Line)
All Other Burlington
Burloak Centre (Burloak Drive & Queen Elizabeth Way, Oakville)
All Other Oakville
Flamborough Power Centre (Waterdown)
All Other Hamilton
All Other Outside of Burlington
CityofBurlington–OfficialPlanReviewCommercialStrategyStudy(Phase1:CommercialMarketSupplyandDemandAnalysis)
151
You indicated that you shopped at a SECOND HAND MERCHANDISE STORE ‐ such as charity shops, antique stores or consignment stores ‐ in the past MONTH. Excluding online shopping, in which of the following retail/service commercial areas was this store located; and approximately how much did you spend there? Downtown Burlington
Burlington Mall (Fairview Street & Guelph Line)
Mapleview Shopping Centre (Fairview Street & Queen Elizabeth Way)
Burlington Power Centre (Brant Street & Queen Elizabeth Way)
Plains Road Corridor (Waterdown Road to Queen Elizabeth Way)
Fairview Street Corridor (Guelph Line to Appleby Line)
Appleby‐Dundas Power Node (Dundas Street & Appleby Line)
Millcroft Shopping Centre Node (Upper Middle Road & Appleby Line)
Appleby Mall (New Street & Appleby Line)
All Other Burlington
Burloak Centre (Burloak Drive & Queen Elizabeth Way, Oakville)
All Other Oakville
Flamborough Power Centre (Waterdown)
All Other Hamilton

CityofBurlington–OfficialPlanReviewCommercialStrategyStudy(Phase1:CommercialMarketSupplyandDemandAnalysis)
152
All Other Outside of Burlington
You indicated that you shopped at a RESTAURANT ‐ including Full Service Restaurants (“sit‐down” restaurants) AND Limited Service Restaurants (“fast‐food” restaurants) ‐ in the past MONTH. In which of the following retail/service commercial areas was this store located; and approximately how much did you spend there? Downtown Burlington
Burlington Mall (Fairview Street & Guelph Line)
Mapleview Shopping Centre (Fairview Street & Queen Elizabeth Way)
Burlington Power Centre (Brant Street & Queen Elizabeth Way)
Plains Road Corridor (Waterdown Road to Queen Elizabeth Way)
Fairview Street Corridor (Guelph Line to Appleby Line)
Appleby‐Dundas Power Node (Dundas Street & Appleby Line)
Millcroft Shopping Centre Node (Upper Middle Road & Appleby Line)
Appleby Mall (New Street & Appleby Line)
All Other Burlington
Burloak Centre (Burloak Drive & Queen Elizabeth Way, Oakville)
All Other Oakville
Flamborough Power Centre (Waterdown)

CityofBurlington–OfficialPlanReviewCommercialStrategyStudy(Phase1:CommercialMarketSupplyandDemandAnalysis)
153
All Other Hamilton
All Other Outside of Burlington
Have you done any online shopping in the last MONTH? Yes
No
In the past MONTH, approximately how much did you spend on the following types of products and services online? Retail merchandise, including downloads (e.g., music, movies, e‐books, etc.)
Tickets and travel‐related services (e.g., event tickets, airline tickets, hotels, etc.)
All other services
How would you describe the following in terms of their availability to you in the City of Burlington? Type of Retail/Service Facilities Need More Just Right Too Many
Department Stores
Specialty Clothing Stores
Home Furnishings Stores
Full‐Service Restaurants
Fast Food Restaurants
CityofBurlington–OfficialPlanReviewCommercialStrategyStudy(Phase1:CommercialMarketSupplyandDemandAnalysis)
154
Supermarkets
Specialty Food Stores
How would you describe the following in terms of their availability to you in the City of Burlington? Format of Retail/Service Facilities: Need More Just Right Too Many
Large Format (“Big‐Box”) Stores
Enclosed Shopping Malls
Convenience/Neighbourhood Scale Retailers
Pedestrian Retail Areas (boutique or "main‐street" shopping)
Retail Accessible by Transit
How would you describe the following in terms of their availability to you in Downtown Burlington? Type of Retail/Service Facilities Need More Just Right Too Many
Department Stores
Specialty Clothing Stores
Home Furnishings Stores
Full‐Service Restaurants
Fast Food Restaurants
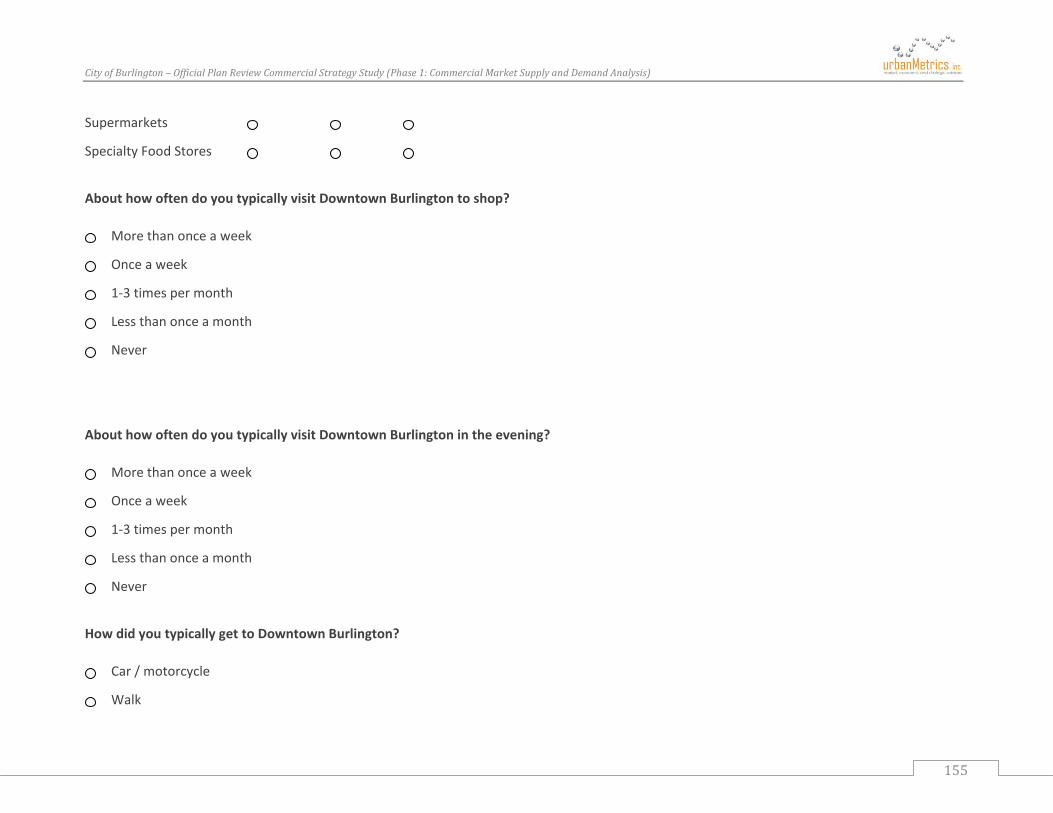
CityofBurlington–OfficialPlanReviewCommercialStrategyStudy(Phase1:CommercialMarketSupplyandDemandAnalysis)
155
Supermarkets
Specialty Food Stores
About how often do you typically visit Downtown Burlington to shop? More than once a week
Once a week
1‐3 times per month
Less than once a month
Never
About how often do you typically visit Downtown Burlington in the evening? More than once a week
Once a week
1‐3 times per month
Less than once a month
Never
How did you typically get to Downtown Burlington? Car / motorcycle
Walk
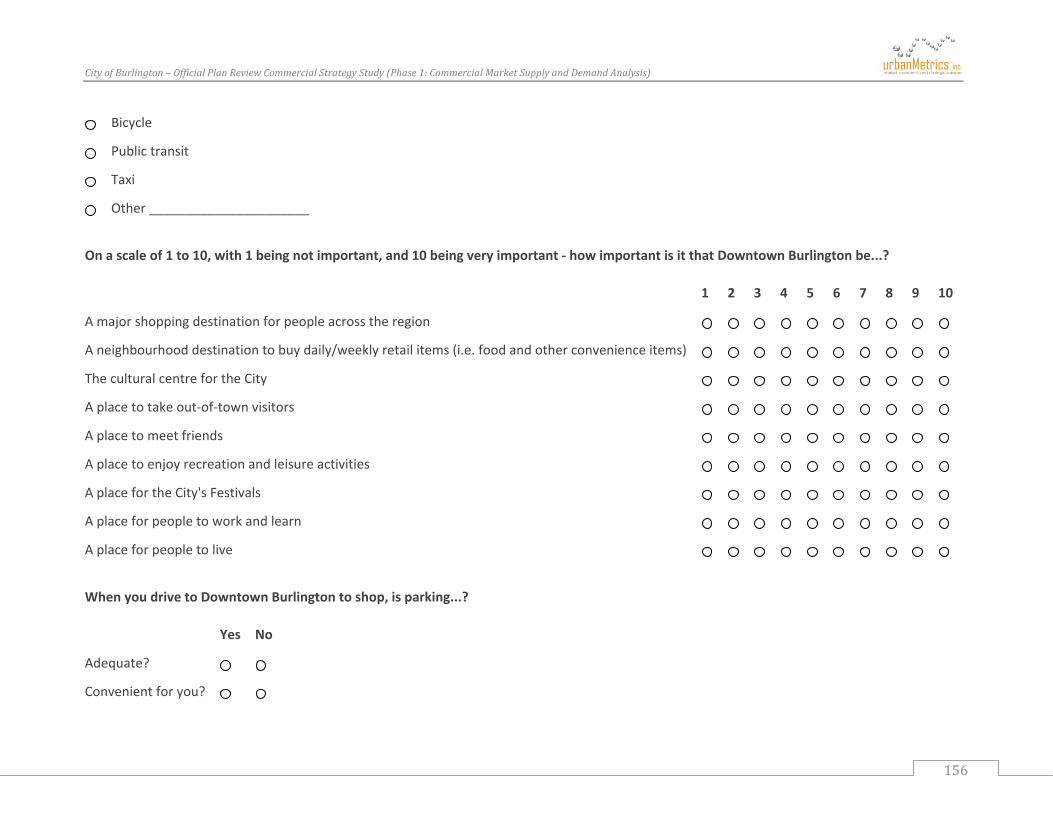
CityofBurlington–OfficialPlanReviewCommercialStrategyStudy(Phase1:CommercialMarketSupplyandDemandAnalysis)
156
Bicycle
Public transit
Taxi
Other ______________________
On a scale of 1 to 10, with 1 being not important, and 10 being very important ‐ how important is it that Downtown Burlington be...? 1 2 3 4 5 6 7 8 9 10
A major shopping destination for people across the region
A neighbourhood destination to buy daily/weekly retail items (i.e. food and other convenience items)
The cultural centre for the City
A place to take out‐of‐town visitors
A place to meet friends
A place to enjoy recreation and leisure activities
A place for the City's Festivals
A place for people to work and learn
A place for people to live
When you drive to Downtown Burlington to shop, is parking...? Yes No
Adequate?
Convenient for you?

CityofBurlington–OfficialPlanReviewCommercialStrategyStudy(Phase1:CommercialMarketSupplyandDemandAnalysis)
157
Reasonably priced?
How many people live in your household?
What is your age? Under 25
25‐34
35‐44
45‐54
55‐64
65‐74
75 and over
What is your gender? Male
Female
Please provide your name and email address if you would like to enter the contest to win 1 of 3 $100.00 gift cards from a Downtown business of your choice. Only winners will be contacted. Your email address will not be shared.

CityofBurlington–OfficialPlanReviewCommercialStrategyStudy(Phase1:CommercialMarketSupplyandDemandAnalysis)
158
SOURCE: urbanMetrics inc. (2012).

CityofBurlington–OfficialPlanReviewCommercialStrategyStudy(Phase1:CommercialMarketSupplyandDemandAnalysis)
159
APPENDIXC–INVENTORYOFCOMMERCIALSPACE
FIGURE C‐1: INVENTORY OF BURLINGTON COMMERCIAL SPACE BY RETAIL CATEGORY AND MAJOR RETAIL NODE
DowntownFairview Street East
Fairview Street, West
Brant Street Power Centre
Ikea Power Centre
Plains Road /Aldershot
Mapleview Shopping Centre
Burlington Mall
Millcroft Power Centre
1 2 3 4 5 6 7 8 9Supermarkets & Grocery 26,300 65,268 32,152 58,434 83,029 59,981 Specialty and Other Food 22,955 19,778 20,704 4,641 47,834 2,604 2,860 1,350 Total Food 49,255 85,046 52,856 63,075 83,029 47,834 2,604 2,860 61,331
Pharmacies & Personal Care 12,000 6,800 1,423 4,700 37,303 18,937 17,006 General Merchandise 11,850 9,956 141,233 126,464 6,128 261,544 408,285 168,009 Apparel and Accessories 58,300 37,627 16,000 34,631 6,050 268,854 114,766 12,000 Home Furnishings 46,800 168,104 36,800 103,186 286,598 34,730 20,278 53,169 11,484 Other Miscellaneous 23,833 116,378 62,743 38,440 50,965 21,303 42,843 11,432 Building and Outdoor Home Supply 3,500 36,162 41,326 21,220 Selected Automotive ‐ 7,300 19,830 10,158 10,000 Total Non‐Food Retail 156,283 382,327 317,932 302,721 288,021 133,951 609,282 648,000 219,931
Other Retail: LBW 6,400 11,260 13,409 1,000 20,806
Banks/Credit Unions 33,000 15,106 12,864 14,745 4,743 7,525 Health Care 121,538 28,164 30,703 44,520 1,391 7,459 13,400 Cultural, Entertainment & Recreation 69,800 24,262 61,898 4,087 28,700 58,062 2,400 Food Services & Drinking Places 150,866 108,840 52,775 35,872 1,094 90,238 22,137 11,232 55,548 Consumer Goods Rental 2,700 8,249 Personal & Household Goods Repair & Maintenance 4,000 10,016 24,466 2,500 26,696 630 1,712 Personal Care 76,000 15,310 5,376 43,590 6,353 6,446 14,632 Selected Civic & Social Organizations 46,563 9,600 10,000 2,500 40,000 880 Social Services 4,300 8,514 7,900 5,500 Other Services 209,310 43,032 102,280 81,763 971 18,116 9,996 Total Services 718,077 262,844 238,463 102,770 5,181 386,401 31,482 108,650 109,001

CityofBurlington–OfficialPlanReviewCommercialStrategyStudy(Phase1:CommercialMarketSupplyandDemandAnalysis)
160
SOURCE: urbanMetrics inc., based on a detailed inventory of retail and service commercial space located in the City of Burlington (2012).
Upper Middle and Guelph Line
Dundas/ Appleby
Power Node (11)
Walkers Line/New Street
Guelph Line/New Street
Appleby Line/New Street
Guelph Line/QEW Power Node
Remainder of North Burlington
Remainder of South Burlington
Total City
10 11 12 13 14 15 16 17Supermarkets & Grocery 116,877 62,000 20,000 69,200 133,976 34,387 761,604 Specialty and Other Food 1,270 10,100 6,888 28,095 5,850 1,000 49,898 10,072 235,899 Total Food 118,147 72,100 26,888 28,095 75,050 1,000 183,874 44,459 997,503
Pharmacies & Personal Care 1,000 26,503 3,200 25,880 38,685 65,928 17,027 276,392 General Merchandise 9,219 137,271 1,300 5,094 10,000 22,212 2,600 1,321,165 Apparel and Accessories 28,000 3,856 10,100 3,700 10,764 1,000 605,648 Home Furnishings 1,015 17,000 1,750 20,494 3,150 51,000 141,330 231,858 1,228,746 Other Miscellaneous 10,870 78,400 14,563 12,286 8,900 25,000 126,315 136,569 780,840 Building and Outdoor Home Supply 1,140 2,200 19,569 148,060 90,405 116,300 479,882 Selected Automotive 2,500 13,500 46,000 109,288 Total Non‐Food Retail 22,104 288,314 24,669 78,554 84,004 224,060 470,454 551,354 4,801,961
Other Retail: LBW 17,986 13,500 16,379 100,740
Banks/Credit Unions 13,544 19,400 16,400 15,477 6,900 47,944 35,232 242,880 Health Care 11,556 11,180 7,000 27,560 26,197 119,397 171,798 621,863 Cultural, Entertainment & Recreation 4,800 49,800 100,000 5,559 79,599 140,134 629,101 Food Services & Drinking Places 20,418 44,300 13,890 27,672 22,775 16,275 116,787 123,377 914,095 Consumer Goods Rental 2,000 21,500 34,449 Personal & Household Goods Repair & Maintenance 728 11,800 1,200 60,869 104,700 249,317 Personal Care 6,350 11,600 8,232 19,955 18,676 1,050 58,473 36,579 328,622 Selected Civic & Social Organizations 1682 5,200 16,500 132,925 Social Services 1,200 14,721 8,084 50,219 Other Services 2,810 26,860 2,850 68,785 7,175 100,049 286,940 960,937 Total Services 59,478 163,140 49,100 272,449 90,164 17,325 605,039 944,844 4,164,408

CityofBurlington–OfficialPlanReviewCommercialStrategyStudy(Phase1:CommercialMarketSupplyandDemandAnalysis)
161
APPENDIXD–BACKGROUNDDATAANDDEFINITIONOFTERMS
GrossLeasableArea(GLA)
Grossleasablearea(GLA)isthetotalretailfloorareadesignedfortenantoccupancyandexclusiveuse,includingbasements,upperfloorsandmezzanines.Itisexpressedinsquarefeetandmeasuredfromthecentrelineofjointpartitionsandfromoutsidewallfaces.GLAistheareaonwhichtenantspayrentandwhichproducesincomeforatenant.Sinceitlendsitselfreadilytomeasurementandcomparison,GLAhasbeenadoptedbytheshoppingcentreindustryasitsstandardforstatisticalcomparison.
PerCapitaIncome
Percapitaincomerepresentsaveragetotalpersonalincomebeforetax,asdefinedbyStatisticsCanada.TheTradeAreaincomeindicestotheProvincearebasedontheresultsofthe2006CensusofCanada,themostrecentyearforwhichthistypeofCensusinformationisavailable.
PerCapitaRetailExpenditures
FigureD‐1detailsourcalculationsofpercapitaretailexpendituresintheProvinceofOntariofor2012,includingtheNFSRandFSRcategories.ThesecalculationsarebasedonStatisticsCanada,RetailTradedata,usingannualizeddataforJanuarytoSeptember2012.
TradeAreaPerCapitaRetailExpenditures
PerCapitaretailexpendituresforTradeArearesidentshavebeencalculatedinthisreportbasedonregressionequationsutilizingStatisticsCanada,SurveyofHouseholdSpendingdata.FigureD‐2presentsthecalculationsofvariousregressionequations,includingforFSRandNFSRexpenditures,basedondataforOntariofrom2010.
ExpenditurePotential
ExpenditurepotentialisthetotalannualexpendituresmadebyTradeArearesidents.ThisincludespurchasesmadebothinsideandoutsidetheTradeArea.Itiscalculatedbymultiplyingtheaveragepercapitaexpenditureineachstorecategorybythetotalpopulationofadefinedarea.
RealGrowth
Realgrowthreferstotheamountthatsalesvolumesorexpenditureswouldincreaseinfutureyears,afterdiscountingforinflation.Therefore,referencestotheCanadiandollar,dealingwithboththepresentandfutureperiod,reflectits2012valueinthisreport.FiguresD‐
CityofBurlington–OfficialPlanReviewCommercialStrategyStudy(Phase1:CommercialMarketSupplyandDemandAnalysis)
162
3andD‐4examinehistoricrealgrowthinpercapitaFSRandNFSRexpendituresinOntario,respectively.Forthepurposesofthisreport,arealgrowthrateof1.5%peryearhasbeenutilizedforpercapitaNFSRexpenditures,whilearealgrowthrateof0.25%peryearhasbeenusedforpercapitaFSRexpenditures.
Retail/ServiceStoreClassification
AdetailedlistingoftheretailandservicespacecategoriesreferredtointhisreportisincludedinFigureD‐5.ThisclassificationschemeisbasedonStatisticsCanada’sNorthAmericanIndustryClassificationSystem(NAICS).

CityofBurlington–OfficialPlanReviewCommercialStrategyStudy(Phase1:CommercialMarketSupplyandDemandAnalysis)
163
FIGURE D‐1: ONTARIO RETAIL TRADE – AVERAGE PER CAPITA EXPENDITURES BY RETAIL CATEGORY (2012)
SOURCE: urbanMetrics inc. * Adjusted for estimated Non‐NFSR portion. ** For part year data, annualized totals calculated by applying average indices of quarters for the past six years as a % of total, to current year partial sales. *** urbanMetrics estimate. Excluded stores include: Mobile Home Dealers and Tomb Stone Dealers.
($Millions)MONTH 1 2 3 4 5 6 7 8 9 ANNUALIZED PerYEAR 2012 2012 2012 2012 2012 2012 2012 2012 2012 TOTAL** CapitaMotor vehicle and parts dealers[441] 2,283.6 2,197.7 3,016.4 3,080.6 3,470.6 3,279.2 2,946.6 3,075.8 2,712.7 $34,012.0 $2,518New car dealers[44111] 1,941.0 1,869.7 2,570.1 2,566.7 2,868.7 2,735.5 2,402.9 2,553.5 2,258.0 $28,384.7 $2,102Used car dealers[44112] 176.9 177.4 224.0 236.3 246.0 238.8 215.9 220.4 195.4 $2,531.3 $187Other motor vehicle dealers[4412] 60.1 64.3 100.1 142.9 209.7 172.4 196.5 168.1 132.1 $1,525.7 $113
Automotive parts, accessories and tire stores[4413] 105.5 86.2 122.3 134.7 146.2 132.5 131.4 133.9 127.2 $1,570.3 $116Furniture and home furnishings stores [442] 422.6 379.0 430.8 406.0 448.8 455.9 472.4 509.0 487.6 $5,554.6 $411Furniture stores [4421] 271.3 233.7 265.4 255.7 284.4 287.9 298.1 324.4 316.0 $3,469.4 $257Home furnishings stores [4422] 151.3 145.4 165.4 150.3 164.4 167.9 174.2 184.6 171.6 $2,085.3 $154Electronics and appliance stores [443] 415.1 377.4 431.0 375.4 390.4 429.5 410.9 484.7 470.0 $5,632.0 $417
Building material and garden equipment and supplies dealers [444] 567.7 562.1 682.7 756.9 1,035.9 957.4 903.6 891.3 814.6 $9,436.0 $699Food and beverage stores [445] 2,727.5 2,715.5 3,103.1 2,896.0 3,285.7 3,447.5 3,198.1 3,297.8 3,198.8 $37,760.0 $2,796Grocery stores [4451] (includes 44511 & 44512) 2,138.7 2,085.1 2,358.8 2,183.1 2,457.5 2,534.1 2,323.2 2,394.3 2,392.9 $28,064.5 $2,078
Supermarkets and other grocery (except convenience) stores [44511] 2,002.4 1,951.0 2,208.3 2,041.6 2,301.6 2,379.9 2,160.9 2,233.6 2,238.7 $26,270.5 $1,945Convenience stores [44512] 136.3 134.1 150.5 141.5 155.9 154.2 162.3 160.7 154.2 $1,794.1 $133Specialty food stores [4452] 137.8 145.8 157.7 168.7 170.7 177.7 170.0 180.3 172.3 $2,054.7 $152Beer, wine and liquor stores [4453] 451.1 484.5 586.6 544.1 657.5 735.7 705.0 723.3 633.7 $7,640.8 $566Health and personal care stores [446] 1,024.7 993.1 1,051.1 1,037.7 1,087.3 1,031.7 1,005.5 1,037.2 1,002.9 $12,667.3 $938Gasoline Stations [447] 1,460.5 1,460.6 1,573.4 1,587.4 1,664.6 1,619.4 1,637.5 1,681.4 1,606.9 $18,964.8 $1,404Clothing and clothing accessories stores [448] 622.1 632.7 778.4 744.3 902.6 895.3 766.0 858.1 892.8 $10,510.9 $778Clothing stores [4481] 483.3 479.6 614.0 588.9 702.0 707.3 594.0 666.8 702.8 $8,199.1 $607Shoe stores [4482] 73.3 60.8 91.4 85.0 103.9 99.0 88.8 102.4 110.2 $1,162.0 $86Jewellery, luggage and leather goods stores [4483] 65.5 92.3 73.0 70.5 96.6 88.9 83.1 88.9 79.9 $1,149.8 $85Sporting goods, hobby, book and music stores [451] 309.9 259.2 303.3 274.8 305.5 313.0 297.5 332.6 382.2 $4,086.7 $303General merchandise stores [452] 1,479.0 1,392.6 1,683.2 1,723.9 1,991.8 1,909.8 1,813.0 1,859.4 1,805.9 $22,554.2 $1,670Department stores [4521] 735.7 698.6 839.5 855.2 912.3 905.8 875.4 905.6 920.8 NA NAOther general merchandise stores [4529] 743.3 694.0 843.7 868.8 1,079.5 1,004.0 937.7 953.8 885.1 NA NAMiscellaneous store retailers [453] 266.2 273.0 304.7 290.4 320.6 327.2 293.7 317.3 352.4 $3,832.5 $255
TOTAL RETAIL TRADE 11,578.9 11,242.9 13,358.1 13,173.4 14,903.8 14,665.9 13,744.8 14,344.6 13,726.8 0.0 0.0 0.0 165,011.2
TOTAL ESTIMATED FSR SALES, ONTARIO [NAICS ‐ 4451, 4452] (partial years calculated by adding 4451 and 4452) $30,119.2POPULATION (July 1st Estimate) Catalogue no. 91‐002‐X, vol. 26, no. 2 (released Sept 27 2012) 13,505,900PER CAPITA FSR SALES $2,230
TOTAL NFSR STORE SALES, ONTARIO [NAICS ‐ 4413, 442, 443, 444, 446, 448, 451, 452, 453 @ 90%] ‐ INCLUDES AUTOMOTIVE TIRES/BATTERIES/AUTO ACCESSORIES $75,844.7Less Miscellaneous Store Retailers ‐ Non‐ NFSR Portion @ *** 10% $383.0ADJUSTED TOTAL NFSR SALES, ONTARIO $75,461.7POPULATION (July 1st Estimate) Catalogue no. 91‐002‐X, vol. 26, no. 2 (released Sept 27 2012) 13,505,900PER CAPITA NFSR STORE SALES $5,587
PER CAPITA GAFO (including NAICS 4413,442,443,448,451,452,453 @90%) ‐ EXCLUDES AUTOMOTIVE TIRES/BATTERIES/AUTO ACCESSORIES @ $116 PER CAPITA $3,834

CityofBurlington–OfficialPlanReviewCommercialStrategyStudy(Phase1:CommercialMarketSupplyandDemandAnalysis)
164
FIGURE D‐2: PROVINCE OF ONTARIO INCOME/EXPENDITURE REGRESSION EQUATIONS, 2010
SOURCE: urbanMetrics inc., based on Statistics Canada Survey of Household Spending in 2010, Ontario (April 2012 62F0032X).
(x) (y1) (y2) (y3) (y4) (y5)
(n)
Average Per Capita Income of Income
Quintile Income FSR NFSR RestaurantHealth and
Personal CareLiquor / Beer /
Wine
1 $11,020 35.2 97.0 72.2 78.7 105.6 47.72 $16,939 54.1 95.8 79.5 67.2 94.3 48.13 $24,067 76.9 92.1 95.1 81.5 101.6 91.04 $30,527 97.5 99.3 101.3 116.6 86.3 127.15 $56,256 179.7 110.0 129.7 129.9 111.6 185.8
All Classes $31,305 100.0 100.0 100.0 100.0 100.0 100.0
REGRESSION EQUATIONS:FSR y1 = 0.10 (x) + 90NFSR y2 = 0.40 (x) + 60Restaurant y3 = 0.43 (x) + 57H&PC y4 = 0.06 (x) + 94LBW y5 = 0.90 (x) + 10
where x = income index (independent variable) and y = expenditure index for selected category (dependent variable)

CityofBurlington–OfficialPlanReviewCommercialStrategyStudy(Phase1:CommercialMarketSupplyandDemandAnalysis)
165
FIGURE D‐3: PROVINCE OF ONTARIO, HISTORIC REAL GROWTH IN FOOD STORE RETAIL (FSR) EXPENDITURES
SOURCE: urbanMetrics inc. 1) Based on Statistics Canada, Retail Trade, Publication 63‐005 (NAICS). The figure for 2012 is an estimate based on January to September data, indexed to
the full year using historic data for the preceding six years. 2) Statistics Canada, The Consumer Price Index (CPI) for Food Purchased from Stores.
Per Capita FSR Expenditures (Current $) (1
Consumer Price Index (2002 Base
Year) (2
Per Capita FSR Expenditures (Constant $)
Annual Real Growth
$1,885 103.0 $1,830$1,937 106.1 $1,824 ‐0.3%$1,943 108.2 $1,795 ‐1.6%$1,994 110.6 $1,804 0.5%$2,113 115.4 $1,831 1.5%$2,193 121.4 $1,806 ‐1.3%$2,182 123.1 $1,772 ‐1.9%$2,188 129.0 $1,696 ‐4.3%$2,230 131.9 $1,691 ‐0.3%
Average Annual Real Growth, 2004 to 2012 ‐1.0%
Year
200420052006200720082009201020112012

CityofBurlington–OfficialPlanReviewCommercialStrategyStudy(Phase1:CommercialMarketSupplyandDemandAnalysis)
166
FIGURE D‐4: PROVINCE OF ONTARIO, HISTORIC REAL GROWTH IN NON‐FOOD STORE RETAIL (NFSR) EXPENDITURES
SOURCE: urbanMetrics inc. 1) Based on Statistics Canada, Retail Trade, Publication 63‐005 (NAICS). The figure for 2012 is an estimate based on January to September data, indexed to
the full year using historic data for the preceding six years. 2) Statistics Canada, The Consumer Price Index (CPI) for All Items Excluding Food and Energy.
Per Capita NFSR Expenditures (Current $) (1
Consumer Price Index (2002 Base
Year) (2
Per Capita NFSR Expenditures (Constant $)
Annual Real Growth
$4,757 104.1 $4,569$4,874 105.3 $4,627 1.3%$5,112 106.6 $4,795 3.6%$5,289 108.5 $4,872 1.6%$5,376 109.8 $4,894 0.4%$5,306 111.1 $4,776 ‐2.4%$5,499 113.4 $4,850 1.6%$5,555 115.6 $4,805 ‐0.9%$5,587 116.8 $4,782 ‐0.5%
Average Annual Real Growth, 2004 to 2012 0.6%
Year
200420052006200720082009201020112012

CityofBurlington–OfficialPlanReviewCommercialStrategyStudy(Phase1:CommercialMarketSupplyandDemandAnalysis)
167
FIGURE D‐5: RETAIL/SERVICE STORE CLASSIFICATION, BASED ON NORTH AMERICAN INDUSTRY CLASSIFICATION SYSTEM (NAICS)
Trade Group NAICS Description
FOOD
90 Supermarkets
44511 Supermarkets and Other Grocery (except Convenience) Stores
100 Convenience and Specialty Food Stores
44512 Convenience Stores 44521 Meat Markets 44522 Fish and Seafood Markets 44523 Fruit and Vegetable Markets 44529 Other Specialty Food Stores, including Baked Goods Stores, & Confectionary & Nut
BEVERAGE STORES
110 Beer, Wine and Liquor Stores
44531 Beer, Wine and Liquor Stores
NON‐FOOD STORE RETAIL (NFSR)
Automotive
20 Used and Recreational Motor Vehicle and Parks Dealers (Tires, Batteries, Automotive Accessories component)
44131 Automotive Parts and Accessories Stores
44132 Tire Dealers

CityofBurlington–OfficialPlanReviewCommercialStrategyStudy(Phase1:CommercialMarketSupplyandDemandAnalysis)
168
Furniture, Home Furnishings and Electronics Stores
30 Furniture Stores 44211 Furniture Stores
40 Home Furnishings Stores 44221 Floor Covering Stores (excludes retailers or only ceramic or only hardwood flooring which are in Building Supply) 44229 Other Home Furnishings Stores (e.g. window treatments, fireplace/accessories, kitchen and tableware, bedding and
linens, brooms and brushes, lamps and shades, and prints and picture frames).
50 Computer and Software Stores 44312 Computer and Software Stores (includes retailing new computers, computer peripherals, pre‐packaged software, game
software and related products) 60 Home Electronics and Appliance Stores 44311 Appliance, Television and other Electronics Stores 44313 Camera and Photographic Supplies Stores
Building and Outdoor Home Supplies Stores
70 Home Centres and Hardware Stores 44411 Home Centres 44413 Hardware Stores (includes tool stores)
80 Specialized Building Materials and Garden Stores 44412 Paint and Wallpaper Stores 44419 Other Building Material Dealers (excluding manufacturing and construction firms) (includes doors, windows, kitchen
cabinets, electrical, glass, plumbing, ceramic floor, roofing materials, fencing) 44421 Outdoor Power Equipment Stores (lawn mowers, tractors, hedge trimmers, snow blowers) 44422 Nursery Stores and Garden Centres
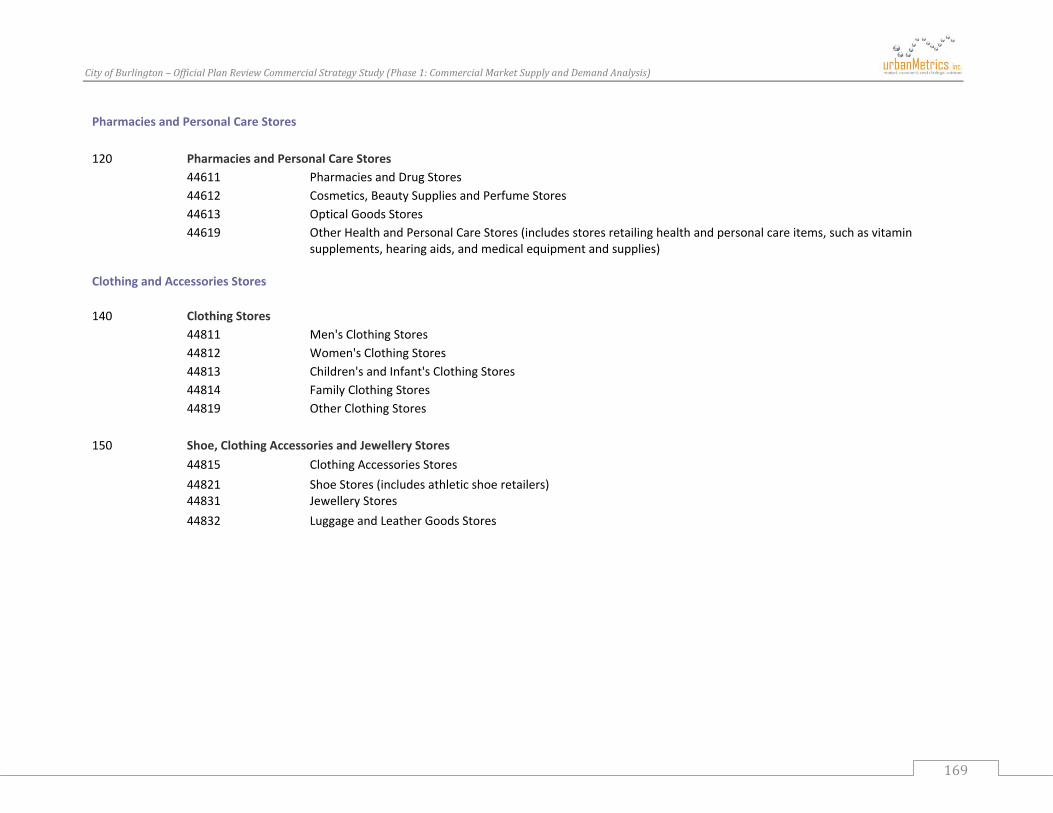
CityofBurlington–OfficialPlanReviewCommercialStrategyStudy(Phase1:CommercialMarketSupplyandDemandAnalysis)
169
Pharmacies and Personal Care Stores 120 Pharmacies and Personal Care Stores 44611 Pharmacies and Drug Stores 44612 Cosmetics, Beauty Supplies and Perfume Stores 44613 Optical Goods Stores 44619 Other Health and Personal Care Stores (includes stores retailing health and personal care items, such as vitamin
supplements, hearing aids, and medical equipment and supplies) Clothing and Accessories Stores 140 Clothing Stores 44811 Men's Clothing Stores 44812 Women's Clothing Stores 44813 Children's and Infant's Clothing Stores 44814 Family Clothing Stores 44819 Other Clothing Stores 150 Shoe, Clothing Accessories and Jewellery Stores 44815 Clothing Accessories Stores 44821 Shoe Stores (includes athletic shoe retailers) 44831 Jewellery Stores 44832 Luggage and Leather Goods Stores

CityofBurlington–OfficialPlanReviewCommercialStrategyStudy(Phase1:CommercialMarketSupplyandDemandAnalysis)
170
General Merchandise Stores 170 Department Stores 45211 Department Stores175 45211 Department Stores with a Large food component (i.e. Walmart Supercentres)180 Other General Merchandise Stores 45291 Warehouse Clubs and Superstores 45299 All Other General Merchandise Stores: Home & Auto (i.e. Canadian Tire) Other General Merchandise Stores (e.g. general stores, variety stores, "dollar" stores) Miscellaneous Retailers 160 Sporting Goods, Hobby, Music and Book Stores 45111 Sporting Goods Stores (excludes athletic shoe retailers) 45112 Hobby, Toy and Game Stores (excludes computer games and software) 45113 Sewing, Needlework and Piece Goods Stores 45114 Musical Instrument and Supplies Stores 45121 Book Stores and News Dealers 45122 Pre‐Recorded Tape, Compact Disc and Record Stores 190 Miscellaneous Store Retailers 45311 Florists 45321 Office Supplies and Stationery Stores 45322 Gift, Novelty and Souvenir Stores 45331 Used Merchandise Stores 45391 Pet and Pet Supplies Stores 45392 Art Dealers (excludes art galleries) 45399 All Other Miscellaneous Store Retailers (e.g. tobacco supplies, artist supplies, collectors’ items, beer & wine making,
swimming pool/spas/accessories, religious goods and accessories)

CityofBurlington–OfficialPlanReviewCommercialStrategyStudy(Phase1:CommercialMarketSupplyandDemandAnalysis)
171
SERVICES 200
Consumer Goods Rental
53221 Consumer Electronics and Appliance (Appliance rental and leasing, rental of consumer audio‐visual equipment (including rent‐to‐own), Television rental and leasing, Video recorder and player rental and leasing, Washers and dryers rental)
53222 Formal Wear and Costume Rental 53223 Video Tape and Disc Rental 53229 Other Rental (sporting goods, garden equipment, home health, fitness etc.) 53231 General Rental Centres (including contractors' and builders' tools and equipment, home repair tools, lawn and garden
equipment, moving equipment and supplies, and party and banquet equipment and supplies
210 Finance
52211 Banks 52213 Credit Unions215 52239 Other Financial (including cheque cashing, mortgage brokers, other financial services (e.g. Edward Jones))
220
Insurance and Real Estate
52421 Insurance Agencies and Brokerages 53121 Offices of Real Estate Agents and Brokers 53132 Office of Real Estate Appraisers
230
Professional, Scientific & Technical Services
54111 Offices of Lawyers 54119 Other Legal Services (e.g. Paralegal, Title search, immigration consultation, notaries) 54121 Offices of Accountants, Tax Preparation Services, Bookings, Payroll 54131 Architectural Services 54132 Landscape Architecture (includes urban planners, industrial development planning, landscape architects) 54134 Drafting Services 54137 Survey and Mapping Services 54138 Testing Labs (excluding medical, auto, veterinary) 54141 Interior Design Services 54143 Graphic Design Services (includes art studios) 54149 Other Specialized Design Services (e.g. clothing, jewellery, fashion)

CityofBurlington–OfficialPlanReviewCommercialStrategyStudy(Phase1:CommercialMarketSupplyandDemandAnalysis)
172
54151 Computer Systems Design and Related Services (e.g. computer consulting and programming) 54161 Management Consulting Services 54162 Environmental Consulting Services 54169 Other Scientific and Technical Consulting (e.g. economic, hydrology, safety ) 54171 Research & Development in the Physical, Engineering and Life Sciences (includes medical research labs) 54172 Research & Development in the Social Sciences and Humanities (e.g. demographic, education, psychology research) 54181 Advertising Agencies 54182 Public Relations Services (e.g. lobbyists, political consultants) 54191 Marketing Research & Public opinion polling 54192 Photographic Services (e.g. passport photography, photo studios portrait photography studies) 54193 Translation and Interpretation Services 54194 Veterinary Services (excludes pet care (81291)) 54199 All Other Professional, Scientific and Technical Services (includes consumer credit counselling)
240
Selected Office Administrative Services
56131 Employment Services (includes placements, executive search, casting agencies etc.) 56141 Document Preparation Services (proofreading, word processing, desktop publishing etc.) 56142 Telephone Call Centres 56143 Business Service Centres (e.g. printing, copying, mail centres) (excludes commercial printing) 56144 Collection Agencies 56145 Credit Bureaus241 56151 Travel Agencies 56159 Other Travel Arrangement & Reservation Services (e.g. ticket sales agency, tourist info, bus ticket offices, etc.) 56162 Security Systems (includes security system sales, installation and monitoring; locksmiths (excluding key duplication ‐
81149))
245
Selected Educational Services
61161 Fine Arts Schools (e.g. dance, drama, music, art, handicrafts) 61162 Athletic Instruction (e.g. aerobic dance, gymnastics, judo, karate, martial arts, scuba, swimming) (excludes athletic
instruction in sport and recreation facility) 61163 Language Schools 61169 All Other Schools and Instruction (e.g. driving instruction, public speaking, Kumon, Oxford)
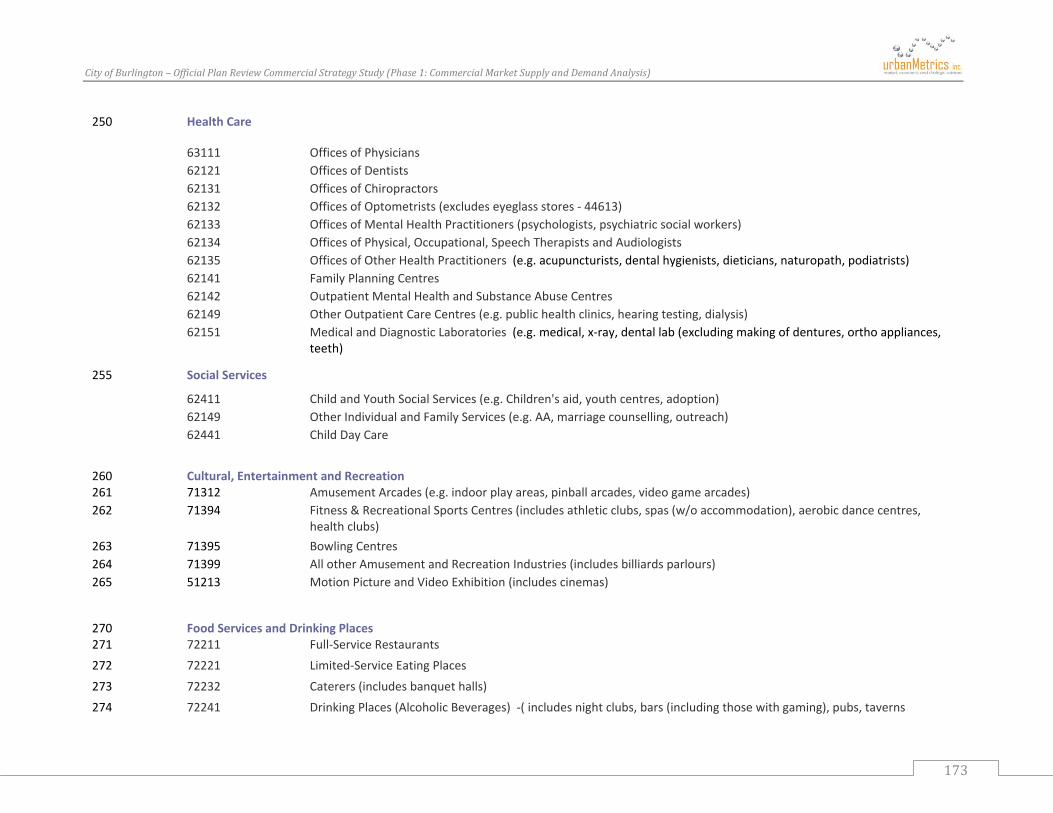
CityofBurlington–OfficialPlanReviewCommercialStrategyStudy(Phase1:CommercialMarketSupplyandDemandAnalysis)
173
250 Health Care
63111 Offices of Physicians 62121 Offices of Dentists 62131 Offices of Chiropractors 62132 Offices of Optometrists (excludes eyeglass stores ‐ 44613) 62133 Offices of Mental Health Practitioners (psychologists, psychiatric social workers) 62134 Offices of Physical, Occupational, Speech Therapists and Audiologists 62135 Offices of Other Health Practitioners (e.g. acupuncturists, dental hygienists, dieticians, naturopath, podiatrists) 62141 Family Planning Centres 62142 Outpatient Mental Health and Substance Abuse Centres 62149 Other Outpatient Care Centres (e.g. public health clinics, hearing testing, dialysis) 62151 Medical and Diagnostic Laboratories (e.g. medical, x‐ray, dental lab (excluding making of dentures, ortho appliances,
teeth)
255 Social Services
62411 Child and Youth Social Services (e.g. Children's aid, youth centres, adoption) 62149 Other Individual and Family Services (e.g. AA, marriage counselling, outreach) 62441 Child Day Care
260
Cultural, Entertainment and Recreation
261 71312 Amusement Arcades (e.g. indoor play areas, pinball arcades, video game arcades)262 71394 Fitness & Recreational Sports Centres (includes athletic clubs, spas (w/o accommodation), aerobic dance centres,
health clubs) 263 71395 Bowling Centres264 71399 All other Amusement and Recreation Industries (includes billiards parlours)265 51213 Motion Picture and Video Exhibition (includes cinemas)
270
Food Services and Drinking Places
271 72211 Full‐Service Restaurants
272 72221 Limited‐Service Eating Places
273 72232 Caterers (includes banquet halls)
274 72241 Drinking Places (Alcoholic Beverages) ‐( includes night clubs, bars (including those with gaming), pubs, taverns
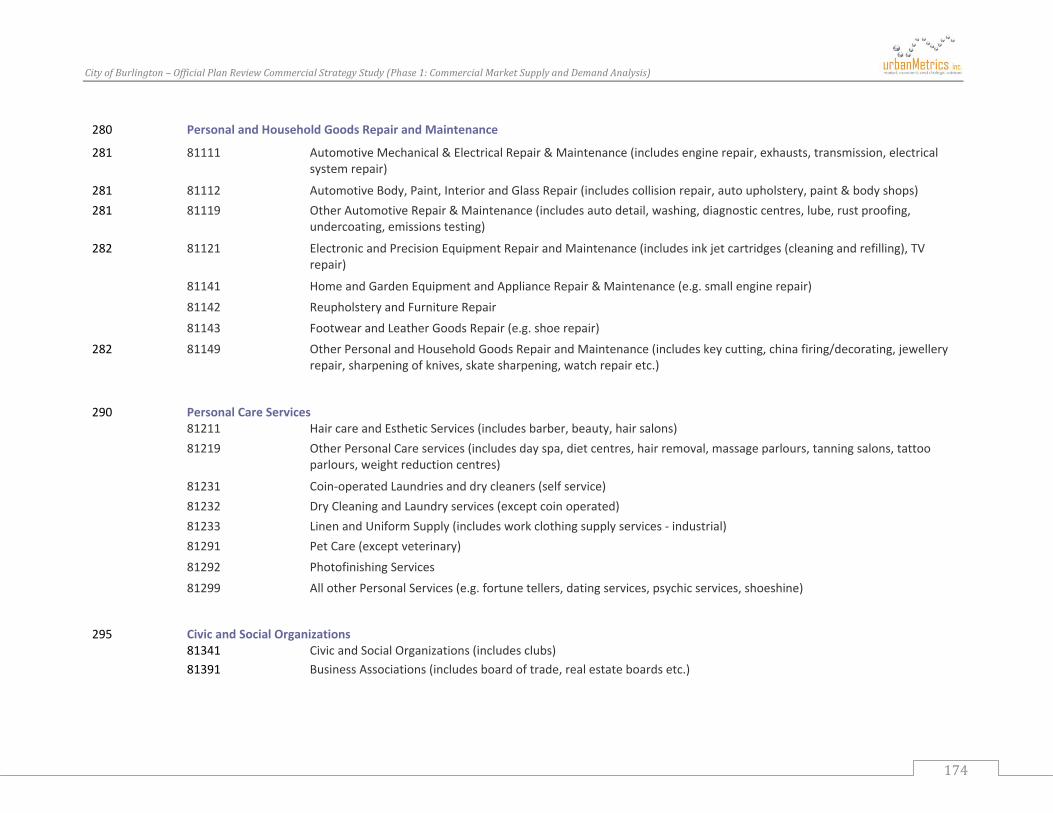
CityofBurlington–OfficialPlanReviewCommercialStrategyStudy(Phase1:CommercialMarketSupplyandDemandAnalysis)
174
280 Personal and Household Goods Repair and Maintenance
281 81111 Automotive Mechanical & Electrical Repair & Maintenance (includes engine repair, exhausts, transmission, electrical system repair)
281 81112 Automotive Body, Paint, Interior and Glass Repair (includes collision repair, auto upholstery, paint & body shops)281 81119 Other Automotive Repair & Maintenance (includes auto detail, washing, diagnostic centres, lube, rust proofing,
undercoating, emissions testing)
282 81121 Electronic and Precision Equipment Repair and Maintenance (includes ink jet cartridges (cleaning and refilling), TVrepair)
81141 Home and Garden Equipment and Appliance Repair & Maintenance (e.g. small engine repair)
81142 Reupholstery and Furniture Repair
81143 Footwear and Leather Goods Repair (e.g. shoe repair)
282 81149 Other Personal and Household Goods Repair and Maintenance (includes key cutting, china firing/decorating, jewellery repair, sharpening of knives, skate sharpening, watch repair etc.)
290
Personal Care Services
81211 Hair care and Esthetic Services (includes barber, beauty, hair salons) 81219 Other Personal Care services (includes day spa, diet centres, hair removal, massage parlours, tanning salons, tattoo
parlours, weight reduction centres)
81231 Coin‐operated Laundries and dry cleaners (self service) 81232 Dry Cleaning and Laundry services (except coin operated) 81233 Linen and Uniform Supply (includes work clothing supply services ‐ industrial) 81291 Pet Care (except veterinary)
81292 Photofinishing Services
81299 All other Personal Services (e.g. fortune tellers, dating services, psychic services, shoeshine)
295
Civic and Social Organizations
81341 Civic and Social Organizations (includes clubs) 81391 Business Associations (includes board of trade, real estate boards etc.)

CityofBurlington–OfficialPlanReviewCommercialStrategyStudy(Phase1:CommercialMarketSupplyandDemandAnalysis)
175
Transportation
296 49111 Postal Service (post office)
300
VACANT
9999 VACANT RETAIL/SERVICE SPACE