Embed Size (px)
Citation preview

CITY OF BOZEMAN
TRANSPORTATION IMPACT FEE STUDY FINAL REPORT
January 3, 2008
Prepared for:
CITY OF BOZEMAN 20 E. Olive Street
Bozeman, Montana 59715
Prepared by:
Tindale-Oliver & Associates, Inc. 1000 N. Ashley Dr., #100 Tampa, Florida, 33602
ph (813) 224-8862, fax (813) 226-2106 497001-00.06

Tindale-Oliver & Associates, Inc. City of Bozeman January 2008 i Impact Fee Study
CITY OF BOZEMAN TRANSPORTATION IMPACT FEE STUDY
Table of Contents 1.0 INTRODUCTION...................................................................................... 1 2.0 TRANSPORTATION IMPACT FEE CALCULATION....................... 4 2.1 Demand Component.............................................................................. 4 2.1.1 Individual Land Use Trip Characteristics .............................. 5 2.2 Cost Component of Transportation Capacity ........................................ 9 2.2.1 City Costs............................................................................... 10 2.2.2 State Costs.............................................................................. 13 2.2.3 Summary of Costs (Blended Cost Analysis) ......................... 15 2.3 Credit Component ................................................................................. 16 2.3.1 Gasoline Tax Credit (Equivalent) .......................................... 16 2.3.2 Facility Life............................................................................ 17 2.3.3 Interest Rate ........................................................................... 18 2.3.4 Fuel Efficiency....................................................................... 18 2.3.5 Effective Days per Year......................................................... 19 2.4 Capacity per Lane Mile ........................................................................ 19 2.5 Cost per Vehicle Mile of Capacity ....................................................... 20 2.6 Interstate Adjustment Factor ................................................................ 21 2.7 Ad Valorem Tax Credit ......................................................................... 22 3.0 PROPOSED TRANSPORTATION FEE SCHEDULE ......................... 23
3.1 Proposed Transportation Impact Fee Schedule...................................... 23 3.2 Indexing ................................................................................................. 31 3.3 Compliance with State Statute – City Impact Fee Expenditures ........... 31
3.3.1 Preparation of Long Range Transportation Plan ................... 32 3.3.2 Classification of the Types of Projects .................................. 32 3.3.3 Development and Update of Capital Improvement Program 32 3.3.4 Project Implementation and Cost Verification ...................... 34
3.4 Revenue Projections............................................................................... 34 APPENDICES Appendix A– Trip Characteristics Database Appendix B– Cost Component Calculation Appendix C– Credit Component Calculation Appendix D– Ad Valorem Credit Calculation

Tindale-Oliver & Associates, Inc. City of Bozeman January 2008 ii Impact Fee Study
Appendix E– Analysis of Travel Behavior of Low-Income Households Appendix F– Proposed City of Bozeman Transportation Impact Fee Schedule Appendix G– Indexing Appendix H– Revenue Projections Appendix I– Evaluation of Funding Sources Appendix J– Glossary of Acronyms and Definitions Appendix K– Trip Exchange District (TED) Definition Characteristics Appendix L– Transportation Impact Fee Comparison Appendix M– Compliance with State Statute Appendix N– Historical Street Impact Fee Funded Projects

Tindale-Oliver & Associates, Inc. City of Bozeman January 2008 1 Impact Fee Study
1.0 INTRODUCTION The City of Bozeman’s Street Impact Fee Ordinance (Bozeman Municipal Code (BMC), Chapter 3.24.050 – Street Impact Fees) was adopted in 1996. The impact fee ordinance was imposed to assist the City in providing adequate transportation facilities needed to accommodate the roadway capacity consumed by new development. The primary purpose of the roadway system is to ensure public safety, specifically in the event of an emergency such as providing a means of mobility for fire and ambulance response vehicles. In addition, the roadway system provides the transportation capacity needed to serve new development. Based on 2000 Census Data, between 1980 and 1990, the city’s population increased by 5 percent and between 1990 and 2000 by 21 percent. The 2007 City of Bozeman Sewer Facility Plan projects that the city’s population is expected to increase by approximately another 147 percent over the next 18 years. This growth results in a need for an increase in roadway capacity. Tindale-Oliver & Associates, Inc. (TOA) was retained to conduct the City’s 2007 Transportation Impact Fee Study. This summary report, which acts as a technical support document to the Ordinance, presents the results of this study. Included in this document is an updated fee schedule, as well as the necessary support material utilized in its calculation. It is recognized that this study is one component in an integrated transportation impact fee program which collectively satisfies the requirement of Title 7, Chapter 6, Part 16 of the Montana Code Annotated (MCA). Tindale-Oliver & Associates and the City of Bozeman have prepared, updated, and relied upon other documentation in developing the transportation facilities impact fee. Much of this information is immediately available to the public through the City of Bozeman website. All information cited is subject to change and updating to maintain currency and some elements are updated at least yearly. This information satisfies the requirements of section 7-6-1602 of the MCA and includes, but is not limited to the following:
(1) Chapter 3.24, Impact Fees, Bozeman Municipal Code (2) Greater Bozeman Area Transportation Plan, 2001 Update; (3) Title 18, Unified Development Ordinance; BMC; (4) Design and Specifications Manual; (5) Street Impact Fee Capital Improvement Program;

Tindale-Oliver & Associates, Inc. City of Bozeman January 2008 2 Impact Fee Study
(6) Capital Improvements Program for General Fund, Street Maintenance Fund, and Street Impact Fee Fund;
(7) the City Budget; and (8) Specified bid tabulations.
The purpose of this collective information and associated established procedures is to implement and administer the impact fee program in a manner that ensures that:
a) The amount of the impact fee is reasonably related to and reasonably attributable to the development's share of the cost of capacity consumed per unit of development and the associated infrastructure improvements made necessary by the new development.
b) The impact fees imposed do not exceed a proportionate share of the costs incurred or to be incurred by the governmental entity in accommodating the development. In accomplishing this, the following factors have been considered in determining a proportionate share of transportation capital improvements costs:
(i) the need for public facilities capital improvements required to serve new development caused by consumption of capacity by new development; and
(ii) consideration of payments for system improvements reasonably anticipated to be made by or as a result of the development in the form of user fees, debt service payments, taxes, and other available non-impact fee sources of funding the system improvements.
c) Costs for correction of existing deficiencies in a public facility have been excluded from the impact fee calculation and expenditure of impact fee funds.
d) New development has not been held to a higher level of service than existing users. e) Non-impact fee funding mechanisms have been identified to provide for installation
of improvements necessary to address transportation needs not related to new development.
f) Impact fees are prohibited from being used for operations and maintenance of the facility.
g) Provision has been made for regular periodic review and updating of information and programs to maintain currency of information and to support development of an accurate fee.
To accurately reflect the cost to provide roadway capacity, this study used recently bid roadway improvements to develop the input variables used herein. The increased impact
Tindale-Oliver & Associates, Inc. City of Bozeman January 2008 3 Impact Fee Study
fees presented in this report are a direct result of cost increases in such items as concrete, asphalt, fuel, and steel. Specifically, in the last two years global demand for these inputs, with growth in other sectors, such as housing, has inflated the unit prices in the roadway construction industry. In addition, this report includes an evaluation of alternative funding sources to pay for capacity expansion and maintenance projects. New innovative financing sources for future roadway capacity expansion projects is necessary since current estimates project that the Highway Trust Fund balance (that provides a majority of funding for improvements on the state roadway system) will approach zero in 2009 or 2010. The general equation used to compute the transportation impact fee for a given land use is:
Demand x Cost - Credits = Fee The demand for travel placed on the transportation system is usually expressed in units of vehicle miles or lane miles of roadway capacity consumed per unit of development. The cost of building capacity is typically expressed in units of dollars per vehicle-mile or lane-mile of roadway capacity. The credits are an estimate of non-impact fee revenues generated by a unit of each land use of new development that are allocated to roadway capacity expansion construction projects. Thus, the fee represents an "up front" payment for a portion of the cost to replace the transportation facilities consumed by each unit of new development. This study is based on a standards driven approach (consumption-based). In the case of a standards driven impact fee, roadway capacity is estimated to be consumed on all roads (state, county and local collector roads and above) by new development whether these roads are improved or not. This review and update recommends changes to the input variables used in the existing impact fee schedule. Additional information relevant to transportation impact fees was reviewed and used in the update process. The general topics considered for the update process are as follows:
• Demand Component o Individual land use trip characteristics (local data collection)
• Cost Component o City roadway improvement cost estimates o State roadway improvement cost estimates
• Credit Component

Tindale-Oliver & Associates, Inc. City of Bozeman January 2008 4 Impact Fee Study
o Gasoline tax distributions and allocations o Other funds
• Other variables used in the impact fee formula These items are all discussed in subsequent sections of this document, with the result being an updated transportation impact fee rate schedule. 2.0 TRANSPORTATION IMPACT FEE CALCULATION There are 12 input variables used in the impact fee equation:
• Number of daily trips generated • Length of those trips • Proportion of travel that is new travel, rather than travel that is already traveling on
the road system • Cost per lane mile • Equivalent gas tax credit (pennies) • Facility life • Interest rate • Fuel efficiency • Effective days per year • Capacity per lane mile • Interstate adjustment factor • Ad valorem tax credit
A review of these variables and corresponding recommendations are presented in the following sections. 2.1 Demand Component The Demand Component includes three of the twelve impact fee variables. These are the number of daily grips generated, the average length of those trips, and the proportion of those trips that are new trips, as opposed to trips that were already traveling on the road system. Each of these variables are discussed in this section.

Tindale-Oliver & Associates, Inc. City of Bozeman January 2008 5 Impact Fee Study
2.1.1 Individual Land Use Trip Characteristics The amount of road system capacity consumed by a new land development is calculated using the following units of measure:
• Number of daily trips generated; • Length of those trips; and • Proportion of travel that is new travel, rather than travel that is estimated to have
already been on the road system. For the purpose of this study, the trip characteristics variables have been obtained primarily from two sources: previous similar trip characteristics studies, including those conducted in the City of Bozeman, and from the Institute of Transportation Engineers’ (ITE) Trip Generation reference report (7th edition). The trip characteristics studies that were conducted as part of this current study are presented in the City of Bozeman Trip Characteristics Study report. These studies include a survey and review of travel characteristics for the following land uses:
• single family residential; • residential condominium/townhouse; • office; and • shopping center.
Local Trip Characteristics
The analysis of trip characteristics data (trip generation rate, trip length, and percent new trips) is used to estimate the lane miles of capacity consumed by specific types of land uses. In order to better understand trip characteristics in the City of Bozeman, a total of 11 sites from the four identified land use categories were studied. This includes the review of three single-family residential sites, two residential condominium/townhouse sites, three office sites, and three shopping center sites. As previously mentioned, the details of these site surveys can be found in the document titled, City of Bozeman Trip Characteristics Study.
Data resulting from the trip characteristics surveys are summarized in Table 1 and are used in the development of the demand component of the transportation impact fee for

Tindale-Oliver & Associates, Inc. City of Bozeman January 2008 6 Impact Fee Study
the four land uses. Table 1 provides a summary of the data collected for the three variables (trip generation rate, trip length, and percent new trips) and the resulting vehicle miles of travel (VMT) for each land use category that was calculated. Land use-based survey/study results that were incorporated into the Trip Characteristics Database are included in Appendix A. This database was used to document the trip length, percent new trips, and trip rate for the land uses contained in the impact fee schedule. An analysis of the trip characteristics of lower income households is presented in Appendix E. The trip characteristics variables used in the calculation of the impact fee for each land use included in the proposed fee schedule are presented in Appendix F. Local Trip Characteristics Adjustment Factor The local trip characteristics data collected for the City of Bozeman land use sites were compared to data contained in the Trip Characteristics Database. Based on this review, trip length reduction factors were applied to both residential and non-residential land uses not studied as part of the local trip characteristics process. The specific adjustment factors presented below were applied to the trip lengths obtained from data in the Trip Characteristics Database for land uses not studied in the City of Bozeman. Appendix A presents the trip lengths for all land uses in the Trip Characteristics Database as well as the adjusted City of Bozeman trip lengths based on the application of the following reduction factors.
1. Single family trip length reduction factor (55%) was applied to the following land uses:
• lodging land uses (hotel, motel) • recreation land uses (golf course, city park, movie theaters)
2. Residential condominium trip length reduction factor (55%) was applied to the
following land uses: • mobile home park

Tindale-Oliver & Associates, Inc. City of Bozeman January 2008 7 Impact Fee Study
Table 1 Summary of Bozeman Trip Characteristic Studies (1)
Development TypeTrip
Generation Rate
Trip Length
Percent New Trips
VMTImpact
Fee VMT(2)
SINGLE FAMILY Site 1 Residential 142 dwelling unit 9.69 3.23 100% 31.30 15.65Site 2(3) Residential 105 dwelling unit N/A 1.59 100% N/A N/ASite 3 Residential 41 dwelling unit 9.32 4.53 100% 42.22 21.11RESIDENTIAL CONDOMINIUM/TOWNHOUSE Site 4 Residential 63 dwelling unit 7.70 2.67 100% 20.56 10.28Site 5 Residential 57 dwelling unit 5.74 3.58 100% 20.55 10.27OFFICE Site 6 Non-Residential 48,344 1,000 sf 21.37 2.83 69% 41.73 20.86Site 7(4) Non-Residential 39,027 1,000 sf N/A 1.64 77% N/A N/ASite 8 Non-Residential 61,199 1,000 sf 28.92 1.74 72% 36.23 18.12SHOPPING CENTER Site 9 Non-Residential 35,888 1,000 sf 69.30 1.39 74% 71.28 35.64Site 10 Non-Residential 104,257 1,000 sf 46.96 3.35 49% 77.08 38.54Site 11 Non-Residential 159,852 1,000 sf 56.49 1.56 54% 47.59 23.79
Net Size
(1) Source: City of Bozeman Trip Characteristics Study, Tindale-Oliver & Associates, Inc., 2007 (2) VMT is divided by two to avoid over-charging a land use since ITE trips are trips to and from two land uses. (3) Trip generation was not calculated due to the presence of cut-through traffic from construction on adjacent street. (4) Trip generation was not calculated due to the presence of cut-through traffic from construction on adjacent street.

Tindale-Oliver & Associates, Inc. City of Bozeman January 2008 8 Impact Fee Study
3. Office trip length reduction factor (43%) was applied to the following land uses: • institution land uses (hospital, nursing home, elementary school, high
school, university, church/synagogue, and day care center) • medical office • industrial land uses (general light industrial, manufacturing, warehouse,
and mini-warehouse)
4. Retail trip length reduction factor (62%) was applied to the following land uses: • retail land uses (all retail tiers, building material/lumber, discount
superstore, nursery/garden center, convenience store, quality restaurant, fast-food restaurant with drive-through, new/used auto sales, furniture store, bank/savings with drive-thru)
In addition, it should be noted that a review of 2000 Census data specifically demographic (median age, age distribution, population, household size), economic (income distribution), and journey-to-work characteristics (travel time, travel mode, vehicle ownership) was conducted to establish a relationship between the studies in the Trip Characteristics Database and the City of Bozeman for land uses that were not studied locally. This review shows that the adjustment factor discussed previously for residential and non-residential trip lengths are justified since journey-to-work travel characteristics indicate that on average trip lengths in Bozeman are shorter than data collected from sites included in the Trip Characteristics Database. In addition, the trip generation rate data recommended in the fee schedule is primarily based on the (ITE) Trip Generation reference report (7th edition) which is a national source. Trip Exchange District (TED) Trip Characteristics In addition, adjustment factors were calculated for the percent new trips for non-residential land uses to account for the travel characteristics unique to the trip exchange district of the City of Bozeman. These adjustments were made to the lodging, recreation, office, retail, restaurant, and bank land uses. Typically, the adjustments reduced the percent new trips variable since in the trip exchange district people link trips as opposed to traveling by vehicle. The adjustment factors were calculated based on the City of Tampa Transportation Impact Fee Study, conducted by Kimley-Horn and Associates, 1988 using the relationship between trip purpose and person trips. The City of Tampa study utilized ITE trip generation rates and the results of a Downtown Portland Circulation Study

Tindale-Oliver & Associates, Inc. City of Bozeman January 2008 9 Impact Fee Study
conducted by DeLeuw, Cather, and Company, 1973 that documented the reasons for individuals entering a building by their main purpose for coming downtown. The data facilitated the calculation of trip adjustment factors for percent new trips that reflect the high level of captured trips in the downtown area. In addition, this data presented the mode of travel to the downtown buildings. A local study in Montana, the Montana Three City Parking Generation/Land Use Pattern Correlation Study, 2004 also confirms the unique characteristics of the TED. This study collected survey data in the cities of Bozeman, Billings, and Great Falls to examine the relationship between trip purpose, number of stores visited, and duration of stay in the TED and other areas of the cities. The results of this study indicate there are more linked trips in the TED (more places are visited). In addition, the study recommends that parking requirements be reduced for businesses that locate in the TED due to parking efficiencies that arise from the linked trips. The results of this study confirm that given the mixture of land uses present in the TED, the travel characteristics of certain land uses in the TED warrant adjustments to the percent new trips variable since the capture rate (1 minus the percent new trips) is higher in the downtown area with trips being linked among land uses. Further, as long as the mix of land uses observed in the TED is present, the adjustment to travel characteristics is warranted regardless of the size of the TED (Portland, Tampa, Bozeman) 2.2 Cost Component of Transportation Capacity Cost Overview The cost of providing transportation system capacity has increased in recent years. Certain phases of lane widening projects, such as construction, have seen significant cost increases recently. Appreciation in land values has resulted in higher right-of-way costs. Information from the City of Bozeman and the Montana Department of Transportation (MDOT) was used to develop a unit cost for all phases involved in the addition of one lane mile of roadway capacity. It should be noted that Gallatin County does not construct any lane mile addition projects in the City of Bozeman. The following sub-sections detail the analyses that were undertaken to review the different costs associated with the construction of city and state roads. Appendix B provides the data and other support information utilized in these analyses.

Tindale-Oliver & Associates, Inc. City of Bozeman January 2008 10 Impact Fee Study
The cost is separated into four phases: design, right-of-way (ROW), construction, and construction engineering/inspection (CEI) costs. Each of these cost components are further discussed for city and state roads below. 2.2.1 City Costs This section examines the construction costs of transportation capacity improvements associated with city roads in the City of Bozeman. For this purpose, recent bids and final project costs of two projects that were recently constructed were used to identify and provide supporting cost data for roadway improvements. Specifically, these two projects include the West Babcock Street project and the West Durston Road project. It should be noted that these improvements were built to be consistent with MDOT design standards. Based on discussion with City staff, design costs were estimated at 8.5 percent of construction costs. It should be noted that the design cost is a separate cost component and was calculated as a percentage of the construction cost. This percentage is based on recent construction project cost estimates and recently completed City projects. The ROW cost was developed based on a review of property acquisitions for the West Babcock Street (22) and West Durston Road (10) projects. Most of the ROW for construction of both projects was obtained in advance of the lane additions. Temporary easements were provided by property owners along the corridor at no cost to the city. City staff confirmed that the ROW acquisition for these two projects is typical of future roadway construction for improvements that will add left-turn storage along a two-lane undivided roadway segment. The weighted average ROW cost per lane mile is presented in Appendix B, Table B-1. As shown in the table, the weighted average ROW cost per lane mile is approximately $280,000 for city roads. As previously mentioned, the construction cost per lane mile was developed based on a review of recent bid prices for the West Babcock Street improvement and the West Durston Road projects in the City of Bozeman. City staff confirmed that the projects used to develop the construction cost are typical of the type of roadway project that the City intends to construct in the future. During discussion with City staff, it was noted that based on prior experience, the following three factors contribute to higher construction costs in the City of Bozeman (relative to other areas in the state of Montana):

Tindale-Oliver & Associates, Inc. City of Bozeman January 2008 11 Impact Fee Study
• Labor market conditions - wage rates in Bozeman are comparatively higher than the rest of Gallatin County and other parts of Montana.
• Lack of construction companies bidding on roadway projects. This lack of competition also leads to an increase in overall roadway construction costs. Based on discussion with City staff, the cost to build city collector roadways is fairly consistent with the state arterial roadway projects due to this competition.
• Based on discussion with City staff, it was noted the city and state roads are built with the similar design specifications.
Based on this analysis, the construction cost of $3.1 million per lane mile to build state roads that add two travel lanes to an existing two-lane divided section (a total of five lanes) was used as a proxy for city roadways of similar type. Since the construction cost per lane mile is intended to reflect the observed cost of future capacity, a weighting was assigned based on project types in the Greater Bozeman Area Transportation Plan, 2001 Update for all city roadway improvements (specifically for programmed projects). These improvements represent the impact fee eligible roads that have not been constructed to date and are contemplated to be built in the Bozeman area. Appendix B, Table B-3 provides the list of improvements and Table B-4 provides a summary of the lane miles by project type used to develop the percentages used in the weighted cost calculation. It should be noted that the Greater Bozeman Area Transportation Plan, 2001 Update has a planning horizon through 2020. The percentages used by improvement type are listed below:
• New construction of two travel lanes and a continuous left turn lane (three-lane section) (16 percent).
• The addition of a continuous left turn lane along a two-lane undivided roadway where the city only pays for the addition of the third lane (three-lane section) (28 percent).
• The addition of a continuous left turn lane along a two-lane undivided roadway that is either a reconstruction of the existing lanes or an offset (three-lane section) (26 percent).
• The addition of two travel lanes to an existing two-lane divided roadway (five lane section) (30 percent).
As shown in Appendix B, Table B-6, the resulting city construction cost per lane mile is approximately $2.8 million. The two projects (West Babcock Street and West Durston Road) are being constructed as an urban cross-section and are consistent with MDOT and

Tindale-Oliver & Associates, Inc. City of Bozeman January 2008 12 Impact Fee Study
City design standards. City staff also indicated that it is anticipated that all future city roadway projects will be built utilizing urban cross-section design. It should be noted that the City of Bozeman is currently updating the Greater Bozeman Area Transportation Plan. Upon completion of this update, it is recommended that the City evaluate the mix of planned future roadway improvements in the updated Greater Bozeman Transportation Plan to determine if adjustments in the mix of project types being used to estimate the construction cost per lane mile in the impact fee calculation need to be made. The mix (addition of travel lanes and continuous left turn lanes to existing two-lane undivided roadways) of future improvements is a policy decision based on the assessment of future growth needs. Further, as a policy decision and consistent with City Code, the City requires new development to construct the first two lanes of a new road project. If the City determines that it is in its best interests to construct a new three-lane roadway section, the City contributes the cost for the third lane. For projects where only two lanes are initially built, the City pays for the cost to improve the two-lane undivided segment to a three-lane section with the addition of the continuous left turn lane. It should be noted that the impact fee network that provides the basis for the consumption-based impact fee approach includes only two-lane undivided roadways and above given this requirement for new developments. The calculations used to develop the city construction costs are shown in Appendix B, Tables B-3 through B-6. Based on an analysis of the project cost information for city roadway capacity-adding projects, the total cost per lane mile is estimated at approximately $3.5 million. Table 2 presents the breakdown of the estimated average cost for each phase of a typical roadway capacity-expansion project in the City of Bozeman.

Tindale-Oliver & Associates, Inc. City of Bozeman January 2008 13 Impact Fee Study
Table 2 Estimated Total Cost per Lane Mile by
City Project Phase (in 2006 Dollars)
Cost PhaseCost Per Lane
Mile(1)
Design $236,459Right-of-Way $276,316Construction $2,781,869CEI $236,459Total Cost $3,531,103
(1) Source: Appendix B, Table B-8 2.2.2 State Costs A similar review also was completed for state roadway projects in order to estimate the typical phase and total costs for capacity-adding projects. A total of four state projects were identified that were either completed (2) or the full project cost was programmed (2) in the FY 2006-2008 State Transportation Improvement Plan (STIP). Of the four projects, the two completed projects provided a basis with which to estimate construction costs for state projects in the City of Bozeman because they were found to be representative of future state projects in the City of Bozeman. The two projects with fully programmed costs from the STIP were used to develop a cost for urban-design state roadways in the City of Bozeman. The construction cost per lane mile was calculated based on weighting project types in the Greater Bozeman Area Transportation Plan, 2001 Update for all state roadway improvements. Appendix B, Table B-3 provides the list of improvements and Table B-4 provides a summary of the lane miles by project type used to develop the percentages used in the weighted cost calculation. The percentage used by improvement type includes the following:
• The addition of a continuous left turn lane along a two-lane undivided roadway (three-lane section) (26 percent).
• The addition of two travel lanes to an existing two-lane divided roadway (five-lane section) (74 percent).

Tindale-Oliver & Associates, Inc. City of Bozeman January 2008 14 Impact Fee Study
The detailed calculations used to develop the state construction cost by section design are presented in Appendix B, Table B-6. As shown in that table, the resulting state construction cost per lane mile for an urban design arterial roadway is approximately $3.4 million. Based on discussion with MDOT staff, it was confirmed that the project used to develop the state costs, South 19th Avenue (Babcock Street to Kagy Boulevard), is typical of future roadway improvements. The South 19th Avenue project is typical of two travel lanes being added to a two-lane divided roadway. In addition, the bid tabulation for the South 19th Avenue project was used to develop standard quantities and current unit prices for estimating cost of adding a continuous left turn lane along a two-lane undivided roadway. The detailed analysis used to develop this construction cost is presented in Appendix B, Table B-5. The construction cost for the Rouse Avenue project were not used since the project scope includes additional features that have a financial impact on the overall project cost that are considered to be atypical when compared to future improvements of this type. Based on discussions with City and MDOT staff, this construction cost was not used in developing the weighted average construction cost per lane mile. It should be noted that other recently bid projects in the state of Montana were also reviewed to confirm consistency of unit prices and quantities with the projects used in this analysis.
ROW cost data for the two roadway projects discussed above were used to estimate the ROW cost per lane mile. The ROW acquisitions associated with these improvements were confirmed to be typical of future improvements. Specifically, the ROW plans for the South 19th Avenue project were evaluated for acquisitions associated with the cross section width and easements. It should be noted that unlike the construction cost for the Rouse Avenue project, the ROW cost was considered typical of future improvements where a continuous left-turn lane is added to a two-lane undivided roadway. As shown in Appendix B, Table B-2, the weighted average ROW cost per lane mile is approximately $335,000.
Table 3 summarizes the estimated average cost per lane mile for state roads. As shown in the table, the total average cost per lane mile for state roads (including all phases) is approximately $4.5 million. It should be noted that the mix of improvements (2 to 3 lane sections and 3 to 5 lane sections) explains the construction cost per lane mile differential between the city and the state. Based on the revised list of Greater Bozeman Area Transportation Plan, 2001 Update projects, the State is constructing a higher percentage five lane sections (74 percent) than the City (30 percent). As noted previously, state projects included in the analysis are presented in Appendix B, Table B-2.

Tindale-Oliver & Associates, Inc. City of Bozeman January 2008 15 Impact Fee Study
Table 3 Estimated Total Cost per Lane Mile by State Project Phase
(in 2006 Dollars)
Cost PhaseCost Per Lane
Mile(1)
Design $343,101Right-of-Way $335,446Construction $3,431,005CEI $343,101Total Cost $4,452,653
(1) Source: Appendix B, Table B-8
2.2.3 Summary of Costs (Blended Cost Analysis) The weighted average cost per lane mile for city and state roads is calculated and presented in Table 4. The resulting weighted average cost of approximately $3.7 million per lane mile will be utilized as the cost input in the calculation of the impact fee schedule. This weighted average cost per lane mile includes city and state projects and is based on weighting by the distribution of city and state lane miles of roadway being constructed in the Greater Bozeman Area Transportation Plan, 2001 Update (Appendix B, Table B-7), which is 84 percent City roads and 16 percent State roads. As noted previously, the project information and methodology used in these calculations is included in Appendix B, Tables B-1 through B-8.
Table 4
City of Bozeman City & State Roadway Capital Projects Estimated Adjusted Total Cost per Lane Mile
(in 2006 Dollars)
Cost Type City Roads State RoadsCity and
State RoadsDesign $236,459 $343,101 $253,522Construction $2,781,869 $3,431,005 $2,885,731Right-of-Way $276,316 $335,446 $285,777CEI $236,459 $343,101 $253,522Total $3,531,103 $4,452,653 $3,678,552 (1) Source: Appendix B, Table B-8

Tindale-Oliver & Associates, Inc. City of Bozeman January 2008 16 Impact Fee Study
2.3 Credit Component Based on the requirements of section 7-6-1602, (5) (b) (iii) of the MCA, a revenue credit is given for capacity expansion expenditures from non-impact fee revenue sources. Sections 2.3.1, 2.7, Appendix C, Tables C-1 through C-4, and Appendix D present the detailed calculations used to develop the revenue credit. 2.3.1 Gasoline Tax Credit (Equivalent) The present value of gasoline taxes generated by a new development over a 25-year period is credited against the cost of the system consumed by travel associated with new development. This is because travel from new development generates gasoline tax revenues, a portion of which is typically allocated to expansion of the transportation system. City A review of the city roadway financing program shows that a combination of impact fees and General Obligation (GO) Bonds are being used to fund capacity expansion projects. The City uses the local allocation of gas tax revenues provided annually by MDOT based on MCA Section 15-70-10 to fund maintenance-related projects such as roadway re-paving, traffic signal maintenance and drainage improvements. It should be noted as described below that the federal transfer of gas tax revenues known as “urban funds” are expended on capacity expansion projects and a credit is given under the state gas tax discussion. Since the City is not spending any of the locally allocated gas tax revenues on capacity expansion projects, no gas tax credit is given. The portion of the GO Bond that is allocated to capacity expansion projects and being backed by ad valorem funds will be discussed in a subsequent section of this report. County It should be noted that, based on a review of the Gallatin County roadway financing program, it was determined that Gallatin County has not programmed any funds to be spent on capacity expansion projects in the City of Bozeman. As such, no credit is given for gas tax revenues received by the County and spent in the City.

Tindale-Oliver & Associates, Inc. City of Bozeman January 2008 17 Impact Fee Study
State
State expenditures in Gallatin County were reviewed and a credit for the capacity expansion portion attributable to state projects was provided. It should be noted that these revenues known as “urban funds” originate from federal gas tax revenues requiring a match provided by MDOT using state gas tax revenues and are expended on state roadway projects identified as local priorities on state routes. The state credit includes this federal funding on projects identified as capacity expansion improvements on state routes. The equivalent number of pennies allocated to fund state projects was determined using information for a 9-year period of the MDOT Work Program (FY 2000 through FY 2008). A list of capacity-adding roadway projects was identified, including lane additions, new road construction, intersection improvements, traffic signal projects, and other capacity-addition projects. This review (which is summarized in Appendix C, Table C-4) indicates that MDOT spending generates an equivalent gas tax credit of 10.2 pennies of gas tax revenue annually. It should be noted that the historical work program for FY 2000 through FY 2006 included preliminary engineering for several capacity expansion projects discussed previously. As such, the variance in the annual revenues dedicated to capacity expansion projects between this period and FY 2007 through FY 2008 is explained by the fact that the ROW and construction phases are programmed in the current phase of the MDOT Work Program. Table 5 provides a summary of the results of the gas tax credit analysis.
Table 5
Gas Tax Equivalent Pennies
(in 2006 Dollars)
Credit
Equivalent Pennies per
GallonState Gas Tax Credit(1) $0.102Total $0.102 (1) Source: Appendix C, Table C-4
2.3.2 Facility Life The facility life used in the proposed fee is 25 years, which represents the reasonable life of the roadway.

Tindale-Oliver & Associates, Inc. City of Bozeman January 2008 18 Impact Fee Study
2.3.3 Interest Rate This is the discount rate at which gasoline tax revenues might be bonded. It is used to compute the present value of the gasoline taxes generated by new development. The discount rate of 4.6 percent is determined based on discussions with representatives from the City’s Finance Department and reflects the rate at which the City is likely to borrow in the future. 2.3.4 Fuel Efficiency In order to calculate future gas tax revenues, it is necessary to estimate the future consumption of gas. The fuel efficiency (i.e., the average miles traveled per gallon of fuel consumed) of the fleet of motor vehicles was estimated using the quantity of gasoline consumed by travel associated with each unique land use. Appendix C documents the calculation of fuel efficiency value (Table C-5), based on the following equation, where “VMT” is vehicle miles of travel and “MPG” is fuel efficiency in terms of miles per gallon.
∑ ∑ ⎟
⎟⎠
⎞⎜⎜⎝
⎛÷=
TypeRoadwayTypeVehicle
TypeVehicleTypeRoadway MPG
VMTVMTEfficiencyFuel
The methodology utilizes non-interstate VMT and average fuel efficiency data for passenger vehicles (i.e., passenger cars and other 2-axle, 4-tire vehicles, such as vans, pickups, and SUVs) and large trucks (i.e., single-unit, 2-axle, 6-tire or more trucks and combination trucks) to calculate the total gallons of fuel utilized by each of these vehicle types. The combined total VMT for the vehicle types is then divided by the combined total gallons of fuel consumed to calculate, in effect, a “weighted” fuel efficiency value that appropriately accounts for the existing fleet mix of traffic on non-interstate roadways. The VMT and average fuel efficiency data were obtained from the most recent Federal Highway Administration’s Highway Statistics 2005.1 Based on the calculation completed
1 The data used in Table C-5 in Appendix C was compiled from Table VM-1 (Section V) of the document, Highway Statistics 2005, Office of Highway Policy Information, Federal Highway Administration, Washington, D.C (see Table C-6). The document can be accessed on-line at http://www.fhwa.dot.gov/policy/ohim/hs05/re.htm.

Tindale-Oliver & Associates, Inc. City of Bozeman January 2008 19 Impact Fee Study
in Table C-5 of Appendix C, the fuel efficiency rate to be used in the updated impact fee equation is 17.70 miles per gallon. 2.3.5 Effective Days per Year An effective 365 days per year of operation was estimated for all land uses in the proposed fee. While not all land uses operate 365 days per year (e.g., office buildings and seasonal land uses such as schools), the use of 365 days per year provides a "conservative" estimate of the amount of gas consumed annually, ensuring that gasoline taxes are adequately credited against the fee. 2.4 Capacity per Lane Mile
The City of Bozeman’s adopted level of service standard of “C” is defined in Section 18.44.060.D of the Bozeman Municipal Code. This standard has been consistent during and after the preparation of the Greater Bozeman Area Transportation Plan, 2001 Update. The City uses this standard to make decisions as to what roads need capacity expansion. From an impact fee perspective, no impact fee funds are used to construct any road or portion of a road that is operating below the adopted level of service standard. An additional component of the impact fee equation is the capacity added per lane mile of roadway constructed. The capacities in the Greater Bozeman Area Transportation Plan, 2001 Update represent trigger volumes and are conservative for impact fee purposes. Based on discussion with City staff, the weighted average capacity added per lane mile was calculated using Table 4-1 of the Greater Bozeman Area Transportation Plan, 2001 Update (specifically for programmed projects). The plan was used because it reflects the most reasonable source of the type of roads and their associated capacity that are planned to be built in the future on which impact fee funds may be spent. City staff indicated that the capacity associated with ideal management conditions (the higher of the two capacity values from Table 4-1 of the Greater Bozeman Area Transportation Plan, 2001 Update) should be used in the calculation of the impact fee since current policies are in place to actively pursue improved access control and optimal signal timing. The use of this higher capacity in the impact fee calculations is conservative and further ensures that new development is not charged at a rate that corrects deficiencies or that is a higher standard than that enjoyed by existing users of the roadway network. Upon completion of the 2007

Tindale-Oliver & Associates, Inc. City of Bozeman January 2008 20 Impact Fee Study
Greater Bozeman Transportation Plan Update, the impact fee capacity figures should be reviewed and updated, if appropriate. The weighted average capacity per lane mile was estimated using the planning level capacities and weighted by the lane distribution of future roadway improvements by jurisdiction in the Greater Bozeman Area Transportation Plan, 2001 Update. As mentioned previously, the mix of future projects is strictly a policy decision based on the assessment of future growth needs. Appendix B, Table B-9 provides the detailed calculation used to develop the weighted average capacity added per lane mile. As shown in Table 6, the resulting weighted average capacity added per lane mile is 8,658.
Table 6 Weighted Average Capacity per Lane Mile
Jurisdiction
Weighted Capacity
Added per Lane Mile(1)
Greater Bozeman Plan Lane Miles
Jurisdiction Weight(2)
Weighted Average Capacity
Added per Lane Mile
City Roads 8,438 84% 7,088State Roads 9,813 16% 1,570Total Weighted Average Capacity Added(3) 8,658 (1) Source: Appendix B, Table B-9 for city and state roads respectively (2) Source: Appendix B, Table B-7 (3) Item (1) for city and state roads weighted by Item (2)
2.5 Cost per Vehicle Mile of Capacity The impact fee cost per unit of development is assessed based on the cost per vehicle mile of capacity. As shown in Tables 2, 3, and 6, the cost and capacity for city and state roads have been calculated based on typical roadway improvements. In order to estimate the weighted average cost per vehicle mile of capacity, the cost per vehicle mile of capacity for city and state roads was weighted by the lane distribution of future roadway improvements by jurisdiction in the Greater Bozeman Area Transportation Plan, 2001 Update. As shown in Table 7, the cost per vehicle mile of capacity for travel on all roads within the City of Bozeman is $424.87. This weighted average cost per vehicle mile of capacity figure is used in the impact fee calculation to determine the total impact cost per unit of development based on the vehicle miles of travel consumed.

Tindale-Oliver & Associates, Inc. City of Bozeman January 2008 21 Impact Fee Study
Table 7 Weighted Average Cost per Vehicle Mile of Capacity
City and State Roadways in Bozeman
Source
Greater Bozeman Plan
Lane Miles Jurisdiction
Weight(1)
Cost per Lane Mile(2)
Average Capacity
Added Per Lane Mile(3)
Cost per VMC(4)
City Roads 84% $3,531,103 8,438 $418.48State Roads 16% $4,452,653 9,813 $453.75Total 100%Weighted Average(5) $3,678,551 8,658 $424.87
(1) Source: Appendix B, Table B-7 (2) Source: Table 2 for city roads and Table 3 for state roads (3) Source: Table 6 for city and state roads (4) Cost per lane mile (Item 2) divided by average capacity added per lane mile (Item 3)
for city roads and state roads respectively (5) Cost per lane mile and average capacity added per lane mile weighted by Greater
Bozeman Plan lane miles distribution in Item (1). Cost per VMC is based on weighted average cost per lane mile, Item (2) divided by weighted average capacity added per lane mile (Item 3).
2.6 Interstate Adjustment Factor This variable is used to recognize that interstate highway improvements are funded by the State using earmarked state and federal funds. Typically, impact fees are not used to pay for these improvements and the portion of vehicle miles traveled on the interstate system is therefore eliminated from the total travel for each use. Based on centerline street maintenance data obtained from the City of Bozeman Planning Department and the Montana Department of Transportation’s Urban Travel Demand Model, an interstate adjustment factor of 15 percent is incorporated into the impact fee calculations. It should be noted that the interstate adjustment factor calculation excludes external-to-external trips, which represent traffic that goes through the City of Bozeman using the interstate, but does not stop in the city. This traffic is excluded from the calculations since it does not travel on the local road system for which impact fees are allocated. Table 8 shows the calculation of the interstate adjustment factor. This factor is used to reduce the vehicle miles of travel that the impact fee charges for each land use.

Tindale-Oliver & Associates, Inc. City of Bozeman January 2008 22 Impact Fee Study
Table 8 Interstate Adjustment Factor (1)
Roadway
2007 (vehicle miles of travel)
2007 Distribution
I-90 70,265 15.0%State Roads 244,438 53.0%County Roads 1,341 0.0%City Roads 147,227 32.0%All Roads 463,271 100.0% (1) Source: City of Bozeman Planning
Department, Centerline Street Maintenance GIS Layer and MDOT Urban Travel Demand Model
2.7 Ad Valorem Tax Credit Based on a review of historical expenditures, the City of Bozeman has been using a portion of ad valorem revenues to fund capacity expansion projects. Of the ad valorem revenues available, approximately $271,417 is projected to be dedicated to transportation capacity expansion projects annually. The value per 1-mil from the general fund calculated based on the FY 2006/2007 City Budget is $63,251. Therefore the ad valorem revenues dedicated to capacity expansion projects translate into 4.29 mills ($217,417 divided by $63,251). Thus, the general fund millage used toward capacity expansion annually is approximately 4 percent (4.29 mills divided by 110.57 mills). Because the City does not have a dedicated percentage of the ad valorem taxes being applied to transportation capital expansion projects, the total ad valorem revenues used toward transportation capacity projects is estimated to be fixed at $271,417 per year. As such, as the tax base increases, the percent of total ad valorem revenues used for capacity projects will decrease. Since the City has historically used ad valorem revenues to retire the debt associated with the 1995 GO Bond that funds capacity expansion projects, a credit is given. Credit due to ad valorem tax revenues for residential uses is calculated based on a review of recent sale prices and taxable values of single family homes in the City of Bozeman, and discussions with the City’s Finance Division. The ad valorem tax credit for non-residential land uses is based on the taxable value of office and commercial properties within the City and

Tindale-Oliver & Associates, Inc. City of Bozeman January 2008 23 Impact Fee Study
estimated unit values from the Consultant’s experience in other jurisdictions and industry knowledge. An explanation of the methodology used to estimate ad valorem tax credit figures is included in Appendix D. 3.0 PROPOSED TRANSPORTATION IMPACT FEE SCHEDULE 3.1 Proposed Transportation Impact Fee Schedule The impact fee calculations for each land use are included in Appendix F. This Appendix includes the major land use categories and the impact fees for the individual land uses contained in each of the major categories. For each land use, this Appendix illustrates the impact fee demand component variables (trip rate, trip length, and percent of new trips), the total impact fee cost, the annual gas tax credit and present value of the gas tax credit, the net impact fee, the current City of Bozeman impact fee, and the percent difference between the potential impact fee and the current impact fee. It should be noted that the net impact fee rates included in Appendix F represent the maximum reasonable defensible transportation impact fee per unit of land use that could be charged in the City of Bozeman. The methodology used herein to calculate these fees is commonly accepted as one that results in an impact fee rate that satisfies the proportionality concept of the dual rational nexus test. It should be noted that this methodology is consistent with the 2005 Montana impact fee law (Senate Bill 185, sections 7-6-1601 through 7-6-1604). As a result, development is charged based upon the proportion of vehicle miles of capacity it is expected to consume on the city roadway network. For clarification purposes, it may be useful to walk through the calculation of an impact fee for one of the land use categories. In the following example, the net impact fee is calculated for the single-family detached residential (1,500 to 2,499 square feet) land use category (ITE LUC 210). This example calculation uses information from the proposed impact fee schedule included in Appendix F, Table F-1 (Non-TED Impact Fee Schedule). For each land use category, the following equations are utilized to calculate the net impact fee:
Net Impact Fee = Total Impact Cost – Gas Tax Credit – Ad Valorem Credit Where:

Tindale-Oliver & Associates, Inc. City of Bozeman January 2008 24 Impact Fee Study
Total Impact Cost = ((Trip Rate × Assessable Trip Length × % New Trips) / 2) × (1 - Interstate Adj. Factor) × (Cost per Lane Mile / Avg. Capacity Added per Lane Mile)
Total Gas Tax Credit = Present Value (Annual Gas Tax Credit), given 4.6% interest rate & 25-year facility life
Annual Gas Tax Credit = (((Trip Rate × Total Trip Length × % New Trips) / 2) × Effective Days per Year × $/Gallon to Capital) / Fuel Efficiency Each of the inputs have been discussed previously in this document; however, for purposes of this example, brief definitions for each input are provided below, along with the actual inputs used in the calculation of the single-family detached residential (1,500 to 2,499 square feet) land use category:
• Trip Rate = the average daily trip generation rate, in vehicle-trips/day (9.57) • Assessable Trip Length = the actual average trip length for the category, in vehicle-
miles (3.52) • Total Trip Length = the assessable trip length plus an adjustment factor of half a
mile is added to the trip length to account for the fact that gas taxes are collected for travel on all roads including local roads (3.52 + 0.50 = 4.02)
• % New Trips = adjustment factor to account for trips that are already on the roadway (100%)
• Divide by 2 = The total daily miles of travel generated by a particular category (i.e., rate X length X % new trips) is divided by two to prevent the double-counting of travel generated among land use codes since every trip has an origin and a destination.
• Interstate Adjustment Factor = adjustment factor to account for the travel demand occurring on interstate highways (15.0%)
• Cost per Lane Mile = unit cost to construct one lane mile of roadway, in $/lane-mile ($3,678,552)
• Average Capacity Added per Lane Mile = represents the average daily traffic on one travel lane at capacity for one lane mile of roadway, in vehicles/lane-mile/day (8,658)
• Cost per Vehicle Mile of Capacity = unit cost to construct to provide a vehicle mile of capacity ($424.87)
• Present Value = calculation of the present value of a uniform series of cash flows, gas tax payments in this case, given an interest rate, “i,” and a number of periods,

Tindale-Oliver & Associates, Inc. City of Bozeman January 2008 25 Impact Fee Study
“n;” for 4.6% interest and a 25-year facility life, the uniform series present worth factor is 14.6768
• Effective Days per Year = 365 days • $/Gallon to Capital = the amount of gas tax revenue per gallon of fuel that is used
for capital improvements, in $/gallon ($0.102) • Fuel Efficiency = average fuel efficiency of vehicles, in vehicle-miles/gallon
(17.70) Using these inputs, a net impact fee can be calculated for the single-family residential (1,500 to 2,499 square feet) land use category as follows. Total Impact Cost = ((9.57 * 3.52 * 1.0) /2) * (1–0.15) * ($3,678,552/8,658) = $6,083 Annual Gas Tax = (((9.57 * 4.02 * 1.0) /2) * 365 * $0.102) / 17.70 = $40 Gas Tax Credit = $40 * 14.6768 = $587 Ad Valorem Tax Credit = $100 (see Appendix E, Table E-1 for details of this calculation) Net Impact Fee = $6,083-$587-$100 = $5,396 Table 9 below presents the net impact fee for all land uses included in the proposed impact fee schedule in Appendix F, Table F-1. These fees will be charged for all areas not designated as the Trip Exchange District (TED) or that otherwise do not reflect travel characteristics of the TED area. Table 10 below presents the net impact fee for all land uses in the proposed fee schedule in Appendix F, Table F-2. These fees will be charged in areas designated as the TED or that other areas that exhibit characteristics as defined in Appendix K.

Tindale-Oliver & Associates, Inc. City of Bozeman January 2008 26 Impact Fee Study
Table 9 Proposed Transportation Impact Fee Schedule (Non-TED) (1)
NetITE ImpactLUC Unit Fee
RESIDENTIAL:
210 Single Family (Detached)
Less than 1,500 sf and very low income(2) du $2,171
Less than 1,500 sf and low income(3) du $3,147
Less than 1,500 sf du $3,968
1,500 to 2,499 sf du $5,396
2,500 sf or larger du $6,082
220 Apartments du $3,339
230 Residential Condominium/ Townhouse du $2,946
240 Mobile Home Park du $1,593
LODGING:
310 Hotel room $3,063
320 Motel room $1,678
RECREATION:
430 Golf Course hole $12,295
411 City Park acre $546
444 Movie Theaters 1,000 sf $6,463
INSTITUTIONS:
610 Hospital 1,000 sf $6,023
620 Nursing Home bed $381
520 Elementary School student $315
530 High School student $477
540 University (7,500 or fewer students)(4) student $609
550 University (more than 7,500 students)(4) student $529
Land Use

Tindale-Oliver & Associates, Inc. City of Bozeman January 2008 27 Impact Fee Study
Table 9 Proposed Transportation Impact Fee Schedule (Non-TED) (continued) (1)
NetITE ImpactLUC Unit Fee
INSTITUTIONS:
560 Church/ Synagogue 1,000 sf $2,428
565 Day Care 1,000 sf $7,433
OFFICE:
710 50,000 sf or less 1,000 sf $3,977
710 50,001-100,000 sf 1,000 sf $3,623
710 100,001-200,000 sf 1,000 sf $3,084
710 greater than 200,000 sf 1,000 sf $2,460
720 Medical Office 1,000 sf $9,584
RETAIL:
820 under 50,000 sf 1,000 sf $9,378
820 50,000-99,000 sf 1,000 sf $9,587
820 100,000-199,000 sf 1,000 sf $9,331
820 200,000-299,000 sf 1,000 sf $8,567
820 greater than 300,000 sf 1,000 sf $8,144
812 Building Material/ Lumber 1,000 sf $21,209
813 Discount Super-Store 1,000 sf $26,996
817 Nursery/Garden Center 1,000 sf $18,903
851 Convenience Store 1,000 sf $44,607
931 Quality Restaurant 1,000 sf $22,036
934 Fast Food Rest w/ Drive-Thru 1,000 sf $61,225
841 New/Used Auto Sales 1,000 sf $12,033
890 Furniture Store 1,000 sf $1,684
912 Bank/ Savings Drive-in 1,000 sf $31,706
Land Use

Tindale-Oliver & Associates, Inc. City of Bozeman January 2008 28 Impact Fee Study
Table 9 Proposed Transportation Impact Fee Schedule (Non-CBD) (continued) (1)
Net
ITE ImpactLUC Unit Fee
INDUSTRY:
110 General Light Industrial 1,000 sf $2,290
140 Manufacturing 1,000 sf $1,250
150 Warehouse 1,000 sf $1,627151 Mini-Warehouse 1,000 sf $810
Land Use
(1) Source: Appendix F, Table F-1 (2) Defined as 50% of city median income based on 2007 Gallatin County Average
Median Income (AMI) (3) Defined as 80% of city median income based on 2007 Gallatin County Average
Median Income (AMI) (4) Impact fee to be assessed on structures with classroom facilities. All auxiliary
structures such as administrative buildings and research centers are to be charged at the office land use rate.

Tindale-Oliver & Associates, Inc. City of Bozeman January 2008 29 Impact Fee Study
Table 10 Proposed Transportation Impact Fee Schedule (TED) (1)
Net
ITE ImpactLUC Unit Fee
RESIDENTIAL:
210 Single Family (Detached)
Less than 1,500 sf and very low income(2) du $2,171
Less than 1,500 sf and low income(3) du $3,147
Less than 1,500 sf du $3,968
1,500 to 2,499 sf du $5,396
2,500 sf or larger du $6,082
220 Apartments du $3,339
230 Residential Condominium/ Townhouse du $2,946
240 Mobile Home Park du $1,593
LODGING:
310 Hotel room $2,835
320 Motel room $1,333
RECREATION:
430 Golf Course hole $4,333
411 City Park acre $182
444 Movie Theaters 1,000 sf $2,333
INSTITUTIONS:
610 Hospital 1,000 sf $6,023
620 Nursing Home bed $381
520 Elementary School student $315
530 High School student $477
540 University (7,500 or fewer students)(4) student $609
550 University (more than 7,500 students)(4) student $529
560 Church/Synagogue 1,000 sf $2,428
565 Day Care 1,000 sf $7,433
Land Use

Tindale-Oliver & Associates, Inc. City of Bozeman January 2008 30 Impact Fee Study
Table 10 Proposed Transportation Impact Fee Schedule (TED) (continued) (1)
Net
ITE ImpactLUC Unit Fee
OFFICE:
710 50,000 sf or less 1,000 sf $3,187
710 50,001-100,000 sf 1,000 sf $2,911
710 100,001-200,000 sf 1,000 sf $2,475
710 greater than 200,000 sf 1,000 sf $1,974
720 Medical Office 1,000 sf $9,584
RETAIL:
820 under 50,000 sf 1,000 sf $5,284
820 50,000-99,000 sf 1,000 sf $5,452
820 100,000-199,000 sf 1,000 sf $5,182
820 200,000-299,000 sf 1,000 sf $5,115
820 greater than 300,000 sf 1,000 sf $4,999
812 Building Material/Lumber 1,000 sf $21,209
813 Discount Super-Store 1,000 sf $26,996
817 Nursery/Garden Center 1,000 sf $18,903
851 Convenience Store 1,000 sf $44,607
931 Quality Restaurant 1,000 sf $6,009
934 Fast Food Rest w/ Drive-Thru 1,000 sf $22,164
841 New/ Used Auto Sales 1,000 sf $12,033
890 Furniture Store 1,000 sf $1,684
912 Bank/ Savings Drive-in 1,000 sf $24,133
INDUSTRY:
110 General Light Industrial 1,000 sf $2,290
140 Manufacturing 1,000 sf $1,250
150 Warehouse 1,000 sf $1,627151 Mini-Warehouse 1,000 sf $810
Land Use
(1) Source: Appendix F, Table F-2 (2) Defined as 50% of city median income based on 2007 Gallatin County
Average Median Income (AMI) (3) Defined as 80% of city median income based on 2007 Gallatin County
Average Median Income (AMI) (4) Impact fee to be assessed on structures with classroom facilities. All
auxiliary structures such as administrative buildings and research centers are to be charged at the office land use rate.

Tindale-Oliver & Associates, Inc. City of Bozeman January 2008 31 Impact Fee Study
3.2 Indexing Currently, the City of Bozeman indexes its transportation impact fees on an annual basis based on the Consumer Price Index (CPI). This section presents a method that calculates a combined index based on the cost variables included in the impact fee calculation. This method helps moderate annual fluctuations from one year to another. The cost variables being recommended for annual adjustment are design, construction, CEI, and ROW costs. First, the design, construction, and CEI costs should be indexed a fixed amount each year based on the Engineering News Record’s Construction Cost Index to account for general increases in the cost for construction materials. Similarly, the land value component of ROW costs should be indexed based on the five-year historical trend in total market values for all property as updated annually by the Gallatin County Property Appraiser. It should be noted that since total market values for all property were not available, the five-year historical trend for total taxable values was used. In addition, the source used to index the construction cost (Engineering News Record’s Construction Cost Index) may be underestimating the recent increase in construction costs. As such, it is recommended that the City consider conducting an independent evaluation of local construction cost increases on an annual basis for the next few years until the recent increases subside. If, however, the City chooses not to conduct such a study, the index included in this study will provide a conservative level of indexing. The method for developing an indexed transportation impact fee is further discussed in Appendix G. 3.3 Compliance with Montana Statute – City Impact Fee Expenditures The law relating to impact fees, Title 7, Chapter 6, Part 16 MCA, contains several restrictions on the use of impact fee funds. These restrictions are intended to ensure that impact fees charged are proportionate to the actual impacts of new development and that the fees are then used to off-set those impacts as required by law. The City ensures compliance with these restrictions through a four step process that examines need for and use of funds throughout the entire impact fee process.

Tindale-Oliver & Associates, Inc. City of Bozeman January 2008 32 Impact Fee Study
3.3.1 Preparation of Long Range Transportation Plan
First, the City periodically prepares a long range transportation plan (LRTP) for the city and surrounding areas. This is done in cooperation with the Montana Department of Transportation, Gallatin County, and other partners. This document is currently titled the Greater Bozeman Area Transportation Plan, 2001 Update. The planning horizon time frame of this Plan is 20 years. The plan begins by identifying current conditions of the transportation network. Demand for transportation facilities needed to serve future growth is then forecast and the impact of that new demand on the transportation system is analyzed. The outcome of the analysis is the identification of future transportation programs and improvements projected to be required to meet the future travel demand at the adopted level of service standards.
3.3.2 Classification of the Types of Projects
The second step is to identify those projects which will be required for maintenance, operations, and correction of existing deficiencies, in contrast to capacity expansion projects of existing and future roads on transportation network for which impact fees may be spent. Chapters 9 and 10 of the Greater Bozeman Area Transportation Plan, 2001 Update identify and describe the extensive list of projects. These descriptions give a summary of the problem the project is intended to solve and any known issues or challenges related to the project. This list includes all the projects anticipated to be required over a twenty year period. This first description of projects allows an initial examination of which projects are likely to be growth related.
3.3.3 Development and Update of Capital Improvement Program
Twenty years is a long time and the development patterns and the timing of growth used to develop the Greater Bozeman Area Transportation Plan, 2001 Update can also change. Therefore, in order to meet the requirements of the MCA, the City, on an annual basis, looks more closely at where new growth is occurring and the additional demand for services being generated by that growth. This is the third step of the process and is where the City develops its Capital Improvement Program (CIP). The CIP is a five-year program of scheduled road construction projects. The CIP is updated each year in connection with preparation of the City’s budget. The City has a distinct transportation impact fee CIP which is also coordinated with other City CIP programs. The CIP identifies each specific project, including the project location, expected outcome of

Tindale-Oliver & Associates, Inc. City of Bozeman January 2008 33 Impact Fee Study
construction, such as additional lanes, and what funding sources and amounts are to be used for project construction. Because the project is defined in more detail at this stage, a more accurate estimate of costs in total and those necessitated by new demand are identified.
The City continually monitors its transportation network through review of proposed development, daily operations, and periodic formal monitoring such as traffic counts. This enables the City to identify locations where new development is creating the need for additional capacity on the transportation network. It is during this step that the City distinguishes planned improvements that are needed in part to correct existing deficiencies, for which impact fees cannot be used to fund the entire project and those that are needed because new growth has occurred and created an impact on the road system. This determination is based, in part, on an analysis of existing level of service standards. Appendix N provides a list of roadway capacity expansion projects that have been constructed over the past 11 years using impact fee and non-impact fee revenues.
The following hypothetical example discusses how impact fees could be allocated for a project where the current level of service is deficient. A calculation would be performed to determine how much over the level of service “C” standard capacity the road is operating. If it was determined that the road was operating 2,000 vehicles per day over capacity at the adopted standard, and the capacity improvement being made would add a daily capacity increase of 10,000 vehicles per day, then at least 20 percent of the cost would need to be funded from non-impact fee funding sources because existing traffic is consuming 20 percent of the increased capacity. The remaining 80 percent of capacity resulting from the capacity improvement (10,000 increase in capacity less 2,000 vehicles over capacity) could be funded with impact fees since new growth has the benefit of the increased capacity.
It is important to note that during this third step, the City Engineering Division works with other departments in preparation of the CIP. Individual citizens and developers may also nominate projects for inclusion on the CIP. If a project is approved to be listed on the CIP by the City Commission, it begins the process of design, right of way acquisition, and other steps needed to become a constructable project. As design proceeds, improved estimates of costs become available. These improved costs are incorporated into the next annual update of the CIP. The updated information also enables an annual re-evaluation of the appropriate blend of funding sources for each project.

Tindale-Oliver & Associates, Inc. City of Bozeman January 2008 34 Impact Fee Study
3.3.4 Project Implementation and Cost Verification
The fourth step occurs once a project is ready for construction and the project is moved into the upcoming year’s budget. The City competitively bids its construction work. The actual bid prices, along with any approved change orders, ultimately determine the final cost of the construction. At the end of the process the City verifies the final costs of work done and whether that work was capacity expanding in nature. The final verification of costs then sets the ultimate payout of funds from the different funding sources which have been allocated for the project.
This process has been used for years in Bozeman and has been refined as described above to ensure compliance with Montana Code requirements for impact fee implementation; in particular the requirements that impact fees (1) be proportionate in amount to the actual impacts of development paying the fee; and (2) be spent so as to benefit those paying them. This study, and its supporting documentation (see Appendix M for a cross-reference table providing specific section references to the impact fee statute and the documents that address these sections), ensures compliance with the first point and the procedures required by the impact fee ordinance itself ensure compliance with the second.
Much of the process described in these four steps is formally incorporated into the City’s impact fee ordinance. Further, Chapter 3.24, BMC, requires the impact fee program to be periodically reviewed and updated to ensure that it continues to represent a reasonable basis upon which to collect and expend impact fees. It should also be noted that this process ensures that impact fees are not used to fund operations and maintenance of the existing facility (i.e., resurfacing projects) per section 7-6-1602, (5) (e) of the MCA.
3.4 Revenue Projections Based on the proposed impact fee schedule presented in Table 9, revenue estimates were developed for the City of Bozeman. The proposed impact fees have been calculated based on a standards driven approach (consumption-based), as such new development will be charged based on capacity consumed. It should be noted that, for impact fee purposes, revenue projections serve only as an overall guideline in planning future infrastructure needs. In their simplest form, impact fees charge each unit of new growth for the net cost (total cost less credits) of infrastructure needed to serve that unit of growth. If the growth rates remain high, the City will have more impact fee revenues to fund growth-related projects sooner rather than later. If the growth rate slows down, less revenue will be

Tindale-Oliver & Associates, Inc. City of Bozeman January 2008 35 Impact Fee Study
generated, and the timing and need for future infrastructure improvements will be later rather than sooner. Appendix H presents revenue projections based on the proposed impact fees.

APPENDIX A Trip Characteristics Database

Tindale-Oliver & Associates, Inc. City of Bozeman January 2008 A-1 Impact Fee Study
Trip Characteristics Database
The Trip Characteristics Database includes over 200 studies on 40 different residential and non-residential land uses collected over the last 18 years. Data from these studies include trip generation, trip length, and percent new trips for each land use. This information has been used in the development of impact fees and the creation of land use plan category trip characteristics for communities throughout Florida and the U.S. The trip generation rate for each respective land use is calculated using machine counts that record daily traffic into and out of the site studied. The traffic count hoses are set at entrances to residential subdivisions for the residential land uses and at all access points for non-residential land uses. The trip length information is obtained through origin-destination surveys that ask respondents where they came from prior to arriving at the site and where they intended to go after leaving the site. The results of these surveys were used to estimate average trip length by land use. Similarly, the percent new trip variable is based on assigning each trip collected through the origin-destination survey process a trip type (primary, secondary, diverted, and captured). The percent new trip variable is then calculated as 1 minus the percentage of trips that are captured.
Single-Family Detached Housing (ITE LUC 210) - Bozeman Trip Characteristics Studies
Bozeman, MT 41 Dec-06 180 180 9.32 - 4.53 N/A 42.22 Tindale-Oliver & AssociatesBozeman, MT 105 Dec-06 249 249 N/A - 1.59 N/A N/A Tindale-Oliver & AssociatesBozeman, MT 142 Dec-06 819 819 9.69 - 3.23 N/A 31.30 Tindale-Oliver & Associates
Total Size 183 Average Trip Length: 3.88Weighted Average Trip Length: 3.52
Weighted Average Trip Generation Rate: N/AITE Average Trip Generation Rate: 9.57
Average VMT: 55.33ITE Average Trip Generation Rate: 35.58
Total # Interviews
Size / Units
Trip Gen Rate Time Period Trip
Length# Trip Length
Interviews SourceVMTPercent New TripsLocation Date

Tindale-Oliver & Associates, Inc. City of Bozeman January 2008 A-2 Impact Fee Study
Single-Family Detached Housing (ITE LUC 210) - Florida Trip Characteristics Studies
Gwinnett Co., GA - 12/13-18/92 - - 5.80 - 5.40 N/A 31.32 Street SmartsGwinnett Co., GA - 12/13-18/92 - - 5.40 - 6.10 N/A 32.94 Street Smarts
Lake Co, FL 42 Dec-06 122 11.26 5.56 62.61 Tindale-Oliver & AssociatesLake Co, FL 49 Apr-02 170 6.70 7a-6p 10.20 N/A 68.34 Tindale-Oliver & AssociatesLake Co, FL 51 Dec-06 346 18.22 9.46 172.36 Tindale-Oliver & AssociatesLake Co, FL 52 Apr-02 212 10.00 7a-6p 7.60 N/A 76.00 Tindale-Oliver & Associates
Pasco Co, FL 55 Apr-02 133 6.80 8a-6p 8.12 N/A 55.22 Tindale-Oliver & AssociatesLake Co, FL 59 Dec-06 144 12.07 10.79 130.24 Tindale-Oliver & Associates
Pasco Co, FL 60 Apr-02 106 7.73 8a-6p 8.75 N/A 67.64 Tindale-Oliver & AssociatesPasco Co, FL 70 Apr-02 188 7.80 8a-6p 6.03 N/A 47.03 Tindale-Oliver & AssociatesPasco Co, FL 74 Apr-02 188 8.18 8a-6p 5.95 N/A 48.67 Tindale-Oliver & Associates
Hernando Co., FL 76 May-96 148 148 10.01 9a-6p 4.85 N/A 48.55 Tindale-Oliver & AssociatesSarasota Co, FL 76 Jun-93 70 70 10.03 - 6.00 N/A 60.18 Sarasota CountySarasota Co, FL 79 Jun-93 86 86 9.77 - 4.40 N/A 42.99 Sarasota County
Collier Co, FL 90 Dec-99 91 12.80 8a-6p 11.40 N/A 145.92 Tindale-Oliver & AssociatesLake Co, FL 90 Dec-06 194 9.12 5.78 52.71 Tindale-Oliver & Associates
Sarasota Co, FL 97 Jun-93 33 33 13.20 - 3.00 N/A 39.60 Sarasota CountyMarion Co, FL 102 Apr-02 167 8.02 7a-6p 5.10 N/A 40.90 Kimley-Horn & AssociatesMarion Co, FL 105 Apr-02 169 7.23 7a-6p 7.22 N/A 52.20 Kimley-Horn & AssociatesCitrus Co, FL 111 Oct-03 273 8.66 7a-6p 7.70 N/A 66.68 Tindale-Oliver & AssociatesMarion Co, FL 124 Apr-02 170 6.04 7a-6p 7.29 N/A 44.03 Kimley-Horn & AssociatesLake Co, FL 126 Apr-02 217 8.50 7a-6p 8.30 N/A 70.55 Tindale-Oliver & Associates
Hernando Co., FL 128 May-96 205 205 8.17 9a-6p 6.03 N/A 49.27 Tindale-Oliver & AssociatesMarion Co, FL 132 Apr-02 171 7.87 7a-6p 7.00 N/A 55.09 Kimley-Horn & AssociatesMarion Co, FL 133 Apr-02 209 8.04 7a-6p 4.92 N/A 39.56 Kimley-Horn & Associates
Sarasota Co, FL 135 Jun-93 75 75 8.05 - 5.90 N/A 47.50 Sarasota CountyCharlotte Co, FL 135 Oct-97 230 5.30 9a-5p 7.90 N/A 41.87 Tindale-Oliver & AssociatesCharlotte Co, FL 142 Oct-97 245 5.20 9a-5p 4.10 N/A 21.32 Tindale-Oliver & AssociatesCharlotte Co, FL 150 Oct-97 160 5.00 9a-5p 10.80 N/A 54.00 Tindale-Oliver & AssociatesSarasota Co, FL 152 Jun-93 63 63 8.55 - 7.30 N/A 62.42 Sarasota County
Pasco Co, FL 189 Apr-02 261 7.46 8a-6p 8.99 N/A 67.07 Tindale-Oliver & AssociatesSarasota Co, FL 193 Jun-93 123 123 6.85 - 4.60 N/A 31.51 Sarasota CountyCharlotte Co, FL 215 Oct-97 158 7.60 9a-5p 4.60 N/A 34.96 Tindale-Oliver & Associates
Citrus Co, FL 231 Oct-03 155 5.71 7a-6p 4.82 N/A 27.52 Tindale-Oliver & AssociatesHernando Co., FL 232 May-96 182 182 7.24 9a-6p 5.04 N/A 36.49 Tindale-Oliver & Associates
Lake Co, FL 239 Dec-06 385 7.58 8.93 67.69 Tindale-Oliver & AssociatesCharlotte Co, FL 257 Oct-97 225 7.60 9a-5p 7.40 N/A 56.24 Tindale-Oliver & AssociatesSarasota Co, FL 282 Jun-93 146 146 6.61 - 8.40 N/A 55.52 Sarasota County
Hernando Co., FL 301 May-96 264 264 8.93 9a-6p 3.28 N/A 29.29 Tindale-Oliver & AssociatesCitrus Co, FL 306 Oct-03 146 8.40 7a-6p 3.94 N/A 33.10 Tindale-Oliver & Associates
Charlotte Co, FL 345 Oct-97 161 7.00 9a-5p 6.60 N/A 46.20 Tindale-Oliver & AssociatesCitrus Co, FL 364 Oct-03 345 7.20 7a-6p 9.14 N/A 65.81 Tindale-Oliver & Associates
Charlotte Co, FL 368 Oct-97 152 6.60 9a-5p 5.70 N/A 37.62 Tindale-Oliver & AssociatesCitrus Co, FL 374 Oct-03 248 12.30 7a-6p 6.88 N/A 84.62 Tindale-Oliver & Associates
Charlotte Co, FL 383 Oct-97 516 8.40 9a-5p 5.00 N/A 42.00 Tindale-Oliver & AssociatesSarasota Co, FL 393 Jun-93 207 207 7.76 - 5.40 N/A 41.90 Sarasota County
Collier Co, FL 400 Dec-99 389 7.80 8a-6p 6.40 N/A 49.92 Tindale-Oliver & AssociatesCharlotte Co, FL 441 Oct-97 195 8.20 9a-5p 4.70 N/A 38.54 Tindale-Oliver & Associates
Collier Co, FL 770 Dec-99 175 4.32 8a-6p 4.96 N/A 21.41 Tindale-Oliver & AssociatesCharlotte Co, FL 1,169 Oct-97 348 6.10 9a-5p 8.00 N/A 48.80 Tindale-Oliver & Associates
Total Size 10,147 Average Trip Length: 6.67Weighted Average Trip Length: 6.43
Weighted Average Trip Generation Rate: 7.53ITE Average Trip Generation Rate: 9.57
Average VMT: 55.83Note: Georgia studies are not included in summary statistics.
Location Date SourceVMTPercent New Trips
# Trip Length Interviews
Trip Gen Rate Time Period Trip
LengthTotal #
InterviewsSize / Units
Lake Co, FL 157 Dec-06 265 265 13.97 N/A 0.00 Tindale-Oliver & AssociatesLake Co, FL 169 Dec-06 212 8.09 N/A 0.00 Tindale-Oliver & Associates
Sarasota Co, FL 212 Jun-93 42 42 5.78 - N/A - 0.00 Sarasota CountyMarion Co, FL 214 Apr-02 175 175 6.84 N/A 0.00 Kimley-Horn & AssociatesLake Co, FL 226 Dec-06 301 6.74 N/A 0.00 Tindale-Oliver & Associates
Marion Co, FL 240 Apr-02 174 174 6.96 N/A 0.00 Kimley-Horn & AssociatesSarasota Co, FL 243 Jun-93 36 36 5.84 - N/A - 0.00 Sarasota County
Lake Co, FL 250 Dec-06 135 135 6.71 N/A 0.00 Tindale-Oliver & AssociatesMarion Co, FL 288 Apr-02 175 175 5.66 N/A 0.00 Kimley-Horn & AssociatesMarion Co, FL 480 Apr-02 175 175 5.73 N/A 0.00 Kimley-Horn & AssociatesMarion Co, FL 500 Apr-02 170 170 5.46 N/A 0.00 Kimley-Horn & Associates
Total Size 2,979 Average Trip Length: N/AITE 1,696 Weighted Average Trip Length: N/A
Blended total 4,675 Weighted Average Trip Generation Rate: 6.60ITE Average Trip Generation Rate: 6.72
Blend of FL Studies and ITE Average Trip Generation Rate: 6.64
Apartment (ITE LUC 220)Size / UnitsLocation Date Total #
Interviews# Trip Length
InterviewsTrip Gen
RateTime
PeriodTrip
LengthPercent
New Trips VMT Source
Residential Condominium/Townhouse (ITE LUC 230) - Bozeman Trip Characteristics Studies
Bozeman, MT 57 Jan-07 95 95 5.74 - 3.58 N/A 20.55 Tindale-Oliver & AssociatesBozeman, MT 63 Dec-06 200 200 7.70 - 2.67 N/A 20.56 Tindale-Oliver & Associates
Total Size 120 Average Trip Length: 3.13Weighted Average Trip Length: 3.10
Weighted Average Trip Generation Rate: 6.77ITE Average Trip Generation Rate: 5.86
Average VMT: 29.62
Size / Units
Trip Length
Percent New Trips
Total # Interviews
# Trip Length Interviews
Trip Gen Rate Time PeriodLocation Date SourceVMT

Tindale-Oliver & Associates, Inc. City of Bozeman January 2008 A-3 Impact Fee Study
Residential Condominium/Townhouse (ITE LUC 230) - Florida Trip Characteristics Studies
Hernando Co., FL 31 May-96 31 31 6.12 9a-6p 4.98 N/A 30.5 Tindale-Oliver & AssociatesHernando Co., FL 128 May-96 198 198 6.47 9a-6p 5.18 N/A 33.5 Tindale-Oliver & Associates
Pasco Co, FL 229 Apr-02 198 198 4.77 9a-6p 12.09 N/A 57.7 Tindale-Oliver & AssociatesPasco Co, FL 248 Apr-02 353 353 4.24 9a-6p 3.53 N/A 15.0 Tindale-Oliver & Associates
Total Size 636 Average Trip Length: 6.45Weighted Average Trip Length: 7.01
Weighted Average Trip Generation Rate: 4.97ITE Average Trip Generation Rate: 5.86
Average VMT: 34.16
Location Date SourceVMTTotal # Interviews
# Trip Length Interviews
Trip Gen Rate Time Period Trip
LengthPercent New
TripsSize / Units
Mobile Home Park (ITE LUC 240)
Marion County, FL 67 Jul-91 22 22 5.40 48hrs. 2.29 N/A 12.37 Tindale-Oliver & AssociatesMarion County, FL 82 Jul-91 58 58 10.80 24hr. 3.72 N/A 40.18 Tindale-Oliver & AssociatesMarion County, FL 137 Jul-91 22 22 3.10 24hr. 4.88 N/A 15.13 Tindale-Oliver & Associates
Marion Co, FL 188 Apr-02 147 - 3.51 24hr. 5.48 N/A 19.23 Kimley-Horn & AssociatesMarion Co, FL 227 Apr-02 173 - 2.76 24hr. 8.80 N/A 24.29 Kimley-Horn & Associates
Sarasota Co, FL 235 Jun-93 100 100 3.51 - 5.10 N/A 17.90 Sarasota CountyMarion Co, FL 297 Apr-02 175 - 4.78 24hr. 4.76 N/A 22.75 Kimley-Horn & Associates
Sarasota Co, FL 996 Jun-93 181 181 4.19 - 4.40 N/A 18.44 Sarasota CountyHernando Co., FL 1892 May-96 425 425 4.13 9a-6p 4.13 N/A 17.06 Tindale-Oliver & Associates
Total Size 4,121 Average Trip Length: 4.84Weighted Average Trip Length: 4.60
Bozeman Adjusted Trip Length: 2.02Weighted Average Trip Generation Rate: 4.17
ITE Average Trip Generation Rate: 4.99Average VMT: 20.82
Trip Length
Percent New Trips
Size / Units
Total # Interviews
# Trip Length Interviews
Trip Gen Rate Time PeriodLocation Date SourceVMT
Pinellas Co.,FL 114 Oct-89 30 14 7.30 12-7:30p 6.20 47.0 21.27 Tindale-Oliver & AssociatesPinellas Co.,FL 174 Aug-89 134 106 12.50 7-11a/3-7p 6.30 79.0 62.21 Tindale-Oliver & Associates
Total Size 288.0 Average Trip Length: 6.25ITE 4760.0 Weighted Average Trip Length: 6.26
Bozeman Adjusted Trip Length: 3.44Blended total 5048.0 Weighted Percent New Trip Average: 66.3
Weighted Average Trip Generation Rate: 10.44ITE Average Trip Generation Rate: 8.17
Blend of ITE & FL Studies - Average Trip Generation Rate: 8.30Average VMT: 41.74
Hotel (ITE LUC 310)SourceSize
(Rooms)Location Date Total # Interviews
# Trip Length Interviews
Trip Gen Rate
Time Period
Trip Length
Percent New Trips VMT
Motel (ITE LUC 320)
Pinellas Co.,FL 48 Oct-89 46 24 - 10a-2:20p 2.80 65.0 - Tindale-Oliver & AssociatesPinellas Co.,FL 54 Oct-89 32 22 - 12p-7p 3.80 69.0 - Tindale-Oliver & AssociatesPinellas Co.,FL 120 Oct-89 26 22 - 2p-7p 5.20 84.6 - Tindale-Oliver & Associates
Total Size 222 Average Trip Length: 3.93Weighted Average Trip Length: 4.34
Bozeman Adjusted Trip Length: 2.39Weighted Percent New Trip Average: 76.6
Weighted Average Trip Generation Rate: -ITE Average Trip Generation Rate: 5.63
Average VMT: -
Trip Length
Percent New Trips VMT SourceTotal #
Interviews# Trip Length
InterviewsTrip Gen
Rate Time PeriodLocation DateSize (Rooms)
Movie Theater with Matinee (ITE LUC 444)
Pinellas Co.,FL 8 Oct-89 151 116 113.10 2p-8p 2.70 77.0 235.13 Tindale-Oliver & AssociatesPinellas Co.,FL 12 Sep-89 122 116 63.40 2p-8p 1.90 95.0 114.44 Tindale-Oliver & Associates
Total Size 20 Average Trip Length: 2.30Weighted Average Trip Length: 2.22
Bozeman Adjusted Trip Length: 1.22Weighted Percent New Trip Average: 87.8
Weighted Average Trip Generation Rate: 83.28ITE Average Trip Generation Rate (per 1,000 sf): 38.00
Average VMT: 174.79
Trip Length
Percent New Trips VMT SourceTotal #
Interviews# Trip Length
InterviewsTrip Gen
Rate Time PeriodSize (Screens)Location Date
Pinellas Co. 5.6 Aug-89 94 66 67.00 7a-6p 1.90 70.0 89.11 Tindale-Oliver & AssociatesPinellas Co. 10.0 Sep-89 179 134 67.00 7a-6p 2.10 75.0 105.53 Tindale-Oliver & AssociatesTampa, FL - Mar-86 28 25 - - 2.60 89.0 - Kimley-Horn & Associates
Total Size 15.6 Average Trip Length: 2.20ITE 30.0 Weighted Average Trip Length: 2.03
Blended total 45.6 Bozeman AdjustedTrip Length: 0.87Weighted Percent New Trip Average: 73.2
Weighted Average Trip Generation Rate: 66.99ITE Average Trip Generation Rate: 79.26
Blend of ITE & FL Studies - Average Trip Generation Rate: 75.07Average VMT: 97.32
VMT SourceTotal # Interviews
# Trip Length Interviews
Trip Gen Rate
Time Period
Day Care Center (ITE LUC 565)Trip
LengthPercent
New TripsSize
(1,000 sf)Location Date

Tindale-Oliver & Associates, Inc. City of Bozeman January 2008 A-4 Impact Fee Study
Lakeland, FL 120 Mar-90 74 66 2.86 11a-4p 2.59 89.0 6.59 Tindale-Oliver & AssociatesTotal Size 120 Average Trip Length: 2.59
ITE 415 Weighted Average Trip Length: 2.59 ITEBlended total 535.0 Bozeman Adjusted Trip Length: 1.11
Weighted Percent New Trip Average: 89.0Weighted Average Trip Generation Rate: 2.86
ITE Average Trip Generation Rate: 2.37Blend of ITE & FL Studies - Average Trip Generation Rate: 2.48
Average VMT: 6.59
Nursing Home (ITE LUC 620)SourceTime
PeriodTrip
LengthPercent
New Trips VMTSize (Beds)Location Date Total #
Interviews# Trip Length
InterviewsTrip Gen
Rate
General Office Building (ITE LUC 710) - Bozeman Trip Characteristics Studies
Bozeman, MT 39.0 Dec-06 107 107 N/A - 1.64 77.0 - Tindale-Oliver & AssociatesBozeman, MT 48.3 Dec-06 153 153 21.37 - 2.83 69.0 41.73 Tindale-Oliver & AssociatesBozeman, MT 61.2 Dec-06 268 268 28.92 - 1.74 72.0 36.23 Tindale-Oliver & Associates
Total Size 109.5 Average Trip Length: 2.07Weighted Average Trip Length: 2.22
Weighted Percent New Trip Average: 71.0
Weighted Average Trip Generation Rate: 25.59ITE Average Trip Generation Rate: 11.01
Average VMT: 38.98
Trip Length
Percent New Trips VMT SourceTotal #
Interviews# Trip Length
InterviewsTrip Gen
Rate Time PeriodLocation DateSize (1,000 sf)
General Office Building (ITE LUC 710) - Trip Characteristics Studies
Sarasota Co, FL 14.3 Jun-93 14 14 46.85 - 11.30 - 529.41 Sarasota CountyGwinnett Co., GA 98.0 12/13-18/92 - - 4.30 - 5.40 - - Street SmartsGwinnett Co., GA 180.0 12/13-18/92 - - 3.60 - 5.90 - - Street Smarts
Pinellas Co. 187.0 Oct-89 431 388 18.49 7a-5p 6.30 90.0 104.84 Tindale-Oliver & AssociatesSt. Petersburg, FL 262.8 Sep-89 291 274 - 7a-5p 3.40 94.0 - Tindale-Oliver & Associates
Total Size 742.1 Average Trip Length: 6.46Weighted Average Trip Length: 5.15
Weighted Percent New Trip Average: 92.3
Weighted Average Trip Generation Rate: 10.84ITE Average Trip Generation Rate: 11.01
Average VMT: 317.12
Size (1,000 sf)Location Date Total #
Interviews# Trip Length
InterviewsTrip Gen
Rate Time Period Trip Length
Percent New Trips VMT Source
Citrus Co, FL 5.3 Dec-03 20 29.36 8-5p 5.25 95.2 146.78 Tindale-Oliver & AssociatesCitrus Co, FL 10.0 Nov-03 340 40.56 8-630p 6.20 92.4 232.33 Tindale-Oliver & Associates
Charlotte Co, FL 11.0 Oct-97 186 49.50 9a-5p 4.60 92.1 209.67 Tindale-Oliver & AssociatesPalm Harbor, FL 14.6 Oct-89 104 76 33.98 9a-5p 6.30 73.0 156.27 Tindale-Oliver & Associates
Hernando Co., FL 28.0 May-96 202 189 49.75 9a-6p 6.06 93.8 282.64 Tindale-Oliver & AssociatesCharlotte Co, FL 28.0 Oct-97 186 31.00 9a-5p 3.60 81.6 91.04 Tindale-Oliver & AssociatesCharlotte Co, FL 30.4 Oct-97 324 39.80 9a-5p 3.30 83.5 109.68 Tindale-Oliver & Associates
Citrus Co, FL 38.9 Oct-03 168 32.26 8-6p 6.80 97.1 213.03 Tindale-Oliver & AssociatesHernando Co., FL 58.4 May-96 390 349 28.52 9a-6p 6.47 89.5 165.09 Tindale-Oliver & AssociatesSt. Petersburg, FL - Nov-89 34 30 57.20 9a-4p 1.20 88.0 - Tindale-Oliver & Associates
Tampa, FL - Mar-86 33 26 - - 6.00 79.0 - Kimley-Horn & AssociatesTotal Size 224.5 Average Trip Length: 5.07
ITE 450.0 Weighted Average Trip Length: 5.55Blended total 674.5 Bozeman Adjusted Trip Length: 2.39
Weighted Percent New Trip Average: 88.9Bozeman Adjusted Percent New Trip Average(1): 69.0
Average Trip Generation Rate: 35.59ITE Average Trip Generation Rate: 36.13
Blend of ITE & FL Studies - Average Trip Generation Rate: 35.95Average VMT: 178.51
Medical-Dental Office Building (ITE LUC 720)Size
(1,000 sf)Location Date Total # Interviews
# Trip Length Interviews
Trip Gen Rate
Time Period
Trip Length
(1) The percent new trips variable has been adjusted based on the relationship observed between the office land use studies conducted in Bozeman (71%) and those previously collected in the TCS Database (92%).
Percent New Trips VMT Source
Building Materials and Lumber Store (ITE LUC 812)
Tampa, FL 86.9 Jun-93 40 - - 7a-430p 6.58 73.0 - Tindale-Oliver & AssociatesTampa, FL 98.5 Jun-93 40 - - 7a-430p 6.00 - - Tindale-Oliver & AssociatesTampa, FL - Jun-93 40 - - 7a-430p 5.87 75.7 - Tindale-Oliver & Associates
Total Size 185.4 Average Trip Length: 6.15Weighted Average Trip Length: 6.27
Bozeman Adjusted Trip Length: 3.89. 74.4
Weighted Average Trip Generation Rate: -ITE Average Trip Generation Rate: 45.16
Average VMT: -
VMT SourceTrip Gen Rate Time Period Trip
LengthPercent New
TripsSize
(1,000 sf)Location Date Total # Interviews
# Trip Length Interviews
Free-Standing Discount Superstore (ITE LUC 813)
Citrus Co, FL 203.6 Nov-03 236 55.01 8a-6p 5.91 91.8 298.55 Tindale-Oliver & AssociatesTotal Size 203.6 Average Trip Length: 5.91
Weighted Average Trip Length: 5.91Bozeman Adjusted Trip Length: 3.66
Weighted Percent New Trip Average: 91.8
Weighted Average Trip Generation Rate: 55.01ITE Average Trip Generation Rate: 49.21
Average VMT: 298.55
Total # Interviews
# Trip Length Interviews
Trip Gen Rate Time Period Trip
LengthPercent New
Trips VMT SourceLocation DateSize (1,000 sf)

Tindale-Oliver & Associates, Inc. City of Bozeman January 2008 A-5 Impact Fee Study
Shopping Center (ITE LUC 820)
Tampa, FL - Mar-86 527 348 - - - 66.0 - Kimley-Horn & AssociatesTampa, FL - Mar-86 170 - - - 1.70 - - Kimley-Horn & AssociatesTampa, FL - Mar-86 354 269 - - - 76.0 - Kimley-Horn & AssociatesTampa, FL - Mar-86 144 - - - 2.50 - - Kimley-Horn & Associates
St. Petersburg, FL 1,192.0 Aug-89 384 298 - 11a-7p 3.60 78.0 - Tindale-Oliver & AssociatesLargo, FL 425.0 Aug-89 160 120 26.73 10a-6p 2.30 75.0 46.11 Tindale-Oliver & Associates
Dunedin, FL 80.5 Sep-89 276 210 81.48 9a-5p 1.40 76.0 86.69 Tindale-Oliver & AssociatesPinellas Park, FL 696.0 Sep-89 485 388 - 9a-6p 3.20 80.0 - Tindale-Oliver & Associates
Seminole, FL 425.0 Oct-89 674 586 - - - 87.0 - Tindale-Oliver & AssociatesHillsborough Co, FL 134.0 Jul-91 - - - - 1.30 74.0 - Tindale-Oliver & AssociatesHillsborough Co, FL 151.0 Jul-91 - - - - 1.30 73.0 - Tindale-Oliver & Associates
Collier Co, FL - Aug-91 68 64 - - 3.33 94.1 0.00 Tindale-Oliver & AssociatesCollier Co, FL - Aug-91 208 154 - - 2.64 74.0 0.00 Tindale-Oliver & Associates
St.Petersburgh,FL 132.3 Sep-92 400 368 77.00 10a-7p 1.80 92.0 127.51 Tindale-Oliver & AssociatesSarasota/Bradenton, FL 109.0 Sep-92 300 185 - 12a-6p - 61.6 - King Engineering Associates, Inc.
Ocala, FL 133.4 Sep-92 300 192 - 12a-6p - 64.0 - King Engineering Associates, Inc.Gwinnett Co, GA 99.1 Dec-92 - - 46.00 - 3.20 70.0 103.04 Street SmartsGwinnett Co, GA 314.7 Dec-92 - - 27.00 - 8.50 84.0 192.78 Street SmartsSarasota Co, FL 110.0 Jun-93 58 58 122.14 - 3.20 - - Sarasota CountySarasota Co, FL 146.1 Jun-93 65 65 51.53 - 2.80 - - Sarasota CountySarasota Co, FL 157.5 Jun-93 57 57 79.79 - 3.40 - - Sarasota CountySarasota Co, FL 191.0 Jun-93 62 62 66.79 - 5.90 - - Sarasota CountyHernando Co, FL 107.8 May-96 608 331 77.60 9a-6p 4.68 54.5 197.85 Tindale-Oliver & AssociatesCharlotte Co, FL 88.0 Oct-97 - - 73.50 9a-5p 1.80 57.1 75.56 Tindale-Oliver & AssociatesCharlotte Co, FL 191.9 Oct-97 - - 72.00 9a-5p 2.40 50.9 87.97 Tindale-Oliver & AssociatesCharlotte Co, FL 51.3 Oct-97 - - 43.00 9a-5p 2.70 51.8 60.08 Tindale-Oliver & Associates
Lake Co, FL 67.8 Apr-01 246 177 102.60 - 3.40 71.2 248.37 Tindale-Oliver & AssociatesLake Co, FL 72.3 Apr-01 444 376 65.30 - 4.50 59.0 173.37 Tindale-Oliver & Associates
Pasco Co, FL 65.6 Apr-02 222 - 145.64 9a-5p 1.46 46.9 99.62 Tindale-Oliver & AssociatesPasco Co, FL 75.8 Apr-02 134 - 38.23 9a-5p 2.36 58.2 52.52 Tindale-Oliver & AssociatesCitrus Co, FL 185.0 Oct-03 - 784 55.84 8a-6p 2.40 88.1 118.05 Tindale-Oliver & AssociatesCitrus Co, FL 91.3 Nov-03 - 390 54.50 8a-6p 1.60 88.0 76.77 Tindale-Oliver & AssociatesBozeman, MT 104.3 Dec-06 359 359 46.96 - 3.35 49.0 77.08 Tindale-Oliver & AssociatesBozeman, MT 159.9 Dec-06 502 502 56.49 - 1.56 54.0 47.59 Tindale-Oliver & AssociatesBozeman, MT 35.9 Dec-06 329 329 69.30 - 1.39 74.0 71.28 Tindale-Oliver & Associates
Total Size 5,757.5 Average Trip Length: 2.66 32.2Weighted Average Trip Length: 3.00
169.3 Weighted Percent New Trip Average: 75.68Weighted Average Trip Generation Rate: 59.46
ITE Average Trip Generation Rate: 42.94Note: Georgia study with trip length of 8.50 is an outlier and has been excluded from weighted average trip length calculation. Average VMT: 98.47
Location DateSize (1,000 sf)
Total # Interviews
# Trip Length Interviews
Trip Gen Rate Time Period Trip
LengthPercent New
Trips VMT Source
St.Petersburg, FL 43.0 Oct-89 152 120 - 9am-5pm 4.70 79.0 - Tindale-Oliver & AssociatesClearwater, FL 43.0 Oct-89 136 106 29.40 9am-5pm 4.50 78.0 103.19 Tindale-Oliver & Associates
Total Size 43.0 Average Trip Length: 4.60ITE 374.0 Weighted Average Trip Length: 4.60
Bozeman Adjusted Trip Length: 2.85Blended total 417.0 Weighted Percent New Trip Average: 78.5
Weighted Average Trip Generation Rate: 29.40ITE Average Trip Generation Rate: 33.34
Blend of ITE & FL Studies - Average Trip Generation Rate: 32.93Average VMT: 103.19
New Car Sales (ITE LUC 841)Total #
Interviews# Trip Length
InterviewsTrip Gen
RateTime
PeriodTrip
LengthPercent
New Trips VMT SourceSize (1,000 sf)Location Date
Convenience Market-24hrs. (ITE LUC 851)
Clearwater 2.1 Nov-89 143 50 635.24 24hr. 1.60 35.0 355.73 Tindale-Oliver & AssociatesMarion County, FL 2.5 Jun-91 94 43 787.20 48hrs. 1.52 46.2 552.80 Tindale-Oliver & AssociatesMarion County, FL 2.5 Jun-91 74 20 714.00 48hrs. 0.75 27.0 144.59 Tindale-Oliver & Associates
Largo, FL 2.5 8/15,25/89 171 116 634.80 - 1.20 68.0 518.00 Tindale-Oliver & AssociatesClearwater, FL 2.5 Aug-89 237 64 690.80 - 1.60 27.0 298.43 Tindale-Oliver & Associates
Gwinnett Co., GA 2.9 12/13-18/92 - - - - 2.30 48.0 - Street SmartsGwinnett Co., GA 3.2 12/13-18/92 - - - - - 37.0 - Street SmartsCollier County, FL - Aug-91 146 36 - - 2.53 24.7 - Tindale-Oliver & AssociatesCollier County, FL - Aug-91 148 38 - - 1.08 25.7 - Tindale-Oliver & Associates
Tampa, FL - Mar-86 80 - - - 1.10 - - Kimley-Horn & AssociatesTotal Size 18.2 Average Trip Length: 1.52
Weighted Average Trip Length: 1.52Bozeman Adjusted Trip Length: 0.94
Weighted Percent New Trip Average: 41.3
Weighted Average Trip Generation Rate: 694.30ITE Average Trip Generation Rate: 737.99
Average VMT: 373.91
VMT SourceTrip Gen Rate Time Period Trip
LengthPercent New
TripsLocation DateSize (1,000 sf)
Total # Interviews
# Trip Length Interviews
Furniture Store (ITE LUC 890)
Largo, FL 15.0 7/28-30/92 64 34 - - 4.63 52.5 - Tindale-Oliver & AssociatesTampa, FL 16.9 Jul-92 68 39 - - 7.38 55.7 - Tindale-Oliver & Associates
Total Size 31.9 Average Trip Length: 6.01Weighted Average Trip Length: 6.09
Bozeman Adjusted Trip Length: 3.78Weighted Percent New Trip Average: 54.2
Average Trip Generation Rate: -ITE Average Trip Generation Rate: 5.06
Average VMT: -
Trip Length
Percent New Trips VMT SourceTotal #
Interviews# Trip Length
InterviewsTrip Gen
Rate Time PeriodLocation DateSize (per 1,000 sf)

Tindale-Oliver & Associates, Inc. City of Bozeman January 2008 A-6 Impact Fee Study
Clearwater, FL 0.4 Aug-89 113 52 - 9am-6pm 5.20 46.0 - Tindale-Oliver & AssociatesLargo, FL 2.0 Sep-89 129 94 192.50 - 1.60 73.0 224.84 Tindale-Oliver & Associates
Marion County, FL 2.3 Jun-91 69 29 680.00 24hr. 1.33 42.0 379.85 Tindale-Oliver & AssociatesMarion County, FL 2.4 Apr-02 70 - 642.00 24hr. 3.55 54.6 1245.31 Kimley-Horn & AssociatesMarion County, FL 2.5 Jul-91 57 26 386.00 48hrs. 2.70 45.6 475.24 Tindale-Oliver & AssociatesMarion County, FL 2.7 May-02 50 - 246.66 24hr. 2.66 40.5 265.44 Kimley-Horn & AssociatesMarion County, FL 3.1 Jun-91 47 32 580.80 24hr. 1.75 68.1 692.17 Tindale-Oliver & Associates
Seminole, FL 4.5 Oct-89 - - 201.78 - - - - Tindale-Oliver & AssociatesHernando Co., FL 5.4 May-96 164 41 364.72 9a-6p 2.77 24.7 249.54 Tindale-Oliver & Associates
Tampa, FL - Mar-86 77 - - - 2.40 - - Kimley-Horn & AssociatesTampa, FL - Mar-86 211 - - - - 54.0 - Kimley-Horn & Associates
Collier County, FL - Aug-91 162 96 - 24hr. 0.88 59.3 - Tindale-Oliver & AssociatesCollier County, FL - Aug-91 116 54 - - 1.58 46.6 - Tindale-Oliver & AssociatesCollier County, FL - Aug-91 142 68 - - 2.08 47.9 - Tindale-Oliver & Associates
Total Size 25.2 Average Trip Length: 2.38ITE 76.0 Weighted Average Trip Length: 2.46
Blended total 101.2 Bozeman Adjusted Trip Length: 1.53Weighted Percent New Trip Average: 46.2
Weighted Average Trip Generation Rate: 393.10ITE Average Trip Generation Rate: 246.49
Blend of ITE & FL Studies - Average Trip Generation Rate: 281.55Average VMT: 504.63
# Trip Length Interviews
Trip Gen Rate
Time Period
Drive-In Bank (ITE LUC 912)Trip
LengthPercent
New Trips VMT SourceTotal # Interviews
Size (1,000 sf)Location Date
St. Petersburg, FL 7.5 Oct-89 177 154 - 30-230/430-83 3.50 87.0 - Tindale-Oliver & AssociatesClearwater, FL 8.0 Oct-89 60 40 110.60 10-230/5-830 2.80 67.0 207.49 Tindale-Oliver & Associates
Tampa, FL - Mar-86 76 62 - - 2.10 82.0 - Kimley-Horn & AssociatesTotal Size 8.0 15.5 Average Trip Length: 2.80
ITE 135.0 135.0 Weighted Average Trip Length: 3.14Blended total 143.0 150.5 Bozeman Adjusted Trip Length: 1.95
Weighted Percent New Trip Average: 76.7Weighted Average Trip Generation Rate: 110.63
ITE Average Trip Generation Rate: 89.95Blend of ITE & FL Studies - Average Trip Generation Rate: 91.10
Average VMT: 207.49
Quality Restaurant (ITE LUC 931)SourceTime
PeriodTrip
LengthPercent
New Trips VMTSize (1,000 sf)Location Date Total #
Interviews# Trip Length
InterviewsTrip Gen
Rate
Marion County, FL 1.6 Jun-91 60 32 962.50 48hrs. 0.91 53.3 466.84 Tindale-Oliver & AssociatesPinellas Co. 2.2 Aug-89 81 48 502.80 11am-2pm 1.70 59.0 504.31 Tindale-Oliver & AssociatesLake Co, FL 2.2 Apr-01 376 252 934.30 2.50 74.6 1742.47 Tindale-Oliver & AssociatesPasco Co, Fl 2.7 Apr-02 100 46 283.12 9a-6p 5.10 46.0 664.20 Tindale-Oliver & AssociatesPasco Co, Fl 3.0 Apr-02 486 164 515.32 9a-6p 2.72 33.7 472.92 Tindale-Oliver & Associates
Hernando Co, FL 3.1 May-96 168 82 547.34 9a-6p 1.59 48.8 425.04 Tindale-Oliver & AssociatesLake Co, FL 3.2 Apr-01 171 182 654.90 4.10 47.8 1283.47 Tindale-Oliver & AssociatesLake Co, FL 3.8 Apr-01 188 137 353.70 3.30 70.8 826.38 Tindale-Oliver & Associates
Marion County, FL 4.0 Jun-91 75 46 625.00 48hrs. 1.54 61.3 590.01 Tindale-Oliver & AssociatesPinellas Co. 4.3 Oct-89 456 260 660.40 1 day 2.30 57.0 865.78 Tindale-Oliver & AssociatesPasco Co, Fl 4.4 Apr-02 168 120 759.24 9a-6p 1.89 71.4 1024.99 Tindale-Oliver & Associates
Hernando Co., FL 5.4 May-96 136 82 311.83 9a-6p 1.68 60.2 315.27 Tindale-Oliver & AssociatesTarpon Springs,FL - Oct-89 233 114 - 7am-7pm 3.60 49.0 - Tindale-Oliver & AssociatesCollier County, FL - Aug-91 66 44 - - 1.91 66.7 - Tindale-Oliver & AssociatesCollier County, FL - Aug-91 118 40 - - 1.17 33.9 - Tindale-Oliver & Associates
Tampa, FL - Mar-86 61 - - - 2.70 - - Kimley-Horn & AssociatesTampa, FL - Mar-86 306 - - - - 65.0 - Kimley-Horn & Associates
Total Size 39.9 Average Trip Length: 2.42ITE 63.0 Weighted Average Trip Length: 2.05
Blended total 102.9 Bozeman Adjusted Trip Length: 1.27(less TL exclusions) 34.0 Weighted Percent New Trip Average: 57.9
Weighted Average Trip Generation Rate: 564.46ITE Average Trip Generation Rate: 496.12
Blend of ITE & FL Studies - Average Trip Generation Rate: 522.62Note: Studies with trip length of 5.10 and 4.10 are outliers and have been excluded from weighted average trip length calculation. Average VMT: 765.14
Size (1,000 sf)Location Date Total #
Interviews# Trip Length
InterviewsTrip Gen
RateTime
PeriodTrip
LengthPercent
New Trips VMT Source
Fast Food Restaurant w/Drive Thru (ITE LUC 934)

APPENDIX B Cost Component Calculation

Tindale-Oliver & Associates, Inc. City of Bozeman January 2008 B-1 Impact Fee Study
Cost Component Calculations All information used to compute a typical cost per lane mile and a typical average daily capacity added per lane mile is presented in this Appendix. As noted, the primary sources for the city project data are recent engineer estimates and recent bids for projects being built and funded in the City of Bozeman. In the case of the state projects data, the source is the MDOT project reports for recently completed or fully programmed capacity expansion projects in the City of Bozeman. As mentioned previously, the cost calculations are based on city and state projects in the City of Bozeman (presented at the end of this section in Tables B-1, B-2, B-3, B-4, B-5, B-6, B-7, and B-8). These projects were utilized in the calculation of the average cost per lane mile figure that is utilized in the update of the impact fee equation for the City of Bozeman. Right-Of-Way Cost City The ROW cost was developed based on two projects that are representative of future roadway improvements. Specifically, the ROW costs associated with the West Babcock Street and West Durston Road street projects were used to calculate a weighted average ROW cost per lane mile. The weighted average ROW cost per lane mile is presented in Table B-1. The weighted average ROW cost per lane mile is approximately $276,316 for city roads. Based on discussion with city staff it was noted that the City acquires right-of-way primarily through the development review process. State As mentioned in the report, ROW cost data for the South 19th Avenue and Rouse Avenue state projects are believed to be representative of typical state land acquisitions. These two projects had a weighted average ROW cost per lane mile of approximately $335,446. Given the fact that the projects evaluated include both future estimate and recent bid roadway improvements, it is expected that the recent increases in land values and recent land purchases associated with these state projects in the City of Bozeman were accounted for in the calculation, which is presented in Table B-2. The Rouse Avenue project costs are based on the acquisitions associated with the addition of a continuous left turn lane to the two-lane undivided roadway.

Tindale-Oliver & Associates, Inc. City of Bozeman January 2008 B-2 Impact Fee Study
Construction Cost The same projects used to calculate the respective ROW costs for city and state projects were used to determine the cost of construction. Tables B-3 through B-8 present the construction cost calculations for the city and state roads. Table B-3 presents the list of projects that will be built based on the Greater Bozeman Area Transportation Plan, 2001 Update. Table B-4 presents a lane mile summary of the projects presented in Table B-3. Table B-5 presents the weighted average calculation for the addition of a continuous left turn lane along a two-lane undivided roadway for city projects. Table B-6 presents the weighted average construction cost per lane mile for city and state roads. Table B-7 presents the lane mile distribution for city and state roads based on the Greater Bozeman Area Transportation Plan, 2001 Update. Table B-8 presents the weighted average total cost per lane mile for city and state roads combined. Table B-9 presents the calculation of the weighted average capacity added per lane mile. Adjustments were made to account for the proportion of future roads based on project features expected to be representative of future City and the State projects. These adjustments were used to develop a weighted average construction cost per lane mile for both city and state roadways. Specifically, as shown in Table B-4 based on the Greater Bozeman Area Transportation Plan, 2001 Update, it is estimated that the following project types will be constructed by the City of Bozeman:
• New construction of two travel lanes and a continuous left turn lane (three-lane section) (16 percent).
• The addition of a continuous left turn lane along a two-lane undivided roadway where the city only pays for the addition of the third lane (three-lane section) (28 percent).
• The addition of a continuous left turn lane along a two-lane undivided roadway that is either a reconstruction of the existing lanes or an offset (three-lane section) (26 percent).
• The addition of two travel lanes to an existing two-lane divided roadway (five lane section) (30 percent).
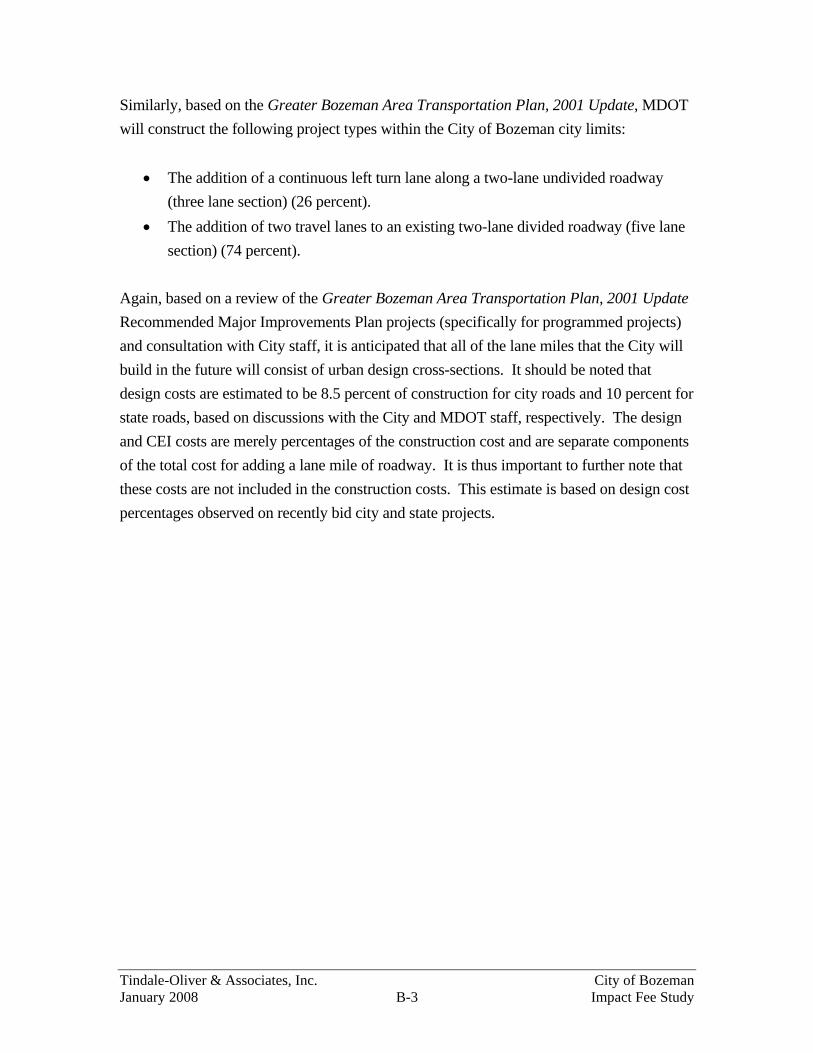
Tindale-Oliver & Associates, Inc. City of Bozeman January 2008 B-3 Impact Fee Study
Similarly, based on the Greater Bozeman Area Transportation Plan, 2001 Update, MDOT will construct the following project types within the City of Bozeman city limits:
• The addition of a continuous left turn lane along a two-lane undivided roadway (three lane section) (26 percent).
• The addition of two travel lanes to an existing two-lane divided roadway (five lane section) (74 percent).
Again, based on a review of the Greater Bozeman Area Transportation Plan, 2001 Update Recommended Major Improvements Plan projects (specifically for programmed projects) and consultation with City staff, it is anticipated that all of the lane miles that the City will build in the future will consist of urban design cross-sections. It should be noted that design costs are estimated to be 8.5 percent of construction for city roads and 10 percent for state roads, based on discussions with the City and MDOT staff, respectively. The design and CEI costs are merely percentages of the construction cost and are separate components of the total cost for adding a lane mile of roadway. It is thus important to further note that these costs are not included in the construction costs. This estimate is based on design cost percentages observed on recently bid city and state projects.
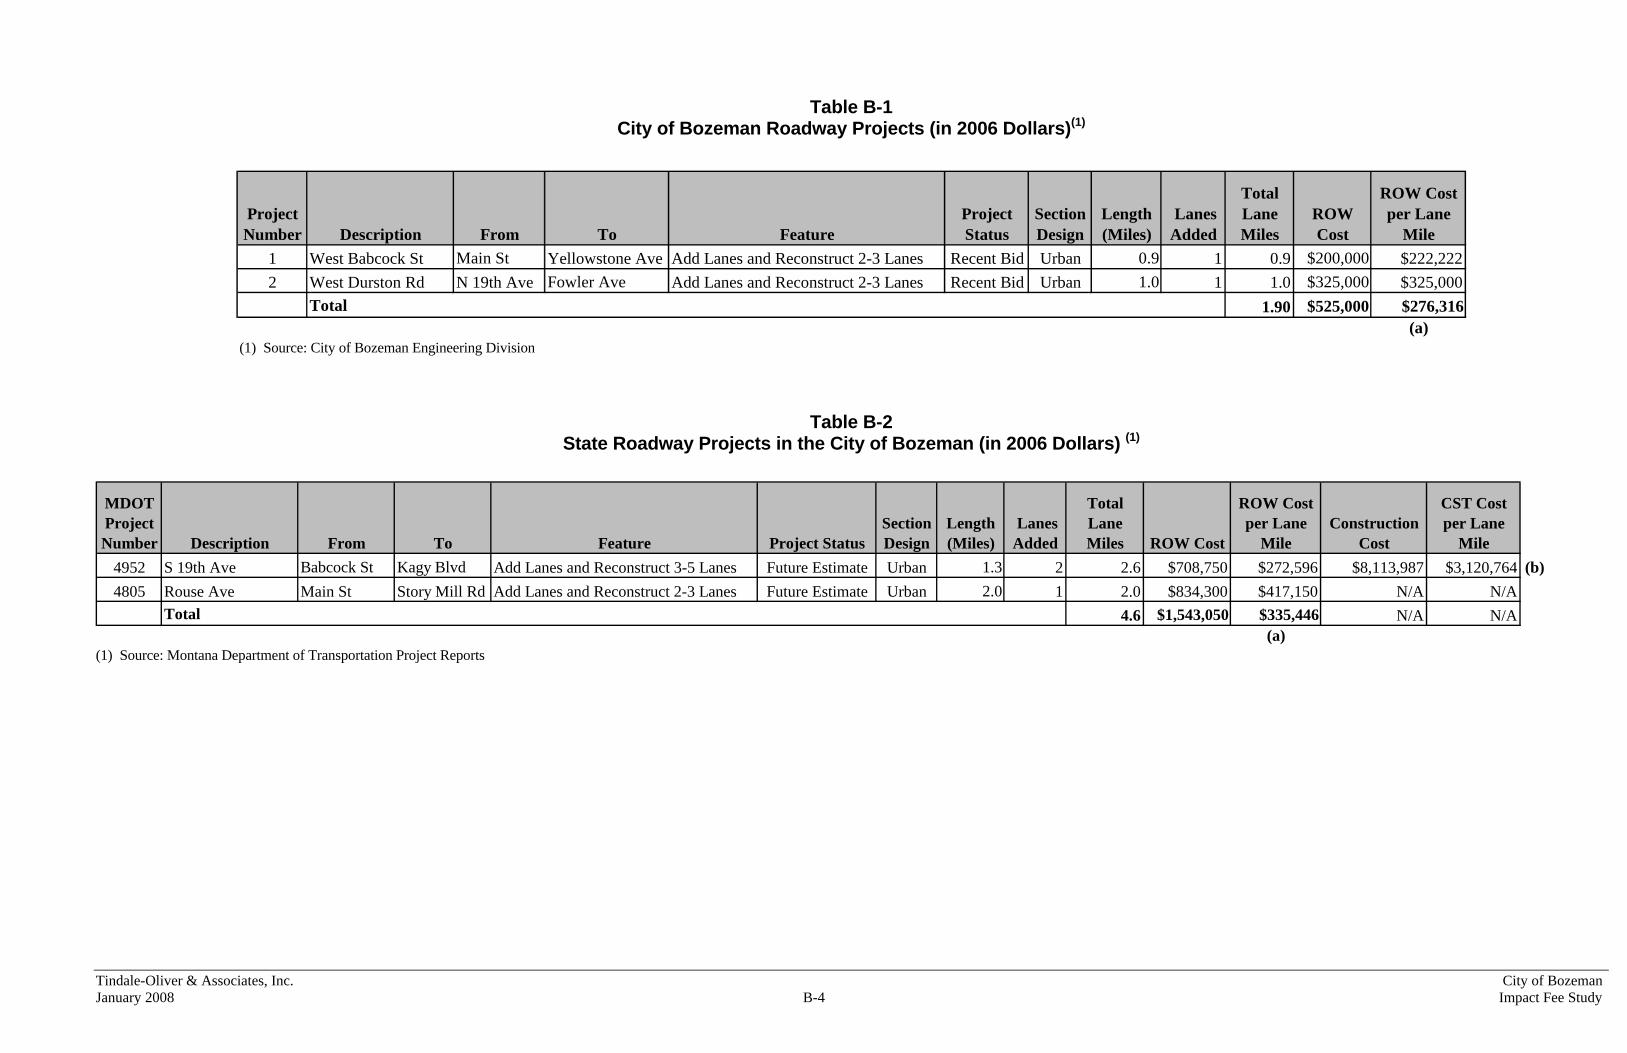
Tindale-Oliver & Associates, Inc. City of Bozeman January 2008 B-4 Impact Fee Study
Table B-1 City of Bozeman Roadway Projects (in 2006 Dollars)(1)
1 West Babcock St Main St Yellowstone Ave Add Lanes and Reconstruct 2-3 Lanes Recent Bid Urban 0.9 1 0.9 $200,000 $222,2222 West Durston Rd N 19th Ave Fowler Ave Add Lanes and Reconstruct 2-3 Lanes Recent Bid Urban 1.0 1 1.0 $325,000 $325,000
Total 1.90 $525,000 $276,316 (a)
Project Status Description From Feature
Length (Miles) To
Total Lane Miles
Lanes Added
Section Design
Project Number
ROW Cost
ROW Cost per Lane
Mile
(1) Source: City of Bozeman Engineering Division
Table B-2 State Roadway Projects in the City of Bozeman (in 2006 Dollars) (1)
4952 S 19th Ave Babcock St Kagy Blvd Add Lanes and Reconstruct 3-5 Lanes Future Estimate Urban 1.3 2 2.6 $708,750 $272,596 $8,113,987 $3,120,764 (b)4805 Rouse Ave Main St Story Mill Rd Add Lanes and Reconstruct 2-3 Lanes Future Estimate Urban 2.0 1 2.0 $834,300 $417,150 N/A N/A
Total 4.6 $1,543,050 $335,446 N/A N/A(a)
MDOT Project Number Project Status
Lanes AddedFeature
Length (Miles) To
Section Design From ROW Cost
ROW Cost per Lane
MileDescriptionConstruction
Cost
CST Cost per Lane
Mile
Total Lane Miles
(1) Source: Montana Department of Transportation Project Reports

Tindale-Oliver & Associates, Inc. City of Bozeman January 2008 B-5 Impact Fee Study
Table B-3 Greater Bozeman Area Transportation Plan, 2001 Update – Recommended Major Improvements (1)
Project Number
2 to 3 Lane Classification
City/ State Description From To
Roadway Class Feature Section Length
Lanes Added
Total Lane Miles
1 full reconstruct State S 19th Ave College St Main St Arterial Add Lanes and Reconstruct 3-5 Lanes 2D-4D 0.6 2 1.22 full reconstruct State S 19th Ave Kagy Blvd College St Arterial Add Lanes and Reconstruct 3-5 Lanes 2D-4D 0.8 2 1.63 offset City Kagy Blvd S 19th Ave Willson Ave Arterial Add Lanes and Reconstruct 2-3 Lanes 2U-2D 1.4 1 1.44 offset City S 3rd Ave Graf St Kagy Blvd Collector Add Lanes and Reconstruct 2-3 Lanes 2U-2D 1.9 1 1.95 full reconstruct State Rouse Ave Oak Street Story Mill Rd Arterial Add Lanes and Reconstruct 2-3 Lanes 2U-2D 1.0 1 1.06 full reconstruct City College St W Main St S 19th Ave Arterial Add Lanes and Reconstruct 2-5 Lanes 2U-4D 0.5 3 1.57 city/developer City Cottonwood Rd-Part 1 Stucky Rd Huffine Ln Arterial Add Lanes and Reconstruct 2-3 Lanes 2U-2D 1.0 1 1.08 offset City Cottonwood Rd-Part 2 Huffine Ln Oak Street Arterial Add Lanes and Reconstruct 2-5 Lanes 2U-4D 1.5 3 4.59 city/developer City Cottonwood Rd-Part 3 Oak Street Valley Center Rd Arterial Add Lanes and Reconstruct 2-3 Lanes 2U-2D 2.5 1 2.510 city/developer City Fowler/Davis Ave Oak Street Valley Center Rd Arterial Add Lanes and Reconstruct 2-3 Lanes 2U-2D 2.2 1 2.211 full reconstruct City Durston Road Fowler Avenue Cottonwood Rd Arterial Add Lanes and Reconstruct 2-3 Lanes 2U-2D 1.0 1 1.012 new construction City Oak Street N 19th Ave Cottonwood Rd Arterial New Road Construction - 3 Lanes 0-2D 1.1 3 3.313 offset City Oak Street N 19th Ave Cottonwood Rd Arterial Add Lanes and Reconstruct 2-3 Lanes 2U-2D 0.9 1 0.9
Total 24.0City Roads 2-3 Additional Lane (Offset)(2) 81% 4.2City Roads 2-3 Additional Lane (Reconstruction)(3) 19% 1.0 (1) Greater Bozeman Area Transportation Plan, 2001 Update and discussion with City staff regarding projects that have been constructed since
the initial development of the plan. (2) Sum of total lane miles for Projects 3, 4 and 13 (3) Sum of total lane miles for Project 11

Tindale-Oliver & Associates, Inc. City of Bozeman January 2008 B-6 Impact Fee Study
Table B-4 Greater Bozeman Area Transportation Plan, 2001 Update – Recommended Major Improvements Lane Mile Summary
Lane Miles Percentage
Lane Miles Percentage
0 to 3(1) 3.3 16% 0.0 0% 3.32 to 3 (city/developer)(2) 5.7 28% 0.0 0% 5.72 to 3 (additional lane)(3) 5.2 26% 1.0 26% 6.23 to 5(4) 6.0 30% 2.8 74% 8.8Total 20.2 100% 3.8 100% 24.0
Total Lane MilesProject Type
City Roads State Roads
(1) Source: Table B-3, total lane miles for project 12 (2) Source: Table B-3, total lane miles for projects 7, 9, and 10 (3) Source: Table B-3 for city roads and state roads (sum of projects 3, 4, 11, and 13 for city roads;
project 5 for state roads) (4) Source: Table B-3 for city and state roads (sum of projects 6 and 8 for city roads; sum of
projects 1 and 2 for state roads)

Tindale-Oliver & Associates, Inc. City of Bozeman January 2008 B-7 Impact Fee Study
Table B-5 Weighted Average Construction Cost
City Roads (2 to 3 Lane Sections – Offset and Reconstruction) (in 2006 Dollars)
Jurisdiction Project FeatureCost per
Lane Mile(3) Weight(4)
Weighted Cost per
Lane Mile(5)
Full Reconstruct with Added Turn Lane(1) $4,800,000 19% $912,000Offset(2) $4,200,000 81% $3,402,000
City Weighted Construction Cost per Lane Mile (2 to 3 Lanes)(6): $4,314,000City
(1) Full reconstruction estimates that the City pays 100 percent for reconstructing the existing two lanes,
adding, the third lane, new curb/gutter/sidewalk on one side (existing to remain on the other side), and all associated roadway costs. Note, the cost includes the addition of the third lane and the cost per lane mile for adding a travel lane
(2) Offset construction estimates reasonable and usable sub-base on existing lanes overlaid with three-quarter inch of new asphalt. It also includes the cost of striping, new signals, drainage needs, and utility extensions to make the roadway segment functional
(3) Cost per lane mile derived based on a review of quantities associated with each improvement type using unit prices from recently bid city projects
(4) Source: Greater Bozeman Area Transportation Plan, 2001 Update projects adjusted by city staff and consultant comments and review (see Table B-3)
(5) Cost per lane mile (Item 3) multiplied by weight (Item 4) for city project features (6) Sum of weighted cost per lane mile (Item 5) for city 2 to 3 lane projects

Tindale-Oliver & Associates, Inc. City of Bozeman January 2008 B-8 Impact Fee Study
Table B-6 Weighted Average Construction Cost City and State Roads (in 2006 Dollars)
Jurisdiction Project FeatureCost per Lane
Mile Weight(7)
Weighted Cost per Lane
Mile(8)
0-3 Lanes(1) $1,900,000 16% $304,0002-3 Lanes - New Road City Contribution(2) $1,500,000 28% $420,0002-3 Lanes - Offset and Reconstruction(3) $4,314,000 26% $1,121,6403-5 Lanes(4) $3,120,764 30% $936,229
City Total Weighted Construction Cost per Lane Mile(9): $2,781,8692-3 Lanes(5) $4,314,000 26% $1,121,6403-5 Lanes(6) $3,120,764 74% $2,309,365
State Total Weighted Construction Cost per Lane Mile(10): $3,431,005
City
State
(1) This improvement type estimates that the City pays for the cost associated with all three brand new lanes in a
corridor where no road currently exists. These improvements will be constructed along corridors with no anticipated adjacent development to pay for the construction of the two new lanes consistent with the city code.
(2) This improvement type estimates that the City only pays for the costs associated with a third lane in a corridor where no road currently exists. Given current city policy, the developer pays for the new construction of the two travel lanes associated with this improvement type.
(3) Source: Table B-5 (4) Source: Table B-2, Item (b) (5) Source: Table B-5 (6) Source: Table B-2, Item (b) (7) Source: Table B-4 (8) Cost per lane mile multiplied by weight (Item 7) for city and state project features (9) Sum of weighted cost per lane mile (Item 8) for city project features (10) Sum of weighted cost per lane mile (Item 8) for state project features

Tindale-Oliver & Associates, Inc. City of Bozeman January 2008 B-9 Impact Fee Study
Table B-7
Lane Mile Distribution
JurisdictionLane
Miles(1)Lane Mile
DistributionCity 20.2 84%State 3.8 16%Total 24.0 100% (1) Source: Table B-4
Table B-8 Weighted Average Cost per Lane Mile
(in 2006 Dollars)
Cost Type City Roads State Roads
City and State
Roads(5)
Design (1) $236,459 $343,101 $253,522Construction(2) $2,781,869 $3,431,005 $2,885,731Right-of-Way(3) $276,316 $335,446 $285,777CEI(4) $236,459 $343,101 $253,522Total $3,531,103 $4,452,653 $3,678,552
(1) City roads estimated at 8.5 percent and state roads at 10 percent of the construction cost based on discussion with City and MDOT staff respectively
(2) Source: Table B-6 for city and state roads respectively (3) Source: Table B-1, Item (a) for city roads and Table B-2,
Item (a) for state roads (4) City roads estimated at 8.5 percent and state roads at 10
percent of construction cost based on discussion with City and MDOT staff respectively
(5) Lane mile distribution from Table B-7 (84 percent city, 16 percent state), multiplied by the design, construction, CEI, and ROW phase costs by jurisdiction to develop a weighted average cost per lane mile
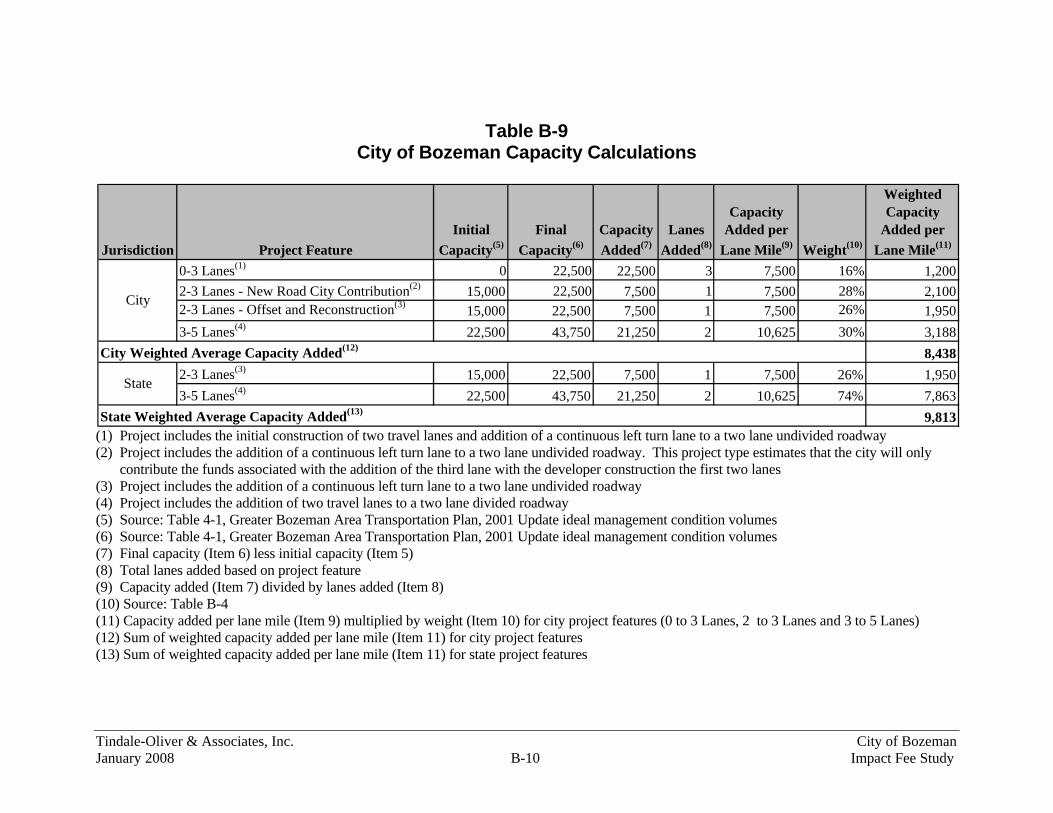
Tindale-Oliver & Associates, Inc. City of Bozeman January 2008 B-10 Impact Fee Study
Table B-9 City of Bozeman Capacity Calculations
Jurisdiction Project FeatureInitial
Capacity(5)Final
Capacity(6)Capacity Added(7)
Lanes Added(8)
Capacity Added per
Lane Mile(9) Weight(10)
Weighted Capacity
Added per Lane Mile(11)
0-3 Lanes(1) 0 22,500 22,500 3 7,500 16% 1,2002-3 Lanes - New Road City Contribution(2) 15,000 22,500 7,500 1 7,500 28% 2,1002-3 Lanes - Offset and Reconstruction(3) 15,000 22,500 7,500 1 7,500 26% 1,9503-5 Lanes(4) 22,500 43,750 21,250 2 10,625 30% 3,188
City Weighted Average Capacity Added(12) 8,4382-3 Lanes(3) 15,000 22,500 7,500 1 7,500 26% 1,9503-5 Lanes(4) 22,500 43,750 21,250 2 10,625 74% 7,863
State Weighted Average Capacity Added(13) 9,813
City
State
(1) Project includes the initial construction of two travel lanes and addition of a continuous left turn lane to a two lane undivided roadway (2) Project includes the addition of a continuous left turn lane to a two lane undivided roadway. This project type estimates that the city will only
contribute the funds associated with the addition of the third lane with the developer construction the first two lanes (3) Project includes the addition of a continuous left turn lane to a two lane undivided roadway (4) Project includes the addition of two travel lanes to a two lane divided roadway (5) Source: Table 4-1, Greater Bozeman Area Transportation Plan, 2001 Update ideal management condition volumes (6) Source: Table 4-1, Greater Bozeman Area Transportation Plan, 2001 Update ideal management condition volumes (7) Final capacity (Item 6) less initial capacity (Item 5) (8) Total lanes added based on project feature (9) Capacity added (Item 7) divided by lanes added (Item 8) (10) Source: Table B-4 (11) Capacity added per lane mile (Item 9) multiplied by weight (Item 10) for city project features (0 to 3 Lanes, 2 to 3 Lanes and 3 to 5 Lanes) (12) Sum of weighted capacity added per lane mile (Item 11) for city project features (13) Sum of weighted capacity added per lane mile (Item 11) for state project features

APPENDIX C Credit Component Calculations
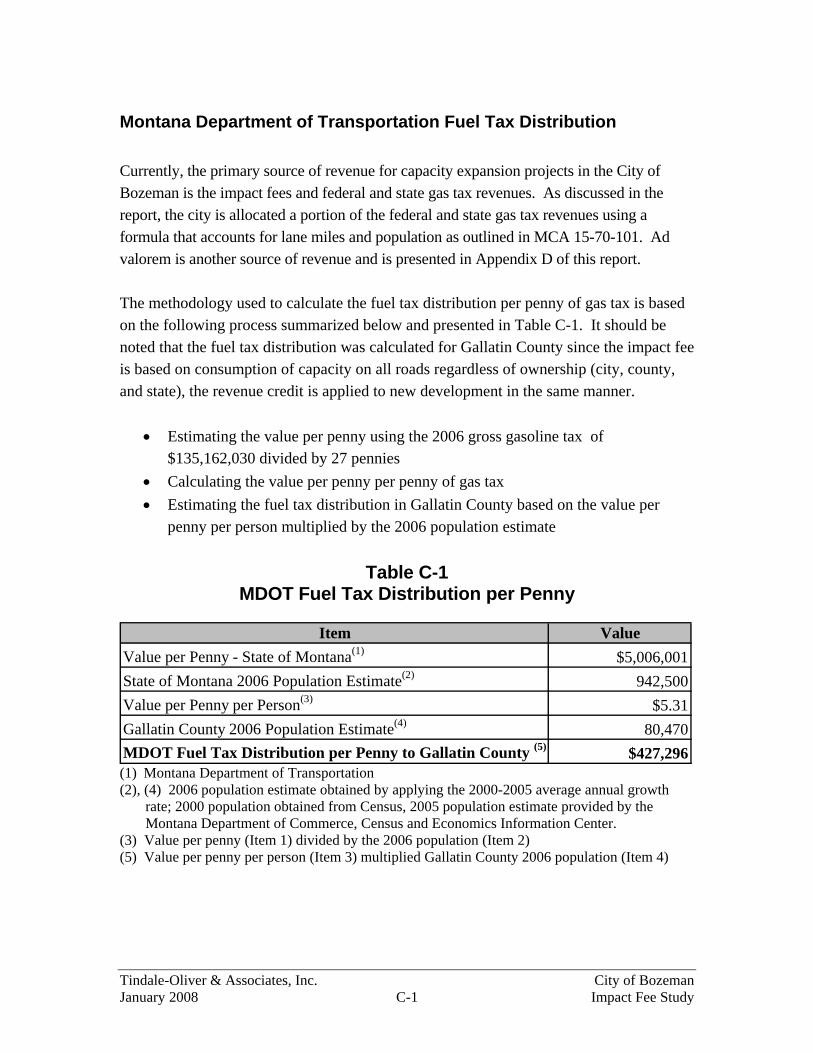
Tindale-Oliver & Associates, Inc. City of Bozeman January 2008 C-1 Impact Fee Study
Montana Department of Transportation Fuel Tax Distribution Currently, the primary source of revenue for capacity expansion projects in the City of Bozeman is the impact fees and federal and state gas tax revenues. As discussed in the report, the city is allocated a portion of the federal and state gas tax revenues using a formula that accounts for lane miles and population as outlined in MCA 15-70-101. Ad valorem is another source of revenue and is presented in Appendix D of this report. The methodology used to calculate the fuel tax distribution per penny of gas tax is based on the following process summarized below and presented in Table C-1. It should be noted that the fuel tax distribution was calculated for Gallatin County since the impact fee is based on consumption of capacity on all roads regardless of ownership (city, county, and state), the revenue credit is applied to new development in the same manner.
• Estimating the value per penny using the 2006 gross gasoline tax of $135,162,030 divided by 27 pennies
• Calculating the value per penny per penny of gas tax • Estimating the fuel tax distribution in Gallatin County based on the value per
penny per person multiplied by the 2006 population estimate
Table C-1 MDOT Fuel Tax Distribution per Penny
Item Value
Value per Penny - State of Montana(1) $5,006,001State of Montana 2006 Population Estimate(2) 942,500Value per Penny per Person(3) $5.31Gallatin County 2006 Population Estimate(4) 80,470MDOT Fuel Tax Distribution per Penny to Gallatin County (5) $427,296 (1) Montana Department of Transportation (2), (4) 2006 population estimate obtained by applying the 2000-2005 average annual growth rate; 2000 population obtained from Census, 2005 population estimate provided by the Montana Department of Commerce, Census and Economics Information Center. (3) Value per penny (Item 1) divided by the 2006 population (Item 2) (5) Value per penny per person (Item 3) multiplied Gallatin County 2006 population (Item 4)

Tindale-Oliver & Associates, Inc. City of Bozeman January 2008 C-2 Impact Fee Study
Gas Tax Credit City Portion A review of the City’s roadway projects and its funding sources reveals that the City uses all gas tax revenues on maintenance projects only. Because no capacity expansion projects are funded with this source now, or in the foreseeable future, no gas tax credit can be applied for City spending. State Portion In the calculation of the equivalent pennies of gas tax from the State, the MDOT Work Program was reviewed for capacity expansion projects in the City of Bozeman, as well as Gallatin County, for the 9-year period from 2000 to 2008. The two years of “future” roadway projects from the currently adopted 2007-2008 Work Program indicate a total state expenditure of almost $26.4 million for capacity-adding projects in the city and county. The specific State projects that were utilized in the equivalent penny calculations are summarized in Tables C-2 through C-3. On an annual basis, this level of expenditure is equivalent to 30.8 pennies of gas tax revenue. Comparatively, the total cost of the capacity-adding projects for the 7-year “historical” period from 2000 to 2006 equates to 4.3 pennies. The combined weighted average over the 9-year total of state expenditures in the City for capacity-adding roadway projects results in a total equivalency of 10.2 pennies. Table C-4 documents this calculation. Note that because most of the construction expenditures for the projects included in this analysis are programmed for construction in 2007 and 2008, the historical expenditures consist primarily of design costs only.

Tindale-Oliver & Associates, Inc City of Bozeman January 2008 C-3 Impact Fee Study
Table C-2 MDOT FY 2000 - 2006 Work Program – City of Bozeman and Gallatin County Expansion Projects
Project Number Description On/From/To 2000 2001 2002 2003 2004 2005 2006 Total City of Bozeman Capacity Expansion Projects
4918 Intersection Upgrade/Signals S 19th & College $0 $0 $616 $47,787 $75,924 $23,009 $79,511 $226,8474555 Intersection Upgrade/Signals Citywide $0 $5,652 $26,883 $22,333 $9,743 $13,526 $11,862 $89,9994713 Intersection Upgrade/Signals Signal- 19th & Koch $0 $0 $1,922 $10,142 $11,566 $14,346 $3,178 $41,1545376 Intersection Upgrade/Signals College St Signal $0 $0 $0 $0 $16,760 $16,902 $43,264 $76,9264952 Add Lanes & Reconstruct Babcock to Kagy $0 $0 $2,245 $669 $4,457 $5,696 $152,967 $166,0344805 Add Lanes & Reconstruct Rouse Ave $0 $0 $905 $2,153 $4,958 $41,018 $582,145 $631,179
Gallatin County Capacity Expansion Projects4471 Intersection Upgrade/Signals Main & Jackrabbit $695 $3,855 $118,601 $109,155 $52,720 $106,867 $3,508,755 $3,900,6484008 Add Turn Lanes Little Bear Rd $39,009 $16,416 $51,300 $18,654 $904,308 $0 $0 $1,029,6874009 Intersection Upgrade/Signals US 20/US 191 Int $10,241 $55,725 $1,047,018 $0 $0 $0 $0 $1,112,9844026 Add Turn Lanes Turn Bays-S of Belgrade $33,371 $32,822 $15,468 $651,732 $0 $0 $0 $733,3934306 Add Lanes & Reconstruct Four Corners-North $615 $124,940 $135,913 $36,258 $44 $63,033 $139,207 $500,0104433 Add Turn Lanes W of Bozeman $0 $23,320 $23,025 $25,859 $73,426 $1,516,029 $0 $1,661,6594179 Intersection Upgrade/Signals 19th & Main $7,805 $61,508 $80,289 $56,445 $2,508,746 $0 ($2,000) $2,712,793Total $91,736 $324,238 $1,504,185 $981,187 $3,662,652 $1,800,426 $4,518,889 $12,883,313
Source: Montana Department of Transportation

Tindale-Oliver & Associates, Inc City of Bozeman January 2008 C-4 Impact Fee Study
Table C-3 MDOT FY 2007 - 2008 Work Program – City of Bozeman and Gallatin County Expansion Projects (1)
Project Number Description On/From/To 2007 2008 Total
City of Bozeman Capacity Expansion Projects4918 Intersection Upgrade/Signals S. 19th & College $3,962,423 $0 $3,962,4234555 Intersection Upgrade/Signals Citywide Signals - Bozeman $3,016,634 $0 $3,016,6344713 Intersection Upgrade/Signals Signal - 19th & Koch - Bozeman $232,737 $0 $232,7375376 Intersection Upgrade/Signals 2002- College Street Signal - Bozeman $278,769 $0 $278,7694952 Add Lanes & Reconstruct S. 19th Ave. from Babcock St. to Kagy Blvd. - Bozeman $0 $9,263,758 $9,263,7584805 Add Lanes & Reconstruct(2) Rouse Avenue from Main St. to Story Mill Rd. - Bozeman $411,451 $0 $411,451
Gallatin County Capacity Expansion Projects4306 Add Lanes & Reconstruct Four Corners- North $7,193 $9,164,693 $9,171,886
Total $7,909,207 $18,428,451 $26,337,658 (1) Source: Montana Department of Transportation (2) Based on discussion with city staff, the construction phase of this project has been postponed until beyond 2011. As such the revenue credit has
been adjusted accordingly.
Table C-4 Equivalent Penny Calculation for State Portion (1)
SourceCost of
Projects(2)Number of Years
Gas Tax Distribution to
Gallatin County(3)
Annual Revenue(4)
Equivalent Pennies
Historical Work Program (2000-2006) $12,883,313 7 $427,296 $1,840,473 $0.043Future Work Program (2007-2008) $26,337,658 2 $427,296 $13,168,829 $0.308Total $39,220,971 9 $427,296 $4,357,886 $0.102
(1) Source: Montana Department of Transportation (2) Source: Table C-2 for the historical work program and Table C-3 for the future work program (3) Source: Table C-1 (4) Total cost of projects (Item 2) divided by number of years.

Tindale-Oliver & Associates, Inc. City of Bozeman January 2008 C-5 Impact Fee Study
Table C-5 Average Motor Vehicle Fuel Efficiency – Excluding Interstate Travel (1)
19.7 6.7 @ 19.7 mpg @ 6.7 mpgOther Arterial Rural 356,437,241,650 40,123,037,750 396,560,279,400 90% 10%Other Rural 348,080,891,010 28,852,429,199 376,933,320,209 92% 8%Other Urban 1,414,612,160,557 62,088,922,445 1,476,701,083,001 96% 4%Total 2,119,130,293,217 131,064,389,393 2,250,194,682,610 94% 6%
Gallons @ 19.7 mpg Gallons @ 6.7 mpg 2,250,195 miles (millions)Other Arterial Rural 18,093,260,997 5,988,513,097 24,081,774,094 127,132 gallons (millions)Other Rural 17,669,080,762 4,306,332,716 21,975,413,478 17.70 mpgOther Urban 71,807,723,886 9,267,003,350 81,074,727,236 Total 107,570,065,645 19,561,849,163 127,131,914,808
Vehicle Miles of Travel (VMT) @
Fuel Consumed
TravelPercent VMT
Total Mileage and Fuel
(1) Source: Table VM-1 (Section V) of the document, Highway Statistics 2005, Office of Highway Policy Information, Federal Highway Administration, Washington, D.C (See Table C-6)

Tindale-Oliver & Associates, Inc. City of Bozeman January 2008 C-6 Impact Fee Study
Table C-6 Annual Vehicle Miles Traveled and Related Data – By Highway Category and Vehicle Type (1)
SUBTOTALS
SINGLE-UNIT PASSENGER SINGLE-UNIT ALLYEAR ITEM OTHER 2-AXLE 6-TIRE CARS 2-AXLE 6-TIRE MOTOR
PASSENGER MOTOR- BUSES 2-AXLE 4-TIRE OR MORE COMBINATION AND OR MORE AND VEHICLESCARS CYCLES VEHICLES 2/ TRUCKS 3/ TRUCKS OTHER 2-AXLE COMBINATION
4-TIRE VEHICLES TRUCKS Motor-Vehic le Tra vel: (m illions o f vehic le-m iles)
2005 Intersta te Rura l 122,470 1,433 971 82,208 7,758 43,950 204,679 51,708 258,7902004 129,415 1,354 999 83,181 7,713 43,583 212,596 51,296 266,2452005 Other Arteria l Rura l 208,127 1,411 961 148,310 14,102 26,021 356,437 40,123 398,9322004 217,495 1,435 992 148,802 14,276 26,414 366,297 40,690 409,4132005 Other Rura l 208,472 1,624 1,658 139,609 14,716 14,136 348,081 28,852 380,2152004 217,599 1,593 1,700 142,532 15,028 14,316 360,131 29,344 392,7682005 All Rura l 539,070 4,467 3,589 370,127 36,577 84,107 909,197 120,683 1,037,9372004 564,509 4,381 3,691 374,515 37,017 84,313 939,024 121,330 1,068,4262005 Intersta te Urb a n 259,602 2,296 964 166,144 10,492 29,572 425,746 40,063 469,0702004 258,666 2,089 986 155,714 9,729 28,355 414,379 38,083 455,5382005 Other Urb a n 891,293 4,006 2,093 523,319 32,105 29,984 1,414,612 62,089 1,482,8002004 876,715 3,652 2,124 496,935 31,696 29,702 1,373,651 61,398 1,440,8242005 All Urb a n 1,150,895 6,302 3,057 689,463 42,597 59,556 1,840,359 102,152 1,951,8702004 1,135,381 5,741 3,110 652,649 41,424 58,056 1,788,030 99,481 1,896,3622005 Tota l Rura l a nd Urb a n 1,689,965 10,770 6,646 1,059,590 79,174 143,662 2,749,555 222,836 2,989,8072004 1,699,890 10,122 6,801 1,027,164 78,441 142,370 2,727,054 220,811 2,964,7882005 Numb er of motor vehic les 136,568,083 6,227,146 807,053 95,336,839 6,395,240 2,086,759 231,904,922 8,481,999 247,421,1202004 reg istered 4/ 136,430,651 5,767,934 795,274 91,845,327 6,161,028 2,010,335 228,275,978 8,171,364 243,010,5502005 Avera ge m iles tra veled 12,375 1,729 8,235 11,114 12,380 68,845 11,856 26,272 12,0842004 p er vehic le 12,460 1,755 8,552 11,184 12,732 70,819 11,946 27,023 12,2002005 Person-miles of tra vel 5/ 2,670,145 13,677 140,910 1,836,988 79,174 143,662 4,507,133 222,836 4,884,5572004 (m illions) 2,685,827 12,855 144,188 1,780,771 78,441 142,370 4,466,598 220,811 4,844,4522005 Fuel c onsumed 6/ 73,870,371 215,393 1,329,254 65,419,170 9,042,283 24,410,512 139,289,541 33,452,796 174,286,9842004 (thousa nd ga llons) 75,401,891 202,447 1,360,178 63,417,148 8,958,622 24,190,904 138,819,039 33,149,526 173,531,1902005 Avera ge fue l c onsump tion p er 541 35 1,647 686 1,414 11,698 601 3,944 7042004 vehic le (ga llons) 6/ 553 35 1,710 690 1,454 12,033 608 4,057 7142005 Avera ge m iles tra veled p er 22.9 50.0 5.0 16.2 8.8 5.9 19.7 6.7 17.22004 ga llon o f fue l c onsumed 6/ 22.5 50.0 5.0 16.2 8.8 5.9 19.6 6.7 17.1
1/ The 50 sta tes and the Distric t o f Co lumb ia rep ort tra vel by highwa y c a tegory, numb er o f motor vehic les reg istered , a nd to ta l fue l c onsumed . The travel a nd fue l da ta b y vehic le type a nd stra tific a tion o f truc ks a re estima ted b y the Federa l Highwa y Administra tion (FHWA). Entries fo r 2004 ma y ha ve b een revised b a sed on the a va ilab ility o f more c urrent da ta . Estima tion p roc ed ures inc lud e use o f Sta te-sup p lied d a ta , the 2002 Census of Tra nsp orta tion Vehic le Inventory a nd Use Survey (VIUS), a nd o ther sourc es. Some Sta tes may still be using 1990 Census-b ased urba nized a rea b ound a ries whic h ma y in turn a ffec t highwa y d a ta by c a tegory. 2/ Other 2-Axle 4-Tire Vehic les whic h a re not p a ssenger c a rs. These inc lud e va ns, p ic kup truc ks, and sp ort/ utility vehic les. 3/ Sing le-Unit 2-Axle 6-Tire or More Truc ks on a sing le fra me w ith a t lea st two axles a nd six tires. 4/ Truc k reg istra tion figures a re from ta b les MV-1 and MV-9 w ith truc k d istrib ution estima ted b y the FHWA using the 2002 VIUS. 5/ Vehic le oc c upa nc y is estima ted b y the FHWA from the 2001 Na tiona l Househo ld Tra ve l Survey (NHTS) w ith nomina l va lues for hea vy truc ks. 6/ Tota l fue l c onsumption figures a re from ta b les MF-21 a nd MF-27. Distrib ution by vehic le typ e is estima ted by the FHWA ba sed on miles p er ga llon for b oth d iesel and ga so line powered vehic les using Sta te-sup p lied da ta , the 2002 VIUS, and other sourc es w ith nomina l va lues for motorc yc les a nd b uses (revised ).

APPENDIX D Transportation Ad Valorem Credit Calculations

Tindale-Oliver & Associates, Inc. City of Bozeman January 2008 D-1 Impact Fee Study
This Appendix presents the calculations used to determine the credit due to ad valorem tax revenues being used to fund capacity expansion projects. The following sections provide an explanation of credit calculations.
Residential Land Uses In determining the ad valorem credit for residential land uses, the study evaluated recent single family home sales and determined the taxable value of a home. Discussions with the City of Bozeman Chamber of Commerce provided a typical home value that could be used for estimating the ad valorem credit for residential land uses. Staff at the Chamber of Commerce provided information regarding recent home sales in the City of Bozeman. Based on this review of sales information, the average market value of a single family home was estimated at $346,112. To determine, the average taxable value of a single family home, the relationship between market and taxable values for non-residential uses was evaluated. Based on this analysis, a taxable value of approximately $211,000 was used for single family homes in the City of Bozeman. It should be noted that the ad valorem revenues used for transportation capital projects are estimated as a percentage of the City’s ad valorem revenues based on the General Obligation Bond being used by the City of Bozeman to finance transportation improvements. Over the next five years and beyond, this amount is projected to be approximately four percent per year based on the capacity expansion expenditures of the General Obligation Bond (specifically the ad valorem revenues being used to retire this debt). Table D-1 presents the projected ad valorem contributions of a new home over a 24-year period, beginning with the 2006 taxable value of approximately $211,000. An eight percent annual increase is applied to provide a generous credit (which results on a conservative impact fee) for the increase in the value of homes in the City of Bozeman. This is based on the increase in taxable values observed between 2002 and 2006. The resulting ad valorem taxes are brought to present value based on an interest rate of 4.6 percent, which is consistent with the interest rate at which the City currently borrows. Table D-1 also provides the portion of the ad valorem collections that would be applied toward transportation capital expansion projects, and the total credit per square foot.

Tindale-Oliver & Associates, Inc. City of Bozeman January 2008 D-2 Impact Fee Study
Table D-1 Ad Valorem Credit Calculation for Single Family Home Land Use
(Based on Taxable Value)
Total allocation from the General Fund FY 2007(1) $6,993,655City General Fund Millage(2) 110.57Revenues generated from 1-mil(3) $63,251Annual ad valorem revenue that goes to transportation capacity(4) $271,417Total mills dedicated transportation capacity(5) 4.29Percentage of millage used for transportation capacity addition projects(6) 4%Average value of a home subject to tax(7) $211,128Annual increase in citywide taxable values(8) 8%
Value Used Ad Valorem Presentfor Credit for Transportation(10) Value(11)
2007 $211,128 $211 $8 $82008 $7 $72009 $6 $52010 $6 $52011 $6 $52012 $6 $52013 $6 $52014 $6 $42015 $6 $42016 $6 $42017 $6 $42018 $6 $42019 $6 $32020 $6 $32021 $6 $32022 $6 $32023 $6 $32024 $6 $32025 $6 $32026 $6 $32027 $6 $22028 $6 $22029 $6 $22030 $6 $2
Total $147 $92Square footage(12) 2,219Credit per square foot $0.04Interest Rate(13) 4.6%Period 24
Year 1-Mil Tax(9)

Tindale-Oliver & Associates, Inc. City of Bozeman January 2008 D-3 Impact Fee Study
(1) Source: City of Bozeman FY 2006-2007 Approved Budget; General Fund allocation obtained by attributing 68 percent of the total property taxes levied in 2007 to the General Fund (General Fund Levy of 110.57 divided by Total Levies of 163.42 is 68%)
(2) Total millage assessed to city residents within Bozeman applied to the General Fund. (3) Total allocation from the ad valorem FY 07 (Item 1) divided by City’s millage rate (Item 2). (4) Portion of the General Obligation Bond being used for capacity expansion. (5) Annual ad valorem that goes to transportation capacity (Item 4) divided by revenue generated
by 1-mil (Item 3). (6) Total mills dedicated to transportation capacity (Item 5) divided by city general fund millage
(Item 2). (7) Source: Market value obtained from discussions with local realtors and adjusted to taxable
value (39%) (8) Annual increase in total citywide taxable values between 2002 and 2006 in the City of
Bozeman. (9) Average home value used for credit divided by 1,000. (10) 1-mil tax (Item 8) multiplied by the percentage dedicated to transportation capital additions
(Item 5). (11) Present value of the ad valorem for transportation (Item 9) based on an annual interest rate of
4.6 percent (Item 12). (12) Average size of a home based on 2004 sales. (13) 4.6 percent discount rate is used based on discussions with the City’s Finance Department To determine the credit for other residential uses (with the exception of multi-family), ad valorem credit per square foot is calculated based on the above table ($0.04 per square foot) and multiplied by the average size of each category. The average size is determined based on home size information obtained from the Montana Department of Revenue. Non-Residential Land Uses Table D-2 provides an explanation of how the ad valorem credit was calculated for non-residential land uses. It should be noted that the ad valorem credit calculations for these land uses represent broad estimates based on data obtained from the Montana Department of Revenue, as available, and the Consultant’s experience in other jurisdictions and knowledge of the industry.

Tindale-Oliver & Associates, Inc. City of Bozeman January 2008 D-4 Impact Fee Study
Table D-2 Ad Valorem Credit Calculation for Non-Residential Land Uses
ITE LUC Land Use UnitTaxable Value(1)
Annual Portion to
Expansion(2)
Total Ad Valorem Credit (3)
110 Industrial sq ft $66,020 $2.64 $19.82150 Warehouse sq ft $44,080 $1.76 $13.90151 Mini Warehouse sq ft $59,840 $2.39 $18.65220 Multi-Family sq ft $135,391 $5.42 $42.47310 Hotel room $23,884 $0.96 $7.47320 Motel sq ft $17,913 $0.72 $5.64411 City Park acre $85,000 $3.40 $26.59430 Golf Course hole $595,000 $23.80 $186.25444 Movie Theater sf $300,000 $12.00 $93.94520 Schools student $40,000 $1.60 $12.47565 Daycare Center sq ft $222,000 $8.88 $69.47610 Hospital sq ft $255,500 $10.22 $79.92620 Nursing Home bed $20,000 $0.80 $6.25710 Office (Multiple stories) sq ft $88,970 $3.56 $27.86720 Medical Office sq ft $63,440 $2.54 $19.91812 Building/Lumber Storage sq ft $15,680 $0.63 $4.95813 Discount Store sq ft $60,120 $2.40 $18.68820 Retail/Office (1-2 stories) sq ft $62,510 $2.50 $19.62851 Convenience Store sq ft $91,140 $3.65 $28.58912 Banks sq ft $121,980 $4.88 $38.19931 Quality Restaurant sq ft $100,820 $4.03 $31.59934 Fast-Food Restaurant sq ft $127,410 $5.10 $39.92
(1) Source: Montana Department of Revenue (2) Annual ad valorem credit based on one percent dedication to capacity
expansion expenditures. (3) Total ad valorem credit based over a 25-year period in present day dollars.

APPENDIX E Analysis of Travel Behavior of Low-Income Households

Tindale-Oliver & Associates, Inc. City of Bozeman January 2008 E-1 Impact Fee Study
Analysis of the Travel Behavior of Low-Income Households The City of Bozeman has begun the process of evaluating workforce and affordable housing options within the city planning process. To accommodate this, an analysis was completed on the comparative relationship between housing unit size and household travel behavior. In addition, an analysis was completed on the travel behavior of lower income households. These analyses utilized data from the 2001 National Household Travel Survey (NHTS) and the 2005 American Housing Survey (AHS) to examine the overall trip-making characteristics of low-income households in the United States. Table E-1 (presented at the end of this section) presents the existing trip characteristics being utilized in the proposed impact fee schedule for the Single Family (Detached) subcategory. The 2001 NHTS database was used to assess average annual household vehicle miles of travel (VMT) for various annual household income levels. In addition, the 2005 AHS database was used to compare median annual family/household incomes with housing unit size. It is important to recognize that the use of the income variable in each of these databases is completed simply to provide a convenient linking mechanism between household VMT from the NHTS and housing unit size from the AHS. This review helped develop three potential tiers for the Single Family (Detached) category based on ranges of housing unit size: less than 1,500 sf, 1,500 to 2,499 sf, and 2,500 sf or more. The results of the analyses of these two sources are included in Tables E-2 and E-4(presented at the end of this section). First, the data shown in Table E-2 indicate that the median income in the U.S. for families/ households living in housing units smaller than 1,500 square feet in size ($34,579) is significantly lower than even the overall median income for the U.S. ($49,702). Then, in Table E-4, annual average household VMT was calculated from the NHTS database for a number of different income levels and ranges related to the resulting AHS income data in Table E-2. These ranges are selected based on the reporting of NHTS data in income ranges of $4,999 increments (i.e. $30,000 to $34,999). In addition, annual average household VMT was calculated for two additional income levels based on the 2007 Gallatin County definitions for low income (<$46,720) and very low income (<$29,200) households, based on a household size of 4 persons as shown in Table E-3(presented at the end of this section).

Tindale-Oliver & Associates, Inc. City of Bozeman January 2008 E-2 Impact Fee Study
The results of these analyses indicate that the most logical income-restricted categories to utilize in conjunction with the smallest Single Family (Detached) housing unit size is the less-than-$46,720 (i.e., median of $23,360 category from Table E-4) and the less-than-$29,200 (i.e., median of $14,600 category from Table E-4) segments. In order to calculate a corresponding trip rate for these new subcategories, however, it was necessary to rely on comparative ratios. The term median is used since as mentioned previously, the NHS data is stratified in increments and the specific income level was estimated using an interpolation procedure. As an example, consider the subcategory for the Single Family (Detached) that is less than 1,500 sf and low income. First, it was determined that the average annual household VMT for the median income level of the less-than-$46,720 segment (median of $23,360 category from Table E-4) is 16,701 miles. This figure was then compared to the overall average annual VMT per household in the U.S., normalized to the median-of-$57,167 (28,541 miles) category to derive a ratio of 0.585. Next, this ratio was applied to the daily VMT for the average Single Family (Detached) housing unit size (i.e., 1,500 to 2,499 s.f.) to generate a daily VMT of 19.71 for the new subcategory, as shown in Table E-5. This daily VMT figure was then divided by the proposed assessable trip length of 3.52 miles to obtain a typical trip rate of 5.60 trips per day. 1 It should be noted that the second income-restricted subcategory was derived in this same manner for the Single Family (Detached) residential land use category of less than 1,500 s.f. and very low income, or annual household income of less than $29,200 (using the normalized ratio to the mean for the median of $14,600 income category from Table E-4). The travel rate calculations for this subcategory are the same as that described previously for the other new subcategory. The calculated daily trip rate for this subcategory is 3.88 trips. Then, these two trip rates were placed in the impact fee schedule to generate a net impact fee value for the new “income-restricted” subcategories. Table E-6 illustrates the impact that the incorporation of the housing unit size and low-income tiers for the Single Family (Detached) land use has on the City’s proposed impact fee schedule. As shown in the table, the net impact fee for a housing unit of less than 1,500 square feet and very low income is $2,171. The net impact fee for a housing unit of less than 1,500 square feet and low income is $3,147. 1 Assessable trip length is assumed to be 3.52 miles based on the trip characteristics studies performed in the City of Bozeman.

Tindale-Oliver & Associates, Inc. City of Bozeman January 2008 E-3 Impact Fee Study
Table E-1Proposed Values Excluding Tiering Assessable Daily Ratio
Trip Rate Trip Length VMT to MeanSingle Family (Detached) 9.57 3.52 33.69 1.00
Source: Proposed City of Bozeman Transportation Impact Fee Schedule.
Table E-2 Table E-32005 AHS Median Income Data by Annual City of BozemanHousing Unit Size (US) Income SHIP Definitions
Less than 1,500 sf $34,5791,500 to 2,499 sf $57,167 Median income ---> $58,4002,500 sf or more $80,889 Low income ---> Less than $46,720Mean of All Housing Unit Sizes $49,702 Very low income ---> Less than $29,200
Table E-42001 NHTS Travel Data by Annual Daily Ratio NormalizedAnnual HH Income (US) VMT/HH Days VMT to Mean to 1.128
Median of $14,600 11,559 365 31.67 0.457 0.405Median of $23,360 16,701 365 45.76 0.660 0.585Median of $34,579 20,976 365 57.47 0.829 0.735
Mean ---> Total 25,294 365 69.30 1.000Median of $57,167 28,541 365 78.19 1.128 1.000Median of $80,889 32,285 365 88.45 1.276 1.131
Source: 2001 National Household Travel Survey Database, Federal Highway Administration.
Table E-5Estimation of Trip Rate By Tier Assessable Daily Ratio
Trip Rate Trip Length VMT to MeanSingle Family (Detached)
Less than 1,500 sf and very low income 3.88 3.52 13.64 0.405Less than 1,500 sf and low income 5.60 3.52 19.71 0.585Less than 1,500 sf 7.03 3.52 24.76 0.735
Mean ---> 1,500 to 2,499 sf 9.57 3.52 33.69 1.0002,500 sf or larger 10.82 3.52 38.10 1.131
Table E-6Impact of Tiering on Fee Schedule Assessable Daily Net
Trip Rate Trip Length VMT FeeSingle Family (Detached)
Less than 1,500 sf and very low income 3.88 3.52 13.64 $2,171Less than 1,500 sf and low income 5.60 3.52 19.71 $3,147Less than 1,500 sf 7.03 3.52 24.76 $3,968
Mean ---> 1,500 to 2,499 sf 9.57 3.52 33.69 $5,3962,500 sf or larger 10.82 3.52 38.10 $6,082
Source: American Housing Survey for the United States in 2005 , U.S. Census Bureau, Table 2-18. Source: Gallatin County Average Median
Income - "Road to Home" - Downpayment Assistance Program . Very low income is define as 50 percent of the median income and low income is 80 percent of the median income for a family of four persons.

APPENDIX F Proposed City of Bozeman Transportation Impact Fee Schedule

Tindale-Oliver & Associates, Inc. City of Bozeman January 2008 F-1 Impact Fee Study
Table F-1 Proposed City of Bozeman Transportation Impact Fee Schedule (Non-TED)
Unit Construction Cost: $3,678,552
$0.102 Capacity per lane mile: 8,658 Interstate Adjustment Factor: 15%25 Fuel Efficiency: 17.70 mpg Cost per VMC: $424.87
4.6% Effective days per year: 365Recommended Assessable Total Recommended Recommended % New Total Annual Gas Ad Net Current Fee Percent
ITE Trip Trip Rate Trip Trip Trip Length % New Trips Net Impact Gas Tax Valorem Impact (100%) Increase/LUC Unit Rate Source Length Length Source Trips Source VMT(1)
Cost Tax Credit Credit Fee 1996 Study DecreaseRESIDENTIAL:
210 Single Family (Detached)
Less than 1,500 sf and very low income(2) du 3.88ITE (NPTS,AHS,
Census) 3.52 4.02Local Studies
(Bozeman) 100% n/a 5.80 $2,466 $16 $235 $60.00 $2,171 $2,241 97%
Less than 1,500 sf and low income(3) du 5.60ITE (NPTS,AHS,
Census) 3.52 4.02Local Studies
(Bozeman) 100% n/a 8.38 $3,559 $24 $352 $60.00 $3,147 $2,241 140%
Less than 1,500 sf du 7.03ITE (NPTS,AHS,
Census) 3.52 4.02Local Studies
(Bozeman) 100% n/a 10.52 $4,468 $30 $440 $60.00 $3,968 $2,241 177%
1,500 to 2,499 sf du 9.57ITE (NPTS,AHS,
Census) 3.52 4.02Local Studies
(Bozeman) 100% n/a 14.32 $6,083 $40 $587 $100.00 $5,396 $2,241 241%
2,500 sf or larger du 10.82ITE (NPTS,AHS,
Census) 3.52 4.02Local Studies
(Bozeman) 100% n/a 16.19 $6,877 $46 $675 $120.00 $6,082 $2,241 271%
220 Apartments du 6.64Blend of ITE 7th
& TC Studies 3.10 3.60 Same as LUC 230 100% n/a 8.75 $3,717 $25 $367 $10.51 $3,339 $1,519 220%
230 Residential Condominium/ Townhouse du 5.86 ITE 7th Edition 3.10 3.60Local Studies
(Bozeman) 100% n/a 7.72 $3,280 $22 $323 $10.51 $2,946 $1,519 194%
240 Mobile Home Park du 4.99 ITE 7th Edition 2.02 2.52TC Studies (Adjusted) 100% n/a 4.28 $1,820 $13 $191 $36.00 $1,593 $1,130 141%
LODGING:
310 Hotel room 8.30Blend of ITE 7th
& TC Studies 3.44 3.94TC Studies (Adjusted) 66% TC Studies 8.01 $3,403 $23 $338 $1.93 $3,063 $2,040 150%
320 Motel room 5.63 ITE 7th Edition 2.39 2.89TC Studies (Adjusted) 77% TC Studies 4.40 $1,871 $13 $191 $1.55 $1,678 $2,040 82%
RECREATION:
430 Golf Course hole 35.74 ITE 7th Edition 2.37 2.87TIF Schedules
(Adjusted) 90% TC Studies 32.40 $13,766 $97 $1,424 $46.51 $12,295 $7,791 158%
411 City Park acre 1.59 ITE 7th Edition 2.37 2.87Same as ITE
LUC 430 90% TC Studies 1.44 $612 $4 $59 $6.69 $546 $232 236%
444 Movie Theaters 1,000 sf 38.00 ITE 7th Edition 1.22 1.72TC Studies (Adjusted) 88% TC Studies 17.34 $7,367 $60 $881 $23.50 $6,463 $7,173 90%
INSTITUTIONS:
610 Hospital 1,000 sf 17.57 ITE 7th Edition 2.75 3.25TIF Schedules
(Adjusted) 77% TIF Schedules 15.81 $6,718 $46 $675 $19.99 $6,023 $2,465 244%
620 Nursing Home bed 2.48Blend of ITE 7th
& TC Studies 1.11 1.61TC Studies (Adjusted) 89% TC Studies 1.04 $442 $4 $59 $1.69 $381 $788 48%
Land Use
Gasoline Tax$$ per gallon to capital:
Facility life (years):Interest rate:
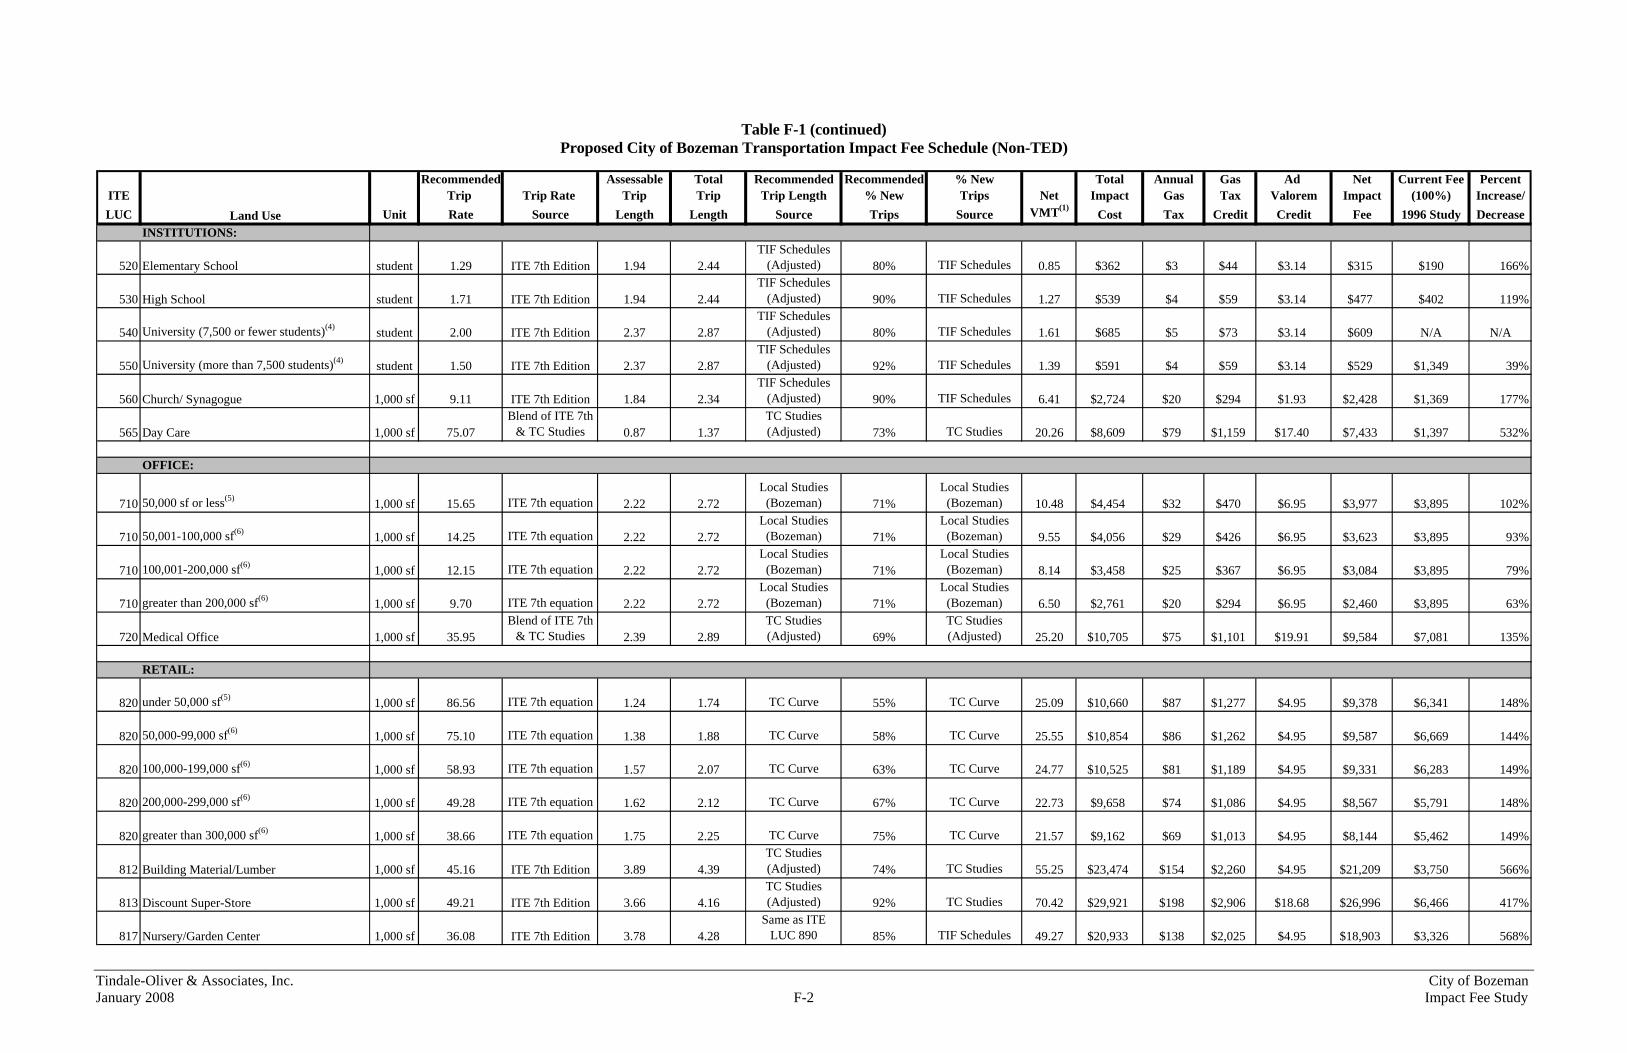
Tindale-Oliver & Associates, Inc. City of Bozeman January 2008 F-2 Impact Fee Study
Table F-1 (continued) Proposed City of Bozeman Transportation Impact Fee Schedule (Non-TED)
Recommended Assessable Total Recommended Recommended % New Total Annual Gas Ad Net Current Fee Percent
ITE Trip Trip Rate Trip Trip Trip Length % New Trips Net Impact Gas Tax Valorem Impact (100%) Increase/LUC Unit Rate Source Length Length Source Trips Source VMT(1)
Cost Tax Credit Credit Fee 1996 Study DecreaseINSTITUTIONS:
520 Elementary School student 1.29 ITE 7th Edition 1.94 2.44TIF Schedules
(Adjusted) 80% TIF Schedules 0.85 $362 $3 $44 $3.14 $315 $190 166%
530 High School student 1.71 ITE 7th Edition 1.94 2.44TIF Schedules
(Adjusted) 90% TIF Schedules 1.27 $539 $4 $59 $3.14 $477 $402 119%
540 University (7,500 or fewer students)(4) student 2.00 ITE 7th Edition 2.37 2.87TIF Schedules
(Adjusted) 80% TIF Schedules 1.61 $685 $5 $73 $3.14 $609 N/A N/A
550 University (more than 7,500 students)(4) student 1.50 ITE 7th Edition 2.37 2.87TIF Schedules
(Adjusted) 92% TIF Schedules 1.39 $591 $4 $59 $3.14 $529 $1,349 39%
560 Church/ Synagogue 1,000 sf 9.11 ITE 7th Edition 1.84 2.34TIF Schedules
(Adjusted) 90% TIF Schedules 6.41 $2,724 $20 $294 $1.93 $2,428 $1,369 177%
565 Day Care 1,000 sf 75.07Blend of ITE 7th
& TC Studies 0.87 1.37TC Studies (Adjusted) 73% TC Studies 20.26 $8,609 $79 $1,159 $17.40 $7,433 $1,397 532%
OFFICE:
710 50,000 sf or less(5) 1,000 sf 15.65 ITE 7th equation 2.22 2.72Local Studies
(Bozeman) 71%Local Studies
(Bozeman) 10.48 $4,454 $32 $470 $6.95 $3,977 $3,895 102%
710 50,001-100,000 sf(6) 1,000 sf 14.25 ITE 7th equation 2.22 2.72Local Studies
(Bozeman) 71%Local Studies
(Bozeman) 9.55 $4,056 $29 $426 $6.95 $3,623 $3,895 93%
710 100,001-200,000 sf(6) 1,000 sf 12.15 ITE 7th equation 2.22 2.72Local Studies
(Bozeman) 71%Local Studies
(Bozeman) 8.14 $3,458 $25 $367 $6.95 $3,084 $3,895 79%
710 greater than 200,000 sf(6) 1,000 sf 9.70 ITE 7th equation 2.22 2.72Local Studies
(Bozeman) 71%Local Studies
(Bozeman) 6.50 $2,761 $20 $294 $6.95 $2,460 $3,895 63%
720 Medical Office 1,000 sf 35.95Blend of ITE 7th
& TC Studies 2.39 2.89TC Studies (Adjusted) 69%
TC Studies (Adjusted) 25.20 $10,705 $75 $1,101 $19.91 $9,584 $7,081 135%
RETAIL:
820 under 50,000 sf(5) 1,000 sf 86.56 ITE 7th equation 1.24 1.74 TC Curve 55% TC Curve 25.09 $10,660 $87 $1,277 $4.95 $9,378 $6,341 148%
820 50,000-99,000 sf(6) 1,000 sf 75.10 ITE 7th equation 1.38 1.88 TC Curve 58% TC Curve 25.55 $10,854 $86 $1,262 $4.95 $9,587 $6,669 144%
820 100,000-199,000 sf(6) 1,000 sf 58.93 ITE 7th equation 1.57 2.07 TC Curve 63% TC Curve 24.77 $10,525 $81 $1,189 $4.95 $9,331 $6,283 149%
820 200,000-299,000 sf(6) 1,000 sf 49.28 ITE 7th equation 1.62 2.12 TC Curve 67% TC Curve 22.73 $9,658 $74 $1,086 $4.95 $8,567 $5,791 148%
820 greater than 300,000 sf(6) 1,000 sf 38.66 ITE 7th equation 1.75 2.25 TC Curve 75% TC Curve 21.57 $9,162 $69 $1,013 $4.95 $8,144 $5,462 149%
812 Building Material/Lumber 1,000 sf 45.16 ITE 7th Edition 3.89 4.39TC Studies (Adjusted) 74% TC Studies 55.25 $23,474 $154 $2,260 $4.95 $21,209 $3,750 566%
813 Discount Super-Store 1,000 sf 49.21 ITE 7th Edition 3.66 4.16TC Studies (Adjusted) 92% TC Studies 70.42 $29,921 $198 $2,906 $18.68 $26,996 $6,466 417%
817 Nursery/Garden Center 1,000 sf 36.08 ITE 7th Edition 3.78 4.28Same as ITE
LUC 890 85% TIF Schedules 49.27 $20,933 $138 $2,025 $4.95 $18,903 $3,326 568%
Land Use
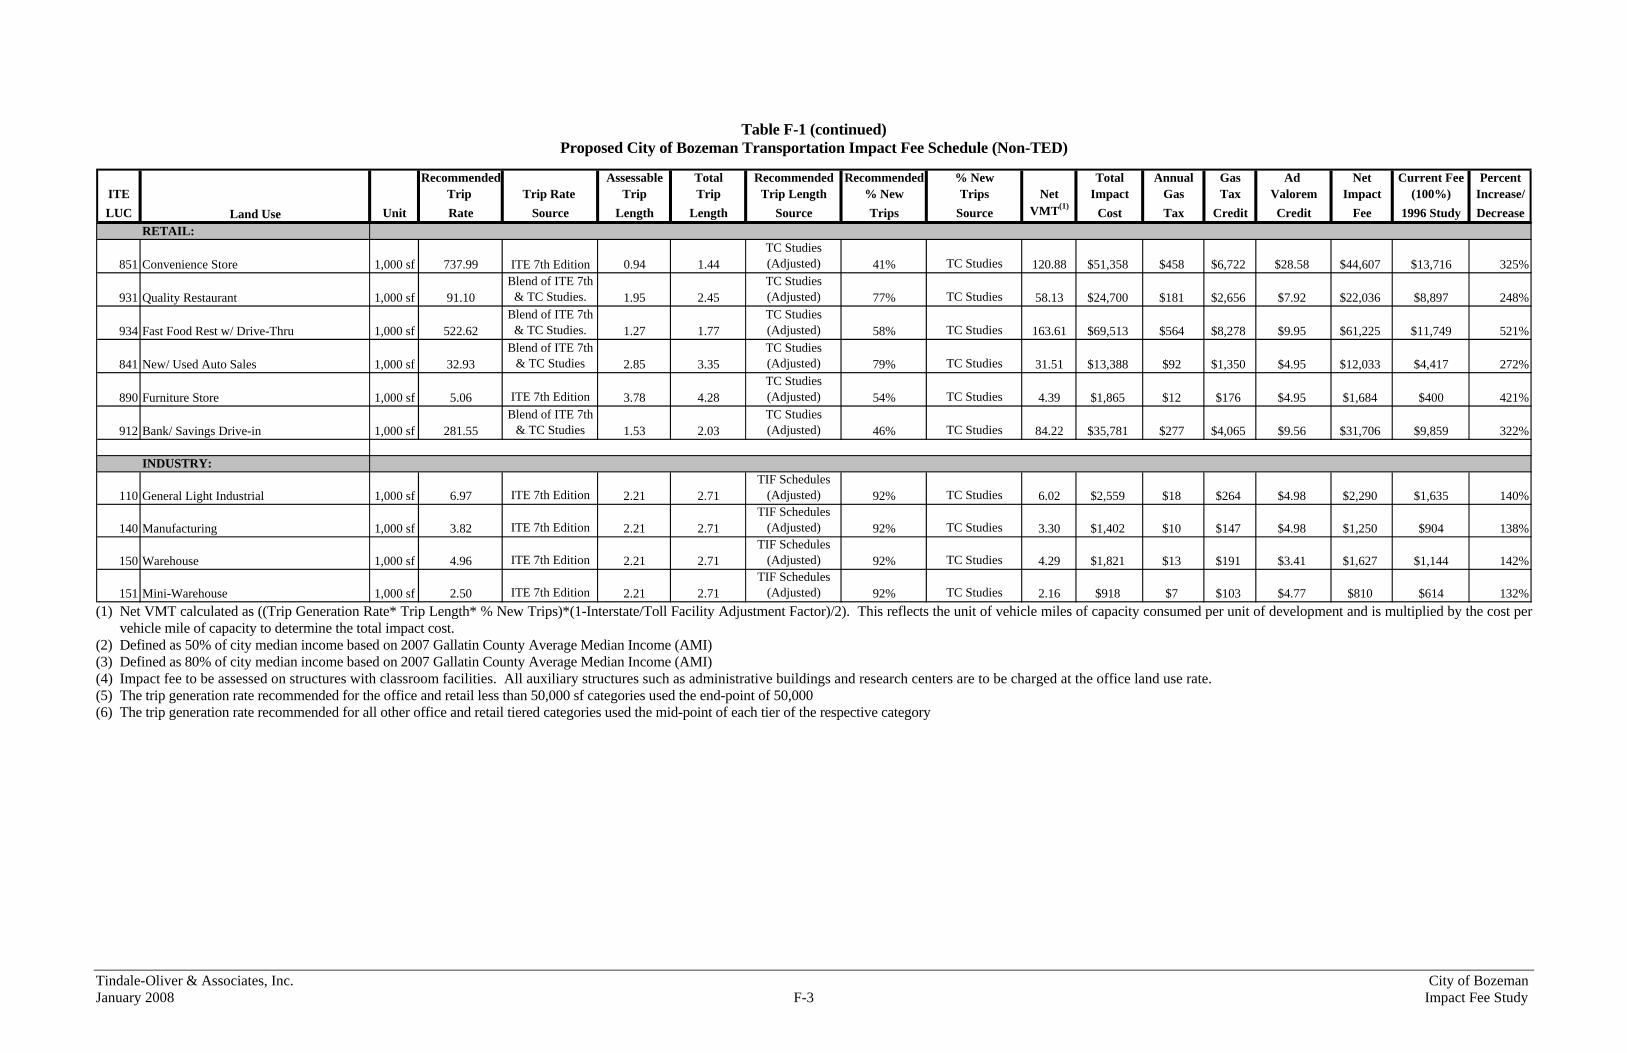
Tindale-Oliver & Associates, Inc. City of Bozeman January 2008 F-3 Impact Fee Study
Table F-1 (continued) Proposed City of Bozeman Transportation Impact Fee Schedule (Non-TED)
Recommended Assessable Total Recommended Recommended % New Total Annual Gas Ad Net Current Fee Percent
ITE Trip Trip Rate Trip Trip Trip Length % New Trips Net Impact Gas Tax Valorem Impact (100%) Increase/LUC Unit Rate Source Length Length Source Trips Source VMT(1)
Cost Tax Credit Credit Fee 1996 Study DecreaseRETAIL:
851 Convenience Store 1,000 sf 737.99 ITE 7th Edition 0.94 1.44TC Studies (Adjusted) 41% TC Studies 120.88 $51,358 $458 $6,722 $28.58 $44,607 $13,716 325%
931 Quality Restaurant 1,000 sf 91.10Blend of ITE 7th
& TC Studies. 1.95 2.45TC Studies (Adjusted) 77% TC Studies 58.13 $24,700 $181 $2,656 $7.92 $22,036 $8,897 248%
934 Fast Food Rest w/ Drive-Thru 1,000 sf 522.62Blend of ITE 7th
& TC Studies. 1.27 1.77TC Studies (Adjusted) 58% TC Studies 163.61 $69,513 $564 $8,278 $9.95 $61,225 $11,749 521%
841 New/ Used Auto Sales 1,000 sf 32.93Blend of ITE 7th
& TC Studies 2.85 3.35TC Studies (Adjusted) 79% TC Studies 31.51 $13,388 $92 $1,350 $4.95 $12,033 $4,417 272%
890 Furniture Store 1,000 sf 5.06 ITE 7th Edition 3.78 4.28TC Studies (Adjusted) 54% TC Studies 4.39 $1,865 $12 $176 $4.95 $1,684 $400 421%
912 Bank/ Savings Drive-in 1,000 sf 281.55Blend of ITE 7th
& TC Studies 1.53 2.03TC Studies (Adjusted) 46% TC Studies 84.22 $35,781 $277 $4,065 $9.56 $31,706 $9,859 322%
INDUSTRY:
110 General Light Industrial 1,000 sf 6.97 ITE 7th Edition 2.21 2.71TIF Schedules
(Adjusted) 92% TC Studies 6.02 $2,559 $18 $264 $4.98 $2,290 $1,635 140%
140 Manufacturing 1,000 sf 3.82 ITE 7th Edition 2.21 2.71TIF Schedules
(Adjusted) 92% TC Studies 3.30 $1,402 $10 $147 $4.98 $1,250 $904 138%
150 Warehouse 1,000 sf 4.96 ITE 7th Edition 2.21 2.71TIF Schedules
(Adjusted) 92% TC Studies 4.29 $1,821 $13 $191 $3.41 $1,627 $1,144 142%
151 Mini-Warehouse 1,000 sf 2.50 ITE 7th Edition 2.21 2.71TIF Schedules
(Adjusted) 92% TC Studies 2.16 $918 $7 $103 $4.77 $810 $614 132%
Land Use
(1) Net VMT calculated as ((Trip Generation Rate* Trip Length* % New Trips)*(1-Interstate/Toll Facility Adjustment Factor)/2). This reflects the unit of vehicle miles of capacity consumed per unit of development and is multiplied by the cost per
vehicle mile of capacity to determine the total impact cost. (2) Defined as 50% of city median income based on 2007 Gallatin County Average Median Income (AMI) (3) Defined as 80% of city median income based on 2007 Gallatin County Average Median Income (AMI) (4) Impact fee to be assessed on structures with classroom facilities. All auxiliary structures such as administrative buildings and research centers are to be charged at the office land use rate. (5) The trip generation rate recommended for the office and retail less than 50,000 sf categories used the end-point of 50,000 (6) The trip generation rate recommended for all other office and retail tiered categories used the mid-point of each tier of the respective category

Tindale-Oliver & Associates, Inc. City of Bozeman January 2008 F-4 Impact Fee Study
Table F-2 Proposed City of Bozeman Transportation Impact Fee Schedule (TED)
Unit Construction Cost: $3,678,552
$0.102 Capacity per lane mile: 8,658 Interstate Adjustment Factor: 15%25 Fuel Efficiency: 17.70 mpg Cost per VMC: $424.87
4.6% Effective days per year: 365Recommended Assessable Total Recommended Recommended % New Total Annual Gas Ad Net Current Fee Percent
ITE Trip Trip Rate Trip Trip Trip Length % New Trips Net Impact Gas Tax Valorem Impact (100%) Increase/LUC Unit Rate Source Length Length Source Trips Source VMT(1)
Cost Tax Credit Credit Fee 1996 Study DecreaseRESIDENTIAL:
210 Single Family (Detached)
Less than 1,500 sf and very low income(1) du 3.88ITE (NPTS,AHS,
Census) 3.52 4.02Local Studies
(Bozeman) 100% n/a 5.80 $2,466 $16 $235 $60.00 $2,171 $2,241 97%
Less than 1,500 sf and low income(2) du 5.60ITE (NPTS,AHS,
Census) 3.52 4.02Local Studies
(Bozeman) 100% n/a 8.38 $3,559 $24 $352 $60.00 $3,147 $2,241 140%
Less than 1,500 sf du 7.03ITE (NPTS,AHS,
Census) 3.52 4.02Local Studies
(Bozeman) 100% n/a 10.52 $4,468 $30 $440 $60.00 $3,968 $2,241 177%
1,500 to 2,499 sf du 9.57ITE (NPTS,AHS,
Census) 3.52 4.02Local Studies
(Bozeman) 100% n/a 14.32 $6,083 $40 $587 $100.00 $5,396 $2,241 241%
2,500 sf or larger du 10.82ITE (NPTS,AHS,
Census) 3.52 4.02Local Studies
(Bozeman) 100% n/a 16.19 $6,877 $46 $675 $120.00 $6,082 $2,241 271%
220 Apartments du 6.64Blend of ITE 7th
& TC Studies 3.10 3.60 Same as LUC 230 100% n/a 8.75 $3,717 $25 $367 $10.51 $3,339 $1,519 220%
230 Residential Condominium/ Townhouse du 5.86 ITE 7th Edition 3.10 3.60Local Studies
(Bozeman) 100% n/a 7.72 $3,280 $22 $323 $10.51 $2,946 $1,519 194%
240 Mobile Home Park du 4.99 ITE 7th Edition 2.02 2.52TC Studies (Adjusted) 100% n/a 4.28 $1,820 $13 $191 $36.00 $1,593 $1,130 141%
LODGING:
310 Hotel room 8.30Blend of ITE 7th
& TC Studies 3.44 3.94TC Studies (Adjusted) 61%
City of Tampa CBD Study 7.40 $3,145 $21 $308 $1.93 $2,835 $2,040 139%
320 Motel room 5.63 ITE 7th Edition 2.39 2.89TC Studies (Adjusted) 61%
City of Tampa CBD Study 3.49 $1,482 $10 $147 $1.55 $1,333 $2,040 65%
RECREATION:
430 Golf Course hole 35.74 ITE 7th Edition 2.37 2.87TIF Schedules
(Adjusted) 32%City of Tampa
CBD Study 11.52 $4,894 $35 $514 $46.51 $4,333 $7,791 56%
411 City Park acre 1.59 ITE 7th Edition 2.37 2.87Same as ITE
LUC 430 32%City of Tampa
CBD Study 0.51 $218 $2 $29 $6.69 $182 $232 79%
444 Movie Theaters 1,000 sf 38.00 ITE 7th Edition 1.22 1.72TC Studies (Adjusted) 32%
City of Tampa CBD Study 6.30 $2,679 $22 $323 $23.50 $2,333 $7,173 33%
INSTITUTIONS:
610 Hospital 1,000 sf 17.57 ITE 7th Edition 2.75 3.25TIF Schedules
(Adjusted) 77% TC Studies 15.81 $6,718 $46 $675 $19.99 $6,023 $2,465 244%
620 Nursing Home bed 2.48Blend of ITE 7th
& TC Studies 1.11 1.61TC Studies (Adjusted) 89% TC Studies 1.04 $442 $4 $59 $1.69 $381 $788 48%
Land Use
Gasoline Tax$$ per gallon to capital:
Facility life (years):Interest rate:

Tindale-Oliver & Associates, Inc. City of Bozeman January 2008 F-5 Impact Fee Study
Table F-2 (continued) Proposed City of Bozeman Transportation Impact Fee Schedule (TED)
Recommended Assessable Total Recommended Recommended % New Total Annual Gas Ad Net Current Fee Percent
ITE Trip Trip Rate Trip Trip Trip Length % New Trips Net Impact Gas Tax Valorem Impact (100%) Increase/LUC Unit Rate Source Length Length Source Trips Source VMT(1)
Cost Tax Credit Credit Fee 1996 Study DecreaseINSTITUTIONS:
520 Elementary School student 1.29 ITE 7th Edition 1.94 2.44TIF Schedules
(Adjusted) 80% TIF Schedules 0.85 $362 $3 $44 $3.14 $315 $190 166%
530 High School student 1.71 ITE 7th Edition 1.94 2.44TIF Schedules
(Adjusted) 90% TIF Schedules 1.27 $539 $4 $59 $3.14 $477 $402 119%
540 University (7,500 or fewer students)(4) student 2.00 ITE 7th Edition 2.37 2.87TIF Schedules
(Adjusted) 80% TIF Schedules 1.61 $685 $5 $73 $3.14 $609 N/A N/A
550 University (more than 7,500 students)(4) student 1.50 ITE 7th Edition 2.37 2.87TIF Schedules
(Adjusted) 92% TIF Schedules 1.39 $591 $4 $59 $3.14 $529 $1,349 39%
560 Church/Synagogue 1,000 sf 9.11 ITE 7th Edition 1.84 2.34TIF Schedules
(Adjusted) 90% TIF Schedules 6.41 $2,724 $20 $294 $1.93 $2,428 $1,369 177%
565 Day Care 1,000 sf 75.07Blend of ITE 7th
& TC Studies 0.87 1.37TC Studies (Adjusted) 73% TC Studies 20.26 $8,609 $79 $1,159 $17.40 $7,433 $1,397 532%
OFFICE:
710 50,000 sf or less(5) 1,000 sf 15.65 ITE 7th equation 2.22 2.72Local Studies
(Bozeman) 57%Local Studies-
Bozeman (adjusted) 8.42 $3,576 $26 $382 $6.95 $3,187 $3,895 82%
710 50,001-100,000 sf(6) 1,000 sf 14.25 ITE 7th equation 2.22 2.72Local Studies
(Bozeman) 57%Local Studies-
Bozeman (adjusted) 7.66 $3,256 $23 $338 $6.95 $2,911 $3,895 75%
710 100,001-200,000 sf(6) 1,000 sf 12.15 ITE 7th equation 2.22 2.72Local Studies
(Bozeman) 57%Local Studies-
Bozeman (adjusted) 6.53 $2,776 $20 $294 $6.95 $2,475 $3,895 64%
710 greater than 200,000 sf(6) 1,000 sf 9.70 ITE 7th equation 2.22 2.72Local Studies
(Bozeman) 57%Local Studies-
Bozeman (adjusted) 5.22 $2,216 $16 $235 $6.95 $1,974 $3,895 51%
720 Medical Office 1,000 sf 35.95Blend of ITE 7th
& TC Studies 2.39 2.89TC Studies (Adjusted) 69%
TC Studies (Adjusted) 25.20 $10,705 $75 $1,101 $19.91 $9,584 $7,081 135%
RETAIL:
820 under 50,000 sf(5) 1,000 sf 86.56 ITE 7th equation 1.24 1.74 TC Curve 31%City of Tampa
CBD Study 14.14 $6,008 $49 $719 $4.95 $5,284 $6,341 83%
820 50,000-99,000 sf(6) 1,000 sf 75.10 ITE 7th equation 1.38 1.88 TC Curve 33%City of Tampa
CBD Study 14.54 $6,176 $49 $719 $4.95 $5,452 $6,669 82%
820 100,000-199,000 sf(6) 1,000 sf 58.93 ITE 7th equation 1.57 2.07 TC Curve 35%City of Tampa
CBD Study 13.76 $5,847 $45 $660 $4.95 $5,182 $6,283 82%
820 200,000-299,000 sf(6) 1,000 sf 49.28 ITE 7th equation 1.62 2.12 TC Curve 40%City of Tampa
CBD Study 13.57 $5,766 $44 $646 $4.95 $5,115 $5,791 88%
820 greater than 300,000 sf(6) 1,000 sf 38.66 ITE 7th equation 1.75 2.25 TC Curve 46%City of Tampa
CBD Study 13.23 $5,620 $42 $616 $4.95 $4,999 $5,462 92%
812 Building Material/Lumber 1,000 sf 45.16 ITE 7th Edition 3.89 4.39TC Studies (Adjusted) 74% TC Studies 55.25 $23,474 $154 $2,260 $4.95 $21,209 $3,750 566%
813 Discount Super-Store 1,000 sf 49.21 ITE 7th Edition 3.66 4.16TC Studies (Adjusted) 92% TC Studies 70.42 $29,921 $198 $2,906 $18.68 $26,996 $6,466 417%
817 Nursery/Garden Center 1,000 sf 36.08 ITE 7th Edition 3.78 4.28Same as ITE
LUC 890 85% TIF Schedules 49.27 $20,933 $138 $2,025 $4.95 $18,903 $3,326 568%
Land Use

Tindale-Oliver & Associates, Inc. City of Bozeman January 2008 F-6 Impact Fee Study
Table F-2 (continued)
Proposed City of Bozeman Transportation Impact Fee Schedule (TED)
Recommended Assessable Total Recommended Recommended % New Total Annual Gas Ad Net Current Fee PercentITE Trip Trip Rate Trip Trip Trip Length % New Trips Net Impact Gas Tax Valorem Impact (100%) Increase/LUC Unit Rate Source Length Length Source Trips Source VMT(1)
Cost Tax Credit Credit Fee 1996 Study DecreaseRETAIL:
851 Convenience Store 1,000 sf 737.99 ITE 7th Edition 0.94 1.44TC Studies (Adjusted) 41% TC Studies 120.88 $51,358 $458 $6,722 $28.58 $44,607 $13,716 325%
931 Quality Restaurant 1,000 sf 91.10Blend of ITE 7th
& TC Studies. 1.95 2.45TC Studies (Adjusted) 21%
City of Tampa CBD Study 15.85 $6,736 $49 $719 $7.92 $6,009 $8,897 68%
934 Fast Food Rest w/ Drive-Thru 1,000 sf 522.62Blend of ITE 7th
& TC Studies. 1.27 1.77TC Studies (Adjusted) 21%
City of Tampa CBD Study 59.24 $25,168 $204 $2,994 $9.95 $22,164 $11,749 189%
841 New/ Used Auto Sales 1,000 sf 32.93Blend of ITE 7th
& TC Studies 2.85 3.35TC Studies (Adjusted) 79% TC Studies 31.51 $13,388 $92 $1,350 $4.95 $12,033 $4,417 272%
890 Furniture Store 1,000 sf 5.06 ITE 7th Edition 3.78 4.28TC Studies (Adjusted) 54% TC Studies 4.39 $1,865 $12 $176 $4.95 $1,684 $400 421%
912 Bank/ Savings Drive-in 1,000 sf 281.55Blend of ITE 7th
& TC Studies 1.53 2.03TC Studies (Adjusted) 35%
City of Tampa CBD Study 64.08 $27,225 $210 $3,082 $9.56 $24,133 $9,859 245%
INDUSTRY:
110 General Light Industrial 1,000 sf 6.97 ITE 7th Edition 2.21 2.71TIF Schedules
(Adjusted) 92% TC Studies 6.02 $2,559 $18 $264 $4.98 $2,290 $1,635 140%
140 Manufacturing 1,000 sf 3.82 ITE 7th Edition 2.21 2.71TIF Schedules
(Adjusted) 92% TC Studies 3.30 $1,402 $10 $147 $4.98 $1,250 $904 138%
150 Warehouse 1,000 sf 4.96 ITE 7th Edition 2.21 2.71TIF Schedules
(Adjusted) 92% TC Studies 4.29 $1,821 $13 $191 $3.41 $1,627 $1,144 142%
151 Mini-Warehouse 1,000 sf 2.50 ITE 7th Edition 2.21 2.71TIF Schedules
(Adjusted) 92% TC Studies 2.16 $918 $7 $103 $4.77 $810 $614 132%
Land Use
(1) Net VMT calculated as ((Trip Generation Rate* Trip Length* % New Trips)*(1-Interstate/Toll Facility Adjustment Factor)/2). This reflects the unit of vehicle miles of capacity consumed per unit of development and is multiplied by the cost per
vehicle mile of capacity to determine the total impact cost. (2) Defined as 50% of city median income based on 2007 Gallatin County Average Median Income (AMI) (3) Defined as 80% of city median income based on 2007 Gallatin County Average Median Income (AMI) (4) Impact fee to be assessed on structures with classroom facilities. All auxiliary structures such as administrative buildings and research centers are to be charged at the office land use rate. (5) The trip generation rate recommended for the office and retail less than 50,000 sf categories used the end-point of 50,000 (6) The trip generation rate recommended for all other office and retail tiered categories used the mid-point of each tier of the respective category

APPENDIX G Indexing Calculations

Tindale-Oliver & Associates, Inc. City of Bozeman January 2008 G-1 Impact Fee Study
Land Cost As shown in Table G-1, the taxable property values for the City of Bozeman increased over the past five years by approximately 8.2 percent per year between 2002 and 2006. It should be noted that market values are typically used to determine the actual increase in land values. Since these data were not available, to provide a conservative estimate of the increase in land values, taxable values were used.
Table G-1
City of Bozeman Taxable Property Value Increase (1)
YearCity of Bozeman Taxable Values
Percent Change
2002 $42,450,000 N/A2003 $46,055,000 8.5%2004 $49,559,000 7.6%2005 $52,985,000 6.9%2006 $58,063,000 9.6%
8.2%Average (1) Source: City of Bozeman Annual
Financial Report, Part III, Revenue Capacity
Construction Cost For construction costs, it is recommended that the construction cost index provided by Engineering News Record be used for indexing purposes. The average annual increases in the construction cost index are used for the design, CEI, and construction cost components of the transportation impact fee indexing. As shown in Table G-2, over the past five years the average annual index is 4.4 percent. It should be noted that this index does not reflect the actual increases in construction costs that have occurred over the past five years. As mentioned previously, the City may consider conducting a separate analysis to determine the increase in local construction costs, or at a minimum, review annual increases in the construction cost per lane mile figures provided by MDOT and consider adjusting the index accordingly. In the absence of such studies or analyses, the index calculated in this section provides a conservative estimate.

Tindale-Oliver & Associates, Inc. City of Bozeman January 2008 G-2 Impact Fee Study
Table G-2 ENR Construction Cost Index (1)
YearAnnual
AvgPercent Change
2002 6,538 N/A2003 6,694 2.4%2004 7,115 6.3%2005 7,446 4.7%2006 7,751 4.1%
Average 4.4% (1) Source: Engineering News
Record’s Construction Cost Index (2002-2006)
Application As presented in Table G-3, of the weighted average total cost per lane mile, 93 percent is for Design, CEI, and Construction Cost, and 7 percent is for ROW. As shown in the table, applying these percentages to the average cost increases presented previously would provide a combined index of 4.7 percent, which then can be applied to the cost component for all land uses presented in the transportation impact fee schedule.
Table G-3 Indexing Application
Phase Cost per
Lane Mile(1)
Percent of Total Cost(2)
Annual Increase(3) Index(4)
Design $253,522 6.9% 4.4% 0.3%ROW $285,777 7.8% 8.2% 0.6%Construction/CEI $3,139,253 85.3% 4.4% 3.8%Total Cost $3,678,552Total Applicable Index(5) 4.7% (1) Source: Table 4 (2) Source: Item (1) for each phase (design, ROW, construction/CEI) divided by total cost (3) Source: Table G-1 for ROW costs and Table G-2 for design and construction/CEI (4) Annual increase (Item 3) multiplied by the percent of total (Item 2) (5) Sum of index components for design, ROW, and construction/CEI
With this index, net impact fee for the single family 1,500 – 2,499 s.f. detached land use would increase to $5,650 ($5,396 x 1.047) at the end of first year after adoption and

Tindale-Oliver & Associates, Inc. City of Bozeman January 2008 G-3 Impact Fee Study
implementation of the updated fee schedule. This index would change all fees within the fee schedule accordingly.

APPENDIX H Revenue Projections

Tindale-Oliver & Associates, Inc. City of Bozeman January 2008 H-1 Impact Fee Study
REVENUE PROJECTIONS
Revenue estimates are based on a review of building permit activity and future population growth estimates. The impact fee schedule by land use presented in Appendix F, Table F-1, provides the basis for this analysis. Table H-1 presents the projected residential units per year through 2025. These population projections are based on the information from the 2007 Sewer Facility Plan and reflect the most recent and localized data. The following estimates were made by projecting the transportation impact fee revenues based on a review of the City of Bozeman historical building permit activity.
• Based on historical impact fee revenue collections, revenues from residential land uses represent 61 percent of total collections and non-residential land uses represent 39 percent.
• Residential building permits are estimated to be generated by single family units (37 percent), townhomes (8 percent), multi-family (53 percent), and mobile homes (2 percent).
• The rate of growth of building permits is projected to increase through 2025 as the City continues annex urbanizing areas in its geographic proximity.
• The average annual number of building permits between 2002 and 2006 was 724. Based on projected population, approximately 23,406 new homes will be constructed in the next 18 years as the county approaches its build-out population in 2025.
• The projection of revenues will be based on an average of 1,300 new homes per year between now and 2025 given the expected population growth.
Table H-1
Residential Units per Year (2008-2025)
Year Population Item2008 39,6022025 92,500Population Growth (2008-2025)(1) 52,898Residents Per Dwelling Unit(2) 2.26New Homes (2008-2025)(3) 23,406New Homes per Year(4) 1,300 (1) Source: Source: Bozeman Sewer Facility Plan, 2007 (2) Source: 2000 Census Data, Table P17 (3) Population growth (Item 1) divided by residents per
dwelling unit (Item 2). (4) New homes (2008-2025) (Item 3) divided by 18 years.

Tindale-Oliver & Associates, Inc. City of Bozeman January 2008 H-2 Impact Fee Study
As shown in Table H-2, the transportation impact fee program will generate a total of approximately $154.8 million, generating an average of approximately $8.6 million annually through 2025. These estimates are based on using the population growth approach. Compared to historical collections, these projections are optimistic since they are based on a higher annual projected number of building permits.
Table H-2 Projected Transportation Impact Fee Revenues
(2008-2025) (in 2007 Dollars)
Land Use Distribution(1) Permits(2) Impact Fee(3)
Total Revenues(4)
Single Family 37% 8,661 $5,396 $46,734,756Townhomes 8% 1,872 $2,946 $5,514,912Multi-Family (Apartments) 53% 12,405 $3,339 $41,420,295Mobile Home Park 2% 468 $1,593 $745,524Total Residential Revenues 100% 23,406 N/A $94,415,487Non-Residential Impact Fee Revenues(5) $60,364,000Total Residential and Non-residential Impact Fee Revenues(6) $154,779,487 (1) Source: Distribution of historical building permits from 2002 through 2006 (2) Source: Table H-1 for total permits. Permits distributed for residential uses by estimated
percentages in (Item 1) (3) Source: Appendix F, Table F-1 (4) Permits (Item 2) multiplied by impact fee (Item 3) (5) Non-residential revenues are estimated to be 39 percent of total collections (6) Sum of total residential impact fees and total non-residential impact fee revenues (Item 5)
Based on the analysis shown in these tables, the City of Bozeman is projected to generate an average of $8.6 million annually in transportation impact fee revenue between 2008 and 2025, and a total of $154.8 million during this 18-year time period. This projection is in 2007 dollars and does not take into account the indexing of the impact fees.

APPENDIX I Evaluation of Funding Sources

Tindale-Oliver & Associates, Inc. City of Bozeman January 2008 I-1 Impact Fee Study
Current Conditions The City’s roadway financing program, including expenditure and revenue policies that have historically been used for capital and operations, was evaluated. It is recommended that the City evaluate alternative revenue sources once every three years to make sure that a dynamic process is in place in case there are any new revenue options. As a part of this review, historical expenditures were reviewed dating to Fiscal Year 2002. Specifically, expenditures were categorized as personnel, operations, capital, other, and capacity expansion. Table I-1 provides a summary of the percentage of the annual street maintenance expenditures by funding source. As shown in the table, the primary funding source has been the Street Maintenance District Fund. Similarly, there has been a strong increase in revenues from impact fees in more recent years primarily due to the settlement of a law suit such that the City could begin expending the impact fees that were collected during the litigation period.
Table I-1 Historical Roadway Expenditures by Funding Source(1)
2002 2003 2004 2005 2006 2007 AverageStreet Maintenance 76% 57% 68% 19% 11% 19% 42%Gas Tax Allocation 22% 37% 28% 6% 4% 6% 17%Special Improvement Districts 0% 0% 0% 51% 11% 0% 10%Impact Fees 2% 3% 2% 23% 74% 58% 27%G.O. Bonds 0% 3% 2% 1% 0% 17% 4%
% of Total Expenditures by Funding SourceFunding Source
(1) Source: City of Bozeman Finance Department Table I-2 presents transportation expenditures by task as a percentage of total expenditure. As shown in the table, the three categories that dominate transportation expenditures on average since 2002 are operations, capacity expansion, and personnel projects. Specifically, an average of 30 percent of funds has been devoted to operations and capacity expansion, while 25 percent has been expended on personnel. Capital expenditures refer to the purchase of specific equipment needed to support the roadway program’s capacity expansion and operational activities. As mentioned previously, as impact fees became available as a source of funding, the percentage of total funds being allocated to capacity expansion projects increased.

Tindale-Oliver & Associates, Inc. City of Bozeman January 2008 I-2 Impact Fee Study
Table I-2 Historical Roadway Maintenance Expenditure
by Task (1)
2002 2003 2004 2005 2006 2007 AveragePersonnel 44% 39% 41% 9% 6% 10% 25%Operations 39% 28% 34% 55% 16% 9% 30%Capital 15% 28% 22% 8% 3% 12% 15%Capacity Expansion 2% 5% 3% 28% 74% 69% 30%
% of Total Expenditures by TaskTask
(1) Source: City of Bozeman Finance Department
Surrounding Communities Table I-3 below presents the funding sources of various cities near the City of Bozeman. The most common source of funding comes from gas tax revenue as distributed by the State of Montana Department of Transportation. It should be noted that this funding source is used primarily for maintenance related expenditures by the City of Bozeman. As shown in the table, the City of Billings has enacted an arterial street fee as an innovative way of generating revenues for the construction and reconstruction of arterial streets within the city. Similarly, special assessments, or special improvement districts, as well as, impact fees, are also common sources of revenue to meet the transportation needs of other communities besides the City of Bozeman.
Table I-3 Comparison of Funding Sources for Transportation Expenditures (1)
CityGeneral
Fund
Special Assessment/
Improvement Districts
Other Debt (e.g. General Obligation
Bonds) Impact
Fees
Arterial Street Fees Gas Tax
Federal Grants
City of Bozeman X X X X XCity of Billings X X X X X XCity of Great Falls X XCity of Missoula X XCity of Belgrade X X XGallatin County X X X X (1) Source: Adopted budgets for Fiscal Year 2007

Tindale-Oliver & Associates, Inc. City of Bozeman January 2008 I-3 Impact Fee Study
Funding Options Aside from the funding sources presented in Table I-3, two other possible funding sources were evaluated. First, a retail sales tax scenario was examined and is presented in Table I-4 below. We understand that the implementation of sales tax may be difficult; since recently the state legislature did not consider this to be a feasible funding option at this time. However, since the sales tax has the potential of generating significant revenues, the sales tax analysis is included as one of the options for purposes of illustration. Based on data collected on retail sales in the City of Bozeman, as well as for the State of Montana, the estimated 2007 retail sales is multiplied by each sales tax scenario. For example, it is estimated that a one-half cent sales tax in the City of Bozeman will generate approximately $4.4 million in revenue annually.
Table I-4
Sales Tax Scenario
Calculation Step Retail Sales Estimated Sales Tax Revenue(5)
Estimated 2007 City of Bozeman Retail SalesState of Montana 2002(1) $10,122,625,000State of Montana 2005(2) $11,886,957,000State of Montana Average Annual Growth Rate Of Retail Sales 5.5%City of Bozeman 2002(3) $679,846,000Number of Years Between 2002-2007 5Estimated 2007 City of Bozeman(4) $888,531,533Sales Tax Scenario
$0.005 $4,442,658$0.010 $8,885,315$0.020 $17,770,631
(1) Source: 2002 Economic Census (2) Source: Montana Department of Commerce, Census and Economics Information
Center (3) Source: 2002 Economic Census (4) Based on the average annual growth rate of retail sales in the State of Montana (5) Sales tax multiplied by the estimated 2007 retail sales in the City of Bozeman (Item 4)
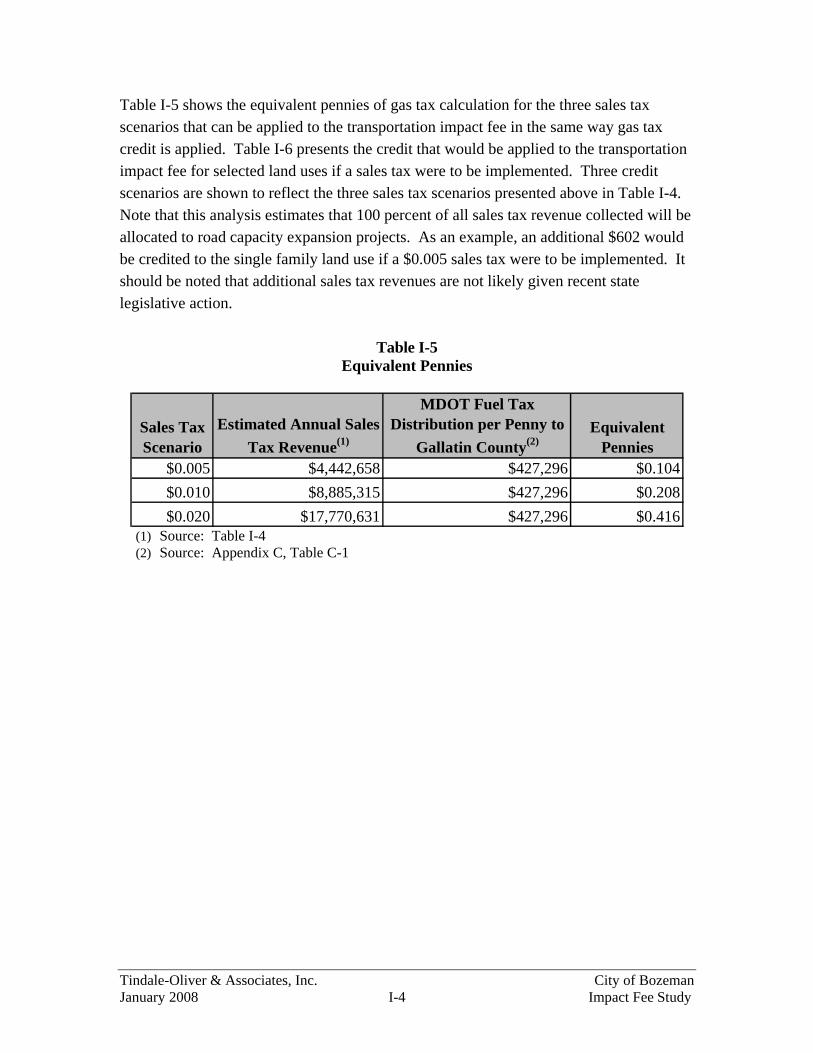
Tindale-Oliver & Associates, Inc. City of Bozeman January 2008 I-4 Impact Fee Study
Table I-5 shows the equivalent pennies of gas tax calculation for the three sales tax scenarios that can be applied to the transportation impact fee in the same way gas tax credit is applied. Table I-6 presents the credit that would be applied to the transportation impact fee for selected land uses if a sales tax were to be implemented. Three credit scenarios are shown to reflect the three sales tax scenarios presented above in Table I-4. Note that this analysis estimates that 100 percent of all sales tax revenue collected will be allocated to road capacity expansion projects. As an example, an additional $602 would be credited to the single family land use if a $0.005 sales tax were to be implemented. It should be noted that additional sales tax revenues are not likely given recent state legislative action.
Table I-5 Equivalent Pennies
Sales Tax Scenario
Estimated Annual Sales Tax Revenue(1)
MDOT Fuel Tax Distribution per Penny to
Gallatin County(2)Equivalent
Pennies$0.005 $4,442,658 $427,296 $0.104$0.010 $8,885,315 $427,296 $0.208$0.020 $17,770,631 $427,296 $0.416
(1) Source: Table I-4 (2) Source: Appendix C, Table C-1

Tindale-Oliver & Associates, Inc. City of Bozeman January 2008 I-5 Impact Fee Study
Table I-6 Transportation Impact Fee Sales Tax Credit (1)
Land Use UnitRecommended
Trip Rate
Total Trip
LengthRecommended % New Trips
Annual Sales Tax
Credit ($0.005)
Total Sales Tax
Credit ($0.005)
Annual Sales Tax
Credit ($0.01)
Total Sales Tax
Credit ($0.01)
Annual Sales Tax
Credit ($0.02)
Total Sales Tax
Credit ($0.02)
Single Family (1,500 to 2,499 sf) du 9.57 4.02 100% $41 $602 $83 $1,218 $165 $2,422Office (50,000 sf) 1,000 sf 15.65 2.72 71% $32 $470 $65 $954 $130 $1,908Retail (100,000 sf) 1,000 sf 58.93 2.07 63% $82 $1,203 $165 $2,422 $330 $4,843Quality Restaurant 1,000 sf 91.10 2.45 77% $184 $2,701 $367 $5,386 $734 $10,773Bank/Savings Drive-in 1,000 sf 281.55 2.03 46% $283 $4,154 $566 $8,307 $1,133 $16,629General Light Industrial 1,000 sf 6.97 2.71 92% $19 $279 $37 $543 $75 $1,101 (1) Trip characteristics variables are presented in the demand component in Appendix F, Table F-1. Sales tax credit is based on a facility life of
25 years, 4.6 percent interest rate, 365 effective days, and a fuel efficiency of 17.70 miles per gallon. (2) This scenario estimate 100 percent of the sales tax revenue will be allocated to capacity expansion projects.

Tindale-Oliver & Associates, Inc. City of Bozeman January 2008 I-6 Impact Fee Study
A millage option was also evaluated as a form of revenue to fund transportation projects. Presented in Table I-6 are various scenarios of levying a millage tax. Based on the revenues generated from 1-mil as presented in Appendix D, Table D-1, a one mil levy will generate approximately $63,251 in revenue per year. Similarly, a three mil levy will generate approximately $189,753 in annual revenue.
Table I-7 Millage Tax Scenario
Calculation StepEstimated
Revenues(2)
Revenue Generated from 1-mil(1) $63,251Millage Scenario:
1.0 $63,2512.0 $126,5023.0 $189,753
(1) Source: Appendix D, Table D-1 (2) Millage scenario multiplied by the amount of
revenue generated from one mil (Item 1). As presented in Table I-6 in the sales tax scenario, Table I-8 below presents the effect on the transportation impact fee if the City of Bozeman levied a 1, 2, or 3-mil tax for the single family (1,500 to 2,499 sf) land use. The additional ad valorem credit that would be applied to various non-residential land uses is presented in Table I-9. Note that the calculation for this analysis is done in the same manner as presented in the applied ad valorem credit analysis in Appendix D. For example, the additional ad valorem credit for the mid-tier single family detached land use of levying a 1-mil tax would be $75. The additional credit that would be applied to a 50,000 square foot office land use is $6.95 if a 1-mil tax were implemented. As shown in the analysis of funding sources presented above, the City has the option of using two primary funding sources (sales tax and ad valorem tax) to finance operations expenditures. It should be noted that additional mills require an independent vote from city residents. These funding sources can be used to develop a cost affordable maintenance program that meets the growing demands of the roadway system. In addition, depending of the use of the special improvement district funds these additional revenues can be used to provide leverage for any funding shortfalls.

Tindale-Oliver & Associates, Inc. City of Bozeman January 2008 I-7 Impact Fee Study
Table I-8 Additional Transportation Impact Fee Ad Valorem Credit
for the Single Family (1,500 to 2,499 sf) Land Use
Mil ScenarioCredit per
Square Foot
Additional Ad Valorem
Credit(1)
1.0 $0.03 $75.002.0 $0.07 $175.003.0 $0.10 $250.00
(1) Credit per square foot multiplied by 2,500 sf

Tindale-Oliver & Associates, Inc. City of Bozeman January 2008 I-8 Impact Fee Study
Table I-9 Additional Transportation Impact Fee Ad Valorem Credit
for Sample Non-Residential Land Uses*
Annual Portion to
Expansion(1)
Total Ad Valorem Credit(2)
Annual Portion to
Expansion(3)
Total Ad Valorem Credit(4)
Annual Portion to
Expansion(5)
Total Ad Valorem Credit(6)
Office (50,000 sf) $0.89 $6.95 $1.78 $13.96 $2.67 $20.89Retail (100,000 sf) $0.63 $4.95 $1.25 $9.80 $1.88 $14.74Quality Restaurant $1.01 $7.92 $2.02 $15.73 $3.02 $23.59Fast Food Rest w/ Drive-Thru $1.27 $9.95 $2.55 $19.94 $3.82 $29.98Bank/Savings Drive-in $1.22 $9.56 $2.44 $19.14 $3.66 $28.64General Light Industrial $0.66 $4.98 $1.32 $9.74 $1.98 $14.79
1 Mil 2 Mil 3 Mil
Land Use
Note: Credit shown for all land uses is per 1,000 square feet
(1) Taxable value of land use divided by 1,000 and multiplied by the percentage of one mill that is attributed to transportation capacity expansion (1%)
(2), (4), (6) Total ad valorem credit over the 24-year period in present day dollar (3) Taxable value of land use divided by 1,000 and multiplied by the percentage of one mill that is attributed to transportation
capacity expansion (2%) (5) Taxable value of land use divided by 1,000 and multiplied by the percentage of one mill that is attributed to transportation
capacity expansion (3%)

APPENDIX J Acronyms and Definitions

Tindale-Oliver & Associates, Inc. City of Bozeman January 2008 J-1 Impact Fee Study
Acronyms
AMI - Average Median Income CBD - Central Business District CEI - Construction Engineering/Inspection CPI - Consumer Price Index GO Bonds - General Obligation Bonds ITE - Institute of Transportation Engineers LUC - Land Use Code MDOT - Montana Department of Transportation MPG - Miles per Gallon PNT - Percent (%) New trips PV - Present Value ROW - Right-of-Way STIP - State Transportation Improvement Plan TC Database - Trip Characteristics Database TGR - Trip Generation Rate TL - Trip Length VMC - Vehicle Miles of Capacity VMT - Vehicle Miles of Travel
Tindale-Oliver & Associates, Inc. City of Bozeman January 2008 J-2 Impact Fee Study
Definitions “Ad Valorem Tax Credit” shall mean a credit applied to the total impact cost that is based on an estimate of the property tax revenues per millage that is generated by a unit of each land use of new development that are allocated to transportation system capacity expansion. “Average Median Income” shall mean the mid-point value in the total distribution of all income levels in the United States. “Capacity” shall mean the maximum number of vehicles for a given time period which a road can safely and efficiently carry, expressed in terms of vehicles per day. “Capacity per Lane Mile” shall mean the number of vehicles added to the roadway network based on an additional lane mile of roadway constructed. “Central Business District” shall mean is the commercial (and often) geographic heart of a city. The CBD is also commonly referred to as “downtown.” “Construction Engineering/Inspection” shall mean the review process of ensuring that roadway construction projects are built in accordance with their plans and specifications. “Consumer Price Index (CPI)” shall mean inflationary indicator that measures the change in the cost of a fixed basket of products and services, including housing, electricity, food, and transportation. The CPI is published monthly. Also called cost-of-living index. “Cost per Lane Mile” shall mean the unit cost to construct on lane mile of roadway. “Design” shall mean to the process of developing a roadway design plan based on a selected roadway section alternative. “Dollar ($)/Gallon to Capital” shall mean the amount of gas tax revenue per gallon of fuel that is used for capital improvements, in $/gallon. “Effective Days per Year” shall mean the total number of days used in the impact fee equation to calculate the consumption of gasoline taxes credited against the fee. “Facility Life” shall mean the reasonable life of a roadway which is proposed at 25 years

Tindale-Oliver & Associates, Inc. City of Bozeman January 2008 J-3 Impact Fee Study
“Fuel Efficiency” shall mean the average energy efficiency of a particular vehicle model, where its total output (mileage) is given as a ratio of range units per a unit amount of input fuel (gasoline, diesel, etc.). “Gas Tax Credit” shall mean a credit applied to the total impact cost that is based on an estimate of the gas tax revenues per gallon of future gasoline consumption that is generated by a unit of each land use of new development that are allocated to roadway construction or transportation system capacity expansion. “General Obligation Bonds” shall mean a municipal bond secured by the taxing and borrowing power of the municipality issuing it. “Interest Rate” shall mean the discount rate at which gasoline tax revenues might be bonded. “Institute of Transportation Engineers” shall mean the ITE Trip Generation 7th Edition, Journal. The three-volume report contains introductory and instructional material as well as two data volumes with land use descriptions, trip generation rates, equations and data plots. Data from more than 500 sites has been included in the seventh edition, bringing the number of data points contained in the database to more than 4,250. In addition, the seventh edition contains a total of 150 land use classifications.
“Interstate Adjustment Factor” shall mean an adjustment factor applied to an impact fee calculation to account for the travel demand occurring on interstate highways.
“Land Use Code” shall mean the three (3) digit number designated to a specific land use by the Institute of Transportation Engineers.
“Montana Department of Transportation” shall mean the governmental entity assigned the task of providing a transportation system and services that emphasize quality, safety, cost effectiveness, economic vitality and sensitivity to the environment for the citizens of the state of Montana.
“Miles per Gallon” shall mean the number of miles a vehicle can travel per gallon of gasoline consumed.
“Net Impact Fee” shall mean the “up-front” fee that is charged to new development based on the adopted City of Bozeman Impact Fee Schedule.
“Percent (%) New Trips” shall mean the proportion of travel that is new travel, rather than travel that is estimated to have already been on the road system.

Tindale-Oliver & Associates, Inc. City of Bozeman January 2008 J-4 Impact Fee Study
“Present Value” shall mean the calculation of the present value of a uniform series of cash flows, given an interest rate, “i,” and a number of periods, “n.”
“Right-of-Way” shall mean an easement or strip of land granted for transportation purposes.
“Square Foot” as referred to in the Fee Schedule, it means total square footage under roof used for occupancy or storage.
“Square Footage” shall mean the gross area measured in square feet from the exterior faces of exterior walls or other exterior boundaries of the building, including all floors and mezzanines within said building, but excluding areas within the interior of the building which are utilized for parking.
“State Transportation Improvement Plan” shall mean the five-year capital and maintenance program developed by the Montana Department of Transportation. The plan is developed in accordance with the requirements of Section 135 of 23 USC (United States Code).
“Total Trip Length” shall mean the (assessable) trip length plus an adjustment factor of half a mile to account for the fact that gas taxes are collected for travel on all roads, including local roads.
“Transportation Impact Fee” shall mean a one-time, "up front" payment for a portion of the cost to replace the transportation facilities consumed by each unit of new development
“Trip” shall mean a one-way movement of vehicular travel from an origin (one trip end) to a destination (the other trip end).
“Trip Characteristics Database” shall mean the database of information collected by TOA containing trip characteristic data for a variety of land uses spanning the state of Florida. Trip characteristic data includes trip lengths, trip generation rates and percent new trips.
“Trip Generation Rate” shall mean the average number of daily trips caused by a given land use, given in vehicle-trips/day.
“Trip Length” shall mean the average length of daily trips (in miles) or travel by land use.
“Vehicle Miles of Capacity” shall mean the average daily traffic on one travel lane at capacity for one lane mile of roadway, in vehicles/lane-mile/day.
“Vehicle Miles of Travel” shall mean a measurement of the total miles traveled for each respective land use in the impact fee schedule and provides the basis for the gross fee

Tindale-Oliver & Associates, Inc. City of Bozeman January 2008 J-5 Impact Fee Study
calculation. It is calculated by multiplying the trip generation rate, trip length, and percent new trips variable. For impact fee purposes, to allocate the assessment for a trip evenly between origin-end development and destination-end development, the vehicle miles of travel are divided in half.

APPENDIX K Trip Exchange District (TED)
Definition Characteristics

Tindale-Oliver & Associates, Inc. City of Bozeman January 2008 K-1 Impact Fee Study
Trip Exchange District (TED) Defining Characteristics
The City of Bozeman is committed to having impact fees which accurately reflect demand on the transportation system. Therefore, the City has adopted different impact fees for the Trip Exchange District (TED) than for other areas in the community. This reflects a difference in the travel characteristics of travel in the TED and a corresponding lower consumption of transportation capacity per unit of development within the TED. Over time, other areas of the community may develop similar travel characteristics and should therefore pay a similar transportation impact fee as development does within the TED.
Development that desires to be categorized as “TED” has the responsibility to demonstrate that their travel demand on the transportation system will have a similar demand as do development projects being built in the TED. Some of the defining characteristics of the TED, relating to different demands on transportation are:
• Shared and consolidated parking; • A high degree of pedestrian and bicycle access to and throughout the TED; • Public Transit availability. • Extensive trip capture within the TED where a person will make one vehicle trip to the
TED and then visit multiple businesses via a mode other than automobile thereby reducing the overall vehicle miles of capacity being consumed;

Tindale-Oliver & Associates, Inc. City of Bozeman January 2008 K-2 Impact Fee Study
Example potential reductions in trip capture are illustrated in Table K-1 below.
Table K-1 TED Percent New Trips Reductions
Non TED TEDOffice 71 57 20%Shopping Center Low 55 31 44%Shopping Center High 74 46 38%Quality Restaurant 77 21 73%Fast Food Restaurant 58 21 64%Bank 46 35 24%General Light Industrial 92 92 0%Hotel 66 61 8%Motel 77 61 21%
Sample Land UsesPercent New Trips %
Reduction
(1) Sources: City of Tampa Transportation Impact Fee Study,
1988 and Downtown Portland Circulation Study conducted by DeLeuw, Cather, and Company, 1973
Some of the physical development characteristics of the TED that facilitate the different travel characteristics are:
• Multi-story development for the majority of buildings, often more than two stories; • Diverse business proprietorships within the TED area; • Primary use at the ground floor is commercial operations of some type; • Businesses tending to be smaller scale (e.g., less than 20,000 sf for the majority of the
businesses); • Structures are in near proximity to each other and the public street (with small or even
zero foot setbacks); • Having a high percentage of each lot covered by buildings and a ratio of total building
floor area typically in excess of 0.5; • The physical characteristics are shared among the entire business area, not just one or a
few of the businesses. Each potential development desiring to be categorized as a TED type development will be reviewed on a case by case basis.

APPENDIX L Transportation Impact Fee Comparison

Tindale-Oliver & Associates, Inc. City of Bozeman January 2008 L-1 Impact Fee Study
Transportation Impact Fee Comparison
As part of the work effort in developing the City of Bozeman transportation impact fee program, a comparison of transportation impact fee schedules of surrounding jurisdictions was completed. In addition, two impact fee schedules were developed for the City of Bozeman. Specifically, a fee schedule for the Trip Exchange District (TED) and a fee schedule for the non-TED area were calculated. The TED fee schedule provides a reduction to the percent new trips variable for certain recreation, lodging, retail, office, restaurant, and bank land uses. Table L-1 presents the existing City of Bozeman impact fees and proposed City of Bozeman impact fees compared to transportation impact fees in the other jurisdictions.

Tindale-Oliver & Associates, Inc. City of Bozeman January 2008 L-2 Impact Fee Study
Table L-1 Transportation Impact Fee Comparison
TEDNon-TED
Date of Last Update 2007 2007 1996 2007 2007
Residential:Single Family Detached (2,000 sq ft) du $5,396 $5,396 $2,241 $1,192 $2,506Non-residential:General Light Industrial 1,000 sf $2,290 $2,290 $1,635 N/A $904Office (50,000 sf) 1,000 sf $3,187 $3,977 $3,895 N/A $2,028Quality Restaurant 1,000 sf $6,009 $22,036 $8,897 N/A $6,318Retail (100,000 sf) 1,000 sf $5,182 $9,331 $6,283 N/A $5,272Bank w/Drive-In 1,000 sf $24,133 $31,706 $9,859 N/A $6,318
Gallatin County
(Adopted)(2)
City of Belgrade
(Adopted)(3)Land Use
City of Bozeman (Existing @ 100%)Unit
City of Bozeman (Proposed)(1)
(1) Source: Appendix F, Table F-2 for TED and Table F-1 for Non-TED (2) Source: Gallatin County Transportation Impact Fee Study, March 2007. Note, fees shown include a five percent
administration charge and represent the BOCC adoption of the full cost at 30 percent for residential uses and an exemption of impact fee for all non-residential land uses
(3) Source: City of Belgrade Transportation Impact Fee Study, February 2007. The commercial/shopping center (50,000 sf or less) fee is shown for the quality restaurant and bank w/drive-in land uses. Impact Fees for the City of Belgrade have been adopted at 65 percent of the impact fee in the 2007 Technical Report

APPENDIX M Compliance with Statute Review
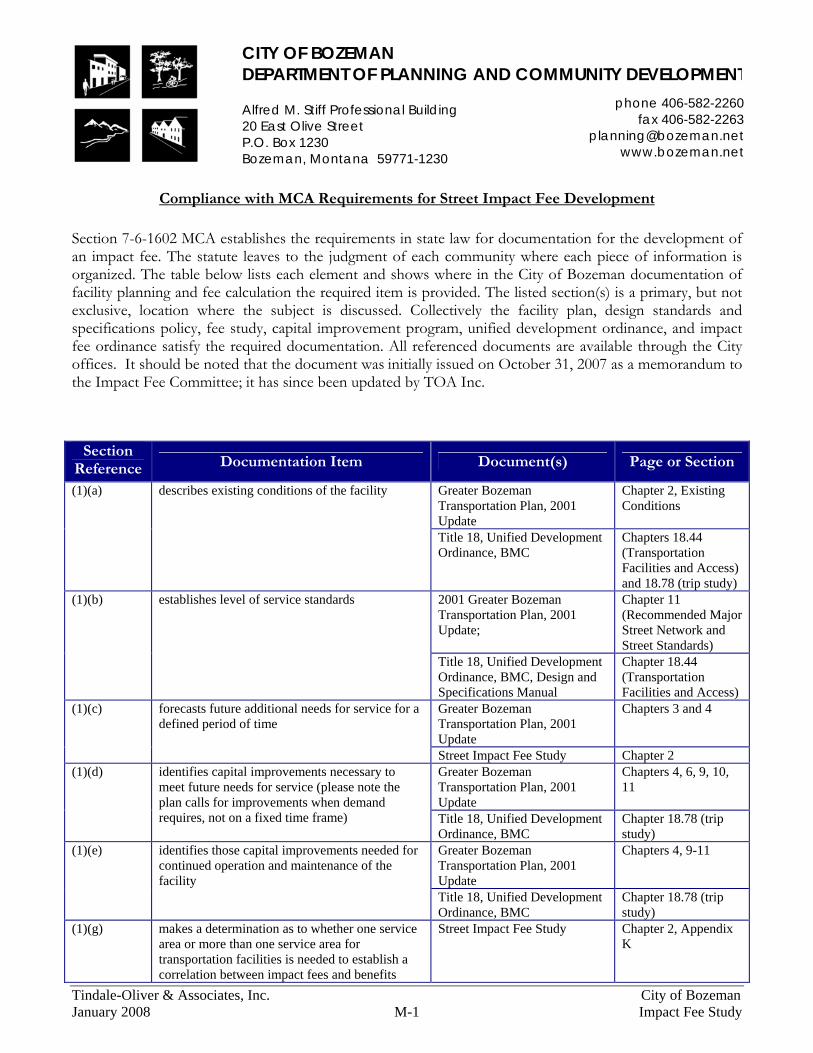
Tindale-Oliver & Associates, Inc. City of Bozeman January 2008 M-1 Impact Fee Study
CITY OF BOZEMAN DEPARTMENT OF PLANNING AND COMMUNITY DEVELOPMENT
Alfred M. Stiff Professional Building 20 East Olive Street P.O. Box 1230 Bozeman, Montana 59771-1230
phone 406-582-2260 fax 406-582-2263
[email protected] www.bozeman.net
Compliance with MCA Requirements for Street Impact Fee Development
Section 7-6-1602 MCA establishes the requirements in state law for documentation for the development of an impact fee. The statute leaves to the judgment of each community where each piece of information is organized. The table below lists each element and shows where in the City of Bozeman documentation of facility planning and fee calculation the required item is provided. The listed section(s) is a primary, but not exclusive, location where the subject is discussed. Collectively the facility plan, design standards and specifications policy, fee study, capital improvement program, unified development ordinance, and impact fee ordinance satisfy the required documentation. All referenced documents are available through the City offices. It should be noted that the document was initially issued on October 31, 2007 as a memorandum to the Impact Fee Committee; it has since been updated by TOA Inc.
Section Reference Documentation Item Document(s) Page or Section
Greater Bozeman Transportation Plan, 2001 Update
Chapter 2, Existing Conditions
(1)(a) describes existing conditions of the facility
Title 18, Unified Development Ordinance, BMC
Chapters 18.44 (Transportation Facilities and Access) and 18.78 (trip study)
2001 Greater Bozeman Transportation Plan, 2001 Update;
Chapter 11 (Recommended Major Street Network and Street Standards)
(1)(b) establishes level of service standards
Title 18, Unified Development Ordinance, BMC, Design and Specifications Manual
Chapter 18.44 (Transportation Facilities and Access)
Greater Bozeman Transportation Plan, 2001 Update
Chapters 3 and 4 (1)(c) forecasts future additional needs for service for a defined period of time
Street Impact Fee Study Chapter 2 Greater Bozeman Transportation Plan, 2001 Update
Chapters 4, 6, 9, 10, 11
(1)(d) identifies capital improvements necessary to meet future needs for service (please note the plan calls for improvements when demand requires, not on a fixed time frame) Title 18, Unified Development
Ordinance, BMC Chapter 18.78 (trip study)
Greater Bozeman Transportation Plan, 2001 Update
Chapters 4, 9-11 (1)(e)
identifies those capital improvements needed for continued operation and maintenance of the facility
Title 18, Unified Development Ordinance, BMC
Chapter 18.78 (trip study)
(1)(g) makes a determination as to whether one service area or more than one service area for transportation facilities is needed to establish a correlation between impact fees and benefits
Street Impact Fee Study Chapter 2, Appendix K

Tindale-Oliver & Associates, Inc. City of Bozeman January 2008 M-2 Impact Fee Study
(1)(h) establishes the methodology and time period over which the governmental entity will assign the proportionate share of capital costs for expansion of the facility to provide service to new development within each service area
Street Impact Fee Study Chapters 2 and 3, Appendices B-D
Greater Bozeman Transportation Plan, 2001 Update
Chapters 4, 9-11, 13
Street Impact Fee Study Chapter 2, Appendices C&D
(1)(i) establishes the methodology that the governmental entity will use to exclude operations and maintenance costs and correction of existing deficiencies from the impact fee
Street Impact Fee Capital Improvement Program
Street CIP; individual project review by City staff
(1)(j) establishes the amount of the impact fee that will be imposed for each unit of increased service demand
Street Impact Fee Study Chapters 2 and 3, Appendix B
has a component of the budget of the governmental entity that: (i) schedules construction of public facility capital improvements to serve projected growth
Capital Improvements Program for General Fund, Street Maintenance Fund and Street Impact Fee Fund
Section for each fund when applicable to an individual funding source
(ii) projects costs of the capital improvements Capital Improvements Program for General Fund, Street Maintenance Fund and Street Impact Fee Fund
Section for each fund when applicable to an individual funding source
(iii) allocates collected impact fees for construction of the capital improvements
Capital Improvements Program for General Fund, Street Maintenance Fund and Street Impact Fee Fund
Section for each fund when applicable to an individual funding source
(1)(k)
(iv) covers at least a 5-year period and is reviewed and updated at least every 2 years
Capital Improvements Program for General Fund, Street Maintenance Fund and Street Impact Fee Fund
Section for each fund when applicable to an individual funding source
(2) The data sources and methodology supporting adoption and calculation of an impact fee must be available to the public upon request
Greater Bozeman Transportation Plan, 2001 Update & Street Impact Fee Study, Unified Development Ordinance, Design and Specification Manual, City Budget, bid tabulations, impact fee ordinance
All documents are available at City offices, many are also available on-line
(3) The amount of each impact fee imposed must be based upon the actual cost of public facility expansion or improvements or reasonable estimates of the cost to be incurred by the governmental entity as a result of new development. The calculation of each impact fee must be in accordance with generally accepted accounting principals.
Street Impact Fee Study Chapters 2 and 3, Appendix B
(4) The ordinance or resolution adopting the impact fee must include a time schedule for periodically updating the documentation required under subsection (1)
Chapter 3.24, BMC Section 3.24.110

Tindale-Oliver & Associates, Inc. City of Bozeman January 2008 M-3 Impact Fee Study
An impact fee must meet the following requirements: (a) The amount of the impact fee must be
reasonably related to and reasonably attributable to the development’s share of the cost of infrastructure improvements made necessary by the new development
Street Impact Fee Study Chapters 2 and 3, Appendices B & F
(b) The impact fees imposed may not exceed a proportionate share of the costs incurred or to be incurred by the governmental entity in accommodating the development. The following factors must be considered in determining a proportionate share of public facilities capital improvements cost;
(i) the need for public facilities capital improvements required to serve new development
Street Impact Fee Study Chapters 2 and 3
(ii) consideration of payments for system improvements reasonably anticipated to be made by or as a result of development in the form of user fees, debt service payments, taxes, and other available sources of funding the system improvements
Street Impact Fee Study Chapters 2 and 3, Appendix C
(c) costs for correction of existing deficiencies in a public facility may not be included in the impact fee;
Street Impact Fee Study Chapters 2, Section 2.4
(d) new development may not be held to a higher level of service than existing users unless there is a mechanism in place for the existing users to make improvements to the existing system to match the higher level of service
Street Impact Fee Study Chapters 2, Section 2.4
(5)
(e) impact fees may not include expenses for operations and maintenance of the facility
Street Impact Fee Study Chapters 2 and 3, Appendix C

APPENDIX N Street Impact Fee Funded Projects

planning • zoning • subdivision review • annexation • historic preservation • housing • grant administration • neighborhood
coordination
CITY OF BOZEMAN DEPARTMENT OF PLANNING AND COMMUNITY DEVELOPMENT
Alfred M. Stiff Professional Building 20 East Olive Street P.O. Box 1230 Bozeman, Montana 59771-1230
phone 406-582-2260 fax 406-582-2263
[email protected] www.bozeman.net
MEMORANDUM
____________________________________________________________________________________
TO: Impact Fee Advisory Committee FROM: Chris Saunders DATE: November 8, 2007 RE: Street Impact Fee Funded Projects List ____________________________________________________________________________________ The City’s impact fee program became effective on March 26, 1996. Since that time the City has used impact fee revenues to construct various capacity expanding projects. A list of projects is presented below. The majority of these projects also received funding other than impact fees. Lane Additions
N 19th Avenue – Oak Street to Baxter Lane, included signal installation N 19th Avenue – Baxter Lane to Valley Center Valley Center – N 19th Avenue to N 27th Avenue Baxter Lane – N 19th Avenue to the east Durston Road – N 19th Avenue to Fowler Avenue Babcock Street – Main Street to Meagher Avenue Signal Installation or Upgrade
N 19th Avenue/ Durston Road S 19th Avenue/ Kagy Boulevard Main Street / Cottonwood Road Main Street/ Ferguson Avenue Durston Road/ N 15th Avenue Rouse Avenue/Griffin Drive* Rouse Avenue/Oak Street


![[Bozeman Daily Chronicle] Bozeman High graduation set for ... · Bozeman High School plans to hold graduation June 7 at Montana State University’s Bobcat Stadium, the biggest venue](https://img.pdfslide.us/doc/110x75/5f23dca25f48fe2e0648d2e7/bozeman-daily-chronicle-bozeman-high-graduation-set-for-bozeman-high-school.jpg)