Embed Size (px)
Citation preview
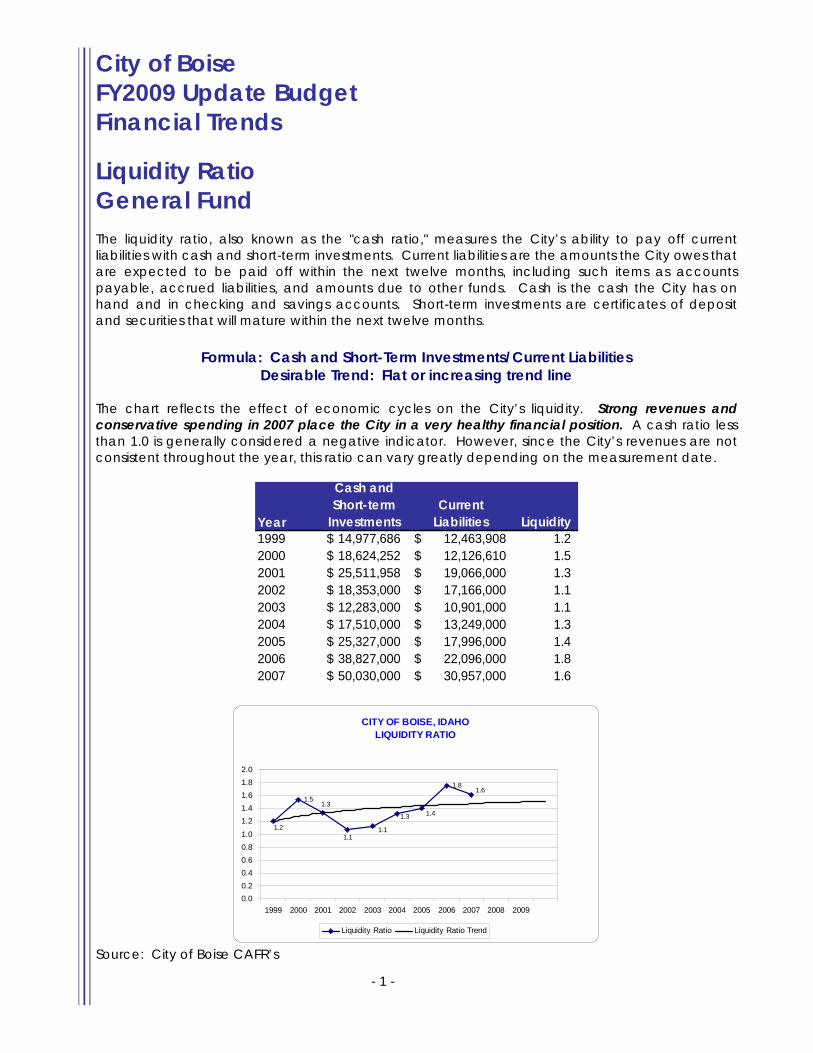
City of Boise FY2009 Update Budget Financial Trends Liquidity Ratio General Fund The liquidity ratio, also known as the "cash ratio," measures the City’s ability to pay off current liabilities with cash and short-term investments. Current liabilities are the amounts the City owes that are expected to be paid off within the next twelve months, including such items as accounts payable, accrued liabilities, and amounts due to other funds. Cash is the cash the City has on hand and in checking and savings accounts. Short-term investments are certificates of deposit and securities that will mature within the next twelve months.
Formula: Cash and Short-Term Investments/Current Liabilities
Desirable Trend: Flat or increasing trend line The chart reflects the effect of economic cycles on the City’s liquidity. Strong revenues and conservative spending in 2007 place the City in a very healthy financial position. A cash ratio less than 1.0 is generally considered a negative indicator. However, since the City’s revenues are not consistent throughout the year, this ratio can vary greatly depending on the measurement date.
Year
Cash andShort-term
InvestmentsCurrent
Liabilities Liquidity1999 14,977,686$ 12,463,908$ 1.22000 18,624,252$ 12,126,610$ 1.52001 25,511,958$ 19,066,000$ 1.32002 18,353,000$ 17,166,000$ 1.12003 12,283,000$ 10,901,000$ 1.12004 17,510,000$ 13,249,000$ 1.32005 25,327,000$ 17,996,000$ 1.42006 38,827,000$ 22,096,000$ 1.82007 50,030,000$ 30,957,000$ 1.6
- 1 -
CITY OF BOISE, IDAHOLIQUIDITY RATIO
1.5
1.8
1.2
1.3
1.11.1
1.3 1.4
1.6
0.00.20.40.60.81.0
1.21.41.61.82.0
1999 2000 2001 2002 2003 2004 2005 2006 2007 2008 2009
Liquidity Ratio Liquidity Ratio Trend
Source: City of Boise CAFR’s

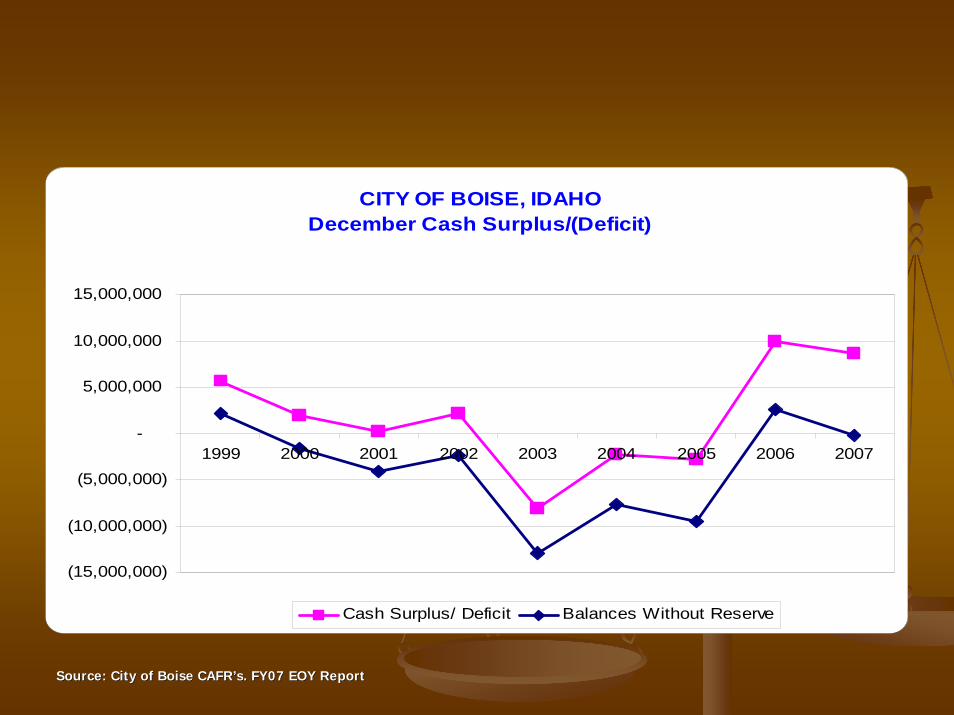
December Cash Balances General Fund
General Fund Investment balances at December 31 The General Fund has adequate liquidity as of September 30, 2007, however, revenues are not even throughout the year and cash can run short. Property tax represents approximately 60% of General Fund revenues and the bulk of property tax is received in late January and July. Below is a chart of the General Fund cash and investment balances as of December 31, 2007, and the amount of fund balance reserved for cash flow. In 2003, there was a deficit of over 8 million dollars that was borrowed from other City funds. Without the cash flow reserve the deficit would have been nearly 13 million dollars. Despite the surplus, as of December 31, 2007, the General Fund borrowed more than 2 million dollars from other City funds prior to the January 25th property tax revenue receipt. The City’s goal is to maintain a cash flow reserve amounting to 8% of revenues. After the allocation of 800 thousand dollars on December 18, 2007, the reserve equated to 6% of budgeted revenues.
YearCash Surplus/
DeficitReserve for Cash Flow
Balances Without Reserve
1999 5,625,988$ 3,454,225$ 2,171,763$ 2000 1,854,455$ 3,454,225$ (1,599,770)$ 2001 176,698$ 4,204,000$ (4,027,302)$ 2002 2,083,374$ 4,426,000$ (2,342,626)$ 2003 (8,116,434)$ 4,867,000$ (12,983,434)$ 2004 (2,327,595)$ 5,371,000$ (7,698,595)$ 2005 (2,751,720)$ 6,733,000$ (9,484,720)$ 2006 9,916,809$ 7,895,000$ 2,021,809$ 2007 8,653,465$ 8,795,247$ (141,782)$
CITY OF BOISE, IDAHODecember Cash Surplus/(Deficit)
(15,000,000)
(10,000,000)
(5,000,000)
-
5,000,000
10,000,000
15,000,000
1999 2000 2001 2002 2003 2004 2005 2006 2007
Cash Surplus/ Deficit Balances Without Reserve
- 2 -
Source: City of Boise CAFR’s, FY07 EOY Report

Operating Revenues to Operating Expenditures General Fund When operating revenues and operating expenditures are compared over time, the picture becomes clearer of how well the City is matching revenues to expenditures. Operating expenditures are defined as all expenditures other than operating transfers out. In this indicator, a positive trend is when operating revenues and operating expenditures move in tandem in the same direction. A negative trend occurs when the lines begin to converge or cross. The trend lines are widening slightly, which reflects the growth of revenues at a faster pace than expenditures. The City made several large land purchases in FY 2002 and FY2003 which created a negative short-term trend. From FY 2004 to FY 2007 an economic recovery combined with department cost saving efforts has yielded the positive results.
Formula: Operating Revenues; Operating Expenditures Desirable Trend: Tandem lines moving in the same direction
Year OperatingRevenues
OperatingExpenditures
1999 87,496,403$ 77,984,048$ 2000 92,671,606$ 83,798,722$ 2001 105,461,172$ 90,911,506$ 2002 104,165,000$ 97,459,000$ 2003 108,041,000$ 102,276,000$ 2004 117,149,000$ 107,216,000$ 2005 126,865,000$ 114,384,000$ 2006 140,957,000$ 118,807,000$ 2007 152,429,000$ 131,929,000$
CITY OF BOISE, IDAHOGENERAL FUND OPERATING REVENUES vs.
OPERATING EXPENDITURES
8793
105 104108 117
127
141 152
132
11911410710297
918478
-
20
40
60
80
100
120
140
160
180
1999 2000 2001 2002 2003 2004 2005 2006 2007 2008 2009
Mill
ions
Revenues Expenditures Revenue Trend Expenditure Trend
- 3 -
Source: City of Boise CAFR’s
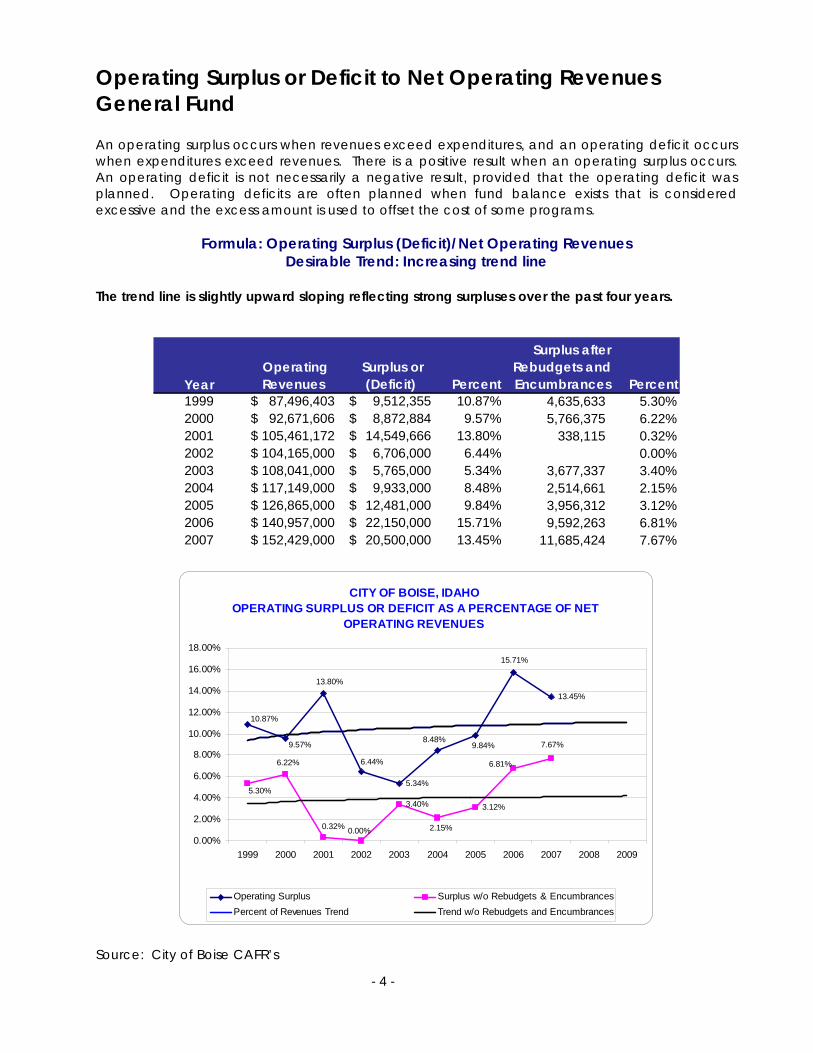
Operating Surplus or Deficit to Net Operating Revenues General Fund An operating surplus occurs when revenues exceed expenditures, and an operating deficit occurs when expenditures exceed revenues. There is a positive result when an operating surplus occurs. An operating deficit is not necessarily a negative result, provided that the operating deficit was planned. Operating deficits are often planned when fund balance exists that is considered excessive and the excess amount is used to offset the cost of some programs.
Formula: Operating Surplus (Deficit)/Net Operating Revenues Desirable Trend: Increasing trend line
The trend line is slightly upward sloping reflecting strong surpluses over the past four years.
Year OperatingRevenues
Surplus or(Deficit) Percent
Surplus after Rebudgets and Encumbrances Percent
1999 87,496,403$ 9,512,355$ 10.87% 4,635,633 5.30%2000 92,671,606$ 8,872,884$ 9.57% 5,766,375 6.22%2001 105,461,172$ 14,549,666$ 13.80% 338,115 0.32%2002 104,165,000$ 6,706,000$ 6.44% 0.00%2003 108,041,000$ 5,765,000$ 5.34% 3,677,337 3.40%2004 117,149,000$ 9,933,000$ 8.48% 2,514,661 2.15%2005 126,865,000$ 12,481,000$ 9.84% 3,956,312 3.12%2006 140,957,000$ 22,150,000$ 15.71% 9,592,263 6.81%2007 152,429,000$ 20,500,000$ 13.45% 11,685,424 7.67%
CITY OF BOISE, IDAHO OPERATING SURPLUS OR DEFICIT AS A PERCENTAGE OF NET
OPERATING REVENUES
5.34%
13.45%
3.40% 3.12%
15.71%
9.84%8.48%
6.44%
9.57%
10.87%
13.80%
7.67%
6.81%
2.15%0.00%0.32%
5.30%
6.22%
0.00%
2.00%
4.00%
6.00%
8.00%
10.00%
12.00%
14.00%
16.00%
18.00%
1999 2000 2001 2002 2003 2004 2005 2006 2007 2008 2009
Operating Surplus Surplus w/o Rebudgets & EncumbrancesPercent of Revenues Trend Trend w/o Rebudgets and Encumbrances
Source: City of Boise CAFR’s
- 4 -
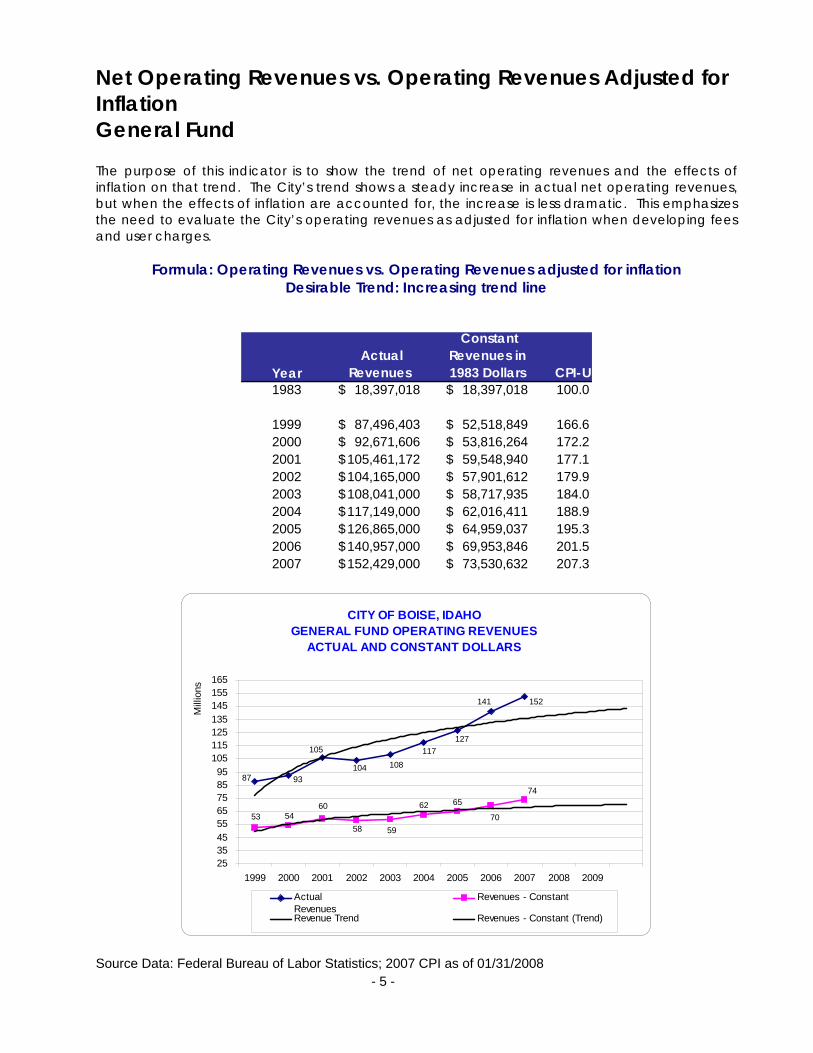
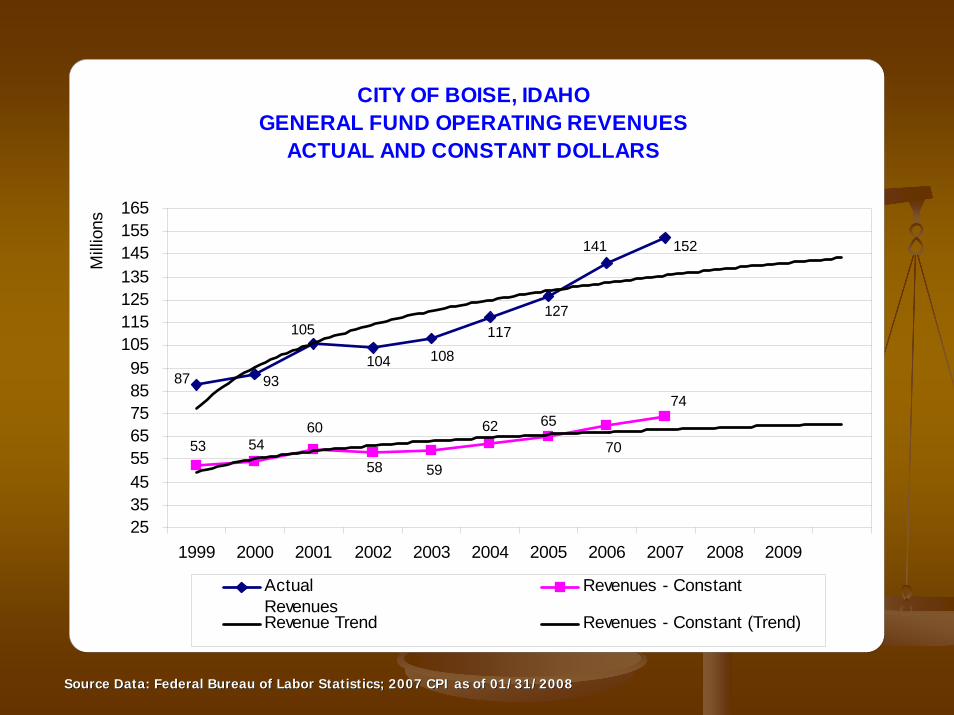
Net Operating Revenues vs. Operating Revenues Adjusted for Inflation General Fund The purpose of this indicator is to show the trend of net operating revenues and the effects of inflation on that trend. The City’s trend shows a steady increase in actual net operating revenues, but when the effects of inflation are accounted for, the increase is less dramatic. This emphasizes the need to evaluate the City’s operating revenues as adjusted for inflation when developing fees and user charges.
Formula: Operating Revenues vs. Operating Revenues adjusted for inflation Desirable Trend: Increasing trend line
Year Actual
Revenues
ConstantRevenues in 1983 Dollars CPI-U
1983 18,397,018$ 18,397,018$ 100.0
1999 87,496,403$ 52,518,849$ 166.62000 92,671,606$ 53,816,264$ 172.22001 105,461,172$ 59,548,940$ 177.12002 104,165,000$ 57,901,612$ 179.92003 108,041,000$ 58,717,935$ 184.02004 117,149,000$ 62,016,411$ 188.92005 126,865,000$ 64,959,037$ 195.32006 140,957,000$ 69,953,846$ 201.52007 152,429,000$ 73,530,632$ 207.3
CITY OF BOISE, IDAHOGENERAL FUND OPERATING REVENUES
ACTUAL AND CONSTANT DOLLARS
152141
127117
108104
105
938774
53 5460
58 59
62 65
70
2535455565758595
105115125135145155165
1999 2000 2001 2002 2003 2004 2005 2006 2007 2008 2009
Mill
ions
ActualRevenues
Revenues - Constant
Revenue Trend Revenues - Constant (Trend)
- 5 -
Source Data: Federal Bureau of Labor Statistics; 2007 CPI as of 01/31/2008

Rate of Change in Revenues vs. CPI General Fund The purpose of this indicator is to show the rate of change in revenues verses the rate of change in the Consumer Price Index (CPI). The trend shows that the City's rate of revenue growth exceeds the annual increase in CPI. This is indicative of strong overall growth in Boise. Note, however, that in 2002 the rate of revenue growth did not keep pace with overall inflation. This emphasizes the need to evaluate our operating revenues as adjusted for inflation when developing fees and user charges.
Formula: Percentage Change in Revenues versus Percentage Change in CPI Desirable Trend: Increasing trend line
Year Actual
Revenues Percent Change
Constant Revenues in 1998 Dollars
% Change Constant Revenues
1998 Base CPI
% Change
CPI1999 87,496,403$ 5% 85,605,724$ 3% 102.2 2%2000 92,671,606$ 6% 87,720,510$ 2% 105.6 3%2001 105,461,172$ 14% 97,064,772$ 11% 108.7 3%2002 104,165,000$ -1% 94,379,628$ -3% 110.4 2%2003 108,041,000$ 4% 95,710,234$ 1% 112.9 2%2004 117,149,000$ 8% 101,086,750$ 6% 115.9 3%2005 126,865,000$ 8% 105,883,231$ 5% 119.8 3%2006 140,957,000$ 11% 114,024,769$ 8% 123.6 3%2007 152,429,000$ 8% 122,502,033$ 5% 124.4 3%
CITY OF BOISE, IDAHOGENERAL FUND OPERATING REVENUES
PERCENTAGE CHANGE
11%
3%3%3%
3%
2%2%
3%3%
8% 8%
8%
4%
-1%
6%
14%
-2%
0%
2%
4%
6%
8%
10%
12%
14%
16%
2000 2001 2002 2003 2004 2005 2006 2007 2008 2009
% Change CPI Revenues % Change Trend-CPI Trend-Revenues
Source: City of Boise CAFR’s, Bureau of Labor Statistics
- 6 -

City of Boise General Fund Operations Revenues Per Capita The purpose of this indicator is to measure how effectively the City is earning revenue by calculating it on a per resident basis. The City’s trend in actual dollars per capita is a strong and steady increase, but in constant dollars the trend is nearly flat but slowly increasing. This is important to remember when developing the City’s revenue estimates and setting the City’s taxes, fees, and other revenues.
Formula: Operating Revenues/Population Desirable Trend: Increasing trend line
Year CPI-U Population OperatingRevenues
Per Capita Actual
Per Capita Constant
1983 100.0 102,451 18,397,018$ 180$ 180$
1999 166.6 175,000 87,496,403$ 500$ 300$ 2000 172.2 185,787 92,671,606$ 499$ 290$ 2001 177.1 188,174 105,461,172$ 560$ 316$ 2002 179.9 189,808 104,165,000$ 549$ 305$ 2003 184.0 190,117 108,041,000$ 568$ 309$ 2004 188.9 203,000 117,149,000$ 577$ 305$ 2005 195.3 208,219 126,865,000$ 609$ 312$ 2006 201.5 211,473 140,957,000$ 667$ 331$ 2007 207.3 213,503 152,429,000$ 714$ 344$
CITY OF BOISE, IDAHOGENERAL FUND NET OPERATING REVENUES
PER CAPITA
$714
$667$609
$577
$568
$549
$560
$499
$500
$344$316
$290
$300
$305
$309
$305
$312
$331
$0
$100
$200
$300
$400
$500
$600
$700
1999 2000 2001 2002 2003 2004 2005 2006 2007 2008 2009
Per Capita Per Capita Constant Per Capita Trend Per Capita Constant
Source Data: Community Planning Association of Southwest Idaho; Bureau of Labor Statistics (2007 CPI as of 1/31/2008) - 7 -

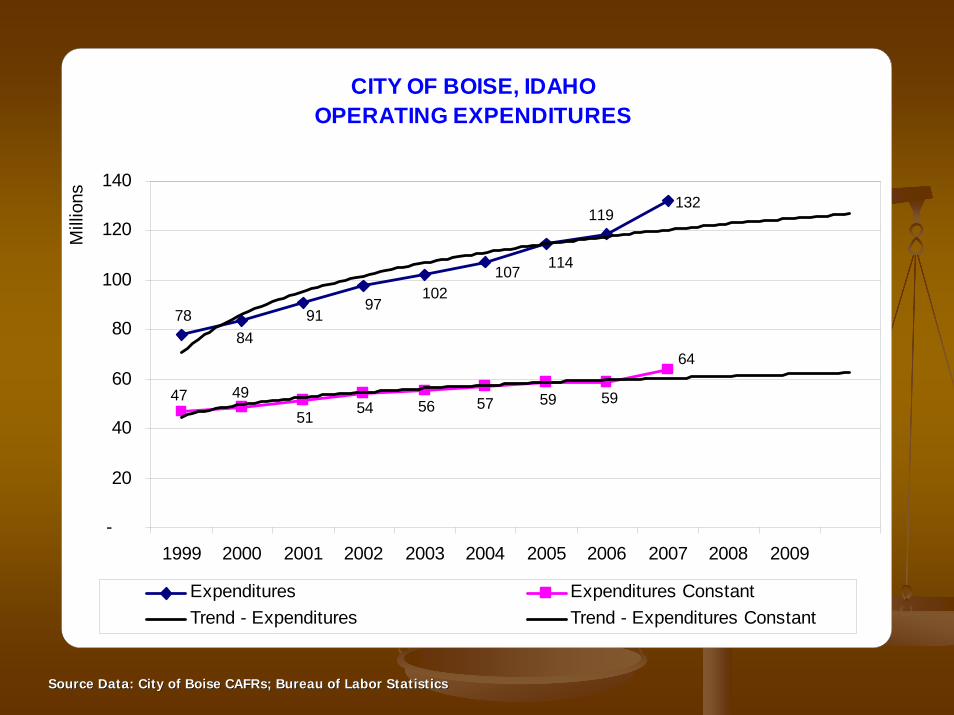
Net Operating Expenditures vs. Expenditures Adjusted for Inflation General Fund The purpose of this indicator is to show the trend of net operating expenditures and the effects of inflation on that trend. The trend reflects actual operating expenditures increasing; however, when the effects of inflation are accounted for, the increase is less dramatic. The increase is primarily due to the significant growth in the City and surrounding areas.
Formula: Net Operating Expenditures vs. Expenditures adjusted for inflation Desirable Trend: Flat or slowly increasing trend line
Year Operating
Expenditures
OperatingExpenditures1983 Dollars CPI-U
1983 18,804,805$ 18,804,805$ 100.0
1998 74,838,098$ 45,912,944$ 163.01999 77,984,048$ 46,809,152$ 166.62000 83,798,722$ 48,663,602$ 172.22001 90,911,506$ 51,333,431$ 177.12002 97,459,000$ 54,173,986$ 179.92003 102,276,000$ 55,584,783$ 184.02004 107,216,000$ 56,758,073$ 188.92005 114,384,000$ 58,568,356$ 195.32006 118,807,000$ 58,961,290$ 201.52007 131,929,000$ 63,641,582$ 207.3
CITY OF BOISE, IDAHOOPERATING EXPENDITURES
119
114107102
9791
8478
132
64
5959575654514947
-
20
40
60
80
100
120
140
1999 2000 2001 2002 2003 2004 2005 2006 2007 2008 2009
Mill
ions
Expenditures Expenditures ConstantTrend - Expenditures Trend - Expenditures Constant
Source Data: City of Boise CAFR’s; Bureau of Labor Statistics - 8 -
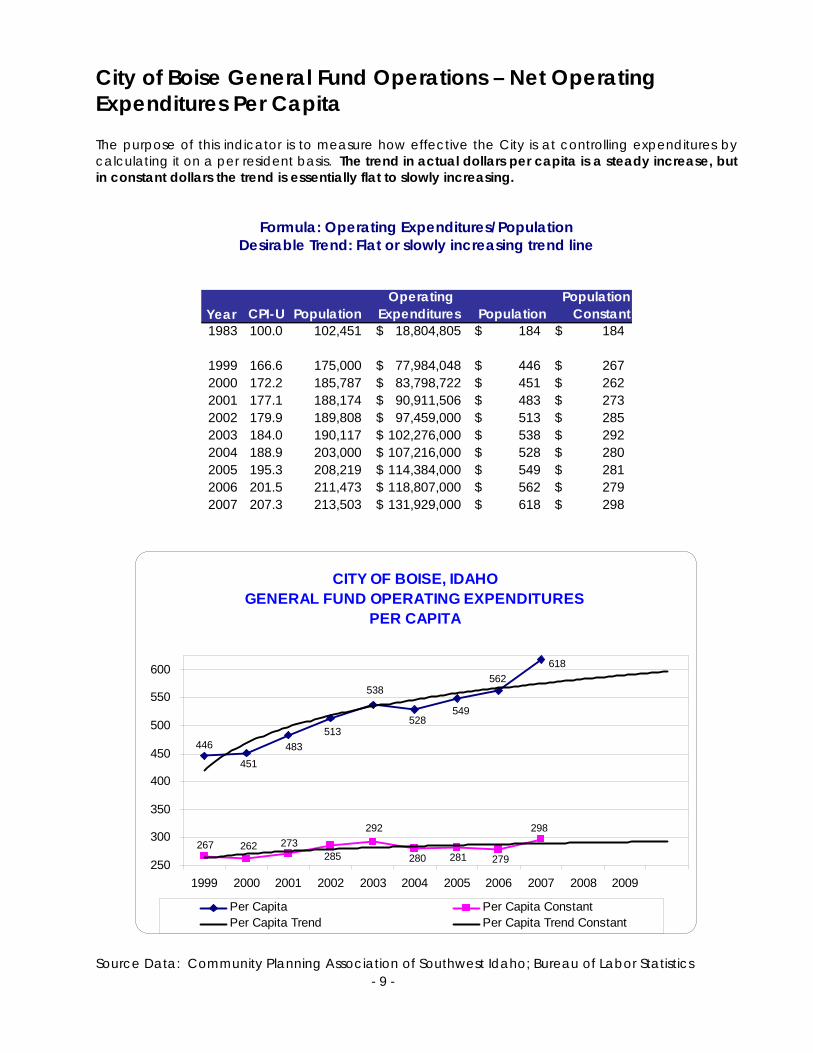
City of Boise General Fund Operations – Net Operating Expenditures Per Capita The purpose of this indicator is to measure how effective the City is at controlling expenditures by calculating it on a per resident basis. The trend in actual dollars per capita is a steady increase, but in constant dollars the trend is essentially flat to slowly increasing.
Formula: Operating Expenditures/Population Desirable Trend: Flat or slowly increasing trend line
Year CPI-U Population Operating
Expenditures Population Population
Constant 1983 100.0 102,451 18,804,805$ 184$ 184$
1999 166.6 175,000 77,984,048$ 446$ 267$ 2000 172.2 185,787 83,798,722$ 451$ 262$ 2001 177.1 188,174 90,911,506$ 483$ 273$ 2002 179.9 189,808 97,459,000$ 513$ 285$ 2003 184.0 190,117 102,276,000$ 538$ 292$ 2004 188.9 203,000 107,216,000$ 528$ 280$ 2005 195.3 208,219 114,384,000$ 549$ 281$ 2006 201.5 211,473 118,807,000$ 562$ 279$ 2007 207.3 213,503 131,929,000$ 618$ 298$
CITY OF BOISE, IDAHOGENERAL FUND OPERATING EXPENDITURES
PER CAPITA
618562
549528
538
513483
451
446
298
279281280
292
285273262267
250
300
350
400
450
500
550
600
1999 2000 2001 2002 2003 2004 2005 2006 2007 2008 2009
Per Capita Per Capita ConstantPer Capita Trend Per Capita Trend Constant
- 9 -
Source Data: Community Planning Association of Southwest Idaho; Bureau of Labor Statistics

Operating Revenues and Expenditures Per Capita General Fund In this exhibit, the per capita indicators for Operating Revenues and Operating Expenditures are analyzed independently. However, when compared side by side the City can measure how effectively it is earning and spending on a per resident basis. The top portion of the chart displays actual reported revenues and expenditures per capita and the bottom portion displays inflation adjusted (Constant) amounts per capita. The goal is to provide cost-effective delivery of services while generating revenue that does not have a dynamic impact on residents. The trend in actual dollars per capita is a steady increase, but in constant dollars the trend is essentially flat to slowly increasing. Note that expenditures per capita constant decreased in 2004 but increased in 2007.
Formula: Net Operating Revenues/Population; Net Operating Expenditures/Population. Desirable Trend: Tandem lines moving in the same direction with no intersection.
Year Population Revenues Per
Capita Expenditures
Per Capita
Revenues Per Capita Constant
Expenditures Per Capita Constant
1999 175,000 500$ 446$ 300$ 267$ 2000 185,787 499$ 451$ 290$ 262$ 2001 188,174 560$ 483$ 316$ 273$ 2002 189,808 549$ 513$ 305$ 285$ 2003 190,117 568$ 538$ 309$ 292$ 2004 203,000 577$ 528$ 305$ 280$ 2005 208,219 609$ 549$ 312$ 281$ 2006 211,473 667$ 562$ 331$ 279$ 2007 213,503 714$ 618$ 344$ 298$
CITY OF BOISE, IDAHOGENERAL FUND OPERATING REVENUES
AND EXPENDITURES PER CAPITA
499
609
667
714
568 577549
560
500
618
562549528538513
483
451446
344300 290
316 305 309 305 312331
298279281280292285273262267
200
250
300
350
400
450
500
550
600
650
700
750
1999 2000 2001 2002 2003 2004 2005 2006 2007 2008 2009
Revenues Per Capita Expenditures Per CapitaRevenues Per Capita Constant Expenditures Per Capita ConstantTrend TrendTrend Trend
Source Data: Community Planning Association of Southwest Idaho; Bureau of Labor Statistics
- 10 -

Property Tax Revenue as a Percentage of Total Revenue General Fund Property taxes are a major component of the City’s general government operations, accounting for more than 60% of the total General Fund Revenues. Property tax revenue is calculated by taking the highest single annual budget from the prior three years increased by 3% plus the “growth formula.” The “growth formula” is calculated by multiplying annexation and new construction values by the prior year base tax rate. The growth amount is the total of the new construction value and the annexation value, multiplied by the prior year’s base tax rate. An increasing trend represents an increasing dependency on property taxes to support core services. The trend line shows a moderating increase in property tax dependency. In fact the past four years have shown reductions in property tax as a percentage of total revenues.
Formula: Property Tax Revenues Desirable Trend: Flat or decreasing trend line
Year Property Tax
Revenues Property Tax as a % of Total Revenues
1983 9,516,862$ 52%
1999 52,043,584$ 59%2000 55,455,361$ 60%2001 61,461,424$ 58%2002 64,089,000$ 62%2003 66,507,000$ 62%2004 71,716,000$ 61%2005 76,448,503$ 60%2006 83,631,000$ 59%2007 88,087,000$ 58%
CITY OF BOISE, IDAHOPROPERTY TAX REVENUES
AS A PERCENT OF NET OPERATING REVENUES
58%
61%
60%
59%
58%
62%62%
60%
59%59%
57.0%
57.5%
58.0%
58.5%
59.0%
59.5%
60.0%
60.5%
61.0%
61.5%
62.0%
1998 1999 2000 2001 2002 2003 2004 2005 2006 2007 2008 2009
Property Tax % of Net Operating RevenuesProperty Tax % of Net Operating Revenues Trend
- 11 -
Source: City of Boise CAFR’s

Elastic Operating Revenues to Net Operating Revenues General Fund This indicator measures how dependent the City’s revenue stream is on elastic revenues. Elastic revenues are defined as that revenue that may be affected by demographic or economic changes in the community, and include charges for services, sales tax, donations, and investment income. A balance between elastic and inelastic revenues mitigates the effects of economic growth and decline. Insufficient elastic revenues may produce revenue shortages during periods of high inflation or rapid economic growth. Over-dependence on elastic revenues can reduce revenues during economic downturns. The trend is slightly increasing reflecting the effect of economic growth on elastic revenues over the past five years.
Formula: Elastic Operating Revenues/Net Operating Revenues Desirable Trend: Flat or increasing trend line
Year Net Operating
Revenues Elastic
Revenues % of TotalRevenues
1999 87,496,403$ 21,705,039$ 24.81%2000 92,671,606$ 23,220,102$ 25.06%2001 105,461,172$ 25,573,000$ 24.25%2002 104,165,000$ 24,626,000$ 23.64%2003 108,041,000$ 26,322,000$ 24.36%2004 117,149,000$ 29,467,000$ 25.15%2005 126,865,000$ 32,770,000$ 25.83%2006 140,957,000$ 36,863,000$ 26.15%2007 152,429,000$ 39,753,000$ 26.08%
CITY OF BOISE, IDAHOELASTIC REVENUES AS A PERCENTAGE
OF NET OPERATING REVENUES - GENERAL FUND
24.25%
23.64%
24.36%
25.15%
26.08%26.15%
25.83%
25.06%
24.81%
22.00%
22.50%
23.00%
23.50%
24.00%
24.50%
25.00%
25.50%
26.00%
26.50%
1999 2000 2001 2002 2003 2004 2005 2006 2007 2007 2008
Percent of Net Operating Revenues Trend
Source: City of Boise CAFR’s and General Ledger
- 12 -

Fringe Benefits to Salaries and Wages General Fund Salaries and employee benefits account for more than 70% of the City’s total General Fund net operating expenditures. Salaries are defined as compensation paid to full-time, part-time and seasonal employees. Fringe benefits include the employer share of social security and Medicare (FICA), retirement, health insurance (including vision and dental), disability and life insurance, and benefit buyback programs. An increasing percentage of fringe benefits to salaries is a negative trend and may reveal increases in total compensation that may not otherwise be clearly seen in negotiated labor agreements. While the overall trend is negative, fringe benefits decreased due to savings in the Health Trust of $1,370,963 in 2006 for the first time in the past five years, but increased slightly in 2007.
Formula: Fringe Benefits/Total Payroll Desirable Trend: Flat or decreasing trend line
Year Salaries and
Wages FringeBenefits Percent
1999 41,930,477$ 14,856,498$ 26.16%2000 44,230,357$ 15,410,926$ 25.84%2001 47,758,229$ 16,584,266$ 25.77%2002 51,656,501$ 19,007,415$ 26.90%2003 53,925,838$ 20,041,732$ 27.10%2004 56,107,608$ 21,548,922$ 27.75%2005 58,937,303$ 23,946,518$ 28.89%2006 60,769,020$ 23,256,919$ * 27.68%2007 67,071,293$ 25,816,921$ 27.79%
CITY OF BOISE, IDAHOGENERAL FUND FRINGE BENEFITS AS A
PERCENTAGE OF TOTAL PAYROLL
25.77%
27.79%27.75%
27.68%
28.89%
27.10%
26.90%
25.84%
26.16%
25.00%
26.00%
27.00%
28.00%
29.00%
1999 2000 2001 2002 2003 2004 2005 2006 2007 2008 2009
Benefits to Total Payroll Benefits to Total Payroll Trend
Source: City of Boise General Ledger *Net of Health Trust Savings of 1,370,963
- 13 -

City FTEs Per Mille For purposes of this indicator, municipal employees are defined as approved, budgeted FTEs (full-time equivalents) for each fiscal year. An increasing trend in the number of full-time employees may foretell expenditures rising faster than revenues, a government that is becoming more labor intensive, and/or a reduction in employee productivity. The trend indicates a slow increase in FTEs per mille. Note that the ratio has decreased from 7.74 in 2003 to 7.43 in 2007. The average number of employees per thousand since 1987 is 7.19.
Formula: Number of Municipal Employees/Population Desirable Trend: Flat Trend Line
1999 175,000 1,223 6.99 2000 185,787 1,169 6.29 2001 188,174 1,282 6.81 2002 189,808 1,391 7.33 2003 190,117 1,471 7.74 2004 203,000 1,509 7.43 2005 208,219 1,523 7.31 2006 211,473 1,555 7.35 2007 213,503 1,586 7.43
CITY OF BOISE, IDAHOFTEs PER THOUSAND POPULATION
6.29
6.81
7.74
7.437.357.31
7.437.33
6.99
3
4
5
6
7
8
1999 2000 2001 2002 2003 2004 2005 2006 2007 2008 2009
Employees Per Thousand Employees Per Thousand Trend
Source Data: Community Planning Association of Southwest Idaho; City Budget Office
- 14 -

City of BoiseCity of Boise2007 Year End2007 Year End
Financial TrendsFinancial Trends

Source: City of Boise Source: City of Boise CAFRsCAFRs
CITY OF BOISE, IDAHOLIQUIDITY RATIO
1.5
1.8
1.2
1.3
1.11.1
1.3 1.4
1.6
0.00.20.40.60.81.0
1.21.41.61.82.0
1999 2000 2001 2002 2003 2004 2005 2006 2007 2008 2009
Liquidity Ratio Liquidity Ratio Trend
Source: City of Boise Source: City of Boise CAFRCAFR’’ss. FY07 EOY Report. FY07 EOY Report
CITY OF BOISE, IDAHODecember Cash Surplus/(Deficit)
(15,000,000)
(10,000,000)
(5,000,000)
-
5,000,000
10,000,000
15,000,000
1999 2000 2001 2002 2003 2004 2005 2006 2007
Cash Surplus/ Deficit Balances Without Reserve

Source: City of Boise Source: City of Boise CAFRsCAFRs
CITY OF BOISE, IDAHOGENERAL FUND OPERATING REVENUES vs.
OPERATING EXPENDITURES
8793
105 104108 117
127
141 152
132
11911410710297
918478
-
20
40
60
80
100
120
140
160
180
1999 2000 2001 2002 2003 2004 2005 2006 2007 2008 2009
Mill
ions
Revenues Expenditures Revenue Trend Expenditure Trend

Source: City of Boise Source: City of Boise CAFRsCAFRs
CITY OF BOISE, IDAHO OPERATING SURPLUS OR DEFICIT AS A PERCENTAGE OF NET
OPERATING REVENUES
5.34%
13.45%
3.40% 3.12%
13.80%
10.87%
9.57%
6.44%
8.48%9.84%
15.71%
6.22%
5.30%
0.32% 0.00% 2.15%
6.81%
7.67%
0.00%
2.00%
4.00%
6.00%
8.00%
10.00%
12.00%
14.00%
16.00%
18.00%
1999 2000 2001 2002 2003 2004 2005 2006 2007 2008 2009
Operating Surplus Surplus w/o Rebudgets & EncumbrancesPercent of Revenues Trend Trend w/o Rebudgets and Encumbrances
Source Data: Federal Bureau of Labor Statistics; 2007 CPI as of Source Data: Federal Bureau of Labor Statistics; 2007 CPI as of 01/31/200801/31/2008
CITY OF BOISE, IDAHOGENERAL FUND OPERATING REVENUES
ACTUAL AND CONSTANT DOLLARS
152141
127117
108104
105
938774
53 5460
58 59
62 65
70
2535455565758595
105115125135145155165
1999 2000 2001 2002 2003 2004 2005 2006 2007 2008 2009
Mill
ions
ActualRevenues
Revenues - Constant
Revenue Trend Revenues - Constant (Trend)

Source: City of Boise Source: City of Boise CAFRsCAFRs; Bureau of Labor Statistics; Bureau of Labor Statistics
CITY OF BOISE, IDAHOGENERAL FUND OPERATING REVENUES
PERCENTAGE CHANGE
11%
3% 3%
2% 2%
3%3% 3%
3%
14%
6%
-1%
4%
8%
8%8%
-2%
0%
2%
4%
6%
8%
10%
12%
14%
16%
2000 2001 2002 2003 2004 2005 2006 2007 2008 2009
% Change CPI Revenues % Change Trend-CPI Trend-Revenues

Source Data: Community Planning Association of Southwest Idaho; Source Data: Community Planning Association of Southwest Idaho; Bureau of Labor Statistics (2007 CPI as of 1/31/2008)Bureau of Labor Statistics (2007 CPI as of 1/31/2008)
CITY OF BOISE, IDAHOGENERAL FUND NET OPERATING REVENUES
PER CAPITA
$714
$667$609
$577
$568
$549
$560
$499
$500
$344$316
$290
$300
$305
$309
$305
$312
$331
$0
$100
$200
$300
$400
$500
$600
$700
1999 2000 2001 2002 2003 2004 2005 2006 2007 2008 2009
Per Capita Per Capita Constant Per Capita Trend Per Capita Constant
Source Data: City of Boise Source Data: City of Boise CAFRsCAFRs; Bureau of Labor Statistics; Bureau of Labor Statistics
CITY OF BOISE, IDAHOOPERATING EXPENDITURES
119
114107102
9791
8478
132
64
5959575654514947
-
20
40
60
80
100
120
140
1999 2000 2001 2002 2003 2004 2005 2006 2007 2008 2009
Mill
ions
Expenditures Expenditures ConstantTrend - Expenditures Trend - Expenditures Constant

Source Data: Community Planning Association of Southwest Idaho; Source Data: Community Planning Association of Southwest Idaho; Bureau of Labor Statistics Bureau of Labor Statistics
CITY OF BOISE, IDAHOGENERAL FUND OPERATING EXPENDITURES
PER CAPITA
618562
549528
538
513483
451
446
298
279281280
292
285273262267
250
300
350
400
450
500
550
600
1999 2000 2001 2002 2003 2004 2005 2006 2007 2008 2009
Per Capita Per Capita ConstantPer Capita Trend Per Capita Trend Constant

Source Data: Community Planning Association of Southwest Idaho; Source Data: Community Planning Association of Southwest Idaho; Bureau of Labor Statistics Bureau of Labor Statistics
CITY OF BOISE, IDAHOGENERAL FUND OPERATING REVENUES
AND EXPENDITURES PER CAPITA
499
609
667
714
568 577549
560
500
618
562549528538513
483
451446
344300 290
316 305 309 305 312331
298279281280292285273262267
200
250
300
350
400
450
500
550
600
650
700
750
1999 2000 2001 2002 2003 2004 2005 2006 2007 2008 2009
Revenues Per Capita Expenditures Per CapitaRevenues Per Capita Constant Expenditures Per Capita ConstantTrend TrendTrend Trend

CITY OF BOISE, IDAHOPROPERTY TAX REVENUES
AS A PERCENT OF NET OPERATING REVENUES
58%
61%
60%
59%
58%
62%62%
60%
59%59%
57.0%
57.5%
58.0%
58.5%
59.0%
59.5%
60.0%
60.5%
61.0%
61.5%
62.0%
1998 1999 2000 2001 2002 2003 2004 2005 2006 2007 2008 2009
Property Tax % of Net Operating RevenuesProperty Tax % of Net Operating Revenues Trend
Source: City of Boise CAFR’s

Source: City of Boise Source: City of Boise CAFRCAFR’’ss and General Ledgerand General Ledger
CITY OF BOISE, IDAHOELASTIC REVENUES AS A PERCENTAGE
OF NET OPERATING REVENUES - GENERAL FUND
24.25%
23.64%
24.36%
25.15%
26.08%26.15%
25.83%
25.06%
24.81%
22.00%
22.50%
23.00%
23.50%
24.00%
24.50%
25.00%
25.50%
26.00%
26.50%
1999 2000 2001 2002 2003 2004 2005 2006 2007 2007 2008
Percent of Net Operating Revenues Trend

Source: City of Boise General LedgerSource: City of Boise General Ledger
CITY OF BOISE, IDAHOGENERAL FUND FRINGE BENEFITS AS A
PERCENTAGE OF TOTAL PAYROLL
25.77%
27.79%27.75%
27.68%
28.89%
27.10%
26.90%
25.84%
26.16%
25.00%
26.00%
27.00%
28.00%
29.00%
1999 2000 2001 2002 2003 2004 2005 2006 2007 2008 2009
Benefits to Total Payroll Benefits to Total Payroll Trend

Source Data: Community Planning Association of Southwest Idaho;Source Data: Community Planning Association of Southwest Idaho; City Budget OfficeCity Budget Office
CITY OF BOISE, IDAHOFTEs PER THOUSAND POPULATION
6.29
6.81
7.74
7.437.357.31
7.437.33
6.99
3
4
5
6
7
8
1999 2000 2001 2002 2003 2004 2005 2006 2007 2008 2009
Employees Per Thousand Employees Per Thousand Trend