Embed Size (px)
Citation preview
City of Bayswater Long-Term Financial Plan 2013-23
CONTENTS Page No.
1 Executive Summary .......................................................................................................1
2 Section 1..........................................................................................................................2 2.1 Introduction.....................................................................................................................2
2.1.1 Disclaimer..........................................................................................................2 2.1.2 Long-Term Financial Plan Objectives...............................................................3 2.1.3 Regular Review of the Plan...............................................................................3 2.1.4 City Profile .........................................................................................................3
3 Section 2..........................................................................................................................5 3.1 Key Planning Assumptions...........................................................................................5
3.1.1 Population and Rateable Property Forecasts...................................................5 3.1.2 Revenue Forecasts ...........................................................................................6 3.1.3 Operational Expenditure Forecasts ..................................................................8
3.2 Key Performance Indicators and Financial Ratios.....................................................8
4 Section 3........................................................................................................................12 4.1 Sensitivity Analysis and Financial Modelling Scenarios ........................................12 4.2 Risk Assessment..........................................................................................................13
5 Section 4........................................................................................................................14 5.1 Summary of Information from Long-Term Financial Plan.......................................14 5.2 Statement of Comprehensive Income by Nature and Type ....................................16 5.3 Statement of Comprehensive Income by Program ..................................................17 5.4 Statement of Cash Flows ............................................................................................19 5.5 Statement of Financial Position .................................................................................20 5.6 Statement of Changes in Equity.................................................................................22 5.7 Rate Setting Statement................................................................................................23 5.8 Ten-Year Capital Works Program...............................................................................24 5.9 Loan Repayment Schedule .........................................................................................25 5.10 Depreciation Schedule ................................................................................................27 5.11 Key Performance Indicators .......................................................................................28 5.12 Cash Reserves..............................................................................................................30 5.13 Variable Assumptions Underpinning the Plan .........................................................34 5.14 Major Works Program..................................................................................................35
6 Section 5........................................................................................................................39 6.1 Conclusion ....................................................................................................................39
City of Bayswater Long-Term Financial Plan 2013-23
Acronyms CoB City of Bayswater CPI Consumer Price Index GRV Gross Rental Valuation LTFP Long Term Financial Plan POS Public Open Space
City of Bayswater Long-Term Financial Plan 2013-23
1
1 Executive Summary The City of Bayswater Long-Term Financial Plan (LTFP) 2013-23 is to be annually revised in accordance with organisational needs and in compliance with the requirements of the Integrated Planning framework. Council’s LTFP contains a set of long-range financial projections and statements based on an informed set of assumptions using Council’s budget and Integrated Planning framework. It is designed to show the financial impacts of providing different levels of service, and asset (infrastructure) delivery. Council’s LTFP covers a 10-year time frame from 2013-14 to 2022-23. This length of time has been selected to align with the timeframe of Council’s Community Strategic Plan 2013-23. The LTFP is structured into five main sections in order to easily demonstrate the contents of the Plan. The structure of Council’s LTFP is as follows: The first section provides:
1. an introduction to the LTFP; The second section details:
1. the planning assumptions upon which the LTFP has been based; and
2. performance indicators. The third section provides:
1. descriptions and assumptions of each of the three scenarios; and
2. risk assessment. The fourth section provides:
1. the 'business as usual' financial summaries in their statutory form. The fifth section provides:
1. the conclusion.
Ultimately, the underlying objective of Council’s LTFP is to ensure and map the financial sustainability of the CoB.
City of Bayswater Long-Term Financial Plan 2013-23
2
2 Section 1
2.1 Introduction
The LTFP is the key ten-year financial planning document of Council that is governed by a series of financial strategies and performance indicators. It establishes the financial framework upon which sound financial decisions are made and provides a responsible and sustainable financial strategy for our community. Council has a legislative requirement to comply with section 5.56 of the Local Government Act 1995 requiring local governments to produce a 'plan for the future'. The CoB is required to meet the intent of the plan for the future in the development of a Strategic Community Plan, which focuses on a 10-year horizon, and a Corporate Business Plan, which has a rolling four-year life span. The City's Strategic Community Plan 2013-23 forms the City's 'plan for the future'. The LTFP is the financial strategy that informs the Corporate Business Plan which has a rolling four-year life span to activate Strategic Community Plan priorities. It indicates the CoB's long-term financial sustainability and allows for the early identification of financial challenges and any long-term impacts. The City has prepared a LTFP for the ten years from 2013-14 to 2022-23 that includes details of a revenue forecast, an operational expenditure forecast, a strategic asset management and maintenance program and a capital expenditure program. All initiatives and services proposed within the City's Long-Term Financial Plan are consistent with the City's Community Strategic Plan 2013-23. The LTFP is based on known revenue and expenditure estimates, existing or expected Council commitments and projections for what is required in relation to the maintenance and improvement of existing strategic assets and development of new capital works.
As a long-term planning tool it does not represent a binding commitment to raise any of the funds identified, undertake any of the expenditure identified or an authorisation for any of the projects considered. It is important to note the plan includes many assumptions. It is possible that many of these assumptions may need to be reviewed and tested or may not be realised at all.
2.1.1 Disclaimer The LTFP is subject to the following disclaimer:
"Disclaimer The 10-Year Financial Plan is a planning tool. It is based on many assumptions. It also includes projects and proposals that in some cases:
have been approved by Council and are in progress;
have been considered by Council but are yet to receive final approval;
have only been considered by Elected Members at a strategy level;
have only been considered by members of staff; and
are operational in nature and based on the continued provision of services and maintenance of City assets and infrastructure.
City of Bayswater Long-Term Financial Plan 2013-23
3
Any of the assumptions and any of the projects or proposals not already approved could prove to be inaccurate both as to likely requirement, timing and financial estimates or may not come to pass at all. They have, however, been included based on the best available information and knowledge to hand at this time in relation to likely requirement, timing and financial estimates. Adoption of the 10 Year Financial Plan by Council does not constitute a commitment or agreement to any of the projects or proposals that have not already been approved.”
2.1.2 Long-Term Financial Plan Objectives The City's 10-Year Financial Plan proposes to achieve the following key objectives within the 10-year time frame:
maintain the existing range and level of service provision and develop the capacity to grow and add new services;
maintain a strong cash position, ensuring long-term financial sustainability;
provide a long-term financial planning and decision-making tool, affording a reference point for discussion about future proposals and projects, for which their financial implications can be assessed and measured;
continue to pursue grant funding for strategic capital funds from the state and federal governments; and
provide equitable rate increases that reflect the level of service provision to ratepayers.
2.1.3 Regular Review of the Plan The LTFP is a fluid document and will be regularly reviewed and updated during the budget review process and the preparation of the annual budget. These reviews and updates will ensure the Plan remains a relevant and effective document to assist with the management of the City's financial affairs.
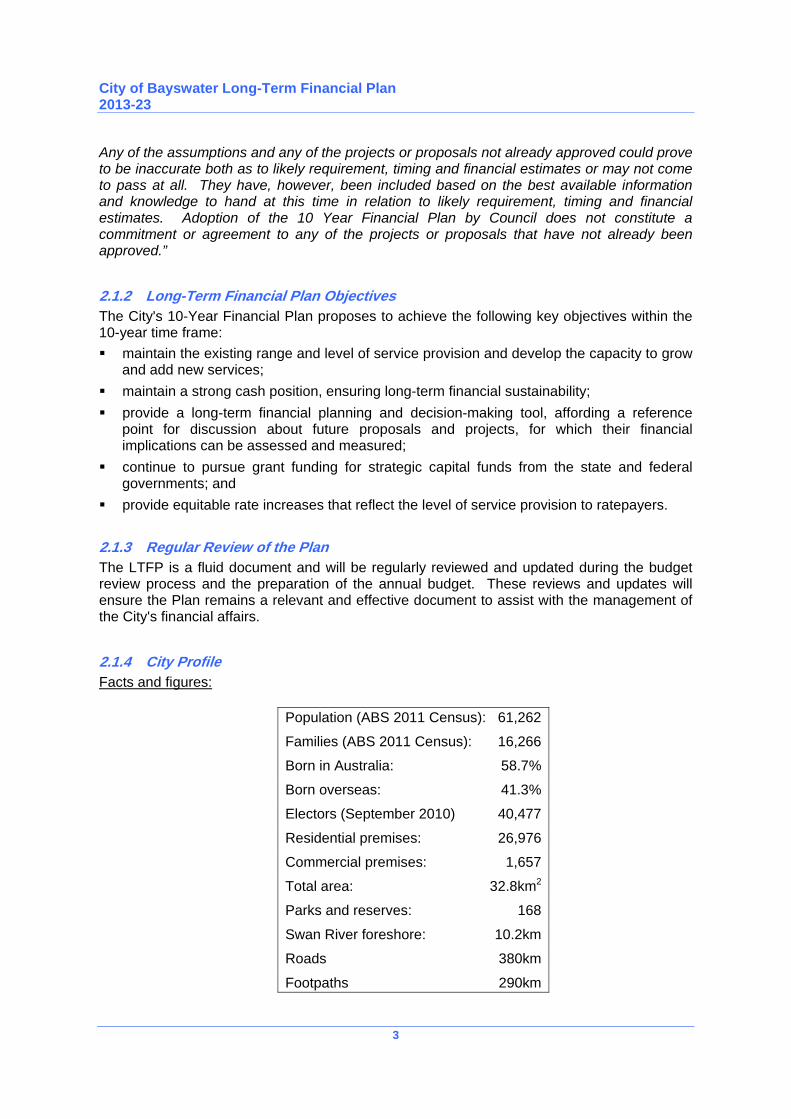
2.1.4 City Profile Facts and figures:
Population (ABS 2011 Census): 61,262
Families (ABS 2011 Census): 16,266
Born in Australia: 58.7%
Born overseas: 41.3%
Electors (September 2010) 40,477
Residential premises: 26,976
Commercial premises: 1,657
Total area: 32.8km2
Parks and reserves: 168
Swan River foreshore: 10.2km
Roads 380km
Footpaths 290km
City of Bayswater Long-Term Financial Plan 2013-23
4
The CoB includes the suburbs of Bayswater, Bedford, Embleton, and Maylands, as well as parts of Morley, Noranda, Mount Lawley and Dianella. About the CoB
The CoB provides an essential mix of over 200 services to a vibrant community of around 61,000 residents and over 1,500 businesses. The City has an established track record in providing innovative services that meet the needs of the community. The City was the first in Western Australia to introduce a co-mingled recycling service and also the first to introduce a 24/7 security watch patrol service. The City has a history of delivering and enabling non-traditional services, such as aged care accommodation and child care facilities. In the early 1970s, the City began work on developing Mertome Village to provide independent living accommodation for the elderly. This was the first development of its kind by any local government in Western Australia. Today, the City remains one of only a few local governments actively committed to providing aged care accommodation and is committed to taking forward initiatives to redevelop Mertome Village and expand the facilities at the Bayswater Aged Care Hostel in Embleton. The City is home to the Centro Galleria Shopping Centre in Morley, making it a major shopping hub and retail destination. To ensure the ongoing success of this area, the City has developed a Master Plan for Morley City Centre to guide its transformation over the next 20 years into a modern, attractive residential, entertainment and retail hub for the 21st Century. This transformation will act as a catalyst to further encourage investment and economic activity within the CoB. In addition to facilitating the ongoing success of the Morley strategic centre, the City is also ensuring the sustainable future of the City's town sites. In partnership with the Department for Planning, the City has developed or been involved in precinct plans for the areas around the Maylands and Ashfield train stations. These represent a new approach to urban development emphasising good urban design and local access to:
more housing choice;
increased employment opportunities;
more shops and cafes; and
improved public transport options to connect communities. The CoB has also focused on strengthening community cohesion and building community capacity. This has been achieved by providing and investing in a wide range of community and recreation facilities, such as the Bayswater Waves Aquatic Centre, The RISE, the Morley Sport and Recreation Centre, Senior Citizens Centres and the City's three libraries. The City's program of free-to-enter events also works to bring people together, build a sense of community identity and add vibrancy to living, working and playing within the City. The City remains committed to providing its community with high-quality and responsive services that meet the needs of our residents.
City of Bayswater Long-Term Financial Plan 2013-23
5
3 Section 2
3.1 Key Planning Assumptions
The LTFP is based on a series of assumptions that drive the model and any changes made to the assumptions influence the results. The base point for the modeling in the plan is the 2013-14 Budget. The assumptions used in the 10-year financial plan are:
achieving a balanced budget each year of the financial plan;
annual operating surpluses will be achieved each year;
existing service levels will be maintained;
no significant changes to the level of subsidisation that existing services receive from Municipal Funds;
staff levels will remain constant in line with current service provision and the Workforce Plan;
materials and contracts will increase by 2% per annum (individual line items will vary);
rates are forecast to increase by 4.5% each year;
cessation of section 12 of the Morley Shopping Centre Redevelopment Agreement Act 1992 in 2014;
natural growth in properties has been forecast at 1% per year;
an expected population increase of 1.75% per year;
commercial lease income (Wotton Tower and Bendigo Bank) to increase by CPI each year. Dome Coffees Australia lease income forecast as per lease agreement schedule;
borrowings are proposed to finance the Mertome redevelopment. This project is proposed to be implemented over eight stages. Stage One of the Mertome redevelopment has been recognised in 2015-16 and 2016-17 assuming a capital value of $22 million. The timing of subsequent stages will be determined by Council at the completion of Stage One using agreed trigger points such as unit sales. It is proposed that Stage One will be funded by a combination of borrowing, reserve transfers and unit sales; and
structural reform and its implications have not been contemplated by the LTFP. The City will continue to strive to protect the interests of its residents including those under joint venture arrangements like the Eastern Metropolitan Regional Council.
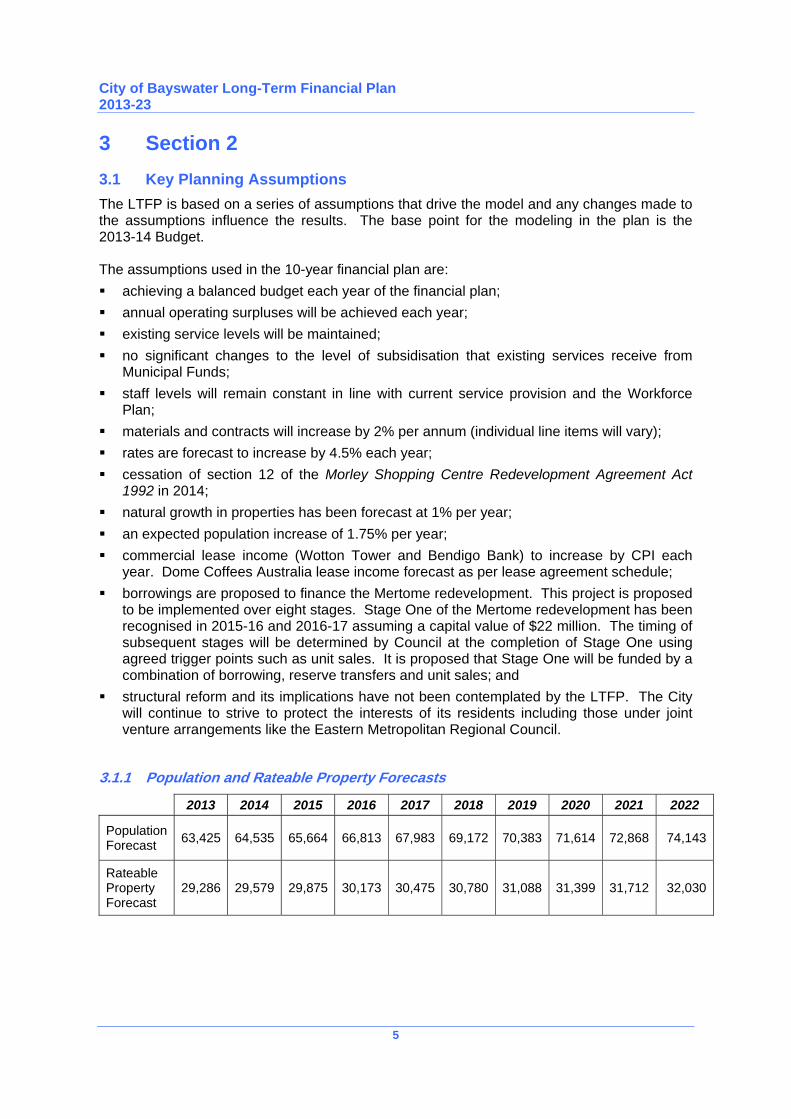
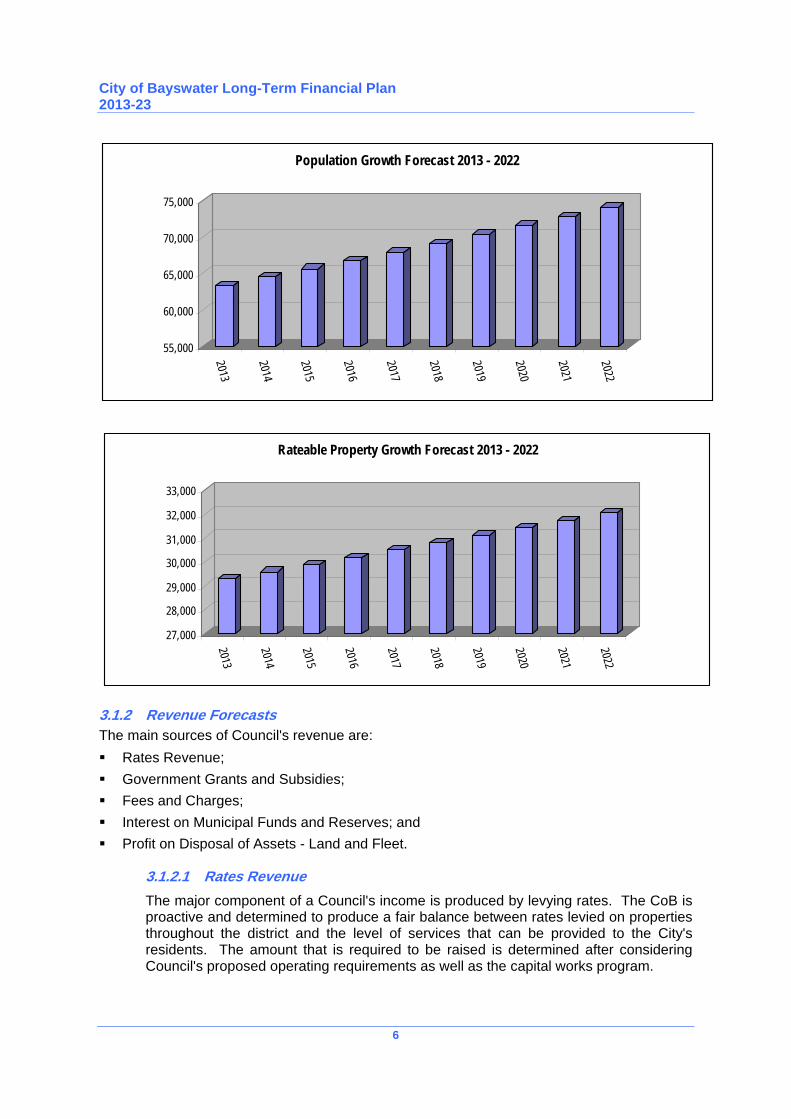
3.1.1 Population and Rateable Property Forecasts
2013 2014 2015 2016 2017 2018 2019 2020 2021 2022
Population Forecast
63,425 64,535 65,664 66,813 67,983 69,172 70,383 71,614 72,868 74,143
Rateable Property Forecast
29,286 29,579 29,875 30,173 30,475 30,780 31,088 31,399 31,712 32,030
City of Bayswater Long-Term Financial Plan 2013-23
6
27,000
28,000
29,000
30,000
31,000
32,000
33,000
2013
2014
2015
2016
2017
2018
2019
2020
2021
2022
Rateable Property Growth Forecast 2013 - 2022
3.1.2 Revenue Forecasts The main sources of Council's revenue are:
Rates Revenue;
Government Grants and Subsidies;
Fees and Charges;
Interest on Municipal Funds and Reserves; and
Profit on Disposal of Assets - Land and Fleet. 3.1.2.1 Rates Revenue
The major component of a Council's income is produced by levying rates. The CoB is proactive and determined to produce a fair balance between rates levied on properties throughout the district and the level of services that can be provided to the City's residents. The amount that is required to be raised is determined after considering Council's proposed operating requirements as well as the capital works program.
55,000
60,000
65,000
70,000
75,000
2013
2014
2015
2016
2017
2018
2019
2020
2021
2022
Population Growth Forecast 2013 - 2022
City of Bayswater Long-Term Financial Plan 2013-23
7
Section 6.32 of the Local Government Act 1995 requires Council to impose a general rate, either uniformly or differentially, as well as imposing a minimum payment amount. Currently the City imposes a uniform rate in the dollar across all rateable land within the district. Rates revenue has been calculated using the 2013-14 Budget as the base year with a 4.5% increase on an annual basis. As land located within the district is predominantly residential improved with no large scale green-fields subdivision, natural growth in properties is forecast at 1% per year. With the impending cessation of section 12 of the Morley Shopping Centre Redevelopment Agreement Act 1992 rates levied on the Galleria Shopping Centre from 2014-15 are forecast using the GRV methodology.
3.1.2.2 Government Grants and Subsidies
Includes all normally expected Federal and State government grants such as Roads Grants, Financial Assistance Grants, POS funding, etc. It does not include special or 'one off' grants that may arise over the life of the Plan. A CPI increase has been factored in each year. 3.1.2.3 Fees and Charges
Sanitation Charges Under the provisions of the Waste Avoidance and Resource Recovery Act 2007
Council levies a sanitation charge per waste receptacle based on a cost recovery basis. An increase of CPI plus 2.5% per year has been forecast.
Other Fees and Charges This includes all other fees, charges, infringements and penalties other than sanitation
charges. An increase per year of CPI plus 1.5% has been forecast.
3.1.2.4 Interest on Municipal Funds and Reserves The Local Government Act 1995, Trustees Act 1962, Local Government (Financial Management) Regulations 1996 and Australian Accounting Standards provide the framework for Council to exercise their powers of investment. Council’s Investment Policy ensures:
a high level of security is maintained by using recognised risk assessment criteria; an adequate level of diversification to minimise risk; immediate access to funds for daily requirements; and investments achieve a predetermined market average rate of return. Council remains conservative in forecasting investment interest rates and has selected to forecast at a rate of 4.5% return. 3.1.2.5 Profit on Disposal of Assets - Land and Fleet This normally represents the book profit on disposal of City assets such as plant and vehicles.
City of Bayswater Long-Term Financial Plan 2013-23
8
3.1.3 Operational Expenditure Forecasts 3.1.3.1 Employee Costs Employee costs are those expenses associated with the employment of staff which include salaries and wages, superannuation, recruitment costs, uniforms, etc. An increase of CPI has been applied across the life of the plan with staffing levels remaining constant in line with current service provision and the Workforce Plan. 3.1.3.2 Loss on Disposal of Assets There have been no projections made for loss on disposal of assets in future years. 3.1.3.3 Program and Services Expenditure This includes all operating expenses other than employee costs, borrowing interest and loss on disposal of assets. Such expenses include materials and contracts, utility charges, insurance expenses and other operating expenses.
The program and services expenditure (community, environment, regulatory and organisation support) forecast is based on:
existing service levels being maintained;
no significant changes to the level of subsidisation that existing services receive from Municipal Funds;
utility costs to increase by CPI plus 5% per year;
HACC User Charges will increase by CPI each year; and
all other costs, including material and contracts, to increase by 2% per year. Depreciation This is included for balancing and information purposes but as it is a non-cash item there is no impact on the net cash calculations.
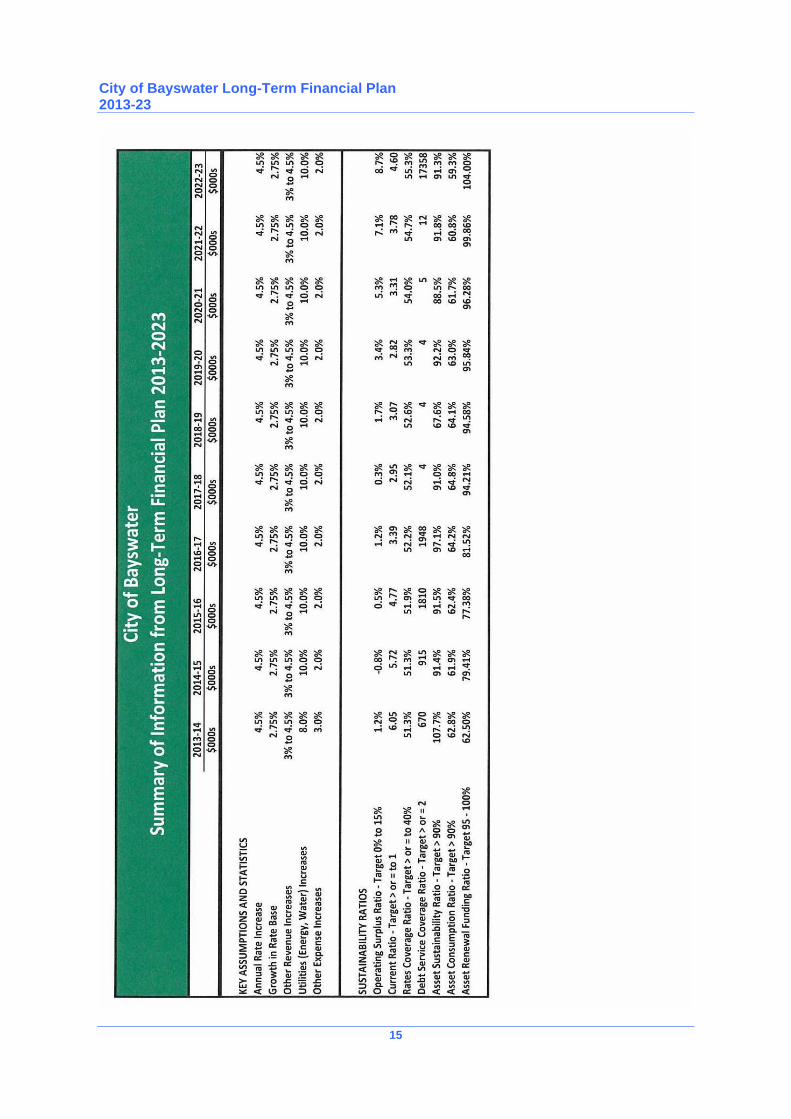
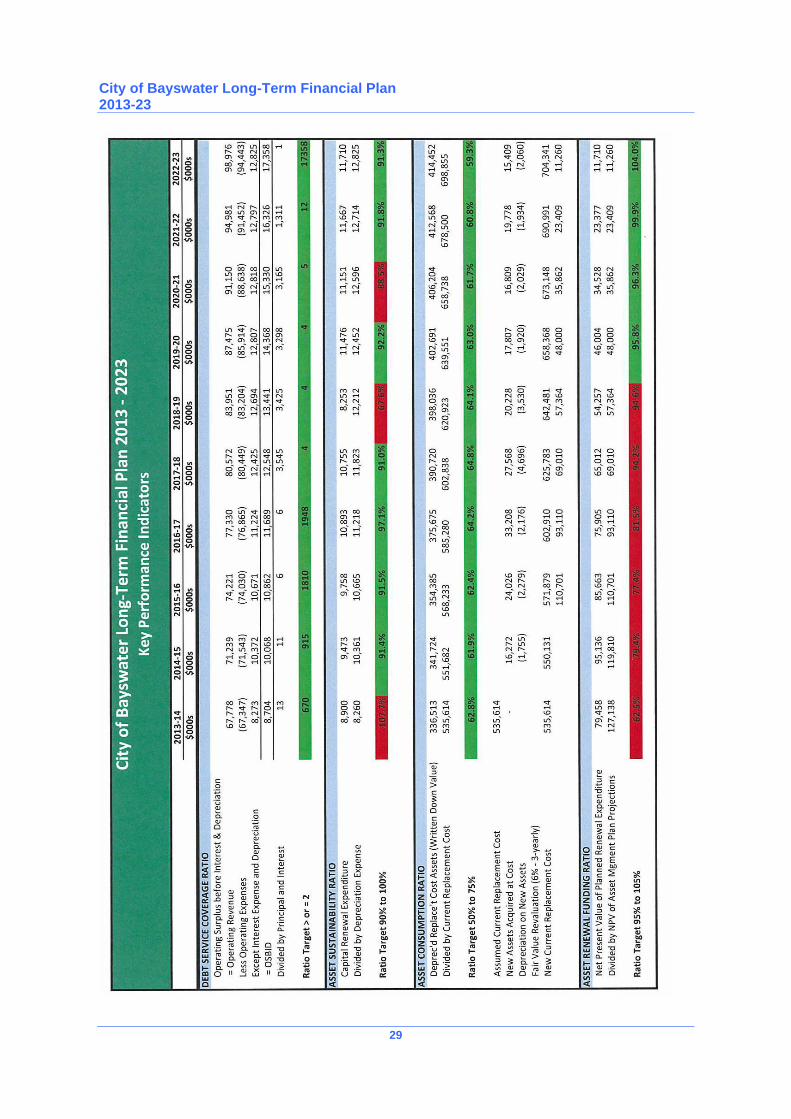
3.2 Key Performance Indicators and Financial Ratios
Financial ratios are designed to indicate an organisation's financial management performance and are a good starting point from which Council can readily ascertain its financial health and financially sustainable position. Whilst ratios are a useful guide, there is no one indicator, or financial year, that can be used to judge the financial sustainability of the City. Each ratio summarised at page 15 should not be considered in isolation. Current Ratio (Liquidity Ratio)
Description Current assets divided by current liabilities.
Objective To measure Council's ability to pay existing liabilities within the next 12 months.
Ratio target Greater than 1.1:1.
City of Bayswater Long-Term Financial Plan 2013-23
9
Rationale Greater than 1.1:1 is the preferred position.
Between 1:1 and 0.9:1 may indicate a short-term funding issue.
Less than 0.9:1 indicates an inability to Council to meet its short-term obligations and immediate remedial action is required.
Factors Influencing the Indicator Anomalies may arise due to heavy loan repayments in the 12 months following the point of calculation of the current ratio. This will effectively inflate the level of current liabilities, when they are not necessarily due at the point of calculation. A disadvantage of this ratio is that it only plots the values at a moment in time (at June 30 each year). Operating Surplus Ratio
Description The operating surplus ratio is the indicator of the extent to which revenues raised cover operational expenses and the extent to which surpluses are generated to fund capital projects.
Objective To highlight Council's rating needs to maintain a positive operating surplus.
Ratio target Between 0% and 15%.
Rationale A positive ratio indicates the percentage of total rates to help fund proposed capital expenditure.
A negative ratio indicates the percentage increase in total rates that would be required to achieve a break even result.
Factors Influencing the Indicator The most significant factor influencing this ratio is the current economic climate and the community's ability to pay increased rates. Rates Coverage Ratio
Description Total rate revenue as a percentage of total expenses.
Objective To measures Council's dependence on rate revenue to fund operations.
Ratio target Greater than 40%.
Rationale Greater than 40% is good.
Less than 40% is poor.
The higher the ratio the higher the dependency on rates (controllable) and the less dependency on government grants and other funding sources (uncontrollable). Councils with a higher rate coverage ratio have greater control over their own revenue and find it easier to cope with unforeseen funding requirements and have more flexible budget options.
City of Bayswater Long-Term Financial Plan 2013-23
10
Factors Influencing the Indicator Decreases in government grant and other funding sources availability. Debt Service Ratio
Description Debt service costs (principal and loan interest) divided by available operating revenue.
Objective To highlight Council's ability to service debt out of general purpose funds.
Ratio target Advanced standard if ratio is greater than five (5). Basic standard if between two (2) and five (5).
Rationale Calculated as annual surplus (before interest and depreciation) divided by annual debt service payments. This indicator is used by the Western Australian Treasury Corporation (WATC) in considering loan applications from the City.
Factors Influencing the Indicator Councils with a higher proportion of revenues from rates can also effectively operate at higher debt service ratios as they are more able to generate revenue via rates increases to cope with the debt burden. Asset Sustainability Ratio
Description Capital expenditure on renewal and replacement of assets as a percentage of depreciation.
Objective To manage the extent to which assets are being replaced in comparison to the rate at which they are wearing out.
Ratio target Between 90% and 100%.
Rationale It is good practice for capital expenditure for existing assets to be renewed or replaced to a level at least equal to average depreciation over time to ensure the value of its existing physical assets is maintained. Failing to maintain these assets will progressively undermine Council's financial sustainability as it is likely that additional maintenance costs associated with assets that have exceeded their economic life will be in excess of costs associated with renewal or replacement. The Asset Management Plans for critical assets play a crucial part in ensuring Council is aware of the status of these assets and the work required to maintain them.
Factors Influencing the Indicator Council's current operating surplus/deficit position and its ability to have the necessary resources to maintain its assets.
City of Bayswater Long-Term Financial Plan 2013-23
11
Asset Consumption Ratio
Description The written down value of Council's depreciable assets as a percentage of the current replacement cost of depreciable assets.
Objective To highlight the aged condition of Council's stock of physical assets.
Ratio target Between 50% and 75%.
Rationale If Council had a low asset consumption ratio it would indicate that, on average, its overall asset stock is relatively aged and has not been maintained. A high ratio would signal that it overall asset stock is in relatively good condition and that it is being maintained. Council must pay particular attention to its Asset Management Plans to ensure it maintains its assets at the required service levels. Asset Renewal Funding Ratio
Description Net present value of planned capital expenditure (from the LTFP) over ten years as a percentage of the net present value of the required capital expenditure (from the Asset Management Plans) over the same period. Net present value is the value of the dollar today compared with the value of the same dollar in the future.
Objective To measure the extent to which assets are being renewed compared to depreciation. This indicates whether the local government has the financial capacity to fund asset renewal as required, and can continue to provide existing levels of service in future.
Ratio target Advanced if between 95% and 105%.
City of Bayswater Long-Term Financial Plan 2013-23
12
4 Section 3
4.1 Sensitivity Analysis and Financial Modelling Scenarios
The LTFP contains a wide range of assumptions about the potential effect of inflation on revenues and expenditures, ongoing external funding sources, interest rates and the level of service provision. Some of these assumptions will have a relatively limited impact if they are incorrect. Others can have a major impact on future financial plans. It is therefore important the plan is tested by varying the parameters of the assumptions. Three scenarios were developed using different assumptions and changes in variables to determine the capacity of the City's to deliver services and assets to the community. The models were: Existing (business as usual); 6.5 - 7.5% rate increase, 3% employee costs increase above CPI and 7% utility costs
increase above CPI; and 5% rate increase and imposition of a Property Surveillance & Security Service Charge. Existing ('business as usual') The existing scenario was based on small population growth, minor changes in service levels and a 4.5% rate increase per annum. Capital expenditure levels have been aligned to the City's Asset Management Plans along with other planned capital projects. A balanced budget for the life of the LTFP has been modelled. 6.5 - 7.5% rate increase, 3% employee costs increase above CPI and 7% utility costs increase above CPI A further scenario was prepared based on the assumptions detailed within the LTFP with the forecasted 6.5 - 7.5% rate increase, 3% employee costs increase above CPI and 7% utility costs increase above CPI. This resulted in: significantly higher operating surpluses; increases in transfers to reserve funds; improved current ratio; decrease (favourable) in rate coverage ratio; and no cash short falls. 5% rate increase and imposition of a Property Surveillance & Security Service Charge Using the above variables, a third scenario was developed with expected population growth, budget surpluses and the same level of operating and reserve fund transfers. A 5% increase in rates and the imposition of a Property Surveillance & Security Service Charge over the life of the plan results in: moderate increases in operating surpluses; moderate improvement to current ratio; and no change to asset ratios.
City of Bayswater Long-Term Financial Plan 2013-23
13
4.2 Risk Assessment
The major risks associated with long-term financial planning relate to: New Capital Works Program Delays in approvals for major capital works projects may occur if the viability of the project relies on land acquisition which may be affected by movements in land prices and funding of the projects.
A number of new building refurbishment and redevelopment projects are included each year in the LTFP. All of these are proposed to be constructed on land owned by the CoB. The developments will not require external approvals and are being funded through grants or municipal funds. The risk associated with construction of major capital projects is therefore considered low. Government Grants and Subsidies Much of the City's operating and capital works expenditure funding is sourced from government and public open space grants. Services and capital works such as the home and community care program, road and footpath renewal, upgrading recreational facilities and equipment, and development and renewal of our sustainable environment are provided to the community through the assistance of government grants.
The LTFP details the grant funding required to provide such services and capital works programs and is based on the assumption the grant funding will continue for the life of the plan.
In the short term, the risk of failure in obtaining government grant funding to deliver these services and programs is considered low. Financial Risks Council’s activities expose it to a variety of financial risks including credit risk, liquidity risk and interest rate risk. The Council’s overall financial risk management focuses on the unpredictability of financial markets and seeks to minimise potential adverse effects on the financial performance of the City.
Cash and Investments Council’s objective is to maximise its return on cash and investments whilst maintaining an
adequate level of liquidity and preserving capital. Cash and investments are subject to interest rate risk, which is the risk at which movements in interest rates could affect returns. To manage the investment and interest risks Council has a robust investment policy and regularly reviews the performance of the portfolio.
Receivables Council’s major receivables comprise annual rates, service charges and user charges and
fees. The major risk associated with these receivables is credit risk, which is the risk that the debts may not be repaid. Council manages this risk by monitoring outstanding debt and employing debt recovery policies.
Accounts Payables and Borrowings Payables and borrowings are both subject to liquidity risk, which is the risk that Council will
have insufficient funds to meet payment obligations as and when they fall due. Council manages this risk by monitoring its cash flow requirements and liquidity levels and maintaining an adequate cash safeguard.
City of Bayswater Long-Term Financial Plan 2013-23
14
5 Section 4
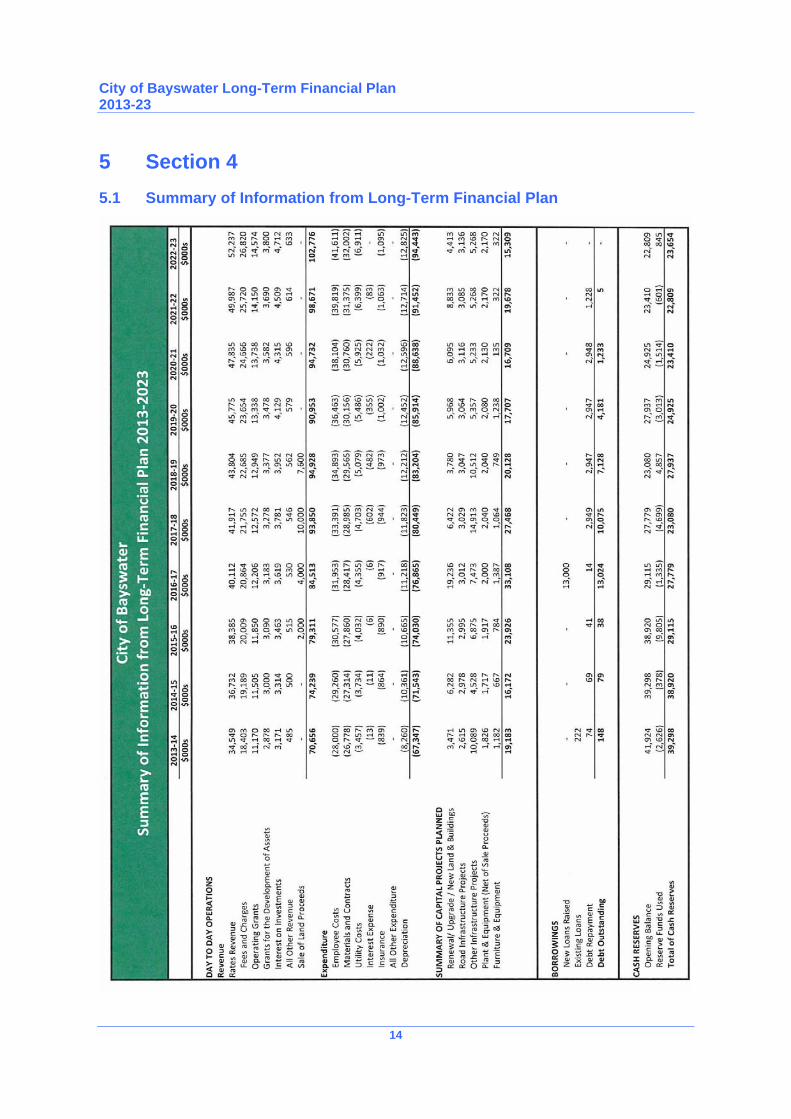
5.1 Summary of Information from Long-Term Financial Plan
City of Bayswater Long-Term Financial Plan 2013-23
15
City of Bayswater Long-Term Financial Plan 2013-23
16
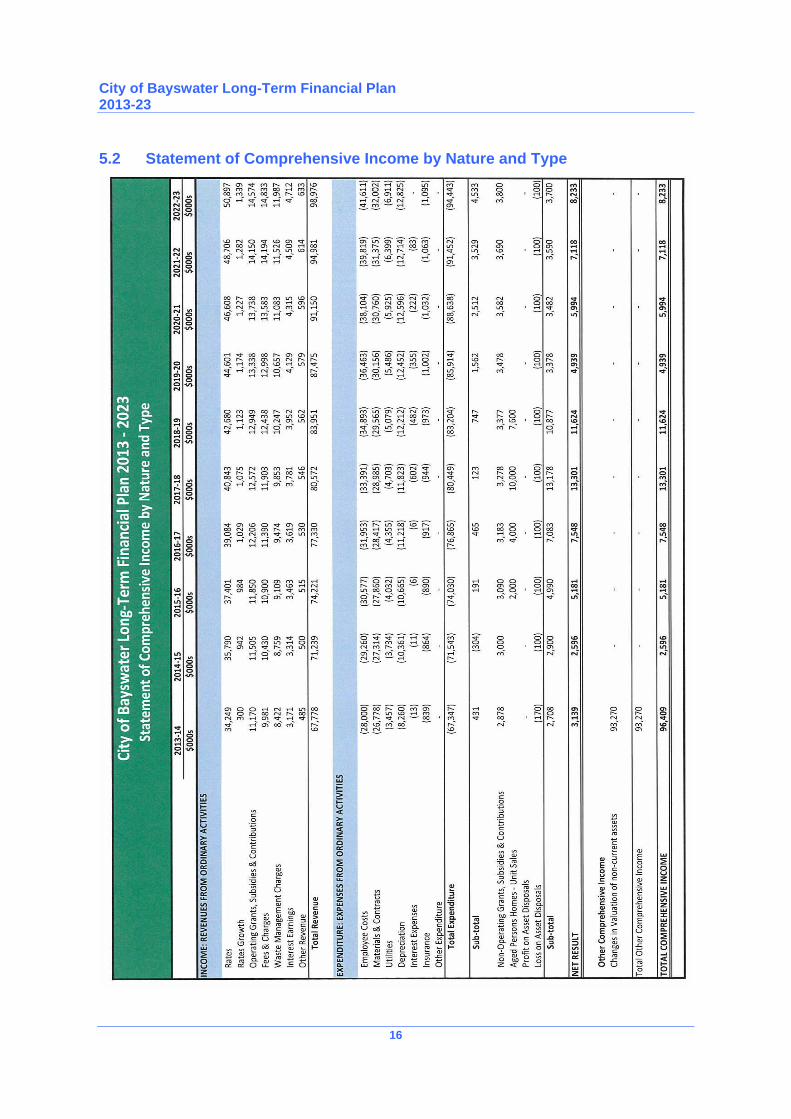
5.2 Statement of Comprehensive Income by Nature and Type
City of Bayswater Long-Term Financial Plan 2013-23
17
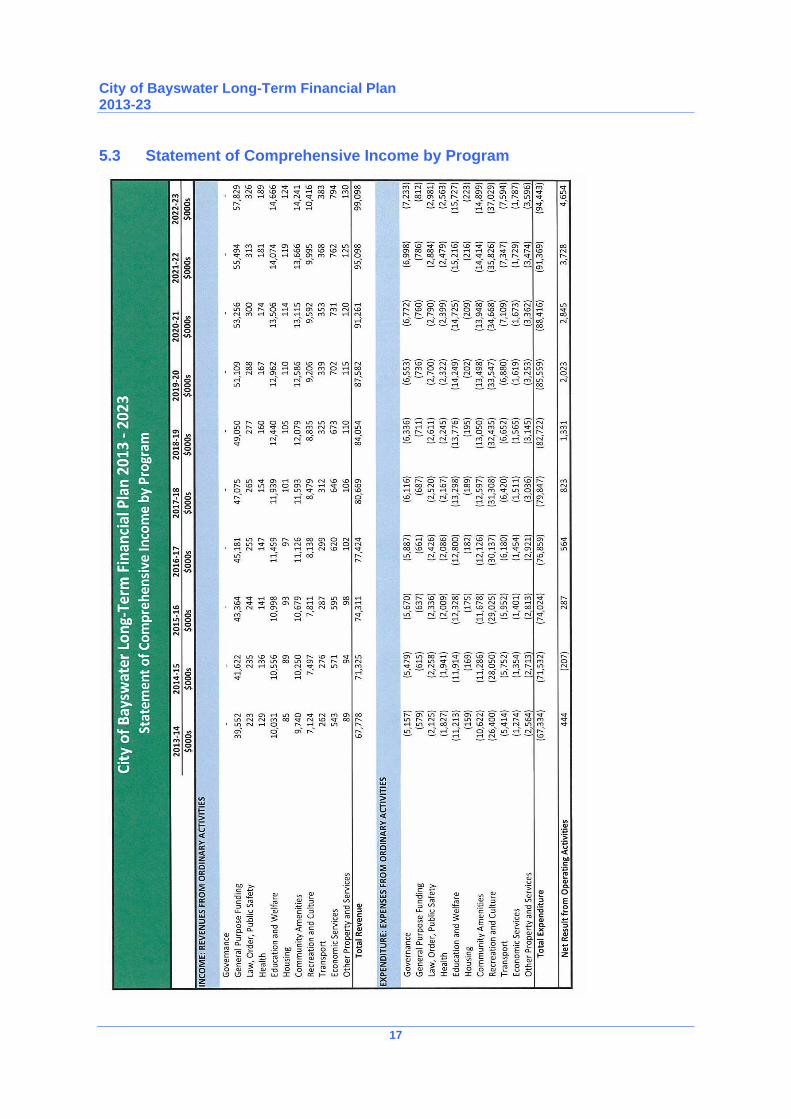
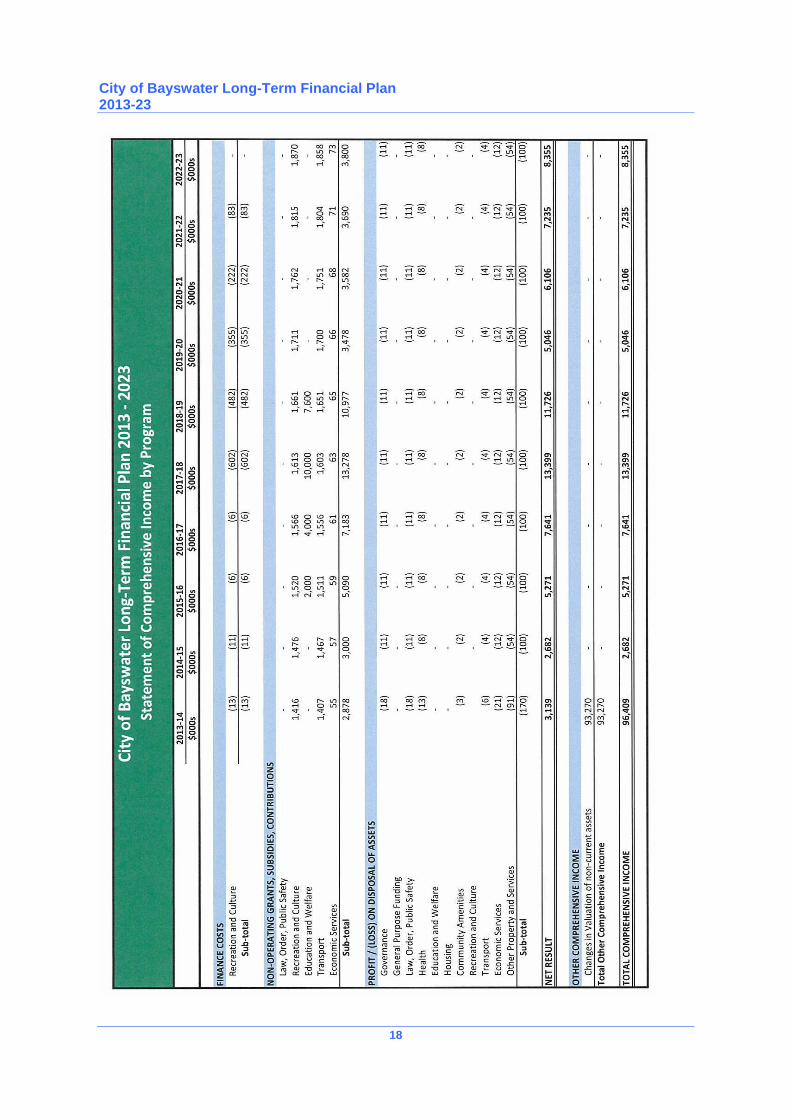
5.3 Statement of Comprehensive Income by Program
City of Bayswater Long-Term Financial Plan 2013-23
18
City of Bayswater Long-Term Financial Plan 2013-23
19
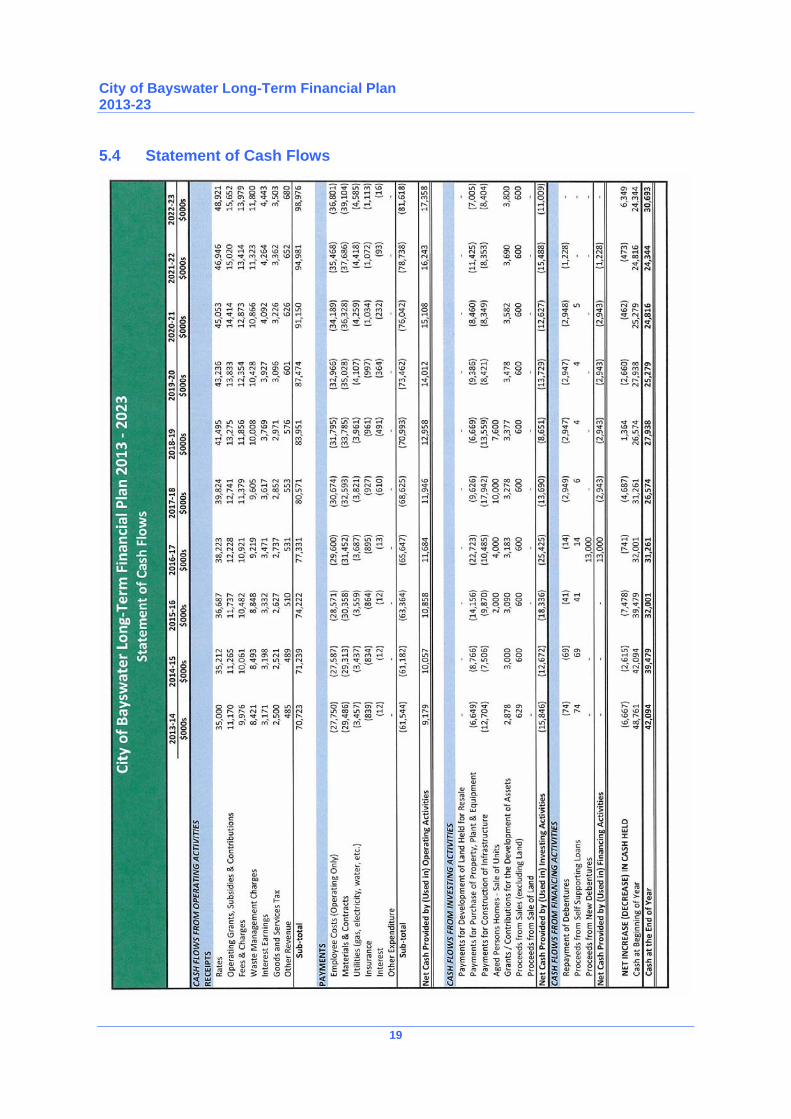
5.4 Statement of Cash Flows
City of Bayswater Long-Term Financial Plan 2013-23
20
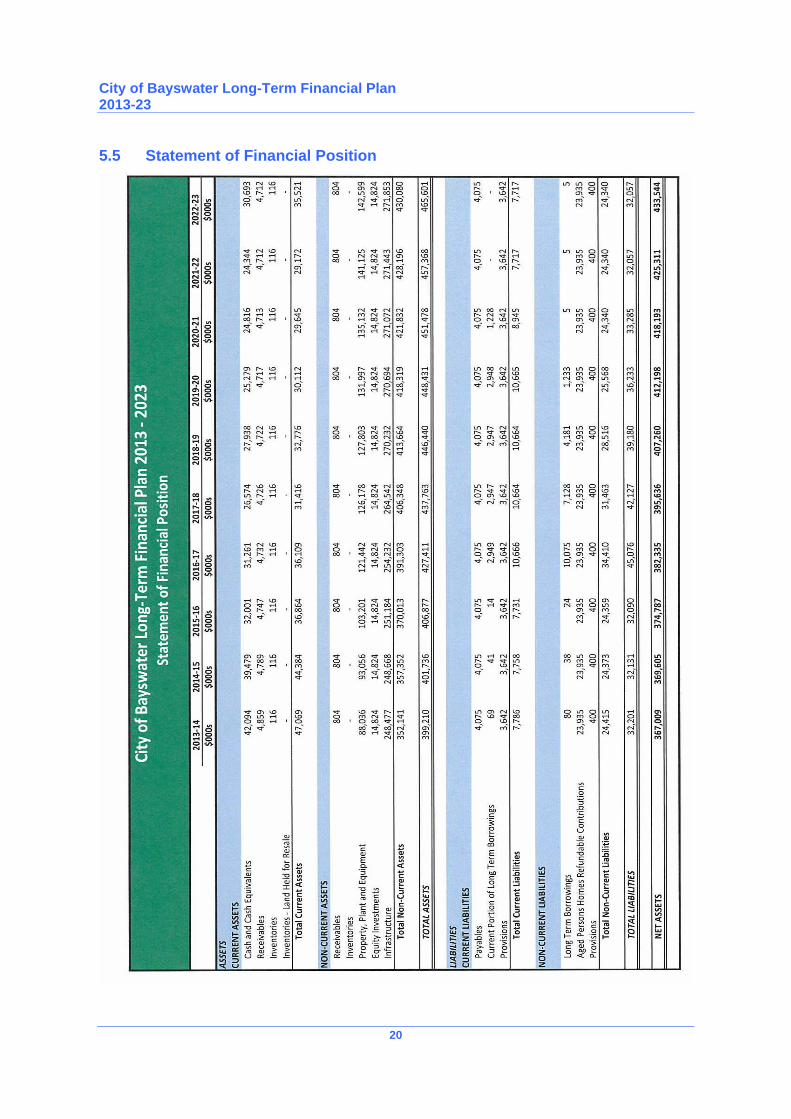
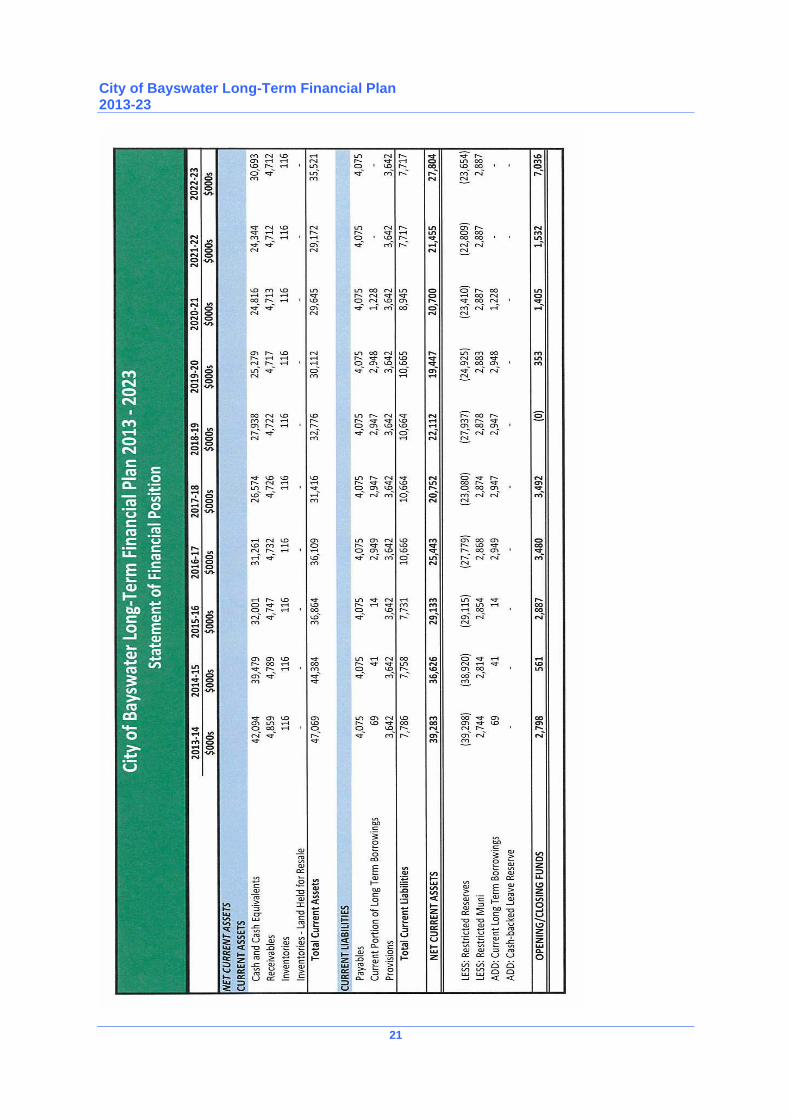
5.5 Statement of Financial Position
City of Bayswater Long-Term Financial Plan 2013-23
21
City of Bayswater Long-Term Financial Plan 2013-23
22
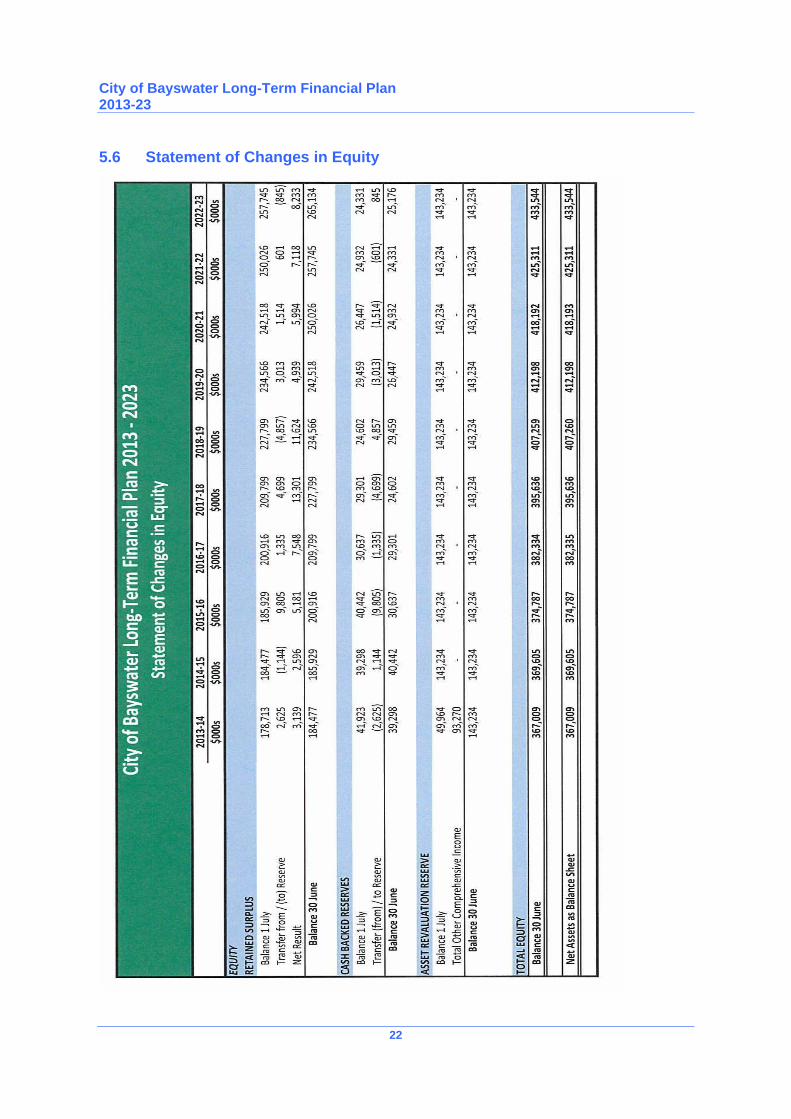
5.6 Statement of Changes in Equity
City of Bayswater Long-Term Financial Plan 2013-23
23
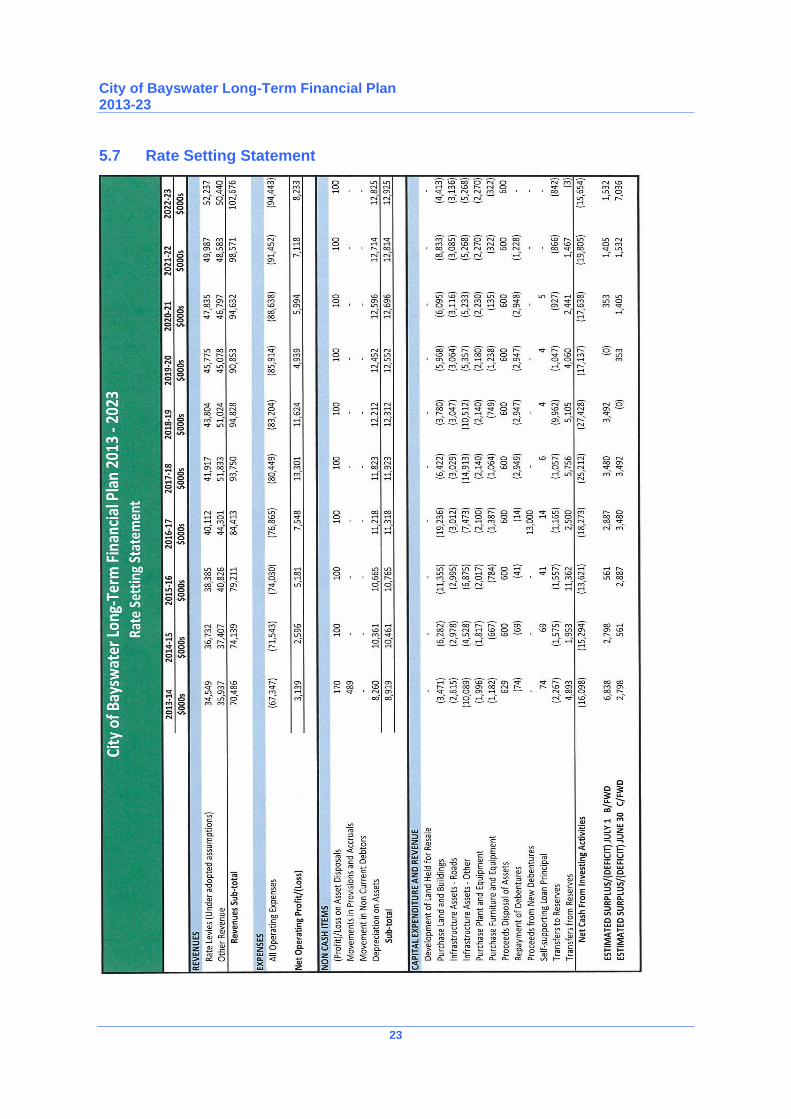
5.7 Rate Setting Statement
City of Bayswater Long-Term Financial Plan 2013-23
24
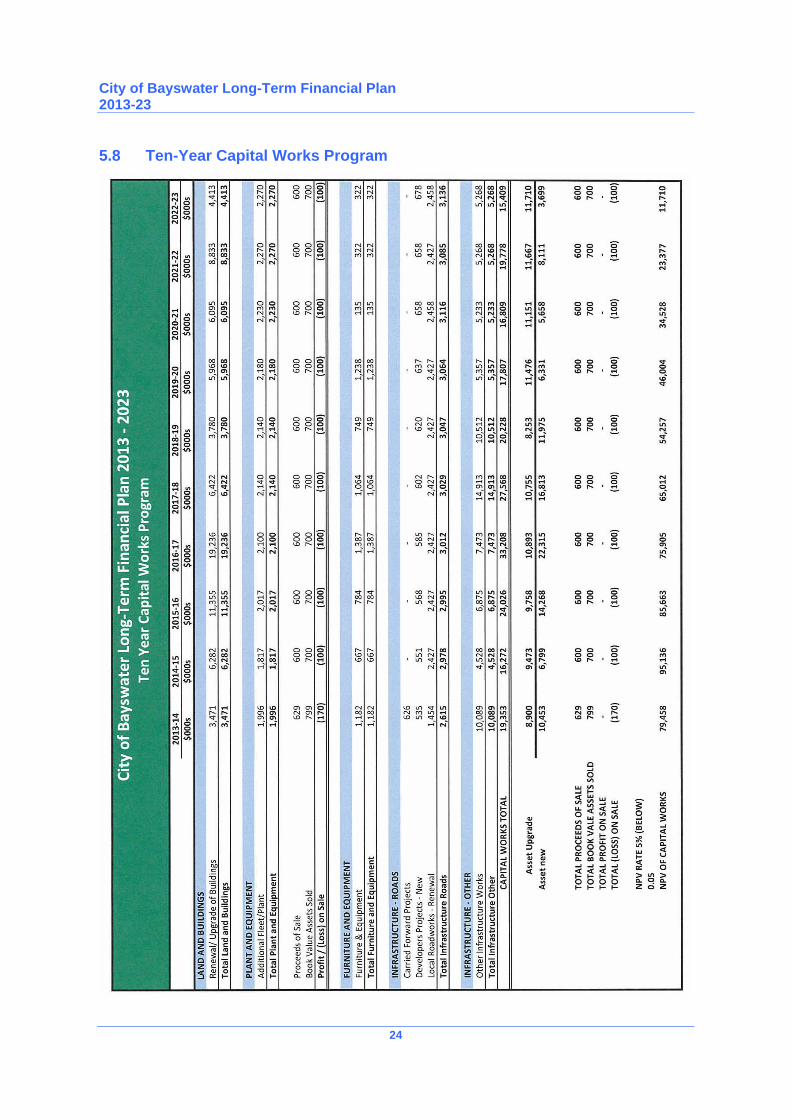
5.8 Ten-Year Capital Works Program
City of Bayswater Long-Term Financial Plan 2013-23
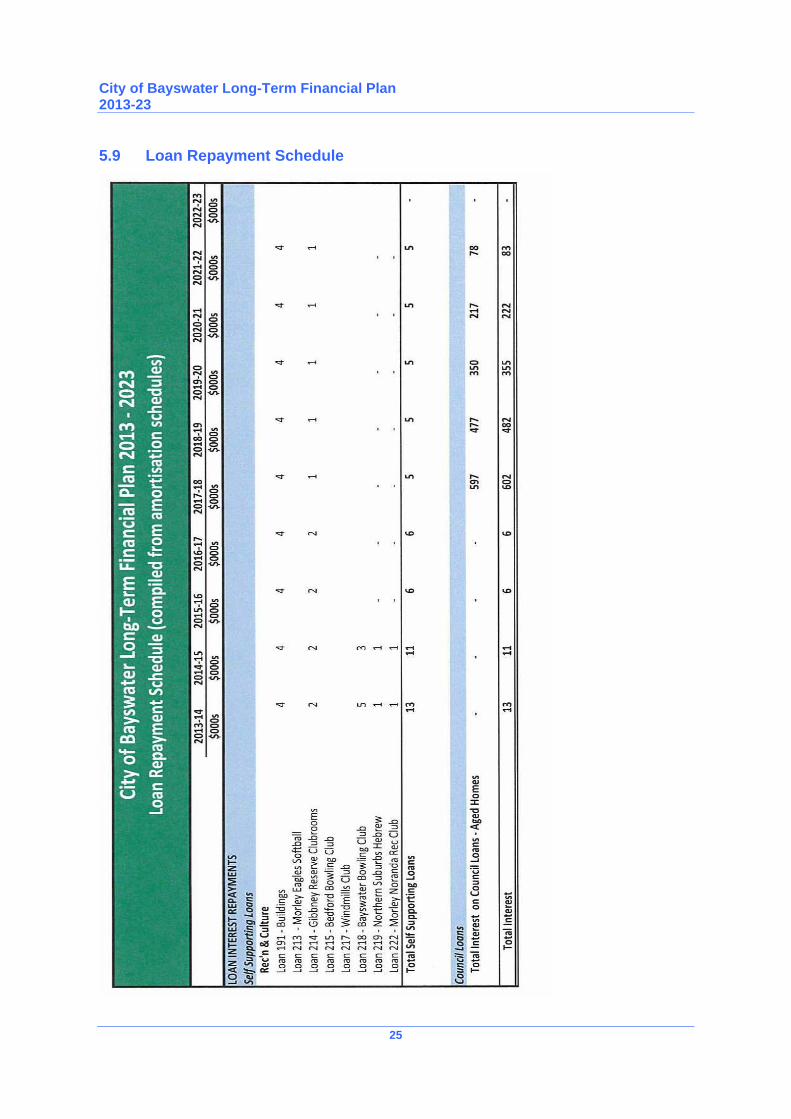
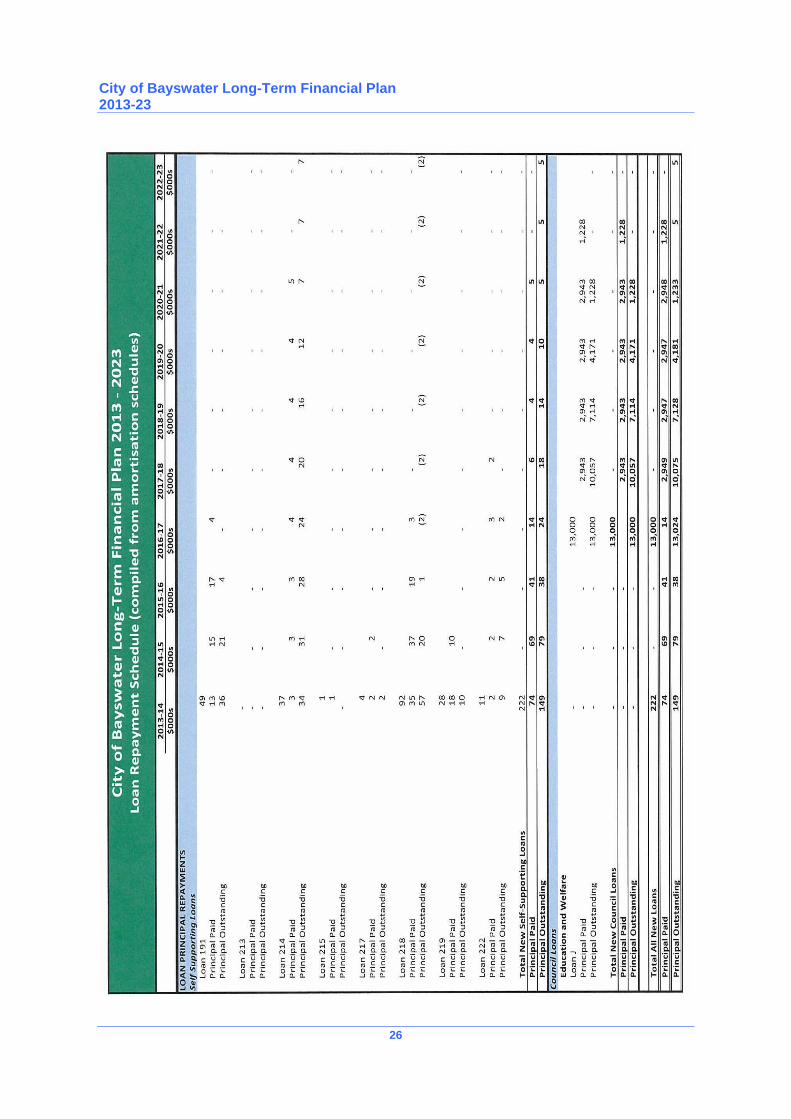
25
5.9 Loan Repayment Schedule
City of Bayswater Long-Term Financial Plan 2013-23
26
City of Bayswater Long-Term Financial Plan 2013-23
27
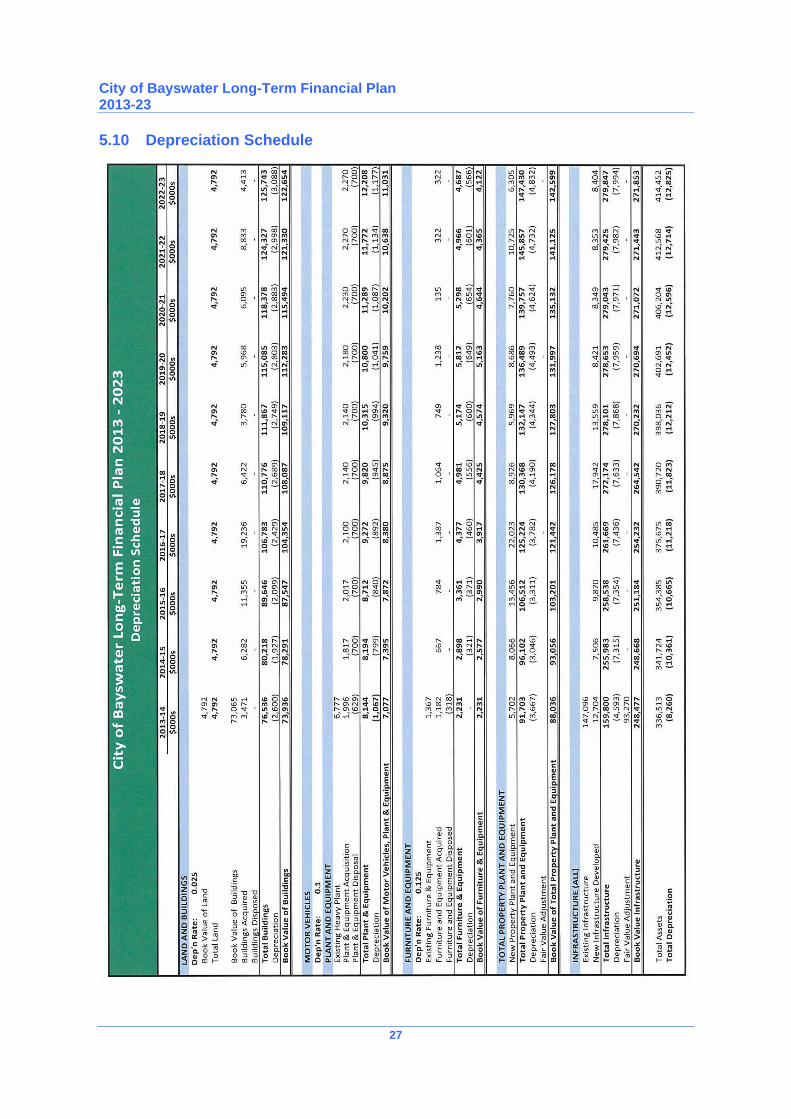
5.10 Depreciation Schedule
City of Bayswater Long-Term Financial Plan 2013-23
28
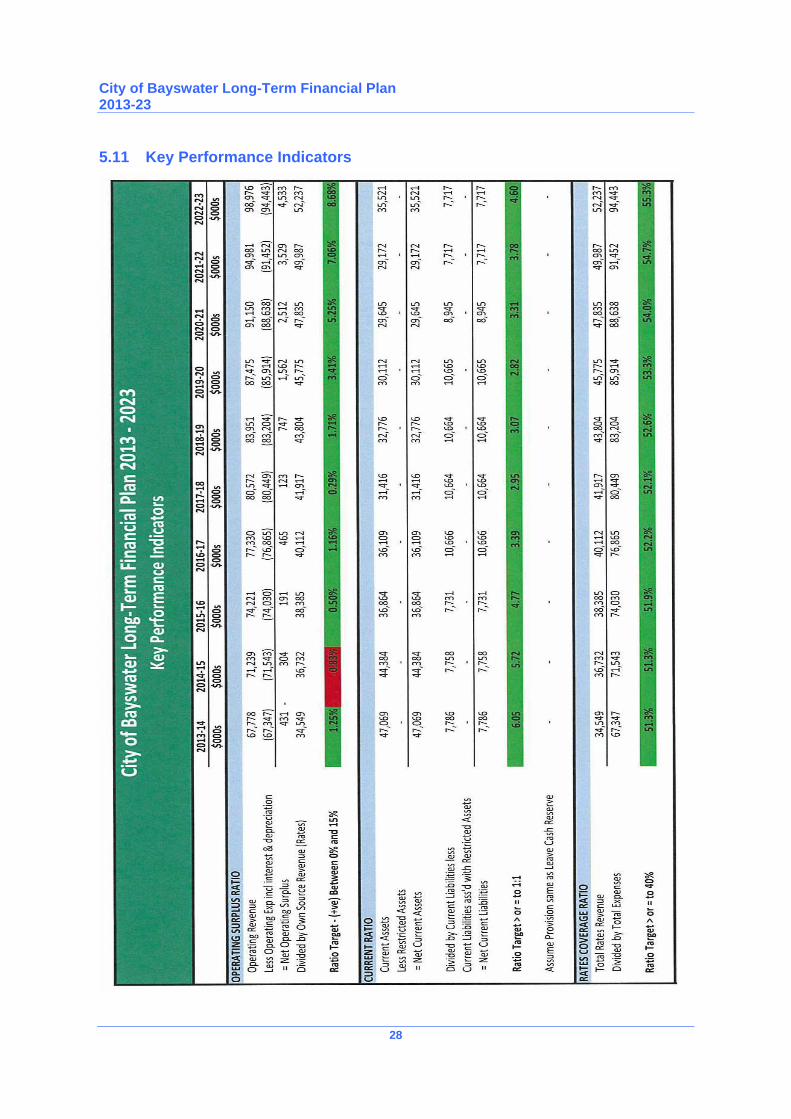
5.11 Key Performance Indicators
City of Bayswater Long-Term Financial Plan 2013-23
29
City of Bayswater Long-Term Financial Plan 2013-23
30
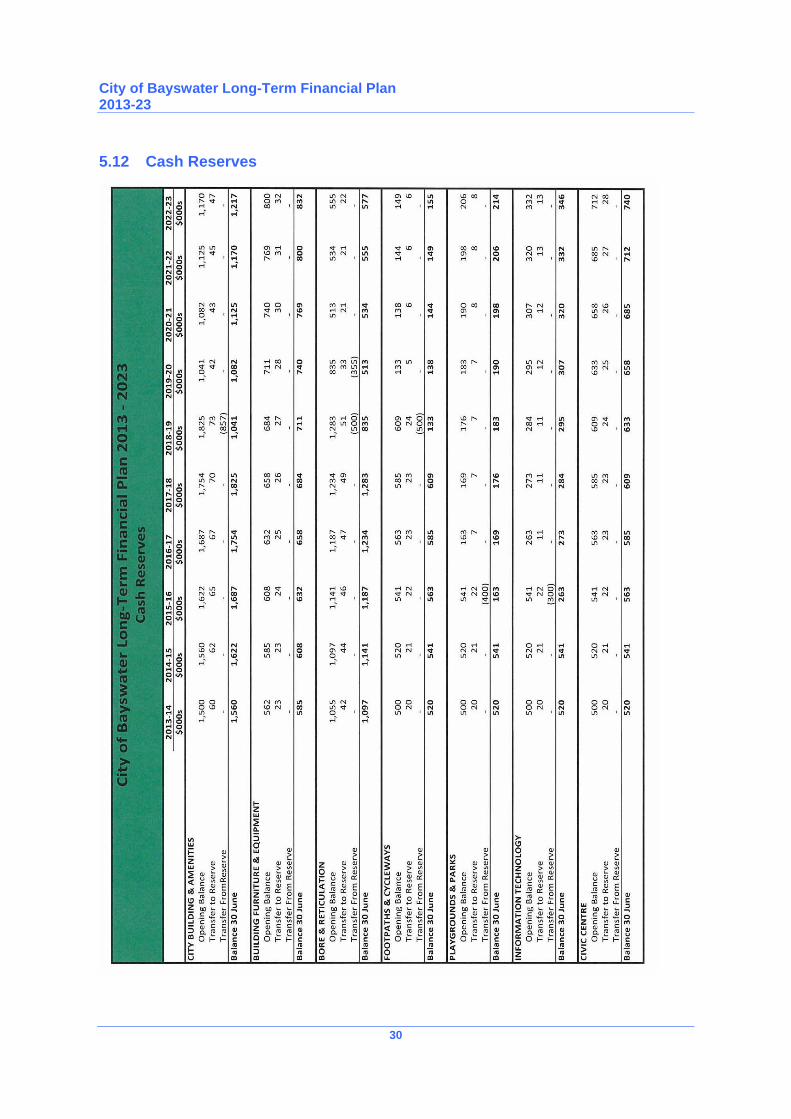
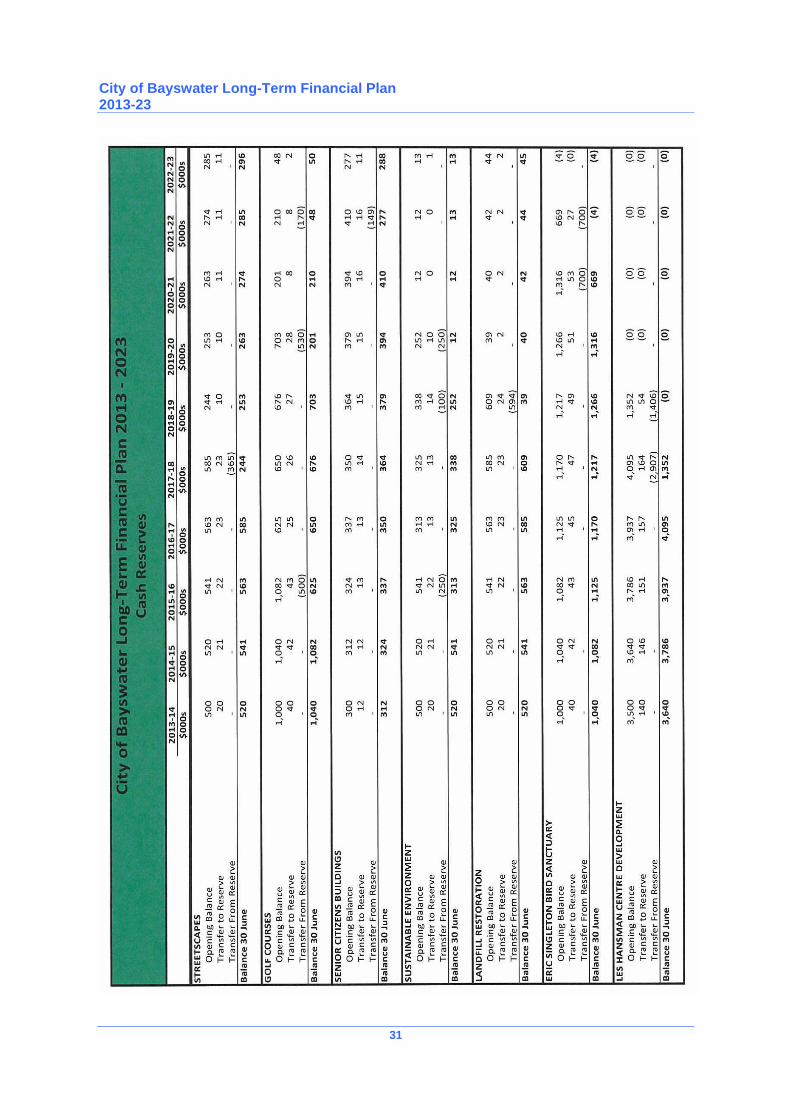
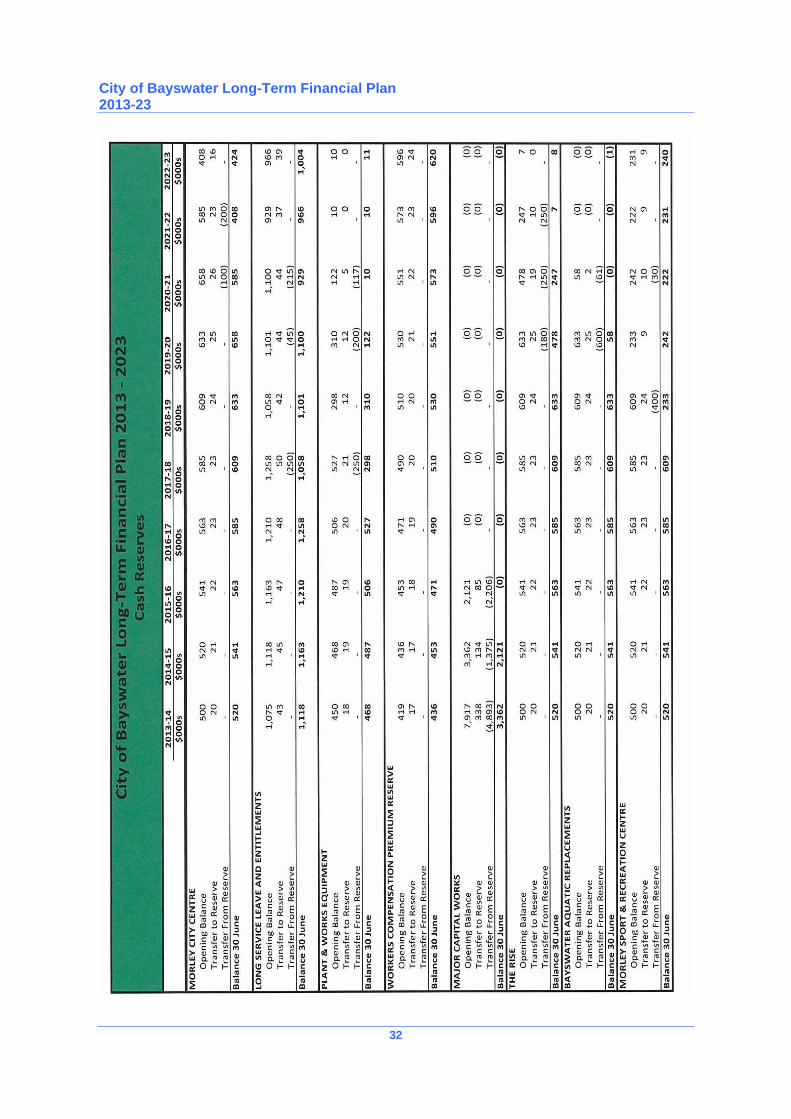
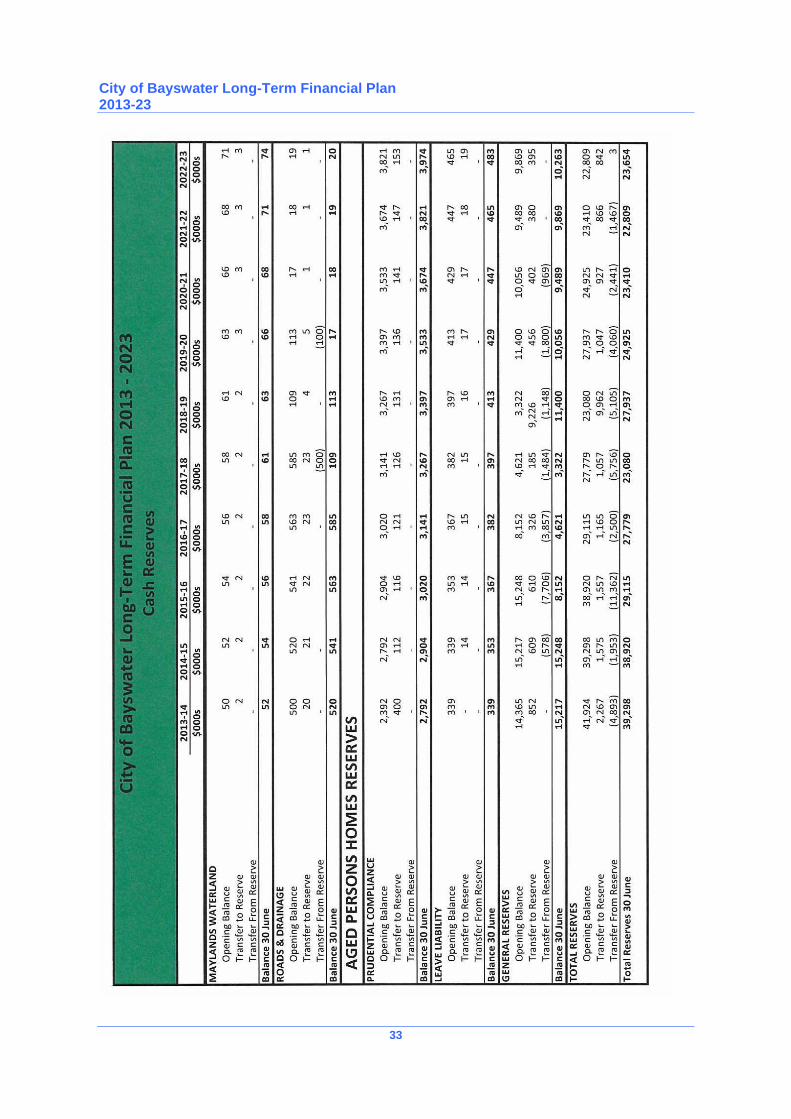
5.12 Cash Reserves
City of Bayswater Long-Term Financial Plan 2013-23
31
City of Bayswater Long-Term Financial Plan 2013-23
32
City of Bayswater Long-Term Financial Plan 2013-23
33
City of Bayswater Long-Term Financial Plan 2013-23
34
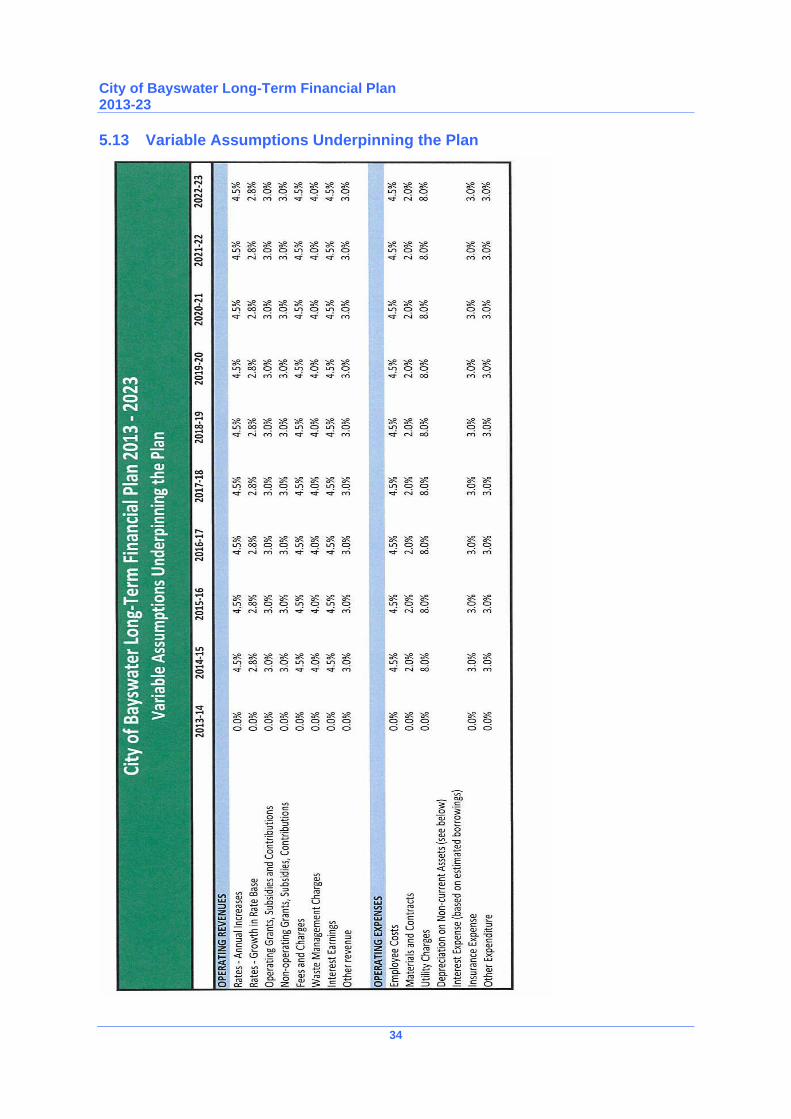
5.13 Variable Assumptions Underpinning the Plan
City of Bayswater Long-Term Financial Plan 2013-23
35
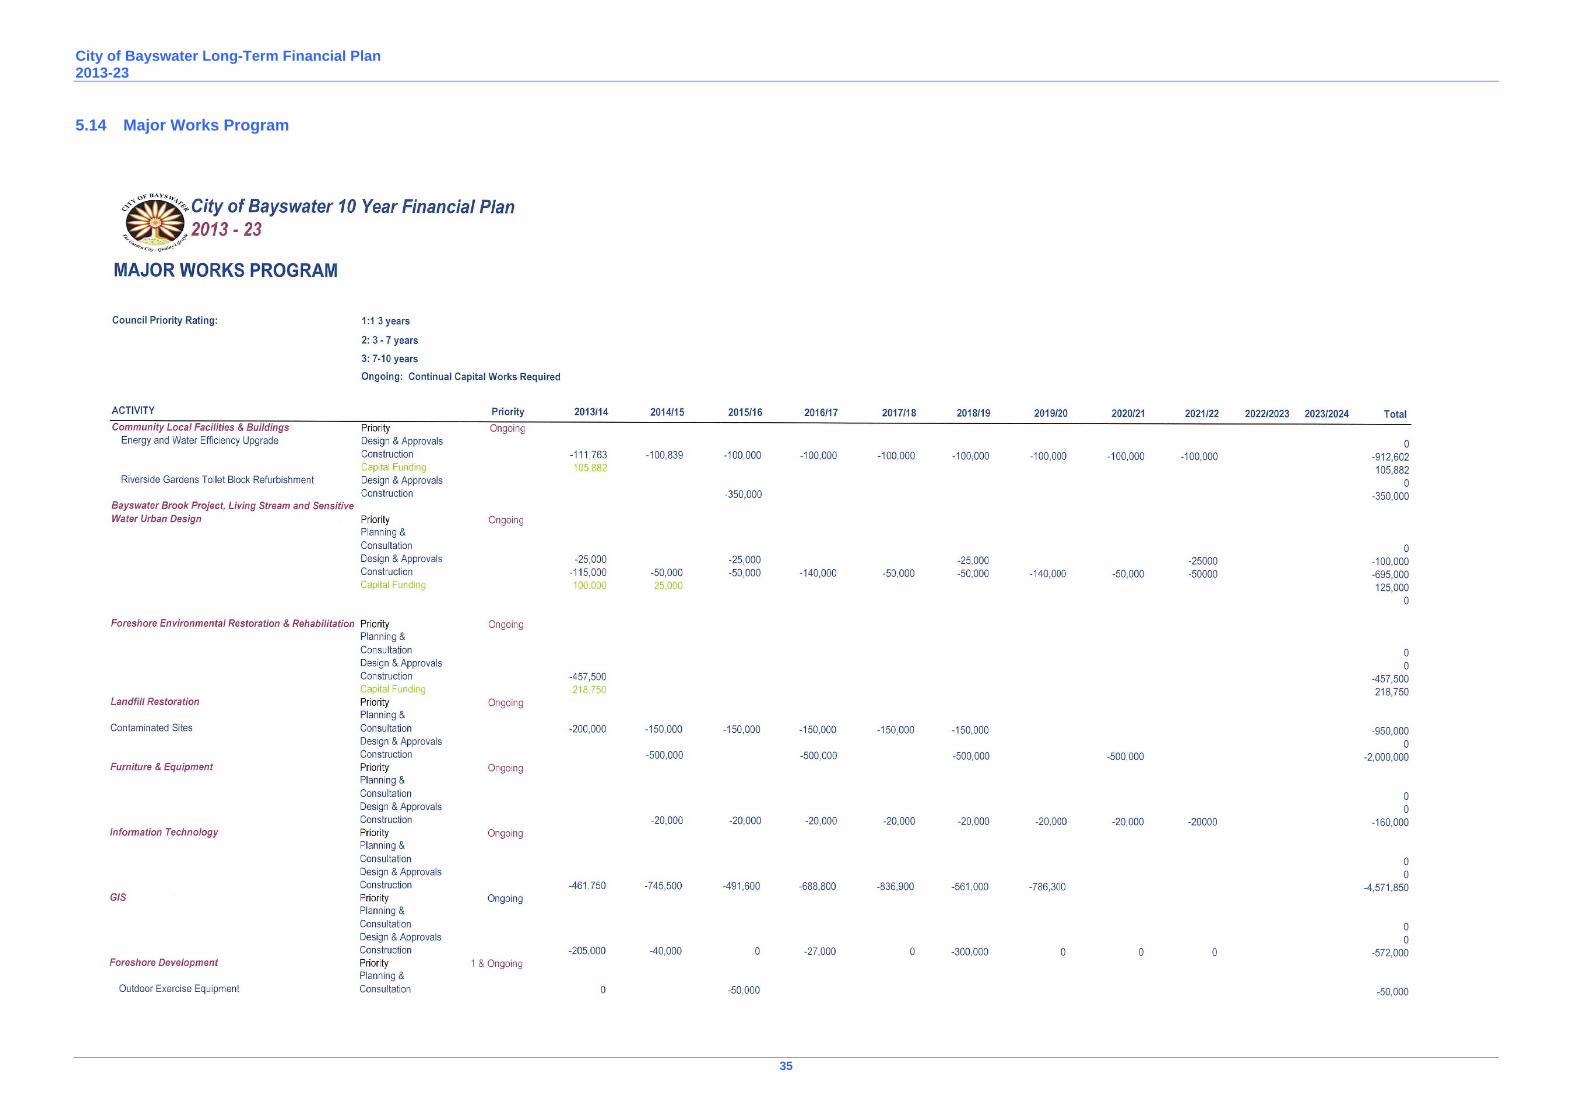
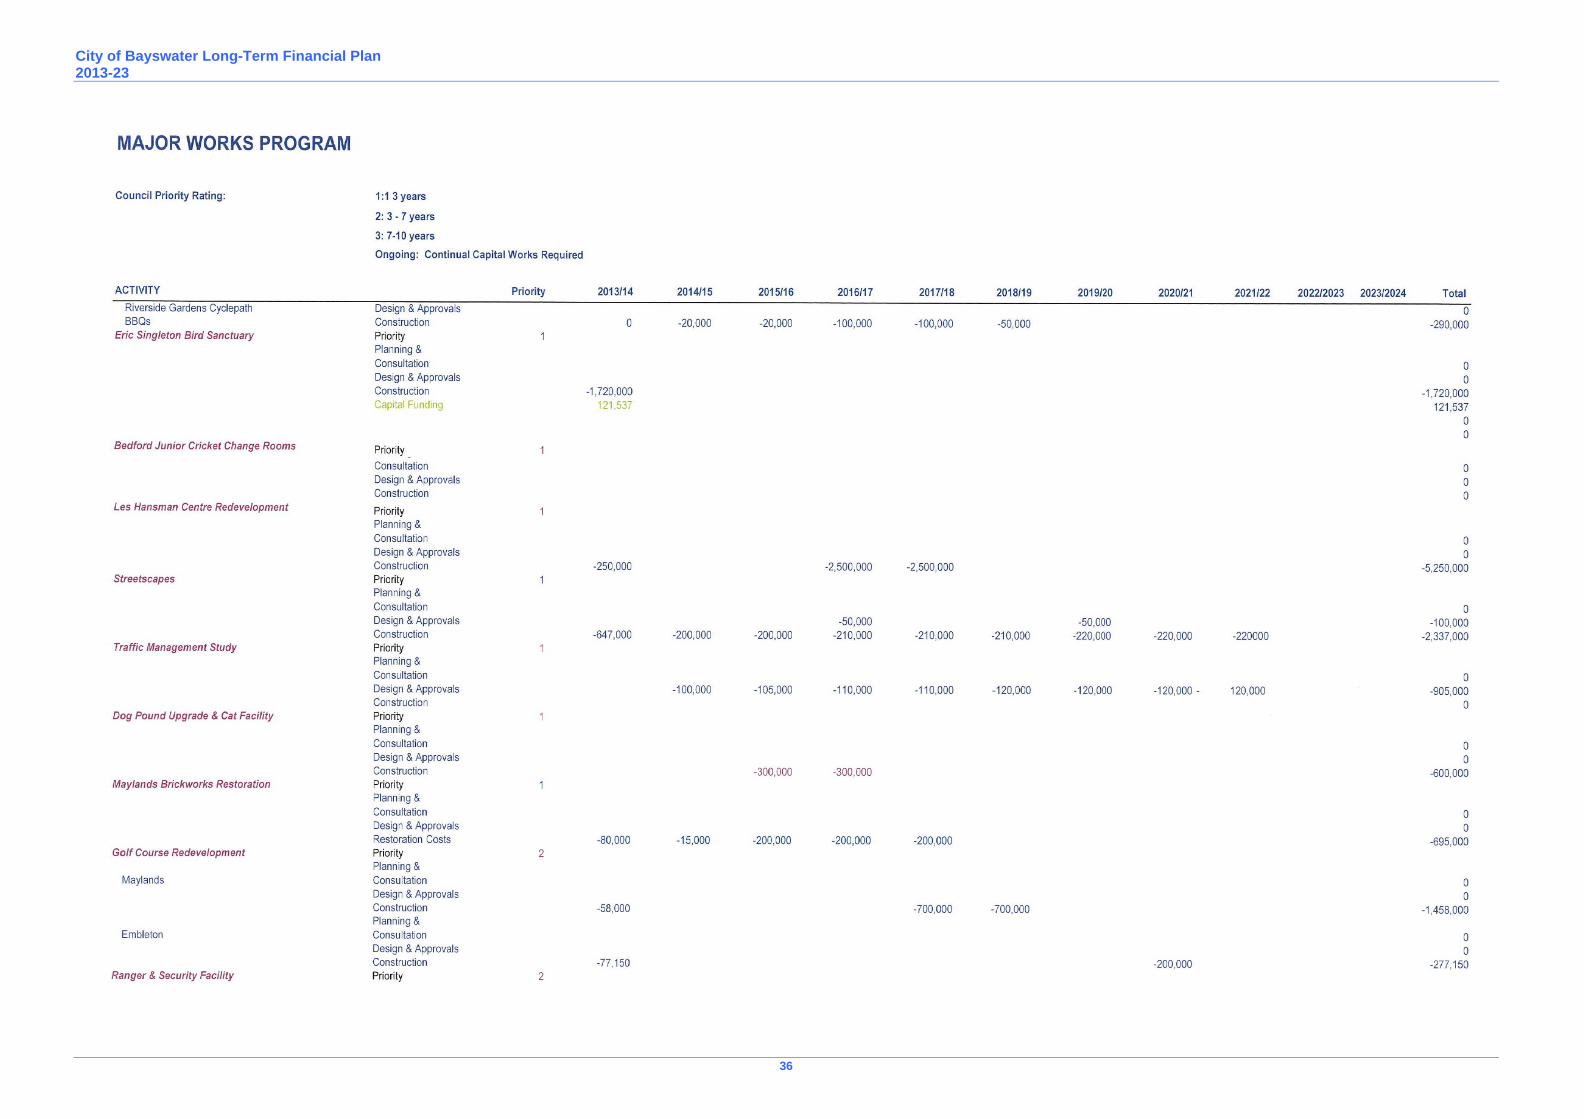
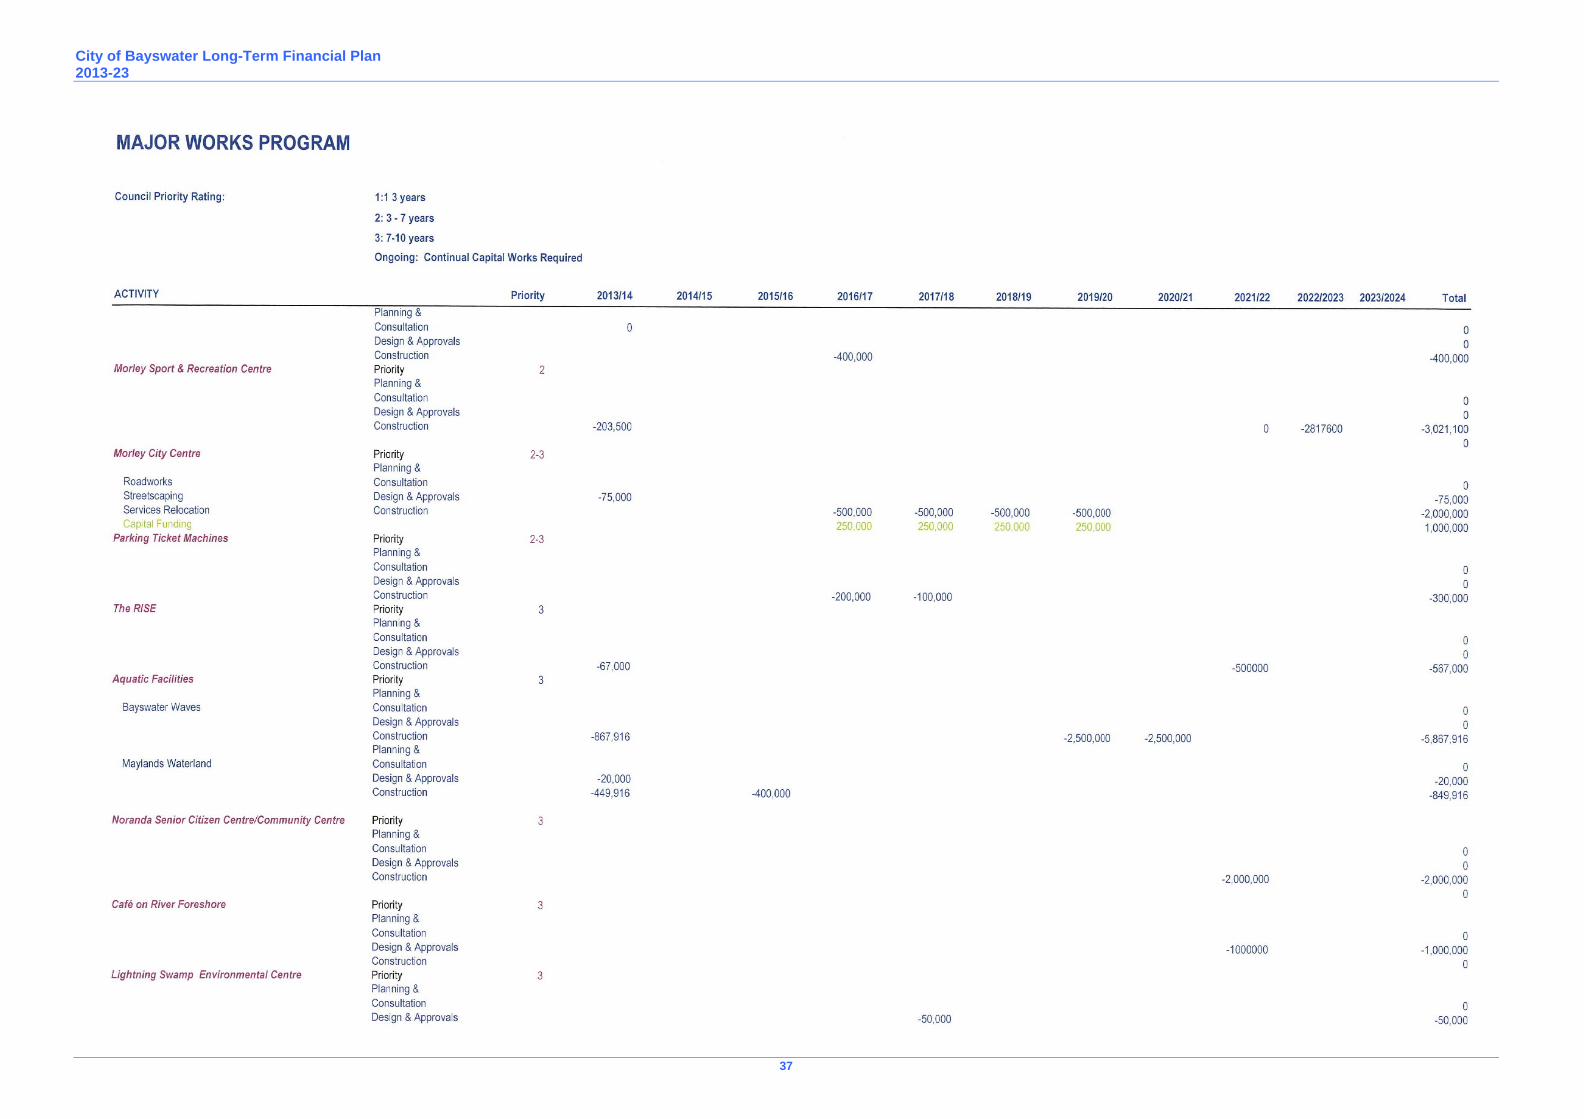
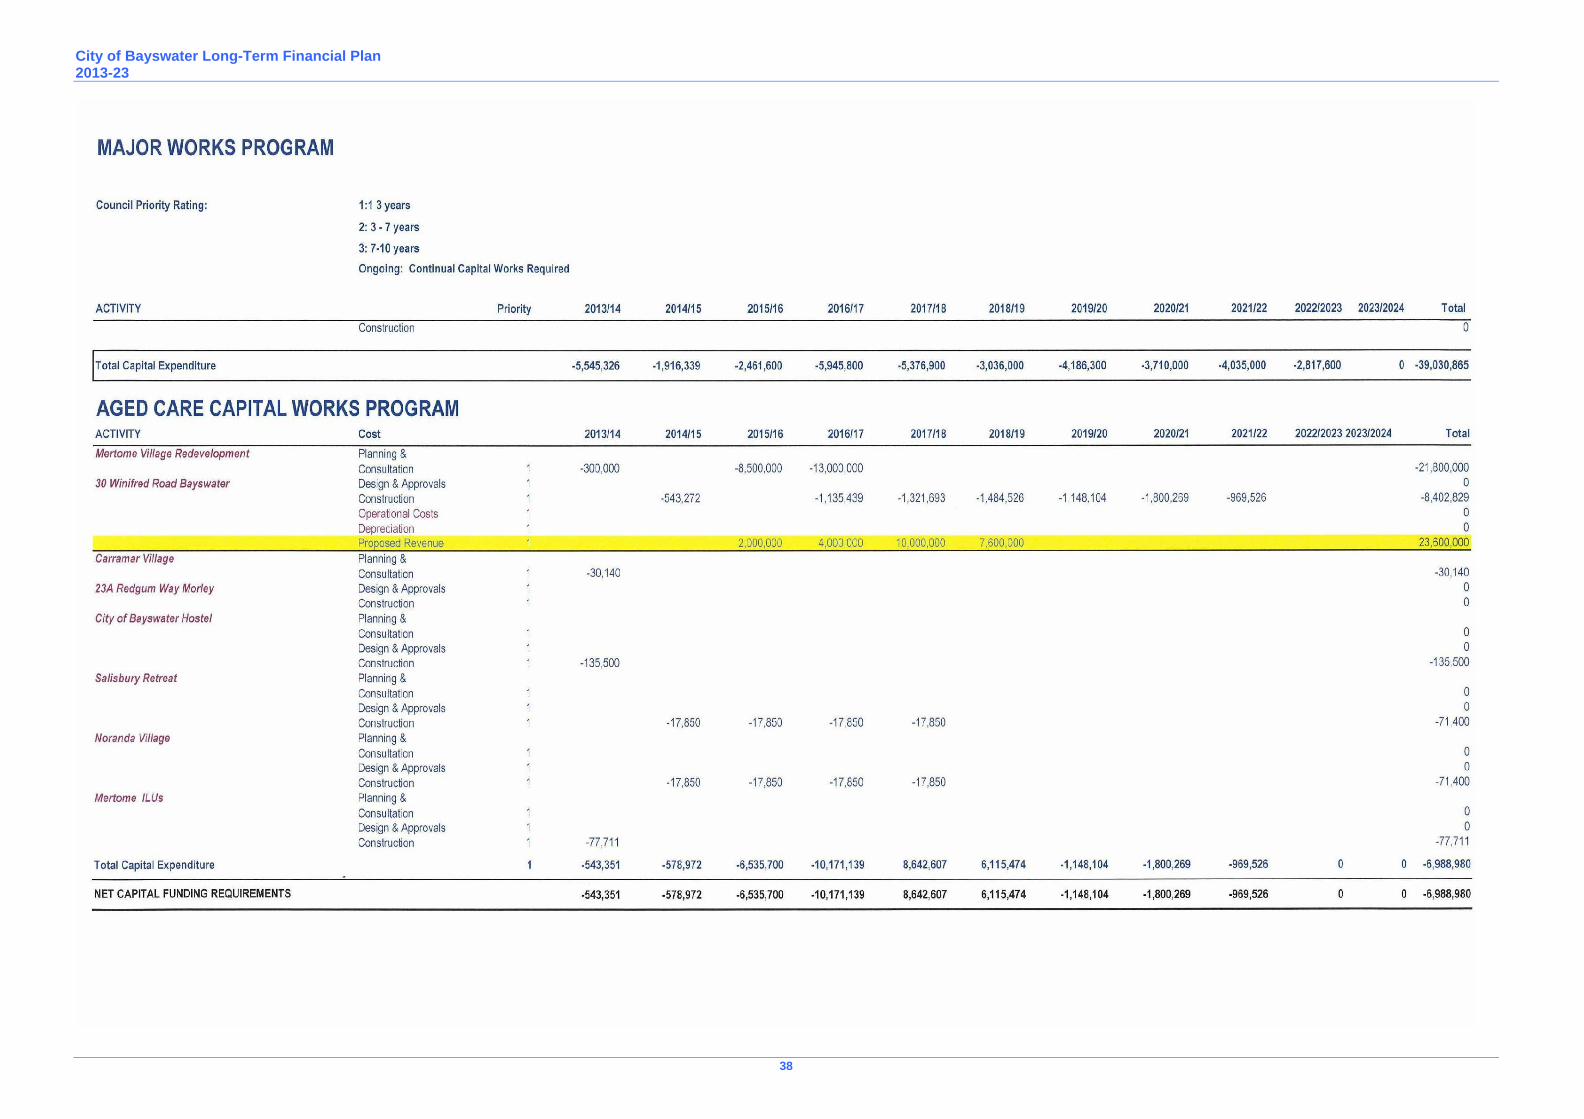
5.14 Major Works Program
City of Bayswater Long-Term Financial Plan 2013-23
36
City of Bayswater Long-Term Financial Plan 2013-23
37
City of Bayswater Long-Term Financial Plan 2013-23
38
City of Bayswater Long-Term Financial Plan 2013-23
39
The following projects have not been listed in the future capital works program on account of uncertainty around cost outlay, operational costs and any associated income streams:
o Tennis/Bowling Club amalgamation
o Bowling Club rebuild
o Maylands Town Hall refurbishment
o Bayswater Material Recovery Facility (Transfer Station: 271 Collier Road Bayswater)
o Paddy Walker Depot refurbishment
o Civic Centre refurbishment
o Frank Drago Sporting Facility
o Hinds Reserve Sports Club
o Wotton Reserve Sports Club
o Joan Rycroft Reserve Sports Club
o Bayswater library & Senior Citizen Centre redevelopment
o Lightning Swamp Environmental Centre As more information becomes available for these projects it is recommended they are listed for discussion by Council in future reviews of the Long Term Financial Plan 2013-23.
6 Section 5
6.1 Conclusion
The LTFP estimates financial data for the next 10-year time frame of 2013-14 to 2022-23. Within the LTFP the major objectives have been to:
provide a platform to deliver the desired infrastructure and services as expressed in the Community Strategic Plan 2013-23;
provide a transparent account of Council’s financial situation to the community;
provide a framework to balance Council’s future financial position;
analyse the cumulative financial effects of Council’s strategic key directions;
identify the financial opportunities and challenges confronting Council;
provide a basis for sound and strategic decision making;and
meet the requirements of the Department of Local Government’s (DLG) Integrated Planning framework.
The LTFP has indicated that:
income source from the projected annual rate increase is essential in maintaining fiscal stability;
Council’s Key Performance Ratios remain stable, especially with respect to the Operating Balance Ratio, Current Ratio, Debt Service Ratio, however Council’s Asset Renewal Ratio still remains moderately low and below Council’s desired ratio of 1.0; and
progression of future major capital works outside those already included in the LTFP are predicated on the basis they will have an income stream to repay any borrowings required to finance both the capital component of the project and also any additional date-to-day running cost implications.
consideration of project proposals or additional services requires an understanding of life cycle cost implications to maintain a position of sound sustainability.
City of Bayswater Long-Term Financial Plan 2013-23
40
The Scenarios modelled within the LTFP are an important part of Council’s overall future financial plans and with sound financial management from Council, the CoB will continue to operate, as it has in the past, towards a sound and highly-productive financial future.