Embed Size (px)
Citation preview
Federal Emergency Management Agency FLOOD INSURANCE STUDY NUMBER
240087V000B
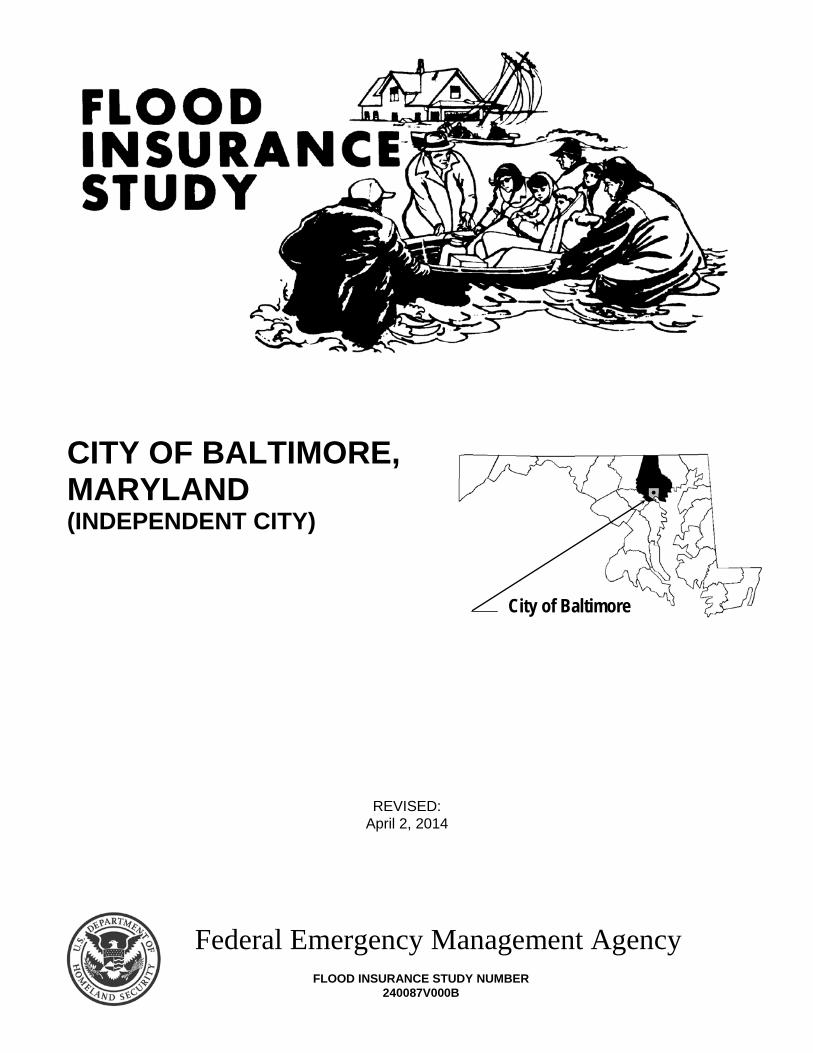
CITY OF BALTIMORE, MARYLAND (INDEPENDENT CITY)
REVISED: April 2, 2014
City of Baltimore
NOTICE TO FLOOD INSURANCE STUDY USERS
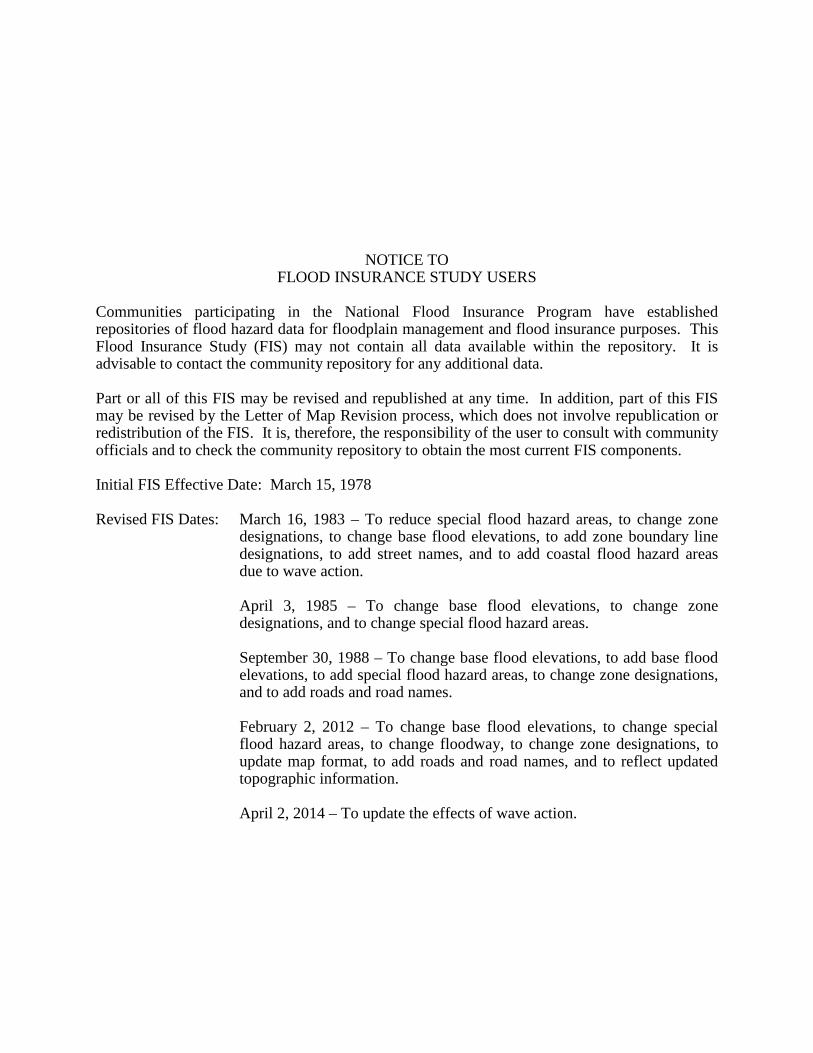
Communities participating in the National Flood Insurance Program have established repositories of flood hazard data for floodplain management and flood insurance purposes. This Flood Insurance Study (FIS) may not contain all data available within the repository. It is advisable to contact the community repository for any additional data. Part or all of this FIS may be revised and republished at any time. In addition, part of this FIS may be revised by the Letter of Map Revision process, which does not involve republication or redistribution of the FIS. It is, therefore, the responsibility of the user to consult with community officials and to check the community repository to obtain the most current FIS components. Initial FIS Effective Date: March 15, 1978 Revised FIS Dates: March 16, 1983 – To reduce special flood hazard areas, to change zone
designations, to change base flood elevations, to add zone boundary line designations, to add street names, and to add coastal flood hazard areas due to wave action.
April 3, 1985 – To change base flood elevations, to change zone designations, and to change special flood hazard areas.
September 30, 1988 – To change base flood elevations, to add base flood elevations, to add special flood hazard areas, to change zone designations, and to add roads and road names.
February 2, 2012 – To change base flood elevations, to change special flood hazard areas, to change floodway, to change zone designations, to update map format, to add roads and road names, and to reflect updated topographic information.
April 2, 2014 – To update the effects of wave action.
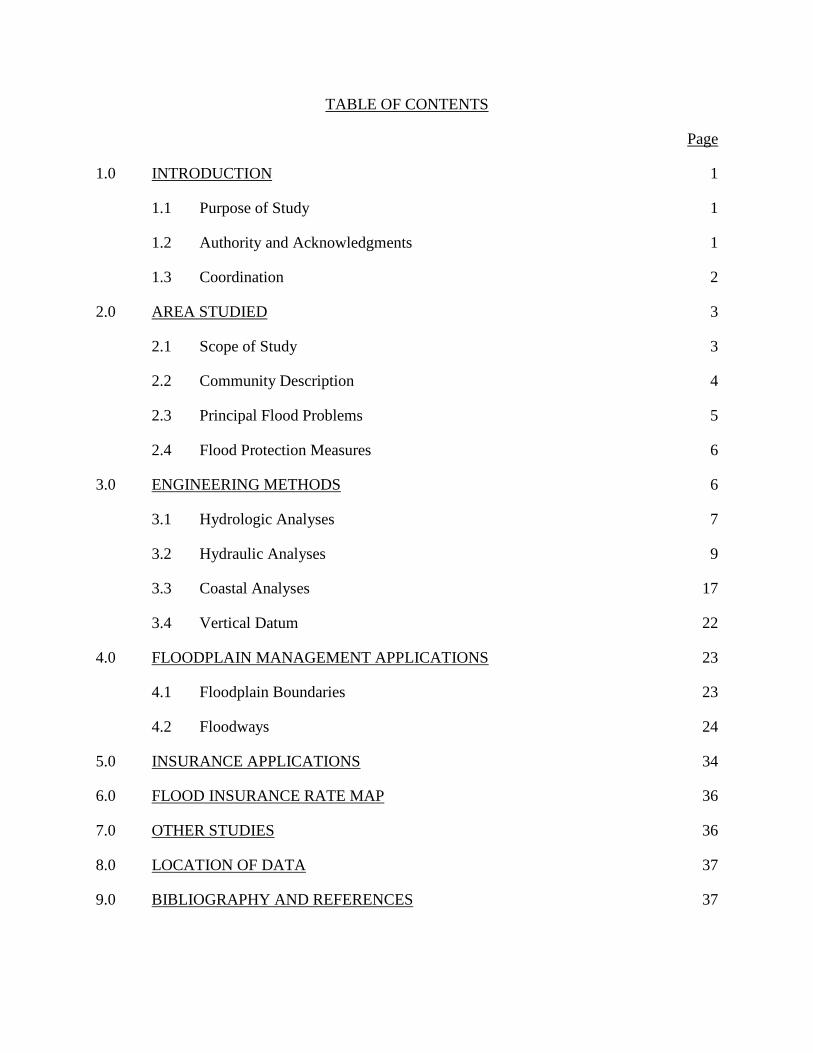
TABLE OF CONTENTS
Page 1.0 INTRODUCTION 1 1.1 Purpose of Study 1 1.2 Authority and Acknowledgments 1 1.3 Coordination 2 2.0 AREA STUDIED 3 2.1 Scope of Study 3 2.2 Community Description 4 2.3 Principal Flood Problems 5 2.4 Flood Protection Measures 6 3.0 ENGINEERING METHODS 6 3.1 Hydrologic Analyses 7 3.2 Hydraulic Analyses 9 3.3 Coastal Analyses 17 3.4 Vertical Datum 22 4.0 FLOODPLAIN MANAGEMENT APPLICATIONS 23 4.1 Floodplain Boundaries 23 4.2 Floodways 24 5.0 INSURANCE APPLICATIONS 34 6.0 FLOOD INSURANCE RATE MAP 36 7.0 OTHER STUDIES 36 8.0 LOCATION OF DATA 37 9.0 BIBLIOGRAPHY AND REFERENCES 37
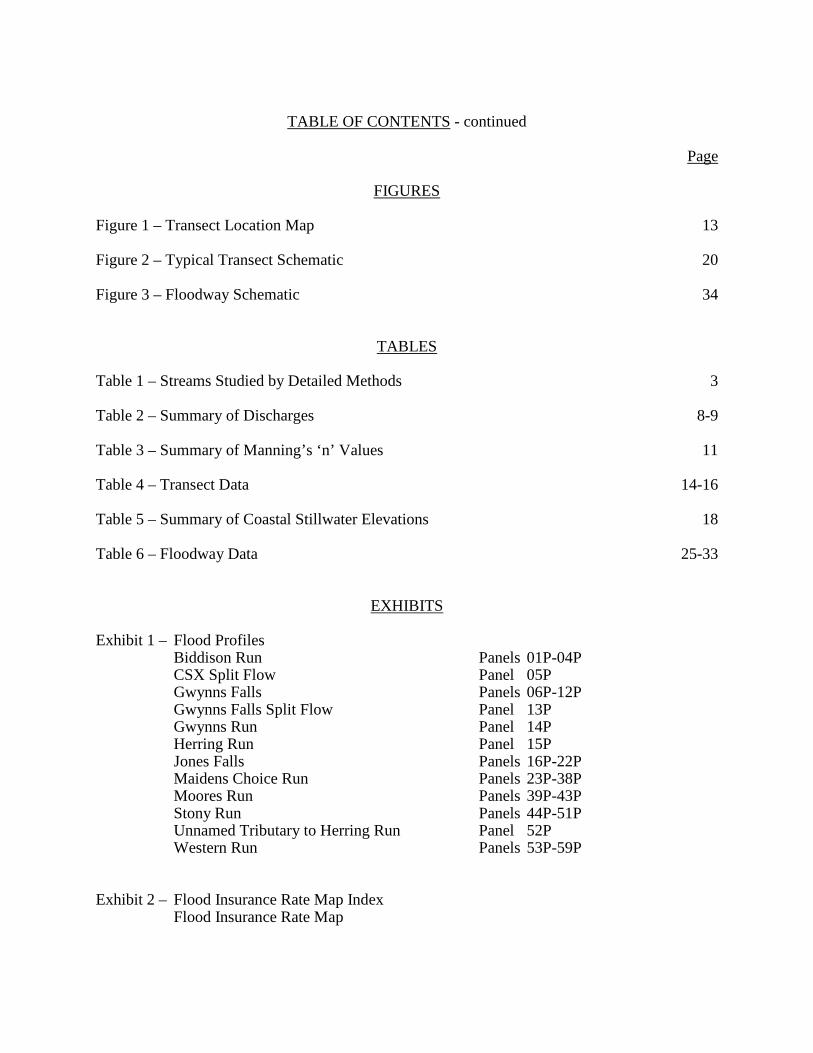
TABLE OF CONTENTS - continued
Page
FIGURES
Figure 1 – Transect Location Map 13 Figure 2 – Typical Transect Schematic 20 Figure 3 – Floodway Schematic 34
TABLES Table 1 – Streams Studied by Detailed Methods 3 Table 2 – Summary of Discharges 8-9 Table 3 – Summary of Manning’s ‘n’ Values 11 Table 4 – Transect Data 14-16 Table 5 – Summary of Coastal Stillwater Elevations 18 Table 6 – Floodway Data 25-33
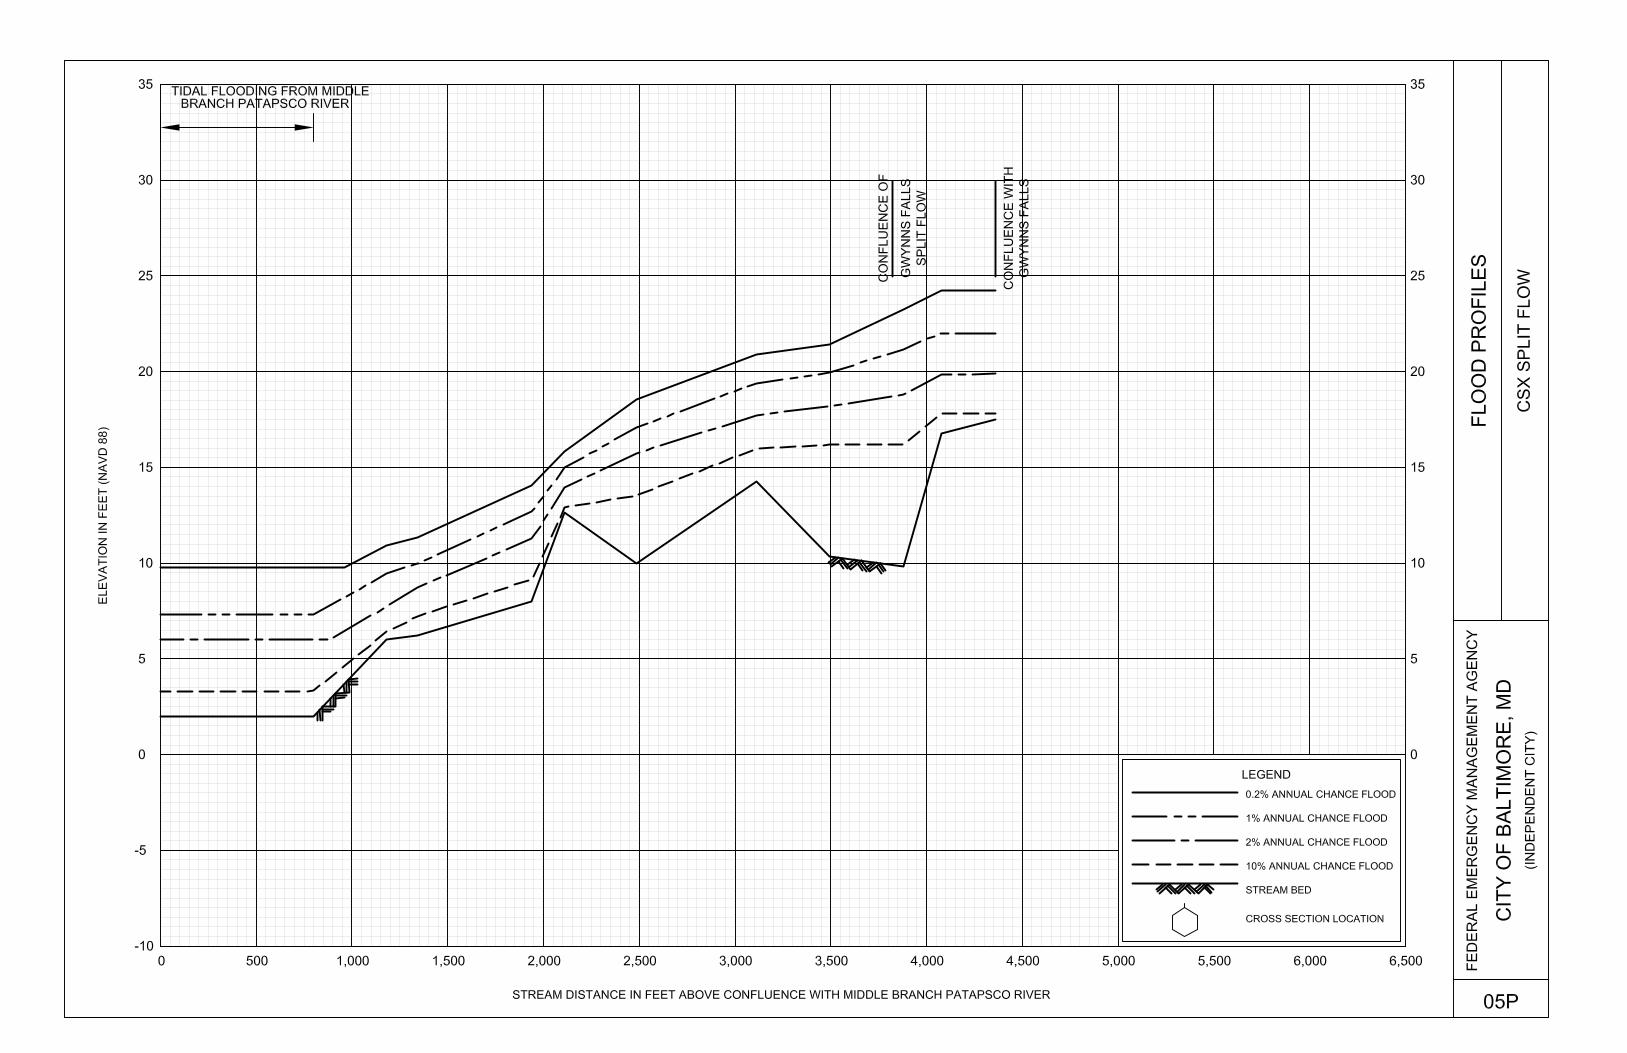
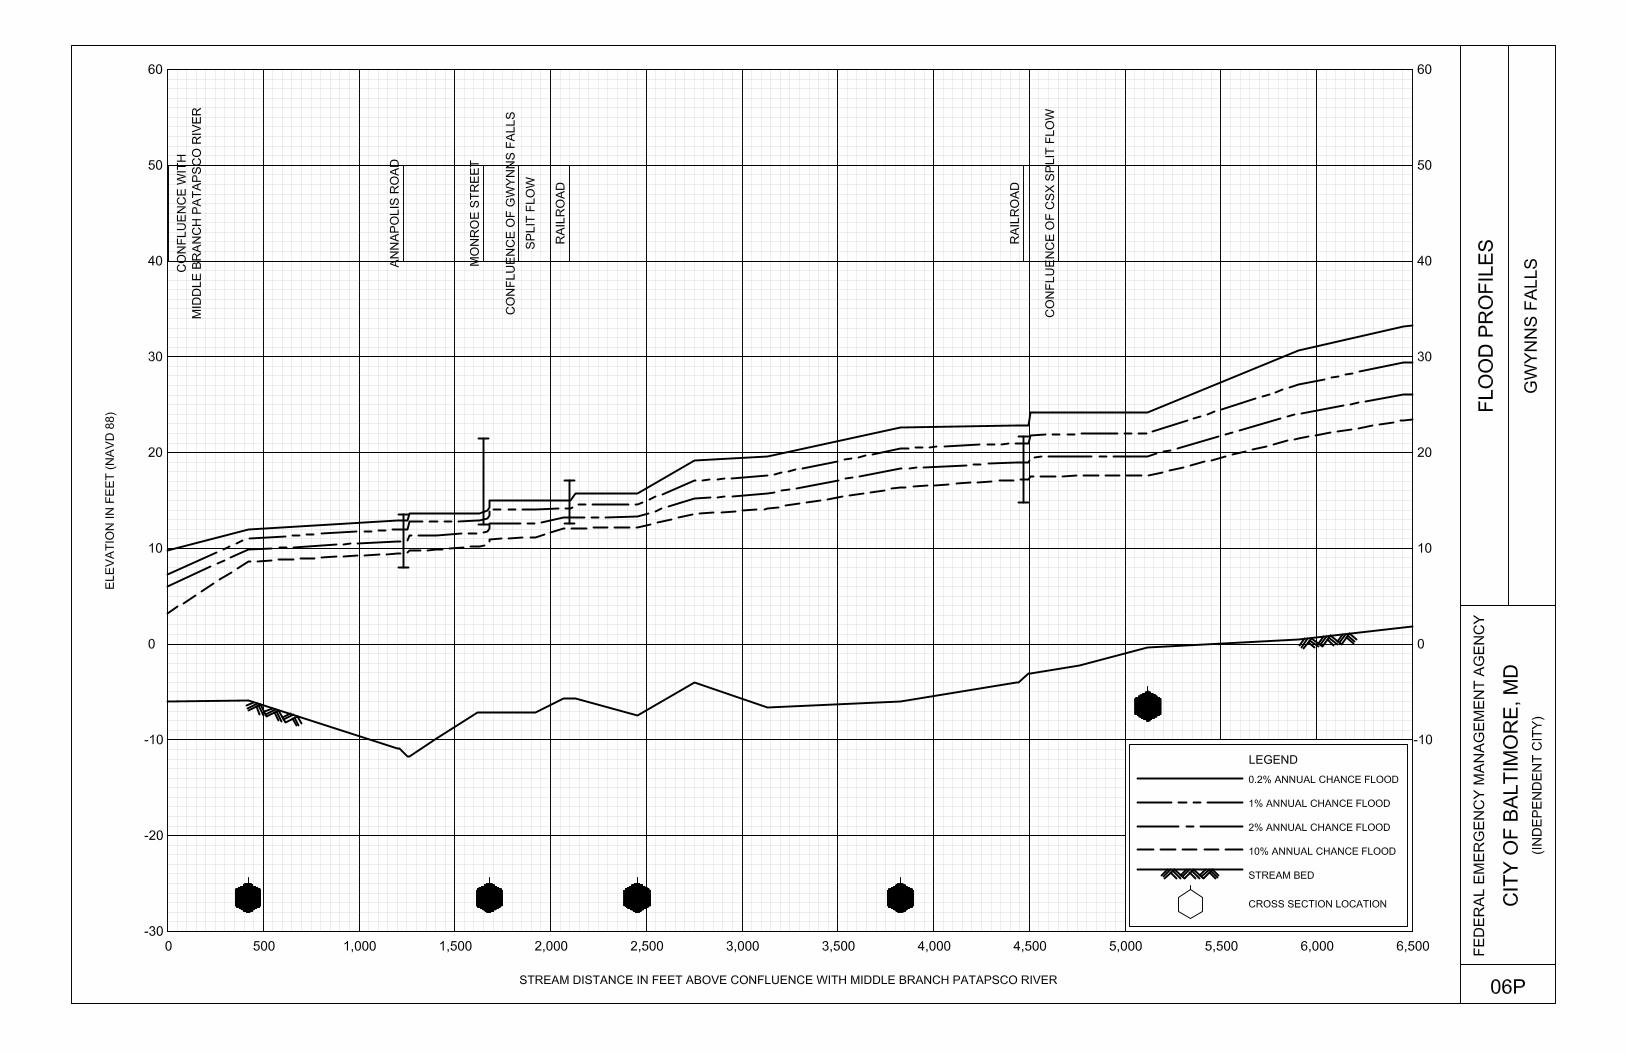
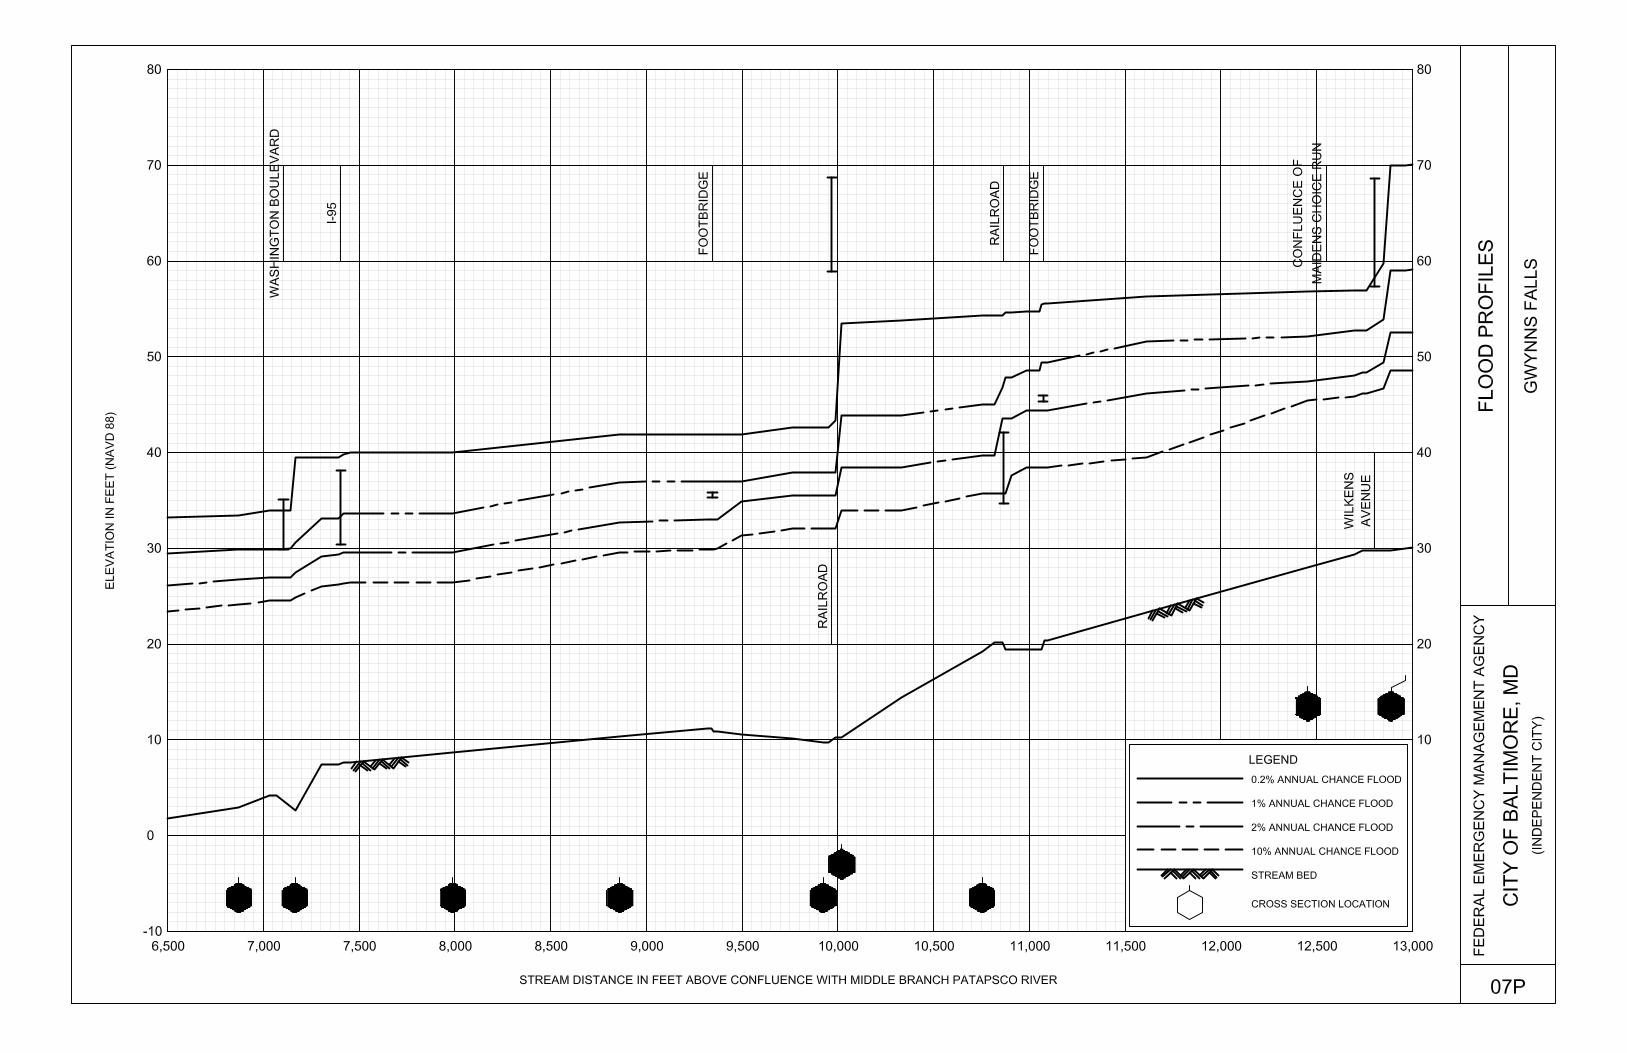
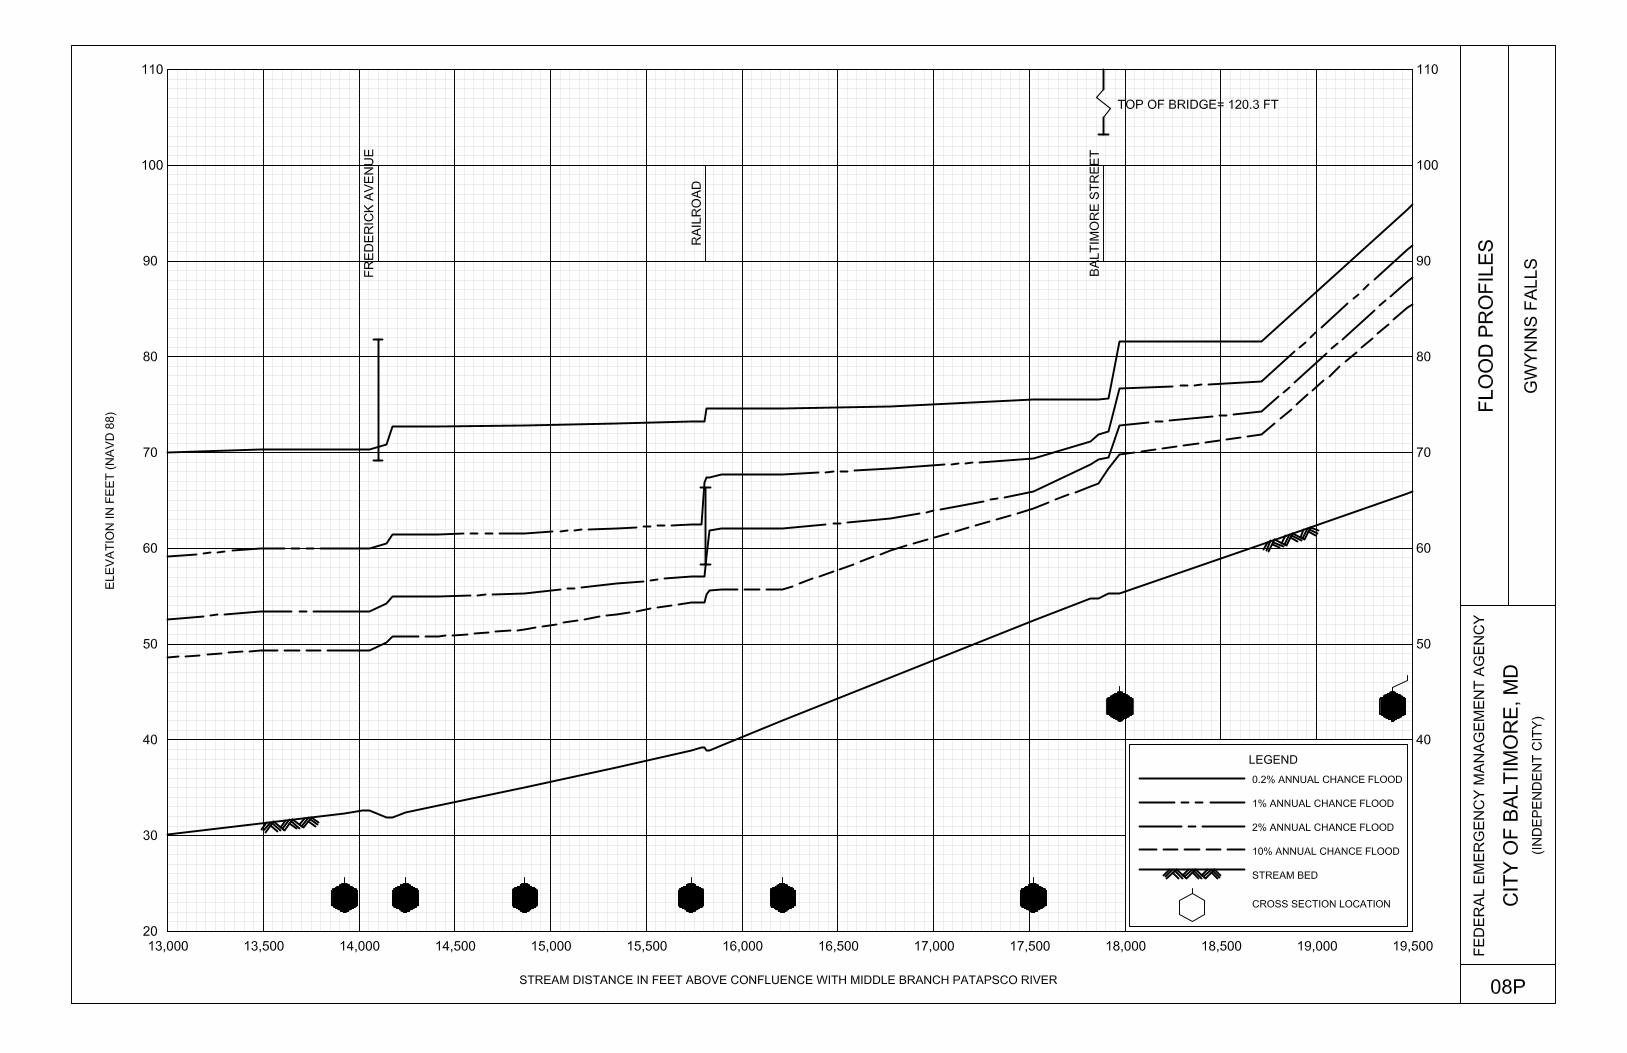
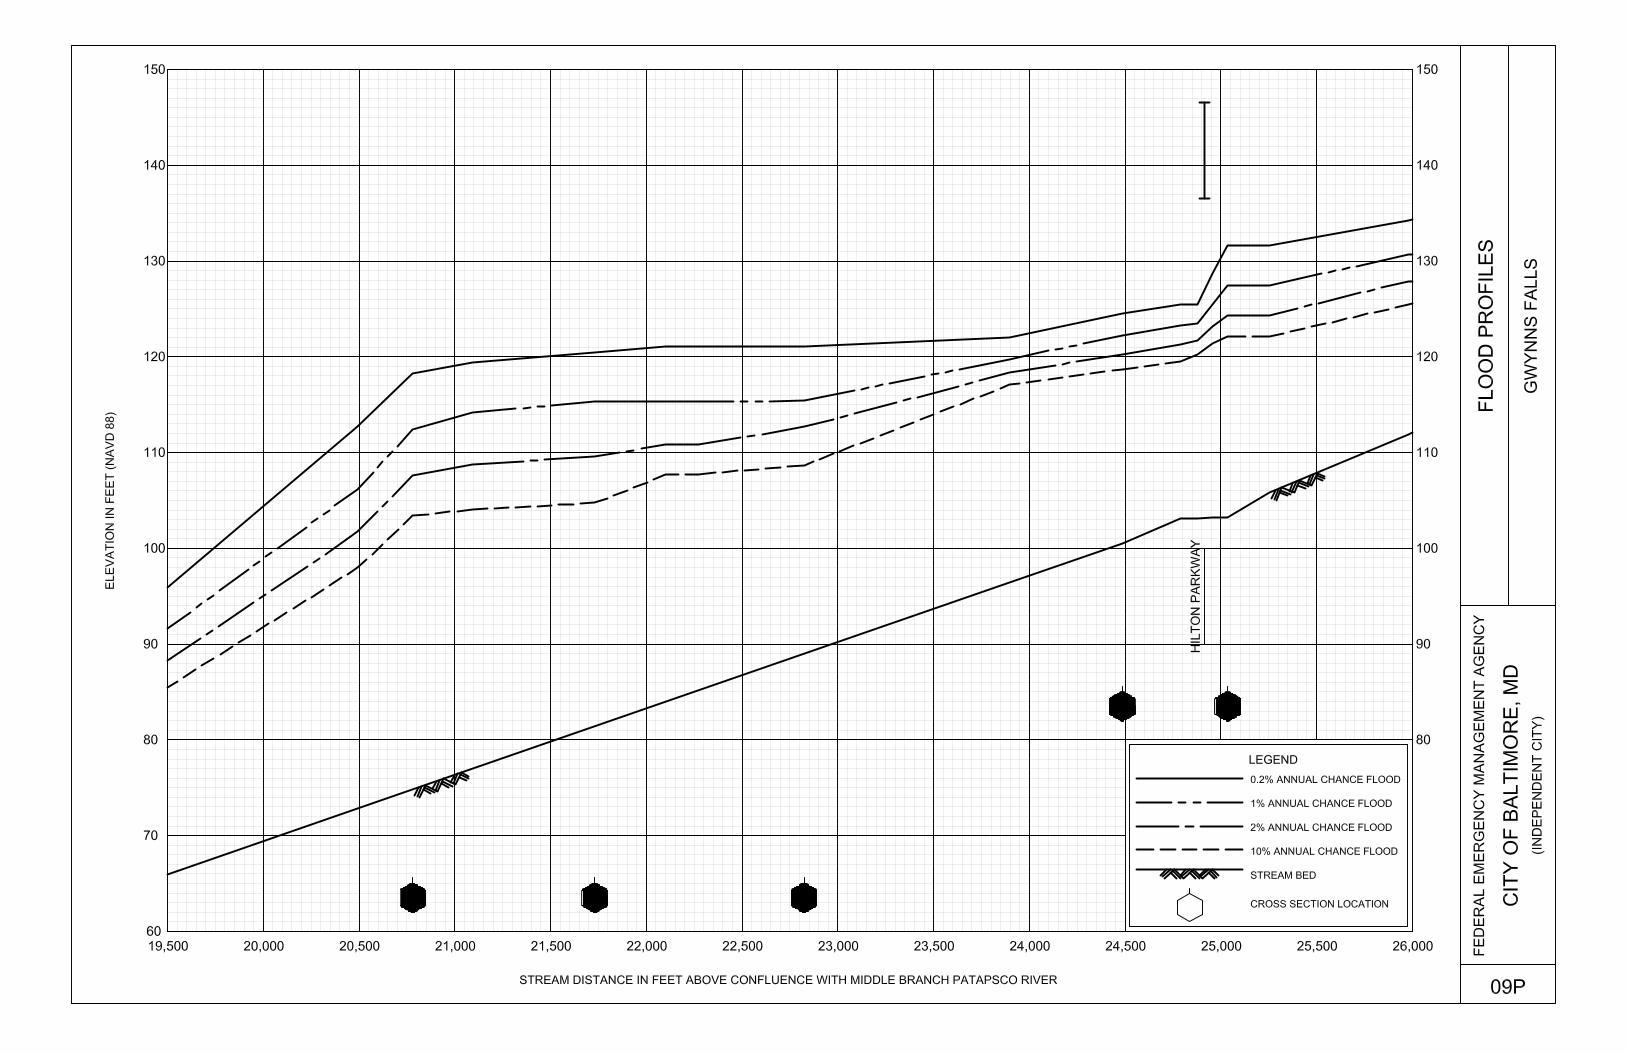
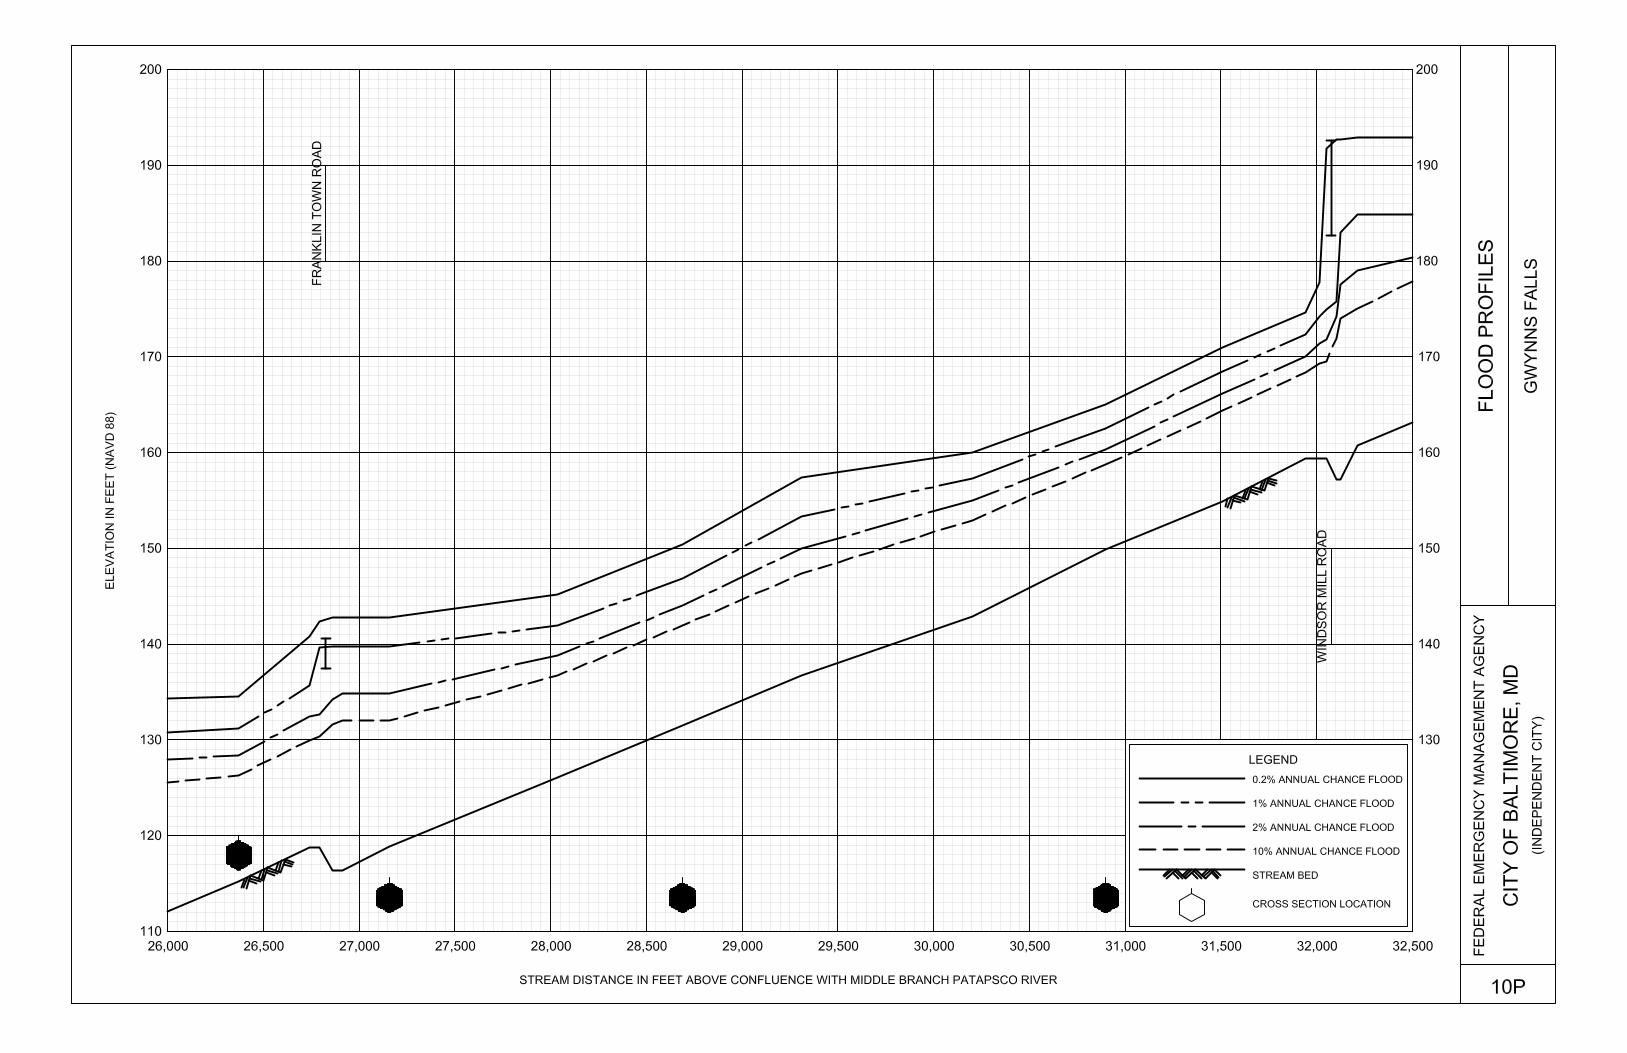
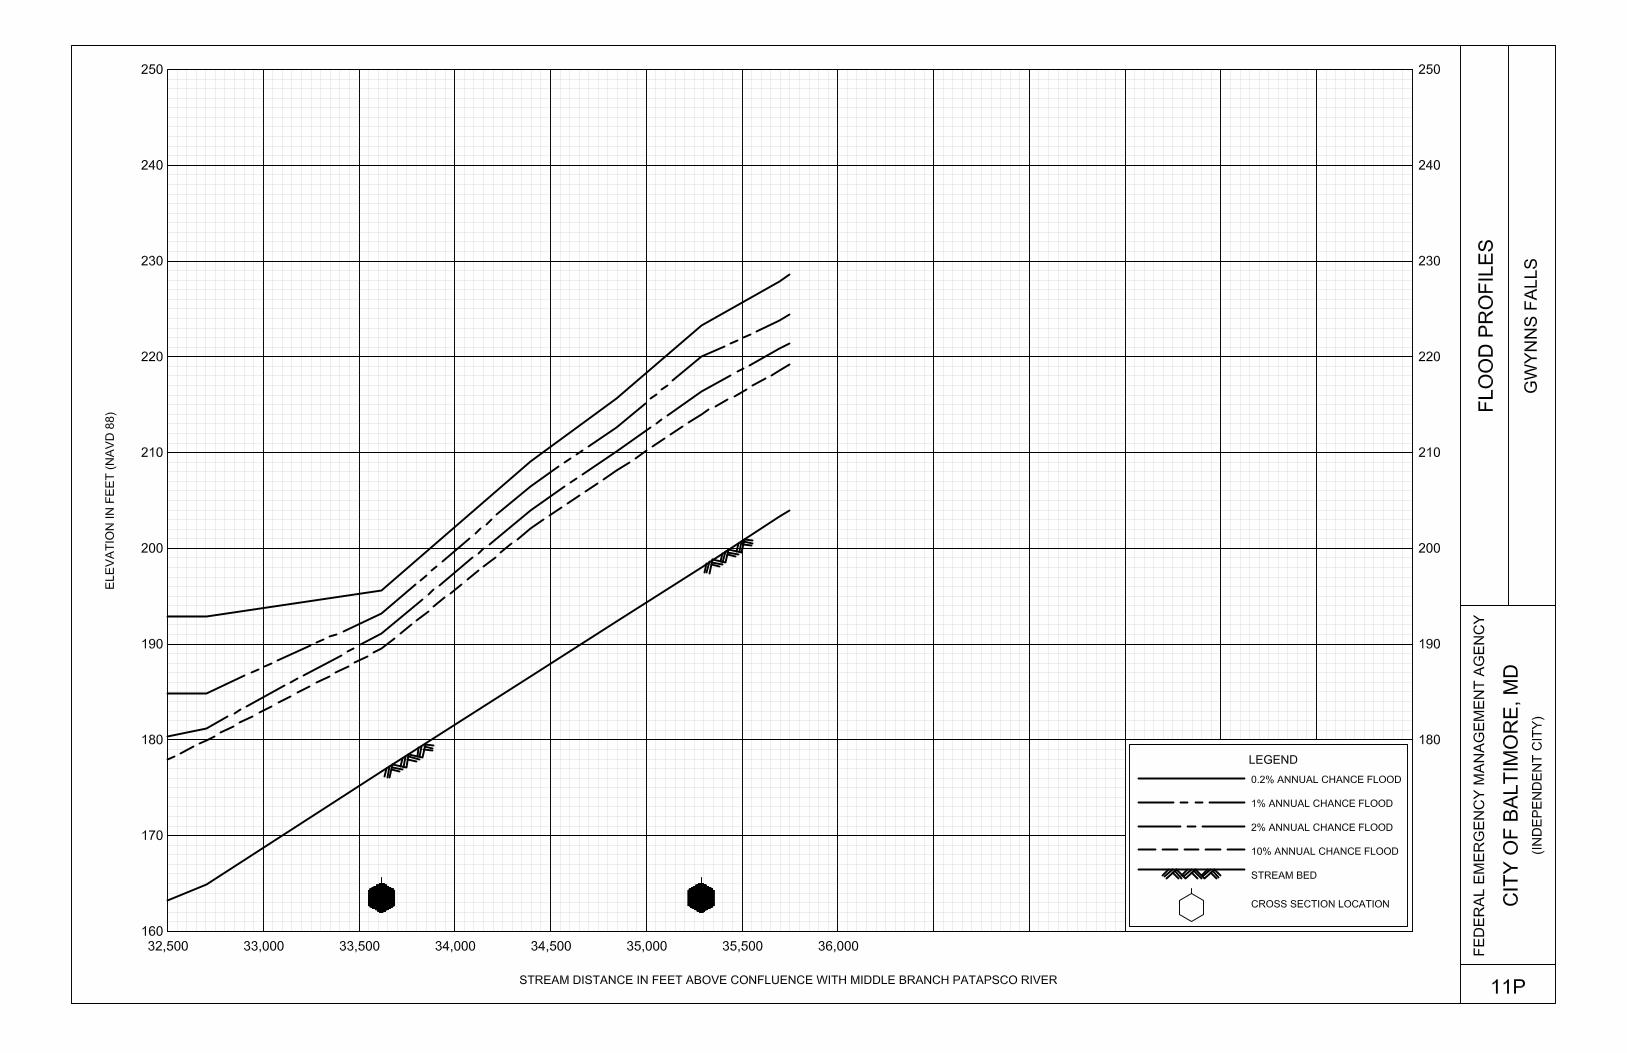
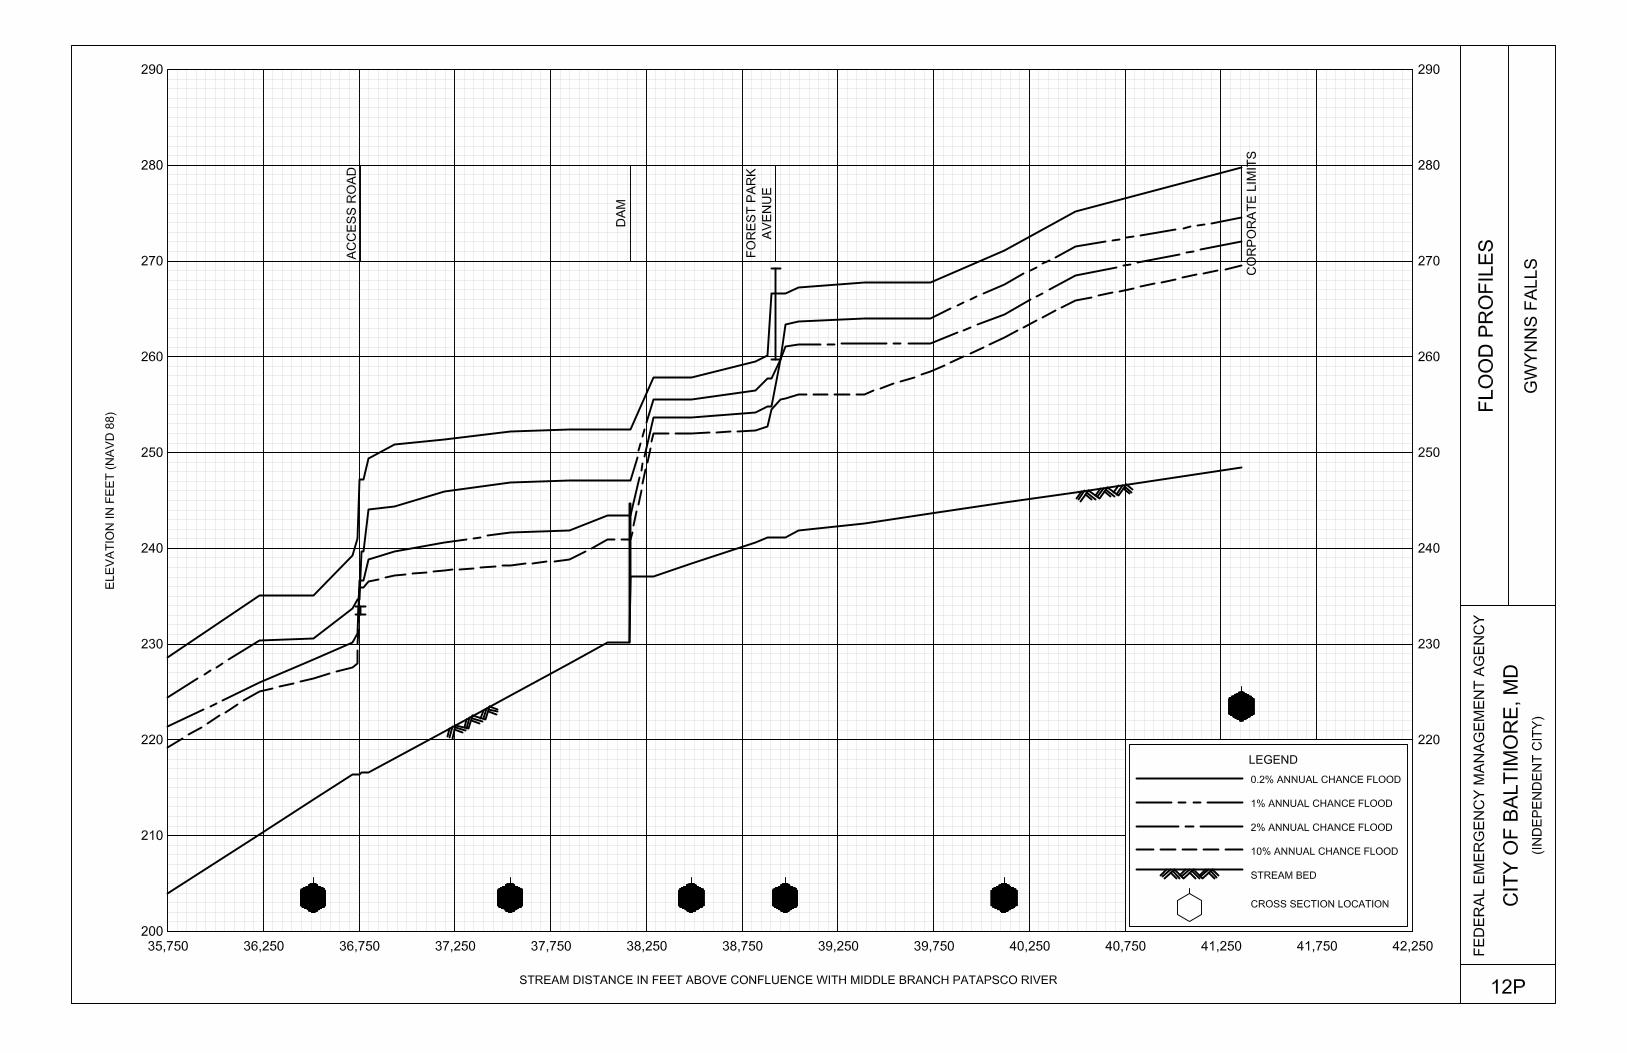
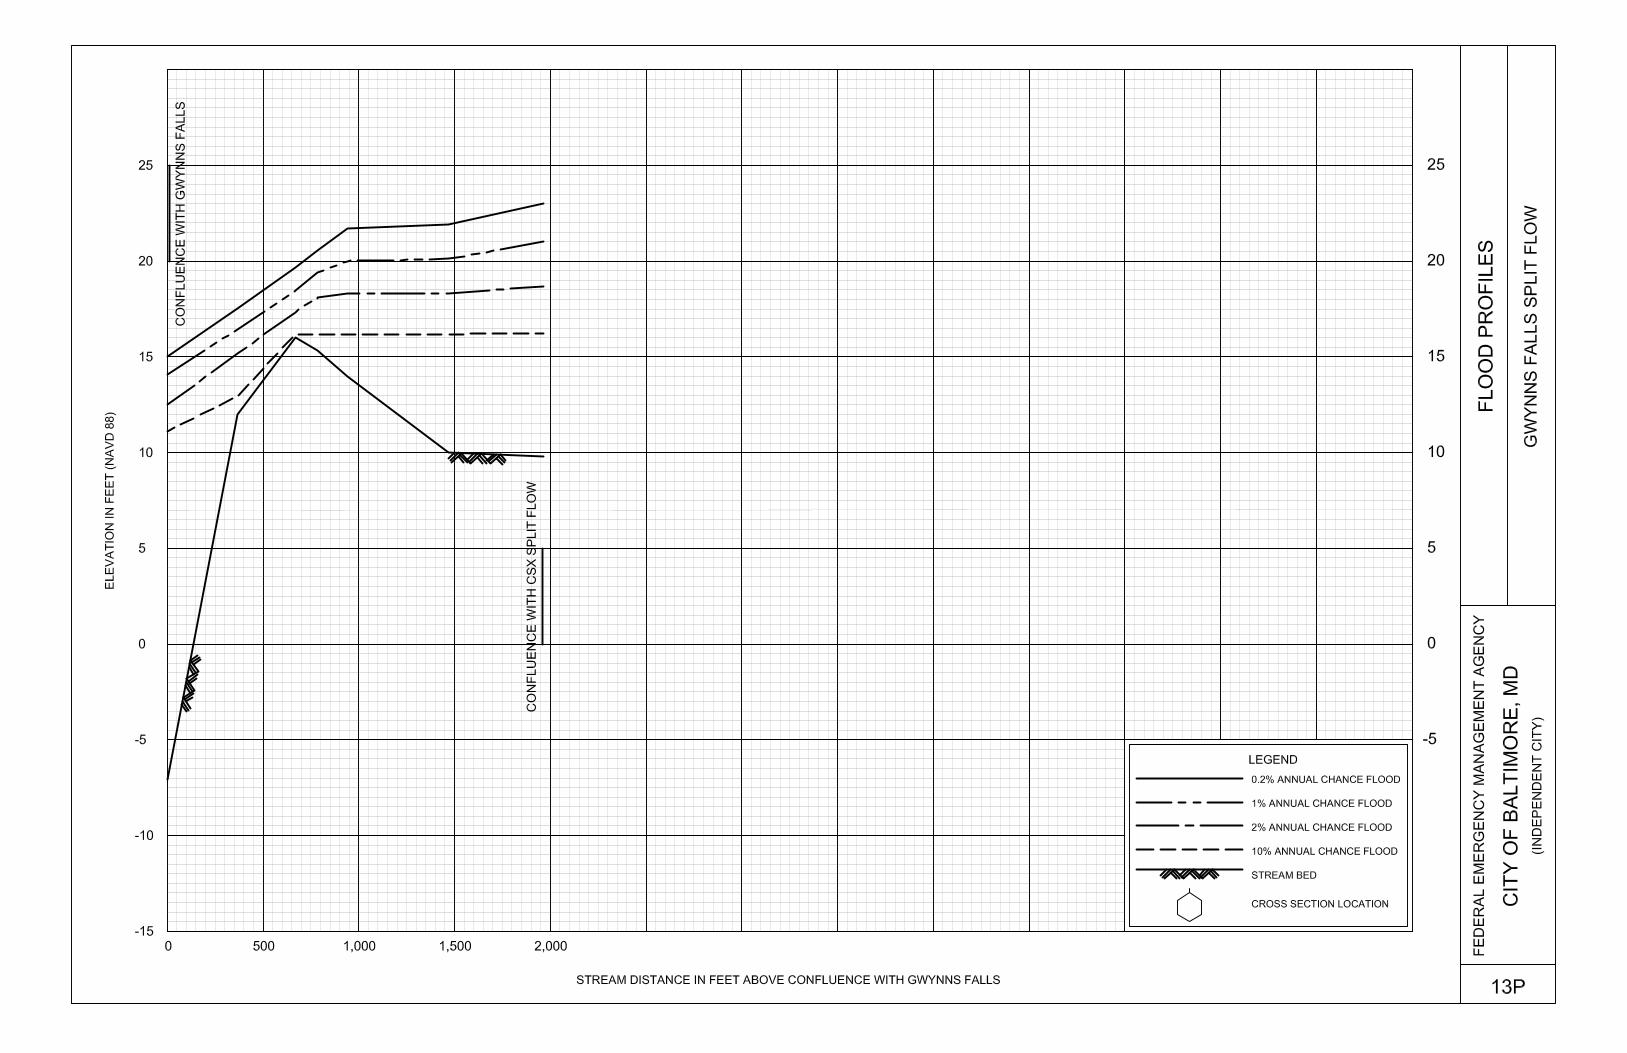
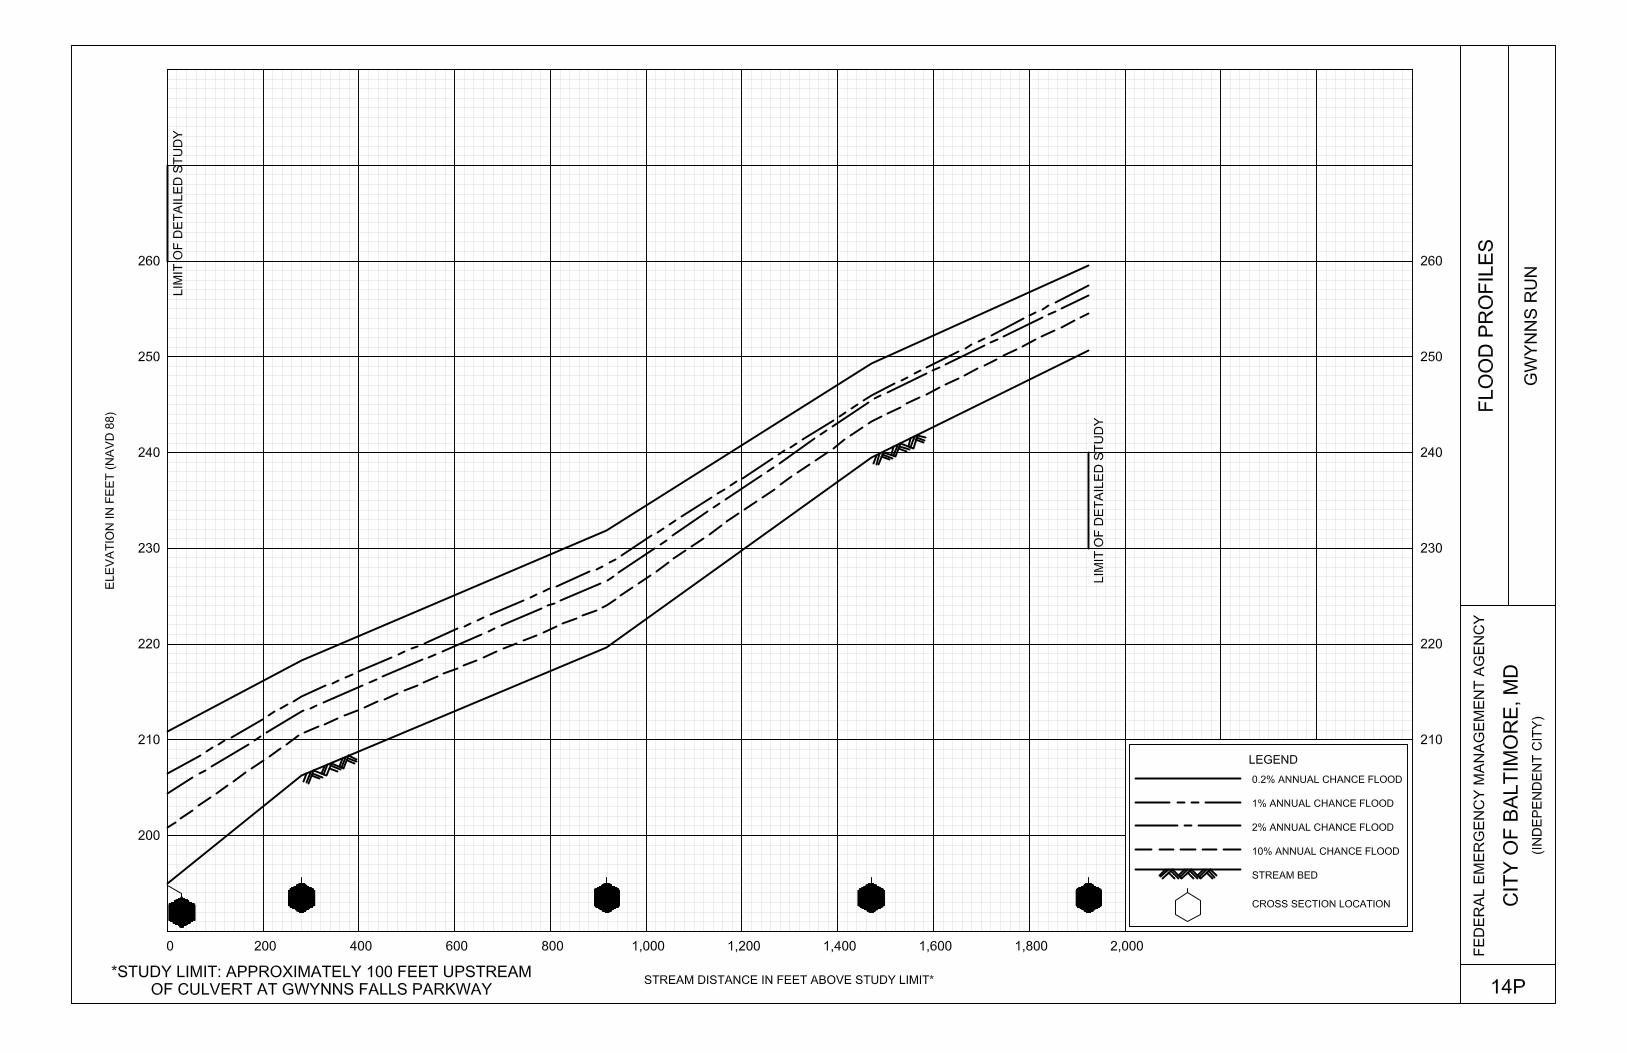
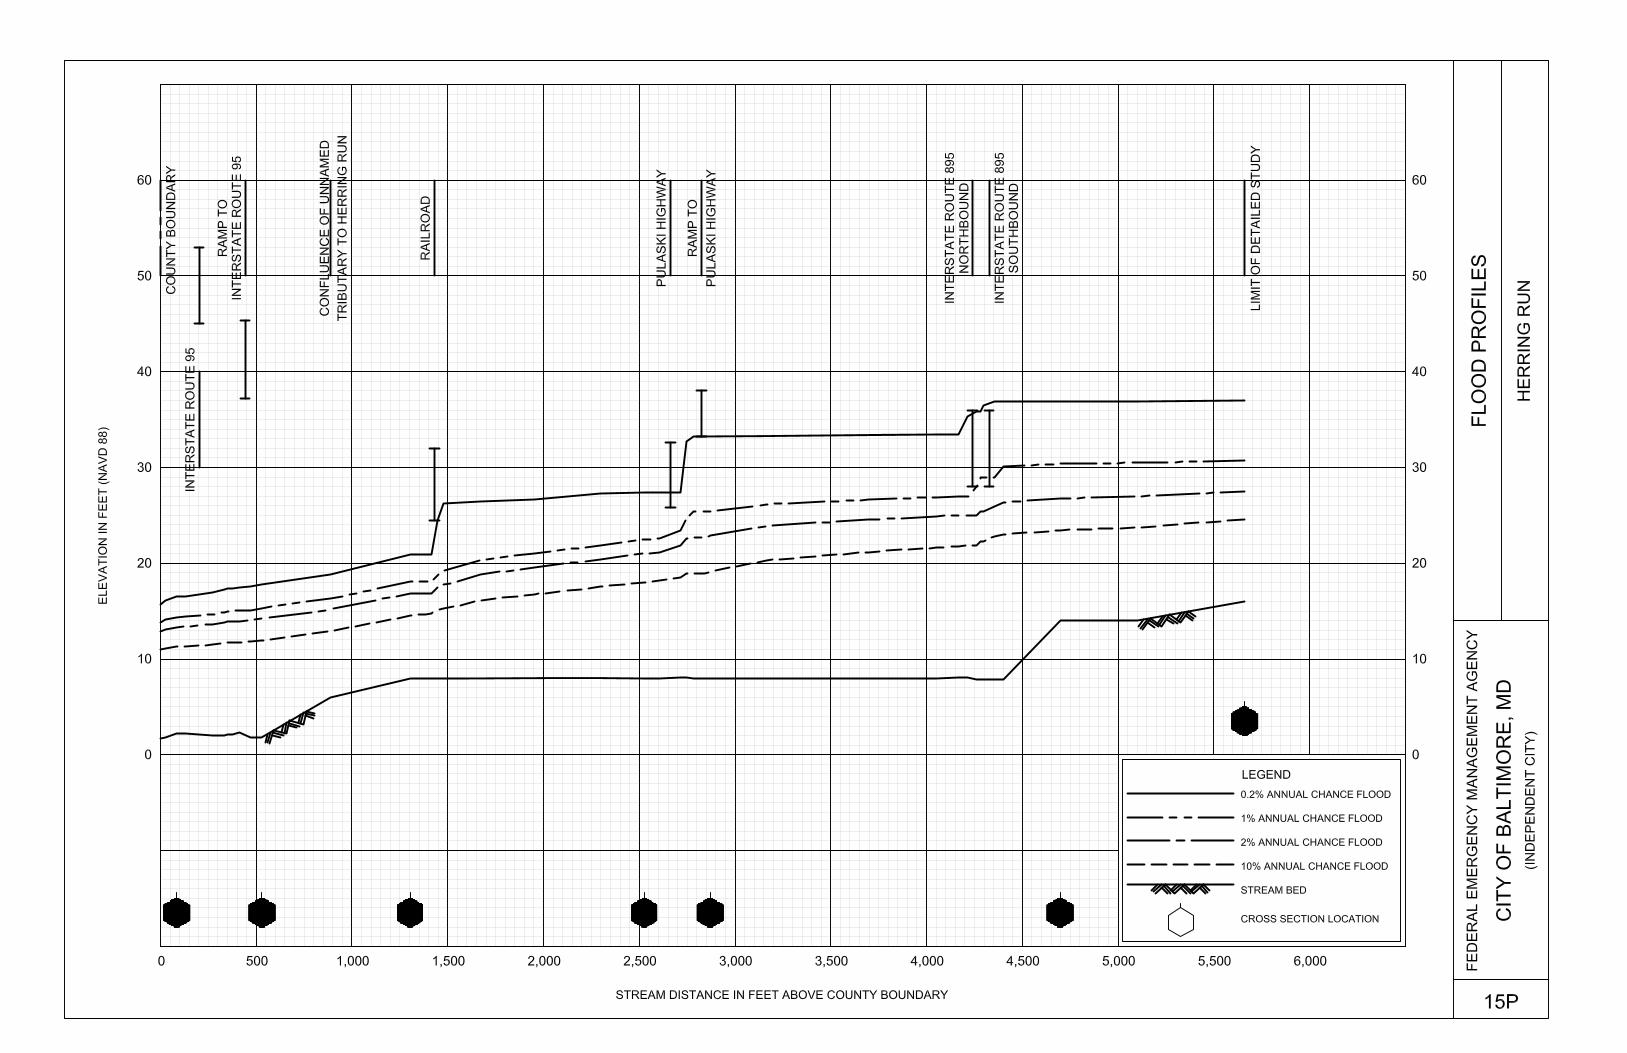
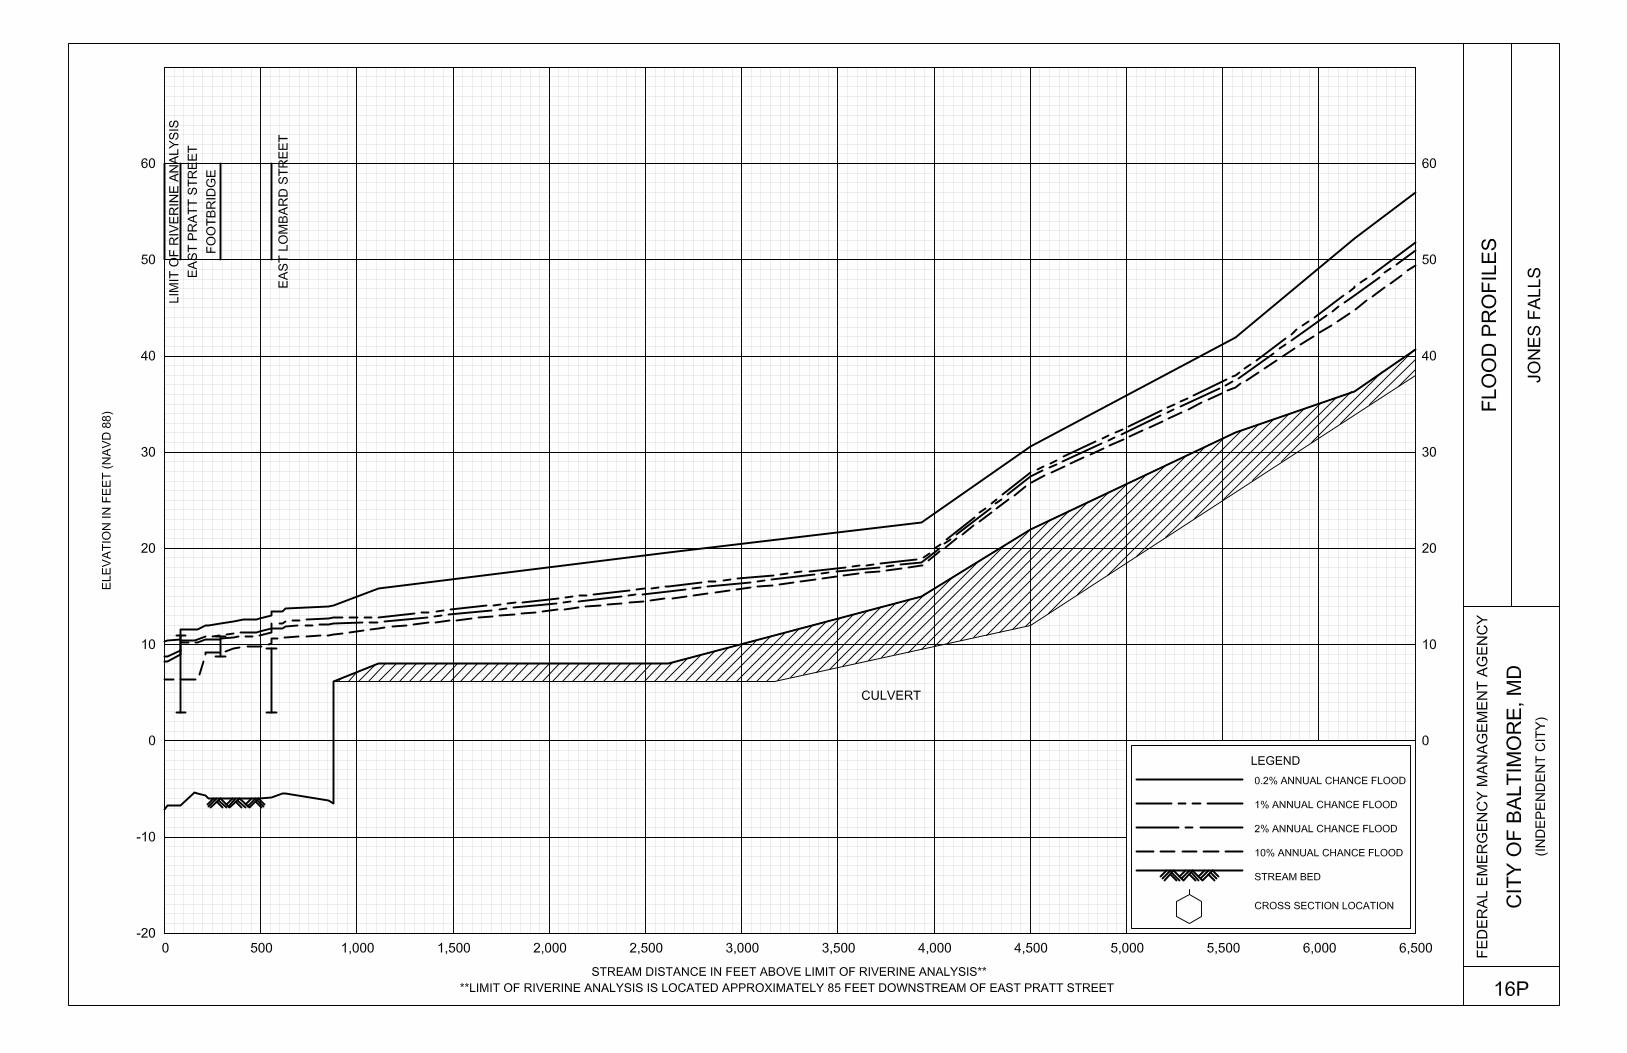
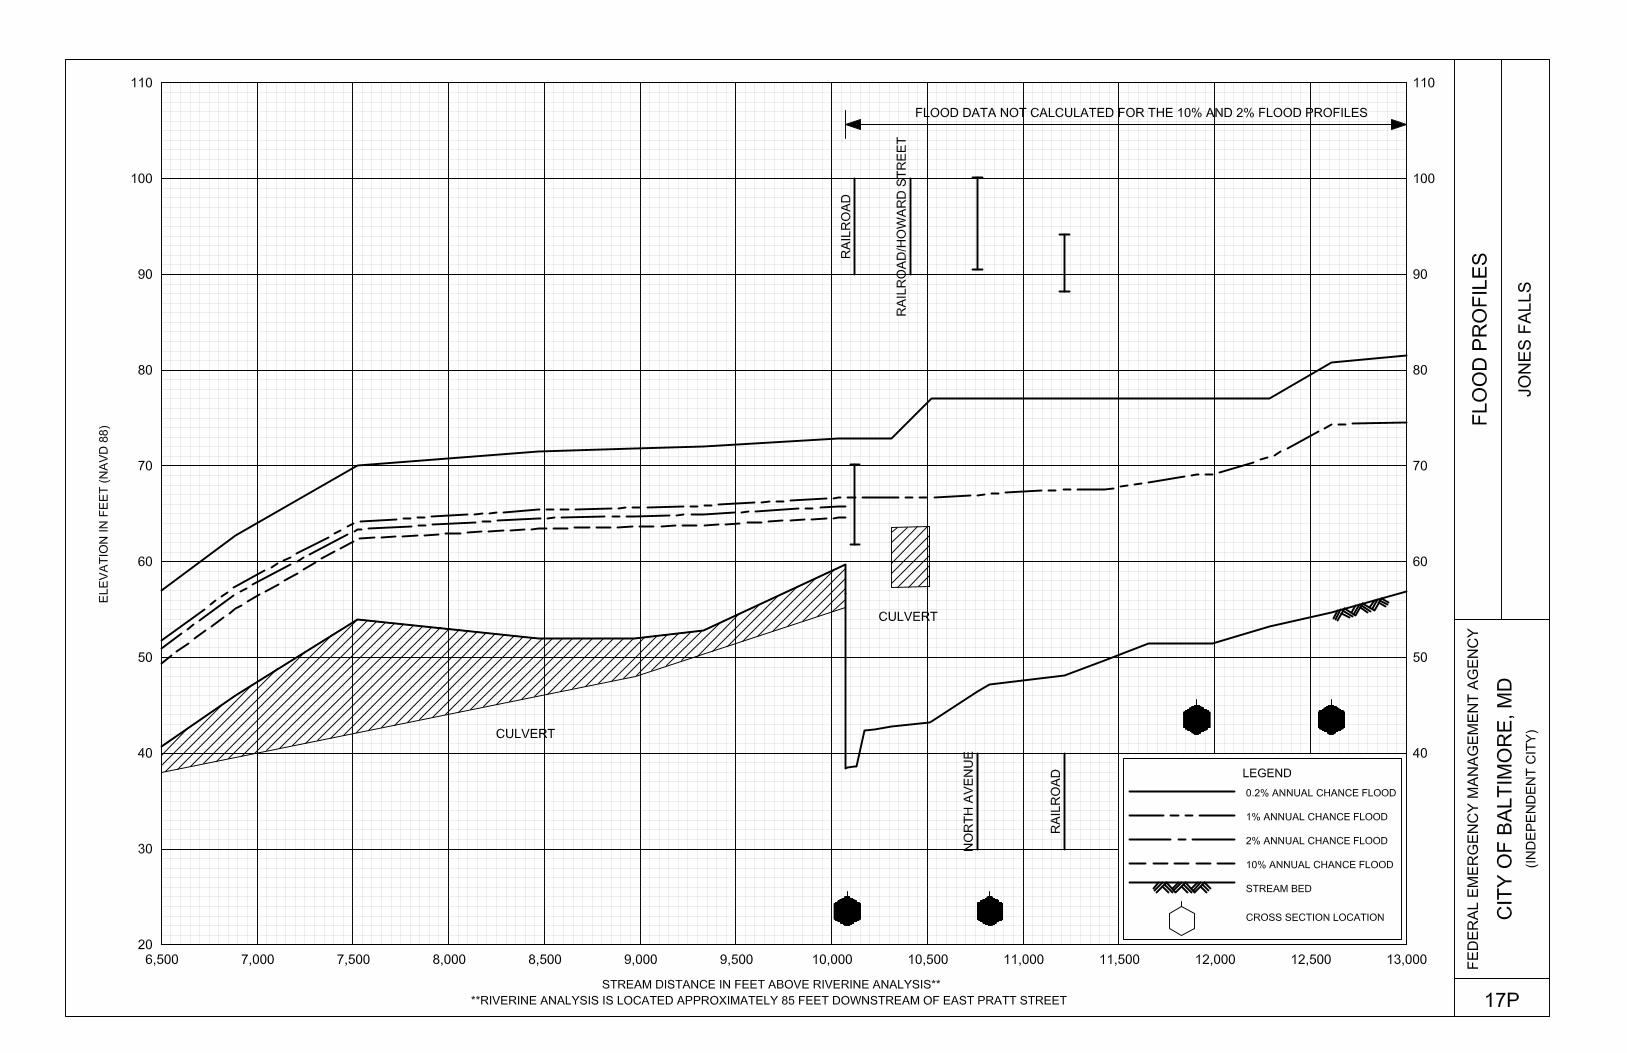
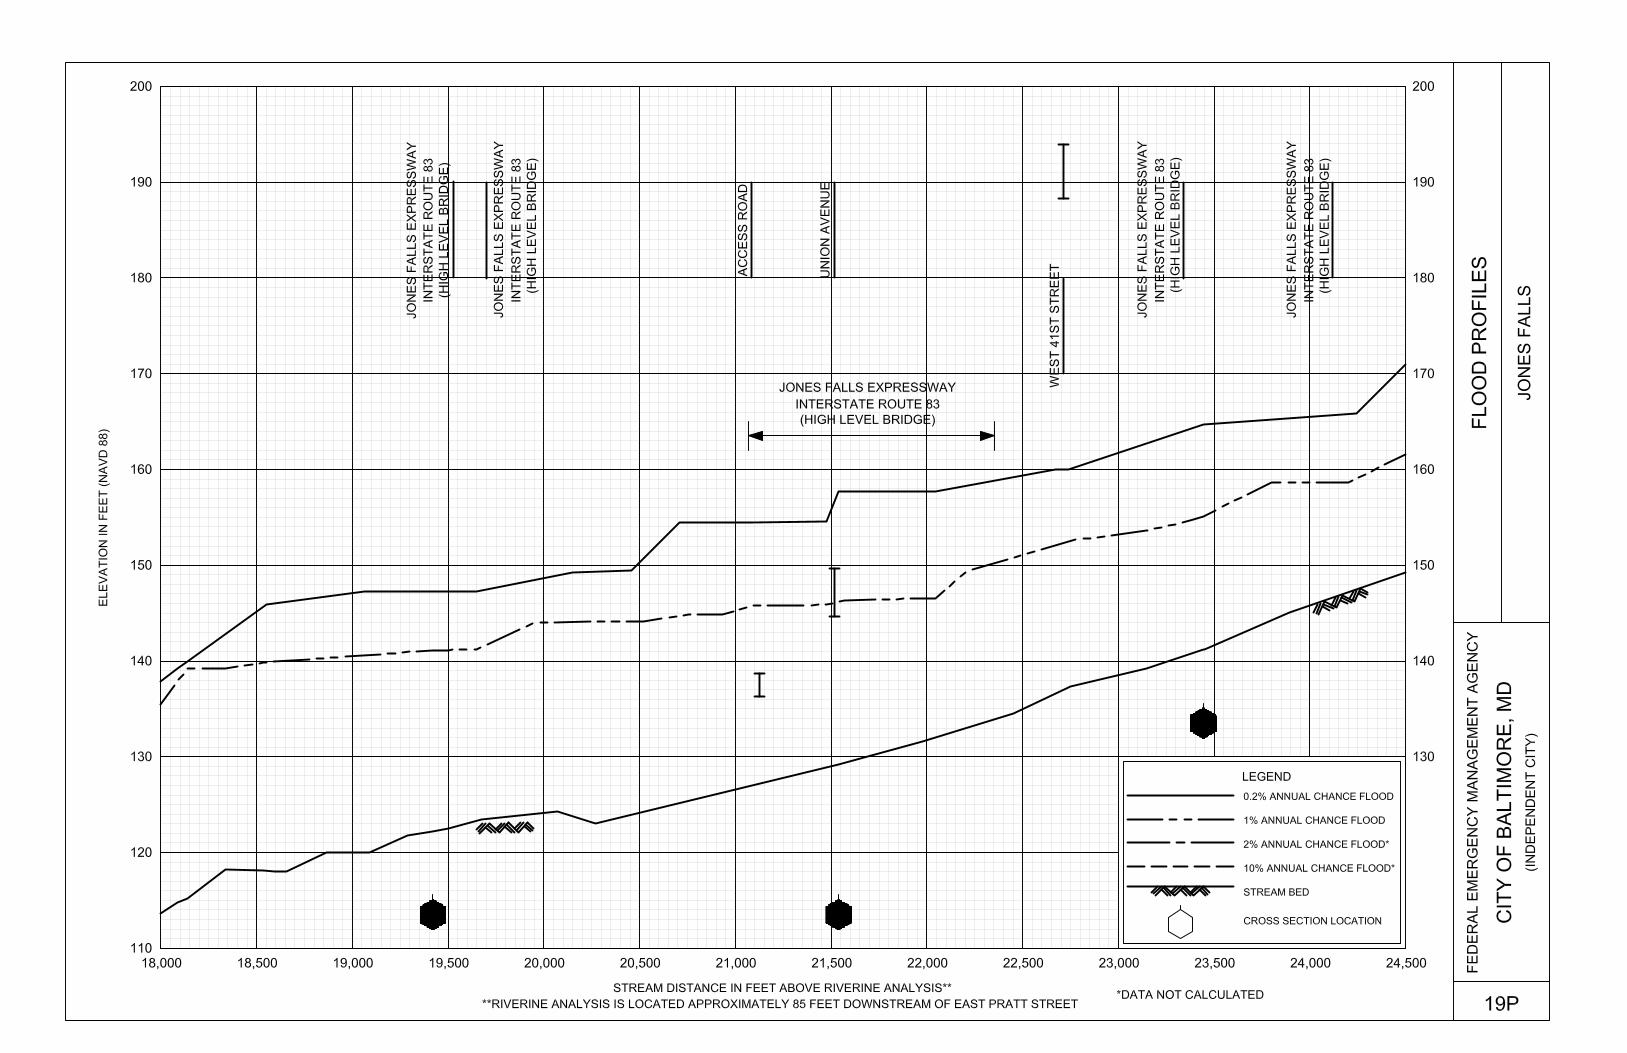
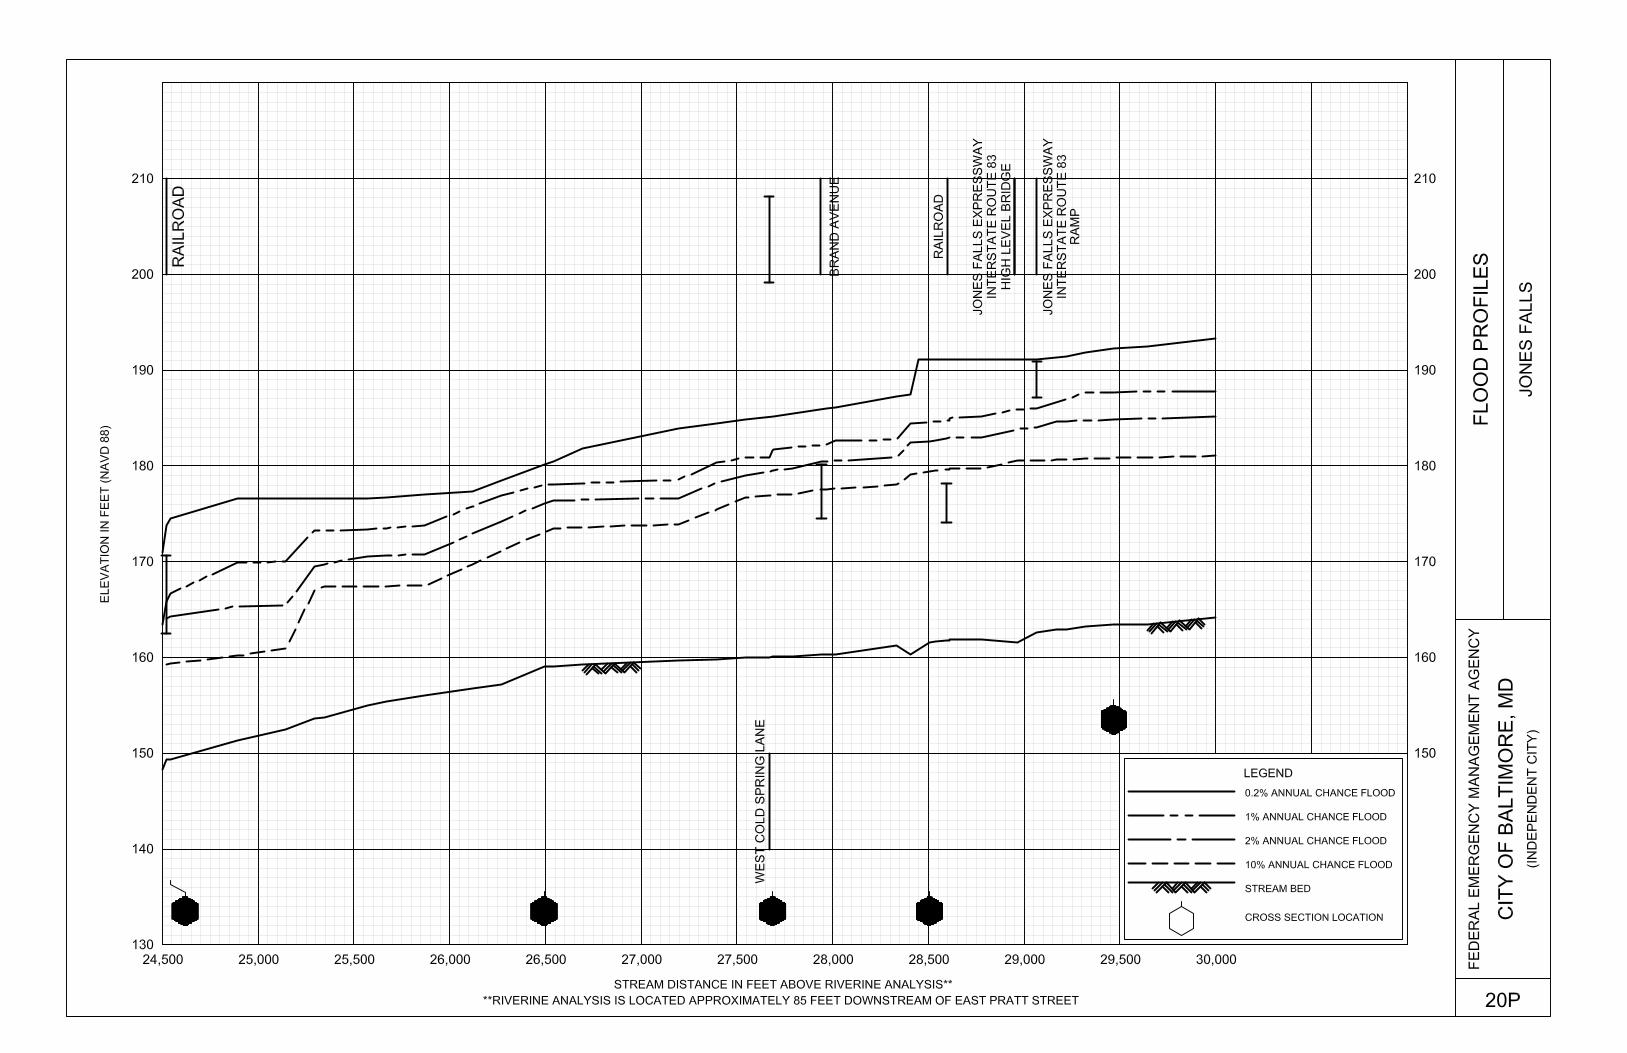
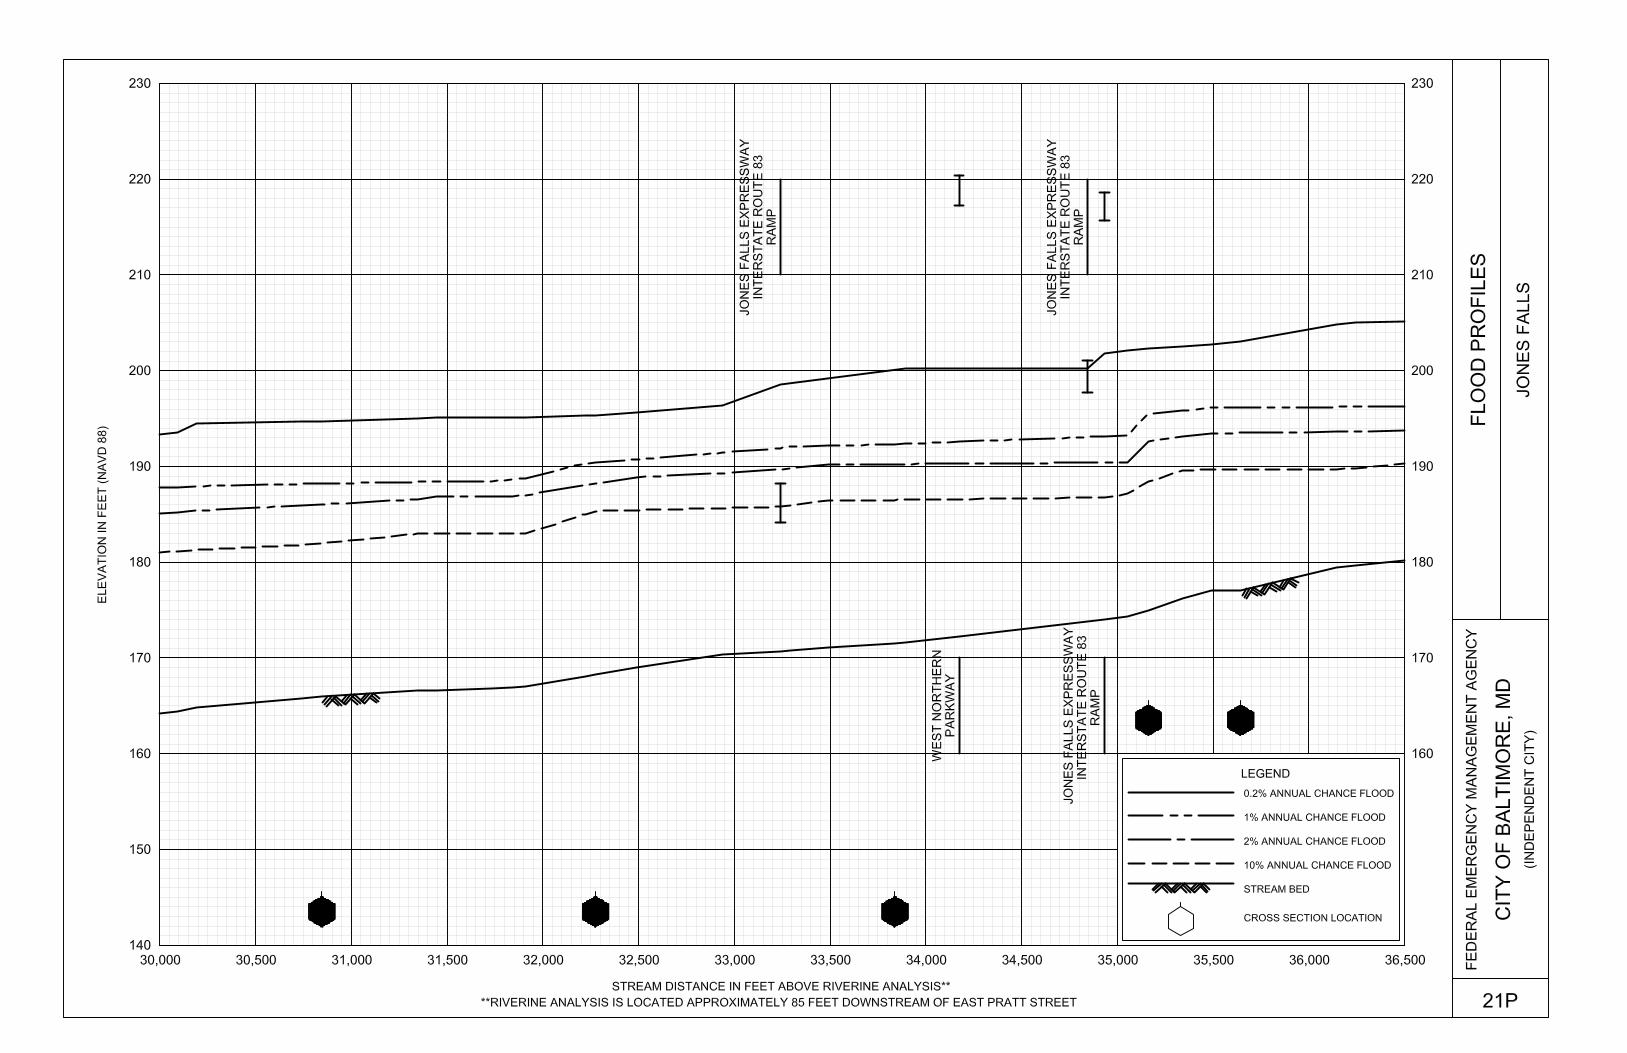
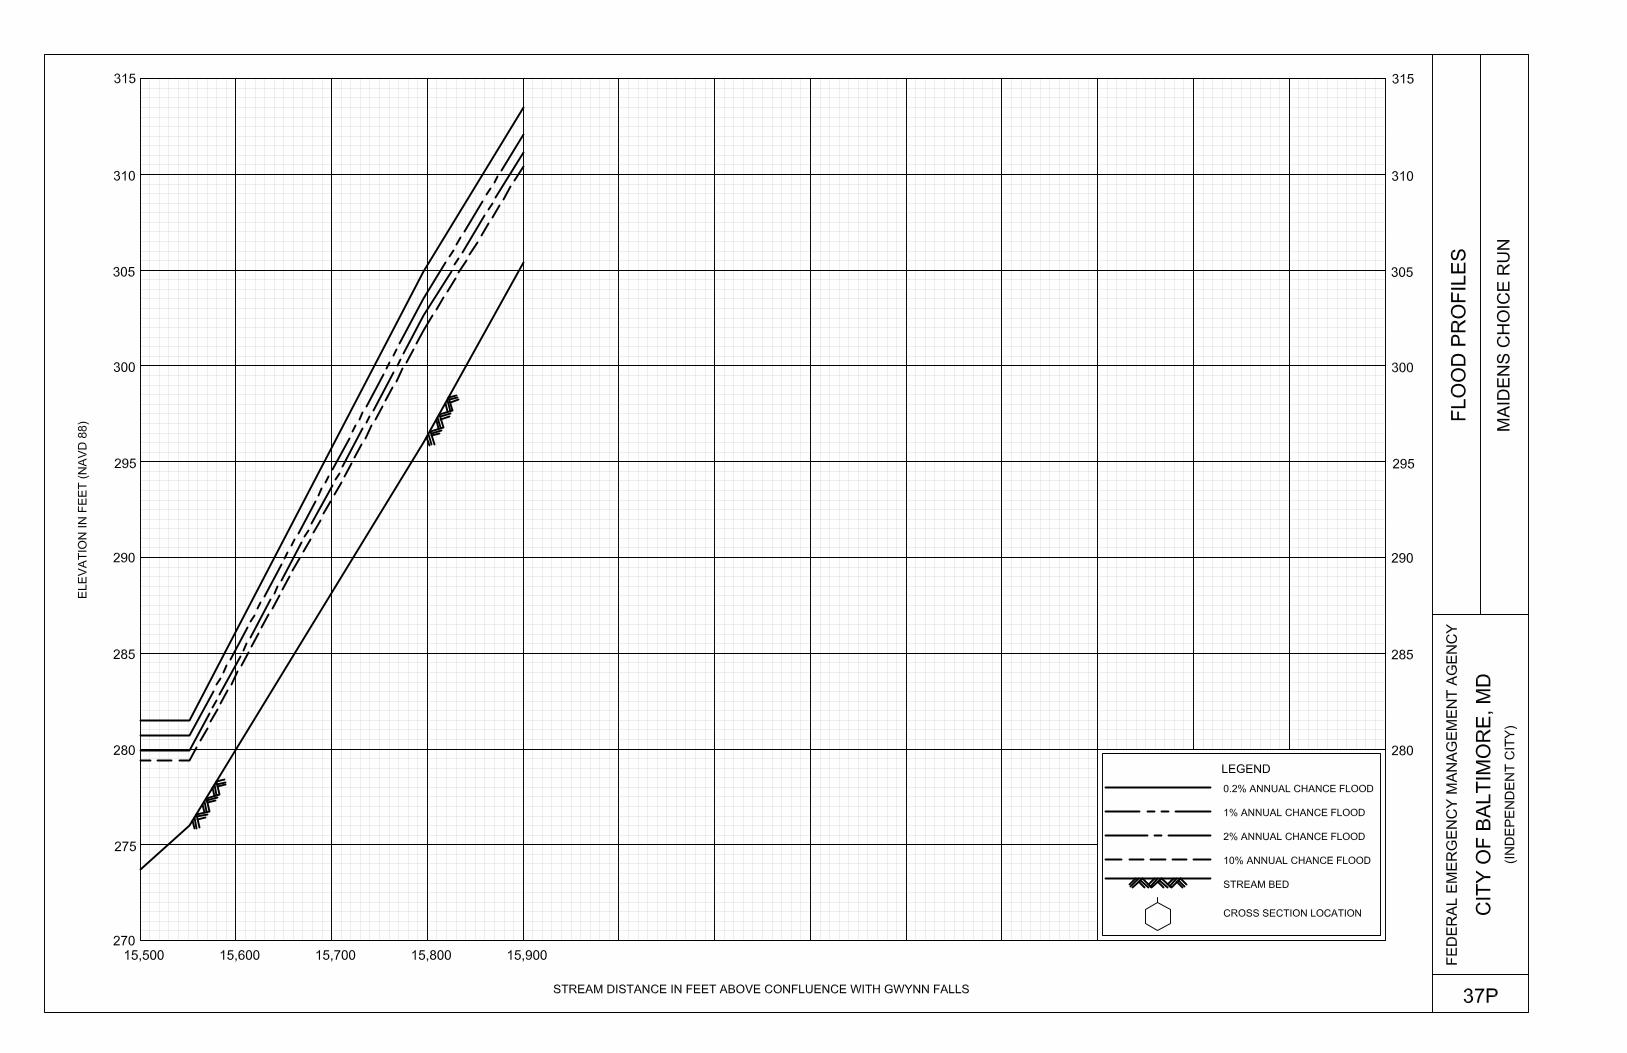
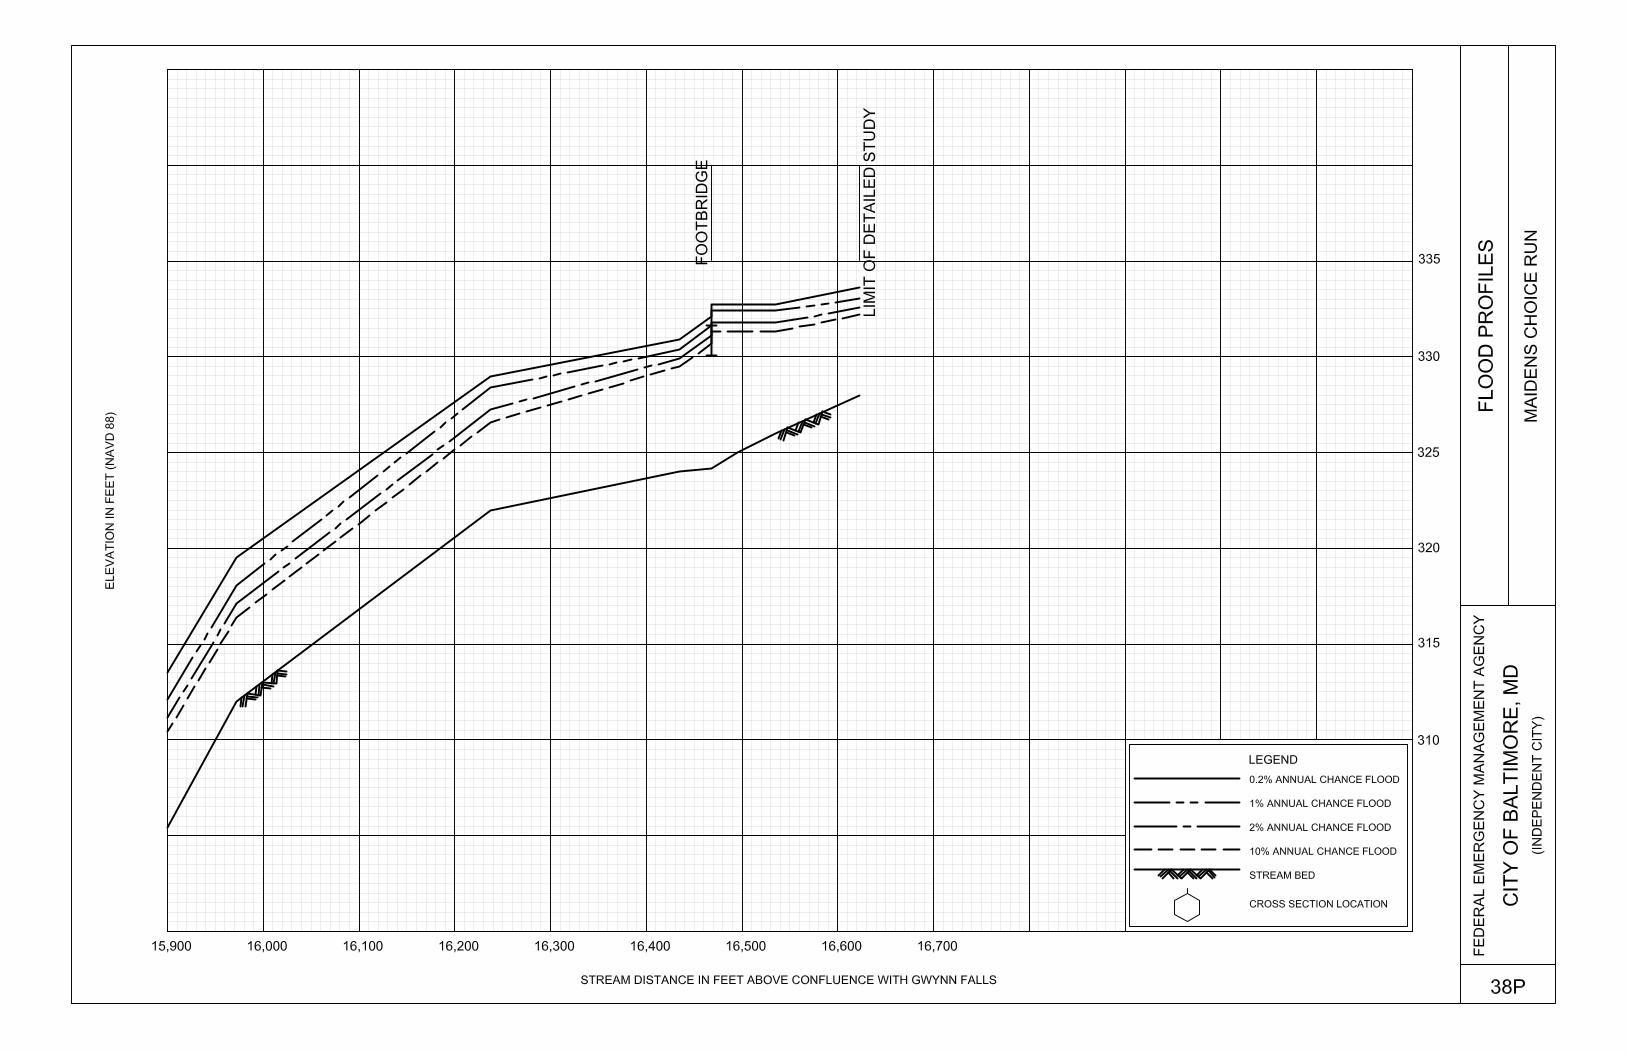
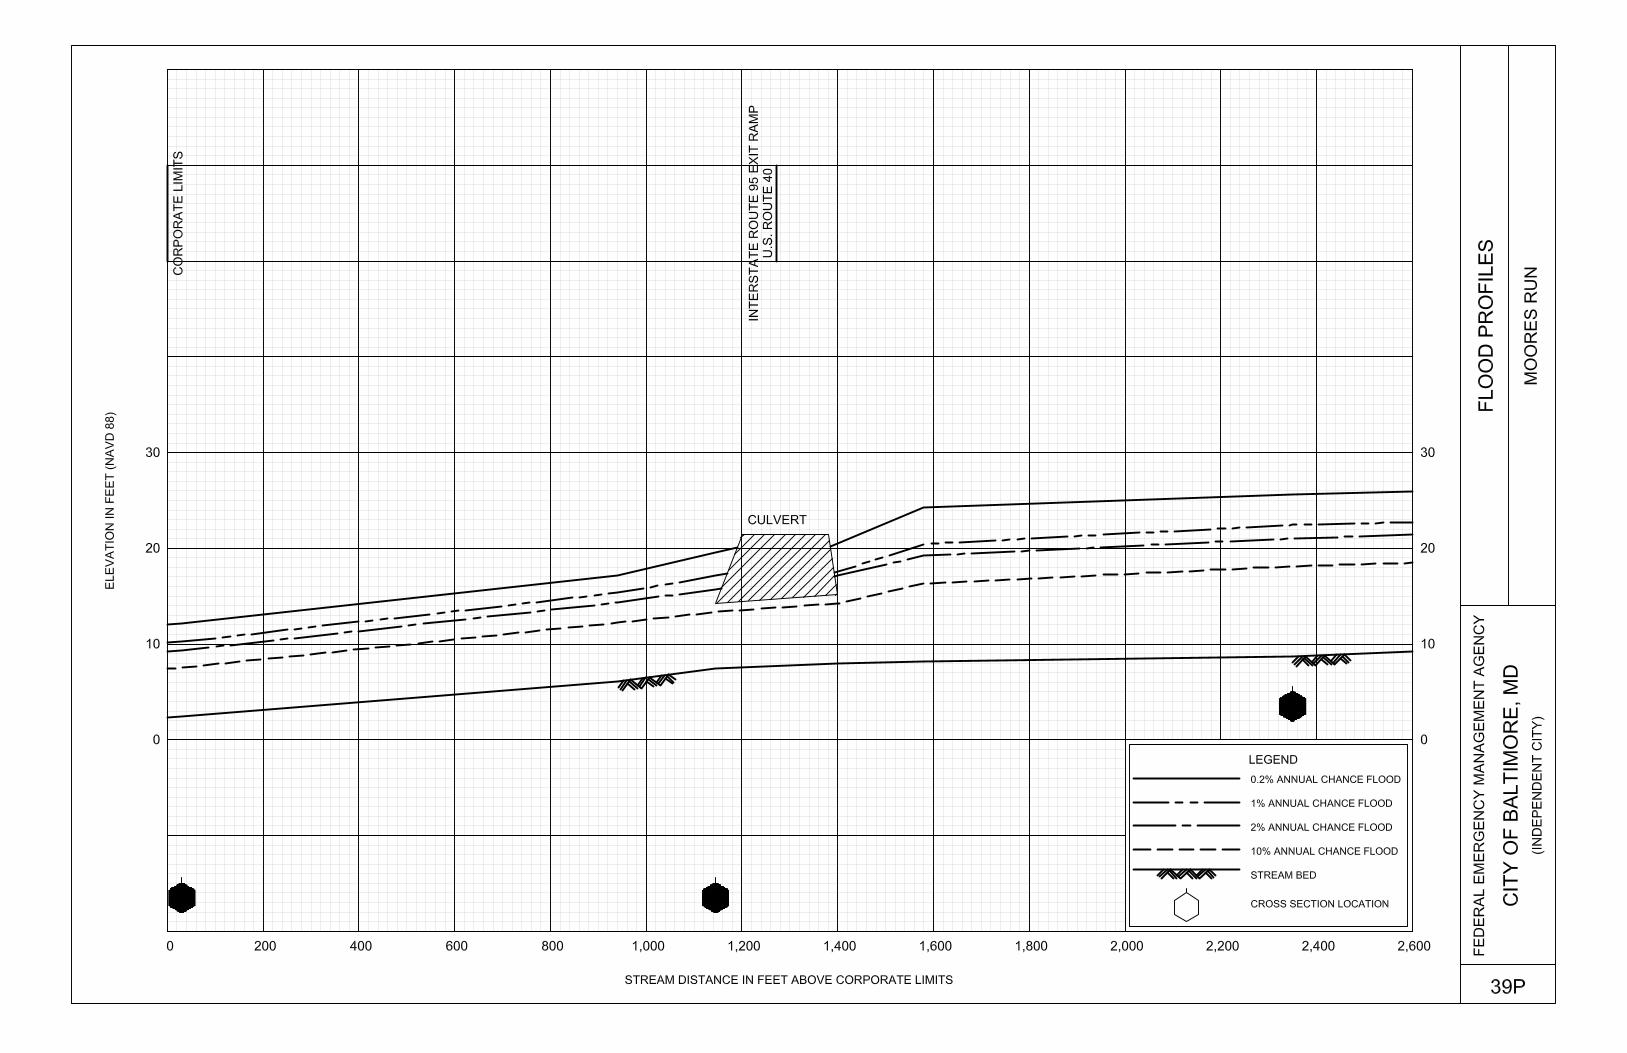
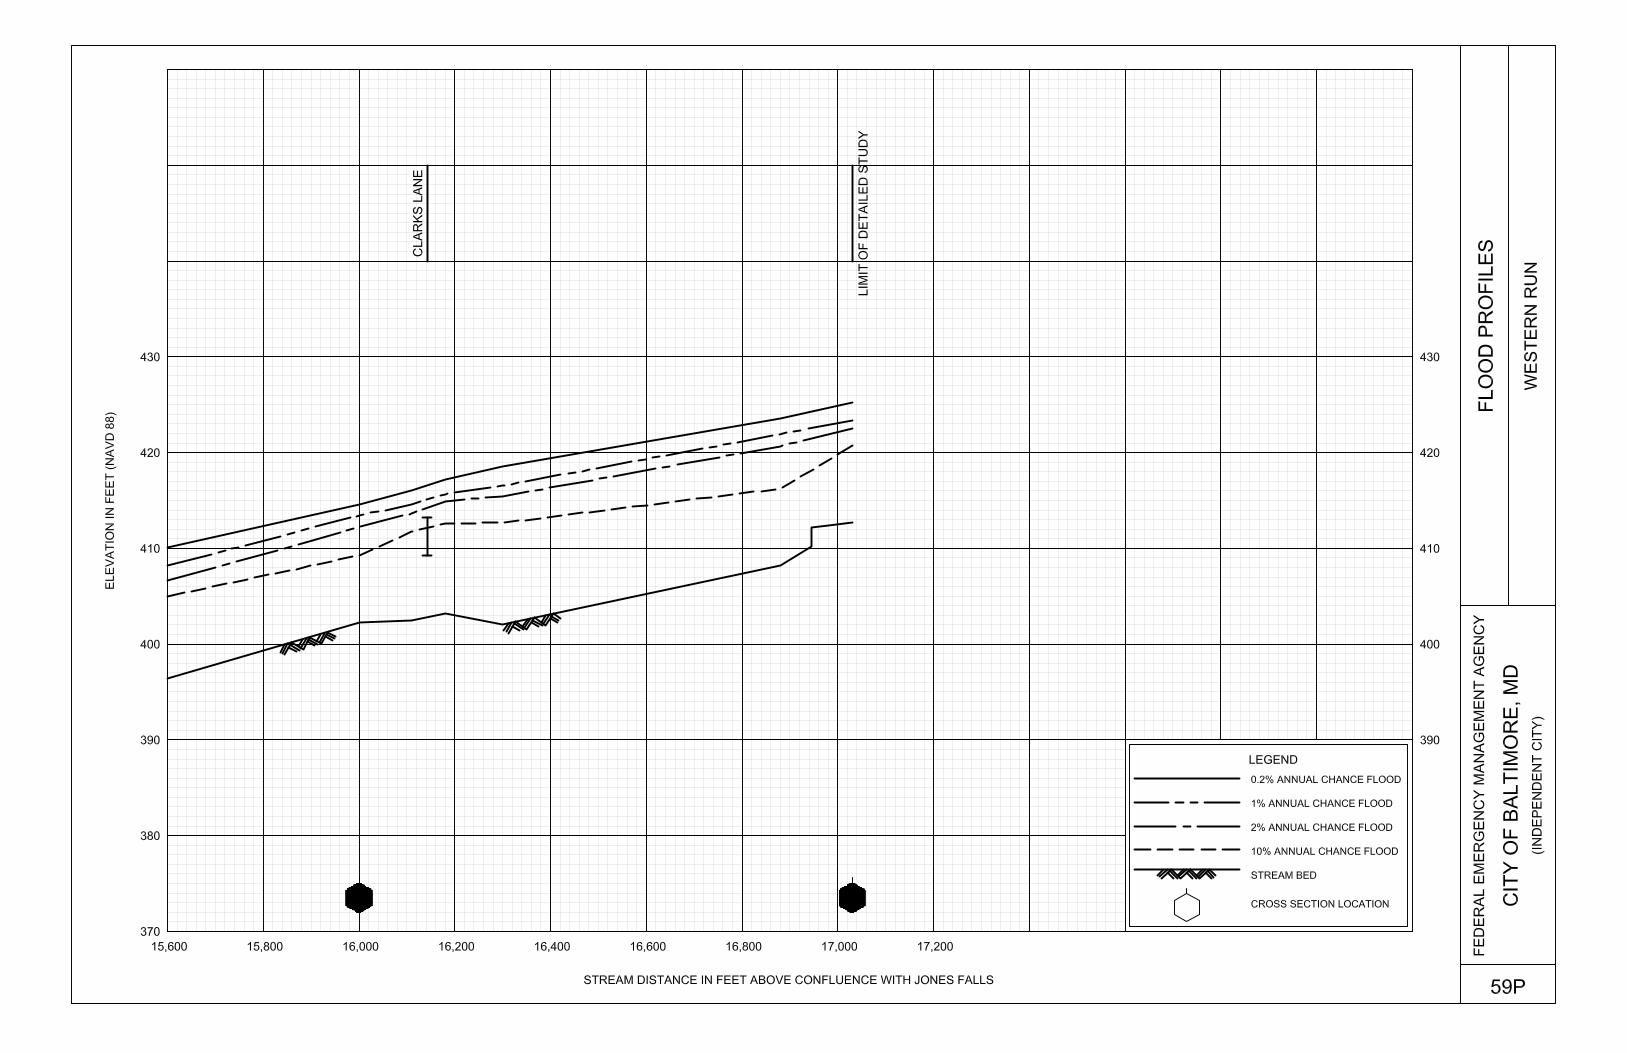
EXHIBITS Exhibit 1 – Flood Profiles Biddison Run Panels 01P-04P CSX Split Flow Panel 05P Gwynns Falls Panels 06P-12P Gwynns Falls Split Flow Panel 13P Gwynns Run Panel 14P Herring Run Panel 15P Jones Falls Panels 16P-22P Maidens Choice Run Panels 23P-38P Moores Run Panels 39P-43P Stony Run Panels 44P-51P Unnamed Tributary to Herring Run Panel 52P Western Run Panels 53P-59P Exhibit 2 – Flood Insurance Rate Map Index Flood Insurance Rate Map
1
FLOOD INSURANCE STUDY CITY OF BALTIMORE, INDEPENDENT CITY, MARYLAND
1.0 INTRODUCTION
1.1 Purpose of Study
This Flood Insurance Study (FIS) revises and updates a previous FIS/Flood Insurance Rate Map (FIRM) for the City of Baltimore, Independent City, Maryland and aids in the administration of the National Flood Insurance Act of 1968 and the Flood Disaster Protection Act of 1973. This FIS has developed flood-risk data for various areas of the community that will be used to establish actuarial flood insurance rates and to assist the community in its efforts to promote sound floodplain management. This information will also be used by the City of Baltimore to update existing floodplain regulations as part of the Regular Phase of the National Flood Insurance Program (NFIP), and will also be used by local and regional planners to further promote sound land use and floodplain development. Minimum floodplain management requirements for participation in the NFIP are set forth in the Code of Federal Regulations at 44 CFR, 60.3. In some States or communities, floodplain management criteria or regulations may exist that are more restrictive or comprehensive than the minimum Federal requirements. In such cases, the more restrictive criteria take precedence and the State (or other jurisdictional agency) will be able to explain them.
1.2 Authority and Acknowledgments
The sources of authority for this FIS are the National Flood Insurance Act of 1968 and the Flood Disaster Protection Act of 1973. Information on the authority and acknowledgments for each previously printed FIS report included in this FIS is shown below. For the March 15, 1978, FIRM, the hydrologic and hydraulic analyses was prepared by the Baltimore District of the U.S. Army Corps of Engineers (USACE) for the Federal Emergency Management Agency (FEMA), under Inter-Agency Agreement No. H-2-73, Project Order No. 2. For the September 30, 1988, FIRM, the wave height analysis in this study was prepared by Michael Baker, Jr., Inc., for FEMA. This work was completed in March 1983. In addition, the updated hydrologic and hydraulic analyses for all flooding sources, except Jones Falls, were prepared by Sheladia Associates, Inc., for FEMA, under Contract No. EMW-83-C-1178; this work was completed in April 1985. The updated hydrologic and hydraulic analyses for Jones Falls were prepared by Rummel, Klepper & Kahl. This work was completed in September 1987.
2
For the February 2, 2012, FIRM, the City of Baltimore, as a Cooperating Technical Partner (CTP), contracted Dewberry & Davis, LLC to update the hydrologic and hydraulic analyses for Gwynn Falls, Herring Run, Unnamed Tributary to Herring Run, Jones Falls, and Maidens Choice Run. All Zone A floodplains were updated by approximate methods. This work was completed in October 2008. For this revision, the coastal analysis and mapping were conducted for FEMA by the USACE and its project partners under Project Nos. HSFE03-06-X-0023 and HSFE03-09-X-1108. The coastal analysis involved transect layout, field reconnaissance, erosion analysis, and overland wave modeling including wave setup, wave height analysis and wave runup. This work was completed in 2011. The coastal analysis and mapping was conducted for FEMA by RAMPP under Contract No. HSFEHQ-09-D-0369, Task Order HSFE03-09-0002. The coastal analysis involved transect layout, field reconnaissance, erosion analysis, and overland wave modeling including wave setup, wave height analysis and wave run-up. This work was completed in August 2012. The FIRM was prepared using the Universal Transverse Mercator (UTM) zone 18N projection. The horizontal datum used is NAD 83, GRS80 spheroid. Differences in datum, spheroid, projection or UTM zones used in the FIRMs for adjacent jurisdictions may result in slight positional differences in map features across jurisdictional boundaries. The base map information shown on the revised FIRM was provided in digital format by the City of Baltimore Department of Public Works. The road centerlines, railroad centerlines, and surface water features were compiled from orthophotography produced at scales of 1"=40' and 1”=100’ from imagery dated June 2003.
1.3 Coordination
The purpose of an initial Consultation Coordination Officer’s (CCO) meeting is to discuss the scope of the FIS. A final CCO meeting is held to review the results of the study. For the September 30, 1988, revision, an initial CCO meeting was held in April 1983 to determine the streams to be studied by detailed methods. This meeting was attended by representatives of FEMA, the city, Sheladia Associates, Inc. (the study contractor), and the Maryland State Department of Natural Resources. The Baltimore City Planning Department served as the city coordinating agency for this study. Results of the hydrologic analyses were coordinated with information furnished by the U.S. Geological Survey (USGS), the USACE, the Maryland State Department of Natural Resources, and the Baltimore City Department of Planning. On August 22, 1986, the results of the September 30, 1988, study were reviewed at a final CCO meeting attended by representatives of FEMA, the city, and the study contractor.
3
For the February 2, 2012, revision, the City of Baltimore as a CTP with FEMA was involved throughout the FIRM update process. A final CCO meeting was held on May 13, 2009, and attended by representatives of the City of Baltimore, FEMA, Dewberry & Davis, LLC, and Greenhorne & O’Mara, Inc. For this revision, the FEMA Region III office initiated a coastal storm surge study in 2008 for the Atlantic Ocean, the Chesapeake Bay including its tributaries, and the Delaware Bay. No initial CCO meeting for the coastal storm surge study was held. For this revision, a final CCO meeting was held on February 20, 2013, with representatives of FEMA, the study contractor, and the City of Baltimore.
2.0 AREA STUDIED
2.1 Scope of Study
This FIS covers the City of Baltimore, Independent City, Maryland. All or portions of the flooding sources listed in Table 1, “Streams Studied by Detailed Methods,” were studied by detailed methods.
TABLE 1 – STREAMS STUDIED BY DETAILED METHODS
Biddison Run Maidens Choice Run CSX Split Flow Moores Run Gwynns Falls Patapsco River / Chesapeake Bay Gwynns Falls Split Flow Stony Run Gwynns Run Unnamed Tributary to Herring Run Herring Run Western Run Jones Falls Limits of detailed study are indicated on the Flood Profiles (Exhibit 1) and on the FIRM (Exhibit 2). The areas studied by detailed methods were selected with priority given to all known flood hazard areas and areas of projected development and proposed construction. All or portions of the following streams were studied by approximate methods: Chinguapin Run, Dead Run, Gwynns Falls, Gwynns Run, Herring Run, Maidens Choice Run, Stony Run, and West Branch Herring Run. Approximate analyses were used to study those areas having a low development potential or minimal flood hazards. The scope and methods of study were proposed to, and agreed upon by, FEMA and the City of Baltimore.
4
Tidal flooding including its wave action from the Chesapeake Bay/Patapsco River and its effects on Northwest Harbor and the Middle Branch Patapsco River was also studied by detailed methods. The areas studied by detailed methods were selected with priority given to all known flood hazard areas and areas of projected development and proposed construction. This revision incorporates new detailed coastal flood hazard analyses for the Chesapeake Bay/Patapsco River.
2.2 Community Description
The City of Baltimore is located in north-central Maryland on the Patapsco River, which connects with the Chesapeake Bay 12 miles to the east. Located in the Northeast Megalopolis, the city is approximately 38 miles northeast of Washington, D.C., and 97 miles southwest of Philadelphia. It is bordered by the unincorporated areas of Baltimore County to the north, east, west, and southwest; and the unincorporated areas of Anne Arundel County to the south. The City of Baltimore was incorporated in 1797. It is one of the largest seaports in the nation. The 2010 population was 620,961, representing a decrease in population from 2006 to 2010 of 1.6 percent. The total land area contained within the corporate limits is approximately 78 square miles. The city is almost completely urbanized except for specific areas such as park land, cemeteries, institution and school campuses, and utility lands. There are a wide variety of occupations and industries within the floodplain zones. In 1950, these zones contained nearly 2,000 manufacturing industries. The leading industries are: the primary metals industry, transportation equipment, food and kindred products, apparel and related products, and fabricated metal products. The city’s port facilitates shipping for major industries. Major rail lines serving the city include CSX Transportation and CONRAIL. Temperature and precipitation have been measured by the Weather Bureau in Baltimore dating back to 1908 at the Custom House, and dating back to 1871 at four other locations in the immediate vicinity. The maximum and minimum temperatures recorded were 107 degrees Fahrenheit (°F) and -7°F, respectively. Mean annual temperatures range from 29°F to 44°F in winter and 73°F to 91°F in summer. Normal annual precipitation is 43 inches. The 1-percent (100-year), 24-hour rainfall for the city is 7.2 inches (U.S. Department of Commerce, 1961). The maximum 24-hour rainfall recorded for the State of Maryland was 10.3 inches at the City of Cambridge, Dorchester County on September 6, 1935. The soils within the city are typically moderately sloping silt and clay loams that are moderately to poorly drained. Riverine deposits of sands, cobbles, and boulders are common along major upland streams.

5
2.3 Principal Flood Problems
The City of Baltimore is subject to tidal flooding caused by northeasters and hurricanes. Northeasters can occur at any time of the year but are more prevalent in late fall through early spring, whereas hurricanes usually occur in late summer and early fall. Riverine flooding in the city can be attributed to the following problems: urbanization, which creates more runoff from impervious zones and higher, sharper flood peaks; stream channel encroachments, which include structures within the floodplain and undersized railroad and roadway bridges; and inadequate storm sewer drainage. These flooding problems are enhanced by high tides along the city waterfront. Flooding in the city has caused loss of life; the flood of 1966 had 39 fatalities. There has also been loss of dwellings, factories, bridges, and farm animals. The most severe storm of record in the Baltimore area was a hurricane that occurred in 1933. This hurricane hit the coast at a higher latitude than most tropical storms that affect the region and entered the Chesapeake Bay directly from the ocean. There was no loss of energy by passing overland. Damage from tidal flooding in the Baltimore area was estimated to be approximately $5 million. Wind velocities reached 60 miles per hour, and tides rose to a record height of 7.87 feet at Fort McHenry. One of the most significant flooding events in recent years was Tropical Storm Isabel in September 2003. Isabel was a federally declared disaster, which caused over $8 million in damage in Maryland. Hurricanes that have affected the Baltimore area are shown in the following tabulation:
Name Date Category1 Proximity to Baltimore (No name) September 19, 1928 4 Hit (post hurricane stage) (No name) August 23, 1933 3 Hit Carol August 30, 1954 2 Near miss Hazel October 15, 1954 4 Hit (post hurricane stage) Connie August 13, 1955 1 Hit (post hurricane stage) Diane August 18, 1955 1 Hit (post hurricane stage) Donna September 12, 1960 4 Near miss Agnes June 22, 1972 1 Tropical Storm at Baltimore David September 6, 1979 2 Tropical Storm at Baltimore Gloria September 27, 1985 2 Near miss Isabel September 23, 2003 1 Tropical Storm at Baltimore Irene August 27, 2011 1 Hit Sandy October 29, 2012 1 Near miss
1At U.S. landfall, based on the Saffir/Simpson Hurricane Scale (range: 1 to 5)
6
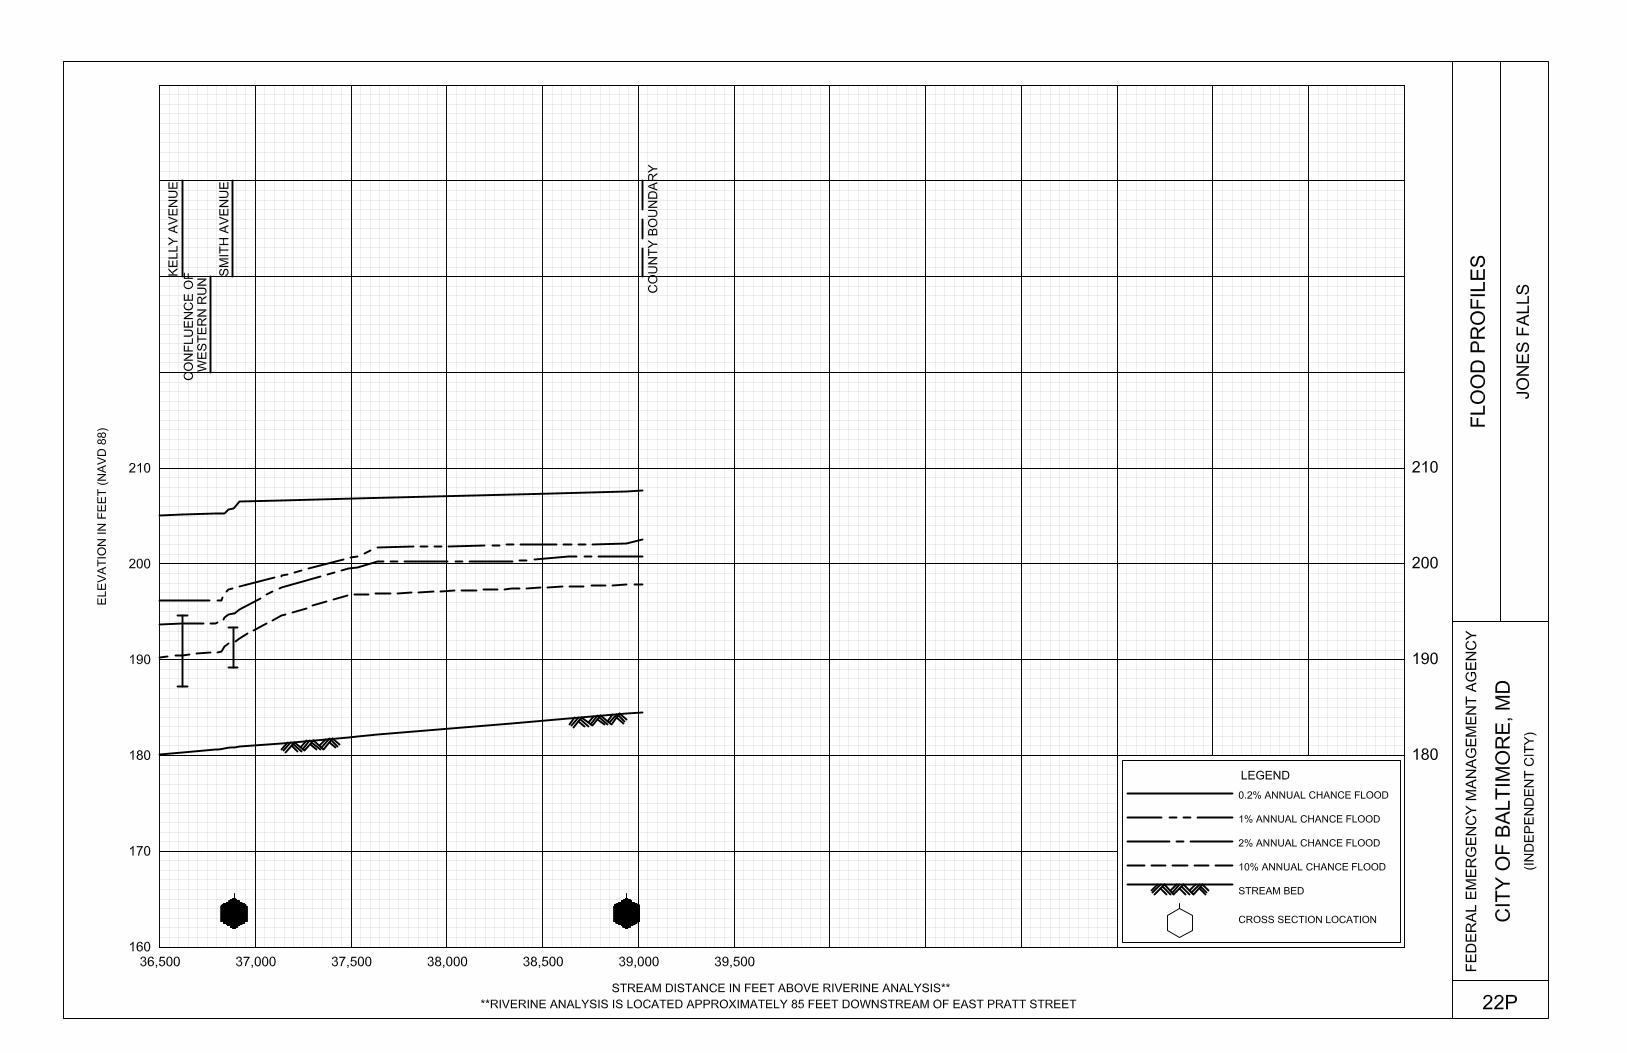
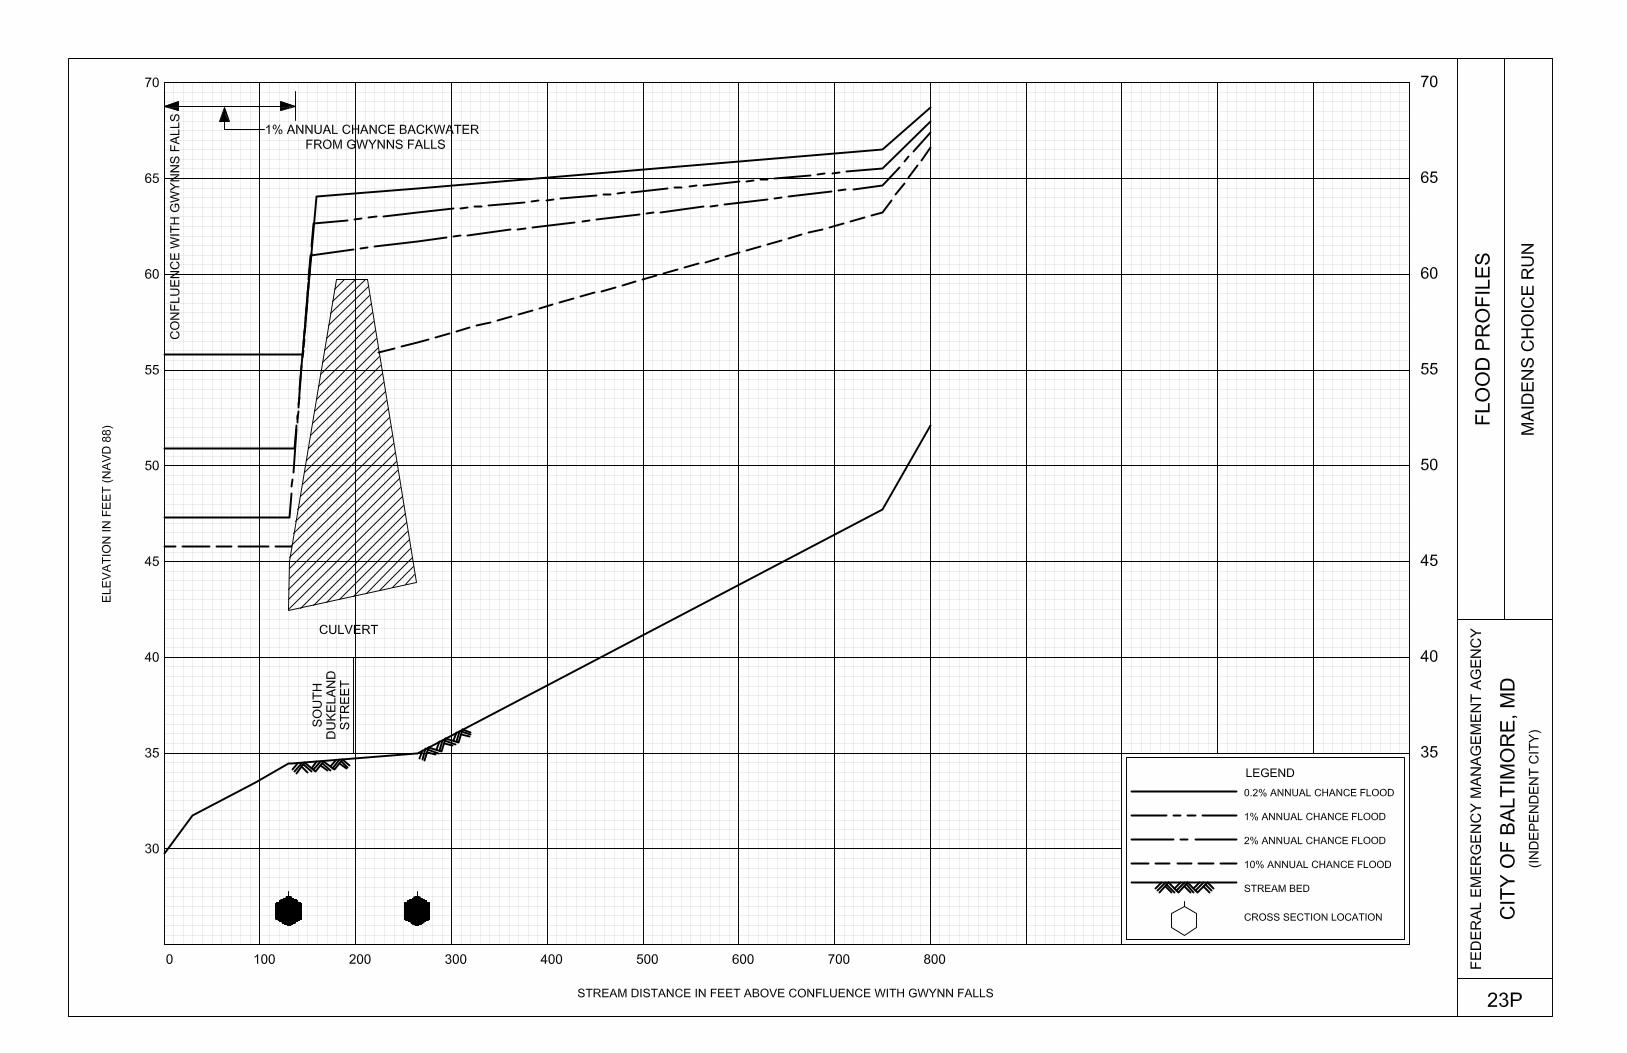
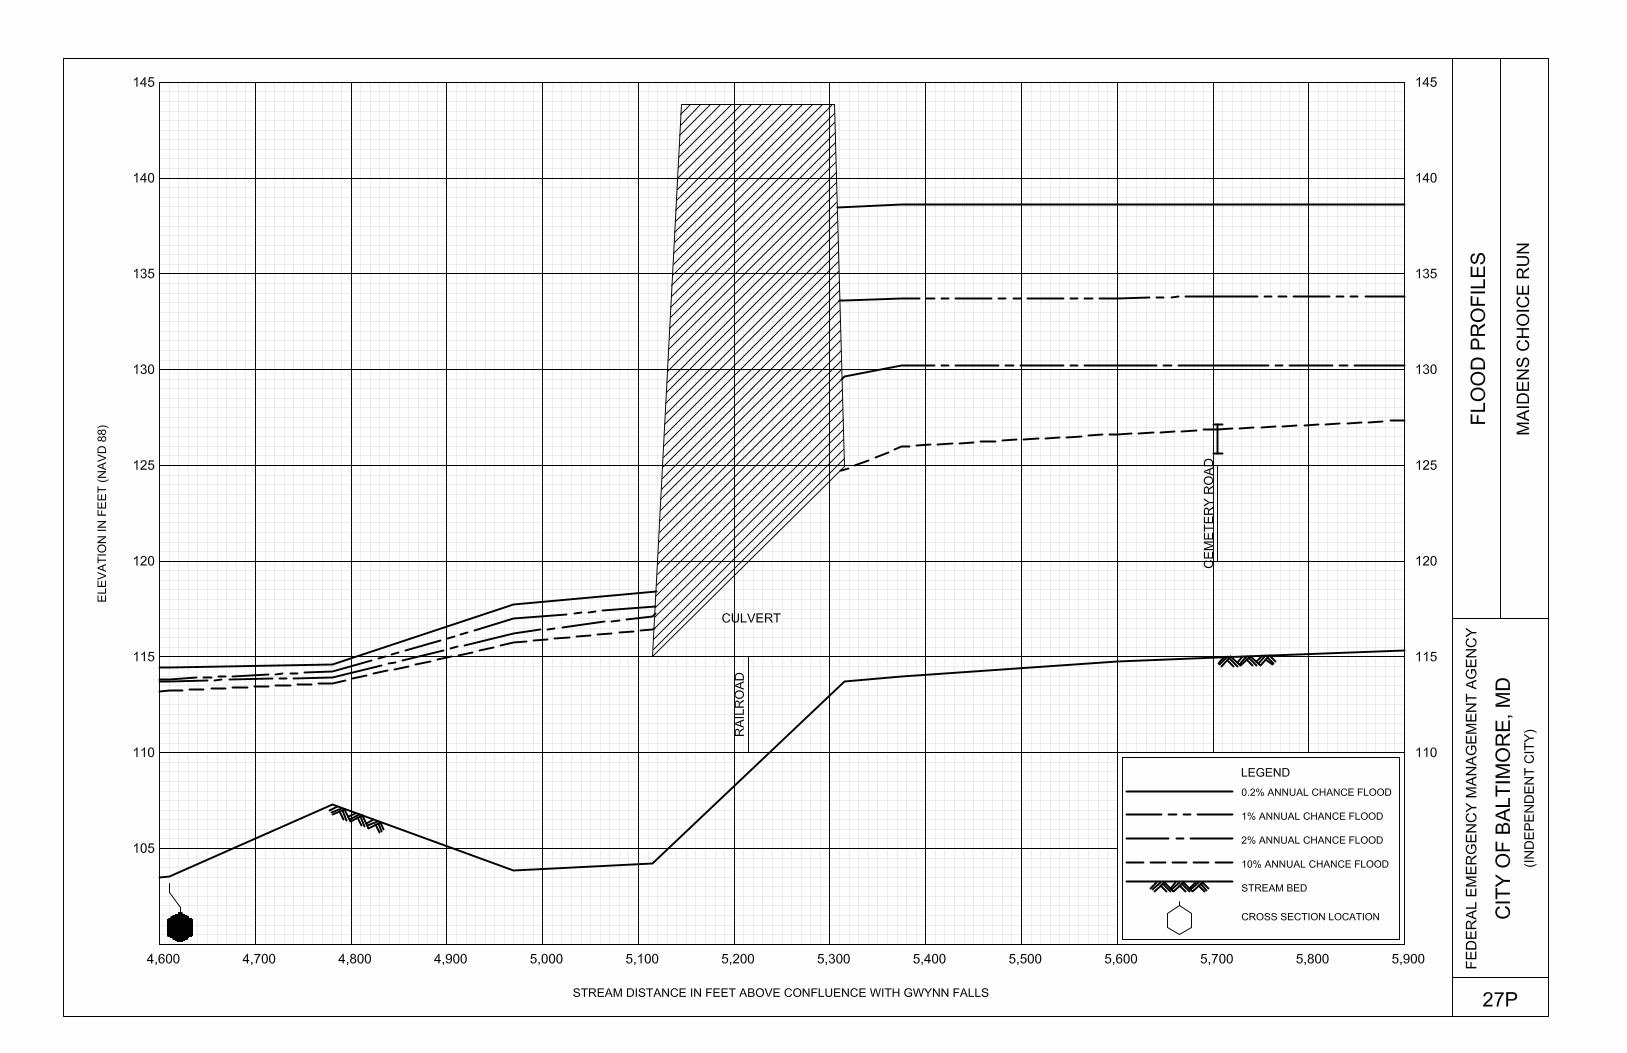
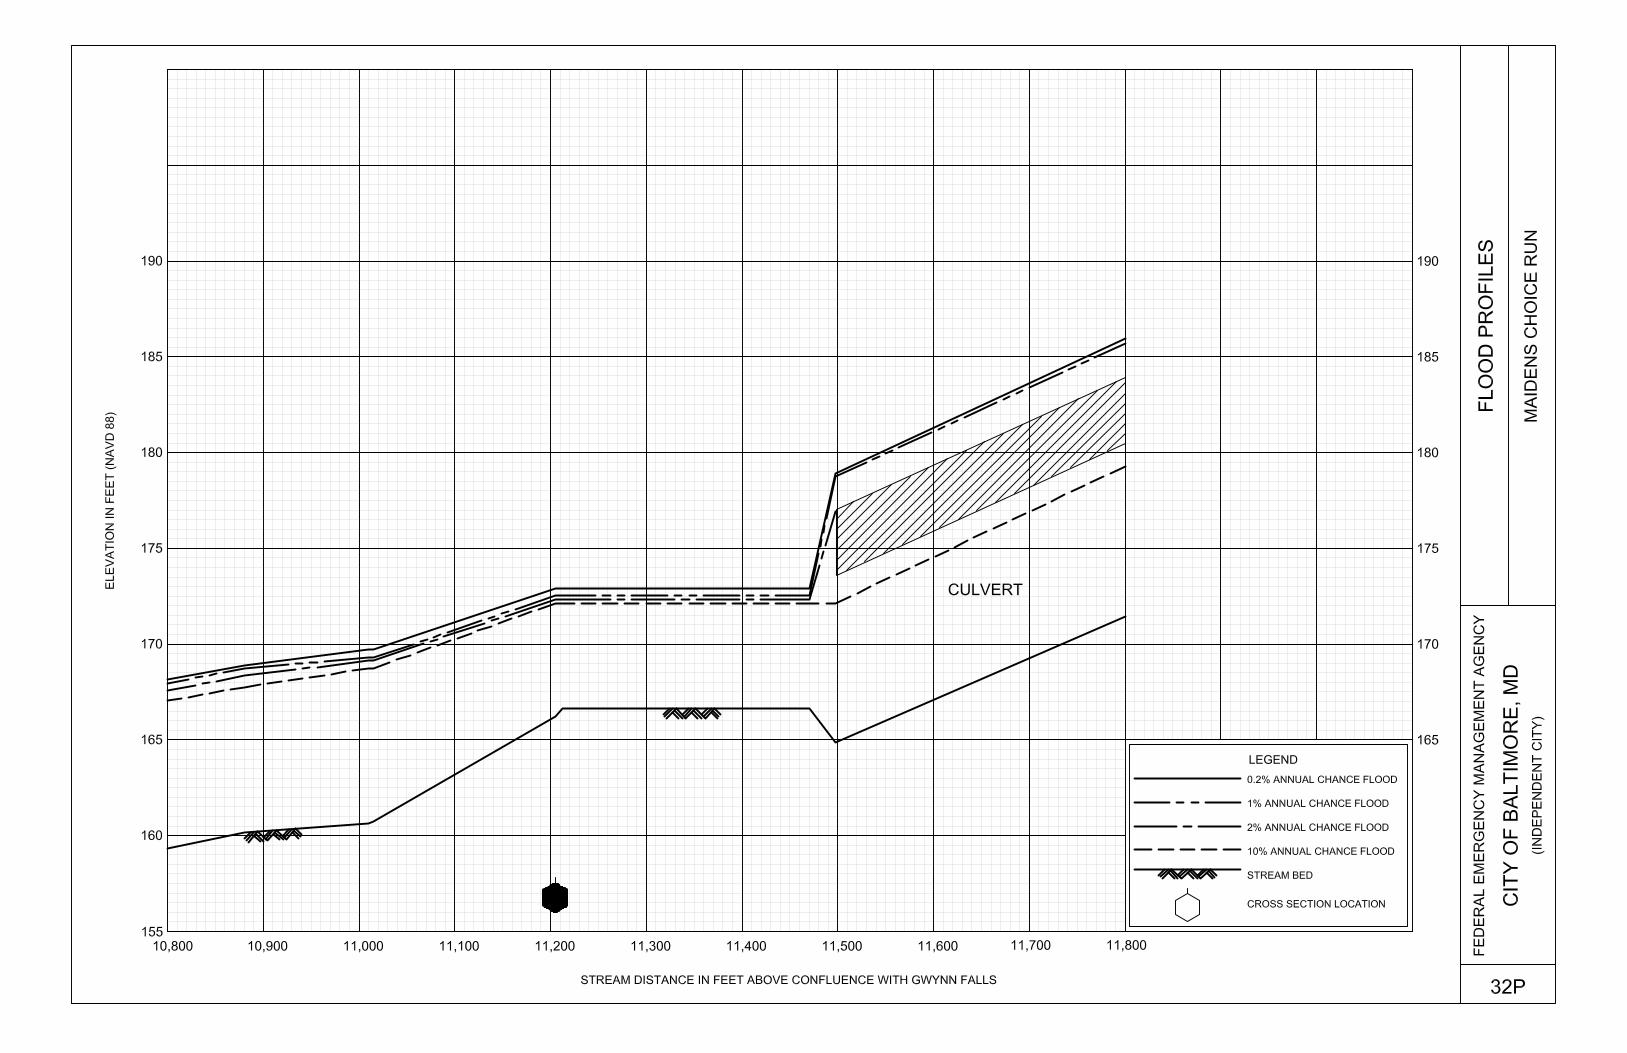
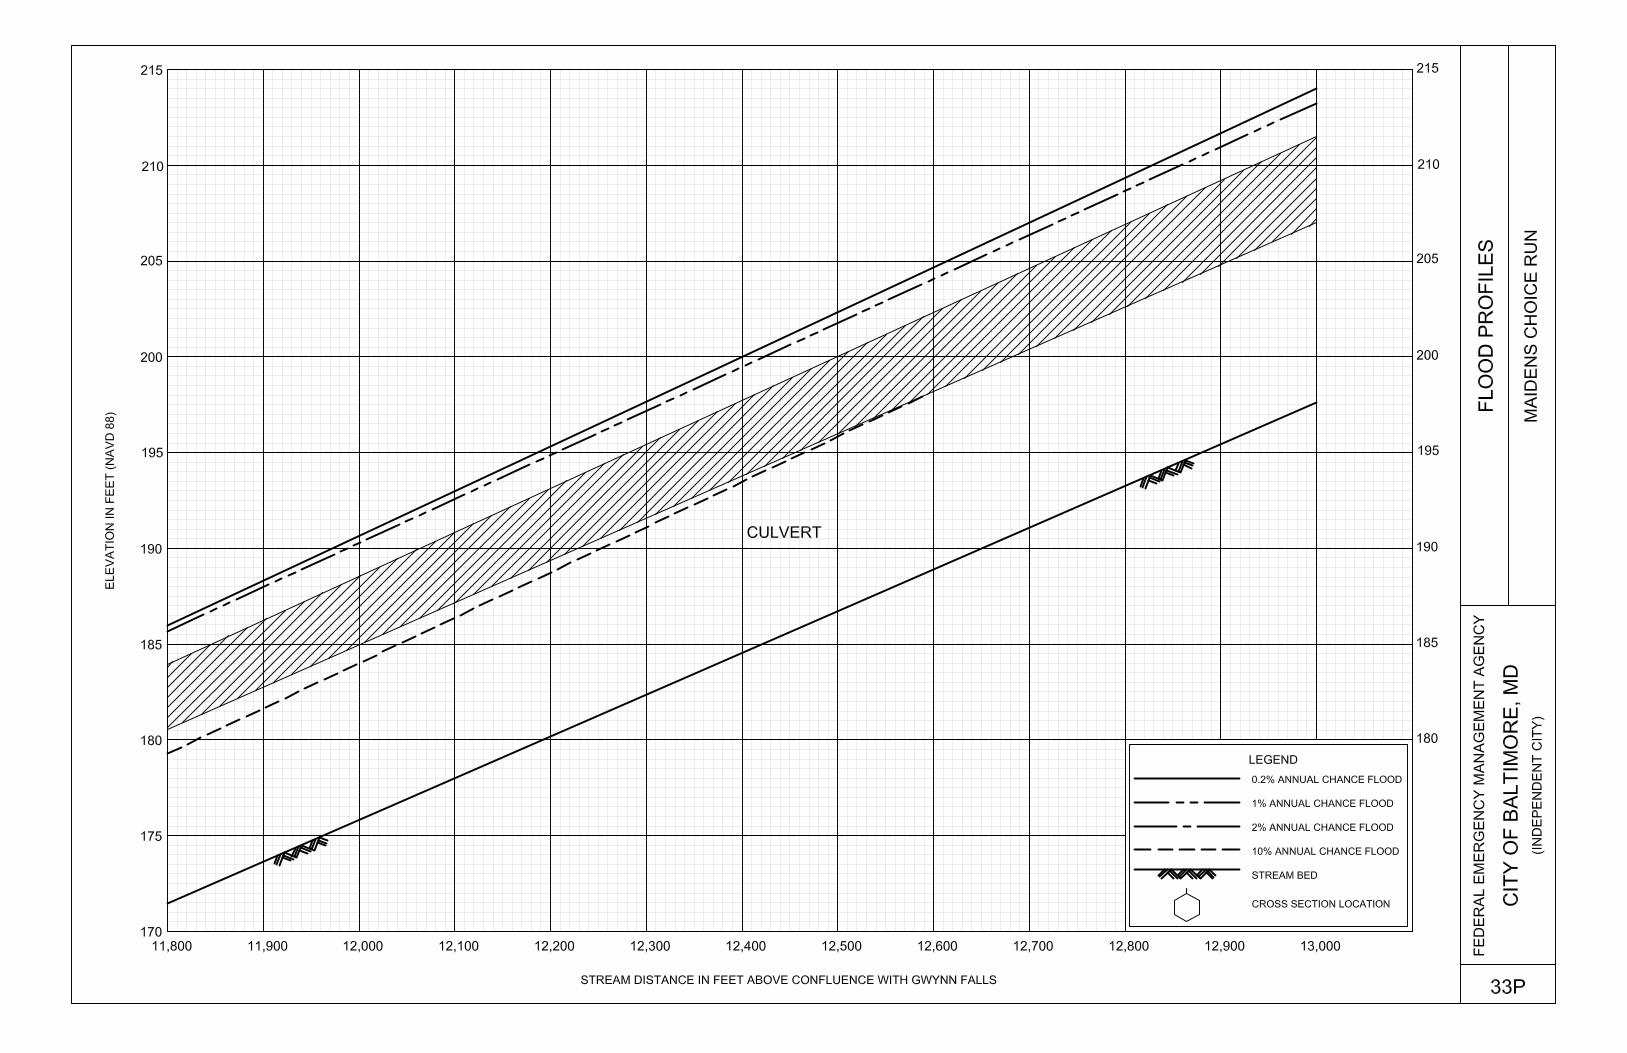
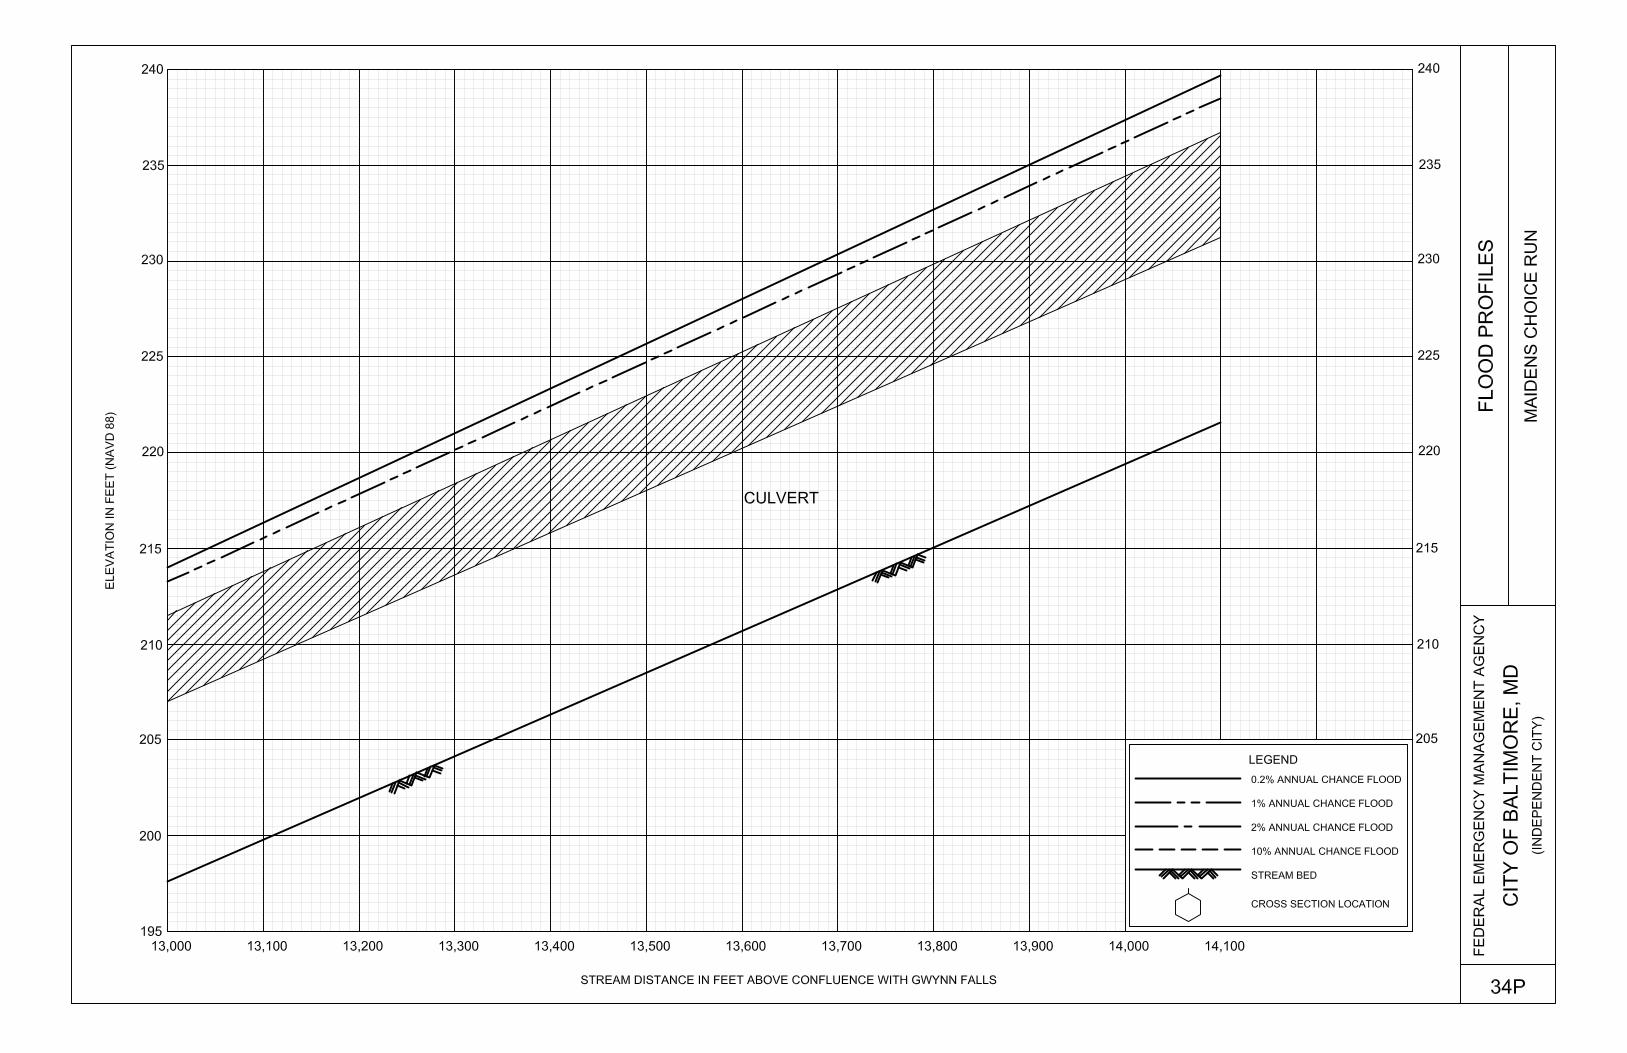
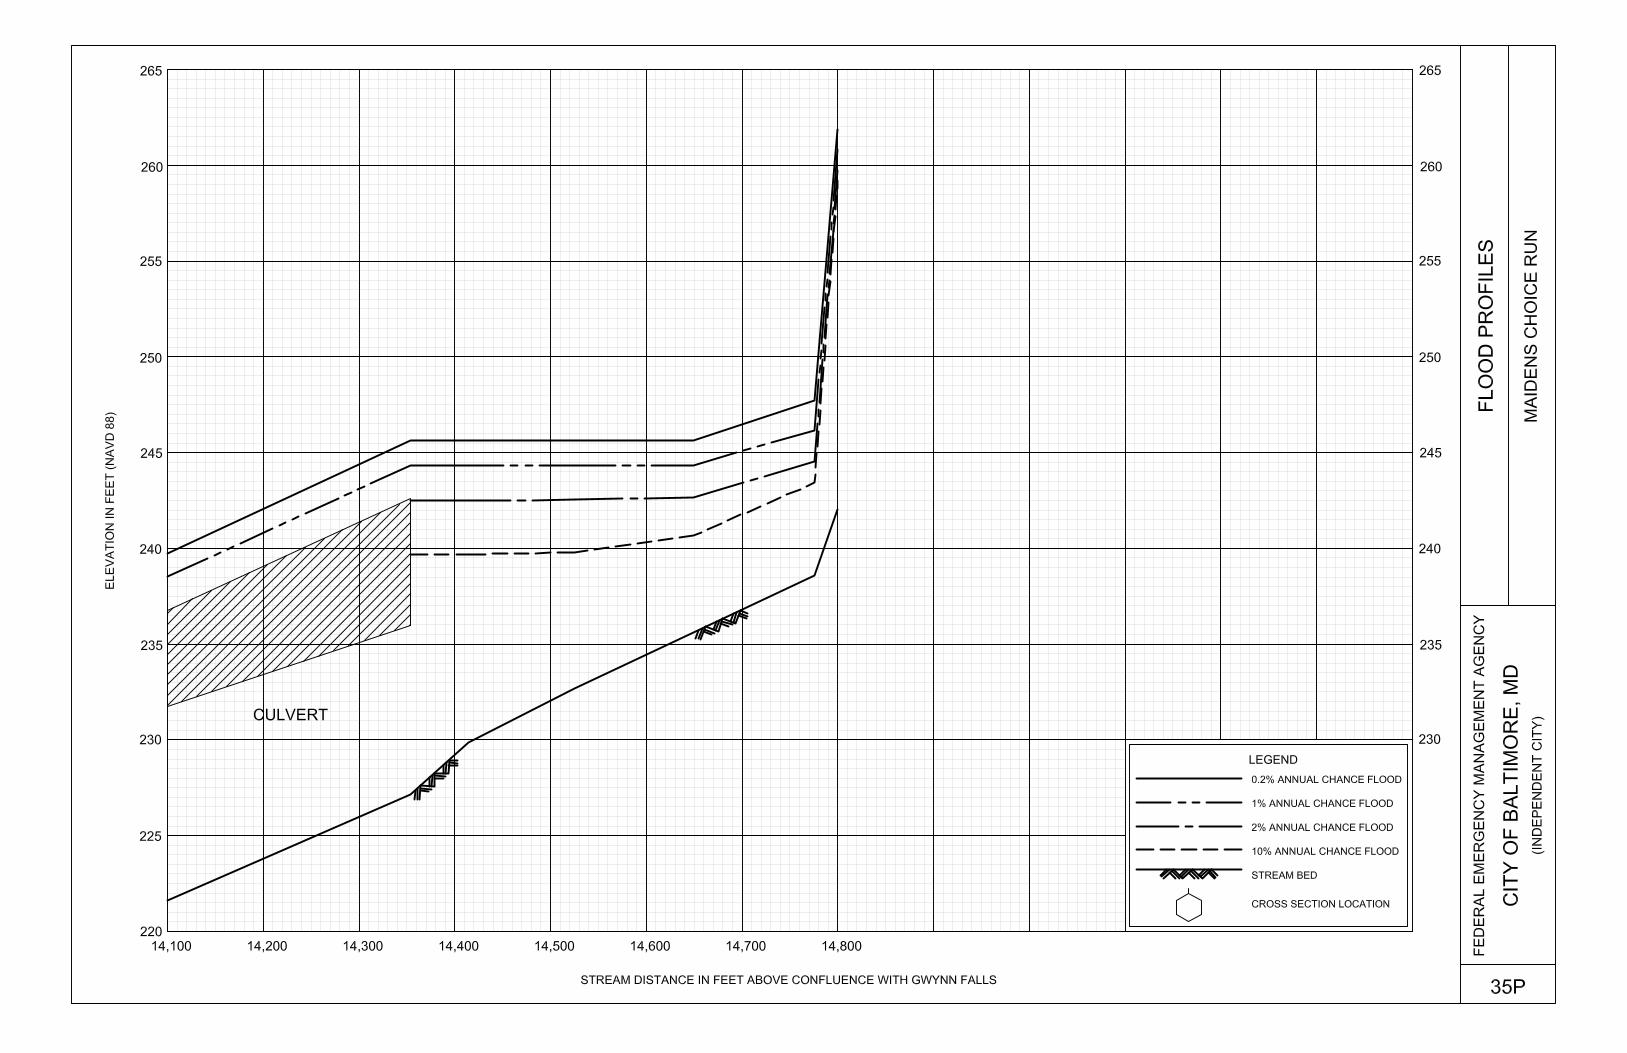
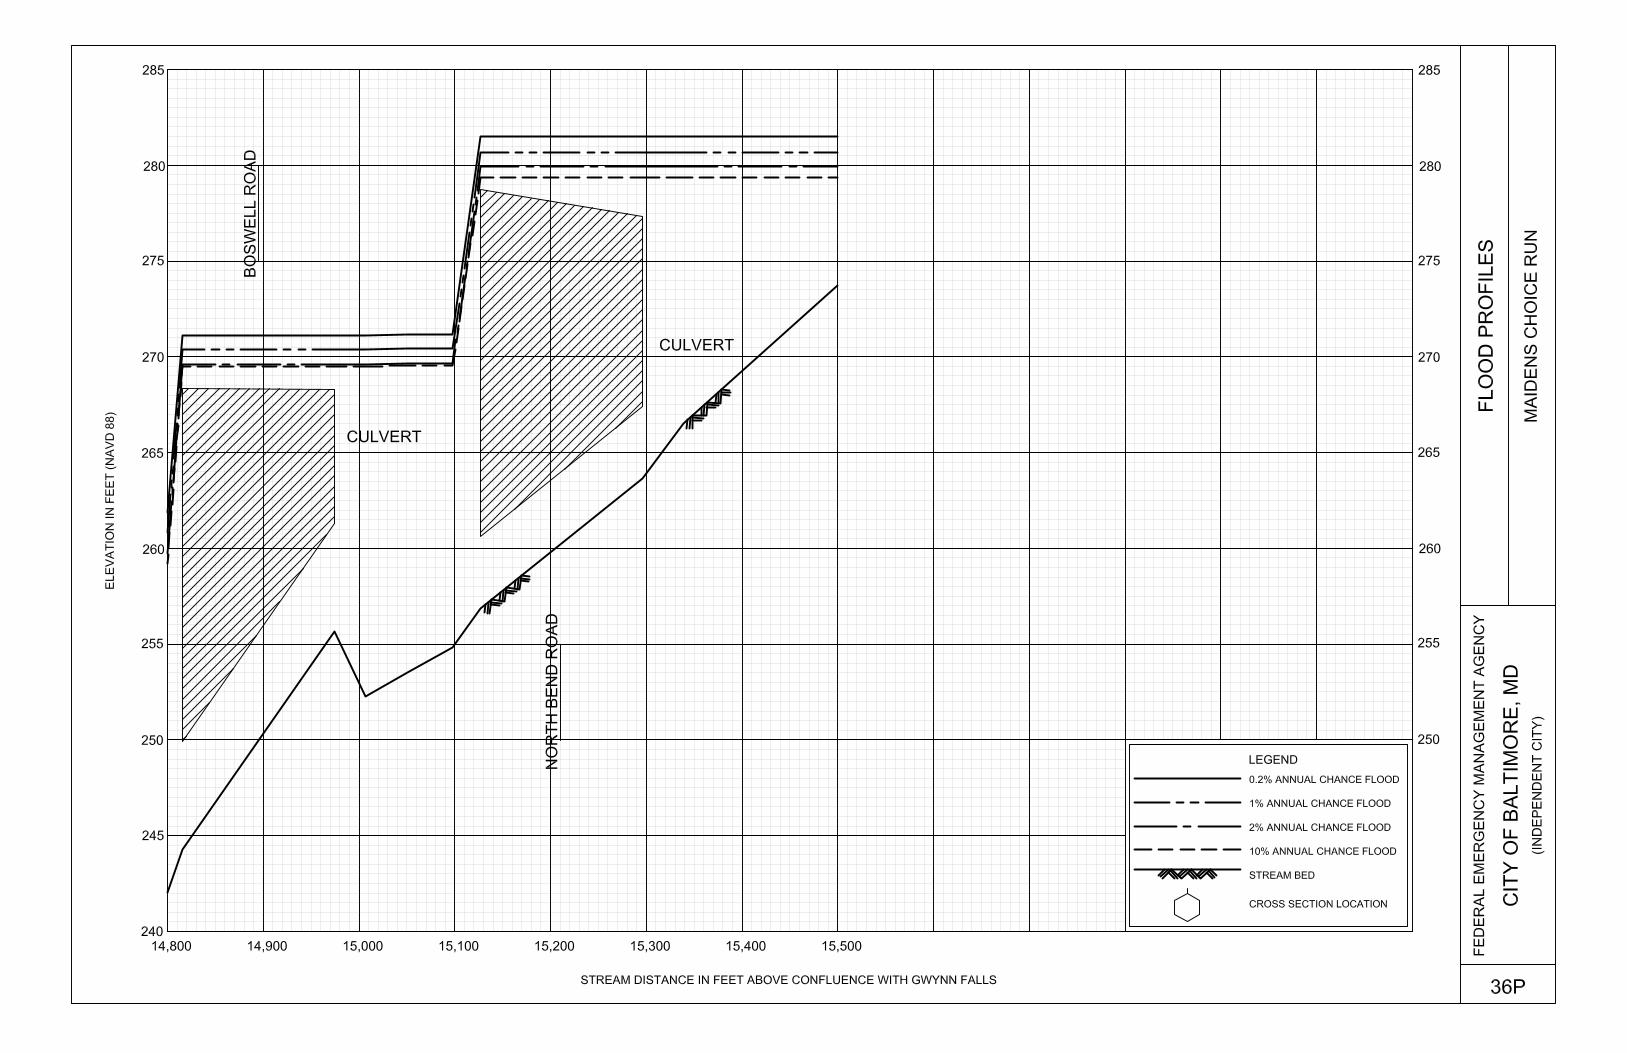
Newspaper accounts have shown evidence of flooding, particularly for Jones Falls. One of the earliest of such accounts was the flood of 1817, which occurred on August 8. One resident recalls that “. . . houses and bridges, horses and cattle were swept down the Jones Falls. Flood level was 15 or 20 feet above usual level. Water reached the windows of second story.” Another resident recalled that the floodwaters of Jones Falls had risen approximately 12 feet. In December 1872, Ross Winans proposed a plan for flood control on Jones Falls to the City Council. His plan entailed “. . . amending the present channel as to curves and width, and increasing the depth 24 feet below mid-tide.” From south of North Avenue to the Northwest Harbor, Jones Falls flows through an underground triple-celled concrete box storm sewer. This sewer lacks adequate conveyance capacity to carry the major Jones Falls floodwaters; therefore, sheet flooding is common on streets in the vicinity of the storm sewer during heavy rain periods. Gwynns Run, from Hanlon Park to Gwynns Falls, also flows through an underground storm sewer. The restricted natural drainage for this storm sewer area causes sheet flow along the streets in this vicinity. It is also noted that three bridges across Jones Falls are undersized and cause major backwater flooding. These are the Union Avenue bridge, the Smith Avenue bridge, and the Amtrak box culvert in the vicinity of North Avenue. In addition, Maidens Choice Run has three major culverts that cause backwater flooding, which include the culverts under Boswell Road, North Bond Road, and Stonecroft Road.
2.4 Flood Protection Measures
Several of the streams within the community have undergone improvements to reduce the effects of flooding. The City of Baltimore had a channel straightening project on a stretch of Moores Run between the eastern corporate limits and Interstate Route 95. On Western Run, several bridges with inadequate waterway openings are to be replaced by the city. Portions of Jones Falls, Herring Run, and Western Run have paved channel beds to facilitate passage of flood flows. The trash catcher on Jones Falls at 29th Street keeps large upstream debris from clogging the underground sections of that stream.
3.0 ENGINEERING METHODS
For the flooding sources studied in detail in the community, standard hydrologic and hydraulic study methods were used to determine the flood hazard data required for this FIS. Flood events of a magnitude which are expected to be equaled or exceeded once on the average during any 10-, 50-, 100-, or 500-year period (recurrence interval) have been selected as having special significance for floodplain management and for flood insurance rates. These events, commonly termed the 10-, 50-, 100-, and 500-year floods, have a 10-, 2-, 1-, and 0.2-percent chance, respectively, of being equaled or exceeded during any year. Although the recurrence interval represents the long term average period between floods of a specific magnitude, rare floods could occur at short intervals or even within the same year. The risk of experiencing a rare flood increases when
7
periods greater than 1 year are considered. For example, the risk of having a flood which equals or exceeds the 100-year flood (1-percent chance of annual exceedence) in any 50-year period is approximately 40 percent (4 in 10), and, for any 90-year period, the risk increases to approximately 60 percent (6 in 10). The analyses reported herein reflect flooding potentials based on conditions existing in the community at the time of completion of this FIS. Maps and flood elevations will be amended periodically to reflect future changes.
For the February 2, 2012 revision, all streams studied by approximate methods were restudied.
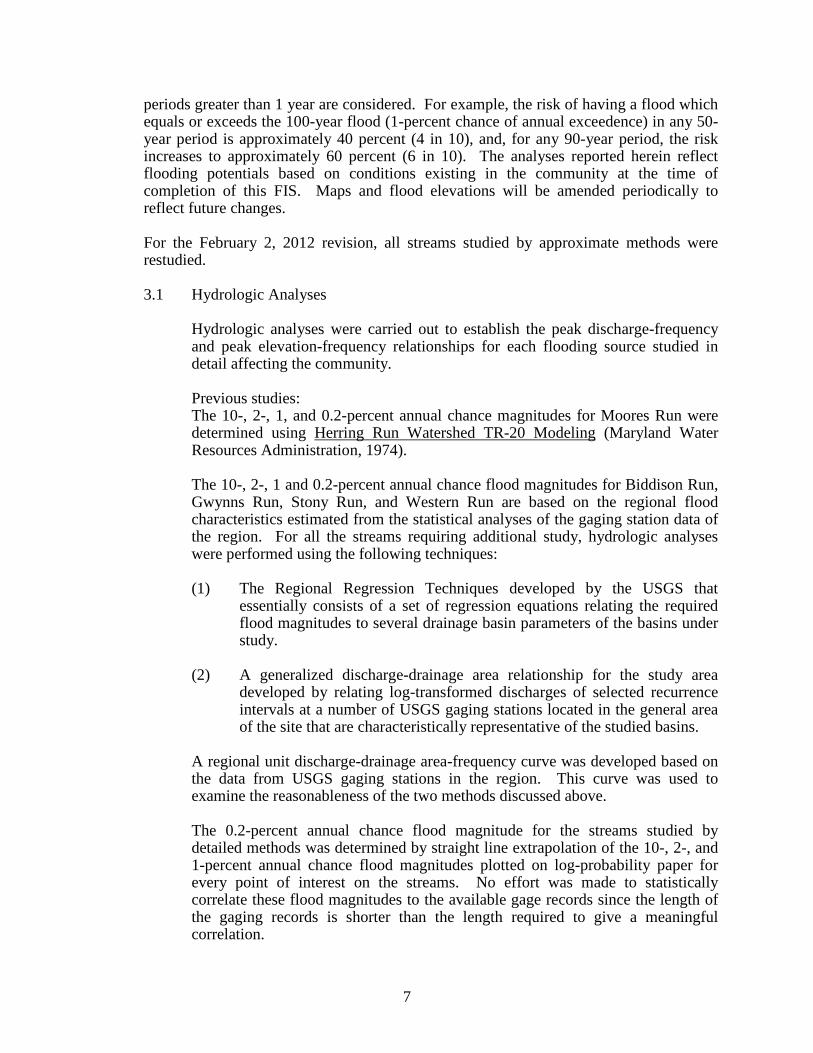
3.1 Hydrologic Analyses
Hydrologic analyses were carried out to establish the peak discharge-frequency and peak elevation-frequency relationships for each flooding source studied in detail affecting the community. Previous studies: The 10-, 2-, 1, and 0.2-percent annual chance magnitudes for Moores Run were determined using Herring Run Watershed TR-20 Modeling (Maryland Water Resources Administration, 1974). The 10-, 2-, 1 and 0.2-percent annual chance flood magnitudes for Biddison Run, Gwynns Run, Stony Run, and Western Run are based on the regional flood characteristics estimated from the statistical analyses of the gaging station data of the region. For all the streams requiring additional study, hydrologic analyses were performed using the following techniques: (1) The Regional Regression Techniques developed by the USGS that
essentially consists of a set of regression equations relating the required flood magnitudes to several drainage basin parameters of the basins under study.
(2) A generalized discharge-drainage area relationship for the study area
developed by relating log-transformed discharges of selected recurrence intervals at a number of USGS gaging stations located in the general area of the site that are characteristically representative of the studied basins.
A regional unit discharge-drainage area-frequency curve was developed based on the data from USGS gaging stations in the region. This curve was used to examine the reasonableness of the two methods discussed above. The 0.2-percent annual chance flood magnitude for the streams studied by detailed methods was determined by straight line extrapolation of the 10-, 2-, and 1-percent annual chance flood magnitudes plotted on log-probability paper for every point of interest on the streams. No effort was made to statistically correlate these flood magnitudes to the available gage records since the length of the gaging records is shorter than the length required to give a meaningful correlation.
8
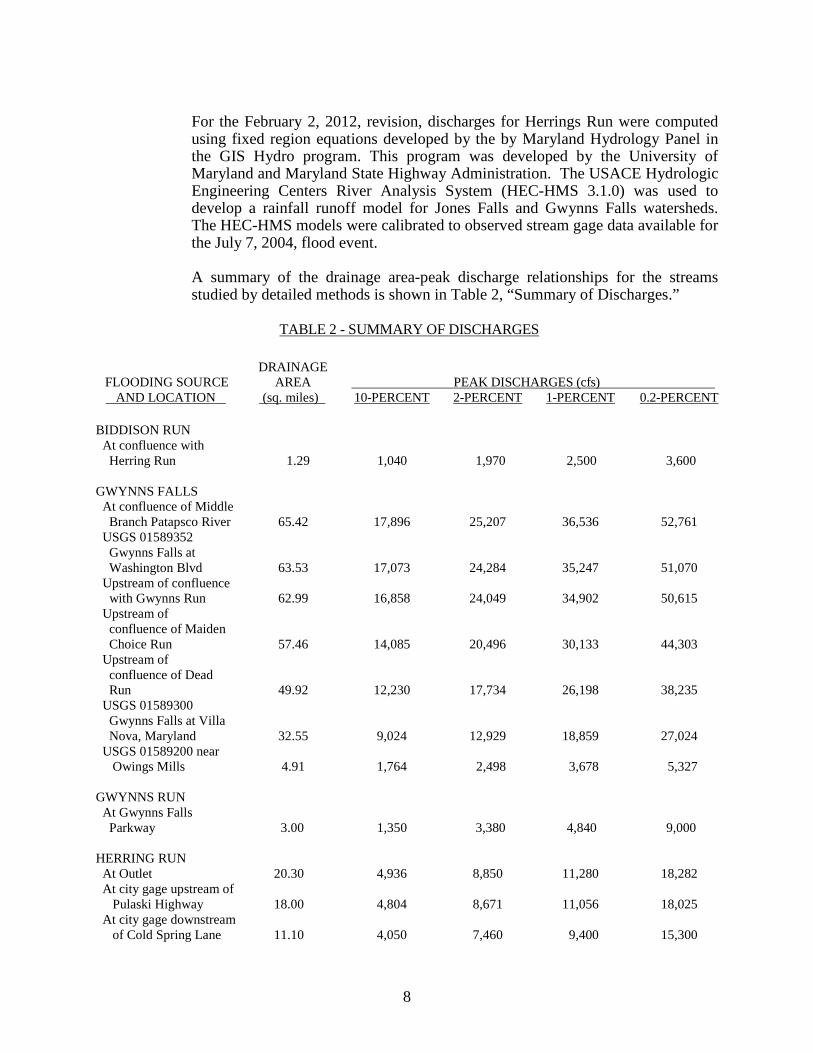
For the February 2, 2012, revision, discharges for Herrings Run were computed using fixed region equations developed by the by Maryland Hydrology Panel in the GIS Hydro program. This program was developed by the University of Maryland and Maryland State Highway Administration. The USACE Hydrologic Engineering Centers River Analysis System (HEC-HMS 3.1.0) was used to develop a rainfall runoff model for Jones Falls and Gwynns Falls watersheds. The HEC-HMS models were calibrated to observed stream gage data available for the July 7, 2004, flood event. A summary of the drainage area-peak discharge relationships for the streams studied by detailed methods is shown in Table 2, “Summary of Discharges.”
TABLE 2 - SUMMARY OF DISCHARGES
FLOODING SOURCE AND LOCATION
DRAINAGE AREA
(sq. miles) PEAK DISCHARGES (cfs) 10-PERCENT 2-PERCENT 1-PERCENT 0.2-PERCENT
BIDDISON RUN At confluence with Herring Run 1.29 1,040 1,970 2,500 3,600 GWYNNS FALLS At confluence of Middle Branch Patapsco River 65.42 17,896 25,207 36,536 52,761 USGS 01589352 Gwynns Falls at Washington Blvd 63.53 17,073 24,284 35,247 51,070 Upstream of confluence with Gwynns Run 62.99 16,858 24,049 34,902 50,615 Upstream of confluence of Maiden Choice Run 57.46 14,085 20,496 30,133 44,303 Upstream of confluence of Dead Run 49.92 12,230 17,734 26,198 38,235 USGS 01589300 Gwynns Falls at Villa Nova, Maryland 32.55 9,024 12,929 18,859 27,024 USGS 01589200 near Owings Mills 4.91 1,764 2,498 3,678 5,327 GWYNNS RUN At Gwynns Falls Parkway 3.00 1,350 3,380 4,840 9,000 HERRING RUN At Outlet 20.30 4,936 8,850 11,280 18,282 At city gage upstream of Pulaski Highway 18.00 4,804 8,671 11,056 18,025 At city gage downstream of Cold Spring Lane 11.10 4,050 7,460 9,400 15,300
9
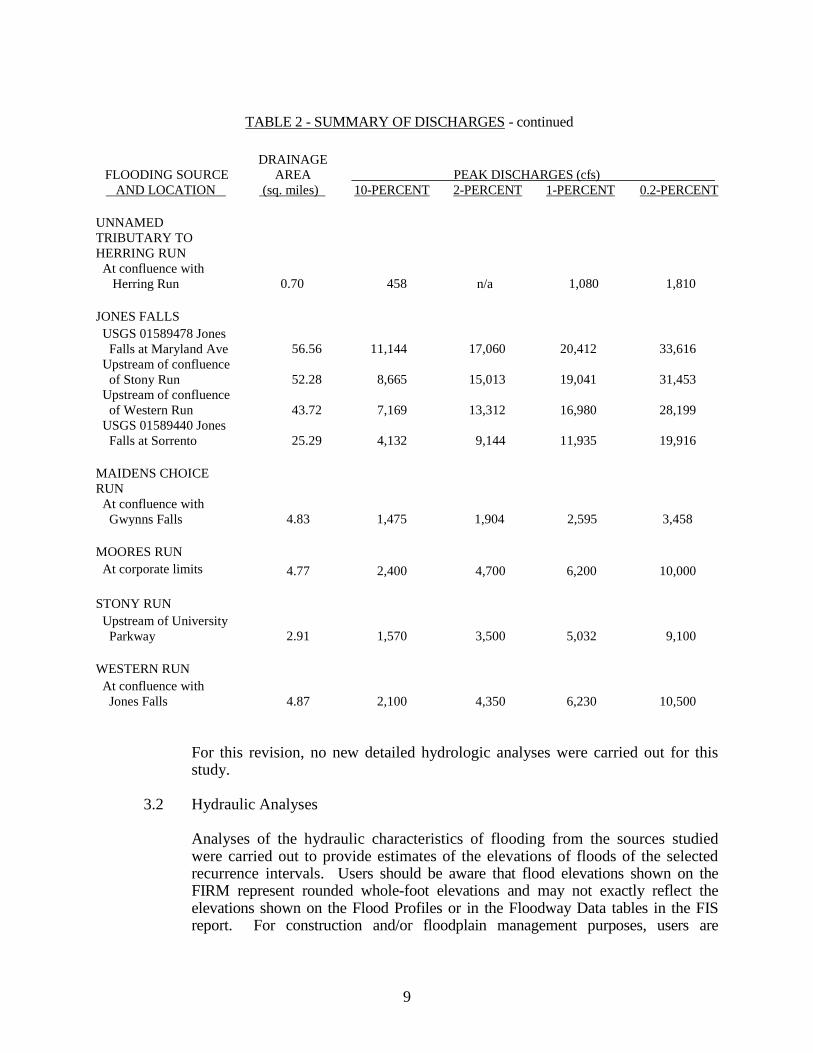
TABLE 2 - SUMMARY OF DISCHARGES - continued
FLOODING SOURCE AND LOCATION
DRAINAGE AREA
(sq. miles) PEAK DISCHARGES (cfs) 10-PERCENT 2-PERCENT 1-PERCENT 0.2-PERCENT
UNNAMED TRIBUTARY TO HERRING RUN At confluence with Herring Run 0.70 458
n/a 1,080 1,810
JONES FALLS USGS 01589478 Jones Falls at Maryland Ave 56.56 11,144 17,060 20,412 33,616 Upstream of confluence of Stony Run 52.28 8,665 15,013 19,041 31,453 Upstream of confluence of Western Run 43.72 7,169 13,312 16,980 28,199 USGS 01589440 Jones Falls at Sorrento 25.29 4,132 9,144 11,935 19,916 MAIDENS CHOICE RUN At confluence with Gwynns Falls 4.83 1,475 1,904 2,595 3,458 MOORES RUN At corporate limits 4.77 2,400 4,700 6,200 10,000 STONY RUN Upstream of University Parkway 2.91 1,570 3,500 5,032 9,100 WESTERN RUN At confluence with Jones Falls 4.87 2,100 4,350 6,230 10,500
For this revision, no new detailed hydrologic analyses were carried out for this study.
3.2 Hydraulic Analyses
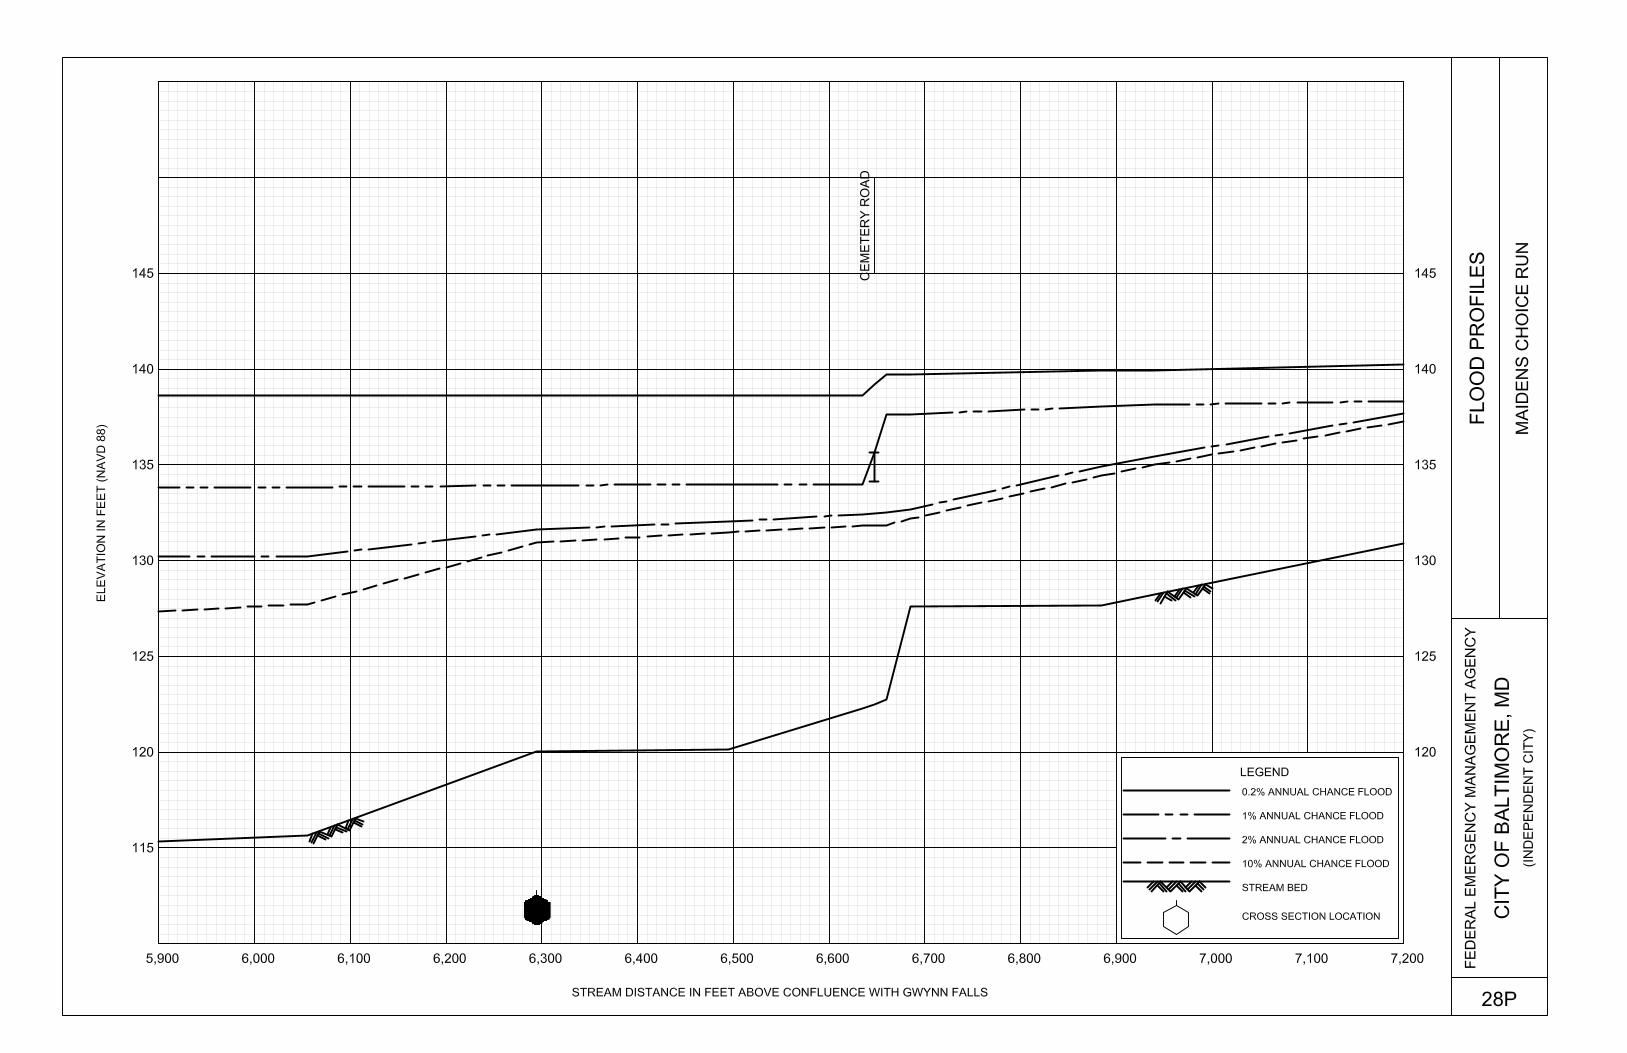
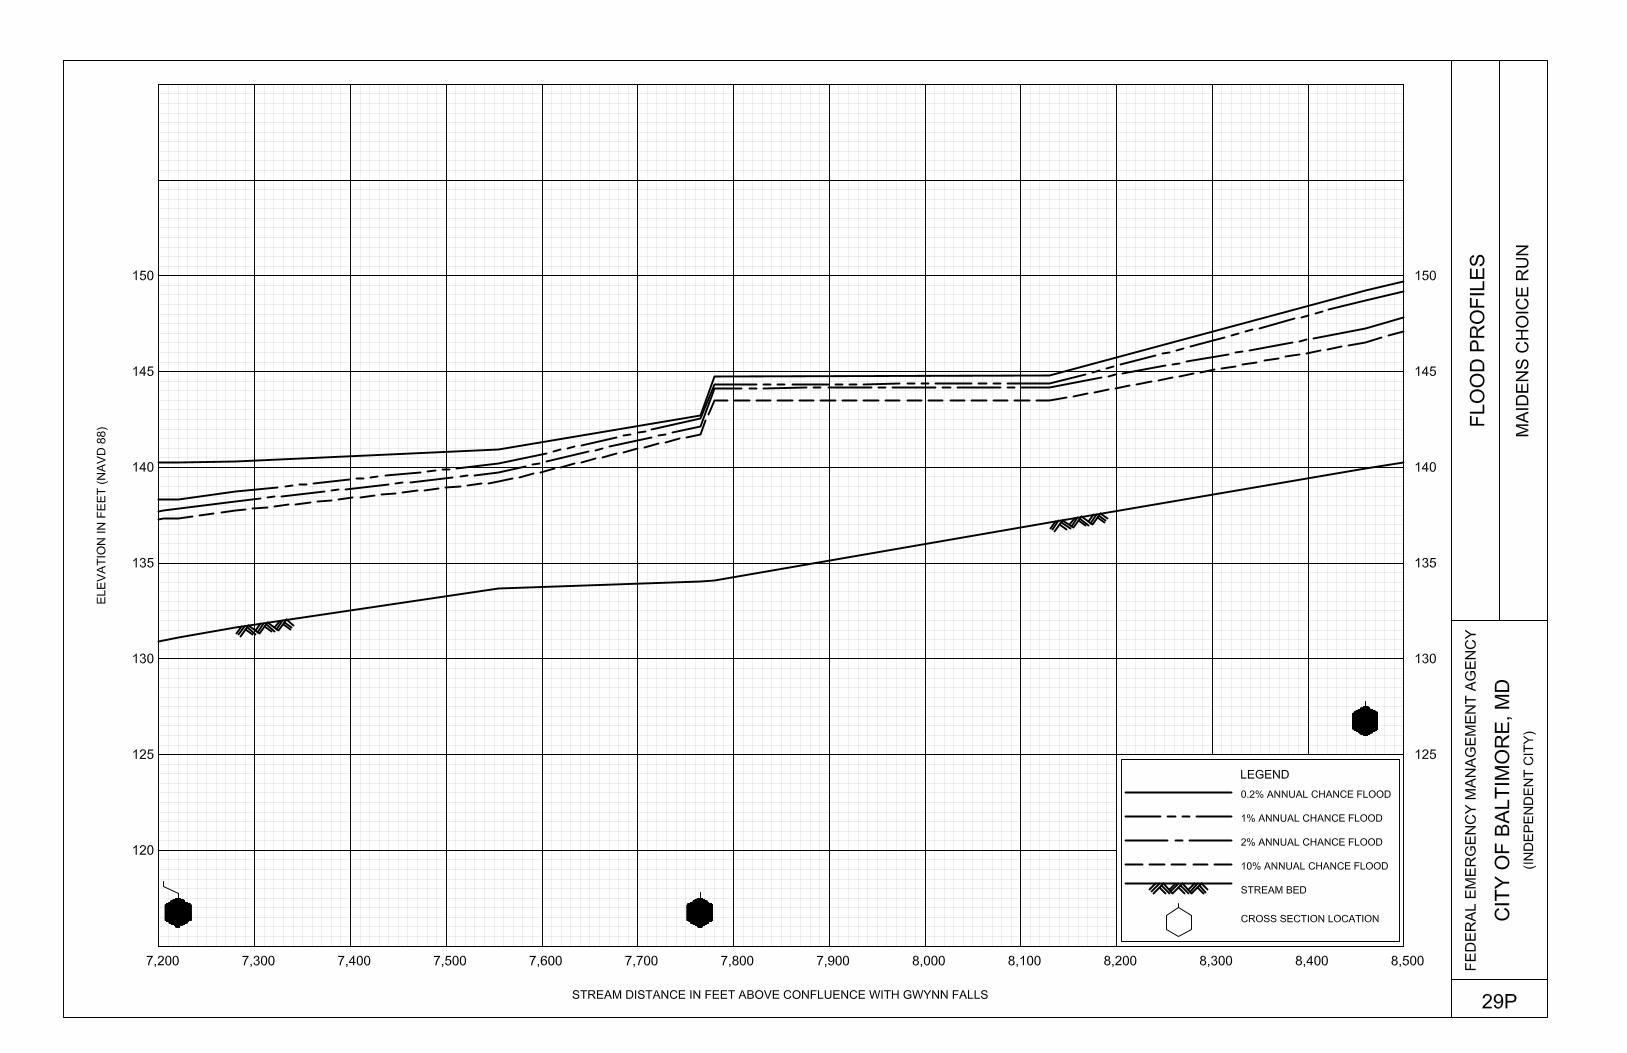
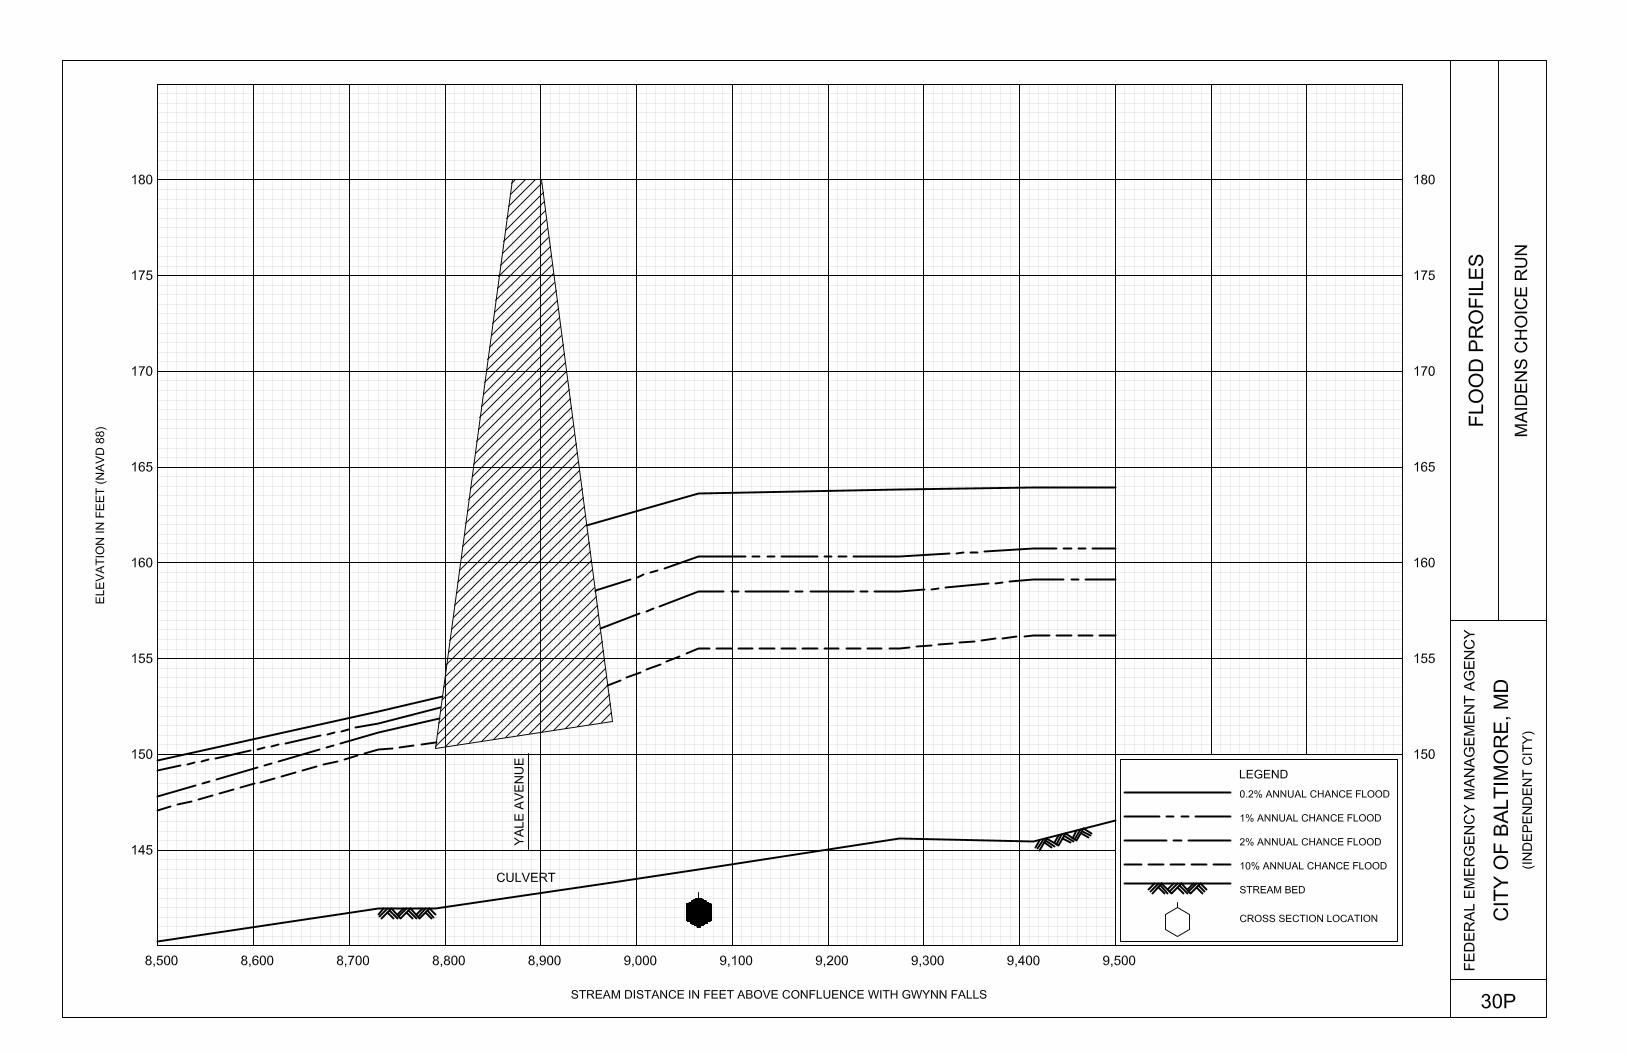
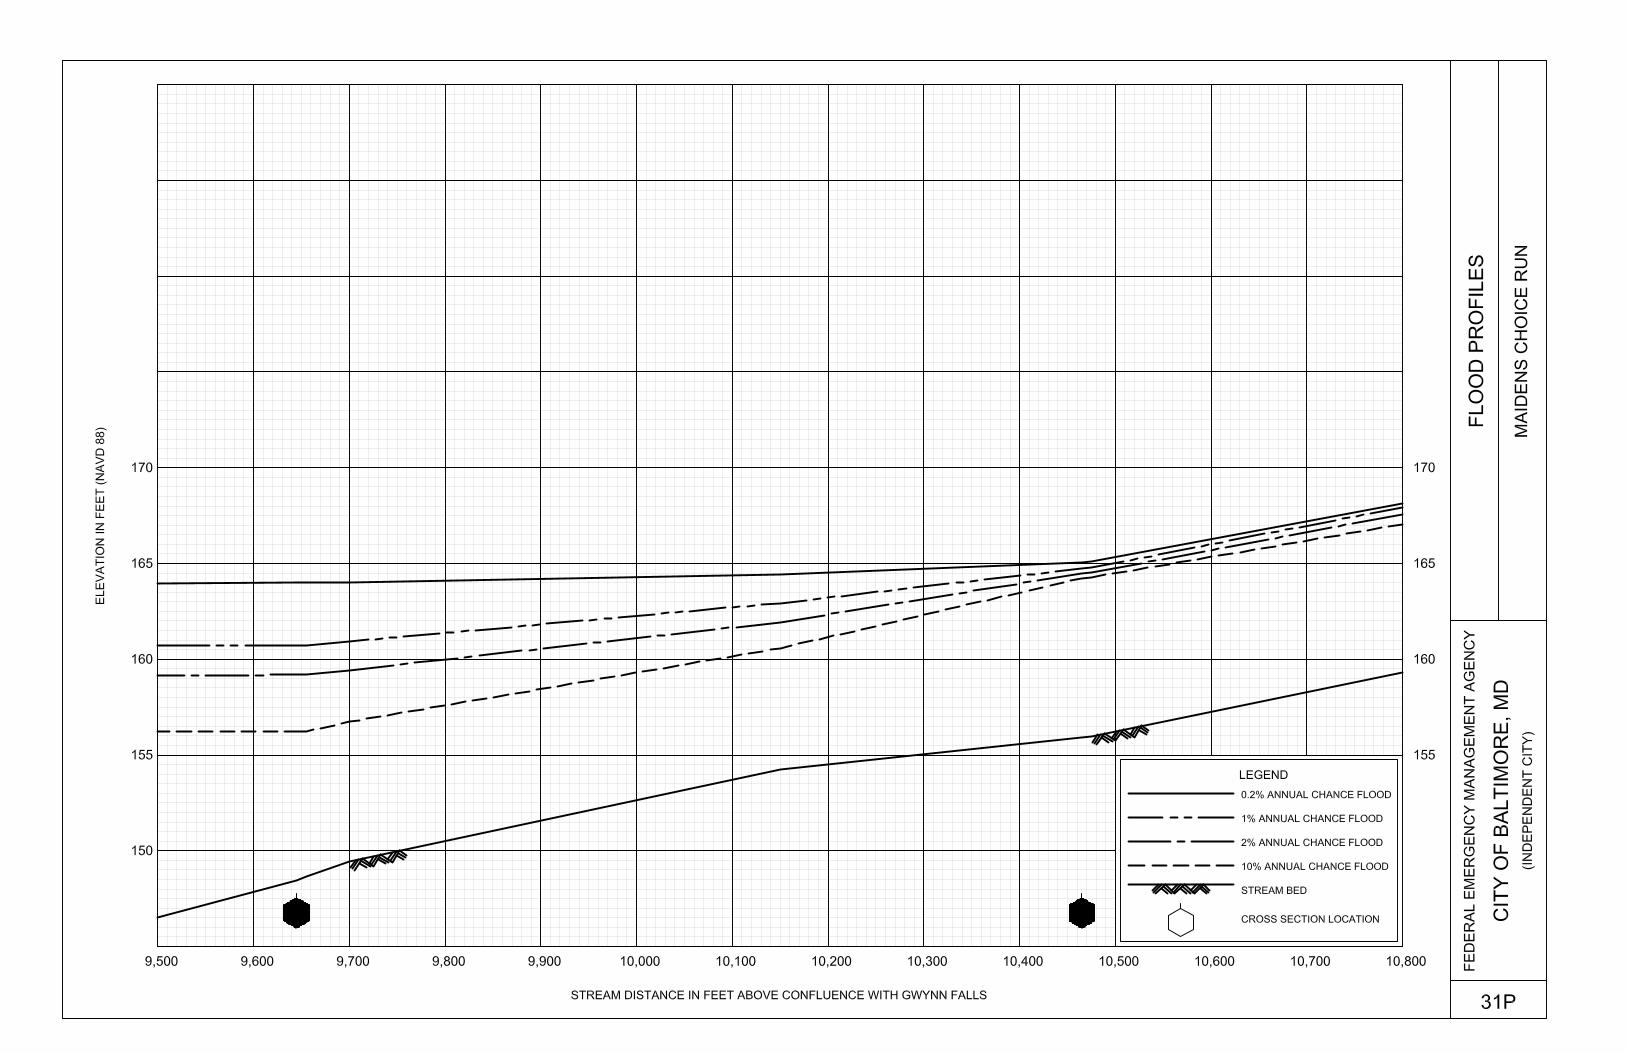
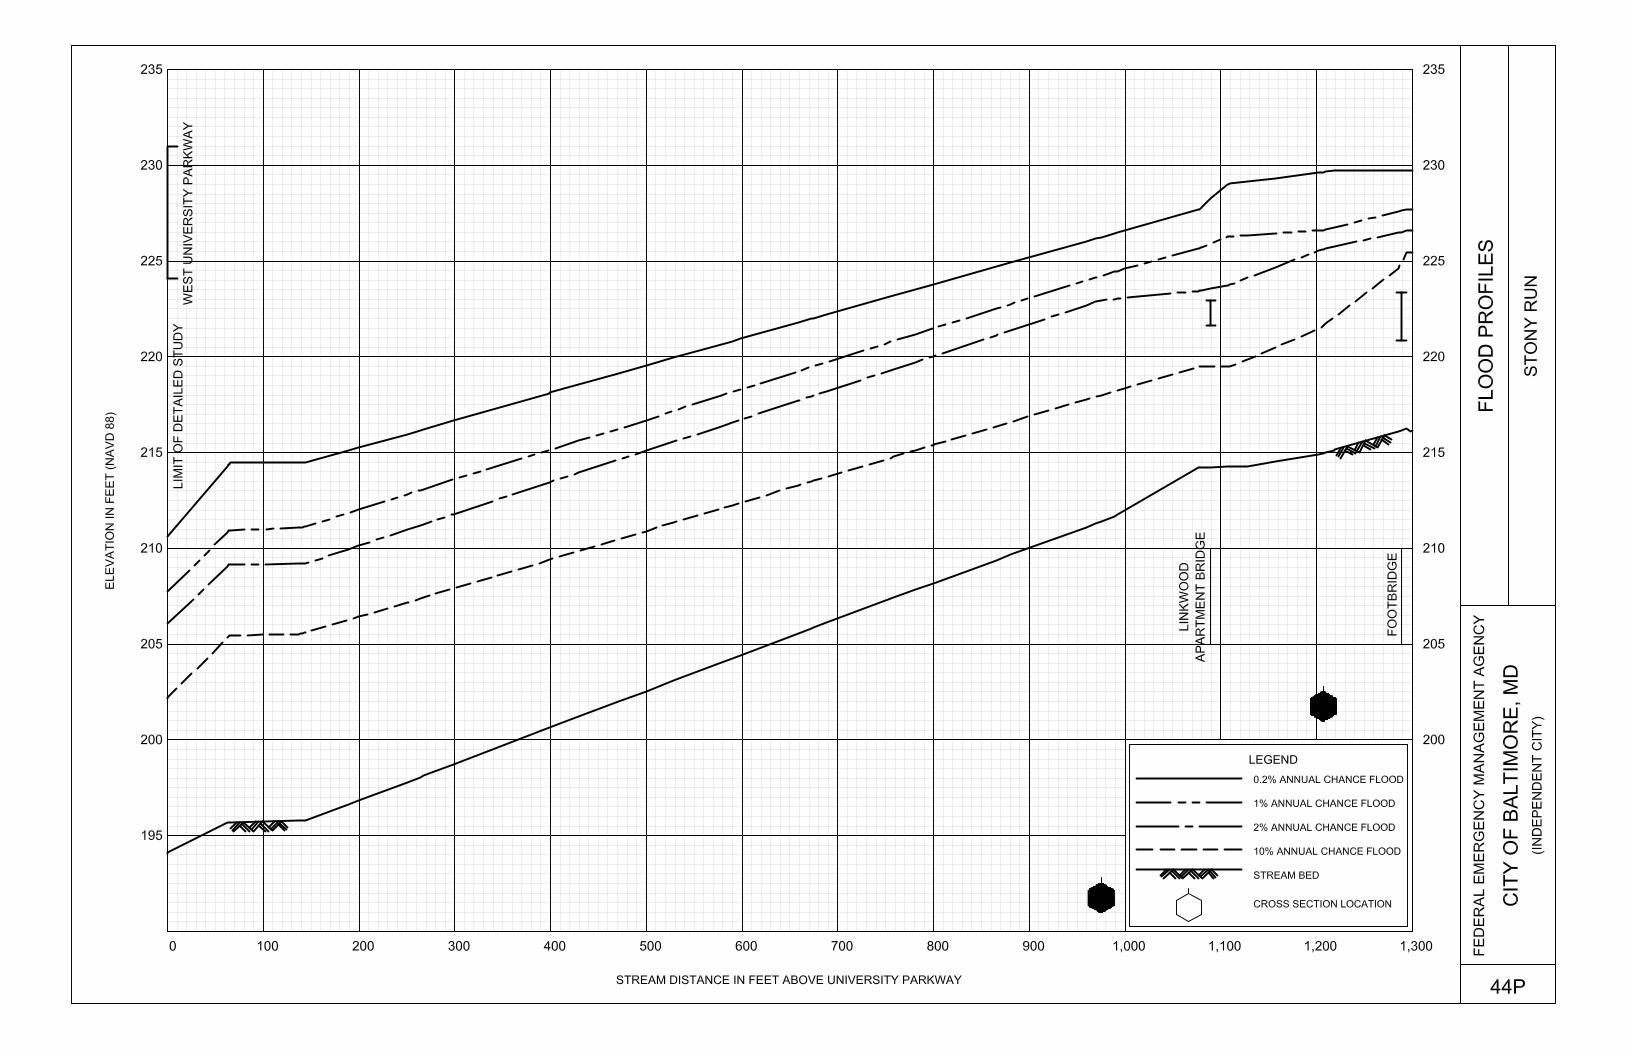
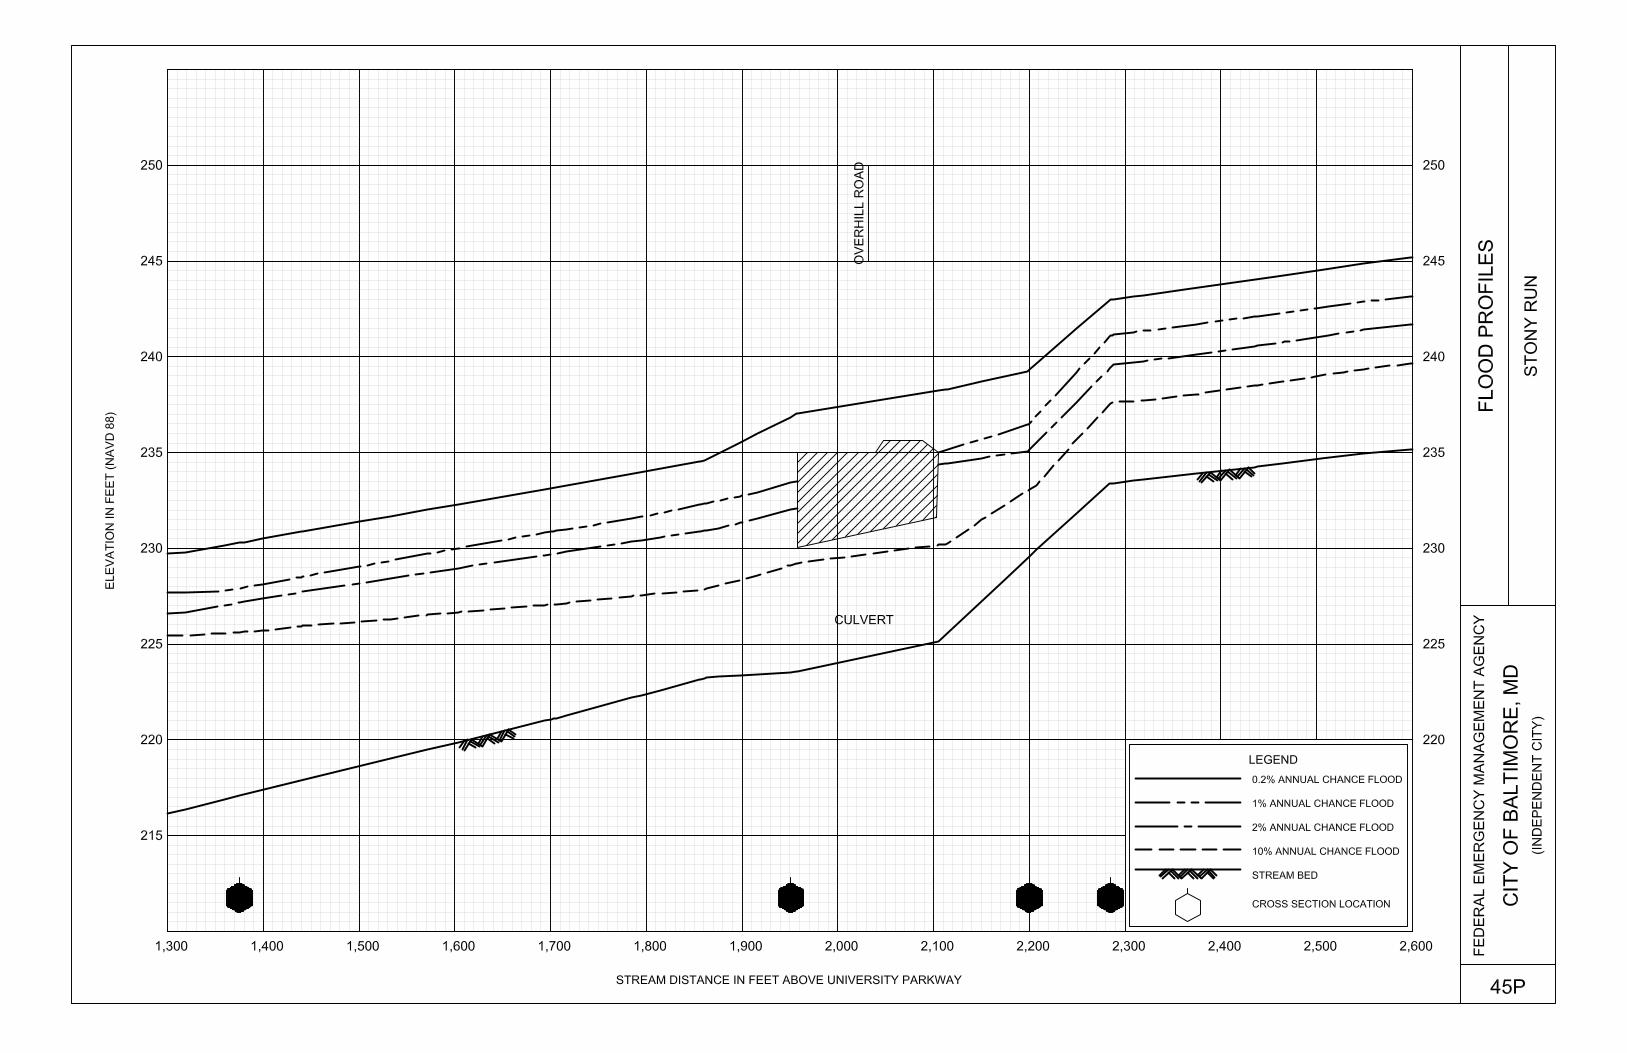
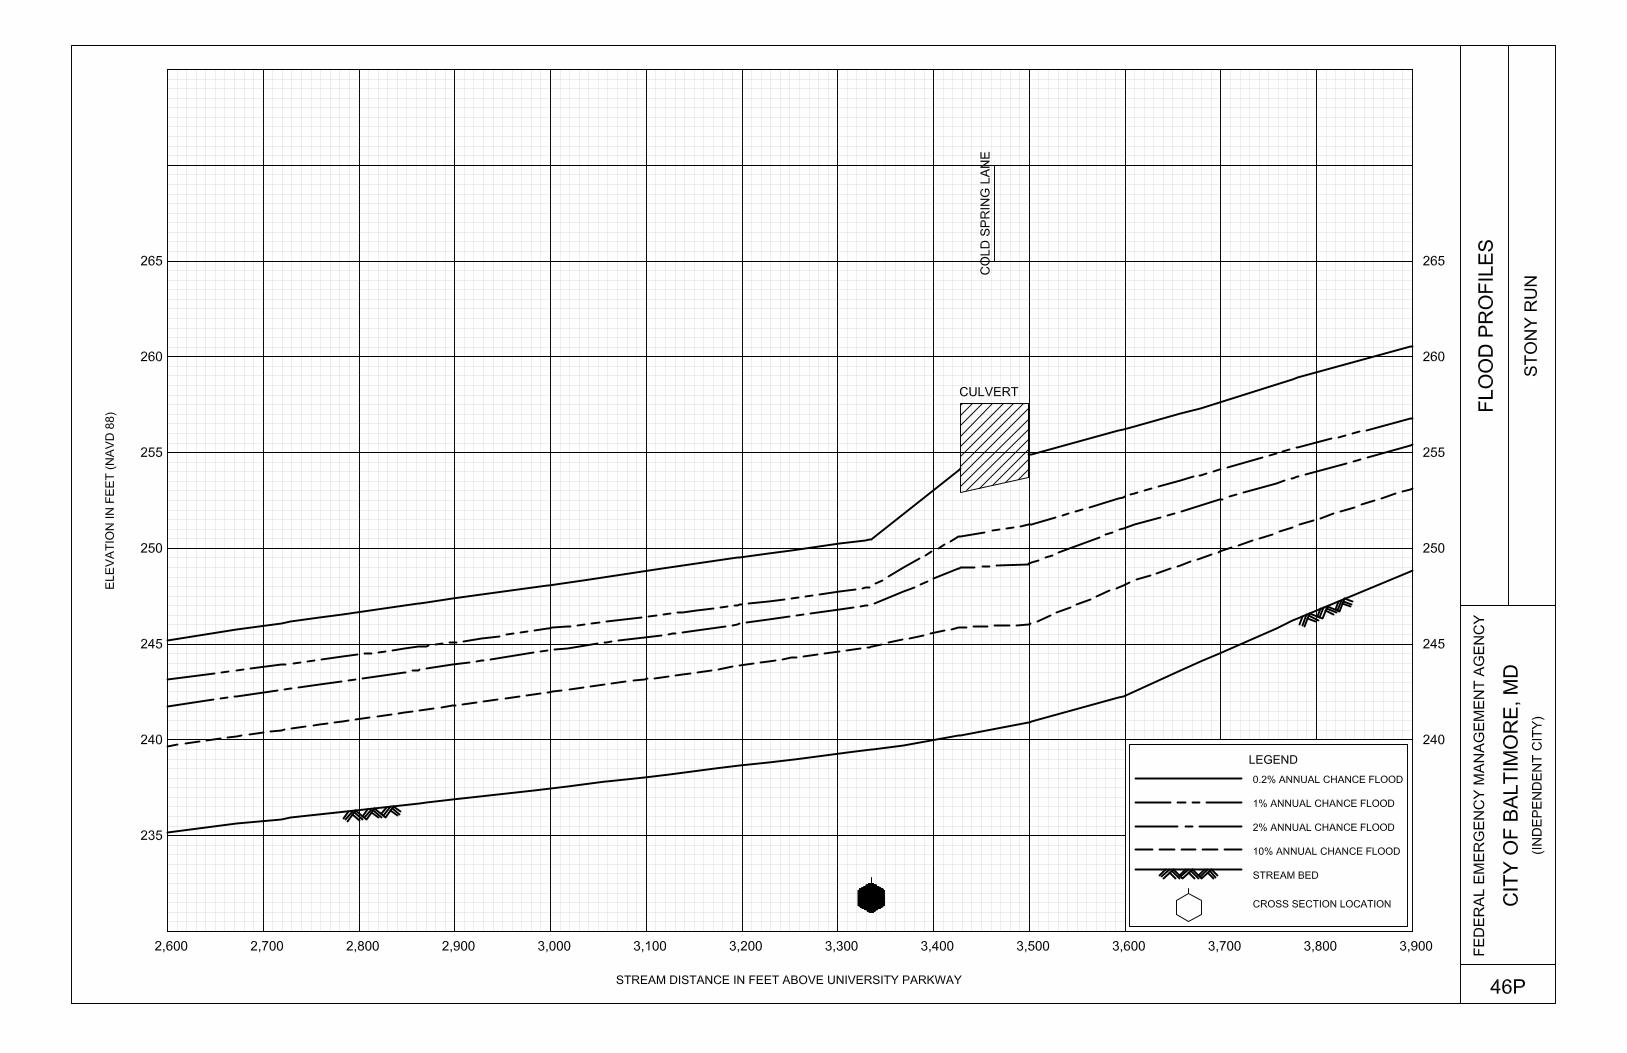
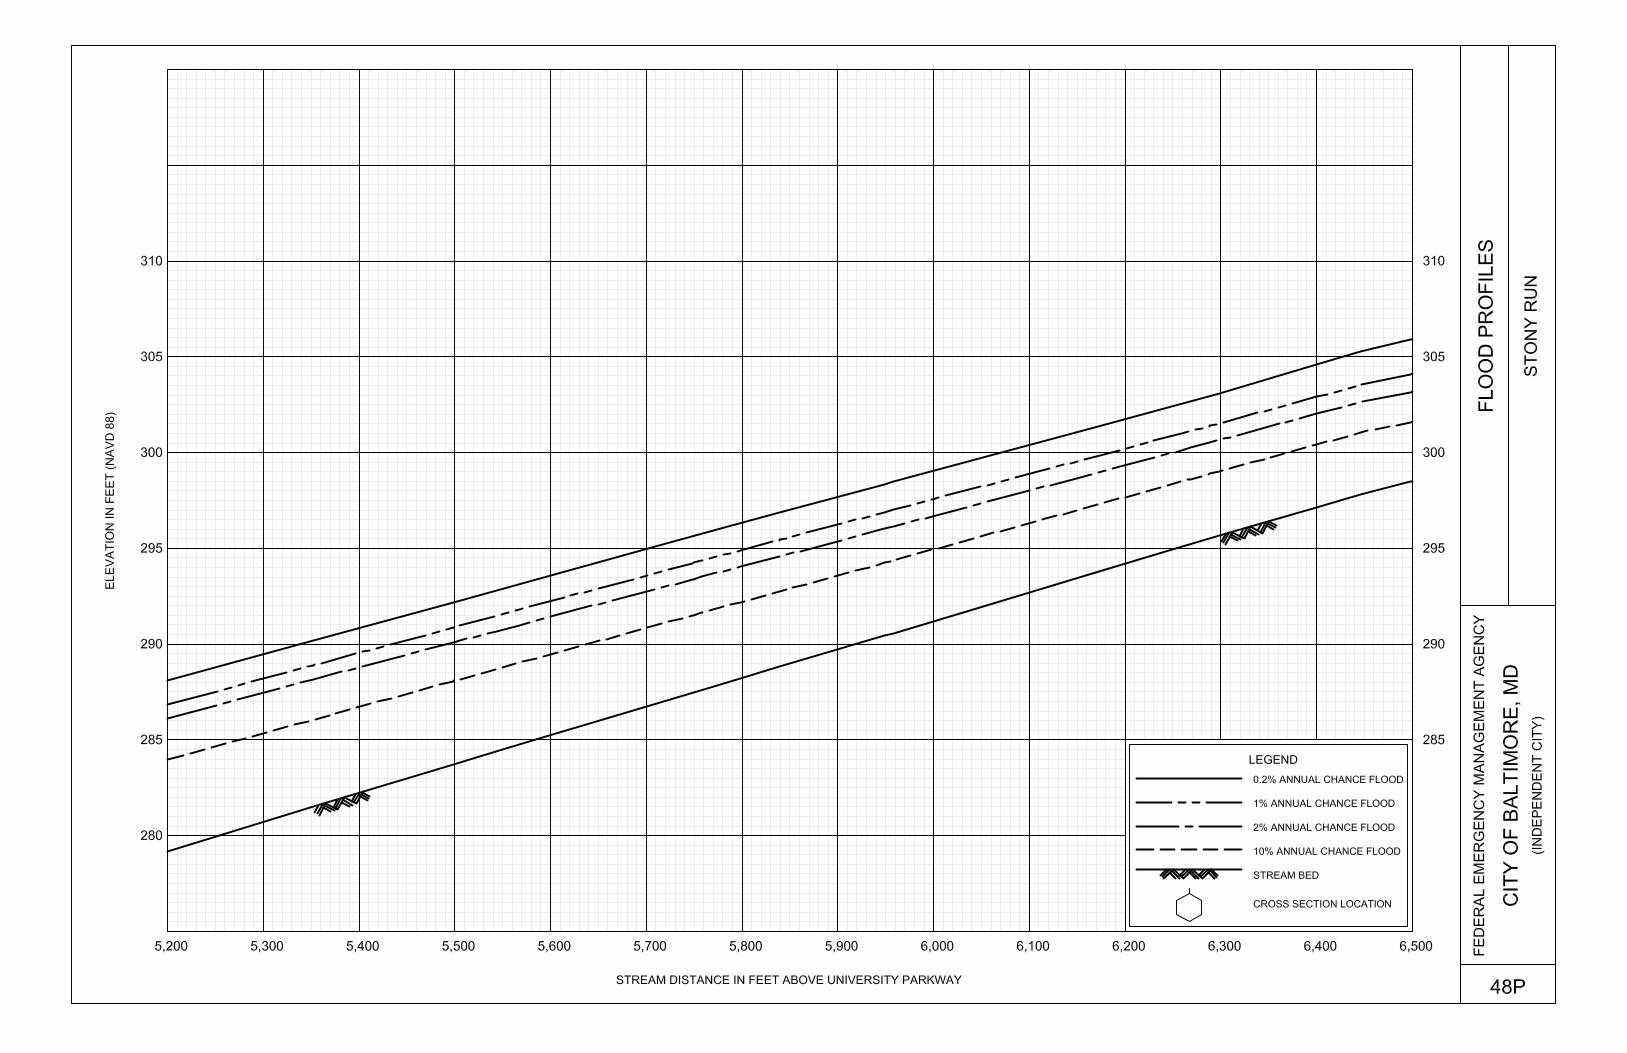
Analyses of the hydraulic characteristics of flooding from the sources studied were carried out to provide estimates of the elevations of floods of the selected recurrence intervals. Users should be aware that flood elevations shown on the FIRM represent rounded whole-foot elevations and may not exactly reflect the elevations shown on the Flood Profiles or in the Floodway Data tables in the FIS report. For construction and/or floodplain management purposes, users are
10
encouraged to use the flood elevation data presented in this FIS in conjunction with the data shown on the FIRM. For the original study, cross sections for the backwater analyses for the streams studied by detailed methods were obtained from field surveys, field data from previous studies, and topographic maps at a scale of 1:1,200 with a contour interval of 2 feet (City of Baltimore, 1967). All bridges, dams, and culverts were field surveyed to obtain elevation data and structural geometry. Locations of selected cross sections used in the hydraulic analyses are shown on the Flood Profiles (Exhibit 1). For stream segments for which a floodway was computed (Section 4.2), selected cross section locations are also shown on the FIRM (Exhibit 2). Water-surface elevations of floods of the selected recurrence intervals were computed using the USACE HEC-2 step-backwater computer program (USACE, 1981). Flood profiles were drawn showing computed water-surface elevations for floods of the selected recurrence intervals. Starting water-surface elevations for the streams studied by detailed methods were calculated using the slope/area method. Where the detailed study began at the existing culvert for these streams, the headwater elevation for each structure was computed and used as the starting water-surface elevation for the hydraulic analyses. For the February 2, 2012, revision: the HEC-RAS hydraulic model version 3.1.3 was used for all streams studied by detailed and approximate methods, with the exception of Gwynns Falls. HEC-RAS 4.0 was used to model Gywnns Falls. Cross sections were obtained from the City of Baltimore’s digital topography and supplemented with field survey data for detailed study streams. No field surveys were conducted for streams studied by approximate methods. Gwynns Falls was modeled with the other streams as part of the City’s CTP project with FEMA. Following preliminary publication of that analysis, EA Engineering, Science, and Technology noted that a split flow condition that existed downstream of the CSX Railroad bridge was not modeled as such in FEMA’s preliminary model. EA engineers generated a split flow model based on the bathymetric information and 2-foot contours and used HEC-RAS 4.0 for the analysis. The split flow paths were verified using the USACE’s RMA2 two-dimensional analysis for the area along Lower Gwynns Falls. The split flow paths are modeled as CSX Split Flow, Gwynns Falls Split Flow, and Westport Split Flow. These paths are shown as Profile Baselines on the FIRMs, with the exception of Westport Split Flow. The split flow condition in the Westport area occurs in the south overbank area of Gwynns Falls in the vicinity of Old Annapolis Road, Clare Street, and Kloman Street. In this area, water leaves Gwynns Falls and flows overland directly into Middle Branch Patapsco River. Because of the limitations of reflecting three-dimensional flow on a two-dimensional map, and associated mapping standards, the split flow

11
streamline is not delineated on the FIRM. Study users wishing to see the modeling for this area should obtain the Westport Spilt Flow model from the FEMA Library (http://www.fema.gov/library/). Roughness factors (Manning’s “n”) used in the hydraulic computations were chosen by engineering judgment and were based on field observations of the streams and floodplain areas. A summary of the channel and overbank “n” values for the streams studied by detailed methods is shown in Table 3, “Summary of Manning’s “n” Values”.
TABLE 3 - SUMMARY OF MANNING’S ‘n’ VALUES Stream Channel “n” Overbank “n” Biddison Run 0.015 – 0.035 0.040 – 0.060 Gwynns Falls 0.022 – 0.130 0.016 – 0.130 Gwynns Run 0.035 0.050 Herring Run 0.055 0.016 – 0.110 Jones Falls 0.035 – 0.057 0.049 – 0.110 Maidens Choice Run 0.019 – 0.110 0.060 – 0.110 Moores Run 0.015 – 0.030 0.015 – 0.050 Stony Run 0.015 – 0.030 0.015 – 0.060 Unnamed Tributary to Herring Run 0.050 0.020 – 0.110 Western Run 0.020 – 0.035 0.020 – 0.042 Hydraulic analyses, considering storm characteristics and the shoreline and bathymetric characteristics of the flooding sources studied, were carried out to provide estimates of the elevations of floods of the selected recurrence intervals along each of the shorelines. Areas of coastline subject to significant wave attack are referred to as coastal high hazard zones. The USACE has established the 3-foot breaking wave as the criterion for identifying the limit of coastal high hazard zones (USACE, 1975). The 3-foot wave has been determined as the minimum size wave capable of causing major damage to conventional wood frame veneer structures. The methodology for analyzing the effects of wave heights associated with coastal storm surge flooding is described in the National Academy of Sciences (NAS) report (National Academy of Sciences, 1977). This method is based on three major concepts. First, depth-limited waves in shallow water reach a maximum breaking height that is equal to 0.78 times the stillwater depth, and the wave crest is 70 percent of the total wave height above the stillwater level. The second major concept is that the wave height may be diminished by the dissipation of energy due to the presence of obstructions such as sand dunes, dikes, seawalls, buildings, and vegetation. The amount of energy dissipation is a function of the physical characteristics of the obstruction and is determined by procedures described in Methodology for Calculating Wave Action Effects Associated with Storm Surges. The third major concept is that wave height can be regenerated in open fetch areas due to the transfer of wind energy to the water. This added energy is related to fetch length and depth.
12
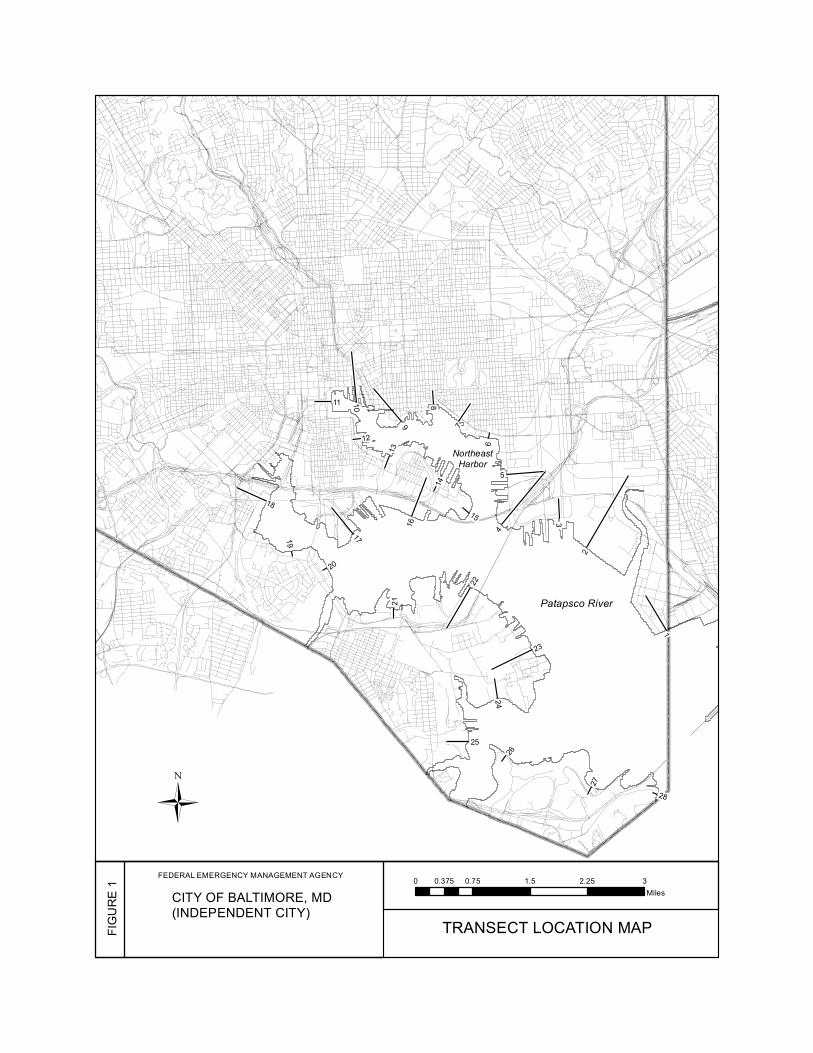
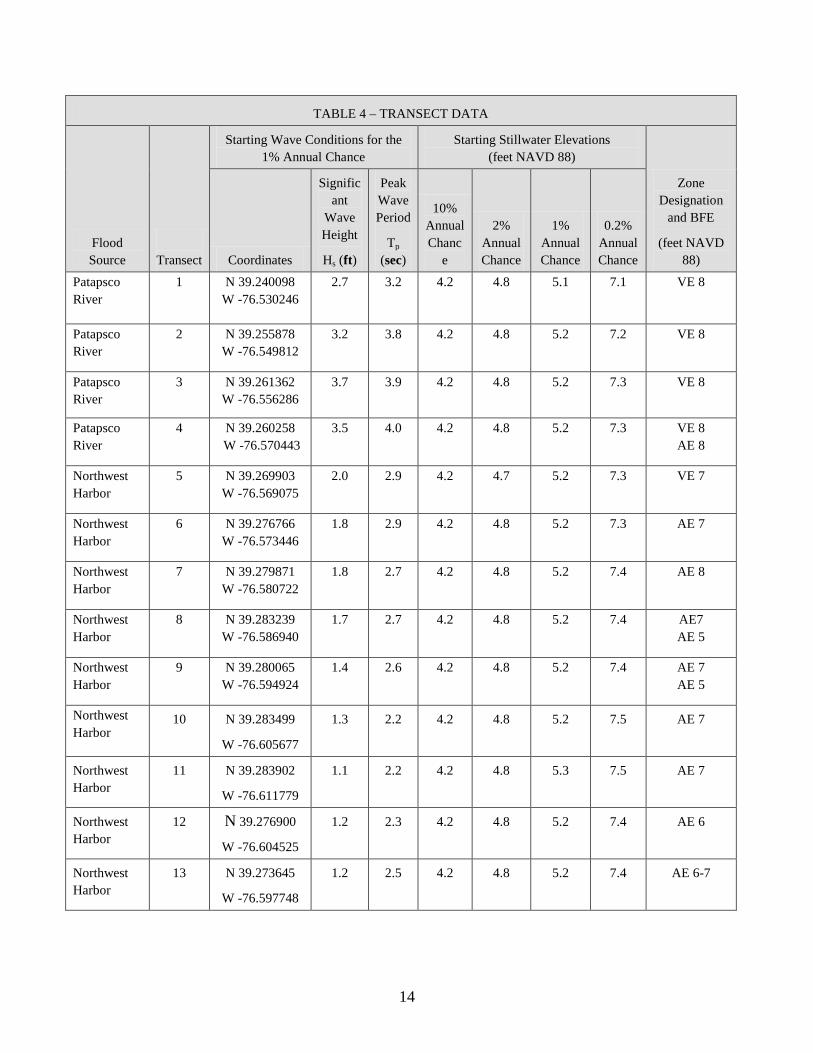
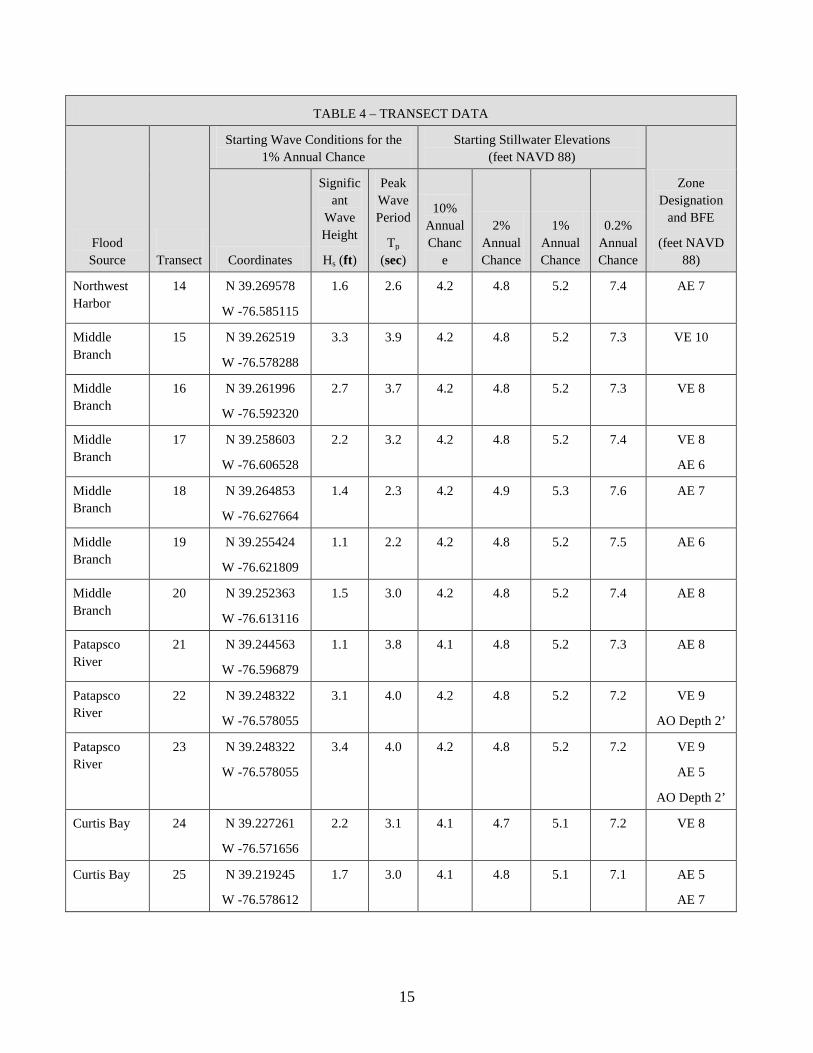
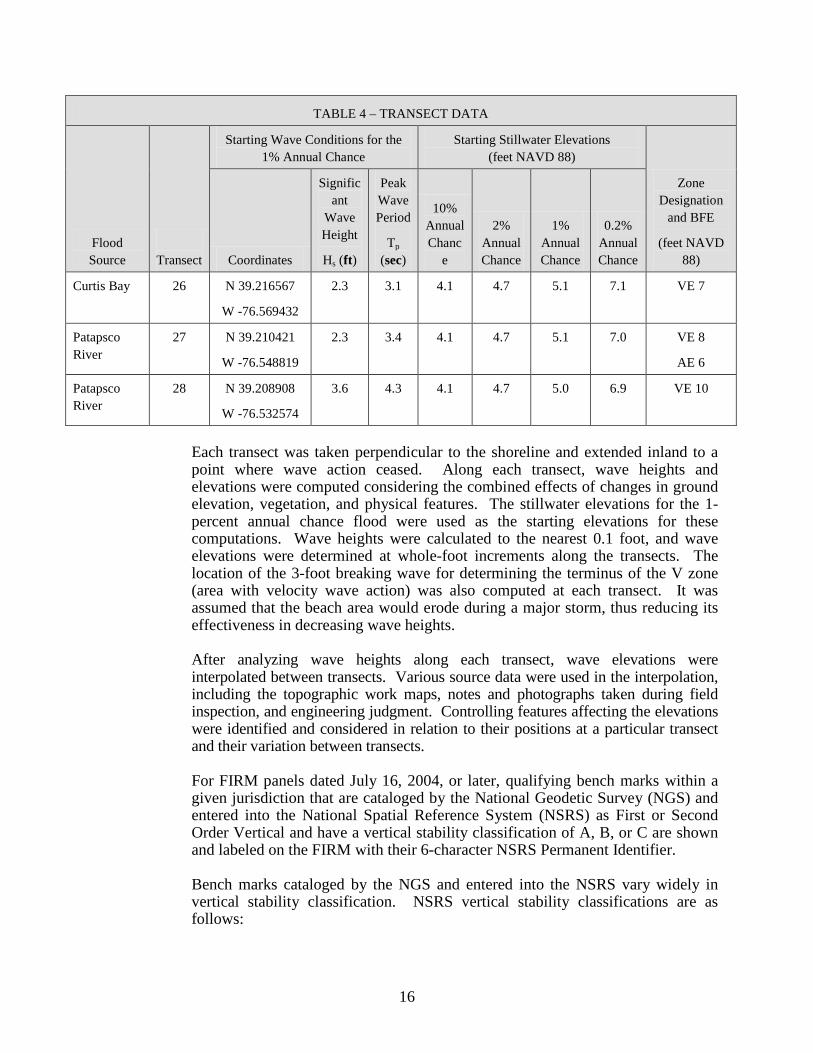
These concepts and equations were used to compute wave heights and wave crest elevations associated with the 1-percent annual chance storm surge. Accurate topographic, land-use, and land-cover data are required for the wave height analysis. Maps of the shoreline areas at a scale of 1:2,400 with a contour interval of 2 feet were used for the topographic data (City of Baltimore, Topographic Maps, Scale 1:2,400, Contour Interval 2 feet). The land-use and land-cover data were obtained from notes and photographs taken during field inspections, engineering judgment, and aerial photographs (AeroEco Company, 1979). Wave heights were computed along transects (cross section lines) that were located along the coastal areas, in accordance with the User’s Manual for Wave Height Analysis (FEMA, 1981). The transects were located with consideration given to the physical and cultural characteristics of the land so that they would closely represent conditions in their locality. Transects were spaced close together in areas of complex topography and dense development. In areas having more uniform characteristics, they were spaced at larger intervals. It was also necessary to locate transects in areas where unique flooding existed and in areas where computed wave heights varied significantly between adjacent transects. A summary of the transect data for the Chesapeake Bay and its tributaries is shown in Figure 1, “Transect Location Map” and in Table 4, “Transect Data,” which provides a listing of the transect locations and stillwater elevations, as well as initial wave crest elevations.
2
4
9
1
510
22
23
16
17
18
7
3
25
8
24
11
14
1321
12 6
2615
27
19
20
28
FEDERAL EMERGENCY MANAGEMENT AGENCY
CITY OF BALTIMORE, MD(INDEPENDENT CITY)
TRANSECT LOCATION MAP
0 0.75 1.5 2.25 30.375Miles
FIG
URE
1
Ü
Patapsco River
NortheastHarbor
14
TABLE 4 – TRANSECT DATA
Flood Source
Transect
Starting Wave Conditions for the 1% Annual Chance
Starting Stillwater Elevations (feet NAVD 88)
Zone Designation
and BFE
(feet NAVD 88) Coordinates
Significant
Wave Height
Hs (ft)
Peak Wave Period
Tp (sec)
10% Annual Chanc
e
2% Annual Chance
1% Annual Chance
0.2% Annual Chance
Patapsco River
1 N 39.240098 W -76.530246
2.7 3.2 4.2 4.8 5.1 7.1 VE 8
Patapsco River
2 N 39.255878 W -76.549812
3.2 3.8 4.2 4.8 5.2 7.2 VE 8
Patapsco River
3 N 39.261362 W -76.556286
3.7 3.9 4.2 4.8 5.2 7.3 VE 8
Patapsco River
4 N 39.260258 W -76.570443
3.5 4.0 4.2 4.8 5.2 7.3 VE 8 AE 8
Northwest Harbor
5 N 39.269903 W -76.569075
2.0 2.9 4.2 4.7 5.2 7.3 VE 7
Northwest Harbor
6 N 39.276766 W -76.573446
1.8 2.9 4.2 4.8 5.2 7.3 AE 7
Northwest Harbor
7 N 39.279871 W -76.580722
1.8 2.7 4.2 4.8 5.2 7.4 AE 8
Northwest Harbor
8 N 39.283239 W -76.586940
1.7 2.7 4.2 4.8 5.2 7.4 AE7 AE 5
Northwest Harbor
9 N 39.280065 W -76.594924
1.4 2.6 4.2 4.8 5.2 7.4 AE 7 AE 5
Northwest Harbor
10 N 39.283499
W -76.605677
1.3 2.2 4.2 4.8 5.2 7.5 AE 7
Northwest Harbor
11 N 39.283902
W -76.611779
1.1 2.2 4.2 4.8 5.3 7.5 AE 7
Northwest Harbor
12 N 39.276900
W -76.604525
1.2 2.3 4.2 4.8 5.2 7.4 AE 6
Northwest Harbor
13 N 39.273645
W -76.597748
1.2 2.5 4.2 4.8 5.2 7.4 AE 6-7
15
TABLE 4 – TRANSECT DATA
Flood Source
Transect
Starting Wave Conditions for the 1% Annual Chance
Starting Stillwater Elevations (feet NAVD 88)
Zone Designation
and BFE
(feet NAVD 88) Coordinates
Significant
Wave Height
Hs (ft)
Peak Wave Period
Tp (sec)
10% Annual Chanc
e
2% Annual Chance
1% Annual Chance
0.2% Annual Chance
Northwest Harbor
14 N 39.269578
W -76.585115
1.6 2.6 4.2 4.8 5.2 7.4 AE 7
Middle Branch
15 N 39.262519
W -76.578288
3.3 3.9 4.2 4.8 5.2 7.3 VE 10
Middle Branch
16 N 39.261996
W -76.592320
2.7 3.7 4.2 4.8 5.2 7.3 VE 8
Middle Branch
17 N 39.258603
W -76.606528
2.2 3.2 4.2 4.8 5.2 7.4 VE 8
AE 6
Middle Branch
18 N 39.264853
W -76.627664
1.4 2.3 4.2 4.9 5.3
7.6 AE 7
Middle Branch
19 N 39.255424
W -76.621809
1.1 2.2 4.2 4.8 5.2 7.5 AE 6
Middle Branch
20 N 39.252363
W -76.613116
1.5 3.0 4.2 4.8 5.2 7.4 AE 8
Patapsco River
21 N 39.244563
W -76.596879
1.1 3.8 4.1 4.8 5.2 7.3 AE 8
Patapsco River
22 N 39.248322
W -76.578055
3.1 4.0 4.2 4.8 5.2 7.2 VE 9
AO Depth 2’
Patapsco River
23 N 39.248322
W -76.578055
3.4 4.0 4.2 4.8 5.2 7.2 VE 9
AE 5
AO Depth 2’
Curtis Bay 24 N 39.227261
W -76.571656
2.2 3.1 4.1 4.7 5.1 7.2 VE 8
Curtis Bay 25 N 39.219245
W -76.578612
1.7 3.0 4.1 4.8 5.1 7.1 AE 5
AE 7
16
TABLE 4 – TRANSECT DATA
Flood Source
Transect
Starting Wave Conditions for the 1% Annual Chance
Starting Stillwater Elevations (feet NAVD 88)
Zone Designation
and BFE
(feet NAVD 88) Coordinates
Significant
Wave Height
Hs (ft)
Peak Wave Period
Tp (sec)
10% Annual Chanc
e
2% Annual Chance
1% Annual Chance
0.2% Annual Chance
Curtis Bay 26 N 39.216567
W -76.569432
2.3 3.1 4.1 4.7 5.1 7.1 VE 7
Patapsco River
27 N 39.210421
W -76.548819
2.3 3.4 4.1 4.7 5.1 7.0 VE 8
AE 6
Patapsco River
28 N 39.208908
W -76.532574
3.6 4.3 4.1 4.7 5.0 6.9 VE 10
Each transect was taken perpendicular to the shoreline and extended inland to a point where wave action ceased. Along each transect, wave heights and elevations were computed considering the combined effects of changes in ground elevation, vegetation, and physical features. The stillwater elevations for the 1-percent annual chance flood were used as the starting elevations for these computations. Wave heights were calculated to the nearest 0.1 foot, and wave elevations were determined at whole-foot increments along the transects. The location of the 3-foot breaking wave for determining the terminus of the V zone (area with velocity wave action) was also computed at each transect. It was assumed that the beach area would erode during a major storm, thus reducing its effectiveness in decreasing wave heights. After analyzing wave heights along each transect, wave elevations were interpolated between transects. Various source data were used in the interpolation, including the topographic work maps, notes and photographs taken during field inspection, and engineering judgment. Controlling features affecting the elevations were identified and considered in relation to their positions at a particular transect and their variation between transects.
For FIRM panels dated July 16, 2004, or later, qualifying bench marks within a given jurisdiction that are cataloged by the National Geodetic Survey (NGS) and entered into the National Spatial Reference System (NSRS) as First or Second Order Vertical and have a vertical stability classification of A, B, or C are shown and labeled on the FIRM with their 6-character NSRS Permanent Identifier. Bench marks cataloged by the NGS and entered into the NSRS vary widely in vertical stability classification. NSRS vertical stability classifications are as follows:
17
• Stability A: Monuments of the most reliable nature, expected to hold position/elevation well (e.g., mounted in bedrock)
• Stability B: Monuments which generally hold their position/elevation
well (e.g., concrete bridge abutment) • Stability C: Monuments which may be affected by surface ground
movements (e.g., concrete monument below frost line) • Stability D: Mark of questionable or unknown vertical stability (e.g.,
concrete monument above frost line, or steel witness post) In addition to NSRS bench marks, the FIRM may also show vertical control monuments established by a local jurisdiction; these monuments will be shown on the FIRM with the appropriate designations. Local monuments will only be placed on the FIRM if the community has requested that they be included, and if the monuments meet the aforementioned NSRS inclusion criteria. To obtain current elevation, description, and/or location information for bench marks shown on the FIRM for this jurisdiction, please contact the Information Services Branch of the NGS at (301) 713-3242, or visit their Web site at www.ngs.noaa.gov. It is important to note that temporary vertical monuments are often established during the preparation of a flood hazard analysis for the purpose of establishing local vertical control. Although these monuments are not shown on the FIRM, they may be found in the Technical Support Data Notebook associated with this FIS and FIRM. Interested individuals may contact FEMA to access this data.
For this revision, no new hydraulic analyses were carried out for this study.
3.3 Coastal Analysis
For this revision, no new hydraulic analyses were carried out for this study. Coastal analysis, considering storm characteristics and the shoreline and bathymetric characteristics of the flooding sources studied, were carried out to provide estimates of the elevations of floods of the selected recurrence intervals along the shoreline. Users of the FIRM should be aware that coastal flood elevations are provided in Table 5, “Summary of Coastal Stillwater Elevations” table in this report. If the elevation on the FIRM is higher than the elevation shown in this table, a wave height, wave run-up, and/or wave setup component likely exists, in which case, the higher elevation should be used for construction and/or floodplain management purposes. An analysis was performed to establish the frequency peak elevation relationships for coastal flooding in the City of Baltimore. The FEMA Region III office initiated a study in 2008 to update the coastal storm surge elevations within the states of Virginia, Maryland, and Delaware, and the District of Columbia
18
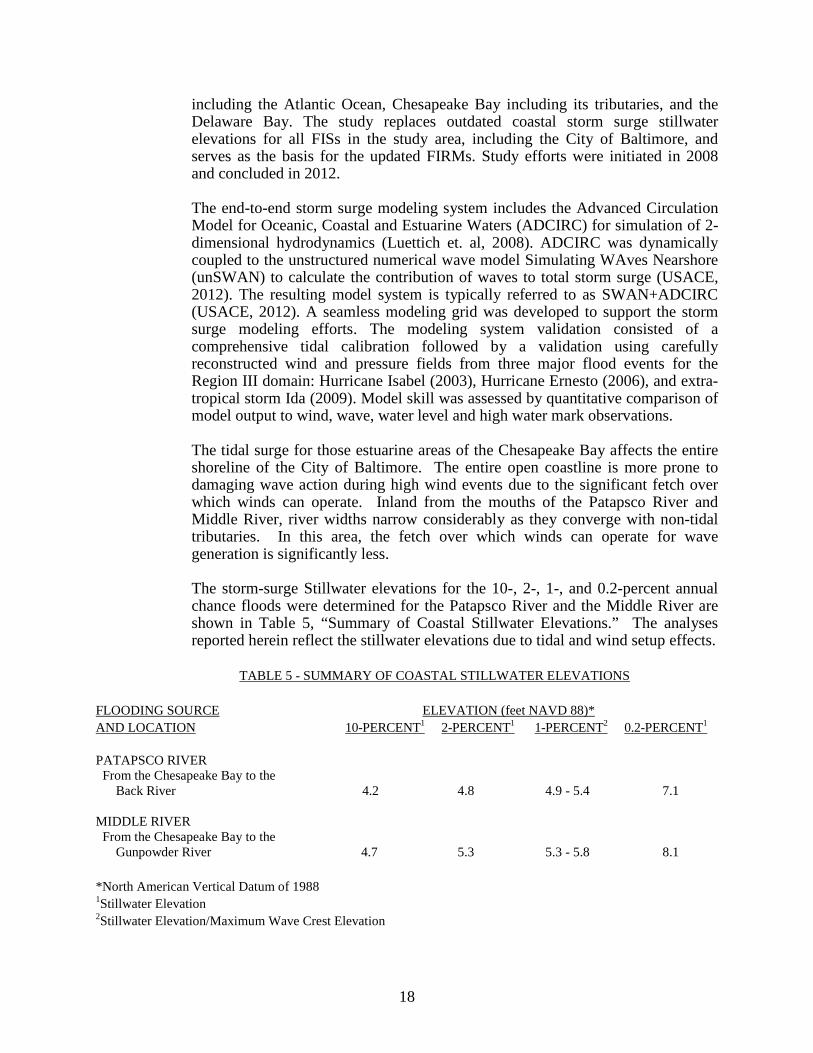
including the Atlantic Ocean, Chesapeake Bay including its tributaries, and the Delaware Bay. The study replaces outdated coastal storm surge stillwater elevations for all FISs in the study area, including the City of Baltimore, and serves as the basis for the updated FIRMs. Study efforts were initiated in 2008 and concluded in 2012. The end-to-end storm surge modeling system includes the Advanced Circulation Model for Oceanic, Coastal and Estuarine Waters (ADCIRC) for simulation of 2-dimensional hydrodynamics (Luettich et. al, 2008). ADCIRC was dynamically coupled to the unstructured numerical wave model Simulating WAves Nearshore (unSWAN) to calculate the contribution of waves to total storm surge (USACE, 2012). The resulting model system is typically referred to as SWAN+ADCIRC (USACE, 2012). A seamless modeling grid was developed to support the storm surge modeling efforts. The modeling system validation consisted of a comprehensive tidal calibration followed by a validation using carefully reconstructed wind and pressure fields from three major flood events for the Region III domain: Hurricane Isabel (2003), Hurricane Ernesto (2006), and extra-tropical storm Ida (2009). Model skill was assessed by quantitative comparison of model output to wind, wave, water level and high water mark observations. The tidal surge for those estuarine areas of the Chesapeake Bay affects the entire shoreline of the City of Baltimore. The entire open coastline is more prone to damaging wave action during high wind events due to the significant fetch over which winds can operate. Inland from the mouths of the Patapsco River and Middle River, river widths narrow considerably as they converge with non-tidal tributaries. In this area, the fetch over which winds can operate for wave generation is significantly less. The storm-surge Stillwater elevations for the 10-, 2-, 1-, and 0.2-percent annual chance floods were determined for the Patapsco River and the Middle River are shown in Table 5, “Summary of Coastal Stillwater Elevations.” The analyses reported herein reflect the stillwater elevations due to tidal and wind setup effects.
TABLE 5 - SUMMARY OF COASTAL STILLWATER ELEVATIONS
FLOODING SOURCE ELEVATION (feet NAVD 88)* AND LOCATION 10-PERCENT1 2-PERCENT1 1-PERCENT2 0.2-PERCENT1 PATAPSCO RIVER From the Chesapeake Bay to the Back River 4.2 4.8 4.9 - 5.4 7.1 MIDDLE RIVER From the Chesapeake Bay to the Gunpowder River 4.7 5.3 5.3 - 5.8 8.1 *North American Vertical Datum of 1988 1Stillwater Elevation 2Stillwater Elevation/Maximum Wave Crest Elevation
19
The methodology for analyzing the effects of wave heights associated with coastal storm surge flooding is described in a report prepared by the National Academy of Sciences (NAS, 1977). This method is based on three major concepts. First, depth-limited waves in shallow water reach maximum breaking height that is equal to 0.78 times the stillwater depth. The wave crest is 70 percent of the total wave height above the stillwater level. The second major concept is that wave height may be diminished by dissipation of energy due to the presence of obstructions, such as sand dunes, dikes and seawalls, buildings and vegetation. The amount of energy dissipation is a function of the physical characteristics of the obstruction and is determined by procedures prescribed in the NAS report. The third major concept is that wave height can be regenerated in open fetch areas due to the transfer of wind energy to the water. This added energy is related to fetch length and depth. Wave heights were computed across transects that were located along coastal areas of Baltimore City, as illustrated on the FIRMs. The transects are located with consideration given to existing transect locations and to the physical and cultural characteristics of the land so that they would closely represent conditions in the locality. Figure 2, “Typical Transect Schematic”, is a profile for a typical transect illustrating the effects of energy dissipation and regeneration on a wave as it moves inland. This figure shows the wave crest elevations being decreased by obstructions, such as buildings, vegetation, and rising ground elevations, and being increased by open, unobstructed wind fetches. Actual conditions in the City of Baltimore may not include all the situations illustrated in Figure 2. Each transect was taken perpendicular to the shoreline and extended inland to a point where coastal flooding ceased. Along each transect, wave heights and elevations were computed considering the combined effects of changes in ground elevation, vegetation, and physical features. The stillwater elevations for a 1-percent-annual chance event were used as the starting elevations for these computations. Wave heights were calculated to the nearest 0.1 foot, and wave elevations were determined at whole-foot increments along the transects. The location of the 3-foot breaking wave for determining the terminus of the Zone VE (area with velocity wave action) was computed at each transect. Along the open coast, the Zone VE designation applies to all areas seaward of the landward toe of the primary frontal dune system. The primary frontal due is defined as the point where the ground profile changes from relatively steep to relatively mild.
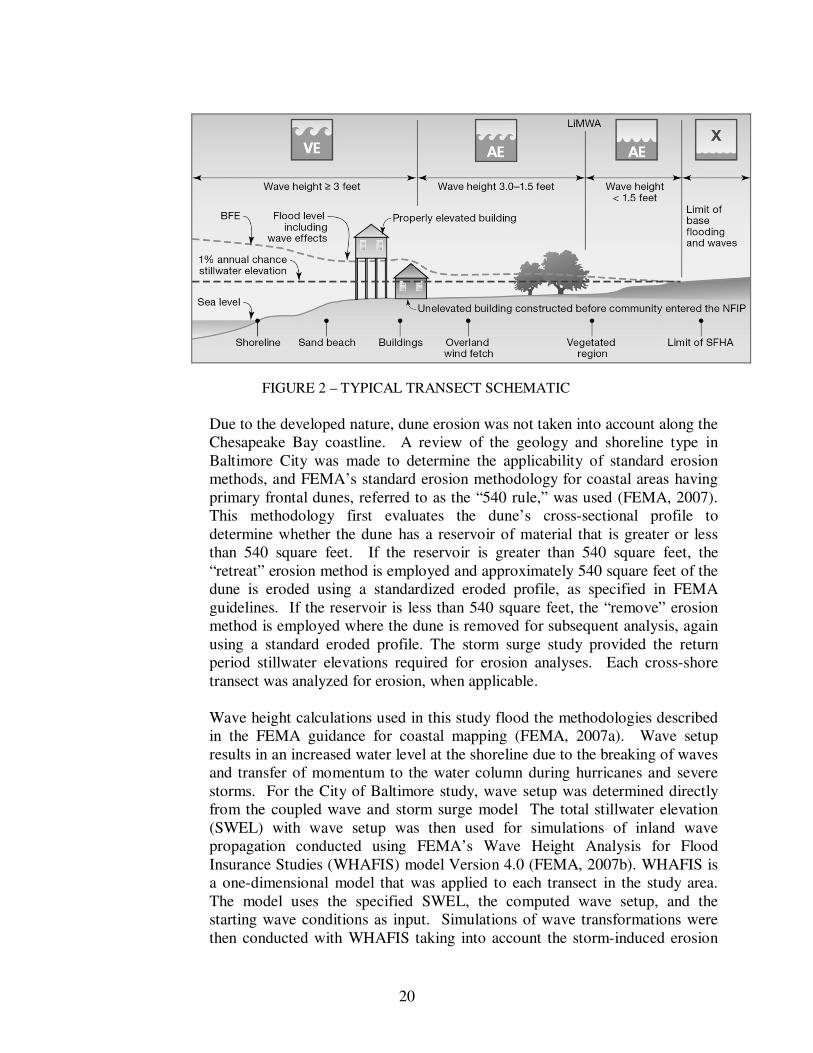
20
FIGURE 2 – TYPICAL TRANSECT SCHEMATIC
Due to the developed nature, dune erosion was not taken into account along the
Chesapeake Bay coastline. A review of the geology and shoreline type in
Baltimore City was made to determine the applicability of standard erosion
methods, and FEMA’s standard erosion methodology for coastal areas having
primary frontal dunes, referred to as the “540 rule,” was used (FEMA, 2007).
This methodology first evaluates the dune’s cross-sectional profile to
determine whether the dune has a reservoir of material that is greater or less
than 540 square feet. If the reservoir is greater than 540 square feet, the
“retreat” erosion method is employed and approximately 540 square feet of the
dune is eroded using a standardized eroded profile, as specified in FEMA
guidelines. If the reservoir is less than 540 square feet, the “remove” erosion
method is employed where the dune is removed for subsequent analysis, again
using a standard eroded profile. The storm surge study provided the return
period stillwater elevations required for erosion analyses. Each cross-shore
transect was analyzed for erosion, when applicable.
Wave height calculations used in this study flood the methodologies described
in the FEMA guidance for coastal mapping (FEMA, 2007a). Wave setup
results in an increased water level at the shoreline due to the breaking of waves
and transfer of momentum to the water column during hurricanes and severe
storms. For the City of Baltimore study, wave setup was determined directly
from the coupled wave and storm surge model The total stillwater elevation
(SWEL) with wave setup was then used for simulations of inland wave
propagation conducted using FEMA’s Wave Height Analysis for Flood
Insurance Studies (WHAFIS) model Version 4.0 (FEMA, 2007b). WHAFIS is
a one-dimensional model that was applied to each transect in the study area.
The model uses the specified SWEL, the computed wave setup, and the
starting wave conditions as input. Simulations of wave transformations were
then conducted with WHAFIS taking into account the storm-induced erosion
21
and overland features of each transect. Output from the model includes the
combined SWEL and wave height along each cross-shore transect allowing for
the establishment of base flood elevations (BFEs) and flood zones from the
shoreline to points inland within the study area.
Wave run-up is defined as the maximum vertical extent of wave uprush on a
beach or structure. FEMA’s 2007 Guidelines and Specifications require the 2
percent wave run-up level be computed for the coastal feature being evaluated
(cliff, coastal bluff, dune, or structure) (FEMA, 2007). The 2 percent run-up
level is the highest 2 percent of wave run-up affecting the shoreline during the
1-percent-annual-chance flood event. Each transect defined within the Region
III study area was evaluated for the applicability of wave run-up, and if
necessary, the appropriate run-up methodology was selected and applied to
each transect. Run-up elevations were then compared to WHAFIS results to
determine the dominant process affecting BFEs and associated flood hazard
levels. Based on wave run-up rates, wave overtopping was computed
following the FEMA 2007 Guidelines and Specifications.
Computed controlling wave heights at the shoreline range from 0.6 feet at the
western end of the county where the fetch is short to 4.0 feet at the eastern end
where the fetch is longer. The corresponding wave elevation at the shoreline
varies from 6.1 feet NAVD 88 at the northern end to 8.5 feet NAVD 88 at the
southern end. Vertical reinforced coastlines serve to reduce wave height z.
It has been shown in laboratory tests and observed in field investigations that wave
heights as little as 1.5 feet can cause damage to and failure of typical Zone AE
construction. Therefore, for advisory purposes only, a Limit of Moderate Wave
Action (LiMWA) boundary has been added in coastal areas subject to wave
action. The LiMWA represents the approximate landward limit of the 1.5-foot
breaking wave.
The effects of wave hazards in the Zone AE between the Zone VE (or shoreline in
areas where VE Zones are not identified) and the limit of the LiMWA boundary
are similar to, but less severe than, those in Zone VE where 3-foot breaking waves
are projected during a 1-percent-annual-chance flooding event.
In areas where wave runup elevations dominate over wave heights, such as areas
with steeply sloped beaches, bluffs, and/or shore-parallel flood protection
structures, there is no evidence to date of significant damage to residential
structures by runup depths less than 3 feet. However, to simplify representation,
the LiMWA was continued immediately landward of the VE/AE boundary in
areas where wave runup elevations dominate. Similarly, in areas where the Zone
VE designation is based on the presence of a primary frontal dune or wave
overtopping, the LiMWA was also delineated immediately landward of the Zone
VE/AE boundary.

22
3.4 Vertical Datum
All FISs and FIRMs are referenced to a specific vertical datum. The vertical datum provides a starting point against which flood, ground, and structure elevations can be referenced and compared. Until recently, the standard vertical datum in use for newly created or revised FISs and FIRMs was the National Geodetic Vertical Datum of 1929 (NGVD 29). With the finalization of the North American Vertical Datum of 1988 (NAVD 88), many FIS reports and FIRMs are being prepared using NAVD 88 as the referenced vertical datum. Prior versions of this FIS reports and FIRM were referenced to NGVD 29. When a datum conversion is effected for a FIS report and FIRM, the Flood Profiles, BFEs and ERMs reflect the new datum values. To compare structure and ground elevations to 1%-annual-chance (100-year) flood elevations shown in the FIS and on the FIRM, the subject structure and ground elevations must be referenced to the new datum values. As noted above, the elevations shown in the FIS report and on the FIRM for Baltimore City are referenced to NAVD 88. Ground, structure, and flood elevations may be compared and/or referenced to NGVD 29 by applying a standard conversion factor. The conversion factor to NGVD 29 is +0.784 feet. The BFEs shown on the FIRM represent whole-foot rounded values. For example, a BFE of 102.4 will appear as 102 on the FIRM and 102.6 will appear as 103. Therefore, users that wish to convert the elevations in this FIS to NGVD 29 should apply the stated conversion factor(s) to elevations shown on the Flood Profiles and supporting data tables in the FIS report, which are shown at a minimum to the nearest 0.1 foot.
NAVD = NGVD – 0.784 All flood elevations shown in this FIS report and on the FIRM are referenced to NAVD 88. Structure and ground elevations in the community must, therefore, be referenced to NAVD 88. It is important to note that adjacent communities may be referenced to NGVD 29. This may result in differences in BFEs across the corporate limits between the communities. For more information on NAVD 88, see Converting the National Flood Insurance Program to the North American Vertical Datum of 1988, FEMA Publication FIA-20/June 1992, or contact the Spatial Reference System Division, National Geodetic Survey, NOAA, Silver Spring Metro Center, 1315 East-West Highway, Silver Spring, Maryland 20910 (Internet address http://www.ngs.noaa.gov).
23
4.0 FLOODPLAIN MANAGEMENT APPLICATIONS
The NFIP encourages State and local governments to adopt sound floodplain management programs. To assist in this endeavor, each FIS provides 100-year floodplain data, which may include a combination of the following: 10-, 2-, 1-, and 0.2-percent annual chance flood elevations; delineations of the 1- and 0.2-percent annual chance floodplains; and 1-percent annual chance floodway. This information is presented on the FIRM and in many components of the FIS, including Flood Profiles, Floodway Data tables, and Summary of Stillwater Elevation tables. Users should reference the data presented in the FIS as well as additional information that may be available at the local community map repository before making flood elevation and/or floodplain boundary determinations.
4.1 Floodplain Boundaries
To provide a national standard without regional discrimination, the 1-percent annual chance flood has been adopted by FEMA as the base flood for floodplain management purposes. The 0.2-percent annual chance flood is employed to indicate additional areas of flood risk in the community. For all flooding sources studied in detail and tidal areas, 1- and 0.2-percent floodplain boundaries have been delineated using topographic maps at a scale of 1 inch = 40 feet, with a contour interval of 2 feet (City of Baltimore, 2003). For the streams studied by approximate methods, the 1-percent annual chance floodplain boundary has been delineated on the same topography. The 1- and 0.2-percent annual chance floodplain boundaries are shown on the FIRM (Exhibit 2). On this map, the 1-percent annual chance floodplain boundary corresponds to the boundary of the areas of special flood hazards (Zones A, AE, AO, and VE), and the 0.2-percent annual chance floodplain boundary corresponds to the boundary of areas of moderate flood hazards. In cases where the 1- and 0.2-percent annual chance floodplain boundaries are close together, only the 1-percent annual chance floodplain boundary has been shown. Small areas within the floodplain boundaries may lie above the flood elevations but cannot be shown due to limitations of the map scale and/or lack of detailed topographic data. Areas of coastline subject to significant wave attack are referred to as coastal high hazard zones. The USACE has established the 3-foot breaking wave as the criterion for identifying the limit of coastal high hazard zones (USACE, 1975). The 3-foot wave has been determined the minimum size wave capable of causing major damage to conventional wood frame of brick veneer structures. The one exception to the 3-foot wave criteria is where a primary frontal dune exists. The limit the coastal high hazard area then becomes the landward toe of the primary frontal dune or where a 3-foot or greater breaking wave exists, whichever is most landward. The coastal high hazard zone is depicted on the FIRMs as Zone VE, where the delineated flood hazard includes wave heights equal to or greater than three feet. Zone AE is depicted on the FIRMs where the delineated flood hazard includes wave heights less than three feet. A depiction of how the Zones VE and AE are mapped is shown in Figure 2, ‘Typical Transect Schematic’ of this report.
24
For the streams studied by approximate methods, only the 1-percent annual chance floodplain boundary is shown on the revised FIRM (Exhibit 2).
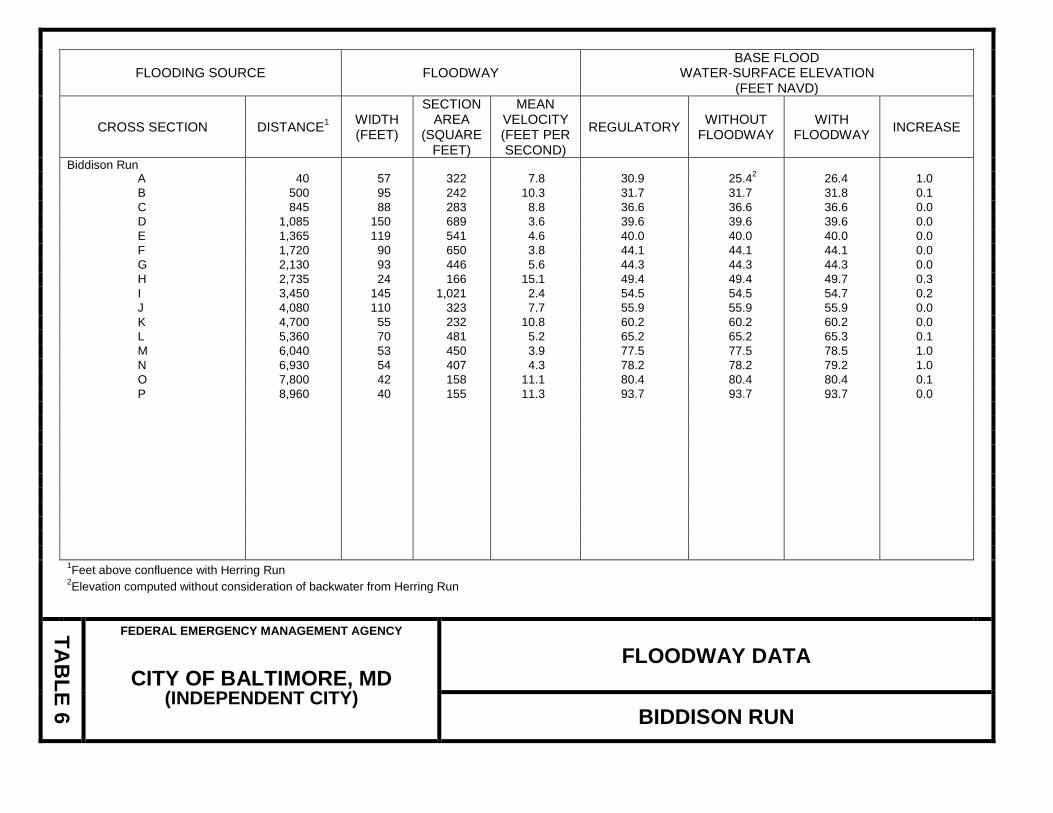
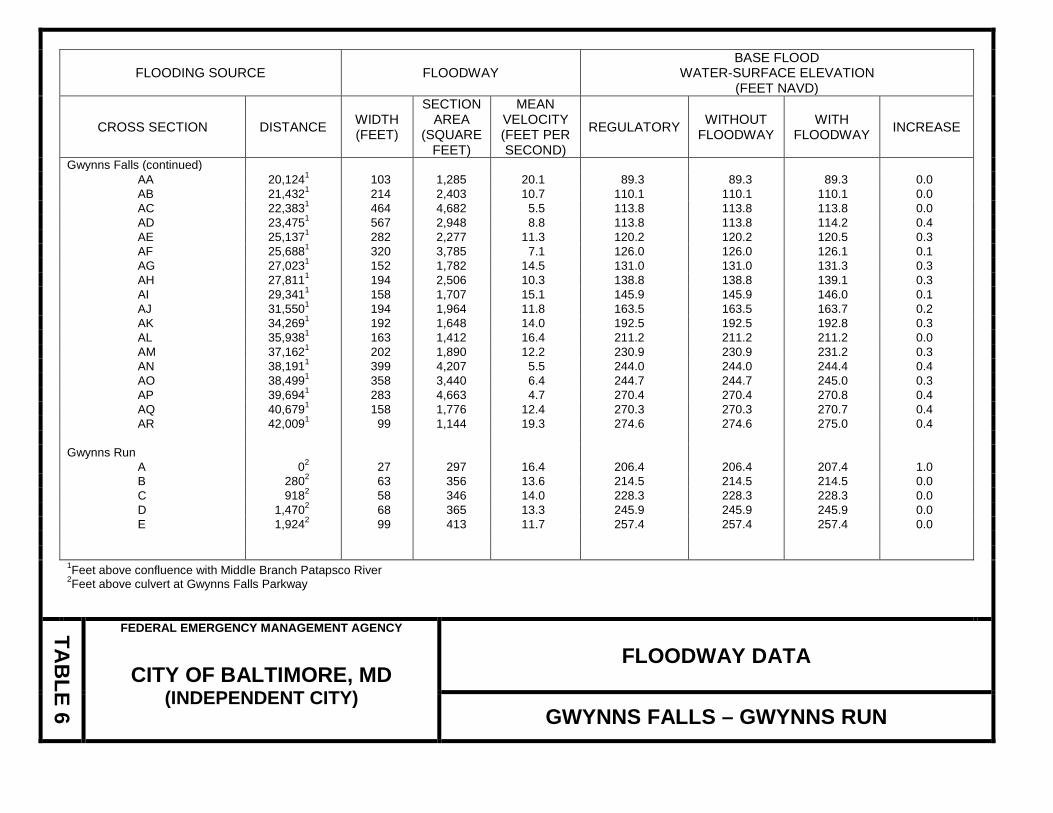
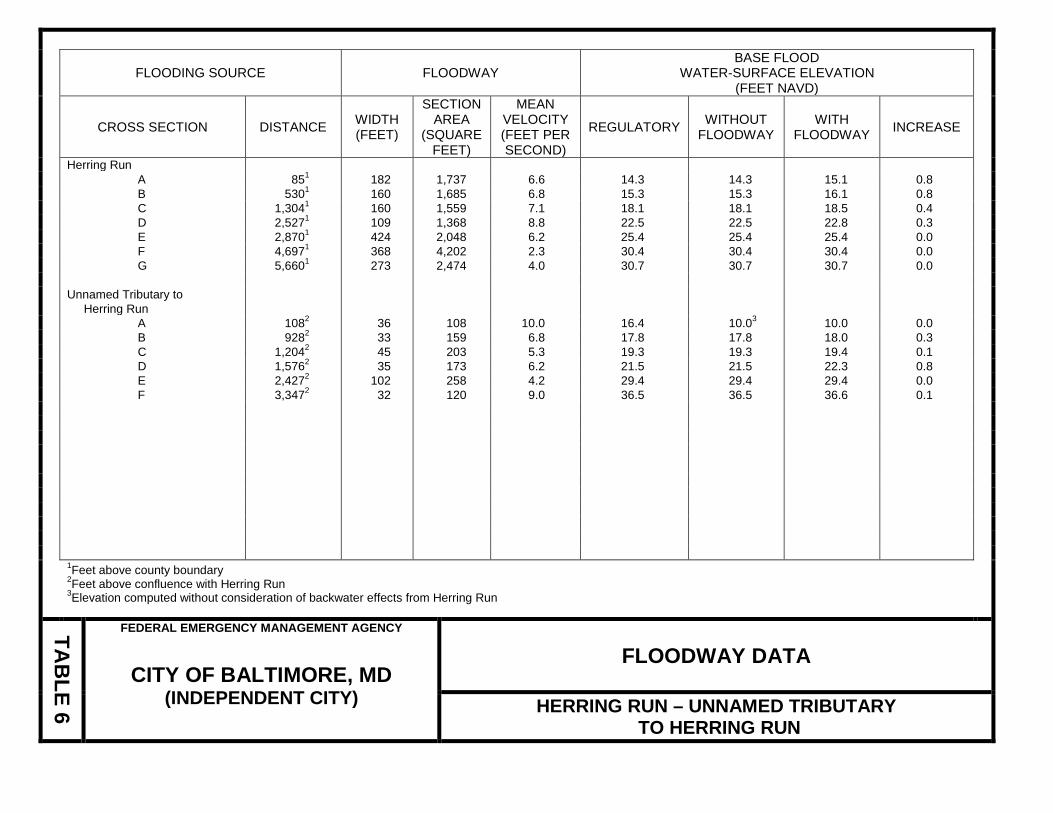
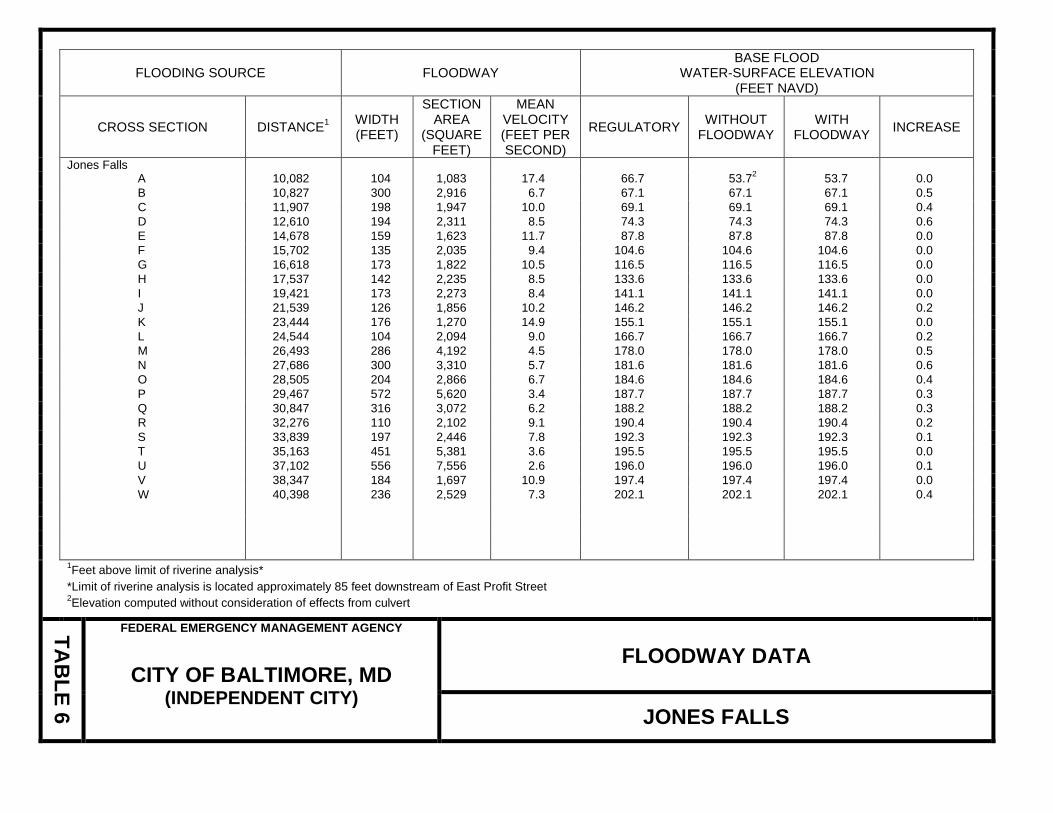
4.2 Floodways Encroachment on floodplains, such as structures and fill, reduces flood-carrying capacity, increases flood heights and velocities, and increases flood hazards in areas beyond the encroachment itself. One aspect of floodplain management involves balancing the economic gain from floodplain development against the resulting increase in flood hazard. For purposes of the NFIP, a floodway is used as a tool to assist local communities in this aspect of floodplain management. Under this concept, the area of the 1-percent annual chance floodplain is divided into a floodway and a floodway fringe. The floodway is the channel of a stream, plus any adjacent floodplain areas, that must be kept free of encroachment so that the 1-percent annual chance flood can be carried without substantial increases in flood heights. Minimum Federal standards limit such increases to 1.0 foot, provided that hazardous velocities are not produced. The floodways in this study are presented to local agencies as a minimum standard that can be adopted directly or that can be used as a basis for additional floodway studies. The floodways presented in this FIS were computed for certain stream segments on the basis of equal conveyance reduction from each side of the floodplain. Floodway widths were computed at cross sections. Between cross sections, the floodway boundaries were interpolated. The results of the floodway computations are tabulated for selected cross sections (Table 6). The computed floodways are shown on the revised FIRM (Exhibit 2). In cases where the floodway and 1-percent annual chance floodplain boundaries are either close together or collinear, only the floodway boundary is shown. Near the mouths of streams studied in detail, floodway computations are made without regard to flood elevations on the receiving water body. Therefore, “Without Floodway” elevations presented in Table 6 for certain downstream cross sections of Biddison Run, Gwynns Falls, and Maidens Choice Run are lower than the regulatory flood elevations in that area, which must take into account the 1-percent annual chance flooding due to backwater from other sources. Floodways are not computed for CSX Split Flow and Gwynns Falls Split Flow.
FLOODING SOURCE FLOODWAY BASE FLOOD
WATER-SURFACE ELEVATION (FEET NAVD)
CROSS SECTION DISTANCE1 WIDTH
(FEET)
SECTION AREA
(SQUARE FEET)
MEAN VELOCITY (FEET PER SECOND)
REGULATORY WITHOUT FLOODWAY
WITH FLOODWAY INCREASE
Biddison Run A 40 57 322 7.8 30.9 25.42 26.4 1.0 B 500 95 242 10.3 31.7 31.7 31.8 0.1 C 845 88 283 8.8 36.6 36.6 36.6 0.0 D 1,085 150 689 3.6 39.6 39.6 39.6 0.0 E 1,365 119 541 4.6 40.0 40.0 40.0 0.0 F 1,720 90 650 3.8 44.1 44.1 44.1 0.0 G 2,130 93 446 5.6 44.3 44.3 44.3 0.0 H 2,735 24 166 15.1 49.4 49.4 49.7 0.3 I 3,450 145 1,021 2.4 54.5 54.5 54.7 0.2 J 4,080 110 323 7.7 55.9 55.9 55.9 0.0 K 4,700 55 232 10.8 60.2 60.2 60.2 0.0 L 5,360 70 481 5.2 65.2 65.2 65.3 0.1 M 6,040 53 450 3.9 77.5 77.5 78.5 1.0 N 6,930 54 407 4.3 78.2 78.2 79.2 1.0 O 7,800 42 158 11.1 80.4 80.4 80.4 0.1 P 8,960 40 155 11.3 93.7 93.7 93.7 0.0 1Feet above confluence with Herring Run
2Elevation computed without consideration of backwater from Herring Run
TAB
LE 6
FEDERAL EMERGENCY MANAGEMENT AGENCY
CITY OF BALTIMORE, MD (INDEPENDENT CITY)
FLOODWAY DATA
BIDDISON RUN

FLOODING SOURCE FLOODWAY BASE FLOOD
WATER-SURFACE ELEVATION (FEET NAVD)
CROSS SECTION DISTANCE1 WIDTH
(FEET)
SECTION AREA
(SQUARE FEET)
MEAN VELOCITY (FEET PER SECOND)
REGULATORY WITHOUT FLOODWAY
WITH FLOODWAY INCREASE
Gwynns Falls A 6 1,182 4,775 6.5 7.3 4.62 4.8 0.2 B 1,185 1,700 2,209 14.1 7.3 5.62 5.7 0.1 C 1,706 2,926 3,997 7.8 12.0 12.0 12.0 0.0 D 2,519 3,542 8,491 3.7 15.3 15.3 15.3 0.0 E 3,098 3,674 5,760 5.4 15.5 15.5 16.3 0.7 F 3,397 3,881 9,805 3.2 18.8 18.8 18.9 0.1 G 4,316 3,253 11,906 2.6 19.2 19.2 19.3 0.1 H 4,850 3,432 17,451 1.8 19.3 19.3 19.5 0.2 I 5,057 3,334 8,698 3.6 19.4 19.4 19.6 0.2 J 5,741 397 2,996 10.4 19.5 19.5 19.7 0.2 K 7,495 228 3,284 9.3 27.4 27.4 28.2 0.8 L 7,788 173 2,755 11.1 28.9 28.9 29.6 0.7 M 8,612 562 3,116 9.5 34.1 34.1 34.1 0.0 N 9,483 604 7,501 4.0 36.4 36.4 36.4 0.0 O 10,514 220 4,045 7.3 37.4 37.4 37.5 0.1 P 10,672 220 4,701 6.3 41.5 41.5 41.6 0.1 Q 11,405 309 4,763 6.2 42.5 42.5 42.8 0.3 R 13,106 371 4,667 6.3 50.8 50.8 51.6 0.8 S 13,615 194 3,859 6.7 56.4 56.4 56.5 0.1 T 14,576 286 4,545 5.7 57.4 57.4 57.7 0.3 U 14,893 256 4,548 5.7 58.8 58.8 59.1 0.4 V 15,516 218 3,219 8.0 59.1 59.1 59.5 0.4 W 16,385 280 3,696 7.0 60.4 60.4 60.7 0.4 X 16,862 183 2,755 9.4 65.4 65.4 65.7 0.3 Y 18,172 202 2,026 12.7 68.7 68.7 68.9 0.2 Z 18,625 204 2,681 9.6 75.7 75.7 75.7 0.0 1Feet above confluence with Middle Branch Patapsco River
2Elevation computed without consideration of backwater effects from Middle Branch Patapsco River
TAB
LE 6
FEDERAL EMERGENCY MANAGEMENT AGENCY
CITY OF BALTIMORE, MD (INDEPENDENT CITY)
FLOODWAY DATA
GWYNNS FALLS
FLOODING SOURCE FLOODWAY BASE FLOOD
WATER-SURFACE ELEVATION (FEET NAVD)
CROSS SECTION DISTANCE WIDTH
(FEET)
SECTION AREA
(SQUARE FEET)
MEAN VELOCITY (FEET PER SECOND)
REGULATORY WITHOUT FLOODWAY
WITH FLOODWAY INCREASE
Gwynns Falls (continued) AA 20,1241 103 1,285 20.1 89.3 89.3 89.3 0.0 AB 21,4321 214 2,403 10.7 110.1 110.1 110.1 0.0 AC 22,3831 464 4,682 5.5 113.8 113.8 113.8 0.0 AD 23,4751 567 2,948 8.8 113.8 113.8 114.2 0.4 AE 25,1371 282 2,277 11.3 120.2 120.2 120.5 0.3 AF 25,6881 320 3,785 7.1 126.0 126.0 126.1 0.1 AG 27,0231 152 1,782 14.5 131.0 131.0 131.3 0.3 AH 27,8111 194 2,506 10.3 138.8 138.8 139.1 0.3 AI 29,3411 158 1,707 15.1 145.9 145.9 146.0 0.1 AJ 31,5501 194 1,964 11.8 163.5 163.5 163.7 0.2 AK 34,2691 192 1,648 14.0 192.5 192.5 192.8 0.3 AL 35,9381 163 1,412 16.4 211.2 211.2 211.2 0.0 AM 37,1621 202 1,890 12.2 230.9 230.9 231.2 0.3 AN 38,1911 399 4,207 5.5 244.0 244.0 244.4 0.4 AO 38,4991 358 3,440 6.4 244.7 244.7 245.0 0.3 AP 39,6941 283 4,663 4.7 270.4 270.4 270.8 0.4 AQ 40,6791 158 1,776 12.4 270.3 270.3 270.7 0.4 AR 42,0091 99 1,144 19.3 274.6 274.6 275.0 0.4 Gwynns Run A 02 27 297 16.4 206.4 206.4 207.4 1.0 B 2802 63 356 13.6 214.5 214.5 214.5 0.0 C 9182 58 346 14.0 228.3 228.3 228.3 0.0 D 1,4702 68 365 13.3 245.9 245.9 245.9 0.0 E 1,9242 99 413 11.7 257.4 257.4 257.4 0.0 1Feet above confluence with Middle Branch Patapsco River
2Feet above culvert at Gwynns Falls Parkway
TAB
LE 6
FEDERAL EMERGENCY MANAGEMENT AGENCY
CITY OF BALTIMORE, MD (INDEPENDENT CITY)
FLOODWAY DATA
GWYNNS FALLS – GWYNNS RUN
FLOODING SOURCE FLOODWAY BASE FLOOD
WATER-SURFACE ELEVATION (FEET NAVD)
CROSS SECTION DISTANCE WIDTH
(FEET)
SECTION AREA
(SQUARE FEET)
MEAN VELOCITY (FEET PER SECOND)
REGULATORY WITHOUT FLOODWAY
WITH FLOODWAY INCREASE
Herring Run A 851 182 1,737 6.6 14.3 14.3 15.1 0.8 B 5301 160 1,685 6.8 15.3 15.3 16.1 0.8 C 1,3041 160 1,559 7.1 18.1 18.1 18.5 0.4 D 2,5271 109 1,368 8.8 22.5 22.5 22.8 0.3 E 2,8701 424 2,048 6.2 25.4 25.4 25.4 0.0 F 4,6971 368 4,202 2.3 30.4 30.4 30.4 0.0 G 5,6601 273 2,474 4.0 30.7 30.7 30.7 0.0 Unnamed Tributary to Herring Run A 1082 36 108 10.0 16.4 10.03 10.0 0.0 B 9282 33 159 6.8 17.8 17.8 18.0 0.3 C 1,2042 45 203 5.3 19.3 19.3 19.4 0.1 D 1,5762 35 173 6.2 21.5 21.5 22.3 0.8 E 2,4272 102 258 4.2 29.4 29.4 29.4 0.0 F 3,3472 32 120 9.0 36.5 36.5 36.6 0.1 1Feet above county boundary
2Feet above confluence with Herring Run 3Elevation computed without consideration of backwater effects from Herring Run
TAB
LE 6
FEDERAL EMERGENCY MANAGEMENT AGENCY
CITY OF BALTIMORE, MD (INDEPENDENT CITY)
FLOODWAY DATA
HERRING RUN – UNNAMED TRIBUTARY TO HERRING RUN
FLOODING SOURCE FLOODWAY BASE FLOOD
WATER-SURFACE ELEVATION (FEET NAVD)
CROSS SECTION DISTANCE1 WIDTH
(FEET)
SECTION AREA
(SQUARE FEET)
MEAN VELOCITY (FEET PER SECOND)
REGULATORY WITHOUT FLOODWAY
WITH FLOODWAY INCREASE
Jones Falls A 10,082 104 1,083 17.4 66.7 53.72 53.7 0.0 B 10,827 300 2,916 6.7 67.1 67.1 67.1 0.5 C 11,907 198 1,947 10.0 69.1 69.1 69.1 0.4 D 12,610 194 2,311 8.5 74.3 74.3 74.3 0.6 E 14,678 159 1,623 11.7 87.8 87.8 87.8 0.0 F 15,702 135 2,035 9.4 104.6 104.6 104.6 0.0 G 16,618 173 1,822 10.5 116.5 116.5 116.5 0.0 H 17,537 142 2,235 8.5 133.6 133.6 133.6 0.0 I 19,421 173 2,273 8.4 141.1 141.1 141.1 0.0 J 21,539 126 1,856 10.2 146.2 146.2 146.2 0.2 K 23,444 176 1,270 14.9 155.1 155.1 155.1 0.0 L 24,544 104 2,094 9.0 166.7 166.7 166.7 0.2 M 26,493 286 4,192 4.5 178.0 178.0 178.0 0.5 N 27,686 300 3,310 5.7 181.6 181.6 181.6 0.6 O 28,505 204 2,866 6.7 184.6 184.6 184.6 0.4 P 29,467 572 5,620 3.4 187.7 187.7 187.7 0.3 Q 30,847 316 3,072 6.2 188.2 188.2 188.2 0.3 R 32,276 110 2,102 9.1 190.4 190.4 190.4 0.2 S 33,839 197 2,446 7.8 192.3 192.3 192.3 0.1 T 35,163 451 5,381 3.6 195.5 195.5 195.5 0.0 U 37,102 556 7,556 2.6 196.0 196.0 196.0 0.1 V 38,347 184 1,697 10.9 197.4 197.4 197.4 0.0 W 40,398 236 2,529 7.3 202.1 202.1 202.1 0.4 1Feet above limit of riverine analysis*
*Limit of riverine analysis is located approximately 85 feet downstream of East Profit Street 2Elevation computed without consideration of effects from culvert
TAB
LE 6
FEDERAL EMERGENCY MANAGEMENT AGENCY
CITY OF BALTIMORE, MD (INDEPENDENT CITY)
FLOODWAY DATA
JONES FALLS

FLOODING SOURCE FLOODWAY BASE FLOOD
WATER-SURFACE ELEVATION (FEET NAVD)
CROSS SECTION DISTANCE1 WIDTH
(FEET)
SECTION AREA
(SQUARE FEET)
MEAN VELOCITY (FEET PER SECOND)
REGULATORY WITHOUT FLOODWAY
WITH FLOODWAY INCREASE
Maidens Choice Run A 130 43 390 17.2 50.9 43.52 43.5 0.0 B 264 71 1,392 4.8 63.2 63.2 63.2 0.0 C 915 46 629 7.6 72.2 72.2 73.1 0.9 D 1,685 80 764 3.9 80.4 80.4 81.4 1.0 E 2,095 55 382 15.0 82.1 82.1 82.1 0.0 F 2,495 57 414 13.8 89.4 89.4 89.4 0.5 G 2,880 69 554 10.3 94.1 94.1 94.1 0.0 H 3,270 70 459 12.5 100.8 100.8 100.8 0.0 I 3,470 57 575 9.9 111.3 111.3 111.3 0.0 J 3,820 151 1,475 3.9 113.1 113.1 114.1 1.0 K 4,040 241 2,493 2.3 113.3 113.3 113.8 0.5 L 4,610 86 600 9.5 113.8 113.8 113.8 0.0 M 6,295 152 956 6.0 133.9 133.9 134.0 0.1 N 7,205 125 707 6.7 138.3 138.3 138.6 0.3 O 7,765 138 769 6.2 142.5 142.5 143.3 0.8 P 8,460 67 378 12.0 148.7 148.7 148.7 0.0 Q 9,065 90 1,322 4.0 160.3 160.3 161.0 0.7 R 9,645 234 1,435 3.6 160.7 160.7 161.4 0.7 S 10,465 140 532 9.8 164.7 164.7 164.9 0.2 T 11,205 135 474 11.0 172.5 172.5 173.4 0.9 1Feet above confluence with Gwynns Falls
2Elevation computed without consideration of backwater effects from Gwynns Falls
TAB
LE 6
FEDERAL EMERGENCY MANAGEMENT AGENCY
CITY OF BALTIMORE, MD (INDEPENDENT CITY)
FLOODWAY DATA
MAIDENS CHOICE RUN
FLOODING SOURCE FLOODWAY BASE FLOOD
WATER-SURFACE ELEVATION (FEET NAVD)
CROSS SECTION DISTANCE1 WIDTH
(FEET)
SECTION AREA
(SQUARE FEET)
MEAN VELOCITY (FEET PER SECOND)
REGULATORY WITHOUT FLOODWAY
WITH FLOODWAY INCREASE
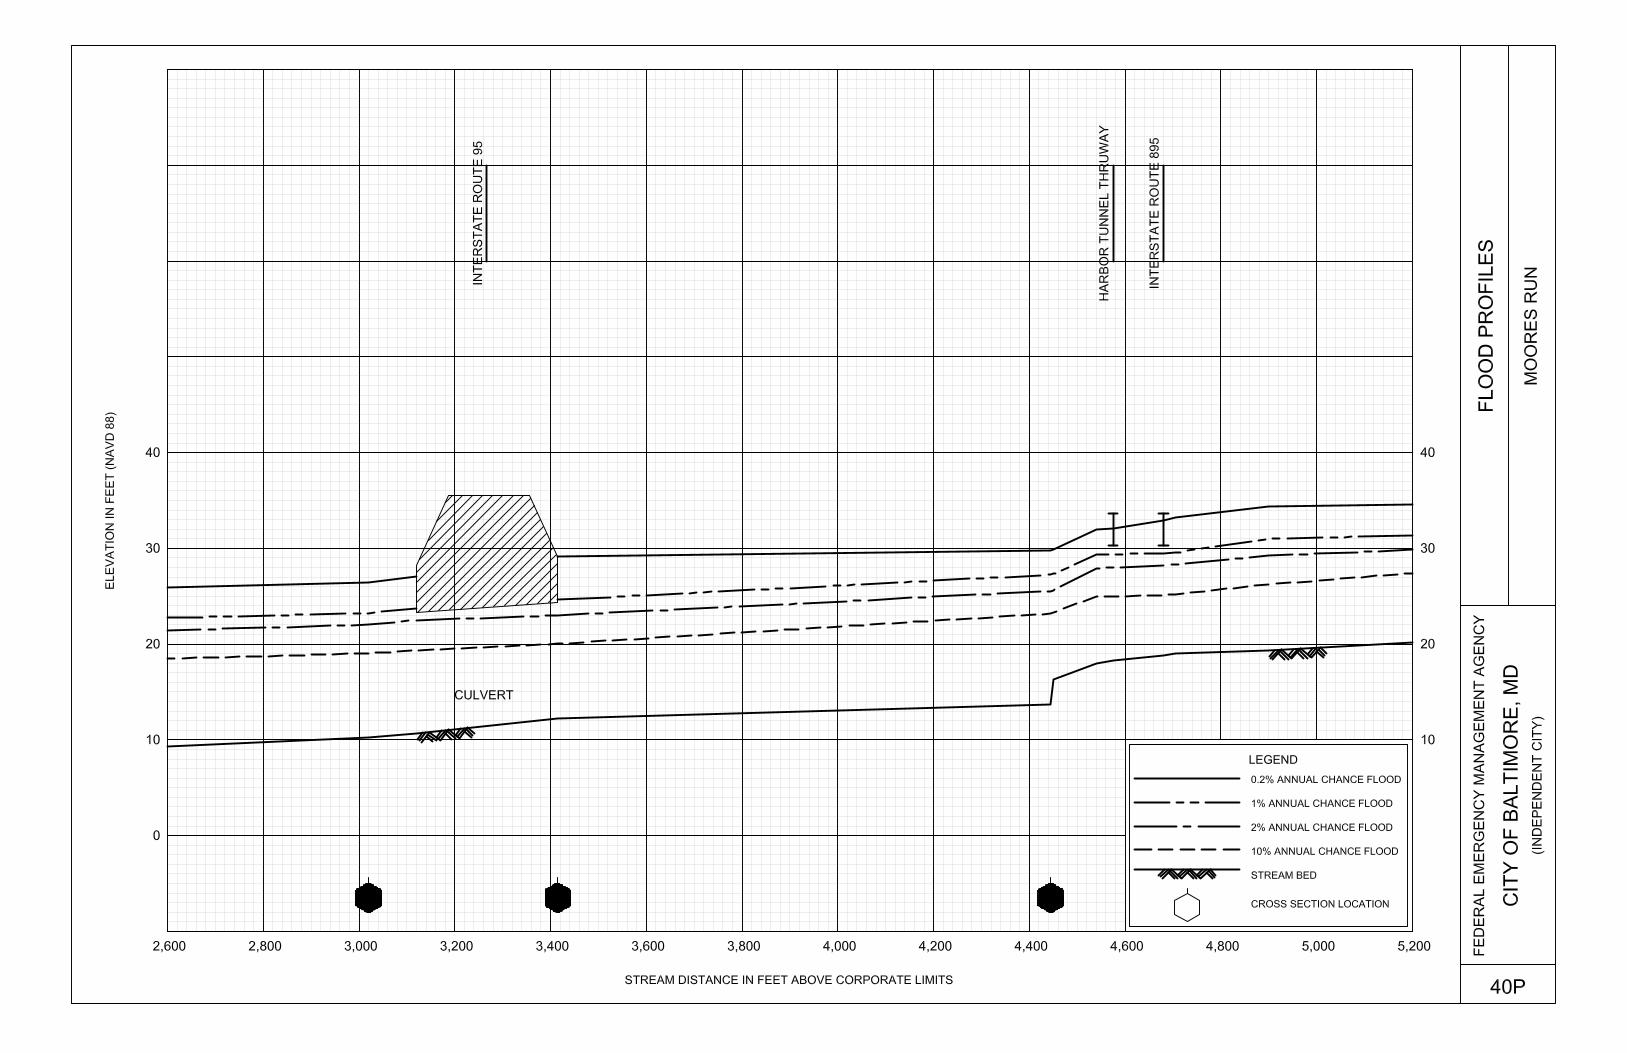
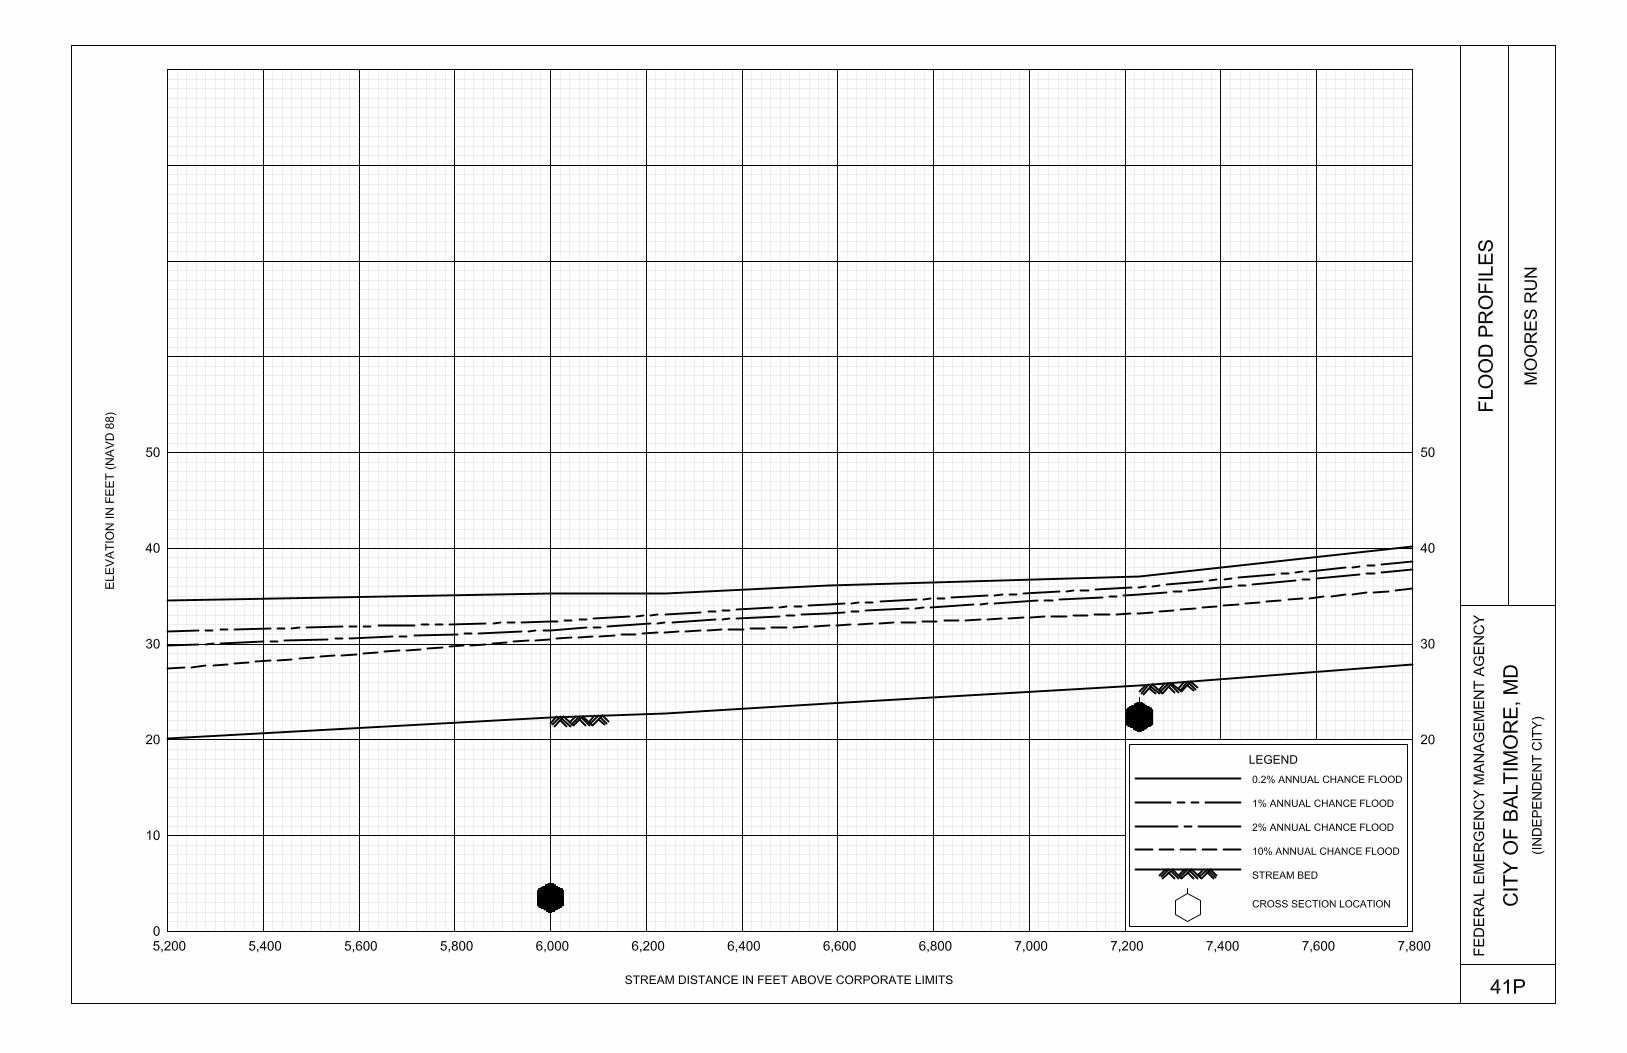
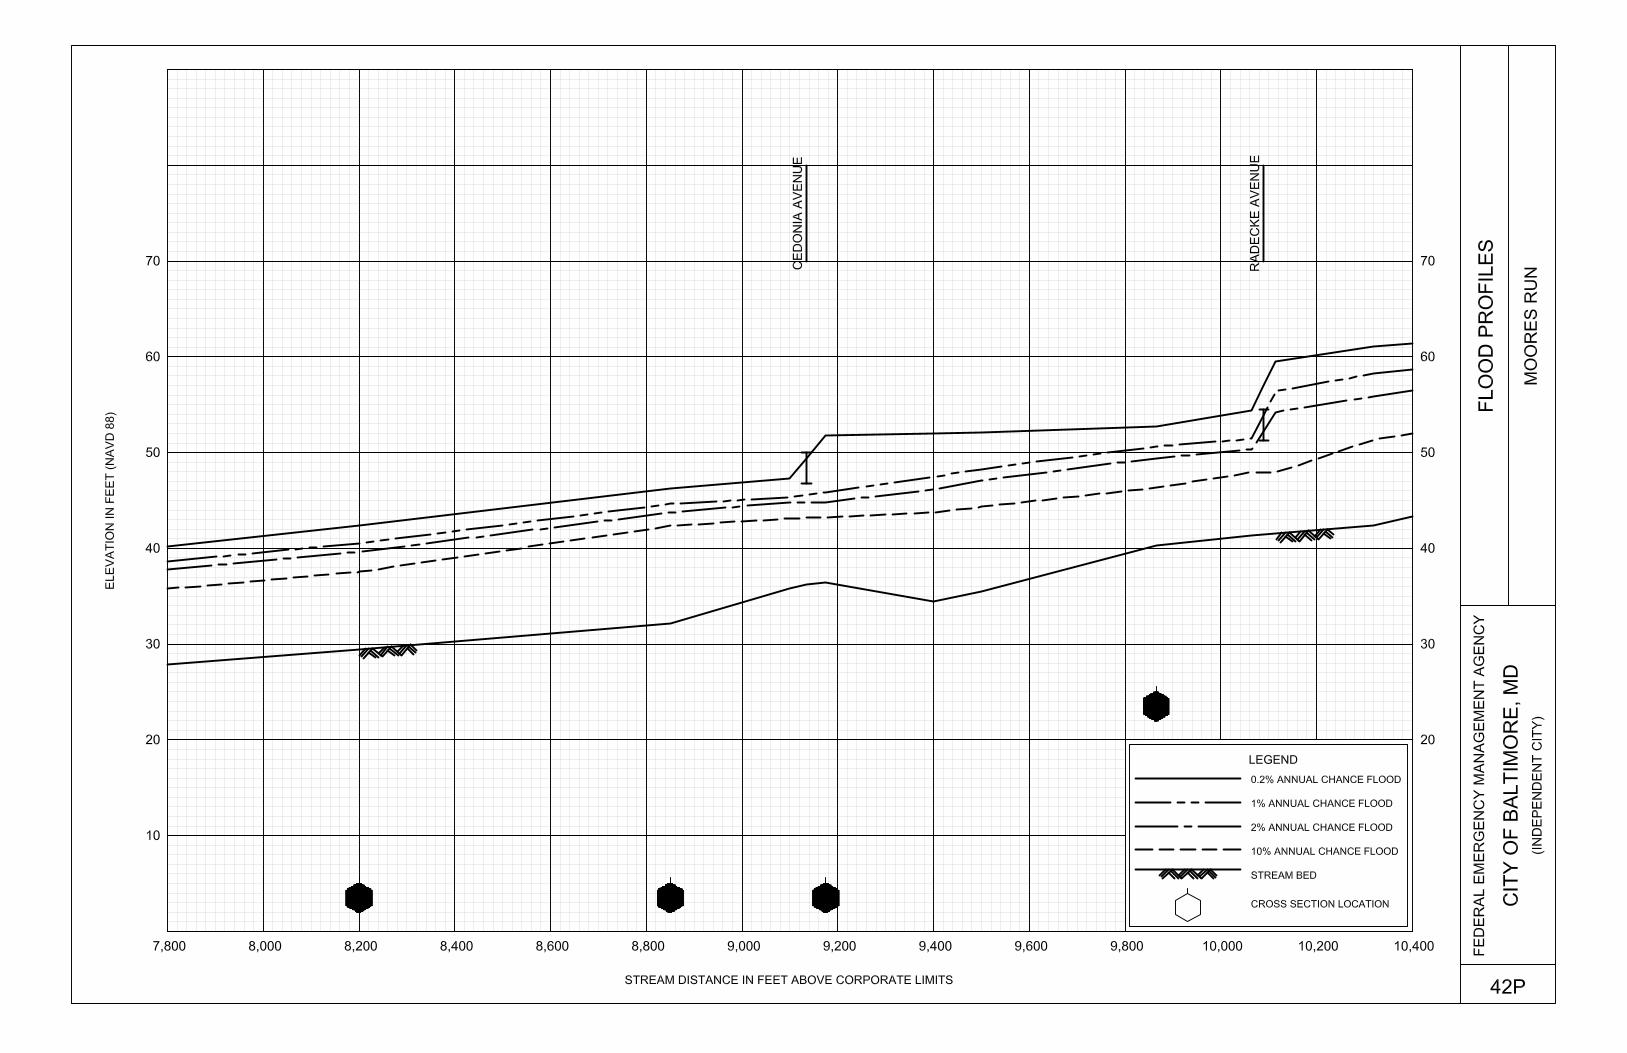
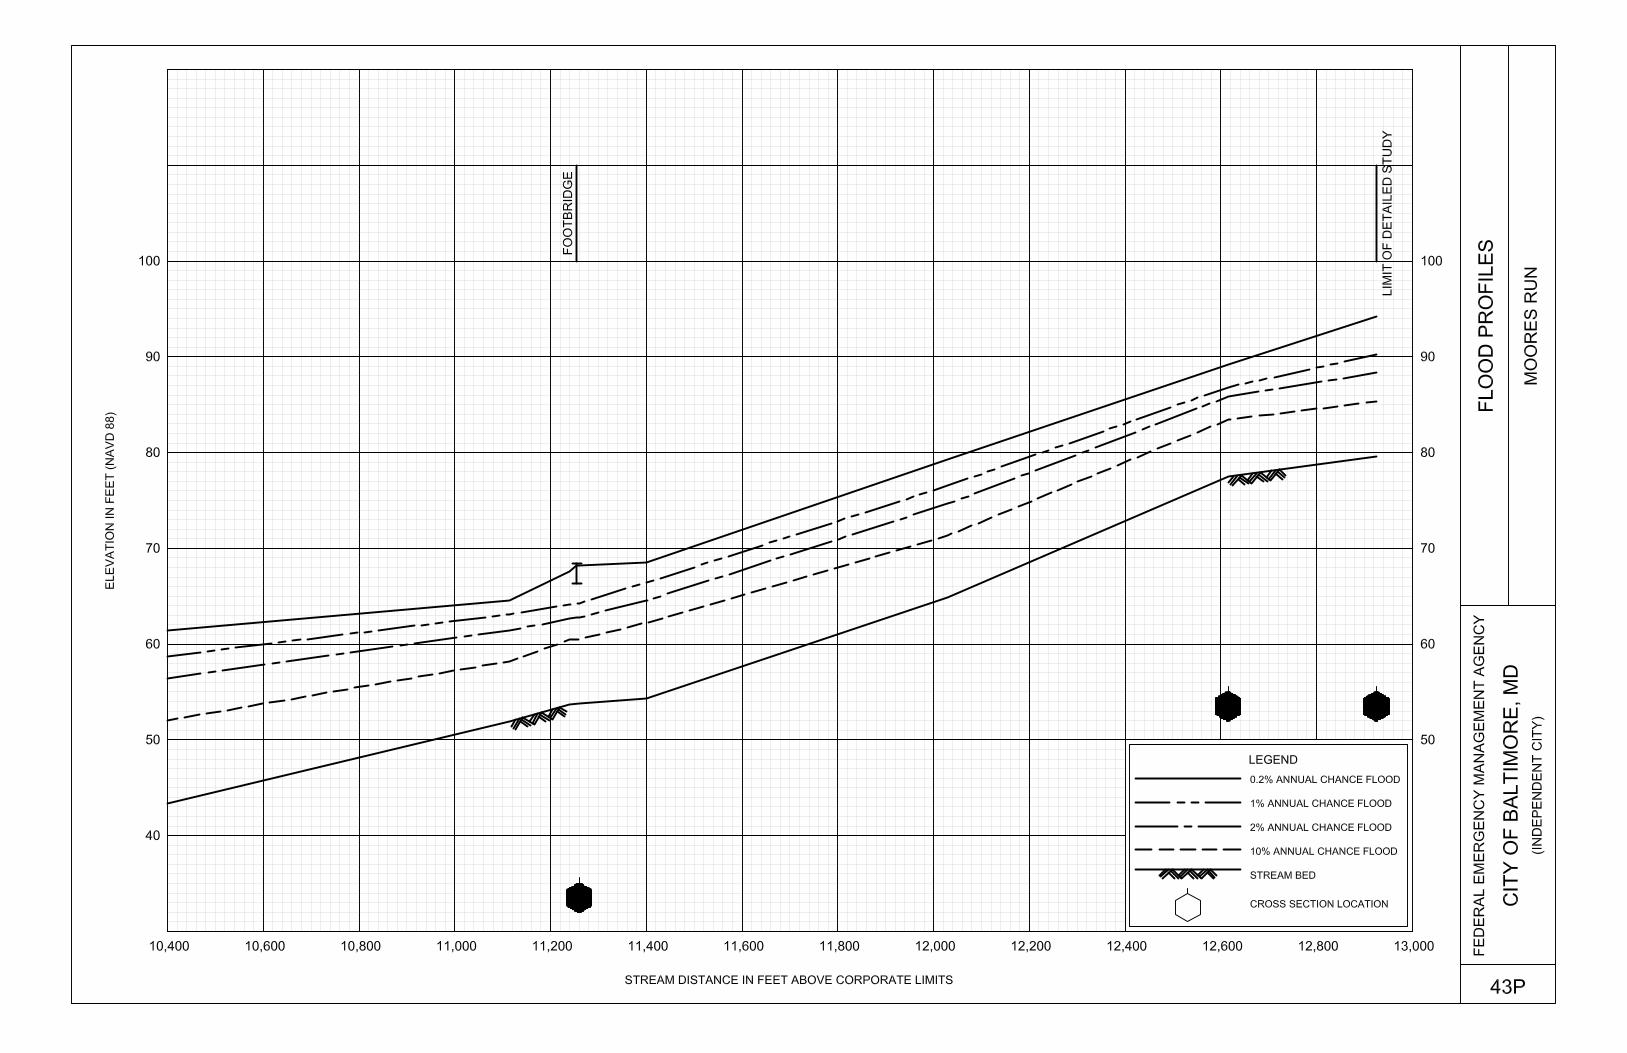
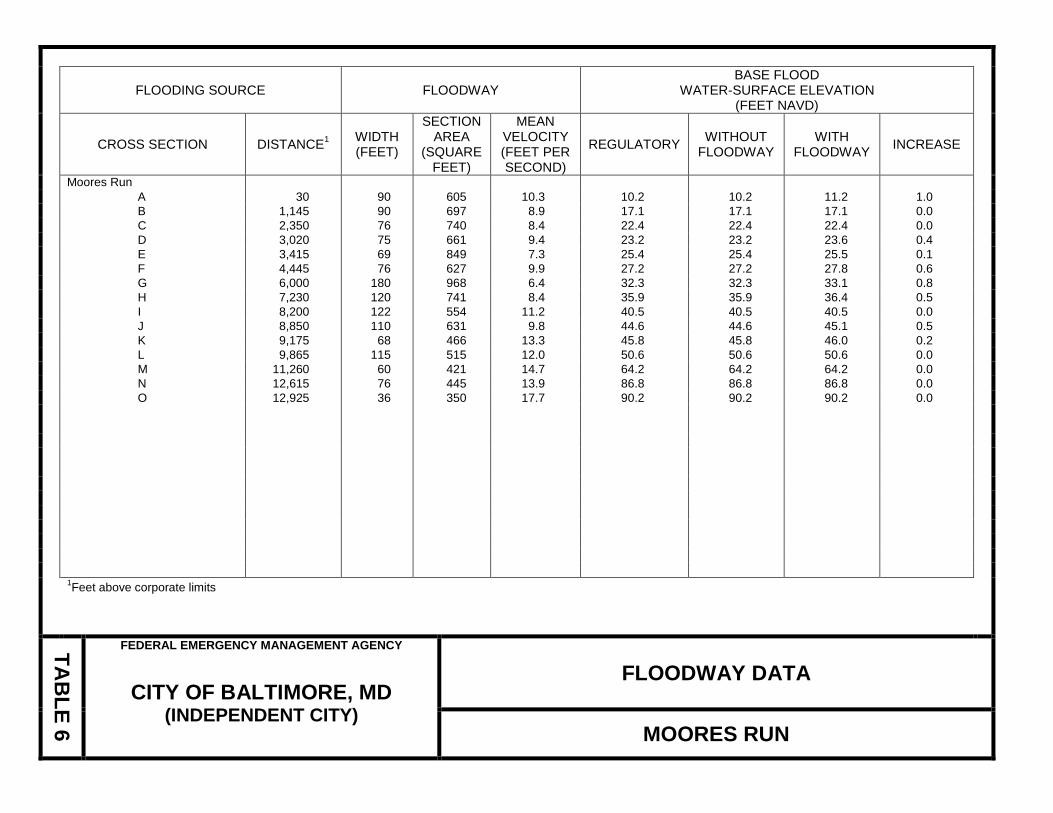
Moores Run A 30 90 605 10.3 10.2 10.2 11.2 1.0 B 1,145 90 697 8.9 17.1 17.1 17.1 0.0 C 2,350 76 740 8.4 22.4 22.4 22.4 0.0 D 3,020 75 661 9.4 23.2 23.2 23.6 0.4 E 3,415 69 849 7.3 25.4 25.4 25.5 0.1 F 4,445 76 627 9.9 27.2 27.2 27.8 0.6 G 6,000 180 968 6.4 32.3 32.3 33.1 0.8 H 7,230 120 741 8.4 35.9 35.9 36.4 0.5 I 8,200 122 554 11.2 40.5 40.5 40.5 0.0 J 8,850 110 631 9.8 44.6 44.6 45.1 0.5 K 9,175 68 466 13.3 45.8 45.8 46.0 0.2 L 9,865 115 515 12.0 50.6 50.6 50.6 0.0 M 11,260 60 421 14.7 64.2 64.2 64.2 0.0 N 12,615 76 445 13.9 86.8 86.8 86.8 0.0 O 12,925 36 350 17.7 90.2 90.2 90.2 0.0 1Feet above corporate limits
TAB
LE 6
FEDERAL EMERGENCY MANAGEMENT AGENCY
CITY OF BALTIMORE, MD (INDEPENDENT CITY)
FLOODWAY DATA
MOORES RUN
FLOODING SOURCE FLOODWAY BASE FLOOD
WATER-SURFACE ELEVATION (FEET NAVD)
CROSS SECTION DISTANCE1 WIDTH
(FEET)
SECTION AREA
(SQUARE FEET)
MEAN VELOCITY (FEET PER SECOND)
REGULATORY WITHOUT FLOODWAY
WITH FLOODWAY INCREASE
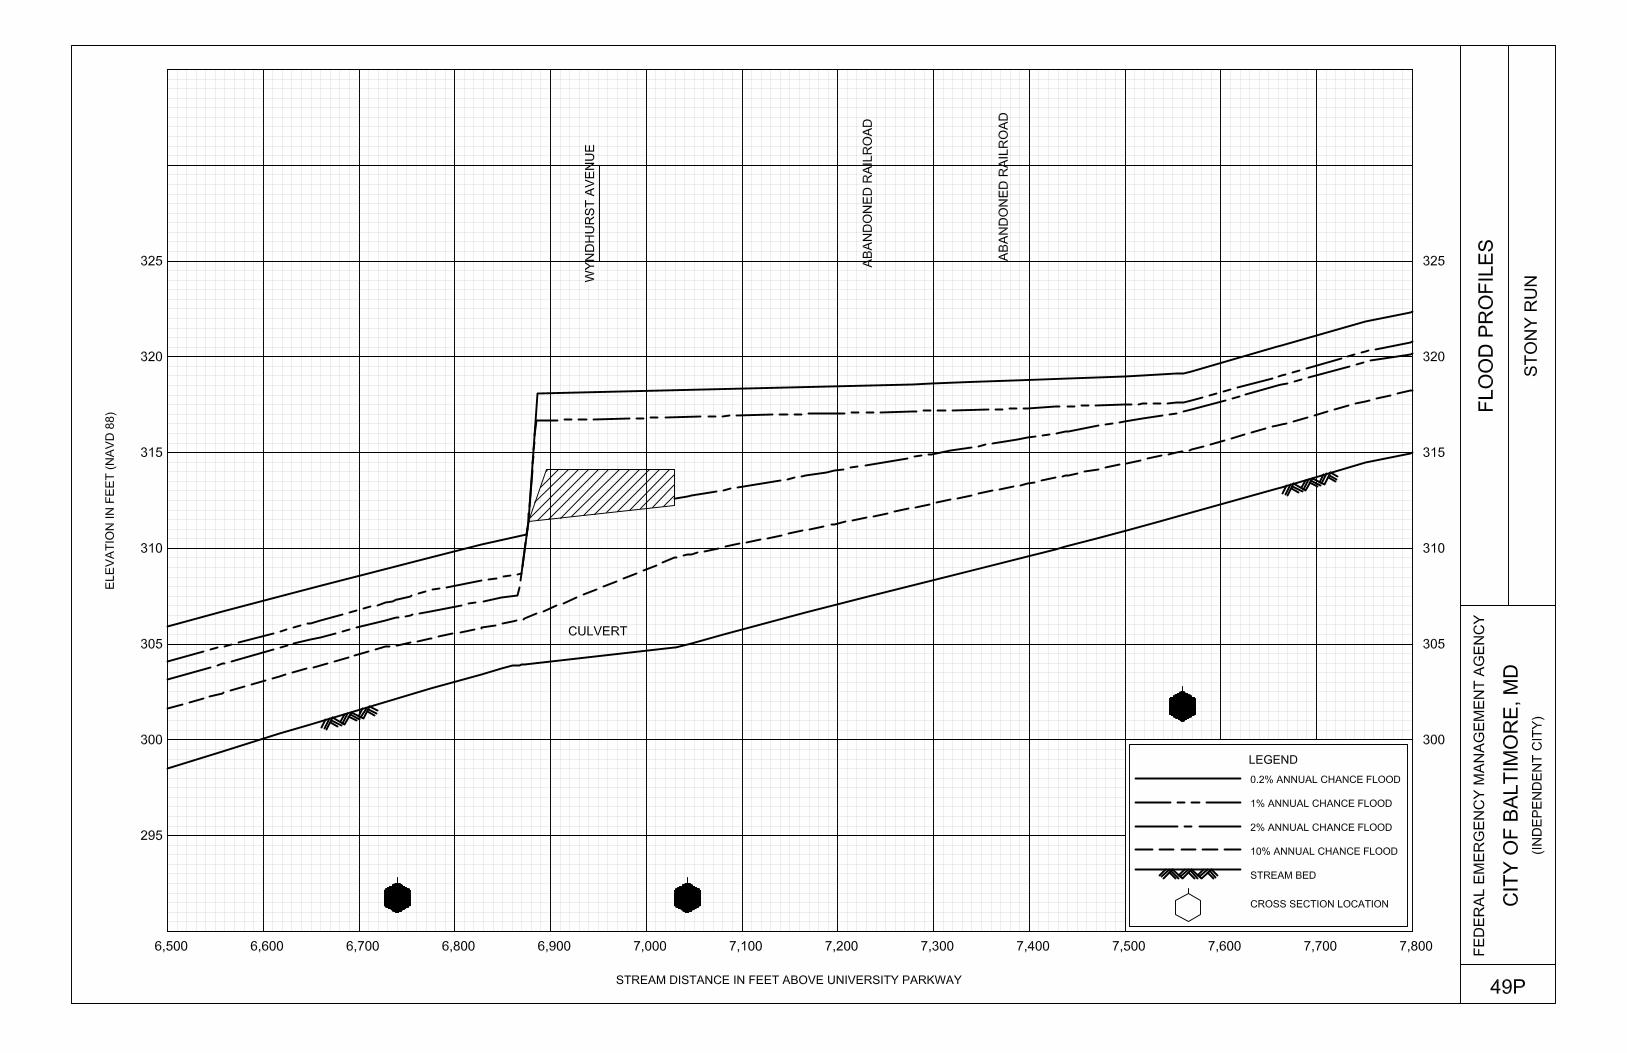
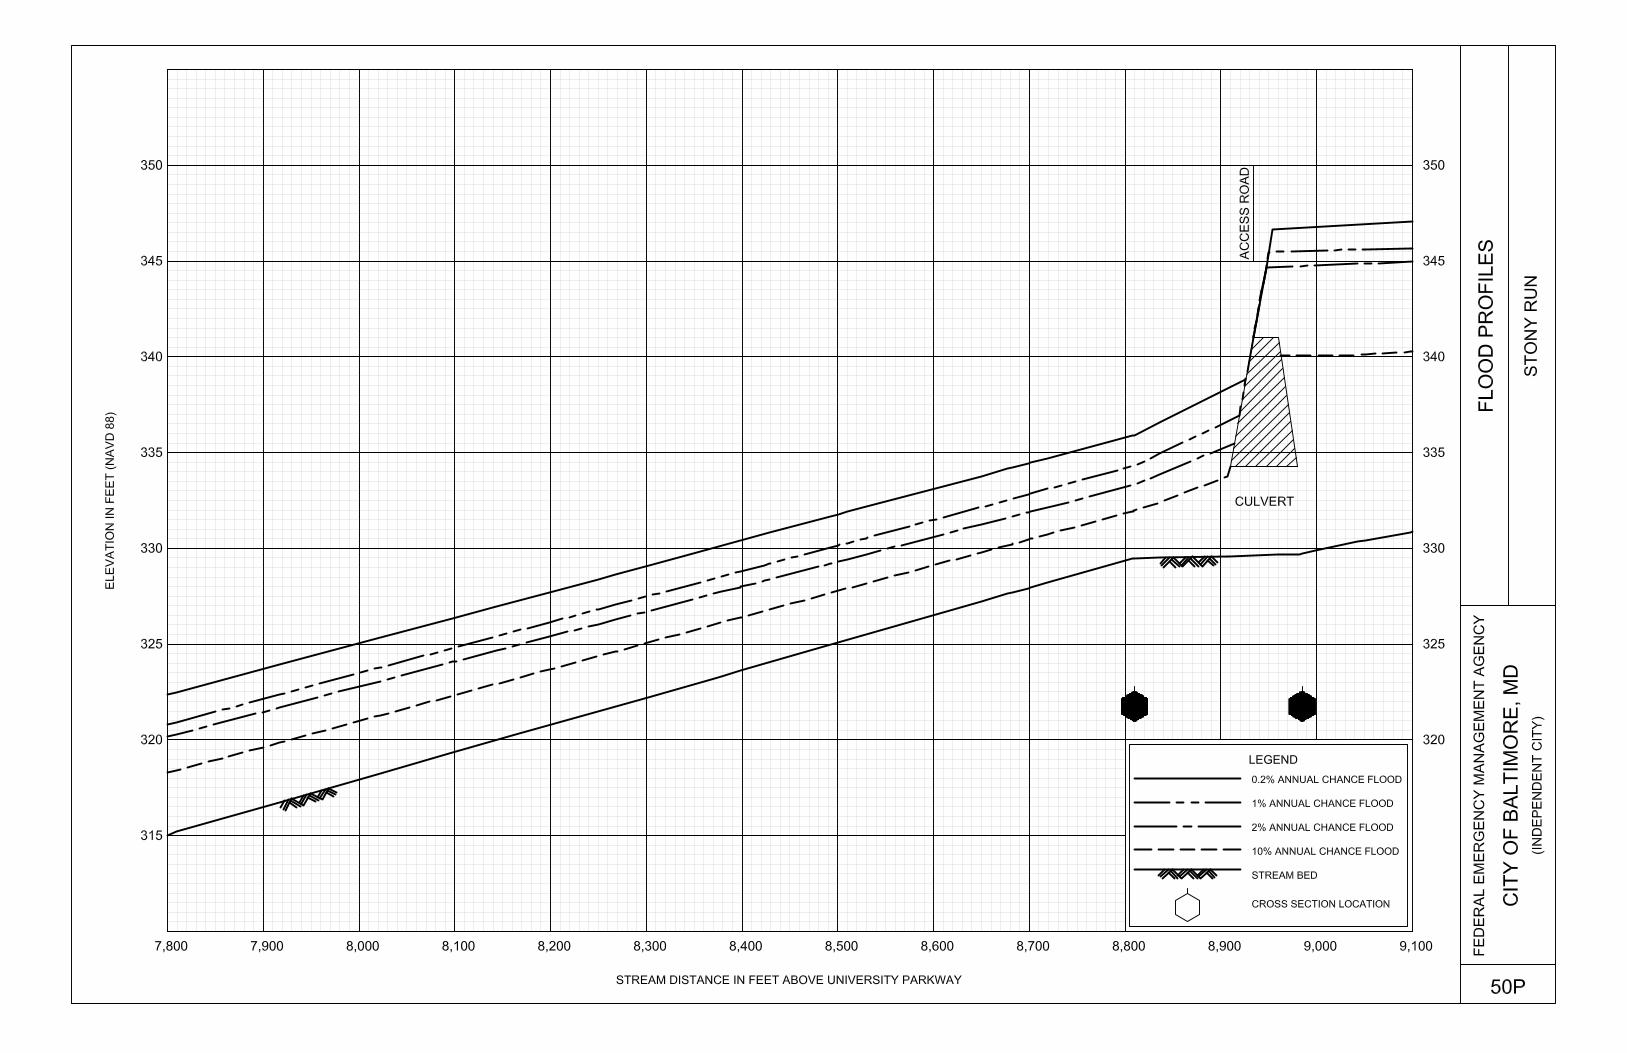
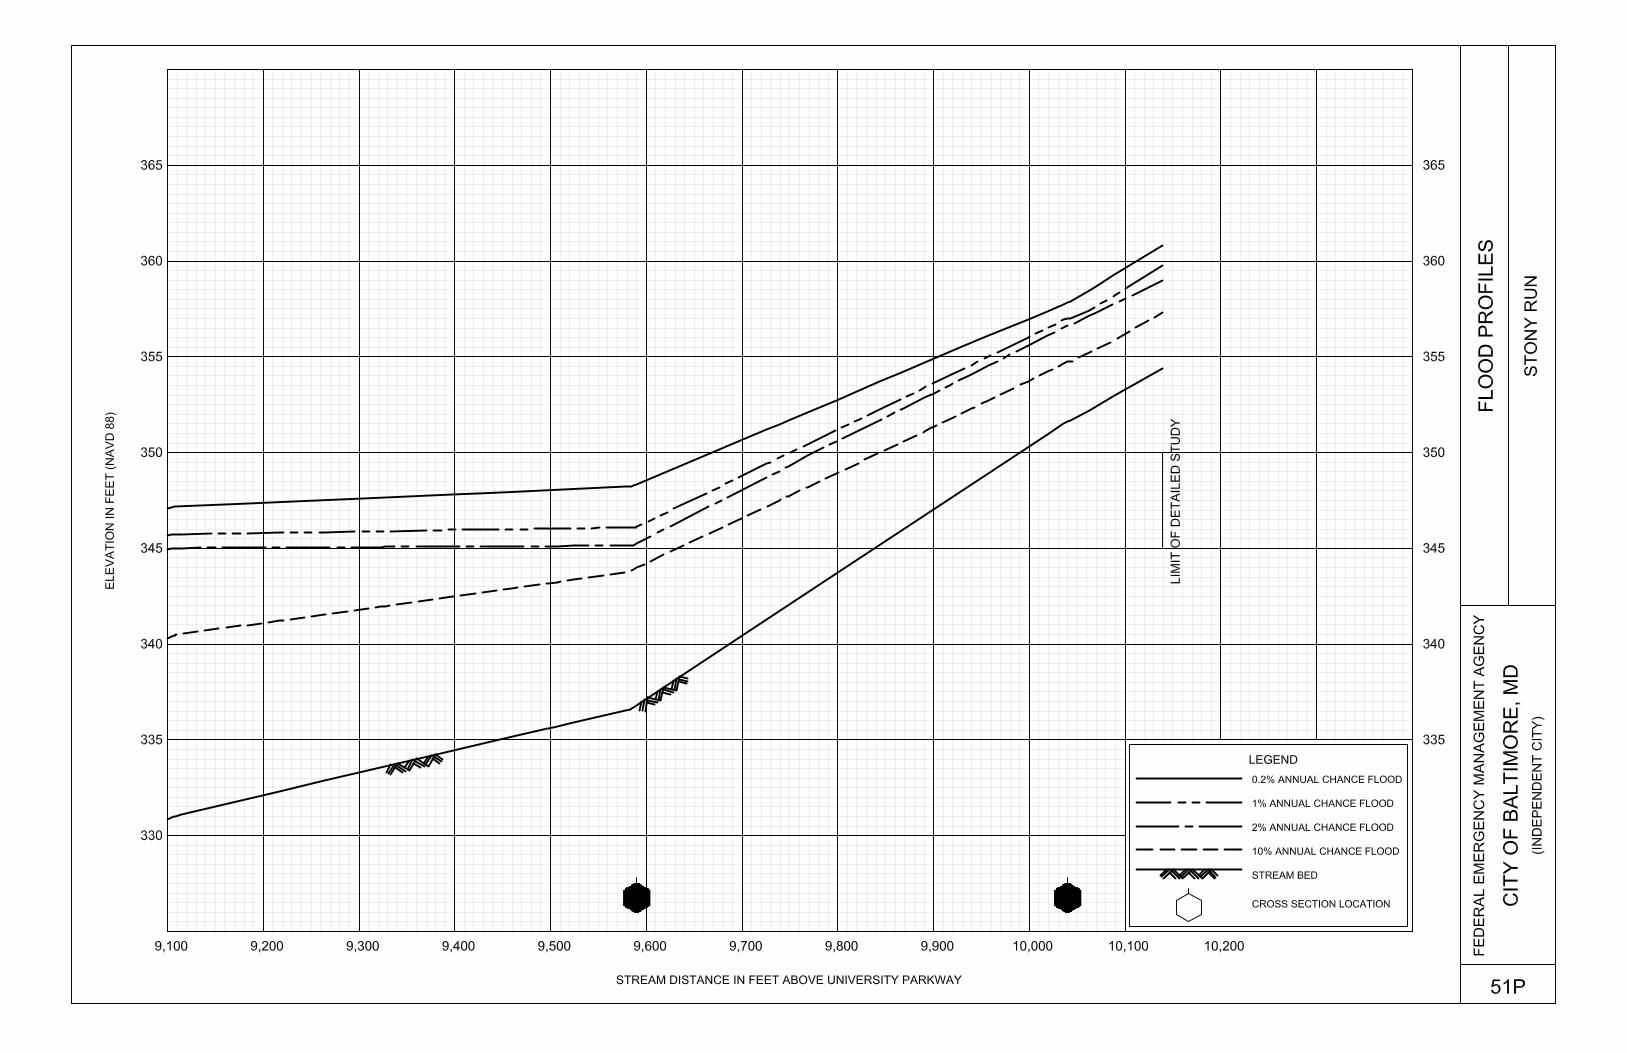
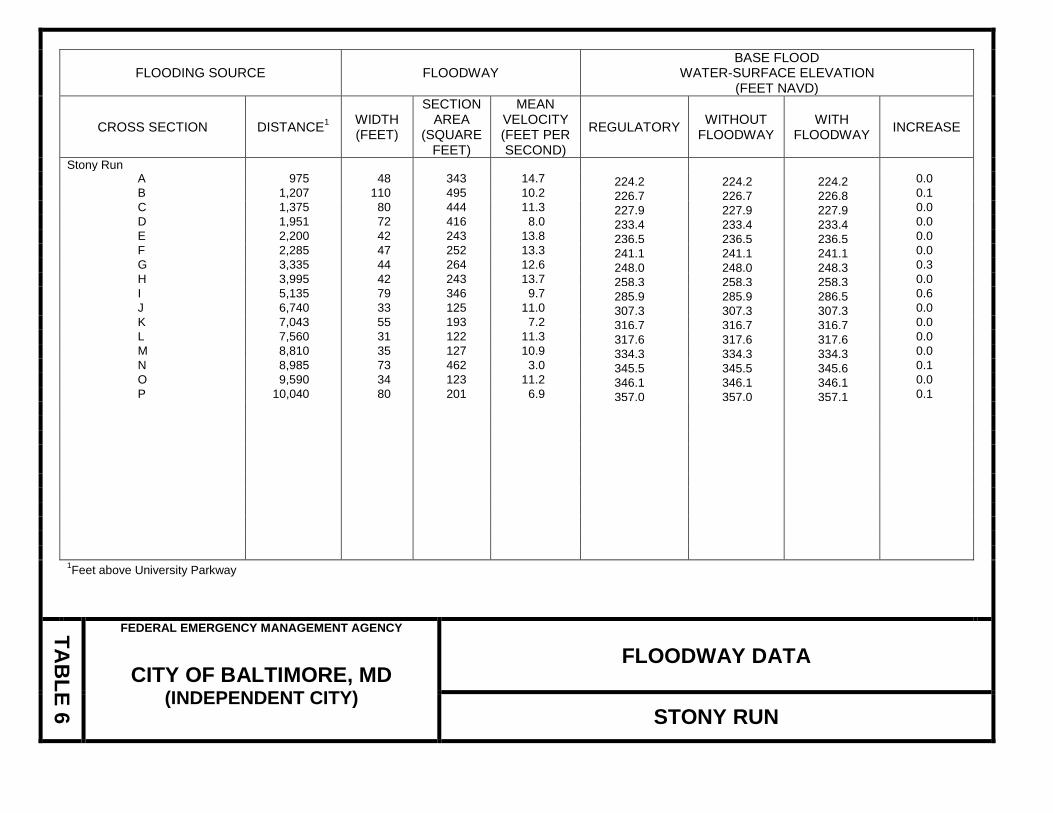
Stony Run A 975 48 343 14.7 224.2 224.2 224.2 0.0 B 1,207 110 495 10.2 226.7 226.7 226.8 0.1 C 1,375 80 444 11.3 227.9 227.9 227.9 0.0 D 1,951 72 416 8.0 233.4 233.4 233.4 0.0 E 2,200 42 243 13.8 236.5 236.5 236.5 0.0 F 2,285 47 252 13.3 241.1 241.1 241.1 0.0 G 3,335 44 264 12.6 248.0 248.0 248.3 0.3 H 3,995 42 243 13.7 258.3 258.3 258.3 0.0 I 5,135 79 346 9.7 285.9 285.9 286.5 0.6 J 6,740 33 125 11.0 307.3 307.3 307.3 0.0 K 7,043 55 193 7.2 316.7 316.7 316.7 0.0 L 7,560 31 122 11.3 317.6 317.6 317.6 0.0 M 8,810 35 127 10.9 334.3 334.3 334.3 0.0 N 8,985 73 462 3.0 345.5 345.5 345.6 0.1 O 9,590 34 123 11.2 346.1 346.1 346.1 0.0 P 10,040 80 201 6.9 357.0 357.0 357.1 0.1 1Feet above University Parkway
TAB
LE 6
FEDERAL EMERGENCY MANAGEMENT AGENCY
CITY OF BALTIMORE, MD (INDEPENDENT CITY)
FLOODWAY DATA
STONY RUN
FLOODING SOURCE FLOODWAY BASE FLOOD
WATER-SURFACE ELEVATION (FEET NAVD)
CROSS SECTION DISTANCE1 WIDTH
(FEET)
SECTION AREA
(SQUARE FEET)
MEAN VELOCITY (FEET PER SECOND)
REGULATORY WITHOUT FLOODWAY
WITH FLOODWAY INCREASE
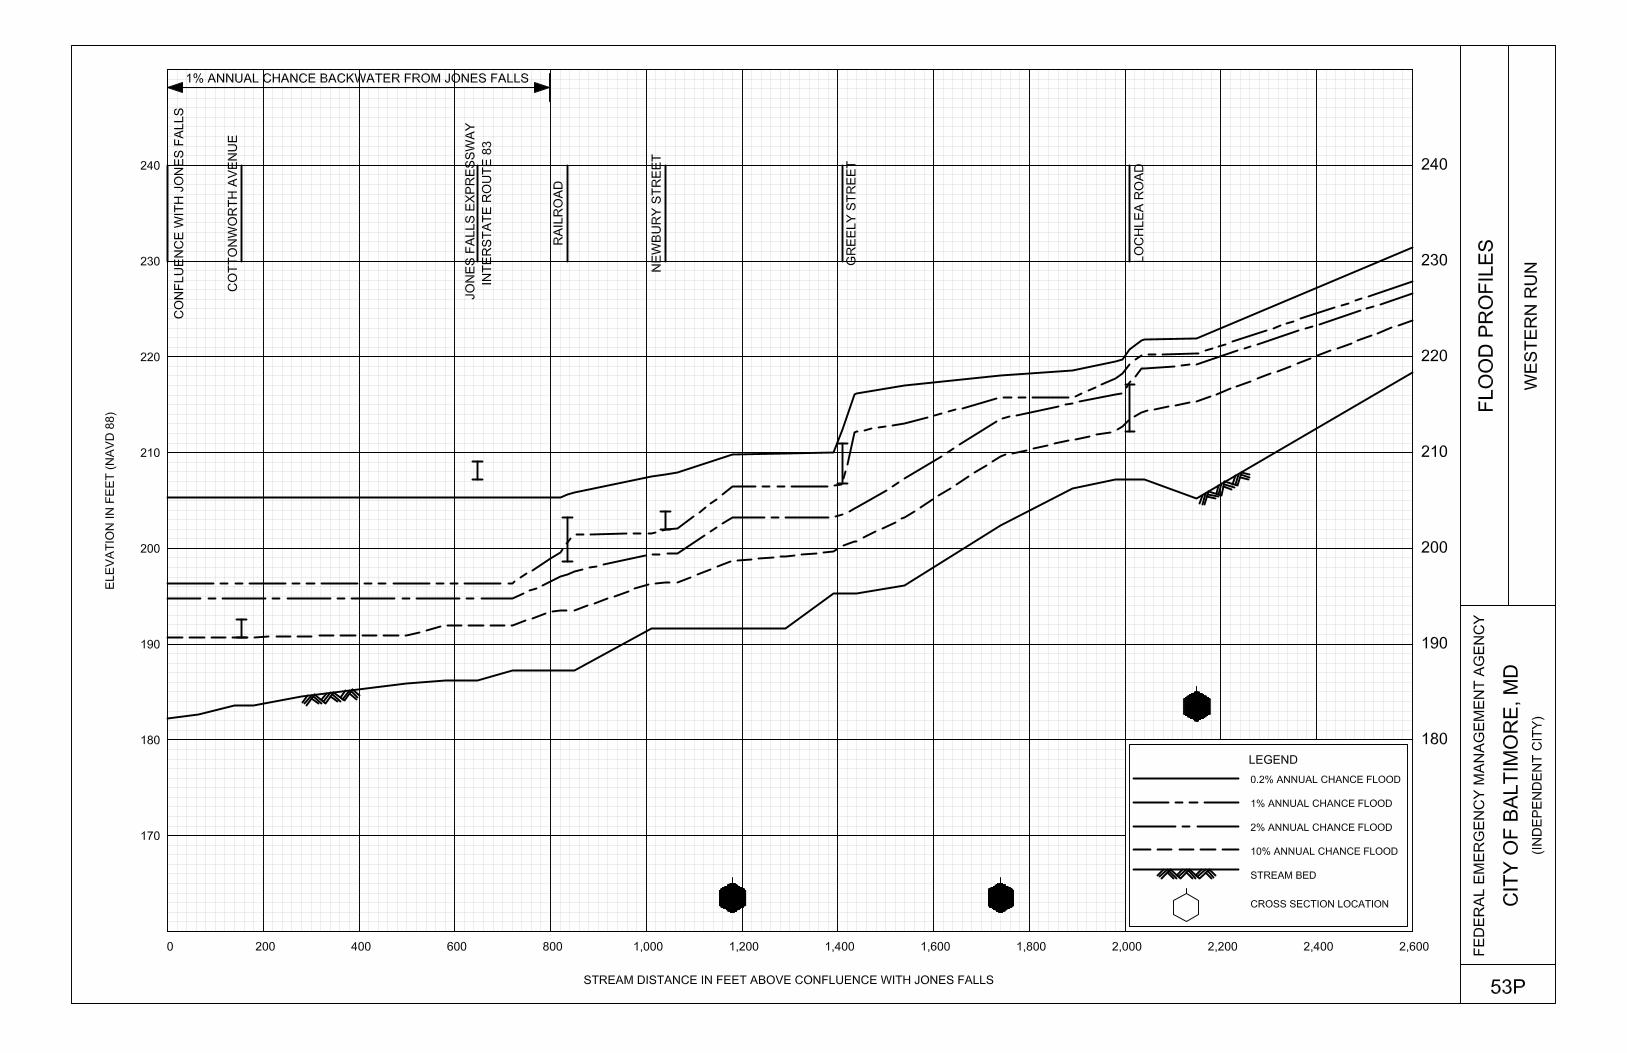
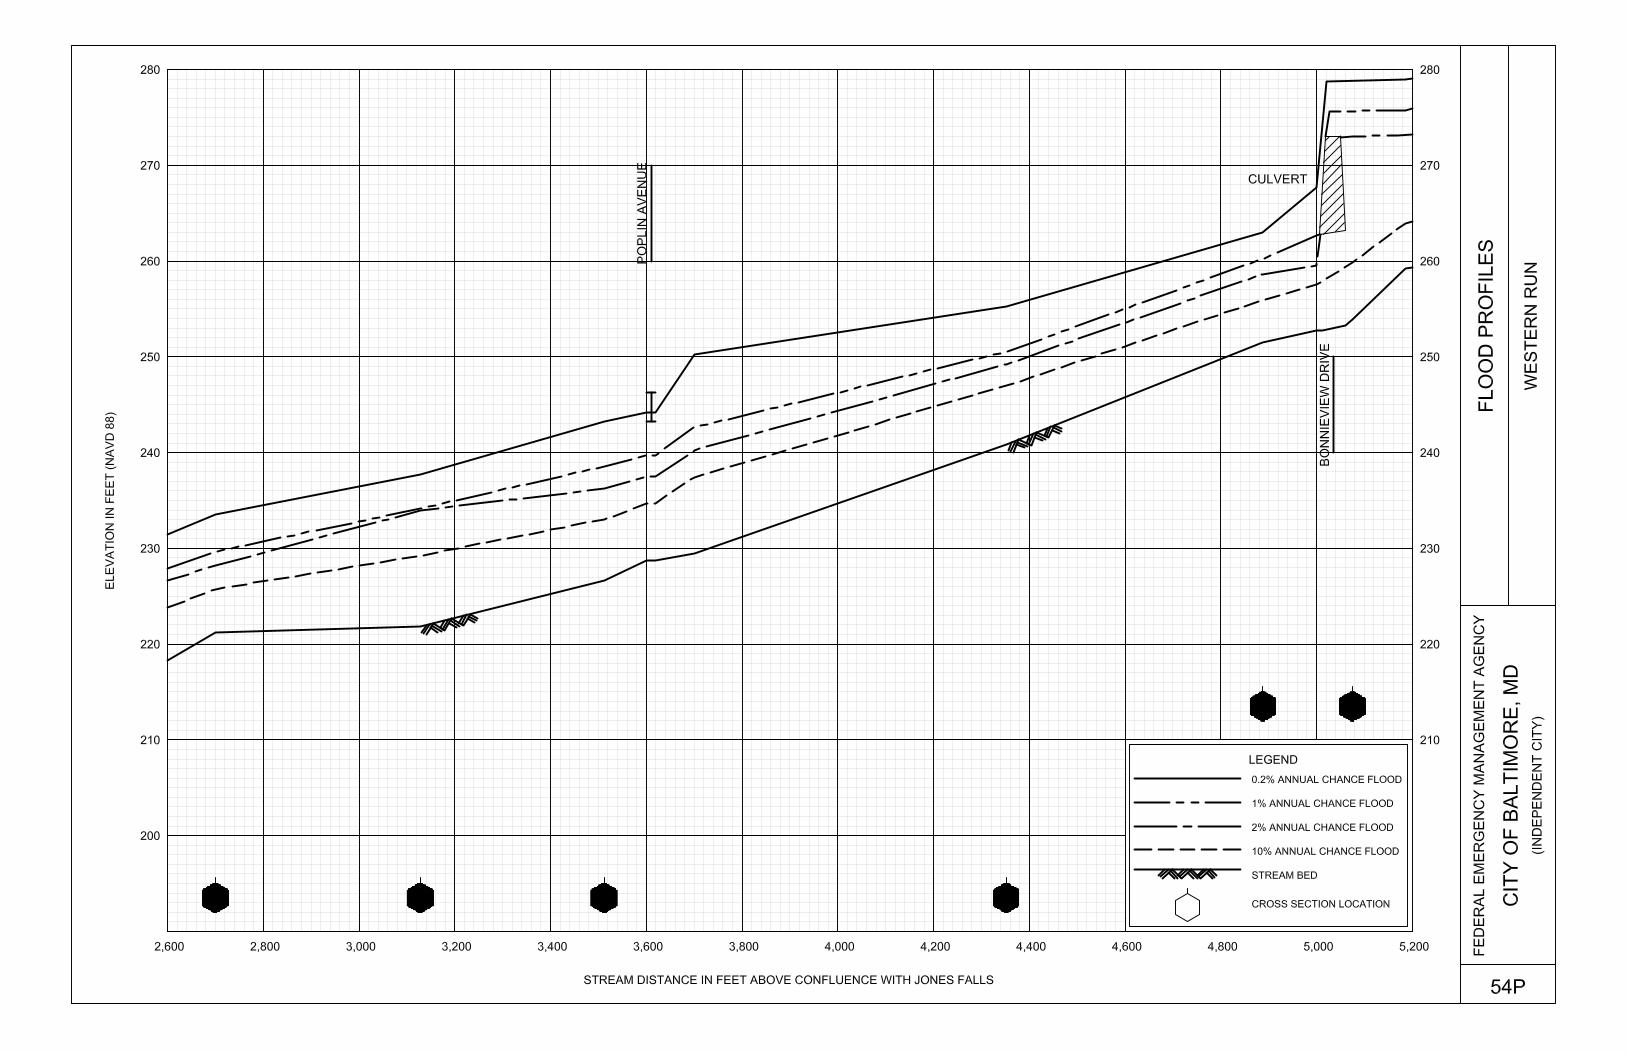
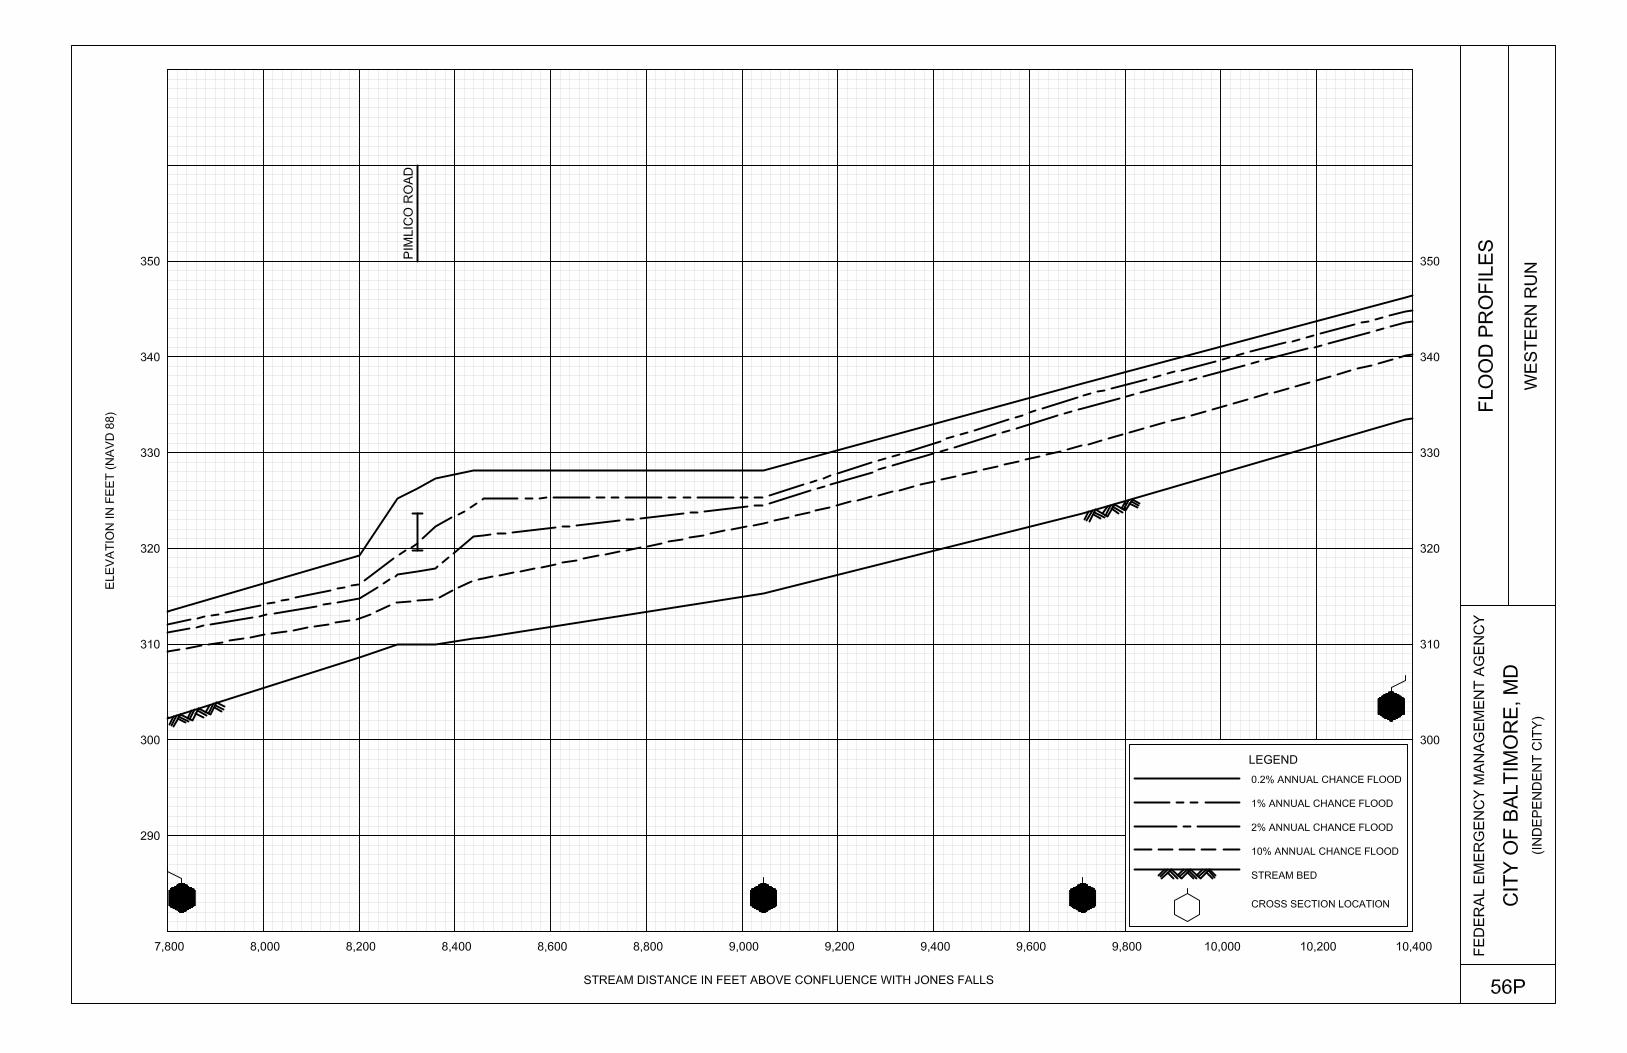
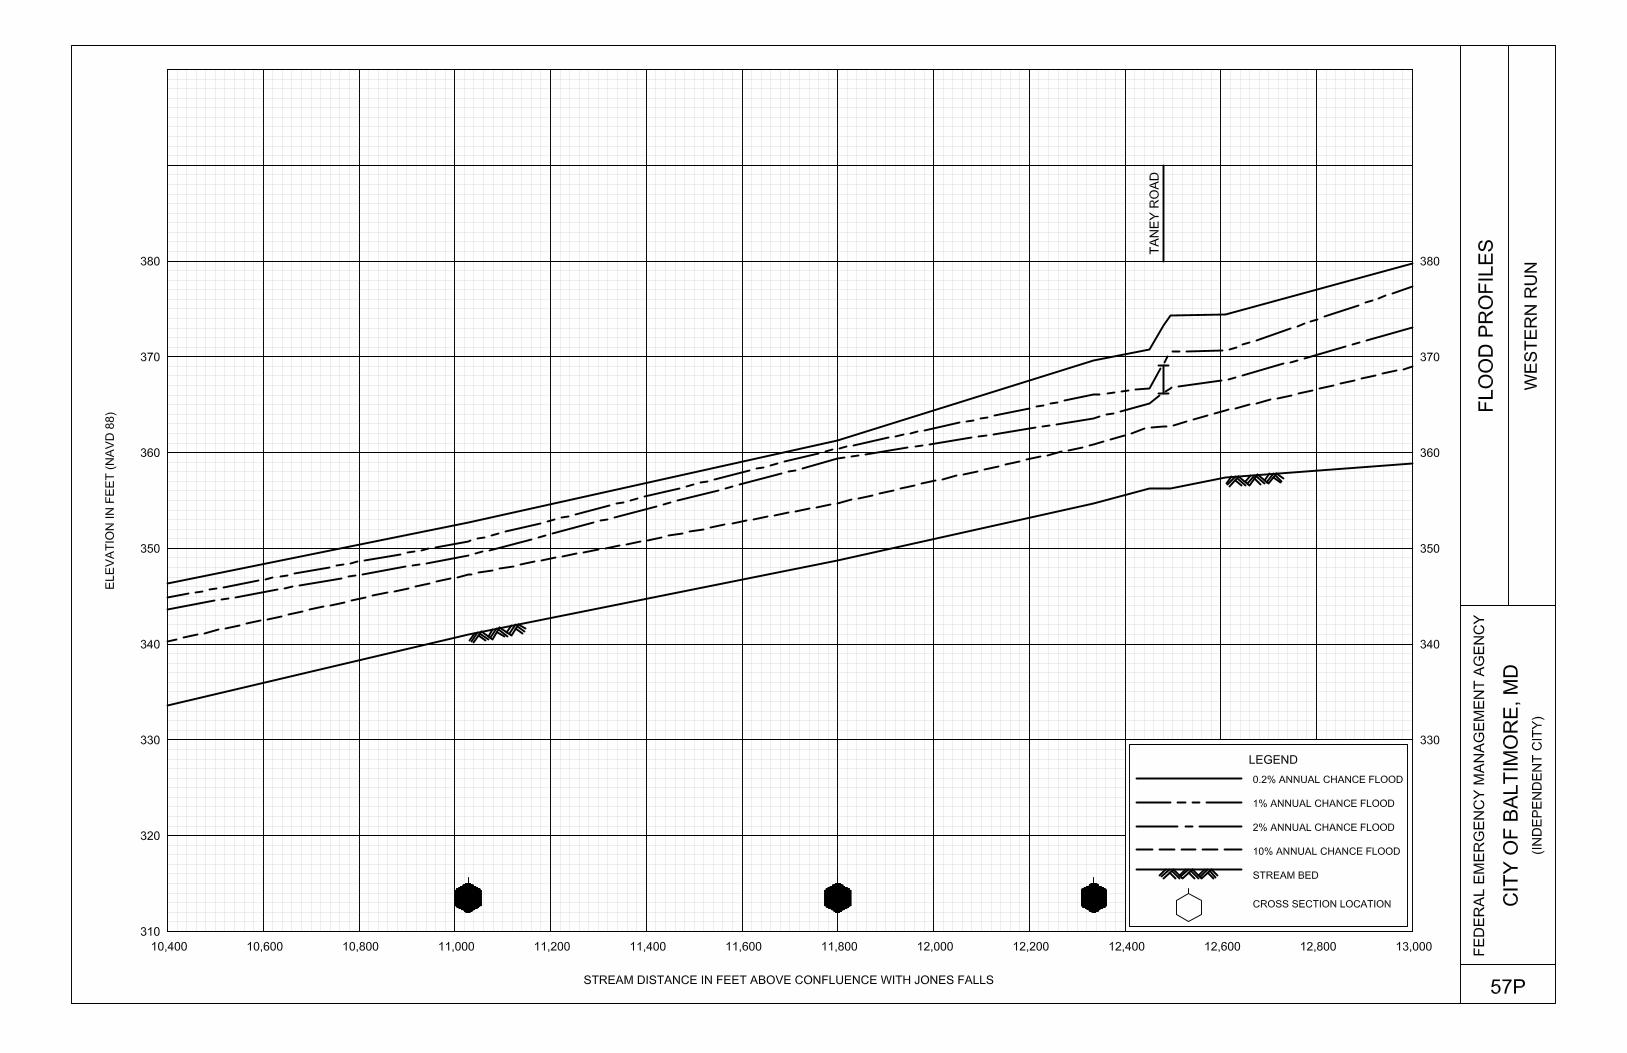
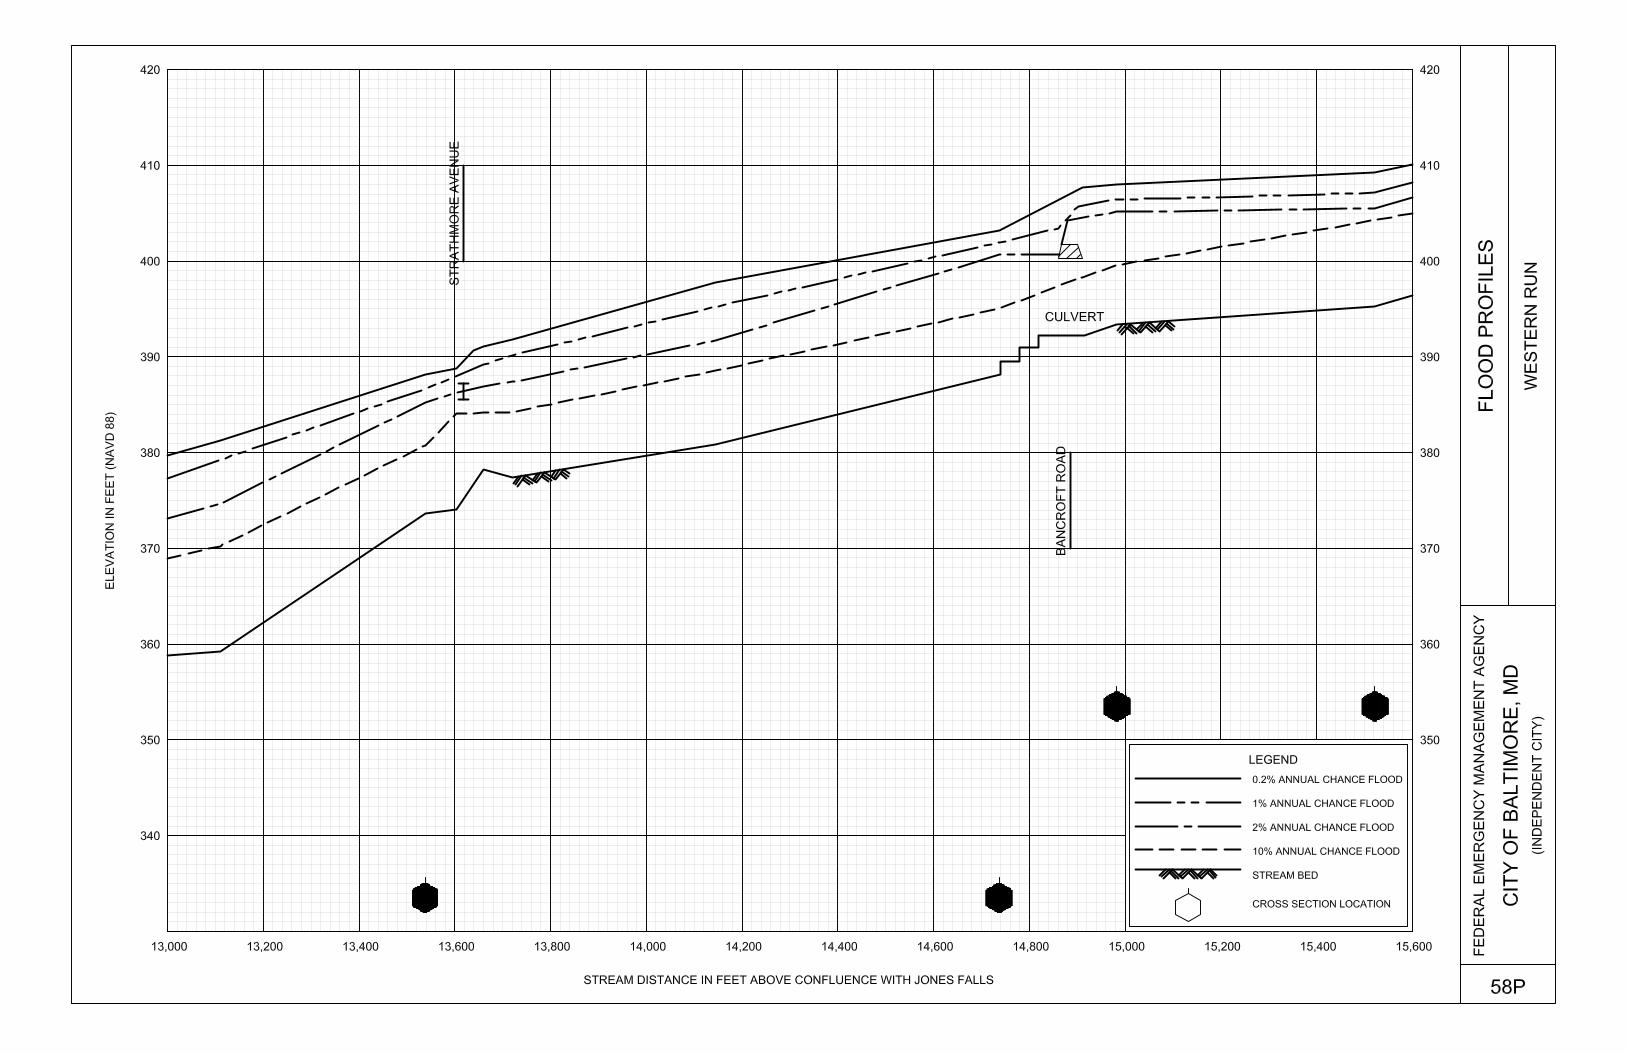
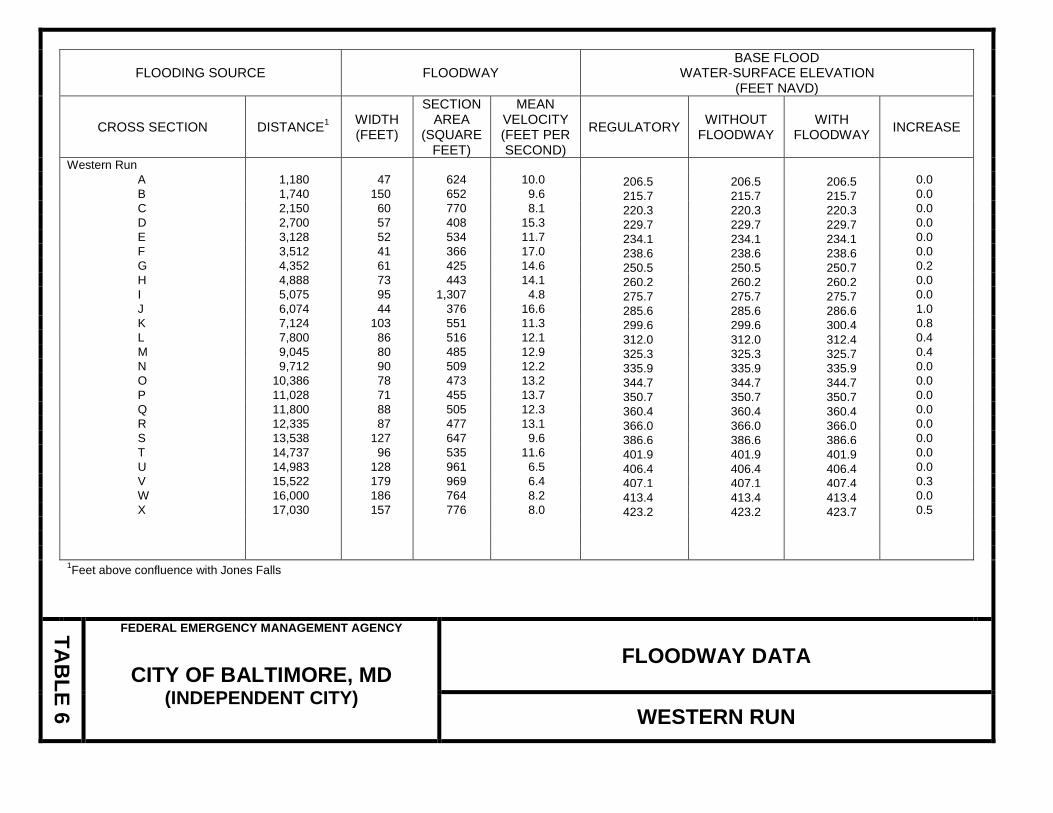
Western Run A 1,180 47 624 10.0 206.5 206.5 206.5 0.0 B 1,740 150 652 9.6 215.7 215.7 215.7 0.0 C 2,150 60 770 8.1 220.3 220.3 220.3 0.0 D 2,700 57 408 15.3 229.7 229.7 229.7 0.0 E 3,128 52 534 11.7 234.1 234.1 234.1 0.0 F 3,512 41 366 17.0 238.6 238.6 238.6 0.0 G 4,352 61 425 14.6 250.5 250.5 250.7 0.2 H 4,888 73 443 14.1 260.2 260.2 260.2 0.0 I 5,075 95 1,307 4.8 275.7 275.7 275.7 0.0 J 6,074 44 376 16.6 285.6 285.6 286.6 1.0 K 7,124 103 551 11.3 299.6 299.6 300.4 0.8 L 7,800 86 516 12.1 312.0 312.0 312.4 0.4 M 9,045 80 485 12.9 325.3 325.3 325.7 0.4 N 9,712 90 509 12.2 335.9 335.9 335.9 0.0 O 10,386 78 473 13.2 344.7 344.7 344.7 0.0 P 11,028 71 455 13.7 350.7 350.7 350.7 0.0 Q 11,800 88 505 12.3 360.4 360.4 360.4 0.0 R 12,335 87 477 13.1 366.0 366.0 366.0 0.0 S 13,538 127 647 9.6 386.6 386.6 386.6 0.0 T 14,737 96 535 11.6 401.9 401.9 401.9 0.0 U 14,983 128 961 6.5 406.4 406.4 406.4 0.0 V 15,522 179 969 6.4 407.1 407.1 407.4 0.3 W 16,000 186 764 8.2 413.4 413.4 413.4 0.0 X 17,030 157 776 8.0 423.2 423.2 423.7 0.5 1Feet above confluence with Jones Falls
TAB
LE 6
FEDERAL EMERGENCY MANAGEMENT AGENCY
CITY OF BALTIMORE, MD (INDEPENDENT CITY)
FLOODWAY DATA
WESTERN RUN
34
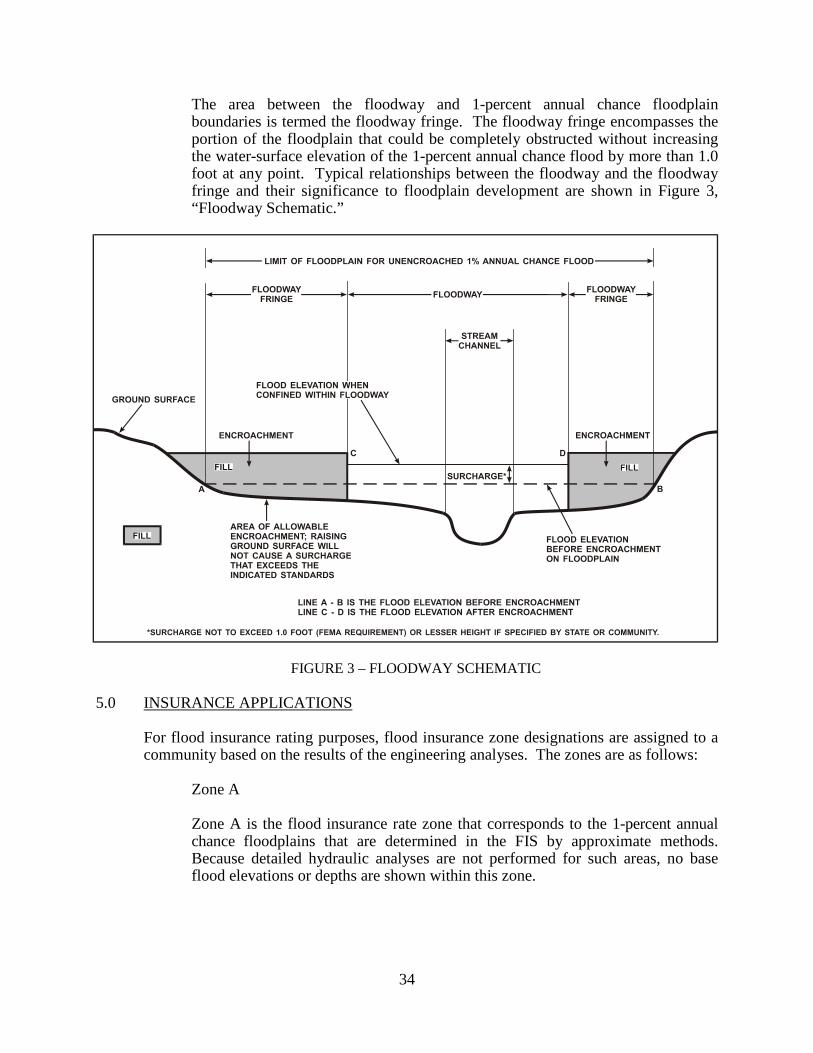
The area between the floodway and 1-percent annual chance floodplain boundaries is termed the floodway fringe. The floodway fringe encompasses the portion of the floodplain that could be completely obstructed without increasing the water-surface elevation of the 1-percent annual chance flood by more than 1.0 foot at any point. Typical relationships between the floodway and the floodway fringe and their significance to floodplain development are shown in Figure 3, “Floodway Schematic.”
FIGURE 3 – FLOODWAY SCHEMATIC
5.0 INSURANCE APPLICATIONS
For flood insurance rating purposes, flood insurance zone designations are assigned to a community based on the results of the engineering analyses. The zones are as follows:
Zone A Zone A is the flood insurance rate zone that corresponds to the 1-percent annual chance floodplains that are determined in the FIS by approximate methods. Because detailed hydraulic analyses are not performed for such areas, no base flood elevations or depths are shown within this zone.
35
Zone AE Zone AE is the flood insurance rate zone that corresponds to the 1-percent annual chance floodplains that are determined in the FIS by detailed methods. In most instances, whole-foot base flood elevations derived from the detailed hydraulic analyses are shown at selected intervals within this zone. Zone AH Zone AH is the flood insurance rate zone that corresponds to the areas of 1-percent annual chance shallow flooding (usually areas of ponding) where average depths are between 1 and 3 feet. Whole-foot base flood elevations derived from the detailed hydraulic analyses are shown at selected intervals within this zone. Zone AO Zone AO is the flood insurance rate zone that corresponds to the areas of 1-percent annual chance shallow flooding (usually sheet flow on sloping terrain) where average depths are between 1 and 3 feet. Average whole-foot depths derived from the detailed hydraulic analyses are shown within this zone.
Zone AR
Area of special flood hazard formerly protected from the 1-percent annual chance flood event by a flood control system that was subsequently decertified. Zone AR indicates that the former flood control system is being restored to provide protection from the 1-percent annual chance or greater flood event. Zone A99 Zone A99 is the flood insurance rate zone that corresponds to areas of the 1-percent annual chance floodplain that will be protected by a Federal flood protection system where construction has reached specified statutory milestones. No base flood elevations or depths are shown within this zone. Zone V Zone V is the flood insurance rate zone that corresponds to the 1-percent annual chance coastal floodplains that have additional hazards associated with storm waves. Because approximate hydraulic analyses are performed for such areas, no base flood elevations are shown within this zone. Zone VE Zone VE is the flood insurance rate zone that corresponds to the 1-percent annual chance coastal floodplains that have additional hazards associated with storm waves. Whole-foot base flood elevations derived from the detailed hydraulic analyses are shown at selected intervals within this zone.
36
Zone X Zone X is the flood insurance rate zone that corresponds to areas outside the 0.2-percent annual chance floodplain, areas within the 0.2-percent annual chance floodplain, and areas of 1-percent annual chance flooding where average depths are less than 1 foot, areas of 1-percent annual chance flooding where the contributing drainage area is less than 1 square mile, and areas protected from the 1-percent annual chance flood by levees. No base flood elevations or depths are shown within this zone. Zone D Zone D is the flood insurance rate zone that corresponds to unstudied areas where flood hazards are undetermined, but possible.
6.0 FLOOD INSURANCE RATE MAP The FIRM is designed for flood insurance and floodplain management applications. For flood insurance applications, the map designates flood insurance rate zones as described in Section 5.0 and, in the 1-percent annual chance floodplains that were studied by detailed methods, shows selected whole-foot BFEs or average depths. Insurance agents use the zones and BFEs in conjunction with information on structures and their contents to assign premium rates for flood insurance policies. For floodplain management applications, the map shows by tints, screens, and symbols, the 1- and 0.2-percent annual chance floodplains, floodways, and the locations of selected cross sections used in the hydraulic analyses and floodway computations. On selected FIRM panels, floodways and the locations of selected cross sections used in the hydraulic analyses and floodway computations are shown where applicable.
7.0 OTHER STUDIES
The Interstate Division of Baltimore City has prepared reports on Jones Falls entitled, Jones Falls Hydrologic Design Report (Rummel, Klepper & Kahl, 1986), Jones Falls Hydraulic Design Report (Rummel, Klepper & Kahl, 1986), Hydraulic Design Report for the Floodway Analyses of the Jones Falls (Rummel, Klepper & Kahl, 1987), and Hydrologic/Hydraulic Design Report for the Jones Falls Expressway from Calvert Street to Howard Street (Rummel, Klepper & Kahl, September 1986). Because it is based on more up-to-date analyses, this FIS supersedes the previously printed FIS for the City of Baltimore. The FIS for the adjoining Baltimore County is being prepared (FEMA, projected date is May 5, 2014).
37
8.0 LOCATION OF DATA Information concerning the pertinent data used in preparation of this FIS can be obtained
by contacting FEMA, Federal Insurance and Mitigation Division, One Independence Mall, Sixth Floor, 615 Chestnut Street, Philadelphia, Pennsylvania 19106-4404.
9.0 BIBLIOGRAPHY AND REFERENCES
AeroEco Company. (City of Baltimore, Maryland, 1979). Aerial Photographs, Scale 1:25,000. Baker Wibberly Associates of Hagerstown, Maryland. (1974). Gwynns Falls Hydrologic Study. City of Baltimore, Department of Public Works. (1967, Revised 1984). Topographic Maps, Scale 1:1,200, Contour Interval 2 feet. City of Baltimore, Department of Public Works and Planning. Topographic Maps, Scale 1:2,400, Contour Interval 2 feet. City of Baltimore, Maryland. Federal Emergency Management Agency. (May 2, 1983). Flood Insurance Study, Anne Arundel County, Maryland (Unincorporated Areas). Washington, D.C. Federal Emergency Management Agency. (May 5, 2014). Flood Insurance Study, Baltimore County, Maryland (Unincorporated Areas). Washington, D.C. Federal Emergency Management Agency. (February 1981). User’s Manual for Wave Height Analysis. Washington, D.C. Federal Emergency Management Agency. (2007). Atlantic Ocean and Gulf of Mexico Update Coastal Guidelines Update. Washington, D.C. Federal Emergency Management Agency. (August 2007). Wave Height Analysis for Flood Insurance Studies (WHAFIS), Version 4.0. Washington, D.C. Hittman Associates, Inc. (June 1981). Jones Falls Survey Phase 2: Hydrologic Analysis of Jones Falls. Columbia, Maryland. Johnson, Mirmiram and Thompson Associates, of Baltimore Maryland. (1983). Analyses of Maidens Choice Run. Knoerle, Bender, Stone and Associates, Inc. (June 1971). Jones Falls Flood Control Study. Baltimore, Maryland. Luettich, R. A. and Westerink, J.J. (February 6, 2008). A (Parallel) Advanced Circulation Model for Oceanic, Coastal and Estuarine Waters (ADCIRC). Version 45.12.
38
University of North Carolina at Chapel Hill, Institute of Marine Sciences, Morehead City, North Carolina. Maryland Water Resources Administration. (1974, updated 1983). Herring Run Watershed TR-20 Modeling. Maryland. National Academy of Sciences. (1977). Methodology for Calculating Wave Action Effects Associated with Storm Surges. Washington, D.C. Purdam & Jeschke. (April 1985). Maiden’s Choice Run Watershed Study. Baltimore, Maryland. Roy F. Weston, Inc., of Baltimore, Maryland. (1975). Jones Falls Watershed Management Study, An Assessment of Flood Control Needs for the Jones Falls Watershed. Rummel, Klepper & Kahl. (September 1987). Hydraulic Design Report for the Floodway Analyses of the Jones Falls. Baltimore, Maryland. Rummel, Klepper & Kahl. (September 1986). Hydrologic/Hydraulic Design Report for the Jones Falls Expressway from Calvert Street to Howard Street. Baltimore, Maryland. Rummel, Klepper & Kahl. (July 1986). Jones Falls Hydrologic Design Report (formerly North Central Busway Hydrologic Design Report). Baltimore, Maryland. Rummel, Klepper & Kahl. (July 1986). Jones Falls Hydraulic Design Report. Baltimore, Maryland. U.S. Army Corps of Engineers. (2012). ERDC/CHL TR11-X. FEMA Region 3 Storm Surge Study Coastal Storm Surge Analysis: Modeling System Validation Submission No.2. U.S. Army Corps of Engineers. U.S. Army Corps of Engineers, Baltimore District. (1977). Baltimore Metropolitan Streams. Baltimore, Maryland. U.S. Army Corps of Engineers, Hydrologic Engineering Center. (January 1981). HEC-2 Water-Surface Profiles, Users Manual. Davis, California. U.S. Army Corps of Engineers, Hydrologic Engineering Center. (May 2005). HEC-RAS River Analysis System. Davis, California. U.S. Army Corps of Engineers, Galveston District. (1975). General Guidelines for Identifying Coastal High Hazard Zones. Galveston, Texas. U.S. Census Bureau, State and County QuickFacts. Data derived from Population Estimates, American Community Survey, Census of Population and Housing, State and County Housing Unit Estimates, County Business Patterns, Non-employer Statistics, Economic Census, Survey of Business Owners, Building Permits, and Consolidated Federal Funds Report. http://quickfacts.census.gov/qfd/states/.
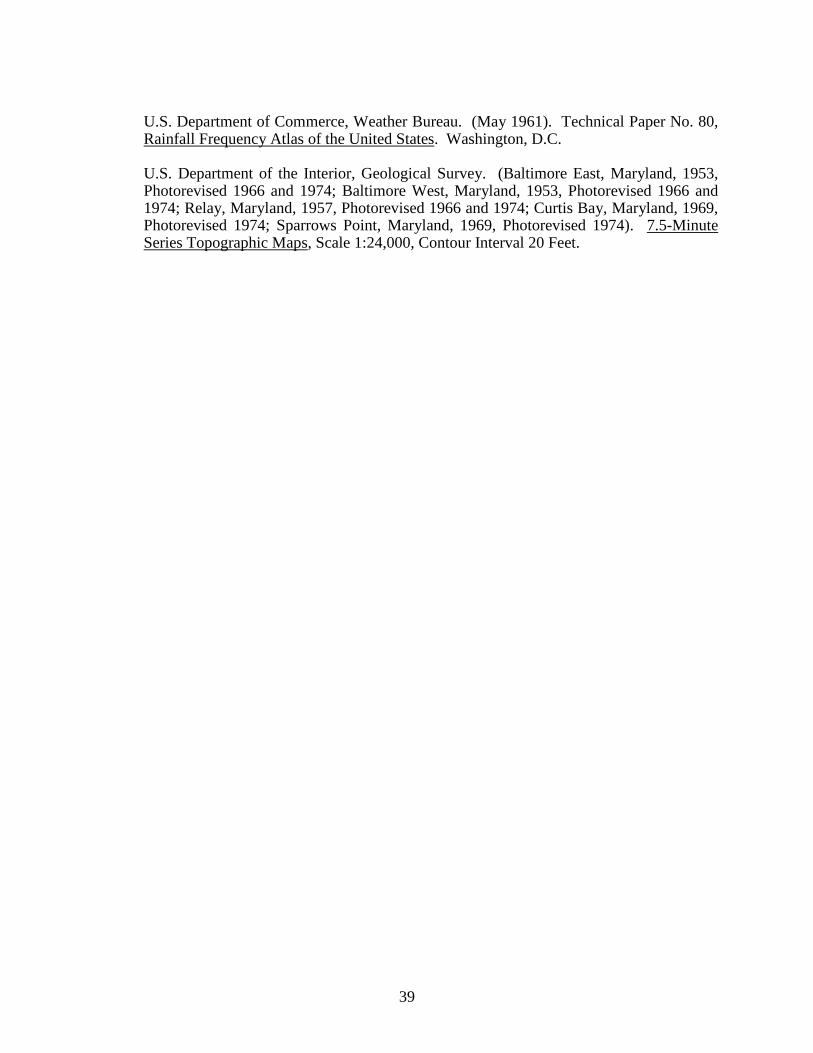
39
U.S. Department of Commerce, Weather Bureau. (May 1961). Technical Paper No. 80, Rainfall Frequency Atlas of the United States. Washington, D.C. U.S. Department of the Interior, Geological Survey. (Baltimore East, Maryland, 1953, Photorevised 1966 and 1974; Baltimore West, Maryland, 1953, Photorevised 1966 and 1974; Relay, Maryland, 1957, Photorevised 1966 and 1974; Curtis Bay, Maryland, 1969, Photorevised 1974; Sparrows Point, Maryland, 1969, Photorevised 1974). 7.5-Minute Series Topographic Maps, Scale 1:24,000, Contour Interval 20 Feet.
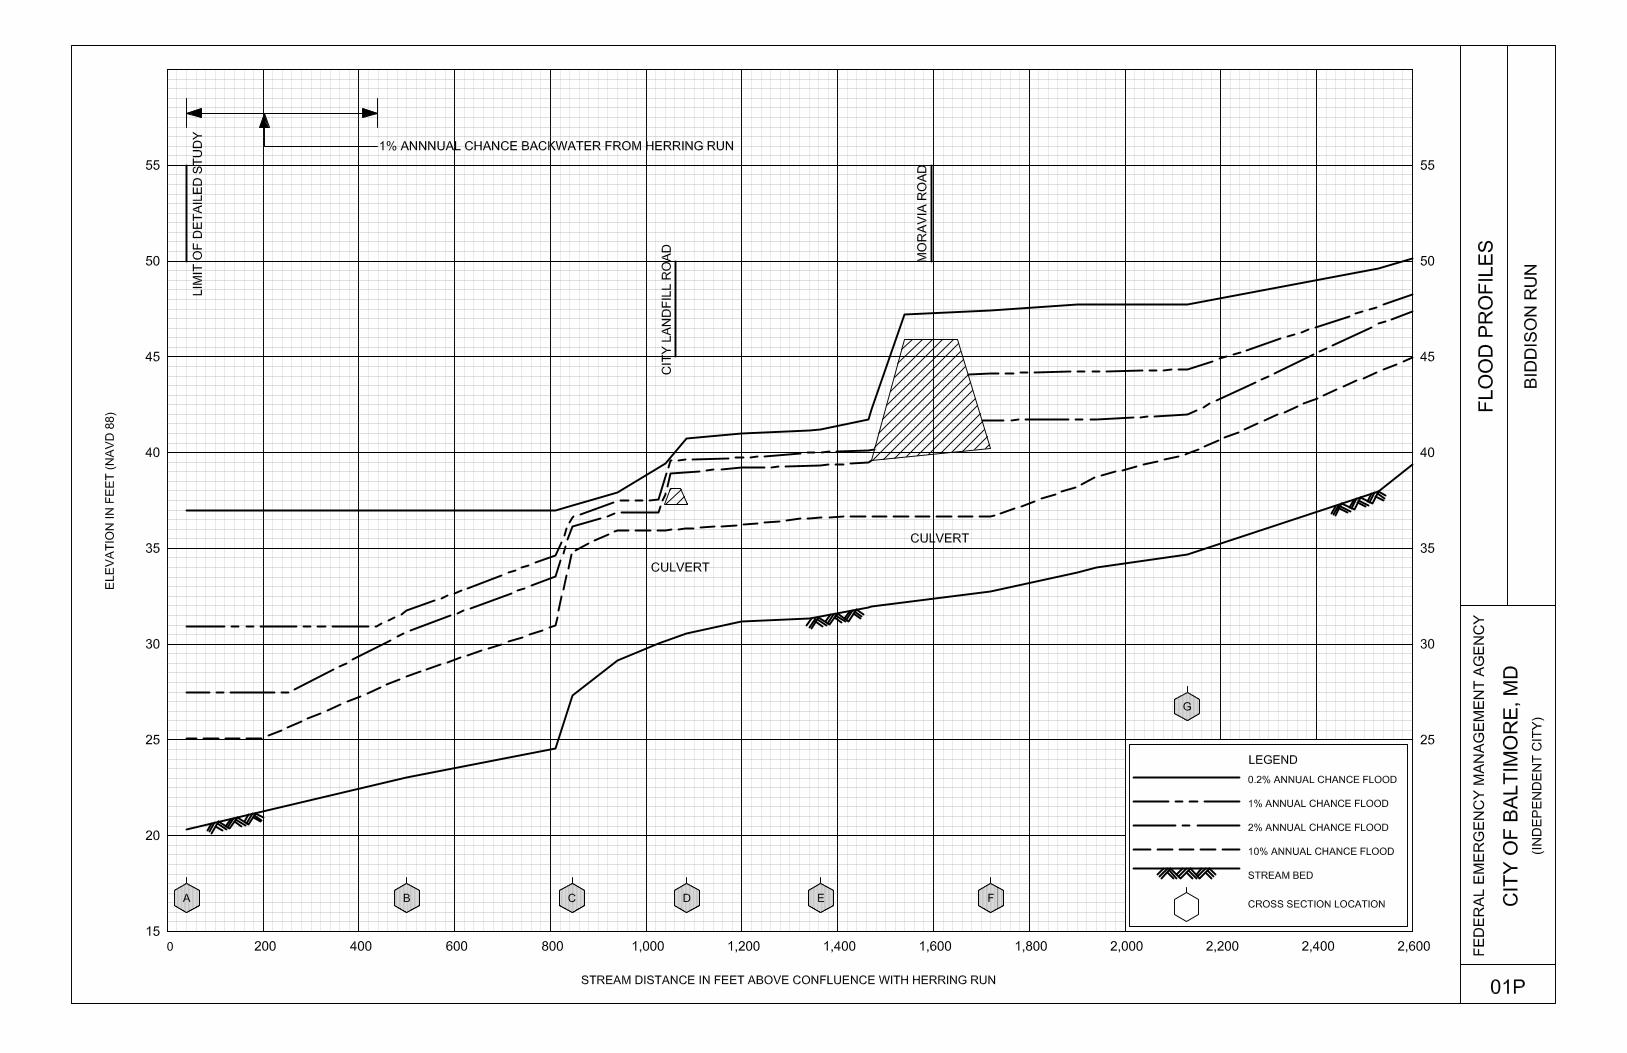

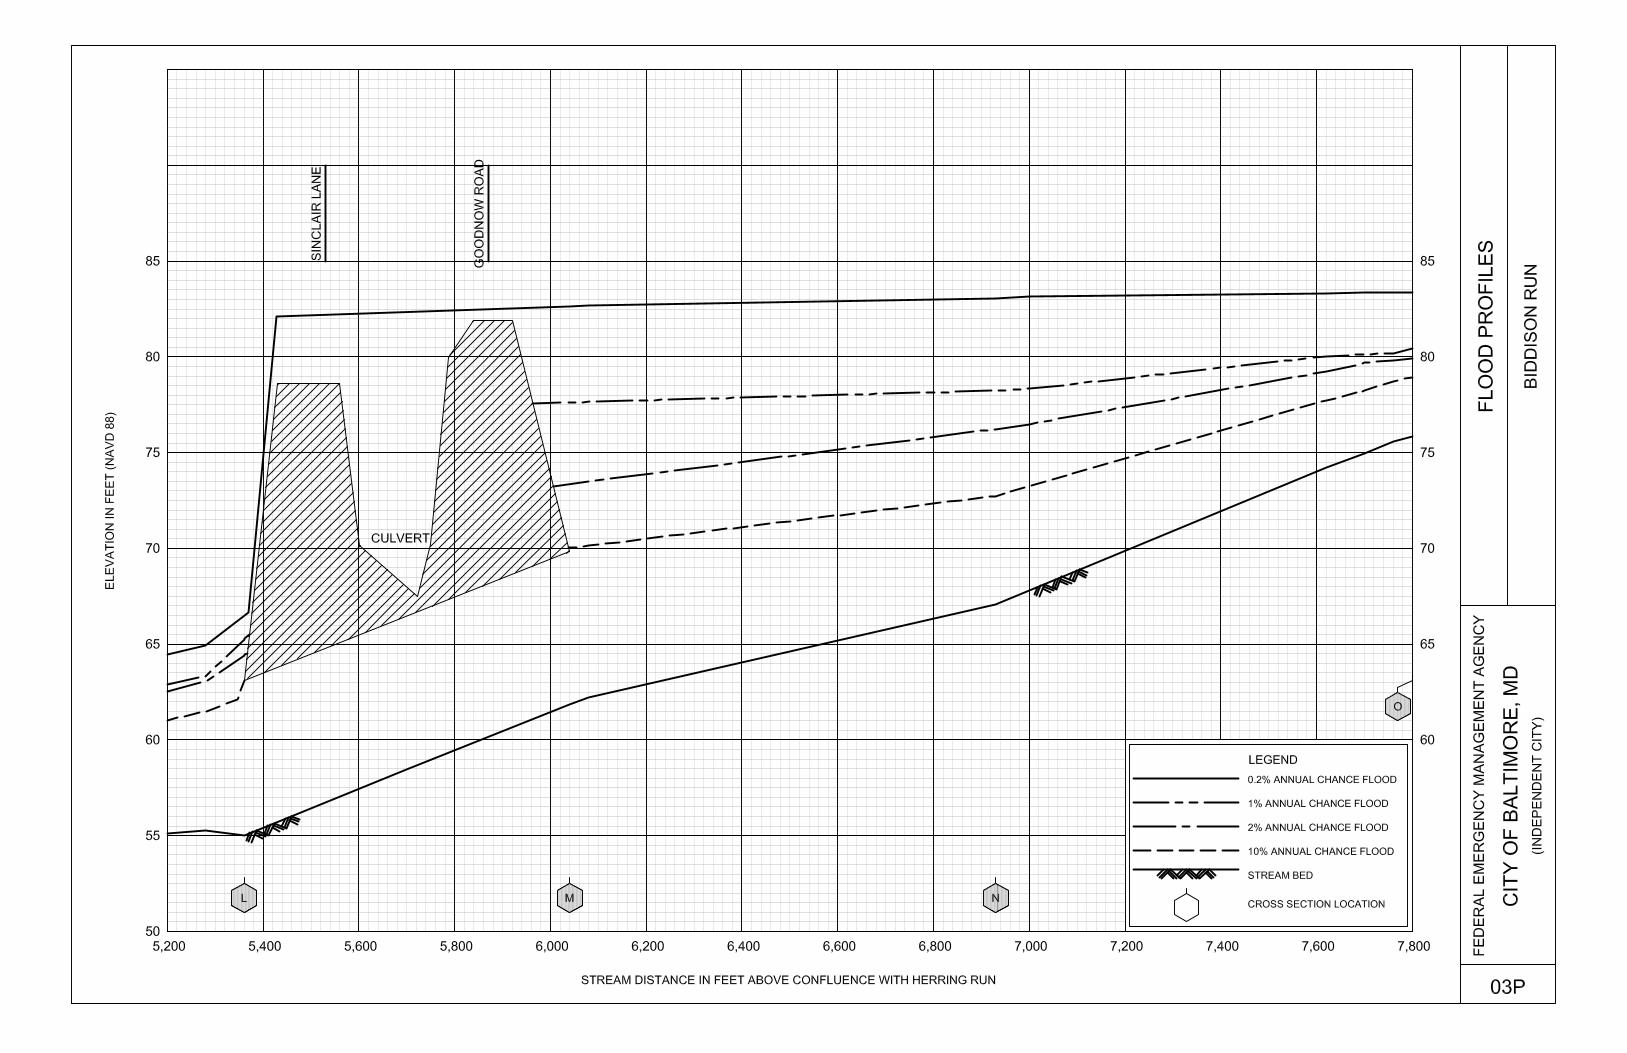
70
75
80 80
85 85
90 90
95 95
100 100
7,800 8,000 8,200 8,400 8,600 8,800 9,000 9,200
ELE
VA
TIO
N IN
F
EE
T (N
AV
D 88)
STREAM DISTANCE IN FEET ABOVE CONFLUENCE WITH HERRING RUN
FE
DE
RA
L E
ME
RG
EN
CY
M
AN
AG
EM
EN
T A
GE
NC
Y
CIT
Y O
F B
ALT
IM
OR
E, M
D
(IN
DE
PE
ND
EN
T C
IT
Y)
FLO
OD
P
RO
FIL
ES
BID
DIS
ON
R
UN
04P
LIM
IT
O
F D
ET
AILE
D S
TU
DY
LEGEND
0.2% ANNUAL CHANCE FLOOD
1% ANNUAL CHANCE FLOOD
2% ANNUAL CHANCE FLOOD
10% ANNUAL CHANCE FLOOD
STREAM BED
CROSS SECTION LOCATION
P