Embed Size (px)
Citation preview

CITY AUDITOR'S OFFICE
Preventative Maintenance and Repair October 11, 2016 AUDIT REPORT NO. 1608
CITY COUNCIL Mayor W.J. “Jim” Lane Suzanne Klapp Virginia Korte Vice Mayor Kathy Littlefield Linda Milhaven Guy Phillips David N. Smith


TABLE OF CONTENTS
AUDIT HIGHLIGHTS ......................................................................................... 1
BACKGROUND ............................................................................................... 3
Table 1. Facilities Management Department Costs ........................................................... 3
Figure 1. Facilities Management Department Organization Chart .......................................... 4
Figure 2. Facilities Management Department’s Trade Areas ................................................ 5
Table 2. Preventative Maintenance Tasks Completed by Trade Area Recorded in ARCHIBUS® ........ 6
Figure 3. Number of Completed Work Orders in ARCHIBUS®, by Type and Fiscal Year ................. 7
Table 3. Example IFMA Maintenance Benchmarks ............................................................. 8
OBJECTIVES, SCOPE, AND METHODOLOGY .............................................................. 9
FINDINGS AND ANALYSIS .................................................................................. 11
1. Data collection and quality controls are needed before reliable preventative maintenance analysis can be performed. ......................................................................... 11
2. The Facilities Management department has not conducted performance analyses for its preventative maintenance activities. ............................................................. 12
3. A preventative maintenance strategic plan, policies and procedures can aid effective resource management. .............................................................................. 14
Table 4. Example Prioritization Assessment Factors ........................................................ 15
Table 5. Comparison of Completed and Canceled Work Orders, by Trade ............................. 16
Figure 4. Preventative Maintenance Task Completion, FY 2015/16 ...................................... 17
MANAGEMENT ACTION PLAN ............................................................................. 19


Page 1
This audit was included on the Council-approved FY 2015/16 Audit Plan to evaluate the City’s preventative maintenance and repairs program, including costs and controls. The audit scope included the Facilities Management department’s citywide preventative maintenance and repairs program.
The Facilities Management department, within the Public Works Division, provides on-demand and preventative maintenance services for the City’s facilities and related equipment. During FY 2015/16, the department spent about $8.9 million on maintenance and repair projects. Skilled trade staffing includes building maintenance, construction services, electrical, HVAC, locksmith, painting and plumbing. Contract services are used for some tasks, such as elevator maintenance and filter replacement. The department’s management information system shows more than 5,000 preventative maintenance tasks scheduled and completed during FY 2015/16. The City has about 69,800 square feet per Facilities maintenance worker, but only about 35,000 per total City maintenance worker. The department’s FY 2015/16 maintenance and repair cost was about $2.40 per square foot.
AUDIT HIGHLIGHTS
WHY WE DID THIS AUDIT
BACKGROUND
Preventative Maintenance and Repair October 11, 2016 Audit Report No. 1608
WHAT WE FOUND Data collection and quality controls are needed before reliable preventative maintenance analysis can be performed. While preventative maintenance and repair (PM) questions have arisen during the last several budget cycles, the department has not yet developed data or performance analyses to address them.
• The department purchased a comprehensive facilities management information system and hired technical support. However, these resources are not fully used to manage and evaluate the PM program.
• Controls are not in place to protect data integrity and reliability. • The PM system module is also being used to track other recurring tasks.
The Facilities Management department has not conducted performance analyses for its preventative maintenance activities. After establishing related performance objectives last fiscal year, the department did not conduct a cost analysis for its PM program. Industry best practices exist that can guide the department’s efforts.
A preventative maintenance strategic plan, policies and procedures can aid effective resource management. A strategic plan would help to focus the program’s limited resources on the highest priorities. Further, current policies and procedures do not provide sufficient guidance to effectively manage the PM program. • The department does not yet have a strategic plan or comprehensive, written
policies and standard operating procedures for its PM program. • While all PM work orders are currently prioritized as urgent, the department
agreed that PM tasks are not all equally important. • The department has not conducted a workload analysis to assess its skilled
trade resource needs. • The department excludes unassigned PM work orders before measuring its
timely completion performance.
WHAT WE RECOMMEND We recommend the Public Works Division Director ensure the Facilities Management department: • Effectively uses the information system to manage the PM program. • Captures relevant, reliable data to evaluate the cost-effectiveness of the PM
program and identify potential deferred maintenance needs. • Develops a strategic plan, policies and procedures for the PM program. • Prioritizes PM tasks based on a documented risk model. • Conducts a staffing analysis and timely completes scheduled PM tasks.
MANAGEMENT RESPONSE The department agreed with the audit recommendations and plans to complete implementation between October 2017 and July 2018.
City Auditor’s Office City Auditor 480 312-7867 Integrity Line 480 312-8348
www.ScottsdaleAZ.gov

Page 2 Audit Report No. 1608

Preventative Maintenance and Repair Page 3
Preventative Maintenance
Planned actions to maintain an item at a specified performance level by performing repetitive scheduled tasks to prolong system operation and useful life. Example tasks include inspection, cleaning, lubrication and parts replacement.
BACKGROUND
The Facilities Management department, within the Public Works Division, provides on-demand and preventative maintenance (PM) services for the City’s facilities and building-related equipment. This program does not routinely provide service to specialized equipment, such as Water’s treatment facilities or Parks & Recreation’s swimming pools.
The department’s maintenance and repair program operating costs, as shown in Table 1, ranged from $6.7 to $8.4 million over the past 3 fiscal years. In addition, the department had $1.5 to $2.1 million in Capital Improvement Plan (CIP) project funds for various maintenance and repair projects to extend the useful life of the City’s buildings and equipment.
Table 1. Facilities Management Department Costs
* FY 2015/16 costs are as of the fourth general ledger close, and are subject to change until the City’s financial statements are finalized. However, these amounts are not expected to change significantly. ** About $984,000 of FY 2014/15 expenses were one-time costs related to consolidating City offices into fewer buildings. SOURCE: Auditor analysis of SmartStream financial reports.
For fiscal year (FY) 2016/17, the department’s maintenance and repair operating budget increased to $8.5 million and its CIP funding increased to $2.9 million.
FY 2013/14 FY 2014/15 FY 2015/16* (amounts rounded to thousands)
Building Maintenance & Repair $1,418,000 $1,835,000 $1,553,000
Construction Svcs Maintenance & Repair 888,000 997,000 1,031,000
Electrical Maintenance & Repair 1,165,000 1,092,000 1,122,000
HVAC Maintenance & Repair 1,199,000 1,323,000 1,252,000
Plumbing Maintenance & Repair 649,000 754,000 696,000
Facilities Management Repair & Maintenance (primarily contract services) 3,075,000 1,263,000 1,090,000
Maintenance & Repair Operating $8,394,000 $7,264,000 $6,744,000
Maintenance & Repair Capital Improvement Plan (CIP) Projects 1,521,000 1,763,000 2,126,000
Maintenance & Repair Total $9,915,000 $9,027,000 $8,870,000
Other Facilities Management Operating Costs ** $11,147,000 $12,197,000 $11,355,000
Facilities Management Operating and Capital $21,062,000 $21,224,000 $20,225,000

Page 4 Audit Report No. 1608
Facilities Management Staffing The Facilities Management Director oversees two primary functions, with a manager and 3 supervisors responsible for the maintenance and repair activities. As shown in Figure 1, 12 to 16 maintenance technicians are assigned to each of the 3 maintenance and repair service areas.
Figure 1. Facilities Management Department Organization Chart
Note: HVAC represents the Heating, Ventilation and Air Conditioning trade area.
SOURCE: Auditor analysis of department organizational structure.
The 9 FTE Other Department Staff, as shown in the figure, includes 4 Contract Coordinators, a Service Area Manager, a Space Planning Analyst, a Technology Specialist, a Management Analyst and a Citizen Services Representative.
The maintenance and repair trade areas are described further in Figure 2 on page 5.
Public Works Division Director
Department Director
Department Manager
Supervisor
Maintenance Tech IIs: HVAC 6 FTE
Plumber 4 FTE Energy Mgmt Spec 2 FTE
Supervisor
Maintenance Tech IIs: Electric 8 FTE Painter 2 FTE
Locksmith 2 FTE
Supervisor
Maintenance Tech IIs: Building 9 FTE
Construction 7 FTE
Other Department Staff 9 FTE
Facilities Management Department
54 Full Time Equivalents (FTE)

Preventative Maintenance and Repair Page 5
Figure 2. Facilities Management Department’s Trade Areas
SOURCE: Auditor interviews with Facilities Management department supervisors and manager.
Building Maintenance: Perform preventative maintenance on roofs and on-demand repairs of City buildings, including floors, ceilings, interior walls and roofs.
Construction Services: Perform on-demand repairs on exterior walls, paths, parking garages, non-motorized gates, fences, and tenant improvement projects.
Electrical: Perform preventative maintenance on City building electrical assets and on-demand repairs such as relighting City buildings and paths.
HVAC: Perform preventative maintenance on City HVAC assets and on-demand adjustments and repairs.
Locksmith: Perform preventative maintenance such as testing master keys of City facilities and on-demand repairs such as reprogramming certain keypad door locks.
Painting: Perform on-demand painting projects.
Plumbing: Perform required testing of the City's 180 backflow preventers as well as preventative maintence and on-demand repairs.

Page 6 Audit Report No. 1608
ARCHIBUS® Licensed Activities
Asset Portal Capital Budgeting
Condition Assessment Energy Management
On Demand Work Personnel & Occupancy Preventive Maintenance
Project Management Space Chargeback
Space Inventory & Performance
Preventative Maintenance Program The Facilities Management department purchased ARCHIBUS®, a facilities management information system, during FY 2010/11 for space management. This system was later used to schedule and track completion of preventative maintenance tasks and on-demand work orders. Other relevant available activities (or system modules) with summarized vendor descriptions include:
• Asset Portal – to track and manage physical assets to increase asset utilization and optimize acquisition or disposition decisions.
• Condition Assessment – to track and effectively manage deferred maintenance liabilities to mitigate risk and track corrective actions. Assessors in the field evaluate the condition of the facility and its equipment to ensure that assets are operating according to established operational and safety guidelines. Once problems are identified, prioritizing and cost estimating tools available within the Condition Assessment module can be used to plan the problem resolution.
• On Demand Work – to schedule, dispatch, manage and report maintenance tasks. On demand work includes any one-time, emergency, breakdown, or corrective work, such as fixing a roof leak, installing new equipment, or painting a ceiling.
• Preventive Maintenance – to monitor and schedule building and equipment maintenance to prevent deterioration and breakdowns. Provides tools and reports to establish and manage a comprehensive preventative maintenance program.
During FY 2011/12, the department started using the Preventive Maintenance module to track Electrical and Plumbing PM activities, adding the other trade areas and contracted PM tasks over the next four years.
Table 2. Preventative Maintenance Tasks Completed by Trade Area Recorded in ARCHIBUS®
Trade Area FY 2011/12 FY 2012/13 FY 2013/14 FY 2014/15 FY 2015/16
Building Maintenance 0 4 8 454 774 Construction Services 0 0 0 25 51
Electrical 189 740 621 322 862
HVAC 0 163 778 1,760 1,688
Locksmith 0 0 0 26 155
Painting 0 0 0 0 22
Plumbing 120 285 366 333 408
Contracted PM Tasks * 0 0 127 735 1,209
Total 309 1,192 1,900 3,655 5,169
* Contracted PM tasks include specialized services such as elevator maintenance, filter replacements and automatic gate/door maintenance.
SOURCE: Auditor analysis of ARCHIBUS® data.

Preventative Maintenance and Repair Page 7
According to the Space Planning Analyst, who provides technical support, the department began using ARCHIBUS® for on-demand work requests in February 2012.
Figure 3 compares completed PM and on-demand activity over the last 5 years. In the 2 most recent fiscal years, when PM activities were tracked for all trades, the on-demand work requests reflect a slight decline.
Figure 3. Number of Completed Work Orders in ARCHIBUS®, by Type and Fiscal Year
SOURCE: Auditor analysis of ARCHIBUS® data.
The premise for a PM program is that routine preventative maintenance reduces unplanned failures and the associated repairs and unanticipated costs. However, the program’s activity will need to be consistently tracked over a longer period to provide any definitive trends. Benchmarking and Performance Measures In November 2015, the Facilities Management Director joined the International Facility Management Association (IFMA), which describes itself as the largest international association for facility management professionals. As one benefit, the IFMA provides benchmarking guidance and data that can be used in evaluating and improving a department’s performance.
Table 3 on page 8 illustrates example benchmarks.
0
2,000
4,000
6,000
8,000
10,000
12,000
14,000
FY2011/12 FY2012/13 FY2013/14 FY2014/15 FY2015/16
On-Demand
PreventativeMaintenance

Page 8 Audit Report No. 1608
Table 3. Example IFMA Maintenance Benchmarks
Fiscal Year (FY) 2013/14 2014/15 2015/16 2016/17 1 IFMA 2 Comparison
Area Maintained per Department Maintenance Worker FTE 3
68,182 81,395 81,395 69,767 61,538 sq ft Higher
Area Maintained per Department FTE 3 55,556 64,815 64,815 55,556 61,538
sq ft Lower
Area Maintained per City Maintenance Worker FTE 3 36,585 41,667 40,230 34,843 61,538
sq ft Lower
Maintenance Cost per Square Foot Maintained 4 $3.37 $2.55 $2.40 $3.56 $2.23 Higher
Square Feet (in millions) 5 3.0 3.5 3.5 3.0
1 Fiscal year 2016/17 amounts are based on the department’s approved budget, including expenses, square footage and employee FTEs. 2 Comparative data for large office facilities, from the International Facility Management Association Foundation’s Benchmarking for Facility Professionals. 3 Maintenance Worker includes maintenance technicians, supervisors and energy management control specialists. We used the same IFMA benchmark for comparison to the department’s total FTE since other department staff support and assist the maintenance and repair activities. We also compared the benchmark to the City’s total maintenance workers, including the additional maintenance technicians in Water Resources and Parks & Recreation and at the Scottsdale Airport. 4 The cost comparison includes only the Facilites Management department’s maintenance and repair operating cost. Other areas of the City did not isolate their facility-related maintenance and repair costs. 5 The Space Planning Analyst explained the building square footage was estimated for FYs 2013/14 through 2015/16. The completed space survey square footage was used for the FY 2016/17 budget. Therefore, FY 2016/17 appears more reliable than the prior years.
SOURCE: Auditor analysis of SmartStream reports, the Facilities Management data in the City’s Budget Books and the IFMA benchmarking publication.
Service Quality The department sends a customer satisfaction survey after completion of on-demand work requests. During FY 2015/16, City staff submitted customer satisfaction ratings for 1,042 of approximately 10,000 on-demand work orders. More than 89% of respondents rated work performed by the department’s trade staff as exceptional, while only about 1% provided a below average or poor rating.

Preventative Maintenance and Repair Page 9
OBJECTIVES, SCOPE, AND METHODOLOGY
An audit of Preventative Maintenance and Repairs was included on the City Council-approved fiscal year (FY) 2015/16 Audit Plan. The audit objective was to evaluate the City’s preventative maintenance and repair program, including costs and controls. The audit scope included the Facilities Management department’s preventative maintenance and repairs program within the Public Works Division. The scope did not include preventative maintenance and repair programs that other divisions or departments have for specialized equipment and facilities, such as water treatment or swimming pools.
To gain an understanding of preventative maintenance and repair programs, we reviewed related audit reports recently completed by other auditors. We also researched best practices in facilities management, including:
• International Facility Management Association (IFMA) Foundation, Benchmarking for Facility Professionals
• National Association of State Facilities Administrators, Association of Higher Education Facilities Officers/APPA, Federal Facilities Council, International Facility Management Association and Holder Construction Company and Infrastructure Strategies, Asset Lifecycle Model for Total Cost of Ownership Management Framework, Glossary & Definitions: A Framework for Facilities Lifecycle Cost Management
• U.S. Department of Energy, Federal Energy Management Program, Operations & Maintenance Best Practices: A Guide to Achieving Operational Efficiency, August 2010
To gain an understanding of the preventative maintenance and repairs program’s objectives, we reviewed relevant City Council agendas, minutes and meeting recording excerpts, as well as related information in the City’s budget books. We interviewed Facilities Management department personnel, including the Director, manager, and supervisors. To gain an understanding of the program’s information system, ARCHIBUS®, we interviewed the Space Planning Analyst, who serves as technical support, and reviewed the software company’s related website.
To evaluate costs and controls over the preventative maintenance and repair program, we:
• Reviewed the department’s historical budget and financial reporting information.
• Tested validity of data maintained in the ARCHIBUS® system. Specifically, we tested data related to buildings, equipment, labor and supplies; including:
Comparing the ARCHIBUS® building and equipment asset inventories to the Accounting department’s fixed asset records.
Comparing the Maintenance Technician labor hours entered into ARCHIBUS® to standard workweek hours.
Comparing supply and material cost data recorded in ARCHIBUS® work request fields to cost center expenses.
• Reviewed select ARCHIBUS® fact sheets for its licensed activities available to Facilities Management department staff.
Page 10 Audit Report No. 1608
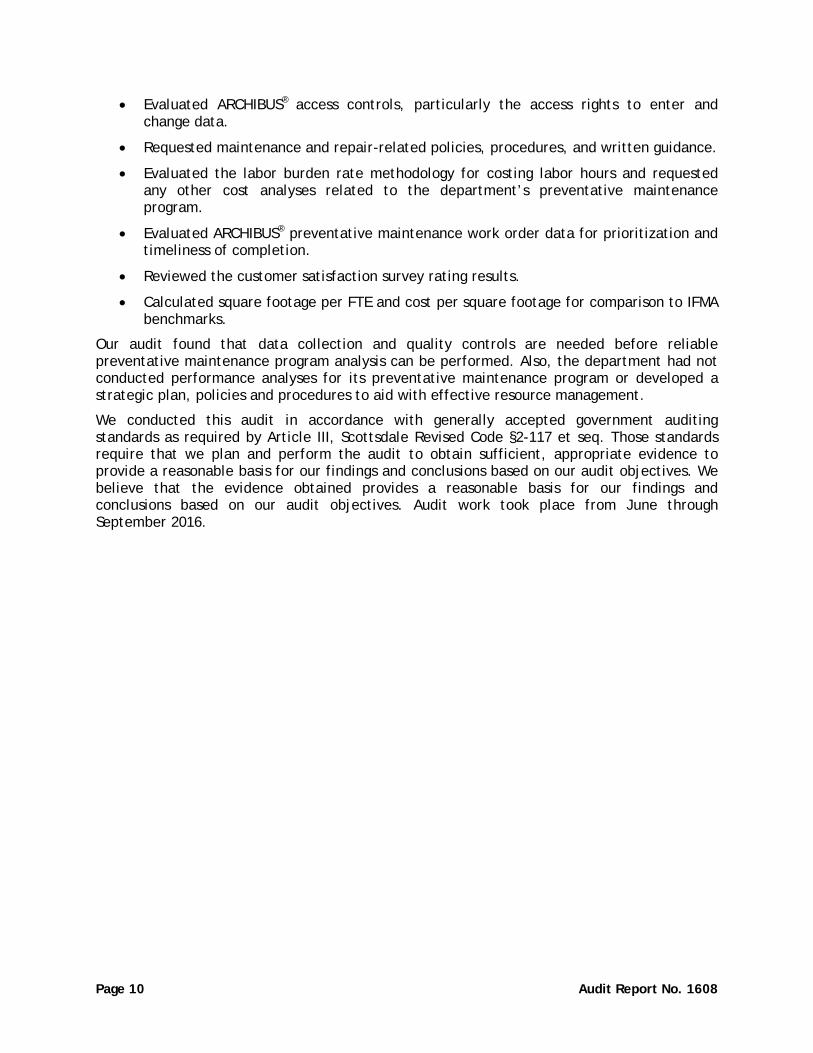
• Evaluated ARCHIBUS® access controls, particularly the access rights to enter and change data.
• Requested maintenance and repair-related policies, procedures, and written guidance.
• Evaluated the labor burden rate methodology for costing labor hours and requested any other cost analyses related to the department’s preventative maintenance program.
• Evaluated ARCHIBUS® preventative maintenance work order data for prioritization and timeliness of completion.
• Reviewed the customer satisfaction survey rating results.
• Calculated square footage per FTE and cost per square footage for comparison to IFMA benchmarks.
Our audit found that data collection and quality controls are needed before reliable preventative maintenance program analysis can be performed. Also, the department had not conducted performance analyses for its preventative maintenance program or developed a strategic plan, policies and procedures to aid with effective resource management.
We conducted this audit in accordance with generally accepted government auditing standards as required by Article III, Scottsdale Revised Code §2-117 et seq. Those standards require that we plan and perform the audit to obtain sufficient, appropriate evidence to provide a reasonable basis for our findings and conclusions based on our audit objectives. We believe that the evidence obtained provides a reasonable basis for our findings and conclusions based on our audit objectives. Audit work took place from June through September 2016.

Preventative Maintenance and Repair Page 11
FINDINGS AND ANALYSIS
1. Data collection and quality controls are needed before reliable preventative maintenance analysis can be performed.
Although preventative maintenance and repair questions have arisen during the last several budget cycles, the department has not yet developed data or performance analyses to address them. Recently, in April 2016, City Councilmembers requested information related to how continuing maintenance adds to the value of City assets and increases their anticipated useful life.
A. The department purchased a comprehensive facilities management information system, ARCHIBUS®, and hired a technical support staff in FY 2010/11. But the department has not fully used these resources to manage and evaluate the program.
1. The ARCHIBUS® building and building-related equipment inventory does not include key information, and the department still considers it incomplete.
The ARCHIBUS® equipment table has 140 data fields available. However, as of August 2016, the department only consistently uses 6 data fields. Data fields that often are not completed include physical dimensions and condition, as-built documents, warranties, cost, original useful life, and remaining useful life. As well, on an ongoing basis, additional information such as operating cost and usage statistics can be captured. While data may not be complete for equipment items owned prior to purchasing ARCHIBUS®, Facilities Management staff also has not recorded detailed information for more recent acquisitions.
2. Labor hours have not been consistently recorded in ARCHIBUS®, causing the data to be unreliable.
During calendar year 2015, the department’s full-time skilled trade positions recorded fewer than 40 hours per week in the ARCHIBUS® system about 13% of the time, on average. In addition, about 10% of the work order tasks completed during FY 2015/16 had zero labor hours recorded.
Currently, there are not automated exception reports to identify such issues. Rather, the department’s supervisors stated they manually review their staff’s recorded ARCHIBUS® labor hours for reasonableness.
3. Material and supply costs are also not accurately or completely captured in the ARCHIBUS® system. Specifically, some tasks that require supplies did not have a cost recorded, and other costs were recorded in even dollar amounts.
A documented procedure has not been established requiring costs to be recorded in ARCHIBUS®, and data entry is inconsistent. In addition, there does not appear to be an effective supervisory review in place to prevent, detect and/or correct errors. And as a final quality control, costs are not reconciled to program costs in the City’s budget and accounting reports.
At this point, unless past maintenance history and cost information are entered, it will be some time before effective trend and cost-benefit analyses can be developed from ARCHIBUS®.
Page 12 Audit Report No. 1608
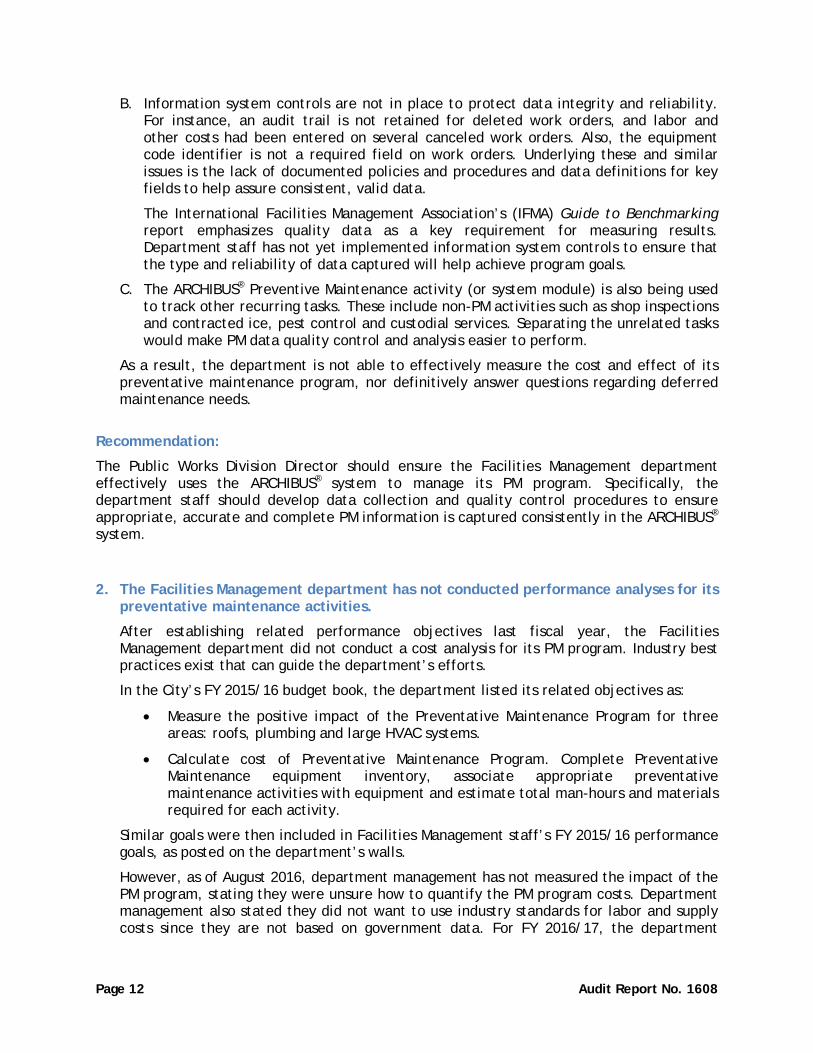
B. Information system controls are not in place to protect data integrity and reliability. For instance, an audit trail is not retained for deleted work orders, and labor and other costs had been entered on several canceled work orders. Also, the equipment code identifier is not a required field on work orders. Underlying these and similar issues is the lack of documented policies and procedures and data definitions for key fields to help assure consistent, valid data.
The International Facilities Management Association’s (IFMA) Guide to Benchmarking report emphasizes quality data as a key requirement for measuring results. Department staff has not yet implemented information system controls to ensure that the type and reliability of data captured will help achieve program goals.
C. The ARCHIBUS® Preventive Maintenance activity (or system module) is also being used to track other recurring tasks. These include non-PM activities such as shop inspections and contracted ice, pest control and custodial services. Separating the unrelated tasks would make PM data quality control and analysis easier to perform.
As a result, the department is not able to effectively measure the cost and effect of its preventative maintenance program, nor definitively answer questions regarding deferred maintenance needs.
Recommendation:
The Public Works Division Director should ensure the Facilities Management department effectively uses the ARCHIBUS® system to manage its PM program. Specifically, the department staff should develop data collection and quality control procedures to ensure appropriate, accurate and complete PM information is captured consistently in the ARCHIBUS® system.
2. The Facilities Management department has not conducted performance analyses for its preventative maintenance activities.
After establishing related performance objectives last fiscal year, the Facilities Management department did not conduct a cost analysis for its PM program. Industry best practices exist that can guide the department’s efforts.
In the City’s FY 2015/16 budget book, the department listed its related objectives as:
• Measure the positive impact of the Preventative Maintenance Program for three areas: roofs, plumbing and large HVAC systems.
• Calculate cost of Preventative Maintenance Program. Complete Preventative Maintenance equipment inventory, associate appropriate preventative maintenance activities with equipment and estimate total man-hours and materials required for each activity.
Similar goals were then included in Facilities Management staff’s FY 2015/16 performance goals, as posted on the department’s walls.
However, as of August 2016, department management has not measured the impact of the PM program, stating they were unsure how to quantify the PM program costs. Department management also stated they did not want to use industry standards for labor and supply costs since they are not based on government data. For FY 2016/17, the department

Preventative Maintenance and Repair Page 13
changed its PM program performance objectives in the City’s budget book to measure the percentage of work orders completed.
Using industry standards for estimating PM task labor hours and supply costs would help the department assess whether PM tasks were completed efficiently with limited labor and material resources. As well, other cost analyses would assist the Facilities Management department in quantifying the cost-benefit of the PM program. For example, the IFMA benchmarking report illustrated the “Percent PM” as a measure of effectiveness and Facility Condition Index (FCI) as a means of comparing building condition.
• The Percent PM measure calculates the percentage of preventative maintenance spending to total maintenance spending. The IFMA benchmarking report notes that the ideal percentage of preventative maintenance spending is 65 to 85%.
• Besides providing a means for objectively comparing building conditions, the FCI provides management information on building renewal funding and deferred maintenance needs.
A building’s FCI is calculated by comparing its current year required renewal cost, which is deferred maintenance and capital repairs, to its current replacement value.
According to the IFMA, the FCI ratio is then generally assessed as follows:
FCI Ratio Assessment 0 to 5% Good >5 to 10% Fair >10 to 30% Poor >30% Critical
Maintaining or improving a building’s FCI rating can also indicate the value of preventative maintenance and repair activities.
Recommendation:
The Public Works Division Director should ensure the Facilities Management department captures relevant, reliable data to conduct cost analyses to evaluate the cost-effectiveness of the preventative maintenance program and identify potential deferred maintenance needs.
Deferred Maintenance
Capital Improvements
Current Replacement
Value FCI

Page 14 Audit Report No. 1608
3. A preventative maintenance strategic plan, policies and procedures can aid effective resource management.
A strategic plan would help to focus the program’s limited resources on the highest priorities. Current departmental procedures do not provide sufficient guidance to effectively manage the preventative maintenance and repair program.
A. The Facilities Management department does not have a strategic plan for its preventative maintenance and repair program, and has not yet developed comprehensive, written policies and standard operating procedures to guide day-to-day operations.
1. Strategic Planning is a systematic process of envisioning a desired future and
translating that vision into broadly defined goals or objectives and a sequence of steps to achieve them. A strategic plan for the preventative maintenance program could include a strategy statement and list the desired results. Other important components of a strategic plan would include implementation steps with target dates and responsible staff along with any budgetary implications.
2. Policies are principles, rules and guidelines used to reach long-term goals. Policies are generally written, accessible and approved by management. Policies can also define responsibilities and provide for management oversight and control. Currently, the Facilities Management department has not developed written policies related to the preventative maintenance program or use of the ARCHIBUS® system. Policies related to the preventative maintenance program could include such guidelines as preventative maintenance task prioritization, supervisory reviews and labor hour and material/supply cost documentation. Policies for the ARCHIBUS® system should include the level of system access given to supervisory and staff positions and the required data fields. Policies for the preventative maintenance program should help fulfill the objectives of the program’s strategic plan.
3. Standard operating procedures are specific methods used to apply policies in day-to-day operations. While the department has some informal PM task procedure lists, these lists are not dated and do not have any indication of management approval. Comprehensive procedures are needed to guide many day-to-day activities, such as documenting the time and costs of completing preventative maintenance and on-demand tasks, reporting deficiencies observed while performing other work, and determining task priorities. Detailed written guidance would assist management in capturing information needed to evaluate the effectiveness and efficiency of the program.
Without a formal strategic plan, policies and procedures, there is an increased risk of inconsistent performance, noncompliance and inefficiencies in the preventative maintenance and repair program that could lead to safety risks, premature equipment failure and increased operating costs.
Strategic Plan Policies Standard Operating Procedures

Preventative Maintenance and Repair Page 15
B. Currently, all preventative maintenance work orders are prioritized in ARCHIBUS® as urgent. However, department management agreed that preventative maintenance work orders are not all equally important.
Prioritizing PM tasks would help management determine where to first use the limited staff and budget resources. A PM task’s priority could be assigned based on the delay impact, which considers both the likelihood and the consequence of a delay in performing the task. Using a risk assessment approach, such as the one shown in Table 4, can help staff assign priority ratings.
Table 4. Example Prioritization Assessment Factors
Consequence (Cost) from Delay Likelihood/Frequency of
Event Negligible Minor Important Major Severe Disaster
Certain Highest Risk
Almost certain
Possible
Rare
Very rare Lowest Risk
SOURCE: Auditor summarization of Tips on Maintenance Job Priority Ratings by Lifetime Reliability Solutions.
Every business is faced with limited resources. Therefore, the highest priority should be addressed first to gain the largest cost-benefit possible. Risk-based ratings can help management evaluate task assignments and communicate to staff which of their assigned preventative maintenance tasks are most important to complete.
C. The Facilities Management department has not conducted a recent staffing analysis for its skilled trade positions to assess its resource needs.
1. Management’s perceived total staffing needs are largely based on the FTE per square feet in 2008, when the department was within the Community Services Division. In addition, the department provided an undated analysis of 2009 IFMA benchmarking data. However, this analysis did not take into account more than 40 additional maintenance technicians working in Water Resources and Parks & Recreation and at the Scottsdale Airport.
As shown in Table 3 on page 8, including all city maintenance technicians results in about 35,000 square feet per maintenance worker, and this measure has ranged between 35,000 and 42,000 square feet since FY 2013/14. This workload is below the 2009 IFMA benchmark of 49,000 square feet and significantly below the 2014 IFMA Foundation benchmark of 61,500 square feet per maintenance worker.
2. While the department has reallocated its administrative and support staff positions over the past few fiscal years, it has not adjusted the skilled trade positions.

Page 16 Audit Report No. 1608
As summarized in Table 5, the available ARCHIBUS® system records indicate the various skilled trades perform a widely varying number of work orders per FTE position.
Table 5. Comparison of Completed and Canceled Work Orders, by Trade
FY 2015/16 Per FTE Total Trade FTEs Prevent Maint On-Demand PM Canceled HVAC 6* 281 189 362 Electrical 8 108 289 10 Plumbing 4 102 562 17 Building Maintenance 9 86 293 75 Locksmith 2 78 441 10 Painting 2 11 52 1 Construction Services 7 7 67 9
Total 484 FY 2014/15 Per FTE Total
Trade FTEs Prevent Maint On-Demand PM Canceled HVAC 6* 293 256 463 Plumbing 4 83 554 5 Building Maintenance 9 50 303 10 Electrical 8 40 326 246 Locksmith 2 13 495 0 Construction Services 7 4 72 0 Painting 2 0 74 0
Total 724
* 8 FTEs, including the 2 Energy Management Control Specialists, were used to calculate HVAC on-demand work orders per FTE.
SOURCE: Auditor analysis of ARCHIBUS® work order data and budgeted FTEs, which approximate actual.
The HVAC trade area has both the most PM work orders per FTE and PM task cancelations, while painting, construction and locksmith areas have relatively low counts. These data indicate service area/trade staffing may need rebalancing.
However, total task times would be a better indicator of resources needed than the number of work orders performed. If accurate task times were recorded in ARCHIBUS®, the data would provide a management tool for reassessing the skills needed whenever a position becomes vacant.
D. The Facilities Management department measures its timely completion performance after excluding canceled work orders, which include tasks that were due but were not scheduled for staff to complete.
Department supervisors use ARCHIBUS® to schedule PM tasks based on staff-determined frequencies. Generally most tasks recur on a monthly, quarterly or annual basis, although some have longer intervals.

Preventative Maintenance and Repair Page 17
Usually on the 25th of each month, PM tasks are scheduled for the following month. Supervisors only schedule the number of PM tasks that they estimate can be completed. The skilled trade staff then has a month to complete their assigned tasks.
During FY 2015/16, only 66% of assigned PM tasks were timely completed, while only 59% of those due were timely completed. As shown in Figure 4, about 93% of the Locksmith trade PM tasks were completed when due. However, only 48% of Construction Services PM tasks due were timely completed.
Figure 4. Preventative Maintenance Task Completion, FY 2015/16
Note: Painting is not included as its PM tasks were for disposing of City materials at the hazardous waste drop off area. This task has since been discontinued after consulting the Office of Environmental Initiatives.
SOURCE: Auditor analysis of ARCHIBUS data.
In the City’s FY 2016/17 budget book, the department projects that 85% of preventative maintenance tasks scheduled will be completed. However, the department’s reported results will not provide an accurate program performance measure unless canceled tasks are included as not completed.
Recommendations:
The Public Works Division Director should ensure the Facilities Management department:
A. Develops and documents a strategic plan for the preventative maintenance program. Further, the Facilities Management department should work to develop and document comprehensive policies and procedures for the program to establish program expectations.
B. Uses ARCHIBUS® to prioritize preventative maintenance tasks based on a documented risk model.
29
1,06
5
460 58
8
293
154
22
624 31
4 274
115
1 9
362 75
10
17
10
0%
10%
20%
30%
40%
50%
60%
70%
80%
90%
100%
Const Svcs HVAC Bldg Maint Electrical Plumbing Locksmith
Cancelled
Untimely
Timely

Page 18 Audit Report No. 1608
C. Conducts a staffing analysis to determine if the department has the right mix of skilled trade positions for maintenance and repair service needs.
D. Measures timeliness based on all preventative maintenance tasks due.

Preventative Maintenance and Repair Page 19
MANAGEMENT ACTION PLAN
1. Data collection and quality controls are needed before reliable preventative maintenance analysis can be performed.
Recommendation:
The Public Works Division Director should ensure the Facilities Management department effectively uses the ARCHIBUS® system to manage its PM program. Specifically, the department staff should develop data collection and quality control procedures to ensure appropriate, accurate and complete PM information is captured consistently in the ARCHIBUS® system.
MANAGEMENT RESPONSE: Agree PROPOSED RESOLUTION: Department staff will develop data collection and quality control procedures. RESPONSIBLE PARTY: Facilities Management COMPLETED BY: 10/01/2017
2. The Facilities Management department has not conducted performance analyses for its preventative maintenance activities.
Recommendation:
The Public Works Division Director should ensure the Facilities Management department captures relevant, reliable data to conduct cost analyses to evaluate the cost-effectiveness of the preventative maintenance program and identify potential deferred maintenance needs.
MANAGEMENT RESPONSE: Agree PROPOSED RESOLUTION: Department staff will establish procedures to capture relevant, reliable data. RESPONSIBLE PARTY: Facilities Management
COMPLETED BY: 10/01/2017
(continued on next page)

Page 20 Audit Report No. 1608
3. A preventative maintenance strategic plan, policies and procedures can aid effective resource management.
Recommendations:
The Public Works Division Director should ensure the Facilities Management department:
A. Develops and documents a strategic plan for the preventative maintenance program. Further, the Facilities Management department should work to develop and document comprehensive policies and procedures for the program to establish program expectations.
B. Uses ARCHIBUS® to prioritize preventative maintenance tasks based on a documented risk model.
C. Conducts a staffing analysis to determine if the department has the right mix of skilled trade positions for maintenance and repair service needs.
D. Measures timeliness based on all preventative maintenance tasks due.
MANAGEMENT RESPONSE: Agree
PROPOSED RESOLUTION:
A. Staff will develop and document a strategic plan for Facilities Management that will include policies and procedures for all Facilities programs, including preventive maintenance.
B. Staff will continue with efforts to prioritize preventive maintenance tasks based on a documented risk model.
C. Staff will continue to conduct staffing analysis to justify sufficient resources to handle the preventive maintenance program along with the repair, space planning and other services we perform.
D. Staff will create procedures to measure timeliness based on all preventive maintenance tasks due.
RESPONSIBLE PARTY: Facilities Management COMPLETED BY: 07/01/2018 (A); 10/01/2017 (B-D)

Preventative Maintenance and Repair
City Auditor’s Office 7447 E. Indian School Rd., Suite 205 Scottsdale, Arizona 85251 OFFICE (480) 312-7756 INTEGRITY LINE (480) 312-8348 www.ScottsdaleAZ.gov/auditor
The City Auditor’s Office conducts audits to promote operational efficiency, effectiveness, accountability, and integrity.
Audit Committee Councilwoman Suzanne Klapp, Chair Councilmember Virginia Korte Vice Mayor Kathy Littlefield City Auditor’s Office Kyla Anderson, Senior Auditor Lai Cluff, Senior Auditor Cathleen Davis, Senior Auditor Brad Hubert, Internal Auditor Dan Spencer, Senior Auditor Sharron Walker, City Auditor