Embed Size (px)
Citation preview
City Auditor’s Diversity Assessment of Boards,
Committees, and Commissions Report # 2017-02|April, 2017
Jorge Oseguera, City Auditor
Farishta Ahrary, Senior Auditor
Abeer Hajeer, Auditor Fellow
Office of the City Auditor 1
April 2017
The City of Sacramento’s Office of the City Auditor can be contacted by phone at 916-808-7270 or at the address below:
915 I Street
MC09100
Historic City Hall, Floor 2
Sacramento, CA 95814
Whistleblower Hotline
In the interest of public accountability and being responsible stewards of public funds, the City has established a whistleblowe r
hotline. The hotline protects the anonymity of those leaving tips to the extent permitted by law. The service is available 24 hours a
day, 7 days week, 365 days per year. Through this service, all phone calls and emails will be received anonymously by third party staff.
Report online at https://www.reportlineweb.com/cityofsacramento or call
toll-free: 888-245-8859.
Office of the City Auditor 2
April 2017
Table of Contents Introduction ...................................................................................................................................................................................................................... 4
Background ....................................................................................................................................................................................................................... 4
Figure 1: Number of Women Officeholders Serving in 2017 ...................................................................................................................................................... 5
City of Sacramento Boards, Committees, and Commissions ...................................................................................................................................................... 6
Figure 2: City Board, Committee, and Commission Seats as of March 2017 ............................................................................................................................. 6
Process for Appointing Board, Committee, and Commission Members .................................................................................................................................... 7
Process for Collecting Demographic Information ....................................................................................................................................................................... 8
Data Limitations ................................................................................................................................................................................................................ 9
Figure 3: Collected Data ............................................................................................................................................................................................................ 10
Objective, Scope, and Methodology ................................................................................................................................................................................ 11
Chapter 1: Data Collection Improvements Are Needed ..................................................................................................................................................... 12
Chapter 2: The City of Sacramento Resident Demographics .............................................................................................................................................. 13
Figure 4: Projected 2015 Population of Sacramento City Residents by Ethnicity .................................................................................................................... 14
Figure 5: Projected 2015 Population of City Residents by Age ................................................................................................................................................ 15
Figure 6: Projected 2015 Population of City Residents by Gender ........................................................................................................................................... 16
Chapter 3: The City of Sacramento Board, Committee, Commission Member Demographics ............................................................................................. 17
Figure 7: Ethnicity of Members by Board, Committee, and Commission ................................................................................................................................ 18
Figure 8: Member Percent Ethnicity Breakdown by Board, Committee, and Commission ..................................................................................................... 20
Figure 9: Board, Committee, and Commission Member Ethnicity Breakdown Compared to City Residents .......................................................................... 22
Figure 10: Gender of Member by Board, Committee, and Commission .................................................................................................................................. 23
Figure 11: Board, Committee, and Commission Member Gender Breakdown Compared to City Residents .......................................................................... 24
Figure 12: Ethnicity of Members by Gender ............................................................................................................................................................................. 25
Figure 13: Average Age of Members by Board, Committee, and Commission ........................................................................................................................ 26
Office of the City Auditor 3
April 2017
Figure 14: Age Breakdown of Members ................................................................................................................................................................................... 28
Figure 15: Board, Committee, and Commission Member Age Breakdown Compared to City Residents ................................................................................ 28
Figure 16: Sexual Orientation Breakdown of Members ........................................................................................................................................................... 29
Chapter 4: City of Sacramento Board, Committee, Commission Members by District ........................................................................................................ 30
Figure 17: Board, Committee, and Commission Members by City Council District Overview (legend is on the following page) ........................................... 31
Figure 18: Gender Breakdown of Members by City Council District ........................................................................................................................................ 33
Figure 19: Breakdown of Members by City Council District Key .............................................................................................................................................. 34
Figure 20: Board, Committee, and Commission Members by City Council District Map A ...................................................................................................... 35
Figure 21: Board, Committee, and Commission Members by City Council District Map B ...................................................................................................... 36
Figure 22: Board, Committee, and Commission Members by City Council District Map C ...................................................................................................... 37
Figure 23: Board, Committee, and Commission Members by City Council District Map D ...................................................................................................... 38
Figure 24: Board, Committee, and Commission Members by City Council District Map E ...................................................................................................... 39
Department Response ..................................................................................................................................................................................................... 40
Office of the City Auditor 4
April 2017
Introduction In accordance with the City Auditor’s 2017/18 Audit Plan, we have completed the City Auditor’s Diversity Assessment of Boards, Commissions, and
Committees. We conducted this assessment in accordance with Generally Accepted Government Auditing Standards. Those standards require that we plan
and perform the audit to obtain sufficient, appropriate evidence to provide a reasonable basis for our findings and conclusions based on our audit objectives.
We believe that the evidence obtained provides a reasonable basis for our findings and conclusions based on our audit objectives.
The City Auditor’s Office would like to thank the City Clerk’s Office; the Information Technology Department; Councilmember Angelique Ashby’s Office; the
City Attorney’s Office; and board, committee, and commission members for their cooperation during the audit process.
Background On May 10, 2016, the City Council directed the City Auditor, with assistance from the Independent Budget Analyst, to conduct an assessment of the diversity
of City of Sacramento employees and compare the results to the demographics of the City of Sacramento residents. On January 24, 2017, the City Council
directed the City Auditor to assess the diversity of City of Sacramento boards, committees, and commissions and compare the results to the demographics of
the City of Sacramento residents. The assessment was to include the City’s board, committee, and commission members’ demographics related to age,
ethnicity, gender, and sexual orientation.
On January 19th, the office of Councilmember Angelique Ashby and the City of Sacramento Women’s Leadership Group, in collaboration with VSP Global,
welcomed McKinsey & Company to Sacramento City Hall for a presentation on gender parity in the workforce. In this session, McKinsey researchers
shared results from their two new studies on gender parity in our workplaces and around the globe. They discussed why it matters, the challenges
organizations face and how innovative thinking and adopting best practices can help us reshape outcomes.
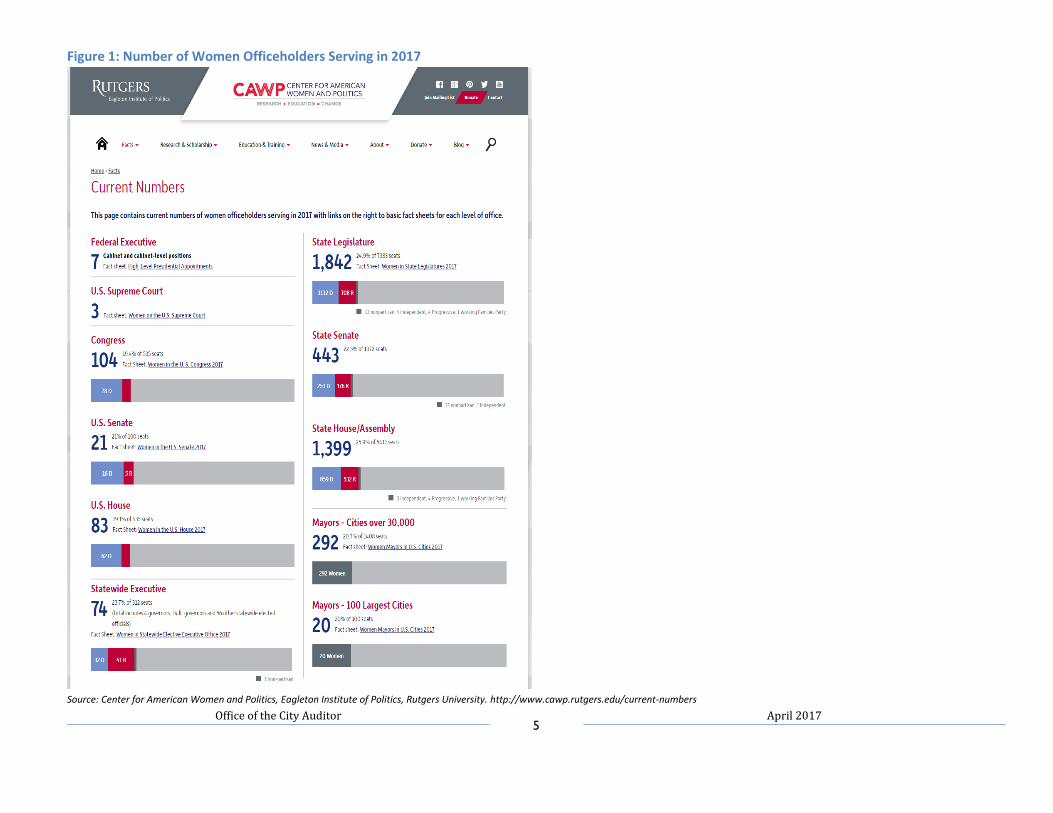
McKinsey & Company highlighted the City of Sacramento’s low representation of females in elected positions. Unfortunately, women underrepresentation in
elected positions is not uncommon. As shown in Figure 1, elected offices throughout all levels of government have consistently struggled to achieve gender
parity. As a result, taking action to encourage women’s participation in our political offices could result in a significant impact to improve gender equity.
Office of the City Auditor 5
April 2017
Figure 1: Number of Women Officeholders Serving in 2017
Source: Center for American Women and Politics, Eagleton Institute of Politics, Rutgers University. http://www.cawp.rutgers.edu/current-numbers
Office of the City Auditor 6
April 2017
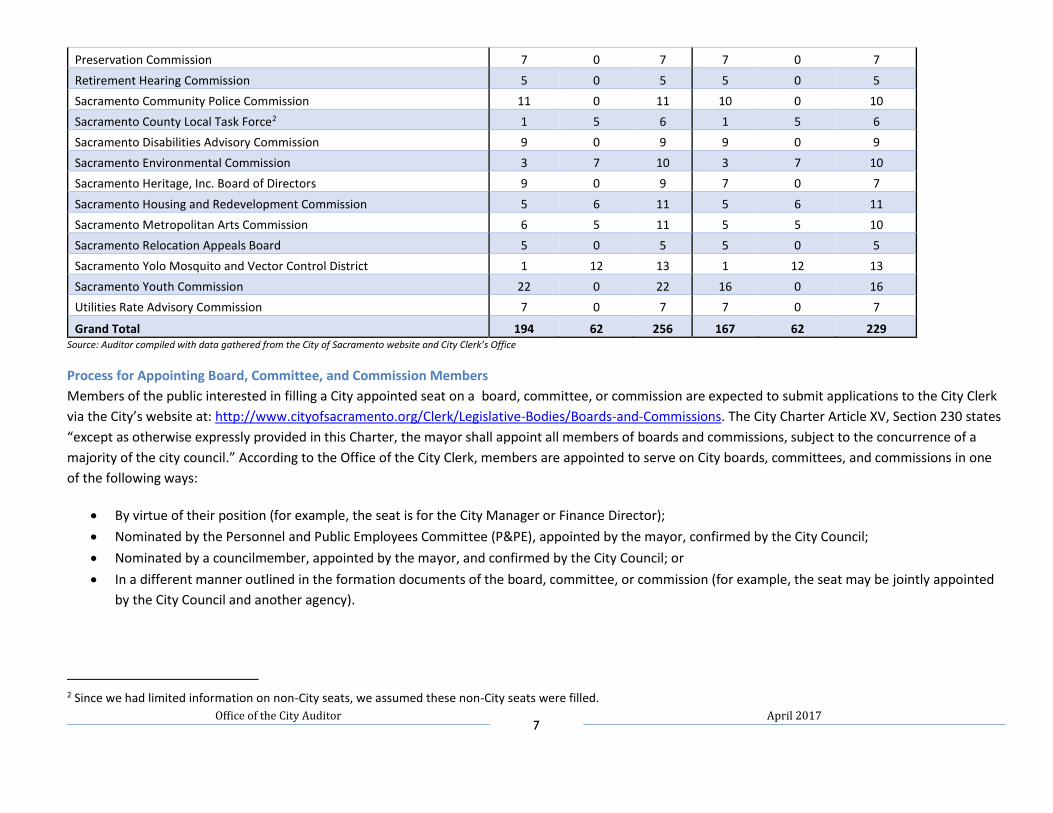
City of Sacramento Boards, Committees, and Commissions
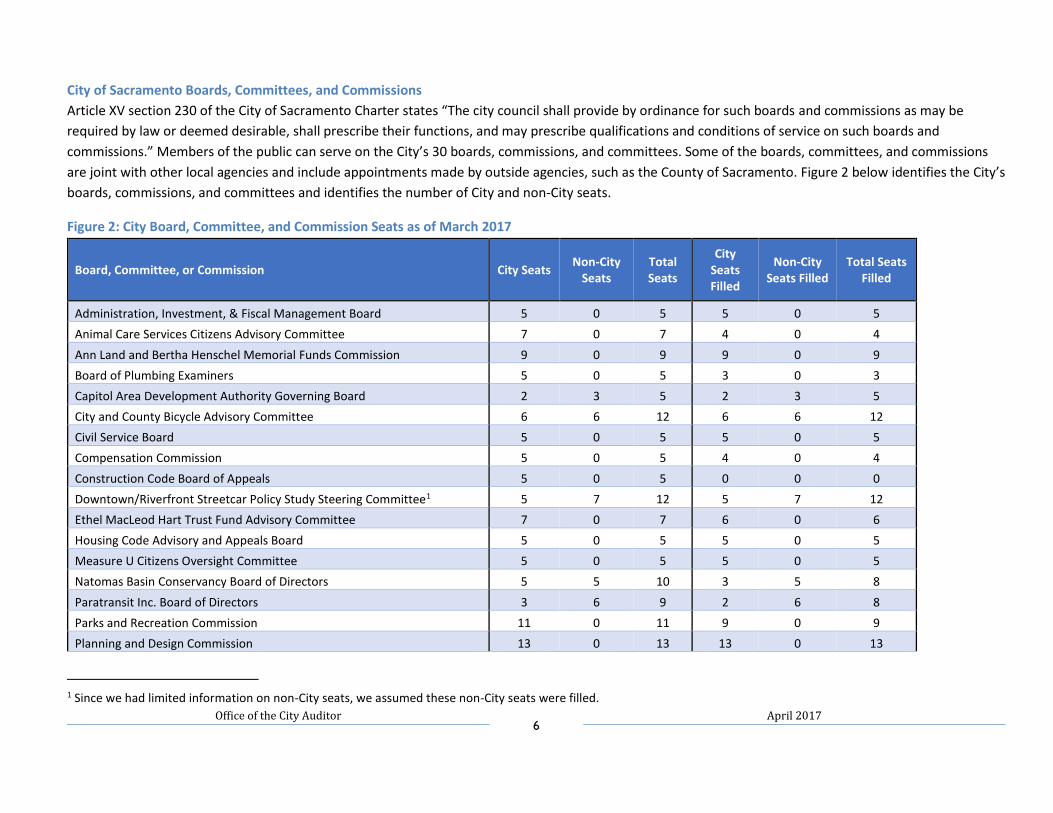
Article XV section 230 of the City of Sacramento Charter states “The city council shall provide by ordinance for such boards and commissions as may be
required by law or deemed desirable, shall prescribe their functions, and may prescribe qualifications and conditions of service on such boards and
commissions.” Members of the public can serve on the City’s 30 boards, commissions, and committees. Some of the boards, committees, and commissions
are joint with other local agencies and include appointments made by outside agencies, such as the County of Sacramento. Figure 2 below identifies the City’s
boards, commissions, and committees and identifies the number of City and non-City seats.
Figure 2: City Board, Committee, and Commission Seats as of March 2017
Board, Committee, or Commission City Seats Non-City
Seats Total Seats
City Seats Filled
Non-City Seats Filled
Total Seats Filled
Administration, Investment, & Fiscal Management Board 5 0 5 5 0 5
Animal Care Services Citizens Advisory Committee 7 0 7 4 0 4
Ann Land and Bertha Henschel Memorial Funds Commission 9 0 9 9 0 9
Board of Plumbing Examiners 5 0 5 3 0 3
Capitol Area Development Authority Governing Board 2 3 5 2 3 5
City and County Bicycle Advisory Committee 6 6 12 6 6 12
Civil Service Board 5 0 5 5 0 5
Compensation Commission 5 0 5 4 0 4
Construction Code Board of Appeals 5 0 5 0 0 0
Downtown/Riverfront Streetcar Policy Study Steering Committee1 5 7 12 5 7 12
Ethel MacLeod Hart Trust Fund Advisory Committee 7 0 7 6 0 6
Housing Code Advisory and Appeals Board 5 0 5 5 0 5
Measure U Citizens Oversight Committee 5 0 5 5 0 5
Natomas Basin Conservancy Board of Directors 5 5 10 3 5 8
Paratransit Inc. Board of Directors 3 6 9 2 6 8
Parks and Recreation Commission 11 0 11 9 0 9
Planning and Design Commission 13 0 13 13 0 13
1 Since we had limited information on non-City seats, we assumed these non-City seats were filled.
Office of the City Auditor 7
April 2017
Preservation Commission 7 0 7 7 0 7
Retirement Hearing Commission 5 0 5 5 0 5
Sacramento Community Police Commission 11 0 11 10 0 10
Sacramento County Local Task Force2 1 5 6 1 5 6
Sacramento Disabilities Advisory Commission 9 0 9 9 0 9
Sacramento Environmental Commission 3 7 10 3 7 10
Sacramento Heritage, Inc. Board of Directors 9 0 9 7 0 7
Sacramento Housing and Redevelopment Commission 5 6 11 5 6 11
Sacramento Metropolitan Arts Commission 6 5 11 5 5 10
Sacramento Relocation Appeals Board 5 0 5 5 0 5
Sacramento Yolo Mosquito and Vector Control District 1 12 13 1 12 13
Sacramento Youth Commission 22 0 22 16 0 16
Utilities Rate Advisory Commission 7 0 7 7 0 7
Grand Total 194 62 256 167 62 229 Source: Auditor compiled with data gathered from the City of Sacramento website and City Clerk’s Office
Process for Appointing Board, Committee, and Commission Members
Members of the public interested in filling a City appointed seat on a board, committee, or commission are expected to submit applications to the City Clerk
via the City’s website at: http://www.cityofsacramento.org/Clerk/Legislative-Bodies/Boards-and-Commissions. The City Charter Article XV, Section 230 states
“except as otherwise expressly provided in this Charter, the mayor shall appoint all members of boards and commissions, subject to the concurrence of a
majority of the city council.” According to the Office of the City Clerk, members are appointed to serve on City boards, committees, and commissions in one
of the following ways:
• By virtue of their position (for example, the seat is for the City Manager or Finance Director);
• Nominated by the Personnel and Public Employees Committee (P&PE), appointed by the mayor, confirmed by the City Council;
• Nominated by a councilmember, appointed by the mayor, and confirmed by the City Council; or
• In a different manner outlined in the formation documents of the board, committee, or commission (for example, the seat may be jointly appointed
by the City Council and another agency).
2 Since we had limited information on non-City seats, we assumed these non-City seats were filled.
Office of the City Auditor 8
April 2017
According to the Office of the City Clerk, most applicants interview with the P&PE Committee that nominates members to the various boards, committees,
and commissions. The P&PE Committee is made up of four City councilmembers, and as of March 2017, consisted of Larry Carr, Angelique Ashby, Allen
Warren, and Steve Hansen.
Process for Collecting Demographic Information
In order to serve as a City representative on a board, commission, or committee, most applicants are asked to complete an application. The application
documents general information, such as name, address, and contact information. The application also includes questions regarding education, gender and
ethnicity. Applications are submitted through the Granicus3 module on the City of Sacramento’s website.
Once appointed, the member roster is updated on the City Clerk’s website for board, commission, and committee members appointed by the City. Since
disclosure of gender and ethnic information on the application is voluntary, the gender and ethnicity of many members of City boards, commissions, and
committees was unavailable. Recognizing that conducting this analysis with incomplete information would produce less valuable results, we decided to
survey the members so that we could provide a more complete analysis.
On March 2017, we sent surveys4 to members asking for their address, employment information, highest education degree earned, age, gender5, sexual
orientation6, and ethnicity.
We used the following gender categories in the survey:
a. Male
b. Female
c. Transgender
d. Other
e. Decline to State
3 Granicus is a cloud-based company used by the City Clerk’s Office to manage legislative and meeting and agenda information. The Granicus Board and Commission Module
is used to accept member applications on the City Clerk’s website. 4 Our initial survey sent to members did not contain a question regarding sexual orientation. We sent out a subsequent survey to members with a new question regarding
sexual orientation. 5 Gender is defined by the City’s Equal Employment Opportunity Policy as referring to sex, gender identity, gender expression, and transgender. 6 Sexual orientation is defined by the United States Office of Personnel Management as one’s emotional or physical attraction to the same and/or opposite sex.
Office of the City Auditor 9
April 2017
We used the following sexual orientation categories in the survey:
a. Heterosexual
b. Lesbian, Gay, Bisexual, Queer (LGBQ)
c. Other
d. Decline to State
We used the following ethnic categories in the survey:
a. White (not of Hispanic origin): All persons having origins in any of the original peoples of Europe, North Africa, or the Middle East.
b. Black (not of Hispanic origin): All persons having origins in any of the black racial groups of Africa.
c. Hispanic: All persons of Mexican, Puerto Rican, Cuban, Central or South American, or other Spanish culture or origin, regardless of race.
d. Asian or Pacific Islander: All persons having origins in any of the original peoples of the Far East, Southeast Asia, the Indian Subcontinent, or the
Pacific Islands. This area includes, for example, China, India, Japan, Korea, the Philippine Islands, and Samoa.
e. American Indian or Alaskan Native: All persons having origins in any of the original peoples of North America, and who maintain cultural
identification through tribal affiliation or community recognition.
We selected the categories above in order to conduct this analysis consistent with our previous review. We recognize that these ethnicity categories were
limited and did not include options such as “Two or More Ethnicities.” However, we used the United States’ Equal Employment Opportunity Commission’s
ethnic categories, which until recently only had the five options listed above. Future analyses will be expanded to include the most up-to-date categories
used by the Equal Employment Opportunity Commission.
Data Limitations During our initial data collection process, the City Clerk’s Office informed us that they only keep track of application information on City-appointed board
members and did not have applications of members appointed by other agencies. Therefore, the City did not have standard information for many of the
members of the Boards, Commissions, and Committees of interest. Of those that the City did have information for, due to some of the information categories
being voluntary, many of the City-appointed members’ information was incomplete.
In order to analyze more complete information, we surveyed members to gather information that would allow us to analyze more complete information. Our
survey was voluntary and as a result, we did not receive survey responses from all board, committee, or commission members We also followed up with
some nonrespondents and received survey responses over the phone. Finally, we spoke with board contacts or others who knew members to identify the
Office of the City Auditor 10
April 2017
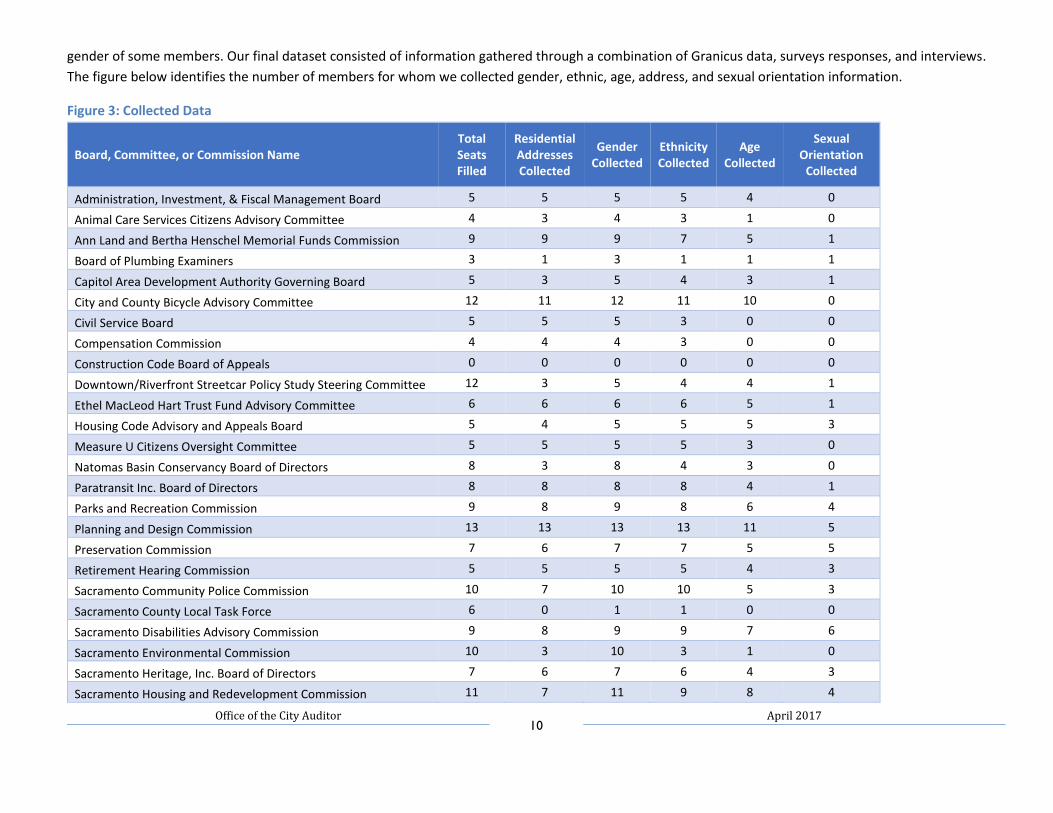
gender of some members. Our final dataset consisted of information gathered through a combination of Granicus data, surveys responses, and interviews.
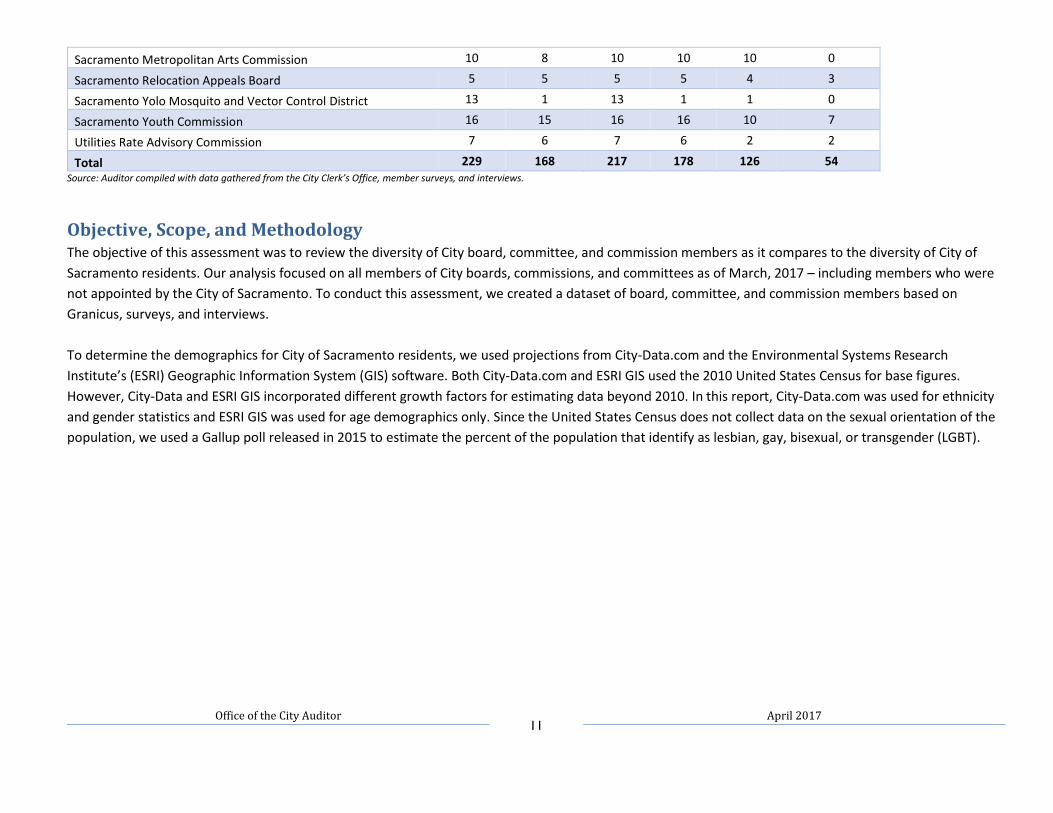
The figure below identifies the number of members for whom we collected gender, ethnic, age, address, and sexual orientation information.
Figure 3: Collected Data
Board, Committee, or Commission Name Total Seats Filled
Residential Addresses Collected
Gender Collected
Ethnicity Collected
Age Collected
Sexual Orientation
Collected
Administration, Investment, & Fiscal Management Board 5 5 5 5 4 0
Animal Care Services Citizens Advisory Committee 4 3 4 3 1 0
Ann Land and Bertha Henschel Memorial Funds Commission 9 9 9 7 5 1
Board of Plumbing Examiners 3 1 3 1 1 1
Capitol Area Development Authority Governing Board 5 3 5 4 3 1
City and County Bicycle Advisory Committee 12 11 12 11 10 0
Civil Service Board 5 5 5 3 0 0
Compensation Commission 4 4 4 3 0 0
Construction Code Board of Appeals 0 0 0 0 0 0
Downtown/Riverfront Streetcar Policy Study Steering Committee 12 3 5 4 4 1
Ethel MacLeod Hart Trust Fund Advisory Committee 6 6 6 6 5 1
Housing Code Advisory and Appeals Board 5 4 5 5 5 3
Measure U Citizens Oversight Committee 5 5 5 5 3 0
Natomas Basin Conservancy Board of Directors 8 3 8 4 3 0
Paratransit Inc. Board of Directors 8 8 8 8 4 1
Parks and Recreation Commission 9 8 9 8 6 4
Planning and Design Commission 13 13 13 13 11 5
Preservation Commission 7 6 7 7 5 5
Retirement Hearing Commission 5 5 5 5 4 3
Sacramento Community Police Commission 10 7 10 10 5 3
Sacramento County Local Task Force 6 0 1 1 0 0
Sacramento Disabilities Advisory Commission 9 8 9 9 7 6
Sacramento Environmental Commission 10 3 10 3 1 0
Sacramento Heritage, Inc. Board of Directors 7 6 7 6 4 3
Sacramento Housing and Redevelopment Commission 11 7 11 9 8 4
Office of the City Auditor 11
April 2017
Sacramento Metropolitan Arts Commission 10 8 10 10 10 0
Sacramento Relocation Appeals Board 5 5 5 5 4 3
Sacramento Yolo Mosquito and Vector Control District 13 1 13 1 1 0
Sacramento Youth Commission 16 15 16 16 10 7
Utilities Rate Advisory Commission 7 6 7 6 2 2
Total 229 168 217 178 126 54 Source: Auditor compiled with data gathered from the City Clerk’s Office, member surveys, and interviews.
Objective, Scope, and Methodology The objective of this assessment was to review the diversity of City board, committee, and commission members as it compares to the diversity of City of
Sacramento residents. Our analysis focused on all members of City boards, commissions, and committees as of March, 2017 – including members who were
not appointed by the City of Sacramento. To conduct this assessment, we created a dataset of board, committee, and commission members based on
Granicus, surveys, and interviews.
To determine the demographics for City of Sacramento residents, we used projections from City-Data.com and the Environmental Systems Research
Institute’s (ESRI) Geographic Information System (GIS) software. Both City-Data.com and ESRI GIS used the 2010 United States Census for base figures.
However, City-Data and ESRI GIS incorporated different growth factors for estimating data beyond 2010. In this report, City-Data.com was used for ethnicity
and gender statistics and ESRI GIS was used for age demographics only. Since the United States Census does not collect data on the sexual orientation of the
population, we used a Gallup poll released in 2015 to estimate the percent of the population that identify as lesbian, gay, bisexual, or transgender (LGBT).
Office of the City Auditor 12
April 2017
Chapter 1: Data Collection Improvements Are Needed The City Council believes that the City’s workforce and operations should be inclusive and reflective of the City’s diversity. This includes staffing, contracting
and procurement, boards and commissions, and other city functions. In regards to its workforce, the City of Sacramento is committed to ensuring equal
opportunity in employment for applicants and existing employees, promoting diversity and inclusion in the workplace, and resolving workplace conflict in a
constructive manner that will support a high functioning and efficient workforce.
The City currently collects information related to gender and ethnicity of all City employees which facilitates the tracking and monitoring of the City’s
workforce diversity. However, as we discovered during this assessment, similar information is not readily available or complete regarding the City’s appointed
board, commission, and committee members. If the City is interested in conducting this kind of review regularly, data collection improvements will be
necessary. This may include revising the application form to better capture data related to age, district, gender, ethnicity, and sexual orientation.
Consideration should also be given to what information will be designated as required and what information is optional. As is done with City employees, if
gender and ethnic information is not provided, the appointing entity may consider assigning this information. The City may also want to consider adding
language to the application form that explains why this information is being asked and how the information may be used by the City. By improving the City
data collection methodology, the City will be better positioned to expeditiously analyze and monitor trends and changes in the overall composition of the
boards, commissions, and committees.
We recommend the City Clerk’s Office:
Recommendation 1: Work with the City Attorney’s office to determine how best to capture, document, and retain desired information regarding City and
Non-City appointed board, commission, and committee members.
Office of the City Auditor 13
April 2017
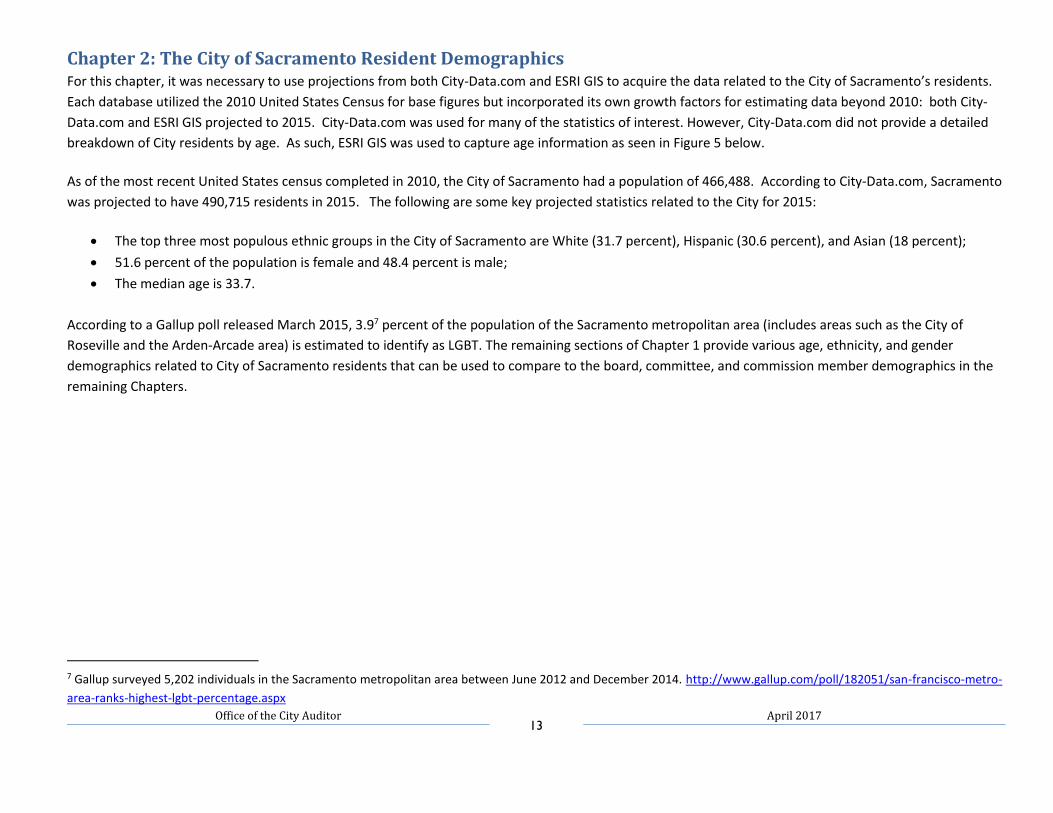
Chapter 2: The City of Sacramento Resident Demographics For this chapter, it was necessary to use projections from both City-Data.com and ESRI GIS to acquire the data related to the City of Sacramento’s residents.
Each database utilized the 2010 United States Census for base figures but incorporated its own growth factors for estimating data beyond 2010: both City-
Data.com and ESRI GIS projected to 2015. City-Data.com was used for many of the statistics of interest. However, City-Data.com did not provide a detailed
breakdown of City residents by age. As such, ESRI GIS was used to capture age information as seen in Figure 5 below.
As of the most recent United States census completed in 2010, the City of Sacramento had a population of 466,488. According to City-Data.com, Sacramento
was projected to have 490,715 residents in 2015. The following are some key projected statistics related to the City for 2015:
• The top three most populous ethnic groups in the City of Sacramento are White (31.7 percent), Hispanic (30.6 percent), and Asian (18 percent);
• 51.6 percent of the population is female and 48.4 percent is male;
• The median age is 33.7.
According to a Gallup poll released March 2015, 3.97 percent of the population of the Sacramento metropolitan area (includes areas such as the City of
Roseville and the Arden-Arcade area) is estimated to identify as LGBT. The remaining sections of Chapter 1 provide various age, ethnicity, and gender
demographics related to City of Sacramento residents that can be used to compare to the board, committee, and commission member demographics in the
remaining Chapters.
7 Gallup surveyed 5,202 individuals in the Sacramento metropolitan area between June 2012 and December 2014. http://www.gallup.com/poll/182051/san-francisco-metro-
area-ranks-highest-lgbt-percentage.aspx
Office of the City Auditor 14
April 2017
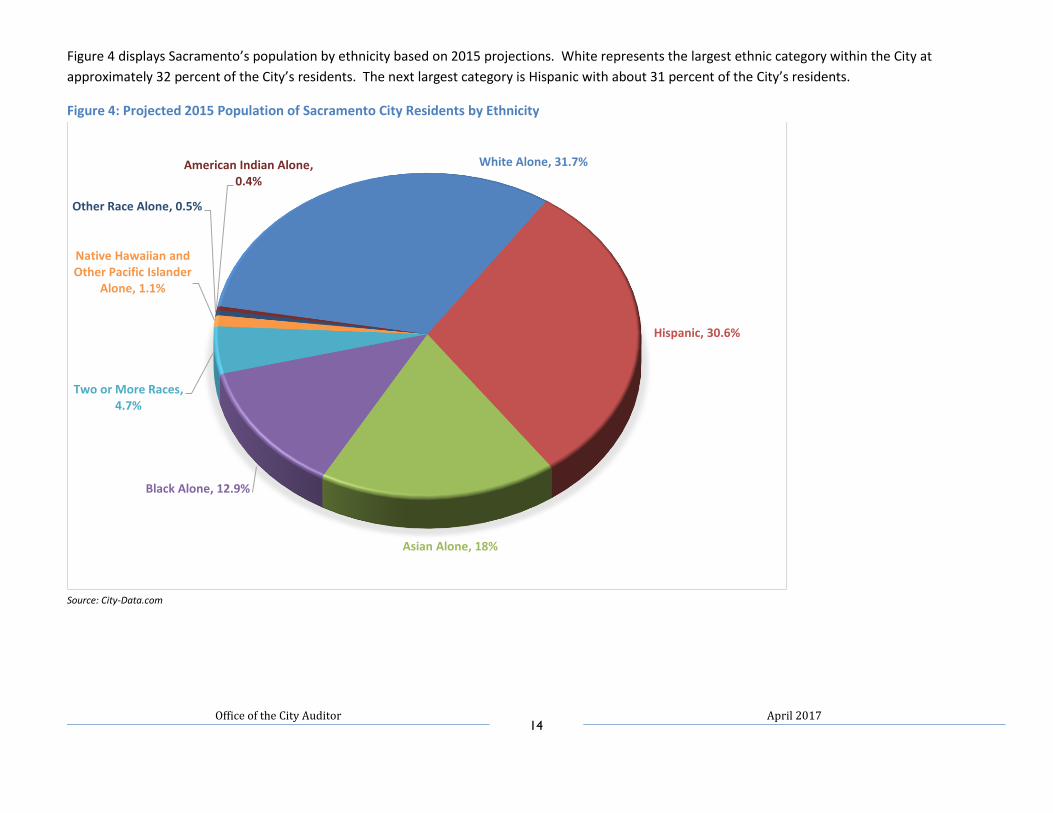
Figure 4 displays Sacramento’s population by ethnicity based on 2015 projections. White represents the largest ethnic category within the City at
approximately 32 percent of the City’s residents. The next largest category is Hispanic with about 31 percent of the City’s residents.
Figure 4: Projected 2015 Population of Sacramento City Residents by Ethnicity
Source: City-Data.com
White Alone, 31.7%
Hispanic, 30.6%
Asian Alone, 18%
Black Alone, 12.9%
Two or More Races, 4.7%
Native Hawaiian and Other Pacific Islander
Alone, 1.1%
Other Race Alone, 0.5%
American Indian Alone, 0.4%
Office of the City Auditor 15
April 2017
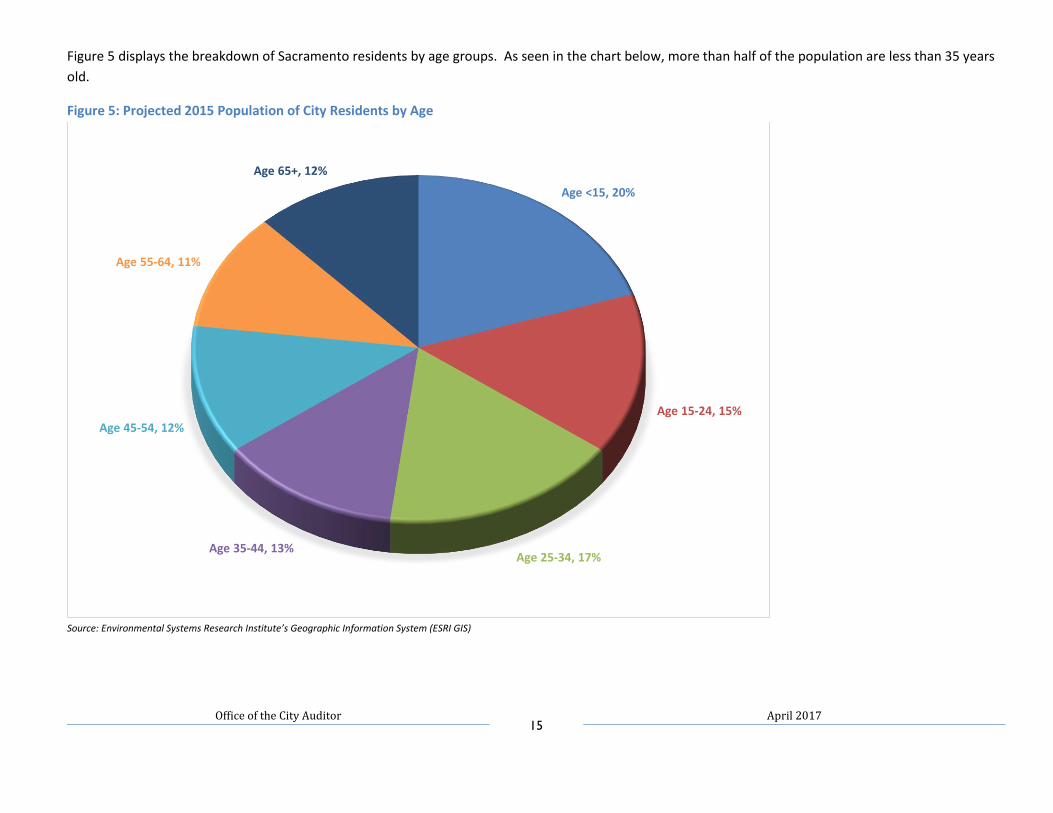
Figure 5 displays the breakdown of Sacramento residents by age groups. As seen in the chart below, more than half of the population are less than 35 years
old.
Figure 5: Projected 2015 Population of City Residents by Age
Source: Environmental Systems Research Institute’s Geographic Information System (ESRI GIS)
Age <15, 20%
Age 15-24, 15%
Age 25-34, 17%Age 35-44, 13%
Age 45-54, 12%
Age 55-64, 11%
Age 65+, 12%
Office of the City Auditor 16
April 2017
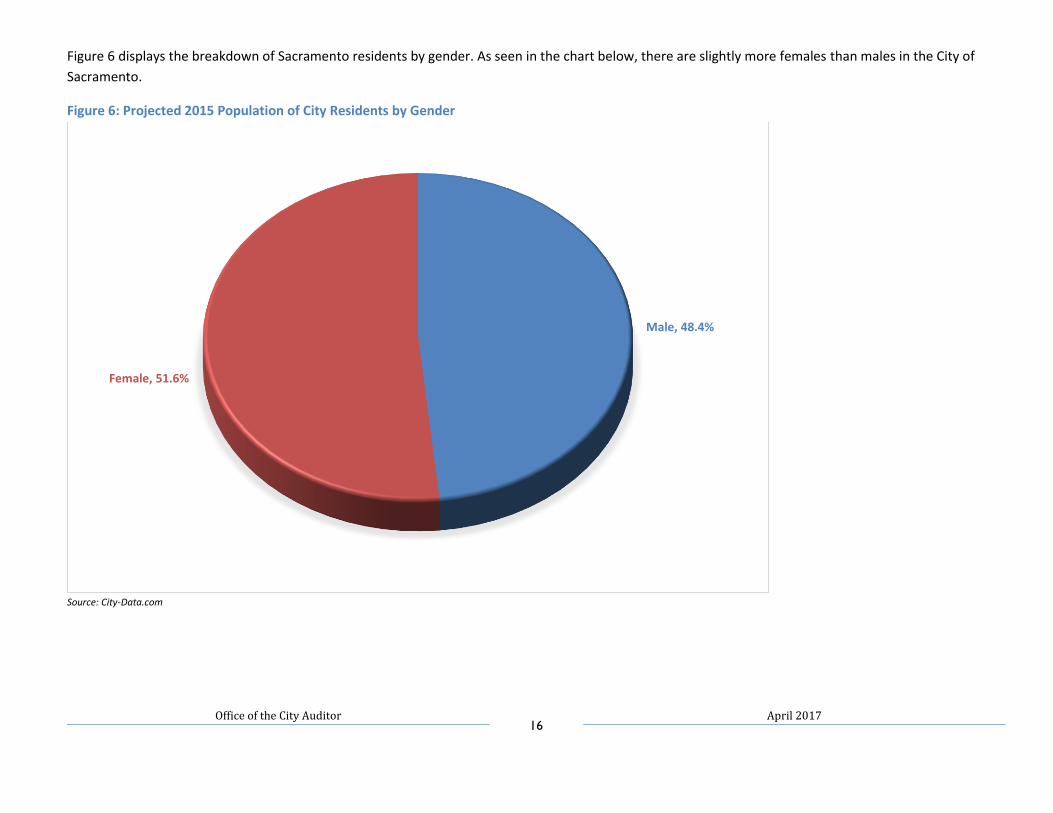
Figure 6 displays the breakdown of Sacramento residents by gender. As seen in the chart below, there are slightly more females than males in the City of
Sacramento.
Figure 6: Projected 2015 Population of City Residents by Gender
Source: City-Data.com
Male, 48.4%
Female, 51.6%
Office of the City Auditor 17
April 2017
Chapter 3: The City of Sacramento Board, Committee, Commission Member Demographics The Sacramento City Council has formed a variety of boards, commissions, and committees to assist the City in information gathering and the deliberative
process. Boards and commissions are vital to the operation of the City and ensure public involvement in the governmental process. City Board and
Commission members are members of the public appointed by the mayor and confirmed by the City Council. The City of Sacramento currently has 30 boards,
committees, and commissions that have either been created by the City and only contain City-appointments or are joint with other agencies and contain both
City and non-City appointments. In this Chapter, we will provide some of the baseline demographic information regarding the ethnic, gender, age, and sexual
orientation distribution we gathered of the City’s board, committee, and commission members. As previously mentioned, because members are not
required to provide the City with such information, we did not receive demographic information from all members and were only able to evaluate data that
we were able to collect in the limited time we had to perform this review.
Office of the City Auditor 18
April 2017
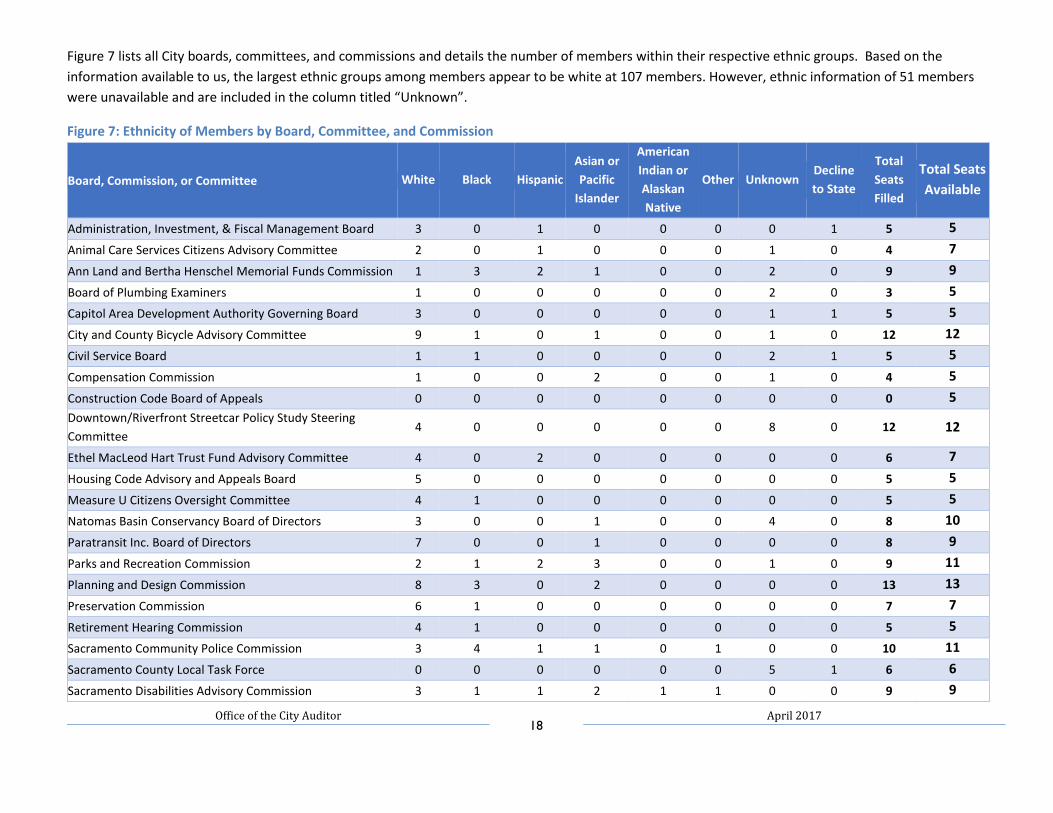
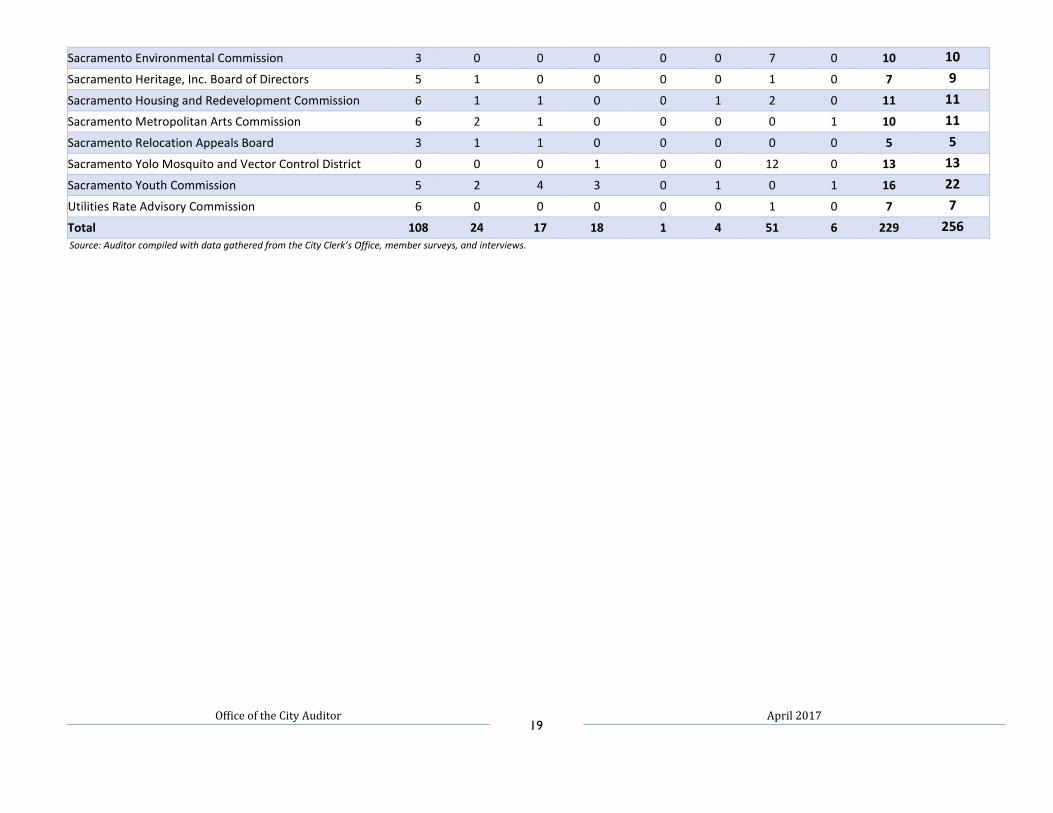
Figure 7 lists all City boards, committees, and commissions and details the number of members within their respective ethnic groups. Based on the
information available to us, the largest ethnic groups among members appear to be white at 107 members. However, ethnic information of 51 members
were unavailable and are included in the column titled “Unknown”.
Figure 7: Ethnicity of Members by Board, Committee, and Commission
Board, Commission, or Committee White Black Hispanic
Asian or
Pacific
Islander
American
Indian or
Alaskan
Native
Other Unknown Decline
to State
Total
Seats
Filled
Total Seats
Available
Administration, Investment, & Fiscal Management Board 3 0 1 0 0 0 0 1 5 5
Animal Care Services Citizens Advisory Committee 2 0 1 0 0 0 1 0 4 7
Ann Land and Bertha Henschel Memorial Funds Commission 1 3 2 1 0 0 2 0 9 9
Board of Plumbing Examiners 1 0 0 0 0 0 2 0 3 5
Capitol Area Development Authority Governing Board 3 0 0 0 0 0 1 1 5 5
City and County Bicycle Advisory Committee 9 1 0 1 0 0 1 0 12 12
Civil Service Board 1 1 0 0 0 0 2 1 5 5
Compensation Commission 1 0 0 2 0 0 1 0 4 5
Construction Code Board of Appeals 0 0 0 0 0 0 0 0 0 5
Downtown/Riverfront Streetcar Policy Study Steering
Committee 4 0 0 0 0 0 8 0 12 12
Ethel MacLeod Hart Trust Fund Advisory Committee 4 0 2 0 0 0 0 0 6 7
Housing Code Advisory and Appeals Board 5 0 0 0 0 0 0 0 5 5
Measure U Citizens Oversight Committee 4 1 0 0 0 0 0 0 5 5
Natomas Basin Conservancy Board of Directors 3 0 0 1 0 0 4 0 8 10
Paratransit Inc. Board of Directors 7 0 0 1 0 0 0 0 8 9
Parks and Recreation Commission 2 1 2 3 0 0 1 0 9 11
Planning and Design Commission 8 3 0 2 0 0 0 0 13 13
Preservation Commission 6 1 0 0 0 0 0 0 7 7
Retirement Hearing Commission 4 1 0 0 0 0 0 0 5 5
Sacramento Community Police Commission 3 4 1 1 0 1 0 0 10 11
Sacramento County Local Task Force 0 0 0 0 0 0 5 1 6 6
Sacramento Disabilities Advisory Commission 3 1 1 2 1 1 0 0 9 9
Office of the City Auditor 19
April 2017
Sacramento Environmental Commission 3 0 0 0 0 0 7 0 10 10
Sacramento Heritage, Inc. Board of Directors 5 1 0 0 0 0 1 0 7 9
Sacramento Housing and Redevelopment Commission 6 1 1 0 0 1 2 0 11 11
Sacramento Metropolitan Arts Commission 6 2 1 0 0 0 0 1 10 11
Sacramento Relocation Appeals Board 3 1 1 0 0 0 0 0 5 5
Sacramento Yolo Mosquito and Vector Control District 0 0 0 1 0 0 12 0 13 13
Sacramento Youth Commission 5 2 4 3 0 1 0 1 16 22
Utilities Rate Advisory Commission 6 0 0 0 0 0 1 0 7 7
Total 108 24 17 18 1 4 51 6 229 256 Source: Auditor compiled with data gathered from the City Clerk’s Office, member surveys, and interviews.
Office of the City Auditor 20
April 2017
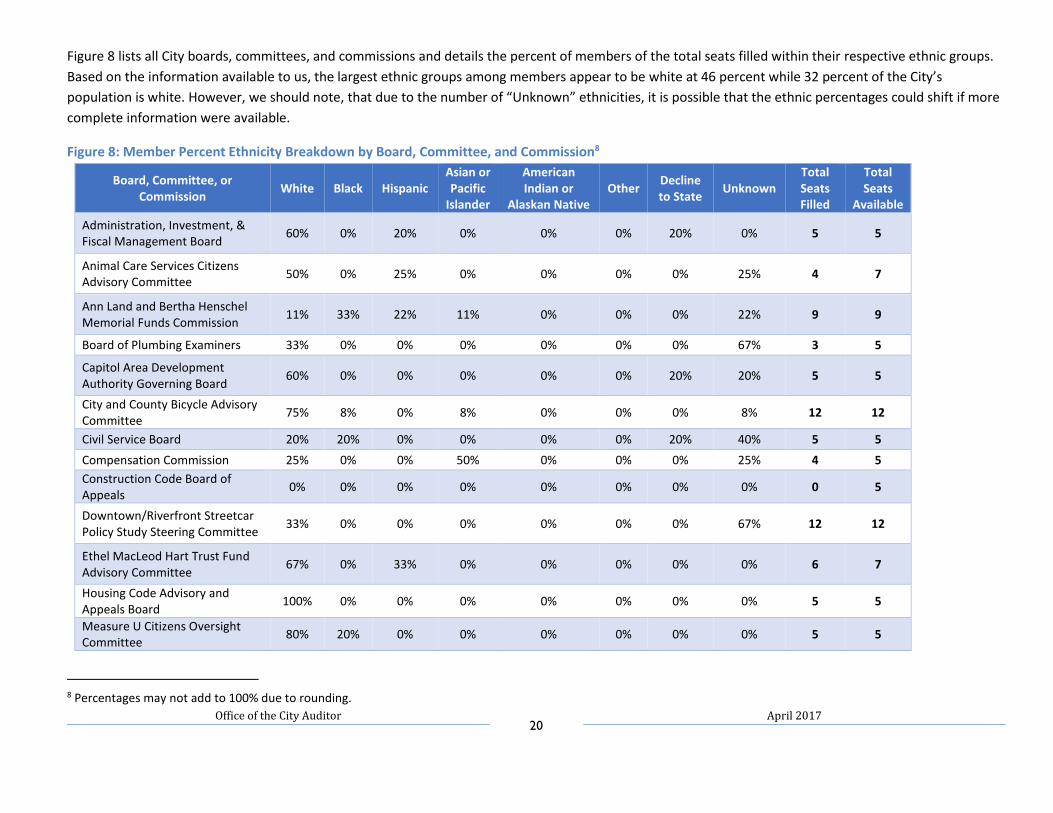
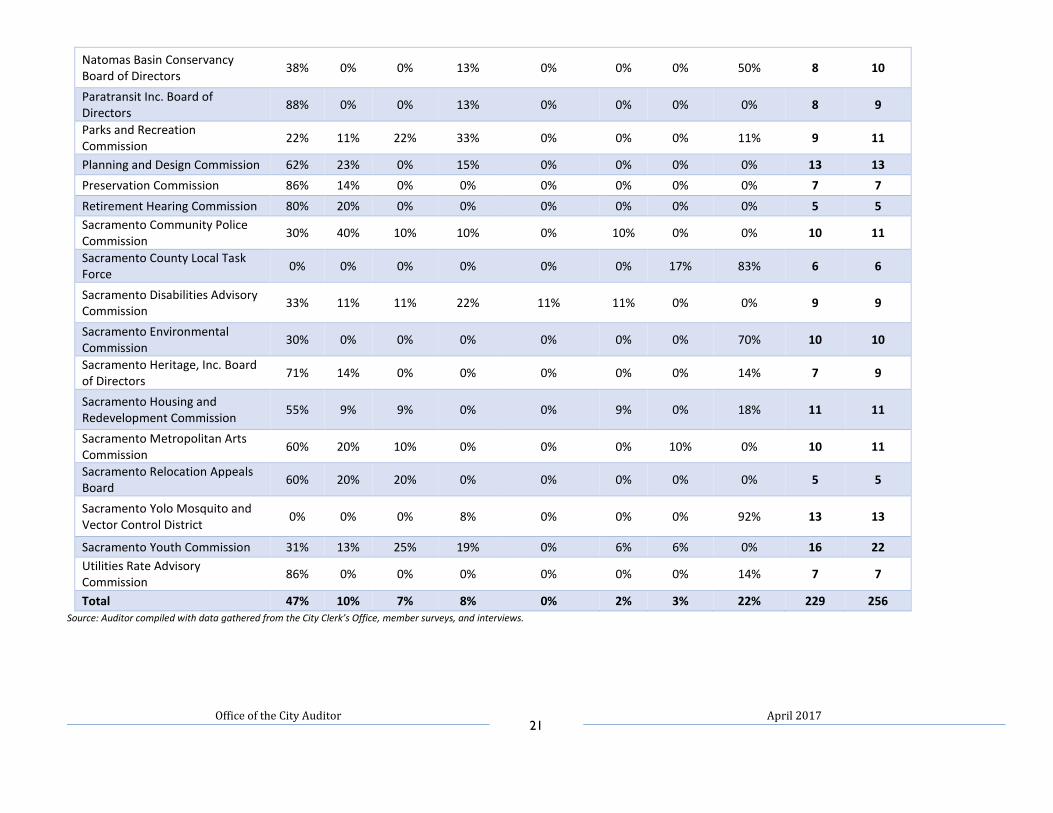
Figure 8 lists all City boards, committees, and commissions and details the percent of members of the total seats filled within their respective ethnic groups.
Based on the information available to us, the largest ethnic groups among members appear to be white at 46 percent while 32 percent of the City’s
population is white. However, we should note, that due to the number of “Unknown” ethnicities, it is possible that the ethnic percentages could shift if more
complete information were available.
Figure 8: Member Percent Ethnicity Breakdown by Board, Committee, and Commission8
Board, Committee, or Commission
White Black Hispanic Asian or Pacific
Islander
American Indian or
Alaskan Native Other
Decline to State
Unknown Total Seats Filled
Total Seats
Available
Administration, Investment, & Fiscal Management Board
60% 0% 20% 0% 0% 0% 20% 0% 5 5
Animal Care Services Citizens Advisory Committee
50% 0% 25% 0% 0% 0% 0% 25% 4 7
Ann Land and Bertha Henschel Memorial Funds Commission
11% 33% 22% 11% 0% 0% 0% 22% 9 9
Board of Plumbing Examiners 33% 0% 0% 0% 0% 0% 0% 67% 3 5
Capitol Area Development Authority Governing Board
60% 0% 0% 0% 0% 0% 20% 20% 5 5
City and County Bicycle Advisory Committee
75% 8% 0% 8% 0% 0% 0% 8% 12 12
Civil Service Board 20% 20% 0% 0% 0% 0% 20% 40% 5 5
Compensation Commission 25% 0% 0% 50% 0% 0% 0% 25% 4 5
Construction Code Board of Appeals
0% 0% 0% 0% 0% 0% 0% 0% 0 5
Downtown/Riverfront Streetcar Policy Study Steering Committee
33% 0% 0% 0% 0% 0% 0% 67% 12 12
Ethel MacLeod Hart Trust Fund Advisory Committee
67% 0% 33% 0% 0% 0% 0% 0% 6 7
Housing Code Advisory and Appeals Board
100% 0% 0% 0% 0% 0% 0% 0% 5 5
Measure U Citizens Oversight Committee
80% 20% 0% 0% 0% 0% 0% 0% 5 5
8 Percentages may not add to 100% due to rounding.
Office of the City Auditor 21
April 2017
Natomas Basin Conservancy Board of Directors
38% 0% 0% 13% 0% 0% 0% 50% 8 10
Paratransit Inc. Board of Directors
88% 0% 0% 13% 0% 0% 0% 0% 8 9
Parks and Recreation Commission
22% 11% 22% 33% 0% 0% 0% 11% 9 11
Planning and Design Commission 62% 23% 0% 15% 0% 0% 0% 0% 13 13
Preservation Commission 86% 14% 0% 0% 0% 0% 0% 0% 7 7
Retirement Hearing Commission 80% 20% 0% 0% 0% 0% 0% 0% 5 5
Sacramento Community Police Commission
30% 40% 10% 10% 0% 10% 0% 0% 10 11
Sacramento County Local Task Force
0% 0% 0% 0% 0% 0% 17% 83% 6 6
Sacramento Disabilities Advisory Commission
33% 11% 11% 22% 11% 11% 0% 0% 9 9
Sacramento Environmental Commission
30% 0% 0% 0% 0% 0% 0% 70% 10 10
Sacramento Heritage, Inc. Board of Directors
71% 14% 0% 0% 0% 0% 0% 14% 7 9
Sacramento Housing and Redevelopment Commission
55% 9% 9% 0% 0% 9% 0% 18% 11 11
Sacramento Metropolitan Arts Commission
60% 20% 10% 0% 0% 0% 10% 0% 10 11
Sacramento Relocation Appeals Board
60% 20% 20% 0% 0% 0% 0% 0% 5 5
Sacramento Yolo Mosquito and Vector Control District
0% 0% 0% 8% 0% 0% 0% 92% 13 13
Sacramento Youth Commission 31% 13% 25% 19% 0% 6% 6% 0% 16 22
Utilities Rate Advisory Commission
86% 0% 0% 0% 0% 0% 0% 14% 7 7
Total 47% 10% 7% 8% 0% 2% 3% 22% 229 256 Source: Auditor compiled with data gathered from the City Clerk’s Office, member surveys, and interviews.
Office of the City Auditor 22
April 2017
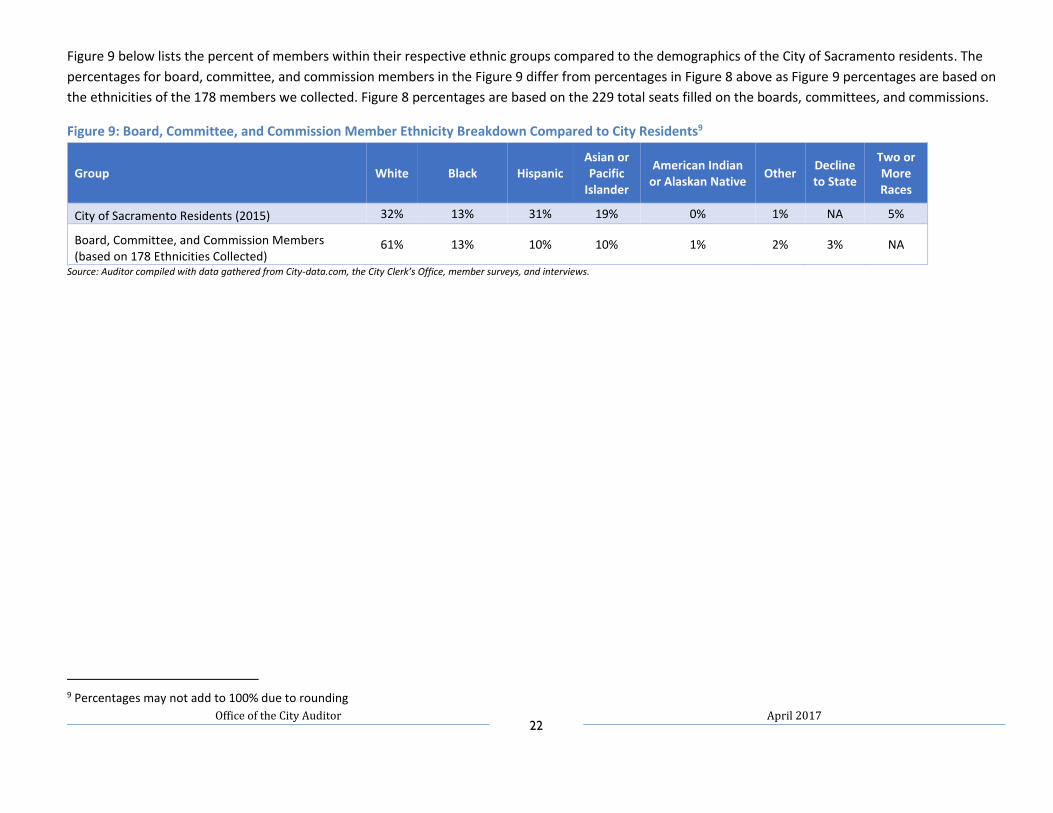
Figure 9 below lists the percent of members within their respective ethnic groups compared to the demographics of the City of Sacramento residents. The
percentages for board, committee, and commission members in the Figure 9 differ from percentages in Figure 8 above as Figure 9 percentages are based on
the ethnicities of the 178 members we collected. Figure 8 percentages are based on the 229 total seats filled on the boards, committees, and commissions.
Figure 9: Board, Committee, and Commission Member Ethnicity Breakdown Compared to City Residents9
Group White Black Hispanic Asian or Pacific
Islander
American Indian or Alaskan Native
Other Decline to State
Two or More Races
City of Sacramento Residents (2015) 32% 13% 31% 19% 0% 1% NA 5%
Board, Committee, and Commission Members (based on 178 Ethnicities Collected)
61% 13% 10% 10% 1% 2% 3% NA
Source: Auditor compiled with data gathered from City-data.com, the City Clerk’s Office, member surveys, and interviews.
9 Percentages may not add to 100% due to rounding
Office of the City Auditor 23
April 2017
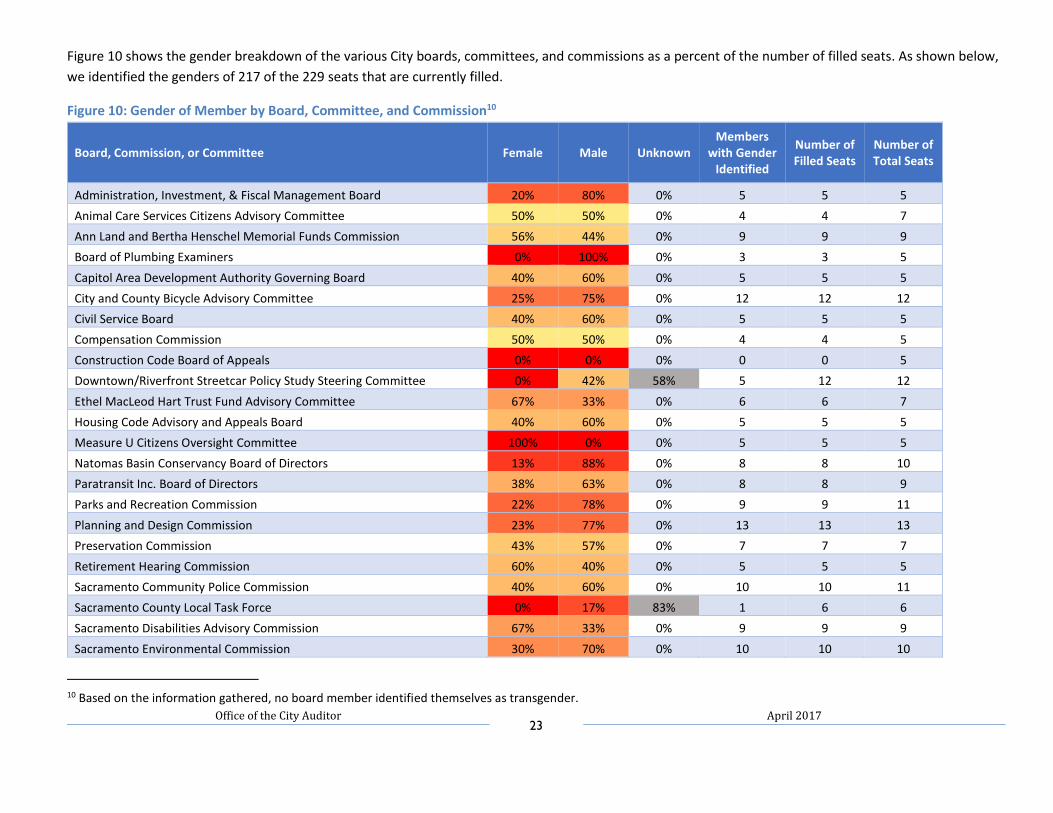
Figure 10 shows the gender breakdown of the various City boards, committees, and commissions as a percent of the number of filled seats. As shown below,
we identified the genders of 217 of the 229 seats that are currently filled.
Figure 10: Gender of Member by Board, Committee, and Commission10
Board, Commission, or Committee Female Male Unknown Members
with Gender Identified
Number of Filled Seats
Number of Total Seats
Administration, Investment, & Fiscal Management Board 20% 80% 0% 5 5 5
Animal Care Services Citizens Advisory Committee 50% 50% 0% 4 4 7
Ann Land and Bertha Henschel Memorial Funds Commission 56% 44% 0% 9 9 9
Board of Plumbing Examiners 0% 100% 0% 3 3 5
Capitol Area Development Authority Governing Board 40% 60% 0% 5 5 5
City and County Bicycle Advisory Committee 25% 75% 0% 12 12 12
Civil Service Board 40% 60% 0% 5 5 5
Compensation Commission 50% 50% 0% 4 4 5
Construction Code Board of Appeals 0% 0% 0% 0 0 5
Downtown/Riverfront Streetcar Policy Study Steering Committee 0% 42% 58% 5 12 12
Ethel MacLeod Hart Trust Fund Advisory Committee 67% 33% 0% 6 6 7
Housing Code Advisory and Appeals Board 40% 60% 0% 5 5 5
Measure U Citizens Oversight Committee 100% 0% 0% 5 5 5
Natomas Basin Conservancy Board of Directors 13% 88% 0% 8 8 10
Paratransit Inc. Board of Directors 38% 63% 0% 8 8 9
Parks and Recreation Commission 22% 78% 0% 9 9 11
Planning and Design Commission 23% 77% 0% 13 13 13
Preservation Commission 43% 57% 0% 7 7 7
Retirement Hearing Commission 60% 40% 0% 5 5 5
Sacramento Community Police Commission 40% 60% 0% 10 10 11
Sacramento County Local Task Force 0% 17% 83% 1 6 6
Sacramento Disabilities Advisory Commission 67% 33% 0% 9 9 9
Sacramento Environmental Commission 30% 70% 0% 10 10 10
10 Based on the information gathered, no board member identified themselves as transgender.
Office of the City Auditor 24
April 2017
Sacramento Heritage, Inc. Board of Directors 43% 57% 0% 7 7 9
Sacramento Housing and Redevelopment Commission 45% 55% 0% 11 11 11
Sacramento Metropolitan Arts Commission 50% 50% 0% 10 10 11
Sacramento Relocation Appeals Board 80% 20% 0% 5 5 5
Sacramento Yolo Mosquito and Vector Control District 23% 77% 0% 13 13 13
Sacramento Youth Commission 56% 44% 0% 16 16 22
Utilities Rate Advisory Commission 14% 86% 0% 7 7 7
Total 38% 57% 5% 217 229 256
Scale 0% 10% 20% 30% 40% 50% 60% 70% 80% 90% 100% Source: Auditor compiled with data gathered from the City Clerk’s Office, member surveys, and interviews.
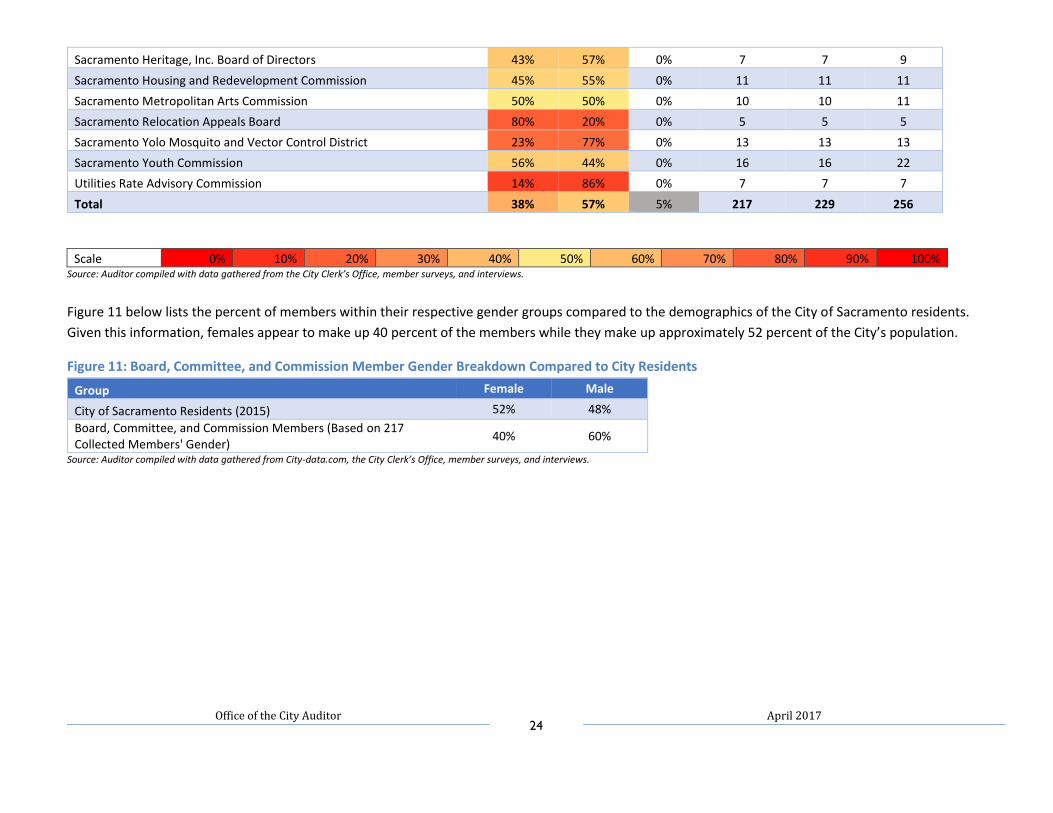
Figure 11 below lists the percent of members within their respective gender groups compared to the demographics of the City of Sacramento residents.
Given this information, females appear to make up 40 percent of the members while they make up approximately 52 percent of the City’s population.
Figure 11: Board, Committee, and Commission Member Gender Breakdown Compared to City Residents
Group Female Male
City of Sacramento Residents (2015) 52% 48%
Board, Committee, and Commission Members (Based on 217 Collected Members' Gender)
40% 60%
Source: Auditor compiled with data gathered from City-data.com, the City Clerk’s Office, member surveys, and interviews.
Office of the City Auditor 25
April 2017
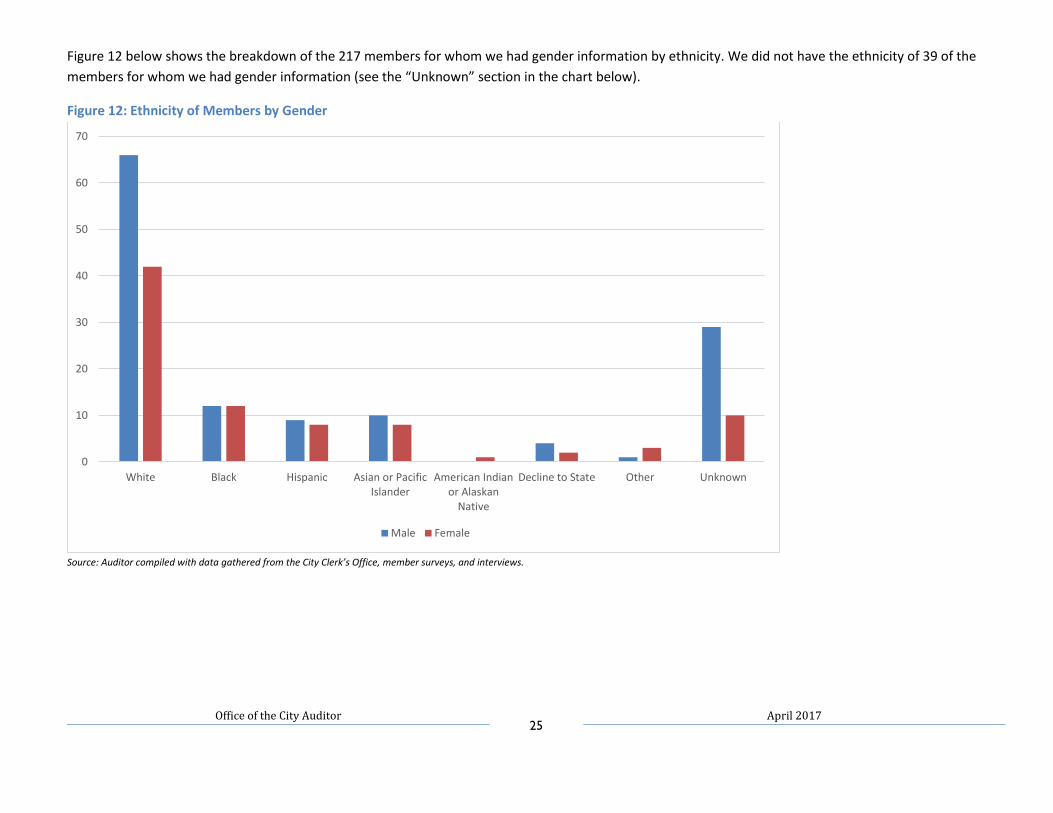
Figure 12 below shows the breakdown of the 217 members for whom we had gender information by ethnicity. We did not have the ethnicity of 39 of the
members for whom we had gender information (see the “Unknown” section in the chart below).
Figure 12: Ethnicity of Members by Gender
Source: Auditor compiled with data gathered from the City Clerk’s Office, member surveys, and interviews.
0
10
20
30
40
50
60
70
White Black Hispanic Asian or PacificIslander
American Indianor Alaskan
Native
Decline to State Other Unknown
Male Female
Office of the City Auditor 26
April 2017
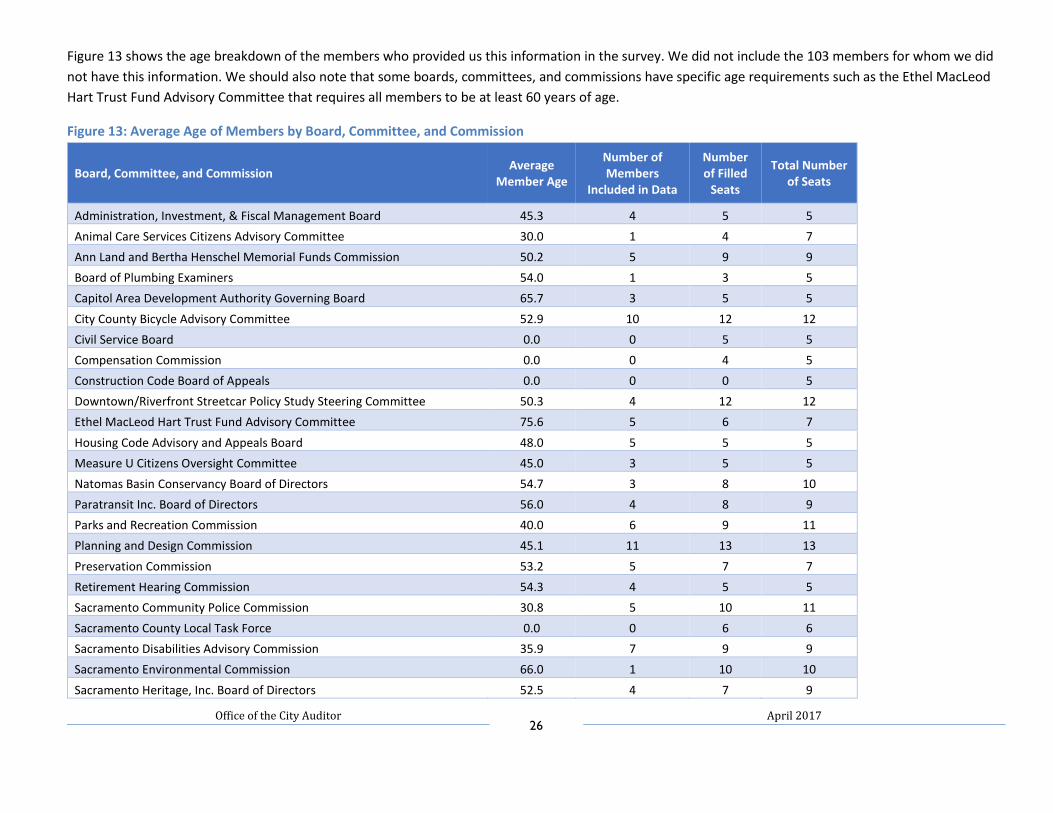
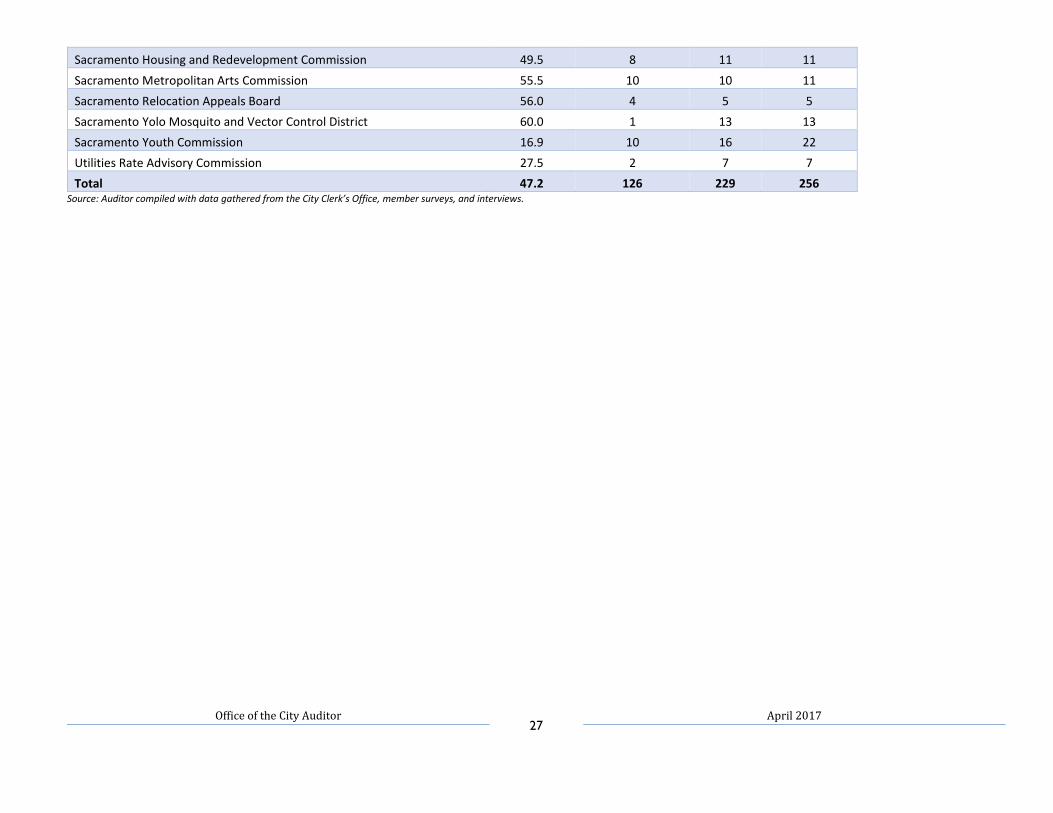
Figure 13 shows the age breakdown of the members who provided us this information in the survey. We did not include the 103 members for whom we did
not have this information. We should also note that some boards, committees, and commissions have specific age requirements such as the Ethel MacLeod
Hart Trust Fund Advisory Committee that requires all members to be at least 60 years of age.
Figure 13: Average Age of Members by Board, Committee, and Commission
Board, Committee, and Commission Average
Member Age
Number of Members
Included in Data
Number of Filled
Seats
Total Number of Seats
Administration, Investment, & Fiscal Management Board 45.3 4 5 5
Animal Care Services Citizens Advisory Committee 30.0 1 4 7
Ann Land and Bertha Henschel Memorial Funds Commission 50.2 5 9 9
Board of Plumbing Examiners 54.0 1 3 5
Capitol Area Development Authority Governing Board 65.7 3 5 5
City County Bicycle Advisory Committee 52.9 10 12 12
Civil Service Board 0.0 0 5 5
Compensation Commission 0.0 0 4 5
Construction Code Board of Appeals 0.0 0 0 5
Downtown/Riverfront Streetcar Policy Study Steering Committee 50.3 4 12 12
Ethel MacLeod Hart Trust Fund Advisory Committee 75.6 5 6 7
Housing Code Advisory and Appeals Board 48.0 5 5 5
Measure U Citizens Oversight Committee 45.0 3 5 5
Natomas Basin Conservancy Board of Directors 54.7 3 8 10
Paratransit Inc. Board of Directors 56.0 4 8 9
Parks and Recreation Commission 40.0 6 9 11
Planning and Design Commission 45.1 11 13 13
Preservation Commission 53.2 5 7 7
Retirement Hearing Commission 54.3 4 5 5
Sacramento Community Police Commission 30.8 5 10 11
Sacramento County Local Task Force 0.0 0 6 6
Sacramento Disabilities Advisory Commission 35.9 7 9 9
Sacramento Environmental Commission 66.0 1 10 10
Sacramento Heritage, Inc. Board of Directors 52.5 4 7 9
Office of the City Auditor 27
April 2017
Sacramento Housing and Redevelopment Commission 49.5 8 11 11
Sacramento Metropolitan Arts Commission 55.5 10 10 11
Sacramento Relocation Appeals Board 56.0 4 5 5
Sacramento Yolo Mosquito and Vector Control District 60.0 1 13 13
Sacramento Youth Commission 16.9 10 16 22
Utilities Rate Advisory Commission 27.5 2 7 7
Total 47.2 126 229 256 Source: Auditor compiled with data gathered from the City Clerk’s Office, member surveys, and interviews.
Office of the City Auditor 28
April 2017
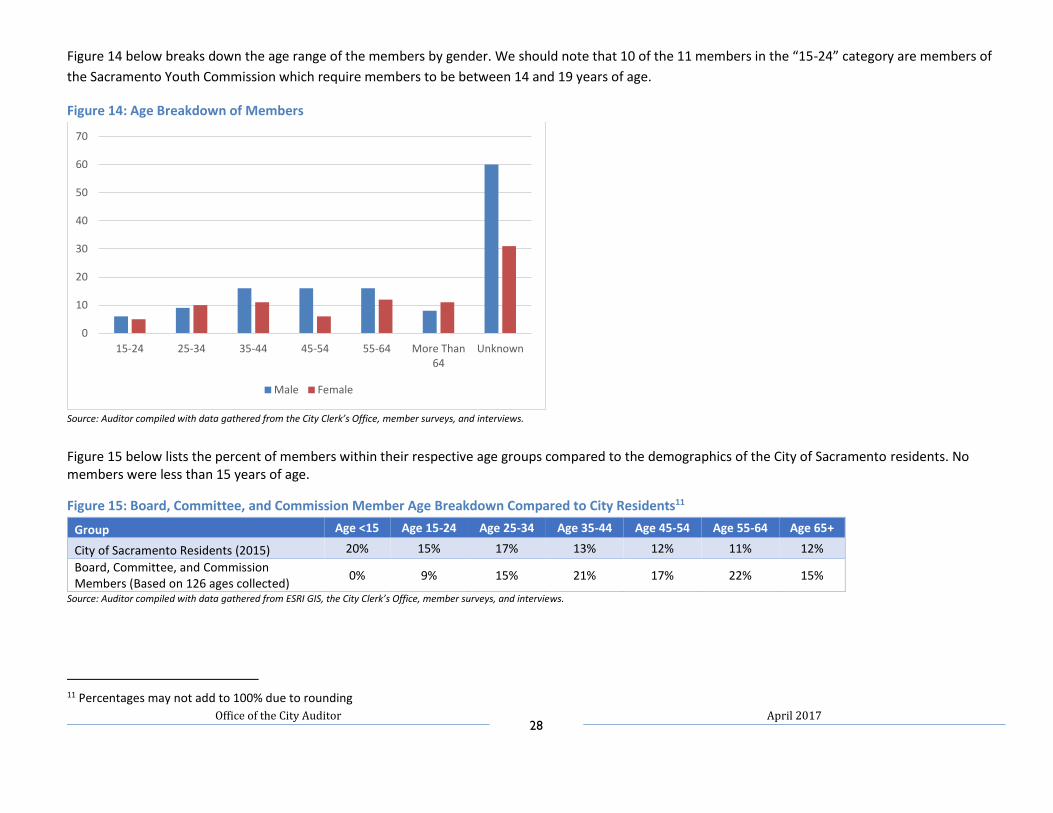
Figure 14 below breaks down the age range of the members by gender. We should note that 10 of the 11 members in the “15-24” category are members of
the Sacramento Youth Commission which require members to be between 14 and 19 years of age.
Figure 14: Age Breakdown of Members
Source: Auditor compiled with data gathered from the City Clerk’s Office, member surveys, and interviews.
Figure 15 below lists the percent of members within their respective age groups compared to the demographics of the City of Sacramento residents. No members were less than 15 years of age.
Figure 15: Board, Committee, and Commission Member Age Breakdown Compared to City Residents11
Group Age <15 Age 15-24 Age 25-34 Age 35-44 Age 45-54 Age 55-64 Age 65+
City of Sacramento Residents (2015) 20% 15% 17% 13% 12% 11% 12%
Board, Committee, and Commission Members (Based on 126 ages collected)
0% 9% 15% 21% 17% 22% 15%
Source: Auditor compiled with data gathered from ESRI GIS, the City Clerk’s Office, member surveys, and interviews.
11 Percentages may not add to 100% due to rounding
0
10
20
30
40
50
60
70
15-24 25-34 35-44 45-54 55-64 More Than64
Unknown
Male Female
Office of the City Auditor 29
April 2017
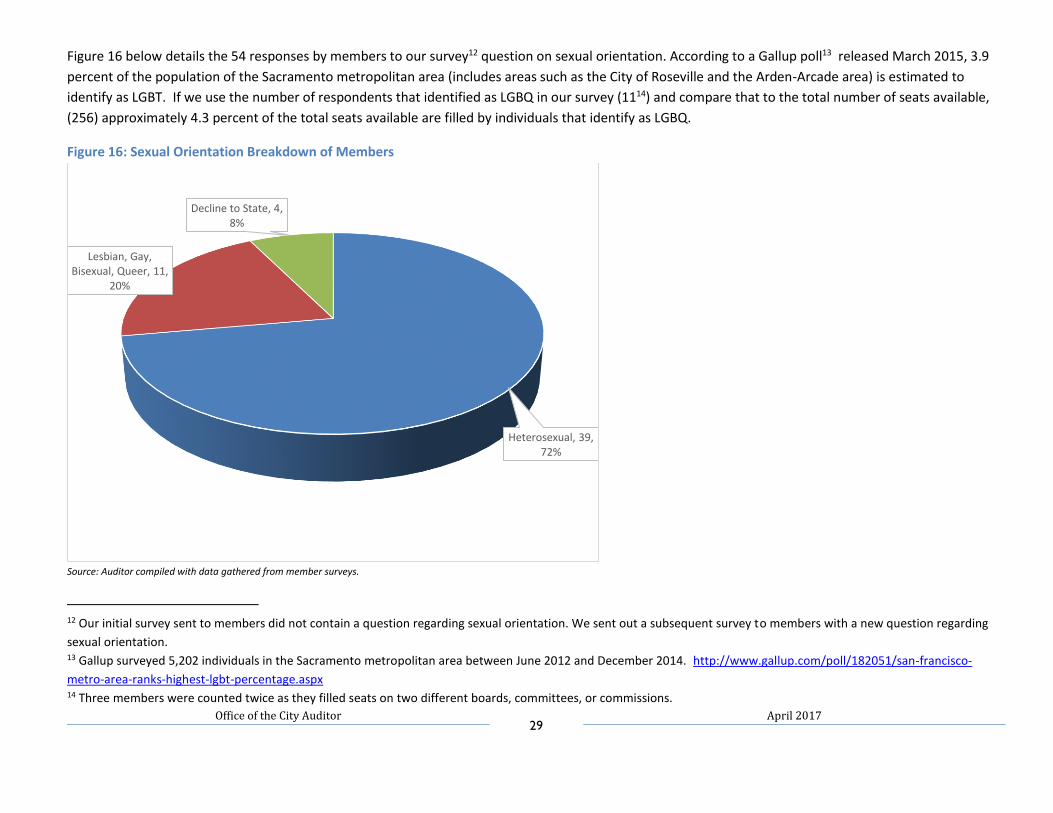
Figure 16 below details the 54 responses by members to our survey12 question on sexual orientation. According to a Gallup poll13 released March 2015, 3.9
percent of the population of the Sacramento metropolitan area (includes areas such as the City of Roseville and the Arden-Arcade area) is estimated to
identify as LGBT. If we use the number of respondents that identified as LGBQ in our survey (1114) and compare that to the total number of seats available,
(256) approximately 4.3 percent of the total seats available are filled by individuals that identify as LGBQ.
Figure 16: Sexual Orientation Breakdown of Members
Source: Auditor compiled with data gathered from member surveys.
12 Our initial survey sent to members did not contain a question regarding sexual orientation. We sent out a subsequent survey to members with a new question regarding
sexual orientation. 13 Gallup surveyed 5,202 individuals in the Sacramento metropolitan area between June 2012 and December 2014. http://www.gallup.com/poll/182051/san-francisco-
metro-area-ranks-highest-lgbt-percentage.aspx 14 Three members were counted twice as they filled seats on two different boards, committees, or commissions.
Heterosexual, 39, 72%
Lesbian, Gay, Bisexual, Queer, 11,
20%
Decline to State, 4, 8%
Office of the City Auditor 30
April 2017
Chapter 4: City of Sacramento Board, Committee, Commission Members by District The City of Sacramento is rich with diverse neighborhoods with a variety of lifestyle choices and perspectives. Given the City’s great diversity, it may be in the
interest of the City Council to monitor the composition of the various boards, commissions, and committees to determine if adequate neighborhood
representation exists. This chapter provides an overview of the members by City Council district. To gather the addresses of the members, we used the
addresses provided on the member survey responses and addresses provided on the applications to the City Clerk’s Office. We performed an online search of
all addresses provided to identify any addresses that may be work or business addresses and excluded them from the data. For members that had provided a
business address on the survey but had provided a residential address on their applications, we used the address provided on their applications in the data
below. Of the 229 filled seats, we received and were able to gather residential address information for 168 members – 151 of which were City appointments
and 17 were non-City appointments.
The following maps provide an overview of the City council districts in which the members reside. Eight members are appointed to two City boards and are
identified twice in the maps.
Office of the City Auditor 31
April 2017
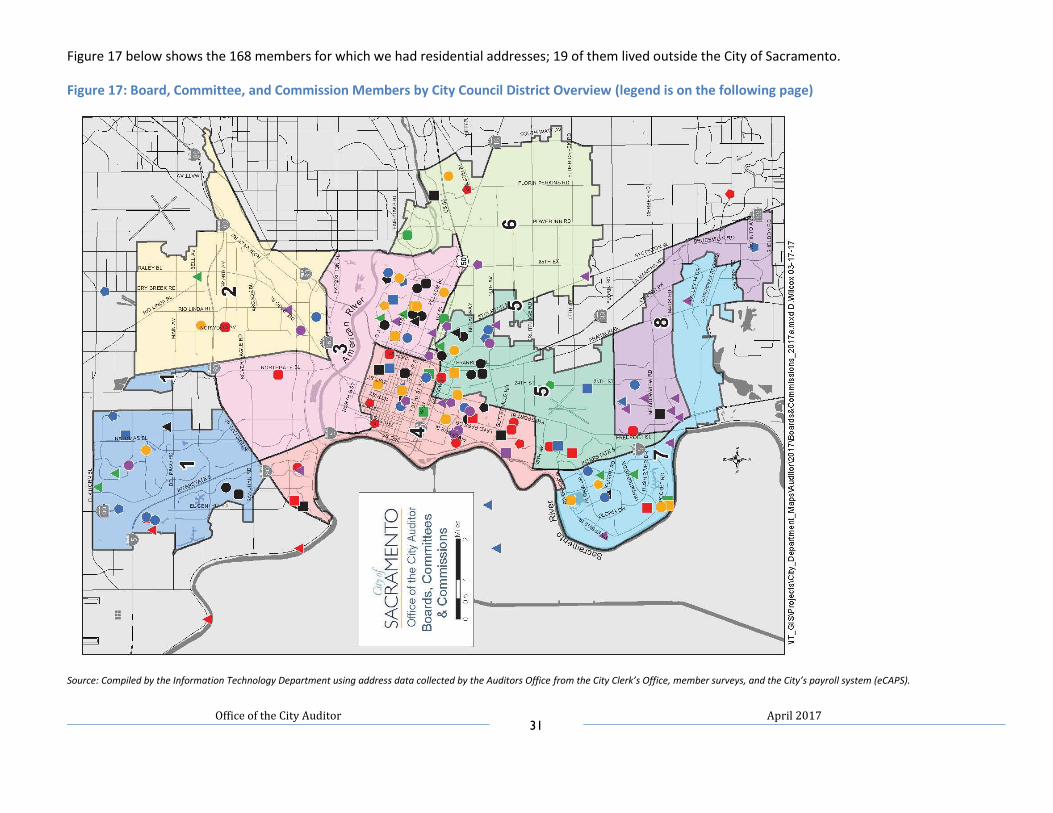
Figure 17 below shows the 168 members for which we had residential addresses; 19 of them lived outside the City of Sacramento.
Figure 17: Board, Committee, and Commission Members by City Council District Overview (legend is on the following page)
Source: Compiled by the Information Technology Department using address data collected by the Auditors Office from the City Clerk’s Office, member surveys, and the City’s payroll system (eCAPS).
Office of the City Auditor 32
April 2017
Source: Compiled by the Information Technology Department using address data collected by the Auditors Office from the City Clerk’s Office, member surveys, and the City’s payroll system (eCAPS).
Office of the City Auditor 33
April 2017
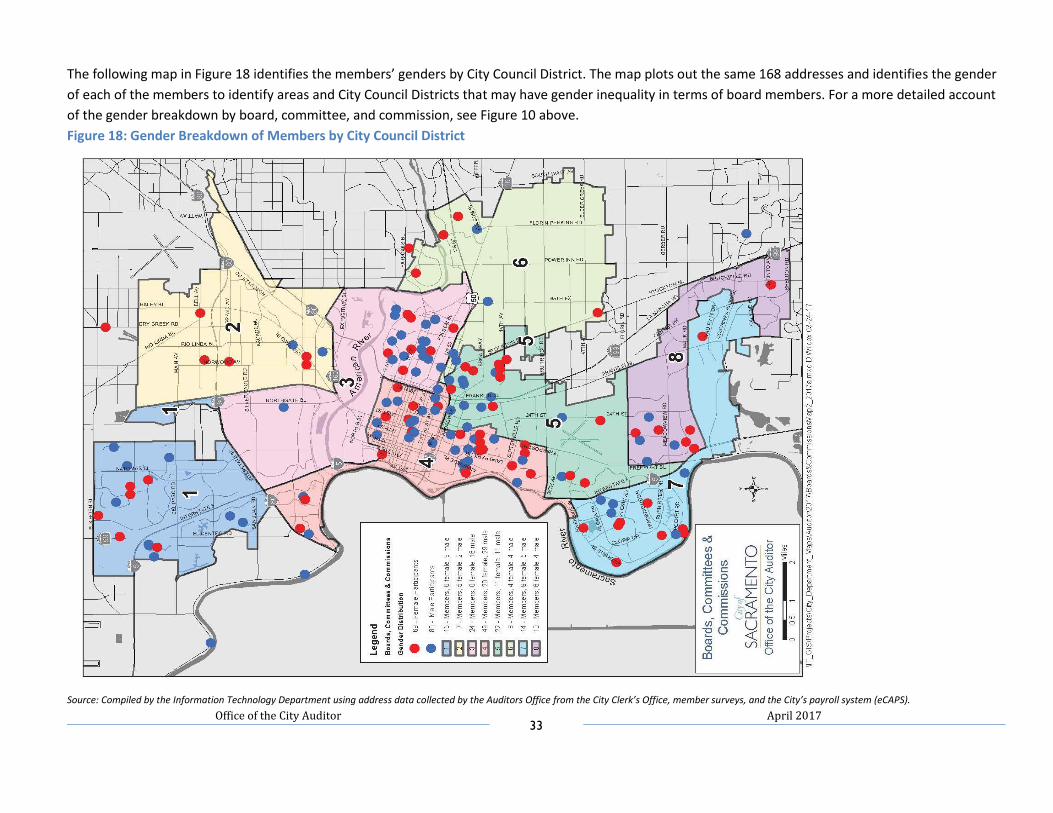
The following map in Figure 18 identifies the members’ genders by City Council District. The map plots out the same 168 addresses and identifies the gender
of each of the members to identify areas and City Council Districts that may have gender inequality in terms of board members. For a more detailed account
of the gender breakdown by board, committee, and commission, see Figure 10 above.
Figure 18: Gender Breakdown of Members by City Council District
Source: Compiled by the Information Technology Department using address data collected by the Auditors Office from the City Clerk’s Office, member surveys, and the City’s payroll system (eCAPS).
Office of the City Auditor 34
April 2017
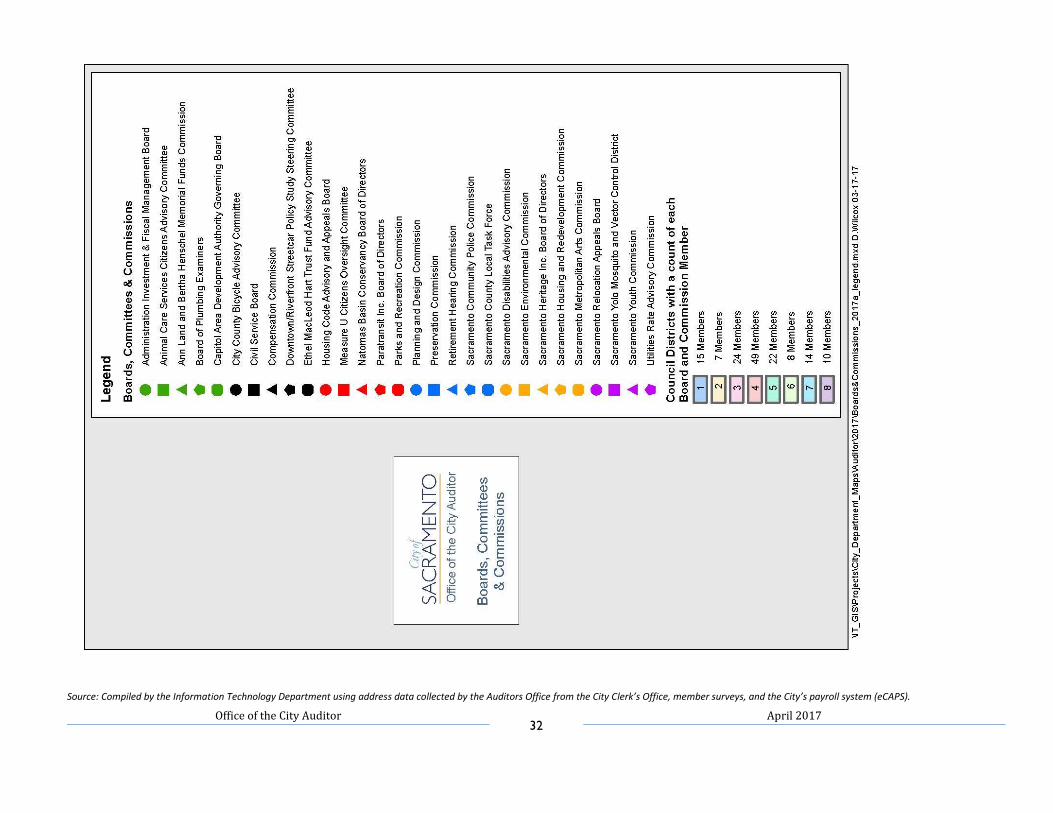
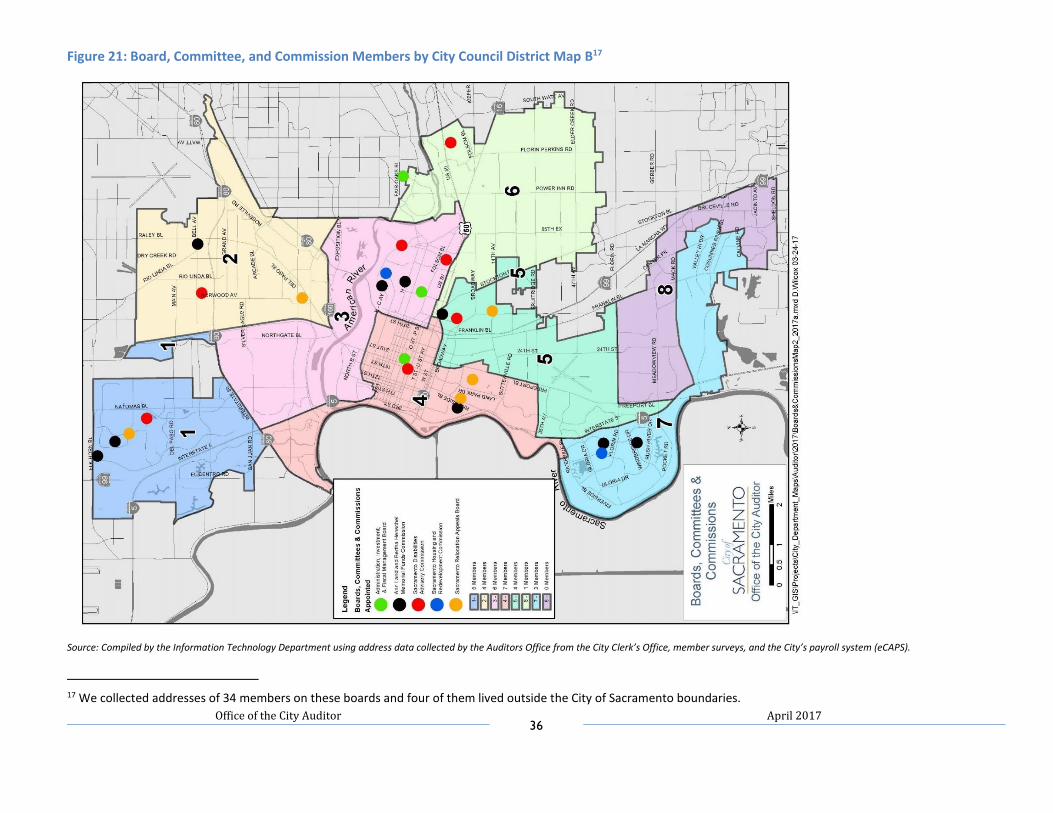
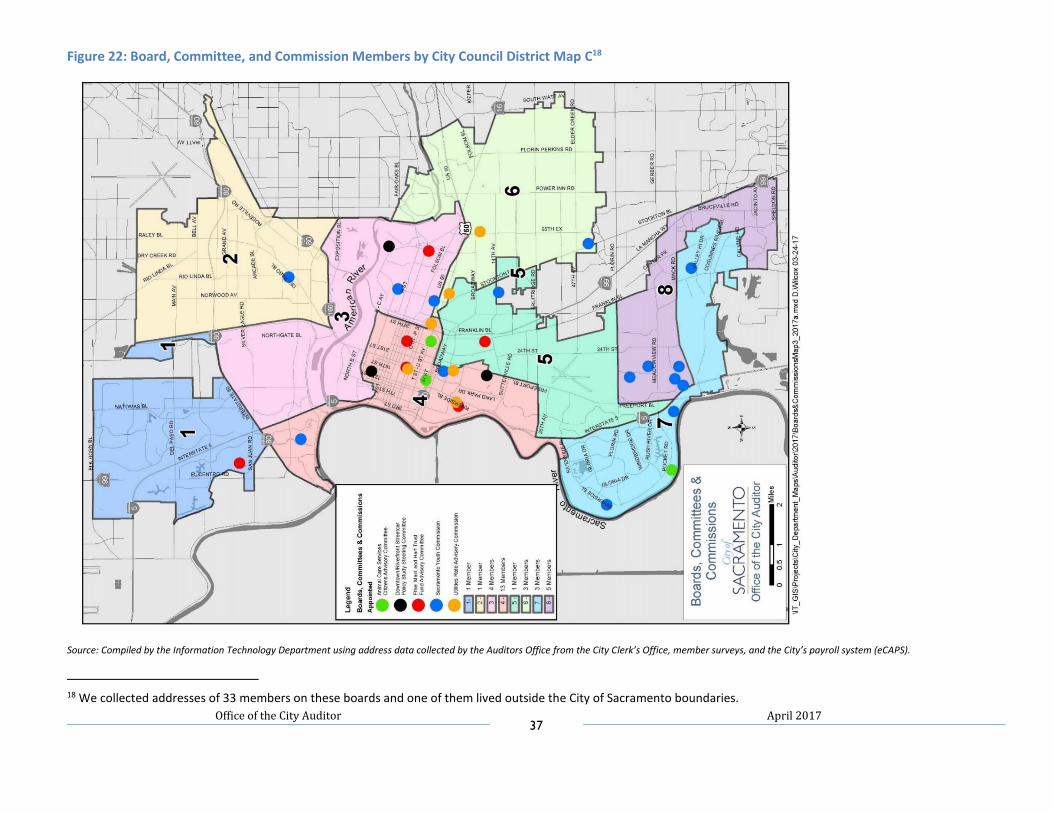
The following five maps breakdown the data in Figure 17 above into groups of five to six boards, committees, and commissions to more easily identify which
City Council districts members of the specific boards reside. The map legends identify the boards, committees, and commissions plotted on each map.
Figure 19: Breakdown of Members by City Council District Key15
Map A Map B Map C Map D Map E
Civil Service Board Administration, Investment, & Fiscal Management Board
Animal Care Services Citizens Advisory Committee
Capitol Area Development Authority Governing Board
Board of Plumbing Examiners
Paratransit Inc. Board of Directors
Ann Land and Bertha Henschel Memorial Funds Commission
Downtown/Riverfront Streetcar Policy Study Steering Committee
City and County Bicycle Advisory Committee
Measure U Citizens Oversight Committee
Retirement Hearing Commission
Sacramento Disabilities Advisory Commission
Ethel MacLeod Hart Trust Fund Advisory Committee
Compensation Commission
Parks and Recreation Commission
Sacramento Community Police Commission
Sacramento Housing and Redevelopment Commission
Sacramento Youth Commission
Housing Code Advisory and Appeals Board
Planning and Design Commission
Sacramento Environmental Commission
Sacramento Relocation Appeals Board
Utilities Rate Advisory Commission
Sacramento Metropolitan Arts Commission
Preservation Commission
Sacramento Heritage, Inc. Board of Directors
Natomas Basin Conservancy Board of Directors
Sacramento Yolo Mosquito and Vector Control District
15 The Construction Code Board of Appeals and the Sacramento County Local Task Force are not mapped or listed as we were not provided with the addresses of any of their
members.

Office of the City Auditor 35
April 2017
Figure 20: Board, Committee, and Commission Members by City Council District Map A16
Source: Compiled by the Information Technology Department using address data collected by the Auditors Office from the City Clerk’s Office, member surveys, and the City’s payroll system (eCAPS).
16 We collected addresses of 34 members on these boards and nine of them lived outside the City of Sacramento boundaries.
Office of the City Auditor 36
April 2017
Figure 21: Board, Committee, and Commission Members by City Council District Map B17
Source: Compiled by the Information Technology Department using address data collected by the Auditors Office from the City Clerk’s Office, member surveys, and the City’s payroll system (eCAPS).
17 We collected addresses of 34 members on these boards and four of them lived outside the City of Sacramento boundaries.
Office of the City Auditor 37
April 2017
Figure 22: Board, Committee, and Commission Members by City Council District Map C18
Source: Compiled by the Information Technology Department using address data collected by the Auditors Office from the City Clerk’s Office, member surveys, and the City’s payroll system (eCAPS).
18 We collected addresses of 33 members on these boards and one of them lived outside the City of Sacramento boundaries.

Office of the City Auditor 38
April 2017
Figure 23: Board, Committee, and Commission Members by City Council District Map D19
Source: Compiled by the Information Technology Department using address data collected by the Auditors Office from the City Clerk’s Office, member surveys, and the City’s payroll system (eCAPS).
19 We collected addresses of 33 members on these boards and four of them lived outside the City of Sacramento boundaries.

Office of the City Auditor 39
April 2017
Figure 24: Board, Committee, and Commission Members by City Council District Map E20
Source: Compiled by the Information Technology Department using address data collected by the Auditors Office from the City Clerk’s Office, member surveys, and the City’s payroll system (eCAPS).
20 We collected addresses of 34 members on these boards and one of them lived outside the City of Sacramento boundaries.
Office of the City Auditor 40
April 2017
Department Response
The City Clerk’s Office agrees with this report’s finding and recommendation.