Embed Size (px)
Citation preview

City and County of HonoluluWastewater System Revenue BondsInvestor Presentation
May 16, 2012
Timothy Houghton, Executive Assistant, City and County of Honolulu, Department of Environmental Services

1
Wastewater System Facilities
The Department Serves Nine Wastewater Basins on the Island of Oahu
Source: City and County of Honolulu, Department of Environmental Services. As of June 30, 2011.
Service Area: Nearly 600 sq. miles
Population: Approximately 640,000 (73% of the City and County)
Customer Accounts: Approximately 144,100 (136,600 of which are residential)
Major Facilities:
9 wastewater treatment plants (combined FY 2011 average flow of 105 MGD)
70 pump stations
Approximately 2,100 miles of collection lines
N
S
EW
Each of the Department’s 10 treatment facilities has adequate capacity to meet projected flows.
2
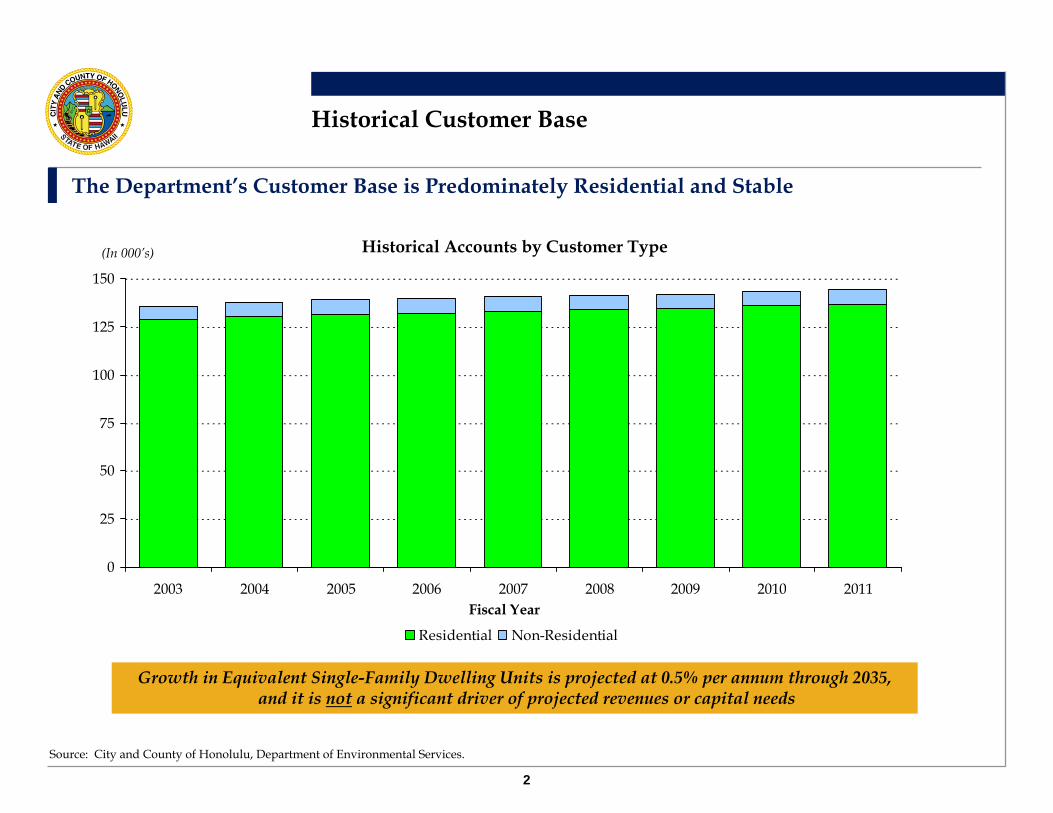
Historical Customer Base
The Department’s Customer Base is Predominately Residential and Stable
Historical Accounts by Customer Type
0
25
50
75
100
125
150
2003 2004 2005 2006 2007 2008 2009 2010 2011
Residential Non-Residential
Fiscal Year
(In 000’s)
Source: City and County of Honolulu, Department of Environmental Services.
Growth in Equivalent Single-Family Dwelling Units is projected at 0.5% per annum through 2035, and it is not a significant driver of projected revenues or capital needs

3
Historical Sewer Service Charges
The City has Demonstrated its Strong Commitment to the Wastewater System by Repeatedly Passing and Implementing Multi-Year Rate Increases
10% 10% 10% 10%
15%
8% 8%5%
4% 4% 4% 4% 5%8%
10%
25%
0%
5%
10%
15%
20%
25%
30%
2006 2007 2008 2009 2010 2011 2012 2013 2014 2015 2016 2017
Adopted in July 2011Adopted in June 2007Adopted in June 2005
25%
18% 18%15%
Adopted Sewer Service Charge Increases
Fiscal Year
Source: City and County of Honolulu, Department of Environmental Services.
The City has adjusted rates as needed to meet funding requirements for its 20-year Capital Improvement Program – including those projects mandated in its 2010 Consent Decree with the United States EPA
4
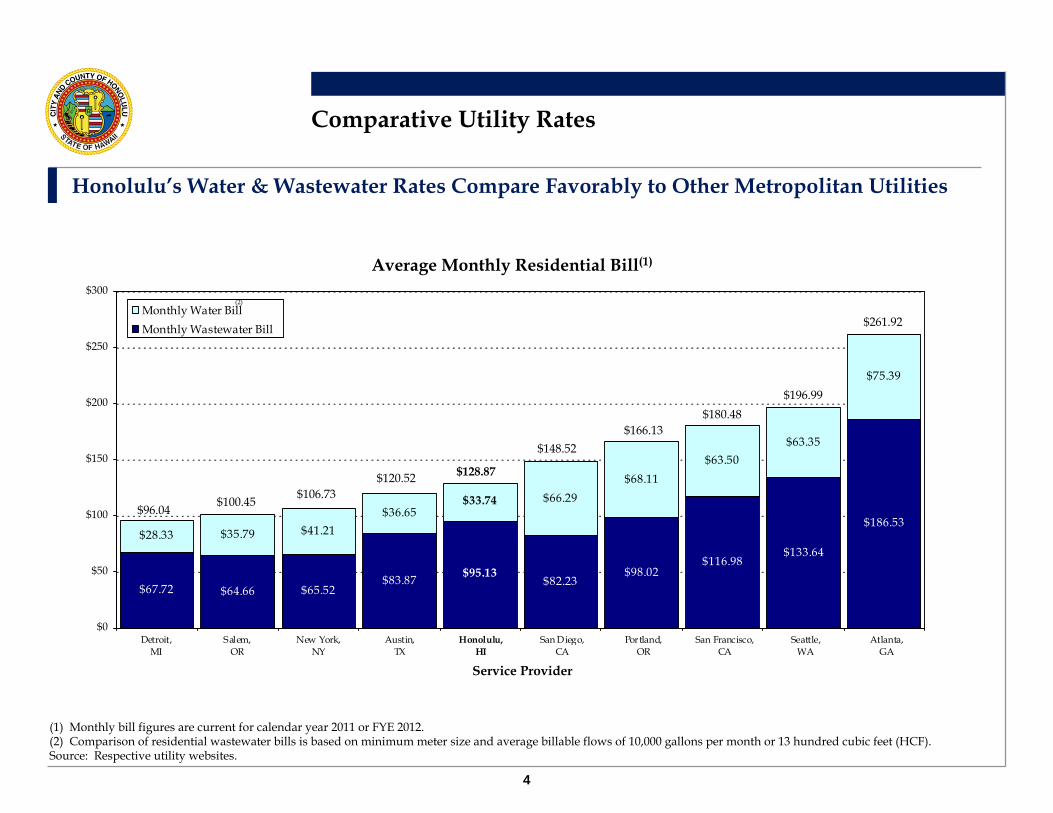
Comparative Utility Rates
Honolulu’s Water & Wastewater Rates Compare Favorably to Other Metropolitan Utilities
$67.72 $64.66 $65.52$83.87 $82.23
$98.02$116.98
$133.64
$186.53$28.33 $35.79 $41.21
$36.65$66.29
$68.11$63.50
$63.35
$75.39
$95.13
$33.74
$0
$50
$100
$150
$200
$250
$300
Detro it, M I Salem, OR New York City, NY Austin, TX Honolulu San Diego, CA Portland, OR San Francisco, CA Seattle, WA Atlanta, GA
Monthly Water Bill Monthly Wastewater Bill
Average Monthly Residential Bill(1)
Service Provider
(1) Monthly bill figures are current for calendar year 2011 or FYE 2012. (2) Comparison of residential wastewater bills is based on minimum meter size and average billable flows of 10,000 gallons per month or 13 hundred cubic feet (HCF). Source: Respective utility websites.
Detroit, MI
Salem, OR
New York, NY
Austin, TX
Honolulu, HI
San Diego, CA
Portland, OR
San Francisco, CA
Seattle, WA
Atlanta, GA
$96.04$100.45 $106.73
$120.52 $128.87
$148.52$166.13
$180.48$196.99
$261.92
(2)

5
System Delinquency Rates
The Wastewater System’s Delinquency Rates Have Been Consistently Low
Delinquencies as a Percentage of Total Revenues*
Fiscal Year
* Includes accounts that are greater than 60 days past due.Source: City and County of Honolulu, Department of Environmental Services.
0.79%0.83%0.90%0.97%0.87%0.75%0.71%0.00%
0.50%
1.00%
1.50%
2.00%
2.50%
3.00%
3.50%
4.00%
4.50%
5.00%
2005 2006 2007 2008 2009 2010 2011
Average = 0.83%
Should bills not be paid, the authority exists, and has been exercised, to terminate City water service for nonpayment.
6
Debt Service Coverage
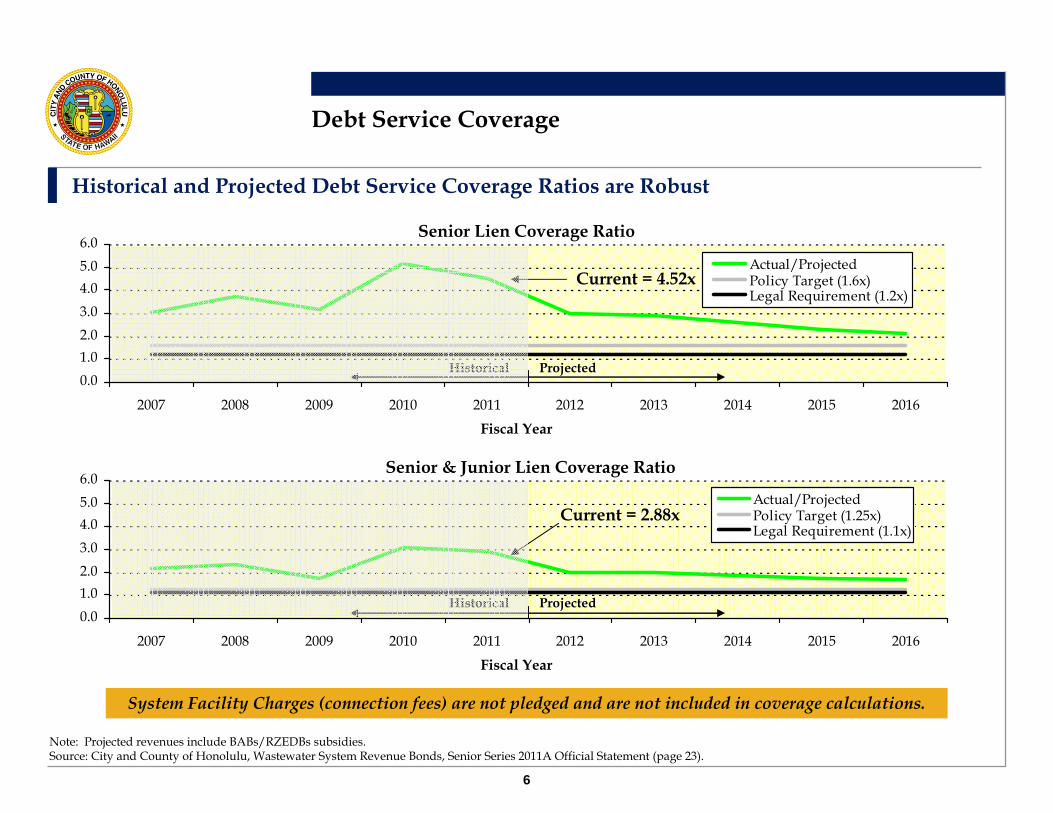
Historical and Projected Debt Service Coverage Ratios are Robust
0.01.02.03.04.05.06.0
2007 2008 2009 2010 2011 2012 2013 2014 2015 2016
Actual/ProjectedPolicy Target (1.6x)Legal Requirement (1.2x)
Senior Lien Coverage Ratio
Fiscal Year
0.01.02.03.04.05.06.0
2007 2008 2009 2010 2011 2012 2013 2014 2015 2016
Actual/ProjectedPolicy Target (1.25x)Legal Requirement (1.1x)
Senior & Junior Lien Coverage Ratio
Fiscal Year
Historical Projected
Note: Projected revenues include BABs/RZEDBs subsidies. Source: City and County of Honolulu, Wastewater System Revenue Bonds, Senior Series 2011A Official Statement (page 23).
Current = 4.52x
Current = 2.88x
System Facility Charges (connection fees) are not pledged and are not included in coverage calculations.
Historical Projected

7
System Reserves
Strong Financial Margins have Allowed the Department to Build Liquidity($ Millions)
(1) The amount shown represents cash deposits in the common and series debt service reserve funds.(2) Equal to 50 percent of following fiscal year’s debt service obligation (due July 1).(3) Equal to 3 months of current year operating expenses (as required by policy).(4) Equal to ending cash balance less operating and bond reserves. Includes federal BABs/RZEDBs subsidy in the rate stabilization fund.Source: City and County of Honolulu, Department of Environmental Services.
$41.5
$241.7 $241.1
$28.7
$34.5
$46.8
$51.7
$60.7 $69.1
$86.7
$93.8
$100.6$114.9
$140.9
$26.3
$28.3
$0
$50
$100
$150
$200
$250
$300
$350
$400
$450
$500
2009 (Actual) 2010 (Actual) 2011 (Unaudited) 2012 (Budgeted)
Common and Series DSRFsBond Payment AccountOperating ReserveUnrestricted Reserve
Fiscal Year
$203.7
$312.7
$431.3
(1)(2)
(3)(4)
The Department has increased the use of net income for capital projects going forward
$459.6

$0
$50
$100
$150
$200
$250
$300
$350
$400
2001 2002 2003 2004 2005 2006 2007 2008 2009 2010 2011*
O&M Debt Service Revenues
8
Conservative Financial Management
Conservative Financial Management Has Produced Predictable and Strong Financial Results
100% conventional fixed rate bonds
All DSRFs are cash funded
No derivatives exposure
Pro-active use of low-cost SRF funding (subordinate to revenue bonds)
Build America Bonds subsidy collected in the fiscal year prior to expenditure
Budgeting Practices($ Millions)
Fiscal Year
(1)
* Unaudited.(1) Includes Revenue Bonds, SRF Loans and Reimbursable G.O. Bonds.(2) Excludes Wastewater System Facility Charge revenues.Source: City and County of Honolulu, Department of Environmental Services.
(2)
Debt Management

9
Outstanding Debt
Wastewater System Outstanding Principal
The City expects to sell approximate $___ million of senior lien Wastewater System Revenue Bonds in _____ 2012.
Outstanding Principal
[$1,275,799] Reimbursable City G.O. Bonds
[$200,391,918] State Revolving Fund Loans
$422,684,910Junior Lien Revenue Bonds
$1,170,430,000Senior Lien Revenue Bonds
Source: City and County of Honolulu, Department of Environmental Services. As of April 2012.
10
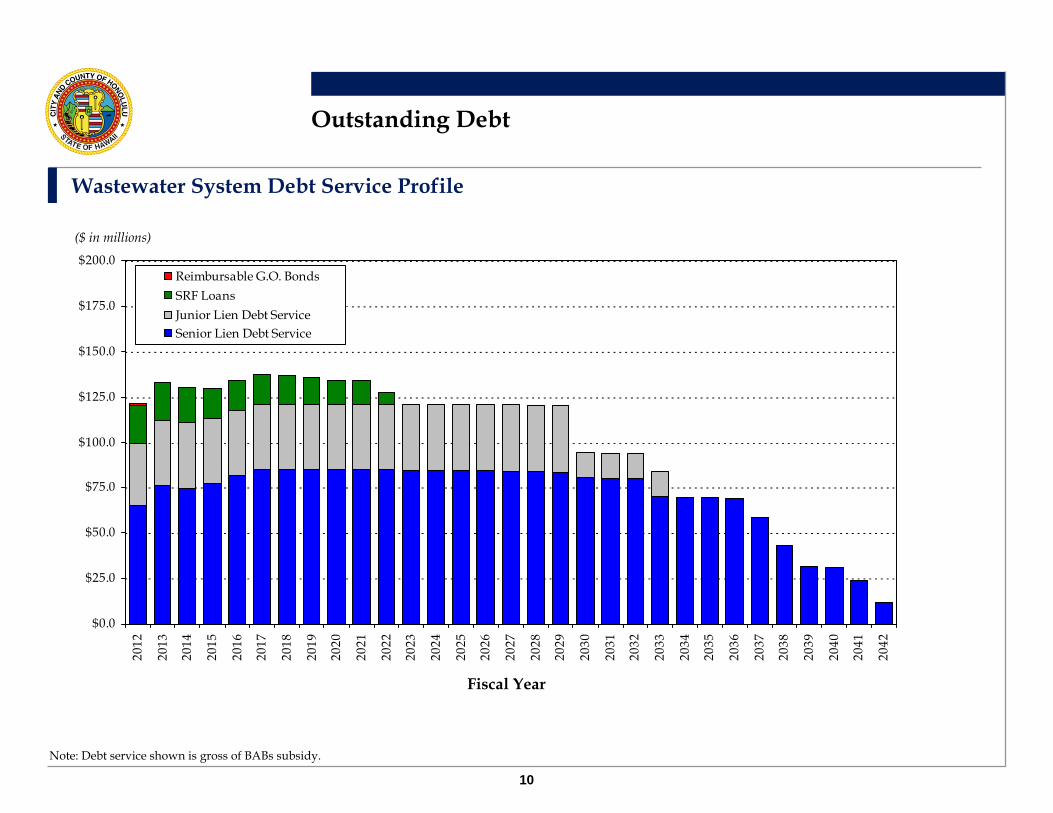
Outstanding Debt
Wastewater System Debt Service Profile
$0.0
$25.0
$50.0
$75.0
$100.0
$125.0
$150.0
$175.0
$200.0
2012
2013
2014
2015
2016
2017
2018
2019
2020
2021
2022
2023
2024
2025
2026
2027
2028
2029
2030
2031
2032
2033
2034
2035
2036
2037
2038
2039
2040
2041
2042
Reimbursable G.O. BondsSRF LoansJunior Lien Debt ServiceSenior Lien Debt Service
Note: Debt service shown is gross of BABs subsidy.
Fiscal Year
($ in millions)

11
Department’s Website
For Additional Information About the Wastewater System…
http://www.envhonolulu.org/


![CITY AND COUNTY OF HONOLULU OFFICE OF THE MAYOR · 2020-05-22 · OFFICE OF THE MAYOR CITY AND COUNTY OF HONOLULU EMERGENCY ORDER NO. 2020-13 (COVID-19[Novel Coronavirus]) SECOND](https://img.pdfslide.us/doc/110x75/5f1dc1549bb7e9560a22e29d/city-and-county-of-honolulu-office-of-the-mayor-2020-05-22-office-of-the-mayor.jpg)