Embed Size (px)
Citation preview

C I T I Z E N S ’ C O M M I T T E E F O R C H I L D R E N O F N E W YO R K
Community Risk RankingChild Well-Being in New York City’s 59 Community Districts
December 2017

iv CCC Community Risk Ranking
We educate and mobilize New Yorkers to make the city a better place for children. Our advocacy combines public policy research and data analysis with citizen action. We cast light on the issues, educate the public, engage allies, and identify and promote practical solutions to ensure that every New York City child is healthy, housed, educated and safe.
For more information about CCC, visit www.cccnewyork.org.

Citizens’ Committee for Children of New York, Inc. 1
The ability to identify where risks concentrate is important, as research tells us that the pres-ence of multiple risk factors can have cumulative negative effects on child development and child well-being.
CCC’s Community Risk Ranking looks at 18 different indicators across six domains of child well-being—economic security, housing, health, education, youth, and family and commu-nity—to determine where risks to child well- being concentrate in New York City. We rank New York City’s 59 community districts from highest to lowest risk, within each domain and overall, and place community districts into one of five risk categories: highest risk, moderate- high risk, moderate risk, moderate-low risk, and lowest risk.
In this edition of the Community Risk Ranking, we look at how risks to child well-being have changed at the community district level from 2010 to 2015 (the most recent year for which data is available). This period represents a time when New York City began to recover from the impacts of the Great Recession. We see in this analysis, however, that not every community district has benefited from the recovery to the same degree or in the same ways.
While discussions of change at the neighborhood level are often centered on demographic shifts, neighborhoods in New York City can change in a variety of ways. Even in areas that don’t experi-ence easily apparent or widely discussed changes, outcomes for children and families may be shifting in ways that suggest either an increase or reduction in risk factors. Those changes may be occurring in vastly different—and often oppos-ing—ways from one neighborhood to the other.
In this publication, we identify changes in ranking for overall risk and within each of the six domains for all 59 community districts. This allows us to see the geographic areas where data suggests outcomes for children have improved, and those where elevated levels of risk to child well-being remain. On each of the domain pages, we provide a brief analysis of citywide trends for the indi-cators that make up that domain, and identify several community districts where outcomes go against the citywide trend.
After the domain pages, there is a section focus-ing on five areas of the city that experienced some of the biggest changes in overall risk ranking, with detail on which domains and indicators drove those changes. This analysis shows us that even where the city has made substantial progress—which it has along several indicators as it recovers from the Great Recession—those gains have not been felt uniformly across the city.
CCC Community Risk Ranking: Child Well-Being in New York City’s 59 Community Districts
levels of risk
In each domain and overall, we have ranked New York City’s 59 community districts from highest risk (#1) to lowest risk (#59).
1 59Highest
RiskModerate High Risk
Moderate Risk
Moderate Low Risk
Lowest Risk
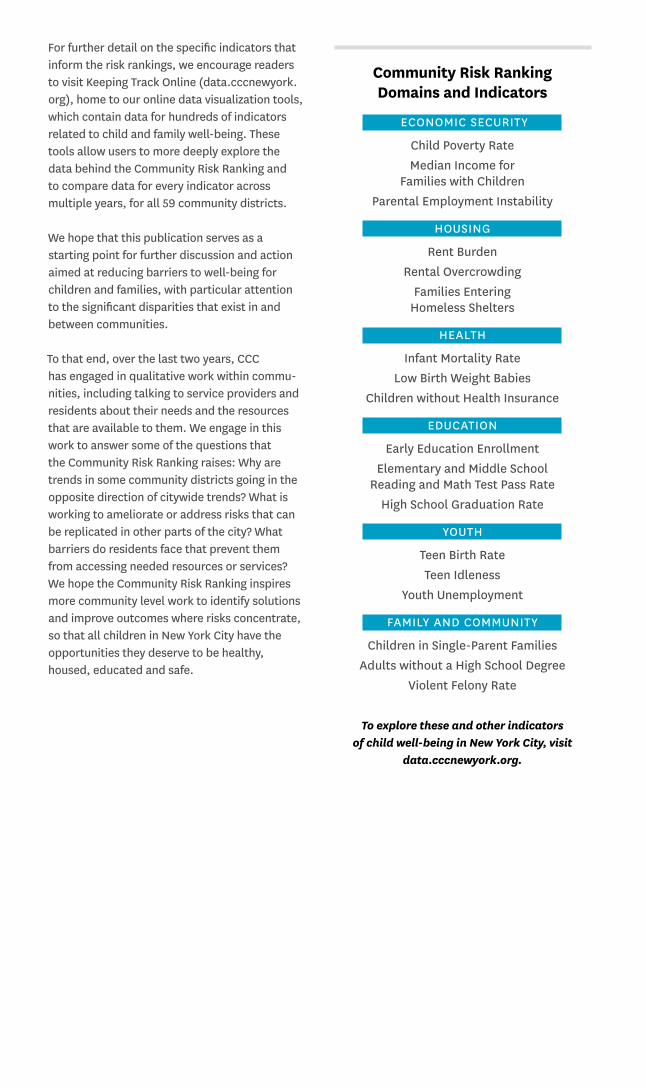
For further detail on the specific indicators that inform the risk rankings, we encourage readers to visit Keeping Track Online (data.cccnewyork.org), home to our online data visualization tools, which contain data for hundreds of indicators related to child and family well-being. These tools allow users to more deeply explore the data behind the Community Risk Ranking and to compare data for every indicator across multiple years, for all 59 community districts.
We hope that this publication serves as a starting point for further discussion and action aimed at reducing barriers to well-being for children and families, with particular attention to the significant disparities that exist in and between communities.
To that end, over the last two years, CCC has engaged in qualitative work within commu-nities, including talking to service providers and residents about their needs and the resources that are available to them. We engage in this work to answer some of the questions that the Community Risk Ranking raises: Why are trends in some community districts going in the opposite direction of citywide trends? What is working to ameliorate or address risks that can be replicated in other parts of the city? What barriers do residents face that prevent them from accessing needed resources or services? We hope the Community Risk Ranking inspires more community level work to identify solutions and improve outcomes where risks concentrate, so that all children in New York City have the opportunities they deserve to be healthy, housed, educated and safe.
Community Risk Ranking Domains and Indicators
ECONOMIC SECURITY
Child Poverty RateMedian Income for
Families with ChildrenParental Employment Instability
HOUSING
Rent BurdenRental Overcrowding
Families Entering Homeless Shelters
HEALTH
Infant Mortality RateLow Birth Weight Babies
Children without Health Insurance
EDUCATION
Early Education EnrollmentElementary and Middle School
Reading and Math Test Pass RateHigh School Graduation Rate
YOUTH
Teen Birth RateTeen Idleness
Youth Unemployment
FAMILY AND COMMUNITY
Children in Single-Parent FamiliesAdults without a High School Degree
Violent Felony Rate
To explore these and other indicators of child well-being in New York City, visit
data.cccnewyork.org.
Citizens’ Committee for Children of New York, Inc. 3
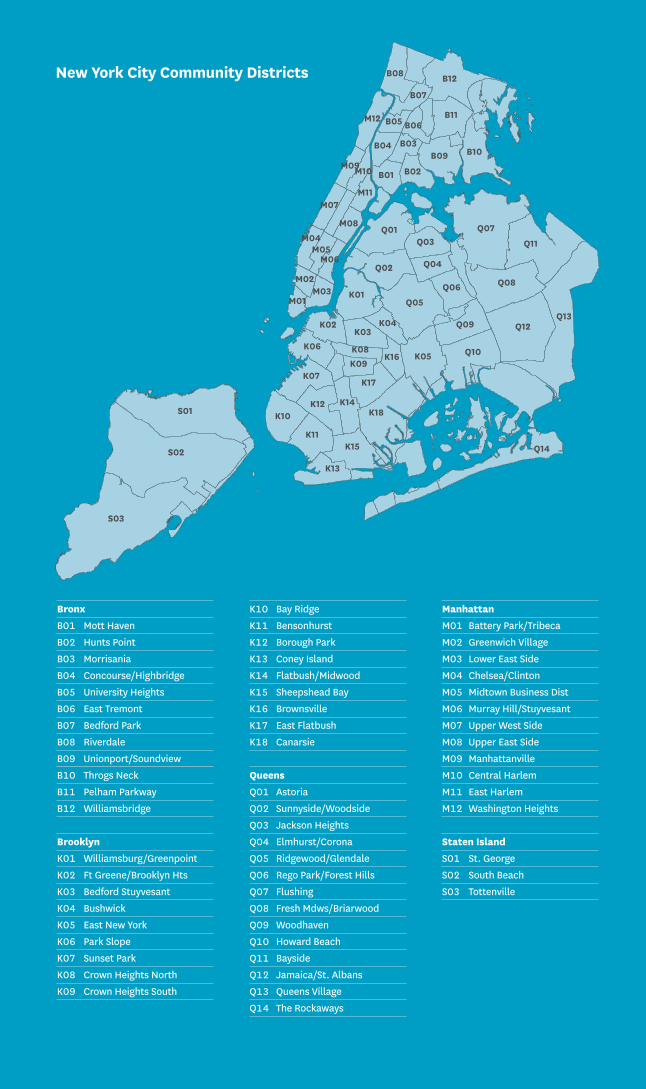
BronxB01 Mott Haven B02 Hunts Point B03 Morrisania B04 Concourse/Highbridge B05 University Heights B06 East Tremont B07 Bedford Park B08 Riverdale B09 Unionport/Soundview B10 Throgs Neck B11 Pelham Parkway B12 Williamsbridge
Brooklyn K01 Williamsburg/Greenpoint K02 Ft Greene/Brooklyn Hts K03 Bedford Stuyvesant K04 Bushwick K05 East New York K06 Park Slope K07 Sunset Park K08 Crown Heights North K09 Crown Heights South
K10 Bay Ridge K11 Bensonhurst K12 Borough Park K13 Coney Island K14 Flatbush/Midwood K15 Sheepshead Bay K16 Brownsville K17 East Flatbush K18 Canarsie
Queens Q01 Astoria Q02 Sunnyside/Woodside Q03 Jackson Heights Q04 Elmhurst/Corona Q05 Ridgewood/Glendale Q06 Rego Park/Forest Hills Q07 Flushing Q08 Fresh Mdws/Briarwood Q09 Woodhaven Q10 Howard Beach Q11 Bayside Q12 Jamaica/St. Albans Q13 Queens Village Q14 The Rockaways
ManhattanM01 Battery Park/Tribeca M02 Greenwich Village M03 Lower East Side M04 Chelsea/Clinton M05 Midtown Business Dist M06 Murray Hill/Stuyvesant M07 Upper West Side M08 Upper East Side M09 Manhattanville M10 Central Harlem M11 East Harlem M12 Washington Heights
Staten Island S01 St. George S02 South Beach S03 Tottenville
New York City Community Districts

4 CCC Community Risk Ranking
2015 HIGHEST RISK COMMUNITY
Hunts Point (B02)
2015 LOWEST RISK COMMUNITY
Upper East Side (M08)
Economic Security Health Youth Housing Education
Family & Community
Economic Security Health Youth Housing Education
Family & Community
4 19 2 11 1 2
59 53 57 59 59 59
2015 Ranking by CDn Highest Risk1 Hunts Point (B02)2 Mott Haven (B01)3 East Tremont (B06)4 Morrisania (B03)5 Concourse/Highbridge (B04)6 Brownsville (K16)7 East New York (K05)8 University Heights (B05)9 Unionport/Soundview (B09)10 Bedford Park (B07)n Moderate High Risk11 Williamsbridge (B12)12 Bedford Stuyvesant (K03)13 East Harlem (M11)14 Pelham Parkway (B11)15 East Flatbush (K17)16 Bushwick (K04)17 Central Harlem (M10)18 Crown Heights North (K08)19 Jamaica/St. Albans (Q12)20 The Rockaways (Q14)21 Throgs Neck (B10)22 Elmhurst/Corona (Q04)n Moderate Risk 23 Washington Heights (M12)24 Sunset Park (K07)25 St. George (S01)26 Coney Island (K13)27 Jackson Heights (Q03)28 Crown Heights South (K09)29 Flatbush/Midwood (K14)30 Borough Park (K12)31 Woodhaven (Q09)32 Howard Beach (Q10)33 Riverdale (B08)34 Bensonhurst (K11)35 Flushing (Q07)36 Lower East Side (M03)37 Canarsie (K18)38 Queens Village (Q13)39 Manhattanville (M09)40 Astoria (Q01)41 Ridgewood/Glendale (Q05)n Moderate Low Risk 42 Sheepshead Bay (K15)43 Sunnyside/Woodside (Q02)44 Williamsburg/Greenpoint (K01)45 Fresh Mdws/Briarwood (Q08)46 Fort Greene/Brooklyn Hts (K02)47 South Beach (S02)48 Bay Ridge (K10)49 Rego Park/Forest Hills (Q06)50 Chelsea/Clinton (M04)51 Midtown Business Dist (M05)52 Tottenville (S03)53 Bayside (Q11)n Lowest Risk54 Park Slope (K06)55 Upper West Side (M07)56 Battery Park/Tribeca (M01)57 Greenwich Village (M02)58 Murray Hill/Stuyvesant (M06)59 Upper East Side (M08)
CCC’s Community Risk Ranking provides a composite picture of the concentration of risk to child well-being across New York City’s 59 community districts (CDs). This measure combines all six domains of child well-being.
LEVEL OF RISK, 2015
n Highest Risk n Moderate High Riskn Moderate Riskn Moderate Low Riskn Lowest Risk
Overall Risk Ranking
B02
M08

Citizens’ Committee for Children of New York, Inc. 5
2010 HIGHEST RISK COMMUNITY
Hunts Point (B02)
2010 LOWEST RISK COMMUNITY
Upper East Side (M08)
Economic Security Health Youth Housing Education
Family & Community
Economic Security Health Youth Housing Education
Family & Community
3 27 2 5 1 1
59 53 59 58 58 59
2010 Ranking by CDn Highest Risk 1 Hunts Point (B02)2 Mott Haven (B01)3 Brownsville (K16)4 East Tremont (B06)5 Morrisania (B03)6 University Heights (B05)7 Concourse/Highbridge (B04)8 East New York (K05)n Moderate High Risk 9 Bedford Park (B07)10 Bedford Stuyvesant (K03)11 East Harlem (M11)12 Bushwick (K04)13 Central Harlem (M10)14 Williamsbridge (B12)15 Unionport/Soundview (B09)16 Washington Heights (M12)17 The Rockaways (Q14)18 Jamaica/St. Albans (Q12)19 East Flatbush (K17)20 Pelham Parkway (B11)n Moderate Risk 21 Crown Heights North (K08)22 Coney Island (K13)23 Sunset Park (K07)24 Jackson Heights (Q03)25 Crown Heights South (K09)26 Elmhurst/Corona (Q04)27 Manhattanville (M09)28 Howard Beach (Q10)29 St. George (S01)30 Borough Park (K12)31 Throgs Neck (B10)32 Astoria (Q01)33 Flatbush/Midwood (K14)34 Riverdale (B08)35 Bensonhurst (K11)36 Williamsburg/Greenpoint (K01)37 Ridgewood/Glendale (Q05)38 Woodhaven (Q09)39 Canarsie (K18)40 Lower East Side (M03)n Moderate Low Risk 41 Sunnyside/Woodside (Q02)42 Flushing (Q07)43 Queens Village (Q13)44 Bay Ridge (K10)45 Fort Greene/Brooklyn Hts (K02)46 Fresh Mdws/Briarwood (Q08)47 Sheepshead Bay (K15)48 Midtown Business Dist (M05)49 Park Slope (K06)50 South Beach (S02)51 Chelsea/Clinton (M04)52 Rego Park/Forest Hills (Q06)n Lowest Risk 53 Bayside (Q11)54 Tottenville (S03)55 Upper West Side (M07)56 Murray Hill/Stuyvesant (M06)57 Greenwich Village (M02)58 Battery Park/Tribeca (M01)59 Upper East Side (M08)
Though the overall risk ranking maps from 2010 and 2015 look quite
similar, many community districts experienced changes in overall
rank, including several that moved from one risk category to another.
Districts that did not change substantially in overall ranking may
have experienced changes within specific domains. For example,
Hunts Point remained the highest ranked district in overall risk,
but it experienced an improvement in ranking in the housing domain,
and a negative change in rank in the health domain.
To further the explore the data behind changes within specific
domains, visit http://data.cccnewyork.org/riskranking.
LEVEL OF RISK, 2010
n Highest Risk n Moderate High Riskn Moderate Riskn Moderate Low Riskn Lowest Risk
B02
M08

6 CCC Community Risk Ranking
2015 Ranking by CDn Highest Risk1 East Harlem (M11)2 Morrisania (B03)2 East Tremont (B06)4 Mott Haven (B01)4 Hunts Point (B02)6 Lower East Side (M03)7 Brownsville (K16)8 University Heights (B05)9 Concourse/Highbridge (B04)10 Bedford Stuyvesant (K03)11 Bedford Park (B07)n Moderate High Risk12 Bushwick (K04)13 Crown Heights North (K08)14 Unionport/Soundview (B09)15 Sunset Park (K07)16 Borough Park (K12)17 Manhattanville (M09)18 Pelham Parkway (B11)19 East New York (K05)20 Central Harlem (M10)21 Flatbush/Midwood (K14)22 Washington Heights (M12)23 Williamsburg/Greenpoint (K01)24 St. George (S01)25 Elmhurst/Corona (Q04)26 Coney Island (K13)27 Williamsbridge (B12)28 The Rockaways (Q14)29 Astoria (Q01)30 Bensonhurst (K11)n Moderate Risk 31 East Flatbush (K17)32 Riverdale (B08)33 Jackson Heights (Q03)34 Jamaica/St. Albans (Q12)35 Crown Heights South (K09)36 Woodhaven (Q09)37 Howard Beach (Q10)38 Throgs Neck (B10)39 Bay Ridge (K10)40 Fort Greene/Brooklyn Hts (K02)41 Sunnyside/Woodside (Q02)42 Canarsie (K18)43 Flushing (Q07)44 Sheepshead Bay (K15)45 Ridgewood/Glendale (Q05)46 Fresh Mdws/Briarwood (Q08)47 Rego Park/Forest Hills (Q06)48 South Beach (S02)n Moderate Low Risk 49 Chelsea/Clinton (M04)49 Midtown Business Dist (M05)51 Bayside (Q11)52 Queens Village (Q13)53 Tottenville (S03)54 Upper West Side (M07)55 Park Slope (K06)n Lowest Risk56 Murray Hill/Stuyvesant (M06)57 Battery Park/Tribeca (M01)57 Greenwich Village (M02)59 Upper East Side (M08)
Children’s well-being is tied closely to the economic security of their families and communities. This domain illustrates whether children live in households where resources are adequate to meet their basic material needs. Indicators: Child Poverty, Median Income for Families with Children, Parental Employment Instability
LEVEL OF RISK, 2015
n Highest Risk n Moderate High Riskn Moderate Riskn Moderate Low Riskn Lowest Risk
Economic Security
2015 HIGHEST RISK COMMUNITY
East Harlem (M11)
2015 LOWEST RISK COMMUNITY
Upper East Side (M08)
Child Poverty RateMedian Income, Families w/ Children
Parental Employment Instability
Child Poverty RateMedian Income, Families w/ Children
Parental Employment Instability
53.2% $23,880 62.2%
2.0% $230,553 6.1%Above, we see that children in East Harlem are over 25 times
more likely to live in poverty than children in the Upper East Side.
Median income for families with children in the Upper East Side is
over $230,000, nearly 10 times higher than the median income
for families with children in East Harlem (under $24,000).
M11
M08

Citizens’ Committee for Children of New York, Inc. 7
2010 Ranking by CDn Highest Risk1 Morrisania (B03)1 East Tremont (B06)3 Mott Haven (B01)3 Hunts Point (B02)5 University Heights (B05)6 Brownsville (K16)7 East New York (K05)8 East Harlem (M11)9 Bedford Stuyvesant (K03)10 Concourse/Highbridge (B04)11 Williamsburg/Greenpoint (K01)n Moderate High Risk12 Central Harlem (M10)13 Bedford Park (B07)14 Borough Park (K12)15 Manhattanville (M09)16 Crown Heights North (K08)17 The Rockaways (Q14)18 Bushwick (K04)19 Lower East Side (M03)20 Unionport/Soundview (B09)21 Williamsbridge (B12)22 Pelham Parkway (B11)23 Washington Heights (M12)24 Crown Heights South (K09)25 Throgs Neck (B10)26 Jamaica/St. Albans (Q12)27 Coney Island (K13)28 Jackson Heights (Q03)29 Astoria (Q01)30 Sunset Park (K07)31 Ridgewood/Glendale (Q05)32 Flatbush/Midwood (K14)n Moderate Risk 33 St. George (S01)34 East Flatbush (K17)35 Elmhurst/Corona (Q04)36 Fort Greene/Brooklyn Hts (K02)37 Bensonhurst (K11)38 Riverdale (B08)39 Bay Ridge (K10)40 Woodhaven (Q09)41 Sunnyside/Woodside (Q02)42 Howard Beach (Q10)43 Flushing (Q07)44 Canarsie (K18)45 Sheepshead Bay (K15)46 Fresh Mdws/Briarwood (Q08)n Moderate Low Risk 47 Chelsea/Clinton (M04)47 Midtown Business Dist (M05)49 Queens Village (Q13)50 Bayside (Q11)51 South Beach (S02)52 Rego Park/Forest Hills (Q06)53 Park Slope (K06)54 Tottenville (S03)n Lowest Risk55 Battery Park/Tribeca (M01)55 Greenwich Village (M02)57 Murray Hill/Stuyvesant (M06)58 Upper West Side (M07)59 Upper East Side (M08)
LEVEL OF RISK, 2010
n Highest Risk n Moderate High Riskn Moderate Riskn Moderate Low Riskn Lowest Risk
2010 HIGHEST RISK COMMUNITY
Morrisania/East Tremont (B03/B06)
2010 LOWEST RISK COMMUNITY
Upper East Side (M08)
Child Poverty RateMedian Income, Families w/ Children
Parental Employment Instability
Child Poverty RateMedian Income, Families w/ Children
Parental Employment Instability
58.6% $24,257 63.5%
2.4% $248,013 8.8%
From 2010 to 2015, New York City made strides in recovering from
the impacts of the Great Recession and, as a result, there were
citywide improvements along all three indicators that make up the
economic security domain. The child poverty rate declined from
30.0% to 28.6%; median income for families with children increased
from $49,943 to $51,854 (in 2015 dollars); and parental employment
instability—or the share of children living in households where
neither parent worked full-time—decreased from 35.8% to 32.5%.
However, not all community districts experienced improved out-
comes along these indicators. Sunset Park and Flatbush in Brooklyn,
Elmhurst/Corona in Queens, and the Lower East Side in Manhattan
had the largest negative changes in risk ranking in the economic
security domain, due primarily to increases in the child poverty rate
or parental employment instability.
B03B06
M08

8 CCC Community Risk Ranking
2015 Ranking by CDn Highest Risk1 Concourse/Highbridge (B04)2 University Heights (B05)3 Morrisania (B03)4 East Tremont (B06)5 Borough Park (K12)6 East New York (K05)7 Bedford Park (B07)n Moderate High Risk8 Mott Haven (B01)9 Sunset Park (K07)10 Elmhurst/Corona (Q04)11 Hunts Point (B02)12 Jackson Heights (Q03)13 Williamsbridge (B12)14 Unionport/Soundview (B09)15 Bedford Stuyvesant (K03)16 Pelham Parkway (B11)17 Flatbush/Midwood (K14)18 Brownsville (K16)n Moderate Risk 19 East Flatbush (K17)20 Bushwick (K04)21 Flushing (Q07)22 Woodhaven (Q09)23 Crown Heights South (K09)24 The Rockaways (Q14)25 Jamaica/St. Albans (Q12)26 Bensonhurst (K11)27 Throgs Neck (B10)28 St. George (S01)29 Canarsie (K18)30 Manhattanville (M09)31 Sheepshead Bay (K15)n Moderate Low Risk 32 Coney Island (K13)33 East Harlem (M11)34 Howard Beach (Q10)35 South Beach (S02)36 Washington Heights (M12)37 Queens Village (Q13)38 Bay Ridge (K10)39 Rego Park/Forest Hills (Q06)40 Crown Heights North (K08)41 Fresh Mdws/Briarwood (Q08)42 Riverdale (B08)43 Sunnyside/Woodside (Q02)44 Williamsburg/Greenpoint (K01)45 Central Harlem (M10)46 Ridgewood/Glendale (Q05)47 Tottenville (S03)48 Astoria (Q01)49 Lower East Side (M03)n Lowest Risk50 Bayside (Q11)51 Fort Greene/Brooklyn Hts (K02)52 Chelsea/Clinton (M04)53 Upper West Side (M07)54 Midtown Business Dist (M05)55 Battery Park/Tribeca (M01)56 Greenwich Village (M02)57 Murray Hill/Stuyvesant (M06)58 Park Slope (K06)59 Upper East Side (M08)
A safe and stable home environment is key to children’s healthy development. The housing domain contains indicators that measure housing affordability, condi-tions, and stability within a community. Indicators: Rent Burden, Rental Overcrowding, Families Entering Homeless Shelters
LEVEL OF RISK, 2015
n Highest Risk n Moderate High Riskn Moderate Riskn Moderate Low Riskn Lowest Risk
Housing
2015 HIGHEST RISK COMMUNITY
Concourse/Highbridge (B04)
2015 LOWEST RISK COMMUNITY
Upper East Side (M08)
Rent Burden Rental OvercrowdingFamilies Entering Homeless Shelters
Rent Burden Rental OvercrowdingFamilies Entering Homeless Shelters
40.9% 18.5% 9.6
17.5% 2.8% 0.2Above, we see that 4 out of 10 households in Concourse/Highbridge
spend at least half of their income on rent, compared to fewer than
1 in 5 households in the Upper East Side. Families in Concourse/
Highbridge are nearly 50 times more likely to enter a homeless
shelter than families in the Upper East Side.
B04
M08

Citizens’ Committee for Children of New York, Inc. 9
2010 Ranking by CDn Highest Risk1 University Heights (B05)2 Morrisania (B03)3 East Tremont (B06)4 Bedford Park (B07)5 Hunts Point (B02)6 Concourse/Highbridge (B04)7 Mott Haven (B01)8 East New York (K05)9 Borough Park (K12)n Moderate High Risk10 Brownsville (K16)11 Jackson Heights (Q03)12 Bushwick (K04)13 Sunset Park (K07)14 Elmhurst/Corona (Q04)15 Bedford Stuyvesant (K03)16 Jamaica/St. Albans (Q12)n Moderate Risk 17 Williamsbridge (B12)18 The Rockaways (Q14)19 Crown Heights South (K09)20 East Flatbush (K17)21 St. George (S01)22 Flatbush/Midwood (K14)23 Howard Beach (Q10)24 Unionport/Soundview (B09)25 Coney Island (K13)26 Flushing (Q07)27 Pelham Parkway (B11)28 East Harlem (M11)29 Washington Heights (M12)30 Manhattanville (M09)n Moderate Low Risk 31 Bay Ridge (K10)32 Williamsburg/Greenpoint (K01)33 Crown Heights North (K08)34 Bensonhurst (K11)35 Central Harlem (M10)36 Woodhaven (Q09)37 Riverdale (B08)38 Sunnyside/Woodside (Q02)39 Ridgewood/Glendale (Q05)40 Rego Park/Forest Hills (Q06)41 Astoria (Q01)42 Queens Village (Q13)43 Canarsie (K18)44 Sheepshead Bay (K15)45 Fresh Mdws/Briarwood (Q08)46 Lower East Side (M03)47 South Beach (S02)n Lowest Risk48 Throgs Neck (B10)49 Tottenville (S03)50 Bayside (Q11)51 Fort Greene/Brooklyn Hts (K02)52 Greenwich Village (M02)53 Upper West Side (M07)54 Battery Park/Tribeca (M01)55 Park Slope (K06)56 Chelsea/Clinton (M04)57 Midtown Business Dist (M05)58 Upper East Side (M08)59 Murray Hill/Stuyvesant (M06)
From 2010 to 2015, the rate of families entering homeless
shelters decreased from 4.3 families per 1,000 households to
3.8. That represents 1,560 fewer families entering a homeless shelter.
It is worth noting that the number of homeless families decreased
sharply from the recession-era peak of 2010 to 2012, before increas-
ing again from 2013 to 2015. Rates of rent burden—the share of
households spending at least half their income on rent—and rental
overcrowding—the share of households in which there is more than
one person per room—were unchanged from 2010 to 2015.
Though citywide rates of rent burden and rental overcrowding were
unchanged, several communities experienced notable increases
in rates of rent burden and rental overcrowding. This includes
Unionport/Soundview and Throgs Neck in the eastern Bronx where
increased rates of rental overcrowding and rent burden contributed
to higher risk levels in the housing domain in those communities.
LEVEL OF RISK, 2010
n Highest Risk n Moderate High Riskn Moderate Riskn Moderate Low Riskn Lowest Risk
2010 HIGHEST RISK COMMUNITY
University Heights (B05)
2010 LOWEST RISK COMMUNITY
Murray Hill Stuyvesant (M06)
Rent Burden Rental OvercrowdingFamilies Entering Homeless Shelters
Rent Burden Rental OvercrowdingFamilies Entering Homeless Shelters
38.1% 18.7% 15.1
22.0% 2.9% 0.2
M06
B05

10 CCC Community Risk Ranking
2015 Ranking by CDn Highest Risk1 Williamsbridge (B12)2 East Flatbush (K17)3 Pelham Parkway (B11)n Moderate High Risk4 Crown Heights North (K08)5 Queens Village (Q13)6 East New York (K05)7 Jamaica/St. Albans (Q12)8 Brownsville (K16)9 The Rockaways (Q14)10 Coney Island (K13)11 East Tremont (B06)12 Throgs Neck (B10)13 Central Harlem (M10)14 Morrisania (B03)15 Unionport/Soundview (B09)n Moderate Risk 16 Mott Haven (B01)17 Crown Heights South (K09)18 East Harlem (M11)19 Hunts Point (B02)20 University Heights (B05)21 St. George (S01)22 Battery Park/Tribeca (M01)23 Bedford Stuyvesant (K03)24 Howard Beach (Q10)25 Concourse/Highbridge (B04)26 Riverdale (B08)27 Flushing (Q07)28 Bensonhurst (K11)29 Woodhaven (Q09)30 Canarsie (K18)n Moderate Low Risk 31 Bayside (Q11)32 Flatbush/Midwood (K14)33 Astoria (Q01)34 Fresh Mdws/Briarwood (Q08)35 Jackson Heights (Q03)36 Bedford Park (B07)37 Rego Park/Forest Hills (Q06)38 Sunnyside/Woodside (Q02)39 Bushwick (K04)40 Lower East Side (M03)41 Washington Heights (M12)42 Chelsea/Clinton (M04)43 Greenwich Village (M02)44 Elmhurst/Corona (Q04)45 South Beach (S02)n Lowest Risk46 Park Slope (K06)47 Manhattanville (M09)48 Tottenville (S03)49 Ridgewood/Glendale (Q05)50 Sheepshead Bay (K15)51 Fort Greene/Brooklyn Hts (K02)52 Upper West Side (M07)53 Upper East Side (M08)54 Murray Hill/Stuyvesant (M06)55 Sunset Park (K07)56 Borough Park (K12)57 Midtown Business Dist (M05)58 Bay Ridge (K10)59 Williamsburg/Greenpoint (K01)
A child’s physical, mental, and emotional health is critical to his or her overall well-being. The health domain contains indicators that reflect both health outcomes and access to healthcare. Indicators: Infant Mortality Rate, Low Birthweight Babies, Children without Health Insurance
LEVEL OF RISK, 2015
n Highest Risk n Moderate High Riskn Moderate Riskn Moderate Low Riskn Lowest Risk
Health
2015 HIGHEST RISK COMMUNITY
Williamsbridge (B12)
2015 LOWEST RISK COMMUNITY
Williamsburg/Greenpoint (K01)
Infant Mortality Rate Low BirthweightChildren without Health Insurance
Infant Mortality Rate Low BirthweightChildren without Health Insurance
7.7 9.5% 6.1%
2.4 5.3% 0.9%Above, we see that infants are over 3 times more likely to
die before their first birthday in Williamsbridge, compared to
Williamsburg/Greenpoint. Children in Williamsbridge are also
much more likely to lack health insurance than children in
Williamsburg/Greepoint.
B12
K01

Citizens’ Committee for Children of New York, Inc. 11
2010 Ranking by CDn Highest Risk1 Brownsville (K16)n Moderate High Risk2 Jamaica/St. Albans (Q12)3 Central Harlem (M10)4 Bedford Stuyvesant (K03)5 East New York (K05)n Moderate Risk 6 East Flatbush (K17)7 Williamsbridge (B12)8 Coney Island (K13)9 The Rockaways (Q14)10 University Heights (B05)11 Queens Village (Q13)12 Bensonhurst (K11)13 Howard Beach (Q10)14 East Harlem (M11)15 Pelham Parkway (B11)16 East Tremont (B06)17 Morrisania (B03)18 Canarsie (K18)19 Riverdale (B08)20 Mott Haven (B01)21 Midtown Business Dist (M05)22 Bedford Park (B07)23 Astoria (Q01)24 Crown Heights North (K08)25 Concourse/Highbridge (B04)26 Unionport/Soundview (B09)27 Hunts Point (B02)n Moderate Low Risk 28 Fresh Mdws/Briarwood (Q08)29 Flatbush/Midwood (K14)30 Chelsea/Clinton (M04)31 Washington Heights (M12)32 St. George (S01)33 Crown Heights South (K09)34 Throgs Neck (B10)35 Manhattanville (M09)36 Sunset Park (K07)37 Woodhaven (Q09)38 Lower East Side (M03)39 Sunnyside/Woodside (Q02)40 Fort Greene/Brooklyn Hts (K02)41 Bushwick (K04)42 Elmhurst/Corona (Q04)43 Rego Park/Forest Hills (Q06)44 Park Slope (K06)45 Murray Hill/Stuyvesant (M06)n Lowest Risk46 Flushing (Q07)47 Bay Ridge (K10)48 Jackson Heights (Q03)49 South Beach (S02)50 Bayside (Q11)51 Ridgewood/Glendale (Q05)52 Sheepshead Bay (K15)53 Upper East Side (M08)54 Tottenville (S03)55 Upper West Side (M07)56 Williamsburg/Greenpoint (K01)57 Battery Park/Tribeca (M01)58 Borough Park (K12)59 Greenwich Village (M02)
From 2010 to 2015, the citywide trends were positive for all
three indicators in the health domain. The infant mortality rate—
the number of infant deaths per 1,000 live births—decreased from
5.2 to 4.4 (or from 609 infant deaths to 526). The share of babies
born with low birthweight decreased from 8.8% in 2010 to 8.3% in
2015; and the share of children without health insurance was cut
in half, from 4.6% in 2010 to 2.3% in 2015.
Not all community districts experienced improvements in the indi-
cators that make up the health domain. Williamsbridge and Pelham
Parkway in the Bronx, and East Flatbush in Brooklyn, all experienced
increases in the infant mortality rate from 2010 to 2015. In 2015, those
districts had three of the four highest infant mortality rates in the city.
LEVEL OF RISK, 2010
n Highest Risk n Moderate High Riskn Moderate Riskn Moderate Low Riskn Lowest Risk
2010 HIGHEST RISK COMMUNITY
Brownsville (KI6)
2010 LOWEST RISK COMMUNITY
Greenwich Village (M02)
Infant Mortality Rate Low BirthweightChildren without Health Insurance
Infant Mortality Rate Low BirthweightChildren without Health Insurance
9.9 14.6% 7.4%
3.1 6.0% 0.6%
K16
M02
12 CCC Community Risk Ranking
2015 Ranking by CDn Highest Risk1 Hunts Point (B02)2 Mott Haven (B01)3 Unionport/Soundview (B09)4 Brownsville (K16)n Moderate High Risk5 East Tremont (B06)6 Concourse/Highbridge (B04)7 East New York (K05)8 Throgs Neck (B10)9 Morrisania (B03)10 Bedford Park (B07)11 Bushwick (K04)12 Washington Heights (M12)13 Williamsbridge (B12)14 Elmhurst/Corona (Q04)15 Bedford Stuyvesant (K03)16 Central Harlem (M10)17 East Flatbush (K17)18 St. George (S01)19 Howard Beach (Q10)20 University Heights (B05)21 Woodhaven (Q09)22 Flushing (Q07)23 Pelham Parkway (B11)24 Jamaica/St. Albans (Q12)n Moderate Risk 25 Crown Heights North (K08)26 Jackson Heights (Q03)27 The Rockaways (Q14)28 Ridgewood/Glendale (Q05)29 Queens Village (Q13)30 East Harlem (M11)31 Sunset Park (K07)32 Canarsie (K18)33 Borough Park (K12)34 Bensonhurst (K11)35 Astoria (Q01)36 Crown Heights South (K09)37 Coney Island (K13)38 Riverdale (B08)39 Flatbush/Midwood (K14)40 Manhattanville (M09)n Moderate Low Risk 41 Sheepshead Bay (K15)42 Sunnyside/Woodside (Q02)43 South Beach (S02)44 Fresh Mdws/Briarwood (Q08)45 Lower East Side (M03)46 Williamsburg/Greenpoint (K01)47 Tottenville (S03)48 Bay Ridge (K10)49 Chelsea/Clinton (M04)50 Fort Greene/Brooklyn Hts (K02)n Lowest Risk51 Midtown Business Dist (M05)52 Rego Park/Forest Hills (Q06)53 Greenwich Village (M02)54 Park Slope (K06)55 Upper West Side (M07)56 Bayside (Q11)57 Battery Park/Tribeca (M01)58 Murray Hill/Stuyvesant (M06)59 Upper East Side (M08)
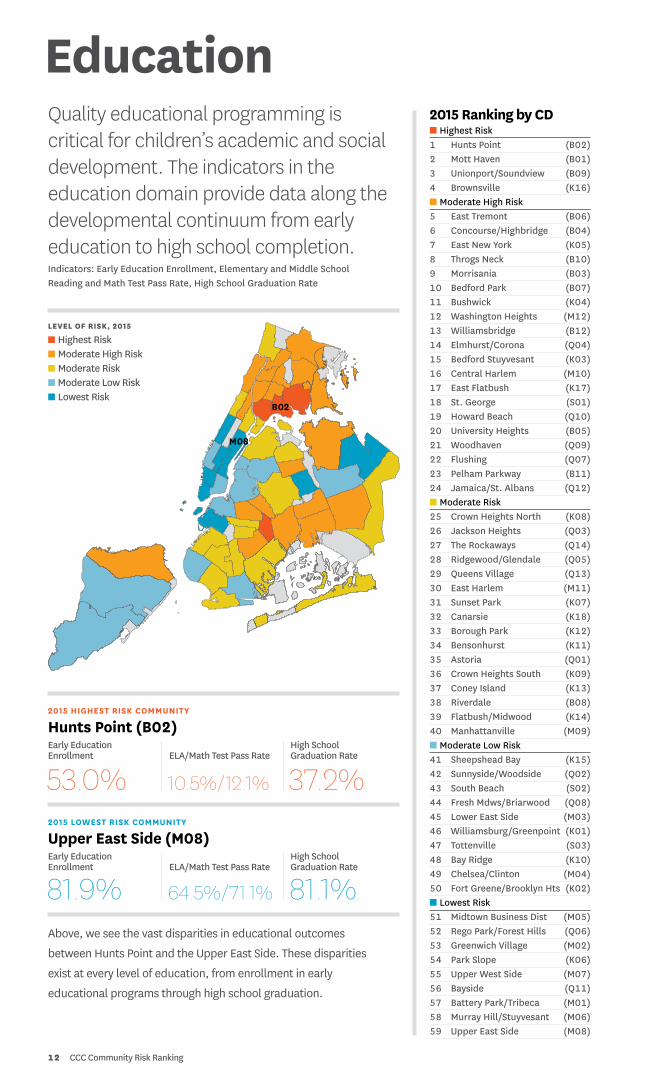
Quality educational programming is critical for children’s academic and social development. The indicators in the education domain provide data along the developmental continuum from early education to high school completion. Indicators: Early Education Enrollment, Elementary and Middle School Reading and Math Test Pass Rate, High School Graduation Rate
LEVEL OF RISK, 2015
n Highest Risk n Moderate High Riskn Moderate Riskn Moderate Low Riskn Lowest Risk
Education
2015 HIGHEST RISK COMMUNITY
Hunts Point (B02)
2015 LOWEST RISK COMMUNITY
Upper East Side (M08)
Early Education Enrollment ELA/Math Test Pass Rate
High School Graduation Rate
Early Education Enrollment ELA/Math Test Pass Rate
High School Graduation Rate
53.0% 10.5%/12.1% 37.2%
81.9% 64.5%/71.1% 81.1% Above, we see the vast disparities in educational outcomes
between Hunts Point and the Upper East Side. These disparities
exist at every level of education, from enrollment in early
educational programs through high school graduation.
B02
M08

Citizens’ Committee for Children of New York, Inc. 13
2010 Ranking by CDn Highest Risk1 Hunts Point (B02)2 Mott Haven (B01)3 Unionport/Soundview (B09)4 Concourse/Highbridge (B04)5 Elmhurst/Corona (Q04)6 Washington Heights (M12)7 Bushwick (K04)8 Brownsville (K16)9 East Tremont (B06)10 Morrisania (B03)11 The Rockaways (Q14)12 Howard Beach (Q10)13 East New York (K05)14 Ridgewood/Glendale (Q05)n Moderate High Risk15 Bedford Park (B07)16 Williamsbridge (B12)17 Pelham Parkway (B11)18 Bedford Stuyvesant (K03)19 East Flatbush (K17)20 Canarsie (K18)21 Coney Island (K13)22 Woodhaven (Q09)23 Throgs Neck (B10)24 St. George (S01)25 Riverdale (B08)26 University Heights (B05)27 Crown Heights North (K08)28 Jackson Heights (Q03)29 Jamaica/St. Albans (Q12)30 Astoria (Q01)31 Sunnyside/Woodside (Q02)32 Borough Park (K12)33 Bensonhurst (K11)34 Manhattanville (M09)35 East Harlem (M11)n Moderate Risk 36 Central Harlem (M10)37 Crown Heights South (K09)38 Flushing (Q07)39 Fresh Mdws/Briarwood (Q08)40 Sunset Park (K07)41 Queens Village (Q13)42 Sheepshead Bay (K15)43 Flatbush/Midwood (K14)44 Williamsburg/Greenpoint (K01)45 Park Slope (K06)46 South Beach (S02)47 Bay Ridge (K10)n Moderate Low Risk 48 Lower East Side (M03)49 Fort Greene/Brooklyn Hts (K02)50 Midtown Business Dist (M05)51 Upper West Side (M07)52 Tottenville (S03)53 Chelsea/Clinton (M04)54 Greenwich Village (M02)n Lowest Risk55 Rego Park/Forest Hills (Q06)56 Murray Hill/Stuyvesant (M06)57 Bayside (Q11)58 Upper East Side (M08)59 Battery Park/Tribeca (M01)
From 2010 to 2015, the citywide high school graduation rate
improved from 62.5% to 67.2%, continuing a decade-plus long
trend. Early education enrollment for 3- and 4-year-olds held steady
during that time at 60%; and Math/ELA scores from 2010 to 2015
are incomparable due to the implementation of Common Core
standards in 2013 that brought scores down considerably.
The largest improvements in ranking within the education domain
were experienced in the Rockaways in Queens and Coney Island in
Brooklyn, thanks largely to improved high school graduation rates
and higher rates of early education enrollment. The largest negative
changes in ranking were experienced in Throgs Neck in the Bronx,
Central Harlem in Manhattan, and Flushing in Queens. All three dis-
tricts had graduation rates that were unchanged from 2010 to 2015,
but much lower rates of early education enrollment.
LEVEL OF RISK, 2010
n Highest Risk n Moderate High Riskn Moderate Riskn Moderate Low Riskn Lowest Risk
2010 HIGHEST RISK COMMUNITY
Hunts Point (B02)
2010 LOWEST RISK COMMUNITY
Battery Park/Tribeca (M01)
Early Education Enrollment ELA/Math Test Pass Rate
High School Graduation Rate
Early Education Enrollment ELA/Math Test Pass Rate
High School Graduation Rate
2010 and 2015 ELA/Math test pass rates are incomparable due to the implementation of Common Core standards in 2013.
50.5% 27.3%/12.1% 48.6%
95.2% 41.3%/81.2% 77.8%
B02
M01

14 CCC Community Risk Ranking
2015 Ranking by CDn Highest Risk1 Mott Haven (B01)2 Hunts Point (B02)3 Bedford Park (B07)4 Morrisania (B03)5 East Tremont (B06)6 Brownsville (K16)7 East New York (K05)n Moderate High Risk8 Unionport/Soundview (B09)9 Concourse/Highbridge (B04)10 University Heights (B05)11 Williamsbridge (B12)12 Bedford Stuyvesant (K03)13 Flatbush/Midwood (K14)14 Bushwick (K04)15 Central Harlem (M10)16 Coney Island (K13)n Moderate Risk 17 Throgs Neck (B10)18 St. George (S01)19 Crown Heights North (K08)20 Washington Heights (M12)21 East Flatbush (K17)22 Pelham Parkway (B11)23 Jamaica/St. Albans (Q12)24 Crown Heights South (K09)25 East Harlem (M11)26 Riverdale (B08)27 Ridgewood/Glendale (Q05)28 Sheepshead Bay (K15)29 Fort Greene/Brooklyn Hts (K02)30 The Rockaways (Q14)31 Canarsie (K18)32 Borough Park (K12)33 Sunset Park (K07)34 Howard Beach (Q10)35 Jackson Heights (Q03)36 Elmhurst/Corona (Q04)37 Woodhaven (Q09)38 Astoria (Q01)n Moderate Low Risk 39 Queens Village (Q13)40 Bay Ridge (K10)41 Rego Park/Forest Hills (Q06)42 Bensonhurst (K11)43 Williamsburg/Greenpoint (K01)44 Flushing (Q07)45 Park Slope (K06)46 Fresh Mdws/Briarwood (Q08)47 Upper West Side (M07)48 South Beach (S02)49 Manhattanville (M09)50 Sunnyside/Woodside (Q02)51 Lower East Side (M03)n Lowest Risk52 Tottenville (S03)53 Chelsea/Clinton (M04)54 Bayside (Q11)55 Midtown Business Dist (M05)56 Murray Hill/Stuyvesant (M06)57 Upper East Side (M08)58 Battery Park/Tribeca (M01)59 Greenwich Village (M02)
The period between childhood and adulthood presents a unique set of challenges for young people and their families. The youth domain focuses on specific risks that children and youth face as they transition to adulthood. Indicators: Teen Birth Rate, Teen Idleness, Youth Unemployment
LEVEL OF RISK, 2015
n Highest Risk n Moderate High Riskn Moderate Riskn Moderate Low Riskn Lowest Risk
Youth
2015 HIGHEST RISK COMMUNITY
Mott Haven (B01)
2015 LOWEST RISK COMMUNITY
Greenwich Village (M01)
Teen Birth Rate Teen Idleness Youth Unemployment
Teen Birth Rate Teen Idleness Youth Unemployment
30.0 21.7% 23.2%
1.2 3.3% 8.6%Above, we see the challenges faced by young people in Mott Haven
compared to those in Greenwich Village. Teen girls are 25 times more
likely to have a baby, and young people are much more likely to
be out of school and out of the labor force in Mott Haven compared
to Greenwich Village.
B01
M01

Citizens’ Committee for Children of New York, Inc. 15
2010 Ranking by CDn Highest Risk1 Mott Haven (B01)2 Hunts Point (B02)3 Brownsville (K16)4 Concourse/Highbridge (B04)n Moderate High Risk5 University Heights (B05)6 East Harlem (M11)7 Central Harlem (M10)8 East Tremont (B06)9 Morrisania (B03)10 Bedford Stuyvesant (K03)11 East New York (K05)12 Bedford Park (B07)n Moderate Risk 13 Williamsbridge (B12)14 Washington Heights (M12)15 Bushwick (K04)16 East Flatbush (K17)17 Unionport/Soundview (B09)18 Sunset Park (K07)19 The Rockaways (Q14)20 Crown Heights South (K09)21 Crown Heights North (K08)22 Jackson Heights (Q03)23 Coney Island (K13)24 Throgs Neck (B10)25 Jamaica/St. Albans (Q12)26 Elmhurst/Corona (Q04)27 Astoria (Q01)28 Pelham Parkway (B11)n Moderate Low Risk 29 Flatbush/Midwood (K14)30 St. George (S01)31 Riverdale (B08)32 Woodhaven (Q09)33 Williamsburg/Greenpoint (K01)34 Howard Beach (Q10)35 Bay Ridge (K10)36 Manhattanville (M09)37 Flushing (Q07)38 Park Slope (K06)39 Ridgewood/Glendale (Q05)40 Borough Park (K12)41 Canarsie (K18)42 Lower East Side (M03)43 Sheepshead Bay (K15)44 Sunnyside/Woodside (Q02)45 Bensonhurst (K11)46 Fresh Mdws/Briarwood (Q08)47 Fort Greene/Brooklyn Hts (K02)48 Rego Park/Forest Hills (Q06)49 South Beach (S02)n Lowest Risk50 Queens Village (Q13)51 Upper West Side (M07)52 Tottenville (S03)53 Chelsea/Clinton (M04)54 Bayside (Q11)55 Midtown Business Dist (M05)56 Murray Hill/Stuyvesant (M06)57 Battery Park/Tribeca (M01)58 Greenwich Village (M02)59 Upper East Side (M08)
From 2010 to 2015, there was citywide progress along all three
indicators within the youth domain. The teen birth rate—the number
of births to teens per 1,000 girls age 15–19—decreased from 29 to
19.4; the youth unemployment rate decreased from 19.9% to 15.3%;
and the teen idleness rate—the share of 16–19 year olds who are not
in school and not in the labor force—decreased from 8.7% to 6.6%.
Not all community districts experienced improved outcomes
along these indicators. Three districts in Brooklyn—Fort Greene,
Flatbush, and Sheepshead Bay—experienced the largest negative
changes in ranking within the youth domain, due primarily to youth
unemployment rates that were much higher in 2015 compared to
2010. The teen birth rate did not drop as dramatically in Flatbush
and Sheepshead Bay as it did citywide.
LEVEL OF RISK, 2010
n Highest Risk n Moderate High Riskn Moderate Riskn Moderate Low Riskn Lowest Risk
2010 HIGHEST RISK COMMUNITY
Mott Haven (B01)
2010 LOWEST RISK COMMUNITY
Upper East Side (M08)
Teen Birth Rate Teen Idleness Youth Unemployment
Teen Birth Rate Teen Idleness Youth Unemployment
61.6 20.8% 26.3%
9.1 2.3% 7.8%
B01
M08

16 CCC Community Risk Ranking
2015 Ranking by CDn Highest Risk1 Mott Haven (B01)2 Hunts Point (B02)3 East Tremont (B06)4 Morrisania (B03)5 Concourse/Highbridge (B04)n Moderate High Risk6 East Harlem (M11)7 Brownsville (K16)8 University Heights (B05)9 East New York (K05)10 Bedford Park (B07)11 Unionport/Soundview (B09)12 Central Harlem (M10)n Moderate Risk 13 Bushwick (K04)14 Williamsbridge (B12)15 Bedford Stuyvesant (K03)16 East Flatbush (K17)17 Washington Heights (M12)18 Sunset Park (K07)19 Jamaica/St. Albans (Q12)20 Crown Heights North (K08)21 The Rockaways (Q14)22 Lower East Side (M03)23 Elmhurst/Corona (Q04)24 Jackson Heights (Q03)25 Manhattanville (M09)26 Crown Heights South (K09)27 Pelham Parkway (B11)n Moderate Low Risk 28 Coney Island (K13)29 Midtown Business Dist (M05)30 Howard Beach (Q10)31 St. George (S01)32 Throgs Neck (B10)33 Riverdale (B08)34 Woodhaven (Q09)35 Fort Greene/Brooklyn Hts (K02)36 Chelsea/Clinton (M04)37 Canarsie (K18)38 Flatbush/Midwood (K14)39 Astoria (Q01)40 Bensonhurst (K11)41 Queens Village (Q13)42 Ridgewood/Glendale (Q05)43 Flushing (Q07)44 Williamsburg/Greenpoint (K01)45 Sunnyside/Woodside (Q02)n Lowest Risk46 Sheepshead Bay (K15)47 Borough Park (K12)48 Bay Ridge (K10)49 Park Slope (K06)50 Fresh Mdws/Briarwood (Q08)51 South Beach (S02)52 Upper West Side (M07)53 Murray Hill/Stuyvesant (M06)54 Greenwich Village (M02)55 Rego Park/Forest Hills (Q06)56 Bayside (Q11)57 Battery Park/Tribeca (M01)58 Tottenville (S03)59 Upper East Side (M08)
Children’s development is greatly influ-enced by the families and communities that surround them. The indicators in the family and community domain capture critical influences in children’s environments. Indicators: Children in Single-Parent Families, Adults without a High School Degree, Violent Felony Rate
LEVEL OF RISK, 2015
n Highest Risk n Moderate High Riskn Moderate Riskn Moderate Low Riskn Lowest Risk
Family and Community
2015 HIGHEST RISK COMMUNITY
Mott Haven (B01)
2015 LOWEST RISK COMMUNITY
Upper East Side (M08)
Children in Single-Parent Families
Adults without a High School Degree Violent Felony Rate
Children in Single-Parent Families
Adults without a High School Degree Violent Felony Rate
70.5% 42.5% 10.8
14.1% 1.9% 1.3Above, we see that children in Mott Haven are 5 times more likely
to live in a single-parent household compared to children in the
Upper East Side. Mott Haven also experiences far higher rates of
crime and has far more adults without a high school degree than
the Upper East Side.
B01
M08

Citizens’ Committee for Children of New York, Inc. 17
2010 Ranking by CDn Highest Risk1 Hunts Point (B02)2 Mott Haven (B01)3 East Tremont (B06)4 Brownsville (K16)5 Morrisania (B03)n Moderate High Risk6 Concourse/Highbridge (B04)7 University Heights (B05)8 Bushwick (K04)9 Bedford Park (B07)10 East Harlem (M11)11 Central Harlem (M10)12 Bedford Stuyvesant (K03)13 East New York (K05)14 Unionport/Soundview (B09)15 Washington Heights (M12)n Moderate Risk 16 Williamsbridge (B12)17 Crown Heights North (K08)18 Manhattanville (M09)19 Jamaica/St. Albans (Q12)20 Pelham Parkway (B11)21 Sunset Park (K07)22 East Flatbush (K17)23 Lower East Side (M03)24 Crown Heights South (K09)25 Jackson Heights (Q03)26 The Rockaways (Q14)n Moderate Low Risk 27 Throgs Neck (B10)28 Fort Greene/Brooklyn Hts (K02)29 Elmhurst/Corona (Q04)30 Riverdale (B08)31 Flatbush/Midwood (K14)32 Howard Beach (Q10)33 Coney Island (K13)34 Williamsburg/Greenpoint (K01)35 Midtown Business Dist (M05)36 Ridgewood/Glendale (Q05)37 St. George (S01)38 Woodhaven (Q09)39 Canarsie (K18)40 Astoria (Q01)41 Sunnyside/Woodside (Q02)42 Bensonhurst (K11)43 Queens Village (Q13)44 Chelsea/Clinton (M04)45 Borough Park (K12)46 Bay Ridge (K10)n Lowest Risk47 Park Slope (K06)48 Flushing (Q07)49 Fresh Mdws/Briarwood (Q08)50 Greenwich Village (M02)51 Sheepshead Bay (K15)52 South Beach (S02)53 Murray Hill/Stuyvesant (M06)54 Battery Park/Tribeca (M01)55 Upper West Side (M07)56 Rego Park/Forest Hills (Q06)57 Bayside (Q11)58 Tottenville (S03)59 Upper East Side (M08)
From 2010 to 2015, the indicators that make up the family and
community domain remained relatively steady, though the violent
felony rate continued a decline that started more than a decade ago.
The violent felony rate—the number of violent felonies committed
per 1,000 residents—decreased from 4.7 in 2010 to 4.5 in 2015.
In both 2010 and 2015, about 1 in 5 New Yorkers age 25 and
over lacked a high school diploma, and around one-third of children
were in single-parent households.
The largest improvement in the family and community domain
occurred in Williamsburg/Greenpoint, which experienced a reduction
in the violent felony rate and the share of children living in single-
parent households. The districts with the largest negative changes
in ranking are Chelsea and Midtown Business District, which both
experienced slight increases in the violent felony rate.
LEVEL OF RISK, 2010
n Highest Risk n Moderate High Riskn Moderate Riskn Moderate Low Riskn Lowest Risk
2010 HIGHEST RISK COMMUNITY
Hunts Point (B02)
2010 LOWEST RISK COMMUNITY
Upper East Side (M08)
Children in Single-Parent Families
Adults without a High School Degree Violent Felony Rate
Children in Single-Parent Families
Adults without a High School Degree Violent Felony Rate
73.5% 43.1% 13.5
12.5% 3.1% 1.3
B02
M08

18 CCC Community Risk Ranking
The community districts of Central Harlem, Manhattanville, and Washington Heights in upper Manhattan all experienced improvements in the overall risk ranking when comparing data from 2010 to 2015. Manhattanville experienced the largest improvement in risk ranking, going from #27 in 2010 to #39 in 2015, nearly moving into the moderate-low risk category.
Focus on:Northern Manhattan
Washington Heights went from #16 in 2010 to #23 in 2015, moving from the moderate-high risk to moderate risk category. Central Harlem remained in the moderate-high risk category with a more modest improvement in risk ranking, going from #13 to #17.
Central Harlem was the lone community district of the three that improved considerably in the economic security domain, going from a rank of #12 in 2010 to #20 in 2015. This was due in large part to a drop in the child poverty rate in Central Harlem—from 36% to 27%. All three districts experienced reductions in parental employment instability.
Central Harlem may have experienced an even larger improvement in overall rank if not for a negative change within the education domain. The change in the education domain was caused by lower rates of early education enrollment, lower test scores for 3rd-8th graders, and lower graduation rates in Central Harlem high schools when comparing 2015 to 2010. Manhattanville and Washington Heights experienced modest improvements within the education domain.
In the health and youth domains, all three districts experienced improvements in ranking. Uninsured rates for children have been going down citywide since 2008, and in 2015, the three upper Manhattan community districts all had rates of uninsured children of 1% or below (compared to 2.3% citywide).
In the youth domain, all three districts have experienced dramatic reductions in the teen birth rate—falling even faster than the citywide rate. In each district, the teen birth rate has been more than cut in half.
In the family and community domain, Manhattan-ville experienced a considerable improvement in ranking, going from #18 to #25. This was largely the result of a substantial reduction in the violent felony rate. In Manhattanville, the violent felony rate went from 7.0 violent felonies per 1,000 res-idents in 2010 to 4.3 in 2015. Central Harlem also experienced a reduction in the violent felony rate and a modest improvement in ranking within the family and community domain.
The improvement in risk ranking in Northern Manhattan is a promising sign, but there remain areas of concern. Central Harlem remains in the moderate-high risk category overall, and its negative change within the education domain is worrisome. In Washington Heights, there was an improvement in rank in the education domain, but it is still ranked #12 (moderate-high risk) in that domain. There is also the open question of whether these changes are the result of gentrifi-cation and if the effects of lower levels of risk are being felt equally by all residents.

Citizens’ Committee for Children of New York, Inc. 19
CHILD POVERTY RATES
n 2010 n 2015
New York City
Manhattan
Manhattanville
Central Harlem
Washington Heights
VIOLENT FELONY RATE
n 2010 n 2015
New York City
Manhattan
Manhattanville
Central Harlem
Washington Heights
PARENTAL EMPLOYMENT INSTABILITY RATES
n 2010 n 2015
New York City
Manhattan
Manhattanville
Central Harlem
Washington Heights
TEEN BIRTH RATE (PER 1,000 GIRLS AGE 15-19)
n New York City n Central Harlem n Manhattanville
n Washington Heights
NORTHERN MANHATTAN
Manhattanville Central Harlem Washington Heights
(M09) (M11) (M12)
2010 2015 2010 2015 2010 2015
Overall 27 39 13 17 16 23
Economic Security 15 17 12 20 23 22
Housing 30 30 35 45 29 36
Health 35 47 3 13 31 41
Education 34 40 36 16 6 12
Youth 36 49 7 15 14 20
Family and Community 18 25 11 12 15 17
30.0%
4.7
35.8%28.6%
4.5
32.5%
24.3%
4.3
33.3%
33.9%
4.3
42.3%
27.1%
7.9
40.0%
29.2%
3.9
34.2%
22.1%
4.6
35.2%
38.5%
7.0
48.1%
35.8%
9.5
55.2%
26.5%
5.1
42.6%
2010 2011 2012 2013 2014 2015
29.0
21.3
41.0
45.1
20.819.919.4
10.2

20 CCC Community Risk Ranking
For the past several years, the Bronx has been disproportionately represented in the overall highest risk category. In both 2010 and 2015, the Bronx districts of Mott Haven, Hunts Point, Morrissania, Concourse/Highbridge, University Heights, East Tremont, and Bedford Park have been among the 10 highest risk community districts in the city. While these Bronx districts continue to have the highest levels of overall risk, the trends in the eastern part of the Bronx are worrisome. Throgs Neck, Pelham Parkway, and Williamsbridge, in particular, have long had higher average incomes and lower poverty rates than the borough as a whole. While this may still be the case, the fact that outcomes along many indicators are trending in the wrong direction deserves increased attention.
Focus on:Eastern Bronx While several districts in the south and central Bronx continue to experience the highest levels of overall risk, community districts in the eastern Bronx experienced negative changes in rank from 2010 to 2015. Unionport/Soundview, Throgs Neck, Pelham Park-way, and Williamsbridge are all ranked higher in overall risk in 2015, with Unionport/Soundview moving from the moderate-high risk to highest risk category, and Throgs Neck moving from the moderate risk to moderate-high risk category.
Throgs Neck may have experienced an even greater negative change in overall ranking if not for its improved rank within the economic security domain (thanks to a significant decrease in the child poverty rate). There are, however, very worrisome trends in specific domains for Throgs Neck and the other districts.
The largest negative changes in risk for these districts came in the housing, health, and youth domains. In the housing domain, much of the change can be attributed to increases in the share of households that are rent burdened and overcrowded. Rent burden refers to the share of households that spend more than 50% of their income on rent, and rental overcrowding refers to renter households in which there is more than one person per room.
In the health domain, each of the districts, except for Throgs Neck, experienced an increase in the infant mortality rate (IMR), despite an im-provement in the citywide trend. In 2015, Pelham Parkway had the highest IMR in the city (at 8.1, up from 6.3 in 2010), and Williamsbridge had the second highest IMR in the city (7.7, up from 7.0 in 2010).
In the youth domain, increases in youth unemployment led to higher risk levels for Unionport/Soundview and Throgs Neck.

Citizens’ Committee for Children of New York, Inc. 21
RENT BURDENED HOUSEHOLDS
n 2010 n 2015
New York City
Bronx
Unionport/Soundview
Throgs Neck
Pelham Parkway
Williamsbridge
INFANT MORTALITY RATE (PER 1,000 LIVE BIRTHS)
n 2010 n 2015
New York City
Bronx
Unionport/Soundview
Throgs Neck
Pelham Parkway
Williamsbridge
RENTAL OVERCROWDING
n 2010 n 2015
New York City
Bronx
Unionport/Soundview
Throgs Neck
Pelham Parkway
Williamsbridge
YOUTH UNEMPLOYMENT (20-24 YEAR OLDS)
n 2010 n 2015
New York City
Bronx
Unionport/Soundview
Throgs Neck
Pelham Parkway
Williamsbridge
EASTERN BRONX
Unionport/Soundview Throgs Neck Pelham Parkway Williamsbridge
(B09) (B10) (B11) (B12)
2010 2015 2010 2015 2010 2015 2010 2015
Overall 15 9 31 21 20 14 14 11
Economic Security 20 14 25 38 22 18 21 27
Housing 24 14 48 27 27 16 17 13
Health 26 15 34 12 15 3 7 1
Education 3 3 23 8 17 23 16 13
Youth 17 8 24 17 28 22 13 11
Family and Community 14 11 27 32 20 27 16 14
27.6%27.8%
32.0%33.8%
26.2%35.2%
26.0%36.6%
29.6%35.3%
32.7%32.1%
11.3%11.4%
14.3%14.9%
10.5%13.7%
3.7%8.6%
13.4%17.3%
12.0%14.9%
5.24.4
6.35.4
4.96.0
4.94.3
6.38.1
7.07.7
17.5%18.3%
23.2%25.3%
16.3%28.0%
17.5%27.4%
20.3%23.4%
26.2%24.8%

22 CCC Community Risk Ranking
Focus on:Eastern Queens In eastern Queens, the community districts of Flushing, Woodhaven, and Queens Village were all in the moderate risk category in overall ranking in 2015, but have experienced some concerning changes in rank since 2010. Flushing moved seven spots, from #42 (moderate-low risk) to #35 (moderate risk). Ridgewood moved seven spots (from #38 to #31), and Queens Village moved five spots (from #43 to #38) from the moderate-low risk to the moderate risk category.
The domains of greatest concern vary by community district, with the exception of health, where each district ranks higher in risk in 2015 compared to 2010. In Flushing, the share of children without health insurance stayed flat from 2010 (6.1%) to 2015 (6.4%) while it dropped citywide and in most other districts; as a result, Flushing had the highest share of children without health insurance in 2015.
All three districts experienced smaller reductions in the infant mortality rate (IMR)—the number of infant deaths per 1,000 live births—compared to the citywide decrease. Queens Village—ranked #5 in health—had among the city’s highest IMRs (5.3, 13th highest out of 59 community districts) and share of babies born with low birthweight (10.8%, 7th highest in the city). This is particu-larly notable given the district’s placement in the moderate-low risk category within the economic security domain. Nearly every district ranked in either the lowest risk or moderate-low risk cate-gory within the economic security domain is also in one of the two lowest risk categories within the health domain—Queens Village is an exception, ranked in the moderate-high risk category within the health domain.
Queens Village and Flushing also experienced negative changes in rank within the education domain. This was largely due to the fact that both districts experienced reductions in early educa-tion enrollment, the share of 3- and 4-year-olds enrolled in early education programs.
The domain in which Woodhaven experienced the largest negative change in rank from 2010 to 2015 was housing. This was due primarily to a much higher share of households that were rent burdened—35% in 2015 compared to 26% in 2010. Rent burden also increased in Flushing, from 35% in 2010 to 42% in 2015. Flushing and Queens Village both experienced modest negative changes in rank within the housing domain.
These eastern Queens districts are still faring quite well, relative to other parts of the city, when looking at overall risk level. However, some of the trends are worrisome, particularly the high and rising level of risk in the health domain in Queens Village. Why a district faring so well in economic security has among the highest infant mortality rates in the city will need to be further explored.

Citizens’ Committee for Children of New York, Inc. 23
INFANT MORTALITY RATE (PER 1,000 LIVE BIRTHS)
n 2010 n 2015
New York City
Queens
Flushing
Woodhaven
Queens Village
RENT BURDEN
n 2010 n 2015
New York City
Queens
Flushing
Woodhaven
Queens Village
EARLY EDUCATION ENROLLMENT
n 2010 n 2015
New York City
Queens
Flushing
Woodhaven
Queens Village
EASTERN QUEENS
Flushing Woodhaven Queens Village
(Q07) (Q09) (Q13)
2010 2015 2010 2015 2010 2015
Overall 42 35 38 31 43 38
Economic Security 43 43 40 36 49 52
Housing 26 21 36 22 42 37
Health 46 27 37 29 11 5
Education 38 22 22 21 41 29
Youth 37 44 32 37 50 39
Family and Community 48 43 38 34 43 41
5.2
27.6%
59.8%4.4
27.8%
60.1%
4.0
28.6%
56.6%
2.6
41.5%
44.0%
4.1
35.0%
47.0%
5.7
28.9%
58.5%
4.5
29.8%
53.9%
2.8
34.9%
56.3%
4.1
26.0%
42.0%
5.9
26.8%
69.0%

24 CCC Community Risk Ranking
Focus on:North Shore (St. George) The overall risk level for Staten Island’s North Shore did not in-crease substantially—from #29 in 2010 to #25 in 2015—but there are specific domains in which it experienced significant negative changes. The improvement in the housing domain—due largely to a reduction in overcrowded housing—may have prevented the North Shore from experiencing an even larger change in overall risk ranking. The most notable negative changes in rank for the North Shore came in the economic security, health, and youth domains.
In the economic security domain, child poverty, median income for families with children, and parental employment instability held relatively steady for the North Shore between 2010 and 2015. However, this was in contrast to the city-wide trend in which there were modest improve-ments along these indicators. This suggests that the North Shore may not be recovering from the effects of the Great Recession at the same pace as the city as a whole. While child poverty was starting to return to its pre-recession level citywide, it was continuing to increase in the North Shore.
In the health domain, the North Shore’s move-ment from the moderate-low risk to moderate risk category (#32 to #21) was largely the result of an increase in the infant mortality rate (IMR). While the citywide rate improved from 2010 to 2015, the North Shore’s IMR did not; in fact, the North Shore’s IMR of 6.9 in 2015 was the 5th highest in the city. In 2010, the North Shore had the 17th highest IMR in the city.
In the youth domain, the teen birth rate in the North Shore decreased from 2010 to 2015, but not at the same rate as the city as a whole. While the teen birth rate in New York City de-creased 33% from 2010 to 2015, it decreased only 15% in the North Shore during that time and has been relatively flat since 2011.
There was also an increase in youth unemploy-ment in the North Shore. Whereas the New York City unemployment rate for 20-24 year olds
increased less than a percentage point from 2010 to 2015, it increased by 5.2 percentage points in the North Shore.
The North Shore also experienced a negative change in ranking within the family and commu-nity domain, going from #37 in 2010 to #31 in 2015. This was largely due to a slight increase in the violent felony rate. The violent felony rate in the North Shore increased from 3.6 violent felonies per 1,000 residents in 2010 to 4.3 in 2015.
Perhaps due to geography, or its borough wide economic stability, Staten Island may not often be considered an area with substantial barriers to child well-being. However, the North Shore increasingly can be found among the districts with the most worrisome outcomes in the city along a range of indicators, primarily in the health, youth, and education domains.

Citizens’ Committee for Children of New York, Inc. 25
ECONOMIC SECURITY INDICATORS
2010 2015 Change
Child Poverty Rate
New York City 30.0% 28.6% -1.4
Staten Island 17.1% 18.2% 0.9
North Shore 26.2% 28.6% 2.4
Median Income, Families with children (2015 $)
New York City $49,697 $51,854 4.3%
Staten Island $86,010 $83,869 -2.5%
North Shore $65,725 $64,478 -1.9%
Parental Employment Instability
New York City 35.8% 32.5% -3.3
Staten Island 24.4% 27.5% 3.1
North Shore 38.7% 39.2% 0.5
INFANT MORTALITY RATE (PER 1,000 LIVE BIRTHS)
n 2010 n 2015
New York City
Staten Island
North Shore
TEEN BIRTH RATE (PER 1,000 TEEN GIRLS)
n New York City n Staten Island n North Shore
YOUTH UNEMPLOYMENT (20-24 YEAR OLDS)
n 2010 n 2015
New York City
Staten Island
North Shore
STATEN ISLAND’S NORTH SHORE
North Shore
(S01)
2010 2015
Overall 29 25
Economic Security 33 24
Housing 21 28
Health 32 21
Education 24 18
Youth 30 18
Family and Community 37 31
5.2 17.5%
2010 2011 2012 2013 2014 2015
18.3
14.6
29.0
23.0
31.4
28.0
4.4 18.3%
4.5 15.6%
6.9 17.2%
4.4 13.5%
5.9 12.0%

26 CCC Community Risk Ranking
Similar to northern Manhattan, the improvements in ranking in north Brooklyn come with some questions and concerns. Bedford Stuyvesant and Bushwick remain among the 20 highest ranked districts in overall risk and in several domains. And there is the question as to whether some of these improvements are the result of gen-trification, and if they are equally impacting all residents in the community. Changes in the share of adults without a high school diploma and children in single-parent families suggest that, in some cases, it may be demographic shifts that are driving improved outcomes.
Focus on:North Brooklyn In north Brooklyn, Williamsburg/Greenpoint experienced a signifi-cant improvement in overall rank, going from #36 (moderate risk) in 2010 to #44 (moderate-low risk) in 2015. Bedford Stuyvesant (ranked #10 in 2010 and #12 in 2015) and Bushwick (ranked #12 in 2010 and #16 in 2015) experienced more modest improvements, remaining in the moderate-high risk category.
Economic security is the domain in which Williamsburg/Greenpoint faces the greatest level of risk, but also where it experienced the largest improvement, moving from #11 (highest risk) in 2010 to #23 (moderate-high risk) in 2015. This was due to substantial improvements along all three indicators in the economic security domain. Bushwick experienced a negative change in rank-ing within the economic security domain, going from #18 in 2010 to #12 in 2015. This was due largely to an increase in parental employment instability; also, the child poverty rate and median income for families with children held relatively steady, even as there was progress along those indicators citywide.
Bushwick did experience an improvement in ranking in the housing domain, going from #12 (moderate-high risk) in 2010 to #20 (moderate risk) in 2015. This was due largely to a substantial decrease in the rate of families entering home-less shelters. In Bedford Stuyvesant, the largest improvement in ranking came within the health domain, moving from #4 (moderate-high risk) in 2010 to #23 (moderate risk) in 2015. This was due primarily to a sizeable reduction in the infant mortality rate.
All three districts experienced improvements in ranking within the family and community domain. Each district had a smaller share of adults without a high school diploma and children in single-parent families in 2015 compared to 2010.

Citizens’ Committee for Children of New York, Inc. 27
21.6%
4.4
5.0
ECONOMIC SECURITY INDICATORS
2010 2015 Change
Child Poverty Rate
Williamsburg/Greenpoint 40.9% 35.0% -5.9
Bedford Stuyvesant 47.0% 49.7% +2.7
Bushwick 42.0% 42.0% 0
Median Income, Families with children (2015 $)
Williamsburg/Greenpoint $35,295 $40,783 +15.5%
Bedford Stuyvesant $31,128 $33,506 +7.6%
Bushwick $33,035 $32,770 -0.8%
Parental Employment Instability
Williamsburg/Greenpoint 52.5% 28.1% -24.4
Bedford Stuyvesant 47.5% 42.4% -5.1
Bushwick 30.1% 39.4% +9.3
INFANT MORTALITY RATE (PER 1,000 LIVE BIRTHS)
n 2010 n 2015
New York City
Brooklyn
Williamsburg/Greenpoint
Bedford Stuyvesant
Bushwick
ADULTS WITHOUT A HIGH SCHOOL DIPLOMA (AGE 25 +)
n 2010 n 2015
New York City
Brooklyn
Williamsburg/Greenpoint
Bedford Stuyvesant
Bushwick
CHILDREN IN SINGLE-PARENT FAMILIES
n 2010 n 2015
New York City
Brooklyn
Williamsburg/Greenpoint
Bedford Stuyvesant
Bushwick
NORTH BROOKLYN
Williamsburg/Greenpoint Bedford Stuyvesant Bushwick
(K01) (K03) (K04)
2010 2015 2010 2015 2010 2015
Overall 36 44 10 12 12 16
Economic Security 11 23 9 10 18 12
Housing 32 44 15 15 12 20
Health 56 59 4 23 41 39
Education 44 46 18 15 7 11
Youth 33 43 10 12 15 14
Family and Community 34 44 12 15 8 13
39.4%29.1%
23.6%18.7%
21.1%15.5%
20.4%19.1%
57.6%
53.8%
3.8 54.1%
8.55.7 43.1%
2.5 22.9%2.4 15.5%
4.8 36.4%3.6 33.6%
5.2 39.3%37.6%
19.5%

28 CCC Community Risk Ranking
*In the inaugural year of the Community Risk Ranking publication, we ranked community districts from lowest risk (# 1) to highest risk (#59). In this and future editions of the Community Risk Ranking, while our method for calculating risks and weighting of indicators did not change, we felt it more appropriate to label the highest risk community district as #1 and lowest risk as #59.
Indicator Criteria CCC based the following indicator criteria on best practices for composite well-being index construction, combined with CCC’s institutional knowledge of the unique issues impacting child well- being in New York City. See references for more information on other well-being indices that informed our work.
• Data must be from a reliable source
• Data must be reliable and comparable at the NYC community district, borough, and city levels
• Data should be available on an annual basis with a reasonable assumption that it will be available (and comparable) in the future
• Indicators should include measurements of well-being for children, families, and the communities in which they live
• All stages of child and youth development should be represented, as well as the conditions that may affect children and youth in those various stages
• Indicators should be easily understandable and replicable
• Indicators should be normalized, i.e. data should be presented as percentages, rates, etc. which take into account variations in population sizes across geographies
• Disaggregation of indicators by racial/ethnic group at the citywide level is preferred for further citywide analysis, but not a mandatory condition for selection
• Comparability to states, other large U.S. cities, and the nation is preferred for further comparison purposes, but not a mandatory condition for selection
Indicator Definitions, Notes, and Sources
Below is a detailed description and
source information for the indicators
included in the CCC Community
Risk Ranking, grouped by domain.
Indicators that are presented as
rates per population are calculated
using population data from the U.S.
Census Bureau’s American Commu-
nity Survey 1-Year Estimates, unless
otherwise stated. Best efforts were
made to collect data from roughly
the same time period in order to
provide a “snapshot” of risks to child
well-being at a given point in time.
Data presented in this report are pri-
marily from calendar year 2015. For
some indicators, where sample sizes
or numbers of events were small,
data from the three-year period
(2013-2015) or five-year period (2011-
2015) were used to provide more
reliable estimates. Such instances
are noted below. Educational out-
come data are for the 2015 school
year, rather than calendar year 2015,
and data for families entering home-
less shelters is for fiscal year 2015.
Notes on Methodology, Indicator Definitions, and Sources

Citizens’ Committee for Children of New York, Inc. 29
Economic ConditionsChild Poverty Rate
The share of children who live in households with incomes below the federal poverty level. At the heart of understanding the economic conditions faced by New York City’s children and families is whether children live in households with enough resources to provide the basic necessities. While not a perfect metric, the poverty rate as measured by the federal poverty level provides a reliable and consis-tent indicator of income adequacy. Child poverty rates are available through the Census Bureau at a variety of geographic levels and disaggregated by racial and ethnic groups. Source: U.S. Census Bureau, American Community Survey 1-Year Estimates (2015), Summary Table S1701. http://factfinder.census.gov/.
Median Income for
Families with Children
The median annual income for families with children. Median income provides another reliable and consistent measure of family resources. This measure includes the income of every resident in a household over the age of 15, and is considered a reliable indicator of a household’s economic condition. Median incomes are available through the Census Bureau at a variety of geographic levels and disaggregated by racial and ethnic groups. Source: U.S. Census Bureau, American Community Survey 5-Year Estimates (2011-2015), Summary Table S1903. http://factfinder.cen-sus.gov/.
Parental Employment Instability
The share of children living in households where neither the householder nor a spouse worked full-time in the last year. In a vast majority of cases, this refers to the child’s parents. The parental employment instability measure adds yet another layer to our understanding of the economic conditions faced by families with children. Even if they earned a reasonable income, families with unstable employment situations may face additional economic stressors, such as the need to find additional (supplemental or new) employment and the lack of stabilizing benefits like employ-er-provided health insurance and sick leave. Information on parental employment status is available through the Census Bureau at a variety of geographic levels and disaggregated by racial and ethnic groups. Source: U.S. Census Bureau, American Community Survey 1-Year Estimates (2015), Public Use Micro-data Sample File. http://factfinder.census.gov/.
Health Infant Mortality Rate
The number of babies who died within one year of birth per 1,000 babies born in that year. The infant mortality rate is widely used as a proxy for the overall health and well-being of a given geographic area. High infant mortality rates often signal problems in healthcare provision and access, while low infant mortality rates suggest that quality medical care is both avail-able and accessed by residents of a given area. Local infant mor-tality rates for New York City are available through the New York City Department of Health and Mental Hygiene. Because of small numbers of events in some geographies, 3-year averages are used. Infant mortality data can be disaggre-gated by racial and ethnic groups. Nationally, the Centers for Disease Control and Prevention provides
statistics at the state and local levels on infant mortality rates. Source: New York City Department of Health and Mental Hygiene, Summary of Vital Statistics, 3-year data averages (2013-2015).
Low Birthweight Babies
The share of babies born weighing less than 2,500 grams. This indi-cator quantifies a major risk factor that is measurable at birth. Like the infant mortality rate, this measure may reflect the quality and accessi-bility to medical (especially prena-tal) care for a particular population. It also indicates how many babies may be at risk for other medical problems both during infancy and throughout their develop-ment. Local statistics on low birth weight babies for New York City are available through the New York City Department of Health and Mental Hygiene and can be disaggre-gated by racial and ethnic groups. Nationally, the Centers for Disease Control and Prevention provides statistics at the state and local levels on the prevalence of low birth weight babies. Source: New York City Department of Health and Mental Hygiene, Summary of Vital Statistics (2015).
Children without Health Insurance
The share of children who do not have health insurance. This indi-cator provides a reasonable estima-tion of how many children do not have affordable access to health care. Since 2008, health insurance coverage has been reported by the Census Bureau at a variety of geo-graphic levels and disaggregated by racial and ethnic groups. Source: U.S. Census Bureau, American Community Survey 1-Year Estimates (2015), Summary Table B27001. http://factfinder.census.gov/.

30 CCC Community Risk Ranking
Housing Rent Burden
The share of households that spend more than 50 percent of their annual income on rent. While imperfect, this measure provides an estimate of housing affordability within communities. Households that spend more than half of their income on rent may be at risk of losing their housing because it is (or may become) unafford-able. Data on housing costs and household income come from the Census Bureau and are available at a variety of geographic levels and disaggregated by racial and ethnic groups. Source: U.S. Census Bureau, American Community Survey 1-Year Estimates (2015), Summary Table B25070. http://factfinder.census.gov/.
Rental Overcrowding
The share of occupied rental hous-ing units that have more than one person per room. This indicator provides an approximation of the living conditions in a community’s rental housing. Crowded conditions with little room for privacy may create stress for families and chil-dren. Rental overcrowding may also suggest greater housing instability, as families settle for housing that is not sufficient for their needs or double up with other families to afford housing costs. Data on hous-ing conditions and occupancy come from the Census Bureau and are available at a variety of geographic levels and disaggregated by racial and ethnic groups. Source: U.S. Census Bureau, American Commu-nity Survey 1-Year Estimates (2015), Summary Table B25014. http://fact-finder.census.gov/.
Families Entering
Homeless Shelters
The number of families entering Department of Homeless Services family shelters per 1,000 house-holds. Another measure of housing instability, this indicator tells us how many families have actually lost their homes and entered an emergency shelter. The New York City Department of Homeless Services tracks homeless families by origin, as well as by racial and ethnic group. Data on entries to homeless shelters for other geogra-phies outside of New York City may be available from other local agen-cies, although comparability may be an issue. Source: New York City Department of Homeless Services, unpublished data (fiscal year 2015).
Education Early Education Enrollment
The share of 3- and 4-year-olds enrolled in early education pro-grams (may include public or pri-vate pre-school or nursery school or child care programs). Research suggests that early education is critical to a child’s long-term academic success. Educational enrollment data come from the Census Bureau and are available at a variety of geographic levels and disaggregated by racial and ethnic groups. Source: U.S. Census Bureau, American Community Survey 5-Year Estimates (2011-2015), Summary Table S1401. http://factfinder.cen-sus.gov/.
Elementary and Middle School
Reading and Math Test Pass Rate
The share of public school children in grades 3 through 8 who pass New York State reading (English Language Arts or ELA) and math tests. Results of the state stan-dardized reading and math tests, released annually by the New York City Department of Education (DOE), provide a performance benchmark for public elementary and middle school students that can be compared across geogra-phies and demographic groups and
over time. CCC used school-level results to aggregate data to the community-district level. New York City’s elementary and middle school test results are comparable to other New York State geogra-phies. Nationally, elementary and middle school test results are available through individual school districts as well as the National Assessment of Educational Prog-ress (NAEP), although compara-bility may be limited. Source: New York City Department of Education, New York State English Language Arts & Mathematics Tests Grades 3-8 School-Level Results (SY2015). http://schools.nyc.gov/Account-ability/data/TestResults/ELAand-MathTestResults.
High School Graduation Rate
The percentage of the cohort of public school students who entered 9th grade in a given year that graduated within four years (as of June). The high school gradu-ation rate provides a benchmark for public school students that is comparable across geographies and demographic groups and over time, both within New York City and in other parts of the country. High school graduation rates for city public school students are reported annually by the New York City Department of Education. CCC used school-level results to aggregate data to the commu-nity-district level. In some years, certain community districts had no public high schools; in these cases, borough graduation rates were used. New York City’s grad-uation results are comparable to other New York State geographies. Nationally, graduation results are available through individual school districts as well as the National Center for Education Statistics (NCES), although comparability may be limited. Source: New York City Department of Education, Cohort Graduation Outcomes (SY2015). http://schools.nyc.gov/Accountability/data/Graduation-DropoutReports/default.htm.

Citizens’ Committee for Children of New York, Inc. 31
Youth Teen Birth Rate
The number of babies born to teen-age girls (ages 15 to 19) per 1,000 teenage girls. Teenage pregnancy and births present risks for both mother and baby and also can reflect the presence of other risky behavior in teens, like unprotected sexual activity. The number of teen births are reported by the New York City Department of Health and Mental Hygiene through its Vital Statistics program, and CCC uses population data from the American Community Survey to calculate the rate per 1,000 teenage girls. Nationally, the Centers for Disease Control and Prevention provides statistics at the state and local levels on teen births. Source: New York City Department of Health and Mental Hygiene, Summary of Vital Statistics (2013-2015).
Teen Idleness
The share of teenagers (ages 16 to 19) who are not in school and not in the labor force. These teens are sometimes called “disconnected youth,” referring to a disconnection in the transition from education to career that should occur during this critical time. Data on educa-tional enrollment and labor force participation are reported by the Census Bureau and are available at a variety of geographic levels and disaggregated by racial and ethnic groups. Source: U.S. Census Bureau, American Community Survey 5-Year Estimates (2011-2015), Summary Table B14005. http://factfinder. census.gov/.
Youth Unemployment
The share of young adults (ages 20 to 24) who are unemployed (in the labor force but not working). This indicator provides additional information about the critical stage where youth transition to be self-sufficient and productive adults. Young adults must secure employment in order to become financially self-sufficient and also to build skills that will lay the groundwork for successful professional careers. A high youth unemployment rate signals trouble for both young adults and the teens that will soon be entering the labor market. Data on labor force participation are reported by the Census Bureau and are available at a variety of geographic levels and disaggregated by racial and ethnic groups. Source: U.S. Census Bureau, American Community Survey 5-Year Estimates (2011-2015), Summary Table S2301. http://factfinder.cen-sus.gov/.
Family & Community Children in Single-Parent FamiliesThe share of children living in families headed by a single parent. We exclude children who live with neither parent or in non-family households. This indicator is common among child well-being indices, as research suggests that children growing up in single-par-ent families may face elevated levels of risk. Single parents may be stressed by the economic hardship of raising a family on a single income or the time constraints of balancing work, family, and other commitments. Data on family structure are reported by the Census Bureau and are available at a variety of geographic levels and disaggregated by racial and ethnic groups. Source: U.S. Census Bureau, American Community Survey 5-Year Estimates (2011-2015), Summary Table B09002. http://factfinder. census.gov/.
Adults Without a
High School Degree
The share of adults ages 25 and older who have less than a high school diploma or equivalent degree. This indicator was previ-ously referred to as Adult Educa-tional Attainment, but the name has been changed to provide greater clarity. This indicator serves as a proxy for human capital avail-able in the community. Commu-nity members who have achieved academic and professional success can have significant influence on the children in their community. Data on educational attainment are reported by the Census Bureau and are available at a variety of geo-graphic levels and disaggregated by racial and ethnic groups. Source: U.S. Census Bureau, American Community Survey 1-Year Estimates (2015), Summary Table C15002. http://factfinder.census.gov/.
Violent Felony Rate
The number of violent felony crimes reported per 1,000 residents. Children need safe communities in which to play and engage with the world around them. Children living in communities plagued with high crime rates may have limited places to play outside and may even face safety risks as they travel from home to school. Crimes are reported by police precinct by the New York City Police Depart-ment and CCC uses a population weighting formula to convert police precinct data to community district data. For racial and ethnic group disaggregation at the city level, arrests for violent felonies may be used. Crime data are available nationally from the FBI’s Uniform Crime Reporting system, as well as from local law enforcement agencies, although comparability may be an issue. Source: New York City Police Department, Historical New York City Crime Data (2015). http://www.nyc.gov/html/nypd/html/analysis_and_planning/his-torical_nyc_crime_data.shtml

32 CCC Community Risk Ranking
Composite Index Construction
CCC’s Community Risk Ranking ranks communities based on risk within six domains of child well-being and overall using a composite index of 18 indicators, as well as indices for each of the six domains. The methodology for the construction of the indices is described below. The 18 indicators are grouped within six domains of well-being, with three indicators in each domain. Indicators in the risk ranking are first standardized using Linear Scaling Technique (LST), which calculates the differ-ence between the value of a given Community District and that of the lowest value Community District, and divides this number by the dif-ference between the highest value Community District and the lowest value Community District:
Value-Min/Max-Min
Standardized values are then adjusted so that they are all scaled from low to high with regard to increasing risks to well-being. The standardized and scaled values are then averaged within their domains using equal weighting to produce domain indices for each Commu-nity District. The domains indices are averaged using equal weighting to produce an overall index of risk to well-being for each Community District. Community Districts are then ranked based on their domain index and overall index values to identify the highest and lowest levels of risk. Community Districts are also placed into one of five risk level categories, for each domain and overall, using equal intervals of the raw index scores.
References Below is a list of the well-being indices reviewed, followed by a list of other resources referenced in the development of the CCC Community Risk Ranking.
Well-being Indices
Annie E. Casey Foundation, Kids Count Index (2012-2014). http:// www.aecf.org/work/kids-count/.
Colorado Children’s Campaign, Colorado Child Well-being Index (2012-2014). http://www.colo-radokids.org/data/kidscount/well-being_index.html.
Foundation for Child Development, National and State Child Well-being Index (2004-2013). http://fcd-us. org/our-work/previous-initiatives/ child-well-being-index-cwi.
Gallup Healthways, Well-Being Index (2008-2014). http://info. healthways.com/wellbeingindex.
Organization for Economic Co-op-eration and Development (OECD), Better Life Index (2011-2014). http:// www.oecdbetterlifeindex.org/.
Unicef, Child Well-being in Rich Countries (April 2013). http:// www.unicef.org/policyanalysis/index_68637.html.
U.S. Census Bureau, SIPP Child Well-being Index (working, May 2012). https://www.census.gov/ hhes/socdemo/children/data/sipp/ Child_Well_Being_Index-FINAL.pdf.
Decode Inc., Youthful Cities (2014). http://www.youthfulcities.com/.
Other References and Resources
Aryeh, A. (2009). Indicators of chil-dren’s well-being: Theory and prac-tice in a multi-cultural perspective. Dordrecht: Springer.
Brown, B., & Moore, K. (2003). Child and Youth Well-Being: The Social Indicators Field. In Hand-book of Applied Developmental Science (Vol. 1, pp. 437-467). Thou-sand Oaks, CA: Sage Publications.
Land, K., Lamb, V., & Mustillo, S. (2001). Child and Youth WellBeing in the United States, 1975- 1998: Some Findings from a New Index. Social Indicators Research, 56(3), 241-318.
Land, K. (2012). The well-being of America’s children: develop-ing and improving the child and youth well-being index. Dordrecht: Springer.
Lippman, L. (2007). Indicators and Indices of Child Well-Being: A Brief American History. Social Indicators Research, 83(1), 39-53.
Salzman, J. (2003). Methodolog-ical Choices Encountered in the Construction of Composite Indices of Economic and Social WellBe-ing. Center for the Study of Living Standard

Citizens’ Committee for Children of New York, Inc. 33
14 Wall Street, Suite 4ENew York, NY 10005(212) 673-1800
Visit Keeping Track Online at data.cccnewyork.org to view data on hundreds of child and family well-being indicators.
14 W
all S
tree
t, S
uite
4E
New
Yor
k, N
Y 10
005
( 212
) 673
-180
0w
ww
.ccc
new
york
.org
Non
-Pro
fit O
rg.
U.S.
Pos
tage
PA
IDN
ew Y
ork,
NY
Perm
it N
o. 2
883
CIT
IZE
NS
’ C
OM
MIT
TE
E F
OR
CH
ILD
RE
N O
F N
EW
YO
RK
Com
mun
ity R
isk
Rank
ing
Child
Wel
l-bei
ng in
New
Yor
k Ci
ty’s
59 C
omm
unity
Dis
tric
ts