Embed Size (px)
Citation preview

CITIGROUP - QUARTERLY FINANCIAL DATA SUPPLEMENT 4Q16 Historical
Page Citigroup Consolidated This revised 4Q16 Historical Financial Data Supplement as of December 31,
Financial Summary 1 2016, which represents the format Citi will use starting with the presentation ofConsolidated Statement of Income 2 its first quarter of 2017 financial results on April 13, 2017, and is beingConsolidated Balance Sheet 3 provided solely to facilitate comparison of first quarter of 2017 results withSegment Detail those of prior periods, reflects the following reporting changes and
Net Revenues 4 reclassifications: Income & Regional Average Assets and ROA 5
. the reporting of Citi Holdings as part of Corporate/Other which, prior toGlobal Consumer Banking (GCB) 6 the first quarter of 2017, was a separately reported business segment
Retail Banking and Cards Key Indicators 7 (as previously announced, the remaining business and portfolios ofassets in Citi Holdings will be reported as part of Corporate/Other and
North America 8 - 10 Citi Holdings will cease to be a separately reported business segmentLatin America 11 - 12 beginning in the first quarter of 2017); Asia (1) 13 - 14
Institutional Clients Group (ICG) 15 . the re-attribution of certain treasury-related costs betweenRevenues by Business 16 Corporate/Other and Global Consumer Banking and Institutional
Clients Group (ICG); Corporate / Other 17
Consumer Key Indicators 18 . the re-attribution of regional revenues within ICG.Memo Page - Citi Holdings (Already Included as a Component of Corporate/Other) 19
. additional income statement line item disclosures for ICG’s MarketsCitigroup Supplemental Detail businesses that were reflected in Citi's 2016 Annual Report on Form
Average Balances and Interest Rates 20 10-K; and Deposits 21Loans 22 . certain other immaterial reclassifications.Consumer Loan Delinquency Amounts and Ratios
90+ Days 23 For additional information on these reporting changes and reclassifications,30-89 Days 24 see Citi’s Current Report on Form 8-K furnished with the U.S. Securities and
Allowance for Credit Losses Exchange Commission on April 6, 2017. Total Citigroup 25Consumer and Corporate 26 - 27
Components of Provision for Loan Losses 28Non-Accrual Assets 29
Regulatory Capital Ratios and TCE & TBV Reconciliation 30
(1) Asia GCB includes the results of operations of GCB activities in certain EMEA countries for all periods presented.
This Excel file is formatted to print on Letter paper displaying the quarters 4Q15 - 4Q16 - and the full yearsfor 2015 and 2016. For the quarters of 2012, 2013 and 2014, please unhide columns F to AB. For the full yearsof 2012, 2013 and 2014, please unhide columns AU to AY.

CITIGROUP -- FINANCIAL SUMMARY(In millions of dollars, except per share amounts, and as otherwise noted)
Full Full1Q 2Q 3Q 4Q 1Q 2Q 3Q 4Q Year Year
2015 2015 2015 2015 2016 2016 2016 2016 2015 2016
Total Revenues, Net of Interest Expense 19,736$ 19,470$ 18,692$ 18,456$ 17,555$ 17,548$ 17,760$ 17,012$ 76,354$ 69,875$ Total Operating Expenses 10,884 10,928 10,669 11,134 10,523 10,369 10,404 10,120 43,615 41,416
Net Credit Losses (NCLs) 1,957 1,920 1,663 1,762 1,724 1,616 1,525 1,696 7,302 6,561 Credit Reserve Build / (Release) (202) (405) (81) 494 162 (226) 221 31 (194) 188 Provision / (Release) for Unfunded Lending Commitments (37) (48) 65 94 71 (30) (45) 33 74 29 Provision for Benefits and Claims 197 181 189 164 88 49 35 32 731 204
Provisions for Credit Losses and for Benefits and Claims 1,915$ 1,648$ 1,836$ 2,514$ 2,045$ 1,409$ 1,736$ 1,792$ 7,913$ 6,982$ Income from Continuing Operations before Income Taxes 6,937$ 6,894$ 6,187$ 4,808$ 4,987$ 5,770$ 5,620$ 5,100$ 24,826$ 21,477$ Income Taxes (benefits) 2,120 2,036 1,881 1,403 1,479 1,723 1,733 1,509 7,440 6,444 Income from Continuing Operations 4,817$ 4,858$ 4,306$ 3,405$ 3,508$ 4,047$ 3,887$ 3,591$ 17,386$ 15,033$ Income (Loss) from Discontinued Operations, net of Taxes (5) 6 (10) (45) (2) (23) (30) (3) (54) (58) Net Income before Noncontrolling Interests 4,812$ 4,864$ 4,296$ 3,360$ 3,506$ 4,024$ 3,857$ 3,588$ 17,332$ 14,975$ Net Income Attributable to Noncontrolling Interests 42 18 5 25 5 26 17 15 90 63 Citigroup's Net Income 4,770$ 4,846$ 4,291$ 3,335$ 3,501$ 3,998$ 3,840$ 3,573$ 17,242$ 14,912$
Diluted Earnings Per Share:Income from Continuing Operations 1.51$ 1.51$ 1.36$ 1.03$ 1.11$ 1.25$ 1.25$ 1.14$ 5.42$ 4.74$ Citigroup's Net Income 1.51$ 1.51$ 1.35$ 1.02$ 1.10$ 1.24$ 1.24$ 1.14$ 5.40$ 4.72$
Shares (in millions):Average Basic 3,034.2 3,020.0 2,993.3 2,968.3 2,943.0 2,915.8 2,879.9 2,813.8 3,004.0 2,888.1 Average Diluted 3,039.3 3,025.0 2,996.9 2,969.5 2,943.1 2,915.9 2,880.1 2,814.2 3,007.7 2,888.3 Common Shares Outstanding, at period end 3,034.1 3,009.8 2,979.0 2,953.3 2,934.9 2,905.4 2,849.7 2,772.4
Preferred Dividends - Basic 128$ 202$ 174$ 265$ 210$ 322$ 225$ 320$ 769$ 1,077$ Preferred Dividends - Diluted 128$ 202$ 174$ 265$ 210$ 322$ 225$ 320$ 769$ 1,077$
Income Allocated to Unrestricted Common Shareholders - BasicIncome from Continuing Operations 4,585$ 4,574$ 4,070$ 3,072$ 3,253$ 3,645$ 3,592$ 3,207$ 16,302$ 13,698$ Citigroup's Net Income 4,580$ 4,580$ 4,061$ 3,028$ 3,251$ 3,623$ 3,562$ 3,204$ 16,249$ 13,640$
Income Allocated to Unrestricted Common Shareholders - DilutedIncome from Continuing Operations 4,585$ 4,574$ 4,070$ 3,072$ 3,253$ 3,645$ 3,592$ 3,207$ 16,302$ 13,698$ Citigroup's Net Income 4,580$ 4,580$ 4,061$ 3,028$ 3,251$ 3,623$ 3,562$ 3,204$ 16,249$ 13,640$
Regulatory Capital Ratios and Performance Metrics:Common Equity Tier 1 Capital Ratio (1) 11.06% 11.37% 11.67% 12.07% 12.34% 12.53% 12.63% 12.57%Tier 1 Capital Ratio (1) 12.07% 12.54% 12.91% 13.49% 13.81% 14.12% 14.23% 14.24%Total Capital Ratio (1) 13.38% 14.14% 14.60% 15.30% 15.71% 16.13% 16.34% 16.24%Supplementary Leverage Ratio (2) 6.44% 6.72% 6.85% 7.08% 7.44% 7.48% 7.40% 7.22%Return on Average Assets 1.04% 1.06% 0.94% 0.74% 0.79% 0.89% 0.83% 0.78% 0.95% 0.82%Return on Average Common Equity 9.4% 9.1% 8.0% 5.9% 6.4% 7.0% 6.8% 6.2% 8.1% 6.6%Efficiency Ratio (Total Operating Expenses/Total Revenues, net) 55% 56% 57% 60% 60% 59% 59% 59% 57% 59%
Balance Sheet Data (in billions of dollars, except per share amounts):Total Assets 1,831.8$ 1,829.4$ 1,808.4$ 1,731.2$ 1,801.0$ 1,818.8$ 1,818.1$ 1,792.1$ Total Average Assets 1,853.1 1,839.7 1,818.4 1,784.3 1,777.6 1,807.3 1,830.2 1,819.8 1,823.9$ 1,808.7$ Total Deposits 899.6 908.0 904.2 907.9 934.6 937.9 940.3 929.4 Citigroup's Stockholders' Equity 214.6 219.4 220.8 221.9 227.5 231.9 231.6 225.1 Book Value Per Share 66.79 68.27 69.03 69.46 71.47 73.19 74.51 74.26 Tangible Book Value Per Share (3) 57.66 59.18 60.07 60.61 62.58 63.53 64.71 64.57
Direct Staff (in thousands) 239 238 239 231 225 220 220 219
(1) Citigroup’s risk-based capital ratios, which reflect full implementation of the U.S. Basel III rules, are non-GAAP financial measures. These ratios are calculated under the Basel III AdvancedApproaches framework. For the composition of Citi's Common Equity Tier 1 Capital and ratio, see page 30.
(2) Citigroup's Supplementary Leverage Ratio (SLR), which reflects full implementation of the U.S. Basel III rules, is a non-GAAP financial measure. For the composition of Citi's SLR, see page 30.(3) Tangible book value per share is a non-GAAP financial measure. For a reconciliation of this measure to reported results, see page 30.N/A Not Applicable.
Note: Ratios and variance percentages are calculated based on the displayed amounts.
Reclassified to conform to the current period's presentation.
Page 1

CITIGROUP CONSOLIDATED STATEMENT OF INCOME(In millions of dollars)
Full Full1Q 2Q 3Q 4Q 1Q 2Q 3Q 4Q Year Year
2015 2015 2015 2015 2016 2016 2016 2016 2015 2016Revenues
Interest revenue 14,600$ 14,873$ 14,714$ 14,364$ 14,167$ 14,356$ 14,653$ 14,439$ 58,551$ 57,615$ Interest expense 3,028 3,051 2,941 2,901 2,940 3,120 3,174 3,277 11,921 12,511
Net interest revenue 11,572 11,822 11,773 11,463 11,227 11,236 11,479 11,162 46,630 45,104
Commissions and fees 3,170 3,194 2,732 2,752 2,463 2,725 2,644 2,689 11,848 10,521 Principal transactions 1,971 2,173 1,327 537 1,840 1,816 2,238 1,691 6,008 7,585 Administrative and other fiduciary fees 962 995 870 821 811 878 862 813 3,648 3,364 Realized gains (losses) on investments 307 183 151 41 186 200 287 275 682 948 Other-than-temporary impairment losses on investments and other assets (72) (43) (80) (70) (465) (118) (32) (5) (265) (620) Insurance premiums 497 482 464 402 264 217 184 171 1,845 836 Other revenue 1,329 664 1,455 2,510 1,229 594 98 216 5,958 2,137
Total non-interest revenues 8,164 7,648 6,919 6,993 6,328 6,312 6,281 5,850 29,724 24,771 Total revenues, net of interest expense 19,736 19,470 18,692 18,456 17,555 17,548 17,760 17,012 76,354 69,875
Provisions for Credit Losses and for Benefits and Claims
Net credit losses 1,957 1,920 1,663 1,762 1,724 1,616 1,525 1,696 7,302 6,561 Credit reserve build / (release) (202) (405) (81) 494 162 (226) 221 31 (194) 188 Provision for loan losses 1,755 1,515 1,582 2,256 1,886 1,390 1,746 1,727 7,108 6,749 Provision for Policyholder benefits and claims 197 181 189 164 88 49 35 32 731 204 Provision for unfunded lending commitments (37) (48) 65 94 71 (30) (45) 33 74 29
Total provisions for credit losses and for benefits and claims 1,915 1,648 1,836 2,514 2,045 1,409 1,736 1,792 7,913 6,982
Operating ExpensesCompensation and benefits 5,520 5,483 5,321 5,445 5,556 5,229 5,203 4,982 21,769 20,970 Premises and Equipment 709 737 722 710 651 642 624 625 2,878 2,542 Technology / communication expense 1,600 1,656 1,628 1,697 1,649 1,657 1,694 1,685 6,581 6,685 Advertising and marketing expense 392 393 391 371 390 433 403 406 1,547 1,632 Other operating 2,663 2,659 2,607 2,911 2,277 2,408 2,480 2,422 10,840 9,587
Total operating expenses 10,884 10,928 10,669 11,134 10,523 10,369 10,404 10,120 43,615 41,416
Income from Continuing Operations beforeIncome Taxes 6,937 6,894 6,187 4,808 4,987 5,770 5,620 5,100 24,826 21,477
Provision (benefits) for income taxes 2,120 2,036 1,881 1,403 1,479 1,723 1,733 1,509 7,440 6,444
Income from Continuing Operations 4,817 4,858 4,306 3,405 3,508 4,047 3,887 3,591 17,386 15,033 Discontinued Operations
Income (Loss) from Discontinued Operations (8) 9 (15) (69) (3) (36) (37) (4) (83) (80) Gain (Loss) on Sale - - - - - - - - - - Provision (benefits) for income taxes (3) 3 (5) (24) (1) (13) (7) (1) (29) (22)
Income (Loss) from Discontinued Operations, net of taxes (5) 6 (10) (45) (2) (23) (30) (3) (54) (58)
Net Income before Noncontrolling Interests 4,812 4,864 4,296 3,360 3,506 4,024 3,857 3,588 17,332 14,975
Net Income attributable to noncontrolling interests 42 18 5 25 5 26 17 15 90 63 Citigroup's Net Income 4,770$ 4,846$ 4,291$ 3,335$ 3,501$ 3,998$ 3,840$ 3,573$ 17,242$ 14,912$
Reclassified to conform to the current period's presentation.
Page 2

CITIGROUP CONSOLIDATED BALANCE SHEET(In millions of dollars)
March 31, June 30, September 30, December 31, March 31, June 30, September 30, December 31,2015 2015 2015 2015 2016 2016 2016 2016
AssetsCash and due from banks (including segregated cash and other deposits) 21,880$ 23,413$ 21,726$ 20,900$ 22,240$ 22,140$ 23,419$ 23,043$ Deposits with banks 133,896 130,685 137,935 112,197 136,049 127,993 132,571 137,451 Fed funds sold and securities borr'd or purch under agree. to resell 239,015 237,054 231,695 219,675 225,093 228,683 236,045 236,813 Brokerage receivables 35,637 43,921 37,875 27,683 35,261 36,851 36,112 28,887 Trading account assets 295,961 271,942 258,233 241,215 265,499 263,174 254,627 243,925 Investments
Available-for-sale and non-marketable equity securities 303,561 301,955 308,499 306,740 316,362 320,390 316,352 307,637 Held-to-maturity 23,254 30,166 33,940 36,215 36,890 35,903 38,588 45,667
Total Investments 326,815 332,121 342,439 342,955 353,252 356,293 354,940 353,304 Loans, net of unearned incomeConsumer 337,431 337,878 328,922 325,454 317,555 326,082 328,372 325,063 Corporate 283,623 294,240 293,522 292,163 301,269 307,433 310,063 299,306
Loans, net of unearned income 621,054 632,118 622,444 617,617 618,824 633,515 638,435 624,369 Allowance for loan losses (14,598) (14,075) (13,626) (12,626) (12,712) (12,304) (12,439) (12,060) Total loans, net 606,456 618,043 608,818 604,991 606,112 621,211 625,996 612,309
Goodwill 23,150 23,012 22,444 22,349 22,575 22,496 22,539 21,659 Intangible assets (other than MSRs) 4,244 4,071 3,880 3,721 3,493 5,521 5,358 5,114 Mortgage servicing rights (MSRs) 1,685 1,924 1,766 1,781 1,524 1,324 1,270 1,564 Other assets 143,062 143,184 141,545 133,743 129,869 133,085 125,240 128,008 Assets related to discontinued operations held for sale - - - - - - - - Total assets 1,831,801$ 1,829,370$ 1,808,356$ 1,731,210$ 1,800,967$ 1,818,771$ 1,818,117$ 1,792,077$
LiabilitiesNon-interest-bearing deposits in U.S. offices 136,568$ 135,013$ 141,425$ 139,249$ 138,153$ 140,145$ 141,899$ 136,698$ Interest-bearing deposits in U.S. offices 275,423 268,947 267,057 280,234 284,969 295,589 288,094 300,972
Total U.S. Deposits 411,991 403,960 408,482 419,483 423,122 435,734 429,993 437,670 Non-interest-bearing deposits in offices outside the U.S. 71,653 72,629 73,188 71,577 77,865 76,574 75,956 77,616 Interest-bearing deposits in offices outside the U.S. 416,003 431,448 422,573 416,827 433,604 425,544 434,303 414,120
Total International Deposits 487,656 504,077 495,761 488,404 511,469 502,118 510,259 491,736
Total deposits 899,647 908,037 904,243 907,887 934,591 937,852 940,252 929,406 Fed funds purch and securities loaned or sold under agree. to repurch. 175,371 177,012 168,604 146,496 157,208 158,001 153,124 141,821 Brokerage payables 58,252 54,867 59,557 53,722 58,257 62,054 61,921 57,152 Trading account liabilities 142,438 136,295 125,981 117,512 136,146 136,307 131,649 139,045 Short-term borrowings 39,405 25,907 23,715 21,079 20,893 18,408 29,527 30,701 Long-term debt 210,522 211,845 213,533 201,275 207,835 207,448 209,051 206,178 Other liabilities (1) 90,143 94,582 90,586 60,147 57,276 65,680 59,903 61,631 Liabilities related to discontinued operations held for sale - - - - - - - - Total liabilities 1,615,778$ 1,608,545$ 1,586,219$ 1,508,118$ 1,572,206$ 1,585,750$ 1,585,427$ 1,565,934$ EquityStockholders' equityPreferred stock 11,968$ 13,968$ 15,218$ 16,718$ 17,753$ 19,253$ 19,253$ 19,253$
Common stock 31 31 31 31 31 31 31 31 Additional paid-in capital 108,124 108,219 108,261 108,288 107,590 107,730 107,875 108,042 Retained earnings 122,463 126,954 130,921 133,841 136,998 140,527 143,678 146,477 Treasury stock (3,275) (4,628) (6,326) (7,677) (8,224) (9,538) (12,069) (16,302) Accumulated other comprehensive income (loss) (24,691) (25,104) (27,257) (29,344) (26,626) (26,115) (27,193) (32,381) Total common equity 202,652$ 205,472$ 205,630$ 205,139$ 209,769$ 212,635$ 212,322$ 205,867$
Total Citigroup stockholders' equity 214,620$ 219,440$ 220,848$ 221,857$ 227,522$ 231,888$ 231,575$ 225,120$ Noncontrolling interests 1,403 1,385 1,289 1,235 1,239 1,133 1,115 1,023 Total equity 216,023 220,825 222,137 223,092 228,761 233,021 232,690 226,143 Total liabilities and equity 1,831,801$ 1,829,370$ 1,808,356$ 1,731,210$ 1,800,967$ 1,818,771$ 1,818,117$ 1,792,077$
(1) Includes allowance for credit losses for unfunded lending commitments. See page 25 for amounts by period.
Reclassified to conform to the current period's presentation.
Page 3

SEGMENT DETAILNET REVENUES(In millions of dollars)
Full Full1Q 2Q 3Q 4Q 1Q 2Q 3Q 4Q Year Year
2015 2015 2015 2015 2016 2016 2016 2016 2015 2016
Global Consumer BankingNorth America 5,008$ 4,848$ 4,840$ 4,819$ 4,830$ 4,709$ 5,161$ 5,059$ 19,515$ 19,759$ Latin America 1,420 1,420 1,533 1,349 1,229 1,236 1,245 1,212 5,722 4,922 Asia (1) 1,810 1,860 1,698 1,646 1,655 1,729 1,758 1,696 7,014 6,838
Total 8,238 8,128 8,071 7,814 7,714 7,674 8,164 7,967 32,251 31,519
Institutional Clients Group (Ex-CVA/DVA) (2)North America 3,248 3,305 3,282 2,705 2,980 3,393 3,191 2,949 12,540 12,513 EMEA 2,998 2,383 2,198 2,077 2,167 2,577 2,506 2,605 9,656 9,855 Latin America 980 987 1,032 937 962 1,022 999 994 3,936 3,977 Asia 1,805 1,791 1,748 1,587 1,786 1,697 1,763 1,636 6,931 6,882
Total 9,031 8,466 8,260 7,306 7,895 8,689 8,459 8,184 33,063 33,227
Corporate / Other 2,540 2,564 2,165 3,517 1,946 1,185 1,137 861 10,786 5,129
Total Citigroup - Net Revenues (Ex-CVA/DVA) (2) 19,809$ 19,158$ 18,496$ 18,637$ 17,555$ 17,548$ 17,760$ 17,012$ 76,100 69,875
CVA/DVA for Periods Prior to 1Q16 (2) (73) 312 196 (181) - - - - 254 -
Total Citigroup - Net Revenues 19,736$ 19,470$ 18,692$ 18,456$ 17,555$ 17,548$ 17,760$ 17,012$ 76,354$ 69,875$
(1) Asia GCB includes the results of operations of GCB activities in certain EMEA countries for all periods presented.(2) Credit valuation adjustments (CVA) on derivatives (counterparty and own-credit), net of hedges; Funding Valuation Adjustments (FVA) on derivatives; and Debt Valuation Adjustments (DVA) on
Citigroup's fair value option liabilities (collectively referred to as CVA/DVA). Effective January 1, 2016, Citigroup early adopted on a prospective basis the amendment inASU No. 2016-01,Financial Instruments – Overall (Subtopic 825-10): Recognition and Measurement of Financial Assets and Financial Liabilities, related to the presentation of DVA on fair value option liabilities.Accordingly, beginning in the first quarter of 2016, the portion of the change in fair value of these liabilities related to changes in Citigroup’s own credit spreads (DVA) are reflected as a componentof Accumulated Other Comprehensive Income (AOCI); previously these amounts were recognized in Citigroup’s revenues and net income. In the tables above and on pages 5, 15 and 16,results for all periods prior to the first quarter of 2016 exclude the impact of CVA/DVA, as applicable, for consistency with the current period's presentation. Citigroup's results of operationsexcluding the impact of CVA/DVA in such periods are non-GAAP financial measures.
Reclassified to conform to the current period's presentation.
Page 4

SEGMENT DETAILINCOME(In millions of dollars)
Full Full1Q 2Q 3Q 4Q 1Q 2Q 3Q 4Q Year Year
2015 2015 2015 2015 2016 2016 2016 2016 2015 2016Income from Continuing Operations:
Global Consumer BankingNorth America 1,121$ 1,056$ 1,049$ 962$ 833$ 815$ 780$ 810$ 4,188$ 3,238$ Latin America 207 181 297 141 146 173 160 154 826 633 Asia (1) 339 338 306 217 215 297 310 261 1,200 1,083
Total 1,667 1,575 1,652 1,320 1,194 1,285 1,250 1,225 6,214 4,954
Institutional Clients Group (Ex-CVA/DVA) (2)North America 927 937 887 465 546 1,005 1,067 877 3,216 3,495 EMEA 998 579 372 196 374 695 649 647 2,145 2,365 Latin America 381 409 380 176 330 392 389 343 1,346 1,454 Asia 643 630 535 423 619 523 555 514 2,231 2,211
Total 2,949 2,555 2,174 1,260 1,869 2,615 2,660 2,381 8,938 9,525
Corporate / Other 248 532 353 939 445 147 (23) (15) 2,072 554
Income From Continuing Operations - Ex-CVA/DVA (2) 4,864 4,662 4,179 3,519 3,508 4,047 3,887 3,591 17,224 15,033
Discontinued Operations (5) 6 (10) (45) (2) (23) (30) (3) (54) (58)
Net Income Attributable to Noncontrolling Interests 42 18 5 25 5 26 17 15 90 63
Citigroup's Net Income - Ex-CVA/DVA (2) 4,817$ 4,650$ 4,164$ 3,449$ 3,501$ 3,998$ 3,840$ 3,573$ 17,080$ 14,912$
CVA/DVA (after-tax) for Periods Prior to 1Q16 (2) (47) 196 127 (114) - - - - 162 -
Total Citigroup - Net Income 4,770$ 4,846$ 4,291$ 3,335$ 3,501$ 3,998$ 3,840$ 3,573$ 17,242$ 14,912$
Average AssetsNorth America 885$ 876$ 882$ 890$ 907$ 926$ 947$ 966$ 883$ 937$ EMEA (1) 317 331 312 300 301 312 316 308 315 309 Latin America 146 145 138 138 134 134 131 128 142 132 Asia (1) 311 313 307 308 307 315 325 318 310 316 Corporate / Other 194 175 179 148 129 120 111 100 174 115
Total 1,853$ 1,840$ 1,818$ 1,784$ 1,778$ 1,807$ 1,830$ 1,820$ 1,824$ 1,809$
Return on Average Assets (ROA)(Ex-CVA/DVA) (2) (3)North America 0.93% 0.91% 0.87% 0.64% 0.61% 0.79% 0.77% 0.70% 0.84% 0.72%EMEA (1) 1.24% 0.69% 0.47% 0.25% 0.49% 0.88% 0.80% 0.82% 0.67% 0.75%Latin America 1.63% 1.63% 1.94% 0.90% 1.43% 1.69% 1.66% 1.54% 1.53% 1.58%Asia (1) 1.29% 1.24% 1.08% 0.82% 1.09% 1.04% 1.06% 0.97% 1.10% 1.04%Corporate/Other 0.48% 1.24% 0.75% 2.35% 1.40% 0.39% (0.17%) (0.08%) 1.14% 0.43%
Total 1.05% 1.01% 0.91% 0.77% 0.79% 0.89% 0.83% 0.78% 0.94% 0.82%
(1) Asia GCB includes the results of operations of GCB activities in certain EMEA countries for all periods presented.(2) See footnote 2 on page 4.(3) For all periods prior to the first quarter of 2016, ROA excluding CVA/DVA is defined as annualized net income (less CVA/DVA), divided by average
assets. See above for after-tax CVA/DVA for each period presented.
Reclassified to conform to the current period's presentation.
Page 5

GLOBAL CONSUMER BANKINGPage 1(In millions of dollars, except as otherwise noted)
Full Full1Q 2Q 3Q 4Q 1Q 2Q 3Q 4Q Year Year
2015 2015 2015 2015 2016 2016 2016 2016 2015 2016
Net Interest Revenue 6,400$ 6,404$ 6,460$ 6,488$ 6,352$ 6,308$ 6,709$ 6,656$ 25,752$ 26,025$ Non-Interest Revenue 1,838 1,724 1,611 1,326 1,362 1,366 1,455 1,311 6,499 5,494 Total Revenues, Net of Interest Expense 8,238 8,128 8,071 7,814 7,714 7,674 8,164 7,967 32,251 31,519 Total Operating Expenses 4,300 4,334 4,225 4,340 4,401 4,297 4,429 4,356 17,199 17,483
Net Credit Losses 1,490 1,504 1,353 1,405 1,371 1,374 1,349 1,516 5,752 5,610 Credit Reserve Build / (Release) (150) (98) (102) (45) 85 23 436 164 (395) 708 Provision for Unfunded Lending Commitments - (4) 1 7 1 8 (3) (3) 4 3 Provision for Benefits and Claims 28 22 28 30 28 20 26 32 108 106
Provisions for Credit Losses and for Benefits and Claims (LLR & PBC) 1,368 1,424 1,280 1,397 1,485 1,425 1,808 1,709 5,469 6,427 Income from Continuing Operations before Taxes 2,570 2,370 2,566 2,077 1,828 1,952 1,927 1,902 9,583 7,609 Income Taxes 903 795 914 757 634 667 677 677 3,369 2,655 Income from Continuing Operations 1,667 1,575 1,652 1,320 1,194 1,285 1,250 1,225 6,214 4,954 Noncontrolling Interests (4) 5 8 1 2 1 3 1 10 7 Net Income 1,671$ 1,570$ 1,644$ 1,319$ 1,192$ 1,284$ 1,247$ 1,224$ 6,204$ 4,947$ EOP Assets (in billions of dollars) 374$ 381$ 376$ 381$ 384$ 399$ 411$ 412$ Average Assets (in billions of dollars) 379$ 380$ 374$ 378$ 377$ 387$ 409$ 410$ 378$ 396$ Return on Average Assets (ROA) 1.79% 1.66% 1.74% 1.38% 1.27% 1.33% 1.21% 1.19% 1.64% 1.25%Efficiency Ratio 52% 53% 52% 56% 57% 56% 54% 55% 53% 55%
Net Credit Losses as a % of Average Loans 2.21% 2.22% 1.99% 2.05% 2.04% 2.02% 1.87% 2.10% 2.12% 2.01%
Revenue by BusinessRetail Banking 3,483$ 3,483$ 3,461$ 3,227$ 3,187$ 3,242$ 3,330$ 3,157$ 13,654$ 12,916$ Cards (1) 4,755 4,645 4,610 4,587 4,527 4,432 4,834 4,810 18,597 18,603
Total 8,238$ 8,128$ 8,071$ 7,814$ 7,714$ 7,674$ 8,164$ 7,967$ 32,251$ 31,519$
Net Credit Losses by BusinessRetail Banking 256$ 261$ 246$ 295$ 221$ 243$ 257$ 286$ 1,058$ 1,007$ Cards (1) 1,234 1,243 1,107 1,110 1,150 1,131 1,092 1,230 4,694 4,603
Total 1,490$ 1,504$ 1,353$ 1,405$ 1,371$ 1,374$ 1,349$ 1,516$ 5,752$ 5,610$
Income from Continuing Operations by BusinessRetail Banking 539$ 517$ 541$ 278$ 298$ 472$ 461$ 335$ 1,875$ 1,566$ Cards (1) 1,128 1,058 1,111 1,042 896 813 789 890 4,339 3,388
Total 1,667$ 1,575$ 1,652$ 1,320$ 1,194$ 1,285$ 1,250$ 1,225$ 6,214$ 4,954$
Foreign Currency (FX) Translation Impact:Total Revenue - as Reported 8,238$ 8,128$ 8,071$ 7,814$ 7,714$ 7,674$ 8,164$ 7,967$ 32,251$ 31,519$ Impact of FX Translation (2) (422) (460) (271) (233) (131) (140) (92) - (998) - Total Revenues - Ex-FX (2) 7,816$ 7,668$ 7,800$ 7,581$ 7,583$ 7,534$ 8,072$ 7,967$ 31,253$ 31,519$
Total Operating Expenses - as Reported 4,300$ 4,334$ 4,225$ 4,340$ 4,401$ 4,297$ 4,429$ 4,356$ 17,199$ 17,483$ Impact of FX Translation (2) (199) (211) (121) (108) (61) (72) (51) - (463) - Total Operating Expenses - Ex-FX (2) 4,101$ 4,123$ 4,104$ 4,232$ 4,340$ 4,225$ 4,378$ 4,356$ 16,736$ 17,483$
Total Provisions for LLR & PBC - as Reported 1,368$ 1,424$ 1,280$ 1,397$ 1,485$ 1,425$ 1,808$ 1,709$ 5,469$ 6,427$ Impact of FX Translation (2) (96) (89) (57) (53) (35) (28) (18) - (213) - Total Provisions for LLR & PBC - Ex-FX (2) 1,272$ 1,335$ 1,223$ 1,344$ 1,450$ 1,397$ 1,790$ 1,709$ 5,256$ 6,427$
Net Income - as Reported 1,671$ 1,570$ 1,644$ 1,319$ 1,192$ 1,284$ 1,247$ 1,224$ 6,204$ 4,947$ Impact of FX Translation (2) (91) (112) (70) (59) (29) (29) (16) - (239) - Net Income - Ex-FX (2) 1,580$ 1,458$ 1,574$ 1,260$ 1,163$ 1,255$ 1,231$ 1,224$ 5,965$ 4,947$
(1) Includes both Citi-Branded Cards and Citi Retail Services.(2) Reflects the impact of foreign currency (FX) translation into U.S. Dollars at the fourth quarter of 2016 average exchange rates for all periods presented.
Citigroup's results of operations excluding the impact of FX translation are non-GAAP financial measures.
Reclassified to conform to the current period's presentation.
Page 6

GLOBAL CONSUMER BANKINGPage 2
1Q 2Q 3Q 4Q 1Q 2Q 3Q 4Q2015 2015 2015 2015 2016 2016 2016 2016
Retail Banking Key Indicators (in billions of dollars, except as otherwise noted)
Branches (actual) 2,786 2,774 2,764 2,754 2,670 2,650 2,648 2,618 Accounts (in millions) 55.1 55.2 56.1 56.1 56.0 56.2 56.2 54.4 Average Deposits 296.6$ 296.5$ 293.5$ 293.8$ 293.9$ 297.4$ 301.2$ 301.1$ Investment Sales 25.5$ 25.5$ 19.7$ 17.3$ 16.4$ 18.8$ 19.5$ 18.6$ Investment Assets under Management (AUMs) 147.8$ 148.5$ 138.9$ 140.3$ 139.8$ 139.9$ 140.9$ 137.5$ Average Loans 141.0$ 142.4$ 139.8$ 140.8$ 139.6$ 141.1$ 142.0$ 138.1$ EOP Loans:
Mortgages 79.3$ 80.1$ 79.0$ 80.2$ 82.2$ 81.6$ 81.4$ 79.4$ Commercial Banking 33.0 33.4 32.0 31.9 32.2 32.6 33.2 32.0 Personal and Other 28.4 28.9 28.1 28.2 27.6 27.2 27.0 24.9
EOP Loans 140.7$ 142.4$ 139.1$ 140.3$ 142.0$ 141.4$ 141.6$ 136.3$
Net Interest Revenue (in millions) (1) 2,110$ 2,168$ 2,152$ 2,165$ 2,165$ 2,154$ 2,191$ 2,129$ As a % of Average Loans 6.07% 6.11% 6.11% 6.10% 6.24% 6.14% 6.14% 6.13%
Net Credit Losses (in millions) 256$ 261$ 246$ 295$ 221$ 243$ 257$ 286$ As a % of Average Loans 0.74% 0.74% 0.70% 0.83% 0.64% 0.69% 0.72% 0.82%
Loans 90+ Days Past Due (in millions) (2) 540$ 567$ 529$ 523$ 498$ 515$ 579$ 474$ As a % of EOP Loans 0.39% 0.40% 0.38% 0.38% 0.35% 0.37% 0.41% 0.35%
Loans 30-89 Days Past Due (in millions) (2) 791$ 746$ 764$ 739$ 793$ 735$ 722$ 726$ As a % of EOP Loans 0.57% 0.53% 0.55% 0.53% 0.56% 0.52% 0.51% 0.54%
Cards Key Indicators (in millions of dollars, except as otherwise noted) (3)EOP Open Accounts (in millions) 135.6 135.9 135.6 135.9 134.1 143.0 143.0 142.7 Purchase Sales (in billions) 80.1$ 89.7$ 88.6$ 96.2$ 84.6$ 95.7$ 115.3$ 125.1$
Average Loans (in billions) (4) 132.4$ 129.9$ 129.7$ 131.5$ 131.3$ 131.9$ 145.5$ 149.3$ EOP Loans (in billions) (4) 129.8$ 131.7$ 130.3$ 136.3$ 130.3$ 143.4$ 147.8$ 155.6$ Average Yield (5) 13.39% 13.33% 13.25% 13.09% 13.21% 13.05% 12.76% 12.54% Net Interest Revenue (6) 4,290$ 4,236$ 4,308$ 4,323$ 4,187$ 4,154$ 4,518$ 4,527$
As a % of Average Loans (6) 13.14% 13.08% 13.18% 13.04% 12.83% 12.67% 12.35% 12.06%Net Credit Losses 1,234$ 1,243$ 1,107$ 1,110$ 1,150$ 1,131$ 1,092$ 1,230$
As a % of Average Loans 3.78% 3.84% 3.39% 3.35% 3.52% 3.45% 2.99% 3.28%Net Credit Margin (7) 3,511$ 3,393$ 3,493$ 3,468$ 3,368$ 3,292$ 3,734$ 3,572$
As a % of Average Loans (7) 10.75% 10.48% 10.68% 10.46% 10.32% 10.04% 10.21% 9.52%Loans 90+ Days Past Due 1,592$ 1,453$ 1,452$ 1,596$ 1,524$ 1,450$ 1,587$ 1,819$
As a % of EOP Loans 1.23% 1.10% 1.11% 1.17% 1.17% 1.01% 1.07% 1.17%Loans 30-89 Days Past Due 1,623$ 1,544$ 1,663$ 1,679$ 1,567$ 1,583$ 1,831$ 1,814$
As a % of EOP Loans 1.25% 1.17% 1.28% 1.23% 1.20% 1.10% 1.24% 1.17%
(1) Also includes net interest revenue related to the international regions' deposit balances in excess of the average loan portfolio. (2) The Loans 90+ Days Past Due and 30-89 Days Past Due and related ratios excludes U.S. mortgage loans that are guaranteed by U.S.
government-sponsored agencies. See footnote 2 on page 9.(3) On June 17, 2016, Citi completed the acquisition of the $10.6 billion Costco U.S. co-brand credit card portfolio.(4) Average loans, EOP loans and the related consumer delinquency amounts and ratios include interest and fees receivables balances.(5) Average yield is gross interest revenue earned divided by average loans.(6) Net interest revenue includes certain fees that are recorded as interest revenue.(7) Net credit margin is total revenues, net of interest expense, less net credit losses and policy benefits and claims.
Reclassified to conform to the current period's presentation.
Page 7

GLOBAL CONSUMER BANKINGNORTH AMERICAPage 1(In millions of dollars, except as otherwise noted) Full Full
1Q 2Q 3Q 4Q 1Q 2Q 3Q 4Q Year Year2015 2015 2015 2015 2016 2016 2016 2016 2015 2016
Net Interest Revenue 4,285$ 4,266$ 4,403$ 4,455$ 4,398$ 4,331$ 4,696$ 4,706$ 17,409$ 18,131$ Non-Interest Revenue 723 582 437 364 432 378 465 353 2,106 1,628 Total Revenues, Net of Interest Expense 5,008 4,848 4,840 4,819 4,830 4,709 5,161 5,059 19,515 19,759 Total Operating Expenses 2,338 2,315 2,315 2,401 2,500 2,426 2,595 2,537 9,369 10,058
Net Credit Losses 961 999 877 914 933 954 927 1,105 3,751 3,919 Credit Reserve Build / (Release) (100) (109) (60) (70) 79 49 408 117 (339) 653 Provision for Unfunded Lending Commitments 1 - - 7 - 7 - (1) 8 6 Provision for Benefits and Claims 10 10 11 8 9 8 8 9 39 34
Provisions for Loan Losses and for Benefits and Claims 872 900 828 859 1,021 1,018 1,343 1,230 3,459 4,612 Income from Continuing Operations before Taxes 1,798 1,633 1,697 1,559 1,309 1,265 1,223 1,292 6,687 5,089 Income Taxes 677 577 648 597 476 450 443 482 2,499 1,851 Income from Continuing Operations 1,121 1,056 1,049 962 833 815 780 810 4,188 3,238 Noncontrolling Interests 1 - 1 1 - (1) - (1) 3 (2) Net Income 1,120$ 1,056$ 1,048$ 961$ 833$ 816$ 780$ 811$ 4,185$ 3,240$ Average Assets (in billions) 208$ 207$ 208$ 209$ 211$ 218$ 238$ 244$ 208$ 228$ Return on Average Assets 2.18% 2.05% 2.00% 1.82% 1.59% 1.51% 1.30% 1.32% 2.01% 1.42%Efficiency Ratio 47% 48% 48% 50% 52% 52% 50% 50% 48% 51%
Net Credit Losses as a % of Average Loans 2.50% 2.58% 2.21% 2.26% 2.32% 2.34% 2.07% 2.42% 2.39% 2.29%
Revenue by BusinessRetail Banking 1,371$ 1,340$ 1,305$ 1,296$ 1,290$ 1,313$ 1,356$ 1,263$ 5,312$ 5,222$ Citi-Branded Cards 2,002 1,927 1,922 1,930 1,860 1,886 2,191 2,213 7,781 8,150 Citi Retail Services 1,635 1,581 1,613 1,593 1,680 1,510 1,614 1,583 6,422 6,387
Total 5,008$ 4,848$ 4,840$ 4,819$ 4,830$ 4,709$ 5,161$ 5,059$ 19,515$ 19,759$
Net Credit Losses by BusinessRetail Banking 36$ 39$ 33$ 42$ 25$ 45$ 52$ 83$ 150$ 205$ Citi-Branded Cards 492 503 443 454 455 467 448 539 1,892 1,909 Citi Retail Services 433 457 401 418 453 442 427 483 1,709 1,805
Total 961$ 999$ 877$ 914$ 933$ 954$ 927$ 1,105$ 3,751$ 3,919$
Income from Continuing Operations by BusinessRetail Banking 183$ 183$ 137$ 113$ 89$ 172$ 187$ 85$ 616$ 533$ Citi-Branded Cards 535 495 517 510 353 320 322 446 2,057 1,441 Citi Retail Services 403 378 395 339 391 323 271 279 1,515 1,264
Total 1,121$ 1,056$ 1,049$ 962$ 833$ 815$ 780$ 810$ 4,188$ 3,238$
Reclassified to conform to the current period's presentation.
Page 8

GLOBAL CONSUMER BANKINGNORTH AMERICAPage 2
1Q 2Q 3Q 4Q 1Q 2Q 3Q 4Q2015 2015 2015 2015 2016 2016 2016 2016
Retail Banking Key Indicators (in billions of dollars, except as otherwise noted)
Branches (actual) 788 779 779 780 729 729 727 723 Accounts (in millions) 11.5 11.3 11.2 11.0 10.9 10.8 10.6 10.5 Average Deposits 180.4$ 179.9$ 181.4$ 181.2$ 180.6$ 182.1$ 183.9$ 186.0$ Investment Sales 6.3$ 5.9$ 4.9$ 4.6$ 4.8$ 5.5$ 5.2$ 5.3$ Investment AUMs 50.6$ 50.6$ 47.9$ 48.9$ 49.4$ 51.4$ 53.1$ 52.8$
Average Loans 47.8$ 49.3$ 50.3$ 51.8$ 52.9$ 54.4$ 55.0$ 55.0$
EOP Loans:Mortgages 37.8$ 38.9$ 40.6$ 41.9$ 42.9$ 43.9$ 44.0$ 44.2$ Commercial Banking 8.5 8.5 8.4 8.3 8.6 8.8 8.8 9.0 Personal and Other 1.8 1.8 2.0 2.0 2.0 2.1 2.0 2.1
Total EOP Loans 48.1$ 49.2$ 51.0$ 52.2$ 53.5$ 54.8$ 54.8$ 55.3$
Mortgage Originations (1) 7.0$ 8.8$ 7.5$ 6.2$ 5.5$ 6.4$ 6.5$ 5.6$
Third Party Mortgage Servicing Portfolio (EOP) 168.2$ 165.0$ 162.6$ 159.5$ 155.9$ 151.8$ 147.6$ 143.2$
Net Servicing & Gain/(Loss) on Sale (in millions) 168.7$ 179.4$ 107.2$ 110.6$ 97.6$ 90.9$ 141.9$ 102.8$
Saleable Mortgage Rate Locks 4.4$ 5.0$ 3.9$ 3.2$ 3.0$ 4.0$ 3.9$ 2.6$
Net Interest Revenue on Loans (in millions) 252$ 269$ 265$ 274$ 277$ 269$ 267$ 256$ As a % of Avg. Loans 2.14% 2.19% 2.09% 2.10% 2.11% 1.99% 1.93% 1.85%
Net Credit Losses (in millions) 36$ 39$ 33$ 42$ 25$ 45$ 52$ 83$ As a % of Avg. Loans 0.31% 0.32% 0.26% 0.32% 0.19% 0.33% 0.38% 0.60%
Loans 90+ Days Past Due (in millions) (2) 123$ 150$ 138$ 165$ 152$ 180$ 256$ 181$ As a % of EOP Loans 0.26% 0.31% 0.28% 0.32% 0.29% 0.33% 0.47% 0.33%
Loans 30-89 Days Past Due (in millions) (2) 203$ 176$ 198$ 221$ 198$ 192$ 198$ 214$ As a % of EOP Loans 0.43% 0.36% 0.40% 0.43% 0.38% 0.36% 0.37% 0.39%
(1) Originations of residential first mortgages.(2) The Loans 90+ Days Past Due and 30-89 Days Past Due and related ratios exclude U.S. mortgage loans
that are guaranteed by U.S. government-sponsored agencies since the potential loss predominantly resides with the U.S. agencies.The amounts excluded for Loans 90+ Days Past Due and (EOP Loans) were $491 million and ($1.1 billion), $456 millionand ($1.1 billion), $408 million and ($0.9 billion), $305 million and ($0.7 billion), and $327 million and ($0.7 billion), as of December 31, 2015, March 31, 2016, June 30, 2016, September 30, 2016 and December 31, 2016, respectively.
The amounts excluded for Loans 30-89 Days Past Due and (EOP Loans) were $87 million and ($1.1 billion), $86 millionand ($1.1 billion), $91 million and ($0.9 billion), $58 million and ($0.7 billion), and $70 million and ($0.7 billion),as of December 31, 2015, March 31, 2016, June 30, 2016, September 30, 2016 and December 31, 2016, respectively.
Reclassified to conform to the current period's presentation.
Page 9
GLOBAL CONSUMER BANKINGNORTH AMERICAPage 3
1Q 2Q 3Q 4Q 1Q 2Q 3Q 4Q2015 2015 2015 2015 2016 2016 2016 2016
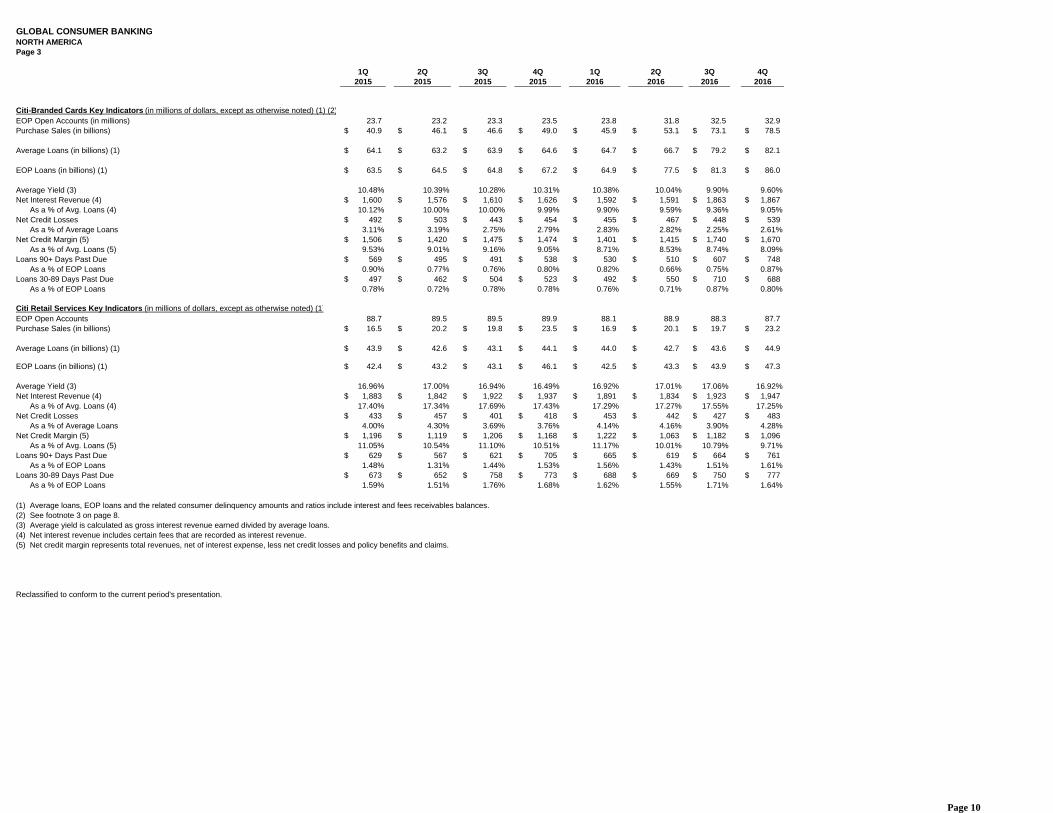
Citi-Branded Cards Key Indicators (in millions of dollars, except as otherwise noted) (1) (2)EOP Open Accounts (in millions) 23.7 23.2 23.3 23.5 23.8 31.8 32.5 32.9 Purchase Sales (in billions) 40.9$ 46.1$ 46.6$ 49.0$ 45.9$ 53.1$ 73.1$ 78.5$
Average Loans (in billions) (1) 64.1$ 63.2$ 63.9$ 64.6$ 64.7$ 66.7$ 79.2$ 82.1$
EOP Loans (in billions) (1) 63.5$ 64.5$ 64.8$ 67.2$ 64.9$ 77.5$ 81.3$ 86.0$
Average Yield (3) 10.48% 10.39% 10.28% 10.31% 10.38% 10.04% 9.90% 9.60%Net Interest Revenue (4) 1,600$ 1,576$ 1,610$ 1,626$ 1,592$ 1,591$ 1,863$ 1,867$
As a % of Avg. Loans (4) 10.12% 10.00% 10.00% 9.99% 9.90% 9.59% 9.36% 9.05%Net Credit Losses 492$ 503$ 443$ 454$ 455$ 467$ 448$ 539$
As a % of Average Loans 3.11% 3.19% 2.75% 2.79% 2.83% 2.82% 2.25% 2.61%Net Credit Margin (5) 1,506$ 1,420$ 1,475$ 1,474$ 1,401$ 1,415$ 1,740$ 1,670$
As a % of Avg. Loans (5) 9.53% 9.01% 9.16% 9.05% 8.71% 8.53% 8.74% 8.09%Loans 90+ Days Past Due 569$ 495$ 491$ 538$ 530$ 510$ 607$ 748$
As a % of EOP Loans 0.90% 0.77% 0.76% 0.80% 0.82% 0.66% 0.75% 0.87%Loans 30-89 Days Past Due 497$ 462$ 504$ 523$ 492$ 550$ 710$ 688$
As a % of EOP Loans 0.78% 0.72% 0.78% 0.78% 0.76% 0.71% 0.87% 0.80%
Citi Retail Services Key Indicators (in millions of dollars, except as otherwise noted) (1)EOP Open Accounts 88.7 89.5 89.5 89.9 88.1 88.9 88.3 87.7 Purchase Sales (in billions) 16.5$ 20.2$ 19.8$ 23.5$ 16.9$ 20.1$ 19.7$ 23.2$
Average Loans (in billions) (1) 43.9$ 42.6$ 43.1$ 44.1$ 44.0$ 42.7$ 43.6$ 44.9$
EOP Loans (in billions) (1) 42.4$ 43.2$ 43.1$ 46.1$ 42.5$ 43.3$ 43.9$ 47.3$
Average Yield (3) 16.96% 17.00% 16.94% 16.49% 16.92% 17.01% 17.06% 16.92%Net Interest Revenue (4) 1,883$ 1,842$ 1,922$ 1,937$ 1,891$ 1,834$ 1,923$ 1,947$
As a % of Avg. Loans (4) 17.40% 17.34% 17.69% 17.43% 17.29% 17.27% 17.55% 17.25%Net Credit Losses 433$ 457$ 401$ 418$ 453$ 442$ 427$ 483$
As a % of Average Loans 4.00% 4.30% 3.69% 3.76% 4.14% 4.16% 3.90% 4.28%Net Credit Margin (5) 1,196$ 1,119$ 1,206$ 1,168$ 1,222$ 1,063$ 1,182$ 1,096$
As a % of Avg. Loans (5) 11.05% 10.54% 11.10% 10.51% 11.17% 10.01% 10.79% 9.71%Loans 90+ Days Past Due 629$ 567$ 621$ 705$ 665$ 619$ 664$ 761$
As a % of EOP Loans 1.48% 1.31% 1.44% 1.53% 1.56% 1.43% 1.51% 1.61%Loans 30-89 Days Past Due 673$ 652$ 758$ 773$ 688$ 669$ 750$ 777$
As a % of EOP Loans 1.59% 1.51% 1.76% 1.68% 1.62% 1.55% 1.71% 1.64%
(1) Average loans, EOP loans and the related consumer delinquency amounts and ratios include interest and fees receivables balances.(2) See footnote 3 on page 8.(3) Average yield is calculated as gross interest revenue earned divided by average loans.(4) Net interest revenue includes certain fees that are recorded as interest revenue.(5) Net credit margin represents total revenues, net of interest expense, less net credit losses and policy benefits and claims.
Reclassified to conform to the current period's presentation.
Page 10

GLOBAL CONSUMER BANKINGLATIN AMERICA - PAGE 1(In millions of dollars, except as otherwise noted)
Full Full1Q 2Q 3Q 4Q 1Q 2Q 3Q 4Q Year Year
2015 2015 2015 2015 2016 2016 2016 2016 2015 2016
Net Interest Revenue 981$ 982$ 950$ 936$ 853$ 861$ 877$ 840$ 3,849$ 3,431$ Non-Interest Revenue 439 438 583 413 376 375 368 372 1,873 1,491 Total Revenues, Net of Interest Expense (1) 1,420 1,420 1,533 1,349 1,229 1,236 1,245 1,212 5,722 4,922 Total Operating Expenses 795 843 792 821 718 725 707 688 3,251 2,838
Net Credit Losses 356 316 301 307 278 260 254 248 1,280 1,040 Credit Reserve Build / (Release) (8) 19 19 3 17 (2) 32 36 33 83 Provision for Unfunded Lending Commitments (3) - 1 - 1 1 - (1) (2) 1 Provision for Benefits and Claims 18 12 17 22 19 12 18 23 69 72
Provisions for Credit Losses and for Benefits and Claims (LLR & PBC) 363 347 338 332 315 271 304 306 1,380 1,196 Income from Continuing Operations before Taxes 262 230 403 196 196 240 234 218 1,091 888 Income Taxes 55 49 106 55 50 67 74 64 265 255 Income from Continuing Operations 207 181 297 141 146 173 160 154 826 633 Noncontrolling Interests - 2 1 - 1 1 2 1 3 5 Net Income 207$ 179$ 296$ 141$ 145$ 172$ 158$ 153$ 823$ 628$ Average Assets (in billions of dollars) 56$ 54$ 50$ 52$ 50$ 50$ 50$ 46$ 53$ 49$ Return on Average Assets 1.50% 1.33% 2.35% 1.08% 1.17% 1.38% 1.26% 1.32% 1.55% 1.28%Efficiency Ratio 56% 59% 52% 61% 58% 59% 57% 57% 57% 58%
Net Credit Losses as a % of Average Loans 5.31% 4.71% 4.70% 4.78% 4.58% 4.30% 4.18% 4.20% 4.87% 4.32%
Revenue by BusinessRetail Banking 960$ 963$ 1,088$ 922$ 856$ 853$ 881$ 857$ 3,933$ 3,447$ Citi-Branded Cards 460 457 445 427 373 383 364 355 1,789 1,475
Total 1,420$ 1,420$ 1,533$ 1,349$ 1,229$ 1,236$ 1,245$ 1,212$ 5,722$ 4,922$
Net Credit Losses by BusinessRetail Banking 150$ 142$ 138$ 159$ 134$ 137$ 132$ 138$ 589$ 541$ Citi-Branded Cards 206 174 163 148 144 123 122 110 691 499
Total 356$ 316$ 301$ 307$ 278$ 260$ 254$ 248$ 1,280$ 1,040$
Income from Continuing Operations by BusinessRetail Banking 135$ 112$ 219$ 54$ 90$ 96$ 84$ 85$ 520$ 355$ Citi-Branded Cards 72 69 78 87 56 77 76 69 306 278
Total 207$ 181$ 297$ 141$ 146$ 173$ 160$ 154$ 826$ 633$
FX Translation Impact:Total Revenue - as Reported (1) 1,420$ 1,420$ 1,533$ 1,349$ 1,229$ 1,236$ 1,245$ 1,212$ 5,722$ 4,922$ Impact of FX Translation (2) (342) (372) (256) (225) (130) (119) (58) - (867) - Total Revenues - Ex-FX (1) (2) 1,078$ 1,048$ 1,277$ 1,124$ 1,099$ 1,117$ 1,187$ 1,212$ 4,855$ 4,922$
Total Operating Expenses - as Reported 795$ 843$ 792$ 821$ 718$ 725$ 707$ 688$ 3,251$ 2,838$ Impact of FX Translation (2) (143) (142) (105) (99) (60) (56) (27) - (357) - Total Operating Expenses - Ex-FX (2) 652$ 701$ 687$ 722$ 658$ 669$ 680$ 688$ 2,894$ 2,838$
Provisions for LLR & PBC - as Reported 363$ 347$ 338$ 332$ 315$ 271$ 304$ 306$ 1,380$ 1,196$ Impact of FX Translation (2) (88) (78) (58) (53) (34) (27) (15) - (201) - Provisions for LLR & PBC - Ex-FX (2) 275$ 269$ 280$ 279$ 281$ 244$ 289$ 306$ 1,179$ 1,196$
Net Income - as Reported 207$ 179$ 296$ 141$ 145$ 172$ 158$ 153$ 823$ 628$ Impact of FX Translation (2) (87) (111) (70) (60) (29) (28) (12) - (239) - Net Income - Ex-FX (2) 120$ 68$ 226$ 81$ 116$ 144$ 146$ 153$ 584$ 628$
(1) Revenues in the full year 2015 include an approximate $180 million ($160 million ex-FX) gain related to the sale of the Mexico merchant acquiring business in the third quarter of 2015.(2) Reflects the impact of foreign currency (FX) translation into U.S. Dollars at the fourth quarter of 2016 average exchange rates for all periods presented.
Citigroup's results of operations excluding the impact of FX translation are non-GAAP financial measures.
Reclassified to conform to the current period's presentation.
Page 11

GLOBAL CONSUMER BANKINGLATIN AMERICA - PAGE 2
1Q 2Q 3Q 4Q 1Q 2Q 3Q 4Q2015 2015 2015 2015 2016 2016 2016 2016
Retail Banking Key Indicators (in billions of dollars, except as otherwise noted)
Branches (actual) 1,498 1,497 1,495 1,492 1,493 1,491 1,494 1,494Accounts (in millions) 26.2 26.5 27.3 27.7 27.9 28.4 28.8 27.4Average Deposits 28.0$ 27.3$ 25.7$ 25.9$ 26.1$ 25.9$ 25.7$ 25.2$ Investment Sales 8.2$ 6.6$ 6.6$ 6.7$ 5.5$ 5.8$ 5.7$ 6.0$ Investment AUMs 38.3$ 37.8$ 35.9$ 34.4$ 34.3$ 32.4$ 31.0$ 28.9$ Average Loans 20.8$ 20.8$ 19.8$ 20.0$ 19.2$ 19.2$ 19.1$ 18.5$ EOP Loans:
Mortgages 4.7$ 4.5$ 4.1$ 3.9$ 4.6$ 4.2$ 4.1$ 3.9$ Commercial Banking 8.5 8.8 8.3 8.8 8.8 8.6 8.6 8.5 Personal and Other 7.6 7.5 7.1 7.0 6.4 6.3 6.0 5.6
Total EOP Loans 20.8$ 20.8$ 19.5$ 19.7$ 19.8$ 19.1$ 18.7$ 18.0$
Net Interest Revenue (in millions) (1) 641$ 639$ 620$ 626$ 587$ 585$ 612$ 593$ As a % of Average Loans (1) 12.50% 12.32% 12.42% 12.42% 12.30% 12.25% 12.75% 12.75%
Net Credit Losses (in millions) 150$ 142$ 138$ 159$ 134$ 137$ 132$ 138$ As a % of Average Loans 2.92% 2.74% 2.77% 3.15% 2.81% 2.87% 2.75% 2.97%
Loans 90+ Days Past Due (in millions) 238$ 232$ 212$ 185$ 172$ 157$ 160$ 136$ As a % of EOP Loans 1.14% 1.12% 1.09% 0.94% 0.87% 0.82% 0.86% 0.76%
Loans 30-89 Days Past Due (in millions) 229$ 217$ 239$ 184$ 256$ 197$ 196$ 185$ As a % of EOP Loans 1.10% 1.04% 1.23% 0.93% 1.29% 1.03% 1.05% 1.03%
Citi-Branded Cards Key Indicators (in billions of dollars, except as otherwise noted) EOP Open Accounts (in millions) 5.9 5.9 5.7 5.6 5.6 5.7 5.8 5.8 Purchase Sales (in billions) 4.1$ 4.2$ 4.0$ 4.4$ 3.7$ 3.8$ 3.8$ 4.0$ Average Loans (in billions) (2) 6.4$ 6.1$ 5.6$ 5.5$ 5.2$ 5.1$ 5.1$ 5.0$ EOP Loans (in billions) (2) 6.1$ 5.9$ 5.4$ 5.4$ 5.3$ 5.0$ 4.9$ 4.8$ Average Yield (3) 20.11% 20.63% 21.19% 20.73% 19.77% 20.24% 20.32% 20.13%
Net Interest Revenue (in millions) (4) 340$ 343$ 330$ 310$ 266$ 276$ 265$ 247$ As a % of Average Loans (4) 21.55% 22.55% 23.38% 22.36% 20.57% 21.77% 20.67% 19.65%
Net Credit Losses (in millions) 206$ 174$ 163$ 148$ 144$ 123$ 122$ 110$ As a % of Average Loans 13.05% 11.44% 11.55% 10.68% 11.14% 9.70% 9.52% 8.75%
Net Credit Margin (in millions) (5) 254$ 283$ 282$ 279$ 229$ 260$ 242$ 245$ As a % of Average Loans (5) 16.10% 18.61% 19.98% 20.13% 17.71% 20.50% 18.88% 19.49%
Loans 90+ Days Past Due (in millions) 203$ 200$ 169$ 173$ 149$ 145$ 131$ 130$ As a % of EOP Loans 3.33% 3.39% 3.13% 3.20% 2.81% 2.90% 2.67% 2.71%
Loans 30-89 Days Past Due (in millions) 204$ 183$ 181$ 157$ 152$ 137$ 131$ 125$ As a % of EOP Loans 3.34% 3.10% 3.35% 2.91% 2.87% 2.74% 2.67% 2.60%
(1) Also includes net interest revenue related to the region's deposit balances in excess of the average loan portfolio. (2) Average loans, EOP loans and the related consumer delinquency amounts and ratios include interest and fees receivables balances.(3) Average yield is gross interest revenue earned divided by average loans.(4) Net interest revenue includes certain fees that are recorded as interest revenue.(5) Net credit margin is total revenues, net of interest expense, less net credit losses and policy benefits and claims.
Page 12

GLOBAL CONSUMER BANKINGASIA (1) - PAGE 1(In millions of dollars, except as otherwise noted)
Full Full1Q 2Q 3Q 4Q 1Q 2Q 3Q 4Q Year Year
2015 2015 2015 2015 2016 2016 2016 2016 2015 2016
Net Interest Revenue 1,134$ 1,156$ 1,107$ 1,097$ 1,101$ 1,116$ 1,136$ 1,110$ 4,494$ 4,463$ Non-Interest Revenue 676 704 591 549 554 613 622 586 2,520 2,375 Total Revenues, Net of Interest Expense 1,810 1,860 1,698 1,646 1,655 1,729 1,758 1,696 7,014 6,838 Total Operating Expenses 1,167 1,176 1,118 1,118 1,183 1,146 1,127 1,131 4,579 4,587
Net Credit Losses 173 189 175 184 160 160 168 163 721 651 Credit Reserve Build / (Release) (42) (8) (61) 22 (11) (24) (4) 11 (89) (28) Provision for Unfunded Lending Commitments 2 (4) - - - - (3) (1) (2) (4) Provision for Benefits and Claims - - - - - - - - - -
Provisions for Credit Losses and for Benefits and Claims (LLR & PBC) 133 177 114 206 149 136 161 173 630 619 Income from Continuing Operations before Taxes 510 507 466 322 323 447 470 392 1,805 1,632 Income Taxes 171 169 160 105 108 150 160 131 605 549 Income from Continuing Operations 339 338 306 217 215 297 310 261 1,200 1,083 Noncontrolling Interests (5) 3 6 - 1 1 1 1 4 4 Net Income 344$ 335$ 300$ 217$ 214$ 296$ 309$ 260$ 1,196$ 1,079$ Average Assets (in billions) 115$ 119$ 116$ 117$ 116$ 119$ 121$ 120$ 117$ 119$ Return on Average Assets 1.21% 1.13% 1.03% 0.74% 0.74% 1.00% 1.02% 0.86% 1.02% 0.91%Efficiency Ratio 64% 63% 66% 68% 71% 66% 64% 67% 65% 67%
Net Credit Losses as a % of Average Loans 0.78% 0.84% 0.80% 0.85% 0.76% 0.76% 0.78% 0.79% 0.81% 0.77%
Revenue by BusinessRetail Banking 1,152$ 1,180$ 1,068$ 1,009$ 1,041$ 1,076$ 1,093$ 1,037$ 4,409$ 4,247$ Citi-Branded Cards 658 680 630 637 614 653 665 659 2,605 2,591
Total 1,810$ 1,860$ 1,698$ 1,646$ 1,655$ 1,729$ 1,758$ 1,696$ 7,014$ 6,838$
Net Credit Losses by BusinessRetail Banking 70$ 80$ 75$ 94$ 62$ 61$ 73$ 65$ 319$ 261$ Citi-Branded Cards 103 109 100 90 98 99 95 98 402 390
Total 173$ 189$ 175$ 184$ 160$ 160$ 168$ 163$ 721$ 651$
Income from Continuing Operations by BusinessRetail Banking 221$ 222$ 185$ 111$ 119$ 204$ 190$ 165$ 739$ 678$ Citi-Branded Cards 118 116 121 106 96 93 120 96 461 405
Total 339$ 338$ 306$ 217$ 215$ 297$ 310$ 261$ 1,200$ 1,083$
FX Translation Impact:Total Revenue - as Reported 1,810$ 1,860$ 1,698$ 1,646$ 1,655$ 1,729$ 1,758$ 1,696$ 7,014$ 6,838$ Impact of FX Translation (2) (80) (88) (15) (8) (1) (21) (34) - (131) - Total Revenues - Ex-FX (2) 1,730$ 1,772$ 1,683$ 1,638$ 1,654$ 1,708$ 1,724$ 1,696$ 6,883$ 6,838$
Total Operating Expenses - as Reported 1,167$ 1,176$ 1,118$ 1,118$ 1,183$ 1,146$ 1,127$ 1,131$ 4,579$ 4,587$ Impact of FX Translation (2) (56) (69) (16) (9) (1) (16) (24) - (106) - Total Operating Expenses - Ex-FX (2) 1,111$ 1,107$ 1,102$ 1,109$ 1,182$ 1,130$ 1,103$ 1,131$ 4,473$ 4,587$
Provisions for LLR & PBC - as Reported 133$ 177$ 114$ 206$ 149$ 136$ 161$ 173$ 630$ 619$ Impact of FX Translation (2) (8) (11) 1 - (1) (1) (3) - (12) - Provisions for LLR & PBC - Ex-FX (2) 125$ 166$ 115$ 206$ 148$ 135$ 158$ 173$ 618$ 619$
Net Income - as Reported 344$ 335$ 300$ 217$ 214$ 296$ 309$ 260$ 1,196$ 1,079$ Impact of FX Translation (2) (4) (1) - 1 - (1) (4) - - - Net Income - Ex-FX (2) 340$ 334$ 300$ 218$ 214$ 295$ 305$ 260$ 1,196$ 1,079$
(1) Asia GCB includes the results of operations of GCB activities in certain EMEA countries for all periods presented.(2) Reflects the impact of foreign currency (FX) translation into U.S. Dollars at the fourth quarter of 2016 average exchange rates for all periods presented.
Citigroup's results of operations excluding the impact of FX translation are non-GAAP financial measures.
Reclassified to conform to the current period's presentation.
Page 13

GLOBAL CONSUMER BANKINGASIA (1) - PAGE 2
1Q 2Q 3Q 4Q 1Q 2Q 3Q 4Q2015 2015 2015 2015 2016 2016 2016 2016
Retail Banking Key Indicators (in billions of dollars, except as otherwise noted)
Branches (actual) 500 498 490 482 448 430 427 401 Accounts (in millions) 17.4 17.4 17.6 17.4 17.2 17.0 16.8 16.5 Average Deposits 88.2$ 89.3$ 86.4$ 86.7$ 87.2$ 89.4$ 91.6$ 89.9$ Investment Sales 11.0$ 13.0$ 8.2$ 6.0$ 6.1$ 7.5$ 8.6$ 7.3$ Investment AUMs 58.9$ 60.1$ 55.1$ 57.0$ 56.1$ 56.1$ 56.8$ 55.8$ Average Loans 72.4$ 72.3$ 69.7$ 69.0$ 67.5$ 67.5$ 67.9$ 64.6$ EOP Loans:
Mortgages 36.8$ 36.7$ 34.3$ 34.4$ 34.7$ 33.5$ 33.3$ 31.3$ Commercial Banking 16.0 16.1 15.3 14.8 14.8 15.2 15.8 14.5 Personal and Other 19.0 19.6 19.0 19.2 19.2 18.8 19.0 17.2
Total EOP Loans 71.8$ 72.4$ 68.6$ 68.4$ 68.7$ 67.5$ 68.1$ 63.0$
Net Interest Revenue (in millions) (2) 667$ 680$ 659$ 646$ 663$ 664$ 669$ 644$ As a % of Average Loans (2) 3.74% 3.77% 3.75% 3.71% 3.95% 3.96% 3.92% 3.97%
Net Credit Losses (in millions) 70$ 80$ 75$ 94$ 62$ 61$ 73$ 65$ As a % of Average Loans 0.39% 0.44% 0.43% 0.54% 0.37% 0.36% 0.43% 0.40%
Loans 90+ Days Past Due (in millions) 179$ 185$ 179$ 173$ 174$ 178$ 163$ 157$ As a % of EOP Loans 0.25% 0.26% 0.26% 0.25% 0.25% 0.26% 0.24% 0.25%
Loans 30-89 Days Past Due (in millions) 359$ 353$ 327$ 334$ 339$ 346$ 328$ 327$ As a % of EOP Loans 0.50% 0.49% 0.48% 0.49% 0.49% 0.51% 0.48% 0.52%
Citi-Branded Cards Key Indicators (in billions of dollars, except as otherwise noted)EOP Open Accounts (in millions) 17.3 17.3 17.1 16.9 16.6 16.6 16.4 16.3 Purchase Sales (in billions) 18.6$ 19.2$ 18.2$ 19.3$ 18.1$ 18.7$ 18.7$ 19.4$ Average Loans (in billions) (3) 18.0$ 18.0$ 17.1$ 17.3$ 17.4$ 17.4$ 17.6$ 17.3$ EOP Loans (in billions) (3) 17.8$ 18.1$ 17.0$ 17.6$ 17.6$ 17.6$ 17.7$ 17.5$ Average Yield (4) 12.62% 12.51% 12.42% 12.39% 12.51% 12.70% 12.82% 12.92%
Net Interest Revenue (in millions) (5) 467$ 475$ 446$ 450$ 438$ 453$ 467$ 466$ As a % of Average Loans (6) 10.52% 10.58% 10.35% 10.32% 10.12% 10.47% 10.56% 10.72%
Net Credit Losses (in millions) 103$ 109$ 100$ 90$ 98$ 99$ 95$ 98$ As a % of Average Loans 2.32% 2.43% 2.32% 2.06% 2.27% 2.29% 2.15% 2.25%
Net Credit Margin (in millions) (6) 555$ 571$ 530$ 547$ 516$ 554$ 570$ 561$ As a % of Average Loans (6) 12.50% 12.72% 12.30% 12.54% 11.93% 12.81% 12.88% 12.90%
Loans 90+ Days Past Due 191$ 191$ 171$ 180$ 180$ 176$ 185$ 180$ As a % of EOP Loans 1.07% 1.06% 1.01% 1.02% 1.02% 1.00% 1.05% 1.03%
Loans 30-89 Days Past Due 249$ 247$ 220$ 226$ 235$ 227$ 240$ 224$ As a % of EOP Loans 1.40% 1.36% 1.29% 1.28% 1.34% 1.29% 1.36% 1.28%
(1) Asia GCB includes the results of operations of GCB activities in certain EMEA countries for all periods presented.(2) Also includes net interest revenue related to the region's deposit balances in excess of the average loan portfolio. (3) Average loans, EOP loans and the related consumer delinquency amounts and ratios include interest and fees receivables balances.(4) Average yield is gross interest revenue earned divided by average loans.(5) Net interest revenue includes certain fees that are recorded as interest revenue.(6) Net credit margin is total revenues, net of interest expense, less net credit losses and policy benefits and claims.
Reclassified to conform to the current period's presentation.
Page 14

INSTITUTIONAL CLIENTS GROUP (In millions of dollars, except as otherwise noted)
Full Full1Q 2Q 3Q 4Q 1Q 2Q 3Q 4Q Year Year
2015 2015 2015 2015 2016 2016 2016 2016 2015 2016
Commissions and Fees 998$ 991$ 959$ 927$ 1,004$ 956$ 929$ 969$ 3,875 3,858 Administration and Other Fiduciary Fees 613 663 594 573 597 638 610 592 2,443 2,437 Investment Banking 1,134 1,120 828 1,028 740 1,029 917 969 4,110 3,655 Principal Transactions 2,198 1,794 1,211 621 1,576 1,912 2,064 1,783 5,824 7,335 Other 258 195 904 55 (7) 46 (125) (66) 1,412 (152)
Total Non-Interest Revenue 5,201 4,763 4,496 3,204 3,910 4,581 4,395 4,247 17,664 17,133 Net Interest Revenue (including Dividends) 3,761 4,006 3,985 3,916 3,985 4,108 4,064 3,937 15,668 16,094
Total Revenues, Net of Interest Expense 8,962 8,769 8,481 7,120 7,895 8,689 8,459 8,184 33,332 33,227 Total Operating Expenses 4,654 4,847 4,718 4,868 4,872 4,763 4,687 4,634 19,087 18,956
Net Credit Losses (1) 82 37 96 211 141 45 119 214 516 Credit Reserve Build / (Release) 119 (123) 193 465 108 (26) (93) (53) 654 (64) Provision for Unfunded Lending Commitments (32) (46) 83 89 71 (33) (42) 38 94 34 Provision for Benefits and Claims - - - - - - - - - -
Provisions for Credit Losses and for Benefits and Claims 86 (87) 313 650 390 82 (90) 104 962 486 Income from Continuing Operations before Taxes 4,222 4,009 3,450 1,602 2,633 3,844 3,862 3,446 13,283 13,785 Income Taxes 1,317 1,264 1,133 459 764 1,229 1,202 1,065 4,173 4,260 Income from Continuing Operations 2,905 2,745 2,317 1,143 1,869 2,615 2,660 2,381 9,110 9,525 Noncontrolling Interests 35 15 (6) 7 10 17 19 12 51 58 Net Income 2,870$ 2,730$ 2,323$ 1,136$ 1,859$ 2,598$ 2,641$ 2,369$ 9,059$ 9,467$ EOP Assets (in billions) 1,277$ 1,272$ 1,264$ 1,218$ 1,293$ 1,303$ 1,303$ 1,277$ Average Assets (in billions) 1,280$ 1,285$ 1,265$ 1,258$ 1,272$ 1,300$ 1,310$ 1,310$ 1,272$ 1,298$ Return on Average Assets (ROA) 0.91% 0.85% 0.73% 0.36% 0.59% 0.80% 0.80% 0.72% 0.71% 0.73%ROA (Excluding CVA/DVA) (1)(2) 0.92% 0.79% 0.68% 0.40% 0.59% 0.80% 0.80% 0.72% 0.70% 0.73%Efficiency Ratio 52% 55% 56% 68% 62% 55% 55% 57% 57% 57%
Revenue by Region - Excluding CVA/DVA (2)North America 3,248$ 3,305$ 3,282$ 2,705$ 2,980$ 3,393$ 3,191$ 2,949$ 12,540$ 12,513$ EMEA 2,998 2,383 2,198 2,077 2,167 2,577 2,506 2,605 9,656 9,855 Latin America 980 987 1,032 937 962 1,022 999 994 3,936 3,977 Asia 1,805 1,791 1,748 1,587 1,786 1,697 1,763 1,636 6,931 6,882
Total 9,031$ 8,466$ 8,260$ 7,306$ 7,895$ 8,689$ 8,459$ 8,184$ 33,063$ 33,227$
CVA/DVA for Periods Prior to 1Q16 {excluded as applicable in lines above} (69) 303 221 (186) - - - - 269 - Total Revenues, net of Interest Expense 8,962$ 8,769$ 8,481$ 7,120$ 7,895$ 8,689$ 8,459$ 8,184$ 33,332$ 33,227$
Income from Continuing Operations by Region - Excluding CVA/DVA (2)North America 927$ 937$ 887$ 465$ 546$ 1,005$ 1,067$ 877$ 3,216$ 3,495$ EMEA 998 579 372 196 374 695 649 647 2,145 2,365 Latin America 381 409 380 176 330 392 389 343 1,346 1,454 Asia 643 630 535 423 619 523 555 514 2,231 2,211
Total 2,949$ 2,555$ 2,174$ 1,260$ 1,869$ 2,615$ 2,660$ 2,381$ 8,938$ 9,525$
CVA/DVA (after-tax) for Periods Prior to 1Q16 {excluded as applicable in lines above} (44) 190 143 (117) - - - - 172 - Income from Continuing Operations 2,905$ 2,745$ 2,317$ 1,143$ 1,869$ 2,615$ 2,660$ 2,381$ 9,110$ 9,525$
Average Loans by Region (in billions)North America 117$ 121$ 127$ 130 133$ 138$ 140$ 144 124$ 138$ EMEA 60 64 63 62 63 67 68 66 62 66 Latin America 39 41 40 41 39 38 38 37 40 38 Asia 62 63 62 61 60 61 60 57 62 60
Total 278$ 289$ 292$ 294$ 295$ 304$ 306$ 304$ 288$ 302$
EOP Deposits by Region (in billions)North America 251$ 262$ 261$ 267$ 270$ 275$ 276$ 282$ EMEA 152 160 160 154 166 162 170 164 Latin America 35 32 30 27 28 25 26 26 Asia 135 136 145 141 145 147 147 140
Total 573$ 590$ 596$ 589$ 609$ 609$ 619$ 612$
EOP Deposits by Business (in billions)Treasury and Trade Solutions 388$ 399$ 400$ 394$ 417$ 407$ 417$ 412$ All Other ICG Businesses 185 191 196 195 192 202 202 200
Total 573$ 590$ 596$ 589$ 609$ 609$ 619$ 612$
(1) For all periods prior to the first quarter of 2016, ROA excluding CVA/DVA is defined as annualized net income (less CVA/DVA), divided by averageassets. See above for after-tax CVA/DVA for each period presented.
(2) See footnote 2 on page 4.
Reclassified to conform to the current period's presentation.
Page 15

INSTITUTIONAL CLIENTS GROUP REVENUES BY BUSINESS(In millions of dollars, except as otherwise noted)
Full Full1Q 2Q 3Q 4Q 1Q 2Q 3Q 4Q Year Year
2015 2015 2015 2015 2016 2016 2016 2016 2015 2016
Revenue Details - Excluding CVA/DVA:Investment Banking:
Advisory 295$ 257$ 239$ 302$ 227$ 238$ 239$ 296$ 1,093$ 1,000$ Equity Underwriting 231 296 173 206 118 174 146 190 906 628 Debt Underwriting 674 735 528 621 528 803 698 645 2,558 2,674
Total Investment Banking 1,200 1,288 940 1,129 873 1,215 1,083 1,131 4,557 4,302 Treasury and Trade Solutions 1,820 1,885 1,862 1,915 1,903 1,999 1,986 2,009 7,482 7,897 Corporate Lending - Excluding Gain/(Loss) on Loan Hedges 480 477 437 433 448 383 439 448 1,827 1,718 Private Bank 675 669 633 605 684 674 680 671 2,582 2,709 Total Banking Revenues (Ex-CVA/DVA and Gain/(Loss) on Loan Hedges) (1) (2) 4,175$ 4,319$ 3,872$ 4,082$ 3,908$ 4,271$ 4,188$ 4,259$ 16,448$ 16,626$
Corporate Lending - Gain/(Loss) on Loan Hedges (2) 52 (66) 352 (14) (66) (203) (218) (107) 324 (594) Total Banking Revenues (Ex-CVA/DVA) and including G(L) on Loan Hedges (1) 4,227$ 4,253$ 4,224$ 4,068$ 3,842$ 4,068$ 3,970$ 4,152$ 16,772$ 16,032$
Fixed Income Markets 3,485$ 3,032$ 2,553$ 2,207$ 3,051$ 3,432$ 3,413$ 2,957$ 11,277$ 12,853$ Equity Markets 862 644 997 598 697 776 654 685 3,101 2,812 Securities Services 535 563 506 510 561 529 533 529 2,114 2,152 Other (78) (26) (20) (77) (256) (116) (111) (139) (201) (622) Total Markets and Securities Services (Ex-CVA/DVA) (1) 4,804$ 4,213$ 4,036$ 3,238$ 4,053$ 4,621$ 4,489$ 4,032$ 16,291$ 17,195$
Total ICG (Ex-CVA/DVA) (1) 9,031$ 8,466$ 8,260$ 7,306$ 7,895$ 8,689$ 8,459$ 8,184$ 33,063$ 33,227$
CVA/DVA for Periods Prior to 1Q16 {excluded as applicable in lines above} (69) 303 221 (186) - - - - 269 - Total Revenues, net of Interest Expense 8,962$ 8,769$ 8,481$ 7,120$ 7,895$ 8,689$ 8,459$ 8,184$ 33,332$ 33,227$
Taxable-equivalent adjustments (3) 164$ 161$ 162$ 173$ 166$ 144$ 162$ 169$ 660$ 641$
Total ICG Revenues (Ex-CVA/DVA) and including taxable-equivalent adjustments (1) (3) 9,195$ 8,627$ 8,422$ 7,479$ 8,061$ 8,833$ 8,621$ 8,353$ 33,723$ 33,868$
Commissions and Fees 129$ 106$ 115$ 117$ 124$ 113$ 115$ 122$ 467$ 474$ Principal Transctions (4) 2,013 1,523 1,063 775 1,344 1,765 1,825 1,604 5,374 6,538 Other 161 112 42 15 216 213 171 (9) 330 591 Total Non-Interest Revenue 2,303$ 1,741$ 1,220$ 907$ 1,684$ 2,091$ 2,111$ 1,717$ 6,171$ 7,603$ Net Interest Revenue 1,182 1,291 1,333 1,300 1,367 1,341 1,302 1,240 5,106 5,250 Total Fixed Income Markets (ex-CVA/DVA) 3,485$ 3,032$ 2,553$ 2,207$ 3,051$ 3,432$ 3,413$ 2,957$ 11,277$ 12,853$
Rates and Currencies 2,145$ 1,972$ 1,767$ 1,732$ 2,236$ 2,461$ 2,362$ 2,230$ 7,616$ 9,289$ Spread Products / Other Fixed Income 1,340 1,060 786 475 815 971 1,051 727 3,661 3,564 Total Fixed Income Markets (ex-CVA/DVA) 3,485$ 3,032$ 2,553$ 2,207$ 3,051$ 3,432$ 3,413$ 2,957$ 11,277$ 12,853$
Commissions and Fees 371$ 336$ 329$ 302$ 357$ 319$ 302$ 322$ 1,338$ 1,300$ Principal Transctions (4) 170 56 95 (51) 51 (48) 45 86 270 134 Other 16 (184) 189 33 2 127 4 6 54 139 Total Non-Interest Revenue 557$ 208$ 613$ 284$ 410$ 398$ 351$ 414$ 1,662$ 1,573$ Net Interest Revenue 305 436 384 314 287 378 303 271 1,439 1,239 Total Equity Markets (ex-CVA/DVA) 862$ 644$ 997$ 598$ 697$ 776$ 654$ 685$ 3,101$ 2,812$
(1) See footnote 2 on page 4.(2) Hedges on accrual loans reflect the mark-to-market on credit derivatives used to economically hedge the corporate loan accrual portfolio.
The fixed premium costs of these hedges are netted against the core lending revenues. Citigroup's results of operations excluding theimpact of gain/(loss) on loan hedges are non-GAAP financial measures.
(3) Primarily relates to income tax credits related to affordable housing and alternative energy investments as well astax exempt income from municipal bond investments.
(4) Excludes principal transactions revenues of ICG businesses other than Markets, primarily treasury and trade solutions in private bank.
Reclassified to conform to the current period's presentation.
Page 16

CORPORATE / OTHER (1)
(In millions of dollars, except as otherwise noted)
Full Full1Q 2Q 3Q 4Q 1Q 2Q 3Q 4Q Year Year
2015 2015 2015 2015 2016 2016 2016 2016 2015 2016
Net Interest Revenue 1,411$ 1,412$ 1,328$ 1,059$ 890$ 820$ 706$ 569$ 5,210$ 2,985$ Non-interest revenue (2)(3) 1,125 1,161 812 2,463 1,056 365 431 292 5,561 2,144 Total Revenues, Net of Interest Expense 2,536 2,573 2,140 3,522 1,946 1,185 1,137 861 10,771 5,129 Total Operating Expenses 1,930 1,747 1,726 1,926 1,250 1,309 1,288 1,130 7,329 4,977
Net Credit Losses 468 334 273 261 142 101 131 61 1,336 435 Credit Reserve Build / (Release) (171) (184) (172) 74 (31) (223) (122) (80) (453) (456) Provision for Benefits and Claims 169 159 161 134 60 29 9 - 623 98 Provision for Unfunded Lending Commitments (5) 2 (19) (2) (1) (5) - (2) (24) (8)
Total provisions for credit losses and for benefits and claims (2)(3)(4) 461 311 243 467 170 (98) 18 (21) 1,482 69 Income from Continuing Operations before Taxes 145 515 171 1,129 526 (26) (169) (248) 1,960 83 Income Taxes (Benefits) (100) (23) (166) 187 81 (173) (146) (233) (102) (471) Income (Loss) from Continuing Operations 245 538 337 942 445 147 (23) (15) 2,062 554 Income (Loss) from Discontinued Operations, net of taxes (5) 6 (10) (45) (2) (23) (30) (3) (54) (58) Noncontrolling Interests 11 (2) 3 17 (7) 8 (5) 2 29 (2) Net Income (Loss) 229$ 546$ 324$ 880$ 450$ 116$ (48)$ (20)$ 1,979$ 498$
EOP Assets (in billions of dollars) 181$ 176$ 168$ 132$ 124$ 117$ 104$ 103$ Average Assets (in billions of dollars) 194$ 175$ 179$ 148$ 129$ 120$ 111$ 100$ 174$ 115$ Return on Average Assets 0.48% 1.25% 0.72% 2.36% 1.40% 0.39% (0.17%) (0.08%) 1.14% 0.43%Efficiency Ratio 76% 68% 81% 55% 64% 110% 113% 131% 68% 97%
Corporate/Other Consumer Key Indicators:
Consumer - International (1) (2)
Branches (actual) 318 301 304 293 246 223 224 61 Average Loans (in billions) 12.9$ 9.9$ 8.8$ 8.3$ 6.7$ 6.1$ 5.4$ 2.4$ EOP Loans (in billions) 10.2$ 9.4$ 8.7$ 8.2$ 6.4$ 5.5$ 5.5$ 2.4$ Net Interest Revenue 435$ 416$ 389$ 336$ 269$ 259$ 246$ 94$
As a % of Average Loans 13.68% 16.25% 17.54% 16.06% 16.15% 17.08% 18.12% 15.58%Net Credit Losses 112$ 116$ 93$ 122$ 78$ 77$ 82$ 32$
As a % of Average Loans 3.52% 4.70% 4.19% 5.83% 4.68% 5.08% 6.04% 5.30%Loans 90+ Days Past Due 194$ 185$ 174$ 157$ 145$ 170$ 164$ 94$
As a % of EOP Loans 1.90% 1.97% 2.00% 1.91% 2.27% 3.09% 2.98% 3.92%Loans 30-89 Days Past Due 234$ 213$ 193$ 179$ 161$ 138$ 135$ 49$
As a % of EOP Loans 2.29% 2.27% 2.22% 2.18% 2.52% 2.51% 2.45% 2.04%
Consumer - North America (3)
Branches (actual) 278 273 272 272 266 261 259 251 Average Loans (in billions of dollars) 68.9$ 55.5$ 52.7$ 49.4$ 39.4$ 37.2$ 35.4$ 32.0$ EOP Loans (in billions of dollars) 56.6$ 54.2$ 50.7$ 40.5$ 38.6$ 35.7$ 33.4$ 30.8$ Net Interest Revenue 828$ 786$ 769$ 529$ 339$ 296$ 231$ 198$
As a % of Average Loans 4.87% 2.07% 2.03% 1.96% 3.46% 3.20% 2.60% 2.46%Net Credit Losses (4) 363$ 193$ 166$ 141$ 65$ 24$ 52$ 28$
As a % of Average Loans 2.14% 1.39% 1.25% 1.13% 0.66% 0.26% 0.58% 0.35%Loans 90+ Days Past Due (5) 1,607$ 1,462$ 1,354$ 770$ 751$ 708$ 693$ 740$
As a % of EOP Loans 2.97% 2.84% 2.81% 2.01% 2.05% 2.09% 2.17% 2.52%Loans 30-89 Days Past Due (5) 1,197$ 1,153$ 1,230$ 857$ 768$ 720$ 714$ 686$
As a % of EOP Loans 2.21% 2.24% 2.56% 2.24% 2.09% 2.12% 2.24% 2.33%
(1) Includes Citi Holdings, certain costs of global staff functions, other corporate expenses and certain global operations and technology expenses,Corporate Treasury, and Discontinued operations.
(2) As a result of Citigroup's entry into an agreement in March 2015 to sell OneMain Financial (OneMain), OneMain was classified as held-for-sale (HFS) at the end of the first quarter 2015. As a result of HFS accounting treatment, approximately $74 million of cost of credit was recorded as a reduction in revenue (Other revenue) during the fourth quarter of 2015. The OneMain sale was completed on November 15, 2015. Additionally, the HFS treatment resulted in the reclassification of loans of OneMain to Other assets, where applicable.
(3) As a result of Citigroup's entry into agreements in October 2016 to sell its Brazil and Argentina consumer banking businesses, these businesses were classified as HFS at the end of the fourth quarter 2016. As aresult of HFS accounting treatment, approximately $35 million of cost of credit was recorded as a reduction in revenue (Other revenue) during the fourthquarter of 2016. Additionally, the HFS treatment resulted in the reclassification of loans of these businesses to Other assets, where applicable.
(4) The fourth quarter of 2015 includes a build of $162 million related to the transfer of approximately $8 billion of mortgage loans to Loans Held-for-sale at the end of the quarter. Thesecond and fourth quarters of 2016 include releases of $89 million and $30 million, respectively, related to sales and transfers of mortgage loans during those quarters.
(5) See footnote 3 on page 18.
Reclassified to conform to the current period's presentation.
Page 17

CORPORATE / OTHERCONSUMER KEY INDICATORS - Continued(In millions of dollars, except as otherwise noted)
1Q 2Q 3Q 4Q 1Q 2Q 3Q 4Q2015 2015 2015 2015 2016 2016 2016 2016
North America Mortgages
Residential First 33.2$ 29.2$ 27.8$ 25.7$ 18.1$ 16.5$ 15.5$ 13.9$ Home Equity 24.4 23.3 22.0 21.0 18.6 18.0 16.7 15.6
Average Loans (in billions of dollars) 57.6$ 52.5$ 49.8$ 46.7$ 36.7$ 34.5$ 32.2$ 29.5$
Residential First 29.8$ 28.6$ 26.4$ 18.7$ 17.6$ 15.8$ 14.8$ 13.4$ Home Equity 23.8 22.7 21.5 19.1 18.3 17.3 16.1 15.0
EOP Loans (in billions of dollars) (1) 53.6$ 51.3$ 47.9$ 37.8$ 35.9$ 33.1$ 30.9$ 28.4$
Third Party Mortgage Serv. Portfolio (EOP, in billions) 43.4$ 39.2$ 36.4$ 34.0$ 29.3$ 28.5$ 18.6$ 18.0$ Net Servicing & Gain/(Loss) on Sale 96.2$ 61.3$ 49.6$ 5.0$ 118.4$ 19.4$ 17.0$ 17.9$ Net Interest Revenue 343$ 301$ 277$ 246$ 258$ 178$ 150$ 114$
As a % of Avg. Loans 2.42% 2.30% 2.21% 2.09% 2.83% 2.08% 1.85% 1.54%
Residential First 103$ 101$ 84$ 65$ 1$ (12)$ 7$ (23)$ Home Equity 81 70 61 56 42 13 23 25
Net Credit Losses (NCLs) 184$ 171$ 145$ 121$ 43$ 1$ 30$ 2$ As a % of Avg. Loans 1.30% 1.31% 1.16% 1.03% 0.47% 0.01% 0.37% 0.03%
Residential First 1,089$ 973$ 881$ 323$ 314$ 267$ 245$ 290$ Home Equity 484 458 441 417 409 414 418 420
Loans 90+ Days Past Due (1) (3) (4) 1,573$ 1,431$ 1,322$ 740$ 723$ 681$ 663$ 710$ As a % of EOP Loans 3.08% 2.94% 2.92% 2.08% 2.13% 2.18% 2.26% 2.63%
Residential First 879$ 830$ 871$ 539$ 454$ 433$ 426$ 395$ Home Equity 269 275 311 271 274 241 244 234
Loans 30-89 Days Past Due (1) (3) (4) 1,148$ 1,105$ 1,182$ 810$ 728$ 674$ 670$ 629$ As a % of EOP Loans 2.25% 2.27% 2.61% 2.28% 2.14% 2.15% 2.28% 2.33%
(1) The fourth quarter of 2015 reflects the transfer of approximately $8 billion of mortgage loans to Loans, held-for-sale (HFS) (included within Other assets).Delinquencies and related ratios are not included for Loans HFS.
(2) See footnote 4 on page 18.
(3) The Loans 90+ Days Past Due and 30-89 Days Past Due and related ratios exclude U.S. mortgage loans that are guaranteed byU.S. government-sponsored agencies since the potential loss predominantly resides with the U.S. agencies.
The amounts excluded for Loans 90+ Days Past Due and (EOP Loans) for each period were $1.5 billion and ($2.2 billion), $1.3 billionand ($1.9 billion), $1.2 billion and ($1.8 billion), $1.0 billion and ($1.5 billion), and $0.9 billion and (1.4 billion) as of December 31, 2015, March 31, 2016, June 30, 2016, September 30, 2016 and December 31, 2016, respectively.
The amounts excluded for Loans 30-89 Days Past Due and (EOP Loans) for each period were $0.2 billion and ($2.2 billion), $0.2billion and ($1.9 billion), $0.2 billion and ($1.8 billion), $0.1 billion and ($1.5 billion), and $0.2 billion and ($1.4 billion), as of December 31, 2015, March 31, 2016, June 30, 2016, September 30, 2016 and December 31, 2016, respectively.
(4) The December 31, 2015, March 31, 2016, June 30, 2016, September 30, 2016 and December 31, 2016 Loans 90+ Days Past Due and30-89 Days Past Due and related ratios exclude $11 million, $9 million, $9 million, $9 million and $7 million, respectively, of loansthat are carried at fair value.
Reclassified to conform to the current period's presentation.
Page 18

CORPORATE / OTHERMEMO - CITI HOLDINGSALREADY INCLUDED AS A COMPONENT OF CORPORATE/OTHER(In millions of dollars, except as otherwise noted)
Full Full1Q 2Q 3Q 4Q 1Q 2Q 3Q 4Q Year Year
2015 2015 2015 2015 2016 2016 2016 2016 2015 2016Revenues
Net interest revenue 1,265$ 1,213$ 1,155$ 855$ 602$ 550$ 479$ 406$ 4,488$ 2,037$ Non-interest revenue (1) (2) 886 769 530 2,318 878 294 395 248 4,503 1,815
Total revenues, net of interest expense 2,151 1,982 1,685 3,173 1,480 844 874 654 8,991 3,852
Provisions for Credit Losses and for Benefits and ClaimsNet Credit Losses 469 334 272 261 143 102 129 59 1,336 433 Credit Reserve Build / (Release) (172) (185) (171) 73 (31) (224) (122) (78) (455) (455) Provision for loan losses 297 149 101 334 112 (122) 7 (19) 881 (22) Provision for Benefits and Claims 169 160 161 134 60 29 10 - 624 99 Provision for unfunded lending commitments (5) 2 (19) (1) (2) (5) - (1) (23) (8)
Total provisions for credit losses and for benefits and claims (1)(2)(3) 461 311 243 467 170 (98) 17 (20) 1,482 69
Total operating expenses 1,384 1,361 1,373 1,449 828 858 826 659 5,567 3,171
Income (Loss) from Continuing Operations beforeIncome Taxes 306 310 69 1,257 482 84 31 15 1,942 612
Provision (benefits) for income taxes 152 146 67 571 131 (15) (41) (70) 936 5
Income (Loss) from Continuing Operations 154 164 2 686 351 99 72 85 1,006 607
Noncontrolling Interests 1 - - 10 1 5 - - 11 6 Citi Holding's Net Income (Loss) 153$ 164$ 2$ 676$ 350$ 94$ 72$ 85$ 995$ 601$ Average Assets (in billions of dollars) 134$ 126$ 120$ 97$ 78$ 71$ 64$ 58$ 119$ 68$ Return on Average Assets 0.46% 0.52% 0.01% 2.76% 1.80% 0.53% 0.45% 0.58% 0.84% 0.88%Efficiency Ratio 64% 69% 81% 46% 56% 102% 95% 101% 62% 82%
Balance Sheet Data (in billions):
Total EOP Assets 130$ 124$ 117$ 81$ 73$ 66$ 61$ 54$ 81$ 54$
Total EOP Loans 67$ 64$ 60$ 49$ 45$ 41$ 39$ 33$ 49$ 33$
Total EOP Deposits 16$ 12$ 11$ 10$ 9$ 6$ 6$ 2$ 10$ 2$
(1) As a result of Citigroup's entry into an agreement in March 2015 to sell OneMain Financial (OneMain), OneMain was classified as held-for-sale (HFS) at the end of the first quarter 2015. As a result of HFS accounting treatment, approximately $74 million of cost of credit was recorded as a reduction in revenue (Other revenue) during the fourth quarter of 2015. The OneMain sale was completed on November 15, 2015. Additionally, the HFS treatment resulted in the reclassification of loans of OneMain to Other assets, where applicable.
(2) As a result of Citigroup's entry into agreements in October 2016 to sell its Brazil and Argentina consumer banking businesses, these businesses were classified as HFS at the end of the fourth quarter 2016. As aresult of HFS accounting treatment, approximately $35 million of cost of credit was recorded as a reduction in revenue (Other revenue) during the fourthquarter of 2016. Additionally, the HFS treatment resulted in the reclassification of loans of these businesses to Other assets, where applicable.
(3) The fourth quarter of 2015 includes a build of $162 million related to the transfer of approximately $8 billion of mortgage loans to Loans Held-for-sale at the end of the quarter. Thesecond and fourth quarters of 2016 include releases of $89 million and $30 million, respectively, related to sales and transfers of mortgage loans during those quarters.
Reclassified to conform to the current period's presentation.
Page 19

AVERAGE BALANCES AND INTEREST RATES (1)(2)(3)(4)(5)
Taxable Equivalent Basis
Fourth Third Fourth Fourth Third Fourth Fourth Third FourthQuarter Quarter Quarter Quarter Quarter Quarter Quarter Quarter Quarter
In millions of dollars, except as otherwise noted 2015 2016 2016 2015 2016 2016 2015 2016 2016Assets:
Deposits with Banks 122,098$ 131,571$ 143,119$ 189$ 247$ 268$ 0.61% 0.75% 0.74%Fed Funds Sold and Resale Agreements (6) 226,388 234,996 235,364 554 636 596 0.97% 1.08% 1.01%Trading Account Assets (7) 195,193 201,206 194,782 1,465 1,471 1,371 2.98% 2.91% 2.80%Investments 343,974 354,789 345,552 1,900 1,946 1,963 2.19% 2.18% 2.26%Total Loans (net of Unearned Income) (8) 624,955 635,771 626,028 9,975 10,246 10,033 6.33% 6.41% 6.38%Other Interest-Earning Assets 60,323 52,668 62,602 409 221 321 2.69% 1.67% 2.04%
Total Average Interest-Earning Assets 1,572,931$ 1,611,001$ 1,607,447$ 14,492$ 14,767$ 14,552$ 3.66% 3.65% 3.60%
Liabilities:Deposits (excluding deposit insurance and FDIC Assessment) 696,560$ 731,231$ 718,871$ 954$ 1,107$ 1,041$ 0.54% 0.60% 0.58%Deposit Insurance and FDIC Assessment - - - 269 336 306
Total Deposits 696,560 731,231 718,871 1,223 1,443 1,347 0.70% 0.79% 0.75%Fed Funds Purchased and Repurchase Agreements (6) 162,998 157,984 150,137 415 459 424 1.01% 1.16% 1.12%Trading Account Liabilities (7) 63,213 76,237 81,670 59 102 124 0.37% 0.53% 0.60%Short-Term Borrowings 89,094 81,304 94,935 87 90 177 0.39% 0.44% 0.74%Long-Term Debt (9) 185,919 181,933 183,637 1,117 1,080 1,205 2.38% 2.36% 2.61%
Total Average Interest-Bearing Liabilities 1,197,784$ 1,228,689$ 1,229,250$ 2,901$ 3,174$ 3,277$ 0.96% 1.03% 1.06% Total Average Interest-Bearing Liabilities
(excluding deposit insurance and FDIC Assessment) 1,197,784$ 1,228,689$ 1,229,250$ 2,632$ 2,838$ 2,971$ 0.87% 0.92% 0.96%
Net Interest Revenue as a % of Average Interest-Earning Assets (NIM) 11,591$ 11,593$ 11,275$ 2.92% 2.86% 2.79%
NIR as a % of Average Interest-Earning Assets (NIM) (excluding deposit insurance and FDIC Assessment) 11,860$ 11,929$ 11,581$ 2.99% 2.95% 2.87%
4Q16 Increase (Decrease) From (13) bps (7) bps
4Q16 Increase (Decrease) (excluding deposit insurance and FDIC Assessment) From (12) bps (8) bps
(1) Interest Revenue includes the taxable equivalent adjustments (based on the U.S. federal statutory tax rate of 35%) of $126 million for the fourth quarter of 2015, $114 million for the third quarter of 2016 and $112 million for the fourth quarter of 2016.
(2) Citigroup average balances and interest rates include both domestic and international operations.(3) Monthly averages have been used by certain subsidiaries where daily averages are unavailable.(4) Average rate % is calculated as annualized interest over average volumes.(5) Preliminary.(6) Average volumes of securities borrowed or purchased under agreements to resell and securities loaned or sold under agreements to repurchase are reported net pursuant to FIN 41; the related interest
excludes the impact of ASU 2013-01 (Topic 210).(7) Interest expense on trading account liabilities of ICG is reported as a reduction of interest revenue. Interest revenue and interest expense on cash collateral positions are reported in trading account assets and
trading account liabilities, respectively.(8) Nonperforming loans are included in the average loan balances.(9) Excludes hybrid financial instruments with changes recorded in Principal Transactions.Reclassified to conform to the current period's presentation.
% Average Rate (4)Average Volumes Interest
Page 20
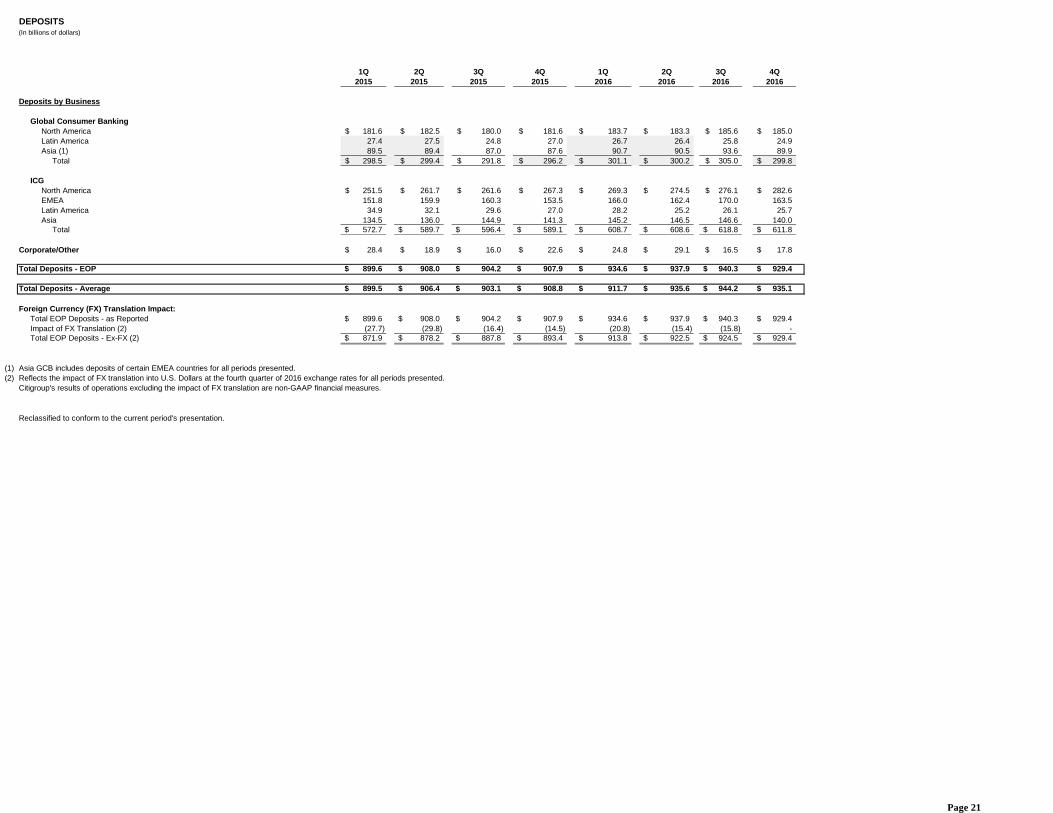
DEPOSITS(In billions of dollars)
1Q 2Q 3Q 4Q 1Q 2Q 3Q 4Q2015 2015 2015 2015 2016 2016 2016 2016
Deposits by Business
Global Consumer BankingNorth America 181.6$ 182.5$ 180.0$ 181.6$ 183.7$ 183.3$ 185.6$ 185.0$ Latin America 27.4 27.5 24.8 27.0 26.7 26.4 25.8 24.9 Asia (1) 89.5 89.4 87.0 87.6 90.7 90.5 93.6 89.9
Total 298.5$ 299.4$ 291.8$ 296.2$ 301.1$ 300.2$ 305.0$ 299.8$
ICGNorth America 251.5$ 261.7$ 261.6$ 267.3$ 269.3$ 274.5$ 276.1$ 282.6$ EMEA 151.8 159.9 160.3 153.5 166.0 162.4 170.0 163.5 Latin America 34.9 32.1 29.6 27.0 28.2 25.2 26.1 25.7 Asia 134.5 136.0 144.9 141.3 145.2 146.5 146.6 140.0
Total 572.7$ 589.7$ 596.4$ 589.1$ 608.7$ 608.6$ 618.8$ 611.8$
Corporate/Other 28.4$ 18.9$ 16.0$ 22.6$ 24.8$ 29.1$ 16.5$ 17.8$
Total Deposits - EOP 899.6$ 908.0$ 904.2$ 907.9$ 934.6$ 937.9$ 940.3$ 929.4$
Total Deposits - Average 899.5$ 906.4$ 903.1$ 908.8$ 911.7$ 935.6$ 944.2$ 935.1$
Foreign Currency (FX) Translation Impact:Total EOP Deposits - as Reported 899.6$ 908.0$ 904.2$ 907.9$ 934.6$ 937.9$ 940.3$ 929.4$ Impact of FX Translation (2) (27.7) (29.8) (16.4) (14.5) (20.8) (15.4) (15.8) - Total EOP Deposits - Ex-FX (2) 871.9$ 878.2$ 887.8$ 893.4$ 913.8$ 922.5$ 924.5$ 929.4$
(1) Asia GCB includes deposits of certain EMEA countries for all periods presented.(2) Reflects the impact of FX translation into U.S. Dollars at the fourth quarter of 2016 exchange rates for all periods presented.
Citigroup's results of operations excluding the impact of FX translation are non-GAAP financial measures.
Reclassified to conform to the current period's presentation.
Page 21

EOP LOANS
(In billions of dollars)
1Q 2Q 3Q 4Q 1Q 2Q 3Q 4Q2015 2015 2015 2015 2016 2016 2016 2016
Global Consumer Banking
North AmericaCredit Cards 105.9$ 107.7$ 107.9$ 113.3$ 107.4$ 120.8$ 125.2$ 133.3$ Retail Banking 48.1 49.2 51.0 52.2 53.5 54.8 54.8 55.3
Total 154.0$ 156.9$ 158.9$ 165.5$ 160.9$ 175.6$ 180.0$ 188.6$
Latin AmericaCredit Cards 6.1$ 5.9$ 5.4$ 5.4$ 5.3$ 5.0$ 4.9$ 4.8$ Retail Banking 20.8 20.8 19.5 19.7 19.8 19.1 18.7 18.0
Total 26.9$ 26.7$ 24.9$ 25.1$ 25.1$ 24.1$ 23.6$ 22.8$
Asia (1)Credit Cards 17.8$ 18.1$ 17.0$ 17.6$ 17.6$ 17.6$ 17.7$ 17.5$ Retail Banking 71.8 72.4 68.6 68.4 68.7 67.5 68.1 63.0
Total 89.6$ 90.5$ 85.6$ 86.0$ 86.3$ 85.1$ 85.8$ 80.5$
Total GCB Consumer LoansCredit Cards 129.8$ 131.7$ 130.3$ 136.3$ 130.3$ 143.4$ 147.8$ 155.6$ Retail Banking 140.7 142.4 139.1 140.3 142.0 141.4 141.6 136.3
Total GCB 270.5$ 274.1$ 269.4$ 276.6$ 272.3$ 284.8$ 289.4$ 291.9$
Corporate/Other - Consumer:
North America Mortgages 53.6 51.3 47.9 37.8 35.9 33.1 30.9 28.4 Other 3.0 2.9 2.8 2.7 2.7 2.6 2.5 2.4
Total 56.6$ 54.2$ 50.7$ 40.5$ 38.6$ 35.7$ 33.4$ 30.8$
International 10.2$ 9.4$ 8.7$ 8.2$ 6.4$ 5.5$ 5.5$ 2.4$
Corporate/Other - Other Consumer 0.1 0.2 0.1 0.2 0.3 0.1 0.1 -
Total Corporate/Other - Consumer 66.9$ 63.8$ 59.5$ 48.9$ 45.3$ 41.3$ 39.0$ 33.2$
Total Consumer Loans 337.4$ 337.9$ 328.9$ 325.5$ 317.6$ 326.1$ 328.4$ 325.1$
Total Corporate LoansNorth America 118.8$ 126.7$ 128.8$ 130.5$ 135.7$ 139.3$ 144.3$ 142.3$ EMEA 61.8 64.3 63.3 60.6 65.2 69.0 67.9 62.5 Latin America 40.3 40.4 40.6 40.3 38.7 38.0 37.7 36.9 Asia 62.7 62.8 60.8 60.8 61.7 61.1 60.2 57.6
Total Corporate Loans 283.6$ 294.2$ 293.5$ 292.2$ 301.3$ 307.4$ 310.1$ 299.3$
Total Loans 621.1$ 632.1$ 622.4$ 617.6$ 618.8$ 633.5$ 638.4$ 624.4$
Foreign Currency (FX) Translation Impact:Total EOP Loans - as Reported 621.1$ 632.1$ 622.4$ 617.6$ 618.8$ 633.5$ 638.4$ 624.4$ Impact of FX Translation (2) (19.5) (19.9) (9.8) (8.5) (12.3) (9.0) (9.0) - Total EOP Loans - Ex-FX (2) 601.6$ 612.2$ 612.6$ 609.1$ 606.5$ 624.5$ 629.4$ 624.4$
Note: Certain small balance consumer loans included in the above lines are classified as corporate loans on the Consolidated Balance Sheet.
(1) Asia GCB includes loans of certain EMEA countries for all periods presented.(2) Reflects the impact of FX translation into U.S. Dollars at the fourth quarter of 2016 exchange rates for all periods presented.
Citigroup's results of operations excluding the impact of FX translation are non-GAAP financial measures.
Reclassified to conform to the current period's presentation.
Page 22

SUPPLEMENTAL DETAILCONSUMER LOANS 90+ DAYS DELINQUENCY AMOUNTS AND RATIOSBUSINESS VIEW(In millions of dollars, except EOP loan amounts in billions of dollars)
1Q 2Q 3Q 4Q 1Q 2Q 3Q 4Q2015 2015 2015 2015 2016 2016 2016 2016
GCB (2)Total 2,132$ 2,020$ 1,981$ 2,119$ 2,022$ 1,965$ 2,166$ 2,293$
Ratio 0.79% 0.74% 0.74% 0.77% 0.75% 0.69% 0.75% 0.79%
Retail Bank (2)Total 540$ 567$ 529$ 523$ 498$ 515$ 579$ 474$
Ratio 0.39% 0.40% 0.38% 0.38% 0.35% 0.37% 0.41% 0.35%North America (2) 123$ 150$ 138$ 165$ 152$ 180$ 256$ 181$
Ratio 0.26% 0.31% 0.28% 0.32% 0.29% 0.33% 0.47% 0.33%Latin America 238$ 232$ 212$ 185$ 172$ 157$ 160$ 136$
Ratio 1.14% 1.12% 1.09% 0.94% 0.87% 0.82% 0.86% 0.76%Asia (3) 179$ 185$ 179$ 173$ 174$ 178$ 163$ 157$
Ratio 0.25% 0.26% 0.26% 0.25% 0.25% 0.26% 0.24% 0.25%
Cards Total 1,592$ 1,453$ 1,452$ 1,596$ 1,524$ 1,450$ 1,587$ 1,819$
Ratio 1.23% 1.10% 1.11% 1.17% 1.17% 1.01% 1.07% 1.17%North America - Citi-Branded 569$ 495$ 491$ 538$ 530$ 510$ 607$ 748$
Ratio 0.90% 0.77% 0.76% 0.80% 0.82% 0.66% 0.75% 0.87%North America - Retail Services 629$ 567$ 621$ 705$ 665$ 619$ 664$ 761$
Ratio 1.48% 1.31% 1.44% 1.53% 1.56% 1.43% 1.51% 1.61%Latin America 203$ 200$ 169$ 173$ 149$ 145$ 131$ 130$
Ratio 3.33% 3.39% 3.13% 3.20% 2.81% 2.90% 2.67% 2.71%Asia (3) 191$ 191$ 171$ 180$ 180$ 176$ 185$ 180$
Ratio 1.07% 1.06% 1.01% 1.02% 1.02% 1.00% 1.05% 1.03%
Corporate/Other - Consumer (2) (4) (5) 1,801$ 1,647$ 1,528$ 927$ 896$ 878$ 857$ 834$ Ratio 2.80% 2.70% 2.69% 1.99% 2.08% 2.23% 2.29% 2.62%
International 194$ 185$ 174$ 157$ 145$ 170$ 164$ 94$ Ratio 1.90% 1.97% 2.00% 1.91% 2.27% 3.09% 2.98% 3.92%
North America (2) (4) (5) 1,607$ 1,462$ 1,354$ 770$ 751$ 708$ 693$ 740$ Ratio 2.97% 2.84% 2.81% 2.01% 2.05% 2.09% 2.17% 2.52%
Total Citigroup (2) (4) (5) 3,933$ 3,667$ 3,509$ 3,046$ 2,918$ 2,843$ 3,023$ 3,127$ Ratio 1.18% 1.10% 1.08% 0.95% 0.93% 0.88% 0.93% 0.97%
(1) The ratio of 90+ Days Past Due is calculated based on end-of-period loans, net of unearned income.
(2) The 90+ Days Past Due and related ratios for North America Consumer Banking and Citi Holdings North America Mortgages excludesU.S. mortgage loans that are guaranteed by U.S. government-sponsored agencies since the potential loss predominantly resides with the U.S.agencies. See footnote 2 on page 9 and footnote 3 on page 18.
(3) Asia includes delinquency amounts, ratios and loans of certain EMEA countries for all periods presented.(4) The December 31, 2015, March 31, 2016, June 30, 2016, September 30, 2016 and December 31, 2016 Loans 90+ Days Past Due and
30-89 Days Past Due and related ratios exclude $11 million, $9 million, $9 million, $9 million and $7 million, respectively, of loansthat are carried at fair value.
(5) See footnote 1 on page 18.
Reclassified to conform to the current period's presentation.
Page 23

SUPPLEMENTAL DETAILCONSUMER LOANS 30-89 DAYS DELINQUENCY AMOUNTS AND RATIOSBUSINESS VIEW(In millions of dollars, except EOP loan amounts in billions of dollars)
1Q 2Q 3Q 4Q 1Q 2Q 3Q 4Q2015 2015 2015 2015 2016 2016 2016 2016
GCB (2)Total 2,414$ 2,290$ 2,427$ 2,418$ 2,360$ 2,318$ 2,553$ 2,540$
Ratio 0.90% 0.84% 0.90% 0.88% 0.87% 0.82% 0.88% 0.87%
Retail Bank (2)Total 791$ 746$ 764$ 739$ 793$ 735$ 722$ 726$
Ratio 0.57% 0.53% 0.55% 0.53% 0.56% 0.52% 0.51% 0.54%North America (2) 203$ 176$ 198$ 221$ 198$ 192$ 198$ 214$
Ratio 0.43% 0.36% 0.40% 0.43% 0.38% 0.36% 0.37% 0.39%Latin America 229$ 217$ 239$ 184$ 256$ 197$ 196$ 185$
Ratio 1.10% 1.04% 1.23% 0.93% 1.29% 1.03% 1.05% 1.03%Asia (3) 359$ 353$ 327$ 334$ 339$ 346$ 328$ 327$
Ratio 0.50% 0.49% 0.48% 0.49% 0.49% 0.51% 0.48% 0.52%
Cards Total 1,623$ 1,544$ 1,663$ 1,679$ 1,567$ 1,583$ 1,831$ 1,814$
Ratio 1.25% 1.17% 1.28% 1.23% 1.20% 1.10% 1.24% 1.17%North America - Citi-Branded 497$ 462$ 504$ 523$ 492$ 550$ 710$ 688$
Ratio 0.78% 0.72% 0.78% 0.78% 0.76% 0.71% 0.87% 0.80%North America - Retail Services 673$ 652$ 758$ 773$ 688$ 669$ 750$ 777$
Ratio 1.59% 1.51% 1.76% 1.68% 1.62% 1.55% 1.71% 1.64%Latin America 204$ 183$ 181$ 157$ 152$ 137$ 131$ 125$
Ratio 3.34% 3.10% 3.35% 2.91% 2.87% 2.74% 2.67% 2.60%Asia (3) 249$ 247$ 220$ 226$ 235$ 227$ 240$ 224$
Ratio 1.40% 1.36% 1.29% 1.28% 1.34% 1.29% 1.36% 1.28%
Corporate/Other - Consumer (2) (4) (5) 1,431$ 1,366$ 1,423$ 1,036$ 929$ 858$ 849$ 735$ Ratio 2.23% 2.24% 2.51% 2.23% 2.16% 2.18% 2.27% 2.31%
International 234$ 213$ 193$ 179$ 161$ 138$ 135$ 49$ Ratio 2.29% 2.27% 2.22% 2.18% 2.52% 2.51% 2.45% 2.04%
North America (2) (4) (5) 1,197$ 1,153$ 1,230$ 857$ 768$ 720$ 714$ 686$ Ratio 2.21% 2.24% 2.56% 2.24% 2.09% 2.12% 2.24% 2.33%
Total Citigroup (2) (4) (5) 3,845$ 3,656$ 3,850$ 3,454$ 3,289$ 3,176$ 3,402$ 3,275$ Ratio 1.15% 1.09% 1.18% 1.07% 1.05% 0.98% 1.04% 1.01%
(1) The ratio of 30-89 Days Past Due is calculated based on end-of-period loans, net of unearned income.(2) The 30-89 Days Past Due and related ratios for North America Consumer Banking and North America Local Consumer Lending excludes
U.S. mortgage loans that are guaranteed by U.S. government-sponsored agencies since the potential loss predominantly resides with the U.S.agencies. See footnote 2 on page 9 and footnote 3 on page 18.
(3) Asia includes delinquency amounts, ratios and loans of certain EMEA countries for all periods presented.
(4) The December 31, 2015, March 31, 2016, June 30, 2016, September 30, 2016 and December 31, 2016 Loans 90+ Days Past Due and30-89 Days Past Due and related ratios exclude $11 million, $9 million, $9 million, $9 million and $7 million, respectively, of loansthat are carried at fair value.
(5) See footnote 1 on page 18.
Reclassified to conform to the current period's presentation.
Page 24

ALLOWANCE FOR CREDIT LOSSES - PAGE 1
(In millions of dollars)
Full Full1Q 2Q 3Q 4Q 1Q 2Q 3Q 4Q Year Year
2015 2015 2015 2015 2016 2016 2016 2016 2015 2016
Total CitigroupAllowance for Loan Losses at Beginning of Period (1) 15,994$ 14,598$ 14,075$ 13,626$ 12,626$ 12,712$ 12,304$ 12,439$ 15,994$ 12,626$
Gross Credit (Losses) (2,458) (2,335) (2,068) (2,180) (2,143) (2,048) (1,948) (2,083) (9,041) (8,222) Gross Recoveries 501 415 405 418 419 432 423 387 1,739 1,661
Net Credit (Losses) / Recoveries (NCLs) (1,957) (1,920) (1,663) (1,762) (1,724) (1,616) (1,525) (1,696) (7,302) (6,561) NCLs 1,957 1,920 1,663 1,762 1,724 1,616 1,525 1,696 7,302 6,561 Net Reserve Builds / (Releases) (2) (91) (199) 43 386 42 (90) 258 130 139 340 Net Specific Reserve Builds / (Releases) (2) (111) (206) (124) 108 120 (136) (37) (99) (333) (152)
Provision for Loan Losses 1,755 1,515 1,582 2,256 1,886 1,390 1,746 1,727 7,108 6,749 Other (3) (4) (5) (6) (7) (8) (9) (1,194) (118) (368) (1,494) (76) (182) (86) (410) (3,174) (754) Allowance for Loan Losses at End of Period (1) (a) 14,598$ 14,075$ 13,626$ 12,626$ 12,712$ 12,304$ 12,439$ 12,060$ 12,626$ 12,060$
Allowance for Unfunded Lending Commitments (5) (10) (a) 1,023$ 973$ 1,036$ 1,402$ 1,473$ 1,432$ 1,388$ 1,418$ 1,402$ 1,418$
Provision for Unfunded Lending Commitments (5) (37)$ (48)$ 65$ 94$ 71$ (30)$ (45)$ 33$ 74$ 29$
Total Allowance for Loans, Leases and Unfunded Lending Commitments [Sum of (a)] 15,621$ 15,048$ 14,662$ 14,028$ 14,185$ 13,736$ 13,827$ 13,478$ 14,028$ 13,478$
Total Allowance for Loan Losses as a Percentage of Total Loans (11) 2.38% 2.25% 2.21% 2.06% 2.07% 1.96% 1.97% 1.94%
(1) Allowance for credit losses represents management's estimate of probable losses inherent in the portfolio. Attribution of the allowance is made foranalytical purposes only, and the entire allowance is available to absorb probable credit losses inherent in the portfolio.
(2) The fourth quarter of 2015 includes a build of $162 million related to the transfer of approximately $8 billion of mortgage loans to Loans Held-for-sale at the end of the quarter. Thesecond and fourth quarters of 2016 include releases of $89 million and $30 million, respectively, related to sales and transfers of mortgage loans during those quarters.
(3) Includes all adjustments to the allowance for credit losses, such as changes in the allowance from acquisitions, dispositions, securitizations, foreign currency translation (FX translation), purchase accounting adjustments, etc.
(4) The fourth quarter of 2015 includes a reduction of approximately $1.1 billion related to the sale or transfers to HFS of various loan portfolios, including areduction of $1.1 billion related to the transfers of a real estate loan portfolio to HFS. Additionally, the fourth quarter includes a reduction of approximately $35 million relatedto FX translation.
(5) The fourth quarter of 2015 includes a reclassification of $271 million of Allowance for Loan Losses to Allowance for Unfunded Lending Commitments, included in theOther line item. This reclassification reflects the re-attribution of $271 million in Allowances for Credit Losses between the funded and unfunded portions of thecorporate credit portfolios and does not reflect a change in the underlying credit performance of these portfolios. The $94 million ($87 million corporate, $7 millionconsumer) Provision for unfunded lending commitments during the fourth quarter of 2015 represents the allowance change during the quarter due to portfolio and economicchanges in the unfunded portfolio during the quarter.
(6) The first quarter of 2016 includes a reduction of approximately $148 million related to the sale or transfers to HFS of various loan portfolios, including areduction of $29 million related to the transfers of a real estate loan portfolio to HFS. Additionally, the first quarter includes an increase of approximately $63 million relatedto FX translation.
(7) The second quarter of 2016 includes a reduction of approximately $101 million related to the sale or transfers to HFS of various loan portfolios, including areduction of $24 million related to the transfers of a real estate loan portfolio to HFS. Additionally, the second quarter includes a reduction of approximately $75 million relatedto FX translation.
(8) The third quarter of 2016 includes a reduction of approximately $58 million related to the sale or transfers to HFS of various loan portfolios, including areduction of $50 million related to the transfers of a real estate loan portfolio to HFS. Additionally, the third quarter includes a reduction of approximately $46 million relatedto FX translation.
(9) The fourth quarter of 2016 includes a reduction of approximately $267 million related to the sale or transfers to HFS of various loan portfolios, including areduction of $3 million related to the transfers of a real estate loan portfolio to HFS. Additionally, the fourth quarter includes a reduction of approximately $141 million relatedto FX translation.
(10) Represents additional credit reserves recorded as other liabilities on the Consolidated Balance Sheet.
(11) December 31, 2015, March 31, 2016, June 30, 2016, September 30, 2016 and December 31, 2016, exclude $5.0 billion, $4.8 billion, $4.1 billion, $4.0 billion and $3.5 billion, respectively, of loans which are carried at fair value.
Reclassified to conform to the current period's presentation.
Page 25

ALLOWANCE FOR CREDIT LOSSES - PAGE 2(In millions of dollars)
Full Full1Q 2Q 3Q 4Q 1Q 2Q 3Q 4Q Year Year
2015 2015 2015 2015 2016 2016 2016 2016 2015 2016
Consumer:Allowance for Loan Losses at Beginning of Period (1) 13,547$ 12,052$ 11,669$ 11,030$ 9,835$ 9,807$ 9,432$ 9,673$ 13,547$ 9,835$
Net Credit Losses (NCLs) (1,965) (1,813) (1,612) (1,668) (1,514) (1,475) (1,483) (1,576) (7,058) (6,048) NCLs 1,965 1,813 1,612 1,668 1,514 1,475 1,483 1,576 7,058 6,048 Net Reserve Builds / (Releases) (2) (203) (167) (73) 32 38 (74) 368 93 (411) 425 Net Specific Reserve Builds / (Releases) (2) (114) (87) (202) (16) 19 (125) (36) (10) (419) (152)
Provision for Loan Losses 1,648 1,559 1,337 1,684 1,571 1,276 1,815 1,659 6,228 6,321 Other (3) (4) (5) (6) (7) (8) (1,178) (129) (364) (1,211) (85) (176) (91) (398) (2,882) (750) Allowance for Loan Losses at End of Period (1) (a) 12,052$ 11,669$ 11,030$ 9,835$ 9,807$ 9,432$ 9,673$ 9,358$ 9,835$ 9,358$
Consumer Allowance for Unfunded Lending Commitments (9) (a) 30$ 29$ 28$ 35$ 37$ 42$ 39$ 35$ 35$ 35$
Provision for Unfunded Lending Commitments (3)$ (1)$ (1)$ 7$ 1$ 4$ (4)$ (3)$ 2$ (2)$
Total Allowance for Loans, Leases and Unfunded Lending Commitments [Sum of (a)] 12,082$ 11,698$ 11,058$ 9,870$ 9,844$ 9,474$ 9,712$ 9,393$ 9,870$ 9,393$
Consumer Allowance for Loan Losses as aPercentage of Total Consumer Loans (10) 3.57% 3.45% 3.35% 3.02% 3.09% 2.89% 2.95% 2.88%
CorporateAllowance for Loan Losses at Beginning of Period (1) 2,447$ 2,546$ 2,406$ 2,596$ 2,791$ 2,905$ 2,872$ 2,766$ 2,447$ 2,791$
Net Credit (Losses) / Recoveries (NCL's) 8 (107) (51) (94) (210) (141) (42) (120) (244) (513) NCLs (8) 107 51 94 210 141 42 120 244 513 Net Reserve Builds / (Releases) 112 (32) 116 354 4 (16) (110) 37 550 (85) Net Specific Reserve Builds / (Releases) 3 (119) 78 124 101 (11) (1) (89) 86 -
Provision for Loan Losses 107 (44) 245 572 315 114 (69) 68 880 428 Other (3) (11) (16) 11 (4) (283) 9 (6) 5 (12) (292) (4) Allowance for Loan Losses at End of Period (1) (b) 2,546$ 2,406$ 2,596$ 2,791$ 2,905$ 2,872$ 2,766$ 2,702$ 2,791$ 2,702$
Corporate Allowance for Unfunded Lending Commitments (9) (11) (b) 993$ 944$ 1,008$ 1,367$ 1,436$ 1,390$ 1,349$ 1,383$ 1,367$ 1,383$
Provision for Unfunded Lending Commitments (11) (34)$ (47)$ 66$ 87$ 70$ (34)$ (41)$ 36$ 72$ 31$
Total Allowance for Loans, Leases and Unfunded Lending Commitments [Sum of (b)] 3,539$ 3,350$ 3,604$ 4,158$ 4,341$ 4,262$ 4,115$ 4,085$ 4,158$ 4,085$
Corporate Allowance for Loan Losses as aPercentage of Total Corporate Loans (12) 0.92% 0.84% 0.90% 0.97% 0.98% 0.95% 0.90% 0.91%
Footnotes to these tables are on the following page (page 27).
Page 26

ALLOWANCE FOR CREDIT LOSSES - PAGE 3
The following footnotes relate to the tables on the prior page (page 26).
(1) Allowance for credit losses represents management's estimate of probable losses inherent in the portfolio. Attribution of the allowance is made foranalytical purposes only, and the entire allowance is available to absorb probable credit losses inherent in the portfolio.
(2) The fourth quarter of 2015 includes a build of $162 million related to the transfer of approximately $8 billion of mortgage loans to Loans Held-for-sale at the end of the quarter. Thesecond and fourth quarters of 2016 include releases of $89 million and $30 million, respectively, related to sales and transfers of mortgage loans during those quarters.
(3) Includes all adjustments to the allowance for credit losses, such as changes in the allowance from acquisitions, dispositions, securitizations, foreign currency translation (FX translation), purchase accounting adjustments, etc.
(4) The fourth quarter of 2015 includes a reduction of approximately $1.1 billion related to the sale or transfers to HFS of various loan portfolios, including areduction of $1.1 billion related to the transfers of a real estate loan portfolio to HFS. Additionally, the fourth quarter includes a reduction of approximately $35 million relatedto FX translation.
(5) The first quarter of 2016 includes a reduction of approximately $148 million related to the sale or transfers to HFS of various loan portfolios, including areduction of $29 million related to the transfers of a real estate loan portfolio to HFS. Additionally, the first quarter includes an increase of approximately $63 million relatedto FX translation.
(6) The second quarter of 2016 includes a reduction of approximately $101 million related to the sale or transfers to HFS of various loan portfolios, including areduction of $24 million related to the transfers of a real estate loan portfolio to HFS. Additionally, the second quarter includes a reduction of approximately $75 million relatedto FX translation.
(7) The third quarter of 2016 includes a reduction of approximately $58 million related to the sale or transfers to HFS of various loan portfolios, including areduction of $50 million related to the transfers of a real estate loan portfolio to HFS. Additionally, the third quarter includes a reduction of approximately $46 million relatedto FX translation.
(8) The fourth quarter of 2016 includes a reduction of approximately $267 million related to the sale or transfers to HFS of various loan portfolios, including areduction of $3 million related to the transfers of a real estate loan portfolio to HFS. Additionally, the fourth quarter includes a reduction of approximately $141 million relatedto FX translation.
(9) Represents additional credit reserves recorded as other liabilities on the Consolidated Balance Sheet.
(10) December 31, 2015, March 31, 2016, June 30, 2016, September 30, 2016 and December 31, 2016 exclude$34 million, $33 million, $32 million, $31 million and $29 million, respectively, of loans which are carried at fair value.
(11) The fourth quarter of 2015 includes a reclassification of $271 million of Allowance for Loan Losses to Allowance for Unfunded Lending Commitments, included in theOther line item. This reclassification reflects the re-attribution of $271 million in Allowances for Credit Losses between the funded and unfunded portions of thecorporate credit portfolios and does not reflect a change in the underlying credit performance of these portfolios. The $94 million ($87 million corporate, $7 millionconsumer) Provision for unfunded lending commitments during the fourth quarter of 2015 represents the allowance change during the quarter due to portfolio and economicchanges in the unfunded portfolio during the quarter.
(12) December 31, 2015, March 31, 2016, June 30, 2016, September 30, 2016 and December 31, 2016 exclude$5.0 billion, $4.8 billion, $4.1 billion, $3.9 billion and $3.5 billion, respectively, of loans which are carried at fair value.
Reclassified to conform to the current period's presentation.
Page 27

COMPONENTS OF PROVISION FOR LOAN LOSSES
(In millions of dollars)Full Full
1Q 2Q 3Q 4Q 1Q 2Q 3Q 4Q Year Year2015 2015 2015 2015 2016 2016 2016 2016 2015 2016
Global Consumer BankingNet Credit Losses 1,490 1,504 1,353 1,405 1,371 1,374 1,349 1,516 5,752 5,610 Credit Reserve Build / (Release) (150) (98) (102) (45) 85 23 436 164 (395) 708 North America
Net Credit Losses 961 999 877 914 933 954 927 1,105 3,751 3,919 Credit Reserve Build / (Release) (100) (109) (60) (70) 79 49 408 117 (339) 653 Retail Banking
Net Credit Losses 36 39 33 42 25 45 52 83 150 205 Credit Reserve Build / (Release) 18 (6) 33 6 63 (12) (40) (22) 51 (11)
Citi-Branded CardsNet Credit Losses 492 503 443 454 455 467 448 539 1,892 1,909 Credit Reserve Build / (Release) (119) (74) (105) (85) (15) 58 263 78 (383) 384
Citi Retail ServicesNet Credit Losses 433 457 401 418 453 442 427 483 1,709 1,805 Credit Reserve Build / (Release) 1 (29) 12 9 31 3 185 61 (7) 280
Latin AmericaNet Credit Losses 356 316 301 307 278 260 254 248 1,280 1,040 Credit Reserve Build / (Release) (8) 19 19 3 17 (2) 32 36 33 83 Retail Banking
Net Credit Losses 150 142 138 159 134 137 132 138 589 541 Credit Reserve Build / (Release) - 17 13 12 16 (3) 47 31 42 91
Citi-Branded CardsNet Credit Losses 206 174 163 148 144 123 122 110 691 499 Credit Reserve Build / (Release) (8) 2 6 (9) 1 1 (15) 5 (9) (8)
Asia (1)Net Credit Losses 173 189 175 184 160 160 168 163 721 651 Credit Reserve Build / (Release) (42) (8) (61) 22 (11) (24) (4) 11 (89) (28) Retail Banking
Net Credit Losses 70 80 75 94 62 61 73 65 319 261 Credit Reserve Build / (Release) (21) (3) (34) 26 3 (21) - 12 (32) (6)
Citi-Branded CardsNet Credit Losses 103 109 100 90 98 99 95 98 402 390 Credit Reserve Build / (Release) (21) (5) (27) (4) (14) (3) (4) (1) (57) (22)
Institutional Clients Group (ICG)Net Credit Losses (1) 82 37 96 211 141 45 119 214 516 Credit Reserve Build / (Release) 119 (123) 193 465 108 (26) (93) (53) 654 (64)
Corporate / OtherNet Credit Losses 468 334 273 261 142 101 131 61 1,336 435 Credit Reserve Build / (Release) (171) (184) (172) 74 (31) (223) (122) (80) (453) (456)
Total Provision for Loan Losses 1,755$ 1,515$ 1,582$ 2,256$ 1,886$ 1,390$ 1,746$ 1,727$ 7,108$ 6,749$
(1) Asia GCB includes NCLs and credit reserve builds (releases) for certain EMEA countries for all periods presented.
Reclassified to conform to the current period's presentation.
Page 28

NON-ACCRUAL ASSETS
(In millions of dollars)
1Q 2Q 3Q 4Q 1Q 2Q 3Q 4Q
2015 2015 2015 2015 2016 2016 2016 2016Non-Accrual Loans (1)Corporate Non-Accrual Loans By Region
North America 347$ 467$ 833$ 818$ 1,331$ 1,280$ 1,057$ 984$ EMEA 305 385 386 347 469 762 857 904 Latin America 379 226 230 303 410 267 380 379 Asia 151 145 129 128 117 151 121 154
Total 1,182$ 1,223$ 1,578$ 1,596$ 2,327$ 2,460$ 2,415$ 2,421$
Consumer Non-Accrual Loans By Region (2) (3) (4)North America 4,184$ 3,928$ 3,622$ 2,515$ 2,519$ 2,520$ 2,429$ 2,160$ Latin America 1,084 1,032 935 874 817 884 841 711 Asia (5) 304 301 272 269 265 301 282 287
Total 5,572$ 5,261$ 4,829$ 3,658$ 3,601$ 3,705$ 3,552$ 3,158$
OTHER REAL ESTATE OWNED AND OTHER REPOSSESSED ASSETS
Institutional Clients Group 28$ 23$ 35$ 32$ 29$ 13$ 12$ 14$ Global Consumer Banking 53 55 44 34 41 38 41 34 Corporate/Other 193 168 148 143 135 124 108 138 TOTAL OTHER REAL ESTATE OWNED (OREO) (6) 274$ 246$ 227$ 209$ 205$ 175$ 161$ 186$
OREO By Region: North America 220$ 190$ 177$ 166$ 159$ 151$ 132$ 161$ EMEA 1 1 1 1 1 - 1 - Latin America 48 50 44 38 35 19 18 18 Asia 5 5 5 4 10 5 10 7
Total 274$ 246$ 227$ 209$ 205$ 175$ 161$ 186$
Other Repossessed Assets -$ -$ -$ -$ -$ -$ -$ -$
Non-Accrual Assets (NAA) (7)Corporate Non-Accrual Loans 1,182$ 1,223$ 1,578$ 1,596$ 2,327$ 2,460$ 2,415$ 2,421$ Consumer Non-Accrual Loans 5,572 5,261 4,829 3,658 3,601 3,705 3,552 3,158 Non-Accrual Loans (NAL) 6,754 6,484 6,407 5,254 5,928 6,165 5,967 5,579 OREO 274 246 227 209 205 175 161 186 Other Repossessed Assets - - - - - - - - Non-Accrual Assets (NAA) 7,028$ 6,730$ 6,634$ 5,463$ 6,133$ 6,340$ 6,128$ 5,765$
NAL as a % of Total Loans 1.09% 1.03% 1.03% 0.85% 0.96% 0.97% 0.93% 0.89%NAA as a % of Total Assets 0.38% 0.37% 0.37% 0.32% 0.34% 0.35% 0.34% 0.32%
Allowance for Loan Losses as a % of NAL 216% 217% 213% 240% 214% 200% 208% 216%
(1) Corporate loans are placed on non-accrual status based upon a review by Citigroup's risk officers. Corporate non-accrual loans may still be current on interestpayments. With limited exceptions, the following practices are applied for Consumer loans: Consumer loans, excluding credit cards and mortgages, are placedon non-accrual status at 90 days past due, and are charged off at 120 days past due; residential mortgage loans are placed on non-accrual status at 90 dayspast due and written down to net realizable value at 180 days past due. Consistent with industry conventions, Citigroup generally accrues interest on credit cardloans until such loans are charged off, which typically occurs at 180 days contractual delinquency. As such, the non-accrual loan disclosures do not includecredit card loans.
(2) The fourth quarter of 2016 reflects the transfers of non accrual loans to HFS resulting from the agreements to sell the Brazil and Argentina consumer banking businesses.(3) Excludes SOP 03-3 purchased distressed loans.(4) The fourth quarter of 2015 decline includes the impact related to the transfer of approximately $8 billion of mortgage loans to Loans, held-for-sale (HFS)
(included within Other assets on the GAAP balance sheet). (5) Asia GCB includes balances for certain EMEA countries for all periods presented.(6) Represents the carrying value of all property acquired by foreclosure or other legal proceedings when Citigroup has taken possession of the collateral. Also
includes former premises and property for use that is no longer contemplated.(7) There is no industry-wide definition of non-accrual assets. As such, analysis against the industry is not always comparable.
Reclassified to conform to the current period's presentation.
Page 29
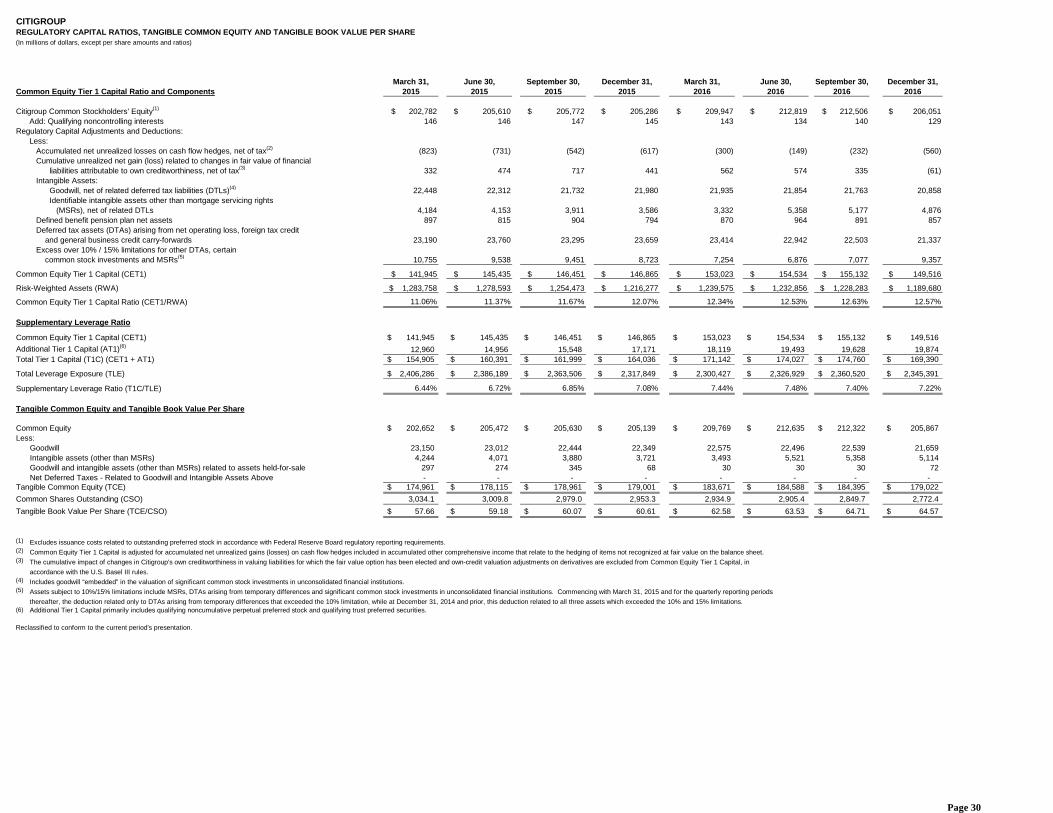
CITIGROUPREGULATORY CAPITAL RATIOS, TANGIBLE COMMON EQUITY AND TANGIBLE BOOK VALUE PER SHARE(In millions of dollars, except per share amounts and ratios)
March 31, June 30, September 30, December 31, March 31, June 30, September 30, December 31,Common Equity Tier 1 Capital Ratio and Components 2015 2015 2015 2015 2016 2016 2016 2016
Citigroup Common Stockholders' Equity(1) $ 202,782 $ 205,610 $ 205,772 $ 205,286 $ 209,947 $ 212,819 $ 212,506 $ 206,051 Add: Qualifying noncontrolling interests 146 146 147 145 143 134 140 129 Regulatory Capital Adjustments and Deductions: Less: Accumulated net unrealized losses on cash flow hedges, net of tax(2) (823) (731) (542) (617) (300) (149) (232) (560) Cumulative unrealized net gain (loss) related to changes in fair value of financial liabilities attributable to own creditworthiness, net of tax(3) 332 474 717 441 562 574 335 (61) Intangible Assets: Goodwill, net of related deferred tax liabilities (DTLs)(4) 22,448 22,312 21,732 21,980 21,935 21,854 21,763 20,858 Identifiable intangible assets other than mortgage servicing rights (MSRs), net of related DTLs 4,184 4,153 3,911 3,586 3,332 5,358 5,177 4,876 Defined benefit pension plan net assets 897 815 904 794 870 964 891 857 Deferred tax assets (DTAs) arising from net operating loss, foreign tax credit and general business credit carry-forwards 23,190 23,760 23,295 23,659 23,414 22,942 22,503 21,337 Excess over 10% / 15% limitations for other DTAs, certain common stock investments and MSRs(5) 10,755 9,538 9,451 8,723 7,254 6,876 7,077 9,357
Common Equity Tier 1 Capital (CET1) $ 141,945 $ 145,435 $ 146,451 $ 146,865 $ 153,023 $ 154,534 $ 155,132 $ 149,516
Risk-Weighted Assets (RWA) $ 1,283,758 $ 1,278,593 $ 1,254,473 $ 1,216,277 $ 1,239,575 $ 1,232,856 $ 1,228,283 $ 1,189,680
Common Equity Tier 1 Capital Ratio (CET1/RWA) 11.06% 11.37% 11.67% 12.07% 12.34% 12.53% 12.63% 12.57%
Supplementary Leverage Ratio
Common Equity Tier 1 Capital (CET1) 141,945$ 145,435$ 146,451$ 146,865$ 153,023$ 154,534$ 155,132$ 149,516$ Additional Tier 1 Capital (AT1)(6) 12,960 14,956 15,548 17,171 18,119 19,493 19,628 19,874 Total Tier 1 Capital (T1C) (CET1 + AT1) 154,905$ 160,391$ 161,999$ 164,036$ 171,142$ 174,027$ 174,760$ 169,390$
Total Leverage Exposure (TLE) 2,406,286$ 2,386,189$ 2,363,506$ 2,317,849$ 2,300,427$ 2,326,929$ 2,360,520$ 2,345,391$
Supplementary Leverage Ratio (T1C/TLE) 6.44% 6.72% 6.85% 7.08% 7.44% 7.48% 7.40% 7.22%
Tangible Common Equity and Tangible Book Value Per Share
Common Equity 202,652$ 205,472$ 205,630$ 205,139$ 209,769$ 212,635$ 212,322$ 205,867$ Less:
Goodwill 23,150 23,012 22,444 22,349 22,575 22,496 22,539 21,659 Intangible assets (other than MSRs) 4,244 4,071 3,880 3,721 3,493 5,521 5,358 5,114 Goodwill and intangible assets (other than MSRs) related to assets held-for-sale 297 274 345 68 30 30 30 72 Net Deferred Taxes - Related to Goodwill and Intangible Assets Above - - - - - - - -
Tangible Common Equity (TCE) 174,961$ 178,115$ 178,961$ 179,001$ 183,671$ 184,588$ 184,395$ 179,022$ Common Shares Outstanding (CSO) 3,034.1 3,009.8 2,979.0 2,953.3 2,934.9 2,905.4 2,849.7 2,772.4 Tangible Book Value Per Share (TCE/CSO) 57.66$ 59.18$ 60.07$ 60.61$ 62.58$ 63.53$ 64.71$ 64.57$
(1) Excludes issuance costs related to outstanding preferred stock in accordance with Federal Reserve Board regulatory reporting requirements.(2) Common Equity Tier 1 Capital is adjusted for accumulated net unrealized gains (losses) on cash flow hedges included in accumulated other comprehensive income that relate to the hedging of items not recognized at fair value on the balance sheet.(3) The cumulative impact of changes in Citigroup’s own creditworthiness in valuing liabilities for which the fair value option has been elected and own-credit valuation adjustments on derivatives are excluded from Common Equity Tier 1 Capital, in
accordance with the U.S. Basel III rules.(4) Includes goodwill “embedded” in the valuation of significant common stock investments in unconsolidated financial institutions.(5) Assets subject to 10%/15% limitations include MSRs, DTAs arising from temporary differences and significant common stock investments in unconsolidated financial institutions. Commencing with March 31, 2015 and for the quarterly reporting periods
thereafter, the deduction related only to DTAs arising from temporary differences that exceeded the 10% limitation, while at December 31, 2014 and prior, this deduction related to all three assets which exceeded the 10% and 15% limitations.(6) Additional Tier 1 Capital primarily includes qualifying noncumulative perpetual preferred stock and qualifying trust preferred securities.
Reclassified to conform to the current period's presentation.
Page 30