Embed Size (px)
Citation preview
Citigroup Inc.
Pillar 3
Basel III Advanced Approaches Disclosures
For the Quarterly Period Ended March 31, 2021
TABLE OF CONTENTS
OVERVIEW 2
SCOPE OF APPLICATION 3
CAPITAL STRUCTURE 4
CAPITAL ADEQUACY 6
CAPITAL CONSERVATION AND COUNTERCYCLICAL CAPITAL BUFFERS 10
RISK MANAGEMENT 11
CREDIT RISK: GENERAL DISCLOSURES 13
CREDIT RISK: PORTFOLIO DISCLOSURES – INTERNAL RATINGS-BASED APPROACH 21
COUNTERPARTY CREDIT RISK: OTC DERIVATIVE CONTRACTS, REPO-STYLE TRANSACTIONS AND ELIGIBLE MARGIN LOANS
28
CREDIT RISK MITIGATION 32
SECURITIZATIONS 34
EQUITY EXPOSURES NOT SUBJECT TO THE MARKET RISK CAPITAL RULES 40
MARKET RISK 42
OPERATIONAL RISK 51
INTEREST RATE RISK: NON-TRADING ACTIVITIES 52
SUPPLEMENTARY LEVERAGE RATIO 53
APPENDIX A: GLOSSARY 54
APPENDIX B: DISCLOSURE INDEX 56
1
CITIGROUP INC. – BASEL III ADVANCED APPROACHES DISCLOSURES – March 31, 2021
OVERVIEW
OrganizationCitigroup Inc. (Citi) is a global diversified financial services holding company incorporated under the laws of the state of Delaware, and whose businesses provide consumers, corporations, governments and institutions with a broad, yet focused, range of financial products and services, including consumer banking and credit, corporate and investment banking, securities brokerage, trade and securities services and wealth management. Citi has approximately 200 million customer accounts and does business in more than 160 countries and jurisdictions.
Citigroup’s activities are conducted through the Global Consumer Banking (GCB) and Institutional Clients Group (ICG) business segments. In addition, Corporate/Other includes activities not assigned to a specific business segment, as well as certain North America and international loan portfolios, discontinued operations and other legacy assets.
Citi’s principal banking (depository institution) subsidiary is Citibank, N.A. (Citibank), a national banking association, with offerings encompassing consumer finance, credit cards, mortgage lending and retail banking products and services; investment banking, commercial banking, cash management, trade finance and e-commerce products and services; and private banking products and services. Significant Citigroup legal entities other than Citibank include Citibanamex, Mexico's second largest bank, as well as Citigroup Global Markets Inc. and Citigroup Global Markets Limited, the primary U.S. and U.K. broker-dealer (nonbanking) subsidiaries, respectively.
Regulatory Capital Standards and DisclosuresCiti is subject to regulatory capital standards issued by the Federal Reserve Board (FRB), which constitute the U.S. Basel III rules. These rules establish an integrated capital adequacy framework, encompassing both risk-based capital ratios and leverage ratios.
The U.S. Basel III rules set forth the composition of regulatory capital (including the application of regulatory capital adjustments and deductions), as well as two comprehensive methodologies (a Standardized Approach and Advanced Approaches) for measuring total risk-weighted assets. Total risk-weighted assets under the Advanced Approaches, which are primarily models-based, include credit, market, and operational risk-weighted assets.
In addition, Citi, as an Advanced Approaches banking organization under the U.S. Basel III rules, is also required to publicly disclose certain qualitative and quantitative information regarding Citi’s capital structure and adequacy, credit risk and related mitigation policies, securitizations, equity exposures, market risk, operational risk, Supplementary Leverage ratio, and other matters (the Basel III Advanced Approaches Disclosures). These Basel III Advanced Approaches Disclosures constitute the often referred to “Pillar 3 Disclosures.”
Moreover, these Citigroup Basel III Advanced Approaches Disclosures were reviewed and approved in accordance with
Citi’s Basel Public Disclosures Policy, the latter of which has been approved by Citi’s Board of Directors.
For additional information regarding the U.S. Basel III rules, see “Capital Resources” in Citi’s 2020 Annual Report on Form 10-K (2020 Form 10-K)and Citi’s Quarterly Report on Form 10-Q for the period ended March 31, 2021 (First Quarter 2021 Form 10-Q). Further, see Citi's FFIEC 101 Report, “Regulatory Capital Reporting for Institutions Subject to the Advanced Capital Adequacy Framework” as of March 31, 2021 (First Quarter 2021 FFIEC 101 Report), available on the National Information Center's website.
2
CITIGROUP INC. – BASEL III ADVANCED APPROACHES DISCLOSURES – March 31, 2021
SCOPE OF APPLICATION
Basis of ConsolidationCiti’s basis of consolidation for both financial and regulatory accounting purposes is in accordance with U.S. GAAP. The U.S. Basel III rules are applied to these consolidated financial statements and off-balance sheet exposures.
Certain of Citi’s equity investments in entities carried under either the cost or equity method of accounting for U.S. GAAP purposes are neither consolidated nor deducted from regulatory capital under the U.S. Basel III rules, but rather are appropriately risk-weighted. However, so-called “significant investments” (greater than 10% ownership or exposure) in the common stock of unconsolidated financial institutions are subject, under the U.S. Basel III rules, to potential deduction in arriving at Common Equity Tier 1 Capital. To the extent not deducted, these significant investments are risk-weighted.
In addition, under the U.S. Basel III rules, Citi must deduct 50% of the minimum regulatory capital requirements of insurance underwriting subsidiaries from each of Tier 1 Capital and Tier 2 Capital.
For further information regarding Citi’s more significantsubsidiaries and basis of consolidation, see Note 1, “Basis ofPresentation, Updated Accounting Policies and AccountingChanges” and Note 18, “Securitizations and Variable InterestEntities” in the Notes to Consolidated Financial Statements inCiti’s First Quarter 2021 Form 10-Q.
Funds and Capital Transfer RestrictionsFor information regarding restrictions or other major impediments on the transfer of funds and capital distributions between Citi entities, see Note 18, “Regulatory Capital” in the Notes to Consolidated Financial Statements in Citi’s 2020 Form 10-K.
Regulated Subsidiaries’ CapitalTotal Capital for each of Citi’s regulated banking subsidiaries was in excess of their respective minimum total capital requirements as of March 31, 2021. Likewise, Citi’s regulated principal broker-dealer subsidiaries were also in compliance with their net capital requirements at that date.
Further, the aggregate amount of surplus capital in Citi’s insurance subsidiaries included in consolidated Total Capital as of March 31, 2021 was $1.5 billion. Separately, no Citi insurance subsidiary had a capital shortfall relative to its minimum regulatory capital requirement as of such date.
3
CITIGROUP INC. – BASEL III ADVANCED APPROACHES DISCLOSURES – March 31, 2021
CAPITAL STRUCTURE
Regulatory Capital InstrumentsAside from common stock, Citi’s other currently qualifying regulatory capital instruments consist of outstanding noncumulative perpetual preferred stock, trust preferred securities and subordinated debt.
Citigroup common stock entitles each holder to one vote per share for the election of directors and for all other matters to be voted on by Citigroup’s common shareholders. Except as otherwise provided by Delaware law, the holders of common stock vote as one class. Upon a liquidation, dissolution or winding up of Citigroup, the holders of common stock share ratably in the assets remaining and available for distribution after payments to creditors and provision for any preference of any preferred stock. There are no preemptive or other subscription rights, conversion rights or redemption or scheduled installment payment provisions relating to the common stock. For additional information on the terms and conditions of Citi’s common stock, see Citi’s Consolidated Balance Sheet and “Unregistered Sales ofEquity Securities, Repurchases of Equity Securities and Dividends—Equity Security Repurchases” in Citi’s First Quarter 2021 Form10-Q.
Each series of Citigroup preferred stock is noncumulative and perpetual and ranks senior to the common stock but ranks equally with each other series of outstanding preferred stock as to dividends and distributions upon a liquidation, dissolution or winding up of Citigroup. Unless full noncumulative dividends for the dividend period then ending have been paid, Citigroup cannot pay any cash dividends on any common stock or other capital stock ranking junior to the preferred stock during the subsequent dividend period. Holders of preferred stock generally do not have voting rights other than those described in the corresponding certificate of designation and as specifically required by Delaware law. For additional information on the terms and conditions of Citi's outstanding preferred stock, see Note 20, “Preferred Stock” in the Notes to Consolidated Financial Statements in Citi’s 2020 Form 10-K.
Under the U.S. Basel III rules however, trust preferred securities largely phase out as qualifying regulatory capital instruments by January 1, 2022. For additional information regarding the structure and terms of Citi’s currently outstanding trust preferred securities, see Note 16, “Debt” in the Notes to Consolidated Financial Statements in Citi’s First Quarter 2021 Form 10-Q, and with respect to the phase out of trust preferred securities, see “Capital Resources—Current Regulatory Capital Standards—Transition Provisions” in Citi’s 2020 Form 10-K
Citi’s subordinated debt contains customary provisions applicable to all debt securities, with the exception that subordinated debt contains no financial covenants and the only events of default are those related to bankruptcy, insolvency, receivership and other similar actions. The following table presents Citi’s qualifying subordinated debt as of March 31, 2021.
4
CITIGROUP INC. – BASEL III ADVANCED APPROACHES DISCLOSURES – March 31, 2021
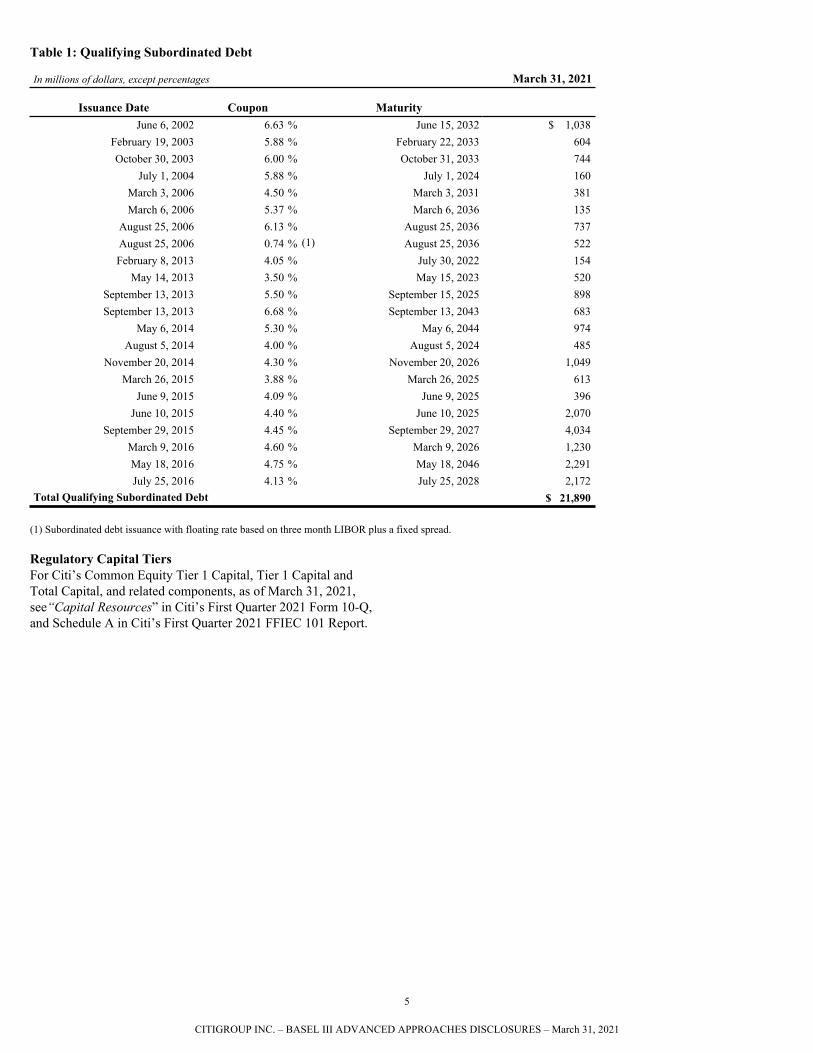
Table 1: Qualifying Subordinated Debt
In millions of dollars, except percentages March 31, 2021
Issuance Date Coupon MaturityJune 6, 2002 6.63 % June 15, 2032 $ 1,038
February 19, 2003 5.88 % February 22, 2033 604 October 30, 2003 6.00 % October 31, 2033 744
July 1, 2004 5.88 % July 1, 2024 160 March 3, 2006 4.50 % March 3, 2031 381 March 6, 2006 5.37 % March 6, 2036 135
August 25, 2006 6.13 % August 25, 2036 737 August 25, 2006 0.74 % (1) August 25, 2036 522 February 8, 2013 4.05 % July 30, 2022 154
May 14, 2013 3.50 % May 15, 2023 520 September 13, 2013 5.50 % September 15, 2025 898 September 13, 2013 6.68 % September 13, 2043 683
May 6, 2014 5.30 % May 6, 2044 974 August 5, 2014 4.00 % August 5, 2024 485
November 20, 2014 4.30 % November 20, 2026 1,049 March 26, 2015 3.88 % March 26, 2025 613
June 9, 2015 4.09 % June 9, 2025 396 June 10, 2015 4.40 % June 10, 2025 2,070
September 29, 2015 4.45 % September 29, 2027 4,034 March 9, 2016 4.60 % March 9, 2026 1,230 May 18, 2016 4.75 % May 18, 2046 2,291 July 25, 2016 4.13 % July 25, 2028 2,172
Total Qualifying Subordinated Debt $ 21,890
(1) Subordinated debt issuance with floating rate based on three month LIBOR plus a fixed spread.
Regulatory Capital TiersFor Citi’s Common Equity Tier 1 Capital, Tier 1 Capital and Total Capital, and related components, as of March 31, 2021, see“Capital Resources” in Citi’s First Quarter 2021 Form 10-Q, and Schedule A in Citi’s First Quarter 2021 FFIEC 101 Report.
5
CITIGROUP INC. – BASEL III ADVANCED APPROACHES DISCLOSURES – March 31, 2021
CAPITAL ADEQUACY
Capital ManagementCiti’s capital management framework is designed to ensure that Citigroup and its principal subsidiaries maintain sufficient capital consistent with each entity’s respective risk profile, management targets and all applicable regulatory standards and guidelines. For additional information regarding Citi’s capital management, see “Capital Resources—Capital Management” in Citi’s 2020 Form 10-K.
Stress Testing Component of Capital PlanningCiti is subject to an annual assessment by the Federal Reserve Board as to whether Citigroup has effective capital planning processes as well as sufficient regulatory capital to absorb losses during stressful economic and financial conditions, while also meeting obligations to creditors and counterparties and continuing to serve as a credit intermediary. This annual assessment includes two related programs: The Comprehensive Capital Analysis and Review (CCAR) and Dodd-Frank Act Stress Testing (DFAST). For additional information regarding the stress testing component of capital planning, see “Forward-LookingStatements” in Citi's First Quarter 2021 Form 10-Q, and “Capital Resources—Current Regulatory Capital Standards—Stress Testing Component of Capital Planning” and “Risk Factors—Strategic Risks” in Citi's 2020 Form 10-K.
Economic CapitalCiti calculates and allocates economic capital (risk capital) across the company in order to consistently measure risk taking amongst business activities and to assess risk-reward relationships.
Citi measures risk capital as the amount of capital required to absorb potential unexpected economic losses resulting from extremely severe events over a one year time period, assuming Citi remains a going concern. Economic losses include any decline in the economic value of assets and any increase in the economic value of liabilities. The drivers of economic losses are risks which, for Citi, are broadly categorized as credit risk, market risk and operational risk. Citi's risk capital framework is reviewed and enhanced on a regular basis in light of market developments and evolving practices.
The calculation of economic losses depends on whether the risk is classified as “price risk” or “value risk.” Price risk is the potential unexpected loss of market value over a one year horizon. Value risk is the potential unexpected loss based on realizable value to maturity. If any of the following criteria are met, the risk is “price risk;” otherwise it is “value risk:”
• intent to sell or hedge exposures at market price; • funding with short-term liabilities (sufficient long-term
financing, even under stress situations, should be
available to support all exposures whose risk capital is determined based on value risk); or
• mark-to-market accounting or equivalent (e.g., fair value).
Citi’s methodology does not include any offset for expected income. For accrual instruments such as loans, this means that risk capital is calculated as the difference between potential total loss at a high confidence level and expected loss (no offset for interest revenue or fee revenue). For mark-to-market instruments, such as those carried in the trading book, this means that the unexpected loss is based on price volatility and assumes an expected total return of zero. Citi’s risk capital framework covers both systematic risk and idiosyncratic risk, where material. It is designed to avoid pro-cyclicality, meaning that changes in risk capital are primarily driven by changes in position, not by changes in shocks or assumptions. Citi’s methodology covers all risk types, legal entities, and Citi’s reportable segments. To account for tail risks, Citi's methodology includes fat-tailed distributions (non-normal price behavior) for individual market factors and high correlation assumptions during stress periods.
As part of its internal evaluation of capital adequacy relative to its internal measurement of economic risk, Citi adds a risk capital buffer to its measured risk capital. The risk capital buffer is a very prudently estimated amount of additional economic risk not captured in risk capital due to three sources:
• A very prudently estimated amount for enhancements to risk capital models not yet in production, or for known missing risks not yet captured.
• A very prudently estimated amount for potential unidentified model errors.
• A very prudent amount for a potential increase in risk taking over the next year above the level measured by current risk capital.
6
CITIGROUP INC. – BASEL III ADVANCED APPROACHES DISCLOSURES – March 31, 2021
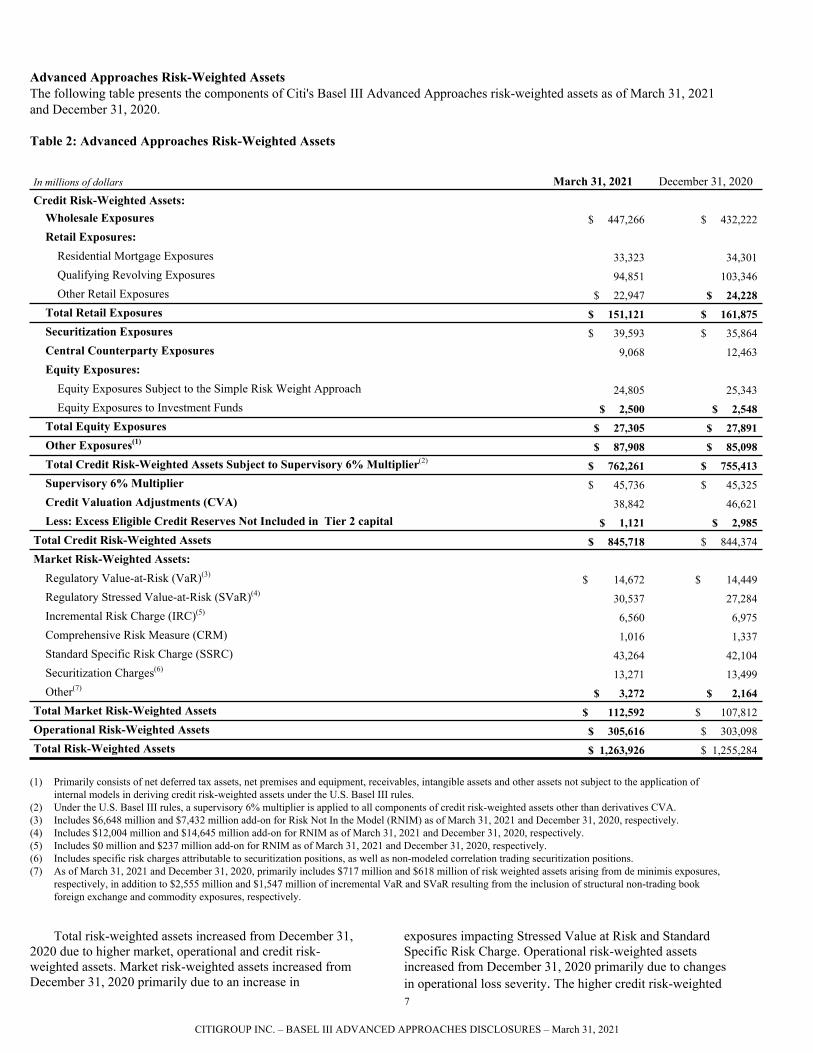
Advanced Approaches Risk-Weighted AssetsThe following table presents the components of Citi's Basel III Advanced Approaches risk-weighted assets as of March 31, 2021 and December 31, 2020.
Table 2: Advanced Approaches Risk-Weighted Assets
In millions of dollars March 31, 2021 December 31, 2020Credit Risk-Weighted Assets:
Wholesale Exposures $ 447,266 $ 432,222 Retail Exposures:
Residential Mortgage Exposures 33,323 34,301 Qualifying Revolving Exposures 94,851 103,346 Other Retail Exposures $ 22,947 $ 24,228
Total Retail Exposures $ 151,121 $ 161,875 Securitization Exposures $ 39,593 $ 35,864 Central Counterparty Exposures 9,068 12,463 Equity Exposures:
Equity Exposures Subject to the Simple Risk Weight Approach 24,805 25,343 Equity Exposures to Investment Funds $ 2,500 $ 2,548
Total Equity Exposures $ 27,305 $ 27,891 Other Exposures(1) $ 87,908 $ 85,098 Total Credit Risk-Weighted Assets Subject to Supervisory 6% Multiplier(2) $ 762,261 $ 755,413 Supervisory 6% Multiplier $ 45,736 $ 45,325 Credit Valuation Adjustments (CVA) 38,842 46,621 Less: Excess Eligible Credit Reserves Not Included in Tier 2 capital $ 1,121 $ 2,985
Total Credit Risk-Weighted Assets $ 845,718 $ 844,374 Market Risk-Weighted Assets:
Regulatory Value-at-Risk (VaR)(3) $ 14,672 $ 14,449 Regulatory Stressed Value-at-Risk (SVaR)(4) 30,537 27,284 Incremental Risk Charge (IRC)(5) 6,560 6,975 Comprehensive Risk Measure (CRM) 1,016 1,337 Standard Specific Risk Charge (SSRC) 43,264 42,104 Securitization Charges(6) 13,271 13,499 Other(7) $ 3,272 $ 2,164
Total Market Risk-Weighted Assets $ 112,592 $ 107,812 Operational Risk-Weighted Assets $ 305,616 $ 303,098 Total Risk-Weighted Assets $ 1,263,926 $ 1,255,284
(1) Primarily consists of net deferred tax assets, net premises and equipment, receivables, intangible assets and other assets not subject to the application of internal models in deriving credit risk-weighted assets under the U.S. Basel III rules.
(2) Under the U.S. Basel III rules, a supervisory 6% multiplier is applied to all components of credit risk-weighted assets other than derivatives CVA. (3) Includes $6,648 million and $7,432 million add-on for Risk Not In the Model (RNIM) as of March 31, 2021 and December 31, 2020, respectively.(4) Includes $12,004 million and $14,645 million add-on for RNIM as of March 31, 2021 and December 31, 2020, respectively.(5) Includes $0 million and $237 million add-on for RNIM as of March 31, 2021 and December 31, 2020, respectively.(6) Includes specific risk charges attributable to securitization positions, as well as non-modeled correlation trading securitization positions.(7) As of March 31, 2021 and December 31, 2020, primarily includes $717 million and $618 million of risk weighted assets arising from de minimis exposures,
respectively, in addition to $2,555 million and $1,547 million of incremental VaR and SVaR resulting from the inclusion of structural non-trading book foreign exchange and commodity exposures, respectively.
Total risk-weighted assets increased from December 31, 2020 due to higher market, operational and credit risk-weighted assets. Market risk-weighted assets increased from December 31, 2020 primarily due to an increase in
exposures impacting Stressed Value at Risk and Standard Specific Risk Charge. Operational risk-weighted assets increased from December 31, 2020 primarily due to changes in operational loss severity.The higher credit risk-weighted 7
CITIGROUP INC. – BASEL III ADVANCED APPROACHES DISCLOSURES – March 31, 2021
assets were primarily attributable to increases in wholesale exposures driven by loan commitments, partially offset by decreases in retail exposures mainly driven by reduction in qualifying revolving (cards) exposures and other exposures.
Citi's credit, market and operational risk-weighted assets under the Basel III Advanced Approaches rules are derived, in part, from various internal models. These internal models remain subject to ongoing review and approval by the FRB
and the Office of the Comptroller of the Currency (OCC). Any modifications or requirements resulting from these ongoing reviews could result in changes in Citi's risk-weighted assets as calculated under the Basel III Advanced Approaches rules.
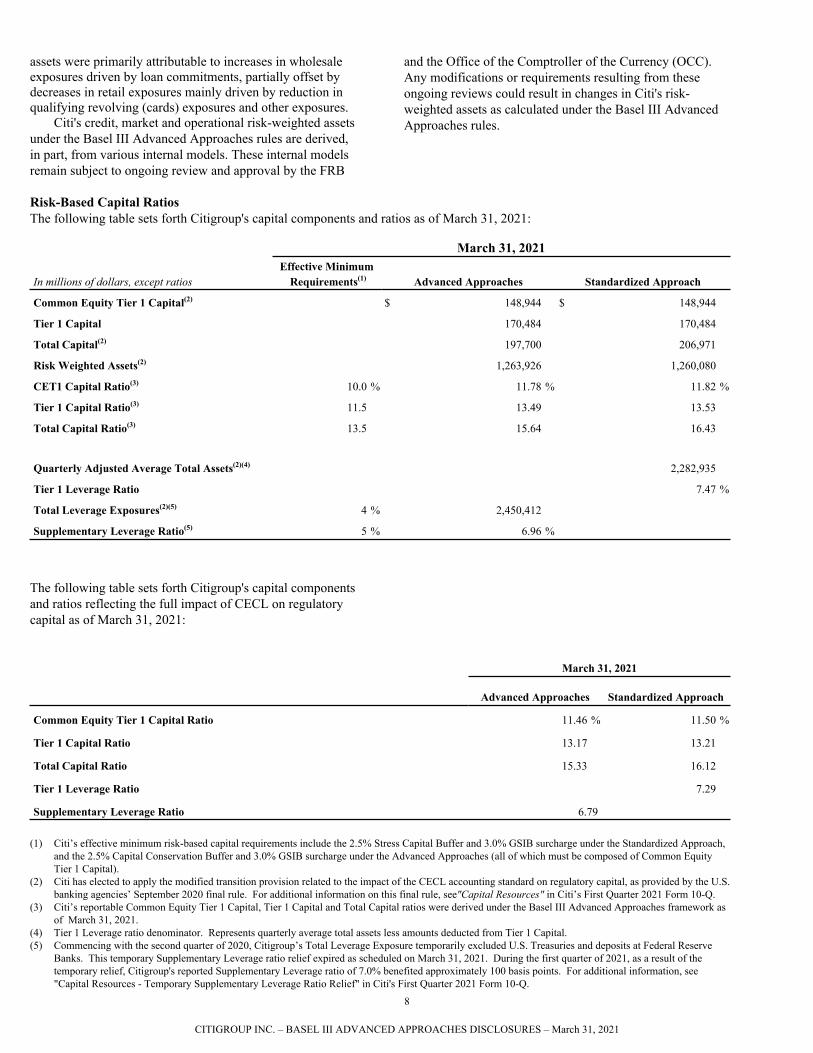
Risk-Based Capital RatiosThe following table sets forth Citigroup's capital components and ratios as of March 31, 2021:
March 31, 2021
In millions of dollars, except ratiosEffective Minimum
Requirements(1) Advanced Approaches Standardized Approach
Common Equity Tier 1 Capital(2) $ 148,944 $ 148,944
Tier 1 Capital 170,484 170,484
Total Capital(2) 197,700 206,971
Risk Weighted Assets(2) 1,263,926 1,260,080
CET1 Capital Ratio(3) 10.0 % 11.78 % 11.82 %
Tier 1 Capital Ratio(3) 11.5 13.49 13.53
Total Capital Ratio(3) 13.5 15.64 16.43
Quarterly Adjusted Average Total Assets(2)(4) 2,282,935
Tier 1 Leverage Ratio 7.47 %
Total Leverage Exposures(2)(5) 4 % 2,450,412
Supplementary Leverage Ratio(5) 5 % 6.96 %
The following table sets forth Citigroup's capital components and ratios reflecting the full impact of CECL on regulatory capital as of March 31, 2021:
March 31, 2021
Advanced Approaches Standardized Approach
Common Equity Tier 1 Capital Ratio 11.46 % 11.50 %
Tier 1 Capital Ratio 13.17 13.21
Total Capital Ratio 15.33 16.12
Tier 1 Leverage Ratio 7.29
Supplementary Leverage Ratio 6.79
(1) Citi’s effective minimum risk-based capital requirements include the 2.5% Stress Capital Buffer and 3.0% GSIB surcharge under the Standardized Approach, and the 2.5% Capital Conservation Buffer and 3.0% GSIB surcharge under the Advanced Approaches (all of which must be composed of Common Equity Tier 1 Capital).
(2) Citi has elected to apply the modified transition provision related to the impact of the CECL accounting standard on regulatory capital, as provided by the U.S. banking agencies’ September 2020 final rule. For additional information on this final rule, see"Capital Resources" in Citi’s First Quarter 2021 Form 10-Q.
(3) Citi’s reportable Common Equity Tier 1 Capital, Tier 1 Capital and Total Capital ratios were derived under the Basel III Advanced Approaches framework as of March 31, 2021.
(4) Tier 1 Leverage ratio denominator. Represents quarterly average total assets less amounts deducted from Tier 1 Capital. (5) Commencing with the second quarter of 2020, Citigroup’s Total Leverage Exposure temporarily excluded U.S. Treasuries and deposits at Federal Reserve
Banks. This temporary Supplementary Leverage ratio relief expired as scheduled on March 31, 2021. During the first quarter of 2021, as a result of the temporary relief, Citigroup's reported Supplementary Leverage ratio of 7.0% benefited approximately 100 basis points. For additional information, see "Capital Resources - Temporary Supplementary Leverage Ratio Relief" in Citi's First Quarter 2021 Form 10-Q.
8
CITIGROUP INC. – BASEL III ADVANCED APPROACHES DISCLOSURES – March 31, 2021

As indicated in the tables above, risk-based capital ratios for Citigroup at March 31, 2021 were in excess of the effective minimum requirements under the U.S. Basel III rules. In addition, Citigroup was also “well capitalized” under current federal bank regulatory agency definitions as of March 31, 2021. For further capital information including regulatory capital relief resulting from the COVID-19 pandemic, see “Capital Resources” in Citi's First Quarter 2021 Form 10-Q, and Schedule A of the First Quarter 2021 FFIEC 101 Report of Citigroup.
9
CITIGROUP INC. – BASEL III ADVANCED APPROACHES DISCLOSURES – March 31, 2021
CAPITAL CONSERVATION AND COUNTERCYCLICAL CAPITAL BUFFERS
As of March 31, 2021, Citi's Capital Conservation Buffer was 7.3%, which was in excess of the current requirement applicable to Citi of 5.5% (comprised of GSIB surcharge of 3% plus either the Capital Conservation Buffer of 2.5% or the Stress Capital Buffer of 2.5%, as applicable). Furthermore, in December 2020, the Federal Reserve Board voted to affirm the Countercyclical Capital Buffer amount at the current level of 0%. For additional information regarding the Capital Conservation Buffer, Stress Capital Buffer, Countercyclical Capital Buffer, and GSIB surcharge, see “Capital Resources—Regulatory Capital Buffers” in Citi’s 2020 Form 10-K.
As of March 31, 2021, Citi's eligible retained income was $9.5 billion, comprised of $16.5 billion of net income (i.e., aggregate net income for the four calendar quarters ended March 31, 2021 as reported in Citi’s FR Y-9C, “Consolidated Financial Statements for Holding Companies”), less applicable distributions of $7.0 billion in the form of common share repurchases as well as common and preferred stock dividends. In addition, Citi’s regulatory capital ratios exceeded effective regulatory minimum requirements. Therefore, Citi is not subject to any payout limitations.
10
CITIGROUP INC. – BASEL III ADVANCED APPROACHES DISCLOSURES – March 31, 2021
RISK MANAGEMENT
OverviewFor Citi, effective risk management is of primary importance to its overall operations. Accordingly, Citi’s risk management process has been designed to monitor, evaluate and manage the principal risks it assumes in conducting its activities. Specifically, the activities that Citi engages in, and the risks those activities generate, must be consistent with Citi’s mission and value proposition, the key principles that guide it and Citi's risk appetite.
Risk management must be built on a foundation of ethical culture. Under Citi’s mission and value proposition, which was developed by its senior leadership and distributed throughout the Company, Citi strives to serve its clients as a trusted partner by responsibly providing financial services that enable growth and economic progress while earning and maintaining the public’s trust by constantly adhering to the highest ethical standards. As such, Citi asks all employees to ensure that their decisions pass three tests: they are in Citi's clients’ interests, create economic value and are always systemically responsible. In addition, Citi evaluates employees’ performance against behavioral expectations set out in Citi’s leadership principles, which were designed in part to effectuate Citi’s mission and value proposition. Other culture-related efforts in connection with conduct risk, ethics and leadership, escalation and treating customers fairly help Citi to execute its mission and value proposition.
Citi's Company-wide risk governance framework consists of the risk management practices that include a risk governance structure and the firm’s key policies, processes, personnel and control systems through which Citi identifies, measures, monitors, and controls risks such that the Company’s risk taking is consistent with its strategy and risk appetite. It also emphasizes Citi's risk culture and lays out standards, procedures and programs that are designed to set, reinforce and enhance the Company's risk culture, integrate its values and conduct expectations into the organization providing employees with tools to assist them with making prudent and ethical risk decisions and to escalate issues appropriately.
Citi’s risk appetite framework sets boundaries for risk taking and consists of a set of risk appetite statements that articulate the aggregate level and types of risk that Citi is willing to accept in order to achieve its strategic objectives and business plan and includes governance processes through which the risk appetite is established, communicated and monitored, and its breaches are escalated and resolved. It is built on quantitative boundaries, which include goals, risk limits and thresholds, and on qualitative principles that guide behavior.
Citi uses a lines of defense construct to manage its risks. The construct comprises units that create risks (first line of defense), those that independently assess risk (second line of defense), units that provide independent assurance (third line of defense) and units tasked with maintaining a strong control environment (control and support functions). The lines of defense, which include control and support functions, coordinate with each other
in the risk management system in support of the common goal of identifying, measuring, monitoring and controlling risk-taking activities so they remain consistent with the firm’s strategy and risk appetite.
First Line of Defense: Front Line Units and Front Line Unit ActivitiesCiti’s first line of defense owns the risks inherent in or arising from their business and is responsible for identifying, assessing and controlling those risks so that they are within Citi's risk appetite. Front line units are responsible and held accountable for managing the risks associated with their activities within the boundaries set by independent risk management. They are also responsible for designing and implementing effective internal controls and maintaining processes for managing their risk profile, including through risk mitigation, so that it remains consistent with Citi’s established risk appetite. Front line unit activities are considered part of the first line of defense and are subject to the oversight and challenge of independent risk management, whether they are conducted by a front line unit or another line of defense designation. The first line of defense is composed of Citi’s Business Management, Regional and Country Management, certain Corporate Functions (Enterprise Operations and Technology (EO&T) and Finance), as well as other front line unit activities.
Second Line of Defense: Independent risk managementIndependent risk management units are independent of front line units. They are responsible for overseeing the risk-taking activities of the first line of defense and challenging the first line of defense in the execution of their risk management responsibilities. They are also responsible for independently identifying, measuring, monitoring and controlling aggregate risks and for setting standards for the management and oversight of risk. At Citi, the second line of defense is defined to include Independent Risk Management and Independent Compliance Risk Management (ICRM). Independent Risk Management and ICRM report to Citi’s Chief Risk Officer (CRO) and Chief Compliance Officer (CCO) respectively, both of whom report directly to the Citigroup CEO and have unrestricted access to the Citigroup Board of Directors or its committees.
Third Line of Defense: Internal AuditInternal audit is independent of front line units and independent risk management units. Internal audit provides independent assurance to the Citigroup Board of Directors on the effectiveness of governance, risk management and internal controls. Internal audit reports to a chief audit executive (i.e., Citi’s Chief Auditor) who has unrestricted access to each Board or its audit committee to facilitate the ability to execute specific responsibilities pertaining to escalation of risks and issues. The Internal Audit function has designated Chief Auditors responsible for assessing the design and effectiveness of controls within the various
11
CITIGROUP INC. – BASEL III ADVANCED APPROACHES DISCLOSURES – March 31, 2021
business units, functions, geographies and legal entities in which Citi operates.
Control and Support FunctionsControl and support functions do not meet the definition of front line unit, independent risk management or internal audit. While they do not report into the CRO or CCO, they are expected to design, implement and maintain an effective control environment with respect to the risks they generate, and also support safety and soundness. At Citi, the control and support functions are defined to include the following organizational units: Chief Administrative Office, Global Public Affairs, Human Resources, International Franchise Management, Legal (including Citi Security & Investigative Services) and the Office of the CBNA CEO.
For more information see “Managing Global Risk – Overview” in Citi’s 2020 Form 10-K.
Scope and Nature of Credit Risk Reporting and Measurement SystemsCiti uses a global risk exposure warehouse and monitoring system to manage, monitor and report credit exposure to its wholesale obligors and counterparties. Retail exposures are booked in local systems specific to local credit risk regulations. However all retail exposures and performance information are captured and reported centrally at the portfolio level for monitoring and managing the risks.
12
CITIGROUP INC. – BASEL III ADVANCED APPROACHES DISCLOSURES – March 31, 2021
CREDIT RISK: GENERAL DISCLOSURES
Credit Risk ManagementCredit risk is the risk of loss resulting from the decline in credit quality or the failure of a borrower, counterparty, third party or issuer to honor its financial or contractual obligations. Credit risk arises in many of Citi’s business activities, including: consumer, commercial and corporate lending; capital markets derivative transactions; structured finance; securities financing transactions (repurchase and reverse repurchase agreements, securities loaned and borrowed); and settlement and clearing activities.
Corporate Credit RiskFor corporate clients and investment banking activities across Citi, the credit process is grounded in a series of fundamental policies, including:
• joint business and independent risk management responsibility for managing credit risks;
• a single center of control for each credit relationship, which coordinates credit activities with each client;
• portfolio limits to ensure diversification and maintain risk/capital alignment;
• a minimum of two authorized credit officer signatures required on most extensions of credit, one of which must be from a credit officer in credit risk management;
• risk rating standards, applicable to every obligor and facility; and
• consistent standards for credit origination documentation and remedial management.
Consumer Credit RiskFor GCB, independent credit risk management is responsible for establishing the Global Consumer Credit Risk Policies (and jointly with Operational Risk Management, Fraud Risk Policies), while both business and independent risk are jointly responsible for approving business-specific policies and procedures, monitoring business risk management performance, providing ongoing assessment of portfolio credit risk, ensuring the appropriate level of loan loss reserves and approving new products and new risks.
Past Due and Impaired Exposures For Citi’s significant accounting policies regarding past due and impaired loans, see Note 1, “Summary of Significant Accounting Policies” and Note 14, “Loans” in the Notes to Consolidated Financial Statements in Citi’s 2020 Form 10-K.
For information on Citi’s significant accounting policies and estimates regarding impaired securities, including the determination of other-than-temporary impairment, see “Significant Accounting Policies and Significant Estimates—Valuations of Financial Instruments” and Note 13, “Investments” in the Notes to Consolidated Financial Statements in Citi’s 2020 Form 10-K.
Allowance for Credit LossesFor a description of Citi’s significant accounting policies and estimates regarding the allowance for credit losses, including policies for charging-off accounts deemed uncollectible, see“Significant Accounting Policies and Significant Estimates—Citi’s Allowance for Credit Losses (ACL)” and Note 1, “Basis of Presentation, Updated Accounting Policies and AccountingChanges” in the Notes to Consolidated Financial Statementsin Citi's First Quarter 2021 Form 10-Q.
13
CITIGROUP INC. – BASEL III ADVANCED APPROACHES DISCLOSURES – March 31, 2021
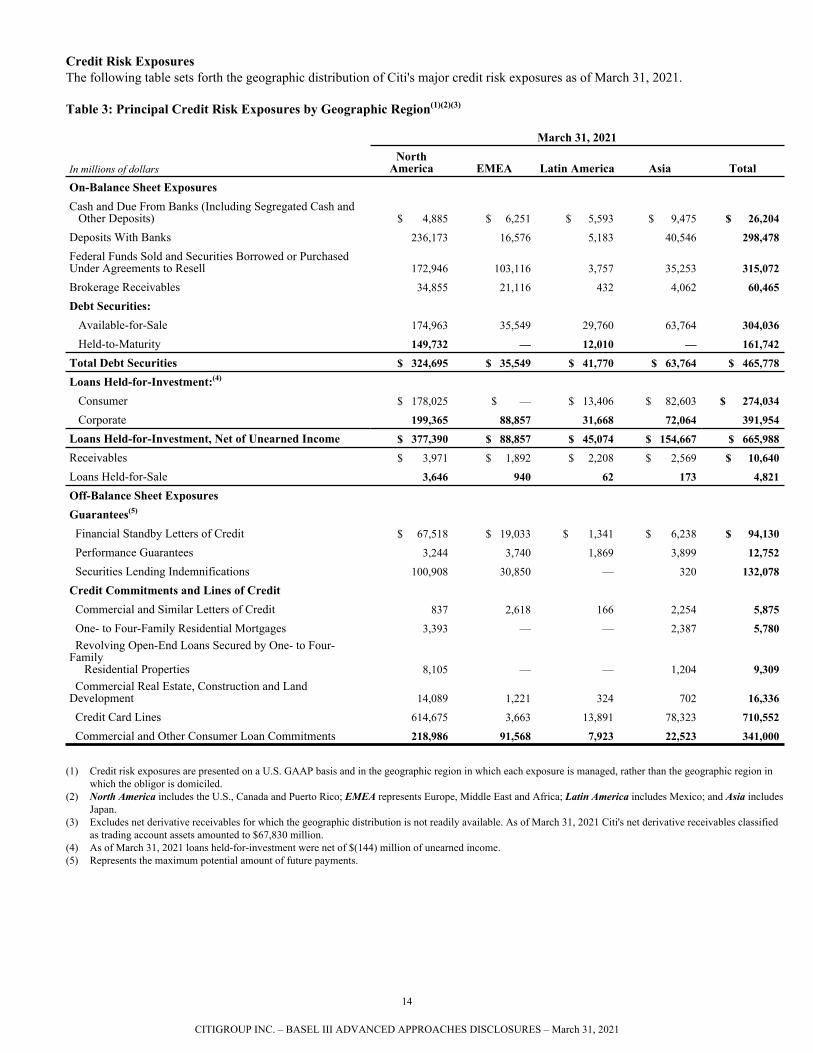
Credit Risk ExposuresThe following table sets forth the geographic distribution of Citi's major credit risk exposures as of March 31, 2021.
Table 3: Principal Credit Risk Exposures by Geographic Region(1)(2)(3)
March 31, 2021
In millions of dollarsNorth
America EMEA Latin America Asia TotalOn-Balance Sheet ExposuresCash and Due From Banks (Including Segregated Cash and Other Deposits) $ 4,885 $ 6,251 $ 5,593 $ 9,475 $ 26,204
Deposits With Banks 236,173 16,576 5,183 40,546 298,478
Federal Funds Sold and Securities Borrowed or Purchased Under Agreements to Resell 172,946 103,116 3,757 35,253 315,072
Brokerage Receivables 34,855 21,116 432 4,062 60,465
Debt Securities: Available-for-Sale 174,963 35,549 29,760 63,764 304,036
Held-to-Maturity 149,732 — 12,010 — 161,742
Total Debt Securities $ 324,695 $ 35,549 $ 41,770 $ 63,764 $ 465,778
Loans Held-for-Investment:(4)
Consumer $ 178,025 $ — $ 13,406 $ 82,603 $ 274,034
Corporate 199,365 88,857 31,668 72,064 391,954
Loans Held-for-Investment, Net of Unearned Income $ 377,390 $ 88,857 $ 45,074 $ 154,667 $ 665,988
Receivables $ 3,971 $ 1,892 $ 2,208 $ 2,569 $ 10,640
Loans Held-for-Sale 3,646 940 62 173 4,821
Off-Balance Sheet ExposuresGuarantees(5)
Financial Standby Letters of Credit $ 67,518 $ 19,033 $ 1,341 $ 6,238 $ 94,130
Performance Guarantees 3,244 3,740 1,869 3,899 12,752
Securities Lending Indemnifications 100,908 30,850 — 320 132,078
Credit Commitments and Lines of Credit Commercial and Similar Letters of Credit 837 2,618 166 2,254 5,875
One- to Four-Family Residential Mortgages 3,393 — — 2,387 5,780 Revolving Open-End Loans Secured by One- to Four-Family Residential Properties 8,105 — — 1,204 9,309 Commercial Real Estate, Construction and Land Development 14,089 1,221 324 702 16,336
Credit Card Lines 614,675 3,663 13,891 78,323 710,552
Commercial and Other Consumer Loan Commitments 218,986 91,568 7,923 22,523 341,000
(1) Credit risk exposures are presented on a U.S. GAAP basis and in the geographic region in which each exposure is managed, rather than the geographic region in which the obligor is domiciled.
(2) North America includes the U.S., Canada and Puerto Rico; EMEA represents Europe, Middle East and Africa; Latin America includes Mexico; and Asia includes Japan.
(3) Excludes net derivative receivables for which the geographic distribution is not readily available. As of March 31, 2021 Citi's net derivative receivables classified as trading account assets amounted to $67,830 million.
(4) As of March 31, 2021 loans held-for-investment were net of $(144) million of unearned income. (5) Represents the maximum potential amount of future payments.
14
CITIGROUP INC. – BASEL III ADVANCED APPROACHES DISCLOSURES – March 31, 2021
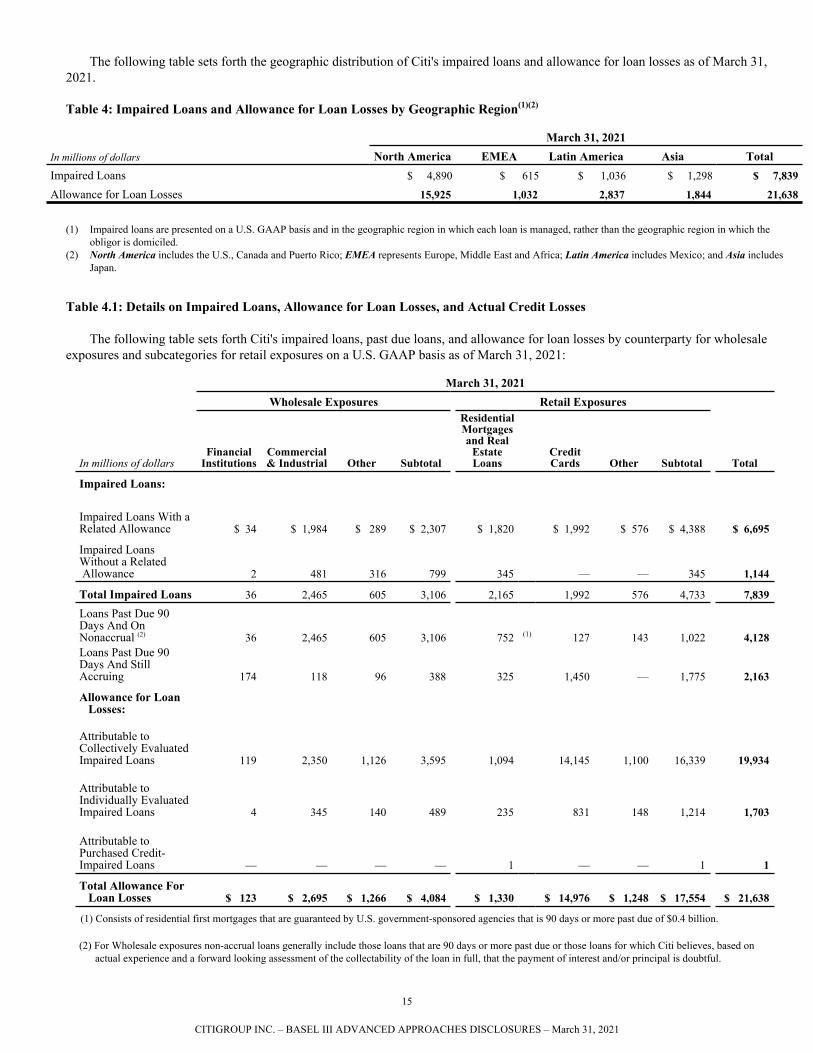
The following table sets forth the geographic distribution of Citi's impaired loans and allowance for loan losses as of March 31, 2021.
Table 4: Impaired Loans and Allowance for Loan Losses by Geographic Region(1)(2)
March 31, 2021In millions of dollars North America EMEA Latin America Asia TotalImpaired Loans $ 4,890 $ 615 $ 1,036 $ 1,298 $ 7,839
Allowance for Loan Losses 15,925 1,032 2,837 1,844 21,638
(1) Impaired loans are presented on a U.S. GAAP basis and in the geographic region in which each loan is managed, rather than the geographic region in which the obligor is domiciled.
(2) North America includes the U.S., Canada and Puerto Rico; EMEA represents Europe, Middle East and Africa; Latin America includes Mexico; and Asia includes Japan.
Table 4.1: Details on Impaired Loans, Allowance for Loan Losses, and Actual Credit Losses
The following table sets forth Citi's impaired loans, past due loans, and allowance for loan losses by counterparty for wholesale exposures and subcategories for retail exposures on a U.S. GAAP basis as of March 31, 2021:
March 31, 2021Wholesale Exposures Retail Exposures
In millions of dollarsFinancial
InstitutionsCommercial & Industrial Other Subtotal
Residential Mortgages and Real
Estate Loans
Credit Cards Other Subtotal Total
Impaired Loans:
Impaired Loans With a Related Allowance $ 34 $ 1,984 $ 289 $ 2,307 $ 1,820 $ 1,992 $ 576 $ 4,388 $ 6,695
Impaired Loans Without a Related Allowance 2 481 316 799 345 — — 345 1,144
Total Impaired Loans 36 2,465 605 3,106 2,165 1,992 576 4,733 7,839
Loans Past Due 90 Days And On Nonaccrual (2) 36 2,465 605 3,106 752 (1) 127 143 1,022 4,128 Loans Past Due 90 Days And Still Accruing 174 118 96 388 325 1,450 — 1,775 2,163
Allowance for Loan Losses:
Attributable to Collectively Evaluated Impaired Loans 119 2,350 1,126 3,595 1,094 14,145 1,100 16,339 19,934
Attributable to Individually Evaluated Impaired Loans 4 345 140 489 235 831 148 1,214 1,703
Attributable to Purchased Credit-Impaired Loans — — — — 1 — — 1 1
Total Allowance For Loan Losses $ 123 $ 2,695 $ 1,266 $ 4,084 $ 1,330 $ 14,976 $ 1,248 $ 17,554 $ 21,638
(1) Consists of residential first mortgages that are guaranteed by U.S. government-sponsored agencies that is 90 days or more past due of $0.4 billion.
(2) For Wholesale exposures non-accrual loans generally include those loans that are 90 days or more past due or those loans for which Citi believes, based on actual experience and a forward looking assessment of the collectability of the loan in full, that the payment of interest and/or principal is doubtful.
15
CITIGROUP INC. – BASEL III ADVANCED APPROACHES DISCLOSURES – March 31, 2021
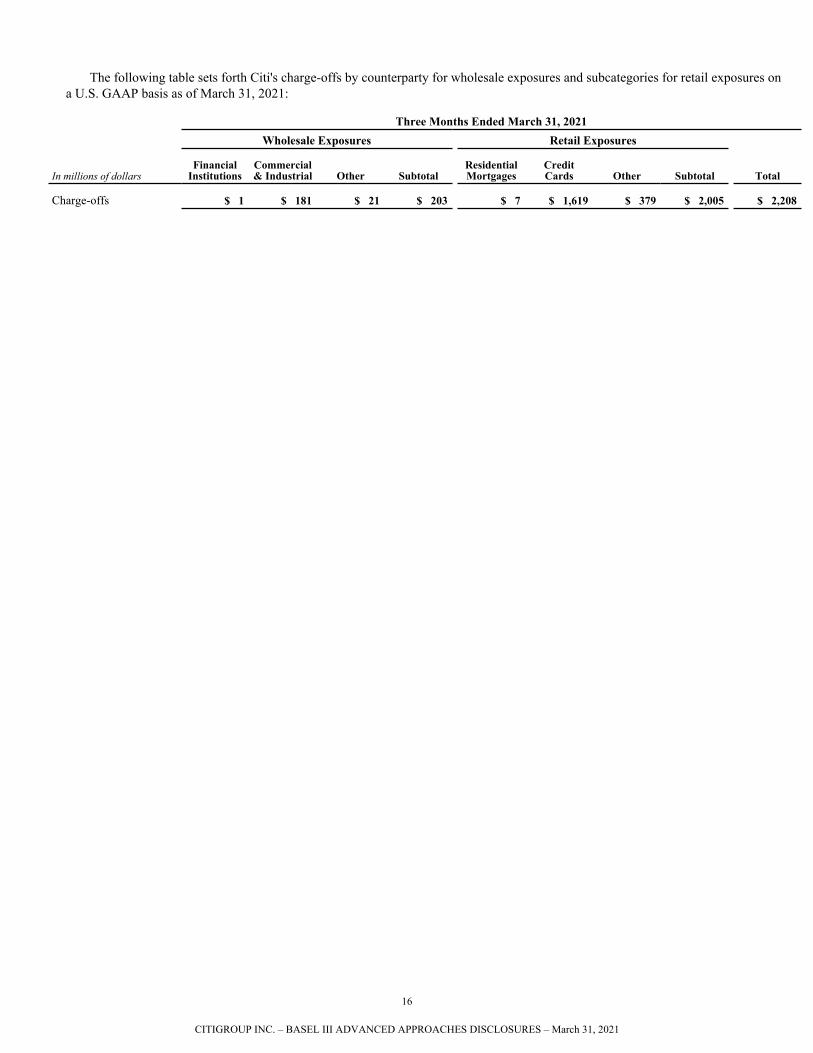
The following table sets forth Citi's charge-offs by counterparty for wholesale exposures and subcategories for retail exposures on a U.S. GAAP basis as of March 31, 2021:
Three Months Ended March 31, 2021Wholesale Exposures Retail Exposures
In millions of dollarsFinancial
InstitutionsCommercial & Industrial Other Subtotal
Residential Mortgages
Credit Cards Other Subtotal Total
Charge-offs $ 1 $ 181 $ 21 $ 203 $ 7 $ 1,619 $ 379 $ 2,005 $ 2,208
16
CITIGROUP INC. – BASEL III ADVANCED APPROACHES DISCLOSURES – March 31, 2021
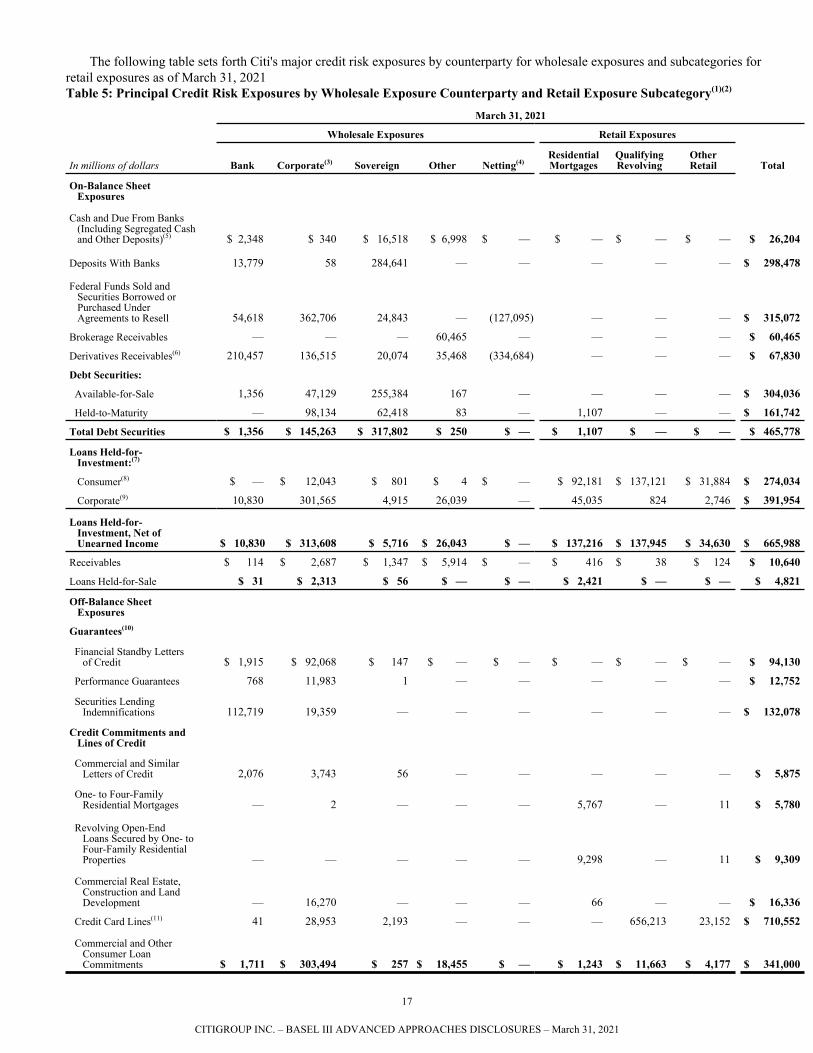
The following table sets forth Citi's major credit risk exposures by counterparty for wholesale exposures and subcategories for retail exposures as of March 31, 2021Table 5: Principal Credit Risk Exposures by Wholesale Exposure Counterparty and Retail Exposure Subcategory(1)(2)
March 31, 2021
Wholesale Exposures Retail Exposures
In millions of dollars Bank Corporate(3) Sovereign Other Netting(4)Residential Mortgages
Qualifying Revolving
OtherRetail Total
On-Balance Sheet Exposures
Cash and Due From Banks (Including Segregated Cash and Other Deposits)(5) $ 2,348 $ 340 $ 16,518 $ 6,998 $ — $ — $ — $ — $ 26,204
Deposits With Banks 13,779 58 284,641 — — — — — $ 298,478
Federal Funds Sold and Securities Borrowed or Purchased Under Agreements to Resell 54,618 362,706 24,843 — (127,095) — — — $ 315,072
Brokerage Receivables — — — 60,465 — — — — $ 60,465
Derivatives Receivables(6) 210,457 136,515 20,074 35,468 (334,684) — — — $ 67,830
Debt Securities:
Available-for-Sale 1,356 47,129 255,384 167 — — — — $ 304,036
Held-to-Maturity — 98,134 62,418 83 — 1,107 — — $ 161,742
Total Debt Securities $ 1,356 $ 145,263 $ 317,802 $ 250 $ — $ 1,107 $ — $ — $ 465,778
Loans Held-for- Investment:(7)
Consumer(8) $ — $ 12,043 $ 801 $ 4 $ — $ 92,181 $ 137,121 $ 31,884 $ 274,034
Corporate(9) 10,830 301,565 4,915 26,039 — 45,035 824 2,746 $ 391,954
Loans Held-for- Investment, Net of Unearned Income $ 10,830 $ 313,608 $ 5,716 $ 26,043 $ — $ 137,216 $ 137,945 $ 34,630 $ 665,988
Receivables $ 114 $ 2,687 $ 1,347 $ 5,914 $ — $ 416 $ 38 $ 124 $ 10,640
Loans Held-for-Sale $ 31 $ 2,313 $ 56 $ — $ — $ 2,421 $ — $ — $ 4,821
Off-Balance Sheet Exposures
Guarantees(10)
Financial Standby Letters of Credit $ 1,915 $ 92,068 $ 147 $ — $ — $ — $ — $ — $ 94,130
Performance Guarantees 768 11,983 1 — — — — — $ 12,752
Securities Lending Indemnifications 112,719 19,359 — — — — — — $ 132,078
Credit Commitments and Lines of Credit
Commercial and Similar Letters of Credit 2,076 3,743 56 — — — — — $ 5,875
One- to Four-Family Residential Mortgages — 2 — — — 5,767 — 11 $ 5,780
Revolving Open-End Loans Secured by One- to Four-Family Residential Properties — — — — — 9,298 — 11 $ 9,309
Commercial Real Estate, Construction and Land Development — 16,270 — — — 66 — — $ 16,336
Credit Card Lines(11) 41 28,953 2,193 — — — 656,213 23,152 $ 710,552
Commercial and Other Consumer Loan Commitments $ 1,711 $ 303,494 $ 257 $ 18,455 $ — $ 1,243 $ 11,663 $ 4,177 $ 341,000
17
CITIGROUP INC. – BASEL III ADVANCED APPROACHES DISCLOSURES – March 31, 2021
(1) Credit risk exposures are presented on a U.S. GAAP basis. (2) Securitization exposures are reflected within wholesale exposure counterparties and retail exposure subcategories, as appropriate, based upon the nature of the
underlying securitized assets or party on which credit risk is assumed.(3) Corporate credit risk exposures include non-depository financial institutions, bank holding companies, insurance companies and non-central government public
sector entities, consistent with FFIEC 101 reporting requirements.(4) Represents the netting of receivable and payable balances with the same counterparty under enforceable netting agreements and, with respect to derivatives
receivables, also the netting of cash collateral paid and received by counterparty under enforceable credit support agreements. For additional information regarding enforceable netting agreements and credit support agreements, see Note 11, “Securities Borrowed, Loaned and Subject to Repurchase Agreements” and Note 22, “Derivatives” in the Notes to Consolidated Financial Statements in Citi's 2020 Form 10-K.
(5) Other represents $6,998 million of currency and coin, as well as cash items in process of collection.(6) Other includes exchange traded and cleared derivatives receivables. Cleared derivatives include derivatives executed bilaterally with a counterparty in the OTC
market but then novated to a central clearing house, whereby the central clearing house becomes the counterparty to both of the original counterparties. Exchange traded derivatives include derivatives executed directly on an organized exchange that provides pre-trade price transparency.
(7) As of March 31, 2021 loans held-for-investment were net of ($144) million of unearned income. (8) Classifiably-managed (individually risk rated) consumer loans are considered wholesale exposures in accordance with the U.S. Basel III rules.(9) Certain wholesale or commercial credit risk exposures less than or equal to $1 million are considered retail exposures in accordance with the U.S. Basel III rules.(10) Represents the maximum potential amount of future payments.(11) Credit card lines extended to wholesale counterparties for use by their employees are considered wholesale exposures in accordance with the U.S. Basel III rules.
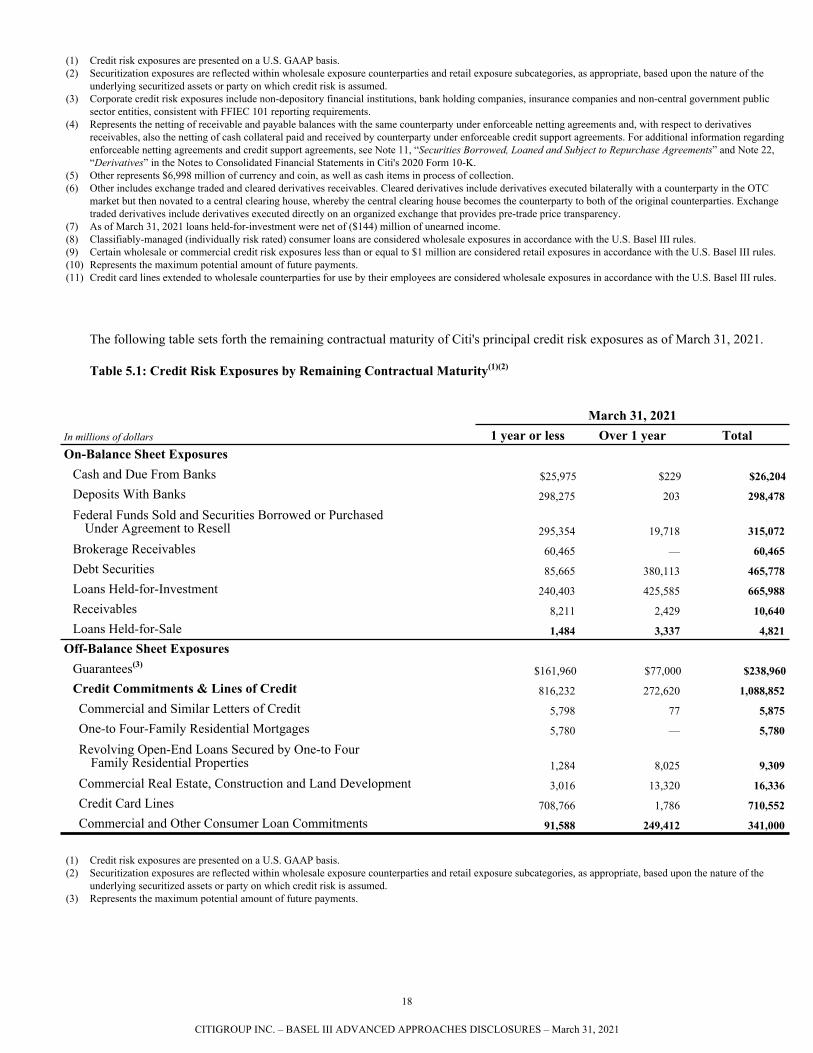
The following table sets forth the remaining contractual maturity of Citi's principal credit risk exposures as of March 31, 2021.
Table 5.1: Credit Risk Exposures by Remaining Contractual Maturity(1)(2)
March 31, 2021In millions of dollars 1 year or less Over 1 year TotalOn-Balance Sheet Exposures
Cash and Due From Banks $25,975 $229 $26,204Deposits With Banks 298,275 203 298,478
Federal Funds Sold and Securities Borrowed or PurchasedUnder Agreement to Resell 295,354 19,718 315,072
Brokerage Receivables 60,465 — 60,465 Debt Securities 85,665 380,113 465,778 Loans Held-for-Investment 240,403 425,585 665,988 Receivables 8,211 2,429 10,640 Loans Held-for-Sale 1,484 3,337 4,821
Off-Balance Sheet ExposuresGuarantees(3)
$161,960 $77,000 $238,960Credit Commitments & Lines of Credit 816,232 272,620 1,088,852 Commercial and Similar Letters of Credit 5,798 77 5,875 One-to Four-Family Residential Mortgages 5,780 — 5,780
Revolving Open-End Loans Secured by One-to FourFamily Residential Properties 1,284 8,025 9,309
Commercial Real Estate, Construction and Land Development 3,016 13,320 16,336 Credit Card Lines 708,766 1,786 710,552 Commercial and Other Consumer Loan Commitments 91,588 249,412 341,000
(1) Credit risk exposures are presented on a U.S. GAAP basis. (2) Securitization exposures are reflected within wholesale exposure counterparties and retail exposure subcategories, as appropriate, based upon the nature of the
underlying securitized assets or party on which credit risk is assumed.(3) Represents the maximum potential amount of future payments.
18
CITIGROUP INC. – BASEL III ADVANCED APPROACHES DISCLOSURES – March 31, 2021
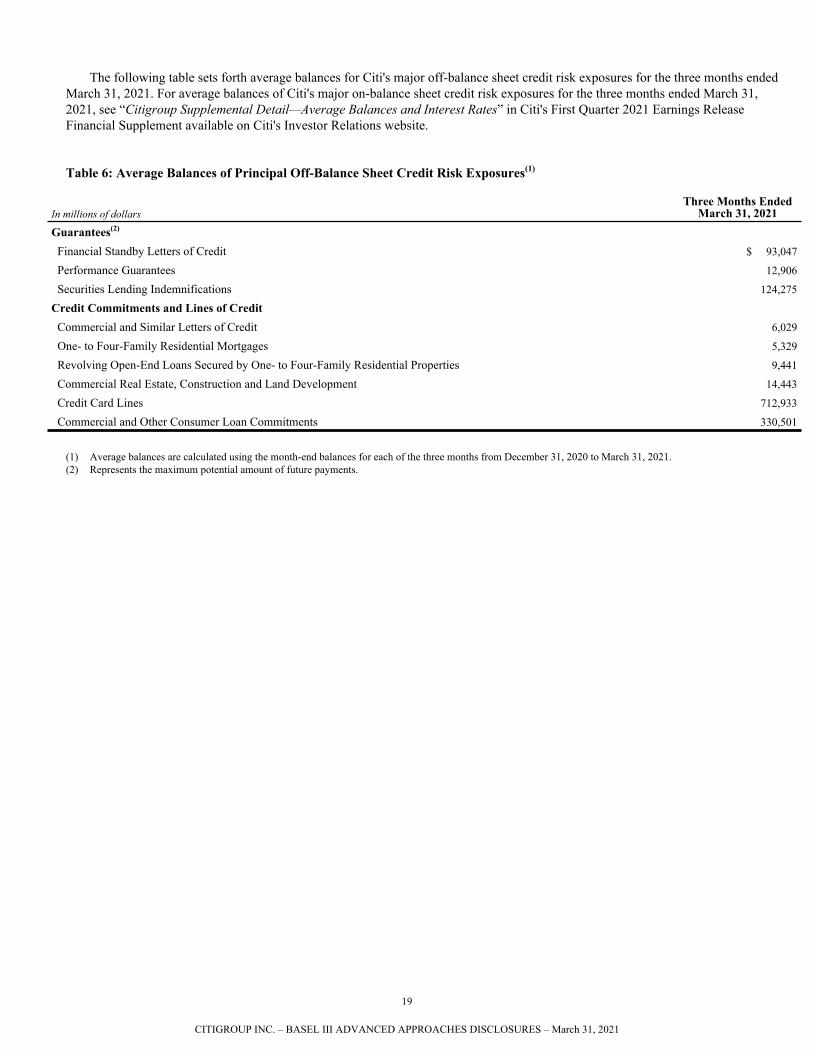
The following table sets forth average balances for Citi's major off-balance sheet credit risk exposures for the three months ended March 31, 2021. For average balances of Citi's major on-balance sheet credit risk exposures for the three months ended March 31, 2021, see “Citigroup Supplemental Detail—Average Balances and Interest Rates” in Citi's First Quarter 2021 Earnings Release Financial Supplement available on Citi's Investor Relations website.
Table 6: Average Balances of Principal Off-Balance Sheet Credit Risk Exposures(1)
In millions of dollarsThree Months Ended
March 31, 2021Guarantees(2)
Financial Standby Letters of Credit $ 93,047
Performance Guarantees 12,906
Securities Lending Indemnifications 124,275
Credit Commitments and Lines of Credit Commercial and Similar Letters of Credit 6,029
One- to Four-Family Residential Mortgages 5,329
Revolving Open-End Loans Secured by One- to Four-Family Residential Properties 9,441
Commercial Real Estate, Construction and Land Development 14,443
Credit Card Lines 712,933
Commercial and Other Consumer Loan Commitments 330,501
(1) Average balances are calculated using the month-end balances for each of the three months from December 31, 2020 to March 31, 2021. (2) Represents the maximum potential amount of future payments.
19
CITIGROUP INC. – BASEL III ADVANCED APPROACHES DISCLOSURES – March 31, 2021
See the following references to Citi’s First Quarter 2021 Form 10-Q for additional quantitative information regarding credit risk exposures, all of which are presented in accordance with U.S. GAAP.
Corporate and Consumer Loans
• See Note 13, “Loans” for additional information on loans outstanding by counterparty type and geographic region, non-accrual and delinquent loans, and impaired loans.
• See “Managing Global Risk—Credit Risk” for additional information on loans outstanding by counterparty type, geographic region, remaining contractual maturity, non-accrual and delinquent loans, and impaired loans.
Investment Securities
• See Note 12, “Investments” for information on investment securities by issuer type, remaining contractual maturity and investment securities determined to be other-than-temporarily impaired.
Repo-Style Transactions, Eligible Margin Loans and OTC Derivative Contracts
• See Note 10, “Securities Borrowed, Loaned and Subject to Repurchase Agreements” for respective carrying values.
• See Note 19, “Derivatives” for derivative notional amounts, gross mark-to-market receivables/payables, collateral netting benefits and net mark-to-market receivables/payables, as well as credit derivative notional amounts and gross mark-to-market receivables/payables by counterparty type and remaining contractual maturity.
Off-Balance Sheet Exposures
• See Note 22, “Guarantees, Leases and Commitments” for information on the maximum potential amount of future payments under guarantees, and credit commitments by type of product” for information on the maximum potential amount of future payments under guarantees, credit commitments by type of product and lease commitments.
Allowance for Credit Losses
• See “Managing Global Risk—Credit Risk—Details of Credit Loss Experience” for a reconciliation of changes in the allowance for credit losses.
• See Note 14, “Allowance for Credit Losses” for a disaggregation of the allowance for credit losses by impairment method.
Additionally, see Citi's 2020 Form 10-K for the followinginformation regarding corporate and consumer loans, as wellas off-balance sheet exposures.• See "Managing Global Risk-Credit Risk" for additionalinformation on certain consumer loans by remainingcontractual maturity.• See Note 26, “Pledged Assets, Collateral, Guaranteesand Commitments” for additional information on leasecommitments.
20
CITIGROUP INC. – BASEL III ADVANCED APPROACHES DISCLOSURES – March 31, 2021
CREDIT RISK: PORTFOLIO DISCLOSURES – INTERNAL RATINGS-BASED APPROACH
OverviewUnder the U.S. Basel III rules Citi is required to categorize its credit risk, in part, into wholesale, retail, securitization, central counterparty, and equity exposures. Each category may cross multiple business segments as presented in Citi’s other publicly disseminated reports, such as its Forms 10-K and 10-Q.
Wholesale exposures are classifiably-managed (individually risk rated) and retail exposures are delinquency-managed (portfolio based). Wholesale exposures are primarily resident in the ICG businesses (including Citi Private Bank), as well as Corporate Treasury. Additionally, classifiably-managed exposures are resident in certain commercial business lines within the GCB and Corporate/Other. Typical financial reporting categories that include wholesale exposures are deposits with banks, debt securities available-for-sale or held-to-maturity, loans, and off-balance sheet exposures such as unused commitments to lend and letters of credit.
Wholesale exposures, which include counterparty credit risk exposures arising from OTC derivative contracts, repo-style transactions and eligible margin loans, consist of exposures such as those to corporates, banks, securities firms, financial institutions, central governments, government agencies, local governments, other public sector entities, income producing real estate, high volatility commercial real estate, high net worth individuals not eligible for retail exposure treatment, and other obligor/counterparty types not included in retail exposures.
Retail exposures are primarily resident in consumer business lines within the GCB and Corporate/Other. Additionally, certain delinquency-managed exposures for business purposes that are less than or equal to $1 million, as well as certain delinquency-managed exposures to individuals for non-business purposes, that are resident in the ICG and Citi Private Bank are treated as retail exposures in accordance with the U.S. Basel III rules. Typical financial reporting categories that include retail exposures are loans and off-balance sheet commitments to lend. Retail exposures consist of three subcategories: residential mortgage exposures, qualifying revolving exposures, and other retail exposures. Residential mortgage exposures include one- to four-family residential mortgages, both first lien and second lien, as well as home equity lines of credit. Qualifying revolving exposures include credit card and charge card products where the overall credit limit is less than or equal to $100,000, and overdraft lines on individual checking accounts. Other retail exposures include credit card products above the $100,000 threshold, personal loans, student loans, and commercial delinquency-managed exposures less than or equal to $1 million.
Wholesale Credit Risk Management
Wholesale Credit Risk ExposuresAs previously noted, Citi’s wholesale credit risk exposures are to corporate, institutional, public sector and high-net worth clients around the world with a range of wholesale banking products and services. Citi’s wholesale businesses that incur credit, market,
operational and franchise risk are covered by risk management policies which set forth core risk principles, policy framework, limits, definitions, rules and standards for identifying, measuring, approving and reporting risk, including business conducted in majority-owned, management-controlled entities.
Obligors are assigned a risk rating through a risk rating process governed by the Citi Risk Rating Policy. Facilities to an obligor are approved in accordance with Citi level and business level risk policies. The risk policies require a comprehensive analysis of each obligor and all proposed credit exposures to that obligor, on at least an annual basis.
Independent risk management periodically reviews exposures across the banking book and trading book portfolios to ensure compliance with various limit and concentration constructs. Quarterly reviews are conducted of certain high risk exposures in the ICG.
Use of Risk Parameter Estimates Other Than for Regulatory Capital PurposesFor Citi’s wholesale exposures, internal credit ratings are used in determining approval levels, concentration limits, economic risk capital, and reserves, in addition to regulatory capital and capital adequacy. Each wholesale obligor is assigned an obligor risk rating (ORR) that reflects the one-year probability of default (PD) of the obligor. Each wholesale facility is assigned a facility risk rating (FRR) that reflects the expected loss rate of the facility, the product of the one-year PD and the expected loss given default (LGD) associated with the facility characteristics.
ORRs are established through an integrated framework that combines quantitative and qualitative tools, calibrated and tested across economic cycles, with risk manager expertise on customers, markets and industries. ORRs are generally expected to change in line with material changes in the PD of the obligor. Rating categories are defined consistently across wholesale credit by ranges of PDs and are used to calibrate and objectively test rating models and the final ratings assigned to individual obligors.
Independently validated models and, in limited cases, external agency ratings, establish the starting point in the internal obligor rating process. The use of external agency ratings in establishing an internal rating occurs when external agency ratings have been evaluated against internal credit rating criteria, and reviewed against internal rating performance and definitions, and is generally limited to ratings of BBB+/Baa1 or higher.
Internal rating models include statistically derived models and expert judgment risk rating models. The statistical models are developed by an independent analytical team in conjunction with independent risk management. The analytical team resides in Credit and Obligor Risk Analytics (CORA) which is part of the corporate-level independent group within Citi’s overall risk management organization. The statistical rating models cover Citi’s corporate and commercial bank segment and certain commercial activity within the consumer business lines, and are based on statistically-significant financial variables. Expert judgment rating models cover industry or obligor segments where
21
CITIGROUP INC. – BASEL III ADVANCED APPROACHES DISCLOSURES – March 31, 2021
there are limited defaults or data histories, or highly specialized or heterogeneous populations.
To the extent that risk management believes the applicable model does not capture all the relevant factors affecting the credit risk of an obligor, discretionary adjustments may be applied to derive the final ORR, within limits defined by policy. For larger corporates, commercial banks and commercial real estate, the final ORRs are derived through the use of a scorecard that is designed to capture the key risks for the segment. For larger credit relationships, the final ORRs are the starting point for deriving a longer term view on the credit rating that is used as the basis for obligor limits and approval levels.
Use of Credit Risk MitigationRisk mitigation may depend on the type of product. For counterparty credit risk, counterparties may be required to post cash or securities margin based upon the terms of the Credit Support Annex with that counterparty. Margin posted by a counterparty is reflected as a reduction of exposure at the netting set level, subject to obtaining an enforceable legal opinion regarding the certainty of the netting and margin agreement. For lending based transactions, the primary risk mitigants are guarantees or other types of support from third parties or related entities, as well as collateral such as cash, securities, real estate, or other asset types. Additionally, exposure can be mitigated through the purchase of credit default swaps. The risk policies define specific documentation requirements for all product contracts, and specific requirements for a guarantee to qualify as “full support” which align with the guarantee eligibility requirements under the U.S. Basel III rules.
Recognizing Credit Risk MitigationFor purposes of calculating regulatory capital for counterparty credit risk, margin posted by a counterparty is reflected as a reduction of exposure at default (EAD) in accordance with the U.S. Basel III rules, subject to obtaining an enforceable legal opinion regarding the certainty of the netting and margin agreement. For purposes of calculating Basel III regulatory capital for lending products, collateral is recognized in the LGD calculation based on the specific LGD for the related collateral as defined annually by CORA. The benefit of eligible guarantees is captured through PD substitution in the regulatory capital calculation and in the internal assignment of FRRs. In certain cases, collateral may be recognized as an improvement in the rating of the facility based on constraints outlined in the Citi Collateral Policy and Citi Risk Rating Policy.
Retail Credit Risk Management
Policies and Processes for Retail Credit Risk ManagementCiti extends retail credit on the basis of the customer’s willingness and ability to repay, our stated risk appetite, and underwriting guidelines, rather than placing primary reliance on credit risk mitigation. Depending on a customer’s standing and the type of product, facilities may be provided on an unsecured basis.
Citi’s retail banking operations use credit models in assessing and managing risk in their businesses and, as a result, models play an integral role in customer approval and management processes.
Models used include PD models, primarily in the form of custom application scorecards, custom behavioral scorecards, and generic bureau scores, for example a FICO score.
Application scorecards are derived from the historically observed performance of new customers. They are derived using customer demographic and financial information, including data available through credit bureaus. Through statistical techniques, the relationship between these variables and the credit performance is quantified to produce output scores reflecting a PD. These scores are used primarily for decision-making regarding new customers and may reflect different default definitions than those required by the U.S. Basel III rules. These scores may be used as segmentation variables in the Basel model.
Behavioral scorecards are derived from the historically observed performance of existing customers (including bureau data). They can be based upon internal information, credit bureau information, or both. The techniques used to derive the output scores reflecting certain PDs are very similar to those used for application scoring. The output scores are used for existing customer management activities. These scores may be used as segmentation variables in the Basel model.
Citi also employs credit loss forecasting models for the purpose of projecting credit losses in various economic scenarios, including CCAR, DFAST, and ICAAP stress loss scenarios, informing portfolio risk appetite, and estimating required loan loss reserves. Such models are developed utilizing a variety of statistical and business analytics methodologies. They include portfolio/product, segment, and/or account level models driven by historical industry data, historical internal portfolio performance, and/or econometric indicators. Such models are not utilized in underwriting, although they may be used to inform risk appetite, or the Basel III Advanced Approaches framework.
Citi’s retail credit risk custom models are primarily internally derived, although external vendors may be contracted to build models on behalf of the businesses. All such external models (including generic scores) are subject to internal independent validation by Citi's Model Risk Management function.
Collateral Valuation and ManagementIn Citi’s residential mortgage businesses, Citi’s credit policy requires annual assessment of portfolio loan to value, with individual loans valued more frequently as necessary. A variety of methods, ranging from the use of market indices to individual professional inspection, may be used. For margin and security backed loans, Citi’s credit policy generally requires that collateral valuations be performed daily.
Types of Collateral In Citi’s residential real estate businesses, a mortgage of the property is obtained to secure claims. Physical collateral is also typically obtained in vehicle financing in most jurisdictions. Loans to private banking or investment management clients may be made against the pledge of eligible marketable securities, cash or real estate.
Calculation of Risk-Weighted Assets Using Internal Parameters In accordance with the requirements of the U.S. Basel III rules, Citi applies the Advanced Internal Ratings Based (A-IRB)
22
CITIGROUP INC. – BASEL III ADVANCED APPROACHES DISCLOSURES – March 31, 2021
approach for credit risk. Under the A-IRB approach, Citi uses its own estimates of PD, LGD and credit conversion factors (CCF) as risk parameter inputs to Basel III supervisory formulas for the different types of wholesale, counterparty, and retail credit risk exposures when calculating risk-weighted assets.
Wholesale Credit RiskFor wholesale credit risk exposures, the estimates for PD, LGD and EAD are updated on an annual basis by an analytics team in CORA. PD is an estimate of the long-run average one-year default rate for each rating category, adjusted to ensure increasing default rates along the rating scale. PDs and EADs are based on internal data as of 2000 onward.
LGD represents the economic loss associated with defaults occurring in a downturn period (or the long-run average, whichever is higher). The economic loss is measured as the present value of the cash flows, post default, and includes costs associated with the work out, such as legal costs. Adjustments are also made for accrued interest and fees and unresolved defaults. Downturn periods are determined in accordance with the U.S. Basel III rules and reflect periods of significantly higher internal default rates by jurisdiction. LGD is segmented by key drivers of losses, such as product type, collateral type and coverage, seniority, jurisdiction, and/or obligor segment (such as large corporates, financial institutions, sovereigns, SMEs or private banking clients). With some exceptions, such as bonds and sovereign LGDs, where external information is sourced to supplement internal data, LGDs are based on Citi’s internal data for defaults resolving as of 2000 onward.
The EAD for each facility is equal to 100% of the on-balance sheet (direct) exposure, plus the exposure arising from any expected drawdown of an off-balance sheet (indirect) unused commitment or contingency. The percentage of the drawdown amount is referred to as the CCF. CCFs for unused commitments are calculated using regression models on internal data. The key drivers for the models include factors such as product type, current usage, obligor segment, credit quality and/or jurisdiction. Average CCFs based on internal data are used for trade letters of credit and performance standby letters of credit, while a fixed 100% CCF value is applied to financial standby letters of credit and other types of contingent credit. CCFs include adjustments for downturn periods, consistent with those used for LGD, and accrued but unpaid interest and fees at the time of default.
Maturity for loans and leases is based on remaining contractual maturity. Maturity is capped at five years and with a floor of one year, except as permitted by the U.S. Basel III rules.
Retail Credit RiskThe estimates for PD, LGD and CCFs for retail credit exposures are generally updated on quarterly basis using internal data covering a range of economic conditions and are defined similarly to those for wholesale credit. As required by the U.S. Basel III rules, PD is an estimate of the one-year default rate based on the long-term averages. The LGD is an estimate of the economic loss that is associated with the defaulted exposures and any risk mitigants, such as insurance and/or collateral, if applicable. CCF is an estimate of the percentage of an undrawn credit line that will be drawn down within a one-year period. The EAD is estimated as a sum of 100% of the drawn exposure at the beginning of this
year and the expected portion of undrawn exposure (as of the beginning of the year) corresponding to CCF.
The long-run average CCFs and LGDs are subject to certain adjustments, including an adjustment to reflect the averages associated with downturn periods. The downturn periods are identified based on internal default rates by major product category and country (similar to the approach used for wholesale credit risk exposures) in accordance with the U.S. Basel III rules.
All Basel III retail parameters are calculated for homogeneous segments of credit exposures delineated by risk drivers, such as consumer credit score band, loan to value ratio, credit line utilization, months-on-book and delinquency aging. Segments are defined by specific product characteristics within a portfolio. The credit scores used are generic bureau scores (for example, a FICO score) or internally developed scoring models, which are subject to Citi’s Model Risk Management Policy, as discussed further below.
Generally, the approach to estimating PD, LGD, and CCF is consistent across all retail exposure subcategories—residential mortgage exposures, qualifying revolving exposures, and other retail exposures.
Credit Rating and Basel Parameter GovernanceThe Citi Risk Rating Policy requires that all wholesale businesses have an approved risk rating process for deriving risk ratings for all obligors and facilities. Establishing the risk rating process is the responsibility of the independent risk manager aligned with each business. The processes must be approved by the head of CORA, based on review of default rates, LGDs, and alternative practices. The process must also be approved by a risk manager who has the highest senior credit officer designation. It is the responsibility of the risk manager to ensure that the process remains appropriate for the business’ activities. The risk rating process must be re-approved at least once every three years, unless more frequent review is specified as a condition of the approval or an extension is approved per the risk rating process approval and control standards. All ratings must be reviewed annually, at a minimum.
Risk and the business share responsibility for the accuracy of risk ratings. Fundamental Credit Review (FCR) reviews the appropriateness of the risk ratings. FCR may change an existing risk rating during a review or during ongoing business monitoring, and has final authority. Recognition of loss mitigation in the FRRs for collateral or support requires that the mitigant and the reporting comply with the collateral and support policies. In addition, the accuracy of ratings is tested on an annual basis and at various levels. The annual ORR validation, as well as the rating model testing, is reviewed by senior credit risk managers. Various levels of backtesting, benchmarking and validation cover all models and methodologies used in the assignment of ratings, as well as the models used to calculate Basel parameters.
The estimation of Basel parameters is governed under parameter control standards for wholesale and retail credit exposures. All models used to estimate Basel parameters must comply with Citi’s Model Risk Management Policy, including the requirement to be validated by an independent model validation unit and approved by senior risk management.
23
CITIGROUP INC. – BASEL III ADVANCED APPROACHES DISCLOSURES – March 31, 2021
Model Risk Management PolicyModel risk refers to the potential adverse impact to Citi from using a model arising from model errors or from incorrect or inappropriate use of the model output. Citi’s Model Risk Management Policy is designed to comply with supervisory guidance on model risk management and is approved by each of Citigroup’s and Citibank’s Chief Risk Officer and Citi’s Board of Directors. This policy establishes a model risk management framework designed to ensure consistent standards across Citi for identifying model risk, assessing its magnitude, and managing the risks that arise when using models. Citi’s Head of Model Risk Management is responsible for and owns this policy. The Citi Model Risk Management Committee oversees Citi's Model Risk Management Framework, monitoring its effectiveness and associated risks.
Independent Validation of ModelsModels for wholesale credit risk and retail credit risk are independently validated by Model Risk Management and approved for use. Generally, Citi's model validation process involves evaluation of conceptual soundness including key assumptions, effective challenge of the model design and construction, identification of model limitations and incremental analysis and testing as necessary. In addition, models for wholesale credit risk and retail credit risk are subject to periodic model risk assessment, ongoing performance monitoring,
outcomes analysis, annual model review, ongoing model validation, and model change management as required under the Citi Model Risk Management Policy. Wholesale credit rating models and Basel parameter models (for both wholesale and retail) are integrated into internal risk systems by business, Risk and information technology. The definition of default for wholesale and retail credit risk conforms with the applicable definitions in the U.S. Basel III rules. Internal audit is responsible for independently assessing the adequacy and effectiveness of the overall model risk management framework and implementation (including risk rating processes).
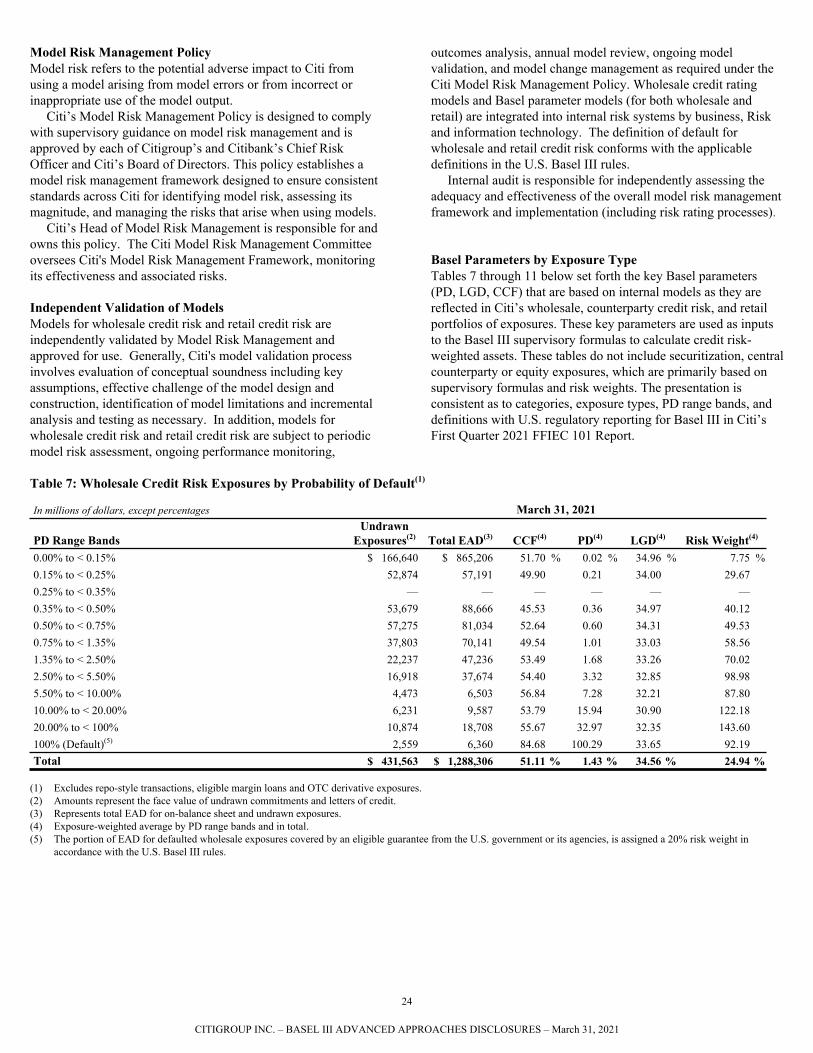
Basel Parameters by Exposure TypeTables 7 through 11 below set forth the key Basel parameters (PD, LGD, CCF) that are based on internal models as they are reflected in Citi’s wholesale, counterparty credit risk, and retail portfolios of exposures. These key parameters are used as inputs to the Basel III supervisory formulas to calculate credit risk-weighted assets. These tables do not include securitization, central counterparty or equity exposures, which are primarily based on supervisory formulas and risk weights. The presentation is consistent as to categories, exposure types, PD range bands, and definitions with U.S. regulatory reporting for Basel III in Citi’s First Quarter 2021 FFIEC 101 Report.
Table 7: Wholesale Credit Risk Exposures by Probability of Default(1)
In millions of dollars, except percentages March 31, 2021
PD Range BandsUndrawn
Exposures(2) Total EAD(3) CCF(4) PD(4) LGD(4) Risk Weight(4)
0.00% to < 0.15% $ 166,640 $ 865,206 51.70 % 0.02 % 34.96 % 7.75 %0.15% to < 0.25% 52,874 57,191 49.90 0.21 34.00 29.67 0.25% to < 0.35% — — — — — — 0.35% to < 0.50% 53,679 88,666 45.53 0.36 34.97 40.12 0.50% to < 0.75% 57,275 81,034 52.64 0.60 34.31 49.53 0.75% to < 1.35% 37,803 70,141 49.54 1.01 33.03 58.56 1.35% to < 2.50% 22,237 47,236 53.49 1.68 33.26 70.02 2.50% to < 5.50% 16,918 37,674 54.40 3.32 32.85 98.98 5.50% to < 10.00% 4,473 6,503 56.84 7.28 32.21 87.80 10.00% to < 20.00% 6,231 9,587 53.79 15.94 30.90 122.18 20.00% to < 100% 10,874 18,708 55.67 32.97 32.35 143.60 100% (Default)(5) 2,559 6,360 84.68 100.29 33.65 92.19 Total $ 431,563 $ 1,288,306 51.11 % 1.43 % 34.56 % 24.94 %
(1) Excludes repo-style transactions, eligible margin loans and OTC derivative exposures.(2) Amounts represent the face value of undrawn commitments and letters of credit. (3) Represents total EAD for on-balance sheet and undrawn exposures.(4) Exposure-weighted average by PD range bands and in total.(5) The portion of EAD for defaulted wholesale exposures covered by an eligible guarantee from the U.S. government or its agencies, is assigned a 20% risk weight in
accordance with the U.S. Basel III rules.
24
CITIGROUP INC. – BASEL III ADVANCED APPROACHES DISCLOSURES – March 31, 2021
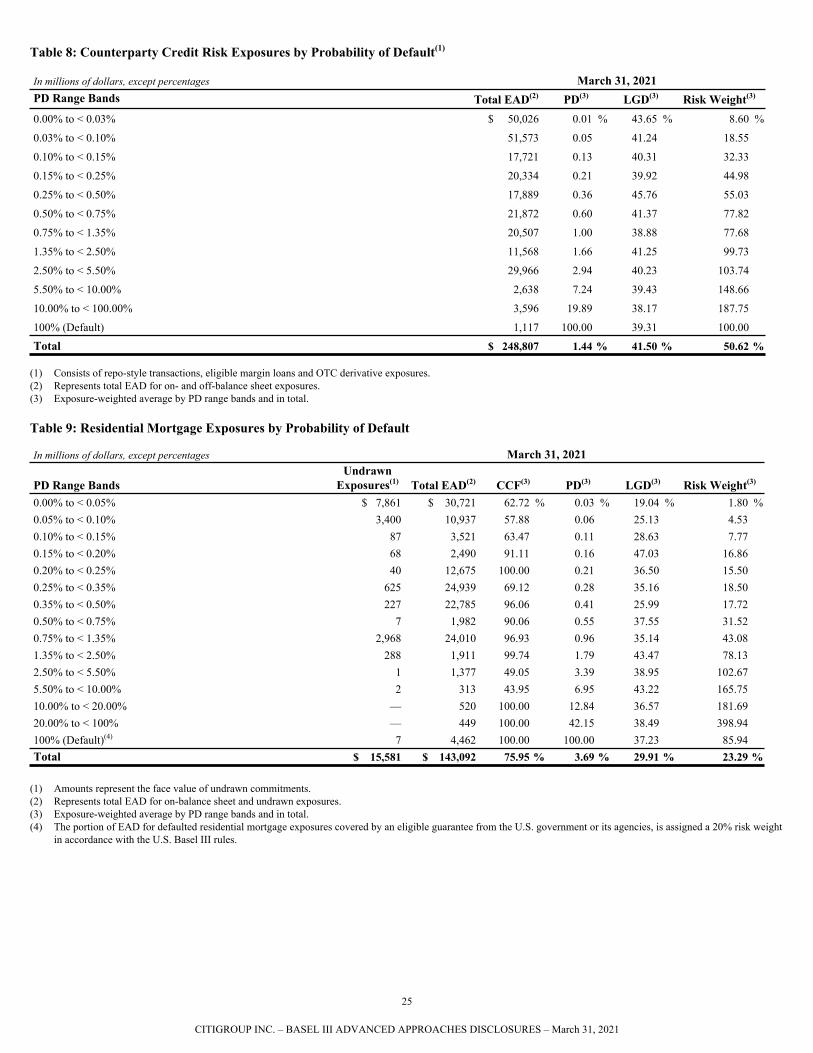
Table 8: Counterparty Credit Risk Exposures by Probability of Default(1)
In millions of dollars, except percentages March 31, 2021PD Range Bands Total EAD(2) PD(3) LGD(3) Risk Weight(3)
0.00% to < 0.03% $ 50,026 0.01 % 43.65 % 8.60 %
0.03% to < 0.10% 51,573 0.05 41.24 18.55
0.10% to < 0.15% 17,721 0.13 40.31 32.33
0.15% to < 0.25% 20,334 0.21 39.92 44.98
0.25% to < 0.50% 17,889 0.36 45.76 55.03
0.50% to < 0.75% 21,872 0.60 41.37 77.82
0.75% to < 1.35% 20,507 1.00 38.88 77.68
1.35% to < 2.50% 11,568 1.66 41.25 99.73
2.50% to < 5.50% 29,966 2.94 40.23 103.74
5.50% to < 10.00% 2,638 7.24 39.43 148.66
10.00% to < 100.00% 3,596 19.89 38.17 187.75
100% (Default) 1,117 100.00 39.31 100.00
Total $ 248,807 1.44 % 41.50 % 50.62 %
(1) Consists of repo-style transactions, eligible margin loans and OTC derivative exposures. (2) Represents total EAD for on- and off-balance sheet exposures.(3) Exposure-weighted average by PD range bands and in total.
Table 9: Residential Mortgage Exposures by Probability of Default
In millions of dollars, except percentages March 31, 2021
PD Range BandsUndrawn
Exposures(1) Total EAD(2) CCF(3) PD(3) LGD(3) Risk Weight(3)
0.00% to < 0.05% $ 7,861 $ 30,721 62.72 % 0.03 % 19.04 % 1.80 %0.05% to < 0.10% 3,400 10,937 57.88 0.06 25.13 4.53 0.10% to < 0.15% 87 3,521 63.47 0.11 28.63 7.77 0.15% to < 0.20% 68 2,490 91.11 0.16 47.03 16.86 0.20% to < 0.25% 40 12,675 100.00 0.21 36.50 15.50 0.25% to < 0.35% 625 24,939 69.12 0.28 35.16 18.50 0.35% to < 0.50% 227 22,785 96.06 0.41 25.99 17.72 0.50% to < 0.75% 7 1,982 90.06 0.55 37.55 31.52 0.75% to < 1.35% 2,968 24,010 96.93 0.96 35.14 43.08 1.35% to < 2.50% 288 1,911 99.74 1.79 43.47 78.13 2.50% to < 5.50% 1 1,377 49.05 3.39 38.95 102.67 5.50% to < 10.00% 2 313 43.95 6.95 43.22 165.75 10.00% to < 20.00% — 520 100.00 12.84 36.57 181.69 20.00% to < 100% — 449 100.00 42.15 38.49 398.94 100% (Default)(4) 7 4,462 100.00 100.00 37.23 85.94 Total $ 15,581 $ 143,092 75.95 % 3.69 % 29.91 % 23.29 %
(1) Amounts represent the face value of undrawn commitments.(2) Represents total EAD for on-balance sheet and undrawn exposures.(3) Exposure-weighted average by PD range bands and in total. (4) The portion of EAD for defaulted residential mortgage exposures covered by an eligible guarantee from the U.S. government or its agencies, is assigned a 20% risk weight
in accordance with the U.S. Basel III rules.
25
CITIGROUP INC. – BASEL III ADVANCED APPROACHES DISCLOSURES – March 31, 2021
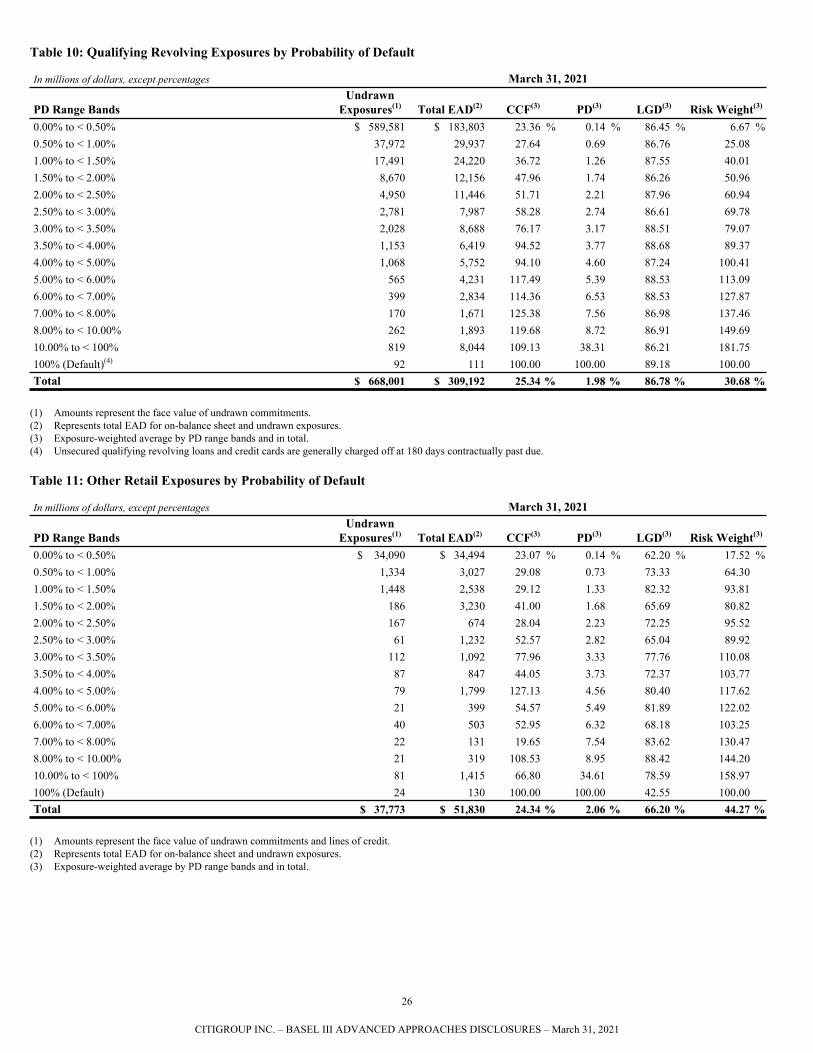
Table 10: Qualifying Revolving Exposures by Probability of Default
In millions of dollars, except percentages March 31, 2021
PD Range BandsUndrawn
Exposures(1) Total EAD(2) CCF(3) PD(3) LGD(3) Risk Weight(3)
0.00% to < 0.50% $ 589,581 $ 183,803 23.36 % 0.14 % 86.45 % 6.67 %0.50% to < 1.00% 37,972 29,937 27.64 0.69 86.76 25.08 1.00% to < 1.50% 17,491 24,220 36.72 1.26 87.55 40.01 1.50% to < 2.00% 8,670 12,156 47.96 1.74 86.26 50.96 2.00% to < 2.50% 4,950 11,446 51.71 2.21 87.96 60.94 2.50% to < 3.00% 2,781 7,987 58.28 2.74 86.61 69.78 3.00% to < 3.50% 2,028 8,688 76.17 3.17 88.51 79.07 3.50% to < 4.00% 1,153 6,419 94.52 3.77 88.68 89.37 4.00% to < 5.00% 1,068 5,752 94.10 4.60 87.24 100.41 5.00% to < 6.00% 565 4,231 117.49 5.39 88.53 113.09 6.00% to < 7.00% 399 2,834 114.36 6.53 88.53 127.87 7.00% to < 8.00% 170 1,671 125.38 7.56 86.98 137.46 8.00% to < 10.00% 262 1,893 119.68 8.72 86.91 149.69 10.00% to < 100% 819 8,044 109.13 38.31 86.21 181.75 100% (Default)(4) 92 111 100.00 100.00 89.18 100.00 Total $ 668,001 $ 309,192 25.34 % 1.98 % 86.78 % 30.68 %
(1) Amounts represent the face value of undrawn commitments.(2) Represents total EAD for on-balance sheet and undrawn exposures.(3) Exposure-weighted average by PD range bands and in total. (4) Unsecured qualifying revolving loans and credit cards are generally charged off at 180 days contractually past due.
Table 11: Other Retail Exposures by Probability of Default
In millions of dollars, except percentages March 31, 2021
PD Range BandsUndrawn
Exposures(1) Total EAD(2) CCF(3) PD(3) LGD(3) Risk Weight(3)
0.00% to < 0.50% $ 34,090 $ 34,494 23.07 % 0.14 % 62.20 % 17.52 %0.50% to < 1.00% 1,334 3,027 29.08 0.73 73.33 64.30 1.00% to < 1.50% 1,448 2,538 29.12 1.33 82.32 93.81 1.50% to < 2.00% 186 3,230 41.00 1.68 65.69 80.82 2.00% to < 2.50% 167 674 28.04 2.23 72.25 95.52 2.50% to < 3.00% 61 1,232 52.57 2.82 65.04 89.92 3.00% to < 3.50% 112 1,092 77.96 3.33 77.76 110.08 3.50% to < 4.00% 87 847 44.05 3.73 72.37 103.77 4.00% to < 5.00% 79 1,799 127.13 4.56 80.40 117.62 5.00% to < 6.00% 21 399 54.57 5.49 81.89 122.02 6.00% to < 7.00% 40 503 52.95 6.32 68.18 103.25 7.00% to < 8.00% 22 131 19.65 7.54 83.62 130.47 8.00% to < 10.00% 21 319 108.53 8.95 88.42 144.20 10.00% to < 100% 81 1,415 66.80 34.61 78.59 158.97 100% (Default) 24 130 100.00 100.00 42.55 100.00 Total $ 37,773 $ 51,830 24.34 % 2.06 % 66.20 % 44.27 %
(1) Amounts represent the face value of undrawn commitments and lines of credit.(2) Represents total EAD for on-balance sheet and undrawn exposures.(3) Exposure-weighted average by PD range bands and in total.
26
CITIGROUP INC. – BASEL III ADVANCED APPROACHES DISCLOSURES – March 31, 2021
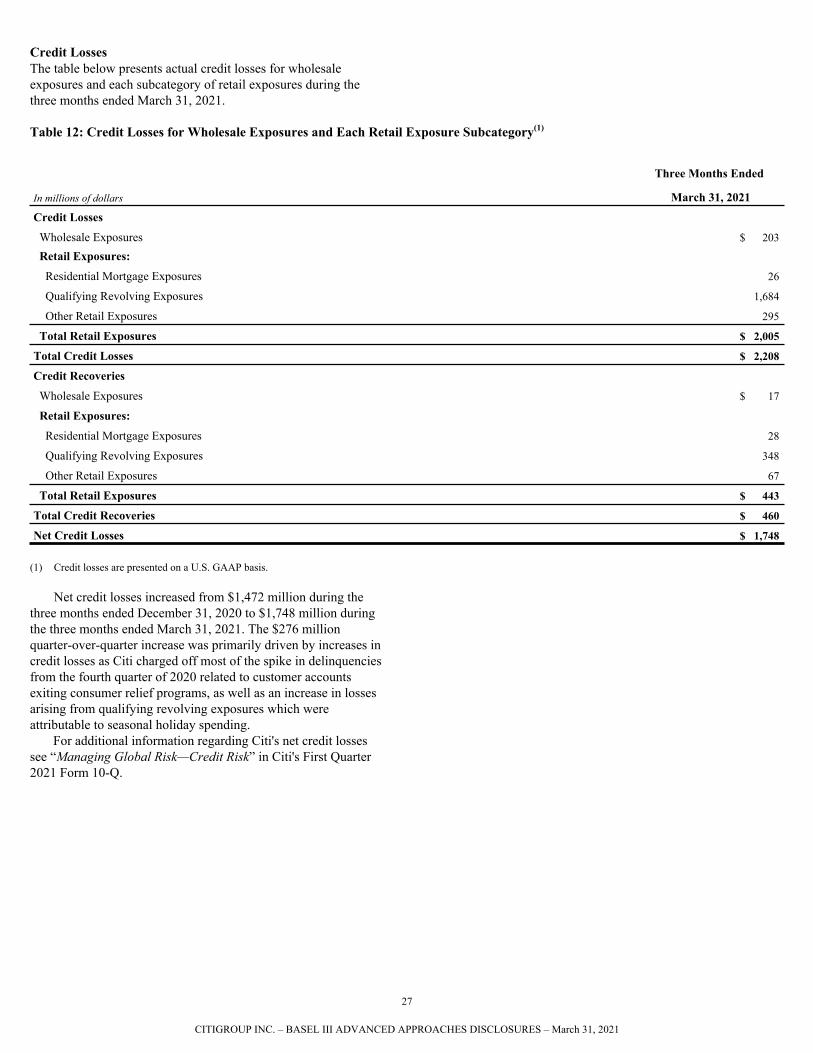
Credit Losses The table below presents actual credit losses for wholesale exposures and each subcategory of retail exposures during the three months ended March 31, 2021.
Table 12: Credit Losses for Wholesale Exposures and Each Retail Exposure Subcategory(1)
In millions of dollars
Three Months Ended
March 31, 2021
Credit Losses
Wholesale Exposures $ 203
Retail Exposures:
Residential Mortgage Exposures 26
Qualifying Revolving Exposures 1,684
Other Retail Exposures 295
Total Retail Exposures $ 2,005
Total Credit Losses $ 2,208
Credit Recoveries
Wholesale Exposures $ 17
Retail Exposures:
Residential Mortgage Exposures 28
Qualifying Revolving Exposures 348
Other Retail Exposures 67
Total Retail Exposures $ 443
Total Credit Recoveries $ 460
Net Credit Losses $ 1,748
(1) Credit losses are presented on a U.S. GAAP basis.
Net credit losses increased from $1,472 million during the three months ended December 31, 2020 to $1,748 million during the three months ended March 31, 2021. The $276 million quarter-over-quarter increase was primarily driven by increases in credit losses as Citi charged off most of the spike in delinquencies from the fourth quarter of 2020 related to customer accounts exiting consumer relief programs, as well as an increase in losses arising from qualifying revolving exposures which were attributable to seasonal holiday spending. For additional information regarding Citi's net credit losses see “Managing Global Risk—Credit Risk” in Citi's First Quarter 2021 Form 10-Q.
27
CITIGROUP INC. – BASEL III ADVANCED APPROACHES DISCLOSURES – March 31, 2021
COUNTERPARTY CREDIT RISK: OTC DERIVATIVE CONTRACTS, REPO-STYLE TRANSACTIONS AND ELIGIBLE MARGIN LOANS
Counterparty Credit Risk Exposures Counterparty credit risk is the risk that the counterparty to a transaction could default before the final settlement of the transaction's cash flows. For derivatives, counterparty credit risk also arises from unsettled security, commodity and foreign exchange transactions with a contractual settlement or delivery lag that is longer than the lesser of the market standard for the particular instrument or five business days (long settlement transactions). Repo-style transactions consist of repurchase or reverse repurchase transactions, or securities borrowing or securities lending transactions, including transactions in which Citi acts as agent for a customer and indemnifies the customer against loss, and are based on securities taken or given as collateral, which are marked-to-market, generally daily. Eligible margin loans are extensions of credit collateralized by liquid and readily marketable debt or equity securities, or gold, and that satisfy other conditions under the U.S. Basel III rules.
Methodology Used to Assign Economic CapitalCiti calculates economic capital for the counterparty credit risk of OTC derivative contracts by simulating the potential economic loss resulting from counterparty defaults and the potential market rate driven changes in each counterparty’s CVA. The latter simulation uses a process that integrates stress scenarios and Monte Carlo simulation.
Methodology Used to Assign Credit LimitsSingle name concentration credit limits are not specific to counterparty credit risk. Rather, single name concentration credit limits are managed at the relationship level. Relationship exposure includes the aggregate of all credit products, including loans, counterparty credit risk, trade and transaction services, etc. The process for managing a relationship's credit risk limit is guided by: core credit policies, procedures and standards, experience and judgment of credit risk professionals, and the amount of exposure and risk capital at risk.
While internal ratings are the starting point in establishing credit assessments, a range of factors, such as quality of management and strategy, nature of industry, and regulatory environment, among others, are also taken into consideration for obligor limits and approval levels. Exposure to credit risk on derivatives is also impacted by market volatility, which may impair the ability of clients to satisfy their obligations to Citi. Credit risk analysts conduct daily monitoring versus limits and any resulting issues are escalated to credit officers and business management as appropriate. Usage against the credit limits may reflect netting agreements and collateral.
Counterparty Credit Risk Capital CalculationsIn accordance with the requirements of the U.S. Basel III rules, Citi calculates counterparty credit risk-weighted assets using the PD and LGD estimates described in the “Credit Risk: Portfolio Disclosures—Internal Ratings Based Approach” section above. The methods used to determine EAD are described below.
For purposes of calculating regulatory capital for counterparty credit risk for derivatives, in accordance with the U.S. Basel III rules, Citi uses a Monte Carlo simulation to determine an expected positive exposure (EPE) measure as input to Citi’s EAD calculation. The model is calibrated with historical volatilities and correlations subject to a set of independent internal validation and statistical backtesting standards. The model utilizes a standard supervisory alpha multiplication factor of 1.4. Citi also uses the mark-to-market method (also known as the current exposure method) for certain counterparty credit risk exposures. This method assigns to each transaction a regulatory stipulated exposure based on the mark-to-market value and a measure of potential future exposure. To calculate EAD for repo-style transactions across all portfolios and for eligible margin loans within Citi's prime lending portfolios, Citi uses the simple VaR methodology. For positions that do not use simple VaR, Citi uses the (supervisory) collateral haircut approach as prescribed in the U.S. Basel III rules. Counterparty credit risk treatment also includes an explicit capital calculation (CVA RWA) to address potential fair value losses from CVA. Citi primarily utilizes the advanced CVA RWA approach for its OTC derivatives. However, the simple CVA RWA approach is used for exchange traded derivatives, other exposures that are cleared through central counterparties for which the current exposure method is applied and for immaterial OTC derivative exposures from counterparties that were deemed to not have specific risk model approval; this approach is also used for certain exposures in non-U.S. jurisdictions.
Netting agreements and margin collateral may be recognized as credit risk mitigants provided they meet certain eligibility criteria outlined in the U.S. Basel III rules, as described below.
Derivative Master Netting AgreementsCredit risk from derivatives is mitigated where possible through netting agreements whereby derivative assets and liabilities with the same counterparty can be offset. Citi policy requires all netting arrangements to be legally documented. ISDA master agreements are Citi’s preferred manner for documenting OTC derivatives. The agreements provide the contractual framework within which dealing activities across a full range of OTC products are conducted and contractually binds both parties to apply close-out netting across all outstanding transactions covered by an agreement if either party defaults or other predetermined events occur. Citi considers the level of legal certainty regarding enforceability of its offsetting rights under master netting agreements and credit support annexes to be an important factor in its risk management process. For further information on Citi’s policies regarding master netting agreements see Note 22, “Derivatives” in the Notes to Consolidated Financial Statements in Citi’s 2020 Form 10-K.
28
CITIGROUP INC. – BASEL III ADVANCED APPROACHES DISCLOSURES – March 31, 2021
Policies for Securing, Valuing and Managing Collateral, and Establishing Credit ReservesCiti’s policies and procedures cover management and governance of financial assets (including securing and valuing collateral) utilized for the purpose of mitigating the credit risk of OTC derivatives, repo-style transactions and eligible margin loans. Specifically, businesses are required to establish standard eligibility criteria for collateral usage and review processes for approving non-standard collateral. Industry standard legal agreements combined with internal reviews for legal enforceability are used to achieve a perfected security interest in the collateral. Additionally, risk management establishes guidelines on appropriate collateral haircuts related to repo-style transactions and eligible margin loans. Potential correlations between the exposure and the underlying collateral are reflected through appropriate haircuts. A haircut is the percentage of reduction in current market value applicable to each type of collateral and is largely based on liquidity and price volatility of the underlying security. Citi considers the liquidity and marketability of its collateral in determining its eligibility as a risk mitigant and in applying appropriate haircuts under the U.S. Basel III rules. The current market value of collateral is monitored on a regular basis. Margin procedures are established for managing margin calls for which daily margining is considered best practice in order to maintain an appropriate level of collateral coverage reflecting market value fluctuations. Trades are reconciled on a regular basis that is consistent with regulatory or industry best practice guidelines and margin dispute processes are in place. Procedures are established surrounding collateral substitution and collateral reuse/rehypothecation. Limits and concentration monitoring are utilized to control Citi’s collateral concentrations to different types of asset classes.
Additionally, for eligible margin loans, procedures are established to ensure an appropriate level of allowance for credit losses, and the counterparty credit risk arising on derivative transactions is managed through CVA to the fair value of derivative contracts.
Primary Types of CollateralEligible collateral including (but not limited to) cash, G10 Government and Government-Sponsored Enterprises debt securities is collected, posted or exchanged as margin on OTC derivative transactions, at a counterparty level, pursuant to applicable regulatory margin requirements.Citi also collects OTC Swap margin in excess of minimum requirements, at such times and in such forms and amounts that Risk Management determines necessary, to appropriately address the credit risk posed by particular counterparties. Collateral posted to open and maintain a master netting agreement with a counterparty, in the form of cash and eligible securities, may be segregated in an account at a third-party custodian pursuant to a tri-party Account Control Agreement. Where such collateral segregation is elected, the custody agreement must prohibit re-hypothecation or re-pledging of the collateral by the custodian.
With respect to repo-style transactions and eligible margin loans, the majority of the collateral is in the form of cash, government debt securities (mostly investment grade), and public equity securities. Non-standard collateral, such as corporate and
municipal bonds, U.S. agency securities and/or mortgage-backed securities may also be accepted, though to a lesser degree, and with appropriate agreement.
Policies With Respect to Wrong-Way Risk ExposuresWrong-way risk (WWR) occurs when a movement in a market factor causes Citi’s exposure to a counterparty to increase at the same time as the counterparty’s capacity to meet its obligations is decreasing. Stated differently, WWR occurs when exposure to a counterparty is adversely correlated with the credit quality of the counterparty.
Specific WWR arises when the exposure to a particular counterparty is positively correlated with the probability of default of the counterparty due to the nature of the transactions with the counterparty. General WWR is less definite than specific WWR and occurs where the credit quality of the counterparty is subject to impairment due to changes in macroeconomic factors.
WWR in a trading exposure arises when there is significant correlation between the underlying asset and the counterparty which, in the event of default, would lead to a significant mark-to-market loss. The interdependence between the counterparty credit exposure and underlying reference asset or collateral for each transaction can exacerbate and magnify the speed in which a portfolio deteriorates. Thus, the goal of Citi’s WWR policy is to provide best practices and guidelines for the identification, approval, reporting and mitigation of specific and general WWR.
Citi’s WWR policy further uses ongoing product stress testing to identify potential general WWR using simulated macroeconomic scenarios.
Impact of Citi Credit Rating Downgrade on Collateral PledgedCertain OTC derivative instruments contain provisions that require Citi to either post additional collateral or immediately settle any outstanding liability balances upon the occurrence of a specified event related to the credit risk of Citi. These events, which are defined by the existing derivative contracts, are primarily downgrades in the credit ratings of Citi and its affiliates. In the event that Citigroup and Citibank were downgraded a single notch across all three major rating agencies as of March 31, 2021, Citi could be required to post an additional $1.5 billion as either collateral or settlement of the OTC derivative transactions. Additionally, Citi could be required to segregate with third-party custodians collateral previously received from existing OTC derivative counterparties in the amount of $0.5 billion upon the single notch downgrade, resulting in aggregate cash obligations and collateral requirements of approximately $1.9 billion.
For repo-style transactions in which Citi acts as a principal, in the event that Citi were to receive a credit rating downgrade as of March 31, 2021, the net impact to Citi resulting from the potential posting of collateral and early termination resulting in an unwinding of transactions would not be material. For repo-style transactions in which Citi acts as agent on behalf of customers and indemnifies customers against loss (i.e., agented customer securities lending and repurchase agreement transactions), Citi would not be required to provide any collateral to the borrower of the securities nor to the lender, if Citi were to receive a credit rating downgrade. Nevertheless, certain repo-style transaction agreements may provide that a Citi credit rating downgrade,
29
CITIGROUP INC. – BASEL III ADVANCED APPROACHES DISCLOSURES – March 31, 2021
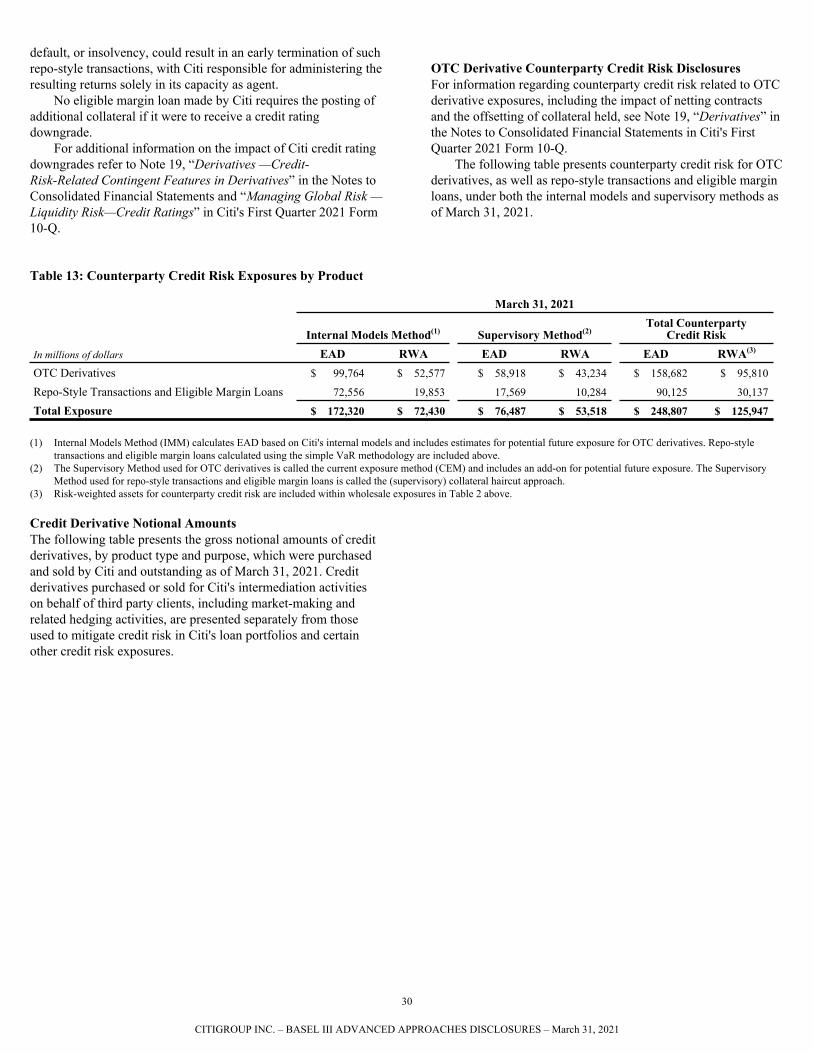
default, or insolvency, could result in an early termination of such repo-style transactions, with Citi responsible for administering the resulting returns solely in its capacity as agent.
No eligible margin loan made by Citi requires the posting of additional collateral if it were to receive a credit rating downgrade.
For additional information on the impact of Citi credit rating downgrades refer to Note 19, “Derivatives —Credit-Risk-Related Contingent Features in Derivatives” in the Notes to Consolidated Financial Statements and “Managing Global Risk — Liquidity Risk—Credit Ratings” in Citi's First Quarter 2021 Form 10-Q.
OTC Derivative Counterparty Credit Risk DisclosuresFor information regarding counterparty credit risk related to OTC derivative exposures, including the impact of netting contracts and the offsetting of collateral held, see Note 19, “Derivatives” in the Notes to Consolidated Financial Statements in Citi's First Quarter 2021 Form 10-Q.
The following table presents counterparty credit risk for OTC derivatives, as well as repo-style transactions and eligible margin loans, under both the internal models and supervisory methods as of March 31, 2021.
Table 13: Counterparty Credit Risk Exposures by Product
March 31, 2021
Internal Models Method(1) Supervisory Method(2)Total Counterparty
Credit RiskIn millions of dollars EAD RWA EAD RWA EAD RWA(3)
OTC Derivatives $ 99,764 $ 52,577 $ 58,918 $ 43,234 $ 158,682 $ 95,810
Repo-Style Transactions and Eligible Margin Loans 72,556 19,853 17,569 10,284 90,125 30,137
Total Exposure $ 172,320 $ 72,430 $ 76,487 $ 53,518 $ 248,807 $ 125,947
(1) Internal Models Method (IMM) calculates EAD based on Citi's internal models and includes estimates for potential future exposure for OTC derivatives. Repo-style transactions and eligible margin loans calculated using the simple VaR methodology are included above.
(2) The Supervisory Method used for OTC derivatives is called the current exposure method (CEM) and includes an add-on for potential future exposure. The Supervisory Method used for repo-style transactions and eligible margin loans is called the (supervisory) collateral haircut approach.
(3) Risk-weighted assets for counterparty credit risk are included within wholesale exposures in Table 2 above.
Credit Derivative Notional AmountsThe following table presents the gross notional amounts of credit derivatives, by product type and purpose, which were purchased and sold by Citi and outstanding as of March 31, 2021. Credit derivatives purchased or sold for Citi's intermediation activities on behalf of third party clients, including market-making and related hedging activities, are presented separately from those used to mitigate credit risk in Citi's loan portfolios and certain other credit risk exposures.
30
CITIGROUP INC. – BASEL III ADVANCED APPROACHES DISCLOSURES – March 31, 2021
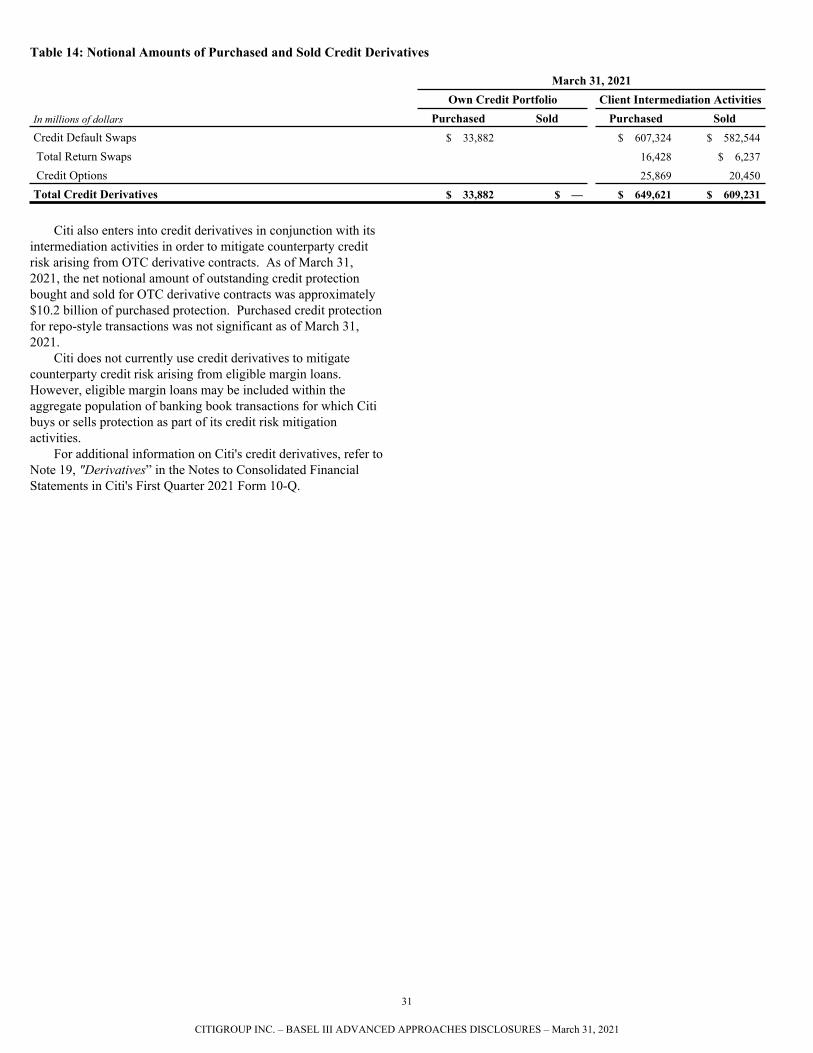
Table 14: Notional Amounts of Purchased and Sold Credit Derivatives
March 31, 2021Own Credit Portfolio Client Intermediation Activities
In millions of dollars Purchased Sold Purchased SoldCredit Default Swaps $ 33,882 $ 607,324 $ 582,544
Total Return Swaps 16,428 $ 6,237
Credit Options 25,869 20,450
Total Credit Derivatives $ 33,882 $ — $ 649,621 $ 609,231
Citi also enters into credit derivatives in conjunction with its intermediation activities in order to mitigate counterparty credit risk arising from OTC derivative contracts. As of March 31, 2021, the net notional amount of outstanding credit protection bought and sold for OTC derivative contracts was approximately $10.2 billion of purchased protection. Purchased credit protection for repo-style transactions was not significant as of March 31, 2021.
Citi does not currently use credit derivatives to mitigate counterparty credit risk arising from eligible margin loans. However, eligible margin loans may be included within the aggregate population of banking book transactions for which Citi buys or sells protection as part of its credit risk mitigation activities.
For additional information on Citi's credit derivatives, refer to Note 19, "Derivatives” in the Notes to Consolidated Financial Statements in Citi's First Quarter 2021 Form 10-Q.
31
CITIGROUP INC. – BASEL III ADVANCED APPROACHES DISCLOSURES – March 31, 2021
CREDIT RISK MITIGATION
OverviewAs part of its risk management activities, Citi uses various risk mitigants to hedge portions of the credit risk in its portfolios, in addition to outright asset sales. Credit risk mitigation, including netting, collateral and other techniques, is important to Citi in the effective management of its credit risk exposures.
Generally, in consultation with legal counsel, Citi determines whether collateral documentation is legally enforceable and gives Citi the right to liquidate or take possession of collateral in a timely manner in the event of the default, insolvency, bankruptcy or other defined credit event of the obligor. Also in consultation with legal counsel, Citi approves relevant jurisdictions and counterparty types for netting purposes.
Credit Risk Mitigation by Exposure Type
Wholesale Banking Book Collateral: Valuation and Management Collateral assets taken as credit risk mitigants in the wholesale banking book receive initial and subsequent periodic valuations. This is part of the facility approval process, and is aimed at ensuring a comprehensive understanding of the potential recovery value of the pledged collateral asset in an event of obligor default. Collateral must be realizable and have either (1) a value capable of being established on the open market or (2) a value that can be provided by a recognized external market source or independent valuer. Valuations must also take into account the environment, the relevant market, and the type of collateral. Different asset types, collateral types, and borrowers’ risk profiles may require different processes with respect to valuation, the frequency of evaluation (and re-evaluation), inspection, and verification.
OTC Derivative Contracts, Repo-Style Transactions and Eligible Margin LoansNetting is generally permitted for OTC derivative contracts and repo-style transactions. In some cases, netting is also permitted for certain margin lending transactions.
For information on policies and processes for collateral valuation and management, as well as the notional amount of credit derivatives used for counterparty credit risk mitigation, see the “Counterparty Credit Risk: OTC Derivative Contracts, Repo-Style Transactions and Eligible Margin Loans” section above.
Retail ExposuresFor information on policies and processes for collateral valuation and management for Citi’s retail businesses, see the “Retail Credit Risk Management” section above.
Wholesale Banking Book ExposuresThe main type of credit risk mitigants utilized for the wholesale banking book exposures are guarantees or other types of full support from parents or third parties, as well as collateral such as real estate or various asset types (securities, receivables, inventories, machinery, etc.).
Collateral ConcentrationsThe collateral obtained for Citi’s wholesale banking book portfolios is generally well diversified across a wide range of assets such as cash, securities, other financial assets (e.g., accounts receivable), real estate and physical assets (plant and equipment, ships, aircraft, etc.), with no or limited concentration within any one asset type.
Guarantors and Credit Derivative Counterparties and their CreditworthinessThe general purpose for hedging is compliance with various risk limits with the largest driver being hedging single name concentrations in the banking book at the relationship level. A dedicated group within Citi’s risk management coordinates risk mitigation for credit risk in the banking book, including monitoring effectiveness and compliance with managing the exposures to be within risk limits on a regular basis. Actions for mitigating accrual credit risk in the banking book are generally limited to purchasing single-name credit default swaps from third parties, and direct asset sales to third parties.
Eligible credit default swap counterparties serving as guarantors of credit risks in the banking book generally include funds, hedge funds, sovereign funds, regional banks, commercial banks, investment banks or insurance companies that are rated BBB- or better by S&P and Moody’s with established ISDA agreements and trading limits in place.
Additionally, Citi Private Bank typically obtains personal guarantees from individuals and/or other guarantors.
Recognizing Credit Risk MitigationThe table below presents the amount of wholesale exposures in the banking book that were covered by eligible guarantees, including eligible credit derivatives, as of March 31, 2021.
32
CITIGROUP INC. – BASEL III ADVANCED APPROACHES DISCLOSURES – March 31, 2021
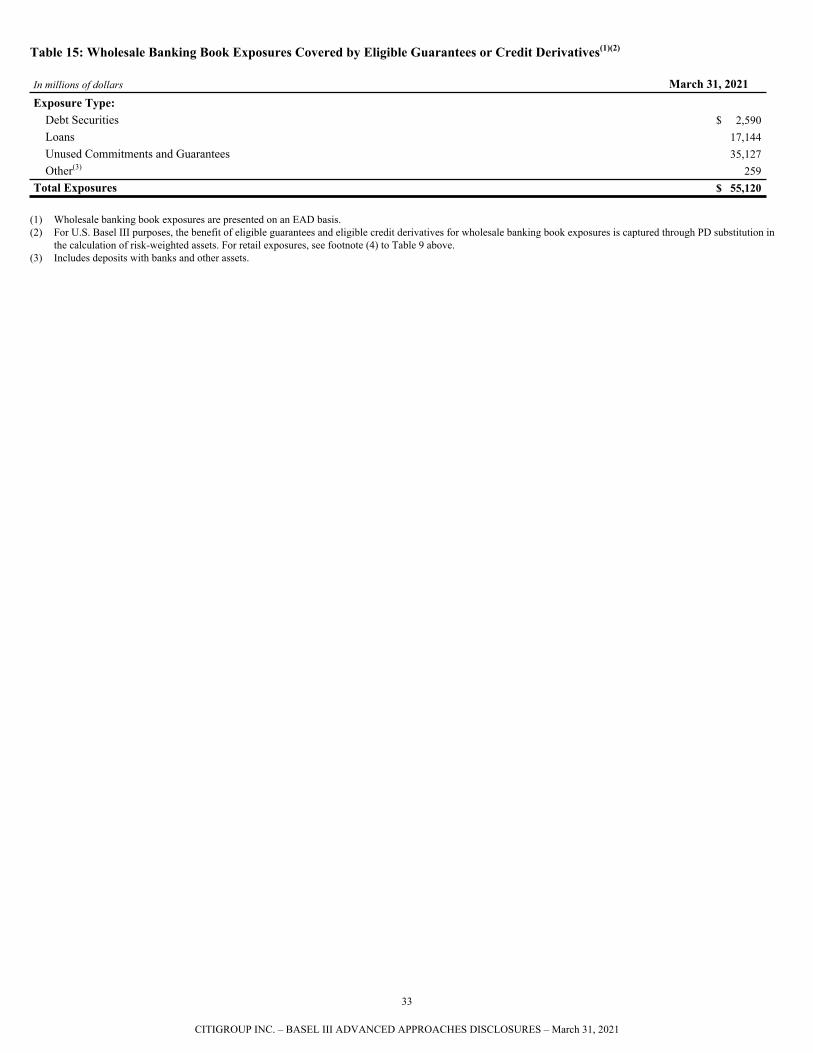
Table 15: Wholesale Banking Book Exposures Covered by Eligible Guarantees or Credit Derivatives(1)(2)
In millions of dollars March 31, 2021Exposure Type:
Debt Securities $ 2,590 Loans 17,144 Unused Commitments and Guarantees 35,127 Other(3) 259
Total Exposures $ 55,120
(1) Wholesale banking book exposures are presented on an EAD basis.(2) For U.S. Basel III purposes, the benefit of eligible guarantees and eligible credit derivatives for wholesale banking book exposures is captured through PD substitution in
the calculation of risk-weighted assets. For retail exposures, see footnote (4) to Table 9 above.(3) Includes deposits with banks and other assets.
33
CITIGROUP INC. – BASEL III ADVANCED APPROACHES DISCLOSURES – March 31, 2021
SECURITIZATIONS
OverviewThe regulatory capital framework for securitization exposures is a risk sensitive framework that focuses on credit risks that have been transferred and repackaged. A securitized transaction is a transaction where all or a portion of the credit risk of one or more financial assets is transferred to one or more third parties. In addition, the related credit risk of the underlying transferred financial assets is tranched. That is, the credit risk is separated into at least two levels of seniority of claims with each class having a different priority on the cash flows from the underlying pool of exposures.
Securitizations can either be traditional securitizations or synthetic securitizations, depending on how the credit risk associated with the underlying assets is transferred. If the credit risk is transferred to third parties through the use of credit derivatives or guarantees, the securitization is considered synthetic. Otherwise, the securitization is considered traditional. Furthermore, any securitization which has more than one underlying exposure and in which one or more of the underlying exposures are securitization exposures is a re-securitization exposure. Asset-backed securities (ABS) and collateralized debt obligations (CDOs) and collateralized loan obligations (CLOs) in which any of the underlying exposures in these structures are themselves securitization exposures (such as an ABS, CDO or CLO tranche(s)) are examples of re-securitizations.
ObjectivesCiti plays a variety of roles in asset securitization transactions, including originator, sponsor and investor. More specifically, Citi acts as underwriter of asset-backed securities, depositor of the underlying assets into securitization vehicles, trustee to securitization vehicles and counterparty to securitization vehicles under derivative contracts. Citi serves as investor in securitization exposures through holdings of such exposures in the banking book. In addition, Citi serves as market maker in securitized products primarily through trading book activity by assisting clients in securitizing their financial assets. Citi may also provide administrative, asset management, underwriting, liquidity facilities and/or other services to the resulting securitization.
Citi provides financing through warehouse facilities for corporate loans for CLO issues; consumer assets for ABS issues; and whole mortgage loans for new residential mortgage backed securities (RMBS) and commercial mortgage backed securities (CMBS) issues. Citi also provides backstop liquidity facilities to asset-backed commercial paper conduits (ABCP Conduits) and Municipal Tender Option Bond programs. Citi, in its role as servicer, may create a securitization exposure(s) by providing servicer cash advances on residential mortgage loan securitizations.
Citi holds various securitization exposures in the banking book and the trading book. Citi invests in highly rated CMBS and RMBS in the investment portfolio. Citi also holds ABS owned by ABCP Conduits that are consolidated onto Citi’s balance sheet. Citi holds securitization positions in the trading
book through secondary market trading, including certain asset backed commercial paper issued by third party bank conduits. In some cases, these positions may be re-securitizations.
Citi is involved in synthetic securitizations which include purchasing credit protection through credit default swaps with the CDO/CLO, owning a portion of the capital structure of the CDO/CLO in the form of both unfunded derivative positions and funded notes, entering into interest-rate swap and total return swap transactions with the CDO/CLO, lending to the CDO/CLO, and making a market in the funded notes. In a synthetic securitization of assets held on the balance sheet, there is no change in the financial accounting treatment for the assets securitized.
Citi engages in re-securitization transactions in which debt securities are transferred to a variable interest entity (VIE) in exchange for new beneficial interests. Private-label re-securitizations are backed by either residential or commercial mortgages and are often structured on behalf of clients. Citi retains senior and subordinated beneficial interests in private-label re-securitization transactions. All re-securitizations of private label residential mortgage securities are subject to an enhanced approval process, including review by the New Product Approval Committee. Citi also re-securitizes U.S. government-agency guaranteed mortgage-backed securities.
Citi enters into these securitization arrangements for a variety of business purposes. In addition to providing a source of liquidity and less expensive funding, securitizing assets reduces credit exposure to the borrowers. Securitization arrangements offer investors access to specific cash flows and risks created through the securitization process. Securitization arrangements assist Citi and Citi’s customers in monetizing their financial assets at more favorable rates than Citi or the customers could otherwise obtain. Citi uses securitization transactions to segregate the seller’s credit risk from the securitized assets and the cash flows generated from those assets, which are to be used for the benefit of purchasers or lenders in the transaction. The segregation is achieved through the transfer of the securitized assets in a ‘true sale’ from the seller to a bankruptcy-remote special purpose entity (SPE), thereby providing legal isolation of the pool of assets from the default risk of the seller.
Risks Securitization transactions can involve a number of risks including portfolio risk, seller’s risk, and liquidity risk. Portfolio risk arises from the performance of the underlying asset pool (i.e., payment rates, dilution, write-offs/losses). Seller risk represents the portion of unsecured credit exposure in a transaction with the seller. Certain securitization structures give rise to contingent liquidity risk, that is, the likelihood that liquidity must be provided unexpectedly, potentially at a time when it is already under stress. Liquidity risk can occur in asset-backed commercial paper conduits or in cases where liquidity backstop arrangements have been provided.
34
CITIGROUP INC. – BASEL III ADVANCED APPROACHES DISCLOSURES – March 31, 2021
Citi’s risk management organization plays an active role in the review and oversight of securitization exposure identification. The nature of identifying a securitization is primarily an economic substance test where Citi seeks to identify evidence of tranching of credit risks in a variety of ways. Securitization identification is subject to a robust review process with controls and oversight. Securitizations can arise in various forms, including but not limited to the following:
• asset- and mortgage-backed securities;• loans, lines of credit, guarantees and financial standby letters
of credit with embedded credit tranching or facing securitization SPEs;
• credit derivatives referencing a securitization tranche;• credit enhancing interest only strips;• assets sold with retained tranched recourse;• single assets with tranched risk;• OTC derivatives with securitization SPEs;• implicit support to a securitization vehicle; and• credit enhancing representation and warranties.
Citi manages its securitization and re-securitization positions within an established risk management policy framework whereby each business and Citi’s risk management monitors changes in positions and changes in the portfolio structure of securitization and re-securitization positions. Credit risk management is responsible for determining the overall risk appetite for securitization transactions, approving extension of credit and ensuring data capture associated with those extensions of credit are accurate and are within Citi’s risk appetite and limits, and ensuring that the transactions meet Citi’s standards for Basel III compliance. Market risk management is responsible for ensuring that securitization transactions that are booked in the trading book are consistent with business mandate and risk management policies. Securitization and re-securitization positions are subject to an established limit monitoring framework to ensure diversification in Citi’s portfolio.
Citi employs several risk mitigation approaches to manage risk appetite for its securitization and re-securitization positions. Under the U.S. Basel III rules, a bank must demonstrate that it has truly transferred credit risk of the underlying exposures to one or more third parties to be able to recognize for risk-based capital purposes the use of a credit risk mitigant. The mitigant must meet the requirements of an eligible guarantee or eligible credit derivative. Failure to meet the operating requirements for a synthetic securitization prevents a bank from using the securitization framework and requires a bank to hold capital against the underlying exposures as if they have not been securitized.
Risk-Based Capital ApproachesCiti utilizes the “hierarchy of approaches” to compute regulatory capital on securitization transactions as required by the U.S. Basel III rules. If a securitization exposure is not required to be deducted from regulatory capital, Citi first calculates the risk-based capital requirement using the Supervisory Formula Approach (SFA). The SFA calculation is a models-driven approach based on complex mathematical formulas that consider the attributes of both the securitization structure and the underlying exposures. SFA requires inputs such as PD and LGD on the underlying collateral. Citi utilizes approved SFA models for a variety of asset classes including credit card receivables, trade receivables, student loans, auto loans, commercial loans and other consumer asset classes within traditional and synthetic securitizations.
Where data is not sufficient to build an SFA model, Citi uses the Simplified Supervisory Formula Approach (SSFA). SSFA requires inputs including the following to calculate regulatory capital:
• Attachment Point: the point at which the collateral losses from underlying assets backing a tranche will have reached an amount that those losses will be applied to the tranche in the form of principal write-downs;
• Detachment Point: the point at which the tranche will be completely wiped out or written-down by losses from the collateral backing the tranche;
• Weighted Average Capital: the weighted average capital charge of the assets in the deal;
• Seriously Delinquent: the percentage of the collateral that are seriously delinquent in the deal (e.g., 90+ days past due, in foreclosure, in bankruptcy); and
• Calibration Parameter: a parameter that increases the riskiness of a tranche for re-securitizations.
A risk weight of 1,250% must be applied to a securitization exposure that does not qualify for the SFA and where Citi does not apply the SSFA, or which is not otherwise required to be deducted from regulatory capital.
35
CITIGROUP INC. – BASEL III ADVANCED APPROACHES DISCLOSURES – March 31, 2021
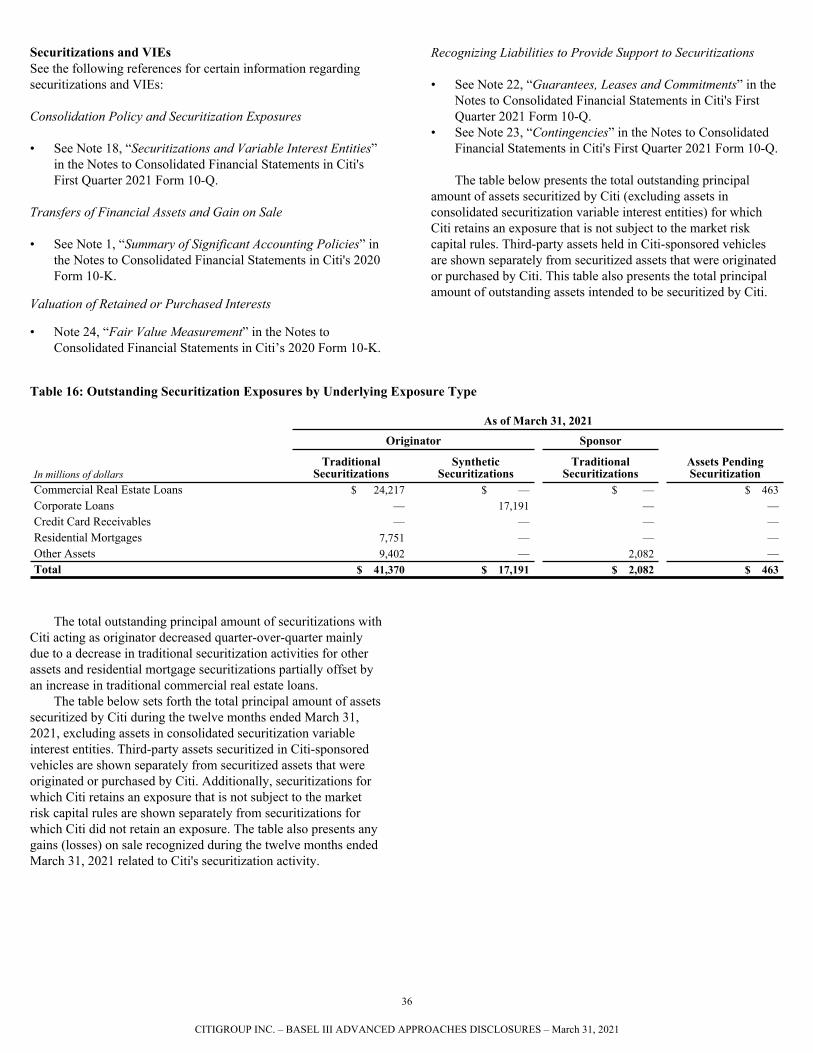
Securitizations and VIEsSee the following references for certain information regarding securitizations and VIEs:
Consolidation Policy and Securitization Exposures
• See Note 18, “Securitizations and Variable Interest Entities” in the Notes to Consolidated Financial Statements in Citi's First Quarter 2021 Form 10-Q.
Transfers of Financial Assets and Gain on Sale
• See Note 1, “Summary of Significant Accounting Policies” in the Notes to Consolidated Financial Statements in Citi's 2020 Form 10-K.
Valuation of Retained or Purchased Interests
• Note 24, “Fair Value Measurement” in the Notes to Consolidated Financial Statements in Citi’s 2020 Form 10-K.
Recognizing Liabilities to Provide Support to Securitizations
• See Note 22, “Guarantees, Leases and Commitments” in the Notes to Consolidated Financial Statements in Citi's First Quarter 2021 Form 10-Q.
• See Note 23, “Contingencies” in the Notes to Consolidated Financial Statements in Citi's First Quarter 2021 Form 10-Q.
The table below presents the total outstanding principal amount of assets securitized by Citi (excluding assets in consolidated securitization variable interest entities) for which Citi retains an exposure that is not subject to the market risk capital rules. Third-party assets held in Citi-sponsored vehicles are shown separately from securitized assets that were originated or purchased by Citi. This table also presents the total principal amount of outstanding assets intended to be securitized by Citi.
Table 16: Outstanding Securitization Exposures by Underlying Exposure Type
As of March 31, 2021
Originator Sponsor
In millions of dollarsTraditional
SecuritizationsSynthetic
SecuritizationsTraditional
SecuritizationsAssets Pending Securitization
Commercial Real Estate Loans $ 24,217 $ — $ — $ 463 Corporate Loans — 17,191 — — Credit Card Receivables — — — — Residential Mortgages 7,751 — — — Other Assets 9,402 — 2,082 — Total $ 41,370 $ 17,191 $ 2,082 $ 463
The total outstanding principal amount of securitizations with Citi acting as originator decreased quarter-over-quarter mainly due to a decrease in traditional securitization activities for other assets and residential mortgage securitizations partially offset by an increase in traditional commercial real estate loans.
The table below sets forth the total principal amount of assets securitized by Citi during the twelve months ended March 31, 2021, excluding assets in consolidated securitization variable interest entities. Third-party assets securitized in Citi-sponsored vehicles are shown separately from securitized assets that were originated or purchased by Citi. Additionally, securitizations for which Citi retains an exposure that is not subject to the market risk capital rules are shown separately from securitizations for which Citi did not retain an exposure. The table also presents any gains (losses) on sale recognized during the twelve months ended March 31, 2021 related to Citi's securitization activity.
36
CITIGROUP INC. – BASEL III ADVANCED APPROACHES DISCLOSURES – March 31, 2021
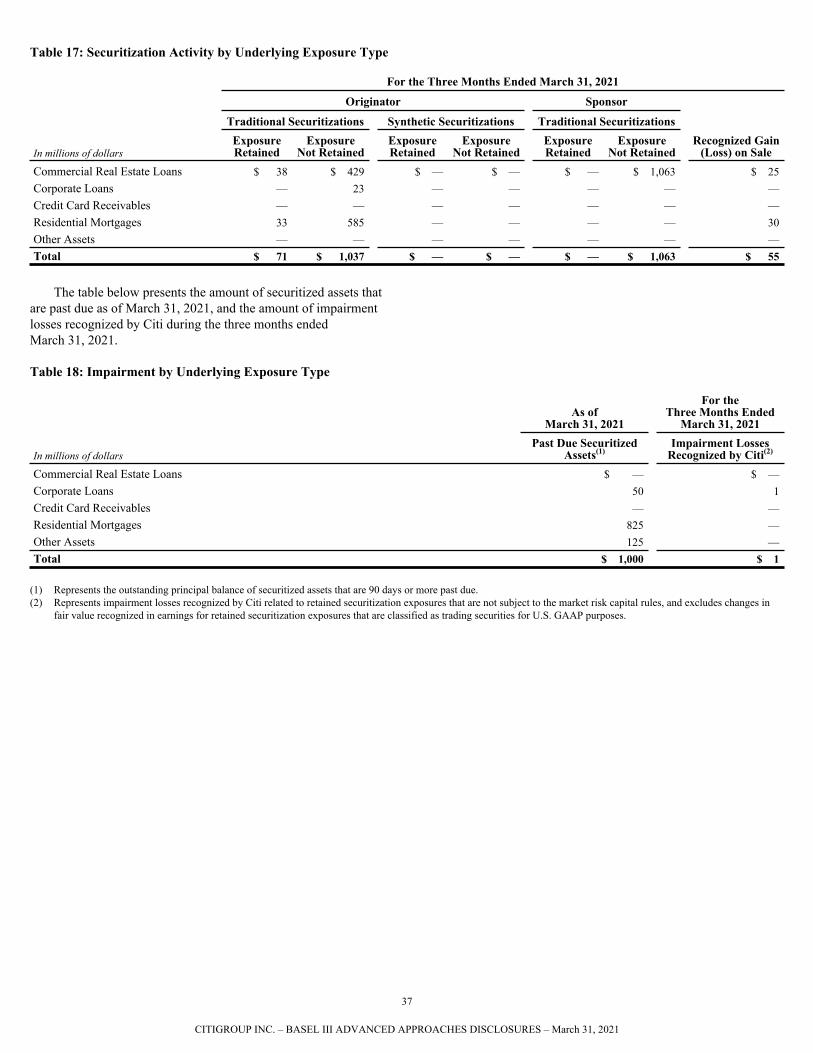
Table 17: Securitization Activity by Underlying Exposure Type
For the Three Months Ended March 31, 2021
Originator Sponsor
Traditional Securitizations Synthetic Securitizations Traditional Securitizations
In millions of dollarsExposure Retained
Exposure Not Retained
Exposure Retained
Exposure Not Retained
Exposure Retained
Exposure Not Retained
Recognized Gain (Loss) on Sale
Commercial Real Estate Loans $ 38 $ 429 $ — $ — $ — $ 1,063 $ 25 Corporate Loans — 23 — — — — — Credit Card Receivables — — — — — — — Residential Mortgages 33 585 — — — — 30 Other Assets — — — — — — — Total $ 71 $ 1,037 $ — $ — $ — $ 1,063 $ 55
The table below presents the amount of securitized assets that are past due as of March 31, 2021, and the amount of impairment losses recognized by Citi during the three months ended March 31, 2021.
Table 18: Impairment by Underlying Exposure Type
As of March 31, 2021
For the Three Months Ended
March 31, 2021
In millions of dollarsPast Due Securitized
Assets(1)Impairment Losses
Recognized by Citi(2)
Commercial Real Estate Loans $ — $ — Corporate Loans 50 1 Credit Card Receivables — — Residential Mortgages 825 — Other Assets 125 — Total $ 1,000 $ 1
(1) Represents the outstanding principal balance of securitized assets that are 90 days or more past due.(2) Represents impairment losses recognized by Citi related to retained securitization exposures that are not subject to the market risk capital rules, and excludes changes in
fair value recognized in earnings for retained securitization exposures that are classified as trading securities for U.S. GAAP purposes.
37
CITIGROUP INC. – BASEL III ADVANCED APPROACHES DISCLOSURES – March 31, 2021
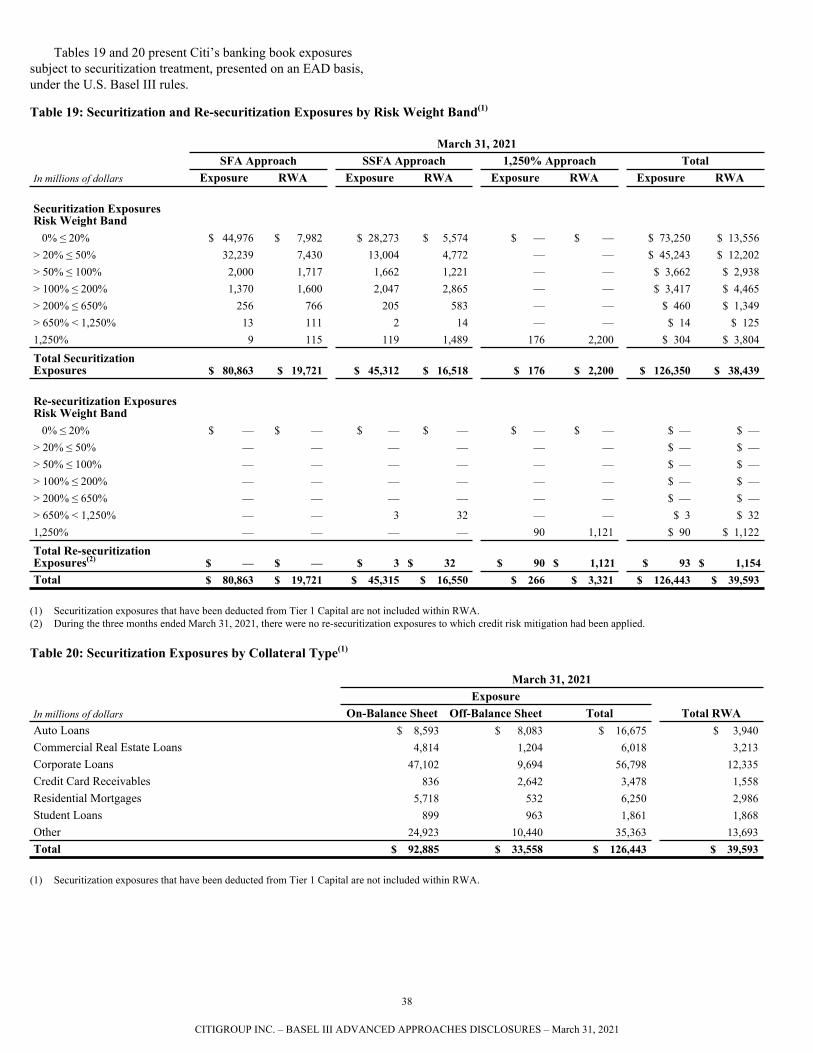
Tables 19 and 20 present Citi’s banking book exposures subject to securitization treatment, presented on an EAD basis, under the U.S. Basel III rules.
Table 19: Securitization and Re-securitization Exposures by Risk Weight Band(1)
March 31, 2021SFA Approach SSFA Approach 1,250% Approach Total
In millions of dollars Exposure RWA Exposure RWA Exposure RWA Exposure RWA
Securitization ExposuresRisk Weight Band 0% ≤ 20% $ 44,976 $ 7,982 $ 28,273 $ 5,574 $ — $ — $ 73,250 $ 13,556 > 20% ≤ 50% 32,239 7,430 13,004 4,772 — — $ 45,243 $ 12,202 > 50% ≤ 100% 2,000 1,717 1,662 1,221 — — $ 3,662 $ 2,938 > 100% ≤ 200% 1,370 1,600 2,047 2,865 — — $ 3,417 $ 4,465 > 200% ≤ 650% 256 766 205 583 — — $ 460 $ 1,349 > 650% < 1,250% 13 111 2 14 — — $ 14 $ 125 1,250% 9 115 119 1,489 176 2,200 $ 304 $ 3,804
Total Securitization Exposures $ 80,863 $ 19,721 $ 45,312 $ 16,518 $ 176 $ 2,200 $ 126,350 $ 38,439
Re-securitization ExposuresRisk Weight Band 0% ≤ 20% $ — $ — $ — $ — $ — $ — $ — $ — > 20% ≤ 50% — — — — — — $ — $ — > 50% ≤ 100% — — — — — — $ — $ — > 100% ≤ 200% — — — — — — $ — $ — > 200% ≤ 650% — — — — — — $ — $ — > 650% < 1,250% — — 3 32 — — $ 3 $ 32 1,250% — — — — 90 1,121 $ 90 $ 1,122
Total Re-securitization Exposures(2) $ — $ — $ 3 $ 32 $ 90 $ 1,121 $ 93 $ 1,154Total $ 80,863 $ 19,721 $ 45,315 $ 16,550 $ 266 $ 3,321 $ 126,443 $ 39,593
(1) Securitization exposures that have been deducted from Tier 1 Capital are not included within RWA.(2) During the three months ended March 31, 2021, there were no re-securitization exposures to which credit risk mitigation had been applied.
Table 20: Securitization Exposures by Collateral Type(1)
March 31, 2021Exposure
In millions of dollars On-Balance Sheet Off-Balance Sheet Total Total RWAAuto Loans $ 8,593 $ 8,083 $ 16,675 $ 3,940 Commercial Real Estate Loans 4,814 1,204 6,018 3,213 Corporate Loans 47,102 9,694 56,798 12,335 Credit Card Receivables 836 2,642 3,478 1,558 Residential Mortgages 5,718 532 6,250 2,986 Student Loans 899 963 1,861 1,868 Other 24,923 10,440 35,363 13,693 Total $ 92,885 $ 33,558 $ 126,443 $ 39,593
(1) Securitization exposures that have been deducted from Tier 1 Capital are not included within RWA.
38
CITIGROUP INC. – BASEL III ADVANCED APPROACHES DISCLOSURES – March 31, 2021

Securitization Exposures Deducted from Regulatory CapitalAs of March 31, 2021 Citi does not have any after-tax gain-on-sale on a securitization that has been deducted from Common Equity Tier 1 Capital, nor any credit-enhancing interest-only strips that have been assigned a 1,250% risk weight.
Re-securitization Exposures Covered by GuaranteesAs of March 31, 2021 no re-securitization exposures were covered by guarantees.
39
CITIGROUP INC. – BASEL III ADVANCED APPROACHES DISCLOSURES – March 31, 2021
EQUITY EXPOSURES NOT SUBJECT TO THE MARKET RISK CAPITAL RULES
OverviewCiti holds equity positions to generate capital gains for its private equity subsidiaries. It can also hold positions as a result of debt to equity conversions, or to maintain strategic relationships. Citi's equity investments (except those accounted for under the equity method of accounting or those that result in consolidation of the investee) are measured at fair value with changes in fair value recognized in net income. However, Federal Reserve Bank and Federal Home Loan Bank stock, as well as certain exchange seats, are presented at cost. Certain equity positions are accounted for under the equity method, or, for Citi's investments in qualified affordable housing partnerships, recorded at cost plus unfunded equity commitments and subsequently amortized in proportion to the amount of tax credits and other tax benefits received.
Citi is also allowed to elect, on an instrument-by-instrument basis, to measure non-marketable equity investments using a measurement alternative. Under the measurement alternative, the investment is carried at cost plus or minus changes resulting from observable prices in orderly transactions for the identical or a similar investment of the same issuer, less impairment (if any).
The disclosures below are consistent with the definition of equity Citi has adopted for U.S. GAAP financial reportingpurposes. For further information, see Note 1, “Basis ofPresentation, Updated Accounting Policies and AccountingChanges” and Note 12, “Investments” in the Notes to Consolidated Financial Statementsin Citi’s First Quarter 2021 Form 10-Q
Risk-Weighting ApproachesAs required under the U.S. Basel III rules, Citi applies different approaches in calculating risk-weighted assets for equity exposures not subject to the market risk capital rules, depending upon whether or not the exposure is to an investment fund. Furthermore, three alternative approaches may be utilized in deriving risk-weighted assets for equity exposures to an investment fund, with the approach applied largely a function of the information available.
Under the Simple Risk Weight Approach the adjusted carrying value for each type of equity exposure is multiplied by a prescribed risk weight. The adjusted carrying value for an on-balance sheet equity exposure is the carrying value of the exposure. The adjusted carrying value of an equity derivative is the effective notional principal amount of the exposure, the size of which is equivalent to a hypothetical on-balance sheet position in the underlying equity instrument that would evidence the same change in fair value (measured in dollars) given a small change in the price of the underlying equity instrument, minus the adjusted carrying value of the on-balance sheet component of the exposure. The adjusted carrying value of an equity exposure is used in the calculation of Hedge Pairs. For an off-balance sheet commitment to acquire an equity exposure (an equity commitment) the effective notional amount of the exposure is multiplied by an applicable CCF based upon whether the commitment is conditional or unconditional, and for conditional
equity commitments the original maturity thereof. The U.S. Basel III rules also permit Citi, subject to prior written approval from regulators, to calculate risk-weighted assets for equity exposures that are not equity exposures to investment funds by utilizing the Internal Models Approach. However, Citi does not currently utilize the Internal Models Approach for any of its equity exposures.
For equity exposures to investment funds, Citi applies the Full Look-Through Approach, the Simple Modified Look-Through Approach, or the Alternative Modified Look-Through Approach. In accordance with the Full Look-Through Approach, risk weights are applied on a proportional ownership share basis to each equity exposure held by the fund, as if Citi held the exposure directly. Under the Simple Modified Look-Through Approach, the highest risk weight applicable to any equity exposure the investment fund is permitted to hold under its prospectus, partnership agreement, or similar agreement is applied to the adjusted carrying value of Citi’s equity exposure to the fund in deriving the amount of risk-weighted assets. With regard to the Alternative Modified Look-Through Approach, the adjusted carrying value of an equity exposure to an investment fund is assigned on a pro-rata basis to the different risk weight categories based on the investment limits in the fund’s prospectus, partnership agreement, or similar contract that defines the fund’s permissible investments. Under this approach it is assumed that the fund invests to the maximum extent permitted under its investment limits in the exposure type with the highest applicable risk weight and continues to make investments in order of the exposure type with the next highest applicable risk weight, until the maximum total investment is reached. The assignment of the pro-rata investment limits risk weights for all exposure types within the fund will not exceed 100 percent.
The following table presents Citi’s equity exposures not subject to the U.S. Basel III market risk capital rule, using the Simple Risk Weight, the Full Look-Through, the Simple Modified Look-Through, and the Alternative Modified Look-Through Approaches in deriving risk-weighted assets as of March 31, 2021.
40
CITIGROUP INC. – BASEL III ADVANCED APPROACHES DISCLOSURES – March 31, 2021
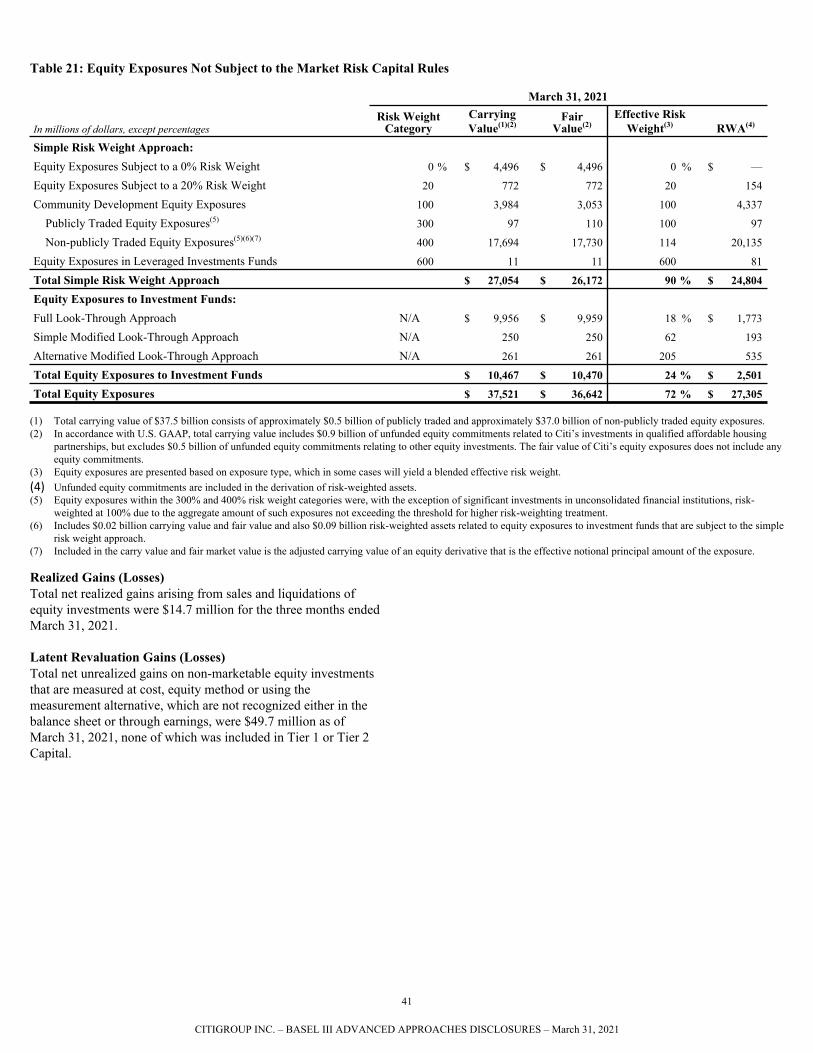
Table 21: Equity Exposures Not Subject to the Market Risk Capital Rules
March 31, 2021
In millions of dollars, except percentagesRisk Weight
CategoryCarrying Value(1)(2)
Fair Value(2)
Effective Risk Weight(3) RWA(4)
Simple Risk Weight Approach:Equity Exposures Subject to a 0% Risk Weight 0 % $ 4,496 $ 4,496 0 % $ —
Equity Exposures Subject to a 20% Risk Weight 20 772 772 20 154
Community Development Equity Exposures 100 3,984 3,053 100 4,337
Publicly Traded Equity Exposures(5) 300 97 110 100 97
Non-publicly Traded Equity Exposures(5)(6)(7) 400 17,694 17,730 114 20,135
Equity Exposures in Leveraged Investments Funds 600 11 11 600 81
Total Simple Risk Weight Approach $ 27,054 $ 26,172 90 % $ 24,804
Equity Exposures to Investment Funds:Full Look-Through Approach N/A $ 9,956 $ 9,959 18 % $ 1,773
Simple Modified Look-Through Approach N/A 250 250 62 193
Alternative Modified Look-Through Approach N/A 261 261 205 535
Total Equity Exposures to Investment Funds $ 10,467 $ 10,470 24 % $ 2,501
Total Equity Exposures $ 37,521 $ 36,642 72 % $ 27,305
(1) Total carrying value of $37.5 billion consists of approximately $0.5 billion of publicly traded and approximately $37.0 billion of non-publicly traded equity exposures. (2) In accordance with U.S. GAAP, total carrying value includes $0.9 billion of unfunded equity commitments related to Citi’s investments in qualified affordable housing
partnerships, but excludes $0.5 billion of unfunded equity commitments relating to other equity investments. The fair value of Citi’s equity exposures does not include any equity commitments.
(3) Equity exposures are presented based on exposure type, which in some cases will yield a blended effective risk weight.(4) Unfunded equity commitmentsare included in the derivation of risk-weighted assets.(5) Equity exposures within the 300% and 400% risk weight categories were, with the exception of significant investments in unconsolidated financial institutions, risk-
weighted at 100% due to the aggregate amount of such exposures not exceeding the threshold for higher risk-weighting treatment.(6) Includes $0.02 billion carrying value and fair value and also $0.09 billion risk-weighted assets related to equity exposures to investment funds that are subject to the simple
risk weight approach. (7) Included in the carry value and fair market value is the adjusted carrying value of an equity derivative that is the effective notional principal amount of the exposure.
Realized Gains (Losses)Total net realized gains arising from sales and liquidations of equity investments were $14.7 million for the three months ended March 31, 2021.
Latent Revaluation Gains (Losses)Total net unrealized gains on non-marketable equity investments that are measured at cost, equity method or using the measurement alternative, which are not recognized either in the balance sheet or through earnings, were $49.7 million as of March 31, 2021, none of which was included in Tier 1 or Tier 2 Capital.
41
CITIGROUP INC. – BASEL III ADVANCED APPROACHES DISCLOSURES – March 31, 2021
MARKET RISK
OverviewMarket risk is the risk of loss on a position that could result from movements in market prices. Citi's market risk arises principally from trading and market making activities by ICG's equity markets and fixed income markets businesses within Markets and Securities Services.
The market risk disclosures discussed in this section provide quantitative information regarding Citi's market risk capital components, as well as qualitative information, such as that related to Citi's risk management policies, practices and internal models. For additional information on Citi's market risk management and policies, see “Managing Global Risk—Market Risk” in Citi's 2020 Form 10-K.
Basel III Covered PositionsAs defined under the U.S. Basel III rules, covered positions include:
(1) Trading assets or trading liabilities (whether on- or off-balance sheet), as reported for regulatory purposes, that meet the following conditions:
(a) The position is a “trading position” or hedges another covered position, other than trading positions that are hedges of Citi’s banking book exposures. Within this context, a trading position means a position that is held for the purpose of short-term resale or with the intent of benefiting from actual or expected short-term price movements, or to lock in profits.
AND
(b) The position is free of any restrictive covenants on its tradability, or the banking organization, such as Citi, is able to hedge the material risk elements of the position in a two-way market.
OR
(2) A foreign exchange or commodity position (other than any structural foreign currency positions chosen to be excluded and for which prior supervisory approval has been received), regardless of whether the position is a trading asset or trading liability.
Among the various types of exposures not considered to be a covered position are: (1) intangible assets, including any servicing asset such as mortgage servicing rights; (2) any hedge of a trading position that is deemed to be outside the scope of Citi’s hedging strategy; (3) any position that, in form or substance, acts as a liquidity facility that provides support to asset-backed commercial paper; (4) any position that Citi holds with the intent to securitize; or (5) any direct real estate holding.
Accordingly, the characterization of an asset or liability as a “trading asset’’ or “trading liability” under U.S. GAAP does not determine whether such assets and liabilities are trading positions for Basel III purposes. The scope of positions or exposures
recognized as trading assets or trading liabilities for U.S. GAAP purposes is generally broader than permissible trading positions under the U.S. Basel III rules. Positions or exposures excluded from market risk capital treatment are subject to the credit risk capital rules applicable to non-covered positions.
Citi has established policies and procedures for determining which of its U.S. GAAP trading assets, trading liabilities, and foreign exchange and commodity positions are covered positions under the U.S. Basel III rules, including the establishment of a firm-wide Basel III Boundary Governance Committee that meets quarterly and serves as a decision-making body on key trading book boundary strategies and reporting approaches. Specifically, the Basel III Boundary Governance Committee reviews the intent and ability to trade positions considering a number of key metrics, including a review of the actual holding period of these positions.
Valuation and Accounting Policies and MethodologiesAccounting Standards Codification (ASC) 820-10, Fair Value Measurement, defines fair value, establishes a consistent framework for measuring fair value and requires disclosures in Citi’s consolidated financial statements about fair value measurements. Fair value is defined as the price that would be received to sell an asset or paid to transfer a liability in an orderly transaction between market participants at the measurement date, and therefore represents an exit price. Material covered positions under the U.S. Basel III rules are carried at fair value on Citi’s consolidated balance sheet. Determination of Fair ValueCiti uses quoted market prices, when available, to determine the fair value of trading securities, including material covered positions under the U.S. Basel III rules. In some cases where a market price is available, Citi will make use of acceptable practical expedients (such as matrix pricing) to calculate fair value. Similarly, exchange-traded derivatives are measured at fair value, typically using quoted market (i.e., exchange) prices where there is an active market.
If quoted market prices are not available, fair value is based upon internally developed valuation techniques that use, where possible, current market-based parameters, such as interest rates, currency rates, option volatilities, etc. Citi may also apply a price-based methodology, which utilizes, where available, quoted prices or other market information obtained from recent trading activity in positions with the same or similar characteristics to the position being valued.
For bonds and secondary market loans traded over the counter, including securitization and re-securitization positions, Citi generally determines fair value utilizing valuation techniques, including discounted cash flows, price-based and internal models. Fair value estimates from these internal valuation techniques are verified, where possible, to prices obtained from independent vendors.
42
CITIGROUP INC. – BASEL III ADVANCED APPROACHES DISCLOSURES – March 31, 2021
Derivatives without a quoted price in an active market and derivatives executed over the counter are valued using internal valuation techniques. The valuation techniques and inputs depend on the type of derivative and the nature of the underlying instrument. The principal techniques used to value these instruments are discounted cash flows and internal models, such as derivative pricing models, for example, Black-Scholes and Monte Carlo simulation.
The key inputs depend upon the type of derivative and the nature of the underlying instrument and include interest rate yield curves, foreign-exchange rates, volatilities and correlation. Citi uses overnight indexed swap (OIS) curves as fair value measurement inputs for the valuation of certain derivatives.
Market Valuation AdjustmentsValuation adjustments are applied to ensure that fair value reflects the price at which a position could be exited and is based on the bid-offer spread for an instrument in the market. These valuation adjustments are based on the bid/offer spread for an instrument in the market. Citi also applies valuation adjustments to account for the size of the net open risk position on certain portfolios of financial instruments, and/or where further valuation adjustments are required to achieve an exit price, for example, model valuation adjustments taken to compensate for model limitations.
CVA and funding valuation adjustments (FVA) are applied to the relevant population of OTC derivative instruments where adjustments to reflect counterparty credit risk, own credit risk and term funding risk are required to estimate fair value. This principally includes derivatives whose base valuation (e.g., discounted OIS) requires adjustment for these effects, for example, uncollateralized interest rate swaps. The CVA represents a portfolio-level adjustment to reflect the risk premium associated with the counterparty's (assets) or Citi's (liabilities) non-performance risk. FVA reflects a market funding risk premium inherent in the uncollateralized portion of derivative portfolios and in certain collateralized derivative portfolios that do not include standard credit support annexes (CSAs), such as where the CSA does not permit the reuse of the collateral received.
Market Risk-Weighted AssetsUnder the U.S. Basel III rules, Citi’s market risk-weighted assets (RWA) are measured as the sum of the risk-weighted assets attributable to the following:
• Regulatory Value-at-Risk (VaR)• Regulatory Stressed Value-at-Risk (SVaR)• Incremental Risk Charge (IRC)• Comprehensive Risk Measure (CRM) • Standard Specific Risk Charge (SSRC)• Securitization Charges• De minimis Exposures Charge (covered positions not
included in the VaR model)
Citi’s Basel III market risk capital requirements, and related risk-weighted assets, reflect the application of Citi’s internal models as well as prescribed standardized approaches with respect to covered positions, as appropriate. Liquidity attributes of Citi's covered positions are considered in the determination of model eligibility in measuring market risk capital requirements. Citi’s internal models are designed to capture all material risk factors. Any material risk factors that are identified through model validation (see “Independent Validation of Models” section below), are included as a RNIM “add-on” in accordance with the U.S. Basel III rules.
Citi’s market risk capital requirements and resulting risk-weighted assets will vary from reporting period to reporting period and may be materially impacted by changes in the treatment of certain positions or portfolios, due to updated regulatory guidance, regulatory reviews or further refinements and enhancements to Citi’s internal models. Where material, such changes are disclosed in Citi's Basel III Advanced Approaches Disclosures and/or in Citi’s Form 10-K or 10-Q, as appropriate, in the reporting period during which the changes were implemented.
Regulatory Value-at-Risk (VaR) Regulatory VaR is the estimate of the potential decline in the value of a position or a portfolio under normal market conditions. Citi uses a three year look back period for correlations between risk factors and the greater of three-year or, in most instances, effectively 30-day volatility. These market risk factors include material first and second-order risk sensitivities of various asset classes/risk types (such as interest rate, credit spread, foreign exchange, equity, and commodity risks).
Citi uses a single, independently approved Monte Carlo simulation VaR model for both Regulatory VaR and Risk Management VaR. The Monte Carlo simulation involves approximately 450,000 market factors, making use of approximately 350,000 time series, with sensitivities updated daily, volatility parameters updated intra-month and correlation parameters updated monthly. The portfolio composition of Citi’s Regulatory VaR is, however, materially different from Citi’s Risk Management VaR. Certain positions that are included in Citi’s Risk Management VaR are not covered positions and therefore are not eligible for market risk capital treatment under the U.S. Basel III rules. While Citi’s confidence interval is 99% for both Risk Management VaR and Regulatory VaR, Citi uses a 1-day time horizon for Risk Management VaR and a 10-day time horizon for Regulatory VaR. For additional information on Citi’s
43
CITIGROUP INC. – BASEL III ADVANCED APPROACHES DISCLOSURES – March 31, 2021
Risk Management VaR model, see “Managing Global Risk—Market Risk—Market Risk of Trading Portfolios” in Citi’s 2020 Form 10-K.
For covered positions that are not captured in Regulatory VaR, Citi calculates market risk-weighted assets based on a de minimis risk add-on in accordance with the Basel III requirements, or in accordance with an alternative methodology that has been approved by the FRB and OCC.
The following table sets forth Citi’s Regulatory VaR and related capital requirement, as well as risk-weighted assets as of March 31, 2021.
Table 22: Regulatory VaR Risk-Weighted Assets
In millions of dollars As of March 31, 2021
Regulatory VaR(1)
RegulatoryVaR-Based Capital(2)
RegulatoryVaR RWA(3)
$ 214 $ 642 $ 14,672
(1) 60-day average, for which each daily Regulatory VaR is based on a 10-day time horizon.
(2) Regulatory VaR times a capital multiplier of 3.(3) Regulatory VaR-Based Capital times 12.5 plus $6,648 million add-on for
RNIM.
• Immaterial differences in calculations above may exist due to rounding.
Presented in the following table are Citi’s period end and high, low and mean Regulatory VaR, as well as associated primary risk factors, as of and for the three months ended March 31, 2021.
Table 22.1: 10-Day Regulatory VaR by Risk Factors
In millions of dollarsAs of
March 31, 2021
Three Months Ended
March 31, 2021Risk Factors High Low Mean(1)
Interest Rate $ 136 $ 207 $ 121 $ 153 Credit Spread 198 276 188 224 Equity Price 33 116 21 34 Foreign Exchange 42 91 23 60 Commodity Price 136 148 64 110 Diversification Benefit(2) (360) NM NM (367) Total Regulatory VaR $ 185 $ 318 $ 160 $ 214
• NM: Not meaningful
(1) Mean is based on a 60-day average used for Regulatory VaR-based RWA.(2) Diversification benefit is the result of correlation between risk factors and,
due to this benefit, the total Regulatory VaR on a given day will be lower than the sum of the Regulatory VaRs relating to each individual risk factor. No diversification benefit can be inferred for the high and low Regulatory VaRs related to each of the respective risk factors as they may come from different close of business dates.
The following table sets forth the period end and high, low and mean Regulatory VaR for each of Citi’s material portfolios of covered positions, as of and for the three months ended March 31, 2021.
Table 22.2: 10-Day Regulatory VaR by Material Portfolios
As of March 31, 2021
Three Months Ended
March 31, 2021In millions of dollars
Material Portfolios High Low Mean(1)
ICG $ 187 $ 319 $ 160 $ 216 Other(2) 6 6 5 6 Diversification Benefit(3) (8) NM NM (8) Total Regulatory VaR $ 185 $ 318 $ 160 $ 214
• NM: Not meaningful
(1) 60-day average, for which each daily Regulatory VaR is based on a 10-day time horizon.
(2) Primarily related to Corporate Treasury covered positions. (3) Diversification benefit is the result of correlation between portfolios and, due
to this benefit, the total Regulatory VaR on a given day will be lower than the sum of the Regulatory VaRs relating to each individual portfolio. No diversification benefit can be inferred for the high and low of respective portfolios as they may come from different close of business dates.
44
CITIGROUP INC. – BASEL III ADVANCED APPROACHES DISCLOSURES – March 31, 2021
Regulatory VaR BacktestingIn accordance with the U.S. Basel III rules, Citi is required to perform backtesting to evaluate the effectiveness of its VaR model and as a basis to determine its Regulatory VaR and Regulatory SVaR-based capital multiplier. For additional information on Regulatory SVaR, see “Regulatory Stressed Value-at-Risk (SVaR)” section below. Regulatory VaR backtesting is the process in which the daily 1-day VaR, at a 99% confidence interval, is compared to the buy-and-hold profit and loss, which represents the daily mark-to-market profit and loss attributable to price movements in covered positions from the close of the previous business day. Buy-and-hold revenue excludes realized trading revenue, net interest, fees and commissions, intra-day trading profit and loss, and changes in reserves.
Citi’s Regulatory VaR and Regulatory SVaR capital multipliers, which can range between 3 and 4, are based upon the number of backtesting exceptions that occur on a rolling 12-month period, as well as the discretion of the FRB and OCC. Based on a 99% confidence level, Citi would expect two to three days in any one year where buy-and-hold losses exceeded the Regulatory VaR. Given the conservative calibration of Citi’s VaR model (as a result of taking the greater of short- and long-term volatilities and fat tail scaling of volatilities), Citi would expect fewer exceptions under normal and stable market conditions. Periods of unstable market conditions could increase the number of backtesting exceptions.
The graph below presents the daily buy-and-hold profit and loss associated with all of Citi’s covered positions compared to Citi’s 1-day Regulatory VaR from January 1, 2021 through March 31, 2021. As the graph indicates, losses observed on any given single day have not exceeded Citi's 1-day 99% Regulatory VaR during the three month period ending March 31, 2021.
45
CITIGROUP INC. – BASEL III ADVANCED APPROACHES DISCLOSURES – March 31, 2021
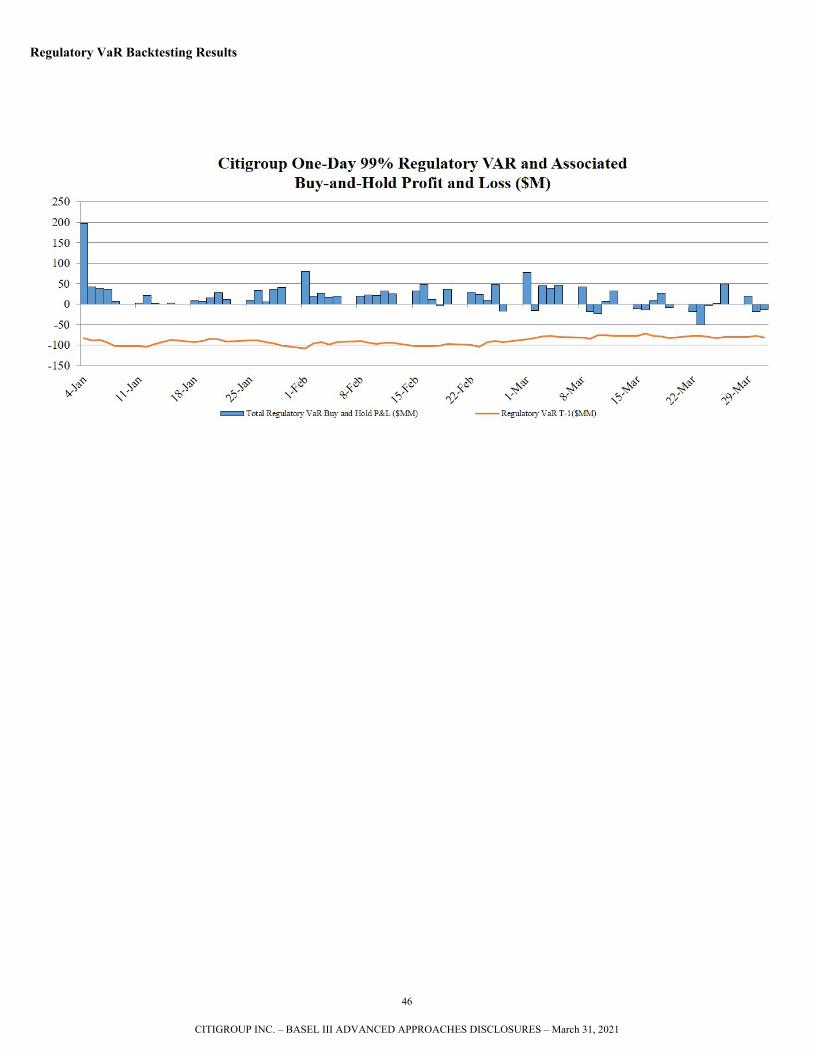
Regulatory VaR Backtesting Results
46
CITIGROUP INC. – BASEL III ADVANCED APPROACHES DISCLOSURES – March 31, 2021
Regulatory Stressed Value-at-Risk (SVaR)Citi’s Regulatory SVaR model methodology is the same as the Regulatory VaR methodology (99% confidence level and 10-day holding period), with the exception of the look back period. Specifically, the Regulatory SVaR uses model parameters such as volatilities and correlations calibrated to historical data from a continuous 12-month period that reflects significant financial stress appropriate to current portfolios. The Regulatory SVaR look back period is periodically calibrated using internal Citi methodologies and policies to determine the most severe stress period for Citi’s current covered positions.
The following table sets forth Citi’s Regulatory SVaR and related capital requirement, as well as risk-weighted assets as of March 31, 2021.
Table 23: Regulatory SVaR Risk-Weighted Assets
In millions of dollars As of March 31, 2021
RegulatorySVaR(1)
RegulatorySVaR-Based
Capital(2)
RegulatorySVaR
RWA(3)
$ 494 $ 1,483 $ 30,537
(1) 60-day average, for which each daily Regulatory SVaR is based on a 10-day time horizon.
(2) Regulatory SVaR times a capital multiplier of 3.(3) Regulatory SVaR-Based Capital times 12.5 plus $12,004 million add-on for
RNIM.
• Immaterial differences in calculations above may exist due to rounding.
The following table presents period end and high, low and mean Regulatory SVaR, for each of Citi’s material portfolios of covered positions, as of and for the three months ended March 31, 2021.
Table 23.1: 10-Day Regulatory SVaR by Material Portfolios
As ofMarch 31, 2021
Three Months Ended
March 31, 2021In millions of dollars
Material Portfolios High Low Mean(1)
ICG $ 386 $ 1,145 $ 253 $ 502
Other(2) 11 11 10 11 Diversification Benefit(3) (17) NM NM (19)
Total Regulatory SVaR $ 380 $ 1,133 $ 246 $ 494
• NM: Not meaningful
(1) 60-day average, for which each daily Regulatory SVaR is based on a 10-day time horizon.
(2) Primarily related to Corporate Treasury covered positions.(3) Diversification benefit is the result of correlation between portfolios and, due
to this benefit, the total Regulatory SVaR on a given day will be lower than the sum of the Regulatory SVaRs relating to each individual portfolio. No diversification benefit can be inferred for the high and low of respective portfolios as they may come from different close of business dates.
Incremental Risk Charge (IRC)IRC represents a charge to cover the default and credit migration risks of non-securitized credit products. IRC is measured over a 1-year time horizon at a 99.9% confidence level under the assumption of constant positions. A constant position assumption means that Citi maintains the same set of positions throughout the 1-year time horizon (regardless of the maturity date of the positions) in order to model profit and loss distributions. Liquidity horizons establish the effective holding period of the assets and are defined as the time that would be required to reduce exposure, or hedge all material risks, in a stressed market environment.
Citi’s IRC model is designed to capture market and issuer-specific concentrations, credit quality and liquidity horizons and recognizes the impact of correlations between default and credit migration events among issuers.
Set forth in the following table is Citi’s IRC and IRC risk-weighted assets as of March 31, 2021.
Table 24: IRC Risk-Weighted Assets
In millions of dollars As of March 31, 2021IRC(1) IRC RWA(2)(3)
$ 529 $ 6,560 (1) IRC is calculated once per week. (2) IRC-based RWA is calculated using the greater of the mean and period end
IRC charge (see table 24.1 below). (3) IRC RWA is IRC times 12.5.
• Immaterial differences in calculation above may exist due to rounding.
Presented in the following table is the period end and high, low and mean IRC for each of Citi’s material portfolios of covered positions as of and for the three months ended March 31, 2021.
Table 24.1: IRC by Material Portfolios
As ofMarch 31, 2021
Three Months Ended
March 31, 2021In millions of dollars
MaterialPortfolios High Low MeanICG $ 529 $ 617 $ 348 $ 485
Other(1) — — — — Diversification Benefit(2) — NM NM (3)
Total IRC $ 529 $ 609 $ 346 $ 482
• NM: Not meaningful
(1) Primarily related to Corporate Treasury covered positions. (2) Diversification benefit is the result of correlation between portfolios and, due
to this benefit, the total IRC on a given day will be lower than the sum of the IRCs relating to each individual portfolio. No diversification benefit can be inferred for the high and low of respective portfolios as they may come from different close of business dates.
47
CITIGROUP INC. – BASEL III ADVANCED APPROACHES DISCLOSURES – March 31, 2021
Comprehensive Risk Measure (CRM) CRM is primarily comprised of correlation trading securitization positions within ICG Markets and Securities Services.
Credit correlation products refer to portfolio-based tranche products and their hedges. The primary inputs to the valuation model used to price and risk manage these tranche products are credit default swap spreads and correlations between the individual credits within the portfolios. Correlation trading positions include both index and bespoke tranches, where index tranches mainly reference U.S. and European credit indices.
Citi received supervisory approval to remove the previously required CRM model surcharge for correlation trading portfolios. Accordingly, the calculation of the CRM under the U.S. Basel III rules is equal to the greater of two components: (i) a model-based measure and (ii) total specific risk add-ons for Citi's modeled correlation trading positions (CRM Floor), which is calculated as 8% of the greater of: (1) the sum of Citi’s specific risk add-ons for each net long correlation trading position, or (2) the sum of Citi’s specific risk add-ons for each net short correlation trading position (both of which are calculated after permitted matching and offsetting under the U.S. Basel III rules).
The model-based measure of the CRM is an extension of the IRC model discussed above. Citi’s CRM price risk model is based on a full revaluation of the portfolio inclusive of all material risk factors. Citi’s CRM model uses a Monte Carlo simulation (like the IRC model); however, the CRM model includes additional risk factors that are only relevant for Citi’s correlation trading portfolio.
Citi’s CRM model is intended to capture all material price risk including, but not limited to, the risks associated with the contractual structure of cash flows of the position, the issuer, and the underlying exposures. Through the use of these market risk factors the model simulates default risk and credit migration risk over a 1-year time horizon with a 99.9% confidence interval, under the assumption of constant positions.
The following tables present Citi’s CRM risk-weighted assets and market risk factors as of March 31, 2021, as well as the period end, and high, low and mean CRM Charge, as of and for the three months ended March 31, 2021.
Table 25: CRM Risk-Weighted Assets
In millions of dollars As of March 31, 2021
CRMCharge(1)
CRM-Based
RWA(2)8% CRM
Floor(3)
TotalCRM
RWA(4)
$ 81 $ 1,016 $ 725 $ 1,016
(1) CRM Charge is calculated once per week. (2) CRM-based RWA is calculated using the greater of the mean and period end
CRM Charge (see Table 25.1 below), multiplied by 12.5.(3) The CRM Floor is based on the fair value of net long positions (inclusive of
netting).(4) Total CRM RWA = Greater of (2) CRM Based RWA and (3) 8% CRM
Floor.
• Immaterial differences in calculations above may exist due to rounding.
Table 25.1: CRM Charge
In millions of dollarsAs of
March 31, 2021Three Months Ended
March 31, 2021CRM Charge High Low Mean
$ 75 $ 88 $ 75 $ 81
Table 25.2: CRM Market Risk Factors
In millions of dollars As of
March 31, 2021Default Risk $ 56 Recovery Rate Risk (1) Credit Spread Risk(1) 23 Cross Gamma Risk — Correlation Risk (3) Total CRM Charge(2) $ 75
(1) Credit spread risk includes credit migration risk.(2) Total CRM Charge is inclusive of diversification benefits across risk factors
and are additive.
The following table presents the net market value of Citi's correlation trading securitization positions included in the CRM model, inclusive of all hedges, as of March 31, 2021. Correlation trading securitization positions that are not included in the CRM model are included in Table 26 “Covered Trading Securitization and Re-Securitization Positions (Non-CRM Modeled)” below.
Table 25.3: Correlation Trading Securitization Positions (Included in CRM Model)
In millions of dollarsAs of
March 31, 2021Net Long Market Value $ 8,355 Net Short Market Value (9,404) Total Net Market Value ($ 1,049)
Standard Specific Risk Charge (SSRC)Specific risk is the risk of loss from changes in the market value of a position that could result from factors other than broad market movements and includes event risk, default risk and idiosyncratic risk.
Standard specific risk charges are derived for any debt or equity positions which have not received a modeled specific risk charge (i.e., Regulatory VaR, CRM, or IRC), or a modeled (SFA) or a non-modeled (SSFA) securitization charge. Under the U.S. Basel III rules, standard specific risk charges are calculated by applying prescribed risk-weighting factors to debt, equity, and securitization positions, which for cash instruments is based on the fair market value, whereas for derivatives is based on the fair value of the effective notional amount. Moreover, the prescribed risk-weighting factors for debt positions are based on particular attributes, such as issuer type, remaining contractual maturity, country risk ratings, Organization for Economic Cooperation and Development membership status, and investment grade/non-investment grade status.
48
CITIGROUP INC. – BASEL III ADVANCED APPROACHES DISCLOSURES – March 31, 2021
Securitization and Re-securitization PositionsFor a description of Citi's involvement in securitization and re-securitization transactions, see “Securitizations’’ above.
The following table sets forth the net market value of Citi's non-modeled trading book securitization and re-securitization positions (i.e., excluding modeled correlation trading securitization positions), by product type, as of March 31, 2021.
Table 26: Covered Trading Securitization and Re-securitization Positions (Non-CRM Modeled)In millions of dollars As of March 31, 2021
Exposure TypeOn-Balance
Sheet(1)Off-Balance
Sheet(2) TotalCMBS $ 708 $ 58 $ 766 RMBS 907 62 970 CDOs/CLOs 824 25 848 Other ABS 480 55 535
$ 2,919 $ 200 $ 3,119
(1) The net market value of cash securitization positions that received non-modeled securitization charges.
(2) The net market value of derivative positions that received non-modeled securitization charges.
• Immaterial differences in calculations above may exist due to rounding.
De minimis Exposures ChargeAs previously noted, a de minimis exposures charge is applied to covered positions that are not captured in Citi’s Regulatory VaR model. The sum of the absolute value of these positions is multiplied by 12.5 to arrive at the applicable RWA under the U.S. Basel III rules.
Market Risk Management
OverviewCiti manages the market risk of covered positions in its trading and non-trading portfolios under established standards, policies, and governance frameworks that were created or enhanced to ensure that Basel III market risk capital charges are only applied to covered positions and that non-covered trading book positions receive the appropriate credit risk capital charges. Citi’s policies have been reviewed by the FRB and OCC. For additional information regarding Citi’s market risk management generally, see “Managing Global Risk—Market Risk—Overview” in Citi’s 2020 Form 10-K.
The market risk of Citi’s trading portfolio of covered positions encompasses, among other things, price risk losses. Price risk losses arise from fluctuations in the market value of covered positions due to changes in interest rates, credit spreads, foreign exchange rates, equity and commodity prices, as well as changes in the implied volatility for option products referencing these markets. Citi’s non-trading portfolio of covered positions also experiences fluctuations in market value resulting from changes in foreign exchange and commodity prices.
Market risk is calculated in accordance with established standards to ensure consistency across Citi’s businesses and enable market risk sensitivities to be aggregated. The measurement used for covered trading positions and non-covered trading positions include:
• VaR• Stress Testing• Factor Sensitivities• Internal Model Review and Validation
Citi requires that its GCB and ICG business segments establish, with approval from Citi’s market risk management, a market risk limit framework for identified risk factors that clearly defines approved risk profiles and is within the parameters of Citi’s overall risk tolerance and internal capital adequacy standards. These limits are monitored by Citi’s independent market risk management organization, Citi’s country and business Asset and Liability Committees and Citigroup’s Asset and Liability Committee. Included in this limit framework are additional controls which detail trading mandates, permitted product lists, and a new product approval process for complex products. Ultimately, Citi’s businesses are responsible for the market risks taken and for remaining within their defined limits, as well as ensuring that covered positions are managed in accordance with Citi’s internal policies.
Citi’s independent market risk management and Product Control within Finance periodically review covered positions to confirm both the realization of intent and ability to trade. Positions failing to meet the criteria of intent and ability to trade are reclassified as non-trading book positions and will be subject to the credit risk capital rules.
Securitization and Re-securitization PositionsCiti manages its securitization and re-securitization positions within an established risk management policy framework whereby each business and Citi’s market risk management work collaboratively to monitor the covered trading book securitization positions, changes in positions, and changes in the portfolio structure. This includes, but is not limited to, the review of approved risk limits versus daily positions using risk measures such as market values, risk factor sensitivities and stress loss scenarios. Securitization due diligence analysis is completed in accordance with the requirements of the U.S. Basel III rules, including pre-trade analysis and supporting documentation within three days of the trade date. The analysis demonstrates a comprehensive understanding of the features of a securitization that would materially affect the performance of the position. On a quarterly basis, follow-up reviews are performed to evaluate and update the securitization risk characteristics as appropriate.
Citi manages the risk appetite for all covered securitization and re-securitization positions through a limit structure which is approved annually by market risk management. These limits measure market value of positions, risk factor sensitivities, VaR and SVaR on a daily basis. In addition, regulatory risk capital and risk-weighted assets for specific risk measures are calculated monthly and are subject to a defined set of controls and governance within market risk, regulatory risk and finance management. This includes, but is not limited to, a review of the exposure classification and application of treatment type hierarchy which is used to verify compliance for securitization transactions under the U.S. Basel III rules.
Clarifications to interpretive questions are issued through a formal capital interpretive forum and are reported to senior management. Citi’s risk management framework includes a
49
CITIGROUP INC. – BASEL III ADVANCED APPROACHES DISCLOSURES – March 31, 2021
weekly scenario analysis in which all underlying risk factors are stressed to determine portfolio sensitivity under stressed conditions.
Citi employs several risk mitigation approaches to manage risk appetite for its securitization and re-securitization positions. Counterparty credit risk positions are approved through credit risk management policies and procedures. Securitization and re-securitization positions are subject to product limits to ensure diversification in Citi’s portfolio. These limits include mezzanine re-securitization position limits.
Citi also uses a variety of hedging strategies for its covered positions, including corporate index hedges, to mitigate systemic price and spread risks. Business trading desks make hedging decisions based on current market conditions in accordance with hedging strategies residing under Citi’s market risk management policy framework. Citi’s material hedging decisions are made in consultation with Citi’s risk management organization and the Citigroup Executive Committee, as appropriate. Any hedging proposals outside the scope of previously approved products would require approval by Citi’s New Product Approval Committee resident within ICG.
Independent Validation of ModelsMarket risk models are independently validated by Model Risk Management and approved for use. Generally, Citi's model validation process involves evaluation of conceptual soundness including key assumptions, effective challenge of the model design and construction, identification of model limitations and incremental analysis and testing as necessary. In addition, market risk models are subject to periodic model risk assessment, ongoing performance monitoring, outcomes analysis, annual model review, ongoing model validation, and model change management as required under the Citi Model Risk Management Policy.
In addition, as part of the model validation process, product specific backtesting on hypothetical portfolios is periodically performed. Furthermore, Citi performs backtesting against the actual change in market value of transactions on a monthly basis at multiple levels of the organization (trading desk, ICG business, and company-wide), and shares the results with the FRB and OCC.
In addition, the FRB and OCC periodically review and approve significant model and assumption changes.
Stress TestingCiti performs stress testing on a regular basis to estimate the impact of extreme market movements. It is performed on individual positions, trading portfolios, as well as in aggregate inclusive of multiple trading portfolios. Citi’s independent market risk management organization, after consultations with the businesses, develops both systemic and specific stress scenarios, reviews the output of periodic stress testing exercises, and uses the information to make judgments on the ongoing appropriateness of exposure levels and limits. Citi uses two complementary approaches to market risk stress testing across all major risk factors (i.e., equity, foreign exchange, commodity, interest rate and credit spreads): top-down systemic stresses and bottom-up business specific stresses. Systemic stresses are designed to quantify the potential impact of extreme market movements on a firm-wide basis, and are constructed using both historical periods of market stress and projections of adverse economic scenarios. Business specific stresses are designed to probe the risks of particular portfolios and market segments, especially those risks that are not fully captured in VaR and systemic stresses.
50
CITIGROUP INC. – BASEL III ADVANCED APPROACHES DISCLOSURES – March 31, 2021
OPERATIONAL RISK
OverviewOperational risk is the risk of loss resulting from inadequate or failed internal processes, people and systems or from external events. This includes legal risk, which is the risk of loss (including litigation costs, settlements, and regulatory fines) resulting from the failure of Citi to comply with laws, regulations, prudent ethical standards, and contractual obligations in any aspect of its businesses, but excludes strategic and reputation risks. Citi also recognizes the impact of operational risk on the reputation risk associated with Citi’s business activities.
Operational risk is inherent in Citi’s global business activities, as well as related support processes, and can result in losses arising from events associated with the following, among others:
• fraud, theft and unauthorized activity;• employment practices and workplace environment;• clients, products and business practices;• physical assets and infrastructure; and • execution, delivery and process management.
Operational Risk MeasurementUnder the U.S. Basel III rules, Citi is required to employ an Advanced Measurement Approaches (AMA) model in deriving its operational risk capital.
Pursuant to the AMA model, Citi utilizes units of measure which group like risks and separate heterogeneous risks for the purpose of analysis and quantification. These units of measure are defined primarily by the type of operational risk event (e.g., fraud or employment practices), but also consider the respective business unit(s) and geography(ies). For each of these units of measure, potential loss severity and frequency are modeled independently. The potential loss severity is based on Citi’s historical (internal) operational risk loss data, as well as historical industry (external) operational risk loss data. Citi employs a selection process with regard to historical industry operational risk loss events, which involves the identification in the relevant business(es) and operational risk management of historical industry operational risk losses that are relevant to Citi, based on the line of business(es) and operational risk exposure by event type. The mean frequency of operational risk losses is estimated from Citi’s internal experience. The modeled operational risk losses across the units of measure are aggregated, considering correlation in operational risk losses across measurement units. The results are subsequently modified each quarter by applying a “qualitative adjustment factor” to reflect the current business and control environment.
Further, Citi conducts scenario analysis by major global business, as a systematic process for obtaining the opinions of business managers and risk management experts, in order to derive reasoned assessments of the likelihood and loss impact of plausible, high severity operational risk losses. These scenarios are then used to benchmark the model results.
Moreover, Citi uses insurance for the purpose of partially mitigating operational risk; however, such insurance does not have a material impact on Citi’s operational risk capital.
Independent Review of ModelsOperational risk models are independently validated by Model Risk Management and approved for use. Generally, Citi’s model validation process involves evaluation of conceptual soundness including key assumptions, effective challenge of the model design and construction, identification of model limitations and incremental analysis and testing as necessary. In addition, operational risk models are subject to periodic model risk assessment, ongoing performance monitoring, outcomes analysis, annual model review, ongoing model validation, and model change management as required under the Citi Model Risk Management Policy.
For additional information on operational risk, “Managing Global Risk—Operational Risk” in Citi’s 2020 Form 10-K.
51
CITIGROUP INC. – BASEL III ADVANCED APPROACHES DISCLOSURES – March 31, 2021
INTEREST RATE RISK: NON-TRADING ACTIVITIES
For information on Citi’s interest rate risk related to non-trading activities, see “Managing Global Risk—Market Risk—Market Risk of Non-Trading Portfolios” in Citi's First Quarter 2021 Form 10-Q.
52
CITIGROUP INC. – BASEL III ADVANCED APPROACHES DISCLOSURES – March 31, 2021

SUPPLEMENTARY LEVERAGE RATIO
For information on Citi’s Supplementary Leverage ratio, and related components, see Schedule A in Citi’s First Quarter 2021 FFIEC 101 Report.
53
CITIGROUP INC. – BASEL III ADVANCED APPROACHES DISCLOSURES – March 31, 2021
APPENDIX A: GLOSSARY
Advanced Approaches banking organization is, in general, a U.S. banking organization with consolidated total assets of at least $250 billion or consolidated total on-balance sheet foreign exposures of at least $10 billion.
Banking book refers to exposures not included in the trading book.
Black-Scholes is a mathematical methodology for valuing derivatives of financial securities such as equity or bond options that takes into account whether an option is in or out of the money, the volatility of the underlying exposure, the time to expiration of the option, whether the option is a put or a call and the current rate of return on a risk-free asset such as a U.S. Treasury bill.
Capital Conservation Buffer, which is to be composed solely of Common Equity Tier 1 Capital, is equal to the lowest of the following risk-based capital ratios (subject to a floor of zero), calculated as of the last day of the previous calendar quarter based on the banking organization's most recent regulatory report:(1) The banking organization's Common Equity Tier 1 Capital ratio minus the banking organization's stated minimum Common Equity Tier 1 Capital ratio requirement;(2) The banking organization's Tier 1 Capital ratio minus the banking organization's stated minimum Tier 1 Capital ratio requirement; and(3) The banking organization's Total Capital ratio minus the banking organization's stated minimum Total Capital ratio requirement.
Central counterparty is a counterparty (for example, a clearing house) that facilitates trades between counterparties in one or more financial markets by either guaranteeing trades or novating contracts.
Confidence interval measures the probability that a population parameter will fall between two set values. The confidence interval can take any number of probabilities, with the most common being 95% or 99%.
Credit valuation adjustment is the fair value adjustment to reflect counterparty credit risk in the valuation of OTC derivative contracts.
Distribution means: (1) A reduction of Tier 1 Capital through the repurchase of a Tier 1 Capital instrument or by other means, except when a banking organization, within the same quarter when the repurchase is announced, fully replaces a Tier 1 Capital instrument it has repurchased by issuing another capital instrument that meets the eligibility criteria for:
(i) A Common Equity Tier 1 Capital instrument if the instrument being repurchased was part of the banking organization’s Common Equity Tier 1 Capital, or (ii) A Common Equity Tier 1 or Additional Tier 1 Capital instrument if the instrument being repurchased was part of the banking organization’s Tier 1 Capital;(2) A reduction of Tier 2 Capital through the repurchase, or redemption prior to maturity, of a Tier 2 Capital instrument or by other means, except when a banking organization, within the same quarter when the repurchase or redemption is announced, fully replaces a Tier 2 Capital instrument it has repurchased by issuing another capital instrument that meets the eligibility criteria for a Tier 1 or Tier 2 Capital instrument;(3) A dividend declaration or payment on any Tier 1 Capital instrument;(4) A dividend declaration or interest payment on any Tier 2 Capital instrument if the banking organization has full discretion to permanently or temporarily suspend such payments without triggering an event of default; or(5) Any similar transaction that the U.S. banking agency (e.g., FRB) determines to be in substance a distribution of capital.
Eligible retained income is equal to the greater of: (i) the banking organization’s net income for the four calendar quarters preceding the current calendar quarter, net of any distributions and tax effects not already reflected in net income, and (ii) the average of the banking organization’s net income for the four calendar quarters preceding the current calendar quarter.
Event risk is the risk of loss on equity or hybrid equity positions as a result of a financial event, such as a company merger, acquisition, spin-off, or dissolution.
Exchange traded derivatives include derivatives executed directly on an organized exchange that provides pre-trade price transparency.
Fair value hierarchy is defined by ASC 820-10 as follows:
• Level 1 inputs as quoted prices for identical instruments in active markets;
• Level 2 inputs as quoted prices for similar instruments in active markets; quoted prices for identical or similar instruments in markets that are not active; and model-derived valuations in which all significant inputs and significant value drivers are observable in active markets; and
• Level 3 inputs as valuations derived from valuation techniques in which one or more significant inputs or significant value drivers are unobservable.
Fat-tailed distribution is a probability distribution for which the likelihood of a large deviation from the mean is greater than would be implied by a normal distribution.
54
CITIGROUP INC. – BASEL III ADVANCED APPROACHES DISCLOSURES – March 31, 2021
FICO score independent credit agencies in the U.S. rate an individual’s risk for assuming debt based on the individual’s credit history and assign every consumer a “FICO” credit score. These scores are continually updated by the agencies based upon an individual’s credit actions (e.g., taking out a loan or missed or late payments).Financial assets may be loans, asset-backed securities, mortgage-backed securities, other debt securities, equity securities, receivables, commitments, guarantees or credit derivatives.
Idiosyncratic risk is the risk of loss in the value of a position that arises from changes in risk factors unique to that position.
ISDA refers to International Swap Dealers Association.
LIBOR refers to London Interbank Offered Rate. Monte Carlo simulation is a statistical technique, widely used in finance, engineering, and physics, for simulating outcomes of complex processes. Citi’s use of Monte-Carlo simulation to calculate the potential loss of market value of a trading portfolio rests on measurements of the volatilities and correlations of the market rates that affect the market value of the portfolio and on the sensitivities of the market value of the portfolio to changes in market rates.
Netting set is a group of transactions with a single counterparty that are subject to a qualifying master netting agreement.
Over-the-counter derivatives include derivatives executed and settled bilaterally with counterparties without the use of an organized exchange or central clearing house.
Potential future exposure is an add-on for expected future credit exposure related to OTC derivative contracts, and is based on the type and remaining maturity of the derivative contract.
Pillar 3 is a component of a mutually reinforcing three pillar capital framework established by the U.S. Basel II rules, and sets forth minimum disclosure requirements for banking organizations which are intended to improve transparency and strengthen market discipline.
Qualifying revolving exposure, generally, is an exposure which is revolving, is unsecured and unconditionally cancelable by the banking organization.
Retail exposure is a residential mortgage exposure, a qualifying revolving exposure, or an other retail exposure.
Scaling factor is a number which scales, or multiplies, some quantity.
Segmentation for retail exposures is required under the U.S. Basel III rules, and means the grouping of retail exposures in each retail subcategory into segments that have homogeneous risk characteristics.
Specific risk is the risk of loss from changes in the market value of a position that could result from factors other than broad market movements, and includes event risk, default risk and other idiosyncratic risks of specific issuers of debt or equity securities.
Structural foreign currency position is a position that is not a trading position and that is: (1) subordinated debt, equity, or a minority interest in a consolidated subsidiary that is denominated in a foreign currency; (2) capital assigned to a foreign branch that is denominated in a foreign currency; (3) a position related to an unconsolidated subsidiary or another item that is denominated in a foreign currency and that is deducted from the banking organization’s Tier 1 or Tier 2 Capital; or (4) a position designed to hedge a banking organization’s capital ratios or earnings.
Synthetic securitization is a transaction in which all or a portion of the credit risk of one or more underlying exposures is retained or transferred to one or more third parties through the use of one or more credit derivatives or guarantees, and the credit risk associated with the underlying exposures has been separated into at least two tranches reflecting different levels of seniority.
Systematic risk is a broad class of market risk that is differentiated from the specific risk of individual issuers of debt and equity securities. Examples of systematic risk include the risk of changes in equity indices, commodity prices, the U.S. Treasury yield curve, spot foreign exchange rates, and average credit spreads per rating and currency. In contrast, examples of specific risk include the risk of changes in the component of the spread of a specific bond or the price of a specific equity that are caused by factors idiosyncratic to the issuer of the security.
Two-way market means a market where there are independent bona fide offers to buy and sell so that a price reasonably related to the last sales price or current bona fide competitive bid and offer quotations can be determined within one day and settled at that price within a relatively short timeframe conforming to trade custom.
U.S. GAAP refers to generally accepted accounting principles in the United States.
Wholesale exposure is a credit exposure to a company, natural person, sovereign, or governmental entity (other than a securitization exposure, retail exposure, pre-sold construction loan, unsettled transaction, or equity exposure).
55
CITIGROUP INC. – BASEL III ADVANCED APPROACHES DISCLOSURES – March 31, 2021
APPENDIX B: DISCLOSURE INDEX
OVERVIEWOrganization 2 Regulatory Capital Standards and Disclosures 2 23-35 32-47
SCOPE OF APPLICATIONBasis of Consolidation 3 96-98, 148-156Funds and Capital Transfer Restrictions 3 224 Regulated Subsidiaries’ Capital 3
CAPITAL STRUCTURERegulatory Capital Instruments 4-5 144, 202 32-33, 222-223,
228-229, 314Regulatory Capital Tiers 5 23-35
CAPITAL ADEQUACYCapital Management 6 32Stress Testing Component of Capital Planning 6 83-85 32-36, 49-55, 131Economic Capital 6-7Advanced Approaches Risk-Weighted Assets 7-8Risk-Based Capital Ratios 8-9 23-35 32-47
CAPITAL CONSERVATION AND COUNTERCYCLICAL CAPITAL BUFFERS
10 32-47
RISK MANAGEMENTOverview 11-12 66-67Scope and Nature of Credit Risk Reporting and Measurement
Systems 12
CREDIT RISK: GENERAL DISCLOSURESCredit Risk Management 13 Corporate Credit Risk 13 Consumer Credit Risk 13 Past Due and Impaired Exposures 13 123, 146-160,
192-203, 204-216Allowance for Credit Losses 13 78-80, 96-98Credit Risk Exposures 14-20 37-56, 110-112,
114-123, 124-137,138-141, 157-167, 187-191
68-90, 188-190. 192-221, 283-290
Pillar 3 Disclosures
First Quarter2021 Form 10Q
2020Form 10-K
56
CITIGROUP INC. – BASEL III ADVANCED APPROACHES DISCLOSURES – March 31, 2021
CREDIT RISK: PORTFOLIO DISCLOSURES – INTERNAL RATINGS-BASED APPROACH
Overview 21 Wholesale Credit Risk Management 21-22 Wholesale Credit Risk Exposures 21 Use of Risk Parameter Estimates Other Than for Regulatory
Capital Purposes21-22
Use of Credit Risk Mitigation 22 Recognizing Credit Risk Mitigation 22 Retail Credit Risk Management 22 Policies and Processes for Retail Credit Risk Management 22 Collateral Valuation and Management 22 Types of Collateral 22 Calculation of Risk-Weighted Assets Using Internal Parameters 22-23 Wholesale Credit Risk 23 Retail Credit Risk 23 Credit Rating and Basel Parameter Governance 23 Model Risk Management Policy 24 Independent Validation of Models 24
Basel Parameters by Exposure Type 24-26 Credit Losses 27 37-56
COUNTERPARTY CREDIT RISK: OTC DERIVATIVE CONTRACTS, REPO-STYLE TRANSACTIONS AND ELIGIBLE MARGIN LOANS
Counterparty Credit Risk Exposures 28 Methodology Used to Assign Economic Capital 28 Methodology Used to Assign Credit Limits 28 Counterparty Credit Risk Capital Calculations 28 Derivative Master Netting Agreements 28 242-257Policies for Securing, Valuing and Managing Collateral, and
Establishing Credit Reserves 29
Primary Types of Collateral 29 Policies With Respect to Wrong-Way Risk Exposures 29 Impact of Citi Credit Rating Downgrade on Collateral Pledged 29-30 62-63, 157-167OTC Derivative Counterparty Credit Risk Disclosures 30 157-167Credit Derivative Notional Amounts 30-31 157-167
CREDIT RISK MITIGATIONOverview 32 Credit Risk Mitigation by Exposure Type 32 Wholesale Banking Book Collateral: Valuation and
Management 32
OTC Derivative Contracts, Repo-Style Transactions and Eligible Margin Loans
32
Retail Exposures 32
Pillar 3 Disclosures
First Quarter2021 Form 10Q
2020Form 10-K
57
CITIGROUP INC. – BASEL III ADVANCED APPROACHES DISCLOSURES – March 31, 2021
Wholesale Banking Book Exposures 32 Collateral Concentrations 32 Guarantors and Credit Derivative Counterparties and their
Creditworthiness 32
Recognizing Credit Risk Mitigation 32-33
SECURITIZATIONSOverview 34 Objectives 34 Risks 34-35Risk-Based Capital Approaches 35 Securitizations and VIEs 36-38 148-156, 187-191,
192-193146-160, 230-241, 259-278, 283-298
Securitization Exposures Deducted from Regulatory Capital 39 Re-securitization Exposures Covered by Guarantees 39
EQUITY EXPOSURES NOT SUBJECT TO THE MARKET RISK CAPITAL RULES
Overview 40 96-98, 114-123Risk-Weighting Approaches 40-41Realized Gains (Losses) 41
Latent Revaluation Gains (Losses) 41
MARKET RISKOverview 42 100-114Basel III Covered Positions 42 Valuation and Accounting Policies and Methodologies 42-43 Determination of Fair Value 42-43 Market Valuation Adjustments 43 Market Risk-Weighted Assets 43 Regulatory Value-at-Risk (VaR) 43-44 110-114Regulatory VaR Backtesting 45-46Regulatory Stressed Value-at-Risk (SVaR) 47 Incremental Risk Charge (IRC) 47 Comprehensive Risk Measure (CRM) 48 Standard Specific Risk Charge (SSRC) 48 Securitization and Re-securitization Positions 49 De Minimis Exposures Charge 49 Market Risk Management 49 Overview 49 100 Securitization and Re-securitization Positions 49-50 Independent Validation of Models 50 Stress Testing 50
Pillar 3 Disclosures
First Quarter2021 Form 10Q
2020Form 10-K
58
CITIGROUP INC. – BASEL III ADVANCED APPROACHES DISCLOSURES – March 31, 2021
OPERATIONAL RISKOverview 51 115-116Operational Risk Measurement 51 115-116Independent Review of Models 51 115-116
INTEREST RATE RISK: NON-TRADING ACTIVITIES 52 64-71
SUPPLEMENTARY LEVERAGE RATIO 53
Pillar 3 Disclosures
First Quarter2021 Form 10Q
2020Form 10-K
59
CITIGROUP INC. – BASEL III ADVANCED APPROACHES DISCLOSURES – March 31, 2021