Embed Size (px)
Citation preview

City Momentum IndexThe Rise of the Innovation-Oriented City
Cities Research Center I 2016

City Momentum Index, 2016 2 JLL
A new era of city competitionThe current cycle of globalisation, urbanisation and technological advancement is leading to a shake-up of the global urban hierarchy and creating sweeping changes to the geography of commercial real estate opportunity. In this new era of city competition, success is no longer purely about size or inherited attributes, but revolves around innovation, liveability and a city’s ability to transform and adapt to a constantly changing socio-economic landscape.
JLL’s City Momentum Index (CMI), now in its third year, tracks the speed of change of a city’s economy and commercial real estate market, identifying those cities which have the most dynamic urban economies and are adapting most rapidly to the imperatives of technological and infrastructural transformation.
Covering 120 major established and emerging business hubs across the globe, the Index measures a city’s short-term socio-economic and commercial real estate momentum (over a three-year horizon) in combination with measures of ‘future-proofing’ – whether a city has the essential ingredients to ensure longer-term sustainable momentum in terms of education, innovation and environment.
A unique IndexThe CMI is unique in that it captures the dynamics of a city’s real estate market – its rates of construction and absorption, price movement and the attraction of a city’s built environment for cross-border capital and corporations.
In this paper, we identify the characteristics of those cities at the top of the CMI, many of which are building innovation-oriented economies and implementing transformative infrastructure and real estate projects that are contributing to their momentum and providing crucial competitive advantage.
In producing this Index, JLL’s intention is to alert the market to signals of change and to highlight the defining features which are enabling cities to successfully compete in a new economic landscape. It does not necessarily hold that the CMI’s leading cities will outperform other cities not featured in the top tier, or provide the most immediately attractive real estate investment environments, but rather that they are the cities where change is occurring most rapidly and are the ones to be closely monitored. Strong momentum can pose both opportunity and risk.
The Rise of the Innovation-Oriented City

City Momentum Index, 2016 3 JLL
Innovation-oriented cities dominate the CMI Top 20The remarkable feature of this year’s CMI Top 20 is the overwhelming dominance of innovation-rich cities. JLL has long emphasised that city momentum involves far more than just raw GDP growth – it is crucially about building the foundations of an innovation-oriented economy through technology, creating cutting-edge new businesses, attracting talent and nurturing vibrant inclusive communities. Many of the cities at the top of this year’s Momentum Index, such as London, New York, San Francisco and Boston, are home to the world’s most dynamic mixed-used districts that are thriving through their ability to incubate and commercialise new ideas. These compact and well-connected city districts, often centred on a range of higher education and research institutions, promote connectivity, co-production and open innovation. And what bonds them together is real estate.
Real estate as a driver of momentum There is increasing recognition among city stakeholders of the role real estate can play in boosting city momentum by providing the infrastructure and environment that facilitates creativity, innovation and entrepreneurship, while also fostering a sense of community and well-being for its citizens in a sustainable urban model. The role of real estate is shifting from one of housing business to being an attractor of corporations and talent, and cities need to ensure that their built environment is attractive by delivering the kind of smart and productive commercial buildings that businesses, capital and workers are now demanding.
The role of transformational projectsAnd in order to build momentum and maintain competitive edge, cities will need to commit to bold urban transformations to meet the demands of rising populations and increasing strains on resources, and to support the shift to new modes of economic activity. JLL is closely tracking the world’s top 500 major urban transformation projects and it is not coincidental that several of the most substantive, visionary and innovative projects are located in cities in the CMI Top 20.
Key Highlights of 2016

City Momentum Index, 2016 4 JLL
Strong momentum of ‘Established World Cities’ The 2016 CMI Top 20 highlights the continued strong momentum of the ‘Established World Cities’ – notably London, New York and Tokyo – as well as their ‘Challengers’1, those cities which are increasingly competing for global reach and influence such as Sydney, Seoul and Shanghai. While both these groups of cities have highly globalised economies, robust infrastructures and deep concentrations of corporations, capital and talent, they are also looking to future-proof their economies by executing bold urban transformations.
Among the ‘Established World Cities’:
• London (1st) tops the CMI for a second consecutive year, as vigorous economic growth and commercial real estate fundamentals are complemented by initiatives which are transforming the city’s transport and building on its unique strengths as a global education and technology hub. The US$22 billion Crossrail project is the largest transport scheme in Europe, while new university campuses such as the US$1.5 billion campus for Imperial College London in White City, which is being planned as London’s first major research quarter, are establishing new networks between business and education.
• New York’s (7th) dynamic start-up sector is flourishing and the city is taking steps to build on its innovation economy through developments such as the new US$2 billion applied research facility on Roosevelt Island, which involves links between Cornell University, the Department of Commerce and the U.S. Patent and Trademark Office. New York’s momentum is also being boosted by major real estate projects such as Hudson Yards on Manhattan’s Far West Side, and the city’s office market is projected to register among the highest rental uplifts of cities in the CMI over the current cycle.
• Tokyo’s (14th) momentum is growing as the 2020 Summer Olympics provides a catalyst for urban renewal. Major projects such as the redevelopment of Shibuya Station District and the planned Tokiwabashi District Redevelopment Project, adjacent to Tokyo Station, will boost the city’s standing as a global technology and financial centre. Tokyo’s high-tech sector is already a major contributor to buoyant demand for new commercial space, and the city is expected to register among the highest rates of office rental growth in 2016.
1 Globalisation and Competition: The New World of Cities, JLL, 2015

City Momentum Index, 2016 5 JLL
Dublin SeattleSilicon Valley Shenzhen
Nairobi
Bangalore TokyoBoston Nanjing
Shanghai AustinNew York Hyderabad
Sydney MelbourneBeijing Seoul
San Francisco Auckland
13
12
11
14
15
16
17
18
19
20
London
3
2
1
4
5
6
7
8
9
10
Top 20
JLL City Momentum Index covers 10 topics – 37 variables
Population
Technology and R&D Education
Environment
Connectivity
Economic Output
Corporate Activity Construction
Real Estate Investment Property Prices
Source: JLL, January 2016
JLL City Momentum Index 2016

City Momentum Index, 2016 6 JLL
The ‘Challengers’ • Despite a slowing national economy, Sydney’s (8th) economic and real estate momentum continues to
accelerate. The city is experiencing robust demand for modern, flexible commercial real estate, aided by a dynamic technology sector, and is forecast to be among the best office rental performers globally over the next year. 2015 saw the first completions at Barangaroo, a mixed-use waterfront development including a dedicated financial district, while work is beginning on the ‘Sydney Metro Northwest’ project, which will create Australia’s first fully-fledged mass rapid transit system.
• Seoul’s (19th) concentration of globally competitive firms, proactive education policy and focus on quality-oriented growth are positioning it as one of the world’s most innovative cities and providing the ingredients for sustainable long-term momentum. The number of companies among the world’s 2,000 largest firms headquartered in the city continues to grow strongly, and the US$35 billion Songdo International Business District is creating a template for smart cities around the world.
• Shanghai (6th) is embracing new opportunities as it transitions to higher-value economic activities. It is continuing to build out capacity and new city systems in areas such as Qiantan and Hongkou, which have been marked out as future commercial and financial districts, and is showing a remarkable ability to absorb new inventory with among the world’s highest levels of net absorption and lowest levels of office vacancy.
City Momentum Index 2016: Long-Term Fundamentals Sub-Index, Top 5
Source: JLL, January 2016
Increasing momentum in U.S. ‘New World Cities’This year’s CMI sees more U.S. cities enter the Top 20, largely represented by ‘New World Cities’ which are among the world’s most dynamic technology centres – namely Silicon Valley, San Francisco, Boston, Seattle and Austin. Many of the U.S cities in the Top 20 are also taking steps to maintain their competitiveness by proactively using real estate to foster sustainability and liveability.
• San Francisco Bay Area’s unrivalled technology sector is enabling Silicon Valley2 (2nd) and San Francisco (10th) to register among North America’s highest levels of economic dynamism, while both are also among the top global markets for the ‘long-term incubators’ which will drive future growth. Liveability and sustainability are increasingly being recognised as essential components of city competitiveness, and low density sprawl is shifting towards higher density, transit-oriented development in the Bay Area with plans for a new downtown in Santa Clara (Related Santa Clara), the ongoing Silicon Valley Bay Area Rapid Transit (BART) extension, and San Francisco’s redevelopment of the Transbay transport terminal which will involve the extension of the Caltrain to Downtown San Francisco and make it the centre of a new transit-friendly neighbourhood.
Paris
London
Boston
Tokyo
Silicon Valley
3
2
1
4
5
2 Silicon Valley refers to the San Jose-Sunnyvale-Santa Clara Metropolitan Statistical Area

City Momentum Index, 2016 7 JLL
Innovation driving ‘Agile Higher-Value Emerging Cities’Innovation is also a driving factor behind the momentum of agile, higher-value Emerging World Cities in the CMI Top 20 which are home to some of the world’s fastest-growing tech companies – notably Bangalore and Shenzhen – as well as contributing to the strong momentum of cities taking steps to build these attributes, such as Nairobi. These high-energy cities are being propelled by robust economic and real estate growth, while they are also beginning to reap the benefits of concerted efforts to move up the value chain and improve their global connectivity.
• Bangalore (4th) is effectively the ‘Silicon Valley of India’ with its mix of research institutes and higher education establishments helping to create a solid and sizeable IT cluster. With 40% of India’s IT industry located in the city, the presence of international IT giants, together with the largest number of high-tech start-ups of any Indian city, is providing added impetus to Bangalore’s entrepreneurial growth.
• Shenzhen (12th) is challenging Beijing and Shanghai as one of China’s top innovation hubs, with around 6,000 international patent applications a year, up from around 600 made 10 years ago. It is a centre for hardware start-ups, venture capital and incubators (including the HAX Accelerator), and its financial sector is receiving a boost from the new economic zone in Qianhai, which will act as a test bed for national economic reforms. At the same time, Shenzhen is increasing its liveability and connectivity with five new metro lines under construction and a new high-speed rail route connecting the city with Guangzhou and Hong Kong set for development. In a country where environmental degradation is a growing issue, Shenzhen’s liveability is also enhanced by its air quality which is among the best of any of China’s major cities.
• Nairobi’s (11th) impressive demographic and economic momentum is necessitating the creation of infrastructure and real estate to support the city’s expansion as it registers among the highest levels of office and retail construction and absorption of any city in the CMI. Nairobi is also pushing to become the centre of technology in Africa, with a growing number of tech incubators and venture capital funds opening in the city. The start of construction on Konza Techno City, an innovation hub including space for higher education and technology firms, is laying a solid foundation for the future.

City Momentum Index, 2016 8 JLL
Smaller cities achieving global reach With globalisation and technology enabling more cities than ever before to ‘go global’, a number of smaller ‘New World Cities’ are gaining rapid momentum and competing in highly contested global markets. Dublin, Austin and Auckland are among the smallest cities in the CMI, with populations of between 1-2 million people, but are still among the most dynamic city economies globally and have been able to achieve global reach without significant economies of scale.
City Momentum Index 2016: Real Estate Momentum Sub-Index, Top 5
Source: JLL, January 2016
Auckland
London
Nairobi
Boston
Dublin
3
2
1
4
5
• Dublin (3rd) has registered the strongest real estate momentum in the CMI, with accelerating economic growth and an impressive innovation ecosystem of global IT headquarters and a high concentration of tech start-ups generating significant demand for commercial property. As a magnet for FDI and with high levels of capital spending, the city’s economy is on a sound footing and Dublin is taking steps to provide the new forms of urban infrastructure needed to maintain its competitiveness and cement its position as one of Europe’s most dynamic cities with projects such as the regeneration of the Docklands, where up to 350,000 sq m of commercial space is set to be built.
• Auckland (20th) is one of the world’s most sustainable and liveable cities. The ongoing redevelopment of the Wynyard Quarter is reshaping the city’s waterfront, while a healthy innovation ecosystem is driving significant demand for new commercial real estate, with Auckland likely to experience the most vigorous office rental growth of any city in the CMI over 2016.
• Austin’s (16th) strengths in education and low business costs are contributing to robust growth in its technology sector and one of the most dynamic urban economies in America. UT Dell Medical School, set to open in 2016, is adding to the expansion of a medical-related tech cluster, while the redevelopment of the Seaholm District includes the city’s largest ever private mixed-use development.

City Momentum Index, 2016 9 JLL
China’s top-tier cities maintain momentumChina’s cities in the Top 20 include those which are moving more decisively into higher-value activities and building the foundations for new forms of economic activity in terms of innovation, infrastructure and connectivity – including Shanghai, Beijing and Shenzhen. Nanjing is a relatively ‘late bloomer’ but an impressive education sector and connectivity are enabling it to move up the value chain and build solid momentum.
Australasian cities outperformTop-tier Australasian cities continue to exhibit strong momentum, with Sydney, Melbourne and Auckland in the Top 20. Despite the impact of slowing commodity prices which have affected many cities in the region, robust education and research systems and dynamic technology sectors are allowing these cities to outperform.
Asia’s growth hotspotsSitting just outside the CMI Top 20, the Vietnamese cities of Hanoi and Ho Chi Minh City feature prominently on economic momentum, propelled by FDI and raw GDP growth. As they transition towards higher-technology manufacturing, the cities are attracting increasing levels of innovation-oriented investment, exemplified by Samsung’s near US$400 million expansion of its R&D centre in Hanoi in 2015.
City Momentum Index 2016: Socio-Economic Momentum Sub-Index, Top 5
Source: JLL, January 2016
Ho Chi Minh City
Bangalore
Hyderabad
Delhi
Hanoi
3
2
1
4
5
India’s dynamic citiesIndia has increased its representation in the Top 20, with Bangalore joined by Hyderabad. Accelerating demographic and economic growth is contributing to the dynamism of India’s cities as they register among the highest rates of population and GDP growth in the world, while they are also taking steps to build out their infrastructure and foster connected, high-tech economies.
• Hyderabad (17th) is rivalling Bangalore for the position of India’s leading tech city, having attracted the likes of Google, Amazon and Uber. Its technology platform is driving economic growth – among the highest of any large city globally – and leading to significant demand for modern office stock as it builds the foundations for the new economy. Infrastructure enhancements such as the ‘Hyderabad Metro Rail’ project, which includes US$4 billion of investment and 1.7 million sq m of transit-oriented development, are also adding to the city’s robust economic and real estate momentum.

City Momentum Index, 2016 10 JLL
The ingredients of future momentumStraight rankings of cities only offer a one-dimensional perspective of city dynamics, so in order to provide insights into city clusters and types of cities, the components of the CMI can be separated into short-term economic and real estate momentum and long-term incubators/future-proofing. This highlights five metropolitan regions — London, the San Francisco Bay Area, New York, Boston and Sydney – that are in a ‘sweet spot’ of registering both strong short-term momentum but also having the incubators to sustain momentum over the long term.
Clustering cities in this way reveals other cities that possess the attributes conducive for longer-term momentum, including many European cities. While London and Dublin are the only European cities in the CMI Top 20, momentum is building elsewhere in Europe, with Paris and the Randstad cities now sitting only just outside the Top 20. Meanwhile, Madrid, Vienna, Brussels and Barcelona continue to score impressively for long-term indicators such as education, innovation, transparency and sustainability, and have shown the greatest improvement in CMI score over the last year.
Short-term momentum v Long-term fundamentals
Singapore, Toronto Brussels, Chicago
Berlin, TaipeiStockholm, San Diego
Tokyo, Hong KongParis, Randstad
Seoul, Los AngelesMelbourne, Austin
London San Francisco Bay Boston, New York
Sydney
Dublin, AucklandShanghai, Beijing
Shenzhen, Bangalore
Nairobi, DelhiNanjing, Xi’an
Hyderabad, Chennai
Lowest
Highest
Short - Term MomentumLowest
High
- Va
lue I
ncub
ator
s
Highest
Source: JLL, January 2016

City Momentum Index, 2016 11 JLL
City Momentum Index 2016: Transformational Journeys
Rank City Transformational Projects and Policies
1 London• US$22 billion Crossrail project• Imperial West and UCL East new university campuses• Nine Elms mixed-use development and London Underground’s Northern Line extension
2 Silicon Valley • Shift to densification and transit-oriented development• Silicon Valley BART extension
3 Dublin • Continued Docklands regeneration• Interconnection and extension of Luas tram system
4 Bangalore • Expansion of Namma Metro• Development of Chennai-Bangalore and Mumbai-Bangalore Industrial Corridors
5 Boston• First city master plan in 50 years underway (Imagine Boston 2030)• New waterfront neighbourhood under development (Seaport District)• Reform and improvements to public transportation underway
6 Shanghai• New financial districts in Qiantan and Hongkou• Expanded cultural offering (Disneyland and DreamWorks projects)• Huge planned expansion of Shanghai Metro network
7 Sydney • Barangaroo mixed-use waterfront neighbourhood, including financial district• Development of Sydney Metro Northwest
8 New York• Transformation of Manhattan’s Far West Side (Hudson Yards/Manhattan West)• Construction of Cornell Tech campus on Roosevelt Island• Completion of Second Avenue Subway Phase 1
9 San Francisco • Transbay Terminal redevelopment, including the 306-metre Salesforce Tower• Caltrain extension to Downtown
10 Nairobi • Construction of ambitious Konza Techno City• Devolution and election of Nairobi Governor in 2013
11 Shenzhen • Completion of Guangzhou-Shenzhen-Hong Kong high-speed rail link• Development of Qianhai Special Economic Zone
12 Seattle• Amazon Campus expansion into Denny Triangle district• Creation of Global Innovation Exchange facility for University of Washington and
Tsinghua University
13 Beijing• Decentralisation to Wangjing and Tongzhou sub-markets• Proposed new international airport in Daxing• Expansion of Beijing Subway network
14 Nanjing• Continued development of Hexi CBD• Establishment of Jiangbei New Area• Redevelopment of transit hub-driven South New City
15 Melbourne • Long-term redevelopment in Fishermans Bend and E-Gate• Establishment of Melbourne Metro Rail Project
16 Hyderabad • First phases of Hyderabad Metro Rail Project (2016)
17 Tokyo• Hosting 2020 Olympics and related infrastructural improvements• Redevelopment of Shibuya Station District• Tokiwabashi District Project adjacent to Tokyo Station
18 Austin • Redevelopment of Seaholm District, including Seaholm Power Plant and GreenWater developments
19 Seoul • Maturing of Songdo International Business District, world’s first ‘smart’ city• Development of Seoul International Exchange Complex
20 Auckland • Continued development of the Wynyard Quarter on the city’s waterfront• Proposed City Rail Link, including new stations in the city centre

City Momentum Index, 2016 12 JLL
The 120 cities covered by the City Momentum Index have been shortlisted on the basis of a combination of a weighted index of population, GDP, corporate presence, air connectivity, real estate investment activity and commercial real estate stock. Each city is defined as its metropolitan region as delineated by national statistical offices or by international organisations (e.g. United Nations).
120 Cities Covered by the Momentum Index
City Coverage
Source: JLL, January 2016
Vancouver, Calgary, Toronto, Montreal Washington DC, Baltimore, Philadelphia, New York, Pittsburgh, Boston
Minneapolis, Chicago, St Louis, Detroit Charlotte, Atlanta, Orlando, Miami, Tampa
Denver, Austin, Dallas, Houston Las Vegas, Phoenix Seattle, Portland, San Francisco, Silicon Valley, Los Angeles, San Diego
North America
Mexico City Lima, Bogota Sao Paulo, Rio de Janeiro Santiago, Buenos Aires
Latin America
Oslo, Stockholm, Copenhagen, Helsinki Dublin, Glasgow, Edinburgh, Manchester, Birmingham, London
Brussels, Randstad, Paris, Lyon Hamburg, Berlin, Dusseldorf, Cologne, Frankfurt, Stuttgart, Munich, Zurich, Vienna, Luxembourg Lisbon, Madrid, Barcelona
Milan, Rome, Athens Prague, Budapest, Warsaw, Bucharest, Kiev, Moscow, St Petersburg Istanbul Abu Dhabi, Dubai, Jeddah, Riyadh
Casablanca, Cairo Cape Town, Johannesburg Lagos, Nairobi
EMEA
Seoul, Osaka, Tokyo Beijing, Tianjin, Shanghai, Chengdu, Wuhan, Guangzhou, Shenzhen, Chongqing, Nanjing, Xian, Shenyang Hong Kong, Taipei
Delhi, Kolkata, Mumbai, Hyderabad, Bangalore, Chennai Bangkok, Ho Chi Minh City, Hanoi, Kuala Lumpur, Singapore, Jakarta, Manila Perth, Brisbane, Melbourne, Sydney, Auckland
Asia Pacific 34 48 31
7
City Momentum Index, 2016 13 JLL
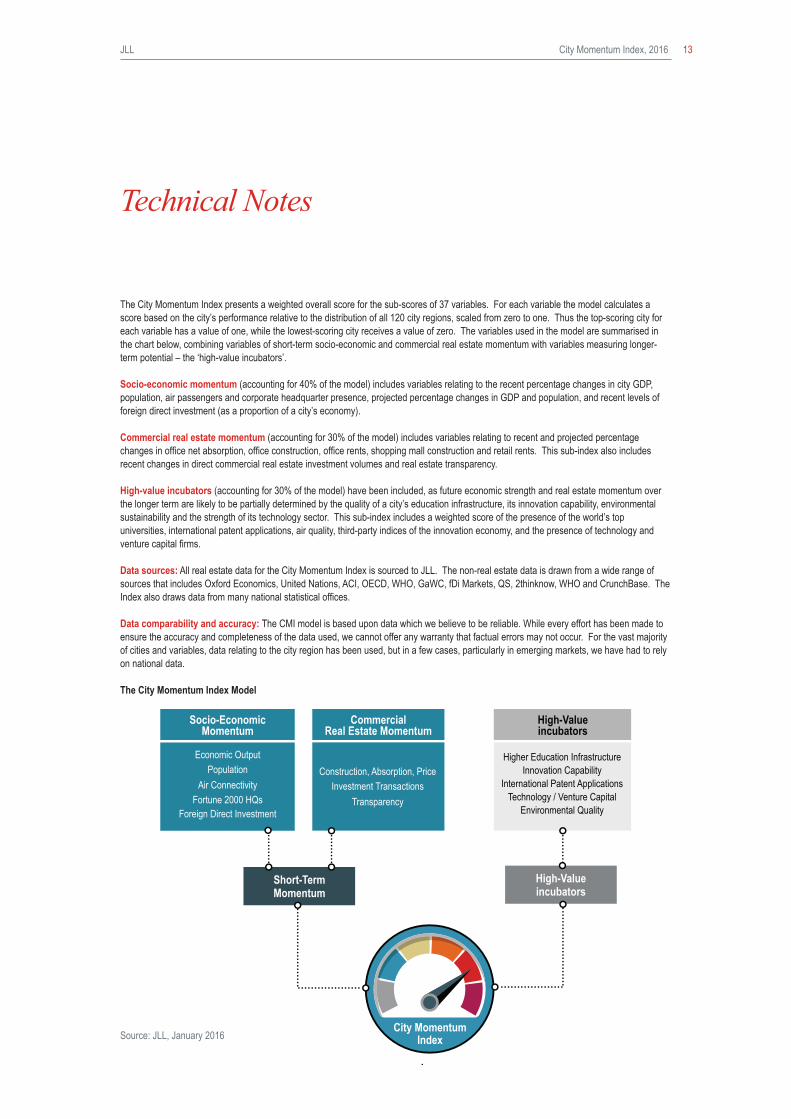
The City Momentum Index presents a weighted overall score for the sub-scores of 37 variables. For each variable the model calculates a score based on the city’s performance relative to the distribution of all 120 city regions, scaled from zero to one. Thus the top-scoring city for each variable has a value of one, while the lowest-scoring city receives a value of zero. The variables used in the model are summarised in the chart below, combining variables of short-term socio-economic and commercial real estate momentum with variables measuring longer-term potential – the ‘high-value incubators’.
Socio-economic momentum (accounting for 40% of the model) includes variables relating to the recent percentage changes in city GDP, population, air passengers and corporate headquarter presence, projected percentage changes in GDP and population, and recent levels of foreign direct investment (as a proportion of a city’s economy).
Commercial real estate momentum (accounting for 30% of the model) includes variables relating to recent and projected percentage changes in office net absorption, office construction, office rents, shopping mall construction and retail rents. This sub-index also includes recent changes in direct commercial real estate investment volumes and real estate transparency.
High-value incubators (accounting for 30% of the model) have been included, as future economic strength and real estate momentum over the longer term are likely to be partially determined by the quality of a city’s education infrastructure, its innovation capability, environmental sustainability and the strength of its technology sector. This sub-index includes a weighted score of the presence of the world’s top universities, international patent applications, air quality, third-party indices of the innovation economy, and the presence of technology and venture capital firms.
Data sources: All real estate data for the City Momentum Index is sourced to JLL. The non-real estate data is drawn from a wide range of sources that includes Oxford Economics, United Nations, ACI, OECD, WHO, GaWC, fDi Markets, QS, 2thinknow, WHO and CrunchBase. The Index also draws data from many national statistical offices.
Data comparability and accuracy: The CMI model is based upon data which we believe to be reliable. While every effort has been made to ensure the accuracy and completeness of the data used, we cannot offer any warranty that factual errors may not occur. For the vast majority of cities and variables, data relating to the city region has been used, but in a few cases, particularly in emerging markets, we have had to rely on national data.
The City Momentum Index Model
Technical Notes
Source: JLL, January 2016
Higher Education Infrastructure Innovation Capability
International Patent Applications Technology / Venture Capital
Environmental Quality
High-Value incubators
Short-Term Momentum
Construction, Absorption, Price Investment Transactions
Transparency
Commercial Real Estate Momentum
Economic Output Population
Air Connectivity Fortune 2000 HQs
Foreign Direct Investment
Socio-Economic Momentum
High-Value incubators
City Momentum Index

COPYRIGHT © JONES LANG LASALLE IP, INC. 2016.This report has been prepared solely for information purposes and does not necessarily purport to be a complete analysis of the topics discussed, which are inherently unpredictable. It has been based on sources we believe to be reliable, but we have not independently verified those sources and we do not guarantee that the information in the report is accurate or complete. Any views expressed in the report reflect our judgment at this date and are subject to change without notice. Statements that are forward-looking involve known and unknown risks and uncertainties that may cause future realities to be materially different from those implied by such forward-looking statements. Advice we give to clients in particular situations may differ from the views expressed in this report. No investment or other business decisions should be made based solely on the views expressed in this report
JLL Regional Headquarters
Chicago200 East Randolph DriveChicago IL 60601USA+1 312 782 5800
London30 Warwick StreetLondon W1B 5NHUnited Kingdom+44 20 7493 4933
Singapore9 Raffles Place#39-00 Republic PlazaSingapore 048619+65 6220 3888
Authors
Jeremy KellyDirector, Global Research+44 (0) 20 3147 1199 [email protected]
Rosemary FeenanHead of Global Research Programmes+44 (0) 20 3147 [email protected]
Contributors
To learn more about cities and real estate visit our websitewww.jll.com/cities-research
Matthew McAuleyGlobal Research+44 20 7852 [email protected]
Lee Fong [email protected]
Shetal Patel [email protected]
Josh Gelormini [email protected]
Craig Plumb [email protected]
William [email protected]