Embed Size (px)
Citation preview

Cities Outlook 2018


1. Urban Britain is faced by stark political divides
2. These divides are mirrored in the economy
£42k
64%
£82k
87%
3. Automation &globalisation may compound these divides
Cities outside the Greater South East are more at risk of losing jobs to automation and globalisation than those within it
29% of jobs at risk by 2030in Mans�eld
13% of jobs at risk by 2030in Oxford
4. How do we bridge the divide?
Empower cities
Empower people
City leaders need the powers and a direct democratic mandate to tackle the speci�c challenges in their place
Both young people about to enter work, and older people at risk of losing their jobs need the relevant skills to succeed in a changing world
£424 £655
GVA per worker
SloughDoncaster
average weekly wage
Hudders�eld Reading
employment rate
Dundee Crawley
54%46%
46%54%
More than half of voters in cities in the Greater South East chose to remain in the EU, but in the rest of the UK, the reverse was true
average weekly wage
employment rate
GVA per worker
Outside the Greater South East
Greater South East
Cities outside the Greater South East tend to be less productive, have a lower average wage and a lower employment rate than cities within it
To reunite urban Britain, policy needs to give both cities and people the tools to succeed
Source: Electoral Commission; ONS 2017, Annual Population Survey, residents analysis, July 2015 - June 2016 and July 2016 - June 2017; DETINI 2017, District Council Area Statistics for Belfast, January 2015 - December 2015 and January 2016 - December 2016 data; ONS 2017, Annual Survey of Hours and Earnings (ASHE), average gross weekly workplace-based earnings, 2017 data; DETINI 2017, Annual Survey of Hours and Earnings (ASHE), average gross weekly workplace-based earnings, 2017 data. Own calculations for PUA-level weighted by number of jobs, CPI inflation adjusted (2015=100). Earnings data is for employees only, whereas the rest of the tables use employment data; ONS 2017, Regional Value Added (Balance Approach), 2016 data. ONS 2017, Business Register and Employment Survey, 2016 data; Nesta 2017, The future of skills: employment in 2030, London: Nesta; ONS 2017, Business Register of Employment Survey; Census 2011.

Centre for Cities
Cities Outlook 2018
“As the pace of technological change rapidly accelerates, Cities Outlook 2018
couldn’t be more relevant. The future of work in UK Cities is a subject that will
dominate local and national level policy making and is of huge importance in
Wakefield and the Key Cities. This report is essential reading for city leaders on
what the impact of these changes could mean, as well as for understanding the
opportunities and challenges that cities will face going ahead.
“This year the Centre for Cities has done an outstanding job in highlighting how at the
policy level cities can continue to attract job growth so to ensure that they remain at
the heart of a strong national economy.”
Cllr Peter Box, Leader, Wakefield Council
“Ways of working in our cities have been changing dramatically. For example: co-
working spaces are no longer the reserve of Shoreditch startups but have sprung up
in every city from London to Belfast; flexible working is becoming the rule rather than
the exception; and young industries like the tech sector are growing at twice the rate
of the wider economy.
“We need to prepare for this change. Reskilling and upskilling must become the
norm, and it’s essential that we equip young people to face the future of work. As
this report highlights, the opportunity is a big one; the UK’s digital economy is worth
$100bn. Resources like the Digital Business Academy already provide free digital
skills training solutions. Now we just need the ambition. We’ve built Tech City. Now
let’s build Tech Nation.”
Gerard Grech, Chief Executive Officer, Tech City UK
“Cities Outlook 2018 gives insight into the future of the UK workforce, to understand
the potential opportunities and risk from the rise of robotics, artificial intelligence and
the other methods of job automation. Bristol and other cities across the UK can use
the advances in technology and globalisation to help raise their productivity, improve
job quality, diversify employment and drive inclusive economic growth.
“This year’s Outlook will be a vital tool for those policy makers who recognise that the
key to facing the national economic challenges ahead is to build upon the strength
and potential of our cities.”
Marvin Rees, Mayor of Bristol

Centre for Cities
Cities Outlook 2018

Contents
01Cities Outlook 2018The State of Urban Britain 1
02The future of work in citiesWhich cities stand to lose or gain? 9
03City MonitorThe latest data 33
Acknowledgements
All views expressed are those of Centre for Cities.
Centre for Cities
Cities Outlook 20181
01Cities Outlook 2018
The State of Urban Britain

Centre for Cities
Cities Outlook 2018 2
Centre for Cities
Cities Outlook 20183
The state of urban Britain in 2018Urban Britain is a divided entity, both in terms of politics and economics. Cities Outlook 2018 shows the extent of these divides, and the implications they have for the future.
Mansfield has broadcast some very clear messages via the ballot box in the last two years. It polled the highest percentage of votes to leave the European Union of any UK city in the EU referendum. And it returned its first non-Labour MP since 1923 in the form of Conservative Ben Bradley in last year’s general election.
There is clearly dissatisfaction among the residents, and the city’s economic performance suggests why this might be the case. In 2017, resident wages were 19 per cent below the national average, while employment rates were lower than the national average too. In much of the recent discussion around ‘left behind’ places, Mansfield is a leading example.
The picture looks very different in Reading where its residents voted to remain in the EU. Resident wages were 18 per cent above the national average, and it saw a swing towards Labour in the last election. And in 2016/17, welfare payments were £1,100 lower for every resident living in Reading compared to Mansfield.
This is a story seen across urban Britain, which is divided both politically and economically. In terms of politics, this can be seen both in the outcomes of the EU referendum and the most recent general election (as shown in Figure 1). In the referendum small and medium sized cities on the coast (such as Southend and Chatham) or in the midlands or the north of England (such as Mansfield and Doncaster) tended to poll a greater share of votes for leave.
A similar geography is seen when looking at the swing towards or away from the Conservative party at the election. The majority of Britain’s cities returned Labour MPs once again. But the swing towards the Conservatives was surprising – cities such as Stoke and Hull, long considered Labour heartlands, saw shifts towards the

Centre for Cities
Cities Outlook 2018 4
Tories. And while many northern cities did see a swing towards Labour, this was smaller than the swing the party enjoyed at the national level.
The economic divides across urban Britain map closely to the political ones (see Figure 2). In terms of wages, welfare spend per capita and employment rates, the patterns tell a story of winners and losers, with southern cities in general being the relative winners. This has come at a cost though (for renters at least, if not homeowners), with housing being much less affordable in southern cities than elsewhere.
Figure1:ThepoliticaldividesacrossurbanBritain
Source: The Electoral Commission 2017
Election 2017 swing to Conservativefrom Labour (England and Wales) or SNP (Scotland) (%)
-9.4 — -5.6
-5.5 — -3.1
-3.0 — 0.0
0.1 — 3.4
3.5 — 16.7
Dundee
EdinburghGlasgow
NewcastleSunderland
Middlesbrough
Hull
York
Leeds
Swansea
Cardiff
Newport
Bristol
Gloucester
Exeter
Plymouth
Portsmouth
Aberdeen
Southampton
Bournemouth BrightonWorthing
SouthendBasildon
Chatham
Crawley
London
Norwich
Ipswich
Peterborough
AldershotReading
Swindon
Oxford
Milton Keynes
Northampton
Luton
Cambridge
Stoke
Telford
BirminghamCoventry
Leicester
Nottingham
Mansfield
Derby
SheffieldDoncaster
Wakefield
Bradford
BirkenheadLiverpool
Wigan
Manchester
Burnley
BlackpoolPrestonBlackburn
Warrington
Barnsley
Slough
Huddersfield
2016 EU Referendum Leave Voters (%)
25.6 - 40.0
40.1 - 50.0
50.1 - 56.0
56.1 - 63.0
63.1 - 70.3

Centre for Cities
Cities Outlook 20185
Figure2:TheeconomicdividesacrossurbanBritain
Source: ONS 2017, Annual Survey of Hours and Earnings (ASHE); NOMIS 2017, Annual Population Survey; Land Registry 2017, Market Trend Data, Price Paid, 2017 data. Simple average used. Scottish neighbourhood statistics 2016, Mean House prices; DWP 2017; HMRC 2017; DCLG 2017; Welsh Government 2017; Scottish Government 2017; NOMIS 2017, Population estimates; ONS 2017, Birth summary tables; National Registers of Scotland 2017, Births by sex, year and council area.
Dundee
EdinburghGlasgow
NewcastleSunderland
Middlesbrough
Hull
York
Leeds
Swansea
Cardiff
Newport
Bristol
Gloucester
Exeter
Plymouth
Portsmouth
Aberdeen
Southampton
Bournemouth BrightonWorthing
SouthendBasildon
Chatham
Crawley
London
Norwich
Ipswich
Peterborough
AldershotReading
Swindon
Oxford
Milton Keynes
Northampton
Luton
Cambridge
Stoke
Telford
BirminghamCoventry
Leicester
Nottingham
Mansfield
Derby
SheffieldDoncaster
Wakefield
Bradford
BirkenheadLiverpool
Wigan
Manchester
Burnley
BlackpoolPrestonBlackburn
Warrington
Barnsley
Slough
Huddersfield
Welfare per capita, 2016/17 (£)
2,105 - 2.649
2,650 - 2,983
2,984 - 3,298
3,299 - 3,710
3,711 - 4,348
Dundee
EdinburghGlasgow
NewcastleSunderland
Middlesbrough
Hull
York
Leeds
Swansea
Cardiff
Newport
Bristol
Gloucester
Exeter
Plymouth
Portsmouth
Aberdeen
Southampton
Bournemouth BrightonWorthing
SouthendBasildon
Chatham
Crawley
London
Norwich
Ipswich
Peterborough
AldershotReading
Swindon
Oxford
Milton Keynes
Northampton
Luton
Cambridge
Stoke
Telford
BirminghamCoventry
Leicester
Nottingham
Mansfield
Derby
SheffieldDoncaster
Wakefield
Bradford
BirkenheadLiverpool
Wigan
Manchester
Burnley
BlackpoolPrestonBlackburn
Warrington
Barnsley
Slough
Huddersfield
Employment rate, 2016/17 (%)
64.1 - 67.9
68.0 - 72.0
72.1 - 75.0
75.1 - 80.0
80.1 - 86.6
399 - 443
444 - 478
479 - 508
509 - 556
557 - 679
Dundee
EdinburghGlasgow
Newcastle
Sunderland
Middlesbrough
Hull
York
Leeds
Swansea
Cardiff
Newport
Bristol
Gloucester
Exeter
Plymouth
Portsmouth
Aberdeen
Southampton
Bournemouth BrightonWorthing
SouthendBasildon
Chatham
Crawley
London
Norwich
Ipswich
Peterborough
AldershotReading
Swindon
Oxford
Milton Keynes
Northampton
Luton
Cambridge
Stoke
Telford
BirminghamCoventry
Leicester
Nottingham
Mansfield
Derby
SheffieldDoncaster
Wakefield
Bradford
BirkenheadLiverpool
Wigan
Manchester
Burnley
BlackpoolPrestonBlackburn
Warrington
Barnsley
Slough
Huddersfield
Weekly resident wages, 2017 (£)
4.2 - 6.2
6.3 - 7.8
7.9 - 9.9
10.0 - 12.7
12.8 - 17.3
Housing affordability ratio, 2017
Dundee
EdinburghGlasgow
NewcastleSunderland
Middlesbrough
Hull
York
Leeds
Swansea
Cardiff
Newport
Bristol
Gloucester
Exeter
Plymouth
Portsmouth
Aberdeen
Southampton
Bournemouth BrightonWorthing
SouthendBasildon
Chatham
Crawley
London
Norwich
Ipswich
Peterborough
AldershotReading
Swindon
Oxford
Milton Keynes
Northampton
Luton
Cambridge
Stoke
Telford
BirminghamCoventry
Leicester
Nottingham
Mansfield
Derby
SheffieldDoncaster
Wakefield
Bradford
BirkenheadLiverpool
Wigan
Manchester
Burnley
BlackpoolPrestonBlackburn
Warrington
Barnsley
Slough
Huddersfield

Centre for Cities
Cities Outlook 2018 6
Whyeconomicdividesexistacrossthecountry
One of the main reasons for these differences in economic outcomes is the differing productivity – the average output of each worker - across the country. While the UK’s productivity woes have been subject to a great deal of comment and analysis in recent years, there has been much less consideration of how this plays out across the country and the implications for the national picture.
Centre for Cities analysis1 has shown that the country’s productivity problems are the result of the underperformance of many cities outside the Greater South East of England. While cities such as London and Reading are among the most productive in Europe, cities such as Leicester and Sheffield perform well below the European average.2 This means that a big part of improving the productivity of the UK as a whole will need to address the poor productivity in these cities.
How well politicians do this will depend in part on how well they use the tools made available to them in the most recent Budget and the Industrial Strategy. Both unveiled a number of helpful place-based initiatives, including new devolution and growth deals and funds designed to tackle the challenges that different cities face, such as the Transforming Cities Fund for local transport. The six metro mayors were also given extra tools and funding to support their economies.
But neither the Budget nor the Industrial Strategy set out with enough clarity the overarching role of place in explaining the UK’s productivity challenges. The productivity divergence seen across the country is the result of the different advantages that cities offer to businesses. Those cities that struggle economically tend to offer many lower-skilled workers and cheap land to businesses, but they don’t offer access to a large number of higher-skilled workers or a network of higher-skilled businesses. The result is that while many have been successful at attracting investment from call centres and distribution warehouses, for example, they have struggled over a long period of time to attract investment from more productive, innovation-focused firms.
1 Swinney P & Breach A (2017) The role of place in the UK’s productivity problem, London: Centre for Cities
2 Bessis H (2016) Competing with the Continent: How UK cities compare with their European counterparts, London: Centre for Cities

Centre for Cities
Cities Outlook 20187
Without this clear overarching strategy, there is a lack of coherence to the many initiatives announced. This makes tackling the underperformance of a number of cities, and the impact this has on national productivity, a much more difficult task.
That said, the commitment within the national strategy to create local industrial strategies offers a chance to address this. The ability of the local industrial strategies to set out a coordinated set of actions to deal with the challenges and opportunities their areas face will make or break the success of the national strategy overall.
A successful local industrial strategy will be one that is able to change a city’s offer to businesses across a range of sectors, with the result being an increase in higher paid, more productive jobs in that city.
Devolutionandlocalleadership
Over the last 12 months there has been increased variation in the way England is governed. Last May six metro mayors took office for the first time, with some powers over skills, planning and transport in particular. Along with the Mayor of London, they now have a mandate which covers one third of England’s population. And while their powers are limited, they are already expanding.
A number of announcements in the last Budget and Industrial Strategy showed a clear preferencing of metro mayors, for example the direct allocations of money to the mayors from the Transforming Cities Fund (while other cities will have to compete for money) and the invitation to Greater Manchester to be the first place to agree a local industrial strategy.
This once again shows that the original devolution deals that the Government struck with particular areas are likely to be the first of many, and have opened the door to further rounds of devolution and access to national funding. This means that those big cities that have not been able to agree an initial deal, such as Leeds and Nottingham, are increasingly being left behind.
A key achievement for national and local policymakers in 2018 would be to secure devolution deals for the remaining big cities that do not have one in place. Cities have long been restricted by the centralised nature of the UK,
Centre for Cities
Cities Outlook 2018 8
and this has limited their ability to tailor policy to respond to the ongoing changes seen in the national and global economies. The variation seen across the country (as shown in the maps above) reduces the effectiveness of blanket national policies which invariably fail to address the different challenges that places face. But those places with a metro mayor now have the ability to tailor policy to do just this.
Urban Britain in 2018 is one characterised by its divides, and as we show in the next chapter, these divides are likely to widen without sufficient policy intervention. Variation in outcomes across cities requires variation in policy. This requires the recognition of the crucial role that place plays in this, be that through national policies such as the Industrial Strategy delivered locally, or more local control through greater devolution.
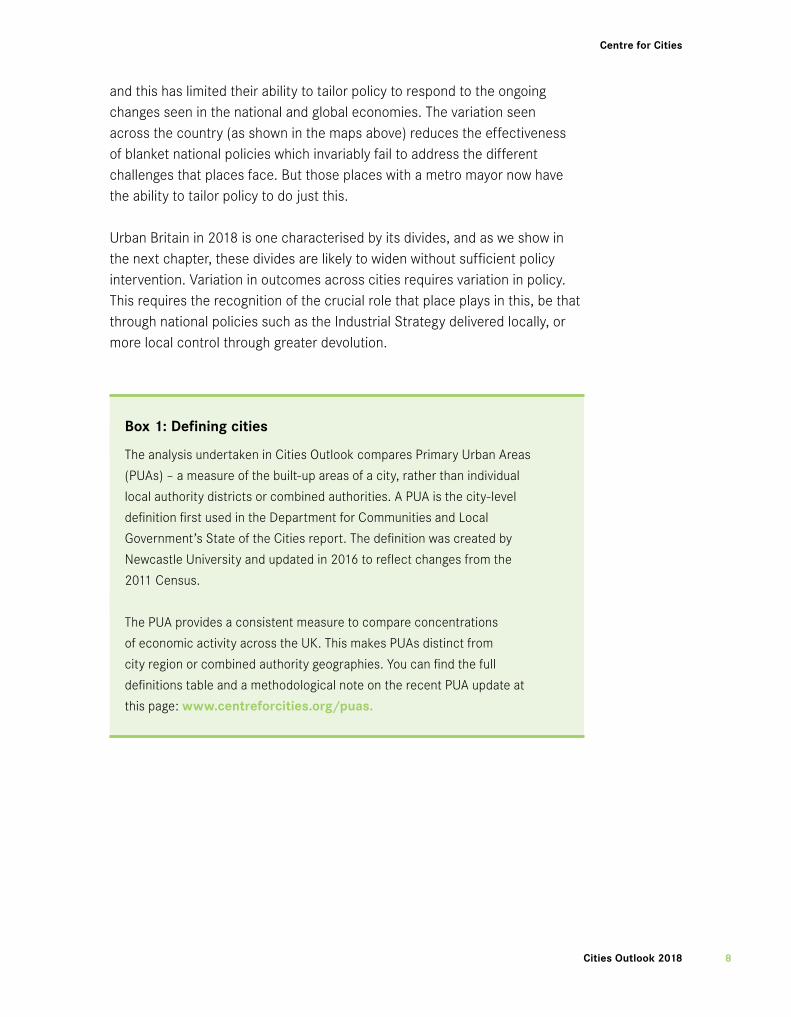
Box1:Definingcities
The analysis undertaken in Cities Outlook compares Primary Urban Areas
(PUAs) – a measure of the built-up areas of a city, rather than individual
local authority districts or combined authorities. A PUA is the city-level
definition first used in the Department for Communities and Local
Government’s State of the Cities report. The definition was created by
Newcastle University and updated in 2016 to reflect changes from the
2011 Census.
The PUA provides a consistent measure to compare concentrations
of economic activity across the UK. This makes PUAs distinct from
city region or combined authority geographies. You can find the full
definitions table and a methodological note on the recent PUA update at
this page: www.centreforcities.org/puas.

Centre for Cities
Cities Outlook 20189
02The future of work in cities
Which cities stand to lose or gain?

Centre for Cities
Cities Outlook 2018 10

Centre for Cities
Cities Outlook 201811
The future of work in UK citiesArtificial intelligence, automation and other technological changes are among the biggest economic issues of our age. They featured in the opening remarks of the Chancellor’s recent Budget speech and are identified as one of the ‘Grand Challenges’ in the Government's new Industrial Strategy.
“The world is on the brink of a technological revolution. One that will change the way we
work and live and transform our living standards for generations to come. And we face a
choice: either we embrace the future, seize the opportunities which lie within our grasp
and build on Britain’s great global success story, or reject change and turn inwards to
the failed and irrelevant dogmas of the past.”
PhilipHammond,Budgetspeech2017
In contrast to the Chancellor’s bullish tone, much of the focus of the debate around automation and technological change to date has been on the potential job losses these trends are likely to cause. Yet much less work has been done on the impact of current technological and non-technological trends on different places across the country and their potential to create jobs for the future.
By 2030, technological advancements - combined with globalisation and changes to the make-up of the country’s population - will have brought significant changes into the labour market, with big implications for policy-makers. However, a point that is often missed is that this change is not new, but an ongoing process. Indeed change has been a good thing, bringing with it innovations and improvements in standards of living.
Centre for Cities
Cities Outlook 2018 12
But as this chapter will show, the problem with the policy response to change in recent decades is that it has not effectively supported all cities to adapt to this ongoing evolution. This means that some people and places have benefited more from this evolution than others.
To inform discussions at the national and local level, this chapter looks at the likely impact of automation and other trends on cities across Great Britain, identifying where job losses are most likely and which places are best placed to see growth in new areas.
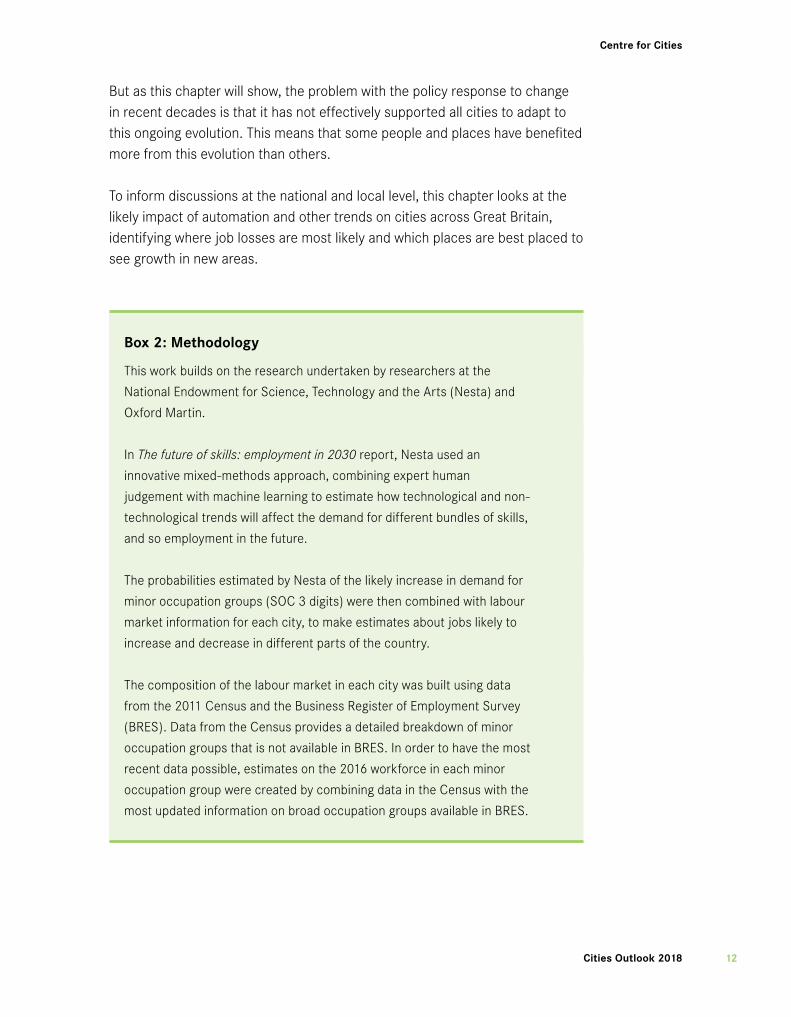
Box2:Methodology
This work builds on the research undertaken by researchers at the
National Endowment for Science, Technology and the Arts (Nesta) and
Oxford Martin.
In The future of skills: employment in 2030 report, Nesta used an
innovative mixed-methods approach, combining expert human
judgement with machine learning to estimate how technological and non-
technological trends will affect the demand for different bundles of skills,
and so employment in the future.
The probabilities estimated by Nesta of the likely increase in demand for
minor occupation groups (SOC 3 digits) were then combined with labour
market information for each city, to make estimates about jobs likely to
increase and decrease in different parts of the country.
The composition of the labour market in each city was built using data
from the 2011 Census and the Business Register of Employment Survey
(BRES). Data from the Census provides a detailed breakdown of minor
occupation groups that is not available in BRES. In order to have the most
recent data possible, estimates on the 2016 workforce in each minor
occupation group were created by combining data in the Census with the
most updated information on broad occupation groups available in BRES.
Centre for Cities
Cities Outlook 201813
Citiesandtheriskofjoblosses
Thejobmarketwilllookverydifferentin2030.As Nesta identifies in The future of skills: employment in 2030, a number of factors, such as technological changes, globalisation and demographic changes will affect employment, reducing demand for some occupations and increasing it for others. Generally, those jobs that are made up of routine tasks are at a greater risk of decline, whereas those occupations requiring interpersonal and cognitive skills are well placed to grow.
Nesta’s study looks at the likely impact for the UK as a whole and finds that there are likely to be more jobs nationally in 2030 than today. But this is likely to play out differently across the country. In what follows, Nesta’s estimates are applied to Britain’s cities to see how these impacts are likely to be felt in different places. Box 2 outlines the methodology used.
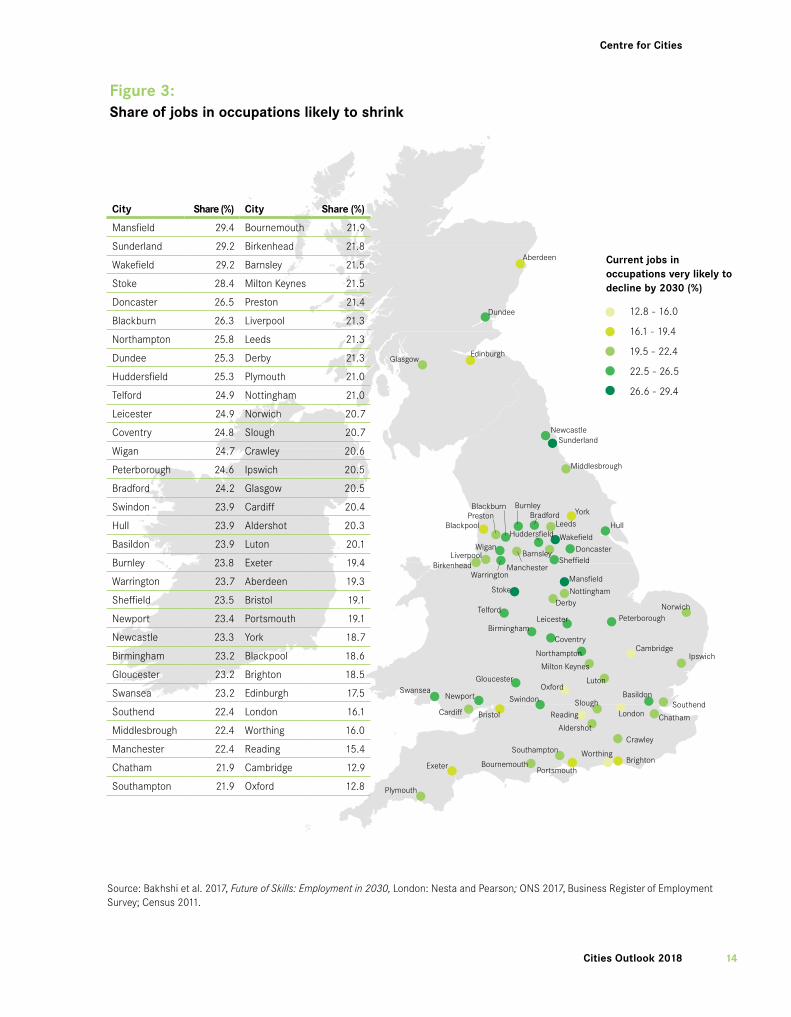
Overall,oneinfivejobsincitiesacrossGreatBritainisinanoccupationthatisverylikelytoshrink. This amounts to approximately 3.6 million jobs, or 20.2 per cent of the current workforce in cities.
However,theriskisnotevenlyspreadacrossthecountry,andcitiesoutsidethesouthofEnglandaremoreexposedtojoblosses. In places like Mansfield, Sunderland, Wakefield and Stoke almost 30 per cent of the current workforce is in an occupation very likely to shrink by 2030. This contrasts with cities such as Cambridge and Oxford where less than 15 per cent of jobs are at risk (see Figure 3).
Box3:Displacementinbigcities
While big cities are relatively less exposed to occupations likely to shrink,
they are likely to see a great deal of disruption. For example, London and
Worthing have a similar share of jobs likely to see a decrease in demand
(16.1 per cent in London, 16.0 per cent in Worthing), but this translates to
around 908,000 jobs in London – 25 per cent of all jobs at risk in cities
across Great Britain – and only 8,400 jobs in Worthing, which is just 0.2
per cent of all jobs at risk in cities.
Centre for Cities
Cities Outlook 2018 14
Figure3:Shareofjobsinoccupationslikelytoshrink
Dundee
EdinburghGlasgow
NewcastleSunderland
Middlesbrough
Hull
York
Leeds
Swansea
Cardiff
Newport
Bristol
Gloucester
Exeter
Plymouth
Portsmouth
Aberdeen
Southampton
Bournemouth BrightonWorthing
SouthendBasildon
Chatham
Crawley
London
Norwich
Ipswich
Peterborough
Aldershot
Reading
Swindon
Oxford
Milton Keynes
Northampton
Luton
Cambridge
Stoke
Telford
BirminghamCoventry
Leicester
Nottingham
Mansfield
Derby
SheffieldDoncaster
Wakefield
Bradford
BirkenheadLiverpool
Wigan
Manchester
Burnley
BlackpoolPrestonBlackburn
Warrington
Barnsley
Slough
Huddersfield
12.8 - 16.0
16.1 - 19.4
19.5 - 22.4
22.5 - 26.5
26.6 - 29.4
Current jobs in occupations very likely to decline by 2030 (%)
Source: Bakhshi et al. 2017, Future of Skills: Employment in 2030, London: Nesta and Pearson; ONS 2017, Business Register of Employment Survey; Census 2011.
City Share(%) City Share(%)
Mansfield 29.4 Bournemouth 21.9
Sunderland 29.2 Birkenhead 21.8
Wakefield 29.2 Barnsley 21.5
Stoke 28.4 Milton Keynes 21.5
Doncaster 26.5 Preston 21.4
Blackburn 26.3 Liverpool 21.3
Northampton 25.8 Leeds 21.3
Dundee 25.3 Derby 21.3
Huddersfield 25.3 Plymouth 21.0
Telford 24.9 Nottingham 21.0
Leicester 24.9 Norwich 20.7
Coventry 24.8 Slough 20.7
Wigan 24.7 Crawley 20.6
Peterborough 24.6 Ipswich 20.5
Bradford 24.2 Glasgow 20.5
Swindon 23.9 Cardiff 20.4
Hull 23.9 Aldershot 20.3
Basildon 23.9 Luton 20.1
Burnley 23.8 Exeter 19.4
Warrington 23.7 Aberdeen 19.3
Sheffield 23.5 Bristol 19.1
Newport 23.4 Portsmouth 19.1
Newcastle 23.3 York 18.7
Birmingham 23.2 Blackpool 18.6
Gloucester 23.2 Brighton 18.5
Swansea 23.2 Edinburgh 17.5
Southend 22.4 London 16.1
Middlesbrough 22.4 Worthing 16.0
Manchester 22.4 Reading 15.4
Chatham 21.9 Cambridge 12.9
Southampton 21.9 Oxford 12.8

Centre for Cities
Cities Outlook 201815
Box4: Whattypesofjobsareatrisk?
The majority of jobs at risk are in a handful of occupations. Nesta identified
36 minor occupation groups likely to shrink in the future, but 53 per cent of
all jobs at risk in cities are just in five occupations (see Figure 4).
Figure4:
Occupationsrepresentingthemajorityofalljobsatriskofdisplacement
MinoroccupationgroupShareofalljobsatrisk
incities(%)
1. Sales assistants and retail cashiers 19.5
2. Other administrative occupations 11.0
3. Customer service occupations 9.0
4. Administrative occupations: finance 7.0
5. Elementary storage occupations 6.6
Source: Bakhshi et al. 2017, Future of Skills: Employment in 2030, London: Nesta and Pearson; ONS 2017, Business Register of Employment Survey; Census 2011.
Sales assistants and retail cashiers is the occupation group most at
risk – as a whole, one in five urban jobs in this occupation is deemed at
risk of displacement. And it is the most at risk occupation in all but three
cities, with only Exeter (where 21.2 per cent of jobs at risk are in customer
services occupations) and Milton Keynes and Wakefield (where the biggest
share of jobs at risk is in elementary storage occupations -16.9 per cent
and 17.9 per cent respectively - reflecting their large distribution sectors)
proving the exceptions.
Other at-risk occupations are also notable in a handful of other cities.
In Oxford and Swindon, assemblers and routine operatives make up a
significant share of all jobs at risk (respectively 10.4 per cent and 9.8 per
cent). In Aberdeen, plant and machine operatives account for 7.4 per cent
of all jobs likely to see a decrease in demand and in Huddersfield, process
operatives represent 10.7 per cent of all jobs at risk.
Overall though, in most cities, jobs at risk are concentrated in a small
number of occupations. 70.2 per cent of all jobs at risk in Worthing are in
just five occupations, and even in Aberdeen – the city where the top five
occupations make up the lowest share of jobs at risk– they still represent
44.1 per cent of all jobs at risk.

Centre for Cities
Cities Outlook 2018 16
Today’sweakestperformingcitiesarealsothosemostexposedtotheriskofjoblossesinthefuture. Mansfield, Stoke, Doncaster and Blackburn not only feature among the top 10 cities where jobs are most at risk, but they are also among the bottom 10 cities in terms of productivity (GVA per worker). In contrast, Oxford, London and Reading, the three cities with the lowest share of jobs likely to shrink, are among the most productive cities of Great Britain (see Figure 5).
Cities with a higher risk of job losses also tend to have a higher welfare spend per capita (see Figure 5),a lower share of jobs in knowledge intensive business services (KIBS) and a lower share of high-skilled workers.
Figure5:Therelationshipbetweenjobsatriskofdecline,productivityperworker(left)andwelfarespendpercapita(right)
Source: Bakhshi et al. 2017, Future of Skills: Employment in 2030, London: Nesta and Pearson; ONS 2017, Business Register of Employment Survey; Census 2011; ONS, Regional Gross Value Added (Income Ap-proach) NUTS3 Tables; NOMIS, Mid-year population estimates, Centre for Cities calculations; DWP; HMRC; DCLG; Welsh Government; Scottish Government; NOMIS, Population estimates, ONS, Birth summary tables; National Registers of Scotland, Births by sex, year and council area.
0
5
10
15
20
25
30
35
30,000
Jobs
at
risk
of
decl
ine,
201
6 (%
)
GVA per worker, 2016 (£)
0
5
10
15
20
25
30
35
1,500 2,000 2,500 3,000 3,500 4,000 4,500
Jobs
at
risk
of
decl
ine,
201
6 (%
)
Welfare spend per capita, 2016/17 (£)
50,000 70,000 90,000
Centre for Cities
Cities Outlook 201817
Citiesandpasttrendsinthelabourmarket
While the potential job losses set out will pose a challenge, history shows that cities were exposed to a similar risk of job losses a hundred years ago resulting from both automation and globalisation. Despite this, most have been able to bounce back and grow.
Automationhasalonghistoryofreshapingthewaypeoplework.The impact of automation and the political reaction to it stretch back to the nineteenth century with the Luddite protests against the introduction of machines into the textile industry.
Citiesarenomoreatriskofautomationtodaythantheywereahundredyearsago. Data from 1911 suggests that, in aggregate, a number of occupations that employed many people a century ago have almost disappeared as a result of machines. For example, laundry workers have mostly been replaced by washing machines and demand for domestic servants has fallen with the rise of electrical domestic appliances. Automation and innovation have also changed the way people shop, and the creation of large supermarkets means that street sellers in city centres or milk floats gliding down residential streets at dawn are a rare sight today.
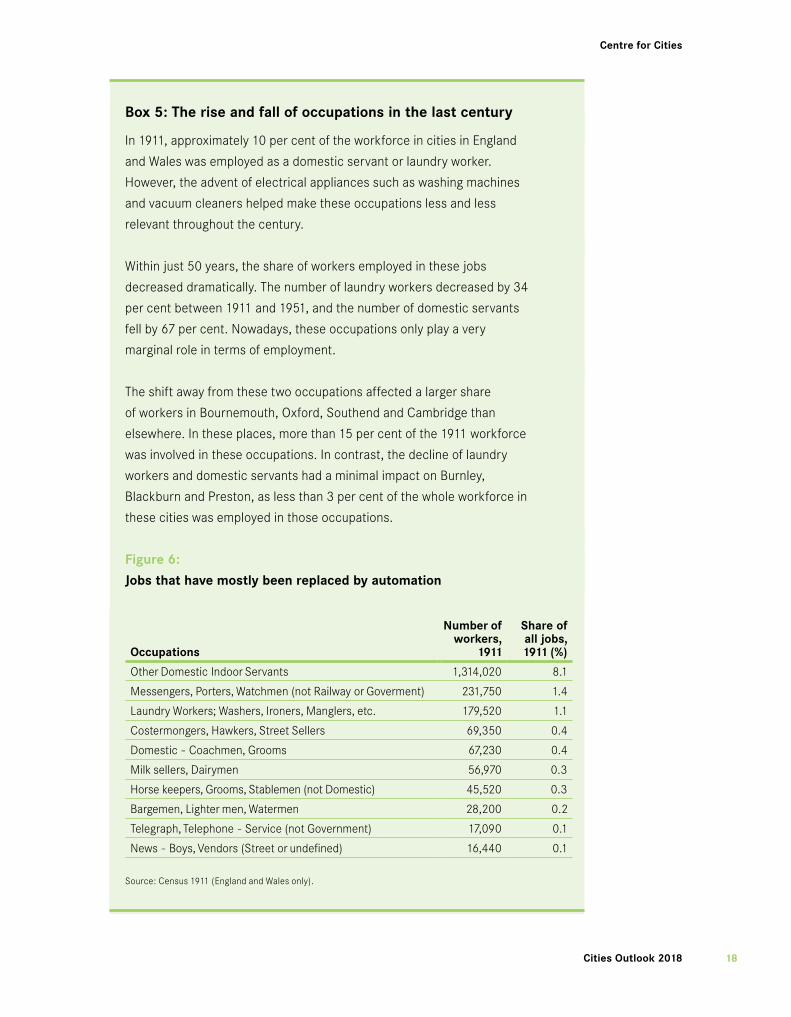
By picking out a selection of these occupations (see Box 5), it emerges that the current challenges faced by cities are not so different from those faced a century ago. As an illustration, these occupations alone (listed in Figure 6) used to employ around 12.4 per cent of the total English and Welsh workforce in 1911. Given that this is just a subset of affected occupations, the total share of jobs affected by automation is likely to have been even higher.
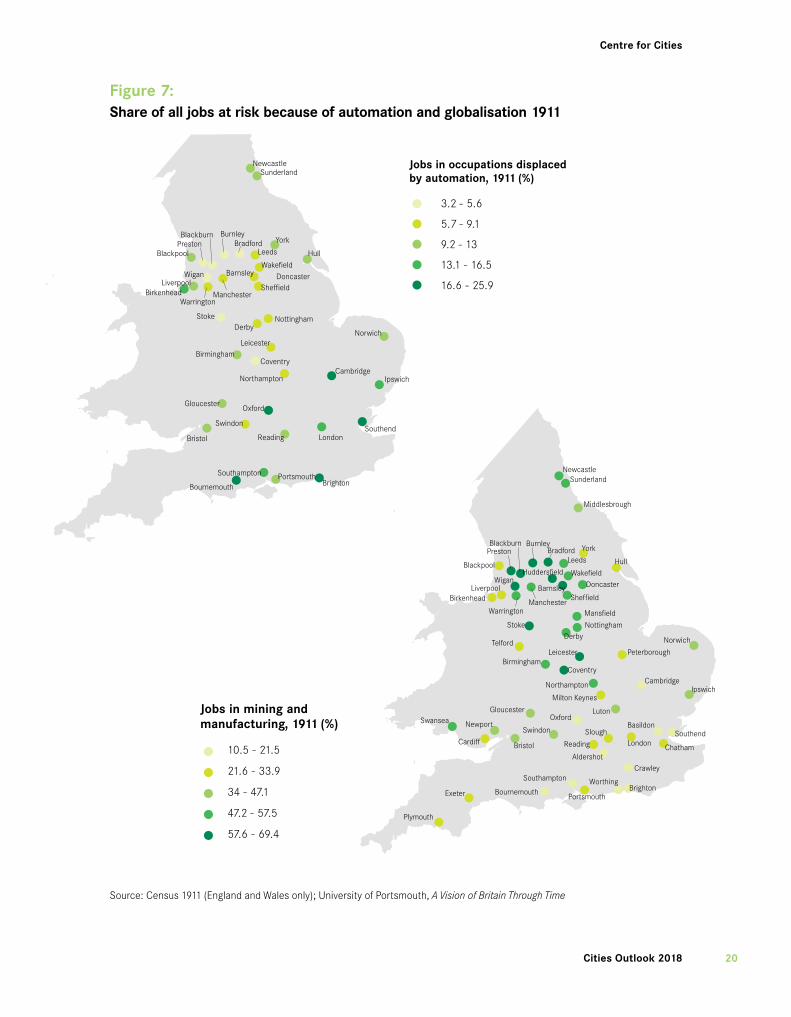
Interestingly, as Figure 7 shows, it was southern cities that were most exposed to automation of these sectors. In Bournemouth, Oxford and Brighton the share of the workforce affected by those changes was above 20 per cent. In contrast, that share was less than 5 per cent in Burnley, Blackburn and Preston.
Globalisation also had a big impact on the labour market, and on mining and manufacturing in particular. Unlike the pattern for automation, it was cities further north that were more exposed to this (see Figure 7). In 1911, 60 per cent of jobs in Barnsley were in mining and manufacturing, while in Coventry it was 61 per cent. A century later it was 13 and 11 per cent respectively.
Centre for Cities
Cities Outlook 2018 18
Box5:Theriseandfallofoccupationsinthelastcentury
In 1911, approximately 10 per cent of the workforce in cities in England
and Wales was employed as a domestic servant or laundry worker.
However, the advent of electrical appliances such as washing machines
and vacuum cleaners helped make these occupations less and less
relevant throughout the century.
Within just 50 years, the share of workers employed in these jobs
decreased dramatically. The number of laundry workers decreased by 34
per cent between 1911 and 1951, and the number of domestic servants
fell by 67 per cent. Nowadays, these occupations only play a very
marginal role in terms of employment.
The shift away from these two occupations affected a larger share
of workers in Bournemouth, Oxford, Southend and Cambridge than
elsewhere. In these places, more than 15 per cent of the 1911 workforce
was involved in these occupations. In contrast, the decline of laundry
workers and domestic servants had a minimal impact on Burnley,
Blackburn and Preston, as less than 3 per cent of the whole workforce in
these cities was employed in those occupations.
Figure6:
Jobsthathavemostlybeenreplacedbyautomation
Occupations
Numberofworkers,
1911
Shareofalljobs,1911(%)
Other Domestic Indoor Servants 1,314,020 8.1
Messengers, Porters, Watchmen (not Railway or Goverment) 231,750 1.4
Laundry Workers; Washers, Ironers, Manglers, etc. 179,520 1.1
Costermongers, Hawkers, Street Sellers 69,350 0.4
Domestic - Coachmen, Grooms 67,230 0.4
Milk sellers, Dairymen 56,970 0.3
Horse keepers, Grooms, Stablemen (not Domestic) 45,520 0.3
Bargemen, Lighter men, Watermen 28,200 0.2
Telegraph, Telephone - Service (not Government) 17,090 0.1
News - Boys, Vendors (Street or undefined) 16,440 0.1
Source: Census 1911 (England and Wales only).

Centre for Cities
Cities Outlook 201819
Box6:Definingoccupationsin1911
The 1911 Census has detailed data on occupations for administrative areas
with populations over 5,000. To understand how history has affected the
performance of modern cities, this data was matched to current Primary
Urban Area boundaries. In most instances, data is available for the core
urban authority only, while some cities have no data available. In total, it
was possible to look at 40 cities across England.
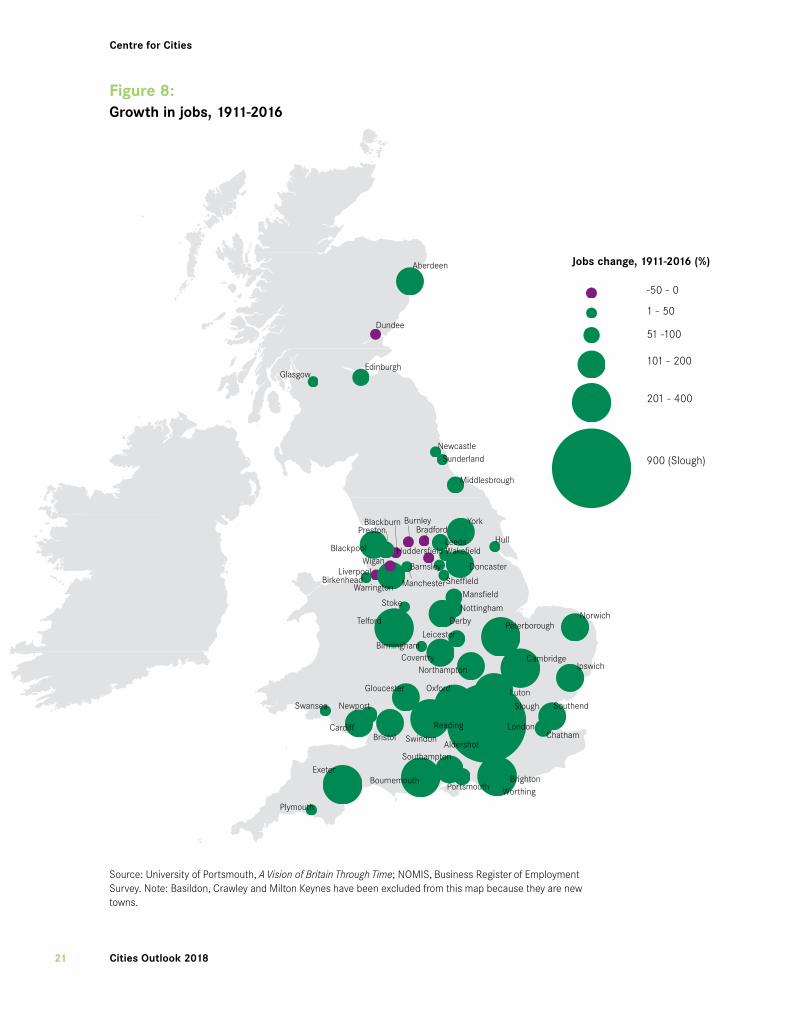
Butcrucially,despitethepressuresofautomationandglobalisation,mostcitieshaveseenjobsgrowthoverthelastcentury(see Figure 8). 52 cities have more jobs now than they used to in 1911; and 27 cities more than doubled their workforce. Meanwhile seven cities have seen a decline in jobs over time.3 There is a clear geography to this, with southern cities growing more than cities in the north.
3 The new towns of Crawley, Basildon and Milton Keynes have been excluded from the analysis as they had a very small number of jobs to start with in 1911.
Centre for Cities
Cities Outlook 2018 20
Figure7:Shareofalljobsatriskbecauseofautomationandglobalisation1911
NewcastleSunderland
Hull
York
Leeds
Bristol
Gloucester
Southampton
Bournemouth BrightonPortsmouth
SouthendLondon
Norwich
Ipswich
Reading
Swindon
Oxford
NorthamptonCambridge
Stoke
BirminghamCoventry
Leicester
NottinghamDerby
SheffieldDoncaster
Wakefield
Bradford
BirkenheadLiverpool
Wigan
Manchester
Burnley
BlackpoolPrestonBlackburn
Warrington
Barnsley
Jobs in occupations displacedby automation, 1911 (%)
3.2 - 5.6
5.7 - 9.1
9.2 - 13
13.1 - 16.5
16.6 - 25.9
NewcastleSunderland
Middlesbrough
Hull
York
Leeds
Swansea
Cardiff
Newport
Bristol
Gloucester
Exeter
Plymouth
Portsmouth
Southampton
Bournemouth BrightonWorthing
SouthendBasildon
Chatham
Crawley
London
Norwich
Ipswich
Peterborough
Aldershot
Reading
Swindon
Oxford
Milton Keynes
Northampton
Luton
Cambridge
Stoke
Telford
BirminghamCoventry
Leicester
Nottingham
Mansfield
Derby
Sheffield
DoncasterWakefield
Bradford
BirkenheadLiverpool
Wigan
Manchester
Burnley
Blackpool
PrestonBlackburn
Warrington
Barnsley
Slough
Huddersfield
Jobs in mining and manufacturing, 1911 (%)
10.5 - 21.5
21.6 - 33.9
34 - 47.1
47.2 - 57.5
57.6 - 69.4
Source: Census 1911 (England and Wales only); University of Portsmouth, A Vision of Britain Through Time
Centre for Cities
Cities Outlook 201821
Figure8:Growthinjobs,1911-2016
Source: University of Portsmouth, A Vision of Britain Through Time; NOMIS, Business Register of Employment Survey. Note: Basildon, Crawley and Milton Keynes have been excluded from this map because they are new towns.
1 - 50
51 -100
101 - 200
201 - 400
900 (Slough)
Jobs change, 1911-2016 (%)
-50 - 0
Dundee
EdinburghGlasgow
NewcastleSunderland
Middlesbrough
Hull
York
Leeds
Swansea
Cardiff
Newport
Bristol
Gloucester
Exeter
Plymouth
Portsmouth
Aberdeen
Southampton
Bournemouth BrightonWorthing
SouthendSlough
ChathamLondon
Norwich
Ipswich
Peterborough
Aldershot
Reading
Swindon
Oxford
Northampton
Luton
Cambridge
Stoke
Telford
BirminghamCoventry
Leicester
Nottingham
Mansfield
Derby
Sheffield
Doncaster
Wakefield
Bradford
BirkenheadLiverpool
Wigan
Manchester
Burnley
Blackpool
PrestonBlackburn
Warrington
Barnsley
Huddersfield
Centre for Cities
Cities Outlook 2018 22
Citiesandjobslikelytoseeanincreaseindemandto2030
Ashashappenedoverthelastcentury,thelabourmarketwillcontinuetoevolve-newoccupationswillariseandsomeoccupationsthatalreadyexistwillbecomeincreasinglyimportant.
It is hard to anticipate what the jobs of the future will look like and where in the country they will be created. However, what can be observed is where the jobs likely to experience an increase in demand are currently located, showing how successful cities have been at attracting these jobs to date, with implications for their ability to continue to do so in the future.
Allcitiesarelikelytoseejobcreationto2030Looking at the locations of jobs that Nesta predicts will grow in the future shows that these occupations are currently more evenly spread across the country than those at risk of decline. With the exceptions of Oxford, Cambridge and Brighton, where the share of jobs likely to grow is slightly higher, these occupations currently account for between 5 and 10 per cent of all jobs. And there is no particular geography to these figures. This suggests that all are well placed to see job creation occur in their economies in the future.
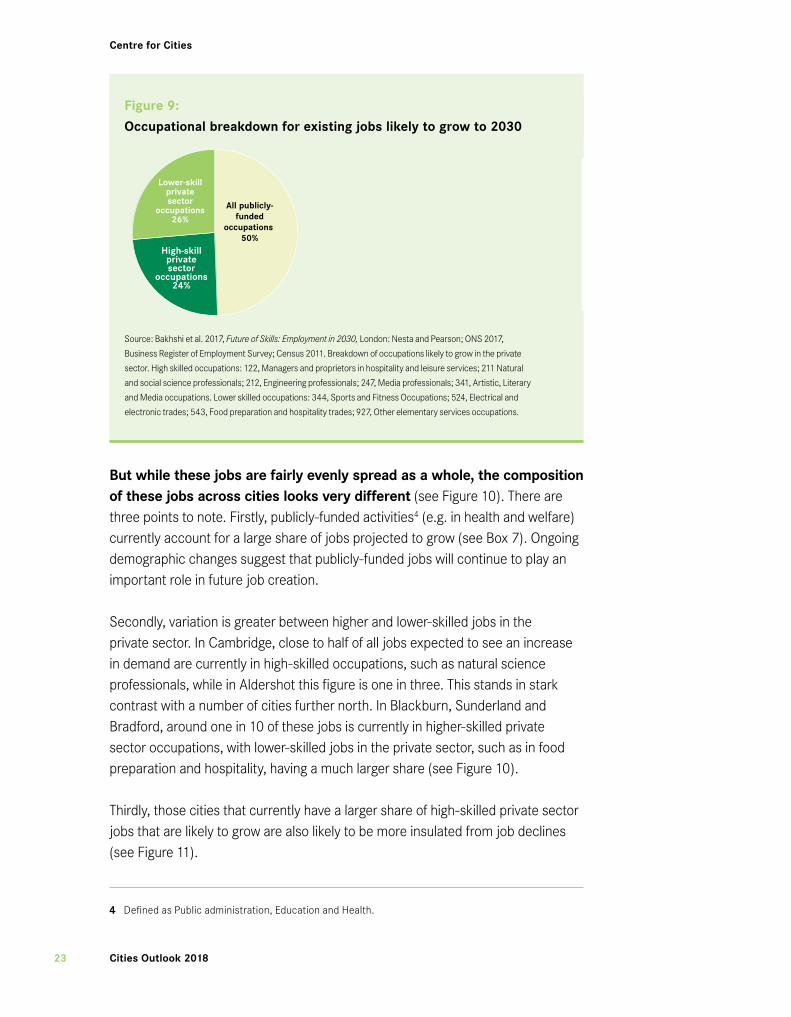
Box7:Thecurrentcompositionofjobslikelytogrowinthefuture
Half of the jobs very likely to experience an increase in demand
according to Nesta’s estimations are currently in publicly-funded
occupations, whereas the remaining fifty per cent is almost evenly
divided into high-skilled and lower-skilled private sector occupations (see
Figure 9).
Growing demand for publicly-funded activities in the future is driven by
demographic shifts and expectations around increased demand for lifelong
learning, with an impact on higher-skilled public sector occupations.
Demand will not just grow for high-skilled jobs though - some non-routine
lower-skilled jobs in the private sector are also expected to grow as a result
of increased demand for services in areas such as sports and fitness.
Centre for Cities
Cities Outlook 201823
Figure9:
Occupationalbreakdownforexistingjobslikelytogrowto2030
Source: Bakhshi et al. 2017, Future of Skills: Employment in 2030, London: Nesta and Pearson; ONS 2017,
Business Register of Employment Survey; Census 2011. Breakdown of occupations likely to grow in the private
sector. High skilled occupations: 122, Managers and proprietors in hospitality and leisure services; 211 Natural
and social science professionals; 212, Engineering professionals; 247, Media professionals; 341, Artistic, Literary
and Media occupations. Lower skilled occupations: 344, Sports and Fitness Occupations; 524, Electrical and
electronic trades; 543, Food preparation and hospitality trades; 927, Other elementary services occupations.
Butwhilethesejobsarefairlyevenlyspreadasawhole,thecompositionofthesejobsacrosscitieslooksverydifferent (see Figure 10). There are three points to note. Firstly, publicly-funded activities4 (e.g. in health and welfare) currently account for a large share of jobs projected to grow (see Box 7). Ongoing demographic changes suggest that publicly-funded jobs will continue to play an important role in future job creation.
Secondly, variation is greater between higher and lower-skilled jobs in the private sector. In Cambridge, close to half of all jobs expected to see an increase in demand are currently in high-skilled occupations, such as natural science professionals, while in Aldershot this figure is one in three. This stands in stark contrast with a number of cities further north. In Blackburn, Sunderland and Bradford, around one in 10 of these jobs is currently in higher-skilled private sector occupations, with lower-skilled jobs in the private sector, such as in food preparation and hospitality, having a much larger share (see Figure 10).
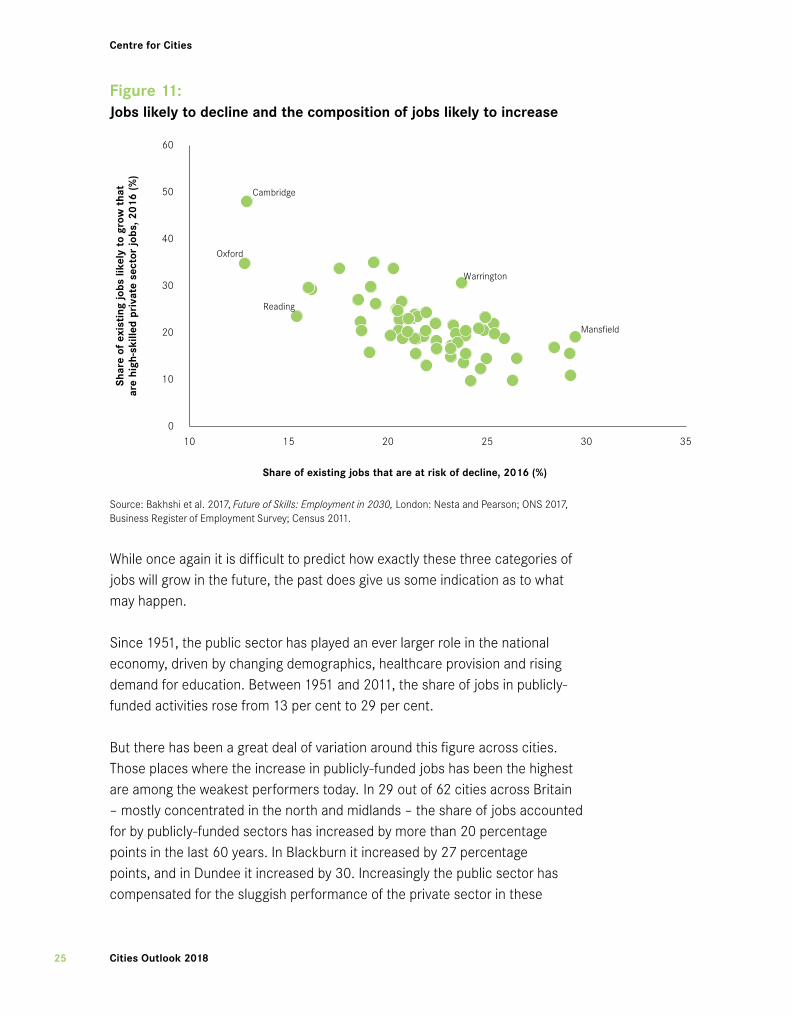
Thirdly, those cities that currently have a larger share of high-skilled private sector jobs that are likely to grow are also likely to be more insulated from job declines (see Figure 11).
4 Defined as Public administration, Education and Health.
All publicly-funded
occupations 50%
Lower-skill private sector
occupations 26%
High-skill private sector
occupations 24%

Centre for Cities
Cities Outlook 2018 24
Figure10:Breakdownofthetypeofjobslikelytogrowineachcityto2030
Source: Bakhshi et al. 2017, Future of Skills: Employment in 2030, London: Nesta and Pearson; ONS 2017, Business Register of Employment Survey; Census 2011.
0 10 20 30 40 50 60 70 80 90 100
BradfordBlackburn
SunderlandWigan
ChathamBurnleyTelford
DoncasterGloucester
PrestonHull
WakefieldPortsmouth
SouthendSwansea
StokeBirmingham
SheffieldMiddlesbrough
LiverpoolBarnsley
NorthamptonNorwich
MansfieldBirkenhead
BasildonLuton
NewportDundee
NottinghamBournemouth
SwindonYork
IpswichCoventry
PeterboroughNewcastle
HuddersfieldManchester
BlackpoolCrawley
PlymouthDerby
LeicesterMilton Keynes
ReadingLeeds
SouthamptonGlasgow
CardiffExeterSlough
BrightonLondon
WorthingBristol
WarringtonAldershotEdinburgh
OxfordAberdeen
CambridgeHigh-skill private sector occupations
Lower-skill private sector occupations
All publicly-funded occupations
Share of jobs current jobs projected to grow (%)
Centre for Cities
Cities Outlook 201825
Figure11:Jobslikelytodeclineandthecompositionofjobslikelytoincrease
Source: Bakhshi et al. 2017, Future of Skills: Employment in 2030, London: Nesta and Pearson; ONS 2017, Business Register of Employment Survey; Census 2011.
While once again it is difficult to predict how exactly these three categories of jobs will grow in the future, the past does give us some indication as to what may happen.
Since 1951, the public sector has played an ever larger role in the national economy, driven by changing demographics, healthcare provision and rising demand for education. Between 1951 and 2011, the share of jobs in publicly-funded activities rose from 13 per cent to 29 per cent.
But there has been a great deal of variation around this figure across cities. Those places where the increase in publicly-funded jobs has been the highest are among the weakest performers today.In 29 out of 62 cities across Britain – mostly concentrated in the north and midlands – the share of jobs accounted for by publicly-funded sectors has increased by more than 20 percentage points in the last 60 years. In Blackburn it increased by 27 percentage points, and in Dundee it increased by 30. Increasingly the public sector has compensated for the sluggish performance of the private sector in these
Cambridge
Mansfield
Oxford
Reading
Warrington
0
10
20
30
40
50
60
10 15 20 25 30 35
Share of existing jobs that are at risk of decline, 2016 (%)
Shar
e of
exi
stin
g jo
bs li
kely
to
grow
tha
t ar
e hi
gh-s
kille
d pr
ivat
e se
ctor
jobs
, 201
6 (%
)
Centre for Cities
Cities Outlook 2018 26
places. And where private sector jobs have been created they have tended to be lower skilled, and thereby lower paid.
In contrast, cities in the Greater South East in particular have mostly experienced a smaller shift towards publicly-funded jobs,5 and a greater share of their private sector jobs growth has been in high-skilled, knowledge-intensive occupations, some of which have been created as a result of innovations in technology. For example, IT professionals and technicians, occupations that did not exist 60 years ago, are mostly concentrated in and around cities in the Greater South East. Similar patterns are seen for jobs in fund management, advertising and market research.
Over the last 100 years, the evolution of the economy has meant that the ability to access and use knowledge has become increasingly important for businesses, people and cities. Those cities that have best been able to provide access to knowledge are the ones that have best been able to deal with change over the last century.6
These patterns have occurred because of the relative advantages that different cities offer. The location decisions made by businesses are based on the trade-off between the availability of skilled workers, access to knowledge and cost of land.
As noted in the first chapter, high-skilled businesses look for locations that offer them access to knowledge – both through the availability of highly-skilled workers and, for services businesses in particular,7 a network of high-skilled businesses. Cities such as Reading and London offer both of these advantages, and this is reflected in the types of jobs they have attracted in spite of the higher cost of commercial space in these cities.8
Businesses undertaking lower-skilled, more-routinised activities (such as in call centres or warehousing) look for different attributes, namely access to a lower-skilled workforce and cheaper land. Cities such as Barnsley and Swansea offer
5 In Aldershot and Portsmouth the share of publicly-funded jobs declined in the last 60 years. This is likely due to the fall in jobs in the military.
6 Swinney P & Thomas E (2014) Century of Cities: Urban economic change since 1911, London: Centre for Cities
7 Graham D (2007) Agglomeration Economies and Transport Investment, Journal of Transport Economics and Policy 41
8 Swinney P (2017) Why don’t we see growth up and down the country? London: Centre for Cities

Centre for Cities
Cities Outlook 201827
these types of benefits, making them more appealing to lower-skilled businesses than higher-skilled ones. The result is that the business investment they have attracted in recent years has tended to create lower-skilled work. And the analysis above shows that these cities are more at risk of job losses due to changes in the labour market.
Withoutanychangetothebenefitsthatplacesoffertobusinesses,thenitislikelythatjobcreationinthefuturewillmatchthatseeninrecentdecades.This will mean that while most places will likely see jobs growth, some will replace routinised jobs lost due to changes in the labour market with more lower-skilled jobs. These tend to be less productive and less innovative, putting them at continued risk over the longer term.
Policyhasnotfocusedonhelpingpeopleandplacestoadapt
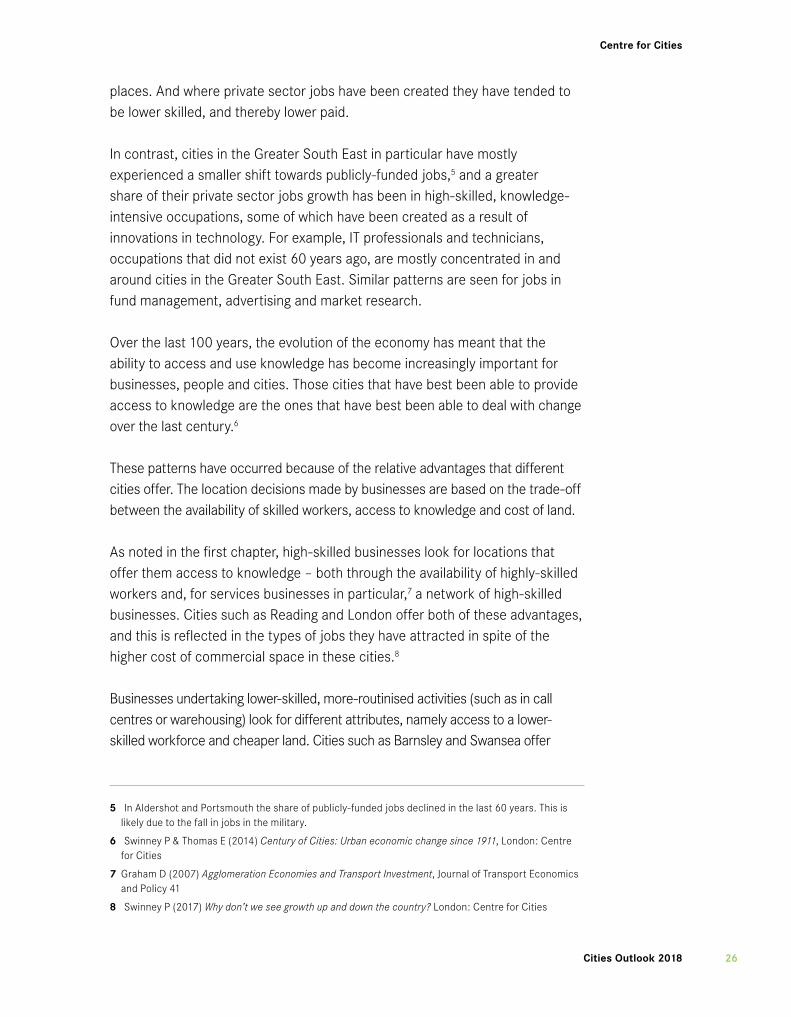
As well the public sector playing an ever larger role in job creation in weaker economies, it has also compensated those people who have seen their jobs disappear as a result of automation and globalisation. As Figure 12 shows, there is a positive relationship between the change in share of jobs accounted for by publicly-funded activities and the share of working-age people on long-term incapacity benefit.
These policy choices have helped cushion the impact of substantial changes in city economies, and the creation of publicly-funded jobs has no doubt been a good thing in terms of increasing employment opportunities available in weaker labour markets.
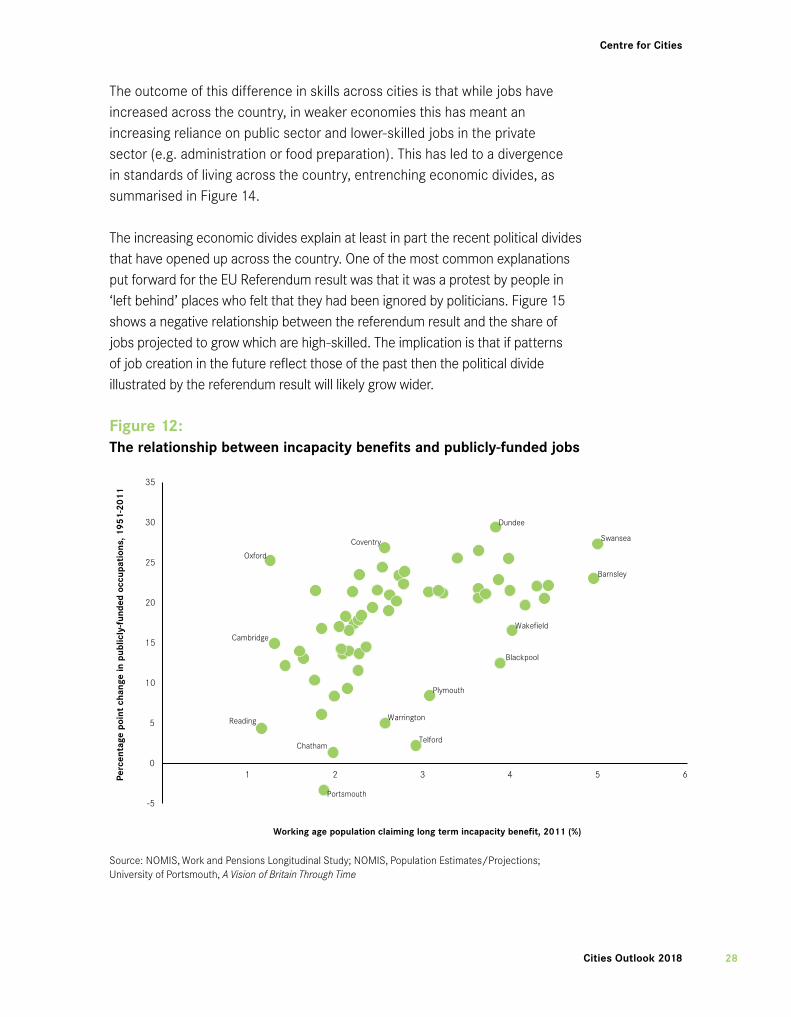
But what they have not done is help people and places adapt to changes in demand for workers. This has had an impact on the relevance of skills available in these cities, especially among workers that have been affected by previous waves of change, with a knock-on impact on how attractive a city is to investment from higher-skilled business activities. Looking at the qualifications levels of those aged between 50-64 in 2016 shows that a much higher share of this age group tend to have no formal qualifications at all in cities in the North. Liverpool leads this list, with 26 per cent of 50-64 year olds having no formal qualifications, followed by Stoke and Birmingham (both 22 per cent). In contrast this figure is just 6 per cent in Swindon, and 7 per cent in Bristol (see Figure 13).
Centre for Cities
Cities Outlook 2018 28
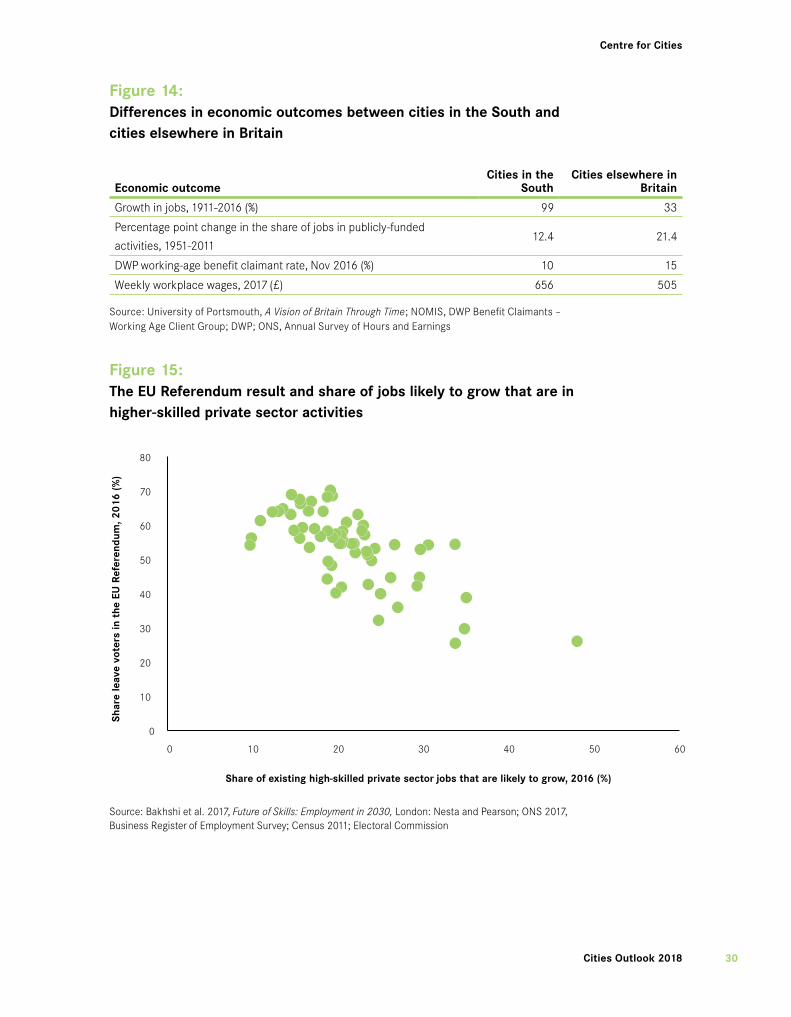
The outcome of this difference in skills across cities is that while jobs have increased across the country, in weaker economies this has meant an increasing reliance on public sector and lower-skilled jobs in the private sector (e.g. administration or food preparation). This has led to a divergence in standards of living across the country, entrenching economic divides, as summarised in Figure 14.
The increasing economic divides explain at least in part the recent political divides that have opened up across the country. One of the most common explanations put forward for the EU Referendum result was that it was a protest by people in ‘left behind’ places who felt that they had been ignored by politicians. Figure 15 shows a negative relationship between the referendum result and the share of jobs projected to grow which are high-skilled. The implication is that if patterns of job creation in the future reflect those of the past then the political divide illustrated by the referendum result will likely grow wider.
Figure12:Therelationshipbetweenincapacitybenefitsandpublicly-fundedjobs
Source: NOMIS, Work and Pensions Longitudinal Study; NOMIS, Population Estimates/Projections; University of Portsmouth, A Vision of Britain Through Time
Barnsley
Blackpool
Cambridge
Chatham
Coventry
Dundee
Oxford
Plymouth
Portsmouth
Reading
Swansea
Telford
Wakefield
Warrington
-5
0
5
10
15
20
25
30
35
1 2 3 4 5 6Perc
enta
ge p
oint
cha
nge
in p
ublic
ly-fu
nded
occ
upat
ions
, 195
1-20
11
Working age population claiming long term incapacity benefit, 2011 (%)
Centre for Cities
Cities Outlook 201829
Figure13:Shareof50-64yearoldswithnoformalqualifications
5.3 - 7.5
7.6 - 9.8
9.9 - 13.7
13.8 - 18.8
18.9 - 25.7
Share of population aged 50-64with no formal qualifications, 2016 (%)
Dundee
EdinburghGlasgow
NewcastleSunderland
Middlesbrough
Hull
York
Leeds
Swansea
Cardiff
Newport
Bristol
Gloucester
Plymouth
Portsmouth
Aberdeen
Southampton
Bournemouth BrightonWorthing
SouthendBasildon
ChathamLondon
Norwich
Ipswich
Peterborough
AldershotReading
Swindon
Oxford
Milton Keynes
Northampton
Luton
Cambridge
Stoke
Telford
BirminghamCoventry
Leicester
Nottingham
Mansfield
Derby
SheffieldDoncaster
Wakefield
Bradford
BirkenheadLiverpool
Wigan
Manchester
Burnley
BlackpoolPrestonBlackburn
Warrington
Barnsley
Slough
Huddersfield
Source: NOMIS, Annual Population Survey. Note: Data not available for Crawley and Exeter.
City Share(%) City Share(%)
Liverpool 25.7 Newport 12.4
Stoke 22.4 Sunderland 12.2
Birmingham 22.1 Southend 12.0
Luton 21.6 Cardiff 11.6
Blackburn 21.0 Plymouth 11.3
Glasgow 18.8 Chatham 11.1
Nottingham 18.5 Derby 11.1
Barnsley 18.2 Edinburgh 11.0
Huddersfield 17.2 London 10.8
Peterborough 17.0 Aldershot 10.7
Swansea 16.9 York 10.5
Dundee 16.3 Preston 9.8
Basildon 16.2 Gloucester 9.1
Hull 15.9 Doncaster 9.0
Newcastle 15.8 Norwich 8.9
Manchester 15.4 Blackpool 8.8
Aberdeen 15.2 Portsmouth 8.8
Wakefield 15.1 Warrington 8.4
Mansfield 15.0 Brighton 7.8
Burnley 14.9 Milton Keynes 7.5
Coventry 14.9 Bournemouth 7.3
Sheffield 14.7 Cambridge 7.3
Leeds 14.6 Southampton 7.0
Wigan 14.6 Reading 6.8
Slough 14.5 Worthing 6.7
Bradford 14.4 Bristol 6.5
Telford 14.2 Northampton 6.0
Leicester 13.9 Swindon 5.6
Ipswich 13.7 Oxford 5.3
Middlesbrough 13.0 Great Britain 11.8
Centre for Cities
Cities Outlook 2018 30
Figure14:DifferencesineconomicoutcomesbetweencitiesintheSouthandcitieselsewhereinBritain
EconomicoutcomeCitiesinthe
SouthCitieselsewherein
Britain
Growth in jobs, 1911-2016 (%) 99 33
Percentage point change in the share of jobs in publicly-funded
activities, 1951-201112.4 21.4
DWP working-age benefit claimant rate, Nov 2016 (%) 10 15
Weekly workplace wages, 2017 (£) 656 505
Source: University of Portsmouth, A Vision of Britain Through Time; NOMIS, DWP Benefit Claimants – Working Age Client Group; DWP; ONS, Annual Survey of Hours and Earnings
Figure15:TheEUReferendumresultandshareofjobslikelytogrowthatareinhigher-skilledprivatesectoractivities
Source: Bakhshi et al. 2017, Future of Skills: Employment in 2030, London: Nesta and Pearson; ONS 2017, Business Register of Employment Survey; Census 2011; Electoral Commission
0
10
20
30
40
50
60
70
80
0 10 20 30 40 50 60
Shar
e le
ave
vote
rs in
the
EU
Ref
eren
dum
, 201
6 (%
)
Share of existing high-skilled private sector jobs that are likely to grow, 2016 (%)

Centre for Cities
Cities Outlook 201831
Policyimplications
The policy response to the changing nature of work in recent decades has not prepared those people and places most affected by these changes to adapt to them. Policy has not sufficiently understood why businesses locate where they do and so has not focused on giving people the skills required to fill the non-routine occupations that have become increasingly common in an ever-evolving world of work. And policy has not helped places to create the environments that are attractive to higher-skilled firms.
So as cities across the country prepare to deal with the latest wave of change brought about by automation, globalisation and changing demographics, there must be a shift in the policy response on both fronts to this change.
For struggling cities in particular, policy needs to create the conditions that support the development of knowledge, and the use and exchange of it. A key element of this will be to provide their residents with the skills they need to be successful in a labour market that is likely to be ever more dominated by non-routine work.
This should take three main approaches:
Prepare:Giveyoungergenerationsenteringthelabourmarkettherightsetofskillsandknowledgetosucceedinthejobsofthefuture.
The basis for the estimation for which occupations will become more or less important is founded on the expectation that interpersonal skills, cognitive skills (such as originality and fluency of ideas) and judgment and decision making will become ever more important. This will require teaching both in schools and at further education colleges to adjust to help their students develop such skills.
A major related concern is that schools in a number of areas are failing to provide quality education based on today’s curriculum, even before further improvements to what is taught are considered. Weaker economies such as Hull and Middlesbrough have very few schools deemed as high performing

Centre for Cities
Cities Outlook 2018 32
according to the Education Policy Institute,9 meaning pupils in these places face the dual challenge of not being given the core skills required to get a high-skilled job as they enter a labour market where higher-skilled opportunities are limited.
Adjust:Thecurrentworkforceshouldbegivenadequateresourcestoadjusttochangesinthelabourmarket.
People currently in the labour market need to be able to adapt as the demand for skills changes. This will require continuous training and upskilling.
The unveiling of the National Retraining Scheme in the most recent Industrial Strategy suggests a move in this direction. At this stage the policy applies only to digital and construction jobs, but as such a scheme is rolled out there should be a shift towards developing the idea of lifelong learning. One way to do this would be to allocate each worker a number of hours a year to devote to training, to encourage workers to further their skillset in light of an ever changing labour market. This would require greater funding of the further education sector.
Compensate:Individualsleastabletoadaptneedtobegivenadequatecompensationfortheirjoblossbutshouldalsobegivenretraining.
As part of any wave of change, not everyone will be better off, at least in the short-term. This means that there will still be a requirement to provide a safety net for people if their job disappears.
But this should be done in conjunction with improved access to and requirement for training, to give individuals the ability to continue to work, as well as helping to shift the skills base of a city to improve its chances of attracting in higher-skilled business investment. Cities and the national government must ensure people who are worse off as a result of future job losses receive adequate support. But unlike the past, this support cannot only come in the form of welfare payments.
9Andrews J &Perera N (2017) Access to high performing schools in England, London: Education Policy Institute

03City monitor
The latest data

Centre for Cities
3535 Cities Outlook 2018
Citymonitor:thelatestdata
There is considerable variation in the economic performance of cities across the UK. The purpose of this chapter is to show the scale and nature of this variation by highlighting the performance of the 63 largest cities on 18 indicators covering:
• Population
• Business dynamics
• Productivity
• Innovation
• Employment
• Skills
• Wages
• Inequality
• Housing
• Environment
• Digital connectivity
For most indicators the 10 strongest and 10 weakest performing cities are presented. Tables of the full list of cities can be found on: www.centreforcities.org/data-tool

Centre for Cities
3636Cities Outlook 2018
Figure16:Citiesasashareofthenationalaverage,
Sources: Land: ONS Census 2011; Housing: Department of Communities and Local Government (DCLG), 2017, Dwelling stock estimates by local authority district 2016. Scottish Neighbourhood Statistics 2017, Dwelling stock estimates 2016 data. Northern Ireland Neighbourhood information service 2017, Land and Property Services, 2016 data; Population: ONS 2017, Population estimates, 2016 data. Business: ONS 2017, Business Demography, 2016 data. Patents: PATSTAT 2017, January-November 2016 data; Intellectual Property Office 2017, Patents granted registered by postcode, January-October 2016 data. ONS 2017, Population es-timates, 2016 data ; Skills: ONS 2017, Annual Population Survey, residents analysis, 2016 data; DETINI 2017, District Council Area Statistics for Belfast, 2016 data; Jobs: ONS 2017, Business register and Employment Survey, 2016 data.
Land HousingStock
Patent applications
Population Business Stock
High Skills Jobs Business Starts
Private KIBS jobs
City
Non-city8%
59%
52% 54% 55%58% 60%
71%
60%

Centre for Cities
3737 Cities Outlook 2018
Population
Growing populations can give an indication of the economic opportunities that are available in cities. Cities that provide more job and career opportunities are likely to attract and retain more people than cities that do not.
• In 2016, 53.9 per cent of the UK population (around 35.4 million) lived in cities.
• The four biggest cities (London, Birmingham, Manchester and Glasgow) accounted for almost a quarter of the total UK population (24.3 per cent) and 45.2 per cent of the total population living in cities.
• London alone was home to 15.3 per cent of the UK population and accounted for 28.3 per cent of the population living in cities.
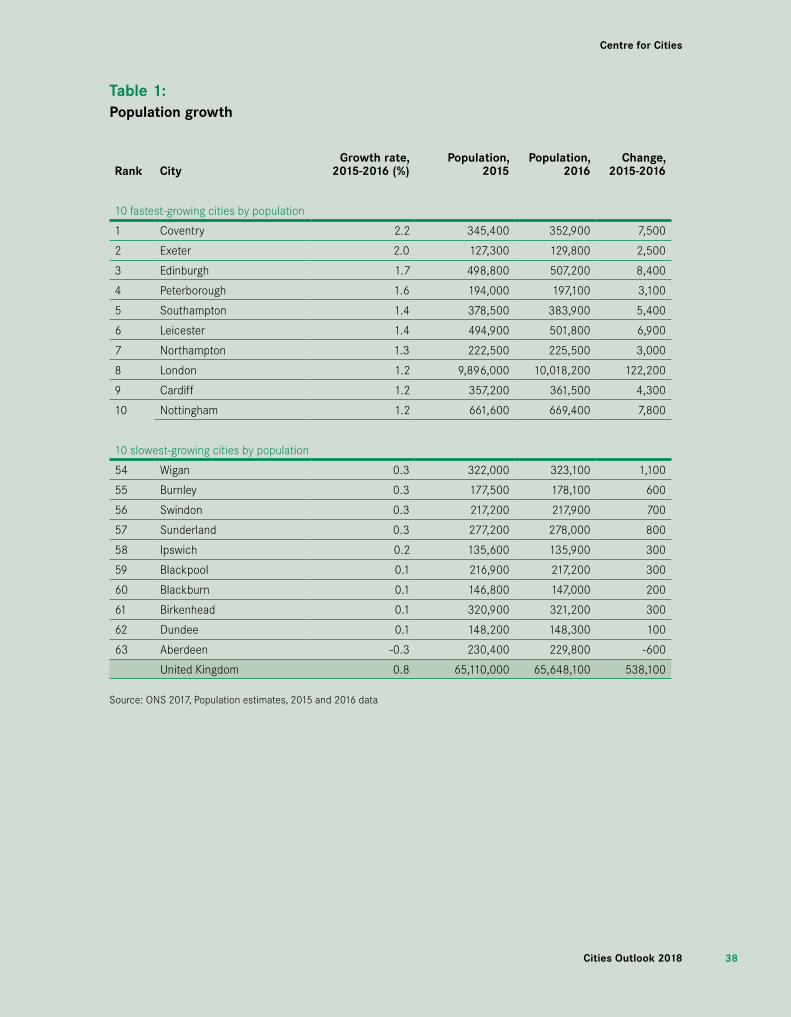
• 29 out of 63 cities experienced a higher population growth than the national average between 2015 and 2016.
• Eight out of the 10 slowest-growing cities were located in northern England and in Scotland. Aberdeen is the only city that recorded a decline in population between 2015 and 2016, shrinking by 0.3 per cent.
• The age breakdown of population growth shows that there have been large increases in those aged over 50. London saw the largest increase of its 50 plus population of any city.
Centre for Cities
3838Cities Outlook 2018
Table1:Populationgrowth
Rank CityGrowthrate,
2015-2016(%)Population,
2015Population,
2016Change,
2015-2016
10 fastest-growing cities by population
1 Coventry 2.2 345,400 352,900 7,500
2 Exeter 2.0 127,300 129,800 2,500
3 Edinburgh 1.7 498,800 507,200 8,400
4 Peterborough 1.6 194,000 197,100 3,100
5 Southampton 1.4 378,500 383,900 5,400
6 Leicester 1.4 494,900 501,800 6,900
7 Northampton 1.3 222,500 225,500 3,000
8 London 1.2 9,896,000 10,018,200 122,200
9 Cardiff 1.2 357,200 361,500 4,300
10 Nottingham 1.2 661,600 669,400 7,800
10 slowest-growing cities by population
54 Wigan 0.3 322,000 323,100 1,100
55 Burnley 0.3 177,500 178,100 600
56 Swindon 0.3 217,200 217,900 700
57 Sunderland 0.3 277,200 278,000 800
58 Ipswich 0.2 135,600 135,900 300
59 Blackpool 0.1 216,900 217,200 300
60 Blackburn 0.1 146,800 147,000 200
61 Birkenhead 0.1 320,900 321,200 300
62 Dundee 0.1 148,200 148,300 100
63 Aberdeen -0.3 230,400 229,800 -600
United Kingdom 0.8 65,110,000 65,648,100 538,100
Source: ONS 2017, Population estimates, 2015 and 2016 data
Centre for Cities
3939 Cities Outlook 2018
Businessdynamics
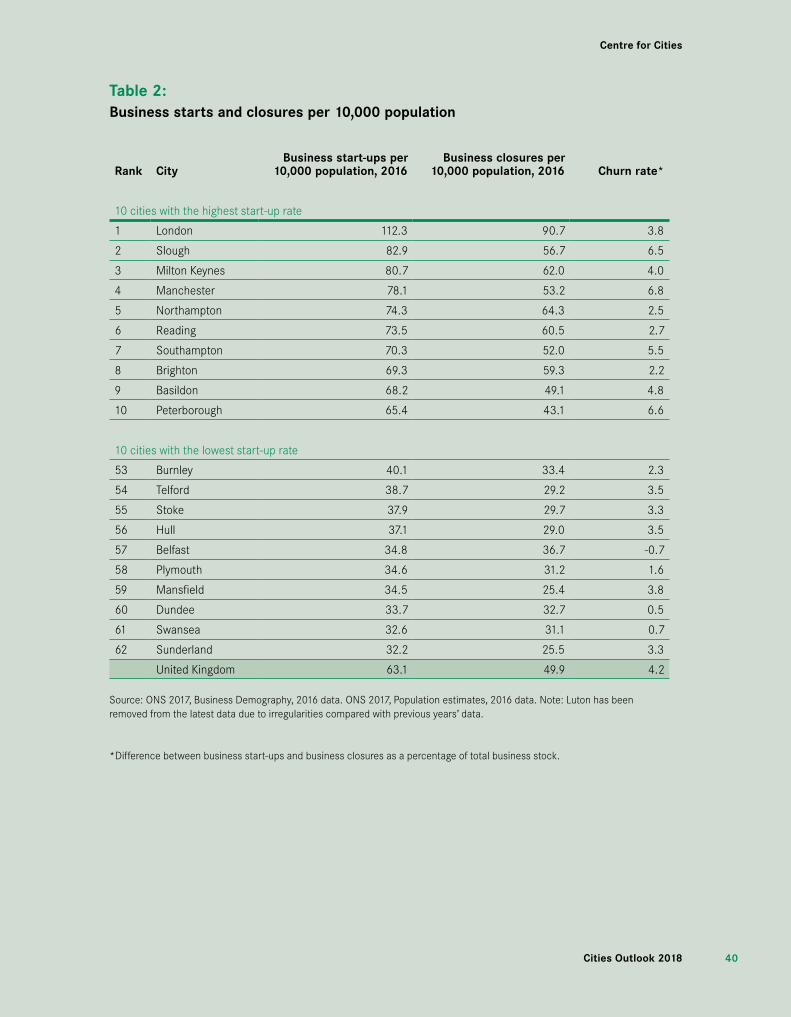
City economies are predominantly driven by their businesses. The overall number of businesses in a city, as well as the number of new business start-ups and closures, are all good indicators of the strength of a city’s economy.
Businessstartsandclosures• Three out of five businesses (60 per cent) that started up in 2016 were
located in cities. This has increased in recent years: in 2010, 58 per cent of business starts were in cities.
• London had the highest number of start-ups per 10,000 population (112.3), followed by Slough (82.9) and Milton Keynes (80.7). At the other end of the spectrum Dundee (33.7), Swansea (32.6) and Sunderland (32.2) were the lowest-ranked cities.
• Meanwhile, 61 per cent of UK business closures occurred in cities in 2016.
• Between 2015 and 2016, the number of business closures increased by 15.9 per cent nationally, with Aberdeen, Belfast and Doncaster experiencing the highest increases in closures (33.1, 42.9 and 59.7 per cent respectively). Moreover, Telford and Plymouth were the only two cities where the number of closures fell.
• London, Aberdeen and Northampton were the three cities with the highest number of closures (90.7, 68.3 and 64.3 per 10,000 population).
• Birmingham, Manchester and Peterborough had the highest churn rate (7.1, 6.8 and 6.6 respectively) – these cities saw the greatest difference between new businesses setting up and current businesses closing.
Centre for Cities
4040Cities Outlook 2018
Table2:Businessstartsandclosuresper10,000population
Rank CityBusinessstart-upsper
10,000population,2016Businessclosuresper
10,000population,2016 Churnrate*
10 cities with the highest start-up rate
1 London 112.3 90.7 3.8
2 Slough 82.9 56.7 6.5
3 Milton Keynes 80.7 62.0 4.0
4 Manchester 78.1 53.2 6.8
5 Northampton 74.3 64.3 2.5
6 Reading 73.5 60.5 2.7
7 Southampton 70.3 52.0 5.5
8 Brighton 69.3 59.3 2.2
9 Basildon 68.2 49.1 4.8
10 Peterborough 65.4 43.1 6.6
10 cities with the lowest start-up rate
53 Burnley 40.1 33.4 2.3
54 Telford 38.7 29.2 3.5
55 Stoke 37.9 29.7 3.3
56 Hull 37.1 29.0 3.5
57 Belfast 34.8 36.7 -0.7
58 Plymouth 34.6 31.2 1.6
59 Mansfield 34.5 25.4 3.8
60 Dundee 33.7 32.7 0.5
61 Swansea 32.6 31.1 0.7
62 Sunderland 32.2 25.5 3.3
United Kingdom 63.1 49.9 4.2
Source: ONS 2017, Business Demography, 2016 data. ONS 2017, Population estimates, 2016 data. Note: Luton has been removed from the latest data due to irregularities compared with previous years’ data.
*Difference between business start-ups and business closures as a percentage of total business stock.
Centre for Cities
4141 Cities Outlook 2018
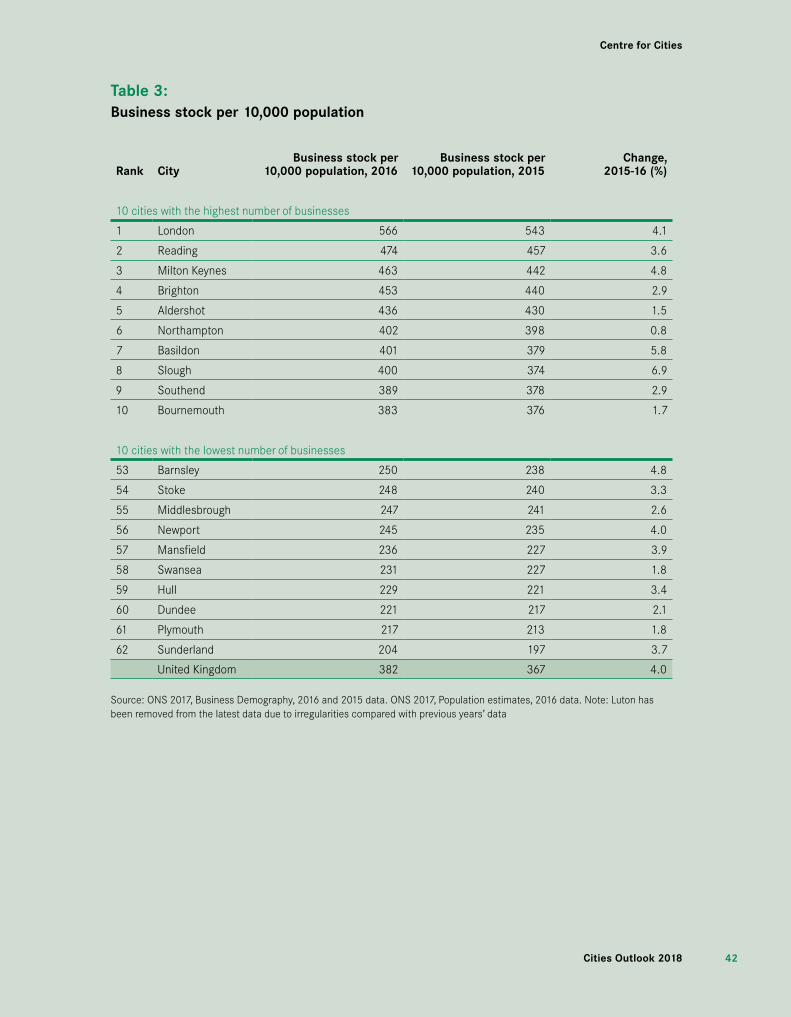
Businessstock• Cities were home to 54 per cent of all UK businesses in 2016. Between
2015 and 2016 the stock of businesses increased by 5 per cent in the UK, and by 6 per cent in cities as a whole. Looking at the past 10 years, the business stock increased by almost a quarter nationally, and by more than a third in cities.
• Leeds was the city with the fastest year on year growth in business stock (11.3 per cent) between 2015 and 2016, followed by Manchester (10 per cent).
• London alone accounted for 23 per cent of the total UK business stock and 42 per cent of total cities business stock, far larger than Manchester and Birmingham (each accounting for less than 4 per cent of the total UK business stock).
• London also ranked first for business stock per capita, with 566 businesses per 10,000 population, followed by Reading (474), Milton Keynes (463) and Brighton (453).
• Dundee (221), Plymouth (217) and Sunderland (204) on the other hand had the lowest levels of business stock per 10,000 population.
Centre for Cities
4242Cities Outlook 2018
Table3:Businessstockper10,000population
Rank CityBusinessstockper
10,000population,2016Businessstockper
10,000population,2015Change,
2015-16(%)
10 cities with the highest number of businesses
1 London 566 543 4.1
2 Reading 474 457 3.6
3 Milton Keynes 463 442 4.8
4 Brighton 453 440 2.9
5 Aldershot 436 430 1.5
6 Northampton 402 398 0.8
7 Basildon 401 379 5.8
8 Slough 400 374 6.9
9 Southend 389 378 2.9
10 Bournemouth 383 376 1.7
10 cities with the lowest number of businesses
53 Barnsley 250 238 4.8
54 Stoke 248 240 3.3
55 Middlesbrough 247 241 2.6
56 Newport 245 235 4.0
57 Mansfield 236 227 3.9
58 Swansea 231 227 1.8
59 Hull 229 221 3.4
60 Dundee 221 217 2.1
61 Plymouth 217 213 1.8
62 Sunderland 204 197 3.7
United Kingdom 382 367 4.0
Source: ONS 2017, Business Demography, 2016 and 2015 data. ONS 2017, Population estimates, 2016 data. Note: Luton has been removed from the latest data due to irregularities compared with previous years’ data

Centre for Cities
4343 Cities Outlook 2018
Productivityandinnovation
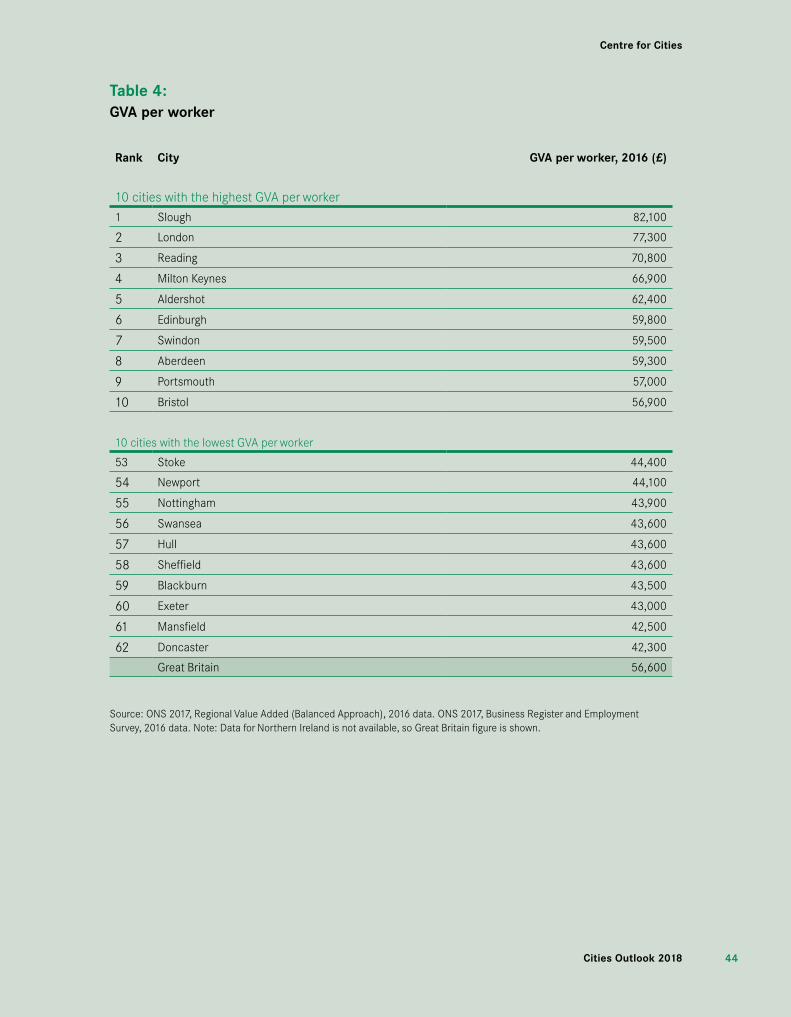
Productivity and innovation are drivers of long-run economic growth. Finding new and better ways of making goods and delivering services improves the performance of businesses which in turn increases the capacity of city economies.
Productivity• Only 10 cities out of 62 had levels of productivity above the British
average in 2016.
• Slough, London and Reading were the three cities with the highest levels of productivity, with GVA per worker at least 25 per cent above Great Britain’s average of £56,600.
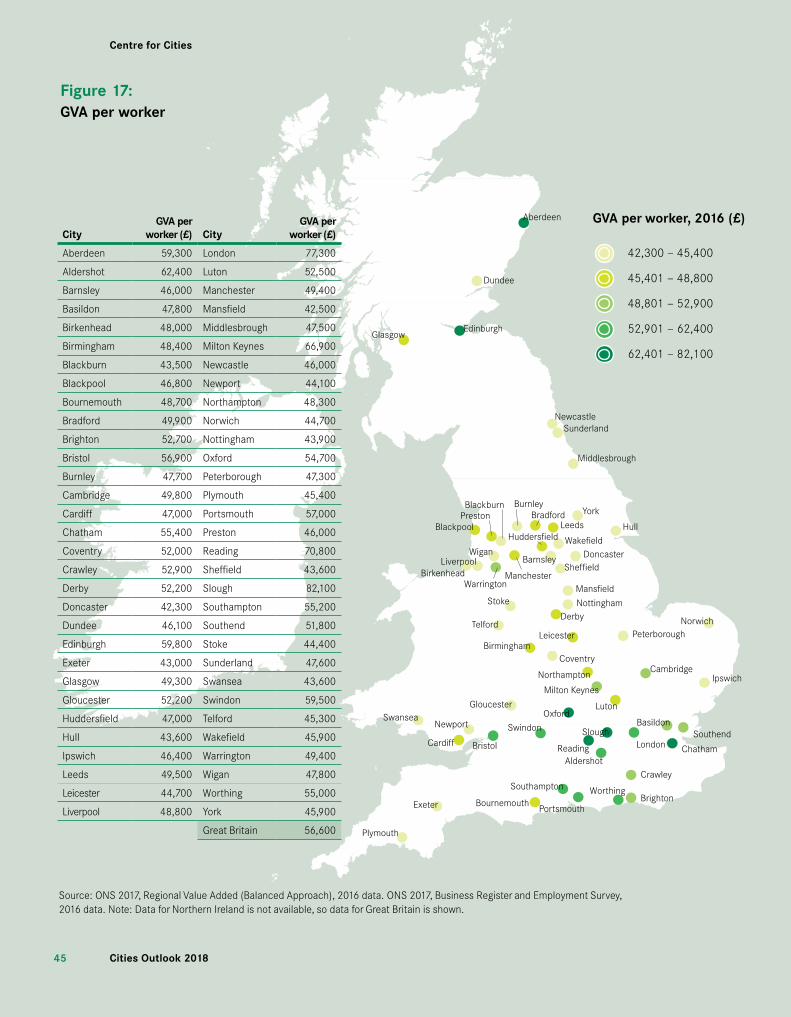
• As Figure 17 shows, there is a very clear geography to productivity, with cities in the Greater South East tending to perform better on this measure than cities elsewhere. This is reflective of the make-up of jobs across cities, with jobs in cities in the Greater South East tending to be in higher-skilled occupations than elsewhere.
Innovation• In total, about 11,400 patent applications from the UK were published
in 2016. Of this, 59 per cent of all patent applications published were registered in cities.
• Cambridge had the highest number of patent applications published per resident in 2016. This was more than three times the number in Coventry, the city with the second highest number (108.9 applications published per 100,000 residents).
• London had the highest absolute number of patent applications published in 2016, with 1,948 publications. Relative to its resident-base the capital ranked 19th nationwide, with 19 applications published per 100,000 residents.
• Seven of the top 10 cities with the highest number of published patent applications are located in the south of England, with the exceptions being Coventry, Derby and Aberdeen.
Centre for Cities
4444Cities Outlook 2018
Table4:GVAperworker
Rank City GVAperworker,2016(£)
10 cities with the highest GVA per worker
1 Slough 82,100
2 London 77,300
3 Reading 70,800
4 Milton Keynes 66,900
5 Aldershot 62,400
6 Edinburgh 59,800
7 Swindon 59,500
8 Aberdeen 59,300
9 Portsmouth 57,000
10 Bristol 56,900
10 cities with the lowest GVA per worker
53 Stoke 44,400
54 Newport 44,100
55 Nottingham 43,900
56 Swansea 43,600
57 Hull 43,600
58 Sheffield 43,600
59 Blackburn 43,500
60 Exeter 43,000
61 Mansfield 42,500
62 Doncaster 42,300
Great Britain 56,600
Source: ONS 2017, Regional Value Added (Balanced Approach), 2016 data. ONS 2017, Business Register and Employment Survey, 2016 data. Note: Data for Northern Ireland is not available, so Great Britain figure is shown.
Centre for Cities
4545 Cities Outlook 2018
Dundee
EdinburghGlasgow
NewcastleSunderland
Middlesbrough
Hull
York
Leeds
Swansea
Cardiff
Newport
Bristol
Gloucester
Exeter
Plymouth
Portsmouth
Aberdeen
Southampton
Bournemouth BrightonWorthing
SouthendBasildon
Chatham
Crawley
London
Norwich
Ipswich
Peterborough
AldershotReading
Swindon
Oxford
Milton Keynes
Northampton
Luton
Cambridge
Stoke
Telford
BirminghamCoventry
Leicester
Nottingham
Mansfield
Derby
SheffieldDoncaster
Wakefield
Bradford
BirkenheadLiverpool
Wigan
Manchester
Burnley
BlackpoolPrestonBlackburn
Warrington
Barnsley
Slough
Huddersfield
42,300 — 45,400
45,401 — 48,800
48,801 — 52,900
52,901 — 62,400
62,401 — 82,100
GVA per worker, 2016 (£)
Figure17:GVAperworker
Source: ONS 2017, Regional Value Added (Balanced Approach), 2016 data. ONS 2017, Business Register and Employment Survey, 2016 data. Note: Data for Northern Ireland is not available, so data for Great Britain is shown.
CityGVAper
worker(£) CityGVAper
worker(£)
Aberdeen 59,300 London 77,300
Aldershot 62,400 Luton 52,500
Barnsley 46,000 Manchester 49,400
Basildon 47,800 Mansfield 42,500
Birkenhead 48,000 Middlesbrough 47,500
Birmingham 48,400 Milton Keynes 66,900
Blackburn 43,500 Newcastle 46,000
Blackpool 46,800 Newport 44,100
Bournemouth 48,700 Northampton 48,300
Bradford 49,900 Norwich 44,700
Brighton 52,700 Nottingham 43,900
Bristol 56,900 Oxford 54,700
Burnley 47,700 Peterborough 47,300
Cambridge 49,800 Plymouth 45,400
Cardiff 47,000 Portsmouth 57,000
Chatham 55,400 Preston 46,000
Coventry 52,000 Reading 70,800
Crawley 52,900 Sheffield 43,600
Derby 52,200 Slough 82,100
Doncaster 42,300 Southampton 55,200
Dundee 46,100 Southend 51,800
Edinburgh 59,800 Stoke 44,400
Exeter 43,000 Sunderland 47,600
Glasgow 49,300 Swansea 43,600
Gloucester 52,200 Swindon 59,500
Huddersfield 47,000 Telford 45,300
Hull 43,600 Wakefield 45,900
Ipswich 46,400 Warrington 49,400
Leeds 49,500 Wigan 47,800
Leicester 44,700 Worthing 55,000
Liverpool 48,800 York 45,900
Great Britain 56,600
Centre for Cities
4646Cities Outlook 2018
Box8:MeasuringInnovation
Patent data is widely used to measure innovation. The data is based on
the number of patent applications, at their date of publication (in 2016).
Applications are usually published about 18 months after the application is
submitted to the patent authority, but this does not mean the patent is granted.
There are some limitations with this data:
• Patents only demonstrate more technical innovations and exclude
process innovations, trademarks and creative innovation, much of
which takes place within service sector businesses
• The address of the patentee does not confirm that the innovative
activity occurred at this address
• That said, the data still offers some insight into where innovation occurs
across the UK, and as shown in the tables, there is a great deal of
variation across the country.
Since 2017, we have included patent applications made to the European
Patent Office (EPO) as well as the UK Intellectual Property Office (IPO).
While firms that only seek protection in the UK will generally apply to the
IPO, those who want a wider international protection are likely to apply
through the EPO instead. The analysis finds that EPO published patent
applications represent more than half of the total number of published
patent applications from the UK in Jan-October 2016.
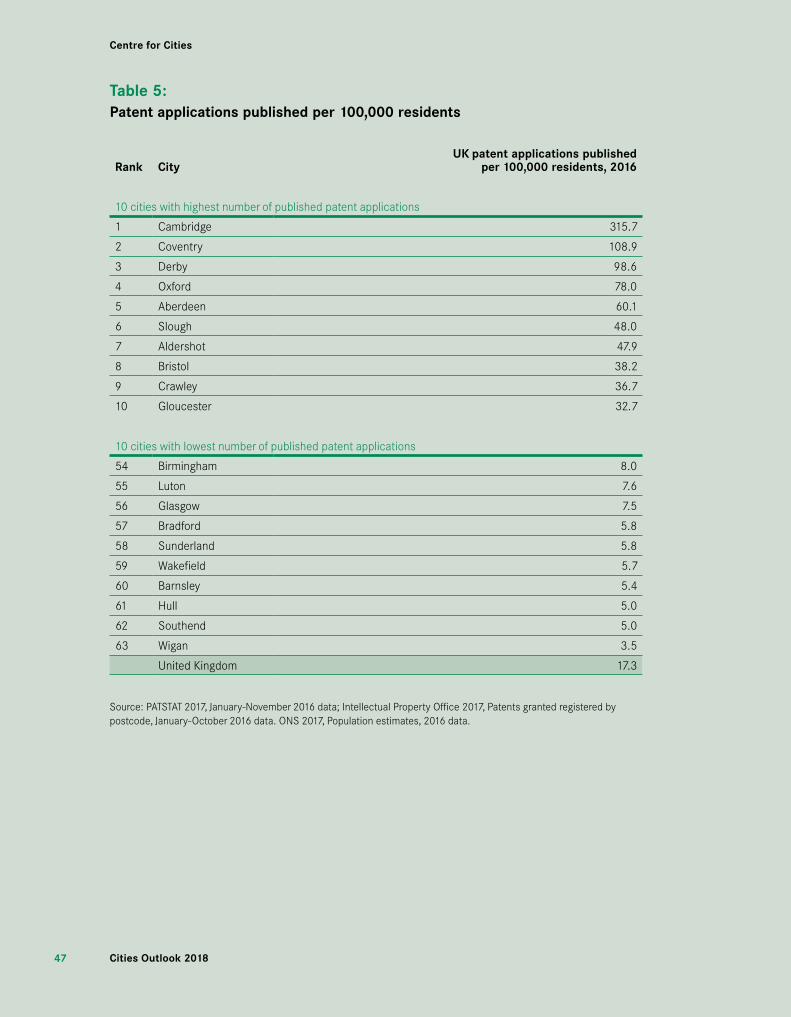
Centre for Cities
4747 Cities Outlook 2018
Table5:Patentapplicationspublishedper100,000residents
Rank CityUKpatentapplicationspublished
per100,000residents,2016
10 cities with highest number of published patent applications
1 Cambridge 315.7
2 Coventry 108.9
3 Derby 98.6
4 Oxford 78.0
5 Aberdeen 60.1
6 Slough 48.0
7 Aldershot 47.9
8 Bristol 38.2
9 Crawley 36.7
10 Gloucester 32.7
10 cities with lowest number of published patent applications
54 Birmingham 8.0
55 Luton 7.6
56 Glasgow 7.5
57 Bradford 5.8
58 Sunderland 5.8
59 Wakefield 5.7
60 Barnsley 5.4
61 Hull 5.0
62 Southend 5.0
63 Wigan 3.5
United Kingdom 17.3
Source: PATSTAT 2017, January-November 2016 data; Intellectual Property Office 2017, Patents granted registered by postcode, January-October 2016 data. ONS 2017, Population estimates, 2016 data.
Centre for Cities
4848Cities Outlook 2018
Employment
High employment rates, employment growth and low unemployment point to well-functioning labour markets, with the demand for workers amongst employers being high. Low employment rates and high unemployment are suggestive of a combination of poor skills and weaker employer demand.
Employmentrate• 42 out of 63 cities across the UK saw their employment rate improve in
2017, and 15 did so by two or more percentage points.
• Overall, UK employment increased by 0.5 percentage points between 2016 and 2017, from 73.7 per cent to 74.2 per cent. The city average remains slightly lower than the national average, at 72.7 per cent.
• 36 cities had employment rates below the national average. To bring these cities up to the current UK average a further 487,400 residents in these places would need to find employment.
• Dundee, the UK city with the lowest employment rate in 2017 (64.1 per cent), would need almost 9,800 of its residents to find employment to reach the UK average. Birmingham (the city with the highest deficit in absolute terms) would need 117,700 of its residents to find jobs to match the UK average.
• Southern cities tend to perform better than cities elsewhere. York is the only city outside of the south of England to feature in the top 10. Moreover, no southern city is listed in the bottom 10.
• Big cities tend to fare worse than the average, with only four (Bristol, Leeds, Portsmouth and London) of the twelve biggest cities having employment rates above the national average. Meanwhile Birmingham, Liverpool and Nottingham are all in the bottom 10.

Centre for Cities
4949 Cities Outlook 2018
Table6:Employmentrate
Rank CityEmploymentrate,
Jul2016-Jun2017(%)Employmentrate,
Jul2015-Jun2016(%)Percentage
pointchange
10 cities with highest employment rate
1 Crawley 86.6 84.8 1.8
2 Worthing 83.1 80.4 2.7
3 Swindon 80.6 79.0 1.6
4 Gloucester 80.0 80.7 -0.7
5 Oxford 79.7 74.6 5.1
6 Aldershot 78.3 83.8 -5.6
7 Reading 78.1 77.4 0.7
8 Bristol 78.0 77.3 0.7
9 Norwich 77.7 79.3 -1.7
10 York 77.3 76.7 0.7
10 cities with lowest employment rate
54 Sunderland 69.3 67.0 2.3
55 Swansea 69.2 68.7 0.5
56 Middlesbrough 69.0 68.8 0.2
57 Nottingham 68.7 71.9 -3.3
58 Cardiff 68.6 69.1 -0.5
59 Bradford 67.8 65.2 2.6
60 Liverpool 66.8 63.9 2.9
61 Birmingham 66.7 64.2 2.5
62 Blackburn 64.5 65.3 -0.8
63 Dundee 64.1 63.8 0.3
United Kingdom 74.2 73.7 0.5
Source: ONS 2017, Annual Population Survey, residents analysis, July 2015 - June 2016 and July 2016 - June 2017; DETINI 2017, District Council Area Statistics for Belfast, January 2015 - December 2015 and January 2016 - December 2016 data.

Centre for Cities
5050Cities Outlook 2018
Jobseeker’sAllowanceclaimantcountJobseeker’s Allowance (JSA) is currently being rolled into Universal Credit which has led to inconsistencies in the definition of a claimant looking for work across the country. While this has a big impact when looking at change in claimant rates, a static picture still provides a good indication of the relative strength of different labour markets and so is presented here.
• Almost two thirds (64 per cent) of those claiming Jobseekers’ Allowance lived in cities in November 2017.
• With the exception of York and Edinburgh, all top 10 cities with the lowest claimant count rate were located in the Greater South East of the UK.
• On the other hand, eight of the bottom 10 cities with highest claimant count rate were located in the north of England.
Privatesectorjobsgrowth• 44 of 62 cities increased their number of private sector jobs between 2015
and 2016, and 28 did so by more than the British average (2 per cent).
• 13 cities saw reductions in their number of private sector positions, and in four cities the number of jobs dropped by more than 2 per cent. (Middlesbrough -5.1 per cent, Aberdeen -4.9 per cent, Newcastle -2.8 per cent and Plymouth -2.1 per cent). Middlesbrough experienced a significant shift in its ranking moving from eighth (3.9 per cent) in 2015 to last (-5.1 percent) in 2016.
• Overall, cities led the private sector jobs growth in 2016 with 269,000 net jobs created, 62 per cent of the total 436,000 net jobs gain in Great Britain.
Publicandprivatesectorjobs• In 2016 the private to public sector employment ratio in Great Britain was
equal to 2.8.
• In general, the job market in cities tends to be more dominated by publicly-funded activities than the national average. Out of 62 cities, only 16 had private to public employment ratios above the British average. Crawley had the smallest public sector of any city, where there were eight private sector jobs for every publicly-funded one. It was followed by Slough and Swindon.
• In the bottom 10 cities, Oxford had almost the same number of private and public sector employees, mainly the result of its universities. This highlights that higher levels of publicly-funded jobs do not necessarily mean a less successful economy.
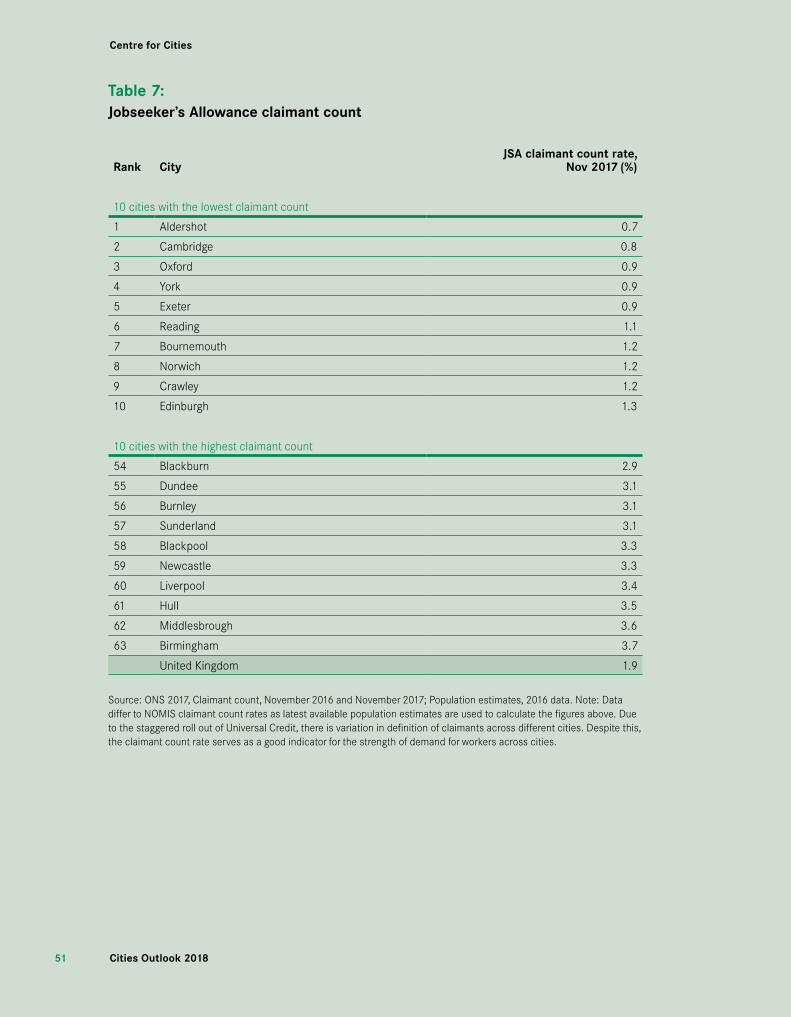
Centre for Cities
5151 Cities Outlook 2018
Table7:Jobseeker’sAllowanceclaimantcount
Rank CityJSAclaimantcountrate,
Nov2017(%)
10 cities with the lowest claimant count
1 Aldershot 0.7
2 Cambridge 0.8
3 Oxford 0.9
4 York 0.9
5 Exeter 0.9
6 Reading 1.1
7 Bournemouth 1.2
8 Norwich 1.2
9 Crawley 1.2
10 Edinburgh 1.3
10 cities with the highest claimant count
54 Blackburn 2.9
55 Dundee 3.1
56 Burnley 3.1
57 Sunderland 3.1
58 Blackpool 3.3
59 Newcastle 3.3
60 Liverpool 3.4
61 Hull 3.5
62 Middlesbrough 3.6
63 Birmingham 3.7
United Kingdom 1.9
Source: ONS 2017, Claimant count, November 2016 and November 2017; Population estimates, 2016 data. Note: Data differ to NOMIS claimant count rates as latest available population estimates are used to calculate the figures above. Due to the staggered roll out of Universal Credit, there is variation in definition of claimants across different cities. Despite this, the claimant count rate serves as a good indicator for the strength of demand for workers across cities.
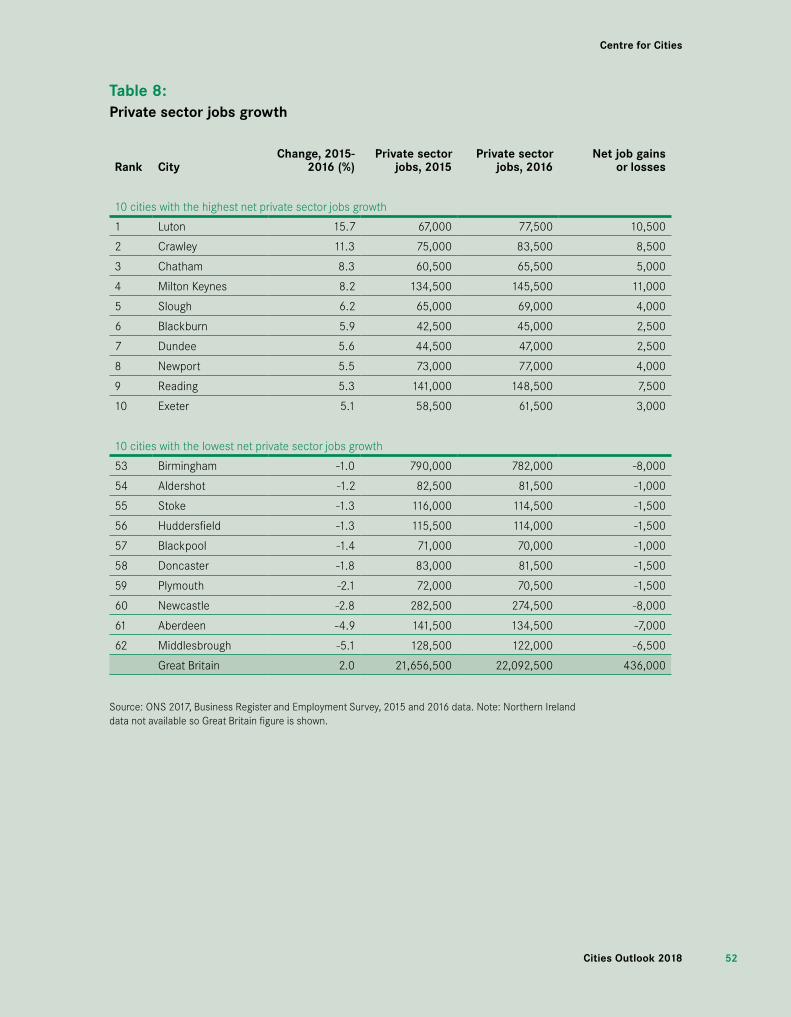
Centre for Cities
5252Cities Outlook 2018
Table8:Privatesectorjobsgrowth
Rank CityChange,2015-
2016(%)Privatesector
jobs,2015Privatesector
jobs,2016Netjobgains
orlosses
10 cities with the highest net private sector jobs growth
1 Luton 15.7 67,000 77,500 10,500
2 Crawley 11.3 75,000 83,500 8,500
3 Chatham 8.3 60,500 65,500 5,000
4 Milton Keynes 8.2 134,500 145,500 11,000
5 Slough 6.2 65,000 69,000 4,000
6 Blackburn 5.9 42,500 45,000 2,500
7 Dundee 5.6 44,500 47,000 2,500
8 Newport 5.5 73,000 77,000 4,000
9 Reading 5.3 141,000 148,500 7,500
10 Exeter 5.1 58,500 61,500 3,000
10 cities with the lowest net private sector jobs growth
53 Birmingham -1.0 790,000 782,000 -8,000
54 Aldershot -1.2 82,500 81,500 -1,000
55 Stoke -1.3 116,000 114,500 -1,500
56 Huddersfield -1.3 115,500 114,000 -1,500
57 Blackpool -1.4 71,000 70,000 -1,000
58 Doncaster -1.8 83,000 81,500 -1,500
59 Plymouth -2.1 72,000 70,500 -1,500
60 Newcastle -2.8 282,500 274,500 -8,000
61 Aberdeen -4.9 141,500 134,500 -7,000
62 Middlesbrough -5.1 128,500 122,000 -6,500
Great Britain 2.0 21,656,500 22,092,500 436,000
Source: ONS 2017, Business Register and Employment Survey, 2015 and 2016 data. Note: Northern Ireland data not available so Great Britain figure is shown.
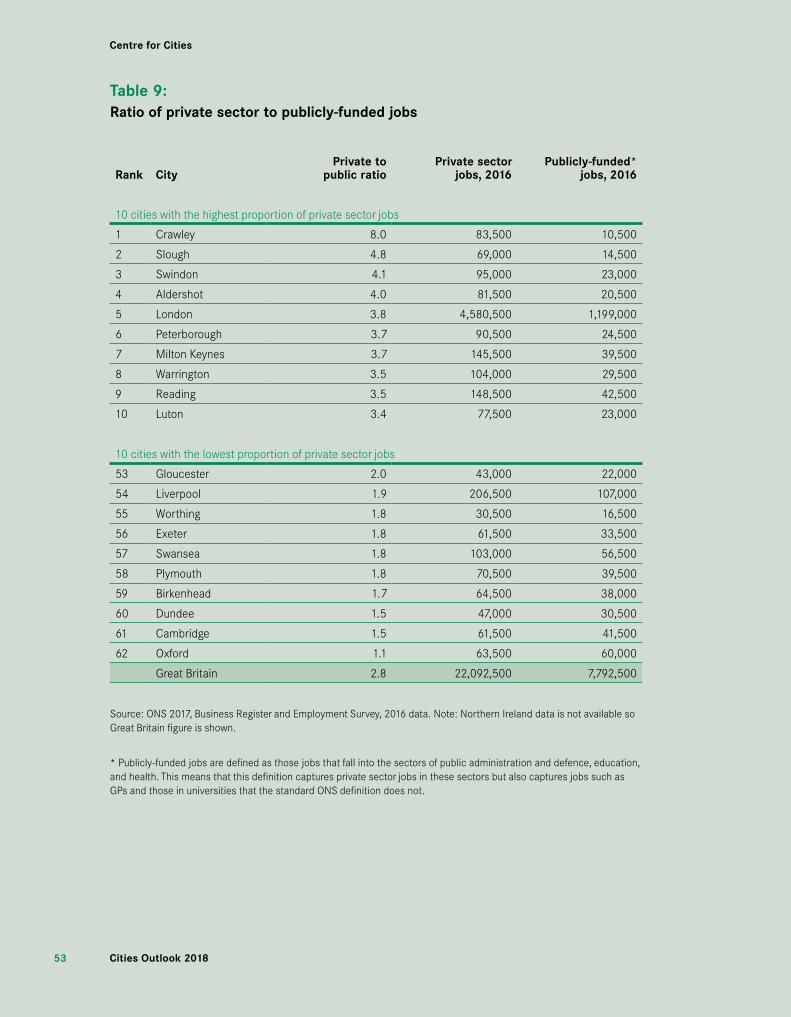
Centre for Cities
5353 Cities Outlook 2018
Table9:Ratioofprivatesectortopublicly-fundedjobs
Rank CityPrivateto
publicratioPrivatesector
jobs,2016Publicly-funded*
jobs,2016
10 cities with the highest proportion of private sector jobs
1 Crawley 8.0 83,500 10,500
2 Slough 4.8 69,000 14,500
3 Swindon 4.1 95,000 23,000
4 Aldershot 4.0 81,500 20,500
5 London 3.8 4,580,500 1,199,000
6 Peterborough 3.7 90,500 24,500
7 Milton Keynes 3.7 145,500 39,500
8 Warrington 3.5 104,000 29,500
9 Reading 3.5 148,500 42,500
10 Luton 3.4 77,500 23,000
10 cities with the lowest proportion of private sector jobs
53 Gloucester 2.0 43,000 22,000
54 Liverpool 1.9 206,500 107,000
55 Worthing 1.8 30,500 16,500
56 Exeter 1.8 61,500 33,500
57 Swansea 1.8 103,000 56,500
58 Plymouth 1.8 70,500 39,500
59 Birkenhead 1.7 64,500 38,000
60 Dundee 1.5 47,000 30,500
61 Cambridge 1.5 61,500 41,500
62 Oxford 1.1 63,500 60,000
Great Britain 2.8 22,092,500 7,792,500
Source: ONS 2017, Business Register and Employment Survey, 2016 data. Note: Northern Ireland data is not available so Great Britain figure is shown.
* Publicly-funded jobs are defined as those jobs that fall into the sectors of public administration and defence, education, and health. This means that this definition captures private sector jobs in these sectors but also captures jobs such as GPs and those in universities that the standard ONS definition does not.
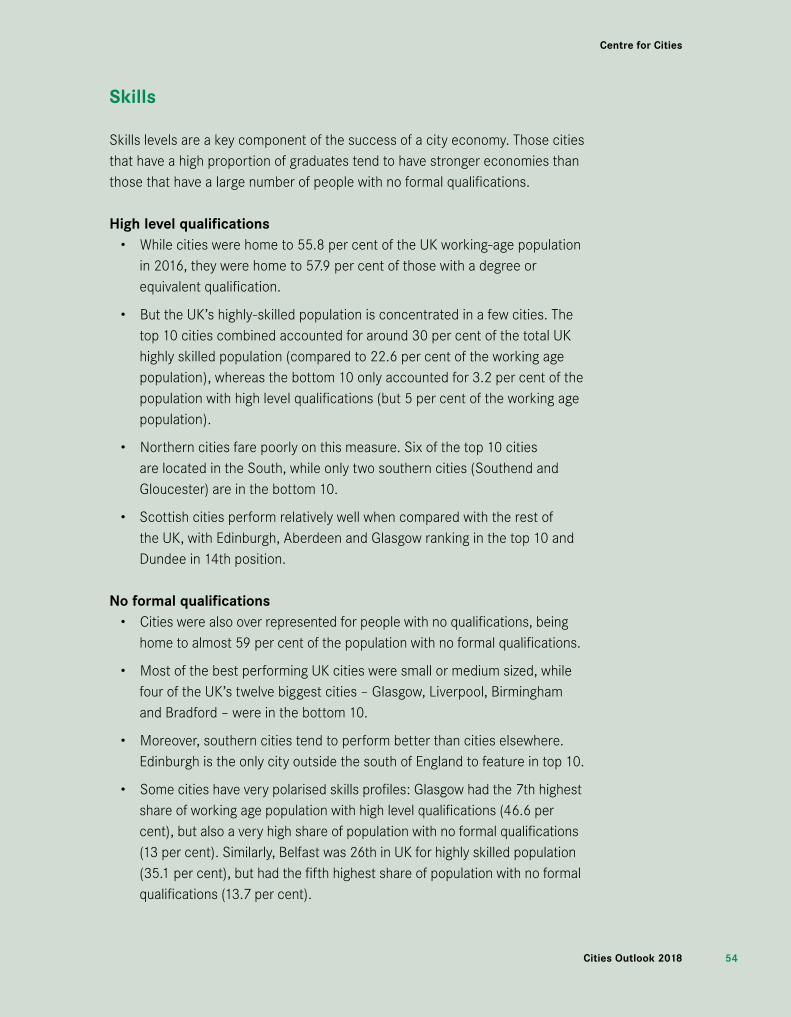
Centre for Cities
5454Cities Outlook 2018
Skills
Skills levels are a key component of the success of a city economy. Those cities that have a high proportion of graduates tend to have stronger economies than those that have a large number of people with no formal qualifications.
Highlevelqualifications• While cities were home to 55.8 per cent of the UK working-age population
in 2016, they were home to 57.9 per cent of those with a degree or equivalent qualification.
• But the UK’s highly-skilled population is concentrated in a few cities. The top 10 cities combined accounted for around 30 per cent of the total UK highly skilled population (compared to 22.6 per cent of the working age population), whereas the bottom 10 only accounted for 3.2 per cent of the population with high level qualifications (but 5 per cent of the working age population).
• Northern cities fare poorly on this measure. Six of the top 10 cities are located in the South, while only two southern cities (Southend and Gloucester) are in the bottom 10.
• Scottish cities perform relatively well when compared with the rest of the UK, with Edinburgh, Aberdeen and Glasgow ranking in the top 10 and Dundee in 14th position.
Noformalqualifications• Cities were also over represented for people with no qualifications, being
home to almost 59 per cent of the population with no formal qualifications.
• Most of the best performing UK cities were small or medium sized, while four of the UK’s twelve biggest cities – Glasgow, Liverpool, Birmingham and Bradford – were in the bottom 10.
• Moreover, southern cities tend to perform better than cities elsewhere. Edinburgh is the only city outside the south of England to feature in top 10.
• Some cities have very polarised skills profiles: Glasgow had the 7th highest share of working age population with high level qualifications (46.6 per cent), but also a very high share of population with no formal qualifications (13 per cent). Similarly, Belfast was 26th in UK for highly skilled population (35.1 per cent), but had the fifth highest share of population with no formal qualifications (13.7 per cent).

Centre for Cities
5555 Cities Outlook 2018
Table10:Residentswithhigh-levelqualifications
Rank City WorkingagepopulationwithNVQ4&above,2016(%)
10 cities with the highest percentage of high qualifications
1 Cambridge 66.8
2 Oxford 60.9
3 Edinburgh 59.2
4 Aberdeen 52.6
5 London 50.7
6 Reading 49.9
7 Glasgow 46.6
8 Brighton 46.5
9 Cardiff 45.6
10 Bristol 44.5
10 cities with the lowest percentage of high qualifications
54 Barnsley 26.8
55 Leicester 26.2
56 Stoke 26.1
57 Sunderland 26.0
58 Wakefield 24.9
59 Doncaster 24.7
60 Bradford 24.5
61 Gloucester 24.2
62 Southend 23.1
63 Mansfield 18.0
United Kingdom 38.0
Source: ONS 2017, Annual Population Survey, residents analysis, 2016 data; DETINI 2017, District Council Area Statistics for Belfast, 2016 data.
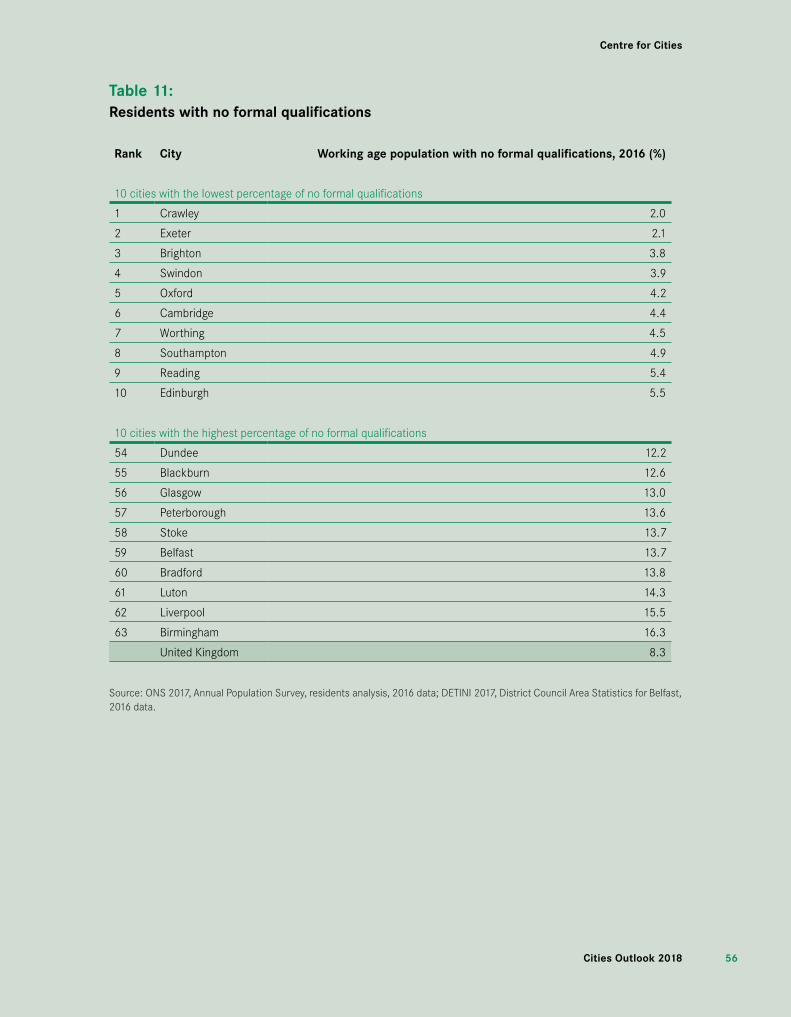
Centre for Cities
5656Cities Outlook 2018
Table11:Residentswithnoformalqualifications
Rank City Workingagepopulationwithnoformalqualifications,2016(%)
10 cities with the lowest percentage of no formal qualifications
1 Crawley 2.0
2 Exeter 2.1
3 Brighton 3.8
4 Swindon 3.9
5 Oxford 4.2
6 Cambridge 4.4
7 Worthing 4.5
8 Southampton 4.9
9 Reading 5.4
10 Edinburgh 5.5
10 cities with the highest percentage of no formal qualifications
54 Dundee 12.2
55 Blackburn 12.6
56 Glasgow 13.0
57 Peterborough 13.6
58 Stoke 13.7
59 Belfast 13.7
60 Bradford 13.8
61 Luton 14.3
62 Liverpool 15.5
63 Birmingham 16.3
United Kingdom 8.3
Source: ONS 2017, Annual Population Survey, residents analysis, 2016 data; DETINI 2017, District Council Area Statistics for Belfast, 2016 data.
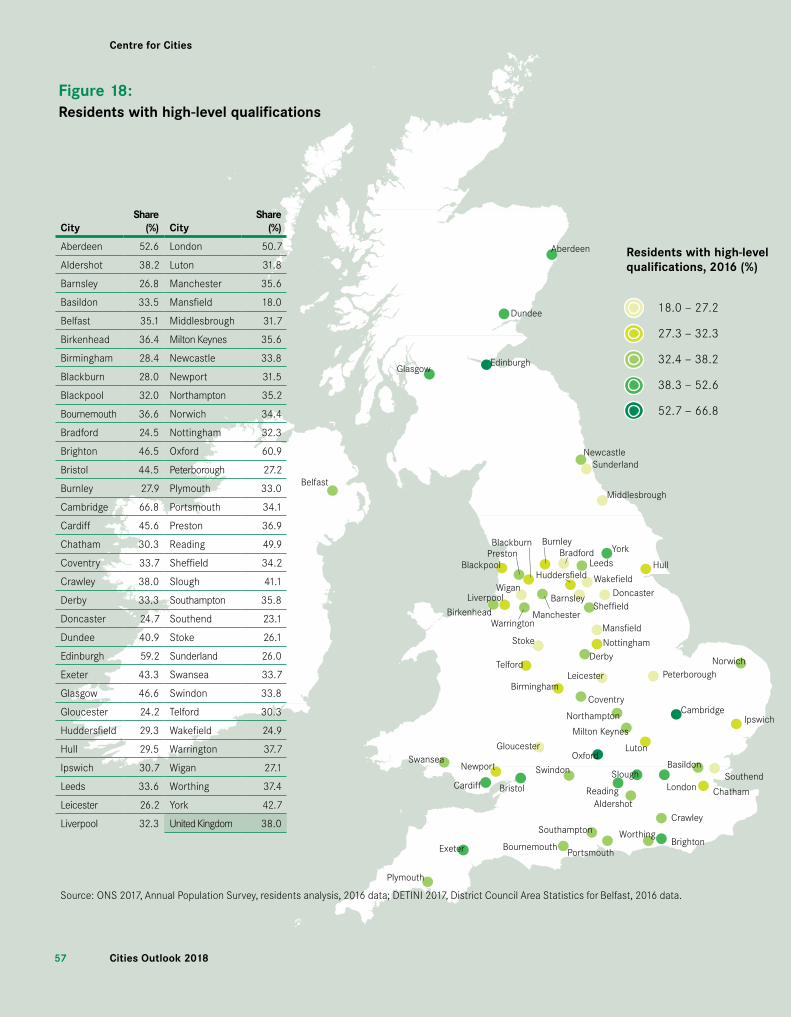
Centre for Cities
5757 Cities Outlook 2018
Dundee
EdinburghGlasgow
NewcastleSunderland
Middlesbrough
Hull
York
Leeds
Swansea
Cardiff
Newport
Bristol
Gloucester
Exeter
Plymouth
Portsmouth
Aberdeen
Southampton
Bournemouth BrightonWorthing
SouthendBasildon
Chatham
Crawley
London
Norwich
Ipswich
Peterborough
AldershotReading
Swindon
Oxford
Milton Keynes
Northampton
Luton
Cambridge
Stoke
Telford
BirminghamCoventry
Leicester
Nottingham
Mansfield
Derby
SheffieldDoncaster
Wakefield
Bradford
Birkenhead
LiverpoolWigan
Manchester
Burnley
BlackpoolPrestonBlackburn
Warrington
Barnsley
Slough
Huddersfield
18.0 — 27.2
27.3 — 32.3
32.4 — 38.2
38.3 — 52.6
52.7 — 66.8
Residents with high-level qualifications, 2016 (%)
Belfast
Figure18:Residentswithhigh-levelqualifications
Source: ONS 2017, Annual Population Survey, residents analysis, 2016 data; DETINI 2017, District Council Area Statistics for Belfast, 2016 data.
CityShare
(%) CityShare
(%)
Aberdeen 52.6 London 50.7
Aldershot 38.2 Luton 31.8
Barnsley 26.8 Manchester 35.6
Basildon 33.5 Mansfield 18.0
Belfast 35.1 Middlesbrough 31.7
Birkenhead 36.4 Milton Keynes 35.6
Birmingham 28.4 Newcastle 33.8
Blackburn 28.0 Newport 31.5
Blackpool 32.0 Northampton 35.2
Bournemouth 36.6 Norwich 34.4
Bradford 24.5 Nottingham 32.3
Brighton 46.5 Oxford 60.9
Bristol 44.5 Peterborough 27.2
Burnley 27.9 Plymouth 33.0
Cambridge 66.8 Portsmouth 34.1
Cardiff 45.6 Preston 36.9
Chatham 30.3 Reading 49.9
Coventry 33.7 Sheffield 34.2
Crawley 38.0 Slough 41.1
Derby 33.3 Southampton 35.8
Doncaster 24.7 Southend 23.1
Dundee 40.9 Stoke 26.1
Edinburgh 59.2 Sunderland 26.0
Exeter 43.3 Swansea 33.7
Glasgow 46.6 Swindon 33.8
Gloucester 24.2 Telford 30.3
Huddersfield 29.3 Wakefield 24.9
Hull 29.5 Warrington 37.7
Ipswich 30.7 Wigan 27.1
Leeds 33.6 Worthing 37.4
Leicester 26.2 York 42.7
Liverpool 32.3 United Kingdom 38.0

Centre for Cities
5858Cities Outlook 2018
Wages
Wages reflect the types of jobs available in cities. Those cities that have higher workplace wages typically have a greater number of high-skilled jobs in them than those that have lower wages.
• In 2017, the average weekly workplace wage in cities was £577, compared to the UK average of £539.
• However in only 15 cities did workers earn more than the UK average. The average London weekly wage was £727; 76 per cent higher than in neighbouring Southend (£413).
• Overall the UK saw no change to its real weekly earnings between 2016 and 2017 (£539).
• However, 35 cities saw their weekly salaries decrease in real terms between 2016 and 2017. Exeter recorded the largest fall (-£35 per week), followed by Bradford (-£34 per week) and Reading (-£31 per week).
• On the other hand, Luton experienced the largest increase in wages, with a real increase of £29 per week between 2016 and 2017, followed by York (£19), Middlesbrough (£13), Dundee (£14) and Brighton (£12).
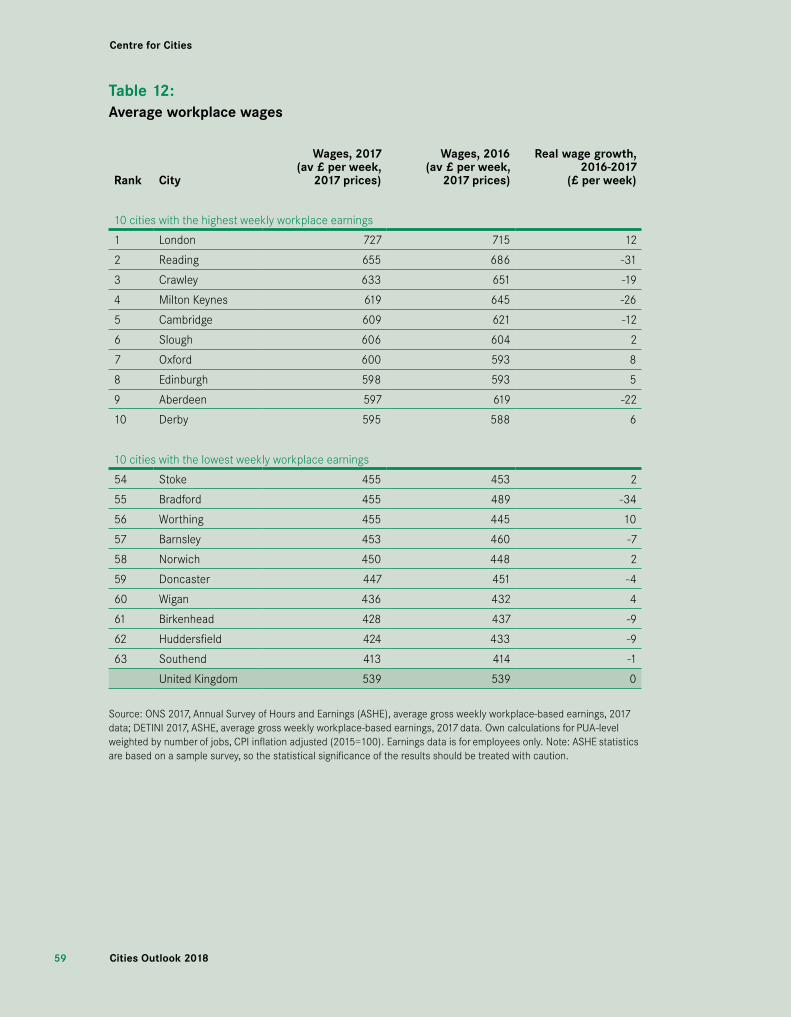
Centre for Cities
5959 Cities Outlook 2018
Table12:Averageworkplacewages
Rank City
Wages,2017(av£perweek,
2017prices)
Wages,2016(av£perweek,
2017prices)
Realwagegrowth,2016-2017
(£perweek)
10 cities with the highest weekly workplace earnings
1 London 727 715 12
2 Reading 655 686 -31
3 Crawley 633 651 -19
4 Milton Keynes 619 645 -26
5 Cambridge 609 621 -12
6 Slough 606 604 2
7 Oxford 600 593 8
8 Edinburgh 598 593 5
9 Aberdeen 597 619 -22
10 Derby 595 588 6
10 cities with the lowest weekly workplace earnings
54 Stoke 455 453 2
55 Bradford 455 489 -34
56 Worthing 455 445 10
57 Barnsley 453 460 -7
58 Norwich 450 448 2
59 Doncaster 447 451 -4
60 Wigan 436 432 4
61 Birkenhead 428 437 -9
62 Huddersfield 424 433 -9
63 Southend 413 414 -1
United Kingdom 539 539 0
Source: ONS 2017, Annual Survey of Hours and Earnings (ASHE), average gross weekly workplace-based earnings, 2017 data; DETINI 2017, ASHE, average gross weekly workplace-based earnings, 2017 data. Own calculations for PUA-level weighted by number of jobs, CPI inflation adjusted (2015=100). Earnings data is for employees only. Note: ASHE statistics are based on a sample survey, so the statistical significance of the results should be treated with caution.

Centre for Cities
6060Cities Outlook 2018
Inequality
As the UK economy has recovered from the last recession, there has been an increasing focus not just on achieving growth but ‘inclusive’ growth. And this has become ever more prescient in light of the EU Referendum vote.
Experimental data on incomes of residents (which includes wages, pensions, benefits and other income) released by the ONS using administrative data sources allows us to create a Gini coefficient for each city to measure what inequality looks like across our cities. The Gini coefficient gives a value between zero and one, with zero representing perfect equality and one representing a very unequal society. The estimates for cities show that:
• The most equal cities tended to be in the north of England or Wales. Burnley and Hull were the most equal of all English and Welsh cities.
• The top 10 least equal cities were dominated by those in the Greater South East, with Cardiff and York being the only two exceptions. Cambridge was the least equal, followed by Oxford and London.
• Those cities that were most equal also tended to have weaker economies, for example having lower average incomes, fewer knowledge-based services jobs and less productive economies (see Figure 19). This means that although these cities were more equal, they were poorer overall.
• Just 10 cities were more unequal than the English and Welsh average. This is likely to reflect the greater preference of higher income people to live in the hinterland around cities rather than in cities themselves.

Centre for Cities
6161 Cities Outlook 2018
Table13:Ginicoefficient
Rank City GiniCoefficient,2015/16
10 least equal cities
1 Cambridge 0.460
2 Oxford 0.452
3 London 0.433
4 Reading 0.433
5 Brighton 0.426
6 Southend 0.421
7 Aldershot 0.418
8 Basildon 0.418
9 York 0.416
10 Cardiff 0.413
10 most equal cities
49 Swansea 0.371
50 Sunderland 0.371
51 Wigan 0.371
52 Barnsley 0.369
53 Newport 0.369
54 Wakefield 0.368
55 Mansfield 0.368
56 Stoke 0.366
57 Hull 0.365
58 Burnley 0.365
England and Wales 0.410
Source: ONS 2017, Research Outputs: Income from PAYE and benefits for tax year ending 2016, 2015/16 data; ONS 2017, Research outputs estimating the size of the population in England and Wales: 2017 release, 2016 data
0 = perfect equality | 1= perfect inequality
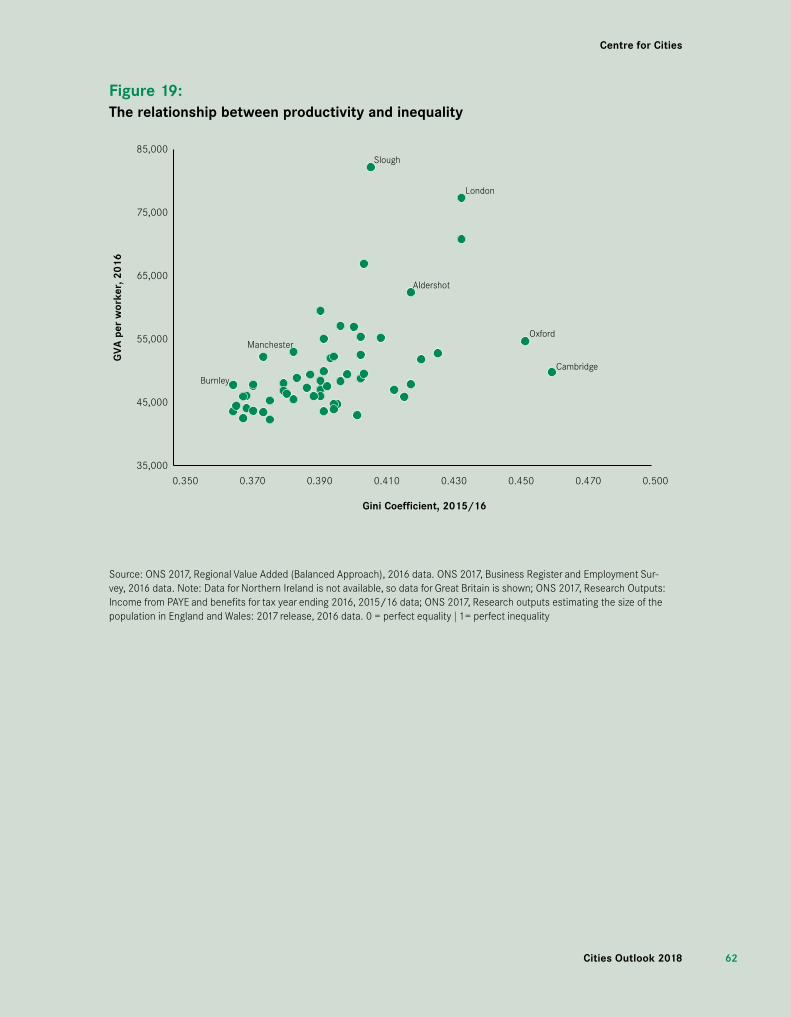
Centre for Cities
6262Cities Outlook 2018
Figure19:Therelationshipbetweenproductivityandinequality
Aldershot
Burnley
London
Manchester
Slough
35,000
45,000
55,000
65,000
75,000
85,000
0.350 0.370 0.390 0.410 0.430 0.450 0.470 0.500
GV
A p
er w
orke
r, 2
016
Gini Coefficient, 2015/16
Oxford
Cambridge
Source: ONS 2017, Regional Value Added (Balanced Approach), 2016 data. ONS 2017, Business Register and Employment Sur-vey, 2016 data. Note: Data for Northern Ireland is not available, so data for Great Britain is shown; ONS 2017, Research Outputs: Income from PAYE and benefits for tax year ending 2016, 2015/16 data; ONS 2017, Research outputs estimating the size of the population in England and Wales: 2017 release, 2016 data. 0 = perfect equality | 1= perfect inequality
Centre for Cities
6363 Cities Outlook 2018
Housing
Housing stocks and prices together provide useful insights into cities’ housing markets, highlighting both supply and demand and their impact on house affordability.
Housingstockgrowth• Cities account for 52 per cent of the UK’s housing stock.
• The UK’s dwelling stock increased by 0.8 per cent between 2015 and 2016, consistent with previous years (0.7 per cent between 2014 and 2015).
• In 30 cities housing stock growth exceeded the UK average, with Telford and Cambridge experiencing the highest growth (1.7 per cent), followed by Swindon and Slough (1.5 per cent).
• Around 34,200 new houses were built in London between 2015 and 2016. This represented a housing stock growth of 0.9 per cent, ranking London 23rd nationally.
Houseprices• In 36 out of 62 cities, house prices grew by more than the Great Britain
average of 3.8 per cent.
• Not all cities saw increases though – five cities saw their average house price fall. Aberdeen saw the largest fall (-1.9 per cent), followed by the northern cities of Burnley, Middlesbrough, Preston and Huddersfield.
• Southend experienced the highest house price growth, with average prices increasing by 11.4 per cent, followed by Slough (10.8 per cent) and Northampton (10.2 per cent).
• House prices in London (£592,500) were twice the British average (£278,200). Oxford and Cambridge were second and third with £523,200 and £505,200, considerably above next placed Brighton (£394,600).
• At the other end of the spectrum, Burnley had the lowest average house price with £102,300, and it decreased by 1.7 per cent compared to last year. The prices in London were 5.8 times than in Burnley, and houses in the city were less than half the British average.

Centre for Cities
6464Cities Outlook 2018
Table14:Housingstockgrowth
Rank CityChange,
2015-2016(%)Housingstock,
2015Housingstock,
2016Change,
2015-2016
10 cities with the highest housing stock growth
1 Telford 1.7 71,960 73,210 1,250
2 Cambridge 1.7 51,120 52,000 880
3 Swindon 1.5 93,900 95,340 1,440
4 Slough 1.5 53,080 53,870 790
5 Wakefield 1.3 149,690 151,610 1,920
6 Crawley 1.2 44,130 44,680 550
7 Exeter 1.2 52,830 53,480 650
8 Peterborough 1.1 80,480 81,400 920
9 Edinburgh 1.1 241,430 244,130 2,700
10 Milton Keynes 1.1 107,550 108,740 1,190
10 cities with the lowest housing stock growth
54 Wigan 0.4 143,220 143,860 640
55 Derby 0.4 108,020 108,500 480
56 Bradford 0.4 210,730 211,640 910
57 Swansea 0.4 175,410 176,160 750
58 Cardiff 0.4 149,960 150,590 630
59 Burnley 0.4 79,710 80,040 330
60 Stoke 0.3 169,100 169,680 580
61 Birkenhead 0.3 146,810 147,300 490
62 Southend 0.3 152,850 153,350 500
63 Blackburn 0.1 60,290 60,380 90
United Kingdom 0.8 28,277,670 28,497,860 220,190
Source: Department of Communities and Local Government (DCLG), 2017, Dwelling stock estimates by local authority district 2015 and 2016. Scottish Neighbourhood Statistics 2017, Dwelling stock estimates 2015 and 2016 data. Northern Ireland Neighbourhood information service 2017, Land and Property Services, 2015 and 2016 data.
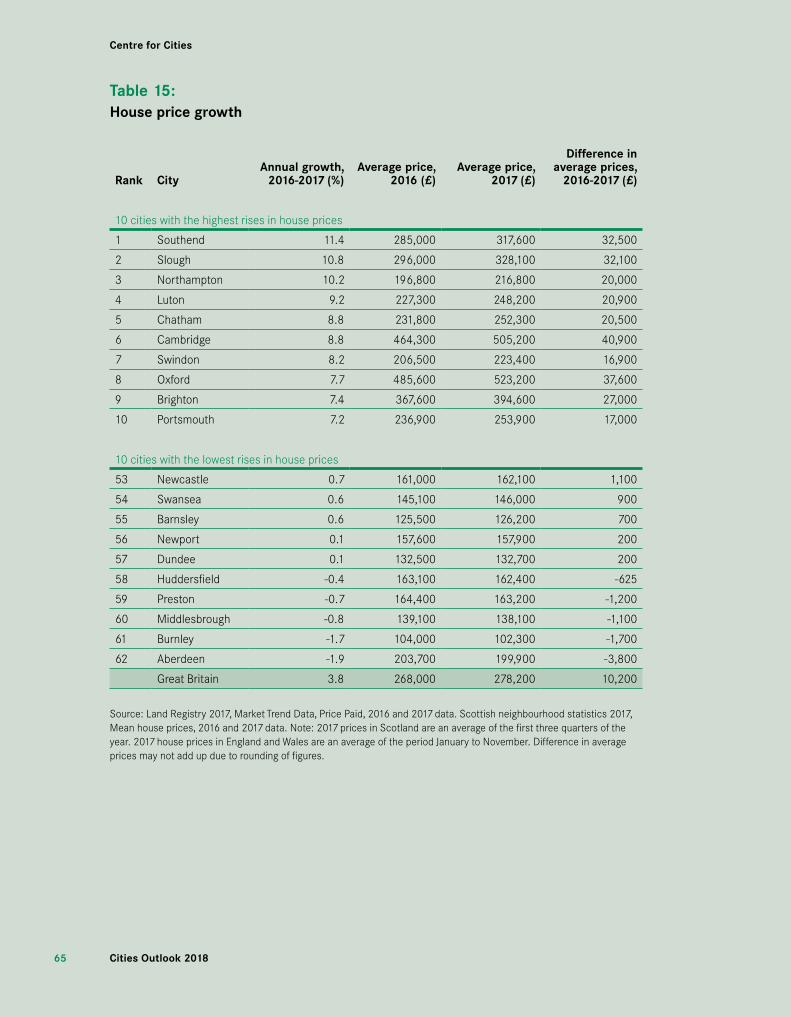
Centre for Cities
6565 Cities Outlook 2018
Table15:Housepricegrowth
Rank CityAnnualgrowth,
2016-2017(%)Averageprice,
2016(£)Averageprice,
2017(£)
Differenceinaverageprices,
2016-2017(£)
10 cities with the highest rises in house prices
1 Southend 11.4 285,000 317,600 32,500
2 Slough 10.8 296,000 328,100 32,100
3 Northampton 10.2 196,800 216,800 20,000
4 Luton 9.2 227,300 248,200 20,900
5 Chatham 8.8 231,800 252,300 20,500
6 Cambridge 8.8 464,300 505,200 40,900
7 Swindon 8.2 206,500 223,400 16,900
8 Oxford 7.7 485,600 523,200 37,600
9 Brighton 7.4 367,600 394,600 27,000
10 Portsmouth 7.2 236,900 253,900 17,000
10 cities with the lowest rises in house prices
53 Newcastle 0.7 161,000 162,100 1,100
54 Swansea 0.6 145,100 146,000 900
55 Barnsley 0.6 125,500 126,200 700
56 Newport 0.1 157,600 157,900 200
57 Dundee 0.1 132,500 132,700 200
58 Huddersfield -0.4 163,100 162,400 -625
59 Preston -0.7 164,400 163,200 -1,200
60 Middlesbrough -0.8 139,100 138,100 -1,100
61 Burnley -1.7 104,000 102,300 -1,700
62 Aberdeen -1.9 203,700 199,900 -3,800
Great Britain 3.8 268,000 278,200 10,200
Source: Land Registry 2017, Market Trend Data, Price Paid, 2016 and 2017 data. Scottish neighbourhood statistics 2017, Mean house prices, 2016 and 2017 data. Note: 2017 prices in Scotland are an average of the first three quarters of the year. 2017 house prices in England and Wales are an average of the period January to November. Difference in average prices may not add up due to rounding of figures.

Centre for Cities
6666Cities Outlook 2018
Housingaffordability• In 2017, on average house prices in Britain were 10 times the annual
salary of residents.
• Oxford was the least affordable city, with house prices being 17.3 times higher than annual earnings. In total, only 16 out of 62 cities were less affordable than the British average.
• On the other hand Burnley was the most affordable city, with an affordability ratio of 4.2.
• All the top 10 least affordable cities were located in the south of England. Meanwhile with the exception of Dundee the 10 most affordable cities were in the north of England.
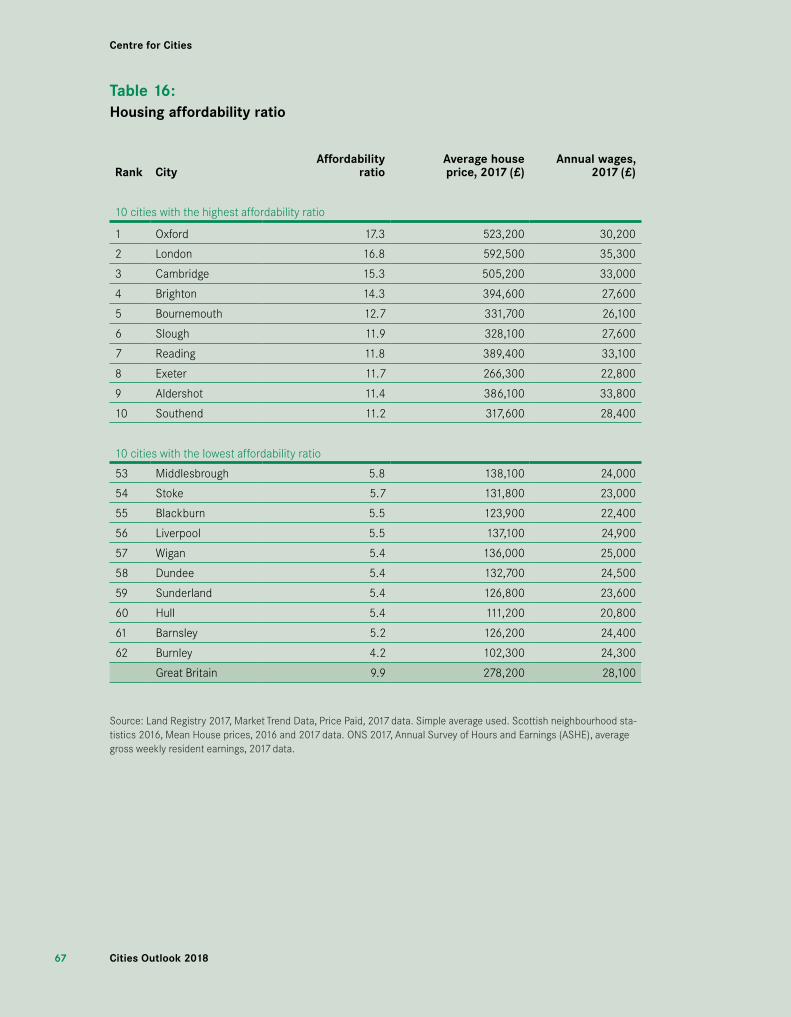
Centre for Cities
6767 Cities Outlook 2018
Table16:Housingaffordabilityratio
Rank CityAffordability
ratioAveragehouseprice,2017(£)
Annualwages,2017(£)
10 cities with the highest affordability ratio
1 Oxford 17.3 523,200 30,200
2 London 16.8 592,500 35,300
3 Cambridge 15.3 505,200 33,000
4 Brighton 14.3 394,600 27,600
5 Bournemouth 12.7 331,700 26,100
6 Slough 11.9 328,100 27,600
7 Reading 11.8 389,400 33,100
8 Exeter 11.7 266,300 22,800
9 Aldershot 11.4 386,100 33,800
10 Southend 11.2 317,600 28,400
10 cities with the lowest affordability ratio
53 Middlesbrough 5.8 138,100 24,000
54 Stoke 5.7 131,800 23,000
55 Blackburn 5.5 123,900 22,400
56 Liverpool 5.5 137,100 24,900
57 Wigan 5.4 136,000 25,000
58 Dundee 5.4 132,700 24,500
59 Sunderland 5.4 126,800 23,600
60 Hull 5.4 111,200 20,800
61 Barnsley 5.2 126,200 24,400
62 Burnley 4.2 102,300 24,300
Great Britain 9.9 278,200 28,100
Source: Land Registry 2017, Market Trend Data, Price Paid, 2017 data. Simple average used. Scottish neighbourhood sta-tistics 2016, Mean House prices, 2016 and 2017 data. ONS 2017, Annual Survey of Hours and Earnings (ASHE), average gross weekly resident earnings, 2017 data.
Centre for Cities
6868Cities Outlook 2018
Environment
Accounting for over 80 per cent of total greenhouse gas emissions, CO2 emissions are one way to gauge how ‘green’ a city is and the size of its carbon footprint.
• In 2015, cities accounted for 54 per cent of the UK population but only 45.5 per cent of the UK’s total CO2 emissions, reflecting the lower carbon emissions per capita in cities than elsewhere.
• Average UK emissions per capita in 2015 totalled 5.9 tonnes (down from 6.2 tonnes in 2014), but the city average was as low as 5 tonnes.
• Swansea and Middlesbrough are significant outliers. They were two of only eight cities to emit more CO2 per capita than the national average. This was driven by large industrial installations which accounted for more than three quarters of total emissions in each city.
• All cities except Crawley, Slough, Stoke and Wakefield reduced their emissions per capita in the year between 2014 and 2015.
• In seven cities (Belfast, Cambridge, Oxford, Telford, Sunderland, Exeter and Middlesbrough) emissions per capita reduced by more than 10 per cent.
• Big cities are significant emitters, but they are very efficient when emissions are considered on a per capita basis. London for example accounted for 10.4 per cent of total UK emissions in 2015, but was twelfth out of 63 cities for per capita emissions with only 4.1 tonnes emitted for every resident (down from 4.4 tonnes in the previous year).

Centre for Cities
6969 Cities Outlook 2018
Table17:TotalCO2emissionspercapita
Rank CityTotalCO2emissionspercapita,2015(t)
TotalCO2emissionspercapita,2014(t)
10 cities with the lowest emissions per capita
1 Luton 3.4 3.7
2 Ipswich 3.4 3.7
3 Chatham 3.5 3.6
4 Southend 3.6 3.7
5 Brighton 3.6 3.8
6 Worthing 3.6 3.9
7 Exeter 3.8 4.3
8 Gloucester 3.8 4.1
9 Plymouth 3.8 4.0
10 Southampton 4.0 4.2
10 cities with the highest emissions per capita
54 Milton Keynes 5.6 5.9
55 Aberdeen 5.8 6.1
56 Stoke 5.9 5.9
57 Preston 6.1 6.3
58 Wakefield 6.5 6.5
59 Warrington 6.5 6.7
60 Doncaster 6.8 7.0
61 Newport 6.9 7.4
62 Middlesbrough 23.0 26.5
63 Swansea 24.6 26.8
United Kingdom 5.9 6.2
Source: Department of Energy and Climate Change (DECC) 2017, CO2 emissions per capita, 2015 data. ONS 2017, Population estimates 2014 and 2015 data.

Centre for Cities
7070Cities Outlook 2018
Digitalconnectivity
Broadband connectivity is a key component of the infrastructure offer that a city can make to businesses, entrepreneurs and residents. The development of optical fibre has considerably increased broadband speed across the country, now enabling access to ‘ultrafast’ (>100Mbps) speeds.
• In 2017, more than half of UK premises (53.1 per cent) had access to ultrafast broadband.
• In 56 out of 63 cities the proportion of properties with access to ultrafast speeds exceeded the UK average.
• Six of the top 10 cities were located in the south of England, whereas only two cities in the bottom 10 were in the south of England (Southend and Milton Keynes).
• While there is variation in the coverage of ultrafast broadband, with the exception of Hull all cities had at least 90 per cent of their properties covered by ‘superfast’ broadband (> 30 Mbps).
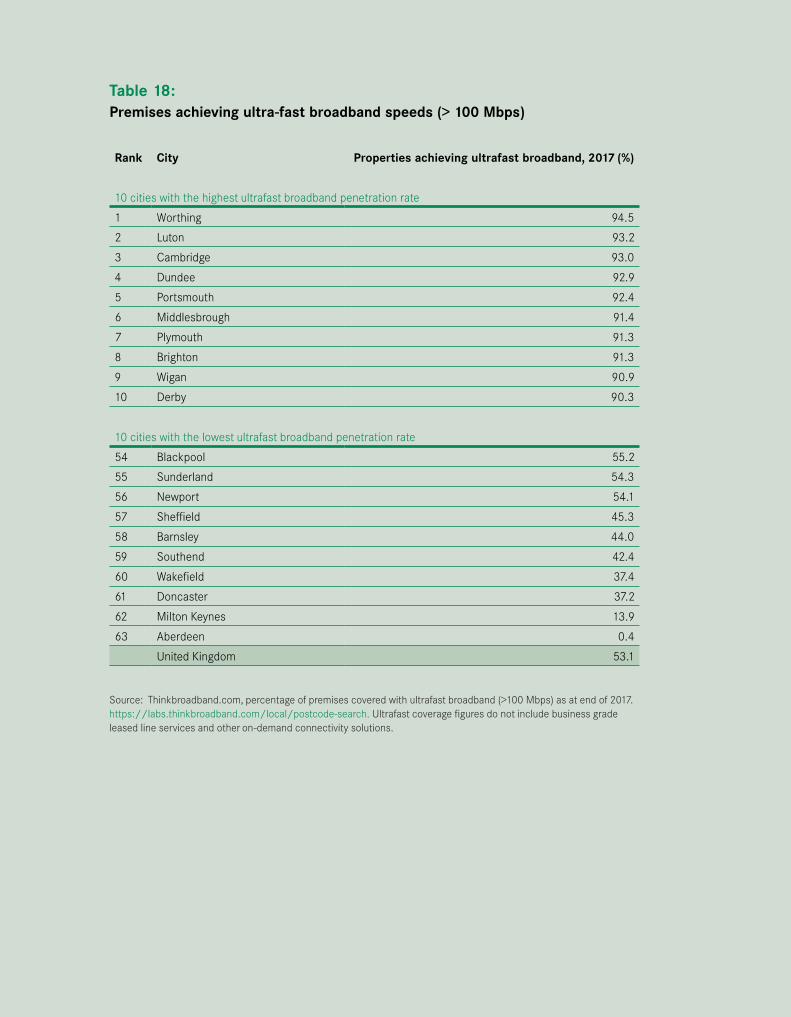
Table18:Premisesachievingultra-fastbroadbandspeeds(>100Mbps)
Rank City Propertiesachievingultrafastbroadband,2017(%)
10 cities with the highest ultrafast broadband penetration rate
1 Worthing 94.5
2 Luton 93.2
3 Cambridge 93.0
4 Dundee 92.9
5 Portsmouth 92.4
6 Middlesbrough 91.4
7 Plymouth 91.3
8 Brighton 91.3
9 Wigan 90.9
10 Derby 90.3
10 cities with the lowest ultrafast broadband penetration rate
54 Blackpool 55.2
55 Sunderland 54.3
56 Newport 54.1
57 Sheffield 45.3
58 Barnsley 44.0
59 Southend 42.4
60 Wakefield 37.4
61 Doncaster 37.2
62 Milton Keynes 13.9
63 Aberdeen 0.4
United Kingdom 53.1
Source: Thinkbroadband.com, percentage of premises covered with ultrafast broadband (>100 Mbps) as at end of 2017. https://labs.thinkbroadband.com/local/postcode-search. Ultrafast coverage figures do not include business grade leased line services and other on-demand connectivity solutions.

AboutCentreforCities
Centre for Cities is a research and policy institute, dedicated to improving the economic success of UK cities.
We are a charity that works with cities, business and Whitehall to develop and implement policy that supports the performance of urban economies. We do this through impartial research and knowledge exchange.
For more information, please visit www.centreforcities.org/about
Partnerships
Centre for Cities is always keen to work in partnership with like-minded organisations who share our commitment to helping cities to thrive, and supporting policy makers to achieve that aim.
As a registered charity (no. 1119841) we rely on external support to deliver our programme of quality research and events.
To find out more please visit: www.centreforcities.org/about/partnerships

January2018
CentreforCities Second Floor 9 Holyrood Street London SE1 2EL
020 7803 4300 [email protected] www.centreforcities.org
© Centre for Cities 2018
Centre for Cities is a registered charity (No 1119841) and a company limited by guarantee registered in England (No 6215397)