Embed Size (px)
Citation preview


Citi GPS: Global Perspectives & Solutions April 2018
Authors
Ajay Khorana
+1 (212) 816-7076 [email protected]
Anil Shivdasani
+1 (212) 816-2348 [email protected]
Cecil Wang
+1 (212) 816-5572 [email protected]
Guocheng Zhong
+1 (212) 816-9078 [email protected]
Peter Hein
+1 (212) 816-2989 [email protected]
Acknowledgements
We thank Peter Babej, Chris Blake, Rick Diamond, Tyler Dickson, Stephen Edelman, Brian Fischbein, Clay Hale, David Head, Heiko Horn, Gabriel Kimyagarov, Cary Kochman, Gordon Kroft, Eric Levengood, Andrew Man, Jan Metzger, Hugh Paisley, Dan Pakenham, Steve Pettigrew, Dean Pimenta, Robert Plowman, Sean Rogers, Mark Shafir, Gustav Sigurdsson, George Tierney, Douglas Trauber, and Herb Yeh for their helpful comments and analytical support; and Celia Gong for her editorial assistance. Anil Shivdasani is a Professor of Finance at the University of North Carolina at Chapel Hill.
About the Financial Strategy and Solutions Group
The Financial Strategy and Solutions Group (FSG) is the corporate finance advisory team in Citi’s Corporate and Investment Banking division. We advise corporate and financial institution clients globally on the full spectrum of corporate finance issues, including valuation, capital structure, credit ratings, risk management, liability management, shareholder distributions, and acquisition and funding strategies. In partnership with Citi’s product and industry experts, we design innovative solutions to assist our clients.

April 2018 Citi GPS: Global Perspectives & Solutions
© 2018 Citigroup
3
DISRUPTORS AT THE GATE Strategic M&A for Managing Disruptive Innovation Technological disruption — driven by the emergence of complementary technologies including artificial intelligence, big data, and digital connectivity, among others — is fundamentally transforming the global economy. Market leaders across all sectors are facing unprecedented challenges to their competitive positions as rapid innovation has enabled technology companies to cross traditional sector boundaries.
For firms outside the technology sector, addressing the impacts of disruption is now a strategic imperative as organic innovation through R&D alone is often proving insufficient in addressing these seismic shifts in competitive landscapes. Instead, these firms are increasingly pursuing acquisitions of technology companies to acquire new digital capabilities and expertise. In 2017, non-technology companies accounted for two-thirds of all acquisitions of technology companies and 80% of global deal volume involving technology targets over $1bn in size was motivated by disruption.
Based on a detailed analysis of all disruption-driven M&A since 2010, we find that investor receptivity to acquisitions involving technology firms has been highly positive. Buyers in such deals have experienced one-year share price outperformance of 7.3%, far outpacing the performance for firms announcing other types of deals and alternative forms of capital deployment.
Underlying this sharp uptick in M&A motivated by technological disruption has been a wide range of strategic motivations. These have ranged from acqui-hire strategies to recruit new talent, acquiring platforms that enable new market opportunities or strengthen existing business models, consolidating acquisitions, and, in some cases, acquisitions of a disruptive new entrant itself. Across these diverse strategies, investors have responded much more positively to acquisitions that have been proactive in nature. Proactive deals — that disrupt an existing business, allow access to nascent markets, or acquire a disruptor — deemed to be transformative have been particularly well received, with one-year acquirer outperformance reaching 18.0%.
M&A transactions designed to address technological disruption typically involve targets that exhibit high valuation multiples driven by high growth rates — both of which can often exceed those of the acquirer. Therefore, balancing the strategic merits of disruption-motivated M&A with its financial impacts should be of particular focus. Buyers that consummated such M&A transactions at deal multiples below the overall market-implied relationship generated substantial share price appreciation.
In addition, our findings emphasize the importance of investor communication for proactive, disruption-driven M&A. Deals that were accretive and accompanied by investor presentations outlining the strategic and financial merits of the transaction have been associated with significant acquirer stock price outperformance.

Citi GPS: Global Perspectives & Solutions April 2018
© 2018 Citigroup
4
Contents Beware of an Evolving Disruption Landscape 5 Sizeable Gains for Tech Disruptors 6 Declining Effectiveness of R&D in Managing Disruption 8
Leverage M&A to Manage Disruption 9 Disruptive Nature of Technology Firms Driving M&A Behavior 9 Many Alternative M&A Strategies Being Used to Manage Disruption 10 Favorable Equity Investor Response to Disruptive M&A 13
Assess the Case for Disruptive M&A 15 A Disruption-Driven M&A Strategy can be Expensive 15 While Expensive, Disruptive M&A Can Enhance Growth Trajectory 16 Proactive Investor Communication Needed to Articulate Deal Rationale 18 Disruptive M&A Favored over Traditional Forms of Capital Deployment 18
Key Takeaways 20

April 2018 Citi GPS: Global Perspectives & Solutions
© 2018 Citigroup
5
Beware of an Evolving Disruption Landscape The global economy is in the midst of a fourth industrial revolution that is transforming the business landscape and disrupting virtually every segment of the global economy. Advances in computing power, storage technology, connectivity, and the use of customer data are transforming existing processes and enabling new disruptive business models. This rapid progress across a host of complementary technologies is creating profound and disruptive changes across every corner of the economic landscape.
The growing confluence of complementary hardware, software, applications, information, and services today has enabled companies to understand and engage their customers like never before. As a result, new entrants are stepping into traditional playing fields and, in some cases, creating new market opportunities that will significantly reshape consumer demand for existing products and services. Firms across all sectors are vulnerable to these technological advancements and their response to these trends may well be a singular determining factor for success in this new digital economy.
Figure 1. Increasing Attention to Disruptive Forces in Investor Communications Fraction of S&P 500 Companies Mentioning Disruption Discussion of Selected Technology Trends by Sector
Source: Citi, Bloomberg. Note: Frequency of disruption keywords contained in earnings calls and company filings for the S&P500 from 12/31/2016 to 12/31/2017.
The recognition of and response to disruptive technologies has been especially pronounced in the U.S. In 2017, nearly two out of every three companies in the S&P 500 discussed an emerging disruptive technology in their financial reports or investor earnings calls. Among the most prominent trends discussed were advancements in computing such as artificial intelligence (A.I.), machine learning, and big data. These developments were noted by 42% of executives and research analysts for S&P 500 firms, with technology companies in particular identifying these innovations as creating new opportunities. Among non-technology firms, machine learning, the internet of things (IoT), and 5G technologies were often identified as forces creating both market opportunities as well as new competition.
42%
23%
22%
15%
6%
11%
23%
10%
35%
2%
Comput ing
Mobilit y
Automat ion
Securit y
Design
Earnings Calls Filings
(e.g. Machine Learning, A.I.)
(e.g. Driverless, Autonomous)
(e.g. 3D Printing, Gene Editing)
(e.g. Blockchain, Cybersecurity)
(e.g. Internet of Things, 5G) CloudCloud
Cloud CloudCloud Big Data Cloud
Computing
Artificial Intelligence
Artificial Intelligence Mobility
Big Data M.L.
Computing
Artificial Intelligence
(A.I.)Machine Learning
(M.L.)
Big DataInternet of Things
M.L.A.I.
IoT
133
105
7262
4034
17
81% 70% 67% 54% 53% 50% 43%
Tech
nolo
gy
Fina
ncia
ls
Cons
umer
Indu
stri
als
Hea
lth
Care
Ener
gy
Com
ms.
Num
ber
of M
entio
ns o
f Key
Dis
rupt
ions
% of companies mentioning a key disruption

Citi GPS: Global Perspectives & Solutions April 2018
© 2018 Citigroup
6
Case Study: Combining the Advantages of Big Data and A.I.
S&P Global Acquires Kensho | $550 million | March 2018
Recognizing the increasing importance of artificial intelligence in shaping the future of analytics, S&P Global acquired Kensho — a startup focused on A.I. solutions for large financial institutions – for $550mm in 2018. Representing the largest A.I. deal in history, the deal combines one of the three largest providers of market and financial data and a leading firm in financial A.I. applications. The transaction positions S&P to achieve significant synergies in delivering sophisticated analytical solutions across its client base.
Firms are also increasingly identifying technological trends as competitive factors and risks. Among financials, blockchain technologies have received recognition by some firms as a potential threat. Across all sectors, however, cybersecurity leads the list of risk factors stemming from the new digital economy, followed by mobility and autonomous vehicles.
The widespread recognition of disruptive forces reflects the tremendous gains by leading technology firms in developing new platforms and entering new markets. Not surprisingly, many firms within the technology sector are widely regarded as being at the forefront of innovation. For example, a recent survey of senior executives that identified the 50 most innovative companies found that a third of these were technology companies.1 Perceptions of innovativeness are also correlated with equity market returns — since 2016, the top innovators in the survey outperformed the S&P 500 by an annualized 8.3%.
Sizeable Gains for Tech Disruptors With new business models prioritizing the collection, analysis, and integration of customer and product data, economic propositions across a wide range of sectors outside of technology are being reshaped. While these developments are creating new market opportunities, traditional approaches to production and customer access are being increasingly challenged.
Recent history provides stark reminders of how technological change has disrupted incumbent business models. Netflix and Amazon transformed how sellers reach customers through data-driven approaches to understanding consumer preferences and behavior. Apple and Tesla have redefined consumer experiences with everyday consumer products. Google and Facebook have revolutionized the dissemination of information and the broader advertising and media industry. In each case, the advent of these disruptors upended business models of leading incumbent firms in their sectors. Relative to the time of disruptor entry, incumbent market leaders across a range of sectors experienced negative or close to zero total shareholder returns in excess of the S&P 500 through the end of 2017. Meanwhile, the technology entrants in their sectors generated sizeable positive excess returns, ranging from 17% to 33% annually over the same time period.
1 See Boston Consulting Group’s survey results of the 50 most innovative companies in “The Most Innovative Companies 2016.”

April 2018 Citi GPS: Global Perspectives & Solutions
© 2018 Citigroup
7
Figure 2. Dominance of Historical market Leaders Is Being Challenged
Source: FactSet. Note: Emergence of disruptors selected based on either IPO date or the date of introduction of a product / service in direct competition with existing offerings from incumbent companies. Incumbents include a representative portfolio of historical market leaders.
As technology firms have leveraged their expertise by expanding into a number of areas outside the technology sector, they have generated sizeable shareholder returns. Over the past five years, the technology sector has experienced sizeable equity market share gains at the expense of virtually every other sector of the global economy. Since 2013, the equity market capitalization of the global technology sector has risen by almost $6 trillion, an amount greater than the increase in equity market value of all other sectors combined.
As a proportion of global equity market capitalization, the share of the technology sector in the MSCI World Index has grown by 10%. While this shift in economic fortunes has been the sharpest in the U.S., the technology sector has also garnered substantial equity market share in Asia, but the disruptive effect has been relatively muted in Europe to date. As the adoption of disruptive technologies spreads globally, effects of increasing technological penetration in coming years will likely expand across other geographies.
Figure 3. Technology Sector Capturing Increased Equity Market Share Technology Firms Have Created the Most Shareholder Value Technology Firms Gaining in Equity Market Share
Source: FactSet. Note: Analysis based on MSCI constituents, excluding financial and utility companies, from 2013 to 2017.
-46
-10 -4
3 3 0
-9
33 20 27 21 24 19 17
Netflix
AppleTesla Paypal Amazon Google Facebook
-60
-40
-20
0
20
40
60
MovieRental
2002
MobilePhone
2007
AutoOEM
2010
PaymentProcessing
2015
Retail /Grocery
2007
Search /Advert ising
2004
News /Media
2006
Ann
ualiz
ed S
hare
hold
er R
etur
nsin
Exc
ess
of S
&P
500
(%)
Incumbents Disruptors
Since DisruptorsEmerged in:
-408
-146
381
556
672
1,409
1,704
5,992
-2,000 0 2,000 4,000 6,000 8,000
Energy
Communicat ions
Retail
Materials
Indust rials
Health Care
Consumer Products
Technology
Change in Aggregate Market Value ($bn)
-4%
-3%
-3%
-1%
-1%
0%
1%
10%
-10 -5 0 5 10 15
Energy
Indust rials
Communicat ions
Materials
Retail
Consumer Products
Health Care
Technology
Change in Fract ion of Market Capitalizat ion (%)
Citi GPS: Global Perspectives & Solutions April 2018
© 2018 Citigroup
8
Declining Effectiveness of R&D in Managing Disruption Historically, increasing research and development (R&D) has been the traditional route to innovation and managing technological change. However, the effectiveness of R&D as a path to innovation has been declining.2 Some have attributed this decline in R&D effectiveness to diminishing returns to scale, while others note that companies have become worse at R&D. Our analysis confirms this trend. Defining the R&D revenue impact as the incremental expected revenue growth from an additional percentage of R&D/revenue, we find that for three of the four sectors that rely heavily on R&D, the revenue impact has declined meaningfully in recent years.3
However, managing disruption extends well beyond R&D. It also often requires investing and redesigning other parts of the business strategy such as sales and marketing. Some of the most meaningful disruptions have occurred not necessarily through increased R&D, but through new applications of existing technologies which have allowed disruptors to solve long-standing problems and capture customers in new ways. Therefore, successful innovation often requires a new vision and way of thinking along with business model reinvention — goals that may be challenging to accomplish without the acquisition of new capabilities and technological expertise.
2 See for example, Robert Gordon, “The Rise and Fall of American Growth” (Princeton University Press, 2016) and Ann Marie Knott, “Is R&D Getting Harder, or Are Companies Just Getting Worse At It?” (Harvard Business Review, 2017) 3 Consumer, industrials, and technology sectors experienced a decline in the revenue impact from R&D while healthcare experienced a slight improvement from 2010 to 2016.

April 2018 Citi GPS: Global Perspectives & Solutions
© 2018 Citigroup
9
Leverage M&A to Manage Disruption As the need to address technological challenges accelerates and organic means of innovation become progressively more difficult, M&A can be an important component of the underlying strategy for managing disruption. Relative to investments in capital expenditures or R&D, an M&A-driven strategy can provide a more timely response to addressing disruptive threats. A growing proportion of companies outside the technology sector are recognizing the value of acquiring technological expertise. These firms are leveraging an array of M&A strategies to manage disruption from new technologies, shifts in demographics and customer behavior, and digital interconnectivity.
Disruptive Nature of Technology Firms Driving M&A Behavior The disruptive effect of technology firms has propelled non-technology companies to explore opportunities outside of their core sectors of expertise. Many non-tech firms are now using technology sector acquisitions to move into new growth areas and catch up to their tech sector competitors. Inbound cross-sector volume into the technology sector has increased from $59bn in 2012 to $235bn in 2017, a four-fold increase. In fact, 65% of all deals involving technology targets in 2017 were from cross-sector acquirers, the highest proportion on record.
Figure 4. Strength of Technology Sector Has Attracted Increasing Cross-Sector M&A Activity Cross-Sector Inbound Tech M&A Reaching All-Time Highs Non-Tech Buyers Account for Growing Majority of Inbound Tech M&A
Source: Dealogic. Note: M&A volumes and deal counts based on all acquisitions of technology sector targets greater than $100 million.
Based on a detailed analysis of all technology sector M&A transactions since 2010, we find that the pace of disruption-motivated deals has accelerated to record levels. Over the past two years, more than 80% of $1bn+ transactions involving technology companies have been motivated by disruption-related considerations. For example, within the retail sector, the lines between traditional brick and mortar and ecommerce have essentially blurred. PetSmart’s 2017 acquisition of Chewy.com highlights the growing importance of a robust e-commerce platform in response to changing consumer purchasing patterns. While this $3.4bn transaction represents the most aggressive M&A into e-commerce to date, PetSmart is only one of many companies to respond by pursuing M&A to strengthen its e-commerce presence.
136 162252
368 344401$59
$101$115
$220
$272$235
0
50
100
150
200
250
300
100
200
300
400
500
600
2012 2013 2014 2015 2016 2017
Vol
ume
of M
&A
($bn
)
Num
ber
of D
eals
Deal Count (Left )Deal Volume (Right )
48 51 55 59 62 65
52 49 45 41 38 35
0
20
40
60
80
100
2012 2013 2014 2015 2016 2017
Prop
orti
on o
f Dea
ls (%
)
Non-Tech Buyers Tech Buyers

Citi GPS: Global Perspectives & Solutions April 2018
© 2018 Citigroup
10
Figure 5. Strong Investor Support for Rising Levels of Disruptive M&A Record Levels of Tech-Related M&A Volume Driven by Disruption Significantly Positive Equity Investor Response to Disruptive M&A
Source: Citi, FactSet, Securities Data Company (SDC) Platinum. Note: Disruptive sample based on acquisitions over $1 billion that involve a technology company (as either acquirer or target) from 2010 to 2017. Disruption-related deals as classified by Citi. Excess returns defined over a risk-adjusted market benchmark.
Investors have reacted favorably to companies using M&A as part of a strategy to respond to disruptive threats. Since 2010, deals motivated by disruption have garnered a positive excess return of 7.3% in the year following announcement. By comparison, one-year excess returns for all M&A transactions have been 3.5%. While the outperformance of disruptive M&A transactions has been significant, disruption-motivated M&A often brings unique risks that need to be managed to realize the benefits of acquiring new capabilities and expertise. Therefore, the experience from managing these unique integration risks potentially confers an incremental advantage to the early responders in their future M&A efforts.
Many Alternative M&A Strategies Being Used to Manage Disruption Since 2016, there has been particularly strong interest from non-tech firms in acquiring capabilities related to e-commerce, cybersecurity, and automation. For example, advancements in sensor technology, computing, and battery efficiency have driven many automotive manufacturers to adopt strategies for developing a market position in autonomous vehicles. GM’s push to accelerate its efforts in developing self-driving vehicles through its acquisition of Cruise Automation represents a strategic response to the efforts of Apple, Uber, and Alphabet’s Waymo in this sector.
Beyond the automotive sector, many ancillary sectors will also feel the need to adapt. This is a reflection of the pervasive impact of new technologies that will impact areas beyond the core sector. Industries such as insurance, energy, media, and communications are all likely to be affected by the progression towards fully autonomous vehicles. For example, property and casualty insurance businesses underwriting personal auto insurance will simultaneously experience the challenge of a shrinking base of car ownership and a potential disadvantage in pricing insurance risks versus both auto manufacturers and technology sector competitors.
$25 $33$82
$210 $228 $236
46% 57% 55%
65%
84% 81%
0
20
40
60
80
100
0
100
200
300
400
2012 2013 2014 2015 2016 2017
Prop
orti
on D
isru
ptiv
e (%
)
Dea
l Vol
ume
($bn
)
Disrupt ive (Left )Proport ion Disrupt ive (Right )
7.3%
3.5%
0
2
4
6
8
10
-10 20 50 80 110 140 170 200 230 260Cum
ulat
ive
Exce
ss R
etur
n (%
)
Days Relat ive to Announcement (Day 0)
Disrupt ive Deals All M&A

April 2018 Citi GPS: Global Perspectives & Solutions
© 2018 Citigroup
11
Figure 6. Technology-Oriented M&A Has Led Firms to Consider Many Alternative Themes
Source: Citi. Note: Selected disruption-related transactions from 2015 to 2107.
In conjunction with traditional M&A strategies, joint ventures, partnership agreements, and acqui-hire strategies are also being used as alternative approaches to manage disruption.4 In addition to its acquisition of Cruise Automation, GM has made concurrent investments in other related areas. In 2016, GM acquired Sidecar as part of an acqui-hire strategy, which has since partnered with Uber. In the same year, its $500 million investment in Lyft helped establish a foothold in the highly competitive ride-hailing segment.
Although the specific circumstances surrounding each disruptive deal are often unique, a number of common themes have emerged in terms of how companies are utilizing M&A to manage technological disruption. The strategic motivation behind these transactions often reflects the company’s relative position against emerging disruptive threats as well as management’s willingness to move boldly in a new strategic direction.
Based on a detailed assessment of each disruption-related M&A transaction since 2010, we classified them into one of three broad strategic approaches: (1) Proactive M&A to capitalize on opportunities emerging from disruption, (2) Reactive deals undertaken in response to disruptive threats, and (3) Consolidative deals that increase the scope and scale of the existing business model.
Within these three categories, five distinct themes emerge:
1. Disrupt the existing business model (e.g. Amazon / Whole Foods) — a strategy characterized by leveraging unique strengths of the acquirer into a new venture outside existing business lines to transform and capture a new market
2. Develop capabilities for new market opportunities / access nascent markets (e.g. Intel / Mobileye) — a strategy that seeks to position the acquirer in a favorable competitive position to take advantage of a developing trend or opportunity
4 An acqui-hire strategy focuses on the acquisition of talent and expertise rather than underlying products or services being acquired.
Acquirer
E-Commerce PetSmartUnileverWalmart
Internet of Things
Simulation / Visualization
Cyber Security
Acqui-Hires
Chewy.comDollar Shave Club
Bonobos
$3.4bn$1.0bn
$310mm
201720162017
Target Value Year
VerizonGeneral Motors
IKEA
Fleetmat icsCruise Automat ion
Task Rabbit
$2.4bn$1.0bn
Undisclosed
201620162017
SiemensUnder Armour
Williams Sonoma
Mentor GraphicsMyFitnessPal
Outward
$4.5bn$475mm$112mm
201620152017
RaytheonCont inental AG
Mastercard
WebsenseArgus
Brighterion
$1.9bn$400mm
Undisclosed
201520172017
FordTarget
General Motors
BlackBerryZet tataSidecar
400 employees25 employees20 employees
201720172016

Citi GPS: Global Perspectives & Solutions April 2018
© 2018 Citigroup
12
3. Acquire a disruptor (e.g. Walmart / Jet.com) — a strategy that offers an immediate way to catch up to the disruption at hand through the outright purchase of new direct competitors
4. Respond to changing economics / strengthen existing platform (e.g. Dell / EMC) — a strategy focused on further establishing technological expertise in a related business area to complement existing internal or organic efforts to innovate
5. Consolidate to remove excess industry capacity and improve efficiency (e.g. Western Digital / Hitachi Global Storage Technologies) — a defensive strategy aimed at becoming a larger, more dominant, and more efficient player in the existing market
Figure 7. Companies Have Adopted an Array of Different M&A Strategies for Managing Disruption
Source: Citi, FactSet, Securities Data Corporation (SDC) Platinum. Note: Disruption-related deals over $1 billion in size as defined by Citi from 2010 to 2017.
Each one of these strategies has its own risks and rewards that need to be balanced in the context of the specific situation. Corporate executives need to carefully evaluate the pros and cons of each strategy and tailor their M&A approach accordingly. The degree of financial flexibility and risk appetite of the acquirer will often influence the timing, size, and scope of these strategies.
Disrupt Existing Business
Model
Develop Capability for New Market Opportunit ies / Access
Nascent Market
Respond to Changing Economics / Strengthen
Existing Platform
Consolidate to Remove Excess
Industry Capacity
Proactive Reactive Consolidative
Acquisit ion SizeMedian $ and % of acquirer’s market cap $3.3bn / 10% $1.9bn / 13% $2.7bn / 64%
Deal Value / Target EBITDAMedian; Forward EBITDA 17.0x 15.7x 11.0x
Target GrowthMedian; Forward EBITDA Growth 14% 14% 9%
Growth Gap: Target – AcquirerMedian; Forward EBITDA Growth 7% 12% 1%
Buy a Disruptor
Mult iple Gap: Target – AcquirerMedian; Forward EBITDA 3.6x 2.6x 1.0x

April 2018 Citi GPS: Global Perspectives & Solutions
© 2018 Citigroup
13
Favorable Equity Investor Response to Disruptive M&A We find that equity investors ascribe a meaningful premium to those firms moving early and aggressively (proactive deals) in the context of disruption-motivated M&A, with a one-year excess return of 5.5%. On the other hand, reactive deals — those undertaken to bolster existing core competencies — generate only 1.2% outperformance. Consolidating deals, however, result in an immediate positive short-term market response of close to 10% that persists over time, reaching 12.1% over a one-year window. This is not surprising since the rationale behind these deals is easier to understand and underlying cost synergies easier to quantify.
Interestingly, the equity market response to proactive deals is accentuated when these deals are truly transformational in nature. Transactions that were greater than 10% of the acquirer’s market capitalization generated meaningfully higher excess returns, outperforming market benchmarks by 18.0% over a one-year period.
Figure 8. Positive but Varied Investor Support for Different Disruptive M&A Strategies Proactive and Consolidative M&A Create Significant Value Transformative Proactive Deals Perform the Best Over Long Horizons
Source: Citi, FactSet, Securities Data Company (SDC) Platinum. Note: Disruption-related deals over $1 billion in size as defined by Citi from 2010 to 2017. Transformative proactive deals defined as deals in excess of 10% of acquirer’s equity market capitalization. Excess returns over a risk-adjusted market benchmark.
Many firms pursuing transformative disruption-motivated M&A have pushed forward with other complementary initiatives as well. These actions include subsequent M&A or additional investments designed to bolster the strategic direction put forth by the initial transaction. For example, to grow beyond its maturing core market, Symantec’s 2016 acquisition of Blue Coat allowed the company to expand its security offerings by gaining a leading market position across web and cloud security. The company subsequently pushed further into consumer identity protection, a related cybersecurity growth area, by acquiring LifeLock less than six months later. Symantec has also increased its ongoing investments in these areas, generating substantial share price outperformance relative to the S&P 500.
5.5%
1.2%
12.1%
0
5
10
15
20
-10 20 50 80 110 140 170 200 230 260Cum
ulat
ive
Exce
ss R
etur
n (%
)
Days Relat ive to Announcement (Day 0)
Proact ive React ive Consolidat ive
18.0%
5.5%
0
5
10
15
20
-10 20 50 80 110 140 170 200 230 260Cum
ulat
ive
Exce
ss R
etur
n (%
)
Days Relat ive to Announcement (Day 0)
Transformat ive Proact ive Deals All Proact ive Deals

Citi GPS: Global Perspectives & Solutions April 2018
© 2018 Citigroup
14
Case Study: Driving Growth in E-Commerce by Acquiring Disruptors
Walmart Acquires Jet.com | $3.3 billion | August 2016
Walmart Acquires Bonobos | $310 million | June 2017
Responding to shifts in consumer shopping behavior, Walmart has made a number of acquisitions designed to strengthen its e-commerce presence. In 2016, Walmart acquired Jet.com for $3.3bn, and in 2017, it acquired Bonobos, an online retailer, for $310mm. Along with its purchases of Shoebuy.com and Moosejaw.com, Walmart has also prioritized new capital expenditures directed towards expanding e-commerce initiatives and announced a slowdown of new store openings to focus more on the growth of its online initiatives.

April 2018 Citi GPS: Global Perspectives & Solutions
© 2018 Citigroup
15
Assess the Case for Disruptive M&A While disruptive deals can help provide new avenues for growth, strengthen a firm’s competitive advantage, and generate substantial market outperformance, they can pose meaningful challenges as well. One of the biggest challenges is that they are often more expensive relative to other M&A alternatives. The potential ability of these deals to help the acquirer manage disruptive threats often results in meaningfully higher acquisition multiples.
Target companies in disruption-motivated M&A are, not surprisingly, often cash flow negative in the near term. Moreover, the meaningful amount of additional investment required at the outset, limited cost synergies, and lack of clarity surrounding long-term revenue potential, can pose internal and external challenges in justifying the deal’s valuation and overall rationale. Further, such transactions may prove more challenging to integrate culturally and organizationally while preserving the entrepreneurial spirit of the acquired entity.
A Disruption-Driven M&A Strategy Can Be Expensive Deal multiples have risen sharply in recent years, bolstered by a strong upward trend in disruptive M&A. Transaction multiples reached an all-time high in 2017 of 14.0x EBITDA, up from 12.9x in 2016 — the second consecutive year that multiples have surpassed the previous high of 12.7x in 2005. For disruption-driven M&A deals, these higher multiples may be the new normal. Since 2010, the median acquisition in a disruption-motivated deal entailed a transaction multiple of 15.3x EBITDA – reflecting both high pre-acquisition trading multiples and high purchase premiums.
Figure 9. Disruption-Related Deals Require Higher Purchase Premiums and Multiples Higher Multiples for Proactive Deals Higher Premiums for Proactive Deals Acquirers Often Pay Up for Disruptive Deals
Source: Citi, FactSet, Securities Data Company (SDC) Platinum. Note: Disruption-related deals over $1 billion in size as defined by Citi from 2010 to 2017. Valuation multiple defined as trading multiple on date of announcement relative to target’s forward EBITDA. Acquirer valuation gap defined as target’s trading multiple less acquirer’s trading multiple.
Proactive and reactive deals have been nearly equally expensive with trading multiples of 12.2x and 11.8x, respectively. However, the range of premiums and trading multiples across proactive deals has been significantly wider, reflecting greater differences in the growth profile of the targets and the varying ability of these transactions to help manage the risk of disruption.
8 .7x 7.6x 7.6x
24.6x
13.8x 10.7x
12.2x
11.8x 8 .2x
Proact ive React iveConsolidat ive
Targ
et V
alua
tion
M
ulti
ple
(x)
25th - 75th Percent ile Median
33% 28% 28%
57%
48% 42% 39%
37% 37%
Proact ive React iveConsolidat ive
Purc
hase
Pre
miu
m
(%, 4
Wee
ks P
rior
)
25th - 75th Percent ile Median 3.6x
2.6x
1.0x
Proact ive React ive Consolidat ive
Targ
et m
inus
Acq
uire
r V
alua
tion
Mul
tipl
e (x
)

Citi GPS: Global Perspectives & Solutions April 2018
© 2018 Citigroup
16
These high acquisition multiples for disruption-driven M&A often require acquirers to pay a meaningful premium above their own valuation multiple. Proactive deals, which in many cases have the ability to allow firms to venture into new growth areas and fundamentally transform the firm’s business model, commanded a median multiple that was 3.6x higher than the acquirer. Similarly, reactive and consolidative deals have been consummated at acquisition multiples 2.6x and 1.0x higher than the acquirer’s.
While Expensive, Disruptive M&A Can Enhance Growth Trajectory How do firms justify paying these high valuation multiples for disruptive deals? One explanation for this lies in the ability of disruptive deals to meaningfully accelerate growth for the acquirer. The typical EBITDA growth rate across targets acquired in disruptive deals from 2010 to 2017 was 11.9% versus 8.4% across the broader M&A universe. Even deals in the bottom quartile of disruptive M&A deals exhibit growth rates 3x larger than the bottom quartile of traditional M&A deals (7.1% vs 2.2%).
Figure 10. Higher Disruption-Related Deal Multiples Accompanied by Superior Growth Profile Disruptive Targets Tend to Have Higher Growth Rates Higher Target Valuations Accompanied by Higher EBITDA Growth
Source: Citi, FactSet, Securities Data Company (SDC) Platinum. Note: Sample of deals over $1 billion in size from 2010 to 2017. Disruption-related deals as defined by Citi. Target’s EBIDA growth defined as two-year forecasted EBITDA growth at deal announcement. Valuation multiple defined as trading multiple on date of announcement relative to target’s forward EBITDA.
While proactive deals tend to be the most expensive disruption-driven M&A alternative, these deals possess superior growth characteristics relative to both reactive and consolidative deals. The faster growth profile is especially pronounced across the subset of proactive and reactive transactions in which the acquiring firm is purchasing a target at a higher multiple of EBITDA than its own. In these instances, the typical earnings growth expectations of the target are 19.1% and 16.2% for proactive deals and reactive deals, respectively, compared to 7.0% and 9.5% for deals in which the acquirer sought a target trading at a lower valuation multiple.
2.2%
7.1%
18.3%
22.8%
8.4%
11.9%
0
5
10
15
20
25
30
All Deals Disruptive Deals
Tar
get
EB
ITD
A G
row
th (
%) 25th - 75th Percentile Median
19.1% 16.2%
9.1% 7.0%
9.5% 9.3%
0
5
10
15
20
Proact ive React ive Consolidat ive
Targ
et E
BIT
DA
Gro
wth
(%)
Target Mult iple > Acquirer Mult ipleTarget Mult iple < Acquirer Mult ipleMedian EBITDA Growth

April 2018 Citi GPS: Global Perspectives & Solutions
© 2018 Citigroup
17
Case Study: Positioning for Growth in Autonomous Transportation
Intel Acquires Mobileye | $15.3 billion | March 2017
The evolution of driverless cars represents the largest potential growth area in computing since the introduction of the smartphone. Proactively positioning ahead of this opportunity within the semiconductor industry, Intel announced the landmark $15.3bn acquisition of Mobileye in 2017. This acquisition sought to combine Intel’s strengths across high-performance computing and connectivity with Mobileye’s industry-leading sensors and visual applications. Although the acquisition entailed a transaction multiple of 35x EBITDA (relative to 2018 estimates), Mobileye’s forecasted EBITDA growth rate of 60% and the strategic benefits of the transaction have the potential to create significant shareholder value.
The valuation environment today also exhibits a significantly higher M&A growth premium. A regression analysis of transaction multiples on target projected EBITDA growth shows that acquirers paid an incremental 0.4x on average for each percentage point of EBITDA growth acquired from 2010 to 2017. Across disruption-related deals, this growth premium has been 3x larger, translating into a growth premium of 1.2x. For example, a target with an EBITDA growth rate of 20% is expected to command a 6.4x incremental valuation differential across disruptive versus all M&A deals.
Figure 11. Investors Reward Firms For Buying Growth at the Right Multiples Disruptive Deals Command a Higher Growth Premium Deals That Acquire Growth at a Reasonable Price are Well Received
Source: Citi, FactSet, Securities Data Company (SDC) Platinum. Note: Sample of deals over $1 billion in size from 2010 to 2017. Disruption-related deals as defined by Citi. Stronger (weaker) growth profile includes deals where the acquired purchased the target at below (above) fair value as implied by the statistical relationship between Transaction Value / Target EBITDA and the target’s two-year forward EBITDA growth forecast at announcement. Excess returns defined over a risk-adjusted market benchmark from 10 days before to one year after announcement.
The market, not surprisingly, pays close attention to deal multiples relative to market-implied relationships. From 2010 to 2017, disruptive deals that were announced at a valuation multiple below the market-implied valuation generated a 10.1% one-year excess return. However, while M&A deals in general saw muted outperformance when the multiple paid was higher than fair value, disruptive deals continued to exhibit strong positive excess returns of 5.3% over this period. This is partially a reflection of the importance of these transformative deals in addressing technological disruption and their ability to recalibrate the firm’s growth trajectory.
10
15
20
25
30
35
40
12 14 16 18 20 22 24 26 28 30Tran
sact
ion
Val
ue /
EB
ITD
A (x
)
Target EBITDA Growth (%)
Disrupt ive Deals All Deals
St ronger Growth Profile
Weaker Growth Profile
6.4x Disrupt ion Premiumfor 20% EBITDA Growth
St ronger Growth Profile
Weaker Growth Profile
10.1%
2.6%
5.3%
-1.6%-3
0
3
6
9
12
Disrupt ive Deals All Deals
Cum
ulat
ive
Exce
ss R
etur
n (%
)
St ronger Growth ProfileWeaker Growth Profile
Citi GPS: Global Perspectives & Solutions April 2018
© 2018 Citigroup
18
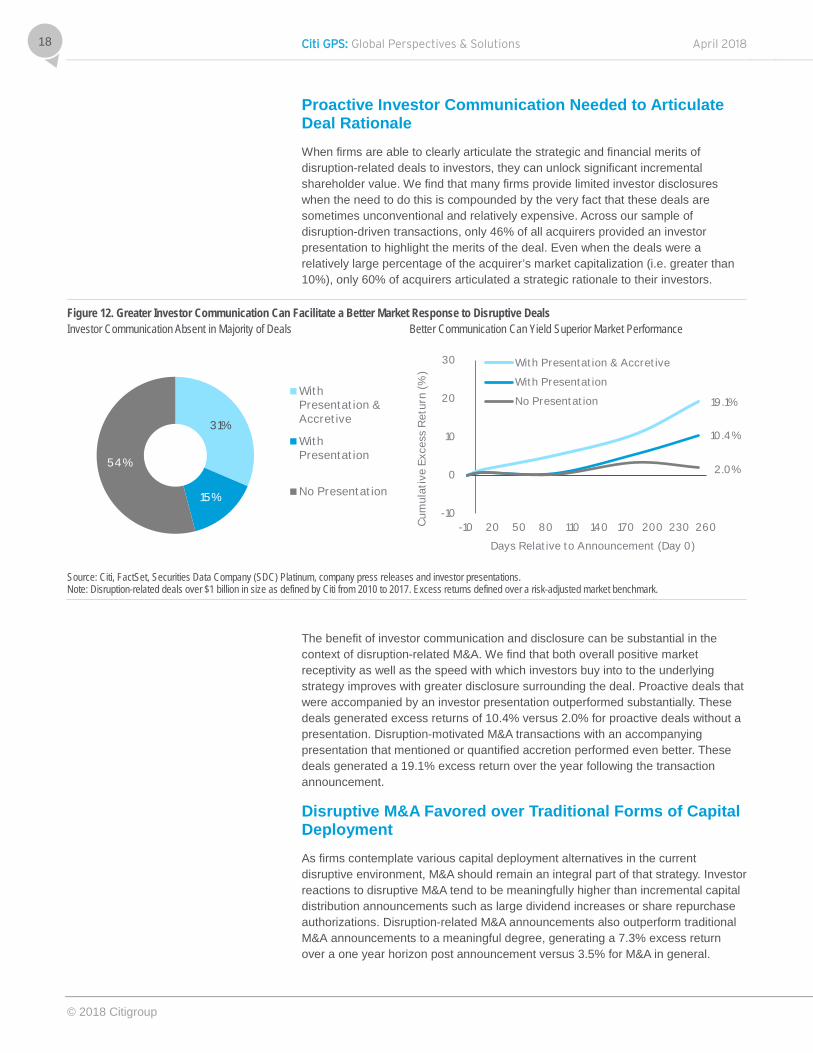
Proactive Investor Communication Needed to Articulate Deal Rationale When firms are able to clearly articulate the strategic and financial merits of disruption-related deals to investors, they can unlock significant incremental shareholder value. We find that many firms provide limited investor disclosures when the need to do this is compounded by the very fact that these deals are sometimes unconventional and relatively expensive. Across our sample of disruption-driven transactions, only 46% of all acquirers provided an investor presentation to highlight the merits of the deal. Even when the deals were a relatively large percentage of the acquirer’s market capitalization (i.e. greater than 10%), only 60% of acquirers articulated a strategic rationale to their investors.
Figure 12. Greater Investor Communication Can Facilitate a Better Market Response to Disruptive Deals Investor Communication Absent in Majority of Deals Better Communication Can Yield Superior Market Performance
Source: Citi, FactSet, Securities Data Company (SDC) Platinum, company press releases and investor presentations. Note: Disruption-related deals over $1 billion in size as defined by Citi from 2010 to 2017. Excess returns defined over a risk-adjusted market benchmark.
The benefit of investor communication and disclosure can be substantial in the context of disruption-related M&A. We find that both overall positive market receptivity as well as the speed with which investors buy into to the underlying strategy improves with greater disclosure surrounding the deal. Proactive deals that were accompanied by an investor presentation outperformed substantially. These deals generated excess returns of 10.4% versus 2.0% for proactive deals without a presentation. Disruption-motivated M&A transactions with an accompanying presentation that mentioned or quantified accretion performed even better. These deals generated a 19.1% excess return over the year following the transaction announcement.
Disruptive M&A Favored over Traditional Forms of Capital Deployment As firms contemplate various capital deployment alternatives in the current disruptive environment, M&A should remain an integral part of that strategy. Investor reactions to disruptive M&A tend to be meaningfully higher than incremental capital distribution announcements such as large dividend increases or share repurchase authorizations. Disruption-related M&A announcements also outperform traditional M&A announcements to a meaningful degree, generating a 7.3% excess return over a one year horizon post announcement versus 3.5% for M&A in general.
31%
15%
54%
WithPresentat ion &Accret ive
WithPresentat ion
No Presentat ion
19.1%
10.4%
2.0%
-10
0
10
20
30
-10 20 50 80 110 140 170 200 230 260Cum
ulat
ive
Exce
ss R
etur
n (%
)
Days Relat ive to Announcement (Day 0)
With Presentat ion & Accret ive
With Presentat ion
No Presentat ion

April 2018 Citi GPS: Global Perspectives & Solutions
© 2018 Citigroup
19
Figure 13. Disruptive M&A Can Create Significantly Greater Value than Other Capital Deployment Alternatives Companies Deploying Significant Capital towards Disruptive M&A Disruptive M&A Can Create Meaningful Shareholder Value
Source: Citi, FactSet, Securities Data Company (SDC) Platinum. Note: Analysis based on dividend increase greater than $1 billion by S&P 500 constituents, announced from 2010 to 2017. Share repurchase announcements over $1 billion from companies domiciled in the U.S. and foreign companies intending to execute repurchases in the U.S. from 2010 to 2017. M&A sample includes acquisitions greater than $1 billion from 2010 to 2017. Disruption-related deals classified by Citi. Excess returns defined over a risk-adjusted market benchmark from 10 days before to 1 year after announcement.
However, it is important to recognize that M&A comes with its inherent risks which are further amplified in the context of managing disruption. Hence, the risks and rewards of these alternative capital deployment alternatives need to be carefully evaluated.
$1.4
$3.4
$4.5
$5.5
0 2 4 6
Dividend Increases
Share Repurchases
M&A
Disrupt ive M&A
Average Amount of Capital Deployed ($bn)
2.0%
3.5%
3.6%
7.3%
0 2 4 6 8
Share Repurchases
M&A
Dividend Increases
Disrupt ive M&A
Cumulat ive Excess Return (%)
Citi GPS: Global Perspectives & Solutions April 2018
© 2018 Citigroup
20
Key Takeaways Technology companies are accelerating their expansion across traditional sector boundaries and creating unprecedented challenges to once unrivaled competitive positions and market share. As organic innovation through R&D alone is often proving insufficient to respond to these shifts in the competitive landscape, companies — especially those outside of the technology sector — are increasingly responding via M&A. A number of key considerations can help guide executives as they adapt their M&A strategies to prioritize the acquisition of new digital capabilities and expertise:
Cross-sector acquisitions of technology targets are increasingly common today, despite their higher valuations which can potentially well exceed that of the acquirer
Investors have responded favorably to disruption-motivated M&A, with acquirers experiencing an excess return of 7.3% over a one-year horizon post announcement
From a value creation perspective, disruptive deals have the potential to far outpace the share price performance for buyers across both other types of deals and alternative means of capital deployment
A proactive approach to disruptive M&A often yields the best outcomes, with such buyers experiencing one-year excess returns of 5.5%, growing to 18.0% when the deal value exceeded 10% of the acquirer’s market capitalization
Acquiring firms at the right valuations remains an important consideration in the context of disruptive M&A, but investors appear more accepting when buyers pay up for a disruptive target
Appropriate investor communication can generate significant shareholder value, especially across proactive transactions, which can be more uncertain and unconventional in their long-term strategic objectives
As the pace of innovation both accelerates and spreads across sectors, addressing the impacts of technological disruption should be one of the foremost considerations in designing an appropriate M&A strategy. While these transactions can entail many unique risks in the short term which will need to be managed, they often have the potential to create significant shareholder value over longer horizon. Companies that can successfully evaluate and execute on these diverse M&A strategies will have the greatest advantage in navigating the current wave of technological disruption and generating sustainable value for their shareholders.

April 2018 Citi GPS: Global Perspectives & Solutions
© 2018 Citigroup
21
IMPORTANT DISCLOSURES This communication has been prepared by Citigroup Global Markets Inc. and is distributed by or through its locally authorised affiliates (collectively, the "Firm") [E6GYB6412478]. This communication is not intended to constitute "research" as that term is defined by applicable regulations. Unless otherwise indicated, any reference to a research report or research recommendation is not intended to represent the whole report and is not in itself considered a recommendation or research report. The views expressed by each author herein are his/ her personal views and do not necessarily reflect the views of his/ her employer or any affiliated entity or the other authors, may differ from the views of other personnel at such entities, and may change without notice. You should assume the following: The Firm may be the issuer of, or may trade as principal in, the financial instruments referred to in this communication or other related financial instruments. The author of this communication may have discussed the information contained herein with others within the Firm and the author and such other Firm personnel may have already acted on the basis of this information (including by trading for the Firm's proprietary accounts or communicating the information contained herein to other customers of the Firm). The Firm performs or seeks to perform investment banking and other services for the issuer of any such financial instruments. The Firm, the Firm's personnel (including those with whom the author may have consulted in the preparation of this communication), and other customers of the Firm may be long or short the financial instruments referred to herein, may have acquired such positions at prices and market conditions that are no longer available, and may have interests different or adverse to your interests. This communication is provided for information and discussion purposes only. It does not constitute an offer or solicitation to purchase or sell any financial instruments. The information contained in this communication is based on generally available information and, although obtained from sources believed by the Firm to be reliable, its accuracy and completeness is not guaranteed. Certain personnel or business areas of the Firm may have access to or have acquired material non-public information that may have an impact (positive or negative) on the information contained herein, but that is not available to or known by the author of this communication. The Firm shall have no liability to the user or to third parties, for the quality, accuracy, timeliness, continued availability or completeness of the data nor for any special, direct, indirect, incidental or consequential loss or damage which may be sustained because of the use of the information in this communication or otherwise arising in connection with this communication, provided that this exclusion of liability shall not exclude or limit any liability under any law or regulation applicable to the Firm that may not be excluded or restricted. The provision of information is not based on your individual circumstances and should not be relied upon as an assessment of suitability for you of a particular product or transaction. Even if we possess information as to your objectives in relation to any transaction, series of transactions or trading strategy, this will not be deemed sufficient for any assessment of suitability for you of any transaction, series of transactions or trading strategy. The Firm is not acting as your advisor, fiduciary or agent and is not managing your account. The information herein does not constitute investment advice and the Firm makes no recommendation as to the suitability of any of the products or transactions mentioned. Any trading or investment decisions you take are in reliance on your own analysis and judgment and/or that of your advisors and not in reliance on us. Therefore, prior to entering into any transaction, you should determine, without reliance on the Firm, the economic risks or merits, as well as the legal, tax and accounting characteristics and consequences of the transaction and that you are able to assume these risks. Financial instruments denominated in a foreign currency are subject to exchange rate fluctuations, which may have an adverse effect on the price or value of an investment in such products. Investments in financial instruments carry significant risk, including the possible loss of the principal amount invested. Investors should obtain advice from their own tax, financial, legal and other advisors, and only make investment decisions on the basis of the investor's own objectives, experience and resources. This communication is not intended to forecast or predict future events. Past performance is not a guarantee or indication of future results. Any prices provided herein (other than those that are identified as being historical) are indicative only and do not represent firm quotes as to either price or size. You should contact your local representative directly if you are interested in buying or selling any financial instrument, or pursuing any trading strategy, mentioned herein. No liability is accepted by the Firm for any loss (whether direct, indirect or consequential) that may arise from any use of the information contained herein or derived herefrom. Although the Firm is affiliated with Citibank, N.A. (together with its subsidiaries and branches worldwide, "Citibank"), you should be aware that none of the other financial instruments mentioned in this communication (unless expressly stated otherwise) are (i) insured by the Federal Deposit Insurance Corporation or any other governmental authority, or (ii) deposits or other obligations of, or guaranteed by, Citibank or any other insured depository institution. This communication contains data compilations, writings and information that are proprietary to the Firm and protected under copyright and other intellectual property laws, and may not be redistributed or otherwise transmitted by you to any other person for any purpose. IRS Circular 230 Disclosure: Citi and its employees are not in the business of providing, and do not provide, tax or legal advice to any taxpayer outside of Citi. Any statements in this Communication to tax matters were not intended or written to be used, and cannot be used or relied upon, by any taxpayer for the purpose of avoiding tax penalties. Any such taxpayer should seek advice based on the taxpayer’s particular circumstances from an independent tax advisor. © 2018 Citigroup Global Markets Inc. Member SIPC. All rights reserved. Citi and Citi and Arc Design are trademarks and service marks of Citigroup Inc. or its affiliates and are used and registered throughout the world.

Citi GPS: Global Perspectives & Solutions April 2018
© 2018 Citigroup
22

April 2018 Citi GPS: Global Perspectives & Solutions
© 2018 Citigroup
23

Citi GPS: Global Perspectives & Solutions © 2018 Citigroup www.citi.com/citigps