Embed Size (px)
Citation preview
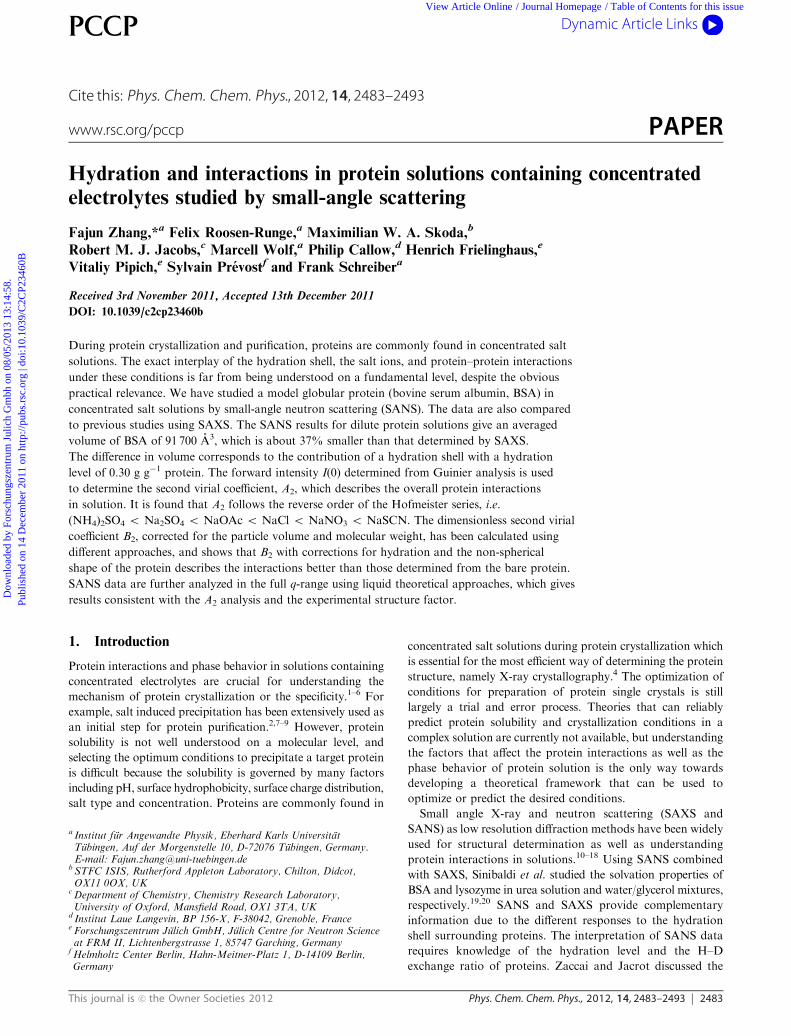
This journal is c the Owner Societies 2012 Phys. Chem. Chem. Phys., 2012, 14, 2483–2493 2483
Cite this: Phys. Chem. Chem. Phys., 2012, 14, 2483–2493
Hydration and interactions in protein solutions containing concentrated
electrolytes studied by small-angle scattering
Fajun Zhang,*aFelix Roosen-Runge,
aMaximilian W. A. Skoda,
b
Robert M. J. Jacobs,cMarcell Wolf,
aPhilip Callow,
dHenrich Frielinghaus,
e
Vitaliy Pipich,eSylvain Prevost
fand Frank Schreiber
a
Received 3rd November 2011, Accepted 13th December 2011
DOI: 10.1039/c2cp23460b
During protein crystallization and purification, proteins are commonly found in concentrated salt
solutions. The exact interplay of the hydration shell, the salt ions, and protein–protein interactions
under these conditions is far from being understood on a fundamental level, despite the obvious
practical relevance. We have studied a model globular protein (bovine serum albumin, BSA) in
concentrated salt solutions by small-angle neutron scattering (SANS). The data are also compared
to previous studies using SAXS. The SANS results for dilute protein solutions give an averaged
volume of BSA of 91 700 A3, which is about 37% smaller than that determined by SAXS.
The difference in volume corresponds to the contribution of a hydration shell with a hydration
level of 0.30 g g�1 protein. The forward intensity I(0) determined from Guinier analysis is used
to determine the second virial coefficient, A2, which describes the overall protein interactions
in solution. It is found that A2 follows the reverse order of the Hofmeister series, i.e.
(NH4)2SO4 o Na2SO4 o NaOAc o NaCl o NaNO3 o NaSCN. The dimensionless second virial
coefficient B2, corrected for the particle volume and molecular weight, has been calculated using
different approaches, and shows that B2 with corrections for hydration and the non-spherical
shape of the protein describes the interactions better than those determined from the bare protein.
SANS data are further analyzed in the full q-range using liquid theoretical approaches, which gives
results consistent with the A2 analysis and the experimental structure factor.
1. Introduction
Protein interactions and phase behavior in solutions containing
concentrated electrolytes are crucial for understanding the
mechanism of protein crystallization or the specificity.1–6 For
example, salt induced precipitation has been extensively used as
an initial step for protein purification.2,7–9 However, protein
solubility is not well understood on a molecular level, and
selecting the optimum conditions to precipitate a target protein
is difficult because the solubility is governed by many factors
including pH, surface hydrophobicity, surface charge distribution,
salt type and concentration. Proteins are commonly found in
concentrated salt solutions during protein crystallization which
is essential for the most efficient way of determining the protein
structure, namely X-ray crystallography.4 The optimization of
conditions for preparation of protein single crystals is still
largely a trial and error process. Theories that can reliably
predict protein solubility and crystallization conditions in a
complex solution are currently not available, but understanding
the factors that affect the protein interactions as well as the
phase behavior of protein solution is the only way towards
developing a theoretical framework that can be used to
optimize or predict the desired conditions.
Small angle X-ray and neutron scattering (SAXS and
SANS) as low resolution diffraction methods have been widely
used for structural determination as well as understanding
protein interactions in solutions.10–18 Using SANS combined
with SAXS, Sinibaldi et al. studied the solvation properties of
BSA and lysozyme in urea solution and water/glycerol mixtures,
respectively.19,20 SANS and SAXS provide complementary
information due to the different responses to the hydration
shell surrounding proteins. The interpretation of SANS data
requires knowledge of the hydration level and the H–D
exchange ratio of proteins. Zaccai and Jacrot discussed the
a Institut fur Angewandte Physik, Eberhard Karls UniversitatTubingen, Auf der Morgenstelle 10, D-72076 Tubingen, Germany.E-mail: [email protected]
b STFC ISIS, Rutherford Appleton Laboratory, Chilton, Didcot,OX11 0OX, UK
cDepartment of Chemistry, Chemistry Research Laboratory,University of Oxford, Mansfield Road, OX1 3TA, UK
d Institut Laue Langevin, BP 156-X, F-38042, Grenoble, Francee Forschungszentrum Julich GmbH, Julich Centre for Neutron Scienceat FRM II, Lichtenbergstrasse 1, 85747 Garching, Germany
fHelmholtz Center Berlin, Hahn-Meitner-Platz 1, D-14109 Berlin,Germany
PCCP Dynamic Article Links
www.rsc.org/pccp PAPER
Dow
nloa
ded
by F
orsc
hung
szen
trum
Jul
ich
Gm
bh o
n 08
/05/
2013
13:
14:5
8.
Publ
ishe
d on
14
Dec
embe
r 20
11 o
n ht
tp://
pubs
.rsc
.org
| do
i:10.
1039
/C2C
P234
60B
View Article Online / Journal Homepage / Table of Contents for this issue
2484 Phys. Chem. Chem. Phys., 2012, 14, 2483–2493 This journal is c the Owner Societies 2012
volume determined by SANS measurement from the forward
intensity, I(0).21 They pointed out that the volume term derived
from I(0) includes not only the ‘‘dry’’ volume of the protein, but
also the volume change of the water molecules from the bulk to
the hydrated state. This perturbation mainly depends on the
density of the hydrated water compared to bulk water. Svergun
et al. studied the density of hydration shell using SAXS and
SANS.16 They found that the density of the hydration shell is
about 10% higher than that of bulk water. This result was
supported by molecular dynamics simulations.22 Given the negative
contrast of the high density hydration shell for SANS
measurements in both H2O and D2O, this will give a reduced
size of the target protein. Indeed, the radius of gyration (Rg)
determined by SAXS was found to be larger than that calculated
from the atomic structure, while Rg values determined by SANS
in H2O and D2O are similar to and slightly smaller compared to
the calculated value. From these results, it seems that SANS is not
sensitive to the hydration shell. Perkins discussed the effect of
hydration shell in both SAXS and SANS measurements:13 For
SAXS, the electron density difference between the hydrated water
(0.408 e A�3) and bulk water (0.334 e A�3) is similar to that of
proteins (0.425 e A�3), and it therefore measures the hydrated
protein molecules as a complete object. For SANS, proteins
in H2O have a SLD of 0.19 � 10�6 A�2, +134% compared
to H2O (�0.562 � 10�6 A�2), while the hydration shell
(�0.69 � 10�6 A�2) has a contrast of about �23%, which is
similar to the 31% variation in SLDwithin the common 20 amino
acids with proteins, the hydration shell is therefore not
detectable in a SANS experiment with H2O buffer. Proteins in
D2O have a SLD of 3.2 � 10�6 A�2, �50% compared to D2O
(6.35� 10�6 A�2). The hydration shell (SLD of 7.82� 10�6 A�2)
has a contrast of about +22%. The contribution from the
hydration shell is still weak, but may not be negligible. As shown
by Svergun et al.16 Rg values determined by SANS in D2O are
slightly smaller than the calculated value (within systematic
error bar). It was concluded that to a good approximation, the
hydration shell is not detectable by SANS in either H2O or D2O.13
These studies indicate that there is a discrepancy between the
theoretical considerations and SANS experiments and more
detailed experimental studies are required to clarify this issue;
and the comparison between SAXS and SANS is necessary for a
comprehensive picture of the hydration shell surrounding proteins.
It has long been known that the solubility of proteins in
solution depends not only on the salt concentration, but also on
the type of the salt. This important phenomenological concept
is known as ‘‘Hofmeister effect’’.23 The classification of ions was
initially performed on their ability to precipitate a protein, and
could be extended to many other systems.8 The order is related
to many key parameters, in particular the propensity of ions to
affect water structure.8 It has been shown that anions have a
stronger effect. However, the combination of cation and anion
in a salt does not result in a trivial sum of ion effects. A
representative Hofmeister anion series can be given as follows:
Citrate3�>SO42�>PO4H
2�>F�>CH3COO�>Cl�>
Br� > I� > NO3� > ClO4
� > SCN�
Ions on the left hand side of the series will precipitate (‘‘salt out’’)
solutes, whereas ions on the right will dissolve or denature
(‘‘salt in’’) solutes. Hofmeister effects have been explained in
terms of structure-making (‘‘kosmotrope’’) and structure-
breaking (‘‘chaotrope’’) abilities of these ions with water.7,9
Kosmotropes interact with water strongly and water molecules
surrounding the salt ions are more structured relative to bulk
water. Chaotropes break up the structure of the surrounding
water molecules because of the large size of the ion and its
weak interaction with water. For example, the specific ion
effects on protein solubility were described in terms of the ability
of ions to ‘‘salt in’’ the polar peptide group and ‘‘salt out’’ the
nonpolar side chains.24 Hofmeister effects on the solubility of
proteins have also been related to the protein–water interfacial
tension.25 Although the molecular basis of Hofmeister effects,
i.e. the specific ion effects, is not yet fully understood, significant
progress has been made by inclusion of dispersion forces
and hydration. Simplified models of electrolytes with proper
inclusion of dispersion forces can capture the essentials of
Hofmeister effects qualitatively.26–28
Serum albumin is the most abundant protein in mammalian
blood with a concentration around 30 g L�1. Bovine and
human serum albumin (BSA and HSA) as model globular
proteins have been involved in many studies due to their
applications as a carrier protein and as a stabilizing agent in
enzymatic reactions. BSA in solution has been studied by
SAXS and SANS with various protein concentration, ionic
strength, and pH.29–33 BSA is a good model for protein
interactions in concentrated salt solutions because of its
stability in a wide salt concentration range. In this context,
we have studied the protein–protein interactions in aqueous
solution using SAXS as a function of protein and ionic
strength.34–37 The protein–protein interactions strongly
depend on the nature of the added salts. When a trivalent salt
was added into protein solution, a novel phase behavior,
named ‘‘reentrant condensation’’, was observed recently in
our laboratory.37–39
In this paper, we present a systematic study of protein
(BSA) in concentrated salt solutions with different types of
salt by using SANS, which provides high contrast and no
radiation damage. By comparison with our previous SAXS
study,36 the contribution from the hydration shell will be
specifically addressed. By using several typical salting-in and
salting-out anions selected from the Hofmeister series, we
address the following questions: first, how sensitive is SANS
in this case to the hydration shell? By calculating the protein
volume and comparing with that determined from SAXS and
protein crystallography, we determine the contribution of the
hydration shell. Second, how to determine the interactions in
such concentrated salt solutions? The second virial coefficient
is evaluated and discussed along the predictions for the
Hofmeister series. Furthermore, modeling based on liquid
state theory will be used to address these questions.
2. Experimental section
2.1. Materials
Bovine serum albumin (BSA) (99% purity) was purchased from
Sigma-Aldrich. It is a lyophilized powder with a molar molecular
weight ofB66 kDa and was used as received. The following salts
Dow
nloa
ded
by F
orsc
hung
szen
trum
Jul
ich
Gm
bh o
n 08
/05/
2013
13:
14:5
8.
Publ
ishe
d on
14
Dec
embe
r 20
11 o
n ht
tp://
pubs
.rsc
.org
| do
i:10.
1039
/C2C
P234
60B
View Article Online
This journal is c the Owner Societies 2012 Phys. Chem. Chem. Phys., 2012, 14, 2483–2493 2485
were used as received: sodium acetate (NaOAc), NaNO3
(Sigma-Aldrich), Na2SO4, NaCl, (NH4)2SO4 (Merck), NaSCN
(Alfa Aesar). BSA solutions were prepared by diluting a stock
solution of 180 � 1 mg mL�1 determined by UV absorption at
280 nm with an extinction coefficient of 39 020 M�1 cm�1, or
0.5912/(mg mL�1) cm�1, calculated from the amino acid
sequence.32 In order to avoid the effect of other ions, no buffer
was used. The pH of protein solutions was 6.8 � 0.1 for most
salts used except (NH4)2SO4 and NaOAc with pH values of
about 6.2 � 0.1 and 8.0 � 0.1, respectively. All the SANS
measurements were performed at 20 1C using D2O (99.9%,
Aldrich or ILL) as solvent.
Caution: It should be noted that concentrated sodium salt
solutions can be radioactive after SANS measurements.
2.2. Small-angle neutron scattering
Small-angle neutron scattering (SANS) measurements were
performed at three different stations, D22 (ILL, Grenoble,
France), KWS2 (JCNS, FRM2, Munich, Germany) and V4
(Helmholtz Center, Berlin, Germany).
D22 diffractometer at the high flux reactor of the Institut
Laue-Langevin (ILL) in Grenoble, France: Two configurations
were used with sample-to-detector distances of 2 m and 8 m and
collimation length of 2 and 8 m, respectively, in order to cover
the q-range from 0.007 to 0.35 A�1 at a wavelength l of 6.0 A
(Dl/l = 10%). Protein solutions in D2O were filled in quartz
cells with a path-length of 1 or 2 mm. Pure H2O was used
for the absolute intensity calibration. Data correction was
performed using GRASP.40
SANS instrument V4 at the Helmholtz Center, Berlin,
Germany:41 Three configurations were used with sample-
to-detector (SD) distances of 1 m, 4 m and 12 m and collimation
lengths of 8 m, 4 m, and 12 m, respectively, in order to cover
the q-range from 0.005 to 0.40 A�1 at a wavelength of 6 A
(Dl/l = 10%). The data were recorded on a 64 � 64 cm2 two-
dimensional detector and radially averaged. The data reduction
was performed using the software BerSANS.42 Protein solutions
in D2O were filled in quartz cells with a path-length of 5 or
10 mm. Pure H2O was used for the absolute intensity calibration.
KWS2 instrument located at the FRM2, Munich, Germany:
Two configurations were used with SD distances of 2 and 8 m
and a collimation length of 8 m in order to cover the q-range
from 0.005 to 0.35 A�1 at a wavelength l of 4.5 A (Dl/l=20%).
A two-dimensional array detector was used to detect neutrons
scattered from sample solutions. Protein solutions were
filled in rectangular quartz cells with path-length of 1 or
2 mm. Plexiglas was used as secondary standard to calibrate
the absolute scattering intensity. The data correction and
absolute intensity calibration were obtained using the software
QtiKWS.43
It is worthy to note that the absolute scale of SANS is
known to be difficult to obtain with a high precision, and
different set-ups and methods from different facilities might
lead to slightly different absolute intensity values.44,45
2.3. Data analysis
SANS intensity from protein solutions can be described as:
I(q) = Np(Dr)2V2
PP(q)S(q) + B (1)
where q= 4p/l� siny, 2y denotes the scattering angle,NP is the
number of protein molecules per unit volume in the solution,
VP is the volume of a single protein and Dr = (rP � rS), is thedifference of scattering length density between protein and
solvent. P(q) is the form factor of a given protein, i.e., the
scattering from a single protein molecule after orientation
averaging. S(q) is the structure factor describing the time-
averaged interaction and distribution of proteins in solution.
B is the protein concentration dependent incoherent background.
Determination of the radius of gyration, Rg. In a dilute
protein solution, where protein molecules are well dispersed,
the interaction between them is negligible. In this case, the
scattering intensity is the summation of the scattering intensities
of all the proteins within the illuminated volume. At sufficiently
low q (qRg o 1), the scattering intensity can be approximated
by the Guinier law:46,47
ln[I(q) � B] = lnI(0) � 13R2gq
2 (2)
where I(0) is the forward scattering at zero angle, Rg the radius
of gyration. Eqn (2) provides a direct method to determine the
Rg. In practice, eqn (2) is valid in the range of qRg up to 1.5.14
Determination of the second virial coefficient, A2. The forward
intensity determined from the Guinier analysis can be used to
determine A2. Tardieu and co-workers have demonstrated that
under weak interactions and low protein concentrations,
the second virial coefficient can be determined from SAXS
measurements.48–51 Eqn (1) can be re-written as:
I(q) = caP(q)S(q) + B (3)
where c is the protein concentration in unit of mg mL�1, and
a a pre-factor. The structure factor at q = 0 is related to the
osmotic pressure, P, by:
Sð0Þ ¼ RT
MW
@P@c
� ��1ð4Þ
where R is the gas constant, andP can be expressed via a virial
expansion:
PcRT
¼ 1
MWþ A2cþ A3c
2 . . . ð5Þ
For low protein concentration and weak interactions, the
A3 and higher order terms can be neglected, which then
yields:
1
Sð0Þ ¼ 1þ ð2MWA2Þc ð6Þ
From eqn (3) and (6) we have
1
Sð0Þ ¼ 1þ ð2MWA2Þc ¼c
Ið0Þ � BaPð0Þ ð7Þ
Model fitting using liquid state methods. The scattering
intensity, I(q), for a polydisperse or a non-spherical system,
is calculated based on approximation approaches. Most often
used are the ‘‘decoupling approximation’’ and ‘‘average structure
factor’’ approximation.52–55 Both approaches assume that
the particle orientation is independent of the particle position,
Dow
nloa
ded
by F
orsc
hung
szen
trum
Jul
ich
Gm
bh o
n 08
/05/
2013
13:
14:5
8.
Publ
ishe
d on
14
Dec
embe
r 20
11 o
n ht
tp://
pubs
.rsc
.org
| do
i:10.
1039
/C2C
P234
60B
View Article Online
2486 Phys. Chem. Chem. Phys., 2012, 14, 2483–2493 This journal is c the Owner Societies 2012
and the form factor results consistently in both approaches
from the angular average of a single particle.
In the decoupling approximation, an explicit angular average
for the assumed particle shape is performed and returns a scaling
factor b(q) for the structure factor.52–54 The average structure
factor approximation accounts implicitly for the angular average
by introducing an effective monodispersed particle.55 While this
thus technically neglects polydispersity and non-sphericity, the
decoupling approximation can induce more delicate errors, since
it is sensitive to the actual choice of the particle shape, which is
not unique if based on the experimental form factor. For the
case of moderately non-spherical but monodispersed particles,
such as globular proteins in solution, both assumptions were
proven to give comparable results. Therefore, in this work, the
scattering intensity is calculated using the average structure
factor approximation.46,52,55,56
In our case, the protein molecules have an overall ellipsoidal
geometry. An effective sphere radius is calculated by equating
the second virial coefficient, A2, of the ellipsoid to a sphere
having the same A2. In the latter discussion, this effective
radius is called ‘‘Isihara radius’’, and will be used to calculate
S(q).36,37,57,58 BSA is negatively charged at physiological pH.
At low ionic strength (o100 mM), the charge induced interaction
can be described using a screened Coulombic potential.59,60 At
moderate and high ionic strength, the surface charge of proteins is
sufficiently screened. The overall interaction is rather weak, and
the protein molecules interact with each other mainly through
hard sphere (excluded volume effect) interactions. Detailed
description can be found in our previous publications.36–38
The data analysis was carried out using macros developed by
the NIST center for neutron scattering research.57
3. Results and discussion
3.1. Form factor and hydration shell
We first present the results on the shape and size of proteins in
dilute solutions (below 20 mg mL�1) with an ionic strength
sufficient to screen the surface charge. Since the global shape
of a particle is mainly reflected in the intermediate q range
where the scattering intensity decays quickly as a function of q,
a model with a simplified particle shape (sphere or ellipsoid
etc.) has the advantage of using a larger q range compared to
the Guinier analysis. It thus provides more precise information
on the size and shape of the particle. The information on the
form factor is very sensitive to the fit in the q range of 0.01 to
0.2 A�1. Data points at larger q have a lower statistical
certainty and are affected by the incoherent background
correction, while the data points at lower q are sensitive to
the effects of beam stop and aggregation.
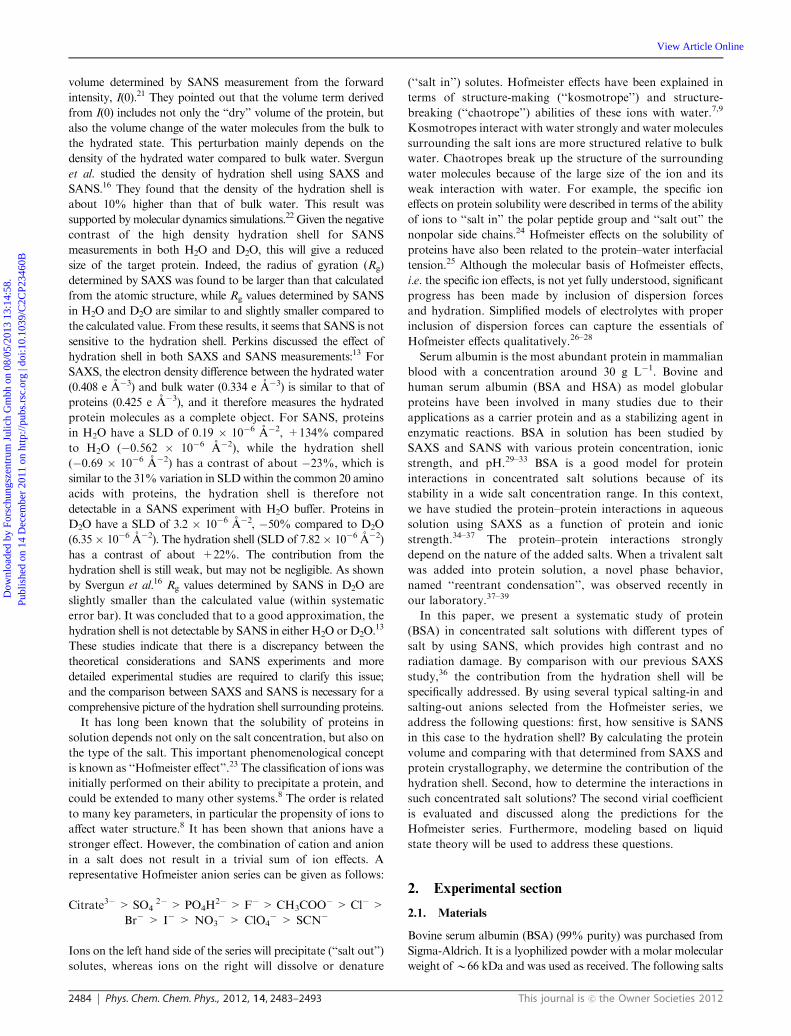
Data fitting using an ellipsoid form factor was performed
on SANS data from all instruments. Fig. 1 shows the SANS
data collected on V4. The SANS curves are almost identical
for BSA 19.4 mg mL�1 with three different salts at an
ionic strength of 100 mM (Fig. 1a). The best fits using an
oblate ellipsoid gives the dimension Ra = 12.5 � 0.2 A and
Rb = 41.9 � 1.1 A, with a constant volume fraction of
(1.1 � 0.1)%, Dr = �(3.3 � 0.2) � 10�6 A�2 and incoherent
background 0.01 cm�1. In the literature,30,32 BSA has been
proposed to possess a cigar-like shape and modeled using a
prolate ellipsoid form factor with Ra = 70 A and Rb = 20 A.
Due to the limited q range in those studies30,32 (o0.16 A�1), the
model is not sensitive to the difference between prolate and
oblate ellipsoid form factor. As seen in Fig. 1b, the differences for
these two types of form factor are clearly seen at q > 0.14 A�1.
First of all, the prolate form factor decays much faster than that
of the oblate. Second, a second scattering maximum would have
to be visible at q = 0.28 A�1 (indicated by an arrow for the red
and green curves in Fig. 1b), which is not observable from the
experimental data and the oblate form factor. The best fit using
prolate form factor gives the dimension of Ra = 53.9 A and
Rb = 21.6 A in our case. Based on these, we conclude that an
oblate ellipsoid form factor is more suitable in our data
analysis. Note that we do not intend to describe the details of
the shape of protein since a high resolution crystal structure for
BSA is not available, but estimate only qualitatively the overall
protein geometry. Despite the simplicity, the form factor should
give a very good estimate of the volume to be compared to the
hydrated volume or dry volume of proteins in solution, in
particular since the focus is on relative changes of the volume
instead of the aspect ratio of the axis.
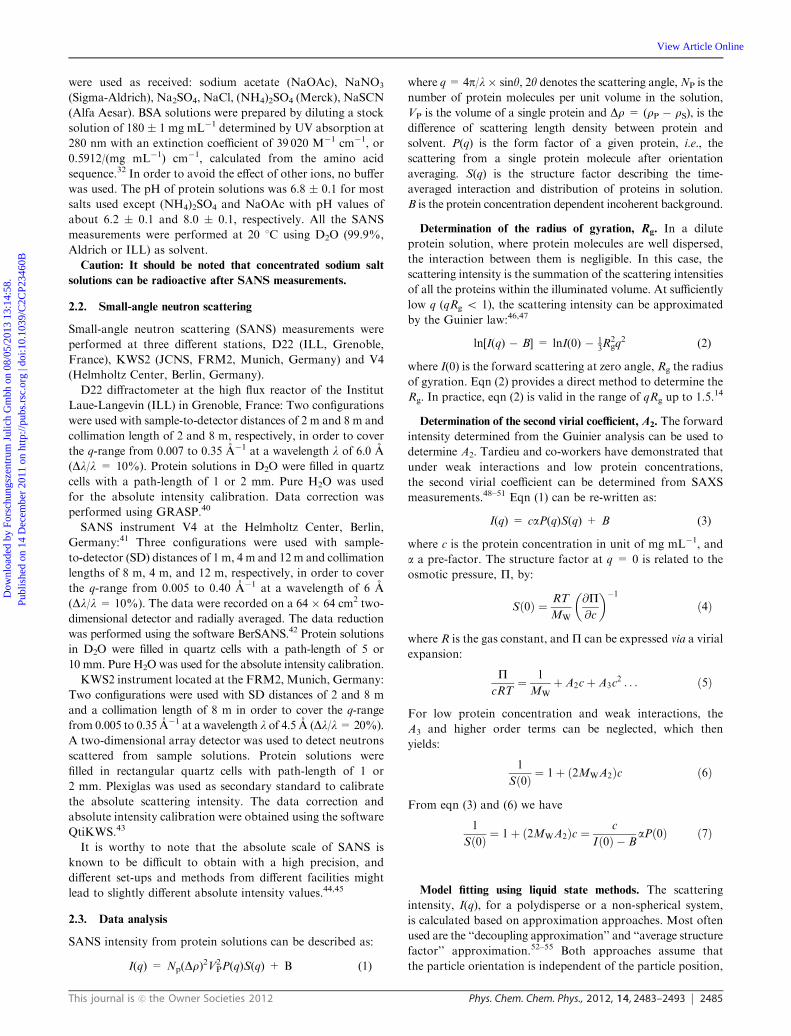
Fig. 2a shows SANS data from KWS2 for BSA 9.5 mg mL�1
with NaCl from low to high ionic strength. The three curves
almost overlap indicating the negligible effects of ionic
strength on the globular structure of proteins and negligible
interactions for these sample solutions. Data from KWS2
give Ra = 13.5 � 0.6 A and Rb = 41.0 � 0.9 A. Data from
D22 give average dimensions of Ra = 12.3 � 0.8 A and
Rb=42.2� 0.7 A. Fig. 2b presents the Kratky plots (I(q)q2E q)
of SANS data for samples with 9.5 mg mL�1 BSA and various
added salts. The Kratky plot is useful to clarify the folding state
of proteins under various conditions.61 For compact proteins in
Fig. 1 Determination of the form factor from SANS profiles for BSA
solutions at low ionic strength. Data were taken at station V4,
Helmholtz Zentrum Berlin. Only 20% of data were plotted for
clarifying (a) best fit using an oblate form factor, data are shifted
for clarity, and (b) comparison of best fits from oblate, prolate and
fixed prolate (70 � 20 � 20 A3) as form factors.
Dow
nloa
ded
by F
orsc
hung
szen
trum
Jul
ich
Gm
bh o
n 08
/05/
2013
13:
14:5
8.
Publ
ishe
d on
14
Dec
embe
r 20
11 o
n ht
tp://
pubs
.rsc
.org
| do
i:10.
1039
/C2C
P234
60B
View Article Online
This journal is c the Owner Societies 2012 Phys. Chem. Chem. Phys., 2012, 14, 2483–2493 2487
solution with their native folding state, as described by the
Porod law, the scattering intensity decays as I(q)E q�4,46 which
in the Kratky plot gives a pronounced peak with a ‘‘bell’’ shape.
On the other hand, for completely unfolded proteins, the
scattering intensity of biopolymers in a random coil state follows
the Debye law, i.e. I(q)E q�1, which in the Kratky plot shows a
steady increase at high q values.61 The resulting plots shown in
Fig. 2b indicate that the addition of salts from both sides of the
Hofmeister series does not reduce the compactness of protein
significantly, consistent with other studies.3,61–63
SANS results collected from different instruments (V4, KWS2,
D22) give an averaged dimension of BSA molecule of (12.5 �0.8) � (41.9 � 0.9) � (41.9 � 0.9) A3. Using the maximum error
of the axes, we estimate the upper limit for the error of the volume
as B6%, which corresponds to a volume of 91700 � 5500 A3.
This value is consistent to that reported in the literature,20 and
close to the volume of HSA determined from the crystal structure
(85280 A3) using the PDB file of 1N5U and calculated by
CRYSOL.64 The dry volume of BSA can also be calculated from
the specific volume (0.74 � 0.02 cm3 g�1)65 divided by NA and
MW (66100 Da), which gives a value of 81200 A3. SANS
measurements thus give a volume about 7.5% larger than the
values calculated from crystal structure of HSA and 13% larger
than that from the specific volume, respectively. This slight
enlargement of resulting volumemay be partly due to the existence
of dimer in BSA solutions. Hunter and Carta analyzed the fraction
of dimer and other oligomers in commercial BSA products and
found an overall fraction about 6.4% for the product used in this
work.66 Dimerization thus cannot be the major contribution to the
observed volume increase. In contrast, this dimension is signifi-
cantly smaller than that determined by SAXS as 17 � 42 � 42 A3
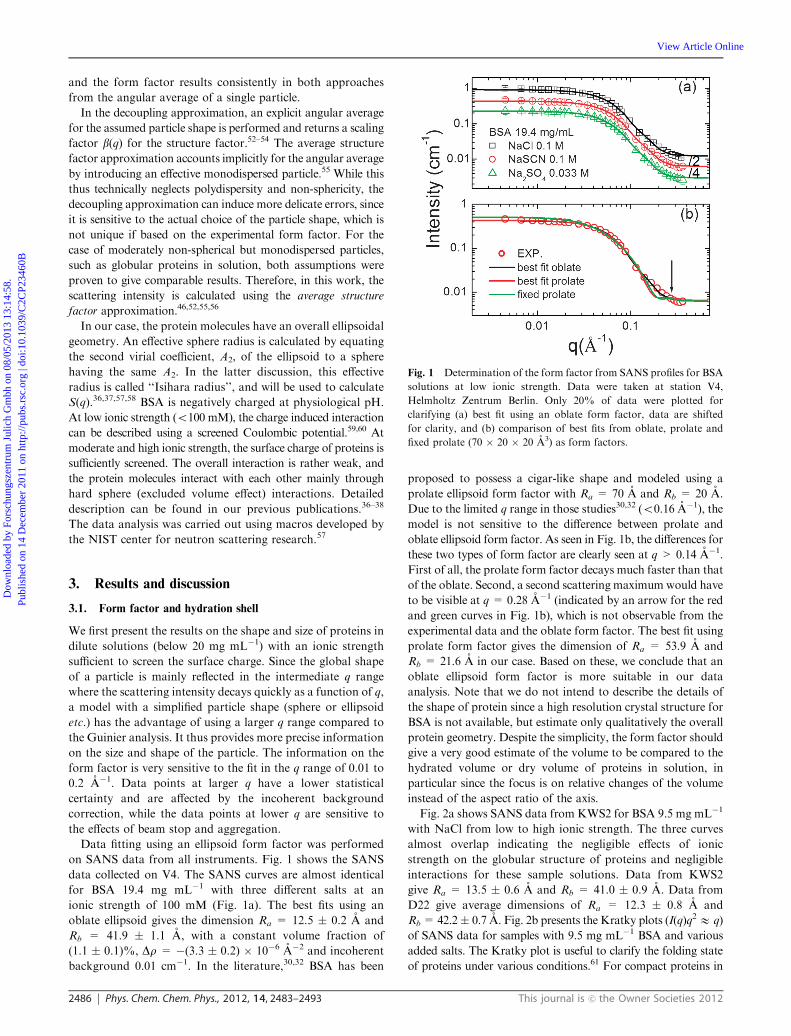
with a volume of 125300 A3. Assuming the density increase of the
hydrated water is B10%,16 the hydration level can be calculated
by 0.74 � 36.6% � 1.1 B 0.30 g g�1 protein for BSA. This
hydration level is in good agreement with the values (from 0.3 to
0.4 g g�1 BSA) reported in the literature.13,30,32,67 This hydration
effect is clearly seen by comparing the SAXS and SANS profiles
on BSA in H2O and D2O (Fig. 3). A diagram of SLD (Fig. 3b)
describes the difference of hydration in SANS and SAXSmeasure-
ment, which is consistent with literature reports.13,16 It is clearly
visible that the SANS data shift towards higher q values compared
to the SAXS data at q > 0.05 A�1, indicating a shrinkage of the
apparent volume of proteins measured by SANS in D2O. It is
worth noting that the shift of SANS data cannot be due to the
smearing effect. As discussed in the literature, the major smearing
effect of SANS measurement is due to the wavelength spread,
Dl/l.44,53 The SANS data from V4 and KWS2 with Dl/l= 10%
and 20%, respectively, show very small differences compared to
the shift with respect to the SAXS data. Similar behavior has been
observed by Svergun et al.16
3.2. Protein–protein interaction from the second virial coefficient
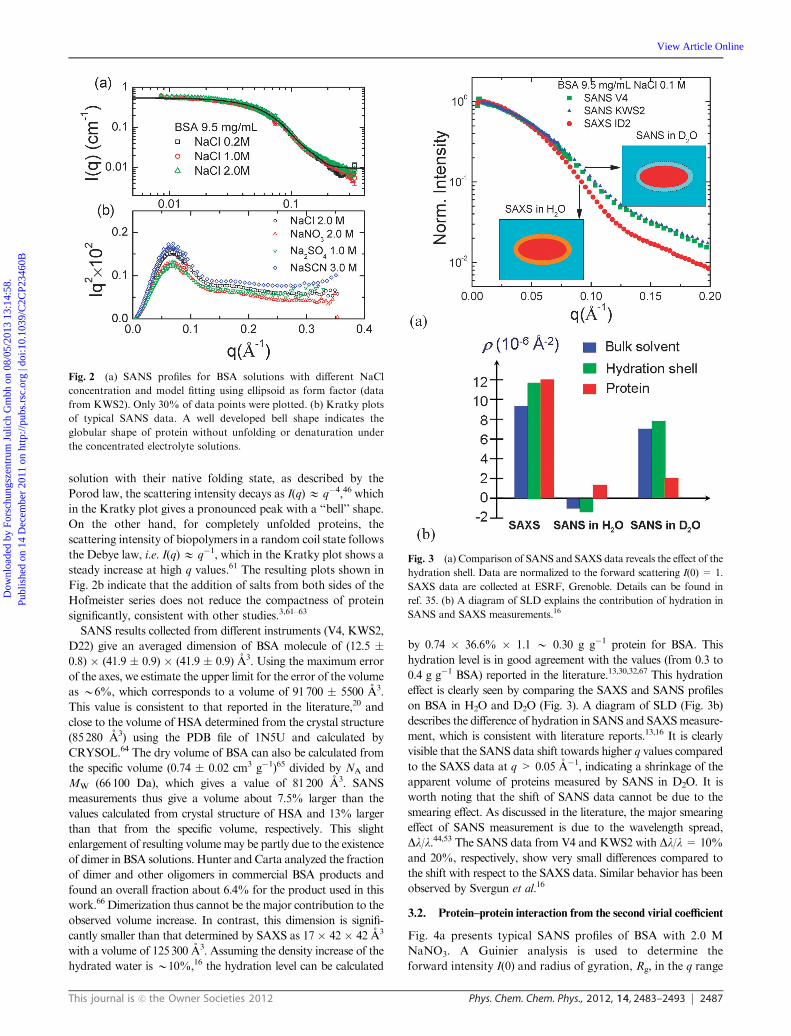
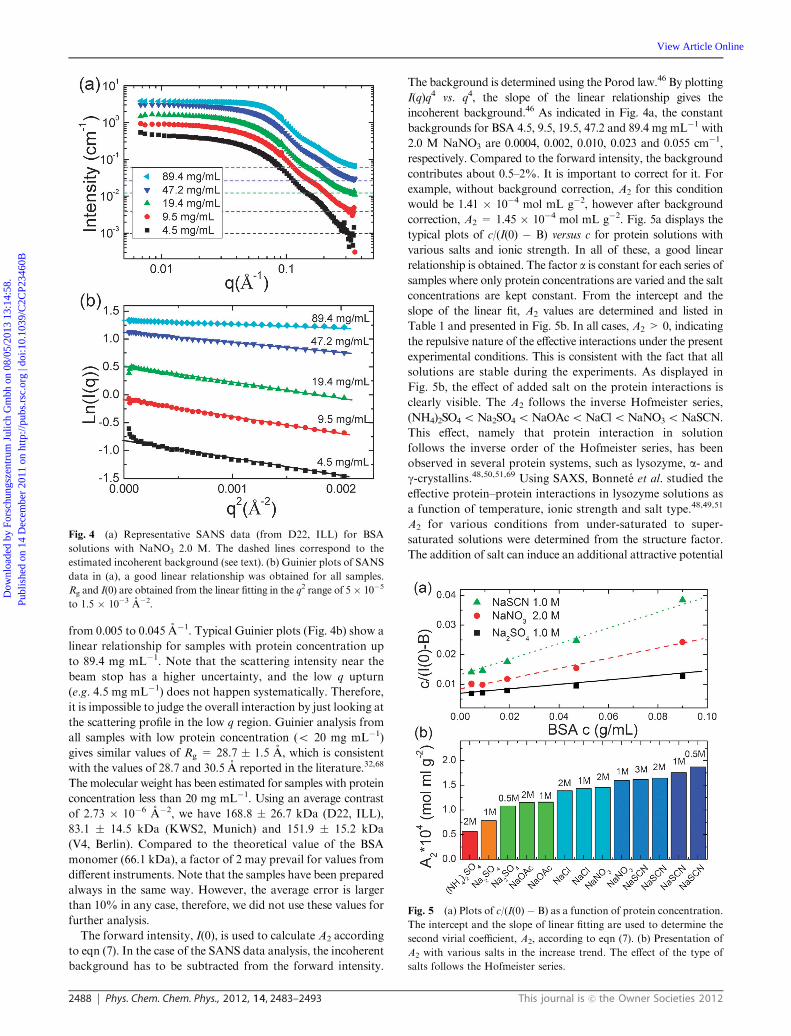
Fig. 4a presents typical SANS profiles of BSA with 2.0 M
NaNO3. A Guinier analysis is used to determine the
forward intensity I(0) and radius of gyration, Rg, in the q range
Fig. 2 (a) SANS profiles for BSA solutions with different NaCl
concentration and model fitting using ellipsoid as form factor (data
from KWS2). Only 30% of data points were plotted. (b) Kratky plots
of typical SANS data. A well developed bell shape indicates the
globular shape of protein without unfolding or denaturation under
the concentrated electrolyte solutions.
Fig. 3 (a) Comparison of SANS and SAXS data reveals the effect of the
hydration shell. Data are normalized to the forward scattering I(0) = 1.
SAXS data are collected at ESRF, Grenoble. Details can be found in
ref. 35. (b) A diagram of SLD explains the contribution of hydration in
SANS and SAXS measurements.16
Dow
nloa
ded
by F
orsc
hung
szen
trum
Jul
ich
Gm
bh o
n 08
/05/
2013
13:
14:5
8.
Publ
ishe
d on
14
Dec
embe
r 20
11 o
n ht
tp://
pubs
.rsc
.org
| do
i:10.
1039
/C2C
P234
60B
View Article Online
2488 Phys. Chem. Chem. Phys., 2012, 14, 2483–2493 This journal is c the Owner Societies 2012
from 0.005 to 0.045 A�1. Typical Guinier plots (Fig. 4b) show a
linear relationship for samples with protein concentration up
to 89.4 mg mL�1. Note that the scattering intensity near the
beam stop has a higher uncertainty, and the low q upturn
(e.g. 4.5 mg mL�1) does not happen systematically. Therefore,
it is impossible to judge the overall interaction by just looking at
the scattering profile in the low q region. Guinier analysis from
all samples with low protein concentration (o 20 mg mL�1)
gives similar values of Rg = 28.7 � 1.5 A, which is consistent
with the values of 28.7 and 30.5 A reported in the literature.32,68
The molecular weight has been estimated for samples with protein
concentration less than 20 mg mL�1. Using an average contrast
of 2.73 � 10�6 A�2, we have 168.8 � 26.7 kDa (D22, ILL),
83.1 � 14.5 kDa (KWS2, Munich) and 151.9 � 15.2 kDa
(V4, Berlin). Compared to the theoretical value of the BSA
monomer (66.1 kDa), a factor of 2 may prevail for values from
different instruments. Note that the samples have been prepared
always in the same way. However, the average error is larger
than 10% in any case, therefore, we did not use these values for
further analysis.
The forward intensity, I(0), is used to calculate A2 according
to eqn (7). In the case of the SANS data analysis, the incoherent
background has to be subtracted from the forward intensity.
The background is determined using the Porod law.46 By plotting
I(q)q4 vs. q4, the slope of the linear relationship gives the
incoherent background.46 As indicated in Fig. 4a, the constant
backgrounds for BSA 4.5, 9.5, 19.5, 47.2 and 89.4 mg mL�1 with
2.0 M NaNO3 are 0.0004, 0.002, 0.010, 0.023 and 0.055 cm�1,
respectively. Compared to the forward intensity, the background
contributes about 0.5–2%. It is important to correct for it. For
example, without background correction, A2 for this condition
would be 1.41 � 10�4 mol mL g�2, however after background
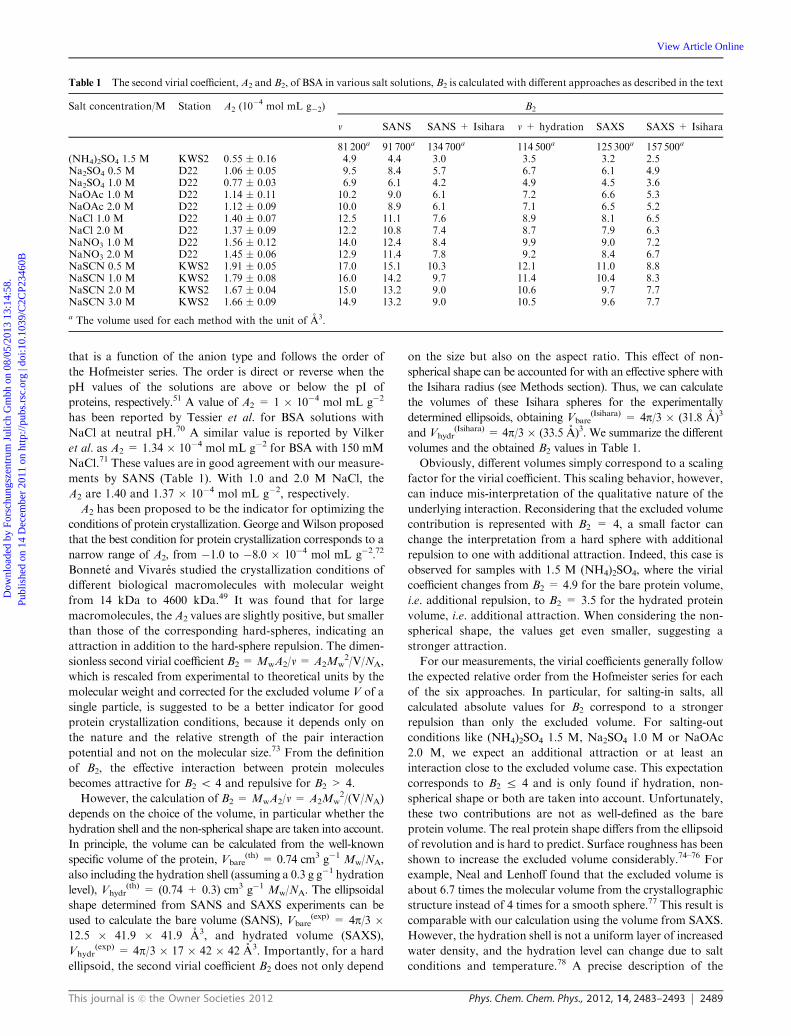
correction, A2 = 1.45 � 10�4 mol mL g�2. Fig. 5a displays the
typical plots of c/(I(0) � B) versus c for protein solutions with
various salts and ionic strength. In all of these, a good linear
relationship is obtained. The factor a is constant for each series of
samples where only protein concentrations are varied and the salt
concentrations are kept constant. From the intercept and the
slope of the linear fit, A2 values are determined and listed in
Table 1 and presented in Fig. 5b. In all cases, A2 > 0, indicating
the repulsive nature of the effective interactions under the present
experimental conditions. This is consistent with the fact that all
solutions are stable during the experiments. As displayed in
Fig. 5b, the effect of added salt on the protein interactions is
clearly visible. The A2 follows the inverse Hofmeister series,
(NH4)2SO4oNa2SO4oNaOAcoNaCloNaNO3oNaSCN.
This effect, namely that protein interaction in solution
follows the inverse order of the Hofmeister series, has been
observed in several protein systems, such as lysozyme, a- andg-crystallins.48,50,51,69 Using SAXS, Bonnete et al. studied the
effective protein–protein interactions in lysozyme solutions as
a function of temperature, ionic strength and salt type.48,49,51
A2 for various conditions from under-saturated to super-
saturated solutions were determined from the structure factor.
The addition of salt can induce an additional attractive potential
Fig. 4 (a) Representative SANS data (from D22, ILL) for BSA
solutions with NaNO3 2.0 M. The dashed lines correspond to the
estimated incoherent background (see text). (b) Guinier plots of SANS
data in (a), a good linear relationship was obtained for all samples.
Rg and I(0) are obtained from the linear fitting in the q2 range of 5� 10�5
to 1.5 � 10�3 A�2.
Fig. 5 (a) Plots of c/(I(0) � B) as a function of protein concentration.
The intercept and the slope of linear fitting are used to determine the
second virial coefficient, A2, according to eqn (7). (b) Presentation of
A2 with various salts in the increase trend. The effect of the type of
salts follows the Hofmeister series.
Dow
nloa
ded
by F
orsc
hung
szen
trum
Jul
ich
Gm
bh o
n 08
/05/
2013
13:
14:5
8.
Publ
ishe
d on
14
Dec
embe
r 20
11 o
n ht
tp://
pubs
.rsc
.org
| do
i:10.
1039
/C2C
P234
60B
View Article Online
This journal is c the Owner Societies 2012 Phys. Chem. Chem. Phys., 2012, 14, 2483–2493 2489
that is a function of the anion type and follows the order of
the Hofmeister series. The order is direct or reverse when the
pH values of the solutions are above or below the pI of
proteins, respectively.51 A value of A2 = 1 � 10�4 mol mL g�2
has been reported by Tessier et al. for BSA solutions with
NaCl at neutral pH.70 A similar value is reported by Vilker
et al. as A2 = 1.34 � 10�4 mol mL g�2 for BSA with 150 mM
NaCl.71 These values are in good agreement with our measure-
ments by SANS (Table 1). With 1.0 and 2.0 M NaCl, the
A2 are 1.40 and 1.37 � 10�4 mol mL g�2, respectively.
A2 has been proposed to be the indicator for optimizing the
conditions of protein crystallization. George andWilson proposed
that the best condition for protein crystallization corresponds to a
narrow range of A2, from �1.0 to �8.0 � 10�4 mol mL g�2.72
Bonnete and Vivares studied the crystallization conditions of
different biological macromolecules with molecular weight
from 14 kDa to 4600 kDa.49 It was found that for large
macromolecules, the A2 values are slightly positive, but smaller
than those of the corresponding hard-spheres, indicating an
attraction in addition to the hard-sphere repulsion. The dimen-
sionless second virial coefficient B2 =MwA2/v = A2Mw2/V/NA,
which is rescaled from experimental to theoretical units by the
molecular weight and corrected for the excluded volume V of a
single particle, is suggested to be a better indicator for good
protein crystallization conditions, because it depends only on
the nature and the relative strength of the pair interaction
potential and not on the molecular size.73 From the definition
of B2, the effective interaction between protein molecules
becomes attractive for B2 o 4 and repulsive for B2 > 4.
However, the calculation of B2 =MwA2/v = A2Mw2/(V/NA)
depends on the choice of the volume, in particular whether the
hydration shell and the non-spherical shape are taken into account.
In principle, the volume can be calculated from the well-known
specific volume of the protein, Vbare(th) = 0.74 cm3 g�1 Mw/NA,
also including the hydration shell (assuming a 0.3 g g�1 hydration
level), Vhydr(th) = (0.74 + 0.3) cm3 g�1 Mw/NA. The ellipsoidal
shape determined from SANS and SAXS experiments can be
used to calculate the bare volume (SANS), Vbare(exp) = 4p/3 �
12.5 � 41.9 � 41.9 A3, and hydrated volume (SAXS),
Vhydr(exp) = 4p/3 � 17 � 42 � 42 A3. Importantly, for a hard
ellipsoid, the second virial coefficient B2 does not only depend
on the size but also on the aspect ratio. This effect of non-
spherical shape can be accounted for with an effective sphere with
the Isihara radius (see Methods section). Thus, we can calculate
the volumes of these Isihara spheres for the experimentally
determined ellipsoids, obtaining Vbare(Isihara) = 4p/3 � (31.8 A)3
and Vhydr(Isihara) = 4p/3 � (33.5 A)3. We summarize the different
volumes and the obtained B2 values in Table 1.
Obviously, different volumes simply correspond to a scaling
factor for the virial coefficient. This scaling behavior, however,
can induce mis-interpretation of the qualitative nature of the
underlying interaction. Reconsidering that the excluded volume
contribution is represented with B2 = 4, a small factor can
change the interpretation from a hard sphere with additional
repulsion to one with additional attraction. Indeed, this case is
observed for samples with 1.5 M (NH4)2SO4, where the virial
coefficient changes from B2 = 4.9 for the bare protein volume,
i.e. additional repulsion, to B2 = 3.5 for the hydrated protein
volume, i.e. additional attraction. When considering the non-
spherical shape, the values get even smaller, suggesting a
stronger attraction.
For our measurements, the virial coefficients generally follow
the expected relative order from the Hofmeister series for each
of the six approaches. In particular, for salting-in salts, all
calculated absolute values for B2 correspond to a stronger
repulsion than only the excluded volume. For salting-out
conditions like (NH4)2SO4 1.5 M, Na2SO4 1.0 M or NaOAc
2.0 M, we expect an additional attraction or at least an
interaction close to the excluded volume case. This expectation
corresponds to B2 r 4 and is only found if hydration, non-
spherical shape or both are taken into account. Unfortunately,
these two contributions are not as well-defined as the bare
protein volume. The real protein shape differs from the ellipsoid
of revolution and is hard to predict. Surface roughness has been
shown to increase the excluded volume considerably.74–76 For
example, Neal and Lenhoff found that the excluded volume is
about 6.7 times the molecular volume from the crystallographic
structure instead of 4 times for a smooth sphere.77 This result is
comparable with our calculation using the volume from SAXS.
However, the hydration shell is not a uniform layer of increased
water density, and the hydration level can change due to salt
conditions and temperature.78 A precise description of the
Table 1 The second virial coefficient,A2 and B2, of BSA in various salt solutions, B2 is calculated with different approaches as described in the text
Salt concentration/M Station A2 (10�4
mol mL g�2) B2
v SANS SANS + Isihara v + hydration SAXS SAXS + Isihara
81 200a 91 700a 134 700a 114 500a 125 300a 157 500a
(NH4)2SO4 1.5 M KWS2 0.55 � 0.16 4.9 4.4 3.0 3.5 3.2 2.5Na2SO4 0.5 M D22 1.06 � 0.05 9.5 8.4 5.7 6.7 6.1 4.9Na2SO4 1.0 M D22 0.77 � 0.03 6.9 6.1 4.2 4.9 4.5 3.6NaOAc 1.0 M D22 1.14 � 0.11 10.2 9.0 6.1 7.2 6.6 5.3NaOAc 2.0 M D22 1.12 � 0.09 10.0 8.9 6.1 7.1 6.5 5.2NaCl 1.0 M D22 1.40 � 0.07 12.5 11.1 7.6 8.9 8.1 6.5NaCl 2.0 M D22 1.37 � 0.09 12.2 10.8 7.4 8.7 7.9 6.3NaNO3 1.0 M D22 1.56 � 0.12 14.0 12.4 8.4 9.9 9.0 7.2NaNO3 2.0 M D22 1.45 � 0.06 12.9 11.4 7.8 9.2 8.4 6.7NaSCN 0.5 M KWS2 1.91 � 0.05 17.0 15.1 10.3 12.1 11.0 8.8NaSCN 1.0 M KWS2 1.79 � 0.08 16.0 14.2 9.7 11.4 10.4 8.3NaSCN 2.0 M KWS2 1.67 � 0.04 15.0 13.2 9.0 10.6 9.7 7.7NaSCN 3.0 M KWS2 1.66 � 0.09 14.9 13.2 9.0 10.5 9.6 7.7
a The volume used for each method with the unit of A3.
Dow
nloa
ded
by F
orsc
hung
szen
trum
Jul
ich
Gm
bh o
n 08
/05/
2013
13:
14:5
8.
Publ
ishe
d on
14
Dec
embe
r 20
11 o
n ht
tp://
pubs
.rsc
.org
| do
i:10.
1039
/C2C
P234
60B
View Article Online
2490 Phys. Chem. Chem. Phys., 2012, 14, 2483–2493 This journal is c the Owner Societies 2012
excluded volume contribution to the second virial coefficient is
difficult and the use of A2 or B2 to describe the effective
interaction between particles should be interpreted with care,
in particular when the interactions are weak.
3.3. Experimental structure factor and effective
protein–protein interactions from model fitting
For BSA in D2O, assuming no H–D exchange, the scattering
length density (SLD) would be about 1.84 � 10�6 A�2.
However, there are 1018 exchangeable hydrogens in one BSA
molecule and up to 90% of them can be exchanged after 24 h,79
which corresponds to a SLD of 3.04 � 10�6 A�2. In practice,
the H–D exchange depends on protein concentration.30 By
considering 70% exchange, the SLD is 2.77 � 10�6 A�2, which
is close to the fitted value. For example, from the data with 4.9
and 89.4 mg mL�1 BSA with 0.1 M NaCl collected at D22
(Fig. 6a), when fixing the solvent SLD (D2O, 6.34 � 10�6 A�2),
we get SLD of BSA of 2.71 and 2.87 � 10�6 A�2, respectively.
These values are consistent to those reported in the literature.30
Since the difference of SLD between protein and solvent con-
tributes to a constant factor of data fitting, for the remaining
data fitting, we fix the SLD of the protein to 2.70 � 10�6 A�2.
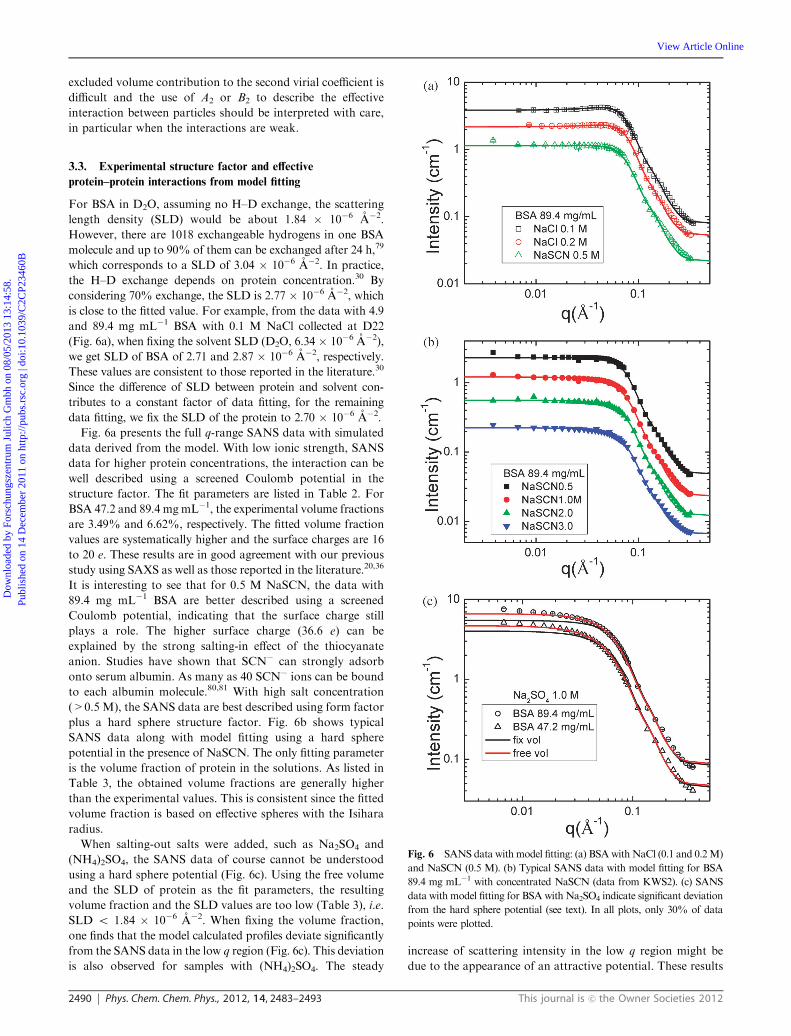
Fig. 6a presents the full q-range SANS data with simulated
data derived from the model. With low ionic strength, SANS
data for higher protein concentrations, the interaction can be
well described using a screened Coulomb potential in the
structure factor. The fit parameters are listed in Table 2. For
BSA 47.2 and 89.4 mgmL�1, the experimental volume fractions
are 3.49% and 6.62%, respectively. The fitted volume fraction
values are systematically higher and the surface charges are 16
to 20 e. These results are in good agreement with our previous
study using SAXS as well as those reported in the literature.20,36
It is interesting to see that for 0.5 M NaSCN, the data with
89.4 mg mL�1 BSA are better described using a screened
Coulomb potential, indicating that the surface charge still
plays a role. The higher surface charge (36.6 e) can be
explained by the strong salting-in effect of the thiocyanate
anion. Studies have shown that SCN� can strongly adsorb
onto serum albumin. As many as 40 SCN� ions can be bound
to each albumin molecule.80,81 With high salt concentration
(>0.5 M), the SANS data are best described using form factor
plus a hard sphere structure factor. Fig. 6b shows typical
SANS data along with model fitting using a hard sphere
potential in the presence of NaSCN. The only fitting parameter
is the volume fraction of protein in the solutions. As listed in
Table 3, the obtained volume fractions are generally higher
than the experimental values. This is consistent since the fitted
volume fraction is based on effective spheres with the Isihara
radius.
When salting-out salts were added, such as Na2SO4 and
(NH4)2SO4, the SANS data of course cannot be understood
using a hard sphere potential (Fig. 6c). Using the free volume
and the SLD of protein as the fit parameters, the resulting
volume fraction and the SLD values are too low (Table 3), i.e.
SLD o 1.84 � 10�6 A�2. When fixing the volume fraction,
one finds that the model calculated profiles deviate significantly
from the SANS data in the low q region (Fig. 6c). This deviation
is also observed for samples with (NH4)2SO4. The steady
increase of scattering intensity in the low q region might be
due to the appearance of an attractive potential. These results
Fig. 6 SANS data with model fitting: (a) BSAwithNaCl (0.1 and 0.2M)
and NaSCN (0.5 M). (b) Typical SANS data with model fitting for BSA
89.4 mg mL�1 with concentrated NaSCN (data from KWS2). (c) SANS
data with model fitting for BSA with Na2SO4 indicate significant deviation
from the hard sphere potential (see text). In all plots, only 30% of data
points were plotted.
Dow
nloa
ded
by F
orsc
hung
szen
trum
Jul
ich
Gm
bh o
n 08
/05/
2013
13:
14:5
8.
Publ
ishe
d on
14
Dec
embe
r 20
11 o
n ht
tp://
pubs
.rsc
.org
| do
i:10.
1039
/C2C
P234
60B
View Article Online
This journal is c the Owner Societies 2012 Phys. Chem. Chem. Phys., 2012, 14, 2483–2493 2491
are consistent with the observation of the previously discussed
smaller second virial coefficient in salting-out conditions. For
B2 o 4, an additional attractive interaction is expected, which
obviously cannot be reproduced with the repulsive hard sphere
potential.
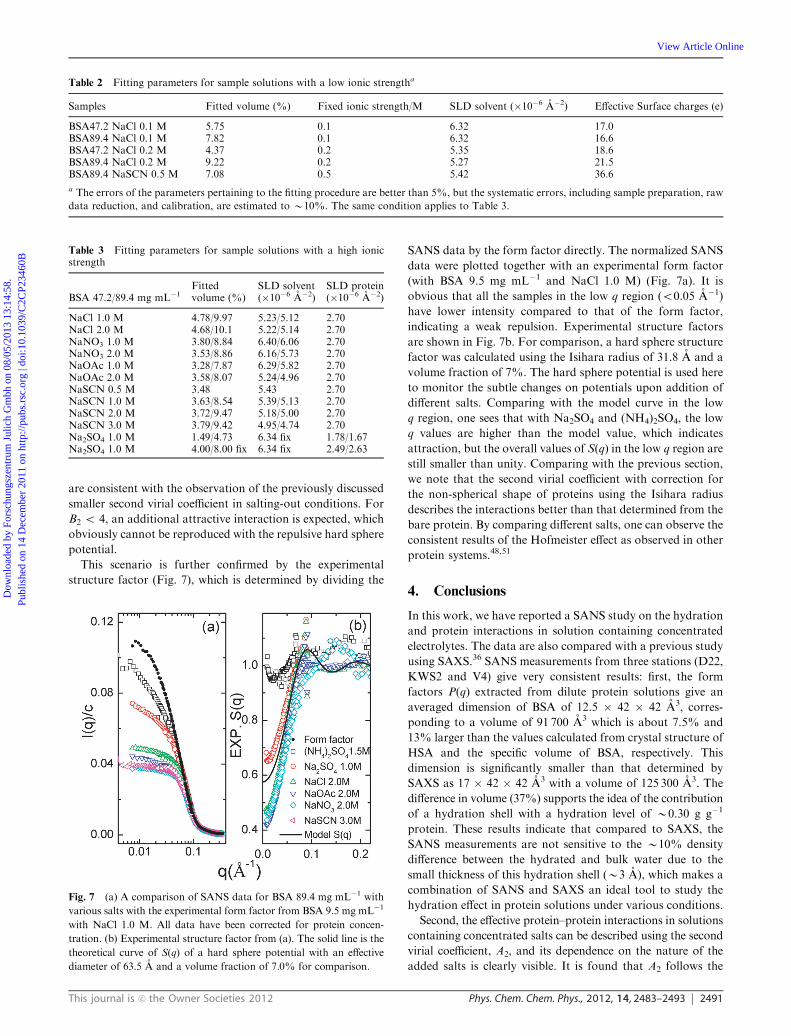
This scenario is further confirmed by the experimental
structure factor (Fig. 7), which is determined by dividing the
SANS data by the form factor directly. The normalized SANS
data were plotted together with an experimental form factor
(with BSA 9.5 mg mL�1 and NaCl 1.0 M) (Fig. 7a). It is
obvious that all the samples in the low q region (o0.05 A�1)
have lower intensity compared to that of the form factor,
indicating a weak repulsion. Experimental structure factors
are shown in Fig. 7b. For comparison, a hard sphere structure
factor was calculated using the Isihara radius of 31.8 A and a
volume fraction of 7%. The hard sphere potential is used here
to monitor the subtle changes on potentials upon addition of
different salts. Comparing with the model curve in the low
q region, one sees that with Na2SO4 and (NH4)2SO4, the low
q values are higher than the model value, which indicates
attraction, but the overall values of S(q) in the low q region are
still smaller than unity. Comparing with the previous section,
we note that the second virial coefficient with correction for
the non-spherical shape of proteins using the Isihara radius
describes the interactions better than that determined from the
bare protein. By comparing different salts, one can observe the
consistent results of the Hofmeister effect as observed in other
protein systems.48,51
4. Conclusions
In this work, we have reported a SANS study on the hydration
and protein interactions in solution containing concentrated
electrolytes. The data are also compared with a previous study
using SAXS.36 SANS measurements from three stations (D22,
KWS2 and V4) give very consistent results: first, the form
factors P(q) extracted from dilute protein solutions give an
averaged dimension of BSA of 12.5 � 42 � 42 A3, corres-
ponding to a volume of 91 700 A3 which is about 7.5% and
13% larger than the values calculated from crystal structure of
HSA and the specific volume of BSA, respectively. This
dimension is significantly smaller than that determined by
SAXS as 17 � 42 � 42 A3 with a volume of 125 300 A3. The
difference in volume (37%) supports the idea of the contribution
of a hydration shell with a hydration level of B0.30 g g�1
protein. These results indicate that compared to SAXS, the
SANS measurements are not sensitive to the B10% density
difference between the hydrated and bulk water due to the
small thickness of this hydration shell (B3 A), which makes a
combination of SANS and SAXS an ideal tool to study the
hydration effect in protein solutions under various conditions.
Second, the effective protein–protein interactions in solutions
containing concentrated salts can be described using the second
virial coefficient, A2, and its dependence on the nature of the
added salts is clearly visible. It is found that A2 follows the
Table 2 Fitting parameters for sample solutions with a low ionic strengtha
Samples Fitted volume (%) Fixed ionic strength/M SLD solvent (�10�6 A�2) Effective Surface charges (e)
BSA47.2 NaCl 0.1 M 5.75 0.1 6.32 17.0BSA89.4 NaCl 0.1 M 7.82 0.1 6.32 16.6BSA47.2 NaCl 0.2 M 4.37 0.2 5.35 18.6BSA89.4 NaCl 0.2 M 9.22 0.2 5.27 21.5BSA89.4 NaSCN 0.5 M 7.08 0.5 5.42 36.6
a The errors of the parameters pertaining to the fitting procedure are better than 5%, but the systematic errors, including sample preparation, raw
data reduction, and calibration, are estimated to B10%. The same condition applies to Table 3.
Table 3 Fitting parameters for sample solutions with a high ionicstrength
BSA 47.2/89.4 mg mL�1Fittedvolume (%)
SLD solvent(�10�6 A�2)
SLD protein(�10�6 A�2)
NaCl 1.0 M 4.78/9.97 5.23/5.12 2.70NaCl 2.0 M 4.68/10.1 5.22/5.14 2.70NaNO3 1.0 M 3.80/8.84 6.40/6.06 2.70NaNO3 2.0 M 3.53/8.86 6.16/5.73 2.70NaOAc 1.0 M 3.28/7.87 6.29/5.82 2.70NaOAc 2.0 M 3.58/8.07 5.24/4.96 2.70NaSCN 0.5 M 3.48 5.43 2.70NaSCN 1.0 M 3.63/8.54 5.39/5.13 2.70NaSCN 2.0 M 3.72/9.47 5.18/5.00 2.70NaSCN 3.0 M 3.79/9.42 4.95/4.74 2.70Na2SO4 1.0 M 1.49/4.73 6.34 fix 1.78/1.67Na2SO4 1.0 M 4.00/8.00 fix 6.34 fix 2.49/2.63
Fig. 7 (a) A comparison of SANS data for BSA 89.4 mg mL�1 with
various salts with the experimental form factor from BSA 9.5 mg mL�1
with NaCl 1.0 M. All data have been corrected for protein concen-
tration. (b) Experimental structure factor from (a). The solid line is the
theoretical curve of S(q) of a hard sphere potential with an effective
diameter of 63.5 A and a volume fraction of 7.0% for comparison.
Dow
nloa
ded
by F
orsc
hung
szen
trum
Jul
ich
Gm
bh o
n 08
/05/
2013
13:
14:5
8.
Publ
ishe
d on
14
Dec
embe
r 20
11 o
n ht
tp://
pubs
.rsc
.org
| do
i:10.
1039
/C2C
P234
60B
View Article Online
2492 Phys. Chem. Chem. Phys., 2012, 14, 2483–2493 This journal is c the Owner Societies 2012
reverse order of the Hofmeister series, i.e. (NH4)2SO4 oNa2SO4 o NaOAc o NaCl o NaNO3 o NaSCN. The
calculation of the dimensionless second virial coefficient B2
reveals that the hydration and the non-spherical shape of
proteins have to be considered for a better description of inter-
actions in protein solutions with concentrated electrolytes.
SANS data are further analyzed using the full q-range based
on liquid theoretical approaches, confirming the results of
experimental structure factor and the A2 analysis. Consistently,
the additional interaction on top of the hard sphere repulsion is
found to change from repulsive for salting-in conditions to
attractive for salting-out conditions.
Acknowledgements
We gratefully acknowledge financial support from Deutsche
Forschungsgemeinschaft (DFG) and the beam time allocation
from ESRF, ILL, JCNS and Helmholtz-Center Berlin (BENSC).
The beam time on V4 at the Helmholtz Zentrum Berlin has
been supported by the European Commission under the 6th
Framework Program through the Key Action: Strengthening
the European Research Area, Research Infrastructures. Contract
No. RII3-CT-2003-505925 (NMI3).
Notes and references
1 R. A. Curtis, H. W. Blanch and J. M. Prausnitz, J. Phys. Chem. B,2001, 105, 2445–2452.
2 R. A. Curtis, J. M. Prausnitz and H. W. Blanch, Biotechnol.Bioeng., 1998, 57, 11–21.
3 R. A. Curtis, J. Ulrich, A. Montaser, J. M. Prausnitz andH. W. Blanch, Biotechnol. Bioeng., 2002, 79, 367–380.
4 S. D. Durbin and G. Feher, Annu. Rev. Phys. Chem., 1996, 47,171–204.
5 R. Piazza, Curr. Opin. Colloid Interface Sci., 2000, 5, 38–43.6 R. Piazza, Curr. Opin. Colloid Interface Sci., 2004, 8, 515–522.7 K. D. Colloins, Methods, 2004, 34, 300–311.8 K. D. Colloins andM. W. Q. Washabaugh,Q. Rev. Biophys., 1985,18, 323–421.
9 K. D. Colloins, Biophys. J., 1997, 72, 65–76.10 B. Jacrot, Rep. Prog. Phys., 1976, 39, 911–953.11 B. Jacrot and G. Zaccai, Biopolymers, 1981, 20, 2413–2426.12 J. Lipfert and S. Doniach, Annu. Rev. Biophys. Biomol. Struct.,
2007, 36, 307–327.13 S. J. Perkins, Biophys. Chem., 2001, 93, 129–139.14 S. J. Perkins, A. I. Okemefuna, A. N. Fernando, A. Bonner,
H. E. Gilbert and P. B. Furtado, Methods Cell Biol., 2008, 84,376–423.
15 M. V. Petoukhov and D. I. Svergun, Eur. Biophys. J., 2006, 35,567–576.
16 D. I. Svergun, S. Richard, M. H. J. Koch, Z. Sayers, S. Kuprin andG. Zaccai, Proc. Natl. Acad. Sci. U. S. A., 1998, 95, 2267–2272.
17 A. Stradner, F. Cardinaux and P. Schurtenberger, J. Phys. Chem. B,2006, 110, 21222–21231.
18 A. Stradner, H. Sedgwick, F. Cardinaux, W. C. K. Poon,S. U. Egelhaaf and P. Schurtenberger, Nature, 2004, 432, 492–495.
19 R. Sinibaldi, J. Chem. Phys., 2007, 126, 235101.20 R. Sinibaldi, M. Ortore, F. Spinozzi, S. de Souza Funari,
J. Teixeira and P. Mariani, Eur. Biophys. J., 2008, 37, 673–681.21 G. Zaccai and B. Jacrot, Annu. Rev. Biophys. Bioeng., 1983, 12,
139–157.22 F. Merzel and J. Smith, Proc. Natl. Acad. Sci. U. S. A., 2002, 99,
5378–5383.23 F. Hofmeister, Arch. Exp. Pathol. Pharmakol., 1888, 24, 247–260.24 R. L. Baldwin, Biophys. J., 1996, 71, 2056–2063.25 A. Der, L. Kelemen, L. Fabian, S. G. Taneva, E. Fodor, T. Pali,
A. Cupane, M. G. Cacace and J. J. Ramsden, J. Phys. Chem. B,2007, 111, 5344–5350.
26 B. W. Ninham and P. Lo Nostro, Molecular Forces and SelfAssembly, Cambridge University Press, New York, 2010.
27 Y. Levin, Phys. Rev. Lett., 2009, 102, 147803.28 N. Schwierz, D. Horinek and R. R. Netz, Langmuir, 2010, 26,
7370–7379.29 L. R. S. Barbosa, M. G. Ortore, F. Spinozzi, P. Mariani,
S. Bernstorff and R. Itri, Biophys. J., 2010, 98, 147–157.30 R. Nossal, C. J. Glinka and S. H. Chen, Biopolymers, 1986, 25,
1157–1175.31 M. Kotlarchyk and S. H. Chen, J. Chem. Phys., 1983, 79,
2461–2469.32 D. Bendedouch and S. H. Chen, J. Phys. Chem., 1983, 87,
1473–1477.33 D. Bendedouch, S. H. Chen and W. C. Koehler, J. Phys. Chem.,
1983, 87, 2621–2628.34 F. Roosen-Runge, M. Hennig, T. Seydel, F. Zhang, M. W. A.
Skoda, S. Zorn, R. M. J. Jacobs, M. Maccarini, P. Fouquet andF. Schreiber, Biochim. Biophys. Acta, 2010, 1804, 68–75.
35 F. Roosen-Runge, M. Hennig, F. Zhang, R. M. J. Jacobs,M. Sztucki, H. Schober, T. Seydel and F. Schreiber, Proc. Natl.Acad. Sci. U. S. A., 2011, 108, 11815–11820.
36 F. Zhang, M. W. A. Skoda, R. M. J. Jacobs, R. A. Martin,C. M. Martin and F. Schreiber, J. Phys. Chem. B, 2007, 111,251–259.
37 F. Zhang, M. W. A. Skoda, R. M. J. Jacobs, S. Zorn,R. A. Martin, C. M. Martin, G. F. Clark, S. Weggler,A. Hildebrandt, O. Kohlbacher and F. Schreiber, Phys. Rev. Lett.,2008, 101, 148101.
38 L. Ianeselli, F. Zhang, M. W. A. Skoda, R. M. J. Jacobs,R. A. Martin, S. Callow, S. Prevost and F. Schreiber, J. Phys.Chem. B, 2010, 114, 3776–3783.
39 F. Zhang, S. Weggler, M. Ziller, L. Ianeselli, B. S. Heck,A. Hildebrandt, O. Kohlbacher, M. W. A. Skoda, R. M. J.Jacobs and F. Schreiber, Proteins: Struct., Funct., Bioinf., 2010,78, 3450–3457.
40 GRASP, http://www.ill.fr/lss/grasp/grasp_main.html.41 U. Keiderling and A. Wiedenmann, Physica B (Amsterdam), 1995,
213–214, 895–897.42 U. Keiderling, Appl. Phys. A: Solid Surf., 2002, 74, S1455–S1457.43 V. Pipich, QtiKWS program: http://www.qtikws.de.44 I. Grillo, in Soft Matter: Characterization, ed.R. Borsali and
R. Pecora, Springer, Berlin-Heidelberg, 2008, vol. II, pp. 705–764.45 P. Lindner, J. Appl. Crystallogr., 2000, 33, 807–811.46 O. Glatter and O. Kratky, Small angle X-ray scattering,
Academic Press, London, 1982.47 A. Guinier and G. Fournet, Small Angle Scattering of X-rays,
John Wiley & Sons Ltd., New York, 1955.48 F. Bonnete, S. Finet and A. Tardieu, J. Cryst. Growth, 1999, 196,
403–414.49 F. Bonnete and D. Vivares, Acta Crystallogr., Sect. D: Biol.
Crystallogr., 2002, 58, 1571–1575.50 A. Tardieu, A. Le Verge, M. Malfois, F. Bonnete, S. Finet,
M. Ries-Kautt and L. Belloni, J. Cryst. Growth, 1999, 196,193–203.
51 S. Finet, F. Skouri-Panet, M. Casselyn, F. Bonnete andA. Tardieu, Curr. Opin. Colloid Interface Sci., 2004, 9, 112–116.
52 S. H. Chen and T. L. Lin, in Neutron Scattering, ed.D. L. Price andK. Skold, Academic Press Inc. Ltd., London, 1987, vol. 23, part B,pp. 489–543.
53 J. S. Pedersen, Adv. Colloid Interface Sci., 1997, 70, 171–210.54 J. B. Hayter and J. Penfold, Colloid Polym. Sci., 1983, 261,
1022–1030.55 S. H. Chen, Annu. Rev. Phys. Chem., 1986, 37, 351–399.56 Neutrons, X-rays and Light: Scattering Methods Applied to Soft
CondensedMatter, ed.P. Lindner and T. Zemb, Elsevier Science B. V.,Amsterdam, 2002.
57 S. R. Kline, J. Appl. Crystallogr., 2006, 39, 895–900.58 A. Isihara, J. Chem. Phys., 1950, 18, 1446–1449.59 J. B. Hayter and J. Penfold, Mol. Phys., 1981, 42, 109.60 J. P. Hansen and J. B. Hayter, Mol. Phys., 1982, 46, 651.61 S. Doniach, Chem. Rev., 2001, 101, 1763–1778.62 P. Baglioni, E. Fratini, B. Lonetti and S. Chen, J. Phys.: Condens.
Matter, 2004, 16, S5003–S5022.63 A. C. Dumetz, A. M. Snellinger-O0Brien, E. W. Kaler and
A. M. Lenhoff, Protein Sci., 2008, 16, 1867–1877.
Dow
nloa
ded
by F
orsc
hung
szen
trum
Jul
ich
Gm
bh o
n 08
/05/
2013
13:
14:5
8.
Publ
ishe
d on
14
Dec
embe
r 20
11 o
n ht
tp://
pubs
.rsc
.org
| do
i:10.
1039
/C2C
P234
60B
View Article Online
This journal is c the Owner Societies 2012 Phys. Chem. Chem. Phys., 2012, 14, 2483–2493 2493
64 D. I. Svergun, C. Barberato andM. H. J. Koch, J. Appl. Crystallogr.,1995, 28, 768–773.
65 E. Mylonas and D. I. Svergun, J. Appl. Crystallogr., 2007, 40,s245–s249.
66 A. K. Hunter and G. Carta, J. Chromatogr., A, 2001, 937, 13–19.67 I. D. Kuntz Jr. and W. Kauzmann, Adv. Protein Chem., 1974, 28,
239–345.68 M. Kozak, J. Appl. Crystallogr., 2005, 38, 555–558.69 S. Finet and A. Tardieu, J. Cryst. Growth, 2001, 232, 40–49.70 P. M. Tessier, S. D. Vandrey, B. W. Berger, R. Pazhianur,
S. I. Sandler and A. M. Lenhoff, Acta Crystallogr., Sect. D: Biol.Crystallogr., 2002, 58, 1531–1535.
71 V. L. Vilker, C. K. Colton and K. A. Smith, J. Colloid InterfaceSci., 1981, 79, 548–566.
72 A. George and W. W. Wilson, Acta Crystallogr., Sect. D: Biol.Crystallogr., 1994, 50, 361–365.
73 D. Asthagiri, A. Paliwal, D. Abras, A. M. Lenhoff andM. E. Paulaitis, Biophys. J., 2005, 88, 3300–3309.
74 H. Frauenfelder, G. Chen, J. Berendzen, P. W. Fenimore,H. Jansson, B. H. McMahon, I. R. Stroe, J. Swenson andR. D. Young, Proc. Natl. Acad. Sci. U. S. A., 2009, 106,5129–5134.
75 V. Makarov, B. M. Pettitt and M. Feig, Acc. Chem. Res., 2002, 35,376–384.
76 A. Paliwal, D. Asthagiri, D. Abras, A. M. Lenhoff andM. E. Paulaitis, Biophys. J., 2005, 89, 1564–1573.
77 B. L. Neal and A. M. Lenhoff, AIChE J., 1995, 41, 1010–1014.78 M. G. Ortore, R. Sinibaldi, F. Spinozzi, F. Carsughi, D. Clemens,
A. Bonincontro and P. Mariani, J. Phys. Chem. B, 2008, 112,12881–12887.
79 J. R. Lu, Annu. Rep. Prog. Chem., Sect. C: Phys. Chem., 1999, 95,3–46.
80 T. Arakawa and S. N. Timasheff, Biochemistry, 1982, 21,6545–6552.
81 G. Scatchard, I. H. Scheinberg and S. H. Armstrong, J. Am. Chem.Soc., 1950, 72, 540–546.
Dow
nloa
ded
by F
orsc
hung
szen
trum
Jul
ich
Gm
bh o
n 08
/05/
2013
13:
14:5
8.
Publ
ishe
d on
14
Dec
embe
r 20
11 o
n ht
tp://
pubs
.rsc
.org
| do
i:10.
1039
/C2C
P234
60B
View Article Online