Embed Size (px)
Citation preview
This is an author produced version of a paper published in
Animal.
This paper has been peer-reviewed but may not include the final publisher
proof-corrections or pagination.
Citation for the published paper:
P. A. Harris, A. D. Ellis, M. J. Fradinho, A. Jansson, V. Julliand, N.
Luthersson, A. S. Santos and I. Vervuert. (2017) Review: Feeding conserved
forage to horses: recent advances and recommendations. Animal.
Volume: 11, Number: 6, pp 958-967.
http://dx.doi.org/10.1017/S1751731116002469.
Access to the published version may require journal subscription.
Published with permission from: Cambridge University Press.
Epsilon Open Archive http://epsilon.slu.se
1
Review: Review of feeding conserved forage to horses: recent advances and 1
recommendations 2
P.A. Harris 1, A.D. Ellis 2, M.J. Fradinho 3, A. Jansson 4, V. Julliand 5, N. Luthersson 6, 3
A.S. Santos 7 and I. Vervuert 8. 4
1 Equine Studies Group, WALTHAM Centre for Pet Nutrition, Leics LE14 4RT, UK 5
2 UNEQUI, Research~Education~Innovation, Southwell, Nottinghamshire, NG25 0DS, 6
UK 7
3 CIISA, Faculdade de Medicina Veterinária, Universidade de Lisboa, Av. 8
Universidade Técnica, 1300-477 Lisboa, Portugal 9
4 Dept of Anatomy, Physiology and Biochemistry, Swedish University of Agricultural 10
Sciences, 750 07 Uppsala, Sweden 11
5AgroSup Dijon, 21079 Dijon Cedex, France 12
6 Hestedoktoren I/S, Bukkerupvej 195, 4360 Kr. Eskilstrup, Denmark 13
7 Department of Veterinary Medicine, Escola Universitária Vasco da Gama, 3020-14
210 Coimbra / CITAB-UTAD – Center for Research and Technology of Agro-15
Environmental and Biological Sciences, Vila Real, PA Box 1013, 5001- 801 Vila 16
Real, Portugal 17
8 Institute of Animal Nutrition, Nutrition Diseases and Dietetics, Faculty of Veterinary 18
Medicine, University of Leipzig, An den Tierkliniken 9, D-04103 Leipzig, Germany. 19
Corresponding Author: Pat Harris. E-mail: [email protected] 20
Short Title: Feeding conserved forage to horses 21
2
Abstract: The horse is a non-ruminant herbivore adapted to eating plant-fibre or forage 22
based diets. Some horses are stabled for most or the majority of the day with limited or no 23
access to fresh pasture and are fed preserved forage typically as hay or haylage and 24
sometimes silage. This raises questions with respect to the quality and suitability of these 25
preserved forages (considering production, nutritional content, digestibility as well as 26
hygiene) and required quantities. Especially for performance horses, forage is often 27
replaced with energy dense feedstuffs which can result in a reduction in the proportion of the 28
diet that is forage based. This may adversely affect the health, welfare, behaviour and even 29
performance of the horse. In the past 20 years a large body of research work has 30
contributed to a better and deeper understanding of equine forage needs and the 31
physiological and behavioural consequences if these are not met. Recent nutrient 32
requirement systems have incorporated some, but not all, of this new knowledge into their 33
recommendations. This review paper amalgamates recommendations based on the latest 34
understanding in forage feeding for horses, defining forage types and preservation methods, 35
hygienic quality, feed intake behaviour, typical nutrient composition, digestion and 36
digestibility as well as health and performance implications. Based on this, consensual 37
applied recommendations for feeding preserved forages are provided. 38
39
40
Key words: forage, health, hygiene, behaviour, requirements 41
42
Implications: Improved consistency in the terminology used for preserved forages 43
and the adoption of consensual recommended minimal forage intake levels. 44
3
Introduction 45
The horse is a non-ruminant grazing herbivore adapted to eating plant-fibre or forage 46
based diets. A wide range of plant species can be hydrolyzed and/or fermented within 47
its specialized gastro-intestinal tract (GIT), thanks to the presence of a mixed microbial 48
symbiotic population throughout the whole GIT, but particularly in the hindgut, which 49
facilitate fibre digestion (de Fombelle et al., 2003; Dougal et al., 2013). Gastrointestinal 50
tract (GIT) digestion provides energy mainly through the production of short-chain fatty 51
acids (SCFA), mostly acetate, propionate and butyrate, also often described as volatile 52
fatty acids (VFA’s) (Merritt and Julliand, 2013). The whole digestive system is well 53
adapted to a trickle (almost continuous intake of small amounts) feeding intake pattern, 54
with the horse naturally foraging for around 10 – 15 hours a day (Ellis, 2010). 55
Historically the energy demands of working horses were too high, and time too short, 56
to be met by forage alone, especially as forage quality was often poor, grazing limited 57
and it was difficult to distribute and transport bulky forages. Therefore, oats, barley, 58
beans and root vegetables were used as a major component of the diet (Stewart, 59
1838). The inclusion of energy rich feedstuffs (particularly cereals and vegetable oils) 60
in the diets of many horses, especially performance horses, continues today despite 61
the availability of better quality forages (Richards et al., 2006, Lindburg 2013). An 62
increase in starch intake, often in combination with a reduction in the amount of forage 63
provided, can have health, welfare and performance consequences. 64
Due mainly to environmental conditions and the lack of availability/undesirability of 65
grazing, many horses are fed preserved forages (hay, haylage and sometimes silage), 66
in particular preserved grass, either at specific times of the year or all year round and 67
therefore preserved forages provide all or part of their forage intake. During the 2012 68
meeting of the European Workshop on Equine Nutrition (EWEN) it was agreed that 69
4
there was a need for a consensus paper on the topic of preserved forage feeding to 70
horses. The aim of this review paper is therefore to summarize recent findings and to 71
provide consensual applied recommendations for feeding preserved forage. 72
73
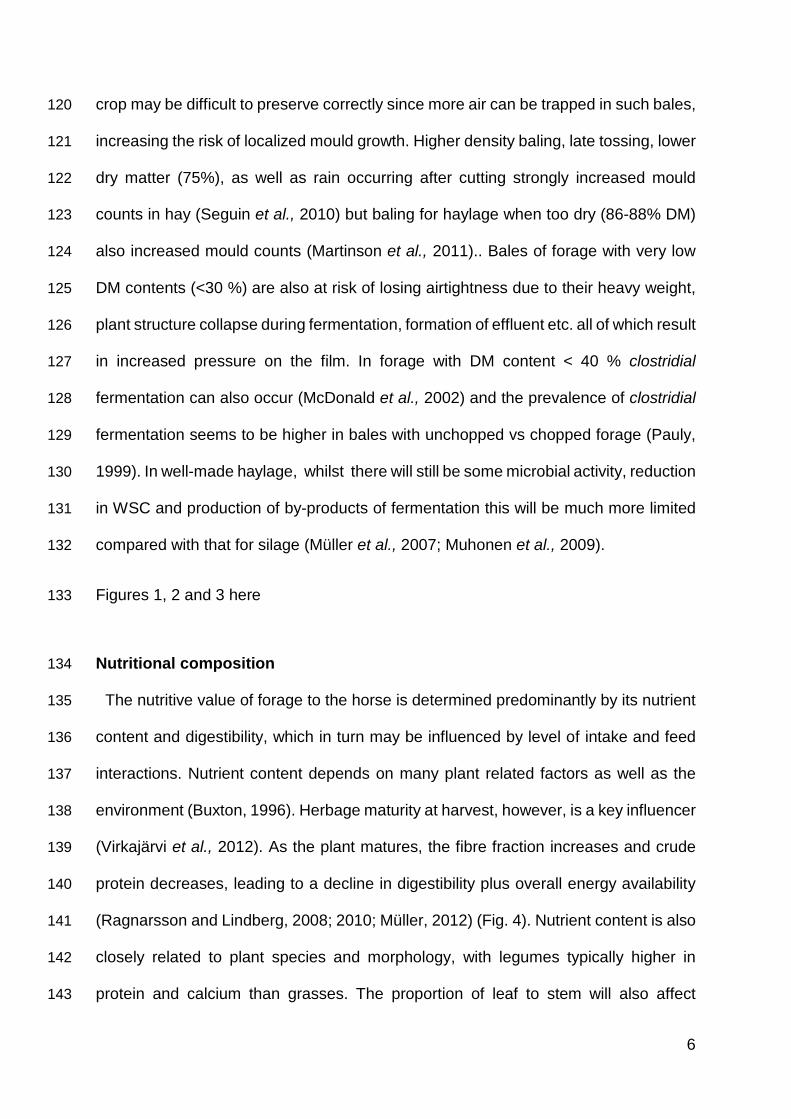
Forage types and preservation methods 74
Roughages are high fibre feeds (Morrisson, 1956) generally obtained as a crop 75
residue or a by-product (Ellis et al., 1988) e.g. straw and cereal hulls. Forages are also 76
high fiber feeds obtained by cutting and preserving the whole plant (except roots). 77
Although they define different products, the words forage and roughage are typically 78
used interchangeably. From a behavioural aspect the term ‘foraging’ encompasses all 79
feed intake activities of horses both on pasture and in housing situations. 80
Cut grass air dried/wilted in the field or a barn is termed hay, whereas silage is forage 81
preserved moist and airtight, and thus fermented (McDonald et al., 1991) The term 82
haylage was originally used to describe silage with a DM content of around 50 % 83
(Gordon et al., 1961) and although haylage (and hay/silage) can be harvested at any 84
stage of plant maturity today haylages are typically grown and cut at later growth 85
stages similarly to hay, but baled before becoming dry resulting in DMs typically >50 86
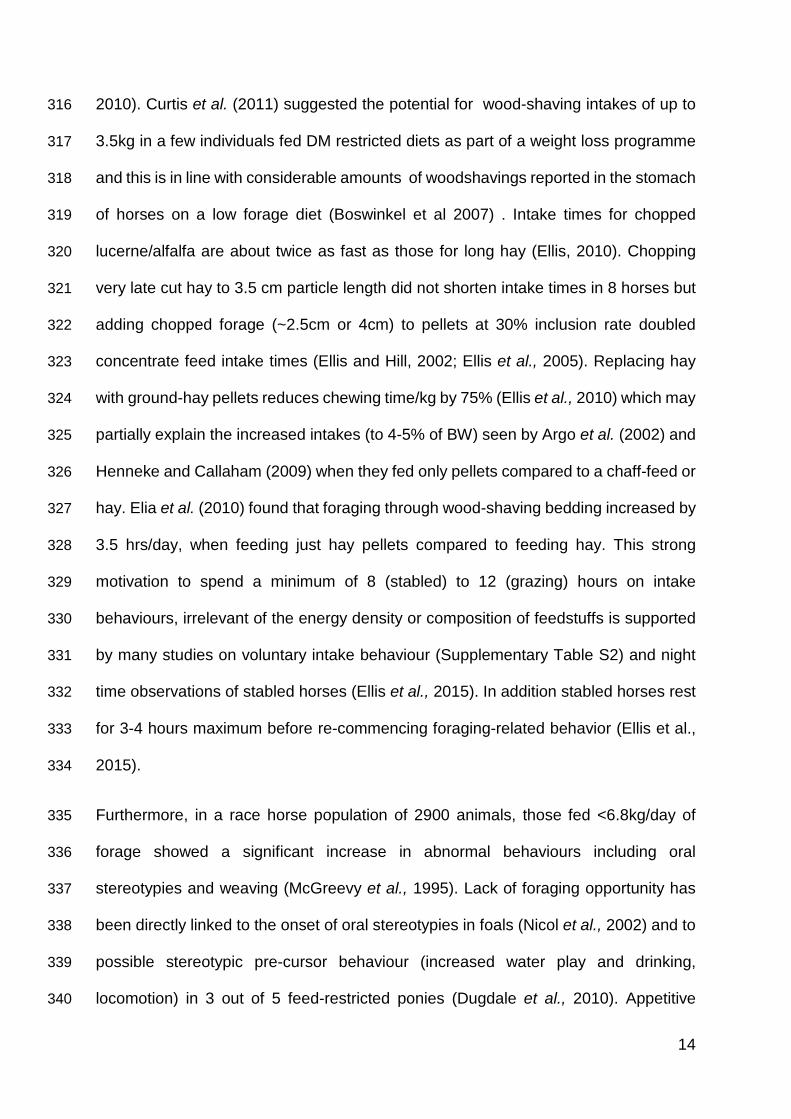
but <70% although occasionally up to 85% (see Fig. 1 and supplementary Table S1). 87
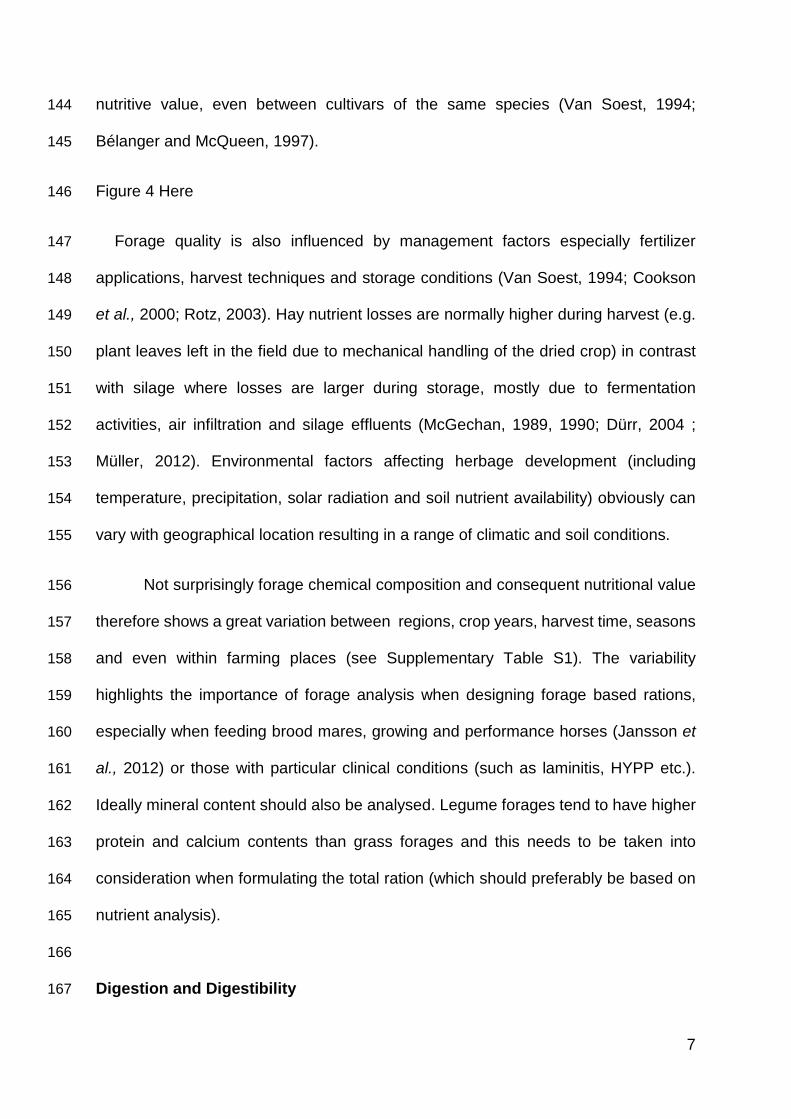
Hay baled with too high a moisture content due to unsuitable weather conditions at 88
cutting time and especially during wilting, insufficient turning especially if in rows 89
(rather than being wilted widespread which helps speed up wilting, thereby helping to 90
reduce protein degradation and loss of nutrients) etc. allows the development of fungal 91
spores/bacteria and increases the risk of mycotoxin development. To stop undesired 92
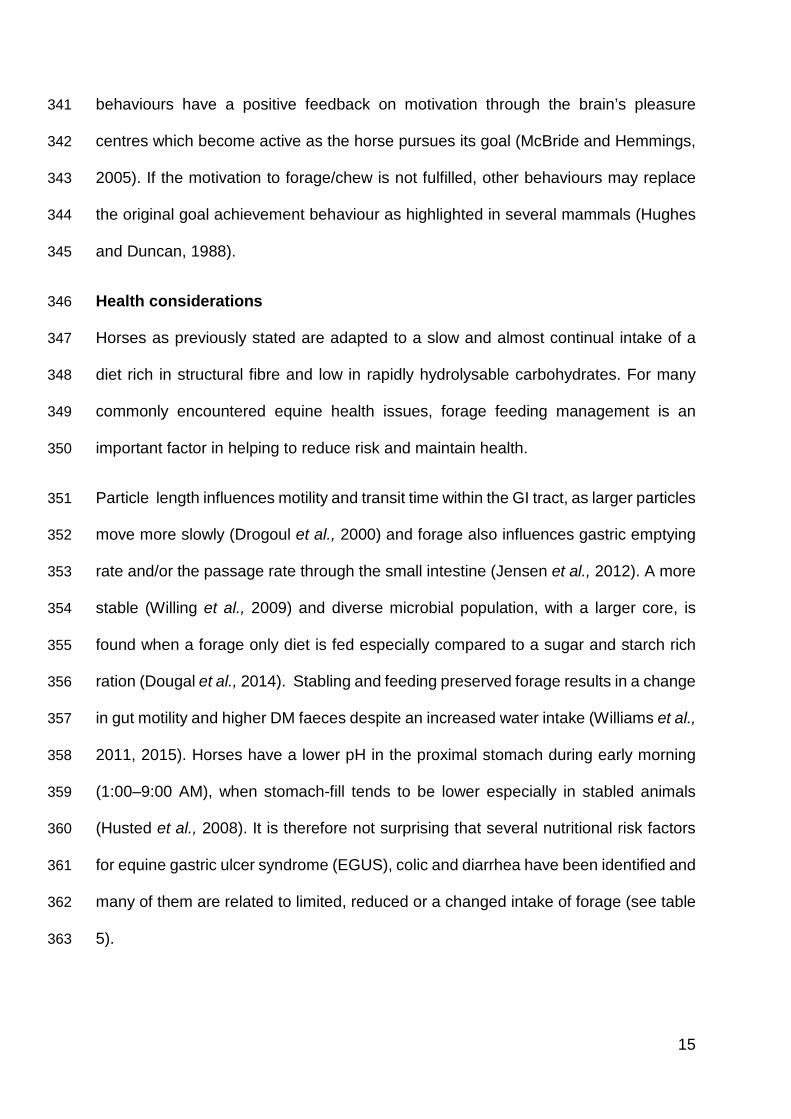
microbial growth, roughage/forage therefore has to be preserved under controlled 93
conditions (Fig. 2). Hay and straw should be preserved during conditions of low water 94
5
activity in the crop (i.e. preserved at a DM content ideally above 85%) and given that 95
the bales will be exposed to air, relative humidity must be lower than required for mould 96
growth at the given temperature (Fig. 2) and therefore ideally <70%. Forages may also 97
be preserved utilizing airtight conditions, with or without lactic acid fermentation. In 98
silage the water soluble carbohydrates in the forage are fermented by anaerobic 99
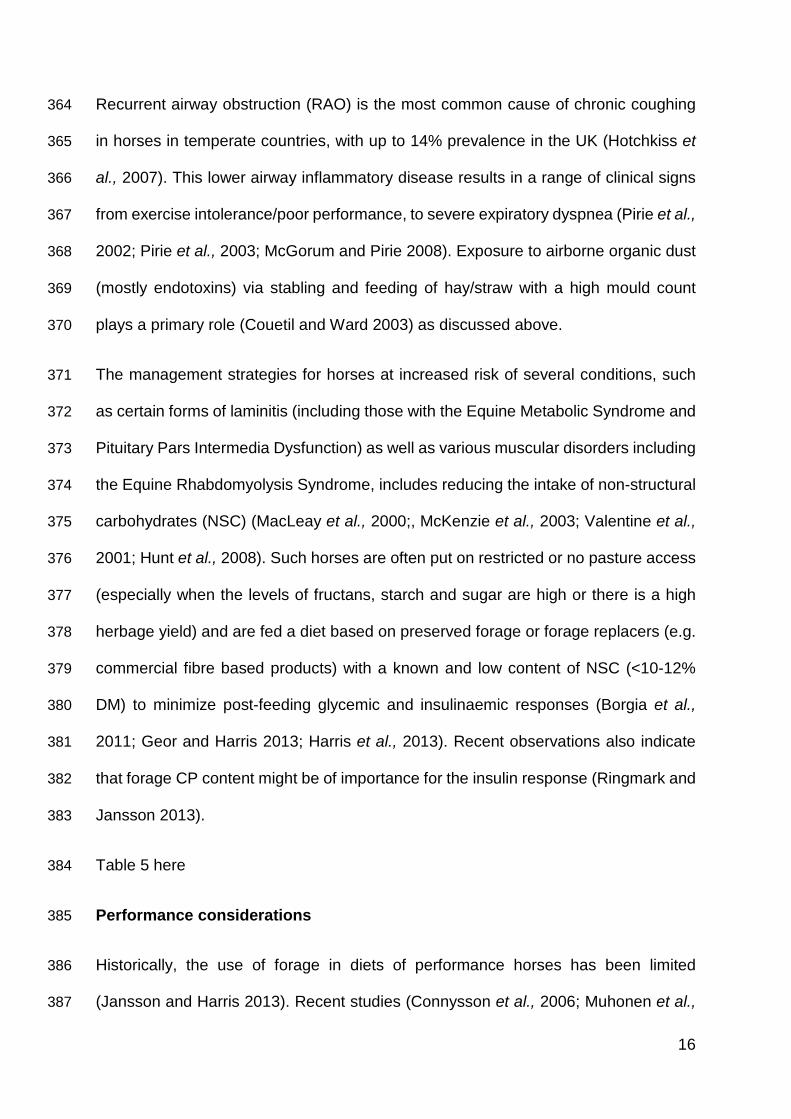
lactic acid bacteria (naturally occurring on the crop or added as inoculants (Fig. 1). For 100
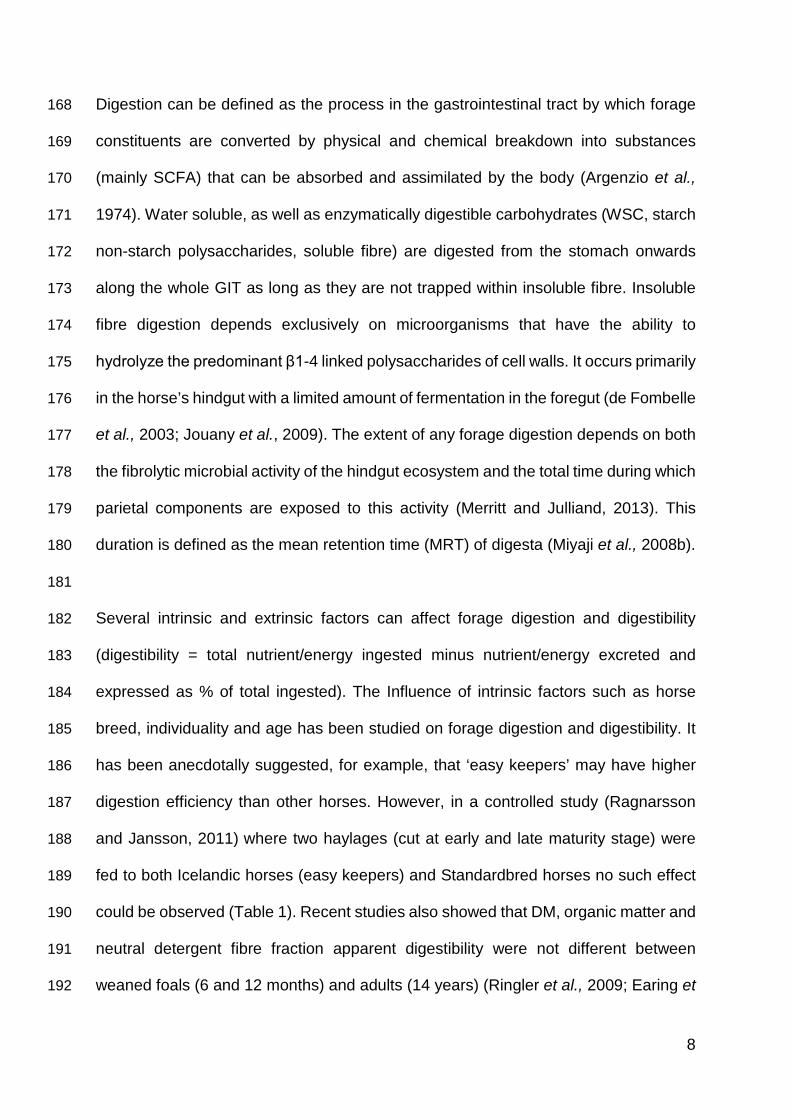
sufficient lactic acid production to occur, the crop DM content must ideally be around 101
30% or less and certainly <50 % (Fig. 3). If the acids produced sufficiently increase 102
hydrogen ion concentrations, undesirable microbial growth will be inhibited. To confirm 103
proper ensiling of forages (without butyrate) with a DM 15-50%, pH can be used as an 104
indicator. Weissbach, 1996 and Spörndly et al., 2003 suggest that the pH should be 105
less than: 0.0257 x DM% + 3.71 (Weissbach, 1996) but according to Field and Wilman, 106
1996 a higher pH (0.0028 x DM(g/kg) + 4.209 (equation estimated from their figure) 107
might be allowed if silage is preserved in bales and not in bunkers. Preservation at 108
higher DM contents relies on maintenance of airtight packaging not a low pH (Mihin, 109
1940). In haylage/silage bale production, at least 4 layers of film are needed to 110
promote good preservation (Keles et al., 2009; McEniry et al., 2011) but adding layers 111
(6- 10) increases the CO2 content (Müller, 2005) and for bales to cope with handling, 112
transportation, birds and long-term storage 8 layers or more are recommended 113
(Jacobsson, 2002; Spörndly pers. com.). In haylages with very high DM contents there 114
may be an increased risk of perforation (allowing air entrance and mould growth) by 115
stiff and sharp stems. To facilitate safer preservation and storage such haylages 116
require more layers of film than forages with a lower DM content. Some professional 117
horse haylage producers may use 12-20 layers (Jansson A, pers. com.). More 118
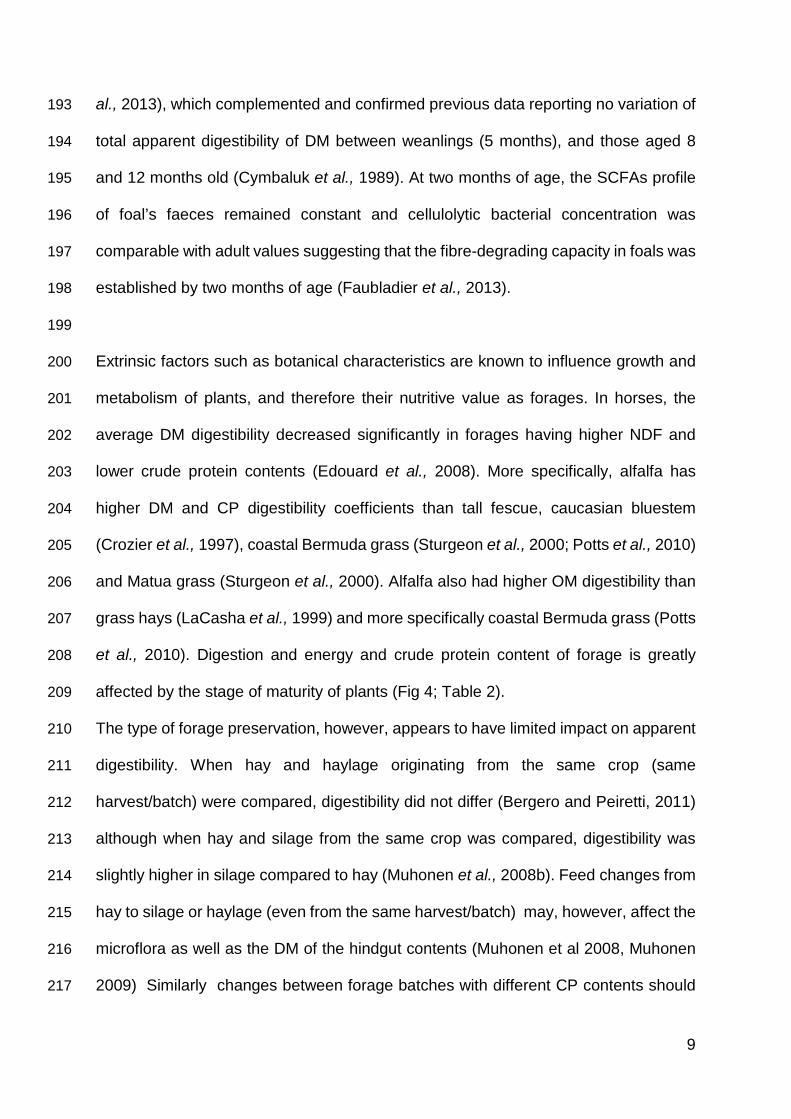
research is needed into the impact of the number of layers used. Mature and rough 119
6
crop may be difficult to preserve correctly since more air can be trapped in such bales, 120
increasing the risk of localized mould growth. Higher density baling, late tossing, lower 121
dry matter (75%), as well as rain occurring after cutting strongly increased mould 122
counts in hay (Seguin et al., 2010) but baling for haylage when too dry (86-88% DM) 123
also increased mould counts (Martinson et al., 2011).. Bales of forage with very low 124
DM contents (<30 %) are also at risk of losing airtightness due to their heavy weight, 125
plant structure collapse during fermentation, formation of effluent etc. all of which result 126
in increased pressure on the film. In forage with DM content < 40 % clostridial 127
fermentation can also occur (McDonald et al., 2002) and the prevalence of clostridial 128
fermentation seems to be higher in bales with unchopped vs chopped forage (Pauly, 129
1999). In well-made haylage, whilst there will still be some microbial activity, reduction 130
in WSC and production of by-products of fermentation this will be much more limited 131
compared with that for silage (Müller et al., 2007; Muhonen et al., 2009). 132
Figures 1, 2 and 3 here 133
Nutritional composition 134
The nutritive value of forage to the horse is determined predominantly by its nutrient 135
content and digestibility, which in turn may be influenced by level of intake and feed 136
interactions. Nutrient content depends on many plant related factors as well as the 137
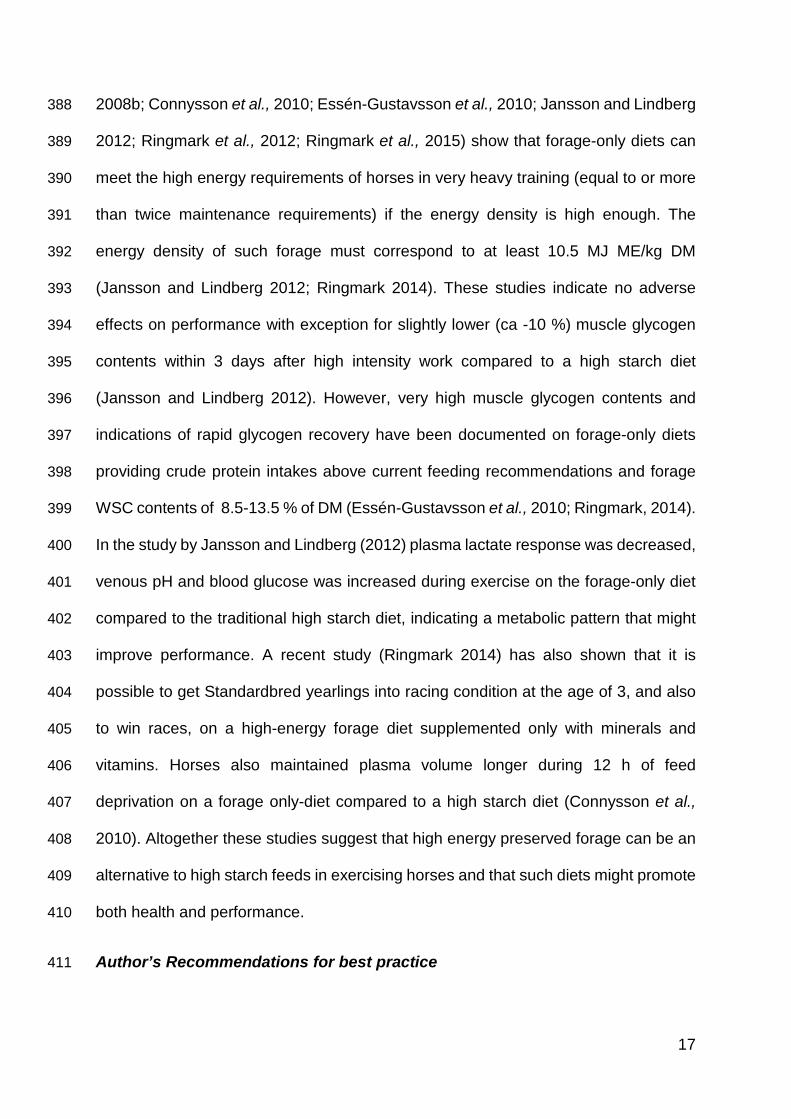
environment (Buxton, 1996). Herbage maturity at harvest, however, is a key influencer 138
(Virkajärvi et al., 2012). As the plant matures, the fibre fraction increases and crude 139
protein decreases, leading to a decline in digestibility plus overall energy availability 140
(Ragnarsson and Lindberg, 2008; 2010; Müller, 2012) (Fig. 4). Nutrient content is also 141
closely related to plant species and morphology, with legumes typically higher in 142
protein and calcium than grasses. The proportion of leaf to stem will also affect 143
7
nutritive value, even between cultivars of the same species (Van Soest, 1994; 144
Bélanger and McQueen, 1997). 145
Figure 4 Here 146
Forage quality is also influenced by management factors especially fertilizer 147
applications, harvest techniques and storage conditions (Van Soest, 1994; Cookson 148
et al., 2000; Rotz, 2003). Hay nutrient losses are normally higher during harvest (e.g. 149
plant leaves left in the field due to mechanical handling of the dried crop) in contrast 150
with silage where losses are larger during storage, mostly due to fermentation 151
activities, air infiltration and silage effluents (McGechan, 1989, 1990; Dürr, 2004 ; 152
Müller, 2012). Environmental factors affecting herbage development (including 153
temperature, precipitation, solar radiation and soil nutrient availability) obviously can 154
vary with geographical location resulting in a range of climatic and soil conditions. 155
Not surprisingly forage chemical composition and consequent nutritional value 156
therefore shows a great variation between regions, crop years, harvest time, seasons 157
and even within farming places (see Supplementary Table S1). The variability 158
highlights the importance of forage analysis when designing forage based rations, 159
especially when feeding brood mares, growing and performance horses (Jansson et 160
al., 2012) or those with particular clinical conditions (such as laminitis, HYPP etc.). 161
Ideally mineral content should also be analysed. Legume forages tend to have higher 162
protein and calcium contents than grass forages and this needs to be taken into 163
consideration when formulating the total ration (which should preferably be based on 164
nutrient analysis). 165
166
Digestion and Digestibility 167
8
Digestion can be defined as the process in the gastrointestinal tract by which forage 168
constituents are converted by physical and chemical breakdown into substances 169
(mainly SCFA) that can be absorbed and assimilated by the body (Argenzio et al., 170
1974). Water soluble, as well as enzymatically digestible carbohydrates (WSC, starch 171
non-starch polysaccharides, soluble fibre) are digested from the stomach onwards 172
along the whole GIT as long as they are not trapped within insoluble fibre. Insoluble 173
fibre digestion depends exclusively on microorganisms that have the ability to 174
hydrolyze the predominant β1-4 linked polysaccharides of cell walls. It occurs primarily 175
in the horse’s hindgut with a limited amount of fermentation in the foregut (de Fombelle 176
et al., 2003; Jouany et al., 2009). The extent of any forage digestion depends on both 177
the fibrolytic microbial activity of the hindgut ecosystem and the total time during which 178
parietal components are exposed to this activity (Merritt and Julliand, 2013). This 179
duration is defined as the mean retention time (MRT) of digesta (Miyaji et al., 2008b). 180
181
Several intrinsic and extrinsic factors can affect forage digestion and digestibility 182
(digestibility = total nutrient/energy ingested minus nutrient/energy excreted and 183
expressed as % of total ingested). The Influence of intrinsic factors such as horse 184
breed, individuality and age has been studied on forage digestion and digestibility. It 185
has been anecdotally suggested, for example, that ‘easy keepers’ may have higher 186
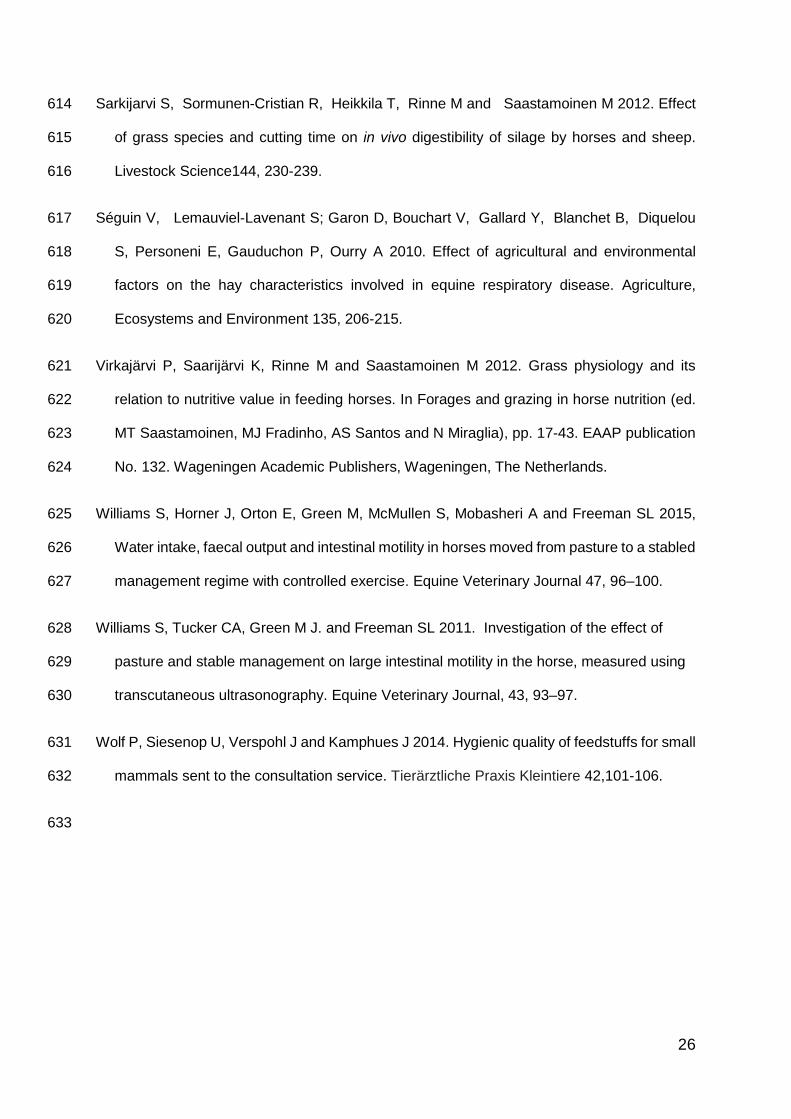
digestion efficiency than other horses. However, in a controlled study (Ragnarsson 187
and Jansson, 2011) where two haylages (cut at early and late maturity stage) were 188
fed to both Icelandic horses (easy keepers) and Standardbred horses no such effect 189
could be observed (Table 1). Recent studies also showed that DM, organic matter and 190
neutral detergent fibre fraction apparent digestibility were not different between 191
weaned foals (6 and 12 months) and adults (14 years) (Ringler et al., 2009; Earing et 192
9
al., 2013), which complemented and confirmed previous data reporting no variation of 193
total apparent digestibility of DM between weanlings (5 months), and those aged 8 194
and 12 months old (Cymbaluk et al., 1989). At two months of age, the SCFAs profile 195
of foal’s faeces remained constant and cellulolytic bacterial concentration was 196
comparable with adult values suggesting that the fibre-degrading capacity in foals was 197
established by two months of age (Faubladier et al., 2013). 198
199
Extrinsic factors such as botanical characteristics are known to influence growth and 200
metabolism of plants, and therefore their nutritive value as forages. In horses, the 201
average DM digestibility decreased significantly in forages having higher NDF and 202
lower crude protein contents (Edouard et al., 2008). More specifically, alfalfa has 203
higher DM and CP digestibility coefficients than tall fescue, caucasian bluestem 204
(Crozier et al., 1997), coastal Bermuda grass (Sturgeon et al., 2000; Potts et al., 2010) 205
and Matua grass (Sturgeon et al., 2000). Alfalfa also had higher OM digestibility than 206
grass hays (LaCasha et al., 1999) and more specifically coastal Bermuda grass (Potts 207
et al., 2010). Digestion and energy and crude protein content of forage is greatly 208
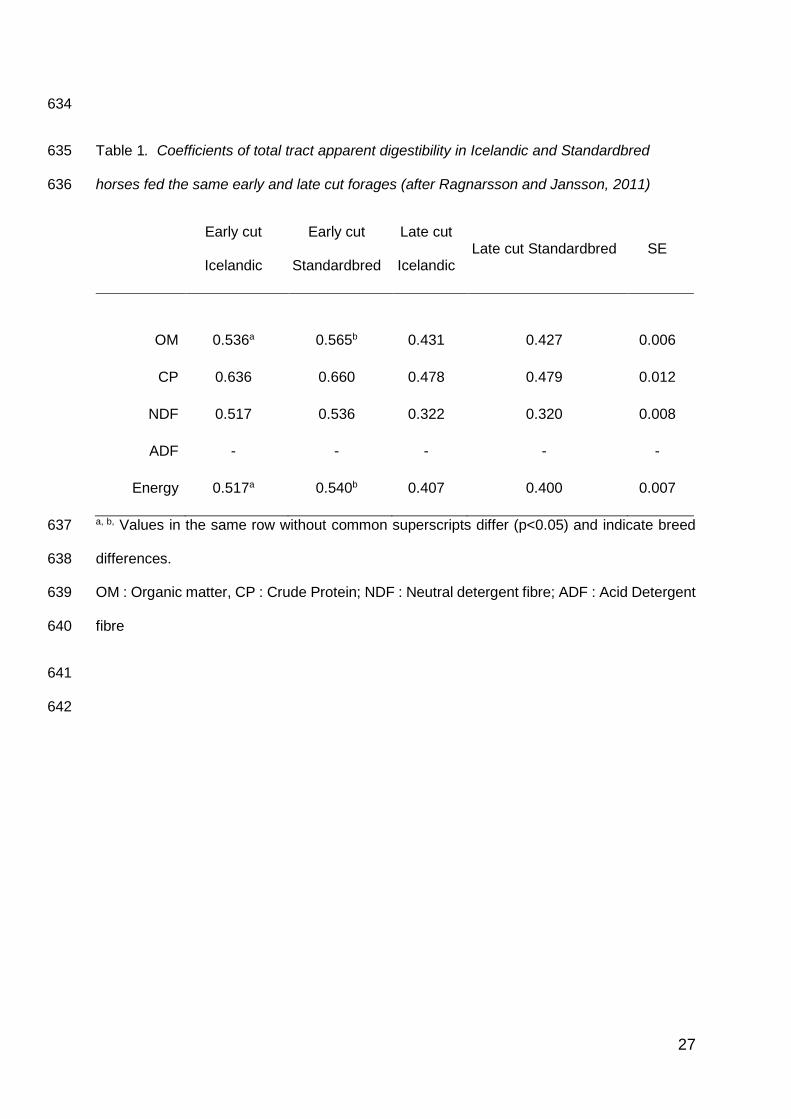
affected by the stage of maturity of plants (Fig 4; Table 2). 209
The type of forage preservation, however, appears to have limited impact on apparent 210
digestibility. When hay and haylage originating from the same crop (same 211
harvest/batch) were compared, digestibility did not differ (Bergero and Peiretti, 2011) 212
although when hay and silage from the same crop was compared, digestibility was 213
slightly higher in silage compared to hay (Muhonen et al., 2008b). Feed changes from 214
hay to silage or haylage (even from the same harvest/batch) may, however, affect the 215
microflora as well as the DM of the hindgut contents (Muhonen et al 2008, Muhonen 216
2009) Similarly changes between forage batches with different CP contents should 217
10
be made slowly, as colonic pH, for example, has been shown not to be stable within 218
3 weeks after such a change (Muhonen et al., 2008a) although further studies are 219
needed to assess the importance of these alterations.. Until we do know more it is 220
recommended that changes between forage batches should therefore be made 221
carefully to minimise the risk of disturbances. In support of these recommendations 222
the incidence of certain types of colic has been shown to increase especially in the 223
first 7 days (but up to 28days) after a change in forage feeding (Hillyer et al 2002). 224
225
Insert Table 1 and 2 226
227
Hygienic quality 228
This is a key issue, as forages fed to horses have often been reported to be of poor 229
hygienic quality (Wichert et al., 2008) which can lead to significant health problems for 230
example, mould spore exposure, especially from Aspergillus fumigatus has been 231
implicated in the aetiology of recurrent airway obstruction in horses (Pirie 2014). 232
Although the term “poor hygienic quality” is not well defined, it may include biological 233
contaminants (e.g. pests, microorganism and their related toxins), chemical 234
contaminants (e.g. fertilizer, heavy metals), and physical contaminants such as soil. 235
In that context, feed hygiene, as stated by EU legislation (Regulation (EC) No 236
183/2005), includes all aspects that must be considered in order to produce, sell and 237
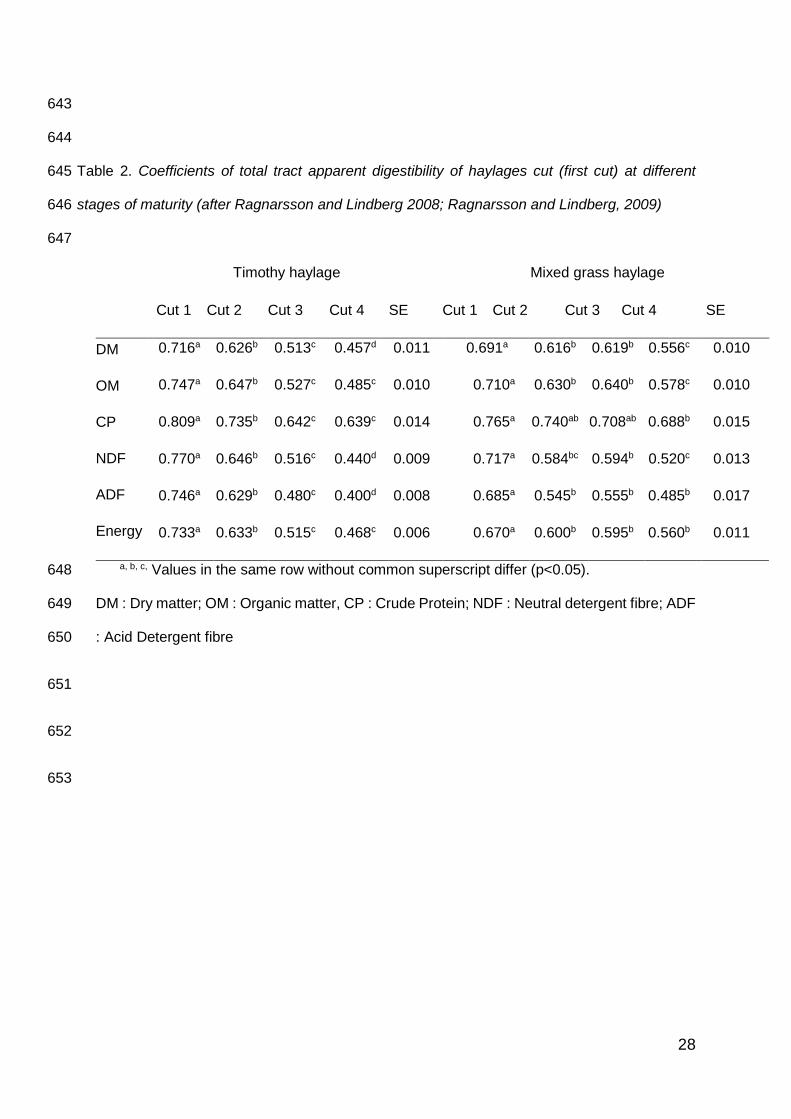
feed a safe feedstuff that will not result in any harmful effects on the animal, and 238
therefore applies to forage as well. EU legislation (EC No 32/2002) defines maximum 239
acceptable levels for a variety of contaminants in feedstuffs including for heavy metals, 240
aflatoxin B1, rye ergot and substances such as pesticides. 241
242
11
Several parameters can be used to evaluate hygienic quality including feel (e.g. dry, 243
clammy), smell (e.g. typical, mouldy), colour (e.g. green, bleached), macroscopic 244
findings (e.g. presence of sand, soil, dead animals) and/or microbial evaluation 245
(Wichert et al., 2008, Kamphues 2013, Wolf et al., 2014). Knowing the DM content is 246
key, as discussed above, as microorganisms need water for survival and multiplication 247
(Kamphues 2013). A macroscopic evaluation should routinely be undertaken for 248
obvious moulds, as well as the presence of sand/soil and other potential contaminants 249
especially poisonous plants. Senecio spp., and Taxus baccata have been suggested 250
to be the main poisonous plants for horses (Berny et al., 2010) although regionally 251
other poisonous plants may be important e.g. vitamin D-intoxication via Golden oat 252
grass in parts of Germany (Bockisch et al., 2015). 253
Much attention is given to the microbiological analysis of feedstuffs but there are 254
significant effects of the analytical methods used. Pre-treatment, incubation 255
temperature, type of incubation substrate and incubation duration can all significantly 256
influence what is cultivated (Raymond et al., 2000; Müller et al., 2011). For example, 257
the growth of thermophilic bacteria such as actinomyces is supported by an incubation 258
temperature of 55°C for three days, whereas the growth of mesophilic aerobic bacteria 259
is supported by a lower incubation temperature (25°C), but a longer incubation time (7 260
days, Raymond et al., 2000). In some European countries, the characterization and 261
benchmarking for bacteria, moulds and yeasts in feedstuffs has been standardized 262
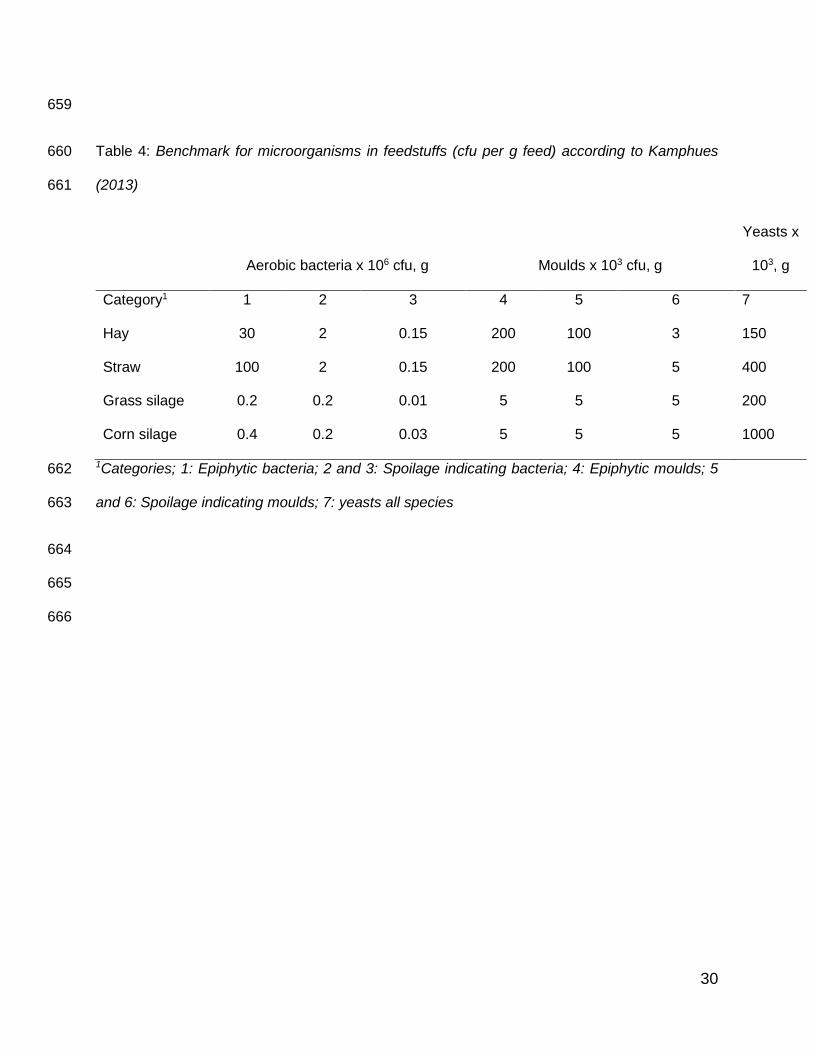
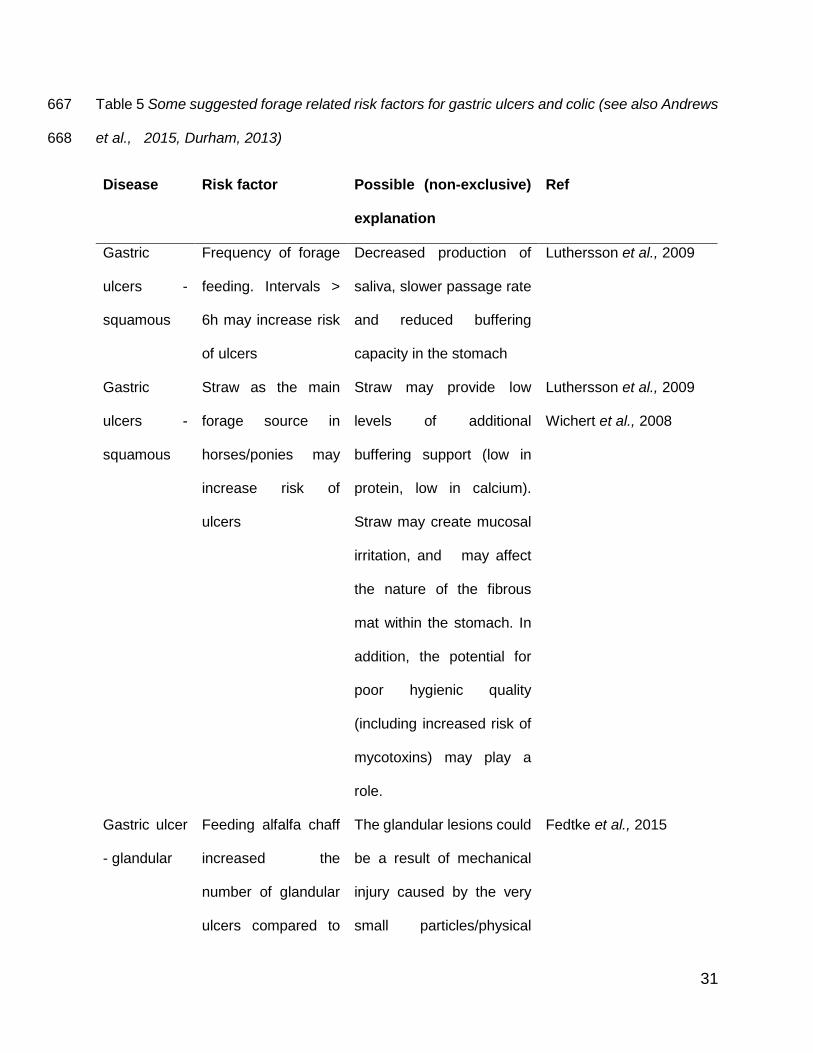
(Tables 3 and 4) to provide upper acceptable levels of contamination which are 263
thought not to have any adverse effects on horse health. For this purpose 264
microorganisms are classified as being either epiphytic (i.e. normal contaminants that 265
are present even under optimal conditions) or spoilage inducing. Importantly, both 266
types may impact health (e.g. respiratory problems by moulds). However, it should be 267
12
emphasised that whilst these benchmark levels can be used to describe spoilage, the 268
consequences on equine health through exceeding the benchmark levels requires 269
more in-depth evaluation. 270
271
Undesirable bacteria, moulds and yeasts multiply under adverse conditions such as 272
rainfall, high humidity, and high ambient temperatures or due to vectors like mites. As 273
outlined above a DM content of >85% reduces microbial activity 274
275
Mycotoxins such as ergot alkaloids, , zearalenone, deoxynivalenol, fumonisin B1 and 276
B2, ochratoxin A or aflatoxin B1 are secondary metabolites produced by fungi that are 277
capable of causing toxicity (see review Riet-Correa et al., 2013). However, little is 278
known about the impact of mycotoxins on equine health status. Several mycotoxins 279
are designated as undesirable substances with maximum levels in human food, 280
whereas only aflatoxin B1 and rye-ergot are currently designated as undesirable 281
substances with maximum levels for animal feedstuffs. Further analyses, therefore, 282
may be required including detailed mycotoxin determinations e.g. clinical signs of 283
leukoencephalomalacia requires fumonisin analysis especially when corn silage with 284
corn cobs is being fed to the affected horses. Whilst it is impossible to fully eliminate 285
mycotoxins, it is important to reduce contamination by optimizing harvesting and 286
storage conditions. 287
Botulism occurs following exposure to toxins (8 different serotypes) produced by 288
anaerobic spore-forming bacterium Clostridium botulinum and other botulinum toxin-289
producing clostridia (Galey 2001). In adult horses, food-borne botulism is acquired by 290
the ingestion of preformed toxins (mainly type B, C or A). Feeding big bale silage or 291
haylage have been often associated with botulism outbreaks in horses, mules or 292
13
cattle (e.g. Ricketts et al., 1984; Divers et al., 1986; Wollanke 2004; Myllykoski et al., 293
2009), although there have been outbreaks linked with hay feeding (Wichtel and 294
Whitlock 1991; Johnson et al., 2010) . Botulinum toxin production typically occurs due 295
to contamination with animals, soil or poultry slurry. Equivocal results have been 296
reported regarding the potential risk of silage or haylage contamination with 297
Clostridium botulinum spores through using the wastage from biogas anaerobic 298
digesters for fertilization (Müller et al., 2013; Neuhaus et al, 2015). 299
300
Methods of sampling 301
A good sampling procedure is crucial so that any analysis (e.g. nutrients, microbial 302
counts) represents the mean value for the whole batch. For the official feed control EU 303
legislation (EC No 691/2013) suggests for example that 5 up to 40 individual samples 304
should be aggregated to form an initial overall sample of between 1 (low specific 305
gravity, e.g. hay or straw) and 4 kg as fed (e.g. silage). . 306
Table 3 and 4 here 307
Forage Intake Behaviour and Welfare considerations 308
Free-ranging horses perform 10-15 individual feed-bouts/day and forage for 12.5±2.5 309
hours per day with recordings as high as 18 hours (Ellis, 2010, Supplementary Table 310
S2). ‘Non-foraging’ bouts are rarely longer than 3 hours duration (2±1.3) (Souris et al., 311
2005; Van Dierendonck et al., 1996; Hallam et al., 2012, Ellis et al., 2015;). Even when 312
stabled, horses tend to spend a minimum time (8.5-12 hrs/day) on foraging related 313
behaviours, at times 'topping up' their food intake behaviour by ingesting wood-314
shavings and performing coprophagy for up to 3hrs per day (Ellis et al., 2006, Ellis 315
14
2010). Curtis et al. (2011) suggested the potential for wood-shaving intakes of up to 316
3.5kg in a few individuals fed DM restricted diets as part of a weight loss programme 317
and this is in line with considerable amounts of woodshavings reported in the stomach 318
of horses on a low forage diet (Boswinkel et al 2007) . Intake times for chopped 319
lucerne/alfalfa are about twice as fast as those for long hay (Ellis, 2010). Chopping 320
very late cut hay to 3.5 cm particle length did not shorten intake times in 8 horses but 321
adding chopped forage (~2.5cm or 4cm) to pellets at 30% inclusion rate doubled 322
concentrate feed intake times (Ellis and Hill, 2002; Ellis et al., 2005). Replacing hay 323
with ground-hay pellets reduces chewing time/kg by 75% (Ellis et al., 2010) which may 324
partially explain the increased intakes (to 4-5% of BW) seen by Argo et al. (2002) and 325
Henneke and Callaham (2009) when they fed only pellets compared to a chaff-feed or 326
hay. Elia et al. (2010) found that foraging through wood-shaving bedding increased by 327
3.5 hrs/day, when feeding just hay pellets compared to feeding hay. This strong 328
motivation to spend a minimum of 8 (stabled) to 12 (grazing) hours on intake 329
behaviours, irrelevant of the energy density or composition of feedstuffs is supported 330
by many studies on voluntary intake behaviour (Supplementary Table S2) and night 331
time observations of stabled horses (Ellis et al., 2015). In addition stabled horses rest 332
for 3-4 hours maximum before re-commencing foraging-related behavior (Ellis et al., 333
2015). 334
Furthermore, in a race horse population of 2900 animals, those fed <6.8kg/day of 335
forage showed a significant increase in abnormal behaviours including oral 336
stereotypies and weaving (McGreevy et al., 1995). Lack of foraging opportunity has 337
been directly linked to the onset of oral stereotypies in foals (Nicol et al., 2002) and to 338
possible stereotypic pre-cursor behaviour (increased water play and drinking, 339
locomotion) in 3 out of 5 feed-restricted ponies (Dugdale et al., 2010). Appetitive 340
15
behaviours have a positive feedback on motivation through the brain’s pleasure 341
centres which become active as the horse pursues its goal (McBride and Hemmings, 342
2005). If the motivation to forage/chew is not fulfilled, other behaviours may replace 343
the original goal achievement behaviour as highlighted in several mammals (Hughes 344
and Duncan, 1988). 345
Health considerations 346
Horses as previously stated are adapted to a slow and almost continual intake of a 347
diet rich in structural fibre and low in rapidly hydrolysable carbohydrates. For many 348
commonly encountered equine health issues, forage feeding management is an 349
important factor in helping to reduce risk and maintain health. 350
Particle length influences motility and transit time within the GI tract, as larger particles 351
move more slowly (Drogoul et al., 2000) and forage also influences gastric emptying 352
rate and/or the passage rate through the small intestine (Jensen et al., 2012). A more 353
stable (Willing et al., 2009) and diverse microbial population, with a larger core, is 354
found when a forage only diet is fed especially compared to a sugar and starch rich 355
ration (Dougal et al., 2014). Stabling and feeding preserved forage results in a change 356
in gut motility and higher DM faeces despite an increased water intake (Williams et al., 357
2011, 2015). Horses have a lower pH in the proximal stomach during early morning 358
(1:00–9:00 AM), when stomach-fill tends to be lower especially in stabled animals 359
(Husted et al., 2008). It is therefore not surprising that several nutritional risk factors 360
for equine gastric ulcer syndrome (EGUS), colic and diarrhea have been identified and 361
many of them are related to limited, reduced or a changed intake of forage (see table 362
5). 363
16
Recurrent airway obstruction (RAO) is the most common cause of chronic coughing 364
in horses in temperate countries, with up to 14% prevalence in the UK (Hotchkiss et 365
al., 2007). This lower airway inflammatory disease results in a range of clinical signs 366
from exercise intolerance/poor performance, to severe expiratory dyspnea (Pirie et al., 367
2002; Pirie et al., 2003; McGorum and Pirie 2008). Exposure to airborne organic dust 368
(mostly endotoxins) via stabling and feeding of hay/straw with a high mould count 369
plays a primary role (Couetil and Ward 2003) as discussed above. 370
The management strategies for horses at increased risk of several conditions, such 371
as certain forms of laminitis (including those with the Equine Metabolic Syndrome and 372
Pituitary Pars Intermedia Dysfunction) as well as various muscular disorders including 373
the Equine Rhabdomyolysis Syndrome, includes reducing the intake of non-structural 374
carbohydrates (NSC) (MacLeay et al., 2000;, McKenzie et al., 2003; Valentine et al., 375
2001; Hunt et al., 2008). Such horses are often put on restricted or no pasture access 376
(especially when the levels of fructans, starch and sugar are high or there is a high 377
herbage yield) and are fed a diet based on preserved forage or forage replacers (e.g. 378
commercial fibre based products) with a known and low content of NSC (<10-12% 379
DM) to minimize post-feeding glycemic and insulinaemic responses (Borgia et al., 380
2011; Geor and Harris 2013; Harris et al., 2013). Recent observations also indicate 381
that forage CP content might be of importance for the insulin response (Ringmark and 382
Jansson 2013). 383
Table 5 here 384
Performance considerations 385
Historically, the use of forage in diets of performance horses has been limited 386
(Jansson and Harris 2013). Recent studies (Connysson et al., 2006; Muhonen et al., 387
17
2008b; Connysson et al., 2010; Essén-Gustavsson et al., 2010; Jansson and Lindberg 388
2012; Ringmark et al., 2012; Ringmark et al., 2015) show that forage-only diets can 389
meet the high energy requirements of horses in very heavy training (equal to or more 390
than twice maintenance requirements) if the energy density is high enough. The 391
energy density of such forage must correspond to at least 10.5 MJ ME/kg DM 392
(Jansson and Lindberg 2012; Ringmark 2014). These studies indicate no adverse 393
effects on performance with exception for slightly lower (ca -10 %) muscle glycogen 394
contents within 3 days after high intensity work compared to a high starch diet 395
(Jansson and Lindberg 2012). However, very high muscle glycogen contents and 396
indications of rapid glycogen recovery have been documented on forage-only diets 397
providing crude protein intakes above current feeding recommendations and forage 398
WSC contents of 8.5-13.5 % of DM (Essén-Gustavsson et al., 2010; Ringmark, 2014). 399
In the study by Jansson and Lindberg (2012) plasma lactate response was decreased, 400
venous pH and blood glucose was increased during exercise on the forage-only diet 401
compared to the traditional high starch diet, indicating a metabolic pattern that might 402
improve performance. A recent study (Ringmark 2014) has also shown that it is 403
possible to get Standardbred yearlings into racing condition at the age of 3, and also 404
to win races, on a high-energy forage diet supplemented only with minerals and 405
vitamins. Horses also maintained plasma volume longer during 12 h of feed 406
deprivation on a forage only-diet compared to a high starch diet (Connysson et al., 407
2010). Altogether these studies suggest that high energy preserved forage can be an 408
alternative to high starch feeds in exercising horses and that such diets might promote 409
both health and performance. 410
Author’s Recommendations for best practice 411
18
Based on the above and other published work (as well as personal views where 412
stated). 413
414
A. The general use of the following terms is recommended 415
416
I. haylage for forages stored airtight and with DM content ≥ 50%. 417
II. silage for forages stored airtight with DM contents below 50% 418
III. hay for forage preserved at a DM content ideally above 85% 419
420
B. To fully understand the value of a forage, and its impact as part of the horse’s 421
diet, nutrient analysis is recommended and an estimation of the energy content 422
should be made. This becomes particular important when feeding horses with health 423
disorders (e.g. low BCS, obesity, laminitis, PSSM). 424
425
C. Hygienic quality of forages must be a key consideration as poor hygienic 426
quality can lead to significant health problems. As a minimum, regular visual and 427
olfactory inspection should be undertaken and poor quality forage appropriately 428
disposed of. Benchmarks for microorganism contamination should be considered. 429
430
D. Changes in forage should be done gradually especially if the nutrient 431
composition (energy, protein, WSC) is unknown or known to differ considerably due 432
to changes in plant-species, growth stage and preservation technique. In such 433
instances at least 2 and possibly more than 3 weeks adaptation period may be 434
required. 435
436
19
In terms of forage requirements for horses it is recommended that: 437
1. The basis of any horse’s diet should be fresh or preserved forage 438
(recommended particle length >2.5 cm) offered ideally ad libitum or spread 439
throughout the day to avoid prolonged periods (i.e. >4-5hrs) in a stable without 440
foraging opportunity. However, in older horses with chewing difficulties, using ground 441
high fibre products in a soaked mash form may be beneficial. 442
2. A horse requires sufficient forage fed in a form that supports species specific 443
feed intake behaviour ideally for a minimum of 8 hrs and preferably 10 hours/24hrs. 444
3. The amount of preserved forage in the ration should be calculated on a g DM 445
/kg BW rather than % of ration or an as-fed basis due to the great variation in DM 446
content of different forages. 447
4. The lower limit of daily forage intake should be 15g DM/kg BW in addition to 448
complementary (concentrate/compound) feeding, with an absolute minimum 449
recommendation of 12.5g DM/kg BW. Previously recommended minimums of forage 450
at 8-10g DM per kg BW/day are not acceptable according to the latest understanding 451
of equine ethological needs and health considerations. 452
5. Any lower amounts should only be fed solus (i.e. no other fibre provision), under 453
exceptional clinical circumstances (e.g. as low energy providing hays for animals 454
undergoing severe restriction for weight loss purposes, post-surgery etc.), under 455
veterinary supervision and with an appropriate forage vitamin/mineral/protein 456
balancer. 457
6. Straw, if required, should be introduced into the diet very slowly, which helps 458
the horse to adapt its chewing behavior and reduce the risk of impaction, although this 459
remains a significant risk with certain individuals. The risk of gastric ulceration also 460
20
may increase when straw is the main roughage. Some of the authors (PH, AE, VJ, NL) 461
personally recommend that not more than 30% of the forage DM ration should be 462
straw (other than for donkeys). Others (AJ, IV) may recommend higher proportions 463
providing the straw is of a good hygienic standard and the overall ration is balanced 464
for protein vitamins, minerals and trace elements. 465
7. For horses requiring increased energy intake due to reproduction status or 466
work level, less mature forages that have a higher energy content, should be 467
considered. Forages cut at an earlier plant maturity stage are less likely to require 468
protein supplementation. 469
8. Intakes above those recommended here may be fed or consumed by horses, 470
as long as a healthy energy balance (body condition) is maintained. If body weight 471
increases even when feeding the minimum recommended intake, a forage with a 472
lower energy content should be fed rather than reducing the dry matter forage intake. 473
474
475
Acknowledgements: We thank all committee members, participants, sponsors and 476
organizers of the European Workshop in Equine Nutrition (EWEN) for their input and 477
support. In addition, special thanks are expressed to Manfred Coenen, Sarah 478
Ralston, Thomas Pauly, Rolf Spörndly, Cecilia Müller, Markku Saastamoinen, Dag 479
Austbø, Anne-Helene Tauson, Sveinn Ragnarsson, Joaquin Clotet, Samy Julliand, 480
Nicoletta Miraglia, Pier Giorgio Peiretti, Teresa Dentinho, Luis Ferreira, Rui Bessa 481
and Andreas Olt. 482
483
484
21
References from 2010 onwards (The list of references from 2009 and before is given in 485
Supplementary Material S1). 486
Andrews FM, Larson C and Harris P 2015. Nutritional management of gastric ulceration. 487
Equine Veterinary education (in press). 488
Bergero D and Peiretti PG 2011. Intake and Apparent Digestibility of Permanent Meadow Hay 489
and Haylage in Ponies. Journal of Equine Veterinary Science 31, 67-71. 490
Berny P, Caloni F, Croubels S, Sachana M, Vandenbroucke V, Davanzo F and Guitart R 491
2010. Animal poisoning in Europe. Part 2: Companion animals. Veterinary Journal 183, 492
255-9. 493
Bockisch F, Aboling S, Coenen M, and Vervuert I. 2015. Yellow oat grass intoxication in 494
horses: Pitfalls by producing hay from extensive landscapes? A case report. 495
Tierarztliche Praxis Grosstiere Nutztiere 43, 296-304. 496
Borgia L, Valberg S, McCue M, Watts K. and Pagan J 2011. Glycaemic and insulinaemic 497
responses to feeding hay with different non‐structural carbohydrate content in control and 498
polysaccharide storage myopathy‐affected horses. Journal of animal physiology and 499
animal nutrition 95, 798-807. 500
Connysson M, Essén-Gustavsson B, Lindberg J E and Jansson A 2010. Effects of feed 501
deprivation on Standardbred horses in training fed a forage-only diet and a 50:50 forage-502
oats diet. Equine Veterinary Journal Suppl. 38, 335-340. 503
Curtis G, Barfoot C, Dugdale A, Harris P and Argo C 2011. Voluntary ingestion of wood 504
shavings by obese horses under dietary restriction. British Journal of Nutrition 106, S178–505
S182. 506
Dougal K, de la Fuente G, Harris PA, Girdwood SE, Pinloche E, Geor RJ, Nielsen BD, Schott 507
II HC, Elzinga S and Newbold CJ 2014. Characterisation of the faecal bacterial community 508
in adult and elderly horses fed a high fibre, high oil or high starch diet using 454 509
pyrosequencing. PloS one, 9 p.e87424. 510
22
Dougal K, de la Fuente G, Harris PA, Girdwood SE, Pinloche E and Newbold CJ 2013. 511
Identification of a core bacterial community within the large intestine of the horse. PloS one 512
8, p.e77660. 513
Dugdale AHA, Curtis GC, Cripps P, Harris PA and Argo C 2010. Effect of dietary restriction 514
on body condition, composition and welfare of overweight and obese pony mares. Equine 515
Veterinary Journal 42, 600-610. 516
Durham A 2013. Intestinal disease In Equine Clinical and Applied nutrition. (ed. RJ Geor, PA 517
Harris and M Coenen), pp 568-581. Elsevier, Amsterdam, the Netherlands. 518
Earing JE, Lawrence LM, Hayes SH, Brummer M and Vanzant E. 2013. Digestive capacity in 519
weanling and mature horses. Journal of Animal Science 91, 2151-2157. 520
Elia JB, Hollis N, Houpt KA 2010. Motivation for hay: Effects of a pelleted diet on behavior and 521
physiology of horses. Physiology and Behavior 101, 623–627. 522
Ellis AD 2010. Biological basis of behaviour and Feed Intake in horses. In The impact of 523
Nutrition on the Health and Welfare of Horses (ed. AD Ellis, A Longland, M Coenen and 524
N Miraglia), pp. 53-74. EAAP Publication No. 128, Wageningen Academic Publishers, 525
Wageningen, the Netherlands. 526
Ellis AD, Redgate S, Zinchenko S, Owen H, Barfoot C and Harris P 2015. The effect of 527
presenting forage in multi-layered haynets and at multiple sites on night time budgets of 528
stabled horses, Applied Animal Behaviour Science 171, 108–116. 529
Essén-Gustavsson B, Connysson M and Jansson A 2010. Effects of crude protein intake from 530
forage-only diets on muscle amino acids and glycogen levels in horses in training. Equine 531
Veterinary Journal 42, 341-346. 532
Faubladier C, Julliand V, Danel J and Philippeau C 2013. Bacterial carbohydrate-degrading 533
capacity in foal faeces: changes from birth to pre-weaning and the impact of maternal 534
supplementation with fermented feed products. British Journal of Nutrition 110, 1040-1052. 535
Fedtke A, Pfaff M, Volquardsen J, Venner M and Vervuert I (2015): Effects of alfalfa chaff on 536
gastric mucosa in weanling foals. Pferdeheilkunde 31, 596. 537
23
Geor RJ and Harris PA 2013. Laminitis. In Equine Applied and Clinical Nutrition, Health, 538
Welfare and Performance. Saunders, Elsevier (ed. RJ Geor, PA Harris and M Coenen), pp. 539
469-486. Elsevier, Amsterdam, the Netherlands. 540
Hallam S, Campbell EP, Qazamel M, Owen H and Ellis AD 2012. Effects of traditional versus 541
novel feeding management on 24 hour time budget of stabled horses. In Forages and 542
Grazing in Horse Nutrition (ed. M Saastamoinen, MJ Fradinho, AS Santos, N Miraglia), pp. 543
319-321. EAAP Publication No. 132, Wageningen Academic Publishers, Wageningen, the 544
Netherlands. 545
Harris PA, Coenen M and Geor RJ 2013. Controversial areas in equine nutrition and feeding 546
management : the editors’ views. In Equine Clinical and Applied nutrition (ed. RJ Geor, 547
PA Harris and M Coenen), pp 455-468. Elsevier, Amsterdam, the Netherlands. 548
Jansson A and Harris P 2013. A bibliometric review on nutrition of the exercising horse from 549
1970 to 2010. Comparative Exercise Physiology 9, 169-180. 550
Jansson A and Lindberg JE 2012. A forage-only diet alters the metabolic response of horses 551
in training. Animal 6, 1939–1946. 552
Jansson A, Saastamoinen M and Lindberg JE 2012. Forage feeding systems. In Forages and 553
grazing in horse nutrition (ed. MT Saastamoinen, MJ Fradinho, AS Santos and N Miraglia), 554
pp. 289-304. EAAP publication No. 132, Wageningen Academic Publishers, Wageningen, 555
The Netherlands. 556
Jensen RB, Austbø D and Tauson AH 2012. Feeding forage before or after oats affects 557
caecum pH profiles in the horse. In: Forages and grazing in horse nutrition (ed. MT 558
Saastamoinen, MJ Fradinho, AS Santos and N Miraglia), pp 327-330. EAAP publication 559
No. 132, Wageningen Academic Publishers, Wageningen, The Netherlands. 560
Johnson AL, McAdams SC and Whitlock RH 2010. Type A botulism in horses in the United 561
States: a review of the past ten years (1998-2008). Journal of Veterinary Diagnostic 562
Investigation 22, 165-73. 563
24
Kamphues J 2013. Feed hygiene and related disorders in horses. In: Equine applied and 564
clinical nutrition (ed. RJ Geor, PA Harris and M Coenen), pp 367-380. Elsevier, 565
Amsterdam, the Netherlands. 566
567
Lindburg JE 2013 Feedstuffs for horses In: Equine applied and clinical nutrition (ed. RJ Geor, PA 568
Harris and M Coenen), pp 319 -331. Elsevier, Amsterdam, the Netherlands.Martinson K, 569
Coblentz, W and Sheaffer C 2011. The Effect of Harvest Moisture and Bale Wrapping on 570
Forage Quality, Temperature, and Mold in Orchardgrass Hay. Journal of Equine Veterinary 571
Science 31, 711-716. 572
McEniry J, Forristal PD and O'Kiely P 2011. Factors influencing the conservation 573
characteristics of baled and precision-chop grass silages. Irish Journal of Agricultural and 574
Food Research 50, 175-188. 575
Merritt AM and Julliand V 2013 Gastrointestinal physiology. In Equine Clinical and Applied 576
nutrition (ed. RJ Geor, PA Harris, and M Coenen), pp 3-32. Elsevier, Amsterdam, the 577
Netherlands. 578
Müller CE, Hultén C, and Gröndahl G 2011. Assessment of hygienic quality of haylage fed to 579
healthy horses. Grass and Forage Science 66, 453-463 580
581
Müller, C.E. 2012. Equine digestion of diets based on haylage harvested at different plant 582
maturities. Animal Feed Science and Technology 177, 65-74. 583
Müller CE, Johansson M, Salomonsson AC and Albihn A 2013. Effect of anaerobic digestion 584
residue vs. livestock manure and inorganic fertilizer on the hygienic quality of silage and 585
haylage in bales. Grass and Forage Science 69, 74-89 586
Neuhaus J, Schrödl W, Shehata AA and Krüger M 2015. Detection of Clostridium botulinum 587
in liquid manure and biogas plant wastes. Folia Microbiologica 60, 451-6. 588
25
Potts L, Hinkson J, Graham B, Löest C and Turner J 2010 Nitrogen Retention and Nutrient 589
Digestibility in Geldings Fed Grass Hay, Alfalfa Hay, or Alfalfa Cubes. Journal of Equine 590
Veterinary Science 30, 330-334. 591
Ragnarsson S and Jansson A 2011. A comparison of grass haylage digestibility and metabolic 592
plasma profile in Icelandic and Standardbred horses. Journal of animal physiology and 593
animal nutrition 95, 273-279. 594
Ragnarsson S and Lindberg JE 2010. Nutritional value of mixed grass haylage in Icelandic 595
horses. Livestock Science 131, 83-87. 596
Riet-Correa F, Rivero R, Odriozola E, Adrien Mde L, Medeiros RM, Schild AL 2013. 597
Mycotoxicoses of ruminants and horses. Journal Veterinary Diagnostic Investigation 25, 598
692-708. 599
. 600
Ringmark S, Roepstorff L, Essén-Gustavsson B, Revold T, Lindholm A, Hedenström U, 601
Rundgren M, Ögren G and Jansson A 2012. Growth, training response and health in 602
Standardbred yearlings fed a forage-only diet. Animal 7, 746-753. 603
Ringmark S, Lindholm A, Hedenstrom U, Lindinger M, Dahlborn K, Kvart C, and Jansson 604
A 2015. Reduced high intensity training distance had no effect on VLa4 but attenuated 605
heart rate response in 2-3-year-old Standardbred horses. Acta Veterinaria Scandinavica 606
57, 1. 607
Ringmark S, Jansson A 2013. Insulin response to feeding forage with varying crude protein 608
and amino acid content in horses at rest and after exercise. Comparative Exercise 609
Physiology 9, 209-217. 610
Ringmark S 2014. A forage-only diet and reduced high intensity training distance in 611
Standardbred horses. PhD thesis, Swedish University of Agricultural Sciences, Uppsala, 612
Sweden. 613
26
Sarkijarvi S, Sormunen-Cristian R, Heikkila T, Rinne M and Saastamoinen M 2012. Effect 614
of grass species and cutting time on in vivo digestibility of silage by horses and sheep. 615
Livestock Science144, 230-239. 616
Séguin V, Lemauviel-Lavenant S; Garon D, Bouchart V, Gallard Y, Blanchet B, Diquelou 617
S, Personeni E, Gauduchon P, Ourry A 2010. Effect of agricultural and environmental 618
factors on the hay characteristics involved in equine respiratory disease. Agriculture, 619
Ecosystems and Environment 135, 206-215. 620
Virkajärvi P, Saarijärvi K, Rinne M and Saastamoinen M 2012. Grass physiology and its 621
relation to nutritive value in feeding horses. In Forages and grazing in horse nutrition (ed. 622
MT Saastamoinen, MJ Fradinho, AS Santos and N Miraglia), pp. 17-43. EAAP publication 623
No. 132. Wageningen Academic Publishers, Wageningen, The Netherlands. 624
Williams S, Horner J, Orton E, Green M, McMullen S, Mobasheri A and Freeman SL 2015, 625
Water intake, faecal output and intestinal motility in horses moved from pasture to a stabled 626
management regime with controlled exercise. Equine Veterinary Journal 47, 96–100. 627
Williams S, Tucker CA, Green M J. and Freeman SL 2011. Investigation of the effect of 628
pasture and stable management on large intestinal motility in the horse, measured using 629
transcutaneous ultrasonography. Equine Veterinary Journal, 43, 93–97. 630
Wolf P, Siesenop U, Verspohl J and Kamphues J 2014. Hygienic quality of feedstuffs for small 631
mammals sent to the consultation service. Tierärztliche Praxis Kleintiere 42,101-106. 632
633
27
634
Table 1. Coefficients of total tract apparent digestibility in Icelandic and Standardbred 635
horses fed the same early and late cut forages (after Ragnarsson and Jansson, 2011) 636
Early cut
Icelandic
Early cut
Standardbred
Late cut
Icelandic Late cut Standardbred SE
OM 0.536a 0.565b 0.431 0.427 0.006
CP 0.636 0.660 0.478 0.479 0.012
NDF 0.517 0.536 0.322 0.320 0.008
ADF - - - - -
Energy 0.517a 0.540b 0.407 0.400 0.007
a, b, Values in the same row without common superscripts differ (p<0.05) and indicate breed 637
differences. 638
OM : Organic matter, CP : Crude Protein; NDF : Neutral detergent fibre; ADF : Acid Detergent 639
fibre 640
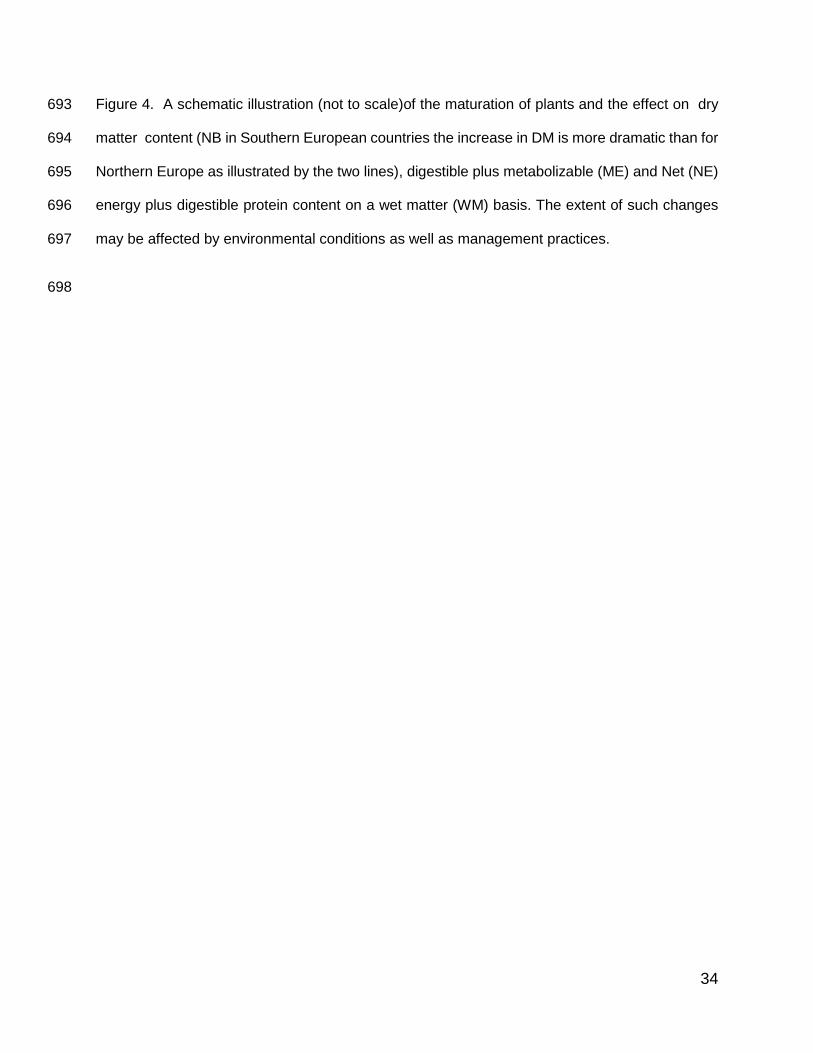
641
642
28
643
644
Table 2. Coefficients of total tract apparent digestibility of haylages cut (first cut) at different 645
stages of maturity (after Ragnarsson and Lindberg 2008; Ragnarsson and Lindberg, 2009) 646
647
Timothy haylage Mixed grass haylage
Cut 1 Cut 2 Cut 3 Cut 4 SE Cut 1 Cut 2 Cut 3 Cut 4 SE
DM
OM
CP
NDF
ADF
Energy
0.716a 0.626b 0.513c 0.457d 0.011 0.691a 0.616b 0.619b 0.556c 0.010
0.747a 0.647b 0.527c 0.485c 0.010 0.710a 0.630b 0.640b 0.578c 0.010
0.809a 0.735b 0.642c 0.639c 0.014 0.765a 0.740ab 0.708ab 0.688b 0.015
0.770a 0.646b 0.516c 0.440d 0.009 0.717a 0.584bc 0.594b 0.520c 0.013
0.746a 0.629b 0.480c 0.400d 0.008 0.685a 0.545b 0.555b 0.485b 0.017
0.733a 0.633b 0.515c 0.468c 0.006 0.670a 0.600b 0.595b 0.560b 0.011
a, b, c, Values in the same row without common superscript differ (p<0.05). 648
DM : Dry matter; OM : Organic matter, CP : Crude Protein; NDF : Neutral detergent fibre; ADF 649
: Acid Detergent fibre 650
651
652
653
29
Table 3: Classification of microorganisms in feedstuffs according to Kamphues (2013) 654
Microorganism Classification Category Species examples
Aerobic bacteria
Epiphytic 1
Flavobacterium
Pseudomonas
Xanthomonas
Erwinia
Spoilage 2
Bacillus spp
Staphylococcus
Micrococcus
3 Streptomyces spp.
Aerobic moulds
Epiphytic 4
Verticillium
Acremonium
Fusarium
Aurebasidium
Spoilage 5
Aspergillus
Penicillium
Scopulariopsis
Wallemia
6 Mucor spp.
Yeasts Spoilage 7 All species
655
656
657
658
30
659
Table 4: Benchmark for microorganisms in feedstuffs (cfu per g feed) according to Kamphues 660
(2013) 661
Aerobic bacteria x 106 cfu, g Moulds x 103 cfu, g
Yeasts x
103, g
Category1 1 2 3 4 5 6 7
Hay 30 2 0.15 200 100 3 150
Straw 100 2 0.15 200 100 5 400
Grass silage 0.2 0.2 0.01 5 5 5 200
Corn silage 0.4 0.2 0.03 5 5 5 1000
1Categories; 1: Epiphytic bacteria; 2 and 3: Spoilage indicating bacteria; 4: Epiphytic moulds; 5 662
and 6: Spoilage indicating moulds; 7: yeasts all species 663
664
665
666
31
Table 5 Some suggested forage related risk factors for gastric ulcers and colic (see also Andrews 667
et al., 2015, Durham, 2013) 668
Disease Risk factor Possible (non-exclusive)
explanation
Ref
Gastric
ulcers -
squamous
Frequency of forage
feeding. Intervals >
6h may increase risk
of ulcers
Decreased production of
saliva, slower passage rate
and reduced buffering
capacity in the stomach
Luthersson et al., 2009
Gastric
ulcers -
squamous
Straw as the main
forage source in
horses/ponies may
increase risk of
ulcers
Straw may provide low
levels of additional
buffering support (low in
protein, low in calcium).
Straw may create mucosal
irritation, and may affect
the nature of the fibrous
mat within the stomach. In
addition, the potential for
poor hygienic quality
(including increased risk of
mycotoxins) may play a
role.
Luthersson et al., 2009
Wichert et al., 2008
Gastric ulcer
- glandular
Feeding alfalfa chaff
increased the
number of glandular
ulcers compared to
The glandular lesions could
be a result of mechanical
injury caused by the very
small particles/physical
Fedtke et al., 2015
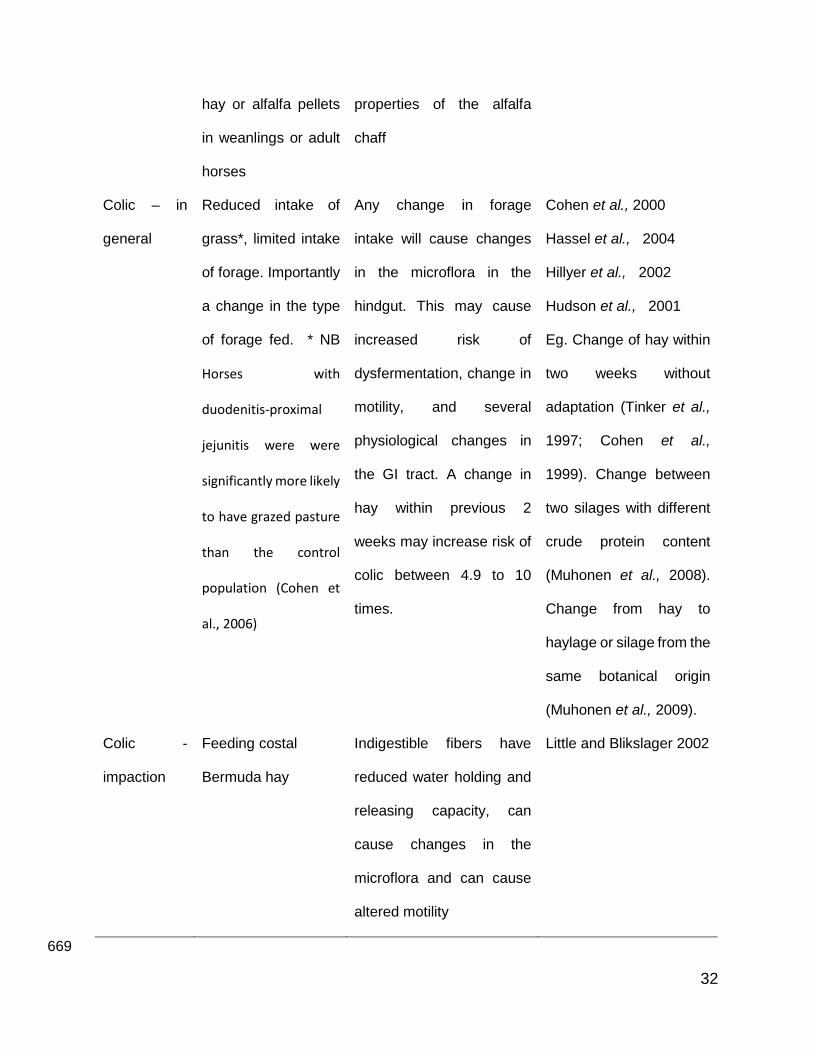
32
hay or alfalfa pellets
in weanlings or adult
horses
properties of the alfalfa
chaff
Colic – in
general
Reduced intake of
grass*, limited intake
of forage. Importantly
a change in the type
of forage fed. * NB
Horses with
duodenitis-proximal
jejunitis were were
significantly more likely
to have grazed pasture
than the control
population (Cohen et
al., 2006)
Any change in forage
intake will cause changes
in the microflora in the
hindgut. This may cause
increased risk of
dysfermentation, change in
motility, and several
physiological changes in
the GI tract. A change in
hay within previous 2
weeks may increase risk of
colic between 4.9 to 10
times.
Cohen et al., 2000
Hassel et al., 2004
Hillyer et al., 2002
Hudson et al., 2001
Eg. Change of hay within
two weeks without
adaptation (Tinker et al.,
1997; Cohen et al.,
1999). Change between
two silages with different
crude protein content
(Muhonen et al., 2008).
Change from hay to
haylage or silage from the
same botanical origin
(Muhonen et al., 2009).
Colic -
impaction
Feeding costal
Bermuda hay
Indigestible fibers have
reduced water holding and
releasing capacity, can
cause changes in the
microflora and can cause
altered motility
Little and Blikslager 2002
669
33
Figures 670
Figure 1. A very schematic overview giving some definitions and characteristics of hay, haylage 671
and silage (WSC=water soluble carbohydrates) made without additives. It is important to note 672
that DM content (and water activity) will determine the potential for fermentation so are linked with 673
lactate production. .In general as lactate starts to be produced the WSC and pH will start to 674
reduce, although other factors can influence pH (including buffer capacity). The WSC of any 675
preserved crop will be lower than the fresh forage it originated from due to respiration (plant and 676
microbial) post harvesting but the WSC content of haylage compared with the hay from the same 677
fresh pasture will depend on whether there have been any lactic acid (or VFA production) If there 678
is virtually no lactic acid (or VFA) production, then there will be no decrease in total WSC in 679
haylage compared to hay (Muhonen et al 2009). 680
681
Figure 2. A schematic figure on how minimum required air humidity (relative humidity, RH) for 682
mould growth varies with ambient temperature (adapted from Lehmann, 1971). 683
Figure 3. The relationship between airtight stored grass forage dry matter (DM) and lactate 684
content. At DM contents higher than 50 % (dotted line) the lactate content is very low. Data from 685
Wilkinson et al., 1976 (3 observations, 16- 45%DM); Müller, 2007 (10 observations 29-68%DM); 686
Muhonen, 2008 (8 observations, 36-81%DM); Ragnarsson, 2009 (8 observations, 36-81%) and 687
Sarkijärvi et al., 2012 (6 observations, 36-55%DM). All observations are from grass forage 688
preserved in wrapped bales except for Wilkinson et al., 1976 which were in silos. Forages were 689
preserved without additives except 6 observations, with lactic acid inoculant, from Muhonen, 2008 690
and formic acid inoculant in the Sarkijärvi et al., 2012 observations. Data fits (R2=0.84) the 691
equation: y = 0,0406x2 - 5,4306x + 179.3 and the equation is relevant in the interval 16-70 % DM. 692
34
Figure 4. A schematic illustration (not to scale)of the maturation of plants and the effect on dry 693
matter content (NB in Southern European countries the increase in DM is more dramatic than for 694
Northern Europe as illustrated by the two lines), digestible plus metabolizable (ME) and Net (NE) 695
energy plus digestible protein content on a wet matter (WM) basis. The extent of such changes 696
may be affected by environmental conditions as well as management practices. 697
698